Embed Size (px)
Citation preview

at SciVerse ScienceDirect
Journal of Power Sources 241 (2013) 121e126
Contents lists available
Journal of Power Sources
journal homepage: www.elsevier .com/locate/ jpowsour
Short communication
Application of electrochemical impedance spectroscopy to monitoringdischarging process of nickel/metal hydride battery
Pawel Slepski a, Kazimierz Darowicki a, Ewa Janicka a,*, Agnieszka Sierczynska b
aDepartment of Electrochemistry Corrosion and Materials Engineering, Gdansk University of Technology, 11/12 Narutowicza Street, 80-233 Gdansk, Polandb Institute of Non-ferrous Metals, Department in Poznan, Central Laboratory of Batteries and Cells, 12 Forteczna Street, 61-362 Poznan, Poland
h i g h l i g h t s
� Impedance-oriented diagnostics of NiMH cells was applied.� At the same time, changes impedance of cells components was obtained.� The cell, where state are determined by the positive, negative or both electrodes.� Duel-electrode measurements don’t reflect the actual condition of the tested battery.
a r t i c l e i n f o
Article history:Received 11 February 2013Received in revised form4 April 2013Accepted 9 April 2013Available online 19 April 2013
Keywords:Electrochemical impedance spectroscopyNickel/metal hydride batteryDischargeDiagnostic
* Corresponding author.E-mail address: [email protected] (E. Janic
0378-7753/$ e see front matter � 2013 Elsevier B.V.http://dx.doi.org/10.1016/j.jpowsour.2013.04.039
a b s t r a c t
This paper presents the possibility of applying impedance analysis to cell diagnostics. In order to obtaincharacteristic curves of both electrodes of a NiMH battery simultaneously, a reference electrode wasadded into the circuit. The authors analysed the cell under three cases, i.e. when its properties aredetermined only by the state of the positive electrode, only by the state of the negative electrode, orwhen both electrodes determine operation of the cell to the same extent. Impedance characteristiccurves of the entire cell in the function of variable state of charge do not allow for a conclusion as towhich electrode determines cell capacity. This is not possible until an analysis of impedance graphs iscarried out for each electrode. In view of the obtained results equivalent circuits for the positive elec-trode, the negative electrode, and the entire cell were selected. Further, a correlation between chargetransfer resistance, calculated for the entire cell, and the values obtained for the positive electrode, aswell as the negative one, is presented.
� 2013 Elsevier B.V. All rights reserved.
1. Introduction
The demand for power sources in the form of rechargeablebatteries is growing year by year, and this is attributable mainly tothe continuous development of mobile electronic equipment.Therefore, there are stricter requirements specified for such cells astheir higher and higher capacity, extended lifetime, and mostimportantly high reliability, are expected. At the same time, thesmallest possible weight and size of such cells are required.Generally, such features are complied with by NiMH batteries, i.e.cells using hydrogen storage alloy as a negative electrode and nickelhydroxide as a positive electrode [1e3].
R&D projects devoted to the NiMH batteries apply charge/discharge characteristics, capacity change analyses, cycle life, cyclic
ka).
All rights reserved.
voltammetry studies and electrochemical impedance spectroscopy(EIS) measurements [4e8]. For the purpose of the analysis, the EISmethod is applied most frequently [9e12]. It enjoys its popularityfrom being associated with the speed and non-destructive natureof the measurement, whereas obtained results allow for analysingmechanisms and kinetics of processes which take place in the cir-cuit being investigated. In the case of testing impedance of NiMHbatteries, measurements include a dual-electrode circuit wheretotal impedance of the positive electrode, the negative electrode,the separator, and electrolyte is to be determined. Obtainedimpedance characteristic curves are conditioned by the state ofsuch a cell, and thus, amongst other things, they can be employed inassessing their state of charge (SOC) [13,14]. Such as dual-electrodemeasurement allows for analysing results just by using simplifiedequivalent circuit diagrams, in which the components, apart fromelectrolyte resistance, cannot be associated with any specific elec-trode processes [15e17]. Therefore, they cannot be applied to pre-cise diagnostics; it is not possible to verify which element limits the
P. Slepski et al. / Journal of Power Sources 241 (2013) 121e126122
operation, properties of which one deviate from the rest, and as aresult, which one affects the behaviour of the entire cell. The degreeof cell consumption is not always associated with even degradationof electrodes, as it may also be caused as a consequence of damageor degradation of one of them. In order to obtain impedancechanges which occur across individual electrodes in the NiMHbattery it is necessary to apply an additional reference electrode.Such an approach, recently presented by the authors, allows notonly for obtaining impedance values of individual elements, butalso for tracking changes during the operation of an electro-chemical cell [18]. Hence it becomes possible to apply the imped-ance method for actual diagnostics of the NiMH batteries, which ispresented in this paper bymeans of a discharging process example.
2. Experimental
2.1. Model NiMH cell
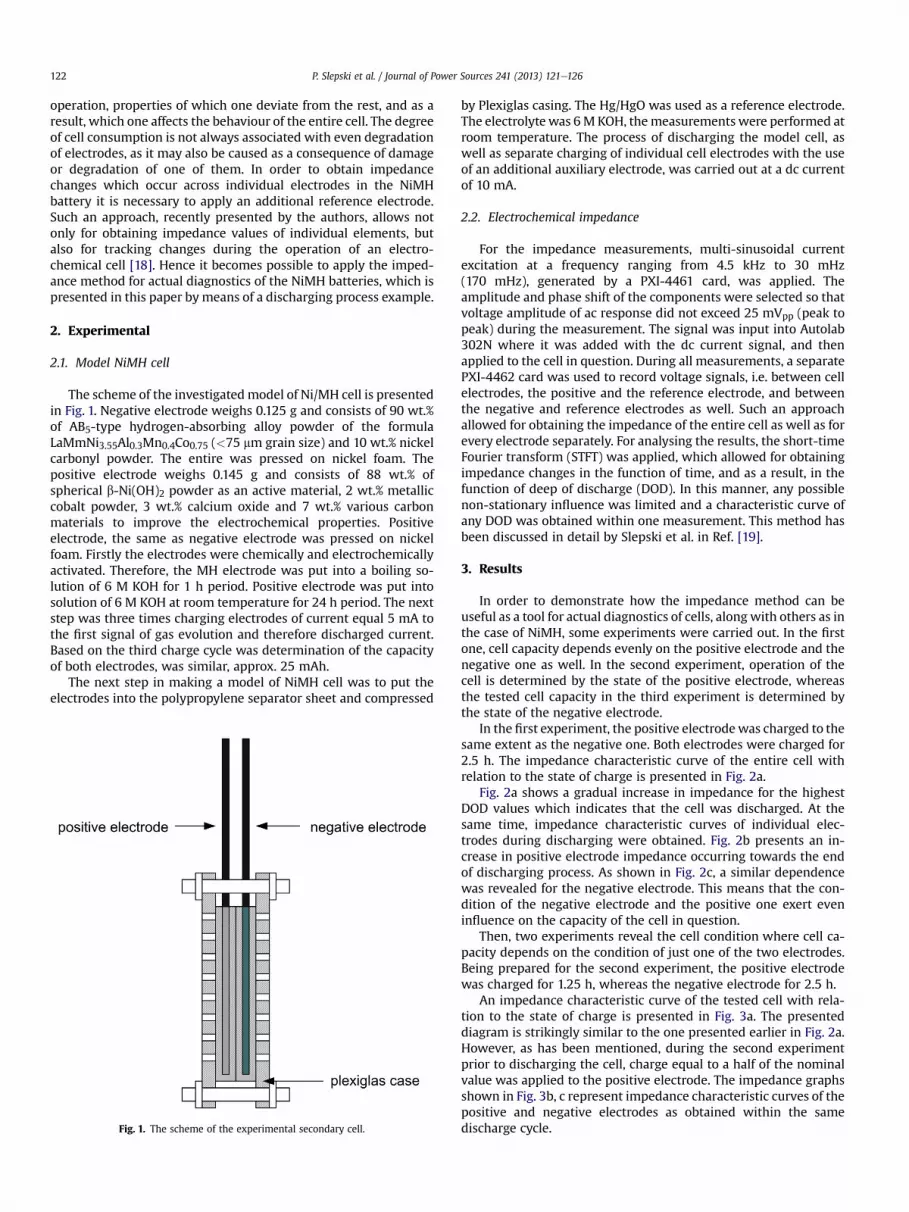
The scheme of the investigatedmodel of Ni/MH cell is presentedin Fig. 1. Negative electrode weighs 0.125 g and consists of 90 wt.%of AB5-type hydrogen-absorbing alloy powder of the formulaLaMmNi3.55Al0.3Mn0.4Co0.75 (<75 mm grain size) and 10 wt.% nickelcarbonyl powder. The entire was pressed on nickel foam. Thepositive electrode weighs 0.145 g and consists of 88 wt.% ofspherical b-Ni(OH)2 powder as an active material, 2 wt.% metalliccobalt powder, 3 wt.% calcium oxide and 7 wt.% various carbonmaterials to improve the electrochemical properties. Positiveelectrode, the same as negative electrode was pressed on nickelfoam. Firstly the electrodes were chemically and electrochemicallyactivated. Therefore, the MH electrode was put into a boiling so-lution of 6 M KOH for 1 h period. Positive electrode was put intosolution of 6 M KOH at room temperature for 24 h period. The nextstep was three times charging electrodes of current equal 5 mA tothe first signal of gas evolution and therefore discharged current.Based on the third charge cycle was determination of the capacityof both electrodes, was similar, approx. 25 mAh.
The next step in making a model of NiMH cell was to put theelectrodes into the polypropylene separator sheet and compressed
Fig. 1. The scheme of the experimental secondary cell.
by Plexiglas casing. The Hg/HgO was used as a reference electrode.The electrolyte was 6MKOH, themeasurements were performed atroom temperature. The process of discharging the model cell, aswell as separate charging of individual cell electrodes with the useof an additional auxiliary electrode, was carried out at a dc currentof 10 mA.
2.2. Electrochemical impedance
For the impedance measurements, multi-sinusoidal currentexcitation at a frequency ranging from 4.5 kHz to 30 mHz(170 mHz), generated by a PXI-4461 card, was applied. Theamplitude and phase shift of the components were selected so thatvoltage amplitude of ac response did not exceed 25 mVpp (peak topeak) during the measurement. The signal was input into Autolab302N where it was added with the dc current signal, and thenapplied to the cell in question. During all measurements, a separatePXI-4462 card was used to record voltage signals, i.e. between cellelectrodes, the positive and the reference electrode, and betweenthe negative and reference electrodes as well. Such an approachallowed for obtaining the impedance of the entire cell as well as forevery electrode separately. For analysing the results, the short-timeFourier transform (STFT) was applied, which allowed for obtainingimpedance changes in the function of time, and as a result, in thefunction of deep of discharge (DOD). In this manner, any possiblenon-stationary influence was limited and a characteristic curve ofany DOD was obtained within one measurement. This method hasbeen discussed in detail by Slepski et al. in Ref. [19].
3. Results
In order to demonstrate how the impedance method can beuseful as a tool for actual diagnostics of cells, along with others as inthe case of NiMH, some experiments were carried out. In the firstone, cell capacity depends evenly on the positive electrode and thenegative one as well. In the second experiment, operation of thecell is determined by the state of the positive electrode, whereasthe tested cell capacity in the third experiment is determined bythe state of the negative electrode.
In the first experiment, the positive electrodewas charged to thesame extent as the negative one. Both electrodes were charged for2.5 h. The impedance characteristic curve of the entire cell withrelation to the state of charge is presented in Fig. 2a.
Fig. 2a shows a gradual increase in impedance for the highestDOD values which indicates that the cell was discharged. At thesame time, impedance characteristic curves of individual elec-trodes during discharging were obtained. Fig. 2b presents an in-crease in positive electrode impedance occurring towards the endof discharging process. As shown in Fig. 2c, a similar dependencewas revealed for the negative electrode. This means that the con-dition of the negative electrode and the positive one exert eveninfluence on the capacity of the cell in question.
Then, two experiments reveal the cell condition where cell ca-pacity depends on the condition of just one of the two electrodes.Being prepared for the second experiment, the positive electrodewas charged for 1.25 h, whereas the negative electrode for 2.5 h.
An impedance characteristic curve of the tested cell with rela-tion to the state of charge is presented in Fig. 3a. The presenteddiagram is strikingly similar to the one presented earlier in Fig. 2a.However, as has been mentioned, during the second experimentprior to discharging the cell, charge equal to a half of the nominalvalue was applied to the positive electrode. The impedance graphsshown in Fig. 3b, c represent impedance characteristic curves of thepositive and negative electrodes as obtained within the samedischarge cycle.

Fig. 2. a. An impedance characteristic curve of the entire cell whose capacity depends evenly on two electrodes in the function of DOD. b. An impedance characteristic curve of thepositive electrode of the cell whose capacity depends evenly on two electrodes in the function of DOD. c. An impedance characteristic curve of the negative electrode of the cellwhose capacity depends evenly on two electrodes in the function of DOD.
Fig. 3. a. An impedance characteristic curve of the entire cell whose capacity depends on the state of the positive electrode (in the function of DOD). b. An impedance characteristiccurve of the positive electrode of the cell whose capacity depends on the state of the electrode (in the function of DOD). c. An impedance characteristic curve of the negativeelectrode cell whose capacity depends on the state of the electrode (in the function of DOD).
P. Slepski et al. / Journal of Power Sources 241 (2013) 121e126 123
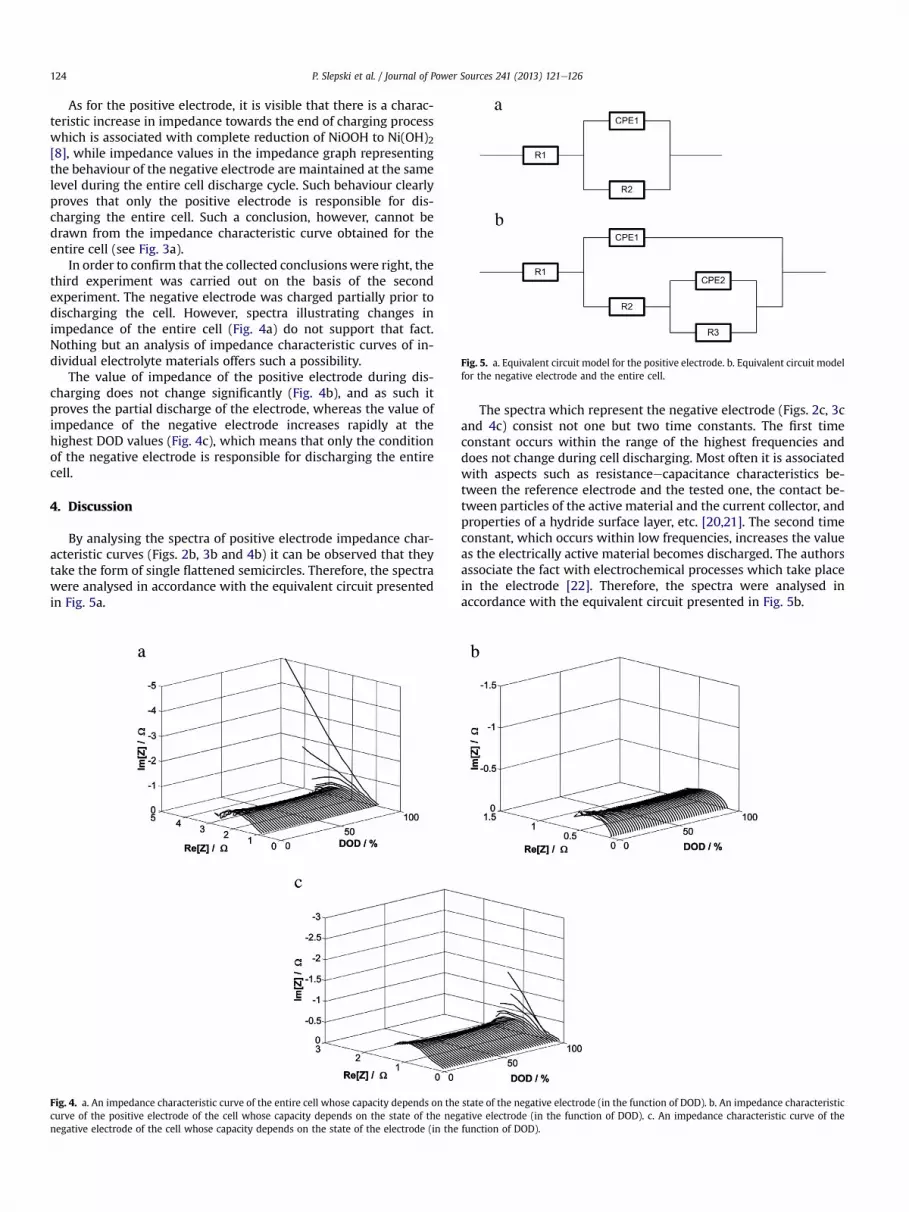
Fig. 5. a. Equivalent circuit model for the positive electrode. b. Equivalent circuit modelfor the negative electrode and the entire cell.
P. Slepski et al. / Journal of Power Sources 241 (2013) 121e126124
As for the positive electrode, it is visible that there is a charac-teristic increase in impedance towards the end of charging processwhich is associated with complete reduction of NiOOH to Ni(OH)2[8], while impedance values in the impedance graph representingthe behaviour of the negative electrode are maintained at the samelevel during the entire cell discharge cycle. Such behaviour clearlyproves that only the positive electrode is responsible for dis-charging the entire cell. Such a conclusion, however, cannot bedrawn from the impedance characteristic curve obtained for theentire cell (see Fig. 3a).
In order to confirm that the collected conclusions were right, thethird experiment was carried out on the basis of the secondexperiment. The negative electrode was charged partially prior todischarging the cell. However, spectra illustrating changes inimpedance of the entire cell (Fig. 4a) do not support that fact.Nothing but an analysis of impedance characteristic curves of in-dividual electrolyte materials offers such a possibility.
The value of impedance of the positive electrode during dis-charging does not change significantly (Fig. 4b), and as such itproves the partial discharge of the electrode, whereas the value ofimpedance of the negative electrode increases rapidly at thehighest DOD values (Fig. 4c), which means that only the conditionof the negative electrode is responsible for discharging the entirecell.
4. Discussion
By analysing the spectra of positive electrode impedance char-acteristic curves (Figs. 2b, 3b and 4b) it can be observed that theytake the form of single flattened semicircles. Therefore, the spectrawere analysed in accordance with the equivalent circuit presentedin Fig. 5a.
Fig. 4. a. An impedance characteristic curve of the entire cell whose capacity depends on thecurve of the positive electrode of the cell whose capacity depends on the state of the negnegative electrode of the cell whose capacity depends on the state of the electrode (in the
The spectra which represent the negative electrode (Figs. 2c, 3cand 4c) consist not one but two time constants. The first timeconstant occurs within the range of the highest frequencies anddoes not change during cell discharging. Most often it is associatedwith aspects such as resistanceecapacitance characteristics be-tween the reference electrode and the tested one, the contact be-tween particles of the active material and the current collector, andproperties of a hydride surface layer, etc. [20,21]. The second timeconstant, which occurs within low frequencies, increases the valueas the electrically active material becomes discharged. The authorsassociate the fact with electrochemical processes which take placein the electrode [22]. Therefore, the spectra were analysed inaccordance with the equivalent circuit presented in Fig. 5b.
state of the negative electrode (in the function of DOD). b. An impedance characteristicative electrode (in the function of DOD). c. An impedance characteristic curve of thefunction of DOD).

Fig. 6. a. Dependence of the resistance of individual components in the cell from experiment #1 in terms of cell discharge. b. Dependence of the resistance of individual componentsin the cell from experiment #2 in terms of cell discharge. c. Dependence of the resistance of individual components in the cell from experiment #3 in terms of cell discharge.
P. Slepski et al. / Journal of Power Sources 241 (2013) 121e126 125
In view of the fact that one time constant can be distinguishedwithin the equivalent circuit which represents the positive elec-trode, whereas there are two time constants for the negativeelectrode, it can be expected that the equivalent circuit describingthe entire cell would have as many as three time constants. Ananalysis with three time constants did not lead to satisfying results.For this reason, a simplified circuit was applied, the same as for thenegative electrode (see Fig. 5b).
By analysing the shape of the impedance spectra (Figs. 2a, 3aand 4a), there are two semicircles where the first occurs at highfrequencies, whereas the second one at low frequencies. A furtheranalysis was devoted to resistance within the range of low fre-quencies, which is associated by the authors with charge transferresistance. Changes in the resistance for every electrically activeelement of the cell, as well as the entire cell during discharging arepresented in Fig. 6aec for the aforementioned elements from ex-periments nos. 1, 2, and 3 respectively.
Fig. 6a shows a correlation between the change in resistance ofthe entire cell during discharging and changes in charge of transferresistance for the positive and the negative electrodes during thesame process. It can be observed that the resistance of the entirecell is a sum of positive and negative electrode resistance values.
By taking a closer look at Fig. 6 it is possible to notice that anincrease in charge transfer resistance, as determined for the entirecell, practically corresponds with the resistance obtained for the
positive electrode which was charged partially with reference tothe negative electrode whose resistance is constant during com-plete discharging of the cell.
A summary of resistance changes during discharging as in thelast experiment reveals an increase in resistance of the negativeelectrode (it was charged partially prior to discharging), to the sameextent as an increase in resistance of the entire cell, along with aprogressing discharge (Fig. 6c). Resistance of the positive electroderemains at the same level during the entire discharge cycle, and assuch it means that it has been discharged partially and does notcondition operation of the entire cell.
5. Conclusions
The presented results obtained during cell discharging undervarious conditions of the electrodes unambiguously indicate thatboth the impedance of the positive, as well as negative electrodes,cannot be passed over. A simple spectrum form obtained within thedual-electrode measurement can be in fact a complicated wave-form containing several time constants. A proper impedance-oriented analysis of the battery should be based on spectra of thepositive and negative electrode.
Impedance monitoring of the cell on the basis of dual-electrodemeasurement can be employed in assessing its state of discharge.In order to obtain detailed information on which electrode is

P. Slepski et al. / Journal of Power Sources 241 (2013) 121e126126
responsible for the condition of the entire cell at a given moment,or what kind of processes are taking place, a simultaneous andcontinuous measurement of impedance values of all secondary cellelectrodes is necessary.
Acknowledgements
The authors acknowledge the financial support from the Min-istry of Science and Higher Education (Poland) under Grant 2012/05/N/ST8/02918.
References
[1] E. Shangguan, Z. Chang, H. Tang, X.Z. Yuan, H. Wang, J. Power Sources 196(2011) 7797e7805.
[2] M. Ortiz, D. Becker, G. Garaventta, A. Visintin, E.B. Castro, S.G. Real, Electro-chim. Acta 56 (2011) 7946e7954.
[3] M. Tliha, H. Mathlouthi, J. Lamloumi, A. Percheron-Guégan, J. Solid StateElectrochem. 15 (2011) 1963e1970.
[4] C. Khaldi, H. Mathlouthi, J. Lamloumi, J. Alloys Compd. 469 (2009) 464e471.[5] S.N. Begum, V.S.Muralidharan, C.A. Basha, J. Alloys Compd. 467 (2009) 124e129.[6] S. Rodrigues, N.Munichandraiah, A.K. Shukla, J. Power Sources 87 (2000) 12e20.
[7] J. Remmlinger, M. Buchholz, M. Meiler, P. Bernreuter, K. Dietmayer, J. PowerSources 196 (2011) 5357e5363.
[8] Y.H. Pan, V. Srinivasan, C.Y. Wang, J. Power Sources 112 (2002) 298e306.[9] M. Tliha, S. Boussami, H. Mathlouthi, J. Lamloumi, A. Percheron-Guégan,
J. Alloys Compd. 506 (2010) 559e564.[10] A. Hammouche, E. Karden, R.W. De Doncker 127 (2004) 105e111.[11] E.B. Castro, D.J. Cuscueta, R.H. Milocco, A.A. Ghilarducci, H.R. Salva, Int. J.
Hydrogen Energy 35 (2010) 5991e5998.[12] U. Troltzsch, O. Kanoun, H.R. Trankler, Electrochim. Acta 51 (2006) 1664e
1672.[13] R.H. Milocco, B.E. Castro, J. Power Sources 194 (2009) 558e567.[14] B. Hariprakash, S.K. Martha, A. Jaikumar, A.K. Shukla, J. Power Sources 137
(2004) 128e133.[15] M. Thele, O. Bohlen, D.U. Sauer, E. Karden, J. Power Sources 175 (2008)
635e643.[16] S.R. Nelatury, P. Singh, J. Power Sources 132 (2004) 309e314.[17] C.T. Love, K. Swider-Lyons, Solid State Lett. 15 (2012) A53eA56.[18] P. Slepski, K. Darowicki, E. Janicka, G. Lentka, J. Solid State Electrochem. 16
(2012) 3539e3549.[19] P. Slepski, K. Darowicki, K. Andrearczyk, J. Electroanal. Chem. 633 (2009)
121e126.[20] N. Kuriyama, T. Sakai, H. Miyamura, I. Uehara, H. Ishikawa, T. Iwasaki,
J. Electrochem. Soc. 139 (1992) L72.[21] A. Yuan, N. Xu, J. Alloys Compd. 322 (2001) 269e275.[22] P. Slepski, K. Darowicki, M. Kopczyk, A. Sierczynska, K. Andrearczyk, J. Power
Sources 195 (2010) 2457e2462.


