Embed Size (px)
Citation preview
_____________________________________________________________________________________________________ *Corresponding author: E-mail: [email protected];
Journal of Scientific Research & Reports 14(6): 1-10, 2017; Article no.JSRR.33739 ISSN: 2320-0227
Application of Costing Techniques in Ornamental Fish Culture
T. Umamaheswari1*, R. Jayaraman2 and N. Felix3
1Department of Fisheries Economics, Fisheries College and Research Institute, Thoothukudi, India.
2Coastal Aquaculture Authority, Chennai, India.
3Fisheries Institute of Technology and Training, Chennai, India.
Authors’ contributions
This work was carried out in collaboration between all authors. Author RJ designed the study. Author
TU performed the statistical analysis, wrote the protocol and first draft of the manuscript. Authors RJ and NF managed the analyses of the study and literature searches. All authors read and approved the
final manuscript.
Article Information
DOI: 10.9734/JSRR/2017/33739 Editor(s):
(1) Rahul Kumar Jaiswal, National Institute of Hydrology, WALMI Campus, Bhopal, India. Reviewers:
(1) Laura Borelli Thomaz Carreira, Universidade Estadual Paulista, Brazil. (2) Adeogun, Oludare Akanni, Nigerian Institute for Oceanography and Marine Research, Nigeria.
Complete Peer review History: http://www.sciencedomain.org/review-history/19900
Received 27th
April 2017 Accepted 5
th June 2017
Published 6th
July 2017
ABSTRACT
Indian fisheries resources need to be properly utilized for more foreign exchange earnings and for upgrading livelihood of ornamental fish farmers and entrepreneurs. Madurai district was purposively chosen as it is marked as an ornamental hub in South Tamil Nadu and offers a huge market for many goods and services including aquarium fishes. The primary data was collected from a random sample of 22 ornamental fish farmers using a pre-tested survey schedule during the year 2002-2003 with an objective of estimating the economics of ornamental fish culture by cost-plus method in Madurai district. The selected farms were classified into leased (0.37 ha) and non-leased (7.395 ha) farm units. The estimated total variable cost was Rs. 68,42,934 and the total fixed cost was Rs. 18,78,496 constituting total cost of Rs. 87,21,430. Apportioned total cost and total variable cost were used for computing mark-up and net returns for ornamental fishes produced in Madurai district. The estimated total returns and net returns were Rs. 1,11,02,500 and Rs. 23,81,070, respectively. The Benefit Cost Ratio on total cost and total variable cost bases were found as1.27 and 1.62, respectively. Cost function was estimated on both total cost and total variable cost bases. The ornamental fishes which showed higher marginal cost were marked-up to 25% and 50% and the results were recorded.
Original Research Article
Umamaheswari et al.; JSRR, 14(6): 1-10, 2017; Article no.JSRR.33739
2
Keywords: Ornamental fish culture; costs and returns; costing techniques; mark-up pricing.
1. INTRODUCTION Fisheries sector in India is of economic importance in view of its resource potential, employment opportunities and export earnings. The trade of ornamental fishes has been expanding in recent years. It has grown into a multi-million dollar enterprise mainly due to the emergence of modern aquarium gadgets and technologies for setting up and maintenance of miniature reef aquaria. It is also a multi-stakeholder industry ranging from specimen collectors, culturists, wholesalers, transhippers, retailers, government resource managers, and conservators. Hence a series of issues are to be addressed and policies formulated in order to develop and expand this trade in a sustainable way indicating a large scope for expanding the ornamental fish production especially in India. Dey and Tomey [1] discussed the importance of ornamental fishes in increasing our exports and on the resource potential of freshwater, brackishwater and marine ornamental fishes in our country. Ninawe [2] reported that India has a great potential to increase the level of exports to about US $ 30 million (about Rs. 110 crores) every year. Gerald Bassler [3] reported that the domestic market for ornamental fishes consisted of 99% home-hobbyists and 1% public aquaria and research institutes. The market was mostly located in areas with dense population, industrial areas and cool climate. Ornamental fishes could fetch about 100 times costlier than their freshwater counterparts. Sasi Nayar [4] emphasized that the freshwater ornamental fishes were found to attract more attention than marine counterparts and the demand for freshwater fishes constituting about 76,000 different kinds of saleable fishes was about 80% of the total demand. The main advantage of this trade is that it could be developed both in the rural and urban areas. Unemployed youth, small and marginal farmers and landless labour can also adopt ornamental fish production to earn additional income and employment to family labour. There found need in collecting the information on the economics of production and marketing of ornamental fishes which could be very helpful to those who intend to take up the activity. In this line, the study attempted to apply costing techniques in order to prioritize the ornamental fishes and to price the products in ornamental farms in Madurai district.
Specifically, the objectives are to
i. Estimate the unit cost of production of selected ornamental fishes through application of costing techniques;
ii. Price the selected ornamental fishes by cost plus method and compare the estimated prices with the actual selling prices for the different ornamental fishes;
iii. Estimate a cost function on the basis of total cost and average cost; and
iv. Compute profitability by deriving profit margin per unit of the selected ornamental fishes.
2. METHODOLOGY Next to Kolathur (Chennai), Madurai district has been marked as an ornamental hub in South Tamil Nadu, as it offers a huge market for many goods and services including aquarium fishes. In this line, the study was carried out in Madurai district during 2002-2003 and the primary data was collected from 22 ornamental fish farms located at places namely Arasaradi, Usilampatti, Perungudi, Kadachanenthal, Alagar Koil and Melur. Survey method was followed to collect primary data required for the study. Survey schedules were prepared and pre-tested in a pilot survey before administering them in field survey. The ornamental fishes of commercial value with high demand in domestic market and cultured by majority of the farmers were chosen for the study. The primary data were collected from the respondents by personal interviews after explaining to them the objectives of the study. Since, fish farmers do not maintain farm records; particularly on costs and returns for obvious reasons, the respondents provided the information by "memory recall". The information was cross-checked, wherever possible to minimise recall bias. Discussions with technical experts, officials of the MPEDA, State fisheries department and banks were held to collect additional information on the status of ornamental fish farming and trade. Secondary data on production and international trade in ornamental fishes were collected from periodicals, internet resources, books and MPEDA publications.
2.1 Tools of Analysis In the present study, simple tools of analyses like tabular and percentage analysis were used to
Umamaheswari et al.; JSRR, 14(6): 1-10, 2017; Article no.JSRR.33739
3
estimate the economics of ornamental fish culture in Ms Excel. Costs were ascertained under different circumstances by using the costing techniques like fixed cost, variable cost and total cost of production [5]. The objectives of costing techniques are to estimate production costs involving joint products; determine net returns product-wise; price the products following cost-plus method; and compare the margins realized in the sale of each product by the farmers. Apportioned total cost and variable cost were used for computing mark-up and net returns for ornamental fishes produced in the study area. Profit margin was estimated for eighteen ornamental fishes on apportioned total cost and thirteen fishes on apportioned variable cost basis. Total cost and variable cost functions were estimated using regression analysis to estimate the marginal cost of the variables and to know the relationships between the costs and production. In case of production of ornamental fishes for which the marginal cost was higher than the selling price, the prevailing price was marked-up by 25% and 50% to know if it could make their production profitable.
3. RESULTS AND DISCUSSION 3.1 General Characteristics of
Ornamental Fish Farms The general characteristics of the sample farms of Madurai district was classified under the following headings namely age of the farmers, experience in ornamental fish culture, literacy level, occupational status and farm size. In
Madurai district, about 46% of the respondent farmers were aged above 40 years and 55% of them had 6-15 years of experience in ornamental fish culture (Table 1).
All the farmers were literates and about 86% of the farmers were practicing ornamental fish culture as their primary occupation and 18% of them as secondary occupation (Table 2). The selected farms in Madurai district were classified into leased and non-leased farm units (Table 3) wherein the non-leased units had a major portion (82%) covering an area of about 7.395 ha.
3.2 Economics of Ornamental Fish Culture
Among the inputs, broodstock and feed form the major items. The major suppliers of ornamental fishes for Madurai district were based at Chennai. Occasionally, they got fry of ornamental fishes from nearby districts namely Thoothukudi, Dindigul and Theni. Among fish feeds, live feed is the most important one, which includes Artemia nauplii, Daphnia, bloodworms and infusoria. Bloodworms and Daphnia were collected from drains and polluted freshwater bodies where as Artemia were collected from salt pans. In addition to the above, homemade feeds and pellet feeds were also used. Other inputs were obtained from private dealers in the district. Other facilities like power, transport, banks and communication were also available in the study area. Free power / concessional supply was given for agricultural operations; but for ornamental fish culture industrial power tariff was charged.
Table 1. Age and experience of ornamental fish farmers
Age class (in years)
Number of farmers reported
Experience (in years)
Number of farmers reported
Ornamental fish culture Allied activities
Below 20 -- 0 – 5 5 (22.7) 2 (25.0) 21 – 25 1 (4.5) 6 – 10 6 (27.3) 2 (25.0) 26 – 30 3 (13.6) 11 – 15 6 (27.3) 1 (12.5) 31 – 35 6 (27.3) Above 15 5 (22.7) 3 (37.5) 36 – 40 2 (9.1) -- -- -- Above 40 10 (45.5) -- -- --
Table 2. Literacy and occupational status of the ornamental fish farmers
Literacy level Number of farmers reported
Occupation Number of farmers reported
Primary Secondary
Illiterate -- Ornamental fish culture 19 (86.36) 3 (13.64) Primary school 2 (9.09) Others 3 (13.64) 2 (9.09) Secondary school 6 (27.27) Agriculture 1 (11.11) 4 (18.18) Higher secondary school 7 (31.82) Business -- 1 (4.55) College 7 (31.82) -- -- --
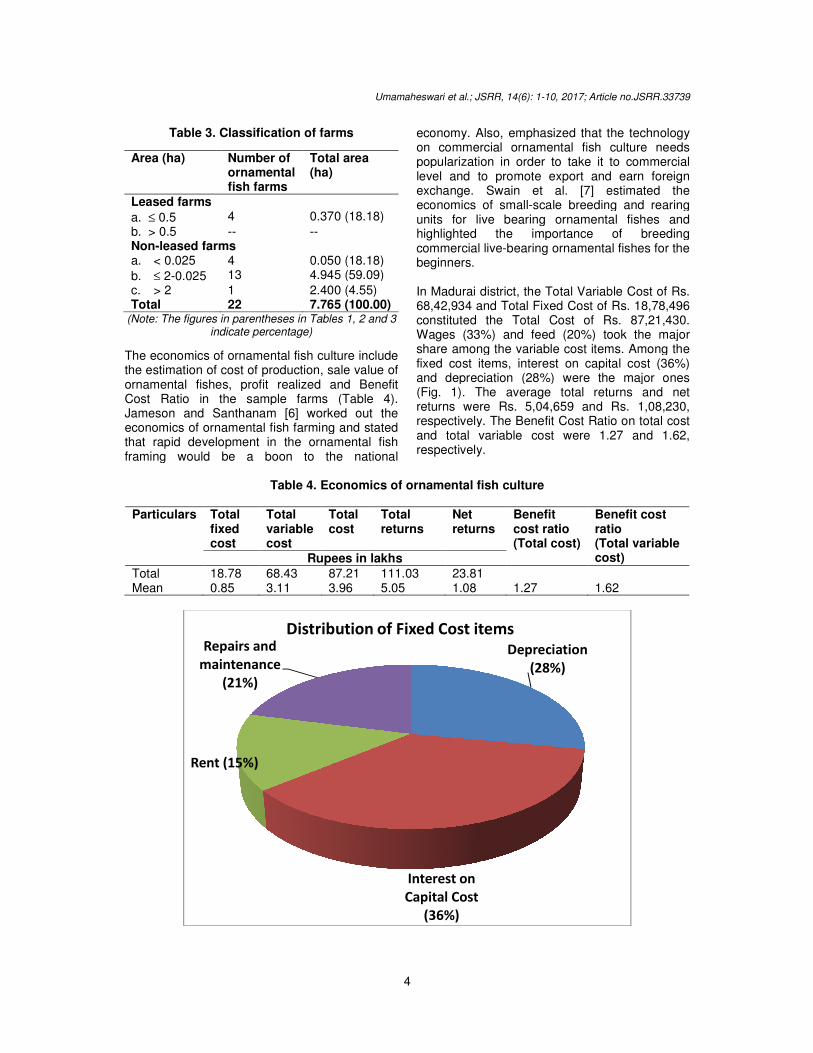
Table 3. Classification of farms
Area (ha) Number of ornamental fish farms
Total area (ha)
Leased farms
a. ≤ 0.5 4 0.370 (18.18)b. > 0.5 -- -- Non-leased farms a. < 0.025 4 0.050 (18.18)
b. ≤ 2-0.025 13 4.945 (59.09)c. > 2 1 2.400 (4.55)Total 22 7.765 (100.00)
(Note: The figures in parentheses in Tableindicate percentage)
The economics of ornamental fish culture include the estimation of cost of production, sale value of ornamental fishes, profit realized and Benefit Cost Ratio in the sample farms (TaJameson and Santhanam [6] worked out the economics of ornamental fish farming and stated that rapid development in the ornamental fish framing would be a boon to the national
Table 4. Economics of ornamental fish culture
Particulars Total fixed cost
Total variable cost
Rupees in
Total 18.78 68.43 Mean 0.85 3.11
Rent (15%)
Repairs and
maintenance
(21%)
Distribution of Fixed Cost items
Umamaheswari et al.; JSRR, 14(6): 1-10, 2017; Article no.
4
Table 3. Classification of farms
Total area (ha)
0.370 (18.18)
0.050 (18.18) 4.945 (59.09) 2.400 (4.55) 7.765 (100.00)
in parentheses in Tables 1, 2 and 3
The economics of ornamental fish culture include the estimation of cost of production, sale value of ornamental fishes, profit realized and Benefit Cost Ratio in the sample farms (Table 4).
] worked out the economics of ornamental fish farming and stated that rapid development in the ornamental fish framing would be a boon to the national
economy. Also, emphasized that the technology on commercial ornamental fish culture needs popularization in order to take it to commercial level and to promote export and earn exchange. Swain et al. [7] estimated the economics of small-scale breeding and rearing units for live bearing ornamental fishes and highlighted the importance of breeding commercial live-bearing ornamental fishes for the beginners. In Madurai district, the Total Variable Cost of Rs. 68,42,934 and Total Fixed Cost of Rs. 18,78,496 constituted the Total Cost of Rs. 87,21,430. Wages (33%) and feed (20%) took the major share among the variable cost items. Among the fixed cost items, interest on capital cost (36%) and depreciation (28%) were the major ones (Fig. 1). The average total returns and net returns were Rs. 5,04,659 and Rs. 1,08,230, respectively. The Benefit Cost Ratio on total cost and total variable cost were 1.27 and 1.62, respectively.
Table 4. Economics of ornamental fish culture
Total cost
Total returns
Net returns
Benefit cost ratio (Total cost)
Benefit ratio(Total costRupees in lakhs
87.21 111.03 23.81 3.96 5.05 1.08 1.27 1.62
Depreciation
(28%)
Interest on
Capital Cost
(36%)
Distribution of Fixed Cost items
; Article no.JSRR.33739
economy. Also, emphasized that the technology sh culture needs
popularization in order to take it to commercial level and to promote export and earn foreign
] estimated the scale breeding and rearing
units for live bearing ornamental fishes and he importance of breeding
bearing ornamental fishes for the
In Madurai district, the Total Variable Cost of Rs. 68,42,934 and Total Fixed Cost of Rs. 18,78,496 constituted the Total Cost of Rs. 87,21,430.
20%) took the major share among the variable cost items. Among the fixed cost items, interest on capital cost (36%) and depreciation (28%) were the major ones
). The average total returns and net returns were Rs. 5,04,659 and Rs. 1,08,230,
ely. The Benefit Cost Ratio on total cost and total variable cost were 1.27 and 1.62,
Benefit cost ratio (Total variable cost)
1.62
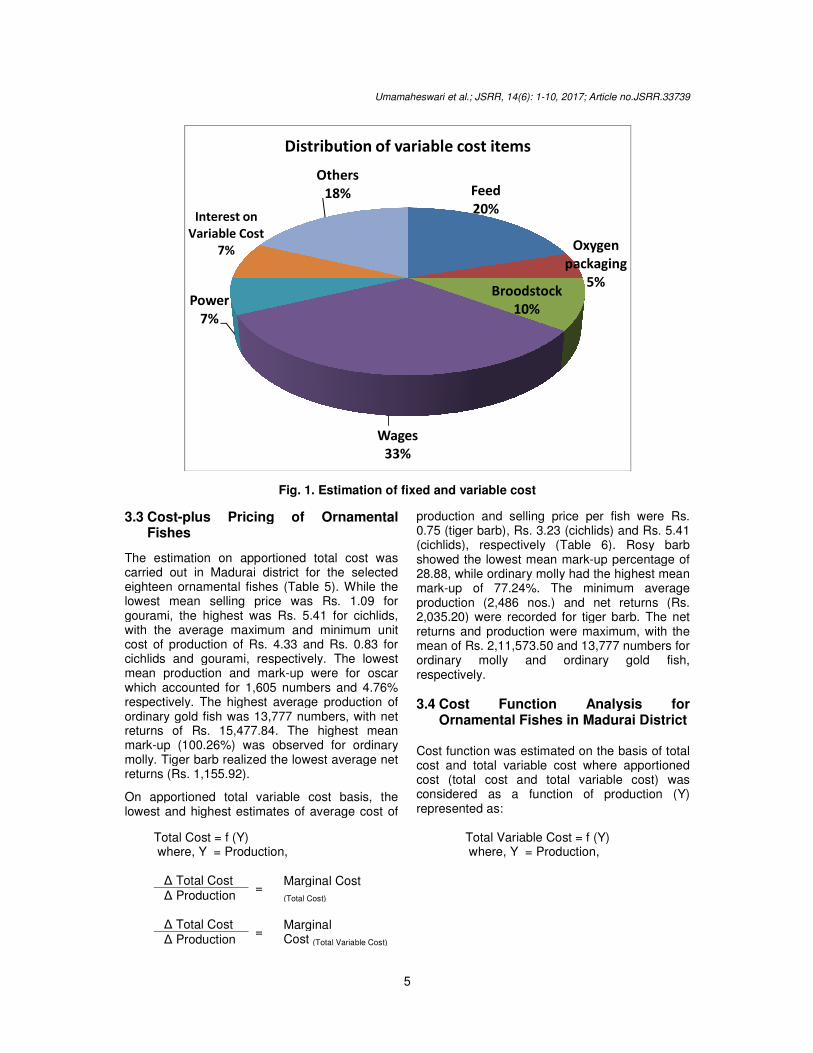
Fig. 1. Estimation of fixed and variable cost
3.3 Cost-plus Pricing of Ornamental Fishes
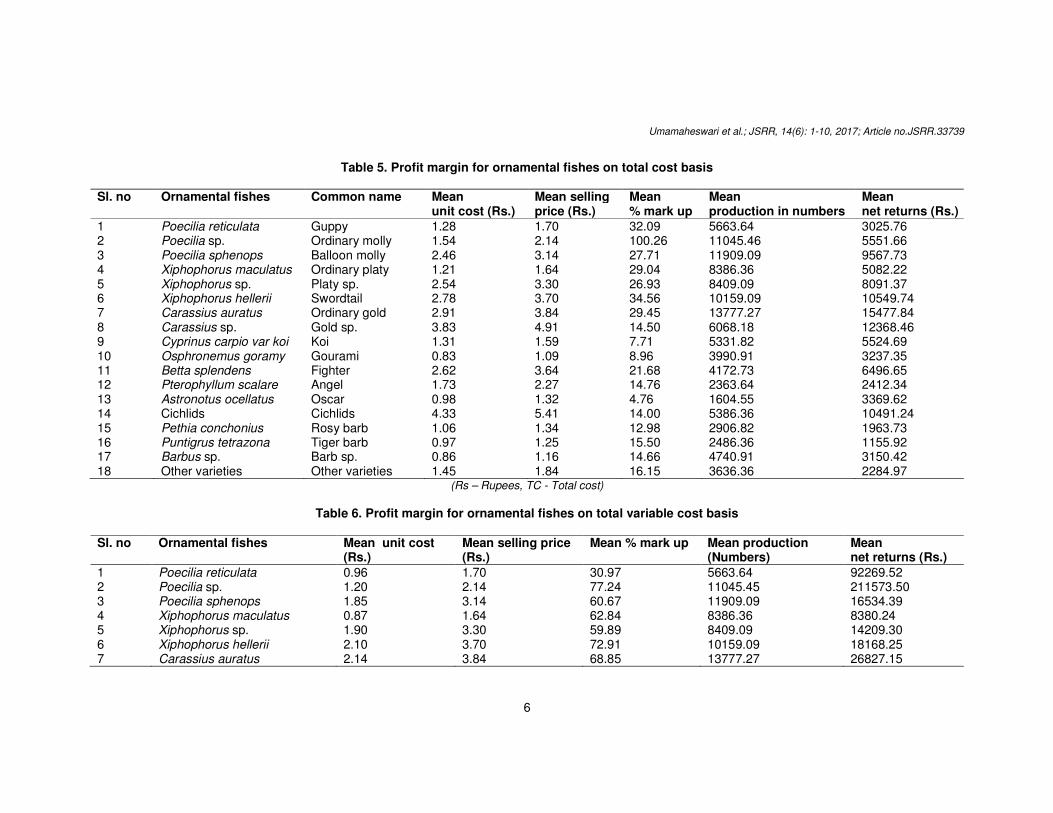
The estimation on apportioned total cost was carried out in Madurai district for the selected eighteen ornamental fishes (Table 5). While the lowest mean selling price was Rs. 1.09 for gourami, the highest was Rs. 5.41 for cichlids, with the average maximum and minimum unit cost of production of Rs. 4.33 and Rs. 0.83 for cichlids and gourami, respectively. The lowest mean production and mark-up were for oscar which accounted for 1,605 numbers and 4.76% respectively. The highest average production of ordinary gold fish was 13,777 numbers, with net returns of Rs. 15,477.84. The highest mean mark-up (100.26%) was observed for ordinary molly. Tiger barb realized the lowest average net returns (Rs. 1,155.92).
On apportioned total variable cost basis, the lowest and highest estimates of average cost of
Total Cost = f (Y) where, Y = Production, ∆ Total Cost
= Marginal Cost
(Total Cost) ∆ Production ∆ Total Cost
= Marginal Cost (Total Variable Cost) ∆ Production
Power
7%
Interest on
Variable Cost
7%
Others
Distribution of variable cost items
Umamaheswari et al.; JSRR, 14(6): 1-10, 2017; Article no.
5
Estimation of fixed and variable cost
Pricing of Ornamental
The estimation on apportioned total cost was carried out in Madurai district for the selected eighteen ornamental fishes (Table 5). While the lowest mean selling price was Rs. 1.09 for gourami, the highest was Rs. 5.41 for cichlids,
m and minimum unit cost of production of Rs. 4.33 and Rs. 0.83 for cichlids and gourami, respectively. The lowest
up were for oscar which accounted for 1,605 numbers and 4.76% respectively. The highest average production of
y gold fish was 13,777 numbers, with net returns of Rs. 15,477.84. The highest mean
up (100.26%) was observed for ordinary molly. Tiger barb realized the lowest average net
On apportioned total variable cost basis, the and highest estimates of average cost of
production and selling price per fish were Rs. 0.75 (tiger barb), Rs. 3.23 (cichlids) and Rs. 5.41 (cichlids), respectively (Table 6). Rosy barb showed the lowest mean mark-up percentage of 28.88, while ordinary molly had the highest mean mark-up of 77.24%. The minimum average production (2,486 nos.) and net returns (Rs. 2,035.20) were recorded for tiger barb. The net returns and production were maximum, with the mean of Rs. 2,11,573.50 and 13,777 numbers for ordinary molly and ordinary gold fish, respectively.
3.4 Cost Function Analysis for Ornamental Fishes in Madurai District
Cost function was estimated on the basis of total cost and total variable cost where apportioned cost (total cost and total variable costconsidered as a function of production (Y) represented as:
Marginal Cost
(Total Cost)
Marginal
(Total Variable Cost)
Total Variable Cost = f (Y) where, Y = Production,
Feed
20%
Oxygen
packaging
5%Broodstock
10%
Wages
33%
Others
18%
Distribution of variable cost items
; Article no.JSRR.33739
production and selling price per fish were Rs. 0.75 (tiger barb), Rs. 3.23 (cichlids) and Rs. 5.41 (cichlids), respectively (Table 6). Rosy barb
up percentage of ly had the highest mean
up of 77.24%. The minimum average production (2,486 nos.) and net returns (Rs. 2,035.20) were recorded for tiger barb. The net returns and production were maximum, with the mean of Rs. 2,11,573.50 and 13,777 numbers for
y molly and ordinary gold fish,
Cost Function Analysis for Ornamental Fishes in Madurai District
Cost function was estimated on the basis of total cost and total variable cost where apportioned cost (total cost and total variable cost) was considered as a function of production (Y)
Total Variable Cost = f (Y)
Oxygen
packaging
Umamaheswari et al.; JSRR, 14(6): 1-10, 2017; Article no.JSRR.33739
6
Table 5. Profit margin for ornamental fishes on total cost basis
Sl. no Ornamental fishes Common name Mean unit cost (Rs.)
Mean selling price (Rs.)
Mean % mark up
Mean production in numbers
Mean net returns (Rs.)
1 Poecilia reticulata Guppy 1.28 1.70 32.09 5663.64 3025.76 2 Poecilia sp. Ordinary molly 1.54 2.14 100.26 11045.46 5551.66 3 Poecilia sphenops Balloon molly 2.46 3.14 27.71 11909.09 9567.73 4 Xiphophorus maculatus Ordinary platy 1.21 1.64 29.04 8386.36 5082.22 5 Xiphophorus sp. Platy sp. 2.54 3.30 26.93 8409.09 8091.37 6 Xiphophorus hellerii Swordtail 2.78 3.70 34.56 10159.09 10549.74 7 Carassius auratus Ordinary gold 2.91 3.84 29.45 13777.27 15477.84 8 Carassius sp. Gold sp. 3.83 4.91 14.50 6068.18 12368.46 9 Cyprinus carpio var koi Koi 1.31 1.59 7.71 5331.82 5524.69 10 Osphronemus goramy Gourami 0.83 1.09 8.96 3990.91 3237.35 11 Betta splendens Fighter 2.62 3.64 21.68 4172.73 6496.65 12 Pterophyllum scalare Angel 1.73 2.27 14.76 2363.64 2412.34 13 Astronotus ocellatus Oscar 0.98 1.32 4.76 1604.55 3369.62 14 Cichlids Cichlids 4.33 5.41 14.00 5386.36 10491.24 15 Pethia conchonius Rosy barb 1.06 1.34 12.98 2906.82 1963.73 16 Puntigrus tetrazona Tiger barb 0.97 1.25 15.50 2486.36 1155.92 17 Barbus sp. Barb sp. 0.86 1.16 14.66 4740.91 3150.42 18 Other varieties Other varieties 1.45 1.84 16.15 3636.36 2284.97
(Rs – Rupees, TC - Total cost)
Table 6. Profit margin for ornamental fishes on total variable cost basis
Sl. no Ornamental fishes Mean unit cost (Rs.)
Mean selling price (Rs.)
Mean % mark up Mean production (Numbers)
Mean net returns (Rs.)
1 Poecilia reticulata 0.96 1.70 30.97 5663.64 92269.52 2 Poecilia sp. 1.20 2.14 77.24 11045.45 211573.50 3 Poecilia sphenops 1.85 3.14 60.67 11909.09 16534.39 4 Xiphophorus maculatus 0.87 1.64 62.84 8386.36 8380.24 5 Xiphophorus sp. 1.90 3.30 59.89 8409.09 14209.30 6 Xiphophorus hellerii 2.10 3.70 72.91 10159.09 18168.25 7 Carassius auratus 2.14 3.84 68.85 13777.27 26827.15
Umamaheswari et al.; JSRR, 14(6): 1-10, 2017; Article no.JSRR.33739
7
Sl. no Ornamental fishes Mean unit cost (Rs.)
Mean selling price (Rs.)
Mean % mark up Mean production (Numbers)
Mean net returns (Rs.)
8 Carassius sp. 2.85 4.91 36.39 6068.18 22166.24 9 Betta splendens 2.00 3.64 41.90 4172.73 10525.04 10 Cichlids 3.23 5.41 34.61 5386.36 21795.51 11 Pethia conchonius 0.83 1.34 28.88 2906.82 3568.18 12 Puntigrus tetrazona 0.75 1.25 33.46 2486.36 2035.20 13 Other varieties 1.07 1.84 40.55 3636.36 4029.13
(Rs – Rupees, TVC - Total variable cost)
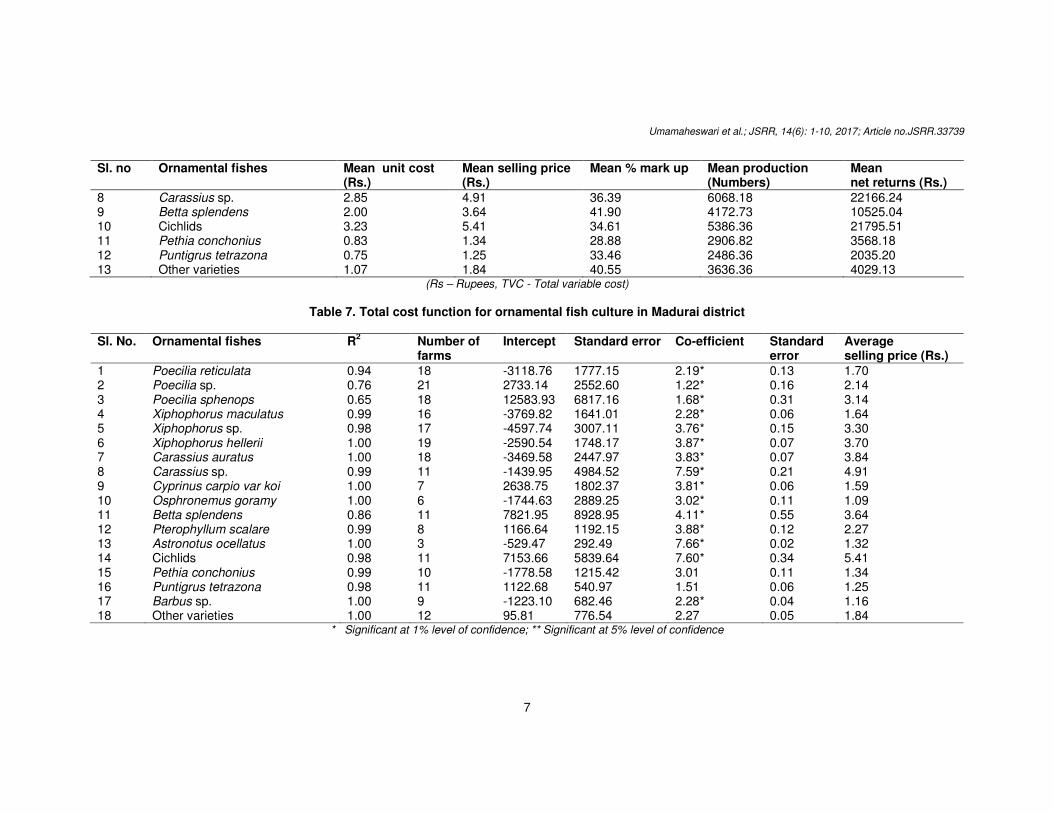
Table 7. Total cost function for ornamental fish culture in Madurai district
Sl. No. Ornamental fishes R2 Number of
farms Intercept Standard error Co-efficient Standard
error Average selling price (Rs.)
1 Poecilia reticulata 0.94 18 -3118.76 1777.15 2.19* 0.13 1.70 2 Poecilia sp. 0.76 21 2733.14 2552.60 1.22* 0.16 2.14 3 Poecilia sphenops 0.65 18 12583.93 6817.16 1.68* 0.31 3.14 4 Xiphophorus maculatus 0.99 16 -3769.82 1641.01 2.28* 0.06 1.64 5 Xiphophorus sp. 0.98 17 -4597.74 3007.11 3.76* 0.15 3.30 6 Xiphophorus hellerii 1.00 19 -2590.54 1748.17 3.87* 0.07 3.70 7 Carassius auratus 1.00 18 -3469.58 2447.97 3.83* 0.07 3.84 8 Carassius sp. 0.99 11 -1439.95 4984.52 7.59* 0.21 4.91 9 Cyprinus carpio var koi 1.00 7 2638.75 1802.37 3.81* 0.06 1.59 10 Osphronemus goramy 1.00 6 -1744.63 2889.25 3.02* 0.11 1.09 11 Betta splendens 0.86 11 7821.95 8928.95 4.11* 0.55 3.64 12 Pterophyllum scalare 0.99 8 1166.64 1192.15 3.88* 0.12 2.27 13 Astronotus ocellatus 1.00 3 -529.47 292.49 7.66* 0.02 1.32 14 Cichlids 0.98 11 7153.66 5839.64 7.60* 0.34 5.41 15 Pethia conchonius 0.99 10 -1778.58 1215.42 3.01 0.11 1.34 16 Puntigrus tetrazona 0.98 11 1122.68 540.97 1.51 0.06 1.25 17 Barbus sp. 1.00 9 -1223.10 682.46 2.28* 0.04 1.16 18 Other varieties 1.00 12 95.81 776.54 2.27 0.05 1.84
* Significant at 1% level of confidence; ** Significant at 5% level of confidence
Umamaheswari et al.; JSRR, 14(6): 1-10, 2017; Article no.JSRR.33739
8
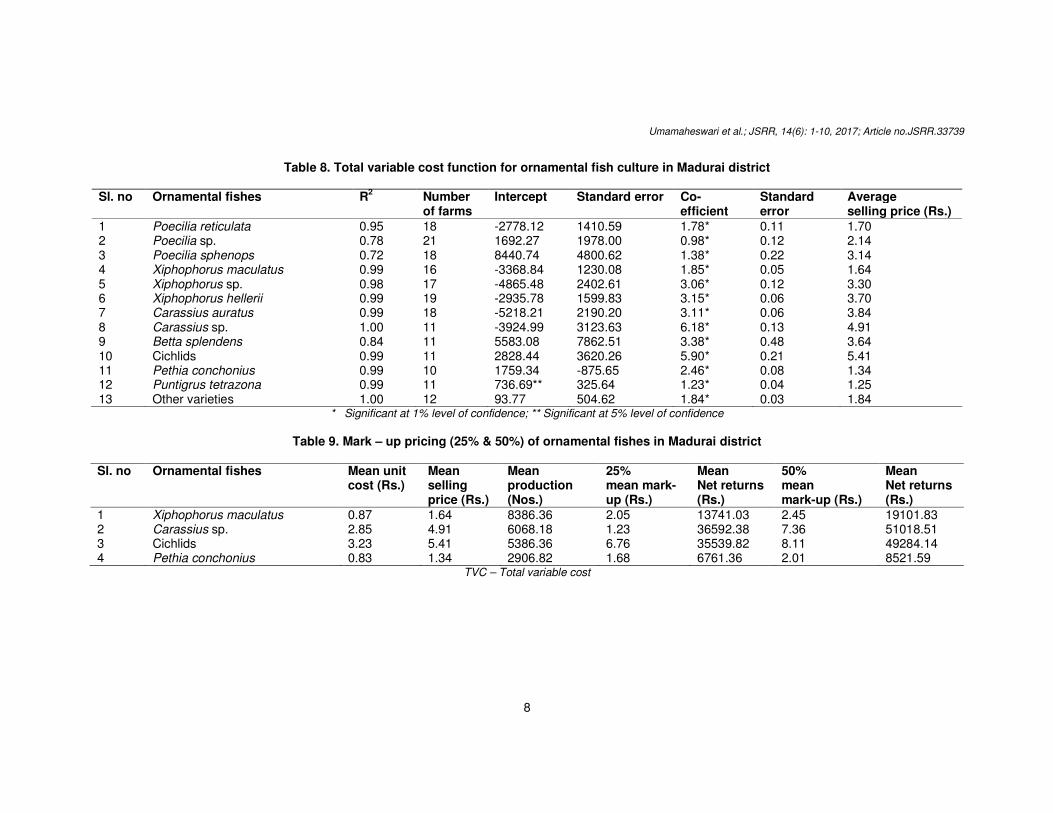
Table 8. Total variable cost function for ornamental fish culture in Madurai district
Sl. no Ornamental fishes R2 Number
of farms Intercept Standard error Co-
efficient Standard error
Average selling price (Rs.)
1 Poecilia reticulata 0.95 18 -2778.12 1410.59 1.78* 0.11 1.70 2 Poecilia sp. 0.78 21 1692.27 1978.00 0.98* 0.12 2.14 3 Poecilia sphenops 0.72 18 8440.74 4800.62 1.38* 0.22 3.14 4 Xiphophorus maculatus 0.99 16 -3368.84 1230.08 1.85* 0.05 1.64 5 Xiphophorus sp. 0.98 17 -4865.48 2402.61 3.06* 0.12 3.30 6 Xiphophorus hellerii 0.99 19 -2935.78 1599.83 3.15* 0.06 3.70 7 Carassius auratus 0.99 18 -5218.21 2190.20 3.11* 0.06 3.84 8 Carassius sp. 1.00 11 -3924.99 3123.63 6.18* 0.13 4.91 9 Betta splendens 0.84 11 5583.08 7862.51 3.38* 0.48 3.64 10 Cichlids 0.99 11 2828.44 3620.26 5.90* 0.21 5.41 11 Pethia conchonius 0.99 10 1759.34 -875.65 2.46* 0.08 1.34 12 Puntigrus tetrazona 0.99 11 736.69** 325.64 1.23* 0.04 1.25 13 Other varieties 1.00 12 93.77 504.62 1.84* 0.03 1.84
* Significant at 1% level of confidence; ** Significant at 5% level of confidence
Table 9. Mark – up pricing (25% & 50%) of ornamental fishes in Madurai district
Sl. no Ornamental fishes Mean unit cost (Rs.)
Mean selling price (Rs.)
Mean production (Nos.)
25% mean mark-up (Rs.)
Mean Net returns (Rs.)
50% mean mark-up (Rs.)
Mean Net returns (Rs.)
1 Xiphophorus maculatus 0.87 1.64 8386.36 2.05 13741.03 2.45 19101.83 2 Carassius sp. 2.85 4.91 6068.18 1.23 36592.38 7.36 51018.51 3 Cichlids 3.23 5.41 5386.36 6.76 35539.82 8.11 49284.14 4 Pethia conchonius 0.83 1.34 2906.82 1.68 6761.36 2.01 8521.59
TVC – Total variable cost
Umamaheswari et al.; JSRR, 14(6): 1-10, 2017; Article no.JSRR.33739
9
Total cost function was estimated for 18 species of ornamental fishes produced and marketed in the district (Table 7).
The regression co-efficients were mostly significant. The co-efficients estimated for the total cost of production were positive and significant for all the species except tiger barb and other varieties. The estimated function showed that the average selling price for balloon molly and ordinary molly were 46% and 43% higher than their marginal cost indicating that it would be profitable to step up their production to enhance farm income. In the case of ordinary gold fish, the marginal cost and the price were the same and for swordtail the marginal cost was about 5% higher than the price. The marginal costs for all the other species were higher than the respective prices. The ornamental fishes of freshwater and marine origin fetched Rs. 8-10 per kg (100-200 nos.) in the domestic market, while their export value was 20 times more, indicating huge loss in foreign exchange [8].
Total variable cost function was estimated for 13 ornamental fishes produced by more than 10 farms in Madurai district (Table 8). The regression co-efficients were positive and significant for all the species, except fighter fish. The estimated function showed that the average selling price for balloon molly (56%), ordinary molly (54%), ordinary gold (19%), sword tail (15%), platy sp. (7%), and fighter (7%) were higher than their marginal costs indicating that it would be profitable for the farmers to increase production. For guppy, tiger barb and other varieties, the marginal cost and average selling price were more or less same and hence, the farmers could still produce them. But, the marginal cost for rosy barb (84%), gold sp. (26%), ordinary platy (13%) and cichlids (9%) were higher than the average selling price indicating that it would not be advisable to produce them in large quantities. However, for convenience of buyers to purchase all the fishes at one place and to attract them, the farmers may have to produce them, but in limited quantities. Das and Archana Singh [9] emphasized that the trade has a sizeable potential for employment that could be harnessed by way of training more and more manpower in the trade. Additionally for refining and expanding the technology, it becomes essential to strengthen the research and extension activities pertaining to production and marketing of ornamental fishes.
The ornamental fishes which showed higher marginal cost were marked-up to 25% and 50%.
From the analysis, it was found that the production of ordinary platy and cichlids were found to be profitable with 25% and 50% mark-up prices. For gold sp., the production would be profitable, only when the price was marked-up to 50%. Rosy barb did not show profitability on 25% and 50% mark-up prices (Table 9).
4. CONCLUSION From the study, it was found that the estimated total cost function for 18 ornamental fishes revealed that the production of Poecilia sphenops (Balloon Molly) and Poecilia sp. (Ordinary Molly) could be stepped up to enhance the profitability as the average selling price were 46% and 43% higher than their marginal cost. The estimated function on total variable cost showed that it would be profitable to increase the production of Poecilia sphenops (Balloon Molly), Poecilia sp. (Ordinary Molly), Carassius auratus (Gold fish), Xiphophorus hellerii (Sword tail), Xiphophorus sp. (Platy sp.) and Betta splendens (Fighter fish) as the average selling prices were 56%, 54%, 19%, 15%, 7%, and 7% higher than their marginal cost, respectively. Also, it would be advisable not to produce Xiphophorus maculates (Ordinary platy), Carassius sp. (Gold sp.), Cichlids and Pethia conchonius (Rosy barb) in large quantities since their marginal cost is on the higher side. The ornamental fishes with higher marginal cost were marked-up to 25% and 50% and the results showed that the production of Xiphophorus maculates (Ordinary platy) and Cichlids would be profitable, if the price was marked-up to 25% and 50%. Thus the ornamental fish business provides vast scope for a strong and powerful buying as well as selling market for the recommended ornamental fishes with adequate investment, technical know-how and managerial skill to fetch more income.
COMPETING INTERESTS
Authors have declared that no competing interests exist.
REFERENCES
1. Dey VK, Tomey WA. Ornamental fish - A boon to increase our exports. Fishing Chimes. 1988;8(1):11-15.
2. Ninawe AS. Ornamental fish culture – new prospects in China. Fish Farmer. 1997; 11(2):32-34.
3. Gerald Bassleer. The International trade in aquarium / ornamental fish. Infofish International. 1994;5:15-17.
Umamaheswari et al.; JSRR, 14(6): 1-10, 2017; Article no.JSRR.33739
10
4. Sasi Nayar. Ornamental fishes – A booming trade. Fishing Chimes. 1996; 16(9):17.
5. Nand Kishore Sharma. Costing techniques. RBSA Publishers, Jaipur. 1992;1-9.
6. Jameson JD, Santhanam R. Manual of Ornamental Fishes and Farming Technologies, Fisheries College and Research Institute, Tamil Nadu Veterinary and Animal Sciences University, Thoothukkudi. 1996; 118-124.
7. Swain SK, Jena JK, Ayappan S. Prospects of freshwater ornamental fish culture in India with reference to export market. Fishing Chimes. 2001;20(10-11): 99-101.
8. Dey VK. Handbook on aquafarming: Ornamental Fishes Manual, The Marine Products Export Development Authority (MPEDA), Cochin; 1997.
9. Das C. Radha, Archana Sinha. Ornamental fish trade in India. Fishing Chimes. 2003;23(2):16-18.
_______________________________________________________________________________ © 2017 Umamaheswari et al.; This is an Open Access article distributed under the terms of the Creative Commons Attribution License (http://creativecommons.org/licenses/by/4.0), which permits unrestricted use, distribution, and reproduction in any medium, provided the original work is properly cited.
Peer-review history: The peer review history for this paper can be accessed here:
http://sciencedomain.org/review-history/19900


