Embed Size (px)
Citation preview
The Journal of Clinical Investigation | July 2003 | Volume 112 | Number 2 275
IntroductionThe rapid increase in the prevalence of antibiotic-resist-ant microorganisms is a global problem that hasthreatened the ability of physicians to treat seriousinfections. Studies have demonstrated that infections
Received for publication September 3, 2002, and accepted in revised formMay 13, 2003.
Address correspondence to: George L. Drusano, OrdwayResearch Institute, 150 New Scotland Avenue, Albany, New York12208, USA. Phone: (518) 262-6330; Fax: (518) 262-6333; E-mail: [email protected]. Conflict of interest: George L. Drusano is a consultant to bothJohnson & Johnson Pharmaceutical Research & Developmentand Ortho-McNeil Pharmaceutical and receives research supportfrom both companies. Karen Bush is an employee of Johnson &Johnson Pharmaceutical Research & Development and ownsstock and stock options. James B. Kahn is an employee of Ortho-McNeil Pharmaceutical and owns stock and stock options.Nonstandard abbreviations used: minimum inhibitoryconcentration (MIC); Mueller-Hinton II broth (MHB); minimumbactericidal concentration (MBC); area under the concentrationtime curve (AUC); nonparametric expectation maximization 2(NPEM2); maximum a posteriori probability (MAP); quinoloneresistance–determining region (QRDR).
caused by antibiotic-resistant bacteria are more diffi-cult to treat, resulting in excess morbidity and mortal-ity as well as higher health care costs. Therefore, it isimperative to identify ways of suppressing the emer-gence of antibiotic-resistant mutants.
Current preclinical methods for assessing the efficacyof an antimicrobial agent most often evaluate the effectof selected dosages of the compound on the reductionin the total bacterial population at an infection site. Theimpact of drug pressure on the amplification of thedrug-resistant subpopulation is ignored (1–3).
For some antibiotic dosages, the drug-susceptiblepopulation may be completely replaced with resistantmutants over time. Clinically, this may manifest as thefailure of an infection to respond to therapy or a relapseof infection with drug-resistant mutants shortly after aprescribed course of antibiotic therapy is completed.
The probability that a resistant subpopulationexists within a predominantly drug-susceptible wild-type population is dependent on the number oforganisms at the infection site (total population bur-den) and the mutational frequency to resistance to
Application of a mathematical model to prevent in vivo amplification of antibiotic-resistant bacterial populations during therapy
Nelson Jumbe,1,2 Arnold Louie,1 Robert Leary,3 Weiguo Liu,2 Mark R. Deziel,1
Vincent H. Tam,1 Reetu Bachhawat,2 Christopher Freeman,2 James B. Kahn,4
Karen Bush,5 Michael N. Dudley,6 Michael H. Miller,2 and George L. Drusano1
1Ordway Research Institute, Albany, New York, USA2Center for Immunology and Microbial Diseases, Albany Medical College, Albany, New York, USA3San Diego Supercomputer Center, University of California, San Diego, San Diego, California, USA4Ortho-McNeil Pharmaceutical, Raritan, New Jersey, USA5Johnson & Johnson Pharmaceutical Research & Development, Raritan, New Jersey, USA6Essential Therapeutics Inc., Mountain View, California, USA
The worldwide increase in the prevalence of multi-antibiotic–resistant bacteria has threatenedthe physician’s ability to provide appropriate therapy for infections. The relationship betweenantimicrobial drug concentration and infecting pathogen population reduction is of primaryinterest. Using data derived from mice infected with the bacterium Pseudomonas aeruginosa andtreated with a fluoroquinolone antibiotic, a mathematical model was developed that describedrelationships between antimicrobial drug exposures and changes in drug-susceptible and -resist-ant bacterial subpopulations at an infection site. Dosing regimens and consequent drug expo-sures that amplify or suppress the emergence of resistant bacterial subpopulations were identi-fied and prospectively validated. Resistant clones selected in vivo by suboptimal regimens werecharacterized. No mutations were identified in the quinolone resistance–determining regions ofgyrA/B or parC/E. However, all resistant clones demonstrated efflux pump overexpression. At baseline, MexAB-OprM, MexCD-OprJ, and MexEF-OprN were represented in the drug-resistant pop-ulation. After 28 hours of therapy, MexCD-OprJ became the predominant pump expressed in theresistant clones. The likelihood of achieving resistance-suppression exposure in humans with aclinically prescribed antibiotic dose was determined. The methods developed in this study pro-vide insight regarding how mathematical models can be used to identify rational dosing regimensthat suppress the amplification of the resistant mutant population.
J. Clin. Invest. 112:275–285 (2003) doi:10.1172/JCI200316814.
the antibiotic prescribed. Emergence of drug-resist-ant mutants with therapy is most often document-ed in patients who receive antibiotics for the treat-ment of pneumonia. This is because the bacterialburden found in a pneumonic lung often exceeds1010 (4). The mutational frequency to resistance formechanisms attributable to single point mutationsis most frequently measured in the range of 10–6 to10–8. When the total bacterial population burdenexceeds the inverse of the mutational frequency toresistance by greater than an order of magnitude,there will be a very high probability that a resistantsubpopulation will be present in the total popula-tion at base line, before any selective pressure isapplied (5). In addition, amplification of a resistantsubpopulation is also dependent on the dosage ofantibiotic administered.
Blondeau et al. (6) demonstrated in vitro that single-step mutants can be selected from a wild-type bacter-ial population when the microorganism is culturedon agar that contains an antibiotic at concentrationsabove the minimum inhibitory concentration (MIC)of the drug. However, as the concentration of drug inthe agar is increased, resistant mutants can no longerbe identified. Zhou et al. (7) showed that a large diver-sity of mutations are amplified with low drug con-centrations in vitro. As the drug concentration isincreased, a progressively smaller diversity of muta-tions are amplified, until a concentration is reachedat which no mutations are isolated. Clearly, these invitro studies show that resistance amplification canbe prevented with an appropriate drug concentration.These in vitro studies are important but employ afixed drug concentration. They provide little guidanceabout selecting a clinical drug dose adequate to sup-press the resistant subpopulation.
In the current study we modified a standardmouse-thigh bacterial infection model to character-ize the effect of escalating doses of an antibiotic onthe in vivo amplification and suppression of thedrug-susceptible and -resistant populations over 24hours. The flow of the experiments to elucidate thisdrug effect is presented in Figure 1. The effect ofincreasing the infection inoculum on selection ofresistant mutants was defined, and the microbiolog-ical effect of increasing drug doses was examined.The time dependency of effect on the sensitive andresistant populations was examined. Using these invivo data, we developed a mathematical model to pre-dict the effect of any antibiotic dose on the suppres-sion or amplification of the drug-susceptible anddrug-resistant bacterial subpopulations as a functionof drug dose and therapy duration. The mathemati-cal model was prospectively validated in an extended48-hour study in the mouse infection system usingdoses not previously examined. The validation studydoses were predicted to maximally amplify and tosuppress resistance. The resistance mechanismsselected throughout therapy were characterized
(8–13). Finally, we wished to be able to translate theinsights obtained in this investigation to drug-doseselection in clinical patients. Monte Carlo simulationallows the variability of drug exposure when an agentis administered to a large population to be examined.Using the target drug exposure that would be pre-dicted to suppress resistance from this study, wedetermined the fraction of patients that wouldachieve the target exposure, accounting for the vari-ability in drug exposure by Monte Carlo simulation,and for the variability in pathogen MIC to the drugin question by examining a large collection of MICsfor the pathogen of interest.
For this investigation, the bacterium Pseudomonasaeruginosa was used as the infecting pathogen, becausethis species is a common cause of nosocomial pneu-monia, particularly in intensive care units. Further-more, this pathogen frequently becomes resistant tothe antibiotic prescribed during therapy. Levofloxacin,a fluoroquinolone antibiotic, was chosen as the antibi-otic probe, because fluoroquinolones are commonlyused in intensive care units.
While resistance among nosocomial pathogens hasbecome a cause for great concern, little has been donewith the choice of dose as a way of ameliorating thisproblem. We present here a paradigm for selectingdrug doses for the clinic that will suppress emergenceof resistance and thereby extend the useful lifetimesof new agents.
276 The Journal of Clinical Investigation | July 2003 | Volume 112 | Number 2
Figure 1Flow diagram of the experimental design.
MethodsOrganism. P. aeruginosa (ATCC 27853; American TypeCulture Collection, Rockville, Maryland, USA) wasused in the mouse infection system. Aliquots of thebacteria were stored in skim milk at –70°C. For eachstudy, fresh isolates were grown on blood agar plates(BBL Microbiology Systems Inc., Cockeysville, Mary-land, USA) overnight at 35°C, then grown to log phasein Mueller-Hinton II broth (MHB; Difco Laboratories,Detroit, Michigan, USA).
Drug. Levofloxacin powder (assay no. 85632; lot no.DW136; potency 97.2%) was supplied by R.W. John-son Pharmaceutical Research Institute (Raritan, NewJersey, USA). Stock solutions of 1 mg/ml of drug werealiquoted and stored at –70°C. For each study a sam-ple was thawed and diluted to the desired concentra-tions with MHB.
Determination of minimum inhibitory and bactericidal con-centrations and mutational frequency to resistance at 3 × MIC.Studies of MIC, defined as the lowest drug concentra-tion that results in no visible growth after 24 hours ofincubation at 35°C in ambient air, and minimum bac-tericidal concentration (MBC), defined as 99.9% bac-terial-density reduction compared with the growthcontrol, were conducted using the standard macro-broth-dilution method of the National Committee forClinical Laboratory Standards (Wayne, Pennsylvania,USA; publication M7-A4, 1997). Serial twofold dilu-tions of drug were used to determine the geometricMIC (bacterial concentration 5 × 10⁵ CFUs/ml), fol-lowed by a narrower range of drug concentration todetermine the arithmetic MIC (serial 0.2 mg/l incre-ments in drug concentration). The arithmetic dilu-tion series were conducted to more precisely identifythe MIC. MBCs were determined by quantitative cul-turing of macrobroth-dilution tube material fromMIC determination studies. Geometric MIC andMBC studies were conducted three times each by twoindependent technicians and six times for the arith-metic MIC determination.
The mutation frequency of the P. aeruginosa isolate to3 × MIC of levofloxacin was determined by inocula-tion of 4 ml of a 2 × 10⁸–CFU/ml bacterial suspensiononto Mueller-Hinton agar supplemented with thedrug at 3 × MIC and onto drug-free agar. After 72hours of incubation at 35°C, the colonies were count-ed and the mutation frequency was calculated by divi-sion of the CFUs/ml that grew on the surface of thedrug-containing agar by the CFUs/ml that grew on thesurface of the drug-free agar. A drug concentration of3 × MIC was chosen for study because a single pointmutation in the genes of gyrA/B and parC/E and effluxpump overexpression all increase the MIC four- toeightfold above that of the wild-type microorganism.
Animals. Normal 24- to 26-g female outbred ICR/Swissmice (Taconic Farms, Taconic, New York, USA) wereused in all in vivo studies. Food and water were providedad libitum. All animal experimentation procedures wereapproved by and conducted in accordance with the
guidelines of the Institutional Animal Care and UseCommittee of Albany Medical College.
Effect of bacterial inoculum on treatment outcome ininfected mice. The mouse-thigh infection model pio-neered by Eagle and colleagues (1) and greatly expand-ed upon by Craig (2, 3) was used as our experimentaldisease system. Two groups of mice (n = 15 per group)were infected in each posterior thigh muscle by anintramuscular injection with 1 × 10⁷ or 1 × 10⁸ CFUsof P. aeruginosa (in 0.1-ml volumes). The densities ofthe bacterial inocula were confirmed by quantitativecultures. Two hours after bacterial inoculation, themice were treated with a single intraperitoneal injec-tion of one of several predetermined doses of drug,ranging from 0 to 1,000 mg/kg of body weight to pro-vide 24-hour area under the concentration timecurve/MIC (AUC/MIC) exposures of 0 to 650. Twen-ty-four hours later, the mice were humanely sacri-ficed. Both posterior thigh muscles were asepticallycollected, homogenized, and washed with normalsaline to prevent drug carry-over. The homogenateswere serially diluted 1:10 in normal saline, then quan-titatively cultured (detection limit = 50 CFUs/g ofthigh muscle) onto drug-free agar plates and agarplates supplemented with 3 × MIC of levofloxacin tocharacterize the effect of therapy on the total (quan-titation on drug-free agar) and drug-resistant (quan-titation on drug-containing agar) populations. A con-centration of 3 × MIC was identified by replica platingstudies to reliably capture drug-resistant mutants. Aseparate group of infected mice was sacrificed justprior to initiation of therapy to determine the bacte-rial density in thigh muscles at the start of therapy.After the plates were incubated at 35°C for 72 hours,the colonies were enumerated.
The relationship between levofloxacin dose and thereduction in the total bacterial density in thigh musclesfor each infection inoculum after 24 hours of therapywas evaluated by an inhibitory sigmoid Emax dose-response model using the identification module of theADAPT II software package of D’Argenio and Schu-mitzky (14). Experimental data were weighted by theinverse of the observation variance. For each group, thedoses (and consequent 24-hour AUC/MIC exposures)of drug needed to reduce the bacterial density in thighmuscle by 1, 2, and 3 log10 (CFUs/g) were calculated.The effect of drug exposure (AUC/MIC ratio) on theselection of the drug-resistant subpopulation for eachgroup also was determined.
Differential effect of antibiotic pressure on drug-susceptibleand -resistant bacterial populations over 24 hours in mice. Todevelop a mathematical model that predicts the possi-ble differential effect of drug doses on the drug-sus-ceptible and -resistant bacterial populations as a func-tion of time, four cohorts of animals (n ≥ 18 per group)were infected with 108 CFUs of P. aeruginosa in each pos-terior thigh muscle and then were treated with a singledose of 0, 90, 215, or 600 mg/kg of levofloxacin. Thesedoses were chosen because they are on the steep part of
The Journal of Clinical Investigation | July 2003 | Volume 112 | Number 2 277
the exposure-response curve. Mice were sacrificed (n ≥ 3per group) at 0, 1, 4, 6, 11, and 24 hours after therapyinitiation. Homogenates of the thigh muscles werewashed, then quantitatively cultured onto drug-freeagar plates for total-population enumeration, and ontodrug-containing agar plates for drug-resistant subpop-ulation enumeration.
Determination of levofloxacin pharmacokinetics in theinfected mouse. To correlate the doses of drug adminis-tered to mice with AUC/MIC exposures, dose-rangestudies for levofloxacin were conducted to determinethe pharmacokinetics of levofloxacin when adminis-tered as a single dose. Mice were treated 2 hours afterinfection by intraperitoneal injection of 25, 50, 150,200, 250, and 350 mg/kg of levofloxacin. Three ani-mals from each group were sacrificed at 0.25, 0.5, 1, 2,3, 4, and 6 hours after drug administration. Blood wascollected by cardiac puncture and allowed to clot onice. The serum was obtained by centrifugation andstored at –70°C. The concentration of levofloxacin ineach serum sample was determined using an HPLCassay adapted from Wong et al. (15). Levofloxacin wasobtained as the hemihydrate powder (assay no. 85632;lot no. DW136; potency 97.2%) from the R.W. JohnsonPharmaceutical Research Institute. Ciprofloxacin, theinternal standard, was obtained as the hydrochloridesalt from Sigma-Aldrich (St. Louis, Missouri, USA).HPLC analysis was performed using a Hewlett-Packard Series 1100 system (Hewlett-Packard, Wald-bronn, Germany). The detector wavelength was set at330 nm. Quantitation of levofloxacin concentrationsin plasma samples was based on linear regressionanalysis of peak area ratios of standard levofloxacinconcentrations. Separation was accomplished on aHewlett-Packard Eclipse XDB-C18 (5 µm; 250 × 4.6mm internal diameter) column (Hewlett-Packard,Palo Alto, California, USA) maintained at 35°C. Theisocratic mobile phase consisted of 5 mM copper (II)sulfate pentahydrate and 10 mM L-isoleucine inmethanol (87.5:12.5, vol/vol) and was extracted with4 ml of dichloromethane and reconstituted in 100 µlof HPLC mobile phase. The assay was linear over arange of 0.01–10 mg/l. Within-day coefficients of vari-ation were less than 9%, and between-day coefficientsof variation were less than 13%. The limit of quanti-tation was 0.01 mg/l.
Changes in drug concentration over time were ana-lyzed by the nonparametric expectation maximization2 (NPEM2) population pharmacokinetic modelingapproach with one- and two-compartment open mod-els with first-order elimination from the central com-partment (i.e., serum) and a first-order input (16).Akaike’s information criterion (17) was used to dis-criminate between the models. The inverse of the SD ofmeasured mean concentrations was used for weightingthe pharmacokinetic data.
Population pharmacokinetic parameters includingSCL (l/h), Vc (l), Ka (h–1), K23 (h–1), and K32 (h–1) were esti-mated by NPEM2. Definitions for these terms are as
follows: SCL (l/h), rate of clearance of drug from serum(central compartment); Ka (h–1), first order absorptionrate constant for the diffusion of drug from the peri-toneal cavity into the central (serum) compartment; K23
(h–1) and K32 (h–1), first-order transfer constants be-tween the central and peripheral compartments.
Mathematical-model development. Details of the math-ematical-model development are supplied in the sup-plementary online material (http://www.jci.org/cgi/content/full/112/2/275/DC1).
Determination of the differential effect of drug pressure onsensitive and resistant bacterial subpopulations using the math-ematical model. Determinations of sensitive and resist-ant populations of P. aeruginosa from all observationswere simultaneously comodeled using the populationmodeling software program BigNPEM at the SanDiego Supercomputer Center (University of California,San Diego; developed under NIH grant RO1-RR11526to Roger Jelliffe). Briefly, the population pharmacoki-netic parameters for drug disposition in the mouse,determined as described above, were applied to Equa-tions 1–3 (see supplementary online material, http://www.jci.org/cgi/content/full/112/2/275/DC1). All de-terminations of sensitive and resistant subpopulationsover time were comodeled using Equations 4–7. Initialconditions (numbers of total and resistant organismspresent at base line) were identified as part of themodel-fitting process.
Maximum a posteriori probability (MAP) Bayesian esti-mates of the system parameters were obtained for eachof the regimens using the “population of one” utility ofBigNPEM. Once estimated, the regimen-specific para-meter values can be used to make model predictions ofbacterial subpopulation responses.
Prospective validation of the mathematical-model analysis inthe mouse infection system. Using the parameters identifiedfrom the mathematical model, two doses and subse-quent exposures were calculated. The first dosage waspredicted to maximally amplify the resistant mutantsubpopulation over 48 hours, when that dosage wasgiven daily for 2 days (regimen 1, AUC/MIC ratio = 52:1).The second dosage was predicted to hold the resistantmutant population stable over 48 hours, again, withtwo doses (regimen 2, AUC/MIC ratio = 157:1). Itshould be recognized that the mathematical model wasmade to predict the future, as the original data used todefine the mathematical model were generated over a24-hour time frame. In this model-validation study,these dosing regimens were administered over 48hours. Homogenates of thigh muscles collected fromsacrificed mice were quantitatively cultured on antibi-otic-free and levofloxacin-supplemented (3 × MIC) agarthroughout the study to determine the effect of eachdrug regimen on the total and drug-resistant bacterialpopulations over time.
Determination of mechanism of levofloxacin resistance.Resistance to quinolone antibiotics can occur via pointmutations in gyrA, gyrB, parC, and parE or an overex-pression of efflux pumps of the Mex-Opr system that
278 The Journal of Clinical Investigation | July 2003 | Volume 112 | Number 2
pumps quinolones out of the bacterium. To definewhether resistance was mediated through mutationsin DNA, chromosomal DNA was obtained using theQIAGEN Blood & Cell Culture Mini Kit (QIAGENInc., Valencia, California, USA). PCR and DNAsequencing were performed for gyrA and parC usingprimer pairs described by Kureishi et al. (18) andNakano et al. (19). For gyrB and parE analysis, the fol-lowing primers were used: gyrB, GYRB forward (5′-GCGCGTGAGATGACCCGCCGT-3′) and reverse (5′-CTG-GCGGTAGGAAGGTCAG-3′); parE, PARE forward(5′-CCTCTCGATGAAGATGCAGGA-3′) and reverse (5′-GAGGATACAGATCTTGCCGTA-3′). Analysis of the se-quences of the quinolone resistance–determining re-gion (QRDR) amplified segments was performeddirectly with purified PCR-amplified genomic DNA.The internal primers GYRA-INT forward (5′-ATGAGC-GAGCTGGGCAACGAC-3′) and reverse (5′-CAGGTC-CGCCAGCAGTTCGTG-3′) were used to sequence gyrA.In vitro–selected P. aeruginosa mutants carrying knownmutations in gyrA and gyrA plus parC were used as pos-itive controls in these studies.
For determination of the presence of Mex-Opr systempump overexpression, we used inhibitors of the differentMex-Opr system pumps (provided by Essential Thera-peutics Inc., Mountain View, California, USA). Geomet-ric levofloxacin MICs were determined for P. aeruginosaisolates by standard broth-microdilution method in 96-well plates. The final concentration of bacteria in eachmicrobroth well was 1 × 10⁵ CFUs/ml. The MICs wereperformed in the presence of drug alone, drug plus indi-vidual efflux pump inhibitors, or drug plus combina-tions of efflux pump inhibitors (the MexAB systeminhibitor was D83-91011, the MexCD system inhibitorwas MC-272457, and the MexEF system inhibitor wasMC-210368). Susceptibility evaluations were performedfor isolates cultured from treated and untreated infect-ed mice in parallel with wild-type test strains, engineeredstrains overexpressing a single Mex pump, and strainsoverexpressing different combinations of two or threeefflux pumps. The efflux pump background of the drug-resistant mutants was determined on the basis of thesimilarity of the susceptibility profile of the in vivo iso-late to that of the test strain when exposed to differentdrug-plus-efflux-pump-inhibitor conditions. Lomov-skaya and Watkins (20) and Lomovskaya et al. (13) haveconfirmed the utility of these inhibitors in determiningefflux pump overexpression, by validation with Westernblot analysis using antibodies against the outer-mem-brane components of the pumps.
Monte Carlo simulations for bridging from mice to humans.Monte Carlo simulation, when used in pharmacoki-netic investigation, is a mathematical method used todefine the variability seen in drug exposure when alarge population receives a specific drug dose. This canbe used to create AUC/MIC ratios for specific MIC val-ues. The fraction of the population receiving the drugthat achieves a specific exposure target (AUC/MICratio) can then be determined.
For the current study, Monte Carlo simulation wasconducted to determine the likelihood that the clini-cally prescribed daily dose of 750 mg of levofloxacinwould attain or exceed the 157:1 AUC24-h/MIC drugexposure predicted by our mathematical model to benecessary to suppress the amplification of the drug-resistant P. aeruginosa subpopulation. The observedpharmacokinetic mean and variance data were previ-ously derived from a population pharmacokinetic
The Journal of Clinical Investigation | July 2003 | Volume 112 | Number 2 279
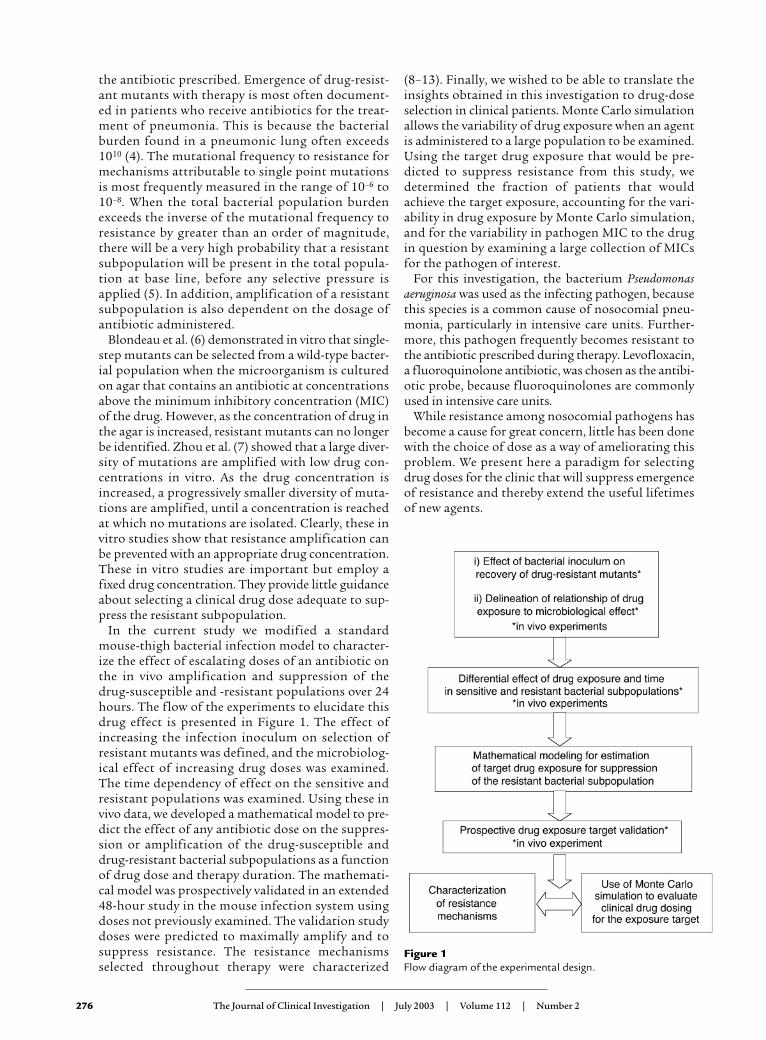
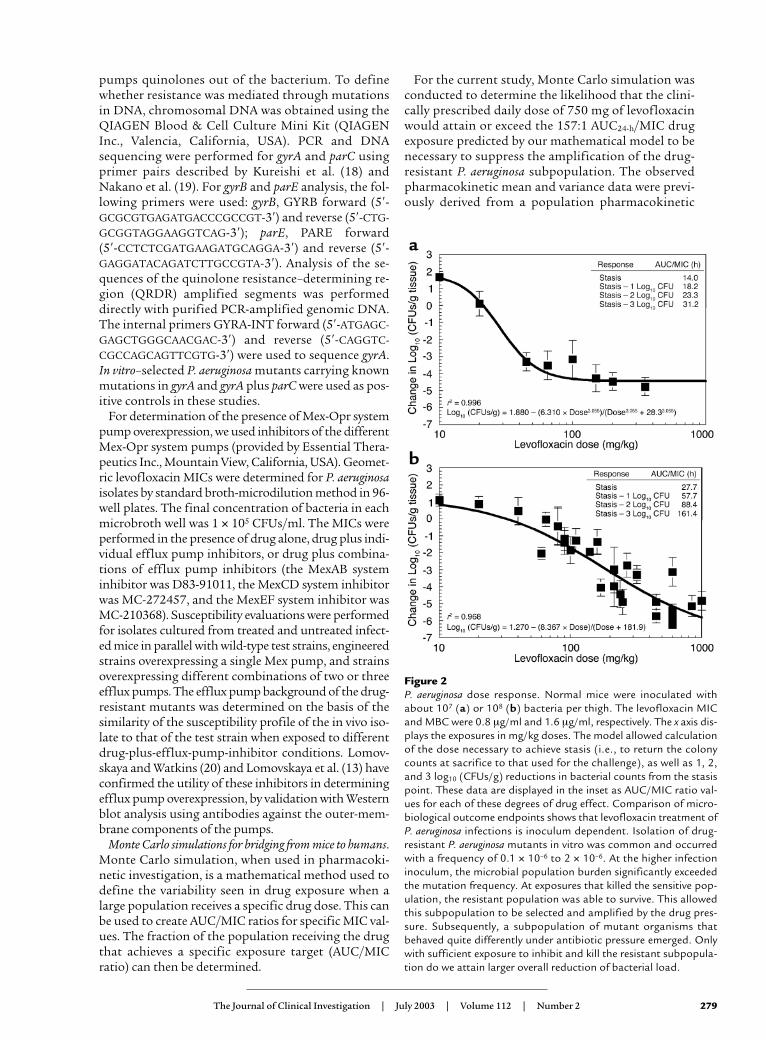
Figure 2P. aeruginosa dose response. Normal mice were inoculated withabout 107 (a) or 108 (b) bacteria per thigh. The levofloxacin MICand MBC were 0.8 µg/ml and 1.6 µg/ml, respectively. The x axis dis-plays the exposures in mg/kg doses. The model allowed calculationof the dose necessary to achieve stasis (i.e., to return the colonycounts at sacrifice to that used for the challenge), as well as 1, 2,and 3 log10 (CFUs/g) reductions in bacterial counts from the stasispoint. These data are displayed in the inset as AUC/MIC ratio val-ues for each of these degrees of drug effect. Comparison of micro-biological outcome endpoints shows that levofloxacin treatment ofP. aeruginosa infections is inoculum dependent. Isolation of drug-resistant P. aeruginosa mutants in vitro was common and occurredwith a frequency of 0.1 × 10⁻⁶ to 2 × 10⁻⁶. At the higher infectioninoculum, the microbial population burden significantly exceededthe mutation frequency. At exposures that killed the sensitive pop-ulation, the resistant population was able to survive. This allowedthis subpopulation to be selected and amplified by the drug pres-sure. Subsequently, a subpopulation of mutant organisms thatbehaved quite differently under antibiotic pressure emerged. Onlywith sufficient exposure to inhibit and kill the resistant subpopula-tion do we attain larger overall reduction of bacterial load.
280 The Journal of Clinical Investigation | July 2003 | Volume 112 | Number 2
analysis of 58 patients with nosocomial pneumoniawho were treated intravenously with 750 mg/d lev-ofloxacin in a phase III clinical trial (21). The meanparameter vector and full covariance matrix wereembedded in Subroutine PRIOR of the ADAPT IIpackage of software programs (14). A 10,000-subjectMonte Carlo simulation was performed. Both normaland log-normal distributions were examined and dif-ferentiated by their ability to reproduce the meanparameter values and their measure of dispersion. Alevofloxacin MIC distribution for 404 P. aeruginosa iso-lates was provided by Focus Technologies Inc. (TSN;http://www.focusanswers.com). An expectation wastaken over the entire MIC distribution of 404 strainsof P. aeruginosa for the MIC-specific target-attainmentrates for a 750-mg/d intravenous dose of levofloxacinand the prevention-of-resistance target.
Results
Effect of fluoroquinolone treatment regimens on P. aeruginosa
MIC, MBC, and mutation-frequency values. The arithmeticmedian MIC and MBC for P. aeruginosa were 0.8 mg/l(range 0.4–1.0 mg/l) and 1.6 mg/l (range 1.4–1.8 mg/l),respectively. The in vitro mutation frequency of thisstrain of P. aeruginosa was 0.1 × 10⁻⁶ to 2 × 10⁻⁶.
Exposure response in mice infected with different bacterialinocula. To examine the inoculum effects of the P. aerugi-nosa test strain on dose-response relationships, lev-ofloxacin single-dose, dose-ranging studies were per-formed in mice infected with 107 or 108 organisms inboth posterior thigh muscles.Quantitative cultures of infect-ed thigh muscles collectedfrom sacrificed mice at 24hours after treatment admin-istration showed that the rela-tionship between exposureand reduction in bacterial loadwas inoculum dependent (Fig-ure 2). There was a major dif-ference between the AUC/MICexposures needed to attainsimilar log10 killing for theinocula tested. The mutation-al frequency to resistance ofthe challenge strain explainedthe differences in antimicro-bial response with differentinocula. Drug-resistant P. aeru-ginosa mutants were readily iso-lated from treated and un-treated animals infected withthe higher inoculum. With thelower bacterial inoculum, re-sistant mutants were isolatedonly from the untreated con-trols (data not shown).
Differential effect of drug exposure on the sensitiveand resistant bacterial subpopulations in mice
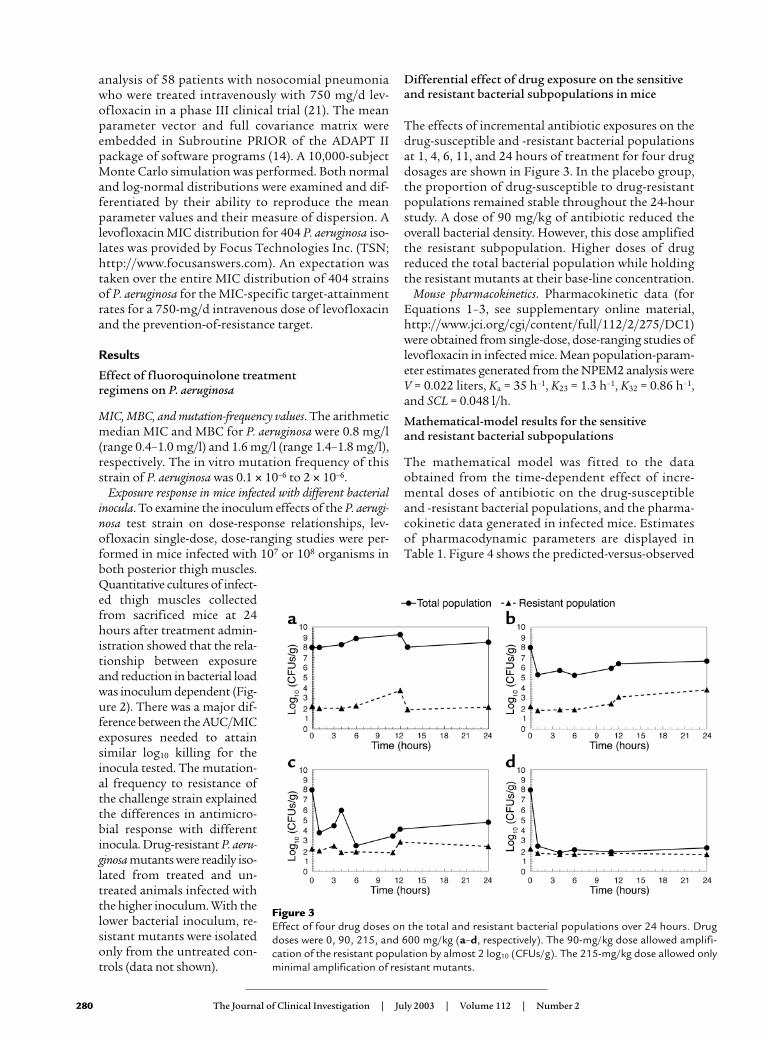
The effects of incremental antibiotic exposures on thedrug-susceptible and -resistant bacterial populationsat 1, 4, 6, 11, and 24 hours of treatment for four drugdosages are shown in Figure 3. In the placebo group,the proportion of drug-susceptible to drug-resistantpopulations remained stable throughout the 24-hourstudy. A dose of 90 mg/kg of antibiotic reduced theoverall bacterial density. However, this dose amplifiedthe resistant subpopulation. Higher doses of drugreduced the total bacterial population while holdingthe resistant mutants at their base-line concentration.
Mouse pharmacokinetics. Pharmacokinetic data (forEquations 1–3, see supplementary online material,http://www.jci.org/cgi/content/full/112/2/275/DC1)were obtained from single-dose, dose-ranging studies oflevofloxacin in infected mice. Mean population-param-eter estimates generated from the NPEM2 analysis wereV = 0.022 liters, Ka = 35 h–1, K23 = 1.3 h–1, K32 = 0.86 h–1,and SCL = 0.048 l/h.
Mathematical-model results for the sensitive and resistant bacterial subpopulations
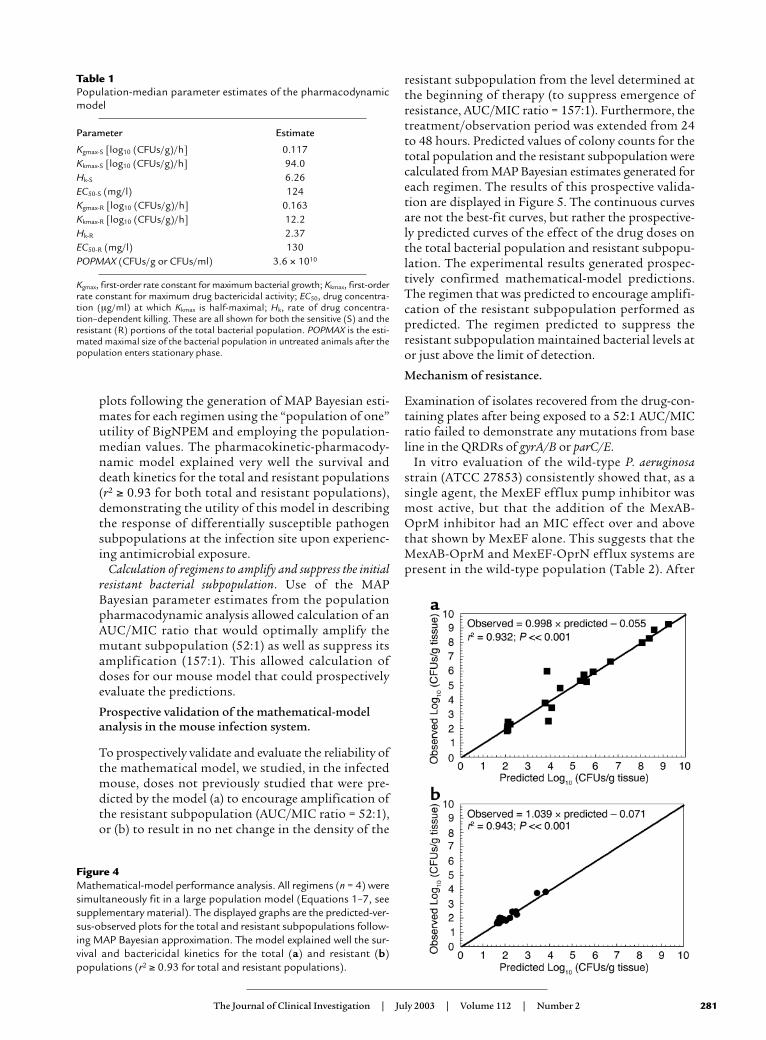
The mathematical model was fitted to the dataobtained from the time-dependent effect of incre-mental doses of antibiotic on the drug-susceptibleand -resistant bacterial populations, and the pharma-cokinetic data generated in infected mice. Estimatesof pharmacodynamic parameters are displayed inTable 1. Figure 4 shows the predicted-versus-observed
Figure 3Effect of four drug doses on the total and resistant bacterial populations over 24 hours. Drugdoses were 0, 90, 215, and 600 mg/kg (a–d, respectively). The 90-mg/kg dose allowed amplifi-cation of the resistant population by almost 2 log10 (CFUs/g). The 215-mg/kg dose allowed onlyminimal amplification of resistant mutants.
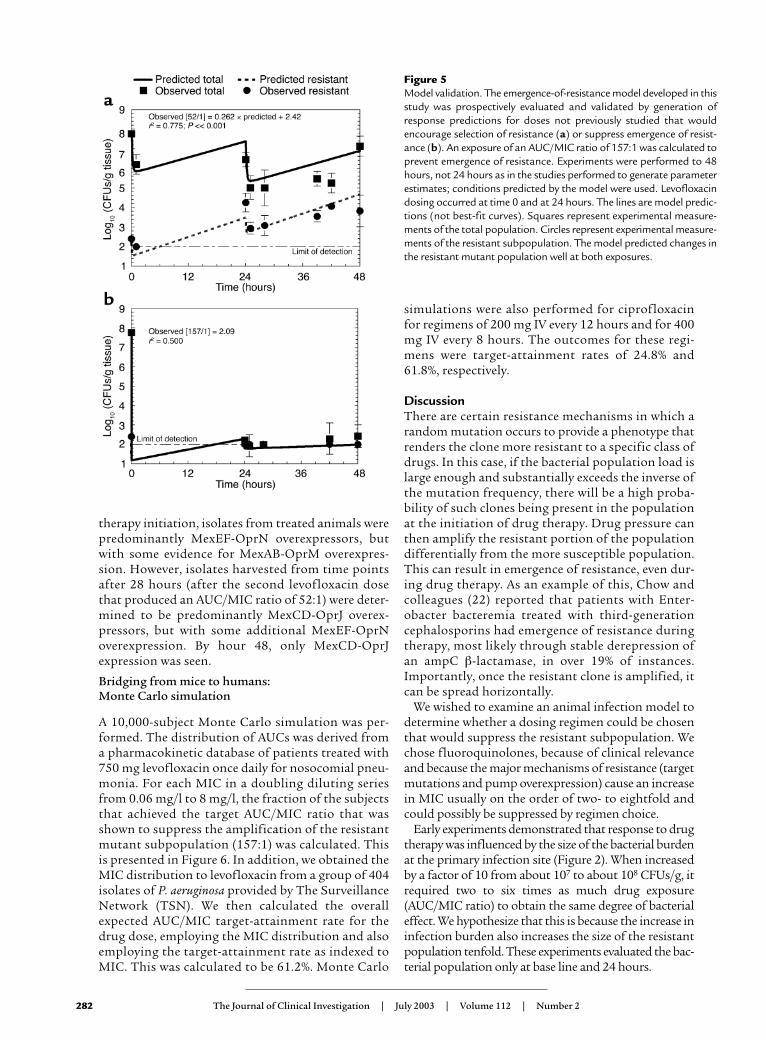
resistant subpopulation from the level determined atthe beginning of therapy (to suppress emergence ofresistance, AUC/MIC ratio = 157:1). Furthermore, thetreatment/observation period was extended from 24to 48 hours. Predicted values of colony counts for thetotal population and the resistant subpopulation werecalculated from MAP Bayesian estimates generated foreach regimen. The results of this prospective valida-tion are displayed in Figure 5. The continuous curvesare not the best-fit curves, but rather the prospective-ly predicted curves of the effect of the drug doses onthe total bacterial population and resistant subpopu-lation. The experimental results generated prospec-tively confirmed mathematical-model predictions.The regimen that was predicted to encourage amplifi-cation of the resistant subpopulation performed aspredicted. The regimen predicted to suppress theresistant subpopulation maintained bacterial levels ator just above the limit of detection.
Mechanism of resistance.
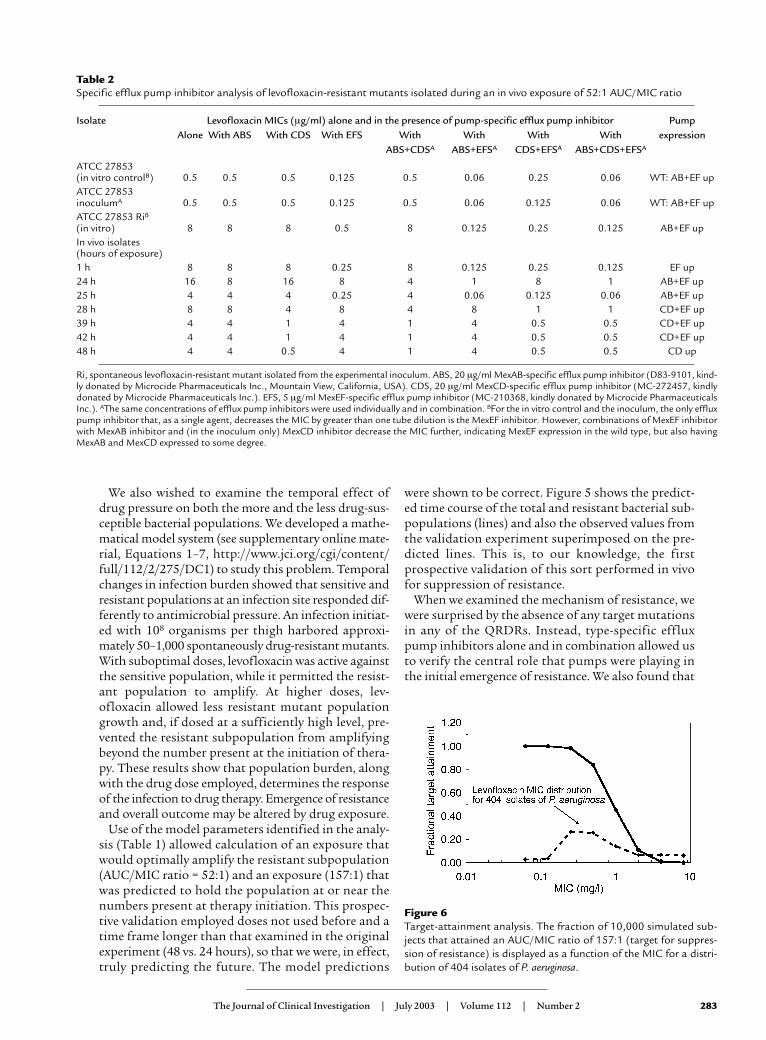
Examination of isolates recovered from the drug-con-taining plates after being exposed to a 52:1 AUC/MICratio failed to demonstrate any mutations from baseline in the QRDRs of gyrA/B or parC/E.
In vitro evaluation of the wild-type P. aeruginosastrain (ATCC 27853) consistently showed that, as asingle agent, the MexEF efflux pump inhibitor wasmost active, but that the addition of the MexAB-OprM inhibitor had an MIC effect over and abovethat shown by MexEF alone. This suggests that theMexAB-OprM and MexEF-OprN efflux systems arepresent in the wild-type population (Table 2). After
The Journal of Clinical Investigation | July 2003 | Volume 112 | Number 2 281
plots following the generation of MAP Bayesian esti-mates for each regimen using the “population of one”utility of BigNPEM and employing the population-median values. The pharmacokinetic-pharmacody-namic model explained very well the survival anddeath kinetics for the total and resistant populations(r2 ≥ 0.93 for both total and resistant populations),demonstrating the utility of this model in describingthe response of differentially susceptible pathogensubpopulations at the infection site upon experienc-ing antimicrobial exposure.
Calculation of regimens to amplify and suppress the initialresistant bacterial subpopulation. Use of the MAPBayesian parameter estimates from the populationpharmacodynamic analysis allowed calculation of anAUC/MIC ratio that would optimally amplify themutant subpopulation (52:1) as well as suppress itsamplification (157:1). This allowed calculation ofdoses for our mouse model that could prospectivelyevaluate the predictions.
Prospective validation of the mathematical-modelanalysis in the mouse infection system.
To prospectively validate and evaluate the reliability ofthe mathematical model, we studied, in the infectedmouse, doses not previously studied that were pre-dicted by the model (a) to encourage amplification ofthe resistant subpopulation (AUC/MIC ratio = 52:1),or (b) to result in no net change in the density of the
Table 1Population-median parameter estimates of the pharmacodynamicmodel
Parameter Estimate
Kgmax-S [log10 (CFUs/g)/h] 0.117Kkmax-S [log10 (CFUs/g)/h] 94.0Hk-S 6.26EC50-S (mg/l) 124Kgmax-R [log10 (CFUs/g)/h] 0.163Kkmax-R [log10 (CFUs/g)/h] 12.2Hk-R 2.37EC50-R (mg/l) 130POPMAX (CFUs/g or CFUs/ml) 3.6 × 10¹⁰
Kgmax, first-order rate constant for maximum bacterial growth; Kkmax, first-orderrate constant for maximum drug bactericidal activity; EC50, drug concentra-tion (µg/ml) at which Kkmax is half-maximal; Hk, rate of drug concentra-tion–dependent killing. These are all shown for both the sensitive (S) and theresistant (R) portions of the total bacterial population. POPMAX is the esti-mated maximal size of the bacterial population in untreated animals after thepopulation enters stationary phase.
Figure 4Mathematical-model performance analysis. All regimens (n = 4) weresimultaneously fit in a large population model (Equations 1–7, seesupplementary material). The displayed graphs are the predicted-ver-sus-observed plots for the total and resistant subpopulations follow-ing MAP Bayesian approximation. The model explained well the sur-vival and bactericidal kinetics for the total (a) and resistant (b)populations (r2 ≥ 0.93 for total and resistant populations).
therapy initiation, isolates from treated animals werepredominantly MexEF-OprN overexpressors, butwith some evidence for MexAB-OprM overexpres-sion. However, isolates harvested from time pointsafter 28 hours (after the second levofloxacin dosethat produced an AUC/MIC ratio of 52:1) were deter-mined to be predominantly MexCD-OprJ overex-pressors, but with some additional MexEF-OprNoverexpression. By hour 48, only MexCD-OprJexpression was seen.
Bridging from mice to humans: Monte Carlo simulation
A 10,000-subject Monte Carlo simulation was per-formed. The distribution of AUCs was derived froma pharmacokinetic database of patients treated with750 mg levofloxacin once daily for nosocomial pneu-monia. For each MIC in a doubling diluting seriesfrom 0.06 mg/l to 8 mg/l, the fraction of the subjectsthat achieved the target AUC/MIC ratio that wasshown to suppress the amplification of the resistantmutant subpopulation (157:1) was calculated. Thisis presented in Figure 6. In addition, we obtained theMIC distribution to levofloxacin from a group of 404isolates of P. aeruginosa provided by The SurveillanceNetwork (TSN). We then calculated the overallexpected AUC/MIC target-attainment rate for thedrug dose, employing the MIC distribution and alsoemploying the target-attainment rate as indexed toMIC. This was calculated to be 61.2%. Monte Carlo
simulations were also performed for ciprofloxacinfor regimens of 200 mg IV every 12 hours and for 400mg IV every 8 hours. The outcomes for these regi-mens were target-attainment rates of 24.8% and61.8%, respectively.
DiscussionThere are certain resistance mechanisms in which arandom mutation occurs to provide a phenotype thatrenders the clone more resistant to a specific class ofdrugs. In this case, if the bacterial population load islarge enough and substantially exceeds the inverse ofthe mutation frequency, there will be a high proba-bility of such clones being present in the populationat the initiation of drug therapy. Drug pressure canthen amplify the resistant portion of the populationdifferentially from the more susceptible population.This can result in emergence of resistance, even dur-ing drug therapy. As an example of this, Chow andcolleagues (22) reported that patients with Enter-obacter bacteremia treated with third-generationcephalosporins had emergence of resistance duringtherapy, most likely through stable derepression ofan ampC β-lactamase, in over 19% of instances.Importantly, once the resistant clone is amplified, itcan be spread horizontally.
We wished to examine an animal infection model todetermine whether a dosing regimen could be chosenthat would suppress the resistant subpopulation. Wechose fluoroquinolones, because of clinical relevanceand because the major mechanisms of resistance (targetmutations and pump overexpression) cause an increasein MIC usually on the order of two- to eightfold andcould possibly be suppressed by regimen choice.
Early experiments demonstrated that response to drugtherapy was influenced by the size of the bacterial burdenat the primary infection site (Figure 2). When increasedby a factor of 10 from about 107 to about 108 CFUs/g, itrequired two to six times as much drug exposure(AUC/MIC ratio) to obtain the same degree of bacterialeffect. We hypothesize that this is because the increase ininfection burden also increases the size of the resistantpopulation tenfold. These experiments evaluated the bac-terial population only at base line and 24 hours.
282 The Journal of Clinical Investigation | July 2003 | Volume 112 | Number 2
Figure 5Model validation. The emergence-of-resistance model developed in thisstudy was prospectively evaluated and validated by generation ofresponse predictions for doses not previously studied that wouldencourage selection of resistance (a) or suppress emergence of resist-ance (b). An exposure of an AUC/MIC ratio of 157:1 was calculated toprevent emergence of resistance. Experiments were performed to 48hours, not 24 hours as in the studies performed to generate parameterestimates; conditions predicted by the model were used. Levofloxacindosing occurred at time 0 and at 24 hours. The lines are model predic-tions (not best-fit curves). Squares represent experimental measure-ments of the total population. Circles represent experimental measure-ments of the resistant subpopulation. The model predicted changes inthe resistant mutant population well at both exposures.
We also wished to examine the temporal effect ofdrug pressure on both the more and the less drug-sus-ceptible bacterial populations. We developed a mathe-matical model system (see supplementary online mate-rial, Equations 1–7, http://www.jci.org/cgi/content/full/112/2/275/DC1) to study this problem. Temporalchanges in infection burden showed that sensitive andresistant populations at an infection site responded dif-ferently to antimicrobial pressure. An infection initiat-ed with 108 organisms per thigh harbored approxi-mately 50–1,000 spontaneously drug-resistant mutants.With suboptimal doses, levofloxacin was active againstthe sensitive population, while it permitted the resist-ant population to amplify. At higher doses, lev-ofloxacin allowed less resistant mutant populationgrowth and, if dosed at a sufficiently high level, pre-vented the resistant subpopulation from amplifyingbeyond the number present at the initiation of thera-py. These results show that population burden, alongwith the drug dose employed, determines the responseof the infection to drug therapy. Emergence of resistanceand overall outcome may be altered by drug exposure.
Use of the model parameters identified in the analy-sis (Table 1) allowed calculation of an exposure thatwould optimally amplify the resistant subpopulation(AUC/MIC ratio = 52:1) and an exposure (157:1) thatwas predicted to hold the population at or near thenumbers present at therapy initiation. This prospec-tive validation employed doses not used before and atime frame longer than that examined in the originalexperiment (48 vs. 24 hours), so that we were, in effect,truly predicting the future. The model predictions
were shown to be correct. Figure 5 shows the predict-ed time course of the total and resistant bacterial sub-populations (lines) and also the observed values fromthe validation experiment superimposed on the pre-dicted lines. This is, to our knowledge, the firstprospective validation of this sort performed in vivofor suppression of resistance.
When we examined the mechanism of resistance, wewere surprised by the absence of any target mutationsin any of the QRDRs. Instead, type-specific effluxpump inhibitors alone and in combination allowed usto verify the central role that pumps were playing inthe initial emergence of resistance. We also found that
The Journal of Clinical Investigation | July 2003 | Volume 112 | Number 2 283
Table 2Specific efflux pump inhibitor analysis of levofloxacin-resistant mutants isolated during an in vivo exposure of 52:1 AUC/MIC ratio
Isolate Levofloxacin MICs (µg/ml) alone and in the presence of pump-specific efflux pump inhibitor Pump Alone With ABS With CDS With EFS With With With With expression
ABS+CDSA ABS+EFSA CDS+EFSA ABS+CDS+EFSA
ATCC 27853 (in vitro controlB) 0.5 0.5 0.5 0.125 0.5 0.06 0.25 0.06 WT: AB+EF upATCC 27853 inoculumA 0.5 0.5 0.5 0.125 0.5 0.06 0.125 0.06 WT: AB+EF upATCC 27853 RiB(in vitro) 8 8 8 0.5 8 0.125 0.25 0.125 AB+EF upIn vivo isolates (hours of exposure)1 h 8 8 8 0.25 8 0.125 0.25 0.125 EF up24 h 16 8 16 8 4 1 8 1 AB+EF up25 h 4 4 4 0.25 4 0.06 0.125 0.06 AB+EF up28 h 8 8 4 8 4 8 1 1 CD+EF up39 h 4 4 1 4 1 4 0.5 0.5 CD+EF up42 h 4 4 1 4 1 4 0.5 0.5 CD+EF up48 h 4 4 0.5 4 1 4 0.5 0.5 CD up
Ri, spontaneous levofloxacin-resistant mutant isolated from the experimental inoculum. ABS, 20 µg/ml MexAB-specific efflux pump inhibitor (D83-9101, kind-ly donated by Microcide Pharmaceuticals Inc., Mountain View, California, USA). CDS, 20 µg/ml MexCD-specific efflux pump inhibitor (MC-272457, kindlydonated by Microcide Pharmaceuticals Inc.). EFS, 5 µg/ml MexEF-specific efflux pump inhibitor (MC-210368, kindly donated by Microcide PharmaceuticalsInc.). AThe same concentrations of efflux pump inhibitors were used individually and in combination. BFor the in vitro control and the inoculum, the only effluxpump inhibitor that, as a single agent, decreases the MIC by greater than one tube dilution is the MexEF inhibitor. However, combinations of MexEF inhibitorwith MexAB inhibitor and (in the inoculum only) MexCD inhibitor decrease the MIC further, indicating MexEF expression in the wild type, but also havingMexAB and MexCD expressed to some degree.
Figure 6Target-attainment analysis. The fraction of 10,000 simulated sub-jects that attained an AUC/MIC ratio of 157:1 (target for suppres-sion of resistance) is displayed as a function of the MIC for a distri-bution of 404 isolates of P. aeruginosa.
the duration of drug pressure had an impact on thetype of pump that was ultimately selected. Drug pres-sure and the hostile environment posed by the infec-tion site modulate efflux pump dominance. Withtherapy, early time points saw the selection of theMexEF-OprN pump. Later time points demonstratedthat the predominant pump system overexpressedwas MexCD-OprJ. We hypothesize that this is themost efficient pump for levofloxacin. Kohler et al.demonstrated, in an in vitro investigation, findingssimilar to those reported here. In the short term,quinolone drug exposure selected more resistantclones that lacked target mutations and that overex-pressed pumps (23). Indeed, they showed that the par-ent drug of levofloxacin (ofloxacin, the 50:50 race-mate) selected primarily MexCD-OprJ.
We demonstrated that it is possible to suppress theamplification of the fluoroquinolone-resistant sub-population in P. aeruginosa at least early on in therapy.We wished to extend this finding into the clinic. We cal-culated the extent to which current drugs and dosingregimens for patients also suppress the emergence ofresistance in this pathogen. Data from our laboratoryhave demonstrated that drug exposures in animals thatdrive a specific degree of microbiological effect are pre-dictive of the necessary exposures in humans (24–26).A 10,000-subject Monte Carlo simulation predictedthat the overall attainment of the target exposure forsuppression of Pseudomonas resistance was 61.2% for alevofloxacin regimen of 750 mg intravenously daily. Toput this into perspective, we performed a similar simu-lation for ciprofloxacin (another fluoroquinoloneantimicrobial) for a regimen of 400 mg IV every 8 hours(27), with a target-exposure attainment of 61.8%. Bothsimulations were derived from data collected frompatients with nosocomial pneumonia. No other fluo-roquinolone, at any approved dose, would attain thistarget at a higher rate.
Indeed, the technique of Monte Carlo simulation pre-dicts well. We could not verify our prediction derivedfrom the Monte Carlo simulation from clinical studydata with levofloxacin (21), because, when P. aeruginosawas identified in the course of that study, a second drugwas added. However, Peloquin et al. studied cipro-floxacin alone at a dose of 200 mg intravenously every12 hours (28). They reported a resistance rate of 70% forP. aeruginosa (n = 10) in patients with nosocomial pneu-monia and reported the ciprofloxacin MICs. We per-formed a second ciprofloxacin Monte Carlo simulationfor this dose and schedule. It predicts that an AUC/MICratio of 157 will be attained at a rate of 24.8% (likelihoodof resistance 75.2%). This is in good concordance withthe observed outcome that seven of ten patients hademergence of pseudomonal resistance. Likewise, a studyby Fink et al. (29) employed a ciprofloxacin dose of 400mg intravenously every 8 hours. The prediction for pre-vention of Pseudomonas resistance was 61.8% (seeabove), while the observed resistance rate was 33%(12/36; 67% not resistant).
Other laboratories, particularly Drlica’s, have notedthe importance of addressing the issue of suppressionof resistance (7, 30). Their studies were in vitro. Ourstudy investigated the development of fluoro-quinolone resistance in a Gram-negative pathogen, P.aeruginosa, in vivo. A mathematical model that de-scribes changes in drug concentrations and bacterialsubpopulations over time was developed and prospec-tively validated. The model enabled (a) the descriptionof the change over time with different drug doses inbacterial subpopulations, (b) the determination of adose and subsequent exposure that prevent the ampli-fication of the resistant subpopulation by drug pres-sure, and, most importantly, (c) accurate prediction ofsubpopulation responses to time frames of therapyand doses not previously studied. The identified tar-get values associated with suppression of resistance ina mouse infection model were used to evaluate clinicaldrug doses using Monte Carlo simulation. The proba-bility of prevention of emergence of resistance was esti-mated for clinical patients.
Clearly, while the search continues for new classes ofantimicrobial agents to which no resistance currentlyexists, development of drug-dosing methods to preventor delay the emergence of resistance like the onedescribed in this study will prolong the utility of cur-rently available anti-infective agents. Such rational dos-ing-regimen design preserves the sensitivity of theinfecting flora to the drug, thus benefiting subsequentpatients. Horizontal transmission is minimized,because the first-stage mutants are suppressed. Theapproach is quite general and may be applied for anynew drug to determine the optimal doses that mini-mize emergence of resistance. This is simply done byidentifying the resistance-suppression drug-exposuretarget and employing population pharmacokineticinformation to evaluate candidate doses for their abil-ity to achieve the drug-exposure target over the rangeof clinically observed MIC values.
AcknowledgmentsThis study was supported by a grant from Ortho-McNeil Pharmaceutical.
1. Eagle, H., Fleischman, R., and Levy, M. 1953. Continuous versus dis-continuous therapy with penicillin: the effect of interval between injec-tions on therapeutic efficacy. N. Engl. J. Med. 248:481–488.
2. Craig, W.A. 1998. Pharmacokinetic/pharmacodynamic parameters:rationale for antibiotic dosing of mice and men. Clin. Infect. Dis. 26:1–10.
3. Craig, W.A. 2001. Does the dose matter? Clin. Infect. Dis. 33(Suppl.3):S233–S237.
4. Jourdain, B., et al. 1995. Role of quantitative cultures of endotrachealaspirates in the diagnosis of nosocomial pneumonia. Am. J. Respir. Crit.Care Med. 152:241–246.
5. Lipsitch, M., and Levin, B.R. 1997. The population dynamics of antimi-crobial chemotherapy. Antimicrob. Agents Chemother. 41:363–373.
6. Blondeau, J.M., Zhao, X., Hansen, G., and Drlica, K. 2001. Mutant pre-vention concentrations of fluoroquinolones for clinical isolates of Strep-tococcus pneumoniae. Antimicrob. Agents Chemother. 45:433–438.
7. Zhou, J., et al. 2000. Selection of antibiotic-resistant bacterial mutants:allelic diversity among fluoroquinolone-resistant mutants. J. Infect. Dis.182:517–525.
8. Drlica, K., Engle, E.C., and Manes, S.H. 1980. DNA gyrase on the bacte-rial chromosome: possibility of two levels of action. Proc. Natl. Acad. Sci.U. S. A. 77:6879–6883.
284 The Journal of Clinical Investigation | July 2003 | Volume 112 | Number 2
21. Drusano, G.L., et al. 2002. Target attainment analysis for levofloxacin750 mg IV daily for nosocomial pneumonia using Monte Carlo simula-tion for common Gram-negative pathogens. Proceedings of the 43rd Inter-science Conference on Antimicrobial Agents and Chemotherapy. September25–29, 2002, San Diego, California, USA. American Society for Micro-biology, Washington, DC, USA. Abstract A-638.
22. Chow, J., et al. 1991. Enterobacter bacteremia: clinical features and emer-gence of antibiotic resistance during therapy. Ann. Intern. Med.115:585–590.
23. Kohler, T., Michea-Hamzehpour, M., Plesiat, P., Kahr, A.-L., and Pechere,J.-C. 1997. Differential selection of multidrug efflux systems byquinolones in Pseudomonas aeruginosa. Antimicrob. Agents Chemother.41:2540–2543.
24. Drusano, G.L., Johnson, D.E., Rosen, M., and Standiford, H.C. 1993.Pharmacodynamics of a fluoroquinolone antimicrobial in a neu-tropenic rat model of Pseudomonas sepsis. Antimicrob. Agents Chemother.37:483–490.
25. Preston, S.L., et al. 1998. Pharmacodynamics of levofloxacin: a new par-adigm for early clinical trials. JAMA. 279:125–129.
26. Drusano, G.L., et al. 2001. Use of preclinical data for the choice of aPhase II/III dose for evernimicin with application to decision supportfor identification of a preclinical MIC breakpoint. Antimicrob. AgentsChemother. 45:13–22.
27. Forrest, A., Ballow, C.H., Nix, D.E., Birmingham, M.C., and Schentag, J.J.1993. Development of a population pharmacokinetic model and opti-mal sampling strategies for intravenous ciprofloxacin. Antimicrob. AgentsChemother. 37:1065–1072.
28. Peloquin, C.A., Cumbo, T.J., Nix, D.E., Sands, M.F., and Schentag, J.J.1989. Evaluation of intravenous ciprofloxacin in patients with nosoco-mial lower respiratory tract infections: impact of plasma concentrationand clinical condition on bacterial eradication. Arch. Intern. Med.149:2269–2273.
29. Fink, M.S., et al. 1994. Treatment of severe pneumonia in hospitalizedpatients: results of a randomized, double-blind trial comparing intra-venous ciprofloxacin with imipenem-cilastatin. Antimicrob. AgentsChemother. 38:547–557.
30. Sindelar, G., et al. 2000. Mutation prevention concentration as a meas-ure of fluoroquinolone potency against Mycobacteria. Antimicrob. AgentsChemother. 44:3337–3343.
The Journal of Clinical Investigation | July 2003 | Volume 112 | Number 2 285
9. Paulsen, I.T., Brown, M.H., and Skurray, R.A. 1996. Proton-dependentmultidrug efflux systems. Microbiol. Rev. 60:575–608.
10. Munoz, R., and De La Campa, A.G. 1996. ParC subunit of DNA topoi-somerase IV of Streptococcus pneumoniae is a primary target of fluoro-quinolones and cooperates with DNA gyrase A subunit in forming resist-ance phenotype. Antimicrob. Agents Chemother. 40:2252–2257.
11. Nikaido, H. 1994. Prevention of drug access to bacterial targets: perme-ability barriers and active efflux. Science. 264:382–388.
12. Ng, E.Y., Trucksis, M., and Hooper, D.C. 1996. Quinolone resistancemutations in topoisomerase IV: relationship to the flqA locus and genet-ic evidence that topoisomerase IV is the primary target and DNA gyraseis the secondary target of fluoroquinolones in Staphylococcus aureus.Antimicrob. Agents Chemother. 40:1881–1888.
13. Lomovskaya, O., et al. 2001. Identification and characterization ofinhibitors of multidrug resistance efflux pumps in Pseudomonas aerugi-nosa: novel agents for combination therapy. Antimicrob. Agents Chemother.45:105–116.
14. D’Argenio, D.Z., and Schumitzky, A. 1997. ADAPT II. A program for sim-ulation, identification, and optimal experimental design. User manual.Biomedical Simulations Resource, University of Southern California,Los Angeles, California, USA. http://bmsr.usc.edu/.
15. Wong, F.A., Juzwin, S.J., and Flor, S.C. 1997. Rapid stereospecific high-performance liquid chromatographic determination of levofloxacin inhuman plasma and urine. J. Pharm. Biomed. Anal. 15:765–771.
16. Schumitzky, A., Jelliffe, R., and van Guilder, M. 1994. NPEM: a program forpharmacokinetic population analysis. Clin. Pharmacol. Ther. 55:163. (Abstr.)
17. Yamaoko, K., Nakagawa, T., and Uno, T. 1978. Application of Akaike’sInformation Criterion in the evaluation of linear pharmacokinetic equa-tions. J. Pharmacokinet. Biopharm. 6:165–175.
18. Kureishi, A., Diver, J.M., Beckthold, B., Schollardt, T., and Bryan, L.E.1994. Cloning and nucleotide sequence of Pseudomonas aeruginosa DNAgyrase gyrA gene from strain PAO1 and quinolone-resistant clinical iso-lates. Antimicrob. Agents Chemother. 38:1944–1952.
19. Nakano, M., et al. 1997. Mutations in the gyrA and parC genes in fluo-roquinolone-resistant clinical isolates of Pseudomonas aeruginosa. Antimi-crob. Agents Chemother. 41:2289–2291.
20. Lomovskaya, O., and Watkins, W. 2001. Inhibition of efflux pumps as anovel approach to combat drug resistance in bacteria. J. Mol. Microbiol.Biotechnol. 3:225–236.


