Embed Size (px)
Citation preview
This article appeared in a journal published by Elsevier. The attachedcopy is furnished to the author for internal non-commercial researchand education use, including for instruction at the authors institution
and sharing with colleagues.
Other uses, including reproduction and distribution, or selling orlicensing copies, or posting to personal, institutional or third party
websites are prohibited.
In most cases authors are permitted to post their version of thearticle (e.g. in Word or Tex form) to their personal website orinstitutional repository. Authors requiring further information
regarding Elsevier’s archiving and manuscript policies areencouraged to visit:
http://www.elsevier.com/authorsrights
Author's personal copy
Applied Catalysis B: Environmental 144 (2014) 674– 685
Contents lists available at ScienceDirect
Applied Catalysis B: Environmental
jo ur nal home p ag e: www.elsev ier .com/ locate /apcatb
Ordered TiO2 nanotubes: The effect of preparation parameters on thephotocatalytic activity in air purification process
Michał Nischka, Paweł Mazierskia, Maria Gazdab, Adriana Zaleskaa,∗
a Department of Chemical Technology, Faculty of Chemistry, Gdansk University of Technology, 80-233 Gdansk, Polandb Department of Solid State Physics, Faculty of Applied Physics and Mathematics, Gdansk University of Technology, 80-233 Gdansk, Poland
a r t i c l e i n f o
Article history:Received 24 April 2013Received in revised form 11 July 2013Accepted 16 July 2013Available online 25 July 2013
Keywords:TiO2 nanotubesOxidative anodizationHeterogeneous photocatalysisAir treatmentLEDs
a b s t r a c t
Vertically ordered TiO2 nanotube arrays were synthesized by anodic oxidation of titanium foil in glycerol,ethylene glycol and water-based electrolytes. The effect of electrolyte composition, anodization voltage,ultrasonic treatment and calcination time on the morphology of the resulting thin films, as well as ontheir photocatalytic activity in toluene removal, used as a model volatile organic compound, was inves-tigated. Toluene, at the concentration of about 100 ppm, was irradiated over TiO2 nanotube arrays usingxenon lamp and light-emitting diodes (LEDs) in four subsequent cycles. The results showed that toluenecould be mostly removed from the air after 30 min of irradiation over TiO2 nanotubes (NTs), even usingLEDs (375 nm) as a irradiation source. Photoactivity increased with increasing of nanotubes lengths anddecreasing of crystallite size. Thus, TiO2 nanotube arrays formed in ethylene glycol-based electrolyte byapplying voltage of 40 V, followed by 1-h calcination at 450 ◦C, revealed the highest photoactivity andmay be used several times without any significant decrease in activity.
© 2013 Elsevier B.V. All rights reserved.
1. Introduction
Air pollutants such as chemicals, particulate matter and bio-logical materials cause harm and discomfort to humans and otherliving organisms. Major chemicals, known as air pollutants and pro-duced by human activity, include: sulfur dioxide (SO2), nitrogenoxides (NOx), volatile organic compounds (VOCs) and pathogenicmicroorganisms. Among to the others methods, heterogeneousphotocatalysis has been proposed to remove both organic and inor-ganic compounds together with microorganisms from outdoor andindoor air. TiO2 materials were used to degrade compounds suchas: trichloroethylene, methanol, benzene [1], toluene [2,3], acetone,ethanol [3], acetaldehyde [4], carbon monoxide, nitric oxides [5],mixture of different VOCs [6] and also a pathogenic microorgan-isms, like Legionella pneumophila bacteria [7]. Different geometryand construction of the reactors were used to perform photocat-alytic air purification process [8,9]. Commercially available P25TiO2 was the most widely investigated and used photocatalystfor air purification processes [1,3,4,10]. Another TiO2 photocata-lyst was obtained via chemical vapor deposition of TiO2 precursor(titanium tetraisopropoxide) [11]. Based on the literature dataand own experience, it could be concluded that the efficiency ofthe photocatalytic air treatment system depends on three basisparameters: (a) activity of the photocatalyst, (b) surface area of
∗ Corresponding author. Tel.: +48 583472437; fax: +48 583472065.E-mail address: [email protected] (A. Zaleska).
the photocatalyst (e.g. surface area of photocatalyst support), and(c) type and power of irradiation source. Thus, one of the chal-lenges in the field of photocatalytic air treatment systems is thedevelopment of photoactive materials, in the form of thin layer,activated by low powered and low cost irradiation sources (suchas LEDs) to remove VOCs, microorganism and to deodorize airstreams. Nanotubes arrays meet these requirement, since they canbe directly grown on a support material and posses high surfacearea, which guarantee enhanced photon absorption together withan extensive adsorption of reactant molecules on the photocatalystsurface [12]. Furthermore, TiO2 NTs possess a number of attrac-tive properties, such as potentially enhancing electron percolationpathways, light conversion, as well as improved ion diffusion atthe semiconductor–electrolyte interface [13]. TiO2 nanotubes, dueto their unique features, could be used as photocatalytic material,in solar cells, in electrochromic devices, as a biomedical coating,drug-delivery capsule and biosensors [14].
The morphological structure of anodized TiO2 nanotubes aswell as their photocatalytic activity can be modified by changingpreparation conditions, like anodization time, applied voltage, tem-perature, Ti foil roughness, calcination parameters and electrolytecomposition including fluoride concentration, solvent, water con-tent, pH, viscosity, conductivity, and organic additives [15,16].According to Zhang et al. [17] there are several generations ofTiO2 nanotubes produced via anodic oxidation. First generationnanotubes were obtained by titanium anodization in an aque-ous electrolyte containing fluorides, i.e. 1 M H2SO4 + 0.15 wt% HF[18] or 0.5 M H3PO4 + 0.14 M NaF [19]. The second generation
0926-3373/$ – see front matter © 2013 Elsevier B.V. All rights reserved.http://dx.doi.org/10.1016/j.apcatb.2013.07.041
Author's personal copy
M. Nischk et al. / Applied Catalysis B: Environmental 144 (2014) 674– 685 675
nanotubes are fabricated using organic-based electrolytes, such asethylene glycol + 10 wt% H2O + 0.135 M NH4F [20] or 55% (v/v) glyc-erol + 45% (v/v). H2O + 0.27 M NH4F [21]. TiO2 nanotube arrays ofdifferent lengths were prepared by electrochemical anodizationof titanium disks in NH4F–H2O–formamide solution, followed byannealing at 450 ◦C and used for water splitting [12]. A square-shaped fast photoresponse was recorded with ordered and fullytop-open nanotubular structures. On the other hand, clogged tubesnot only yielded low current densities, but also showed delayedphotocurrent transient signals due to the reduced mobility of thecharge carriers within the preferentially oriented anatase layer[12]. Recently, it was demonstrated that TiO2 nanotube arrays canindeed have a higher photocatalytic reactivity than a comparablenanoparticulate layer [22] and it was shown that TiO2 NTs dopedwith small amounts of Ru, Nb or Ta [23–25] dramatically enhancedwater-splitting. However, there is only a few reports about usinganodized, ordered TNTs arrays as a photocatalytic material for airtreatment. TiO2 NTs were used to remove acetalaldehyde [26],toluene and benzene [27] and NOx oxidation [28] in the gas phase.
Although the TiO2 NTs have been studied intensively for watersplitting, to our best knowledge, there has been no report on usingUV-light-emitting diodes for gas phase treatment over orderedTiO2 nanotubes. LEDs are a promising irradiation source, whichallow to reduce power consumption and costs of photocatalyticprocesses. In this work, a series of TiO2 NTs were fabricated by Tianodization followed by calcination. The effect of the anodizationvoltage, electrolyte composition, calcination time and applicationof ultrasonic treatment before calcination on TiO2 nanotubes mor-phology (length, diameter and smoothness), photocatalytic activityand photocatalysts stability in four subsequent cycles were inves-tigated.
2. Experimental
2.1. Materials and instruments
Titanium foil (0.127 mm thickness, 99.7% purity) was purchasedfrom Sigma-Aldrich and used as a Ti substrate for producingordered TiO2 nanotubes. Isopropanol (p.a., POCh S.A., Poland), ace-tone and methanol (p.a., P.P.H. STANLAB, Poland) were used forcleaning Ti substrate surface. Sulfuric acid (95%, p.a.), ethyleneglycol (99.0%, p.a.), glycerol anhydrous (99.5%, p.a.), ammonium flu-oride (p.a.) and hydrofluoric acid (40%, p.a.) were purchased fromPOCh S.A. (Poland) and used as components for preparation of elec-trolytes used in Ti anodizing process. Toluene (99.5%, p.a., POCh S.A.,Poland) was used as a model air contaminant. All reagents wereused without further purification.
The morphology of the resulting TiO2 nanotubes in the form ofa thin film was determined by using scanning electron microscopy(SEM) (Quanta 3D FEG, FEI Company). The cross-section imageswere obtained from the cracked spaces of the samples. Crystalstructure of the resulting TiO2 nanotubes photocatalysts was deter-mined from X-Ray diffraction patterns (XRD) measured in therange of 2� = 20–80◦, using X-ray diffractometer (Xpert PRO-MPD,Philips) with copper K� radiation (� = 1.5404 A). The XRD estima-tion of the crystallite size was based on the Scherrer formula:
d = 0.9�
(Be − Bt) cos �
where � is the X-ray wavelength, Be indicates the measured breadthof a peak profile, while Bt is the ideal, non-broadened breadth of apeak and � is the diffraction angle. The value of Bt was estimated onthe basis of the measurements performed for the standard sampleof polycrystalline Si with large crystalline grains. The accuracy ofthe grain size analysis has been estimated to be about 20%.
Light-absorption properties of TiO2 nanotubes were character-ized by recording diffuse reflectance (DR) spectra and convertingthe data in order to obtain absorption spectra. The measurementswere performed on UV–vis spectrophotometer (Evolution 220,Thermo Scientific) equipped with an integrating sphere. The base-line was determined using barium sulphate as a reference and pureTi foil.
2.2. Preparation of TiO2 nanotubes
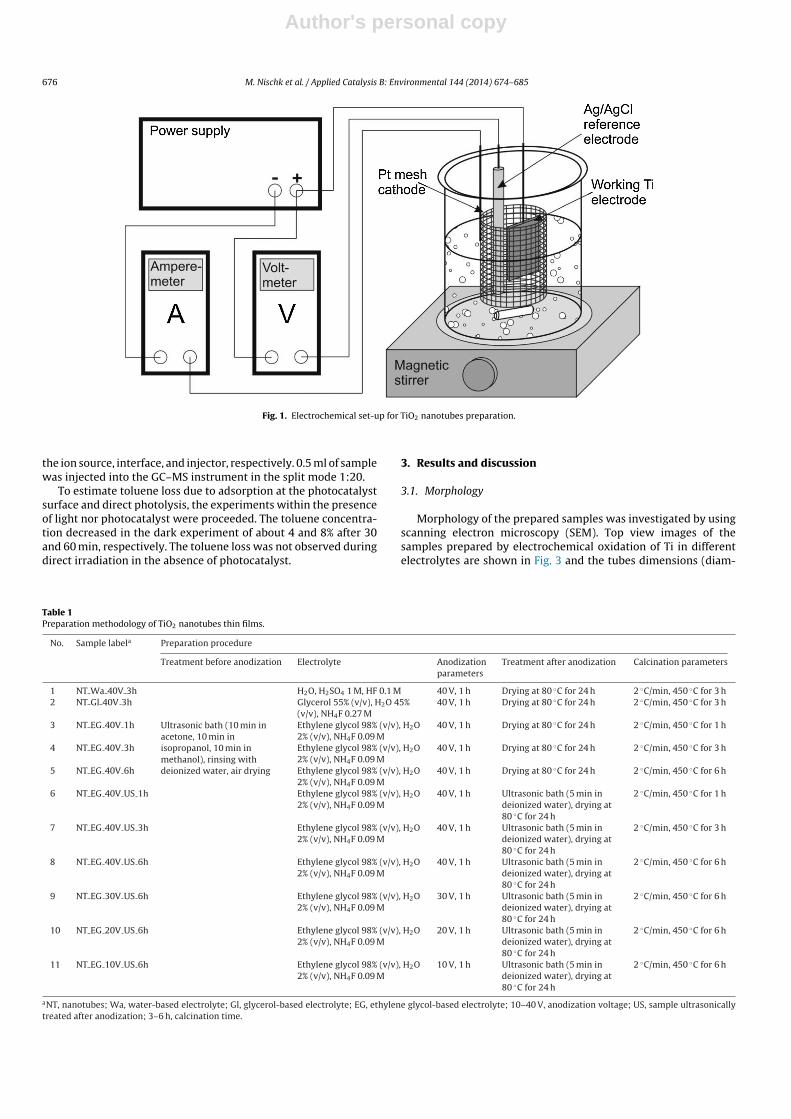
The substrate sample (Ti foil, dimensions 2 cm × 3 cm) wasultrasonically cleaned in acetone (10 min), isopropanol (10 min)and methanol (10 min) and subsequently rinsed with deionizedwater and dried in air. Titanium substrate was anodized in a two-electrode electrochemical set-up, using platinum mesh as a counterelectrode as shown in Fig. 1. Ag/AgCl reference electrode was usedonly for controlling the process and obtaining information aboutactual potential of Ti working electrode. Three types of electrolytesolutions containing fluoride ions were used in the electrochemi-cal process: (i) water-based electrolyte (H2O, H2SO4 1 M, HF 0.1 M),(ii) glycerol-based electrolyte (glycerol 55%, v/v, H2O 45%, v/v,NH4F 0.27 M), (iii) ethylene glycol-based electrolyte (ethylene gly-col 98%, v/v, H2O 2%, v/v, NH4F 0.09 M). Each substrate sample wasanodized for 1 h at the applied voltage from the range of 10–40 Vusing programmable DC power supply (MANSON SDP 2603). Theactual current and potential of Ti electrode vs. Ag/AgCl referenceelectrode was measured and recorded using digital multimeters(BRYMEN BM857a) connected to the computer. Obtained sampleswere rinsed with deionized water, ultrasonically treated (deionizedwater, 5 min), dried in air (80 ◦C for 24 h) and calcinated at 450 ◦C(heating rate 2 ◦C/min). The description of all produced samplesincluding their preparation methodology is summarized in Table 1.
2.3. Measurement of photocatalytic activity
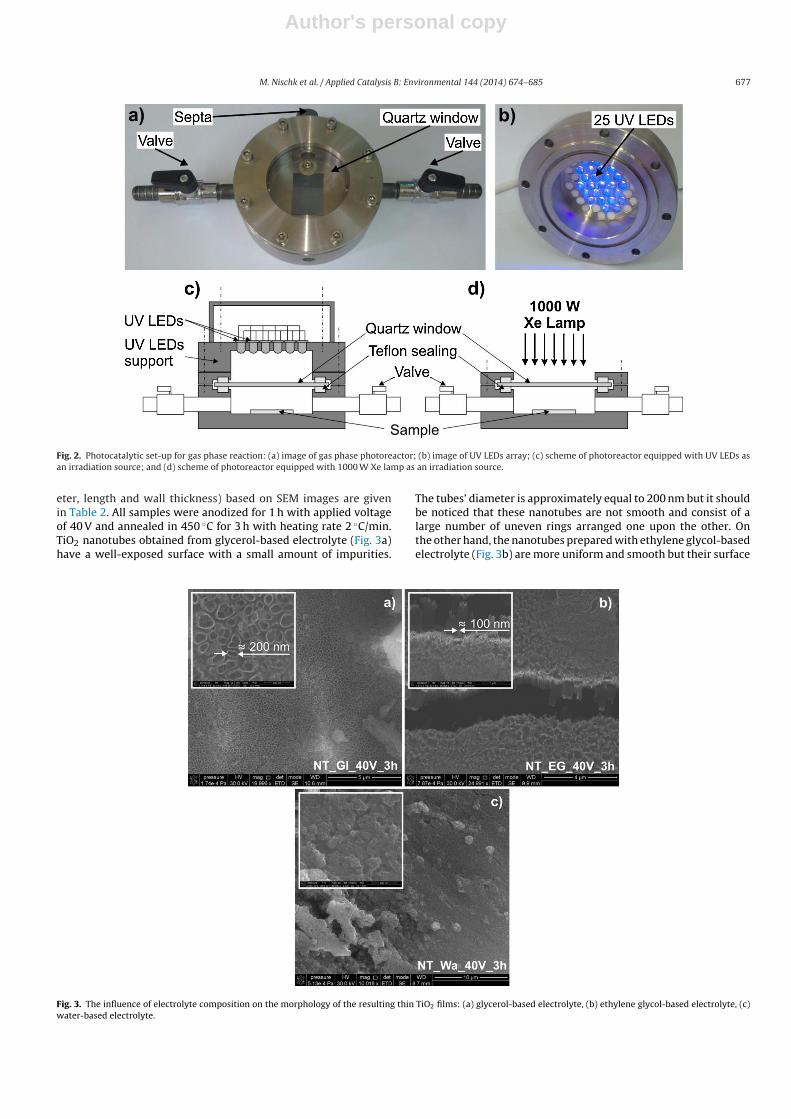
Photocatalytic activity of prepared TiO2 nanotubes thin filmswas determined in the process of cleaning air from volatile organiccompounds (VOC). Toluene was used as a model air contaminant.The photocatalysts activity tests were carried out in a flat stain-less steel reactor with the working volume of about 30 cm3 (seedetails in Fig. 2). The reactor was equipped with a quartz win-dow, two valves and a septa (Fig. 2a). An array of 25 UV LEDs(�max = 375 nm, 63 mW per diode) or 1000 W Xe lamp (OPTELOpole, Poland) was used as an irradiation source, as shown inFig. 2c and d. Measured light flux (in the range from 310 to 380 nm)was 11.2 and 17.3 mW/cm2 for LEDs and Xe lamp, respectively(Hamamatsu UV Power meter, model C9536-01). Titanium platecovered by TiO2 nanotubes (2 cm × 2 cm) was placed at the bot-tom side of the reactor followed by closing the reactor with aquartz window. Subsequently, the gaseous mixture was passedthrough the reaction space for 2 min. After closing the valves,the reactor was kept in dark for 10 min in order to achieveequilibrium. A reference sample was taken just before starting irra-diation. The analysis of toluene concentration in the gas phasewas performed using gas chromatograph (Clarus 500, PerkinElmer)equipped with flame ionization detector (FID) and Elite-5 cap-illary column (30 m × 0.25 mm, 0.25 �m). The samples (200 �l)were dosed by using a gas-tight syringe. By-product formed duringtoluene irradiation were identified using GC–MS analyses (Shi-madzu GCMS-QP2010 Plus chromatograph). A fused-silica capillarycolumn DB-5 MS (60 m × 0.25 mm I.D., 0.5 �m film thickness) fromMarchel-Nagel was used. Helium 1 ml/min was used as the carriergas. The following oven temperature program was used: 5 min at40 ◦C, then an increase to 200 ◦C at rate of 20 ◦C/min and hold for3 min. Constant temperatures of 200, 220, and 200 ◦C were kept at
Author's personal copy
676 M. Nischk et al. / Applied Catalysis B: Environmental 144 (2014) 674– 685
Fig. 1. Electrochemical set-up for TiO2 nanotubes preparation.
the ion source, interface, and injector, respectively. 0.5 ml of samplewas injected into the GC–MS instrument in the split mode 1:20.
To estimate toluene loss due to adsorption at the photocatalystsurface and direct photolysis, the experiments within the presenceof light nor photocatalyst were proceeded. The toluene concentra-tion decreased in the dark experiment of about 4 and 8% after 30and 60 min, respectively. The toluene loss was not observed duringdirect irradiation in the absence of photocatalyst.
3. Results and discussion
3.1. Morphology
Morphology of the prepared samples was investigated by usingscanning electron microscopy (SEM). Top view images of thesamples prepared by electrochemical oxidation of Ti in differentelectrolytes are shown in Fig. 3 and the tubes dimensions (diam-
Table 1Preparation methodology of TiO2 nanotubes thin films.
No. Sample labela Preparation procedure
Treatment before anodization Electrolyte Anodizationparameters
Treatment after anodization Calcination parameters
1 NT Wa 40V 3h
Ultrasonic bath (10 min inacetone, 10 min inisopropanol, 10 min inmethanol), rinsing withdeionized water, air drying
H2O, H2SO4 1 M, HF 0.1 M 40 V, 1 h Drying at 80 ◦C for 24 h 2 ◦C/min, 450 ◦C for 3 h2 NT Gl 40V 3h Glycerol 55% (v/v), H2O 45%
(v/v), NH4F 0.27 M40 V, 1 h Drying at 80 ◦C for 24 h 2 ◦C/min, 450 ◦C for 3 h
3 NT EG 40V 1h Ethylene glycol 98% (v/v), H2O2% (v/v), NH4F 0.09 M
40 V, 1 h Drying at 80 ◦C for 24 h 2 ◦C/min, 450 ◦C for 1 h
4 NT EG 40V 3h Ethylene glycol 98% (v/v), H2O2% (v/v), NH4F 0.09 M
40 V, 1 h Drying at 80 ◦C for 24 h 2 ◦C/min, 450 ◦C for 3 h
5 NT EG 40V 6h Ethylene glycol 98% (v/v), H2O2% (v/v), NH4F 0.09 M
40 V, 1 h Drying at 80 ◦C for 24 h 2 ◦C/min, 450 ◦C for 6 h
6 NT EG 40V US 1h Ethylene glycol 98% (v/v), H2O2% (v/v), NH4F 0.09 M
40 V, 1 h Ultrasonic bath (5 min indeionized water), drying at80 ◦C for 24 h
2 ◦C/min, 450 ◦C for 1 h
7 NT EG 40V US 3h Ethylene glycol 98% (v/v), H2O2% (v/v), NH4F 0.09 M
40 V, 1 h Ultrasonic bath (5 min indeionized water), drying at80 ◦C for 24 h
2 ◦C/min, 450 ◦C for 3 h
8 NT EG 40V US 6h Ethylene glycol 98% (v/v), H2O2% (v/v), NH4F 0.09 M
40 V, 1 h Ultrasonic bath (5 min indeionized water), drying at80 ◦C for 24 h
2 ◦C/min, 450 ◦C for 6 h
9 NT EG 30V US 6h Ethylene glycol 98% (v/v), H2O2% (v/v), NH4F 0.09 M
30 V, 1 h Ultrasonic bath (5 min indeionized water), drying at80 ◦C for 24 h
2 ◦C/min, 450 ◦C for 6 h
10 NT EG 20V US 6h Ethylene glycol 98% (v/v), H2O2% (v/v), NH4F 0.09 M
20 V, 1 h Ultrasonic bath (5 min indeionized water), drying at80 ◦C for 24 h
2 ◦C/min, 450 ◦C for 6 h
11 NT EG 10V US 6h Ethylene glycol 98% (v/v), H2O2% (v/v), NH4F 0.09 M
10 V, 1 h Ultrasonic bath (5 min indeionized water), drying at80 ◦C for 24 h
2 ◦C/min, 450 ◦C for 6 h
aNT, nanotubes; Wa, water-based electrolyte; Gl, glycerol-based electrolyte; EG, ethylene glycol-based electrolyte; 10–40 V, anodization voltage; US, sample ultrasonicallytreated after anodization; 3–6 h, calcination time.
Author's personal copy
M. Nischk et al. / Applied Catalysis B: Environmental 144 (2014) 674– 685 677
Fig. 2. Photocatalytic set-up for gas phase reaction: (a) image of gas phase photoreactor; (b) image of UV LEDs array; (c) scheme of photoreactor equipped with UV LEDs asan irradiation source; and (d) scheme of photoreactor equipped with 1000 W Xe lamp as an irradiation source.
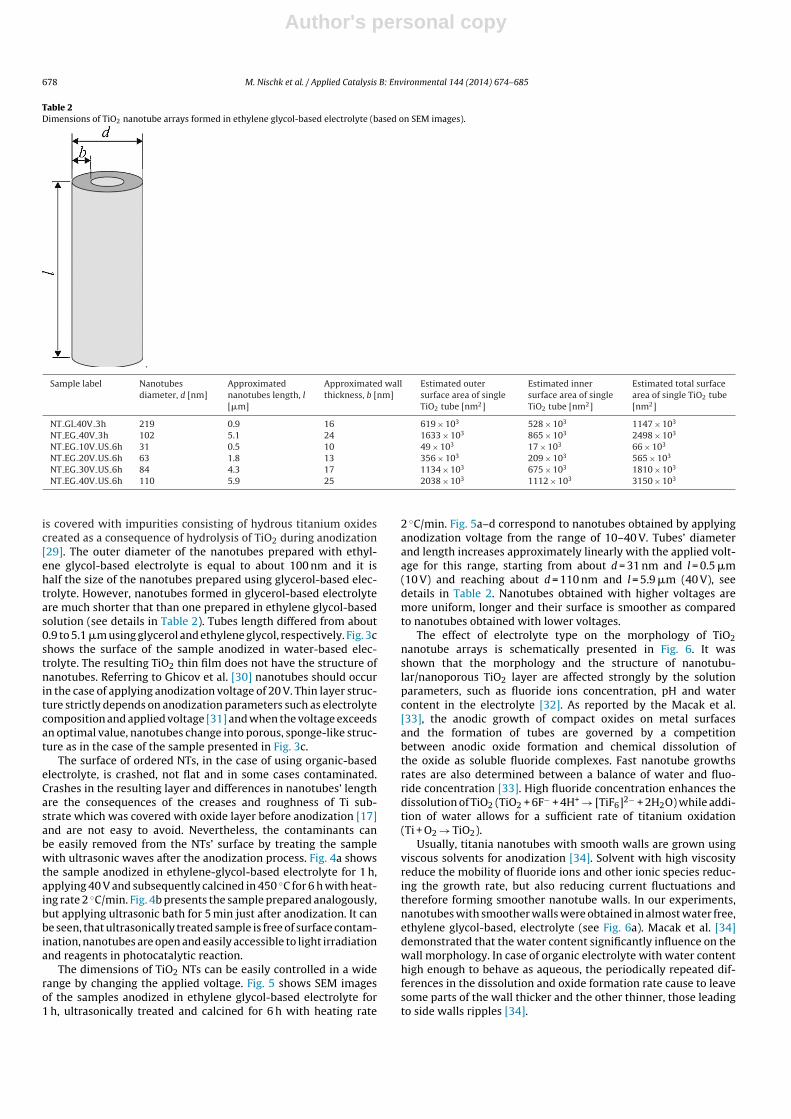
eter, length and wall thickness) based on SEM images are givenin Table 2. All samples were anodized for 1 h with applied voltageof 40 V and annealed in 450 ◦C for 3 h with heating rate 2 ◦C/min.TiO2 nanotubes obtained from glycerol-based electrolyte (Fig. 3a)have a well-exposed surface with a small amount of impurities.
The tubes’ diameter is approximately equal to 200 nm but it shouldbe noticed that these nanotubes are not smooth and consist of alarge number of uneven rings arranged one upon the other. Onthe other hand, the nanotubes prepared with ethylene glycol-basedelectrolyte (Fig. 3b) are more uniform and smooth but their surface
Fig. 3. The influence of electrolyte composition on the morphology of the resulting thin TiO2 films: (a) glycerol-based electrolyte, (b) ethylene glycol-based electrolyte, (c)water-based electrolyte.
Author's personal copy
678 M. Nischk et al. / Applied Catalysis B: Environmental 144 (2014) 674– 685
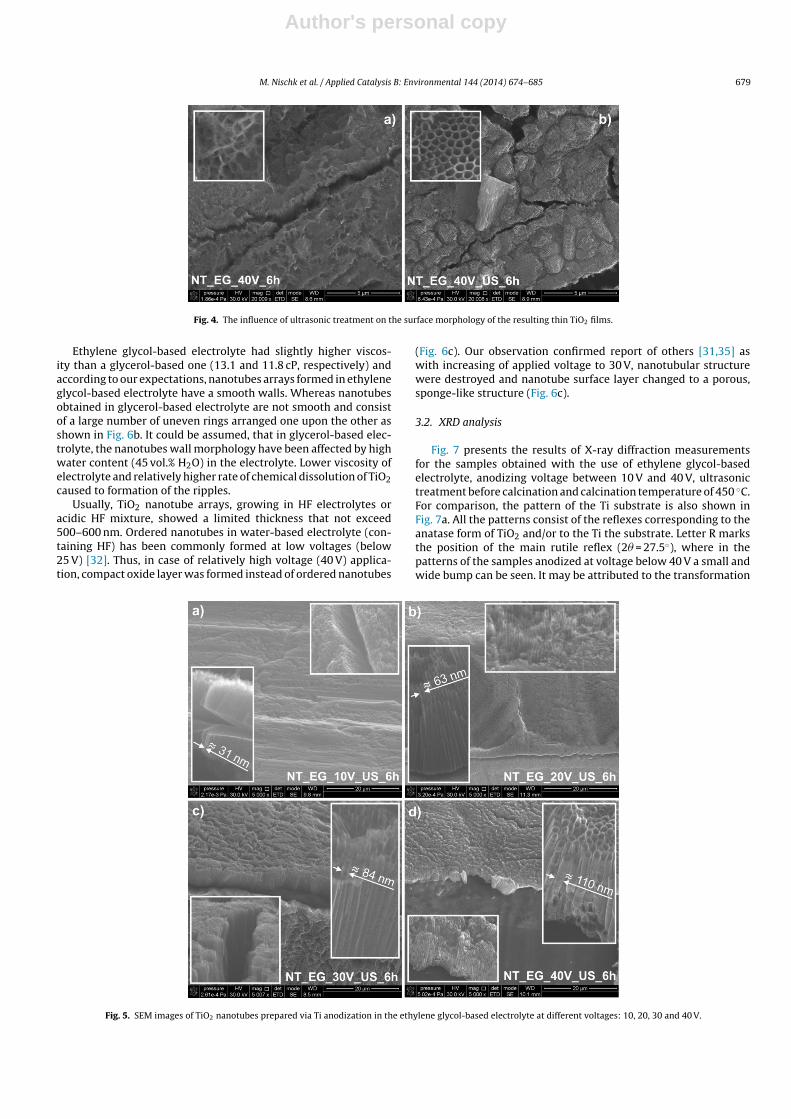
Table 2Dimensions of TiO2 nanotube arrays formed in ethylene glycol-based electrolyte (based on SEM images).
.
Sample label Nanotubesdiameter, d [nm]
Approximatednanotubes length, l[�m]
Approximated wallthickness, b [nm]
Estimated outersurface area of singleTiO2 tube [nm2]
Estimated innersurface area of singleTiO2 tube [nm2]
Estimated total surfacearea of single TiO2 tube[nm2]
NT Gl 40V 3h 219 0.9 16 619 × 103 528 × 103 1147 × 103
NT EG 40V 3h 102 5.1 24 1633 × 103 865 × 103 2498 × 103
NT EG 10V US 6h 31 0.5 10 49 × 103 17 × 103 66 × 103
NT EG 20V US 6h 63 1.8 13 356 × 103 209 × 103 565 × 103
NT EG 30V US 6h 84 4.3 17 1134 × 103 675 × 103 1810 × 103
NT EG 40V US 6h 110 5.9 25 2038 × 103 1112 × 103 3150 × 103
is covered with impurities consisting of hydrous titanium oxidescreated as a consequence of hydrolysis of TiO2 during anodization[29]. The outer diameter of the nanotubes prepared with ethyl-ene glycol-based electrolyte is equal to about 100 nm and it ishalf the size of the nanotubes prepared using glycerol-based elec-trolyte. However, nanotubes formed in glycerol-based electrolyteare much shorter that than one prepared in ethylene glycol-basedsolution (see details in Table 2). Tubes length differed from about0.9 to 5.1 �m using glycerol and ethylene glycol, respectively. Fig. 3cshows the surface of the sample anodized in water-based elec-trolyte. The resulting TiO2 thin film does not have the structure ofnanotubes. Referring to Ghicov et al. [30] nanotubes should occurin the case of applying anodization voltage of 20 V. Thin layer struc-ture strictly depends on anodization parameters such as electrolytecomposition and applied voltage [31] and when the voltage exceedsan optimal value, nanotubes change into porous, sponge-like struc-ture as in the case of the sample presented in Fig. 3c.
The surface of ordered NTs, in the case of using organic-basedelectrolyte, is crashed, not flat and in some cases contaminated.Crashes in the resulting layer and differences in nanotubes’ lengthare the consequences of the creases and roughness of Ti sub-strate which was covered with oxide layer before anodization [17]and are not easy to avoid. Nevertheless, the contaminants canbe easily removed from the NTs’ surface by treating the samplewith ultrasonic waves after the anodization process. Fig. 4a showsthe sample anodized in ethylene-glycol-based electrolyte for 1 h,applying 40 V and subsequently calcined in 450 ◦C for 6 h with heat-ing rate 2 ◦C/min. Fig. 4b presents the sample prepared analogously,but applying ultrasonic bath for 5 min just after anodization. It canbe seen, that ultrasonically treated sample is free of surface contam-ination, nanotubes are open and easily accessible to light irradiationand reagents in photocatalytic reaction.
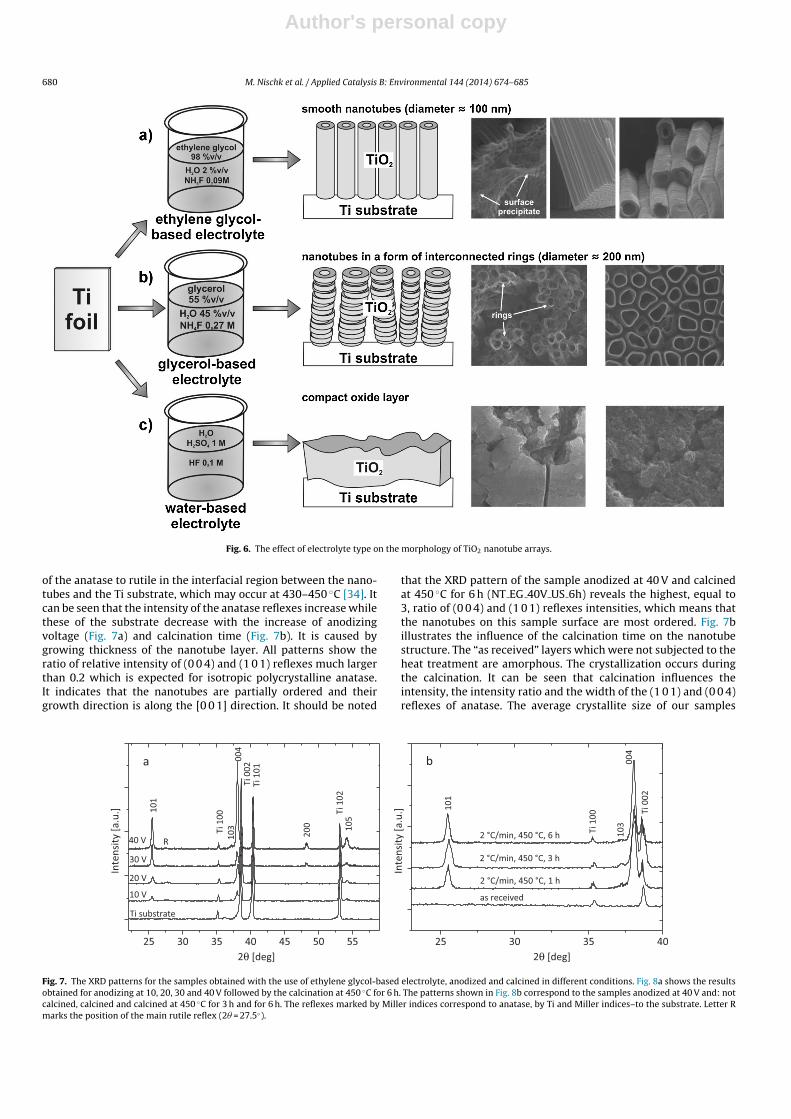
The dimensions of TiO2 NTs can be easily controlled in a widerange by changing the applied voltage. Fig. 5 shows SEM imagesof the samples anodized in ethylene glycol-based electrolyte for1 h, ultrasonically treated and calcined for 6 h with heating rate
2 ◦C/min. Fig. 5a–d correspond to nanotubes obtained by applyinganodization voltage from the range of 10–40 V. Tubes’ diameterand length increases approximately linearly with the applied volt-age for this range, starting from about d = 31 nm and l = 0.5 �m(10 V) and reaching about d = 110 nm and l = 5.9 �m (40 V), seedetails in Table 2. Nanotubes obtained with higher voltages aremore uniform, longer and their surface is smoother as comparedto nanotubes obtained with lower voltages.
The effect of electrolyte type on the morphology of TiO2nanotube arrays is schematically presented in Fig. 6. It wasshown that the morphology and the structure of nanotubu-lar/nanoporous TiO2 layer are affected strongly by the solutionparameters, such as fluoride ions concentration, pH and watercontent in the electrolyte [32]. As reported by the Macak et al.[33], the anodic growth of compact oxides on metal surfacesand the formation of tubes are governed by a competitionbetween anodic oxide formation and chemical dissolution ofthe oxide as soluble fluoride complexes. Fast nanotube growthsrates are also determined between a balance of water and fluo-ride concentration [33]. High fluoride concentration enhances thedissolution of TiO2 (TiO2 + 6F− + 4H+ → [TiF6]2− + 2H2O) while addi-tion of water allows for a sufficient rate of titanium oxidation(Ti + O2 → TiO2).
Usually, titania nanotubes with smooth walls are grown usingviscous solvents for anodization [34]. Solvent with high viscosityreduce the mobility of fluoride ions and other ionic species reduc-ing the growth rate, but also reducing current fluctuations andtherefore forming smoother nanotube walls. In our experiments,nanotubes with smoother walls were obtained in almost water free,ethylene glycol-based, electrolyte (see Fig. 6a). Macak et al. [34]demonstrated that the water content significantly influence on thewall morphology. In case of organic electrolyte with water contenthigh enough to behave as aqueous, the periodically repeated dif-ferences in the dissolution and oxide formation rate cause to leavesome parts of the wall thicker and the other thinner, those leadingto side walls ripples [34].
Author's personal copy
M. Nischk et al. / Applied Catalysis B: Environmental 144 (2014) 674– 685 679
Fig. 4. The influence of ultrasonic treatment on the surface morphology of the resulting thin TiO2 films.
Ethylene glycol-based electrolyte had slightly higher viscos-ity than a glycerol-based one (13.1 and 11.8 cP, respectively) andaccording to our expectations, nanotubes arrays formed in ethyleneglycol-based electrolyte have a smooth walls. Whereas nanotubesobtained in glycerol-based electrolyte are not smooth and consistof a large number of uneven rings arranged one upon the other asshown in Fig. 6b. It could be assumed, that in glycerol-based elec-trolyte, the nanotubes wall morphology have been affected by highwater content (45 vol.% H2O) in the electrolyte. Lower viscosity ofelectrolyte and relatively higher rate of chemical dissolution of TiO2caused to formation of the ripples.
Usually, TiO2 nanotube arrays, growing in HF electrolytes oracidic HF mixture, showed a limited thickness that not exceed500–600 nm. Ordered nanotubes in water-based electrolyte (con-taining HF) has been commonly formed at low voltages (below25 V) [32]. Thus, in case of relatively high voltage (40 V) applica-tion, compact oxide layer was formed instead of ordered nanotubes
(Fig. 6c). Our observation confirmed report of others [31,35] aswith increasing of applied voltage to 30 V, nanotubular structurewere destroyed and nanotube surface layer changed to a porous,sponge-like structure (Fig. 6c).
3.2. XRD analysis
Fig. 7 presents the results of X-ray diffraction measurementsfor the samples obtained with the use of ethylene glycol-basedelectrolyte, anodizing voltage between 10 V and 40 V, ultrasonictreatment before calcination and calcination temperature of 450 ◦C.For comparison, the pattern of the Ti substrate is also shown inFig. 7a. All the patterns consist of the reflexes corresponding to theanatase form of TiO2 and/or to the Ti the substrate. Letter R marksthe position of the main rutile reflex (2� = 27.5◦), where in thepatterns of the samples anodized at voltage below 40 V a small andwide bump can be seen. It may be attributed to the transformation
Fig. 5. SEM images of TiO2 nanotubes prepared via Ti anodization in the ethylene glycol-based electrolyte at different voltages: 10, 20, 30 and 40 V.
Author's personal copy
680 M. Nischk et al. / Applied Catalysis B: Environmental 144 (2014) 674– 685
Fig. 6. The effect of electrolyte type on the morphology of TiO2 nanotube arrays.
of the anatase to rutile in the interfacial region between the nano-tubes and the Ti substrate, which may occur at 430–450 ◦C [34]. Itcan be seen that the intensity of the anatase reflexes increase whilethese of the substrate decrease with the increase of anodizingvoltage (Fig. 7a) and calcination time (Fig. 7b). It is caused bygrowing thickness of the nanotube layer. All patterns show theratio of relative intensity of (0 0 4) and (1 0 1) reflexes much largerthan 0.2 which is expected for isotropic polycrystalline anatase.It indicates that the nanotubes are partially ordered and theirgrowth direction is along the [0 0 1] direction. It should be noted
that the XRD pattern of the sample anodized at 40 V and calcinedat 450 ◦C for 6 h (NT EG 40V US 6h) reveals the highest, equal to3, ratio of (0 0 4) and (1 0 1) reflexes intensities, which means thatthe nanotubes on this sample surface are most ordered. Fig. 7billustrates the influence of the calcination time on the nanotubestructure. The “as received” layers which were not subjected to theheat treatment are amorphous. The crystallization occurs duringthe calcination. It can be seen that calcination influences theintensity, the intensity ratio and the width of the (1 0 1) and (0 0 4)reflexes of anatase. The average crystallite size of our samples
25 30 35 40 45 50 55
103
Ti 1
02
Ti 1
00
Ti 1
01
105
200
004
Inte
nsity
[a.u
.]
2θ [deg] 2θ [deg]
101
Ti 0
02
Ti substrate
10 V
20 V
30 V
40 V R
a
25 30 35 40
2 °C/min, 450 °C, 1 h
as received
103
2 °C/min, 450 °C, 6 h
101
Inte
nsity
[a.u
.]
Ti 1
00
004
Ti 0
02
2 °C/min, 450 °C, 3 h
b
Fig. 7. The XRD patterns for the samples obtained with the use of ethylene glycol-based electrolyte, anodized and calcined in different conditions. Fig. 8a shows the resultsobtained for anodizing at 10, 20, 30 and 40 V followed by the calcination at 450 ◦C for 6 h. The patterns shown in Fig. 8b correspond to the samples anodized at 40 V and: notcalcined, calcined and calcined at 450 ◦C for 3 h and for 6 h. The reflexes marked by Miller indices correspond to anatase, by Ti and Miller indices–to the substrate. Letter Rmarks the position of the main rutile reflex (2� = 27.5◦).
Author's personal copy
M. Nischk et al. / Applied Catalysis B: Environmental 144 (2014) 674– 685 681
(treated in ethylene glycol-based electrolyte with different voltagefollowed by calcination, 450 ◦C for 6 h), increased from 40 ± 5 to60 ± 5 nm with increasing voltage from 10 to 40 V, respectively. Itwas also observed, that 6 h calcination leads to formation of largercrystallites in the tube wall compared with 3 h thermal treatment.Increase in calcination time from 1 to 6 h caused increase ofaverage crystallite size up from 30 to 40 nm up to 60 ± 5 nm,respectively. According to the literature data, the structure of theas grown oxide can be amorphous or crystalline and it stronglydependent on the specific electrochemical parameters, such as theapplied potential, the time of anodization, or the sweep rate ofthe potential ramp. For example, the structure of the oxide film onTiO2 has typically been reported to be amorphous at low voltages(below 20 V) and crystallization to take place at higher voltages.Depending on the anodization conditions the crystal structurehas been reported to be anatase, a mixture of anatase rutile orrutile [32]. In our case, while the higher voltages (40 V) have beenapplied, obtained TiO2 nanotubes have amorphous structure.
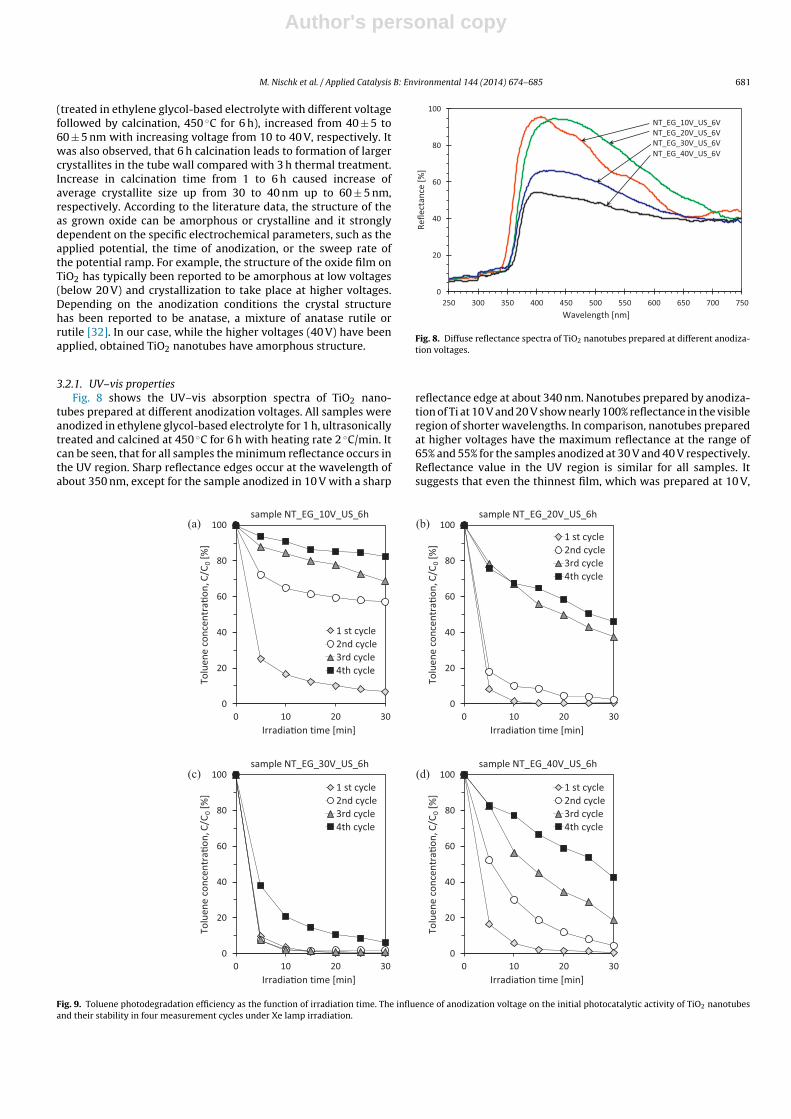
3.2.1. UV–vis propertiesFig. 8 shows the UV–vis absorption spectra of TiO2 nano-
tubes prepared at different anodization voltages. All samples wereanodized in ethylene glycol-based electrolyte for 1 h, ultrasonicallytreated and calcined at 450 ◦C for 6 h with heating rate 2 ◦C/min. Itcan be seen, that for all samples the minimum reflectance occurs inthe UV region. Sharp reflectance edges occur at the wavelength ofabout 350 nm, except for the sample anodized in 10 V with a sharp
0
20
40
60
80
100
250 300 350 400 450 500 550 600 650 700 750
Refle
ctan
ce [%
]
Wavelength [nm]
NT_EG_10V_US_6VNT_EG_20V_US_6VNT_EG_30V_US_6VNT_EG_40V_US_6V
Fig. 8. Diffuse reflectance spectra of TiO2 nanotubes prepared at different anodiza-tion voltages.
reflectance edge at about 340 nm. Nanotubes prepared by anodiza-tion of Ti at 10 V and 20 V show nearly 100% reflectance in the visibleregion of shorter wavelengths. In comparison, nanotubes preparedat higher voltages have the maximum reflectance at the range of65% and 55% for the samples anodized at 30 V and 40 V respectively.Reflectance value in the UV region is similar for all samples. Itsuggests that even the thinnest film, which was prepared at 10 V,
(a) (b)
(c) (d)
0
20
40
60
80
100
0 10 20 30
Tolu
ene
conc
entr
a�on
, C/C
0[%
]
Irradia�on time [min]
sample NT_EG_10V_US_ 6h
1 st cycle 2nd cycle3rd cycle4th cycle
0
20
40
60
80
100
0 10 20 30
Tolu
ene
conc
entr
a�on
, C/C
0[%
]
Irradia�on time [min]
sample NT_EG_20V_US_ 6h
1 st cycle 2nd cycle3rd cycle4th cycle
0
20
40
60
80
100
0 10 20 30
Tolu
ene
conc
entr
a�on
, C/C
0[%
]
Irradia�on time [min]
sample NT_EG_ 30V_US_ 6h
1 st cycle 2nd cycle3rd cycle4th cycle
0
20
40
60
80
100
0 10 20 30
Tolu
ene
conc
entr
a�on
, C/C
0[%
]
Irradia�on time [min]
sample NT_EG_40V_US_ 6h
1 st cycle 2nd cycle3rd cycle4th cycle
Fig. 9. Toluene photodegradation efficiency as the function of irradiation time. The influence of anodization voltage on the initial photocatalytic activity of TiO2 nanotubesand their stability in four measurement cycles under Xe lamp irradiation.
Author's personal copy
682 M. Nischk et al. / Applied Catalysis B: Environmental 144 (2014) 674– 685
(a) (b)
(c) (d)
0
20
40
60
80
100
0 10 20 30
Tolu
ene
conc
entr
a�on
, C/C
0[%
]
Irradia�on time [min]
sample NT_EG_10V_US_6h
1st cycle2nd cycle3rd cycle4th cycle
0
20
40
60
80
100
0 10 20 30
Tolu
ene
conc
entr
a�on
, C/C
0[%
]
Irradia�on time [min]
sample NT_EG_20V_US_ 6h
1st cycle2nd cycle3rd cycle4th cycle
0
20
40
60
80
100
0 10 20 30
Tolu
ene
conc
entr
a�on
, C/C
0[%
]
Irradia�on time [min]
sample NT_EG_30V_US_ 6h
1st cycle2nd cycle3rd cycle4th cycle
0
20
40
60
80
100
0 10 20 30
Tolu
ene
conc
entr
a�on
, C/C
0[%
]
Irradia�on time [min]
sample NT_EG_40V_US_ 6h
1st cycle2nd cycle3rd cycle4th cycle
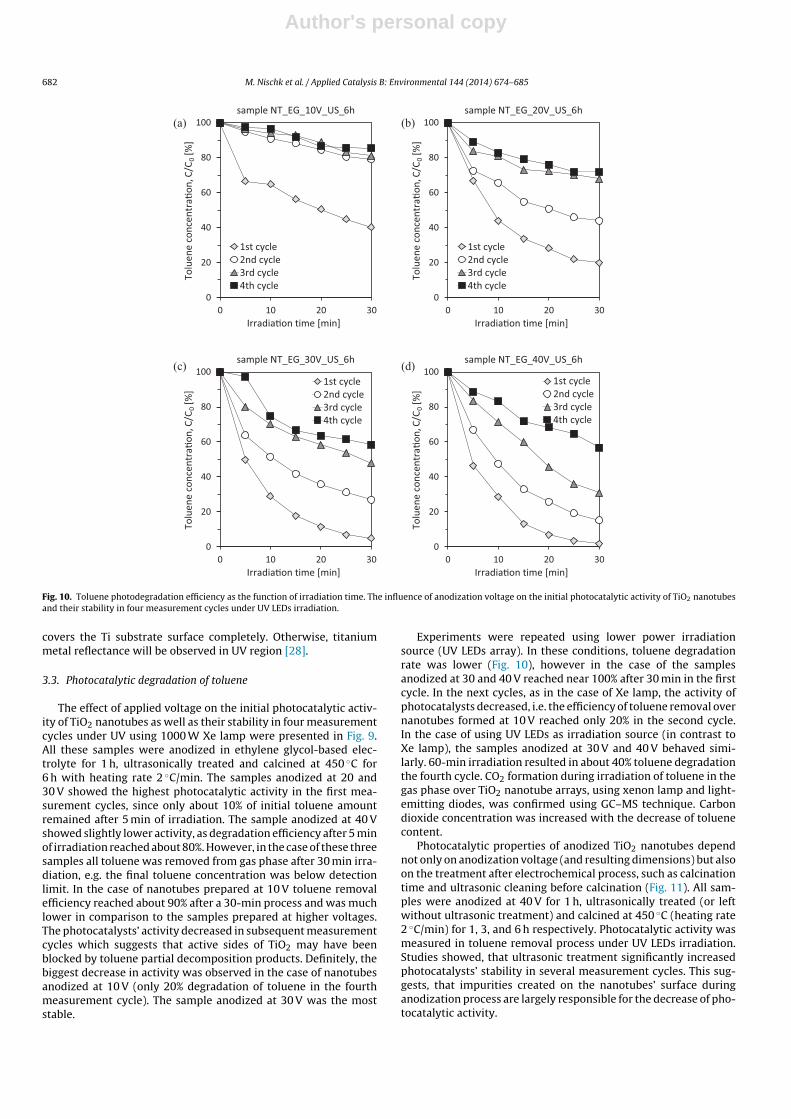
Fig. 10. Toluene photodegradation efficiency as the function of irradiation time. The influence of anodization voltage on the initial photocatalytic activity of TiO2 nanotubesand their stability in four measurement cycles under UV LEDs irradiation.
covers the Ti substrate surface completely. Otherwise, titaniummetal reflectance will be observed in UV region [28].
3.3. Photocatalytic degradation of toluene
The effect of applied voltage on the initial photocatalytic activ-ity of TiO2 nanotubes as well as their stability in four measurementcycles under UV using 1000 W Xe lamp were presented in Fig. 9.All these samples were anodized in ethylene glycol-based elec-trolyte for 1 h, ultrasonically treated and calcined at 450 ◦C for6 h with heating rate 2 ◦C/min. The samples anodized at 20 and30 V showed the highest photocatalytic activity in the first mea-surement cycles, since only about 10% of initial toluene amountremained after 5 min of irradiation. The sample anodized at 40 Vshowed slightly lower activity, as degradation efficiency after 5 minof irradiation reached about 80%. However, in the case of these threesamples all toluene was removed from gas phase after 30 min irra-diation, e.g. the final toluene concentration was below detectionlimit. In the case of nanotubes prepared at 10 V toluene removalefficiency reached about 90% after a 30-min process and was muchlower in comparison to the samples prepared at higher voltages.The photocatalysts’ activity decreased in subsequent measurementcycles which suggests that active sides of TiO2 may have beenblocked by toluene partial decomposition products. Definitely, thebiggest decrease in activity was observed in the case of nanotubesanodized at 10 V (only 20% degradation of toluene in the fourthmeasurement cycle). The sample anodized at 30 V was the moststable.
Experiments were repeated using lower power irradiationsource (UV LEDs array). In these conditions, toluene degradationrate was lower (Fig. 10), however in the case of the samplesanodized at 30 and 40 V reached near 100% after 30 min in the firstcycle. In the next cycles, as in the case of Xe lamp, the activity ofphotocatalysts decreased, i.e. the efficiency of toluene removal overnanotubes formed at 10 V reached only 20% in the second cycle.In the case of using UV LEDs as irradiation source (in contrast toXe lamp), the samples anodized at 30 V and 40 V behaved simi-larly. 60-min irradiation resulted in about 40% toluene degradationthe fourth cycle. CO2 formation during irradiation of toluene in thegas phase over TiO2 nanotube arrays, using xenon lamp and light-emitting diodes, was confirmed using GC–MS technique. Carbondioxide concentration was increased with the decrease of toluenecontent.
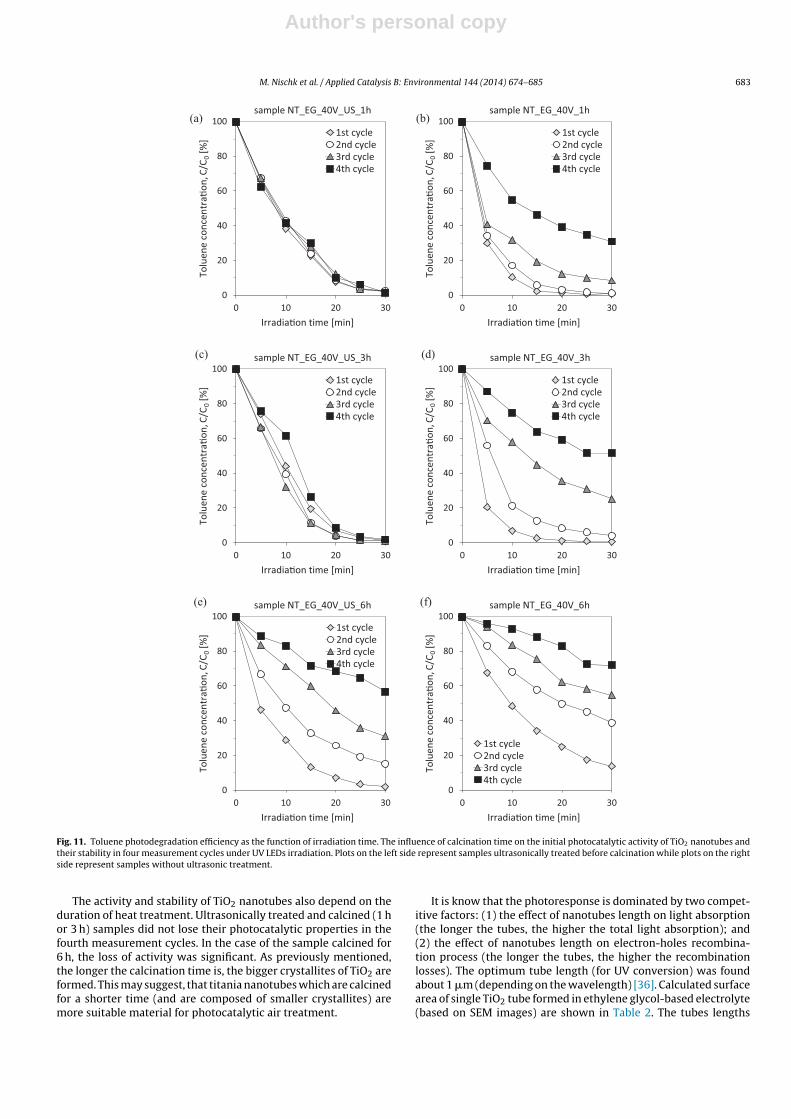
Photocatalytic properties of anodized TiO2 nanotubes dependnot only on anodization voltage (and resulting dimensions) but alsoon the treatment after electrochemical process, such as calcinationtime and ultrasonic cleaning before calcination (Fig. 11). All sam-ples were anodized at 40 V for 1 h, ultrasonically treated (or leftwithout ultrasonic treatment) and calcined at 450 ◦C (heating rate2 ◦C/min) for 1, 3, and 6 h respectively. Photocatalytic activity wasmeasured in toluene removal process under UV LEDs irradiation.Studies showed, that ultrasonic treatment significantly increasedphotocatalysts’ stability in several measurement cycles. This sug-gests, that impurities created on the nanotubes’ surface duringanodization process are largely responsible for the decrease of pho-tocatalytic activity.
Author's personal copy
M. Nischk et al. / Applied Catalysis B: Environmental 144 (2014) 674– 685 683
(a) (b)
(c) (d)
(e) (f)
0
20
40
60
80
100
0 10 20 30
Tolu
ene
conc
entr
a�on
, C/C
0[%
]
Irradia�on time [min]
sample NT_EG_ 40V_US_ 1h
1st cycle2nd cycle3rd cycle4th cycle
0
20
40
60
80
100
0 10 20 30
Tolu
ene
conc
entr
a�on
, C/C
0[%
]
Irradia�on time [min]
sample NT_EG_40V_ 1h
1st cycle2nd cycle3rd cycle4th cycle
0
20
40
60
80
100
0 10 20 30
Tolu
ene
conc
entr
a�on
, C/C
0[%
]
Irradia�on time [min]
sample NT_EG_ 40V_US_ 3h
1st cycle2nd cycle3rd cycle4th cycle
0
20
40
60
80
100
0 10 20 30
Tolu
ene
conc
entr
a�on
, C/C
0[%
]
Irradia�on time [min]
sample NT_EG_40V_ 3h
1st cycle2nd cycle3rd cycle4th cycle
0
20
40
60
80
100
0 10 20 30
Tolu
ene
conc
entr
a�on
, C/C
0[%
]
Irradia�on time [min]
sample NT_EG_ 40V_US_ 6h
1st cycle2nd cycle3rd cycle4th cycle
0
20
40
60
80
100
0 10 20 30
Tolu
ene
conc
entr
a�on
, C/C
0[%
]
Irradia�on time [min]
sample NT_EG_40V_ 6h
1st cycle2nd cycle3rd cycle4th cycle
Fig. 11. Toluene photodegradation efficiency as the function of irradiation time. The influence of calcination time on the initial photocatalytic activity of TiO2 nanotubes andtheir stability in four measurement cycles under UV LEDs irradiation. Plots on the left side represent samples ultrasonically treated before calcination while plots on the rightside represent samples without ultrasonic treatment.
The activity and stability of TiO2 nanotubes also depend on theduration of heat treatment. Ultrasonically treated and calcined (1 hor 3 h) samples did not lose their photocatalytic properties in thefourth measurement cycles. In the case of the sample calcined for6 h, the loss of activity was significant. As previously mentioned,the longer the calcination time is, the bigger crystallites of TiO2 areformed. This may suggest, that titania nanotubes which are calcinedfor a shorter time (and are composed of smaller crystallites) aremore suitable material for photocatalytic air treatment.
It is know that the photoresponse is dominated by two compet-itive factors: (1) the effect of nanotubes length on light absorption(the longer the tubes, the higher the total light absorption); and(2) the effect of nanotubes length on electron-holes recombina-tion process (the longer the tubes, the higher the recombinationlosses). The optimum tube length (for UV conversion) was foundabout 1 �m (depending on the wavelength) [36]. Calculated surfacearea of single TiO2 tube formed in ethylene glycol-based electrolyte(based on SEM images) are shown in Table 2. The tubes lengths
Author's personal copy
684 M. Nischk et al. / Applied Catalysis B: Environmental 144 (2014) 674– 685
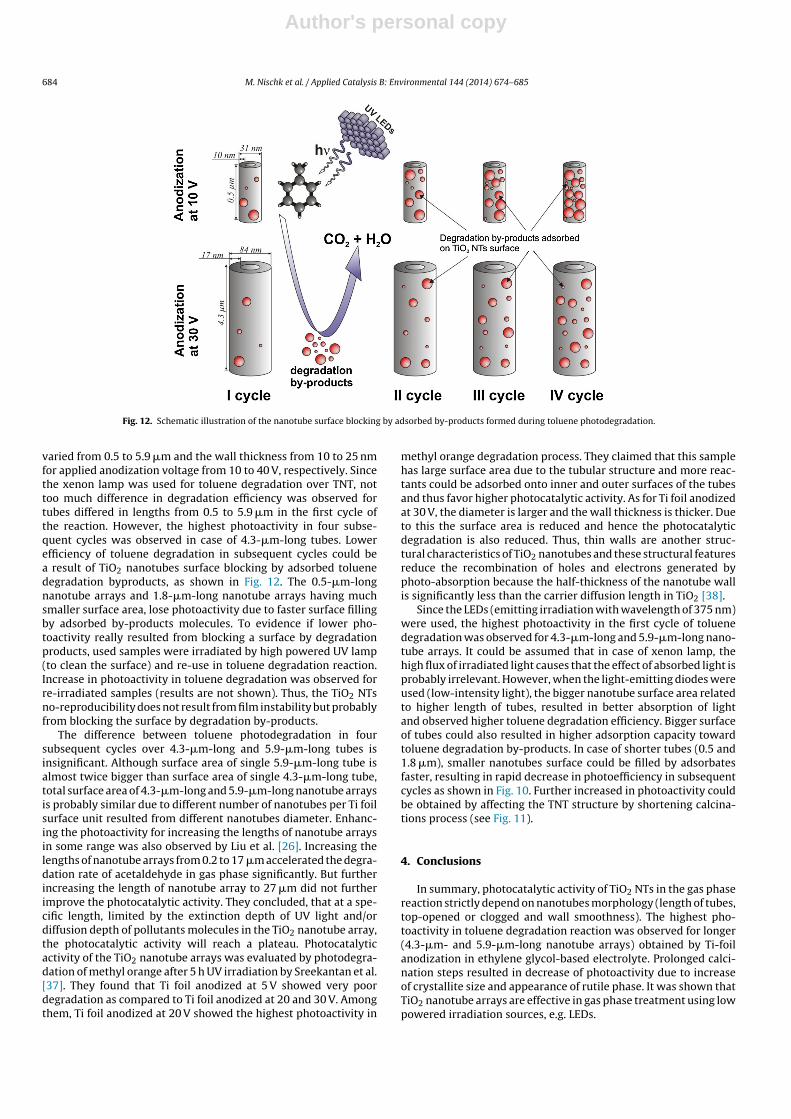
Fig. 12. Schematic illustration of the nanotube surface blocking by adsorbed by-products formed during toluene photodegradation.
varied from 0.5 to 5.9 �m and the wall thickness from 10 to 25 nmfor applied anodization voltage from 10 to 40 V, respectively. Sincethe xenon lamp was used for toluene degradation over TNT, nottoo much difference in degradation efficiency was observed fortubes differed in lengths from 0.5 to 5.9 �m in the first cycle ofthe reaction. However, the highest photoactivity in four subse-quent cycles was observed in case of 4.3-�m-long tubes. Lowerefficiency of toluene degradation in subsequent cycles could bea result of TiO2 nanotubes surface blocking by adsorbed toluenedegradation byproducts, as shown in Fig. 12. The 0.5-�m-longnanotube arrays and 1.8-�m-long nanotube arrays having muchsmaller surface area, lose photoactivity due to faster surface fillingby adsorbed by-products molecules. To evidence if lower pho-toactivity really resulted from blocking a surface by degradationproducts, used samples were irradiated by high powered UV lamp(to clean the surface) and re-use in toluene degradation reaction.Increase in photoactivity in toluene degradation was observed forre-irradiated samples (results are not shown). Thus, the TiO2 NTsno-reproducibility does not result from film instability but probablyfrom blocking the surface by degradation by-products.
The difference between toluene photodegradation in foursubsequent cycles over 4.3-�m-long and 5.9-�m-long tubes isinsignificant. Although surface area of single 5.9-�m-long tube isalmost twice bigger than surface area of single 4.3-�m-long tube,total surface area of 4.3-�m-long and 5.9-�m-long nanotube arraysis probably similar due to different number of nanotubes per Ti foilsurface unit resulted from different nanotubes diameter. Enhanc-ing the photoactivity for increasing the lengths of nanotube arraysin some range was also observed by Liu et al. [26]. Increasing thelengths of nanotube arrays from 0.2 to 17 �m accelerated the degra-dation rate of acetaldehyde in gas phase significantly. But furtherincreasing the length of nanotube array to 27 �m did not furtherimprove the photocatalytic activity. They concluded, that at a spe-cific length, limited by the extinction depth of UV light and/ordiffusion depth of pollutants molecules in the TiO2 nanotube array,the photocatalytic activity will reach a plateau. Photocatalyticactivity of the TiO2 nanotube arrays was evaluated by photodegra-dation of methyl orange after 5 h UV irradiation by Sreekantan et al.[37]. They found that Ti foil anodized at 5 V showed very poordegradation as compared to Ti foil anodized at 20 and 30 V. Amongthem, Ti foil anodized at 20 V showed the highest photoactivity in
methyl orange degradation process. They claimed that this samplehas large surface area due to the tubular structure and more reac-tants could be adsorbed onto inner and outer surfaces of the tubesand thus favor higher photocatalytic activity. As for Ti foil anodizedat 30 V, the diameter is larger and the wall thickness is thicker. Dueto this the surface area is reduced and hence the photocatalyticdegradation is also reduced. Thus, thin walls are another struc-tural characteristics of TiO2 nanotubes and these structural featuresreduce the recombination of holes and electrons generated byphoto-absorption because the half-thickness of the nanotube wallis significantly less than the carrier diffusion length in TiO2 [38].
Since the LEDs (emitting irradiation with wavelength of 375 nm)were used, the highest photoactivity in the first cycle of toluenedegradation was observed for 4.3-�m-long and 5.9-�m-long nano-tube arrays. It could be assumed that in case of xenon lamp, thehigh flux of irradiated light causes that the effect of absorbed light isprobably irrelevant. However, when the light-emitting diodes wereused (low-intensity light), the bigger nanotube surface area relatedto higher length of tubes, resulted in better absorption of lightand observed higher toluene degradation efficiency. Bigger surfaceof tubes could also resulted in higher adsorption capacity towardtoluene degradation by-products. In case of shorter tubes (0.5 and1.8 �m), smaller nanotubes surface could be filled by adsorbatesfaster, resulting in rapid decrease in photoefficiency in subsequentcycles as shown in Fig. 10. Further increased in photoactivity couldbe obtained by affecting the TNT structure by shortening calcina-tions process (see Fig. 11).
4. Conclusions
In summary, photocatalytic activity of TiO2 NTs in the gas phasereaction strictly depend on nanotubes morphology (length of tubes,top-opened or clogged and wall smoothness). The highest pho-toactivity in toluene degradation reaction was observed for longer(4.3-�m- and 5.9-�m-long nanotube arrays) obtained by Ti-foilanodization in ethylene glycol-based electrolyte. Prolonged calci-nation steps resulted in decrease of photoactivity due to increaseof crystallite size and appearance of rutile phase. It was shown thatTiO2 nanotube arrays are effective in gas phase treatment using lowpowered irradiation sources, e.g. LEDs.
Author's personal copy
M. Nischk et al. / Applied Catalysis B: Environmental 144 (2014) 674– 685 685
30-min of irradiation by twenty five UV-LEDs (�max = 375 nm,63 mW per diode) was enough to complete removal of toluene(C0 = 100 ppm) from the gas phase in the presence of TiO2 nano-tube arrays formed in ethylene glycol-based electrolyte at 30 V,followed by ultrasound treatment and 1 h calcinations at 450 ◦C.The same photoactivity was observed in four subsequent cycles.For NTs obtained in another reaction conditions, photoactivity waslowered in subsequent cycles probably due to adsorption of toluenedegradation by-products at tubes surface. Photoactivity could bere-established by extended UV irradiation.
Although the total light flux intensity emitted by 25 LEDs arrayis less than emitted by Xe lamp (11.2 and 17.3 mW/cm2 for LEDsand Xe lamp, respectively), efficiency of gas phase treatment overTiO2 nanotubes was comparable for both irradiation sources. Nev-ertheless, power consumption of 25 diodes array was only 1.575 Wcompared to 1000 W for Xe lamp. Thus, TiO2 nanotubes orderedarrays are a promising photocatalytic material that are relativelyeasy to synthesize and by further optimization of its preparationconditions it may be practically applied in the air purification pro-cesses using energy efficient light sources [39].
Acknowledgement
This work was supported by the Polish National Science Centre(contract No.: 2011/01/N/ST5/05540).
References
[1] N. Doucet, F. Bocquillon, O. Zahraa, M. Bouchy, Chemosphere 65 (2006)1188–1196.
[2] F. Shiraishi, T. Ishimatsu, Chemical Engineering Science 64 (2009) 2466–2472.[3] N.R. Neti, G.R. Parmar, S. Bakardjieva, J. Subrt, Chemical Engineering Journal
163 (2010) 219–229.[4] F.-L. Toma, L.M. Berger, D. Jacquet, D. Wicky, I. Villaluenga, Y.R. de Miguel, J.S.
Lindeløv, Surface and Coatings Technology 203 (2009) 2150–2156.[5] C.H. Ao, S.C. Lee, J.C. Yu, Journal of Photochemistry and Photobiology A: Chem-
istry 156 (2003) 171–177.[6] W. Chen, J.S. Zhang, Building and Environment 43 (2008) 246–252.[7] S. Josset, S. Hajiesmailia, D. Begina, D. Edouarda, C. Pham-Huua, M.-C. Lett, N.
Kellera, V. Kellera, Journal of Hazardous Materials 175 (2010) 372–381.[8] Y. Paz, Applied Catalysis B: Environmental 99 (2010) 448–460.[9] A. Zaleska, A. Hänel, M. Nischk, Recent Patents on Engineering 4 (2010)
200–216.[10] J. Taranto, D. Frochot, P. Pichat, Separation and Purification Technology 67
(2009) 187–193.[11] C. Sarantopoulos, E. Puzenat, C. Guillard, J.-M. Herrmann, A.N. Gleizes, F. Maury,
Applied Catalysis B: Environmental 91 (2009) 225–233.
[12] M. Altomare, M. Pozzi, M. Allieta, L.G. Bettini, E. Selli, Applied Catalysis B136/137 (2013) 81–88.
[13] S. Bauer, A. Pittrof, H. Tsuchiya, P. Schmuki, Electrochemistry Communications13 (2011) 538–541.
[14] P. Roy, S. Berger, P. Schmuki, Angewandte Chemie International Edition 50(2011) 2904–2939.
[15] Y. Sun, G. Wang, K. Yan, International Journal of Hydrogen Energy 36 (2011)15502–15508.
[16] A. Harring, A. Morris, M. Hu, Materials 5 (2012) 1890–1909.[17] Z. Zhang, Md. F. Hossain, T. Takahashi, International Journal of Hydrogen Energy
35 (2010) 8528–8535.[18] S.K. Mohapatra, N. Kondamudi, S. Banerjee, M. Misra, Langmuir 24 (2008)
11276–11281.[19] Z. Liu, B. Pesic, K.S. Raja, R.R. Rangarajua, M. Misra, International Journal of
Hydrogen Energy 34 (2009) 3250–3257.[20] D. Kowalski, P. Schmuki, Chemical Communications 46 (2010) 8585–8587.[21] P.M. Perillo, D.F. Rodríguez, Sensors and Actuators B 171/172 (2012)
639–643.[22] J.M. Macak, M. Zlamal, J. Krysa, P. Schmuki, Small 3 (2007) 300–304.[23] C. Das, P. Roy, M. Yang, H. Jha, P. Schmuki, Nanoscale 3 (2011) 3094–3096.[24] M. Yang, D. Kim, H. Jha, K. Lee, J. Paul, P. Schmuki, Chemical Communications
(2011) 2032–2034.[25] M. Altomare, K. Lee, M.S. Killian, E. Selli, P. Schmuki, Chemistry – A European
Journal 19 (2013) 5841–5844.[26] Z. Liu, X. Zhang, S. Nishimoto, T. Murakami, A. Fujishima, Environmental Science
& Technology 42 (2008) 8547–8551.[27] A.G. Kontos, A. Katsanaki, T. Maggos, V. Likodimos, A. Ghicov, D. Kim, J.
Kunze, C. Vasilakos, P. Schmuki, P. Falaras, Chemical Physics Letters 490 (2010)58–62.
[28] A.G. Kontos, A. Katsanaki, V. Likodimos, T. Maggos, D. Kim, C. Vasilakos, D.D.Dionysiou, P. Schmuki, P. Falaras, Chemical Engineering Journal 179 (2012)151–157.
[29] H. Xu, Q. Zhang, C. Zheng, W. Yan, W. Chu, Applied Surface Science 257 (2011)8478–8480.
[30] A. Ghicov, J.M. Macak, H. Tsuchiya, J. Kunze, V. Haeublein, L. Frey, P. Schmuki,Nano Letters 5 (2006) 1080–1082.
[31] H. Omidvar, S. Goodarzi, A. Seif, A.R. Azadmehr, Superlattices and Micro-structures 50 (2011) 26–39.
[32] J.M. Macak, H. Tsuchiya, A. Ghicov, K. Yasuda, R. Hahn, S. Bauer, P. Schuki,Current Opinion in Solid State & Materials Science 11 (2007) 3–18.
[33] J.M. Macak, H. Tsuchiya, P. Schmuki, Angewandte Chemie International Edition44 (2005) 2100–2102.
[34] J.M. Macak, H. Hildebrand, U. Marten-Jahns, P. Schmuki, Journal of Electroana-lytical Chemistry 621 (2008) 254–266.
[35] D.J. Yang, H.G. Kim, S.J. Cho, W.Y. Choi, Materials Letters 62 (2008) 775–779.[36] J.M. Macak, M. Zlaman, J. Krysa, P. Schmuki, Small 3 (2007) 300–304.[37] S. Sreekantan, R. Hazan, Z. Lockman, Thin Solid Films 518 (2009) 16–21.[38] K. Nakata, A. Fujishima, Journal of Photochemistry and Photobiology C 13
(2012) 169–189.[39] W. Dytrych, M.A. Zaleska Nischk, A. Zielinska-Jurek, A. Cybula, A. Gołebiewska,
J. Reszczynska, M. Klein, E. Grabowska, Method of making of materials withphotocatalytic and biocidal properties containing ordered TiO2 nanotube arraymodified with metals, particularly noble metals (in Polish), Pat. Apl. P401627(2012).


