Embed Size (px)
Citation preview
Appendix AMCA Spatial Analysis
The aim of the spatial network analysis applied in this research is to:
• identity type of layout (e.g. gridded, tree-like etc.);• numerically express the level of compactness and complexity of the layout.
The total length of streets in a neighbourhood along with node density andsprawl can express the compactness of layout, for example, more accuratelymathematically speaking than a simple measure of the residential density of landarea. Multiple Centrality Analysis (MCA) provides an objective way of consistentlyidentifying elements such as streets and junctions as well as a set of scale variablesthat distinguish the spatial and network characteristics of an urban layout.
Fundamental to MCA is the representation of spatial relationships in a city orneighbourhoods as a primal graph and then the calculation of a centrality space(point) by its location in the network (betweenness) or by its physical distance toall other spaces in the network (closeness). Thus a space with high ‘betweenness’value indicates a strategically central space that it is crucial to a large number ofshort routes1 between two other spaces. While betweenness and closeness valuesare useful in distinguishing relative centrality or compactness of individual spaceswithin a neighbourhood, measures such as cost, efficiency, meshedness and fractal(sprawl) dimensions and complexity distinguish the structural characteristics (size,type, shape) of the spatial network of a whole neighbourhood or sub area.
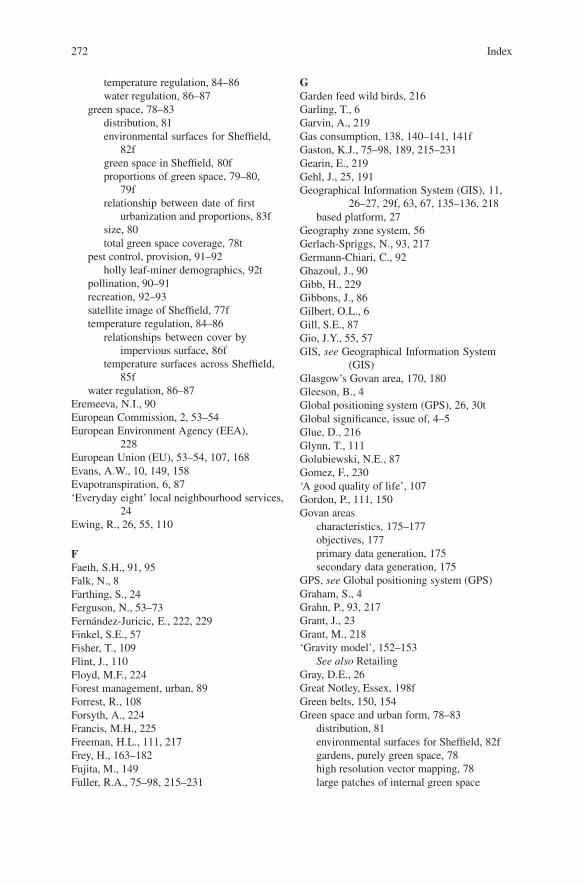
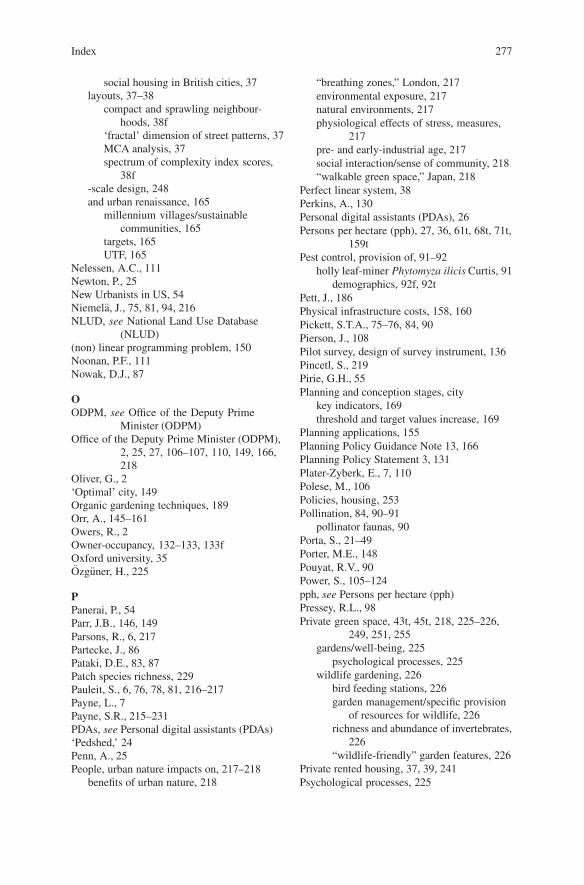
Two indicators of the structural characteristics of the street layout of aneighbourhood, taken from the range detailed in Table A.1, have been used inthe book. First, node density is calculated as the number of street intersectionsper hectare. Second, a composite ‘complexity index’ is derived to systematicallyidentify types of layouts such as grid-like or tree like patterns (see Fig. A.1). Therelationship between the index and the layout typology was tested by a number ofschematic layouts before validating them with real cases from the study areas.
The complexity index is constructed in two steps based on assessments of the‘efficiency’ of a spatial network that is determined by reference to the choices ofroutes available. Choices of routes within a network can be calculated using twoMCA efficiency indicators: (‘network efficiency’ and ‘MST efficiency’: for detailssee Cardillo et al., 20002). Network efficiency calculates the efficiency of the actual
257M. Jenks, C. Jones (eds.), Sustainable City Form, Future City 2,DOI 10.1007/978-1-4020-8647-2, C© Springer Science+Business Media B.V. 2010

258 Appenidx A MCA Spatial Analysis
Table A.1 Indicators of urban layout
Measurement DescriptionExamples of aspects/featuresmeasured
Indicators of spatial characteristics
BetweennessCentrality(individual space,neighbourhood &Sub-area)
Strategic spaces that are located onthe short routes between a pair ofspaces in the network
Spaces within the city andneighbourhoods
Closeness Centrality(individual space,neighbourhood &Sub-area)
The proximity of a space to all otherspaces using shortest path
All possible routes from A to BAverage distance of all pathsbetween A and B
Indicators of structural characteristics
Node density Number of street junctions per hectare Street junctions (e.g.T-junctions, culs-de-sac)
Cost of network The total physical length of the spaces Size of network
Efficiency ofnetwork(Neighbourhood &Sub-area)
The evenness of distribution andconnectedness of a network
The ratio of proximity of twospaces compared with thevirtual distance (i.e. ‘as thecrow flies’ distance)
Note on Cost andefficiency(Neighbourhood &Sub-area)
Efficiency and cost of networkindicates the layout’s compactnessMST (Minimum Spanning Tree)used to compare above with mostefficient layout
Cost of network + node densityMST: spatial network isreduced to a tree pattern byremoving choices of routesbefore calculating the costand efficiency
Meshedness(Neighbourhood &Sub-area)
– Meshedness of whole networkcalculates the complexity of anetwork
Number of circular routes in thenetwork
Fractal dimension(Neighbourhood &Sub-area)
– The sprawl of a network measuredby taking into account bothphysical area and the network
Measure a regular sized box tocover the perimeter of thenetwork
Complexity index(Neighbourhood &Sub-area)
– Index can indicate the layout pattern(i.e. more tree-like or grid-like)
Ratio of MST to Network cost
network, while MST (Minimum Spanning Tree) efficiency calculates the efficiencyof the network once all the possible choices of routes have been reduced to aminimum. These two indicators are then combined to give the ‘complexity index’which is the ratio of efficiency values calculated by the minimum spanning tree(MST) to network method. A high value ratio (where there is a greater difference
Appenidx A MCA Spatial Analysis 259
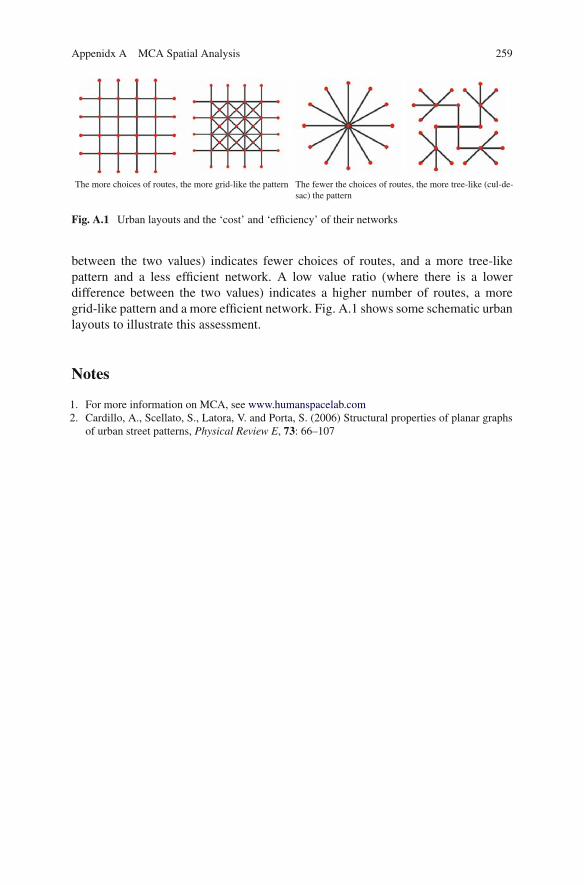
The more choices of routes, the more grid-like the pattern The fewer the choices of routes, the more tree-like (cul-de-sac) the pattern
Fig. A.1 Urban layouts and the ‘cost’ and ‘efficiency’ of their networks
between the two values) indicates fewer choices of routes, and a more tree-likepattern and a less efficient network. A low value ratio (where there is a lowerdifference between the two values) indicates a higher number of routes, a moregrid-like pattern and a more efficient network. Fig. A.1 shows some schematic urbanlayouts to illustrate this assessment.
Notes
1. For more information on MCA, see www.humanspacelab.com2. Cardillo, A., Scellato, S., Latora, V. and Porta, S. (2006) Structural properties of planar graphs
of urban street patterns, Physical Review E, 73: 66–107

Appendix BOverview of Case Study Neighbourhoods
The analysis presented is based on the statistics listed in Chapter 2, Table 2.6 andTable B.1.
Inner Neighbourhoods
The highest densities are in the inner neighbourhoods of Edinburgh and Glasgowwhere traditional tenements and flats are prevalent. Both of these neighbourhoodshave net densities above 225 dwellings/ha. A very high proportion of buildings inthese neighbourhoods are more than four storeys in height. Although a traditionalform of housing in Scotland, there are now few families living in these tenementedneighbourhoods, which tend to be dominated by small households with one or twoadults. Aside from tenements, the inner case studies in the English cities are verysimilar with lots of tall buildings, lots of flats and few families. The main exceptionto this is Oxford, where only half of homes are flats and there is a significantproportion of terraced housing. Patterns of tenure vary greatly between the innercase study neighbourhoods. In both Leicester and Sheffield more than 70% ofhomes are rented, with social housing making up more than 50% of housing stock.Edinburgh and Glasgow’s inner neighbourhoods have more of a balance betweenowner occupation and rented accommodation – with owner occupation accountingfor around 50% of housing stock and private renting for 25% of housing stock.Oxford is also exceptional here with little social housing in the inner case studyneighbourhood and just over 30% privately rented.
As might be expected, residential buildings are only part of the building stockin these inner neighbourhoods. In the neighbourhoods studied, around 15–20% ofthe land in the neighbourhood is covered by non-residential buildings – althoughthe Edinburgh inner neighbourhood is notable for having a much smaller proportionof land covered by non-residential buildings (6%). These buildings are mainly usedfor retail, with office uses also occupying a significant proportion of non-residentialproperties. The inner neighbourhood of Glasgow is the main exception to this rule,with a far higher proportion of offices than retail uses. This is largely explained bythe location of the case study neighbourhood which coincides with the commercialrather than retail centre of the city.
261

262 Appendix B Overview of Case Study Neighbourhoods
Table B.1 Some Physical Characteristics of the Neighbourhoods
Urban Form
EdinburghInner(2958 ha)
Density Gross density 92.3Net density 270.5
Land use 5% of buildings are mixed use14% of the area is covered by residential buildings,
11% by residential gardens and 6% bynon-residential buildings.
24% is green spacePublic transport Mainly buses/ 34% residents do not own a carLayout Compact, with grid and cul-de-sac formBuilding
characteristics78% of buildings are between 4 and 6 storeys13% have access to a private garden; 73% access
to a shared garden
GlasgowInner(3694 ha)
Density Gross density 34.7Net density 226.2
Land use 14% of the area covered by residential buildings; 1%by residential gardens; and 21% bynon-residential buildings; 29% is green space
Public transport Buses and train station within case study area/ 37%residents do not own a car
Layout Deformed compact gridBuilding
characteristics62% of buildings between 4 and 6 storeys, and 13%
more than 6 storeys8% have access to a private garden; 28% access to a
shared garden.
LeicesterInner(3635 ha)
Density Gross density 15.7Net density127.1
Land use 7% of area is covered by residential buildings, 4%by residential gardens and 21% by non-residentialbuildings; 27% is green space
Public transport Mainly buses/ 86% residents do not own a carLayout Deformed wheel, radialBuilding
characteristics34% of buildings between 4 and 6 storeys, and 28%
more than 6 storeys10% have access to a private garden; 25% access to
a shared garden.
OxfordInner(3363 ha)
Density Gross density 30.6Net density 83.7
Land use 10% of the area is covered by residential buildings,10% by residential gardens and 15% bynon-residential buildings; 31% is green space
Public transport Mainly buses (with main bus station) and trainstation close to case study/ 59% residents do notown a car

Appendix B Overview of Case Study Neighbourhoods 263
Table B.1 (continued)
Urban Form
Layout Crucifix form, with small blocks at the centreBuilding
characteristics35% of buildings are 2 storeys and 37% are 3 storeys43% have access to a private garden; 25% access to ashared garden.
SheffieldInner(4027 ha)
Density Gross density 22.8Net density 116.9
Land use 14% of buildings are mixed use, 6% of the area iscovered by residential buildings, 10% by residentialgardens and 9% by non-residential buildings; 38% isgreen space
Public transport Buses and trams with train station outside 400 m bufferzone/ 81% residents do not own a car
Layout Deformed compact gridBuilding
characteristics35% of buildings are 3 storeys 27% are more than 6
storeys22% have access to a private garden; 20% access to a
shared garden.
EdinburghBetween(4107 ha)
Density Gross density 37.9Net density 69.5
Land use 14% of the area is covered by residential buildings and31% by residential gardens; 24% is green space
Public transport Mainly buses/ 26% residents do not own a carLayout Predominantly gridded, not orthogonalBuilding
characteristics29% of buildings between 4 and 6 storeys56% have access to a private garden; 45% access to a
shared garden.
GlasgowBetween(9863 ha)
Density Gross density 33.1Net density 68.4
Land use 14% of the area is covered by residential buildings and40% by residential gardens16% is green space
Public transport Buses and train station within case study area/ 15%residents do not own a car
Layout Deformed grid with some compact gridsBuilding
characteristics36% of buildings are 3 storeys and 47% are 4 to 6
storeys31% have access to a private garden; 66% access to a
shared garden.
LeicesterBetween(2066 ha)
Density Gross density 48.2Net density 79.9
Land use 22% of the land is covered by residential buildings and37% by residential gardens9% is green space

264 Appendix B Overview of Case Study Neighbourhoods
Table B.1 (continued)
Urban Form
Public transport Mainly buses/ 37% residents do not own a carLayout Deformed gridBuilding
characteristics79% of buildings are 2 storeys71% have access to a private garden; 8% access to a
shared garden.
OxfordBetween(4049 ha)
Density Gross density 39.9Net density 80.8
Land use 14% of the area is covered by residential buildings and33% by residential gardens22% is green space
Public transport Relatively poor provision of bus routes due toproximity to city centre. Train station is close to casestudy/ 50% residents do not own a car
Layout Elongated deformed grid with compact grid withinBuilding
characteristics47% of buildings are 2 storeys, 30% are 3 storeys57% have access to a private garden; 25% access to a
shared garden.
SheffieldBetween(4964 ha)
Density Gross density 37.5Net density 59.1
Land use 16% of the area is covered by residential buildings and47% by residential gardens
13% is green spacePublic transport Mainly buses with tram stops close to case study/ 47%
residents do not own a carLayout Deformed compact gridBuilding
characteristics79% of buildings are 2 storeys75% have access to a private garden; 8% access to a
shared garden.
EdinburghOuter(17227 ha)
Density Gross density 18.3Net density 26.6
Land use 10% of the area is covered by residential buildings and34% by residential gardens
38% is green spacePublic transport Mainly buses/ 9% residents do not own a carLayout Compact super gridBuilding
characteristics32% of buildings are single storey and 60% are 2 storey88% have access to a private garden; 13% access to a
shared garden.
GlasgowOuter(6456 ha)
Density Gross density 8.2Net density 46.3
Land use 2% of the area is covered by residential buildings and8% by residential gardens
77% is green spacePublic transport Mainly buses with train station outside case study area/
19% residents do not own a car

Appendix B Overview of Case Study Neighbourhoods 265
Table B.1 (continued)
Urban Form
Layout Clustered dispersed culs-de-sacBuilding
characteristics84% of buildings are 2 storeys86% have access to a private garden; 4% access to a
shared garden.
LeicesterOuter(4998 ha)
Density Gross density 17.2Net Density 24.5
Land use 9% of the area is covered by residential buildings and54% by residential gardens
17% is green spacePublic transport Mainly buses/ 19% residents do not own a carLayout Very deformed grid with culs-de-sacBuilding
characteristics96% of buildings are 2 storeys97% have access to a private garden; 1% access to a
shared garden.
OxfordOuter(4449 ha)
Density Gross density 30.8Net density 62.8
Land use 11% of the area is covered by residential buildings; and30% by residential gardens
27% is green spacePublic transport Buses only/ 46% residents do not own a carLayout Predominantly culs-de-sacBuilding
characteristics76% of buildings are 2 storeys80% have access to a private garden; 12% access to a
shared garden.
SheffieldOuter(8660 ha)
Density Gross density 18.6Net density 26.5
Land use 11% of the area is covered by residential buildings and57% by residential gardens 13% is open space
Public transport Buses only/ 22% residents do not own a carLayout Curvilinear with culs-de-sacBuilding
characteristics79% of buildings are 2 storeys84% have access to a private garden; 11% access to a
shared garden.
Between Neighbourhoods
As a group the between case study neighbourhoods are characterised by theirdiversity. Net residential density ranges from 60 to 80 dwellings/ha. Two and threestorey homes are common, although in both Glasgow and Edinburgh around onethird of homes are between 4 and 6 storeys (e.g. tenements), and the vast majorityof residents have access to a private or shared garden. Flats dominate the Glasgowbetween neighbourhood making up 80% of housing stock, while terraced housesdominate in Sheffield. The other between neighbourhoods have a more mixed
266 Appendix B Overview of Case Study Neighbourhoods
housing stock, and tend to include a variety of terraced, detached and semi-detachedhouses as well as flats. Tenure mix is also variable, ranging from almost no socialrenting in the Leicester case study neighbourhood (lowest) to around one-quarterin the Edinburgh case study neighbourhood (highest). As might be expected, thevariety in housing type and tenure is reflected in the resident population. Retiredand family households both feature here, although they usually account for no morethan half of households.
Non-residential land uses also vary considerably amongst this group. Whileretail is the most important non-residential land use in all of the 5 betweenneighbourhoods, both Glasgow and Oxford are distinguished by a significantproportion of office buildings. Generally between neighbourhoods are also includedsome industrial buildings, which are not so plentiful in either inner or outer casestudy neighbourhoods.
Outer Neighbourhoods
The outer case study neighbourhoods fall into two groups: Sheffield, Leicesterand Edinburgh typically have net densities around 25 or 26 dph. Glasgow andOxford on the other hand have much higher residential densities of 46 and 63 dphrespectively. In the lower density suburbs, the housing stock is almost exclusively2 storeys in height, with some single storey housing (bungalows) in the Edinburghneighbourhood. Residential gardens account for a significant proportion of landcover in these neighbourhoods. This is particularly true in the outer neighbourhoodsof the English cities studied. Here, around 50% of land is taken up by residentialgardens in addition to open green space. The outer case study neighbourhoods arealso notable for the small proportion of rented accommodation – although Oxfordis also exceptional here, with 40% of homes owned by social landlords and 10% inshared ownership.
Non-residential buildings in the outer case study neighbourhoods are morevaried in their character than in the inner and between neighbourhoods. No clearpattern is evident here. Retail uses dominate in the Edinburgh and Sheffield outerneighbourhoods, while warehouses are dominant in Leicester and industrial uses inGlasgow and Oxford.

Index
Note: The letters ‘f’, ‘n’ and ‘t’ following the locators refer to figures, notes and tables respectively
AAccessibility/transport infrastructure, 146–147
impact on, 147‘pedshed,’ 24transport system, 24
Acioly, C., 4Additional housing, demand for, 166–167
average household size, 166Barker review, 166dwelling density, 166environmental/ecological arguments, 167resistance, 166–167
Addoms, D.L., 219Affordability constraint, 151, 160Agglomeration economies, 146, 148–151, 160,
246See also Economics of city forms
Akbari, H., 90Alberti, M., 91Allen-Wardell, G., 90Alonso, W., 146, 149Alpine Close, Maidenhead, 197fAmersham Road, Reading, 197fAnas, A., 149Anderson, L.M., 224Anderson, W.P., 21Anthropogenically-perturbed ecosystems,
90Area profiles, case study, 32–33
CityForm research, 33empirical analysis in five British cities
small number of neighbourhoods, 32Arnold, C.L., 86Atkinson, R., 109–110Attention-deficit/hyperactivity disorder, 218Attwell, K., 6Audirac, I., 111
Avendano, V.L.G., 90Aydinalp-Koksal, M.V., 137
BBadoe, D.A., 7–8, 55Bagaeen, S., 163–182Bailey, N., 109Baillie, S.R., 94Baker, K., 129–142Baker, N., 84Balram, S., 219Banister, D., 55, 60Barbosa, O., 92–93, 217, 229Barker review, additional housing, 166Barton, H., 110, 149, 166, 169, 171, 189–191Basantani, M., 5Bastin, L., 76, 80, 229Bed spaces per hectare, 27Beer, A., 78, 219Begg, I., 10Behaviours
car owning, 208–209factors influencing car ownership, 209fnumber of cars owned/available, 209,
209fencouraging wildlife, 206, 206ffactors, encouraging to walk/cycle/use
public transport, 208fhome-based sustainable behaviours, 188
efficient, use of water, 189encouraging wildlife in gardens, 189home energy consumption, reduction
of, 188–189waste recycling and composting, 189
home energy use and water efficiency,203–204, 203f–204f
267
268 Index
local services/amenities/businesses, use of,192
links, common, 192shorter journeys, fuel-efficient modes of
transport, 206–208, 207fsocial participation, 191, 210travel behaviour and car ownership
car owning, 190–191parking space for pool of shared cars,
191shorter journeys, fuel-efficient modes of
transport, 190walking/cycling/public transport use,
190use of local services, 210–211, 210fwaste recycling and composting, 204–205,
205fBell, S., 219Bentley, I., 169Berens, G., 219Bernardini, C., 218, 225Bhat, C., 55, 57, 225Bhatti, M., 225Bibby, R., 87Bicycle, 35, 190Bierwagen, B.G., 81Biesmeijer, J.C., 90Biodiversity
and environment, 75–98See also Environment and biodiversity
and people, spatial configuration, 226–230Central Arizona-Phoenix region in
U.S., 227coverage by green space, 227ecological surveys of gardens, 229–230EEA, 228green space management, 230hump-shaped relationship, 227Index of Multiple Deprivation, 228patch species richness, 229pattern of biodiversity, 227UK government agency, 228–229urban matrix, 229vegetation structure or habitat
heterogeneity, 226–227woodland habitats, 227
and urban form, 93–97housing density, 95–96, 96frelationship between noise lev-
els/impervious surfaces, 97frelationships between housing density,
96f
species richness of taxonomic groups,93–94
surfaces for Sheffield of birds, 95furban noise, 96
Biodiversity value, elements of, 221Bixler, R.D., 224Bjerke, R., 225Boardman, B., 142Boarnet, M.G., 4, 54–55, 60Bogota, 4Bolund, P., 6, 83Bonaiuto, M., 6Borooah, V.K., 58Botanical gardens (large formal spaces), 222Bourdeau, P., 92, 228Bowers, K., 109Bowman, R., 95Bramley, G., 10, 21–49, 105–124, 158,
239–256“Breathing zones,” London, 217BREDEM, see UK Building Research
Establishment Domestic EnergyModel (BREDEM)
Breheny, M., 4, 9, 23, 110, 167, 186Bridge, G., 111The Bristol Accord, 107Brown, C., 21–49, 105–124, 218Brownhill, D., 189–190Brueckner, J., 150Brundtland, definition, 145Bryman, A., 122Buchmann, S.L., 90Buffer zone, 27, 263tBuilding fabric aspects, 129, 131Building regulations, 25, 131Built environment and sustainable behaviour,
relationship between, 185–186Bunker, R., 110Burgess, J., 7, 219Burgess, R., 4Burton, E., 2, 8, 24, 106, 108, 110–111Butler, S., 186
CCABE Space, see Commission for Architecture
and Built Environment (CABESpace)
Cabeza, M., 98Cadenasso, M.L., 76Calthorpe, P., 4, 110Camagni, R., 149Cameron, E., 91Cannon, A.R., 6, 94

Index 269
Capello, R., 149‘Capital,’ broad classes of, 106
economic, 106environmental, 106social, 106
Carbon emissions, 87, 90Carbon pools, 87, 89–90Carbon sequestration, 84, 87–90, 244
carbon emissions, 90carbon pools, 87, 89–90distribution of circumferences of trees
across urban Sheffield, 89fpatterns in tree species richness and size,
88significance of, 90surfaces for Sheffield of trees, 88furban forest management, 89
Cardillo, A., 257, 259 n2Carmona, M., 9, 192Carreiro, M.M., 90Car use, traditional urban forms in reducing,
54–55Catanzaro, C., 225CBD, see Central business district (CBD)CEC, see Commission of the European
Communities (CEC)Central Arizona-Phoenix region in U.S, 227Central business district (CBD), 21, 147, 158Cervero, R., 4, 7, 55, 150Chace, J.F., 75, 94, 216Chamberlain, D.E., 217, 222Characklis, G.W., 87Chen, W.Y., 84, 225Cheptou, P.O., 90–91Cheshire, P., 10, 150Chiesura, A., 219Choice tasks, housing, 157Church, A., 225Churchman, A., 23Chu, Y-L., 57Ciccone, A., 149Cities, characteristics of, 35
Edinburgh, Scotland capitaladministrative/financial services centre,
35Glasgow and Sheffield, 35
lowest proportion of private renters, 35traditional industrial cities, 35
Leicester/Oxfordeconomic structure/thriving ethnic
minority community, 35tourist and business centre, 35
City, adaptation
additional housing, demand for, 166–167case study tests, 181–182indicators of sustainable development
urban regeneration and development,current practice, 164–165
urban renaissance/urban neighbour-hoods, 165
tool application, levels of (un)sustainabilitymeasurement, 170
Drumoyne area investigation, 177–180Govan areas investigation, 175–177
tool development of sustainabilitymeasurement, 168–170
urban intensification, 167–168See also Drumoyne area; Govan areas
City formeconomics of
accessibility/transport infrastructure,146–147
characteristics of built environment,147–148
density, 28t, 147land use patterns, 146
infrastructure costs, 157–159road lengths and densities, 158, 159turban infrastructure costs, types, 157
See also Economics of city formsCityForm’s case study neighbourhoods survey,
218–219Clausen, C.P., 91Clergeau, P., 95, 226–227CNU, see Congress of the New Urbanism
(CNU)Cognitive functioning in children, 217–218Coley, R.L., 218Collie, M., 110Collins, J.P., 227Colton, R.D., 140Commercial space, 147, 154Commission for Architecture and Built
Environment (CABE Space), 76,122, 219, 221
Commission of the European Communities(CEC), 2, 106, 110–111
‘Compact city,’ 1, 8, 14, 110, 124, 239, 245Compactness or sprawl, degree of, 37Complexity index, 257–258Congress of the New Urbanism (CNU), 110Constraints-based accessibility, 55, 66Construction costs model, 155Conway, H., 217Cook, E.A., 81Coombe, D., 8

270 Index
Cooper Road, East Sussex, 198fCornelis, J., 222Cote, S., 191Cowan, R., 25Crane, D.E., 87Crane, R., 4, 54–55Crepis sancta: Asteraceae, 91Crisp, V., 6Crookston, M., 9“Cultural cues to care,” 224Curitiba, 4, 17Curtis, S., 91Cutsinger, J., 26
DDair, C., 183–212Darlow, A., 110Dataset, 26, 56–57, 60, 72, 120, 131, 138,
140–142Davies, C., 2, 81Davies, R.G., 75–98Dawson, R., 2Dehnen-Schmutz, K., 96Dempsey, N., 1, 5, 21–49, 105–124, 188Density, urban element
English housing policy, 23measuring, 27
bed spaces per hectare, 27DPH, 27habitable rooms per hectare, 27pph, 27residential, definition, 27
planning policy and practices, 23Trafalgar Square in London, 23UK policy makers, 23
Department of Business Enterprise andRegulatory Reform, 130f, 137
Department of the Environment, Transport andRegions (DETR), 1–2, 7, 24, 54,106, 110, 131, 166, 190, 192
DETR, see Department of the Environment,Transport and Regions (DETR)
Devine-Wright, P., 215–231De Vries, S., 76, 218, 225Diamond, H.L., 111Dichotomous variables, 138
See also DatasetDickman, C.R., 229Dicks, S.E., 75Digital elevation models, 130Dimensions, core sustainability
economic viability, 246–247environment, ecology and biodiversity,
243–244
environment, energy use, 246social acceptability, 244–245transport, travel and mobility, 242–243
Dimensions of sustainable city, future city 2CityForm research, structure of, 13economic viability
methodology, 11–12researching sustainable city, 10
global significance, issue of, 4–5urban form and claims to sustainability,
1–3Dines, N., 219Dixon, T., 192Domestic energy consumption, 131–134, 142,
246fabric, 131–132
dwelling’s energy efficiency, 132household appliances use, 133–134
“mood” lighting, 134models, 129, 131, 134foccupancy, 132–133
owner-occupancy, type, 132Dongtan, 5Donnelly, R., 229DPH, see Dwellings per hectare (DPH)Dragicevic, S., 219Drumoyne area, 177–180
total area, 177two best scenario neighbourhoods, 177
Duany, A., 7, 54, 110Duhme, F., 6, 76, 78, 81Dunnett, N., 76, 219Dunse, N., 146Dwellings per hectare (DPH), 27, 28t, 35–36,
118, 121f, 131, 173t, 178t, 193tDwelling types, 113, 129–132, 132f, 135–138,
174t, 180
EEast Midlands region of UK, 219‘Eco-aesthetic,’ 195Ecological surveys of gardens, 229–230Economics of city forms
accessibility/transport infrastructure,146–147
characteristics of built environment,147–148
building maintenance, 148influencing factors, 147
density, 28t, 147CBD, 147
land use patterns, 146demand factors, 146
Index 271
Economic viability, 3, 9–10, 12, 15, 145–161,169, 180, 246–247
economics of city form, 145–148accessibility/transport infrastructure,
146–147characteristics of built environment,
147–148density, 28t, 147land use patterns, 146
of individual land uses, 151commercial and retail change, 153–154housing, 154–157offices, 151–152retailing, 152–153
infrastructure costs and city form, 157–159methodology, 11–12researching sustainable city, 10urban form, economic performance and
sustainability, 148–151Ecosystem services and urban form
carbon sequestration, 87–90pollination, 90–91provision of pest control, 91–92recreation, 92–93temperature regulation, 84–86
diurnal temperature range, 84water regulation, 86–87See also Individual
Eco-towns, 2, 5EEA, see European Environment Agency
(EEA)Effland, W.R., 90Ekanem, E., 225Elements of urban form, 8, 14, 21–49, 22f,
56–57, 63, 110, 145, 153, 216, 239,250, 252, 254
accessibility/transport infrastructure, 24measuring, 28–29GIS-generated land use map, 29f
characteristics of cities, 35–36density, 23housing and building characteristics, 25land use, 23–24measuring density, 27–28measuring housing/building characteristics,
29–31indicators of accessibility, 31tindicators of housing/building
characteristics, 31tindicators of land use, 30t
measuring land use, 27–28indicators of density, 28t
measuring layout, 32
measuring urban form, 26–27neighbourhoods, 36–38
characteristics, 37layouts, 37–38
non-physical aspects, 21physical characteristics of cities, 35–36
density and housing types, 36tprofiles, case study area
location of the case study cities, 34fMCA-generated map of Leicester, 33f
‘urban form,’ description, 21urban layout, 25
Elkin, T., 106Energy use
analysis results, 138–140, 139t–140tcontrols type, 140glazing type, 138TRV, 140
clusters, 130f, 138–139tmodelling domestic energy consumption
fabric, 131–132household appliances use, 133–134occupancy, 132–133
and urban form, relationship, 130–131physical form of buildings, 130
variation in, research methodcluster analysis, 137data analysis procedure, 137–138design of survey instrument, 136–137energy consumption, 137, 139thome energy efficiency questionnaires,
136multiple regression analysis, 137–138samples selection, 135–136, 135f–136fsimple regression, 137
Environmental/ecological arguments, 167Environmental exposure, 217Environment and biodiversity, 75–98
biodiversity/urban form, 93–97relationship between noise lev-
els/impervious surfaces, 97frelationships between housing density,
96fsurfaces for Sheffield of birds, 95f
carbon sequestration, 87–90distribution of circumferences of trees
across urban Sheffield, 89fsurfaces for Sheffield of trees, 88f
ecosystem servicescarbon sequestration, 87–90pollination, 90–91provision of pest control, 91–92recreation, 92–93
272 Index
temperature regulation, 84–86water regulation, 86–87
green space, 78–83distribution, 81environmental surfaces for Sheffield,
82fgreen space in Sheffield, 80fproportions of green space, 79–80,
79frelationship between date of first
urbanization and proportions, 83fsize, 80total green space coverage, 78t
pest control, provision, 91–92holly leaf-miner demographics, 92t
pollination, 90–91recreation, 92–93satellite image of Sheffield, 77ftemperature regulation, 84–86
relationships between cover byimpervious surface, 86f
temperature surfaces across Sheffield,85f
water regulation, 86–87Eremeeva, N.I., 90European Commission, 2, 53–54European Environment Agency (EEA),
228European Union (EU), 53–54, 107, 168Evans, A.W., 10, 149, 158Evapotranspiration, 6, 87‘Everyday eight’ local neighbourhood services,
24Ewing, R., 26, 55, 110
FFaeth, S.H., 91, 95Falk, N., 8Farthing, S., 24Ferguson, N., 53–73Fernandez-Juricic, E., 222, 229Finkel, S.E., 57Fisher, T., 109Flint, J., 110Floyd, M.F., 224Forest management, urban, 89Forrest, R., 108Forsyth, A., 224Francis, M.H., 225Freeman, H.L., 111, 217Frey, H., 163–182Fujita, M., 149Fuller, R.A., 75–98, 215–231
GGarden feed wild birds, 216Garling, T., 6Garvin, A., 219Gas consumption, 138, 140–141, 141fGaston, K.J., 75–98, 189, 215–231Gearin, E., 219Gehl, J., 25, 191Geographical Information System (GIS), 11,
26–27, 29f, 63, 67, 135–136, 218based platform, 27
Geography zone system, 56Gerlach-Spriggs, N., 93, 217Germann-Chiari, C., 92Ghazoul, J., 90Gibb, H., 229Gibbons, J., 86Gilbert, O.L., 6Gill, S.E., 87Gio, J.Y., 55, 57GIS, see Geographical Information System
(GIS)Glasgow’s Govan area, 170, 180Gleeson, B., 4Global positioning system (GPS), 26, 30tGlobal significance, issue of, 4–5Glue, D., 216Glynn, T., 111Golubiewski, N.E., 87Gomez, F., 230‘A good quality of life’, 107Gordon, P., 111, 150Govan areas
characteristics, 175–177objectives, 177primary data generation, 175secondary data generation, 175
GPS, see Global positioning system (GPS)Graham, S., 4Grahn, P., 93, 217Grant, J., 23Grant, M., 218‘Gravity model’, 152–153
See also RetailingGray, D.E., 26Great Notley, Essex, 198fGreen belts, 150, 154Green space and urban form, 78–83
distribution, 81environmental surfaces for Sheffield, 82fgardens, purely green space, 78high resolution vector mapping, 78large patches of internal green space
Index 273
building/housing density, 80Edinburgh/Oxford, 79public parks/playing fields, 80
Peak District National Park, 78proportions of green space, 79–80,
79frelationship between date of first
urbanization and proportions, 83fin Sheffield, 80fsize, 80small patches of green space
domestic gardens/roadside verges, 80Glasgow/Leicester, 79–80
total green space coverage, 78turban area, definition, 78
Green space, ecological/psychological value,215–231
collaborative research projects, 216coverage, 76, 79, 86, 227“greenness” of urban landscape, 215interactions between people/urban nature,
218–230biodiversity/people, spatial configura-
tion, 226–230private green space, 225–226public green space, 218–225
people/urban nature, 216–218human impacts on urban nature,
216–217people, impacts of urban nature on,
217–218regional/national biodiversity conservation
networks, 215urban ecosystems, 215urban residents, 215
Gregory, R.D., 94‘Grey’ water systems, 3Gross population densities, 37Grove, J.M., 6Guertler, P., 186Guy, S., 5, 10
HHabitable rooms per hectare, 27Habitat heterogeneity, 217, 221, 226–227Hadidian, J., 222Handy, S.L., 1, 7, 55, 72, 93Hanson, J., 25Haughton, G., 110, 184, 187Hayward, G., 220Healey, P., 24Healey, T., 191Heat loss standards, 131
Hedgcock, D., 106Henderson, J., 148Henry, J.A., 75Hermy, M., 222Herzog, T.R., 218, 224Hey, D., 76High-rise city centre apartment dwellers, 25Hillier, B., 25Hirschfield, A., 109Hochuli, D.F., 229Holmes, C., 25Home-based sustainable behaviours, 188
efficient, use of water, 189encouraging wildlife in gardens, 189home energy consumption, reduction of,
188–189waste recycling and composting, 189
Hope, D., 227Hope, S., 56Household car availability, 57–59
neo-traditional developments, 57ordered logit model
for cars available to households, 58tfor change in available cars on moving
house, 59tHousing
analysis steps, 154(building) characteristics, 25
high-rise city centre apartment dwellers,25
household questionnaire, 29‘lifetime homes’ model, 25measuring, 29–31non-domestic buildings, 29
constituent attribute, 155densities, 156household characteristics, 157house prices model, 155spatial price structures, 154
Huberman, A.M., 122Hull, R.B., 218Human impacts on urban nature, 216–217
city features, 216factors on spatial distribution, 216
species richness, 216varying biological response, 216
human factorssocio-economic deprivation, 217wildlife gardening popularity, 217
invertebrate richness, 216–217physical garden features, 216Sheffield, neighbourhoods, 217tree cover/habitat heterogeneity, 217

274 Index
urbanization process, 216Hunhammar, S., 6, 83Hunter, C., 110, 184, 187Hunt, R., 217Hunziker, M., 222
IIMD, see Indices of Multiple Deprivation
(IMD)‘IMD Geog Access’, 116–117, 117tIndex of Multiple Deprivation, 174t, 228–229,
229fIndicators, sustainable development
goals of research, 164socially balanced and inclusive urban
neighbourhood, 169urban neighbourhood, characteristics
economic, 170urban form, 169
urban regeneration and development,current practice, 164–165
urban renaissance and sustainable urbanneighbourhoods, 165
Indices of Multiple Deprivation (IMD), 113,121
Individual land uses, economic viability of,151
commercial and retail change, 153–154new property forms, 154
housing, 154–157analysis steps, 154constituent attribute, 155densities, 156household characteristics, 157house prices model, 155spatial price structures, 154
offices, 151–152retailing, 152–153
‘gravity model’, 152Industrial age, pre/early, 217Ingress Park, Kent, 186f, 193t–194t, 199fIntegrated elements, 25–26
compatibility/statistical analyses, 26pedestrian/cycling/public transport
network, 26Interactions between people/urban nature,
218–230biodiversity/people, spatial configuration,
226–230green space
private, 225–226public, 218–225
Intrinsic biodiversity value, 219
Irvine, K.N., 215–231Iverson, L.R., 81
JJackson, L.E., 92Jacobs, J., 148Jenerette, G.D., 84Jenks, M, 1–15, 21–49, 110, 239–256Jim, C.Y., 225Jo, H.-K., 87Johnson, E.A., 75Jokimaki, J., 222Jones, C., 1–15, 21–49, 145–161, 224,
239–256Jorgensen, A., 92Julian, D., 111
KKang, J., 222Kaplan, R., 218, 222, 225, 231Kaplan, S., 218, 222, 231Katz, P., 2, 110Kaye, J.P., 87Kearns, A., 90, 108tKellett, J.E., 229Kendle, A.D., 217, 225Khattak, A.J., 57Kim, J., 218Kintrea, K., 109Kinzig, A., 6, 226–227Klein, A.-M., 90Klemens, M.W., 75Knight, C., 110Kowarik, I., 94Kozak, D., 4Krizek, K.J., 55Krueger, R.A., 122Kuo, F.E., 76, 217–218Kwan, M-P., 55
LLacy, R., 6Lafrance, G., 130Lambregts, B., 4Land Registry, 155Land use, 23–24
description, 23‘everyday eight’ local neighbourhood
services, 24‘locally-unwanted land uses’,
23–24measuring, 27–28
‘buffer zone’, 27GIS-based platform, 27

Index 275
NLUD, 27primary data collection, 27
Langdon, P., 7Larivier, I., 130Latora, V., 259 n2Layout
measuring, 32MCA, street network systems, 32spatial network analysis, 32
urbanhistorical develop-
ment/planning/building regulations,25
Lazarus, N., 186Least squares regression, 114Lee, C.-W., 148Lee, W., 53–73Lee, W.S., 229Leicester subsample, 138Leishman, C., 145–161Lepczyk, C.A., 93, 217, 226‘Lifetime homes’ model, 25Lighting energy consumption, 130Lindsay, M., 183–212Littlefair, P.J., 131Liu, S., 24Livingstone, M., 109Llewelyn-Davies, 1–2, 190Local Agenda 21, 133, 164‘Locally-unwanted land uses’, 23–24Local services/amenities/businesses, use of,
192links, common, 192
Lomas, K.J., 129–142, 215–231London, 23, 89,217, 254Loram, A., 225Lorenz, K., 87, 90Low, N., 4Low-tech eco-design/communal-living, 188Lynch, K., 145
MMaas, J., 218MacDonald, C., 145–161MacDougall, E.B., 217Macintyre, S., 93, 218, 225March, L., 130Mardaljevic, J., 25Margo, J., 123Marston, A., 192Martin, C.A., 92, 227Martin, L., 130Marvin, S., 4, 5
Marzluff, J.M., 94, 229Masdar, 5Masnavi, M.-R., 9Mason, C.F., 94Matlack, G.R., 217MCA, see Multiple Centrality Assessment
(MCA)MCA spatial analysis, 257–259McCann, P., 149McKinney, M.L., 75, 94, 216McMichael, T., 217McPherson, E.G., 87, 90Measurement, urban form, 26–27
GIS, 26GPS, 26PDAs, 26prototype software, 26‘snapshot’ approach, 26street-by-street basis, 26two-pronged process of data collection, 26valuation roll and ordnance survey data, 26
Melles, S., 227Mental fatigue, 217Merrill, S.B., 230Michael, S.E., 218Miles, M.B., 122Millennium Ecosystem Assessment, 93Millennium village, 2, 165, 168
at Greenwich, 184, 195f–196fMiller, E.J., 7–8, 55, 224Miller, H.J., 55Mobility and travel
car use, traditional urban forms in reducing,54–55
distance travelledby car in Edinburgh (non-work day),
70fby car in Glasgow (work/non-work
day), 69fmultiple linear regression analy-
ses/models, 67–68, 68tordered logit model for change, 71tTravel Diary, 67
household car availability, 57–59neo-traditional developments, 57ordered logit model, 58tordered logit model for change, 59t
new urbanists in the US, 54research approach
analysis, 56–57data, 56multivariate statistical models, 57
trip generation
276 Index
trip frequency, 60–63use of local amenities, 63–65
urban sprawl, 53Urban Villages Campaign, 54
Modelling domestic energy consumptionfabric, 131–132
dwelling’s energy efficiency, 132household appliances use, 133–134
“mood” lighting, 134occupancy, 132–133
owner-occupancy, type, 132Moilanen, A., 98Monk, S., 10Moran, M.A., 217Morgan, J., 109, 111Mortberg, U., 229Mown grass (amenity turf), 222Mulholland, H., 186Multichotomous variables, 138
See also DatasetMultiple Centrality Assessment (MCA), 11,
32, 37, 113street network systems, 32
Mumbai, 5Mumford, K., 109Municipal parks, 219Muth, R., 147
NNabhan, G.P., 90Nasar, J.L., 224Nassauer, J.I., 224Næss, P., 60, 62, 66–67National Land Use Database (NLUD), 27Natural environments, 92, 216–217, 220–222,
225, 230Neighbourhood design and lifestyles
Alpine Close, Maidenhead, 197fAmersham Road, Reading, 197fbehaviours
home-based sustainable behaviours,188
social participation, 191travel behaviour and car ownership,
190–191use of local services, 192See also Behaviours
built environment and sustainablebehaviour, relationship, 185–186
‘technical’ and ‘behavioural’sustainability, contrast, 185, 185f
comparison surveys, 187Cooper Road, East Sussex, 198f
differences, behaviours study andcomparison surveys, 196–200
effectiveness of new ‘sustainable’ housingdevelopments, 184
findings on sustainable behaviourscar owning, 208–209cars owned/available, 209encouraging wildlife, 206, 206ffactors, encouraging to walk/cycle/use
public transport, 208fhome energy use and water efficiency,
203–204, 203f–204fshort journeys, fuel-efficient modes of
transport, 206–208, 207fsocial participation, 210use of local services, 210–211, 210fwaste recycling and composting,
204–205, 205fGreat Notley, Essex, 198fIngress Park, Kent, 199fneighbourhood-scale design, 183research methods, case study locations,
186–187, 186fresults, 212
residents’ attitudes, 200–202environment concerns, 201, 201fneed to improve quality of life and
environment, 202freasons for choosing home, 202f
The Staiths, Gateshead, 200fsustainable design features in housing
schemes, 187–188low-tech eco-design/communal-living,
188‘physical’ or design features, 188sustainability in global policy context,
objectives, 187‘sustainable’ developments, 192–196,
193t–194tNeighbourhoods, 36–37
case study, 261–266between, 265–266indicators of layout, 258tinner, 261outer, 266physical characteristics, 262t–265turban layout, cost’ and ‘efficiency’ of
networks, 259tcharacteristics, 37
consistent spatial demographic patterns,37
gross population densities, 37private rented housing, 37
Index 277
social housing in British cities, 37layouts, 37–38
compact and sprawling neighbour-hoods, 38f
‘fractal’ dimension of street patterns, 37MCA analysis, 37spectrum of complexity index scores,
38f-scale design, 248and urban renaissance, 165
millennium villages/sustainablecommunities, 165
targets, 165UTF, 165
Nelessen, A.C., 111Newton, P., 25New Urbanists in US, 54Niemela, J., 75, 81, 94, 216NLUD, see National Land Use Database
(NLUD)(non) linear programming problem, 150Noonan, P.F., 111Nowak, D.J., 87
OODPM, see Office of the Deputy Prime
Minister (ODPM)Office of the Deputy Prime Minister (ODPM),
2, 25, 27, 106–107, 110, 149, 166,218
Oliver, G., 2‘Optimal’ city, 149Organic gardening techniques, 189Orr, A., 145–161Owers, R., 2Owner-occupancy, 132–133, 133fOxford university, 35Ozguner, H., 225
PPanerai, P., 54Parr, J.B., 146, 149Parsons, R., 6, 217Partecke, J., 86Pataki, D.E., 83, 87Patch species richness, 229Pauleit, S., 6, 76, 78, 81, 216–217Payne, L., 7Payne, S.R., 215–231PDAs, see Personal digital assistants (PDAs)‘Pedshed,’ 24Penn, A., 25People, urban nature impacts on, 217–218
benefits of urban nature, 218
“breathing zones,” London, 217environmental exposure, 217natural environments, 217physiological effects of stress, measures,
217pre- and early-industrial age, 217social interaction/sense of community, 218“walkable green space,” Japan, 218
Perfect linear system, 38Perkins, A., 130Personal digital assistants (PDAs), 26Persons per hectare (pph), 27, 36, 61t, 68t, 71t,
159tPest control, provision of, 91–92
holly leaf-miner Phytomyza ilicis Curtis, 91demographics, 92f, 92t
Pett, J., 186Physical infrastructure costs, 158, 160Pickett, S.T.A., 75–76, 84, 90Pierson, J., 108Pilot survey, design of survey instrument, 136Pincetl, S., 219Pirie, G.H., 55Planning and conception stages, city
key indicators, 169threshold and target values increase, 169
Planning applications, 155Planning Policy Guidance Note 13, 166Planning Policy Statement 3, 131Plater-Zyberk, E., 7, 110Polese, M., 106Policies, housing, 253Pollination, 84, 90–91
pollinator faunas, 90Porta, S., 21–49Porter, M.E., 148Pouyat, R.V., 90Power, S., 105–124pph, see Persons per hectare (pph)Pressey, R.L., 98Private green space, 43t, 45t, 218, 225–226,
249, 251, 255gardens/well-being, 225
psychological processes, 225wildlife gardening, 226
bird feeding stations, 226garden management/specific provision
of resources for wildlife, 226richness and abundance of invertebrates,
226“wildlife-friendly” garden features, 226
Private rented housing, 37, 39, 241Psychological processes, 225

278 Index
self-esteem/self-efficacy/personal identity,225
Public green spacebiodiversity management, 222–225
concept of “mystery,” 224correlations between perceptions of
safety/vegetation across, 224t“cultural cues to care,” 224large formal spaces (botanical gardens),
222mown grass (amenity turf), 222negatively impacted activities, 222Sheffield park usage, 223shrub layer volume per hectare, 224species richness, 222tree canopy volume per hectare, 224“urban savannah” design, 222“welfare of plants and animals,” 222woodland and rough grassland, 224
Public green space, 30t, 92–93, 217–226,228–229, 231, 249–250
uses/motivations, 218–222broader constructions of nature,
221CABE Space, 219CityForm’s case study neighbourhoods
survey, 219East Midlands region of UK, 219ecological surveys, 219elements of biodiversity value,
221flora and fauna, 221intrinsic biodiversity value, 219mechanical sounds, 221municipal parks, 219natural environment, 221Sheffield park, 219Sheffield park interviewees, 221“soundscape” (acoustic environment),
221total urban space, 219urban residents of local neighbourhood
green spaces, 220tPublic sector investment, 146Putnam, R.D., 108t, 191
Q‘Quality of life,’ good, 124, 245Quantitative relationships, social acceptability
‘pride/attachment’ factor, 120stability/mobility criterion, 114
Quasim, M., 76Quigley, M.F., 88
RRaman, S., 21–49Rao, S., 189–190Rapoport, A., 23‘Rateable value,’ 152
spatial structure, 152tRatti C., 130Rebele, F., 75, 230Recreation, 30t, 84, 92–93, 112–113, 167, 217,
219–220t, 222–224, 244, 249–250domestic garden and human health, 93
Registered Social Landlords (RSLs), 132,196–197
Residents’ attitudes, 200–202environment concerns, 201, 201fneed to improve quality of life and
environment, 202freasons for choosing home, 202f
Resistance to higher densitieslower-density suburb, 166northern regions, 167weaker market areas, 166
Retailing, 15, 146, 152–153, 160, 251‘gravity model,’ 152level of shopping trips, 153
Revill, J., 2Richardson, H.W., 111, 149–150Rodgers, M.O., 84–85Rohde, C.L.E., 217Rollinson, D.J., 226Rowntree, R.A., 87Roy, D.B., 94, 217RSLs, see Registered Social Landlords (RSLs)Rudlin, D., 8Ryan, R., 218Rylatt, M., 129–142
SSalvador, P., 230Sarmiento, S., 60Satellite image of Sheffield, 77fSavard, J-P.L., 6Scellato, S., 259 n2Schoon, N., 24Schroeder, J.W., 224Scottish Household Survey (SHS), 56, 58, 60,
66, 67Seeland, K., 92SEH, see Survey of English Housing (SEH)Selman, P., 106Shaftoe, H., 110Shanghai, 5Shaw, S-H., 55
Index 279
Shay, E., 57Sheffield city, 76
distinct urban character, 76public green spaces
visitor composition, 220tvisitors activities, 221t
relationships betweengreen space coverage, 228flocal levels of deprivation/avian species
richness, 229fpeople using sub-areas within public
green spaces, 223fsteel manufacturing industry, 76westward sprawl of city boundary/increased
population growth, 76Sheffield park, 219
interviewees, 221usage, 223
Sheppard, S., 10, 150Shibata, S., 218Shochat, E., 95Shore, W.B., 111Shorrock, L.D., 132Shrub layer volume per hectare, 224SHS, see Scottish Household Survey (SHS)Sime, J., 225Simmel, G., 111Simmie, J., 10Simmonds, D., 8Skjaeveland, O., 6Smith, G., 81, 85, 89–90, 96, 217, 230Smith, R.M., 81, 85, 89–90, 96, 217, 230‘Snapshot’ approach, 26Social acceptability, 105
definition, 105–111broad classes of ‘capital,’ 106equity, 106‘Quality of Life Counts,’ 106(sense of) community, 106social capital, cohesion and inclusion,
107–108social equity issues, 108social sustainability/urban form,
relationship, 110–111urbanity, 106
household survey, 105measurement, 111–113
composite measures, 112qualitative findings, 121–124
community/attachment, 123–124local services/spaces, 122–123
quantitative relationships, 114–121area effects, 120–121
descriptive patterns, 114regression modelling results, 114–118urban form relationships, 118–120urban form variables, individual
impacts of, 117fSocial acceptability, quantitative relationships
‘pride/attachment’ factor, 120stability/mobility criterion, 114
Social capital, social cohesion/social inclusionsocial exclusion, 107
comparison, 108toutcome by location/density, 115tsocial networks, 107
Social composition factors, 111Social equity, 8, 106, 108, 110, 244, 247
issues, 108facilities, 108opportunities, 108services, 108
Social exclusion, 107–108, 108f, 191Social housing in British cities, 37, 39, 241Social infrastructure costs, 157–158Social sustainability/urban form, relationship,
110–111‘compact city’ vs. ‘sprawl,’ 110
Socio-economic-demographic composition,230
Solar gainheating energy consumption, 130–131
Sorace, A., 222“Soundscape” (acoustic environment),
221–222Sounds, mechanical vs. natural, 221Sound theory, application of, 8Spatial network analysis, 32Species richness, 88, 93–94, 97, 215–216,
221–222, 251alien plant, 96bee, 90bird, 227–229, 229f, 244of breeding birds, 94, 95f–96f, 228fnative plant, 94, 95f–96f, 227patch, 229positively correlated with park area, 222
Speirs, L.J., 218Spicer, J.I., 93Sprawling layout of Glasgow, 38Staiths, Gateshead, 200fStanners, D., 92, 228Stansfield, S.A., 217Stead, D., 7, 57, 66Steemers K., 131Stigsdotter, U.A., 93, 217

280 Index
Stone, B. Jr., 84, 85Street patterns, ‘fractal’ dimension of, 37Stren, R., 106Stubbs, M., 2Suhonen, J., 222Sukopp, H., 96Sullivan, W.C., 76, 218Surgical recovery time, 217Survey
instrument, design of, 136street-by-street basis, 26
Survey of English Housing (SEH), 113,120–121
Sushchev, D.V., 90Sustainability issues
developments and sustainable behaviour,248–249
ecological and psychological benefits ofurban green space, 249–250
intensifying neighbourhood density,247–248
Sustainability measurementtool application, 170
Drumoyne area, detailed investigation,177–180
Govan areas, investigation, 175–177tool development, 168–170
indicators, categories, 169–170planning and conception stages, 169
Sustainable behaviours (SB), 15, 183–189,196–200, 212, 248–249
built environment and, 185definition, 187developments and, 248–249differences between study and comparison
surveys, 196–200elements of, 248findings on, 203–211home-based, 188–189survey, 186–187sustainable design features and, 187–188See also Behaviours
‘Sustainable business parks,’ 184Sustainable city, meaning, 1
researching dimensions of, 6–12economy, see Economic viabilityenvironmental sustainability, 6–7social benefits, 8–9transport, 7–8
Sustainable Communities Plan, 107Sustainable community, 165, 168–169, 191
crime/anti-social behaviour, 107
‘friendly and cooperative communities,’107
‘identity and belonging,’ 107leisure and cultural opportunities, 107‘tolerance of difference,’ 107
Sustainable design features in housingschemes, 187–188
‘Sustainable holiday villages,’ 184‘Sustainable housing schemes,’ effects of, 184Sustainable urban neighbourhood
economic characteristics, 170urban form characteristics, 169See also Indicators, sustainable
developmentSuzuki, N., 218Syme, G., 7
TTakano, T., 218Talen, E., 24, 110Taylor, A.F., 218TCRP, see Transit Cooperative Research
Program (TCRP)‘Technical’ and ‘behavioural’ sustainability,
contrast, 185Temperature, 84–86
ecological consequences on change in,85–86
relationships between cover by impervioussurface, 86f
surfaces across Sheffield, 85fThermostatic radiator valves (TRV), 140Thisse, J-F., 149Thomas, C.D., 76, 80, 229Thompson-Fawcett, M., 54Thompson, K., 54, 230Thorington, K.K., 95Thwaites, K., 237Tinsley, D.J., 6–7Titheridge, H., 57Total urban space, 219Trafalgar Square in London, 23Train, K., 67Tram network, Sheffield, 35Transit Cooperative Research Program
(TCRP), 111Transit oriented development, 4Transmilenio, 4Transport infrastructure, 14, 22–23, 22f,
28–29, 31t, 148–149, 151, 160,240–241, 240f, 252–253, 255
accessibility, 24, 146–147measuring accessibility and, 28–29

Index 281
private, 31tpublic, 23, 29, 31, 31t
Tratalos, J., 75–98, 215–231Travel behaviour
car ownershipowning car, 190–191parking space for pool of shared cars,
191shorter journeys, fuel-efficient modes of
transport, 190walking/cycling/public transport use,
190distance travelled
by car in Edinburgh (non-work day),70f
by car in Glasgow (work/non-workday), 69f
multiple linear regression analyses/models,67–68t
ordered logit model for change in cartravel, 71t
Travel Diary, 67See also Mobility and travel
Travel Diary, 60, 66–67Tree canopy volume per hectare, 224Trip generation
trip frequency, 60–63household income, 62number of available cars, effect of, 63ordered logit model for trip frequency,
61, 61t–62tSHS travel diary, 60
use of local amenities, 63–65frequency of use of classes of local
amenity, 64tSee also Mobility and travel
Trotter, C., 5TRV, see Thermostatic radiator valves (TRV)Tyrvainen, 6
UUK Building Research Establishment Domestic
Energy Model (BREDEM), 131UK government agency, 228–229Ulrich, R.S., 6, 92, 217, 219Underground system, Glasgow, 35United States Fish and Wildlife Service, 226Urban
ecosystems, 215, 249infrastructure costs, types, 157intensification, 163, 167–168
advantages, 167goals of researches, 164
research stages, 163vehicular traffic reduction, 167
matrix, 229nature
human impacts on, 216–217impacts on people, 217–218interactions between people and, 218people and, 215–216social-psychological perspective, 215
noiseEuropean robins Erithacus rubecula, 96relationship between noise levels and
impervious surfaces, 97(public) space, management of, 124regeneration and development, 164–165residents, 215savannah, 222sprawl, 53sustainability, 241, 250–253
Urban form, economic performance, 148–151affordability constraint, 151arguments, 149benefits, 148environments, 149‘optimal’ city, 149retailing, relationships, 152role of density, land use, 148–149
Urban form elements and sustainabilitydimensions, relationship, 240f
Urbanization, 78, 81, 83–85, 87, 90–91, 93–94,98, 216
ecology transformation, 75effects of, 75–76green space
built environment, 76cover/urban density, 76impervious surface, 76nature of urban form, 76
Urban Task Force (UTF), 1–2, 4, 8, 24, 54,165, 171t–172t, 191
Urban Villages, 165, 169campaign, 54
Urban White Paper, 1UTF, see Urban Task Force (UTF)Utley, J.I., 132
VVan Diepen, A., 9Vegetation structure, 75, 224, 226Vehicular traffic reduction, 167Verheij, R.A., 217Victorian era, 217Vu, T., 6
282 Index
W“Walkable green space,” Japan, 218Wallentinus, H.-G., 229Walsh, J.J., 75, 94, 216Walters, S., 2Warber, S.L., 217Ward Thompson, C., 230Warren, P.H., 75–98, 215–231Water regulation, 84, 86–87
evapotranspiration, 87Watkins, D., 105–124, 145–161Watkins, R., 6–7, 10Watson, J.E.M., 81Webster-Brown J.G., 87Weitzer, W.H., 220“Welfare of plants and animals,” 222Wells, N.M., 217Whitehead, C., 10Whitford, V., 76, 87Whyte, W.H., 6Wiesner, M.R., 87Wildlife gardening, 216–217, 226Williams, K., 1, 9, 21, 110, 183–212Winter, J., 24, 84, 85f–86f
Wirth, L., 111Wittig, R., 94Wong, N.H., 84Woodford, G., 27Woodland and rough grassland, 224Woodland habitats, 227Woods, L., 53–73Woolever, C., 109Wray, S., 228Wu, J., 86Wurzel, A., 96
YYang, W., 222Yannis, S., 6Yiftachel, O., 106Yli-Pelkonen, V., 81
ZZhang, X.Y., 86Zhu, X., 24Zifou, M., 111Zonneveld, W., 4