Embed Size (px)
Citation preview
Board Approved 8-3-15
1
Curriculum: AP Statistics Curricular Unit: Exploring Data Instructional Unit: A. Univariate data – Patterns and departures from patterns
Standard Alignments (Section 2) College Board: APS.1.A-C,E Knowledge: (MA) 3,6 CCSS: N/A NETS: 3d; 4c; 6b Performance: 1.6, 1.8, 3.5
Unit (Section 3)
Learning Targets: • Create marginal and conditional distributions • Create segmented bar graphs and determine if two categorical variables are associated • Create box plots, parallel box plots, dot plots, histograms, stemplots, time plots,
normal probability plots, and normal distributions • Compare distributions and ogives by using shapes, centers, spreads, and outliers • Find summary statistics – mean, median, mode, midrange, mid-quartile,
interquartile range, standard deviation, variance, quartiles, and percentiles and interpret for a specific audience
• Use normal distributions for applications involving standardized scores • Analyze categorical data involving Simpson’s Paradox Instructional Strategies: • Direct and explicit instruction • Guided and independent practice • Small group instruction/facilitation • Summarizing/synthesizing concepts • Student self-reflection • Teacher self-reflection • Class discussions • Activities:
• Foot and Hand Length Measurements – Students will: • measure their feet and hand lengths • collect data that will enable them to make box plots and stemplots • analyze the results comparing females and males
Board Approved 8-3-15
2
• String Length Bias – Students will: • guess the lengths of two different pieces of string • collect data that will enable them to make parallel box plots • discover biases in guessing
• Random ACT scores – Students will: • generate data from the TI calculators using the RandNorm command • make normal probability plots • compare results in a circle movement comparison game
Assessments/Evaluations: • Formative:
• Direct teacher observations • Quizzes • Homework assignments – see pacing guide
• Summative: Formal common assessment – Unit “A” test Mastery: 75% Sample Assessment Questions: • Students in a biology class kept a record of the height (cm) of plants for a class
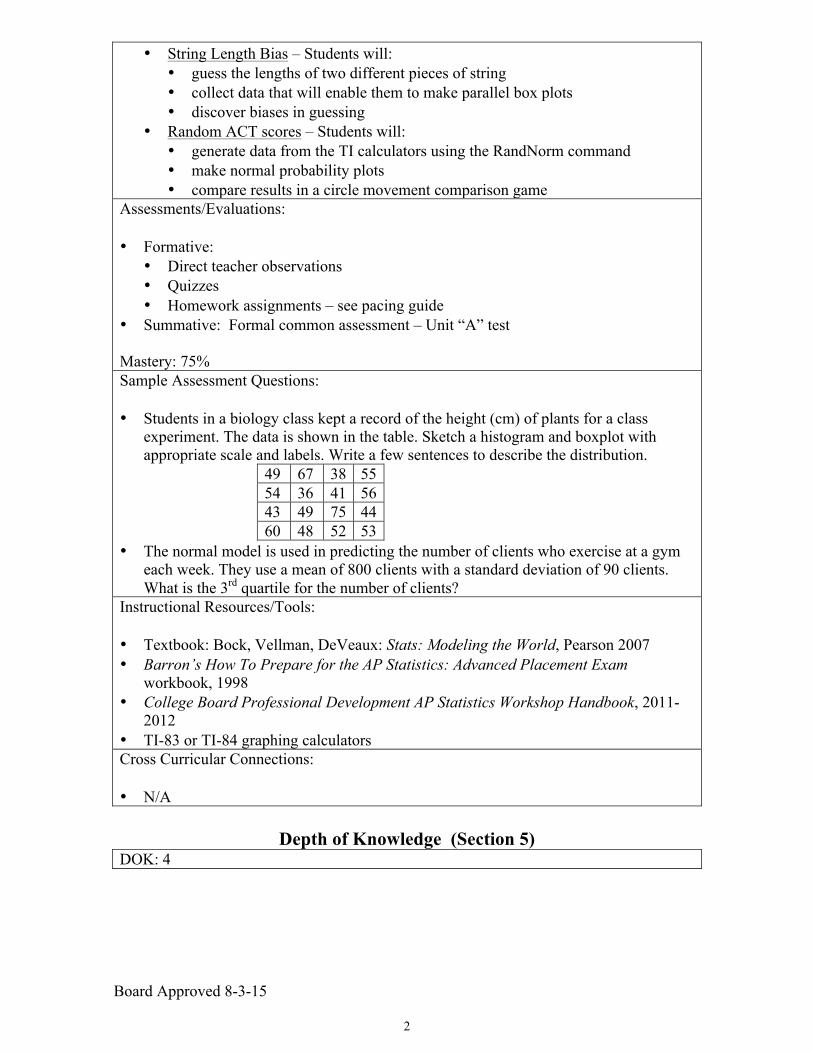
experiment. The data is shown in the table. Sketch a histogram and boxplot with appropriate scale and labels. Write a few sentences to describe the distribution.
49 67 38 55 54 36 41 56 43 49 75 44 60 48 52 53
• The normal model is used in predicting the number of clients who exercise at a gym each week. They use a mean of 800 clients with a standard deviation of 90 clients. What is the 3rd quartile for the number of clients?
Instructional Resources/Tools: • Textbook: Bock, Vellman, DeVeaux: Stats: Modeling the World, Pearson 2007 • Barron’s How To Prepare for the AP Statistics: Advanced Placement Exam
workbook, 1998 • College Board Professional Development AP Statistics Workshop Handbook, 2011-
2012 • TI-83 or TI-84 graphing calculators Cross Curricular Connections: • N/A
Depth of Knowledge (Section 5) DOK: 4
Board Approved 8-3-15
3
Curriculum: AP Statistics Curricular Unit: Exploring Data Instructional Unit: B. Bivariate data – Patterns and departures from patterns
Standard Alignments (Section 2) College Board: APS.1.D Knowledge: (MA) 3,6 CCSS: N/A NETS: 1c; 1d; 3c; 4a,c; 6c Performance: 1.6, 1.8, 3.5
Unit (Section 3)
Learning Targets: • Create scatter and residual plots • Describe the relationship between two quantitative variables using a graph or
regression output • Interpret the slope, y-intercept, correlation coefficient, percent explained
variation in context of the problem from either regression output or original data
• Use linear and non-linear models to make predictions • Find the best fitting model for a set of data • Determine if a given data point is influential, has high leverage, or is an outlier Instructional Strategies: • Direct and explicit instruction • Guided and independent practice • Small group instruction/facilitation • Summarizing/synthesizing concepts • Student self-reflection • Teacher self-reflection • Class discussions • Activities:
• Foot and Hand Length Again – Students will: • revisit the data collected from Unit A • create a scatter plot with legend for males and females
• Matching Correlation Game – Students will use a website and the SMART Board to match correlation coefficients to the scatter plots
• Colored Residual Activity – Students will use a particular set of data to: • make colored residuals • get a visual for percent of unexplained variation
Board Approved 8-3-15
4
• Guess Regression Line – Students will use a website and the SMART Board to have random students draw the line of best fit for a set of data with immediate feedback
• Influential Points and Outliers – Students will use a website and the SMART Board to determine: • if a given data point is either influential, an outlier, or has high leverage • what effect that point has on the correlation coefficient
Assessments/Evaluations: • Formative:
• Direct teacher observations • Quizzes • Homework assignments – see pacing guide
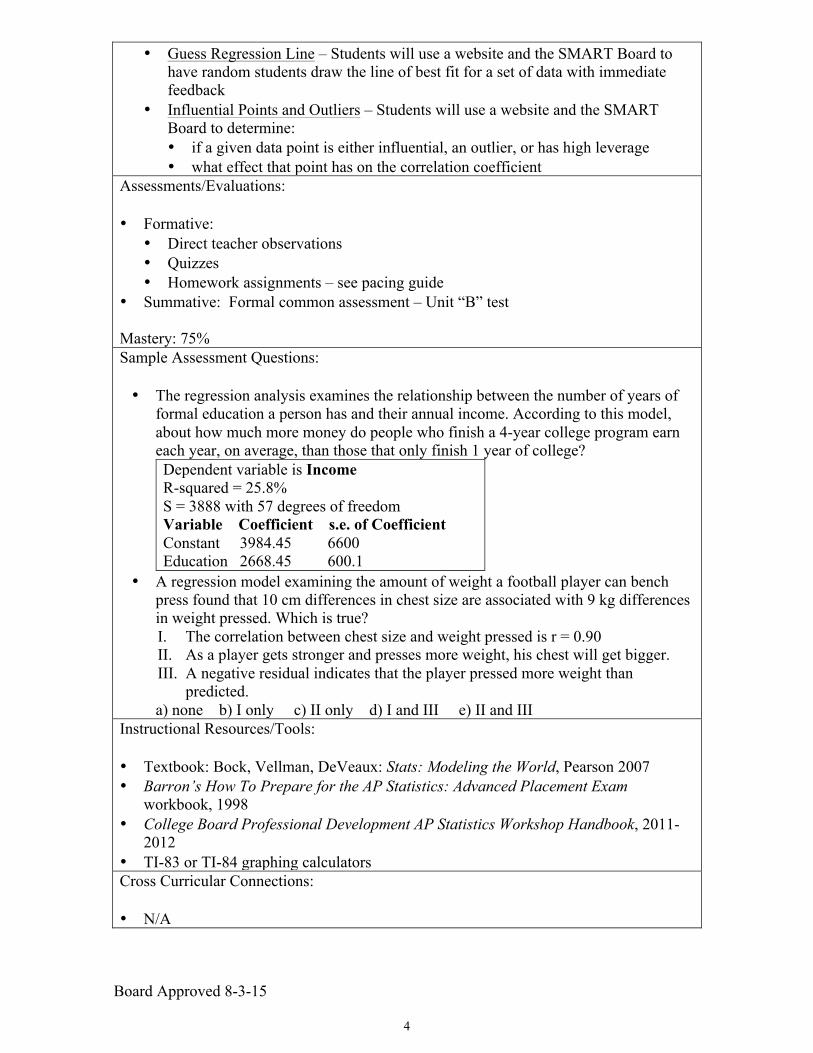
• Summative: Formal common assessment – Unit “B” test Mastery: 75% Sample Assessment Questions: • The regression analysis examines the relationship between the number of years of
formal education a person has and their annual income. According to this model, about how much more money do people who finish a 4-year college program earn each year, on average, than those that only finish 1 year of college? Dependent variable is Income R-squared = 25.8% S = 3888 with 57 degrees of freedom Variable Coefficient s.e. of Coefficient Constant 3984.45 6600 Education 2668.45 600.1
• A regression model examining the amount of weight a football player can bench press found that 10 cm differences in chest size are associated with 9 kg differences in weight pressed. Which is true? I. The correlation between chest size and weight pressed is r = 0.90 II. As a player gets stronger and presses more weight, his chest will get bigger. III. A negative residual indicates that the player pressed more weight than
predicted. a) none b) I only c) II only d) I and III e) II and III
Instructional Resources/Tools: • Textbook: Bock, Vellman, DeVeaux: Stats: Modeling the World, Pearson 2007 • Barron’s How To Prepare for the AP Statistics: Advanced Placement Exam
workbook, 1998 • College Board Professional Development AP Statistics Workshop Handbook, 2011-
2012 • TI-83 or TI-84 graphing calculators Cross Curricular Connections: • N/A
Board Approved 8-3-15
5
Depth of Knowledge (Section 5) DOK: 4
Board Approved 8-3-15
6
Curriculum: AP Statistics Curricular Unit: Sampling and Experimentations Instructional Unit: C. Planning and conducting a study and analyzing experiments
Standard Alignments (Section 2) College Board: APS.2.A-D Knowledge: (MA) 3,6 CCSS: N/A NETS: 3b; 3d; 4c; 5a Performance: 1.6, 1.8, 3.5
Unit (Section 3)
Learning Targets: • Use a random digit table and the TI RandInt function to randomize groups and take
random samples • Identify and use sampling techniques – SRS, stratified, systematic, cluster, and
multistage • Identify and avoid using poor sampling techniques – convenience and voluntary
response • Identify different types of biases and explain ways to overcome them • Design a randomized comparative experiment, both with and without blocking • Critique experiments using the basic principals of statistical design and analyze
the results • Explain the differences between surveys, observational studies, censuses, and
experiments • Perform simulations and explore sampling variabilities of different sample
distributions • Describe the different types of sampling methods and apply them to real-life
problems • Explain the difference between “blind” and “double blind” and describe the placebo
effect and its consequences
Board Approved 8-3-15
7
Instructional Strategies: • Direct and explicit instruction • Guided and independent practice • Small group instruction/facilitation • Summarizing/synthesizing concepts • Student self-reflection • Teacher self-reflection • Class discussions • Activities:
• Experiment of Choice – In small groups, students will design an experiment and give a brief oral report on the: • experimental units • treatments • method of measurement • factors and levels • blocking and any how-to control for any lurking variables
• The Great Gummy Bear Launch – In small, randomized groups, students will: • build a catapult and launch gummy bears and measure the distance traveled • use the basic principals of statistical design to record and interpret their results
• P-HAT Activity – Students will: • use the RandInt function on the TI to create sample proportions by simulations • record and interpret the results of the class (p-hat, as in a specific symbol
above the p, which means population proportion) • Sample the Candy – Students will break up into groups, under guidance by the
teacher, using candy to illustrate the six sampling techniques • You Said It, Now Prove It – Students will:
• critique local cases of anecdotal evidence • develop logical arguments against them
Assessments/Evaluations: • Formative:
• Direct teacher observations • Quizzes • Homework assignments – see pacing guide
• Summative: Formal common assessment – Unit “C” test Mastery: 75% Sample Assessment Questions: • A manufacturer of boots plans to conduct an experiment to compare a new method of
waterproofing to the current method. The appearance of the boots is not changed by either method. The company recruits 100 volunteers in Seattle, where it rains frequently, to wear the boots as they normally would for 6 months. At the end of the 6 months, the boots will be returned to the company to be evaluated for water damage. Draw a diagram, then describe a double blind design for this experiment. Indicate how it would be implemented.
Board Approved 8-3-15
8
• The JCPS district is planning on surveying parents of JCHS students about a second high school. Several lists are generated: a complete alphabetized list; parents sorted by students grade level (9th, 10th, 11th, 12th) and alphabetized in each section; parents sorted by voting precinct and alphabetized. Describe how you could do each type of the following sampling techniques – cluster, SRS, stratified, and systematic.
Instructional Resources/Tools: • Textbook: Bock, Vellman, DeVeaux: Stats: Modeling the World, Pearson 2007 • Barron’s How To Prepare for the AP Statistics: Advanced Placement Exam
workbook, 1998 • College Board Professional Development AP Statistics Workshop Handbook, 2011-
2012 • TI-83 or TI-84 graphing calculators Cross Curricular Connections: • N/A
Depth of Knowledge (Section 5) DOK: 4
Board Approved 8-3-15
9
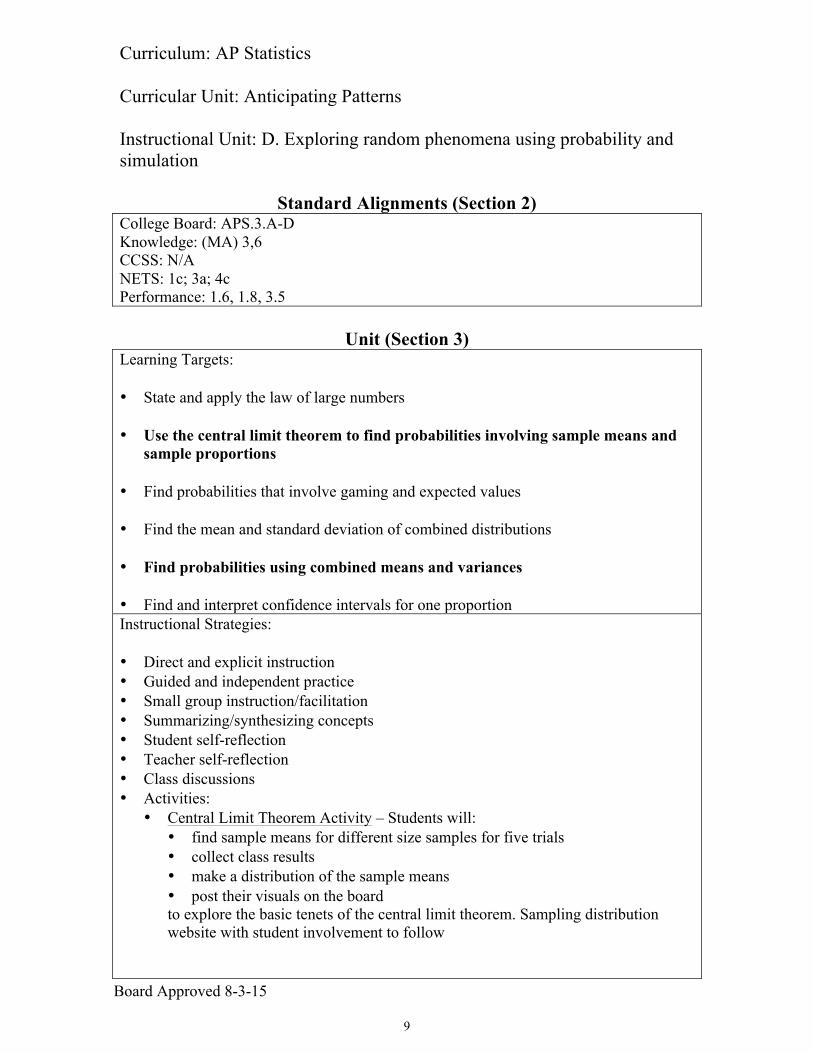
Curriculum: AP Statistics Curricular Unit: Anticipating Patterns Instructional Unit: D. Exploring random phenomena using probability and simulation
Standard Alignments (Section 2) College Board: APS.3.A-D Knowledge: (MA) 3,6 CCSS: N/A NETS: 1c; 3a; 4c Performance: 1.6, 1.8, 3.5
Unit (Section 3)
Learning Targets: • State and apply the law of large numbers • Use the central limit theorem to find probabilities involving sample means and
sample proportions • Find probabilities that involve gaming and expected values • Find the mean and standard deviation of combined distributions • Find probabilities using combined means and variances • Find and interpret confidence intervals for one proportion Instructional Strategies: • Direct and explicit instruction • Guided and independent practice • Small group instruction/facilitation • Summarizing/synthesizing concepts • Student self-reflection • Teacher self-reflection • Class discussions • Activities:
• Central Limit Theorem Activity – Students will: • find sample means for different size samples for five trials • collect class results • make a distribution of the sample means • post their visuals on the board to explore the basic tenets of the central limit theorem. Sampling distribution website with student involvement to follow
Board Approved 8-3-15
10
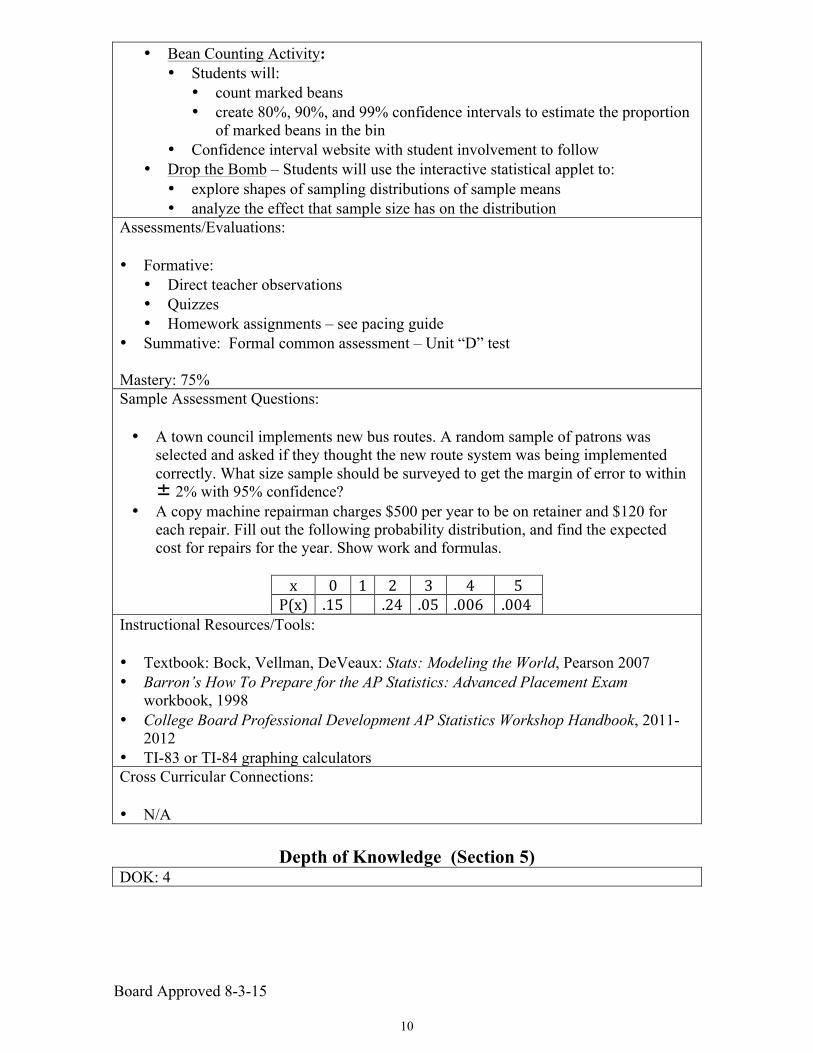
• Bean Counting Activity: • Students will:
• count marked beans • create 80%, 90%, and 99% confidence intervals to estimate the proportion
of marked beans in the bin • Confidence interval website with student involvement to follow
• Drop the Bomb – Students will use the interactive statistical applet to: • explore shapes of sampling distributions of sample means • analyze the effect that sample size has on the distribution
Assessments/Evaluations: • Formative:
• Direct teacher observations • Quizzes • Homework assignments – see pacing guide
• Summative: Formal common assessment – Unit “D” test Mastery: 75% Sample Assessment Questions: • A town council implements new bus routes. A random sample of patrons was
selected and asked if they thought the new route system was being implemented correctly. What size sample should be surveyed to get the margin of error to within
2% with 95% confidence? • A copy machine repairman charges $500 per year to be on retainer and $120 for
each repair. Fill out the following probability distribution, and find the expected cost for repairs for the year. Show work and formulas.
x 0 1 2 3 4 5 P(x) .15 .24 .05 .006 .004
Instructional Resources/Tools: • Textbook: Bock, Vellman, DeVeaux: Stats: Modeling the World, Pearson 2007 • Barron’s How To Prepare for the AP Statistics: Advanced Placement Exam
workbook, 1998 • College Board Professional Development AP Statistics Workshop Handbook, 2011-
2012 • TI-83 or TI-84 graphing calculators Cross Curricular Connections: • N/A
Depth of Knowledge (Section 5) DOK: 4
!
±
Board Approved 8-3-15
11
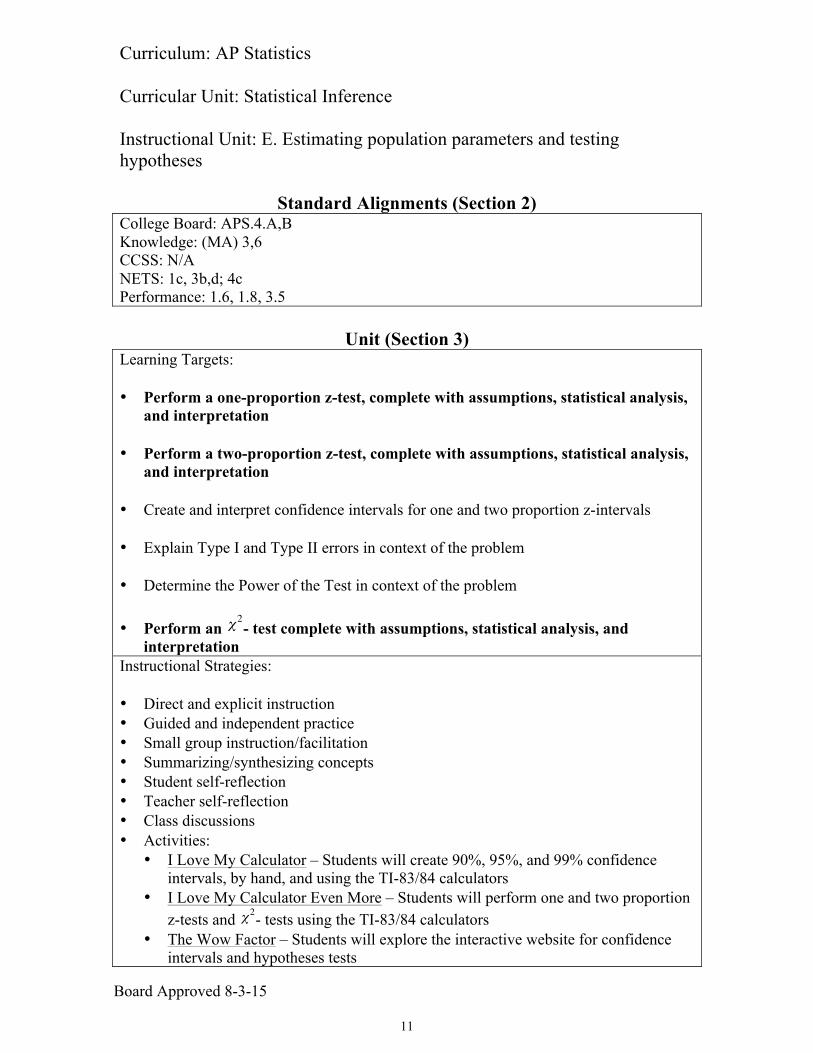
Curriculum: AP Statistics Curricular Unit: Statistical Inference Instructional Unit: E. Estimating population parameters and testing hypotheses
Standard Alignments (Section 2) College Board: APS.4.A,B Knowledge: (MA) 3,6 CCSS: N/A NETS: 1c, 3b,d; 4c Performance: 1.6, 1.8, 3.5
Unit (Section 3)
Learning Targets: • Perform a one-proportion z-test, complete with assumptions, statistical analysis,
and interpretation • Perform a two-proportion z-test, complete with assumptions, statistical analysis,
and interpretation • Create and interpret confidence intervals for one and two proportion z-intervals • Explain Type I and Type II errors in context of the problem • Determine the Power of the Test in context of the problem • Perform an - test complete with assumptions, statistical analysis, and
interpretation Instructional Strategies: • Direct and explicit instruction • Guided and independent practice • Small group instruction/facilitation • Summarizing/synthesizing concepts • Student self-reflection • Teacher self-reflection • Class discussions • Activities:
• I Love My Calculator – Students will create 90%, 95%, and 99% confidence intervals, by hand, and using the TI-83/84 calculators
• I Love My Calculator Even More – Students will perform one and two proportion z-tests and - tests using the TI-83/84 calculators
• The Wow Factor – Students will explore the interactive website for confidence intervals and hypotheses tests
!
"2
!
"2
Board Approved 8-3-15
12
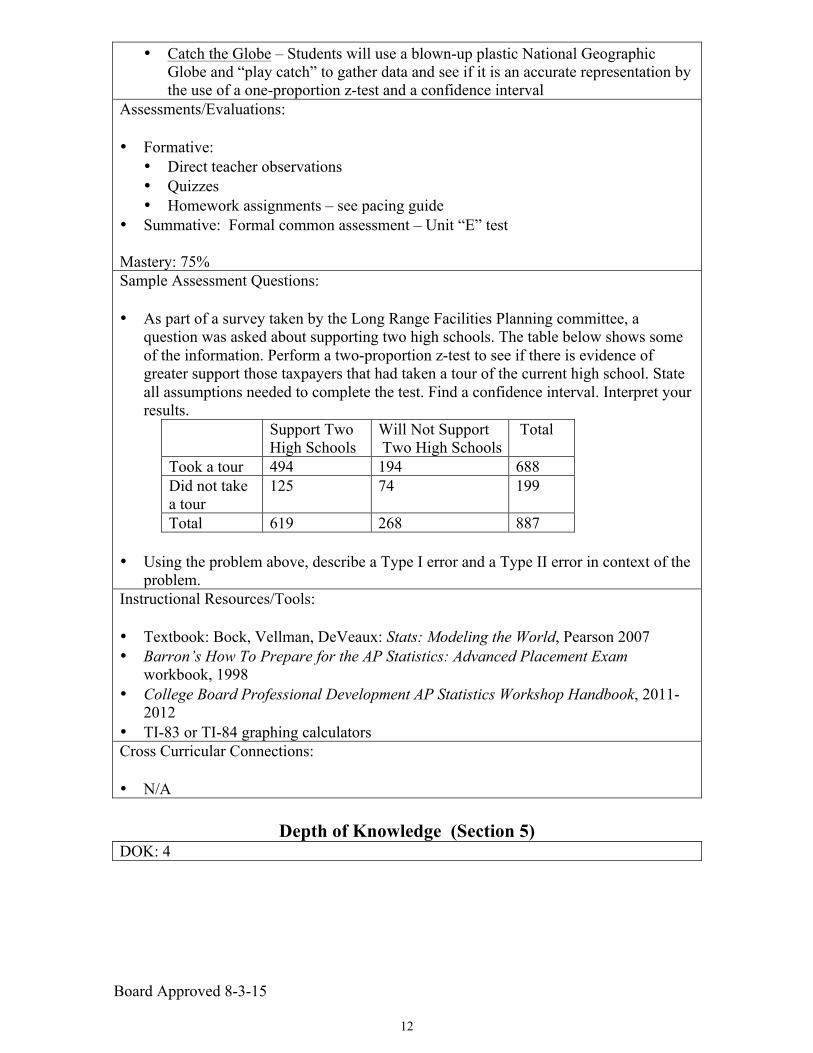
• Catch the Globe – Students will use a blown-up plastic National Geographic Globe and “play catch” to gather data and see if it is an accurate representation by the use of a one-proportion z-test and a confidence interval
Assessments/Evaluations: • Formative:
• Direct teacher observations • Quizzes • Homework assignments – see pacing guide
• Summative: Formal common assessment – Unit “E” test Mastery: 75% Sample Assessment Questions: • As part of a survey taken by the Long Range Facilities Planning committee, a
question was asked about supporting two high schools. The table below shows some of the information. Perform a two-proportion z-test to see if there is evidence of greater support those taxpayers that had taken a tour of the current high school. State all assumptions needed to complete the test. Find a confidence interval. Interpret your results.
Support Two High Schools
Will Not Support Two High Schools
Total
Took a tour 494 194 688 Did not take a tour
125 74 199
Total 619 268 887 • Using the problem above, describe a Type I error and a Type II error in context of the
problem. Instructional Resources/Tools: • Textbook: Bock, Vellman, DeVeaux: Stats: Modeling the World, Pearson 2007 • Barron’s How To Prepare for the AP Statistics: Advanced Placement Exam
workbook, 1998 • College Board Professional Development AP Statistics Workshop Handbook, 2011-
2012 • TI-83 or TI-84 graphing calculators Cross Curricular Connections: • N/A
Depth of Knowledge (Section 5) DOK: 4
Board Approved 8-3-15
13
Curriculum: AP Statistics Curricular Unit: Statistical Inference Instructional Unit: F. Estimating population parameters and testing hypotheses
Standard Alignments (Section 2) College Board: APS.3.D; APS.4.A,B Knowledge: (MA) 3,6 CCSS: N/A NETS: 1c; 3b,d; 4c Performance: 1.6, 1.8, 3.5
Unit (Section 3)
Learning Targets: • Perform a one-sample t-test and matched pairs t-test, complete with
assumptions, statistical analysis, and interpretation • Perform a two-sample t-test, complete with assumptions, statistical analysis, and
interpretation • Create and interpret confidence intervals for one and two sample t-intervals Instructional Strategies: • Direct and explicit instruction • Guided and independent practice • Small group instruction/facilitation • Summarizing/synthesizing concepts • Student self-reflection • Teacher self-reflection • Class discussions • Activities:
• My Calculator Is Amazing – Students will create 90%, 95%, and 99% confidence intervals for one and two sample t-tests and matched pairs t-test using the TI-83/84 calculators
• I Am Thankful For My Calculator – Students will perform one and two sample t-tests using the TI-83/84 calculators
• Hand and Foot Again – Students will: • perform a two sample t-test • create a confidence interval to test statistical significance for a difference of
means between the sexes (not gender) using the TI-83/84 calculators
Board Approved 8-3-15
14
Assessments/Evaluations: • Formative:
• Direct teacher observations • Quizzes • Homework assignments – see pacing guide
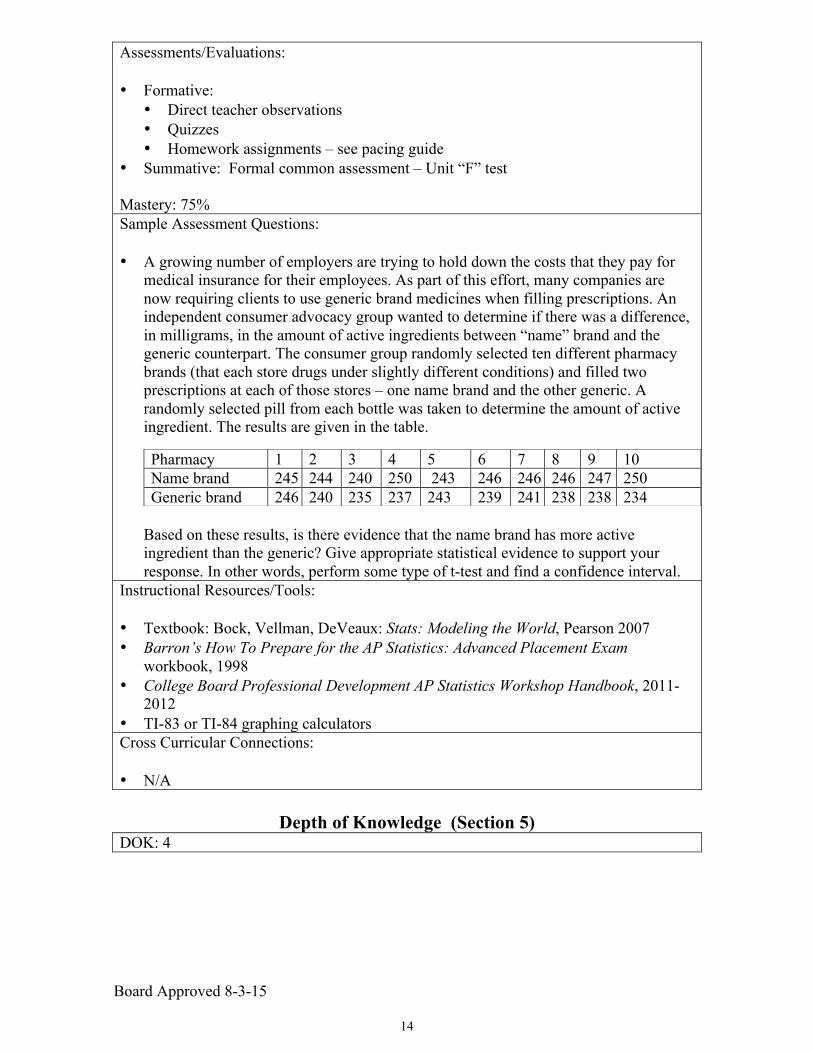
• Summative: Formal common assessment – Unit “F” test Mastery: 75% Sample Assessment Questions: • A growing number of employers are trying to hold down the costs that they pay for
medical insurance for their employees. As part of this effort, many companies are now requiring clients to use generic brand medicines when filling prescriptions. An independent consumer advocacy group wanted to determine if there was a difference, in milligrams, in the amount of active ingredients between “name” brand and the generic counterpart. The consumer group randomly selected ten different pharmacy brands (that each store drugs under slightly different conditions) and filled two prescriptions at each of those stores – one name brand and the other generic. A randomly selected pill from each bottle was taken to determine the amount of active ingredient. The results are given in the table.
Based on these results, is there evidence that the name brand has more active ingredient than the generic? Give appropriate statistical evidence to support your response. In other words, perform some type of t-test and find a confidence interval.
Pharmacy 1 2 3 4 5 6 7 8 9 10 Name brand 245 244 240 250 243 246 246 246 247 250 Generic brand 246 240 235 237 243 239 241 238 238 234
Instructional Resources/Tools: • Textbook: Bock, Vellman, DeVeaux: Stats: Modeling the World, Pearson 2007 • Barron’s How To Prepare for the AP Statistics: Advanced Placement Exam
workbook, 1998 • College Board Professional Development AP Statistics Workshop Handbook, 2011-
2012 • TI-83 or TI-84 graphing calculators Cross Curricular Connections: • N/A
Depth of Knowledge (Section 5) DOK: 4
Board Approved 8-3-15
15
Curriculum: AP Statistics Curricular Unit: Statistical Inference Instructional Unit: G. Estimating population parameters and testing hypotheses
Standard Alignments (Section 2) College Board: APS.3.D; APS.4.A,B Knowledge: (MA) 3,6 CCSS: N/A NETS: 1c; 4a,b; 4c Performance: 1.6, 1.8, 3.5
Unit (Section 3)
Learning Targets: • Perform a linear regression t-test for slope complete with assumptions, statistical
analysis and interpretation • Create and interpret a confidence interval for slope, intercept, and predicted value Instructional Strategies: • Direct and explicit instruction • Guided and independent practice • Small group instruction/facilitation • Summarizing/synthesizing concepts • Student self-reflection • Teacher self-reflection • Class discussions • Activities:
• My Calculator Is STILL Amazing – Students will create 90%, 95%, and 99% Confidence intervals for: • slope • y-intercept • predicted value using the TI-83/84 calculators
• I Am STILL Thankful For My Calculator – Students will perform a linear regression t-test for slope using the TI-83/84 calculators
• This Old Data Set from day one of the course – Students will: • perform a linear regression t-test for slope • create a confidence interval to test statistical significance [segregated by sex-
boys use boys’ data; girls use girls’ data] using the TI-83/84 calculators
Board Approved 8-3-15
16
Assessments/Evaluations: • Formative:
• Direct teacher observations • Quizzes • Homework assignments – see pacing guide
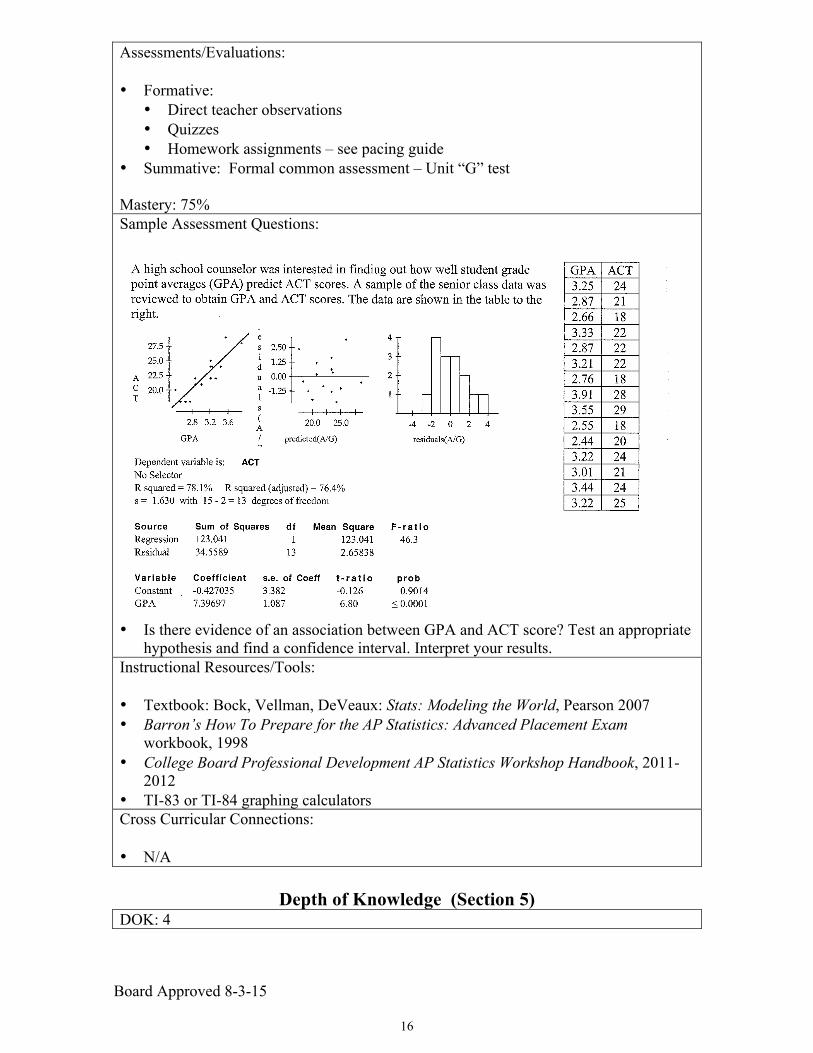
• Summative: Formal common assessment – Unit “G” test Mastery: 75% Sample Assessment Questions:
• Is there evidence of an association between GPA and ACT score? Test an appropriate
hypothesis and find a confidence interval. Interpret your results. Instructional Resources/Tools: • Textbook: Bock, Vellman, DeVeaux: Stats: Modeling the World, Pearson 2007 • Barron’s How To Prepare for the AP Statistics: Advanced Placement Exam
workbook, 1998 • College Board Professional Development AP Statistics Workshop Handbook, 2011-
2012 • TI-83 or TI-84 graphing calculators Cross Curricular Connections: • N/A
Depth of Knowledge (Section 5) DOK: 4
Board Approved 8-3-15
17
Curriculum: AP Statistics Curricular Unit: Anticipating Patterns Instructional Unit: H. Exploring random phenomena using probability and simulation
Standard Alignments (Section 2) College Board: APS.3.A Knowledge: (MA) 3,6 CCSS: N/A NETS: 1c; 3c,d; 4b Performance: 1.6, 1.8, 3.5
Unit (Section 3)
Learning Targets: • Make Venn and tree diagrams and compute probabilities from given information • Determine if events are independent; mutually exclusive • Use- probability rules, conditional probability (Baye’s Theorem), binomial
probabilities, law of large numbers • Create binomial and geometric probability distributions • Find means and standard deviations of probability models • Graph binomial distributions Instructional Strategies: • Direct and explicit instruction • Guided and independent practice • Small group instruction/facilitation • Summarizing/synthesizing concepts • Student self-reflection • Teacher self-reflection • Class discussions • Activities:
• Just Take It! – Students will take “fake” multiple choice and true/false tests and compare class results to theoretical binomial probabilities
• I’ve Lost My Marbles – Students will use BB’s in a plastic model to see the binomial formula in action with n=8 and p=1/2
• I’ve Found My Marbles – Website with Plinko simulations and The Quincunx • Missouri Lottery Simulation – “You Can’t Win if You Don’t Play” becomes
“You Will Lose if You Play” when students simulate the lottery
Board Approved 8-3-15
18
• Interactive Probability Applets: • Venn diagrams • Binomial functions with changing parameters • Law of large numbers (with coins and dice)
Assessments/Evaluations: • Formative:
• Direct teacher observations • Quizzes • Homework assignments – see pacing guide
• Summative: Formal common assessment – Unit “G” test Mastery: 75% Sample Assessment Questions: • When blood tests are given to detect the presence of disease, often times there are
“false positives” and “false negatives”. This occurs when a patient does not have the disease, but the test shows he does, or the patient has the disease, but the test shows he does not. Assume that 99.6% of a population does not have the disease, and the chance that if the disease is present, then there is a .5% of false negatives. However, if the disease is not present, then there is a .2% of false positives. A patient comes to the doctor’s office and is tested. For the following, draw a tree diagram and show all your formulas and work. Interpret your answers. A) What is the probability that he tests positive for the disease? B) What is the probability that if he indeed tested negative, that he does not have the
disease? • Many times, educators give multiple-choice questions and are under the mistaken
impression that because there are 4 choices, there is a one-in-four chance of passing the assessment. Assume that a 20 question multiple-choice test is given with 4 choices, and a student randomly guesses on every question. What is the probability that the student will pass (i.e., get 12 or more correct)? What is the expected number of questions a student who guesses randomly would get correct? Show your formulas, your work, and include some type of graph to help explain your answer.
Instructional Resources/Tools: • Textbook: Bock, Vellman, DeVeaux: Stats: Modeling the World, Pearson 2007 • Barron’s How To Prepare for the AP Statistics: Advanced Placement Exam
workbook, 1998 • College Board Professional Development AP Statistics Workshop Handbook, 2011-
2012 • TI-83 or TI-84 graphing calculators Cross Curricular Connections: • N/A
Depth of Knowledge (Section 5) DOK: 4


