Embed Size (px)
Citation preview
La Industria Alimentaria Animal de México 2021
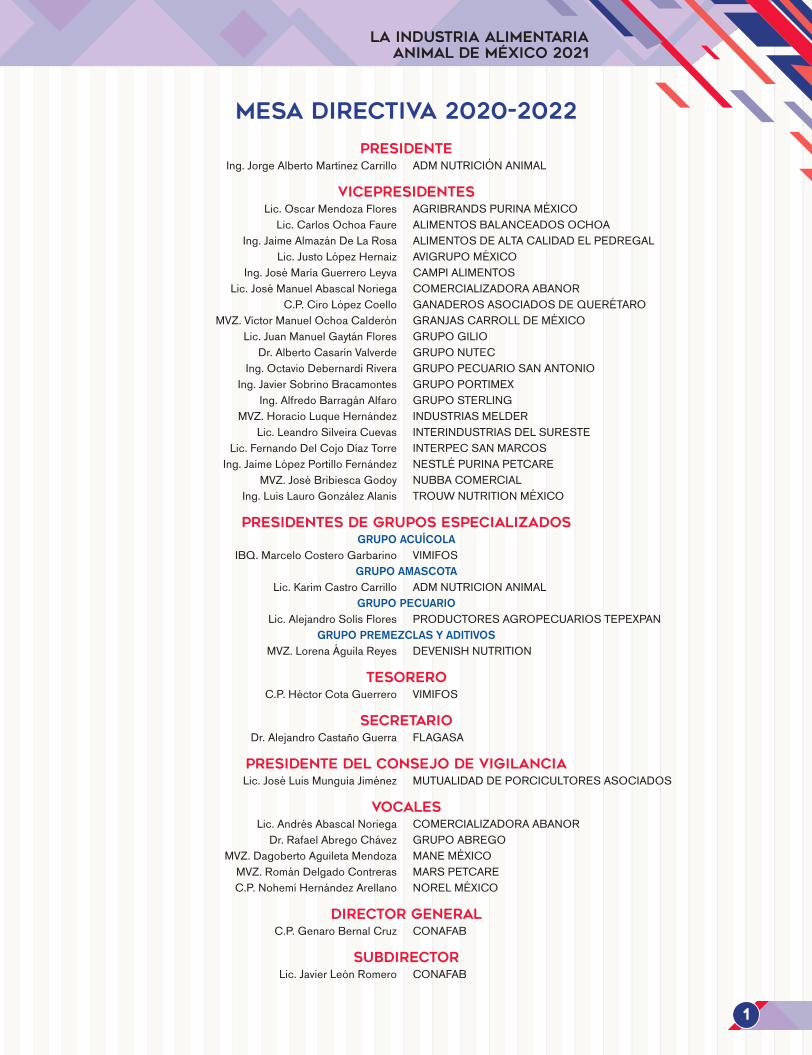
MESA DIRECTIVA 2020-2022
PRESIDENTE Ing.JorgeAlbertoMartínezCarrillo ADMNUTRICIÓNANIMAL
VICEPRESIDENTES Lic.OscarMendozaFlores AGRIBRANDSPURINAMÉXICO Lic.CarlosOchoaFaure ALIMENTOSBALANCEADOSOCHOA Ing.JaimeAlmazánDeLaRosa ALIMENTOSDEALTACALIDADELPEDREGAL Lic.JustoLópezHernaiz AVIGRUPOMÉXICO Ing.JoséMaríaGuerreroLeyva CAMPIALIMENTOS Lic.JoséManuelAbascalNoriega COMERCIALIZADORAABANOR C.P.CiroLópezCoello GANADEROSASOCIADOSDEQUERÉTARO MVZ.VíctorManuelOchoaCalderón GRANJASCARROLLDEMÉXICO Lic.JuanManuelGaytánFlores GRUPOGILIO Dr.AlbertoCasarínValverde GRUPONUTEC Ing.OctavioDebernardiRivera GRUPOPECUARIOSANANTONIO Ing.JavierSobrinoBracamontes GRUPOPORTIMEX Ing.AlfredoBarragánAlfaro GRUPOSTERLING MVZ.HoracioLuqueHernández INDUSTRIASMELDER Lic.LeandroSilveiraCuevas INTERINDUSTRIASDELSURESTE Lic.FernandoDelCojoDíazTorre INTERPECSANMARCOS Ing.JaimeLópezPortilloFernández NESTLÉPURINAPETCARE MVZ.JoséBribiescaGodoy NUBBACOMERCIAL Ing.LuisLauroGonzálezAlanis TROUWNUTRITIONMÉXICO
PRESIDENTES DE GRUPOS ESPECIALIZADOSGRUPO ACUÍCOLA
IBQ.MarceloCosteroGarbarino VIMIFOSGRUPO AMASCOTA
Lic.KarimCastroCarrillo ADMNUTRICIONANIMALGRUPO PECUARIO
Lic.AlejandroSolísFlores PRODUCTORESAGROPECUARIOSTEPEXPANGRUPO PREMEZCLAS Y ADITIVOS
MVZ.LorenaÁguilaReyes DEVENISHNUTRITION
TESORERO C.P.HéctorCotaGuerrero VIMIFOS
SECRETARIO Dr.AlejandroCastañoGuerra FLAGASA
PRESIDENTE DEL CONSEJO DE VIGILANCIA Lic.JoséLuisMunguíaJiménez MUTUALIDADDEPORCICULTORESASOCIADOS
VOCALES Lic.AndrésAbascalNoriega COMERCIALIZADORAABANOR Dr.RafaelAbregoChávez GRUPOABREGO MVZ.DagobertoAguiletaMendoza MANEMÉXICO MVZ.RománDelgadoContreras MARSPETCARE C.P.NohemíHernándezArellano NORELMÉXICO
DIRECTOR GENERAL C.P.GenaroBernalCruz CONAFAB
SUBDIRECTOR Lic.JavierLeónRomero CONAFAB
1
Prólogo / Foreword
Sobradecirquelacaídadelaeconomíamexicanaen2020notieneparenlahistoriareciente.Elimpactoenelingresodeloshogaressindudarepercute
directamenteenlamaneradecómosedestinaelgasto.Enestecontexto,parasorpresademuchos,elsectorprimariohamarcadolatendenciaacontracorrientedelrestodelaeconomíaycontinuócreciendoaunritmoimportantedel3.8%,deacuerdoconlascifrasdelINEGI.
PorloquerespectalaproduccióndealimentobalanceadoenMéxicoen2020,podemosafirmarquefueunmuybuenañoconuncrecimientodel3%envolumen,loquesignificóunaproducciónde37.6millonesdetoneladas.
Elsorprendentedesempeñoseexplicaenbuenamedidaporquetodoelsectorfueconsideradocomoesencialdentrodelasactividadeseconómicasynuncadetuvosusoperacionesduranteelconfinamientoporlapandemia.Apesardelascondicionesexcepcionalesquesepresentaron,semantuvolademandadeproteína.Unaexplicaciónrazonabletienequeverconqueloshogaresdejarondegastarendiversosbienesyserviciosporelconfinamiento,yconellosefavoreciólademandadealimentosengeneral.Lospreciosdelasprincipalesmateriasprimasen2020tuvieronenpromedioincrementosimportantes,porejemplo,elmaízamarillocon7.5%ylapastadesoyacon18.4%respectoalañoanterior.Poresemotivolaindustriarealizóajustesenlaformulaciónparamantenerlosperfilesnutricionalesyeficientargastosinternosparanoperderrentabilidad.
DeltotaldealimentobalanceadoproducidoenMéxicoen2020,casilamitadfuedestinadoalaaviculturacon10.6y7.3millonesdetoneladasparapollodeengordayhuevoparaplato,respectivamente.Enamboscasoselcrecimientosuperóel3%yconellocontribuyóalfavorabledesempeñodelaindustriaensuconjunto
N eedless to say, the drop of the Mexican economy in 2020 is unrivaled in recent history. The impact on household income certainly has had a direct impact
on the way money is spent. Surprisingly, in this context, the primary sector went counter-current to the rest of the economy and continued growing at a significant rate of 3.8%, as per INEGI figures.
Regarding feed production in Mexico in 2020, it was particularly a good year, with a 3% growth rate in volume, which resulted in 37.6 million MT.
The surprising performance is, to a large extent, because the entire sector was considered essential within economic activities and never halted operations during the pandemic lockdown. Despite these exceptional conditions, demand for protein was constant. A reasonable explanation is that households stopped spending on several goods and services through lockdown, thereby helping the demand for foods in general. Prices of the main raw materials in 2020 averaged significant increases, for example, 7.5% for yellow corn and 18.4% for soybean meal with respect to the previous year. That is why the industry made formulation adjustments to maintain nutritional profiles and to make in-house expenditures more efficient so as to be profitable.
Of the total feed manufactured in Mexico in 2020, almost half was destined to poultry, with 10.6 and 7.3 million MT for broilers and layers, respectively. In both cases, growth exceeded 3% and thus contributed to the favorable performance of the industry.
2
La Industria Alimentaria Animal de México 2021
Porsupartelaproduccióndealimentoparacerdo,sibientuvounincrementoimportantetambién,noalcanzólaexpectativaquesetenía.En2020seprodujeron6.1millonesdetoneladasdealimentoloquerepresentaunincrementodel3.5%respectodeañoanterior.Sinembargo,esecrecimientofuesólolamitaddeloquehabíacrecidounañoantes.Enlosrumiantesmayores,seregistróunincrementoenelvolumendealimentobalanceadodel3.6y2.9%paraganadodecarneyleche,respectivamente.
Elsectorconelmejordesempeñofueeldelosalimentosparamascotas,queregistróunincrementodel8%enelvolumenproducido,impulsadoporlamodificacióndehábitosenlapoblaciónenmediodelapandemia.Latenenciadeanimalesdecompañíafueunfenómenoquesedioenelmundoconmotivodelconfinamiento.Laindustriapudocapitalizaresaoportunidadaldemostrarlosbeneficiosdealimentaralasmascotasconalimentobalanceadoynoconsobrasocomidacasera.
Laproduccióndealimentoparapecesycamaróntuvounincrementodel3.5%que,sinserbajo,esmenoraloquehabíaregistradorecientemente.Esposiblequeenlosañosveniderosesterubroregistreimportantesincrementos,dadoslosproyectosdemariculturaquevanafianzándose.
Elaño2021presentómuchasparticularidades,confactoresquepodríanseradversosparalaindustriaalimentariaanimal,comolaescaladadepreciosinternacionalesdelasmateriasprimas,riesgosdeinflaciónyseñalesquenogeneranelmejorambienteparalosnegociosylainversión.Noobstante,vemosenestoselementosunbalancefavorableparalacadenadevalorensuconjuntoconoportunidadesimportantesenlosmercadosinternoyexterno.Estasoportunidadesarrojandatosparaafirmarquelaproduccióncreceráun3.4%,conincentivostalescomolaaperturacasitotaldelaeconomíaenlapospandemia,elfuerteimpulsodelaeconomíadeEstadosUnidosylosnivelesrécordderemesasconimpactodirectoenelgastodeloshogares,partedelcualsetraduceenunamayordemandadeproteínaanimal.
On the other hand, although swine feed production showed a significant increase, it did not reach the expectations. In 2020, 6.1 million MT of swine feeds were manufactured, a 3.5% increase over the previous year. However, growth rate was only half of that of a year earlier. In feeds for ruminants, there was an increase in volume of 3.6% and 2.9% for beef and dairy cattle, respectively.
The best performing sector was pet food, with an 8% increase in volume, driven by changing population habits amid the pandemic. Companion animal ownership was a phenomenon that occurred in the world on the grounds of lockdown. The industry was able to capitalize on that opportunity by demonstrating the benefits of feeding pets with manufactured feeds rather than leftovers or home-made food.
Feed production for fish and shrimp increased by 3.5%. Although considered a good rate, it was lower than that recently achieved. In the coming years, it is likely that aqua feed will significantly increase, given the mariculture projects that are being developed.
The year 2021 witnessed many particularities, with factors that could be adverse to the feed industry, such as the surge in international commodity prices, inflation risks and signals that do not create the best environment for business and investment. However, there is a favorable balance for the value chain, with significant opportunities in the domestic and foreign markets. These opportunities provide data to claim that feed production will grow by 3.4%, with incentives such as the near-total opening of the economy in the post-pandemic, the strong momentum of the U.S. economy, and record levels of remittances with direct impact on household spending, part of which results in an increased demand for animal protein.
Ing. JORGE ALBERTO MARTÍNEZ CARRILLO
PRESIDENTE / PRESIDENT
3
CONTENIDO / CONTENTS
Mesa Directiva 1 Board of Directors
Prólogo 2 Foreword
Contenido 4 Contents
Indicadores Económicos de la Industria de Alimentos Balanceados en México en 2021 7 Economic Indicators of the Mexican Feed Industry, 2021
Principales Países Productores de Alimentos Balanceados en el Mundo en 2020 8 Main Feed Producing Countries in the World, 2020
Producción de Alimentos Balanceados por especie en el Mundo en 2020 10 World Feed Production by Species, 2020
Producción de Alimentos Balanceados en América en 2020 12 Feed Production in the Americas, 2020
Producción Pecuaria y Alimento Balanceado en México en 2021 13 Livestock and Feed Production in Mexico, 2021
Producción Anual de Alimento Balanceado Integrado y Comercial en 2017-2021 14 Annual Feed Production of Integrators and Commercial Producers, 2017-2021
Producción Histórica de Alimento Balanceado Nacional en 2017-2021 16 Evolution of Domestic Feed Production, 2017-2021
Producción Histórica de Alimento Balanceado por Especie en 2017-2021 18 Evolution of Feed Production by Species, 2017-2021
Histórico de Producción de Alimentos Balanceados en 2017-2021 Plantas Integradas y Comerciales 19
Evolution of Feed Production, 2017-2021 — Integrators and Commercial Feed Mills
Producción de Alimentos Balanceados por Especie en 2021 Plantas Integradas y Comerciales 20
Feed Production by Species, 2021 — Integrators and Commercial Feed Mills
Producción de Alimentos Balanceados por Integrados en 2021 22 Feed Production by Integrators, 2021
4
La Industria Alimentaria Animal de México 2021
Histórico de Producción Por Plantas Integradas en 2017-2021 24 Evolution of Feed Production by Integrators, 2017-2021
Producción de Alimentos Balanceados por Comerciales en 2021 25 Feed Production by Commercial Feed Mills, 2021
Histórico de Producción por Plantas Comerciales en 2017-2021 28 Evolution of Feed Production by Commercial Feed Mills, 2017-2021
Histórico de Producción de Alimento para Aves de Engorda en 2017-2021 30 Evolution of Broiler Feed Production, 2017-2021
Histórico de Producción de Alimento para Aves de Postura en 2017-2021 31 Evolution of Layer Feed Production, 2017-2021
Histórico de Producción de Alimento para Cerdo en 2017-2021 32 Evolution of Swine Feed Production, 2017-2021
Histórico de Producción de Alimento Balanceado para Ganado de Engorda en 2017-2021 34 Evolution of Beef Cattle Feed Production, 2017-2021
Histórico de Producción de Alimento para Ganado Lechero en 2017-2021 36 Evolution of Dairy Cattle Feed Production, 2017-2021
Histórico de Producción de Alimento para Otras Especies en 2017-2021 38 Evolution of Feed Production for Other Species, 2017-2021
Participación Integrados y Comerciales 39 Integrator and Commercial Feed Mills Share
Consumo Nacional Aparente de Alimentos Balanceados 2017-2021 40 Apparent Domestic Feed Consumption, 2017-2021
Producción Pecuaria Nacional de 2017-2021 42 Domestic Livestock Production, 2017-2021
Producción Nacional de Huevo de 2017-2021 44 Domestic Egg Production, 2017-2021
Producción Nacional de Carne en Canal de Pollo de 2017-2021 46 Domestic Dressed Chicken Production, 2017-2021
Producción Nacional de Carne en Canal de Cerdo de 2017-2021 47 Domestic Pork Carcass Production, 2017-2021
Producción Nacional de Carne en Canal de Bovino de 2017-2021 50 Domestic Beef Carcass Production, 2017-2021
Producción Nacional de Leche de Bovino de 2017-2021 52 Domestic Milk Production, 2017-2021
Balanza de productos pecuarios de 2017-2020 54 Animal Products Balance, 2017-2020
5
Consumo Per Cápita de Productos Pecuarios de 2016-2020 55 Per Capita Consumption of Animal Products, 2016-2020
Principales Materias Primas Utilizadas por la Industria en 2020 56 Main Raw Materials Used by the Feed Industry in 2020
Importación Anual de la Industria de los Principales Insumos en 2016-2020 58 Annual Imports of the Major Ingredients for the Feed Industry, 2016-2020
Producción Nacional de Pasta de Soya en 2016-2020 60 Domestic Soybean Meal Production, 2016-2020
Estimación de Balance Producción — Consumo 2020 de Granos Forrajeros 62 Estimated Production Balance — Feed Grains Consumption, 2020
Precios de Insumos 2012-2021 63 Commodities Prices, 2012-2021
Costos de Producción de Pollo, Huevo y Cerdo 2013-2021 64 Production Costs of Chicken, Eggs and Pork, 2013-2021
Grupo Amascota 66 Amascota (Pet Food) Group
Grupo Acuícola 70 Aquafeed Group
Grupo Premezclas 73 Premixes Group
Demanda Estimada de Microingredientes 2021 76 Estimated Micro-ingredient Demand 2021
México: Aranceles Vigentes en 2021 con Socios Comerciales y el Resto del Mundo 77 Mexico: Tariffs in Force in 2021 with Trading Partners and the Rest of the World
Directorio de Empresas 78 Company Directory
Fuentes de Información 94 Sources
Agradecimientos 95 Acknowledgments
6
La Industria Alimentaria Animal de México 2021
Indicadores económicos de la industria de alimentos balanceados en México EN 2021*
Economic indicators of the Mexican feed industry, 2021
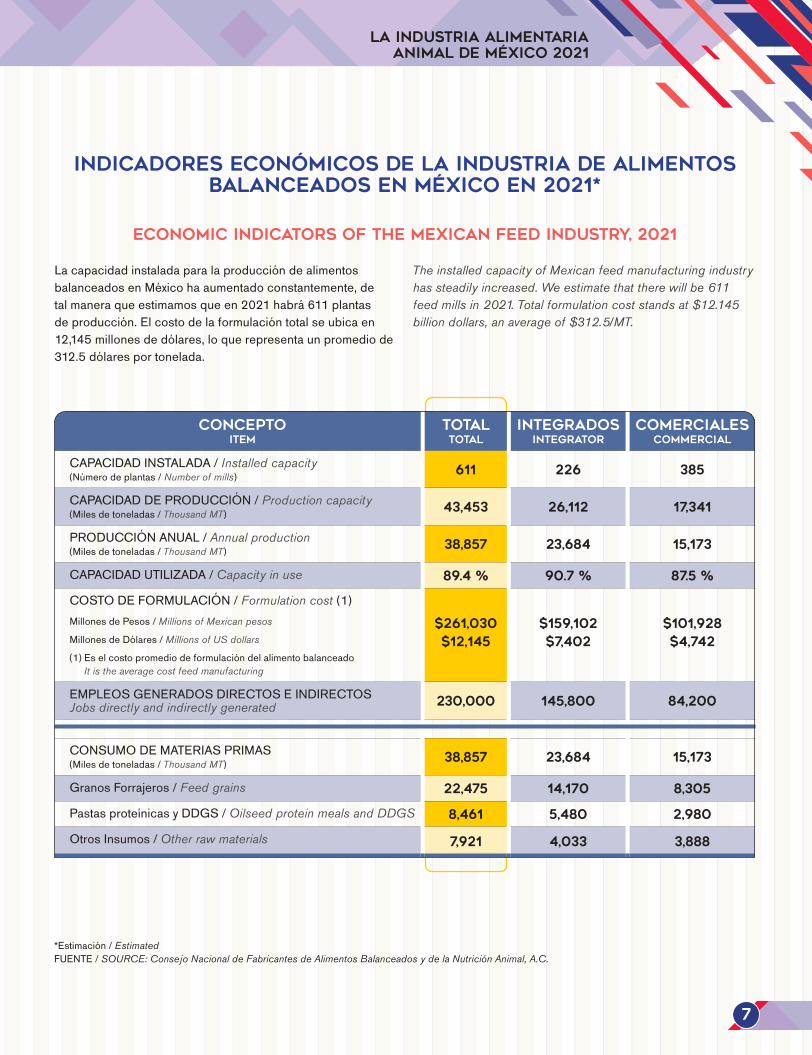
LacapacidadinstaladaparalaproduccióndealimentosbalanceadosenMéxicohaaumentadoconstantemente,detalmaneraqueestimamosqueen2021habrá611plantasdeproducción.Elcostodelaformulacióntotalseubicaen12,145millonesdedólares,loquerepresentaunpromediode312.5dólaresportonelada.
The installed capacity of Mexican feed manufacturing industry has steadily increased. We estimate that there will be 611 feed mills in 2021. Total formulation cost stands at $12.145 billion dollars, an average of $312.5/MT.
*Estimación/EstimatedFUENTE/SOURCE: Consejo Nacional de Fabricantes de Alimentos Balanceados y de la Nutrición Animal, A.C.
7
CONCEPTO ITEM
total TOTAL
INTEGRADOS IntegratOR
COMERCIALES Commercial
CAPACIDADINSTALADA/Installed capacity(Númerodeplantas/Number of mills) 611 226 385
CAPACIDADDEPRODUCCIÓN/Production capacity(Milesdetoneladas/Thousand MT) 43,453 26,112 17,341
PRODUCCIÓNANUAL/Annual production(Milesdetoneladas/Thousand MT) 38,857 23,684 15,173
CAPACIDADUTILIZADA/Capacity in use 89.4 % 90.7 % 87.5 %
COSTODEFORMULACIÓN/Formulation cost (1)MillonesdePesos/Millions of Mexican pesos $261,030 $159,102 $101,928MillonesdeDólares/Millions of US dollars $12,145 $7,402 $4,742(1)Eselcostopromediodeformulacióndelalimentobalanceado
It is the average cost feed manufacturing
EMPLEOSGENERADOSDIRECTOSEINDIRECTOSJobs directly and indirectly generated 230,000 145,800 84,200
CONSUMODEMATERIASPRIMAS(Milesdetoneladas/Thousand MT) 38,857 23,684 15,173
GranosForrajeros/Feed grains 22,475 14,170 8,305
PastasproteínicasyDDGS/Oilseed protein meals and DDGS 8,461 5,480 2,980
OtrosInsumos/Other raw materials 7,921 4,033 3,888
Main feed producing countries in the world, 2020*
*Preliminar/PreliminaryFUENTE/SOURCE: ConsejoNacionaldeFabricantesdeAlimentosBalanceadosydelaNutriciónAnimal,A.C.
condatosdel/with data from:2021AlltechGlobalFeedSurvey.
Principales países productores de alimentos balanceados en el mundo en 2020*
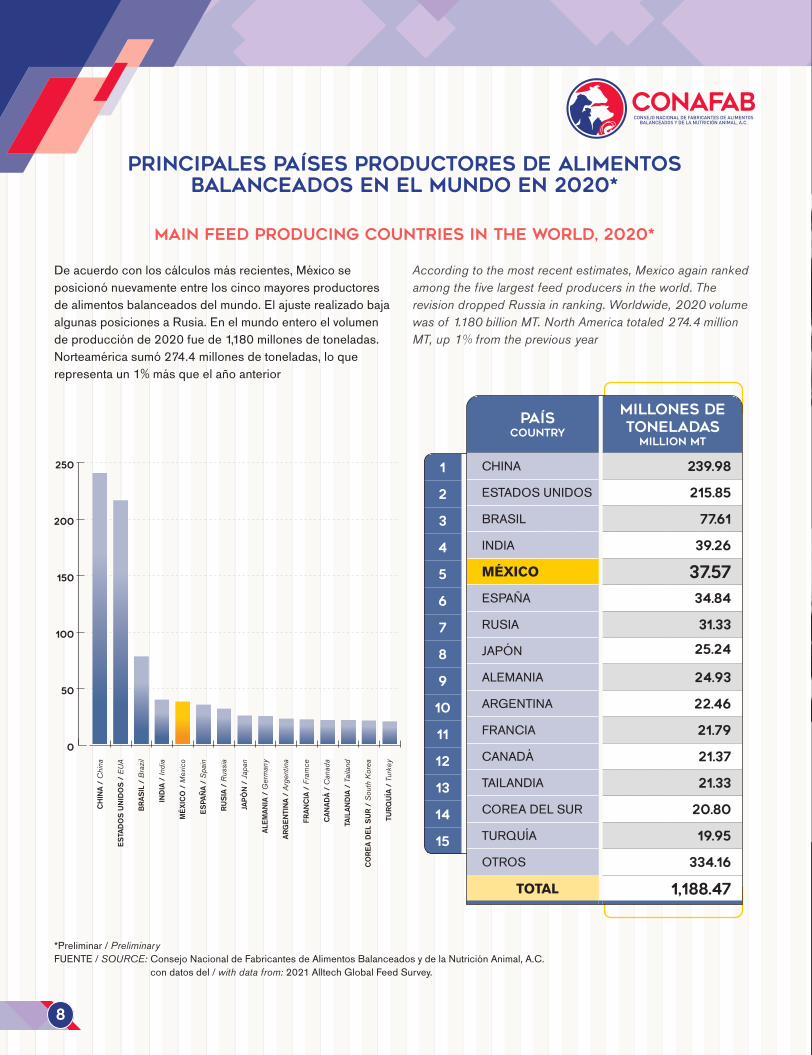
Deacuerdoconloscálculosmásrecientes,Méxicoseposicionónuevamenteentreloscincomayoresproductoresdealimentosbalanceadosdelmundo.ElajusterealizadobajaalgunasposicionesaRusia.Enelmundoenteroelvolumendeproducciónde2020fuede1,180millonesdetoneladas.Norteaméricasumó274.4millonesdetoneladas,loquerepresentaun1%másqueelañoanterior
According to the most recent estimates, Mexico again ranked among the five largest feed producers in the world. The revision dropped Russia in ranking. Worldwide, 2020 volume was of 1.180 billion MT. North America totaled 274.4 million MT, up 1% from the previous year
8
1
2
3
4
5
6
7
8
9
10
11
12
13
14
15
PAÍS COUntry
MILLONES DE TONELADAS
MilLion MT
CHINA 239.98
ESTADOSUNIDOS 215.85
BRASIL 77.61
INDIA 39.26
MÉXICO 37.57ESPAÑA 34.84
RUSIA 31.33
JAPÓN 25.24
ALEMANIA 24.93
ARGENTINA 22.46
FRANCIA 21.79
CANADÁ 21.37
TAILANDIA 21.33
COREADELSUR 20.80
TURQUÍA 19.95
OTROS 334.16
TOTAL 1,188.47
CH
INA
/ C
hina
ESTA
DOS
UNID
OS
/ EU
A
BRAS
IL /
Bra
zil
INDI
A /
Indi
a
MÉX
ICO
/ M
exic
o
ESPA
ÑA /
Spa
in
RUSI
A /
Rus
sia
JAPÓ
N /
Japa
n
ALEM
ANIA
/ G
erm
any
ARG
ENTI
NA /
Arg
entin
a
FRA
NCIA
/ F
ram
ce
CAN
ADÁ
/ C
anad
a
TAIL
ANDI
A /
Taila
nd
CO
REA
DEL
SUR
/ So
uth
Kore
a
TURQ
UÍA
/ Tu
rkey
0
50
100
150
200
250
World feed production by species, 2020*
Producción de alimentos balanceados por especie en el mundo en 2020*
*Preliminar/PreliminaryFUENTE/SOURCE: ConsejoNacionaldeFabricantesdeAlimentosBalanceadosydelaNutriciónAnimal,A.C.,
condatosdel/with data from:2021AlltechGlobalFeedSurvey.
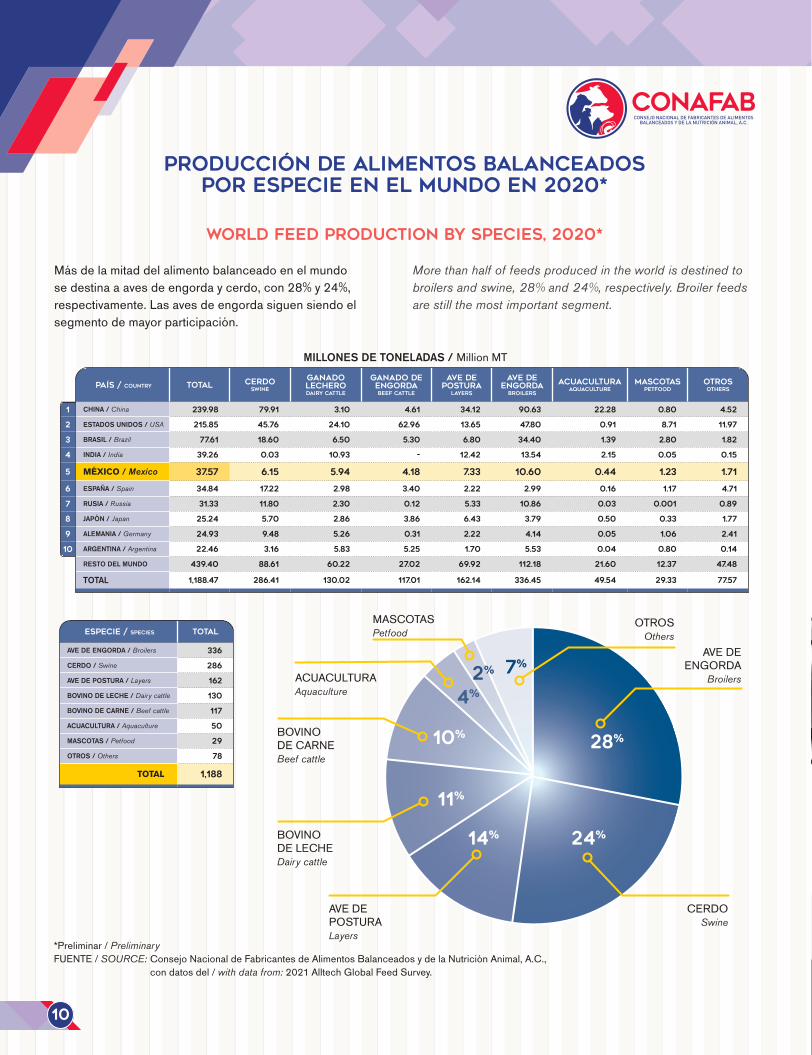
Másdelamitaddelalimentobalanceadoenelmundosedestinaaavesdeengordaycerdo,con28%y24%,respectivamente.Lasavesdeengordasiguensiendoelsegmentodemayorparticipación.
More than half of feeds produced in the world is destined to broilers and swine, 28% and 24%, respectively. Broiler feeds are still the most important segment.
10
1
2
3
4
5
6
7
8
9
10
PAÍS / COUntry TOTAL CERDOSwine
GANADO LECHEROdairy cattle
GANADO DE ENGORDAbeEf cattle
AVE DE POSTURA
layers
AVE DE ENGORDA
broilers
ACUACULTURAaquaculture
MASCOTASpetFOOD
OTROSothers
CHINA / China 239.98 79.91 3.10 4.61 34.12 90.63 22.28 0.80 4.52
ESTADOS UNIDOS / USA 215.85 45.76 24.10 62.96 13.65 47.80 0.91 8.71 11.97
BRASIL / Brazil 77.61 18.60 6.50 5.30 6.80 34.40 1.39 2.80 1.82
INDIA / India 39.26 0.03 10.93 - 12.42 13.54 2.15 0.05 0.15
MÉXICO /Mexico 37.57 6.15 5.94 4.18 7.33 10.60 0.44 1.23 1.71
ESPAÑA / Spain 34.84 17.22 2.98 3.40 2.22 2.99 0.16 1.17 4.71
RUSIA / Russia 31.33 11.80 2.30 0.12 5.33 10.86 0.03 0.001 0.89
JAPÓN / Japan 25.24 5.70 2.86 3.86 6.43 3.79 0.50 0.33 1.77
ALEMANIA / Germany 24.93 9.48 5.26 0.31 2.22 4.14 0.05 1.06 2.41
ARGENTINA / Argentina 22.46 3.16 5.83 5.25 1.70 5.53 0.04 0.80 0.14
RESTO DEL MUNDO 439.40 88.61 60.22 27.02 69.92 112.18 21.60 12.37 47.48
TOTAL 1,188.47 286.41 130.02 117.01 162.14 336.45 49.54 29.33 77.57
ESPECIE / SPECIES TOTAL
AVE DE ENGORDA / Broilers 336
CERDO / Swine 286
AVE DE POSTURA / Layers 162
BOVINO DE LECHE / Dairy cattle 130
BOVINO DE CARNE / Beef cattle 117
ACUACULTURA / Aquaculture 50
MASCOTAS / Petfood 29
OTROS / Others 78
TOTAL 1,188
AVEDEENGORDA
Broilers
OTROSOthers
BOVINODECARNEBeef cattle
ACUACULTURAAquaculture
MASCOTASPetfood
AVEDEPOSTURALayers
BOVINODELECHEDairy cattle
CERDOSwine
28%
24%14%
11%
10%
4%
2% 7%
MILLONES DE TONELADAS / MillionMT
Feed production in the Americas, 2020*
Producción de alimentos balanceados en América en 2020*
*Preliminar/PreliminaryFUENTE/SOURCE: ConsejoNacionaldeFabricantesdeAlimentosBalanceadosydelaNutriciónAnimal,A.C.
condatosdel/with data from:2021AlltechGlobalFeedSurvey.
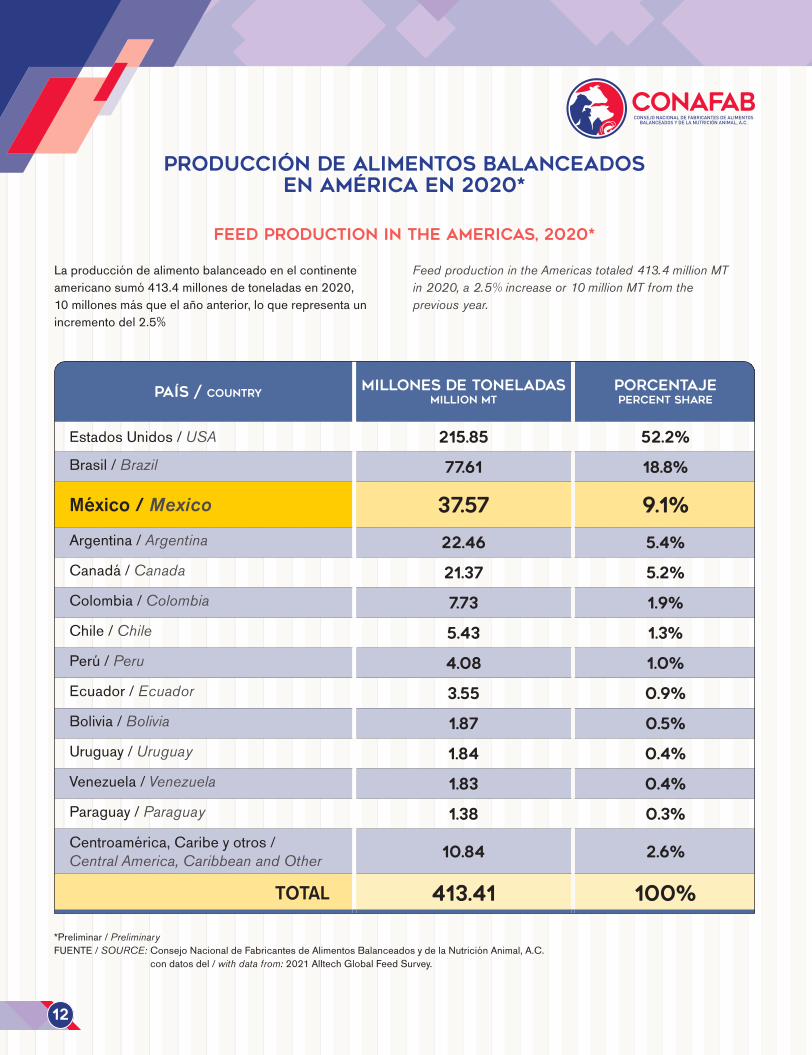
Laproduccióndealimentobalanceadoenelcontinenteamericanosumó413.4millonesdetoneladasen2020,10millonesmásqueelañoanterior,loquerepresentaunincrementodel2.5%
Feed production in the Americas totaled 413.4 million MT in 2020, a 2.5% increase or 10 million MT from the previous year.
12
PAÍS / COUNTRYMILLONES DE TONELADAS
MILLION MTPORCENTAJE PERCENT SHARE
EstadosUnidos/USA 215.85 52.2%
Brasil/Brazil 77.61 18.8%
México /Mexico 37.57 9.1%
Argentina/Argentina 22.46 5.4%
Canadá/Canada 21.37 5.2%
Colombia/Colombia 7.73 1.9%
Chile/Chile 5.43 1.3%
Perú/Peru 4.08 1.0%
Ecuador/Ecuador 3.55 0.9%
Bolivia/Bolivia 1.87 0.5%
Uruguay/Uruguay 1.84 0.4%
Venezuela/Venezuela 1.83 0.4%
Paraguay/Paraguay 1.38 0.3%
Centroamérica,Caribeyotros/Central America, Caribbean and Other 10.84 2.6%
TOTAL 413.41 100%
La Industria Alimentaria Animal de México 2021
LIVESTOCK and feed production in Mexico, 2021*
Producción pecuaria y alimento balanceado en México en 2021*
(1)Millonesdelitros/Million liters(2)Correspondeacamarónypeces/Shrimp & fish only(3)Eslaproducciónnacionaldealimentobalanceadoparaperrosygatos,sinincluirimportaciones/Domestic dog & cat food, imports not included(4)Incluye:Alimentoparacaballos,conejos,gallos,ovejas,caprinos,etc./Includes feeds for horses, rabbits, fighting cocks, sheep, goats, etc.
*Preliminar/PreliminaryFUENTE/SOURCE: ConsejoNacionaldeFabricantesdeAlimentosBalanceadosydelaNutriciónAnimal,A.C.
condatosde/with data from:UNAySIAP-SADER
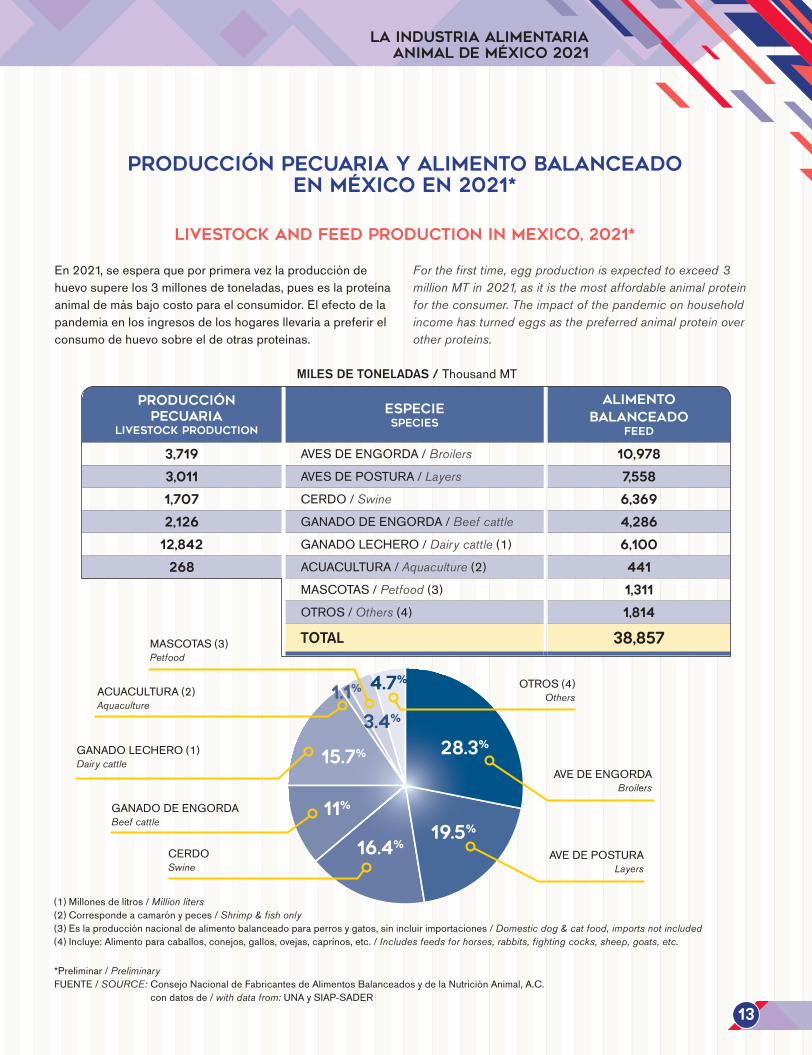
En2021,seesperaqueporprimeravezlaproduccióndehuevosuperelos3millonesdetoneladas,pueseslaproteínaanimaldemásbajocostoparaelconsumidor.Elefectodelapandemiaenlosingresosdeloshogaresllevaríaapreferirelconsumodehuevosobreeldeotrasproteínas.
For the first time, egg production is expected to exceed 3 million MT in 2021, as it is the most affordable animal protein for the consumer. The impact of the pandemic on household income has turned eggs as the preferred animal protein over other proteins.
13
PRODUCCIÓN PECUARIA
LIVESTOCK PRODUCTION
ESPECIE SPECIES
ALIMENTO BALANCEADO
FEED
3,719 AVESDEENGORDA/Broilers 10,978
3,011 AVESDEPOSTURA/Layers 7,558
1,707 CERDO/Swine 6,369
2,126 GANADODEENGORDA/Beef cattle 4,286
12,842 GANADOLECHERO/Dairy cattle (1) 6,100
268 ACUACULTURA/Aquaculture (2) 441
MASCOTAS/Petfood (3) 1,311
OTROS/Others (4) 1,814
TOTAL 38,857
AVEDEENGORDABroilers
OTROS(4)Others
GANADODEENGORDABeef cattle
ACUACULTURA(2)Aquaculture
MASCOTAS(3)Petfood
AVEDEPOSTURALayers
GANADOLECHERO(1)Dairy cattle
CERDOSwine
28.3%
19.5%
16.4%
11%
15.7%
1.1%
3.4%
4.7%
MILES DE TONELADAS / ThousandMT
Annual feed production of integrators & commercial producers, 2017-2021*
Producción anual de alimento balanceado integrado y comercial en 2017-2021*
1)Incluyealimentoparacamarónypeces/Includes shrimp & fish feed2)Incluyealimentoparaperrosygatos/Includes dog & cat food3)Incluyealimentoparacaballos,conejos,gallos,ovejas,caprinos,etc./Includes feeds for horses, rabbits, fighting cocks, sheep, goats, etc.
* 2020Preliminar/ Preliminary,2021Estimado/EstimatedFUENTE/SOURCE: ConsejoNacionaldeFabricantesdeAlimentosBalanceadosydelaNutriciónAnimal,A.C.
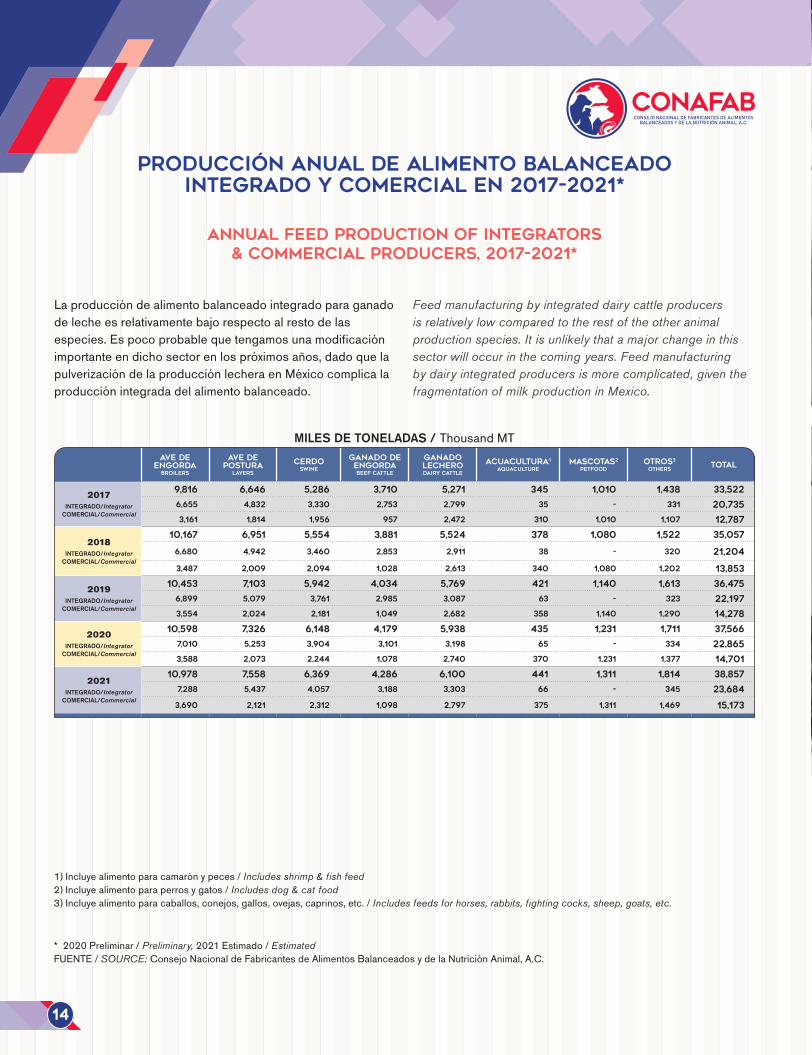
Laproduccióndealimentobalanceadointegradoparaganadodelecheesrelativamentebajorespectoalrestodelasespecies.Espocoprobablequetengamosunamodificaciónimportanteendichosectorenlospróximosaños,dadoquelapulverizacióndelaproducciónlecheraenMéxicocomplicalaproducciónintegradadelalimentobalanceado.
Feed manufacturing by integrated dairy cattle producers is relatively low compared to the rest of the other animal production species. It is unlikely that a major change in this sector will occur in the coming years. Feed manufacturing by dairy integrated producers is more complicated, given the fragmentation of milk production in Mexico.
14
AVE DE ENGORDA
broilers
AVE DE POSTURA
layers
CERDOSwine
GANADO DE ENGORDAbeEf cattle
GANADO LECHEROdairy cattle
ACUACULTURA1
aquacultureMASCOTAS2
petFOODOTROS3
othersTOTAL
2017INTEGRADO/Integrator
COMERCIAL/Commercial
9,816 6,646 5,286 3,710 5,271 345 1,010 1,438 33,522
6,655 4,832 3,330 2,753 2,799 35 - 331 20,735
3,161 1,814 1,956 957 2,472 310 1,010 1,107 12,787
2018INTEGRADO/Integrator
COMERCIAL/Commercial
10,167 6,951 5,554 3,881 5,524 378 1,080 1,522 35,057
6,680 4,942 3,460 2,853 2,911 38 - 320 21,204
3,487 2,009 2,094 1,028 2,613 340 1,080 1,202 13,853
2019INTEGRADO/Integrator
COMERCIAL/Commercial
10,453 7,103 5,942 4,034 5,769 421 1,140 1,613 36,475
6,899 5,079 3,761 2,985 3,087 63 - 323 22,197
3,554 2,024 2,181 1,049 2,682 358 1,140 1,290 14,278
2020INTEGRADO/Integrator
COMERCIAL/Commercial
10,598 7,326 6,148 4,179 5,938 435 1,231 1,711 37,566
7,010 5,253 3,904 3,101 3,198 65 - 334 22,865
3,588 2,073 2,244 1,078 2,740 370 1,231 1,377 14,701
2021INTEGRADO/Integrator
COMERCIAL/Commercial
10,978 7,558 6,369 4,286 6,100 441 1,311 1,814 38,857
7,288 5,437 4,057 3,188 3,303 66 - 345 23,684
3,690 2,121 2,312 1,098 2,797 375 1,311 1,469 15,173
MILES DE TONELADAS / ThousandMT
Para más información, visite www.diamondv.com
Nuestros productos comprobados con investigación y nuestra experiencia son el resultado de más de 75 años de ciencia y tecnología innovadora yexperiencia en campo.
Estamos dedicados a ayudar a nuestros clientes a tener éxito:• Proporcionando productos naturales* y de apoyo immune que optimizan la salud
y el desempeño animal y la inocuidad alimentaria.• Transfiriendo el conocimiento basado en la ciencia para lograr soluciones
rentables y sostenibles.• Desarrollando relaciones que resulten en sociedades confiables y duraderas.
Circuito Balvanera # 5-A | Fracc. Industrial Balvanera | Corregidora, Qro | C.P. 76900 México Phone: +52 442 183 7160 | FAX: +52 442 183 7163* Natural como lo define la Asociación Ameriana de Oficiales para el Control de Alimentos (AAFCO)
evolution OF Domestic feed production, 2017-2021*
* 2020Preliminar/Preliminary, 2021 Estimado / EstimatedFUENTE/SOURCE: ConsejoNacionaldeFabricantesdeAlimentosBalanceadosydelaNutriciónAnimal,A.C.
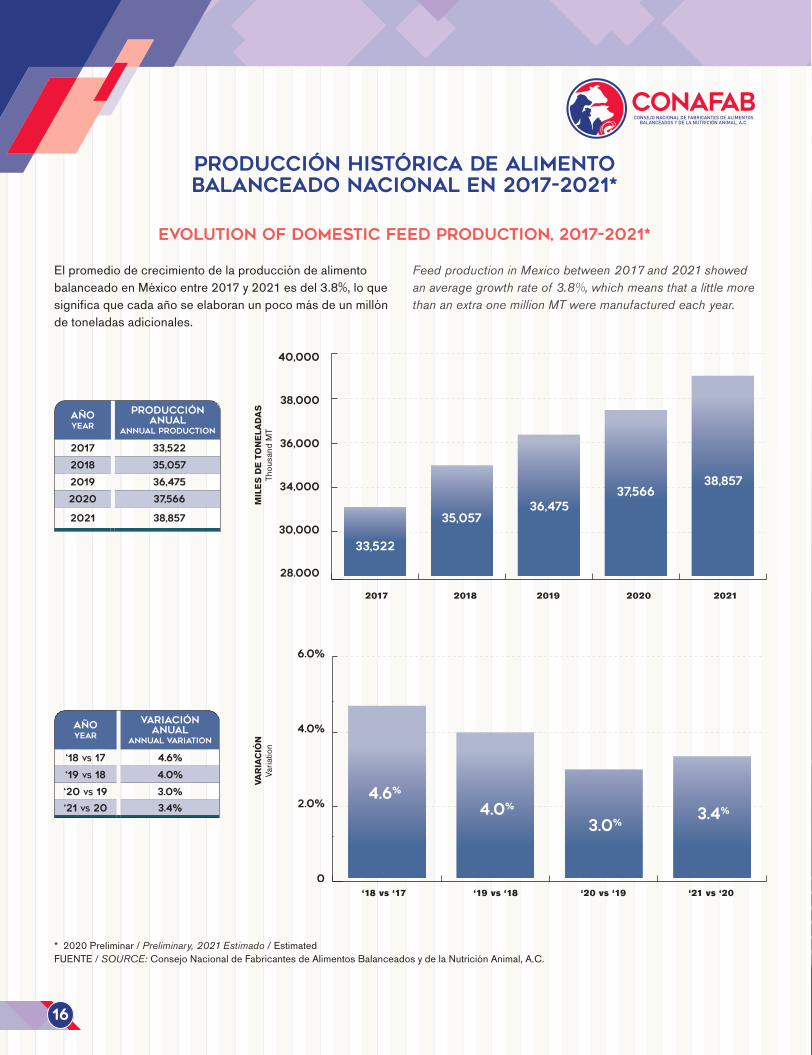
ElpromediodecrecimientodelaproduccióndealimentobalanceadoenMéxicoentre2017y2021esdel3.8%,loquesignificaquecadaañoseelaboranunpocomásdeunmillóndetoneladasadicionales.
Feed production in Mexico between 2017 and 2021 showed an average growth rate of 3.8%, which means that a little more than an extra one million MT were manufactured each year.
Producción histórica de alimento balanceado nacional en 2017-2021*
16
2017 2018 2019 2020 2021
‘18vs‘17 ‘19vs‘18 ‘20vs‘19 ‘21vs‘20
MIL
ES D
E TO
NEL
ADAS
Thou
sand
MT
VAR
IAC
IÓN
Varia
tion
AÑOYEAR
PRODUCCIÓN Anual
ANNUAL PRODUCTION
2017 33,522
2018 35,057
2019 36,475
2020 37,566
2021 38,857
AÑOYEAR
VARIACIÓN Anual
ANNUAL VARIATION
‘18 vs 17 4.6%
‘19 vs 18 4.0%
‘20 vs 19 3.0%
‘21 vs 20 3.4%
33,522
35,05736,475
37,56638,857
4.6%
4.0%
3.0%3.4%
2017 2018 2019 2020 2021
‘18vs‘17 ‘19vs‘18 ‘20vs‘19 ‘21vs‘20
evolution OF Feed production by species, 2017-2021*
Producción histórica de alimento balanceado por especie en 2017-2021*
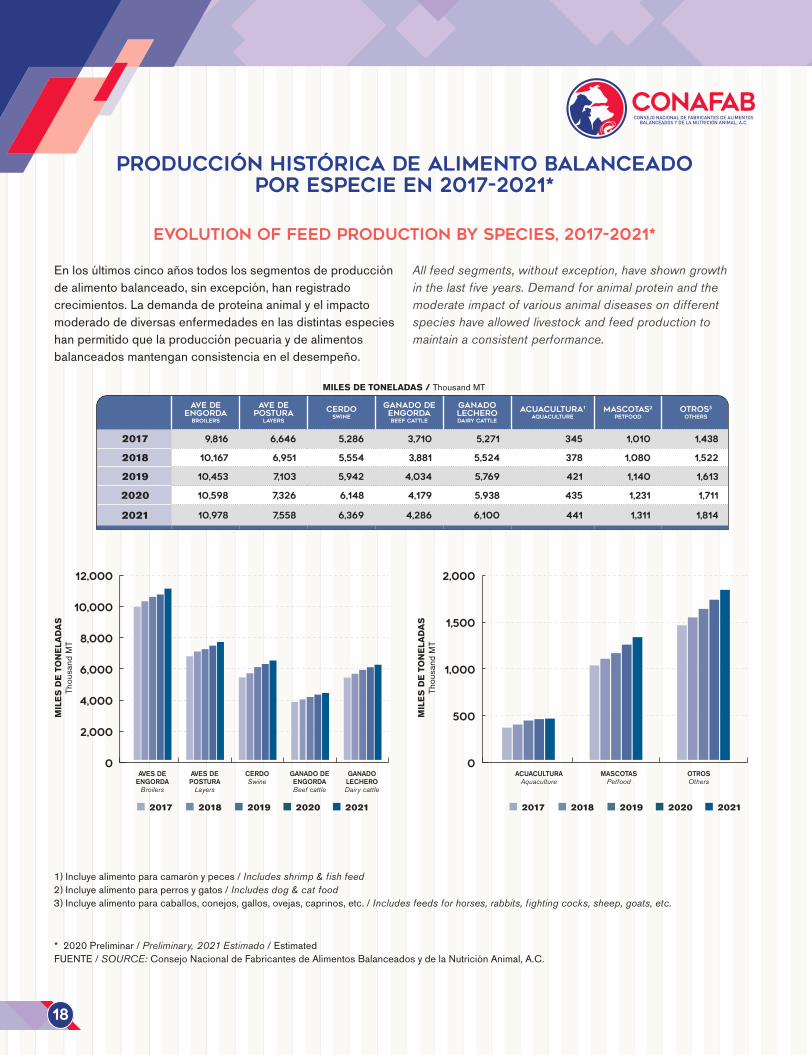
Enlosúltimoscincoañostodoslossegmentosdeproduccióndealimentobalanceado,sinexcepción,hanregistradocrecimientos.Lademandadeproteínaanimalyelimpactomoderadodediversasenfermedadesenlasdistintasespecieshanpermitidoquelaproducciónpecuariaydealimentosbalanceadosmantenganconsistenciaeneldesempeño.
All feed segments, without exception, have shown growth in the last five years. Demand for animal protein and the moderate impact of various animal diseases on different species have allowed livestock and feed production to maintain a consistent performance.
1)Incluyealimentoparacamarónypeces/Includes shrimp & fish feed2)Incluyealimentoparaperrosygatos/Includes dog & cat food3)Incluyealimentoparacaballos,conejos,gallos,ovejas,caprinos,etc./Includes feeds for horses, rabbits, fighting cocks, sheep, goats, etc.
* 2020Preliminar/Preliminary, 2021 Estimado / EstimatedFUENTE/SOURCE: ConsejoNacionaldeFabricantesdeAlimentosBalanceadosydelaNutriciónAnimal,A.C.
18
AVE DE ENGORDA
broilers
AVE DE POSTURA
layers
CERDOSwine
GANADO DE ENGORDAbeEf cattle
GANADO LECHEROdairy cattle
ACUACULTURA1
aquacultureMASCOTAS2
petFOODOTROS3
others
2017 9,816 6,646 5,286 3,710 5,271 345 1,010 1,438
2018 10,167 6,951 5,554 3,881 5,524 378 1,080 1,522
2019 10,453 7,103 5,942 4,034 5,769 421 1,140 1,613
2020 10,598 7,326 6,148 4,179 5,938 435 1,231 1,711
2021 10,978 7,558 6,369 4,286 6,100 441 1,311 1,814
0
2,000
4,000
6,000
8,000
10,000
12,000
0
500
1,000
1,500
2,000
2017 2018 2019 2020 2021 2017 2018 2019 2020 2021
AVES DE ENGORDA
Broilers
AVES DE POSTURA
Layers
CERDO Swine
GANADO DE ENGORDA Beef cattle
GANADO LECHERO Dairy cattle
ACUACULTURAAquaculture
MASCOTAS Petfood
OTROS Others
MIL
ES D
E TO
NEL
ADAS
Thou
sand
MT
MIL
ES D
E TO
NEL
ADAS
Thou
sand
MT
MILES DE TONELADAS / ThousandMT
La Industria Alimentaria Animal de México 2021
evolution OF Feed production, 2017-2021* Integrator & commercial feed mills
Histórico de producción de alimentos balanceados en 2017-2021* - Plantas integradas y comerciales
* 2020Preliminar/Preliminary, 2021 Estimado / EstimatedFUENTE/SOURCE: Consejo Nacional de Fabricantes de Alimentos Balanceados y de la Nutrición Animal, A.C.
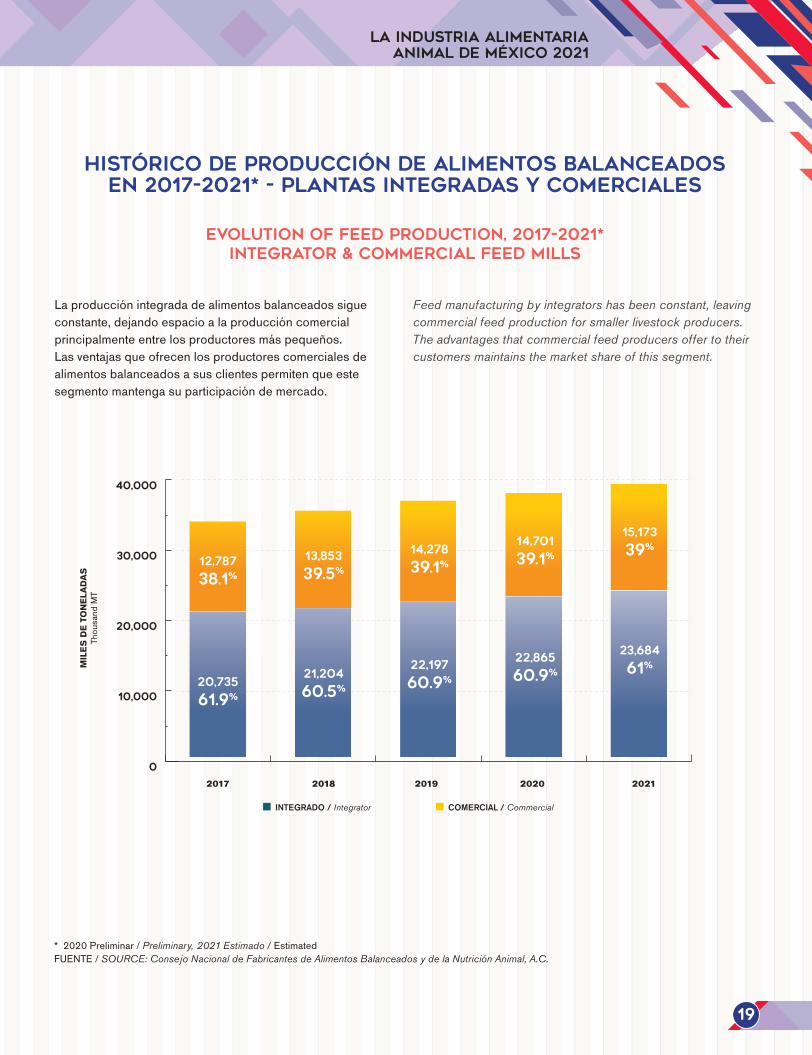
Laproducciónintegradadealimentosbalanceadossigueconstante,dejandoespacioalaproduccióncomercialprincipalmenteentrelosproductoresmáspequeños.Lasventajasqueofrecenlosproductorescomercialesdealimentosbalanceadosasusclientespermitenqueestesegmentomantengasuparticipacióndemercado.
Feed manufacturing by integrators has been constant, leaving commercial feed production for smaller livestock producers. The advantages that commercial feed producers offer to their customers maintains the market share of this segment.
19
0
10,000
20,000
30,000
40,000
2017 2018 2019 2020 2021
20,735
61.9%
21,204
60.5%
22,197
60.9%
22,865
60.9%
23,684
61%
12,787
38.1%
13,853
39.5%
14,278
39.1%
14,701
39.1%
15,173
39%
INTEGRADO / Integrator COMERCIAL / Commercial
MIL
ES D
E TO
NEL
ADAS
Thou
sand
MT
Feed production by species, 2021* Integrator & commercial feed mills
Producción de alimentos balanceados por especie en 2021* - Plantas integradas y comerciales
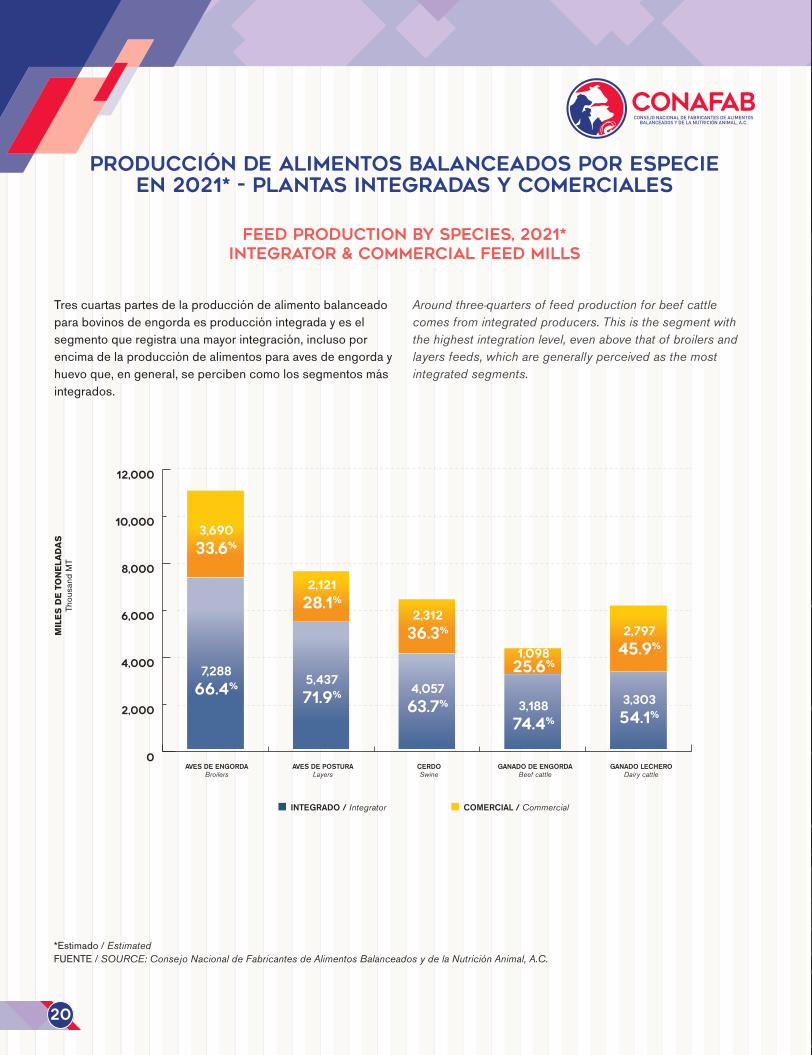
Trescuartaspartesdelaproduccióndealimentobalanceadoparabovinosdeengordaesproducciónintegradayeselsegmentoqueregistraunamayorintegración,inclusoporencimadelaproduccióndealimentosparaavesdeengordayhuevoque,engeneral,sepercibencomolossegmentosmásintegrados.
Around three-quarters of feed production for beef cattle comes from integrated producers. This is the segment with the highest integration level, even above that of broilers and layers feeds, which are generally perceived as the most integrated segments.
*Estimado/EstimatedFUENTE/SOURCE: Consejo Nacional de Fabricantes de Alimentos Balanceados y de la Nutrición Animal, A.C.
20
0
2,000
4,000
6,000
8,000
10,000
12,000
7,288
66.4%5,437
71.9% 4,057
63.7% 3,188
74.4%
3,303
54.1%
3,690
33.6%
2,121
28.1%
2,312
36.3%
1,09825.6%
2,797
45.9%
INTEGRADO / Integrator COMERCIAL / Commercial
AVES DE ENGORDA Broilers
AVES DE POSTURA Layers
CERDO Swine
GANADO DE ENGORDA Beef cattle
GANADO LECHERO Dairy cattle
MIL
ES D
E TO
NEL
ADAS
Thou
sand
MT
Feed production by integrators, 2021*
Producción de alimentos balanceados por integrados en 2021*
*Estimado/EstimatedFUENTE/SOURCE: Consejo Nacional de Fabricantes de Alimentos Balanceados y de la Nutrición Animal, A.C.
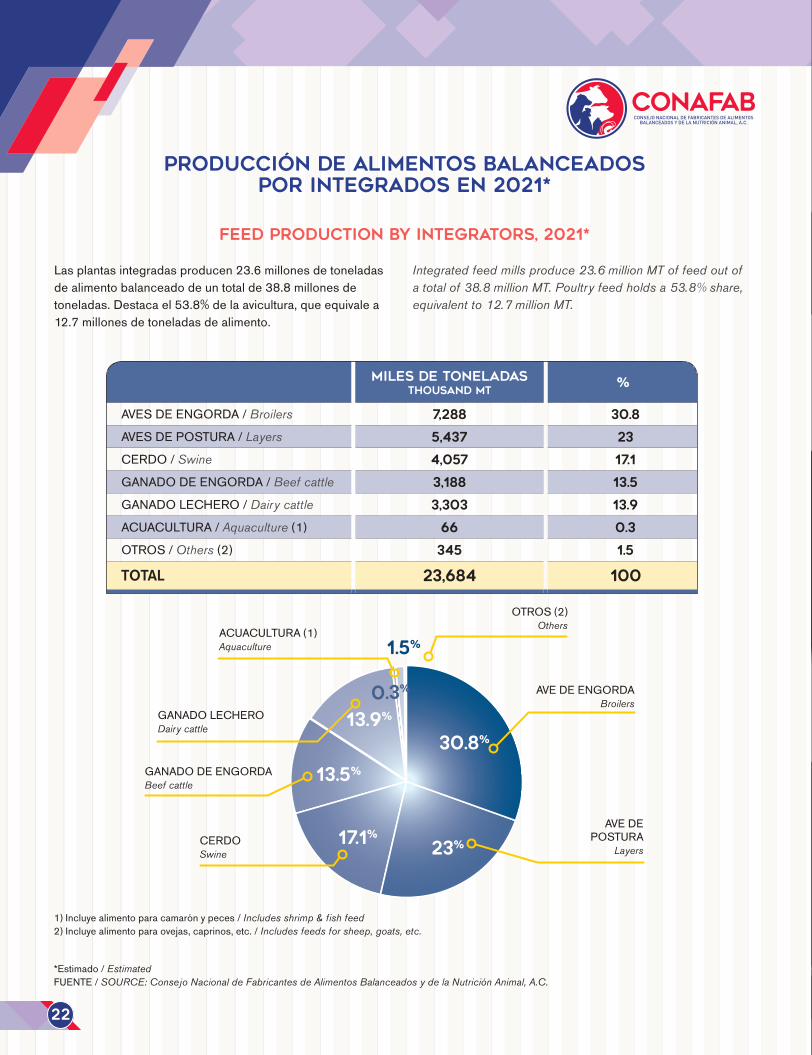
Lasplantasintegradasproducen23.6millonesdetoneladasdealimentobalanceadodeuntotalde38.8millonesdetoneladas.Destacael53.8%delaavicultura,queequivalea12.7millonesdetoneladasdealimento.
Integrated feed mills produce 23.6 million MT of feed out of a total of 38.8 million MT. Poultry feed holds a 53.8% share, equivalent to 12.7 million MT.
1)Incluyealimentoparacamarónypeces/Includes shrimp & fish feed2)Incluyealimentoparaovejas,caprinos,etc./Includes feeds for sheep, goats, etc.
22
MILES DE TONELADASThousand MT
%
AVESDEENGORDA/Broilers 7,288 30.8
AVESDEPOSTURA/Layers 5,437 23
CERDO/Swine 4,057 17.1
GANADODEENGORDA/Beef cattle 3,188 13.5
GANADOLECHERO/Dairy cattle 3,303 13.9
ACUACULTURA/Aquaculture (1) 66 0.3
OTROS/Others (2) 345 1.5
TOTAL 23,684 100
AVEDEENGORDABroilers
OTROS(2)Others
GANADODEENGORDABeef cattle
ACUACULTURA(1)Aquaculture
AVEDEPOSTURA
Layers
GANADOLECHERODairy cattle
CERDOSwine
30.8%
23%17.1%
13.5%
13.9%
0.3%
1.5%

Evolution of feed production by integrators, 2017-2021*
Histórico de producción por plantas integradas en 2017-2021*
* 2020Preliminar/Preliminary, 2021 Estimado / EstimatedFUENTE/SOURCE: ConsejoNacionaldeFabricantesdeAlimentosBalanceadosydelaNutriciónAnimal,A.C.
Entre2017y2021seobservaunconstantecrecimientodealimentobalanceadoenplantasintegradas,consistenteconelcrecimientodelaproduccióntotaldealimentosbalanceadosenMéxico.
Between 2017 and 2021, Mexico had a steady growth of feed manufactured by integrated producers, consistent with the growth rate of total feed production.
1)Incluyealimentoparacamarónypeces/Includes shrimp & fish feed2)Incluyealimentoparaovejas,caprinos,etc./Includes feeds for sheep, goats, etc.
24
AVESDEENGORDA/Broilers
AVESDEPOSTURA/Layers
CERDO/Swine
GANADODEENGORDA/Beef cattle
GANADOLECHERO/Dairy cattle
ACUACULTURA/Aquaculture (1)
OTROS/Others (2)
TOTAL
2017 2018 2019 2020 2021
6,655 6,680 6,899 7,010 7,288
4,832 4,942 5,079 5,253 5,437
3,330 3,460 3,761 3,904 4,057
2,753 2,853 2,985 3,101 3,188
2,799 2,911 3,087 3,198 3,303
35 38 63 65 66
331 320 323 334 345
20,735 21,204 22,197 22,865 23,684
20,000
21,000
20,73521,204
22,197
22,865
23,684
22,000
23,000
24,000
25,000
2017 2018 2019 2020 2021
MIL
ES D
E TO
NEL
ADAS
Thou
sand
MT
MILES DE TONELADASThousandMT
La Industria Alimentaria Animal de México 2021
Feed production by commercial feed mills, 2021*
Producción de alimentos balanceados por comerciales en 2021*
*Estimado/EstimatedFUENTE/SOURCE: Consejo Nacional de Fabricantes de Alimentos Balanceados y de la Nutrición Animal, A.C.
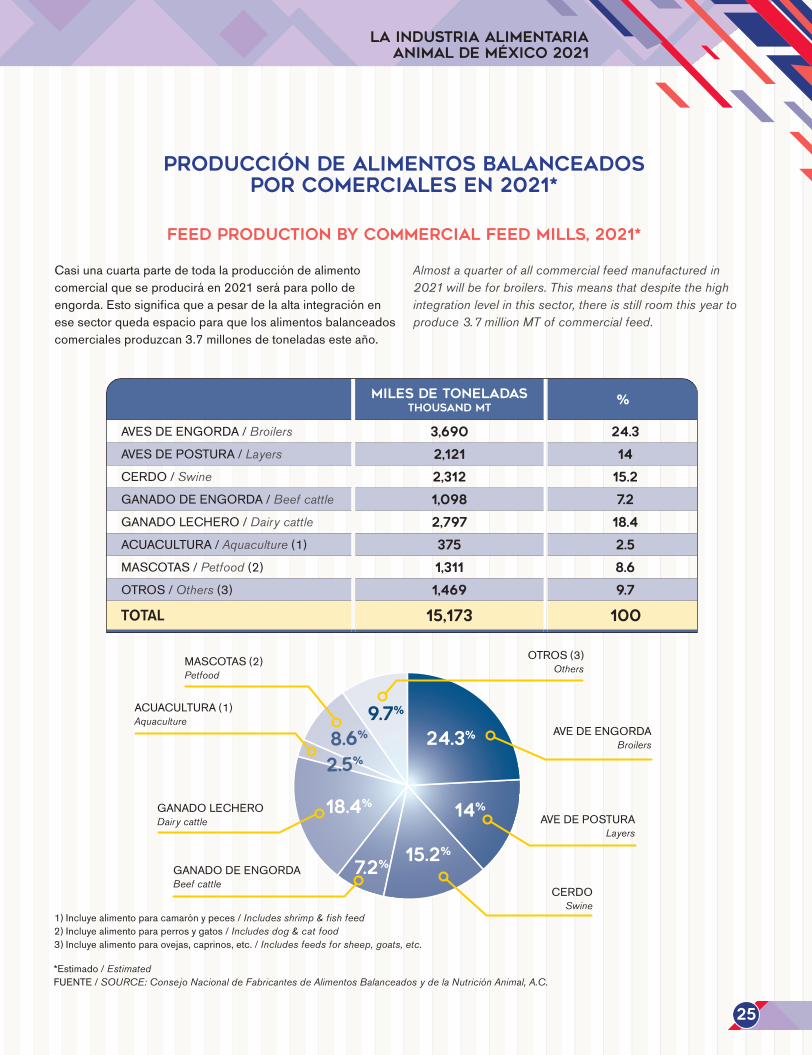
Casiunacuartapartedetodalaproduccióndealimentocomercialqueseproduciráen2021seráparapollodeengorda.Estosignificaqueapesardelaaltaintegraciónenesesectorquedaespacioparaquelosalimentosbalanceadoscomercialesproduzcan3.7millonesdetoneladasesteaño.
Almost a quarter of all commercial feed manufactured in 2021 will be for broilers. This means that despite the high integration level in this sector, there is still room this year to produce 3.7 million MT of commercial feed.
1)Incluyealimentoparacamarónypeces/Includes shrimp & fish feed2)Incluyealimentoparaperrosygatos/Includes dog & cat food3)Incluyealimentoparaovejas,caprinos,etc./Includes feeds for sheep, goats, etc.
25
MILES DE TONELADASThousand MT
%
AVESDEENGORDA/Broilers 3,690 24.3
AVESDEPOSTURA/Layers 2,121 14
CERDO/Swine 2,312 15.2
GANADODEENGORDA/Beef cattle 1,098 7.2
GANADOLECHERO/Dairy cattle 2,797 18.4
ACUACULTURA/Aquaculture (1) 375 2.5
MASCOTAS/Petfood (2) 1,311 8.6
OTROS/Others (3) 1,469 9.7
TOTAL 15,173 100
AVEDEENGORDABroilers
OTROS(3)Others
GANADOLECHERODairy cattle
MASCOTAS(2)Petfood
AVEDEPOSTURALayers
ACUACULTURA(1)Aquaculture
GANADODEENGORDABeef cattle
CERDOSwine
24.3%
14%
15.2%
7.2%
18.4%
8.6%
2.5%
9.7%
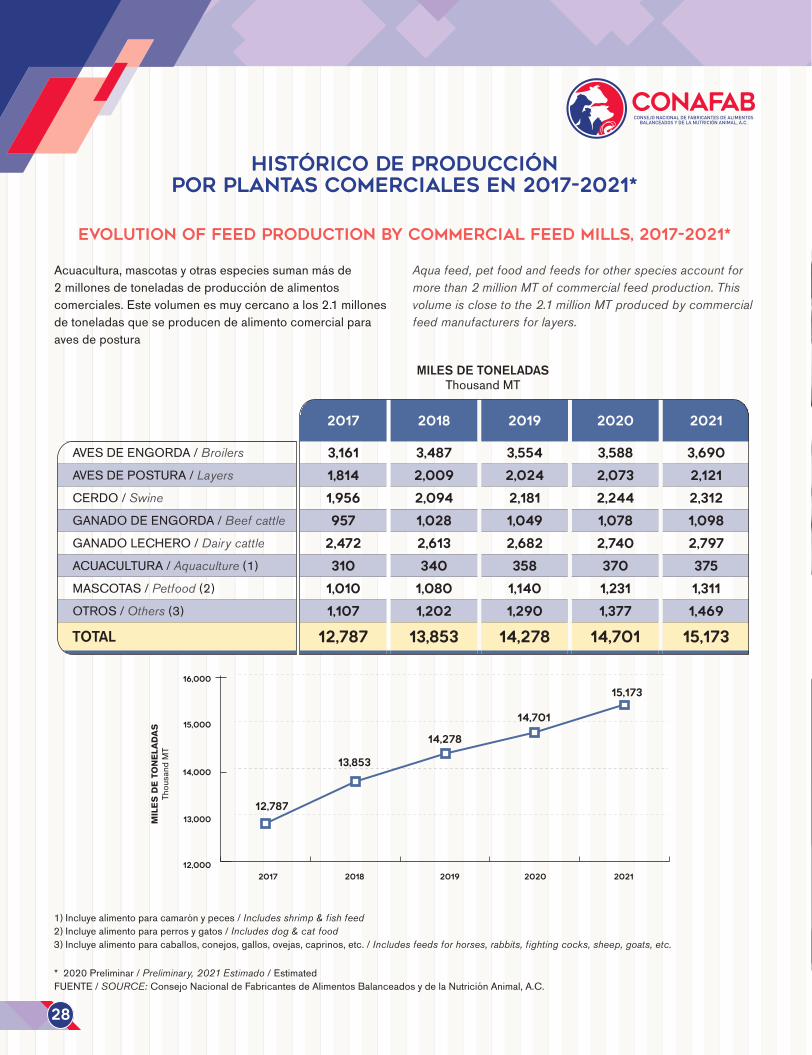
Acuacultura,mascotasyotrasespeciessumanmásde2millonesdetoneladasdeproduccióndealimentoscomerciales.Estevolumenesmuycercanoalos2.1millonesdetoneladasqueseproducendealimentocomercialparaavesdepostura
Aqua feed, pet food and feeds for other species account for more than 2 million MT of commercial feed production. This volume is close to the 2.1 million MT produced by commercial feed manufacturers for layers.
Evolution of feed production by commercial feed mills, 2017-2021*
Histórico de producción por plantas comerciales en 2017-2021*
* 2020Preliminar/Preliminary, 2021 Estimado / EstimatedFUENTE/SOURCE: ConsejoNacionaldeFabricantesdeAlimentosBalanceadosydelaNutriciónAnimal,A.C.
1)Incluyealimentoparacamarónypeces/Includes shrimp & fish feed2)Incluyealimentoparaperrosygatos/Includes dog & cat food3)Incluyealimentoparacaballos,conejos,gallos,ovejas,caprinos,etc./Includes feeds for horses, rabbits, fighting cocks, sheep, goats, etc.
28
AVESDEENGORDA/Broilers
AVESDEPOSTURA/Layers
CERDO/Swine
GANADODEENGORDA/Beef cattle
GANADOLECHERO/Dairy cattle
ACUACULTURA/Aquaculture (1)
MASCOTAS/Petfood (2)
OTROS/Others (3)
TOTAL
2017 2018 2019 2020 2021
3,161 3,487 3,554 3,588 3,690
1,814 2,009 2,024 2,073 2,121
1,956 2,094 2,181 2,244 2,312
957 1,028 1,049 1,078 1,098
2,472 2,613 2,682 2,740 2,797
310 340 358 370 375
1,010 1,080 1,140 1,231 1,311
1,107 1,202 1,290 1,377 1,469
12,787 13,853 14,278 14,701 15,173
12,000
15,000
14,000
13,000
16,000
2017 2018 2019 2020 2021
10,000
15,000
20,000
2017 2018 2019 2020 2021
12,787
13,853
14,278
14,701
15,173
12,787
13,85314,278
14,70115,173
MIL
ES D
E TO
NEL
ADAS
Thou
sand
MT
MILES DE TONELADASThousandMT
Provimi tu consultor de confianza
Mejores soluciones, resultados exitosos
Soluciones nutricionales ideales para todas las etapas de tus cerdos.
ReproducciónPreinicioEngorda
Soluciones únicas adaptadas a las necesidades del productor.
Porcicultura Avicultura
En Provimi trabajamos día a día para ofrecerte soluciones de calidad que se adecúen a las necesidades de tu negocio.
www.provimi.mx¡Contáctanos!
Contamos con productos específicospara problemas específicos que se adaptan a tus necesidades.
Aditivos
Evolution of broiler feed production, 2017-2021*
Histórico de producción de alimento para aves de engorda en 2017-2021*
*Estimado/EstimatedFUENTE/SOURCE: Consejo Nacional de Fabricantes de Alimentos Balanceados y de la Nutrición Animal, A.C.
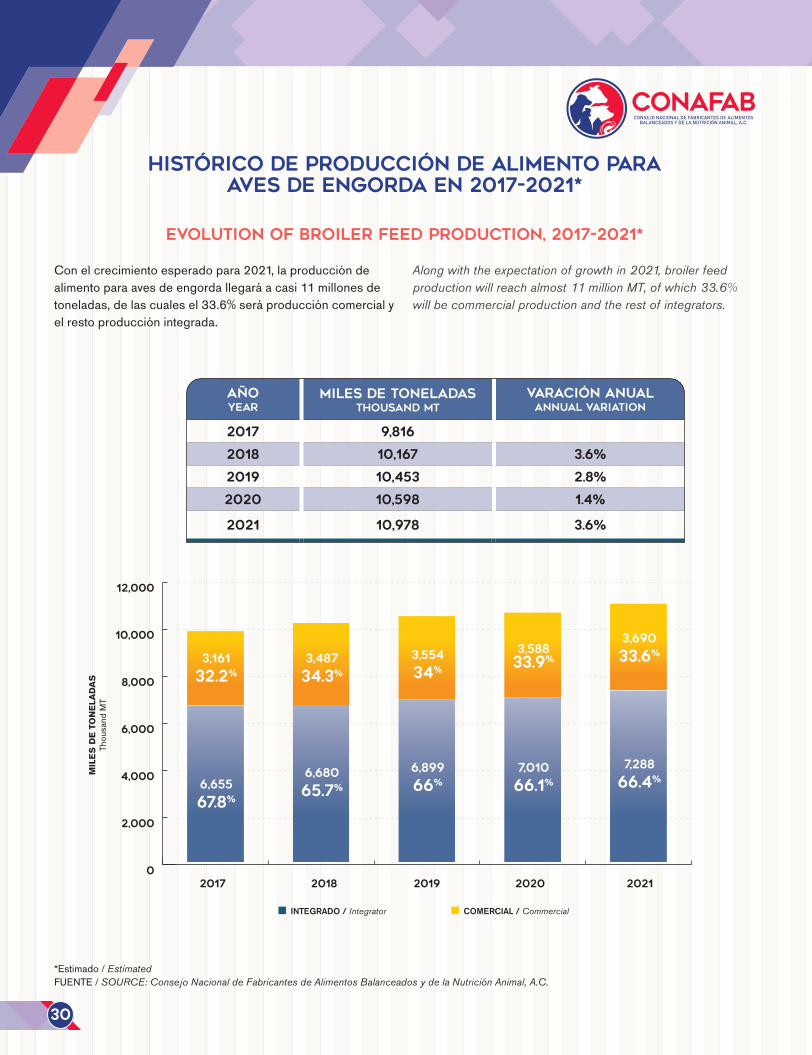
Conelcrecimientoesperadopara2021,laproduccióndealimentoparaavesdeengordallegaráacasi11millonesdetoneladas,delascualesel33.6%seráproduccióncomercialyelrestoproducciónintegrada.
Along with the expectation of growth in 2021, broiler feed production will reach almost 11 million MT, of which 33.6% will be commercial production and the rest of integrators.
30
AÑOYEAR
MILES DE TONELADASThousand MT
VARACIÓN AnualANNUAL VARIATION
2017 9,816
2018 10,167 3.6%
2019 10,453 2.8%
2020 10,598 1.4%
2021 10,978 3.6%
0
2,000
4,000
6,000
8,000
10,000
12,000
2017 2018 2019 2020 2021
6,655
67.8%
6,680
65.7%
6,899
66%
7,010
66.1%
7,288
66.4%
3,161
32.2%
3,487
34.3%
3,554
34%
3,58833.9%
3,690
33.6%
INTEGRADO / Integrator COMERCIAL / Commercial
MIL
ES D
E TO
NEL
ADAS
Thou
sand
MT
La Industria Alimentaria Animal de México 2021
*Estimado/EstimatedFUENTE/SOURCE: ConsejoNacionaldeFabricantesdeAlimentosBalanceadosydelaNutriciónAnimal,A.C.
Evolution of layer feed production, 2017-2021*
Histórico de producción de alimento para aves de postura en 2017-2021*
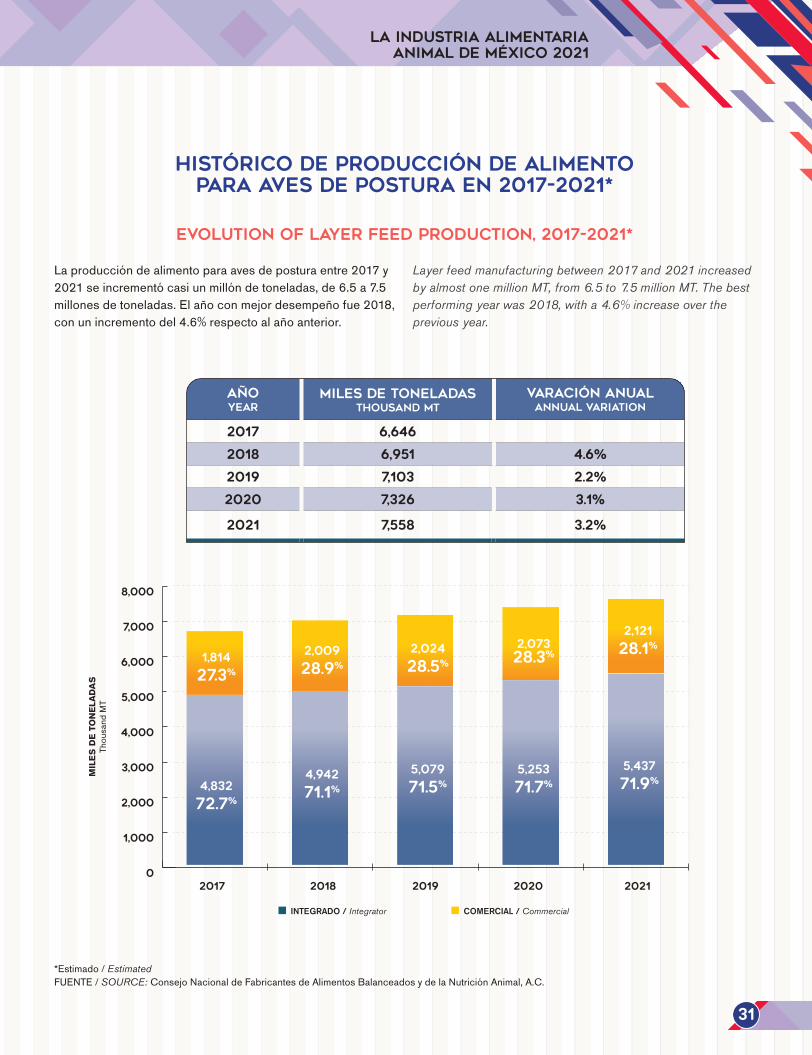
Laproduccióndealimentoparaavesdeposturaentre2017y2021seincrementócasiunmillóndetoneladas,de6.5a7.5millonesdetoneladas.Elañoconmejordesempeñofue2018,conunincrementodel4.6%respectoalañoanterior.
Layer feed manufacturing between 2017 and 2021 increased by almost one million MT, from 6.5 to 7.5 million MT. The best performing year was 2018, with a 4.6% increase over the previous year.
31
AÑOYEAR
MILES DE TONELADASThousand MT
VARACIÓN AnualANNUAL VARIATION
2017 6,646
2018 6,951 4.6%
2019 7,103 2.2%
2020 7,326 3.1%
2021 7,558 3.2%
0
1,000
2,000
3,000
4,000
5,000
6,000
7,000
8,000
2017 2018 2019 2020 2021
4,832
72.7%
4,942
71.1%
5,079
71.5%
5,253
71.7%
5,437
71.9%
1,814
27.3%
2,009
28.9%
2,024
28.5%
2,07328.3%
2,121
28.1%
INTEGRADO / Integrator COMERCIAL / Commercial
MIL
ES D
E TO
NEL
ADAS
Thou
sand
MT
Evolution of swine feed production, 2017-2021*
Histórico de producción de alimento para cerdo en 2017-2021*
*Estimado/EstimatedFUENTE/SOURCE: ConsejoNacionaldeFabricantesdeAlimentosBalanceadosydelaNutriciónAnimal,A.C.
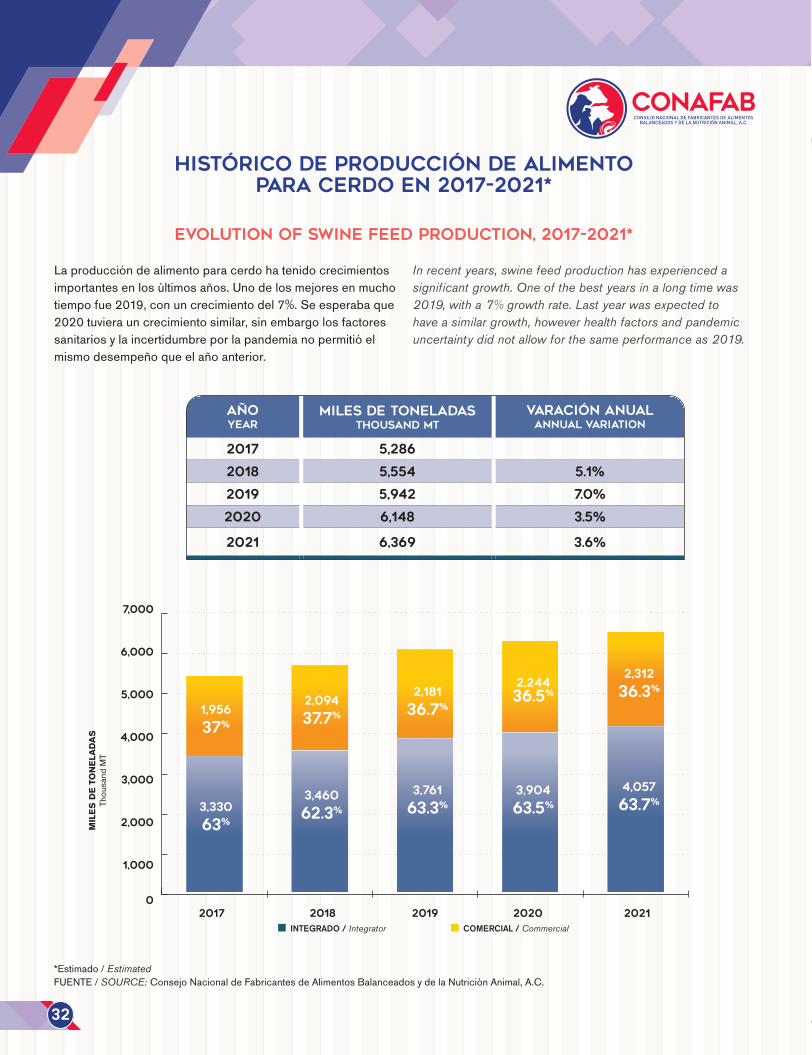
Laproduccióndealimentoparacerdohatenidocrecimientosimportantesenlosúltimosaños.Unodelosmejoresenmuchotiempofue2019,conuncrecimientodel7%.Seesperabaque2020tuvierauncrecimientosimilar,sinembargolosfactoressanitariosylaincertidumbreporlapandemianopermitióelmismodesempeñoqueelañoanterior.
In recent years, swine feed production has experienced a significant growth. One of the best years in a long time was 2019, with a 7% growth rate. Last year was expected to have a similar growth, however health factors and pandemic uncertainty did not allow for the same performance as 2019.
32
AÑOYEAR
MILES DE TONELADASThousand MT
VARACIÓN AnualANNUAL VARIATION
2017 5,286
2018 5,554 5.1%
2019 5,942 7.0%
2020 6,148 3.5%
2021 6,369 3.6%
02017 2018 2019 2020 2021
0
1,000
2,000
3,000
4,000
5,000
6,000
7,000
8,000
2017 2018 2019 2020 2021
1,000
2,000
3,000
4,000
5,000
6,000
7,000
3,330
63%
3,460
62.3%
3,761
63.3%
3,904
63.5%
4,057
63.7%
1,956
37%
2,094
37.7%
2,181
36.7%
2,24436.5%
2,312
36.3%
INTEGRADO / Integrator COMERCIAL / Commercial
MIL
ES D
E TO
NEL
ADAS
Thou
sand
MT
¡La solución enzimática ideal para lograr el máximo potencial de su producción!
www.adisseo.com
La única combinación capaz de extraer el máximo de nutrientes
Rovabio® Advance Phy: la nueva generación de FEEDASEMulticarboidrasas + Superdosifi cación de Fitasa
SINERGIA comprobada
TERMOESTABILIDAD a través de la tecnología patentada T-Flex
CONSISTENCIA de resultados en diferentes dietas
Liberación TOTAL de nutrientes (Energía, Aminoácidos y Minerales)
MÁXIMA economía
Evolution of beef cattle feed production, 2017-2021*
Histórico de producción de alimento para ganado de engorda en 2017-2021*
*Estimado/EstimatedFUENTE/SOURCE: ConsejoNacionaldeFabricantesdeAlimentosBalanceadosydelaNutriciónAnimal,A.C.
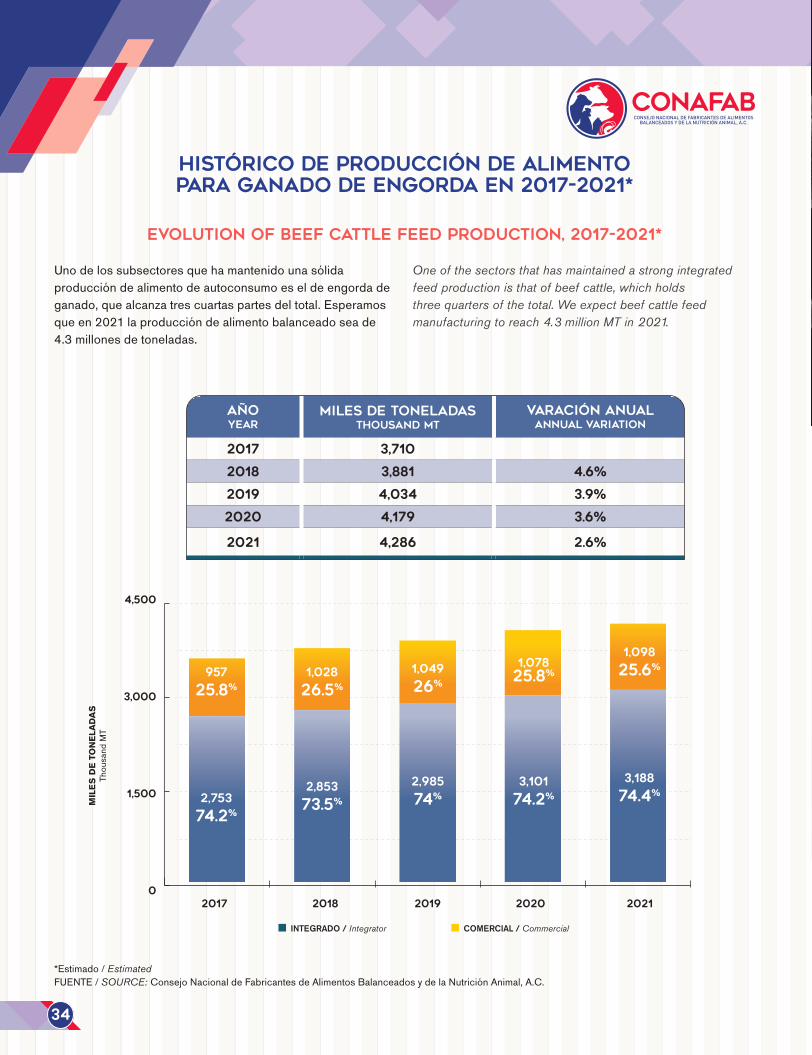
Unodelossubsectoresquehamantenidounasólidaproduccióndealimentodeautoconsumoeseldeengordadeganado,quealcanzatrescuartaspartesdeltotal.Esperamosqueen2021laproduccióndealimentobalanceadoseade4.3millonesdetoneladas.
One of the sectors that has maintained a strong integrated feed production is that of beef cattle, which holds three quarters of the total. We expect beef cattle feed manufacturing to reach 4.3 million MT in 2021.
34
AÑOYEAR
MILES DE TONELADASThousand MT
VARACIÓN AnualANNUAL VARIATION
2017 3,710
2018 3,881 4.6%
2019 4,034 3.9%
2020 4,179 3.6%
2021 4,286 2.6%
02017 2018 2019 2020 2021
0
1000
2000
3000
4000
5000
2017 2018 2019 2020 2021
1,500
3,000
4,500
2,753
74.2%
2,853
73.5%
2,985
74%
3,101
74.2%
3,188
74.4%
957
25.8%
1,028
26.5%
1,049
26%
1,07825.8%
1,098
25.6%
INTEGRADO / Integrator COMERCIAL / Commercial
MIL
ES D
E TO
NEL
ADAS
Thou
sand
MT
PREPARAR.APUNTAR.CRECER.
AB Vista es una empresa de tecnología de nutrición animal
que proporciona productos y servicios técnicos pioneros
a la industria mundial de alimentos para animales.
abvista.com
PREPARAR.APUNTAR.CRECER.
AB Vista es una empresa de tecnología de nutrición animal
que proporciona productos y servicios técnicos pioneros
a la industria mundial de alimentos para animales.
abvista.com
Evolution of dairy cattle feed production, 2017-2021*
Histórico de producción de alimento para ganado lechero en 2017-2021*
*Estimado/EstimatedFUENTE/SOURCE: Consejo Nacional de Fabricantes de Alimentos Balanceados y de la Nutrición Animal, A.C.
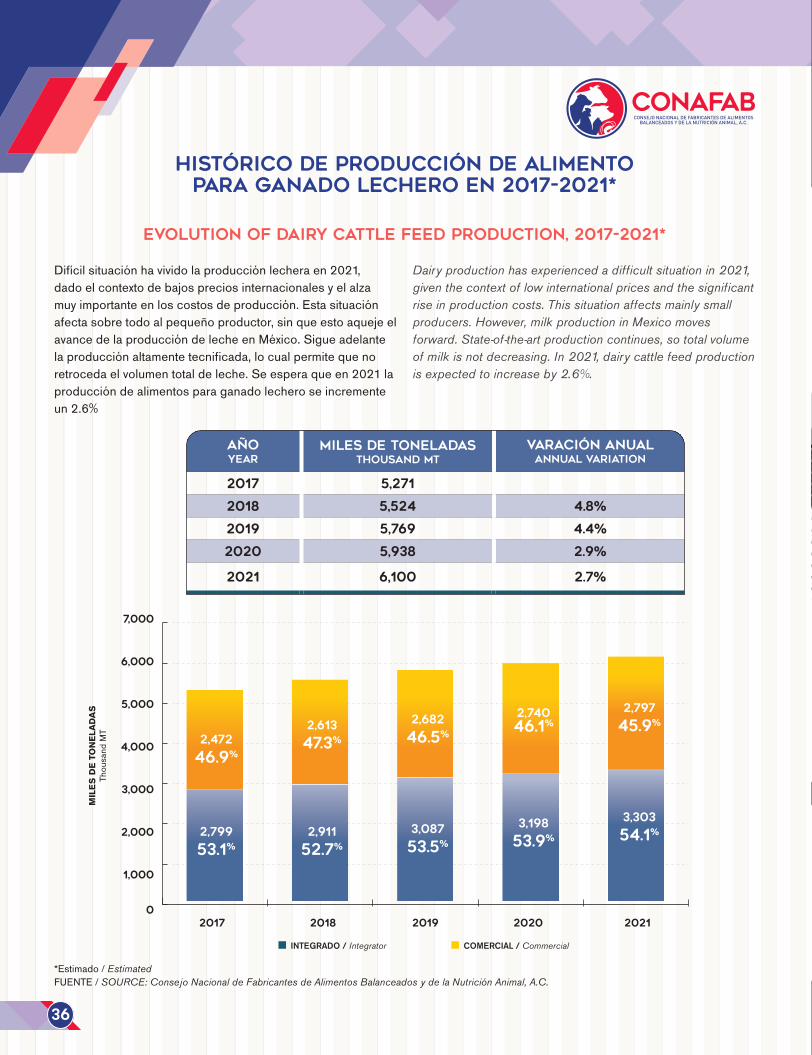
Difícilsituaciónhavividolaproducciónlecheraen2021,dadoelcontextodebajospreciosinternacionalesyelalzamuyimportanteenloscostosdeproducción.Estasituaciónafectasobretodoalpequeñoproductor,sinqueestoaquejeelavancedelaproduccióndelecheenMéxico.Sigueadelantelaproducciónaltamentetecnificada,locualpermitequenoretrocedaelvolumentotaldeleche.Seesperaqueen2021laproduccióndealimentosparaganadolecheroseincrementeun2.6%
Dairy production has experienced a difficult situation in 2021, given the context of low international prices and the significant rise in production costs. This situation affects mainly small producers. However, milk production in Mexico moves forward. State-of-the-art production continues, so total volume of milk is not decreasing. In 2021, dairy cattle feed production is expected to increase by 2.6%.
36
AÑOYEAR
MILES DE TONELADASThousand MT
VARACIÓN AnualANNUAL VARIATION
2017 5,271
2018 5,524 4.8%
2019 5,769 4.4%
2020 5,938 2.9%
2021 6,100 2.7%
02017 2018 2019 2020 2021
0
1000
2000
3000
4000
5000
6000
7000
8000
2017 2018 2019 2020 2021
1,000
2,000
3,000
4,000
5,000
6,000
7,000
2,799
53.1%
2,911
52.7%
3,087
53.5%
3,198
53.9%
3,303
54.1%
2,472
46.9%
2,613
47.3%
2,682
46.5%
2,74046.1%
2,797
45.9%
INTEGRADO / Integrator COMERCIAL / Commercial
MIL
ES D
E TO
NEL
ADAS
Thou
sand
MT
www.animine.eu
ÓXIDO DE ZINC POTENCIADO
ÓXIDO DE COBRE MONOVALENTE
ÓXIDO DE ZINC POTENCIADO
ÓXIDO DE COBRE MONOVALENTE
e independiente de minerales de precisión
Superioresíndices deSuperioresíndices de
ConcentraciónFluidezSeguridadEstabilidadBiodisponibilidadDesempeño animal
ConcentraciónFluidezSeguridadEstabilidadBiodisponibilidadDesempeño animal
Precision minerals
75%
, un proveedor internacional
ÓXIDO DE MANGANESO ALTAMENTE PURIFICADO
ÓXIDO DE MANGANESO ALTAMENTE PURIFICADO
Contacto José Ramon Perez H
[email protected] +52 (442) 258-1877
*Estimado/EstimatedFUENTE/SOURCE: ConsejoNacionaldeFabricantesdeAlimentosBalanceadosydelaNutriciónAnimal,A.C.
Evolution of feed production for other species, 2017-2021*
Histórico de producción de alimento para otras especies en 2017-2021*
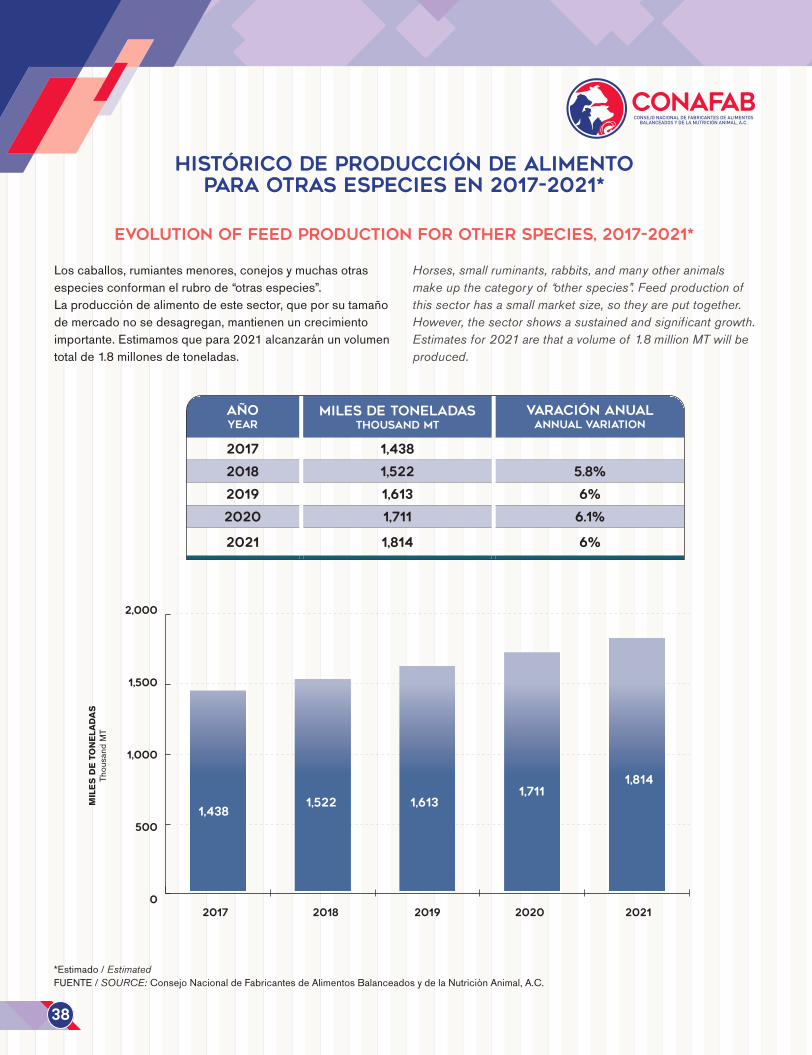
Loscaballos,rumiantesmenores,conejosymuchasotrasespeciesconformanelrubrode“otrasespecies”.Laproduccióndealimentodeestesector,queporsutamañodemercadonosedesagregan,mantienenuncrecimientoimportante.Estimamosquepara2021alcanzaránunvolumentotalde1.8millonesdetoneladas.
Horses, small ruminants, rabbits, and many other animals make up the category of “other species”. Feed production of this sector has a small market size, so they are put together. However, the sector shows a sustained and significant growth. Estimates for 2021 are that a volume of 1.8 million MT will be produced.
38
AÑOYEAR
MILES DE TONELADASThousand MT
VARACIÓN AnualANNUAL VARIATION
2017 1,438
2018 1,522 5.8%
2019 1,613 6%
2020 1,711 6.1%
2021 1,814 6%
02017 2018 2019 2020 2021
0
500
1000
1500
2000
2017 2018 2019 2020 2021
500
1,000
1,500
2,000
1,4381,522 1,613
1,7111,814
MIL
ES D
E TO
NEL
ADAS
Thou
sand
MT
La Industria Alimentaria Animal de México 2021
*Estimado/EstimatedFUENTE/SOURCE: ConsejoNacionaldeFabricantesdeAlimentosBalanceadosydelaNutriciónAnimal,A.C.
Integrator & commercial feed mills share
PARTICIPACIÓN INTEGRADOS Y COMERCIALES
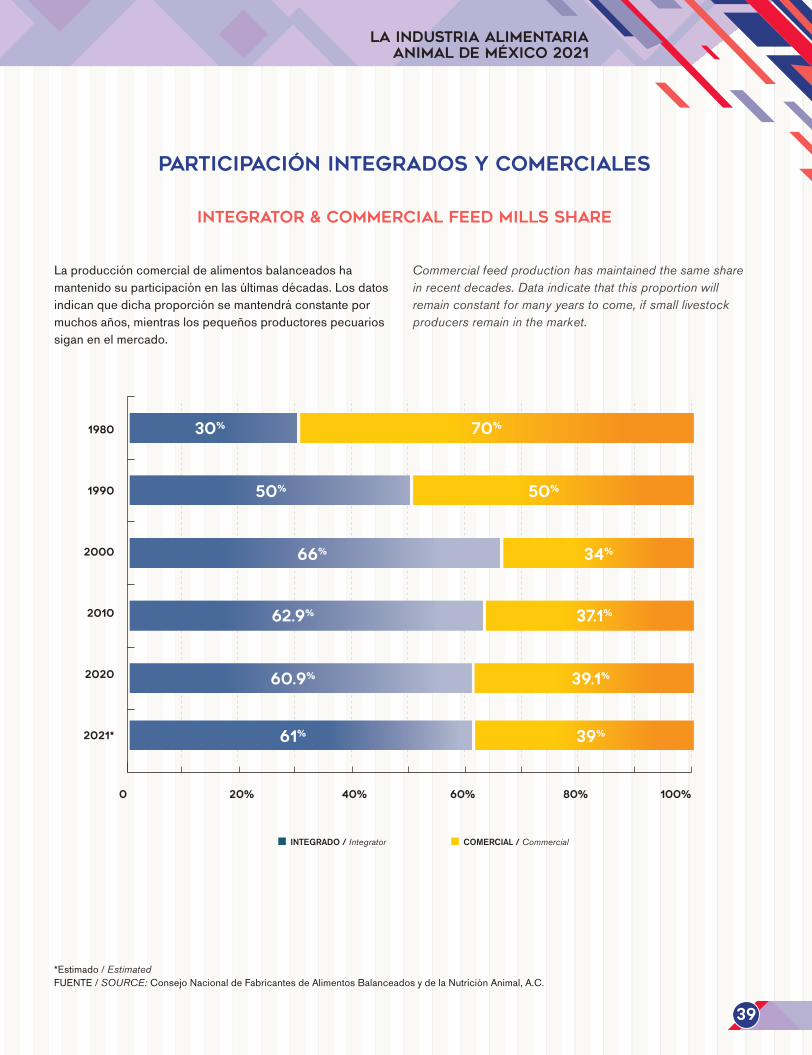
Laproduccióncomercialdealimentosbalanceadoshamantenidosuparticipaciónenlasúltimasdécadas.Losdatosindicanquedichaproporciónsemantendráconstantepormuchosaños,mientraslospequeñosproductorespecuariossiganenelmercado.
Commercial feed production has maintained the same share in recent decades. Data indicate that this proportion will remain constant for many years to come, if small livestock producers remain in the market.
39
0 20% 40% 60% 80% 100%
0 20 40 60 80 100
1980
1990
2000
2010
2020
2021*
INTEGRADO / Integrator COMERCIAL / Commercial
60.9% 39.1%
30% 70%
50% 50%
66% 34%
62.9% 37.1%
61% 39%
*Estimado/EstimatedFUENTE/SOURCE: ConsejoNacionaldeFabricantesdeAlimentosBalanceadosydelaNutriciónAnimal,A.C.,
condatosde/with data from:SIAVI-SE.
Apparent DOMESTIC FEED consumption, 2017-2021*
Consumo nacional aparente DE ALIMENTOS BALANCEADOS 2017-2021*
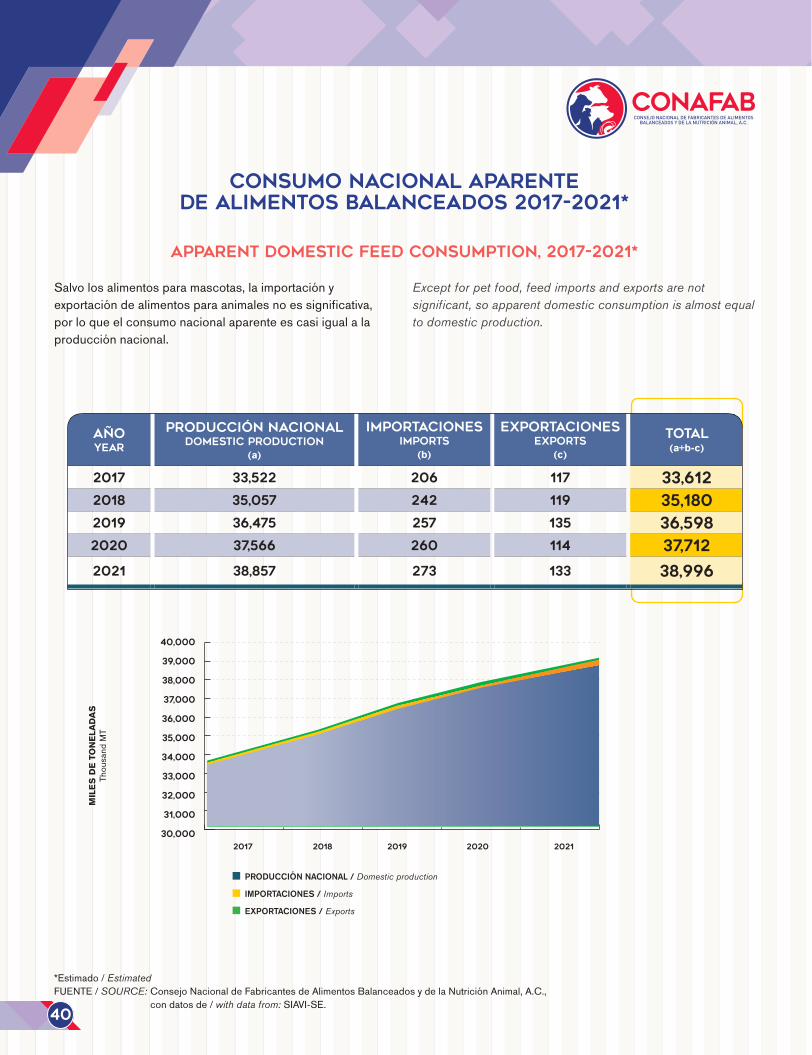
Salvolosalimentosparamascotas,laimportaciónyexportacióndealimentosparaanimalesnoessignificativa,porloqueelconsumonacionalaparenteescasiigualalaproducciónnacional.
Except for pet food, feed imports and exports are not significant, so apparent domestic consumption is almost equal to domestic production.
40
PRODUCCIÓN NACIONAL / Domestic production
IMPORTACIONES / Imports
EXPORTACIONES / Exports
AÑOYEAR
PRODUCCIÓN NACIONALDOMESTIC PRODUCTION
(a)
IMPORTACIONESIMPORTS
(b)
EXPORTACIONESEXPORTS
(c)
TOTAL(a+b-c)
2017 33,522 206 117 33,6122018 35,057 242 119 35,1802019 36,475 257 135 36,5982020 37,566 260 114 37,712
2021 38,857 273 133 38,996
05000
10000150002000025000300003500040000
2017 2018 2019 2020 2021
MIL
ES D
E TO
NEL
ADAS
Thou
sand
MT
INTERNATIONAL FEED AND FOODS TECHNOLOGIES S.A. DE C.V.
PREMEZCLAS
ANTIFÚNGICOS
ACIDIFICANTES
PIGMENTOS
GRASA DE SOBREPASO
SERVICIOS DE LABORATORIO
ASESORÍA TÉCNICA
MAQUILAS
Carretera Córdoba a Veracruz Km 342, Zona Industrial, C.P. 94690, Córdoba, Veracruz, México. Tel: (+52) 271 751 7350; (+52) 271 751 7396
www.intecmx.com [email protected]
ÚLTIMAS TECNOLOGÍAS EN NUTRICIÓN ANIMAL
PART OF MIDLAND INDUSTRIAL GROUP
Domestic livestock production, 2017-2021*
* 2020Preliminar/Preliminary, 2021 Estimado / Estimated(1)Lecheenmillonesdelitros/Million liters of milkFUENTE/SOURCE: ConsejoNacionaldeFabricantesdeAlimentosBalanceadosydelaNutriciónAnimal,A.C.
condatosde/with data from:laUNA,GCMAySIAP-SADER.
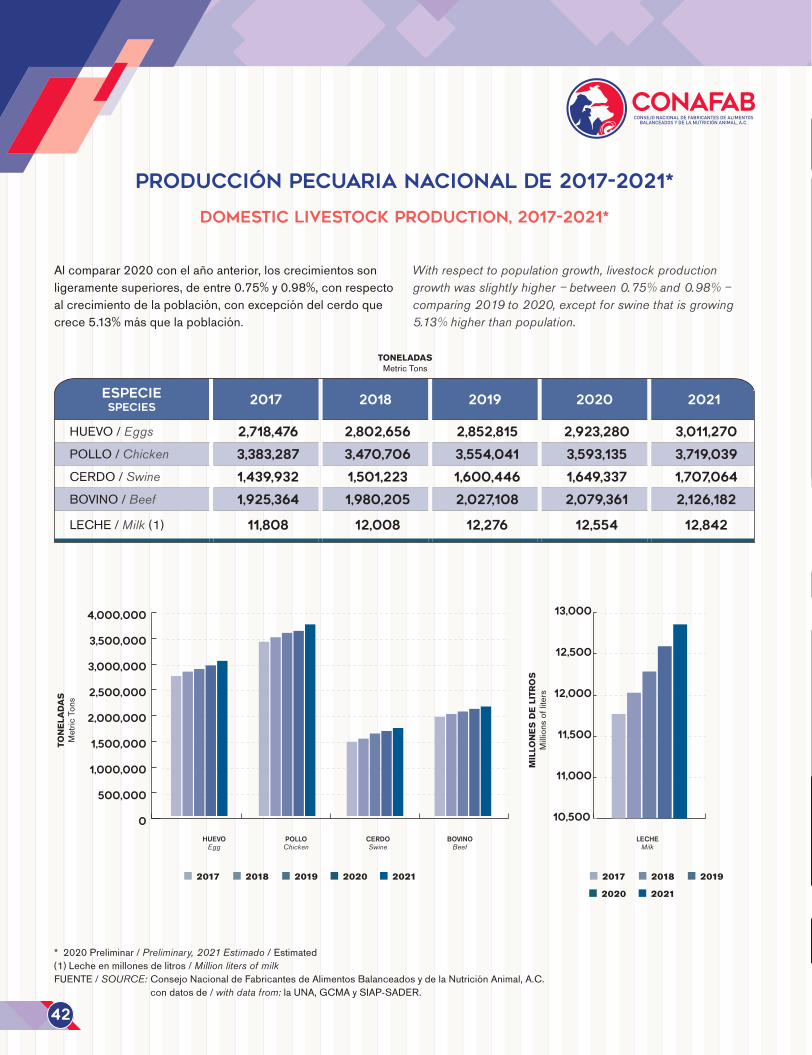
Alcomparar2020conelañoanterior,loscrecimientossonligeramentesuperiores,deentre0.75%y0.98%,conrespectoalcrecimientodelapoblación,conexcepcióndelcerdoquecrece5.13%másquelapoblación.
With respect to population growth, livestock production growth was slightly higher – between 0.75% and 0.98% – comparing 2019 to 2020, except for swine that is growing 5.13% higher than population.
Producción pecuaria nacional de 2017-2021*
42
ESPECIESPECIES
2017 2018 2019 2020 2021
HUEVO/Eggs 2,718,476 2,802,656 2,852,815 2,923,280 3,011,270
POLLO/Chicken 3,383,287 3,470,706 3,554,041 3,593,135 3,719,039
CERDO/Swine 1,439,932 1,501,223 1,600,446 1,649,337 1,707,064
BOVINO/Beef 1,925,364 1,980,205 2,027,108 2,079,361 2,126,182
LECHE/Milk (1) 11,808 12,008 12,276 12,554 12,842
0
500,000
1,000,000
1,500,000
2,000,000
2,500,000
3,000,000
3,500,000
4,000,000
10,500
11,000
11,500
12,000
12,500
13,000
0
500,000
1,000,000
1,500,000
2,000,000
2,500,000
3,000,000
3,500,000
4,000,000
0
3000
6000
9000
12000
15000
2017 2018 2019 2020 2021 2017 2018 2019
2020 2021
HUEVO Egg
POLLO Chicken
CERDO Swine
BOVINO Beef
LECHEMilk
TON
ELAD
ASM
etric
Ton
s
MIL
LON
ES D
E LI
TRO
SM
illion
sof
lite
rs
TONELADASMetricTons
Domestic egg production, 2017-2021*
Producción nacional de huevo de 2017-2021*
*Estimado/EstimatedFUENTE/SOURCE: ConsejoNacionaldeFabricantesdeAlimentosBalanceadosydelaNutriciónAnimal,A.C.,
condatosde/with data from:laUNA
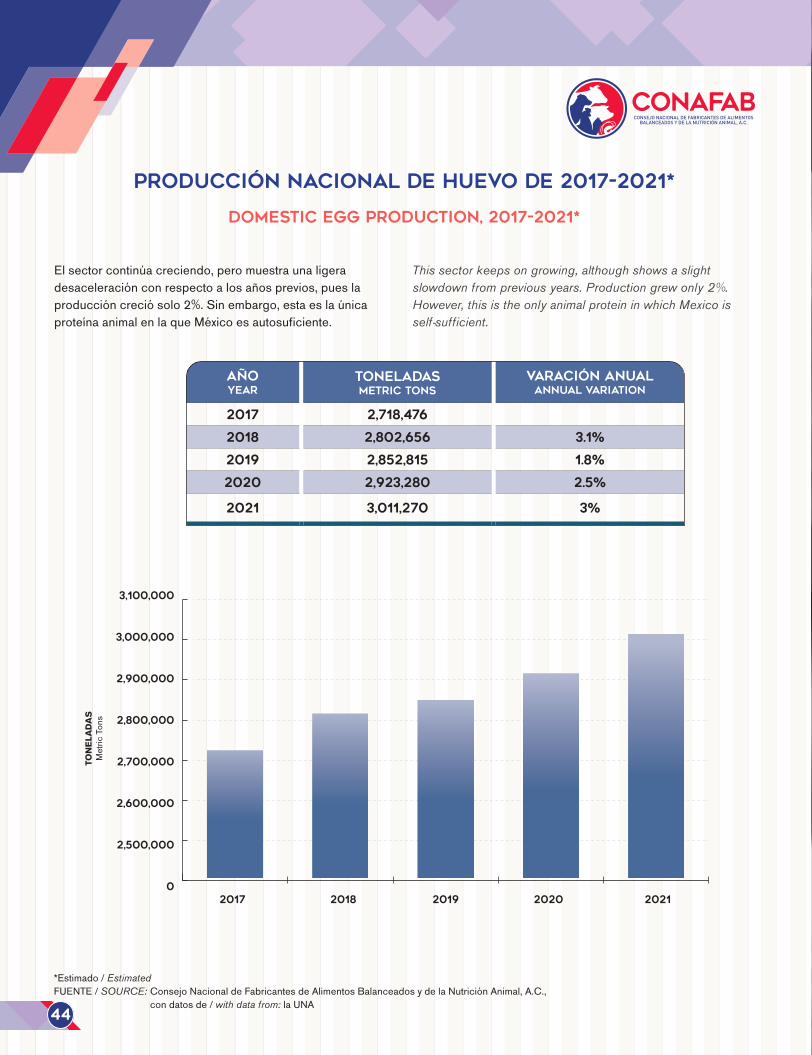
Elsectorcontinúacreciendo,peromuestraunaligeradesaceleraciónconrespectoalosañosprevios,pueslaproduccióncreciósolo2%.Sinembargo,estaeslaúnicaproteínaanimalenlaqueMéxicoesautosuficiente.
This sector keeps on growing, although shows a slight slowdown from previous years. Production grew only 2%. However, this is the only animal protein in which Mexico is self-sufficient.
44
AÑOYEAR
TONELADASMetric Tons
VARACIÓN AnualANNUAL VARIATION
2017 2,718,476
2018 2,802,656 3.1%
2019 2,852,815 1.8%
2020 2,923,280 2.5%
2021 3,011,270 3%
02017 2018 2019 2020 2021
0
500000
1000000
1500000
2000000
2500000
3000000
3500000
2017 2018 2019 2020 2021
2,500,000
2,700,000
2,600,000
2,900,000
2,800,000
3,100,000
3,000,000
TON
ELAD
ASM
etric
Ton
s
*Estimado/EstimatedFUENTE/SOURCE: ConsejoNacionaldeFabricantesdeAlimentosBalanceadosydelaNutriciónAnimal,A.C.
condatosde/with data from:laUNA.
Domestic dressed chicken production, 2017-2021*
Producción nacional de carne en canal de pollo de 2017-2021*
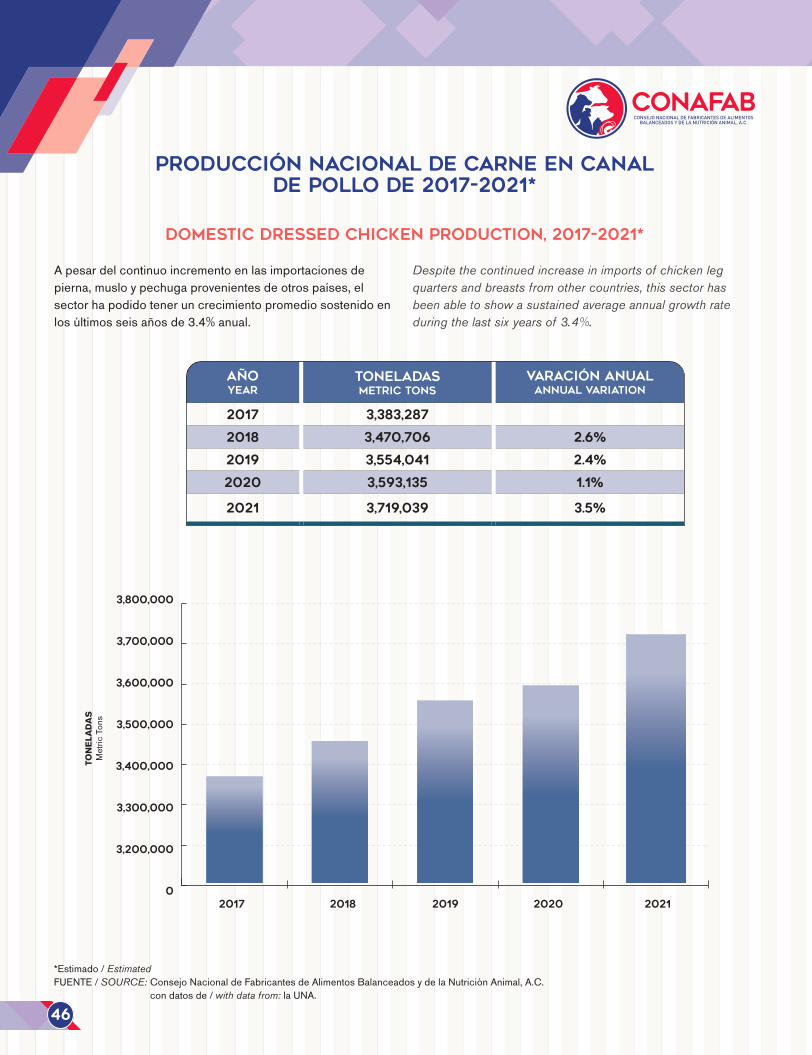
Apesardelcontinuoincrementoenlasimportacionesdepierna,musloypechugaprovenientesdeotrospaíses,elsectorhapodidoteneruncrecimientopromediosostenidoenlosúltimosseisañosde3.4%anual.
Despite the continued increase in imports of chicken leg quarters and breasts from other countries, this sector has been able to show a sustained average annual growth rate during the last six years of 3.4%.
46
AÑOYEAR
TONELADASMetric Tons
VARACIÓN AnualANNUAL VARIATION
2017 3,383,287
2018 3,470,706 2.6%
2019 3,554,041 2.4%
2020 3,593,135 1.1%
2021 3,719,039 3.5%
02017 2018 2019 2020 2021
0
500000
1000000
1500000
2000000
2500000
3000000
3500000
4000000
2017 2018 2019 2020 2021
3,200,000
3,400,000
3,300,000
3,600,000
3,500,000
3,800,000
3,700,000
TON
ELAD
ASM
etric
Ton
s
La Industria Alimentaria Animal de México 2021
Domestic pork carcass production, 2017-2021*
Producción nacional de carne en canal de cerdo de 2017-2021*
*Estimado/EstimatedFUENTE/SOURCE: ConsejoNacionaldeFabricantesdeAlimentosBalanceadosydelaNutriciónAnimal,A.C.,
condatosde/with data from:GCMAySIAP-SADER.
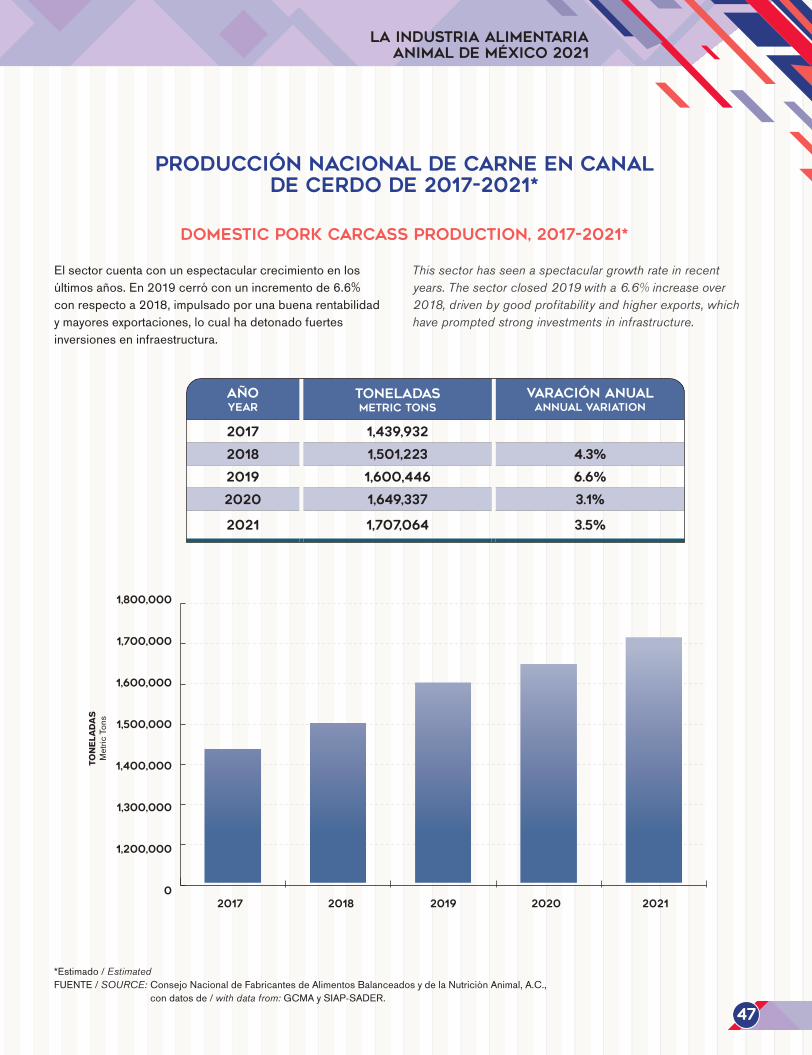
Elsectorcuentaconunespectacularcrecimientoenlosúltimosaños.En2019cerróconunincrementode6.6%conrespectoa2018,impulsadoporunabuenarentabilidadymayoresexportaciones,locualhadetonadofuertesinversioneseninfraestructura.
This sector has seen a spectacular growth rate in recent years. The sector closed 2019 with a 6.6% increase over 2018, driven by good profitability and higher exports, which have prompted strong investments in infrastructure.
47
AÑOYEAR
TONELADASMetric Tons
VARACIÓN AnualANNUAL VARIATION
2017 1,439,932
2018 1,501,223 4.3%
2019 1,600,446 6.6%
2020 1,649,337 3.1%
2021 1,707,064 3.5%
02017 2018 2019 2020 2021
0
500000
1000000
1500000
2000000
2017 2018 2019 2020 2021
1,200,000
1,400,000
1,300,000
1,600,000
1,500,000
1,800,000
1,700,000
TON
ELAD
ASM
etric
Ton
s
Energéticos
��������������������������� �������������
Energéticos
��������������������������� �������������
Domestic beef carcass production, 2017-2021*
Producción nacional de carne en canal de bovino de 2017-2021*
*Estimado/EstimatedFUENTE/SOURCE: ConsejoNacionaldeFabricantesdeAlimentosBalanceadosydelaNutriciónAnimal,A.C.,
condatosde/with data from:SIAP-SADER.
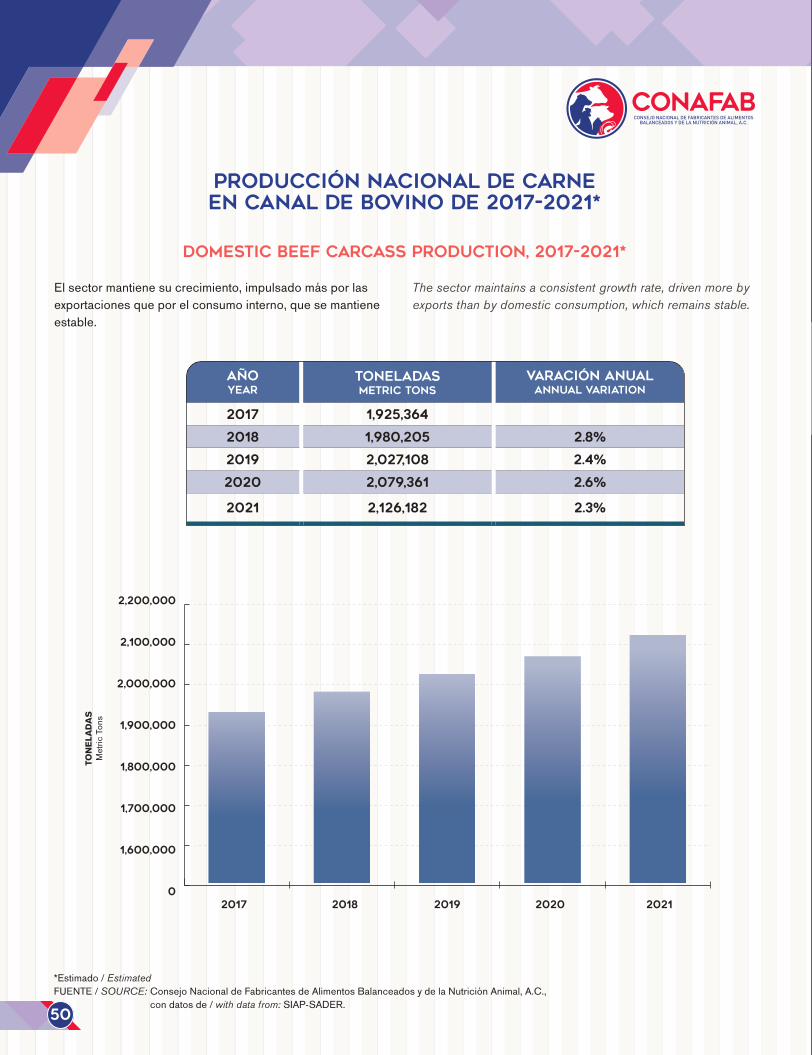
Elsectormantienesucrecimiento,impulsadomásporlasexportacionesqueporelconsumointerno,quesemantieneestable.
The sector maintains a consistent growth rate, driven more by exports than by domestic consumption, which remains stable.
50
AÑOYEAR
TONELADASMetric Tons
VARACIÓN AnualANNUAL VARIATION
2017 1,925,364
2018 1,980,205 2.8%
2019 2,027,108 2.4%
2020 2,079,361 2.6%
2021 2,126,182 2.3%
02017 2018 2019 2020 2021
0
500000
1000000
1500000
2000000
2500000
2017 2018 2019 2020 2021
1,600,000
1,800,000
1,700,000
2,000,000
1,900,000
2,200,000
2,100,000
TON
ELAD
ASM
etric
Ton
s
Elinicio óptimo...Un buen inicio hace toda la diferencia para la salud y productividad animal. Es por esto que los animales jóvenes necesitan la mejor nutrición desde la etapa más temprana posible.
Las especialidades de ingredientes de Hamlet Protein basadas en soya han comprobado que mejoran la salud, el bienestar y la productividad en animales jóvenes.
Así es como entregamos una robusta tasa de retorno de la inversión a los productores alrededor del mundo.
Mejora en la SALUD
Mejora en el BIENESTAR ANIMAL
Mejora en el PRODUCTIVIDAD
¿Quiere saber cómo podemos ayudarle?Visite nuestra página web y encuentre a su contacto local
www.hamletprotein.com
Domestic milk production, 2017-2021*
Producción nacional de leche de bovino de 2017-2021*
*Estimado/EstimatedFUENTE/SOURCE: Consejo Nacional de Fabricantes de Alimentos Balanceados y de la Nutrición Animal, A.C
con datos de / with data from: SIAP-SADER..
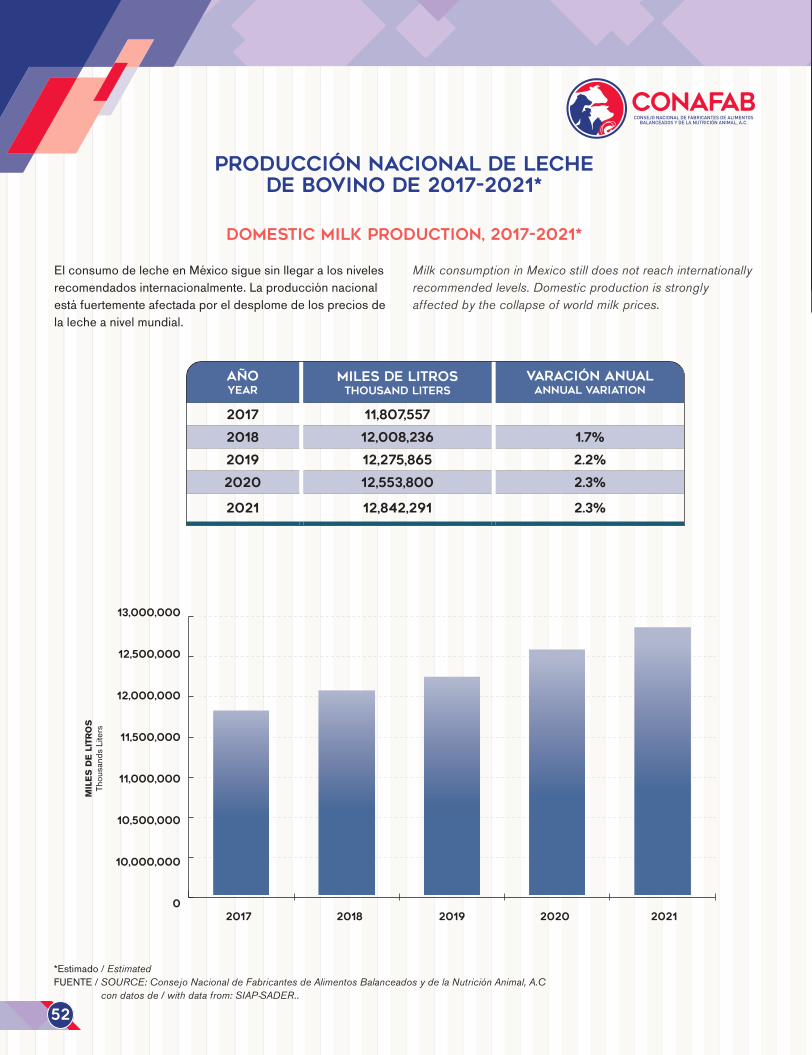
ElconsumodelecheenMéxicosiguesinllegaralosnivelesrecomendadosinternacionalmente.Laproducciónnacionalestáfuertementeafectadaporeldesplomedelospreciosdelalecheanivelmundial.
Milk consumption in Mexico still does not reach internationally recommended levels. Domestic production is strongly affected by the collapse of world milk prices.
52
AÑOYEAR
MILES DE LITROSTHOUSAND LITERS
VARACIÓN AnualANNUAL VARIATION
2017 11,807,557
2018 12,008,236 1.7%
2019 12,275,865 2.2%
2020 12,553,800 2.3%
2021 12,842,291 2.3%
02017 2018 2019 2020 2021
0
3000000
6000000
9000000
12000000
15000000
2017 2018 2019 2020 2021
10,000,000
11,000,000
10,500,000
12,000,000
11,500,000
13,000,000
12,500,000
MIL
ES D
E LI
TRO
STh
ousa
nds
Lite
rs
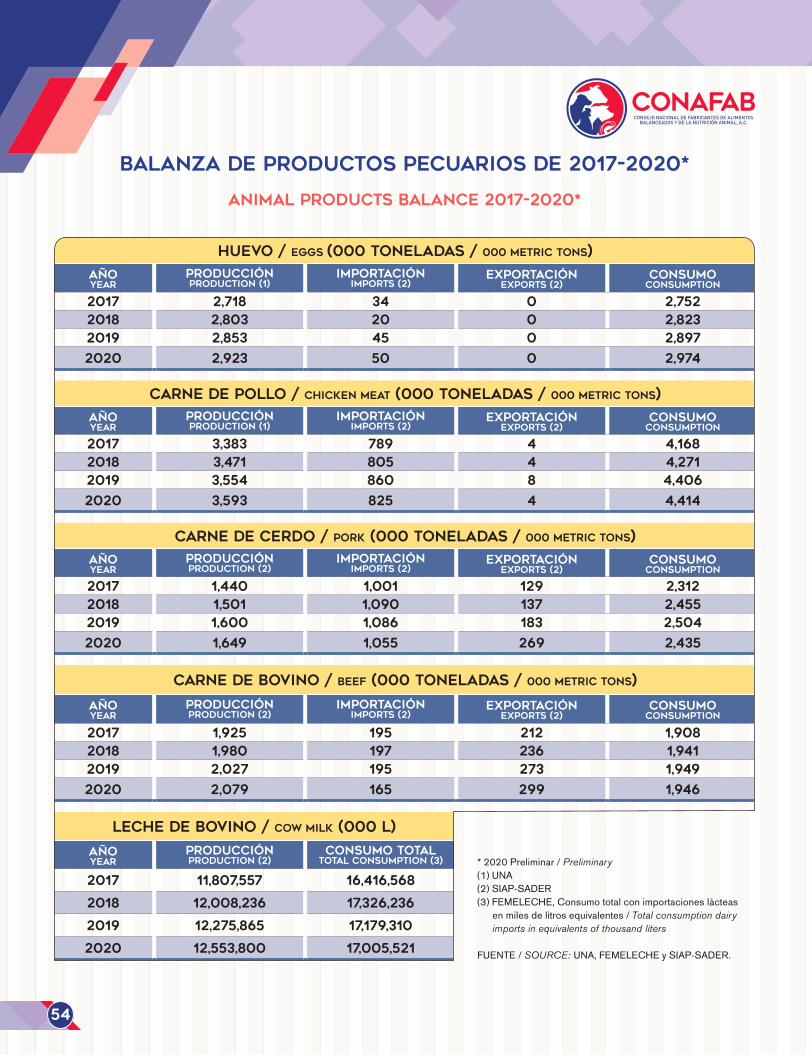
Animal products balance 2017-2020*
BALANZA DE PRODUCTOS PECUARIOS DE 2017-2020*
*2020Preliminar/Preliminary(1)UNA(2)SIAP-SADER(3)FEMELECHE,Consumototalconimportacioneslácteas
enmilesdelitrosequivalentes/Total consumption dairy imports in equivalents of thousand liters
FUENTE/SOURCE: UNA,FEMELECHEySIAP-SADER.
54
HUEVO / EGGS (000 TONELADAS / 000 Metric Tons)
AÑOyear
PRODUCCIÓN PRODUCTION (1)
IMPORTACIÓN IMPORTS (2)
EXPORTACIÓN EXPORTS (2)
CONSUMOCONSUMPTION
2017 2,718 34 0 2,7522018 2,803 20 0 2,8232019 2,853 45 0 2,897
2020 2,923 50 0 2,974
Carne de Pollo / CHICKEN MEAT (000 toneladas / 000 Metric Tons)
AÑOyear
PRODUCCIÓN PRODUCTION (1)
IMPORTACIÓN IMPORTS (2)
EXPORTACIÓN EXPORTS (2)
CONSUMOCONSUMPTION
2017 3,383 789 4 4,1682018 3,471 805 4 4,2712019 3,554 860 8 4,406
2020 3,593 825 4 4,414
Carne de CERDO / PORK (000 toneladas / 000 Metric Tons)
AÑOyear
PRODUCCIÓN PRODUCTION (2)
IMPORTACIÓN IMPORTS (2)
EXPORTACIÓN EXPORTS (2)
CONSUMOCONSUMPTION
2017 1,440 1,001 129 2,3122018 1,501 1,090 137 2,4552019 1,600 1,086 183 2,504
2020 1,649 1,055 269 2,435
Carne de BOVINO / BEEF (000 toneladas / 000 Metric Tons)
AÑOyear
PRODUCCIÓN PRODUCTION (2)
IMPORTACIÓN IMPORTS (2)
EXPORTACIÓN EXPORTS (2)
CONSUMOCONSUMPTION
2017 1,925 195 212 1,9082018 1,980 197 236 1,9412019 2,027 195 273 1,949
2020 2,079 165 299 1,946
LECHE de BOVINO / COW MILK (000 L)
AÑOyear
PRODUCCIÓN PRODUCTION (2)
CONSUMO TOTAL TOTAL Consumption (3)
2017 11,807,557 16,416,568
2018 12,008,236 17,326,236
2019 12,275,865 17,179,310
2020 12,553,800 17,005,521
La Industria Alimentaria Animal de México 2021
Per capita consumption of animal products, 2016-2020*
Consumo per cápita de productos pecuarios de 2016-2020*
*2020Preliminar/Preliminary1/Incluyeimportacioneslácteas/Includes dairy importsFUENTE/SOURCE: ConsejoNacionaldeFabricantesdeAlimentosBalanceadosydelaNutriciónAnimal,A.C.
condatosde/with data from:laUNA,FEMELECHEySIAP-SADER.
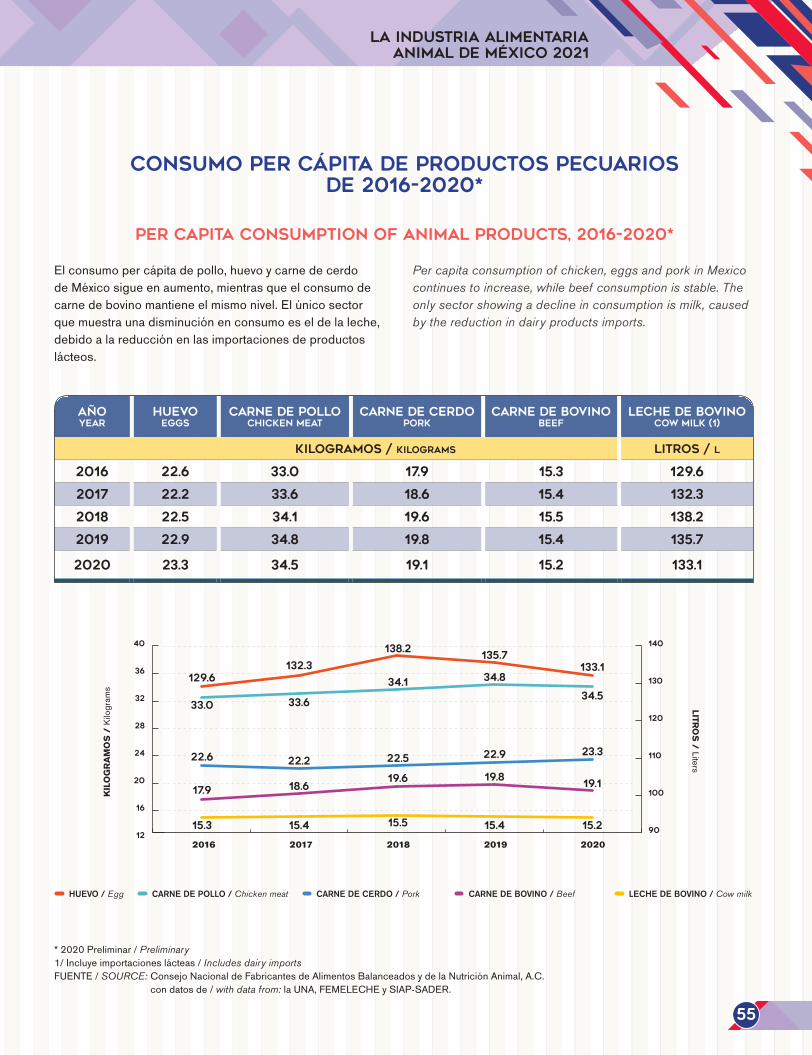
Elconsumopercápitadepollo,huevoycarnedecerdodeMéxicosigueenaumento,mientrasqueelconsumodecarnedebovinomantieneelmismonivel.Elúnicosectorquemuestraunadisminuciónenconsumoeseldelaleche,debidoalareducciónenlasimportacionesdeproductoslácteos.
Per capita consumption of chicken, eggs and pork in Mexico continues to increase, while beef consumption is stable. The only sector showing a decline in consumption is milk, caused by the reduction in dairy products imports.
55
15
20
25
30
35
40
32
16
40
36
20
28
24
12
120
90
140
130
100
110
129.6
33.0
22.6
15.3
17.9
133.1
34.5
23.3
15.2
19.1
138.2
34.1
22.5
15.5
19.6
135.7
34.8
22.9
19.8
132.3
33.6
22.2
15.4 15.4
18.6
AÑOYEAR
HUEVOEGGS
CARNE DE POLLOCHICKEN MEAT
CARNE DE CErdoPORK
CARNE DE BOVINOBEEF
LECHE DE BOVINOCOW MILK (1)
KILOGRAMOS / KILOGRAMS LITROS / L
2016 22.6 33.0 17.9 15.3 129.6
2017 22.2 33.6 18.6 15.4 132.3
2018 22.5 34.1 19.6 15.5 138.2
2019 22.9 34.8 19.8 15.4 135.7
2020 23.3 34.5 19.1 15.2 133.1
LITROS
/ Liters
HUEVO / Egg CARNE DE POLLO / Chicken meat CARNE DE CERDO / Pork CARNE DE BOVINO / Beef LECHE DE BOVINO / Cow milk
2016 2017 2018 2019 2020
KIL
OG
RAM
OS
/ K
ilogr
ams
Main raw materials used by the feed industry in 2020*
Principales materias primas utilizadas por la industria en 2020*
*Estimado/EstimatedFUENTE/SOURCE: ConsejoNacionaldeFabricantesdeAlimentosBalanceadosydelaNutriciónAnimal,A.C.
condatosde/with data from:ANIAME,GCMAySIAVI-SE
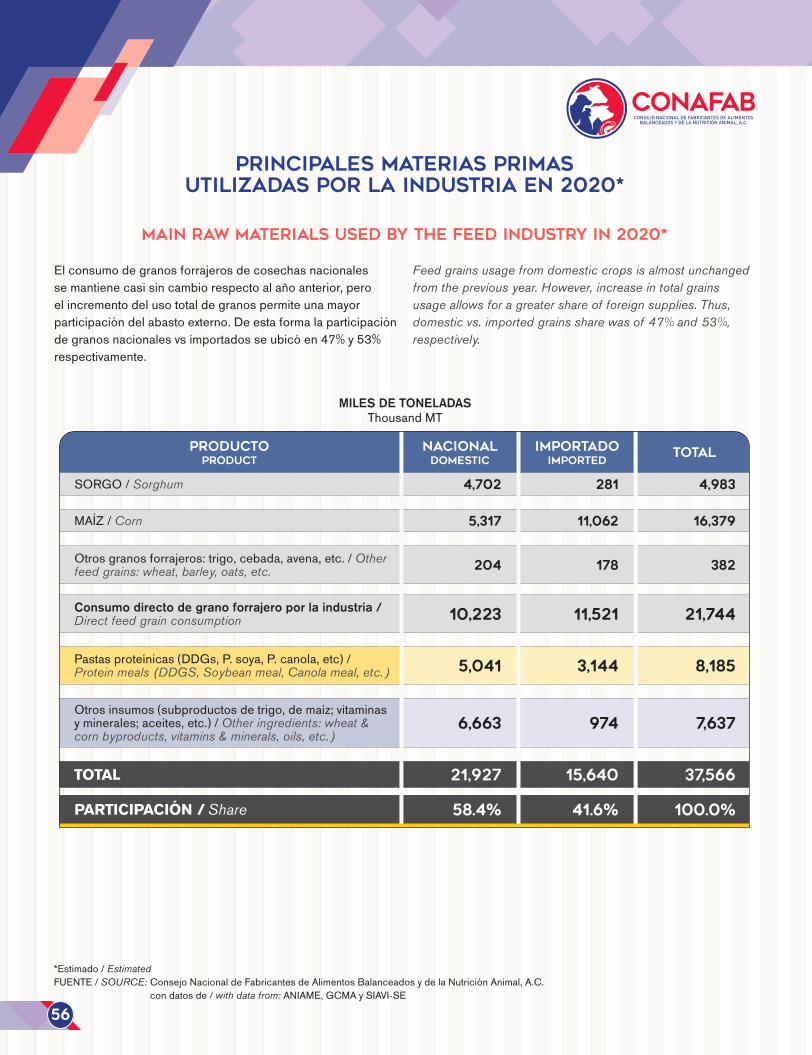
Elconsumodegranosforrajerosdecosechasnacionalessemantienecasisincambiorespectoalañoanterior,peroelincrementodelusototaldegranospermiteunamayorparticipacióndelabastoexterno.Deestaformalaparticipacióndegranosnacionalesvsimportadosseubicóen47%y53%respectivamente.
Feed grains usage from domestic crops is almost unchanged from the previous year. However, increase in total grains usage allows for a greater share of foreign supplies. Thus, domestic vs. imported grains share was of 47% and 53%, respectively.
56
PRODUCTOPRODUCT
NACIONALDOMESTIC
IMPORTADOIMPORTED
TOTAL
SORGO/Sorghum 4,702 281 4,983
MAÍZ/Corn 5,317 11,062 16,379
Otrosgranosforrajeros:trigo,cebada,avena,etc./Other feed grains: wheat, barley, oats, etc. 204 178 382
Consumo directo de grano forrajero por la industria /Direct feed grain consumption 10,223 11,521 21,744
Pastasproteínicas(DDGs,P.soya,P.canola,etc)/Protein meals (DDGS, Soybean meal, Canola meal, etc.) 5,041 3,144 8,185
Otrosinsumos(subproductosdetrigo,demaíz;vitaminasyminerales;aceites,etc.)/Other ingredients: wheat & corn byproducts, vitamins & minerals, oils, etc.)
6,663 974 7,637
TOTAL 21,927 15,640 37,566
PARTICIPACIÓN /Share 58.4% 41.6% 100.0%
MILES DE TONELADASThousandMT
Líderes en el sector de la alimentación animalElocom cuenta con una trayectoria de más de 25 años en el sector del ensacado y paletizado, ofreciendo todo tipo de soluciones. En los últimos años ha logrado ser líder en Europa en el sector del petfood de la mano deUmbra packaging.
www.elocom.com
E N S A C A D O Y P A L E T I Z A C I Ó N
Elocom
*2020Preliminar/PreliminaryFUENTE/SOURCE: ConsejoNacionaldeFabricantesdeAlimentosBalanceadosydelaNutriciónAnimal,A.C.
condatosde/with data from:GCMAySIAVI-SE
Annual imports of MAJOR INGREDIENTS FOR the FEED industry, 2016-2020*
Importación anual de la industria de los principales insumos en 2016-2020*
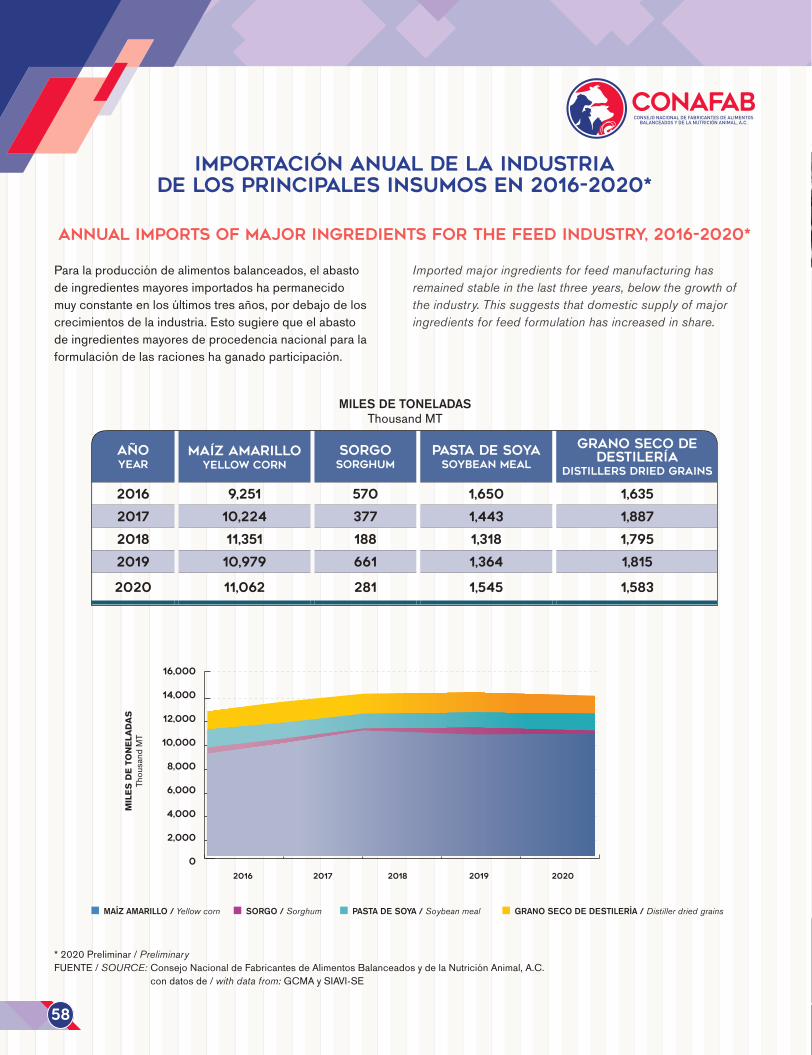
Paralaproduccióndealimentosbalanceados,elabastodeingredientesmayoresimportadoshapermanecidomuyconstanteenlosúltimostresaños,pordebajodeloscrecimientosdelaindustria.Estosugierequeelabastodeingredientesmayoresdeprocedencianacionalparalaformulacióndelasracioneshaganadoparticipación.
Imported major ingredients for feed manufacturing has remained stable in the last three years, below the growth of the industry. This suggests that domestic supply of major ingredients for feed formulation has increased in share.
58
AÑOYEAR
MAÍZ AMARILLOYELLOW CORN
SORGOSORGHUM
PASTA DE SOYASOYBEAN MEAL
GRANO SECO DE DESTILERÍA
DISTILLERS DRIED GRAINS
2016 9,251 570 1,650 1,635
2017 10,224 377 1,443 1,887
2018 11,351 188 1,318 1,795
2019 10,979 661 1,364 1,815
2020 11,062 281 1,545 1,583
0
3000
6000
9000
12000
15000
2016 2017 2018 2019 2020
16,000
14,000
12,000
10,000
8,000
6,000
4,000
2,000
0
MAÍZ AMARILLO / Yellow corn SORGO / Sorghum PASTA DE SOYA / Soybean meal GRANO SECO DE DESTILERÍA / Distiller dried grains
MILES DE TONELADASThousandMT
MIL
ES D
E TO
NEL
ADAS
Thou
sand
MT
Engineering your feed solutions
www.orffa.com - Follow us on � � �
Hector NavarroInternational Technical Manager� +52 155 52172602� [email protected]
Diego PinedaInternational Commercial Manager� +52 55 43688104� [email protected]
Mauricio SantibanezInternational Commercial Manager� +52 1 7771033864� [email protected]
EXCENTIALS TOP SOLUTIONSDiseñado por Orffa
BETA-KEY
SELENIUM 4000 RUMENPASS CH BUTYCOAT ALLIIN PLUS ZINCOAT
ENERGY PLUS SMARTBetaínas
Selenio orgánico:L-Seleniometionina
Colina protegida Butiratos Ajo y canela Óxido de Zinc Microencapsulado
Emulsifi cante Hidroximinerales
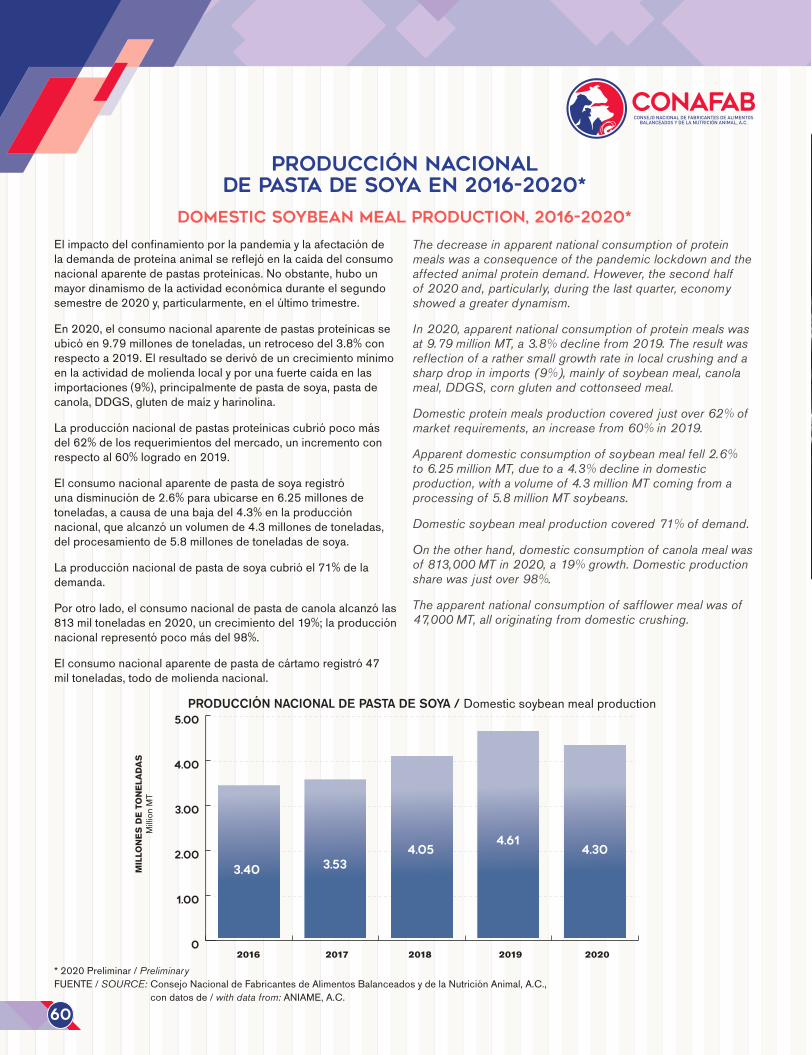
Elimpactodelconfinamientoporlapandemiaylaafectacióndelademandadeproteínaanimalsereflejóenlacaídadelconsumonacionalaparentedepastasproteínicas.Noobstante,hubounmayordinamismodelaactividadeconómicaduranteelsegundosemestrede2020y,particularmente,enelúltimotrimestre.
En2020,elconsumonacionalaparentedepastasproteínicasseubicóen9.79millonesdetoneladas,unretrocesodel3.8%conrespectoa2019.Elresultadosederivódeuncrecimientomínimoenlaactividaddemoliendalocalyporunafuertecaídaenlasimportaciones(9%),principalmentedepastadesoya,pastadecanola,DDGS,glutendemaízyharinolina.
Laproducciónnacionaldepastasproteínicascubriópocomásdel62%delosrequerimientosdelmercado,unincrementoconrespectoal60%logradoen2019.
Elconsumonacionalaparentedepastadesoyaregistróunadisminuciónde2.6%paraubicarseen6.25millonesdetoneladas,acausadeunabajadel4.3%enlaproducciónnacional,quealcanzóunvolumende4.3millonesdetoneladas,delprocesamientode5.8millonesdetoneladasdesoya.
Laproducciónnacionaldepastadesoyacubrióel71%delademanda.
Porotrolado,elconsumonacionaldepastadecanolaalcanzólas813miltoneladasen2020,uncrecimientodel19%;laproducciónnacionalrepresentópocomásdel98%.
Elconsumonacionalaparentedepastadecártamoregistró47miltoneladas,tododemoliendanacional.
The decrease in apparent national consumption of protein meals was a consequence of the pandemic lockdown and the affected animal protein demand. However, the second half of 2020 and, particularly, during the last quarter, economy showed a greater dynamism.
In 2020, apparent national consumption of protein meals was at 9.79 million MT, a 3.8% decline from 2019. The result was reflection of a rather small growth rate in local crushing and a sharp drop in imports (9%), mainly of soybean meal, canola meal, DDGS, corn gluten and cottonseed meal.
Domestic protein meals production covered just over 62% of market requirements, an increase from 60% in 2019.
Apparent domestic consumption of soybean meal fell 2.6% to 6.25 million MT, due to a 4.3% decline in domestic production, with a volume of 4.3 million MT coming from a processing of 5.8 million MT soybeans.
Domestic soybean meal production covered 71% of demand.
On the other hand, domestic consumption of canola meal was of 813,000 MT in 2020, a 19% growth. Domestic production share was just over 98%.
The apparent national consumption of safflower meal was of 47,000 MT, all originating from domestic crushing.
Domestic soybean meal production, 2016-2020*
PRODUCCIÓN NACIONAL DE PASTA DE SOYA en 2016-2020*
*2020Preliminar/PreliminaryFUENTE/SOURCE: ConsejoNacionaldeFabricantesdeAlimentosBalanceadosydelaNutriciónAnimal,A.C.,
condatosde/with data from:ANIAME,A.C.
60
3.43.53 4.05
4.61 4.3
0
1.00
2.00
3.00
4.00
5.00
MIL
LON
ES D
E TO
NEL
ADAS
Milli
onM
T
2016 2017 2018 2019 2020
4.054.61
4.303.533.40
PRODUCCIÓN NACIONAL DE PASTA DE SOYA / Domesticsoybeanmealproduction
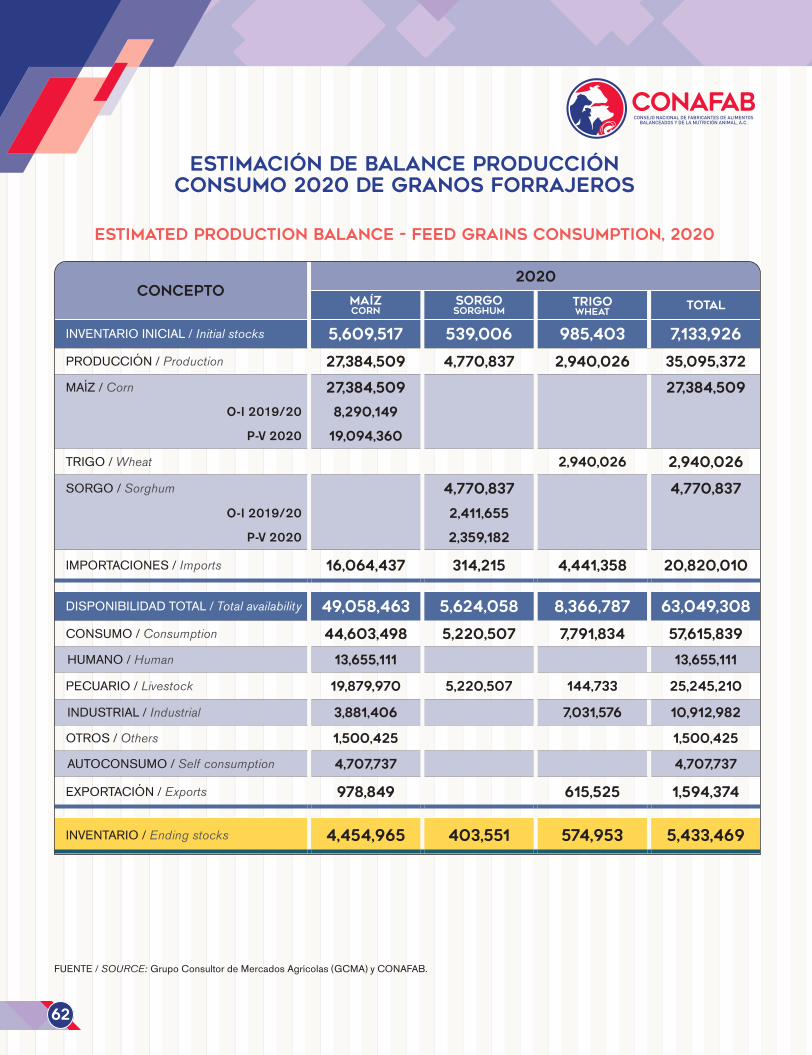
Estimated production balance - Feed grains consumption, 2020
Estimación de Balance Producción Consumo 2020 de Granos Forrajeros
FUENTE/SOURCE: GrupoConsultordeMercadosAgrícolas(GCMA)yCONAFAB.
62
CONCEPTO2020
MAÍZ CORN
SORGO SORGHUM
TRIGO WHEAT
TOTAL
INVENTARIOINICIAL/Initial stocks 5,609,517 539,006 985,403 7,133,926
PRODUCCIÓN/Production 27,384,509 4,770,837 2,940,026 35,095,372
MAÍZ/Corn 27,384,509 27,384,509
O-I 2019/20 8,290,149
P-V 2020 19,094,360
TRIGO/Wheat 2,940,026 2,940,026
SORGO/Sorghum 4,770,837 4,770,837
O-I 2019/20 2,411,655
P-V 2020 2,359,182
IMPORTACIONES/Imports 16,064,437 314,215 4,441,358 20,820,010
DISPONIBILIDADTOTAL/Total availability 49,058,463 5,624,058 8,366,787 63,049,308
CONSUMO/Consumption 44,603,498 5,220,507 7,791,834 57,615,839
HUMANO/Human 13,655,111 13,655,111
PECUARIO/Livestock 19,879,970 5,220,507 144,733 25,245,210
INDUSTRIAL/Industrial 3,881,406 7,031,576 10,912,982
OTROS/Others 1,500,425 1,500,425
AUTOCONSUMO/Self consumption 4,707,737 4,707,737
EXPORTACIÓN/Exports 978,849 615,525 1,594,374
INVENTARIO/Ending stocks 4,454,965 403,551 574,953 5,433,469
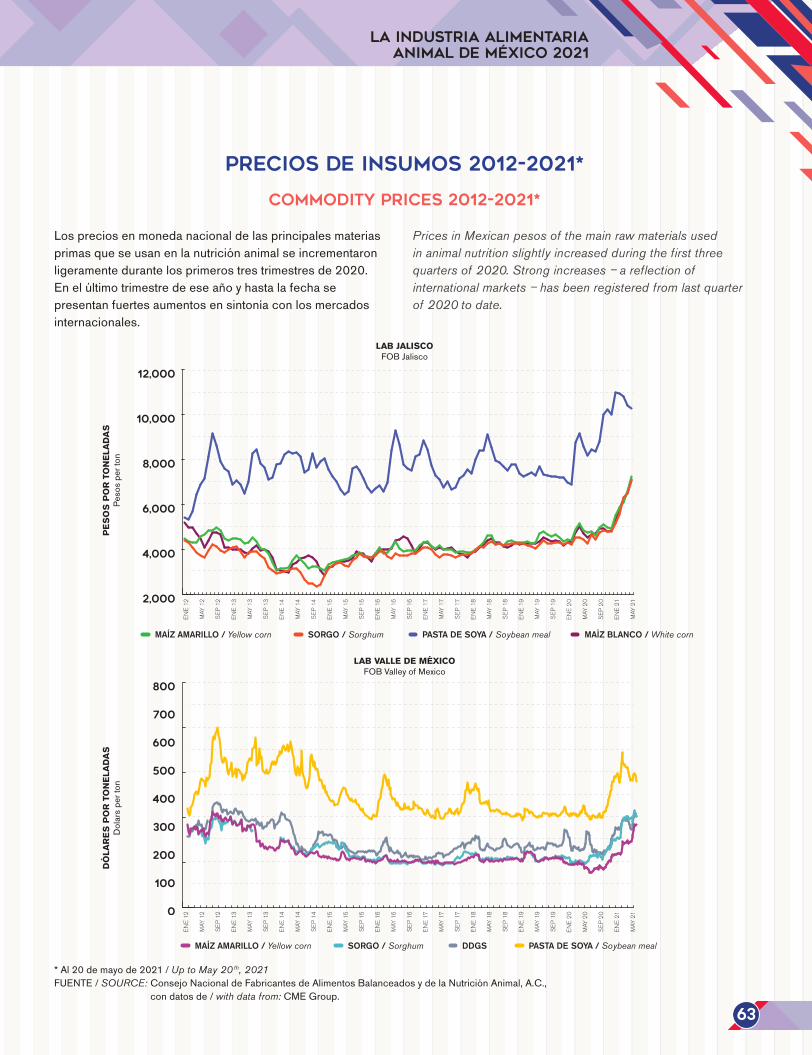
La Industria Alimentaria Animal de México 2021
Lospreciosenmonedanacionaldelasprincipalesmateriasprimasqueseusanenlanutriciónanimalseincrementaronligeramentedurantelosprimerostrestrimestresde2020.Enelúltimotrimestredeeseañoyhastalafechasepresentanfuertesaumentosensintoníaconlosmercadosinternacionales.
Prices in Mexican pesos of the main raw materials used in animal nutrition slightly increased during the first three quarters of 2020. Strong increases – a reflection of international markets – has been registered from last quarter of 2020 to date.
COMMODITY PRICES 2012-2021*
PRECIOS DE INSUMOS 2012-2021*
*Al20demayode2021/Up to May 20 th, 2021FUENTE/SOURCE: ConsejoNacionaldeFabricantesdeAlimentosBalanceadosydelaNutriciónAnimal,A.C.,
condatosde/with data from:CMEGroup.
63
2,000
4,000
6,000
8,000
10,000
12,000
2,000
4,000
6,000
8,000
10,000
12,000
ENE
12
MAY
12
SEP
12
ENE
13
MAY
13
SEP
13
ENE
14
MAY
14
SEP
14
ENE
15
MAY
15
SEP
15
ENE
16
MAY
16
SEP
16
ENE
17
MAY
17
SEP
17
ENE
18
MAY
18
SEP
18
ENE
19
MAY
19
SEP
19
ENE
20
MAY
20
SEP
20
ENE
21
MAY
21
ENE
12
MAY
12
SEP
12
ENE
13
MAY
13
SEP
13
ENE
14
MAY
14
SEP
14
ENE
15
MAY
15
SEP
15
ENE
16
MAY
16
SEP
16
ENE
17
MAY
17
SEP
17
ENE
18
MAY
18
SEP
18
ENE
19
MAY
19
SEP
19
ENE
20
MAY
20
SEP
20
ENE
21
MAY
21
MAÍZ AMARILLO / Yellow corn SORGO / Sorghum PASTA DE SOYA / Soybean meal MAÍZ BLANCO / White corn
MAÍZ AMARILLO / Yellow corn SORGO / Sorghum DDGS PASTA DE SOYA / Soybean meal
LAB VALLE DE MÉXICOFOBValleyofMexico
PES
OS
PO
R T
ON
ELAD
ASPe
sos
pert
onD
ÓLA
RES
PO
R T
ON
ELAD
ASD
olar
spe
rton
LAB JALISCOFOBJalisco
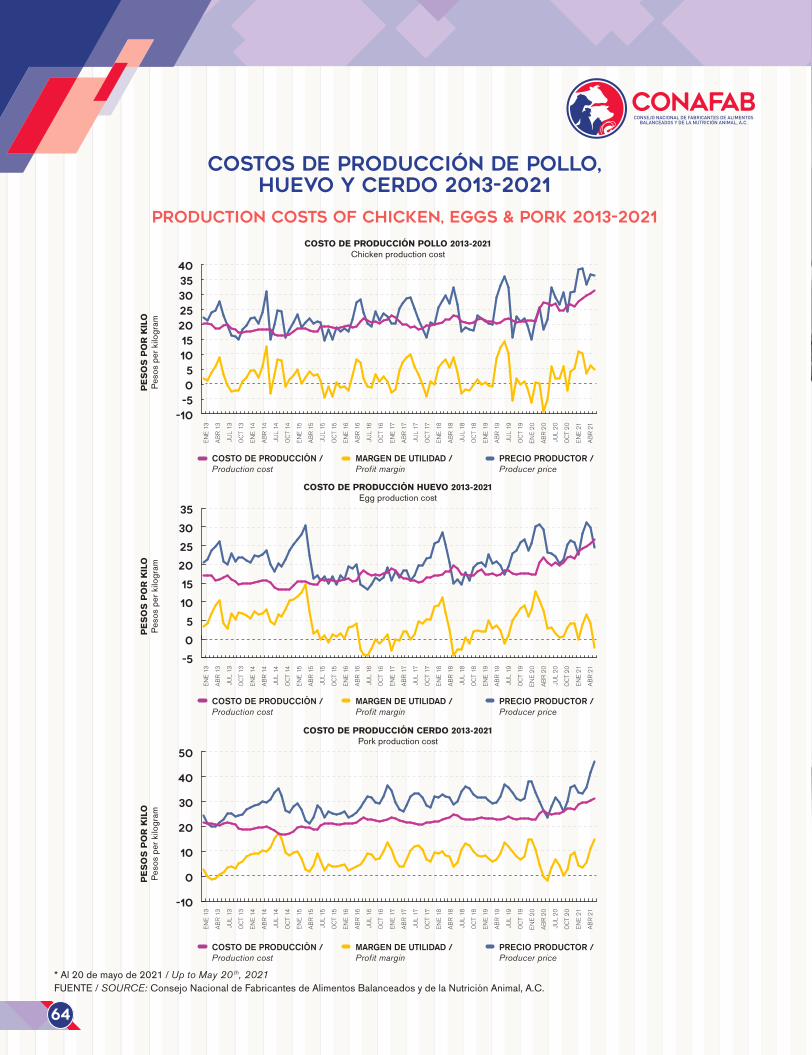
*Al20demayode2021/Up to May 20 th, 2021FUENTE/SOURCE: ConsejoNacionaldeFabricantesdeAlimentosBalanceadosydelaNutriciónAnimal,A.C.
Production Costs of Chicken, EggS & Pork 2013-2021
COSTOS DE PRODUCCIÓN DE POLLO, HUEVO Y CERDO 2013-2021
64
ENE
13
ABR
13
JUL
13
OCT
13
ENE
14
ABR
14
JUL
14
OCT
14
ENE
15
ABR
15
JUL
15
OCT
15
ENE
16
ABR
16
JUL
16
OCT
16
ENE
17
ABR
17
JUL
17
OCT
17
ENE
18
ABR
18
JUL
18
OCT
18
ENE
19
ABR
19
JUL
19
OCT
19
ENE
20
ABR
20
JUL
20
OCT
20
ENE
21
ABR
21
-10-505
10152025303540
-5
0
5
10
15
20
25
30
35
-10
0
10
20
30
40
50
ENE
13
ABR
13
JUL
13
OCT
13
ENE
14
ABR
14
JUL
14
OCT
14
ENE
15
ABR
15
JUL
15
OCT
15
ENE
16
ABR
16
JUL
16
OCT
16
ENE
17
ABR
17
JUL
17
OCT
17
ENE
18
ABR
18
JUL
18
OCT
18
ENE
19
ABR
19
JUL
19
OCT
19
ENE
20
ABR
20
JUL
20
OCT
20
ENE
21
ABR
21
-10-505
10152025303540
-5
0
5
10
15
20
25
30
35
-10
0
10
20
30
40
50
COSTO DE PRODUCCIÓN HUEVO 2013-2021Eggproductioncost
COSTO DE PRODUCCIÓN CERDO 2013-2021Porkproductioncost
PES
OS
PO
R K
ILO
Peso
spe
rkilo
gram
PES
OS
PO
R K
ILO
Peso
spe
rkilo
gram
COSTO DE PRODUCCIÓN / Production cost
MARGEN DE UTILIDAD / Profit margin
PRECIO PRODUCTOR / Producer price
COSTO DE PRODUCCIÓN / Production cost
MARGEN DE UTILIDAD / Profit margin
PRECIO PRODUCTOR / Producer price
COSTO DE PRODUCCIÓN / Production cost
MARGEN DE UTILIDAD / Profit margin
PRECIO PRODUCTOR / Producer price
-10-505
10152025303540
-5
0
5
10
15
20
25
30
35
-10
0
10
20
30
40
50
ENE
13
ABR
13
JUL
13
OCT
13
ENE
14
ABR
14
JUL
14
OCT
14
ENE
15
ABR
15
JUL
15
OCT
15
ENE
16
ABR
16
JUL
16
OCT
16
ENE
17
ABR
17
JUL
17
OCT
17
ENE
18
ABR
18
JUL
18
OCT
18
ENE
19
ABR
19
JUL
19
OCT
19
ENE
20
ABR
20
JUL
20
OCT
20
ENE
21
ABR
21
PES
OS
PO
R K
ILO
Peso
spe
rkilo
gram
COSTO DE PRODUCCIÓN POLLO 2013-2021Chickenproductioncost
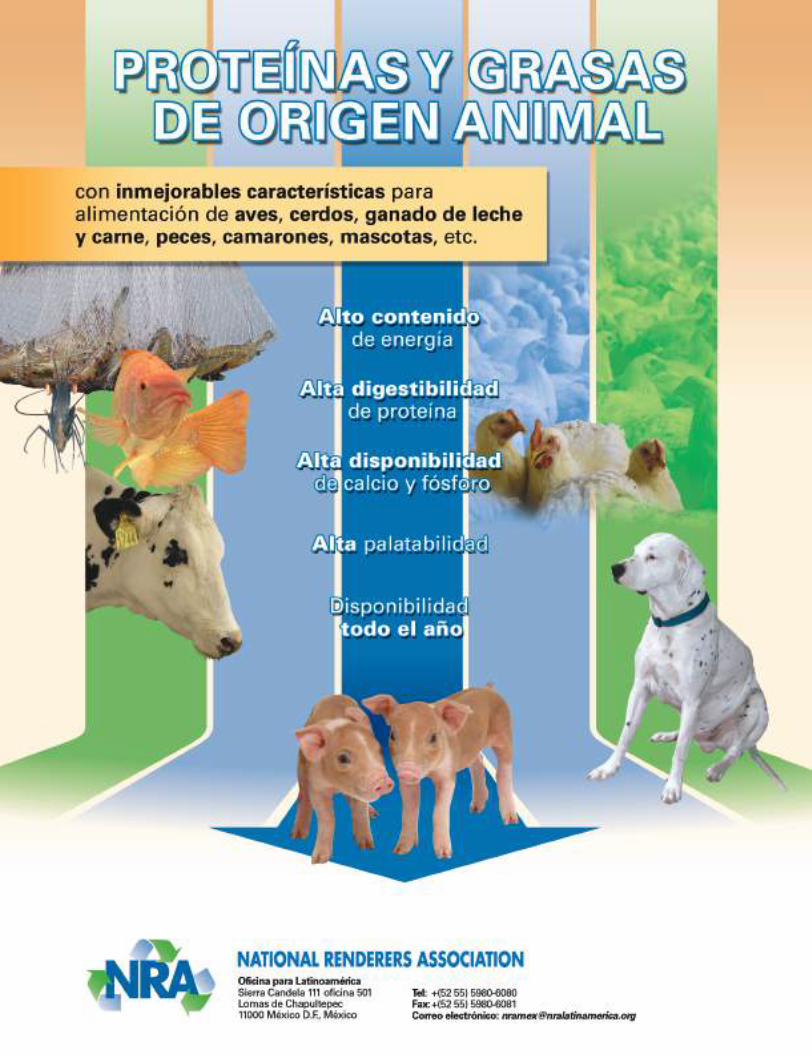
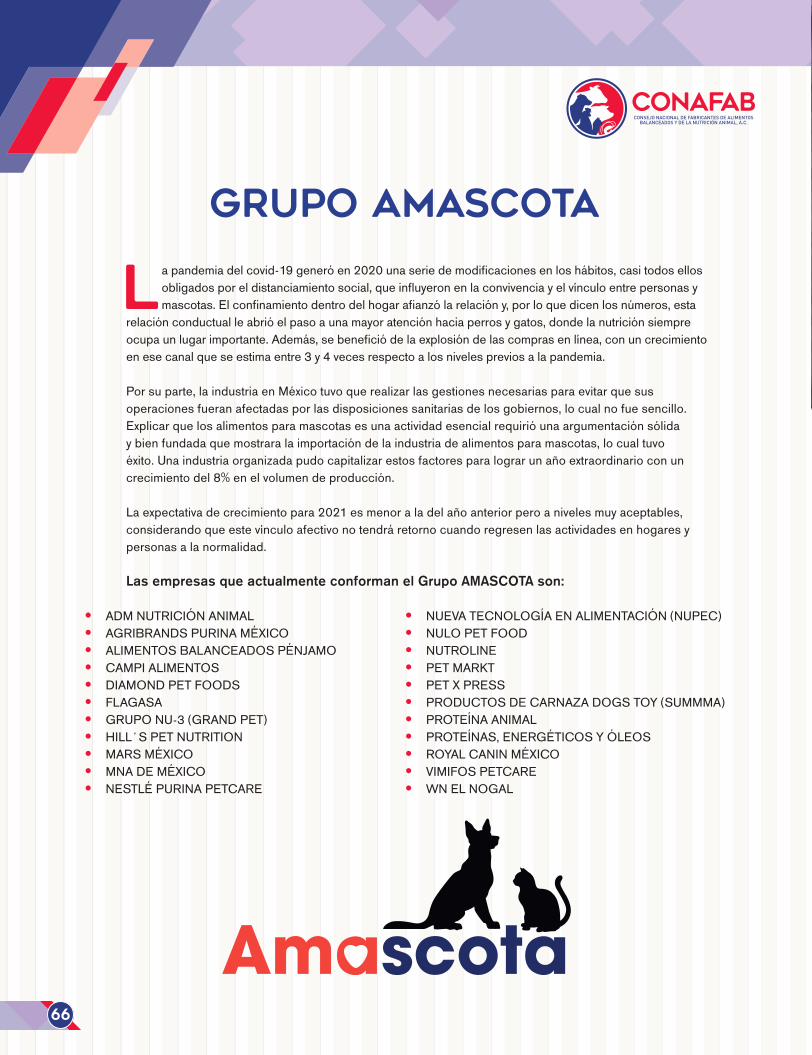
GRUPO AMASCOTA
Lapandemiadelcovid-19generóen2020unaseriedemodificacionesenloshábitos,casitodosellosobligadosporeldistanciamientosocial,queinfluyeronenlaconvivenciayelvínculoentrepersonasymascotas.Elconfinamientodentrodelhogarafianzólarelacióny,porloquedicenlosnúmeros,esta
relaciónconductualleabrióelpasoaunamayoratenciónhaciaperrosygatos,dondelanutriciónsiempreocupaunlugarimportante.Además,sebeneficiódelaexplosióndelascomprasenlínea,conuncrecimientoenesecanalqueseestimaentre3y4vecesrespectoalosnivelespreviosalapandemia.
Porsuparte,laindustriaenMéxicotuvoquerealizarlasgestionesnecesariasparaevitarquesusoperacionesfueranafectadasporlasdisposicionessanitariasdelosgobiernos,locualnofuesencillo.Explicarquelosalimentosparamascotasesunaactividadesencialrequirióunaargumentaciónsólidaybienfundadaquemostraralaimportacióndelaindustriadealimentosparamascotas,locualtuvoéxito.Unaindustriaorganizadapudocapitalizarestosfactoresparalograrunañoextraordinarioconuncrecimientodel8%enelvolumendeproducción.
Laexpectativadecrecimientopara2021esmenoraladelañoanteriorperoanivelesmuyaceptables,considerandoqueestevínculoafectivonotendráretornocuandoregresenlasactividadesenhogaresypersonasalanormalidad.
Las empresas que actualmente conforman el Grupo AMASCOTA son:
• ADMNUTRICIÓNANIMAL• AGRIBRANDSPURINAMÉXICO• ALIMENTOSBALANCEADOSPÉNJAMO• CAMPIALIMENTOS• DIAMONDPETFOODS• FLAGASA• GRUPONU-3(GRANDPET)• HILL´SPETNUTRITION• MARSMÉXICO• MNADEMÉXICO• NESTLÉPURINAPETCARE
• NUEVATECNOLOGÍAENALIMENTACIÓN(NUPEC)• NULOPETFOOD• NUTROLINE• PETMARKT• PETXPRESS• PRODUCTOSDECARNAZADOGSTOY(SUMMMA)• PROTEÍNAANIMAL• PROTEÍNAS,ENERGÉTICOSYÓLEOS• ROYALCANINMÉXICO• VIMIFOSPETCARE• WNELNOGAL
66
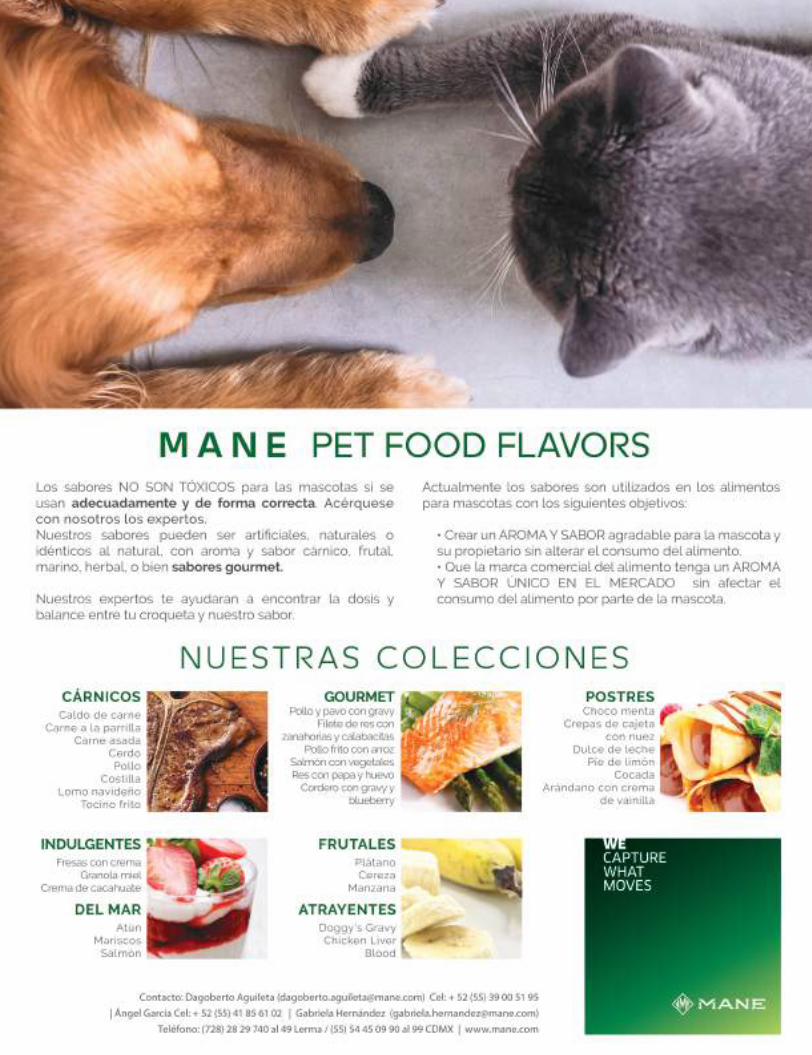
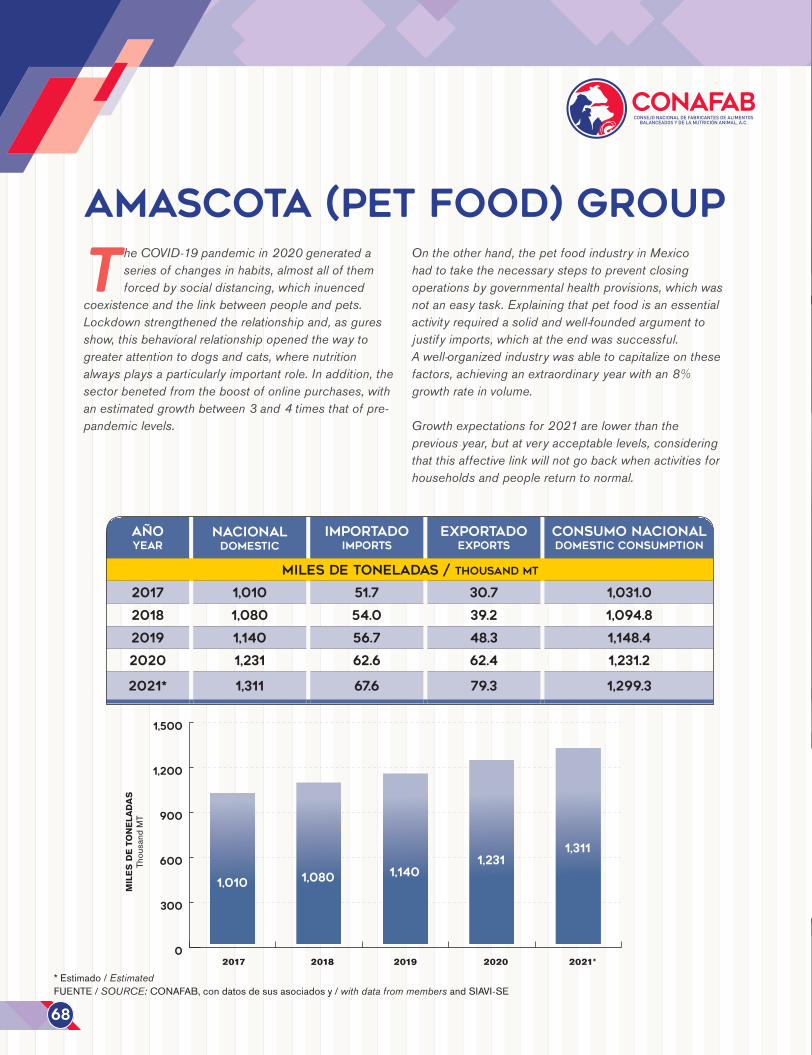
*Estimado/EstimatedFUENTE/SOURCE: CONAFAB,condatosdesusasociadosy/with data from membersandSIAVI-SE
T he COVID-19 pandemic in 2020 generated a series of changes in habits, almost all of them forced by social distancing, which influenced
coexistence and the link between people and pets. Lockdown strengthened the relationship and, as figures show, this behavioral relationship opened the way to greater attention to dogs and cats, where nutrition always plays a particularly important role. In addition, the sector benefited from the boost of online purchases, with an estimated growth between 3 and 4 times that of pre-pandemic levels.
On the other hand, the pet food industry in Mexico had to take the necessary steps to prevent closing operations by governmental health provisions, which was not an easy task. Explaining that pet food is an essential activity required a solid and well-founded argument to justify imports, which at the end was successful. A well-organized industry was able to capitalize on these factors, achieving an extraordinary year with an 8% growth rate in volume.
Growth expectations for 2021 are lower than the previous year, but at very acceptable levels, considering that this affective link will not go back when activities for households and people return to normal.
AMASCOTA (pet food) GROUP
68
AÑOYEAR
NACIONALDOMESTIC
IMPORTADOIMPORTS
EXPORTADOEXPORTS
CONSUMO NACIONALDOMESTIC CONSUMPTION
MILES DE TONELADAS / Thousand MT
2017 1,010 51.7 30.7 1,031.0
2018 1,080 54.0 39.2 1,094.8
2019 1,140 56.7 48.3 1,148.4
2020 1,231 62.6 62.4 1,231.2
2021* 1,311 67.6 79.3 1,299.3
0
300
600
900
1,200
1,500
2017 2018 2019 2020 2021*
MIL
ES D
E TO
NEL
ADAS
Thou
sand
MT
1,010 1,080 1,1401,231
1,311
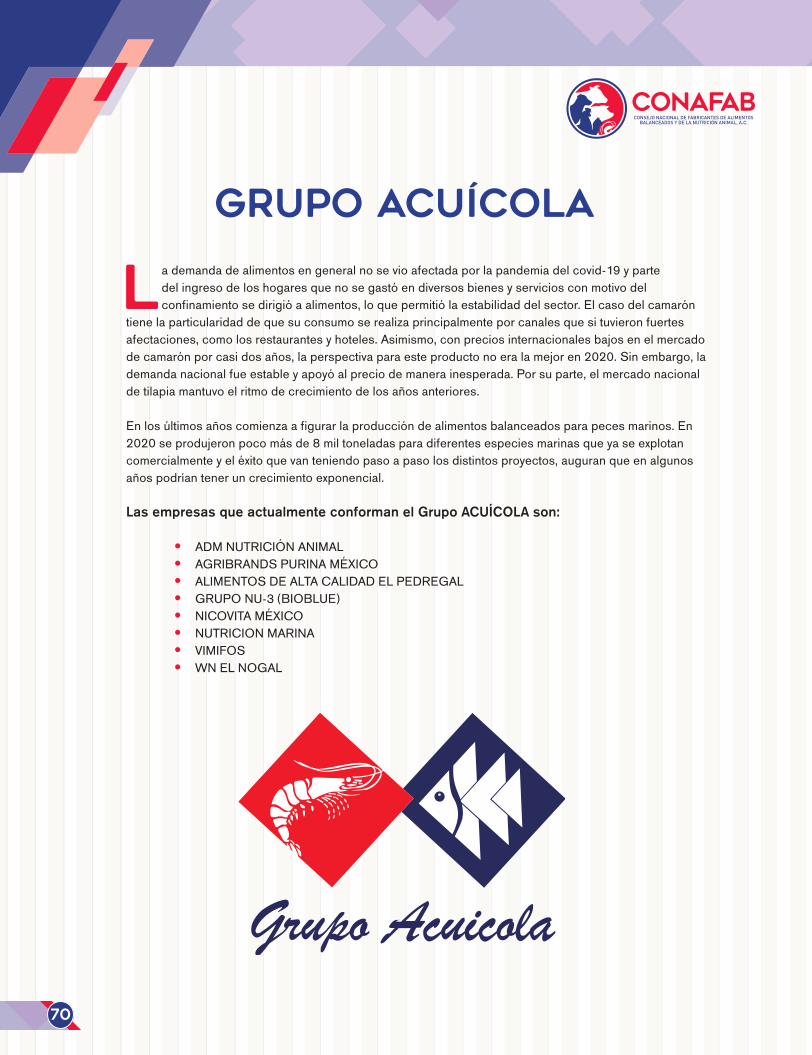
GRUPO ACUÍCOLA
Lademandadealimentosengeneralnosevioafectadaporlapandemiadelcovid-19ypartedelingresodeloshogaresquenosegastóendiversosbienesyserviciosconmotivodelconfinamientosedirigióaalimentos,loquepermitiólaestabilidaddelsector.Elcasodelcamarón
tienelaparticularidaddequesuconsumoserealizaprincipalmenteporcanalesquesituvieronfuertesafectaciones,comolosrestaurantesyhoteles.Asimismo,conpreciosinternacionalesbajosenelmercadodecamarónporcasidosaños,laperspectivaparaesteproductonoeralamejoren2020.Sinembargo,lademandanacionalfueestableyapoyóalpreciodemanerainesperada.Porsuparte,elmercadonacionaldetilapiamantuvoelritmodecrecimientodelosañosanteriores.
Enlosúltimosañoscomienzaafigurarlaproduccióndealimentosbalanceadosparapecesmarinos.En2020seprodujeronpocomásde8miltoneladasparadiferentesespeciesmarinasqueyaseexplotancomercialmenteyeléxitoquevanteniendopasoapasolosdistintosproyectos,auguranqueenalgunosañospodríanteneruncrecimientoexponencial.
Las empresas que actualmente conforman el Grupo ACUÍCOLA son:
• ADMNUTRICIÓNANIMAL• AGRIBRANDSPURINAMÉXICO• ALIMENTOSDEALTACALIDADELPEDREGAL• GRUPONU-3(BIOBLUE)• NICOVITAMÉXICO• NUTRICIONMARINA• VIMIFOS• WNELNOGAL
70
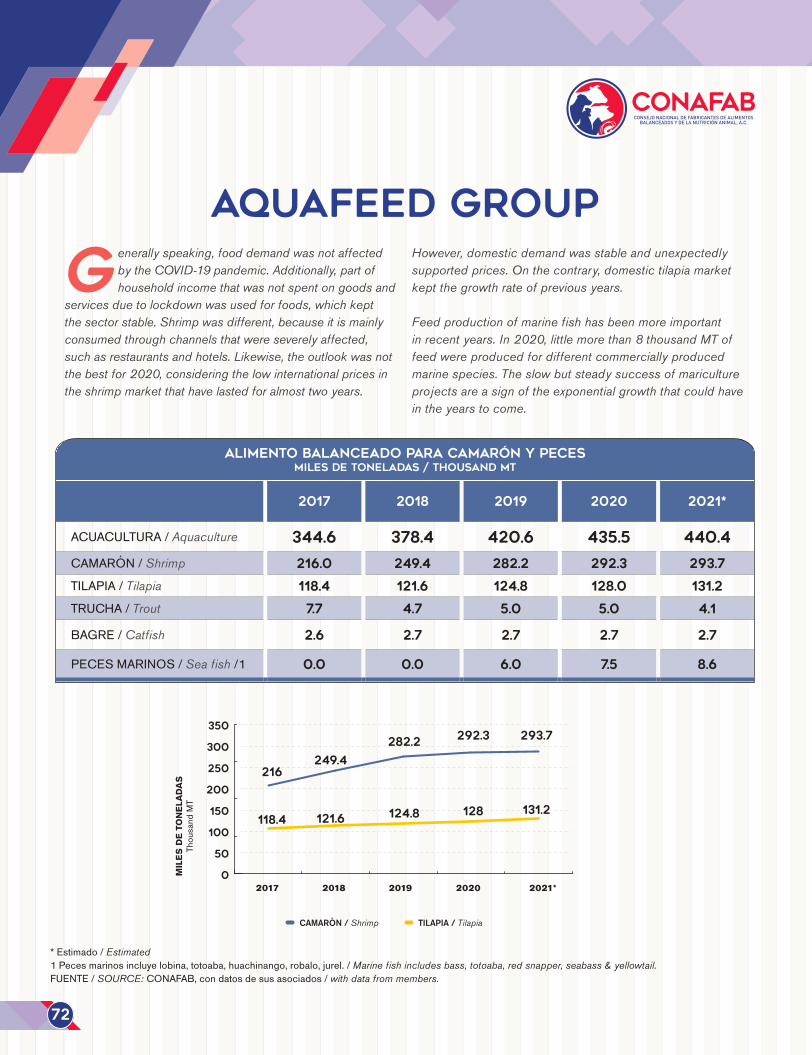
*Estimado/Estimated1Pecesmarinosincluyelobina,totoaba,huachinango,robalo,jurel./Marine fish includes bass, totoaba, red snapper, seabass & yellowtail.FUENTE/SOURCE: CONAFAB,condatosdesusasociados/with data from members.
G enerally speaking, food demand was not affected by the COVID-19 pandemic. Additionally, part of household income that was not spent on goods and
services due to lockdown was used for foods, which kept the sector stable. Shrimp was different, because it is mainly consumed through channels that were severely affected, such as restaurants and hotels. Likewise, the outlook was not the best for 2020, considering the low international prices in the shrimp market that have lasted for almost two years.
However, domestic demand was stable and unexpectedly supported prices. On the contrary, domestic tilapia market kept the growth rate of previous years.
Feed production of marine fish has been more important in recent years. In 2020, little more than 8 thousand MT of feed were produced for different commercially produced marine species. The slow but steady success of mariculture projects are a sign of the exponential growth that could have in the years to come.
AQUAfEEd GROUP
72
ALIMENTO BALANCEADO PARA CAMARÓN Y PECESMILES DE TONELADAS / Thousand MT
2017 2018 2019 2020 2021*
ACUACULTURA/Aquaculture 344.6 378.4 420.6 435.5 440.4
CAMARÓN/Shrimp 216.0 249.4 282.2 292.3 293.7
TILAPIA/Tilapia 118.4 121.6 124.8 128.0 131.2
TRUCHA/Trout 7.7 4.7 5.0 5.0 4.1
BAGRE/Catfish 2.6 2.7 2.7 2.7 2.7
PECESMARINOS/Sea fish/1 0.0 0.0 6.0 7.5 8.6
MIL
ES D
E TO
NEL
ADAS
Thou
sand
MT
100
150
200
250
300
CAMARÓN / Shrimp TILAPIA / Tilapia
2017 2018 2019 2020 2021*
216
118.4
249.4
121.6
282.2
124.8
292.3
128
293.7
131.2
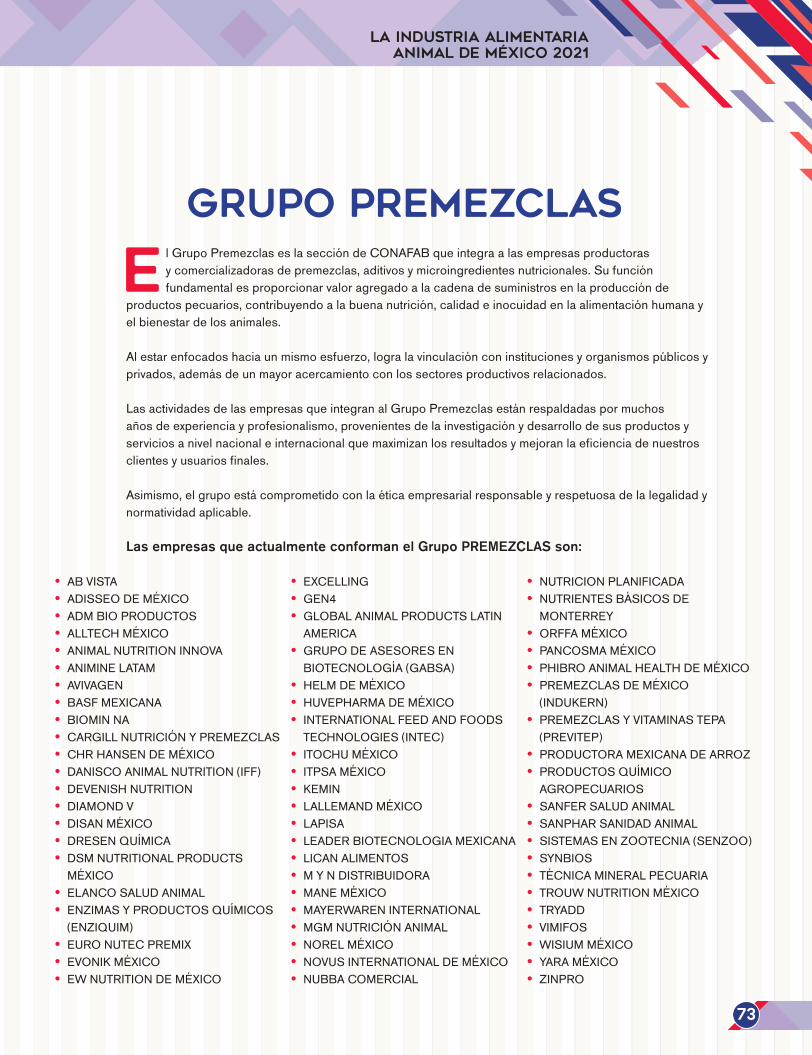
La Industria Alimentaria Animal de México 2021
GRUPO Premezclas
ElGrupoPremezclaseslaseccióndeCONAFABqueintegraalasempresasproductorasycomercializadorasdepremezclas,aditivosymicroingredientesnutricionales.Sufunciónfundamentalesproporcionarvaloragregadoalacadenadesuministrosenlaproducciónde
productospecuarios,contribuyendoalabuenanutrición,calidadeinocuidadenlaalimentaciónhumanayelbienestardelosanimales.
Alestarenfocadoshaciaunmismoesfuerzo,logralavinculaciónconinstitucionesyorganismospúblicosyprivados,ademásdeunmayoracercamientoconlossectoresproductivosrelacionados.
LasactividadesdelasempresasqueintegranalGrupoPremezclasestánrespaldadaspormuchosañosdeexperienciayprofesionalismo,provenientesdelainvestigaciónydesarrollodesusproductosyserviciosanivelnacionaleinternacionalquemaximizanlosresultadosymejoranlaeficienciadenuestrosclientesyusuariosfinales.
Asimismo,elgrupoestácomprometidoconlaéticaempresarialresponsableyrespetuosadelalegalidadynormatividadaplicable.
Las empresas que actualmente conforman el Grupo PREMEZCLAS son:
• ABVISTA• ADISSEODEMÉXICO• ADMBIOPRODUCTOS• ALLTECHMÉXICO• ANIMALNUTRITIONINNOVA• ANIMINELATAM• AVIVAGEN• BASFMEXICANA• BIOMINNA• CARGILLNUTRICIÓNYPREMEZCLAS• CHRHANSENDEMÉXICO• DANISCOANIMALNUTRITION(IFF)• DEVENISHNUTRITION• DIAMONDV• DISANMÉXICO• DRESENQUÍMICA• DSMNUTRITIONALPRODUCTS
MÉXICO• ELANCOSALUDANIMAL• ENZIMASYPRODUCTOSQUÍMICOS
(ENZIQUIM)• EURONUTECPREMIX• EVONIKMÉXICO• EWNUTRITIONDEMÉXICO
• EXCELLING• GEN4• GLOBALANIMALPRODUCTSLATIN
AMERICA• GRUPODEASESORESEN
BIOTECNOLOGÍA(GABSA)• HELMDEMÉXICO• HUVEPHARMADEMÉXICO• INTERNATIONALFEEDANDFOODS
TECHNOLOGIES(INTEC)• ITOCHUMÉXICO• ITPSAMÉXICO• KEMIN• LALLEMANDMÉXICO• LAPISA• LEADERBIOTECNOLOGIAMEXICANA• LICANALIMENTOS• MYNDISTRIBUIDORA• MANEMÉXICO• MAYERWARENINTERNATIONAL• MGMNUTRICIÓNANIMAL• NORELMÉXICO• NOVUSINTERNATIONALDEMÉXICO• NUBBACOMERCIAL
• NUTRICIONPLANIFICADA• NUTRIENTESBÁSICOSDE
MONTERREY• ORFFAMÉXICO• PANCOSMAMÉXICO• PHIBROANIMALHEALTHDEMÉXICO• PREMEZCLASDEMÉXICO
(INDUKERN)• PREMEZCLASYVITAMINASTEPA
(PREVITEP)• PRODUCTORAMEXICANADEARROZ• PRODUCTOSQUÍMICO
AGROPECUARIOS• SANFERSALUDANIMAL• SANPHARSANIDADANIMAL• SISTEMASENZOOTECNIA(SENZOO)• SYNBIOS• TÉCNICAMINERALPECUARIA• TROUWNUTRITIONMÉXICO• TRYADD• VIMIFOS• WISIUMMÉXICO• YARAMÉXICO• ZINPRO
73
T he Premixes Group is the CONAFAB section integrating companies that manufacture and market feed premixes, additives, and micro-ingredients. This section’s basic function is to provide added value to the supply chain in the production of animal products, contributing to good nutrition, quality, and food
safety, as well as animal welfare.
Since members are focused towards the same efforts, they are all linked with institutions and public and private agencies, as well as developing closer ties with associated productive sectors.
The activities of the companies comprising the Premix Group are backed by many years of experience and professional work, from research and development of their products and services at national and international level, to maximizing results and improving efficiency of customers and end users.
Likewise, the group is also committed to responsible business ethics and respect of applicable laws and regulations.
Premixes Group
74
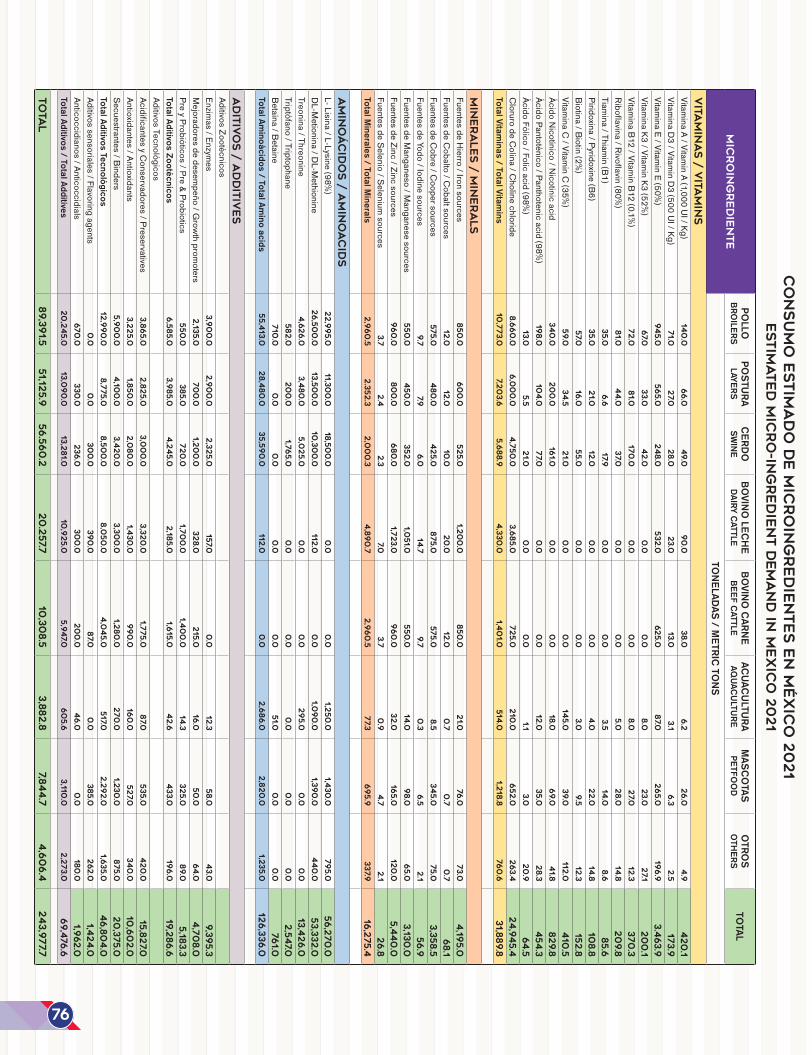
CO
NSU
MO
ESTIM
AD
O D
E M
ICR
OIN
GR
ED
IEN
TES E
N M
ÉX
ICO
20
21
Estim
ated
mic
ro
-ing
red
ien
t d
em
an
d in
Mex
ico
20
21
MIC
RO
ING
RED
IEN
TE
POLLO
BRO
ILERSPO
STURA LAYERS
CERDO
SW
INEBO
VINO LEC
HE
DAIRY CATTLE
BOVINO
CARNE
BEEF CATTLE
ACUAC
ULTURA AQ
UACULTURE
MASC
OTAS
PETFOO
DO
TROS
OTH
ERSTO
TAL
TONELADAS / M
ETRIC TO
NSV
ITAM
INA
S / V
ITAM
INS
VitaminaA/Vitam
inA(1,000UI/Kg)14
0.0
66.0
49.0
90
.038.0
6.2
26.0
4.9
420
.1Vitam
inaD3/Vitam
inD3(500UI/Kg)
71.0
27.0
28.0
23.0
13.0
3.1
6.3
2.5
173.9
VitaminaE/Vitam
inE(50%)
945.0
565.0
248.0
532.0
625.0
87.0
265.0
196.9
3.4
63.9
VitaminaK3/Vitam
inK3(52%)
67.0
33.0
42.0
0.0
0.0
8.0
23.0
27.1
20
0.1
VitaminaB12/Vitam
inB12(0.1%)
72.0
81.0
170
.00
.00
.08.0
27.0
12.3
370
.3Riboflavina/Rivoflavin(80%
)81.0
44.0
37.0
0.0
0.0
5.0
28.0
14.8
20
9.8
Tiamina/Thiam
in(B1)35.0
6.6
17.90
.00
.03.5
14.0
8.6
85.6
Piridoxina/Pyridoxine(B6)35.0
21.0
12.0
0.0
0.0
4.0
22.0
14.8
108.8
Biotina/Biotin(2%)
57.0
16.0
55.0
0.0
0.0
3.0
9.5
12.3
152.8
VitaminaC
/VitaminC
(35%)
59.0
34.5
21.0
0.0
0.0
145.0
39.0
112.0
410
.5ÁcidoN
icotínico/Nicotinicacid
340
.020
0.0
161.0
0.0
0.0
18.0
69.0
41.8
829.8
ÁcidoPantoténico/Panthotenicacid(98%)
198.0
104.0
77.0
0.0
0.0
12.0
35.0
28.3
454.3
ÁcidoFólico/Folicacid(98%)
13.0
5.5
21.0
0.0
0.0
1.13.0
20
.964.5
ClorurodeC
olina/Cholinechloride
8.6
60
.06,0
00
.04,7
50
.03,6
85.0
725.0
210
.0652.0
263.4
24,9
45.4
Total Vitaminas / Total Vitam
ins10
,773.0
7,20
3.6
5,6
88.9
4,3
30
.01,4
01.0
514
.01,2
18.8
760
.631,8
89.8
MIN
ER
ALES / M
INER
ALS
FuentesdeHierro/Ironsources
850
.060
0.0
525.0
1,20
0.0
850
.021.0
76.0
73.0
4,19
5.0
FuentesdeCobalto/C
obaltsources12
.012
.010
.020
.012
.00
.70
.70
.768.1
FuentesdeCobre/C
oopersources575.0
480
.0425.0
875.0
575.0
8.5
345.0
75.0
3,3
58.5
FuentesdeYodo/Iodinesources9.7
7.96.0
14.7
9.7
0.3
6.5
2.1
56.9
FuentesdeManganeso/M
anganesesources550
.0450
.0352.0
1,051.0
550
.014
.098.0
65.0
3,13
0.0
FuentesdeZinc/Zincsources960
.080
0.0
680
.01,7
23.0
960
.032.0
165.0
120
.05,4
40
.0FuentesdeSelenio/Selenium
sources3.7
2.4
2.3
7.03.7
0.9
4.7
2.1
26.8
Total Minerales / Total M
inerals2,9
60
.52.3
52.3
2,0
00
.34,8
90
.72,9
60
.577.3
695.9
337.9
16,2
75.4
AM
INO
ÁC
IDO
S / A
MIN
OA
CID
SL-Lisina/L-Lysine(98%
)22,9
95.0
11,30
0.0
18,5
00
.00
.00
.01,2
50
.01,4
30
.0795.0
56,2
70
.0D
L-Metionina/D
L-Methionine
26,5
00
.013
,50
0.0
10,3
00
.0112
.00
.01,0
90
.01,3
90
.0440
.053,3
32.0
Treonina/Threonine4,6
26.0
3,4
80
.05,0
25.0
0.0
0.0
295.0
0.0
0.0
13,4
26.0
Triptófano/Triptophane582.0
20
0.0
1,765.0
0.0
0.0
0.0
0.0
0.0
2,5
47.0
Betaína/Betaine710
.00
.00
.00
.00
.051.0
0.0
0.0
761.0
Total Aminoácidos / Total Am
ino acids55,4
13.0
28,4
80
.035,5
90
.0112
.00
.02,6
86.0
2,8
20
.01,2
35.0
126,3
36.0
AD
ITIV
OS / A
DD
ITIV
ES
AditivosZootécnicosEnzim
as/Enzymes
3,9
00
.02,9
00
.02,3
25.0
157.0
0.0
12.3
58.0
43.0
9,3
95.3
Mejoradoresdedesem
peño/Grow
thpromoters
2,13
5.0
70
0.0
1,20
0.0
328.0
215
.016
.050
.064.0
4,7
08.0
PreyProbióticos/Pre&Probiotics550
.0385.0
720
.01,7
00
.01,4
00
.014
.3325.0
89.0
5,18
3.3
Total Aditivos Zootécnicos6,5
85.0
3,9
85.0
4,2
45.0
2,18
5.0
1,615
.042.6
433.0
196.0
19,2
86.6
AditivosTecnológicosAcidificantesyC
onservadores/Preservatives3,8
65.0
2,8
25.0
3,0
00
.03,3
20
.01,7
75.0
87.0
535.0
420
.015
,827.0
Antioxidantes/Antioxidants3,2
25.0
1,850
.02,0
80
.01,4
30
.0990
.016
0.0
527.0
340
.010
,60
2.0
Secuestrantes/Binders5,9
00
.04,10
0.0
3,4
20
.03,3
00
.01,2
80
.0270
.01,2
30
.0875.0
20
,375.0
Total Aditivos Tecnológicos12
,990
.08,7
75.0
8,5
00
.08,0
50
.04,0
45.0
517.0
2,2
92.0
1,635.0
46,8
04.0
Aditivossensoriales/Flavoringagents0
.00
.030
0.0
390
.087.0
0.0
385.0
262.0
1,424.0
Anticoccidianos/Anticoccidials670
.0330
.0236.0
30
0.0
20
0.0
46.0
0.0
180
.01,9
62.0
Total Aditivos / Total Additives20
,245.0
13,0
90
.013
,281.0
10,9
25.0
5,9
47.0
60
5.6
3,110
.02,2
73.0
69,4
76.6
TO
TAL
89,3
91.5
51,12
5.9
56.5
60
.220
.257.7
10,3
08.5
3,8
82.8
7,844.7
4,6
06.4
243,9
77.7
76
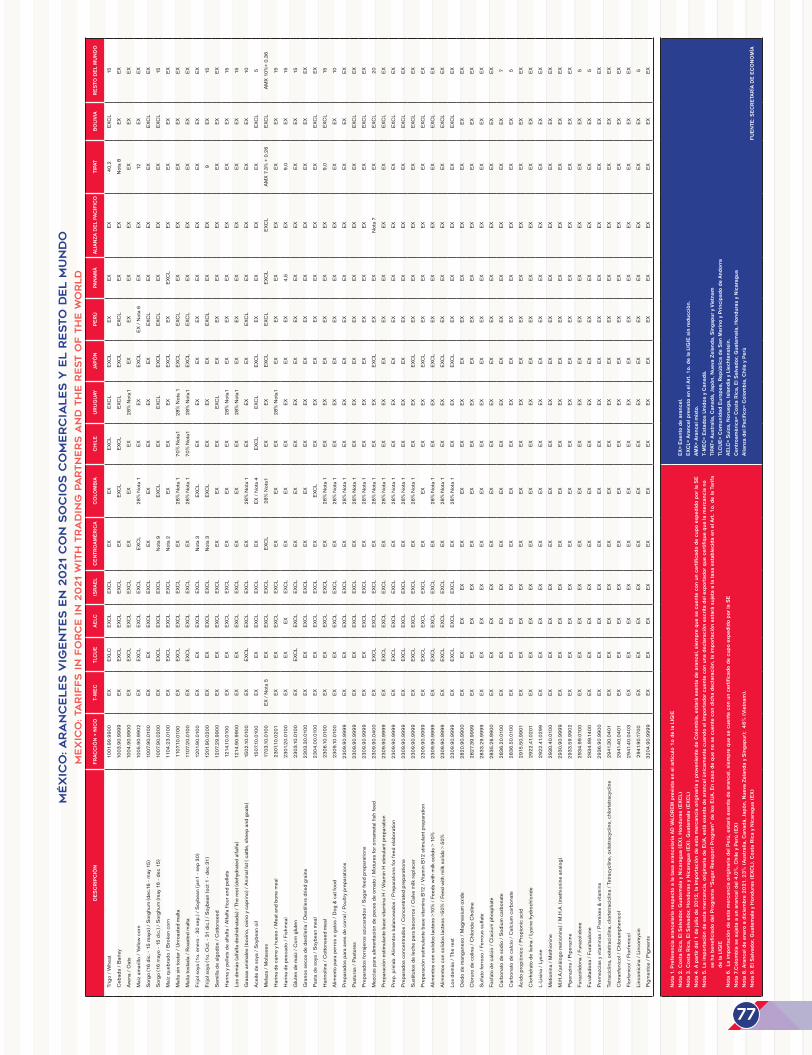
MÉX
ICO
: A
RA
NC
ELES V
IGEN
TES E
N 2
021
CO
N S
OC
IOS C
OM
ER
CIA
LES Y
EL R
ESTO
DEL M
UN
DO
MEX
ICO
: TA
RIF
FS IN
FO
RC
E IN
20
21
WIT
H T
RA
DIN
G P
ARTN
ER
S A
ND
TH
E R
EST O
F T
HE W
OR
LD
DES
CRI
PCIÓ
NFR
ACC
IÓN
+ N
ICO
T-M
ECTL
CU
EAE
LCIS
RAEL
CEN
TRO
AMÉR
ICA
CO
LOM
BIA
CH
ILE
URU
GU
AYJA
PÓN
PERÚ
PAN
AMÁ
ALIA
NZA
DEL
PAC
IFIC
OTI
PAT
BO
LIVI
ARE
STO
DEL
MU
ND
O
Trig
o/W
heat
1001
.99.
9900
EXEX
LCEX
CL
EXC
LEX
EXEX
CL
EXC
LEX
CL
EXEX
EX40
,2EX
CL
15
Ceb
ada
/Bar
ley
1003
.90.
9999
EXEX
CL
EXC
LEX
CL
EXEX
CL
EXC
LEX
CL
EXC
LEX
CL
EXEX
Not
a8
EXEX
Aven
a/O
ats
1004
.90.
9900
EXEX
CL
EXC
LEX
CL
EXEX
EX28
%N
ota1
EXEX
EXEX
EXEX
EX
Maí
zam
arill
o/Y
ello
wc
orn
1005
.90.
9902
EXEX
CL
EXC
LEX
CL
EXC
L28
%N
ota
1EX
EXEX
CL
EX/
Not
a6
EXEX
12EX
EX
Sor
go(1
6di
c.-
15m
ayo)
/S
orgh
um(d
ec.16
-m
ay1
5)10
07.9
0.01
00EX
EXEX
CL
EXC
LEX
EXEX
EXEX
EXC
LEX
EXEX
EXC
LEX
Sor
go(1
6m
ayo
-15
dic.
)/S
orgh
um(m
ay1
6-d
ec1
5)10
07.9
0.02
00EX
EXC
LEX
CL
EXC
LN
ota
9EX
CL
EXEX
CL
EXC
LEX
CL
EXEX
EXEX
CL
15
Maí
zqu
ebra
do/
Bro
ken
corn
1104
.23.
0100
EXEX
CL
EXC
LEX
CL
Not
a2
EXEX
EX
EXC
LEX
EXC
LEX
EXEX
EX
Mal
tas
into
star
/U
nroa
sted
mal
ta11
07.10
.010
0EX
EXC
LEX
CL
EXC
LEX
28%
Not
a1
70%
Not
a128
%N
ota
1EX
CL
EXC
LEX
EXEX
EXEX
Mal
tato
stad
a/R
oast
edm
alta
1107
.20.
0100
EXEX
CL
EXC
LEX
CL
EX28
%N
ota
170
%N
ota1
28%
Not
a1EX
CL
EXC
LEX
EXEX
EXEX
Frijo
lsoy
a(1
o.e
nero
-30
sep
.)/S
oybe
an(j
an1
-sep
30)
1201
.90.
0100
EXEX
EXC
LEX
CL
Not
a3
EXC
LEX
EXEX
EXEX
EXEX
EXEX
Frijo
lsoy
a(1
o.O
ct.-
31
dic.
)/S
oybe
an(o
ct1
-de
c31
)12
01.9
0.02
00EX
EXEX
CL
EXC
LN
ota
3EX
CL
EXEX
EXEX
CL
EXEX
9EX
15
Sem
illa
dea
lgod
ón/
Cot
tons
eed
1207
.29.
9900
EXEX
EXC
LEX
CL
EXEX
EX
EXC
LEX
EXEX
EXEX
EXEX
Har
ina
ype
llets
de
alfa
lfa/
Alfa
lfafl
oura
ndp
elle
ts12
14.10
.010
0EX
EXEX
CL
EXC
LEX
EXEX
28%
Not
a1EX
EXEX
EXEX
EX15
Los
dem
ás(a
lfalfa
des
hidr
atad
a)/
The
rest
(deh
ydra
ted
alfa
lfa)
1214
.90.
9900
EXEX
EXC
LEX
CL
EXEX
EX28
%N
ota1
EXEX
EXEX
EXEX
15
Gra
sas
anim
ales
(bov
ino,
ovin
oy
capr
ino)
/An
imal
fat(
cat
tle,s
heep
and
goa
ts)
1502
.10.0
100
EXEX
CL
EXC
LEX
CL
EX28
%N
ota
1EX
EXEX
EXC
LEX
EXEX
EX10
Acei
ted
eso
ya/
Soy
bean
oil
1507
.10.0
100
EXEX
EXC
LEX
CL
EXEX
/N
ota
4EX
CL
EXC
LEX
CL
EXEX
EXEX
EXC
L5
Mel
aza
/Mol
asse
s17
03.10
.010
0EX
/N
ota
5EX
EXC
LEX
CL
EXC
L28
%N
ota1
EXEX
EXC
LEX
CL
EXC
LEX
CL
AMX
7.3%
+0
.26
EXC
LAM
X10
%+
0.36
Har
ina
dec
arne
yh
ueso
/M
eata
ndb
one
mea
l23
01.10
.020
1EX
EXEX
CL
EXC
LEX
EXEX
28%
Not
a1EX
EXEX
EXEX
EX15
Har
ina
dep
esca
do/
Fish
mea
l23
01.2
0.01
00EX
EXEX
EXC
LEX
EXEX
EXEX
EX4,
5EX
9,0
EX15
Glu
ten
dem
aíz
/Cor
ngl
uten
2303
.10.0
100
EXEX
CL
EXC
LEX
CL
EXEX
EXEX
EXEX
EXEX
EXEX
15
Gra
nos
seco
sde
des
tiler
ia/
Des
tille
rsd
ried
grai
ns
2303
.30.
0100
EXEX
EXC
LEX
CL
EXEX
EXEX
EXEX
EXEX
EXEX
EX
Past
ade
soy
a/S
oybe
anm
eal
2304
.00.
0100
EXEX
EXC
LEX
CL
EXEX
CL
EXEX
EXEX
EXEX
EXEX
CL
EX
Har
inol
ina
/Cot
tons
eed
mea
l23
06.10
.010
0EX
EXEX
CL
EXC
LEX
28%
Not
a1
EXEX
EXEX
EXEX
9,0
EXC
L15
Alim
ento
par
ape
rros
og
atos
/D
og&
cat
food
2309
.10.0
100
EXEX
EXC
LEX
CL
EX28
%N
ota
1EX
EXEX
EXEX
EXEX
EX10
Prep
arad
osp
ara
aves
de
corr
al/
Poul
tryp
repa
ratio
ns23
09.9
0.99
99EX
EXEX
CL
EXC
LEX
28%
Not
a1
EXEX
EXEX
EXEX
EXEX
EX
Past
uras
/Pa
stur
es
2309
.90.
9999
EXEX
EXC
LEX
CL
EX28
%N
ota
1EX
EXEX
EXEX
EXEX
EXC
LEX
Prep
arad
osfo
rraj
eros
azu
cara
dos
/Sug
arfe
edp
repa
ratio
ns23
09.9
0.99
99EX
EXEX
CL
EXC
LEX
28%
Not
a1
EXEX
EXEX
EXEX
EXEX
CL
EX
Mez
clas
par
aal
imen
taci
ónd
epe
ces
deo
rnat
o/M
ixtur
esfo
rorn
amet
alfi
shfe
ed23
09.9
0.04
00EX
EXC
LEX
CL
EXC
LEX
28%
Not
a1
EXEX
EXC
LEX
EXN
ota
7EX
EXC
L20
Prep
arac
ión
estim
ulan
teb
ase
vitam
ina
H/
Vita
min
Hs
timul
antp
repa
ratio
n23
09.9
0.99
99EX
EXC
LEX
CL
EXC
LEX
28%
Not
a1
EXEX
EXEX
EXEX
EXEX
CL
EX
Prep
.p/e
lab.
Alim
ento
sba
lanc
eado
s/P
repa
ratio
nsfo
rfee
del
abor
atio
n23
09.9
0.99
99EX
EXC
LEX
CL
EXC
LEX
28%
Not
a1
EXEX
EXEX
EXEX
EXEX
CL
EX
Prep
arad
osc
once
ntra
dos
/Con
cent
rate
dpr
epar
atio
ns23
09.9
0.99
99EX
EXC
LEX
CL
EXC
LEX
28%
Not
a1
EXEX
EXEX
EXEX
EXEX
CL
EX
Sus
titut
osd
ele
che
para
bec
erro
s/C
alve
milk
repl
acer
2309
.90.
9999
EXEX
CL
EXC
LEX
CL
EX28
%N
ota
1EX
EXEX
CL
EXEX
EXEX
EXC
LEX
Prep
arac
ión
estim
ulan
teb
ase
vitam
ina
B12
/Vi
tam
inB
12s
timul
antp
repa
ratio
n23
09.9
0.99
99EX
EXC
LEX
CL
EXC
LEX
EXEX
EXEX
CL
EXEX
EXEX
EXC
LEX
Alim
ento
sco
nso
lidos
lact
eos
>10%
/Fe
eds
with
milk
sol
ids
>10
%23
09.9
0.99
99EX
EXC
LEX
CL
EXC
LEX
28%
Not
a1
EXEX
EXC
LEX
EXEX
EXEX
CL
EX
Alim
ento
sco
nso
lidos
lact
eos
>50%
/Fe
edw
ithm
ilks
olid
s>
50%
2309
.90.
9999
EXEX
CL
EXC
LEX
CL
EX28
%N
ota
1EX
EXEX
CL
EXEX
EXEX
EXC
LEX
Los
dem
ás/
The
rest
2309
.90.
9999
EXEX
CL
EXC
LEX
CL
EX28
%N
ota
1EX
EXEX
CL
EXEX
EXEX
EXC
LEX
Oxid
ode
man
gane
so/
Mag
nesi
umo
xide
2820
.90.
9900
EXEX
EXEX
EX
EXEX
EXEX
EXEX
EXEX
EXEX
Clo
ruro
de
colin
a/C
hlor
ide
Cho
line
2827
.39.
9999
EXEX
EXEX
EXEX
EXEX
EXEX
EXEX
EXEX
EX
Sul
fato
ferr
oso
/Fer
rous
sul
fate
2833
.29.
9999
EXEX
EXEX
EXEX
EXEX
EXEX
EXEX
EXEX
EX
Fosf
ato
dec
alci
o/C
laci
ump
hosp
hate
2835
.26.
9900
EXEX
EXEX
EXEX
EXEX
EXEX
EXEX
EXEX
EX
Car
bona
tod
eso
dio
/Sod
ium
car
bona
te28
36.2
0.01
00EX
EXEX
EXEX
EXEX
EXEX
EXEX
EXEX
EX7
Car
bona
tod
eca
lcio
/C
alci
umc
arbo
nate
2836
.50.
0100
EXEX
EXEX
EXEX
EXEX
EXEX
EXEX
EXEX
5
Ácid
opr
opió
nico
/Pr
opio
nic
acid
2915
.50.
9901
EXEX
EXEX
EXEX
EXEX
EXEX
EXEX
EXEX
EX
Clo
rhid
rato
de
lisin
a/L
ysin
ehy
droc
hlor
ide
2922
.41.
0201
EXEX
EXEX
EXEX
EXEX
EXEX
EXEX
EXEX
EX
L-Li
sina
/Ly
sine
2922
.41.
0299
EXEX
EXEX
EXEX
EXEX
EXEX
EXEX
EXEX
EX
Met
ioni
na/
Met
hion
ine
2930
.40.
0100
EXEX
EXEX
EXEX
EXEX
EXEX
EXEX
EXEX
EX
M.H
.A.(a
nálo
gom
etio
nina
)/M
.H.A
.(m
ethi
onin
ean
alog
)29
30.9
0.99
99EX
EXEX
EXEX
EXEX
EXEX
EXEX
EXEX
EXEX
Pipe
razi
na/
Pipe
razi
ne29
33.5
9.99
02EX
EXEX
EXEX
EXEX
EXEX
EXEX
EXEX
EXEX
Fura
zolid
ona
/Fur
azol
idon
e29
34.9
9.01
00EX
EXEX
EXEX
EXEX
EXEX
EXEX
EXEX
EX5
Fura
ltado
na/
Fura
ltado
ne29
34.9
9.14
00EX
EXEX
EXEX
EXEX
EXEX
EXEX
EXEX
EX5
Prem
ezcl
asy
vita
min
as/
Prem
ixes
&vit
amin
s29
36.9
0.99
00EX
EXEX
EXEX
EXEX
EXEX
EXEX
EXEX
EXEX
Tetra
cicl
ina,
oxit
etra
cicl
ina,
clo
rtetra
cicl
ina
/Tet
racy
clin
e,o
xitet
racy
clin
e,c
hlor
tetra
cycl
ine
2941
.30.
0401
EXEX
EXEX
EXEX
EXEX
EXEX
EXEX
EXEX
EX
Clo
ranf
enic
ol/
Chl
oram
phen
icol
2941
.40.
0401
EXEX
EXEX
EXEX
EXEX
EXEX
EXEX
EXEX
EX
Flor
feni
col/
Flo
rfeni
col
2941
.40.
0403
EXEX
EXEX
EXEX
EXEX
EXEX
EXEX
EXEX
EX
Linc
omic
ina
/Lin
com
ycin
2941
.90.
1700
EXEX
EXEX
EXEX
EXEX
EXEX
EXEX
EXEX
5
Pigm
ento
s/P
igm
ents
3204
.90.
9999
EXEX
EXEX
EXEX
EXEX
EXEX
EXEX
EXEX
EX
Not
a 1.
Pre
fere
ncia
ara
ncel
aria
resp
ecto
a la
tasa
ara
ncel
aria
AD
VAL
ORE
M p
revi
sta
en e
l art
ícul
o 1o
de
la L
IGIE
Not
a 2.
Cos
ta R
ica,
El S
alva
dor,
Gua
tem
ala
y N
icar
agua
(EX
). H
ondu
ras
(EXC
L)N
ota
3. C
osta
Ric
a, E
l Sal
vado
r, H
ondu
ras
y N
icar
agua
(EX
). G
uate
mal
a (E
XCL)
Not
a 4.
A p
artir
del
1 d
e ju
lio d
e 20
12, l
a im
port
ació
n de
est
a m
erca
ncía
orig
inar
ia y
pro
veni
ente
de
Col
ombi
a, e
star
á ex
enta
de
aran
cel,
siem
pre
que
se c
uent
e co
n un
cer
tific
ado
de c
upo
expe
dido
por
la S
EN
ota
5. L
a im
port
ació
n de
est
a m
erca
ncía
, orig
inar
ia d
e EU
A, e
stá
exen
ta d
e ar
ance
l úni
cam
ente
cua
ndo
el im
port
ador
cue
nte
con
una
decl
arac
ión
escr
ita d
el e
xpor
tado
r que
cer
tifiq
ue q
ue la
mer
canc
ía n
o se
ha
bene
ficia
do d
el P
rogr
ama
“Sug
ar R
eexp
ort P
rogr
am”
de lo
s EU
A. E
n ca
so d
e qu
e no
se
cuen
te c
on d
icha
dec
lara
ción
, la
impo
rtac
ión
esta
rá s
ujet
a a
la ta
sa e
stab
leci
da e
n el
Art
. 1o.
de
la T
arifa
de
la L
IGIE
Not
a 6.
La
impo
rtac
ión
de e
sta
mer
canc
ía o
rigin
aria
del
Per
ú, e
star
á ex
enta
de
aran
cel,
siem
pre
que
se c
uent
e co
n un
cer
tific
ado
de c
upo
expe
dido
por
la S
EN
ota
7.C
olom
bia
se s
ujet
a a
un a
ranc
el d
el 4
.0%
. Chi
le y
Per
ú (E
X)N
ota
8. A
ranc
el d
e en
ero
a di
ciem
bre
2021
. 23%
(Au
stra
lia, C
anad
á, J
apón
, Nue
va Z
elan
da y
Sin
gapu
r);
46%
(Vi
etna
m).
Not
a 9.
El S
alva
dor,
Gua
tem
ala
y H
ondu
ras
(EXC
L). C
osta
Ric
a y
Nic
arag
ua (
EX)
EX=
Exen
to d
e ar
ance
l.EX
CL=
Ara
ncel
pre
vist
o en
el A
rt. 1
o. d
e la
LIG
IE s
in re
ducc
ión.
AMX=
Ara
ncel
mix
to.
T-M
EC=
Esta
dos
Uni
dos
y C
anad
á.TI
PAT=
Aus
tral
ia, C
anad
á, J
apón
, Nue
va Z
elan
da, S
inga
pur y
Vie
tnam
TLC
UE=
Com
unid
ad E
urop
ea, R
epúb
lica
de S
an M
arin
o y
Prin
cipa
do d
e An
dorr
aAE
LC=
Sui
za, N
orue
ga, I
slan
dia
y Li
echt
enst
ein.
Cen
troa
mér
ica=
Cos
ta R
ica,
El S
alva
dor,
Gua
tem
ala,
Hon
dura
s y
Nic
arag
uaAl
ianz
a de
l Pac
ifico
= C
olom
bia,
Chi
le y
Per
úFU
ENTE
: SEC
RETA
RÍA
DE
ECO
NO
MÍA
CO
NSU
MO
ESTIM
AD
O D
E M
ICR
OIN
GR
ED
IEN
TES E
N M
ÉX
ICO
20
21
Estim
ated
mic
ro
-ing
red
ien
t d
em
an
d in
Mex
ico
20
21
MIC
RO
ING
RED
IEN
TE
POLLO
BRO
ILERSPO
STURA LAYERS
CERDO
SW
INEBO
VINO LEC
HE
DAIRY CATTLE
BOVINO
CARNE
BEEF CATTLE
ACUAC
ULTURA AQ
UACULTURE
MASC
OTAS
PETFOO
DO
TROS
OTH
ERSTO
TAL
TONELADAS / M
ETRIC TO
NSV
ITAM
INA
S / V
ITAM
INS
VitaminaA/Vitam
inA(1,000UI/Kg)14
0.0
66.0
49.0
90
.038.0
6.2
26.0
4.9
420
.1Vitam
inaD3/Vitam
inD3(500UI/Kg)
71.0
27.0
28.0
23.0
13.0
3.1
6.3
2.5
173.9
VitaminaE/Vitam
inE(50%)
945.0
565.0
248.0
532.0
625.0
87.0
265.0
196.9
3.4
63.9
VitaminaK3/Vitam
inK3(52%)
67.0
33.0
42.0
0.0
0.0
8.0
23.0
27.1
20
0.1
VitaminaB12/Vitam
inB12(0.1%)
72.0
81.0
170
.00
.00
.08.0
27.0
12.3
370
.3Riboflavina/Rivoflavin(80%
)81.0
44.0
37.0
0.0
0.0
5.0
28.0
14.8
20
9.8
Tiamina/Thiam
in(B1)35.0
6.6
17.90
.00
.03.5
14.0
8.6
85.6
Piridoxina/Pyridoxine(B6)35.0
21.0
12.0
0.0
0.0
4.0
22.0
14.8
108.8
Biotina/Biotin(2%)
57.0
16.0
55.0
0.0
0.0
3.0
9.5
12.3
152.8
VitaminaC
/VitaminC
(35%)
59.0
34.5
21.0
0.0
0.0
145.0
39.0
112.0
410
.5ÁcidoN
icotínico/Nicotinicacid
340
.020
0.0
161.0
0.0
0.0
18.0
69.0
41.8
829.8
ÁcidoPantoténico/Panthotenicacid(98%)
198.0
104.0
77.0
0.0
0.0
12.0
35.0
28.3
454.3
ÁcidoFólico/Folicacid(98%)
13.0
5.5
21.0
0.0
0.0
1.13.0
20
.964.5
ClorurodeC
olina/Cholinechloride
8.6
60
.06,0
00
.04,7
50
.03,6
85.0
725.0
210
.0652.0
263.4
24,9
45.4
Total Vitaminas / Total Vitam
ins10
,773.0
7,20
3.6
5,6
88.9
4,3
30
.01,4
01.0
514
.01,2
18.8
760
.631,8
89.8
MIN
ER
ALES / M
INER
ALS
FuentesdeHierro/Ironsources
850
.060
0.0
525.0
1,20
0.0
850
.021.0
76.0
73.0
4,19
5.0
FuentesdeCobalto/C
obaltsources12
.012
.010
.020
.012
.00
.70
.70
.768.1
FuentesdeCobre/C
oopersources575.0
480
.0425.0
875.0
575.0
8.5
345.0
75.0
3,3
58.5
FuentesdeYodo/Iodinesources9.7
7.96.0
14.7
9.7
0.3
6.5
2.1
56.9
FuentesdeManganeso/M
anganesesources550
.0450
.0352.0
1,051.0
550
.014
.098.0
65.0
3,13
0.0
FuentesdeZinc/Zincsources960
.080
0.0
680
.01,7
23.0
960
.032.0
165.0
120
.05,4
40
.0FuentesdeSelenio/Selenium
sources3.7
2.4
2.3
7.03.7
0.9
4.7
2.1
26.8
Total Minerales / Total M
inerals2,9
60
.52.3
52.3
2,0
00
.34,8
90
.72,9
60
.577.3
695.9
337.9
16,2
75.4
AM
INO
ÁC
IDO
S / A
MIN
OA
CID
SL-Lisina/L-Lysine(98%
)22,9
95.0
11,30
0.0
18,5
00
.00
.00
.01,2
50
.01,4
30
.0795.0
56,2
70
.0D
L-Metionina/D
L-Methionine
26,5
00
.013
,50
0.0
10,3
00
.0112
.00
.01,0
90
.01,3
90
.0440
.053,3
32.0
Treonina/Threonine4,6
26.0
3,4
80
.05,0
25.0
0.0
0.0
295.0
0.0
0.0
13,4
26.0
Triptófano/Triptophane582.0
20
0.0
1,765.0
0.0
0.0
0.0
0.0
0.0
2,5
47.0
Betaína/Betaine710
.00
.00
.00
.00
.051.0
0.0
0.0
761.0
Total Aminoácidos / Total Am
ino acids55,4
13.0
28,4
80
.035,5
90
.0112
.00
.02,6
86.0
2,8
20
.01,2
35.0
126,3
36.0
AD
ITIV
OS / A
DD
ITIV
ES
AditivosZootécnicosEnzim
as/Enzymes
3,9
00
.02,9
00
.02,3
25.0
157.0
0.0
12.3
58.0
43.0
9,3
95.3
Mejoradoresdedesem
peño/Grow
thpromoters
2,13
5.0
70
0.0
1,20
0.0
328.0
215
.016
.050
.064.0
4,7
08.0
PreyProbióticos/Pre&Probiotics550
.0385.0
720
.01,7
00
.01,4
00
.014
.3325.0
89.0
5,18
3.3
Total Aditivos Zootécnicos6,5
85.0
3,9
85.0
4,2
45.0
2,18
5.0
1,615
.042.6
433.0
196.0
19,2
86.6
AditivosTecnológicosAcidificantesyC
onservadores/Preservatives3,8
65.0
2,8
25.0
3,0
00
.03,3
20
.01,7
75.0
87.0
535.0
420
.015
,827.0
Antioxidantes/Antioxidants3,2
25.0
1,850
.02,0
80
.01,4
30
.0990
.016
0.0
527.0
340
.010
,60
2.0
Secuestrantes/Binders5,9
00
.04,10
0.0
3,4
20
.03,3
00
.01,2
80
.0270
.01,2
30
.0875.0
20
,375.0
Total Aditivos Tecnológicos12
,990
.08,7
75.0
8,5
00
.08,0
50
.04,0
45.0
517.0
2,2
92.0
1,635.0
46,8
04.0
Aditivossensoriales/Flavoringagents0
.00
.030
0.0
390
.087.0
0.0
385.0
262.0
1,424.0
Anticoccidianos/Anticoccidials670
.0330
.0236.0
30
0.0
20
0.0
46.0
0.0
180
.01,9
62.0
Total Aditivos / Total Additives20
,245.0
13,0
90
.013
,281.0
10,9
25.0
5,9
47.0
60
5.6
3,110
.02,2
73.0
69,4
76.6
TO
TAL
89,3
91.5
51,12
5.9
56.5
60
.220
.257.7
10,3
08.5
3,8
82.8
7,844.7
4,6
06.4
243,9
77.7
77
GRUPO PECUARIO
DIRECTORIO DE EMPRESAS AFILIADAS A CONAFAB
A ADM NUTRICIÓN ANIMAL MÉXICOErnesto Gómez Pombo InsurgentesSurNo.1602Int.19Col.CréditoConstructor03940,BenitoJuárez,[email protected].(55)5089-8600www.adm.com
AGRIBRANDS PURINA MÉXICO, S. DE R.L. DE C.V.
Ing. Miguel Ochoa Apodaca AntonioDovaliJaimeNo.70,TorresCyDPiso11Col.SantaFe01210,ÁlvaroObregón,[email protected].(462)606-8127www.nutrimentospurina.com
Planta CuautitlánCarreteraTlalnepantla-CuautitlánNo.515Col.ElPartidor54879,Cuautitlán,Edo.deMéxicoTel.(55)5899-9313
Planta IrapuatoAv.SanMigueldeAllendeNo.1415Col.Cd.Industrial36541,Irapuato,Gto.Tel.(462)606-8100
Planta MonterreyAv.RuizCortinesNo.1038Ote.Col.SanRafael67110,Guadalupe,N.L.Tel.(81)8131-8246Planta SalamancaKm100CarreteraQuerétaro-IrapuatoTramoSalamanca-Irapuato36700,Salamanca,Gto.Tel.(464)647-1375Planta TehuacánCalle19PonienteNo.401,Col.Purina75770,Tehuacán,Pue.Tel.(238)384-1114
AGROPECUARIA FC, S.A. DE C.V.M. en C. Carlos Chávez DelgadilloAntiguoCaminoaSanAgustínNo.3Col.Atlatongo55843,SanJuanTeotihuacán,Edo.deMé[email protected].(594)933-2216www.forrajeselcorral.com
AGROPECUARIA SANFANDILA, S.A. DE C.V.Ing. Juan Ramón Pérez RamírezBlvd.CampestreNo.132,Col.JardinesdelMoral37160,León,[email protected].(477)214-5400www.sanfandila.com.mx
Planta LagosCarreteraLagos-LeónKm1Col.CañadadeRicos47450,LagosdeMoreno,[email protected].(474)741-2400
ALIMENTOS BALANCEADOS LORGAM, S.A. DE C.V.
Planta 1C.P. William Pérez PaviaCalle59-AAv.JacintoCanekNo.813-CPor50y58Col.NuevaHidalgo97220,Mérida,[email protected].(999)945-0723,945-4993
Planta 2Calle17No.408CiudadIndustrial97288,Mérida,[email protected].(999)940-6360al69
ALIMENTOS BALANCEADOS OCHOA, S.A. DE C.V. (ALBAOSA)
Lic. Enriqueta Andrade BazSur11No.2101Col.Centro94300,Orizaba,[email protected].(272)724-2320www.albaosa.com.mx
ALIMENTOS BALANCEADOS PÉNJAMO, S.A. DE C.V. (ALBAPESA)
MVZ. Carlos Ramon Peña RamírezKm63CarreteraIrapuato-LaPiedad36900,Pénjamo,[email protected].(469)696-0080al85www.albapesa.com
78
La Industria Alimentaria Animal de México 2021
ALIMENTOS BALANCEADOS SIMÓN BOLÍVAR, S.A. DE C.V.
C.P. Arturo Gilio RodríguezMtro. Arturo Gilio HamdanLic.JuanManuelGaytánFloresBlvd.IndependenciaNo.850Ote.,Interior3CCol.Centro27000,Torreón,[email protected].(871)747-0202www.alimentosbalanceadoslagunero.com.mx
ALIMENTOS CONCENTRADOS DE DELICIAS, S.A. DE C.V.
Ing. Marco Antonio Guerrero ChávezCalleJulimesS/NParqueIndustrialDelicias33000,Cd.Delicias,[email protected].(639)472-8366,472-7393Ext.112www.grupoalcodesa.com
AVIGRUPO MÉXICO, S.A. DE C.V. CorporativoAlex MannAv.EjércitoNacionalNo.769Col.Polanco11570,MiguelHidalgo,[email protected].(55)5938-9200www.avigrupo.com.mxwww.agropecuarialafortuna.com
Región ChalcoAv.JazmínS/N,Col.Ayotzingo66623,Chalco,Edo.deMéxicoTels.(55)1709-6830,1709-6831
Región MorelosCarreteraaTolucaS/N,Col.Atzompa62600,Miacatlán,Mor.Tel.(737)373-0227
Región PueblaC.P.JesúsGallegosGarcíaExHaciendadeZacatepecKm53.8Col.Oriental75020,Zacatepec,[email protected].(55)5938-9200
Región TehuacánC.P.PauloMarioFuentesVelaCarmenSerdánS/NMagdalenaCuayucatepec75853,Tehuacán,[email protected].(55)5938-9200
Región TepojacoC.P.ReynaldoRodríguezCórdobaKm0.5CarreteraTizayuca-TemazcalapaCol.Tepojaco43810,Tepojaco,[email protected].(55)5938-9200
B BARTLETT CONTRI, S.A. DE C.V.Ing. Luis Galindo SevillaJamesWattNo.4Col.ParqueIndustrialLaJoya54730,CuautitlánIzcalli,Edo.deMé[email protected].(55)1083-2030www.bartlett.com.mx
C CAMPI ALIMENTOS, S.A. DE C.V.Ing. José María Guerrero LeyvaAv.TecnológicoNo.40,1Cd.Industrial38010,Celaya,[email protected].(461)618-8800Ext.15402www.campialimentos.com
Planta ChinamecaCalleAltamiranos/nBarrioLaMaseca95980,Chinameca,[email protected].(922)225-0560
Planta CuautlaVíadeFFCCMéxico-PueblaNo.3Col.Cuautlixco62747,Cuautla,[email protected].(735)353-6314
Planta MéridaIng.JoséMaríaGuerreroLeyvaCalle17No.400por20CiudadIndustrial97288,Mérida,[email protected].(999)400-0023
COMERCIALIZADORA ABANOR, S.A. DE C.V.Lic. José Manuel Abascal NoriegaAbancayNo.1207Col.SanPedroZacatenco07360,GustavoA.Madero,[email protected].(55)5754-0776,5586-7998
COMERCIALIZADORA Y DISTRIBUIDORA EL TEMPORAL, S.A. DE C.V.
Sr. Enrique Hernández HernándezCarreteraCruceroBernalKm2S/N76280,Colón,[email protected].(441)265-1076Oficina.(419)107-0247www.eltemporal.com
COMPAÑÍA SCOULAR DE MÉXICO, S. DE R.L. DE C.V.
José Raúl Velarde HernándezAv.Acueducto4851,Piso3Oficina2Col.PuertadeHierro45116,Zapopan,[email protected].(33)3679-3000www.scoular.com
79
CONCENTRA CONSORCIO AGROINDUSTRIAL, S.A. DE C.V.
C.P. Alfredo Aguirre de la PazLAE. José Luis López LópezKm2AvenidaUniversitariaApartadoPostal16843600,Tulancingo,[email protected].(775)755-0220,755-0221www.nutricon.com.mx
E ED&F MAN LIQUID PRODUCTS, S.A. DE C.V.Lic. Diego Lozano LuquinPabloNerudaNo.2886,Oficina3Col.Providencia4ª.Sección44639,Guadalajara,[email protected].(33)3331-9125www.edfman.com
F FÁBRICA Y LABORATORIOS DE ALIMENTOS PARA GANADERÍA Y AVICULTURA, S.A. DE C.V.
Lic. Luis Miguel Hernaiz VigilMVZ. Alejandro Castaño GuerraPoniente146No.900Col.IndustrialVallejo02300,Azcapotzalco,[email protected].(55)5010-8700www.flagasa.com
FORRAJES Y GRANOS AGROPECUARIOSDE YUCATÁN, S.A. DE C.V.
Ing. Arturo Gary ValleCalle71No.370Por30y32Col.ElRobleAgrícola97295,Mérida,[email protected].(999)919-0022www.fogysa.com.mx
G GANADERA MEXICALI, S.A. DE C.V.Lic. Claudia Cecilia Palomino AraizaCarreteraaEjidoNuevoLeón,Km.4Col.Pólvora21620,Mexicali,[email protected].(686)287-0473www.bonaprime.com
GANADEROS ASOCIADOSDE QUERÉTARO, S.A. DE C.V.
C.P. Ciro Alberto López CoelloAv.TepeyacNo.1280ParqueIndustrialO´DonnellAeropuerto76250,ElMarqués,[email protected].(442)253-0038,253-0165,253-0164www.gaqsa.com
GRUPO GRAMOSAGramosa AgroalimentosCarreteraEstatal100,Km3.6EjidoSanIdelfonso76295,Colón,Qro.Tel.(442)278-1600www.gramosa.com
Gramosa HidalgoLote29s/n,Col.PaloGordo43400,Metepec,[email protected].(774)745-5230
Agroalimentos de PueblaCarreteraFederalMéxico-Puebla,Km8174129,SanMartínTexmelucan,Pue.Tel.(227)[email protected]
Nutri Sow Planta AlboradaCarr.LasTrancas-CoatepecPredioPasoLimón,Col.Alborada91635,EmilianoZapata,[email protected].(228)833-2750
Nutri Sow Planta QuerétaroCarreteraSanJuandelRío-Xilitla,Km32.4Col.ElCardonal76650,EzequielMontes,[email protected].(441)277-0258
Nutri Sow Cedis TolucaCarreteraToluca-Zitácuaro,Km26Col.CieneguillasdeGuadalupe50900,AlmoloyadeJuárez,Edo.deMé[email protected].(725)1748-030
Nutri Sow Cedis IxmiquilpanAv.InsurgentesOriente,Km156.5Col.DiosPadreIxmiquilpan,[email protected].(759)723-2435
Nutri Sow Cedis OaxacaCarreteraaPuertoÁngel10071244,ÁnimasTrujan,[email protected].(951)511-6127
Nutri Sow Cedis La JoyaCarreteraNacionalXalapa-Perote,Km12991325,LaJoya,Acajete,[email protected].(228)811-4211,811-4235
80
La Industria Alimentaria Animal de México 2021
Puerto ChiapasEdificioOperativoRecintoFiscals/nPuertoChiapasMuelleFiscal30830,Tapachula,[email protected].(962)620-4080
Puerto TuxpanCarr.CobosKm7.5,Col.BarraSur92770,Tuxpan,[email protected].(783)837-5016
Puerto VeracruzInteriordelNuevoPuertodeVeracruzCol.Centro91700,Veracruz,Ver.
GRANJAS CARROLL DE MÉXICO, S. DE R.L. DE C.V.
MVZ. Víctor Manuel Ochoa CalderónPrivadadeTlalpanNo.3FraccionamientoAzteca91270,Perote,[email protected].(282)825-2256al58www.granjascarroll.mx
GRUPO ABREGOSr. Rafael Abrego OsornioKm1CaminoaNativitasS/N76295,Colón,[email protected]@grupoabrego.com.mxTel.(442)153-3100www.polloqro.com.mx
GRUPO FERNÁNDEZPollo Industrializado de MéxicoCalle18No.205-A,por29y31Col.GarcíaGinerés97070,Mérida,Yuc.Tel.(999)942-1430www.crio.com.mx
Productora Nacional de HuevoCalle18No.205-A,por29y31Col.GarcíaGinerés97070,Mérida,Yuc.Tel.(999)942-1430www.crio.com.mx
GRUPO PECUARIO SAN ANTONIO, S.A. DE C.V.Ing. Octavio Debernardi RiveraKm335CarreteraFederalFortín-CórdobaS/NCol.SanNicolás94540,Córdoba,[email protected].(271)717-0300Ext.130www.pollosanantonio.com.mx
GRUPO PORCÍCOLA MEXICANO, S.A. DE C.V.
Omar Salinas BastarracheaFernando Heredia P.Calle27-ANo.495-ACol.Itzimná97100,Mérida,[email protected]@keken.com.mxTel.(999)930-2200www.keken.com.mx
Planta UmanTablajeCatastral1035y1039Entre16-AyCarreteraFederal26197390,Umán,Yuc.
Planta San Antonio ChelTablaje6337,Km.14CarreteraMérida-Tetiz97353,Hunucma,Yuc.
Planta KomchenTablaje11,661denominadoChun-OxilKm3CarreteraKomchen-CosgayaMérida,Yuc.
GRUPO STERLINGLAE. Eduardo José Sterling BoursCondedeMiravalleNo.110Int.302Col.Carretas76050,SantiagodeQuerétaro,Qro.Tels.(442)213-7015,213-7002
Planta de AlimentosIng.AlfredoBarragánAlfaroCarreteraQuerétaro-BernalKm.2.576047,ElMarques,[email protected].(442)216-0933,216-0920
I IGUALA CONCENTRADOS, S.A. DE C.V.Ing. Francisco Javier Sobrino BracamontesLic. Juan Antonio Sobrino BracamontesAugustoRodinNo.43PBCol.Nápoles03810,BenitoJuárez,[email protected].(55)5682-3335www.comercializadoraportimex.com.mx
INDUSTRIAS MELDER, S.A. DE C.V.MVZ. Horacio Luque HernándezProlongaciónVallartaNo.375Col.Centro46600,Ameca,[email protected].(375)758-0549,758-0052www.melder.com.mx
INTERINDUSTRIAS DEL SURESTE, S.A. DE C.V.Lic. Leandro Silveira CuevasLic. Arturo Basulto TamayCalle1-DNo.303Fracc.Campestre,Col.México97125,Mérida,[email protected]@interindustrias.netTels.(999)925-1138,920-0643
81
INTERPEC SAN MARCOS, S.A.Ing. Fernando Chávez VillalpandoJulioDíazTorreNo.104-ACiudadIndustrial20290,Aguascalientes,[email protected]@sabro.com.mxTel.(449)910-6470www.sabro.com.mx
L LUCTA MEXICANA, S.A. DE C.V.Dr. Rodolfo Sánchez ReséndezMVZ. José Alberto Rodríguez VargasCarreteraEstatal100“ElColoradoHiguerillas”No.4200,Int.3-MParqueIndustrialAeropuerto76295,SanIldefonso,Colón,Qro.Tel.(55)[email protected]@lucta.comwww.lucta.com
M MNA DE MÉXICO S. A. DE C. V.Dr. Benito Ávila JaimeCarreteraHuinalá-Juárez,km59.6,67250,Juárez,[email protected].(81)1917-6549www.mnademexico.com
MUTUALIDAD DE PORCICULTORES ASOCIADOS, S.A. DE C.V.
Lic. José Luis Munguía JiménezCuitláhuacNo.46Col.Anáhuac11320,MiguelHidalgo,[email protected].(55)5396-1100,5396-3005www.muporsa.com
N NUEVA TECNOLOGÍA EN ALIMENTACIÓN, S.A. DE C.V.
Ing. Jérémie LarcherAv.delasFuentesNo.14ParqueIndustrialBernardoQuintana76246,ElMarqués,[email protected].(442)196-0100www.gponutec.com
Planta GalerasCarreteraaBernalKm11.576295,Colón,Qro.Tel.(442)196-0100
Laboratorio EURO-NUTECAvenidadelMarquésNo.32ParqueIndustrialBernardoQuintana76246,ElMarqués,Qro.Tel.(442)196-0100
Grupo NUTEC Planta TREATSAvenidadelMarquesNo.32ParqueIndustrialBernardoQuintana76246,ElMarqués,Qro.Tel.(442)196-0100
Grupo NUTEC Planta AQUAFOCUSCarreteraaKinoKm.14s/nLaManga83220,Hermosillo,Son.Tel.(442)196-0100
CEDIS Grupo NUTECCircuitoElMarquésNorteNo.68ParqueIndustrialElMarqués76246,ElMarqués,Qro.Tel.(442)196-0100
NUTRIGAFER, S.A. DE C.V.Sr. José Abelardo Gallegos FernándezBlvd.FernandoBaezaNo.3975BarrioDelicias31520,Cuauhtémoc,[email protected]ó[email protected]ó[email protected].(625)582-2026,582-2027,582-5945www.nutrigafer.com
NUTRIMENTOS CONCENTRA, S.A. DE C.V.C.P. Alfredo Aguirre de la PazKm9.5CarreteraLaPiedad-GuadalajaraApartadoPostal9459300,LaPiedad,[email protected].(352)526-9170www.nutricon.com.mx
P PRODUCTORES AGROPECUARIOS TEPEXPAN, S.A. DE C.V.
Lic. Alejandro Solís FloresCarreteraLosReyes-LecheríaKm3555885,Tepexpan,Edo.deMé[email protected].(55)5836-9060www.tepexpan.com.mx
PRODUCTOS AGRÍCOLAS Y PECUARIOS DE NERIA, S. DE P.R. DE R.L. DE C.V.
Lic. Rafael Reyes BañuelosIng. José Alejandro Reyes BañuelosDomicilioConocidoS/NSanJoséNeria94160,Chocamán,[email protected].(273)732-2055,732-2324
82
La Industria Alimentaria Animal de México 2021
PRODUCTOS AGROINDUSTRIALES AZTECA, S.A. DE C.V. (AGROMAS)
Dr. Juan Carlos Robles OrtizCalz.SanPedroNo.407Ote.Col.DelValle66220,SanPedroGarzaGarcía,[email protected].(81)8152-7400www.agromasmexico.com
PROTEÍNAS, ENERGÉTICOS Y ÓLEOS, S.A. DE C.V.
Lic. Manuel Escobedo IbargüengoytiaAntonioGonzálezMendozaNo.1Col.ViverosdeXalostoc55340,Ecatepec,Edo.deMé[email protected].(55)5755-8191
PROVEEDORA DE ALIMENTOS AVE-PECUARIOS, S.A. DE C.V.
C.P. Manuel Medina RodríguezC.P.LandyPérezBastoCalle14No.343,entre41y45Col.EmilianoZapataOriente97144,Mérida,[email protected].(999)982-2221,982-2223www.provi.mx
S SERVICIOS E INSUMOS PARA LA PORCICULTURA, S.A. DE C.V.
Ing. Javier Pérez ZavalaAv.delLagoNo.2,MZ.700,LT.01Locales18al21Col.Tepanquiahuac54783,Teoloyucan,Edo.deMé[email protected].(55)4605-6298,(778)688-0153www.sipor-aba.com.mx
U UNIÓN DE CRÉDITO ALPURA, S.A. DE C.V.Ing. Juan Bernardo Rojo GarcíaKm37.4AutopistaMéxico-QuerétaroParqueIndustrialCuamatla54730,CuautitlánIzcalli,Edo.deMé[email protected].(55)5899-2000Ext.2016ó2041www.alpura.com
W WN EL NOGAL, S.C. DE R.L. DE C.V.Sr. Antonio Ornelas GonzálezAv.20deNoviembreNo.934Col.NuevoFuerte47899,Ocotlán,Jal.Tel.(392)[email protected]
GRUPO DE PREMEZCLAS Y ADITIVOS
A AB VISTAMVZ. M.Sc. Jorge Rubio ArgüelloCda.XicoténcatlNo.812-12Col.ExHaciendaSantaTeresa72810,SanAndrésCholula,[email protected].(222)563-3075www.abvista.com
ADISSEO DE MÉXICO, S.A. DE C.V.MVZ. César O. Vázquez GutiérrezProlongaciónAméricasNo.1592,2°PisoCol.CountryClub44610,Guadalajara,[email protected].(33)3648-5970www.adisseo.com
ADM BIOPRODUCTOS, S.A. DE C.V.MVZ. Francisco Báez MedinaBlvd.EmilianoZapataNo.825PlazaLaJoya,LocalKCol.Tlaltenango62170,Cuernavaca,[email protected].(777)317-8411,317-8412
ALLTECH DE MÉXICO, S.A. DE C.V.Dra. Bianca MartinsCircuitodelaProductividadNo.110ParqueIndustrialGuadalajaraCol.LasPintas45690,ElSalto,[email protected]@alltech.comTel.(33)3695-5562www.alltech.com/es
ANIMALNUTRI MÉXICO, S.A. DE C.V.Dra. Aurea MauriesPequeñaIndustriaNo.2135-ACol.ParqueIndustrial85065,Cd.Obregón,[email protected].(462)606-8127www.provimi.mx
Planta ObregónPequeñaIndustriaNo.2135-ACol.ParqueIndustrial85065,Cd.Obregón,Cajeme,Son.Tel.(644)410-9600
83
Planta El SaltoCalle4No.10561Col.ParqueIndustrialElSalto45680,ElSalto,Jal.Tel.(33)3688-2184
Planta HermosilloCalledelCobreNo.1Col.ParqueIndustrialHermosillo83297,Hermosillo,Son.Tel.(662)251-1085
ANIMAL NUTRITION INNOVA, S.A. DE C.V.Ing. Eduardo Pérez IbarraCardenalNo.26-4Col.RincóndeAguaAzul44467,Guadalajara,[email protected].(33)9688-7219www.aninnova.com
ANIMINE LATAMMVZ. José Ramón Pérez HerreraTenayucaNo.140Col.LetránValle03650,BenitoJuárez,CDMXTel.(442)[email protected]://animine.eu
AVIVAGEN, INC.Alejandro Meyenberg100SussexDriveOttawa,ON,[email protected].(33)5980-0329www.avivagen.com
B BASF MEXICANA, S.A. DE C.V.Ing. José Luis Jasso PitolInsurgentesSurNo.975Col.CiudaddelosDeportes03710,BenitoJuárez,[email protected].(55)5325-2600Móvil.(55)5400-8274www.basf.com.mx
BIOMIN NA, S.A. DE C.V.Dr. José Buitrón BeizaAv.PatriaNo.2085,PisoM,SuiteM17Col.PuertadeHierro45116,Zapopan,[email protected].(81)1988-5511www.biomin.net
C CHR HANSEN DE MÉXICO, S.A. DE C.V.Lic. José Juan Herrera GutiérrezAv.InsurgentesSurNo.1431,Piso11Col.InsurgentesMixcoac03920,BenitoJuárez,[email protected].(55)5804-7425www.chr-hansen.com
D DANISCO ANIMAL NUTRITION (IFF)José Luis Muñoz OrozcoLagoAlbertoNo.319Col.Granada11520,MiguelHidalgo,[email protected].(33)3968-0607www.iff.com
DEVENISH NUTRITION, S. DE R.L. DE C.V.PhD. MBA. Manuel de la LlataMVZ MC Lorena Águila ReyesCarretera57Qro-SLP,No24000,Int.38y39ConjuntoIndustrialLaPresaBusinessPark76220,Sta.RosaJáuregui,[email protected].(442)198-0214http://us.devenishnutrition.com
DIAMOND V MEX, S. DE R.L. DE C.V.Dr. Jaime Fernando de la Colina TreviñoCircuitoBalvaneraNo.5AFracc.Ind.Balvanera76900,Corregidora,[email protected].(442)183-7160www.diamondv.com
DISAN MÉXICO, S.A. DE C.V.Luis Eduardo Urquijo B.BoulevardTolucaNo.44Col.IndustrialAtoto53519,NaucalpandeJuárez,Edo.deMé[email protected].(55)5576-3232Ext.105www.disanlatinoamerica.com
DRESEN QUÍMICA S.A.P.I. DE C.V.José Arturo Paulin NardoniAv.HidalgoNo.71Col.DelCarmen04100,Coyoacán,[email protected].(55)56888543www.dresen.com.mx
DSM NUTRITIONAL PRODUCTS MÉXICO, S.A. DE C.V.
Andrés CollazoKm22.5CarreteraGuadalajara-ElSalto45680,ElSalto,[email protected].(33)3668-6001www.dsm.com/latam
E ELANCO ANIMAL HEALTH MÉXICOMVZ. MC. Juan Carlos Padilla RamírezBoulevardPuertadeHierroNo.5153Piso18Col.PuertadeHierro45116,Zapopan,[email protected].(33)8526-3226www.elanco.com
84
La Industria Alimentaria Animal de México 2021
ENZIMAS Y PRODUCTOS QUÍMICOS, S.A. DE C.V.
Ing. José Ignacio Dávila SotoAldamaNo.37Col.DelCarmen04100,Coyoacán,[email protected].(55)5658-0820,5659-6569www.enziquim.com
Planta de producciónFranciscoVillaNo.18Col.SantaMaríaAztahuacán09570,Iztapalapa,CDMX
EURO-NUTEC PREMIX, S.A. DE C.V.Ing. Gonzalo OchoaAv.delMarquésNo.32ParqueIndustrialBernardoQuintana76246,ElMarqués,[email protected].(442)196-0100www.gponutec.com
EVONIK MÉXICO, S.A. DE C.V.Ing. Cristian FischlCalz.México-XochimilcoNo.5149BisCol.ArenalTepepan14610,Tlalpan,[email protected].(55)5483-1011www.evonik.com
EW NUTRITION DE MÉXICO, S.A DE C.V.Ing. Francisco J. Zorrilla FierroAv.MartínChimaltecatlNo.163Col.BarriodeSantaMaría52740,Ocoyoacac,Edo.deMé[email protected].(55)3900-5600www.ew-nutrition.com/es
EXCELLING, S.A. DE C.V.Ma. Beatriz Ibarra MacariPaseodelaRepública,14695,Piso276230,Juriquilla,Queré[email protected].(442)161-2059www.excelling.com.mx
G GEN4, S.A. DE C.V.OctavioAcostaLópezSergioClementeHernándezCaminoComunidadPasodelaLajaNo.847120,Jalostotitlan,[email protected]@gen-four.com.mx
GLOBAL ANIMAL PRODUCTS LATIN AMERICA, S.A. DE C.V.
Lic. Lucia Amescua GarcíaAv.delasFuentesNo.106-8ParqueIndustrialFINSA76246,ElMarqués,[email protected].(442)210-6919
GRUPO DE ASESORES EN BIOTECNOLOGÍA, S.A. DE C.V. (GABSA)
Dra. Gladys Hoyos LópezProlongaciónCalle18No.218Col.SanPedrodelosPinos01180,ÁlvaroObregón,[email protected].(55)3095-8888Ext.101y201www.gabiotec.com.mx
H HELM DE MÉXICO, S.A.MVZ. Martín David Manzanares GómezProtónNo.2ParqueIndustrialNaucalpan53489,NaucalpandeJuárez,Edo.deMé[email protected].(55)5228-9900www.helm-mexico.com.mx
HUVEPHARMA DE MÉXICO, S.A. DE C.V.Dr. Pedro SchmidAv.AméricasNo.1600–5CCol.CountryClub44610,Guadalajara,[email protected].(33)2472-8057
I INTERNATIONAL FEED AND FOODS TECHNOLOGIES, S.A. DE C.V. (INTEC)
Dr. José Gerardo Abín MartínIng. Mario Alberto Puente FloresCarreteraCórdobaaVeracruzKm342S/NCol.ZonaIndustrial94690,Córdoba,[email protected]@intecmx.comTel.(271)751-7350,751-7396
ITOCHU MÉXICO, S.A. DE C.V.Ing. Leonardo UemuraAv.PaseodelaReformaNo.483,Piso5106500,Cuauhtémoc,[email protected].(55)5350-4100www.itochu.com.mx
ITPSA MÉXICO (ADITIVOS ALIMENTICIOS ITP DE MÉXICO, S.A. DE C.V.)
Ing. Carlos H. Morett MohenoAv.Vallarta6503-D7(PlazaConcentro)Col.CiudadGranja45010,Zapopan,[email protected].(33)3809-2814www.itpsa.com
Sede centralAv.deRoma157,7aplanta08011,Barcelona,EspañaTel.+34(934)520-330
Planta de producción y unidades de investigación principalesPolígonoIndustrialdeVallsTarragona,España
85
K KEMIN, S. DE R.L. DE C.V.Lic. José de Jesús Gómez OrozcoPaseodelNorteNo.5600-AGuadalajaraTechnologyPark45010,Zapopan,[email protected].(33)3365-0000www.kemin.com/na/es-mx/home
L LALLEMAND MÉXICO, S.A. DE C.V.MVZ. Bernardo Ramírez BasurtoNaranjos128Fracc.Flamboyanes89330,Tampico,[email protected].(83)3155-8096www.lallemandanimalnutrition.com
LAPISA, S.A. DE C.V.Ing. Francisco GonzálezCarreteraLaPiedad-GuadalajaraKm5.5Col.Camelinas59375,LaPiedad,[email protected].(352)526-1300Ext.134www.lapisa.com
LEADER BIOTECNOLOGÍA DE MÉXICO, S.A. DE C.V.
MVZ. V. Manuel Rojo BarrañónBlvd.AdolfoLópezMateos1550Pte.Col.Resurrección38060,Celaya,[email protected]@live.com.mxTel.(461)421-3542www.leader.com
LICAN ALIMENTOS MÉXICO, S.A.P.I. DE C.V.Ing. Carlos Manuel Beltrán HurtadoBlvd.delosSerisNo.76ParqueIndustrial83299,Hermosillo,[email protected].(662)251-0354,251-0442www.licanfood.com
M M Y N DISTRIBUIDORA, S.A. DE C.V. (NUTRIMYN)
C.P. Jorge Carlos Mendoza PinzónCalle10No.445,por43y45Col.SanMarcosNocoh97290,Mérida,[email protected].(999)946-3056,946-3057www.nutrimyn.com
MANE MÉXICO, S.A. DE C.V.Oficina de VentasMVZ. Dagoberto Aguileta MendozaLic. Ángel GarcíaSrita. Gabriela HernándezCalleEmilioCarranzaNo.440,Col.ElRetoño09440,Iztapalapa,[email protected]@[email protected]@mane.comTels.(55)5445-0990al99www.mane.com
Planta Estado de MéxicoMVZ. Dagoberto Aguileta MendozaLic. Ángel GarcíaSrita. Gabriela HernándezNemesioDiezRiegaNo.9,Col.CerrilloII52004,Lerma,Edo.deMé[email protected]@[email protected]@mane.comTels.(728)282-9740al49www.mane.com
MAYERWAREN INTERNATIONAL, S.A. DE C.V.Dr. Juan Pablo Celis G.CarreteraNacional7821–610Col.LaEstanzuela64988,Monterrey,[email protected].(81)1353-0344www.mayerwaren.com
MGM NUTRICIÓN ANIMAL, S.A. DE C.V.Lic. Gloria Núñez SánchezCarreteraAguascalientesaSanLuisPotosíKm14.520337,ElRetoño,[email protected].(449)413-4927,971-1914www.mgmnutricionanimal.com
N NOREL MÉXICO, S.A. DE C.V.C.P. Nohemí Hernández ArellanoCircuitoelMarquésSurNo.1ParqueIndustrialElMarquésAutopistaMéxico-QuerétaroKm195.576246,ElMarqués,[email protected].(442)227-3700www.norel.net
NOVUS INTERNATIONAL DE MÉXICO, S.A. DE C.V.
MV. Gonzalo Prat VergaraAv.5deFebrero#1351Sequoia202ZonaIndustrialBenitoJuárez476116,Querétaro,[email protected].(442)428-6808www.novusint.com
86
La Industria Alimentaria Animal de México 2021
NUBBA COMERCIAL, S.A. DE C.V. (R&B NUTRITION)
Lic. Santiago Bribiesca OrozcoPrivadadeConstituyentesOte.No.202Col.ElVergel38070,Celaya,[email protected].(461)612-1277,612-4083,612-1035
NUTRICIÓN PLANIFICADA, S.A. DE C.V.Dr. Adrián Escobosa LaveagaBlvd.RealdelValleNo.901,PrimerPisoCol.RealdelValle42086,Pachuca,[email protected].(771)717-0217www.nutriplan.com.mx
NUTRIENTES BÁSICOS DE MONTERREY, S.A. DE C.V.
Ariel Santos GarzaCaminoalMilagroNo.103Col.ElMilagro66634,Apodaca,[email protected].(81)8748-2244www.nubam.com
O ORFFA NUTRICIÓN ANIMAL, S. DE R.L.Dr. Diego PinedaGolfodeSanLorenzo59-3Col.Tacuba11400,MiguelHidalgo,[email protected].(55)4368-8104www.orffa.com
P PANCOSMA MÉXICO, S.A. DE C.V.Dr. Manuel Soto MartínezCalleIgnacioAllendeNo.187Col.SantaCruzSanMateoOtzacatipan50120,TolucaEdo.deMé[email protected].(722)196-4377www.pancosma.com
PHIBRO ANIMAL HEALTH CORPORATIONDr. Milton GorocicaFranciscodeQuevedoNo.117,TorreA,Piso6Col.ArcosVallarta44130,Guadalajara,[email protected].(33)3818-0529www.pahc.com
PREMEZCLAS DE MÉXICO, S.A. DE C.V. (INDUKERN)
Ing. Jorge Faugier MejíaPaseosdelValleNo.5211GuadalajaraTechnologyPark45019,Zapopan,[email protected].(33)3777-4343www.indukern.com.mx
PREMEZCLAS Y VITAMINAS TEPA, S.A. DE C.V. (PREVITEP)
Ing. Francisco Javier González RiveraAv.JaliscoNo.840Col.LasAguilillas47698,Tepatitlán,[email protected]@previtep.comTel.(378)781-0730www.previtep.com
PRODUCTORA MEXICANA DE ARROZ, S.A. P.I. DE C.V.
Ing. César Ramón Baez SoledadAv.Manatí247ParqueIndustrialOlmeca91808,Veracruz,Ver.Tel.(229)[email protected]
PRODUCTOS QUÍMICO AGROPECUARIOS, S.A. DE C.V.
Ing. Carlos Priego GarciapiñaMitla282Col.Narvarte03020,BenitoJuárez,[email protected].(55)5682-1501www.grupopqa.com
S SANFER SALUD ANIMAL, S.A. DE C.V.Lic. Denisse Becerril CholulaBlvd.AdolfoLópezMateosNo.314Col.Tlacopac01049,ÁlvaroObregón,[email protected].(55)5481-5400www.sanfersaludanimal.com.mx
SANPHAR SANIDAD ANIMAL, S. DE R.L. DE C.V.C.P.C. Enrique Pastor EscobarAv.PatriaNo.2085,PisoM,SuiteM02Col.PuertadeHierro45116,Zapopan,[email protected].(55)5217-1148www.sanphar.net
SISTEMAS EN ZOOTECNIA, S.A. DE C.V. (SENZOO)
Ing. Rogelio Elizarraráz VargasProlongaciónAldamaNo.78Col.NicolásR.Casillas45645,TlajomulcodeZúñiga,[email protected].(33)3673-6837
SYNBIOS, S.A. DE C.V.Dr. José Luis SantosCiruelosNo.137-112Col.Jurica76100,Querétaro,[email protected].(442)218-6919www.synbios.com.mx
87
T TÉCNICA MINERAL PECUARIA, S.A. DE C.V.MVZ. Víctor Hugo Monterrosa DomínguezMiguelAlemánNo.1541Col.AguablancaSur45235,Zapopan,[email protected].(33)3145-1117www.tmpmexico.mx
TROUW NUTRITION MÉXICO, S.A. DE C.V.Planta MonterreyIng. Luis Lauro González AlanísIng. Roberto Téllez SalazarIng. M.Sc. Víctor A. Siller ChapaAv.“C”No.1101Fracc.CentraldeCarga66494,SanNicolásdelosGarza,[email protected]@[email protected].(81)8144-7400www.trouwnutrition.mx
Planta MorelosIng.RubénVillalobosOrtizEjeNorte-SurNo.1CiudadIndustrialValledeCuernavaca62578,Jiutepec,[email protected].(777)320-0302
Planta JaliscoMarketingandCommunicationLuisEnriqueWilliamsNo.792ParqueIndustrialBelenesNorte45150,Zapopan,Jal.Tels.(33)3656-6400
TRYADD, SAPI DE C.V.Dr. José Rubén Bustos SerranoDra. María Isabel Valdéz MartínezProl.CorregidoraNte.No.911Int.701Col.QuintasLaLarborcilla76168,Querétaro,[email protected]@tryadd.mxTel.(442)234-0310www.tryadd.mx
V VIMIFOS, S.A. DE C.V.Planta El SaltoC.P.HéctorCotaGuerreroParqueIndustrialElSalto45680,ElSalto,[email protected].(33)3284-1200
W WISIUM MÉXICOPlanta TepatitlánIng. Reginaldo PadovaniBlvd.AnacletoGonzálezFloresNo.359Col.Centro47600,TepatitlándeMorelos,[email protected]@mx.wisium.comTels.(378)782-2780www.wisium.com
Planta TultitlanIng. César Gregorio Peña CastellanosCalleTezozomocNo.4local2Col.RecursosHidráulicos54913,Tultitlan,Edo.deMé[email protected].(55)5894-8665
Y YARA MÉXICO, S. DE R.L. DE C.V.MVZ. Vanessa Segoviano DíazAv.AméricasNo.1545,Piso24Col.Providencia44630,Guadalajara,Jal.Tel.(55)[email protected]
Z ZINPRO NUTRICIÓN ANIMAL, S. DE R.L. DE C.V.Ing. Guillermo Vela StainesAv.RicardoMargainZozayaNo.335A,Piso4Col.ValledelCampestre66265,SanPedroGarzaGarcía,[email protected].(818)000-5644www.zinpro.com
88
La Industria Alimentaria Animal de México 2021
A ADM NUTRICIÓN ANIMAL MÉXICOLic. Karim Castro CarrilloVP División MascotasInsurgentesSur1602-1902Col.CréditoConstructor03940,BenitoJuárez,[email protected].(55)7877-4561www.adm.com
AGRIBRANDS PURINA MÉXICO, S. DE R.L. DE C.V.
Lic. Oscar Mendoza FloresAv.SanMigueldeAllendeNo.1415Cd.Industrial36541,Irapuato,[email protected].(462)606-8100www.dogui.com.mx
ALIMENTOS BALANCEADOS PÉNJAMO, S.A. DE C.V. (ALBAPESA)
MVZ. Carlos Ramón Peña RamírezKm63CarreteraIrapuato-LaPiedad36900,Pénjamo,[email protected].(469)696-0080al85www.albapesa.com
C CAMPI ALIMENTOS, S.A. DE C.V.Ing. José María Guerrero LeyvaAv.TecnológicoNo.401Cd.Industrial38010,Celaya,[email protected].(461)618-8800Ext.15402www.campialimentos.com
COMERCIALIZADORA CJM, S.A. DE C.V.MVZ. Francisco Urteaga MerinoSanMiguelNo.143Col.BodegasdeSanJuan45019,Zapopan,[email protected].(55)5677-0909,5603-6125www.diamondpet.com.mx
E EURO-NUTEC PREMIX, S.A. DE C.V. PET FOODIng. Óscar Martínez GuajardoAv.delMarquésNo.32Fracc.IndustrialBernardoQuintana76246,ElMarqués,[email protected].(442)196-1000www.nupec.com
F FÁBRICA Y LABORATORIOS DE ALIMENTOS PARA GANADERÍA Y AVICULTURA, S.A. DE C.V.
Lic. Luis Miguel Hernaiz VigilMVZ. Alejandro Castaño GuerraCarreteraaVilladeTezontepecKm.5.5ParqueIndustrialPLATAH43880,VillasdeTezontepec,[email protected].(55)5010-8700www.flagasa.com
G GRUPO NU-3 MULTISERVICIOS 2001, S.A. DE C.V.
Ing. Juan Carlos García ReyesKm1CarreteraLaPiedad-Cd.ManuelDobladoS/N36910,SantaAnaPacueco,[email protected].(352)126-5400www.nu3.mx
H HILL´S PET NUTRITION DE MÉXICO, S.A. DE C.V.Aline RamírezCorporativoAntara1Av.EjércitoNacional843-BCol.Granada11520,MiguelHidalgo,[email protected].(55)9126-7000Ext.8108www.hillspet.com.mx
M MARS MÉXICOMVZ. Román DelgadoPresidenteMasarik111Piso3Col.Polanco11570,MiguelHidalgo,[email protected].(55)1102-1826Tel.(442)211-0700www.mars.com/mexico
MNA DE MÉXICO S. A. DE C. V.Dr. Benito Ávila JaimeCarreteraHuinalá-Juárez,Km59.667250Juárez,NuevoLeó[email protected].(81)1917-6549www.mnademexico.com
N NESTLÉ PURINA PETCARE, S.A. DE C.V.Jaime López Portillo FernándezErnesto Ávila EscaleraQuedma Sarai Vega LópezAv.FerronalesPte.No.515Col.Guadalupe54800,Cuautitlán,Edo.deMéxicoTel.(55)5899-3400www.purina.com.mx
GRUPO
AMASCOTA
89
NULO PET FOODSr. Chris Bracamontes2530WalshTarltonLane#14078746,Austin,Texas,[email protected].(464)656-0043
NUTROLINEIng. Edgar Martínez QuillaresCarreteraLibreFederalPanamericanaSalamanca-IrapuatoKm101.836700,Salamanca,[email protected].(464)656-0043
P PET MARKTIng. Alejandro González GarzaProl.PaseodelasAméricasNo.2101L18-C67174,Guadalupe,NuevoLeó[email protected].(81)8029-8008
PET X PRESS, S.A. DE C.V.Lic. Guillermo Obregón CentenoCalle3No.20Col.EjidosdelMoralDeleg.Iztapalapa09040,[email protected]@gmail.comTels.(55)5600-0340,5600-0341
PRODUCTOS DE CARNAZA DOGS TOY, S.A. DE C.V. (SUMMMA)
Lic. Oscar Díaz GarcíaAv.GuadalupeNo.107Col.Maravillas20900,JesúsMaría,[email protected].(449)910-9363,910-9364
PROTEÍNA ANIMAL, S.A. DE C.V.Pascual Padilla JiménezKm2CarreteraSanJuan-Guadalajara47000,SanJuandeLosLagos,[email protected].(395)725-2820Ladasincosto(800)713-7841www.proan.com
PROTEÍNAS, ENERGÉTICOS Y ÓLEOS, S.A. DE C.V.
Lic. Manuel Escobedo IbargüengoytiaAntonioGonzálezMendozaNo.1Col.ViverosdeXalostoc55340,Ecatepec,Edo.deMé[email protected].(55)5755-8191
R ROYAL CANIN MÉXICO, S.A. DE C.V.Pierre WagnerDirectorGeneralLagoZúrichNo.245,TorreFrisco,Piso12Col.AmpliaciónGranada11529,MiguelHidalgo,[email protected].(55)5811-6062www.royalcanin.com/mx
V VIMIFOS PET CARE, S.A. DE C.V.Fernán Gonzalez de Castilla PalomarCalle4No.10500ParqueIndustrialElSalto45680,ElSalto,[email protected].(33)3880-2400www.vimifospetcare.com
W WN EL NOGAL, S.C. DE R.L. DE C.V.Sr. Antonio Ornelas GonzálezAv.20deNoviembreNo.934Col.NuevoFuerte47899,Ocotlán,Jal.Tel.(392)[email protected]
GRUPO ACUICOLA
A ADM NUTRICIÓN ANIMAL MÉXICOMVZ. Rosendo García DelgadoAv.MiguelHidalgoNo.5483Ote.Col.ElBarrio80080,Culiacán,[email protected].(667)126-0463www.maltacleyton.com.mx
AGRIBRANDS PURINA MÉXICO, S. DE R.L. DE C.V.
Lic. Carlos Anzaldo RodríguezIng. Osvaldo AnayaCarreteraInternacionalyCalleFresnoS/N85000,Cd.Obregón,[email protected][email protected].(644)410-6200,410-6228,410-6207Fax.(800)640-6400www.nutrimentospurina.com
90
La Industria Alimentaria Animal de México 2021
ALIMENTOS DE ALTA CALIDAD EL PEDREGAL, S.A. DE C.V. (SILVER CUP)
Martha Hernández DíazJuan Gutenberg No. 112Col.ReformaFerrocarrilesNacionales50070,Toluca,Edo.deMé[email protected].(722)213-4008Fax.(722)215-7102www.el-pedregal.com
G GRUPO NU-3 (BIOBLUE) MULTISERVICIOS 2001, S.A. DE C.V.
Ing. Jaime Enrique Borboa SandovalKm1CarreteraLaPiedad-Cd.ManuelDobladoS/N36910,SantaAnaPacueco,[email protected].(352)144-0502www.nu3.mx
N NICOVITA MÉXICO, S.A. DE C.V.José Jiménez AyalaAv.InsurgentesSur2375Piso3Col.TizapánSanÁngel01090,ÁlvaroObregón,[email protected].(33)1862-0364www.nicovita.com.pe
NUTRICIÓN MARINA, S.A.Ing. Luis Fernando Báez ValenzuelaCarreteraFederalLibreLosMochisSanMiguelZapotitlánKM6.581340,SanMiguelZapotitlán,[email protected].(668)817-5471,817-5975www.nutrimar.com.mxwww.grupoacuicolamexicano.com.mx
V VIMIFOS, S.A. DE C.V.Planta GuadalajaraIng. Manuel ZazuetaCalle4No.10500ParqueIndustrialElSalto45680,ElSalto,[email protected].(33)3284-1200www.vimifos.com
Planta Cd. ObregónIBQ. Marcelo Costero GarbarinoCarreteraInternacionalMéxico15Km13S/N85205,Cd.Obregón,[email protected].(644)410-9500Fax.(644)410-9517www.vimifos.com
Planta SuresteCarreteraFederal180VSA-CárdenasKm145+776RancheríaPlátanoyCacao1raSecciónMegaParqueIndustrialTabasco86280,Mpio.Centro,Tab.www.vimifos.com
W WN EL NOGAL, S.C. DE R.L. DE C.V.Sr. Antonio Ornelas GonzálezAv.20deNoviembreNo.934Col.NuevoFuerte47899,Ocotlán,Jal.Tel.(392)[email protected]
GRUPO DE PROVEEDORESA ACUACULTORES DE AHOME, A.C.
Lic. Michel Alejandra Padilla CotaLeonaVicario323Ote.Col.Burócrata81290,LosMochis,[email protected].(668)815-6227www.acuacultoresdeahome.com
ADM BIO PRODUCTOS S.A. DE C.V.Lic. Valeria Sáenz ReyesAndrésBelloNo.10,Piso5Col.Chapultepec11560,MiguelHidalgo,[email protected].(55)5279-4700www.adm.com
AK GRUPO ELOCOM, S.L.Sr. Patxi ApalateguiJMIparraguirre820350,Irun,Españ[email protected].+34(943)631905
ALMACENADORA MERCADER, S.A.C.P. Héctor Eduardo Magallón GraciánDirectordeServiciosFinancierosAv.VallartaNo.5846Col.JardinesVallarta45027,Zapopan,[email protected].(33)3777-6951www.almer.com.mx
91
ASOCIACIÓN MEXICANA DE PLANTAS RECICLADORAS DE SUBPRODUCTOS DE ORIGEN ANIMAL, A.C. (AMEXPRESO)
Sr. Ezequiel Mejía DuarteEsterosAndador1Mod.53002Col.AcueductodeGuadalupe07279,GustavoA.Madero,[email protected].(55)5755-0303
ASOCIACIÓN NACIONAL DE RENDIDORES, A.C.Ing. Fernando Mendizábal FernándezCarreteraMonterrey-MonclovaKm7.5Int.B66553,ElCarmen,[email protected].(81)8154-3219www.anr.org.mx
B BAJA AGRO INTERNATIONAL, S.A. DE C.V.Ing. Martín Loperena NúñezPrivadaKinoEsteNo.100-A1ParqueIndustrialMisión22830,Ensenada,BajaCaliforniaTel.(646)[email protected]
C CARGILL DE MÉXICO, S.A. DE C.V.Ing. David BelloAntonioDovaliJaimeNo.70,TorresCyD,Piso11Col.SantaFe01210,ÁlvaroObregón,[email protected].(55)1105-7900,1105-7400www.cargill.com.mx
COMERCIALIZADORA DE GRANOS UNIPRO, S.C. DE R.L.
Sr. Peter Elías FriessenSr. Cornelio Fehr KlassenIng. Eva Zulema Sánchez CaroKm6CarreteraaLaJuntaS/N31500,Cd.Cuauhtémoc,[email protected]@[email protected].(625)578-6122,578-6124www.unipro.com.mx
CONSOLIDADORA DE FORRAJESSAN HIPÓLITO, S.A. DE C.V.
Sra. Martha Victoria González ChavarríaCiruelos4,PrimerPiso54900,Tultitlán,Edo.deMéxicoTel.(55)[email protected]
F FIGAP, S. DE R.L. DE C.V.Lic. Patricia Jazo AltamiranoAv.México3370,Local19C,PlazaBonitaCol.Monraz44670,Guadalajara,[email protected].(33)3641-8119www.figap.com
FUMIGACIONES SAN MOL, S.A. DE C.V.Ing. Gilberto Saavedra LiraWashingtonNo.73Col.SanIsidro27100,Torreón,[email protected].(871)204-0772www.fumigacionessanmol.com
G GAVILON DE MÉXICO, S.A. DE C.V.Lic. Daniel Jerez HernándezAv.Acueducto4851Piso945116,Zapopan,[email protected].(33)3880-9350www.gavilon.com
GRUPO AGROPECUARIO UCOIng. Andrés Antonio González LópezBlvd.PalmasHillsNo.1,piso7Col.ValledelasPalmas52787,Huixquilucan,Edo.deMé[email protected].(55)5453-1153I
IDTEC AUTOMATIZACIÓN, S.A. DE C.V.Ing. Luis Arturo Flores IslasVeredadeTamarindosNo.320Col.LaVictoria67110,Guadalupe,[email protected].(81)8008-1050www.ptchronos.com
L LAND O’LAKES ANIMAL NUTRITION DE MÉXICO, S.A. DE C.V.
Sr. Brian TaylorAv.5deFebreroNo.1351TorreSequoia,Int.204Col.FelipeCarrilloPuerto76120,Querétaro,[email protected].(442)171-7166
LEK WORLDWIDE TRADING, S.A. DE C.V.Ing. Francisco Javier Casas LópezPrivadadelaSoledadNo.503Col.ElJagüey02519,Azcapotzalco,[email protected].(442)428-6130
92
La Industria Alimentaria Animal de México 2021
M MACLOTECH GLOBAL SOLUTIONSIng. Ricardo Velasco VázquezCañadadelCobreNo.107Col.CañadadelRefugio37358,León,Gto.Tel.(462)[email protected]@maclotech.comwww.maclotech.com
N NAMASTE PRODUCTS, S.A. DE C.V.Ing. José G. Molina TorresCarreteraMéxico-Toluca5631Col.Cuajimalpa05000,Cuajimalpa,CDMXTel.(55)[email protected]
NATIONAL RENDERERS ASSOCIATION, INC.SierraCandelaNo.111,Desp.501Col.LomasdeChapultepec11000,MiguelHidalgo,[email protected].(55)5980-6080www.nationalrenderers.org
NUPROXA MÉXICO, S. DE R.L. DE C.V.MVZ. Carlos Sánchez H.SenderodeMiradorNo.36,PB76060,SantiagodeQuerétaro,[email protected].(442)291-1479Cel.(55)2271-9290www.nuproxa.ch
O OMG INTERNATIONAL, S.A. DE C.V.Lic. Mario Raúl González GarcíaIndustriaMadereraNo.226-ACol.ParqueIndustrialZapopanNorte45130,Zapopan,[email protected].(33)3616-6251www.agromg.com.mx
P PROCESADORA DE AVES DE TEPA, S.A. DE C.V.C.P. Arnulfo Federico Cervantes CuevasKm2CarreteraSanJuan-Guadalajara47600,SanJuandelosLagos,[email protected].(395)725-2800www.pate.com.mx
PRODUCTOS PARA AVES Y ANIMALES, S.A. DE C.V.
Sr. Eduardo López AcevesPorvenirNo.67Col.LosOlivos13210,Tláhuac,[email protected]@servmail.com.mxTel.(55)5845-0126
PRODUCTOS SANTA OFELIA, S.A. DE C.V.Sr. Víctor Manuel González MagañaBlvd.DiagonalReformaNúm.1800,Bodega173Col.SantaMaría27020,Torreón,[email protected].(871)717-2300
PROTEÍNAS MARINAS Y AGROPECUARIAS, S.A. DE C.V.
Ing. Lilia Marín MartínezLic. Luis Raúl Iñiguez MarínCalle2Cañas2775Col.LaNogalera44470,Guadalajara,[email protected]@protmagro.comTel.(33)3810-2185www.protmagro.com
PROTEÍNAS Y HARINAS DE MÉXICO (PROHAMEX)
Sr. Osvaldo Francisco Razo RodríguezBlvd.VascodeQuirogaNo.812Col.SanFelipedeJesús37250,León,[email protected].(477)780-1466
R RAGASA INDUSTRIAS, S.A. DE C.V.Lic. Leopoldo Alcorta MaldonadoJoséEleuterioGonzález#2815Col.MitrasNte.64320,Monterrey,[email protected].(81)8389-7575
T TECNOLOGÍA DE ENSACADO PAYPER, S.A. DE C.V.
Sr. Fermín GarcíaIgnacioMarianodelasCasasNo.15Col.Cimatorio76030,Querétaro,[email protected].(442)248-0026,248-0027www.payper.com
U UMBRA PACKAGING S.R.L.Sra. Michelle CarloniVialedeiPinni,46/48-06081PetrignanodiAssini(PG),[email protected].+39(075)809780/8299
93
SOURCES
FUENTES DE INFORMACIÓN
• AsociacióndelasIndustriasdeAlimentaciónAnimaldeAméricaLatinayCaribe(FEEDLATINA)
• AsociaciónMexicanadeProductoresdeCarne(AMEG)
• AsociaciónNacionaldeFabricantesdeAlimentosBalanceadosparaConsumoAnimal(ANFACA)
• AsociaciónNacionaldeIndustrialesdeAceitesyMantecasComestibles(ANIAME)
• BancodeMéxico(BANXICO)
• OrganizacióndePorcicultoresMexicanos(OPORMEX)
• ConsejoMexicanodelaCarne(COMECARNE)
• ConsejoNacionalAgropecuario(CNA)
• ConsejoNacionaldeFabricantesdeAlimentosBalanceadosydelaNutriciónAnimal(CONAFAB)
• FederaciónMexicanadeLechería(FEMELECHE)
• GrupoAcuícola,pertenecientealCONAFAB
• GrupoAmascota,pertenecientealCONAFAB
• GrupoConsultordeMercadosAgrícolas(GCMA)
• GrupoPecuario,pertenecientealCONAFAB
• GrupoPremezclas,AditivosyMicroingredientesNutricionales,pertenecientealCONAFAB
• SecretaríadeAgricultura,Ganadería,DesarrolloRural,PescayAlimentación(SADER)
• ServiciodeInformaciónAgroalimentariayPesquera(SIAP)
• SistemadeinformaciónComercialVíaInternet(SIAVI)
• U.S.DepartmentofAgriculture(USDA)
• U.S.GrainsCouncil(USGC)
• UniónNacionaldeAvicultores(UNA)
REVISTAS / MAGAZINES
• 2021AlltechGlobalFeedSurvey
• EncuestaseInvestigacionesDirectasporelConsejoNacionaldeFabricantesdeAlimentosBalanceadosydelaNutriciónAnimal,A.C.
94
La Industria Alimentaria Animal de México 2021
Acknowledgments
AGRADECIMIENTOS
Nuestrosmássincerosagradecimientosalvaliosoapoyoypatrocinioparalaedicióndeestapublicación,realizadoporlasagrupacionesyempresasqueacontinuaciónsemencionan:
Our most sincere thanks to the valuable support and sponsorship for the edition of this publication, produced by the following groups and companies listed below:
ABVISTAADISSEODEMÉXICOADMNUTRICIÓNANIMALAGRIBRANDSPURINAMÉXICOANIMINELATAMAPCINC.BASFMEXICANABIOMINBMEDITORESCAMPIALIMENTOSDIAMONDVMEXELOCOMENLACESNACIONALESDEAGRONEGOCIOSEXCELLINGGRUPOACUÍCOLAGRUPOAMASCOTAGRUPOPECUARIOGRUPOPREMEZCLAS,ADITIVOSYMICROINGREDIENTESNUTRICIONALESHAMLETPROTEININTERNATIONALFEEDANDFOODSTECHNOLOGIES(INTEC)LABORATORIOEURONUTECMANEMÉXICONATIONALRENDERERSASSOCIATION–AMERICALATINANORELMÉXICOORFFANUTRICIÓNANIMALPROVIMIMÉXICORAGASAINDUSTRIASSANFERSALUDANIMALTROUWNUTRITIONMÉXICOTRYADDU.S.SOYBEANEXPORTCOUNCILWISIUM
95
EstaobraseterminódeimprimirenlostalleresdePolicromíaImpresora,S.A.deC.V.
BenitoJuárezNo.16Col.BarrioSantaCruz
08910,Iztacalco,CiudaddeMé[email protected]
Tel.(55)5633-3777Laimpresiónconstade3,000ejemplares
Diseño:LaFá[email protected]
www.fabulare.com
UN MEJOR LEGADO.
ALIMENTA SUESFUERZO
En Purina® contamos con un amplio portafolio de productos, diseñados especialmente para satisfacer las necesidades nutrimentales de cada uno de tus animales.
Para más información del portafolio de productos contacta a tu distribuidor Purina® más cercano


