Embed Size (px)
Citation preview
DOCTORA L T H E S I S
Luleå University of TechnologyDepartment of Business Administration and Social Sciences
Industrial Marketing and E-commerce Research Group
2007:62|: 02-5|: - -- 07⁄62 --
2007:62
Antecedents of Intention to Use Mobile Music Services
A Study among Swedish Consumers
Bui Quang Thong

2
Acknowledgement I am indebted to numerous people who have generously helped me in the process of writing this
thesis. First and foremost, I wish to thank Professor Esmail Salehi-Sangari, the Chairman of the
Industrial Marketing and E-commerce Research Group, Lulea University of Technology (LTU),
who has not only given me the opportunity to pursue my doctoral study but has also helped me
overcome several unexpected difficulties during my four years of work. Esmail was an ideal
mentor for me to follow in my future academic career. He gave me full freedom to pursue my
interests but kept me focused. His encouragements and discipline demands always came at the
right time. I thank him for both.
I thank my supervisor, Prof. Albert Caruana, Center for Communication Technology, University
of Malta. The very existence of this thesis is largely thanks to his professional guidance. During
the work process, we communicated mainly via email. Albert always answered my questions
clearly and quickly. I learned from him how to simplify things, which I believe is an essential
factor for success in life.
I wish to thank Prof. Nicolaas Terblanche, Department of Business Management, University of
Stellenbosch, South Africa for his valuable comments for the draft of this dissertation in the pie
seminar held in June 2007. I am grateful to my colleague, Magnus Hultman, on whom I relied
more than he realized for his tireless assistance. My gratitude also goes to Pham Tuan Ngoc, who
has helped me to collect the empirical data. I also thank all of the participants in the surveys.
It is obvious that I could not write this thesis without background knowledge. I am obliged to
Lennart Persson, Lars-Ole Forsberg, Lars Bäckström, Tim Foster, Leyland Pitt, Moez Limayem,
Constantine Katsikeas, Tawfik Jellassi, and other professors who have given me great lectures
during my graduate and Ph.D studies at LTU. I would like to thank Prof. Parasuraman and
Rockbridge Associates for giving me the right to use the Technology Readiness scale in this
thesis.
I also owe a debt of gratitude to the administrators in the Department of Business Administration
and Social Sciences, LTU, including Carola Strandberg, Tatiana Lijeström, Monika Öhman, and

3
others who are always available when I am in need. I am appreciative of the helps and
encouragements from my colleagues in the department: Atanu Nath, Robert Opoku, Pejvak
Oghazi, Ted Karlsson, Marie-Louise Jung, Jinhui Wang, Maria Styvén, Anne Engström, Parmita
Saha, and many others. I definitely remembered every moment – in classes, at works, and after-
works- that we have had together.
The list of people who helped with this thesis would not be complete without mentioning the
library and the computer staff at LTU. Their professional work attitude is admiring to me. In
particular, I thank Paula Filén, who has generously given her time to help me with the Endnote
program.
It has not been easy to live away from home for such a long time. I wish to thank my two great
Swedish friends, Britt-Louise and Ake Malgrem, whose hospitality and care made me feel at
home. I also thank my Vietnamese friends, Le Quang Hoai, Luong Hoang Nga, and Pham Tuan
Ngoc, who shared with me the joys and difficulties during our stay in this peaceful country.
Finally, I would like to thank the institutions that provided financial support for my PhD study:
Längmanska Företagarfonden, Nordbankens Norrlandsstiftelse, Luleå University of Technology,
Norrbottens Forskningsgåd, Mål 1 Norra Norrland, Sparbanksstiftelsen Norrbotten, and
Innovationsbron Luleå AB. I wish them all the best.
Lulea, Sweden, 10 October 2007
Bui Quang Thong
4
Abstract This study investigates the antecedents of intentions to use mobile music services among Swedish
consumers. Relying on the theory of planned behavior, image congruence theory, and the
technology readiness index, this study proposes an integrated research model that explains
consumer intentions to use mobile music services. In the model, attitude, subjective norm,
perceived behavioral control, image congruence and technology readiness index are independent
variables and behavioral intention is the dependent variable. Seven hypotheses are suggested.
Hypotheses 1 to 4 are about the positive relationships among attitude, subjective norm, perceived
behavioral control, image congruence, and behavioral intention. Hypothesis 5A postulates a
positive relationship between technology readiness index and intention. Hypothesis 5B suggests a
positive relationship between the technology readiness index and perceived behavioral control.
Hypothesis 5C considers the possibility that the effect of the technology readiness index on
intention is mediated by perceived behavioral control. A cross-sectional survey is conducted
among 236 respondents from a shopping center sample. Bivariate correlations and multiple
regressions were used to test the hypotheses. Attitude is found to be the strongest predictor of
intention, followed by image congruence, subjective norm, and perceived behavioral control. The
technology readiness index correlates with perceived behavioral control but not with intention.
Thus hypotheses 1 to 4 as well as hypothesis 5B are supported, hypothesis 5A is not supported
and hypothesis 5C is not applicable. A second survey with a convenience sample of students at
Lulea University of Technology validates the results from the first survey. Since image
congruence contributes significantly and independently to the explanation of intentions to use
mobile music services, the proposed research model improves the prediction of consumers’
intention over the TPB. This implies that, for a service like mobile music, practitioners should
consider symbolic and expressive motives in addition to utilitarian benefits.
5
Table of Contents
Abstract ............................................................................................................................................4 Table of Contents .............................................................................................................................5 List of Tables....................................................................................................................................8 List of Figures ..................................................................................................................................9 Chapter 1 Introduction ...................................................................................................................10 1.1 Background ..............................................................................................................................10 1.2 Purpose of the study .................................................................................................................11 1.3 Contributions of the study........................................................................................................14 1.4 Structure of the study ...............................................................................................................15 Chapter 2 Literature Review ..........................................................................................................16 Part A The Theory of Planned Behavior........................................................................................16 2.1 Attitude research development.................................................................................................16
2.1.1 Consistency between attitude and behavior ......................................................................16 2.1.2 Development of multicomponent view of attitude............................................................17 2.1.3 Consistency between cognition, affect, and behavior .......................................................19
2.2 Consistency Theories ...............................................................................................................21 2.2.1 Balance theory...................................................................................................................21 2.2.2 Theory of cognitive dissonance.........................................................................................23
2.3 Fishbein model .........................................................................................................................26 2.4 Theory of Reasoned Action .....................................................................................................29
2.4.1 Conceptualization..............................................................................................................30 2.4.2 Principles...........................................................................................................................36 2.4.3 External variables..............................................................................................................38 2.4.4 Summary ...........................................................................................................................39
2.5 Theory of Planned Behavior ....................................................................................................39 2.5.1 Criticism............................................................................................................................41 2.5.2 Empirical support ..............................................................................................................42
Part B Image Congruence Theory..................................................................................................43 2.6 Product symbolism...................................................................................................................44 2.7 Impression management theory ...............................................................................................47 2.8 Image congruence theory .........................................................................................................48 Part C Technology Readiness Index ..............................................................................................50 2.9 Diffusion of Innovations Theory..............................................................................................51 2.10 Additional research ................................................................................................................52 2.11 Description of the Technology readiness index .....................................................................53
2.11.1 Empirical support ............................................................................................................55 Chapter 3 Hypothesis and Proposed Research Model ...................................................................57
6
3.1 Theory of Planned Behavior ....................................................................................................57
3.1.1 Attitude..............................................................................................................................57 3.1.2 Subjective norms ...............................................................................................................58 3.1.3 Perceived behavioral control .............................................................................................58
3.2 Image congruence ....................................................................................................................59 3.3 Technology readiness...............................................................................................................60 3.4 Research model ........................................................................................................................61 Chapter 4 Research Methodology..................................................................................................63 4.1 Research strategy: quantitative and qualitative........................................................................63 4.2 Research design........................................................................................................................64 4.3 Survey method .........................................................................................................................65 4.4 Sampling ..................................................................................................................................65
4.4.1 Target population ..............................................................................................................66 4.4.2 Sampling method...............................................................................................................66 4.4.3 Sample size........................................................................................................................67
4.5 Data collection method ............................................................................................................68 4.5.1 Shopping center sampling .................................................................................................68 4.5.2 Sampling time ...................................................................................................................69 4.5.3 Data collection...................................................................................................................70
4.6 Measurement ............................................................................................................................70 4.6.1 Intention ............................................................................................................................71 4.6.2 Attitudes ............................................................................................................................71 4.6.3 Subjective norm.................................................................................................................72 4.6.4 Perceived behavioral control .............................................................................................72 4.6.5 Eliciting behavioral, normative, and control beliefs .........................................................73 4.6.6 Image congruence .............................................................................................................74 4.6.7 Technology readiness index ..............................................................................................76
4.7 Data examination .....................................................................................................................77 4.7.1 Missing data ......................................................................................................................77 4.7.2 Assumptions in multivariate analysis................................................................................78
4.8 Data analysis ............................................................................................................................78 4.8.1 Reliability analysis ............................................................................................................78 4.8.2 Factor analysis...................................................................................................................78 4.8.3 Multiple regression............................................................................................................79 4.8.4 T-test and analysis of variance (ANOVA)........................................................................81
4.9 The validation study.................................................................................................................82 4.9.1 Sampling frame .................................................................................................................82 4.9.2 Measurement .....................................................................................................................82 4.9.3 Incentives ..........................................................................................................................82 4.9.4 Responses rate ...................................................................................................................83 4.9.5 Handling missing data.......................................................................................................83
Chapter 5 Results ...........................................................................................................................84
7
Part A: The main study ..................................................................................................................84 5.1 Demographic Characteristics ...................................................................................................84 5.2 Descriptive data........................................................................................................................86
5.2.1 Constructs of the Theory of Planned Behavior .................................................................86 5.2.2 Semantic differential measurement for image congruence ...............................................91 5.2.3 Technology Readiness Index ............................................................................................93
5.3 Preliminary analysis .................................................................................................................95 5.3.1 Reliability analysis ............................................................................................................95 5.3.2 Validity analysis ................................................................................................................96
5.4 Correlation................................................................................................................................99 5.5 Main analyses.........................................................................................................................100
5.5.1 Testing hypotheses H1–H4 .............................................................................................100 5.5.2 Testing hypotheses 5A, 5B, and 5C ................................................................................103
5.6 Mean differences in demographic groups ..............................................................................104 5.6.1 Age ..................................................................................................................................104 5.6.2 Gender .............................................................................................................................106 5.6.3 Education.........................................................................................................................107 5.6.4 Occupation ......................................................................................................................108 5.6.5 Annual spending on music ..............................................................................................109 5.6.6 Past use of mobile music service.....................................................................................110 5.6.7 Demographic profile of mobile music service users .......................................................111
Part B: The validation study.........................................................................................................113 5.7 Demographic characteristics ..................................................................................................113 5.8 Descriptive data......................................................................................................................114
5.8.1 Image congruence and constructs of the theory of planned behavior .............................114 5.8.2 Technology Readiness Index ..........................................................................................115
5.9 Preliminary analysis ...............................................................................................................116 5.9.1 Reliability analysis ..........................................................................................................116 5.9.2 Validity analysis ..............................................................................................................116
5.10 Correlation............................................................................................................................119 5.11 Main analysis .......................................................................................................................119
5.11.1 Testing hypotheses H1- H4 ...........................................................................................119 5.11.2 Testing hypotheses 5A, 5B, 5C.....................................................................................121
5.12 Analyses of mean differences among demographic groups.................................................122 5.12.1 Age ................................................................................................................................122 5.12.2 Gender ...........................................................................................................................122 5.12.3 Past use of mobile music service...................................................................................122
Chapter 6 Discussion and Conclusion..........................................................................................124 6.1 Discussion ..............................................................................................................................124
6.1.1 Hypothesis testing ...........................................................................................................124 6.1.2 The relationship between demographic variables and constructs ...................................127
6.2 Theoretical implications.........................................................................................................129 6.3 Managerial implications.........................................................................................................131 6.4 Limitations .............................................................................................................................132
8
6.5 Directions for future studies...................................................................................................134 6.6 Conclusion..............................................................................................................................136 References ....................................................................................................................................138 Appendix ......................................................................................................................................154
List of Tables Table 2. 1 Examples of dissonant and consonant pair of cognitive elements ................................25 Table 2. 2 Hypothetical attitude toward MS (adapted from Fishbein and Ajzen 1975, p. 29-30).28 Table 2. 3 Summary of findings from quantitative reviews and meta-analyses of TRA and TPB
(adapted from Sutton 1998)....................................................................................................43 Table 2. 4 Differing beliefs of technology adoption segments ......................................................54 Table 2. 5 Relationship between the Technology readiness index (TRI) and ownership of
technology-based products and services (adapted from Parasuraman 2000).........................55
Table 4. 1 Differences between quantitative and qualitative research (adapted from Neuman 2003,
p.145)......................................................................................................................................63 Table 4. 2 Population statistics (Sweden 2006) .............................................................................67 Table 4. 3 Selection of modal salient beliefs .................................................................................73
Table 5. 1 Demographic statistics ..................................................................................................85 Table 5. 2 Means, standard deviations of attitude, subjective norm, PBC, image congruence, and
intention (N=236)...................................................................................................................87 Table 5. 3 Means and standard deviations of behavioral belief strength, outcome evaluation,
product of belief strength, and outcome evaluation, and correlations of products of belief strength and outcome evaluation with intention (N=236)......................................................90
Table 5. 4 Means and standard deviations of control belief, power of control belief, product of control belief and power of control belief, and correlations of product of control belief and power of control beliefs with intention (N=236) ...................................................................91
Table 5. 5 Means, standard deviation of typical user image, self image, their absolute difference, and paired sample t-test..........................................................................................................92
Table 5. 6 Minimum, maximum, mean and standard deviation of TRI (N=236) ..........................94 Table 5. 7 Reliability analysis of measurement scales (N=236) ....................................................95 Table 5. 8 Results of factor analysis (varimax rotation) ................................................................97 Table 5. 9 Total variance explained by each component ...............................................................97 Table 5. 10 Final eight-item technology readiness scale: factor loadings after varimax rotation..98 Table 5. 11 Total variance explained by each component .............................................................99 Table 5. 12 Correlations among variables in the research model ................................................100 Table 5. 13 Casewise diagnostic with dependent variable intention............................................100
9
Table 5. 14 Prediction of intention using hierarchical regression analyses .................................102 Table 5. 15 Difference in means of intention, attitude, subjective norm, PBC, image congruence
and TRI among age groups ..................................................................................................105 Table 5. 16 Differences in means of perceived behavioral control between gender groups........107 Table 5. 17 Differences in means of attitude and subjective norm among education groups......107 Table 5. 18 Differences in means of intention, attitude, and subjective norm among occupation
groups ...................................................................................................................................108 Table 5. 19 Differences in means of TRI among groups categorized by annual spending on music
..............................................................................................................................................109 Table 5. 20 Differences in means of intention, attitude, subjective norm, PBC, and image
congruence among groups categorized by past use of the service.......................................110 Table 5. 21 Demographic profiles of users, non-users, and droppers ..........................................112 Table 5. 22 Student demographic statistics ..................................................................................113 Table 5. 23 Means and standard deviation of attitude, subjective norm, PBC, image congruence,
and intention (N= 135) .........................................................................................................114 Table 5. 24 Means and standard deviations of TRI (N=135).......................................................115 Table 5. 25 Reliability analysis of measurement scales (N=135) ................................................116 Table 5. 26 Results of factor analysis (Varimax Rotation) for attitude, PBC, image congruence,
and subjective norm .............................................................................................................117 Table 5. 27 Total variance explained by each component ...........................................................117 Table 5. 28 Final eight-item technology readiness scale: factor loadings after varimax rotation118 Table 5. 29 Total variance explained by each component ...........................................................118 Table 5. 30 Correlations among variables in the validation study ...............................................119 Table 5. 31 Prediction of intention using hierarchical regression analyses .................................120 Table 5. 32 Differences in means of TRI between gender groups ...............................................122 Table 5. 33 Differences in means of intention, attitude, subjective norm, PBC, image congruence
and TRI among groups categorized by past service use ......................................................122
List of Figures Figure 2. 1 Schematic conception of attitudes (Rosenberg and Hovland 1960, p.3) .....................19 Figure 2. 2 Schematic representations of balance theory (adapted from Heider, 1946) ................22 Figure 2. 3 Semantic view of the Theory of Reasoned Action (Ajzen and Fishbein 1980, p.84) .36 Figure 2. 4 The Theory of Reasoned Action and indirect effects of external variables on behavior
(adapted from Ajzen and Fishbein 1980, p. 84) .....................................................................38 Figure 2. 5 The Theory of Planned Behavior (adapted from Ajzen 1991) ....................................41 Figure 2. 6 Types of innovation adopters (adapted from Rogers, 2003) .......................................52
Figure 3. 1 The proposed research model ......................................................................................62
10
Chapter 1 Introduction This chapter discusses the background of the present research, the purpose of the study, expected
contributions, and the structure of the study.
1.1 Background Consumer use of mobile communication devices has been increasing rapidly. Devices based on
mobile technology are now popular in everyday life (Balasubramanian et al. 2002). The distinct
advantage of mobile services is the universal and unified access to information and personalized
services (Watson et al. 2002). Mobile entertainment services are expected to become major
revenues for players in the mobile commerce chain (Baldi and Thaung 2002; Maciness et al.
2002). Holden (2006) from Juniper Research reports that mobile entertainment services are
currently worth US $17 billion and will grow to US $47 billion by 2009 and US $77 billion by
2011. Typical services include mobile music, mobile gaming, mobile advertising, location-based
information service, etc. The players include mobile operators, handset manufacturers, software
and platform providers, and mobile content providers. These companies are trying to develop and
market mobile applications and services.
Among the above services, mobile music service1 is the top entertainment product for mobile
phones and is expected to “be one of the biggest revenue generators for mobile operators” (ARC
Group 2001). Edgar Bronfman Jr., Warner Music Group's CEO, notes that although there are
already millions of music phones available throughout the world, only about 8.8 percent of
people with these devices actually buy their music wirelessly. "We need to make it easy,
affordable, and quick to get music on mobile phones," he said. "Until we achieve this goal, we
will be leaving billions of dollars on the table" (Reardon 2007).
The potential growth of mobile music is remarkable, since there are more mobile handset owners
than iPods or MP3 player owners. Among business players in the mobile music value chain,
mobile operators are in the most advantageous position to increase revenue from mobile music
1 Mobile music service here is limited to full-track downloads and music streaming. Ringtones and ringbacks are not included.
11
services, because they own distribution networks and know their subscribers’ network settings,
devices, personal information, and preferences.
Although the service just emerged in the US in late 2005, IDC forecasts that US mobile music
services will have over 50 million users and generate more than a billion dollars in revenue by
2010, probably surpassing online music users at the end of the same period. In Japan, 90 percent
of the 268 million digital songs purchased in 2005 were downloaded over mobile phones instead
of PC-based service like iTunes, according to the Recording Industry Association of Japan (Stone
and Kashiwagi 2006). On a global scale, although revenue from mobile music service was $20
million in 2004, it is predicted to increase to $1.8 billion by 2009 (Holden 2006). As Bruce
Gibson, Research Director at Juniper Research, put it: “full track music has been central offering
of many 3G service launches around the world and as 3G usage gathers pace, the mobile music
market is preparing to enter a new growth phase”.
Technological advancement is the main driver for the growth of mobile music service, e.g., the
possibility of dual downloads, increased bandwidth offered by 3G networks, and especially the
evolution of mobile handsets. In 2006, manufacturers such as Sony Ericsson and Nokia
developed phones designed specifically for mobile music downloads. Even Apple announced the
launch of iPhone (IFPI 2007). Handsets with integrated music players are becoming mass-storage
devices that can hold thousands of tracks (Reid 2007). Research suggests that the convenience of
downloading songs to both wireless handsets and computers will drive users to pay a premium of
around 35 percent compared to traditional procurement methods, e.g., stores or the Internet
(Koprowski 2006).
1.2 Purpose of the study The above-mentioned advantages are not enough to secure high consumer adoption of mobile
music services. Service providers must have a clear understanding of what consumers want on
their phones and how they want it supplied to them (Daniel 2007). Otherwise, they may repeat a
failure similar to the classic case of technology push (Basso 2001). Shankar et al. (2003) suggest
that one of the most important reasons for the disappointing uptake of a majority of mobile
services is the failure of firms to understand customer value creation; moreover, the added value
12
of wireless services lacks the advantages needed to create a market pull. Handsets may be
advanced in technology and service may be sophisticated, but customers can still resist the
feature. To successfully move beyond the technological push, marketers should identify what
determines consumers’ intentions to use mobile music services (Barnes 2002, Nohria and
Leetsma 2001, Nysveen et al. 2005). Thus, the research question for the study is proposed as
follows:
In order to answer this question, it is of great importance to develop a theoretically sound and
solid model. In the field of social psychology in general and consumer behavior in particular, the
theory of reasoned action (TRA) (Fishbein and Ajzen 1975) and its extension, the theory of
planned behavior (Ajzen 1991) are two of the dominant models used to explain human behavior
(Armitage and Conner 2001; Sutton 1998; Eagly and Chaiken 1993; Ajzen 2001). According to
the TRA, people are assumed to make decisions in a rational manner based on available
information and the consequences of the behavior (Fishbein and Ajzen 1975). Behavior is the
result of discrete personal decisions to engage in an action. Intention is considered the immediate
determinant of behavior. Intention, in turn, is a direct function of attitudes and subjective norm.
As early as 1975, the TRA model had been recognized as a solid model by consumer researchers.
It provides a basis for studies integrating attitude and normative influences relative to behavior
and is useful for the explanation and prediction of consumer behavior for utilizing behavioral
intention as a mediator. Most importantly, it has sound conceptual antecedents and empirical
support (Ryan and Bonfield 1975)
In reality, because the execution of many behaviors faces difficulties that limit volitional control,
Ajzen (1991) reformulated the TRA into the theory of planned behavior (TPB) by suggesting a
perceived behavioral control (PBC) variable to predict behavior. In TPB, PBC is considered
another independent variable that influences intention. This model has received considerable
attention in the literature and has been applied in great numbers of studies in various domains. A
“What are the antecedents to the intention to use mobile music services?”
13
compilation of TPB bibliography by Ajzen (2006) comprises more than 600 empirical studies and
40 theoretical review papers.
According to the TPB, it should be possible to influence intention and behavior by designing an
intervention that has significant effects on one or more antecedent factors, that is, on attitudes,
subjective norms, and perceptions of behavioral control (Ajzen and Fishbein 1980). By
understanding the factors that influence consumers’ decisions to use mobile music services,
marketers can develop successful intervention programs aimed at modifying consumer behavior
by influencing motives. The programs can influence behavior by changing beliefs, which leads to
changes in attitudes, which in turn results in changes in intention and behavior.
The main predictors of behavioral intention in the TPB are attitude, subjective norm, and
perceived behavioral control. However, previous research suggest a number of additional
constructs that might be useful. In fact, the model is “open to the inclusion of additional
predictors if it can be shown that they capture a significant proportion of the variance in intention
of behavior after the theory’s current variables have been taken into account” (Ajzen 1991,
p.199). This study introduces two additional independent variables: image congruence and
technology readiness. According to Conner and Armitage (1998), when adding a variable to the
TPB, it is necessary to give theoretical justification for the role of the variable within the model
and to specify the process by which the new variable influences intention as well as the range of
conditions over which such a variable might be expected to impact.
The first additional construct, image congruence, is derived from image congruence theory.
Image congruence refers to the degree of fit between the perceived self-image of consumers and
the perceived image of a typical user of the product or service in investigation (Grubb and
Grathwohl 1967; Kleijnen et al. 2005). One important implication of image congruence theory is
found in its association with behavior: the more similar a person’s self-image is with the
perceived image of a typical user of a product or service, the higher the probability that the
person will buy/use the service (Birdwell 1968; Grubb and Grathwohl 1967; Kleijnen et al. 2005).
This study begins with the assumption that the ability of the TPB to explain intentions to use
mobile music services will increase with the addition of the image congruence construct. Image
14
congruence can be employed with three classic constructs: attitude, subjective norm, and
perceived behavioral control.
The second additional construct, technology readiness, refers to consumers’ propensity to
embrace technology-based products and services (Parasuraman 2000). Based on the theory of
diffusion of innovation (Rogers 1962), Parasuraman’s technology readiness index focuses on the
relationship between technology readiness and intention to adopt technology-based products and
services. The more ready that one is to embrace new technology, the higher the possibility that
the person will intend to use technology-related products or services. Since the use of mobile
music services may involve a certain level of technical complexity, it is justifiable to examine
whether technology readiness influences behavioral intention to use the service.
In short, the objectives of the study are two-fold: (1) to identify antecedents of the intention to
use mobile music services and (2) to explore the relative importance of each determinant on the
above intention. To achieve these goals, a model that explains customers’ intention to use mobile
music services will be developed based on the TPB, image congruence theory, and the
technology readiness index. The proposed model is posited to link image congruence and
technology readiness with attitude, subjective norm, and perceived behavioral control in order to
predict intention to use mobile music services.
1.3 Contributions of the study This study is the first to investigate antecedents to consumers’ intentions to use mobile music
services. Previous studies in the mobile service domain mainly focused on text messaging,
chatting, WAP, or mobile banking (Hung et al. 2003; Nysveen et al. 2005; Teo and Pok 2003).
The results are expected to provide more information about motivational factors influencing
consumers’ behavioral intentions in a new service industry with rapid growth.
Theoretically, the contribution of the study is to provide a research model for understanding
motivational factors for consumer behavior. This model is constructed based on an integration of
various well-established theories that deal with consumer motives for deliberate behaviors; it is
15
expected to capture a broader and more holistic understanding of the antecedents to the intention
to use mobile music services (Nysveen et al. 2005).
Practically, the study is expected to provide a solid base for practitioners to design appropriate
marketing strategies aimed at convincing consumers to adopt mobile music services. The results
are also expected to shed light on the demographic profiles of current service users, thus allowing
service providers to obtain better understandings of customers and, consequently, to serve them
better.
1.4 Structure of the study This study comprises six chapters. The first three chapters present the background of the research.
Chapter Two reviews the history of attitude research that served as springboard for the formation
of the theory of reasoned action and the theory of planned behavior. This chapter also reviews the
theory of image congruence and the concept of technology readiness. Chapter Three provides the
rationale for the development of the hypotheses and the research model, while Chapter Four
describes the research methodology and the rationales for methodological choices. Results from
data collection are presented in Chapter Five. Chapter Six discusses the results of this study,
theoretical and managerial implications, limitations, and directions for future research. A
reference list and an appendix are presented at the end of the thesis.
16
Chapter 2 Literature Review The first part of this chapter reviews the development of attitude research, the relationship
between attitude and behavior, the multicomponent view of attitude, and the theories that serve
as ground for the hypothesis: balance theory, the theory of cognitive dissonance, the Fishbein
model, the theory of reasoned action, and the theory of planned behavior. Part B discusses
product symbolism, impression management theory, and image congruence theory. Part C
presents a review of Diffusion of innovation theory as well as previous research about the
influence of individual difference on technology adoption behavior. The section ends with a
description of Technology readiness index.
Part A The Theory of Planned Behavior
2.1 Attitude research development The study of attitude has become popular in the fields of social science, social psychology, and
consumer behavior. More than 100 definitions and 500 measures of attitude have been put forth
(Fishbein and Ajzen 1975, p.2). Early on, Allport (1935, p.35) noted that “the concept of attitude
is probably the most distinctive and indispensable concept in contemporary American social
psychology. No other term appears more frequently in experimental and theoretical literature.”
More than half a century has passed, and the comment is still valid (Bagozzi et al. 2002, p.4;
Eagly and Chaiken 1993, p.1). Attitude serves many important psychological functions and
motivates behavior, thus allowing the prediction of behavior (Petty and Cacioppo 1996, p.7). In
attitude research, the relationship between attitude and behavior has long been a major topic.
2.1.1 Consistency between attitude and behavior The assumption of consistency between attitude and behavior has been tested with controversial
results. LaPiere (1934) investigated the relationship between people’s attitude and behaviors by
accompanying a young Chinese couple in their travel throughout the United States. They were
refused service only once in 251 restaurants, hotels, and campgrounds that they visited. Six
months later, the author mailed a questionnaire to each establishment asking, “Will you accept
members of the Chinese race as guests at your establishment?” Over 90 percent of the 128
establishments that replied answered no. Based on these findings, LaPiere questioned the
17
traditional assumption that attitudes correlates strongly with behavior. 2 This result was later
supported by Corey (1937), who found that students’ cheating behavior was unrelated to attitude.
That is, the probability of cheating among students with positive attitudes toward cheating was
not different compared to those with negative attitudes.
When studies with negative findings began to outnumber studies supporting a strong relation
between attitude and behavior, researchers searched for ways to explain such failure to predict
behavior.3 One of the trends was to reconsider the conceptualization of attitude, which led to the
emergence of the multicomponent view of attitude (Ajzen and Fishbein 1980, p.18). This view
regards attitude as comprising three components: cognition, affect, and behavior (Cartwright
1949; Katz and Stotland 1959; Rosenberg and Hovland 1960; Smith 1947). With this view, when
looking at the relationship between attitude and behavior, researchers must look at the
relationship between these components and behavior. Thus, the question of the consistency
between attitude and behavior became a question of the consistency between cognition, affect,
and behavior.
2.1.2 Development of multicomponent view of attitude Before reviewing the consistency among cognition, affect, and behavior, it is necessary to review
the development of the multicomponent view of attitude. Allport’s (1935) article titled
“Attitudes” is considered the first step in the development of the multicomponent view of attitude
(Ajzen and Fishbein 1980, p.19). Reviewing more than 100 different definitions of attitude,
Allport (1935, p.25) points out that the most distinctive feature of attitude is its bipolar direction:
“An attitude characteristically provokes behavior that is acquisitive or aversive, favorable or
unfavorable, affirmative or negative toward the object or class of objects with which it is related.”
The author argues that one dimension (i.e., the evaluative dimension) cannot represent the
complexity of attitude. He gives an example of two people with the same affect for the church
who differ in “their sacramental, liturgical, social, Protestant or Catholic interpretation of the
church.” Thus, they may differ qualitatively in their attitude toward the church (Fishbein 1967).
Based on this argument, Allport (1935, p.35) proposes his own definition of attitude as “a mental 2 In fact, there are some flaws in the methodology of LaPiere’s study that account for the failure of attitude to predict behavior (see Section 2.4). 3 For a review of studies with negative results for the attitude and behavior relationship, see Wicker (1969)
18
and neural state of readiness, organized through experience, exerting a directive or dynamic
influence upon the individual’s response to all objects and situations with which it is related.”
Smith (1947) suggests a framework for describing attitude that includes three main components:
the affective aspect (how a person feels about a subject), the cognitive aspect (what he thinks
about it), and the policy orientation of the individual (what action he believes he should be taken).
Katz and Stotland (1959) provide a more elaborative discussion on cognition, affect, and
behavior. In line with Kretch and Crutchfield (1948), Katz and Stotland (1959) view affect as the
central aspect of the attitude: “A person may have beliefs and judgments about various objects
and aspects of his world but these are not attitudes unless an attribution of good or bad qualities
accompanies in the specific beliefs.” The cognitive component has three basic characteristics: the
number of beliefs, the organization of these beliefs into a hierarchical pattern, and the generality
or specificity of the beliefs. The behavioral component refers to an action tendency toward the
object of the attitude.
Katz and Stotland (1959) clearly distinguish between attitudes and beliefs:
“We have limited attitudes to evaluations of objects and have ruled out beliefs which are not
colored by affect and affective process which are not tied to cognitive elements” (p.464). They
further argue that “judgments which are purely cognitive would not fall into the category of
attitudes” (p.429). Thus, attitudes refer to evaluations of objects and are distinctly different from
beliefs, which comprise cognitive aspects. As we will see in later sections, Fishbein (1967) builds
on this idea by proposing that attitude is composed only of the affective component. Cognitive
elements, which are called beliefs, are determinants of attitude, not a component of attitude itself.
It was not until 1960 that a clear conceptualization of a multidimensional view of attitude
emerged. Arguing that previous studies lacked a holistic view (Stouffer, 1931; Murphy, Murphy
and Newcomb, 1943, cited in Rosenberg, 1960, p.168), Rosenberg and Hovland (1960)
conceptualize attitude as a predisposition to respond in a particular way toward a specified class
of objects. Responses can be classified into three types: cognitive, affective, and behavioral.
Cognition includes perceptions, concepts, and beliefs about the attitude object and verbal
statements of beliefs. Affect refers to “sympathetic nervous responses and verbal statement of
19
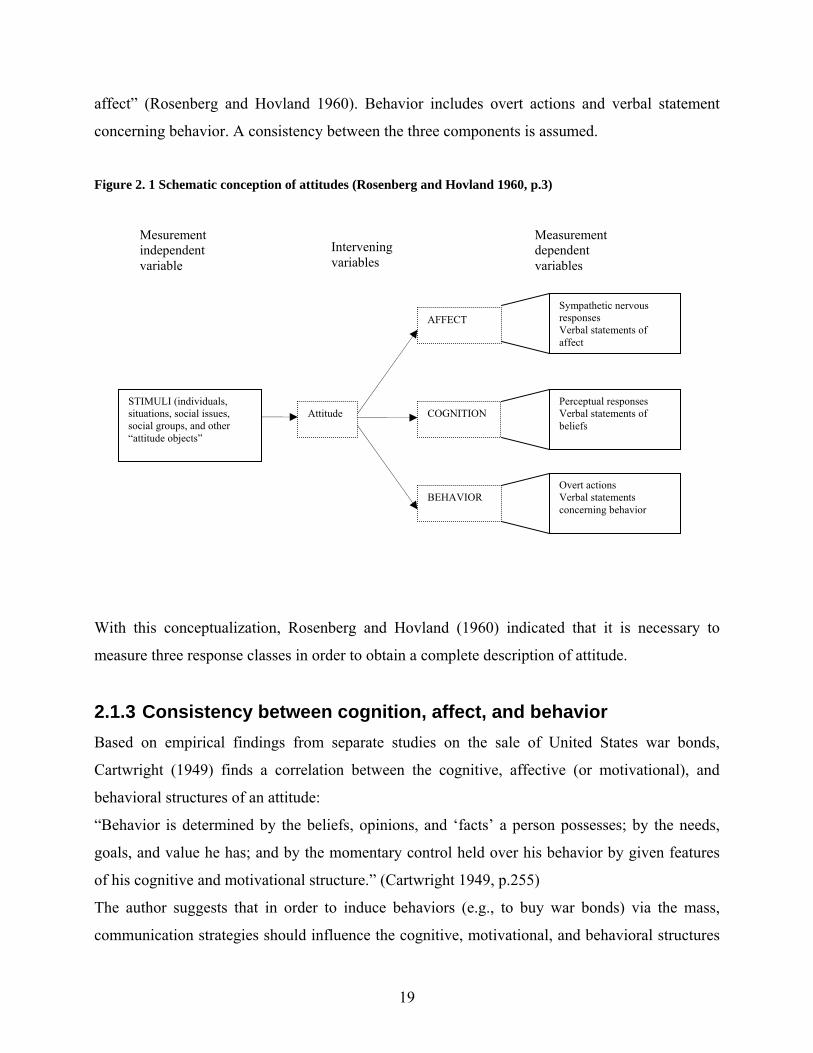
affect” (Rosenberg and Hovland 1960). Behavior includes overt actions and verbal statement
concerning behavior. A consistency between the three components is assumed.
Figure 2. 1 Schematic conception of attitudes (Rosenberg and Hovland 1960, p.3)
With this conceptualization, Rosenberg and Hovland (1960) indicated that it is necessary to
measure three response classes in order to obtain a complete description of attitude.
2.1.3 Consistency between cognition, affect, and behavior Based on empirical findings from separate studies on the sale of United States war bonds,
Cartwright (1949) finds a correlation between the cognitive, affective (or motivational), and
behavioral structures of an attitude:
“Behavior is determined by the beliefs, opinions, and ‘facts’ a person possesses; by the needs,
goals, and value he has; and by the momentary control held over his behavior by given features
of his cognitive and motivational structure.” (Cartwright 1949, p.255)
The author suggests that in order to induce behaviors (e.g., to buy war bonds) via the mass,
communication strategies should influence the cognitive, motivational, and behavioral structures
STIMULI (individuals, situations, social issues, social groups, and other “attitude objects”
Attitude
AFFECT
COGNITION
BEHAVIOR
Sympathetic nervous responses Verbal statements of affect
Perceptual responses Verbal statements of beliefs
Overt actions Verbal statements concerning behavior
Mesurement independent variable
Intervening variables
Measurement dependent variables
20
of the targeted people. Cartwright (1949) also mentions the role of perceived instrumentality
learning in the formation of cognition and attitudes: “To induce a given action by mass
persuasion, this action must be seen by the person as a path to some goal that he has.” This idea
is close to the expectancy value principle later applied by attitude theorists. For example,
Rosenberg (1956) shows that people have more favorable evaluations about objects that they
perceive as functional than other non-instrumental objects.
Katz and Stotland (1959), Carlson (1956), and particularly Rosenberg (1956) also support
consistency between cognition, affect, and behavior. Rosenberg (1956, p.367) uses a
comprehensive measurement of the cognitive component made up of “beliefs about the
potentialities of that object for attaining or blocking the realization of valued states.” His main
hypothesis is stated as follows:
“When a person has a relatively stable tendency to respond to a given object with either positive
or negative affect, such a tendency is accompanied by a cognitive structure made up beliefs
about the potentialities of that object for attaining or blocking the realization of valued states;
the sign (positive or negative) and extremity of the affect felt toward the object are correlated
with the content of its associated cognitive structure.” (p.367)
Rosenberg attempts to show a positive correlation between beliefs and attitude. Empirical results
support the notion that attitudes result from beliefs about attributes of attitude object.
Rosenberg’s greatest contribution was his application of the expectancy value model4 to measure
cognitive and affective consistency. He was the first to propose that the affect component
correlates with the cognitive component; this can be calculated as the algebraic sum of value
importance and instrumentality estimate related to the attitude object:
“The degree and sign of affect aroused in an individual by an object (as reflected by the position
he chooses on an attitude scale) vary as a function of the algebraic sum of the products obtained
by multiplying the rated importance of each value associated with that object by the rated potency
of the object for achieving or blocking the realization of that value.” (Rosenberg 1956, p.369)
4 One of the most popular expectancy-value theories is by Edwards (1954). It states that “when a person has to make a behavioral choice, the person will select that alternative which has the highest subjective expected utility, i.e., the alternative which is likely to lead to the most favorable outcomes” (Fishbein and Ajzen 1975, p., 30). For other theories, see Tolman (1932), Rotter (1954) and Atkinson (1957).
21
Following Rosenberg’s work, Katz and Stotland (1959) argue that attitudes can be changed if
certain related components are changed. Among them, beliefs and goal-achieving instrumentality
of the object are the two most noticeable variables. More specifically, Katz and Stotland (1959)
state that attitudes can be changed by modifying the cognitive component (i.e., beliefs), provided
that the attitude is high in its cognitive component. 5 “Individuals characteristically seek
rationalizations and often must find them before they act or before they feel comfortable about
their actions” (see also Katz and Stotland 1959, p. 459 for a review on two studies supporting this
hypothesis). This assumption was also supported by Carlson (1956), who showed that affect and
behavioral components can be changed by modifying the cognitive structure.
Katz and Stotland (1959), Carlson (1956), and Rosenberg (1956) are among many theorists who
address the inconsistencies among beliefs, attitude, intention, and behaviors (Fishbein and Ajzen
1975, p.32). The origins of these theories can be traced back to the 1950s, when several attitude
theories were developed, focusing on the role of cognition and the inconsistencies that may arise
between people’s beliefs; these theories became known as cognitive consistency theories (Hogg
and Vaughan 2005, p.153). The main assumption of these theories is that an attitude structure is
built on beliefs that are in disagreement will be subjectively aversive. Consistency theories, such
as Heider’s (1946) balance theory and Festinger’s (1957) theory of cognitive dissonance,
dominated social psychology in the 1960s.
2.2 Consistency Theories 2.2.1 Balance theory Heider’s balance theory describes how an individual perceives the relationship among persons
and an impersonal entity. The theory deals with a triad consisting of two people (P and O) and
one nonhuman entity X (a situation, an event, or an idea). According to Heider (1946), balance is
a harmonious state in which all three elements appear to be internally consistent to the person. It
is also noted that balance is a state existing in people’s minds rather than an objective fact. The
5 The authors use the term “intellectualized and balanced attitudes” to refer to attitudes high in the cognitive component. In addition to cognitive elements, the authors also propose needs, values, perceptions, and behavior as the targets for change. However, these areas are beyond the scope of this thesis.
22
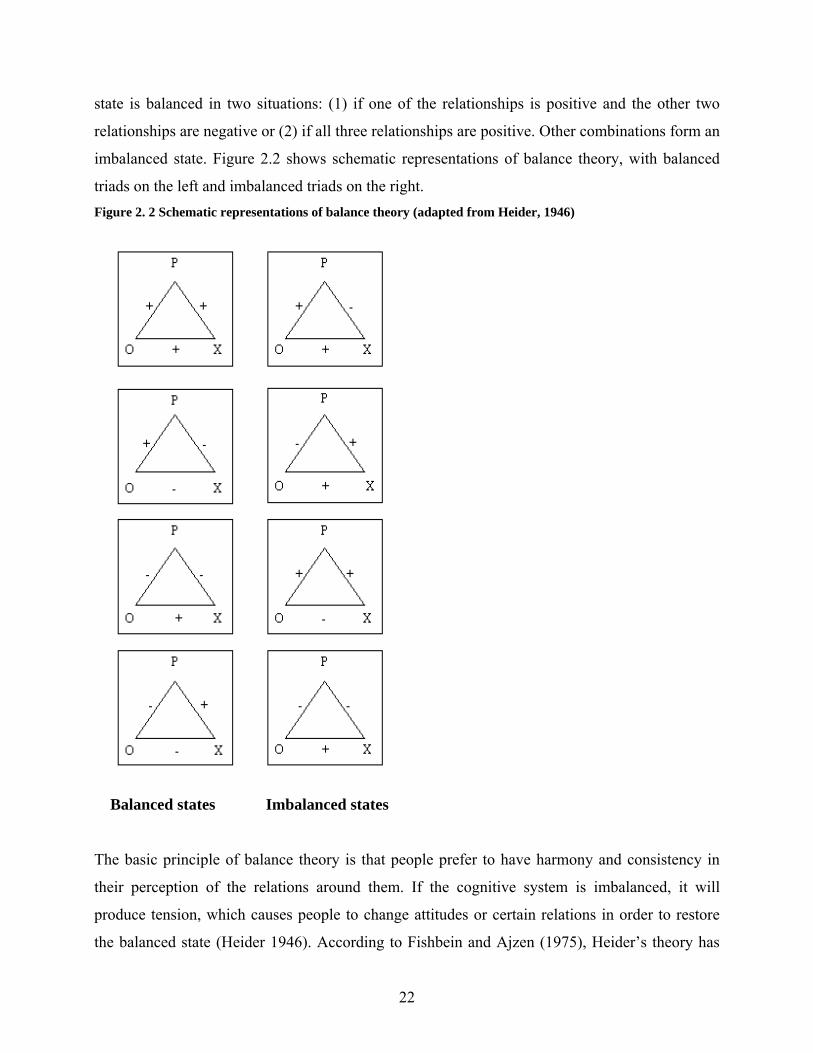
state is balanced in two situations: (1) if one of the relationships is positive and the other two
relationships are negative or (2) if all three relationships are positive. Other combinations form an
imbalanced state. Figure 2.2 shows schematic representations of balance theory, with balanced
triads on the left and imbalanced triads on the right. Figure 2. 2 Schematic representations of balance theory (adapted from Heider, 1946)
Balanced states Imbalanced states
The basic principle of balance theory is that people prefer to have harmony and consistency in
their perception of the relations around them. If the cognitive system is imbalanced, it will
produce tension, which causes people to change attitudes or certain relations in order to restore
the balanced state (Heider 1946). According to Fishbein and Ajzen (1975), Heider’s theory has
23
some implications about the relationship between beliefs and attitude. If a person’s perception of
a relation between O and X can be interpreted as a belief of O, then the theory implies that a
person’s attitude toward an object may be influenced by the person’s belief about the object and
by the evaluation of the related attributes. For example, marketers use balance theory to create
desirable changes in consumer attitudes toward certain brands or product by creating attitudinal
conflicts, so that consumers must change their attitude to maintain balance (Assael 1995, p.311).
However, balance theory also has a number of limitations: (1) the relations between entities are
either positive or negative, without taking into account the degree of variance; and (2) the theory
deals with relationships between three entities whereas, in reality, multiple relations between two
entities can exist (Fishbein and Ajzen 1975). Notwithstanding, research on balance theory has
been extensive and mostly supportive (Hogg and Vaughan 2005, p.154). The development of
balance theory resulted in various extensions, variations, and specific applications derived from it.
Among them, Festinger’s (1957) theory of cognitive dissonance can be considered “the jewel in
the consistency family crown” (Eagly and Chaiken 1993, p.456).
2.2.2 Theory of cognitive dissonance Festinger formulated the theory of cognitive dissonance in 1957. The theory combines cognition
and motivation to explain attitude changes. In its heyday, the theory generated over a thousand
separate experiments with startling findings about human behavior (Aronson 1992). Although
there were several criticisms about its vagueness (Eagly and Chaiken 1993, p.469), the theory is
considered “the most important and most provocative theory in social psychology” (Aronson et al.
1999, p.191)6
The main pillar of the theory is the consistency principle, which refers to the idea that “people’s
mental representations of their beliefs, attitudes, and attitudinally significant behaviors, decisions,
and commitments tend to exist in harmony with each other, and that disharmony motivates
cognitive changes designed to restore harmony” (Eagly and Chaiken 1993, p.456). Based on this
principle, dissonance theory holds that “the existence of dissonance, being psychologically
uncomfortable, will motivate the person to try to reduce the dissonance and achieve some
consonance” (Festinger 1957, p.13). The theory also proposes that in case of dissonance arousal,
6 Psychological Inquiry, Vol.3, No.4 (1992) is devoted to discussing the contributions and limitations of the theory.
24
people tend to avoid information that might result in further increments of the magnitude of
dissonance.
Dissonance relation between two cognitive elements occurs when “considering these two alone,
the obverse of one element would follow from the other” (Festinger 1957, p.13). For example, the
knowledge that “using mobile music services is very costly” will be dissonant with the element “I
use mobile music services,” because the obverse of the latter element seems to follow from the
former element. Consonance, on the other hand, refers to the relation between two cognitive
elements that “either one does follow from the other” (Festinger 1957, p.15). For example, the
element “I use mobile music services” follows the element “I enjoy using mobile music services.”
Thus, the relation of these two elements is consonant.
Cognitive elements refer to “the things a person knows about himself, about his behavior, and
about his surroundings” (Festinger 1957, p.9). Anything that the person cognizes or knows is a
cognitive element (Eagly and Chaiken 1993, p.470). For examples, “I use mobile music service”,
“using mobile music service is very costly”, and “I enjoy using mobile music service” are
possible cognitive elements. Fishbein and Ajzen (1975, p.42) argue that cognitive elements are
equivalent to beliefs, which refer to “a person’s knowledge that he holds a certain attitude or
certain belief or that he performed a certain behavior.” They also remark that consonance and
dissonance refer to relations between beliefs that may influence other variables such as attitudes,
intentions, and behaviors. In Festinger’s theory, the cognitive representations of beliefs and
attitude are not distinct; therefore, the theory “makes no differential predictions about the effects
of dissonance on changes in beliefs and attitudes” (ibid).
Magnitude of dissonance
According to Festinger (1957, p.18), “the strength of the pressure to reduce the dissonance is a
function of the magnitude of the dissonance.” The larger dissonance that people experience, the
more that motivated people are to reduce it. The magnitude of dissonance is influenced by two
factors. First, it is determined by the importance of elements in dissonance to the person.
Important elements are those that are more central to the perceiver’s self-concept or that are
highly valued by the perceiver (Eagly and Chaiken 1993, p.471). Aronson and Carlsmith (1962)
25
suggest that magnitude of dissonance is strongest when people’s self-concept is engaged. Their
study shows that a person with a low self-concept experiences lower dissonance compared to
someone with high self-concept. Further studies by Aronson (1992) and his colleagues suggest
that motivations to reduce dissonance may include preserving a consistent, stable, and predictable
sense of self; a competent sense of self; and a morally good sense of self.
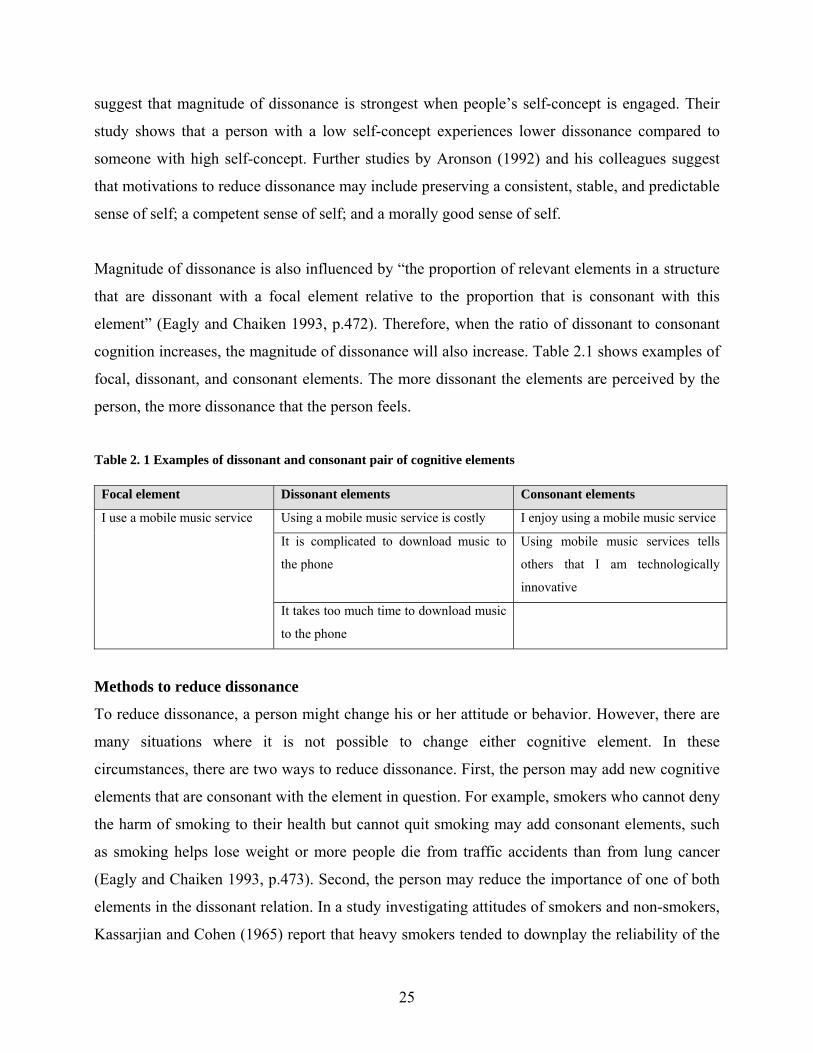
Magnitude of dissonance is also influenced by “the proportion of relevant elements in a structure
that are dissonant with a focal element relative to the proportion that is consonant with this
element” (Eagly and Chaiken 1993, p.472). Therefore, when the ratio of dissonant to consonant
cognition increases, the magnitude of dissonance will also increase. Table 2.1 shows examples of
focal, dissonant, and consonant elements. The more dissonant the elements are perceived by the
person, the more dissonance that the person feels.
Table 2. 1 Examples of dissonant and consonant pair of cognitive elements
Focal element Dissonant elements Consonant elements
Using a mobile music service is costly I enjoy using a mobile music service
It is complicated to download music to
the phone
Using mobile music services tells
others that I am technologically
innovative
I use a mobile music service
It takes too much time to download music
to the phone
Methods to reduce dissonance
To reduce dissonance, a person might change his or her attitude or behavior. However, there are
many situations where it is not possible to change either cognitive element. In these
circumstances, there are two ways to reduce dissonance. First, the person may add new cognitive
elements that are consonant with the element in question. For example, smokers who cannot deny
the harm of smoking to their health but cannot quit smoking may add consonant elements, such
as smoking helps lose weight or more people die from traffic accidents than from lung cancer
(Eagly and Chaiken 1993, p.473). Second, the person may reduce the importance of one of both
elements in the dissonant relation. In a study investigating attitudes of smokers and non-smokers,
Kassarjian and Cohen (1965) report that heavy smokers tended to downplay the reliability of the
26
findings more than non-smokers. Gibbon (1997) found that smokers who succumbed to smoking
after an in-clinic quitting period lowered their perceptions of its dangers. The latter method can
be considered a consequence of the former, because adding a consonant element reduces the
importance of the dissonant element (Eagly and Chaiken 1993, p.473).
Conditions for cognitive dissonance arousal
Festinger (1957) suggests four basic situations that could give rise to cognitive dissonance:
decision making, forced compliance, voluntary and involuntary exposure to dissonant
information, and disagreement with other persons. By reviewing relevant research published from
1957 to 1976, Wicklund and Brehm (1976) suggest that the main condition for cognitive arousal
occurs when a person feels responsible for cognitive inconsistencies. In a marketing context,
conditions for arousal of cognitive dissonance occur when consumers are free to make their own
choices; consumers are irrevocably committed to the purchase choice made; and the purchase
choice is important to consumers (Cummings and Venkatesan 1976).
To sum up, balance theory and cognitive dissonance theory both rely on the assumption that
people are motivated to maintain consistency among their beliefs, attitudes, and behaviors (Ajzen
1988, p.27). This consistency can be considered as a foundation of the development of the
multicomponent view of attitude (Rosenberg and Hovland 1960) and the formulation of the
Fishbein model some years later.
2.3 Fishbein model Continuing the work of Carlson (1956), Katz and Stotland (1959), Rosenberg (1956), as well as
Rosenberg and Hovland (1960), Fishbein (1963) developed a model to measure attitude that later
became the most popular multiattribute model of attitude7 in marketing. The Fishbein model has
been said to have had the “greatest influence on consumer attitude research over the past two
decades” (Lutz 1991). Unlike multicomponent attitude theorists, Fishbein (1963) conceptualizes
attitude as having only one component: affect. He defined it as “the evaluative dimension of a
7 The name “multiattribute model” derives from that fact that an attitude object is considered as having many attributes differing in importance (Runyon and Stewart 1987)
27
concept…or as mediating evaluative responses.” Cognition and connation components of attitude
are considered separate concepts that can be related to attitudes. The essence of the Fishbein
model can be described as follows:
“(1) an individual holds many beliefs about any given object, i.e. many different characteristics,
attributes, values, goals, and objects are positively or negatively associated with a given object;
(2) associated with each of these ‘related objects’ is a mediating evaluative response, i.e. an
attitude; (3) these evaluative responses summate; (4) through the mediation process, the
summated evaluative response is associated with the attitude object, and thus (5) on the future
occasions the attitude object will elicit this summated evaluative response, i.e. this attitude”
(Fishbein 1963, p.233)
While Rosenberg and Hovland (1960) suggest that attitudes result from beliefs about the
instrumentality of the object in obtaining goals and the value importance of those goals, Fishbein
(1963) defines a person’s attitude toward any object as a function of the person’s beliefs about
the object and the evaluative responses associated with those beliefs. A belief about an object in
the Fishbein model is defined as the “probability dimension of a ‘concept’ where the concept is a
relational statement (e.g. ‘Negroes have dark skin’).” The model can be expressed algebraically
as follows:
where
Ao = the attitude toward some object “O”
bi = belief i about O or the subjective probability that O is related to the attribute i
ei = the evaluation of attribute i
n = the number of beliefs
Let us use the Fishbein model to illustrate the attitude of consumer C8 toward mobile music
services. Suppose that through empirical data, C is found to have following beliefs about mobile
music service (MS): trendy; costly; complicated to use; and slow to download. According to the
model, the attitude of consumer C toward MS is a function of the strength with which he/she
8 This example is modified from Fishbein and Ajzen (1975, p.29-30); the figures are hypothetical
Ao ≈ ∑biei n
i=1
28
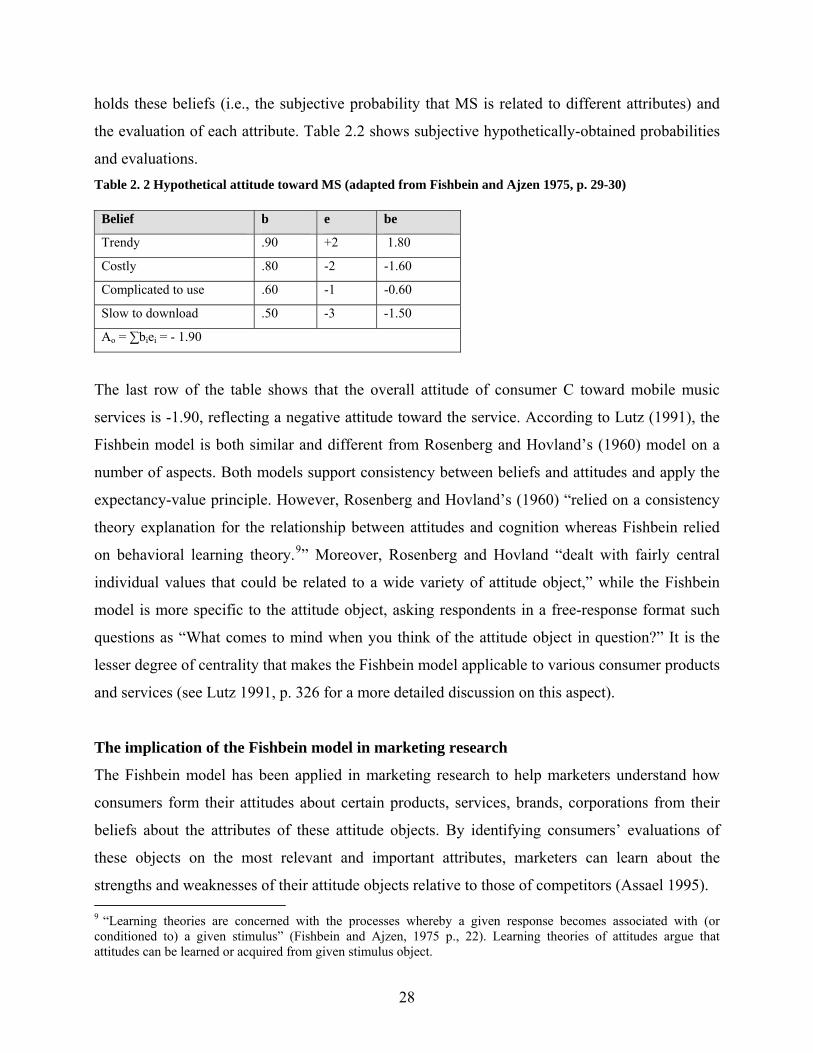
holds these beliefs (i.e., the subjective probability that MS is related to different attributes) and
the evaluation of each attribute. Table 2.2 shows subjective hypothetically-obtained probabilities
and evaluations. Table 2. 2 Hypothetical attitude toward MS (adapted from Fishbein and Ajzen 1975, p. 29-30)
Belief b e be
Trendy .90 +2 1.80
Costly .80 -2 -1.60
Complicated to use .60 -1 -0.60
Slow to download .50 -3 -1.50
Ao = ∑biei = - 1.90
The last row of the table shows that the overall attitude of consumer C toward mobile music
services is -1.90, reflecting a negative attitude toward the service. According to Lutz (1991), the
Fishbein model is both similar and different from Rosenberg and Hovland’s (1960) model on a
number of aspects. Both models support consistency between beliefs and attitudes and apply the
expectancy-value principle. However, Rosenberg and Hovland’s (1960) “relied on a consistency
theory explanation for the relationship between attitudes and cognition whereas Fishbein relied
on behavioral learning theory.9” Moreover, Rosenberg and Hovland “dealt with fairly central
individual values that could be related to a wide variety of attitude object,” while the Fishbein
model is more specific to the attitude object, asking respondents in a free-response format such
questions as “What comes to mind when you think of the attitude object in question?” It is the
lesser degree of centrality that makes the Fishbein model applicable to various consumer products
and services (see Lutz 1991, p. 326 for a more detailed discussion on this aspect).
The implication of the Fishbein model in marketing research
The Fishbein model has been applied in marketing research to help marketers understand how
consumers form their attitudes about certain products, services, brands, corporations from their
beliefs about the attributes of these attitude objects. By identifying consumers’ evaluations of
these objects on the most relevant and important attributes, marketers can learn about the
strengths and weaknesses of their attitude objects relative to those of competitors (Assael 1995). 9 “Learning theories are concerned with the processes whereby a given response becomes associated with (or conditioned to) a given stimulus” (Fishbein and Ajzen, 1975 p., 22). Learning theories of attitudes argue that attitudes can be learned or acquired from given stimulus object.
29
The Fishbein model also implies that marketers can use advertising and marketing
communication tools to change consumers’ attitude by deploying strategies aimed at changing
belief strength (bi) associated with an attribute or changing an evaluative factor (ei) associated
with an attribute. Marketers can also introduce a previously non-salient10 attribute (usually a
brand, product, and service) into the cognitive structure of consumers (Lutz 1991).
2.4 Theory of Reasoned Action As noted in previous sections, the development of the multicomponent view of attitude stemmed
from the demand of attitude researchers to find explanations for the inconsistency between
attitude and behavior. According to Fishbein (1967), although the contribution of this view is
considerable in its ability to “stimulate new types of research” and “improve our understanding of
the relationship between belief and attitude,” the view fails to give adequate explanations for the
inconsistency between attitude and behavior. Moreover, it did not contribute much to the
understanding of the “specific relationships between attitude and behavior.”11 Therefore, instead
of seeing attitude as comprising three components, Fishbein (1963) views attitude as “a
unidimensional concept that referred to the amount of affect for or against some psychological
object.”
The Fishbein model conceptualizes attitude as a function of beliefs about the attributes of attitude
object and the evaluative response toward those attributes. Based on this model as well as on
Dulany’s12 (1961) theory of propositional control, which was developed within the context of
verbal conditioning and concept attainment research, Fishbein (1967) proposed a similar
approach to understanding the relationships between attitude and behavior, called the Theory of
Reasoned Action (TRA). The TRA is based on the assumption that people are intentional and
rational in their behaviors. They decide to perform (or not perform) a given behavior after they
consciously consider the consequences of their behaviors based on available information (Ajzen
and Fishbein 1980).
10 Salient attributes of an attitude object are those aspects of the object that the consumer mentions without prompting in response to the above free-response format question. This issue will be later discussed in detail. 11 Refer to Fishbein and Ajzen (1975, p. 341) for a complete argument. 12 Due to space limitations of the thesis, Dulany’s theory is not presented here, but interested readers can refer to Dulany (1961).
30
The essence of the Theory of Reasoned Action is that a person’s behavior can be predicted from
their intention to perform a behavior. A person’s behavioral intention to perform a specific
behavior with respect to a given stimulus object in a given situation is determined by two factors:
(1) the person’s attitude toward performing the behavior in a given situation and (2) subjective
norms. The person’s attitude toward the behavior is in turn a function of a set of salient beliefs
about the consequences of the behavior (behavioral beliefs). Subjective norms are also a function
of normative beliefs and the person’s motivation to comply with those norms. The theory can be
algebraically expressed as follows:
B ≈ BI = [Aact]wo + [SN]w1
where
B: A specific behavior
BI: Intention to perform a specific behavior
Aact = Attitude toward a specific behavior
wo and w1 = empirical determined weights, varying according to different behavior and different
person
SN = Subjective norm
2.4.1 Conceptualization Attitude
Attitude toward behavior in the TRA is conceptualized as “the person’s judgment that performing
the behavior is good or bad, that he is in favor of or against performing the behavior” (Ajzen and
Fishbein 1980, p.5). Attitude should be measured “by a procedure which located the subject on a
bipolar affective or evaluative dimension vis-à-vis a given object” (Fishbein and Ajzen, 1975,
p.11). Thus, attitude in the TRA is equal to the affect component in Rosenberg and Hovland’s
(1960) multicomponent view and can be measured directly, usually by means of an evaluative
semantic differential.13
Antecedents of attitude toward behavior
13 Measurement method will be discussed in detail in Chapter Methodology
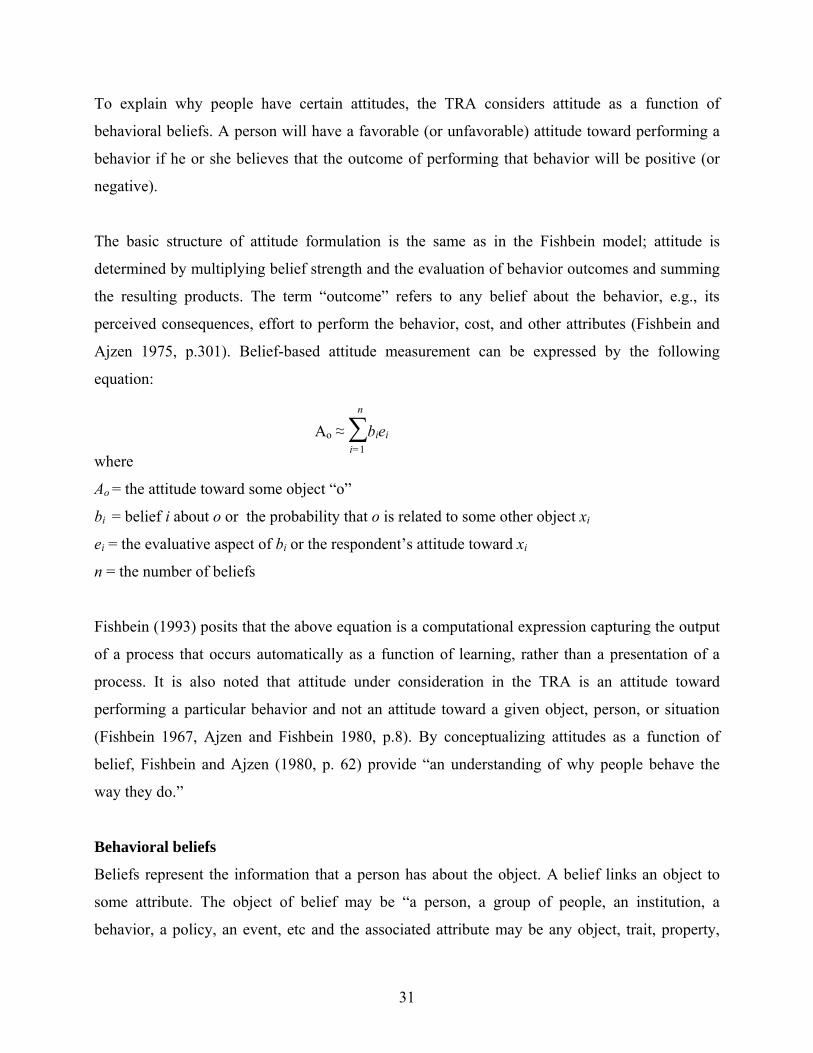
31
To explain why people have certain attitudes, the TRA considers attitude as a function of
behavioral beliefs. A person will have a favorable (or unfavorable) attitude toward performing a
behavior if he or she believes that the outcome of performing that behavior will be positive (or
negative).
The basic structure of attitude formulation is the same as in the Fishbein model; attitude is
determined by multiplying belief strength and the evaluation of behavior outcomes and summing
the resulting products. The term “outcome” refers to any belief about the behavior, e.g., its
perceived consequences, effort to perform the behavior, cost, and other attributes (Fishbein and
Ajzen 1975, p.301). Belief-based attitude measurement can be expressed by the following
equation:
where
Ao = the attitude toward some object “o”
bi = belief i about o or the probability that o is related to some other object xi
ei = the evaluative aspect of bi or the respondent’s attitude toward xi
n = the number of beliefs
Fishbein (1993) posits that the above equation is a computational expression capturing the output
of a process that occurs automatically as a function of learning, rather than a presentation of a
process. It is also noted that attitude under consideration in the TRA is an attitude toward
performing a particular behavior and not an attitude toward a given object, person, or situation
(Fishbein 1967, Ajzen and Fishbein 1980, p.8). By conceptualizing attitudes as a function of
belief, Fishbein and Ajzen (1980, p. 62) provide “an understanding of why people behave the
way they do.”
Behavioral beliefs
Beliefs represent the information that a person has about the object. A belief links an object to
some attribute. The object of belief may be “a person, a group of people, an institution, a
behavior, a policy, an event, etc and the associated attribute may be any object, trait, property,
Ao ≈ ∑biei n
i=1
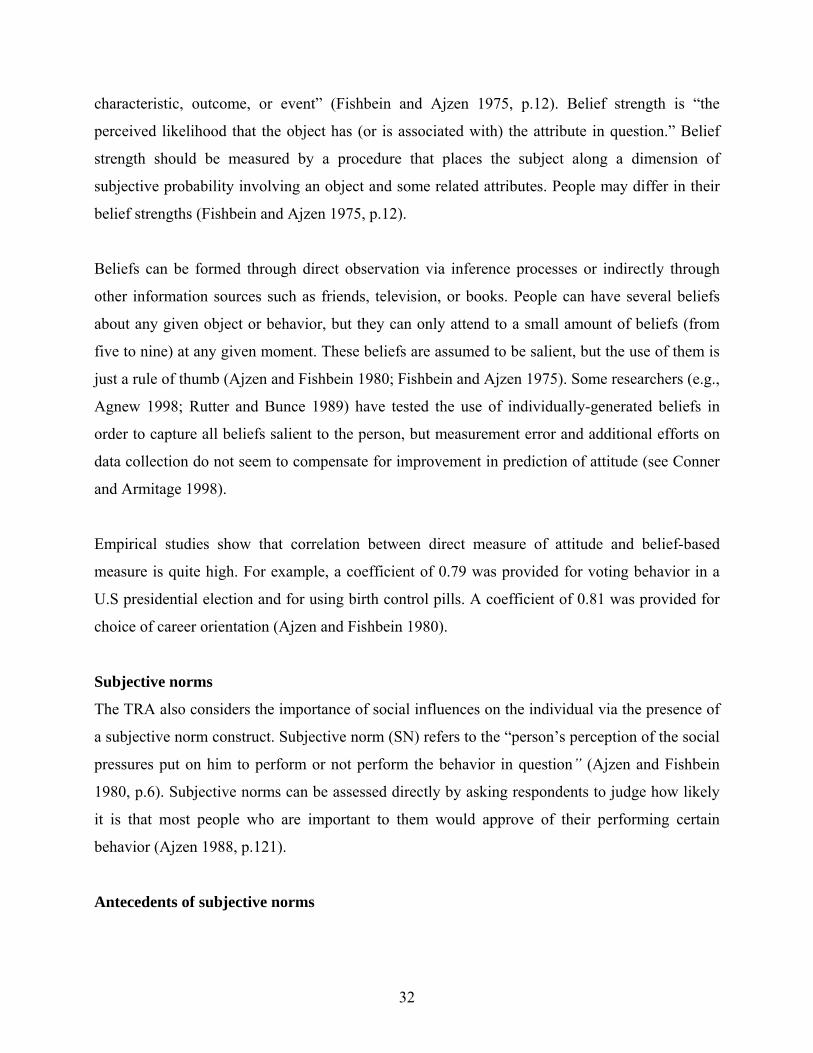
32
characteristic, outcome, or event” (Fishbein and Ajzen 1975, p.12). Belief strength is “the
perceived likelihood that the object has (or is associated with) the attribute in question.” Belief
strength should be measured by a procedure that places the subject along a dimension of
subjective probability involving an object and some related attributes. People may differ in their
belief strengths (Fishbein and Ajzen 1975, p.12).
Beliefs can be formed through direct observation via inference processes or indirectly through
other information sources such as friends, television, or books. People can have several beliefs
about any given object or behavior, but they can only attend to a small amount of beliefs (from
five to nine) at any given moment. These beliefs are assumed to be salient, but the use of them is
just a rule of thumb (Ajzen and Fishbein 1980; Fishbein and Ajzen 1975). Some researchers (e.g.,
Agnew 1998; Rutter and Bunce 1989) have tested the use of individually-generated beliefs in
order to capture all beliefs salient to the person, but measurement error and additional efforts on
data collection do not seem to compensate for improvement in prediction of attitude (see Conner
and Armitage 1998).
Empirical studies show that correlation between direct measure of attitude and belief-based
measure is quite high. For example, a coefficient of 0.79 was provided for voting behavior in a
U.S presidential election and for using birth control pills. A coefficient of 0.81 was provided for
choice of career orientation (Ajzen and Fishbein 1980).
Subjective norms
The TRA also considers the importance of social influences on the individual via the presence of
a subjective norm construct. Subjective norm (SN) refers to the “person’s perception of the social
pressures put on him to perform or not perform the behavior in question” (Ajzen and Fishbein
1980, p.6). Subjective norms can be assessed directly by asking respondents to judge how likely
it is that most people who are important to them would approve of their performing certain
behavior (Ajzen 1988, p.121).
Antecedents of subjective norms
33
Subjective norm is also assumed as the totality of the person’s normative beliefs and the
motivation to comply with these norms (Fishbein and Ajzen 1975). By multiplying the strength
of each normative belief (NB) by the person’ motivation to comply (Mcn) with the referent and
summing the resulting products across the n salient referents, the subjective norm is obtained as
follows:
where
SN: subjective norm toward the performance of a particular behavior
NB: normative belief i toward the performance of a particular behavior
MC: motivation to comply i with the normative belief i
n: the number of beliefs
Normative beliefs
The original version of the TRA (Fishbein 1967) considers normative beliefs (NB) as: (1) “the
individual’s belief about what he personally feels he should do (i.e., personal norm or rule of
behavior)”, (2) “the individual’s belief about what ‘society’ says (i.e., most other people, his
‘significant others’ etc.) he should do (i.e., a social or group norm).” However, in the later
version of the theory written with Ajzen (Fishbein and Ajzen 1975, p.305), Fishbein removed
personal norms from normative beliefs on the ground that various empirical findings show that
personal normative beliefs serve mainly as an alternative measure of behavioral intention.14 It is
noted that normative beliefs can vary according to different situations and different people.
Motivation to comply
14 However, empirical findings in the 1980s and 1990s show that personal normative beliefs have a strong influence on an individual’s intention to perform certain behaviors in circumstances involving moral or ethical components. Some behavior examples are cheating on a test, shoplifting, lying to get out of taking a test (Beck and Ajzen 1991), committing driving violations (Parker et al 1995) and using condom (Godin et al 1996) (also see Conner and Armitage, 1998; Manstead and Parker, 1995 for a review).
SN ≈ ∑NBiMci
n
i=1
34
According to Fishbein and Ajzen (1975, p. 306), motivation to comply is “best perceived as the
person’s general tendency to accept the directives or a given reference group or individual.”
Motivation to comply depends on the referent’s perceived expertise, the referent’s power to
reward or punish the person, the legitimate degree of the referent's demand, the person’s liking
for the referent, as well as the need for approval from the reference groups (French and Ravens
1959). Correlations between direct measures and belief-based measures of subjective norms in
empirical studies are quite high, varying from coefficient s of 0.60 to 0.80 (Ajzen and Fishbein
1980).
Relative weights of attitudinal and normative components
Empirical research shows that in most cases, attitudinal component has greater weight than the
normative component (see meta-analysis review by Armitage and Conner 2001; Sheppard et al.
1988). By examining thirty behaviors, Trafimow and Finlay (1996) found that individual
difference influence the relative weight between attitude and subjective norm toward behavior.
Fishbein and Ajzen (1975) suggest that these weights can vary according to the types of behavior,
the situation, individual differences, and the target of intention. For example, the normative
component was reported as having greater weights than the attitudinal component in predicting
behavioral intentions in the following cases: premarital sexual intercourse (male student only),
marital acceptance, buying coffee and gasoline (vs. detergents and potato chips), behaviors in
cooperative situation (vs. competitive situation), intention to avoid the sun by respondents
strongly identified with the group (vs. low identifiers), the readiness of inexperienced managers
to undertake benchmarking in their organization (vs. experienced managers).
Fishbein and Ajzen (1975, p.311) and Ajzen (2001) provide a thorough review of this issue.
According to Armitage and Conner (2001) the weaker influence of subjective norms may be due
to measurement problems, e.g., single item measurement instead of multi-item scales or due to
failure to represent appropriate components of normative influence such as moral norms, personal
norms, self-identity (Conner and Armitage 1998).
Behavioral intention
35
Behavioral intention is defined as a person’s intention to perform a given behavior. According to
Ajzen and Fishbein (1980), behavioral intention can be used to predict corresponding behavior
provided that the behavior is under volitional control, i.e., if the person can perform the behavior
voluntarily. Thus, “intention is assumed to capture the motivational factors that influence a
behavior; they are indicators of how hard people are willing to try, of how much of an effort they
are planning to exert, in order to engage in a behavior” (Ajzen 1991). The intention strength is
decided by the subjective probability that a person will carry out the behavior; this is measured
by a procedure placing the subject along a subjective-probability dimension involving a relation
between the person and some behaviors (Fishbein and Ajzen 1975, p. 12). As previously
mentioned, a person’s intention to perform a given behavior is a function of the person’s attitude
and the subjective norms toward the behavior. Empirical studies support the strong relationship
between behavioral intention and behavior. For example, a review of thirteen studies applying the
TRA to predict behavioral intention report a very high correlation of over 0.75 (Fishbein and
Ajzen 1975, p. 310).
It is noted that several studies have used measures of self-predictions (e.g. How likely is it that
you will perform behavior x?) instead of measures of behavioral intention (e.g. I intend to
perform behavior x) (Warshaw and Davis 1985). Sheppard et al. (1988) show that measures of
self-prediction can more accurately predict behavior (mean r = 0.57) than measures of behavioral
intention (mean r = 0.49).15
Behavior
Behaviors are defined as observable acts of the subject. The TRA deals only with behaviors
belonging to the volitional or voluntary class; that is, people can perform behaviors if they want
or refrain from performing them if they do not want. Behaviors requiring skills, resources, or
opportunities that the actors may lack are not fully volitional and thus cannot be explained very
well by the TRA. The novel contribution of the TRA compared to previous theories dealing with
attitude-behavior relation is that it postulates a person’s intention to perform (or to not perform) a
15 However, this issue became less significant when perceived behavioral control variable was introduced into TRA by Ajzen (1991), and named the extended model The Theory of Planned Behavior (which will be discussed in next section) since measures of self-prediction include factors implying the difficulties in performing (or not performing) a given behavior.
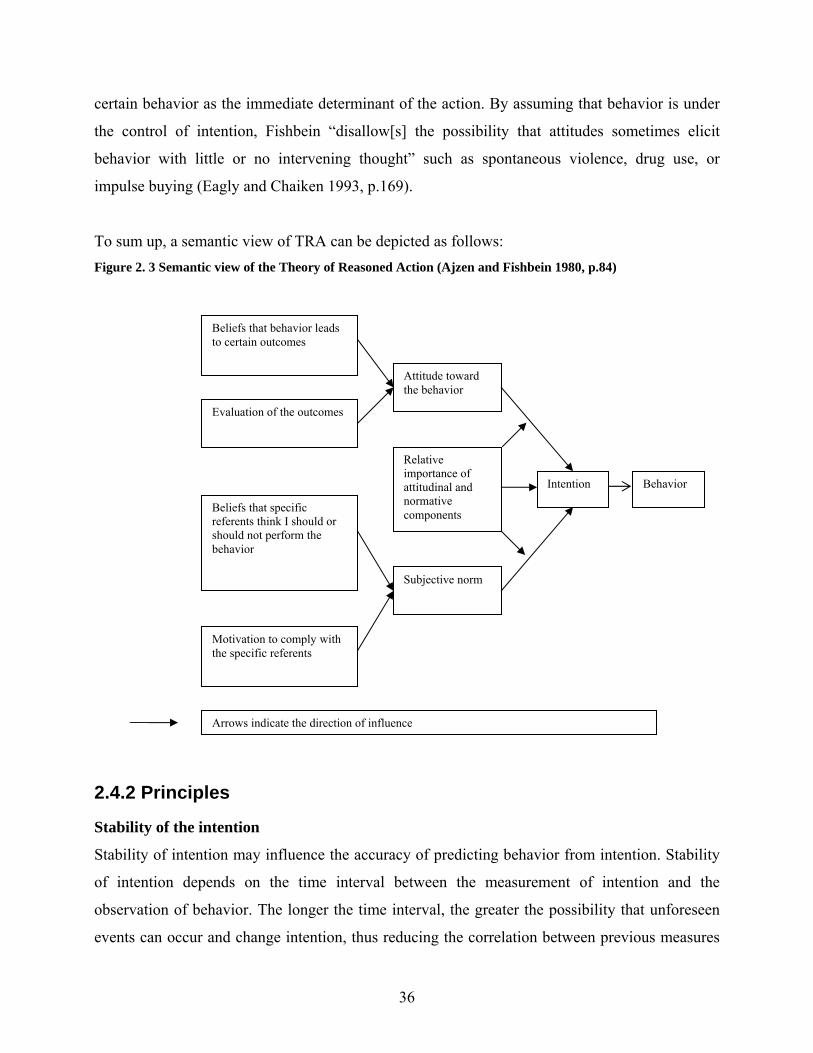
36
certain behavior as the immediate determinant of the action. By assuming that behavior is under
the control of intention, Fishbein “disallow[s] the possibility that attitudes sometimes elicit
behavior with little or no intervening thought” such as spontaneous violence, drug use, or
impulse buying (Eagly and Chaiken 1993, p.169).
To sum up, a semantic view of TRA can be depicted as follows: Figure 2. 3 Semantic view of the Theory of Reasoned Action (Ajzen and Fishbein 1980, p.84)
2.4.2 Principles
Stability of the intention
Stability of intention may influence the accuracy of predicting behavior from intention. Stability
of intention depends on the time interval between the measurement of intention and the
observation of behavior. The longer the time interval, the greater the possibility that unforeseen
events can occur and change intention, thus reducing the correlation between previous measures
Behavior Intention
Attitude toward the behavior
Relative importance of attitudinal and normative components
Subjective norm
Beliefs that behavior leads to certain outcomes
Evaluation of the outcomes
Beliefs that specific referents think I should or should not perform the behavior
Motivation to comply with the specific referents
Arrows indicate the direction of influence
37
of intention and behavior. Unexpected events might include sudden illness, injury, natural
disaster, job loss, unexpected pregnancy, or economic recession (Ajzen and Fishbein 1980).
Principle of compatibility16
The principle of compatibility holds that “two indicators of a given disposition are said to be
compatible with each other to the extent that their target, action, context, and time elements are
assessed at identical levels of generality or specificity…The more similar the target, action,
context and time elements of one indicator to those of the others, the stronger the statistical
relation between them.” (Ajzen 1988, p.96) A researcher must ensure a correspondence between
behavioral predictors and the criterion in terms of the action to which they refer, the target
towards which the action is directed, the context in which the action occurs and the time at which
the behavior is performed (Fishbein and Ajzen 1975). The influence of the principle of
compatibility is best illustrated by LaPiere’s (1934) study.
According to Ajzen et al. (1970), the main flaw in LaPiere’s study is the lack of correspondence
of specificity between measurement of intention and behavior. LaPiere observed the behavior of
owners of travel establishments to determine if they would accept “a young, well-dressed, well-
spoken, pleasant, self-confident, well-to-do Chinese couple accompanied by a mature, well-
dressed, well-spoken…educated European gentleman as guests.” (p.270). However, when
sending out questionnaires measuring attitude, LaPiere only asked the respondents whether “they
would accept members of Chinese race as guests in their establishments.”17
Relating the principle of compatibility to the topic of this thesis, if we want to predict the use of
mobile music services in the next six months, then the measurement of intention, attitude should
correspond. Thus, we should measure the attitude toward using mobile music services in the next
six months, not the attitude toward the service itself or toward using the service. Moreover, when
eliciting beliefs underlying a person’s attitude, questions must be structured in terms of
advantages and disadvantages of using mobile music services in the next six months. The same
16 This was originally called the principle of correspondence (Fishbein and Ajzen 1975). 17 It is also possible that the survey respondents differed from the ones having received LaPiere and the Chinese couple in reality; furthermore, the reliability of the survey results can be questioned, as some behaviors involving impoliteness are more easily said than done.
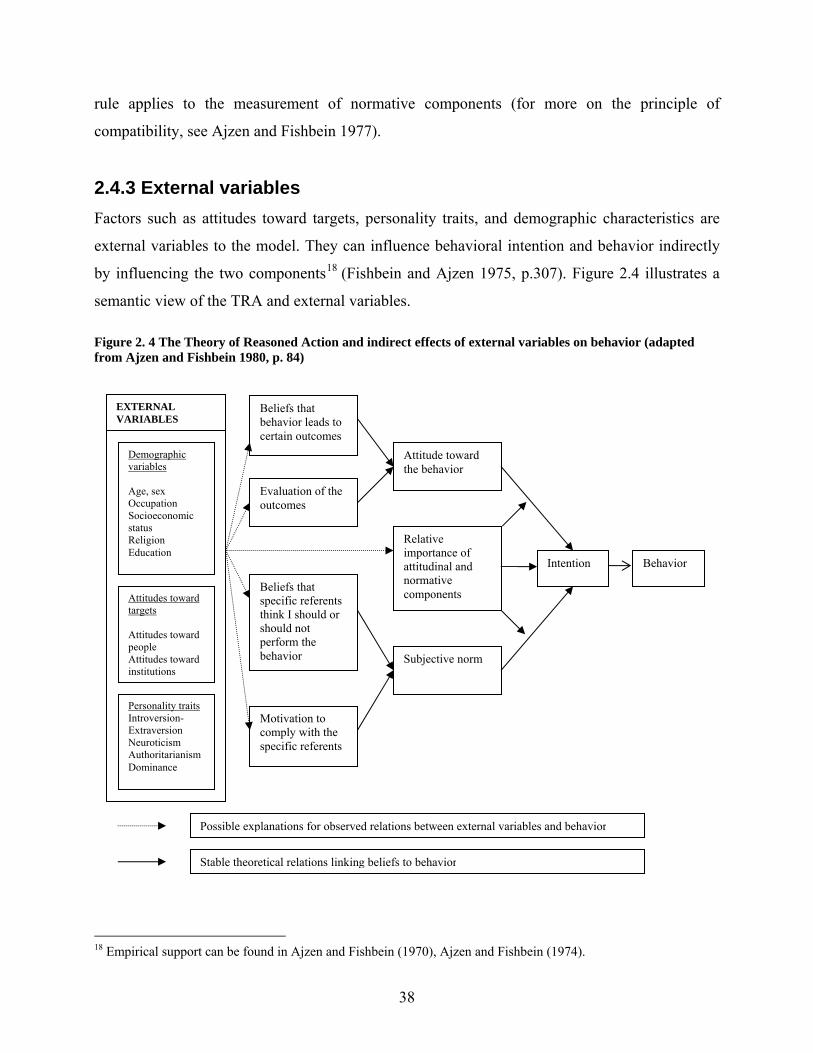
38
rule applies to the measurement of normative components (for more on the principle of
compatibility, see Ajzen and Fishbein 1977).
2.4.3 External variables Factors such as attitudes toward targets, personality traits, and demographic characteristics are
external variables to the model. They can influence behavioral intention and behavior indirectly
by influencing the two components18 (Fishbein and Ajzen 1975, p.307). Figure 2.4 illustrates a
semantic view of the TRA and external variables. Figure 2. 4 The Theory of Reasoned Action and indirect effects of external variables on behavior (adapted from Ajzen and Fishbein 1980, p. 84)
18 Empirical support can be found in Ajzen and Fishbein (1970), Ajzen and Fishbein (1974).
Behavior Intention
Attitude toward the behavior
Relative importance of attitudinal and normative components
Subjective norm
Beliefs that behavior leads to certain outcomes
Evaluation of the outcomes
Beliefs that specific referents think I should or should not perform the behavior
Motivation to comply with the specific referents
EXTERNAL VARIABLES
Demographic variables Age, sex Occupation Socioeconomic status Religion Education
Attitudes toward targets Attitudes toward people Attitudes toward institutions
Personality traits Introversion-Extraversion Neuroticism Authoritarianism Dominance
Possible explanations for observed relations between external variables and behavior
Stable theoretical relations linking beliefs to behavior
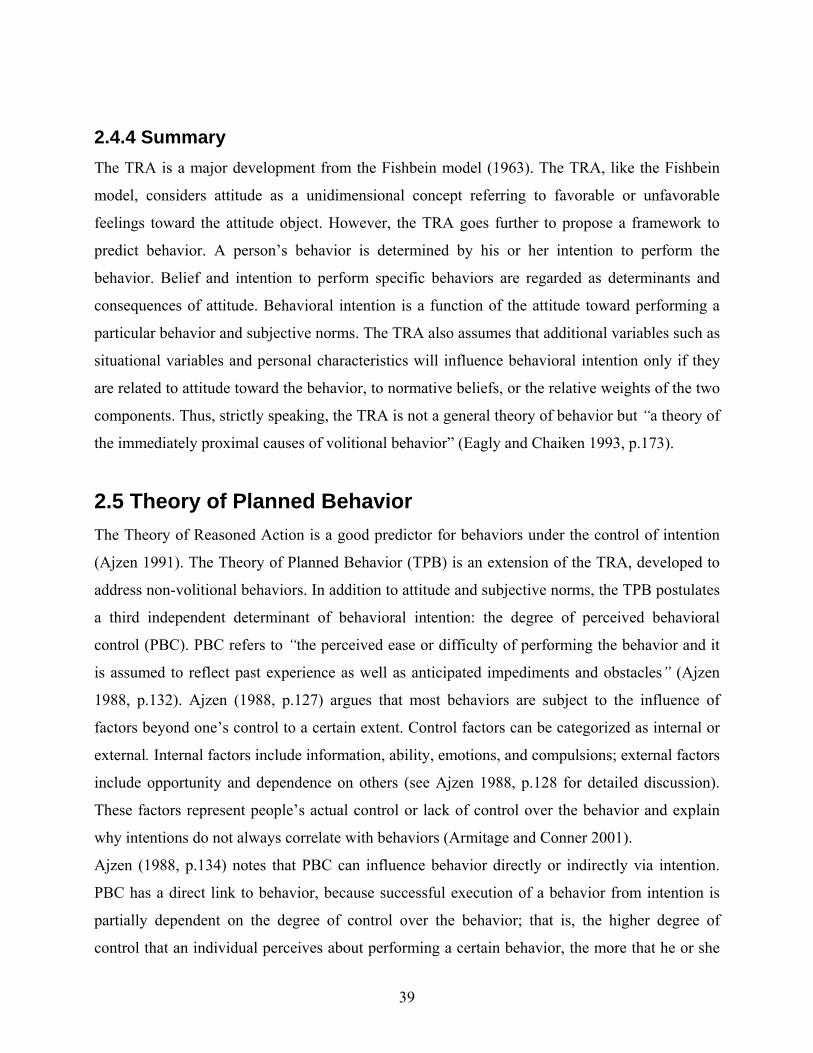
39
2.4.4 Summary The TRA is a major development from the Fishbein model (1963). The TRA, like the Fishbein
model, considers attitude as a unidimensional concept referring to favorable or unfavorable
feelings toward the attitude object. However, the TRA goes further to propose a framework to
predict behavior. A person’s behavior is determined by his or her intention to perform the
behavior. Belief and intention to perform specific behaviors are regarded as determinants and
consequences of attitude. Behavioral intention is a function of the attitude toward performing a
particular behavior and subjective norms. The TRA also assumes that additional variables such as
situational variables and personal characteristics will influence behavioral intention only if they
are related to attitude toward the behavior, to normative beliefs, or the relative weights of the two
components. Thus, strictly speaking, the TRA is not a general theory of behavior but “a theory of
the immediately proximal causes of volitional behavior” (Eagly and Chaiken 1993, p.173).
2.5 Theory of Planned Behavior The Theory of Reasoned Action is a good predictor for behaviors under the control of intention
(Ajzen 1991). The Theory of Planned Behavior (TPB) is an extension of the TRA, developed to
address non-volitional behaviors. In addition to attitude and subjective norms, the TPB postulates
a third independent determinant of behavioral intention: the degree of perceived behavioral
control (PBC). PBC refers to “the perceived ease or difficulty of performing the behavior and it
is assumed to reflect past experience as well as anticipated impediments and obstacles” (Ajzen
1988, p.132). Ajzen (1988, p.127) argues that most behaviors are subject to the influence of
factors beyond one’s control to a certain extent. Control factors can be categorized as internal or
external. Internal factors include information, ability, emotions, and compulsions; external factors
include opportunity and dependence on others (see Ajzen 1988, p.128 for detailed discussion).
These factors represent people’s actual control or lack of control over the behavior and explain
why intentions do not always correlate with behaviors (Armitage and Conner 2001).
Ajzen (1988, p.134) notes that PBC can influence behavior directly or indirectly via intention.
PBC has a direct link to behavior, because successful execution of a behavior from intention is
partially dependent on the degree of control over the behavior; that is, the higher degree of
control that an individual perceives about performing a certain behavior, the more that he or she
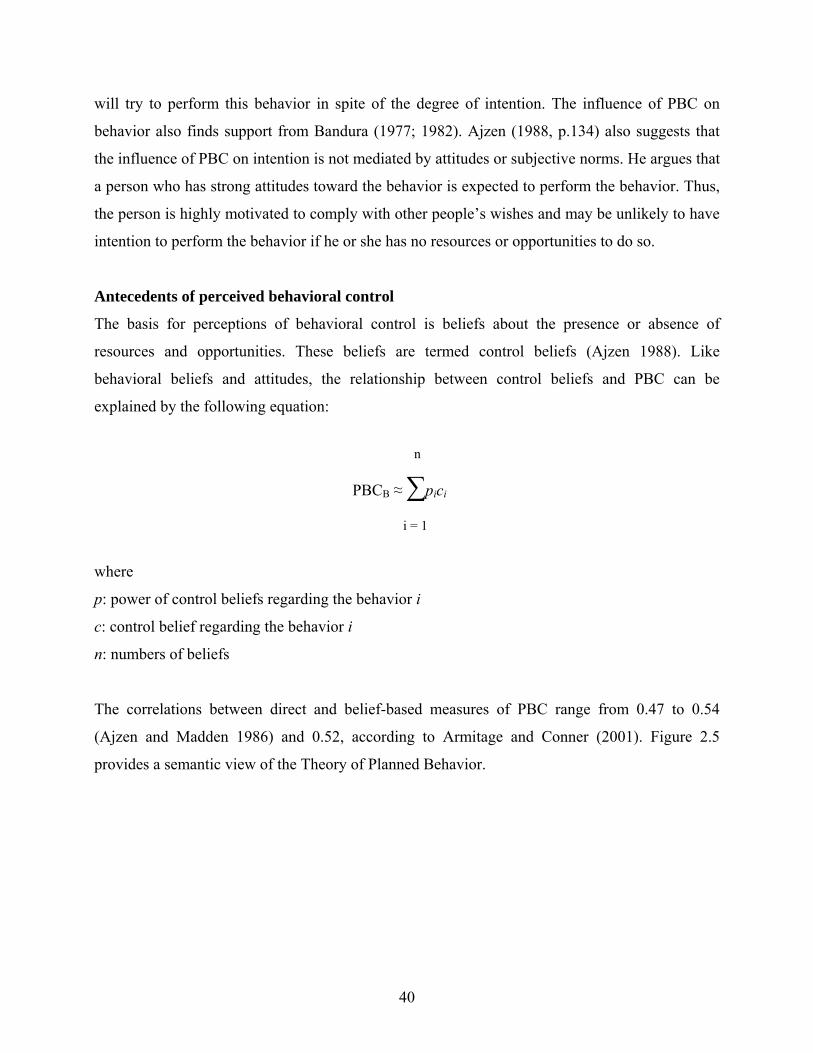
40
will try to perform this behavior in spite of the degree of intention. The influence of PBC on
behavior also finds support from Bandura (1977; 1982). Ajzen (1988, p.134) also suggests that
the influence of PBC on intention is not mediated by attitudes or subjective norms. He argues that
a person who has strong attitudes toward the behavior is expected to perform the behavior. Thus,
the person is highly motivated to comply with other people’s wishes and may be unlikely to have
intention to perform the behavior if he or she has no resources or opportunities to do so.
Antecedents of perceived behavioral control
The basis for perceptions of behavioral control is beliefs about the presence or absence of
resources and opportunities. These beliefs are termed control beliefs (Ajzen 1988). Like
behavioral beliefs and attitudes, the relationship between control beliefs and PBC can be
explained by the following equation:
where
p: power of control beliefs regarding the behavior i
c: control belief regarding the behavior i
n: numbers of beliefs
The correlations between direct and belief-based measures of PBC range from 0.47 to 0.54
(Ajzen and Madden 1986) and 0.52, according to Armitage and Conner (2001). Figure 2.5
provides a semantic view of the Theory of Planned Behavior.
PBCB ≈ ∑pici
PBCB ≈ ∑pici
i = 1
n
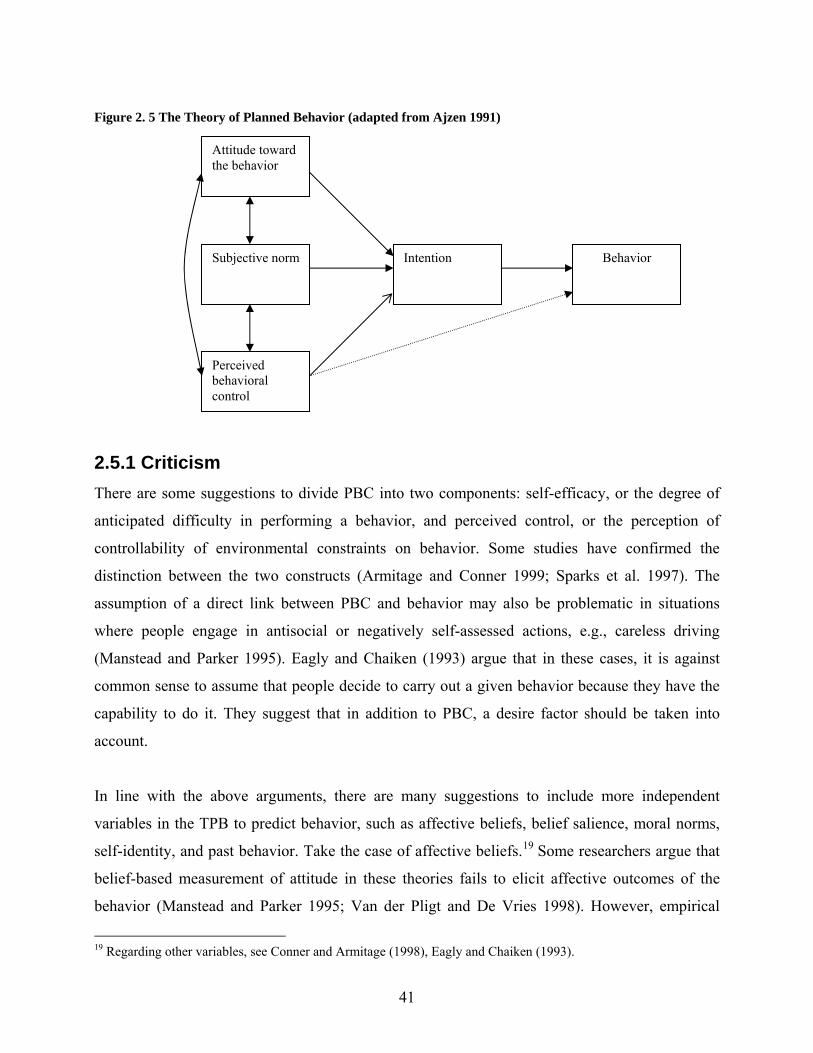
41
Figure 2. 5 The Theory of Planned Behavior (adapted from Ajzen 1991)
2.5.1 Criticism There are some suggestions to divide PBC into two components: self-efficacy, or the degree of
anticipated difficulty in performing a behavior, and perceived control, or the perception of
controllability of environmental constraints on behavior. Some studies have confirmed the
distinction between the two constructs (Armitage and Conner 1999; Sparks et al. 1997). The
assumption of a direct link between PBC and behavior may also be problematic in situations
where people engage in antisocial or negatively self-assessed actions, e.g., careless driving
(Manstead and Parker 1995). Eagly and Chaiken (1993) argue that in these cases, it is against
common sense to assume that people decide to carry out a given behavior because they have the
capability to do it. They suggest that in addition to PBC, a desire factor should be taken into
account.
In line with the above arguments, there are many suggestions to include more independent
variables in the TPB to predict behavior, such as affective beliefs, belief salience, moral norms,
self-identity, and past behavior. Take the case of affective beliefs.19 Some researchers argue that
belief-based measurement of attitude in these theories fails to elicit affective outcomes of the
behavior (Manstead and Parker 1995; Van der Pligt and De Vries 1998). However, empirical
19 Regarding other variables, see Conner and Armitage (1998), Eagly and Chaiken (1993).
Behavior Intention
Attitude toward the behavior
Subjective norm
Perceived behavioral control
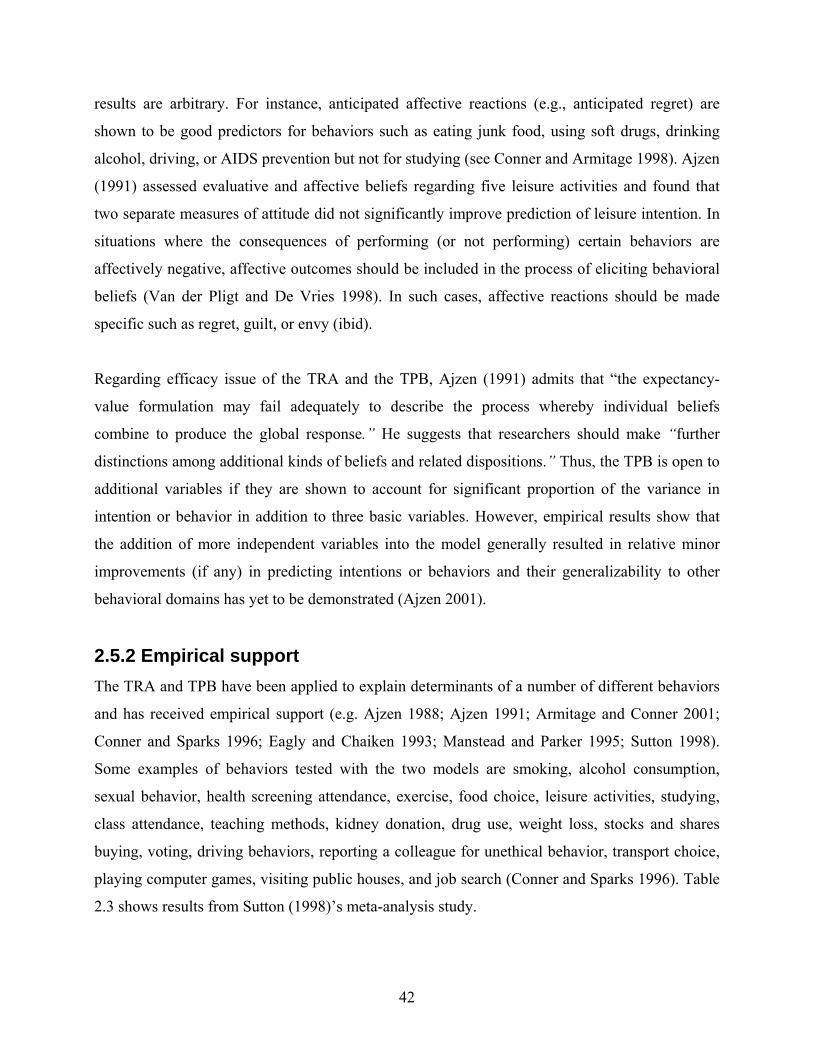
42
results are arbitrary. For instance, anticipated affective reactions (e.g., anticipated regret) are
shown to be good predictors for behaviors such as eating junk food, using soft drugs, drinking
alcohol, driving, or AIDS prevention but not for studying (see Conner and Armitage 1998). Ajzen
(1991) assessed evaluative and affective beliefs regarding five leisure activities and found that
two separate measures of attitude did not significantly improve prediction of leisure intention. In
situations where the consequences of performing (or not performing) certain behaviors are
affectively negative, affective outcomes should be included in the process of eliciting behavioral
beliefs (Van der Pligt and De Vries 1998). In such cases, affective reactions should be made
specific such as regret, guilt, or envy (ibid).
Regarding efficacy issue of the TRA and the TPB, Ajzen (1991) admits that “the expectancy-
value formulation may fail adequately to describe the process whereby individual beliefs
combine to produce the global response.” He suggests that researchers should make “further
distinctions among additional kinds of beliefs and related dispositions.” Thus, the TPB is open to
additional variables if they are shown to account for significant proportion of the variance in
intention or behavior in addition to three basic variables. However, empirical results show that
the addition of more independent variables into the model generally resulted in relative minor
improvements (if any) in predicting intentions or behaviors and their generalizability to other
behavioral domains has yet to be demonstrated (Ajzen 2001).
2.5.2 Empirical support The TRA and TPB have been applied to explain determinants of a number of different behaviors
and has received empirical support (e.g. Ajzen 1988; Ajzen 1991; Armitage and Conner 2001;
Conner and Sparks 1996; Eagly and Chaiken 1993; Manstead and Parker 1995; Sutton 1998).
Some examples of behaviors tested with the two models are smoking, alcohol consumption,
sexual behavior, health screening attendance, exercise, food choice, leisure activities, studying,
class attendance, teaching methods, kidney donation, drug use, weight loss, stocks and shares
buying, voting, driving behaviors, reporting a colleague for unethical behavior, transport choice,
playing computer games, visiting public houses, and job search (Conner and Sparks 1996). Table
2.3 shows results from Sutton (1998)’s meta-analysis study.
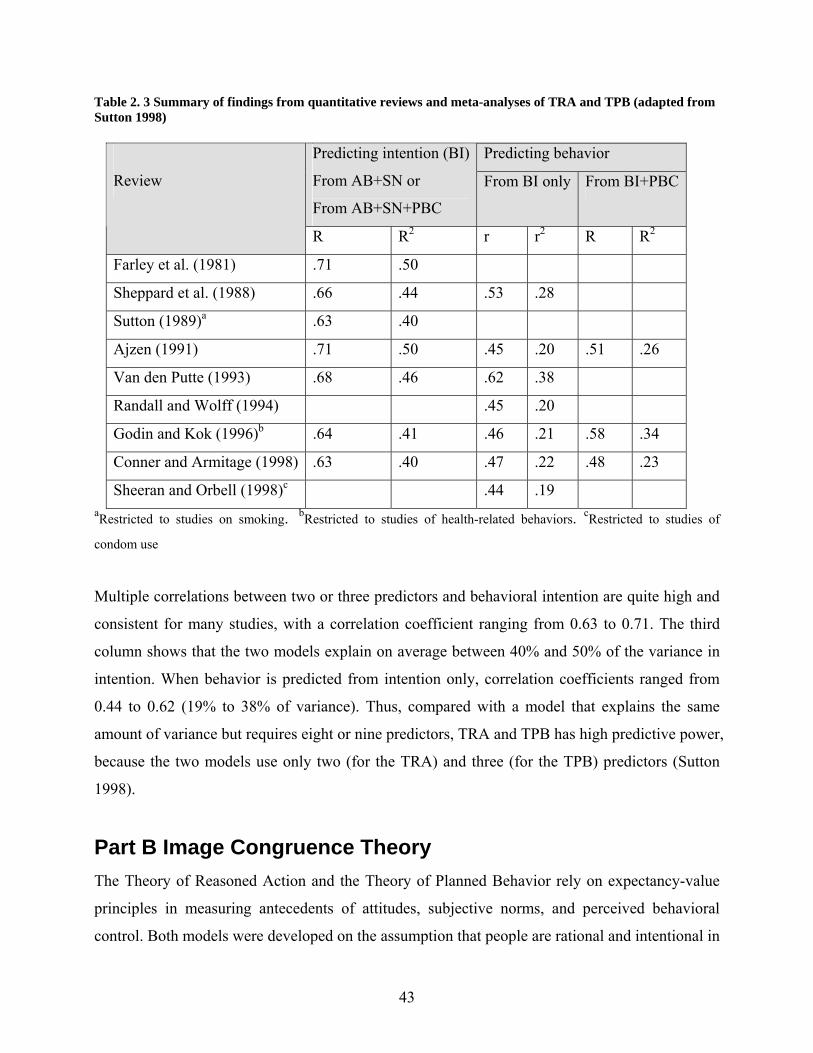
43
Table 2. 3 Summary of findings from quantitative reviews and meta-analyses of TRA and TPB (adapted from Sutton 1998)
Predicting behavior Predicting intention (BI)
From AB+SN or
From AB+SN+PBC
From BI only From BI+PBC
Review
R R2 r r2 R R2
Farley et al. (1981) .71 .50
Sheppard et al. (1988) .66 .44 .53 .28
Sutton (1989)a .63 .40
Ajzen (1991) .71 .50 .45 .20 .51 .26
Van den Putte (1993) .68 .46 .62 .38
Randall and Wolff (1994) .45 .20
Godin and Kok (1996)b .64 .41 .46 .21 .58 .34
Conner and Armitage (1998) .63 .40 .47 .22 .48 .23
Sheeran and Orbell (1998)c .44 .19 aRestricted to studies on smoking.
bRestricted to studies of health-related behaviors. cRestricted to studies of
condom use
Multiple correlations between two or three predictors and behavioral intention are quite high and
consistent for many studies, with a correlation coefficient ranging from 0.63 to 0.71. The third
column shows that the two models explain on average between 40% and 50% of the variance in
intention. When behavior is predicted from intention only, correlation coefficients ranged from
0.44 to 0.62 (19% to 38% of variance). Thus, compared with a model that explains the same
amount of variance but requires eight or nine predictors, TRA and TPB has high predictive power,
because the two models use only two (for the TRA) and three (for the TPB) predictors (Sutton
1998).
Part B Image Congruence Theory The Theory of Reasoned Action and the Theory of Planned Behavior rely on expectancy-value
principles in measuring antecedents of attitudes, subjective norms, and perceived behavioral
control. Both models were developed on the assumption that people are rational and intentional in
44
performing certain behaviors and attempt to maximize their satisfaction in exchange. This
assumption is close to the notion of economic man (Schneider 1974).
However, consumer behavior has long been recognized to involve not only utilitarian outcomes
but also symbolic ones. As Levy (1959, p.117) puts it, “people buy things not only for what they
can do, but also for what they mean.” Consumers not only buy goods and services to satisfy their
physical needs but also to express their self-images through the symbols of goods (Ditmar and
Drury 2000; Markus and Nurius 1986). Thus, consumers are best regarded as marketers (Bagozzi
1975) whose behaviors are sometimes rational, sometimes irrational, and involved in utilitarian
as well as symbolic benefits. In order to explain behaviors involving symbolic gains, consumer
researchers generally rely on product symbolism, impression management theory, and image
congruence theory.
2.6 Product symbolism Certain20 products or services have utilitarian as well as symbolic benefits that express value and
identity of users (Belk 1988; Kleijnen et al. 2005; Levy 1959; Snyder and Debono 1985).
Products or services in these cases are said to have symbolic values. Product symbols can be
defined as signs and meanings conveyed by the goods established and understood by related
segments of society (Grubb and Grathwohl 1967, p.24). Two of the five symbolic roles of
products21 are related to self-images of consumers in terms of expressing the self and social status
of the consumer (Tharp and Scott 1990). According to Wright et al. (1992), product images22
personify the product by assigning certain meaning to it: “The product comes to say ‘this is the
kind of person who would use this product’ or these are the qualities of a person who would use
this product’.”
Thus, like people, products are assumed to have a personality that can be described in terms of “a
set of attributes such as friendly, modern, youthful, and traditional” (Sirgy 1985, p.195). It is
20 Hamm and Cundiff (1969), and Landon (1974) show that not all products can communicate self-image. 21 Other roles are as a means of sharing experience, hedonic, or experiential. 22 It is noted that the concept of product images as used here are not limited to tangibles but can be extended to services and organizations. For example, people tend to regard a person who flies business class as rich and successful. The terms “product images” and “product symbols” in this thesis refer to same meaning and are thus used interchangeably.
45
noted that these images are distinguished from functional attributes such as quality, price, or
performance (Sirgy 1982). For example, a sport car is associated with a kind of person who is
sexy, attractive, young, and socially outgoing. In the consumer self-concept literature, this
construct is also referred as “product value-expressiveness” (Wright et al. 1992).
The idea that products have symbolic images has its roots in symbolic interactionism, a
sociological approach proposing that reference to other people plays an important part in creating
the self.23 In other words, we learn and perceive who we are through others. James (1890)
suggests that by comparing ourselves with significant others, we form an idea about what we are
like. A person may have different selves according to different social situations. Cooley (1902,
1983) introduced the theory of “looking glass self.” This suggests that other people serve as a
mirror in which we see ourselves. Similarly, Mead (1934) posits that we see ourselves by relating
to what significant others think of us and then incorporating these perceptions into our self-
concept. The more complex the social interactions, the more details we add to the picture of
ourselves. He also argues that social interaction is symbolic, because when we interact with
people, we use language and gestures that symbolize more meaning than what can be seen from
our behavior. For example, we share the notion that the “golden arches” means fast food and that
“blonds have more fun” (Solomon 2004, p.153). Social interaction may include social reactions,
social norms, personal values, and cultural patterns. Over time, people learn to use these
components as criteria to form their self-concepts regardless of the presence of others.
In consumer research, as early as 1954, Turker (1957, p.139) suggests that consumers’
personalities can be defined through product use:
“There has long been an implicit concept that consumers can be defined in terms of either the
products they acquire or use, or in terms of the meanings products have for them or their attitudes
toward products”
The main principle of symbolic interactionism is that people form their self-concept based on
how they think that others see them. According to Solomon (2004, p.154), people tend to make
23 Previous studies have showed that people form their self-concept through introspection, by observing their own behavior, by comparing themselves with others and by organizing their autobiographical memories (Brehm et al. 1999).
46
inferences about others based on products they use. This tendency allows people to express the
self through consumption (Belk et al. 1982). Over time, the influence of symbolic consumption
on the formation and evaluation of the self has found more and more support in empirical
investigations (e.g., Belk 1988; Kleine et al. 1995; Laverie et al. 2002; Solomon 1983). Solomon
and Douglas (1987) report that female executives use clothing to create and enhance their self-
images. In technology acceptance research, it is found that one of the most important motivations
for a consumer to adopt an innovation is the desire to gain social status (Chau 1996). Schlosser
(2002) reports that consumers believe mobile technology help them express who they are.
Product images can be formed from stereotypes of generalized or typical users (Grubb and
Grathwohl 1967; Levy 1959) and are sometimes referred to as the “stereotypic image of the
product user” (Sirgy 1986) or the “idealized people associated with a product” (Sirgy 1982).
Product images are usually measured on a semantic differential scale (Grubb and Hubb 1968;
Schewe and Dillon 1978) or with the semantic differential type of methodology (Birdwell 1968;
Ross 1971; also see Sirgy 1982). However, there is considerably less research on the relationship
between symbolic consumption and consumer decision making than on the role of utilitarian
product attributes in consumer choice (Hogg et al. 2000).
Self-concept
A closer look at contemporary literature reveals that self-concept has many attributes. People
emphasize some attributes over others when they evaluate the overall self (Solomon 2004, p.150).
Self-concept is defined as the totality of the individual’s thoughts and feelings about himself as
an object (Rosenberg 1979, p.7). Onkvisit and Shaw (1987) state that self-concept is the personal
perception of one’s own abilities, limitations, appearance, and characteristics, including one’s
own personality. Schouten (1991) propose that self-concept includes “role identity, attributes,
possessions, relationships, and other symbols” that consumers use to create the self. Self-concept
relates to subjective perceptions, rather than objective evaluations, toward the self (Mehta 1999).
Empirical studies have shown that in reality, we are more inclined to see ourselves as we thought
others see us, instead of seeing ourselves as others see us (Shrauger and Schoeneman 1979).
Actual self and ideal self
47
Self-concept is a multidimensional construct. Self-concept theory holds that individuals have a
conception of the self based on who they think they are (the actual self) and who they would like
to be (the ideal self) (Zinkhan and Hong 1991). The actual self and the ideal self have received
extensive theoretical consideration and empirical research (Sirgy 1982). The actual self refers to
our perception about how we are in reality. The ideal self is our perception about how we would
like to be. The actual self concept is based on the perceptual reality of oneself, while the ideal self
concept is based on the imagination (Zinkhan and Hong 1991). In addition, researchers also
suggested the ought self, which refers to how we think we should be (Higgins 1987). 24 In
consumer research, the self-concept is posited to play a role in consumer behavior. People may
choose certain products or services, because they think they are consistent with their actual self
and other products or services to help them achieve the standard set by the ideal self (Solomon
2004, p.151). Self-concept can be measured using Q-sort methodology, the semantic differential,
or an adjective checklist (see Sirgy 1982, p.290).
2.7 Impression management theory According to Hogg and Vaughan (2005, p.159), “selves are constructed, modified and played out
in interaction with other people. Since the self we project has consequences for how other react,
we try to control the self we present.” Impression management theory deals with how people
manage the presentation of the self. The theory holds that people try to make others view
themselves in favorable or positive ways (Schlenker 1980). The theory is also applicable to
mundane activities. Leary and Kowalski (1990, p.34) note:
“People have an ongoing interest in how others perceive and evaluate them. … Even in relatively
mundane encounters at home, work, school, and elsewhere, people monitor others' reactions to
them and often try to convey images of themselves that promote their attainment of desired
goals.”
Goffman (1959, 1990) was one of the first researchers to address this aspect of behavior. He
explains social interaction as a stage where people play different roles for different audiences and
that impression management is a function of social setting. Leary and Kowalski (1990) report that
people in general want to display to others’ certain aspects of themselves that they value at the 24 For a thorough review of self-concept construct in consumer behavior, see Sirgy (1982).
48
appropriate time. People are motivated to behave in certain ways when the behavior has a high
probability to be observed and known about by others or help the person achieve some expressive
goals (Houses 1980).
Regarding self-presentation methods, it is generally agreed that people use non-verbal behaviors
in addition to self-description (DePaulo 1992). For example, women have a tendency to eat less
than men in order to appear feminine (Pliner and Chaiken 1990). In consumer behavior, people
use material possessions to present their images (Belk 1988). Consumers can intentionally exploit
product symbols for the presentation of the self (McCracken 1986). For example, females use
men’s suits to reveal how they want to be viewed in the workplace (ibid), and religious
consumers use profane items (e.g., enticing perfume, sexy lingerie) to express marital fidelity
(O'Guinn and Belk 1989). Adolescents express their adulthood through certain products and
services (Wright et al. 1992).
Overall, product symbols are assumed to interact with consumer self-images. This interaction
results in self-image congruence, which in turn influences consumer preferences and purchase
decisions (Sirgy 1985).
2.8 Image congruence theory Image congruence theory refers to the idea that the cognitive matching process between
consumer self-concept and product image impacts buying decisions (Mehta 1999). Image
congruence theory “links the psychological construct of an individual’s self-concept with the
symbolic value of goods purchased in the marketplace” (Grubb and Hubb 1968, p.22). The
essence of image congruence theory is that the more congruent the self-image of consumers is
with their perceived image of a certain products, the more they will prefer these products over
others. Consumers tend to ignore products that do not match their self-image and tend to avoid
repurchase of products with image incongruence (Onkvisit and Shaw 1987).
Although Gardner and Levy (1955) were the first to develop such a hypothesis about consumer
preferences, it is generally agreed that Grubb and Grathwohl (1967) were the first to propose the
theory.
49
“The self concept of an individual will be sustained and buoyed if he believes the good he has
purchased is recognized publicly and classified in a manner that supports and matches his self-
concept.”
The image congruence hypothesis suggests that consumer behaviors are aimed at enhancing the
self-concept. One of the methods used involves consumption of goods as symbols, because the
purchase, display, and use of goods convey symbolic meanings to the consumer and his/her
social contacts. The formulation of congruence hypothesis has stimulated various empirical
studies testing the impact of the fit between consumer self-images and product symbols on
consumer choice (Kleine et al. 1995). Several studies support the relationship between actual
self-image/product image as well as ideal self-image/product congruence and a wide range of
consumer choices, i.e., product preference, purchase intention, product usage, ownership, and
loyalty (Sirgy 1982).
In a study with six magazines and automobile brands, Ross (1971) found that the magnitude of
the discrepancy between self-concept and brand image increased as a function of a decrease in
the subject’s preference for those brands. Sirgy (1985) reported that image congruence
significantly influenced purchase motivation for two magazines and two automobiles. In an
experiment with the Reebok shoe brand, Graeff (1996) found that the similarities between the
consumer’s self-image and brand image positively influence the consumer’s attitude toward the
brand. Mannetti et al. (2002) demonstrate that image congruence positively influences the
intention to purchase three types of products: cellular phones, fashionable watches, and trendy
backpacks. Most noticeably, the image congruence variable was found to be a stronger predictor
of behavioral intention than other variables such as attitude, subjective norms, and perceived
behavioral control.
The hypothesis has found empirical supports with other types of products (Dolich 1969; Landon
1974; Jamal and Goode 2001; Stern et al. 1977).25 However, a few studies show contradictory
results (e.g., Hogg et al. 2000; Hughes and Phillipe 1970). Hogg et al. (2000) note that the image
congruence hypothesis may work in either a positive or negative direction. A possible
25 For a fuller list, see Belk et al. (1982).
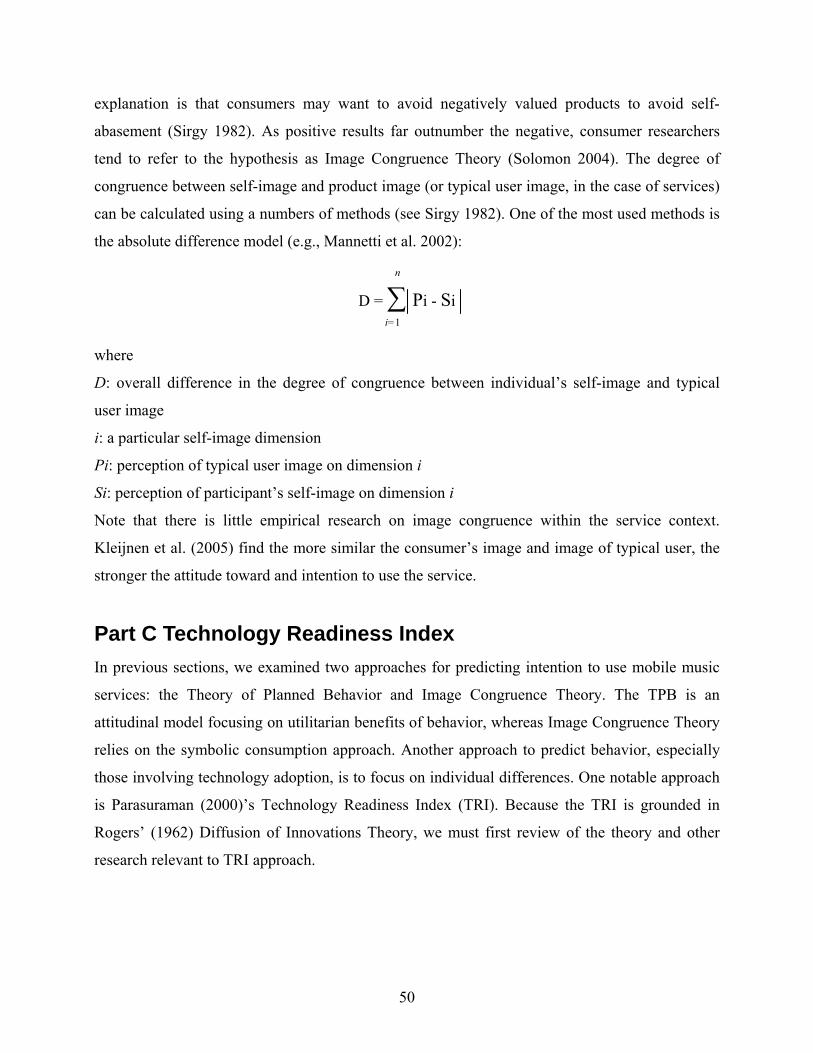
50
explanation is that consumers may want to avoid negatively valued products to avoid self-
abasement (Sirgy 1982). As positive results far outnumber the negative, consumer researchers
tend to refer to the hypothesis as Image Congruence Theory (Solomon 2004). The degree of
congruence between self-image and product image (or typical user image, in the case of services)
can be calculated using a numbers of methods (see Sirgy 1982). One of the most used methods is
the absolute difference model (e.g., Mannetti et al. 2002):
where
D: overall difference in the degree of congruence between individual’s self-image and typical
user image
i: a particular self-image dimension
Pi: perception of typical user image on dimension i
Si: perception of participant’s self-image on dimension i
Note that there is little empirical research on image congruence within the service context.
Kleijnen et al. (2005) find the more similar the consumer’s image and image of typical user, the
stronger the attitude toward and intention to use the service.
Part C Technology Readiness Index In previous sections, we examined two approaches for predicting intention to use mobile music
services: the Theory of Planned Behavior and Image Congruence Theory. The TPB is an
attitudinal model focusing on utilitarian benefits of behavior, whereas Image Congruence Theory
relies on the symbolic consumption approach. Another approach to predict behavior, especially
those involving technology adoption, is to focus on individual differences. One notable approach
is Parasuraman (2000)’s Technology Readiness Index (TRI). Because the TRI is grounded in
Rogers’ (1962) Diffusion of Innovations Theory, we must first review of the theory and other
research relevant to TRI approach.
n
D = ∑ Pi - Si
i=1
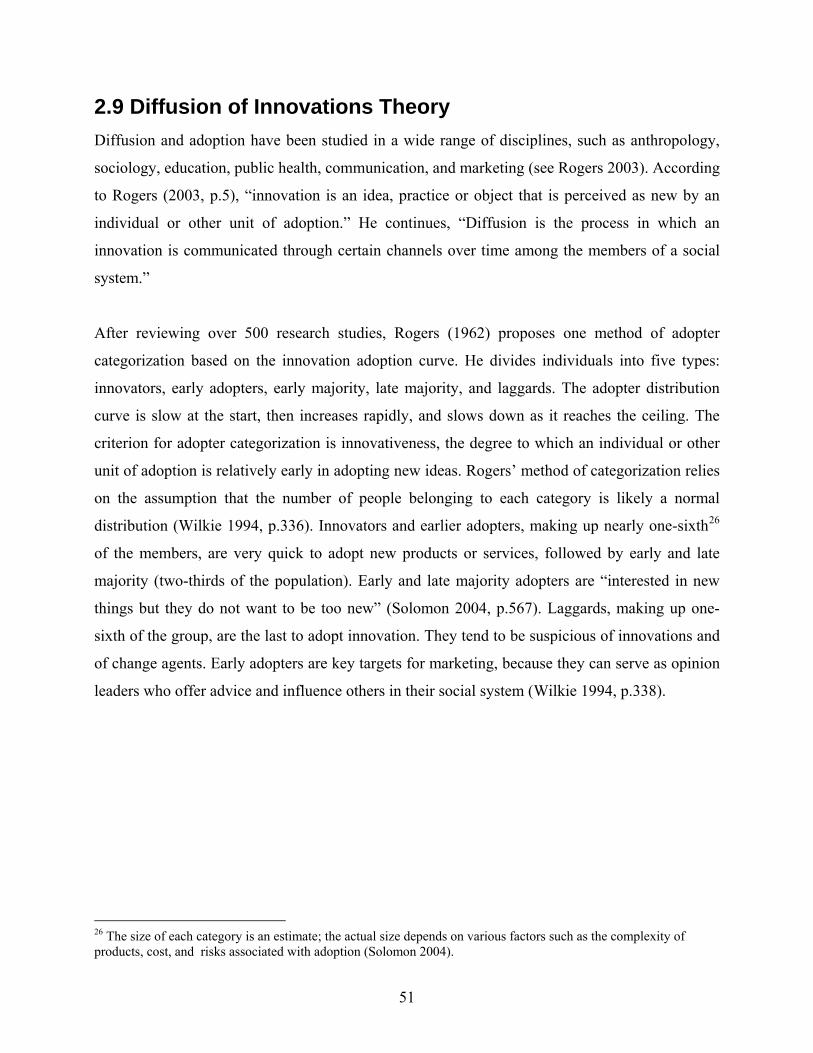
51
2.9 Diffusion of Innovations Theory Diffusion and adoption have been studied in a wide range of disciplines, such as anthropology,
sociology, education, public health, communication, and marketing (see Rogers 2003). According
to Rogers (2003, p.5), “innovation is an idea, practice or object that is perceived as new by an
individual or other unit of adoption.” He continues, “Diffusion is the process in which an
innovation is communicated through certain channels over time among the members of a social
system.”
After reviewing over 500 research studies, Rogers (1962) proposes one method of adopter
categorization based on the innovation adoption curve. He divides individuals into five types:
innovators, early adopters, early majority, late majority, and laggards. The adopter distribution
curve is slow at the start, then increases rapidly, and slows down as it reaches the ceiling. The
criterion for adopter categorization is innovativeness, the degree to which an individual or other
unit of adoption is relatively early in adopting new ideas. Rogers’ method of categorization relies
on the assumption that the number of people belonging to each category is likely a normal
distribution (Wilkie 1994, p.336). Innovators and earlier adopters, making up nearly one-sixth26
of the members, are very quick to adopt new products or services, followed by early and late
majority (two-thirds of the population). Early and late majority adopters are “interested in new
things but they do not want to be too new” (Solomon 2004, p.567). Laggards, making up one-
sixth of the group, are the last to adopt innovation. They tend to be suspicious of innovations and
of change agents. Early adopters are key targets for marketing, because they can serve as opinion
leaders who offer advice and influence others in their social system (Wilkie 1994, p.338).
26 The size of each category is an estimate; the actual size depends on various factors such as the complexity of products, cost, and risks associated with adoption (Solomon 2004).
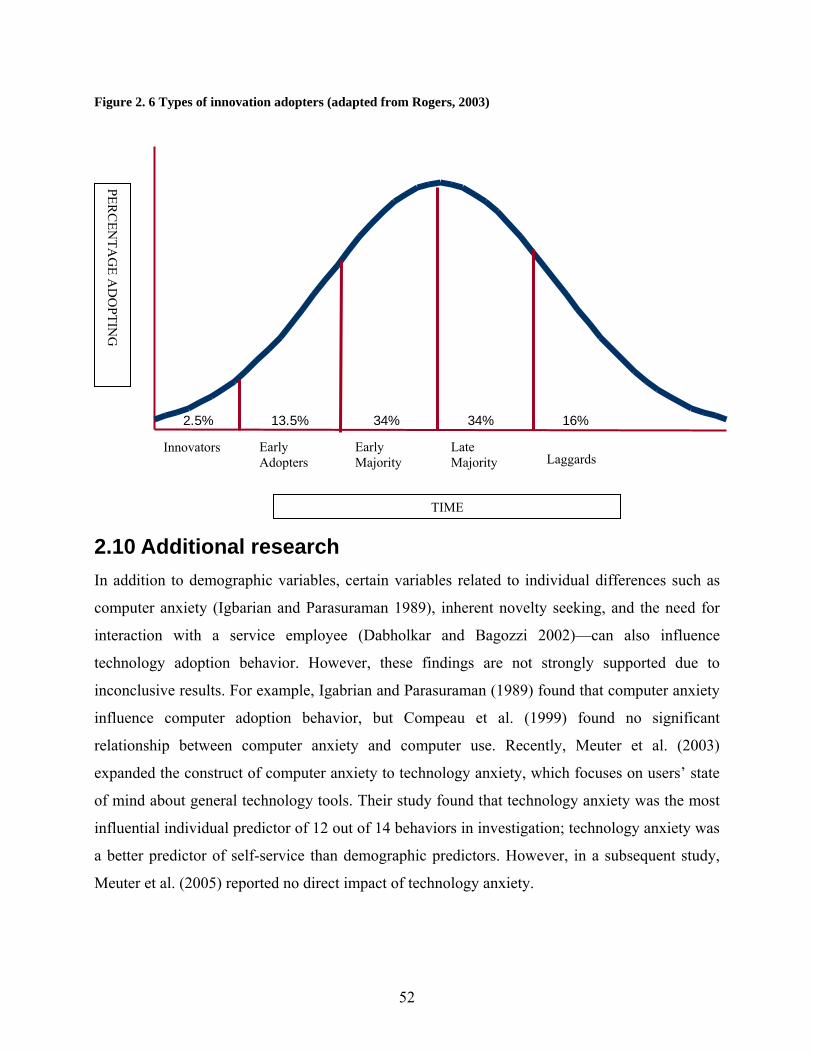
52
Figure 2. 6 Types of innovation adopters (adapted from Rogers, 2003)
2.10 Additional research In addition to demographic variables, certain variables related to individual differences such as
computer anxiety (Igbarian and Parasuraman 1989), inherent novelty seeking, and the need for
interaction with a service employee (Dabholkar and Bagozzi 2002)—can also influence
technology adoption behavior. However, these findings are not strongly supported due to
inconclusive results. For example, Igabrian and Parasuraman (1989) found that computer anxiety
influence computer adoption behavior, but Compeau et al. (1999) found no significant
relationship between computer anxiety and computer use. Recently, Meuter et al. (2003)
expanded the construct of computer anxiety to technology anxiety, which focuses on users’ state
of mind about general technology tools. Their study found that technology anxiety was the most
influential individual predictor of 12 out of 14 behaviors in investigation; technology anxiety was
a better predictor of self-service than demographic predictors. However, in a subsequent study,
Meuter et al. (2005) reported no direct impact of technology anxiety.
34% 34% 16% 13.5% 2.5%
Innovators Early Adopters
Early Majority
Late Majority Laggards
TIME
PERC
ENTA
GE A
DO
PTING
53
2.11 Description of the Technology readiness index Based on insights from the literature and extensive qualitative research on customer reactions to
technology, Parasuraman (2000) developed the Technology readiness index (TRI). He argues that
technology product adoption is a process involving a complex belief system that is not applicable
to conventional products and services, because each individual possesses different levels of
optimism, discomfort, and security with technology as well as a tendency to innovate. The
technology readiness construct refers to “people’s propensity to embrace and use new
technologies for accomplishing goals in home life and at work” (Parasuraman 2000, p.308). The
TRI can be categorized into four distinct groupings: optimism, innovativeness, discomfort, and
insecurity (Parasuraman 2000, Parasuraman and Colby 2001, p.38).
Respondents who exhibit optimism are said to have “a positive view of technology and a belief
that offers people increased control, flexibility, and efficiency in their lives.” People in this
component normally have a positive view of technology (Parasuraman and Colby 2001, p.34).
Some examples of beliefs representing optimism to technology could be: you prefer to use the
most advanced technology available, technology gives people more control over their daily lives,
technology makes you more efficient in your occupation.
Respondents who show innovativeness have “a tendency to be a technology pioneer and thought
leader. It measures the extent to which an individual believes that he or she is at the forefront of
trying out new technology-based products and/or services and is considered by others as an
opinion leader on technology-related issues” (Parasuraman and Colby 2001, p. 38). People that
fall into this group generally confirm the following statements: other people come to you for
advice on new technologies, you enjoy the challenge of figuring out high-tech gadgets, you keep
up with the latest technological developments in your area of interest.
Respondents that show discomfort see themselves as having “a perceived lack of control over
technology and a feeling of being overwhelmed by it. It represents the extent to which people
have a general paranoia about technology-based products and services believing that they tend to
be exclusionary rather than inclusive of all kinds of people” (Parasuraman and Colby 2001, p.40).
The following statements illustrate the types of beliefs contributing to discomfort: sometimes you
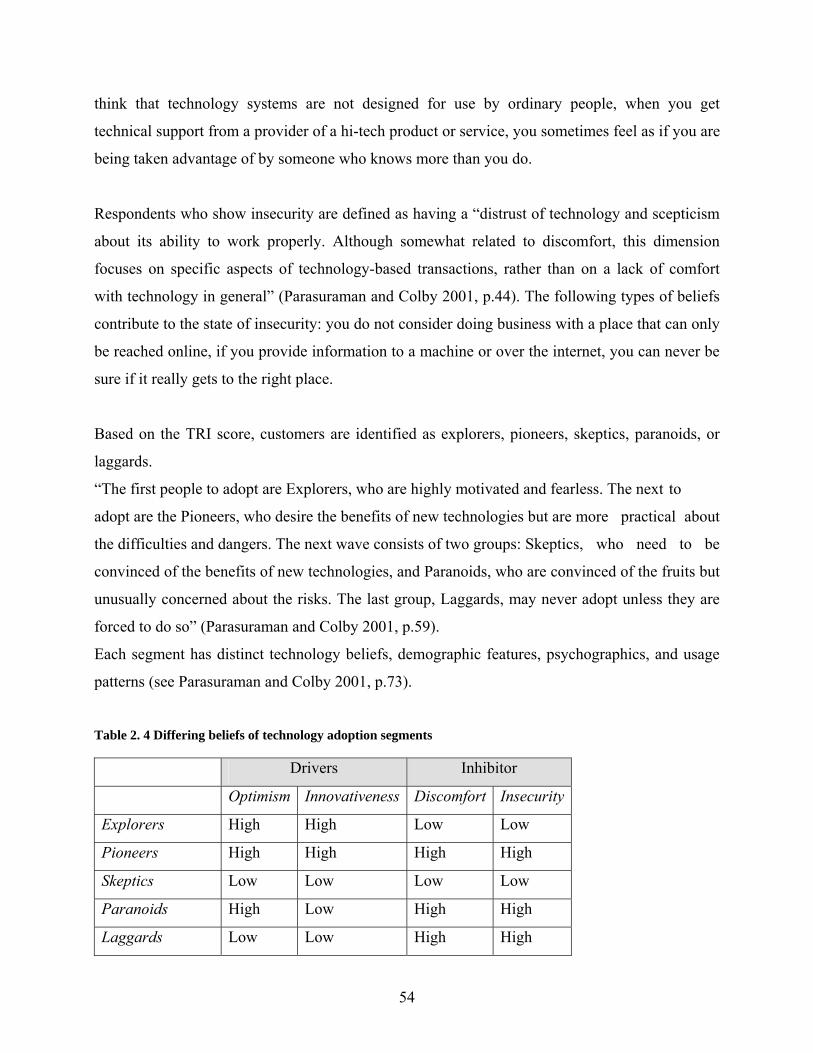
54
think that technology systems are not designed for use by ordinary people, when you get
technical support from a provider of a hi-tech product or service, you sometimes feel as if you are
being taken advantage of by someone who knows more than you do.
Respondents who show insecurity are defined as having a “distrust of technology and scepticism
about its ability to work properly. Although somewhat related to discomfort, this dimension
focuses on specific aspects of technology-based transactions, rather than on a lack of comfort
with technology in general” (Parasuraman and Colby 2001, p.44). The following types of beliefs
contribute to the state of insecurity: you do not consider doing business with a place that can only
be reached online, if you provide information to a machine or over the internet, you can never be
sure if it really gets to the right place.
Based on the TRI score, customers are identified as explorers, pioneers, skeptics, paranoids, or
laggards.
“The first people to adopt are Explorers, who are highly motivated and fearless. The next to
adopt are the Pioneers, who desire the benefits of new technologies but are more practical about
the difficulties and dangers. The next wave consists of two groups: Skeptics, who need to be
convinced of the benefits of new technologies, and Paranoids, who are convinced of the fruits but
unusually concerned about the risks. The last group, Laggards, may never adopt unless they are
forced to do so” (Parasuraman and Colby 2001, p.59).
Each segment has distinct technology beliefs, demographic features, psychographics, and usage
patterns (see Parasuraman and Colby 2001, p.73).
Table 2. 4 Differing beliefs of technology adoption segments Drivers Inhibitor
Optimism Innovativeness Discomfort Insecurity
Explorers High High Low Low
Pioneers High High High High
Skeptics Low Low Low Low
Paranoids High Low High High
Laggards Low Low High High
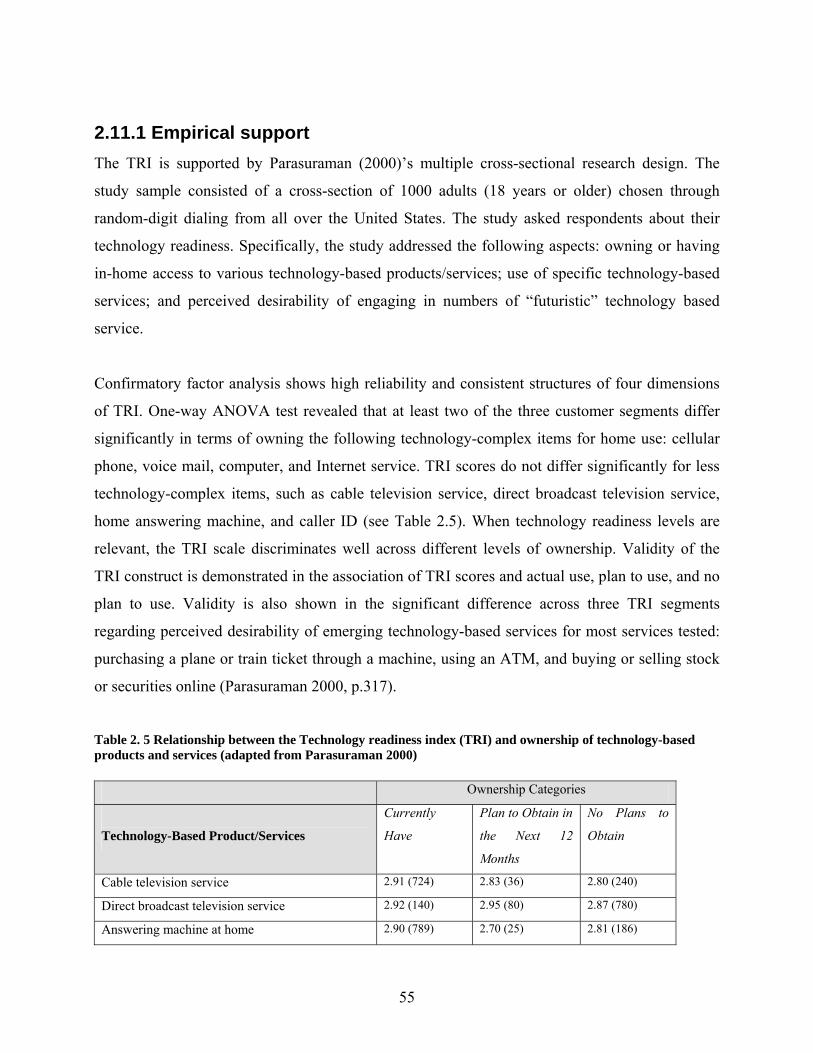
55
2.11.1 Empirical support The TRI is supported by Parasuraman (2000)’s multiple cross-sectional research design. The
study sample consisted of a cross-section of 1000 adults (18 years or older) chosen through
random-digit dialing from all over the United States. The study asked respondents about their
technology readiness. Specifically, the study addressed the following aspects: owning or having
in-home access to various technology-based products/services; use of specific technology-based
services; and perceived desirability of engaging in numbers of “futuristic” technology based
service.
Confirmatory factor analysis shows high reliability and consistent structures of four dimensions
of TRI. One-way ANOVA test revealed that at least two of the three customer segments differ
significantly in terms of owning the following technology-complex items for home use: cellular
phone, voice mail, computer, and Internet service. TRI scores do not differ significantly for less
technology-complex items, such as cable television service, direct broadcast television service,
home answering machine, and caller ID (see Table 2.5). When technology readiness levels are
relevant, the TRI scale discriminates well across different levels of ownership. Validity of the
TRI construct is demonstrated in the association of TRI scores and actual use, plan to use, and no
plan to use. Validity is also shown in the significant difference across three TRI segments
regarding perceived desirability of emerging technology-based services for most services tested:
purchasing a plane or train ticket through a machine, using an ATM, and buying or selling stock
or securities online (Parasuraman 2000, p.317).
Table 2. 5 Relationship between the Technology readiness index (TRI) and ownership of technology-based products and services (adapted from Parasuraman 2000)
Ownership Categories
Technology-Based Product/Services
Currently
Have
Plan to Obtain in
the Next 12
Months
No Plans to
Obtain
Cable television service 2.91 (724) 2.83 (36) 2.80 (240)
Direct broadcast television service 2.92 (140) 2.95 (80) 2.87 (780)
Answering machine at home 2.90 (789) 2.70 (25) 2.81 (186)
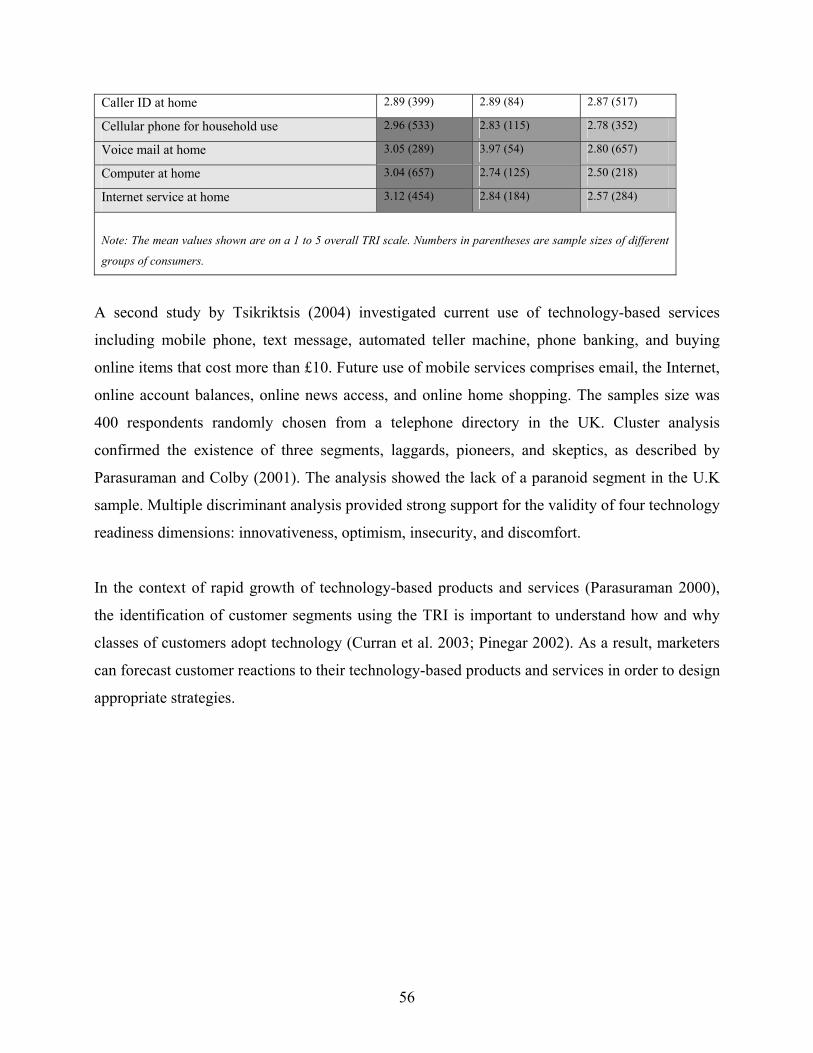
56
Caller ID at home 2.89 (399) 2.89 (84) 2.87 (517)
Cellular phone for household use 2.96 (533) 2.83 (115) 2.78 (352)
Voice mail at home 3.05 (289) 3.97 (54) 2.80 (657)
Computer at home 3.04 (657) 2.74 (125) 2.50 (218)
Internet service at home 3.12 (454) 2.84 (184) 2.57 (284)
Note: The mean values shown are on a 1 to 5 overall TRI scale. Numbers in parentheses are sample sizes of different
groups of consumers.
A second study by Tsikriktsis (2004) investigated current use of technology-based services
including mobile phone, text message, automated teller machine, phone banking, and buying
online items that cost more than £10. Future use of mobile services comprises email, the Internet,
online account balances, online news access, and online home shopping. The samples size was
400 respondents randomly chosen from a telephone directory in the UK. Cluster analysis
confirmed the existence of three segments, laggards, pioneers, and skeptics, as described by
Parasuraman and Colby (2001). The analysis showed the lack of a paranoid segment in the U.K
sample. Multiple discriminant analysis provided strong support for the validity of four technology
readiness dimensions: innovativeness, optimism, insecurity, and discomfort.
In the context of rapid growth of technology-based products and services (Parasuraman 2000),
the identification of customer segments using the TRI is important to understand how and why
classes of customers adopt technology (Curran et al. 2003; Pinegar 2002). As a result, marketers
can forecast customer reactions to their technology-based products and services in order to design
appropriate strategies.
57
Chapter 3 Hypothesis and Proposed Research Model In this chapter, seven hypotheses are proposed. The first five hypotheses concern direct impacts
of attitude, subjective norm, perceived behavioral control, image congruence, and the technology
readiness index on behavioral intention. The sixth hypothesis refers to a correlation between TRI
and perceived behavioral control. The final hypothesis postulates that perceived behavioral
control may partly mediate the impact of the TRI on intention.
3.1 Theory of Planned Behavior According to the theory of planned behavior, behavior is guided by the formation of behavioral
intention and a sufficient degree of actual control over the behavior. Behavioral intention results
from a combination of attitudes, subjective norms, and perceived behavioral control. Attitude is
influenced by behavioral beliefs, which are about the consequences of behavior; subjective norms
are influenced by beliefs about normative expectations of others; and perceived behavioral
control is influenced by beliefs about the presence of factors that may further or hinder
performance of the behavior (Ajzen 1991).
3.1.1 Attitude According to Ajzen (1991), attitude refers to the degree to which a person has a favorable or
unfavorable evaluation of the behavior in question. Attitudes have been shown to influence
behavioral intention in various studies (Ajzen 1991; Ajzen and Fishbein 1980; Fishbein and
Ajzen 1975; Armitage and Conner 2001; Conner and Sparks 1996; Sutton 1998). In the area of
mobile service adoption, the effect of attitude on intention to use mobile services has been
demonstrated in a number of studies. Hung (2003) reports that attitude has a positive impact on
intention to adopt WAP services. Nysveen et al. (2005) find that attitude influences intention to
use text messaging, mobile contact, payment, and gaming services.
However, the limitation of these studies is that only a direct measure of attitude was utilized.
According to Fishbein and Ajzen (1975) belief-based measurement of attitude provides
understanding of information foundation. By targeting underlying beliefs, marketers can change
attitude, intention, and, ultimately, behavior. In this light, it is necessary to test a hypothesis about
58
the direct effect of attitude on intention to use mobile music service via the operationalization of
attitude measurement recommended by the TPB (Ajzen 2006; Ajzen and Fishbein 1980).
Hypothesis 1: The stronger the attitude toward using mobile music services, the greater the
intention to use the service.
3.1.2 Subjective norms According to Ajzen (1991), subjective norm (SN) occurs when a person feels that other relevant
people may see performing the behavior as positive, thus motivating them to act in compliance
with expectations. Several empirical studies have shown that subjective norms have a positive
and direct impact on behavioral intention, but this influence is usually weaker than that of attitude
and PBC (Ajzen and Fishbein 1980; Armitage and Conner 2001). In technology adoption
research, Davis (1993) suggests that subjective norms have a weak impact on consumer adoption
of new technology. Empirical studies in consumer behaviors related to Internet and mobile
service demonstrate inconsistent results. For example, in the case of WAP service, the correlation
coefficient between SN and intention ranged from r=0.22 (Teo and Pok 2003) to r=0.51 (Hung et
al. 2003). Lim and Dubinsky (2005) found an r=0.13 for the link between SN and intention to
shop online. Pavlou and Fygenson (2006) reported a very weak effect of SN on intention to
obtain information and to purchase from web vendors(r=0.03 and r=0.04, respectively). From the
above findings, it seems that the impact of subjective norm on behavioral intention may be
determined by the type of behavior in question (Trafimow and Fishbein 1994). No study has
investigated the link between SN and intention to use mobile music.
Hypothesis 2: The stronger the subjective norm toward using mobile music services, the greater
the intention to use the service.
3.1.3 Perceived behavioral control Perceived behavioral control refers to the perceived ease or difficulty of performing the behavior;
it is assumed to reflect past experience as well as anticipated obstacles (Ajzen 1991). PBC is
defined in this study as a person’s perceived ease or difficulty using mobile music services. The
individual may have positive attitudes toward using mobile music services, but he or she may
59
have low intentions to use the service due to lack of skills or resources required to perform the
behavior. PBC has demonstrated significant effects on behavioral intention (Ajzen 1991;
Armitage and Conner 2001). As in the case of attitude measurement, only direct measurement of
PBC has been used in most mobile service adoption research (e.g., Hung et al. 2003; Nysveen et
al. 2005). Belief-based measurement of PBC allows researchers to identify specific factors
underlying the PBC construct and their relative impact on intention. Marketers can use this
information to devise appropriate strategies to help consumers overcome these difficulties.
Hypothesis 3: The stronger the perceived behavioral control toward using mobile music services,
the greater the intention to use the service.
3.2 Image congruence Image congruence refers to the degree of fit between the perceived consumer self-image and the
perceived image of the typical user of the product or service in investigation (Grubb and
Grathwohl 1967). Image congruence is added to the model, because using mobile music services
may be hedonic and help users to express personality, status, and public image (Leung and Wei
2000; Nysveen et al. 2005). Consumer behaviors rely not only on utilitarian outcomes but also on
symbolic benefits (Belk et al. 1982; Hirschman 1981; Hirschman and Hollbrook 1982; Levy
1959). They are more likely to choose products or services that display good fit with their own
image (Rogers 2003), since they form their self-image based on how others see them (Mead
1934) and on their product possessions (Solomon 2004; Turker 1957).
Because people tend to present positive sides of their self-image, they intentionally choose
products or services that express the desired self (Belk 1988; McCracken 1986; O'Guinn and
Belk 1989; Wright et al. 1992). The role of image congruence in behaviors involving symbolic
benefits has been established in the literature (Sirgy 1982). The more congruent the self-image of
consumers is with the perceived images of a certain product, the more they will prefer that
product over others (Grubb and Grathwohl 1967). Empirically, this hypothesis has received
strong support in the case of product purchasing behaviors (Birdwell 1968; Dolich 1969; Sirgy
1982). Kleijnen et al. (2005) show that consumers who perceive high image congruence view
mobile banking service more positively than consumers who experience low image congruence
60
in terms of attitude and intention to adopt. Since mobile music is a new and lifestyle related
service, prediction of intention to use mobile music services may be improved by adding the
image congruence construct. Thus, it is necessary to examine the role of congruence between
consumer self-image and the image of the typical service user on the intention to use mobile
music services.
Hypothesis 4: The more congruence between an individual’s self-image and the image of the
typical mobile music user, the greater the intention to use mobile music services.
3.3 Technology readiness More than 30 years ago, Kassarjian (1971) summarized the relationship between individual
difference variables and consumer behaviors as follows: “The great majority indicates that if
correlations do exist they are so weak as to be questionable or perhaps meaningless.” In
technology adoption research, attempts to test this relationship (Igbarian and Parasuraman 1989;
Meuter et al. 2003) have provided inconclusive results. Parasuraman (2000)’s technology
readiness index measures the propensity to adopt new technology for everyday activities. He
shows that respondents who rate high on the TRI show stronger intentions to use technology-
based services. A replicate study with a UK sample by Tsikriktsis (2004) yielded the same
conclusions.
Ajzen and Fishbein (1980) remark that personality traits correspond only to behavioral categories,
not single actions. The TRI can be regarded as a kind of personality trait that is oriented toward
technology-based products and services. Using mobile music services can be considered a single
act; thus, empirical results from Parasuraman (2000) and Tsikriktsis (2004) seem to disagree with
Ajzen and Fishbein’s (1980) suggestions. Therefore, it is necessary to test the effect of the TRI
on intention to use mobile music services in another sample set: Swedish consumers.
Hypothesis 5A: Respondents that rate high on the technology readiness index (TRI) will show a
stronger intention to use mobile music services.
61
Perceived behavioral control refers to people’s perception of the ease or difficulty of performing
the behavior of interest (Ajzen 1991). Previous research demonstrates that behavior is strongly
influenced by an individual’s confidence in their ability to perform the behavior (Bandura 1977).
Since using mobile music services may involve a certain level of technical complexity, a
relationship between perceived behavioral control and the TRI is postulated as follows:
Hypothesis 5B: Respondents that rate higher on the technology readiness index (TRI) will show a
stronger perceived behavioral control for using mobile music services.
In the conceptualization of the TRA and the TPB, the relationship between external variables and
behavior is mediated by attitude, subjective norm, and perceived behavioral control (Ajzen and
Fishbein 1980). Many attempts have been made to examine the effects of personality traits on the
purchase of different products. The results were quite disappointing, since these variables seldom
account for variance in individual behavior (Wells 1975). Empirical studies by Hrubes and Ajzen
(2001) and Fulton et al. (1996) show that personal values indirectly affect behavior through
attitudes. In a cross-sectional survey, Courneya et al. (1999) report that the relationship between
personality and behavior was only partially mediated by components in the TPB. Research on the
TRI and the TPB in the mobile service domain has been carried out independently. Therefore, it
is unknown whether the relationship between TRI and intention to use mobile music service is
mediated by perceived behavioral control.
Hypothesis 5C: The effect of the technology readiness index on intention to use mobile music
services is partly mediated by perceived behavioral control.
3.4 Research model A research model is proposed to determine the antecedents of the intention among Swedish
consumers to use mobile music services. The present study seeks to understand the intentions of a
person to use mobile music services by examining attitude, subjective norm, perceived behavioral
control, the congruence between one’s self-image and the image of the typical mobile music
service user. The study also hypothesizes that a person’s TRI has an impact on intention and
correlates to perceived behavioral control. Finally, it is postulated that the effect of the TRI on
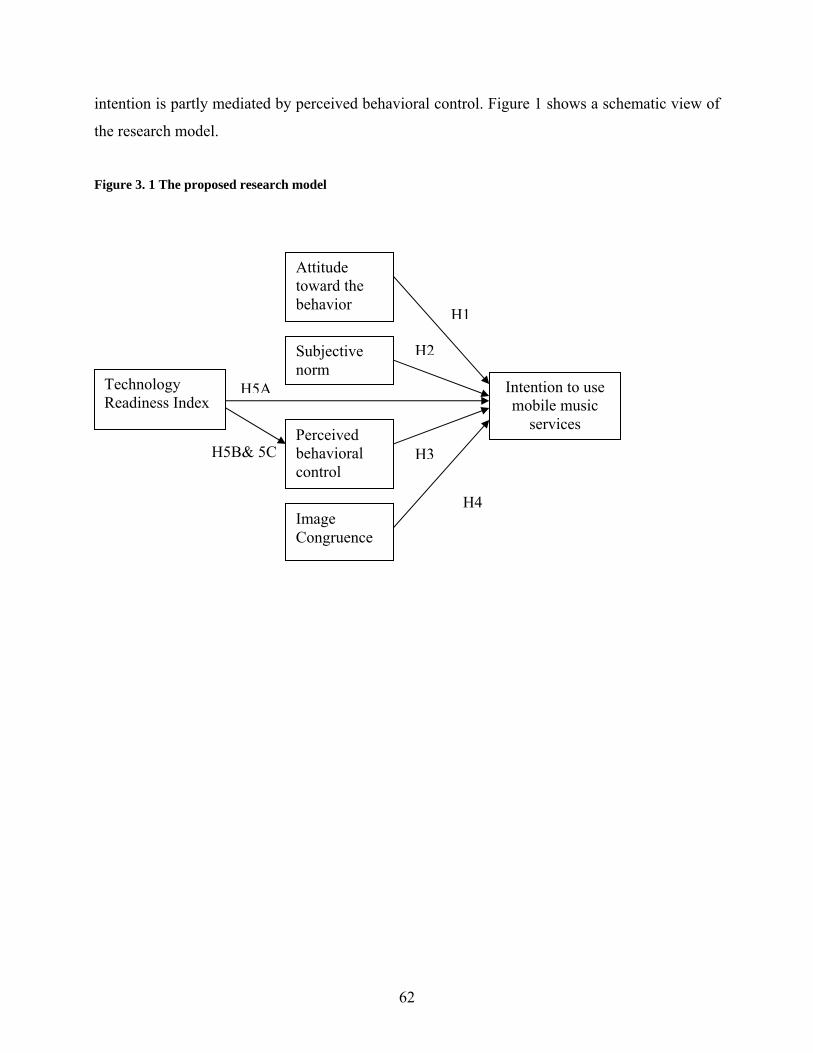
62
intention is partly mediated by perceived behavioral control. Figure 1 shows a schematic view of
the research model.
Figure 3. 1 The proposed research model
H5B& 5C
H5A
H4
H1
H2
H3
Intention to use mobile music
services
Attitude toward the behavior
Subjective norm
Perceived behavioral control
Image Congruence
Technology Readiness Index
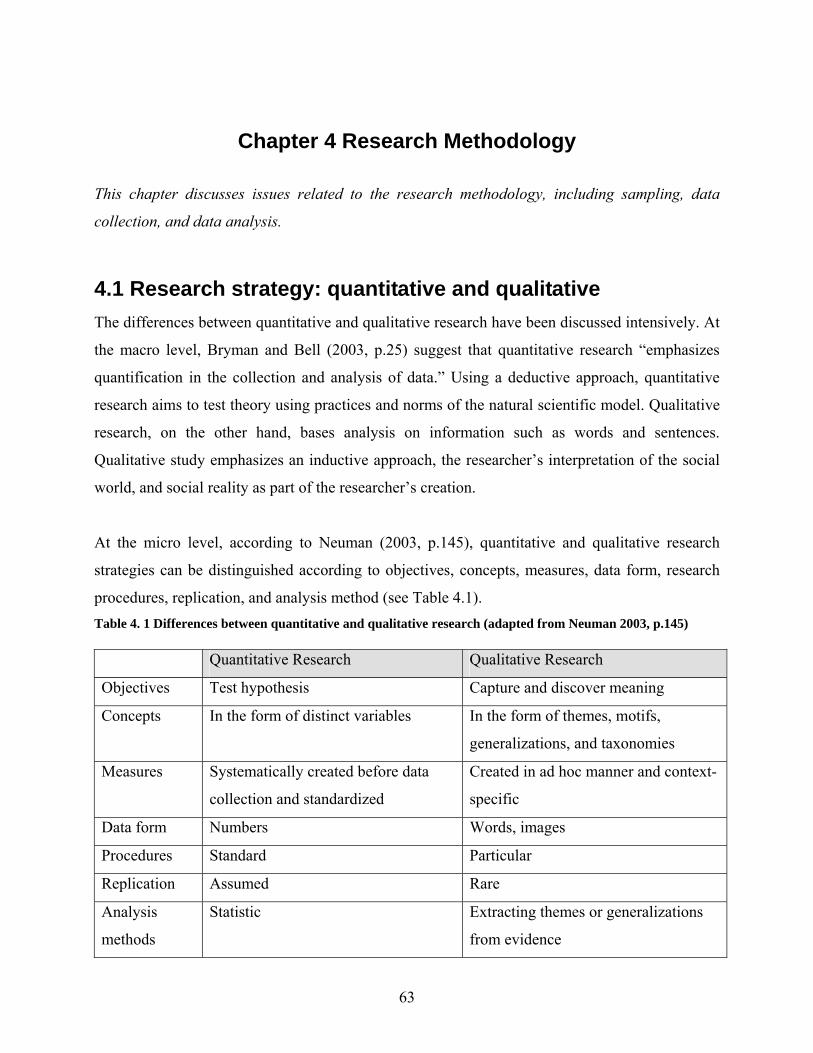
63
Chapter 4 Research Methodology
This chapter discusses issues related to the research methodology, including sampling, data
collection, and data analysis.
4.1 Research strategy: quantitative and qualitative The differences between quantitative and qualitative research have been discussed intensively. At
the macro level, Bryman and Bell (2003, p.25) suggest that quantitative research “emphasizes
quantification in the collection and analysis of data.” Using a deductive approach, quantitative
research aims to test theory using practices and norms of the natural scientific model. Qualitative
research, on the other hand, bases analysis on information such as words and sentences.
Qualitative study emphasizes an inductive approach, the researcher’s interpretation of the social
world, and social reality as part of the researcher’s creation.
At the micro level, according to Neuman (2003, p.145), quantitative and qualitative research
strategies can be distinguished according to objectives, concepts, measures, data form, research
procedures, replication, and analysis method (see Table 4.1). Table 4. 1 Differences between quantitative and qualitative research (adapted from Neuman 2003, p.145) Quantitative Research Qualitative Research
Objectives Test hypothesis Capture and discover meaning
Concepts In the form of distinct variables In the form of themes, motifs,
generalizations, and taxonomies
Measures Systematically created before data
collection and standardized
Created in ad hoc manner and context-
specific
Data form Numbers Words, images
Procedures Standard Particular
Replication Assumed Rare
Analysis
methods
Statistic Extracting themes or generalizations
from evidence
64
The distinction between qualitative and quantitative approach is not hard-and-fast. Some studies
combine both strategies within the overall research project (Bryman and Bell 2003, p. 481). In
this particular study, in order to answer the research question postulated in Chapter 1, a research
model was developed based on the theory of planned behavior, the theory of image congruence,
and the technology readiness index. From these backgrounds, seven hypotheses were proposed as
stated in Chapter 3. According to criteria by Bryman and Bell (2003, p. 481) as well as Neuman
(2003), this research could be considered quantitative in nature. However, during the research
process, qualitative approach was also utilized when necessary. For example, the pilot study,
which aimed to elicit beliefs about mobile music services, is qualitative. More descriptions about
this pilot study are given in later sections.
4.2 Research design A research design provides the basic plan to guide the research process in order to achieve
research objectives most efficiently (Hair et al. 2003, p.57). Research designs can be classified
into three broad categories: exploratory, descriptive, or causal.
• Exploratory research is used to develop a better understanding of the nature of a problem
where there are few prior theories for guidance. Exploratory research can be conducted through a
literature review, focus groups, or in-depth interviews. In the present study, an exploratory
approach was used for the pilot study that aimed at discovering salient beliefs of respondents
about mobile music services.
• Causal research is used to test whether one event causes another (Cooper and Schindler 2003,
p. 57; Hair et al. 2003). Causality is normally established through experiments in which the
impact of a treatment or intervention on an outcome is examined (Creswell 1994). In this study,
since no intervention was provided, the choice of experiment was ruled out. However, the present
study aims at testing the effect of the TPB’s construct, image congruence, and TRI on intention to
use mobile music service. Therefore, it can be considered causal research.
• Descriptive research normally has three objectives: (1) description of phenomena or
characteristics of certain population in investigation, (2) estimation of the proportions of a
population that have these characteristics, and (3) discovery of relationships among different
65
variables (Cooper and Schindler 2003, p.162). Descriptive research is often confirmatory and
aims at testing hypotheses. In this study, the objectives specified in Chapter 3 were to test the
relationships between independent variables (attitudes, subjective norms, perceived behavioral
control, image congruence, and the technology readiness index) and the dependent variable of
intention to use mobile music services. Thus, this study is descriptive in nature.
Descriptive studies can be cross-sectional or longitudinal (Hair et al. 2003, p.60). Cross-sectional
studies provide readers with a description of the phenomena at a given point in time. In contrast,
longitudinal studies describe phenomena over time and are useful for tracking changes in which
time can play a critical part. A cross-sectional approach was used for this study, because the
relationships of variables tested in this study can be considered stable over time.
4.3 Survey method A typical method for cross-sectional studies is the survey method (Hair et al. 2003, p.60).
Surveys are appropriate when a research project requires a large amount of information from a
large sample of respondents. Many variables can be measured in a survey, thus allowing multiple
hypotheses and associations among different variables to be tested (Neuman 2003, p.267). The
survey method does not require any objective perception of information. It is appropriate for
studying self-reported attitudes, opinions, and intentions of respondents and is economical to
administer (Blumberg et al. 2005, p.244). Based on these advantages, the survey method was
selected for this study.
4.4 Sampling Sampling design is an important part of the research process. Appropriate sampling design can
minimize errors and increase the probability that the sample is representative of the population
under investigation (Hair et al. 2003, p.209). Sampling design involves determining the target
population, sampling method, and sample size.
66
4.4.1 Target population The target population is the complete group of objects relevant to the research project (Hair et al.
2003, p.209). According to Lehmann et al (1998), choice of target population is very important:
“Choice of a target population that is too large leads to the collection of data from people whose
responses are meaningless…On the other hand, choice of an overly narrow frame will tend to
exclude potential useful responses” (Lehmann et al. 1998, p.286). Therefore, researchers should
balance the above extremes. Since the aim of this research was to generalize the results for the
Swedish consumers, the target population is Swedish consumers age 14 and older.
4.4.2 Sampling method Traditional sampling methods include probability and non-probability sampling. “Probability
methods are based on the premise that each element of the target population has a known, but not
necessarily equal, probability of being selected in a sample” (Hair et al. 2003, p.211). In non-
probability sampling, the researcher decides which elements should be included or excluded in
the sampling unit. The probability sampling method was selected for this study.
Probability sampling can be classified into five categories: simple random, systematic, stratified,
cluster, and multi-stage (Hair et al. 2003, p.211). In the present study, stratified sampling was
utilized. Stratified sampling requires the researcher to partition the target population into
relatively homogeneous and distinct sub-groups. Elements for stratified sample are usually
selected either by drawing simple random or systematic samples of the specified size from all the
strata of the target population. Stratified sampling is used to “ensure adequate representation of
key subgroups of the target population” (Lehmann et al. 1998, p. 301). There are two types of
stratified sampling: proportionate and disproportionate. In disproportionately stratified sampling,
the overall sample size is the total of all elements from each stratum. The number of elements for
each stratum is decided based on practical considerations such as economic importance (Hair et
al. 2003, p.214). “Certain segments of the population may be considered key for marketing
strategy, and a researcher will want a relatively large number of sample points in these segments,
while at the same time other strata may be sufficiently important that they cannot be totally
ignored” (Lehmann et al. 1998, p. 299). In this study, age was used as a criterion for forming
different strata. Swedish population statistics were used as the reference (see Table 4.2).
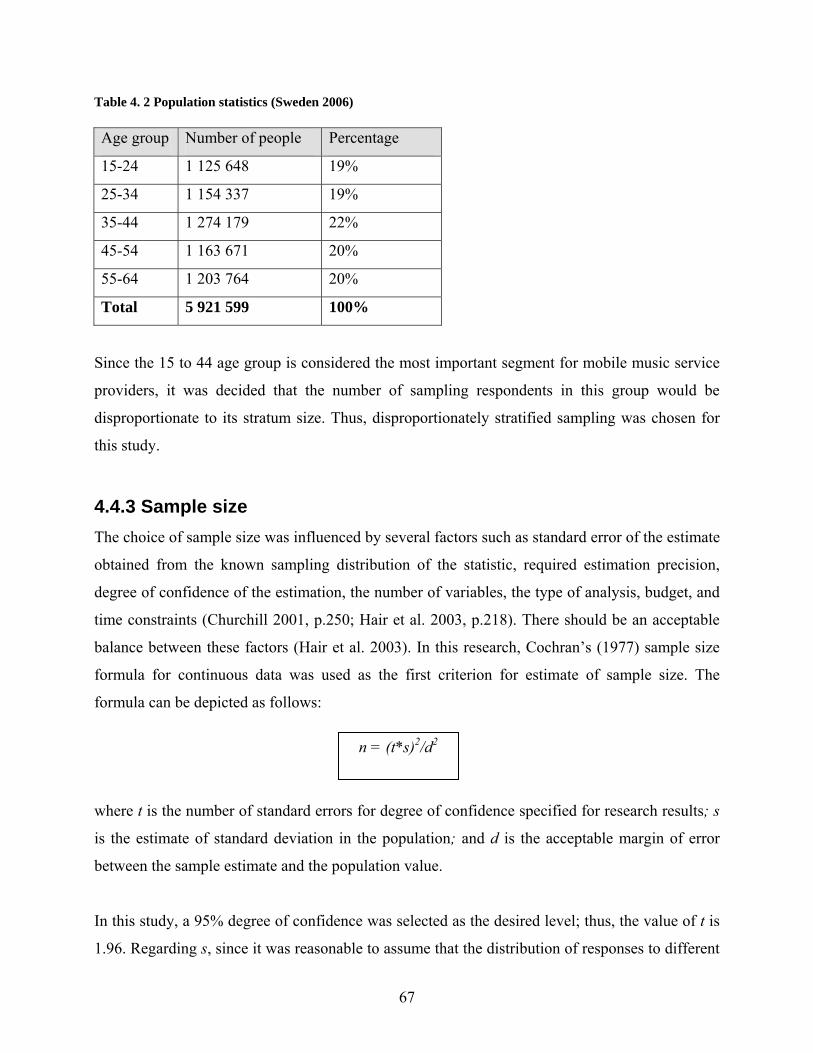
67
Table 4. 2 Population statistics (Sweden 2006) Age group Number of people Percentage
15-24 1 125 648 19%
25-34 1 154 337 19%
35-44 1 274 179 22%
45-54 1 163 671 20%
55-64 1 203 764 20%
Total 5 921 599 100%
Since the 15 to 44 age group is considered the most important segment for mobile music service
providers, it was decided that the number of sampling respondents in this group would be
disproportionate to its stratum size. Thus, disproportionately stratified sampling was chosen for
this study.
4.4.3 Sample size The choice of sample size was influenced by several factors such as standard error of the estimate
obtained from the known sampling distribution of the statistic, required estimation precision,
degree of confidence of the estimation, the number of variables, the type of analysis, budget, and
time constraints (Churchill 2001, p.250; Hair et al. 2003, p.218). There should be an acceptable
balance between these factors (Hair et al. 2003). In this research, Cochran’s (1977) sample size
formula for continuous data was used as the first criterion for estimate of sample size. The
formula can be depicted as follows:
where t is the number of standard errors for degree of confidence specified for research results; s
is the estimate of standard deviation in the population; and d is the acceptable margin of error
between the sample estimate and the population value.
In this study, a 95% degree of confidence was selected as the desired level; thus, the value of t is
1.96. Regarding s, since it was reasonable to assume that the distribution of responses to different
n = (t*s)2/d2
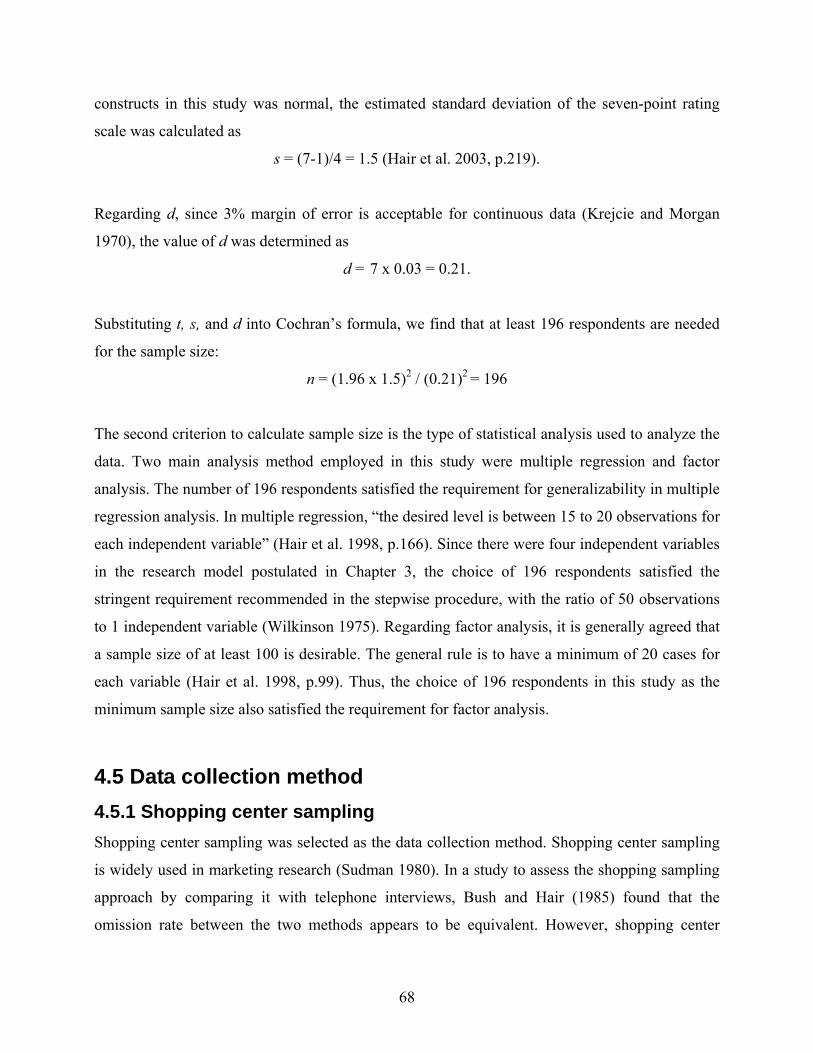
68
constructs in this study was normal, the estimated standard deviation of the seven-point rating
scale was calculated as
s = (7-1)/4 = 1.5 (Hair et al. 2003, p.219).
Regarding d, since 3% margin of error is acceptable for continuous data (Krejcie and Morgan
1970), the value of d was determined as
d = 7 x 0.03 = 0.21.
Substituting t, s, and d into Cochran’s formula, we find that at least 196 respondents are needed
for the sample size:
n = (1.96 x 1.5)2 / (0.21)2 = 196
The second criterion to calculate sample size is the type of statistical analysis used to analyze the
data. Two main analysis method employed in this study were multiple regression and factor
analysis. The number of 196 respondents satisfied the requirement for generalizability in multiple
regression analysis. In multiple regression, “the desired level is between 15 to 20 observations for
each independent variable” (Hair et al. 1998, p.166). Since there were four independent variables
in the research model postulated in Chapter 3, the choice of 196 respondents satisfied the
stringent requirement recommended in the stepwise procedure, with the ratio of 50 observations
to 1 independent variable (Wilkinson 1975). Regarding factor analysis, it is generally agreed that
a sample size of at least 100 is desirable. The general rule is to have a minimum of 20 cases for
each variable (Hair et al. 1998, p.99). Thus, the choice of 196 respondents in this study as the
minimum sample size also satisfied the requirement for factor analysis.
4.5 Data collection method 4.5.1 Shopping center sampling Shopping center sampling was selected as the data collection method. Shopping center sampling
is widely used in marketing research (Sudman 1980). In a study to assess the shopping sampling
approach by comparing it with telephone interviews, Bush and Hair (1985) found that the
omission rate between the two methods appears to be equivalent. However, shopping center
69
sampling yields less distorted responses as well as high response rates and provides access to
respondents who may be knowledgeable about shopping. According to Sudman (1980, p. 431),
“there are no intrinsic reasons why careful shopping center samples cannot be selected that will
provide only slightly biased estimates of the population.”
People also treat a visit to the shopping center as a social event (Sudman 1980). The basic
assumption of shopping center sampling is that “all adults or households have a nonzero (but not
equal) probability of being found in a shopping center” (Sudman 1980, p. 424). Previous studies
showed that about 90 to 95% of all adults and more than 95% of all households go to shopping
centers at least once a year; about two thirds do so in a two-week period (ibid).
The choice of this data collection method was also justified, because the survey questionnaire
was quite long (see Appendix 3). Given the low response rate of mail surveys reported in recent
years (Hikmet and Chen 2003), the choice of a mail survey with such a long questionnaire would
not have been effective. According to Mayer (1974), the physical interaction between the
researcher and respondents as well as the presence of the researcher may increase cooperation; as
a result, a high response rate can be obtained. Smedjan, the biggest shopping center in downtown
Luleå City, was chosen as the location for the data collection process. This place was believed to
receive visits from diverse groups of people.
4.5.2 Sampling time Visits to shopping centers vary by season, day, time, and other less predictable factors such as
weather or special events (Sudman 1980). Since characteristics of respondents in a shopping
center can vary (Bush and Hair 1985), the survey was carried out from the end of November to
the end of December 2006. To ensure that respondents are representative of the population, data
were collected on four Saturdays, four Sundays, one Monday, one Thursday, and one Friday. The
time was from 12am to 16pm for weekends and 14pm to 17pm for weekdays. One Sunday had a
heavy snow storm, resulting in low traffic. However, as the sampling period expanded over more
than one week, the effects of special events and weather were averaged out (Sudman 1980).
Before and during the data collection period, there was no particular marketing campaign from
mobile music service providers and no negative media attention or service breakdowns. Thus, it
70
is reasonable to conclude that the sampling time did not affect the external validity of the results
(Nysveen et al. 2005).
4.5.3 Data collection The selection of the shopping center sample of this study followed the sampling procedures
suggested by Sudman (1980) and Blair (1983). According to these two authors, sampling from
only one entrance of a shopping center can create a socioeconomic or geographical bias.
Therefore, various locations such as door entrances and different stores were rotated to avoid
potential biases (Sudman 1980). Intercepted visitors were informed of the purpose of the study.
They were then asked to spare about 15 minutes to answer the questionnaire. A total of 542
visitors were asked to take part, and 136 people agreed. The response rate was a little higher for
the group under age 25 and lower for the group over age 45. Among the questionnaires answered,
three responses were unusable, because more than 15% of the total items were missing (Darren
and Mallery 2005). Thus, the response rate for this group is 25%.
People who did not have time to answer the survey at that moment were asked to complete it at
home. They were given the questionnaire, a prepaid envelope, and a cover letter (see Appendix 4).
In situations when visitors looked quite occupied with their shopping activities, they were
directly asked to fill in the questionnaire at home. A total of 388 people were asked to complete
the survey at home; 310 respondents agreed. A period of three weeks after the last survey date
was the deadline; 114 questionnaires were returned, of which 2 were blank and 4 were unusable.
Thus, the response rate is 28% (Hidiroglu et al. 1993). Five respondents reported that they were
under age 15. These questionnaires were omitted from the database. Thus, the total number of
usable questionnaires was 236.
4.6 Measurement At least three items were used to measure attitude, subjective norm, and perceived behavioral
control constructs. From a psychometric point of view, multi-item measures are more appropriate
than a single item measure (Nunnally 1978).
71
4.6.1 Intention Three seven-point semantic differential items were used to elicit respondents’ intentions to use
mobile music services in the next six months. The provision of time frame in intention was
justified on the ground that it is difficult to express an intention without a time frame (Ajzen and
Driver 1992). The reliability coefficients of these items in previous studies ranged from 0.88
(Taylor and Todd 1995a) to 0.95 (Ajzen and Driver 1992).
Intention 1 I intend to use mobile music services in the next six months.
Intention 2 I plan to use mobile music services in the next six months.
Intention 3 I will try to use mobile music services in the next six months.
4.6.2 Attitudes Attitude can be measured with a procedure that locates the person’s response on a bipolar
affective or evaluative dimension (Fishbein and Ajzen 1975). Previous research has demonstrated
the reliability and validity of semantic differential as measure of attitudes (Fishbein and Raven
1962; Osgood et al. 1957). In this study, six seven-point scales were used:
Using mobile music service in the next six months is
Attitude 1 Bad – Good
Attitude 2 Useless – Useful
Attitude 3 Worthless – Valuable
Attitude 4 Unenjoyable – Enjoyable
Attitude 5 Unpleasant – Pleasant
Attitude 6 Unimportant - Important
These scales were adapted from previous TPB and attitude research in the technology adoption
and related fields (Ajzen and Driver 1992; Kleijnen et al. 2005; Taylor and Todd 1995b).
Reliability coefficients ranged from 0.86 (Ajzen and Driver 1992) to 0.96 (Kleijnen et al. 2005).
Since intercorrelations among various bipolar adjective scales are sufficiently high (Heise 1970),
the choice of six scales was justified. Note that scale selection satisfied Ajzen’s (2006)
recommendations that attitude direct measures should have both adjectives of instrumental tone
72
and affective tone. Three of the six adjective pairs (useless-useful, valuable-worthless,
unimportant-important) had an instrumental tone, while two items had a more affective tone
(pleasant-unpleasant, enjoyable-unenjoyable); one item (good-bad) had a general tone.
4.6.3 Subjective norm According to Ajzen (2006), since people generally approve of desirable behaviors and disapprove
of undesirable behaviors, questionnaires regarding subjective norms should identify whether
respondents perform the behavior in question. In this study, three scales measuring subjective
norm were designed in this manner. Reliability coefficients in previous studies ranged from 0.61
(Ajzen and Driver 1992) to 0.95 (Taylor and Todd 1995a).
SN1 Most people who are important to me use mobile music services.
SN2 The people in my life whose opinions I value use mobile music services.
SN3 Many people like me use mobile music services.
4.6.4 Perceived behavioral control As mentioned in earlier chapters, PBC can be assessed directly by asking respondents about the
degree of control or difficulty needed to perform a given behavior. However, researchers must be
careful in formulating measurement questions, as they may result in low inter-item reliability
among PBC direct measures (see Conner and Sparks 1996). Because PBC is a broad concept,
measures to assess it are diverse. For example, respondents may have different conceptions of
control and difficulty (Chan and Fishbein 1993). A behavior can be considered under control but
difficult to perform (Conner, 1996). In this study, two items were used to address control beliefs;
two more items assessed perceived capability of performing the behavior (Ajzen 2006).
Reliability coefficients in previous studies ranged from 0.76 (Ajzen and Driver 1992) to 0.84
(Taylor and Todd 1995a).
PBC1 If I want to, I could use mobile music services in the next six months.
PBC2 It is up to me whether or not I use mobile music services in the next six
months.
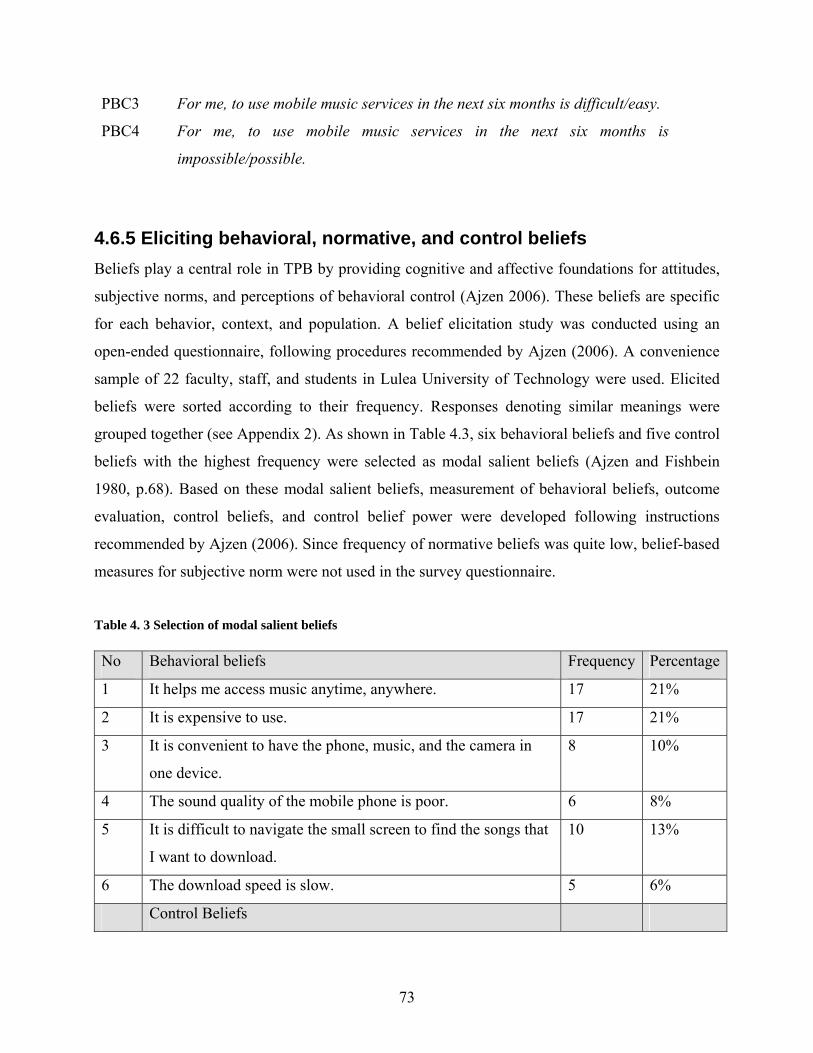
73
PBC3 For me, to use mobile music services in the next six months is difficult/easy.
PBC4 For me, to use mobile music services in the next six months is
impossible/possible.
4.6.5 Eliciting behavioral, normative, and control beliefs Beliefs play a central role in TPB by providing cognitive and affective foundations for attitudes,
subjective norms, and perceptions of behavioral control (Ajzen 2006). These beliefs are specific
for each behavior, context, and population. A belief elicitation study was conducted using an
open-ended questionnaire, following procedures recommended by Ajzen (2006). A convenience
sample of 22 faculty, staff, and students in Lulea University of Technology were used. Elicited
beliefs were sorted according to their frequency. Responses denoting similar meanings were
grouped together (see Appendix 2). As shown in Table 4.3, six behavioral beliefs and five control
beliefs with the highest frequency were selected as modal salient beliefs (Ajzen and Fishbein
1980, p.68). Based on these modal salient beliefs, measurement of behavioral beliefs, outcome
evaluation, control beliefs, and control belief power were developed following instructions
recommended by Ajzen (2006). Since frequency of normative beliefs was quite low, belief-based
measures for subjective norm were not used in the survey questionnaire.
Table 4. 3 Selection of modal salient beliefs No Behavioral beliefs Frequency Percentage
1 It helps me access music anytime, anywhere. 17 21%
2 It is expensive to use. 17 21%
3 It is convenient to have the phone, music, and the camera in
one device.
8 10%
4 The sound quality of the mobile phone is poor. 6 8%
5 It is difficult to navigate the small screen to find the songs that
I want to download.
10
13%
6 The download speed is slow. 5 6%
Control Beliefs
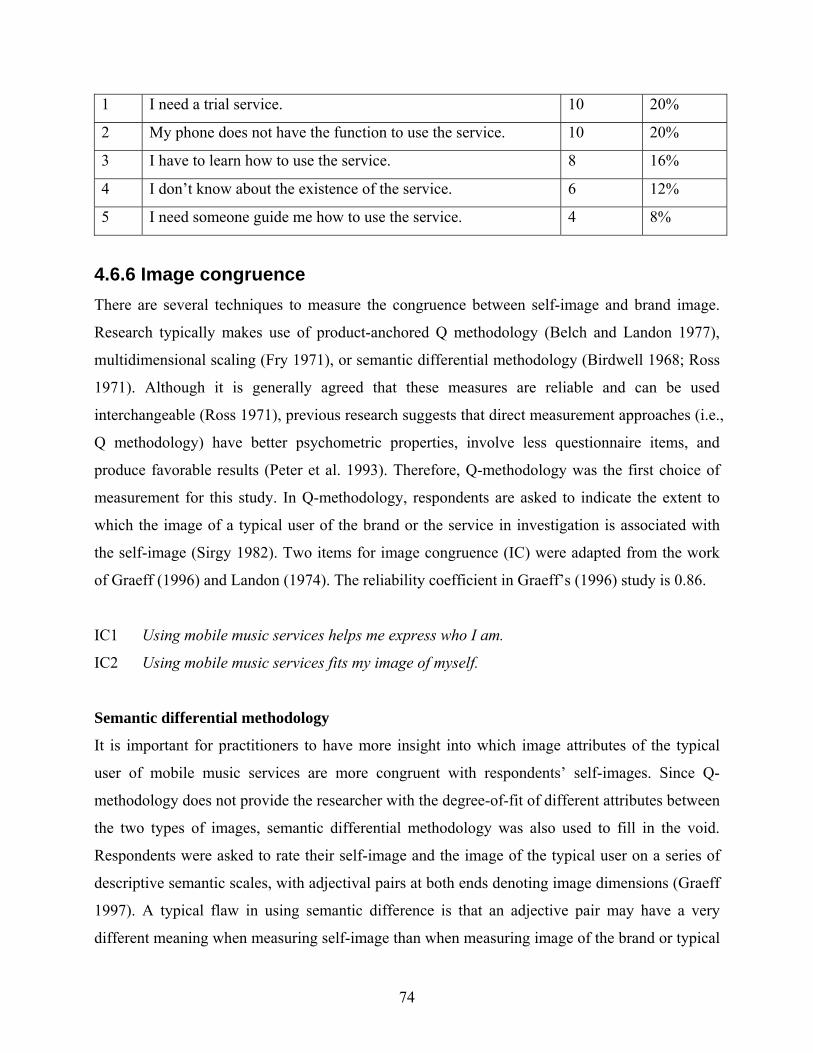
74
1 I need a trial service. 10 20%
2 My phone does not have the function to use the service. 10 20%
3 I have to learn how to use the service. 8 16%
4 I don’t know about the existence of the service. 6 12%
5 I need someone guide me how to use the service. 4 8%
4.6.6 Image congruence There are several techniques to measure the congruence between self-image and brand image.
Research typically makes use of product-anchored Q methodology (Belch and Landon 1977),
multidimensional scaling (Fry 1971), or semantic differential methodology (Birdwell 1968; Ross
1971). Although it is generally agreed that these measures are reliable and can be used
interchangeable (Ross 1971), previous research suggests that direct measurement approaches (i.e.,
Q methodology) have better psychometric properties, involve less questionnaire items, and
produce favorable results (Peter et al. 1993). Therefore, Q-methodology was the first choice of
measurement for this study. In Q-methodology, respondents are asked to indicate the extent to
which the image of a typical user of the brand or the service in investigation is associated with
the self-image (Sirgy 1982). Two items for image congruence (IC) were adapted from the work
of Graeff (1996) and Landon (1974). The reliability coefficient in Graeff’s (1996) study is 0.86.
IC1 Using mobile music services helps me express who I am.
IC2 Using mobile music services fits my image of myself.
Semantic differential methodology
It is important for practitioners to have more insight into which image attributes of the typical
user of mobile music services are more congruent with respondents’ self-images. Since Q-
methodology does not provide the researcher with the degree-of-fit of different attributes between
the two types of images, semantic differential methodology was also used to fill in the void.
Respondents were asked to rate their self-image and the image of the typical user on a series of
descriptive semantic scales, with adjectival pairs at both ends denoting image dimensions (Graeff
1997). A typical flaw in using semantic difference is that an adjective pair may have a very
different meaning when measuring self-image than when measuring image of the brand or typical
75
user (Landon 1974). Therefore, a series of nine adjectives were developed from a pilot study
following procedures recommended by previous researchers (Graeff 1997; Hogg et al. 2000;
Quester et al. 2000).
The purpose of this pilot study was to identify a small set of image dimensions that were
considered relevant in describing images of the typical user of mobile music services (Malhotra
1981). First, Malthotra's (1981) self-concept scale was used as starting point for developing
measurement scale for images of the typical user. Three colleagues of the researcher were invited
to join a panel of judges to discuss the relevance of 15 original pairs of adjectives in Malthotra's
(1981) self-concept scale. Five pairs of adjectives were selected as follows:
• Modest – Vain
• Thrifty – Indulgent
• Contemporary – Uncontemporary
• Youthful – Mature
• Orthodox - liberal
Next, 24 students were asked to write down adjectives that describe the typical user of mobile
music services. A total of 82 adjectives were produced (see Appendix 5). Roget’s Thesaurus was
then used to check meaning of those adjectives perceived to have similar meanings. If the results
confirmed that they were synonyms, these similar adjectives were then put into one group. Six
attributes with the highest frequency were chosen from the list: stylish, young, fashionable,
friendly, modern, and comfortable.
The next step was to compare the results from Malhotra (1981) and students. It was found that
two items have somewhat the same meaning: contemporary–modern and youthful–young. Items
from Malhotra’s (1981) work served as representatives. The Oxford Dictionary was then used to
find antonyms for the remaining four adjectives generated from the student test. By merging the
two sources, a list of nine dimensions for measuring images of the typical user of mobile music
services emerged as follows:
• Modest – Vain
• Stylish – Outdated
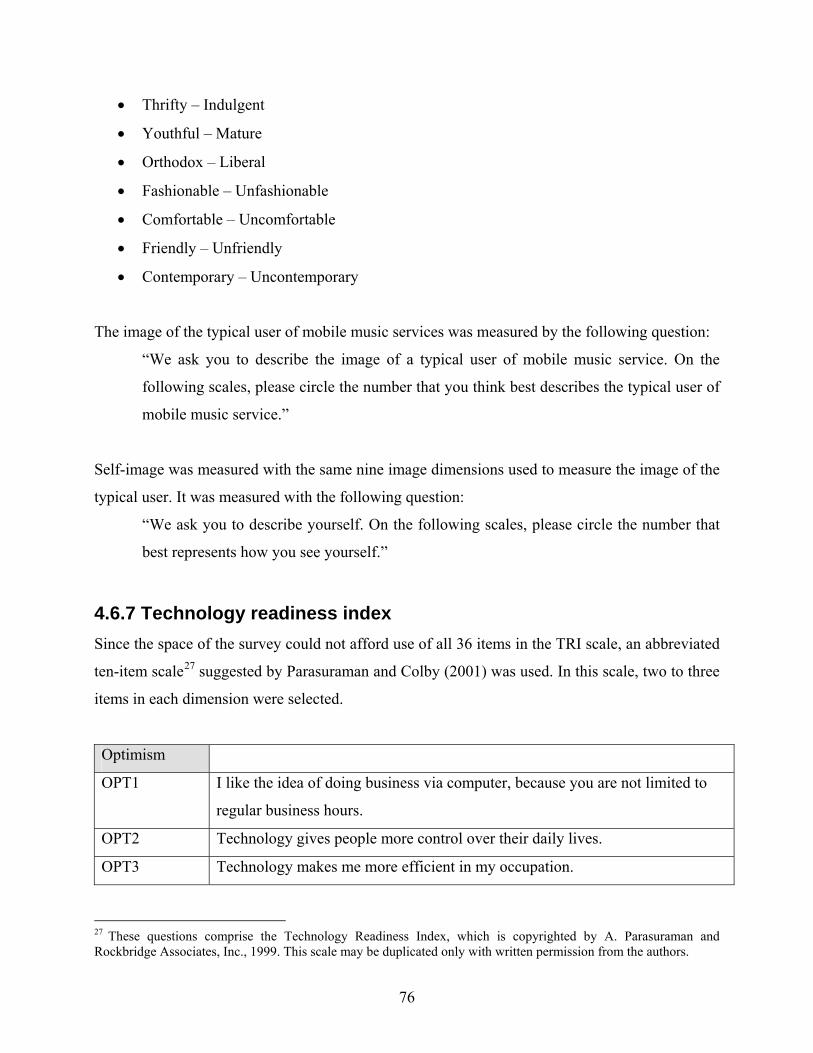
76
• Thrifty – Indulgent
• Youthful – Mature
• Orthodox – Liberal
• Fashionable – Unfashionable
• Comfortable – Uncomfortable
• Friendly – Unfriendly
• Contemporary – Uncontemporary
The image of the typical user of mobile music services was measured by the following question:
“We ask you to describe the image of a typical user of mobile music service. On the
following scales, please circle the number that you think best describes the typical user of
mobile music service.”
Self-image was measured with the same nine image dimensions used to measure the image of the
typical user. It was measured with the following question:
“We ask you to describe yourself. On the following scales, please circle the number that
best represents how you see yourself.”
4.6.7 Technology readiness index Since the space of the survey could not afford use of all 36 items in the TRI scale, an abbreviated
ten-item scale27 suggested by Parasuraman and Colby (2001) was used. In this scale, two to three
items in each dimension were selected.
Optimism
OPT1 I like the idea of doing business via computer, because you are not limited to
regular business hours.
OPT2 Technology gives people more control over their daily lives.
OPT3 Technology makes me more efficient in my occupation.
27 These questions comprise the Technology Readiness Index, which is copyrighted by A. Parasuraman and Rockbridge Associates, Inc., 1999. This scale may be duplicated only with written permission from the authors.
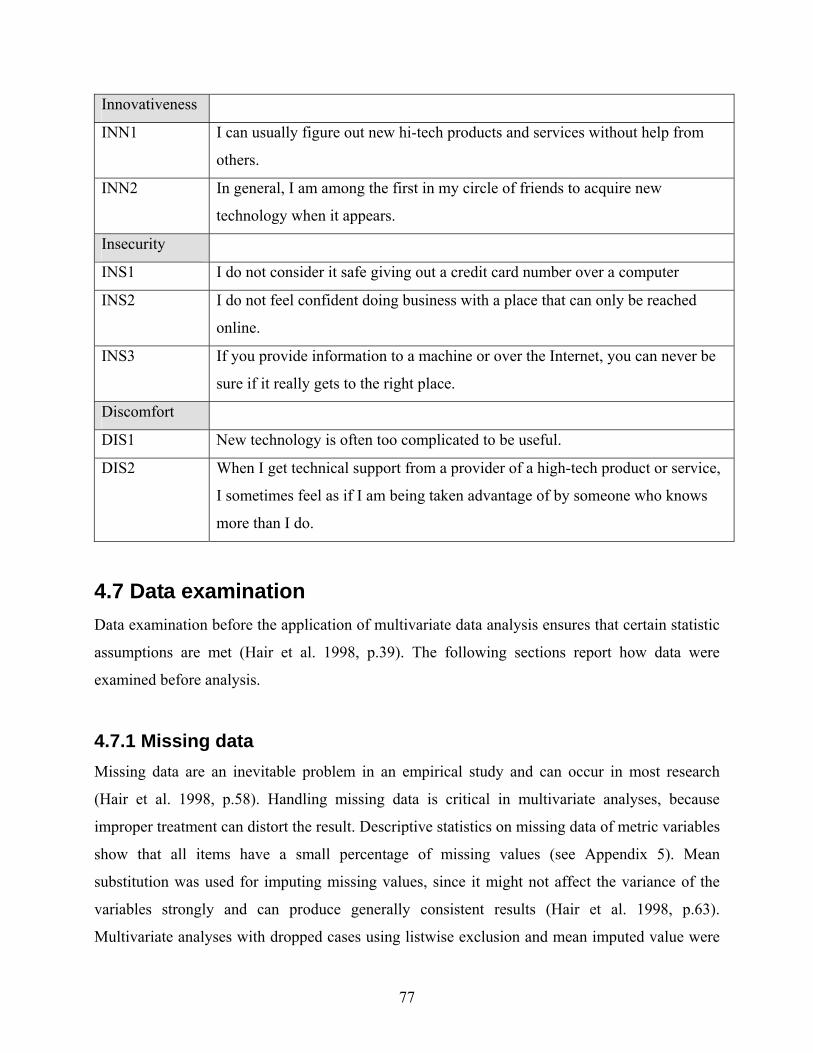
77
Innovativeness
INN1 I can usually figure out new hi-tech products and services without help from
others.
INN2 In general, I am among the first in my circle of friends to acquire new
technology when it appears.
Insecurity
INS1 I do not consider it safe giving out a credit card number over a computer
INS2 I do not feel confident doing business with a place that can only be reached
online.
INS3 If you provide information to a machine or over the Internet, you can never be
sure if it really gets to the right place.
Discomfort
DIS1 New technology is often too complicated to be useful.
DIS2 When I get technical support from a provider of a high-tech product or service,
I sometimes feel as if I am being taken advantage of by someone who knows
more than I do.
4.7 Data examination Data examination before the application of multivariate data analysis ensures that certain statistic
assumptions are met (Hair et al. 1998, p.39). The following sections report how data were
examined before analysis.
4.7.1 Missing data Missing data are an inevitable problem in an empirical study and can occur in most research
(Hair et al. 1998, p.58). Handling missing data is critical in multivariate analyses, because
improper treatment can distort the result. Descriptive statistics on missing data of metric variables
show that all items have a small percentage of missing values (see Appendix 5). Mean
substitution was used for imputing missing values, since it might not affect the variance of the
variables strongly and can produce generally consistent results (Hair et al. 1998, p.63).
Multivariate analyses with dropped cases using listwise exclusion and mean imputed value were
78
also conducted; no significant difference was found. Regarding missing data on categorical
variables, the listwise deletion method was applied.
4.7.2 Assumptions in multivariate analysis For multivariate analysis to be considered valid, certain requirements such as linearity, normality,
and homoscedasticity (Hair et al. 1998) must be met. Histograms, partial plots, and scatter plots
were used to check the satisfaction of these assumptions. Since each type of multivariate analysis
requires different assumptions, this issue will be addressed in greater detail in the next section.
4.8 Data analysis 4.8.1 Reliability analysis Reliability refers to the ability to obtain similar results by measuring constructs with independent
measures (Churchill 2001). The most popular method to measure reliability of a measurement
scale with multi-point items is Cronbach's (1951) coefficient alpha. Nunnally (1978) suggested
that, for early stage of basic research, a reliability coefficient of 0.5 or 0.6 is sufficient. For
applied research, a reliability of 0.9 is minimum requirement and a reliability of 0.95 should be
considered desirable. The traditionally recommended minimum is 0.7 (ibid).
4.8.2 Factor analysis Factor analysis for TRI scale
In this study, factor analysis was used to test discriminant and convergent validity of the
abbreviated TRI scales. Discriminant validity assesses the degree to which two similar concepts
are distinct. Convergent validity is the degree to which two measures of the same concept are
correlated (Hair, 1998, p.118). For factor analysis to be considered appropriate, certain
assumptions should be met, such as the presence of correlations among variables and the degree
of intercorrelations among the variables (Hair, 1998, p.99). In the present study, the Barlett test of
sphericity, a measure of sampling adequacy statistics (Kaiser-Meyer-Olkin - KMO) were
examined to determine if the assumptions were met. KMO is used to assess which variables
should be excluded from the model due to severe multicollinearity. The overall KMO should be
79
0.50 or higher; items with the lowest individual statistic values should be dropped until the KMO
rises above 0.50 (Hair, 1998, p.122).
Since the original TRI scale conceptually comprises four dimensions (Parasuraman 2000), a
priori criterion was used in which four factors were set to extract from the abbreviated scale. This
approach is applicable when researchers replicate others’ works and extract the same number of
factors that were originally found (Hair, 1998, p.104). Criteria for significance of factor loadings
were calculated according to the following guidelines: (1) the sample size of this study was 236
respondents, (2) the objective for power level was 80%, (3) the level of significance was 0.05, (4)
the standard errors were assumed to be twice those of conventional correlation coefficients.
Applying Table 3.2 in Hair et al. (1998, p.122) it was decided that only factor loadings of over
0.40 were considered significant. This criterion was used as a starting point in factor
interpretation. Regarding communalities, variables with communality of less than 0.50 were
considered insufficient and possible candidates for elimination.
Factor scores for TPB and image congruence constructs
In this study, factor analysis was also used to confirm discriminant and convergent validity of the
four constructs attitude, subjective norm, PBC, and image congruence. Factor scores were chosen
over summated or averaged scores, because they could handle multicollinearity in subsequent
multiple regression analyses in which the above four constructs were independent variables and
intention was the dependent variable. According to Grice (2001), averaged or summated scores
are invariably intercorrelated, even when the factors are orthogonal. They also have no unit
variance and correlate less with the factors compared with factors scores. Thus, factor scores
have less bias and are favored as proxies for latent constructs. Thurstone’s (1935) regression
method for computing factor scores was chosen, since it is the most popular method (Grice 2001).
4.8.3 Multiple regression In order to test the seven hypotheses proposed in Chapter 3, bivariate regression and multiple
regression were used. Regression analysis is regarded as the most widely applied data analysis
technique for measuring linear relationships between two or more variables (Hair et al. 2003).
Bivariate regression has a single metric dependent variable and a single metric dependent
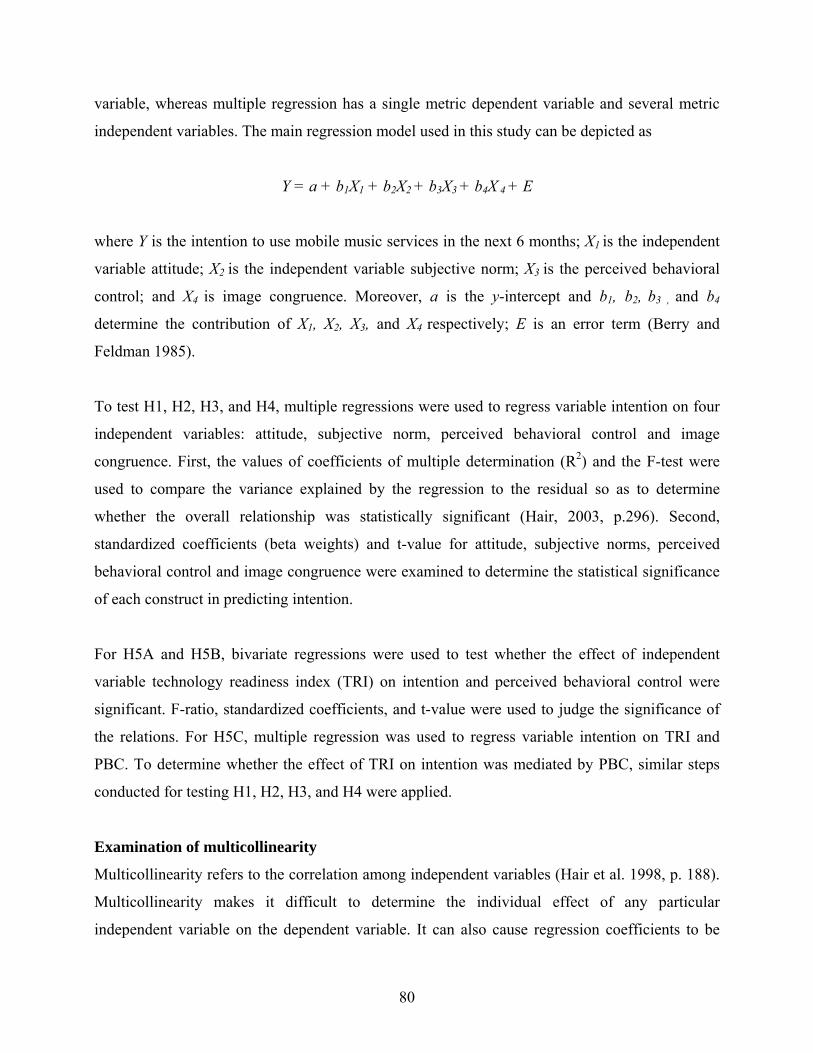
80
variable, whereas multiple regression has a single metric dependent variable and several metric
independent variables. The main regression model used in this study can be depicted as
Y = a + b1X1 + b2X2 + b3X3 + b4X 4 + E
where Y is the intention to use mobile music services in the next 6 months; X1 is the independent
variable attitude; X2 is the independent variable subjective norm; X3 is the perceived behavioral
control; and X4 is image congruence. Moreover, a is the y-intercept and b1, b2, b3 , and b4
determine the contribution of X1, X2, X3, and X4 respectively; E is an error term (Berry and
Feldman 1985).
To test H1, H2, H3, and H4, multiple regressions were used to regress variable intention on four
independent variables: attitude, subjective norm, perceived behavioral control and image
congruence. First, the values of coefficients of multiple determination (R2) and the F-test were
used to compare the variance explained by the regression to the residual so as to determine
whether the overall relationship was statistically significant (Hair, 2003, p.296). Second,
standardized coefficients (beta weights) and t-value for attitude, subjective norms, perceived
behavioral control and image congruence were examined to determine the statistical significance
of each construct in predicting intention.
For H5A and H5B, bivariate regressions were used to test whether the effect of independent
variable technology readiness index (TRI) on intention and perceived behavioral control were
significant. F-ratio, standardized coefficients, and t-value were used to judge the significance of
the relations. For H5C, multiple regression was used to regress variable intention on TRI and
PBC. To determine whether the effect of TRI on intention was mediated by PBC, similar steps
conducted for testing H1, H2, H3, and H4 were applied.
Examination of multicollinearity
Multicollinearity refers to the correlation among independent variables (Hair et al. 1998, p. 188).
Multicollinearity makes it difficult to determine the individual effect of any particular
independent variable on the dependent variable. It can also cause regression coefficients to be
81
incorrectly estimated or misleading. In this study, tolerance and the variance inflation factor
(VIF) were used to determine whether the problem of multicollinearity was serious.
Examination of residuals and outliers
Residuals represent the error term for the regression model. Analysis of the residuals helps
determine whether the assumptions made about the regression model are appropriate (Hair et al.
1998, p. 324). In this study, residual plot against dependent variable intention was used, because
there was more than one independent variable. Since the sample size in this study was more than
80, cases with absolute standardized residual of more than 3.0 were considered outliers and were
dropped from the analysis (Hair et al. 1998). A normal probability plot was also used to check if
errors were normally distributed.
4.8.4 T-test and analysis of variance (ANOVA) T-test and ANOVA were used to assess differences between group means for the following
constructs: attitudes, subjective norms, perceived behavioral control, image congruence, and
technology readiness index. Groups of respondents were formed based on the following
categorical independent variables: age, gender, education, occupation, spending on CDs and
songs from stores and the internet.
ANOVA assumption
The main assumption underlying ANOVA is homogeneity of variances. Dependent variables
should have same variance in each group. In order to decide which ANOVA test was most
appropriate, the issue of equal sample size among different groups was examined. Since Welch’s
test of equality of means is generally recommended when group sizes are unequal (Garson 2007),
this test was deployed to examine the difference between groups when the groups in investigation
are of heavily unequal size. From a practical perspective, it is important to know the magnitude
of difference of means among different age groups. In this case, post hoc multiple comparisons
among groups were performed. The choice of post hoc test depends on whether the assumption of
homogeneity of variances was met. If the assumption was not violated, then the Tukey HSD test
(honestly significant difference) was used. This method is recommended when all pairwise
comparisons are tested; it is appropriate when the large number of groups threatens to inflate
82
Type I errors (Garson 2007). If the assumption was violated, the Games-Howell (GH) test was
used. The GH test is based on the Q-statistic distribution and is recommended for unequal
variances (Toothacker 1993).
4.9 The validation study In order to validate the generalizability of the main study, a second study was conducted with a
convenience sample of students at Lulea University of Technology (LTU). An email survey was
used for this study. The advantages of an email survey include cost efficiency, speed, and
convenience. Moreover, sending the questionnaire to the right person can be more effective via
email, because a postal mail questionnaire might be thrown away before it reaches the intended
person or someone else might answer it (Mehta and Sivadas 1995). However, an email survey
may generate a lower response rate (Simsek and Veiga 2000; Mehta and Sivadas 1995).
4.9.1 Sampling frame “The sampling frame is a master listings of population members usually used to draw a random
sample from which data will be collected…The ideal sampling frame is one in which every
element of the population is not only represented but also only represented once” (Simsek and
Veiga 2000, p.96). The email addresses of 5230 students were obtained from the database of
students registering for study programs at LTU. This mailing list was used as the sampling frame
for this study.
4.9.2 Measurement The same questionnaire as in the main study was used for the student survey. However, since the
validation aimed at testing the hypotheses proposed in Chapter 3, questions about behavioral,
control beliefs, and semantic differential for image congruence were excluded in this survey.
Tourangeau and Smith (1996) report that computer-assisted, self-administered surveys produce
similar outcomes to other conventional self-administered techniques. The questionnaire was
attached with a cover letter, and a reminder email was sent out two weeks after the first invitation.
4.9.3 Incentives Monetary incentives have consistently been found to positively influence response rate (Roth and
Bevier 1998). Two lottery tickets were given to ten lucky respondents picked randomly from the
total list of respondents.
83
4.9.4 Responses rate In the first two weeks, 92 responses were returned. The reminder email resulted in 57 additional
responses in one week, bringing the total responses to 149. Among these, 14 were unusable
because they had more than 15% variables with missing data. The remaining usable responses
were 135. Thus, the response rate for this email survey was 2.6%. Since the response rate was
quite low, non-response bias is a concern. Therefore, t-tests were used to compare the means of
attitudes, subjective norms, PBC, image congruence, and intention between the early and late
response groups. The results showed that there is no significant difference between the two
groups.
4.9.5 Handling missing data Statistics on missing data of metric variables showed that the average percentage of missing
values is 0.7% (Appendix 13). Since this percentage is marginal, mean substitution was used for
imputing missing values.
84
Chapter 5 Results The first part of this chapter addresses the demographic characteristics of respondents,
reliability and validity analysis for constructs in the research model, descriptive data, correlation
analysis, multiple regressions and ANOVA analysis. The second part provides results for the
validation study.
Part A: The main study 5.1 Demographic Characteristics Demographic characteristics of respondents such as gender, age, education, occupation, usage of
mobile music service, and spending on CDs and music from stores and the Internet are
summarized in Table 5.1. Regarding age, compared with Table 4.1 in Chapter 4, it can be seen
that the size of the 15 to 44 age group was larger than the Swedish population statistics. Similarly,
a sample size of participants who are age 35 and older was smaller than that of the Swedish
population statistic. This result was reasonable, since younger groups constitute important market
segments for mobile music services providers. As a result, these groups were given a higher
proportion in the stratified sampling.
Female and male respondents accounted for 48.3% and 50.8%, respectively. Thus, the difference
between female and male sample is not significant (χ=0.154, p=0.695). Regarding education,
Swedish education statistics showed that the percentage of completed primary, completed
secondary, completed college and university and complete postgraduate among population in
2006 is 24%, 45%, 30% and 1% respectively (Statistic Sweden 2006). Compared with the
percentage distributed in the sampling, it is found that the percentage of respondents with
completed college and postgraduate are higher than that of Statistic Sweden. This can be
explained by the fact that Lulea city is a university town, of which the students accounted for
15% of the population (there are 11.000 students among a population of 72.751 people) (Lulea
Kommun 2006).
Based on age, gender, and education, it can be concluded that the sample provides a reasonable
representation of the population. Furthermore, 25.4% of respondents were current users of mobile
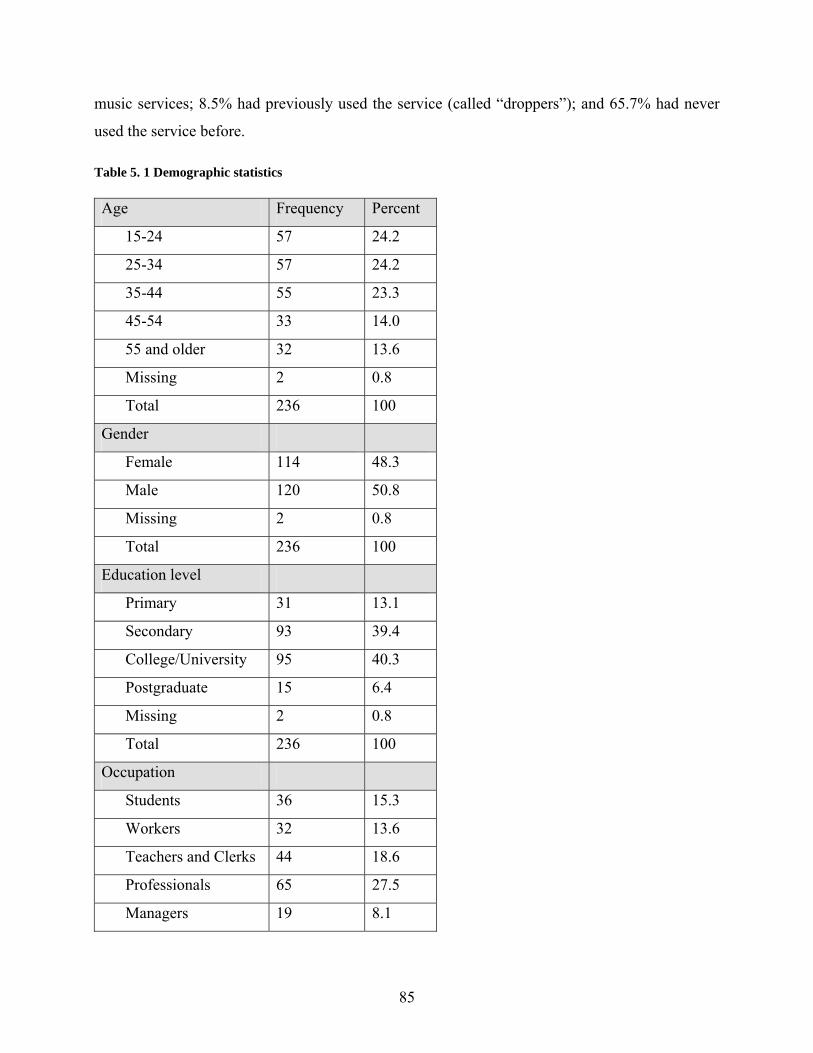
85
music services; 8.5% had previously used the service (called “droppers”); and 65.7% had never
used the service before. Table 5. 1 Demographic statistics Age Frequency Percent
15-24 57 24.2
25-34 57 24.2
35-44 55 23.3
45-54 33 14.0
55 and older 32 13.6
Missing 2 0.8
Total 236 100
Gender
Female 114 48.3
Male 120 50.8
Missing 2 0.8
Total 236 100
Education level
Primary 31 13.1
Secondary 93 39.4
College/University 95 40.3
Postgraduate 15 6.4
Missing 2 0.8
Total 236 100
Occupation
Students 36 15.3
Workers 32 13.6
Teachers and Clerks 44 18.6
Professionals 65 27.5
Managers 19 8.1
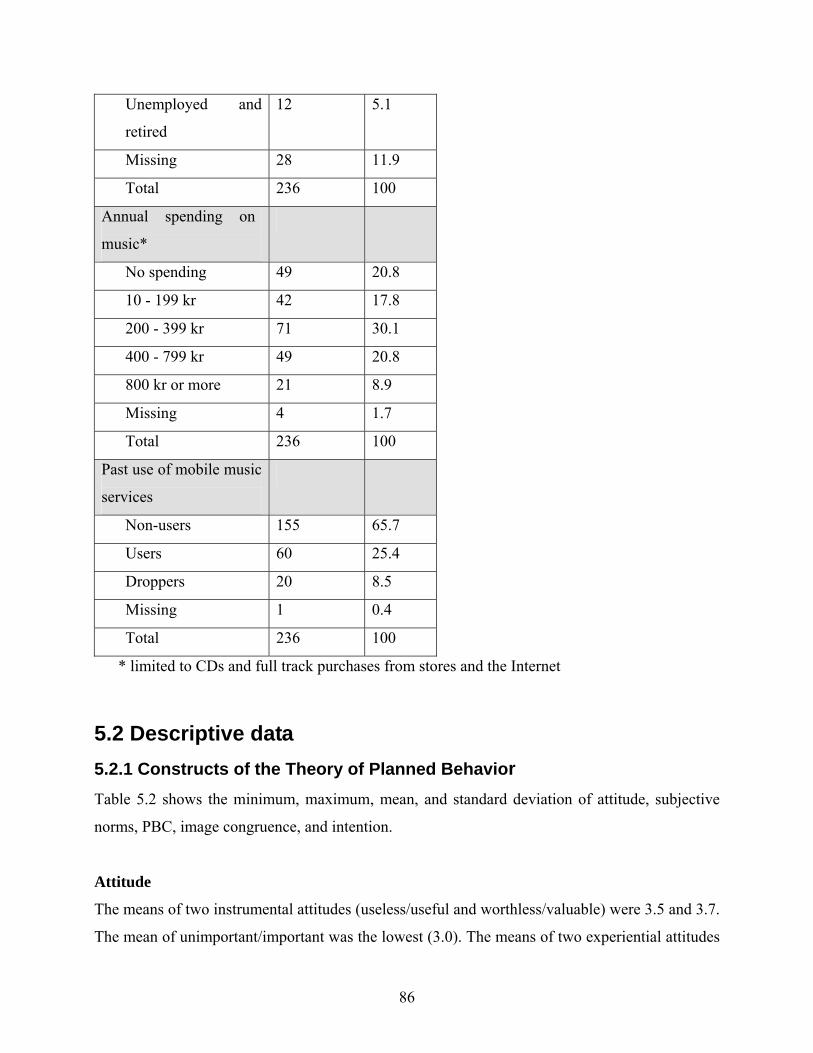
86
Unemployed and
retired
12 5.1
Missing 28 11.9
Total 236 100
Annual spending on
music*
No spending 49 20.8
10 - 199 kr 42 17.8
200 - 399 kr 71 30.1
400 - 799 kr 49 20.8
800 kr or more 21 8.9
Missing 4 1.7
Total 236 100
Past use of mobile music
services
Non-users 155 65.7
Users 60 25.4
Droppers 20 8.5
Missing 1 0.4
Total 236 100
* limited to CDs and full track purchases from stores and the Internet
5.2 Descriptive data 5.2.1 Constructs of the Theory of Planned Behavior Table 5.2 shows the minimum, maximum, mean, and standard deviation of attitude, subjective
norms, PBC, image congruence, and intention.
Attitude
The means of two instrumental attitudes (useless/useful and worthless/valuable) were 3.5 and 3.7.
The mean of unimportant/important was the lowest (3.0). The means of two experiential attitudes
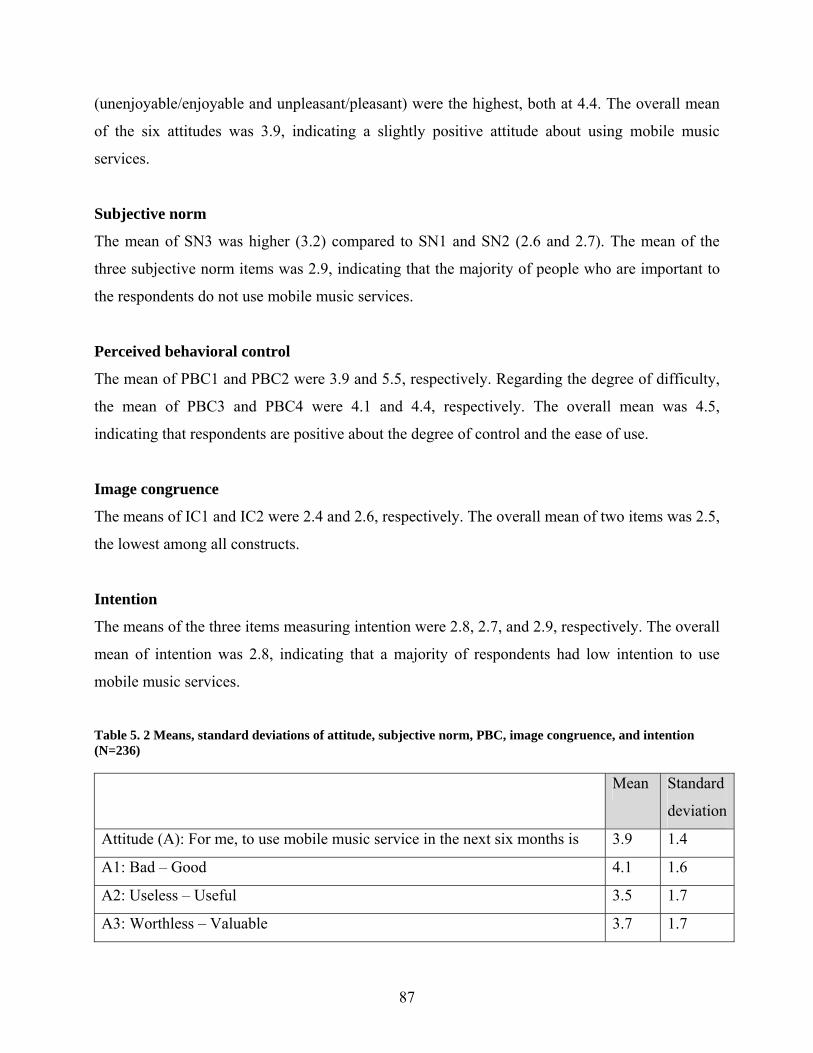
87
(unenjoyable/enjoyable and unpleasant/pleasant) were the highest, both at 4.4. The overall mean
of the six attitudes was 3.9, indicating a slightly positive attitude about using mobile music
services.
Subjective norm
The mean of SN3 was higher (3.2) compared to SN1 and SN2 (2.6 and 2.7). The mean of the
three subjective norm items was 2.9, indicating that the majority of people who are important to
the respondents do not use mobile music services.
Perceived behavioral control
The mean of PBC1 and PBC2 were 3.9 and 5.5, respectively. Regarding the degree of difficulty,
the mean of PBC3 and PBC4 were 4.1 and 4.4, respectively. The overall mean was 4.5,
indicating that respondents are positive about the degree of control and the ease of use.
Image congruence
The means of IC1 and IC2 were 2.4 and 2.6, respectively. The overall mean of two items was 2.5,
the lowest among all constructs.
Intention
The means of the three items measuring intention were 2.8, 2.7, and 2.9, respectively. The overall
mean of intention was 2.8, indicating that a majority of respondents had low intention to use
mobile music services.
Table 5. 2 Means, standard deviations of attitude, subjective norm, PBC, image congruence, and intention (N=236) Mean Standard
deviation
Attitude (A): For me, to use mobile music service in the next six months is 3.9 1.4
A1: Bad – Good 4.1 1.6
A2: Useless – Useful 3.5 1.7
A3: Worthless – Valuable 3.7 1.7
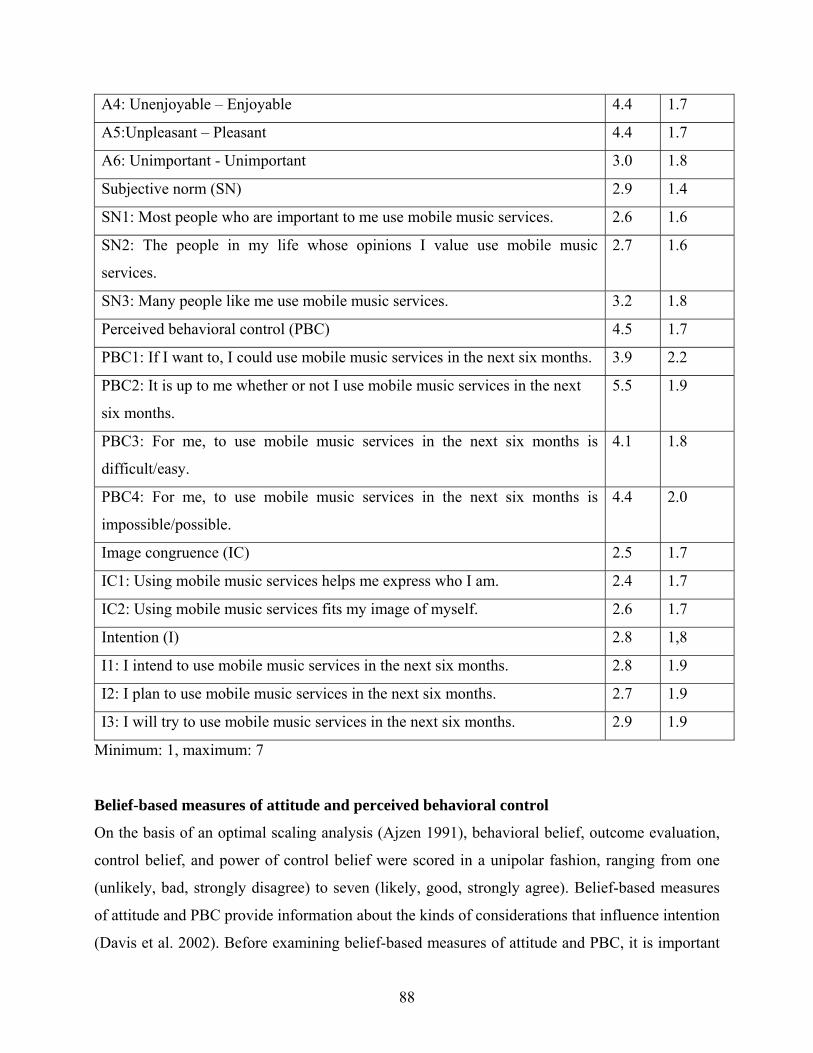
88
A4: Unenjoyable – Enjoyable 4.4 1.7
A5:Unpleasant – Pleasant 4.4 1.7
A6: Unimportant - Unimportant 3.0 1.8
Subjective norm (SN) 2.9 1.4
SN1: Most people who are important to me use mobile music services. 2.6 1.6
SN2: The people in my life whose opinions I value use mobile music
services.
2.7 1.6
SN3: Many people like me use mobile music services. 3.2 1.8
Perceived behavioral control (PBC) 4.5 1.7
PBC1: If I want to, I could use mobile music services in the next six months. 3.9 2.2
PBC2: It is up to me whether or not I use mobile music services in the next
six months.
5.5 1.9
PBC3: For me, to use mobile music services in the next six months is
difficult/easy.
4.1 1.8
PBC4: For me, to use mobile music services in the next six months is
impossible/possible.
4.4 2.0
Image congruence (IC) 2.5 1.7
IC1: Using mobile music services helps me express who I am. 2.4 1.7
IC2: Using mobile music services fits my image of myself. 2.6 1.7
Intention (I) 2.8 1,8
I1: I intend to use mobile music services in the next six months. 2.8 1.9
I2: I plan to use mobile music services in the next six months. 2.7 1.9
I3: I will try to use mobile music services in the next six months. 2.9 1.9
Minimum: 1, maximum: 7
Belief-based measures of attitude and perceived behavioral control
On the basis of an optimal scaling analysis (Ajzen 1991), behavioral belief, outcome evaluation,
control belief, and power of control belief were scored in a unipolar fashion, ranging from one
(unlikely, bad, strongly disagree) to seven (likely, good, strongly agree). Belief-based measures
of attitude and PBC provide information about the kinds of considerations that influence intention
(Davis et al. 2002). Before examining belief-based measures of attitude and PBC, it is important
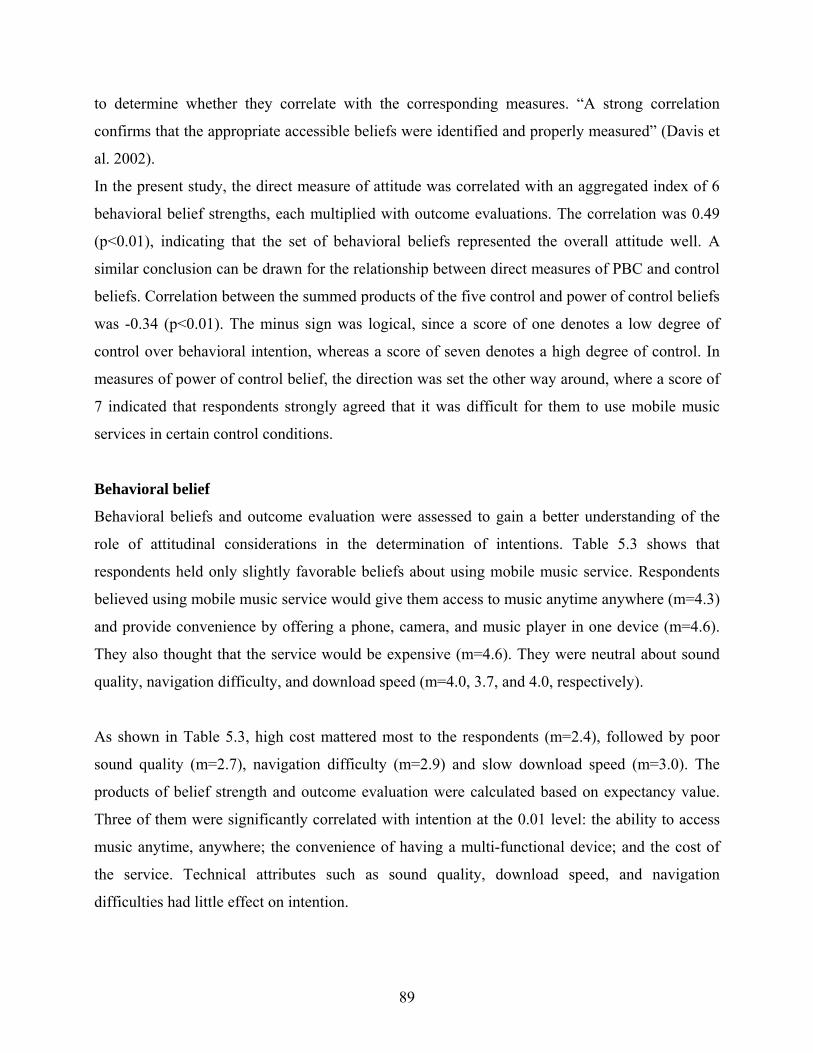
89
to determine whether they correlate with the corresponding measures. “A strong correlation
confirms that the appropriate accessible beliefs were identified and properly measured” (Davis et
al. 2002).
In the present study, the direct measure of attitude was correlated with an aggregated index of 6
behavioral belief strengths, each multiplied with outcome evaluations. The correlation was 0.49
(p<0.01), indicating that the set of behavioral beliefs represented the overall attitude well. A
similar conclusion can be drawn for the relationship between direct measures of PBC and control
beliefs. Correlation between the summed products of the five control and power of control beliefs
was -0.34 (p<0.01). The minus sign was logical, since a score of one denotes a low degree of
control over behavioral intention, whereas a score of seven denotes a high degree of control. In
measures of power of control belief, the direction was set the other way around, where a score of
7 indicated that respondents strongly agreed that it was difficult for them to use mobile music
services in certain control conditions.
Behavioral belief
Behavioral beliefs and outcome evaluation were assessed to gain a better understanding of the
role of attitudinal considerations in the determination of intentions. Table 5.3 shows that
respondents held only slightly favorable beliefs about using mobile music service. Respondents
believed using mobile music service would give them access to music anytime anywhere (m=4.3)
and provide convenience by offering a phone, camera, and music player in one device (m=4.6).
They also thought that the service would be expensive (m=4.6). They were neutral about sound
quality, navigation difficulty, and download speed (m=4.0, 3.7, and 4.0, respectively).
As shown in Table 5.3, high cost mattered most to the respondents (m=2.4), followed by poor
sound quality (m=2.7), navigation difficulty (m=2.9) and slow download speed (m=3.0). The
products of belief strength and outcome evaluation were calculated based on expectancy value.
Three of them were significantly correlated with intention at the 0.01 level: the ability to access
music anytime, anywhere; the convenience of having a multi-functional device; and the cost of
the service. Technical attributes such as sound quality, download speed, and navigation
difficulties had little effect on intention.
90
Control beliefs
Table 5.4 shows that respondents believed that they would have to learn how to use the mobile
music service (m=4.5). They were neutral about the need for service trial (m=3.9), the need for
guidance (m=3.8), and the lack of capability from their mobile phone (m=3.9). They slightly
disagreed that lack of awareness prevented them from using the service (m=3.3). Four of the
products of control beliefs and control belief power correlated significantly with intention at the
0.05 level. This suggests that people are less likely to use mobile music service if they believe
that they face a usability problem; if they have older handsets that do not support the use of
mobile music service; or if they are not aware of the service. Table 5. 3 Means and standard deviations of behavioral belief strength, outcome evaluation, product of belief strength, and outcome evaluation, and correlations of products of belief strength and outcome evaluation with intention (N=236)
Outcomes
Belief
strength (b)
Outcome
evaluation (e)
Product of belief
strength and
outcome
evaluationa (biei)
Correlation
of biei and
intention
M SD M SD M SD
Access to music anytime,
anywhere
4.3 1.9 4.0 1.9 19 14 0.55**
Convenience of a multi-
functional device
4.6 1.5 4.5 1.9 21 12 0.23**
Expensive to use 4.6 1.8 2.4 1.7 10 8 0.39**
Poor sound quality 4.0 1.4 2.7 1.9 11 9 -0.01
Difficult to navigate 3.7 1.5 2.9 1.9 11 9 0.01
Slow download speed 4.0 1.4 3.0 1.9 12 8 -0.04
Note: Belief strength and outcome evaluation scored from 1 to 7
a: Possible range = 1 to 49
**. Correlation is significant at the 0.01 level
*. Correlation is significant at the 0.05 level
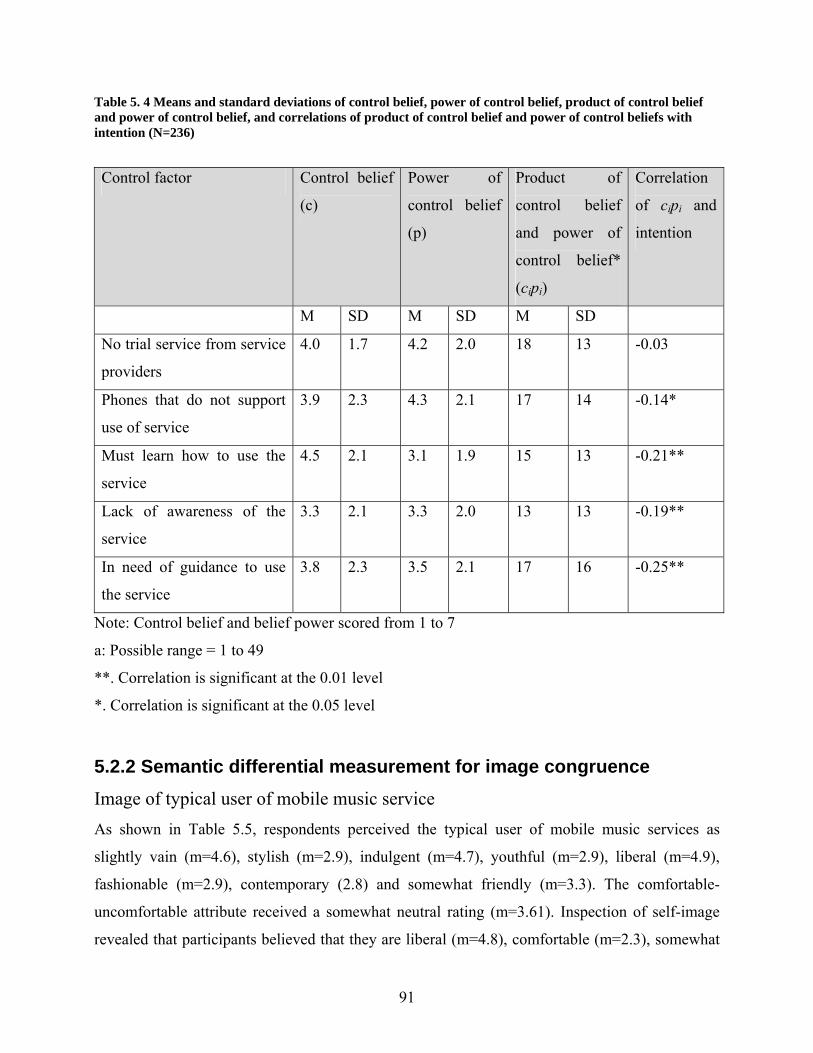
91
Table 5. 4 Means and standard deviations of control belief, power of control belief, product of control belief and power of control belief, and correlations of product of control belief and power of control beliefs with intention (N=236)
Control factor Control belief
(c)
Power of
control belief
(p)
Product of
control belief
and power of
control belief*
(cipi)
Correlation
of cipi and
intention
M SD M SD M SD
No trial service from service
providers
4.0 1.7 4.2 2.0 18 13 -0.03
Phones that do not support
use of service
3.9 2.3 4.3 2.1 17 14 -0.14*
Must learn how to use the
service
4.5 2.1 3.1 1.9 15 13 -0.21**
Lack of awareness of the
service
3.3 2.1 3.3 2.0 13 13 -0.19**
In need of guidance to use
the service
3.8 2.3 3.5 2.1 17 16 -0.25**
Note: Control belief and belief power scored from 1 to 7
a: Possible range = 1 to 49
**. Correlation is significant at the 0.01 level
*. Correlation is significant at the 0.05 level
5.2.2 Semantic differential measurement for image congruence Image of typical user of mobile music service As shown in Table 5.5, respondents perceived the typical user of mobile music services as
slightly vain (m=4.6), stylish (m=2.9), indulgent (m=4.7), youthful (m=2.9), liberal (m=4.9),
fashionable (m=2.9), contemporary (2.8) and somewhat friendly (m=3.3). The comfortable-
uncomfortable attribute received a somewhat neutral rating (m=3.61). Inspection of self-image
revealed that participants believed that they are liberal (m=4.8), comfortable (m=2.3), somewhat
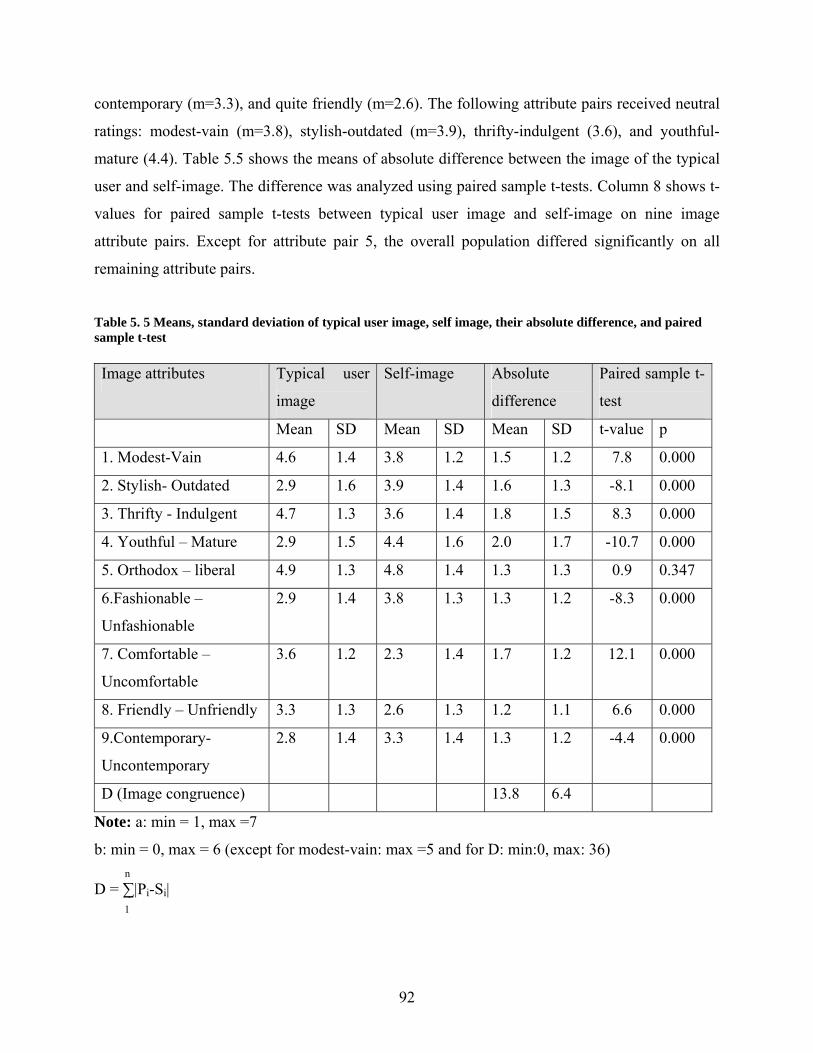
92
i 1
contemporary (m=3.3), and quite friendly (m=2.6). The following attribute pairs received neutral
ratings: modest-vain (m=3.8), stylish-outdated (m=3.9), thrifty-indulgent (3.6), and youthful-
mature (4.4). Table 5.5 shows the means of absolute difference between the image of the typical
user and self-image. The difference was analyzed using paired sample t-tests. Column 8 shows t-
values for paired sample t-tests between typical user image and self-image on nine image
attribute pairs. Except for attribute pair 5, the overall population differed significantly on all
remaining attribute pairs.
Table 5. 5 Means, standard deviation of typical user image, self image, their absolute difference, and paired sample t-test Image attributes Typical user
image
Self-image Absolute
difference
Paired sample t-
test
Mean SD Mean SD Mean SD t-value p
1. Modest-Vain 4.6 1.4 3.8 1.2 1.5 1.2 7.8 0.000
2. Stylish- Outdated 2.9 1.6 3.9 1.4 1.6 1.3 -8.1 0.000
3. Thrifty - Indulgent 4.7 1.3 3.6 1.4 1.8 1.5 8.3 0.000
4. Youthful – Mature 2.9 1.5 4.4 1.6 2.0 1.7 -10.7 0.000
5. Orthodox – liberal 4.9 1.3 4.8 1.4 1.3 1.3 0.9 0.347
6.Fashionable –
Unfashionable
2.9 1.4 3.8 1.3 1.3 1.2 -8.3 0.000
7. Comfortable –
Uncomfortable
3.6 1.2 2.3 1.4 1.7 1.2 12.1 0.000
8. Friendly – Unfriendly 3.3 1.3 2.6 1.3 1.2 1.1 6.6 0.000
9.Contemporary-
Uncontemporary
2.8 1.4 3.3 1.4 1.3 1.2 -4.4 0.000
D (Image congruence) 13.8 6.4
Note: a: min = 1, max =7
b: min = 0, max = 6 (except for modest-vain: max =5 and for D: min:0, max: 36) n D = ∑|Pi-Si|
93
5.2.3 Technology Readiness Index As illustrated in Table 5.6, the means of OPT1, OPT2, and OPT3 were 3.6, 3.4 and 3.7
respectively, indicating respondents were generally optimistic about the benefits of technology.
They somewhat agreed that technology gave them more control over their daily lives and made
them more efficient in their occupations. The mean of item INN1 (3.5) indicates that respondents
were slightly positive about their ability to figure out new hi-tech products and services without
help from others. However, the low mean of item INN2 (2.7) reveals that the population
generally does not agree with the statement that they are among the first to acquire new
technology. The difference between the means of items INN1 and INN2 is quite large (m=3.5 and
2.7), indicating that respondents were more positive about figuring out new high-tech products
and services by themselves but more negative about being the first to acquire new technology.
When asked about doing business with an online-only company and whether information
provided over the internet gets to the right place, respondents gave neutral ratings (m=2.9 and 3.0,
respectively). Respondents agreed that it is not safe giving out a credit card number over a
computer (m=3.4). The means of item DIS1 and DIS2 were both below 3 (m=2.6 and 2.8),
indicating that respondents did not feel uncomfortable about technology. They generally
disagreed that new technology is too complicated to be useful or that they are taken advantage by
someone who knows more about technology than they do. In order to create a total TR score, the
insecurity and discomfort dimensions were reversed by subtracting from 6. Then, all eight items
was summated to create an aggregate index.
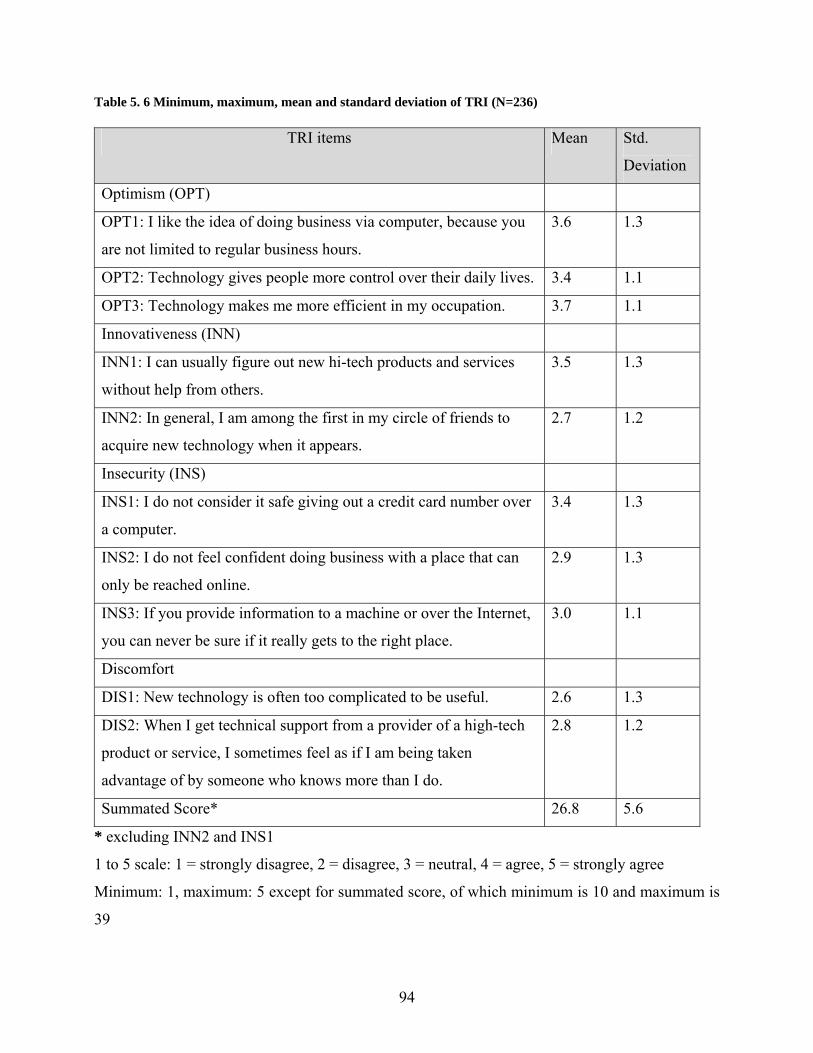
94
Table 5. 6 Minimum, maximum, mean and standard deviation of TRI (N=236)
TRI items Mean Std.
Deviation
Optimism (OPT)
OPT1: I like the idea of doing business via computer, because you
are not limited to regular business hours.
3.6 1.3
OPT2: Technology gives people more control over their daily lives. 3.4 1.1
OPT3: Technology makes me more efficient in my occupation. 3.7 1.1
Innovativeness (INN)
INN1: I can usually figure out new hi-tech products and services
without help from others.
3.5 1.3
INN2: In general, I am among the first in my circle of friends to
acquire new technology when it appears.
2.7 1.2
Insecurity (INS)
INS1: I do not consider it safe giving out a credit card number over
a computer.
3.4 1.3
INS2: I do not feel confident doing business with a place that can
only be reached online.
2.9 1.3
INS3: If you provide information to a machine or over the Internet,
you can never be sure if it really gets to the right place.
3.0 1.1
Discomfort
DIS1: New technology is often too complicated to be useful. 2.6 1.3
DIS2: When I get technical support from a provider of a high-tech
product or service, I sometimes feel as if I am being taken
advantage of by someone who knows more than I do.
2.8 1.2
Summated Score* 26.8 5.6
* excluding INN2 and INS1
1 to 5 scale: 1 = strongly disagree, 2 = disagree, 3 = neutral, 4 = agree, 5 = strongly agree
Minimum: 1, maximum: 5 except for summated score, of which minimum is 10 and maximum is
39
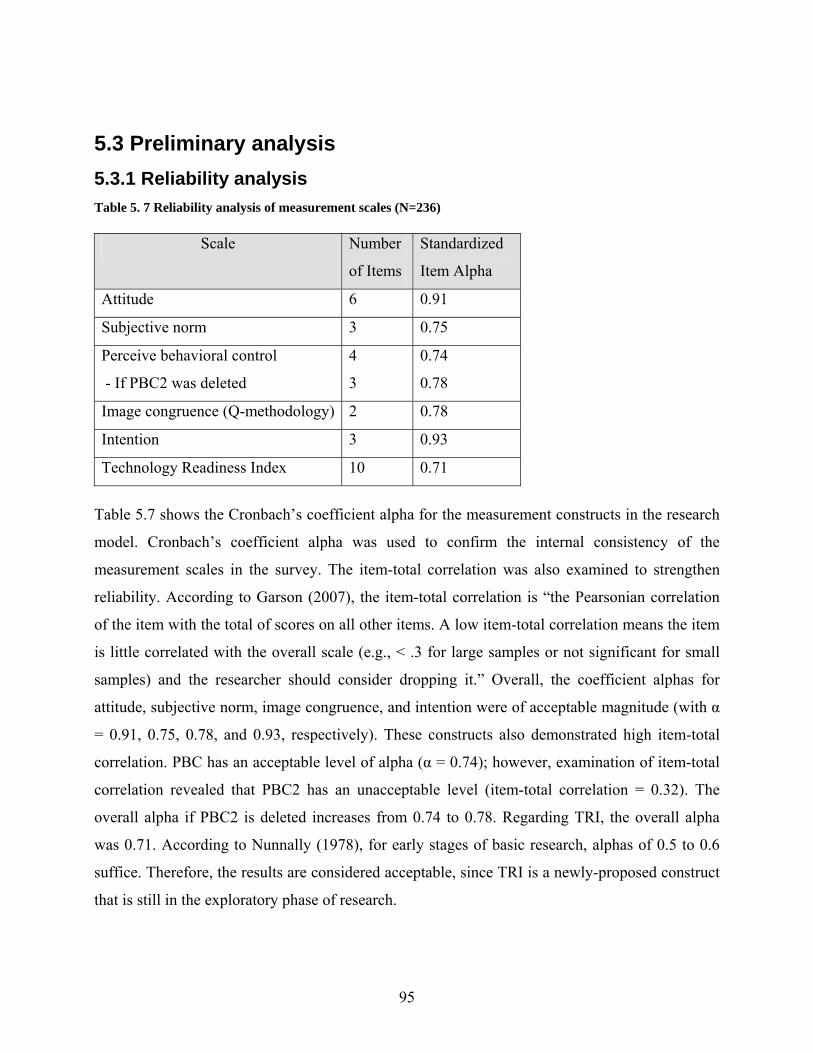
95
5.3 Preliminary analysis 5.3.1 Reliability analysis Table 5. 7 Reliability analysis of measurement scales (N=236)
Scale Number
of Items
Standardized
Item Alpha
Attitude 6 0.91
Subjective norm 3 0.75
Perceive behavioral control
- If PBC2 was deleted
4
3
0.74
0.78
Image congruence (Q-methodology) 2 0.78
Intention 3 0.93
Technology Readiness Index 10 0.71
Table 5.7 shows the Cronbach’s coefficient alpha for the measurement constructs in the research
model. Cronbach’s coefficient alpha was used to confirm the internal consistency of the
measurement scales in the survey. The item-total correlation was also examined to strengthen
reliability. According to Garson (2007), the item-total correlation is “the Pearsonian correlation
of the item with the total of scores on all other items. A low item-total correlation means the item
is little correlated with the overall scale (e.g., < .3 for large samples or not significant for small
samples) and the researcher should consider dropping it.” Overall, the coefficient alphas for
attitude, subjective norm, image congruence, and intention were of acceptable magnitude (with α
= 0.91, 0.75, 0.78, and 0.93, respectively). These constructs also demonstrated high item-total
correlation. PBC has an acceptable level of alpha (α = 0.74); however, examination of item-total
correlation revealed that PBC2 has an unacceptable level (item-total correlation = 0.32). The
overall alpha if PBC2 is deleted increases from 0.74 to 0.78. Regarding TRI, the overall alpha
was 0.71. According to Nunnally (1978), for early stages of basic research, alphas of 0.5 to 0.6
suffice. Therefore, the results are considered acceptable, since TRI is a newly-proposed construct
that is still in the exploratory phase of research.
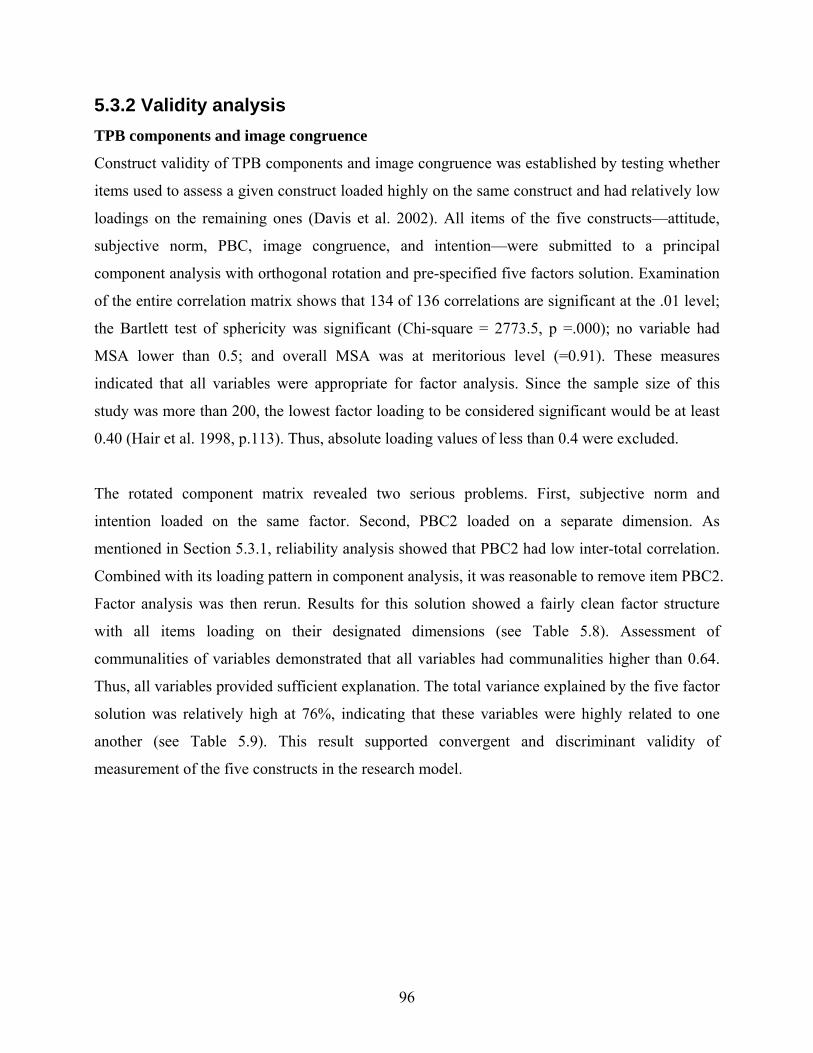
96
5.3.2 Validity analysis TPB components and image congruence
Construct validity of TPB components and image congruence was established by testing whether
items used to assess a given construct loaded highly on the same construct and had relatively low
loadings on the remaining ones (Davis et al. 2002). All items of the five constructs—attitude,
subjective norm, PBC, image congruence, and intention—were submitted to a principal
component analysis with orthogonal rotation and pre-specified five factors solution. Examination
of the entire correlation matrix shows that 134 of 136 correlations are significant at the .01 level;
the Bartlett test of sphericity was significant (Chi-square = 2773.5, p =.000); no variable had
MSA lower than 0.5; and overall MSA was at meritorious level (=0.91). These measures
indicated that all variables were appropriate for factor analysis. Since the sample size of this
study was more than 200, the lowest factor loading to be considered significant would be at least
0.40 (Hair et al. 1998, p.113). Thus, absolute loading values of less than 0.4 were excluded.
The rotated component matrix revealed two serious problems. First, subjective norm and
intention loaded on the same factor. Second, PBC2 loaded on a separate dimension. As
mentioned in Section 5.3.1, reliability analysis showed that PBC2 had low inter-total correlation.
Combined with its loading pattern in component analysis, it was reasonable to remove item PBC2.
Factor analysis was then rerun. Results for this solution showed a fairly clean factor structure
with all items loading on their designated dimensions (see Table 5.8). Assessment of
communalities of variables demonstrated that all variables had communalities higher than 0.64.
Thus, all variables provided sufficient explanation. The total variance explained by the five factor
solution was relatively high at 76%, indicating that these variables were highly related to one
another (see Table 5.9). This result supported convergent and discriminant validity of
measurement of the five constructs in the research model.
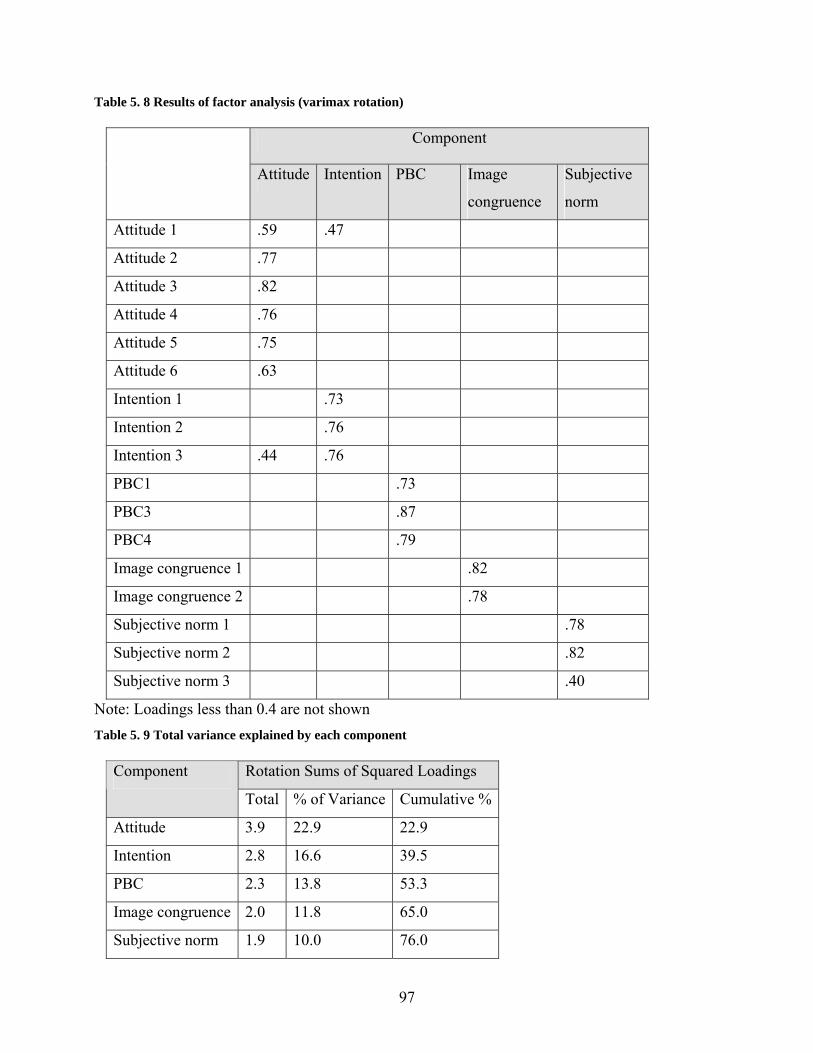
97
Table 5. 8 Results of factor analysis (varimax rotation)
Component
Attitude Intention PBC Image
congruence
Subjective
norm
Attitude 1 .59 .47
Attitude 2 .77
Attitude 3 .82
Attitude 4 .76
Attitude 5 .75
Attitude 6 .63
Intention 1 .73
Intention 2 .76
Intention 3 .44 .76
PBC1 .73
PBC3 .87
PBC4 .79
Image congruence 1 .82
Image congruence 2 .78
Subjective norm 1 .78
Subjective norm 2 .82
Subjective norm 3 .40
Note: Loadings less than 0.4 are not shown Table 5. 9 Total variance explained by each component
Rotation Sums of Squared Loadings Component
Total % of Variance Cumulative %
Attitude 3.9 22.9 22.9
Intention 2.8 16.6 39.5
PBC 2.3 13.8 53.3
Image congruence 2.0 11.8 65.0
Subjective norm 1.9 10.0 76.0
98
Technology Readiness Index
The construct validity of ten items in the TRI scale was assessed using factor analysis. Visual
examination of the correlation matrix revealed that 32 of 45 correlations (71%) were significant
at the .05 level. The Bartlett test of sphericity was significant (Chi-square = 365.2, p=.00), no
variable had MSA lower than 0.5, and overall MSA was at acceptable level (0.75). Ten items
were submitted to a principal component analysis with four factors pre-specified. All eigenvalues
exceeded the 1.0 threshold. However, the rotated factor matrix showed that items INN2 loaded on
two components, optimism and insecurity, while items INS1 loaded on a separate component.
Facing this problem, it is decided to investigate statistic results of item-total correlation and alpha
if item deleted in reliability analysis. Item-total correlation of items INS1 and INN2 were quite
low: 0.21 and 0.17, respectively. Therefore, it was reasonable to drop these two items from
further analysis.
The coefficient alpha for the eight retained items in the TRI was 0.72. Another factor analysis
with the remaining eight TRI items was rerun with four factor extraction pre-specified. As shown
in Table 5.10, the four subscales collectively had a clean factor structure. Examination of
communalities showed that all items had an index of 1.0, indicating that a large amount of the
variance had been extracted by this solution. The total amount of variance explained by the four
factors solution was also relatively high (71.4%), demonstrating that eight retained items in this
abbreviated TRI scale were highly related to one another. Specifically, optimism, insecurity,
discomfort had somewhat equal percentage variance (20.5%, 20% and 18%). Innovativeness
accounted for the lowest percentage of variance (12.9%). Table 5. 10 Final eight-item technology readiness scale: factor loadings after varimax rotation
Technology Readiness Dimension
Optimism Insecurity Discomfort Innovativeness
OPT1 .50 -.48
OPT2 .80
OPT3 .83
INS2 .75
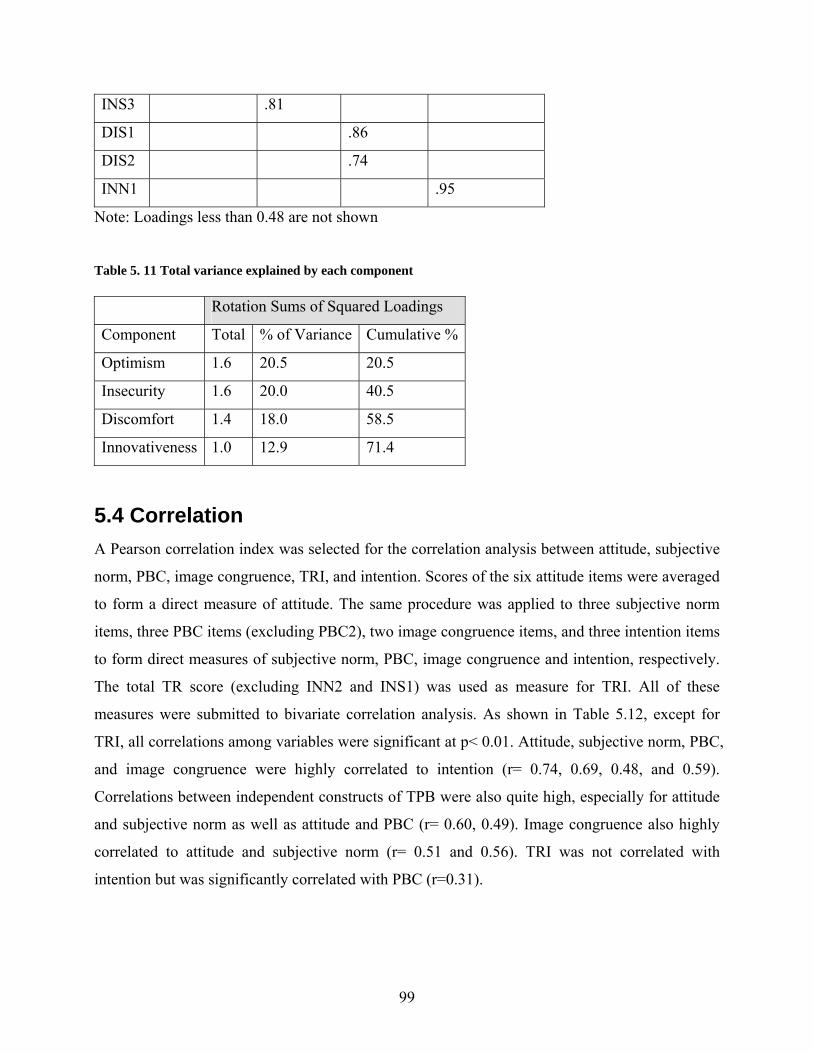
99
INS3 .81
DIS1 .86
DIS2 .74
INN1 .95
Note: Loadings less than 0.48 are not shown
Table 5. 11 Total variance explained by each component Rotation Sums of Squared Loadings
Component Total % of Variance Cumulative %
Optimism 1.6 20.5 20.5
Insecurity 1.6 20.0 40.5
Discomfort 1.4 18.0 58.5
Innovativeness 1.0 12.9 71.4
5.4 Correlation A Pearson correlation index was selected for the correlation analysis between attitude, subjective
norm, PBC, image congruence, TRI, and intention. Scores of the six attitude items were averaged
to form a direct measure of attitude. The same procedure was applied to three subjective norm
items, three PBC items (excluding PBC2), two image congruence items, and three intention items
to form direct measures of subjective norm, PBC, image congruence and intention, respectively.
The total TR score (excluding INN2 and INS1) was used as measure for TRI. All of these
measures were submitted to bivariate correlation analysis. As shown in Table 5.12, except for
TRI, all correlations among variables were significant at p< 0.01. Attitude, subjective norm, PBC,
and image congruence were highly correlated to intention (r= 0.74, 0.69, 0.48, and 0.59).
Correlations between independent constructs of TPB were also quite high, especially for attitude
and subjective norm as well as attitude and PBC (r= 0.60, 0.49). Image congruence also highly
correlated to attitude and subjective norm (r= 0.51 and 0.56). TRI was not correlated with
intention but was significantly correlated with PBC (r=0.31).
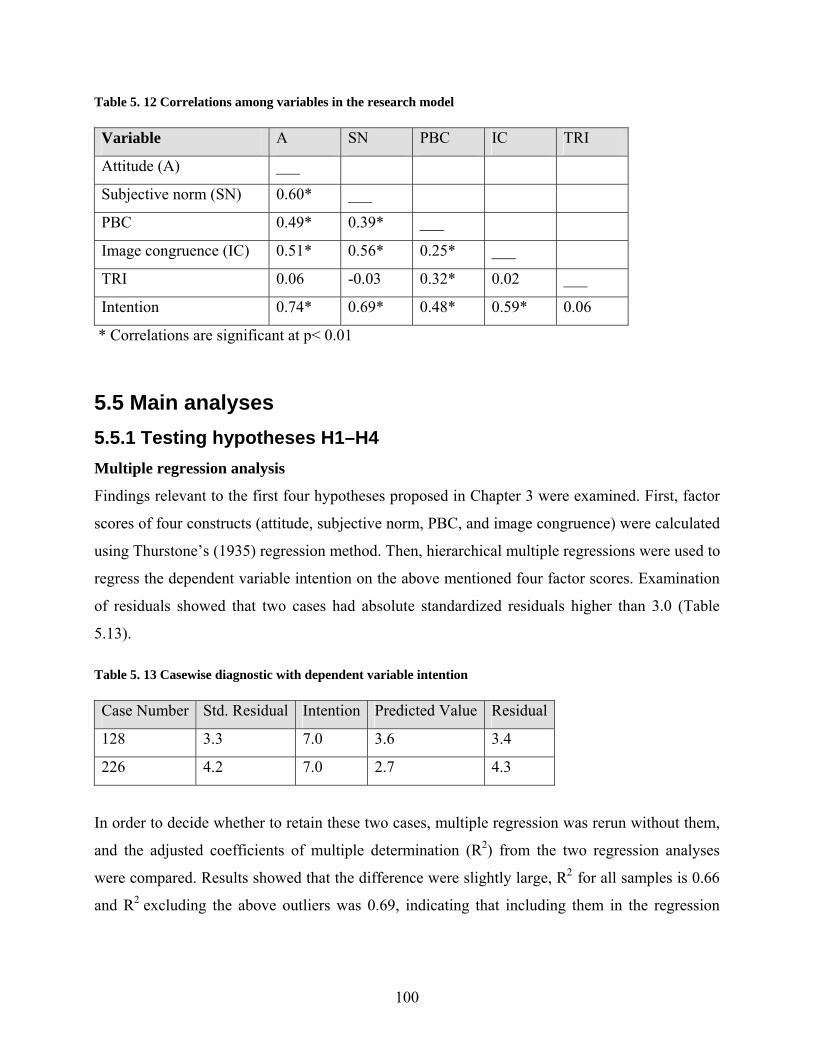
100
Table 5. 12 Correlations among variables in the research model Variable A SN PBC IC TRI
Attitude (A) ___
Subjective norm (SN) 0.60* ___
PBC 0.49* 0.39* ___
Image congruence (IC) 0.51* 0.56* 0.25* ___
TRI 0.06 -0.03 0.32* 0.02 ___
Intention 0.74* 0.69* 0.48* 0.59* 0.06
* Correlations are significant at p< 0.01
5.5 Main analyses 5.5.1 Testing hypotheses H1–H4 Multiple regression analysis
Findings relevant to the first four hypotheses proposed in Chapter 3 were examined. First, factor
scores of four constructs (attitude, subjective norm, PBC, and image congruence) were calculated
using Thurstone’s (1935) regression method. Then, hierarchical multiple regressions were used to
regress the dependent variable intention on the above mentioned four factor scores. Examination
of residuals showed that two cases had absolute standardized residuals higher than 3.0 (Table
5.13). Table 5. 13 Casewise diagnostic with dependent variable intention Case Number Std. Residual Intention Predicted Value Residual
128 3.3 7.0 3.6 3.4
226 4.2 7.0 2.7 4.3
In order to decide whether to retain these two cases, multiple regression was rerun without them,
and the adjusted coefficients of multiple determination (R2) from the two regression analyses
were compared. Results showed that the difference were slightly large, R2 for all samples is 0.66
and R2 excluding the above outliers was 0.69, indicating that including them in the regression
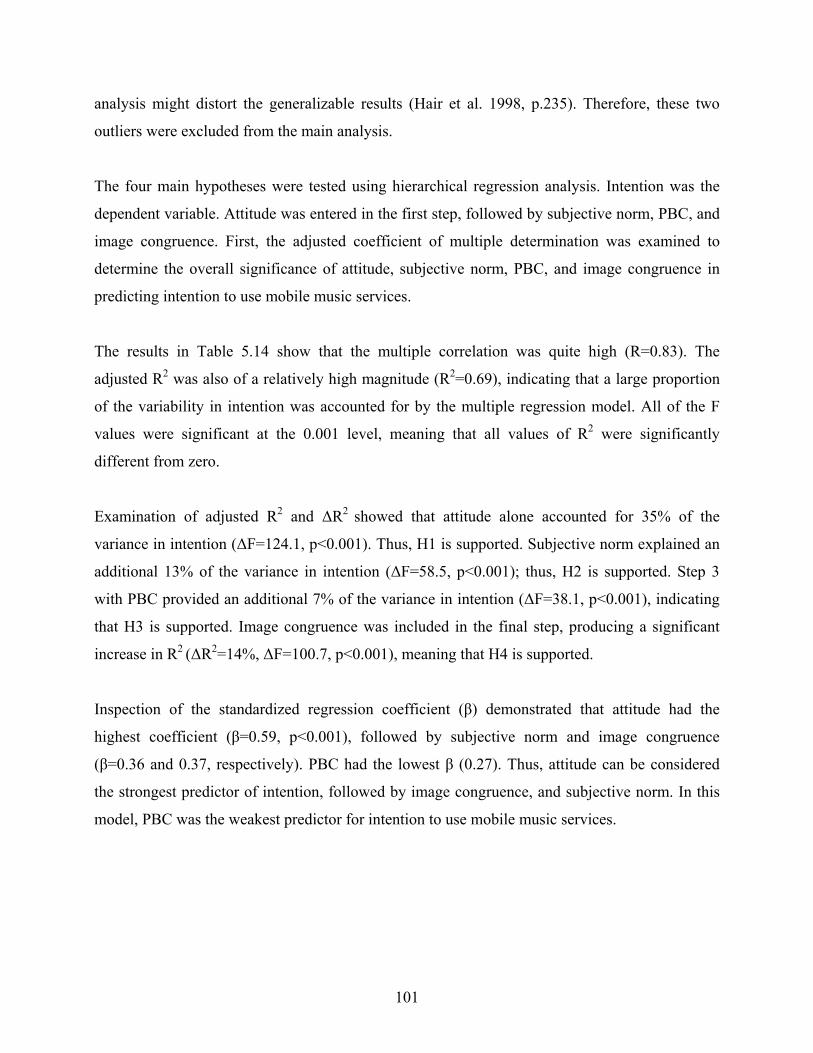
101
analysis might distort the generalizable results (Hair et al. 1998, p.235). Therefore, these two
outliers were excluded from the main analysis.
The four main hypotheses were tested using hierarchical regression analysis. Intention was the
dependent variable. Attitude was entered in the first step, followed by subjective norm, PBC, and
image congruence. First, the adjusted coefficient of multiple determination was examined to
determine the overall significance of attitude, subjective norm, PBC, and image congruence in
predicting intention to use mobile music services.
The results in Table 5.14 show that the multiple correlation was quite high (R=0.83). The
adjusted R2 was also of a relatively high magnitude (R2=0.69), indicating that a large proportion
of the variability in intention was accounted for by the multiple regression model. All of the F
values were significant at the 0.001 level, meaning that all values of R2 were significantly
different from zero.
Examination of adjusted R2 and ΔR2 showed that attitude alone accounted for 35% of the
variance in intention (ΔF=124.1, p<0.001). Thus, H1 is supported. Subjective norm explained an
additional 13% of the variance in intention (ΔF=58.5, p<0.001); thus, H2 is supported. Step 3
with PBC provided an additional 7% of the variance in intention (ΔF=38.1, p<0.001), indicating
that H3 is supported. Image congruence was included in the final step, producing a significant
increase in R2 (ΔR2=14%, ΔF=100.7, p<0.001), meaning that H4 is supported.
Inspection of the standardized regression coefficient (β) demonstrated that attitude had the
highest coefficient (β=0.59, p<0.001), followed by subjective norm and image congruence
(β=0.36 and 0.37, respectively). PBC had the lowest β (0.27). Thus, attitude can be considered
the strongest predictor of intention, followed by image congruence, and subjective norm. In this
model, PBC was the weakest predictor for intention to use mobile music services.
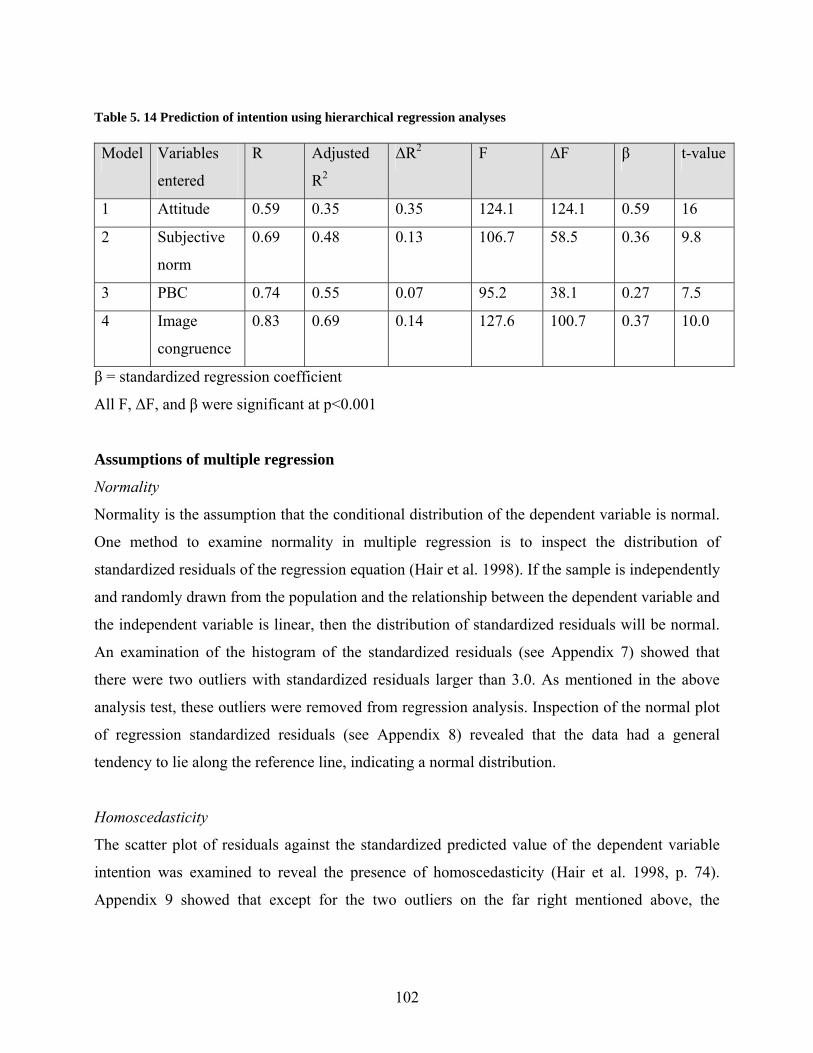
102
Table 5. 14 Prediction of intention using hierarchical regression analyses Model Variables
entered
R Adjusted
R2
ΔR2 F ΔF β t-value
1 Attitude 0.59 0.35 0.35 124.1 124.1 0.59 16
2 Subjective
norm
0.69 0.48 0.13 106.7 58.5 0.36 9.8
3 PBC 0.74 0.55 0.07 95.2 38.1 0.27 7.5
4 Image
congruence
0.83 0.69 0.14 127.6 100.7 0.37 10.0
β = standardized regression coefficient
All F, ΔF, and β were significant at p<0.001
Assumptions of multiple regression
Normality
Normality is the assumption that the conditional distribution of the dependent variable is normal.
One method to examine normality in multiple regression is to inspect the distribution of
standardized residuals of the regression equation (Hair et al. 1998). If the sample is independently
and randomly drawn from the population and the relationship between the dependent variable and
the independent variable is linear, then the distribution of standardized residuals will be normal.
An examination of the histogram of the standardized residuals (see Appendix 7) showed that
there were two outliers with standardized residuals larger than 3.0. As mentioned in the above
analysis test, these outliers were removed from regression analysis. Inspection of the normal plot
of regression standardized residuals (see Appendix 8) revealed that the data had a general
tendency to lie along the reference line, indicating a normal distribution.
Homoscedasticity
The scatter plot of residuals against the standardized predicted value of the dependent variable
intention was examined to reveal the presence of homoscedasticity (Hair et al. 1998, p. 74).
Appendix 9 showed that except for the two outliers on the far right mentioned above, the
103
remaining residuals were relatively evenly distributed. Thus, the assumption of homoscedasticity
was met for the regression equation.
Linearity
The scatter plot was visually examined to assess the linearity between each of the independent
variables (attitude, subjective norm, PBC, and image congruence) and the dependent variable
(intention). No non-linear relationships were found. Thus, the assumption of linearity was not
violated.
Multicollinearity
The simplest method to examine multicollinearity is to assess the absolute value of the
correlation coefficients among independent variables. Correlation coefficients of more than 0.9
may indicate high multicollinearity (Hair et al. 1998, p.193). Table 5.12 shows that the highest
correlation coefficient among independent variables was between attitude and subjective norm
(r=0.6). Another way to assess multicollinearity is to assess the tolerance value and variance
inflation factors (VIF). These two measures show the degree to which one independent variable
can be explained by all other independent variables in the equation (Hair et al. 1998, p.193).
Since factor scores of independent variables were used in the regression equation, the
intercorrelations among independent variables were removed during the process of score
computing (Grice 2001). Thus, the contribution of each independent variable was no longer
confounded. Collinearity statistics from the regression model showed that all tolerance values and
variance inflation factors (VIF) equaled one, confirming that the shared variance among the
independent variables was mostly removed.
5.5.2 Testing hypotheses 5A, 5B, and 5C Table 5.12 shows that the Pearson correlation between TRI and intention was quite low (r= 0.06)
and not significant. Examination of the scatter diagram (Appendix 10) revealed that there might
be some outliers that had low scores on TRI but high scores on intention. The inspection of
residuals from the regression equation, in which intention was dependent variable and TRI was
independent variable, showed that there were no outliers with residuals larger than three standard
deviations. However, there were 14 cases with residuals larger than two standard deviations (see
104
Appendix 11). These cases were then removed from the database, and the Person correlation test
was rerun for TRI and intention. The result of r was still not significant (r= 0.11, p=0.11).
Therefore, the empirical results do not support H5A.
Regarding H5B, Table 5.12 shows that the Pearson correlation between TRI and PBC was
significant (r=0.32, p<0.01). Thus, H5B is supported.
Since H5A was rejected, H5C is no longer applicable and was not tested.
5.6 Mean differences in demographic groups
5.6.1 Age
As mentioned in section 4.8.4 in the methodology chapters, the issue of equal sample size among
different groups was examined in order to decide which ANOVA test was most appropriate.
Results from the Chi-square test of frequency among different age groups demonstrated that the
sample size in each group was different (λ=14.6, p=0.006). Since Welch’s test of equality of
means is generally recommended when group sizes are unequal (Garson 2007), this test was
deployed to examine the difference between age groups on six constructs: intention, attitude,
subjective norm, PBC, image congruence, and TRI. As shown in Table 5.15, there was evidence
that not all the means of attitude, subjective norm, PBC and image congruence of five groups of
age were equal (p=0.000, 0.000, 0.003, 0.005, and 0.024, respectively).
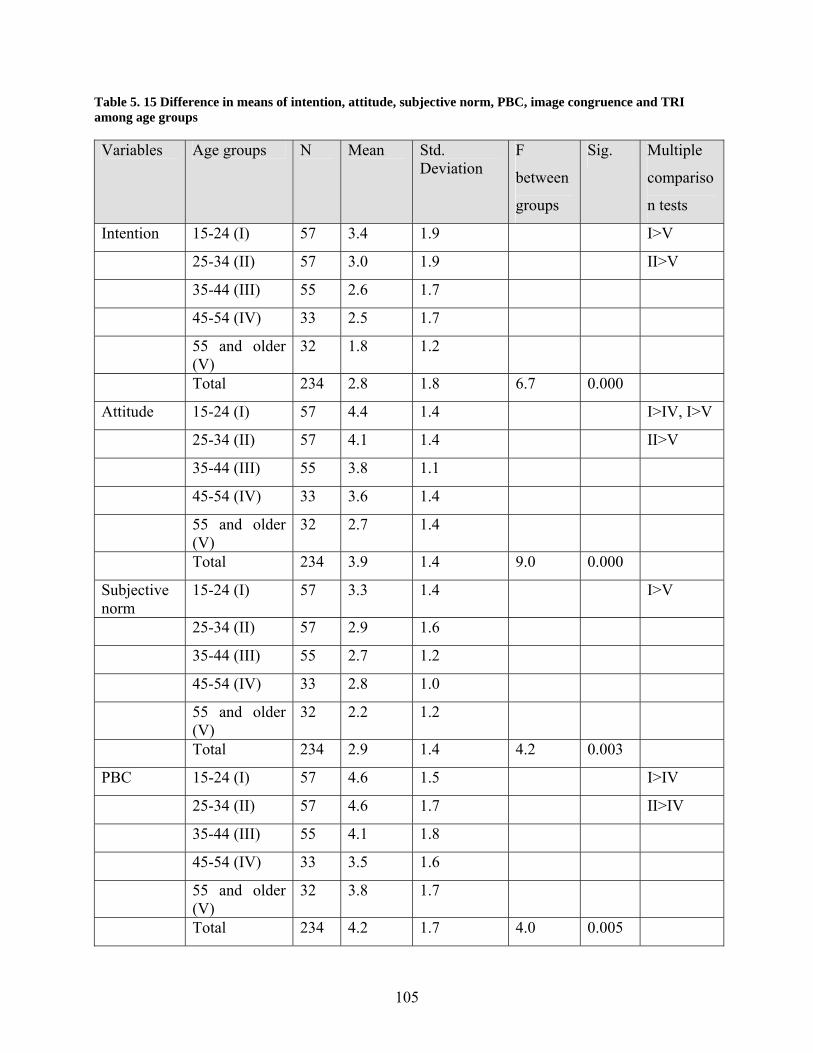
105
Table 5. 15 Difference in means of intention, attitude, subjective norm, PBC, image congruence and TRI among age groups Variables Age groups N Mean Std.
Deviation F
between
groups
Sig. Multiple
compariso
n tests
Intention 15-24 (I) 57 3.4 1.9 I>V
25-34 (II) 57 3.0 1.9 II>V
35-44 (III) 55 2.6 1.7
45-54 (IV) 33 2.5 1.7
55 and older (V)
32 1.8 1.2
Total 234 2.8 1.8 6.7 0.000
Attitude 15-24 (I) 57 4.4 1.4 I>IV, I>V
25-34 (II) 57 4.1 1.4 II>V
35-44 (III) 55 3.8 1.1
45-54 (IV) 33 3.6 1.4
55 and older (V)
32 2.7 1.4
Total 234 3.9 1.4 9.0 0.000
Subjective norm
15-24 (I) 57 3.3 1.4 I>V
25-34 (II) 57 2.9 1.6
35-44 (III) 55 2.7 1.2
45-54 (IV) 33 2.8 1.0
55 and older (V)
32 2.2 1.2
Total 234 2.9 1.4 4.2 0.003
PBC 15-24 (I) 57 4.6 1.5 I>IV
25-34 (II) 57 4.6 1.7 II>IV
35-44 (III) 55 4.1 1.8
45-54 (IV) 33 3.5 1.6
55 and older (V)
32 3.8 1.7
Total 234 4.2 1.7 4.0 0.005
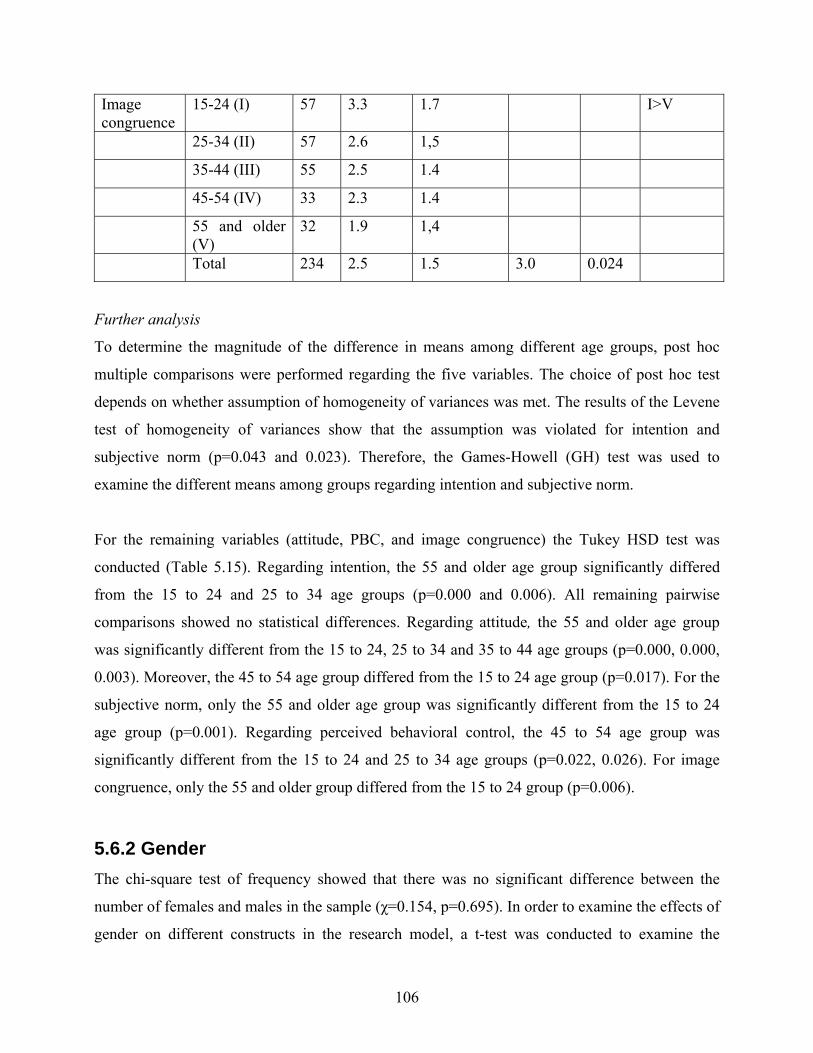
106
Image congruence
15-24 (I) 57 3.3 1.7 I>V
25-34 (II) 57 2.6 1,5
35-44 (III) 55 2.5 1.4
45-54 (IV) 33 2.3 1.4
55 and older (V)
32 1.9 1,4
Total 234 2.5 1.5 3.0 0.024
Further analysis
To determine the magnitude of the difference in means among different age groups, post hoc
multiple comparisons were performed regarding the five variables. The choice of post hoc test
depends on whether assumption of homogeneity of variances was met. The results of the Levene
test of homogeneity of variances show that the assumption was violated for intention and
subjective norm (p=0.043 and 0.023). Therefore, the Games-Howell (GH) test was used to
examine the different means among groups regarding intention and subjective norm.
For the remaining variables (attitude, PBC, and image congruence) the Tukey HSD test was
conducted (Table 5.15). Regarding intention, the 55 and older age group significantly differed
from the 15 to 24 and 25 to 34 age groups (p=0.000 and 0.006). All remaining pairwise
comparisons showed no statistical differences. Regarding attitude, the 55 and older age group
was significantly different from the 15 to 24, 25 to 34 and 35 to 44 age groups (p=0.000, 0.000,
0.003). Moreover, the 45 to 54 age group differed from the 15 to 24 age group (p=0.017). For the
subjective norm, only the 55 and older age group was significantly different from the 15 to 24
age group (p=0.001). Regarding perceived behavioral control, the 45 to 54 age group was
significantly different from the 15 to 24 and 25 to 34 age groups (p=0.022, 0.026). For image
congruence, only the 55 and older group differed from the 15 to 24 group (p=0.006).
5.6.2 Gender The chi-square test of frequency showed that there was no significant difference between the
number of females and males in the sample (χ=0.154, p=0.695). In order to examine the effects of
gender on different constructs in the research model, a t-test was conducted to examine the
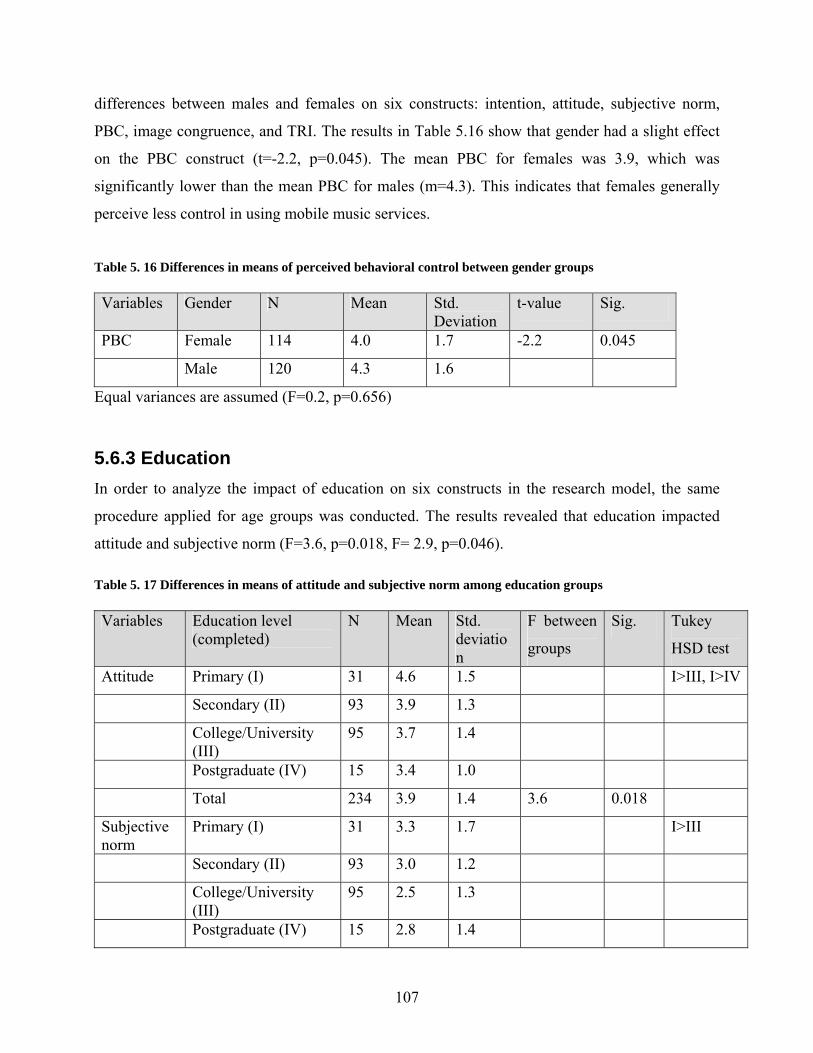
107
differences between males and females on six constructs: intention, attitude, subjective norm,
PBC, image congruence, and TRI. The results in Table 5.16 show that gender had a slight effect
on the PBC construct (t=-2.2, p=0.045). The mean PBC for females was 3.9, which was
significantly lower than the mean PBC for males (m=4.3). This indicates that females generally
perceive less control in using mobile music services.
Table 5. 16 Differences in means of perceived behavioral control between gender groups Variables Gender N Mean Std.
Deviation t-value Sig.
PBC Female 114 4.0 1.7 -2.2 0.045
Male 120 4.3 1.6
Equal variances are assumed (F=0.2, p=0.656)
5.6.3 Education In order to analyze the impact of education on six constructs in the research model, the same
procedure applied for age groups was conducted. The results revealed that education impacted
attitude and subjective norm (F=3.6, p=0.018, F= 2.9, p=0.046). Table 5. 17 Differences in means of attitude and subjective norm among education groups Variables Education level
(completed) N Mean Std.
deviation
F between
groups
Sig. Tukey
HSD test
Attitude Primary (I) 31 4.6 1.5 I>III, I>IV
Secondary (II) 93 3.9 1.3
College/University (III)
95 3.7 1.4
Postgraduate (IV) 15 3.4 1.0
Total 234 3.9 1.4 3.6 0.018
Subjective norm
Primary (I) 31 3.3 1.7 I>III
Secondary (II) 93 3.0 1.2
College/University (III)
95 2.5 1.3
Postgraduate (IV) 15 2.8 1.4
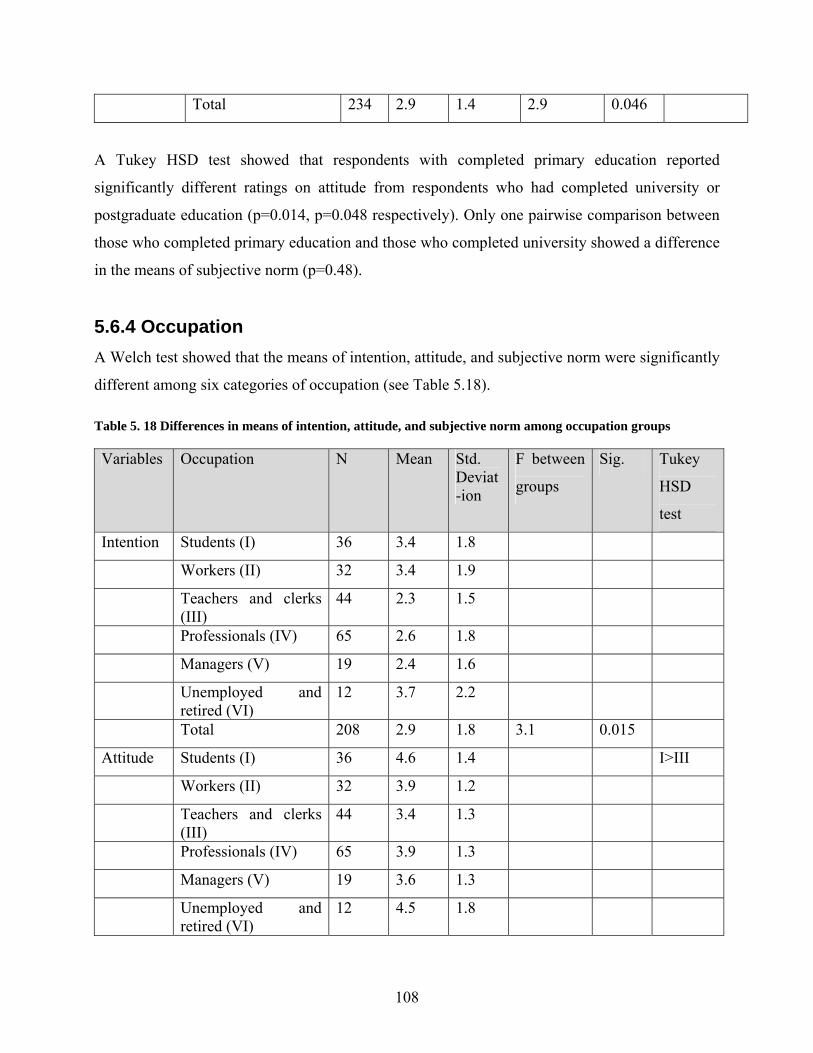
108
Total 234 2.9 1.4 2.9 0.046
A Tukey HSD test showed that respondents with completed primary education reported
significantly different ratings on attitude from respondents who had completed university or
postgraduate education (p=0.014, p=0.048 respectively). Only one pairwise comparison between
those who completed primary education and those who completed university showed a difference
in the means of subjective norm (p=0.48).
5.6.4 Occupation A Welch test showed that the means of intention, attitude, and subjective norm were significantly
different among six categories of occupation (see Table 5.18). Table 5. 18 Differences in means of intention, attitude, and subjective norm among occupation groups Variables Occupation N Mean Std.
Deviat-ion
F between
groups
Sig. Tukey
HSD
test
Intention Students (I) 36 3.4 1.8
Workers (II) 32 3.4 1.9
Teachers and clerks (III)
44 2.3 1.5
Professionals (IV) 65 2.6 1.8
Managers (V) 19 2.4 1.6
Unemployed and retired (VI)
12 3.7 2.2
Total 208 2.9 1.8 3.1 0.015
Attitude Students (I) 36 4.6 1.4 I>III
Workers (II) 32 3.9 1.2
Teachers and clerks (III)
44 3.4 1.3
Professionals (IV) 65 3.9 1.3
Managers (V) 19 3.6 1.3
Unemployed and retired (VI)
12 4.5 1.8
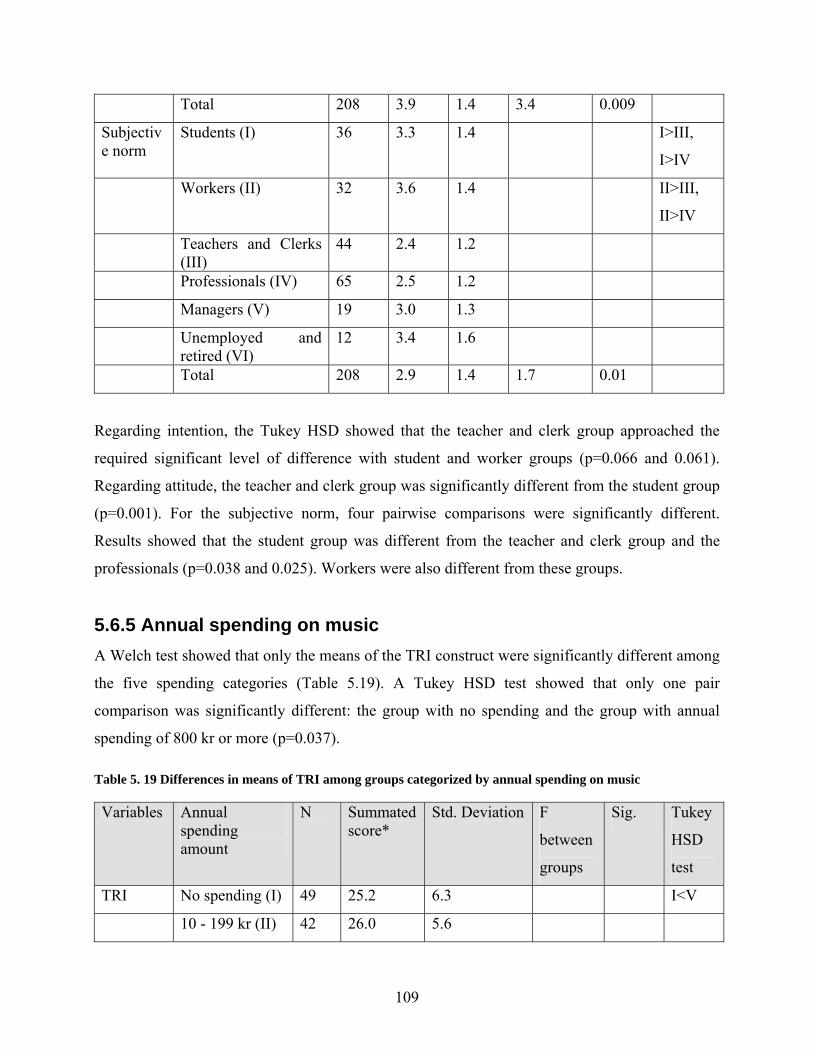
109
Total 208 3.9 1.4 3.4 0.009
Subjective norm
Students (I) 36 3.3 1.4 I>III,
I>IV
Workers (II) 32 3.6 1.4 II>III,
II>IV
Teachers and Clerks (III)
44 2.4 1.2
Professionals (IV) 65 2.5 1.2
Managers (V) 19 3.0 1.3
Unemployed and retired (VI)
12 3.4 1.6
Total 208 2.9 1.4 1.7 0.01
Regarding intention, the Tukey HSD showed that the teacher and clerk group approached the
required significant level of difference with student and worker groups (p=0.066 and 0.061).
Regarding attitude, the teacher and clerk group was significantly different from the student group
(p=0.001). For the subjective norm, four pairwise comparisons were significantly different.
Results showed that the student group was different from the teacher and clerk group and the
professionals (p=0.038 and 0.025). Workers were also different from these groups.
5.6.5 Annual spending on music A Welch test showed that only the means of the TRI construct were significantly different among
the five spending categories (Table 5.19). A Tukey HSD test showed that only one pair
comparison was significantly different: the group with no spending and the group with annual
spending of 800 kr or more (p=0.037). Table 5. 19 Differences in means of TRI among groups categorized by annual spending on music Variables Annual
spending amount
N Summated score*
Std. Deviation F
between
groups
Sig. Tukey
HSD
test
TRI No spending (I) 49 25.2 6.3 I<V
10 - 199 kr (II) 42 26.0 5.6
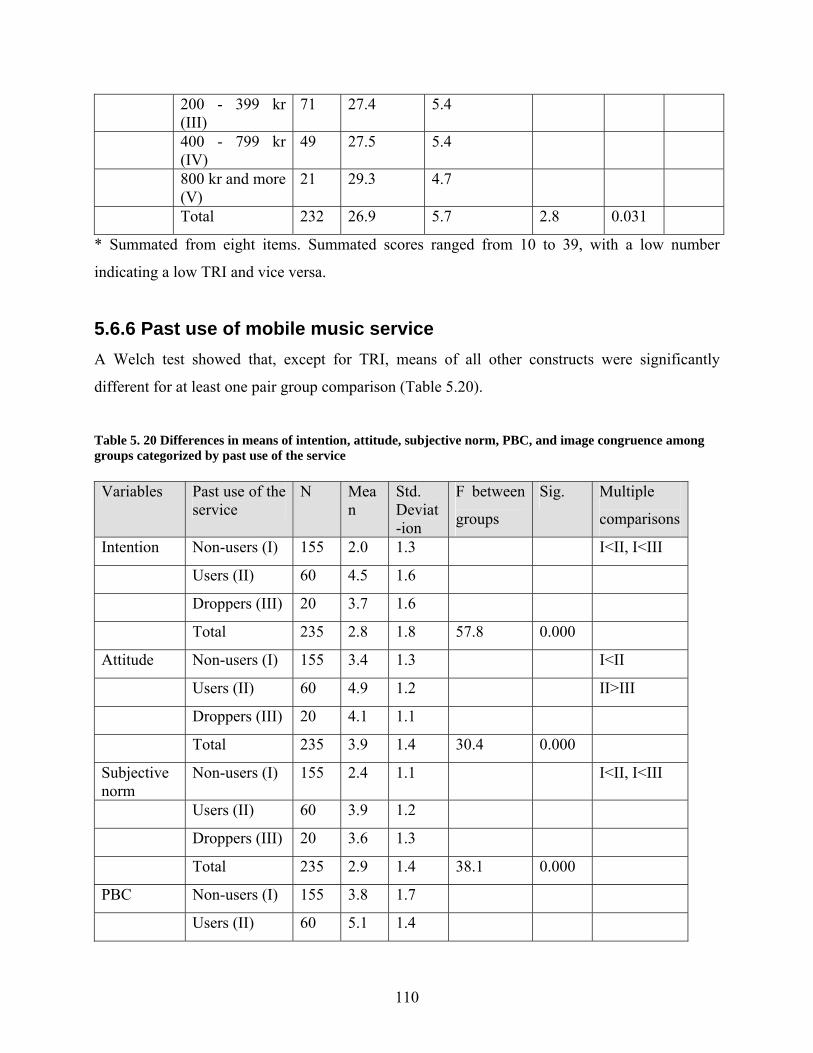
110
200 - 399 kr (III)
71 27.4 5.4
400 - 799 kr (IV)
49 27.5 5.4
800 kr and more (V)
21 29.3 4.7
Total 232 26.9 5.7 2.8 0.031
* Summated from eight items. Summated scores ranged from 10 to 39, with a low number
indicating a low TRI and vice versa.
5.6.6 Past use of mobile music service A Welch test showed that, except for TRI, means of all other constructs were significantly
different for at least one pair group comparison (Table 5.20).
Table 5. 20 Differences in means of intention, attitude, subjective norm, PBC, and image congruence among groups categorized by past use of the service Variables Past use of the
service N Mea
n Std. Deviat-ion
F between
groups
Sig. Multiple
comparisons
Intention Non-users (I) 155 2.0 1.3 I<II, I<III
Users (II) 60 4.5 1.6
Droppers (III) 20 3.7 1.6
Total 235 2.8 1.8 57.8 0.000
Attitude Non-users (I) 155 3.4 1.3 I<II
Users (II) 60 4.9 1.2 II>III
Droppers (III) 20 4.1 1.1
Total 235 3.9 1.4 30.4 0.000
Subjective norm
Non-users (I) 155 2.4 1.1 I<II, I<III
Users (II) 60 3.9 1.2
Droppers (III) 20 3.6 1.3
Total 235 2.9 1.4 38.1 0.000
PBC Non-users (I) 155 3.8 1.7
Users (II) 60 5.1 1.4
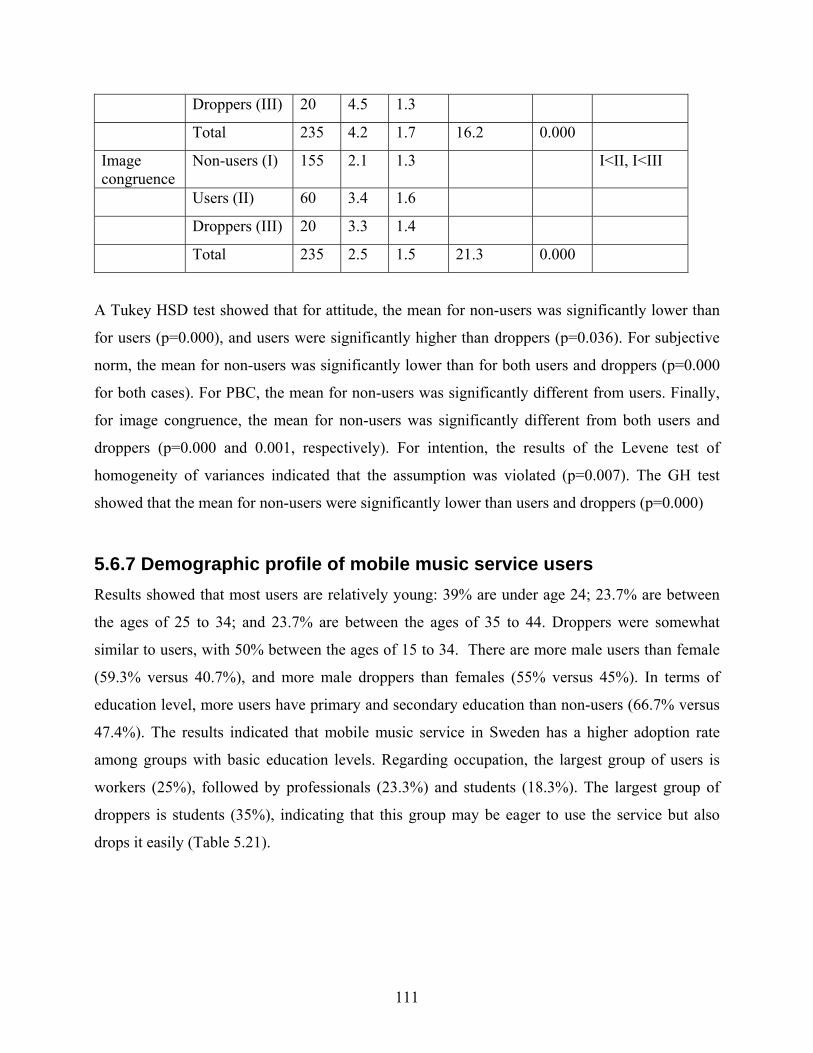
111
Droppers (III) 20 4.5 1.3
Total 235 4.2 1.7 16.2 0.000
Image congruence
Non-users (I) 155 2.1 1.3 I<II, I<III
Users (II) 60 3.4 1.6
Droppers (III) 20 3.3 1.4
Total 235 2.5 1.5 21.3 0.000
A Tukey HSD test showed that for attitude, the mean for non-users was significantly lower than
for users (p=0.000), and users were significantly higher than droppers (p=0.036). For subjective
norm, the mean for non-users was significantly lower than for both users and droppers (p=0.000
for both cases). For PBC, the mean for non-users was significantly different from users. Finally,
for image congruence, the mean for non-users was significantly different from both users and
droppers (p=0.000 and 0.001, respectively). For intention, the results of the Levene test of
homogeneity of variances indicated that the assumption was violated (p=0.007). The GH test
showed that the mean for non-users were significantly lower than users and droppers (p=0.000)
5.6.7 Demographic profile of mobile music service users Results showed that most users are relatively young: 39% are under age 24; 23.7% are between
the ages of 25 to 34; and 23.7% are between the ages of 35 to 44. Droppers were somewhat
similar to users, with 50% between the ages of 15 to 34. There are more male users than female
(59.3% versus 40.7%), and more male droppers than females (55% versus 45%). In terms of
education level, more users have primary and secondary education than non-users (66.7% versus
47.4%). The results indicated that mobile music service in Sweden has a higher adoption rate
among groups with basic education levels. Regarding occupation, the largest group of users is
workers (25%), followed by professionals (23.3%) and students (18.3%). The largest group of
droppers is students (35%), indicating that this group may be eager to use the service but also
drops it easily (Table 5.21).
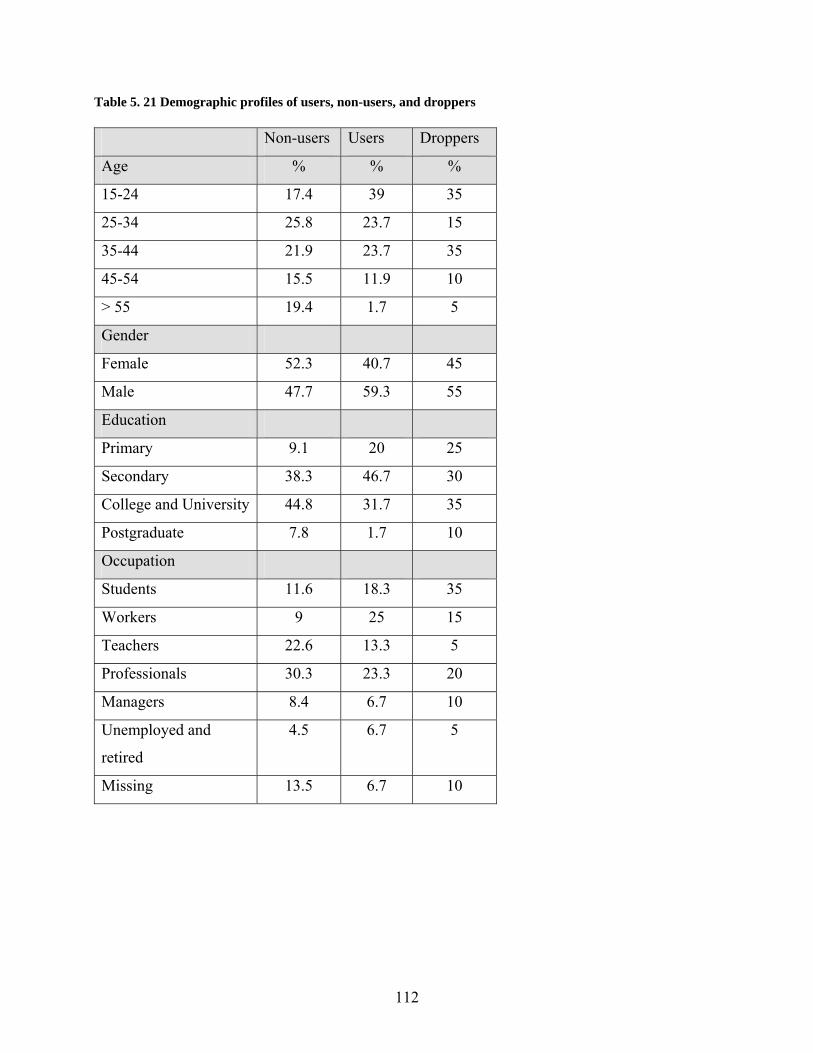
112
Table 5. 21 Demographic profiles of users, non-users, and droppers Non-users Users Droppers
Age % % %
15-24 17.4 39 35
25-34 25.8 23.7 15
35-44 21.9 23.7 35
45-54 15.5 11.9 10
> 55 19.4 1.7 5
Gender
Female 52.3 40.7 45
Male 47.7 59.3 55
Education
Primary 9.1 20 25
Secondary 38.3 46.7 30
College and University 44.8 31.7 35
Postgraduate 7.8 1.7 10
Occupation
Students 11.6 18.3 35
Workers 9 25 15
Teachers 22.6 13.3 5
Professionals 30.3 23.3 20
Managers 8.4 6.7 10
Unemployed and
retired
4.5 6.7 5
Missing 13.5 6.7 10
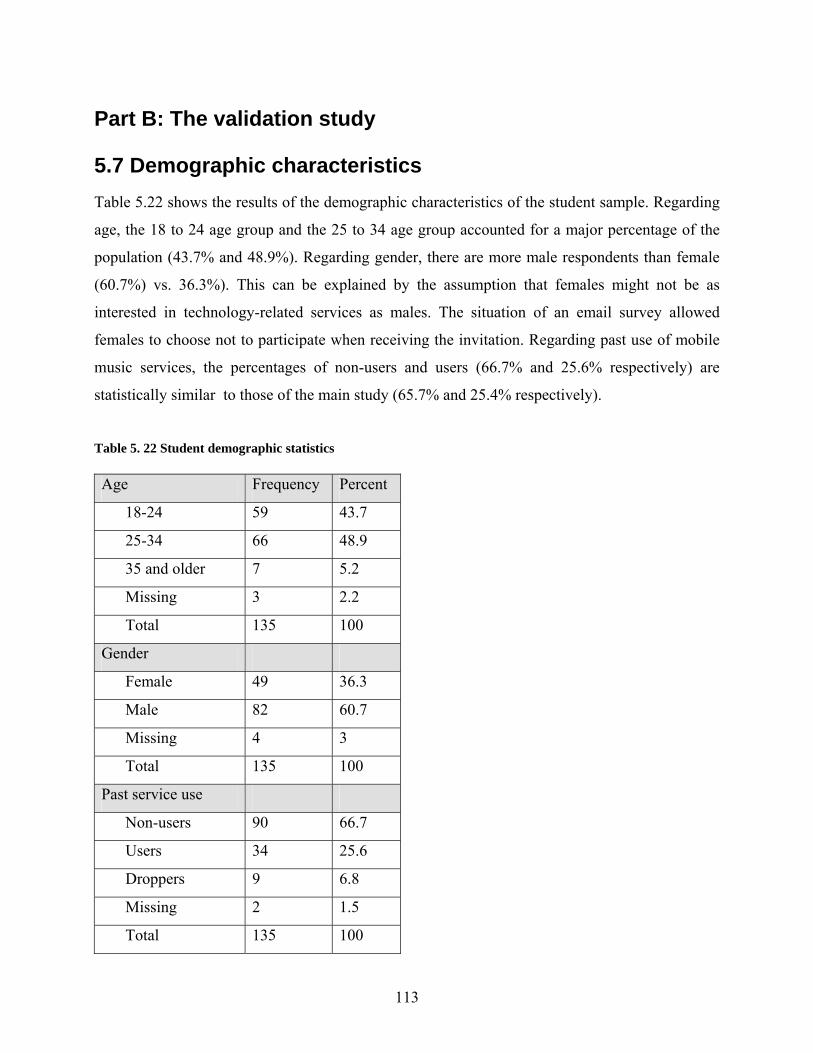
113
Part B: The validation study 5.7 Demographic characteristics Table 5.22 shows the results of the demographic characteristics of the student sample. Regarding
age, the 18 to 24 age group and the 25 to 34 age group accounted for a major percentage of the
population (43.7% and 48.9%). Regarding gender, there are more male respondents than female
(60.7%) vs. 36.3%). This can be explained by the assumption that females might not be as
interested in technology-related services as males. The situation of an email survey allowed
females to choose not to participate when receiving the invitation. Regarding past use of mobile
music services, the percentages of non-users and users (66.7% and 25.6% respectively) are
statistically similar to those of the main study (65.7% and 25.4% respectively).
Table 5. 22 Student demographic statistics Age Frequency Percent
18-24 59 43.7
25-34 66 48.9
35 and older 7 5.2
Missing 3 2.2
Total 135 100
Gender
Female 49 36.3
Male 82 60.7
Missing 4 3
Total 135 100
Past service use
Non-users 90 66.7
Users 34 25.6
Droppers 9 6.8
Missing 2 1.5
Total 135 100
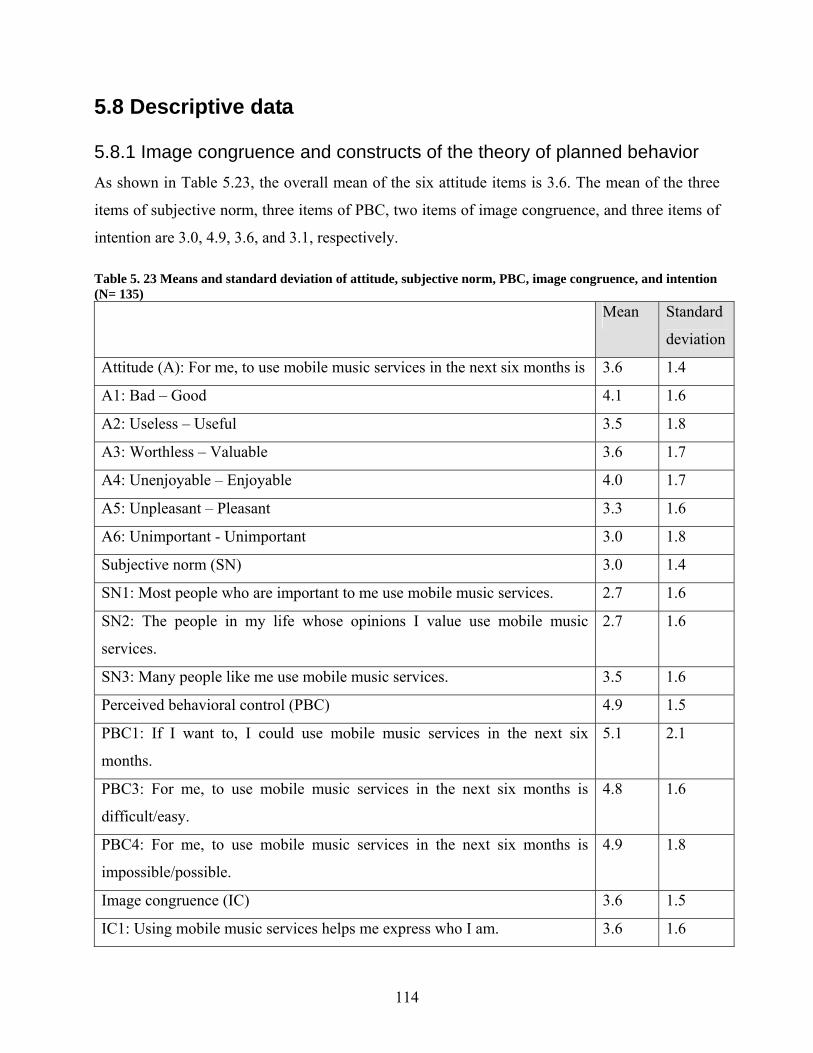
114
5.8 Descriptive data 5.8.1 Image congruence and constructs of the theory of planned behavior As shown in Table 5.23, the overall mean of the six attitude items is 3.6. The mean of the three
items of subjective norm, three items of PBC, two items of image congruence, and three items of
intention are 3.0, 4.9, 3.6, and 3.1, respectively. Table 5. 23 Means and standard deviation of attitude, subjective norm, PBC, image congruence, and intention (N= 135) Mean Standard
deviation
Attitude (A): For me, to use mobile music services in the next six months is 3.6 1.4
A1: Bad – Good 4.1 1.6
A2: Useless – Useful 3.5 1.8
A3: Worthless – Valuable 3.6 1.7
A4: Unenjoyable – Enjoyable 4.0 1.7
A5: Unpleasant – Pleasant 3.3 1.6
A6: Unimportant - Unimportant 3.0 1.8
Subjective norm (SN) 3.0 1.4
SN1: Most people who are important to me use mobile music services. 2.7 1.6
SN2: The people in my life whose opinions I value use mobile music
services.
2.7 1.6
SN3: Many people like me use mobile music services. 3.5 1.6
Perceived behavioral control (PBC) 4.9 1.5
PBC1: If I want to, I could use mobile music services in the next six
months.
5.1 2.1
PBC3: For me, to use mobile music services in the next six months is
difficult/easy.
4.8 1.6
PBC4: For me, to use mobile music services in the next six months is
impossible/possible.
4.9 1.8
Image congruence (IC) 3.6 1.5
IC1: Using mobile music services helps me express who I am. 3.6 1.6
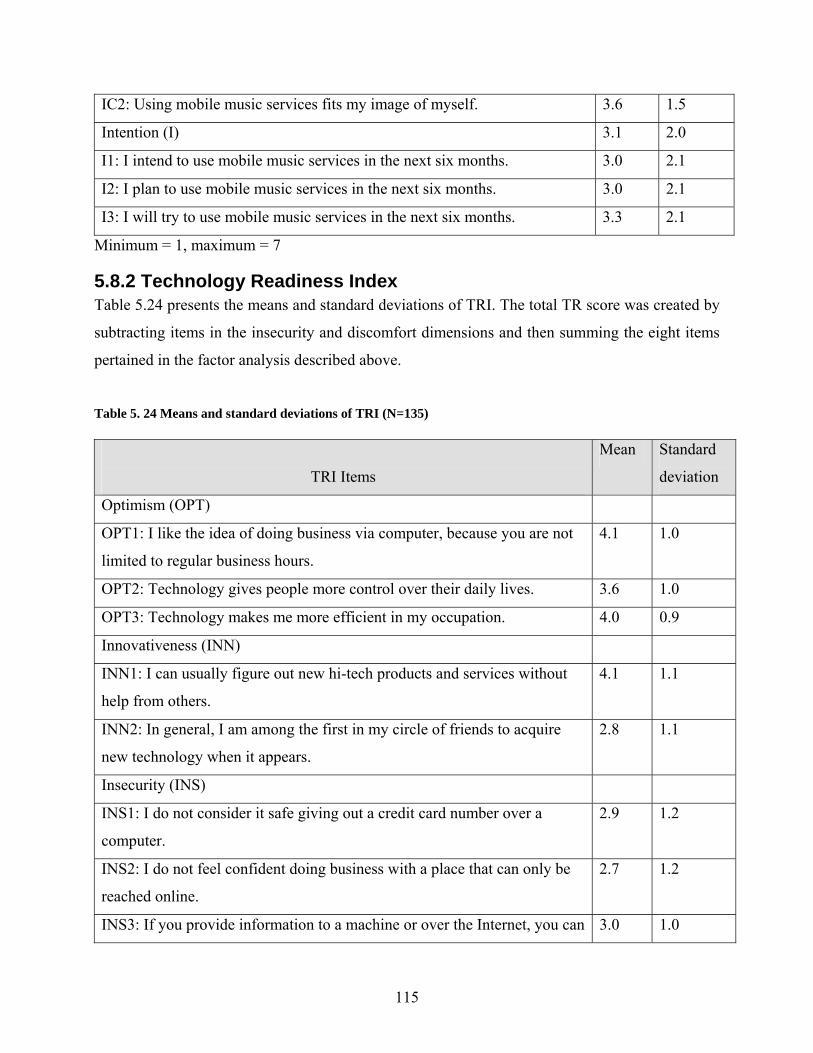
115
IC2: Using mobile music services fits my image of myself. 3.6 1.5
Intention (I) 3.1 2.0
I1: I intend to use mobile music services in the next six months. 3.0 2.1
I2: I plan to use mobile music services in the next six months. 3.0 2.1
I3: I will try to use mobile music services in the next six months. 3.3 2.1
Minimum = 1, maximum = 7
5.8.2 Technology Readiness Index Table 5.24 presents the means and standard deviations of TRI. The total TR score was created by
subtracting items in the insecurity and discomfort dimensions and then summing the eight items
pertained in the factor analysis described above.
Table 5. 24 Means and standard deviations of TRI (N=135)
TRI Items
Mean Standard
deviation
Optimism (OPT)
OPT1: I like the idea of doing business via computer, because you are not
limited to regular business hours.
4.1 1.0
OPT2: Technology gives people more control over their daily lives. 3.6 1.0
OPT3: Technology makes me more efficient in my occupation. 4.0 0.9
Innovativeness (INN)
INN1: I can usually figure out new hi-tech products and services without
help from others.
4.1 1.1
INN2: In general, I am among the first in my circle of friends to acquire
new technology when it appears.
2.8 1.1
Insecurity (INS)
INS1: I do not consider it safe giving out a credit card number over a
computer.
2.9 1.2
INS2: I do not feel confident doing business with a place that can only be
reached online.
2.7 1.2
INS3: If you provide information to a machine or over the Internet, you can 3.0 1.0
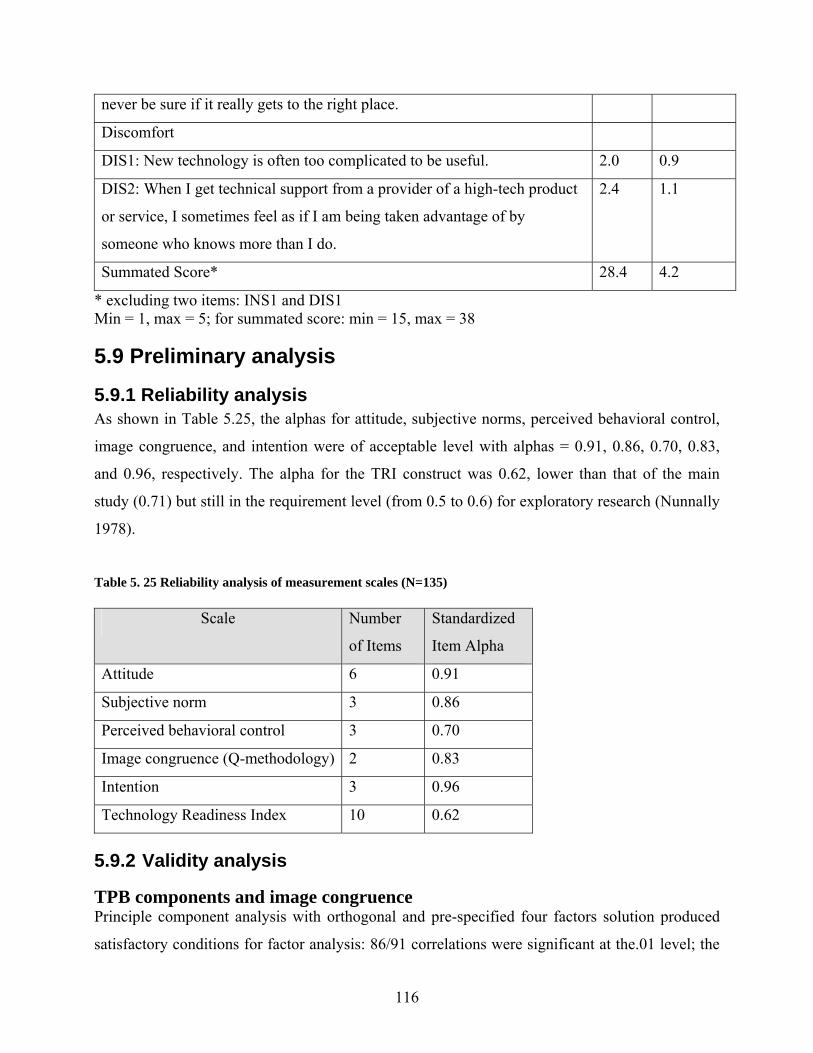
116
never be sure if it really gets to the right place.
Discomfort
DIS1: New technology is often too complicated to be useful. 2.0 0.9
DIS2: When I get technical support from a provider of a high-tech product
or service, I sometimes feel as if I am being taken advantage of by
someone who knows more than I do.
2.4 1.1
Summated Score* 28.4 4.2
* excluding two items: INS1 and DIS1 Min = 1, max = 5; for summated score: min = 15, max = 38
5.9 Preliminary analysis
5.9.1 Reliability analysis As shown in Table 5.25, the alphas for attitude, subjective norms, perceived behavioral control,
image congruence, and intention were of acceptable level with alphas = 0.91, 0.86, 0.70, 0.83,
and 0.96, respectively. The alpha for the TRI construct was 0.62, lower than that of the main
study (0.71) but still in the requirement level (from 0.5 to 0.6) for exploratory research (Nunnally
1978).
Table 5. 25 Reliability analysis of measurement scales (N=135)
Scale Number
of Items
Standardized
Item Alpha
Attitude 6 0.91
Subjective norm 3 0.86
Perceived behavioral control 3 0.70
Image congruence (Q-methodology) 2 0.83
Intention 3 0.96
Technology Readiness Index 10 0.62
5.9.2 Validity analysis
TPB components and image congruence Principle component analysis with orthogonal and pre-specified four factors solution produced
satisfactory conditions for factor analysis: 86/91 correlations were significant at the.01 level; the
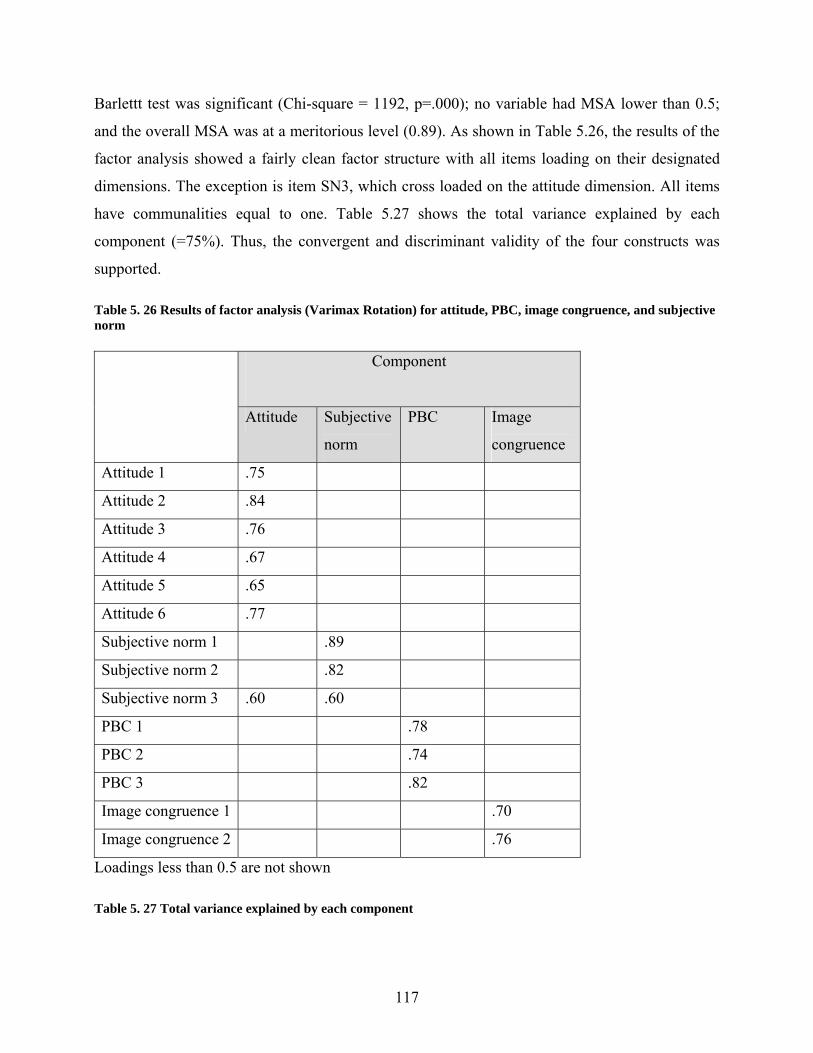
117
Barlettt test was significant (Chi-square = 1192, p=.000); no variable had MSA lower than 0.5;
and the overall MSA was at a meritorious level (0.89). As shown in Table 5.26, the results of the
factor analysis showed a fairly clean factor structure with all items loading on their designated
dimensions. The exception is item SN3, which cross loaded on the attitude dimension. All items
have communalities equal to one. Table 5.27 shows the total variance explained by each
component (=75%). Thus, the convergent and discriminant validity of the four constructs was
supported. Table 5. 26 Results of factor analysis (Varimax Rotation) for attitude, PBC, image congruence, and subjective norm
Component
Attitude Subjective
norm
PBC Image
congruence
Attitude 1 .75
Attitude 2 .84
Attitude 3 .76
Attitude 4 .67
Attitude 5 .65
Attitude 6 .77
Subjective norm 1 .89
Subjective norm 2 .82
Subjective norm 3 .60 .60
PBC 1 .78
PBC 2 .74
PBC 3 .82
Image congruence 1 .70
Image congruence 2 .76
Loadings less than 0.5 are not shown Table 5. 27 Total variance explained by each component
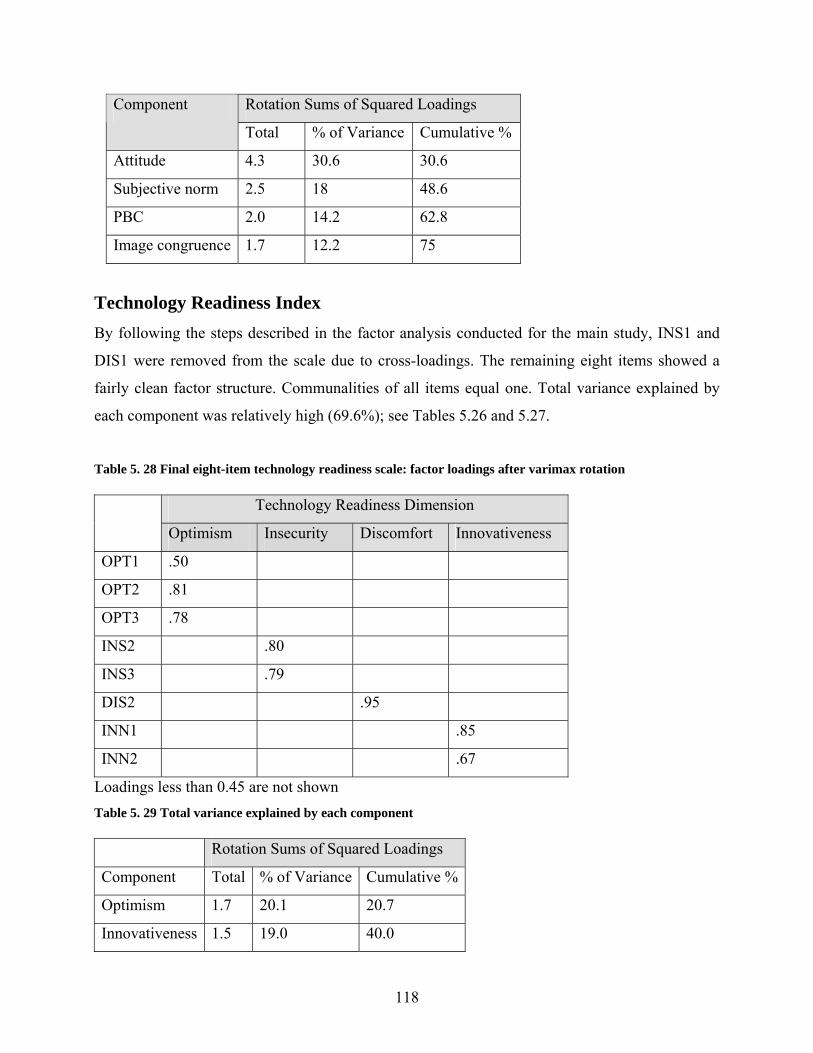
118
Rotation Sums of Squared Loadings Component
Total % of Variance Cumulative %
Attitude 4.3 30.6 30.6
Subjective norm 2.5 18 48.6
PBC 2.0 14.2 62.8
Image congruence 1.7 12.2 75
Technology Readiness Index By following the steps described in the factor analysis conducted for the main study, INS1 and
DIS1 were removed from the scale due to cross-loadings. The remaining eight items showed a
fairly clean factor structure. Communalities of all items equal one. Total variance explained by
each component was relatively high (69.6%); see Tables 5.26 and 5.27.
Table 5. 28 Final eight-item technology readiness scale: factor loadings after varimax rotation
Technology Readiness Dimension
Optimism Insecurity Discomfort Innovativeness
OPT1 .50
OPT2 .81
OPT3 .78
INS2 .80
INS3 .79
DIS2 .95
INN1 .85
INN2 .67
Loadings less than 0.45 are not shown Table 5. 29 Total variance explained by each component Rotation Sums of Squared Loadings
Component Total % of Variance Cumulative %
Optimism 1.7 20.1 20.7
Innovativeness 1.5 19.0 40.0
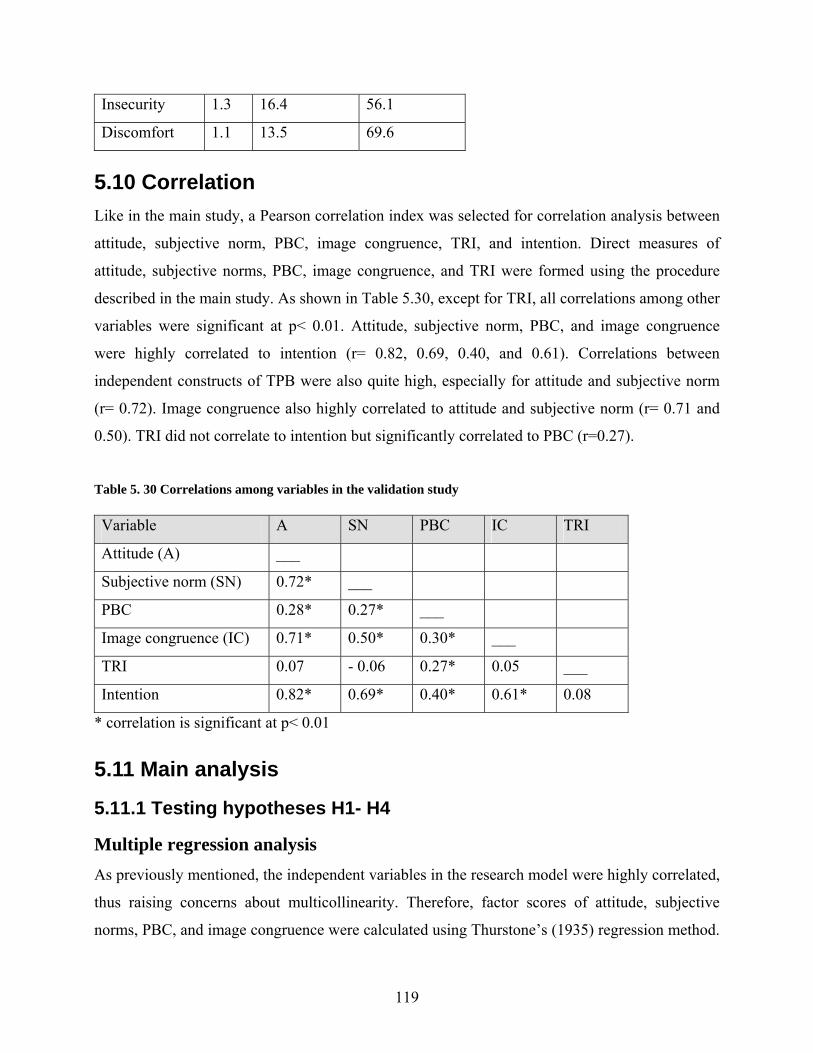
119
Insecurity 1.3 16.4 56.1
Discomfort 1.1 13.5 69.6
5.10 Correlation Like in the main study, a Pearson correlation index was selected for correlation analysis between
attitude, subjective norm, PBC, image congruence, TRI, and intention. Direct measures of
attitude, subjective norms, PBC, image congruence, and TRI were formed using the procedure
described in the main study. As shown in Table 5.30, except for TRI, all correlations among other
variables were significant at p< 0.01. Attitude, subjective norm, PBC, and image congruence
were highly correlated to intention (r= 0.82, 0.69, 0.40, and 0.61). Correlations between
independent constructs of TPB were also quite high, especially for attitude and subjective norm
(r= 0.72). Image congruence also highly correlated to attitude and subjective norm (r= 0.71 and
0.50). TRI did not correlate to intention but significantly correlated to PBC (r=0.27).
Table 5. 30 Correlations among variables in the validation study Variable A SN PBC IC TRI
Attitude (A) ___
Subjective norm (SN) 0.72* ___
PBC 0.28* 0.27* ___
Image congruence (IC) 0.71* 0.50* 0.30* ___
TRI 0.07 - 0.06 0.27* 0.05 ___
Intention 0.82* 0.69* 0.40* 0.61* 0.08
* correlation is significant at p< 0.01
5.11 Main analysis
5.11.1 Testing hypotheses H1- H4
Multiple regression analysis As previously mentioned, the independent variables in the research model were highly correlated,
thus raising concerns about multicollinearity. Therefore, factor scores of attitude, subjective
norms, PBC, and image congruence were calculated using Thurstone’s (1935) regression method.
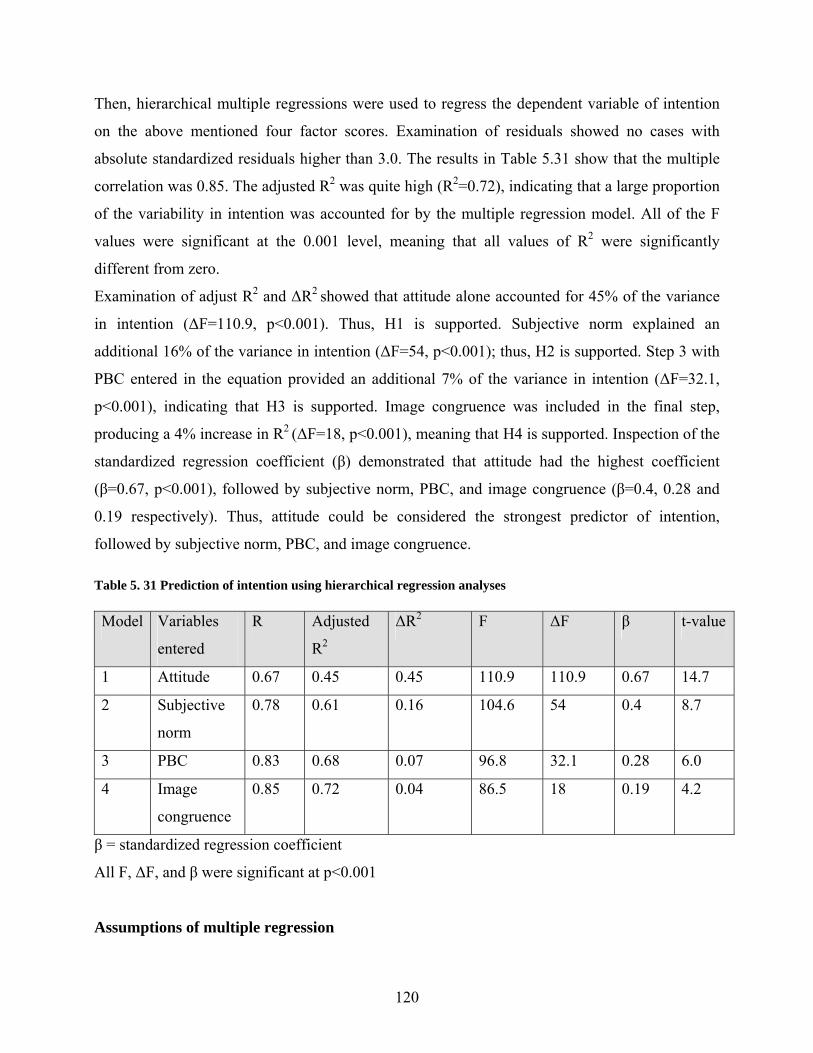
120
Then, hierarchical multiple regressions were used to regress the dependent variable of intention
on the above mentioned four factor scores. Examination of residuals showed no cases with
absolute standardized residuals higher than 3.0. The results in Table 5.31 show that the multiple
correlation was 0.85. The adjusted R2 was quite high (R2=0.72), indicating that a large proportion
of the variability in intention was accounted for by the multiple regression model. All of the F
values were significant at the 0.001 level, meaning that all values of R2 were significantly
different from zero.
Examination of adjust R2 and ΔR2 showed that attitude alone accounted for 45% of the variance
in intention (ΔF=110.9, p<0.001). Thus, H1 is supported. Subjective norm explained an
additional 16% of the variance in intention (ΔF=54, p<0.001); thus, H2 is supported. Step 3 with
PBC entered in the equation provided an additional 7% of the variance in intention (ΔF=32.1,
p<0.001), indicating that H3 is supported. Image congruence was included in the final step,
producing a 4% increase in R2 (ΔF=18, p<0.001), meaning that H4 is supported. Inspection of the
standardized regression coefficient (β) demonstrated that attitude had the highest coefficient
(β=0.67, p<0.001), followed by subjective norm, PBC, and image congruence (β=0.4, 0.28 and
0.19 respectively). Thus, attitude could be considered the strongest predictor of intention,
followed by subjective norm, PBC, and image congruence. Table 5. 31 Prediction of intention using hierarchical regression analyses Model Variables
entered
R Adjusted
R2
ΔR2 F ΔF β t-value
1 Attitude 0.67 0.45 0.45 110.9 110.9 0.67 14.7
2 Subjective
norm
0.78 0.61 0.16 104.6 54 0.4 8.7
3 PBC 0.83 0.68 0.07 96.8 32.1 0.28 6.0
4 Image
congruence
0.85 0.72 0.04 86.5 18 0.19 4.2
β = standardized regression coefficient
All F, ΔF, and β were significant at p<0.001
Assumptions of multiple regression
121
Normality
Examination of the histogram of the standardized residuals (Appendix 14) showed no outliers
with standardized residuals larger than 3.0 Inspection of the normal plot of regression
standardized residuals (Appendix 15) revealed that the data had a general tendency to lie along
the reference line, indicating a normal distribution.
Homoscedasticity
Appendix 16 shows that all residuals were relatively evenly distributed. Thus, the assumption of
homoscedasticity was met for the regression equation.
Linearity
The scatter plot was visually examined to assess the linearity between attitude, subjective norm,
PBC, image congruence, intention. No non-linear relationships were found. Thus, the assumption
of linearity was not violated.
5.11.2 Testing hypotheses 5A, 5B, 5C Table 5.30 shows that the Pearson correlation between TRI and intention was quite low (r= 0.08)
and not significant. Examination of scatter diagram (Appendix 17) revealed that there might be
some outliers that had low scores on TRI but high scores on intention or vice versa. However,
inspection of the scatter plot of residuals from the regression equation, in which intention was the
dependent variable and TRI was the independent variable, showed that there were no outliers
with residuals larger than two standard deviations. Thus, it can be concluded that the empirical
results do not support H5A. Table 5.30 also shows that the Pearson correlation between TRI and
PBC was significant (r=0.27, p<0.01). Thus, H5B is supported. Since H5A was rejected, H5C is
no longer applicable and was not tested.
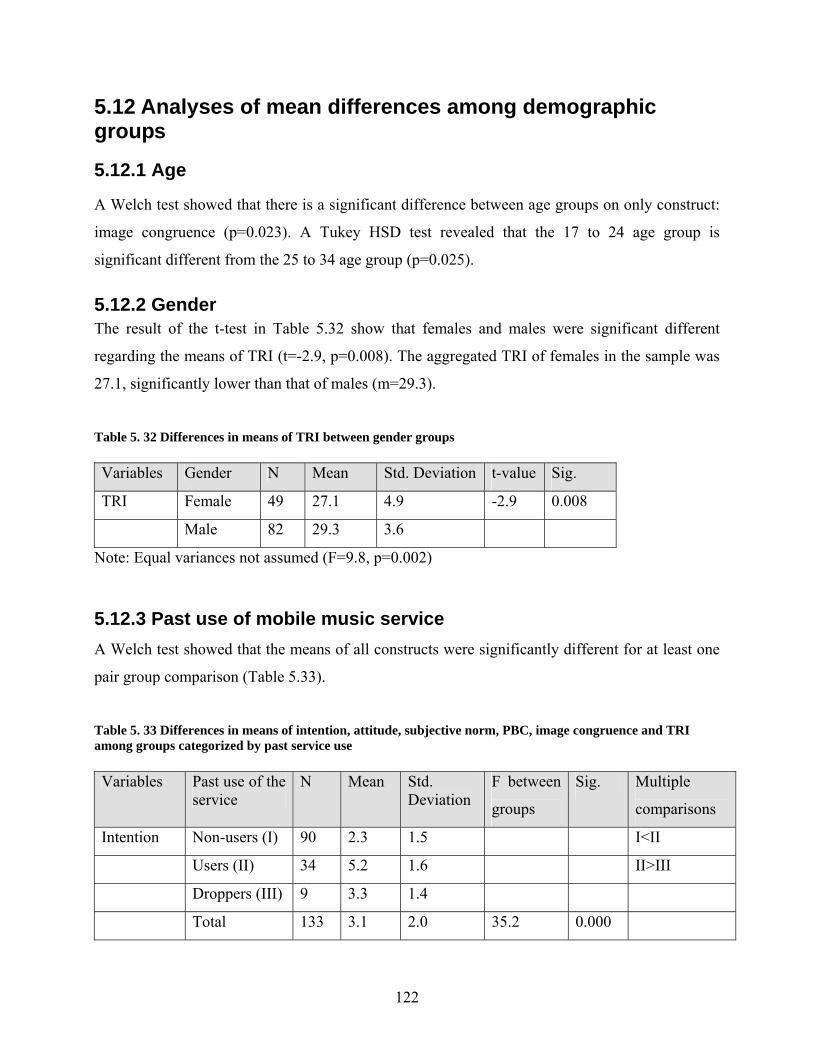
122
5.12 Analyses of mean differences among demographic groups
5.12.1 Age
A Welch test showed that there is a significant difference between age groups on only construct:
image congruence (p=0.023). A Tukey HSD test revealed that the 17 to 24 age group is
significant different from the 25 to 34 age group (p=0.025).
5.12.2 Gender The result of the t-test in Table 5.32 show that females and males were significant different
regarding the means of TRI (t=-2.9, p=0.008). The aggregated TRI of females in the sample was
27.1, significantly lower than that of males (m=29.3).
Table 5. 32 Differences in means of TRI between gender groups Variables Gender N Mean Std. Deviation t-value Sig.
TRI Female 49 27.1 4.9 -2.9 0.008
Male 82 29.3 3.6
Note: Equal variances not assumed (F=9.8, p=0.002)
5.12.3 Past use of mobile music service A Welch test showed that the means of all constructs were significantly different for at least one
pair group comparison (Table 5.33).
Table 5. 33 Differences in means of intention, attitude, subjective norm, PBC, image congruence and TRI among groups categorized by past service use Variables Past use of the
service N Mean Std.
Deviation F between
groups
Sig. Multiple
comparisons
Intention Non-users (I) 90 2.3 1.5 I<II
Users (II) 34 5.2 1.6 II>III
Droppers (III) 9 3.3 1.4
Total 133 3.1 2.0 35.2 0.000
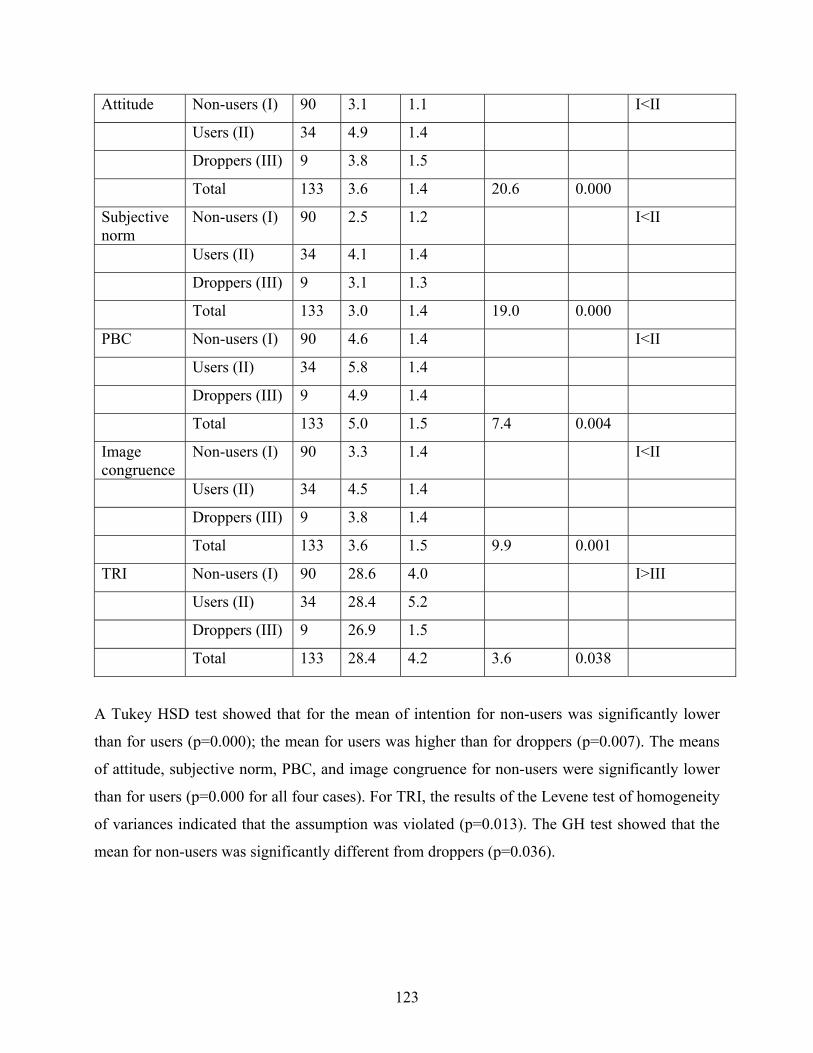
123
Attitude Non-users (I) 90 3.1 1.1 I<II
Users (II) 34 4.9 1.4
Droppers (III) 9 3.8 1.5
Total 133 3.6 1.4 20.6 0.000
Subjective norm
Non-users (I) 90 2.5 1.2 I<II
Users (II) 34 4.1 1.4
Droppers (III) 9 3.1 1.3
Total 133 3.0 1.4 19.0 0.000
PBC Non-users (I) 90 4.6 1.4 I<II
Users (II) 34 5.8 1.4
Droppers (III) 9 4.9 1.4
Total 133 5.0 1.5 7.4 0.004
Image congruence
Non-users (I) 90 3.3 1.4 I<II
Users (II) 34 4.5 1.4
Droppers (III) 9 3.8 1.4
Total 133 3.6 1.5 9.9 0.001
TRI Non-users (I) 90 28.6 4.0 I>III
Users (II) 34 28.4 5.2
Droppers (III) 9 26.9 1.5
Total 133 28.4 4.2 3.6 0.038
A Tukey HSD test showed that for the mean of intention for non-users was significantly lower
than for users (p=0.000); the mean for users was higher than for droppers (p=0.007). The means
of attitude, subjective norm, PBC, and image congruence for non-users were significantly lower
than for users (p=0.000 for all four cases). For TRI, the results of the Levene test of homogeneity
of variances indicated that the assumption was violated (p=0.013). The GH test showed that the
mean for non-users was significantly different from droppers (p=0.036).
124
Chapter 6 Discussion and Conclusion
This chapter presents the results of the data analyses as well as the theoretical and managerial
implications of the study. The study limitations are also discussed along with suggestions for
future research.
6.1 Discussion 6.1.1 Hypothesis testing The aim of this study is to gain a better understanding of the antecedents of the intention to use
mobile music services among Swedish consumers. The research process identified four
constructs—attitude, subjective norm, perceived behavioral control, and image congruence—that
played important roles in the prediction of intention to use mobile music services among Swedish
consumers.
A few studies dealt with antecedents to intention to use mobile services; some discussed general
attitudes that influence intention to use mobile services (Bouwman et al. 2006). Other studies
concentrated on two main motivations of intention, perceived ease of use and perceived
usefulness, as suggested in the technology acceptance model (Teo and Pok 2003). This thesis
focuses on specific beliefs and attitudes related to intention to use mobile music services. It also
proposes the important role of image congruence in predicting consumers’ intention, since the
use of mobile music service can be a way to express personality, status, and image in a public
context (Nysveen et al. 2005).
Consistent with the theory of planned behavior (Ajzen 1991), intentions to use mobile music
services were predicted very well from consumers’ attitudes toward using mobile music services,
from subjective norms, and from perceived control over the use of the service. The results in the
data analysis showed that the attitude construct was most important in predicting intention to use
mobile music services, accounting for 35% of the variance in intention in the main survey and
45% in the student survey. Although the important role of attitude in the prediction of behavioral
intention using the TPB model has been well-established (Conner and Armitage 1998), its role in
predicting intention to use mobile-related services remains controversial. Nysveen et al. (2005)
125
reported that attitude is the most important construct in predicting intention to use mobile
services, whereas Hung et al. (2003) found that the role of attitude in predicting intention to use
WAP services was more modest.
The present study also found that intention to use mobile music services was strongly influenced
by the use of the service by important others. This finding implicates that market gain for mobile
music services in terms of customer base is promising since acquisition of one more customer
may lead to the participation of other who are important to the former. Perceived behavioral
control, the third construct in the theory of planned behavior, accounted for a small additional
variance in intention (ΔR2 = 7% in both surveys). This is in line with the results from previous
research applying the TPB in explaining behavioral intention. Meta-analysis directly comparing
the TRA and TPB (Conner and Armitage 1998) reported that the PBC construct added an average
of 5% to the variance explained by intention, over and above attitude and subjective norm. Direct
PBC in the current study represented the weakest influence on intention, suggesting that the use
of mobile music services is largely under volitional control and that the majority of Swedish
consumers are not concerned about their ability to overcome difficulties in downloading mobile
songs or listening to streaming music on the phone.
Of most importance is the result from the inclusion of image congruence in the TPB. The
addition of image congruence significantly increased the amount of variance explained over
classic TPB constructs. Thus, results from both surveys supported the notion that although the
theory of planned behavior is relevant to the prediction of intention to use mobile-related services,
our understanding is improved by combining the TPB model with concepts derived from image
congruence theory. Given the findings suggesting the predictability of intention from image
congruence (Fitzmaurice 2005; Nysveen et al. 2005, Mannetti, 2002), it is reasonable to conclude
that image congruence represents an active and deliberate cognitive process that is different from
the TPB constructs, supporting the proposed hypothesis that image congruence has an
independent effect on behavioral intention.
Overall, the present research model accounted for 69% variance in intention in the main survey
and 72% in the student survey. Compared with the average variance of 40% to 50% of previous
126
research using TPB (Sutton, 1998), it can be concluded that the model performed well in
predicting intention to use mobile music service. The explanatory power of the model was more
impressed when 69% and 72% of variance in intention was accounted by only four predictors:
attitude, subjective norm, PBC and image congruence. According to Sutton (1988, p. 1322),
“other things being equal, we would be more impressed by a model that accounted for 50% of the
variance intentions using two or three predictors than by a model that explained the same amount
of variance but required eight or nine predictors to do so.”
Beyond demonstrating the effectiveness of the research model in predicting intentions, the
findings also supported the assumption in TPB that attitudes and perceived behavioral control are
derived from behavioral and control beliefs, respectively. The significant correlations between
direct measures of these constructs and their respective belief-based aggregates support the
arguments that attitudes toward an action are determined by beliefs about the outcomes of the
behavior and that perceived behavioral control are determined by beliefs about factors that make
it difficult or easy to perform the behavior. The investigation of beliefs about difficulties in using
mobile music services gives a better understanding of the factors that might be involved. The
results reveal that not knowing how to use the service, lack of awareness of the service, and
having handsets without appropriate function to use the service are among the important control
factors. Service providers should target these factors to increase service use.
Beliefs about the advantages and disadvantages of using mobile music services and their likely
outcomes offer insights into the determinants of attitude. Intention to use mobile music services
was associated with three general beliefs: the service provides access to music anytime,
anywhere; the service is expensive; and it is convenient to have a multi-functional device.
Technology-specific beliefs such as sound quality, navigation, and download speed were not
found significantly correlated to intention. In designing intervention programs to promote the use
of mobile music services, service providers should rather emphasize that using mobile music
services will provide users with the convenience about ubiquitous access of music and the
benefits of owning a multi-functional device than promote highly advanced functions of their
service such as sound quality, download speed since the result of the study indicated that these
attributes are perceived less important by consumers. Service providers should also note that the
127
majority of Swedish consumers perceive using mobile music services as very costly. Since this
belief is found significantly associated with intention, it might be necessary for service providers
to design interventions that can change this perception.
Finally, of particular interest was a hypothesized positive correlation between the technology
readiness index (Parasuraman 2000) and the intention to use mobile music services that was not
supported by the empirical data in both surveys. There were two possible explanations for this
result. First, the technology readiness index was originally developed based on a US sample.
Second, the full TRI scale comprises 36 items used for studies focusing primarily on technology
readiness. In the present study, since TRI was one of the variables for the analysis but not the
main focus of the research, a ten-item scale (Parasuraman and Colby 2001) was utilized. As a
result of these changes, the instrument may lack equivalence.
However, the results from the two surveys show that TRI was positively correlated with
perceived behavioral control, indicating that people with a high level of technology readiness
may face less difficulty in using mobile music services. According to the theory of planned
behavior (Ajzen 1991), psychographics are the background variables that influence behavioral
intention indirectly through their influence on beliefs and other direct-measured TPB constructs.
Although the data analysis in the current study does not support a psychographic-PBC-intention
cognitive hierarchy, our findings confirm the relationship between PBC and the technology
readiness index, which can be considered as a psychographic variable.
6.1.2 The relationship between demographic variables and constructs In the main survey, the result of the analysis of differences in means of intention showed that
Swedish consumers in four age groups between 15 and 54 were not significantly different in their
intentions to use mobile music services. A significant difference was found between the 15 to 24
age group and the 55 and older age group as well as between the 25 to 34 age group and the 55
and older age group. It has been generally presumed that the most important market segment for
mobile music services is young people. Most marketing campaigns aiming to promote mobile
music services have targeted this group. This finding suggests that other age groups, except for
the 55 and older age group, might represent potential growth for the market and could be
included in the market target strategy for practitioners.
128
Similar to results regarding intention, differences in means of attitude, subjective norm, PBC, and
image congruence were found between the 15 to 24 age group and the 55 and older age group
only. Thus, the findings were inconsistent with the negative relationship between age and
acceptance of technological change in the information system research area (Harrison and Rainer
Jr. 1992; Nickel and Pinto 1986). One possible explanation is that Swedish consumers might not
perceive the use of mobile music services as a technological change. The main survey found that
Swedish men reported more positive control over the use of mobile music services than Swedish
women. The student survey found significant differences between male and female students
regarding TRI. This finding was in line with past research in which men tend to be more skillful
in technology than women (Harrison and Rainer Jr. 1992; Venkatesh and Morris 2000).
Regarding education, respondents with primary education reported more positive attitudes toward
using mobile music services than respondents with college and postgraduate education. This
finding contrasts with well-established results in information system research. For example,
education was found to be negatively associated to computer anxiety (Igbarian and Parasuraman
1989); moreover, lack of education and knowledge about technology were found to cause
operational fears about how to use technology (Howard and Smith 1986). This inconsistency
favored the above-mentioned explanation that using mobile music services might not be a
technological challenge to Swedish consumers.
Of most importance were the findings about users and non-users. In the main survey, 25.4% of
the sampling population were current users of mobile music services and 65.7 % were non-users.
In the student survey, a statistically similar percentage was found among users and non-users
(25.6% and 66.7%, respectively) despite the smaller sample size and different demographic
characteristics. These figures demonstrate that the Swedish market has potential for growth.
Droppers of the service accounted for 9% of the sampling population. This fact signals a warning
to service providers in terms of the defection rate. The results of the data analysis show that users
have stronger intention to use mobile music services, have a more positive attitude toward the
service, have more social pressure to use the service, and find the image of the typical users to be
129
more similar to their self image than non-users. Droppers also reported more social pressure,
higher image congruence, and stronger intention to use mobile music services.
The results from the main survey suggest a basic profile for mobile music service users as
relatively young (86.4% are under age 45) without a high level of education (66.7% completed
primary and secondary education). Workers accounted for highest percentage of users (25%).
Students accounted for a small portion of mobile music users (18.3%) but a large proportion of
droppers (35%), indicating the instability of this group. A tentative explanation is that students
may not afford it over the long term due to the perceived high cost of the service.
6.2 Theoretical implications The results of the two surveys supported the power of the theory of planned behavior in
predicting intention to use mobile music services. In the main survey, direct measures of attitude,
subjective norm, and perceived behavioral control accounted for a significant proportion of
variance in behavioral intention (R2 = 0.69). In the student survey, they accounted for an even
higher percentage (72%). Consistent with previous research (Ajzen 1991; Armitage and Conner
2001), attitude was the strongest predictor (R2 = 0.35 in the main survey and = 0.45 in the student
survey). However, in both surveys, subjective norm was found to be a stronger predictor than
PBC. In the main survey, it added 13% to the variance in intention, compared to 7% of PBC. In
the student survey, it added 16% to the variance in intention compared to 7% of PBC. This
finding was not in line with previous studies. Meta analysis on research using TPB demonstrated
that subjective norm, in the majority of cases, had the weakest effect on intention (Ajzen and
Fishbein 1980; Armitage and Conner 2001). This suggests that the type of behavior under
investigation may affect the relative importance of independent variables on intention in the TPB.
In this context, the decision to use mobile music services is more likely to be influenced by
normative pressures. The weakest effect of PBC on intention implicates that using mobile music
services may be under volitional control, especially for male respondents.
A number of researchers have suggested that the addition of certain variables can increase the
predictive power of the TPB (Armitage and Conner 2001; Charng et al. 1988; Eagly and Chaiken
1993). In this thesis, the inclusion of image congruence led to a significant increment of 14% and
130
4% for variance in intention in the main survey and in the student survey, respectively. This
result supported the view that it is not sufficient for a model explaining intention and behavior to
be based only on expected utility. Rather, the decisions to engage in a behavior are influenced by
a multitude of considerations. Classic constructs within the TPB are conceptualized based on
utilitarian expectations. The successful incorporation of image congruence into the TPB of this
study suggests that, in addition to utilitarian considerations, symbolic benefits could be another
type of motivation for behavior. However, as Featherstone (1991, p.82) suggested, utilitarian and
symbolic motives of behaviors should be regarded as a balance in consumer culture instead of as
“exclusive either/or polarities.”
This study also regards the use of mobile music services as a technology adoption process. In this
view, the inclusion of theories in the domain of technology adoption such as the technology
readiness index (Parasuraman 2000) into the research model is considered necessary, since it
gave a holistic view for explaining motivations for behavioral intention. The TRI did not
correlate with intention in either survey; this result was no surprise, since Ajzen and Fishbein
(1980) suggested that personality-related variables should be regarded as external variables and
their influence on intention is generally indirect and mediated by TPB constructs. However, TRI
was found to correlate with PBC in both surveys, indicating that these two concepts share certain
similarities. In fact, the TRI is conceptualized as the propensity of consumers toward a broad
categories of behaviors (e.g., adopting new technology), whereas PBC refers to the control of a
person regarding a specific behavioral context and not to a generalized predisposition (Ajzen
1991). The findings thus implicitly emphasize the importance of compatibility in the TPB. The
principle of compatibility requires that measures of independent variables and intention should
involve the same behavior, target, context, and time elements, whether defined at a specific or at
a general level (Fishbein and Ajzen 1975). As Ajzen (2006) notes, “Compatibility principle has
been broadly applied to many domains, and empirical support for the principle is so strong and
consistent as to justify its designation as a law of human behavior.”
To sum up, this study has successfully constructed a research model that integrated the TPB and
image congruence theory in an attempt to explain consumers’ antecedents to behavioral intention.
The study thus contributes to the growing body of literature and empirical studies supporting the
131
importance of image congruence as an independent predictor of behavioral intention (e.g.,
Kleijnen et al. 2005; Nysveen et al. 2005; Fitzmaurice 2005; Mannetti et al. 2002). Regarding
TRI, the study contributed in terms of replication. The relationship between TRI and intention
was not supported in this study, thus calling for future research in this domain.
6.3 Managerial implications The findings of this study support the proposal that attitudes are a function of beliefs about the
attitude object (Ajzen 1991). This implies that practitioners can deliver persuasive messages
attacking beliefs about a service in order to produce changes in consumer attitudes toward that
service. By the same line of reasoning, persuasive communications aimed at normative and
control beliefs will induce changes in subjective norms and perceived behavioral control. These
findings facilitate practitioners in devising appropriate measures to enhance the adoption of
mobile music services. Intervention programs should strengthen positive beliefs that correlate
with intention. Regarding behavioral beliefs, marketers should emphasize the benefits of
accessing music anytime, anywhere, and of having a multi-functioning device. They should also
alter consumers’ negative beliefs about the high cost of the service. Marketers should also tackle
issues of usability, service awareness, and supporting handsets. One tentative solution is to
provide personal guidance service in mobile phone stores that offer instructions, frequently asked
questions, a toll-free number, and online help (Meuter et al. 2005). Another solution could be to
provide free trial of the service for a period of time. Since females were found to have more
usability problems with the service than males, this group should receive more attention in any
solution aimed at modifying beliefs about the ease of use of the service.
This study also shows that users are influenced by their social circles and important people in
their lives when deciding whether to adopt mobile music services. This implies that marketers
should pay attention to the reference group that comprises early adopters. Since this group can
influence the adoption decision of their social circles, marketers should build customer
relationship management programs to shape their perceptions about the service in positive
directions. Furthermore, the results from the main survey reveal that age does not strongly impact
intention to use mobile music services. Thus, service providers can target customers in older age
132
groups. The basic profile of mobile music users can be described as relatively young, without
high education levels; the majority are workers and professionals.
Finally, the findings support image congruence as a strong predictor of behavioral intention. This
suggests that mobile music services should be promoted as lifestyle service rather than a
functional service. Instead of promoting advanced functional possibility of the service, marketers
should emphasize symbolic and expressive benefits as well as the fit between the image of typical
user of the service and one’s self image. By this, they have to segment their markets in terms of
consumer image (Kleijnen et al. 2005) and provide timely, updated and personalized music
contents. They should also design marketing campaigns that aim at developing and positioning
the image of the typical service user closer to the perceived self-image of the target customer
groups. Just like Fitzmaurice (2005, p.925) notes, “messages depicting a fuller picture of the type
of person who would engage in the new behavior may encourage consumers to more easily
discover that their own self images matches the image of the typical person who would engage in
the new behavior.” The use of opinion leaders as spokespersons for the mobile music user
community is also another possible solution. In summary, the inclusion of image congruence as
an antecedent to intention to use mobile music services provides a broad perspective for
persuasive marketing, in which symbolic benefits should be taken into consideration.
6.4 Limitations It is important to note a number of limitations in the present study. First, the study looked at
mobile music services from a consumer’s perspective. For an overview, perspectives from other
players in the mobile value chain, such as mobile operators, content and application providers,
handset manufacturers, should be investigated. Second, the actual measure for future action was
not obtained. According to Sutton (1998), intention should be cautiously used as a predictor for
behavior, because intention expressed in the questionnaire may be hypothetical or provisional.
Solution to this is to “present participants with a real decision that has significant personal
consequences and to measure their intention in that situation (Sutton 1998, p.1327).
However, there is substantial empirical support for the predictive validity of intentions for
behavior in a number of domains (Ajzen 1991; Ryan and Bonfield 1980; Sheppard et al. 1988).
133
Meta analysis research reports that measures of behavioral intention typically account for 20 to
40% of the variance in behavior (Ajzen 1991; Conner and Armitage 1998). The predictive power
of intention for behavior is “limited only by the legality or morality of the course of action being
studied” (Harrison and Rainer Jr. 1992). For example, people generally do not report their
intention to perform illegal or immoral acts. Since intention to use mobile music services has
none of these problems, the lack of measurement of future behavior is not regarded as a major
methodological concern.
Moreover, the study is cross-sectional in nature, acting as a snapshot of independent constructs
and behavioral intention. Since mobile technology and the media sector change rapidly, it
remains to be seen how future development will affect the variables examined in the research
model. Consequently, the relationship between these variables may be altered. A longitudinal
research design might be more appropriate.
The research model in the present study assumed a causal process by which constructs such as
attitudes, subjective norms, PBC, image congruence effect intention. The covariation found
between independent variables and intention in the model “are necessary, but not sufficient
conditions” (Harrison et al 1992, p.188) for inferring that independent variables have causal
influences on intention to use mobile music services. This issue needs to be validated through
further experimental studies. Many field-based experiments of the TPB have supported causal
effects among TPB constructs and intention (Ajzen 1988), but none have been conducted in the
context of adopting mobile music services.
The study also lacks a measure of non-response bias and failed to determine whether there was a
difference in response patterns between participants and non-participants. There is a high
proportion of respondents in the study that have never used mobile music services. As a
consequence, the advantages and disadvantages of the service might be based to a great extent on
their imagination (Burke 2002). Thus, caution should be given in the generalization of the
findings.
134
Self-reports in both surveys might have increased correlations between independent variables due
to common method variance, which “generates more shared variance among independent
variables, making it less likely that any one of them would have made a unique contribution to
the dependent variable” (Harrison et al 1992, p.188). However, in this study, the factor scores of
the independent variables were used in the regression equation. This method reduced the
multicollinearity among the four independent variables and enabled each variable to add
incremental variance to the explanation of intention in the regression analysis.
More advanced and rigorous statistic techniques, such as confirmatory factor analysis and
structural equation modeling, could have been used for data analysis instead of the principal
component factor analysis and multiple regressions. Moreover, the study was conducted in
Sweden, which is one of the countries with the highest penetration of mobile service usage. This
may limit the generalization of the study to other countries with less advancement in the field.
6.5 Directions for future studies The basic assumption of the theory of planned behavior is that the behavior of a person is
intentional. The TPB works well when used to predict behavior that is deliberate and rational.
Thus, in certain situations when the behavior is spontaneous, alternative models that consider the
role of accessibility might be needed (Fazio 1990; Kallgren and Woods 1986).
Since the study is a cross-sectional design, it reflects the relationship between independent
constructs and behavioral intention at a given point of time. Therefore, our understanding of how
these beliefs, attitudes and intention change over time is restricted. Thus, longitudinal design will
also help measure future behavior. A high correlation will strengthen arguments that intention
alone can serve as a reliable approximation for actual behavior. According to Taylor and Todd
(1995a), “examining a new product innovation at early point in the diffusion cycle may show
results that run counter to those where product use or consumption are measured after adoption.”
A longitudinal design can investigate pre- and post-adoption beliefs and attitudes (Karahanna and
Straub 1999), thus providing a better understanding of the changes of these constructs over time.
135
As previously stated, service evaluations from some non-users might be based on imagination
about the benefits and features of the service. Examination of respondents’ preferences based on
real experiments with mobile music services could be another direction for future studies. In
experimental design, constructs in the present research model can be manipulated to obtain
different levels across subsets of respondent groups. This will validate the assumption of causal
effects among independent constructs with intention in the present research model. According
Ajzen and Fishbein (1980, p. 46), “a person’s intention to perform a given behavior can not be
used to predict the extent, magnitude, or frequency of that action.” Similarly, in this thesis, the
result did not tell us how frequently a person uses mobile music services. Future research could
investigate the relation between usage frequency and constructs such as attitude, subjective norm,
PBC, image congruence, and intention.
One of the theoretical contributions of the present study is to incorporate the role of image
congruence in determining behavioral intention. This study focused on the degree-of-fit between
self-image and the image of the typical service user. In the self-concept literature, self-image is
only one dimension related to self-concept. Other dimensions include the ideal self, the relational
self, and the social self (Sirgy 1982); future research should also consider these dimensions.
Additional studies should identify and examine other variables that may moderate the effect of
image congruence on behavioral intention. One promising variable might be the involvement
level of consumers regarding the image congruence relationship. According to Graeff (1996,
p.16), “when consumers are highly involved (e.g. when buying a car) versus when they are less
involved (e.g. buying a soft drink), they will probably want more information about the brand
than just its image.” Future research could elaborate more on this issue to give deeper
understanding of these relationships.
The successful incorporation of image congruence into the TPB model also indicates that
research on technology adoption should go beyond functional and utilitarian aspects (Davis 1993;
Taylor and Todd 1995a). Future research should pay more attention to variables that provide
symbolic and expressive benefits to consumers. The direct effect of the TRI on intention to use
mobile music services was not supported by the empirical data. Future studies could examine the
relation between TRI and behavioral intention in other technology-related service domains. If
136
possible, a full 36-item TRI scale should be used to provide a comparative analysis with original
studies by Parasuraman (2000) and other replications (e.g., Tsikriktsis 2004).
The research domain of this study is mobile music service, which is quite new to consumers.
According to Tornatzky and Klein (1982), “innovation characteristic studies should gather
measures of innovation characteristics across several innovations, not a single innovation at a
time.” Therefore, future research should replicate the model with other mobile services such as
mobile gaming, mobile payment, and mobile television. The results from these studies might
provide a strong validation to the existing model. Besides, this study looked at mobile music
services from a consumer perspective, but other studies might investigate the perspectives of
business players in the mobile value chain such as mobile operators, content providers, record
companies, device manufacturers, and middleware providers.
Finally, the study was conducted in Lulea, a small city in the Northern Sweden. Replication of
the research in other countries might increase the validity of the results. The effect of cultural
differences (Hofstede 1980) on mobile music service adoption of consumers from different
cultures (e.g., collectivist versus individualist) could be another interesting area for future
research.
6.6 Conclusion Previous studies (Hung et al. 2003; Nysveen et al. 2005; Teo and Pok 2003) have focused on
investigating the determinants of intention to use mobile services; this study is the first to
investigate antecedents to intention to use mobile music services. Using the TPB as the core
model, the study identified factors that might facilitate or hinder service use. The relation
between TPB constructs and intention to use mobile music services appeared to be consistent
with previous studies. However, the relation between TRI and intention was not supported by the
empirical results. This calls for more research in the domain.
The successful incorporation of the image congruence construct into the TPB increases the
predictive power of the model. Attitudes within the TPB are conceptualized based on utilitarian
outcomes, not symbolic outcomes (McCracken 1986).The proposed research model considers
137
utilitarian motivations as well as symbolic benefits that drive behavioral intention. The findings
support a positive relation between image congruence and behavioral intention, demonstrating
that it is not sufficient to use an attitudinal model based only on expected utility. Instead,
researchers must consider “socially and culturally fashioned symbolic meanings” (Sparks and
Guthrie 1988, p.397). The findings of the study support Featherstone’s (1991) view about a co-
existence of instrumental and expressive dimensions of consumer concerns. In sum, the research
model can be applicable to other domains as long as behaviors are deliberate and driven by both
utilitarian and symbolic motivations. The findings inspire confidence for marketers in developing
marketing programs that aim at increasing the adoption rate of mobile music services.
+ + + + + + + + ++
138
References Agnew, C. (1998), "Modal versus individually derived behavioral and normative belief about condom use: Comparing measurement alternatives of the cognitive underpinnings of the theory of reasoned action and planned behavior," Psychology and Health, 13, 271-87. Ajzen, Icek. and Martin Fishbein (1980), Understanding attitudes and predicting social behavior. EngleCliffs-Wood: NJ: Prentice Hall. Ajzen, Icek. and T.J. Madden (1986), "Prediction of goal-directed behavior: Attitudes, intentions, and perceived behavioral control," Journal of Experimental Social Psychology, 22, 453-74. Ajzen, Icek (1988), Attitudes, personality and behavior. Milton Keynes: Open University Press. ---- (2006), "Constructing a TPB Questionnaire: Conceptual and Methodological Considerations." Amherst: University of Massachusetts. ---- (2001), "Nature and operation of attitudes," Annual Review of Psychology, 52, 27-58. ---- (1991), "The theory of planned behavior," Organizational Behavior and Human Decision Processes, 50, 179-211. Ajzen, Icek, R.K Darroch, Martin Fishbein, and J.A Hornik (1970), "Looking backward revisited: A reply to Deutscher," The American Sociologist, 5, 267-73. Ajzen, Icek and B. L Driver (1992), "Application of the Theory of Planned Behavior to Leisure Choice," Journal of Leisure Research, 24 (3), 207-24. Ajzen, Icek and Martin Fishbein (1977), "Attitude-Behavior Relations: A Theoretical Analysis and Review of Empirical Research," Psychological Bulletin, 84 (5), 888-918. ---- (1974), "Factors influencing intentions and the intention-behavior relation," Human Relations, 27, 1-15. ---- (1970), "The prediction of behavior from attitudinal and normative variables," Journal of Experimental Social Psychology, 6, 466-87. Allport, Gordon W (1935), "Attitudes," in Handbook of Social Psychology, C Murchison, Ed. Worcester, Mass: Clark University Press. ARC Group (2001), "Ringtones to dominate mobile music," in http://www.arcgroup.com/homepage/nsf/prs/pr011009, accessed date: 16 March 2007

139
Armitage, C.J. and M. Conner (1999), "Distinguishing Perceptions of Control From Self-Efficacy: Predicting Consumption of a Low-Fat Diet Using the Theory of Planned Behavior," Journal of Applied Social Psychology, 29 (1), 72-90. ---- (2001), "Efficacy of the Theory of Planned Behavior: A meta-analytic review," British Journal of Social Psychology., 40, 471-99. Aronson, Elliot (1992), "The return of the Repressed: Dissonance theory makes a comeback," Psychological Inquiry, 3 (4), 303-11. Aronson, Elliot, Timothy D Wilson, and Robin M Akert (1999), Social Psychology. New York: Longman. Assael, Henry (1995), Consumer behavior and marketing action (Fifth ed.). Cincinnati, Ohio: South-Western College Publishing. Atkinson, J.W (1957), "Motivational determinants of risk-taking behavior," Psychological Review, 64, 359-72. Bagozzi, Richard P (1975), "Marketing as Exchange," Journal of Marketing, 39 (4), 32-39. Bagozzi, Richard P, Zeynep Gurhan-Canli, and Joseph R Priester (2002), The Social Psychology of Consumer Behavior. Buckingham: Open University Press. Balasubramanian, Sridhar, Robert A. Peterson, and Sirkka L. Jarvenppa (2002), "Exploring the implications of M-commerce for markets and marketing," Journal of the Academy of Marketing Sciences, 30 (4), 348-61. Baldi, Stefan and Heike Pyu-Pyu Thaung (2002), "The entertaining way to M-commerce: Japan's approach to the mobile internet - a model for Europe?" Electronic markets, 12 (1), 6-13. Bandura, A. (1977), "Self-efficacy: Toward a unifying theory of behavioral change," Psychological Review, 84, 191-215. Barnes, Stuart J. (2002), "The mobile commerce value chain: analysis and future developments," International journal of information management, 22 (2), 91-108. Basso, Monica (2001), "Mobile portals: Five critical success factors," in http://www.gartner.com/1_researchanalysis/focus/wireless120601.html, accessed date: 26 Feb 2007 Beck, L. and L. Ajzen (1991), "Predicting dishonest actions using the theory of planned behavior," Journal of Research in Personality, 25, 285-301. Belch, George E and E Laird Jr. Landon (1977), "Discriminant validity of a product-anchored self-concept measure," Journal of Marketing Research, 14, 252-56.
140
Belk, Russell W (1988), "Possession and the extended self," Journal of Consumer Research, 15 (2), 139-68. Belk, Russell W, Kenneth D. Bahn, and Robert N. Mayer (1982), "Developmental Recognition of Consumption Symbolism," The journal of consumer research, 9 (1), 4-17. Berry, William D. and Stanley Feldman (1985), Multiple regression in practice: Sage Publishers. Birdwell, A E (1968), "A study of the influence of image congruence in consumer choice," Journal of Business, 41 (January), 76-88. Blumberg, Boris, Donald R. Cooper, and Pamela S. Schindler (2005), Business Research Method. London: McGraw-Hill. Bouwman, Harry, Carlsson Christer, Francisco Monila-Castillo, and Walden Pirkko (2006), "Barriers and drivers in the adoption of current and future mobile services in Finland," Telematics and Informatics, xxx, 1-16. Brehm, Sharon S, Saul M Kassin, and Steven Fein (1999), Social Psychology. Boston: Houghton Mifflin Company. Bryman, Alan and Emma Bell (2003), Business Research Method. Oxford: Oxford University Press. Burke, R. R. (2002), "Technology and the customer interface: what consumers want in the physical and virtual store," Journal of the Academy of Marketing Sciences, 30 (4), 411-32. Bush, Alan J, Hair, Joseph F. Jr., “An assessment of the mall intercept as a data collection method,” Journal of Marketing Research, 22 (2), 158-167 Carlson, E R (1956), "Attitude change through modification of attitude structure," Journal of Abnormal and Social Psychology, 52, 256-61. Cartwright, Dorwin D C (1949), "Some Principles of Mass Persuasion," Human Relations, 2 (3), 253. Chan, D.K and Martin Fishbein (1993), "Determinants of college women's intentions to tell their partners to use condoms," Journal of Applied Social Psychology, 23, 1455-70. Chapin, F Stuart Jr. (1974) “Human activity patterns in the city.” New York: John Wiley and Son, Inc. Charng, Hong-Wen, Jane Allyn Piliavin, and Peter L Callero (1988), "Role identity and Reasoned Action in the Prediction of Repeated Behavior," Social Psychology Quarterly, 51 (4), 303-17.
141
Chau, Patrick. Y. K. (1996), "An Empirical Assessment of a Modified Technology Acceptance Model," Journal of Management Information System, 13 (2), 185-204. Churchill, Gilbert A, Jr. (2001), Basic Marketing Research: Thompson Learning. Cochran, W. G. (1977), Sampling techniques (Third ed.). New York: John Wiley and Sons. Compeau, Deborah and Christopher E. Higgins (1999), "Social Cognitive Theory and Individual Reactions to Computing Technology: A longitudinal Study," MIS Quarterly, 23 (2), 145-58. Conner, M. and C.J. Armitage (1998), "Extending the Theory of Planned Behavior: a review and avenues for further research," Journal of Applied Social Psychology, 28 (15), 1429-64. Conner, Mark and Paul Sparks (1996), "The Theory of Planned Behavior and Health Behaviors," in Predicting Health Behaviour, Mark Conner and P. Norman, Eds. Buckingham: Open University Press. Cooley, Charles Horton (1902/1983), Human Nature and Social Order. New York: Schocken books. Cooper, Donal R. and Pamela S. Schindler (2003), Business Research Methods (Eighth ed.). Singapore: McGraw Hill. Corey, S M (1937), "Professed attitudes and actual behavior," Journal of Educational Psychology, 28, 271-80. Courneya, Kerry S., Todd M. Bobick, and Robert J. Schinke (1999), "Does the Theory of Planned Behavior Mediate the Relation Between Personality and Exercise Behavior?" Basic and Applied Social Psychology, 21 (4), 317-24. Creswell, J.W. (1994), Research design: qualitative and quantitative approaches. Thousand Oaks: Sage Publications. Cronbach, Lee J. (1951), "Coefficient alpha and the internal structure of tests," Psychometrika, 16 (October), 297-334. Cummings, William H and M Venkatesan (1976), "Cognitive dissonance and consumer behavior: a review of evidence," Journal of Marketing Research, XIII (August 1976), 303-08. Curran, James M., Mathew L. Meuter, and Carol F. Surprenant (2003), "Intentions to use Self-Service Technologies: A confluence of Multiple Attitudes," Journal of Service Research, 5 (3), 209-24. Dabholkar, Pratibha A. and Richard P Bagozzi (2002), "An Attitudinal Model of Technology-Based Self-Service: Moderating Effects of Consumer Traits and Situational Factors," Journal of the Academy of Marketing Sciences, 30 (3), 184-201.
142
Daniel, Elizabeth (2007), "Will mobile music sound the blues for the music industry?" in http://www.open2.net/money/briefs_20060519mobile.html, accessed date: 27 March 2007. Darren, George and Paul Mallery (2005), SPSS for windows step by step: a simple guide and reference 12.0 update. Boston: Allyna and Bacon. Davis, F.D (1993), "User Acceptance of Information Technology: System Characteristics, User Perceptions and Behavioral Impacts," International Journal of Man-Machine Studies, 39, 475-87. Davis, Larry E., Icek Ajzen, Jeanne Saunders, and Trina Williams (2002), "The decision of African American students to comple high school: An application of the Theory of Planned Behavior," Journal of Educational Psychology, 94 (4), 810-19. Day GS, Montgomery DB. (1999), "Charting new directions for marketing," Journal of Marketing, 63 (5), 3-13. DePaulo, Bella M (1992), "Nonverbal Behavior and Self-Presentation," Psychological Bulletin, 111 (2), 203-43. Ditmar, Helga and John Drury (2000), "Self-image - is it in the bag? A qualitative comparison between "ordinary" and "excessive" consumers," Journal of Economic Psychology, 21, 109-42. Dolich, I (1969), "Congruence relationships between self-images and product brands," Journal of Marketing Research, 5, 50-63. Dulany, D. E. (1961), "Hypotheses and habits in verbal "operant conditioning"," Journal of Abnormal and Social Psychology, 63, 251-63. Eagly, Alice H and Shelly Chaiken (1993), The psychology of attitudes. New York: Harcourt. Edwards, W. (1954), "The theory of decision making," Psychological Bulletin, 51, 380-417. Fazio, R. H. (1990), "Multiple processes by which attitudes guide behavior: The MODE model as an integrative framework," in Advances in experimental social psychology, M. P Zanna, Ed. New York: Academic Press. Featherstone, M. (1991), Consumer culture and postmodernism. London: Sage. Festinger, Leon (1957), A theory of cognitive dissonance. Stanford, Calif: Stanford U.P. Fishbein, Martin (1967), "Attitude and the Prediction of Behavior," in Readings in Attitude theory and Measurement, Martin Fishbein, Ed. New York: John Wiley and Son. ---- (1993), "Introduction," in The Theory of Reasoned Action: Its Application to AIDS-preventive Behavior, D. J. Terry and C. Gallois and M. McCamish, Eds. Oxford: Pergamon.
143
---- (1963), "An Investigation of the Relationships between Beliefs about an Object and the Attitude toward that Object," Human Relations, 16 (3), 233. Fishbein, Martin and Icek Ajzen (1975), Belief, attitude, intention, and behavior: An introduction to theory and research: MA, Addison-Wesley. Fishbein, Martin and Bertram Raven (1962), "The AB Scales," Human Relations, 15 (1), 35. Fitzmaurice, Julie (2005), "Incorporating consumers' motivation into the Theory of Reasoned Action," Psychology and Marketing, 22 (11), 911-29.
French, J. R. P., and Raven, B. H. (1959). The bases of social power. In D. Cartwright (Ed.), Studies in social power (pp. 150-167). Ann Arbor: University of Michigan.
Fry, J. N. (1971), "Personality variables and cigarette brand choice," Journal of Marketing Research, 8, 298-304. Fulton, D. C., M. J. Manfredo, and J. Lipscomb (1996), "Wildlife value orientations: A conceptual and measuring approach," Human Dimension of Wildlife, 1 (2), 24-47. Gardner, Burleigh B and Levy J. Sidney (1955), "The Product and the Brand," Harvard Business Review, 33 (April), 33-39. Garson, David (2007), "Univariate GLM, ANOVA, and ANCOVA," Vol. 2007, http://www2.chass.ncsu.edu/garson/PA765/anova.htm, accessed date: 10 December, 2006. Gibbons, Frederick, Tami Eggleston, and Alida C Benthin (1997), "Cognitive Reactions to Smoking Relapse: The Reciprocal Relation Between Dissonance and Self-Esteem," Journal of Personality and Social Psychology, 72 (1), 184-95. Godin, G., E. Maticka-Tyndale, A. Adrien, and S. Manson-Singer (1996), "Cross-culture testing of three social cognitive theories: An application to condom use," Journal of Applied Social Psychology, 26, 1556-86. Goffman, Erving (1959/1990), The presentation of self in everyday life. London: Penguin. Graeff, Timothy R (1997), "Consumption situations and the effects of brand image on consumers' brand evaluations," Psychology and Marketing, 14 (1), 49-70. ---- (1996), "Using Promotional Messages to Manage the Effects of Brand and Self-Image on Brand Evaluations," Journal of Consumer Marketing, 13 (3), 4-18. Grice, J. W (2001), "Computing and evaluating factor scores," Psychological methods, 6, 430-50. Grubb, Edward L and Gregg Hubb (1968), "Perception of Self, generalized stereotypes, and brand selection," Journal of Marketing Research, 5 (1), 58-63.
144
Grubb, Edward L. and Harrison L. Grathwohl (1967), "Consumer Self-Concept, Symbolism and Market Behavior: A Theoretical Approach," Journal of Marketing, 31 (4), 22-27. Hair, Joseph F., Jr, Rolph E. Anderson, Tatham L. Ronald, and William C. Black (1998), Multivariate Data Analysis: Prentice-Hall International. Hair, Joseph F., Jr, Barry Babin, Arthur H. Money, and Phillip Samouel (2003), Essentials of Business Research Methods: Willey. Hamm, B Curtis and Edward W Cundiff (1969), "Self-actualization and product perception," Journal of Marketing Research, 6 (4), 470-72. Harrison, A. W. and R. K. Rainer Jr (1992), "The influence of individual differences on skill in end-user computing," Journal of Management Information System, 9 (1), 93-111. Harrison, David A., Mykytyn Jr, Peter P., Riemenschneider, Cynthia K. (1997), “Executive decisions about adoption of information technology in small business: theory and empirical tests,” Information System Research, 8 (2), 171-195 Heider, Fritz (1946), "Attitudes and Cognitive Organization," Journal of Psychology, 21, 107-12. Heise, D. R. (1970), "The Semantic Differential and Attitude Research," in Attitude measurement, G. F. Summers, Ed. Chicago: Rand McNally. Hikmet, N. and K. Chen (2003), "An investigation into low mail survey response rates of information technology users in health care organizations," International Journal of Medical Informatics, 72 (1), 29-34. Hidiroglu, M. A., James H. Drew, and G. B. Gray (1993), "A Framework for measuring and reducing nonresponse in surveys," Survey methodology, 19, 81-94. Higgins, Tory E (1987), "Self-discrepancy: a theory relating self and affect," Psychological Review, 94 (3), 319-40. Hirschman, Elizabeth C (1981), "Symbolism and Technology as Sources for the Generation of Innovations," in Advances in Consumer Research, Andrew Mitchel, Ed. Vol. 9. St. Louis, MO: Association for Consumer Research. Hirschman, Elizabeth C and Morris B Hollbrook (1982), "Hedonic consumption: emerging concepts, methods and propositions," Journal of Marketing, 46 (3), 92-101. Hofstede, Geert (1980), Culture’s Consequences: International Differences in Work-Related Values. Beverly Hills, CA: Sage. Hogg, Margaret K., Alastair J. Cox, and Kathy Keeling (2000), "The impact of self-monitoring on image congruence and product/brand evaluation," European Journal of Marketing, 34 (5/6), 641-66.
145
Hogg, Michael M and Graham M Vaughan (2005), Social Psychology (Fourth ed.). Essex: Pearson Education. Holden, Windsor (2006), "Mobile music ringtones, ringbacks and full tracks," in http://www.juniperresearch.com/shop/viewreport.php?id=57, accessed date: 27 March 2007 Houses, W C (1980), "Effects of knowledge that attributions will be observed by others," Journal of Research in Personality, 14, 528-45. Howard, G. S. and M Smith (1986), "Computer anxiety in management: myth or reality?" Communication of the ACM, 29 (7), 611-15. Hrubes, Daniel, Icek Ajzen, and John Daigle (2001), "Predicting Hunting and Behavior: An Application of the Theory of Planned Behavior," Leisure Sciences, 23, 165-78. Hughes, David G. and Naert A. Phillipe (1970), "A Computer Controlled Experiment in Consumer Behavior," Journal of Business, 43 (July), 354-72. Hung, Shin Yuan, Cheng Yuan Ku, and Chia Ming Chang (2003), "Critical Factors of WAP Services Adoption: An Empirical Study," Electronic Commerce Research And Applications, 2, 42-60. IFPI (2007), "IFPI publishes digital music report 2007," in www.ifpi.org, accessed date: 15 March 2007. Igbarian, Magid and Saroj Parasuraman (1989), "A Path Analytic Study of Individual Characteristics, Computer Anxiety and Attitudes toward Microcomputers," Journal of Management Information System, 15 (3), 373-88. James, William (1890), Principles of psychology. New York: Holt. Kallgren, C. A. III. and W. Woods (1986), "Access to attitude-relevant information in memory as a determinant of attitude-behavior consistency," Journal of Experimental Social Psychology (22), 328-38. Karahanna, Elena and A. Straub (1999), "The Psychological Origins of Perceived Usefulness and Perceived Ease-of-Use," Information & Management, 35, 237-50. Kassarjian, H H and J B Cohen (1965), "Cognitive dissonance and consumer behavior," California Management Review, 55-64. Kassarjian, Harold H. (1971), "Personality and Consumer Behavior: A Review," Journal of Marketing Research, 8 (4), 409-18.
146
Katz, Daniel and Erza Stotland (1959), "A preliminary statement to a theory of attitude structure and change," in Psychology: A Study of a Science, Sigmund Koch, Ed. Vol. 3. New York: McGraw-Hill. Kleijnen, Miralla, Ko de Ruyter, and Tor W Andreassen (2005), "Image congruence and the adoption of service innovations," Journal of Service Research, 7 (4), 343-59. Kleine, Susan Schultz, Robert E III Kleine, and Christ T Allen (1995), "How is a possession "Me" or "Not me” characterize types and an antecedent of material possession attachment," The journal of consumer research, 22 (3), 327-43. Koprowski, Gene J. (2006), "Mobile music overpriced, consumers say," in http://www.ecommercetimes.com/story/50746.html, accessed date: 28 March 2007 Krejcie, R.V. and D.W Morgan (1970), "Determining sample size for research activities," Educational and Psychological Measurement, 30, 606-10. Kretch, D and R S Crutchfield (1948), Theory and problem in social psychology. New York: McGraw-Hill. Landon, E Laird Jr (1974), "Self concept, ideal self concept, and consumer purchase intentions," The journal of consumer research, 1 (2), 44-51. LaPiere, Richard T (1934), "Attitudes versus Actions," Social Forces, 13, 230-37. Laverie, Debra A, Robert E Kleine, and Susan Schultz Kleine (2002), "Reexamination and extension of Kleine, Kleine and Kernan's social identity model of mundane consumption: the mediating role of the appraisal process," Journal of Consumer Research, 28 (March 2002), 659-69. Leary, M R and R M Kowalski (1990), "Impression management: a literature review and two-component model," Psychological Bulletin, 107, 34-47. Lehmann, Donald R., Gupta, Sunil, Steckel, Joel H. (1997), "Marketing research“ Reading, Massachusetts: Addison-Wesley Publishers Inc. Leung, Louis and Ran Wei (2000), "More Than Just Talk on the Move: Uses and Gratifications of the Cellular Phone," Journalism and Mass Communication Quarterly, 77, 308-20. Levy, S. J. (1959), "Symbols for sale," Harvard Business Review, 37, 117-24. Lim, Heejin and Alan J. Dubinsky (2005), "The Theory of Planned Behavior in E-Commerce: Making a Case for Interdependencies between Salient Beliefs," Psychology and Marketing, 22 (10), 833-55.
147
Lulea Kommun (2006) “Short facts about Lulea”, http://www.lulea.se/english/inenglish/moreaboutlulea/shortfactsaboutlulea.4.142ad110e98d650dc800012927.html, accessed date: Feb 15, 2007 Lutz, Richard J. (1991), "The role of attitude theory in marketing," in Perspectives in consumer behavior, Harold H. Kassarjian and Thomas S. Robertson, Eds. Fourth ed.: Prentice-Hall International Editions. Maciness, Ian, Janusz Moneta, Julio Carabalo, and Dominic Sarni (2002), "Business models for mobile content: the cases of m-games," Electronic Markets, 12 (4), 218-27. Malhotra, Naresh K (1981), "A scale to measure self-concepts, person concepts, and product concepts," Journal of Marketing Research, 18 (4), 456-64. Mannetti, Lucia, Antonio Pierro, and Stefano Livi (2002), "Explaining Consumer Conduct: From Planned to Self-Expressive Behavior," Journal of Applied Social Psychology, 32 (7), 1431-51. Manstead, A.S.R. and D. Parker (1995), "Evaluating and expanding theory of planned behavior," European Review of Social Psychology, 6, 69-95. Markus, H and P Nurius (1986), "The possible selves," American Psychologist, 41, 954-69. Mayer, Charles S (1974 “Data collection methods: Personal interviews,” in Handbook of Marketing Research, Robert Ferber, ed. New York: McGraw-Hill Book Company, 2-82-9. McCracken, Grant. (1986), "Culture and Consumption: A Theoretical Account of the Structure and Movement of the Cultural Meaning of Consumer Goods," Journal of Consumer Research, 13 (June), 71-84. Mead, G H (1934), Mind, self, and society. Chicago, Ill: University of Chicago Press. Mehta, Abhilasha (1999), "Using self-concept to assess advertising effectiveness," Journal of Advertising Research, 39 (January-February 1999), 81-90. Mehta, R. and Sivada, E. (1995), ”Comparing response rates and response content in mail versus electronic mail surveys,” Journal of the Market Research Society, 37, 429-439. Meuter, Mathew L., Mary Jo Bitner, Amy L. Ostrom, and Stephen W. Brown (2005), "Choosing Among Alternative Service Delivery Modes: An Investigation of Customer Trial of Self-Service Technologies," Journal of Marketing, 69 (April 2005), 61-83. Meuter, Mathew L., Amy L. Ostrom, Mary Jo Bitner, and Robert Roundtree (2003), "The influence of technology anxiety on consumer use and experiences with self-service technologies," Journal of Business Research, 56, 899-906. Neuman, Lawrence W. (2003), Social Research Methods (Fifth ed.). Boston: Pearson Education Inc.
148
Nickel, G. S. and J. N. Pinto (1986), "The computer attitude scale," Computers in Human Behavior, 2, 301-06. Nohria, Nitin and Marty Leetsma (2001), "A moving target: The mobile commerce customer," MIT Sloan Management Review, 42 (4), 104. Nunnally, Jum C. (1978), Psychometric theory (Second ed.). New York: McGraw-Hill. Nysveen, Herbjorn, Pedersen Per E., and Helge Thorbjornsen (2005), "Intentions to Use Mobile Services: Antecedents and Cross-Service Comparisons," Journal of the Academy of Marketing Sciences, 33 (3), 330-46. O'Guinn, Thomas C. and Russell W Belk (1989), "Heaven on Earth: Consumption at Heritage Village, UAS," Journal of Consumer Research, 16, 227-38. Onkvisit, S and J Shaw (1987), "Self-concept and image congruence: Some research and managerial implications," Journal of Consumer Marketing, 4 (1), 13-23. Osgood, Charles E., George J. Suci, and Percy H. Tannenbaum (1957), The Measurement of Meaning. Urbana: University of Illinois Press. Parasuraman, A. (2000), "Technology Readiness Index: A Multiple-Item Scale to Measure Readiness to Embrace New Technologies," Journal of Service Research, 2 (4), 307-20. Parasuraman, A. and Charles L. Colby (2001), Techno-Ready Marketing. New York: The Free Press. Parker, D, A S R Manstead, and S G Stradling (1995), "Extending the theory of planned behavior: The role of personal norm," British Journal of Social Psychology, 34, 127-37. Pavlou, Paul A. and Mendel Fygenson (2006), "Understanding and Predicting Electronic Commerce Adoption: An Extension of The Theory of Planned Behavior," MIS Quarterly, 30 (1), 115-43. Peter, Paul J., Gilbert A Churchill, Jr, and Tom J. Brown (1993), "Caution in the use if difference scores in consumer research," Journal of Consumer Research, 19 (4), 655-62. Petty, Richard E and John T Cacioppo (1996), Attitudes and Persuasion: Classic and Contemporary Approaches. Colorado: Westview Press. Pinegar, Jeffrey S. (2002), "Book reviews," The Journal of Product Innovation Management, 19, 324-27. Pliner, P and S Chaiken (1990), "Eating, social motives and self presentation in women and men," Journal of Experimental Social Psychology, 26, 240-54.
149
Quester, Pascale. G., Amal. Karunaratna, and Goh. Li Kee (2000), "Self-congruity and product evaluation: a cross-cultural study," Journal of Consumer Marketing, 17 (6), 525-37. Reardon, Marguerite (2007), “Music exec slams mobile entertainment experience” in http://www.news.com/2100-1039_3-6159218.html, accessed date: 15 March 2007 Reid, David (2007), "Sound future for music on mobiles," in http://news.bbc.co.uk/2/hi/programmes/click_online/6366261.stm, accessed date: 14 March 2007 Rogers, Everett (1962), Diffusion of Innovation. New York: Free Press. ---- (2003), Diffusion of Innovations (Fifth ed.). New York: Free Press. Rosenberg, M J (1979), Conceiving the Self. New York: Basic Books Rosenberg, M.J. (1956), "Cognitive structure and attitudinal affect," Journal of Abnormal and Social Psychology, 53, 367-72. Rosenberg, Milton J and Carl I Hovland (1960), "Cognitive, affective, and behavioral components of attitudes," in Attitude Organization and Change, Carl I Hovland and Milton J Rosenberg, Eds. New Haven and London: Yale University Press. Ross, Ivan (1971), "Self-concept and Brand Preference," The journal of Business, 44 (1), 38-50. Roth, P. L. and BeVier, C.A. (1998) “Response rates in HRM/OB survey research: Norms and correlates,” 1990-1994. Journal of Management, 24, 97-118 Rotter, J.B (1954), Social Learning and Clinical Psychology. Englewood Cliffs, New Jersey: Prentice-Hall. Runyon, K. E and D. E Stewart (1987), Consumer behavior and the practice of marketing. Columbus, Ohio: Merrill Publishing Company. Rutter, J.B and D.J. Bunce (1989), "The theory of reasoned action of Fishbein and Ajzen: A test of Towriss's amended procedure for measuring beliefs," Journal of Applied Social Psychology, 28, 39-46. Ryan, Michael. J. and E.H Bonfield (1980), "Fishbein' intentions model: a test of external and pragmatic validity," Journal of Marketing, 44 (2), 82-95. Schewe, Charles D. and William R. Dillon (1978), "Marketing Information System Utilization: an Application of Self-Concept Theory," Journal of Business Research, 6, 67-79. Schlenker, B R (1980), Impression management: The self-concept, social identity, and interpersonal relations. Monterey, CA: Brooks/Cole.
150
Schlosser, Francine. K. (2002), "How Do People Really Use Their Handheld Devices? An Interactive Study of Wireless Technology Use," Journal of Organization Behavior, 23, 401-23. Schneider, Harold K. (1974), Economic Man. New York: The Free Press. Schouten, John W (1991), "Selves in transition: Symbolic consumption in personal rites of passage and identity construction," Journal of Consumer Research, 17 (March), 412-25. Shankar, Venkatesh, Tony O’Driscoll, and David Reibstein (2003), "Rational Exuberance: The Wireless Industry’s Killer," B. Strategy & Business, 31 (Summer), 68-77. Sheppard, B. H., J. Hartwick, and P. R. Warshaw (1988), "The theory of reasoned action: A meta-analysis of past research with recommendations for modifications and future research," Journal of Consumer Research, 15, 325 - 43. Shrauger, J S and T J Schoeneman (1979), "Symbolic interactionist view of self concept: through the looking glass darkly," Psychological Bullentin, 86, 549-73. Simsek, Zeki and Veiga, John F., (2000), “The electronic survey technique: an integration and assessment,” Organizational Research Methods, 3 (1), 2000, 93-115 Sirgy, M J (1982), "Self-concept in consumer behavior: A critical review," Journal of Consumer Research, 9, 287–300. Sirgy, M. Joseph (1986), Self-Congruity: Toward a Theory of Personality and Cybernetics. New York: Praeger. ---- (1985), "Using self-congruity and ideal congruity to predict purchase motivation," Journal of Business Research, 13, 195-206. Smith, M Brewster (1947), "The Personal Setting of Public Opinions: A Study of Attitudes Toward Russia," Public Opinion Quarterly, 11 (4), 507-23. Snyder, M and K G Debono (1985), "Appeals to image and claims about quality: understanding the psychology of advertising," Journal of Personality and Social Psychology, 49, 586-97. Solomon, M and S P Douglas (1987), "Diversity in product symbolism: The case of female executive clothing," Psychology and Marketing, 4, 189-212. Solomon, Michael R (2004), Consumer behavior (6 ed.). Upper saddle River, New Jersey: Pearson Education. ---- (1983), "The role of products as social stimuli: a symbolic interactionism perspective," Journal of Consumer Research, 10 (December, 1983), 319-29. Sparks, P, C A Guthrie, and R Shepherd (1997), "The dimensional structure of the perceived behavioral control construct," Journal of Applied Psychology, 27, 418-38.
151
Sparks, Paul and Carol A Guthrie (1988), "Self-identity and the theory of planned behavior: a useful addition or an unhelpful artifice?" Journal of Applied Social Psychology, 28 (15), 1393-410. Stern, Bruce L., Ronald F. Bush, and Joseph F. Hair, Jr (1977), "The Self-Image/Store Image Matching process: An empirical Test," The journal of Business, 50 (1), 63-69. Stone, Brad and Akiko Kashiwagi (2006), "Our Cellphone Future," Newsweek (October 2). Sudman, Seymour (1980), "Improving the quality of shopping center sampling," Journal of Marketing Research, 18 (November 1980), 423-31. Sutton, S. (1998), "Predicting and explaining intentions and behavior: How well are we doing?" Journal of Applied Social Psychology, 28, 1317-38. Statistics Sweden (2006), "Sweden's Population by sex and age on 31/12/2005," Vol. 2006. Statistics Sweden (2006), “Level of educational attainment” http://www.ssd.scb.se/databaser/makro/SaveShow.asp, accessed date: Feb 15, 2007 Taylor, Shirley and Peter Todd (1995a), "Decomposition and Crossover Effects in the Theory of Planned Behavior: A Study of Consumer Adoption Intentions," International Journal of Research in Marketing, 12 (1995), 137-55. ---- (1995b), "Understanding Information Technology Usage: A Test of Competing Models," Information System Research, 6 (2), 144-76. Teo, T. S. H. and Siau Heong Pok (2003), "Adoption of WAP-enabled Mobile Phones among Internet Users," Omega, 31 (2003), 483-98. Tharp, Mary and Linda M Scott (1990), "The role of marketing processes in creating cultural meaning," Journal of Macromarketing (Fall), 7-60. Thurstone, L. L. (1935), The vectors of mind. Chicago: University of Chicago Press. Tolman, E.C. (1932), Purposive behavior in Animals and Men. New York: Appleton-Century-Crofts. Toothacker, Larry E. (1993), Multiple comparisons procedures. Thousand Oaks, CA: Sage Publications. Tornatzky, Louis G. and Katherine J. Klein (1982), "Innovation Characteristics and Innovation Adoption-Implementation> A Meta-Analysis of Findings," IEEE Transactions on Engineering Management, Em-29 (1), 28-34.
152
Tourangeau, R. and Smith, T.W. (1996), “Asking sensitive questions: The impact of data collection mode, question format, and question context,” Public Opinion Quarterly, 60, 275-304 Trafimow, D and K.A. Finlay (1996), "The importance of subjective norms for a minority of people: Between subjects and within-subjects analyses," Personality and Social Psychology Bullentin, 22, 820-28. Trafimow, D and Martin Fishbein (1994), "The Moderating Effect on Behavior Type on the Subjective Norm-Behavior Relationship," Journal of Social Psychology, 134, 755-9763. Tsikriktsis, Nikos (2004), "A Technology Readiness-Based Taxonomy of Customers: A Replication and Extension," Journal of Service Research, 7 (1), 42-52. Turker, William Thomas (1957), Foundations for a Theory of Consumer Behavior. New York: Holt, Rinehart and Winston. Van der Pligt, J. and N. De Vries (1998), "Expectancy-value models of health behaviors: The role of salience and anticipated affect," Psychology and Health, 13, 289-305. Van der Pligt, J., M. Zeelenberg, W.W van Dijk, N.K de Vries, and R. Richard (1998), "Affect, attitudes and decisions: Let's be more specific," in European review of social psychology, W. Stroebe and Miles Hewstone, Eds. Vol. 8. Chichester, UK: John Wiley and Son. Venkatesh, V. and M.G. Morris (2000), "Why don't men ever stop to ask for directions: gender, social influence, and their role in technology acceptance and usage behavior," MIS Quarterly, 24 (1), 115-39. Warshaw, P. R. and F.D Davis (1985), "Disentangling behavioral intentions and behavioral expectations," Journal of Experimental Social Psychology, 21, 213-28. Watson, Richard T., Leyland F. Pitt, Pierre Berthon, and George M Zinkhan (2002), "U-commerce: expanding the universe of marketing," Journal of the Academy of Marketing Sciences, 30 (4), 333-47. Wells, William D. (1975), "Psychographic: A Critical Reviews," Journal of Marketing Research, 12 (2), 196-213. Wicker, A W (1969), "Attitudes vs. actions: The relationship of verbal and overt behavioral responses to attitude object," Journal of Social Issues (25), 41-78. Wicklund, Robert A and Jack W Brehm (1976), Perspectives on cognitive dissonance. Hillsdale, N.J: Erlbaum. Wilkie, William L. (1994), Consumer Behavior (Third ed.). New York: John Willey and Sons. Wilkinson, L (1975), "Tests of Significance in Stepwise Regression," Psychological Bullentin, 86, 168-74.

153
Wright, Newell. D., C.B Clairborne, and M. Joseph Sirgy (1992), "The Effects of Product Symbolism on Consumer Self-Concept," Advances in Consumer Research, 19, 311-18. Zinkhan, George M and Jae W Hong (1991), "Self-concept and advertising effectiveness: A model of congruency, conspicuousness and response mode," Advances in Consumer Research, 18, 348-54.
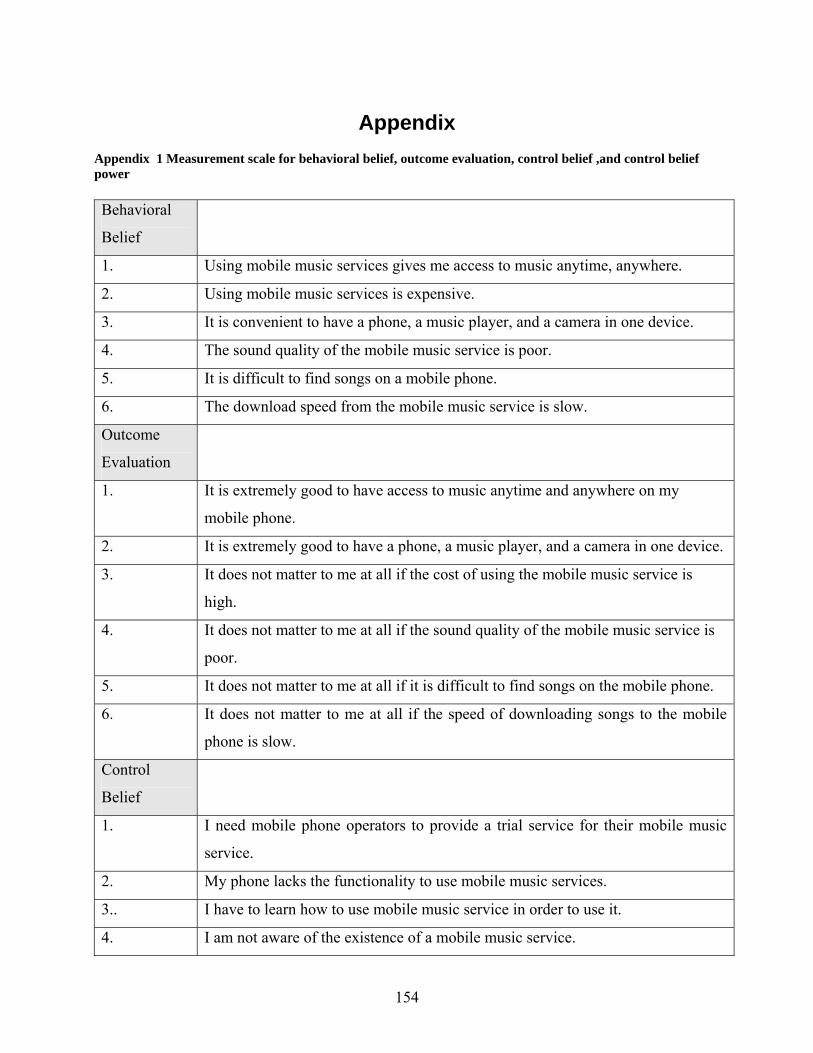
154
Appendix Appendix 1 Measurement scale for behavioral belief, outcome evaluation, control belief ,and control belief power Behavioral
Belief
1. Using mobile music services gives me access to music anytime, anywhere.
2. Using mobile music services is expensive.
3. It is convenient to have a phone, a music player, and a camera in one device.
4. The sound quality of the mobile music service is poor.
5. It is difficult to find songs on a mobile phone.
6. The download speed from the mobile music service is slow.
Outcome
Evaluation
1. It is extremely good to have access to music anytime and anywhere on my
mobile phone.
2. It is extremely good to have a phone, a music player, and a camera in one device.
3. It does not matter to me at all if the cost of using the mobile music service is
high.
4. It does not matter to me at all if the sound quality of the mobile music service is
poor.
5. It does not matter to me at all if it is difficult to find songs on the mobile phone.
6. It does not matter to me at all if the speed of downloading songs to the mobile
phone is slow.
Control
Belief
1. I need mobile phone operators to provide a trial service for their mobile music
service.
2. My phone lacks the functionality to use mobile music services.
3.. I have to learn how to use mobile music service in order to use it.
4. I am not aware of the existence of a mobile music service.
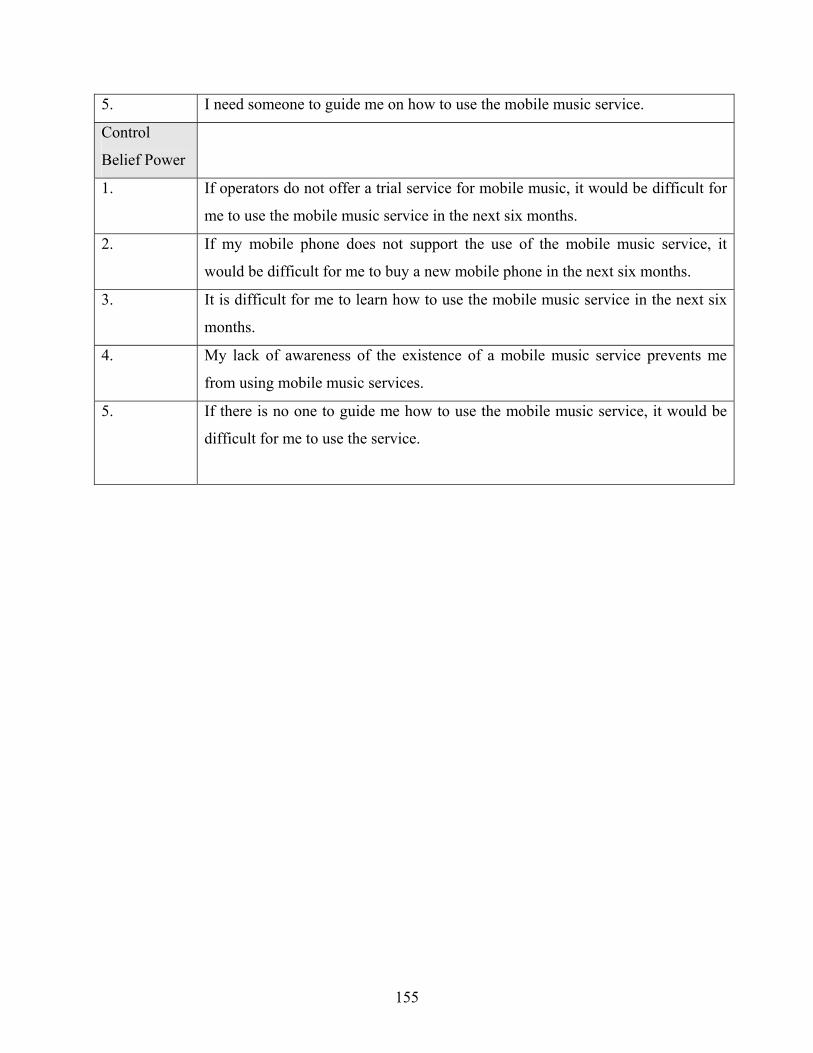
155
5. I need someone to guide me on how to use the mobile music service.
Control
Belief Power
1. If operators do not offer a trial service for mobile music, it would be difficult for
me to use the mobile music service in the next six months.
2. If my mobile phone does not support the use of the mobile music service, it
would be difficult for me to buy a new mobile phone in the next six months.
3. It is difficult for me to learn how to use the mobile music service in the next six
months.
4. My lack of awareness of the existence of a mobile music service prevents me
from using mobile music services.
5. If there is no one to guide me how to use the mobile music service, it would be
difficult for me to use the service.
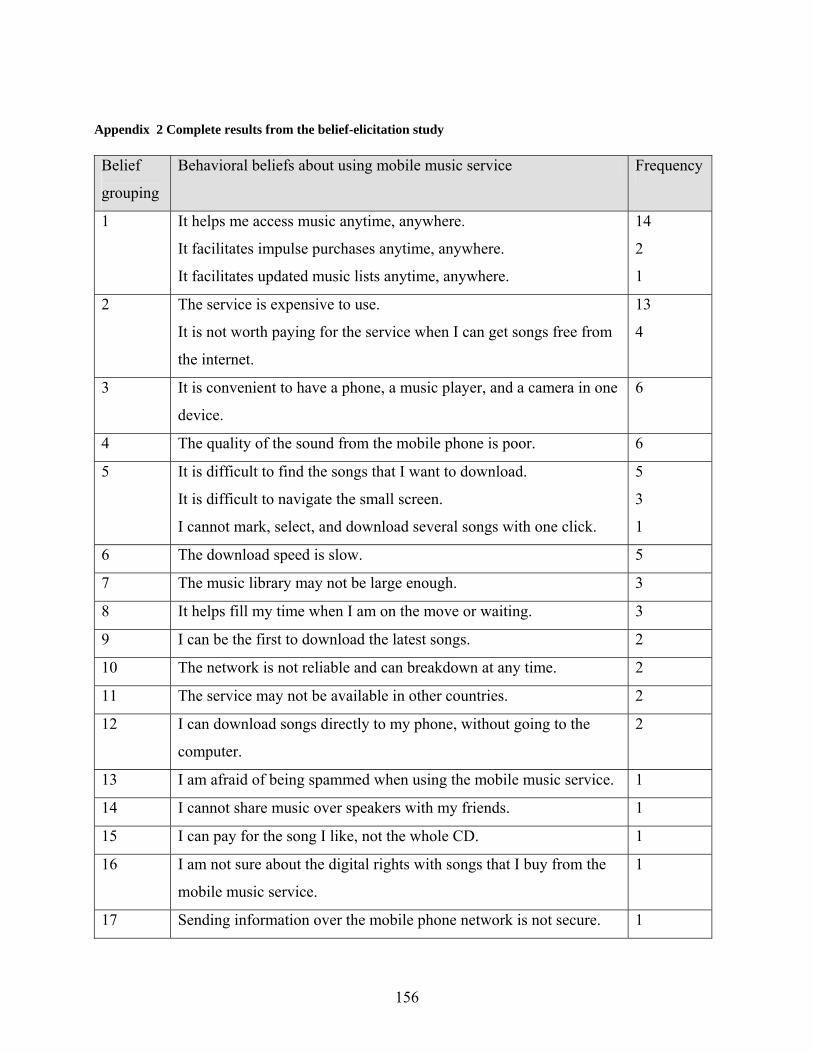
156
Appendix 2 Complete results from the belief-elicitation study Belief
grouping
Behavioral beliefs about using mobile music service Frequency
1 It helps me access music anytime, anywhere.
It facilitates impulse purchases anytime, anywhere.
It facilitates updated music lists anytime, anywhere.
14
2
1
2 The service is expensive to use.
It is not worth paying for the service when I can get songs free from
the internet.
13
4
3 It is convenient to have a phone, a music player, and a camera in one
device.
6
4 The quality of the sound from the mobile phone is poor. 6
5 It is difficult to find the songs that I want to download.
It is difficult to navigate the small screen.
I cannot mark, select, and download several songs with one click.
5
3
1
6 The download speed is slow. 5
7 The music library may not be large enough. 3
8 It helps fill my time when I am on the move or waiting. 3
9 I can be the first to download the latest songs. 2
10 The network is not reliable and can breakdown at any time. 2
11 The service may not be available in other countries. 2
12 I can download songs directly to my phone, without going to the
computer.
2
13 I am afraid of being spammed when using the mobile music service. 1
14 I cannot share music over speakers with my friends. 1
15 I can pay for the song I like, not the whole CD. 1
16 I am not sure about the digital rights with songs that I buy from the
mobile music service.
1
17 Sending information over the mobile phone network is not secure. 1
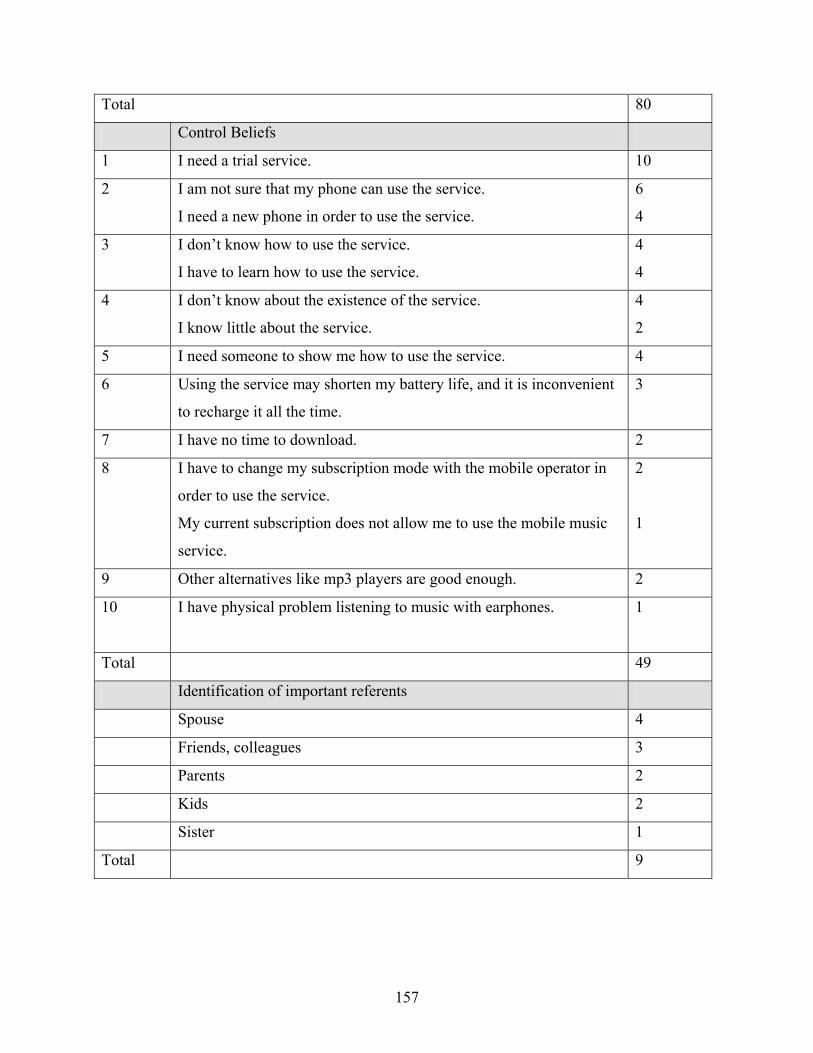
157
Total 80
Control Beliefs
1 I need a trial service. 10
2 I am not sure that my phone can use the service.
I need a new phone in order to use the service.
6
4
3 I don’t know how to use the service.
I have to learn how to use the service.
4
4
4 I don’t know about the existence of the service.
I know little about the service.
4
2
5 I need someone to show me how to use the service. 4
6 Using the service may shorten my battery life, and it is inconvenient
to recharge it all the time.
3
7 I have no time to download. 2
8 I have to change my subscription mode with the mobile operator in
order to use the service.
My current subscription does not allow me to use the mobile music
service.
2
1
9 Other alternatives like mp3 players are good enough. 2
10 I have physical problem listening to music with earphones.
1
Total 49
Identification of important referents
Spouse 4
Friends, colleagues 3
Parents 2
Kids 2
Sister 1
Total 9
158
Appendix 3 Final survey questionnaire
Industrial Marketing and e-Commerce Research Group
Mobile Music Service Survey Instructions
In this particular questionnaire, we are mainly concerned with people’s views toward using
mobile music services. Mobile music services are offered by mobile operators such as Telia,
Comviq, and Tre to allow people to download songs directly from the operators’ website to their
phone handsets. People can also use the computer to download the songs and then transfer them
to their mobile phone. Mobile music services also provide streaming music on mobile phones.
People must pay fees for this service.
Many questions in this survey make use of a seven-point rating scale; please circle the number
that best describes your opinion. For example, if you think the weather in Luleå is slightly good,
then you would circle number 3, as shown:
good _____1______2______3______4______5______6______7___ bad extremely quite slightly neither slightly quite extremely
● Please be sure to answer all items.
● Please do not circle two numbers on each scale.
Thank you very much!
3
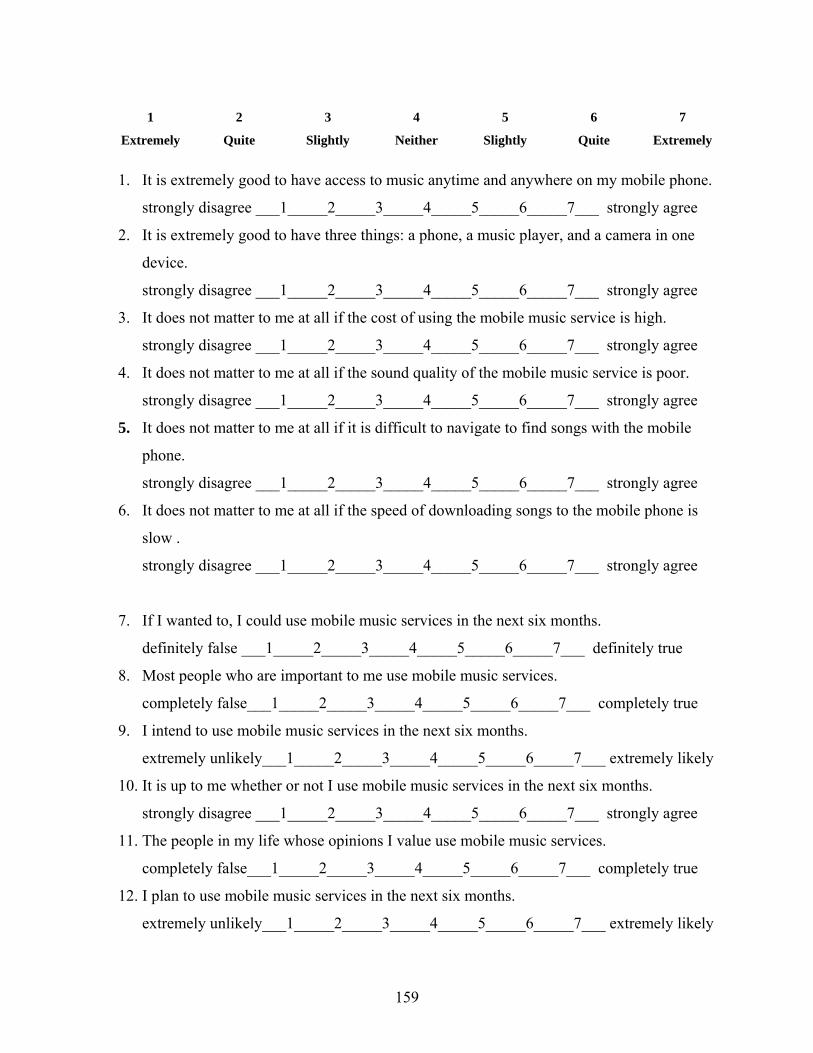
159
1 2 3 4 5 6 7
Extremely Quite Slightly Neither Slightly Quite Extremely
1. It is extremely good to have access to music anytime and anywhere on my mobile phone.
strongly disagree ___1_____2_____3_____4_____5_____6_____7___ strongly agree
2. It is extremely good to have three things: a phone, a music player, and a camera in one
device.
strongly disagree ___1_____2_____3_____4_____5_____6_____7___ strongly agree
3. It does not matter to me at all if the cost of using the mobile music service is high.
strongly disagree ___1_____2_____3_____4_____5_____6_____7___ strongly agree
4. It does not matter to me at all if the sound quality of the mobile music service is poor.
strongly disagree ___1_____2_____3_____4_____5_____6_____7___ strongly agree
5. It does not matter to me at all if it is difficult to navigate to find songs with the mobile
phone.
strongly disagree ___1_____2_____3_____4_____5_____6_____7___ strongly agree
6. It does not matter to me at all if the speed of downloading songs to the mobile phone is
slow .
strongly disagree ___1_____2_____3_____4_____5_____6_____7___ strongly agree
7. If I wanted to, I could use mobile music services in the next six months.
definitely false ___1_____2_____3_____4_____5_____6_____7___ definitely true
8. Most people who are important to me use mobile music services.
completely false___1_____2_____3_____4_____5_____6_____7___ completely true
9. I intend to use mobile music services in the next six months.
extremely unlikely___1_____2_____3_____4_____5_____6_____7___ extremely likely
10. It is up to me whether or not I use mobile music services in the next six months.
strongly disagree ___1_____2_____3_____4_____5_____6_____7___ strongly agree
11. The people in my life whose opinions I value use mobile music services.
completely false___1_____2_____3_____4_____5_____6_____7___ completely true
12. I plan to use mobile music services in the next six months.
extremely unlikely___1_____2_____3_____4_____5_____6_____7___ extremely likely
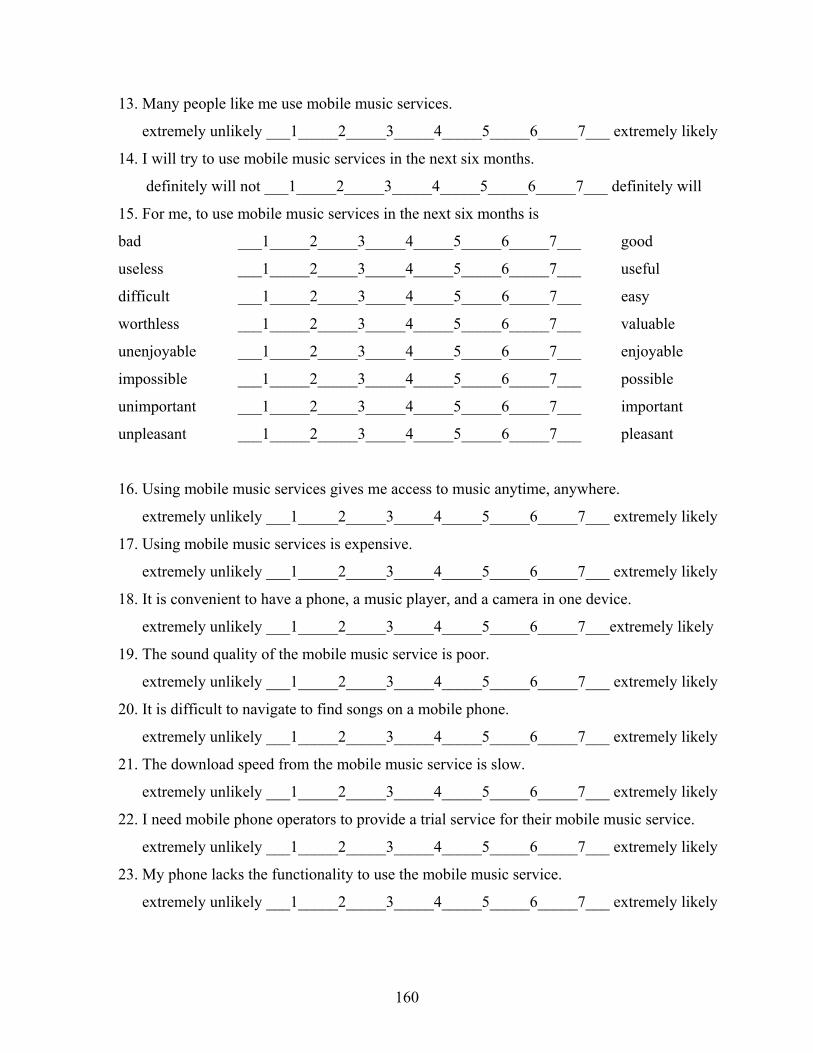
160
13. Many people like me use mobile music services.
extremely unlikely ___1_____2_____3_____4_____5_____6_____7___ extremely likely
14. I will try to use mobile music services in the next six months.
definitely will not ___1_____2_____3_____4_____5_____6_____7___ definitely will
15. For me, to use mobile music services in the next six months is
bad ___1_____2_____3_____4_____5_____6_____7___ good
useless ___1_____2_____3_____4_____5_____6_____7___ useful
difficult ___1_____2_____3_____4_____5_____6_____7___ easy
worthless ___1_____2_____3_____4_____5_____6_____7___ valuable
unenjoyable ___1_____2_____3_____4_____5_____6_____7___ enjoyable
impossible ___1_____2_____3_____4_____5_____6_____7___ possible
unimportant ___1_____2_____3_____4_____5_____6_____7___ important
unpleasant ___1_____2_____3_____4_____5_____6_____7___ pleasant
16. Using mobile music services gives me access to music anytime, anywhere.
extremely unlikely ___1_____2_____3_____4_____5_____6_____7___ extremely likely
17. Using mobile music services is expensive.
extremely unlikely ___1_____2_____3_____4_____5_____6_____7___ extremely likely
18. It is convenient to have a phone, a music player, and a camera in one device.
extremely unlikely ___1_____2_____3_____4_____5_____6_____7___extremely likely
19. The sound quality of the mobile music service is poor.
extremely unlikely ___1_____2_____3_____4_____5_____6_____7___ extremely likely
20. It is difficult to navigate to find songs on a mobile phone.
extremely unlikely ___1_____2_____3_____4_____5_____6_____7___ extremely likely
21. The download speed from the mobile music service is slow.
extremely unlikely ___1_____2_____3_____4_____5_____6_____7___ extremely likely
22. I need mobile phone operators to provide a trial service for their mobile music service.
extremely unlikely ___1_____2_____3_____4_____5_____6_____7___ extremely likely
23. My phone lacks the functionality to use the mobile music service.
extremely unlikely ___1_____2_____3_____4_____5_____6_____7___ extremely likely
161
24. I have to learn how to use the mobile music service in order to use it.
extremely unlikely ___1_____2_____3_____4_____5_____6_____7___ extremely likely
25. I am not aware of the existence of a mobile music service.
extremely unlikely ___1_____2_____3_____4_____5_____6_____7___ extremely likely
26. I need someone to guide me how to use the mobile music service.
extremely unlikely ___1_____2_____3_____4_____5_____6_____7___ extremely likely
27. Using mobile music service helps me express who I am.
strongly disagree ___1_____2_____3_____4_____5_____6_____7___ strongly agree
28. If operators do not offer a trial service for mobile music, it would be difficult for me to
use the service in the next six months.
strongly disagree ___1_____2_____3_____4_____5_____6_____7___ strongly agree
29. If my mobile phone does not support the use of a mobile music service, it would be
difficult for me to buy a new mobile phone in the next six months.
strongly disagree ___1_____2_____3_____4_____5_____6_____7___ strongly agree
30. It is difficult for me to learn how to use the mobile music service in the next six months.
strongly disagree ___1_____2_____3_____4_____5_____6_____7___ strongly agree
31. My lack of awareness of mobile music services prevents me from using it.
strongly disagree ___1_____2_____3_____4_____5_____6_____7___ strongly agree
32. If there is no one to guide me how to use the mobile music service, it would be difficult
for me to use it.
strongly disagree ___1_____2_____3_____4_____5_____6_____7___ strongly agree
Using mobile music service fits my image of myself.
strongly disagree ___1_____2_____3_____4_____5_____6_____7___ strongly agree
33. In the following section, we ask you to describe the image of a typical user of mobile
music services. On the following scales, please circle the number that you think best
describes a typical user.
Modest ___1_____2_____3_____4_____5_____6_____7___ Vain
Stylish ___1_____2_____3_____4_____5_____6_____7___ Outdated
Thrifty ___1_____2_____3_____4_____5_____6_____7___ Indulgent
Youthful ___1_____2_____3_____4_____5_____6_____7___ Mature
Orthodox ___1_____2_____3_____4_____5_____6_____7___ Liberal
162
Fashionable ___1_____2_____3_____4_____5_____6_____7___ Unfashionable
Friendly ___1_____2_____3_____4_____5_____6_____7___ Unfriendly
Comfortable ___1_____2_____3_____4_____5_____6_____7___ Uncomfortable
Contemporary ___1_____2_____3_____4_____5_____6_____7___ Non-contemporary
34. In the following section, we ask you to describe yourself. On the following scales, please
circle the number that best represents how you see yourself.
Modest ___1_____2_____3_____4_____5_____6_____7___ Vain
Stylish ___1_____2_____3_____4_____5_____6_____7___ Outdated
Thrifty ___1_____2_____3_____4_____5_____6_____7___ Indulgent
Youthful ___1_____2_____3_____4_____5_____6_____7___ Mature
Orthodox ___1_____2_____3_____4_____5_____6_____7___ Liberal
Fashionable ___1_____2_____3_____4_____5_____6_____7___ Unfashionable
Friendly ___1_____2_____3_____4_____5_____6_____7___ Unfriendly
Comfortable ___1_____2_____3_____4_____5_____6_____7___ Uncomfortable
Contemporary ___1_____2_____3_____4_____5_____6_____7___ Non-contemporary
In the following section, please indicate how you feel about the following statements.28
Strongly
disagree
Somewhat
disagree
Neither
agree nor
disagree
Somewhat
agree
Strongly agree
1 2 3 4 5
35. I can usually figure out new hi-tech products and services without help from others.
strongly disagree ____1______2______3______4______5____ strongly agree
36. New technology is often too complicated to be useful.
strongly disagree ____1______2______3______4______5____ strongly agree
28 These questions comprise the Technology Readiness Index, which is copyrighted by A. Parasuraman and Rockbridge Associates, Inc., 1999. This scale may be duplicated only with written permission from the authors.
163
37. I like the idea of doing business via computers, because you are not limited to regular
business hours.
strongly disagree ____1______2______3______4______5____ strongly agree
38. When I get technical support from a provider of a high-tech product or service, I
sometimes feel as if I am being taken advantage of by someone who knows more than I
do.
strongly disagree ____1______2______3______4______5____ strongly agree
39. Technology gives people more control over their daily lives.
strongly disagree ____1______2______3______4______5____ strongly agree
40. I do not consider it safe giving out a credit card number over a computer.
strongly disagree ____1______2______3______4______5____ strongly agree
41. In general, I am among the first in my circle of friends to acquire new technology when it
appears.
strongly disagree ____1______2______3______4______5____ strongly agree
42. I do not feel confident doing business with a place that can only be reached online.
strongly disagree ____1______2______3______4______5____ strongly agree
43. Technology makes me more efficient in my occupation.
strongly disagree ____1______2______3______4______5____ strongly agree
44. If you provide information to a machine or over the Internet, you can never be sure if it
really gets to the right place.
strongly disagree ____1______2______3______4______5____ strongly agree
Please answer the following questions by checking the appropriate box:
45. Have you used a mobile music service in the last twelve months? No Yes Yes, but then stopped
46. Estimated annual spending on music purchases (CDs and songs from stores and the
Internet) None 10-199 kr 200-399 kr 400-799 kr more than 800kr 47. Gender : Female Male
164
48. Education Completed Grundskola Completed Gymnasium
Completed Höskola/Universitet Completed Postgraduate
49. Year of birth: ________ 50. Occupation (Yrke): ___________
51. How many times did you go to Smedjan in the last month except for this time?
_________
Thank you very much for your help.
165
Appendix 4 Cover letter for respondents who agreed to fill in the survey at home
Industrial Marketing and e-Commerce Research Group
Dear Sir or Madam,
My name is Thong Bui Quang. I am a doctoral student at the Industrial Marketing and E-
Commerce Group, Luleå University of Technology. I am earnestly asking you to help me by
answering the questions in this survey. It takes only about 10 minutes. By filling out this
questionnaire, you are helping me to complete the most important part of my doctoral thesis,
which was carried out at Luleå University from 2004 to 2008. Without your help, the thesis can
not be completed. I would be extremely grateful to you. If possible, please send it back in one
week in the enclosed prepaid envelope. Thank you very much.
Best regards,
Bui Quang Thong
PhD Student
Industrial Marketing and E-commerce group
Lulea University of Technology
Tel: 0920 - 493120
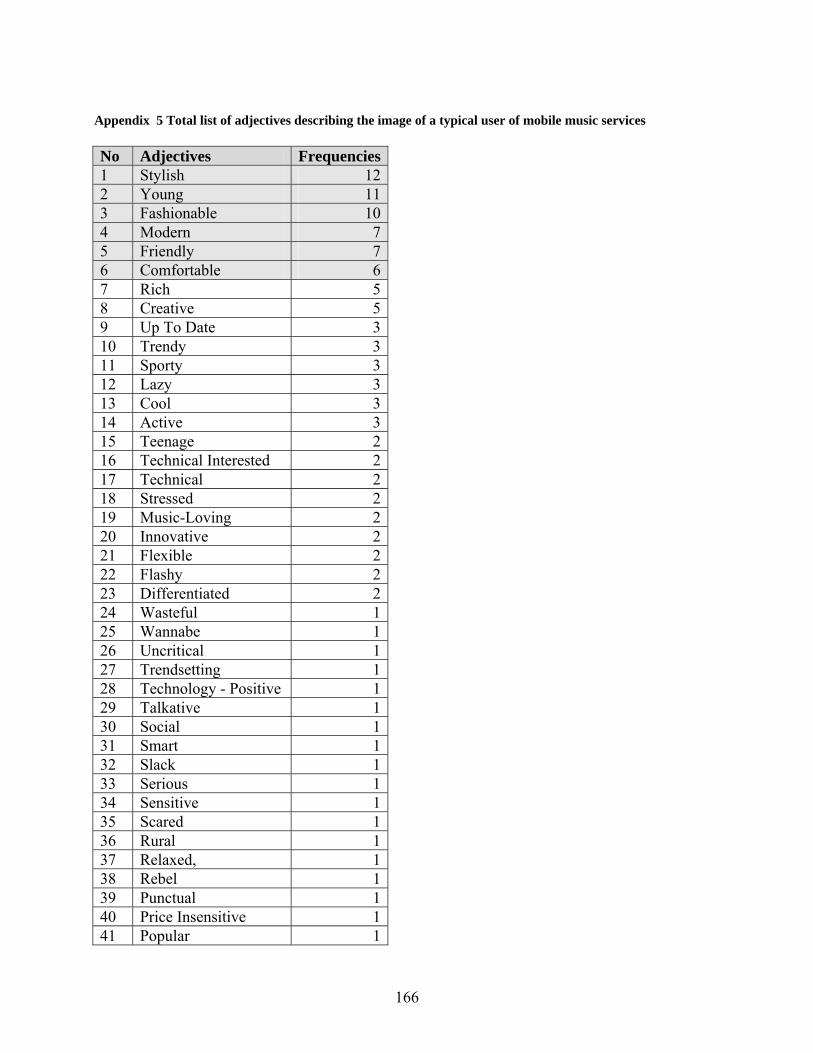
166
Appendix 5 Total list of adjectives describing the image of a typical user of mobile music services No Adjectives Frequencies1 Stylish 122 Young 113 Fashionable 104 Modern 75 Friendly 76 Comfortable 67 Rich 58 Creative 59 Up To Date 310 Trendy 311 Sporty 312 Lazy 313 Cool 314 Active 315 Teenage 216 Technical Interested 217 Technical 218 Stressed 219 Music-Loving 220 Innovative 221 Flexible 222 Flashy 223 Differentiated 224 Wasteful 125 Wannabe 126 Uncritical 127 Trendsetting 128 Technology - Positive 129 Talkative 130 Social 131 Smart 132 Slack 133 Serious 134 Sensitive 135 Scared 136 Rural 137 Relaxed, 138 Rebel 139 Punctual 140 Price Insensitive 141 Popular 1
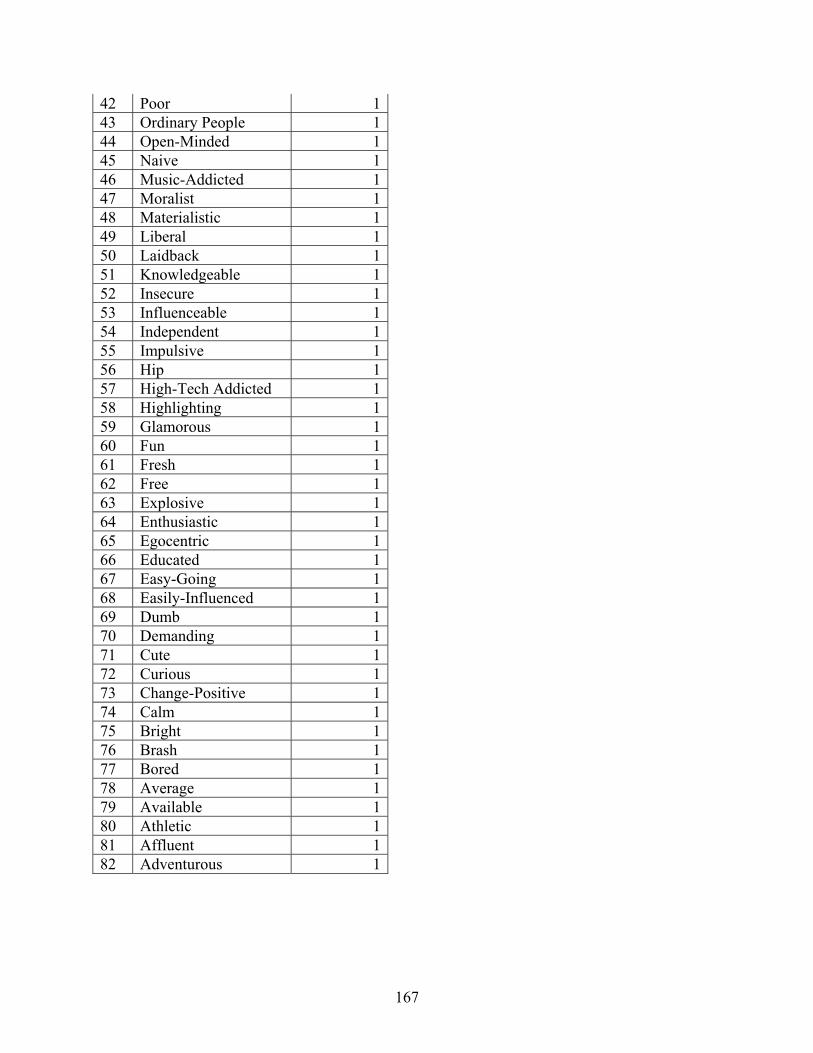
167
42 Poor 143 Ordinary People 144 Open-Minded 145 Naive 146 Music-Addicted 147 Moralist 148 Materialistic 149 Liberal 150 Laidback 151 Knowledgeable 152 Insecure 153 Influenceable 154 Independent 155 Impulsive 156 Hip 157 High-Tech Addicted 158 Highlighting 159 Glamorous 160 Fun 161 Fresh 162 Free 163 Explosive 164 Enthusiastic 165 Egocentric 166 Educated 167 Easy-Going 168 Easily-Influenced 169 Dumb 170 Demanding 171 Cute 172 Curious 173 Change-Positive 174 Calm 175 Bright 176 Brash 177 Bored 178 Average 179 Available 180 Athletic 181 Affluent 182 Adventurous 1
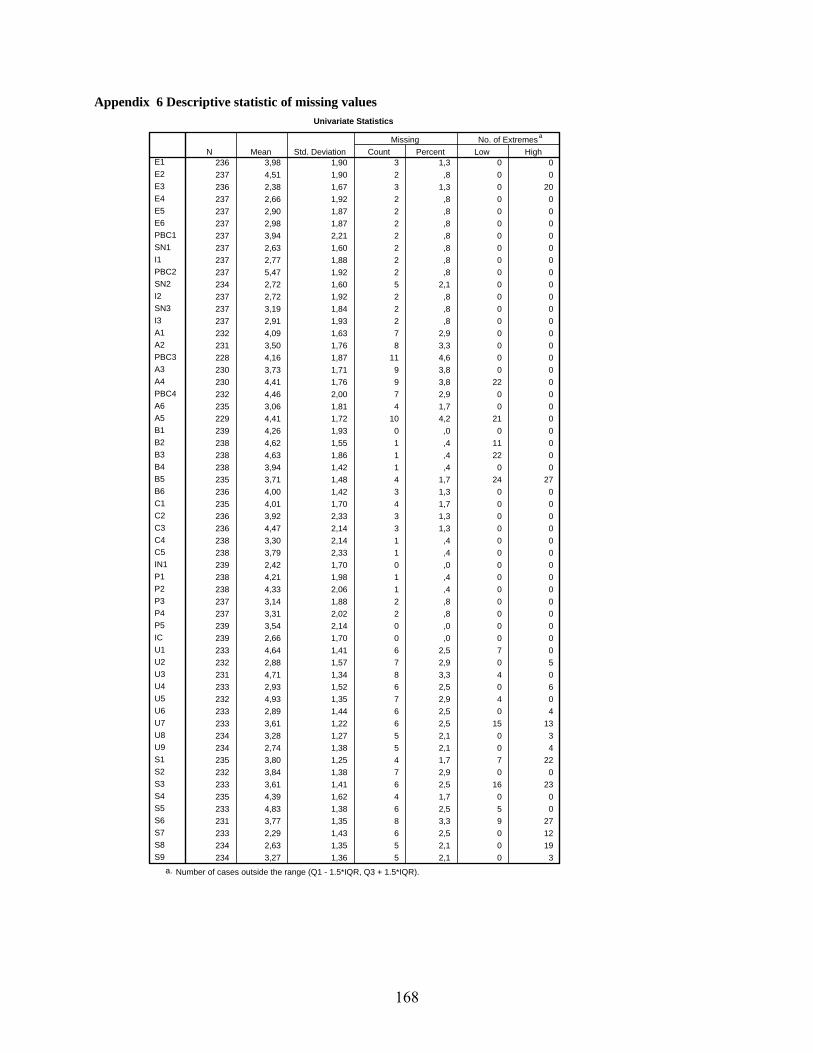
168
Appendix 6 Descriptive statistic of missing values
Univariate Statistics
236 3,98 1,90 3 1,3 0 0237 4,51 1,90 2 ,8 0 0236 2,38 1,67 3 1,3 0 20237 2,66 1,92 2 ,8 0 0237 2,90 1,87 2 ,8 0 0237 2,98 1,87 2 ,8 0 0237 3,94 2,21 2 ,8 0 0237 2,63 1,60 2 ,8 0 0237 2,77 1,88 2 ,8 0 0237 5,47 1,92 2 ,8 0 0234 2,72 1,60 5 2,1 0 0237 2,72 1,92 2 ,8 0 0237 3,19 1,84 2 ,8 0 0237 2,91 1,93 2 ,8 0 0232 4,09 1,63 7 2,9 0 0231 3,50 1,76 8 3,3 0 0228 4,16 1,87 11 4,6 0 0230 3,73 1,71 9 3,8 0 0230 4,41 1,76 9 3,8 22 0232 4,46 2,00 7 2,9 0 0235 3,06 1,81 4 1,7 0 0229 4,41 1,72 10 4,2 21 0239 4,26 1,93 0 ,0 0 0238 4,62 1,55 1 ,4 11 0238 4,63 1,86 1 ,4 22 0238 3,94 1,42 1 ,4 0 0235 3,71 1,48 4 1,7 24 27236 4,00 1,42 3 1,3 0 0235 4,01 1,70 4 1,7 0 0236 3,92 2,33 3 1,3 0 0236 4,47 2,14 3 1,3 0 0238 3,30 2,14 1 ,4 0 0238 3,79 2,33 1 ,4 0 0239 2,42 1,70 0 ,0 0 0238 4,21 1,98 1 ,4 0 0238 4,33 2,06 1 ,4 0 0237 3,14 1,88 2 ,8 0 0237 3,31 2,02 2 ,8 0 0239 3,54 2,14 0 ,0 0 0239 2,66 1,70 0 ,0 0 0233 4,64 1,41 6 2,5 7 0232 2,88 1,57 7 2,9 0 5231 4,71 1,34 8 3,3 4 0233 2,93 1,52 6 2,5 0 6232 4,93 1,35 7 2,9 4 0233 2,89 1,44 6 2,5 0 4233 3,61 1,22 6 2,5 15 13234 3,28 1,27 5 2,1 0 3234 2,74 1,38 5 2,1 0 4235 3,80 1,25 4 1,7 7 22232 3,84 1,38 7 2,9 0 0233 3,61 1,41 6 2,5 16 23235 4,39 1,62 4 1,7 0 0233 4,83 1,38 6 2,5 5 0231 3,77 1,35 8 3,3 9 27233 2,29 1,43 6 2,5 0 12234 2,63 1,35 5 2,1 0 19234 3,27 1,36 5 2,1 0 3
E1E2E3E4E5E6PBC1SN1I1PBC2SN2I2SN3I3A1A2PBC3A3A4PBC4A6A5B1B2B3B4B5B6C1C2C3C4C5IN1P1P2P3P4P5ICU1U2U3U4U5U6U7U8U9S1S2S3S4S5S6S7S8S9
N Mean Std. Deviation Count PercentMissing
Low HighNo. of Extremes a
Number of cases outside the range (Q1 - 1.5*IQR, Q3 + 1.5*IQR).a.
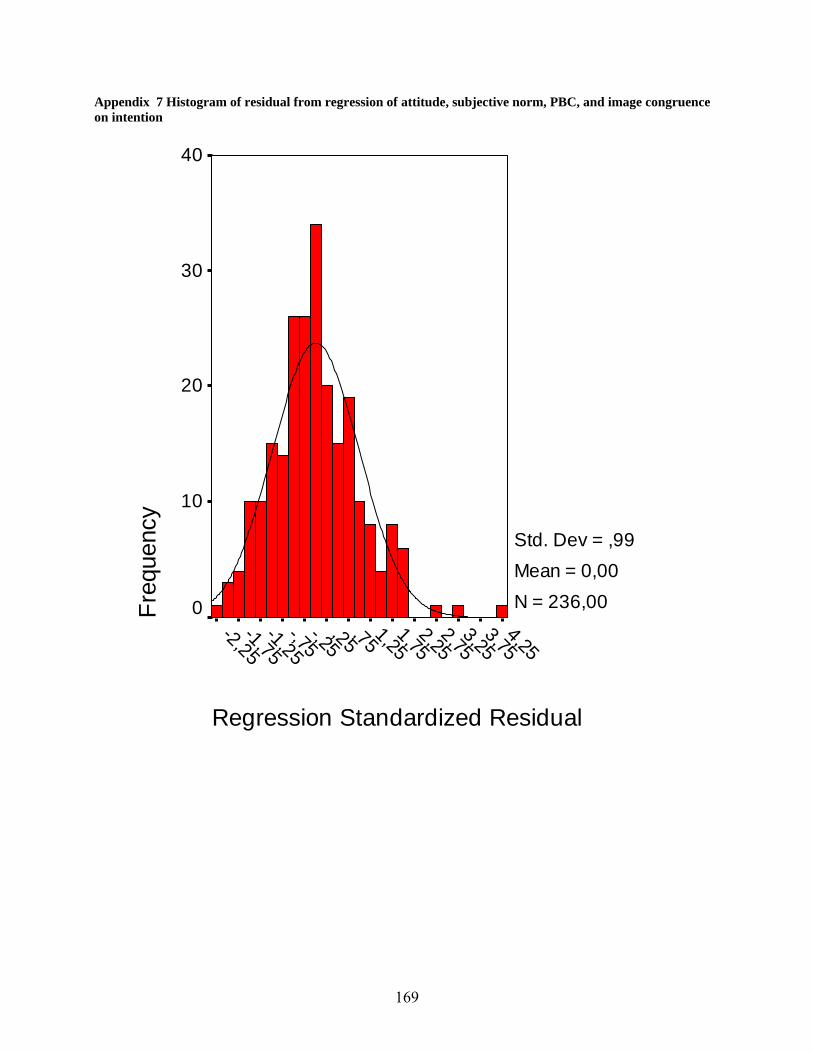
169
Appendix 7 Histogram of residual from regression of attitude, subjective norm, PBC, and image congruence on intention
Regression Standardized Residual
4,253,75
3,252,75
2,251,75
1,25,75,25-,25
-,75-1,25
-1,75-2,25
Freq
uenc
y40
30
20
10
0
Std. Dev = ,99 Mean = 0,00N = 236,00
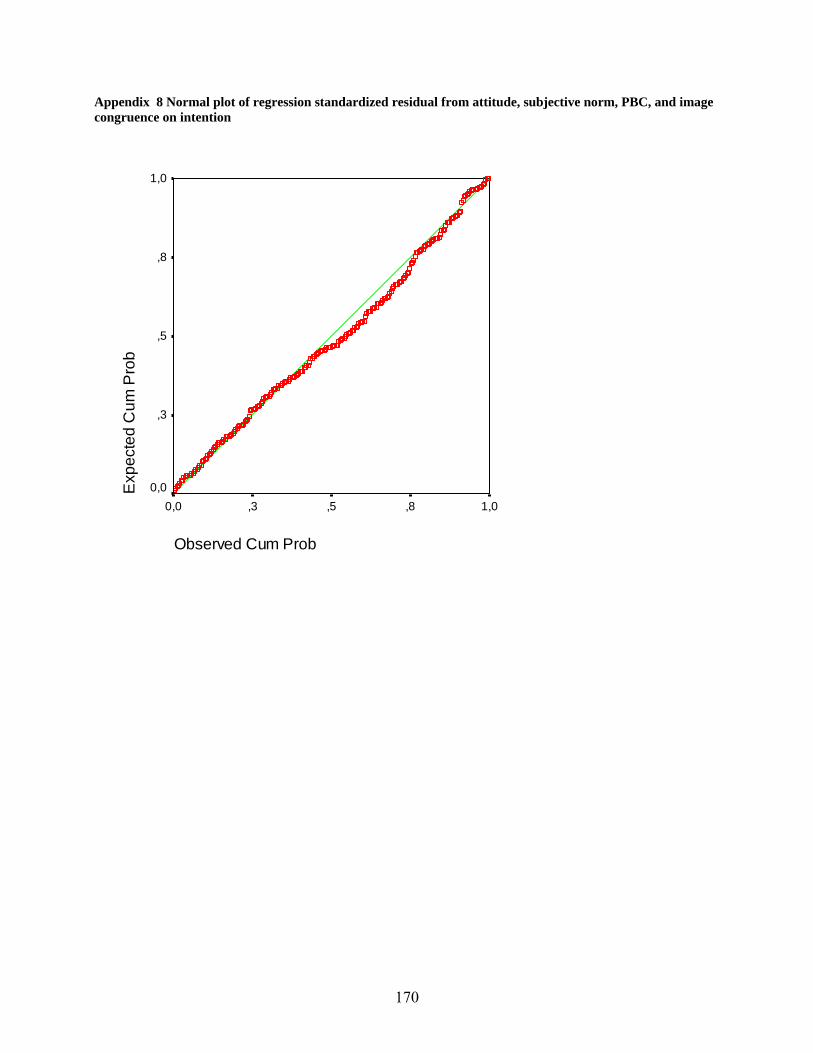
170
Appendix 8 Normal plot of regression standardized residual from attitude, subjective norm, PBC, and image congruence on intention
Observed Cum Prob
1,0,8,5,30,0
Exp
ecte
d C
um P
rob
1,0
,8
,5
,3
0,0
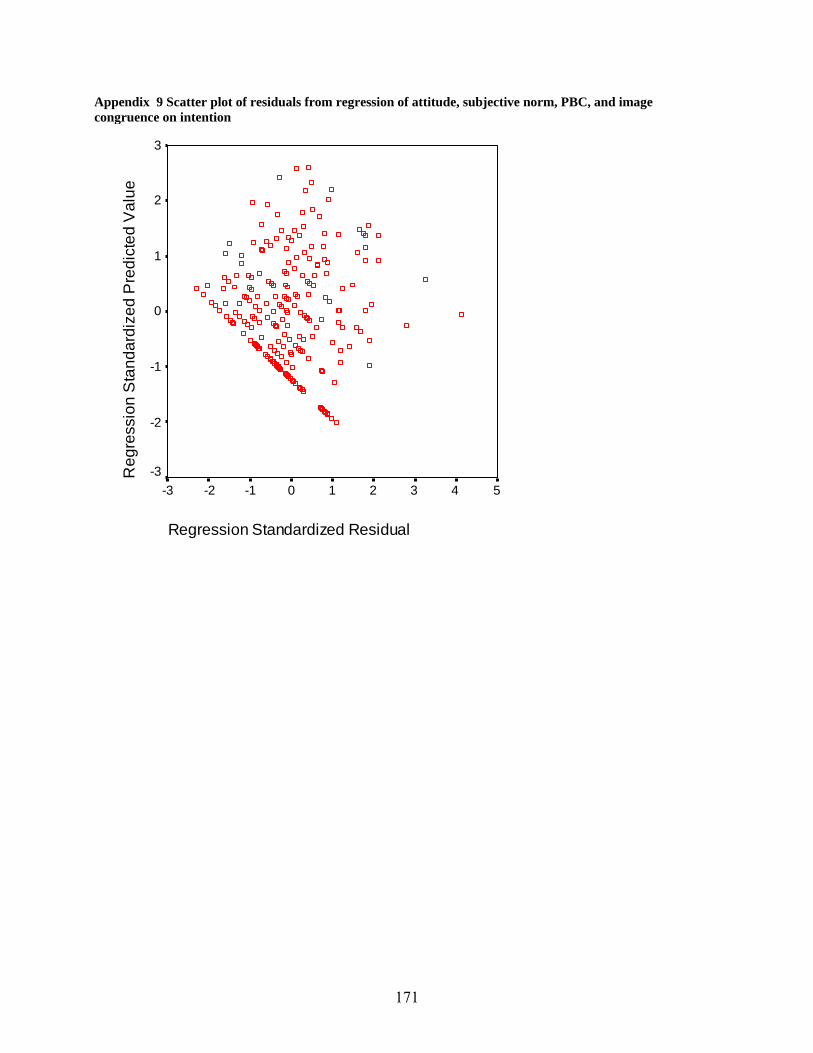
171
Appendix 9 Scatter plot of residuals from regression of attitude, subjective norm, PBC, and image congruence on intention
Regression Standardized Residual
543210-1-2-3
Reg
ress
ion
Sta
ndar
dize
d P
redi
cted
Val
ue3
2
1
0
-1
-2
-3
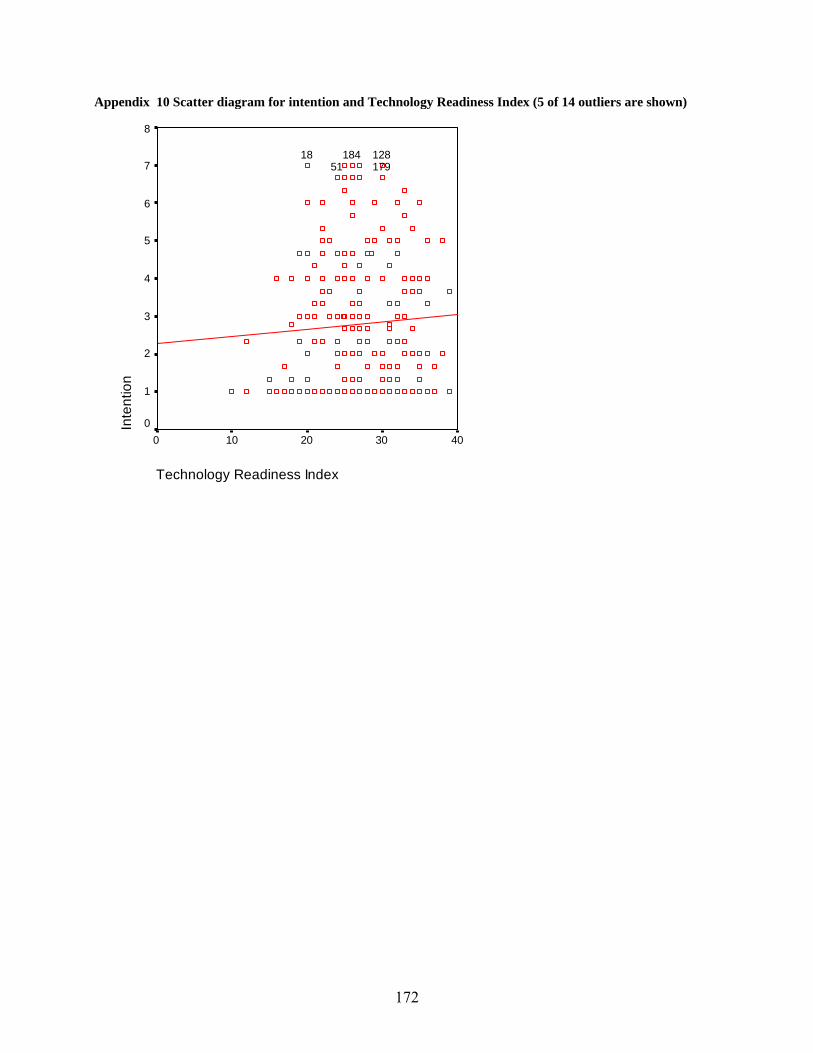
172
Appendix 10 Scatter diagram for intention and Technology Readiness Index (5 of 14 outliers are shown)
Technology Readiness Index
403020100
Inte
ntio
n8
7
6
5
4
3
2
1
0
184179128
5118
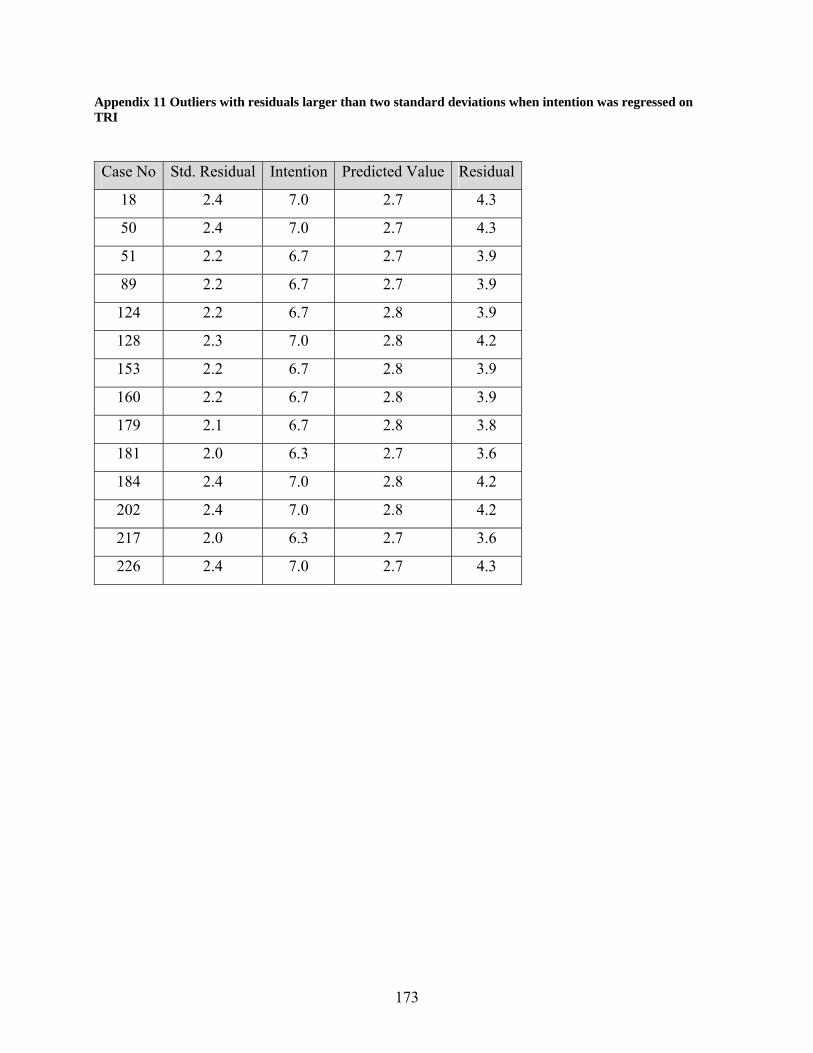
173
Appendix 11 Outliers with residuals larger than two standard deviations when intention was regressed on TRI Case No Std. Residual Intention Predicted Value Residual
18 2.4 7.0 2.7 4.3
50 2.4 7.0 2.7 4.3
51 2.2 6.7 2.7 3.9
89 2.2 6.7 2.7 3.9
124 2.2 6.7 2.8 3.9
128 2.3 7.0 2.8 4.2
153 2.2 6.7 2.8 3.9
160 2.2 6.7 2.8 3.9
179 2.1 6.7 2.8 3.8
181 2.0 6.3 2.7 3.6
184 2.4 7.0 2.8 4.2
202 2.4 7.0 2.8 4.2
217 2.0 6.3 2.7 3.6
226 2.4 7.0 2.7 4.3
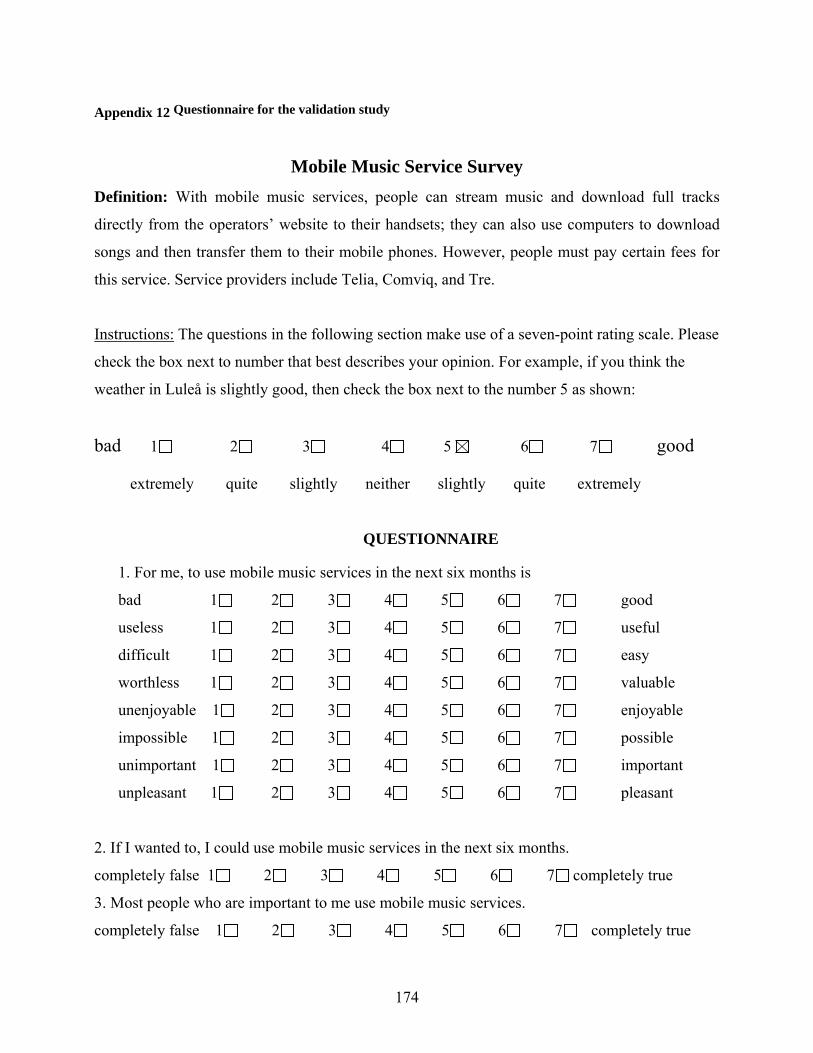
174
Appendix 12 Questionnaire for the validation study
Mobile Music Service Survey Definition: With mobile music services, people can stream music and download full tracks
directly from the operators’ website to their handsets; they can also use computers to download
songs and then transfer them to their mobile phones. However, people must pay certain fees for
this service. Service providers include Telia, Comviq, and Tre.
Instructions: The questions in the following section make use of a seven-point rating scale. Please
check the box next to number that best describes your opinion. For example, if you think the
weather in Luleå is slightly good, then check the box next to the number 5 as shown:
bad 1 2 3 4 5 6 7 good
extremely quite slightly neither slightly quite extremely
QUESTIONNAIRE
1. For me, to use mobile music services in the next six months is
bad 1 2 3 4 5 6 7 good
useless 1 2 3 4 5 6 7 useful
difficult 1 2 3 4 5 6 7 easy
worthless 1 2 3 4 5 6 7 valuable
unenjoyable 1 2 3 4 5 6 7 enjoyable
impossible 1 2 3 4 5 6 7 possible
unimportant 1 2 3 4 5 6 7 important
unpleasant 1 2 3 4 5 6 7 pleasant
2. If I wanted to, I could use mobile music services in the next six months.
completely false 1 2 3 4 5 6 7 completely true
3. Most people who are important to me use mobile music services.
completely false 1 2 3 4 5 6 7 completely true
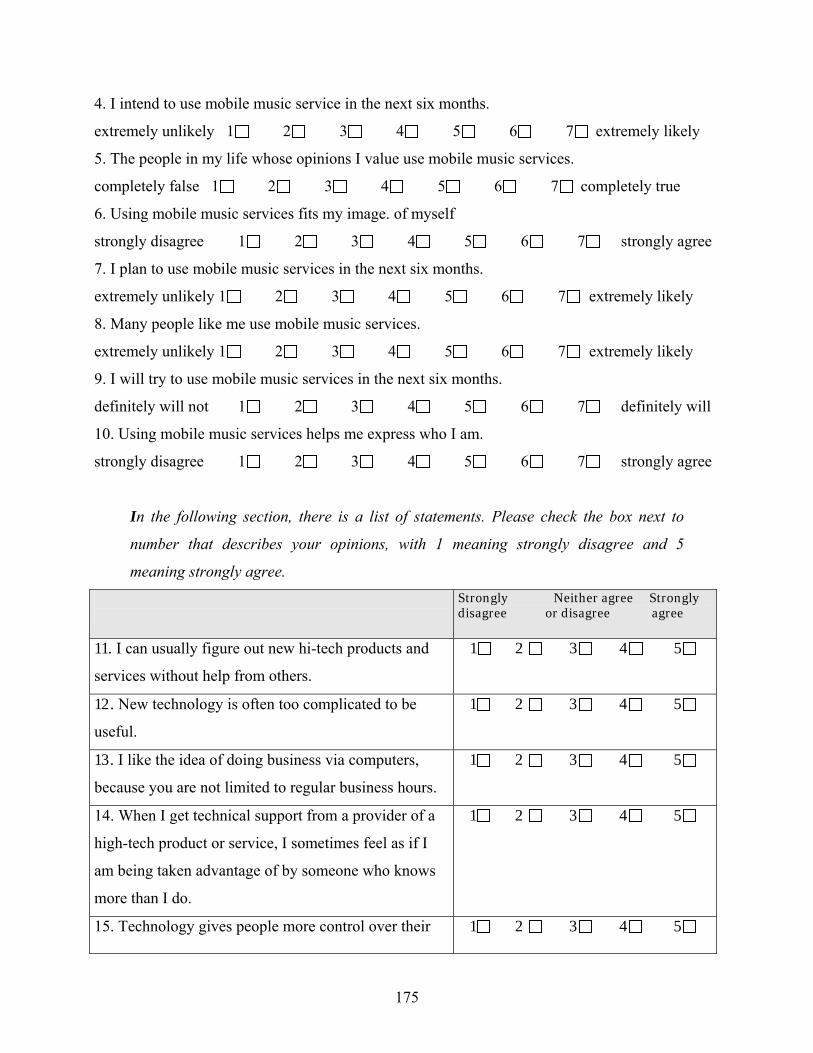
175
4. I intend to use mobile music service in the next six months.
extremely unlikely 1 2 3 4 5 6 7 extremely likely
5. The people in my life whose opinions I value use mobile music services.
completely false 1 2 3 4 5 6 7 completely true
6. Using mobile music services fits my image. of myself
strongly disagree 1 2 3 4 5 6 7 strongly agree
7. I plan to use mobile music services in the next six months.
extremely unlikely 1 2 3 4 5 6 7 extremely likely
8. Many people like me use mobile music services.
extremely unlikely 1 2 3 4 5 6 7 extremely likely
9. I will try to use mobile music services in the next six months.
definitely will not 1 2 3 4 5 6 7 definitely will
10. Using mobile music services helps me express who I am.
strongly disagree 1 2 3 4 5 6 7 strongly agree
In the following section, there is a list of statements. Please check the box next to
number that describes your opinions, with 1 meaning strongly disagree and 5
meaning strongly agree.
Strongly Neither agree Strongly disagree or disagree agree
11. I can usually figure out new hi-tech products and
services without help from others.
1 2 3 4 5
12. New technology is often too complicated to be
useful.
1 2 3 4 5
13. I like the idea of doing business via computers,
because you are not limited to regular business hours.
1 2 3 4 5
14. When I get technical support from a provider of a
high-tech product or service, I sometimes feel as if I
am being taken advantage of by someone who knows
more than I do.
1 2 3 4 5
15. Technology gives people more control over their 1 2 3 4 5
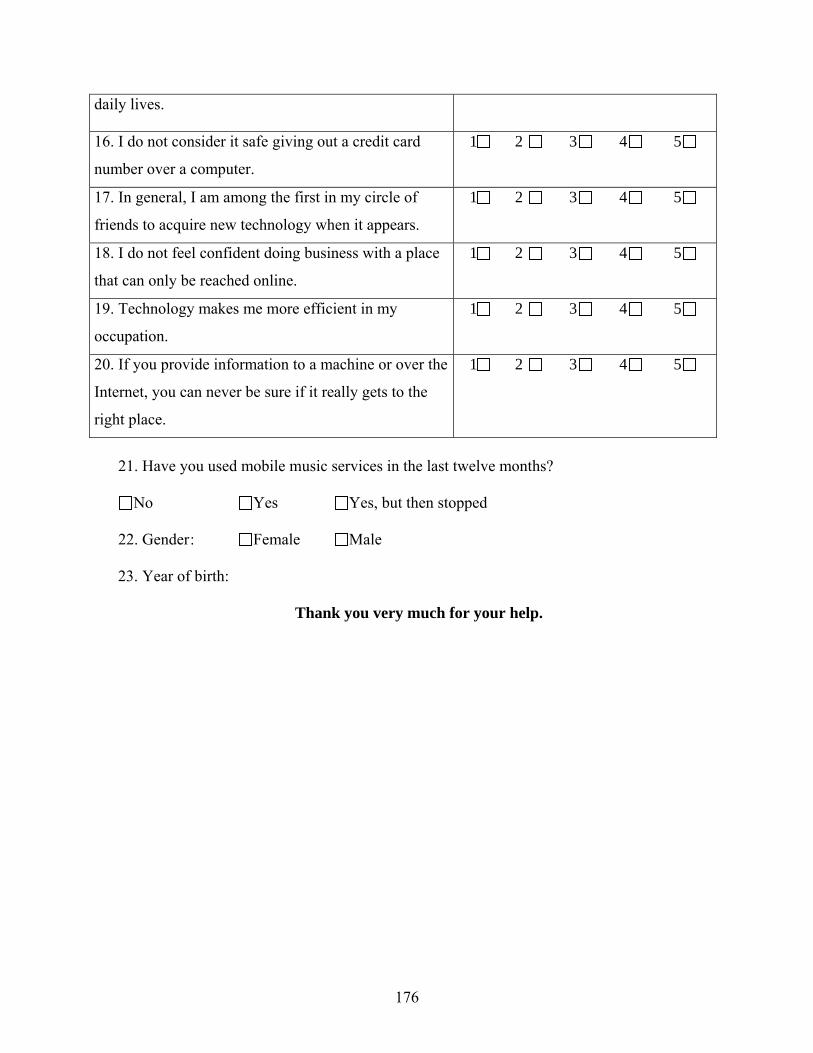
176
daily lives.
16. I do not consider it safe giving out a credit card
number over a computer.
1 2 3 4 5
17. In general, I am among the first in my circle of
friends to acquire new technology when it appears.
1 2 3 4 5
18. I do not feel confident doing business with a place
that can only be reached online.
1 2 3 4 5
19. Technology makes me more efficient in my
occupation.
1 2 3 4 5
20. If you provide information to a machine or over the
Internet, you can never be sure if it really gets to the
right place.
1 2 3 4 5
21. Have you used mobile music services in the last twelve months?
No Yes Yes, but then stopped
22. Gender : Female Male 23. Year of birth:
Thank you very much for your help.
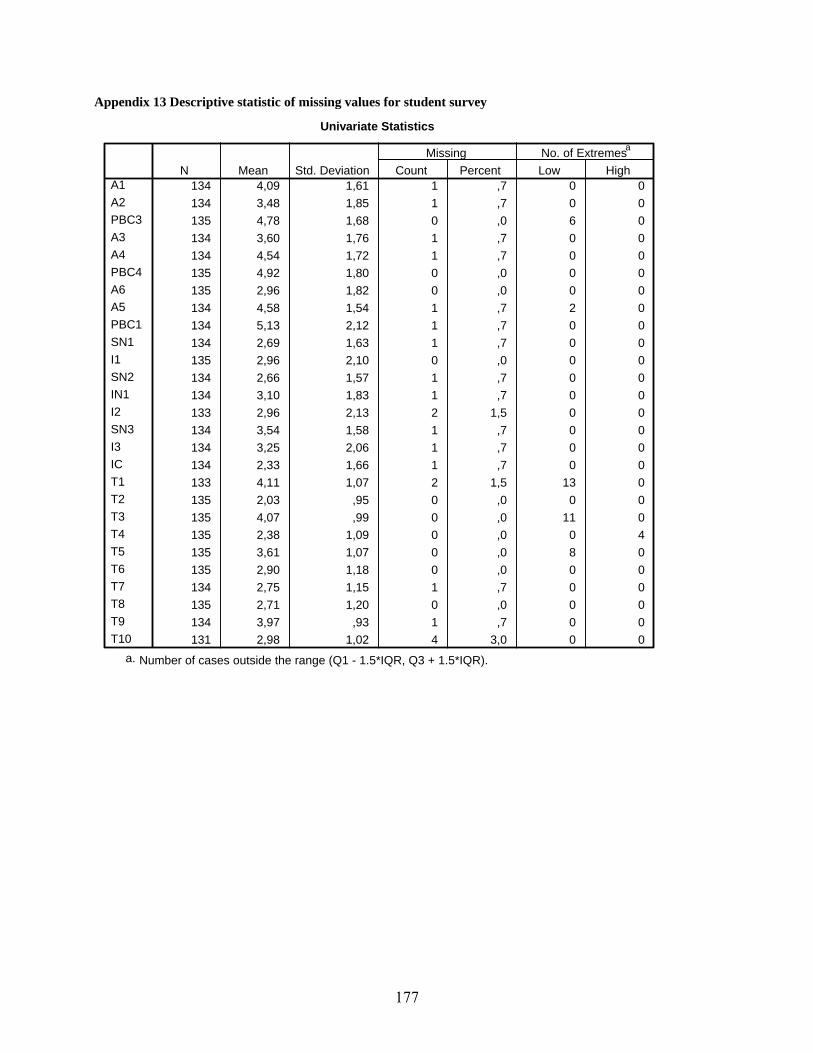
177
Appendix 13 Descriptive statistic of missing values for student survey
Univariate Statistics
134 4,09 1,61 1 ,7 0 0134 3,48 1,85 1 ,7 0 0135 4,78 1,68 0 ,0 6 0134 3,60 1,76 1 ,7 0 0134 4,54 1,72 1 ,7 0 0135 4,92 1,80 0 ,0 0 0135 2,96 1,82 0 ,0 0 0134 4,58 1,54 1 ,7 2 0134 5,13 2,12 1 ,7 0 0134 2,69 1,63 1 ,7 0 0135 2,96 2,10 0 ,0 0 0134 2,66 1,57 1 ,7 0 0134 3,10 1,83 1 ,7 0 0133 2,96 2,13 2 1,5 0 0134 3,54 1,58 1 ,7 0 0134 3,25 2,06 1 ,7 0 0134 2,33 1,66 1 ,7 0 0133 4,11 1,07 2 1,5 13 0135 2,03 ,95 0 ,0 0 0135 4,07 ,99 0 ,0 11 0135 2,38 1,09 0 ,0 0 4135 3,61 1,07 0 ,0 8 0135 2,90 1,18 0 ,0 0 0134 2,75 1,15 1 ,7 0 0135 2,71 1,20 0 ,0 0 0134 3,97 ,93 1 ,7 0 0131 2,98 1,02 4 3,0 0 0
A1A2PBC3A3A4PBC4A6A5PBC1SN1I1SN2IN1I2SN3I3ICT1T2T3T4T5T6T7T8T9T10
N Mean Std. Deviation Count PercentMissing
Low HighNo. of Extremesa
Number of cases outside the range (Q1 - 1.5*IQR, Q3 + 1.5*IQR).a.
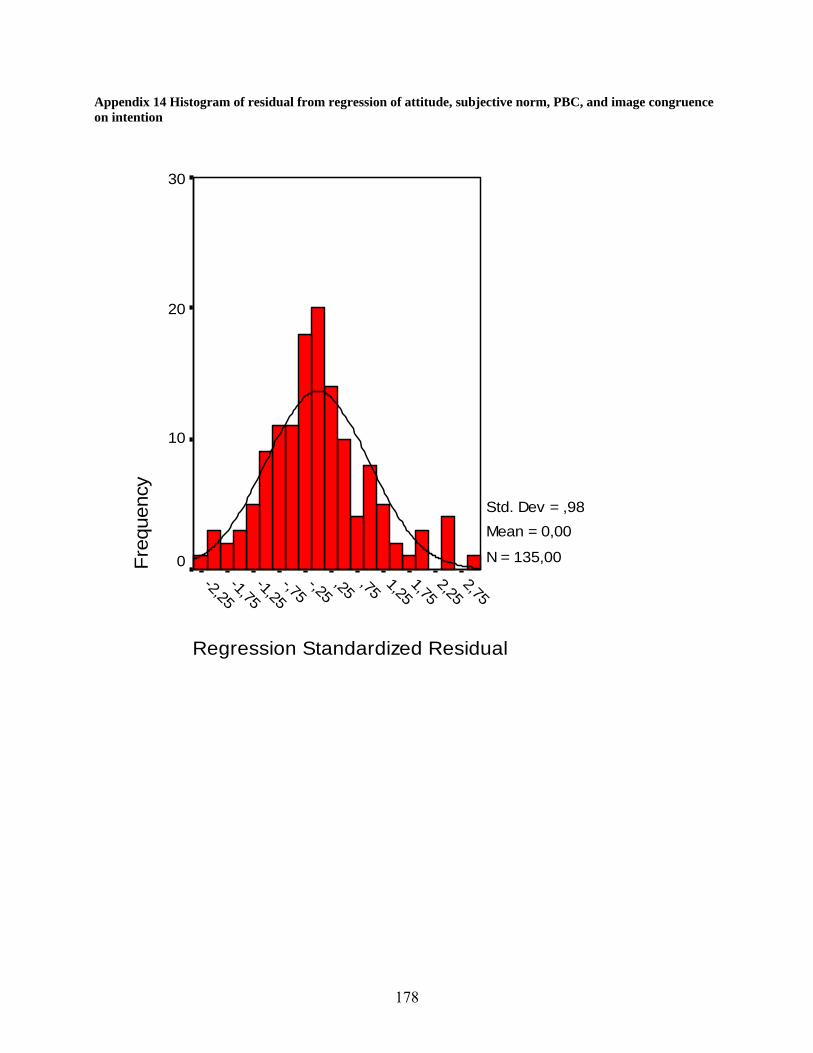
178
Appendix 14 Histogram of residual from regression of attitude, subjective norm, PBC, and image congruence on intention
Regression Standardized Residual
2,752,25
1,751,25
,75,25-,25-,75
-1,25-1,75
-2,25
Freq
uenc
y
30
20
10
0
Std. Dev = ,98 Mean = 0,00
N = 135,00
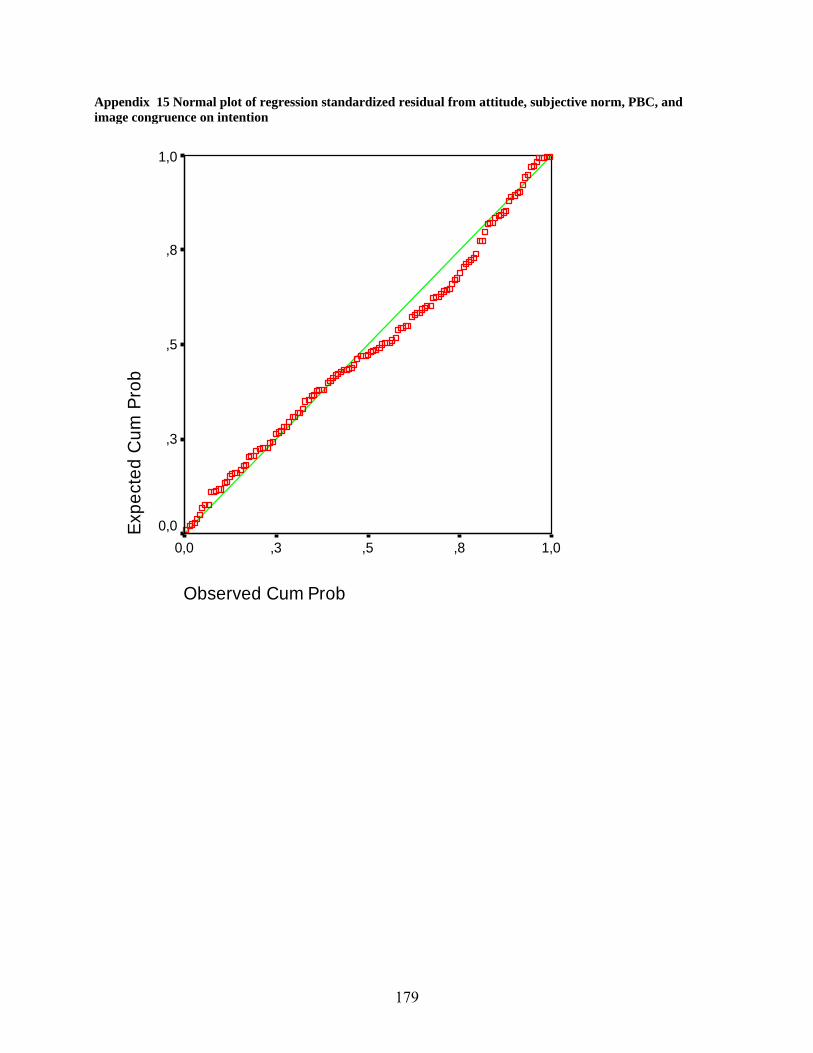
179
Appendix 15 Normal plot of regression standardized residual from attitude, subjective norm, PBC, and image congruence on intention
Observed Cum Prob
1,0,8,5,30,0
Expe
cted
Cum
Pro
b1,0
,8
,5
,3
0,0
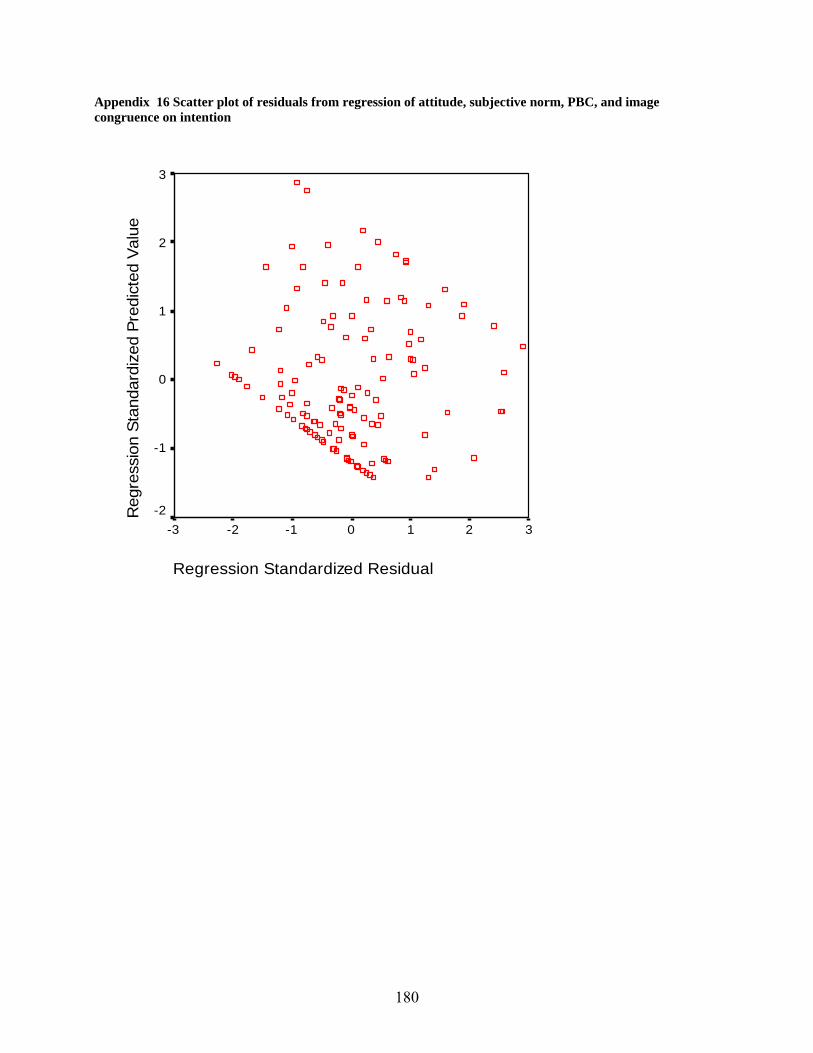
180
Appendix 16 Scatter plot of residuals from regression of attitude, subjective norm, PBC, and image congruence on intention
Regression Standardized Residual
3210-1-2-3
Reg
ress
ion
Stan
dard
ized
Pre
dict
ed V
alue
3
2
1
0
-1
-2
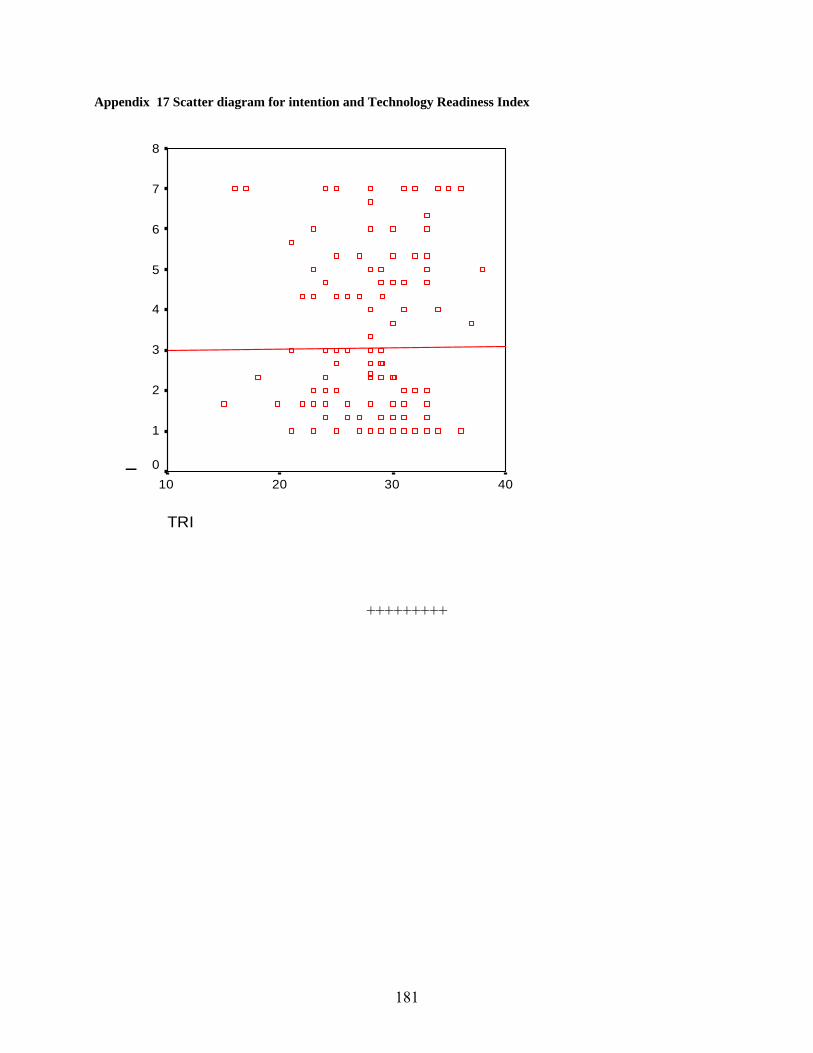
181
Appendix 17 Scatter diagram for intention and Technology Readiness Index
TRI
40302010
I8
7
6
5
4
3
2
1
0
+++++++++


