Embed Size (px)
Citation preview
NHESSD1, 6829–6848, 2013
Anomalous VHFradio propagation
before earthquakes
K. Motojima and N. Naga
Title Page
Abstract Introduction
Conclusions References
Tables Figures
J I
J I
Back Close
Full Screen / Esc
Printer-friendly Version
Interactive Discussion
Discussion
Paper
|D
iscussionP
aper|
Discussion
Paper
|D
iscussionP
aper|
Nat. Hazards Earth Syst. Sci. Discuss., 1, 6829–6848, 2013www.nat-hazards-earth-syst-sci-discuss.net/1/6829/2013/doi:10.5194/nhessd-1-6829-2013© Author(s) 2013. CC Attribution 3.0 License.
Natural Hazards and Earth System
Sciences
Open A
ccess
Discussions
This discussion paper is/has been under review for the journal Natural Hazards and EarthSystem Sciences (NHESS). Please refer to the corresponding final paper in NHESS if available.
Stochastic relation between anomalouspropagation in the line-of-sight VHF radioband and occurrences of earthquakesK. Motojima and N. Haga
Gunma University, Kiryu Gunma, Japan
Received: 22 March 2013 – Accepted: 9 November 2013 – Published: 29 November 2013
Correspondence to: K. Motojima ([email protected])
Published by Copernicus Publications on behalf of the European Geosciences Union.
6829
NHESSD1, 6829–6848, 2013
Anomalous VHFradio propagation
before earthquakes
K. Motojima and N. Naga
Title Page
Abstract Introduction
Conclusions References
Tables Figures
J I
J I
Back Close
Full Screen / Esc
Printer-friendly Version
Interactive Discussion
Discussion
Paper
|D
iscussionP
aper|
Discussion
Paper
|D
iscussionP
aper|
Abstract
This paper was intended to find out any relation between anomalous line-of-sight prop-agation on the VHF band and occurrences of earthquakes near the VHF propagationpaths. The television and FM radio broadcasting waves on the VHF band were mon-itored continuously over the long term. For that purpose, a multidirectional VHF band5
monitoring system was established and utilized. Anomalous line-of-sight propagationon the VHF band was distinguished from the monitored wave by using a statisticalanalysis. After the stochastic consideration, it was found out that earthquakes asso-ciated with anomalous propagation were characterized by magnitude of earthquakesM ≥ 4.5, and distances from epicenters L ≤ 75km. The anomalous propagation was10
monitored on the VHF band a few days earlier the associated earthquakes occurred.Moreover, the anomaly appeared on multidirectional propagation paths simultaneously.The anomaly on the line-of-sight propagation indicates possibility of narrow focusingthe area of epicenter of earthquake.
1 Introduction15
Short-term earthquake prediction is one of the most important research tasks for disas-ter prevention in a country with frequent earthquakes like Japan. There have been re-ported many geophysical electromagnetic phenomena associated with seismicity, andmost reports can be classified into two groups; direct or indirect observations. As oneof the direct observations, low-frequency magnetic waves from earthquake hypocen-20
ter were measured for earthquake predictions (Smith et al., 1990). The observationsindicate that the background noise had been increased a few weeks prior to the cor-responding earthquake (Hayakawa et al., 1996a), and these ULF noises might be re-sulted from microfracturing progression in the lithosphere. As for indirect observations,anomalous propagation in VLF or upper band was suggested as a promising candidate25
for earthquake prediction, because any disturbance at the bottom of ionosphere causes
6830
NHESSD1, 6829–6848, 2013
Anomalous VHFradio propagation
before earthquakes
K. Motojima and N. Naga
Title Page
Abstract Introduction
Conclusions References
Tables Figures
J I
J I
Back Close
Full Screen / Esc
Printer-friendly Version
Interactive Discussion
Discussion
Paper
|D
iscussionP
aper|
Discussion
Paper
|D
iscussionP
aper|
anomalous propagation of the radio waves. Remarkable data have been reported onVLF Omega propagation signal from Tsushima Japan to Inubo Japan in January 1995(Hayakawa et al., 1996b). The phenomenon was the signal amplitude (and/or phase)variations around sunrise and sunset times and appeared a few days prior to the KobeJapan earthquake which occurred on 17 January 1995. The anomalous propagation5
data can be explained in terms of fall of ionospheric bottom (Molchanov and Hayakawa,1998).
In the meanwhile, some researchers observed the FM radio waves on the VHF bandin Japan. They reported that anomalous propagation from over-horizon FM transmit-ter signals were observed. The anomaly seemed to be associated with earthquakes10
(Kushida and Kushida, 2002). Other researchers inferred that the anomalous propaga-tion was influenced by the perturbation in the troposphere. They considered that theperturbed region was within a radius of 100 km from the epicenters of earthquakes(Yonaiguchi et al., 2007).
The purpose of this paper is to find out any relation between anomalous line-of-sight15
propagation on the VHF band and occurrences of earthquakes. Waves from FM radioand TV broadcasting stations within the line-of-sight region had been observed contin-uously over the long term. The main target of transmitting stations was placed at Tokyoin Japan. An observation point has been set at Kiryu, which is located about 90 kmnorth from Tokyo. Therefore, the observation point is placed near the outer edge of the20
line-of-sight range, not over-the-horizon. To find out the relation between the anoma-lous propagation and seismicity, we adopted statistical analysis to the observationalresults and calculated the probability gain which is the ratio of the observational prob-ability to the non-related probability. These are further distinguished from the previousreports (Fujiwara et al., 2004; Fukumoto et al., 2002; Yonaiguchi et al., 2007).25
6831
NHESSD1, 6829–6848, 2013
Anomalous VHFradio propagation
before earthquakes
K. Motojima and N. Naga
Title Page
Abstract Introduction
Conclusions References
Tables Figures
J I
J I
Back Close
Full Screen / Esc
Printer-friendly Version
Interactive Discussion
Discussion
Paper
|D
iscussionP
aper|
Discussion
Paper
|D
iscussionP
aper|
2 Multidirectional VHF band monitoring system
The purpose of this paper is to find out any relation between anomalous line-of-sightpropagation on the VHF band and occurrences of earthquakes near the propagationpaths. We intended to explore the relation, so that a multidirectional VHF band moni-toring system was established. The original feature of the monitoring system is a line-5
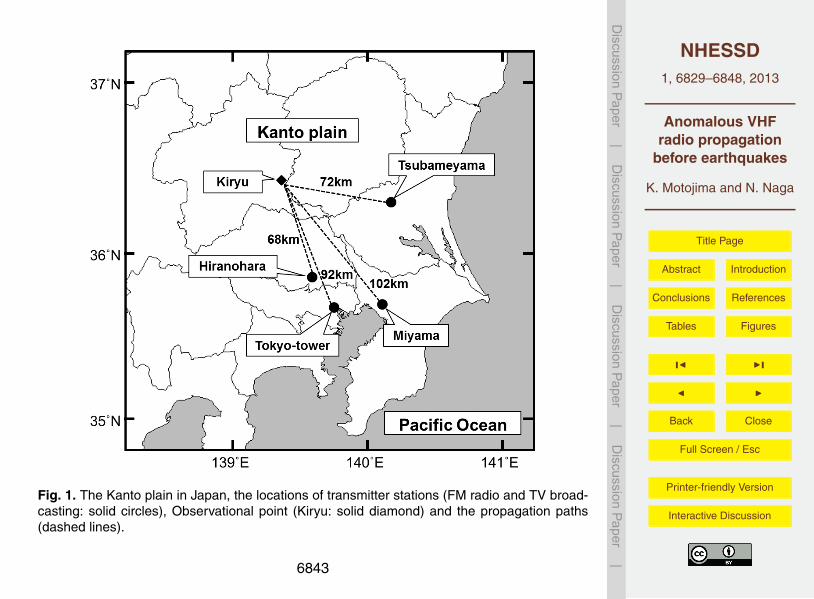
of-sight observation method in which the VHF radio band propagation from multidirec-tional line-of-sight broadcast stations is monitored. The monitoring system is placedin Kiryu Japan (36◦25′26′′ N, 139◦20′58′′ E), which is located about 90 km north fromTokyo. Map positions of Kiryu, Tokyo and the FM radio and TV broadcasting stations,are described in Fig. 1. The path-lengths from each target broadcasting station to mon-10
itoring point (Kiryu), station names and broadcasting frequencies are listed as Table 1.In the troposphere the refractive index is known to affect the line-of-sight propagation
on the VHF radio wave directly. The range of line-of-sight propagation can be estimatedby using following equation:
d =√
2kR(√
hTX +√hRX
)(1)15
where d is the range scale of line-of-sight from the transmitting point, kR is the effectiveEarth-radius. The normal atmosphere has the coefficient of effective Earth-radius, k =4/3. The hTX and hRX are the height of transmitting and receiving antennas above sealevel, respectively.
Kiryu is located near the outer edges of the line-of-sight ranges from transmitting20
stations. Therefore, the refractive index has affected the strength of received wavesdirectly. It means that the receiving point in Kiryu has high sensitivity for anomalouspropagation in the troposphere.
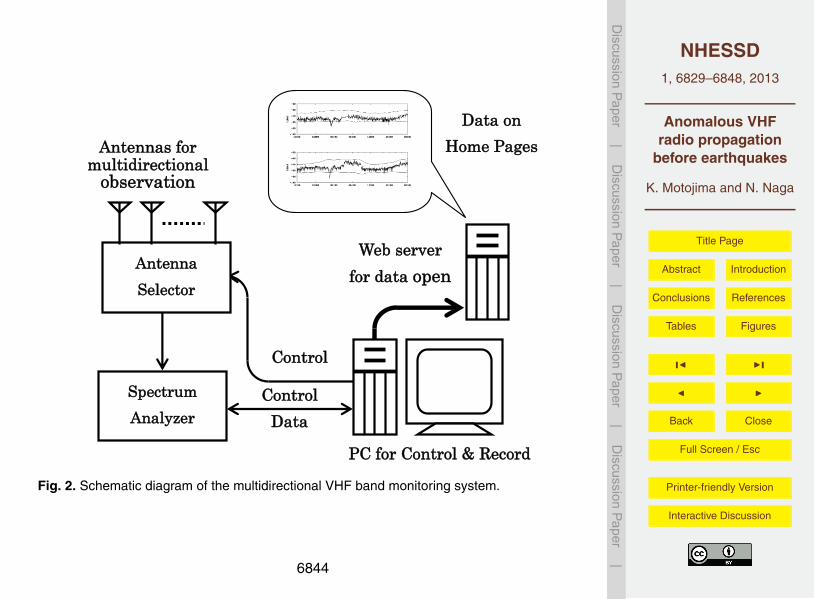
For long-term observation an automatic and around-the-clock monitoring systemconsists of multiple antennas, an automatic antenna selector, a spectrum analyzer for25
radio receiver, a PC for monitoring data storage and a web server for data release. Inthis monitoring system four 5-elements Yagi antennas are used for the multidirectional
6832
NHESSD1, 6829–6848, 2013
Anomalous VHFradio propagation
before earthquakes
K. Motojima and N. Naga
Title Page
Abstract Introduction
Conclusions References
Tables Figures
J I
J I
Back Close
Full Screen / Esc
Printer-friendly Version
Interactive Discussion
Discussion
Paper
|D
iscussionP
aper|
Discussion
Paper
|D
iscussionP
aper|
stations. Each antenna is horizontally orientated to each direction, north, south, eastand west, they are installed on the roof of a five-story building. The spectrum analyzerhas a role of receiver, which is required wideband and high sensitive monitor. The au-tomatic antenna selector switches the spectrum analyzer to the antenna oriented totarget transmitting station. Data storage PC acquires the receiving signal strength ev-5
ery thirty seconds. Each raw data of the received broadcasting wave is graphed anduploaded onto the web server at thirty minute intervals, then the graphed data can bealways visited on the internet. Schematic block diagram of the monitoring system isdescribed in Fig. 2.
3 Anomalous line-of-sight propagation on the VHF band10
In other studies the VHF radio waves from over-the-horizon stations were monitored,reception itself means occurrences of anomalous propagation. On the other hand wemonitored the line-of-sight propagation wave on the VHF band. Transmitted wave canreach normally into the line-of-sight coverage, so discrimination rule for detection ofanomalous propagation was required. For the purpose a certain statistical process15
was adopted. The data process method is following.
1. Received wave has short-time fluctuation and random noise. In order to avoid theinfluence of them, moving averaged values (twenty-minute window) were calcu-lated as observed data.
2. Even the line-of-sight propagation was affected by a diurnal variation on the VHF20
band. Received waves on the ordinary propagation become weaker in daytimethan in night time. The reason is that sunlight promotes the atmospheric con-vection, which decreases the difference in atmospheric refractive index betweenthe surface and the upper air. In order to reduce the diurnal variation, a statisti-cal analysis was performed separately for each specific time slot in a day. A day25
was divided into 72 time slots, each one has twenty-minute period, for example,6833
NHESSD1, 6829–6848, 2013
Anomalous VHFradio propagation
before earthquakes
K. Motojima and N. Naga
Title Page
Abstract Introduction
Conclusions References
Tables Figures
J I
J I
Back Close
Full Screen / Esc
Printer-friendly Version
Interactive Discussion
Discussion
Paper
|D
iscussionP
aper|
Discussion
Paper
|D
iscussionP
aper|
00:00–00:20 LT, 00:20–00:40 LT, 00:40–01:00 LT and so on. Mean values (m) andstandard deviations (σ) of observed data were separately calculated for each timeslot through the observing period.
3. In order to distinguish anomalous observed data from normal ones, we consid-ered the data exceeded beyond m±3σ as the anomalous data. If strength of5
the propagated wave follows a normal distribution, the probability of exceedingbeyond 3σ from the mean value m is about 0.27 %. It was confirmed through theobserving period that the reception data in dBm for each wave had the normal dis-tribution approximately. When the anomalous data over the m±3σ lasted 30 minor more, we recognized that the anomalous propagation occurred.10
Using above process for received wave, we could discriminate the anomalous propa-gation from normal ones in the line-of-sight propagation on the VHF band.
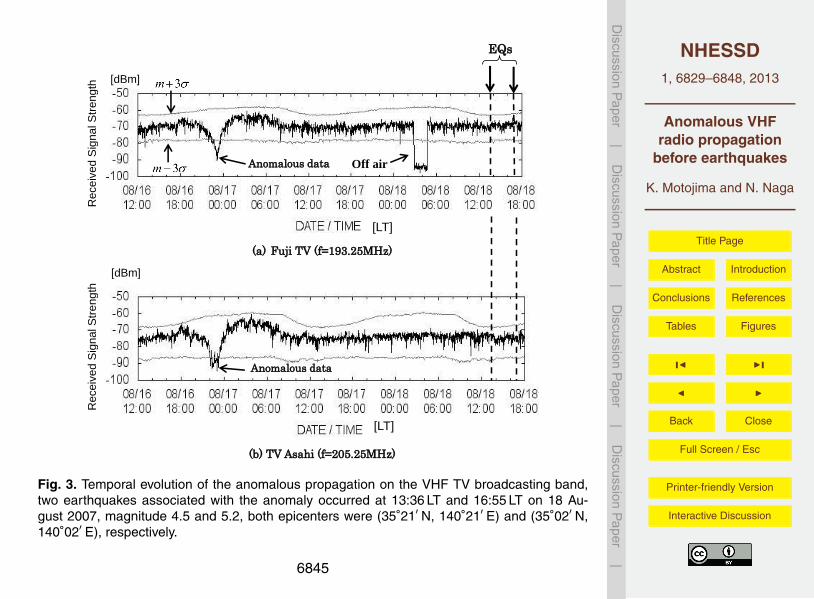
A temporal evolution which was included an anomalous propagation is shown asFig. 3, the upper and lower panel are the received analog TV signal strength on theVHF band, f = 193.25 MHz, 205.25 MHz, respectively. In the upper panel, the anomaly15
appeared at midnight on 16 August 2007, maximum dip below the m−6σ level oc-curred at 23:15 LT. Such a low signal strength remained rare event. In the lower panel,same anomaly occurred simultaneously on the different frequency. About forty hourslater the associated two earthquakes occurred at 13:36 LT and 16:55 LT on 18 Augustmagnitude 4.5 and 5.2, both were centered within 75 km from the propagation path,20
time of occurrences are indicated in dashed lines.
4 Relationship between anomalous propagation and occurrencesof earthquakes
The waves of analog TV video signals on the VHF band had been measured for1155 days starting from 1 February 2007 to 31 March 2010. Now, they had gone off-air25
6834
NHESSD1, 6829–6848, 2013
Anomalous VHFradio propagation
before earthquakes
K. Motojima and N. Naga
Title Page
Abstract Introduction
Conclusions References
Tables Figures
J I
J I
Back Close
Full Screen / Esc
Printer-friendly Version
Interactive Discussion
Discussion
Paper
|D
iscussionP
aper|
Discussion
Paper
|D
iscussionP
aper|
because of migrating over to digital broadcast on UHF band. The multidirectional ob-servation on the FM broadcast waves has started from 8 October 2010, it is ongoingobservation.
We defined the successive occurrence of anomalous propagation and earthquakegeneration within a short period of time as “occurrence of anomalous propagation as-5
sociated with earthquake.” However, even if there were no relation between the anoma-lous propagation and earthquake, both just happened to occur in a short term. There-fore, we estimated the unrelated probability Punrel(tper) of the successive occurrencesbetween the occurrence of anomalous propagation and earthquake under no relation.The probability can be calculated by using the following equation:10
Punrel(tper) = 1−(
Tall − tper
Tall
)Neq
(2)
where tper is the defined length of time period associated anomalous propagation withearthquake, Tall is the amount of observing time (Tall = 1155days for analog TV waveobservation), and Neq is the number of earthquake occurrences during the whole ob-servation period. Accordingly, the unrelated probability Punrel(tper) depends on the de-15
fined length of time tper.On the other hand, the observational probability Pobs(tper) of occurrence of anoma-
lous propagation associated with earthquake can be obtained from the observationresult. It is based on real events and is calculated by the following equation:
Pobs(tper) =Nobs(tper)
Nanom(3)20
where Nobs(tper) is the number of occurrences of anomalous propagation associatedwith earthquakes in the length of time period tper, Nanom is the number of occurrencesof anomalous propagation during the whole observation period Tall (Nanom = 33 on theanalog TV video wave). If the observational probability Pobs(tper) shows comparable to
6835
NHESSD1, 6829–6848, 2013
Anomalous VHFradio propagation
before earthquakes
K. Motojima and N. Naga
Title Page
Abstract Introduction
Conclusions References
Tables Figures
J I
J I
Back Close
Full Screen / Esc
Printer-friendly Version
Interactive Discussion
Discussion
Paper
|D
iscussionP
aper|
Discussion
Paper
|D
iscussionP
aper|
the unrelated probability Punrel(tper), it means that there may be no relation between theanomalous propagation and earthquake.
The number of occurrences of anomalous propagation associated with earthquakesNobs(tper) depends on the length of time period tper, because the longer time periodtper makes the more anomalous propagation identified as “occurrence of anomalous5
propagation associated with earthquake.” In addition, we propose a new concept ofthe probability gain PG(tper) for estimating the relationship between the anomalouspropagation and earthquake. The probability gain PG(tper) is the ratio of the observa-tional probability Pobs(tper) to the unrelated probability Punrel(tper), it can be obtained asfollows.10
PG(tper) =Pobs(tper)
Punrel(tper)(4)
If the PG(tper) closes to one, it means that there may be no relation between theanomalous propagation and earthquake.
We estimated the probability gains PG(tper) for the varied time period tper carefully.As the result of it, we reached a conclusion that the probability gain PG(tper) became15
maximum value at the length of time period tper = 2days. In the following subsectionsthe probability gains PG(tper = 2days) are shown with respect to magnitude of earth-quakes and distances between epicenters and propagation path.
4.1 Probability gain PG with respect to the magnitude of earthquakes
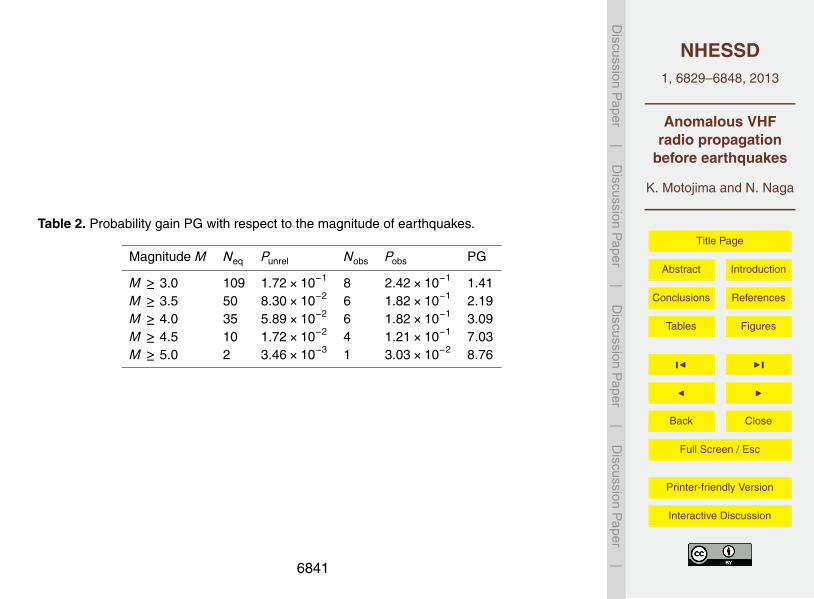
Table 2 shows the relation between magnitude of earthquakes and the probability gain20
PG(tper = 2days). The result indicates that the larger magnitude of earthquake had themore associated with the anomalous propagation. Especially, when the magnitude ofearthquakes were larger than 4.5, they had strong relation with anomalous propaga-tion.
6836
NHESSD1, 6829–6848, 2013
Anomalous VHFradio propagation
before earthquakes
K. Motojima and N. Naga
Title Page
Abstract Introduction
Conclusions References
Tables Figures
J I
J I
Back Close
Full Screen / Esc
Printer-friendly Version
Interactive Discussion
Discussion
Paper
|D
iscussionP
aper|
Discussion
Paper
|D
iscussionP
aper|
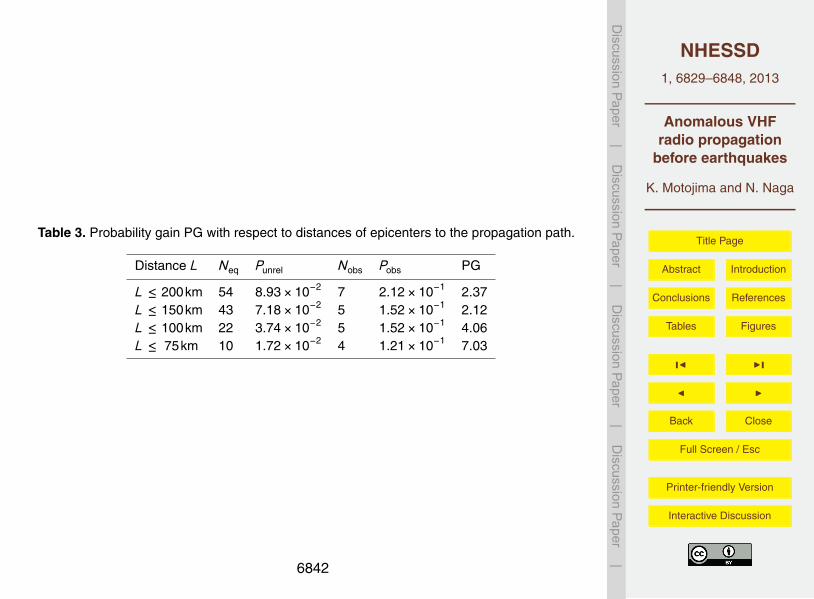
4.2 Probability gain PG with respect to distances of epicenters to thepropagation path
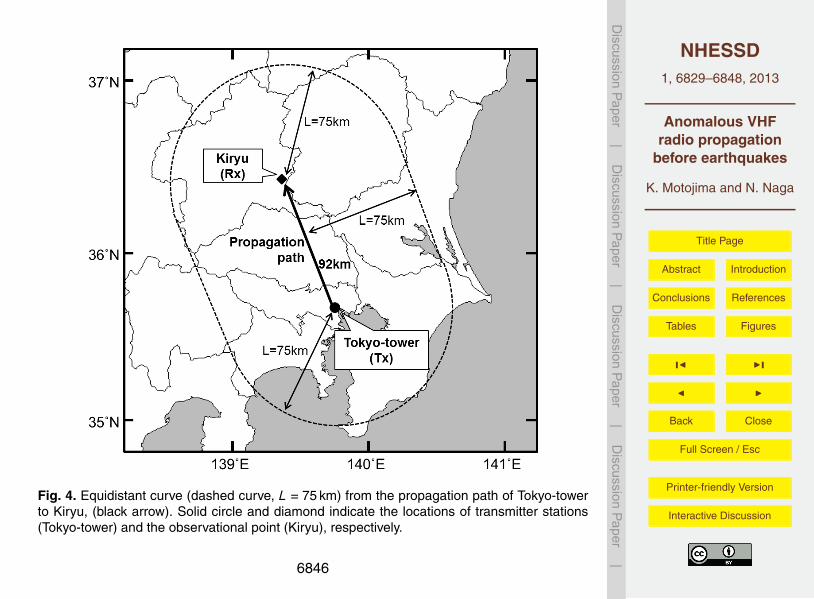
We considered the positional relation between the epicenter location and the prop-agation path. Therefore, the perpendicular distance from epicenters to the propaga-tion path was defined as a distance L. Equidistant curve from the propagation path of5
Tokyo-tower to Kiryu is shown as an example of L = 75 km in Fig. 4.Table 3 shows the relation between the distance L and the probability gain
PG(tper = 2days). The result indicates that the closer epicenters to the propagationpath had the more associated with the anomalous propagation. Earthquakes about150 km away from the propagation path had little relation to the anomalous propaga-10
tion.
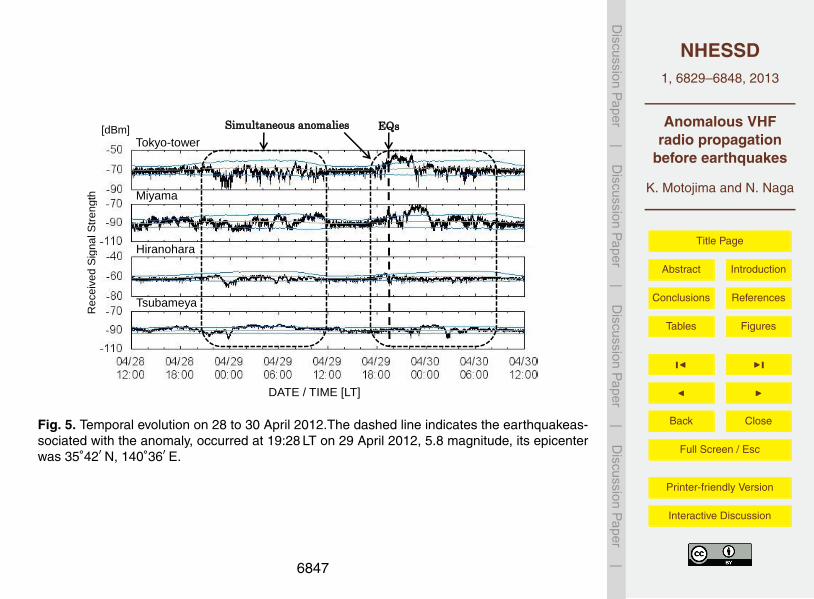
4.3 Synchronism detection of anomalous propagation in the multidirectionalFM broadcasting waves
Figures 5 and 6 are the observational result in the multidirectional FM waves, whichwere incoming from four different transmitting stations, Tokyo-tower, Miyama, Hira-15
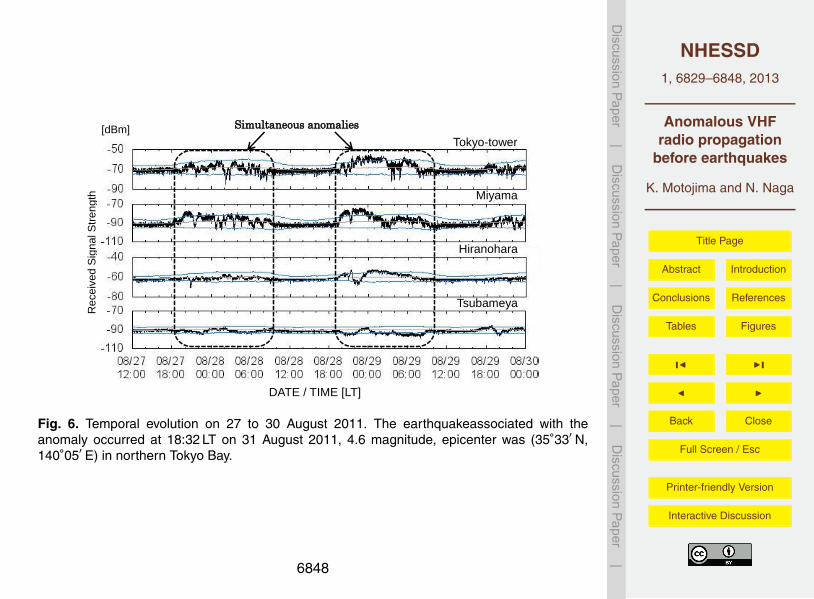
nohara and Tsubameyama stations, as shown in Fig. 1. Black solid lines indicate thereceived signal strengths. Three gray lines mean an upper limit of ordinary propagation(m+3σ), mean value (m) and a lower limit of it (m−3σ) in order from top. They werestatistically derived from the long term observational data.
Figure 5 shows the temporal evolutions on 28 to 30 April 2012. The received signal20
strengths from Tokyo-tower and Miyama station had two obvious anomalies occurredclose to same time, from 10 p.m. on 28 April to 11 a.m. on 29, and from 7 p.m. on29 April to 6 a.m. on 30. Both anomalies lasted half a day. The other two waves fromHiranohara and Tsubameyama stations had short time anomaly at 23:30 LT on 28 April.During the second simultaneous anomalies, an earthquake occurred at 19:28 LT on25
29 April 2012, 5.8 magnitude, epicenter location (35◦42′ N, 140◦36′ E). The anomalouspropagation on above data seemed to be a precursor of the earthquake.
6837
NHESSD1, 6829–6848, 2013
Anomalous VHFradio propagation
before earthquakes
K. Motojima and N. Naga
Title Page
Abstract Introduction
Conclusions References
Tables Figures
J I
J I
Back Close
Full Screen / Esc
Printer-friendly Version
Interactive Discussion
Discussion
Paper
|D
iscussionP
aper|
Discussion
Paper
|D
iscussionP
aper|
Figure 6 shows another anomalous propagation which occurred on 27 to 30 Au-gust 2011. The received signal strengths from Tokyo-tower and Miyama station hadobvious anomalies. And the waves from Hiranohara and Tsubameyama stations hadweakly anomalies. It indicated a similar tendency of the observation in Fig. 5. Anearthquake happened subsequent to this anomaly in several days later. It occurred at5
18:32 LT on 31 Auguast 2011, 4.6 magnitude earthquake, centered in northern TokyoBay, (35◦33′ N, 140◦05′ E). The anomalous propagation may be the precursor of theearthquake.
5 Summary
In this paper, the relation between anomalous line-of-sight propagation on the VHF10
band and occurrences of earthquakes was investigated by using the statistical anal-ysis. For that purpose, the multidirectional VHF band monitoring system was estab-lished, and the line-of-sight VHF waves had been monitored for a long term. In order toestimate the relation between the two, the new conception of the probability gain wasintroduced. As the results of observation for over three years and the stochastic con-15
sideration, we found out the relation between anomalous line-of-sight propagation andearthquakes. Especially, earthquakes associated with anomalous propagation werecharacterized by magnitude of earthquakes M ≥ 4.5, and distances from epicentersL ≤ 75 km. The event probability of the line-of-sight propagation increased just a fewdays prior to earthquakes categorized by the above. Moreover, synchronism detection20
of anomalous propagation in the multidirectional FM broadcasting waves was shown.The anomalies associated with earthquakes sometimes occurred almost at the sametime on the plural radio waves via different pathways. These phenomena have the pos-sibility of narrow focusing the area of epicenter of earthquake.
The important relation between the two could be found, but it is not yet ready to25
be accepted as a fact. Additionally we have to elucidate the mechanism between theanomalous propagation and occurrences of earthquakes. These are considered to be
6838
NHESSD1, 6829–6848, 2013
Anomalous VHFradio propagation
before earthquakes
K. Motojima and N. Naga
Title Page
Abstract Introduction
Conclusions References
Tables Figures
J I
J I
Back Close
Full Screen / Esc
Printer-friendly Version
Interactive Discussion
Discussion
Paper
|D
iscussionP
aper|
Discussion
Paper
|D
iscussionP
aper|
our future works, and so the observation and the analysis should be continued exten-sively in future as well.
References
Fujiwara, H., Kamogara, M., Ikeda, M., Liu, J. Y., Sakata, H., Chen, Y. I., Ofuruton, H., Mura-matsu, S., Chuo, Y. J., and Ohtsuki, Y. H.: Atmospheric anomalies observed during earth-5
quake occurrences, Geophys. Res. Lett., 31, L17110, doi:10.1029/2004GL019865, 2004.Fukumoto, Y., Hayakawa, M., and Yasuda, H.: Reception of over-horizon FM signals associated
with earthquakes, in: Seismo Electromagnetics (Lithosphere – Atmosphere – IonosphereCoupling), edited by: Hayakawa, M. and Molchanov, O. A., TERRAPUB, Tokyo, 263–266,2002.10
Hayakawa, M., Kawate, R., Molchanov, O. A., and Yumoto, K.: Results of ultra-low-frequencymagnetic field measurements during the Guam earthquake of 8 August 1993, Geophys. Res.Lett., 23, 241–244, 1996a.
Hayakawa, M., Molchanov, O. A., Ondoh, T., and Kawai, E.: The precursory signature effect ofthe Kobe earthquake on VLF subionospheric signals, J. Commun. Res. Lab., 43, 169–180,15
1996b.Kushida, Y. and Kushida, R.: Possibility of earthquake forecast by radio observations in the
VHF band, J. Atoms. Electr., 22, 239–255, 2002.Molchanov, O. A. and Hayakawa, M.: Subionospheric VLF signal perturbations possibly related
to earthquakes, J. Geophys. Res., 103, A8, 17489–17504, 1998.20
Smith, A. C. F., Bernardi, A., McGill, P. R., Ladd, M. E., Helliwell, R. A., and Villard Jr., O. G.:Low-frequency magnetic field measurements near the epicenter of the Ms 7.1 Loma Prietaearthquake, Geophys. Res. Lett., 17, 1465–1468, 1990.
Yonaiguchi, N., Ida, Y., and Hayakawa, M.: On the statistical correlation of over-horizon VHFsignals with meteorological radio ducting and seismicity, J. Atmos. Solar-terr. Phys., 69, 661–25
674, 2007.
6839
NHESSD1, 6829–6848, 2013
Anomalous VHFradio propagation
before earthquakes
K. Motojima and N. Naga
Title Page
Abstract Introduction
Conclusions References
Tables Figures
J I
J I
Back Close
Full Screen / Esc
Printer-friendly Version
Interactive Discussion
Discussion
Paper
|D
iscussionP
aper|
Discussion
Paper
|D
iscussionP
aper|
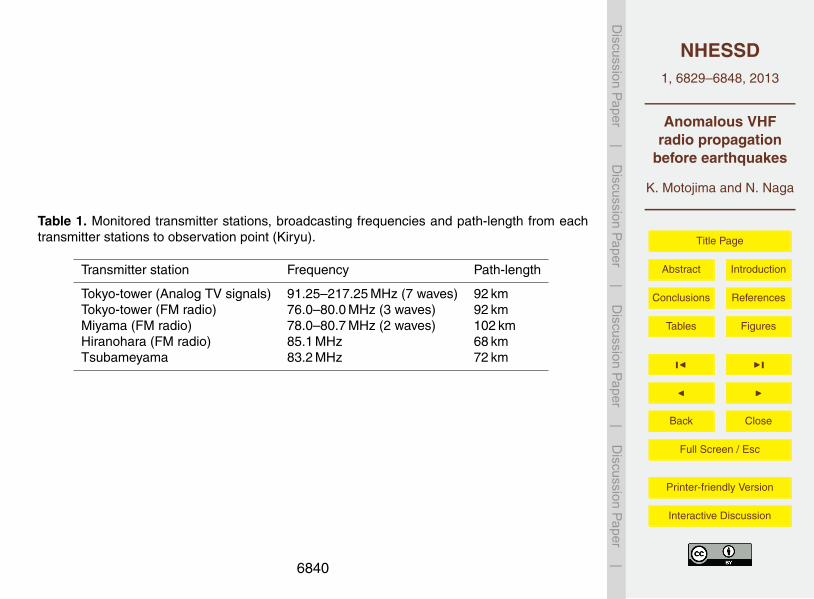
Table 1. Monitored transmitter stations, broadcasting frequencies and path-length from eachtransmitter stations to observation point (Kiryu).
Transmitter station Frequency Path-length
Tokyo-tower (Analog TV signals) 91.25–217.25 MHz (7 waves) 92 kmTokyo-tower (FM radio) 76.0–80.0 MHz (3 waves) 92 kmMiyama (FM radio) 78.0–80.7 MHz (2 waves) 102 kmHiranohara (FM radio) 85.1 MHz 68 kmTsubameyama 83.2 MHz 72 km
6840
NHESSD1, 6829–6848, 2013
Anomalous VHFradio propagation
before earthquakes
K. Motojima and N. Naga
Title Page
Abstract Introduction
Conclusions References
Tables Figures
J I
J I
Back Close
Full Screen / Esc
Printer-friendly Version
Interactive Discussion
Discussion
Paper
|D
iscussionP
aper|
Discussion
Paper
|D
iscussionP
aper|
Table 2. Probability gain PG with respect to the magnitude of earthquakes.
Magnitude M Neq Punrel Nobs Pobs PG
M ≥ 3.0 109 1.72×10⁻¹ 8 2.42×10⁻¹ 1.41M ≥ 3.5 50 8.30×10⁻² 6 1.82×10⁻¹ 2.19M ≥ 4.0 35 5.89×10⁻² 6 1.82×10⁻¹ 3.09M ≥ 4.5 10 1.72×10⁻² 4 1.21×10⁻¹ 7.03M ≥ 5.0 2 3.46×10⁻³ 1 3.03×10⁻² 8.76
6841
NHESSD1, 6829–6848, 2013
Anomalous VHFradio propagation
before earthquakes
K. Motojima and N. Naga
Title Page
Abstract Introduction
Conclusions References
Tables Figures
J I
J I
Back Close
Full Screen / Esc
Printer-friendly Version
Interactive Discussion
Discussion
Paper
|D
iscussionP
aper|
Discussion
Paper
|D
iscussionP
aper|
Table 3. Probability gain PG with respect to distances of epicenters to the propagation path.
Distance L Neq Punrel Nobs Pobs PG
L ≤ 200km 54 8.93×10⁻² 7 2.12×10⁻¹ 2.37L ≤ 150km 43 7.18×10⁻² 5 1.52×10⁻¹ 2.12L ≤ 100km 22 3.74×10⁻² 5 1.52×10⁻¹ 4.06L ≤ 75km 10 1.72×10⁻² 4 1.21×10⁻¹ 7.03
6842
NHESSD1, 6829–6848, 2013
Anomalous VHFradio propagation
before earthquakes
K. Motojima and N. Naga
Title Page
Abstract Introduction
Conclusions References
Tables Figures
J I
J I
Back Close
Full Screen / Esc
Printer-friendly Version
Interactive Discussion
Discussion
Paper
|D
iscussionP
aper|
Discussion
Paper
|D
iscussionP
aper|
Figure 1 The Kanto plain in Japan, the locations of transmitter stations (FM
radio and TV broadcasting: solid circles), Observational point (Kiryu: solid
diamond) and the propagation paths (dashed lines).
Fig. 1. The Kanto plain in Japan, the locations of transmitter stations (FM radio and TV broad-casting: solid circles), Observational point (Kiryu: solid diamond) and the propagation paths(dashed lines).
6843
NHESSD1, 6829–6848, 2013
Anomalous VHFradio propagation
before earthquakes
K. Motojima and N. Naga
Title Page
Abstract Introduction
Conclusions References
Tables Figures
J I
J I
Back Close
Full Screen / Esc
Printer-friendly Version
Interactive Discussion
Discussion
Paper
|D
iscussionP
aper|
Discussion
Paper
|D
iscussionP
aper|
Figure 2 Schematic diagram of the multidirectional VHF band monitoring
system.
Spectrum
Analyzer
PC for Control & Record
Control
Data
acquisition
Control
Antennas for multidirectional
observation
U
p
l
o
a
d
Web server
for data open
Data on
Home Pages
Antenna
Selector
Fig. 2. Schematic diagram of the multidirectional VHF band monitoring system.
6844
NHESSD1, 6829–6848, 2013
Anomalous VHFradio propagation
before earthquakes
K. Motojima and N. Naga
Title Page
Abstract Introduction
Conclusions References
Tables Figures
J I
J I
Back Close
Full Screen / Esc
Printer-friendly Version
Interactive Discussion
Discussion
Paper
|D
iscussionP
aper|
Discussion
Paper
|D
iscussionP
aper|
(a) Fuji TV (f=193.25MHz)
(b) TV Asahi (f=205.25MHz)
Figure 3 Temporal evolution of the anomalous propagation on the VHF TV
broadcasting band, two earthquakes associated with the anomaly occurred at 13:36
LT and 16:55 LT on Aug. 18th, 2007, magnitude 4.5 and 5.2, both epicenters were
EN 12140,1235 and EN 20140,2035 , respectively.
Anomalous data
Anomalous data
EQs
Off air
[dBm]
[dBm]
[LT]
[LT]
Receiv
ed S
ignal S
trength
R
eceiv
ed S
ignal S
trength
Fig. 3. Temporal evolution of the anomalous propagation on the VHF TV broadcasting band,two earthquakes associated with the anomaly occurred at 13:36 LT and 16:55 LT on 18 Au-gust 2007, magnitude 4.5 and 5.2, both epicenters were (35◦21′ N, 140◦21′ E) and (35◦02′ N,140◦02′ E), respectively.
6845
NHESSD1, 6829–6848, 2013
Anomalous VHFradio propagation
before earthquakes
K. Motojima and N. Naga
Title Page
Abstract Introduction
Conclusions References
Tables Figures
J I
J I
Back Close
Full Screen / Esc
Printer-friendly Version
Interactive Discussion
Discussion
Paper
|D
iscussionP
aper|
Discussion
Paper
|D
iscussionP
aper|
Figure 4 Equidistant curve (dashed curve, kmL 75 ) from the propagation path
of Tokyo-tower to Kiryu, (black arrow). Solid circle and diamond indicate the
locations of transmitter stations (Tokyo-tower) and the observational point (Kiryu),
respectively.
Fig. 4. Equidistant curve (dashed curve, L = 75 km) from the propagation path of Tokyo-towerto Kiryu, (black arrow). Solid circle and diamond indicate the locations of transmitter stations(Tokyo-tower) and the observational point (Kiryu), respectively.
6846
NHESSD1, 6829–6848, 2013
Anomalous VHFradio propagation
before earthquakes
K. Motojima and N. Naga
Title Page
Abstract Introduction
Conclusions References
Tables Figures
J I
J I
Back Close
Full Screen / Esc
Printer-friendly Version
Interactive Discussion
Discussion
Paper
|D
iscussionP
aper|
Discussion
Paper
|D
iscussionP
aper|
Figure 5 Temporal evolution on April 28th to 30th, 2012. The dashed line
indicates the earthquake associated with the anomaly, occurred at 19:28 LT on April
29th, 2012, 5.8 magnitude, its epicenter was EN 63140,2435 .
Re
ceiv
ed S
igna
l S
tre
ng
th
[dBm]
DATE / TIME [LT]
Tokyo-tower
Miyama
Hiranohara
Tsubameya
ma
Simultaneous anomalies EQs
Fig. 5. Temporal evolution on 28 to 30 April 2012.The dashed line indicates the earthquakeas-sociated with the anomaly, occurred at 19:28 LT on 29 April 2012, 5.8 magnitude, its epicenterwas 35◦42′ N, 140◦36′ E.
6847
NHESSD1, 6829–6848, 2013
Anomalous VHFradio propagation
before earthquakes
K. Motojima and N. Naga
Title Page
Abstract Introduction
Conclusions References
Tables Figures
J I
J I
Back Close
Full Screen / Esc
Printer-friendly Version
Interactive Discussion
Discussion
Paper
|D
iscussionP
aper|
Discussion
Paper
|D
iscussionP
aper|
Figure 6 Temporal evolution on Aug. 27th to 30th, 2011. The earthquake
associated with the anomaly occurred at 18:32 LT on Aug. 31st, 2011, 4.6 magnitude,
epicenter was EN 50140,3335 in northern Tokyo Bay.
Re
ceiv
ed S
igna
l S
tre
ng
th
[dBm]
DATE / TIME [LT]
Tokyo-tower
Miyama
Hiranohara
Tsubameya
ma
Simultaneous anomalies
Fig. 6. Temporal evolution on 27 to 30 August 2011. The earthquakeassociated with theanomaly occurred at 18:32 LT on 31 August 2011, 4.6 magnitude, epicenter was (35◦33′ N,140◦05′ E) in northern Tokyo Bay.
6848


![[Anomalous pregnancies in ancient medicine]](https://img.dokumen.tips/doc/110x75/635b01af9d85dc43cb073b1d/anomalous-pregnancies-in-ancient-medicine.jpg)


