Embed Size (px)
Citation preview

Annuities Markets Around the World: Money’s Worth and Risk Intermediation
By
Estelle James, Consultant, World Bank*
Xue Song, Institute for Women’s Policy Research
This is a revised and greatly expanded version of papers prepared for presentation at the AmericanEconomic Association meetings, January 2001 and the World Bank Pension Research Conference,September 1999. The World Bank and AEA papers were co-authored by Dimitri Vittas. Work on thispaper was carried out while Estelle James was a Visiting Fellow at CeRP (Center for Research onPensions and Welfare Policies), Turin, Italy. We wish to thank industry representatives, including MarkHug (Equitable), Alex Scheitlin (Metlife), Michael Koller and Fred Siegrist (Swiss life), Tim Pfeiffer(insurance industry consultant), Shane Chalke (AnnuityNet), Nick Bauer (Eckler Partners, Montreal),D’Alton S. Rudd (formerly Pension Commission of Ontario), Juan Carlos Padilla (Hewitt Associates,Mexico) and Peter Foo (NTUC Income, Singapore) for their helpful comments and insights. Thanksalso to Chris Daykin (Government Actuary’s Department, UK), J. Michael Orszag (Birkbeck College,UK), Rob Brown (University of Waterloo, Canada), Martin Janssen (University of Zurich), MukulAsher (National University of Singapore), Rahul Sen (National University of Singapore), AugustoIglesias (Primamerica, Chile), Jeffrey Brown (Harvard University) and Don McIsaac (World Bank) fortheir assistance. And to all the participants in the World Bank Annuity Research Project for their countryreports (see endnote 1).
* Correspondence about this paper should be directed to Estelle James [email protected].

Abstract:Annuities Markets Around the World: Money’s Worth and Risk Intermediation
Annuities markets around the world are small. However, they have been growing in recentyears and are likely to grow further as a result of reforms in public social security systems and privatepension plans, that partially replace defined benefit plans with funded defined contribution plans. Whenpeople retire they may choose, and are sometimes required, to annuitize these defined contributionsavings. Therefore, it is important to learn whether or not annuities markets exist, how they operate andwhat kinds of market failure can be anticipated. Several papers have already analyzed US annuitiesmarkets. This paper extends that analysis by examining annuities markets in other countries. We presentevidence from Canada, the UK, Switzerland, Australia, Israel, Chile and Singapore—a variety of highand middle-income countries—and replicate the results from the US.
This paper focuses on analyses of the expected present discounted value (EPDV) of cash flowsfrom the annuity, and the money’s worth ratio (MWR), which is the EPDV divided by the initial premiumcost. We find that, when discounting at the risk-free rate, MWR’s for annuitants are surprisingly high—greater than 95% in most countries and sometimes greater than 100%. MWR’s for the average populationmember are lower but still exceed 90% in most cases. We show that differential interest rate structureslargely explain differential monthly payouts across countries, while differential mortality rates, especiallyprojected improvement factors, help explain differences in measured MWR’s, given these monthlypayouts and interest rates.
The high MWR’s raise the question: How do insurance companies cover their costs despitethese high MWR’s? We hypothesize that for each annuity sale, insurance companies get a large sum ofmoney up-front that they invest in a portfolio of corporate bonds, mortgages, and some equities, earninga rate of return that exceeds the risk-free rate by 1.3% or more per year. They turn this “risky” portfoliointo a safer annuity by a variety of risk-intermediation, term-intermediation techniques. This allowsthem to sell a product that is nearly risk-free, while earning a “spread” that covers their costs. Wepresent data on cost and investment returns that are consistent with this hypothesis. The limitedopportunity to earn this spread may help explain why price indexed annuities in the UK charge higherloads to cover their costs and risks. For consumers who would prefer to accept this investment risk andcapture this spread themselves, the appropriate discount rate is higher and the MWR is lower, helpingto explain the low demand for annuities in voluntary markets.
Annuities Markets Around the World:Money’s Worth and Risk Intermediation
Structural reforms of social security and pension systems, that incorporate funded individual
accounts, have been taking place around the world during the past two decades. Most of the attention
thus far has focused on the accumulation phase, during which mandatory retirement savings accounts
are being built up. But ultimately retirement savings will be withdrawn and consumed. So in the second
generation of reforms countries have begun paying attention to decumulation. Annuitization is often
encouraged and in some cases required in the new mandatory systems—an increasing number of workers

are likely to take this route toward decumulation. At this point, it becomes important to learn whether
or not annuities markets exist, how they operate and what kinds of market failure can be anticipated. In
the U.S., where social security reform including individual accounts is already on the political agenda,
similar questions will arise. Several papers have already analyzed US annuity markets, including analyses
of money’s worth, adverse selection and redistributional effects. (For example, see Mitchell, Poterba,
Warshawsky and Brown 1999, Brown Mitchell and Poterba 2000, Poterba and Warshawsky 1999,
Brown 2000).
This paper extends that analysis by examining annuities markets in other countries. We present
evidence from Canada, the UK, Switzerland, Australia, Israel, Chile and Singapore—a variety of high
and middle-income countries—and replicate the results from the US. This sample is clearly too small
for econometric testing, but it yields some interesting insights. We explore whether and why the monthly
payouts and “money’s worth ratios” (MWR’s) differ across countries and how insurance companies
cover their costs in countries if the MWR’s are high.
The MWR is the ratio of expected discounted lifetime benefits to initial capital cost of the
annuity. We focus on annuities that provide longevity insurance. While we structure this paper as a
search by analysts for the MWR, insurance companies, consumers, regulators and policy-makers must
carry out the same search for their own reasons. Companies must figure out how large are the payouts
they can offer, consumers must calculate the expected value to them of alternative annuity products
(versus no annuitization at all), regulators must ensure that the system as a whole is solvent and policy-
makers must understand the industry in order to set the rules of the game.
Annuities markets are still poorly developed in virtually all these countries. The
underdevelopment of the industry manifests itself in: its small size relative to other kinds of insurance,
the absence of mortality tables which are a prerequisite to sound pricing and funding policies, and the
relative paucity of long term financial instruments with which to match assets and liabilities, thereby
creating substantial reinvestment risk. Given the underdevelopment of annuity markets we might expect
to find random variations in payouts and low money’s worth ratios, implying high costs for consumers.
However, as reported in an earlier paper, we found surprisingly high MWR’s in a variety of countries
(James and Vittas 1999b). In this paper we re-examine these results and examine their plausibility in
four ways: we 1) refine and improve the data; 2) analyze the degree to which interest rate or mortality
differentials are responsible for differences across countries in monthly and expected lifetime payouts;
3) examine costs of providing annuities, and how insurance companies cover their costs if the MWR is
high; and 4) address the questions—why do firms supply annuities (and why don’t consumers buy
annuities) in view of their high MWR’s?
Our data indicate that monthly annuity payouts vary widely across countries, but the variation
is systematic and the MWR’s are much less dispersed. We show that differential interest rates, which
vary widely across countries, largely explain the differential monthly payouts and are set to equalize
expected discounted lifetime payouts for a common mortality structure. In contrast, differential mortality
rates, especially projected improvement factors, help explain the smaller differences in measured MWR’s,

given these monthly payouts and interest rates. As before, we find that, when discounting at the risk-
free treasury rate, these payouts yield money’s worth ratios for the average annuitant that exceed 95%
in almost every case—and sometimes even exceed 100%. Annuitants get back, in expected present
value, almost exactly what they put in and sometimes more. For the average member of the population
(who has a shorter life expectancy than the average annuitant) the MWR exceeds 90% in most countries.
If workers had the objective of smoothing consumption over their life cycle, one would expect a higher
level of annuitization, given these MWR’s. Later we return to this issue.
Where do insurance companies get the money to cover their administrative costs, risk premium
and profits, in view of these seemingly high MWR’s? Some analysts have defined administrative costs
as the difference between 100% of premiums and the MWR—the share that is returned to annuitants.
Our more direct measurements indicate that the present value of administrative expenses (including
marketing and operational costs) over the lifetime of an average annuity is about 7-8% of the premium.
Additionally, companies bear reinvestment and longevity improvement risk and incur an opportunity
cost of equity capital, which bring total costs, capitalized, to 10-12% of initial premiums, or 1.2-1.5%
of assets per year.
We hypothesize that in the annuities market, the insurance company acts as an institution for
risk and term intermediation and earns a spread in the process. The annuitant pays a large sum of
money up-front in exchange for a guarantee of fixed periodic payments at a price that is actuarially fair
at the risk-free discount rate. The company takes the premium paid up-front and invests (mainly in long
term public and private bonds and mortgages but also in some equities) to earn an uncertain return with
a higher expected value. The insurance company then retains the residual or “spread” between the
actual risky return and the guaranteed payout. Our data on investment portfolios and returns of insurance
companies (buttressed by discussions with industry executives from several countries) demonstrate
that the spread usually exceeds 1.3-2% of assets per year. The supply behavior of insurance companies
suggests that this spread is ample cover their administrative costs, risk and profits.
Part I presents capsule summaries of annuities markets and pension systems that impact the
annuities markets in each of our 8 sample countries. The markets in the US and Canada are voluntary.
In the other countries the annuities markets are part of their mandatory social security systems. In Israel
and Switzerland we compare the voluntary and quasi-mandatory markets that co-exist. Part II sets forth
our data on payouts of different annuity products. Parts III and IV analyze the money’s worth ratios,
including the sources of differences across countries in payouts and MWR’s. Part V presents cost data
and expense ratios. Part VI outlines investment portfolios of life insurance companies and imputes the
returns. The Conclusion raises some questions about the future development of the annuity industry.
I. The Annuities Market in Sample Countries
The annuities market depends in large part upon the nature of the mandatory social security
system in a country. Most countries of our sample initially had defined benefit pay-as-you-go social
security systems, but during the past twenty years funded personal (defined contribution) accounts
have become mandatory or important options in all our sample countries except for Canada and the
US. Upon retirement some form of gradual withdrawal is required, and annuitization is usually one of
the few acceptable forms. Governments often place restrictions on the type or price of annuities that
may be purchased within the mandatory system, which influence the way the market will develop.
Therefore we start out with thumbnail sketches of these systems and how they are changing.
Even in countries that have introduced personal accounts as part of their mandatory social
security systems, the new systems are far from mature. It takes 60 years to generate a mature system—
a full complement (i.e. about 20 cohorts) of retirees, each contributing to the accounts for a full working
life (i.e. about 40 years). Until full maturity is reached, the potential annuities market increases in size
each year. So far only Chile, Switzerland, the UK and Singapore have had their defined contribution
accounts, with annuitization as an encouraged option for withdrawal, for more than ten years, and only
Chile for more than 20 years. We are therefore observing at this point only the beginnings of the
potential growth of the annuities market and the collection of data on annuitants.
Data on the current size and recent growth of annuities markets, compared with total life insurance
markets, are presented in Table 1 and more detailed data for Chile in Table 2. These data show that
annuity markets are growing, but the nature of this growth is largely dictated by incentives and constraints
set by public policy. In Chile we observe the most rapid growth of annuities with longevity insurance,
because of regulatory constraints on the ways in which mandatory retirement savings can be disbursed
and incentives to retire early by annuitizing. In contrast, in Canada, the US and Australia, where tax
advantages encourage saving in “variable annuities”, most “annuity” products are still in the accumulation
stage and may never become payout annuities that offer longevity insurance.
UK. Until 1978 the UK had only a flat basic benefit in its public system (or first pillar). The flat
benefit was virtually universal but small—currently it is only about 16% of the average wage. Many
workers depended on employer-sponsored defined benefit pensions, often collectively bargained, for
their retirement income. In 1978 the UK added a state earnings-related component (SERPS) to the
public system but allowed employers to opt out if they offered their own pension plans that met specified
standards. Small employers sometimes used insurance companies to handle these pensions, so a pension-
annuity business developed. Still a further development occurred in 1988 when individual workers
were allowed to opt out of SERPS or their employer’s plan into their own personal saving plan.
At present the majority of workers, particularly middle and high earners, are in employer plans
or their own personal plans, that is, in privately managed plans, rather than SERPS. In contrast, most
low income workers (about a quarter of the total labor force) remain in SERPS. This public-private mix
is the UK’s “second pillar” (Pillar II) of retirement security. For workers who opt out of SERPS, part of
their social insurance contribution (about 4-9% of wages, depending on age) is rebated to their accounts;
additional amounts may also be contributed on a voluntary basis. Workers are required to annuitize the
rebated portion at some point between the age of 65 and 75. Workers can also take their money out of
their employer-sponsored plan and annuitize in the open market. Thus the annuity market is a growth

industry in the UK.
In addition to this market that is part of the compulsory system, workers can purchase annuities
out of their voluntary savings (the “third pillar), but these amounts are relatively small—less than 20%
of the total. By 1997, annual premiums paid in the voluntary and compulsory parts of the market
together were almost 5 billion pounds (US$7.5 billion), having grown over 50% during the 1990’s and
expected to grow substantially in the future (Murthi, Orszag and Orszag 1999). In this paper we analyze
data from a mix of these two markets—since they are not firmly separated—but the compulsory part
dominates.
Switzerland. Switzerland offers a modest public benefit (Pillar I) that depends on wages and
years of work. A compressed progressive formula pays a high replacement rate to low earners. This is
supplemented by employer-sponsored plans that covered about half of the labor force on a voluntary or
collectively bargained basis during the 1970’s and early 1980’s but, since 1985, have become mandatory
for all workers except low earners (Pillar II). The second pillar provides a high replacement rate to
middle and high earners. Annual contributions to the second pillar range between 12 and 15% of wages.
Upon retirement, this accumulation is usually annuitized, in a form and at a price tightly regulated by
the government. The annuity is often provided by an insurance company chosen by the pension fund or
employer. Lump sum withdrawals are also permitted, but tax incentives as well as favorable terms
strongly encourage annuitization.
Workers who desire additional annuitization can purchase it in the purely voluntary market
(Pillar III). However, the voluntary market is very small in Switzerland, as in the UK. We analyze both
the voluntary and mandatory markets in this paper. These two markets are separated, due to tight
restrictions over Pillar II. In 1996 premiums paid into the Pillar III market, mostly for immediate
annuities, totaled SF 2.3billion (US$1.5 billion), while contributions into Pillar II, largely during the
accumulation stage, totaled $SF27 billion (US$18 billion) (Breuer and Zweifel 1999).
Australia. Australia, like the UK, has long offered a flat benefit to the old. In Australia this
benefit is broad-based but means- and asset-tested; it goes to 70% of the older population. The means-
testing allows it to be higher than the level in the UK—25% of the average wage for an individual, 40%
for a couple. As in the UK and Switzerland, this has long been supplemented by collectively bargained
pension plans that covered much of the labor force. Concerned about the aging of the population and
the increasing fiscal burden this would imply, and desiring to increase worke compensation without
generating inflationary pressures, in 1992 the government made these employer-sponsored plans
mandatory—Australia’s superannuation system. Most take the form of defined contribution plans, with
the contribution rate starting at 4% but scheduled to reach 9% (and remain there) by 2002. All but the
lowest earners are covered.
The Australian system is still very immature and very much in the accumulation rather than the
payout phase. Annuitization is one of the options for drawing down these accounts upon retirement, but
annuities are not required or strongly encouraged, nor does the government constrain the form of the
annuity as it does in the UK or Switzerland. Australia therefore will permit us to examine the situation

where retirement savings are accumulated but the manner of withdrawal is left to the worker’s discretion.
Interestingly, “allocated annuities” where workers choose the investment strategy and take scheduled
withdrawals over a fixed time period, are most popular and “life annuities” that provide longevity
insurance but give annuitants little or no control over investment strategy are least popular. Out of total
assets backing annuities in 1998, only 38% were in the payout stage and, of these, only 32% were life
annuities. In this paper we do not distinguish between the mandatory and voluntary parts of the market,
but most of current demand and expected future growth comes from the mandatory scheme.
Singapore. Unlike other countries in this study, Singapore has no public cash benefit (Pillar I)
for the old, although it provides a variety of means-tested subsidized services for both old and young—
subsidized housing, medical care and the like. The basis for retirement income in Singapore is the
defined contribution (Pillar II) that has been made each year, since 1955, to the Central Provident Fund.
The contribution rate is currently 35% although it has been 40% in the past and is expected to rise again
in the future. The money is turned over the Singapore’s Monetary Authority to invest and CPF members
receive, in return, an interest rate that, for many years, has been approximately 2% above the rate of
inflation. This contribution is used to finance many services besides old age security—medical insurance
and most important, loans for home ownership. As a result, relatively little money has been left in the
accounts when workers retire.
Concerned about this situation, in 1987 the Singapore government instituted the Minimum
Sum Scheme: At the age of 55 workers must set aside $55,000 (now $65,000 and rising gradually to
$80,000) to 1) buy a deferred life annuity payable at age 62, 2) deposit with a bank or 3) leave with the
Central Provident Fund and take out in gradual withdrawals. As a result of this Scheme, the annuity
business is now growing rapidly in Singapore—more rapidly than in other countries since workers had
already been accumulating funds in their accounts for many years. While annuity policies in force are
only a tiny fraction of life policies business in force, new annuities are now 13% of new insurance
premiums. We analyze the annuity industry that is newly emerging as a result of the Minimum Sum
Scheme. Two large insurance companies occupy more than two-thirds of the market, the dominant one
being the National Trade Union Income Company, which is run by the largest trade union in Singapore.
The most popular type of annuity is the “participating” annuity that gives the company substantial
discretion in passing on mortality and investment risk and return.
Chile. In Chile the annuity market is the largest of all the countries in our sample (relative to
GDP), due to the new pension system that started in 1981 and is therefore mature enough to have many
retirees. This system features a defined contribution of 10% in Pillar II, reaching 13% when administrative
costs and survivors and disability insurance are added. The first pillar is very small—a minimum pension
guarantee targeted toward low earners with small accumulations. When they retire, workers in Chile
are permitted to 1) leave their retirement savings in their pension funds and take programmed withdrawals,
2) take an immediate annuity, or 3) take a deferred annuity with programmed withdrawals in the interim.
Incentives and constraints in the system largely shape which choice workers make.
The experience of Chile illustrates how the detailed rules of the system determine the growth

path of the annuity market. Two factors enabled the annuity market to get off to an early start, even
before the new pension system matured: 1) Workers who switched into the new pension system received
a “bono”—a compensation bond for their work under the previous system—which could be cashed
upon retirement and applied toward the purchase of an annuity, thereby enlarging the size of the annuity;
and 2) Disability and survivors insurance were provided through the private market, in exchange for a
required annual premium, as part of the pension reform. The earliest growth of the annuity market,
during the first decade, came from workers who became disabled and those who cashed in their bonos
upon normal retirement.
However, the largest growth, in the second decade, came from regulations that allow workers to
retire early if they had enough savings to purchase an annuity that exceeds 110% of the minimum
pension (i.e. about 27% of the average wage in the economy) and also exceeds 50% of own average
wage over the last 10 years. Early retirement means simply that a worker can stop contributing to the
mandatory system and start drawing out money, while continuing to work if he chooses to do so.
Moreover, if the annuity exceeds 70% of his average wage, the rest can be taken out as a lump sum—
he gets immediate access to much of his retirement savings. Starting in 1987, workers were permitted
to apply their recognition bonds toward an early retirement pension; in 1990 these bonds were made
tradeable; and in 1994 pension funds were authorized to buy recognition bonds. Enterprising insurance
companies seized upon this opportunity to entice customers into the market. They approached workers
who were close to eligibility for early retirement (a large group as the annual rate of return on pension
funds exceeded 10% real during the 1980’s and 1990’s) and offered to facilitate the process. They
handled the paper work to maximize the size of the lump sum withdrawal, bought the worker’s “bono”
early at a discount and lent him money to deposit in his account, to help him meet the criteria. Additional
(unofficial) incentives were provided by salesmen who shared part of their commissions with the
annuitant. (If the insurance company gave a large commission to the salesman, knowing it would be
shared, this was another way to provide a lump sum to the worker).
As a result of these incentives, the annuity business has grown dramatically in Chile. Its reserves
have risen from US$1.5 billion in 1988 to $7.7 billion in 1998 and are expected to reach $37 billion in
2010. Total premiums now exceed US$1 billion per year. Annuitants rose from less than 10% of all
beneficiaries in 1988 to over 50% in 2000 (Tables 2A and 2C), as early retirement beneficiaries rose
from 1% to over a third of all recipients, accounting for over half of all payouts (Table 2B). Annuity
premiums are now twice as large as life insurance premiums (Table 1). And most of these are early
retirement annuities with longevity insurance. While annuitization is commonly associated with a desire
to smooth consumption over the remaining lifetime, under these conditions it has become a mechanism
for getting access to retirement savings sooner rather than later.
Regulations have also shaped which groups buy annuities. Chilean workers have a choice between
annuities, gradual withdrawals, and a combination of temporary withdrawals plus deferred annuity. By
2000 more than half of all recipients and even more of the payouts were in the form of annuities.
However, a closer examination shows that few workers faced a level playing field and the playing field
differed systematically by type of benefit and socio-economic group.
Early retirees were the wealthiest group (as evidenced by the fact that they had the highest
annual payouts which far exceeded the minimum pension; see Table 2A). Among early retirees the vast
majority—about 85%—purchased annuities in 2000. Initially annuity purchase was required to meet
the eligibility criteria. Later workers were allowed to qualify on the basis of gradual withdrawals. But
insurance companies still had a big advantage owing to their ability to buy the bonos, lend money and
handle the paperwork that would enable workers to qualify and get large lump sums; these are real
services given the rules of the game in Chile. Only those with the highest earnings and savings (hence
the largest payouts) could accomplish this and retire early without the help of an insurance company.
Unconstrained choice would probably have led to a lower level of annuitization among early retirees.
In contrast, among those retiring at normal old age only one-third purchase annuities, and this
tends to be the better-off group, as evidenced by their higher average payouts among the normal retirees.
The remaining two-thirds consist of three sub-groups: those who prefer a variable to a fixed return,
those who are already receiving pensions from the old system, and, especially, those whose retirement
savings are not large enough to purchase a minimum pension (low earners). The latter sub-group must
take gradual withdrawals until their savings are exhausted, whereupon the government steps in to pay
the minimum pension. Thus, the lowest earners are largely excluded from the annuities market by
social security system rules, in Chile as in most other countries in our sample. The excluded proportion
will decline as the system matures so retiring workers have longer years of contributions and larger
accounts and do not have pensions from the old system. Unconstrained choice in the long run would
probably lead to a higher level of annuitization among normal retirees.
Among the disabled and survivors, one-third choose annuitization. Our data on payouts and
money’s worth ratios, based on retirement at age 65, are primarily for the old age (early and normal
retirement) market.
Israel. Israel has a small but very complex annuity market, including a voluntary and quasi-
mandatory part. The public benefit in Israel (Pillar I) is a universal flat benefit, about 25% of the
average wage, paid to every resident over the age of 65. Supplementing this were defined benefit
pension arrangements that were put in place many years ago by labor unions, heavily subsidized by
government, covering about half of the labor force (in general, the upper half)—which we call “quasi-
compulsory”. The subsidy took the form of special non-tradeable government bonds, in which the
funds were fully invested, that paid an above-market interest rate. Despite the subsidy, however, the
accumulated reserves were not large enough to pay the promised benefits, which became a contingent
liability of the government.
Concerned about this growing fiscal burden, in 1997 the government negotiated a new
arrangement which downsized its obligation: The subsidy on government bonds was reduced, the bonds
would cover only 70% of the pension funds’ investments, and benefits were changed to age-specific
deferred non-guaranteed annuities that were required to be adjusted frequently to remain actuarially
sound. Each year, out of the 16% contribution rate, disability and survivors insurance is purchased, as

well as a deferred old age annuity, payable at 65, whose promised payout depends on the contribution
amount and the worker’s age. The annuity promise, however, is not binding, as it might have to be
adjusted downward later for actuarial sustainability. Upon retirement all the bits of deferred annuities
are added up and become the actual annuity. To create a more competitive annuity market, workers
were given the right to change pension funds (annuity providers) rather than staying with the fund
chosen by the union. No workers have yet retired under this new system.
In addition to this quasi-mandatory annuity market, Israel has a small voluntary annuity market.
Middle managers, not covered by the union agreement, are often given annuities by their employers as
part of their compensation package; this is called “managers’ insurance.” Furthermore, and even tinier,
is the annuity market for individuals. Neither of these voluntary arrangements is government subsidized.
The entire market is dominated by three large companies, of which one has a market share exceeding
50%. We present data on both voluntary arrangements (individual and managers’ insurance) as well as
the quasi-compulsory subsidized arrangement.
Canada and U.S. In contrast to the 6 cases just described, annuity purchase in the US and
Canada is not part of a mandatory or quasi-mandatory program. Both countries offer tax-deferred
voluntary retirement savings account during the working life (IRA’s, 401k’s, 403(b)’s and Keogh’s in
the US, RRSP’s in Canada). An inducement to buy annuities comes at the age of 69 in Canada, 70 in the
US, when holders of these accounts are required to start decumulating in the form of scheduled
withdrawals or annuities. Scheduled withdrawals (called RRIF’s in Canada), which allow individuals
to retain control of the investment strategy but which do not provide longevity insurance, are most
popular, just as allocated annuities are in Australia.
As a result of its voluntary nature, the annuities market is very small in both these countries and
most so-called “annuities” are, in reality, tax-advantaged variable deferred annuities that are still in the
accumulation stage. These carry an option to turn them into life annuities at the payout stage, but so far
few people have exercised that option. To give an idea of relative magnitudes: In Canada in 1999, out
of CAN$11.1 billion paid in as premiums for individuals, only 19% was for the payout stage and only
6% was for the purchase of immediate life annuities. Group annuities (often purchased by small
employers in settlement of their defined benefit obligations) formed another, smaller, part of the annuity
market (Kim and Sharp 1999).
In the US in 1999, out of $116 billion in premiums paid for individual annuities, only 6% were
for immediate annuities in the payout stage and much of these were for term certain annuities lasting
for a specified period, rather than for annuities offering longevity insurance. Similarly, out of $154
billion in the group market, only 24% was in the payout stage (Table 1). By far the greatest share, and
the fastest growing share of the market, was for variable annuities in the accumulation stage. However,
if individual accounts are adopted as part of the US social security system, and as 401k plans grow, we
are likely to see the growth of this market and the development of new annuity products—most likely
products that entail risk and return sharing between insurance companies and annuitants.
In sum, annuity markets seem to grow when they become part of the mandatory social security

system, and that is happening in many countries. In countries where both co-exist, the quasi-mandatory
market is much larger than the voluntary one and much further growth is anticipated as none of these
arrangements are close to maturity. Detailed incentives and constraints set by public policy largely
determine how the annuities market evolves. This paper deals with the mandatory or quasi-compulsory
markets in the UK, Chile, Australia and Singapore, the voluntary markets in Canada and the US and
presents data on both markets for Switzerland and Israel.
II. Payouts
Suppose a worker starts his career by earning $31,043 (or pesos or pounds), works for 40 years
with a real annual wage growth rate of 2% (due to economy-wide growth + age-earnings growth) and
contributes 2% of his wage every year to a retirement savings account on which he earns a real rate of
return of 5%. Then, at the end of 40 years his final wage is $67,200 and his retirement savings
accumulation is $100,000 (abstracting from inflation). If he turns this accumulation into an annuity,
what will he receive in exchange for his $100,000? In this section we investigate how the answer to this
question varies by country, product and insurance company that is chosen.
Differences across countries. Table 3 presents average monthly payouts beginning at age 65
for a variety of annuity products in our sample of countries. These data are based on surveys conducted
in each country during the spring of 1999, as part of this study. Insurance companies were asked what
their monthly payouts would be for a variety of annuity products for a premium of 100,000 in local
currency. These annuity products are almost all SPIA’s—single premium immediate annuities—where
the worker pays a single amount and immediately begins collecting benefits. The promised benefits
take the form of 1) an individual level annuity that pays a fixed amount per month until the worker dies;
2) an annuity that provides a partial bequest in the form of 10 or 15 years of guaranteed payments
(which would be paid to the beneficiaries in case of death); 3) joint annuities that include survivors’
insurance, with a specified percentage of the original benefit to the survivor in case of death; 4) an
escalating annuity that increases a given % per year; or 5) an indexed annuity that increases with
inflation and thereby holds purchasing power constant. The guaranteed or joint annuities might be
chosen by an individual who want to leave a bequest to his family; and the escalating or indexed
annuities by a person who does not want his annuity to dwindle relative to prices or wages as he
becomes very old.
Focus first on the individual level annuity for men in Panel A, row 1. We see there that a SPIA
purchased for $100,000 at the age of 65 will yield widely varying amounts ranging from $590 in
Switzerland to $740 in Canada, with Australia and the UK in the middle. In the US the payout would be
$733 monthly or $8796 annually, so our hypothetical worker who had a final annual wage of $67,200
would get a replacement rate of 13% from his 2% annual contribution. In Switzerland his replacement
rate would be less than 11%. These differences may be due to: 1) international differences in interest
rates; 2) different current mortality rates among annuitants in different countries; 3) different mortality
improvement projections; or 4) different degrees of competition and willingness to accept risk on the
part of insurance companies. In Parts III and IV we analyze whether these different monthly payouts
also imply differences in expected lifetime benefits and how much each of these explanations contributes
to the variation.
Differences across products. Moving toward other annuity products in Panel A, the data allow
us to measure the trade-offs between different types of insurance that a worker might want to buy. In
the UK, where the largest variety of products is offered, a male annuitant can get $727 per month for an
individual nominal SPIA, but if he wants to purchase a partial bequest in the form of a 10-year guaranteed
payment he must forego 5% of that monthly benefit and gets only $691. If he wants a joint annuity that
will provide 50% of the original benefit to the survivor (who is assumed to be the same age in this
example), he must forego 12% and will receive only $642 monthly. In Canada, Australia and the US
the trade-offs are not identical but they are similar. In most countries, the majority of annuitants choose
to purchase guaranteed payments or joint annuities in order to provide a survivors’ benefit, but they pay
an opportunity cost in terms of a lower initial benefit.
Annuities that escalate at a fixed rate of 3% per year start out with a monthly payout of $564 in
the UK. Of course, the payout automatically increases each month so after 9 years it passes the $727
that the annuitant would have gotten with a non-escalating SPIA. An escalating annuity may be a crude
way for payouts to keep pace with expected inflation; but it does not protect workers against unexpected
increases in inflation. Only an annuity that is indexed to the price level will accomplish this. Panel B
presents real price-indexed annuity payouts for the three countries where they have existed for some
time. For the UK, the price-indexed annuity starts by paying only $522 monthly, much less than the
escalating annuity or the level nominal SPIA; clearly inflation indexation costs. Moving from the level
nominal SPIA to the real SPIA cuts the initial payout by 28% and if we moved to a real joint annuity the
payout would be reduced still further to $438, a total cut of 40%. The replacement rate of our hypothetical
worker would, in that case, be less than 8% of final wage, instead of the initial 13%, in exchange for
inflation protection for himself and his beneficiary. However, it is interesting to note that the payout is
highest of all in Chile, where all annuities are indexed—so indexation seems to have different effects in
different contexts. In Part VI we suggest that this difference is due to the different types of financial
instruments that are available for hedging inflation risk in the UK and Chile.
Panel C shows that if gender-specific mortality tables are used women get lower payouts than men.
Their trade-offs are somewhat less because of their greater expected longevity, but the direction of the
above relationships holds for them as well.
As described above, most of these annuity markets operate as part of a country’s mandatory
social security system. In such cases, governments often place restrictions on the type of annuity to be
purchased and sometimes on price as well. Most common is the requirement for a joint annuity, designed
to include survivor’s benefits and prevent old age poverty among dependent spouses. Unisex tables,
designed to prevent low incomes among older women retirees, is increasingly common, and price
indexation is sometimes required. For example, in Switzerland a joint annuity with 60% benefit to

survivor is required in Pillar II (whether or not the individual is married), and this form is also required
for married men who purchase an annuity in Chile. Thus the mandatory markets for Chile and Switzerland
are concentrated in joint annuities. In Switzerland, government regulations specify the actuarial factor
that must be used when transforming the savings into a joint annuity; both for men and women the
initial annual benefit must equal 7.2% of the retirement savings. This transformation yields $600 monthly,
which is 20% more than is available in the voluntary market. In Israel, too, the subsidized deferred
annuity must be joint, with 60% going to the survivor, and is also higher than that available in the
voluntary market. In Chile and Israel the annuity is price-indexed, as are all long-term financial
transactions. In Switzerland, which has had low historical rates of inflation, the annuity is not indexed,
although discretionary ad hoc adjustments are sometimes made. In the UK the annuity that must be
purchased by age 75 with the mandatory contribution rebate must be indexed (up to 5% inflation rate),
joint (even if not married) and uses unisex tables, which would reduce the rate further for males—but
this is a relatively new mandate in the UK. In contrast, in Singapore the annuity option is individual,
not joint, but must guarantee the return of the worker’s capital, which usually implies a 15-year payout
guarantee.
These requirements should be taken into account in projecting the retirement savings that will
be needed to finance an acceptable income level in old age. Because inflation protection and/or survivors’
insurance through joint annuities or period certain guarantees are often part of the package, the amount
of savings and contributions required to provide a given replacement rate is greater than it would
otherwise be; or the replacement rate will be much less than anticipated. Policy-makers should—but it
is not clear that they do—take these trade-offs into account in specifying annuitization requirements.
In some cases (e.g. Israel and Switzerland), a below-market price (above-market payout) is specified to
avoid the higher savings and contribution rate. This in turn implies subsidization by government or
cross-subsidization by other groups of consumers.
Payout differences across insurance companies. The numbers given above are all industry-
wide averages. Table 4 presents evidence of price dispersion in Canada, Australia, Chile, the UK, the
U.S. and Singapore. We see there that payouts are widely dispersed in the US—implying that the
annuitant’s choice of company matters—but tightly clustered in Canada and Singapore, where price
dispersion is less than 5% from top to bottom. The ready availability of on-line information in Canada
and the standardized distribution of information by the Central Provident fund in Singapore may lead
to clustering for companies that want to stay in the market. Factors such as a desire to increase sales at
a particular time, or to offset life insurance risk, or to take aggressive advantage of good investment
opportunities may explain high payouts. Low payouts may imply a decision to withdraw from the
market. Unfortunately we do not know the quantities that go along with these prices. Anecdotal evidence
indicates that in Switzerland and Israel regulations and cartel-like behavior among a concentrated number
of firms keep prices even closer together. Underlying the similarities in price is the fact that SPIA’s are
a relatively standardized product where consumers, regulators and industry associations can compare
prices with great ease. While simple products with limited choice do not allow all individuals to optimize,

they have the advantage of facilitating price comparison and price competition. As more complex
products are offered (e.g. with payouts tied to investment performance or mortality experience), price
comparisons will become more difficult. We might then expect greater price dispersion, with competition
taking the form of product differentiation and marketing.
III. Calculating the Money’s Worth Ratio: Interest and Mortality Rate Assumptions
Do these annuities provide good value for money? Are annuitants likely to get back the premium
they pay in, over time? And does this hold across countries, even countries that offer very different
payouts?
To answer these questions:
1. We calculate and compare the money’s worth ratio (MWR), that is, the present value of the
expected future payments relative to the initial premium cost, in different countries and for
different annuity products. Concretely, the MWR for a single life annuity is:
( )( )
a
aT
tt
t
ata Ci
APMWR
••ü
îíì
+
•= å
-
=
12*
1
,
1
where: T = Maximum attainable agea = Age (in years) of annuitant at start of contractt = Number of months beyond annuity starting dateP
a,t= Probability of individual being alive t months after age a
Aa
= Monthly annuity payment for annuity purchased at age aC
a= Cost of policy for individual purchasing annuity at age a
it
= Nominal monthly t-period spot rate
The numerator of this expression is the “expected present discounted value” (EPDV) of the
lifetime income stream from the annuity, while the denominator Ca is the initial
capital cost. If the
MWR is 100%, this means that consumers can expect to get back what they paid in, in addition to
longevity and investment insurance. (100%-MWR) is often referred to as the “load factor”. If the
MWR is considerably less than 100% (a high load factor), consumers are getting back a lot less than
they put in, and this may not be a good deal for them. If it is much greater than 100%, this raises the
prospect that insurance companies are offering too much in order to gain market share in the short run
and may not be able to keep their promises in the long run; possibly regulators should be concerned.
2. We measure the asset-based margin, that is, the subtraction from the risk-free interest rate,
that consumers pay each year, in exchange for this insurance. If m = the margin, i = the risk
free rate and r = the discount rate for which the MWR’s in the above equation = 100%, m =
i – r. If the MWR when discounted at the risk-free rate is 100%, this means r = i and m = 0.

The MWR, clearly, depends on market payouts, interest rate and mortality rates. Interest rates
turn future payouts into present discounted values while mortality rates turn them into expected values,
depending on survival probabilities. Earlier studies done for the US and UK used, alternatively, the
government term structure and the corporate term structure for discounting, and well-established mortality
tables created by the government or the society of actuaries for computing expected values. Not
surprisingly, when we tried to apply this procedure to countries where financial markets and mortality
data are relatively undeveloped, methodological problems soon emerged.
Interest rates
Ideally, the discount rate used should reflect consumers’ time and risk preferences, which should
also coincide with the rate available on alternative investments. Using the term structure of government
interest rates as a risk-free rate would be appropriate for consumers who had savings, preferred (or
were at the margin of making) risk-free investments, and considered annuities completely safe. For
consumers with a preference for riskier assets, or those who consider annuities unsafe, a higher discount
rate is appropriate. Mitchell, Poterba, Warshawsky and Brown (1999) and Brown, Mitchell and Poterba
(2000) used the AA corporate bond term structure as their risky discount rate. Consumers who have no
voluntary savings, are liquidity constrained or are borrowing rather than investing might have an even
higher discount rate.
To start with, we use the government rate as a risk-free benchmark by which to measure the
relative return to consumers, across countries. However, since most low earners have little voluntary
savings and many high earners probably want to invest in riskier assets with a higher expected return,
it is likely that for many potential annuitants the appropriate discount rate is higher than the government
rate. Moreover, as we show later, the portfolios in which insurance companies invest are not completely
safe. Therefore, we also present results for a “risky” rate: the government term structure+1.4%. This is
close to the risky discount rate used by Poterbo and Warshawsky (2000). As we shall see, it corresponds
to the rate of return on investments which would be just high enough to cover insurance company costs,
and it is a better approximation of their actual portfolios.
Both short and long term government rates and corporate rates, are available in the US, UK and
Canada. However, in most of the countries in our study long-term government bonds are not available.
For example, in Australia the longest government bond is 12 years. In Singapore, where the government
doesn’t run deficits but issues bonds only to build the bond market, government bonds are scarce and
the term limit is 10 years. In Israel it is 15 years and in Chile 18 years. The corporate bond market is
even more limited and shorter term. Apart from the US and Canada, corporate bond terms rarely exceed
10 years—and this includes well-developed markets such as Switzerland, the UK and Australia. In
Israel the corporate bond market hardly exists. In Singapore it was meager before 1999, when the
Monetary Authority of Singapore began to allow statutory boards, banks, finance companies and foreign
corporations to issue bonds—partly motivated by the perception that insurance companies would soon
need these investments. In Chile, too, impetus to the corporate bond market has been given only by the
pension reform. Where they do exist, the spread between high grade corporate and government bonds

is usually less than 1%, so a risky discount rate of 1.4% implies some investments in lower grade
bonds, mortgages and/or equities—consistent with insurance company portfolios.
Where long-term rates were not available we extrapolated forward the last available government
bond rate, into the future. On the one hand, this procedure may understate the appropriate discount rate
since it ignores increases in uncertainty for consumers and reinvestment risk for insurance companies
as time extends. On the other hand, annuities may constitute one of the few available long-term
investments for consumers in incomplete markets, so they may discount benefits in the distant future at
a lower rate because of the scarcity of such options. In general, the absence of varied long term financial
instruments is expected to make annuity provision more costly and also makes it more difficult to
measure the money’s worth to consumers. Many countries that have recently reformed their social
security systems to include individual accounts are in this difficult situation.
Both the level and slope of the yield curve vary among the countries in our sample, in ways that
may affect payouts and MWR’s. For example, the level is relatively low in Switzerland and relatively
high in Chile. In Israel the term structure is almost completely flat, while in the UK it falls, in the US
and Canada it rises gradually and in Singapore and Switzerland it rises steeply with term. We would
expect the following relationships to hold:
1. Higher interest rates would lead to higher payouts (because they provide a higher return on
insurance company investments) while if the payouts were actuarially fair the MWR would be
unaffected.
2. In contrast, steeply rising interest rates would lead to higher MWR’s (because consumers will
be discounting the early years at low rates while insurance companies can invest in long term
instruments and avoid reinvestment risk).
3. In some countries (e.g. Singapore and Switzerland) insurance companies may, because of
regulation or cartelization, follow smoothing policies that hold annuity prices constant through
time as interest rates change. In these cases, current interest rates would not be a good predictor
of current annuity payouts or MWR’s.
We will return to these hypotheses later as we analyze empirically the impact of interest rates on
payouts and MWR’s across countries. Appendix F presents our term structures.
Mortality tables
Period and cohort mortality tables: what are they and do they exist? Consumers and companies
need cohort mortality tables to calculate the expected lifetime payouts of the annuity. A cohort table
shows, for any given cohort such as all those who are age 65 today, its age-specific mortality and
survival probabilities.
To construct a cohort table one starts with a period column that displays mortality rates based on
cross-sectional data for different age groups within a time period such as 1996-98. This gives us a
single age-specific mortality rate for each age, which applied in 1996-98. If mortality rates did not
change, this would also give us the age-specific mortality rates for all cohorts. However, mortality rates
have been falling continuously over time so it is necessary to build in a longevity improvement factor

per year to show how the period column is likely to evolve through time—the period column for 2010
will show lower mortality at every age than the period column for 1996-98. From this set of period
tables we can build a cohort table, which shows different age-specific mortality rates for each cohort.
For the cohort that was 65 in 2000, mortality increases as individuals age, but the mortality improvement
factor retards this rate of increase. The individual who will be 75 in 2010 will have lower age-specific
mortality rates than the individual who was 75 in 2000. If I do not take into account that I will probably
live longer than my parents, I will underestimate the benefits from annuitization. If insurance companies
do not take projected longevity improvements into account they overestimate how much they can pay
each year and still cover their costs. Cohort mortality tables include such improvement factors. However,
cohort tables depend on guesses about future longevity, which no one knows for sure. The next section
deals with this uncertainty.
In addition to the need to project longevity improvements, insurance companies must take
account of the differences between the mortality of annuitants versus the population as a whole. Often,
only population-wide data are available, collected by the government, but companies really want to
know about the annuitant group, whose mortality rates may be lower (see discussion of adverse selection
below). However, especially in the early years of an annuity market, cohort tables for the population
and period or cohort tables for annuitants may simply not be available. And when annuitant data exist
they may have been collected by separate companies that consider them proprietary and do not make
them publicly available. That is exactly what we found—and it poses a potential problem for countries
newly developing their annuity markets as part of their mandatory systems. Below we summarize how
we handled this problem in our calculations and further details are given in Appendices A, B and C.
Of all the countries in our sample, the UK has the most developed financial market and longest-
standing pension industry, largely based on employer-sponsored pensions. Pension plans of large
employers were self-financed but small employers often obtained annuities through insurance companies.
These employer-sponsored pension plans are now part of the quasi-mandatory retirement savings
program in the UK, since they function as an optional alternative to the state’s pay-as-you-go defined
benefit plan (SERPS). The UK began collecting data on pensioners’ mortality in 1955-58, then
recalculated every 4 years, in a series called “life office pensioners”. Initially the data had few females
and few males over the age of 90 but it now has many more. Since 1980 an improvement factor,
devised by an industry body, the Continuous Mortality Investigations Bureau (CMIB) has been built in,
to enable the construction of cohort tables, but actual longevity improvements have generally exceeded
expected improvements; that is, actual deaths have been less than expected deaths.
Until recently the UK did not have data on retirees with personal pensions, a growing group
under the current UK scheme which permits workers to opt out of the state or employer-run plans into
their own personal plan. A new table indicates that this group may have lower mortality rates than the
others, but experience is small (Murthi, Orszag and Orszag 1999; Finkelstein and Poterba 1999).
Fortunately, all these UK tables are public information and UK data for employer-sponsored plans
have served as the basis for mortality tables in many other countries. We use the pensioner cohort tables

for calculating the MWR in the UK, in this paper.
In contrast to the UK, the Australian annuity business is developing only now, as a consequence
of its new superannuation scheme, which requires workers to accumulate large retirement savings.
Population cohort tables were constructed only recently in Australia. The absence of previous life or
annuity business means that no annuitants’ mortality table has been constructed. Instead they use a
period table based on UK annuitants in 1980, with an allowance for mortality improvements up to
1999. Australian regulators assume that current retirees in Australia will have a mortality rate 60% that
of the 1980 UK table. This seems to fit recent Australian experience with males but may underestimate
their survival rate as they age and, even more, may underestimate the increasing longevity of older
females. We turned this period table into a cohort table by applying the same improvement factor for
future annuitants as was used in constructing the population cohort table (Knox 1999).
In Switzerland the first population cohort tables were published by the government in 1998.
Annuitant tables, produced by the Life Insurance Association, have long existed but are proprietary and
not publicly available. However, similar data supplied to us by a large life insurance company reflected
period mortality experience and projected improvement factors for pensioners in the quasi-mandatory
second pillar and the voluntary third pillar. Mortality rates for the latter group are by far the lowest and
mortality improvement rates among the highest in our sample of countries.
In contrast, cohort tables simply do not exist in Singapore, Israel or Chile. Singapore’s annuity
market started in 1987 when annuities became one of the allowable options for the retirement savings
that workers were required to accumulate in their retirement savings accounts (the Minimum Sum
Scheme). However, the companies have little data on which to base their pricing. Population mortality
data published by the government are given in five-year age categories, rather than for each age separately,
and without any projected improvement factors. Therefore, Singapore, like Australia, uses UK data,
this time from 1967-70, with mortality improvements projected to 1990 and with a two-year setback to
account for lower mortality among annuitants. (A two-year setback means that a 65 year old is treated
as having the same mortality rate as a 63 year old has in the initial table). In Singapore, where people
are quite healthy, the scanty evidence available thus far suggests that actual deaths are far less than
expected (Chang 1999).
In the past Israel has also used UK tables, and for survivors and disability insurance Swiss
tables, in both cases adjusted for Israeli experience. Currently, insurance companies are legally required
to use a 3-year setback of the population period tables as an estimate of annuitant mortality. Recently
an actuaries’ committee developed another period table that is supposed to be a more accurate
representation of annuitant mortality, but has yet to be implemented (Spivak 1999).
Until the mid-1980’s Chile relied heavily on US mortality data but, spurred by the emerging
demand for annuities at that time, it began to develop and up-date its own annuitant and population
mortality tables, based on census and social security data. Cohort tables do not yet exist (Callund
1999). We use the population period tables for 1996, calculated by the Institute Nacional de Estadisticas
and the new annuitant table for 1998 developed on the basis of AFP experience during 1983-96. For

MWR calculations in Table 4 for Chile, Singapore and Israel we use the period tables that are employed
in these countries. In table 5 we “cohortize” these data by applying the Canadian mortality improvement
factor as a proxy.
The US and Canada have the opposite problem from other countries—many mortality tables
are publicly available, each based on somewhat different data, smoothing methods and projection factors.
The results will vary slightly, although not grossly, depending on which table is used. In the US, the
Social Security Administration constructs population period and cohort tables, with high, medium and
low improvement scenarios, as part of its regular periodic reports. The Society of Actuaries constructs
period annuitant tables, with longevity adjusted upward from its basic 1983 tables. Recently this was
projected forward to become the 2000 tables. Mitchell et al 1999 and Brown, Mitchell and Poterba
2000 turned these into cohort tables by applying the medium-improvement factor from the latest SSA
report to the SOA tables. For comparability, we have used their resulting tables in this paper. For
sensitivity analysis, in Appendix D we present calculations based on historical data for Canada and the
US supplied to us by SSA (see Goss et al 1998).
Projections about future life expectancy. Even in the presence of accurate public information
about past and current mortality, it is difficult to construct cohort tables and value annuities because
future life expectancy remains an unknown. (For thorough reviews of the literature on this topic, including
the variety of forecasting models and their shortcomings, see Tuljapurkar and Boe 1999; Bongaarts and
Bulatao 2001).
One possible reason for the low voluntary purchase of annuities is that people have consistently
underestimated their life expectancy, basing their guesses upon the death rates of people around them
now, rather than on what is likely to happen in the future, i.e. without factoring in the mortality decline
that will occur over their lifetimes. Better-informed government actuaries, too, have consistently
underestimated longevity improvements. Until 1980 UK actuaries did not build an improvement factor
into their tables, nor was this done initially in the US social security system, leading to predictable
underestimates of system expenditures. Similar underestimates have occurred in the private insurance
sector. Annuity providers in the US lost money in the late 1930’s, both because interest rates fell and
because life expectancy turned out to be longer than expected (Poterba 1997). It has been argued that
some insurance companies in the UK have underestimated average life expectancy of their annuitant
pool by two years or more, which could cause a loss that will become apparent in the future (Blake
1999).
When working with these projections, very different methods are used in different countries. In
the US, UK and Australia, at the population level, historical data by age, sex and cause of death are
taken into account (Friedland 1998; Knox 1999). In Canada, additionally, projected real wage
improvement enters into the projection of future mortality. Since real wage growth is expected to fall,
so too is mortality improvement, in the future (Friedland 1998; Goss et al 1998). Australia projects
higher improvement factors for the first decade than for the longer run. Usually past trends have been
slightly modified and extrapolated; but unfortunately past trends in these underlying factors are not

necessarily indicative of future trends. In particular, distortions can result from projecting recent short
term improvements into the future, as some studies have done in building cohort tables (see Doyle,
Mitchell and Piggott 2001).
As one empirical example of the wide variation in improvement rates across countries and over
time: over the twentieth century the average annual percentage reduction in death rates for men 65+
was .2% in Canada, .5% in the US and 1% in Mexico. In Canada, mortality rates actually increased
(negative improvement) during the first part of the century. But during the last 20 years, Canada has
improved more than the other two countries. For the US, the average annual improvement rate for men
by decades ranged from -.5% during the 1920’s to 1.5% in the 1970’s to .4% in the 1990’s. For most of
the period in the US female mortality improved faster than male mortality but during the past 2 decades
this pattern has been reversed (Goss, Wade, Bell and Dussault 1998; also see summary in Friedland
1998). Over-all, the mortality improvement factors implied by these data for the future are higher than
those used in our calculations for the US, supplied by Brown et al (2000), but lower than those used for
Canada, based on Canadian Pension Plan (CPP) projections. However, both sets of US improvement
projections are very small compared with those of other countries in our sample. (See Appendix D for
more details about this comparison).
In addition to these difficulties in projecting population mortality, the annuitant group may
improve faster or slower than the population at large, depending on the underlying mortality model and
the selection process that is at work. If life style forces are responsible for mortality improvement,
annuitants, who tend to be more educated and have a longer time horizon, might experience a faster
increase in longevity. But if the annuitant group has become less selected as a result of policy change,
longevity of future annuitant cohorts might increase slower than that of the population at large. In most
of our sample countries the improvement projection factor is assumed to be the same for population
and annuitants.
In the UK and Switzerland industry bodies make the projections for annuitants and are responsible
for the faster improvement postulated. In Switzerland the process for making these projections about
annuitants is highly secretive. In the UK details of the deliberations of the Continuous Mortality
Investigation Bureau (CMIB) appear on the web (www.actuaries.org.uk, CMI Reports #16 and 17).
During the latest round of up-dates the CMIB deliberated whether the same improvement projection
should be made for all groups including company pensioners, voluntary individual annuitants, males
and females. Although the actual experience of these groups has been quite different, the committee
decided to keep the improvement projection identical, for purposes of simplicity. Its initial projection
was discussed broadly among actuaries and others, and raised upward as a result. This process illustrates
the uncertainty and subjectivity of cohort mortality tables, even in situations where they are done very
carefully. Selection into the group of personal pensioners is expected to expand rapidly and to become
a more broad-based group, one of the reasons that UK insurance companies do not want to assume
lower mortality and faster mortality improvement in this category.
Appendix E1 presents the mortality tables for all eight countries in our sample and E2 presents

the improvement factors (IF’s) used in the five countries that had cohort tables. Except for the US, the
annual IF’s range from over 2% for the “young” old to less than .5% for the “old” old. Table 5 illustrates
the differences in life expectancy at age 65 and expected present value of lifetime payouts with and
without the mortality improvement factor (period versus cohort tables) for the population and annuitant
groups in our sample countries. The difference is noticeable but not huge. Except for the US, life
expectancy gains at age 65 due to mortality improvement are slightly more than one year and lifetime
payouts jump 3-4%. The average population male is expected to live 16-17 years after retirement at age
65 (19-20 years for females) and annuitants’ live another 2-4 years beyond that. To deal with the
possibility that different apparent MWR’s across countries may simply be an artifact of the different
methodologies that they used for predicting the future, in some analyses we “standardize” the mortality
improvement factor (see Tables 7 and 11).
The wide variance in mortality improvement factors and interest rates across countries plus the
fact that different methods have been used in different places raises the question of who will bear the
risk if the projections turn out to be too low or if interest rates change unexpectedly. This suggests that:
1) in some cases the true MWR may be lower than given here, if longevity has been overstated or long
run interest rates understated, and 2) thought must be given to who will bear the risk if longevity
increases or interest rates fall much faster than insurance companies expect. We will return to this
important policy question below.
IV. The High Money’s Worth Ratio of Annuities
Table 6 presents the MWR for annuities that begin at age 65 for our sample countries, in 1999,
using the government bond “risk-free” rate and the mortality tables in use in each country. As discussed,
cohort tables are not used in Israel, Singapore and Chile, and cohort tables for the other five countries
use varying mortality improvement projections. To facilitate comparability and to investigate how
much difference this makes, we went back to the original period tables for all countries, applied a
standardized improvement factor—the factor used in Canada—to bring the period tables up to 1999,
and then “cohortized” them, using that same standard factor. Canada was chosen as a base because it
has an intermediate improvement factor—higher than the US but lower than Switzerland. This
standardization makes the countries using period tables more comparable with the others, and avoids
MWR differences stemming from different projection methodologies across countries, but it also omits
justifiable differences in future improvement projections. Table 7 presents the standardized MWR’s for
all 8 countries.
A few points should be made about special situations. For Switzerland, Pillar III annuities
typically include a “bonus” that is 7.8% of the total payout. This bonus is not guaranteed but it has been
paid regularly for many years. This may be one mechanism used to raise payouts for annuitants while
cushioning risk for insurance companies. We present the MWR with and without the bonus. Also for
Switzerland we present the MWR for the quasi-mandatory annuity in Pillar II, which allows us to

compare voluntary and compulsory contexts. The form and payout on this annuity are set by the
government: it must be a joint annuity with 60% to survivor, that annually pays 7.2% of the worker’s
total accumulation at retirement, both for men and women. This actuarial factor has been constant since
Switzerland started its system in 1985—despite falling interest rates and rising longevity. However, it
is scheduled to fall gradually to 6.65% by 2015.
For Singapore, where annuities are purchased under regulations of the Minimum Sum Scheme,
the required return of capital guarantee is usually implemented in the form of a 15 YG, which we
present here. Our method for handling the fact that it is a deferred annuity, purchased at age 55 for
disbursements beginning at age 62, is described in Appendix A.
For Israel, we present results for voluntary annuities that are sold to individuals and, through
employers, to managers, using the recently developed actuaries’ period mortality tables in Table 6 as
well as the standardized cohortized versions in Table 7. Additionally, we present the MWR for the
quasi-mandatory deferred annuity that is purchased in bits throughout the worker’s life. This requires a
complex calculation that is described in Appendix B.
Differences across countries. Looking now at Table 6, we observe that the variance in discounted
lifetime payouts is much less than the variance in monthly payouts. Among annuitants, the MWR’s
exceed 95% for practically every country (exceptions are the voluntary annuities in Israel and indexed
annuities in the UK) and in several instances exceed 100%. The US, UK and Canada, which operate in
the freest markets, are tightly clustered between 97 and 98%, consistent with earlier studies. Although
Switzerland has the lowest monthly payout, it has the highest MWR in the voluntary market —108%,
when the bonus is included. While the bonus has been constant for many years, it can be eliminated at
the discretion of the insurance company, and therefore constitutes a risk-sharing technique. Without the
bonus, the MWR falls to 100%. Thus the low payout does not imply low value to consumers, if the
mortality rates used in these calculations are correct.
The highest MWR’s are found in the quasi-mandatory heavily regulated systems of Switzerland
(120%) and Israel (109%). In Israel this is facilitated by a direct subsidy in the form of access of
pension funds to above-market interest rates on government bonds. In Switzerland price is set by the
government and hidden cross-subsidization across generations and product lines must be involved. For
example, the same insurance companies often handle the accumulation stage as well as the payout
stage, and may earn a profit on the former that is used to cross-subsidize the latter. Insurance companies
in Switzerland are not anxious to increase their Pillar II business but are reluctant to cancel what they
have because of tied business as well as their long-standing relationships with clients.
Differences across products and gender. Despite their very different payouts that were discussed
above, all the nominal annuity products offer virtually the same MWR to annuitants. Similarly, although
payouts were much lower for women, the MWR is very close for both genders. This suggests that the
differential monthly payouts are largely due to the different expected time patterns of payment across
products and genders.
One important exception is the much lower MWR offered for price-indexed products in the

UK, compared with nominal annuities in the UK, suggesting that inflation protection is costly. But
price-indexed annuities in Chile have high payouts and similar MWR’s to nominal products in other
countries; so they do not always cost more. We hypothesize the load factor on indexed annuities depends
on how much of the spread insurance companies have to surrender to protect themselves against inflation
risk when they offer indexed annuities; and this in turn depends on the variety of indexed financial
instruments available in the economy.
Impact of standardizing mortality improvement projections. Comparing Table 6 with Table
7, which standardizes the mortality improvement projection, we see this produces an increase for the
US, which used only a small improvement factor, and for Chile, Singapore and Israel, which did not
impute an improvement factor of their own, but a decrease for Switzerland, which imputes a high
improvement factor for annuitants; but the changes are only 2-4% and the range is largely unchanged.
This lack of sensitivity is encouraging given the uncertainty and variation in future mortality projections.
This relationship is examined in greater detail below.
The small “margin.” This picture is reiterated when we examine the “margin”—the amount
by which the equivalent annual asset-based return to the average annuitant lies below the risk-free
return (Table 8 and Murthi, Orszag and Orszag 1999). As a rule of thumb, given these life expectancies,
each point of MWR translates into .12% of margin. Thus, the margin is only 20-30 basis points for the
average annuitant in most countries and in some cases this charge is negative, corresponding to an
MWR > 100%. We sum up our findings thus far by noting that, in our sample countries, if people want
a risk-free annuity and if these annuities are indeed risk-free, the average annuitant has gotten a good
deal, paying virtually nothing for longevity and investment insurance.
The lower MWR when discounting at the “risky” discount rate.” However, many people
do not consider the annuity safe or do not want a risk-free investment; they might prefer to accept more
market risk in exchange for a higher return. Also, many individuals borrow at high rates and take other
actions to front-load their consumption, consistent with empirical evidence that subjective discount
rates are often high. For example, a recent study of the willingness of US military personnel to take
lump sum separation allowances versus annuities indicates personal discount rates exceeding 18% for
most. For such consumers, discounting the proceeds of an annuity at the low risk-free rate overestimates
its present value to them. For consumers who regard the annuity as unsafe, or who would prefer more
risky higher-yielding investments, as well as those who have a higher time preference, a higher discount
rate is appropriate. Many potential annuitants probably fall into these categories.
We therefore recalculate the MWR for these groups, using the government term structure +
1.4% (Table 9). We use 1.4% because it has been used by others (Poterba and Warshawsky 2000) as an
indicator of the risk in a typical insurance company’s portfolio. Additionally, it approximates the return
on investments that companies must earn or the charge which they must extract from consumers to
cover their costs. With this higher discount rate the MWR for annuitants falls by 10-12%. For individuals
with higher discount rates, the load factor would be higher still. The smaller MWR received by people
with a higher time preference and those who prefer to accept higher risk in exchange for a higher
expected return, may go far toward explaining why the demand for annuities has been very low in most
countries.
The lower MWR for the average population member. The MWR’s also drop substantially,
by 6-12%, if we apply the higher mortality rates of the average population member. As a typical example:
using the risk-free rate, an average Canadian worker who wants to buy an individual level SPIA will
get an MWR of only 91.4%, compared with 98.1% for the average annuitant. This phenomenon,
sometimes ascribed to adverse selection, is often given as the reason for the low purchase of annuities.
In interpreting these data, it is important to distinguish between “active” selection that is due to
asymmetric information about expected longevity and “passive” selection, that is due to positive
correlations between socio-economic status, longevity, and purchase of annuities. These two types of
selection have quite different policy implications, since only active selection implies market failure.
For other insurance proudcts, companies have invested in information that allows them to place different
consumers in different risk categories, thereby counteracting active selection based on asymmetric
information. This has not yet happened in the annuity market, perhaps due to its small size. As for
passive selection, we expect to find it in purely voluntary markets, due to a positive income and wealth
elasticity of demand for annuities.
While passive selection may diminish in quasi-mandatory markets, sometimes the rules of the
mandatory system structure it back in. First of all, coverage in these markets is often only partial and
lower income workers (who tend to have lower longevity) tend to be the excluded group, especially for
second pillar arrangements. For example, in Chile only 60% of the labor force is covered by the new
system; informal sector and agricultural workers are excluded. And the lowest income covered workers,
who qualify for the minimum pension guarantee, are not permitted to purchase annuities, while
annuitization is encouraged for early retirees, who constitute the highest income workers. In the UK
the lowest earners tend to remain in SERPS, the state DB plan, instead of the system of private personal
accounts or employer-sponsored plans. In Switzerland and Australia contributions to retirement savings
accounts are not mandatory for low earners. Secondly, the fact that these systems are still immature
suggests that only the better-off workers who were covered in the pre-mandatory days have large
enough accumulations to annuitize currently. All these factors imply that some selection will remain,
even in quasi-mandatory systems. Nevertheless, we would hypothesize that selection will be lower (1)
in quasi-mandatory systems where payout options are restricted, as compared with purely voluntary
systems, (2) in countries where the public pillar provides a lower replacement rate, hence does not
crowd out annuitization by middle income groups, and (3) where income and wealth inequality, hence
the relevance of passive selection, is smaller.
Given all these possible variations, as well as imprecision in mortality data, our current sample is
obviously much too small to test these hypotheses econometrically. However, using the standardized
mortality improvement factor in order to control for different guesses about the future, we find patterns
that are consistent with these expectations (Tables 7 and 10). Selection (as measured by the difference
between population and annuitant MRS) is lowest in Singapore and the UK—where the annuities

market is part of a quasi-mandatory system that has existed for some time and where the public benefit
is exceptionally small—and in Canada, which has the least inequality in our sample. In Switzerland
selection is much smaller in the quasi-mandatory pillar (II) than in the voluntary pillar (III), which tops
up a generous replacement rate in Pillars I and II. In Chile the structure of incentives and constraints
within the mandatory system, that we have already described, results in noticeable selection.
For all countries, we would expect products to develop that would attract low-longevity
individuals. Examples of such products are the 10 or 15 YG and joint annuities, where expected payouts
are less sensitive to the expected lifetime of the primary beneficiary so the difference between population
and annuitant MWR is smaller. Additionally, we would expect this difference to be smaller (1) when
the higher “risky” discount rate is used, since this depresses the present value of benefits for long-lived
annuitants; and 2) for women, whose longer expected lifetimes mean that part of the difference accrues
in the distant future, which is discounted more heavily than the near future. This is indeed the case. For
example, in Canada’s voluntary system the difference in MWR falls from 6.7 percentage points for
male purchases of the level SPIA to 4.1 for the joint annuity (both discounted at the risk-free rate) to 3.5
when the “risky” discount rate is used to 1.7 percentage points for female purchases of the 10YG at the
risky rate (Tables 6-10). Thus, if the risky rate applies to many people because of their time or investment
preferences, and if products such as joint annuities and 10YG are popular because of their bequest
value, load differentials between the average population member and annuitants are compressed and
do not seem to be the main reason for the low purchase of annuities.
How do we explain differential monthly and expected lifetime payouts (MWR’s)?
Earlier we found that the MWR’s across countries and products are less dispersed than the
monthly payouts. This suggests that the monthly payout differentials are needed to produce approximately
the same lifetime expected present value (EPDV) of benefits; they are not simply random variations. In
this section we analyze the degree to which the payout differences are due to interest differentials,
current mortality rate differentials and differences in mortality improvement projections. This distinction
is important because interest rates are exogenously given so causation is clearly one-way while future
mortality projections are quite subjective, sometimes made by people associated with the industry, and
may be determined simultaneously with payouts and MWR’s.
It is difficult to compare interest (or mortality) rates in two countries directly, because they may
be higher in country A for one term (or age) and in country B for another term (or age). Instead, we
examine the impact of differential interest and mortality rates on monthly payouts and expected lifetime
payouts for annuitants with the level SPIA. We find that interest rate differentials play the most important
role in explaining differential monthly payouts, in the following sense: Once we know the country-
specific term structures of interest rates, we are able to predict with considerable accuracy the actual
monthly payouts that will be offered in each country, simply by assuming they all have the same
standardized mortality tables and end up paying the same lifetime payouts. Under the assumption of
standardized mortality tables, it turns out that monthly payout differentials are just enough to offset
discount rate differentials and achieve similar lifetime payouts across countries. Once own-country

mortality is introduced, greater differences in lifetime payouts emerge, and these appear to stem from
differences in mortality tables, especially in projected improvement factors.
We show this in Table 11 by standardizing all these variables at the level found in one country,
Canada (column 1), and then sequentially introducing own-country monthly payouts (column 2), own-
country term structure (column 3), own-country period mortality rates (column 4) and own-country
improvement factors (column 5)—calculating the EDPV and MWR in each case. (Column 4 corresponds
to Table 5 and column 5 corresponds to Table 6). If monthly payouts differ while everything else is
standardized, this should and does produce wide differences in EDPV (column 2). But as own-country
interest and mortality rates are introduced, this should bring the EPDV of lifetime payouts back toward
equality with Canada’s, if both these variables matter and if market competition leads to similar loads
across countries.
We find that substantial equality is achieved in EDPV’s and MWR’s among annuitants,
corresponding to the relative lack of dispersion in Tables 6 and 7. Whereas the MWR’s for male annuitants
in column 2 range from 78% to 109% (a range of 31 percentage points), the range is cut to 12 percentage
points when own-country interest rate are entered in column 3. Both the range and standard deviation,
as simple measures of dispersion, are minimized in column 3—which is based on country-specific
discount rates but standardized mortality rates. And the average is close to Canada’s. Thus we can
predict monthly payouts by using the mortality tables of one country, i, as a common standard, allowing
interest rates to vary across countries, and finding the country-specific payouts that will yield the same
MWR as in country i. Predictions made in this way fall within 4% of actual payouts for 6 countries and
within 10% for all countries in our sample, using Canadian mortality rates and MWR as the common
standard. Introducing own-country mortality rates does not increase the accuracy of these predictions,
on average. While these precise numbers hold for males, who dominate among annuitants, the over-all
picture is the same for females. This implies that varying term structures play a key role in explaining
varying monthly payouts—which is reassuring, given their obvious exogeneity. This is also consistent
with our hypothesis that insurance companies cover their costs out of investment returns, which strongly
influence their calculation of affordable payouts.
To investigate further this relationship between interest rates, monthly and lifetime payouts,
Table 12 displays the rank order of countries by their (1) medium-term interest rate (the 8-year spot
interest rate), (2) monthly payouts on the level SPIA for males, (3) expected lifetime payouts, holding
mortality rates constant across countries, (4) expected lifetime payouts, allowing for country-specific
mortality rates, and (5) projected improvement factors. We find an almost perfect rank order correlation
between columns (1) and (2), suggesting again that monthly payouts are very responsive to interest
rates. In contrast, we find no particular correlation between columns (1) or (2) versus (3) or (4): neither
interest rates nor monthly payouts are correlated with lifetime payouts based on standardized or country-
specific mortality. But, with the exception of Singapore, column 4 is perfectly correlated with the
improvement factor in column 5. In particular, when own-mortality rates are applied, countries with
outlying lifetime benefits are seen to be those with outlying improvement factors. A sequential process

is suggested by these data: the interest rate structure determines monthly payouts while the projected
improvement factor determines the country’s measured MWR. Knowledge of the improvement factor
used in the MWR calculations therefore allows us to predict whether a country’s expected lifetime
payouts will deviate substantially from those in other countries, while the monthly payouts have already
been determined by interest rates.
Israel is a case in point at the bottom end; its low interest rate leads to low monthly payouts and,
since it uses period tables only, with no improvement factor imputed, it has the lowest EPDV of lifetime
payouts. And Switzerland fits this pattern at the upper end. Switzerland has the lowest monthly payouts
but the highest expected lifetime payouts in the voluntary market. Table 11 tells us that its low monthly
payouts are due to low interest rates, while its high average lifetime benefits and MWR are due primarily
to the low mortality rates and high mortality improvement projected in that country for annuitants. The
improvement projection is strongly influenced by the industry in Switzerland. It generates a high
measured value for consumers while building in a cushion of safety for the companies. If the high
mortality improvements do not materialize, the Swiss MWR will be closer to international norms. If
they do materialize, companies can protect themselves by eliminating the bonus, which is a risk-sharing
device.
Given the subjectivity in constructing cohort tables and improvement factors, analysts should view
with caution the outlying MWR’s that stem from unusual mortality tables. Since insurance companies
seem to set loads close to those in other countries when these are evaluated according to standardized
cohort tables, perhaps even they are wary of their own outlying mortality improvement expectations.
V. Administrative Costs of Providing Annuities
When issuing annuities, companies incur costs. One object of this paper is to figure out how
they cover these costs, given the observed MWR’s to annuitants in the vicinity of 100%. We seek now
to estimate how high these costs are. It is difficult to obtain cost data but we present data culled from a
variety of published and unpublished sources. We present these costs as a % of premiums and as a % of
assets per year.
The biggest cost item and the one that varies most across countries is marketing costs—much
as it is for the accumulation stage of competitive retirement accounts that operate through the retail
market. In the U.S. sales commissions on immediate annuities are about 4% of premiums, with total
distribution costs amounting to 5-6% of the initial premium. Marginal operating expenses of immediate
fixed annuities are low because the premium per policy is large relative to other kinds of insurance (e.g.
see average premium per annuity contract versus per life insurance contract for Singapore in Table 1),
is fully paid in one lump sum, consumers can’t switch companies or investment options, and don’t need
to be serviced in other ways; only the monthly check must be mailed out. Using a $100,000 policy as
our model, first year set-up costs are about $100-$300 or .2% of the premium and small annual operating
expenses (for issuing monthly checks, annual statements and other communications with annuitant)
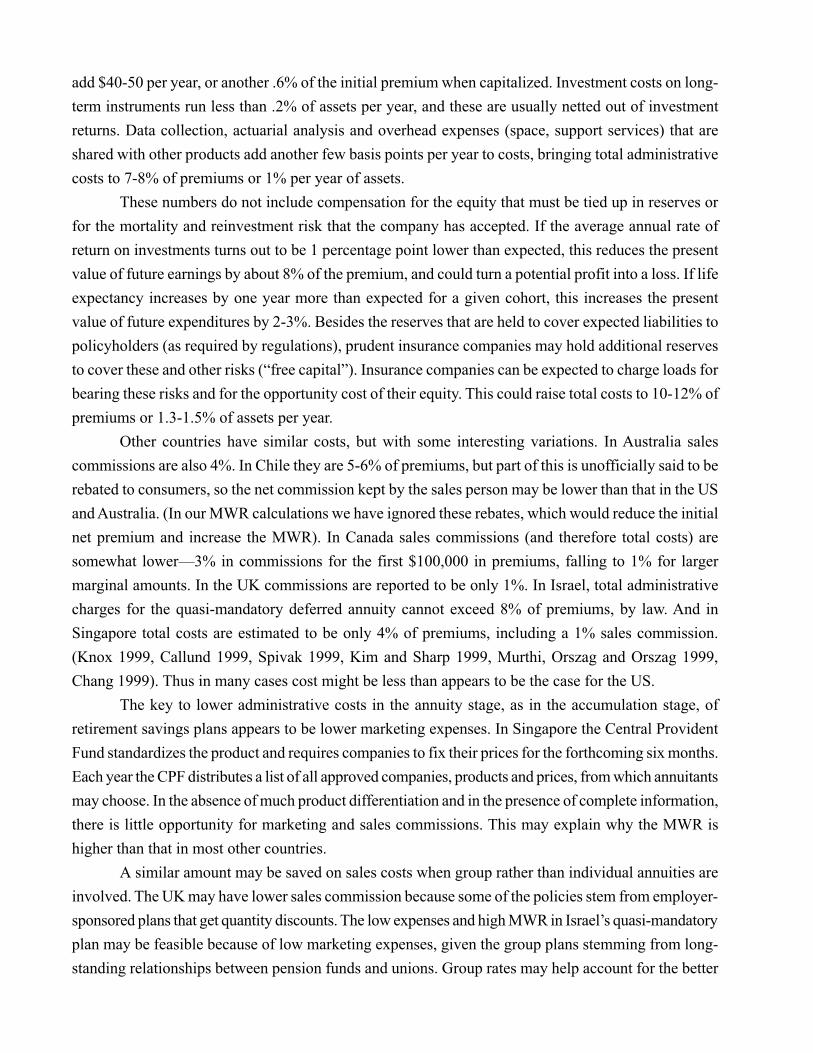
add $40-50 per year, or another .6% of the initial premium when capitalized. Investment costs on long-
term instruments run less than .2% of assets per year, and these are usually netted out of investment
returns. Data collection, actuarial analysis and overhead expenses (space, support services) that are
shared with other products add another few basis points per year to costs, bringing total administrative
costs to 7-8% of premiums or 1% per year of assets.
These numbers do not include compensation for the equity that must be tied up in reserves or
for the mortality and reinvestment risk that the company has accepted. If the average annual rate of
return on investments turns out to be 1 percentage point lower than expected, this reduces the present
value of future earnings by about 8% of the premium, and could turn a potential profit into a loss. If life
expectancy increases by one year more than expected for a given cohort, this increases the present
value of future expenditures by 2-3%. Besides the reserves that are held to cover expected liabilities to
policyholders (as required by regulations), prudent insurance companies may hold additional reserves
to cover these and other risks (“free capital”). Insurance companies can be expected to charge loads for
bearing these risks and for the opportunity cost of their equity. This could raise total costs to 10-12% of
premiums or 1.3-1.5% of assets per year.
Other countries have similar costs, but with some interesting variations. In Australia sales
commissions are also 4%. In Chile they are 5-6% of premiums, but part of this is unofficially said to be
rebated to consumers, so the net commission kept by the sales person may be lower than that in the US
and Australia. (In our MWR calculations we have ignored these rebates, which would reduce the initial
net premium and increase the MWR). In Canada sales commissions (and therefore total costs) are
somewhat lower—3% in commissions for the first $100,000 in premiums, falling to 1% for larger
marginal amounts. In the UK commissions are reported to be only 1%. In Israel, total administrative
charges for the quasi-mandatory deferred annuity cannot exceed 8% of premiums, by law. And in
Singapore total costs are estimated to be only 4% of premiums, including a 1% sales commission.
(Knox 1999, Callund 1999, Spivak 1999, Kim and Sharp 1999, Murthi, Orszag and Orszag 1999,
Chang 1999). Thus in many cases cost might be less than appears to be the case for the US.
The key to lower administrative costs in the annuity stage, as in the accumulation stage, of
retirement savings plans appears to be lower marketing expenses. In Singapore the Central Provident
Fund standardizes the product and requires companies to fix their prices for the forthcoming six months.
Each year the CPF distributes a list of all approved companies, products and prices, from which annuitants
may choose. In the absence of much product differentiation and in the presence of complete information,
there is little opportunity for marketing and sales commissions. This may explain why the MWR is
higher than that in most other countries.
A similar amount may be saved on sales costs when group rather than individual annuities are
involved. The UK may have lower sales commission because some of the policies stem from employer-
sponsored plans that get quantity discounts. The low expenses and high MWR in Israel’s quasi-mandatory
plan may be feasible because of low marketing expenses, given the group plans stemming from long-
standing relationships between pension funds and unions. Group rates may help account for the better

payout for “manager’s insurance” in Israel, which is employer-sponsored, and for the ability of insurance
companies to offer such a high return on the quasi-mandatory annuity in Switzerland that is handled
through employers. Lower marketing costs also help explain why the U.S. federal government’s group
annuity plan for civil servants, the Thrift Saving Plan—which was contracted out to a private insurance
company in a competitive bidding process—pays 4-5% per month more than an average individual
would get in the retail market (Poterba and Warshawsky 2000). Other countries that are planning to use
annuitization in their funded retirement savings plans may learn from these examples how to keep
costs low. The chief reduction can come by reducing marketing costs through standardized information
and group plans. This can potentially increase the MWR by 4-5%.
VI. Investment Portfolios and Returns of Annuity Companies
How do insurance companies cover their costs—which range from 7-12% of premiums—if the
MWR to consumers is in the vicinity of 100% or even more? Some analysts argue that a MWR equal to
or greater than 100% is implausible, because of administrative costs (Poterba and Warshawsky 2000).
We argue that it is plausible because companies cover their costs and profits on the spread between the
risk-free rate on which our calculations of the high MWR are based, and the higher rate they earn on a
riskier portfolio. The insurance company takes the entire premium paid by the annuitants, subtracts the
sales commission and other up-front expenses, and invests the rest. The company gives the annuitant a
fixed payment and keeps the residual of investment earnings. As more than one insurance industry
expert has expressed to us: this is a spread business. Indeed, in a competitive environment, as investment
earnings rise, payouts and MWR’s measured by the risk-free rate will also rise, sometimes surpassing
100%, while still leaving a spread large enough to cover costs. However, the higher spread comes at the
expense of a riskier portfolio, including higher default risk and reinvestment risk. This raises questions
about the safety of the funds, the need for careful regulations and whether the risk-free rate is appropriate
for discounting.
Anecdotal evidence supports this view. For example, if one peruses the annual financial
statements of life insurance companies such as Metlife or Swisslife, one finds that income from
investment earnings is almost as large as income from premiums and far exceeds operating expenses. A
recent analysis of the financial conglomerate Berkshire Hathaway, pointed out that its large insurance
business made losses (in the sense that claims exceeded premiums) in 2000, but earnings on invested
premiums more than offset this loss so on balance Berkshire Hathaway made a profit. Part of its insurance
losses were due to the fact that its competitor, State Farm, was able to absorb even larger insurance
losses without raising its rates, because of its huge net worth on which it earned investment profits.
Warren Buffett, the CEO of Berkshire Hathaway, referred to the “float” as central to his business
strategy (Treaster 2001). The short term “float” for property and casualty insurance becomes a “spread”
on the medium and long term investments of annuity companies. Table 9 showed that a spread of 1.4%
per year is equivalent to a load of 10-12% of the initial premium, large enough to cover administrative

costs.
We have tried to estimate this spread for some of the countries in our sample. Unfortunately we
do not have data on the investment portfolios of the annuity business alone since this business is usually
merged with other insurance business, especially life business. While implicitly insurance companies
may have separate portfolios for life and annuities as they carry out their asset-liability analyses, explicitly
these portfolios are rarely separated. Moreover, the life business usually dominates, although annuities
have been a growing share in many countries. The few companies that concentrate their business on
annuities may not be typical of others in mixed business that offers annuities. Furthermore, most of the
assets attributed to “annuities” in countries such as the US, Canada and Australia are actually in the
accumulation phase, as tax advantaged retirement saving, and may never become payouts offering
longevity insurance—which is our definition of annuities. Thus we can observe, at best, only an imperfect
proxy for the portfolios that actually back the annuity-as-longevity-insurance business.
With these strong caveats in mind, we present in Table 13 a summary of the investment portfolios
of life insurance companies in a number of countries, over time. We see there that fixed interest securities
almost invariably exceed 50% of the portfolio, due in part to regulations that require this or impose
heavy risk reserve requirements if a large proportion of other assets are chosen. However, we also see
that public bonds are generally less than half of this amount, with most of the fixed interest portfolio
invested in corporate bonds, mortgages, and loans. In the US and perhaps elsewhere the quality of
bonds has been falling, due to competitive pressures to obtain a higher yield and allow product prices
to improve. Junk (non-investment-grade) bonds and private placements of securities not registered
with the SEC are the fastest growing categories (Townsend 1998 and 2000). One of the most striking
uniformities across countries is the increasing allocation to equities over time. This now exceeds 25%
in most industrialized countries in our sample. The equity share is particularly high in segregated and
unit-linked portfolios backing variable annuity products in which consumers bear some of the investment
risk; many of these are in the accumulation phase (see US, Canada and Australia). Non-segregated and
non-unit-linked portfolios in Canada, Australia and the US, which have lower equity shares than the
life industry as a whole, may be more representative of assets backing annuities.
Given the long-term nature of annuities and the investments which back them, it is not appropriate
to use a snapshot picture of returns, which may be especially high or low in a particular year. Instead,
we use data on annual returns by asset class over a longer time period, 1967-95, and apply them to the
most recent investment portfolios (1998 or 1999) taken from Table 12. This is a conservative estimate
of long run returns, as the shorter period from 1980-95 yields much higher rates due to rising stock
markets and falling inflation over this period (Davis 2001). Where the breakdown into public and
private bonds is not available, we impute 50% of the bonds as public, although the actual proportion is
lower in most cases where we have the breakdown.
Table 13 presents the excess real return over the government bonds rate for the life insurance
industry in these five countries. Panle A applies own-country returns by asset class and Panel B applies
the average returns for 12 OECD countries; the picture is very similar. This shows what the spread

would be if insurance companies maintained their current portfolios and earned the long term historical
returns on these portfolios. The spread varies between 1.6 and 4%, with most of it coming from mortgages
and equities. Investments implicitly backing the fixed annuity business in “general” accounts have a
somewhat lower spread, but one which nonetheless exceeds 1.3% in virtually all countries. This is
enough to cover costs as calculated in the previous section, while still allowing a payout whose expected
present value equals the total premium (MWR close to 100%), consistent with our data in Tables 6 and
7.
Besides earning the equity and mortgage premium, part of these gains are made by strategic choice
of duration of bonds, which does not show up in this table. When discounting by the term structure, we
are implicitly assuming that short-term investments must be made to cover payouts that are due in the
near future. This may be true for an individual financing her own retirement. However, an insurance
company has an inter-generational life and therefore has the opportunity to engage in inter-generational
exchanges—using net cash inflows from new business and from maturing old investments, as well as
current interest and dividends, to finance near-term payouts, while investing the remaining money in
long term securities. This reduces reinvestment risk and raises the average return if the yield curve is
rising. Indeed, discussions with people in the industry suggest that most of the bonds are long term.
This is an especially valuable strategy in countries such as Switzerland and Singapore, which had very
steep yield curves at the time we carried out our quantitative analyses. Companies in these countries
were able to earn long-term rates while meeting short run obligations. Long term bonds are more risky
in the sense that their prices are more sensitive to interest rate change. However, life insurance companies
with a cash inflow from other sources can adopt a “buy and hold” strategy that makes them less vulnerable
to this risk. The spread they earn between the short and long-term rates can then help to cover their
costs and finance a high MWR.
The fact that equity returns in the US over the last two decades have been rising and have far
exceeded the long term returns we used in these calculations may be one explanation for the rising
MWR observed by analysts (Brown, Mitchell and Poterba 2000). This approach also helps explain
why, in the UK, the MWR of price-indexed annuities is substantially lower than that of nominal annuities
in the UK or elsewhere, while this is not true of indexed annuities in Chile. The chief explanation for
the higher load associated with indexed annuities in the UK is probably not selection, as escalating
annuities in the UK, which should produce the same selection, have a much higher MWR. Rather, the
explanation may stem from differential access to the spread between the risk-free and risky rates.
Companies offering price-indexed annuities in countries where most financial instruments are not price-
indexed have less access to the spread. In such countries only government bonds are indexed and
usually for short or medium terms. To earn the equity premium or the higher yield from long term
corporate bonds or mortgages these companies must bear inflation risk, for which they will charge
consumers. If, in contrast, they decide to invest mainly in indexed government bonds to avoid inflation
risk, they lose the opportunity to earn a higher return on their portfolio, and must charge consumers
explicitly for their administrative and equity costs. In either case, the MWR will be significantly lower,

as we have seen. Companies in the UK that offer escalating annuities do not face this trade-off, as their
liability is not subject to the same uncertainty, so they can offer a higher return to annuitants. Similarly,
in countries where a broader range of indexed instruments are available, as in Chile, this trade-off does
not arise and companies can offer price-indexed annuities with a lower risk and load.
If insurance companies invest in a risky portfolio, how can they sell the resulting annuities as
“risk-free?” Should a higher discount rate be used, in view of the risky underlying portfolio? The
company turns the risky investments that it makes into “safe” or “safer” annuities by reducing over-all
risk and shifting the remaining risk to others besides its annuity consumers. It reduces risk (compared
with the total risk of numerous small investors) by:
• investment diversification in a large portfolio, including foreign diversification;
• applying expertise to use derivatives and other hedging techniques;
• sharing risk across several different product lines, including life insurance and annuities whose risk
is negatively correlated;
• better access to information or lower information costs relative to assets;
• using its continual cash inflow to provide liquidity and make it less vulnerable to market timing
risk.
It shifts risk by:
• reinsurance (though this has rarely been used for annuities);
• resort to annuity guarantee pools, especially in quasi-mandatory situations;
• risk-sharing and cross-subsidization among annuitants of different cohorts or consumers of different
products—this works if competition is imperfect, demand is inelastic for other products and annuities
are only a small part of the total business;
• using stockholders as residual claimants whose profits (negative or positive) buffer and smooth
unexpected events;
• and by bankruptcy laws that give annuitants and other policy-holders high priority in such cases. It is sometimes argued that mandatory retirement accumulations should be annuitized through a
public agency, which would be best able to reduce risk by widespread pooling and to guarantee the
promised amounts to beneficiaries by shifting risk to society at large. However, public annuity providers
would have less access to the other risk-reducing and risk-shifting techniques that private companies
use, including the insurance of risks that are negatively correlated, investment in diversified portfolios,
reinsurance, use of shareholders as buffers and protective bankruptcy laws. The combination of these
arrangements reduces risk and shifts risk away from fixed rate annuitants, toward others who are more
willing to bear it. The spread between the interest rate paid to annuitants and earned on the underlying
investment portfolios is a measure of the risk and term intermediation provided by insurance companies.
It is large enough to cover the companies’ administrative costs and yield an MWR close to 100% in our
sample of countries. A public provider with limited investment options would not be able to cover its
costs by these means and would have to charge an explicit load instead.
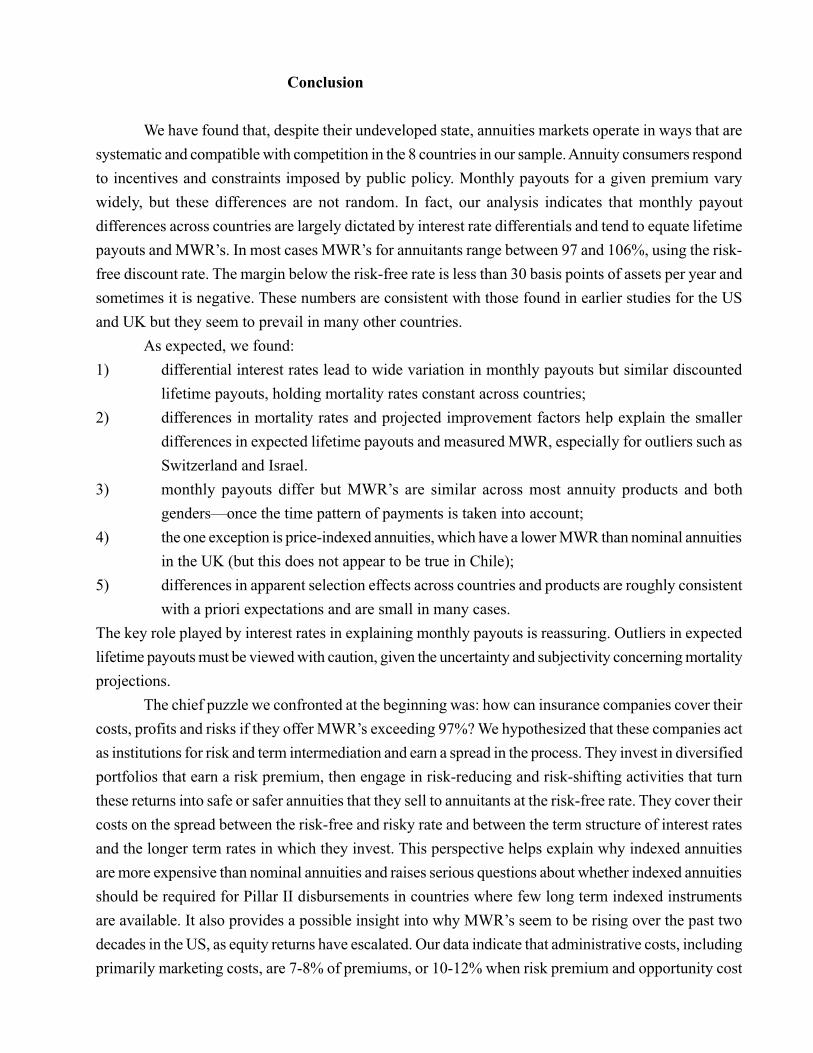
Conclusion
We have found that, despite their undeveloped state, annuities markets operate in ways that are
systematic and compatible with competition in the 8 countries in our sample. Annuity consumers respond
to incentives and constraints imposed by public policy. Monthly payouts for a given premium vary
widely, but these differences are not random. In fact, our analysis indicates that monthly payout
differences across countries are largely dictated by interest rate differentials and tend to equate lifetime
payouts and MWR’s. In most cases MWR’s for annuitants range between 97 and 106%, using the risk-
free discount rate. The margin below the risk-free rate is less than 30 basis points of assets per year and
sometimes it is negative. These numbers are consistent with those found in earlier studies for the US
and UK but they seem to prevail in many other countries.
As expected, we found:
1) differential interest rates lead to wide variation in monthly payouts but similar discounted
lifetime payouts, holding mortality rates constant across countries;
2) differences in mortality rates and projected improvement factors help explain the smaller
differences in expected lifetime payouts and measured MWR, especially for outliers such as
Switzerland and Israel.
3) monthly payouts differ but MWR’s are similar across most annuity products and both
genders—once the time pattern of payments is taken into account;
4) the one exception is price-indexed annuities, which have a lower MWR than nominal annuities
in the UK (but this does not appear to be true in Chile);
5) differences in apparent selection effects across countries and products are roughly consistent
with a priori expectations and are small in many cases.
The key role played by interest rates in explaining monthly payouts is reassuring. Outliers in expected
lifetime payouts must be viewed with caution, given the uncertainty and subjectivity concerning mortality
projections.
The chief puzzle we confronted at the beginning was: how can insurance companies cover their
costs, profits and risks if they offer MWR’s exceeding 97%? We hypothesized that these companies act
as institutions for risk and term intermediation and earn a spread in the process. They invest in diversified
portfolios that earn a risk premium, then engage in risk-reducing and risk-shifting activities that turn
these returns into safe or safer annuities that they sell to annuitants at the risk-free rate. They cover their
costs on the spread between the risk-free and risky rate and between the term structure of interest rates
and the longer term rates in which they invest. This perspective helps explain why indexed annuities
are more expensive than nominal annuities and raises serious questions about whether indexed annuities
should be required for Pillar II disbursements in countries where few long term indexed instruments
are available. It also provides a possible insight into why MWR’s seem to be rising over the past two
decades in the US, as equity returns have escalated. Our data indicate that administrative costs, including
primarily marketing costs, are 7-8% of premiums, or 10-12% when risk premium and opportunity cost

of equity capital are added. This is equivalent to 1.2-1.5% of assets per year. At the same time, life
insurance companies earn 1.6-4% of assets per year above the risk-free rate; the general accounts that
back annuities earn a somewhat smaller spread but one which nonetheless exceeds 1.3%. This spread is
enough to cover their costs, as well as profits. In the face of this large revenue from investing annuitant
premiums, competition keeps the direct load very low, in some cases negative. Thus, the high MWR’s
are quite compatible with insurance company supply behavior.
We return to the second question we posed at the beginning: How can we reconcile these numbers
with consumer behavior? Why are annuity purchases so small despite these apparently high MWR’s?
Part of the answer lies in the fact that the MWR for the individual annuity is 6-12% lower for the
average population member than for the average annuitant—due to some combination of active and
passive selection. But if lifetime consumption smoothing were the major objective of consumers, this
load factor caused by selection probably would not be enough to cause the demand for annuities to
disappear. Moreover, this MWR difference is substantially reduced for joint and period certain annuities.
Additionally, for other insurance products, insurance companies have learned to invest in information
that allows them to place different consumers into different risk categories, thereby counteracting adverse
selection due to asymmetric information. That they do not do so for annuities suggests that they do not
see a potential market there, even when asymmetric information is removed. Crowd-out of voluntary
annuitization by public and private defined benefit plans is part of the explanation. Annuity purchases
are larger and selection smaller in quasi-mandatory than in voluntary markets and in countries where
the public benefits are less important, suggesting that annuitization will increase further as DB plans
decline and mandatory retirement savings accounts become a more common part of social security
systems.
Possibly more important, the MWR is 10-12% lower when a risky discount rate is used; so it is
important to determine which rate is relevant to potential annuitants making their decisions. For those
who want a very safe product, discounting at the risk-free rate (or something close to it) may be
appropriate and annuities in their present form may be a good deal. But for those who prefer a risky
investment with a correspondingly higher return, the risky rate may be appropriate. This includes, in
particular, individuals with other savings that are largely invested in risky assets, indicating a preference
for a higher risk-return trade-off. Similarly, for people who are liquidity constrained a higher subjective
discount rate may be appropriate. This includes those who are already borrowing at high rates of interest
that constitutes their discount rate. It also includes those with meager accumulations who would prefer
greater flexibility in access to their savings to meet unforeseen contingencies; purchasing an annuity
that yields a rigid income stream takes away the precautionary function of their savings and introduces
new risks for them.
These two groups—the risk-preferring and the liquidity constrained—may comprise a large
share of the potential market. They may not purchase annuities despite the apparently high MWR’s we
have calculated, because they are applying a different discount rate that yields a lower MWR. To attract
these groups into the voluntary annuity market, or to give them a good deal in the quasi-mandatory
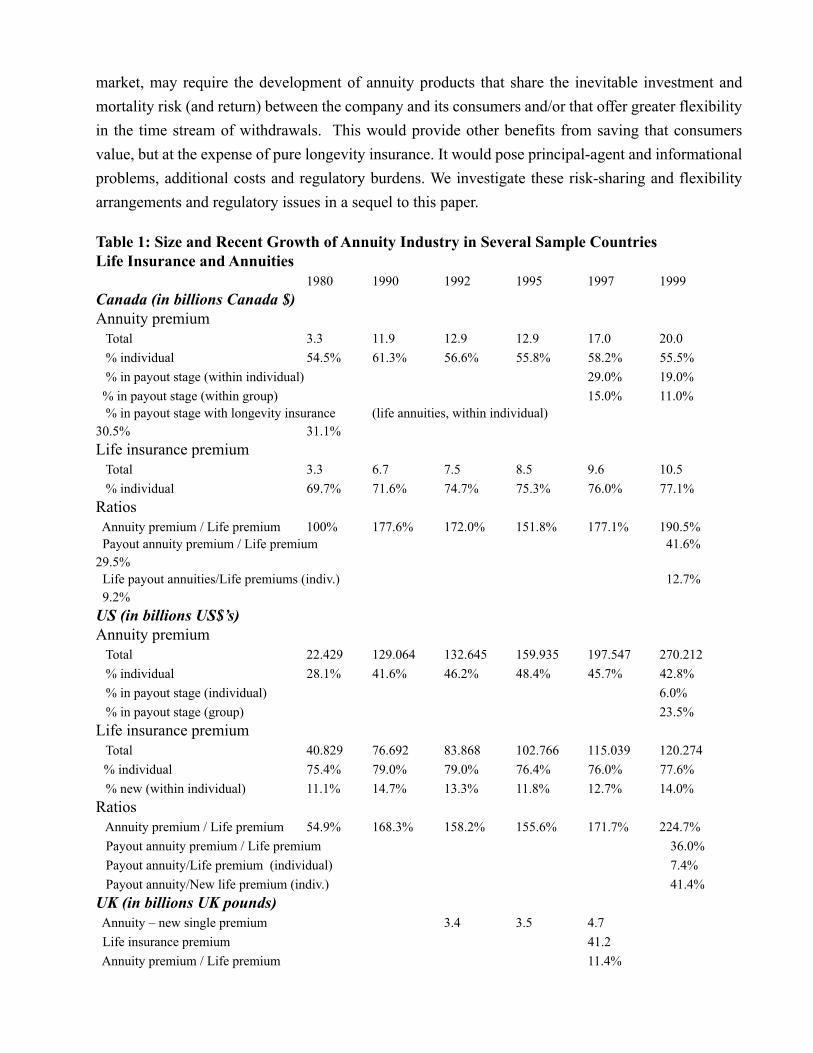
market, may require the development of annuity products that share the inevitable investment and
mortality risk (and return) between the company and its consumers and/or that offer greater flexibility
in the time stream of withdrawals. This would provide other benefits from saving that consumers
value, but at the expense of pure longevity insurance. It would pose principal-agent and informational
problems, additional costs and regulatory burdens. We investigate these risk-sharing and flexibility
arrangements and regulatory issues in a sequel to this paper.
Table 1: Size and Recent Growth of Annuity Industry in Several Sample CountriesLife Insurance and Annuities
1980 1990 1992 1995 1997 1999
Canada (in billions Canada $)Annuity premium Total 3.3 11.9 12.9 12.9 17.0 20.0
% individual 54.5% 61.3% 56.6% 55.8% 58.2% 55.5%
% in payout stage (within individual) 29.0% 19.0%
% in payout stage (within group) 15.0% 11.0% % in payout stage with longevity insurance (life annuities, within individual)30.5% 31.1%
Life insurance premium Total 3.3 6.7 7.5 8.5 9.6 10.5
% individual 69.7% 71.6% 74.7% 75.3% 76.0% 77.1%
Ratios Annuity premium / Life premium 100% 177.6% 172.0% 151.8% 177.1% 190.5% Payout annuity premium / Life premium 41.6%29.5% Life payout annuities/Life premiums (indiv.) 12.7% 9.2%
US (in billions US$’s)Annuity premium Total 22.429 129.064 132.645 159.935 197.547 270.212
% individual 28.1% 41.6% 46.2% 48.4% 45.7% 42.8%
% in payout stage (individual) 6.0%
% in payout stage (group) 23.5%
Life insurance premium Total 40.829 76.692 83.868 102.766 115.039 120.274
% individual 75.4% 79.0% 79.0% 76.4% 76.0% 77.6%
% new (within individual) 11.1% 14.7% 13.3% 11.8% 12.7% 14.0%
Ratios Annuity premium / Life premium 54.9% 168.3% 158.2% 155.6% 171.7% 224.7%
Payout annuity premium / Life premium 36.0%
Payout annuity/Life premium (individual) 7.4%
Payout annuity/New life premium (indiv.) 41.4%
UK (in billions UK pounds) Annuity – new single premium 3.4 3.5 4.7
Life insurance premium 41.2
Annuity premium / Life premium 11.4%

Singapore (in Singapore $) 1988
Annuity premium Total (S$M) 17.4 12.6 43.2 74.5 104.2
Premium / Contract (S 1000$) 31.0 32.8 32.5 37.9 40.9
Life insurance premium New – Total (S$M) 188.6 267.9 370.9 559.5 804.8
New—Premium / Contract (S 1000$)1.0 1.1 1.1 1.3 1.8
In force – Total (S$M) 659.2 1,070.8 1,629.9 2,928.5 4,093.2
In force — Premium / Contract (S 1000$) 0.9 1.0 1.1 1.2 1.3
Ratios Annuity premium / Life premium 2.1% 0.9% 2.2% 2.1% 2.1%
Annuity premium / New life premium 9.2% 4.7% 11.6% 13.3% 12.9%
1991 1992 1995 1997 1998Chile (in millions US$) Annuity premium 598 650 979 1,161 1,103 Life insurance premium 268 291 378 515 605 Annuity premium / Life premium 223.1% 223.4% 259.0% 225.4% 182.3%Australia (in billions Australia $) 1994 1995 1997 1998
Annuity market Total assets backing annuity products 10.3 12.3 20.0 24.7 % in payout stage 44.2% 46.7% 41.5% 38.2% % in payout stage that are life annuities 29.6% 26.3% 28.4% 31.7%Assets in life insurance excl. annuity 90.0 95.5 131.8 135.3
Ratios Annuity assets / Life assets 11.4% 12.9% 15.2% 18.3% Payout annuity assets/Life assets 5.0% 6.0% 6.3% 7.0% Life payout annuity assets/Life assets 1.5% 1.6% 1.8% 2.2%
Footnote: For Chile, most annuities are in payout stage and for Singapore most are deferred annuities with payoutsbeginning 7 years after purchase, so distinction between payout and accumulation is not given. Most of the payoutannuities in these two countries are life annuities—joint annuities in Chile, 15YG in Singapore—as a result of regulatoryrequirements.
Sources:Canada: Office of the Superintendent of Financial Institutions, CLHIA, and Kim and Sharp (1999).US: ACLI Life Insurers Fact Book 2000.UK: Murthi, Orszag, and Orszag (page 9 and Figure 1, page 10).Singapore: Chang (p5 & 6).Chile: annuity market survey conducted by Insurance Superintendency in 1999 cited in Callund (1999).Australia: Knox (Table 1 & 2) who lists his source as Rice Kachor (1999); APRA (1999).
Table 2. Annuities and Other Payouts in Chile 1988-2000A. Aggregate Payouts by Payout Method and Benefit Category
Number of policies Average size of policy (CH$’s) Total annual amount (CH$millions) % within category (total annual amount)1988Old Age Normal 11,818 67,101 793.00 Annuity 3,433 118,748 407.66 51.4% Gradual withdraw 8,385 45,947 385.27 48.6% Other NA 144,515 0.14 0.0%

Early Retirement 771 147,067 113.39 Annuity 766 146,378 112.13 98.9% Gradual withdraw 5 200,552 1.00 0.9% Other NA 407,313 0.41 0.4%Disability& Survivor 43,774 65,939 2,886.40 Annuity 1,443 91,973 132.2 4.6% Gradual withdraw 9,744 35,763 348.47 12.1% Other 32,587 73,813 2,405.33 83.3%Grand Total 56,363 67,298 3,793.13 Annuity 5,642 115,651 652.50 17.2% Gradual withdraw 18,134 40,517 734.74 19.4% Other 32,587 73,830 2,405.89 63.4%1993Old Age Normal 43,089 89,331 3,849.18 Annuity 11,529 121,879 1,405.14 36.5% Gradual withdraw 30,868 71,321 2,201.54 57.2% Other 692 350,423 242.49 6.3%Early Retirement 37,521 154,515 5,797.56 Annuity 33,127 133,608 4,426.03 76.3% Gradual withdraw 2,288 232,981 533.06 9.2% Other 2,106 398,129 838.46 14.5%Disability& Survivor 74,716 67,252 5,024.79 Annuity 13,250 82,524 1,093.45 21.8% Gradual withdraw 35,112 45,580 1,600.41 31.9% Other 26,354 88,448 2,330.95 46.4%Grand Total 155,326 94,456 14,671.53 Annuity 57,906 119,584 6,924.62 47.2% Gradual withdraw 68,268 63,500 4,335.01 27.5% Other 28,152 117,038 3,411.90 23.3%2000Old Age Normal 93,152 103,278 9,620.71 Annuity 30,726 139,248 4,278.55 44.5% Gradual withdraw 61,678 81,846 5,048.09 52.5% Other 748 393,144 294.07 3.1%Early Retirement 132,221 159,338 21,067.81 Annuity 111,720 139,564 15,592.07 74.0% Gradual withdraw 15,032 222,671 3,347.19 15.9% Other 5,469 389,202 2,128.54 10.1%Disability& Survivor 137,978 72,229 9,966.04 Annuity 47,355 81,400 3,854.69 38.7% Gradual withdraw 70,822 56,234 3,982.57 40.0% Other 19,801 107,511 2,128.82 21.4%Grand Total 363,351 111,888 40,654.60 Annuity 189,801 125,001 23,725.30 58.4% Gradual withdraw 147,532 83,900 12,377.86 30.4% Other 26,018 174,934 4,551.44 11.2%
B. Payouts by Type of Benefit% of total recipients % of total payout % of total recipients %
of total payout % of total recipients % of total payout1988 1990 1993
Old Age Normal 21.0 20.9 27.4 28.2 27.7 26.2Early Retirement 1.4 3.0 6.7 12.1 24.2 39.5Disability & Survivor 77.7 76.1 65.9 59.7 48.1 34.2
1996 1998 2000Old Age Normal 25.7 23.2 24.5 22.6 25.6 23.7

Early Retirement 33.8 50.6 36.6 52.0 36.4 51.8Disability & Survivor 40.5 26.2 38.9 25.4 38.0 24.5
C. Payout Methods – Annuity, Gradual Withdrawal, and Other% of recipients within category % amount within category % of recipients
within category % amount within category % of recipients within category % amount withincategory
1988 1990 1993Old Age Normal Annuity 29.0 51.4 29.2 49.4 26.8 36.5 Gradual withdraw 71.0 48.6 70.6 49.2 71.6 57.2 Other NA 0.0 0.2 1.4 1.6 6.3Early Retirement Annuity 99.4 98.9 98.7 96.6 88.3 76.3 Gradual withdraw 0.6 0.9 0.7 1.5 6.1 9.2 Other NA 0.4 0.6 1.9 5.6 14.5Disability & Survivor Annuity 3.3 4.6 13.2 18.5 17.7 21.8 Gradual withdraw 22.3 12.1 34.5 19.2 47.0 31.9 Other 74.4 83.3 52.3 62.3 35.3 46.4All Benefit Types Annuity 10.0 17.2 23.3 36.7 37.3 47.2 Gradual withdraw 32.2 19.4 42.1 25.5 44.0 29.5 Other 57.8 63.4 34.6 37.9 18.8 23.3
1996 1998 2000Old Age Normal Annuity 27.3 37.4 30.6 43.6 33.0 44.5 Gradual withdraw 71.1 57.2 68.2 52.1 66.2 52.5 Other 1.6 5.4 1.3 4.3 0.8 3.1Early Retirement Annuity 79.2 64.6 85.1 77.3 84.5 74.0 Gradual withdraw 13.4 17.8 11.3 13.2 11.4 15.9 Other 7.4 17.6 3.6 9.5 4.1 10.1Disability & Survivor Annuity 22.3 26.1 30.2 34.4 34.3 38.7 Gradual withdraw 53.3 38.9 50.5 37.1 51.3 40.0 Other 24.4 35.0 19.3 28.5 14.4 21.4All Benefit Types Annuity 42.8 48.2 50.4 58.8 52.2 58.4 Gradual withdraw 44.4 32.4 40.5 28.1 40.6 30.4 Other 12.8 19.3 9.1 13.1 7.2 11.2
D. Payout — Benefits Category Used for Each Payout Method: Annuity, Gradual Withdrawal,and Other
% of recipients within category % amount within category % of recipientswithin category % amount within category % of recipients within category % amount withincategory
1988 1990 1993Annuity Old Age Normal 60.8 62.5 34.4 38.0 19.9 20.3 Early Retirement 13.6 17.2 28.2 32.0 57.2 63.9 Disability & Survivor 25.6 20.3 37.4 30.0 22.9 15.8Gradual Withdraw Old Age Normal 46.2 52.4 45.9 54.4 45.2 50.8

Early Retirement 0.0 0.1 0.1 0.7 3.4 12.3 Disability & Survivor 53.7 47.4 54.0 44.9 51.4 36.9Other Old Age Normal 0.0 0.0 0.2 1.1 2.4 7.2 Early Retirement 0.0 0.0 0.1 0.6 7.2 24.6 Disability & Survivor 1.0 1.0 99.7 98.3 90.4 68.3
1996 1998 2000Annuity Old Age Normal 16.4 18.0 14.9 16.8 16.2 18.0 Early Retirement 62.5 67.8 61.8 68.4 58.9 65.7 Disability & Survivor 21.1 14.2 23.3 14.9 24.9 16.2Gradual Withdraw Old Age Normal 41.2 40.9 41.3 41.9 41.8 40.8 Early Retirement 10.2 27.8 10.2 24.5 10.2 27.0 Disability & Survivor 48.6 31.4 48.5 33.6 48.0 32.2Other Old Age Normal 3.2 6.5 3.4 7.4 2.9 6.5 Early Retirement 19.5 46.0 14.3 37.5 21.0 46.8 Disability & Survivor 77.3 47.5 82.3 55.1 76.1 46.8Source: Augusto Iglesias from PrimAmerica’s database.
Table 3: Monthly Annuity Pay-Outs for Immediate Annuities at Age 65($100,000 premium, paid in spring 1999)
A. Male-NominalCanada US Australia UK Switzerland Singapore
Level SPIA1 740 733 700 727 59010YG2 702 658 691 571 650Joint SPIA3 664 648 543 642 501 (600)Escalating SPIA4 564B. Male-Price Indexed
UK Chile Israel5
Immediate annuity Managers insuranceDeferred annuityLevel SPIA 522 820 625 64210YG 761 584 600Joint SPIA 438 731 (663)
C. Female-NominalCanada US Australia UK Switzerland Singapore
Level SPIA 662 662 621 640 52610YG 644 599 626 519 607Escalating SPIA 475D. Female-Price Indexed
UK Chile IsraelImmediate annuity Managers insurance
Level SPIA 436 723 552 56710YG 695 530 5441 SPIA = single premium immediate annuity. For Switzerland a bonus that is not guaranteed but has been regularly paid for

many years, is included.2 10YG means payment continues for at least 10 years even if individual dies; beneficiary is named. For Singapore this isthe payout beginning at age 62 for a premium of $73,927 paid at age 55 that had accumulated to $100,000 by age 62,compounded at the 7-year bond rate, under the deferred annuity option of the Minimum Sum Scheme. It carries a 15-yearguarantee. See Appendix A for further details.3 For Canada, US, UK joint annuity is based on assumption that both spouses are same age and survivor gets 50% of initialpayout. For Switzerland number in parentheses is for Pillar 2—quasi-mandatory annuity that pays $600 based on regulationsthat require annual payout = 7.2% of accumulation, 60% to survivor. In Chile, joint annuity pays 60% to survivor as perregulations in quasi-mandatory market (Pillar 2). For Australia husband is assumed to be 65, wife is 60 and survivor gets85% of initial payout. Joint annuity with female as primary beneficiary has slightly high payout but is much less commonform.4 Escalating annuity means that payment increases at fixed rate per year— 3% for UK. Payout given is for initial year; inlater years payout will be higher by this fixed rate.5 For Israel: immediate annuity is in voluntary market; managers insurance is employer-sponsored voluntary; number inparentheses is for quasi-mandatory deferred annuity purchased with annual contributions throughout working life. This isthe payout beginning at age 65 for a premium of $1052 in present value paid annually from age 25 to age 65, that accumulatesto $100,000 at age 65, compounded at the 4% net rate of return. Joint annuity with 60% to survivor is required. Payout is notbinding; can be decreased if needed for actuarial solvency. See Appendix B for further details.
Table 4
Price Dispersion in the Annuity MarketMonthly Pay-Outs, Male Age 65 (SPIA)
Canada US Australia UK Chile SingaporeTop 1 754 840 764 772 835 6665th Best 748 807 720* 723 819 642Average 740 733 700 708 820 650Worst 723 638 626 748 632
*This is AMP price, not 5th best.Note: See Table 3 for definition.
Table 5
Life Expectancy at Age 65
A. Male
Country Population Period Population Cohort Annuitant PeriodAnnuitant Cohort Annuitant Cohort MWR – Annuitant Period MWRCanada 80.9 81.8 83.1 84.1 2.7US 80.5 80.7 84.1 84.4 0.6Australia 80.8 81.9 84.1 85.4 3.4UK 79.1 80.4 80.9 82.1 4.1Switzerland 80.9 82.0 84.8 (82.6) 87.2 (84.4) 6.7 (7.2)Singapore 80.1 81.5Chile 79.5 82.3Israel 78.9 81.8

B. Female
Country Population Period Population Cohort Annuitant PeriodAnnuitant Cohort Annuitant Cohort MWR – Annuitant Period MWRCanada 84.9 86.3 86.4 88.1 3.0US 83.6 84.1 86.6 87.1 1.0Australia 84.5 85.4 87.5 88.5 2.3UK 82.4 83.9 84.2 85.4 3.5Switzerland 85.0 86.4 87.8 90.1 5.4Singapore 84.1 85.7Chile 82.7 85.8Israel 80.2 84.6
Note: Calculated by authors based on mortality tables for each country. For Switzerland, annuitantnumbers are for voluntary annuitants (pillar 3) and numbers in parenthesis are for quasi-mandatoryannuitants (pillar 2). Israel annuitant number is for mortality tables constructed by actuaries’ committee.The difference in MWR is for level SPIA, except for Switzerland Pillar II, where it applies to therequired joint annuity. Cohort numbers are not given for Singapore, Chile and Israel because they donot use cohort tables or have their own mortality improvement factors.
Table 6Money’s Worth Ratio (MWR) with Risk-Free Interest Rate – Age 65 (as %)1
A. Male-NominalCanada US Australia UK Switzerland2
Singapore3
popul annuit popul annuit popul annuit popul annuit popul annuit No Bonuspopul annuitLevel SPIA 91.4 98.1 85.8 97.4 91.1 101.0 91.2 98.3 91.6 108.2 99.8
10YG 92.8 97.4 91.5 99.6 94.4 99.3 94.5 108.0 99.699.6 102.4Joint 93.9 98.0 86.4 95.1 86.7 93.6 93.3 98.8 90.2 (111.0) 101.3 (119.8)93.4Escalating 91.8 100.6
B. Male-Price IndexedUK Chile Israelpopul annuit popul annuit popul Actuaries’ Committee Managers’ Insurance
Committee Deferred Annuity-Committee (age 65 cohort)Level SPIA 81.7 89.4 86.5 96.7 76.9 88.2 90.610YG 88.7 95.4 79.7 87.7 90.1Joint 81.8 88.0 90.5 98.5 (109.2)
C. Female-NominalCanada US Australia UK Switzerland
Singaporepopul annuit popul annuit popul annuit popul annuit popul annuit No Bonus
popul annuit

Level SPIA 95.0 97.6 87.1 95.4 91.5 98.4 92.6 97.4 96.9 105.7 97.5
10YG 95.5 97.3 91.2 97.2 94.9 98.7 98.2 105.7 97.5100.8 103.9Escalating 92.5 98.8
D. Female-Price IndexedUK Chile Israelpopul annuit popul annuit popul Actuaries’ Committee Managers’ Insurance-
CommitteeLevel SPIA 81.3 86.7 86.1 94.9 73.0 86.9 89.210YG 87.8 94.2 75.6 86.6 88.9
1 For definitions of annuity types and payouts see Table 3. Mortality tables are those in use in country (period tables in Chile,Israel, Singapore, cohort tables in others); for further details see Appendices A, B and C. Risk-free interest rate is termstructure of government bond rates.2 For Switzerland we give MWR for payouts in voluntary market (Pillar 3) and use Pillar 3 mortality rates. “No bonus”column subtracts the bonus. Numbers in parentheses for joint annuity give MWR for payouts of quasi-mandatory annuity(Pillar 2) and use Pillar 2 mortality rates. Although insurance companies sometimes build in a safety margin, these aremortality rates without the safety margin.3 For Singapore the MWR is given for an individual who is age 55 in 1999 and buys a deferred annuity that begins at age 62.See Table 3 and Appendix A for further details.4 For annuitants in Israel we use a new table by an actuaries committee that gives a MWR about 2% higher than the legallyrequired table. See Table 3 and Appendix B for further details.
Table 7Money’s Worth Ratio (MWR) with Risk-Free Interest Rate – Age 65 (as %)
Using Standardized Mortality Improvement Factor to Cohortize All Countries1
E. Male-NominalCanada US Australia UK Switzerland
Singapore2
popul annuit popul annuit popul annuit popul annuit popul annuit No Bonuspopul annuitLevel SPIA 91.4 98.1 87.9 99.5 90.7 101.3 89.8 97.7 90.9 104.6 96.4
10YG 92.8 97.4 91.1 99.7 93.1 98.8 93.8 104.5 96.3103.8 106.6Joint 93.9 98.0 88.4 97.0 92.5 98.8 92.2 98.7 89.7 (110.4) 98.5 (116.2)90.8Escalating 89.7 99.8
F. Male-Price IndexedUK Chile Israel3
popul annuit popul annuit popul Actuaries’ Committee Managers’ Insurance CommitteeDeferred Annuity-Committee (age 65 cohort) Deferred Annuity-Committee (age 25 cohort)Level SPIA 79.9 88.7 89.4 99.5 80.2 91.5 94.010YG 91.0 97.7 82.4 90.5 93.0Joint 80.6 88.0 93.4 101.3 (113.6) (127.1)

G. Female-NominalCanada US Australia UK Switzerland
SingaporePopul annuit popul annuit popul annuit popul annuit popul annuit No Bonus
popul annuitLevel SPIA 95.0 97.6 89.3 97.4 92.5 100.2 92.1 97.9 96.8 103.6 95.5
10YG 95.5 97.3 92.2 98.9 94.5 99.3 98.0 103.7 95.6 105.6108.8Escalating 92.1 100.0
H. Female-Price IndexedUK Chile IsraelPopul annuit popul annuit popul Actuaries’ Committee Managers’ Insurance
CommitteeLevel SPIA 80.9 87.7 89.1 97.8 76.5 90.9 93.410YG 90.5 96.9 78.6 90.4 92.7
1 See Tables 3 and 6 for definitions. Table 7 is based on cohort tables constructed imputing Canada’s CPP improvementfactor for all countries.2 For Singapore the MWR is given for an individual who was in the age 55 cohort in 1999 and will begin collecting payoutsfrom the deferred annuity at age 62. See Table 3 and Appendix A for details.3 For Israel the MWR in first 3 columns is given for the cohort aged 65 in 1999. For columns on deferred annuity the MWRis given for cohorts age 65 and 25 in 1999, under the hypothesis that these individuals have been and will be in this schemethroughout the ages of 25 and 65. The MWR is higher for the age 25 cohort because mortality improvement plays a largerrole. See Table 3 and Appendix B for further details.
Table 8: Annuity Margin with Risk-Free Interest Rate (as %) – Age 651
A. Male-Cohort Tables based on own mortality data (Table 6)2
Canada US Australia UK Switzerlandpopul annuit popul annuit popul annuit popul annuit popul annuit
Level SPIA 1.11 0.23 1.97 0.31 1.13 -0.11 1.14 0.21 0.97 -0.7910YG 0.95 0.32 1.09 0.05 0.74 0.09 0.64 -0.78Joint 0.69 0.23 1.70 0.55 0.80 0.19 0.78 0.13 0.99 (-1.06) -0.12 (-1.75)Escalating 0.97 -0.61 0.82 -0.17Indexed level 2.07 1.10
B. Male-Cohort Tables based on standardized mortality improvement (Table 7) 2
Singapore Chile Israelpopul annuit popul annuit popul Actuaries Committee Managers’ Insurance
Committee Deferred Annuity-Committee
Level SPIA 1.52 0.06 2.60 0.98 0.6910YG -0.42 -0.71 1.31 0.30 2.36 1.12 0.82Joint 0.82 -0.15 (-1.33)
C. Female-Cohort Tables based on own mortality data (Table 6)2
Canada US Australia UK Switzerland
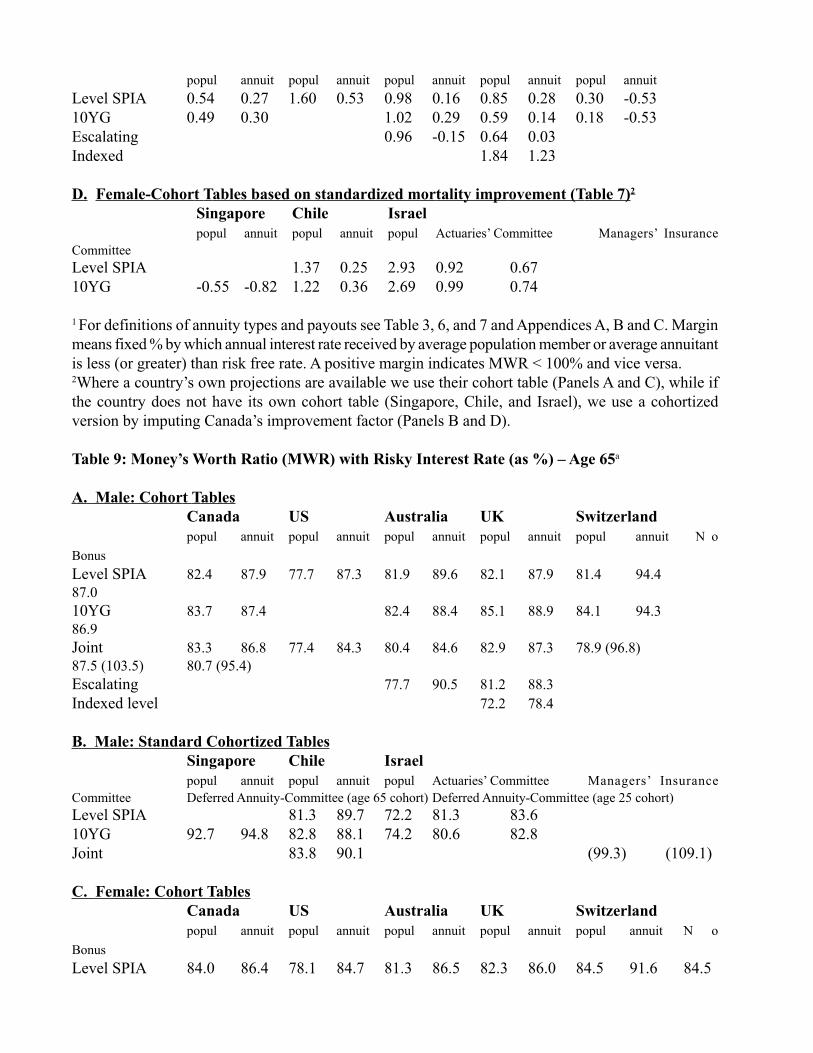
popul annuit popul annuit popul annuit popul annuit popul annuit
Level SPIA 0.54 0.27 1.60 0.53 0.98 0.16 0.85 0.28 0.30 -0.5310YG 0.49 0.30 1.02 0.29 0.59 0.14 0.18 -0.53Escalating 0.96 -0.15 0.64 0.03Indexed 1.84 1.23
D. Female-Cohort Tables based on standardized mortality improvement (Table 7)2
Singapore Chile Israelpopul annuit popul annuit popul Actuaries’ Committee Managers’ Insurance
CommitteeLevel SPIA 1.37 0.25 2.93 0.92 0.6710YG -0.55 -0.82 1.22 0.36 2.69 0.99 0.74
1 For definitions of annuity types and payouts see Table 3, 6, and 7 and Appendices A, B and C. Marginmeans fixed % by which annual interest rate received by average population member or average annuitantis less (or greater) than risk free rate. A positive margin indicates MWR < 100% and vice versa.2Where a country’s own projections are available we use their cohort table (Panels A and C), while ifthe country does not have its own cohort table (Singapore, Chile, and Israel), we use a cohortizedversion by imputing Canada’s improvement factor (Panels B and D).
Table 9: Money’s Worth Ratio (MWR) with Risky Interest Rate (as %) – Age 65a
A. Male: Cohort TablesCanada US Australia UK Switzerlandpopul annuit popul annuit popul annuit popul annuit popul annuit N o
Bonus
Level SPIA 82.4 87.9 77.7 87.3 81.9 89.6 82.1 87.9 81.4 94.487.010YG 83.7 87.4 82.4 88.4 85.1 88.9 84.1 94.386.9Joint 83.3 86.8 77.4 84.3 80.4 84.6 82.9 87.3 78.9 (96.8)87.5 (103.5) 80.7 (95.4)Escalating 77.7 90.5 81.2 88.3Indexed level 72.2 78.4
B. Male: Standard Cohortized TablesSingapore Chile Israelpopul annuit popul annuit popul Actuaries’ Committee Managers’ Insurance
Committee Deferred Annuity-Committee (age 65 cohort) Deferred Annuity-Committee (age 25 cohort)Level SPIA 81.3 89.7 72.2 81.3 83.610YG 92.7 94.8 82.8 88.1 74.2 80.6 82.8Joint 83.8 90.1 (99.3) (109.1)
C. Female: Cohort TablesCanada US Australia UK Switzerlandpopul annuit popul annuit popul annuit popul annuit popul annuit N o
Bonus
Level SPIA 84.0 86.4 78.1 84.7 81.3 86.5 82.3 86.0 84.5 91.6 84.5

10YG 84.5 86.2 81.1 85.5 84.4 87.3 85.7 91.6 84.5Escalating 75.6 84.8 80.4 85.2Indexed level 70.6 74.7
D. Female: Standard Cohortized TablesSingapore Chile Israelpopul annuit popul annuit popul Actuaries’ Committee Managers’ Insurance
Committee
Level SPIA 80.1 87.1 68.4 79.6 81.710YG 92.7 94.9 81.4 86.3 68.4 79.2 81.3
Notes:a Risky rate = government term structure + 1.4%For definitions of annuity types, payouts and mortality tables, see Table 3, 6, and 7 and Appendices A,B and C.
Table 10. Selection: Difference in MWR’s Between Annuitants and Population 1
A. Male
Countries Annuitant - population: Level SPIA, Risk-Free Annuitant –population: Level SPIA, Risky Annuitant –population: Joint Annuity, Risk-Free2 Annuitant–population: Joint Annuity, Risky2
Canada 6.7 5.5 4.1 3.5US 11.6 9.6 8.6 6.9Australia 9.9 7.7 6.9 4.2UK 7.1 5.8 5.5 4.4Switzerland 13.7 13.0 8.8 (5.8) 8.6 (6.7)Singapore NA NA 2.8 2.1Chile 10.1 8.4 7.9 6.3Israel 11.3 9.1 8.1 6.4
B. Female
Countries Annuitant - population: Level SPIA, Risk-Free Annuitant –population: LevelSPIA, RiskyCanada 2.6 2.4US 8.1 6.6Australia 7.7 5.2UK 5.8 3.7Switzerland 6.8 7.1Singapore NA NAChile 8.7 7.0Israel 14.4 11.2

1 Risk-free numbers for Canada, US, UK and Australia are from Table 6, others are from Table 7, tostandardize mortality improvement factor for population and annuitants. Risky numbers are based onTable 9.2 Terms of joint annuity vary as described in Table 3. For Singapore 15YG is given instead of joint. ForIsrael voluntary market payouts for 10YG are used.
Table 11
Differences in MWR (in %) and EPDV of Lifetime Payouts (per 100 premium):Attribution to Interest versus Mortality Rate Differences, Using Canada as Standard
A. MaleAll Canada data (Canada’s EPDV) (1) Monthly payout from own-
country; other variables standardized (2) Monthly payout + interest rates-own-country; mortality rates standardized (3) Payout + interest rates+ period table – own-country; improvement factor standard (4) All data from own-country (5)US 98.1 97.2 96.8 99.5 97.4Australia 98.1 92.8 98.3 101.3 101.0UK 98.1 96.4 105.9 97.7 98.3Switzerland (PIII) 98.1 78.2 98.5 104.6 108.2Singapore 97.4 99.4 108.5 106.6 102.4Chile 98.1 108.7 102.2 99.5 96.7Israel 98.1 82.9 96.2 91.5 88.2Average 98.0 93.7 100.9 100.5 98.9Standard deviation 0.3 10.3 4.8 5.2 6.1Range 0.7 30.5 12.3 15.1 20.0
B. FemaleUS 97.6 97.6 92.1 97.4 95.4Australia 97.6 91.5 97.6 100.2 98.4UK 97.6 94.3 105.2 97.9 97.4Switzerland (PIII) 97.6 77.5 99.2 103.6 105.7Singapore 97.3 98.7 108.8 108.8 103.9Chile 97.6 106.6 99.7 97.8 94.9Israel 97.6 81.4 96.5 90.9 86.9Average 97.6 92.5 99.9 99.8 97.5Standard deviation 0.1 10.1 5.6 6.1 6.2Range 0.3 29.1 16.7 17.9 28.8
Note: For definitions see Tables 3, 6 and 7.Column 4 is from Table 7 and column 5 is from Table 6. Comparison is for level SPIA for all countriesexcept Singapore, where it is for 15YG. Numbers for Singapore, Chile and Israel are italicized incolumn 5 because they do not have their own improvement factor or cohort tables; they use periodtables.

Table 11
Rank Order by Interest Rate, Monthly and Expected Lifetime Payouts, Level SPIA
RankCountry 8-Year interest rate Monthly Payout Expected lifetime payout—standardmortality Expected lifetime payout—own mortality Own-country improvement factorChile 1 1 3 7 7Canada 2 2 6 5 4US 3 3 7 6 5Australia 4 5 5 3 2UK 5 4 2 4 3Singapore 6 6 1 2 6Israel 7 7 8 8 8Switzerland 8 8 4 1 1
Note: Column 2 is from Table 3. Column 3 is from column 3, Table 11. Column 4 is from Table 6 andcolumn 5, Table 9. Columns 1 and 5 are from Appendices E and F.
Table 12: Insurance Company Investment Portfolio
Country Bonds Loans & Mortgages Equities Real Estate and Land
Liquid Assets Other Total
Public BondsCorporate Bonds
US1970 3.9 36.9 45.0 7.7 1.9 4.6 100.01990 14.2 42.0 24.4 8.3 5.1 6.0 100.01995 17.6 42.3 15.0 16.7 3.6 5.1 100.01998 11.1 40.8 11.5 27.3 6.8 2.5 100.01999 10.0 38.2 10.7 32.9 7.0 1.1 100.0Separate account 1999 4.7 8.5 0.6 81.1 1.2 0.1 3.8100.0General account 1999 15.7 55.5 16.3 5.1 1.3 0.2 5.9100.0Canada1970 37.0 48.2 6.9 4.6 1.0 2.2 100.01990 39.2 38.0 10.8 5.1 1.7 5.1 100.01995 45.0 28.3 13.1 5.0 4.4 4.2 100.01998 44.0 20.9 22.4 3.3 4.9 4.6 100.01999 40.0 17.5 29.3 2.9 5.8 4.5 100.0Segregated 1999 16.3 2.0 70.4 1.8 8.7 0.9 100.0Non-segregated 1999 49.8 21.9 12.3 3.4 4.6 8.0100.0UK1998 30.2 0.8 53.4 8.1 7.5 100.0Switzerland
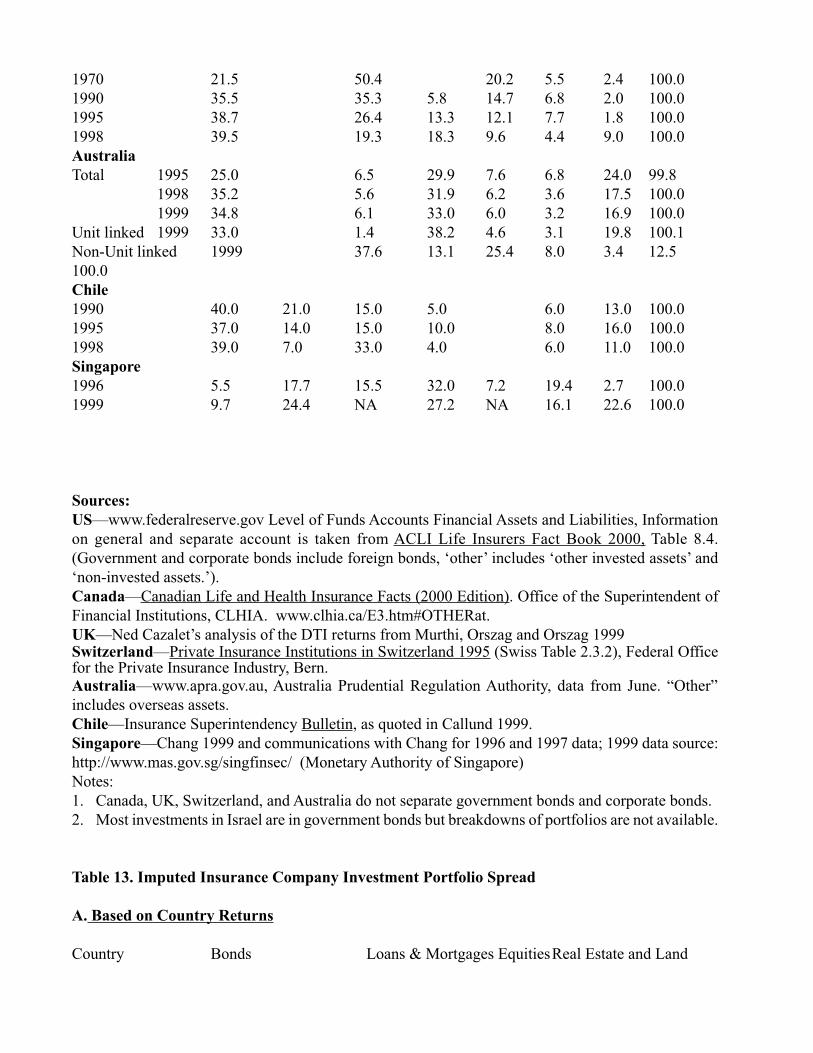
1970 21.5 50.4 20.2 5.5 2.4 100.01990 35.5 35.3 5.8 14.7 6.8 2.0 100.01995 38.7 26.4 13.3 12.1 7.7 1.8 100.01998 39.5 19.3 18.3 9.6 4.4 9.0 100.0AustraliaTotal 1995 25.0 6.5 29.9 7.6 6.8 24.0 99.8
1998 35.2 5.6 31.9 6.2 3.6 17.5 100.01999 34.8 6.1 33.0 6.0 3.2 16.9 100.0
Unit linked 1999 33.0 1.4 38.2 4.6 3.1 19.8 100.1Non-Unit linked 1999 37.6 13.1 25.4 8.0 3.4 12.5100.0Chile1990 40.0 21.0 15.0 5.0 6.0 13.0 100.01995 37.0 14.0 15.0 10.0 8.0 16.0 100.01998 39.0 7.0 33.0 4.0 6.0 11.0 100.0Singapore1996 5.5 17.7 15.5 32.0 7.2 19.4 2.7 100.01999 9.7 24.4 NA 27.2 NA 16.1 22.6 100.0
Sources:US—www.federalreserve.gov Level of Funds Accounts Financial Assets and Liabilities, Informationon general and separate account is taken from ACLI Life Insurers Fact Book 2000, Table 8.4.(Government and corporate bonds include foreign bonds, ‘other’ includes ‘other invested assets’ and‘non-invested assets.’).Canada—Canadian Life and Health Insurance Facts (2000 Edition). Office of the Superintendent ofFinancial Institutions, CLHIA. www.clhia.ca/E3.htm#OTHERat.UK—Ned Cazalet’s analysis of the DTI returns from Murthi, Orszag and Orszag 1999Switzerland—Private Insurance Institutions in Switzerland 1995 (Swiss Table 2.3.2), Federal Officefor the Private Insurance Industry, Bern.Australia—www.apra.gov.au, Australia Prudential Regulation Authority, data from June. “Other”includes overseas assets.Chile—Insurance Superintendency Bulletin, as quoted in Callund 1999.Singapore—Chang 1999 and communications with Chang for 1996 and 1997 data; 1999 data source:http://www.mas.gov.sg/singfinsec/ (Monetary Authority of Singapore)Notes:1. Canada, UK, Switzerland, and Australia do not separate government bonds and corporate bonds.2. Most investments in Israel are in government bonds but breakdowns of portfolios are not available.
Table 13. Imputed Insurance Company Investment Portfolio Spread
A. Based on Country Returns
Country Bonds Loans & Mortgages EquitiesReal Estate and Land

Liquid Assets TotalPublic Bonds Corporate Bonds
US1990 0.223 0.864 0.443 0.043 1.5731995 0.222 0.508 0.876 0.030 1.6361998 0.209 0.377 1.401 0.056 2.0431999 0.193 0.351 1.661 0.057 2.262Separate account 1999 0.044 0.020 4.215 0.054 0.0014.334General account 1999 0.295 0.559 0.270 0.060 0.0021.186Canada1990 0.268 1.143 0.342 0.400 0.013 2.1661995 0.306 0.842 0.410 0.385 0.032 1.9751998 0.300 0.624 0.703 0.257 0.036 1.9201999 0.272 0.523 0.921 0.227 0.042 1.985Segregated 1999 0.107 0.057 2.129 0.134 0.061 2.489Non-segregated 1999 0.352 0.678 0.401 0.273 0.0351.740UK1998 0.180 0.006 4.212 0.044 4.442Switzerland1990 0.085 0.889 0.540 0.003 0.106 1.6231995 0.090 0.658 1.200 0.002 0.116 2.0661998 0.087 0.476 1.564 0.180 0.062 2.370AustraliaTotal 1995 0.329 0.360 3.320 0.451 0.170 4.630
1998 0.427 0.285 3.248 0.338 0.083 4.3811999 0.419 0.308 3.336 0.325 0.073 4.461
Unit linked 1999 0.411 0.073 3.996 0.258 0.073 4.811Non-Unit linked 1999 0.430 0.629 2.438 0.411 0.0743.982
Note: Spread for each asset class = proportion of total portfolio in that class (from Table 11)multiplied by the long run return to that class from Davis 2001 (returns from each country, see fn23). For countries that do not distinguish public bonds and corporate bond, we treat the bonds ashalf public and half corporate. US and Swiss spreads on mortgage and loans are calculatedseparately, and the sum is given in the loans & mortgages column.
B. Based on Average Returns
Country Bonds Loans & Mortgages EquitiesReal Estate and LandLiquid Assets Total
Public Bonds Corporate BondsUS1990 0.446 0.623 0.558 0.005 1.6331995 0.444 0.379 1.104 0.004 1.930
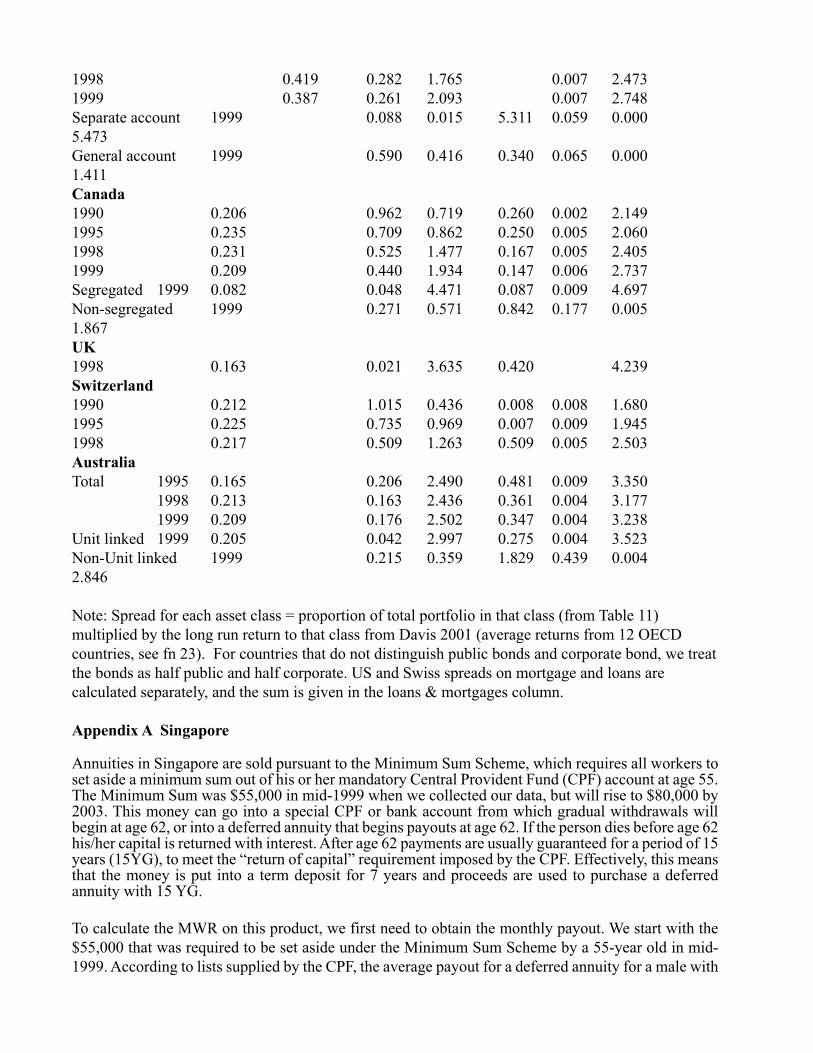
1998 0.419 0.282 1.765 0.007 2.4731999 0.387 0.261 2.093 0.007 2.748Separate account 1999 0.088 0.015 5.311 0.059 0.0005.473General account 1999 0.590 0.416 0.340 0.065 0.0001.411Canada1990 0.206 0.962 0.719 0.260 0.002 2.1491995 0.235 0.709 0.862 0.250 0.005 2.0601998 0.231 0.525 1.477 0.167 0.005 2.4051999 0.209 0.440 1.934 0.147 0.006 2.737Segregated 1999 0.082 0.048 4.471 0.087 0.009 4.697Non-segregated 1999 0.271 0.571 0.842 0.177 0.0051.867UK1998 0.163 0.021 3.635 0.420 4.239Switzerland1990 0.212 1.015 0.436 0.008 0.008 1.6801995 0.225 0.735 0.969 0.007 0.009 1.9451998 0.217 0.509 1.263 0.509 0.005 2.503AustraliaTotal 1995 0.165 0.206 2.490 0.481 0.009 3.350
1998 0.213 0.163 2.436 0.361 0.004 3.1771999 0.209 0.176 2.502 0.347 0.004 3.238
Unit linked 1999 0.205 0.042 2.997 0.275 0.004 3.523Non-Unit linked 1999 0.215 0.359 1.829 0.439 0.0042.846
Note: Spread for each asset class = proportion of total portfolio in that class (from Table 11)multiplied by the long run return to that class from Davis 2001 (average returns from 12 OECDcountries, see fn 23). For countries that do not distinguish public bonds and corporate bond, we treatthe bonds as half public and half corporate. US and Swiss spreads on mortgage and loans arecalculated separately, and the sum is given in the loans & mortgages column.
Appendix A Singapore
Annuities in Singapore are sold pursuant to the Minimum Sum Scheme, which requires all workers toset aside a minimum sum out of his or her mandatory Central Provident Fund (CPF) account at age 55.The Minimum Sum was $55,000 in mid-1999 when we collected our data, but will rise to $80,000 by2003. This money can go into a special CPF or bank account from which gradual withdrawals willbegin at age 62, or into a deferred annuity that begins payouts at age 62. If the person dies before age 62his/her capital is returned with interest. After age 62 payments are usually guaranteed for a period of 15years (15YG), to meet the “return of capital” requirement imposed by the CPF. Effectively, this meansthat the money is put into a term deposit for 7 years and proceeds are used to purchase a deferredannuity with 15 YG.
To calculate the MWR on this product, we first need to obtain the monthly payout. We start with the$55,000 that was required to be set aside under the Minimum Sum Scheme by a 55-year old in mid-1999. According to lists supplied by the CPF, the average payout for a deferred annuity for a male with
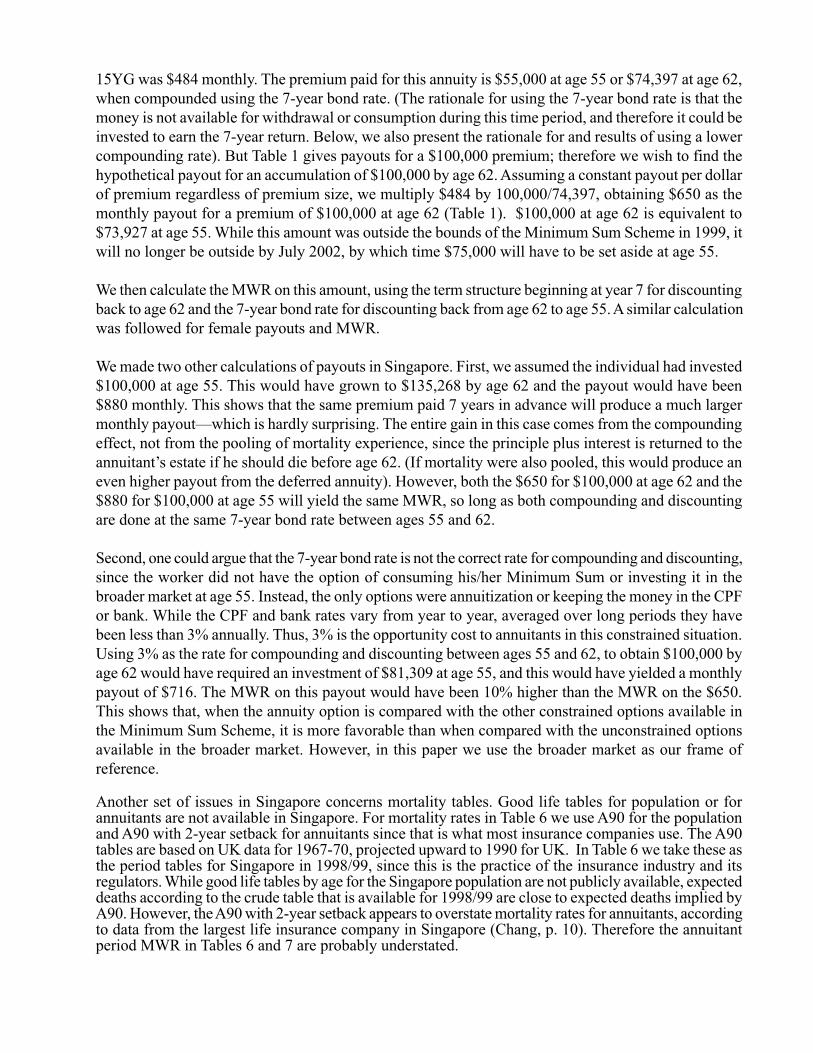
15YG was $484 monthly. The premium paid for this annuity is $55,000 at age 55 or $74,397 at age 62,when compounded using the 7-year bond rate. (The rationale for using the 7-year bond rate is that themoney is not available for withdrawal or consumption during this time period, and therefore it could beinvested to earn the 7-year return. Below, we also present the rationale for and results of using a lowercompounding rate). But Table 1 gives payouts for a $100,000 premium; therefore we wish to find thehypothetical payout for an accumulation of $100,000 by age 62. Assuming a constant payout per dollarof premium regardless of premium size, we multiply $484 by 100,000/74,397, obtaining $650 as themonthly payout for a premium of $100,000 at age 62 (Table 1). $100,000 at age 62 is equivalent to$73,927 at age 55. While this amount was outside the bounds of the Minimum Sum Scheme in 1999, itwill no longer be outside by July 2002, by which time $75,000 will have to be set aside at age 55.
We then calculate the MWR on this amount, using the term structure beginning at year 7 for discountingback to age 62 and the 7-year bond rate for discounting back from age 62 to age 55. A similar calculationwas followed for female payouts and MWR.
We made two other calculations of payouts in Singapore. First, we assumed the individual had invested$100,000 at age 55. This would have grown to $135,268 by age 62 and the payout would have been$880 monthly. This shows that the same premium paid 7 years in advance will produce a much largermonthly payout—which is hardly surprising. The entire gain in this case comes from the compoundingeffect, not from the pooling of mortality experience, since the principle plus interest is returned to theannuitant’s estate if he should die before age 62. (If mortality were also pooled, this would produce aneven higher payout from the deferred annuity). However, both the $650 for $100,000 at age 62 and the$880 for $100,000 at age 55 will yield the same MWR, so long as both compounding and discountingare done at the same 7-year bond rate between ages 55 and 62.
Second, one could argue that the 7-year bond rate is not the correct rate for compounding and discounting,since the worker did not have the option of consuming his/her Minimum Sum or investing it in thebroader market at age 55. Instead, the only options were annuitization or keeping the money in the CPFor bank. While the CPF and bank rates vary from year to year, averaged over long periods they havebeen less than 3% annually. Thus, 3% is the opportunity cost to annuitants in this constrained situation.Using 3% as the rate for compounding and discounting between ages 55 and 62, to obtain $100,000 byage 62 would have required an investment of $81,309 at age 55, and this would have yielded a monthlypayout of $716. The MWR on this payout would have been 10% higher than the MWR on the $650.This shows that, when the annuity option is compared with the other constrained options available inthe Minimum Sum Scheme, it is more favorable than when compared with the unconstrained optionsavailable in the broader market. However, in this paper we use the broader market as our frame ofreference.
Another set of issues in Singapore concerns mortality tables. Good life tables for population or forannuitants are not available in Singapore. For mortality rates in Table 6 we use A90 for the populationand A90 with 2-year setback for annuitants since that is what most insurance companies use. The A90tables are based on UK data for 1967-70, projected upward to 1990 for UK. In Table 6 we take these asthe period tables for Singapore in 1998/99, since this is the practice of the insurance industry and itsregulators. While good life tables by age for the Singapore population are not publicly available, expecteddeaths according to the crude table that is available for 1998/99 are close to expected deaths implied byA90. However, the A90 with 2-year setback appears to overstate mortality rates for annuitants, accordingto data from the largest life insurance company in Singapore (Chang, p. 10). Therefore the annuitantperiod MWR in Tables 6 and 7 are probably understated.

For Table 7 we start with these estimated period tables for 1998/99, and cohortize them for the cohortthat was age 55 in 1999 (so will be 62 in 2006), using the standard Canadian improvement factor. Bothin Tables 6 and 7, but especially in the latter, the MWR exceeds 100%.
While our calculations deal with fixed annuities, most of the annuity business in Singapore takes theform of “participating” annuities where the guaranteed payout is smaller, with some upside potentialthat is determined on a discretionary basis. If people live longer than the companies expect, this upsidepotential may not be realized and in effect the “participating” consumers may end up cross-subsidizingthe guaranteed consumers (see footnote on the UK Equitable case). As the purchase of annuities grows,it will become increasingly important to base the prices and payouts on accurate mortality tables andprojections.
Appendix B: Calculation of Payouts and MWR for Quasi-Mandatory Deferred Annuity in Israel
In Israel under the new deferred annuity system, the worker buys a bit of an annuity each year, andwhen he retires these bits are all added up to form his pension. The pension rights for each year are age-specific. For example, a 25-year old male pays a 17.5% contribution and then, upon reaching age 65,gets a joint annuity for his contribution that year that equals 6.48% of his (age-25) wage, with 60% tosurviving spouse upon his death. But for that same contribution rate the 35 year old worker gets only4.03% of his (age-35) wage, because his (age-35) contribution has fewer years to accumulate withinterest. If we add up all the pension rights accumulated between ages 25 and 65, we find the worker atage 65 is entitled to a pension that equals 120.97% of his wage, assuming 0 real wage growth. Allpension rights are price-indexed, as are all long-term financial transactions in Israel.
To calculate how much the worker pays over his lifetime for his annuity, and how much he collectsafter retirement, we started with a table from Spivak (2000) that gives pension rights as a % of wage forthe contribution that a worker makes at each age. This table tells us that (as stated above), if we assume0 real wage growth, the pension rights that a worker has acquired if he starts contributing at age 25 andcontinues contributing every year until age 65 add up to 120.97% of his wage. Prior to age 65 thisaccumulation provides survivors and disability insurance, in addition to building his retirement fund.Based on the experience of other countries, we attribute 1.5% of the 17.5% contribution to the pooledamount that is necessary to top-up the individual’s accumulation to cover the cost of the promised S&Dbenefits. This leaves a 16% net contribution rate that we may conceive of as being allocated to theindividual’s old age pension. We assume that this accumulation earns a net return of 4% annually,which is the same as the discount rate during the annuity stage. (The difference between this net rateand the higher gross subsidized rate is assumed to cover administrative costs).
For comparability with other countries in Tables 6 and 7, we want to find the monetary payout from a$100,000 accumulation at age 65. To accomplish this, we find the constant wage for which 16% eachyear, compounded at the assumed real interest rate of 4%, equals $100,000 after 40 years. This constantreal wage turns out to be $6577. We then multiply $6577 by 120.97 % to get the annual deferredpension, and divide by 12 to get the monthly payout of $663 (Table 3). Using this number, combinedwith the $100,000 premium at age 65, we obtain the MWR for a joint annuity with 60% to survivor of109.2% in Table 6, 113.6% in Table 7 where the age 65 cohort is cohortized. (Note that the $100,000premium at age 65 is equivalent in present value to a lump sum of $20,829 paid at age 25 or $1052 paidannually between ages 25-65).
This is the MWR that someone would receive who is age 65 today and had been in the system for hisentire life. Of course, this is a new system so 65 year olds today are actually not in it. We thereforecalculate the MWR that would be received by a 25 year old who just entered the new system and stayedin it for his entire life. The biggest difference between these two groups is that the 25-year old is in ayounger cohort with lower mortality rates. Thus, these two individuals would experience the same

MWR in Table 6 which uses period tables, but the 25-year old would have a much higher MWR—127.1%—in Table 5, which cohortizes the mortality tables.
These numbers are only a rough approximation, for several reasons:
1. We are not sure what is the correct amount to subtract for D&S insurance and administrative costs inthe pre-retirement years. Most of this insurance is effectively covered by the pre-retirement accumulation,which is used for this purpose if the worker dies or becomes disabled. We base our estimate of 1.5% forD&S insurance on the experience of several Latin American countries, which also top up the pre-retirement accumulated savings to provide D&S insurance. We base our estimate of a net return of 4%per year on the assumption that the subsidized gross return is 4.5% and administrative costs are .5% ofassets per year which is equivalent to the ceiling on administrative costs set by regulations, of 8% ofnew contributions.
2. The time period under consideration for pre-and post-retirement for a worker who is age 25 today isover 70 years. For a 55-year old worker today it is over 40 years. The period of deferment and theretirement period therefore vary, depending on age of worker today. And the period is very long, duringwhich many changes are likely to occur. In particular, we do not know how interest rates will changeover the next 70 years. Currently the term structure is flat, at 4%, and we assume this will continue.
3. We also do not have accurate mortality tables. Israel has only period tables. The legally required ratefor annuitants is a 3-year setback from the general population. Recently an actuaries’ committeedeveloped another period table that was supposed to be more accurate, but that has not yet been put intouse. In this paper we use the actuaries’ table; the MWR’s are about 2% higher than for the legallyrequired table. In Table 7 we cohortize the actuaries’ table, using the standard Canadian improvementfactor. We carry out this cohortization for two representative workers—one who is age 25 today andplans to stay in the system for his entire life, and one who is age 65 today and theoretically has been inthe system his entire life. Obviously, the MWR ratio turns out to be much higher—in fact, unsustainablyhigh—for the worker who is age 25 today, because the mortality improvement factor has many moreyears in which to work.
4. According to the law, these pension rights that accumulate for each year of contributions are notlegally binding. Instead, they can and indeed must be adjusted for financial sustainability as needed.These numbers imply that the promises being made to young workers today cannot be kept, and thatthere will be tremendous political pressures in the future to bail out the system even more than it ispresently being bailed out. The need for more accurate mortality tables, including cohort tables, forcompanies, regulators and policy-makers to feed into these calculations, is obviously crucial, especiallywhen long lasting commitments such as deferred annuities are under consideration.
Appendix C: Sources of Mortality Data
Canada• Population period table originated with the Canadian Life Table of 1991 (CLT91), available from
the Society of Actuaries (SOA). This was projected (“aged”) to 1999 by authors, using improvementfactors (IF’s) taken from the Canadian Pension Plan (CPP, see Table VII.B.2 of Office ofSuperintendent of financial Institutions, 1998). Formula was:MortCLT91proj99*(1-IF)(age-65) =MortCLT91(1-IF)8
where MortCLT91 is mortality for population period 1991 and MortCLTproj99 is mortality forpopulation period 1991 projected to 1999
• Authors then used the CPP IF’s to cohortize the 1999 period tables for the 1934 birth cohort, accordingto following formula, for each age:MortCoh99=MortCLT91proj99*(1-IF)(age-65)=MortCLT91(age-65+8)

where MortCoh99 is mortality for population cohort age 65 in 1999.• Annuitant period table was taken from IA83, Individual Annuitant Mortality Basic Table (SOA,
1983). Since annuitant mortality did not appear to change between 1983 and 1995, this was assumedby Kim and Sharp (1999) to represent period table for 1995. Authors “aged” this table to 1999 andcohortized using same CPP scale as for population. Formula was:MortCoh99=MortPer99*(1-IF)(age-65)
• IF was taken from CPP scale and is same for population and annuitants.• For sensitivity analysis we also obtain a different population cohort table by deriving IF from
mortality data used in and supplied to us by Goss et al 1998. IF’s implied by these data were lowerand cohort mortality higher than with CPP data supplied by Kim and Sharp (see Appendix D forcomparison).
US• Population period and cohort table is from SSA 1999 Trustees’ Report, scenario 2, pertaining to
1998 mortality, supplied by Jeffrey Brown.• Annuitant cohort data were supplied by Jeffrey Brown (same data that were used in Brown, Mitchell
and Poterba 2000), applied to birth cohort 1933 in 1998.• Annuitant period tables are not available. Our table was reconstructed by authors assuming annuitant
IF was same as population IF so period/cohort mortality ratios were same for population andannuitants.
• Population IF was derived by authors from ratio between period and cohort mortalities. Same IFis assumed for annuitants. Formula used for each age was:MortCoh = MortPer* (1-IF)(age-65) =>IF = 1- (MortCoh/MortPer)(1/(age-65))
• For sensitivity analysis we also use data based on and supplied by Goss et al 1998 for populationperiod, cohort and IF, for years 1997-99. These data implied somewhat higher IF’s than but similarcohort tables to BMP data (see Appendix D).
Australia• Population period table is based on A95-97, prepared jointly by the Australian Bureau of Statistics
and the Office of the Australian Government Actuary and published in ABS (1998). Authors projectedthis to 1998 using IF developed by ABS, as supplied by Knox 2000. Formula used, for each age,was:MortPerA95-97*(1-IF)2=MortPerA98where MortPerA95-97 is mortality of population period 1995-97 (taken as in 1996) andMortPerA98 is mortality of population period 1998.
• For population cohort table authors cohortized period table using IF developed by ABS.• Australia has not yet developed its own annuitant tables. Annuitant period table is based on 60%IM80/
IF80. IM/IF80 is a UK annuitant table from 1980, as reported in Institute of Actuaries and Facultyof Actuaries (1990). 60% of this mortality is used to make it consistent with recent Australianannuitant experience and because it is the rate quoted in the Solvency Standard.
• Annuitant cohort table was constructed by authors assuming the same IF as for the general population.• IF is from Population Projections 1997-2051, ABS (1998), based on analysis of past trends in
mortality rates for the five underlying causes of death from 1967-96. We assumed same IF forpopulation and annuitants.

UK• Population cohort table comes from Government Actuary’s Department (GAD65), as supplied by
Murthi, Orszag and Orszag (1999).• Population period table was derived from cohort table and annuitant IF, under assumption that
population IF is same as annuitant IF.• Annuitant period table is from Continuous Mortality Investigation Bureau (CMIR) Report No. 16
(http://www.actuaries.org.uk), which provides base tables about the experience of annuitants 1992.These were aged to 1999 using formula in CMIR 17, which presents IF’s based on 20=year trendsince 1975. “Pensioners” tables are used in this paper, rather than “annuitants” tables that wereadded only recently, on assumption that pensioners’ tables were more likely to approximateexperience in compulsory market, which is dominant group covered by this paper.
• Annuitant cohort table cohortizes this period table based on IF formula in CMIR 17.• Formula for IF in CMIR 17 is:
IF = (1-RF), where RF (age,t)=a(age) + [1-a(age)]*[1-f(age)]t/20
a(age) = 1 + (1-c)*(age-110)/50f(age) = [(110-age)*h + (age-60)*k]/50, both for 60 < age < 110c = .13, h = .55, k = .29t = time elapsed since 1992
Switzerland• Population period and cohort tables were provided by Breuer and Zweifel (2000) from Swiss Federal
Office of Statistics data. Period table was from 1988-93. Authors “aged” this to 1998, using populationIF as derived below. First population cohort table was published in 1998. Tables give probability ofdying by 5-year age intervals. Authors smoothed within 5-year intervals for cohort table.
• Annuitant period table for Pillar II for 1985 is from Koller 1998b. Authors “aged” it to 1998 andcohortized for 1933 birth cohort using Pillar II IF.
• Annuitant period table for Pillar III for 1993 is from Koller 1998a. Authors “aged” it to 1998 andcohortized for 1933 cohort using Pillar III IF. IF without safety margin for insurance companieswas used.
• IF’s for population were derived by authors by comparing period table from 1988-93 with cohortmortality for 1998 according to following formula, for each age:MortCoh98=MortPer90*(1-IF)(age-65+8)=>
IF = 1- (MortCoh/MortPer)(1/(age-57))
where MortPer90 is mortality of population period 1988-93 (taken as in 1990) and MortCoh98 ismortality of population cohort 1998.
• IF’s for Pillars II and III are from Koller 1998a and b.
Singapore• Singapore does not have its own mortality tables. Population period tables published by government
group large age intervals together and hence were not appropriate for our purposes.• Population period tables (A90 M and F) used are UK tables based on UK annuitant mortality
experience in 1967-70 with mortality projected to 1990.• Annuitant period table applies two-year set-back to A90. These tables are used by all insurance
companies. However, recent data suggest that they overestimate annuitant mortality rates(underestimate survival) in Singapore.
• Tables were supplied by Chang 1999.• Annuitant cohort tables and IF’s are not available. For some runs authors applied Canadian IF to

age period data to 1998 and cohortize.
Chile• Population mortality table is calculated by the Instituto Nacional de Estadisticas (INE), 1996, based
on 1992 Census with adjustments to 1996.• Annuitant period table—RV98—was recently developed, on basis of mortality experience of
annuitants in AFP system 1983-96.• Data were supplied by Callund 1999.• No cohort tables or IF’s are available. For some runs authors applied Canadian IF to age period data
to 1998 and cohortize.
Israel• Population period table is national table.• Insurance regulators mandate 3-year displacement of population table to be used as annuitants’
period table. But new table has been constructed by actuaries’ committee set up by Ministry ofFinance, which we use. This gives slightly lower mortality rates.
• Data were supplied by Spivak 1999.• No cohort tables or IF’s are available. For some runs we apply Canadian IF to cohortize.
Appendix D: Mortality Rates and Improvement Factors for US and Canada
The wide variations in annual improvement factors (IF’s) are illustrated in Table D1, adapted fromGoss et al (1998), which compares IF’s in different decades in Canada, US and Mexico. This tablemakes it clear that one must beware of projecting to the long run based on any short run experience.
Table D1. Average Annual Percentage Reductions in Death Rates for Ages over 65:
Canada, Mexico, and U.S.
Males FemalesCountry Canada Mexico U.S. Canada Mexico U.S.1900-10 -0.30 0.11 -0.47 0.021910-20 -0.38 0.62 -0.51 0.531920-30 -0.67 -0.50 -0.32 0.101930-40 -0.24 0.29 0.02 0.33 0.29 0.381940-50 0.69 2.72 1.28 1.03 3.31 1.901950-60 0.35 1.80 0.09 1.48 1.63 0.781960-70 0.49 0.15 0.17 1.85 0.47 1.501970-80 0.80 0.46 1.51 1.67 1.77 2.101980-90 0.98 1.12 0.72 1.32 1.39 0.481990-94 0.97 0.28 0.41 1.36 1.17 -0.24Average 0.21 1.04 0.54 0.82 1.45 1.09
Source: Goss, Stephen C., Alice Wade, Felicitie Bell and Bernard Dussault. “Historical and Projected Mortality for Mexico,Canada, and the United States, North American Actuarial Journal, 2 (4): 108-126.
Tables D2 shows the change in improvement factors (IF), life expectancies and MWR’s in movingfrom period to cohort tables that would have been implied by the Goss et al data, and compares thesevariables with data used in our study. For the age 65+ group, the Goss et al data imply an IF for the USthat is larger than the Brown data that we adopted. In contrast, the Goss et al data imply an IF forCanada that is only half as large as the Kim and Sharp data used in our study. (However, for the US the
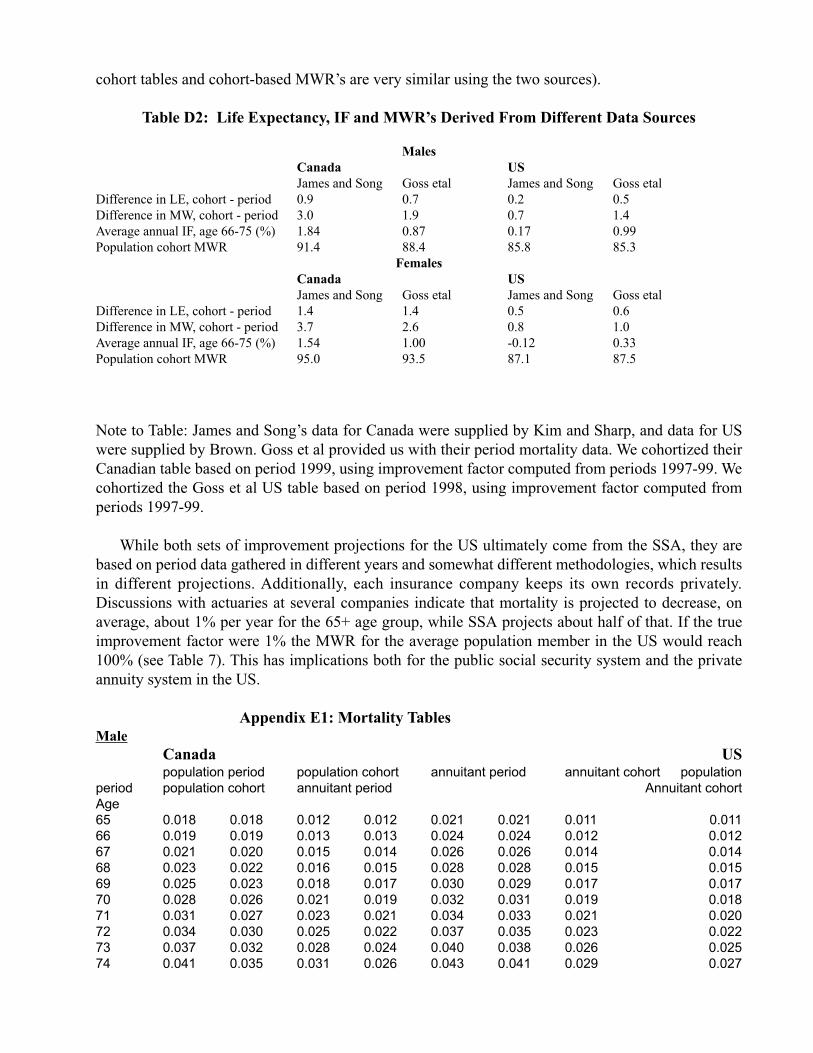
cohort tables and cohort-based MWR’s are very similar using the two sources).
Table D2: Life Expectancy, IF and MWR’s Derived From Different Data Sources
MalesCanada USJames and Song Goss etal James and Song Goss etal
Difference in LE, cohort - period 0.9 0.7 0.2 0.5Difference in MW, cohort - period 3.0 1.9 0.7 1.4Average annual IF, age 66-75 (%) 1.84 0.87 0.17 0.99Population cohort MWR 91.4 88.4 85.8 85.3
FemalesCanada USJames and Song Goss etal James and Song Goss etal
Difference in LE, cohort - period 1.4 1.4 0.5 0.6Difference in MW, cohort - period 3.7 2.6 0.8 1.0Average annual IF, age 66-75 (%) 1.54 1.00 -0.12 0.33Population cohort MWR 95.0 93.5 87.1 87.5
Note to Table: James and Song’s data for Canada were supplied by Kim and Sharp, and data for USwere supplied by Brown. Goss et al provided us with their period mortality data. We cohortized theirCanadian table based on period 1999, using improvement factor computed from periods 1997-99. Wecohortized the Goss et al US table based on period 1998, using improvement factor computed fromperiods 1997-99.
While both sets of improvement projections for the US ultimately come from the SSA, they arebased on period data gathered in different years and somewhat different methodologies, which resultsin different projections. Additionally, each insurance company keeps its own records privately.Discussions with actuaries at several companies indicate that mortality is projected to decrease, onaverage, about 1% per year for the 65+ age group, while SSA projects about half of that. If the trueimprovement factor were 1% the MWR for the average population member in the US would reach100% (see Table 7). This has implications both for the public social security system and the privateannuity system in the US.
Appendix E1: Mortality TablesMale
Canada USpopulation period population cohort annuitant period annuitant cohort population
period population cohort annuitant period Annuitant cohortAge65 0.018 0.018 0.012 0.012 0.021 0.021 0.011 0.01166 0.019 0.019 0.013 0.013 0.024 0.024 0.012 0.01267 0.021 0.020 0.015 0.014 0.026 0.026 0.014 0.01468 0.023 0.022 0.016 0.015 0.028 0.028 0.015 0.01569 0.025 0.023 0.018 0.017 0.030 0.029 0.017 0.01770 0.028 0.026 0.021 0.019 0.032 0.031 0.019 0.01871 0.031 0.027 0.023 0.021 0.034 0.033 0.021 0.02072 0.034 0.030 0.025 0.022 0.037 0.035 0.023 0.02273 0.037 0.032 0.028 0.024 0.040 0.038 0.026 0.02574 0.041 0.035 0.031 0.026 0.043 0.041 0.029 0.027

75 0.047 0.041 0.035 0.031 0.047 0.045 0.031 0.03076 0.051 0.044 0.039 0.033 0.051 0.049 0.034 0.03377 0.056 0.048 0.042 0.036 0.056 0.053 0.038 0.03678 0.061 0.051 0.047 0.039 0.061 0.058 0.042 0.04079 0.066 0.055 0.052 0.043 0.068 0.064 0.046 0.04480 0.075 0.065 0.059 0.051 0.075 0.071 0.051 0.04985 0.121 0.108 0.097 0.087 0.115 0.113 0.079 0.07895 0.232 0.209 0.206 0.186 0.249 0.246 0.174 0.172105 0.429 0.372 0.417 0.391 0.363 0.340
Australia UK
population period population cohort annuitant period annuitant cohort populationperiod population cohort annuitant period Annuitant cohortage65 0.017 0.017 0.014 0.014 0.021 0.021 0.015 0.01566 0.019 0.019 0.015 0.015 0.024 0.023 0.017 0.01667 0.021 0.020 0.016 0.016 0.026 0.025 0.019 0.01868 0.023 0.022 0.018 0.017 0.029 0.027 0.022 0.02069 0.026 0.024 0.019 0.018 0.032 0.029 0.024 0.02270 0.028 0.026 0.021 0.019 0.036 0.032 0.027 0.02571 0.031 0.028 0.023 0.020 0.040 0.035 0.031 0.02772 0.034 0.030 0.025 0.022 0.044 0.038 0.034 0.03073 0.038 0.032 0.027 0.023 0.049 0.041 0.038 0.03374 0.041 0.034 0.030 0.025 0.054 0.045 0.043 0.03775 0.046 0.038 0.032 0.027 0.060 0.049 0.048 0.04076 0.050 0.041 0.035 0.029 0.066 0.054 0.053 0.04577 0.055 0.045 0.038 0.031 0.073 0.059 0.058 0.04978 0.061 0.048 0.041 0.033 0.081 0.065 0.065 0.05479 0.068 0.053 0.045 0.035 0.089 0.071 0.071 0.05980 0.076 0.064 0.049 0.041 0.098 0.078 0.078 0.06585 0.126 0.119 0.074 0.070 0.151 0.120 0.121 0.10195 0.236 0.217 0.160 0.147 0.281 0.235 0.244 0.216105 0.295 0.263 0.313 0.280 0.484 0.453 0.390 0.374
Switzerland
population period population cohort pillar II period pillar II cohort pil-lar III period pillar III cohortage65 0.016 0.016 0.014 0.014 0.009 0.00966 0.018 0.018 0.015 0.015 0.010 0.01067 0.020 0.020 0.017 0.016 0.011 0.01168 0.023 0.022 0.018 0.018 0.012 0.01169 0.025 0.024 0.020 0.019 0.014 0.01270 0.028 0.026 0.022 0.020 0.015 0.01471 0.031 0.028 0.024 0.022 0.017 0.01572 0.033 0.030 0.026 0.024 0.019 0.01673 0.037 0.033 0.029 0.026 0.021 0.01874 0.041 0.036 0.032 0.028 0.024 0.01975 0.045 0.039 0.035 0.030 0.027 0.02176 0.050 0.043 0.039 0.033 0.030 0.02377 0.055 0.046 0.043 0.036 0.033 0.02578 0.061 0.051 0.048 0.039 0.037 0.02879 0.068 0.056 0.054 0.043 0.041 0.03080 0.075 0.062 0.060 0.047 0.046 0.03385 0.123 0.098 0.099 0.071 0.078 0.054

95 0.293 0.255 0.237 0.156 0.202 0.134105 1.000 1.000 0.421 0.286
Chile Singapore Israelpopulation period annuitant period population period annuitant period population
period actuaries committee periodage65 0.023 0.015 0.022 0.018 0.023 0.01566 0.026 0.016 0.024 0.020 0.026 0.01767 0.028 0.018 0.026 0.022 0.028 0.01968 0.031 0.020 0.028 0.024 0.031 0.02169 0.033 0.022 0.031 0.026 0.035 0.02370 0.036 0.024 0.034 0.028 0.038 0.02571 0.040 0.026 0.037 0.031 0.042 0.02872 0.043 0.029 0.040 0.034 0.047 0.03173 0.047 0.031 0.044 0.037 0.051 0.03474 0.052 0.035 0.048 0.040 0.057 0.03775 0.056 0.038 0.052 0.044 0.062 0.04176 0.061 0.042 0.057 0.048 0.068 0.04577 0.066 0.047 0.062 0.052 0.075 0.05078 0.072 0.052 0.067 0.057 0.082 0.05579 0.079 0.057 0.073 0.062 0.089 0.06180 0.085 0.062 0.079 0.067 0.098 0.06785 0.129 0.096 0.119 0.101 0.145 0.10795 0.278 0.221 0.249 0.217 0.269 0.235105 0.535 0.456 0.449 0.405 0.500 0.403
FemaleCanada USpopulation period population cohort annuitant period annuitant cohort population
period population cohort annuitant period Annuitant cohortage65 0.010 0.010 0.007 0.007 0.013 0.013 0.007 0.00766 0.011 0.010 0.008 0.008 0.014 0.015 0.008 0.00867 0.012 0.011 0.009 0.009 0.016 0.016 0.009 0.00968 0.013 0.012 0.010 0.009 0.017 0.017 0.009 0.00969 0.014 0.013 0.010 0.010 0.018 0.018 0.010 0.01070 0.015 0.014 0.012 0.011 0.020 0.020 0.011 0.01171 0.017 0.015 0.013 0.012 0.021 0.021 0.012 0.01272 0.018 0.017 0.014 0.013 0.023 0.023 0.014 0.01473 0.020 0.018 0.016 0.014 0.025 0.025 0.016 0.01574 0.023 0.020 0.018 0.015 0.028 0.027 0.018 0.01775 0.026 0.023 0.020 0.018 0.031 0.030 0.020 0.01976 0.029 0.025 0.023 0.020 0.034 0.033 0.022 0.02277 0.032 0.027 0.026 0.022 0.037 0.036 0.025 0.02478 0.035 0.030 0.029 0.024 0.041 0.039 0.029 0.02779 0.039 0.033 0.033 0.027 0.045 0.042 0.032 0.03080 0.043 0.036 0.037 0.031 0.050 0.047 0.036 0.03485 0.075 0.059 0.066 0.052 0.084 0.076 0.065 0.05995 0.196 0.145 0.179 0.132 0.225 0.205 0.177 0.162105 0.349 0.234 0.417 0.361 0.353 0.305
Australia UKpopulation period population cohort annuitant period annuitant cohort population
period population cohort annuitant period Annuitant cohort
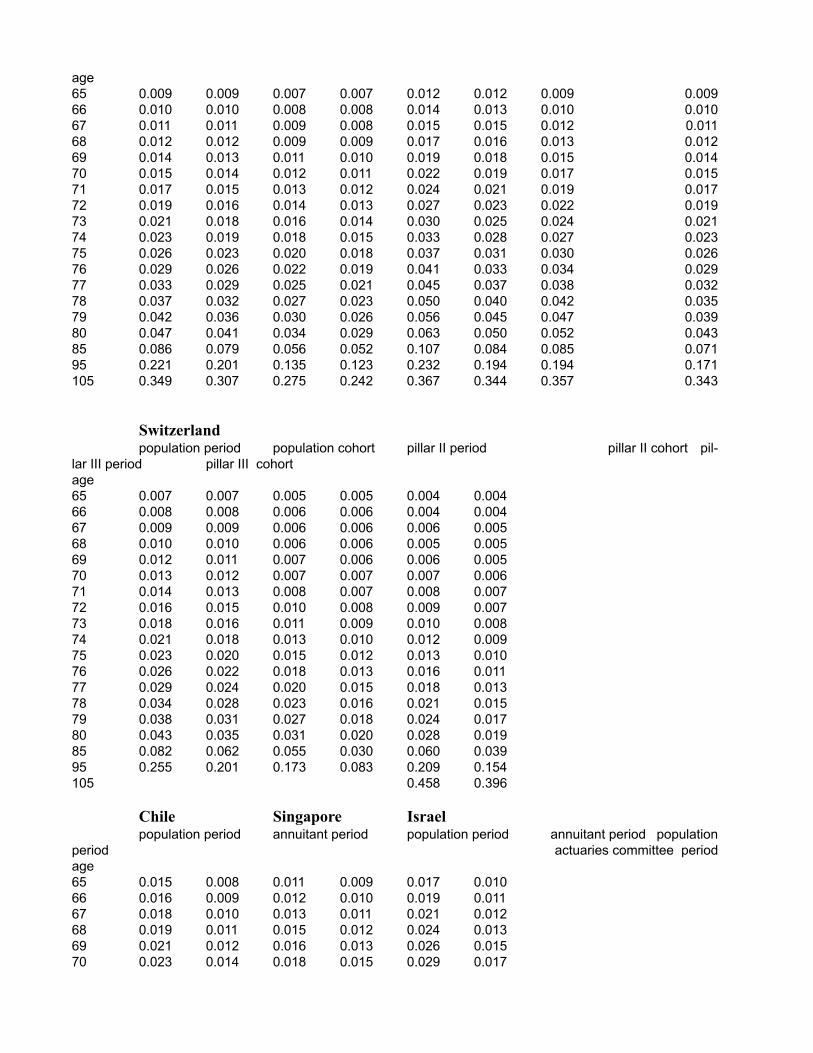
age65 0.009 0.009 0.007 0.007 0.012 0.012 0.009 0.00966 0.010 0.010 0.008 0.008 0.014 0.013 0.010 0.01067 0.011 0.011 0.009 0.008 0.015 0.015 0.012 0.01168 0.012 0.012 0.009 0.009 0.017 0.016 0.013 0.01269 0.014 0.013 0.011 0.010 0.019 0.018 0.015 0.01470 0.015 0.014 0.012 0.011 0.022 0.019 0.017 0.01571 0.017 0.015 0.013 0.012 0.024 0.021 0.019 0.01772 0.019 0.016 0.014 0.013 0.027 0.023 0.022 0.01973 0.021 0.018 0.016 0.014 0.030 0.025 0.024 0.02174 0.023 0.019 0.018 0.015 0.033 0.028 0.027 0.02375 0.026 0.023 0.020 0.018 0.037 0.031 0.030 0.02676 0.029 0.026 0.022 0.019 0.041 0.033 0.034 0.02977 0.033 0.029 0.025 0.021 0.045 0.037 0.038 0.03278 0.037 0.032 0.027 0.023 0.050 0.040 0.042 0.03579 0.042 0.036 0.030 0.026 0.056 0.045 0.047 0.03980 0.047 0.041 0.034 0.029 0.063 0.050 0.052 0.04385 0.086 0.079 0.056 0.052 0.107 0.084 0.085 0.07195 0.221 0.201 0.135 0.123 0.232 0.194 0.194 0.171105 0.349 0.307 0.275 0.242 0.367 0.344 0.357 0.343
Switzerlandpopulation period population cohort pillar II period pillar II cohort pil-
lar III period pillar III cohortage65 0.007 0.007 0.005 0.005 0.004 0.00466 0.008 0.008 0.006 0.006 0.004 0.00467 0.009 0.009 0.006 0.006 0.006 0.00568 0.010 0.010 0.006 0.006 0.005 0.00569 0.012 0.011 0.007 0.006 0.006 0.00570 0.013 0.012 0.007 0.007 0.007 0.00671 0.014 0.013 0.008 0.007 0.008 0.00772 0.016 0.015 0.010 0.008 0.009 0.00773 0.018 0.016 0.011 0.009 0.010 0.00874 0.021 0.018 0.013 0.010 0.012 0.00975 0.023 0.020 0.015 0.012 0.013 0.01076 0.026 0.022 0.018 0.013 0.016 0.01177 0.029 0.024 0.020 0.015 0.018 0.01378 0.034 0.028 0.023 0.016 0.021 0.01579 0.038 0.031 0.027 0.018 0.024 0.01780 0.043 0.035 0.031 0.020 0.028 0.01985 0.082 0.062 0.055 0.030 0.060 0.03995 0.255 0.201 0.173 0.083 0.209 0.154105 0.458 0.396
Chile Singapore Israelpopulation period annuitant period population period annuitant period population
period actuaries committee periodage65 0.015 0.008 0.011 0.009 0.017 0.01066 0.016 0.009 0.012 0.010 0.019 0.01167 0.018 0.010 0.013 0.011 0.021 0.01268 0.019 0.011 0.015 0.012 0.024 0.01369 0.021 0.012 0.016 0.013 0.026 0.01570 0.023 0.014 0.018 0.015 0.029 0.017
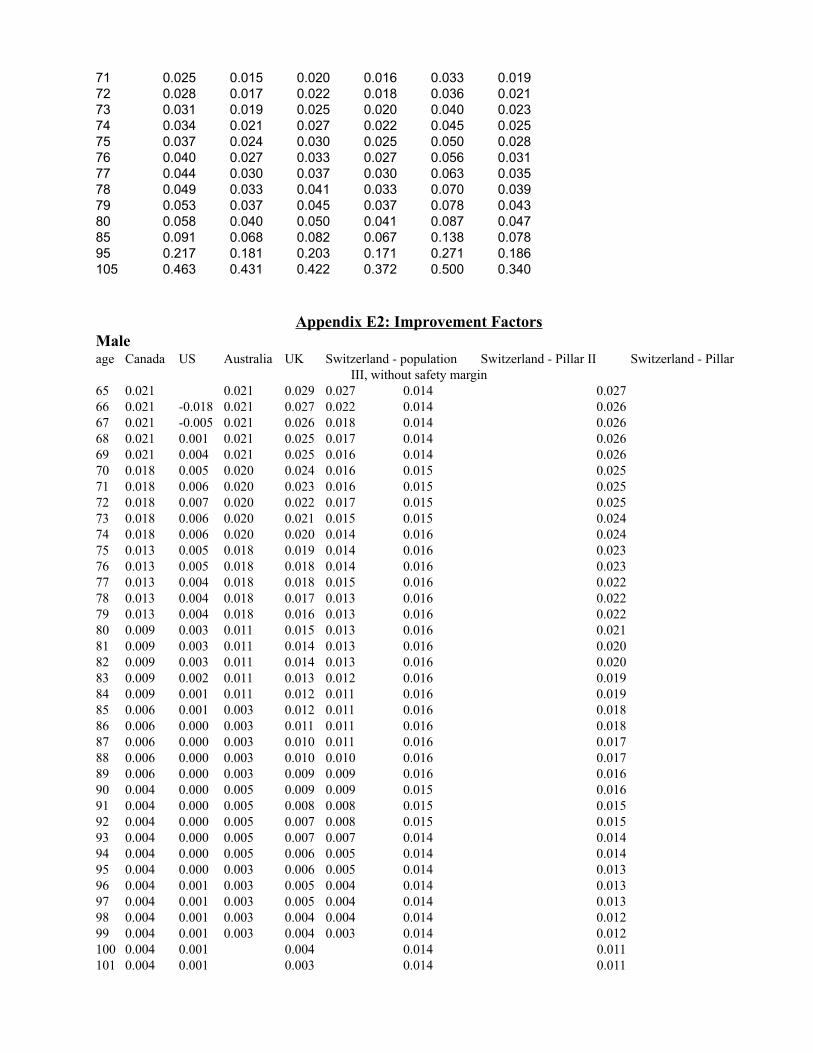
71 0.025 0.015 0.020 0.016 0.033 0.01972 0.028 0.017 0.022 0.018 0.036 0.02173 0.031 0.019 0.025 0.020 0.040 0.02374 0.034 0.021 0.027 0.022 0.045 0.02575 0.037 0.024 0.030 0.025 0.050 0.02876 0.040 0.027 0.033 0.027 0.056 0.03177 0.044 0.030 0.037 0.030 0.063 0.03578 0.049 0.033 0.041 0.033 0.070 0.03979 0.053 0.037 0.045 0.037 0.078 0.04380 0.058 0.040 0.050 0.041 0.087 0.04785 0.091 0.068 0.082 0.067 0.138 0.07895 0.217 0.181 0.203 0.171 0.271 0.186105 0.463 0.431 0.422 0.372 0.500 0.340
Appendix E2: Improvement FactorsMaleage Canada US Australia UK Switzerland - population Switzerland - Pillar II Switzerland - Pillar
III, without safety margin65 0.021 0.021 0.029 0.027 0.014 0.02766 0.021 -0.018 0.021 0.027 0.022 0.014 0.02667 0.021 -0.005 0.021 0.026 0.018 0.014 0.02668 0.021 0.001 0.021 0.025 0.017 0.014 0.02669 0.021 0.004 0.021 0.025 0.016 0.014 0.02670 0.018 0.005 0.020 0.024 0.016 0.015 0.02571 0.018 0.006 0.020 0.023 0.016 0.015 0.02572 0.018 0.007 0.020 0.022 0.017 0.015 0.02573 0.018 0.006 0.020 0.021 0.015 0.015 0.02474 0.018 0.006 0.020 0.020 0.014 0.016 0.02475 0.013 0.005 0.018 0.019 0.014 0.016 0.02376 0.013 0.005 0.018 0.018 0.014 0.016 0.02377 0.013 0.004 0.018 0.018 0.015 0.016 0.02278 0.013 0.004 0.018 0.017 0.013 0.016 0.02279 0.013 0.004 0.018 0.016 0.013 0.016 0.02280 0.009 0.003 0.011 0.015 0.013 0.016 0.02181 0.009 0.003 0.011 0.014 0.013 0.016 0.02082 0.009 0.003 0.011 0.014 0.013 0.016 0.02083 0.009 0.002 0.011 0.013 0.012 0.016 0.01984 0.009 0.001 0.011 0.012 0.011 0.016 0.01985 0.006 0.001 0.003 0.012 0.011 0.016 0.01886 0.006 0.000 0.003 0.011 0.011 0.016 0.01887 0.006 0.000 0.003 0.010 0.011 0.016 0.01788 0.006 0.000 0.003 0.010 0.010 0.016 0.01789 0.006 0.000 0.003 0.009 0.009 0.016 0.01690 0.004 0.000 0.005 0.009 0.009 0.015 0.01691 0.004 0.000 0.005 0.008 0.008 0.015 0.01592 0.004 0.000 0.005 0.007 0.008 0.015 0.01593 0.004 0.000 0.005 0.007 0.007 0.014 0.01494 0.004 0.000 0.005 0.006 0.005 0.014 0.01495 0.004 0.000 0.003 0.006 0.005 0.014 0.01396 0.004 0.001 0.003 0.005 0.004 0.014 0.01397 0.004 0.001 0.003 0.005 0.004 0.014 0.01398 0.004 0.001 0.003 0.004 0.004 0.014 0.01299 0.004 0.001 0.003 0.004 0.003 0.014 0.012100 0.004 0.001 0.004 0.014 0.011101 0.004 0.001 0.003 0.014 0.011

102 0.004 0.001 0.003 0.014 0.011103 0.004 0.001 0.002 0.014 0.010104 0.004 0.002 0.002 0.010105 0.004 0.002 0.002 0.010106 0.004 0.002 0.001 0.009107 0.004 0.002 0.001 0.009108 0.004 0.002 0.001 0.009109 0.004 0.002 0.000 0.008110 0.004 0.002 0.000 0.008
Femaleage Canada US Australia UK Switzerland - population Switzerland - Pillar II Switzerland - Pillar
III, without safety margin65 0.016 0.016 0.029 0.026 0.022 0.02766 0.016 -0.013 0.016 0.027 0.017 0.022 0.02767 0.016 -0.005 0.016 0.026 0.013 0.022 0.02868 0.016 -0.003 0.016 0.025 0.011 0.022 0.02869 0.016 -0.001 0.016 0.025 0.011 0.022 0.02870 0.015 0.000 0.019 0.024 0.011 0.023 0.02871 0.015 0.001 0.019 0.023 0.012 0.024 0.02872 0.015 0.002 0.019 0.022 0.014 0.025 0.02873 0.015 0.002 0.019 0.021 0.013 0.025 0.02874 0.015 0.003 0.019 0.020 0.013 0.026 0.02875 0.013 0.003 0.012 0.019 0.013 0.027 0.02876 0.013 0.003 0.012 0.018 0.014 0.027 0.02877 0.013 0.004 0.012 0.018 0.016 0.028 0.02778 0.013 0.004 0.012 0.017 0.015 0.028 0.02779 0.013 0.005 0.012 0.016 0.014 0.029 0.02780 0.012 0.005 0.010 0.015 0.014 0.029 0.02681 0.012 0.005 0.010 0.014 0.015 0.029 0.02582 0.012 0.005 0.010 0.014 0.016 0.029 0.02483 0.012 0.005 0.010 0.013 0.015 0.029 0.02484 0.012 0.005 0.010 0.012 0.014 0.029 0.02385 0.012 0.005 0.004 0.012 0.014 0.029 0.02286 0.011 0.005 0.004 0.011 0.014 0.029 0.02187 0.011 0.004 0.004 0.010 0.015 0.029 0.02088 0.011 0.004 0.004 0.010 0.013 0.028 0.01889 0.011 0.004 0.004 0.009 0.012 0.028 0.01790 0.011 0.004 0.005 0.009 0.012 0.028 0.01691 0.010 0.004 0.005 0.008 0.012 0.027 0.01592 0.010 0.003 0.005 0.007 0.012 0.026 0.01393 0.010 0.003 0.005 0.007 0.010 0.026 0.01294 0.010 0.003 0.005 0.006 0.009 0.025 0.01195 0.010 0.003 0.003 0.006 0.008 0.024 0.01096 0.010 0.003 0.003 0.005 0.007 0.023 0.00997 0.010 0.003 0.003 0.005 0.007 0.022 0.00898 0.010 0.003 0.003 0.004 0.006 0.022 0.00799 0.010 0.003 0.003 0.004 0.006 0.022 0.007100 0.010 0.003 0.004 0.022 0.006101 0.010 0.003 0.003 0.022 0.005102 0.010 0.003 0.003 0.022 0.005103 0.010 0.004 0.002 0.022 0.004104 0.010 0.004 0.002 0.004105 0.010 0.004 0.002 0.004106 0.010 0.003 0.001 0.003107 0.010 0.003 0.001 0.003

108 0.010 0.003 0.001 0.003109 0.010 0.003 0.000 0.002110 0.010 0.003 0.000 0.002
Footnote:For details on sources of mortality data, see Appendix C. Improvement factors are from:CanadaAnnual Percentage Mortality Improvement Factors, Canada Pension Plan: Seventeenth AnnualReport, taken from Table VII.B.2 of Office of the Superintendent of Financial Institutions (1998), asreproduced in Appendix A-5, Kim and Sharp (1999).
AustraliaProjected annual rates of change in mortality rates from 1997, from ABS (1998), PopulationProjections 1997-2051, as reproduced in Table 9, Knox (2000).
SwitzerlandAuthors’ calculation for population IF is based on population period 1988-93 (taken as in year 1990)and cohort 1993 that was age 65 in 1998. Cohort 1933 mortality table was smoothed before IFcalculation.Annuitant IF is from Koller 1998a and b.
USAuthors’ calculation using population period and cohort mortality 1998 from SSA 1999 Trustee’sReport, scenario 2, supplied by Brown.
UKDerived from formula in CMIR, Report No. 17.
Authors assume the improvement factors for population and annuitants are the same in all countriesexcept Switzerland.
Appendix F
Term Structure of Government Rates
Year Canada US Australia UK UK(real) Switzerland Singapore ChileIsrael
0 4.63 5.52 4.67 4.94 3.28 2.08 2.38 6.884.00
1 5.43 5.52 4.67 4.94 3.28 2.08 2.38 6.884.00
2 5.35 5.55 4.69 4.94 3.28 2.08 2.38 6.844.00
3 5.53 5.56 4.70 4.89 2.73 2.08 2.88 6.824.00
4 5.55 5.56 4.74 4.85 2.46 2.13 3.39 6.754.00

5 5.58 5.60 4.80 4.81 2.30 2.53 3.89 6.724.00
6 5.64 5.63 4.89 4.77 2.19 2.53 4.15 6.664.00
7 5.70 5.65 4.99 4.74 2.11 2.53 4.41 6.584.00
8 5.69 5.68 5.00 4.71 2.06 2.53 4.53 6.534.00
9 5.68 5.74 5.04 4.68 2.01 2.53 4.65 6.504.00
10 5.67 5.77 5.07 4.66 1.97 2.71 4.76 6.494.00
11 5.69 5.79 5.09 4.63 1.94 2.71 4.76 6.484.00
12 5.71 5.81 5.13 4.61 1.92 2.71 4.76 6.484.00
13 5.73 5.83 5.13 4.59 1.90 2.71 4.76 6.464.00
14 5.75 5.84 5.13 4.57 1.88 2.71 4.76 6.444.00
15 5.77 5.85 5.13 4.56 1.86 2.71 4.76 6.434.00
16 5.79 5.86 5.13 4.54 1.85 2.71 4.76 6.424.00
17 5.81 5.87 5.13 4.53 1.84 4.05 4.76 6.404.00
18 5.84 5.87 5.13 4.52 1.83 4.05 4.76 6.384.00
19 5.86 5.88 5.13 4.51 1.82 4.05 4.76 6.374.00
20 5.88 5.88 5.13 4.50 1.81 4.05 4.76 6.354.00
21 5.87 5.88 5.13 4.50 1.80 4.05 4.76 6.354.00
22 5.86 5.88 5.13 4.49 1.80 4.05 4.76 6.354.00
23 5.85 5.88 5.13 4.49 1.79 4.12 4.76 6.354.00
24 5.84 5.88 5.13 4.49 1.78 4.12 4.76 6.354.00
25 5.83 5.87 5.13 4.49 1.78 4.12 4.76 6.354.00
26 5.83 5.86 5.13 4.49 1.78 4.12 4.76 6.354.00
27 5.82 5.85 5.13 4.49 1.78 4.12 4.76 6.354.00
28 5.81 5.84 5.13 4.49 1.78 4.23 4.76 6.354.00
29 5.80 5.83 5.13 4.49 1.78 4.23 4.76 6.354.00
30 5.79 5.83 5.13 4.49 1.78 4.23 4.76 6.354.00
Source: Country studies cited in fn 1.

REFERENCES
Ausubel, Lawrence, 1991. “The Failure of Competition in the Credit Card Market.” American EconomicReview. 81 (1), 50-81.
Attanasio, Orazio and Hilary Hoynes. 1995. “Differential Mortality and Wealth Accumulation. NBERworking Paper 5126.
Blake, David. 1999. “Annuity Markets: Problems and Solutions.” The Geneva Papers on Risk andInsurance. 24 (3) 358-75.
Bongaarts, John and Rodolfo A. Bulatao, eds. 2001. Beyond Six Billion: Forecasting the World’sPopulation. Washington DC: National Academy Press.
Breuer, Michael and Peter Zweifel. 1999. “Annuity Products in Switzerland.” Report for World BankResearch Project.”
Brown, Jeffrey R. 2000. “Differential Mortality and the Value of Individual Account RetirementAnnuities.” NBER Working Paper No. 7560.
Brown, Jeffrey R., Olivia S. Mitchell and James M. Poterba. 2000. “Mortality Risk, Inflation Risk, andAnnuity Products.” NBER Working Paper 7812.
Callund, Jonathan. 1999. “The Annuity Market in Chile.” Report for World Bank Annuity ResearchProject.
Chang, Chiu-Cheng. 1999. “The Annuity Market in Singapore.” Report for World Bank Annuity ResearchProject.
Davis, E. Philip. 2001. “Portfolio Regulation of Life Insurance Companies and Pension Funds.” Workingpaper available from Davis at Brunel University, London, UK.
Davis, E.P. and Steil, B. 2000. Institutional Investors. MIT Press. Cambridge, MA.
Doyle, Suzanne, Olivia Mitchell and John Piggott. 2001. “Annuity Values in Defined ContributionRetirement Systems: The Case of Singapore and Australia.” Draft.
Goss, Stephen, Alice Wade, Felicitie Bell and Bernard Dussault. 1998. “Historical and Projected Mortalityfor Mexico, Canada, and the United States.” North American Actuarial Journal. 2 (4) 108-126.
Finkelstein, Amy and James Poterba. 1999. “The Market for Individual Annuity Products in the UnitedKingdom.” NBER Working Paper. N. 7168.
Finkelstein, Amy and James Poterba. 2000. “Adverse Selection in Insurance Markets: PolicyholderEvidence from the UK Annuity Market”. NBER Working Paper.
Robert Friedland. 1998. “Life Expectancy in the Future: A Summary of a Discussion Among Experts.”

North American Actuarial Journal, v. 2, #4, 48-63.
Hug, Mark. 1999. “Immediate Annuity Pricing Strategies.” Paper prepared for World Bank AnnuitiesWorkshop, June 1999.
James, Estelle and Dimitri Vittas. 1999a. “The Decumulation (Payout) Phase of Defined ContributionPillars.” Presented at APEC meeting, Chile, 1999 and World Bank Policy Research Discussion PaperNo. 2464, 2000.
James, Estelle and Dimitri Vittas. 1999b. “Annuities Markets in Comparative Perspective: Do ConsumersGet Their Money’s Worth?” Conference on New Ideas for Old Age Security, World Bank and WorldBank Policy Research Discussion Paper No. 2493, 2000.
Kim, Hyun Tae and Keith Sharp. 1999. “Annuities in Canada.” Report prepared for the World BankAnnuity Research Project.
Knox, David. 1999. “The Australian Annuity Market.” Report for World Bank Annuity Research Projectand World Bank Discussion Paper 2000.
Koller, Michael. 1998a. “Methodik zur Konstruktin von Generationentafeln.” May 1.
Koller, Michael. 1998b. “Reservationspolitik von Pensionskassen und die Altersrentenproblematik.”Herrliberg, July 1.
Laurence, Emily. 1991. “Poverty and the Rate of Time Preference: Evidence from Panel Data.” Journalof Political Economy. 99 (1), 54-77.
LIMRA. 1998. “Product Design Series: Immediate Annuities.” Windsor, CT: LIMRA International.
Mitchell, Olivia, James Poterba, Mark Warshawsky and Jeffrey Brown. 1999. “New Evidence on theMoney’s Worth of Individual Annuities”. American Economic Review. 89 (5), 1299-1318.
Murthi, Mamta, J. Michael Orszag and Peter Orszag. 1999. “The Value for Money of Annuities in theUK: Theory, Experience and Policy.” Report for World Bank Annuity Project and Centre for Pensionsand Social Insurance Research Report, 1999-09.
Murthi, Mamta, J. Michael Orszag and Peter Orszag. 2000. “Annuity Margins in the UK”. Centre forPensions and Social Insurance Research Report, 2000-22. Forthcoming in OECD volume.
Palacios, Robert and Rafael Rofman. 2000. “Annuity Market and Benefit Design in Multi-Pillar PensionSchemes: Experience and Lessons form Four Latin American Countries.” World Bank Discussion Paper.
Plender, John. 2000. “Equitable’s Fatal Flaws”, Financial Times, Dec. 15.
Poterba, James. 1997. The History of Annuities in the United States. Working Paper No. 6001. CambridgeMA: NBER

Poterba, James and Mark Warshawsky. 2000. “The Costs of Annuitizing Retirement Payouts fromIndividual Accounts.”
Queisser, Monika and Dimitri Vittas. 2000. The Swiss Pension System. World Bank and OECDDiscussion Paper, in process.
Spivak, Avia. 1999. “Pension Reform in Israel and Money’s Worth of Pensions and Annuities.” Reportfor World Bank Annuity Research Project and World Bank Discussion Paper forthcoming 2001.
Thaler, Richard. 1994. “Some Empirical Evidence on Dynamic Inconsistency.” In R. Thaler, ed. Quasi-Rational Economics. New York: Russell Sage Foundation: 130.
The Economist. 2000. “Trust Betrayed.” Dec. 23.
Treaster, Joseph. 2001. “Berkshire Hathaway Faces A Tough Insurance Market.” New York Times.March 12, C10.
Townsend, Frederick. 1998 and 2000. National Underwriter. Nov. 7, 2000; June 1, 1998.
Tuljapurkar and Carl Boe. 1998. “Mortality Change and Forecasting: How Much and How Little DoWe Know?” North American Actuarial Journal. 2 (4), 13-47.
Wadsworth, Mike, Alec Findlater and Tom Boardman. 2001. Reinventing Annuities. presented toStaple Inn Actuarial Society, London.
Wall Street Journal. 1995. “Offered a Lump Sum, Many Retirees Blow It and Risk Their Future.” July31. p. A1.
Wall Street Journal. 1998. “Thriving Industry Buys Insurance Settlements from Injured Plaintiffs.”Feb. 25. p. A1.
Warner, John T. and Saul Pleeter. 2001. “The Personal Discount Rate: Evidence from MilitaryDownsizing Programs.” American Economic Review. 91 (1), 33-53


