Embed Size (px)
Citation preview

2016ANNUAL REPORT
COM
PASS GR
OU
P PLC ANN
UAL R
EPOR
T 2016
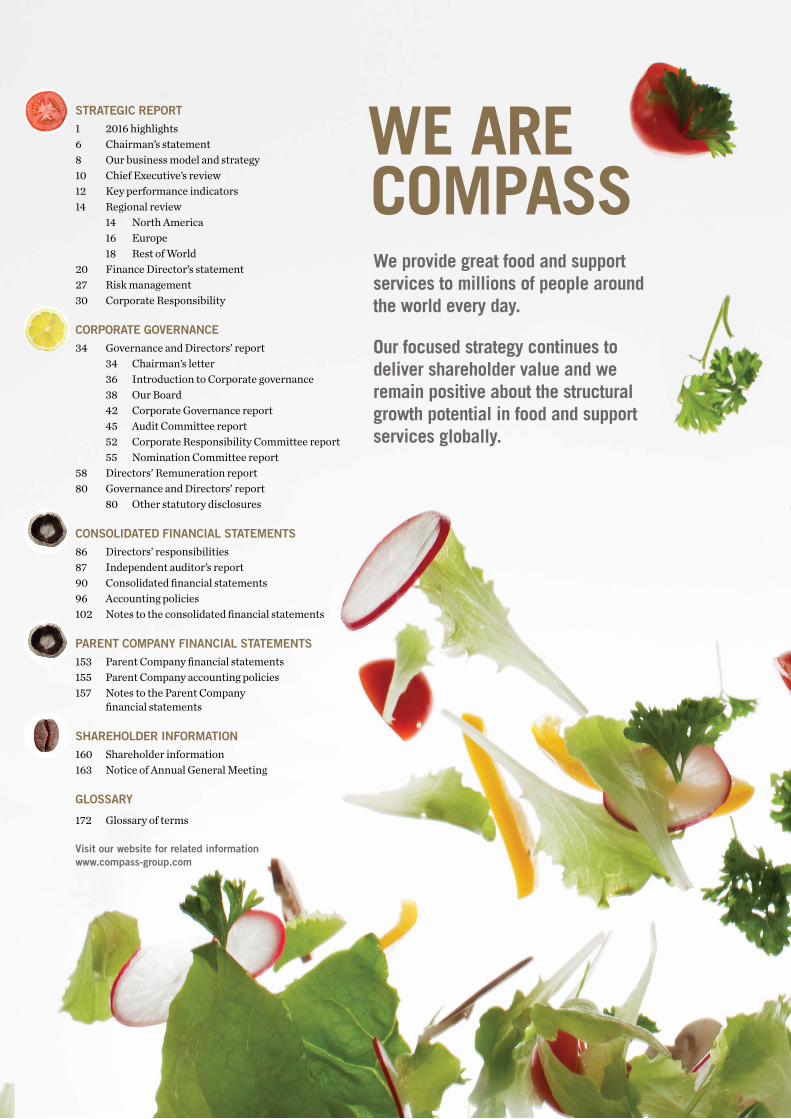
STRATEGIC REPORT1 2016 highlights6 Chairman’s statement8 Our business model and strategy10 Chief Executive’s review12 Key performance indicators14 Regional review
14 North America16 Europe18 Rest of World
20 Finance Director’s statement27 Risk management30 Corporate Responsibility
CORPORATE GOVERNANCE34 Governance and Directors’ report
34 Chairman’s letter36 Introduction to Corporate governance38 Our Board42 Corporate Governance report45 Audit Committee report52 Corporate Responsibility Committee report55 Nomination Committee report
58 Directors’ Remuneration report80 Governance and Directors’ report
80 Other statutory disclosures
CONSOLIDATED FINANCIAL STATEMENTS86 Directors’ responsibilities87 Independent auditor’s report90 Consolidated financial statements96 Accounting policies102 Notes to the consolidated financial statements
PARENT COMPANY FINANCIAL STATEMENTS153 Parent Company financial statements155 Parent Company accounting policies157 Notes to the Parent Company
financial statements
SHAREHOLDER INFORMATION160 Shareholder information163 Notice of Annual General Meeting
GLOSSARY
172 Glossary of terms
Visit our website for related information www.compass-group.com
WE ARE COMPASSWe provide great food and support services to millions of people around the world every day.
Our focused strategy continues to deliver shareholder value and we remain positive about the structural growth potential in food and support services globally.
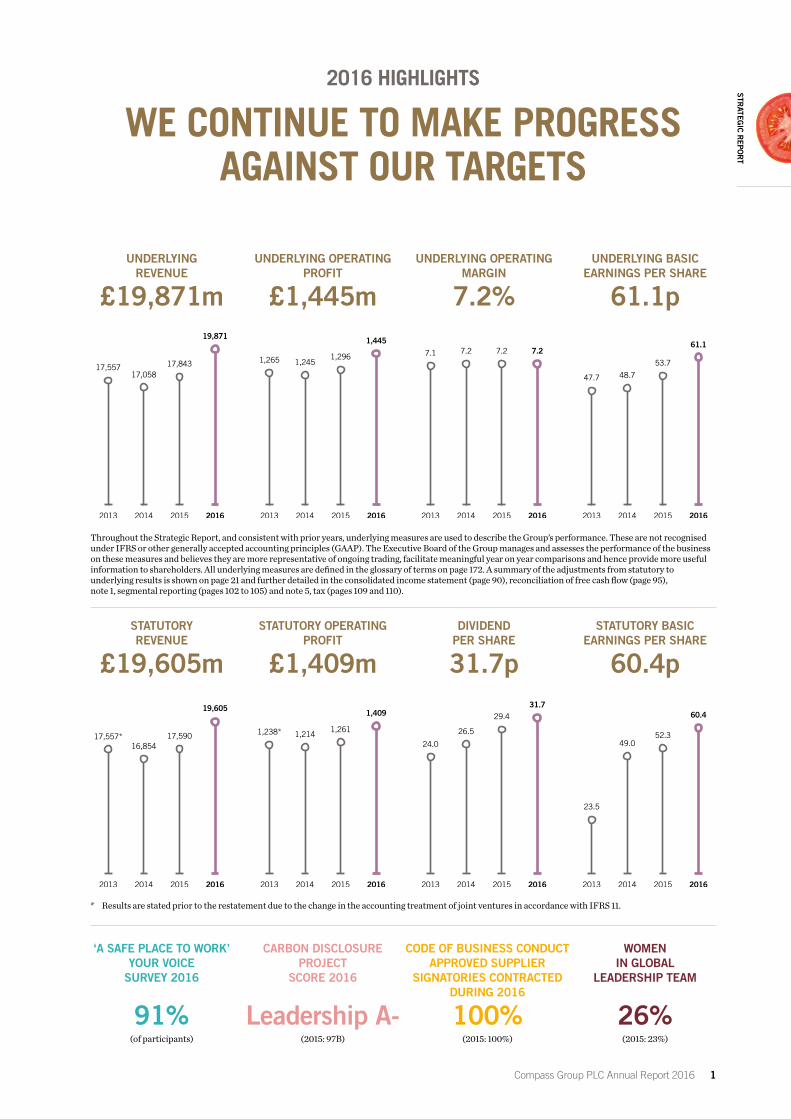
17,55717,058
17,843
19,871
2013 2014 2015 2016
7.1 7.2 7.2 7.2
2013 2014 2015 2016
1,238* 1,2141,261
1,409
2013 2014 2015 2016
17,557*16,854
17,590
19,605
2013 2014 2015 2016
47.7 48.7
53.7
61.1
2013 2014 2015 2016
23.5
49.052.3
60.4
2013 2014 2015 2016
1,265 1,2451,296
1,445
2013 2014 2015 2016
24.0
26.5
29.431.7
2013 2014 2015 2016
UNDERLYING BASIC EARNINGS PER SHARE
61.1p
UNDERLYING REVENUE
£19,871m
STATUTORY REVENUE
£19,605m
* Results are stated prior to the restatement due to the change in the accounting treatment of joint ventures in accordance with IFRS 11.
STATUTORY BASIC EARNINGS PER SHARE
60.4p
UNDERLYING OPERATING PROFIT
£1,445m
UNDERLYING OPERATING MARGIN
7.2%
STATUTORY OPERATING PROFIT
£1,409m
DIVIDEND PER SHARE
31.7p
WE CONTINUE TO MAKE PROGRESS AGAINST OUR TARGETS
‘A SAFE PLACE TO WORK’ YOUR VOICE
SURVEY 2016
91%(of participants)
CARBON DISCLOSURE PROJECT
SCORE 2016
Leadership A-(2015: 97B)
CODE OF BUSINESS CONDUCT APPROVED SUPPLIER
SIGNATORIES CONTRACTED DURING 2016
100%(2015: 100%)
WOMEN IN GLOBAL
LEADERSHIP TEAM
26%(2015: 23%)
2016 HIGHLIGHTS
Throughout the Strategic Report, and consistent with prior years, underlying measures are used to describe the Group’s performance. These are not recognised under IFRS or other generally accepted accounting principles (GAAP). The Executive Board of the Group manages and assesses the performance of the business on these measures and believes they are more representative of ongoing trading, facilitate meaningful year on year comparisons and hence provide more useful information to shareholders. All underlying measures are defined in the glossary of terms on page 172. A summary of the adjustments from statutory to underlying results is shown on page 21 and further detailed in the consolidated income statement (page 90), reconciliation of free cash flow (page 95), note 1, segmental reporting (pages 102 to 105) and note 5, tax (pages 109 and 110).
Compass Group PLC Annual Report 2016 1
STRATEG
IC REPO
RT

WE ARE FOCUSED ON FOOD
WE HAVE GLOBAL REACH
NORTH AMERICAUNDERLYING REVENUE
£11,198m(2015: £9,361m)
56%of Group total
EUROPEUNDERLYING REVENUE
£5,458m(2015: £5,192m)
28%of Group total
REST OF WORLDUNDERLYING REVENUE
£3,215m(2015: £3,290m)
16%of Group total
Food is our core competence and we pride ourselves on our ability to provide clients with a wide range of innovative dining solutions
WE WORK IN OVER
CLIENT LOCATIONS
50,000MEALS A YEAR
WE SERVE OVER
5 BILLIONGREAT PEOPLE
WE EMPLOY OVER
500,000COUNTRIES
WE OPERATE IN OVER
50
WE ARE COMPASS
2 Compass Group PLC Annual Report 2016

WE ARE COMPASS
WE HAVE A SECTORISED APPROACH
We differentiate ourselves by sectorising and sub-sectorising our business. This enables us to get closer to our clients and consumers to create innovative, bespoke offers that best meet their needs and requirements
BUSINESS & INDUSTRY38% of Group underlying revenue
We provide a choice of quality, nutritious and well balanced food for employees during their working day. In addition, where clients seek broader service offerings, we can deliver a range of support services to the highest standard, and at the best value.
HEALTHCARE & SENIORS23% of Group underlying revenue
We are specialists in helping hospitals in the public and private sectors on their journey of managing efficiency and enhancing quality across a range of food and support services. We have an increasing presence in the growing senior living market.
EDUCATION18% of Group underlying revenue
From kindergarten to college, we provide fun, nutritious dining solutions that help support academic achievement at the highest levels. We educate young people on how to have a happy, safe and healthy lifestyle while contributing to a sustainable world.
SPORTS & LEISURE12% of Group underlying revenue
Operating at some of the world’s most prestigious sporting and leisure venues, exhibition centres, visitor attractions and major events, we have an enviable reputation for providing outstanding hospitality and true service excellence.
DEFENCE, OFFSHORE & REMOTE9% of Group underlying revenue
Through our established health and safety culture, we are a market leader in providing food and support services to major companies in the oil and gas and mining and construction industries. For our defence sector clients, we are a partner that runs efficient operations outside areas of conflict.
Compass Group PLC Annual Report 2016 3
STRATEG
IC REPO
RT

WE SEE A SIGNIFICANT STRUCTURAL GROWTH OPPORTUNITY…
The addressable food service market is estimated to be worth over £200 billion and, with 80% of the market serviced by regional players or in-house providers, we are in
a strong position to capitalise on this structural growth opportunity
WE ARE COMPASS
Numbers relating to market size and penetration rates are based on management estimates and a range of external data.
12%
80%
Other large players
8%Compass
Regional players30%
Self operated
50%
Structural growth opportunity
FOOD SERVICE MARKET
c£200 BILLION
4 Compass Group PLC Annual Report 2016

…ACROSS OUR SECTORS AND MARKETS
The market for food and support services continues to offer significant growth potential as we drive outsourcing and deliver
a strong proposition across our sectors and regions
Compass provides outsourced food and support services in a market worth over £400 billion (comprising approximately £200 billion food service and £200 billion support services) across over 50 countries. The five sectors in which Compass operates are Business & Industry; Healthcare & Seniors; Education; Defence, Offshore & Remote and Sports & Leisure. All five sectors continue to offer significant opportunities for growth.
Food service remains at the core of the Compass offer. Business & Industry accounts for around half of this value, and this important sector continues to offer attractive growth opportunities. In more developed markets where outsourcing rates are routinely in excess of 60%, our combination of scale, efficiencies and first class service delivery supports continued revenue growth. In more emerging markets, outsourcing rates are still only around 10%, providing an enormous opportunity for future growth in our core sector.
The Healthcare & Seniors and Education sectors also continue to grow, with less than half of the addressable global market currently outsourced. We are developing operational excellence in areas such as our proposition for hospital visitors and nutritional meal planning in schools and, by sharing this expertise, we can better serve our clients and consumers across multiple markets.
The Defence, Offshore & Remote sector offers significant opportunities to build lasting strategic relationships with large local and international operators. Creating strong client relationships allows us to respond positively to tougher market conditions, for example, in the basic commodities sector where we have leveraged our cost base and changed our offer to meet our clients’ needs and have retained business in the face of real budgetary pressure.
Sports & Leisure is a highly outsourced sector with a global outlook in which we benefit from our strong reputation across key markets.
Support services remains an important market for Compass, particularly in Healthcare & Seniors and Defence, Offshore & Remote. In these sectors, we are recognised for fulfilling the needs of clients who require excellent services without compromising on quality.
In all the markets and regions in which Compass operates, we continue to build our business and our reputation based on our ongoing focus on health and safety, the environment and our firm commitment to responsible corporate practices.
WE ARE COMPASS
Compass Group PLC Annual Report 2016 5
STRATEG
IC REPO
RT

CHAIRMAN’S STATEMENT
I’m delighted to report another excellent year for Compass. We continue to pursue our clear and focused strategy, which has again delivered a strong performance for shareholders, and we remain positive about the future opportunities we see.
I’d like to take this opportunity to thank everyone who works for Compass for their hard work and dedication, which are fundamental to our ongoing success.
PERFORMANCEOur commitment to generating sustainable organic growth by winning new contracts and retaining existing business remains. We have achieved excellent levels of organic growth in North America and we have continued to make good progress in Europe, following the return to growth last year. The economic environment in parts of our Rest of World region, particularly in the Offshore & Remote sector, is challenging but the non-commodity related business is performing well.
Our focus on embedding the Management and Performance (MAP) framework deeper into the organisation and generating efficiencies remains as strong as ever. This has enabled us to reinvest in the business to support growth and maintain the underlying margin in line with last year.
Richard talks more about the drivers of our performance on pages 10 and 11 of this Report.
SHAREHOLDER RETURNSAs a result of this strong performance, I’m pleased to announce that the Board has recommended a final dividend of 21.1 pence per share, which brings the total dividend for the year to 31.7 pence per share, an increase of 7.8% over the prior year. The final dividend will be paid to shareholders on 20 February 2017. During the year,
Sept
2015 2016
Compass FTSE 100 (rebased)
Oct Nov Dec Jan Feb Mar Apr May Jun Jul Aug Sept9
10
11
12
13
14
15
16
Last 12 months
Last 24 months
Last 36 months
28%
46%
59%
CONSISTENT PERFORMANCE
2016 has been another year of consistent performance for Compass, delivering sustainable organic revenue growth and returns for shareholders.
COMPASS SHARE PRICE PERFORMANCE V FTSE 100 OVER LAST 3 YEARS (%)
POSITION IN FTSE 100 INDEX AS AT 30 SEPTEMBER 2016 (2015: 25)
24
COMPASS SHARE PRICE PERFORMANCE V FTSE 100 INDEX (£)
6 Compass Group PLC Annual Report 2016

we have also bought back 8.7 million shares for a total of £100 million.
Creating shareholder value is a key priority for the Group and, going forward, our priorities for how we use our cash remain unchanged. We will continue to invest in the business to support organic growth, grow the dividend in line with constant currency earnings per share and pursue small to medium sized infill acquisitions. We remain committed to maintaining strong investment grade credit ratings and will therefore continue to return any surplus cash to shareholders to target net debt/EBITDA of around 1.5x.
COMMITMENT TO CORPORATE RESPONSIBILITYCorporate responsibility (CR) underpins our business, enabling us to achieve our strategic goals in a responsible and sustainable way. This year, we have refreshed our CR strategy to ensure that we are continuing to address the issues that are important to our stakeholders. In September 2015, the United Nations introduced their Sustainable Development Goals and we have identified six where we believe we can make the most positive social impact.
Our teams around the world continue to enhance the contributions we make. Our focus includes developing our people, the health and wellbeing of our consumers, the responsible use of resources and improving the integrity of our supply chain. This year, we were delighted to be included in Fortune Magazine’s list of 50 Companies that Change the World, which recognises companies that make a positive social impact through their core business strategy. Our recent commitment to source 100% cage free eggs globally by 2025 is a good example of this in practice.
There is more information on our CR performance during the year in the CR section of this Report, which starts on page 30.
LEADERSHIP AND BOARD CHANGESAs I wrote in my letter last year, Andy Martin stood down from the Board on 1 December 2015 after 11 years with the Group, initially as Group Finance Director and then as Group Chief Operating Officer, Europe & Japan. As a result of Andy’s departure, Dominic Blakemore moved from his role as Group Finance Director to become Group Chief Operating Officer, Europe from 1 December 2015. Johnny Thomson succeeded Dominic as Group Finance Director from his position as Regional Managing Director of our business in Latin America and joined the Board on 1 December 2015.
After nine years’ service, Sir Ian Robinson retired from the Board at the conclusion of the Annual General Meeting on 4 February 2016 and was succeeded by Don Robert as Senior Independent Director. On 5 May 2016, Stefan Bomhard was appointed as a non-executive director.
Susan Murray will step down from the Board at the conclusion of the Company’s AGM on 2 February 2017, having served on the Board for just over nine years. Nelson Silva will succeed Susan as Chairman of the Corporate Responsibility Committee on the same day.
On behalf of the Board, I’d like to thank Andy, Sir Ian and Susan for their contribution and welcome Johnny and Stefan to the Board.
SUMMARY AND OUTLOOKCompass has had another strong year. Performance in North America continues to be excellent, and we are pleased with our progress in Europe. In the Rest of World, the performance is mixed, with the impact of the cyclical downturn in our commodity related business offsetting reasonable progress elsewhere.
Our expectations for 2017 are positive, with growth weighted to the second half of the year. The pipeline of new contracts is good and our focus on organic growth, efficiencies and cash gives us confidence in another year of delivery.
In the longer term, we remain excited about the significant structural growth opportunities globally and the potential for further revenue growth, margin improvement, and continued returns.
Paul WalshChairman 22 November 2016
OUR VALUES
• OPENNESS, TRUST AND INTEGRITY• PASSION FOR QUALITY• WIN THROUGH TEAMWORK• RESPONSIBILITY• CAN DO SAFELY
Compass Group PLC Annual Report 2016 7
STRATEG
IC REPO
RT
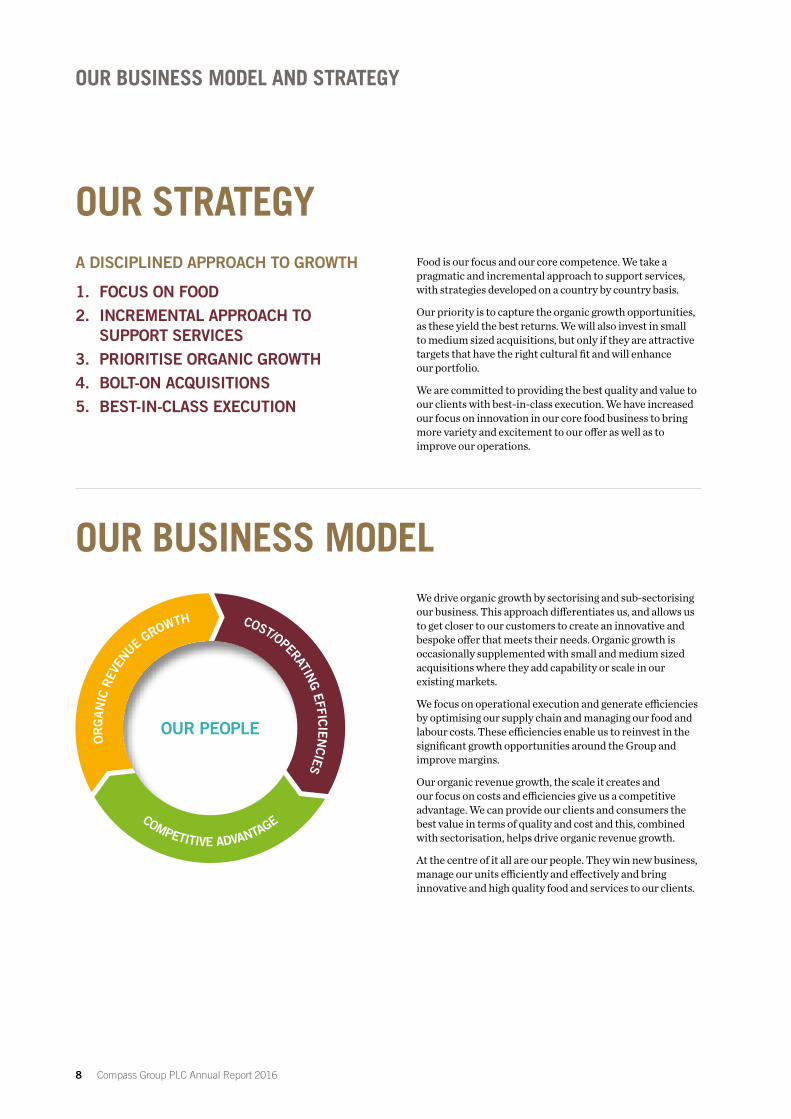
OUR BUSINESS MODELWe drive organic growth by sectorising and sub-sectorising our business. This approach differentiates us, and allows us to get closer to our customers to create an innovative and bespoke offer that meets their needs. Organic growth is occasionally supplemented with small and medium sized acquisitions where they add capability or scale in our existing markets.
We focus on operational execution and generate efficiencies by optimising our supply chain and managing our food and labour costs. These efficiencies enable us to reinvest in the significant growth opportunities around the Group and improve margins.
Our organic revenue growth, the scale it creates and our focus on costs and efficiencies give us a competitive advantage. We can provide our clients and consumers the best value in terms of quality and cost and this, combined with sectorisation, helps drive organic revenue growth.
At the centre of it all are our people. They win new business, manage our units efficiently and effectively and bring innovative and high quality food and services to our clients.
OR
GAN
IC R
EVEN
UE GROWTH COST/OPERATIN
G EFFICIENCIES
COMPETITIVE ADVANTAGE
OUR PEOPLE
OUR BUSINESS MODEL AND STRATEGY
OUR STRATEGYA DISCIPLINED APPROACH TO GROWTH
1. FOCUS ON FOOD2. INCREMENTAL APPROACH TO
SUPPORT SERVICES3. PRIORITISE ORGANIC GROWTH4. BOLT-ON ACQUISITIONS5. BEST-IN-CLASS EXECUTION
Food is our focus and our core competence. We take a pragmatic and incremental approach to support services, with strategies developed on a country by country basis.
Our priority is to capture the organic growth opportunities, as these yield the best returns. We will also invest in small to medium sized acquisitions, but only if they are attractive targets that have the right cultural fit and will enhance our portfolio.
We are committed to providing the best quality and value to our clients with best-in-class execution. We have increased our focus on innovation in our core food business to bring more variety and excitement to our offer as well as to improve our operations.
8 Compass Group PLC Annual Report 2016

MAP 1: CLIENT SALES AND MARKETINGWe invest in sales and retention to win new business and retain our existing clients. We are increasingly sectorising and sub-sectorising the business around the world to allow us to get closer to our customers. This approach allows us to develop bespoke offers that best meet our clients’ needs.
MAP 2: CONSUMER SALES AND MARKETINGLike for like revenue consists of both volume and price. It is heavily influenced both by the number of people at a client’s site and by macroeconomic conditions. We are making good progress with intelligent marketing programmes and training schemes as we work hard to attract and satisfy our customer base with strong consumer propositions.
MAP 3: COST OF FOODFood makes up around one third of our costs. In addition to the benefits of our scale in food procurement, we are able to manage food costs through careful menu planning and by rationalising the number of products we buy and the suppliers we buy from.
MAP 4: IN UNIT COSTSIn unit costs are made up predominantly of labour. We focus on getting the right people in the right place at the right time. By using labour scheduling techniques and improving productivity, we are able to deliver the optimum level of service in the most efficient way.
MAP 5: ABOVE UNIT OVERHEADSHaving reduced costs considerably when MAP was first introduced in 2006, by creating a simpler organisational model with fewer layers of management and less bureaucracy, we now strive to leverage those gains by maintaining costs at a constant level whilst we continue to grow revenue.
DRIVING ORGANIC TOPLINE GROWTH GENERATING EFFICIENCIES
UNDERPINNED BY OUR CULTURE
HOW WE CREATE SHAREHOLDER VALUE
GROWTH
MARGIN
INVESTMENT
RETURNS TO SHAREHOLDERS
Our priority is organic growth and we continue to put focus and resources behind both MAP 1 (driving new business and retention), and MAP 2 (consumer sales).
We remain focused on costs and improving MAP 3 (cost of food), MAP 4 (in unit labour costs and overheads) and MAP 5 (above unit overheads). This generates operating efficiencies and enables us to improve margins.
We invest with discipline to support our organic growth. Capital expenditure tends to be between 2.5-3.0% of revenue. We also invest in infill acquisitions when they add capability or scale in an existing market and have returns that exceed the cost of capital by year two.
We create value for our shareholders by delivering a balanced package of progressive dividends which grow in line with constant currency earnings and returning any additional surplus capital to shareholders to maintain net debt/EBITDA at 1.5x.
Compass Group PLC Annual Report 2016 9
STRATEG
IC REPO
RT

CHIEF EXECUTIVE’S REVIEW
DELIVERING GROWTHHOW DID COMPASS PERFORM THIS YEAR?Revenue for the Group increased by 5.0% on an organic basis. New business wins were 8.8% driven by strong MAP 1 (client sales and marketing) performance in most countries. Our retention rate was 94.1% as a result of our ongoing focus and investment. We aim to increase participation and spend through MAP 2 (consumer sales and marketing) initiatives. Like for like revenue growth of 2.1% reflected sensible price increases and modest volume improvement in North America offset by negative volumes in Rest of World.
The restructuring programme announced in July 2015 to reduce the cost base in our Offshore & Remote business and in some emerging markets is now complete and delivering the expected savings. Restructuring costs totalled £51 million (£25 million and £26 million charged in 2016 and 2015 respectively). These costs have been included in underlying Group operating profit.
Underlying operating profit increased by 5.6% on a constant currency basis. The underlying operating margin was flat, as we continue to drive efficiencies across the business using our Management and Performance (MAP) framework. We have maintained our focus on MAP 3 (cost of food) with initiatives such as menu planning and supplier rationalisation, as well as continually optimising MAP 4 (labour and in unit costs) and MAP 5 (above unit overheads). These efficiencies enabled us to invest to support the exciting growth opportunities we see around the world.
Returns to shareholders continue to be an integral part of our business model. The Group returned £596 million to shareholders in the year, £496 million by way of dividends and £100 million in share buybacks. Our leverage policy is to maintain strong investment grade credit ratings, returning any surplus cash to shareholders to target net debt to underlying EBITDA of around 1.5x.
WHAT IS THE GROUP’S STRATEGY?Food is our focus and our core competence. The addressable food service market is estimated to be more than £200 billion. With only around 50% of the market currently outsourced, there is a significant structural growth opportunity. We believe the benefits of outsourcing become increasingly apparent as economic conditions and regulatory changes put pressure on organisations’ budgets. As one of the largest providers in all of our sectors, we are well placed to benefit from these trends.
Our approach to support and multi services is low risk and incremental, with strategies developed on a country by country basis. This is a complex segment and there are significant differences in client buying behaviour across countries, sectors and sub-sectors. Our largest sector in this market is Defence, Offshore & Remote, where the model is almost universally multi service. In addition, we have an excellent support services business in North America and other selected countries.
Compass’ clear strategy and scale has led to another year of good growth.
10 Compass Group PLC Annual Report 2016

WHAT IS THE GROUP’S GEOGRAPHIC SPREAD?We have a truly international business, with operations in over 50 countries. We manage the business in three geographic regions.
North America (56% of underlying Group revenue) is the principal growth engine for the Group. The outsourcing culture is vibrant and the addressable market is significant. We have a market leading business, which delivers high levels of growth by combining a sectorised client facing approach with the cost advantage of our scale.
The fundamentals of our businesses in Europe (28% of underlying Group revenue) are good and we see many opportunities to drive revenue growth and margin improvement. We have invested in MAP 1 sales and retention to return the region to growth. This year, we have created nine new business units to leverage our scale in procurement, lower costs and speed up the sharing and implementation of best practices.
Rest of World (16% of underlying Group revenue) offers very good long term growth potential. Our largest markets are Australia, Japan and Brazil, and we are growing in India and China. Lower commodity prices and weak volumes have impacted our Offshore & Remote business. We have restructured our business to adapt to the changing market environment, and remain excited about the attractive long term growth prospects of the region.
WHAT ARE THE GROUP’S MAIN COMPETITIVE ADVANTAGES?SECTORISED APPROACHWe segment the market and create sectors and sub-sectors to develop customised solutions that meet the requirements of a wide and growing range of clients and consumers. Our portfolio of B2B brands enables us to differentiate these propositions and maximise our market coverage.
SCALEAs we continue to grow, our increasing scale allows us to achieve our goal of being the lowest cost, most efficient provider of food and support services. Scale is a benefit in terms of food procurement, labour management and back office costs. It underpins our competitiveness and enables us to deliver sustainable growth over time.
MANAGEMENT AND PERFORMANCE (MAP) CULTUREWe speak one common MAP language. All our employees use this simple framework to drive performance across the business. It helps us focus on a common set of business drivers, whether it is winning new business in the right sector on the right terms (MAP 1), increasing our consumer participation and spend (MAP 2), reducing our food costs (MAP 3), or labour costs (MAPs 4 and 5).
WHAT ARE THE GROUP’S MAIN USES OF CASH AND BALANCE SHEET PRIORITIES?The Group’s cash flow generation remains excellent and it will continue to be a key part of the business model. Our priorities for how we use our cash remain unchanged. We will continue to: (i) invest in the business to support organic growth where we see opportunities with good returns; (ii) pursue M&A opportunities, our preference is for small to medium sized infill acquisitions, where we look for returns greater than our cost of capital by the end of year two; (iii) grow the dividend in line with constant currency earnings per share; and (iv) maintain strong investment grade credit ratings by returning any surplus cash to shareholders to target net debt/EBITDA of around 1.5x.
HOW WOULD YOU SUMMARISE 2016?Compass has had another strong year. Performance in North America continues to be excellent, and we are pleased with our progress in Europe. In the Rest of World, the performance is mixed, with the impact of the cyclical downturn in our commodity related business offsetting reasonable progress elsewhere.
WHAT IS YOUR OUTLOOK FOR 2017?Our expectations for 2017 are positive, with growth weighted to the second half of the year. The pipeline of new contracts is good and our focus on organic growth, efficiencies and cash gives us confidence in another year of delivery.
In the longer term, we remain excited about the significant structural growth opportunities globally and the potential for further revenue growth, margin improvement, and continued returns.
Richard CousinsGroup Chief Executive 22 November 2016
Compass Group PLC Annual Report 2016 11
STRATEG
IC REPO
RT

MEASURING PROGRESSKEY PERFORMANCE INDICATORS
STRATEGIC FINANCIAL FINANCIAL
NON-FINANCIAL
UNDERLYING OPERATING MARGINUnderlying operating margin divides the underlying operating profit before share of profit of associates by the underlying revenue.
WHY WE MEASUREThe operating profit margin is an important measure of the efficiency of our operations in delivering great food and support services to our clients and consumers.
7.2%
HEALTH AND SAFETYLOST TIME INCIDENT FREQUENCY RATE PERFORMANCECases where one of our colleagues is away from work for one or more shifts as a result of a work related injury or illness.
WHY WE MEASUREA reduction in lost time incidents is an important measure of the effectiveness of our Safety First culture. It also lowers rates of absenteeism and costs associated with work related injuries and illnesses.
29.0%reduction since 2013
7.1 7.2 7.2 7.2
2013 2014 2015 2016 2013 2014 2015 2016
ORGANIC REVENUE GROWTHOrganic revenue growth compares the underlying revenue delivered from continuing operations in the current year with that from the prior year, adjusting for the impact of acquisitions, disposals and exchange rate movements.
WHY WE MEASUREOur organic revenue performance embodies our success in growing and retaining our customer base, as well as our ability to drive volumes in our existing business and maintain appropriate pricing levels in light of input cost inflation.
RETURN ON CAPITAL EMPLOYED (ROCE)ROCE divides the net operating profit after tax (NOPAT) by the 12 month average capital employed. NOPAT is calculated as underlying operating profit less operating profit of non-controlling interests, net of income tax at the underlying rate of the year.
WHY WE MEASUREROCE demonstrates how we have delivered against the various investments we make in the business, be it operational expenditure, capital expenditure or infill acquisitions.
5.0%
19.4%
19.1 19.3 19.1 19.4
2013 2014 2015 2016
4.34.1
5.8
5.0
2013 2014 2015 2016
We track our performance against a mix of financial and non-financial measures, which we believe best reflect our strategic priorities of growth, efficiency and shareholder returns underpinned by safe and responsible working practices.KPI METRICSOur strategic priorities are driven by our goal to deliver shareholder value and we use a number of financial KPIs to measure our progress. Growing the business and driving ongoing efficiencies are integral to our strategy.
The importance of safety in everything we do is demonstrated by three non-financial performance indicators that we use across our global business.
12 Compass Group PLC Annual Report 2016

FOOD SAFETYFOOD SAFETY INCIDENT RATE PERFORMANCECases of substantiated food safety incidents, including food borne illnesses.
WHY WE MEASUREThe Food Safety Incident Rate is a helpful measure of our ability to provide food that is safe and of the right quality to our consumers globally.
ENVIRONMENTGHG INTENSITY RATIOGHG intensity ratio relating to the top 20 countries, which represent 94% of total Group revenue.
WHY WE MEASURESince 2008, we have been focused on lowering our carbon emissions to reduce our impact on the environment and increase operational efficiency. We measure Greenhouse Gas emissions to assess our progress.
19.0%reduction since 2013
16.0%reduction since 2013
2013 2014 2015 2016
6.3
7.36.7
5.3
2013 2014 2015 2016
UNDERLYING BASIC EARNINGS PER SHAREUnderlying basic earnings per share divides the underlying attributable profit by the weighted average number of shares in issue during the year.
WHY WE MEASUREEarnings per share measures the performance of the Group in delivering value to shareholders.
UNDERLYING FREE CASH FLOWMeasures cash generated by continuing operations, after working capital, capital expenditure, interest and tax but before acquisitions, disposals, dividends and share buybacks.
WHY WE MEASUREMeasures the success of the Group in turning profit into cash through the careful management of working capital and capital expenditure. Maintaining a high level of cash generation supports our progressive dividend policy.
61.1p
£908m
47.7 48.7
53.7
61.1
2013 2014 2015 2016
834
737 722
908
2013 2014 2015 2016
The Group KPIs should be read in conjunction with the Strategy and Risk sections.
See pages 8 and 9 and 27 to 29 respectively
Compass Group PLC Annual Report 2016 13
STRATEG
IC REPO
RT

Group revenue contribution
NORTH AMERICACORE GROWTH ENGINE
REGIONAL REVIEW
Our business in North America has had another strong year, with organic revenue growth of 8.1%, driven by new business wins and high retention rates.
1
2
3
4
5
GROUP UNDERLYING REVENUE CONTRIBUTION
56%(2015: 52%)
UNDERLYING REVENUE BY SECTORBusiness & Industry .....................................................30%Healthcare & Seniors .................................................29%Education............................................................................................. 24%Defence, Offshore & Remote ......................... 2%Sports & Leisure .....................................................................15%
UNDERLYING REVENUE
£11,198m(2015: £9,361m)
ORGANIC REVENUE GROWTH
+8.1%(2015: +7.9%)
UNDERLYING OPERATING PROFIT
£908m(2015: £760m)
UNDERLYING OPERATING MARGIN
8.1%(2015: 8.1%)
REGIONAL FINANCIAL SUMMARYUNDERLYING CHANGE
2016 2015REPORTED
RATESCONSTANT CURRENCY ORGANIC
Revenue £11,198m £9,361m 19.6% 10.5% 8.1%Operating profit £908m £760m 19.5% 10.3% 9.1%Operating margin 8.1% 8.1% –Region as a % of Group revenue 56% 52%
KEY HIGHLIGHTS
Revenue by sector
1
2
5
4
3
14 Compass Group PLC Annual Report 2016
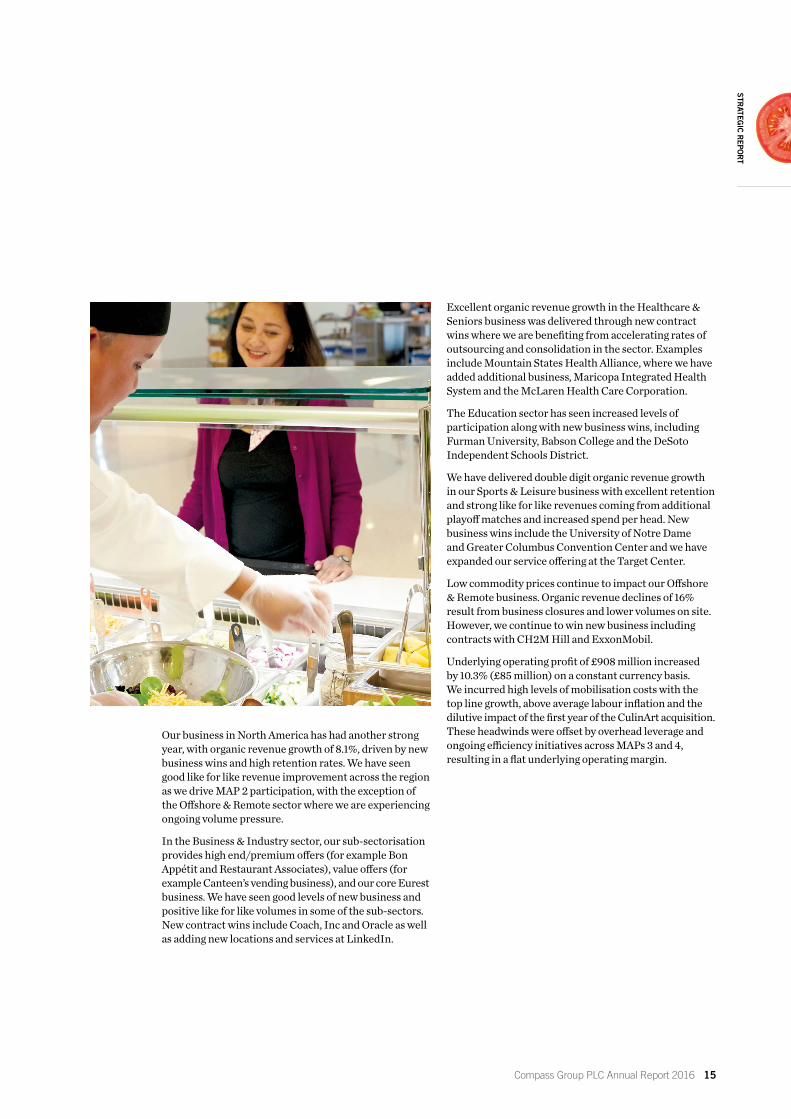
Our business in North America has had another strong year, with organic revenue growth of 8.1%, driven by new business wins and high retention rates. We have seen good like for like revenue improvement across the region as we drive MAP 2 participation, with the exception of the Offshore & Remote sector where we are experiencing ongoing volume pressure.
In the Business & Industry sector, our sub-sectorisation provides high end/premium offers (for example Bon Appétit and Restaurant Associates), value offers (for example Canteen’s vending business), and our core Eurest business. We have seen good levels of new business and positive like for like volumes in some of the sub-sectors. New contract wins include Coach, Inc and Oracle as well as adding new locations and services at LinkedIn.
Excellent organic revenue growth in the Healthcare & Seniors business was delivered through new contract wins where we are benefiting from accelerating rates of outsourcing and consolidation in the sector. Examples include Mountain States Health Alliance, where we have added additional business, Maricopa Integrated Health System and the McLaren Health Care Corporation.
The Education sector has seen increased levels of participation along with new business wins, including Furman University, Babson College and the DeSoto Independent Schools District.
We have delivered double digit organic revenue growth in our Sports & Leisure business with excellent retention and strong like for like revenues coming from additional playoff matches and increased spend per head. New business wins include the University of Notre Dame and Greater Columbus Convention Center and we have expanded our service offering at the Target Center.
Low commodity prices continue to impact our Offshore & Remote business. Organic revenue declines of 16% result from business closures and lower volumes on site. However, we continue to win new business including contracts with CH2M Hill and ExxonMobil.
Underlying operating profit of £908 million increased by 10.3% (£85 million) on a constant currency basis. We incurred high levels of mobilisation costs with the top line growth, above average labour inflation and the dilutive impact of the first year of the CulinArt acquisition. These headwinds were offset by overhead leverage and ongoing efficiency initiatives across MAPs 3 and 4, resulting in a flat underlying operating margin.
Compass Group PLC Annual Report 2016 15
STRATEG
IC REPO
RT

Group revenue contribution
Revenue by sector
EUROPEANOTHER GOOD YEAR
REGIONAL REVIEW
1
2
3
4
5
GROUP UNDERLYING REVENUE CONTRIBUTION
28%(2015: 29%)
Europe grew organic revenue by 2.8%, the highest growth rate we have seen since 2008. This was driven by good levels of new business wins.
UNDERLYING REVENUE
£5,458m(2015: £5,192m)
ORGANIC REVENUE GROWTH
+2.8%(2015: +2.2%)
UNDERLYING OPERATING PROFIT
£394m(2015: £374m)
UNDERLYING OPERATING MARGIN
7.2%(2015: 7.2%)
REGIONAL FINANCIAL SUMMARYUNDERLYING CHANGE
2016 2015REPORTED
RATESCONSTANT CURRENCY ORGANIC
Revenue £5,458m £5,192m 5.1% 2.7% 2.8%Operating profit £394m £374m 5.3% 2.6% 2.6%Operating margin 7.2% 7.2% –Region as a % of Group revenue 28% 29%
Prior year comparatives have been restated to reflect a change in the way the Region is managed.
KEY HIGHLIGHTS
UNDERLYING REVENUE BY SECTORBusiness & Industry ......................................................57%Healthcare & Seniors ...................................................14%Education...............................................................................................14%Defence, Offshore & Remote ..........................7%Sports & Leisure .........................................................................8%
1
2
5
4
3
16 Compass Group PLC Annual Report 2016
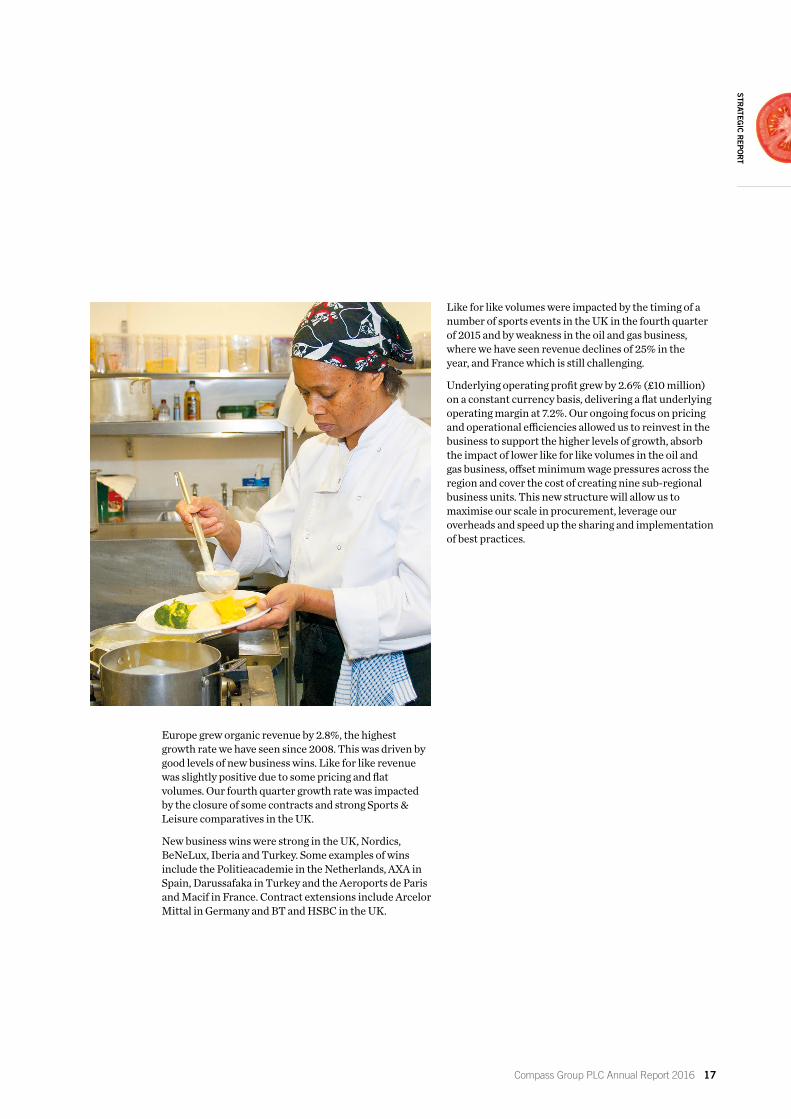
Europe grew organic revenue by 2.8%, the highest growth rate we have seen since 2008. This was driven by good levels of new business wins. Like for like revenue was slightly positive due to some pricing and flat volumes. Our fourth quarter growth rate was impacted by the closure of some contracts and strong Sports & Leisure comparatives in the UK.
New business wins were strong in the UK, Nordics, BeNeLux, Iberia and Turkey. Some examples of wins include the Politieacademie in the Netherlands, AXA in Spain, Darussafaka in Turkey and the Aeroports de Paris and Macif in France. Contract extensions include Arcelor Mittal in Germany and BT and HSBC in the UK.
Like for like volumes were impacted by the timing of a number of sports events in the UK in the fourth quarter of 2015 and by weakness in the oil and gas business, where we have seen revenue declines of 25% in the year, and France which is still challenging.
Underlying operating profit grew by 2.6% (£10 million) on a constant currency basis, delivering a flat underlying operating margin at 7.2%. Our ongoing focus on pricing and operational efficiencies allowed us to reinvest in the business to support the higher levels of growth, absorb the impact of lower like for like volumes in the oil and gas business, offset minimum wage pressures across the region and cover the cost of creating nine sub-regional business units. This new structure will allow us to maximise our scale in procurement, leverage our overheads and speed up the sharing and implementation of best practices.
Compass Group PLC Annual Report 2016 17
STRATEG
IC REPO
RT

Group revenue contribution
Revenue by sector
REST OF WORLDCORE BUSINESS PERFORMING WELL
REGIONAL REVIEW
1
2
3
4
5
GROUP UNDERLYING REVENUE CONTRIBUTION
16%(2015: 19%)
UNDERLYING REVENUE
£3,215m(2015: £3,290m)
ORGANIC REVENUE GROWTH
-1.2%(2015: +5.9%)
UNDERLYING OPERATING PROFIT
£218m(2015: £241m)
UNDERLYING OPERATING MARGIN
6.8%(2015: 7.3%)
In the Rest of World region, organic revenue declined by 1.2%. Excluding the Offshore & Remote business, organic revenue grew by 3.6% while in the Offshore & Remote business, organic revenue declined by 10%.
REGIONAL FINANCIAL SUMMARYUNDERLYING CHANGE
2016 2015REPORTED
RATESCONSTANT CURRENCY ORGANIC
Revenue £3,215m £3,290m (2.3)% (1.9)% (1.2)%Operating profit £218m £241m (9.5)% (8.8)% (7.9)%Operating margin 6.8% 7.3% (50)bpsRegion as a % of Group revenue 16% 19%
Prior year comparatives have been restated to reflect a change in the way the Region is managed.
KEY HIGHLIGHTS
UNDERLYING REVENUE BY SECTORBusiness & Industry ..................................................... 36%Healthcare & Seniors ...................................................14%Education...................................................................................................5%Defence, Offshore & Remote .................... 36%Sports & Leisure ........................................................................ 9%
1
2
5
4
3
18 Compass Group PLC Annual Report 2016
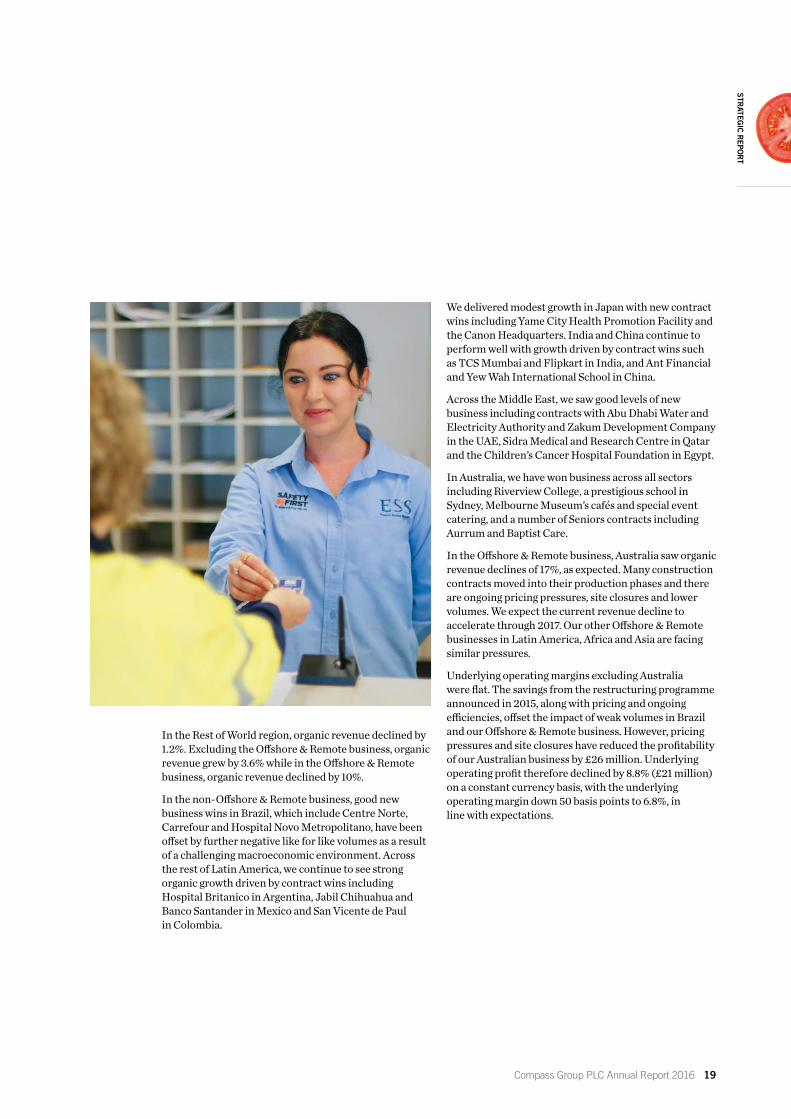
In the Rest of World region, organic revenue declined by 1.2%. Excluding the Offshore & Remote business, organic revenue grew by 3.6% while in the Offshore & Remote business, organic revenue declined by 10%.
In the non-Offshore & Remote business, good new business wins in Brazil, which include Centre Norte, Carrefour and Hospital Novo Metropolitano, have been offset by further negative like for like volumes as a result of a challenging macroeconomic environment. Across the rest of Latin America, we continue to see strong organic growth driven by contract wins including Hospital Britanico in Argentina, Jabil Chihuahua and Banco Santander in Mexico and San Vicente de Paul in Colombia.
We delivered modest growth in Japan with new contract wins including Yame City Health Promotion Facility and the Canon Headquarters. India and China continue to perform well with growth driven by contract wins such as TCS Mumbai and Flipkart in India, and Ant Financial and Yew Wah International School in China.
Across the Middle East, we saw good levels of new business including contracts with Abu Dhabi Water and Electricity Authority and Zakum Development Company in the UAE, Sidra Medical and Research Centre in Qatar and the Children’s Cancer Hospital Foundation in Egypt.
In Australia, we have won business across all sectors including Riverview College, a prestigious school in Sydney, Melbourne Museum’s cafés and special event catering, and a number of Seniors contracts including Aurrum and Baptist Care.
In the Offshore & Remote business, Australia saw organic revenue declines of 17%, as expected. Many construction contracts moved into their production phases and there are ongoing pricing pressures, site closures and lower volumes. We expect the current revenue decline to accelerate through 2017. Our other Offshore & Remote businesses in Latin America, Africa and Asia are facing similar pressures.
Underlying operating margins excluding Australia were flat. The savings from the restructuring programme announced in 2015, along with pricing and ongoing efficiencies, offset the impact of weak volumes in Brazil and our Offshore & Remote business. However, pricing pressures and site closures have reduced the profitability of our Australian business by £26 million. Underlying operating profit therefore declined by 8.8% (£21 million) on a constant currency basis, with the underlying operating margin down 50 basis points to 6.8%, in line with expectations.
Compass Group PLC Annual Report 2016 19
STRATEG
IC REPO
RT

FINANCE DIRECTOR’S STATEMENT
FINANCIAL SUMMARY
2016 2015INCREASE/
(DECREASE)
RevenueUnderlying at constant currency £19,871m £18,725m 6.1%Underlying at reported rates £19,871m £17,843m 11.4%Statutory £19,605m £17,590m 11.5%Organic growth 5.0% 5.8%Total operating profitUnderlying at constant currency £1,445m £1,368m 5.6%Underlying at reported rates £1,445m £1,296m 11.5%Statutory £1,409m £1,261m 11.7%Operating marginUnderlying at reported rates 7.2% 7.2% –Statutory 7.1% 7.1% –Profit before taxUnderlying at constant currency £1,344m £1,260m 6.7%Underlying at reported rates £1,344m £1,192m 12.8%Statutory £1,321m £1,159m 14.0%Basic earnings per shareUnderlying at constant currency 61.1p 56.7p 7.8%Underlying at reported rates 61.1p 53.7p 13.8%Statutory 60.4p 52.3p 15.5%Free cash flowUnderlying at reported rates £908m £722m 25.8%Statutory £899m £686m 31.0%Full year dividend per ordinary share 31.7p 29.4p 7.8%
STRONG PERFORMANCE
2016 has been another strong year with good organic revenue growth of 5.0%, underlying margin delivery of 7.2% and an increase in free cash flow of 26%.
BUSINESS REVIEW
20 Compass Group PLC Annual Report 2016

SEGMENTAL PERFORMANCEUNDERLYING REVENUE UNDERLYING REVENUE GROWTH
2016 £M
20151
£MREPORTED
RATESCONSTANT CURRENCY ORGANIC
North America 11,198 9,361 19.6% 10.5% 8.1%Europe 5,458 5,192 5.1% 2.7% 2.8%Rest of World 3,215 3,290 (2.3)% (1.9)% (1.2)%Total 19,871 17,843 11.4% 6.1% 5.0%
UNDERLYING OPERATING PROFIT
UNDERLYING OPERATING MARGIN
2016 £M
20151
£M2016
%20151
%
North America 908 760 8.1% 8.1%Europe 394 374 7.2% 7.2%Rest of World 218 241 6.8% 7.3%Unallocated overheads (65) (66)Total before associates and EM & OR restructuring 1,455 1,309 7.3% 7.3%EM & OR restructuring (25) (26)Total before associates 1,430 1,283 7.2% 7.2%Associates 15 13Total 1,445 1,296
1. 2015 Europe and Rest of World segments have been restated to reflect a change in the way these are managed.
STATUTORY AND UNDERLYING RESULTS2016 2015
STATUTORY £M
ADJUSTMENTS £M
UNDERLYING £M
STATUTORY £M
ADJUSTMENTS £M
UNDERLYING £M
CONSTANT CURRENCY
£M
Revenue 19,605 266 19,871 17,590 253 17,843 18,725
Operating profit 1,409 36 1,445 1,261 35 1,296 1,368Other gains/(losses) 1 (1) – (1) 1 – –Net finance costs (89) (12) (101) (101) (3) (104) (108)Profit before tax 1,321 23 1,344 1,159 33 1,192 1,260Tax (319) (11) (330) (282) (10) (292) (309)Profit after tax 1,002 12 1,014 877 23 900 951Non-controlling interest (10) – (10) (8) – (8) (8)Attributable profit 992 12 1,004 869 23 892 943
Average number of shares (millions) 1,643 – 1,643 1,662 – 1,662 1,662Basic earnings per share (pence) 60.4p 0.7p 61.1p 52.3p 1.4p 53.7p 56.7p
EBITDA 1,835 5 1,840 1,627 9 1,636 n/aGross capex 580 – 580 506 1 507 n/aFree cash flow 899 9 908 686 36 722 n/a
Further details of the adjustments can be found in the consolidated income statement, consolidated cash flow statement, note 1 segmental reporting and note 5 tax.
STRATEG
IC REPO
RT
Compass Group PLC Annual Report 2016 21

Finance Director’s statement continued
STATUTORY RESULTSStatutory revenue was £19,605 million (2015: £17,590 million), with growth of 11.5%. Statutory operating profit was £1,409 million (2015: £1,261 million), an increase of 11.7% over the prior year. Statutory profit before tax of £1,321 million (2015: £1,159 million) delivered basic earnings per share of 60.4 pence (2015: 52.3 pence), an increase of 15.5% over the prior year. The weakening of sterling against the majority of the Group’s key currencies has given rise to approximately 6% positive impact in each of these measures.
UNDERLYING RESULTSThroughout the Strategic Report, and consistent with prior years, underlying measures are used to describe the Group’s performance. These are not recognised under IFRS or other generally accepted accounting principles (GAAP).
The Executive Board of the Group manages and assesses the performance of the business on these measures and believes they are more representative of ongoing trading, facilitate meaningful year on year comparisons and hence provide more useful information to shareholders. All underlying measures are defined in the glossary of terms on page 172.
A summary of adjustments from statutory results to underlying results is shown on page 21 and further detailed in the consolidated income statement (page 90), reconciliation of free cash flow from operations (page 95), the segmental reporting note (pages 102 to 105), and the tax note (pages 109 to 110).
UNDERLYING REVENUEUnderlying revenue was £19,871 million (2015: £ 17,843 million), an increase of 11.4%. If we restate 2015’s revenue at the 2016 average exchange rates for the year, it would increase by £882 million. On a constant currency basis, underlying revenue has therefore increased by £1,146 million, or 6.1%. Organic revenue growth for the year was 5.0%, comprising new business of 8.8%, a retention rate of 94.1% and like for like growth of 2.1%.
UNDERLYING OPERATING PROFITUnderlying operating profit was £1,445 million (2015: £1,296 million), an increase of 11.5%. If we restate 2015’s profit at the 2016 average exchange rates for the year, it would increase by £72 million. On a constant currency basis, underlying operating profit has therefore increased by £77 million, or 5.6%.
UNDERLYING FINANCE COSTSThe underlying net finance cost was £101 million (2015: £104 million), with the decrease a result of lower pension interest costs given the increased surplus on the UK scheme. For 2017, we expect an underlying net finance cost of around £110 million, reflecting the weakness of sterling on foreign denominated debt. This equates to an effective interest rate of around 3% on gross debt.
UNDERLYING INCOME TAX EXPENSEOn an underlying basis, the tax charge was £330 million (2015: £292 million), equivalent to an effective tax rate of 24.5% (2015: 24.5%).
In 2017, we expect to see upward pressure on the tax rate. This is a consequence of both the changing regulatory environment affecting all multinationals and the impact of exchange rates. Our current expectations are for the 2017 tax rate to be around 1% higher than 2016, but we note that we are likely to see a continuing period of significant uncertainty in the international corporate tax environment as we look forward.
UNDERLYING BASIC EARNINGS PER SHAREOn an underlying basis, the basic earnings per share grew by 13.8% to 61.1 pence (2015: 53.7 pence). If we restate 2015’s basic earnings per share at the 2016 average rates for the year, it would be 56.7 pence. On a constant currency basis, basic earnings per share therefore increased by 7.8%.
DIVIDENDSOur dividend policy is to grow the dividend in line with growth in underlying constant currency earnings per share. It is therefore proposed that a final dividend of 21.1 pence per share be paid on 20 February 2017 to shareholders on the register on 20 January 2017. This will result in a total dividend for the year of 31.7 pence per share (2015: 29.4 pence per share), a year on year increase of 7.8%. The dividend is covered 1.9 times on an underlying earnings basis and 1.8 times on a cash basis. We remain committed to growing the dividend in line with constant currency earnings.
22 Compass Group PLC Annual Report 2016

UNDERLYING FREE CASH FLOWUnderlying free cash flow grew by 26% to £908 million (2015: £722 million), in part due to foreign exchange. Free cash flow conversion has increased to 63% (2015: 56%).
Underlying gross capital expenditure of £580 million (2015: £507 million) is equivalent to 2.9% of underlying revenues (2015: 2.8% of underlying revenues), and we expect that capex in 2017 will be at a similar percentage of underlying revenues. We continue to deliver strong returns on our capital expenditure across all regions.
Excluding pensions and provisions, trade working capital has decreased by £12 million (2015: £17 million increase). Some underlying improvements and some timing differences offset the negative impact of around £70 million from the timing of our payroll run in September in the USA and UK. We continue to focus on improving working capital and expect a small outflow in 2017.
The cash outflow of £39 million (2015: £59 million) on post employment benefit obligations largely reflects payments agreed with trustees to reduce deficits on the defined benefit pension scheme in the UK. Following the completion of the triannual valuation of the Compass Group Pension Plan in the UK, which now has a funding surplus, we have agreed with the trustees that we will stop our deficit reduction payments. We therefore expect our cash outflow on post employment benefit obligations to reduce to around £20 million in 2017.
The underlying cash tax rate for the year was 18% (2015: 20%) which is slightly lower than the expected level. This is largely a result of certain legislation changes during the year in North America. In 2017, we expect the cash tax rate to be in the range of 20 to 23%.
The net interest outflow for the year was £94 million (2015: £93 million).
POST EMPLOYMENT BENEFIT OBLIGATIONSThe Group has continued to review and monitor its pension obligations throughout the year, working closely with the trustees and members of schemes around the Group to ensure proper and prudent assumptions are used and adequate provision and contributions are made.
The Group has a net pension deficit of £21 million at 30 September 2016, calculated in accordance with IAS 19, for all Group defined benefit schemes (2015: £9 million deficit). The total pensions charge for defined contribution schemes in the year was £100 million (2015: £84 million) and £17 million (2015: £21 million) for defined benefit schemes. Included in the defined benefit scheme costs was a £1 million charge to net finance cost (2015: £5 million), which has reduced due to the increase in the UK accounting surplus in 2015 compared to 2014.
ACQUISITION PAYMENTSThe total cash spend on acquisitions in the year, net of cash acquired, was £180 million (2015: £89 million), comprising £148 million of infill acquisitions, £2 million on acquisition transaction costs and £30 million of deferred consideration relating to prior years’ acquisitions.
RETURN ON CAPITAL EMPLOYEDReturn on capital employed was 19.4% (2015: 19.1%) based on underlying operations, net of tax at the effective underlying rate of 24.5% (2014: 24.5%), and excluding the Group’s non-controlling partners’ share of total operating profit. The average capital employed was £5,565 million (2015: £5,093 million). On a constant currency basis, the increase in return on capital employed would have been 10 basis points, with the remainder a result of currency movements.
PURCHASE OF OWN SHARESDuring the year, the Group purchased shares for a consideration of £100 million (2015: £328 million).
RELATED PARTY TRANSACTIONSDetails of transactions with related parties are set out in note 29 of the consolidated financial statements. These transactions have not had, and are not expected to have, a material effect on the financial performance or position of the Group.
STRATEG
IC REPO
RT
Compass Group PLC Annual Report 2016 23

Finance Director’s statement continued
FINANCIAL POSITIONThe ratio of net debt to market capitalisation of £24,737 million as at 30 September 2016 was 12% (2015: 15%).
At the end of the year, net debt was £2,874 million (2015: £2,603 million). The ratio of net debt to underlying EBITDA was 1.6x, higher than usual due to movements in currency in the final quarter of the year. Our leverage policy is to maintain strong investment grade credit ratings, returning any surplus cash to shareholders to target net debt to underlying EBITDA of around 1.5x.
SHAREHOLDER RETURNThe market price of the Group’s ordinary shares at the close of the financial year was 1,495.00 pence per share (2015: 1,053.00 pence per share).
LIQUIDITY RISKThe Group finances its borrowings from a number of sources including the bank, the public and the private placement markets. The Group has developed long term relationships with a number of financial counterparties with the balance sheet strength and credit quality to provide credit facilities as required. The Group seeks to avoid a concentration of debt maturities in any one period to spread its refinancing risk. The maturity profile of the Group’s principal borrowings at 30 September 2016 shows that the average period to maturity is 5.0 years (2015: 6.2 years).
The Group’s undrawn committed bank facilities at 30 September 2016 were £1,000 million (2015: £1,000 million).
FINANCIAL MANAGEMENTThe Group continues to manage its interest rate and foreign currency exposure in accordance with the policies set out below. The Group’s financial instruments comprise cash, borrowings, receivables and payables that are used to finance the Group’s operations. The Group also uses derivatives, principally interest rate swaps, forward currency contracts and cross currency swaps, to manage interest rate and currency risks arising from the Group’s operations. The Group does not trade in financial instruments. The Group’s treasury policies are designed to mitigate the impact of fluctuations in interest rates and exchange rates and to manage the Group’s financial risks. The Board approves any changes to the policies. These policies have not changed in the year.
FOREIGN CURRENCY RISKThe Group’s policy is to match as far as possible its principal projected cash flows by currency to actual or effective borrowings in the same currency. As currency cash flows are generated, they are used to service and repay debt in the same currency. Where necessary, to implement this policy, forward currency contracts and cross currency swaps are taken out which, when applied to the actual currency liabilities, convert these to the required currency.
FINANCING – MATURITY PROFILE OF PRINCIPAL BORROWINGS AS AT 30 SEPTEMBER 2016 (£M)
Bank £ Private Placement US$ Private Placement
1. Based on borrowings and facilities in place as at 30 September 2016, maturing in the financial year ending 30 September.2. The average life of the Group’s principal borrowings is 5.0 years (2015: 6.2 years).
€ Bond £ Bond
0 200 400 600 800 1,000
2017
2018
2019
2020
2021
2022
2023
2024
2025
2026
2027
35 250
281
519 192
154
1,000
306
433
271
308
250
231
24 Compass Group PLC Annual Report 2016
The borrowings in each currency can give rise to foreign exchange differences on translation into sterling. Where the borrowings either are less than, or equate to, the net investment in overseas operations, these exchange rate movements are treated as movements on reserves and recorded in the consolidated statement of comprehensive income rather than in the income statement.
Non-sterling earnings streams are translated at the average rate of exchange for the year. Fluctuations in exchange rates have given, and will continue to give, rise to translation differences. The Group is only partially protected from the impact of such differences through the matching of cash flows to currency borrowings.
INTEREST RATE RISKAs set out above, the Group has effective borrowings in a number of currencies and its policy is to ensure that, in the short term, it is not materially exposed to fluctuations in interest rates in its principal currencies. The Group implements this policy either by borrowing fixed rate debt or by using interest rate swaps so that the interest rates on at least 80% of the Group’s projected debt are fixed for one year, reducing to 60% fixed for the second year and 40% fixed for the third year.
GROUP TAX POLICYAs a Group, we are committed to creating long term shareholder value through the responsible, sustainable and efficient delivery of our key business objectives. This will enable us to grow the business and make significant investments into the Group and its operations.
We therefore adopt an approach to tax that supports this strategy and also balances the various interests of our stakeholders including shareholders, governments, employees and the communities in which we operate. Our aim is to pursue a principled and sustainable tax strategy that has strong commercial merit and is aligned with our business strategy. We believe this will enhance shareholder value whilst protecting Compass’ reputation.
In doing so, we act in compliance with the relevant local and international laws and disclosure requirements, and we conduct an open and transparent relationship with the relevant tax authorities that fully complies with the Group’s Code of Business Conduct and Code of Ethics.
In an increasingly complex international environment, a degree of tax risk and uncertainty is, however, inevitable. We manage and control these risks in a proactive manner and in doing so, exercise our judgement and seek appropriate advice from relevant professional firms. Tax risks are assessed as part of the Group’s formal governance process and are reviewed by the Board and the Audit Committee on a regular basis.
RISKS AND UNCERTAINTIESThe Board takes a proactive approach to risk management with the aim of protecting its employees and customers and safeguarding the interests of the Group, its shareholders, employees, clients, consumers and all other stakeholders.
The principal risks and uncertainties that face the business and the activities the Group undertakes to mitigate these are set out on pages 27 to 29.
GOING CONCERNThe Group’s business activities, together with the factors likely to affect its future development, performance and position are set out in the Business Review, as is the financial position of the Group, its cash flows, liquidity position, and borrowing facilities. In addition, note 17 includes the Group’s objectives, policies and processes for managing its capital, its financial risk management objectives, details of its financial instruments and hedging activities and its exposures to credit risk and liquidity risk.
The Group has considerable financial resources together with longer term contracts with a number of clients and suppliers across different geographic areas and industries. As a consequence, the directors believe that the Group is well placed to manage its business risks successfully.
After making enquiries, the directors have a reasonable expectation that the Group has adequate resources to continue in operational existence for the 12 months from the date of approval of this Annual Report. For this reason, they continue to adopt the going concern basis in preparing the financial statements.
VIABILITY STATEMENTIn accordance with provision C.2.2 of the UK Corporate Governance Code 2014, the directors have assessed the viability of the Group over a three year period, taking into account the Group’s current position and the potential impact of the principal risks documented on pages 27 to 29 of the Annual Report. Based on this assessment, the directors confirm that they have a reasonable expectation that the Company will be able to continue in operation and meet its liabilities as they fall due over the period to 30 September 2019.
STRATEG
IC REPO
RT
Compass Group PLC Annual Report 2016 25

The directors have determined that a three year period to 30 September 2019 is an appropriate period over which to provide its viability statement. This is the period reviewed by the Group Board in our strategic planning process and is also aligned to our typical contract length (three to five years). We believe that this presents the Board and readers of the Annual Report with a reasonable degree of confidence over this longer term outlook.
In making this statement, the Board carried out a robust assessment of the principal risks facing the Group, including those that would threaten its business model, future performance, solvency or liquidity.
The Board considers annually and on a rolling basis a three year, bottom up strategic plan. The output of this plan is used to perform central debt and headroom profile analysis, which includes a review of sensitivity to ‘business as usual’ risks, such as profit growth and working capital variances and severe but plausible events. It also considers the ability of the Group to raise finance and deploy capital. The results take into account the availability and likely effectiveness of the mitigating actions that could be taken to avoid or reduce the impact or occurrence of the identified underlying risks.
While the review has considered all the principal risks identified by the Group, the following were focused on for enhanced stress testing: health and safety, economic and political environment, and clients and consumers. The geographical and sector diversification of the Group’s operations helps minimise the risk of serious business interruption or catastrophic damage to our reputation. Furthermore, our business model is structured so
that the Group is not reliant on one particular group of clients or sector. Our largest client constitutes only 2% of Group revenue and our top 10 clients account for less than 9% of Group revenue. Also, our ability to flex our cost base protects our viability in the face of adverse economic conditions and/or political uncertainty.
While this review does not consider all of the risks that the Group may face, the directors consider that this stress testing based assessment of the Group’s prospects is reasonable in the circumstances of the inherent uncertainty involved.
Johnny ThomsonGroup Finance Director 22 November 2016
The Strategic Report, as set out on pages 1 to 33, has been approved by the Board.
On behalf of the Board
Mark WhiteGeneral Counsel and Company Secretary 22 November 2016
Finance Director’s statement continued
26 Compass Group PLC Annual Report 2016
IDENTIFYING AND MANAGING RISK
RISK MANAGEMENT
Risk Management should be read in conjunction with the Strategy and KPI sections.
See pages 8 and 9 and 12 and 13 respectively
As set out in the Corporate Governance section within the Annual Report, the Group has policies and procedures in place to ensure that risks are properly identified, evaluated and managed at the appropriate level within the business.
The identification of risks and opportunities, the development of action plans to manage the risks and maximise the opportunities, and the continual monitoring of progress against agreed key performance indicators (KPIs) are integral parts of the business process and core activities throughout the Group.
The table on pages 28 and 29 sets out the principal risks and uncertainties facing the business at the date of this Report. These have been subject to robust assessment and review. They do not comprise all of the risks that the Group may face and are not listed in any order of priority. Additional risks and uncertainties not presently known to management, or deemed to be less material at the date of this Report, may also have an adverse effect on the Group. These include risks resulting from the UK’s recent EU referendum which could adversely affect the risks noted under the ‘economic and political environment’ section of the table on the following pages as well as affecting financial risks such as liquidity and credit. Although the risks related to the EU referendum have been discussed by the Board,
it is too early to properly understand the impact on the business. In accordance with the provisions of the UK Corporate Governance Code, the Board has taken into consideration the principal risks in the context of determining whether to adopt the going concern basis of accounting and when assessing the prospects of the Company for the purpose of preparing the Viability Statement. The Going Concern and Viability Statement can be found on pages 25 and 26 of the Strategic Report.
The Group faces a number of operational risks on an ongoing basis such as litigation and financial (including liquidity and credit) risk and some wider risks, for example, environmental and reputational. Additionally, there are risks (such as those relating to the eurozone economy, pensions, and acquisitions and investments) which vary in importance depending on changing conditions. All risks disclosed in previous years can be found in the annual reports available on our website at www.compass-group.com. We recognise that these risks remain important to the business and they are kept under review. However, we have focused the disclosures on pages 28 and 29 on those risks that are currently considered to be more significant to the Group.
The Board continues to take a proactive approach to recognising, assessing and mitigating risk with the aim of protecting its employees and consumers and safeguarding the interests of the Company and its shareholders in the constantly changing environment in which it operates.
STRATEG
IC REPO
RT
Compass Group PLC Annual Report 2016 27

PRINCIPAL RISKS
CHANGE IN RISK
Increased risk Consistent risk
RISKS DESCRIPTION EXAMPLES OF MITIGATION
HEALTH AND SAFETY
HEALTH AND SAFETY
2015
2016
Health and safety is our number one operational priority. We are focused on protecting people’s wellbeing, as well as avoiding serious business interruption and potential damage to our reputation. Compass feeds millions of consumers and employs thousands of people around the world every day. Therefore, setting the highest standards for food hygiene and safety is paramount.
All management meetings throughout the Group feature a health and safety update as their first agenda item.Health and safety improvement KPIs are included in the annual bonus plans for each of the business’ management teams.The Group has policies, procedures and standards in place to ensure compliance with legal obligations and industry standards.The safety and quality of our global supply chain are assured through compliance against a robust set of standards which are regularly reviewed, audited and upgraded as necessary to improve supply chain visibility and product integrity.
CLIENTS AND CONSUMERS
CLIENT AND CONSUMER SALES AND RETENTION
2015
2016
Our business relies on securing and retaining a diverse range of clients.
We have strategies which strengthen our long term relationships with our clients and consumers based on quality, value and innovation.Our business model is structured so that we are not reliant on one particular sector, geography or group of clients.
BIDDING
2015
2016
Each year, the Group could bid for a large number of opportunities.
A rigorous tender review process is in place, which includes a critical assessment of contracts to identify potential risks (including social and ethical risks) and rewards, prior to approval at an appropriate level in the organisation.
SERVICE DELIVERY AND CONTRACTUAL COMPLIANCE
2015
2016
The Group’s operating companies contract with a large number of clients. Failure to comply with the terms of these contracts, including proper delivery of services, could lead to loss of business.
Processes are in place to ensure that the services delivered to clients are of an appropriate standard and comply with the required contract terms and conditions.
COMPETITION
2015
2016
We operate in a highly competitive marketplace. The levels of concentration and outsource penetration vary by country and by sector. Some markets are relatively concentrated with two or three key players. Others are highly fragmented and offer significant opportunities for consolidation and penetration of the self-operated market. Aggressive pricing from our competitors could cause a reduction in our revenues and margins.
We aim to minimise this by continuing to promote our differentiated propositions and by focusing on our points of strength, such as flexibility in our cost base, quality and value of service and innovation.
PEOPLE
RECRUITMENT
2015
2016
Failure to attract and recruit people with the right skills at all levels could limit the success of the Group. The Group faces resourcing challenges in some of its businesses due to a lack of industry experience amongst candidates and appropriately qualified people, and the seasonal nature of some of our business.
The Group aims to mitigate this risk by efficient, time critical resource management, mobilisation of existing, experienced employees within the organisation and through offering training and development programmes.
RETENTION AND MOTIVATION
2015
2016
Retaining and motivating the best people with the right skills, at all levels of the organisation, is key to the long term success of the Group.
The Group has established training, development, performance management and reward programmes to retain, develop and motivate our best people.The Group has a well established employee engagement initiative, Your Voice, which helps us to monitor, understand and respond to our employees’ needs.
28 Compass Group PLC Annual Report 2016
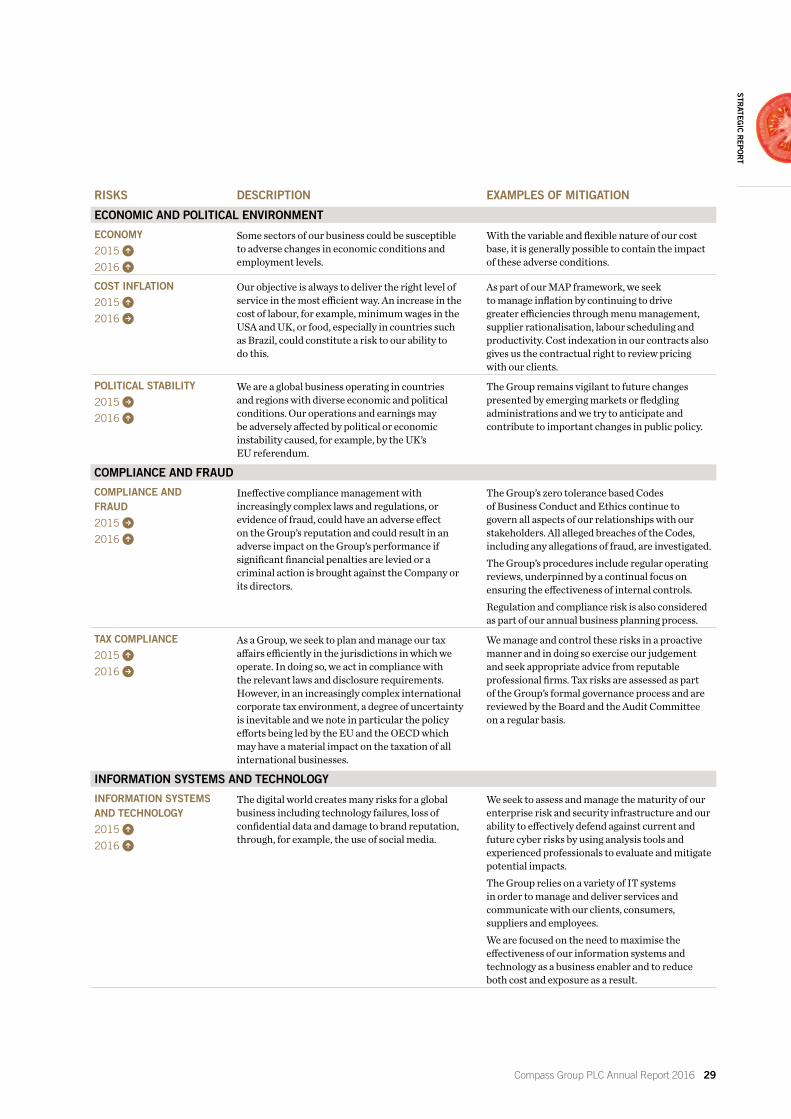
RISKS DESCRIPTION EXAMPLES OF MITIGATION
ECONOMIC AND POLITICAL ENVIRONMENT
ECONOMY
2015
2016
Some sectors of our business could be susceptible to adverse changes in economic conditions and employment levels.
With the variable and flexible nature of our cost base, it is generally possible to contain the impact of these adverse conditions.
COST INFLATION
2015
2016
Our objective is always to deliver the right level of service in the most efficient way. An increase in the cost of labour, for example, minimum wages in the USA and UK, or food, especially in countries such as Brazil, could constitute a risk to our ability to do this.
As part of our MAP framework, we seek to manage inflation by continuing to drive greater efficiencies through menu management, supplier rationalisation, labour scheduling and productivity. Cost indexation in our contracts also gives us the contractual right to review pricing with our clients.
POLITICAL STABILITY
2015
2016
We are a global business operating in countries and regions with diverse economic and political conditions. Our operations and earnings may be adversely affected by political or economic instability caused, for example, by the UK’s EU referendum.
The Group remains vigilant to future changes presented by emerging markets or fledgling administrations and we try to anticipate and contribute to important changes in public policy.
COMPLIANCE AND FRAUD
COMPLIANCE AND FRAUD
2015
2016
Ineffective compliance management with increasingly complex laws and regulations, or evidence of fraud, could have an adverse effect on the Group’s reputation and could result in an adverse impact on the Group’s performance if significant financial penalties are levied or a criminal action is brought against the Company or its directors.
The Group’s zero tolerance based Codes of Business Conduct and Ethics continue to govern all aspects of our relationships with our stakeholders. All alleged breaches of the Codes, including any allegations of fraud, are investigated.The Group’s procedures include regular operating reviews, underpinned by a continual focus on ensuring the effectiveness of internal controls.Regulation and compliance risk is also considered as part of our annual business planning process.
TAX COMPLIANCE
2015
2016
As a Group, we seek to plan and manage our tax affairs efficiently in the jurisdictions in which we operate. In doing so, we act in compliance with the relevant laws and disclosure requirements. However, in an increasingly complex international corporate tax environment, a degree of uncertainty is inevitable and we note in particular the policy efforts being led by the EU and the OECD which may have a material impact on the taxation of all international businesses.
We manage and control these risks in a proactive manner and in doing so exercise our judgement and seek appropriate advice from reputable professional firms. Tax risks are assessed as part of the Group’s formal governance process and are reviewed by the Board and the Audit Committee on a regular basis.
INFORMATION SYSTEMS AND TECHNOLOGY
INFORMATION SYSTEMS AND TECHNOLOGY
2015
2016
The digital world creates many risks for a global business including technology failures, loss of confidential data and damage to brand reputation, through, for example, the use of social media.
We seek to assess and manage the maturity of our enterprise risk and security infrastructure and our ability to effectively defend against current and future cyber risks by using analysis tools and experienced professionals to evaluate and mitigate potential impacts.The Group relies on a variety of IT systems in order to manage and deliver services and communicate with our clients, consumers, suppliers and employees.We are focused on the need to maximise the effectiveness of our information systems and technology as a business enabler and to reduce both cost and exposure as a result.
STRATEG
IC REPO
RT
Compass Group PLC Annual Report 2016 29

CORPORATE RESPONSIBILITY
REDUCING RISK AND DRIVING GROWTHThe Group’s strategy and approach to corporate responsibility (CR) are well aligned as we improve the business model to reflect more sustainable practices. CR is a keystone of our commitment to provide the highest quality service to our customers. Across the business, the safety of our colleagues and consumers is our number one operational priority and supports our growth strategy, increases trust and helps us attract the best talent.
OUR PILLARS, PRIORITIES AND PROGRESSOUR PILLARS OUR PRIORITIES OUR PROGRESS
OUR PEOPLEOur people are fundamental to our great service and reputation and we recognise their positive contribution to our performance.
Ensuring our employees are well trained, safe, motivated and productive is an essential component of our business model.
1 WORKPLACE HEALTH & SAFETYTransparency around the processes and controls in place to ensure the safety and wellbeing of our people.
2 EMPLOYEE RECRUITMENT & RETENTIONProvide our people with training and development opportunities. Recognise and reward their great work.
• Since 2013, we have achieved a 29% reduction in our Lost Time Incident Frequency Rate performance. However, this year we have seen our performance plateau. We are not complacent and continue to embed a strong safety leadership culture, as well as improved return to work programmes
• Sadly, we had one work related fatality as a result of a motor vehicle accident. As part of our commitment for continuous improvement, we have shared lessons learned
Global Lost Time Incident Frequency Rate
-29%(vs 2013)
RESPONSIBLE SOURCINGHaving a responsible supply chain is important for us to deliver the quality of food service which is a key business driver for Compass and of paramount importance to our customers.
As a result of our actions across our supply chain, we are able to build client and consumer confidence, reduce potential risks and develop sustainable relationships.
3 PRODUCT SAFETYVisibility around the ingredients that we source for our operations.
4 SUPPLY CHAIN INTEGRITYEnsure our supply chain is acting responsibly and humanely towards its workforce.
5 CBC COMPLIANCEEnsure the implementation of our Codes of Business Conduct and Ethics. Measure and report concerns via the Speak Up whistleblowing programme.
• We have extended our third party audit programme to validate around the world that all our markets are complying with the requirements of our Global Food Safety Standards
• Audit results identified that some of our developing markets, including India and Singapore, required further support to implement effective controls. We have responded by investing in additional resource to help local teams embed the required operational standards
Global Food Safety Incident Rate
-19%(vs 2013)
HEALTH & WELLBEINGBy pursuing our passion for wellbeing and nutrition, we can help our consumers and employees adopt a more balanced lifestyle.
We support our clients to deliver improved employee performance and satisfaction, encouraging client retention in our business.
6 WELLBEING AND NUTRITIONPromote simple product labelling and signposting to encourage our consumers to make healthy choices.
• In our more developed markets including the UK and US, we have introduced apps such as My Fitness Pal, that enable consumers to track their calorie and nutritional intake, directly linked to our menus. These apps help our consumers to make healthier choices
Number of sites offering healthy eating programmes
+21%(vs 2013)
ENVIRONMENTAL REPORTINGAs a leading food and support services provider, we have a clear responsibility to help protect the environment.
We are reducing our impact by implementing programmes that focus on the improved use of resources, helping us to manage our costs and those of our clients more effectively.
7 ENVIRONMENTAL REPORTINGTransparency around our environmental impacts, target setting and reporting to demonstrate progress.
• We have extended the roll out of our food waste measurement and tracking technology solution
• In sites where we have implemented this solution, we have seen a reduction in food waste of around 50%
• In 2017, we will expand the pilot roll out to around 10 countries to assess the viability of a wider geographic scope
GHG intensity ratio
-16%(vs 2013)
OUR CR STRATEGYEach year, we review the issues which matter most to our business and stakeholders to help us better assess our key business risks and opportunities. Through this process we have identified seven issues we believe materially impact our business and our relationships with our stakeholders (see matrix below).
OUR MATERIAL IMPACTS
In the following table we outline how our four CR pillars address these seven issues, why they matter to us and how they inform our priorities and activities moving forward.
Through our strategic review, stakeholders and international clients have indicated their growing interest in supporting the United Nations’ Sustainable Development Goals (SDGs) as agreed by world leaders in September 2015. In response to this feedback, we have focused our attention on how our business activities can help us to deliver towards the SDGs at a global and local level. See pages 32 and 33 for a more detailed narrative on those specific SDGs where we believe we can make the most positive social impact.
IMPACT
PROBABILITYH
igh
Low Medium High
Medium
Low
2
7
6
5
1
4
3
Visit our website for more information about our approach to CR and progress against performance
www.compass-group.com
30 Compass Group PLC Annual Report 2016
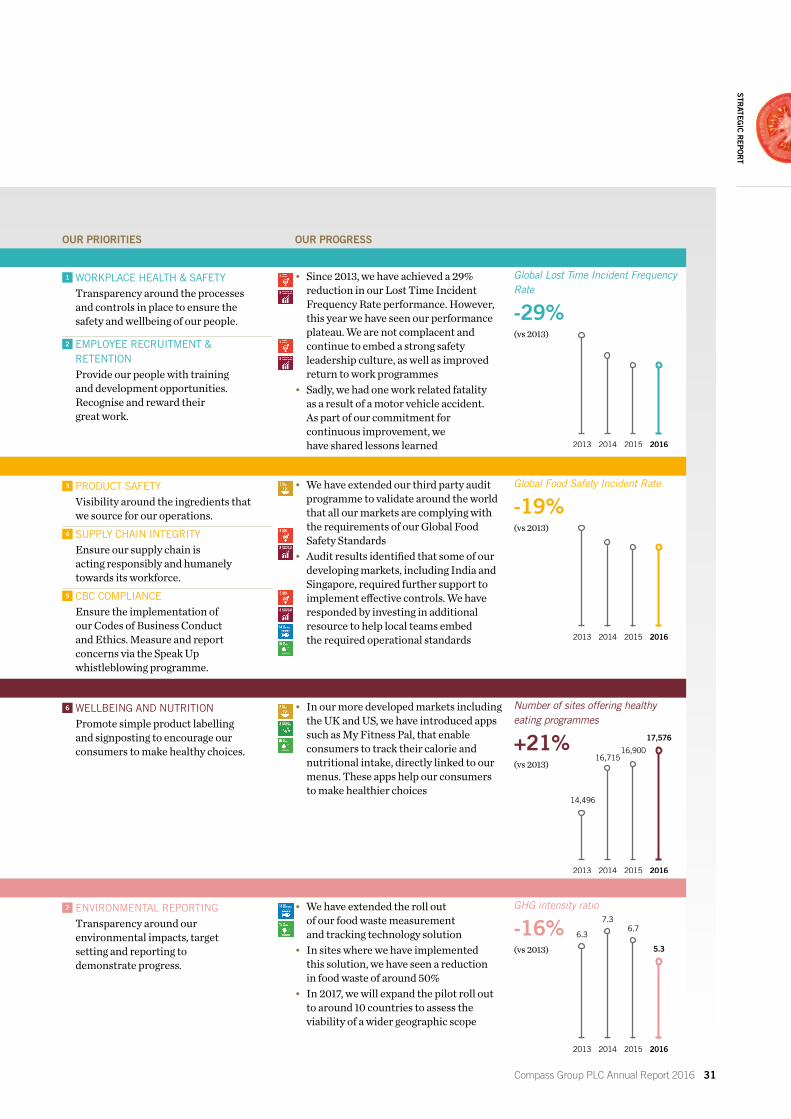
OUR PILLARS, PRIORITIES AND PROGRESSOUR PILLARS OUR PRIORITIES OUR PROGRESS
OUR PEOPLEOur people are fundamental to our great service and reputation and we recognise their positive contribution to our performance.
Ensuring our employees are well trained, safe, motivated and productive is an essential component of our business model.
1 WORKPLACE HEALTH & SAFETYTransparency around the processes and controls in place to ensure the safety and wellbeing of our people.
2 EMPLOYEE RECRUITMENT & RETENTIONProvide our people with training and development opportunities. Recognise and reward their great work.
• Since 2013, we have achieved a 29% reduction in our Lost Time Incident Frequency Rate performance. However, this year we have seen our performance plateau. We are not complacent and continue to embed a strong safety leadership culture, as well as improved return to work programmes
• Sadly, we had one work related fatality as a result of a motor vehicle accident. As part of our commitment for continuous improvement, we have shared lessons learned
Global Lost Time Incident Frequency Rate
-29%(vs 2013)
RESPONSIBLE SOURCINGHaving a responsible supply chain is important for us to deliver the quality of food service which is a key business driver for Compass and of paramount importance to our customers.
As a result of our actions across our supply chain, we are able to build client and consumer confidence, reduce potential risks and develop sustainable relationships.
3 PRODUCT SAFETYVisibility around the ingredients that we source for our operations.
4 SUPPLY CHAIN INTEGRITYEnsure our supply chain is acting responsibly and humanely towards its workforce.
5 CBC COMPLIANCEEnsure the implementation of our Codes of Business Conduct and Ethics. Measure and report concerns via the Speak Up whistleblowing programme.
• We have extended our third party audit programme to validate around the world that all our markets are complying with the requirements of our Global Food Safety Standards
• Audit results identified that some of our developing markets, including India and Singapore, required further support to implement effective controls. We have responded by investing in additional resource to help local teams embed the required operational standards
Global Food Safety Incident Rate
-19%(vs 2013)
HEALTH & WELLBEINGBy pursuing our passion for wellbeing and nutrition, we can help our consumers and employees adopt a more balanced lifestyle.
We support our clients to deliver improved employee performance and satisfaction, encouraging client retention in our business.
6 WELLBEING AND NUTRITIONPromote simple product labelling and signposting to encourage our consumers to make healthy choices.
• In our more developed markets including the UK and US, we have introduced apps such as My Fitness Pal, that enable consumers to track their calorie and nutritional intake, directly linked to our menus. These apps help our consumers to make healthier choices
Number of sites offering healthy eating programmes
+21%(vs 2013)
ENVIRONMENTAL REPORTINGAs a leading food and support services provider, we have a clear responsibility to help protect the environment.
We are reducing our impact by implementing programmes that focus on the improved use of resources, helping us to manage our costs and those of our clients more effectively.
7 ENVIRONMENTAL REPORTINGTransparency around our environmental impacts, target setting and reporting to demonstrate progress.
• We have extended the roll out of our food waste measurement and tracking technology solution
• In sites where we have implemented this solution, we have seen a reduction in food waste of around 50%
• In 2017, we will expand the pilot roll out to around 10 countries to assess the viability of a wider geographic scope
GHG intensity ratio
-16%(vs 2013)
2013 2014 2015 2016
6.3
7.36.7
5.3
2013 2014 2015 2016
14,496
16,71516,900
17,576
2013 2014 2015 2016
2013 2014 2015 2016
STRATEG
IC REPO
RT
Compass Group PLC Annual Report 2016 31
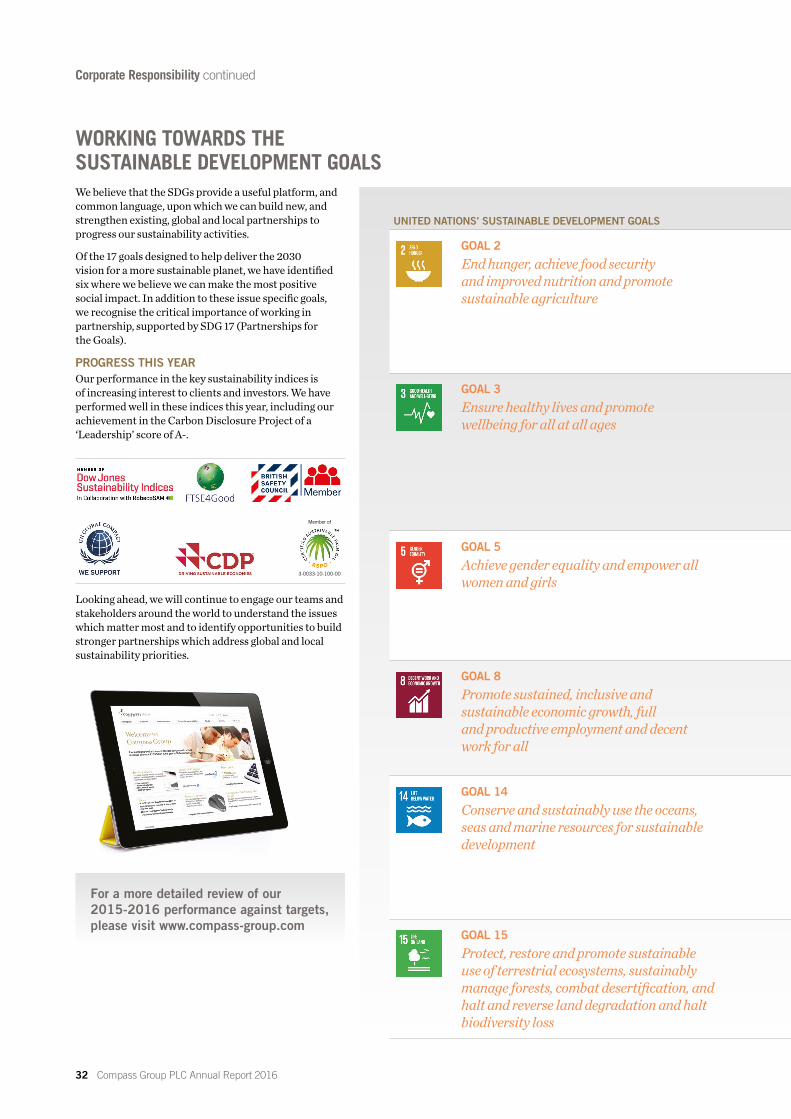
We believe that the SDGs provide a useful platform, and common language, upon which we can build new, and strengthen existing, global and local partnerships to progress our sustainability activities.
Of the 17 goals designed to help deliver the 2030 vision for a more sustainable planet, we have identified six where we believe we can make the most positive social impact. In addition to these issue specific goals, we recognise the critical importance of working in partnership, supported by SDG 17 (Partnerships for the Goals).
PROGRESS THIS YEAROur performance in the key sustainability indices is of increasing interest to clients and investors. We have performed well in these indices this year, including our achievement in the Carbon Disclosure Project of a ‘Leadership’ score of A-.
Looking ahead, we will continue to engage our teams and stakeholders around the world to understand the issues which matter most and to identify opportunities to build stronger partnerships which address global and local sustainability priorities.
WORKING TOWARDS THE SUSTAINABLE DEVELOPMENT GOALS
UNITED NATIONS’ SUSTAINABLE DEVELOPMENT GOALS THE GLOBAL CHALLENGE COMPASS’ ROLE FOR EXAMPLE
GOAL 2
End hunger, achieve food security and improved nutrition and promote sustainable agriculture
By 2050, the world’s population is expected to increase by two billion. At present almost 800 million of the world’s population are malnourished and starving. This means that the need to improve sustainable agriculture will become increasingly critical as the demand on natural resources intensifies.
Every year, we spend around £5 billion on food. Collaborating with our supply chain to design and deliver scalable and practical solutions for food security and sustainable agriculture is therefore vitally important to safeguard the future of our business.
Since 2014, our Imperfectly Delicious Produce programme run by our US business has used over 200,000 kgs of imperfect fruit and vegetables that would otherwise have rotted in fields, been sent to composting or landfill for simply not meeting an artificial standard of attractiveness.
GOAL 3
Ensure healthy lives and promote wellbeing for all at all ages
Nutrition is essential for sustainable development. Every year, poor nutrition kills over three million children under five, whilst around the world over two billion people are overweight or obese.
Each year, we serve over five billion meals. By pursuing our passion for wellbeing and nutrition, we are committed to helping our consumers and employees adopt a more balanced lifestyle.
Since 2010, we have worked towards a target that 100% of our units will provide Balanced Choices or similar healthy eating programmes by 2016. This year, we have seen a further improvement in our performance (67% vs 66% in 2015). We have not met our stated target of 100% of units by 2016 and will continue to work towards achieving this through 2017.
GOAL 5
Achieve gender equality and empower all women and girls
Women and girls around the world struggle to exercise their rights, face discrimination, legal barriers and violence and receive unequal pay for equal work.
Women make up 57% of our global workforce and 26% of our global leadership team. We are resolved to empower all our female employees as we know this leads to increases in productivity, organisational effectiveness and consumer satisfaction.
In 2016, our UK business launched the Women in Food programme, to tackle the shortage of female chefs. By 2020, we expect that 50% of the chefs in our UK workplace will be female.
GOAL 8
Promote sustained, inclusive and sustainable economic growth, full and productive employment and decent work for all
The availability of decent work is a must for lasting, inclusive and economic growth, yet while the global labour force continues to grow, there are not enough jobs available, particularly amongst young people and indigenous communities.
Our 500,000+ employees are fundamental to our great service and reputation. Around the world we are working with local communities to offer fair employment and great career opportunities.
In Australia, we launched Project 1050 to support the recruitment of an additional 1,050 indigenous jobseekers into the Compass workforce by 2019.
GOAL 14
Conserve and sustainably use the oceans, seas and marine resources for sustainable development
30% of the world’s fish stocks are overexploited, compromising their ability to produce sustainable yields.
Three words encapsulate our approach to sustainable seafood; (1) Avoid: by not serving seafood on the Marine Stewardship Council’s (MSC) ‘fish to avoid’ list; (2) Improve: by buying more certified sustainable seafood each year; (3) Promote: the availability of responsibly sourced fish to our consumers.
We have partnered with the MSC in the UK to develop the Good Fish Guide app, which encourages everyone from chefs to consumers to make more sustainable choices easily and quickly.
GOAL 15
Protect, restore and promote sustainable use of terrestrial ecosystems, sustainably manage forests, combat desertification, and halt and reverse land degradation and halt biodiversity loss
People need nature to thrive. It is particularly critical for sustainable agriculture, yet deforestation, desertification and loss of biodiversity and natural habitats are degrading fertile land and reducing crop productivity.
We are working across our supply chain, to ensure we source our food and non-food products in a sustainable manner with the least possible impact on the environment.
Globally, we are a member of the Roundtables on Responsible Soy and Responsible Palm Oil, whilst 17 of our top 20 countries have already established sustainable and ethical sourcing programmes.
Corporate Responsibility continued
3-0033-10-100-00
Member of
32 Compass Group PLC Annual Report 2016
For a more detailed review of our 2015-2016 performance against targets, please visit www.compass-group.com

UNITED NATIONS’ SUSTAINABLE DEVELOPMENT GOALS THE GLOBAL CHALLENGE COMPASS’ ROLE FOR EXAMPLE
GOAL 2
End hunger, achieve food security and improved nutrition and promote sustainable agriculture
By 2050, the world’s population is expected to increase by two billion. At present almost 800 million of the world’s population are malnourished and starving. This means that the need to improve sustainable agriculture will become increasingly critical as the demand on natural resources intensifies.
Every year, we spend around £5 billion on food. Collaborating with our supply chain to design and deliver scalable and practical solutions for food security and sustainable agriculture is therefore vitally important to safeguard the future of our business.
Since 2014, our Imperfectly Delicious Produce programme run by our US business has used over 200,000 kgs of imperfect fruit and vegetables that would otherwise have rotted in fields, been sent to composting or landfill for simply not meeting an artificial standard of attractiveness.
GOAL 3
Ensure healthy lives and promote wellbeing for all at all ages
Nutrition is essential for sustainable development. Every year, poor nutrition kills over three million children under five, whilst around the world over two billion people are overweight or obese.
Each year, we serve over five billion meals. By pursuing our passion for wellbeing and nutrition, we are committed to helping our consumers and employees adopt a more balanced lifestyle.
Since 2010, we have worked towards a target that 100% of our units will provide Balanced Choices or similar healthy eating programmes by 2016. This year, we have seen a further improvement in our performance (67% vs 66% in 2015). We have not met our stated target of 100% of units by 2016 and will continue to work towards achieving this through 2017.
GOAL 5
Achieve gender equality and empower all women and girls
Women and girls around the world struggle to exercise their rights, face discrimination, legal barriers and violence and receive unequal pay for equal work.
Women make up 57% of our global workforce and 26% of our global leadership team. We are resolved to empower all our female employees as we know this leads to increases in productivity, organisational effectiveness and consumer satisfaction.
In 2016, our UK business launched the Women in Food programme, to tackle the shortage of female chefs. By 2020, we expect that 50% of the chefs in our UK workplace will be female.
GOAL 8
Promote sustained, inclusive and sustainable economic growth, full and productive employment and decent work for all
The availability of decent work is a must for lasting, inclusive and economic growth, yet while the global labour force continues to grow, there are not enough jobs available, particularly amongst young people and indigenous communities.
Our 500,000+ employees are fundamental to our great service and reputation. Around the world we are working with local communities to offer fair employment and great career opportunities.
In Australia, we launched Project 1050 to support the recruitment of an additional 1,050 indigenous jobseekers into the Compass workforce by 2019.
GOAL 14
Conserve and sustainably use the oceans, seas and marine resources for sustainable development
30% of the world’s fish stocks are overexploited, compromising their ability to produce sustainable yields.
Three words encapsulate our approach to sustainable seafood; (1) Avoid: by not serving seafood on the Marine Stewardship Council’s (MSC) ‘fish to avoid’ list; (2) Improve: by buying more certified sustainable seafood each year; (3) Promote: the availability of responsibly sourced fish to our consumers.
We have partnered with the MSC in the UK to develop the Good Fish Guide app, which encourages everyone from chefs to consumers to make more sustainable choices easily and quickly.
GOAL 15
Protect, restore and promote sustainable use of terrestrial ecosystems, sustainably manage forests, combat desertification, and halt and reverse land degradation and halt biodiversity loss
People need nature to thrive. It is particularly critical for sustainable agriculture, yet deforestation, desertification and loss of biodiversity and natural habitats are degrading fertile land and reducing crop productivity.
We are working across our supply chain, to ensure we source our food and non-food products in a sustainable manner with the least possible impact on the environment.
Globally, we are a member of the Roundtables on Responsible Soy and Responsible Palm Oil, whilst 17 of our top 20 countries have already established sustainable and ethical sourcing programmes.
STRATEG
IC REPO
RT
Compass Group PLC Annual Report 2016 33

DEAR SHAREHOLDEROn behalf of the Board, I am pleased to present Compass Group PLC’s annual Corporate Governance Report which aims to provide shareholders and other stakeholders with an insight into the Company’s governance activities, performance and priorities.
BOARD EFFECTIVENESSIn my role as Chairman, it is my responsibility to ensure that we have an effective Board with a suitable range of skills, expertise and experience. Each year, we conduct a performance evaluation of the Board and its committees to ensure that they continue to be effective and that each of the directors shows a demonstrable commitment to their role and has sufficient time to devote to their responsibilities at Compass, notwithstanding any other commitments.
In accordance with the UK Corporate Governance Code (the Code) an externally facilitated evaluation must be conducted every three years. EquityCommunications Limited (ECL) conducted this year’s external evaluation, as they did in 2013. The purpose of ECL’s evaluation was to consider progress in closing the gaps that were identified in the last external evaluation in 2013, reflect on progress made against last year’s internal assessment, evaluate how the Group had responded to changes in both the business and regulatory environment and to review the way the Board and its committees operate.
Information on this year’s external evaluation process, the lessons learned from last year’s review and our areas of focus in the coming year, can be found on page 43.
GOVERNANCE IN ACTIONAs a Board, we remain committed to maintaining the highest standards of corporate governance. We strongly believe that good governance is at the heart of, and is fundamental to, the effective management of the business, its long term sustainability and continued success.
Last year, I wrote to you about the importance of succession planning. This has, and will continue to be, an area of focus for the Board and the Nomination Committee. We operate in intrinsically dynamic markets and it is therefore vitally important to the Company’s future success that it has a stable and sustainable leadership which adapts and evolves in tandem with current and future business needs.
We continuously plan for the future. As I have set out in the Nomination Committee Report, finding the right individuals for the Board takes time and the principal aim of our succession plan is to ensure that we will always have access to a potential pool of talented individuals capable of leading the Company and delivering its strategic goals. This year, in line with our plan, we appointed Johnny Thomson as Group Finance Director and Stefan Bomhard as a non-executive director. In addition to these appointments, in October 2015, Don Robert succeeded Sir Ian Robinson as Senior Independent Director (SID). In December of the same year, Andy Martin stepped down as a director and Dominic Blakemore became Group Chief Operating Officer, Europe. It is also planned that Susan Murray, who completed her nine year tenure as a non-executive director in October, will step down from the Board at the conclusion of the Company’s Annual General Meeting (AGM). I would like to take this opportunity to thank Susan for her services to the Board, particularly for her excellent work as Chairman of the Corporate Responsibility Committee and to wish her every success for the future. Nelson Silva will succeed Susan as Chairman of the Corporate Responsibility Committee at the conclusion of the Company’s AGM and I wish him well in his new role.
Governance and Directors’ Report
CHAIRMAN’S LETTER
PROMOTING SUCCESS
We believe that strong leadership combined with a robust governance framework is vital to positive performance and to the continued success of your Company.
34 Compass Group PLC Annual Report 2016

I am pleased to report that it has been another year of positive progress and development in the Company’s governance agenda and I am confident that the changes we have made to the Board leave us better placed as we look to the Company’s future. In the coming year, we will continue to build on our work to date and to focus on our plan for the next three years. I look forward to reporting on our progress next year.
In the meantime, in the pages which follow we have set out our governance structures and processes and how we have applied the main principles and complied with the relevant provisions of the Code. We have sought to show how governance works in practice by giving examples of the types of activity undertaken by the Board and its committees during the year. I hope that you find our narrative insightful.
Paul WalshChairman 22 November 2016
THE COMPANY’S ANNUAL GENERAL MEETINGEarlier this year, we held our AGM at Twickenham Stadium, just one of the many sporting venues where we provide hospitality services. I am pleased that the event was well attended by shareholders.
During the question and answer session, shareholders were able to ask the Board questions about the Company’s performance and its plans for the future and several discussions were continued after the meeting when shareholders and directors met on a more informal basis.
As ever, the Board and I were impressed by the quality and breadth of shareholder questions. On behalf of my fellow directors, I would like to thank you for your interest in the Company and for your continued support.
We look forward to meeting you at the Company’s next AGM on Thursday 2 February 2017.
COR
POR
ATE GO
VERN
ANCE
Compass Group PLC Annual Report 2016 35
UK CORPORATE GOVERNANCE CODE COMPLIANCEResponsibility for good governance lies with the Board. The Board is accountable to shareholders and is committed to the highest standards of corporate governance as set out in the Code. The Code can be found on the Financial Reporting Council (FRC) website at www.frc.org.uk. This Corporate Governance Report, together with the Directors’ Remuneration Report set out on pages 58 to 79, describes how the Board has applied the main principles of good governance, as set out in the Code, during the year under review.
COMPLIANCE STATEMENTIt is the Board’s view that for the year ended 30 September 2016 the Company has been fully compliant with all of the principles set out in the Code applicable to this reporting period. The Company’s auditor, KPMG LLP, is required to review whether the above statement reflects the Company’s compliance with the provisions of the Code specified for its review by the UK Listing Authority (UKLA) Rules and to report if it does not reflect such compliance. No such report has been made.
The directors present their Annual Report and the audited consolidated financial statements of the Company and its subsidiaries for the year ended 30 September 2016. This Corporate Governance Report on pages 34 to 57 and the other statutory disclosures on pages 80 to 84 together with the Directors’ Responsibilities statement on page 86 make up the Directors’ Report.
HOW WE GOVERN THE COMPANYThe Board leads the Group’s governance framework; it is responsible for setting the strategic targets for the Group, monitoring progress made, approving proposed actions and for ensuring that the appropriate internal controls are in place and that they are operating effectively.
The Board is assisted by four principal committees (Audit, Corporate Responsibility, Nomination and Remuneration), each of which is responsible for reviewing and dealing with matters within its own terms of reference. At scheduled Board meetings, the minutes of all committee meetings are circulated and a summary of committee meetings discussed (as appropriate). All of the non-executive directors are members of all principal committees. Individual reports from each principal committee chairman can be found on pages 45 to 79. The Company also has a number of executive management committees (Disclosure, General Business and Executive Board). These have been established in order to consider various issues and matters for recommendation to the Board and its principal committees or to deal with day to day matters within the authority granted by the Board.
This Directors’ Report also contains information required to be disclosed under the UKLA’s Rules and under the Disclosure Guidance and Transparency Rules (DGTR). To the extent necessary, certain information is incorporated into this Report by reference.
Our governance structure comprises the functions below supported by the Group’s standards, policies and internal controls, which are described in more detail over the following pages.
Governance and Directors’ Report
INTRODUCTION TO CORPORATE GOVERNANCE
COMMITTED TO THE HIGHEST STANDARDS
CORPORATE RESPONSIBILITY
COMMITTEE
SEE PAGE 52
EXECUTIVE BOARD
DISCLOSURE COMMITTEE
GENERAL BUSINESS
COMMITTEE
NOMINATION COMMITTEE
SEE PAGE 55
REMUNERATION COMMITTEE
SEE PAGE 58
AUDIT COMMITTEE
SEE PAGE 45
Board
Chairman
36 Compass Group PLC Annual Report 2016
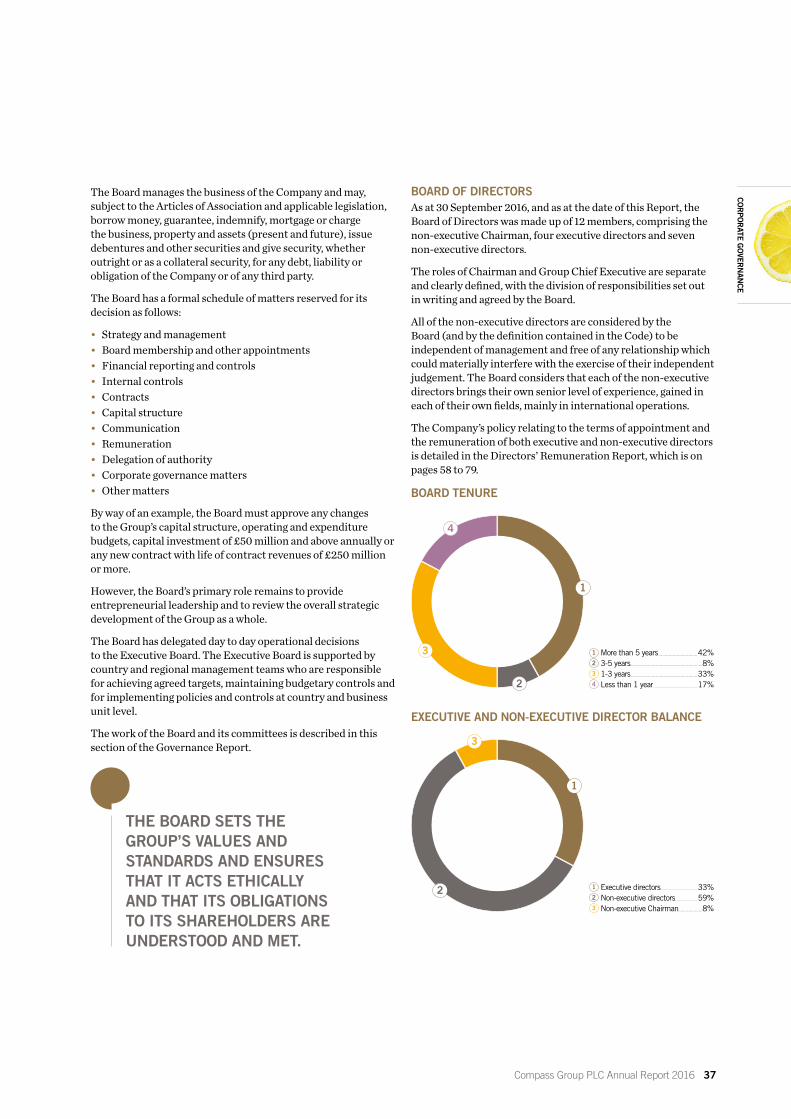
The Board manages the business of the Company and may, subject to the Articles of Association and applicable legislation, borrow money, guarantee, indemnify, mortgage or charge the business, property and assets (present and future), issue debentures and other securities and give security, whether outright or as a collateral security, for any debt, liability or obligation of the Company or of any third party.
The Board has a formal schedule of matters reserved for its decision as follows:
• Strategy and management• Board membership and other appointments• Financial reporting and controls• Internal controls• Contracts• Capital structure• Communication• Remuneration• Delegation of authority• Corporate governance matters• Other matters
By way of an example, the Board must approve any changes to the Group’s capital structure, operating and expenditure budgets, capital investment of £50 million and above annually or any new contract with life of contract revenues of £250 million or more.
However, the Board’s primary role remains to provide entrepreneurial leadership and to review the overall strategic development of the Group as a whole.
The Board has delegated day to day operational decisions to the Executive Board. The Executive Board is supported by country and regional management teams who are responsible for achieving agreed targets, maintaining budgetary controls and for implementing policies and controls at country and business unit level.
The work of the Board and its committees is described in this section of the Governance Report.
BOARD OF DIRECTORSAs at 30 September 2016, and as at the date of this Report, the Board of Directors was made up of 12 members, comprising the non-executive Chairman, four executive directors and seven non-executive directors.
The roles of Chairman and Group Chief Executive are separate and clearly defined, with the division of responsibilities set out in writing and agreed by the Board.
All of the non-executive directors are considered by the Board (and by the definition contained in the Code) to be independent of management and free of any relationship which could materially interfere with the exercise of their independent judgement. The Board considers that each of the non-executive directors brings their own senior level of experience, gained in each of their own fields, mainly in international operations.
The Company’s policy relating to the terms of appointment and the remuneration of both executive and non-executive directors is detailed in the Directors’ Remuneration Report, which is on pages 58 to 79.
THE BOARD SETS THE GROUP’S VALUES AND STANDARDS AND ENSURES THAT IT ACTS ETHICALLY AND THAT ITS OBLIGATIONS TO ITS SHAREHOLDERS ARE UNDERSTOOD AND MET.
1
2
3
4
More than 5 years................................................42%3-5 years........................................................................................8%1-3 years..................................................................................33%Less than 1 year......................................................17%
1
2
3
4
1
2
3
Executive directors.............................................33%Non-executive directors...........................59%Non-executive Chairman.............................8%
1
2
3
BOARD TENURE
EXECUTIVE AND NON-EXECUTIVE DIRECTOR BALANCE
COR
POR
ATE GO
VERN
ANCE
Compass Group PLC Annual Report 2016 37

Paul Walsh (61) C N *
ChairmanJoined as a non-executive director in January 2014. Appointed Chairman in February 2014.
Key skills and competenciesPaul has significant experience in marketing, buying and retail operations as well as substantial corporate leadership experience.
CareerFormer Chief Executive, Diageo plc, from September 2000 to June 2013 and now an adviser to the Chairman and Chief Executive, having originally joined the Board in 1997. Formerly Chief Executive Officer of the Pillsbury Company, Chairman of Ontex Group N.V. and a director of GrandMet. Former non-executive director of Unilever PLC, Centrica plc and United Spirits Limited. Business Ambassador on the UK Government’s Business Ambassador network and a Member of the Council of the Scotch Whisky Association.
External appointmentsChairman of Avanti Communications Group plc and Chime Communications Limited. Non-executive director of HSBC Holdings plc, FedEx Corporation, RM2 International S.A. and Simpsons Malt Limited. Adviser to TPG Capital LLP (TPG) and a nominee director of the various companies as required by TPG including Pace Holdings Corp.
Richard Cousins (57) C E G N
Group Chief ExecutiveJoined the Board in May 2006 and was appointed Group Chief Executive in June 2006.
Key skills and competenciesRichard brings invaluable UK and international corporate expertise to the Board. He has experience in operational research and strategic planning and has held a number of key management roles.
CareerRichard spent six years as Chief Executive Officer of BPB plc, having previously held a number of positions with that company. His earlier career was with Cadbury Schweppes Plc and BTR plc. He is also a former non-executive director of P&O plc, HBOS plc and Reckitt Benckiser Group plc.
External appointmentsSenior independent non-executive director of Tesco PLC and a Member of the Advisory Board of Lancaster University Business School.
Johnny Thomson (44) C D E G
Group Finance DirectorJoined the Board and appointed Group Finance Director on 1 December 2015.
Key skills and competenciesJohnny brings extensive finance and accounting experience across a range of businesses as well as operational experience within the Group.
CareerAssociate of the Institute of Chartered Accountants in England and Wales, Johnny joined the Group in April 2009 as Finance Director for the Group’s Brazilian business. He was appointed Chief Executive Officer for the Brazilian business in October 2012 and, from 1 February 2014, became the Regional Managing Director for Latin America, comprising Argentina, Brazil, Chile, Colombia and Mexico. Prior to joining the Group, Johnny was Vice President Finance for the UK and Ireland Division of Hilton Hotels and served in a variety of audit and transactional services and international/client secondments at PricewaterhouseCoopers LLP.
External appointmentsNone.
Dominic Blakemore (47) E G
Group Chief Operating Officer, EuropeJoined the Board in February 2012 and appointed as Group Finance Director in April 2012. Dominic was appointed Group Chief Operating Officer, Europe on 1 December 2015 and stepped down as Group Finance Director on the same day.
Key skills and competenciesDominic has extensive financial management experience in a number of international businesses together with general corporate management experience.
CareerFormer Chief Financial Officer of Iglo Foods Group Limited, which Dominic joined from Cadbury Plc, where he was European Finance & Strategy Director, having previously held senior finance roles as Corporate Finance Director and Group Financial Controller. Prior to joining Cadbury Plc, Dominic was a director of PricewaterhouseCoopers LLP.
External appointmentsNon-executive director of Shire plc and a Member of the Academic Council of University College London.
Governance and Directors’ Report
OUR BOARD
38 Compass Group PLC Annual Report 2016

Gary Green (59) E G
Group Chief Operating Officer, North AmericaAppointed to the Board in April 2007 and became Group Chief Operating Officer, North America in April 2012.
Key skills and competenciesGary brings strong business and operational leadership as well as business development and wide ranging sales experience.
CareerGary is a Chartered Accountant and in 2001 received an honorary doctorate from Johnson & Wales University in the USA. Gary joined the Group in 1986 in a senior finance role in the UK and became a UK director in 1992. He relocated to the USA in 1994 as Chief Finance Officer of the Group’s North American business and in 1999 became Chief Executive Officer.
External appointmentsNone.
Don Robert (57) A C N R
Senior Independent Non-executive Director (SID)Joined the Board in May 2009. Appointed SID on 1 October 2015.
Key skills and competenciesDon has extensive international board and general management experience, especially in the financial sector.
CareerDon was formerly the Chief Executive Officer of Experian plc, former Chairman of the Consumer Data Industry Association and Trustee of the Education and Employers Taskforce and previously held positions with First American Corporation, Credco, Inc. and US Bancorp.
External appointmentsChairman of Experian plc, Achilles Holdco Limited and Validis Holdings Limited. Don is also a non-executive director of the Court of the Bank of England.
John Bason (59) A * C N R
Non-executive DirectorAppointed to the Board in June 2011.
Key skills and competenciesJohn brings significant financial and international experience to the Board, gained from his long career with major global businesses.
CareerMember of the Institute of Chartered Accountants in England and Wales. John was previously Finance Director of Bunzl plc.
External appointmentsFinance Director of Associated British Foods plc, trustee of Voluntary Service Overseas and Chairman of the charity FareShare.
Carol Arrowsmith (62) A C N R *
Non-executive DirectorAppointed to the Board in June 2014.
Key skills and competenciesCarol brings extensive advisory experience, especially of advising boards on executive remuneration across a range of sectors.
CareerCarol is a former partner of Deloitte LLP and was Vice Chairman of the UK business and former director of the Remuneration Consultants Group. Carol is a Fellow of the Chartered Institute of Personnel and Development.
External appointmentsAdviser to Deloitte LLP, Member of the Advisory Group for Spencer Stuart, director and trustee of Northern Ballet Limited and a director of Arrowsmith Advisory Limited.
Stefan Bomhard (49) A C N R
Non-executive DirectorAppointed to the Board in May 2016.
Key skills and competenciesStefan brings extensive experience of working in international environments, particularly relating to the operation, sales and marketing of well-known consumer food and drink brands.
CareerStefan was previously Regional President, Europe, Geneva at Bacardi Martini for five years and held a number of worldwide senior positions at Cadbury Plc, Unilever PLC, Diageo plc, Burger King and Procter & Gamble.
External appointmentsChief Executive Officer of Inchcape plc.
Susan Murray (59) A C * N R
Non-executive DirectorAppointed to the Board in October 2007.
Key skills and competenciesSusan brings extensive executive and non-executive retail, financial and strategic experience to the Board.
CareerSusan is former Chairman of Farrow & Ball, a former non-executive director of Pernod Ricard S.A., Imperial Tobacco PLC, Enterprise Inns Plc, Aberdeen Asset Management PLC, SSL International PLC and Wm Morrison Supermarkets PLC, and former Chief Executive of Littlewoods Stores Limited. She is also former Worldwide President and Chief Executive of The Pierre Smirnoff Company, part of Diageo plc, and a former Council Member of the Advertising Standards Authority.
External appointmentsNon-executive director of Grafton Group plc and of Boparan Holdings Limited trading as 2 Sisters Food Group and a Fellow of the Royal Society of Arts.
COR
POR
ATE GO
VERN
ANCE
Compass Group PLC Annual Report 2016 39

Governance and Directors’ Report
Our Board continued
Nelson Silva (61) A C N R
Non-executive DirectorAppointed to the Board in July 2015.
Key skills and competenciesNelson has considerable executive management experience in a variety of senior leadership roles within major international companies, with a particular focus on Brazil.
CareerNelson was formerly President of the Aluminium business unit at BHP Billiton, based in the UK. Prior to joining BHP Billiton, he held a number of senior positions at Vale, including Sales and Marketing Director based in Belgium, Japan and Brazil. Nelson was also Managing Director of Embraer for Europe and Africa based in France and Chief Executive Officer of All Logistica in Argentina.Nelson previously held the position of Senior Vice President of BG Group plc responsible for Brazil, Bolivia and Uruguay. He is a former board member of the Brazilian Institute of Oil and Gas and of the Brazilian Association of Petroleum Companies and of the Social and Development Council of Brazil’s Presidency. Nelson was formerly a senior consultant to BHP Billiton Brazil.
External appointmentsNelson is an executive director of Petróleo Brasileiro S.A. and is a Board Member of the Brazilian Symphonic Orchestra.
Ireena Vittal (48) A C N R
Non-executive DirectorAppointed to the Board in July 2015.
Key skills and competenciesIreena brings strong advisory, business and operational experience across a variety of retail businesses with a particular focus on India.
CareerIreena was formerly a non-executive director of GlaxoSmithKline Consumer Healthcare and Axis Bank Limited, Head of Marketing and Sales at Hutchinson Max Telecom and a former partner at McKinsey and Company.
External appointmentsNon-executive director of Zomato Media Private Limited, Godrej Consumer Products Limited, WIPRO Limited, The Indian Hotels Company Limited, Tata Global Beverages Limited, Tata Industries and Titan Company Limited.
Mark White (56) A ° C N ° R ° D E G °
General Counsel and Company SecretaryJoined the Group as General Counsel and Company Secretary in June 2007.
Key skills and competenciesMark has extensive legal and corporate secretariat experience gained in a number of major international businesses. Mark is also a Trustee of the Compass Group Pension Plan and the Compass Retirement Income Savings Plan.
CareerMark is a Solicitor. He was previously Group Company Secretary and General Counsel of Wolseley plc and Company Secretary of Enterprise Oil plc and Rotork plc.
External appointmentsMember of the Upper Tribunal, Tax and Chancery Chamber.
Board Committee MembershipA Audit Committee ..............................................................................................................................................................................................................................................................page 46
C Corporate Responsibility Committee .....................................................................................................................................................................................page 53
N Nomination Committee ..................................................................................................................................................................................................................................... page 56
R Remuneration Committee ..............................................................................................................................................................................................................................page 61
D Disclosure Committee ...........................................................................................................................................................................................................................................page 44
E Executive Board ..................................................................................................................................................................................................................................................................page 44
G General Business Committee ..................................................................................................................................................................................................................page 44
* Chairman
° Secretary
40 Compass Group PLC Annual Report 2016

DIRECTOR EFFECTIVENESS AND TRAININGThe Board meets regularly during the year as well as on an ad hoc basis, as required by business needs. The Board met six times during the year and director attendance for each meeting is shown in the table below.
MEETINGS ATTENDANCENAME ATTENDANCE1
Carol Arrowsmith 6 of 6John Bason 6 of 6Dominic Blakemore 6 of 6Stefan Bomhard2 2 of 2Richard Cousins 6 of 6Gary Green 6 of 6Andrew Martin3 1 of 1Susan Murray 6 of 6Don Robert 6 of 6Sir Ian Robinson4 2 of 2Nelson Silva 6 of 6Johnny Thomson5 5 of 5Ireena Vittal6 5 of 6Paul Walsh 6 of 6
1. The number of meetings attended out of the number of meetings eligible to attend.
2. Appointed 5 May 2016.3. Stepped down from the Board on 1 December 2015.4. Stepped down from the Board at the conclusion of the Company’s AGM
on 4 February 2016.5. Appointed 1 December 2015.6. Unable to attend a meeting due to unforeseen circumstances. Prior to the
meeting the director read the papers for the meeting and discussed her comments with the Chairman of the Board.
If a director is unable to attend a Board or committee meeting, the Chairman of the Board and/or committee chairman are informed and the absent director is encouraged to communicate comments and opinions on the matters to be considered. Each director also attends the AGM to answer shareholder questions.
Board activities are structured to help the Board to achieve its goals and to provide support and advice to the executive management on the delivery of Group strategy within a robust governance framework.
BOARD VISIT TO CANADAThe March 2016 Board meeting was held in Toronto, Canada, when senior executives from the North American business met with the Board and gave in-depth presentations on strategy and business operations. During its visit, the Board also visited a number of operational sites including the Centre Bell sports and entertainments complex in Montreal, one of many sporting venues where Compass North America provides hospitality services.
2015-2016 INSIGHTS• Received health and safety updates at every meeting• Reviewed the Group’s strategy• Succession planning• Risk reviews• Conducted Board meetings together with site visits in Canada
and France• Received in-depth presentations from country managers,
sector leaders (e.g. Education) and various function heads, for example, finance, tax, treasury, investor relations and legal
• Reviewed the potential implications of the UK leaving the EU pre and post the June 2016 referendum
• Commissioned an external evaluation of the Board in line with the requirements of the Code
• Monitored the progress of changes to Company governance policies and practices in connection with the EU Market Abuse Regulation which came into force on 3 July 2016
Meetings between the non-executive directors, both with and without the presence of the Group Chief Executive, are scheduled in the Board’s annual programme. During the year there were a number of meetings at which senior management from our businesses made presentations to the Board. This enabled the non-executive directors to engage with colleagues from across the Group. On one occasion, this included a presentation from our North American business which covered topics such as health and safety performance and prevention, the competitive landscape and business sectors, growth trends, working capital management, financial forecasts, business wins and pipelines, risk mitigation and succession planning.
110
8
9
2
3
4
56
7
HSE...........................................................................................................................................................................................5%Strategy.......................................................................................................................................................................25%Acquisitions/disposals.......................................................................................................................5%Capital expenditure.................................................................................................................................5%Executive/committee reports........................................................................................10%Financial reporting/planning.........................................................................................13%Understanding the business.........................................................................................20%Succession planning............................................................................................................................7%Risk management......................................................................................................................................5%Other matters.......................................................................................................................................................5%
1
2
3
4
5
6
7
8
9
10
2015-2016 PRIORITIES (TIME SPENT) COR
POR
ATE GO
VERN
ANCE
Compass Group PLC Annual Report 2016 41

Governance and Directors’ Report
CORPORATE GOVERNANCE
A formal, comprehensive and tailored induction is given to all non-executive directors following their appointment, including access to external training courses and visits to key locations within the Group and meetings with members of the Executive Board and other key senior executives. The induction also covers a review of the Group’s governance policies, structures and business, including details of the risks and operating issues facing the Group.
Succession planning is a matter for the whole Board, rather than for a committee. The Company’s Articles of Association provide that one third of the directors retire by rotation each year and that each director will seek re-election at the AGM every three years. However, in accordance with the Code, all directors submit themselves for annual re-election by shareholders. New directors may be appointed by the Board, but are subject to election by shareholders at the first opportunity after their appointment. Stefan Bomhard will seek election at the 2017 AGM. The Articles of Association limit the number of directors to not less than two and not more than 20, save where shareholders decide otherwise. Non-executive directors are normally appointed for an initial term of three years, which is reviewed and may be extended by two further three year terms. It is Board policy that non-executive director appointments should last for no more than nine years.
Don Robert succeeded Sir Ian Robinson as the SID on 1 October 2015. His role includes providing a sounding board for the Chairman and acting as an intermediary for the non-executive directors, where necessary. The Board believes that Don has the appropriate experience, knowledge and independence to continue in this role. As announced on 22 November 2016, Susan Murray, who completed her nine year tenure as a non-executive director in October 2016, will step down from the Board at the conclusion of the 2017 AGM. Nelson Silva will succeed Susan as Chairman of the Corporate Responsibility Committee on the same date.
The Chairman ensures that the Board maintains an appropriate dialogue with shareholders. For example, in June 2016, the Group Chief Executive and Group Finance Director hosted an investor seminar where they and members of the management team met with existing and potential investors. The business overview included presentations covering the Group’s regions and the key themes were structural growth, our people and innovation. Feedback from the event was positive with particular emphasis on the passion of the presenters and the Group’s proactive approach.
Although the non-executive directors are not formally required to meet the shareholders of the Company, their attendance at presentations of the interim and annual results is encouraged.
Site visits to operating business units allow the Board as a whole to interact with a diverse group of colleagues, provide the non-executive directors with a unique insight into how the business works on a day to day basis and help to assess local management performance and potential. Each year, the Board aims to hold two meetings at Group locations. These visits also give the directors a unique opportunity to meet with colleagues on a more informal basis and greatly assist in the succession planning process.
The Board has established a procedure for directors, if deemed necessary, to take independent professional advice at the Company’s expense in the furtherance of their duties. Every director also has access to the General Counsel and Company Secretary, who is charged with ensuring that Board procedures are followed and that good corporate governance and compliance are implemented throughout the Group. Together with the Group Chief Executive and the General Counsel and Company Secretary, the Chairman ensures that the Board is kept properly informed and is consulted on all issues reserved to it. Board papers and other information are distributed in a timely fashion to allow directors to be properly briefed in advance of meetings. In accordance with the Company’s Articles of Association, directors have been granted an indemnity issued by the Company to the extent permitted by law in respect of liabilities incurred as a result of their office. The indemnity would not provide any coverage where a director is proved to have acted fraudulently or dishonestly. The Company has also arranged appropriate insurance cover in respect of legal action against its directors and officers.
In accordance with best practice, the Chairman addresses the developmental needs of the Board as a whole, with a view to further developing its effectiveness as a team, and ensures that each director refreshes and updates his or her individual skills, knowledge and expertise.
BOARD VISIT TO FRANCEIn July 2016, the Managing Director of the French business hosted a visit by the Board to Paris. The Board heard from the local executive team about the current French economic and political environment and the opportunities and challenges facing the business and its operations. Management also gave an in-depth review of how these challenges were being addressed. The Board was also afforded an insight into the offer provided by Compass France to its Business & Industry clients.
42 Compass Group PLC Annual Report 2016

BOARD EFFECTIVENESSEvery year, a performance evaluation of the Board and of its committees is carried out to ensure that they continue to be effective, that each of the directors demonstrates commitment to his or her respective role and each has sufficient time to meet his or her commitment to the Company.
In accordance with the Code, every third year, the evaluation must be undertaken by an independent external provider. This year, as was the case in 2013, the performance evaluation of the Board was again conducted by independent external providers, EquityCommunications Limited (ECL). ECL has no connection with the Company other than evaluating the Board and its committees.
ECL had the benefit of being able to directly compare the evaluation exercise with that conducted in 2013. ECL found a Board that had successfully transitioned chairmen and a number of non-executive retirements and appointments, but which had continued to perform well throughout. ECL found that the Board remained effective with positive stewardship by the Chairman and noted that the experience of the newer non-executive directors was beginning to emerge. Strategically, ECL found that the Board was aligned in its understanding of the Group’s strategy, that a number of strategic questions which were being considered in 2013 had been answered and that the clarity of approach was fully supported. A key pillar to the success of the Board remained being forward looking and ensuring that succession planning was a matter of constant concern and review, at both executive and non-executive level.
It is the view of the Board that each of the non-executive directors brings considerable management expertise and an independent perspective to the Board’s deliberations and that they are considered to be independent of management and free from any relationship or circumstance that could affect, or appear to affect, the exercise of their independent judgement. Overall, the Board considered the performance of each director to be effective and concluded that both the Board and its committees continue to provide effective leadership and exert the required levels of governance and control. The Board will continue to review its procedures, effectiveness and development in the year ahead.
PHASE 1ECL was given a clear and comprehensive brief by the Chairman and the General Counsel and Company Secretary. The questions that were prepared took into account the principal themes which had emerged from the preceding 2015 internal evaluation as well as the 2013 external evaluation which ECL had undertaken.
The evaluation process took place in May 2016. Each director received a copy of the questionnaire in advance of their meeting with ECL.
PHASE 2ECL conducted a series of one to one interviews with the Chairman, each member of the Board and the General Counsel and Company Secretary.
Each interview covered an agenda which included questions about strategy and operations, Board composition, succession planning, Board administration and the Board committee structure and any specific matters which the director wished to raise. Directors were very much encouraged to raise any other matters they felt relevant to the Board evaluation process.
PHASE 3A report on the outcome of the evaluation exercise was presented to the Board at its September 2016 meeting.
PHASE 1 – BRIEFIN
GPHAS
E 3
– RE
PORTING
PHASE 2 – INTERVIEWS
Comprehensive brief by the Chairman and the General Counsel and Company Secretary
A series of one to one interviews
Report on the outcome
The external performance evaluation has three distinct phases:
COR
POR
ATE GO
VERN
ANCE
Compass Group PLC Annual Report 2016 43

Directors who are not members of individual Board committees may also be invited to attend one or more meetings of those committees during the year.
The General Counsel and Company Secretary acts as Secretary to all Board committees. The chairmen of each of the principal committees attend the AGM to respond to any shareholder questions that might be raised on a committee’s activities.
The Board committees are:
DISCLOSURE COMMITTEE
The Disclosure Committee ensures the accuracy and timeliness of public announcements of the Company and monitors the Company’s obligations under the UKLA Rules and the DGTR.
Meetings are held as required. At the date of this Report, the Disclosure Committee comprises Johnny Thomson, Mark White, the Group Financial Controller, the Director of Group Internal Audit, the Director of Strategy and Communications and the Head of Investor Relations.
EXECUTIVE BOARD
The Executive Board is the key management committee for the Group and at the date of this Report comprises the executive directors of the Company, Mark Van Dyck (Regional Managing Director, Asia Pacific), Alfredo Ruiz Plaza (Regional Managing Director, Latin America), Mark White (General Counsel and Company Secretary) and Robin Mills (Group HR Director).
The Executive Board meets regularly and is responsible for developing the Group’s strategy, capital expenditure and investment budgets. It reports on these areas to the Board for approval, implementing Group policy, monitoring financial, operational and customer quality of service performance, health and safety, purchasing and supply chain issues, succession planning and day to day management of the Group.
GENERAL BUSINESS COMMITTEE
The General Business Committee comprises all of the executive directors and meets as required to conduct the Company’s business within clearly defined limits delegated by the Board and subject to those matters reserved to the Board.
AUDIT COMMITTEE PAGE 45
CORPORATE RESPONSIBILITY COMMITTEE PAGE 52
NOMINATION COMMITTEE PAGE 55
REMUNERATION COMMITTEE PAGE 58
CONFLICTS OF INTERESTAs part of their ongoing development, the executive directors may seek one external non-executive role on a non-competitor board, for which they may retain the remuneration in respect of the appointment. In order to avoid any conflict of interest, all appointments are subject to the Board’s approval and the Board monitors the extent of directors’ other interests and the time commitment required to fulfil those interests to ensure that its effectiveness is not compromised.
Each director has a duty under the Companies Act 2006 (CA 2006) to avoid a situation in which he or she has or can have a direct or indirect interest that conflicts or possibly may conflict with the interests of the Company. This duty is in addition to the obligation that he or she owes to the Company to disclose to the Board an interest in any transaction or arrangement under consideration by the Company. The Company’s Articles of Association authorise the directors to approve such situations and to include other provisions to allow conflicts of interest to be dealt with. The Board follows an established procedure when deciding whether to authorise an actual or potential conflict of interest. Only independent directors (i.e. those who have no interest in the matter under consideration) will be able to take the relevant decision, and in taking the decision the directors must act in good faith and in a way they consider will be most likely to promote the Company’s success. Furthermore, the directors may, if appropriate, impose limits or conditions when granting authorisation.
Any authorities are reviewed at least every 15 months. The Board considered and authorised each director’s reported actual and potential conflicts of interest at its July 2016 Board meeting and considers any changes on an ad hoc basis throughout the year.
COMMITTEES OF THE BOARDAs noted on page 36, the Board has established a number of committees to assist in the discharge of its duties.
The formal terms of reference for the principal committees, approved by the Board and complying with the Code, are available from the General Counsel and Company Secretary and can also be found on the Company’s website at www.compass-group.com. Terms of reference are reviewed annually and updated when necessary to reflect changes in legislation or best practice.
Governance and Directors’ Report
Corporate Governance continued
44 Compass Group PLC Annual Report 2016

DEAR SHAREHOLDEROn behalf of the Board, I am pleased to present this year’s Audit Committee Report. It has been another busy and interesting year for the Committee.
In December 2015, Johnny Thomson was appointed as Group Finance Director and I have spent time with him over the year discussing his initial observations and priorities in the short and medium term. In May 2016, Stefan Bomhard was appointed to the Board. Stefan’s appointment brings a new perspective to the Committee and I am pleased to welcome him aboard. In the following month, the country voted to leave the EU. The long term effects of the UK’s EU referendum are not yet known and will only become clear in time. Until then the Committee will continue to monitor for changes that could impact on the Company’s internal risk control processes and procedures and to advise the Board accordingly.
As in previous years, the Committee’s primary focus has been centred on the accuracy of the Group’s financial reporting, together with related internal control activities and risk and compliance matters.
The Code provides that through its financial reporting, the Board should provide a fair, balanced and understandable assessment of the Company’s prospects. At the Board’s request, the Committee has reviewed the 2016 Annual Report to determine whether it considered that the document, taken as a whole, meets this standard and provides the information necessary for shareholders to assess the Company’s position and performance, business model and strategy. The Committee concluded that the requirement has been met.
The Committee has also considered new developments in corporate governance and reporting and, in light of its review of such matters, was able to offer advice on such issues and, as necessary, recommend an appropriate course of action to the Board. For example, on 17 June 2016, the EU Audit Directive (the Directive) and Audit Regulation (the Regulation) became effective, resulting in changes to the audit regime for EU public interest entities including the Company. Notwithstanding the outcome of the UK’s EU referendum, all EU legislation will remain in place for the time being. The new legislation introduces mandatory rotation of auditors and tighter restrictions on the provision of non-audit services, as well as setting out requirements in relation to the responsibilities and composition of audit committees. It has also resulted in changes being made to the CA 2006, the Code and the DGTR and consequently to the Committee’s terms of reference.
We continue to develop and grow our business but, of course, in some of the territories where we operate the concept of corporate governance is still underdeveloped. In these regions in particular, it is important to have a clear, well-established system of risk management and internal control to ensure that growth is underpinned by solid business practice. In this regard, we have continued our work to strengthen our Regional Governance Committees (RGCs) with the aim of further embedding the Group’s risk management culture within the business.
The Board’s attitude to and appetite for risk are communicated to the Group’s businesses through the strategy planning process. In determining its risk appetite, the Board recognises that a prudent and robust approach to risk mitigation must be carefully balanced with a degree of flexibility so that the entrepreneurial spirit which has greatly contributed to the success of the Company is not inhibited. The Committee and the Board remain satisfied that the Company’s internal risk control framework continues to provide the necessary element of flexibility without compromising the integrity of risk management and internal control systems.
During the year, we reviewed the Group’s ongoing principal operational risks, more details of which can be found on pages 27 to 29, and in the pages which follow, we have set out details of the Committee’s activities during the year.
Over the coming year, the Committee will continue to monitor the ongoing status and progress of action plans against key risks on a regular basis; review its activities in the light of regulatory and best practice developments and to report its findings to the Board.
John BasonChairman of the Audit Committee 22 November 2016
AUDIT COMMITTEE REPORT
RIGOROUS AND EFFECTIVE OVERSIGHT
The Board recognises that a prudent and robust approach to risk mitigation must be carefully balanced with a degree of flexibility so that the entrepreneurial spirit which has greatly contributed to the success of your Company is not inhibited.
COR
POR
ATE GO
VERN
ANCE
Compass Group PLC Annual Report 2016 45

THE AUDIT COMMITTEECOMPOSITIONThe Audit Committee comprises John Bason, Chairman, and all of the non-executive directors in office at the date of this Report. Members of the Audit Committee are appointed by the Board following recommendations by the Nomination Committee and the Audit Committee’s membership is reviewed by the Nomination Committee and as part of the annual Board performance evaluation.
Each member of the Audit Committee brings an appropriate balance of senior level financial and commercial experience in multinational and/or complex organisations, combined with a good understanding of the Company’s business and is therefore considered by the Board to be competent in the Company’s sector. The expertise and experience of the members of the Audit Committee are summarised on pages 38 to 40. The Board considers that each member of the Audit Committee is independent within the definition set out in the Code. The Audit Committee’s Chairman, John Bason, is the Finance Director of Associated British Foods plc and is therefore considered by the Board to have significant, recent and relevant financial experience and to be competent in auditing and accounting.
All members of the Audit Committee receive an appropriate induction, which includes an overview of the business, its financial dynamics and its risks. Audit Committee members are expected to have an understanding of the principles of, and recent developments in, financial reporting, including the applicable accounting standards and statements of recommended practice, key aspects of the Company’s policies, financing, internal control mechanisms, and matters that require the use of judgement in the presentation of accounts and key figures as well as the role of internal and external auditors. Members of the Audit Committee undertake ongoing training as required.
The Audit Committee meets throughout the year and its agenda is linked to events in the Company’s financial calendar. Each member of the Audit Committee may require reports on matters of interest in addition to the regular items. The Audit Committee met three times during the year and members’ attendance at the meetings is set out in the table below.
MEETINGS ATTENDANCENAME ATTENDANCE1
John Bason 3 of 3Carol Arrowsmith 3 of 3Stefan Bomhard2 1 of 1Susan Murray 3 of 3Don Robert 3 of 3Sir Ian Robinson3 1 of 1Nelson Silva 3 of 3Ireena Vittal 3 of 3
1. The number of meetings attended out of the number of meetings each director was eligible to attend.
2. Appointed to the Board on 5 May 2016.3. Stepped down from the Board at the conclusion of the Company’s AGM
on 4 February 2016.
The Audit Committee invites Paul Walsh (Chairman), Richard Cousins (Group Chief Executive), Johnny Thomson (Group Finance Director), Kate Dunham (Group Financial Controller) and Kamal Zoghbi (Director of Group Internal Audit), together with senior representatives of the external auditor, to attend each meeting although, periodically, it reserves time for discussions without invitees being present. Other senior management are invited to present such reports as are required for the Audit Committee to discharge its duties.
The Chairman of the Audit Committee attends the AGM to respond to any shareholder questions that might be raised concerning its activities. The remuneration of the members of the Audit Committee and the policy with regard to the remuneration of the non-executive directors are set out on pages 68 and 71.
OBJECTIVESThe Audit Committee’s key objectives are the provision of effective governance over the appropriateness of the Group’s financial reporting, including the adequacy of related disclosures, the performance of both the internal and external audit functions, and the management of the Group’s systems of internal control, business risks and related compliance activities.
ACTIVITY DURING THE YEARThe key matters reviewed and evaluated by the Audit Committee during the year are set out below:
FINANCIAL REPORTING• the appropriateness of the interim and annual financial
statements (including the announcements thereof to the London Stock Exchange) with both management and the external auditor, including:
– at the Board’s request, whether the Annual Report and Accounts, taken as a whole, is fair, balanced and understandable and provides the information necessary for shareholders to assess the Company’s position and performance, business model and strategy
– the clarity of disclosures and compliance with financial reporting standards and relevant financial and governance reporting requirements and guidelines, including the recently published European Securities and Markets Authority Guidelines on Alternative Performance Measures which apply to all publications of regulated information from 3 July 2016
– discussing the critical accounting policies and use of assumptions and estimates, as noted in section B of the accounting policies on page 96 of this Annual Report, and concluding that the estimates, judgements and assumptions used were reasonable based on the information available and had been used appropriately in applying the Company’s accounting policies. This included, for example, the consideration of any goodwill impairment assessments and how these were addressed
Governance and Directors’ Report
Audit Committee Report continued
46 Compass Group PLC Annual Report 2016

are important. The Committee discussed with management the key judgements made, in particular, the policy efforts being led by the EU and OECD which may have a material impact on the taxation of all international businesses, including relevant legal advice. The external auditor also reports on all material provisions to the Committee
• Going Concern and the Viability Statement
OTHER MATTERSIn addition to its key role in the financial reporting process, the Audit Committee also considered the following as well as developments in regulation, such as in relation to the retendering of audit services, noted below:
• the material areas in which significant judgements have been applied, namely:
– considering the nature and quantum of the purchasing income earned by the Group during the financial year. It also assessed the extent to which the amounts recognised required estimation and reviewed the recoverability of amounts accrued at the year end with reference to aged analyses and subsequent cash receipts. Nothing arose during the course of this review to indicate that anything but limited judgement was required, or that purchasing income had not been accounted for in accordance with the Group’s accounting policies
– the level of provisioning for liabilities (including tax) where management, accounting and legal judgements
ITEMS DISCUSSEDNOV 2015
MAY 2016
SEPT 2016
INTERNAL AUDIT
• approval of the Group’s internal audit plan and risk controls and the review of internal audit activity reports and updates, together with the continued rollout of key financial controls
EXTERNAL AUDIT
• audit report on interim results• approval and review of proposed audit plan and procedures
– review of auditor effectiveness/independence following KPMG LLP’s second year as external auditor
– agreement of external auditor fees for 2016-20171
– review of the policy and update of the provision of non-audit services provided by the external auditor
– assessment of the deployment of the audit planOTHER MATTERS
• litigation and contingent liabilities• operation of the Group’s Speak Up whistleblowing policy• country and theme specific audit matters• the RGC structure and the outputs from the committee meetings• tax matters, including provisioning for potential current tax liabilities and the level of deferred tax
asset recognition as well as compliance with statutory tax reporting obligations• terms of reference: annual review
1. A three year fee was agreed as part of the audit retender noted on page 48 and in the coming year the Committee will review and determine future fees.
COR
POR
ATE GO
VERN
ANCE
Compass Group PLC Annual Report 2016 47

accordingly, to exclude such services. Therefore, the external auditor should be excluded from providing the Company with general consultancy and all other non-audit services, unless there is no other competent and available provider. Engagements for non-audit services that are not prohibited are subject to formal approval by the Audit Committee based on the level of fees involved. Non-audit services that are pre-approved are either routine in nature with a fee that is not significant in the context of the audit or are audit related services.
Within the constraints of applicable UK rules, the external auditor has traditionally undertaken some due diligence reviews and other pieces of non-audit work. The provision of non-audit services within such constraints and the agreed policy is assessed on a case by case basis so that the best placed adviser is retained. Principal non-audit services provided by KPMG LLP and approved by the Audit Committee during the year ended 30 September 2016 primarily comprised assistance on tax related services and other services including share register analysis.
During the year, the Audit Committee reviewed KPMG LLP’s fees for its services performed to 30 September 2016 (which had been set for three years from appointment), its effectiveness and whether the agreed audit plan had been fulfilled and the reasons for any variation from the plan. The review included a formal evaluation process involving the use of questionnaires completed by finance teams around the business.
The Audit Committee also considered the robustness of the 2016 audit and the degree to which KPMG LLP was able to assess key accounting and audit judgements and the content of the management letter issued by the external auditor. The Audit Committee concluded that both the audit and the audit process were effective.
The total fees paid to KPMG LLP in the year ended 30 September 2016 were £5.1 million of which £0.6 million related to non-audit work (2015: £5.2 million of which £0.7 million related to non-audit work). Further disclosure of the non-audit fees paid during the year can be found in note 2 to the consolidated financial statements on page 106.
To ensure objectivity, key members of the audit team rotate off the Company’s audit. To safeguard the independence of the Company’s external auditor and the integrity of the audit process, the recruitment of senior employees from the Company’s auditor is not permitted for a period of at least two years after they cease to be involved in the provision of services to the Company.
EXTERNAL AUDITLast year, the Committee reported that EU legislation to reform the statutory audit market was expected to apply to Public Interest Entities (PIEs) (including the Company) from mid June 2016. The government has now published The Statutory Auditors and Third Country Auditors Regulations 2016 (the Regulations) which implement the Directive and make legislative provisions to apply the directly applicable Regulation to all PIEs. The Regulation has resulted in changes to the CA 2006 and to the Code with any changes being reflected in this year’s Report. Amongst other things, the Company is required to rotate its auditors every 10 years, to give advance notice of any tendering plans and to cap the non-audit fees paid to auditors at 70% of the three year average audit fees at Group level, with there being a prohibition on the provision of certain non-audit services.
The Company last retendered its external audit appointment in 2013-2014 when KPMG LLP was appointed as the auditor. Under the terms of the new legislation and in line with the Code, the Company is required to put its external audit process out to tender again in 2023-2024. The Company has in force a policy on non-audit fees which it reviews annually and discloses the ratio of audit to non-audit fees paid in each financial year and will monitor non-audit fees to ensure that they remain within the parameters of the Regulation.
The Audit Committee is responsible for the development, implementation and monitoring of the Company’s policy on external audit. The Audit Committee reserves oversight responsibility for monitoring the auditor’s independence, objectivity and compliance with ethical, professional and regulatory requirements. The Audit Committee is responsible for the retendering selection process and recommends the appointment, reappointment and removal of the Company’s external auditor, and considers the risks associated with its withdrawal from the market in its risk evaluation and planning. The Audit Committee also reviews and sets the terms, areas of responsibility and scope of the audit as set out in the external auditor’s engagement letter; the overall work plan for the forthcoming year, together with the associated fee proposal and cost effectiveness of the audit; the external auditors’ independence; any major issues which arise during the course of the audit and their resolution; key accounting and audit judgements; the level of errors identified during the audit; the recommendations made to management by the auditor and management’s response; and the auditor’s overall performance.
The Audit Committee also ensures that key partners within the external auditor are rotated from time to time in accordance with applicable legislation. The current key partner of the Company’s external auditor is Anthony Sykes. Mr Sykes has held this position since KPMG LLP was appointed as the Company’s external auditor in 2014. The Audit Committee monitors the extent of non-audit work which the external auditor can perform, to ensure that the provision of those non-audit services that can be undertaken by the external auditor falls within the agreed policy and does not impair its objectivity or independence. Following the change of external auditor in 2014, the Audit Committee agreed that Deloitte LLP should continue to provide tax services to the Group and has amended its policy on the provision of non-audit services by the external auditor
Governance and Directors’ Report
Audit Committee Report continued
48 Compass Group PLC Annual Report 2016
REAPPOINTMENT OF AUDITORThere are no contractual restrictions on the Company’s choice of external auditor and in making its recommendation on the reappointment of KPMG LLP, the Committee took into account, amongst other matters, the tenure, objectivity and independence of KPMG LLP and its continuing effectiveness and cost as well as the availability of firms within the wider audit market. KPMG LLP has expressed its willingness to continue as auditor of the Company. Separate resolutions proposing KPMG LLP’s reappointment and determination of its remuneration by the Audit Committee will be proposed at the 2017 AGM.
DISCLOSURE OF RELEVANT AUDIT INFORMATIONThe directors confirm that, so far as they are each aware, there is no relevant audit information of which KPMG LLP is unaware and each director has taken all the steps that ought to have been taken as a director to be aware of any relevant audit information and to establish that KPMG LLP is aware of that information.
OUR STANDARDSThe Company remains committed to the highest standards of business conduct and expects all of its employees to act accordingly. The Group’s Speak Up policy (an extension of the Code of Ethics incorporated within the Group’s Code of Business Conduct (CBC) which is available in 40 languages) sets out arrangements for the receipt, in confidence, of complaints on accounting, risk issues, internal controls, auditing issues and related matters which would, as appropriate, be reported to the Audit Committee. Speak Up is a standard review item on all internal audit work programmes. The CBC and Code of Ethics are available on the Company’s website at www.compass-group.com.
The Audit Committee also receives updates on any allegations of bribery and fraud in the business at every meeting, with individual updates being given to the Audit Committee, as needed, in more serious cases of alleged bribery, fraud or related activities. The Group’s theft and anti-fraud policies are a subset of the CBC, which does not tolerate any activity involving fraud, dishonesty or deception. These policies, for which the Audit Committee retains overall responsibility, set out how allegations of fraud or bribery are dealt with, such as by the local human resources or finance team, and the frequency of local reporting that feeds into the regular updates, which are presented to the Audit Committee. Reporting of these matters to the Audit Committee is managed and overseen by the internal audit function. The Speak Up policy operates when the complaint is received through the whistleblowing channel and that policy will redirect the alleged fraud or bribery for investigation at the most appropriate level of the organisation which may, for example, be by a member of the local human resources team or, on occasion, the Audit Committee itself.
Each year, the Audit Committee critically reviews its own performance and considers where improvements can be made and in so doing it considers, amongst other things, those matters discussed by the Audit Committee, such as:
• whether the membership of the Committee meets the requirements of the Code
• whether the Committee’s terms of reference are appropriate for the particular circumstances of the Company and comply with prevailing legislation and best practice
• whether the number and length of time of Committee meetings are sufficient to meet the role and responsibilities of the Committee and coincide with key dates within the financial reporting and audit cycle
This is underpinned by the annual evaluation of the Board and its committees. This year, in accordance with the Code, an external evaluation was conducted by ECL and more details of this can be found on page 43.
INTERNAL AUDITThe Audit Committee reviews the effectiveness of the Group’s internal audit function and its relationship with the external auditor, including internal audit resources, plans and performance as well as the degree to which the function is free of management restrictions. Throughout the year, the Audit Committee reviewed the internal audit function’s plans and its achievements against those plans. The Audit Committee considered the results of the audits undertaken by the internal audit function and the adequacy of management’s response to matters raised, including the time taken to resolve any such matters.
INTERNAL CONTROLThe Audit Committee also reviews the integrity of material financial statements made by the Company. The Audit Committee monitors and conducts a robust review of the effectiveness of the Group’s internal control systems, accounting policies and practices and compliance controls (including key financial controls) as well as the Company’s statements on internal control before they are agreed by the Board for each year’s Annual Report. The Board retains overall responsibility for internal control and the identification and management of business risk. The key features of the Group’s internal control and risk management systems that ensure the accuracy and reliability of financial reporting include clearly defined lines of accountability and delegation of authority, policies and procedures that cover financial planning and reporting, preparing consolidated accounts, capital expenditure, project governance and information security and the Group’s CBC. The internal audit function is involved in the assessment of the quality of risk management and internal control and helps to promote and further develop effective risk management within the business. Certain internal audit assignments (such as those requiring specialist expertise) continue to be outsourced by the Director of Group Internal Audit as appropriate. The Audit Committee reviews internal audit reports and considers the effectiveness of the function.
COR
POR
ATE GO
VERN
ANCE
Compass Group PLC Annual Report 2016 49

In a Group where local management have considerable autonomy to run and develop their businesses, a well- designed system of internal control is necessary to safeguard shareholders’ investments and the Company’s assets. The directors acknowledge that they have overall responsibility for risk management, the Group’s systems of internal control, for reviewing the effectiveness of those controls and for ensuring that an appropriate culture has been embedded throughout the organisation. In accordance with the guidance set out in the FRC’s Guidance on Risk Management, Internal Control and Related Financial Business Reporting 2014, and in the Code itself, an ongoing process has been established for identifying, managing and evaluating the risks faced by the Group. This process has been in place for the full financial year and up to the date on which the financial statements were approved.
The systems are designed to manage rather than eliminate the risk of failure to achieve the Group’s strategic objectives, safeguard the Group’s assets against material loss, fairly report the Group’s performance and position, and to ensure compliance with relevant legislation, regulation and best practice including that related to social, environmental and ethical matters. The systems provide reasonable, but not absolute, assurance against material misstatement or loss. Such systems are reviewed by the Board to deal with changing circumstances.
A summary of the key financial risks inherent in the Group’s business is given on pages 27 to 29. Risk assessment and evaluation are an integral part of the annual planning cycle. Each business documents the strategic objectives and the effectiveness of the Group’s systems of internal control. As part of the review, each significant business and function has been required to identify and document each substantial risk, together with the mitigating actions implemented to manage, monitor and report to management on the effectiveness of these controls. Senior managers are also required to sign biannual confirmations of compliance with key procedures and to report any breakdowns in, or exceptions to, these procedures. Summarised results have been presented to senior management (including to the members of the Executive Board) and to the Board.
These processes have been in place throughout the financial year ended 30 September 2016 and have continued to the date of this Report. Taken together, these processes and the reports they generate, which are considered by the Audit Committee, constitute a robust assessment of key risks and the internal controls that exist, and are designed to mitigate these risks. The Board has reviewed the effectiveness of the Group’s system of internal control for the year under review and a summary of the principal control structures and processes in place across the Group is set out in this Report.
CONTROL ENVIRONMENTWhilst the Board has overall responsibility for the Group’s system of internal control and for reviewing its effectiveness, it has delegated responsibility for the operation of the internal control and risk management programme to the Executive Board. The detailed review of internal control has been delegated to the Audit Committee. The management of each business is responsible for internal control and risk management within its own business and for ensuring compliance with the Group’s policies and procedures. Each business has appointed a risk champion whose primary role in such capacity is to ensure compliance by local management with the Group’s risk management and internal control programme. The internal and external independent auditors have reviewed the overall approach adopted by the Group towards its risk management activities so as to reinforce these internal control requirements.
CONTROL PROCEDURESThe Board reviews its strategic plans and objectives on an annual basis and approves Group budgets and strategies in light of these. Control is exercised at Group, regional and business level through the Group’s Management and Performance framework (as well as through the RGCs) and monthly monitoring of performance by comparison with budgets, forecasts and cash targets, and by regular visits to Group businesses by the Group Chief Executive, Group Finance Director and Group Chief Operating Officers.
This is underpinned by a formal major risk assessment process, which is an integral part of the annual business cycle and is also a robust process adopted to support the Viability Statement. Each of the Group’s businesses is required to identify and document major risks facing their business and appropriate mitigating activities and controls, and to monitor and report to management on the effectiveness of these controls on a biannual basis. These reports, together with reports on internal control and departures, if any, from established Group procedures prepared by both the internal and external auditors, are reviewed by the Group Finance Director and the Audit Committee. Group companies also submit biannual risk and internal control assurance letters to the Group Finance Director on internal control and risk management issues, with comments on the control environment within their operations. The Group Finance Director summarises these submissions for the Audit Committee, and the Chairman of the Audit Committee reports to the Board on any matters that have arisen from the Audit Committee’s review of the way in which risk management and internal control processes have been applied.
Governance and Directors’ Report
Audit Committee Report continued
50 Compass Group PLC Annual Report 2016

The Board has formal procedures in place for the approval of client contracts, capital investment and acquisition projects, with clearly designated levels of authority, supported by post investment review processes for selected acquisitions, client contracts and major capital expenditure. The Board considers social, environmental and ethical matters in relation to the Group’s business and assesses these when reviewing the risks faced by the Group; further information regarding environmental and ethical matters is available on pages 30 to 33. The Board is conscious of the effect such matters may have on the short and long term value of the Company. The external auditor of the Company and the Director of Group Internal Audit attend Audit Committee meetings and receive its papers. The Audit Committee members meet regularly with the external auditor and with the Director of Group Internal Audit, without the presence of executive management.
There were no changes to the Company’s internal control over financial reporting that occurred during the year ended 30 September 2016 that have affected materially, or are reasonably likely to affect materially, the Company’s internal control over financial reporting.
COR
POR
ATE GO
VERN
ANCE
Compass Group PLC Annual Report 2016 51
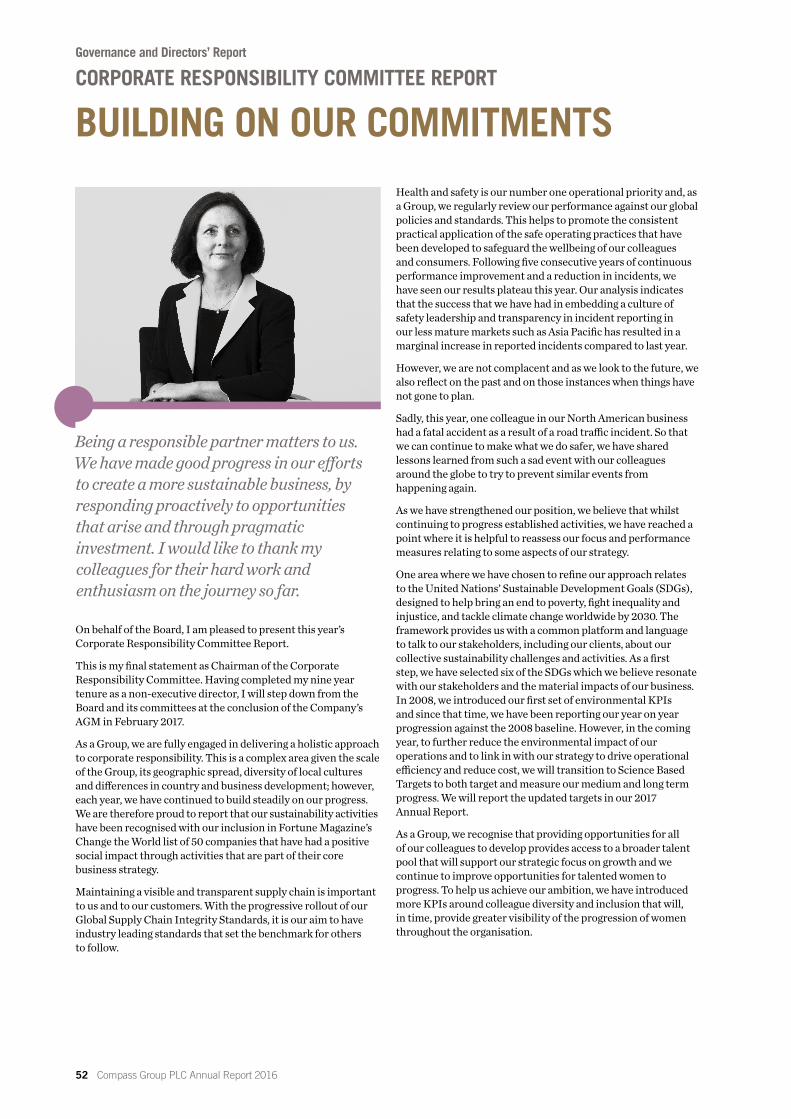
On behalf of the Board, I am pleased to present this year’s Corporate Responsibility Committee Report.
This is my final statement as Chairman of the Corporate Responsibility Committee. Having completed my nine year tenure as a non-executive director, I will step down from the Board and its committees at the conclusion of the Company’s AGM in February 2017.
As a Group, we are fully engaged in delivering a holistic approach to corporate responsibility. This is a complex area given the scale of the Group, its geographic spread, diversity of local cultures and differences in country and business development; however, each year, we have continued to build steadily on our progress. We are therefore proud to report that our sustainability activities have been recognised with our inclusion in Fortune Magazine’s Change the World list of 50 companies that have had a positive social impact through activities that are part of their core business strategy.
Maintaining a visible and transparent supply chain is important to us and to our customers. With the progressive rollout of our Global Supply Chain Integrity Standards, it is our aim to have industry leading standards that set the benchmark for others to follow.
Health and safety is our number one operational priority and, as a Group, we regularly review our performance against our global policies and standards. This helps to promote the consistent practical application of the safe operating practices that have been developed to safeguard the wellbeing of our colleagues and consumers. Following five consecutive years of continuous performance improvement and a reduction in incidents, we have seen our results plateau this year. Our analysis indicates that the success that we have had in embedding a culture of safety leadership and transparency in incident reporting in our less mature markets such as Asia Pacific has resulted in a marginal increase in reported incidents compared to last year.
However, we are not complacent and as we look to the future, we also reflect on the past and on those instances when things have not gone to plan.
Sadly, this year, one colleague in our North American business had a fatal accident as a result of a road traffic incident. So that we can continue to make what we do safer, we have shared lessons learned from such a sad event with our colleagues around the globe to try to prevent similar events from happening again.
As we have strengthened our position, we believe that whilst continuing to progress established activities, we have reached a point where it is helpful to reassess our focus and performance measures relating to some aspects of our strategy.
One area where we have chosen to refine our approach relates to the United Nations’ Sustainable Development Goals (SDGs), designed to help bring an end to poverty, fight inequality and injustice, and tackle climate change worldwide by 2030. The framework provides us with a common platform and language to talk to our stakeholders, including our clients, about our collective sustainability challenges and activities. As a first step, we have selected six of the SDGs which we believe resonate with our stakeholders and the material impacts of our business. In 2008, we introduced our first set of environmental KPIs and since that time, we have been reporting our year on year progression against the 2008 baseline. However, in the coming year, to further reduce the environmental impact of our operations and to link in with our strategy to drive operational efficiency and reduce cost, we will transition to Science Based Targets to both target and measure our medium and long term progress. We will report the updated targets in our 2017 Annual Report.
As a Group, we recognise that providing opportunities for all of our colleagues to develop provides access to a broader talent pool that will support our strategic focus on growth and we continue to improve opportunities for talented women to progress. To help us achieve our ambition, we have introduced more KPIs around colleague diversity and inclusion that will, in time, provide greater visibility of the progression of women throughout the organisation.
Governance and Directors’ Report
CORPORATE RESPONSIBILITY COMMITTEE REPORT
BUILDING ON OUR COMMITMENTS
Being a responsible partner matters to us. We have made good progress in our efforts to create a more sustainable business, by responding proactively to opportunities that arise and through pragmatic investment. I would like to thank my colleagues for their hard work and enthusiasm on the journey so far.
52 Compass Group PLC Annual Report 2016
More information about what we have been doing this year, our performance against the targets we set ourselves last year and our ambition for the future can be found below and on our website at www.compass-group.com.
I would like to take this opportunity to thank all of my Compass colleagues for their efforts to date. I am extremely proud of what has been achieved and it would not have been possible without their commitment and enthusiasm. Thank you. I also wish Nelson every success as the new Chairman of the Committee.
Susan MurrayChairman of the Corporate Responsibility Committee 22 November 2016
COMPOSITIONThe Corporate Responsibility (CR) Committee comprises Susan Murray, Chairman, Paul Walsh, Richard Cousins, Johnny Thomson (in succession to Dominic Blakemore from 1 December 2015), Robin Mills (Group HR Director), Mark White (General Counsel and Company Secretary), and all of the non-executive directors in office at the date of this Report.
The CR Committee meets at least twice a year. The Committee met twice during the year and members’ attendance is set out in the table below.
MEETINGS ATTENDANCENAME ATTENDANCE1
Susan Murray 2 of 2Carol Arrowsmith 2 of 2John Bason 2 of 2Dominic Blakemore2 1 of 1Stefan Bomhard3 0 of 0Richard Cousins 2 of 2Robin Mills 2 of 2Don Robert 2 of 2Sir Ian Robinson4 1 of 1Nelson Silva 2 of 2Johnny Thomson5 1 of 1Ireena Vittal 2 of 2Paul Walsh 2 of 2Mark White 2 of 2
1. The number of meetings attended out of the number of meetings which each director/member was eligible to attend.
2. Stepped down as a member of the Committee on 1 December 2015.3. Appointed to the Board on 5 May 2016.4. Stepped down from the Board at the conclusion of the Company’s AGM
on 4 February 2016.5. Appointed to the Board on 1 December 2015.
RESPONSIBILITIESThe Committee’s primary responsibilities include health, safety and environmental practices, ethical business conduct, the promotion of employee engagement and diversity as well as community investment.
The Committee has a rolling agenda and receives reports from the Director of Health, Safety and Environment and other senior managers to ensure that progress is being made towards meeting the Group’s specific corporate responsibility KPIs and in our ongoing corporate responsibility commitments.
We are dedicated to maintaining the highest standards of corporate governance and throughout the Annual Report there are examples of how we are endeavouring to achieve our strategic goals whilst underpinning our CR core values.
For the purposes of the CA 2006, the Directors’ Report for the year ended 30 September 2016 comprises pages 34 to 57, pages 80 to 84 and the Directors’ Responsibilities statement on page 86. In accordance with the CA 2006, the Board has elected to set out in the Strategic Report some of those matters required to be disclosed in the Directors’ Report which it considers to be of importance to the Company. These are as follows:
• carbon emissions• likely future developments• risk management
ACTIVITY DURING THE YEARDuring the year, the Committee addressed a number of governance matters and in this regard we received updates from the General Counsel and Company Secretary on new developments in corporate governance and reporting. The Committee considered recommendations to the Board concerning these matters, examples of which can be found in the highlights on page 54.
We continue to make steady progress in advancing our sustainability priorities, including our supply chain integrity which continues to be a complex challenge for the Group given its geographic spread and scale.
COMING YEARGood corporate governance underpins all of our corporate activities and the Committee will continue to offer comment and advice to the Board on those areas in the business where governance might be enhanced. In conjunction with the General Counsel and Company Secretary, the Committee will also keep the Board up to date with the latest legislative changes and best practices in governance and reporting, and of any action required to be taken by the Company as a result of the changes.
During the next 12 months, the Committee will continue to review CR commitments and targets to ensure they remain aligned to the business strategy. The introduction of additional KPIs sets new challenges, but as a business we remain focused on building on our achievements to date and we look forward to reporting our progress in the 2017 Annual Report.
COR
POR
ATE GO
VERN
ANCE
Compass Group PLC Annual Report 2016 53

HIGHLIGHTS
Health & Safety (H&S) Overview
Health and safety is our number one operational priority and is central to our business around the world. The Committee continued to review progress against existing H&S performance measures, recommend new performance measures and to oversee recommended actions/initiatives to ensure that we continue to make what we do safer.
Details of our H&S KPIs and our year on year performance against targets at www.compass-group.com.
Modern Slavery Act 2015 (MSA) Statement
The Committee oversaw preparation and review of the Company’s MSA statement.
The Company’s MSA statement can be found at www.compass-group.com.
Review of the Group’s Charitable Donations Policy
Conducted the annual review of the Group’s charitable donations policy to ensure that it continued to be fit for purpose.
See page 84 for details of charitable donations made by the Group during the year.
EU Audit Directive Monitored and advised on changes to legislation concerning audit committee composition, for example, the requirement that the audit committee as a whole has competence relevant to the sector in which the Company operates and changes to auditor responsibilities.
See pages 45 to 51 for more details.
The Small Business, Enterprise and Employment Act 2015 (SBEEA)
Monitored and advised on the requirement for companies to maintain a beneficial ownership register of persons with significant control (PSC); and the ‘Trust and Transparency’ reforms which include the requirement for companies to publish pay information by gender which includes five different types of information.
As a PLC the Company is not itself required to maintain a PSC register, but all of its UK registered subsidiaries have been required to do so with effect from 30 June 2016.
The Company will publish the five point gender pay data in due course as required by the SBEEA.
EU Market Abuse Regulation (MAR)
MAR came into force on 3 July 2016 and introduced a new regime for market abuse (market manipulation and insider dealing) alongside new rules on disclosure of inside information, insider lists and revised obligations and restrictions on persons discharging managerial responsibilities (PDMRs) and persons closely associated with them (PCAs).
In conjunction with the Disclosure Committee, the Committee advised on changes required to be made to Company policies and processes as a result of the new legislation, for example, updating the Group’s Share Dealing and Communications Codes, terms of reference of the Disclosure Committee and the introduction of a formal Market Soundings Policy.
The Disclosure Committee’s terms of reference adopted by the Board on 14 July 2016 can be found at www.compass-group.com.
Further embed the CBC and Code of Ethics
Over the past 12 months, the Group has continued to implement measures to maintain the profile of the CBC and Code of Ethics with colleagues around the world.
We constantly challenge our leadership teams to implement new measures to refresh the understanding and importance of the CBC and Code of Ethics to our business, and we will continue to work with our businesses to further eliminate risk and reduce any vulnerabilities in our supply chain.
Group policies including the CBC and Code of Ethics can be found at www.compass-group.com.
Introduction of new KPIs
Introduction of additional KPIs centred on our workforce and environmental performance which complement the existing suite of non-financial KPIs and ensure that we continue to meet the evolving requirements of our stakeholders.
Details of these KPIs can be found at www.compass-group.com.
Review of KPI performance over the year under review and consideration of targets for the coming year
The Committee reviewed the performance of existing KPIs over the 12 months to 30 September 2016.
Details of our performance against the goals we set at the end of last year can be found at www.compass-group.com.
Governance and Directors’ Report
Corporate Responsibility Committee Report continued
54 Compass Group PLC Annual Report 2016

NOMINATION COMMITTEE REPORT
MAINTAINING BALANCE
DEAR SHAREHOLDEROn behalf of the Board, I am pleased to present this year’s Nomination Committee Report.
It has been another busy year for the Committee with a number of changes being made to the Board.
The appointments of Johnny Thomson, who took over from Dominic Blakemore as the Group Finance Director in December last year, and of Stefan Bomhard who joined the Board as a non-executive director in May this year, further strengthen the capabilities of the Board. Johnny’s existing knowledge of the business has been key in helping him to smoothly transition from roles in our Latin American business to become Group Finance Director, while Stefan’s extensive experience of the global food, beverage and retail markets will be invaluable in his role on the Board.
The process to appoint a new director takes time and requires careful planning. You can find more details of the practical considerations and process behind the appointment of a director on page 57.
Biographical details of the members of the Board who held office during the year and up to the date of this Report can be found on pages 38 to 40.
In the coming year, in consultation with the chairmen of the principal committees, we will continue to build on our work to date. Our aim is to ensure that the Group’s succession planning policy remains fit for purpose and evolves to maintain the right mix of strengths and experience on the Board, whether executive or non-executive, and to meet the ongoing strategic aims of the Group.
Paul WalshChairman of the Nomination Committee 22 November 2016
HIGHLIGHTSDATE DETAILS OF CHANGE
1 October 2015
Sir Ian Robinson stepped down as SID and was succeeded by Don Robert on the same day.
1 December 2015
Johnny Thomson succeeded Dominic Blakemore as Group Finance Director. On the same day, Andrew Martin stepped down as a director and as Group Chief Operating Officer, Europe & Japan and Dominic Blakemore was appointed Group Chief Operating Officer, Europe.
4 February 2016
Sir Ian Robinson stepped down from the Board at the conclusion of the Company’s AGM.
5 May 2016
Stefan Bomhard was appointed as a non-executive director.
22 November 2016
The Company announced that Susan Murray will step down from the Board at the conclusion of the Company’s AGM to be held on 2 February 2017. Nelson Silva will succeed Susan as Chairman of the Corporate Responsibility Committee on the same day.
We operate in dynamic markets and the Board and its committees must adapt and evolve to ensure that they make an effective contribution.
COR
POR
ATE GO
VERN
ANCE
Compass Group PLC Annual Report 2016 55
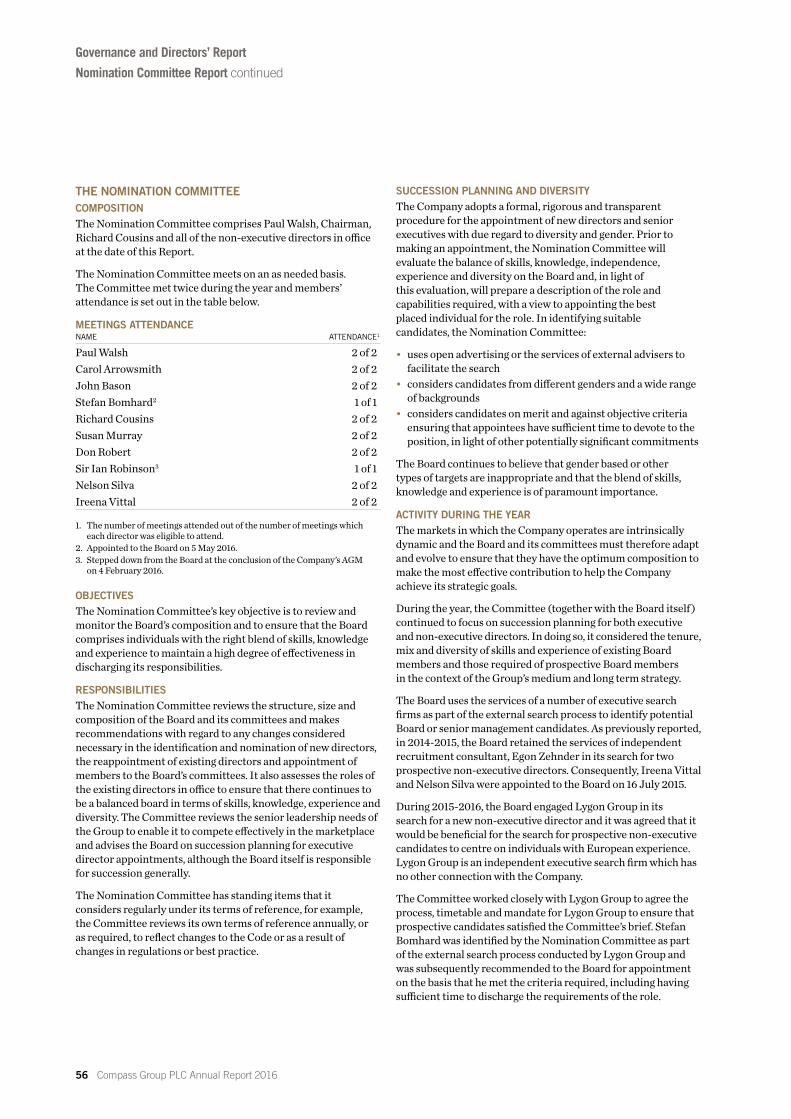
THE NOMINATION COMMITTEECOMPOSITIONThe Nomination Committee comprises Paul Walsh, Chairman, Richard Cousins and all of the non-executive directors in office at the date of this Report.
The Nomination Committee meets on an as needed basis. The Committee met twice during the year and members’ attendance is set out in the table below.
MEETINGS ATTENDANCENAME ATTENDANCE1
Paul Walsh 2 of 2Carol Arrowsmith 2 of 2John Bason 2 of 2Stefan Bomhard2 1 of 1Richard Cousins 2 of 2Susan Murray 2 of 2Don Robert 2 of 2Sir Ian Robinson3 1 of 1Nelson Silva 2 of 2Ireena Vittal 2 of 2
1. The number of meetings attended out of the number of meetings which each director was eligible to attend.
2. Appointed to the Board on 5 May 2016.3. Stepped down from the Board at the conclusion of the Company’s AGM
on 4 February 2016.
OBJECTIVESThe Nomination Committee’s key objective is to review and monitor the Board’s composition and to ensure that the Board comprises individuals with the right blend of skills, knowledge and experience to maintain a high degree of effectiveness in discharging its responsibilities.
RESPONSIBILITIESThe Nomination Committee reviews the structure, size and composition of the Board and its committees and makes recommendations with regard to any changes considered necessary in the identification and nomination of new directors, the reappointment of existing directors and appointment of members to the Board’s committees. It also assesses the roles of the existing directors in office to ensure that there continues to be a balanced board in terms of skills, knowledge, experience and diversity. The Committee reviews the senior leadership needs of the Group to enable it to compete effectively in the marketplace and advises the Board on succession planning for executive director appointments, although the Board itself is responsible for succession generally.
The Nomination Committee has standing items that it considers regularly under its terms of reference, for example, the Committee reviews its own terms of reference annually, or as required, to reflect changes to the Code or as a result of changes in regulations or best practice.
SUCCESSION PLANNING AND DIVERSITYThe Company adopts a formal, rigorous and transparent procedure for the appointment of new directors and senior executives with due regard to diversity and gender. Prior to making an appointment, the Nomination Committee will evaluate the balance of skills, knowledge, independence, experience and diversity on the Board and, in light of this evaluation, will prepare a description of the role and capabilities required, with a view to appointing the best placed individual for the role. In identifying suitable candidates, the Nomination Committee:
• uses open advertising or the services of external advisers to facilitate the search
• considers candidates from different genders and a wide range of backgrounds
• considers candidates on merit and against objective criteria ensuring that appointees have sufficient time to devote to the position, in light of other potentially significant commitments
The Board continues to believe that gender based or other types of targets are inappropriate and that the blend of skills, knowledge and experience is of paramount importance.
ACTIVITY DURING THE YEARThe markets in which the Company operates are intrinsically dynamic and the Board and its committees must therefore adapt and evolve to ensure that they have the optimum composition to make the most effective contribution to help the Company achieve its strategic goals.
During the year, the Committee (together with the Board itself ) continued to focus on succession planning for both executive and non-executive directors. In doing so, it considered the tenure, mix and diversity of skills and experience of existing Board members and those required of prospective Board members in the context of the Group’s medium and long term strategy.
The Board uses the services of a number of executive search firms as part of the external search process to identify potential Board or senior management candidates. As previously reported, in 2014-2015, the Board retained the services of independent recruitment consultant, Egon Zehnder in its search for two prospective non-executive directors. Consequently, Ireena Vittal and Nelson Silva were appointed to the Board on 16 July 2015.
During 2015-2016, the Board engaged Lygon Group in its search for a new non-executive director and it was agreed that it would be beneficial for the search for prospective non-executive candidates to centre on individuals with European experience. Lygon Group is an independent executive search firm which has no other connection with the Company.
The Committee worked closely with Lygon Group to agree the process, timetable and mandate for Lygon Group to ensure that prospective candidates satisfied the Committee’s brief. Stefan Bomhard was identified by the Nomination Committee as part of the external search process conducted by Lygon Group and was subsequently recommended to the Board for appointment on the basis that he met the criteria required, including having sufficient time to discharge the requirements of the role.
Governance and Directors’ Report
Nomination Committee Report continued
56 Compass Group PLC Annual Report 2016

COMING YEARThe Committee understands that planning for the future and having a succession planning policy designed to progressively bring new skills and different perspectives to the Board are key to maintaining an appropriate balance on the Board.
There is a wealth of talent within our organisation and, together with the Board, the Committee will continue to offer its support to coaching and mentoring development programmes for executive and senior managers in the Group to help mould and encourage the potential leaders of the future.
Paul WalshChairman of the Nomination Committee 22 November 2016
SUCCESSION PLANNING IN ACTIONWHAT DOES IT INVOLVE?The process of recruiting an individual to join the Board takes time and if not managed properly can have a detrimental impact on the performance of the Board and its committees. From the initial planning stage where the need for a new director is identified through to the new director joining the Company may take a year or more and a well-established and carefully executed succession planning process is key. The narrative which follows gives a flavour of the practical steps involved in the recruitment of a new director where the services of an external recruitment consultant are used to help the Committee.
When changes to Board membership are considered, an assessment is made of the existing qualities and competencies that already exist around the boardroom table with a view to strengthening any areas that might be considered to be weaker and to support the priorities of the Company and its stakeholders.
WHAT DO WE LOOK FOR IN A NEW DIRECTOR?Generally, in view of the geographic spread of the Company’s businesses, current or previous experience at board or senior level in a listed company or multinational and/or complex organisation is required although not necessarily in the same type of business or sector, together with an ability to understand complex issues and to communicate clearly and objectively. Depending on the Company’s strategic aims, the candidate may also be required to possess bi or multilingual skills and to have an understanding of another country, its culture and way of conducting business. A specific technical expertise/qualification may also be necessary (for example, if the new director is going to be appointed as the Chairman of the Audit Committee).
WHAT HAPPENS ONCE WE HAVE DRAWN UP A SHORT LIST OF POTENTIAL CANDIDATES?As a general proposition, the Chairman, Group Chief Executive and SID interview each prospective candidate
although other directors may also be involved in the interview process depending on the role being filled. For example, if the director being recruited was intended to be the Chairman of the Audit Committee, it would be appropriate for the existing Audit Committee Chairman and/or the Group Finance Director to participate in interviews to ensure that the candidate had the requisite technical skills, knowledge and understanding to undertake that role.
WHAT HAPPENS ONCE THE PREFERRED CANDIDATE HAS BEEN SELECTED?Subject to the Committee’s recommendations to the Board, the Board as a whole would then be involved in the decision to appoint a director.
Subject to formal Board approval, the individual is appointed (in the case of a non-executive director for an initial period of three years, which may be extended up to a maximum of nine years). If appropriate, a director’s potential conflicts of interest arising from pre-existing appointments are considered in the context of the time commitment required to carry out their role and responsibilities at Compass effectively. All directors retire and offer themselves for election and/or re-election at every AGM of the Company and any new director’s appointment is subject to shareholder approval at the first AGM following their appointment.
HOW DOES THE NEW DIRECTOR LEARN ABOUT THE COMPANY?The Chairman of the Board is responsible for ensuring that the newly appointed director receives a tailored induction so that he or she is able to undertake his or her role and responsibilities on the Board and its committees effectively. Inductions are tailored to suit the needs and requirements of the incoming individual. Ongoing development needs and training requirements are reviewed as necessary by the Chairman of the Board and agreed with the new director. More details of the Company’s induction process can be found on page 42.
COR
POR
ATE GO
VERN
ANCE
Compass Group PLC Annual Report 2016 57

DEAR SHAREHOLDEROn behalf of the Board, I am pleased to present the 2015-2016 Annual Remuneration Report which sets out our philosophy and policy for directors’ remuneration and the activities of the Remuneration Committee for the financial year ended 30 September 2016. This Report complies with the UK executive remuneration reporting guidelines and contains:
(i) this Annual Statement, incorporating a new ‘at a glance’ summary setting out both how the business’ strategic key performance indicators (KPIs) link to the incentive plans and the key remuneration decisions made this year;
(ii) the Governance Summary;
(iii) the Company’s Remuneration Policy; and
(iv) the Annual Remuneration Report on the implementation of the Policy in the year ended 30 September 2016.
PERFORMANCE IN 2015-2016Compass has delivered another year of excellent performance with strong top line growth, which is converting well into profits and cash. As a truly global business, the balanced exposure to different sectors, regions and countries has meant that the challenges in some emerging markets have been offset by the strength of North America and encouraging progress in Europe.
Over the three year performance period for the Long Term Incentive Plan (1 October 2013 to 30 September 2016), Compass’ share price grew by 76%, from 850 pence to 1495 pence, and a total dividend of 138.5 pence per share (including 56 pence for the Return of Cash to shareholders in July 2014) was paid as well as approximately £606 million returned to shareholders by way of the share buyback programme*. The dividend distribution to shareholders for the year ended 30 September 2016 was increased by 7.8% compared to the previous year, as referred to on page 22.
* The buyback is shown net of £97 million used for treasury shares to settle share awards granted under employee incentive schemes in the period.
Governance and Directors’ Report
DIRECTORS’ REMUNERATION REPORT
REWARDING STRATEGIC PROGRESS
ANNUAL STATEMENT
We believe our consistent approach to remuneration, clearly linked to the KPIs by which we measure the delivery of our business strategy, is fundamental to the superior returns to shareholders which Compass has delivered over time.
58 Compass Group PLC Annual Report 2016

2015-2016 REMUNERATION REVIEWThe remuneration philosophy at Compass is to ensure close alignment between performance and reward so we have incentive plans which are based on the strategic KPIs by which the business is measured and managed. We measure performance delivered in the financial year for the annual bonus and over three financial years to determine the number of shares that have been earned under the LTIP. The measures and the incentive opportunity are unchanged from last year.
For the annual bonus we measure both Group and, where relevant, regional performance. This has led to a range of bonus outcomes as illustrated in the ‘at a glance’ summary on page 60 and also in the main Directors’ Remuneration Report, where both the Group and Regional bonus targets, to which these outcomes relate, are disclosed in full.
The TSR element of the LTIP was earned in full because Compass ranked 8th against other FTSE 100 companies (excluding financial services companies). The targets we set based on Adjusted Group Free Cash Flow and Return on Capital Employed were demanding and were satisfied in part (92.7% and 60.7% respectively). The Committee considers this outcome to be a fair and balanced result.
We have maintained our approach of basing our pay decisions on reported numbers with principled and consistent adjustments to ensure that we are paying for underlying performance. The Committee believes that a clear approach to the treatment of any adjustments to reported numbers, for the purposes of determining the incentive outcome, is in the best interests of both shareholders and participants. This is why, for example, we exclude the impact of currency movements, whether positive or negative, from the measures used in the management incentives. Other potential adjustments are tested against a set of pre-agreed criteria to ensure an appropriate outcome in the circumstances which reflects the true underlying performance of the business.
Our historic balanced approach has continued this year with salary increases for the executive directors within the general adjustment range used for others within the Group, with one exception. As was signalled in last year’s remuneration report, Johnny Thomson was appointed to the role of Group Finance Director at a salary below the market rate, reflecting that this was his first PLC director role. Johnny has performed very well during the year and, consequently, will receive an increase of 8% in salary, with effect from 1 January 2017, to reflect both his strong performance and increasing experience. This will still place Johnny below the market rate for equivalent roles in similar organisations. As indicated previously, above inflation pay increases are likely to be necessary for another one to two years to ensure his pay is appropriately aligned with that of his peers, subject, of course, to his continued strong performance in the role.
In developing the remuneration policy for shareholder approval in 2018, the Committee will consider the changing executive remuneration environment, including that related to pensions.
CONCLUSIONThe Committee believes that the current executive remuneration policy works effectively to motivate and retain our executive team whilst supporting the delivery of superior returns to shareholders. Therefore, the principles underlying our executive remuneration remain unchanged, namely a balanced approach, with incentives based on strategic key performance metrics so our executives’ remuneration reflects business performance. The Policy approved at the 2015 AGM will remain in place until the 2018 AGM when, in accordance with the Large and Medium-sized Companies and Groups (Accounts and Reports) (Amendment) Regulations 2013 (the 2013 Regulations), the policy to apply for the next three years to the 2021 AGM will be submitted to shareholders for approval.
In the meantime, we welcome the opportunity to engage with shareholders about any aspect of our remuneration policy, its implementation and how we believe it drives superior returns to shareholders. We were very pleased to receive good support for the 2015 Directors’ Remuneration Report at the AGM in February 2016. Shareholders will have the opportunity to vote on the Annual Remuneration Report for 2015-2016 at our AGM to be held on Thursday 2 February 2017. I look forward to welcoming you and hope to receive your support again.
Carol ArrowsmithChairman of the Remuneration Committee 22 November 2016
COR
POR
ATE GO
VERN
ANCE
Compass Group PLC Annual Report 2016 59

REMUNERATION IN 2015-2016The performance measures used in the management incentive schemes have been chosen to reflect Compass’ strategic KPIs to ensure close alignment between management and shareholder interests, as indicated below:
PERFORMANCE MEASURE STRATEGIC KPI1 MANAGEMENT INCENTIVE WEIGHTING2
ORG ORG Annual Bonus 25%PBIT Underlying operating margin Annual Bonus 55%AFCF Underlying Free Cashflow Annual Bonus/LTIP 15%/33.3%HSE – LTIR – FSIR
HSE – LTIR – FSIR
Annual Bonus 2.5%2.5%
ROCE ROCE LTIP 33.3%TSR Outcome reflects all strategic KPIs LTIP 33.3%
1. For more information on Compass’ strategic KPIs, see pages 12 and 13.2. Weightings reflect those for the Group Chief Executive and Group Finance Director, based on total Group performance; for Dominic Blakemore and
Gary Green, a proportion of their annual bonus measure is based on the performance of the region for which they are responsible, details of which are set out on page 72.
KEY REMUNERATION OUTCOMES FOR 2015-2016The table below summarises the key remuneration outcomes related to executive director appointments for 2015-2016, reflecting a year of strong performance:
ELEMENT DOMINIC BLAKEMORE RICHARD COUSINS GARY GREEN JOHNNY THOMSONBase Salary at 1 January 2016 £640,000 £1,044,785 $1,294,000 £575,000Base Salary at 1 January 2017 £656,000 £1,070,000 $1,345,760 £621,000Increase on prior year 2.5% 2.4% 4.0% 8.0%Benefits and Pension Unchanged from last yearAnnual Bonus 65.1%
of maximum85.8%
of maximum100%
of maximum85.8%
of maximumLTIP 84.5%
of maximum84.5%
of maximum84.5%
of maximum84.5%
of maximumTotal Remuneration £2.461m £5.822m £4.130m £1.924m
TOTAL SHAREHOLDER RETURNWe believe that our consistent, balanced approach to remuneration, clearly linked to the KPIs by which we measure the delivery of our business strategy, is fundamental to the superior returns to shareholders which Compass has delivered over time. This is demonstrated in the table below which shows our TSR compared to the FTSE 100 since 2008, and the total remuneration earned by Richard Cousins.
Governance and Directors’ Report
Directors’ Remuneration Report continued
AT A GLANCE
TOTAL RETURN INDICES – COMPASS V FTSE 100
(SEPTEMBER)
2008 2009 2010 2011 2012 2013 2014 2015 2016
Compass FTSE 100 Chief Executive total remuneration
50
100
200
300
400
500
5
10
15
20
Total Shareholder Return value of hypothetical £100 holding
Chief Executive total remuneration
£ million
60 Compass Group PLC Annual Report 2016

THE REMUNERATION COMMITTEEThe Board sets the Company’s Remuneration Policy and the Remuneration Committee (the Committee) is responsible, within the authority delegated by the Board, for determining specific remuneration packages and the terms and conditions of employment for the members of the Executive Board, which comprises the executive directors and other senior executives. The Committee ensures that the members of the Executive Board are provided with the appropriate incentives to enhance the Group’s performance and to reward them for their personal contribution to the success of the business. The Committee reviews the remuneration arrangements for Group employees whose salaries exceed a specified level and administers the Company’s share incentive plans. The Committee also determines the Chairman’s remuneration, although the Board itself determines the level of fees paid to the non-executive directors. No directors are involved in determining their own remuneration. The Committee maintains an active dialogue with shareholder representatives and its full terms of reference are set out on the Company’s website at www.compass-group.com.
The Committee consists entirely of independent non-executive directors, as defined in the Code.
COMMITTEE COMPOSITIONThe Committee comprises Carol Arrowsmith, Chairman, and all of the other non-executive directors in office at the date of this Report. The Remuneration Committee met three times during the year and directors’ attendance can be found in the table below.
MEETINGS ATTENDANCENAME ATTENDANCE1
Carol Arrowsmith 3 of 3John Bason 3 of 3Stefan Bomhard2 1 of 1Susan Murray 3 of 3Don Robert 3 of 3Sir Ian Robinson3 1 of 1Nelson Silva 3 of 3Ireena Vittal 3 of 3
1. The number of meetings attended out of the number of meetings which each director was eligible to attend.
2. Stefan Bomhard joined the Board on 5 May 2016.3. Sir Ian Robinson stepped down from the Board at the conclusion of the
Company’s AGM on 4 February 2016.
Biographical details of the current members of the Committee are set out on pages 38 to 40. The General Counsel and Company Secretary acts as the Secretary to the Committee. Details of advisers to the Committee can be found on page 79. The Chairman of the Remuneration Committee attends the AGM to respond to any shareholder questions that might be raised on the Committee’s activities.
ACTIVITY DURING THE YEARThe key activities of the Committee during the year ended 30 September 2016 were:
• a review of the draft Directors’ Remuneration Report (DRR) for 2014-2015 and a review of the 2015 and 2016 AGM voting results
• determination of the extent to which the 2014-2015 performance measures for the long term incentive and bonus plans were achieved
• annual review of directors’ share ownership against the Company’s agreed policy and guidelines
• review of salary proposals for the Executive Board effective from 1 January 2016
• determination of proposed bonus targets for 2015-2016• determination of proposed targets under the LTIP and other
incentive schemes operating below executive management level for 2015-2016
• review of the Company’s remuneration practice to ensure that the overall remuneration structure continues to promote the Company’s long term business strategy
• regular reviews of performance under Group wide share plans and approval of any discretionary matters for individuals below executive director level
• determination of the remuneration package elements for the executive directors and the fees for the Chairman in light of the wider remuneration landscape and that prevailing within the business
• annual review of terms of reference for the Committee
STRUCTURE AND CONTENT OF DRRAs for last year, this DRR has been prepared on behalf of the Board by the Committee in accordance with the requirements of the CA 2006 and the 2013 Regulations. The current Policy was approved by shareholders at the Company’s 2015 AGM and will remain in place for three years. Although there is no requirement to do so, the Committee has once again, in the interests of transparency and good governance, published the Policy in full for ease of reference. To the extent that changes have been made to the Policy since last year, these are merely to ensure that the content of the Policy remains relevant to the financial year under review; in all other respects, the Policy remains unchanged. The next two sections of the DRR cover the following matters:
• the Company’s remuneration policy from 5 February 2015 for the three years thereafter, including each of the components of directors’ remuneration (the Policy Report)
• how the Policy approved by shareholders at the 2015 AGM was implemented in the year ended 30 September 2016 (the Annual Remuneration Report)
GOVERNANCE SUMMARY
COR
POR
ATE GO
VERN
ANCE
Compass Group PLC Annual Report 2016 61
The information set out on pages 58 to 79 of this DRR represents the auditable disclosures referred to in the auditor’s report on pages 87 to 89 as specified by the UKLA and the 2013 Regulations, save for the TSR graph; Group Chief Executive’s remuneration history and remuneration percentage change tables; spend on pay table; details of advice provided to the Committee and statement of shareholder voting.
SHAREHOLDER ENGAGEMENTThe voting outcome at the 2016 AGM in respect of the DRR for the year ended 30 September 2015 is set out on page 79 and reflected good private and institutional shareholder support. Major shareholders were consulted regarding changes to the Remuneration Policy which took effect following approval by shareholders at the 2015 AGM. No changes are proposed to the Policy this year and, as such, it is intended that the next vote on the Company’s Remuneration Policy will be put to shareholders at the Company’s 2018 AGM.
Shareholders will be invited to approve the Annual Remuneration Report for the year ended 30 September 2016 (which will be a non-binding advisory vote) at the Company’s 2017 AGM.
The Committee will continue to be mindful of the interests of shareholders and other stakeholders, and welcomes shareholder feedback on any issue related to executive remuneration.
Governance and Directors’ Report
Directors’ Remuneration Report continued
As set out in the Annual Statement, the Policy set out on pages 62 to 68 was approved by shareholders at the 2015 AGM. Resolution 2 to adopt the Policy received 90.79% of the votes cast in favour of the resolution. The underlying principles of the Policy remain unchanged, however, the Dilution Limits charts on page 65, the Illustrations of the Application of our Remuneration Policy graphs on page 66, the tables on page 68 and, where appropriate, references to page numbers, have been updated to ensure that they remain relevant to the year under review.
In line with the authority given by shareholders at the 2015 AGM, it is intended that the Policy will remain in force for three years. In accordance with the CA 2006 and the 2013 Regulations, the Committee will next submit the policy to shareholders at the 2018 AGM for their approval. The current Policy is also available at www.compass-group.com.
REMUNERATION POLICY AND COMPONENTSThe Committee reviews the Company’s remuneration philosophy and structure to ensure that remuneration supports the Company’s strategic objectives, is in line with best practice and can fairly reward individuals for the contribution that they make to the business. In doing this, we have regard to the size and complexity of the Group’s operations and the need to motivate and attract employees of the highest calibre.
We have tried to develop our policy to maintain stability in the executive team and to ensure appropriate positioning against our comparator groups. Overall, we believe that the Policy is structured so that the executive directors are fairly rewarded, with the aim to keep reward at or around median and in line with appropriate benchmarks for the markets in which the Company operates. We consider our approach to be balanced and that it will stand the test of time.
REMUNERATION POLICY
The Group has more than 500,000 employees in over 50 different jurisdictions, which means that formal consultation with employees in respect of remuneration is impracticable. However, the Committee considers general pay and employment conditions of all employees within the Group and is sensitive to these, to prevailing market and economic conditions and to governance trends when assessing the level of salaries and remuneration packages of executive directors and other members of the Executive Board.
The total remuneration package links corporate and individual performance with an appropriate balance between short and long term elements, and fixed and variable components. The Policy is designed to incentivise executives to meet the Company’s key objectives, such that a significant portion of total remuneration is performance related, based on a mixture of internal targets linked to the Company’s key business drivers (which can be measured, understood and accepted by both executives and shareholders, with whom we consulted during 2014 when the Policy was being formulated for shareholders’ approval) and appropriate external comparator groups.
The Committee considers that the targets set for the different components of performance related remuneration are both appropriate and sufficiently demanding in the context of the business environment and the challenges with which the Group is faced as well as complying with the provisions of the Code.
The Committee has the discretion to amend certain aspects of the Policy in exceptional circumstances when considered to be in the best interests of shareholders. Should such discretion be used, this will be explained and reported in the DRR for the following year.
62 Compass Group PLC Annual Report 2016

COMPONENT PARTS OF THE REMUNERATION PACKAGEThe key components of executive directors’ remuneration for the period from 5 February 2015 and beyond (the Policy Period) are summarised below:COMPONENT AND LINK TO STRATEGY OPERATION OF THE COMPONENT MAXIMUM OPPORTUNITY PERFORMANCE MEASURES
BASE SALARYReflects the individual’s role, experience and contribution. Set at levels to attract and retain individuals of the calibre required to lead the business.
Base salaries are reviewed annually with any increases normally taking effect on 1 January of each year. Salaries are appropriately benchmarked and reflect the role, job size and responsibility as well as the performance and effectiveness of the individual.
Whilst there is no prescribed formulaic maximum, any increases will take into account prevailing market and economic conditions and the approach to employee pay throughout the organisation.
Significant increases may occur when an executive director progresses in the role; gains substantially in experience; there is a significant increase in the scale of the role; has been recruited on a salary below the market median.
Where changes in responsibilities or significant variances to the market exist, these will be appropriately explained.
None.
BENEFITS AND PENSIONTo provide a competitive level of benefits.
Benefits include, but are not limited to, healthcare insurance for executive directors and their dependants, limited financial advice, life assurance and car benefit.
These are offered to executive directors as part of a competitive remuneration package.
Executive directors are invited to participate in the Company’s defined contribution pension scheme or to take a cash allowance in lieu of pension entitlement.
The cost of providing these benefits can vary in accordance with market conditions, which will, therefore, determine the maximum value.
For the Company’s defined contribution pension scheme or cash allowance, the maximum annual contribution is 35% of base salary.
None.
ANNUAL BONUSIncentivise and reward the achievement of stretching one year key performance targets set by the Committee at the start of each financial year.
The annual bonus is earned by the achievement of one year performance targets set by the Committee at the start of each financial year and is delivered in cash.
The Committee retains the discretion to adjust the bonus outcomes to ensure that they reflect underlying business performance. In particular, adjustments may be made for acquisitions and disposals. Bonus measures dependent on Adjusted Free Cash Flow (AFCF) are subject to the caveat that AFCF should not be affected by Board approved capital expenditure or other special or irregular timing differences.
A supplementary financial underpin also applies such that the amount payable pursuant to the achievement of the non-Profit Before Interest and Tax (PBIT) measures may not exceed the on target payment unless the threshold Group PBIT measure has been achieved.
The annual bonus is subject to malus and/or clawback in the event of discovery of a material misstatement in the accounts or in the assessment of a relevant performance condition or where the action or conduct of a participant amounts to fraud or serious misconduct or has a detrimental impact on the reputation of the Group.
The target award for executive directors (excluding the Group Chief Executive) is 75% of base salary, with a further maximum of 75% of base salary available for enhanced performance. 0% of the bonus pays out for below threshold performance but increases on a straight line basis to target payout.
The target award for the Group Chief Executive is 100% of base salary, with a further maximum of 100% for enhanced performance. 0% of the bonus pays out for below threshold performance but increases on a straight line basis to target payout.
Performance is measured over the financial year. Performance measures are determined by the Committee each year and may vary to ensure that they promote the Company’s long term business strategy and shareholder value.
The bonus measures and their percentage weightings may vary, depending upon a director’s area of responsibility.
Bonus measures may include, but are not limited to, profit, revenue and cash flow metrics. Strategic KPIs may also be chosen. However, the overall metrics would always be substantially weighted to financial performance measures.
Annual bonus targets are set with reference to internal budgets and analyst consensus forecasts, with maximum payout requiring performance well ahead of budget.
Details of the specific measures applying to each element of the bonus for the year being reported on and the following financial year are shown in the Annual Remuneration Report on pages 72 and 73.
COR
POR
ATE GO
VERN
ANCE
Compass Group PLC Annual Report 2016 63

Governance and Directors’ Report
Directors’ Remuneration Report continued
Remuneration Policy continued
COMPONENT AND LINK TO STRATEGY OPERATION OF THE COMPONENT MAXIMUM OPPORTUNITY PERFORMANCE MEASURES
LONG TERM INCENTIVE PLAN (LTIP)Incentivise and reward executive directors for the delivery of longer term financial performance and shareholder value.
Share-based to provide alignment with shareholder interests.
ADJUSTED FREE CASH FLOW (AFCF)The generation of cash is fundamental to the ongoing success of the Group and the use of AFCF as an LTIP performance measure directly aligns to this.
RETURN ON CAPITAL EMPLOYED (ROCE)In parallel, ROCE supports the strategic focus on growth and margins through ensuring that cash is reinvested to generate appropriate returns.
RELATIVE TOTAL SHAREHOLDER RETURN (TSR)The third performance measure of TSR provides direct alignment between the interests of executive directors and shareholders.
An annual conditional award of ordinary shares in the capital of the Company which may be earned after a single three year performance period, based on the achievement of stretching performance conditions.
Calculations of the achievement of the targets are independently performed and are approved by the Committee. In order to ensure continued alignment between executive directors’ and shareholders’ interests, the Committee also reviews the underlying financial performance of the Group and retains its discretion to adjust vesting if it considers that performance is unsatisfactory.
In respect of awards made from 2014-2015 onwards, executive directors will be required to hold vested LTIP shares (net of any shares sold to meet tax and social security liabilities) for a period of two years post vesting.
Dividend equivalents may be accrued on the shares earned from any awards after 5 February 2015.
Malus and clawback rules operate in respect of the LTIP. The Committee may decide at any time before an award vests, or for a period of three years after an award vests, that any participant will be subject to malus and/or clawback in the event of discovery of a material misstatement in the accounts or in the assessment of a relevant performance condition, or where the action or conduct of a participant amounts to fraud or serious misconduct or has a detrimental impact on the reputation of the Group.
Awards are delivered in shares. However, the rules contain excepted provisions to deliver value in cash if necessary (for example, because of securities laws), subject to the discretion of the Committee, determined at any time up to their release.
In the event of a change of control, any unvested awards will vest immediately, subject to satisfaction of performance conditions and reduction on a time apportioned basis.
Awards may be made with the following maximum levels:
• Group Chief Executive: 250%• Other executive directors: 200%
For performance measures other than TSR, 0% of the award vests for below threshold performance, increasing to 50% vesting on a straight line basis for achievement of on target performance, increasing to maximum vesting on a straight line basis for achievement of maximum performance.
The element of an award based on relative TSR will vest in full for top quartile performance achievement and 25% of that element of the award will vest if performance is at the median. Awards will vest on a straight line basis between median and top quartile performance achievement. No shares will be released for this element of an award if the Company’s TSR performance is below the median.
Performance is measured over three financial years.
Performance measures are AFCF, improvement in ROCE and TSR, each measure applying to one third of an award.
Relative TSR is measured relative to the companies comprising the TSR comparator group at the start of the period (the constituent members of the FTSE 100, excluding financial services companies).
LTIP targets are set with reference to internal budgets and analysts’ consensus forecasts, with maximum payment requiring performance well ahead of budget.
Details of the targets for LTIP awards vesting and granted are set out as required in the Annual Remuneration Report on pages 74 and 75.
For awards made prior to 7 February 2013, 50% of any award was based on AFCF over the three year performance period and 50% on the Company’s TSR over the same period relative to the companies comprising the TSR comparator group at the start of the relevant period.
The executive directors’ Remuneration Policy differs from that of other members of the Executive Board solely in respect of quantum of the various components and remuneration. Members of the wider leadership team receive each of the components of remuneration awarded to the executive directors. The wider employee population of the Group will receive remuneration that is considered to be appropriate in relation to their geographic location, level of responsibility and performance.
64 Compass Group PLC Annual Report 2016

CLOSED INCENTIVE PLANSThe LTIP described in the table on page 64 is the primary form of equity incentive for executive directors. There are no outstanding awards to executive directors made prior to 2010 under the former long term incentive plan, being The Compass Group Long Term Incentive Plan.
DILUTION LIMITSAll of the Company’s equity based incentive plans incorporate the current Investment Association Share Capital Management Guidelines (Guidelines) on headroom which provide that overall dilution under all plans should not exceed 10% over a 10 year period in relation to the Company’s issued share capital (or reissue of treasury shares), with a further limitation of 5% in any 10 year period for executive plans.
The Committee monitors the position regularly and prior to the making of any award, to ensure that the Company remains within these limits. Any awards which are required to be satisfied by market purchased shares are excluded from such calculations. On 30 September 2016, the Company held 11,575,887 treasury shares. During the financial year ended 30 September 2016, 3,780,997 treasury shares were utilised for the purpose of satisfying the Company’s obligations under the Group’s employee equity incentive schemes. As at 30 September 2016, the Company’s headroom position, which remains within current Guidelines, was as shown in the charts below:
SHARE OWNERSHIP GUIDELINESIn order that their interests are linked with those of shareholders, directors are expected to build up and maintain a personal shareholding in the Company.
Under the share ownership guidelines, the Group Chief Executive is required to hold a personal shareholding equal to the value of twice his base salary. Other executive directors are required to hold a personal shareholding equal to the value of one and a half times their base salary, and members of the Executive Board a personal shareholding equal to the value of their base salary. Non-executive directors are required to hold a personal shareholding equal to the value of their base fee.
For executive directors, the guideline shareholding may be achieved by retaining shares received as a result of participating in the Company’s share plans. The guidance specifically excludes the need to make a personal investment should awards not vest. Non-executive directors are expected to purchase shares equating to a minimum value of one third of their net of tax fee each year until the guideline is met. The required level of shareholding is expected to be achieved within a four year period, commencing from the date of appointment.
Directors’ shareholdings are reviewed annually by the Committee to ensure that directors are on course to achieve their guideline shareholding within the period required. However, if it becomes apparent to the Committee that the guideline is unlikely to be met within the timeframe, then the Committee will discuss with the director a plan to ensure that the guideline is met over an acceptable timeframe. The granting of future LTIP awards to an executive director will be conditional upon reaching the appropriate threshold in the required timeframe.
Details of the interests of directors in shares and equity incentives are set out on page 78, together with the extent to which each of the directors has complied with the guidelines as at 30 September 2016.
1
2
3
1
2
3
Headroom......................................................................7.20%Discretionary options.............................1.70%LTIP.............................................................................................1.10%
1
2
3
1
2
3
Headroom......................................................................2.20%Discretionary options.............................1.70%LTIP.............................................................................................1.10%
HEADROOM AS AT 30 SEPTEMBER 201610% IN 10 YEARS 5% IN 10 YEARS
COR
POR
ATE GO
VERN
ANCE
Compass Group PLC Annual Report 2016 65

ILLUSTRATIONS OF APPLICATION OF REMUNERATION POLICYThe graphs below show an estimate of the remuneration that could be received by executive directors under the Policy set out in this Report. Each bar gives an indication of the minimum amount of remuneration payable, remuneration payable at target performance and remuneration payable at maximum performance to each director under the Policy.
Each of the bars is broken down to show how the total under each scenario is made up of fixed elements of remuneration, the annual bonus and the LTIP.
The scenarios in the above graphs are defined as follows:
FIXED ELEMENTS OF REMUNERATION • Base salary as at 30 September 2016• Estimated value of benefits provided under the Remuneration Policy• Cash supplement in lieu of pension of 35% of base salaryMINIMUM PERFORMANCE TARGET PERFORMANCE MAXIMUM PERFORMANCE
ANNUAL BONUS(payout as a % maximum opportunity)
0% 50% 100%
LONG TERM INCENTIVE PLAN(vesting as a % maximum opportunity)
0% 54%2 100%
1. Note that Gary Green’s elements of pay are converted into sterling with an exchange rate of $1.4218/£1 as used elsewhere in the Annual Report.2. Based on AFCF and ROCE performance measures vesting at 50% of maximum and the TSR measure paying out at 62.5% of maximum
(midway between threshold and maximum payout).
Governance and Directors’ Report
Directors’ Remuneration Report continued
Remuneration Policy continued
RICHARD COUSINS
ILLUSTRATION OF PACKAGE (£m)
DOMINIC BLAKEMORE
ILLUSTRATION OF PACKAGE (£m)
JOHNNY THOMSON
ILLUSTRATION OF PACKAGE (£m)
GARY GREEN1
ILLUSTRATION OF PACKAGE (£m)
Maximum Total: £6.2m
Target Total: £3.9m
Minimum Total: £1.4m
0.0 1.0 2.0 3.0 4.0 5.0 6.0 7.0
24% 34% 42%
37% 27% 36%
100%
Maximum Total: £3.1m
Target Total: £2.0m
Minimum
Fixed elements of remuneration Annual bonus Long Term Incentive Plan
Total: £0.9m
0.0 0.5 1.0 1.5 2.5 3.02.0 3.5
28% 31% 41%
43% 23% 34%
100%
Maximum Total: £3.1m
Target Total: £2.0m
Minimum
Fixed elements of remuneration Annual bonus Long Term Incentive Plan
Total: £0.9m
0.0 0.5 1.0 1.5 2.5 3.02.0 3.5
28% 31% 41%
43% 23% 34%
100%
Maximum Total: £2.8m
Target Total: £1.8m
Minimum Total: £0.8m
0.0 0.5 1.0 1.5 2.0 2.5 3.0
28% 31% 41%
43% 23% 34%
100%
Maximum Total: £4.5m
Target Total: £2.9m
Minimum Total: £1.3m
0.0 1.0 2.0 3.0 4.0 5.0
29% 30% 41%
44% 23% 33%
100%
66 Compass Group PLC Annual Report 2016

APPROACH TO RECRUITMENT REMUNERATIONThe Committee will apply the same remuneration policy during the Policy Period as that which applies to existing executive directors when considering the recruitment of a new executive director in respect of all elements of remuneration, that is: salary, benefits, pension and short and long term incentives. It is envisaged that the maximum level of variable remuneration which may be granted to a new executive director would be within plan rules and identical to the policy maximum opportunity for existing executive directors and the Group Chief Executive. The recommended maximum awards permissible under the LTIP are 200% and 250% of base salary in respect of the bonus and LTIP opportunity per annum respectively. However, in exceptional circumstances, the rules allow for a maximum of 400% of base salary to be utilised for the LTIP opportunity.
Other arrangements may be established specifically to facilitate recruitment of a particular individual, albeit that any such arrangement would be made within the context of minimising the cost to the Company. The policy for the recruitment of executive directors during the Policy Period includes the opportunity to provide a level of compensation for forfeiture of bonus entitlements and/or unvested long term incentive awards from an existing employer, if any, and the additional provision of benefits in kind, pensions and other allowances, such as relocation, education and tax equalisation, as may be required in order to achieve a successful recruitment. Any arrangement established specifically to facilitate recruitment of a particular individual would be intended to be of comparable commercial value and capped as appropriate. The quantum, form and structure of any buyout arrangement will be determined by the Committee taking into account the terms of the previous arrangement being forfeited. The buyout may be structured as an award of cash or shares. However, the Committee will normally have a preference for replacement awards to be made in the form of shares, deliverable no earlier than the previous awards. Where an executive director is appointed from either within the Company or following corporate activity/reorganisation, the normal policy would be to honour any legacy arrangements in line with the original terms and conditions.
The policy on the recruitment of new non-executive directors during the Policy Period would be to apply the same remuneration elements as for the existing non-executive directors. It is not intended that variable pay, day rates or benefits in kind be offered, although in exceptional circumstances such remuneration may be required in currently unforeseen circumstances.
The Committee will include in annual reports details of the implementation of the Policy as utilised during the Policy Period in respect of any such recruitment to the Board.
EXECUTIVE DIRECTORS’ SERVICE AGREEMENTSIt is the Company’s policy that executive directors have rolling service contracts.
The current executive directors’ service contracts contain the key terms shown in the table below:
SERVICE CONTRACT KEY TERMS BY PROVISION
PROVISION DETAILED TERMS
REMUNERATION • Base salary, pension and benefits• Company car or cash allowance• Private health insurance for director
and dependants• Life assurance• Financial planning advice• 25 days paid annual leave• Participation in annual bonus plan,
subject to plan rules• Participation in LTIP, subject to
plan rulesCHANGE OF CONTROL
• No special contractual provisions apply in the event of a change of control
NOTICE PERIOD • 12 months notice from the Company• 6 months notice from the director
(12 months from Richard Cousins)TERMINATION PAYMENT
Payment in lieu of notice equal to:• 12 months base salary• Pension supplement• 10% of base salary in respect of benefits
All of the above would be paid in monthly instalments, subject to an obligation on the part of the director to mitigate his loss such that payments will either reduce, or cease completely, in the event that the director gains new employment/remuneration.
RESTRICTIVE COVENANTS
• During employment and for 12 months after leaving
The historic policy on the payment of bonus on termination, which was in place prior to June 2008, was the provision of a payment, at par or target, of bonus in respect of the notice period, where the Company exercised its right to make a payment in lieu of notice. Messrs Cousins and Green’s service contracts are based on this historic policy as was Mr Martin’s (details of payments made to Mr Martin for loss of office can be found on page 77). When introducing the revised policy in June 2008 and after careful consideration, the Committee concluded that it was not in shareholders’ interests to migrate such contracts onto the amended policy. Dominic Blakemore and Johnny Thomson’s service contracts fully comply with the policy in effect from June 2008. All executive directors’ service contracts impose a clear obligation to mitigate such payment should a departing executive director take on new employment or receive alternative remuneration. The Committee believes the obligation to mitigate adequately addresses the issue.
COR
POR
ATE GO
VERN
ANCE
Compass Group PLC Annual Report 2016 67
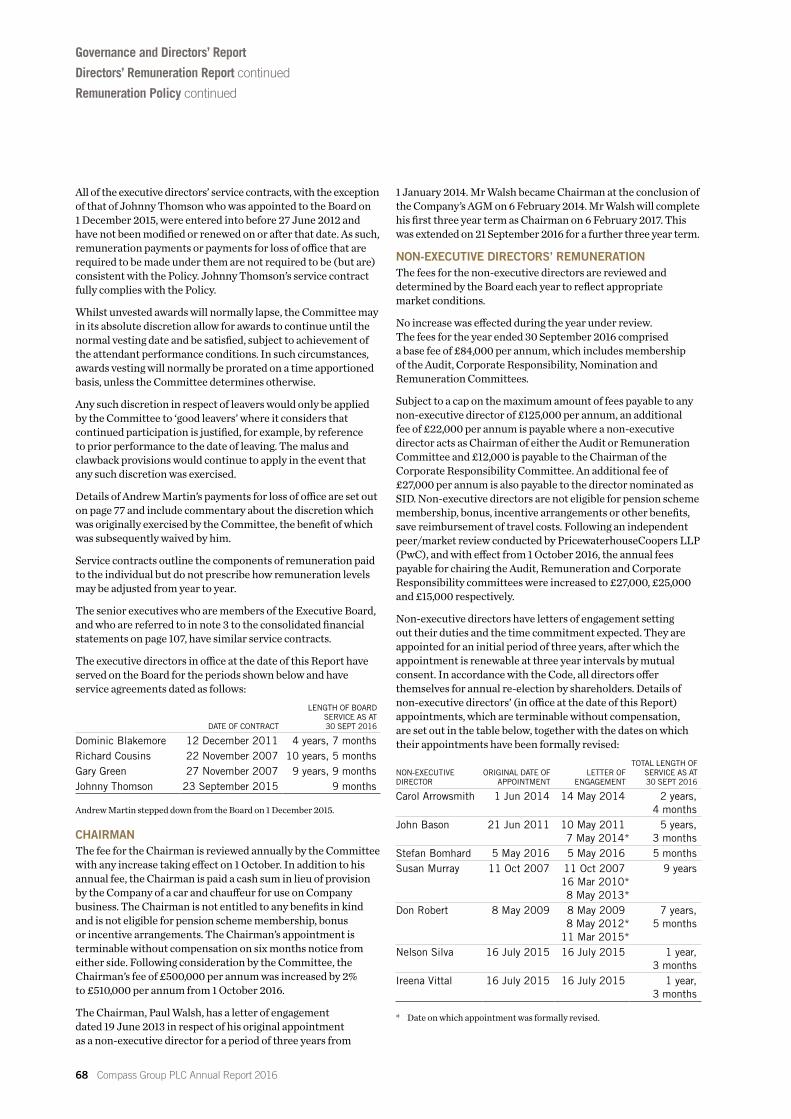
All of the executive directors’ service contracts, with the exception of that of Johnny Thomson who was appointed to the Board on 1 December 2015, were entered into before 27 June 2012 and have not been modified or renewed on or after that date. As such, remuneration payments or payments for loss of office that are required to be made under them are not required to be (but are) consistent with the Policy. Johnny Thomson’s service contract fully complies with the Policy.
Whilst unvested awards will normally lapse, the Committee may in its absolute discretion allow for awards to continue until the normal vesting date and be satisfied, subject to achievement of the attendant performance conditions. In such circumstances, awards vesting will normally be prorated on a time apportioned basis, unless the Committee determines otherwise.
Any such discretion in respect of leavers would only be applied by the Committee to ‘good leavers’ where it considers that continued participation is justified, for example, by reference to prior performance to the date of leaving. The malus and clawback provisions would continue to apply in the event that any such discretion was exercised.
Details of Andrew Martin’s payments for loss of office are set out on page 77 and include commentary about the discretion which was originally exercised by the Committee, the benefit of which was subsequently waived by him.
Service contracts outline the components of remuneration paid to the individual but do not prescribe how remuneration levels may be adjusted from year to year.
The senior executives who are members of the Executive Board, and who are referred to in note 3 to the consolidated financial statements on page 107, have similar service contracts.
The executive directors in office at the date of this Report have served on the Board for the periods shown below and have service agreements dated as follows:
DATE OF CONTRACT
LENGTH OF BOARD SERVICE AS AT 30 SEPT 2016
Dominic Blakemore 12 December 2011 4 years, 7 monthsRichard Cousins 22 November 2007 10 years, 5 monthsGary Green 27 November 2007 9 years, 9 monthsJohnny Thomson 23 September 2015 9 months
Andrew Martin stepped down from the Board on 1 December 2015.
CHAIRMANThe fee for the Chairman is reviewed annually by the Committee with any increase taking effect on 1 October. In addition to his annual fee, the Chairman is paid a cash sum in lieu of provision by the Company of a car and chauffeur for use on Company business. The Chairman is not entitled to any benefits in kind and is not eligible for pension scheme membership, bonus or incentive arrangements. The Chairman’s appointment is terminable without compensation on six months notice from either side. Following consideration by the Committee, the Chairman’s fee of £500,000 per annum was increased by 2% to £510,000 per annum from 1 October 2016.
The Chairman, Paul Walsh, has a letter of engagement dated 19 June 2013 in respect of his original appointment as a non-executive director for a period of three years from
1 January 2014. Mr Walsh became Chairman at the conclusion of the Company’s AGM on 6 February 2014. Mr Walsh will complete his first three year term as Chairman on 6 February 2017. This was extended on 21 September 2016 for a further three year term.
NON-EXECUTIVE DIRECTORS’ REMUNERATIONThe fees for the non-executive directors are reviewed and determined by the Board each year to reflect appropriate market conditions.
No increase was effected during the year under review. The fees for the year ended 30 September 2016 comprised a base fee of £84,000 per annum, which includes membership of the Audit, Corporate Responsibility, Nomination and Remuneration Committees.
Subject to a cap on the maximum amount of fees payable to any non-executive director of £125,000 per annum, an additional fee of £22,000 per annum is payable where a non-executive director acts as Chairman of either the Audit or Remuneration Committee and £12,000 is payable to the Chairman of the Corporate Responsibility Committee. An additional fee of £27,000 per annum is also payable to the director nominated as SID. Non-executive directors are not eligible for pension scheme membership, bonus, incentive arrangements or other benefits, save reimbursement of travel costs. Following an independent peer/market review conducted by PricewaterhouseCoopers LLP (PwC), and with effect from 1 October 2016, the annual fees payable for chairing the Audit, Remuneration and Corporate Responsibility committees were increased to £27,000, £25,000 and £15,000 respectively.
Non-executive directors have letters of engagement setting out their duties and the time commitment expected. They are appointed for an initial period of three years, after which the appointment is renewable at three year intervals by mutual consent. In accordance with the Code, all directors offer themselves for annual re-election by shareholders. Details of non-executive directors’ (in office at the date of this Report) appointments, which are terminable without compensation, are set out in the table below, together with the dates on which their appointments have been formally revised:
NON-EXECUTIVE DIRECTOR
ORIGINAL DATE OF APPOINTMENT
LETTER OF ENGAGEMENT
TOTAL LENGTH OF SERVICE AS AT 30 SEPT 2016
Carol Arrowsmith 1 Jun 2014 14 May 2014 2 years, 4 months
John Bason 21 Jun 2011 10 May 20117 May 2014*
5 years, 3 months
Stefan Bomhard 5 May 2016 5 May 2016 5 monthsSusan Murray 11 Oct 2007 11 Oct 2007
16 Mar 2010*8 May 2013*
9 years
Don Robert 8 May 2009 8 May 20098 May 2012*
11 Mar 2015*
7 years, 5 months
Nelson Silva 16 July 2015 16 July 2015 1 year, 3 months
Ireena Vittal 16 July 2015 16 July 2015 1 year, 3 months
* Date on which appointment was formally revised.
Governance and Directors’ Report
Directors’ Remuneration Report continued
Remuneration Policy continued
68 Compass Group PLC Annual Report 2016
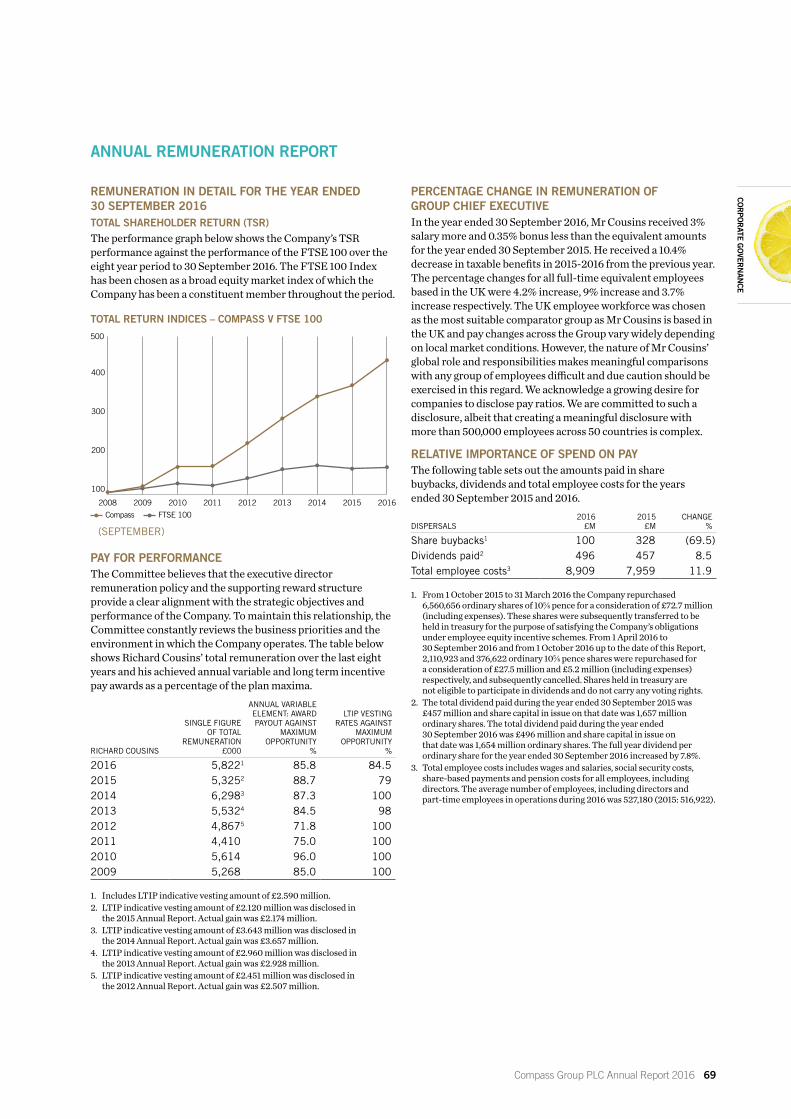
REMUNERATION IN DETAIL FOR THE YEAR ENDED 30 SEPTEMBER 2016TOTAL SHAREHOLDER RETURN (TSR)The performance graph below shows the Company’s TSR performance against the performance of the FTSE 100 over the eight year period to 30 September 2016. The FTSE 100 Index has been chosen as a broad equity market index of which the Company has been a constituent member throughout the period.
PAY FOR PERFORMANCEThe Committee believes that the executive director remuneration policy and the supporting reward structure provide a clear alignment with the strategic objectives and performance of the Company. To maintain this relationship, the Committee constantly reviews the business priorities and the environment in which the Company operates. The table below shows Richard Cousins’ total remuneration over the last eight years and his achieved annual variable and long term incentive pay awards as a percentage of the plan maxima.
RICHARD COUSINS
SINGLE FIGURE OF TOTAL
REMUNERATION £000
ANNUAL VARIABLE ELEMENT: AWARD PAYOUT AGAINST
MAXIMUM OPPORTUNITY
%
LTIP VESTING RATES AGAINST
MAXIMUM OPPORTUNITY
%
2016 5,8221 85.8 84.52015 5,3252 88.7 792014 6,2983 87.3 1002013 5,5324 84.5 982012 4,8675 71.8 1002011 4,410 75.0 1002010 5,614 96.0 1002009 5,268 85.0 100
1. Includes LTIP indicative vesting amount of £2.590 million.2. LTIP indicative vesting amount of £2.120 million was disclosed in
the 2015 Annual Report. Actual gain was £2.174 million.3. LTIP indicative vesting amount of £3.643 million was disclosed in
the 2014 Annual Report. Actual gain was £3.657 million.4. LTIP indicative vesting amount of £2.960 million was disclosed in
the 2013 Annual Report. Actual gain was £2.928 million.5. LTIP indicative vesting amount of £2.451 million was disclosed in
the 2012 Annual Report. Actual gain was £2.507 million.
PERCENTAGE CHANGE IN REMUNERATION OF GROUP CHIEF EXECUTIVEIn the year ended 30 September 2016, Mr Cousins received 3% salary more and 0.35% bonus less than the equivalent amounts for the year ended 30 September 2015. He received a 10.4% decrease in taxable benefits in 2015-2016 from the previous year. The percentage changes for all full-time equivalent employees based in the UK were 4.2% increase, 9% increase and 3.7% increase respectively. The UK employee workforce was chosen as the most suitable comparator group as Mr Cousins is based in the UK and pay changes across the Group vary widely depending on local market conditions. However, the nature of Mr Cousins’ global role and responsibilities makes meaningful comparisons with any group of employees difficult and due caution should be exercised in this regard. We acknowledge a growing desire for companies to disclose pay ratios. We are committed to such a disclosure, albeit that creating a meaningful disclosure with more than 500,000 employees across 50 countries is complex.
RELATIVE IMPORTANCE OF SPEND ON PAYThe following table sets out the amounts paid in share buybacks, dividends and total employee costs for the years ended 30 September 2015 and 2016.
DISPERSALS2016
£M2015
£MCHANGE
%
Share buybacks1 100 328 (69.5)Dividends paid2 496 457 8.5Total employee costs3 8,909 7,959 11.9
1. From 1 October 2015 to 31 March 2016 the Company repurchased 6,560,656 ordinary shares of 105⁄8 pence for a consideration of £72.7 million (including expenses). These shares were subsequently transferred to be held in treasury for the purpose of satisfying the Company’s obligations under employee equity incentive schemes. From 1 April 2016 to 30 September 2016 and from 1 October 2016 up to the date of this Report, 2,110,923 and 376,622 ordinary 105⁄8 pence shares were repurchased for a consideration of £27.5 million and £5.2 million (including expenses) respectively, and subsequently cancelled. Shares held in treasury are not eligible to participate in dividends and do not carry any voting rights.
2. The total dividend paid during the year ended 30 September 2015 was £457 million and share capital in issue on that date was 1,657 million ordinary shares. The total dividend paid during the year ended 30 September 2016 was £496 million and share capital in issue on that date was 1,654 million ordinary shares. The full year dividend per ordinary share for the year ended 30 September 2016 increased by 7.8%.
3. Total employee costs includes wages and salaries, social security costs, share-based payments and pension costs for all employees, including directors. The average number of employees, including directors and part-time employees in operations during 2016 was 527,180 (2015: 516,922).
TOTAL RETURN INDICES – COMPASS V FTSE 100
(SEPTEMBER)
2008
Compass FTSE 100
2009 2010 2011 2012 2013 2014 20162015
100
200
300
400
500
ANNUAL REMUNERATION REPORT
COR
POR
ATE GO
VERN
ANCE
Compass Group PLC Annual Report 2016 69

Governance and Directors’ Report
Directors’ Remuneration Report continued
Annual Remuneration Report continued
DIRECTORS’ SINGLE TOTAL FIGURE OF REMUNERATIONThe table below sets out in a single figure the total amount of remuneration, including each element, received by each of the executive directors in office for the year ended 30 September 2016.
DOMINIC BLAKEMORE
RICHARD COUSINS
GARY GREEN1
ANDREW MARTIN2
JOHNNY THOMSON3
2016 £000
2015 £000
2016 £000
2015 £000
2016 £000
2015 £000
2016 £000
2015 £000
2016 £000
2015 £000
Fixed payBase salary4 633 581 1,037 1,009 900 795 112 665 479 –Taxable benefits5 16 16 39 44 46 41 7 42 101 –Pension6 222 203 363 353 315 279 39 233 168 –Total fixed pay 871 800 1,439 1,406 1,261 1,115 158 940 748 –Performance related payBonus7 624 798 1,793 1,799 1,365 1,136 144 730 617 –LTIP7,8,9,10
Value delivered through corporate performance 585 507 1,568 1,360 910 781 132 687 338 –Value delivered through TSR 381 284 1,022 760 594 437 86 384 221 –Total long term incentives 966 791 2,590 2,120 1,504 1,218 218 1,071 559 –Total remuneration related to executive
director appointment 2,461 2,389 5,822 5,325 4,130 3,469 520 2,741 1,924 –
Other performance related pay11
Awards granted prior to appointment as executive director – performance conditions relate to previous role
The Plan – – – – – – – – 577 –Total single figure 2,461 2,389 5,822 5,325 4,130 3,469 520 2,741 2,501 –
1. Gary Green’s salary of US$1.294 million and his other emoluments are shown in sterling at an exchange rate of US$1.4218/£1 (2015: US$1.5482/£1). In US$ terms Gary Green’s salary was paid at the annual rate of US$1,241,337 from 1 January 2015 and US$1,294,000 from 1 January 2016, being an increase of 4.24%.
2. Andrew Martin stepped down from the Board on 1 December 2015. The amounts shown for 2016 in relation to salary, benefits and bonus are the amounts paid during the year, prorated by reference to the period during which he was an executive director of the Company. Details of payments for loss of office can be found on page 77.
3. Johnny Thomson was appointed as a director of the Company on 1 December 2015. His base salary on appointment was £575,000 per annum. No disclosure has been made in respect of his fixed pay and bonus for the year ended 30 September 2015 as it was earned by him in a period prior to his appointment as an executive director of the Company. The amounts disclosed for 2016 for fixed and performance related pay have been prorated to reflect his time in office during the year.
4. Salary increases of 6.66%, 3%, and 4.24% for Messrs Blakemore, Cousins and Green respectively were implemented on 1 January 2016 (1 December 2015 for Mr Blakemore) as disclosed in the 2015 DRR.
5. Taxable benefits comprise healthcare insurance, limited financial advice, life assurance and car benefit. Mr Thomson also received a relocation allowance from Brazil to the UK of £50,000 grossed up, which is included in the table above.
6. Pension: a supplement of 35% of base salary is paid in monthly instalments in lieu of pension participation.7. Details of the performance measures and weighting as well as achieved results for the bonus and LTIP components are shown on pages 72 to 75.8. LTIP 2016: amount shown is the indicative value based on the average market price of Compass Group PLC shares over three months from 1 July to
30 September 2016 of LTIPs that have become receivable as a result of the achievement of conditions relating to performance in the three years ended 30 September 2016.
9. LTIP 2015: amount shown is the indicative vesting value on 24 November 2015. The actual value subsequently received by Messrs Cousins, Green and Martin, based on a sale price of 1107.3513 pence on 26 November 2015, was £2,174,030, £1,248,583 and £1,097,695 respectively. Mr Blakemore disposed of 33,623 shares on the same day at 1107.3513 pence for which he received £372,325. Theoretically, if Mr Blakemore had chosen to exercise his vested awards in full, he would have received the notional value of £810,615. Theoretically, if all of the directors had chosen to dispose of their 2015 LTIP award in full, this would have equated to a combined total of £5,330,923, approximately £131,673 more than the indicative value reported.
10. Mr Martin retained an interest in 105,747 shares that were awarded conditionally to him in 2013, prior to his leaving the Board. The award vested in part at 84.5% on 22 November 2016. The indicative value of this award has been calculated on the basis of average market value of Compass Group PLC shares over the three months between 1 July and 30 September 2016 and then prorated for the period during which Mr Martin was an executive director of the Company.
11. At the date of his appointment on 1 December 2015, Mr Thomson had an interest in 59,630 shares that were awarded conditionally prior to him joining the Board under a ‘below board’ plan, (the Plan). The Plan has a three year performance period and is subject to corporate performance conditions. On 3 December 2015, following satisfaction of the associated corporate performance conditions, 49,008 of these awards were released and retained by Mr Thomson. If Mr Thomson had elected to sell these shares, he would have received a notional sum of £577,314 based on the indicative vesting value on 2 December 2015 of 1178.00 pence per share. The remaining 10,622 shares conditionally awarded to Mr Thomson under the Plan are due to vest, subject to satisfaction of the associated corporate performance conditions, on 29 November 2016.
70 Compass Group PLC Annual Report 2016

The annual rate of base salaries of the executive directors in office for the year ended 30 September 2016 was:DIRECTOR BASE SALARY EFFECTIVE DATE INCREASE REASON
Dominic Blakemore £640,000 1 December 2015 6.66% Changes in responsibility and roleRichard Cousins £1,044,785 1 January 2016 3% Benchmarked v comparator groupGary Green $1,294,000 1 January 2016 4.24% Benchmarked v comparator groupAndrew Martin1 £669,500 1 January 2015 3% Benchmarked v comparator groupJohnny Thomson2 £575,000 1 December 2015 – Benchmarked v comparator group
1. Mr Martin stepped down as a director of the Company on 1 December 2015. The 3% year on year increase is in comparison to his salary for the year ended 31 December 2014. Details of payments for loss of office can be found on page 77.
2. Johnny Thomson was appointed to the Board on 1 December 2015. Prior to the appointment being made, the Committee asked PwC to perform a benchmarking review of salaries for peer roles in FTSE 50 companies. In line with the Policy, the Committee adopted a balanced approach when determining the level of remuneration to be paid, having regard to the findings of the benchmarking report and bearing in mind that it was Mr Thomson’s first role as a Group Finance Director of a listed company. His salary on appointment was set at £575,000 per annum, below the median for comparable FTSE 50 roles, with the aim of making incremental increases if considered appropriate to reflect experience and progression in the role and to bring Mr Thomson’s base salary in line with that of his FTSE peers.
The proposed annual rate of base salaries of the executive directors in office on 1 January 2017 will be:DIRECTOR BASE SALARY EFFECTIVE DATE INCREASE REASON
Dominic Blakemore £656,000 1 January 2017 2.5% Relevant peer/market & performanceRichard Cousins £1,070,000 1 January 2017 2.4% Relevant peer/market & performanceGary Green $1,345,760 1 January 2017 4% Relevant peer/market & performanceJohnny Thomson1 £621,000 1 January 2017 8% Progression in the role, gain in experience
1. The base salary from 1 January 2017 reflects Johnny Thomson’s progression in his role and the gain in his experience since appointment. Please refer to note 2 in the table above.
Non-executive directors receive fees only, which are shown on page 68, together with the Chairman’s fees and benefits. The aggregate total amount of remuneration received by all directors in office during the year ended 30 September 2016 is shown below:
2016 £000
2015 £000
Executive directors 15,434 13,924Chairman and non-executive directors 1,200 1,064Total 16,634 14,988
COR
POR
ATE GO
VERN
ANCE
Compass Group PLC Annual Report 2016 71

Governance and Directors’ Report
Directors’ Remuneration Report continued
Annual Remuneration Report continued
2015-2016 BONUSThe financial targets for the bonus for the year ended 30 September 2016, and the extent to which they were achieved, were as set out below. It is intended to continue to disclose regional targets, as set out below, on a retrospective basis. The achievement of targets is calculated on a straight line basis between Minimum and Par (target) and between Par (target) and Maximum.
As was the case for previous years, the measurement of the achievement of the AFCF and PBIT results is based on the underlying outcome achieved in the financial year, with gains/losses attributable to currency movements, charges and the impacts of restructuring and/or acquisitions/disposals, usually being excluded.
2015-2016 TARGETSMESSRS COUSINS, THOMSON AND MARTIN (TO 31 DECEMBER 2015)FINANCIAL MEASURES1 % WEIGHTING MINIMUM PAR (TARGET) MAXIMUM ACHIEVED
PBIT2 55 £1,320m £1,347m £1,374m £1,375mAFCF3 15 £646m £666m £686m £841mORG4 25 3.60% 4.60% 5.60% 4.9%
GROUP HSE IMPROVEMENT TARGET ACHIEVED ACHIEVED
Lost Time Injury Rate 2.5 4.36 4.37 NoFood Safety Incident Rate 2.5 0.33 0.34 No
DOMINIC BLAKEMOREFINANCIAL MEASURES1 % WEIGHTING MINIMUM PAR (TARGET) MAXIMUM ACHIEVED
PBIT2 5 £1,320m £1,347m £1,374m £1,375mRPBIT5 50 £393.40m £397.40m £401.30m £400mMAWC6 15 (£204.10m) (£213.70m) (£233.00m) (£211.90m)RORG7 25 2.30% 3.30% 4.30% 2.90%
EUROPE HSE IMPROVEMENT TARGET ACHIEVED ACHIEVED
Regional Lost Time Injury Rate 2.5 5.95 5.71 YesRegional Food Safety Incident Rate 2.5 0.37 0.36 Yes
GARY GREENFINANCIAL MEASURES1 % WEIGHTING MINIMUM PAR (TARGET) MAXIMUM ACHIEVED
PBIT2 5 £1,320m £1,347m £1,374m £1,375mRPBIT growth5 55 6.6% 7.4% 8.4% 9.1%MAWC6 15 ($721.30m) ($736.30m) ($751.30m) ($769.0m)RORG7 25 5.00% 6.00% 8.00% 8.00%
NORTH AMERICA HSE IMPROVEMENT
HSE for the North American business is measured through North American underlying PBIT.
2015-2016 OUTCOMESDOMINIC BLAKEMORE8 RICHARD COUSINS8 GARY GREEN8 ANDREW MARTIN8,10 JOHNNY THOMSON8
MEASURE% OF PERFORMANCE
TARGET ACHIEVED% OF PERFORMANCE
TARGET ACHIEVED% OF PERFORMANCE
TARGET ACHIEVED% OF PERFORMANCE
TARGET ACHIEVED% OF PERFORMANCE
TARGET ACHIEVED
PBIT/RPBIT2,5 47/552,5 55/552 60/602,5 55/552 55/552
ACFC3 – 15/15 – 15/15 15/15MAWC6 6/15 – 15/15 – –ORG/RORG4,7 7/257 15.8/254 25/257 15.8/254 15.8/254
HSE 5/5 0/5 –9 0/5 0/5Total 65/100 85.8/100 100/100 85.8/100 85.8/100
NOTES TO TABLES1. Financial measures for 2015-2016 bonus purposes are all set at 2016 foreign exchange budget rates, not actuals.2. PBIT is underlying Profit Before Interest and Tax (Group).3. AFCF is Adjusted Free Cash Flow (Group).4. ORG is Organic Revenue Growth (Group).5. RPBIT is underlying Profit Before Interest and Tax for Region of responsibility.6. MAWC is 10 months/12 months Average Working Capital Balance for region of responsibility for Mr Green and Mr Blakemore respectively.7. RORG is Organic Revenue Growth for Region of responsibility.8. Messrs Blakemore, Cousins, Green, Thomson and Martin’s entitlements to any bonus related to the achievement of AFCF and PBIT were adjusted, in
accordance with the established framework to exclude all unbudgeted M&A spend together with routine restructuring costs.9. HSE for the North American business is measured through North American underlying PBIT.10. Mr Martin stepped down as a director of the Company on 1 December 2015. Details of payments for loss of office can be found on page 77.
72 Compass Group PLC Annual Report 2016

BONUS PAYOUTThe outcome of the annual bonus for the year ended 30 September 2016 was due to the strong underlying financial performance aligned with the delivery of the Group’s long term strategy. The table below shows the resulting payout to each executive director in office during the year in such capacity:
2015-2016 BONUS PAYMENT (AS % OF BASE SALARY) VALUE OF BONUS
Dominic Blakemore 97.5% £624,481Richard Cousins 171.6% £1,792,777Gary Green 150% $1,941,000Andrew Martin 128.25% £143,602Johnny Thomson 128.25% £616,663
No discretion was applied by the Committee in respect of the directors’ bonuses for the year under review. The rules of the current annual bonus plan do not include any deferment of payment of any element of the same.
Mr Martin stepped down as a director with effect from 1 December 2015 and Mr Thomson became a director on the same day. The values shown have, therefore, been prorated to reflect their periods in office during the financial year ended 30 September 2016. Details of payments made for loss of office can be found on page 77.
2016-2017 BONUSPERFORMANCE MEASURESThe annual bonus elements for executive directors for the year ending 30 September 2017 are unchanged. They are:MEASURE DOMINIC BLAKEMORE RICHARD COUSINS GARY GREEN JOHNNY THOMSON
PBIT 55%1 55%2 60%1 55%2
AFCF – 15% – 15%MAWC 15%3 – 15%3 –ORG/RORG 25%4 25%5 25%4 25%5
HSE 5% 5% –6 5%Total 100% 100% 100% 100%
1. Underlying PBIT split between Group PBIT and PBIT for Region of responsibility (Mr Blakemore: 5% Group/50% Regional, Mr Green: 5% Group/55% Regional).
2. Underlying PBIT (Group).3. MAWC for Region of responsibility.4. RORG for Region of responsibility.5. ORG (Group).6. HSE for the North American business is measured through North American underlying PBIT.
The Committee has set the targets for the annual bonus plan for the year ending 30 September 2017 but has chosen not to disclose the details in this Report, as it is the opinion of the Committee that it may be seriously prejudicial to the interests of the Company to do so, and our major competitors do not disclose their targets or projected forecasts. However, the specific targets and the extent to which the targets have been met (both at Group and Regional levels) will be disclosed in next year’s Report.
LONG TERM INCENTIVE AWARDSDuring the year ended 30 September 2016, executive directors received a conditional award of shares which may vest after a three year performance period which will end on 30 September 2018, based on the achievement of stretching performance conditions. The maximum levels achievable under these awards are set out in the table below:
DIRECTORLTIP AWARD
(AS A % OF BASE SALARY)FACE VALUE OF AWARD1
£000
Dominic Blakemore 200% 1,280Richard Cousins 250% 2,536Gary Green 200% 1,604Johnny Thomson 200% 1,150
6,570
1. Face value of award as at the date of grant on 25 November 2015 is based on the closing market price of 1080.00 pence per share on 24 November 2015. No award was made to Andrew Martin during the year ended 30 September 2016.
In accordance with the Company’s Share Ownership Guidelines, executive directors are required to hold vested awards for a period of two years following vesting so as to further strengthen the long term alignment of executives’ remuneration packages with shareholders’ interests and, if required, to facilitate the implementation of provisions related to malus and clawback.
COR
POR
ATE GO
VERN
ANCE
Compass Group PLC Annual Report 2016 73

Governance and Directors’ Report
Directors’ Remuneration Report continued
Annual Remuneration Report continued
The table below sets out the performance measures for the awards:DEFINITION OF MEASURE WEIGHTING
Adjusted FCF Adjusted FCF includes capital expenditure, net interest and net tax spend but excludes discontinued activities, acquisition spend, disposal proceeds, and unusual or irregular items or timing differences.
1⁄3
ROCE achievement The definition aims to measure the underlying economic performance of the Company. ROCE is calculated using constant currency values for the underlying operating profit, net of tax at the underlying rate for the year, and after profit relating to non-controlling interests. The capital employed figure excludes the post-employment benefit asset/liability, net of deferred tax, impaired goodwill, amortised intangibles arising on acquisitions and the net assets relating to non-controlling interests.
1⁄3
TSR Performance compared to that of constituent members of the FTSE 100 (excluding financial services companies). TSR is the aggregate of share price growth and dividends paid (assuming reinvestment of those dividends in the Company’s shares during the three year performance period).
1⁄3
In setting the performance targets, the Committee considers internal budgets and the Group’s strategic plan, market expectations and general economic conditions. The table on page 75 shows the targets against which performance has been measured to determine the vesting of the grant of awards for the year ended 30 September 2016 and forms part of the Policy detailed in the Policy Report on pages 62 to 68.
TARGETS FOR AWARDS VESTED IN THE YEAR ENDED 30 SEPTEMBER 2016
AFCF target
LEVEL OF PERFORMANCE THRESHOLD MAXIMUM ACHIEVED
Vesting % of each component 0% 100% 92.7%AFCF £2,423m £2,679m £2,660m
ROCE target
LEVEL OF PERFORMANCE THRESHOLD MAXIMUM ACHIEVED
Vesting % of each component 0% 100% 60.7%As at date of Award 18.4% 20.1% –Reconciled at the end of the performance period* 18.99% 20.88% 20.13%
TSR target
LEVEL OF PERFORMANCE BELOW MEDIAN MEDIAN UPPER QUARTILE ACHIEVED
Vesting % of each component 0% 25% 100% 100%
* ROCE targets are updated at the end of the performance period to reflect actual acquisition spend and constant currency.
LONG TERM INCENTIVE PLAN PERFORMANCE100% of the TSR, 92.7% of AFCF and 60.7% of the ROCE performance measures were achieved at the end of the three year performance period, such that 84.5% of the LTIP awards made during the 2013-2014 financial year vested. Shares will be delivered to individuals following the release of the preliminary results for the year ended 30 September 2016. The Committee applied the established framework to deal with items that were unforeseen at the time the targets were set in 2013-2014 and which were in the long term interests of shareholders. AFCF was adjusted to exclude a one-off supplementary contribution to the US pension and additional interest incurred in connection with the 2014 Return of Cash to shareholders. Both the ACFC and ROCE measures were adjusted to exclude a payroll timing distortion, a one-off capital investment in the Defence, Offshore & Remote business and restructuring both in the Defence, Offshore & Remote and European businesses to reflect trading conditions.
74 Compass Group PLC Annual Report 2016

2013-2014 LTIP PERFORMANCE PERIOD ENDED 30 SEPTEMBER 2016 AND VESTED 22 NOVEMBER 2016
PERFORMANCE CONDITIONS
DIRECTORTSR % VESTEDON MATURITY3
AFCF % VESTED ON MATURITY
ROCE % VESTED ON MATURITY
NUMBER OF SHARES AWARDED
NUMBER OF
SHARES VESTED
VALUE OF SHARESON VESTING4
£000
Dominic Blakemore 100% 92.7% 60.7% 78,090 65,959 966Richard Cousins 100% 92.7% 60.7% 209,436 176,902 2,590Gary Green 100% 92.7% 60.7% 121,620 102,727 1,504Andrew Martin1 100% 92.7% 60.7% 105,747 89,320 1,308Johnny Thomson2 100% 92.7% 60.7% 45,180 38,161 559
1. Mr Martin stepped down from the Board on 1 December 2015. Details of payments for loss of office can be found on page 77.2. 26/36 months of the performance period was completed by Mr Thomson prior to his appointment as a director of the Company. Mr Thomson also has an
interest in 10,622 shares which were awarded in connection with a ‘below board’ plan prior to his appointment as a director of the Company, more details of which can be found on page 70.
3. TSR ranking was 8th in its comparator group.4. The value of the shares on vesting has been calculated by reference to the average market price of Compass Group PLC shares over the three months from
1 July to 30 September 2016 (1464.25 pence per share).
The table below shows the targets against which performance will be measured to determine the vesting of the grant of awards to be made in the year ending 30 September 2017 and forms part of the Policy detailed in the Policy Report on pages 62 to 68.
TARGETS FOR AWARDS TO BE MADE ON 23 NOVEMBER 2016 FOR THE YEAR ENDING 30 SEPTEMBER 2017
AFCF and ROCE target
LEVEL OF PERFORMANCE VESTING % OF EACH COMPONENT AFCF ROCE
Threshold 0% £2,609m 18.10%Par (target) 50% £2,746m 18.60%Maximum 100% £2,883m 19.10%
TSR target
LEVEL OF PERFORMANCE VESTING % OF EACH COMPONENT
Below Median 0%Median 25%Upper Quartile 100%
The vesting of the shares under each performance condition is independent. Therefore, the total vesting amount is based on the relevant percentage achievement for each performance measure. Awards vest on a straight line basis between Threshold and Par and between Par and Maximum. If performance under a component does not exceed the Threshold level, vesting for that component will be nil. At the end of the performance period, the Committee will review the underlying financial performance of the Company and retain its discretion to adjust vesting if it considers that financial performance is unsatisfactory.
In setting targets for the awards in the year ending 30 September 2017, the Committee set a target requiring an improvement in underlying ROCE. It is recognised that tax rates for the performance period will be higher for the prior periods, and this will reduce reported ROCE. The Committee considers the measures and targets to be appropriate and challenging. Calculations of the achievement of the targets will be independently performed and approved by the Committee. The Committee will retain discretion to adjust for material events which occur during the performance period and the nature of any such adjustments will be disclosed in the DRR, together with details of the achieved AFCF, ROCE and TSR performance, as determined by the above definitions, at the end of the performance period.
The table below sets out the percentage of each LTIP award made to executive directors within the last five years which has vested and the percentage of each extant award, had it vested on 30 September 2016:
YEAR OF AWARDMATURITY
DATEPERFORMANCE
CONDITIONS
TSR % VESTED ON MATURITY OR INDICATIVE
VESTING PERCENTAGEAFCF % VESTED
ON MATURITYROCE % VESTED
ON MATURITY
2011-2012 1 Oct 2014 TSR/AFCF 100% 100% n/a2012-2013 1 Oct 2015 TSR/AFCF/ROCE 85% 78% 74%2013-2014 1 Oct 2016 TSR/AFCF/ROCE 100% 92.7% 60.7%2014-2015 1 Oct 2017 TSR/AFCF/ROCE 100% (after 24 months) 100% (after 24 months) 61% (after 24 months)2015-2016 1 Oct 2018 TSR/AFCF/ROCE 100% (after 12 months) 84% (after 12 months) 100% (after 12 months)
AFCF targets for each of the last three years are shown within note 22 to the consolidated financial statements on pages 136 to 140.
COR
POR
ATE GO
VERN
ANCE
Compass Group PLC Annual Report 2016 75

Governance and Directors’ Report
Directors’ Remuneration Report continued
Annual Remuneration Report continued
EXTANT EQUITY INCENTIVE AWARDS HELD BY EXECUTIVE DIRECTORSDetails of all existing equity incentive awards as at the date of this Report, including the awards conditionally made under the long term incentive plans to the executive directors at any time during the year ended 30 September 2016, are shown in the table below. None of the executive directors hold any extant award under any previously operated share option scheme:
LTIP
DIRECTOR
AS AT 30 SEPT 2015:
NUMBER OF SHARES
AWARDED DURING
THE YEAR: NUMBER OF
SHARES
RELEASED DURING
THE YEAR: NUMBER OF
SHARES
LAPSED DURING
THE YEAR: NUMBER OF
SHARES
AS AT 30 SEPT 2016:
NUMBER OF SHARES
MARKET PRICE AT DATE
OF AWARD: PENCE
DATE OF AWARD
MATURITY DATE
Dominic Blakemore 92,664 – 73,203 19,461 – 775.00 12 Feb 2013 1 Oct 201578,090 – – – 78,090 921.00 29 Nov 2013 1 Oct 2016
104,802 – – – 104,802 1145.00 6 Feb 2015 1 Oct 2017– 118,518 – – 118,518 1080.00 25 Nov 2015 1 Oct 2018
Total 275,556 118,518 73,203 19,461 301,410Richard Cousins 248,517 – 196,327 52,190 – 775.00 12 Feb 2013 1 Oct 2015
209,436 – – – 209,436 921.00 29 Nov 2013 1 Oct 2016221,475 – – – 221,475 1145.00 6 Feb 2015 1 Oct 2017
– 234,804 – – 234,804 1080.00 25 Nov 2015 1 Oct 2018Total 679,428 234,804 196,327 52,190 665,715Gary Green 142,728 – 112,754 29,974 – 775.00 12 Feb 2013 1 Oct 2015
121,620 – – – 121,620 921.00 29 Nov 2013 1 Oct 2016130,785 – – – 130,785 1145.00 6 Feb 2015 1 Oct 2017
– 148,479 – – 148,479 1080.00 25 Nov 2015 1 Oct 2018Total 395,133 148,479 112,754 29,974 400,884Andrew Martin 125,481 – 99,128 26,353 – 775.00 12 Feb 2013 1 Oct 2015
105,747 – – – 105,747 921.00 29 Nov 2013 1 Oct 2016116,9436 – – 29,2356 87,7086 1145.00 6 Feb 2015 1 Oct 2017
Total 348,171 – 99,128 55,588 193,455Johnny Thomson 11,841 – 9,352 2,489 – 775.00 12 Feb 2013 1 Oct 2015
45,180 – – – 45,180 921.00 29 Nov 2013 1 Oct 201642,870 – – – 42,870 1145.00 6 Feb 2015 1 Oct 2017
– 106,482 – – 106,482 1080.00 25 Nov 2015 1 Oct 2018Total 99,891 106,482 9,352 2,489 194,532
DIRECTOR
AS AT 30 SEPT 2015:
NUMBER OF SHARES
RELEASED DURING
THE YEAR: NUMBER OF
SHARES
LAPSED DURING
THE YEAR: NUMBER OF
SHARES
AS AT 30 SEPT 2016:
NUMBER OF SHARES
DATE OF AWARD
MATURITY DATE
Johnny Thomson 49,008 49,008 – – 3 Dec 2012 3 Dec 201510,6227 – – 10,6227 29 Nov 2013 29 Nov 2016
Total 59,630 49,008 – 10,6227
1. One third of each award granted is based on a three year AFCF target, one third on a ROCE target and one third on growth in the Company’s TSR relative to the FTSE 100, excluding its financial services constituents. The performance period of the award granted on 12 February 2013 came to an end on 30 September 2015. This award vested in part at 79% of the maximum award. The shares disclosed as lapsed during the year represent the proration of the original award.
2. The aggregate gross gain realised by Messrs Blakemore, Cousins, Green and Martin was £5,330,923 in the year ended 30 September 2016. The closing share price at the time of release of their awards was 1080.00 pence per share.
3. The performance period of the award granted on 29 November 2013, came to an end on 30 September 2016. The award vested in part at 84.5% of maximum award.
4. All awards were granted for nil consideration.5. The highest mid-market price of the Company’s ordinary shares during the year ended 30 September 2016 was 1521.00 pence per share and the lowest was
1013.00 pence per share. The year end price was 1495.00 pence per share.6. As detailed on page 77, at the discretion of the Committee in view of his exceptional past performance, Mr Martin’s award granted on 6 February 2015 will be
permitted to vest in 2017, subject to the achievement of corporate performance targets and to time proration (which is reflected in the figure disclosed above), and he will be released from his obligation to hold the vested award for two years thereafter.
7. As detailed in note 11 on page 70, Mr Thomson also has an interest in 10,622 shares which were awarded in connection with a ‘below board’ plan prior to his appointment as a director of the Company.
PENSIONSAt 30 September 2016, there were no executive directors actively participating in any Compass Group defined benefit pension arrangements and none of the executive directors were accruing additional entitlement to benefit under any arrangements that existed prior to their appointment as executive directors.
76 Compass Group PLC Annual Report 2016

Dominic Blakemore, Richard Cousins, Gary Green and Johnny Thomson each receive a salary supplement equal to 35% of their base salaries in lieu of pension. Andrew Martin had, since 6 April 2006, received a salary supplement equal to 35% of his base salary and waived all rights to his final salary pension, money purchase pension and unfunded unapproved pension relating to his employment prior to that date. Mr Martin stepped down as a director of the Company on 1 December 2015 and details of payments for loss of office can be found below.
EXIT PAYMENTSNo payments (other than regular pension benefits which were commenced in previous years and to Mr Martin as noted below) were made during the year ended 30 September 2016 to any past director of the Company.
Sir Ian Robinson stepped down from the Board and its committees at the conclusion of the 2016 AGM. Other than the fees payable to Sir Ian for the period up to 4 February 2016, no remuneration or payment was made to him in connection with his ceasing to be a director of the Company. In accordance with section 430(2B) of the CA 2006 (Section 430(2B)), a statement to this effect was posted on the Company’s website at www.compass-group.com.
Andrew Martin stepped down from the Board on 1 December 2015 and ceased, from the same date, to be responsible for the Company’s business in Europe & Japan. In accordance with Section 430(2B), the Company published a statement on its website regarding payments made to Mr Martin in connection with him ceasing to be a director of the Company. The information below is substantively the same as that which may be found in the statement on the Company’s website, but updated to reflect events since the statement was originally published.
From 1 December 2015 to 31 December 2015, Mr Martin continued to be employed on his existing terms while he assisted in the transition of the management of the European business to Dominic Blakemore. Mr Martin received £55,791 plus pension contributions and pro rated bonus for the month of December 2015. In accordance with Mr Martin’s service contract, which was entered into in 2007 and before the Company’s policy with regard to the inclusion of bonus in termination payments was changed in 2008 (so as to exclude them), Mr Martin’s employment will end on 31 December 2016. Mr Martin will be entitled to receive a maximum of £1,472,900 calculated as:
• £669,500 base salary• £502,125 bonus calculated at 75% of base salary (being par bonus)• £66,950 being 10% of base salary in lieu of benefits in kind• £234,325 pension contribution at 35% of base salary
Mr Martin did not and will not receive a further award of any long term incentives.
All long term incentives are subject to performance conditions set for periods of three years and vest on the third anniversary of the performance period. During the year, an award made in 2013-2014 over 125,481 shares vested on 25 November 2015 to the extent of 99,128 shares. The shares were sold and the sale announced on 26 November 2015.
The 2013-2014 award, whose performance period ended on 30 September 2016, vested on 22 November 2016. The performance conditions were satisfied as to 84.5% and so 89,320 shares vested out of 105,747 shares (see page 75).
The conditional award of shares made in February 2015 over 116,943 shares will vest in 2017, subject to the achievement of corporate performance targets and prorated for time in employment. In light of Mr Martin’s contribution to the Company’s performance, the Committee determined that the shares could be released in 2017 subject to achievement of the associated corporate performance targets. As set out on the Company’s website in January 2016, Mr Martin agreed to waive the benefit, and to accept the proration of this award, in light of shareholder views. Accordingly, the number of shares under the award will be reduced pro rata to the time in employment.
The Remuneration Committee has agreed in accordance with the plan rules that, in respect of the award made on 6 February 2015, the post vest holding period obligation will be released.
As announced on 22 November 2016, Susan Murray will step down from the Board and its committees at the conclusion of the 2017 AGM. Other than the fees payable to Mrs Murray for the period up to 2 February 2017, no remuneration payment has been or will be made to her in connection with her ceasing to be a director of the Company. In accordance with Section 430(2B), a statement to this effect will be posted on the Company’s website as soon as reasonably practicable following the conclusion of the 2017 AGM.
EXTERNAL APPOINTMENTSExecutive directors may take up one non-executive directorship outside of the Group subject to the Board’s approval, provided that such appointment is not likely to lead to a conflict of interest. It is recognised that non-executive duties can broaden experience and knowledge which can benefit the Company. Dominic Blakemore, Richard Cousins and Andrew Martin received fees of €167,074, £120,000 and £10,000 (for the disclosable period from 1 October 2015 to 1 December 2015) during the year in respect of their directorships of Shire plc, Tesco PLC and easyJet plc respectively, which they were permitted to retain. At the date of this Report, Gary Green and Johnny Thomson do not hold any external appointments.
COR
POR
ATE GO
VERN
ANCE
Compass Group PLC Annual Report 2016 77

Governance and Directors’ Report
Directors’ Remuneration Report continued
Annual Remuneration Report continued
NON-EXECUTIVE DIRECTORS’ REMUNERATIONFrom 1 October 2016 the Chairman’s fee is £510,000 per annum. In addition, £50,000 plus VAT per annum is paid in lieu of the provision by the Company of a car and chauffeur for use on Company business.
Details of amounts received by Paul Walsh during the year ended 30 September 2016 are shown below:
CHAIRMANFEES £000
BENEFITS1
£0002016 £000
2015 £000
Paul Walsh 500 50 550 525
1. Benefits comprise payment in lieu of the provision by the Company of a car and chauffeur for use on Company business.
Details of the fees paid to each of the non-executive directors in office for the year ended 30 September 2016 are set out below:2016 £000
2015 £000
Carol Arrowsmith 106 106John Bason 106 106Stefan Bomhard1 34 –Susan Murray 96 96Don Robert2 111 84Sir Ian Robinson2 29 111Nelson Silva 84 18Ireena Vittal 84 18Total 650 539
1. Appointed to the Board on 5 May 2016.2. Sir Ian Robinson stepped down as the SID on 1 October 2015 and was succeeded by Don Robert. The resultant changes to their fees are reflected above.
Sir Ian stepped down from the Board at the conclusion of the 2016 AGM.
SHARE OWNERSHIP GUIDELINES AND DIRECTORS’ INTERESTS IN SHARESIn order that their interests are linked with those of shareholders, directors are expected to build up and maintain a personal shareholding in the Company as set out in the share ownership guidelines as described on page 65 of the Policy.
The Committee reviewed and noted that the guidelines were satisfied by all directors in office during the year. The interests of the directors in office during the year ended 30 September 2016 in shares (including the interests of Persons Closely Associated) and share incentives are shown in the table below:
BENEFICIAL CONDITIONAL
DIRECTOR
SHARES HELD AS AT 30 SEPT 2016 OR
DATE OF LEAVINGSHARES HELD
AS AT 30 SEPT 2015
LTIP HOLDINGS AS AT 30 SEPT 2016 OR
DATE OF LEAVINGLTIP HOLDINGS
AS AT 30 SEPT 2015SHAREHOLDING
REQUIRED1
COMPLIANCE WITH SHAREHOLDING
GUIDELINES2
Carol Arrowsmith 9,711 7,503 n/a n/a 1 x P
John Bason 10,927 10,823 n/a n/a 1 x P
Dominic Blakemore 100,546 60,966 301,410 275,556 1.5 x P
Stefan Bomhard 6,100 – n/a n/a 1 x P
Richard Cousins 1,215,815 1,515,815 665,715 679,428 2 x P
Gary Green 265,819 365,819 400,884 395,133 1.5 x P
Andrew Martin3 500,000 500,000 193,4553 348,171 1.5 x P
Susan Murray 12,234 12,234 n/a n/a 1 x P
Don Robert 28,235 28,235 n/a n/a 1 x P
Sir Ian Robinson4 14,117 14,117 n/a n/a 1 x P
Nelson Silva 8,200 8,200 n/a n/a 1 x P
Johnny Thomson 96,643 38,283 194,532 99,891 1.5 x P
Ireena Vittal 1,863 – n/a n/a 1 x P
Paul Walsh 21,411 21,411 n/a n/a 1 x P
1. As a multiple of base salary or fee.2. Requirement to achieve within a four year period commencing from date of appointment. Dominic Blakemore (appointed February 2013), Ireena Vittal and
Nelson Silva (appointed July 2015) and Johnny Thomson (appointed December 2015) intend to progressively build up their share ownership in the Company.3. Mr Martin’s beneficial interest and LTIP holding is shown as at 1 December 2015 when he stepped down from the Board.4. Sir Ian’s beneficial interest is shown as at 4 February 2016.
There were no changes in directors’ interests between 30 September 2016 and 22 November 2016.
78 Compass Group PLC Annual Report 2016
REMUNERATION OF OTHER SENIOR EXECUTIVES AND MANAGEMENTA number of senior executives and the executive directors comprise the Executive Board. These key management roles influence the ability of the Group to meet its strategic targets. The Committee has regard to the remuneration level and structure of this group whose total remuneration including salary and other short term benefits, target (or par) bonus and the expected value of long term incentives is summarised in note 3 to the consolidated financial statements on page 107.
REMUNERATION ADVICEThe Chairman and the Group Chief Executive, together with Robin Mills (Group HR Director) and the Group Reward Director are normally invited to attend each Committee meeting and provide advice and guidance to the Committee (other than in respect of their own remuneration) for which they are not paid a fee in addition to their salaries from the Company under their service contracts. Details of the members of the Committee who served during the year ended 30 September 2016 are set out on pages 38 to 40.
The Committee also has access to detailed external information and research on market data and trends from independent consultants. During the year, the Company retained PwC to advise on compensation related matters, including undertaking a benchmarking exercise in respect of the remuneration of the Chairman, the non-executive directors and of the UK based directors for which it received total fees (based on hours spent) of £37,775 (2015: £39,900).
Alithos Limited (Alithos) provided information for the testing of the TSR performance conditions for the Company’s LTIP awards, for which it received fixed fees of £24,000 (2015: £24,000). It also provided the TSR performance graph for the Directors’ Remuneration Report, for which it received a fixed fee of £500 (2015: £500).
Alithos was appointed by the Company in 2002 and PwC was appointed in 2007 (renewed in 2011). Both appointments were made with the approval of the Committee following a selection exercise. Alithos did not provide any other advice or services to the Company during the year. PwC provided services globally which comprised pension, expatriate, internal audit, merger and acquisition, due diligence, tax and other consultancy advice. The Committee is satisfied that the advice it received during the year was objective and independent, based on the experience of its members generally, including Carol Arrowsmith, Chairman of the Committee, who was formerly a remuneration consultant with Deloitte LLP and Susan Murray who has experience of being a member of the remuneration committees of other quoted companies, including one as chair of the committee.
SHAREHOLDER VOTE ON 2014-2015 DIRECTORS’ REMUNERATION REPORTThe table below shows the voting outcome at the AGM held on 4 February 2016 for the 2014-2015 Annual Remuneration Report (advisory vote):
NUMBER OF VOTES ‘FOR’ & ‘DISCRETIONARY’
% OF VOTES CAST
NUMBER OF VOTES ‘AGAINST’
% OF VOTES CAST
TOTAL NUMBER OF VOTES CAST
NUMBER OF VOTES‘WITHHELD’1
Annual Remuneration Report 1,117,203,682 89.12 136,383,197 10.88 1,253,586,879 49,045,531
1. A vote withheld is not a vote in law.
The Committee welcomed the endorsement of the Remuneration Report by shareholders and took steps, wherever practicable, to understand shareholders’ concerns when withholding their support.
The Remuneration Policy approved by shareholders at the 2015 AGM remains in force and will not be voted on by shareholders until the 2018 AGM but, for ease of reference, the voting outcome is shown below (binding vote):
NUMBER OF VOTES ‘FOR’ & ‘DISCRETIONARY’
% OF VOTES CAST
NUMBER OF VOTES ‘AGAINST’
% OF VOTES CAST
TOTAL NUMBER OF VOTES CAST
NUMBER OF VOTES‘WITHHELD’1
Remuneration Policy 1,094,017,323 90.79 110,932,945 9.21 1,204,950,268 55,045,261
1. A vote withheld is not a vote in law.
At the 2017 AGM, shareholders will be invited to vote on the Annual Remuneration Report for 2015-2016.
On behalf of the Board
Carol ArrowsmithChairman of the Remuneration Committee 22 November 2016
COR
POR
ATE GO
VERN
ANCE
Compass Group PLC Annual Report 2016 79
Payment of the recommended final dividend, if approved at the 2017 AGM, will be made on 20 February 2017 to shareholders registered at the close of business on 20 January 2017. The shares will be quoted ex-dividend from 19 January 2017.
During the year, the trustees of each of the employee benefit trusts which operate in connection with the Company’s share plans waived their rights to receive dividends on any shares held by them. Details of the trusts can be found on page 82 of this Report. The amount of dividends waived during the year ended 30 September 2016 in relation to the trusts was £7,725 (2015: £11,815).
As at the date of this Report, there were 11,550,642 ordinary 105⁄8 pence shares held in treasury for the purpose of satisfying the Company’s obligations under the Company’s employee equity incentive schemes. Shares held in treasury are not entitled to receive dividends. Therefore, £3,743,780 worth of dividends were not paid during the financial year in relation to treasury shares.
A dividend reinvestment plan is available to eligible shareholders. Details can be found on page 160.
SHARE CAPITALGENERALAs at the date of this Report, 1,654,289,837 ordinary shares of 105⁄8 pence each (of which 11,550,642 are held in treasury) have been issued, are fully paid up and are quoted on the London Stock Exchange. The total voting rights attaching to the issued ordinary share capital (excluding treasury shares) at the date of this Report is 1,642,739,195. In addition, the Company sponsors a Level I American Depositary Receipts programme with BNY Mellon, under which the Company’s shares are traded on the over the counter market in the form of American Depositary Shares.
During the year ended 30 September 2016, 2,666,477 options were exercised and 1,126,121 awards released pursuant to the Company’s share option schemes and long term incentive plans. Of those options exercised and awards released, all were satisfied by the reissue of 3,780,997 treasury shares with an additional 11,601 shares released from the Compass Group Employee Share Trust. A further 25,245 treasury shares have been used to satisfy awards under these schemes since the end of the financial year to the date of this Report.
There are no restrictions on the transfer of ordinary shares in the capital of the Company other than certain restrictions which may from time to time be imposed by law, for example, insider trading law. In accordance with the EU Market Abuse Regulation (which came into effect on 3 July 2016), certain employees are required to seek the approval of the Company to deal in its shares.
The Company is not aware of any agreements between shareholders that may result in restrictions on the transfer of securities and/or voting rights.
The Company’s Articles of Association may only be amended by special resolution at a general meeting of shareholders.
This Directors’ Report forms part of the management report as required under DGTR 4. The Strategic Report on pages 1 to 33 includes an indication of future likely developments in the Company, details of important events and the Company’s business model and strategy. The Corporate Governance Report on pages 34 to 57, the Other Statutory Disclosures on pages 80 to 84 and the Directors’ Responsibilities statement on page 86 are incorporated into the Directors’ Report by reference.
The following disclosures have been included elsewhere within the Annual Report and are incorporated into the Directors’ Report by reference.DISCLOSURE PAGE
Financial Risk Management 24Going Concern 25Viability Statement 25Risk Management 27Carbon Emissions 31Corporate Governance Report, including Reports from
each principal Board Committee 34Directors’ Responsibilities statement 86
DIRECTORSParticulars of the directors in office at the date of this Report are listed on pages 38 to 40. In accordance with the Code, each director will retire and submit himself or herself for election or re-election at the 2017 AGM.
There were a number of changes to the composition of the Board and its committees during the year. On 1 October 2015, Don Robert succeeded Sir Ian Robinson as SID. On 1 December 2015, Johnny Thomson succeeded Dominic Blakemore as Group Finance Director, Andrew Martin stepped down as the Chief Operating Officer of Europe & Japan and Dominic Blakemore became Chief Operating Officer, Europe on the same day. Sir Ian Robinson stepped down from the Board at the conclusion of the Company’s AGM on 4 February 2016.
RESULTS AND DIVIDENDSIn the year ended 30 September 2016, the Group delivered an increase of 12.8% in Group underlying profit before tax from £1,192 million to £1,344 million and an increase of 14% in Group profit before tax from £1,159 million to £1,321 million.
A summary of the dividends on ordinary shares for the year ended 30 September 2016 compared with 2015 is shown below:YEAR DIVIDEND PENCE PER SHARE
2016 Interim 10.62016 Final (recommended) 21.12016 Total 31.72015 Interim 9.82015 Final 19.62015 Total 29.4
The 2016 interim dividend of 10.6 pence per share (2015: 9.8 pence) was paid to shareholders on 25 July 2016.
Governance and Directors’ Report
OTHER STATUTORY DISCLOSURES
80 Compass Group PLC Annual Report 2016

ISSUE OF SHARESAt the 2017 AGM, the directors will ask shareholders to renew the authority last granted to them at the 2016 AGM to allot equity shares representing approximately one third of the issued ordinary shares calculated at the latest practicable date prior to the publication of the Notice of AGM (the section 551 authority) and, in accordance with the Investment Association Share Capital Management Guidelines, the directors again propose to extend this by a further one third of the Company’s issued ordinary share capital, provided that such amount shall only be used in connection with a rights issue. If approved, the authority will expire no later than 15 months from the date on which the resolution is passed, or at the conclusion of the AGM to be held in 2018, whichever is the sooner.
The limited power granted to the directors at the 2016 AGM to allot equity shares for cash other than pro rata to existing shareholders expires no later than 3 May 2017. Subject to the terms of the section 551 authority, this authority is in line with the Statement of Principles on Pre-emption Rights issued by the Pre-Emption Group and supported by the Investment Association and the Pensions and Lifetime Savings Association (the Principles). If granted, this authority will give the directors the ability (until the AGM to be held in 2018) to issue ordinary shares for cash, other than pro rata to existing shareholders, in connection with a rights issue or up to a limit of 5% of the issued ordinary share capital (whether or not in connection with an acquisition or specified capital investment) calculated at the latest practicable date prior to the publication of the Notice of AGM and, in accordance with the Principles, the directors propose to extend this by an additional 5% of the Company’s issued ordinary share capital calculated at the latest practicable date prior to the publication of the Notice of AGM, provided that the additional authority would only be used for the purpose of an acquisition or a specified capital investment which is announced contemporaneously with the issue or which has taken place in the preceding six month period and is disclosed in the announcement of the issue. This year, in line with recommended best practice, the Company has split the section 561 resolution into two separate resolutions. The first resolution seeks authorisation for 5% of the issued ordinary share capital to be issued on an unrestricted basis, whilst the second resolution seeks authority for the additional 5% of the issued ordinary share capital to be used for an acquisition or a specified capital investment.
In line with best practice, the Company has not issued more than 7.5% of its issued ordinary share capital on a non-prorated basis over the last three years. The directors have no present intention to issue ordinary shares, other than pursuant to the Company’s employee equity incentive share schemes, and this authority will maintain the Company’s flexibility in relation to future share issues, including any issues to finance business opportunities, should appropriate circumstances arise.
Details of repurchases into treasury shares and the reissue of treasury shares made during the year, together with details of options granted over unissued capital, are set out in note 21 to the consolidated financial statements on pages 134 and 135.
The Company is not aware of any significant agreements to which it is party that take effect, alter or terminate upon a change of control of the Company following a takeover.
More detailed information relating to the rights and obligations attaching to the Company’s ordinary shares, in addition to those conferred by law, are set out in the Company’s Articles of Association, which are available on the Company’s website as well as on pages 24 and 25 of the Annual Report for the year ended 30 September 2007. The 2007 Annual Report is available on the Company’s website at www.compass-group.com.
REPURCHASE OF SHARESFrom 1 October 2015 to 31 March 2016 the Company repurchased 6,560,656 ordinary shares of 105⁄8 pence for a consideration of £72.7 million (including expenses). These shares were subsequently transferred to be held in treasury for the purpose of satisfying the Company’s obligations under employee equity incentive schemes. From 1 April 2016 to 30 September 2016 and from 1 October 2016 up to the date of this Report, 2,110,923 and 376,622 ordinary 105⁄8 pence shares were repurchased for a consideration of £27.5 million and £5.2 million (including expenses) respectively, and subsequently cancelled. Shares held in treasury are not eligible to participate in dividends and do not carry any voting rights.
Returns to shareholders continue to be an integral part of our business model and it is the Board’s intention to continue to maintain strong investment grade credit ratings by returning any surplus cash to shareholders.
At the 2017 AGM, a special resolution will be proposed to renew the directors’ limited authority to repurchase ordinary shares in the market, last granted at the 2016 AGM. The directors consider it desirable for these general authorisations to be available in order to maintain an efficient capital structure whilst at the same time retaining the flexibility to fund any infill acquisitions.
The authority sets the minimum and maximum prices which may be paid and it will be limited to a maximum of 10% of the Company’s issued ordinary share capital calculated at the latest practicable date prior to the publication of the Notice of AGM. Any purchases of ordinary shares will be by means of market purchases through the London Stock Exchange and any shares purchased may be cancelled or placed into treasury in accordance with the Companies (Acquisition of Own Shares) (Treasury Shares) Regulations 2003.
COR
POR
ATE GO
VERN
ANCE
Compass Group PLC Annual Report 2016 81

EMPLOYEE POLICIES AND INVOLVEMENTThe Group places particular importance on the involvement of its employees, keeping them regularly informed, through informal bulletins and other in-house publications, meetings and the Company’s internal websites, on matters affecting them as employees and on the issues affecting their performance. Since 1996, those Group businesses in the European Economic Area (EEA) have been represented on the Compass European Council (CEC), which provides a forum for exchanging information and engaging in consultation on the Group’s performance and plans, and relevant transnational issues affecting those countries in the EEA. As reported previously, the Group’s CEC Article 13 Agreement terminated in December 2012. A process of negotiation commenced through a Special Negotiating Body, which comprised employee representatives from each of the countries in which the Group operates within the EEA. On 22 March 2016, a new Agreement was reached between the employee representatives and management on behalf of the total EEA workforce under the EU Council Directive 2009/38/EC, and will operate for an initial period of three years.
Permanent UK employees are normally invited to join the Company’s defined contribution pension scheme, Compass Retirement Income Savings Plan (CRISP), on the completion of two years’ service (this includes any service that may have transferred across under the Transfer of Undertakings (Protection of Employment) Regulations 2006 (TUPE). CRISP has a corporate trustee. Nigel Palmer, a former employee of the Group, is chairman of the trustees. The other five trustee directors are UK based employees of the Group, two of whom have been nominated by CRISP members.
Those UK employees who transferred from the public sector under TUPE have been eligible to join the Compass Group Pension Plan (the Plan), a defined benefit pension arrangement which is otherwise closed to new entrants. However, under the Government’s revised guidance for ‘Fair Deal for staff pensions’, the expectation is that the Group will in future participate in the relevant public sector pension scheme and close the Plan to future new entrants. The Plan also has a corporate trustee. Phillip Whittome is the independent chairman. There are a further six trustee directors, five of whom are either UK based employees or former employees of the Group (three of whom have been nominated by Plan members), and the sixth is an independent trustee director.
SUBSTANTIAL SHAREHOLDINGSThe following major shareholdings have been notified to the Company as at 30 September 2016 and up to the date of this Report.
% OF ISSUEDCAPITAL1
% OF COMPASS GROUP PLC’S
VOTING RIGHTS1
Blackrock, Inc. 9.99 9.99Invesco Limited 4.95 4.95Massachusetts Financial
Services Company 9.96 9.96
1. At the date of disclosure.
Since the disclosure date, the shareholders’ interests in the Company may have changed.
The number of shares held by the directors as at 30 September 2016 can be found on page 78 in the Directors’ Remuneration Report.
EMPLOYEE SHARE TRUSTSThe Compass Group Employee Share Trust (ESOP) and The Compass Group Employee Trust Number 2 (CGET) were established on 13 January 1992 and 12 April 2001 respectively in connection with the Company’s share option plans. The Compass Group Long Term Incentive Plan Trust (LTIPT) was established on 5 April 2001 in connection with the Company’s long term incentive plans. Details of all employee equity incentive schemes are set out in the Directors’ Remuneration Report on pages 58 to 79. The trustees of the ESOP, LTIPT and CGET hold nil (2015: 11,601), 16,198 (2015: 16,198) and nil (2015: nil) ordinary shares of the Company respectively.
The Compass Group Executive Option Share Trust and the Compass Group Executive Share Trust were established on 15 and 22 February 2010 respectively in relation to the operation of equity incentive schemes in Australia. No ordinary shares were held by these trusts as at 30 September 2016 (2015: nil).
AWARDS UNDER EMPLOYEE SHARE SCHEMESDetails of awards made during the year and held by executive directors as at 30 September 2016 are set out in the Directors’ Remuneration Report on pages 58 to 79.
Details of employee equity incentive schemes and grants made during the year ended 30 September 2016 to, and extant awards held by, employees are disclosed in note 22 to the consolidated financial statements on pages 136 to 140.
Governance and Directors’ Report
Other Statutory Disclosures continued
82 Compass Group PLC Annual Report 2016

Our people are instrumental in our success; we respect and value the individuality and diversity that every employee brings to the Group. We base our relationship with our employees on respect for the dignity of the individual and fair treatment for all.
As at 30 September 2016, there were 527,180 (2015: 516,992) people employed by the Group (average number of employees including directors and part-time employees) of whom 300,493 were female (2015: 294,646) and 226,687 were male (2015: 222,276). Of these, 844 were senior managers (646 male, 198 female) (2015: 634 male, 173 female) which include members of our global leadership team and individuals who are statutory directors of the corporate entities whose financial information is included in the Group’s consolidated accounts in this Annual Report. In terms of the Company’s Board, as at 30 September 2016 there were 12 directors, nine of whom were male and three were female. Prior to any appointment to the Board, the Nomination Committee gives due regard to diversity and gender with a view to appointing the most suitable candidate for the role.
We seek to create a positive, open working environment wherever we operate. Our employee policies are set locally to comply with local law within an overall Group framework and we monitor our employee satisfaction and engagement through a number of key performance indicators, details of which can be found on pages 30 to 33 of the Corporate Responsibility section of the Strategic Report.
We also consider the concerns of wider communities where we operate, including national and local interests, utilising our relevant expertise to help contribute to the wellbeing of communities which are appropriate to our business objectives. Furthermore, the Group supports the rights of all people as set out in the UN Universal Declaration of Human Rights (UN Declaration) and considers carefully before doing any business in countries that do not adhere to the UN Declaration.
GREENHOUSE GAS EMISSIONS REPORTINGThe Company is required to state the annual quantity of emissions in tonnes of carbon dioxide equivalent from activities for which the Group is responsible, including the combustion of fuel and the operation of any facility. Details of our emissions during the year ended 30 September 2016 are set out within the Corporate Responsibility section of the Strategic Report on pages 30 and 31 and form part of the Directors’ Report disclosures. Further details of the actions which the Group is taking to reduce emissions can also be found online at www.compass-group.com. This Annual Report is certified carbon neutral by sponsoring a carbon neutral cause to offset against the emissions arising from the production, printing and delivery of this Report.
The Company became subject to the automatic enrolment regulations for its workforce in the UK on 1 November 2012, but deferred its staging date for automatic enrolment of eligible employees to 2 January 2013 as permitted by the regulations. Both the Plan and CRISP are compliant arrangements under these regulations and have been registered as such. All new UK employees who meet the statutory requirements, and who are not immediately entered into the Plan or CRISP, are automatically enrolled into the National Employment Savings Trust (NEST). The Group’s compliance with the auto-enrolment regulations, and the performance of NEST, are kept under regular review by the Group’s Pensions Department.
Permanent employees outside the UK are usually offered membership of local pension arrangements if and where they exist and where it is appropriate to have Company sponsored arrangements.
Employees are offered a range of benefits, such as private medical cover, depending on the local environment. Priority is given to the training of employees and the development of their skills. Employment of disabled people is considered on merit with regard only to the ability of any applicant to carry out the role. Arrangements to enable disabled people to carry out the duties required will be made if it is reasonable to do so. An employee becoming disabled would, where appropriate, be offered retraining.
The Group continues to operate on a decentralised basis. This provides the maximum encouragement for the development of entrepreneurial flair, balanced by a rigorous control framework exercised by a small head office team. Local management teams are responsible for maintaining high standards of health and safety and for ensuring that there is appropriate employee involvement in decision making.
EMPLOYEE DIVERSITY AND HUMAN RIGHTSOur Code of Ethics was developed in consultation with the CEC and the Institute of Business Ethics and sets out clear standards of behaviour that we expect all of our people to demonstrate and adhere to. The Code of Ethics, which is part of our CBC, underpins our social, ethical and environmental commitments and sends a clear message to our stakeholders of our commitment to responsible business practice. The 10 principles of the United Nations (UN) Global Compact, to which we are a signatory, underpin our own Code of Ethics. This UN initiative encourages companies to make human rights, labour standards, environmental responsibility and anti-corruption part of their business agenda. Our annual Communication on Progress can be viewed at www.unglobalcompact.org.
COR
POR
ATE GO
VERN
ANCE
Compass Group PLC Annual Report 2016 83

The primary method of communicating with shareholders is by electronic means, helping to make the Company more environmentally friendly by reducing waste and pollution associated with the production and posting of its Annual Report. The Annual Report and Accounts is available to all shareholders and can be accessed via the Company’s website at www.compass-group.com. The Group’s annual and interim results are also published on the Company’s website, together with all other announcements and documents issued to the market, such as statements, interviews and presentations by the Group Chief Executive and Group Finance Director.
The Notice of Annual General Meeting is circulated to all shareholders at least 20 working days prior to such meeting and it is Company policy not to combine resolutions to be proposed at general meetings. All shareholders are invited to the Company’s AGM at which they have the opportunity to put questions to the Board and it is standard practice to have the chairmen of the Audit, Corporate Responsibility, Nomination and Remuneration committees available to answer questions. The results of proxy voting for and against each resolution, as well as abstentions, are announced to the London Stock Exchange and are published on the Company’s website as soon as practicable after the meeting. Further shareholder information is available on pages 160 to 162.
CRESTThe Company’s ordinary shares and sterling Eurobonds are in CREST, the settlement system for stocks and shares.
DISCLOSURES REQUIRED UNDER UK LISTING RULE 9.8.4There are no disclosures required to be made under UK Listing Rule 9.8.4. Details of long term incentive plans can be found in the Directors’ Remuneration Report on pages 58 to 79.
SHAREHOLDER SERVICESDetails of services provided to shareholders can be found in the Shareholder Information section on pages 160 to 162 and on the Company’s website.
AGMThe Notice of Meeting setting out the resolutions to be proposed at the 2017 AGM, together with explanatory notes, is set out on pages 163 to 171 of this Annual Report and is also available at www.compass-group.com. The directors consider that each of the resolutions is in the best interests of the Company and the shareholders as a whole and recommend that shareholders vote in favour of all of the resolutions.
On behalf of the Board
Mark WhiteGeneral Counsel and Company Secretary 22 November 2016
DONATIONS AND POLITICAL EXPENDITURECharitable objectives support the Company’s CR strategy and have primarily focused on improving the environment, education, health and wellbeing, community engagement and responsible business practice. Donations have included employee involvement through fundraising and financial support.GROUP CHARITABLE DONATIONS £M
2016 8.52015 7.9
Since 2004, shareholders have passed an annual resolution, on a precautionary basis, to approve donations to EU political organisations and to incur EU political expenditure (as such terms were defined under the then relevant legislation) not exceeding a monetary limit approved by shareholders. The Board has consistently confirmed that it operates a policy of not giving any cash contribution to any political party in the ordinary meaning of those words and that it has no intention of changing that policy.
No material amount of corporate funds or paid employee time has been utilised during the year for political activities and, in accordance with the Company’s CBC, employees must not engage in any form of lobbying or have contact with political representatives, government employees or public interest groups unless they are doing so legitimately and adhering to internal control processes. Further information regarding the CBC can be found on page 49 of this Annual Report and on the Company’s website at www.compass-group.com.
The directors propose to renew the authority granted at the 2016 AGM for the Group to make political donations and incur political expenditure (as such terms are defined in sections 362 to 365 of the CA 2006) until the Company’s next AGM, which they might otherwise be prohibited from making or incurring under the terms of the CA 2006 and which would not amount to ‘donations’ in the ordinary sense of the word. It is proposed to maintain the limit of such authority at £100,000.
COMMUNICATING WITH SHAREHOLDERSThe Company places considerable importance on communication with its shareholders, including its private shareholders. The Group Chief Executive and the Group Finance Director are closely involved in investor relations and a senior executive has day to day responsibility for such matters. The views of the Company’s major shareholders are reported to the Board by the Group Chief Executive and the Group Finance Director as well as by the Chairman (who remains in contact with our largest shareholders) and are discussed at its meetings.
There is regular dialogue with institutional shareholders and this has been extended to include private shareholders through the AGM. Contact with institutional shareholders (and with financial analysts, brokers and the media) is controlled by written guidelines (during the year, in compliance with EU Market Abuse Regulation requirements, the Company updated its Corporate Communications Code and introduced a formal Market Soundings Policy) to ensure the continued protection of share price sensitive information that has not already been made generally available to the Company’s shareholders. Contact is also maintained, when appropriate, with shareholders to discuss overall remuneration plans and policies.
Governance and Directors’ Report
Other Statutory Disclosures continued
84 Compass Group PLC Annual Report 2016
NOTES TO THE CONSOLIDATED FINANCIAL STATEMENTS102 Segmental reporting106 Operating costs107 Employees108 Finance income, costs and related (gains)/losses109 Tax111 Earnings per share112 Dividends112 Goodwill114 Other intangible assets115 Property, plant and equipment116 Equity accounted investments117 Other investments117 Trade and other receivables118 Inventories119 Cash and cash equivalents120 Short term and long term borrowings122 Derivative financial instruments127 Trade and other payables128 Provisions129 Post employment benefit obligations134 Share capital136 Share-based payments140 Business combinations141 Reconciliation of operating profit to cash
generated by operations141 Reconciliation of net cash flow to movement in net debt142 Contingent liabilities143 Capital commitments143 Operating lease and concessions commitments143 Related party transactions143 Post balance sheet events144 Exchange rates145 Details of related undertakings of Compass Group PLC
86 Directors’ responsibilities for consolidated and Parent Company financial statements
87 Independent auditor’s report
CONSOLIDATED FINANCIAL STATEMENTS90 Consolidated income statement91 Consolidated statement of comprehensive income92 Consolidated statement of changes in equity94 Consolidated balance sheet95 Consolidated cash flow statement95 Reconciliation of free cash flow96 Accounting policies
CONSOLIDATED FINANCIAL STATEMENTS
FINAN
CIAL STATEMEN
TS
Compass Group PLC Annual Report 2016 85

CONSOLIDATED FINANCIAL STATEMENTS
DIRECTORS’ RESPONSIBILITIESThe Annual Report and Accounts complies with the Disclosure Guidance and Transparency Rules of the United Kingdom’s Financial Conduct Authority and the UK Corporate Governance Code in respect of the requirements to produce an annual financial report.
The Annual Report and Accounts is the responsibility of, and has been approved by, the directors.
We confirm that to the best of our knowledge:
• the Annual Report and Accounts, taken as a whole, is fair, balanced and understandable and provides the information necessary for shareholders to assess the Group’s position and performance, business model and strategy
• the financial statements, prepared in accordance with the applicable set of accounting standards, give a true and fair view of the assets, liabilities, financial position and profit or loss of the Company and the undertakings included in the consolidation taken as a whole
• the Annual Report and Accounts includes a fair review of the development and performance of the business and the position of the Company and the undertakings included in the consolidation taken as a whole, together with a description of the principal risks and uncertainties that they face
The directors have permitted the auditor to undertake whatever inspections they consider to be appropriate for the purpose of enabling them to give their audit opinion.
On behalf of the Board
Mark White General Counsel and Company Secretary 22 November 2016
STATEMENT OF DIRECTORS’ RESPONSIBILITIES IN RESPECT OF THE ANNUAL REPORT AND THE FINANCIAL STATEMENTSThe directors are responsible for preparing the Annual Report and the Group and Parent Company financial statements in accordance with applicable law and regulations.
Company law requires the directors to prepare Group and Parent Company financial statements for each financial year. Under that law they are required to prepare the Group financial statements in accordance with IFRS as adopted by the EU and applicable law and have elected to prepare the Parent Company financial statements in accordance with FRS 101 Reduced Disclosure framework.
Under company law the directors must not approve the financial statements unless they are satisfied that they give a true and fair view of the state of affairs of the Group and Parent Company and of their profit or loss for that period. In preparing each of the Group and Parent Company financial statements, the directors are required to:
• select suitable accounting policies and then apply them consistently
• make judgements and estimates that are reasonable and prudent
• for the Group financial statements, state whether they have been prepared in accordance with IFRS as adopted by the EU
• for the Parent Company financial statements, state whether applicable UK Accounting Standards have been followed, subject to any material departures disclosed and explained in the Parent Company financial statements
• prepare the financial statements on the going concern basis unless it is inappropriate to presume that the Group and the Parent Company will continue in business
The directors are responsible for keeping adequate accounting records that are sufficient to show and explain the Parent Company’s transactions and disclose with reasonable accuracy at any time the financial position of the Parent Company and enable them to ensure that its financial statements comply with the Companies Act 2006. They have general responsibility for taking such steps as are reasonably open to them to safeguard the assets of the Group and to prevent and detect fraud and other irregularities.
Under applicable law and regulations, the directors are also responsible for preparing a Strategic Report, Directors’ Report, Directors’ Remuneration Report and Corporate Governance Statement that comply with that law and those regulations.
The directors are responsible for the maintenance and integrity of the corporate and financial information included on the Company’s website. Legislation in the UK governing the preparation and dissemination of financial statements may differ from legislation in other jurisdictions.
86 Compass Group PLC Annual Report 2016
INDEPENDENT AUDITOR’S REPORT TO THE MEMBERS OF COMPASS GROUP PLC ONLY
OPINIONS AND CONCLUSIONS ARISING FROM OUR AUDIT1 OUR OPINION ON THE FINANCIAL STATEMENTS IS UNMODIFIEDWe have audited the financial statements of Compass Group PLC for the year ended 30 September 2016 set out on pages 90 to 159. In our opinion:
• the financial statements give a true and fair view of the state of the Group’s and of the Parent Company’s affairs as at 30 September 2016 and of the Group’s profit for the year then ended;
• the Group financial statements have been properly prepared in accordance with International Financial Reporting Standards as adopted by the European Union;
• the Parent Company financial statements have been properly prepared in accordance with UK Accounting Standards, including FRS 101 Reduced Disclosure Framework; and
• the financial statements have been prepared in accordance with the requirements of the Companies Act 2006; and, as regards the Group financial statements, Article 4 of the IAS Regulation.
2 OUR ASSESSMENT OF RISKS OF MATERIAL MISSTATEMENTIn arriving at our audit opinion above on the financial statements the risks of material misstatement that had the greatest effect on our audit, in decreasing order of audit significance, were as follows:
TAXATIONRefer to page 47 (Governance and Directors’ Report), page 98 (accounting policy) and page 142 (financial disclosures).
• The risk: The Group has extensive international operations and in the normal course of business the directors make judgements and estimates in relation to direct and indirect tax issues and exposures. As a result of the complexities of tax rules on transfer pricing and other tax legislation the accounting for tax exposures is a key audit judgement.
• Our response: Our audit procedures included evaluating the controls the Group has in place to identify and quantify its tax exposures. We used our tax specialists to analyse and challenge the assumptions used to determine provisions using our knowledge and experience of the application of international and local legislation by the relevant authorities and courts, and assessed whether the approach applied by the Group is supported by custom and practice in the industry. We have examined the calculations prepared by the directors and agreed assumptions used to underlying data, and considered the judgements applied including the maximum potential exposure and the likelihood of a payment being required. We have inspected correspondence with relevant tax authorities to identify tax risk areas and assessed third party tax advice received to evaluate the conclusions drawn in the advice. In addition, transfer pricing documentation was critically assessed as part of our consideration of the tax positions taken by the Group. We also considered the adequacy of the Group’s disclosures in respect of tax and uncertain tax positions.
SUPPLIER REBATES AND DISCOUNTSRefer to page 47 (Governance and Directors’ Report) and page 98 (financial disclosures).
• The risk: The Group has a variety of agreements with suppliers whereby rebates and discounts are earned based on the quantity of goods bought. The majority of the rebates and discounts due to the Group are reflected in the net price charged by its suppliers or are based on fixed percentages linked to the quantity of goods bought. There is little estimation or judgement involved in determining the timing and amount to be recognised. However, due to the large number of agreements in place across numerous jurisdictions within the Group, the complexity of transaction processing as well as supplier rebate periods frequently not being coterminous with the year end date, we consider there is a risk of error.
• Our response: We evaluated the controls that the Group has in place over the accounting for rebates and discounts. Our audit procedures included inspecting underlying contractual terms and supplier correspondence for a selection of arrangements in place and considered whether the accounting policy had been applied appropriately to the terms of the rebate. We performed detailed testing on a sample basis of the largest rebates and discounts recognised in the period, with particular attention to whether the rebates and discounts were recognised in the correct period and the appropriateness of any rebates and discounts accrued at the period end. This involved selecting a sample of amounts invoiced and accrued as at the balance sheet date and agreeing the underlying calculation to contractual terms and supplier correspondence. We also considered the adequacy of the Group’s disclosures in respect of supplier rebates and discounts.
We continue to perform procedures over the valuation of goodwill. However, following continued improved performance in the UK business, we have not assessed this as one of the risks that had the greatest effect on our audit and, therefore, it is not separately identified in our report this year.
3 OUR APPLICATION OF MATERIALITY AND AN OVERVIEW OF THE SCOPE OF OUR AUDITThe materiality for the Group financial statements as a whole was set at £60.7 million (2015: £62.7 million), determined with reference to a benchmark of Group profit before tax of £1.3 billion (2015: £1.2 billion), of which it represents 5% (2015: 5%).
We report to the Audit Committee any corrected or uncorrected identified misstatements exceeding £3.0 million (2015: £3.1 million), in addition to other identified misstatements that warranted reporting on qualitative grounds.
FINAN
CIAL STATEMEN
TS
Compass Group PLC Annual Report 2016 87

Of the Group’s 52 (2015: 52) reporting components, we subjected 25 (2015: 44) to audits for Group reporting purposes and none (2015: one) to specified risk-focused audit procedures. The components within the scope of our work accounted for the following percentages of the Group’s results:
The remaining 4% (2015: 1%) of total Group revenue, 3% (2015: 1%) of Group profit before tax and 3% (2015: 1%) of total Group assets is represented by 27 reporting components, none of which individually represented more than 0.5% of any of total Group revenue, Group profit before tax or total Group assets. For these remaining components, we performed analysis at an aggregated Group level to re-examine our assessment that there were no significant risks of material misstatement within these.
The Group audit team instructed component auditors as to the significant areas to be covered, including the relevant risks detailed above and the information to be reported back. The Group audit team determined the component materialities, which ranged from £0.2 million to £49.2 million (2015: £0.1 million to £49.2 million), having regard to the mix of size and risk profile of the Group across the components. Consistent with 2015, aside from the audit of the Parent Company and the non-trading head office entities that was performed by the Group audit team, the work on all of the components was performed by component auditors.
The Group audit team visited 8 (2015: 18) component locations, to assess the audit risk and strategy. Video and telephone conference meetings were also held with the component auditors of all countries in scope for Group reporting purposes. At these visits and meetings, the findings reported to the Group audit team were discussed in more detail, and any further work required by the Group audit team was then performed by the component auditor.
4 OUR OPINION ON OTHER MATTERS PRESCRIBED BY THE COMPANIES ACT 2006 IS UNMODIFIEDIn our opinion:
• the part of the Directors’ Remuneration Report to be audited has been properly prepared in accordance with the Companies Act 2006; and
• the information given in the Strategic Report and the Directors’ Report for the financial year for which the financial statements are prepared is consistent with the financial statements.
5 WE HAVE NOTHING TO REPORT ON THE DISCLOSURES OF PRINCIPAL RISKSBased on the knowledge we acquired during our audit, we have nothing material to add or draw attention to in relation to:
• the directors’ statement of viability on pages 25 and 26, concerning the principal risks, their management, and, based on that, the directors’ assessment and expectations of the Group’s continuing in operation over the three years to 2019; or
• the disclosures in note A of the accounting policies concerning the use of the going concern basis of accounting.
1. Audits for Group reporting purposes..................96% (2015: 95%)2. Group-level procedures only................................................4% (2015: 1%)3. Specified risk-focused audit procedures.....................0% (2015: 4%)
1
2
1
2
1. Audits for Group reporting purposes..................97% (2015: 96%)2. Group-level procedures only................................................3% (2015: 1%)3. Specified risk-focused audit procedures.....................0% (2015: 3%)
1
2
1. Audits for Group reporting purposes..................97% (2015: 95%)2. Group-level procedures only................................................3% (2015: 1%)3. Specified risk-focused audit procedures.....................0% (2015: 4%)
GROUP REVENUE (%)
GROUP PROFIT BEFORE TAX (%)
GROUP TOTAL ASSETS (%)
Independent auditor’s report to the members of Compass Group PLC only continued
88 Compass Group PLC Annual Report 2016

6 WE HAVE NOTHING TO REPORT IN RESPECT OF THE MATTERS ON WHICH WE ARE REQUIRED TO REPORT BY EXCEPTIONUnder ISAs (UK and Ireland) we are required to report to you if, based on the knowledge we acquired during our audit, we have identified other information in the Annual Report that contains a material inconsistency with either that knowledge or the financial statements, a material misstatement of fact, or that is otherwise misleading.
In particular, we are required to report to you if:
• we have identified material inconsistencies between the knowledge we acquired during our audit and the directors’ statement that they consider that the Annual Report and financial statements taken as a whole is fair, balanced and understandable and provides the information necessary for shareholders to assess the Group’s position and performance, business model and strategy; or
• the Audit Committee Report does not appropriately address matters communicated by us to the Audit Committee.
Under the Companies Act 2006 we are required to report to you if, in our opinion:
• adequate accounting records have not been kept by the Parent Company, or returns adequate for our audit have not been received from branches not visited by us; or
• the Parent Company financial statements and the part of the Directors’ Remuneration Report to be audited are not in agreement with the accounting records and returns; or
• certain disclosures of directors’ remuneration specified by law are not made; or
• we have not received all the information and explanations we require for our audit.
Under the Listing Rules we are required to review:
• the directors’ statements, set out on pages 25 and 26, in relation to going concern and longer term viability; and
• the part of the Corporate Governance Statement on page 36 relating to the company’s compliance with the eleven provisions of the 2014 UK Corporate Governance Code specified for our review.
We have nothing to report in respect of the above responsibilities.
SCOPE AND RESPONSIBILITIESAs explained more fully in the Directors’ Responsibilities statement set out on page 86, the directors are responsible for the preparation of the financial statements and for being satisfied that they give a true and fair view. A description of the scope of an audit of financial statements is provided on the Financial Reporting Council’s website at www.frc.org.uk/auditscopeukprivate. This report is made solely to the Company’s members as a body and is subject to important explanations and disclaimers regarding our responsibilities, published on our website at www.kpmg.com/uk/auditscopeukco2014a, which are incorporated into this report as if set out in full and should be read to provide an understanding of the purpose of this report, the work we have undertaken and the basis of our opinions.
Anthony Sykes(Senior Statutory Auditor)
for and on behalf of KPMG LLP, Statutory Auditor Chartered Accountants 15 Canada Square, London E14 5GL 22 November 2016
FINAN
CIAL STATEMEN
TS
Compass Group PLC Annual Report 2016 89
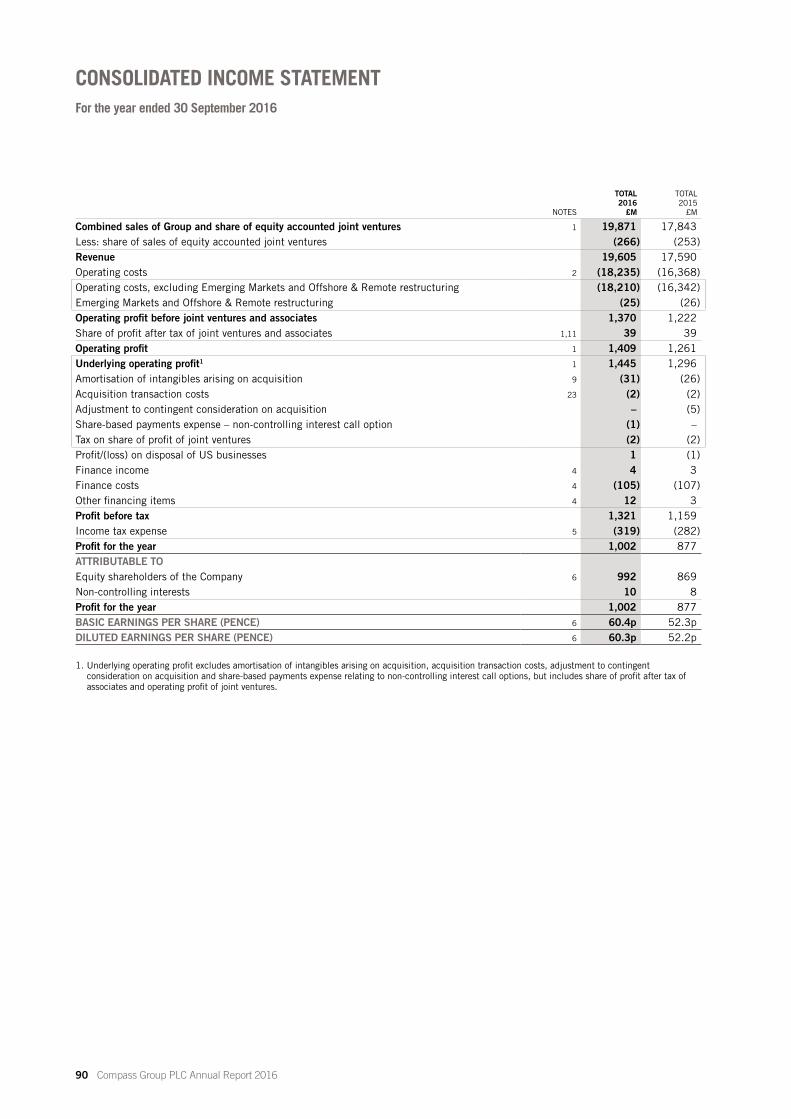
NOTES
TOTAL 2016
£M
TOTAL 2015
£M
Combined sales of Group and share of equity accounted joint ventures 1 19,871 17,843Less: share of sales of equity accounted joint ventures (266) (253)Revenue 19,605 17,590Operating costs 2 (18,235) (16,368)Operating costs, excluding Emerging Markets and Offshore & Remote restructuring (18,210) (16,342)Emerging Markets and Offshore & Remote restructuring (25) (26)Operating profit before joint ventures and associates 1,370 1,222Share of profit after tax of joint ventures and associates 1,11 39 39Operating profit 1 1,409 1,261Underlying operating profit1 1 1,445 1,296Amortisation of intangibles arising on acquisition 9 (31) (26)Acquisition transaction costs 23 (2) (2)Adjustment to contingent consideration on acquisition – (5)Share-based payments expense – non-controlling interest call option (1) –Tax on share of profit of joint ventures (2) (2)Profit/(loss) on disposal of US businesses 1 (1)Finance income 4 4 3Finance costs 4 (105) (107)Other financing items 4 12 3Profit before tax 1,321 1,159Income tax expense 5 (319) (282)Profit for the year 1,002 877ATTRIBUTABLE TOEquity shareholders of the Company 6 992 869Non-controlling interests 10 8Profit for the year 1,002 877BASIC EARNINGS PER SHARE (PENCE) 6 60.4p 52.3pDILUTED EARNINGS PER SHARE (PENCE) 6 60.3p 52.2p
1. Underlying operating profit excludes amortisation of intangibles arising on acquisition, acquisition transaction costs, adjustment to contingent consideration on acquisition and share-based payments expense relating to non-controlling interest call options, but includes share of profit after tax of associates and operating profit of joint ventures.
CONSOLIDATED INCOME STATEMENTFor the year ended 30 September 2016
90 Compass Group PLC Annual Report 2016
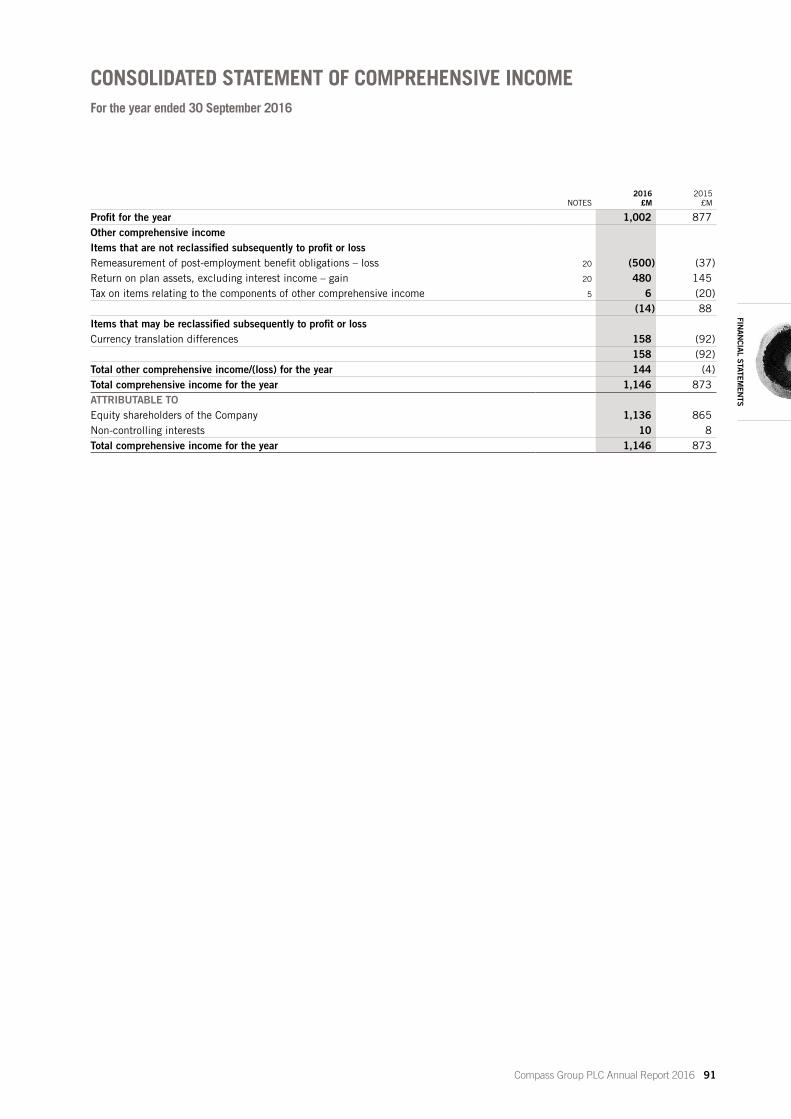
NOTES2016
£M2015
£M
Profit for the year 1,002 877Other comprehensive incomeItems that are not reclassified subsequently to profit or lossRemeasurement of post-employment benefit obligations – loss 20 (500) (37)Return on plan assets, excluding interest income – gain 20 480 145Tax on items relating to the components of other comprehensive income 5 6 (20)
(14) 88Items that may be reclassified subsequently to profit or lossCurrency translation differences 158 (92)
158 (92)Total other comprehensive income/(loss) for the year 144 (4)Total comprehensive income for the year 1,146 873ATTRIBUTABLE TOEquity shareholders of the Company 1,136 865Non-controlling interests 10 8Total comprehensive income for the year 1,146 873
CONSOLIDATED STATEMENT OF COMPREHENSIVE INCOMEFor the year ended 30 September 2016
FINAN
CIAL STATEMEN
TS
Compass Group PLC Annual Report 2016 91

ATTRIBUTABLE TO EQUITY SHAREHOLDERS OF THE COMPANY
SHARE CAPITAL
£M
SHARE PREMIUM ACCOUNT
£M
CAPITAL REDEMPTION
RESERVE £M
OWN SHARES
£M
OTHER RESERVES
£M
RETAINED EARNINGS
£M
NON-CONTROLLING INTERESTS
£MTOTAL
£M
At 1 October 2015 176 182 295 (1) 4,189 (2,904) 13 1,950Profit for the year – – – – – 992 10 1,002Other comprehensive income Currency translation differences – – – – 158 – – 158Remeasurement of post-employment benefit
obligations – loss – – – – – (500) – (500)Return on plan assets, excluding interest
income – gain – – – – – 480 – 480Tax on items relating to the components of
other comprehensive income (note 5) – – – – (2) 8 – 6Total other comprehensive income/(loss) – – – – 156 (12) – 144Total comprehensive income for the year – – – – 156 980 10 1,146Fair value of share-based payments – – – 1 16 1 – 18Release of LTIP award settled by issue
of shares – – – – (2) – – (2)Tax on items taken directly to equity (note 5) – – – – – 9 – 9Share buyback1 – – – – – (100) – (100)Issue of treasury shares to satisfy employee
share scheme awards exercised – – – – – 3 – 3Other changes – – – – – – 1 1
176 182 295 – 4,359 (2,011) 24 3,025Dividends paid to Compass
shareholders (note 7) – – – – – (496) – (496)Dividends paid to non-controlling interests – – – – – – (9) (9)At 30 September 2016 176 182 295 – 4,359 (2,507) 15 2,520
1. Including stamp duty and brokers’ commission.
OTHER RESERVES
SHARE-BASED PAYMENT RESERVE
£M
MERGER RESERVE
£M
REVALUATION RESERVE
£M
TRANSLATION RESERVE
£M
ADJUSTMENT FOR NON-CONTROLLING
INTEREST PUT OPTIONS RESERVE
£M
TOTAL OTHER
RESERVES £M
At 1 October 2015 179 4,170 7 (161) (6) 4,189Other comprehensive incomeCurrency translation differences – – – 158 – 158Tax on items relating to the components of
other comprehensive income (note 5) – – – (2) – (2)Total other comprehensive income – – – 156 – 156Fair value of share-based payments 16 – – – – 16Release of LTIP award settled by issue of shares (2) – – – – (2)At 30 September 2016 193 4,170 7 (5) (6) 4,359
Own shares held by the Group represent 16,198 ordinary shares in Compass Group PLC (2015: 27,799 ordinary shares). No shares (2015: 11,601) are held by the Compass Group Employee Share Trust (ESOP) and 16,198 (2015: 16,198) shares are held by the Compass Group Long Term Incentive Plan Trust (LTIPT). These shares are listed on a recognised stock exchange and their market value at 30 September 2016 was £0.2 million (2015: £0.3 million). The nominal value held at 30 September 2016 was £1,721 (2015: £2,954).
ESOP and LTIPT are discretionary trusts for the benefit of employees and the shares held are used to satisfy some of the Group’s liabilities to employees for share options, share bonus and long term incentive plans. All of the shares held by the ESOP and LTIPT are required to be made available in this way.
Up to 31 March 2016, repurchased ordinary shares were transferred and held in treasury for the purpose of satisfying the Company’s obligations under employee equity incentive schemes from 1 April onwards; all repurchased ordinary shares were cancelled rather than being placed in treasury.
The merger reserve arose in 2000 following the demerger from Granada Compass plc.
CONSOLIDATED STATEMENT OF CHANGES IN EQUITYFor the year ended 30 September 2016
92 Compass Group PLC Annual Report 2016

ATTRIBUTABLE TO EQUITY SHAREHOLDERS OF THE COMPANY
SHARE CAPITAL
£M
SHARE PREMIUM ACCOUNT
£M
CAPITAL REDEMPTION
RESERVE £M
OWN SHARES
£M
OTHER RESERVES
£M
RETAINED EARNINGS
£M
NON-CONTROLLING INTERESTS
£MTOTAL
£M
At 1 October 2014 178 174 293 (1) 4,277 (3,082) 9 1,848Profit for the year – – – – – 869 8 877Other comprehensive incomeCurrency translation differences – – – – (92) – – (92)Remeasurement of post-employment benefit
obligations – loss – – – – – (37) – (37)Return on plan assets, excluding interest
income – gain – – – – – 145 – 145Tax on items relating to the components
of other comprehensive income (note 5) – – – – (1) (19) – (20)Total other comprehensive (loss)/income – – – – (93) 89 – (4)Total comprehensive (loss)/income for the year – – – – (93) 958 8 873Issue of shares (for cash) – 2 – – – – – 2Fair value of share-based payments – – – – 15 – – 15Tax on items taken directly to equity (note 5) – – – – – 2 – 2Share buyback1 (2) – 2 – – (328) – (328)Issue of treasury shares to satisfy employee
share scheme awards exercised – – – – – 1 – 1Release of LTIP award settled by issue of
new shares – 6 – – (6) – – –Other changes – – – – (4) 2 2 –
176 182 295 (1) 4,189 (2,447) 19 2,413Dividends paid to Compass shareholders
(note 7) – – – – – (457) – (457)Dividends paid to non-controlling interests – – – – – – (6) (6)At 30 September 2015 176 182 295 (1) 4,189 (2,904) 13 1,950
1. Including stamp duty and brokers’ commission.
OTHER RESERVES
SHARE-BASED PAYMENT RESERVE
£M
MERGER RESERVE
£M
REVALUATION RESERVE
£M
TRANSLATION RESERVE
£M
ADJUSTMENT FOR NON-CONTROLLING
INTEREST PUT OPTIONS RESERVE
£M
TOTAL OTHER
RESERVES £M
At 1 October 2014 170 4,170 7 (70) – 4,277Other comprehensive incomeCurrency translation differences – – – (92) – (92)Tax on items relating to the components
of other comprehensive income (note 5) – – – (1) – (1)Total other comprehensive loss – – – (93) – (93)Fair value of share-based payments 15 – – – – 15Release of LTIP award settled by issue of new shares (6) – – – – (6)Other changes – – – 2 (6) (4)At 30 September 2015 179 4,170 7 (161) (6) 4,189
FINAN
CIAL STATEMEN
TS
Compass Group PLC Annual Report 2016 93

NOTES 2016
£M2015
£M
NON-CURRENT ASSETSGoodwill 8 4,050 3,538Other intangible assets 9 1,469 1,130Property, plant and equipment 10 953 764Interests in joint ventures and associates 11 222 203Other investments 12 50 38Trade and other receivables 13 97 71Deferred tax assets* 5 149 182Derivative financial instruments** 17 184 58Non-current assets 7,174 5,984CURRENT ASSETSInventories 14 347 282Trade and other receivables 13 2,596 2,115Tax recoverable* 77 64Cash and cash equivalents** 15 346 283Derivative financial instruments** 17 2 19Current assets 3,368 2,763Total assets 10,542 8,747CURRENT LIABILITIESShort term borrowings** 16 (321) (247)Derivative financial instruments** 17 (9) (7)Provisions 19 (143) (136)Current tax liabilities* (195) (169)Trade and other payables 18 (3,851) (3,157)Current liabilities (4,519) (3,716)NON-CURRENT LIABILITIESLong term borrowings** 16 (3,075) (2,684)Derivative financial instruments** 17 (1) (25)Post-employment benefit obligations 20 (21) (9)Provisions 19 (280) (251)Deferred tax liabilities* 5 (40) (28)Trade and other payables 18 (86) (84)Non-current liabilities (3,503) (3,081)Total liabilities (8,022) (6,797)Net assets 2,520 1,950EQUITYShare capital 21 176 176Share premium account 182 182Capital redemption reserve 295 295Less: Own shares – (1)Other reserves 4,359 4,189Retained earnings (2,507) (2,904)Total equity shareholders’ funds 2,505 1,937Non-controlling interests 15 13Total equity 2,520 1,950
* Component of current and deferred taxes.** Component of net debt.
Approved by the Board of Directors on 22 November 2016 and signed on their behalf by
Richard Cousins, Director Johnny Thomson, Director
CONSOLIDATED BALANCE SHEETAs at 30 September 2016
94 Compass Group PLC Annual Report 2016

NOTES 2016
£M2015
£M
CASH FLOW FROM OPERATING ACTIVITIESCash generated from operations 24 1,768 1,476Interest paid (98) (96)Tax received 17 19Tax paid 5 (263) (261)Net cash from operating activities 1,424 1,138CASH FLOW FROM INVESTING ACTIVITIESPurchase of subsidiary companies and investments in associated undertakings1 (180) (89)Proceeds from sale of subsidiary companies and associated undertakings1 2 3Purchase of intangible assets 9 (267) (222)Purchase of property, plant and equipment2 (311) (282)Proceeds from sale of property, plant and equipment/intangible assets 29 28Purchase of other investments 12 (6) (1)Proceeds from sale of other investments 2 1Dividends received from joint ventures and associates 33 27Interest received 4 3Net cash used in investing activities (694) (532)CASH FLOW FROM FINANCING ACTIVITIESProceeds from issue of ordinary share capital – 2Purchase of own shares3 (100) (328)Receipts from issue of treasury shares to satisfy employee share scheme awards exercised 3 1Increase in borrowings 25 194 334Repayment of borrowings 25 (309) (250)Repayment of obligations under finance leases 25 (3) (5)Equity dividends paid 7 (496) (457)Dividends paid to non-controlling interests (9) (6)Net cash used in financing activities (720) (709)CASH AND CASH EQUIVALENTSNet increase/(decrease) in cash and cash equivalents 25 10 (103)Cash and cash equivalents at beginning of the year 25 283 408Currency translation gains/(losses) on cash and cash equivalents 25 53 (22)Cash and cash equivalents at end of the year 15, 25 346 283
1. Net of cash acquired or disposed and payments received or made under warranties and indemnities.2. Includes property, plant and equipment purchased under client commitments.3. Includes stamp duty and brokers’ commission.
RECONCILIATION OF FREE CASH FLOWFor the year ended 30 September 2016
2016 £M
2015 £M
Net cash from operating activities 1,424 1,138Purchase of intangible assets (267) (222)Purchase of property, plant and equipment (311) (282)Proceeds from sale of property, plant and equipment/intangible assets 29 28Purchase of other investments (6) (1)Proceeds from sale of other investments 2 1Dividends received from joint ventures and associates 33 27Interest received 4 3Dividends paid to non-controlling interests (9) (6)Free cash flow 899 686Add back: Europe & Japan cash restructuring costs in the year 9 36Underlying free cash flow 908 722
CONSOLIDATED CASH FLOW STATEMENTFor the year ended 30 September 2016
FINAN
CIAL STATEMEN
TS
Compass Group PLC Annual Report 2016 95
INTRODUCTIONThe significant accounting policies adopted in the preparation of the Group’s financial statements are set out below:
A ACCOUNTING CONVENTION AND BASIS OF PREPARATIONThe financial statements have been prepared in accordance with International Financial Reporting Standards (IFRS) and International Financial Reporting Interpretations Committee (IFRIC) interpretations as adopted by the European Union that are effective for the year ended 30 September 2016. They have been prepared under the historical cost convention as modified by the revaluation of certain financial instruments.
The financial statements have been prepared on a going concern basis. This is discussed in the Finance Directors’ statement on page 25.
In the current financial year, the Group has adopted:
Amendments to IAS 19 – Defined benefit plans: Employee contributions
Improvements to IFRS 2010-2013 Cycle
Improvements to IFRS 2011-2013 Cycle
In addition, there have been other minor improvements to existing IFRS and interpretations that are effective for the first time in the current financial year which have been adopted by the Group with no impact on its consolidated results or financial position.
ACCOUNTING STANDARDS, AMENDMENTS AND INTERPRETATIONS TO EXISTING STANDARDS THAT ARE NOT YET EFFECTIVECertain new standards, amendments and interpretations of existing standards have been published that, once they have been endorsed by the European Union, will be mandatory for the Group’s accounting period beginning on 1 October 2016 or for later periods. The Group has not yet adopted these pronouncements and does not currently believe that the adoption of these standards, amendments or interpretations would have a material effect on the consolidated results or financial position of the Group unless stated otherwise.
IFRS 9 ‘Financial Instruments’ (not yet endorsed by the European Union) removes the multiple classification and measurement models for financial assets required by IAS 39 and introduces a model that has only two classification categories: amortised cost and fair value. Classification is driven by the business model for managing the financial assets and the contractual cash flow characteristics of those assets. The accounting and presentation for financial liabilities and for derecognising financial instruments is relocated from IAS 39 without any significant changes. The Group continues to assess the impact this standard would have on its consolidated results and financial position.
IFRS 15 ‘Revenue from Contracts with Customers’ (not yet endorsed by the European Union). The standard introduces a new revenue recognition model that recognises revenue either at a point in time or over time. The model features a contract-based five step analysis of transactions to determine whether, how much and when revenue is recognised. The
Group is currently assessing the impact this standard would have on its consolidated results and financial position and work is underway to train our people and identify areas of divergence with current practice. Based on a preliminary assessment, the Group believes that IFRS 15 will not have a significant impact on the timing and recognition of revenue; however, it is anticipated that there will be some impact on the Group as a result of changes in the accounting treatment of some client commitment contract intangibles, variable payments to clients, variable receipts from clients and sales commissions. We expect that Compass will apply IFRS 15 for the year ended 30 September 2019 with a retrospective approach to the restatement of comparatives.
IFRS 16 ‘Leases’ (not yet endorsed by the European Union). A single model will be applied by lessees to all leases with the option not to recognise leases of small value or with terms less than 12 months. It is expected that, as a result of this standard, most operating leases will be included on the balance sheet as an asset, together with the corresponding liability, namely the present value of the future lease payments. A Group-wide project team has been established and is currently assessing the application of this new standard.
Amendments to IAS 1 – Disclosure initiative
Amendments to IAS 7 – Disclosure initiative
Amendments to IAS 12 – Recognition of deferred tax assets from unrealised losses
Amendments to IAS 16 and IAS 38 – Clarification of acceptable methods of depreciation and amortisation
Amendments to IAS 27 (revised) – Equity method in separate financial statements
Amendments to IFRS 2 – Classification and measurement of share-based payment transactions
Amendments to IFRS 11 – Accounting for acquisitions of interests in joint operations
Improvements to IFRS 2012-2014 Cycle
B CRITICAL ACCOUNTING POLICIES AND USE OF ASSUMPTIONS AND ESTIMATESThe preparation of the consolidated financial statements requires management to make judgements, estimates and assumptions that affect the application of policies and reported amounts of assets and liabilities, income and expenses. These estimates and assumptions are based on historical experience and other factors that are believed to be reasonable under the circumstances. Actual results may differ from these estimates. The estimates and assumptions that have a significant risk of causing a material adjustment to the carrying value of assets and liabilities in the next financial year are discussed below.
TAXESThe Group is subject to direct and indirect taxes in numerous jurisdictions. Significant judgement is required in determining the worldwide provision for taxes as there are many transactions and calculations for which the ultimate tax determination is uncertain during the ordinary course of business. The Group
ACCOUNTING POLICIESFor the year ended 30 September 2016
96 Compass Group PLC Annual Report 2016

recognises liabilities based on estimates of whether additional taxes will be due. Where the final tax outcome of these matters is different from the amounts that were initially recorded, such differences will impact the results for the year and the respective tax and deferred tax provisions in the year in which such determination is made.
GOODWILLThe Group tests annually whether goodwill has suffered any impairment in accordance with the accounting policy set out in section M on page 99. The recoverable amounts of cash-generating units (CGU) have been determined based on value in use calculations. These calculations require the use of estimates and assumptions consistent with the most up to date budgets and plans that have been formally approved by management. The key assumptions used for the value in use calculations are set out in note 8 to the consolidated financial statements.
POST-EMPLOYMENT BENEFITSDefined benefit schemes are reappraised annually by independent actuaries based on actuarial assumptions. Significant judgement is required in determining these actuarial assumptions. The principal assumptions used are described in note 20 to the financial statements.
C BASIS OF CONSOLIDATIONThe consolidated financial statements consist of the financial statements of the Company, entities controlled by the Company (its subsidiaries) and the Group’s share of interests in joint arrangements and associates made up to 30 September each year.
D SUBSIDIARIES, ASSOCIATES AND JOINT ARRANGEMENTSSUBSIDIARIESSubsidiaries are entities over which the Company has control. Control exists when the Company has power over an entity, exposure to variable returns from its involvement with an entity and the ability to use its power over the entity to affect its returns. The existence and effect of potential voting rights that are currently exercisable or convertible are also considered when assessing control.
ASSOCIATESAssociates are undertakings that are not subsidiaries or joint arrangements over which the Group has significant influence and can participate in financial and operating policy decisions. Investments in associated undertakings are accounted for using the equity method. The consolidated income statement includes the Group’s share of the profit after tax of the associated undertakings. Investments in associates include goodwill identified on acquisition and are carried in the Group balance sheet at cost plus post-acquisition changes in the Group’s share of the net assets of the associate, less any impairment in value.
JOINT ARRANGEMENTSJoint arrangements are entities in which the Group holds an interest on a long term basis and which are jointly controlled by the Group and other entities under a contractual agreement. The Group accounts for its own share of assets, liabilities,
revenues and expenses measured according to the terms of the agreements covering the joint operations. Joint ventures are accounted for using the equity method.
ADJUSTMENTSWhere necessary, adjustments are made to the financial statements of subsidiaries, associates and joint arrangements to bring the accounting policies used in line with those used by the Group.
ACQUISITIONS AND DISPOSALSThe results of subsidiaries, associates or joint arrangements acquired or disposed of during the period are included in the consolidated income statement from the effective date of acquisition or up to the effective date of disposal, as appropriate.
INTRA-GROUP TRANSACTIONSAll intra-group transactions, balances, income and expenses are eliminated on consolidation. Where a Group subsidiary transacts with a joint operation of the Group, profits or losses are eliminated to the extent of the Group’s interest in the relevant joint operation.
E ACQUISITIONSThe acquisition of subsidiaries is accounted for using the purchase method. The cost of acquisition is measured at the aggregate of the fair values, at the date of exchange, of assets given, liabilities incurred or assumed, and equity instruments issued.
Identifiable assets acquired and liabilities and contingent liabilities assumed are recognised at the fair values at the acquisition date, except for non-current assets (or disposal groups) that are classified as held for sale which are recognised and measured at fair value less costs to sell.
The cost of the acquisition in excess of the Group’s interest in the net fair value of the identifiable net assets acquired is recorded as goodwill. If the cost of the acquisition is less than the fair value of the net assets of the subsidiary acquired, the difference is recognised directly in the income statement.
F FOREIGN CURRENCYThe consolidated financial statements are prepared in sterling, which is the functional currency of the Company.
In preparing the financial statements of individual companies within the Group, transactions in currencies other than the companies’ functional currency are recorded at the rates of exchange on the dates of the transaction. At each balance sheet date, monetary assets and liabilities that are denominated in foreign currencies are retranslated at the rates on the balance sheet date. Gains and losses arising on retranslation are included in the income statement for the period, except for where they arise on items taken directly to other comprehensive income, in which case they are also recognised in the consolidated statement of comprehensive income.
In order to hedge its exposure to certain foreign exchange risks the Group enters into forward currency contracts (see section Q on page 99 for the Group’s accounting policies in respect of derivative financial instruments).
FINAN
CIAL STATEMEN
TS
Compass Group PLC Annual Report 2016 97

On consolidation, the assets and liabilities of the Group’s overseas operations (expressed in their functional currencies, being the currency of the primary economic environment in which each entity operates) are translated at the exchange rates on the balance sheet date. Income and expense items are translated at the average exchange rates for the period. Exchange differences arising, if any, are classified as equity and transferred to the Group’s translation reserve. Such translation differences are recognised as income or expense in the period in which the operation is disposed of.
Goodwill and fair value adjustments arising on the acquisition of a foreign entity are treated as assets and liabilities of the foreign entity and translated at the closing rate.
G REVENUERevenue is recognised in the period in which goods and services are provided in accordance with the terms of the contractual relationships with third parties. Revenue represents the fair value of the consideration received or receivable for goods and services provided in the normal course of business, excluding trade discounts, value added tax and similar sales taxes.
MANAGEMENT FEE CONTRACTSRevenue from management fee contracts comprises the total of sales, the subsidy charged to clients, together with the management fee charged to clients. Revenue from management fee contracts is recognised as goods and services are provided over the life of the contract.
FIXED PRICE CONTRACTSRevenue from fixed price contracts is recognised as services are provided in each period.
PROFIT AND LOSS CONTRACTSRevenue from profit and loss contracts comprises the total of sales made to consumers, typically with little or no subsidy charged to clients.
INTER-SEGMENT TRANSACTIONSThere is little or no intra-group trading between the reported business segments. Where such trading does take place, it is on similar terms and conditions to those available to third parties.
H REBATES AND OTHER AMOUNTS RECEIVED FROM SUPPLIERSRebates and other amounts received from suppliers include agreed discounts from suppliers’ list prices, value and volume related rebates.
Income from value and volume related rebates is recognised based on actual purchases in the period as a proportion of total purchases made or forecast to be made over the rebate period.
Rebates received in respect of plant and equipment are deducted from the costs capitalised and are recognised in the income statement in line with depreciation.
Agreed discounts relating to inventories are credited to the income statement within cost of sales as the goods are consumed.
Rebates relating to items purchased, but still held at the balance sheet date, are deducted from the carrying value of these items so that the cost of inventories is recorded net of applicable rebates.
I BORROWING COSTSBorrowing costs which are directly attributable to the acquisition, construction or production of a qualifying asset are capitalised as part of the cost of that asset.
J OPERATING PROFITOperating profit is stated after the share of profit after tax of joint ventures and associates, and before finance costs.
K EXCEPTIONAL ITEMSExceptional items are disclosed and described separately in the consolidated financial statements where it is necessary to do so to provide further understanding of the financial performance of the Group. They are material items of income or expense that have been shown separately due to the significance of their nature or amount.
L TAXIncome tax expense comprises current and deferred tax. Tax is recognised in the income statement except where it relates to items taken directly to the consolidated statement of comprehensive income or equity, in which case it is recognised in the consolidated statement of comprehensive income or equity as appropriate.
Current tax is the expected tax payable on the taxable income for the period, using tax rates that have been enacted or substantively enacted in respect of that period by the balance sheet date.
Deferred tax is provided using the balance sheet liability method, providing for temporary differences between the carrying amounts of assets and liabilities for financial reporting purposes and the amounts used for tax purposes. Deferred tax liabilities are generally recognised for all taxable temporary differences and deferred tax assets are recognised to the extent that it is probable that taxable profits will be available against which deductible temporary differences can be utilised. Such assets and liabilities are not recognised if the temporary difference arises from the initial recognition of goodwill or from the initial recognition (other than in a business combination) of other assets and liabilities in a transaction that affects neither the taxable profit nor the accounting profit.
Deferred tax liabilities are recognised for taxable temporary differences arising on investments in subsidiaries and associates, and interest in joint arrangements, except where the Group is able to control the reversal of the temporary difference and it is probable that the temporary difference will not reverse in the foreseeable future.
The carrying amount of deferred tax assets is reviewed at each balance sheet date and reduced to the extent that it is no longer probable that sufficient taxable profits will be available to allow all or part of the asset to be recovered.
Deferred tax is calculated at the enacted or substantively enacted tax rates that are expected to apply in the period when the liability is settled or the asset realised.
Accounting policies continued
For the year ended 30 September 2016
98 Compass Group PLC Annual Report 2016

Deferred tax assets and liabilities are offset against each other when they relate to income taxes levied by the same tax jurisdiction and the Group intends to settle its current tax assets and liabilities on a net basis.
M INTANGIBLE ASSETSGOODWILLGoodwill arising on consolidation represents the excess of the cost of acquisition over the fair value of the Group’s share of the identifiable assets and liabilities of the acquired subsidiary, associate or joint arrangement at the date of acquisition. Goodwill is tested annually for impairment and is carried at cost less any accumulated impairment losses.
Goodwill is allocated to CGUs for the purpose of impairment testing. A CGU is identified at the lowest aggregation of assets that generate largely independent cash inflows, and that which is looked at by management for monitoring and managing the business and relates to the total business for a country.
If the recoverable amount of the CGU is less than the carrying amount, an impairment loss is allocated first to reduce the carrying amount of any goodwill allocated to the unit and then to the other assets of the unit pro rata on the basis of the carrying amount of each asset in the unit. Any impairment is immediately recognised in the income statement and an impairment loss recognised for goodwill is not subsequently reversed.
On disposal, the attributable amount of goodwill is included in the determination of the gain or loss on disposal.
Goodwill arising on acquisitions before the date of transition to IFRS has been retained at the previous UK GAAP amounts subject to being tested for impairment at that date. Goodwill written off to reserves under UK GAAP prior to 1998 has not been reinstated and is not included in determining any subsequent gain or loss on disposal.
OTHER INTANGIBLE ASSETSIntangible assets acquired separately are capitalised at cost or, if acquired as part of a business combination, are capitalised at fair value as at the date of the acquisition. Amortisation is charged on a straight line basis over the expected useful lives of the assets. Internally generated intangible assets are not capitalised. Intangible assets are reviewed for impairment annually.
The following rates applied for the Group:
• Contract related intangible assets: the life of the contract• Computer software: 6% to 33% per annum
The typical life of contract related intangibles is 2 to 20 years.
Contract related intangible assets arising on acquisition of a business such as client contracts, customer databases or trademarks, are recognised at fair value and amortised over the life of the contract, including the renewal period where appropriate. Underlying operating profit and underlying earnings per share exclude the amortisation of contract related intangible assets arising on acquisition of a business as it is not considered to be relevant to the underlying trading performance of the Group.
N PROPERTY, PLANT AND EQUIPMENTAll tangible fixed assets are reviewed for impairment when there are indications that the carrying value may not be recoverable. Freehold land is not depreciated. All other property, plant and equipment assets are carried at cost less accumulated depreciation and any recognised impairment in value.
Depreciation is provided on a straight line basis over the anticipated useful lives of the assets.
The following rates applied for the Group:
• Freehold buildings and long term leasehold property: 2% per annum
• Short term leasehold property: the life of the lease• Plant and machinery: 8% to 33% per annum• Fixtures and fittings: 8% to 33% per annum
When assets are sold, the difference between sales proceeds and the carrying amount of the assets is dealt with in the income statement.
O ASSETS HELD FOR SALENon-current assets and disposal groups are classified as held for sale if the carrying amount will be recovered through a sale transaction rather than through continuing use. This condition is regarded as met only when the sale is highly probable, management is committed to a sale plan, the asset is available for immediate sale in its present condition and the sale is expected to be completed within one year from the date of classification. These assets are measured at the lower of carrying value and fair value less costs to sell.
P INVENTORIESInventories are valued at the lower of cost and net realisable value. Cost is calculated using either the weighted average price or the first in, first out method as appropriate to the circumstances. Net realisable value is the estimated selling price in the ordinary course of business, less applicable variable selling expenses.
Q FINANCIAL INSTRUMENTSFinancial assets and financial liabilities are recognised on the Group’s balance sheet when the Group becomes a party to the contractual provisions of the instrument. Financial assets and liabilities, including derivative financial instruments, denominated in foreign currencies are translated into sterling at period end exchange rates. Gains and losses are dealt with through the income statement, unless hedge accounting treatment is available.
INVESTMENTSThe Group’s available for sale investments are measured at fair value or, where fair value cannot be reliably measured, at cost less impairment. They are included in non-current assets unless management intends to dispose of the investment within 12 months of the balance sheet date.
CASH AND CASH EQUIVALENTSCash and cash equivalents comprise cash at bank and in hand and short term deposits with an original maturity of three months or less.
FINAN
CIAL STATEMEN
TS
Compass Group PLC Annual Report 2016 99
BORROWINGSBorrowings are recognised initially at the proceeds received, net of direct issue costs. Borrowings are subsequently stated at amortised cost; any difference between the proceeds (net of direct issue costs) and the redemption value is recognised in the income statement over the period of the borrowings using the effective interest method, unless included in a fair value hedge.
EQUITY INSTRUMENTSEquity instruments issued by the Company are recorded at the proceeds received, net of direct issue costs.
DERIVATIVE FINANCIAL INSTRUMENTS AND HEDGE ACCOUNTINGThe Group uses derivative financial instruments such as forward currency contracts and interest rate swaps to hedge the risks associated with changes in foreign exchange rates and interest rates. Such derivative financial instruments are initially measured at fair value on the contract date, and are remeasured to fair value at subsequent reporting dates.
The use of financial derivatives is governed by the Group’s policies approved by the Board of Directors that provide written principles on the use of financial derivatives consistent with the Group’s risk management strategy. The Group does not use derivative financial instruments for speculative purposes.
The fair value of forward currency contracts is calculated by reference to current forward exchange rates for contracts with similar maturity profiles. The fair value of interest rate swaps is determined by reference to market values for similar instruments.
For the purpose of hedge accounting, hedges are classified as either fair value hedges when they hedge the exposure to changes in the fair value of a recognised asset or liability; or cash flow hedges where they hedge the exposure to variability in cash flows that is either attributable to a particular risk associated with a recognised asset or liability or a forecasted transaction.
In relation to fair value hedges (interest rate swaps) which meet the conditions for hedge accounting, any gain or loss from remeasuring the hedging instrument at fair value is recognised immediately in the income statement. Any gain or loss on the hedged item attributable to the hedged risk is adjusted against the carrying amount of the hedged item and recognised in the income statement. Where the adjustment is to the carrying amount of a hedged interest bearing financial instrument, the adjustment is amortised to the net profit and loss such that it is fully amortised by maturity.
When fair value hedge accounting is discontinued, any adjustment to the carrying amount of the hedged item for the designated risk for interest bearing financial instruments is amortised to profit or loss, with amortisation commencing no later than when the hedged item ceases to be adjusted.
The Group’s policy is to convert a proportion of its floating rate debt to fixed rates, using floating to fixed interest rate swaps. The Group designates these as cash flow hedges of interest rate risk.
In relation to cash flow hedges (forward currency contracts) to hedge firm commitments which meet the conditions for hedge accounting, the portion of the gain or loss on the hedging instrument that is determined to be an effective hedge is recognised directly in equity and the ineffective portion is recognised in the income statement.
When the hedged firm commitment results in the recognition of an asset or liability, then at the time the asset or liability is recognised, the associated gains or losses that had previously been recognised in equity are included in the initial measurement of the acquisition cost and carrying amount of the asset or liability. For all other cash flow hedges, the gains or losses that are recognised in equity are transferred to the income statement in the same period in which the hedged firm commitment affects the net profit and loss, for example when the future sale actually occurs.
For derivative financial instruments that do not qualify for hedge accounting, any gains or losses arising from changes in fair value are taken directly to the income statement in the period.
Hedge accounting is discontinued when the hedging instrument expires or is sold, terminated or exercised, or no longer qualifies for hedge accounting. At that point in time, any cumulative gain or loss on the hedging instrument recognised in equity is kept in equity until the forecasted transaction occurs. If a hedged transaction is no longer expected to occur, the net cumulative gain or loss recognised in equity is transferred to the income statement in the period.
R LEASESLeases are classified as finance leases whenever the terms of the lease transfer substantially all the risks and rewards of ownership to the lessee. All other leases are classified as operating leases.
Assets held under finance leases are recognised as assets of the Group at their fair value or, if lower, at the present value of the minimum lease payments, each determined at the inception of the lease. The corresponding liability to the lessor is included in the balance sheet as a finance lease obligation. Lease payments are apportioned between finance charges and reduction of the lease obligation so as to achieve a constant rate of interest on the remaining balance of the liability. Finance charges are charged directly against income.
Payments made under operating leases are charged to income on a straight line basis over the period of the lease. Any incentives to enter into an operating lease are also spread on a straight line basis over the lease term.
S PROVISIONSProvisions are recognised when the Group has a present obligation as a result of a past event and it is probable that the Group will be required to settle that obligation. Provisions are measured at the directors’ best estimate of the cost of settling these liabilities and are discounted to present value where the effect is material.
Accounting policies continued
For the year ended 30 September 2016
100 Compass Group PLC Annual Report 2016

T EMPLOYEE BENEFITSPENSION OBLIGATIONSPayments made to defined contribution pension schemes are charged as an expense when they fall due. Payments made to state managed schemes are dealt with as payments to defined contribution schemes where the Group’s obligations under the schemes are equivalent to those arising in a defined contribution pension scheme.
For defined benefit pension schemes, the cost of providing benefits is determined using the Projected Unit Credit Method, with actuarial valuations being carried out at each balance sheet date. Actuarial gains and losses are recognised immediately in the consolidated statement of comprehensive income.
Past service cost is recognised immediately.
The pension obligation recognised in the balance sheet represents the present value of the defined benefit obligation as adjusted for unrecognised past service cost, as reduced by the fair value of scheme assets. Any asset resulting from this calculation is limited to the present value of available refunds and reductions in future contributions to the plan.
OTHER POST EMPLOYMENT OBLIGATIONSSome Group companies provide other post employment benefits. The expected costs of these benefits are accrued over the period of employment using a similar basis to that used for defined benefit pension schemes. Actuarial gains and losses are recognised immediately in the consolidated statement of comprehensive income.
SHARE-BASED PAYMENTSThe Group issues equity-settled and cash-settled share-based payments to certain employees. In accordance with the requirements of IFRS 2 ‘Share-based Payments’, the Group has applied IFRS 2 to all equity-settled share options granted after 7 November 2002 that had vested before 1 January 2005. Equity-settled share-based payments are measured at fair value (excluding the effect of non-market based vesting conditions) at the date of grant. The fair value determined at the grant date of the equity-settled share-based payments is expensed on a straight line basis over the vesting period, based on the Group’s estimate of the shares that will eventually vest and adjusted for the effect of non-market based vesting conditions.
Fair value is measured using either the binomial distribution or Black-Scholes pricing models as is most appropriate for each scheme. The expected life used in the models has been adjusted, based on management’s best estimate, for the effects of exercise restrictions and behavioural considerations.
For cash-settled share-based payments, a liability equal to the portion of the goods or services received is recognised at the current fair value determined at each balance sheet date.
HOLIDAY PAYPaid holidays and similar entitlements are regarded as an employee benefit and are charged to the income statement as the benefits are earned. An accrual is made at the balance sheet date to reflect the fair value of holidays earned but not taken.
FINAN
CIAL STATEMEN
TS
Compass Group PLC Annual Report 2016 101

1 SEGMENTAL REPORTINGThe management of the Group’s operations, excluding Central activities, is organised within three segments: North America, Europe and our Rest of World markets. These, together with Central activities, comprise the Group’s reportable segments. Each segment derives revenue from delivery of food and support services. Our geographical segments have been restated in 2015 to reflect a change in the way these are managed: Europe now includes Turkey and Russia, and Rest of World now includes Japan.
GEOGRAPHICAL SEGMENTS
REVENUE1
NORTH AMERICA
£MEUROPE
£M
REST OF WORLD
£MTOTAL
£M
YEAR ENDED 30 SEPTEMBER 2016Combined sales of Group and share of equity accounted joint ventures2,3 11,198 5,458 3,215 19,871YEAR ENDED 30 SEPTEMBER 20154
Combined sales of Group and share of equity accounted joint ventures2,3 9,361 5,192 3,290 17,843
SECTORS
REVENUE¹
BUSINESS & INDUSTRY
£MEDUCATION
£M
HEALTHCARE & SENIORS
£M
SPORTS & LEISURE
£M
DEFENCE, OFFSHORE & REMOTE
£MTOTAL
£M
YEAR ENDED 30 SEPTEMBER 2016Combined sales of Group and share of equity
accounted joint ventures2 7,602 3,621 4,472 2,416 1,760 19,871YEAR ENDED 30 SEPTEMBER 2015Combined sales of Group and share of equity
accounted joint ventures2 6,743 3,139 3,847 2,138 1,976 17,843
1. There is no inter-segmental trading.2. This is the revenue measure considered by the chief operating decision maker.3. Underlying revenue from external customers arising in the UK, the Group’s country of domicile, was £1,981 million (2015: £1,912 million). Underlying
revenue from external customers arising in the US was £10,350 million (2015: £8,557 million). Underlying revenue from external customers arising in all foreign countries from which the Group derives revenue was £17,890 million (2015: £15,931 million).
4. 2015 Europe and Rest of World segments have been restated to reflect a change in the way these are managed.
NOTES TO THE CONSOLIDATED FINANCIAL STATEMENTSFor the year ended 30 September 2016
102 Compass Group PLC Annual Report 2016

1 SEGMENTAL REPORTING CONTINUEDGEOGRAPHICAL SEGMENTS
RESULT
NORTH AMERICA
£MEUROPE
£M
REST OF WORLD
£M
CENTRAL ACTIVITIES
£MTOTAL
£M
YEAR ENDED 30 SEPTEMBER 2016Underlying operating profit before joint ventures and associates
and Emerging Markets and Offshore & Remote restructuring 906 394 194 (65) 1,429Add: Share of profit before tax of joint ventures 2 – 24 – 26Underlying operating profit before associates and Emerging Markets
and Offshore & Remote restructuring2 908 394 218 (65) 1,455Add: Share of profit of associates 10 5 – – 15Underlying operating profit before Emerging Markets and Offshore
& Remote restructuring 918 399 218 (65) 1,470Less: Emerging Markets and Offshore & Remote restructuring1 – (6) (19) – (25)Underlying operating profit2 918 393 199 (65) 1,445Less: Amortisation of intangibles arising on acquisition (20) (8) (3) – (31)Less: Acquisition transaction costs (1) (1) – – (2)Add: Adjustment to contingent consideration on acquisition 4 (4) – – –Less: Share-based payments expense – non-controlling interest
call option – – (1) – (1)Less: Tax on share of profit of joint ventures – – (2) – (2)Total operating profit 901 380 193 (65) 1,409Profit on disposal of US businesses 1Finance income 4Finance costs (105)Other financing items 12Profit before tax 1,321Income tax expense (319)Profit for the year 1,002
RESULTYEAR ENDED 30 SEPTEMBER 20153
Underlying operating profit before joint ventures and associates and Emerging Markets and Offshore & Remote restructuring 759 372 216 (66) 1,281
Add: Share of profit before tax of joint ventures 1 2 25 – 28Underlying operating profit before associates and Emerging Markets
and Offshore & Remote restructuring2 760 374 241 (66) 1,309Add: Share of profit of associates 8 5 – – 13Underlying operating profit before Emerging Markets and Offshore
& Remote restructuring 768 379 241 (66) 1,322Less: Emerging Markets and Offshore & Remote restructuring1 – (3) (18) (5) (26)Underlying operating profit2 768 376 223 (71) 1,296Less: Amortisation of intangibles arising on acquisition (15) (7) (4) – (26)Less: Acquisition transaction costs (2) – – – (2)Add: Adjustment to contingent consideration on acquisition (5) – – – (5)Less: Tax on share of profit of joint ventures – (1) (1) – (2)Total operating profit 746 368 218 (71) 1,261Loss on disposal of US businesses (1)Finance income 3Finance costs (107)Other financing items 3Profit before tax 1,159Income tax expense (282)Profit for the year 877
1. The Group has incurred charges resulting from the restructuring in response to the downturn in the trading conditions of its Emerging Markets and Offshore & Remote activities which include headcount reductions £22 million (2015: £17 million), other expenses £3 million (2015: £6 million), depreciation of owned property, plant and equipment £nil (2015: £2 million) and property lease rentals £nil (2015: £1 million).
2. Underlying operating profit is the profit measure considered by the chief operating decision maker.3. 2015 Europe and Rest of World segments have been restated to reflect a change in the way these are managed.
FINAN
CIAL STATEMEN
TS
Compass Group PLC Annual Report 2016 103
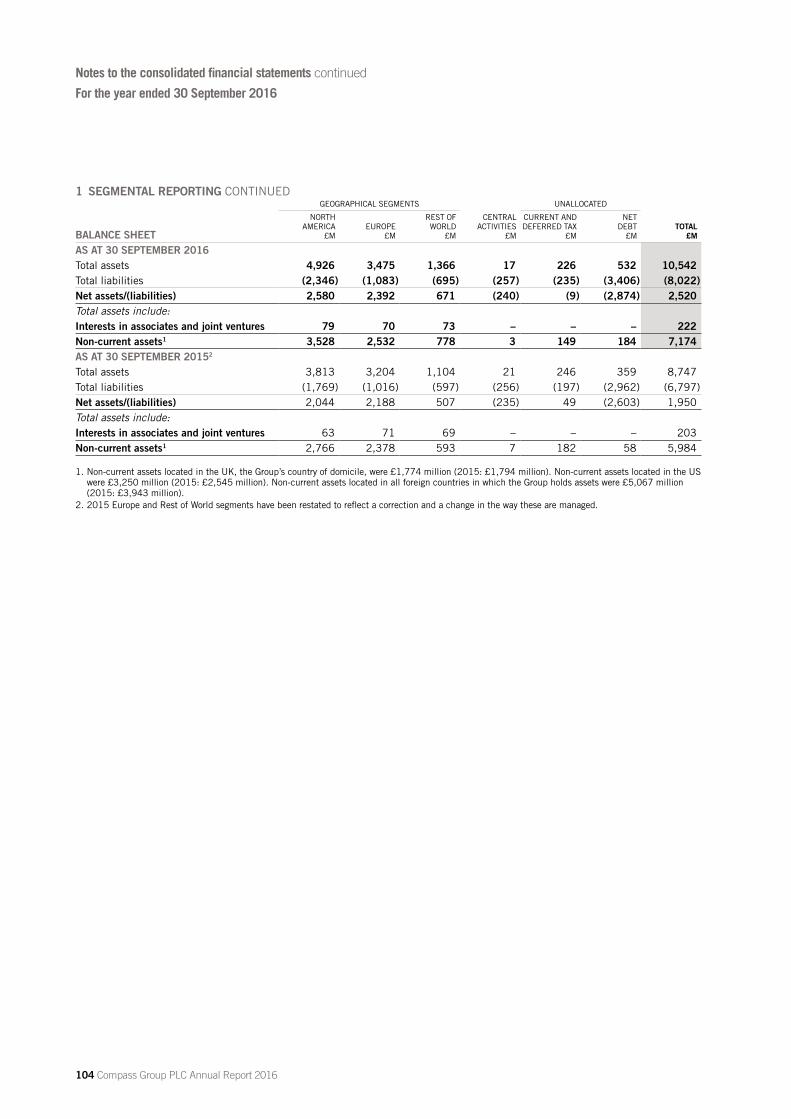
1 SEGMENTAL REPORTING CONTINUEDGEOGRAPHICAL SEGMENTS UNALLOCATED
BALANCE SHEET
NORTH AMERICA
£MEUROPE
£M
REST OF WORLD
£M
CENTRAL ACTIVITIES
£M
CURRENT AND DEFERRED TAX
£M
NET DEBT
£MTOTAL
£M
AS AT 30 SEPTEMBER 2016Total assets 4,926 3,475 1,366 17 226 532 10,542Total liabilities (2,346) (1,083) (695) (257) (235) (3,406) (8,022)Net assets/(liabilities) 2,580 2,392 671 (240) (9) (2,874) 2,520Total assets include:Interests in associates and joint ventures 79 70 73 – – – 222Non-current assets1 3,528 2,532 778 3 149 184 7,174AS AT 30 SEPTEMBER 20152
Total assets 3,813 3,204 1,104 21 246 359 8,747Total liabilities (1,769) (1,016) (597) (256) (197) (2,962) (6,797)Net assets/(liabilities) 2,044 2,188 507 (235) 49 (2,603) 1,950Total assets include:Interests in associates and joint ventures 63 71 69 – – – 203Non-current assets1 2,766 2,378 593 7 182 58 5,984
1. Non-current assets located in the UK, the Group’s country of domicile, were £1,774 million (2015: £1,794 million). Non-current assets located in the US were £3,250 million (2015: £2,545 million). Non-current assets located in all foreign countries in which the Group holds assets were £5,067 million (2015: £3,943 million).
2. 2015 Europe and Rest of World segments have been restated to reflect a correction and a change in the way these are managed.
Notes to the consolidated financial statements continued
For the year ended 30 September 2016
104 Compass Group PLC Annual Report 2016

1 SEGMENTAL REPORTING CONTINUEDGEOGRAPHICAL SEGMENTS
ADDITIONS TO OTHER INTANGIBLE ASSETS
NORTH AMERICA
£MEUROPE
£M
REST OF WORLD
£M
CENTRAL ACTIVITIES
£MTOTAL
£M
YEAR ENDED 30 SEPTEMBER 2016Total additions to other intangible assets 224 31 10 2 267YEAR ENDED 30 SEPTEMBER 20151
Total additions to other intangible assets 169 35 17 1 222
GEOGRAPHICAL SEGMENTS
ADDITIONS TO PROPERTY, PLANT AND EQUIPMENT
NORTH AMERICA
£MEUROPE
£M
REST OF WORLD
£M
CENTRAL ACTIVITIES
£MTOTAL
£M
YEAR ENDED 30 SEPTEMBER 2016Total additions to property, plant and equipment2 146 114 35 1 296YEAR ENDED 30 SEPTEMBER 20151
Total additions to property, plant and equipment2 108 114 41 10 273
GEOGRAPHICAL SEGMENTS
AMORTISATION OF OTHER INTANGIBLE ASSETS
NORTH AMERICA
£MEUROPE
£M
REST OF WORLD
£M
CENTRAL ACTIVITIES
£MTOTAL
£M
YEAR ENDED 30 SEPTEMBER 2016Total amortisation of other intangible assets3 170 29 11 – 210YEAR ENDED 30 SEPTEMBER 20151
Total amortisation of other intangible assets3 137 27 9 – 173
GEOGRAPHICAL SEGMENTS
DEPRECIATION OF PROPERTY, PLANT AND EQUIPMENT
NORTH AMERICA
£MEUROPE
£M
REST OF WORLD
£M
CENTRAL ACTIVITIES
£MTOTAL
£M
YEAR ENDED 30 SEPTEMBER 2016Total depreciation of property, plant and equipment 94 87 34 1 216YEAR ENDED 30 SEPTEMBER 20151
Total depreciation of property, plant and equipment 78 76 39 – 193
GEOGRAPHICAL SEGMENTS
OTHER NON-CASH EXPENSES
NORTH AMERICA
£MEUROPE
£M
REST OF WORLD
£M
CENTRAL ACTIVITIES
£MTOTAL
£M
YEAR ENDED 30 SEPTEMBER 2016Total other non-cash expenses4 5 4 4 3 16YEAR ENDED 30 SEPTEMBER 20151
Total other non-cash expenses4 4 3 4 4 15
1. 2015 Europe and Rest of World segments have been restated to reflect a change in the way these are managed.2. Includes leased assets of £2 million (2015: £2 million).3. Including the amortisation of intangibles arising on acquisition.4. Other non-cash expenses are mainly comprised of share-based payments.
FINAN
CIAL STATEMEN
TS
Compass Group PLC Annual Report 2016 105
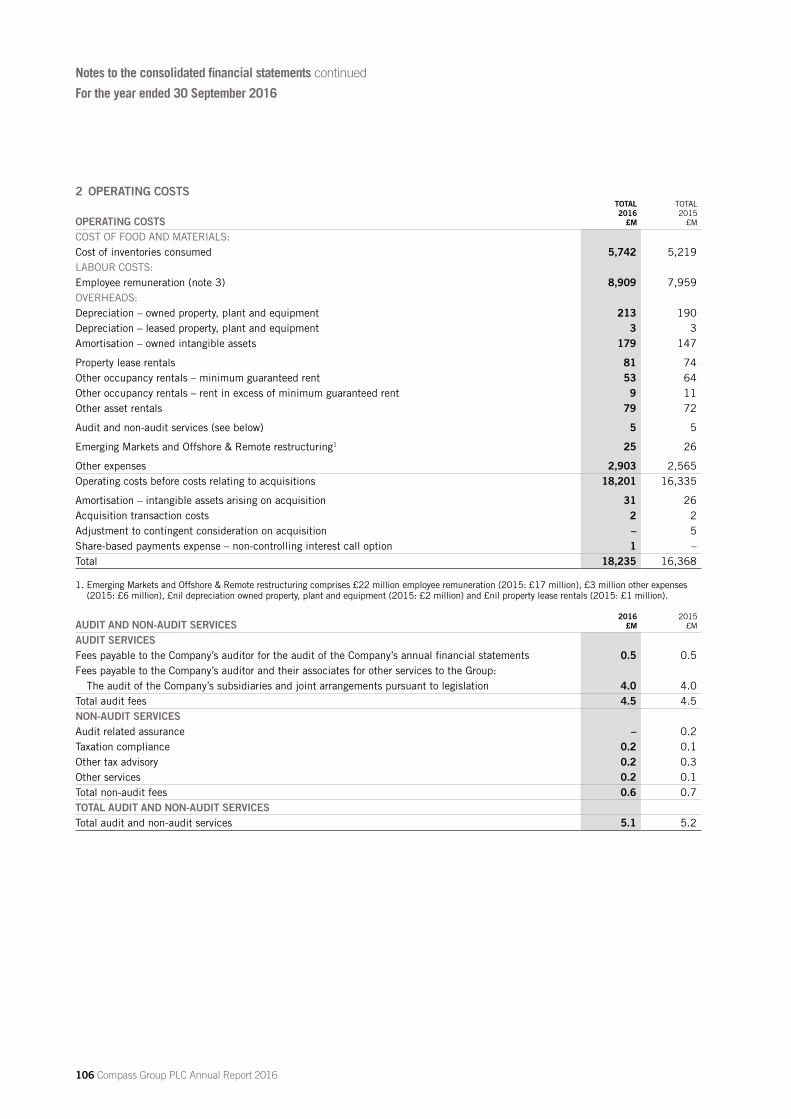
2 OPERATING COSTS
OPERATING COSTS
TOTAL 2016
£M
TOTAL 2015
£M
COST OF FOOD AND MATERIALS:Cost of inventories consumed 5,742 5,219LABOUR COSTS:Employee remuneration (note 3) 8,909 7,959OVERHEADS:Depreciation – owned property, plant and equipment 213 190Depreciation – leased property, plant and equipment 3 3Amortisation – owned intangible assets 179 147
Property lease rentals 81 74Other occupancy rentals – minimum guaranteed rent 53 64Other occupancy rentals – rent in excess of minimum guaranteed rent 9 11Other asset rentals 79 72
Audit and non-audit services (see below) 5 5
Emerging Markets and Offshore & Remote restructuring1 25 26
Other expenses 2,903 2,565Operating costs before costs relating to acquisitions 18,201 16,335
Amortisation – intangible assets arising on acquisition 31 26Acquisition transaction costs 2 2Adjustment to contingent consideration on acquisition – 5Share-based payments expense – non-controlling interest call option 1 –Total 18,235 16,368
1. Emerging Markets and Offshore & Remote restructuring comprises £22 million employee remuneration (2015: £17 million), £3 million other expenses (2015: £6 million), £nil depreciation owned property, plant and equipment (2015: £2 million) and £nil property lease rentals (2015: £1 million).
AUDIT AND NON-AUDIT SERVICES2016
£M2015
£M
AUDIT SERVICESFees payable to the Company’s auditor for the audit of the Company’s annual financial statements 0.5 0.5Fees payable to the Company’s auditor and their associates for other services to the Group:
The audit of the Company’s subsidiaries and joint arrangements pursuant to legislation 4.0 4.0Total audit fees 4.5 4.5NON-AUDIT SERVICESAudit related assurance – 0.2Taxation compliance 0.2 0.1Other tax advisory 0.2 0.3Other services 0.2 0.1Total non-audit fees 0.6 0.7TOTAL AUDIT AND NON-AUDIT SERVICESTotal audit and non-audit services 5.1 5.2
Notes to the consolidated financial statements continued
For the year ended 30 September 2016
106 Compass Group PLC Annual Report 2016

3 EMPLOYEES
AVERAGE NUMBER OF EMPLOYEES, INCLUDING DIRECTORS AND PART-TIME EMPLOYEES2016
NUMBER2015
NUMBER1
North America 237,281 226,618Europe 160,133 157,463Rest of World 129,766 132,841Total 527,180 516,922
AGGREGATE REMUNERATION OF ALL EMPLOYEES INCLUDING DIRECTORS22016
£M2015
£M
Wages and salaries 7,543 6,708Social security costs 1,234 1,136Share-based payments 16 15Pension costs – defined contribution plans 100 84Pension costs – defined benefit plans 16 16Total 8,909 7,959
1. 2015 Europe and Rest of World segments have been restated to reflect a correction and a change in the way these are managed.2. Aggregate remuneration of all employees including directors excludes Emerging Markets and Offshore & Remote restructuring costs of £22 million
(2015: £17 million).
In addition to the pension cost shown in operating costs above, there is a pensions-related net charge within finance costs of £1 million (2015: £5 million).
The remuneration of directors and key management personnel1 is set out below. Additional information on directors’ and key management remuneration, share options, long term incentive plans, pension contributions and entitlements can be found in the audited section of the Directors’ Remuneration Report on pages 69 to 79 and forms part of these accounts.
REMUNERATION OF KEY PERSONNEL2016
£M2015
£M
Salaries 6.4 6.1Other short term employee remuneration 6.8 6.6Share-based payments 2.9 4.9Pension salary supplement 1.7 1.8Total 17.8 19.4
1. Key management personnel is defined as the Board of Directors and eight individuals who made up the Executive Board from time to time during the year (2015: five).
FINAN
CIAL STATEMEN
TS
Compass Group PLC Annual Report 2016 107

4 FINANCE INCOME, COSTS AND RELATED (GAINS)/LOSSESFinance income and costs are recognised in the income statement in the period in which they are earned or incurred.
FINANCE INCOME AND COSTS2016
£M2015
£M
FINANCE INCOMEBank interest 4 3Total finance income 4 3FINANCE COSTInterest on bank loans and overdrafts 16 13Interest on other loans 82 82Finance lease interest 1 1Interest on bank loans, overdrafts, other loans and finance leases 99 96Unwinding of discount on provisions 5 6Interest on net post-employment benefit obligations (note 20) 1 5Total finance costs 105 107ANALYSIS OF FINANCE COSTS BY DEFINED IAS 39¹ CATEGORYFair value through profit or loss (unhedged derivatives) 4 5Derivatives in a fair value hedge relationship (19) (23)Derivatives in a net investment hedge relationship 3 5Other financial liabilities 111 109Interest on bank loans, overdrafts, other loans and finance leases 99 96Fair value through profit or loss (unwinding of discount on provisions) 5 6Outside of the scope of IAS 39 (net pension scheme charge) 1 5Total finance costs 105 107
1. IAS 39 ‘Financial Instruments: Recognition and Measurement’.
The Group uses derivative financial instruments such as forward currency contracts, cross currency swaps and interest rate swaps to hedge the risks associated with changes in foreign currency exchange rates and interest rates. As explained in section Q of the Group’s accounting policies, such derivative financial instruments are initially measured at fair value on the contract date, and are remeasured to fair value at subsequent reporting dates. For derivative financial instruments that do not qualify for hedge accounting, any gains or losses arising from changes in fair value are taken directly to the income statement in the period.
FAIR VALUE MEASUREMENTAll derivative financial instruments are shown at fair value in the balance sheet. All the derivatives held by the Group at fair value are considered to have fair values determined by Level 2 inputs as defined by the fair value hierarchy of IFRS 13 ‘Fair value measurement’. The fair values of derivative financial instruments represent the maximum credit exposure.
FINANCING RELATED (GAINS)/LOSSES2016
£M2015
£M
HEDGE ACCOUNTING INEFFECTIVENESSUnrealised net (gains)/losses on unhedged derivative financial instruments1 (1) 3Unrealised net gains on derivative financial instruments in a designated fair value hedge2 (45) (32)Unrealised net losses on the hedged item in a designated fair value hedge 39 26Total hedge accounting ineffectiveness (7) (3)CHANGE IN THE FAIR VALUE OF INVESTMENTSGain from the changes in the fair value of investments1,3 (3) –OTHER FINANCING RELATED GAINSGain from other financing related activity (2) –
1. Categorised as derivatives that are designated and effective as hedging instruments carried at fair value (IAS 39).2. Categorised as ‘fair value through profit or loss’ (IAS 39).3. Life insurance policies used by overseas companies to meet the cost of unfunded post employment benefit obligations included in note 20.
Notes to the consolidated financial statements continued
For the year ended 30 September 2016
108 Compass Group PLC Annual Report 2016

5 TAXRECOGNISED IN THE INCOME STATEMENT: INCOME TAX EXPENSE
2016 £M
2015 £M
CURRENT TAXCurrent year 315 284Adjustment in respect of prior years (38) (24)Current tax expense 277 260DEFERRED TAXCurrent year 27 12Impact of changes in statutory tax rates 6 1Adjustment in respect of prior years 9 9Deferred tax expense 42 22TOTAL INCOME TAXIncome tax expense 319 282
The income tax expense for the year is based on the effective UK statutory rate of corporation tax for the period of 20% (2015: 20.5%). The impact of changes in statutory rates relates principally to the reduction of the UK corporation tax rate from 20% to 19% from 1 April 2017 and to 17% from 1 April 2020. These changes have resulted in a deferred tax charge arising from the reduction in the balance sheet carrying value of deferred tax assets to reflect the anticipated rate of tax at which those assets are expected to reverse. Overseas tax is calculated at the rates prevailing in the respective jurisdictions.
Underlying income tax expense of £330 million (2015: £292 million) adjusts for the tax effect of: the amortisation of intangibles arising an acquisition of £11 million (2015: £7 million), the adjustment to contingent consideration on acquisition of £nil (2015: £2 million), the share of profit of joint ventures of £2 million (2015: £2 million), and is offset by the tax effect of hedge accounting ineffectiveness of £2 million (2015: £1 million).
Underlying cash tax paid of £261 million (2015: £259 million) adjusts tax paid of £263 million (2015: £261 million) for the cash tax effect of: the amortisation of intangibles arising on acquisition of £1 million (2015: £1 million) and hedge accounting ineffectiveness of £1 million (2015: £1 million).
2016 £M
2015 £M
Profit before tax from operations 1,321 1,159Notional income tax expense at the effective UK statutory rate of 20% (2015: 20.5%)
on profit before tax 264 238Effect of different tax rates of subsidiaries operating in other jurisdictions 159 136Impact of changes in statutory tax rates 6 1Permanent differences (83) (74)Impact of share-based payments 1 1Tax on profit of associates and equity accounted joint ventures (2) (3)Losses and other temporary differences not previously recognised 1 (6)Unrelieved current year tax losses 2 4Prior year items (29) (15)Income tax expense on operations 319 282
Permanent differences primarily relate to the internal financing that is in place to ensure the Group’s overseas businesses are appropriately capitalised. These intra-group arrangements provide a benefit to the Group’s effective tax rate. Prior year items relate to the reassessment of prior year tax estimates and the resolution of open items.
Tax uncertainties and associated risks are increasing for multinational groups as a consequence of the changing regulatory environment, for example the OECD’s Base Erosion and Profit Shifting project. The Group’s tax rate is also sensitive to the geographic mix of profits and movements in exchange rates. These factors may lead to an increase in the tax rate in future years. The Group continues to monitor the position closely.
FINAN
CIAL STATEMEN
TS
Compass Group PLC Annual Report 2016 109

5 TAX CONTINUED
TAX CREDITED/(CHARGED) TO OTHER COMPREHENSIVE INCOME2016
£M2015
£M
Current and deferred tax credit/(charge) on actuarial and other movements on post employment benefits 8 (19)Current and deferred tax charge on foreign exchange movements (2) (1)Tax credit/(charge) on items recognised in other comprehensive income 6 (20)
TAX CREDITED TO EQUITY2016
£M2015
£M
Current and deferred tax credit in respect of share-based payments 9 2Tax credit on items recognised in equity 9 2
MOVEMENT IN NET DEFERRED TAX ASSET/(LIABILITY)
TAX DEPRECIATION
£MINTANGIBLES
£M
PENSIONS AND POST
EMPLOYMENT BENEFITS
£MTAX LOSSES
£M
SELF-FUNDED INSURANCE PROVISIONS
£M
NET SHORT TERM TEMPORARY
DIFFERENCES £M
TOTAL £M
At 1 October 2014 13 (191) 136 21 67 161 207(Charge)/credit to income (4) (13) 3 1 (1) (8) (22)Charge to equity/other comprehensive
income – – (28) – – (3) (31)Business acquisitions – (4) – – – 1 (3)Other movements – (1) – 1 – (1) (1)Exchange adjustment (2) 1 7 (2) 5 (5) 4At 30 September 2015 7 (208) 118 21 71 145 154At 1 October 2015 7 (208) 118 21 71 145 154(Charge)/credit to income (24) (14) 7 (11) 7 (7) (42)Credit to equity/other comprehensive
income – – 1 – – 3 4Business acquisitions – (31) – 7 – 4 (20)Other movements (2) 1 – – – (4) (5)Exchange adjustment (6) (41) 24 2 12 27 18At 30 September 2016 (25) (293) 150 19 90 168 109
Net short term temporary differences relate principally to provisions and other liabilities of overseas subsidiaries.
After netting off balances within countries, the following are the deferred tax assets and liabilities recognised in the consolidated balance sheet:
NET DEFERRED TAX BALANCE2016
£M2015
£M
Deferred tax assets 149 182Deferred tax liabilities (40) (28)Net deferred tax asset 109 154
Deferred tax assets have not been recognised in respect of tax losses of £101 million (2015: £129 million) and other temporary differences of £16 million (2015: £18 million). Of the total tax losses, £92 million (2015: £83 million) will expire at various dates between 2017 and 2022. These deferred tax assets have not been recognised as the timing of recovery is uncertain.
The Group does not recognise any deferred tax liability on temporary differences relating to potentially taxable unremitted earnings of overseas subsidiaries totalling £416 million (2015: £370 million) because it is able to control the timing of reversal of these differences. It is probable that no reversal will take place in the foreseeable future.
Notes to the consolidated financial statements continued
For the year ended 30 September 2016
110 Compass Group PLC Annual Report 2016
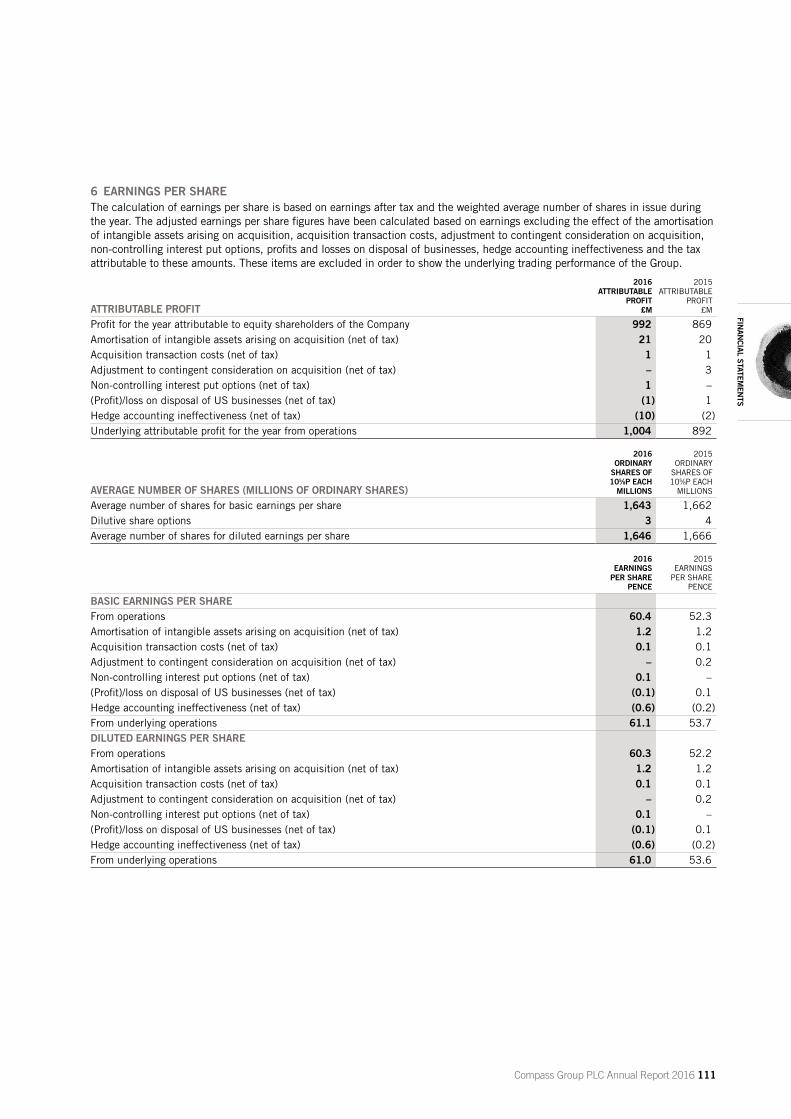
6 EARNINGS PER SHAREThe calculation of earnings per share is based on earnings after tax and the weighted average number of shares in issue during the year. The adjusted earnings per share figures have been calculated based on earnings excluding the effect of the amortisation of intangible assets arising on acquisition, acquisition transaction costs, adjustment to contingent consideration on acquisition, non-controlling interest put options, profits and losses on disposal of businesses, hedge accounting ineffectiveness and the tax attributable to these amounts. These items are excluded in order to show the underlying trading performance of the Group.
ATTRIBUTABLE PROFIT
2016 ATTRIBUTABLE
PROFIT £M
2015 ATTRIBUTABLE
PROFIT £M
Profit for the year attributable to equity shareholders of the Company 992 869Amortisation of intangible assets arising on acquisition (net of tax) 21 20Acquisition transaction costs (net of tax) 1 1Adjustment to contingent consideration on acquisition (net of tax) – 3Non-controlling interest put options (net of tax) 1 –(Profit)/loss on disposal of US businesses (net of tax) (1) 1Hedge accounting ineffectiveness (net of tax) (10) (2)Underlying attributable profit for the year from operations 1,004 892
AVERAGE NUMBER OF SHARES (MILLIONS OF ORDINARY SHARES)
2016 ORDINARY
SHARES OF 105⁄8P EACH
MILLIONS
2015 ORDINARY
SHARES OF 105⁄8P EACH
MILLIONS
Average number of shares for basic earnings per share 1,643 1,662Dilutive share options 3 4Average number of shares for diluted earnings per share 1,646 1,666
2016 EARNINGS
PER SHARE PENCE
2015 EARNINGS
PER SHARE PENCE
BASIC EARNINGS PER SHAREFrom operations 60.4 52.3Amortisation of intangible assets arising on acquisition (net of tax) 1.2 1.2Acquisition transaction costs (net of tax) 0.1 0.1Adjustment to contingent consideration on acquisition (net of tax) – 0.2Non-controlling interest put options (net of tax) 0.1 –(Profit)/loss on disposal of US businesses (net of tax) (0.1) 0.1Hedge accounting ineffectiveness (net of tax) (0.6) (0.2)From underlying operations 61.1 53.7DILUTED EARNINGS PER SHAREFrom operations 60.3 52.2Amortisation of intangible assets arising on acquisition (net of tax) 1.2 1.2Acquisition transaction costs (net of tax) 0.1 0.1Adjustment to contingent consideration on acquisition (net of tax) – 0.2Non-controlling interest put options (net of tax) 0.1 –(Profit)/loss on disposal of US businesses (net of tax) (0.1) 0.1Hedge accounting ineffectiveness (net of tax) (0.6) (0.2)From underlying operations 61.0 53.6
FINAN
CIAL STATEMEN
TS
Compass Group PLC Annual Report 2016 111

7 DIVIDENDSA final dividend in respect of 2016 of 21.1 pence per share, £347 million in aggregate1, has been proposed, giving a total dividend in respect of 2016 of 31.7 pence per share (2015: 29.4 pence per share). The proposed final dividend is subject to approval by shareholders at the Annual General Meeting on 2 February 2017 and has not been included as a liability in these financial statements.
2016 2015
DIVIDENDS ON ORDINARY SHARES
DIVIDENDS PER SHARE
PENCE £M
DIVIDENDS PER SHARE
PENCE £M
Amounts recognised as distributions to equity shareholders during the year:Final 2014 – 17.7p per share – – 17.7p 295Interim 2015 – 9.8p per share – – 9.8p 162Final 2015 – 19.6p per share 19.6p 322 – –Interim 2016 – 10.6p per share 10.6p 174 – –Total dividends 30.2p 496 27.5p 457
1. Based on the number of ordinary shares, excluding treasury shares, in issue at 30 September 2016: 1,643 million shares.
8 GOODWILLDuring the year the Group made a number of acquisitions. See note 23 for more details.
GOODWILL £M
COSTAt 1 October 2014 4,010Additions 25Currency adjustment (13)At 30 September 2015 4,022At 1 October 2015 4,022Additions 105Currency adjustment 448At 30 September 2016 4,575IMPAIRMENTAt 1 October 2014 482Disposals 2At 30 September 2015 484At 1 October 2015 484Currency adjustment 41At 30 September 2016 525
At 30 September 2015 3,538At 30 September 2016 4,050
Notes to the consolidated financial statements continued
For the year ended 30 September 2016
112 Compass Group PLC Annual Report 2016

8 GOODWILL CONTINUED
GOODWILL BY BUSINESS SEGMENT2016
£M20151
£M
USA 1,619 1,316Canada 156 125Total North America 1,775 1,441UK 1,440 1,433Rest of Europe 420 358Total Europe 1,860 1,791Japan 172 124Rest of Rest of World 243 182Total Rest of World 415 306Total 4,050 3,538
1. 2015 Europe and Rest of World segments have been restated to reflect a change in the way these are managed.
The Group tests goodwill annually for impairment, or more frequently if there are indications that goodwill might be impaired. The recoverable amount of a CGU is determined from value in use calculations. The key assumptions for these calculations are long term growth rates and pre-tax discount rates and use cash flow forecasts derived from the most recent financial budgets and forecasts approved by management covering a five year period. Budgets and forecasts are based on expectations of future outcomes taking into account past experience, adjusted for anticipated revenue growth, from both new business and like for like growth and taking into consideration external economic factors. Cash flows beyond the five year period are extrapolated using estimated growth rates based on local expected economic conditions and do not exceed the long term average growth rate for that country. The pre-tax discount rates are based on the Group’s weighted average cost of capital adjusted for specific risks relating to the country in which the CGU operates.
2016 20151
GROWTH AND DISCOUNT RATES
RESIDUAL GROWTH
RATES
PRE-TAX DISCOUNT
RATES
RESIDUAL GROWTH
RATES
PRE-TAX DISCOUNT
RATES
USA 1.9% 10.2% 2.0% 10.0%Canada 1.8% 9.0% 2.0% 8.2%UK 2.0% 8.5% 2.0% 8.2%Rest of Europe 1.2-5.8% 7.9-19.7% 1.3-5.7% 7.6-16.0%Rest of World 0.8-5.6% 7.5-16.1% 1.6-5.5% 8.1-15.9%
Given the current economic climate, a sensitivity analysis has been performed in assessing recoverable amounts of goodwill for all CGUs. This has been based on changes in key assumptions considered to be reasonably possible by management. The directors do not consider that any reasonably possible changes in the key assumptions would cause the value in use of the net operating assets of the individually significant CGUs disclosed above to fall below their carrying values.
1. 2015 Europe and Rest of World segments have been restated to reflect a change in the way these are managed.
FINAN
CIAL STATEMEN
TS
Compass Group PLC Annual Report 2016 113

9 OTHER INTANGIBLE ASSETSCONTRACT AND OTHER
INTANGIBLES1
COMPUTER SOFTWARE
£M
ARISING ON ACQUISITION
£MOTHER
£MTOTAL
£M
COSTAt 1 October 2014 232 473 973 1,678Additions 31 – 191 222Disposals (3) – (85) (88)Business acquisitions – 62 – 62Business disposals – (1) – (1)Reclassified – (1) 2 1Currency adjustment (6) (12) 47 29At 30 September 2015 254 521 1,128 1,903At 1 October 2015 254 521 1,128 1,903Additions 27 – 240 267Disposals (10) (3) (82) (95)Business acquisitions – 101 1 102Reclassified 2 – (4) (2)Currency adjustment 41 86 190 317At 30 September 2016 314 705 1,473 2,492AMORTISATIONAt 1 October 2014 167 84 417 668Charge for the year 21 26 126 173Disposals (2) – (75) (77)Reclassified – (1) – (1)Currency adjustment (2) (6) 18 10At 30 September 2015 184 103 486 773At 1 October 2015 184 103 486 773Charge for the year 24 31 155 210Disposals (10) (3) (76) (89)Reclassified – – (4) (4)Currency adjustment 28 21 84 133At 30 September 2016 226 152 645 1,023NET BOOK VALUEAt 30 September 2015 70 418 642 1,130At 30 September 2016 88 553 828 1,469
1. Contract related intangible assets, other than those arising on acquisition, result from payments made by the Group in respect of client contracts and generally arise where it is economically more efficient for a client to purchase assets used in the performance of the contract and the Group funds these purchases. The intangible assets arising on acquisition are all contract related.
Notes to the consolidated financial statements continued
For the year ended 30 September 2016
114 Compass Group PLC Annual Report 2016

10 PROPERTY, PLANT AND EQUIPMENT
PROPERTY, PLANT AND EQUIPMENT
LAND AND BUILDINGS
£M
PLANT AND MACHINERY
£M
FIXTURES AND FITTINGS
£MTOTAL
£M
COSTAt 1 October 2014 356 1,038 544 1,938Additions1 13 171 89 273Disposals (21) (104) (40) (165)Business disposals – other activities – (1) – (1)Business acquisitions 2 2 2 6Reclassified (1) 9 (1) 7Currency adjustment (10) (15) (29) (54)At 30 September 2015 339 1,100 565 2,004At 1 October 2015 339 1,100 565 2,004Additions1 26 178 92 296Disposals (19) (87) (41) (147)Business disposals – other activities – (3) – (3)Business acquisitions – 3 1 4Reclassified 4 8 1 13Currency adjustment 72 186 81 339At 30 September 2016 422 1,385 699 2,506DEPRECIATIONAt 1 October 2014 175 682 357 1,214Charge for the year 21 118 54 193Disposals (18) (92) (35) (145)Business disposals – other activities – (1) – (1)Reclassified – 4 – 4Currency adjustment (1) (7) (17) (25)At 30 September 2015 177 704 359 1,240At 1 October 2015 177 704 359 1,240Charge for the year 21 135 60 216Disposals (13) (74) (37) (124)Business disposals – other activities – (2) – (2)Reclassified – 15 (1) 14Currency adjustment 35 121 53 209At 30 September 2016 220 899 434 1,553NET BOOK VALUEAt 30 September 2015 162 396 206 764At 30 September 2016 202 486 265 953
The net book value of the Group’s property, plant and equipment includes assets held under finance leases as follows:
PROPERTY, PLANT AND EQUIPMENT HELD UNDER FINANCE LEASES
LAND AND BUILDINGS
£M
PLANT AND MACHINERY
£M
FIXTURES AND FITTINGS
£MTOTAL
£M
At 30 September 2015 6 6 1 13At 30 September 2016 6 7 1 14
1. Includes leased assets at a net book value of £2 million (2015: £2 million).
FINAN
CIAL STATEMEN
TS
Compass Group PLC Annual Report 2016 115

11 EQUITY ACCOUNTED INVESTMENTSSignificant interests in associates are:
COUNTRY OF INCORPORATION
2016OWNERSHIP1
2015OWNERSHIP1
Twickenham Experience Limited2 England & Wales 16% 16%Oval Events Limited3 England & Wales 25% 25%AEG Facilities, LLC4 USA 49% 49%Thompson Hospitality Services, LLC4 USA 49% 49%
1. % ownership is of the ordinary share capital.2. Financial statements applied using the equity method relate to the year ended 30 June, rolled forward to 30 September.3. Financial statements applied using the equity method relate to the year ended 31 January, rolled forward to 30 September.4. Financial statements applied using the equity method relate to the year ended 31 December of the prior year, rolled forward to 30 September.
Significant interests in joint ventures are:
COUNTRY OF INCORPORATION
2016OWNERSHIP1
2015OWNERSHIP1
Quadrant Catering Ltd2 England & Wales 49% 49%ADNH-Compass Middle East LLC United Arab Emirates 50% 50%Express Support Services Limitada2 Angola 49% 49%
1. % ownership is of the ordinary share capital.2. 49% ownership entitles Compass Group to 50% of voting rights.
None of these investments is held directly by the ultimate Parent Company. All joint ventures provide food and/or support services in their respective countries of incorporation and make their accounts up to 30 September, except for Express Support Services Limitada which is to 31 December. All holdings are in the ordinary shares of the respective joint venture company.
These investments are structured through separate vehicles and the Group has a residual interest in their respective net assets. Accordingly, the Group has classified its interests as joint ventures which are equity accounted. The tables below reconcile the summarised financial information to the carrying amount of the Group’s interests in its associates and joint ventures.
INTERESTS IN ASSOCIATES AND JOINT VENTURES2016
£M2015
£M
NET BOOK VALUEInterests in associates 137 122Interests in joint ventures 85 81At 30 September 222 203At 1 October 203 189Additions 2 2Share of profits less losses (net of tax) 39 39Dividends declared (34) (33)Currency and other adjustments 12 6At 30 September 222 203
The Group’s share of revenues and profits is included below:
2016 2015
ASSOCIATES AND JOINT VENTURESASSOCIATES
£M
JOINT VENTURES
£MTOTAL
£MASSOCIATES
£M
JOINT VENTURES
£MTOTAL
£M
SHARE OF REVENUE AND PROFITSRevenue 52 266 318 57 253 310Expenses/taxation1 (37) (242) (279) (42) (229) (271)Profit after tax for the year 15 24 39 15 24 39SHARE OF NET ASSETSNon-current assets 132 44 176 121 44 165Current assets 69 134 203 49 108 157Non-current liabilities (7) (10) (17) (5) (8) (13)Current liabilities (57) (83) (140) (42) (64) (106)Net assets 137 85 222 123 80 203SHARE OF CONTINGENT LIABILITIESContingent liabilities – (26) (26) – (22) (22)
1. Expenses include the relevant portion of income tax recorded by associates and joint ventures.
Notes to the consolidated financial statements continued
For the year ended 30 September 2016
116 Compass Group PLC Annual Report 2016

12 OTHER INVESTMENTS2016
£M2015
£M
NET BOOK VALUEAt 1 October 38 36Additions 6 1Disposals (2) (1)Currency and other adjustments 8 2At 30 September 50 38COMPRISED OFOther investments1,2 12 9Life insurance policies and mutual fund investments1,2,3 38 29Total 50 38
1. Categorised as ‘available for sale’ financial assets (IAS 39).2. As per the fair value hierarchies explained in note 17, other investments are Level 1 and the life insurance policies are Level 2.3. Life insurance policies used by overseas companies to meet the cost of unfunded post employment benefit obligations as set out in note 20.
13 TRADE AND OTHER RECEIVABLES2016 2015
TRADE AND OTHER RECEIVABLESCURRENT
£MNON-CURRENT
£MTOTAL
£MCURRENT
£M NON-CURRENT
£MTOTAL
£M
NET BOOK VALUEAt 1 October 2,115 71 2,186 2,069 70 2,139Net movement 124 12 136 142 2 144Currency adjustment 357 14 371 (96) (1) (97)At 30 September 2,596 97 2,693 2,115 71 2,186COMPRISED OFTrade receivables 1,994 – 1,994 1,627 – 1,627Less: Provision for impairment of trade receivables (60) – (60) (57) – (57)Net trade receivables1 1,934 – 1,934 1,570 – 1,570Other receivables 330 111 441 254 80 334Less: Provision for impairment of other receivables (6) (22) (28) (9) (15) (24)Net other receivables 324 89 413 245 65 310Accrued income 168 4 172 177 – 177Prepayments 153 4 157 117 6 123Amounts owed by associates, joint ventures
and related parties1 17 – 17 6 – 6Trade and other receivables 2,596 97 2,693 2,115 71 2,186
1. Categorised as ‘loans and receivables’ financial assets (IAS 39).
TRADE RECEIVABLESThe book value of trade and other receivables approximates to their fair value due to the short term nature of the majority of the receivables.
Credit sales are only made after credit approval procedures have been completed satisfactorily. The policy for making provisions for bad and doubtful debts varies from country to country as different countries and markets have different payment practices, but various factors are considered, including how overdue the debt is, the type of receivable and its past history, and current market and trading conditions. Full provision is made for debts that are not considered to be recoverable.
There is limited concentration of credit risk with respect to trade receivables due to the diverse and unrelated nature of the Group’s client base. Accordingly, the directors believe that there is no further credit provision required in excess of the provision for the impairment of receivables. The book value of trade and other receivables represents the Group’s maximum exposure to credit risk.
Trade receivable days at 30 September 2016 were 41 days (2015: 42 days) on a constant currency basis.
FINAN
CIAL STATEMEN
TS
Compass Group PLC Annual Report 2016 117

13 TRADE AND OTHER RECEIVABLES CONTINUEDThe ageing of gross trade receivables and of the provision for impairment is as follows:
2016
TRADE RECEIVABLES
NOT YET DUE £M
0-3 MONTHS
OVERDUE £M
3-6 MONTHS
OVERDUE £M
6-12 MONTHS
OVERDUE £M
OVER 12 MONTHS
OVERDUE £M
TOTAL £M
Gross trade receivables 1,577 316 41 21 39 1,994Less: Provision for impairment of trade receivables (6) (10) (13) (8) (23) (60)Net trade receivables 1,571 306 28 13 16 1,934
2015
TRADE RECEIVABLES
NOT YET DUE £M
0-3 MONTHS
OVERDUE £M
3-6 MONTHS
OVERDUE £M
6-12 MONTHS
OVERDUE £M
OVER 12 MONTHS
OVERDUE £M
TOTAL £M
Gross trade receivables 1,294 260 29 12 32 1,627Less: Provision for impairment of trade receivables (2) (9) (9) (10) (27) (57)Net trade receivables 1,292 251 20 2 5 1,570
Movements in the provision for impairment of trade and other receivables are as follows:
2016 2015
PROVISION FOR IMPAIRMENT OF TRADE AND OTHER RECEIVABLES
TRADE £M
OTHER £M
TOTAL £M
TRADE £M
OTHER £M
TOTAL £M
At 1 October 57 24 81 75 27 102Charged to income statement 26 – 26 18 6 24Credited to income statement (21) (1) (22) (13) – (13)Utilised (10) – (10) (21) (2) (23)Reclassified 2 (2) – – – –Currency adjustment 6 7 13 (2) (7) (9)At 30 September 60 28 88 57 24 81
At 30 September 2016, trade receivables of £363 million (2015: £278 million) were past due but not impaired. The Group has made a provision based on a number of factors, including past history of the debtor, and all amounts not provided for are considered to be recoverable.
14 INVENTORIES
INVENTORIES2016
£M2015
£M
NET BOOK VALUEAt 1 October 282 265Business acquisitions 3 3Net movement 13 17Currency adjustment 49 (3)At 30 September 347 282
Notes to the consolidated financial statements continued
For the year ended 30 September 2016
118 Compass Group PLC Annual Report 2016

15 CASH AND CASH EQUIVALENTS
CASH AND CASH EQUIVALENTS2016
£M2015
£M
Cash at bank and in hand 291 224Short term bank deposits 55 59Cash and cash equivalents1 346 283
1. Categorised as ‘loans and receivables’ financial assets (IAS 39).
CASH AND CASH EQUIVALENTS BY CURRENCY2016
£M2015
£M
Sterling 87 72US Dollar 53 33Euro 35 44Japanese Yen 7 14Other 164 120Cash and cash equivalents 346 283
The Group’s policy to manage the credit risk associated with cash and cash equivalents is set out in note 17. The book value of cash and cash equivalents represents the maximum credit exposure.
MASTER NETTING OR SIMILAR AGREEMENTSThe Group has master netting agreements for its cash and bank overdrafts and the following balances are offset within the consolidated balance sheet:
2016
GROSS £M
OFFSET £M
NET £M
Cash and cash equivalents 444 (98) 346Bank overdrafts (125) 98 (27)
2015
GROSS £M
OFFSET £M
NET £M
Cash and cash equivalents 328 (45) 283Bank overdrafts (104) 45 (59)
FINAN
CIAL STATEMEN
TS
Compass Group PLC Annual Report 2016 119

16 SHORT TERM AND LONG TERM BORROWINGS2016 2015
SHORT TERM AND LONG TERM BORROWINGSCURRENT
£MNON-CURRENT
£MTOTAL
£MCURRENT
£MNON-CURRENT
£MTOTAL
£M
Bank overdrafts 27 – 27 59 – 59Bank loans 255 287 542 78 251 329Loan notes 35 1,525 1,560 107 1,330 1,437Bonds – 1,253 1,253 – 1,093 1,093Borrowings (excluding finance leases) 317 3,065 3,382 244 2,674 2,918Finance leases 4 10 14 3 10 13Borrowings (including finance leases)1 321 3,075 3,396 247 2,684 2,931
1. Categorised as ‘other financial liabilities’ (IAS 39).
Bank overdrafts principally arise as a result of uncleared transactions. Interest on bank overdrafts is at the relevant money market rates.
All amounts due under bonds, loan notes and bank facilities are shown net of unamortised issue costs. Additionally, the Group adjusts the carrying values of the bonds and loan notes that are designated in effective fair value hedge relationships, for fair value gains and losses (based on observable market inputs) attributable to the risk being hedged.
The Group has fixed term, fixed interest private placements denominated in US dollar and sterling.
LOAN NOTESNOMINAL
VALUE REDEEMABLE INTEREST
2016 CARRYING
VALUE £M
2015 CARRYING
VALUE £M
US$ private placement $162m Oct 2015 6.72% – 107Sterling private placement £35m Oct 2016 7.55% 35 36US$ private placement $250m Oct 2018 3.31% 196 170US$ private placement $200m Sep 2020 3.09% 154 132US$ private placement $398m Oct 2021 3.98% 306 262US$ private placement $352m Oct 2023 4.12% 301 250US$ private placement $100m Dec 2024 3.54% 107 66US$ private placement $300m Sep 2025 3.81% 231 216US$ private placement $300m Dec 2026 3.64% 230 198
1,560 1,437
BONDSNOMINAL
VALUE REDEEMABLE INTEREST
2016 CARRYING
VALUE £M
2015 CARRYING
VALUE £M
Euro Eurobond €600m Feb 2019 3.13% 537 458Euro Eurobond €500m Jan 2023 1.88% 469 386Sterling Eurobond £250m Jun 2026 3.85% 247 249
1,253 1,093
The maturity profile of borrowings (excluding finance leases) is as follows:
MATURITY PROFILE OF BORROWINGS (EXCLUDING FINANCE LEASES)2016
£M2015
£M
Within 1 year, or on demand 317 244Between 1 and 2 years 287 287Between 2 and 3 years 733 –Between 3 and 4 years 154 628Between 4 and 5 years – 132In more than 5 years 1,891 1,627Borrowings (excluding finance leases) 3,382 2,918
Notes to the consolidated financial statements continued
For the year ended 30 September 2016
120 Compass Group PLC Annual Report 2016

16 SHORT TERM AND LONG TERM BORROWINGS CONTINUEDThe fair value of the Group’s borrowings is calculated by discounting future cash flows to net present values at current market rates for similar financial instruments. The fair values have been determined by reference to Level 2 inputs as defined by the fair value hierarchy of IFRS 13 ‘Fair value measurements’. The table below shows the fair value of borrowings excluding accrued interest:
2016 2015
CARRYING VALUE AND FAIR VALUE OF BORROWINGS (EXCLUDING FINANCE LEASES)
CARRYING VALUE
£M
FAIR VALUE
£M
CARRYING VALUE
£M
FAIR VALUE
£M
Bank overdrafts 27 27 59 59Bank loans 542 542 329 329Loan notes 1,560 1,601 1,437 1,456
€600m Eurobond Feb 2019 537 557 458 478€500m Eurobond Jan 2023 469 475 386 379£250m Eurobond Jun 2026 247 300 249 269Bonds 1,253 1,332 1,093 1,126Borrowings (excluding finance leases) 3,382 3,502 2,918 2,970
2016 2015
GROSS AND PRESENT VALUE OF FINANCE LEASE LIABILITIESGROSS
£M
PRESENT VALUE
£MGROSS
£M
PRESENT VALUE
£M
FINANCE LEASE PAYMENTS FALLING DUE:Within 1 year 5 4 4 3In 1 to 5 years 9 9 7 7In more than 5 years 1 1 3 3
15 14 14 13Less: Future finance charges (1) – (1) –Gross and present value of finance lease liabilities 14 14 13 13
2016 2015
BORROWINGS BY CURRENCYBORROWINGS
£M
FINANCE LEASES
£MTOTAL
£MBORROWINGS
£M
FINANCE LEASES
£MTOTAL
£M
Sterling 534 – 534 584 – 584US Dollar 1,813 – 1,813 1,441 – 1,441Euro 1,013 10 1,023 853 11 864Other 22 4 26 40 2 42Total 3,382 14 3,396 2,918 13 2,931
The Group had the following undrawn committed facilities available at 30 September, in respect of which all conditions precedent had then been met:
UNDRAWN COMMITTED FACILITIES2016
£M2015
£M
Expiring between 1 and 5 years 1,000 1,000
FINAN
CIAL STATEMEN
TS
Compass Group PLC Annual Report 2016 121
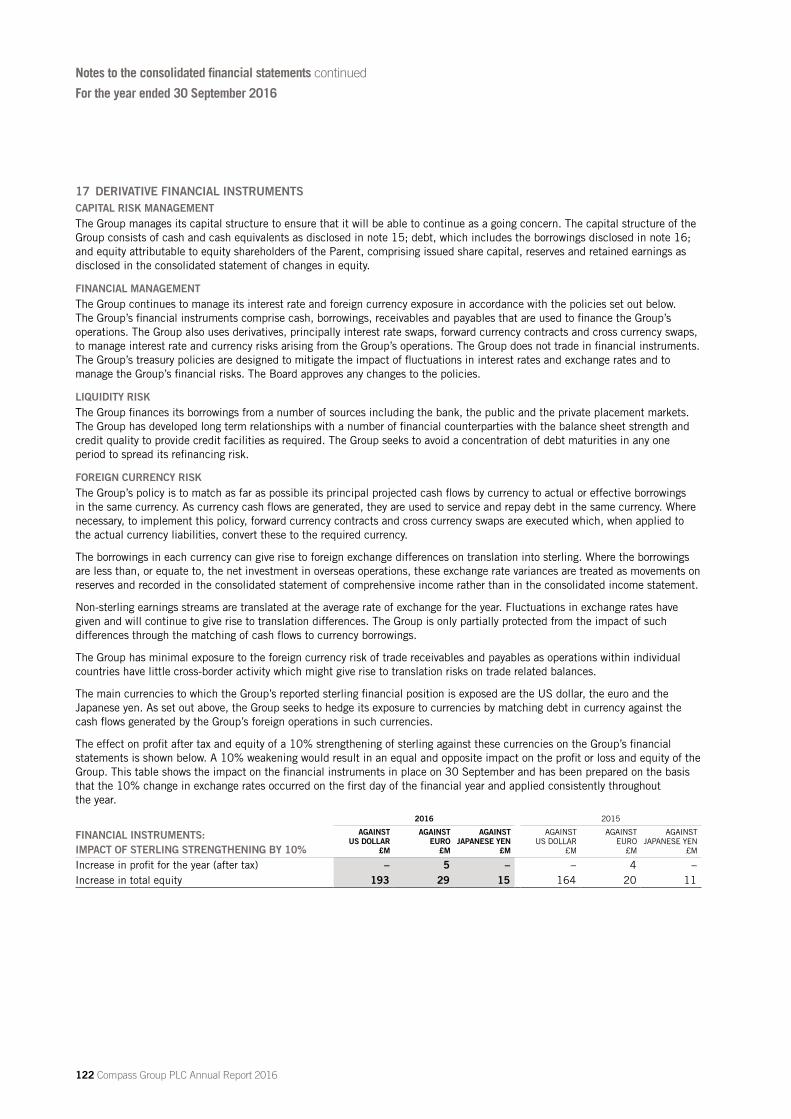
17 DERIVATIVE FINANCIAL INSTRUMENTSCAPITAL RISK MANAGEMENTThe Group manages its capital structure to ensure that it will be able to continue as a going concern. The capital structure of the Group consists of cash and cash equivalents as disclosed in note 15; debt, which includes the borrowings disclosed in note 16; and equity attributable to equity shareholders of the Parent, comprising issued share capital, reserves and retained earnings as disclosed in the consolidated statement of changes in equity.
FINANCIAL MANAGEMENTThe Group continues to manage its interest rate and foreign currency exposure in accordance with the policies set out below. The Group’s financial instruments comprise cash, borrowings, receivables and payables that are used to finance the Group’s operations. The Group also uses derivatives, principally interest rate swaps, forward currency contracts and cross currency swaps, to manage interest rate and currency risks arising from the Group’s operations. The Group does not trade in financial instruments. The Group’s treasury policies are designed to mitigate the impact of fluctuations in interest rates and exchange rates and to manage the Group’s financial risks. The Board approves any changes to the policies.
LIQUIDITY RISKThe Group finances its borrowings from a number of sources including the bank, the public and the private placement markets. The Group has developed long term relationships with a number of financial counterparties with the balance sheet strength and credit quality to provide credit facilities as required. The Group seeks to avoid a concentration of debt maturities in any one period to spread its refinancing risk.
FOREIGN CURRENCY RISKThe Group’s policy is to match as far as possible its principal projected cash flows by currency to actual or effective borrowings in the same currency. As currency cash flows are generated, they are used to service and repay debt in the same currency. Where necessary, to implement this policy, forward currency contracts and cross currency swaps are executed which, when applied to the actual currency liabilities, convert these to the required currency.
The borrowings in each currency can give rise to foreign exchange differences on translation into sterling. Where the borrowings are less than, or equate to, the net investment in overseas operations, these exchange rate variances are treated as movements on reserves and recorded in the consolidated statement of comprehensive income rather than in the consolidated income statement.
Non-sterling earnings streams are translated at the average rate of exchange for the year. Fluctuations in exchange rates have given and will continue to give rise to translation differences. The Group is only partially protected from the impact of such differences through the matching of cash flows to currency borrowings.
The Group has minimal exposure to the foreign currency risk of trade receivables and payables as operations within individual countries have little cross-border activity which might give rise to translation risks on trade related balances.
The main currencies to which the Group’s reported sterling financial position is exposed are the US dollar, the euro and the Japanese yen. As set out above, the Group seeks to hedge its exposure to currencies by matching debt in currency against the cash flows generated by the Group’s foreign operations in such currencies.
The effect on profit after tax and equity of a 10% strengthening of sterling against these currencies on the Group’s financial statements is shown below. A 10% weakening would result in an equal and opposite impact on the profit or loss and equity of the Group. This table shows the impact on the financial instruments in place on 30 September and has been prepared on the basis that the 10% change in exchange rates occurred on the first day of the financial year and applied consistently throughout the year.
2016 2015
FINANCIAL INSTRUMENTS: IMPACT OF STERLING STRENGTHENING BY 10%
AGAINST US DOLLAR
£M
AGAINST EURO
£M
AGAINST JAPANESE YEN
£M
AGAINST US DOLLAR
£M
AGAINST EURO
£M
AGAINST JAPANESE YEN
£M
Increase in profit for the year (after tax) – 5 – – 4 –Increase in total equity 193 29 15 164 20 11
Notes to the consolidated financial statements continued
For the year ended 30 September 2016
122 Compass Group PLC Annual Report 2016

17 DERIVATIVE FINANCIAL INSTRUMENTS CONTINUEDINTEREST RATE RISKAs set out above, the Group has effective borrowings in a number of currencies and the policy is to ensure that, in the short term, it is not materially exposed to fluctuations in interest rates in its principal currencies. The Group implements this policy either by borrowing fixed rate debt or by using interest rate swaps so that the interest rates on at least 80% of the Group’s projected debt are fixed for one year, reducing to 60% fixed for the second year and 40% fixed for the third year.
The sensitivity analysis given below has been determined based on the derivative and non-derivative financial instruments the Group had in place at the year end date only.
The effect of a 1% increase in interest rates prevailing at the balance sheet date on the Group’s cash and cash equivalents and debt subject to variable rates of interest at the balance sheet date would be a loss of £10 million (2015: loss of £6 million) over the course of a year. A similar 1% decrease in interest rates would result in an equal and opposite effect over the course of a year.
2016
INTEREST RATE SENSITIVITY ANALYSISSTERLING
£MUS DOLLAR
£MEURO
£MJAPANESE YEN
£MOTHER
£MTOTAL
£M
Increase in interest rate +1% +1% +1% +1% +1% n/aFloating rate exposure – cash/(debt) 224 (1,133) (125) (81) (167) (1,282)Increase/(decrease) in profit for the year (after tax) 2 (9) (1) (1) (1) (10)
2015
INTEREST RATE SENSITIVITY ANALYSISSTERLING
£MUS DOLLAR
£MEURO
£MJAPANESE YEN
£MOTHER
£MTOTAL
£M
Increase in interest rate +1% +1% +1% +1% +1% n/aFloating rate exposure – cash/(debt) 45 (681) (49) (20) (73) (778)Decrease in profit for the year (after tax) – (5) – – (1) (6)
These changes are the result of the exposure to interest rates from the Group’s floating rate cash and cash equivalents and debt. The sensitivity gains and losses given above may vary because cash flows vary throughout the year and interest rate and currency hedging may be implemented after the year end date in order to comply with the treasury policies outlined above.
CREDIT RISKThe Group’s policy is to minimise its exposure to credit risk from the failure of any single financial counterparty by spreading its risk across a portfolio of financial counterparties and managing the aggregate exposure to each against certain pre-agreed limits. Exposure to counterparty credit risk arising from deposits and derivatives (including forward currency contracts and cross currency swaps) is concentrated at the Group centre where possible. Financial counterparty limits are derived from the long and short term credit ratings, and the balance sheet strength of the financial counterparty. All financial counterparties are required to have a minimum short term credit rating from Moody’s of P-1 or equivalent from another recognised agency.
The Group’s policy to manage the credit risk associated with trade and other receivables is set out in note 13.
HEDGING ACTIVITIESThe following section describes the derivative financial instruments the Group uses to apply the interest rate and foreign currency hedging strategies described above.
FAIR VALUE HEDGESThe Group uses interest rate swaps to hedge the fair value of fixed rate borrowings. These instruments swap the fixed interest payable on the borrowings into floating interest rates and hedge the fair value of the borrowings against changes in interest rates. These interest rate swaps all qualify for fair value hedge accounting as defined by IAS 39.
FINAN
CIAL STATEMEN
TS
Compass Group PLC Annual Report 2016 123

17 DERIVATIVE FINANCIAL INSTRUMENTS CONTINUEDCASH FLOW HEDGESThe Group uses interest rate swaps to hedge the cash flows from floating rate borrowings. These instruments swap floating interest payable on these borrowings into fixed interest rates and hedge against cash flow changes caused by changing interest rates. The cash flows and income statement impact hedged in this manner will occur between one and three years of the balance sheet date.
These interest rate swaps do not qualify for cash flow hedge accounting as defined by IAS 39 because the Group creates synthetic floating rate foreign currency borrowings (see net investment hedges below) through the use of forward currency contracts and cross currency swaps which IAS 39 disallows as being designated as a hedged item.
These interest rate swaps are an effective economic hedge against the exposure of the Group’s floating rate borrowings to interest rate risk.
NET INVESTMENT HEDGESThe Group uses foreign currency denominated debt, forward currency contracts and cross currency swaps to partially hedge against the change in the sterling value of its foreign currency denominated net assets due to movements in foreign exchange rates. The fair value of debt in a net investment hedge was £3,092 million (2015: £2,613 million). A foreign exchange loss of £507 million (2015: loss of £18 million) relating to the net investment hedges has been netted off within currency translation differences as presented on the consolidated statement of comprehensive income.
DERIVATIVES NOT IN A HEDGING RELATIONSHIPThe Group has a number of derivative financial instruments that do not meet the criteria for hedge accounting. These include some interest rate swaps and some forward currency contracts.
FAIR VALUE MEASUREMENTAll derivative financial instruments are shown at fair value in the balance sheet. The fair values have been determined by reference to Level 2 inputs as defined by the fair value hierarchy of IFRS 13 ‘Fair value measurements’. Derivative financial instrument fair values are present values determined from future cashflows discounted at rates derived from market sourced data. There were no transfers between levels in either the year ended 30 September 2016 or 2015. The fair values of derivative financial instruments represent the maximum credit exposure.
2016 2015
DERIVATIVE FINANCIAL INSTRUMENTS
CURRENT ASSETS
NON-CURRENT ASSETS
CURRENT LIABILITIES
NON-CURRENT LIABILITIES
CURRENT ASSETS
NON-CURRENT ASSETS
CURRENT LIABILITIES
NON-CURRENT LIABILITIES
INTEREST RATE SWAPS:Fair value hedges1 – 74 – – 2 58 – –Not in a hedging relationship2 – – (3) (1) – – (2) (2)OTHER DERIVATIVES:Forward currency contracts and
cross currency swaps 2 110 (6) – 17 – (5) (23)Total 2 184 (9) (1) 19 58 (7) (25)
1. Derivatives that are designated and effective as hedging instruments carried at fair value (IAS 39).2. Derivatives carried at ‘fair value through profit or loss’ (IAS 39).
2016 2015
NOTIONAL AMOUNT OF DERIVATIVE FINANCIAL INSTRUMENTS BY CURRENCY
FAIR VALUE SWAPS
£M
CASH FLOW SWAPS
£M
FAIR VALUE SWAPS
£M
CASH FLOW SWAPS
£M
Sterling 20 – 20 –
US Dollar 694 485 658 390
Euro 823 34 700 22
Japanese Yen – 141 – 73
Other – 351 – 236
Total 1,537 1,011 1,378 721
Notes to the consolidated financial statements continued
For the year ended 30 September 2016
124 Compass Group PLC Annual Report 2016
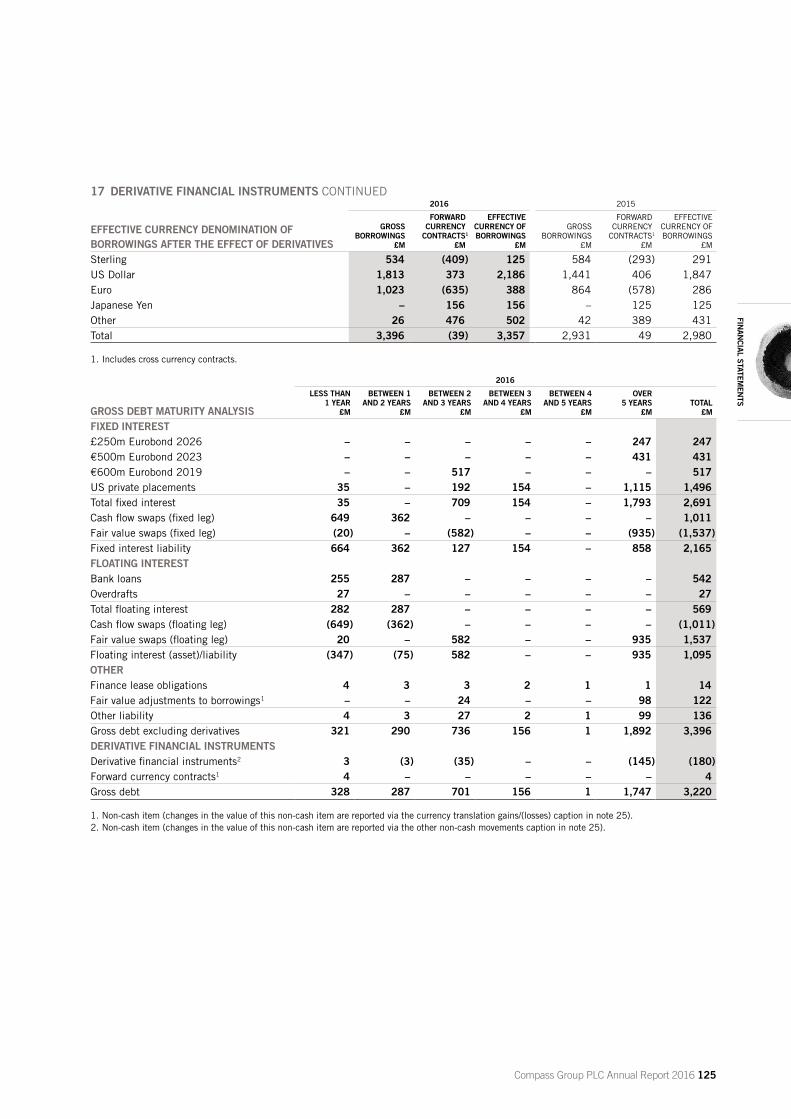
17 DERIVATIVE FINANCIAL INSTRUMENTS CONTINUED2016 2015
EFFECTIVE CURRENCY DENOMINATION OF BORROWINGS AFTER THE EFFECT OF DERIVATIVES
GROSS BORROWINGS
£M
FORWARDCURRENCY
CONTRACTS1
£M
EFFECTIVE CURRENCY OF BORROWINGS
£M
GROSS BORROWINGS
£M
FORWARDCURRENCY
CONTRACTS1
£M
EFFECTIVE CURRENCY OF BORROWINGS
£M
Sterling 534 (409) 125 584 (293) 291US Dollar 1,813 373 2,186 1,441 406 1,847Euro 1,023 (635) 388 864 (578) 286Japanese Yen – 156 156 – 125 125Other 26 476 502 42 389 431Total 3,396 (39) 3,357 2,931 49 2,980
1. Includes cross currency contracts.
2016
GROSS DEBT MATURITY ANALYSIS
LESS THAN 1 YEAR
£M
BETWEEN 1 AND 2 YEARS
£M
BETWEEN 2 AND 3 YEARS
£M
BETWEEN 3 AND 4 YEARS
£M
BETWEEN 4 AND 5 YEARS
£M
OVER 5 YEARS
£MTOTAL
£M
FIXED INTEREST£250m Eurobond 2026 – – – – – 247 247€500m Eurobond 2023 – – – – – 431 431€600m Eurobond 2019 – – 517 – – – 517US private placements 35 – 192 154 – 1,115 1,496Total fixed interest 35 – 709 154 – 1,793 2,691Cash flow swaps (fixed leg) 649 362 – – – – 1,011Fair value swaps (fixed leg) (20) – (582) – – (935) (1,537)Fixed interest liability 664 362 127 154 – 858 2,165FLOATING INTERESTBank loans 255 287 – – – – 542Overdrafts 27 – – – – – 27Total floating interest 282 287 – – – – 569Cash flow swaps (floating leg) (649) (362) – – – – (1,011)Fair value swaps (floating leg) 20 – 582 – – 935 1,537Floating interest (asset)/liability (347) (75) 582 – – 935 1,095OTHERFinance lease obligations 4 3 3 2 1 1 14Fair value adjustments to borrowings1 – – 24 – – 98 122Other liability 4 3 27 2 1 99 136Gross debt excluding derivatives 321 290 736 156 1 1,892 3,396DERIVATIVE FINANCIAL INSTRUMENTSDerivative financial instruments2 3 (3) (35) – – (145) (180)Forward currency contracts1 4 – – – – – 4Gross debt 328 287 701 156 1 1,747 3,220
1. Non-cash item (changes in the value of this non-cash item are reported via the currency translation gains/(losses) caption in note 25).2. Non-cash item (changes in the value of this non-cash item are reported via the other non-cash movements caption in note 25).
FINAN
CIAL STATEMEN
TS
Compass Group PLC Annual Report 2016 125

Notes to the consolidated financial statements continued
For the year ended 30 September 2016
17 DERIVATIVE FINANCIAL INSTRUMENTS CONTINUED2016
PRINCIPAL AND INTEREST MATURITY
LESS THAN 1 YEAR
£M
BETWEEN 1 AND 2 YEARS
£M
BETWEEN 2 AND 3 YEARS
£M
BETWEEN 3 AND 4 YEARS
£M
BETWEEN 4 AND 5 YEARS
£M
OVER 5 YEARS
£MTOTAL
£M
Gross debt 328 287 701 156 1 1,747 3,220Less: Overdrafts (27) – – – – – (27)Less: Fees and premiums capitalised
on issue (1) (1) (1) (1) (1) (3) (8)Less: Other non-cash items (7) 3 11 – – 47 54Repayment of principal 293 289 711 155 – 1,791 3,239Interest cash flows on debt and derivatives
(settled net) 100 95 90 70 63 204 622Settlement of forward currency contracts
and cross currency swaps – payable leg (538) – – – – – (538)Settlement of forward currency contracts
and cross currency swaps – receivable leg 532 – – – – – 532Repayment of principal and interest 387 384 801 225 63 1,995 3,855
2015
GROSS DEBT MATURITY ANALYSIS
LESS THAN 1 YEAR
£M
BETWEEN 1 AND 2 YEARS
£M
BETWEEN 2 AND 3 YEARS
£M
BETWEEN 3 AND 4 YEARS
£M
BETWEEN 4 AND 5 YEARS
£M
OVER 5 YEARS
£MTOTAL
£M
FIXED INTEREST£250m Eurobond 2026 – – – – – 249 249€500m Eurobond 2023 – – – – – 367 367€500m Eurobond 2019 – – – 438 – – 438US private placements 107 35 – 164 132 955 1,393Total fixed interest 107 35 – 602 132 1,571 2,447Cash flow swaps (fixed leg) 505 216 – – – – 721Fair value swaps (fixed leg) (63) (20) – (497) – (798) (1,378)Fixed interest liability 549 231 – 105 132 773 1,790FLOATING INTERESTBank loans 78 251 – – – – 329Overdrafts 59 – – – – – 59Total floating interest 137 251 – – – – 388Cash flow swaps (floating leg) (505) (216) – – – – (721)Fair value swaps (floating leg) 63 20 – 497 – 798 1,378Floating interest (asset)/liability (305) 55 – 497 – 798 1,045OTHERFinance lease obligations 3 3 1 1 2 3 13Fair value adjustments to borrowings1 – 1 – 26 – 56 83Other (asset)/liability 3 4 1 27 2 59 96Gross debt excluding derivatives 247 290 1 629 134 1,630 2,931DERIVATIVE FINANCIAL INSTRUMENTSDerivative financial instruments2 (16) 1 – (1) – (33) (49)Forward currency contracts1 4 – – – – – 4Gross debt 235 291 1 628 134 1,597 2,886
1. Non-cash item (changes in the value of this non-cash item are reported via the currency translation (losses)/gains caption in note 25).2. Non-cash item (changes in the value of this non-cash item are reported via the other non-cash movements caption in note 25).
126 Compass Group PLC Annual Report 2016

17 DERIVATIVE FINANCIAL INSTRUMENTS CONTINUED2015
PRINCIPAL AND INTEREST MATURITY
LESS THAN 1 YEAR
£M
BETWEEN 1 AND 2 YEARS
£M
BETWEEN 2 AND 3 YEARS
£M
BETWEEN 3 AND 4 YEARS
£M
BETWEEN 4 AND 5 YEARS
£M
OVER 5 YEARS
£MTOTAL
£M
Gross debt 235 291 1 628 134 1,597 2,886Less: Overdrafts (59) – – – – – (59)Less: Fees and premiums capitalised
on issue (1) (1) (1) (1) (1) (5) (10)Less: Other non-cash items 12 (2) – (25) – (23) (38)Repayment of principal 187 288 – 602 133 1,569 2,779Interest cash flows on debt and derivatives
(settled net) 96 88 79 81 62 237 643Settlement of forward currency contracts
and cross currency swaps – payable leg (912) – – (251) – (399) (1,562)Settlement of forward currency contracts
and cross currency swaps – receivable leg 931 – – 221 – 369 1,521Repayment of principal and interest 302 376 79 653 195 1,776 3,381
18 TRADE AND OTHER PAYABLES2016 2015
TRADE AND OTHER PAYABLESCURRENT
£MNON-CURRENT
£MTOTAL
£MCURRENT
£MNON-CURRENT
£MTOTAL
£M
NET BOOK VALUEAt 1 October 3,157 84 3,241 3,077 78 3,155Net movement 185 (13) 172 149 12 161Reclassification – – – 1 (2) (1)Currency adjustment 509 15 524 (70) (4) (74)At 30 September 3,851 86 3,937 3,157 84 3,241COMPRISED OFTrade payables 1,707 – 1,707 1,400 – 1,400Social security and other taxes 343 – 343 273 – 273Other payables 172 32 204 155 28 183Deferred consideration on acquisitions1 29 17 46 16 28 44Accruals2 1,214 37 1,251 1,027 28 1,055Deferred income 380 – 380 286 – 286Capital creditors 6 – 6 – – –Trade and other payables 3,851 86 3,937 3,157 84 3,241
1. Categorised as ‘other financial liabilities’ (IAS 39).2. Of this balance £577 million (2015: £415 million) is categorised as ‘other financial liabilities’ (IAS 39).
The directors consider that the carrying amount of trade and other payables approximates to their fair value. The current trade and other payables are payable on demand.
Trade payable days at 30 September 2016 were 75 days (2015: 74 days) on a constant currency basis.
FINAN
CIAL STATEMEN
TS
Compass Group PLC Annual Report 2016 127

Notes to the consolidated financial statements continued
For the year ended 30 September 2016
19 PROVISIONS
PROVISIONS
WORKERS’ COMPENSATION
AND SIMILAR OBLIGATIONS
£M
PROVISIONS IN RESPECT OF
DISCONTINUED AND DISPOSED
BUSINESSES £M
ONEROUS CONTRACTS
£M
LEGAL AND OTHER CLAIMS
£M
RE-ORGANISATION
£MOTHER
£MTOTAL
£M
At 1 October 2014 232 46 29 64 36 31 438Reclassified1 – – (1) 1 (1) – (1)Expenditure in the year2 (54) (1) (11) (15) (20) (6) (107)Charged to income statement2 58 – 9 17 7 2 93Credited to income statement (12) – (6) (16) (4) (4) (42)Business disposals – – – – (2) – (2)Unwinding of discount on provisions 5 – 1 – – – 6Currency adjustment 13 – (1) (7) (2) (1) 2At 30 September 2015 242 45 20 44 14 22 387At 1 October 2015 242 45 20 44 14 22 387Expenditure in the year (48) (1) (9) (9) (5) (7) (79)Charged to income statement 53 3 4 2 9 5 76Credited to income statement (8) – (2) (2) (4) – (16)Business acquisitions – – – 2 – – 2Business disposals – – – – (1) – (1)Unwinding of discount on provisions 4 – 1 – – – 5Currency adjustment 35 – 1 7 3 3 49At 30 September 2016 278 47 15 44 16 23 423
1. Including items reclassified between accrued liabilities and other balance sheet captions.2. 2015 has been restated reflecting a split in workers’ compensation charged and paid.
PROVISIONS2016
£M2015
£M
Current 143 136Non-current 280 251Total provisions 423 387
The provision for workers’ compensation and similar obligations relates mainly to the potential settlement of claims by employees in the US for medical benefits and lost wages associated with injuries incurred in the course of their employment, and is essentially long term in nature.
Provisions in respect of discontinued and disposed of businesses relate to estimated amounts payable in connection with onerous contracts and claims arising from disposals. The final amount payable remains uncertain as, at the date of approval of these financial statements, there remains a further period during which claims may be received. The timing of any settlement will depend upon the nature and extent of claims received.
Provisions for onerous contracts represent the liabilities in respect of short and long term leases on unoccupied properties and other contracts lasting under five years.
Provisions for legal and other claims relate principally to provisions for the estimated cost of litigation and other sundry claims. The timing of the settlement of these claims is uncertain.
Provisions for reorganisation include provision for redundancy costs and these are expected to be utilised over the next year.
Other provisions include environmental provisions. These are in respect of potential liabilities relating to the Group’s responsibility for maintaining its operating sites in accordance with statutory requirements and the Group’s aim to have a low impact on the environment. These provisions are expected to be utilised as operating sites are disposed of or as environmental matters are resolved.
Provisions are discounted to present value where the effect is material using the discount rate applicable to the liability.
128 Compass Group PLC Annual Report 2016

20 POST EMPLOYMENT BENEFIT OBLIGATIONSPENSION SCHEMES OPERATEDThe Group operates a number of pension arrangements throughout the world which have been developed in accordance with statutory requirements and local customs and practices. The majority of schemes are self-administered and the schemes’ assets are held independently of the Group’s assets. Pension costs are assessed in accordance with the advice of independent, professionally qualified actuaries. The Group makes employer contributions to the various schemes in existence within the range of 2% to 39% of pensionable salaries.
The contributions payable for defined contribution schemes of £100 million (2015: £84 million) have been fully expensed against profits in the current year.
UK SCHEMESWithin the UK there are now three main arrangements: the Compass Retirement Income Savings Plan (CRISP), the Compass Group Pension Plan (the Plan), and the Company’s stakeholder pension arrangement.
CRISP was launched on 1 February 2003. This has been the main vehicle for pension provision for new joiners in the UK since that date but existing members of the Plan had continued to accrue benefits under those arrangements up until 5 April 2010. CRISP is a contracted-in money purchase arrangement whereby the Group will match employee contributions up to 6% of pay (minimum 3%). Within CRISP a new defined contribution section was established from April 2006 known as the Compass Higher Income Plan (CHIP). Senior employees who contribute to CRISP will receive an additional employer-only contribution into CHIP. The amount of contribution and eligibility for CHIP are decided annually at the Company’s discretion. The payment towards CHIP may be taken in part, or in whole, as a cash supplement instead of a pension contribution.
CRISP has a corporate trustee. The Chairman, Nigel Palmer, is a former employee of the Group. The other five trustee directors are UK based employees of the Group, two of whom have been nominated by CRISP members.
The Plan is a defined benefit arrangement. Those UK employees who transfer from the public sector under the Transfer of Undertakings (Protection of Employment) Regulations 2006 are eligible to join the Plan, which has otherwise been closed to new entrants since 2003. Such transferees enter into the GAD sections of the Plan and are known as ‘GAD members’. The Plan closed to future accrual for all existing members, other than GAD members, on 5 April 2010. The affected members were offered membership of CRISP from 6 April 2010.
The Plan is operated on a pre-funded basis. The funding policy is to contribute such variable amounts, on the advice of the actuary, as achieves a 100% funding level on a projected salary basis. The actuarial assessments covering expense and contributions are carried out by independent qualified actuaries. A formal actuarial valuation of the Plan is carried out every three years. The most recent valuation of the Plan took place as at 5 April 2016. At the valuation date the total market value of the assets of the Plan was £2,233 million which represented 103% of the benefits that had accrued to members after allowing for expected future increases in earnings.
By agreement with the trustees, the Company is no longer funding any deficit. The next triennial valuation is due to be completed as at 5 April 2019. The Plan is reappraised annually by independent actuaries in accordance with IAS 19 ‘Employee Benefits’ requirements.
The Plan has a corporate trustee. The Chairman, Phillip Whittome, is independent. There are a further six trustee directors, five of whom are either UK based employees or former employees of the Group, three of whom have been nominated by Plan members and the sixth is an independent trustee director.
The Company became subject to the Pensions Automatic Enrolment Regulations for its workforce in the UK on 1 November 2012 but, in accordance with the Regulations, deferred its staging date for automatic enrolment of eligible employees until 2 January 2013. Both the Plan and CRISP are compliant arrangements under these Regulations and have been registered as such.
Employees who are not already in one of these registered compliant arrangements have been automatically enrolled into the National Employment Savings Trust (NEST). The Company considers that NEST provides the right type of service, communication material and investment choice for our employees and that it has the capabilities to support a company as large and diverse as Compass.
FINAN
CIAL STATEMEN
TS
Compass Group PLC Annual Report 2016 129

Notes to the consolidated financial statements continued
For the year ended 30 September 2016
20 POST EMPLOYMENT BENEFIT OBLIGATIONS CONTINUEDOVERSEAS SCHEMESIn the USA, the main plan is a defined benefit plan. The funding policy, in accordance with government guidelines, is to contribute such variable amounts, on the advice of the actuary, as achieves a 100% funding level on a projected salary basis. In Canada, Norway and Switzerland, the Group also participates in funded defined benefit arrangements.
In other countries, Group employees participate primarily in state arrangements to which the Group makes the appropriate contributions.
Other than where required by local regulation or statute, the defined benefit schemes are closed to new entrants. For these schemes the current service cost will increase under the projected unit credit method as the members of the schemes approach retirement.
In addition, the Group contributes to a number of multi-employer union sponsored pension plans, primarily in the USA. These plans are accounted for as defined contribution plans, as the information provided by the plan administrators is insufficient for them to be accounted for as defined benefit plans. The Group made total contributions of £12 million in the year (2015: £11 million) to these arrangements.
ALL DEFINED BENEFIT SCHEMESThe Group’s obligations in respect of defined benefit pension schemes are calculated separately for each scheme by estimating the amount of future benefit that employees have earned in return for their service in the current and prior years. That benefit is discounted to determine its present value and the fair value of scheme assets is then deducted. The discount rate used is the yield at the valuation date on high quality corporate bonds, whose term is consistent with the timing of the expected benefit payments over future years.
The Group takes advice from independent actuaries relating to the appropriateness of the assumptions which include life expectancy of members, expected salary and pension increases, and inflation. It is important to note that comparatively small changes in the assumptions used may have a significant effect on the consolidated income statement and balance sheet.
The liabilities of the defined benefit schemes are measured by discounting the best estimate of future cash flows to be paid using the projected unit method. This method is an accrued benefits valuation method that makes allowances for projected earnings. These calculations are performed by a qualified actuary.
Disclosures showing the assets and liabilities of the schemes are set out below. These have been calculated on the following assumptions:
UK SCHEMES USA SCHEMES OTHER SCHEMES
2016 2015 2016 2015 2016 2015
Discount rate 2.3% 3.8% 3.2% 3.9% 1.5% 2.2%Inflation 3.1% 3.1% 2.1% 2.1% 1.5% 1.4%CPI inflation 2.35% 2.35% n/a n/a n/a n/aRate of increase in salaries 3.1% 3.1% 3.0% 3.0% 1.7% 1.7%Rate of increase for pensions in payment 3.0% 3.0% 2.1% 2.1% 0.2% 0.2%Rate of increase for deferred pensions1 2.7% 2.7% 0.0% 0.0% 0.0% 0.0%
1. This assumption is now presented as a weighted average.
The mortality assumptions used to value the current year UK pension schemes are derived from the S2PA generational mortality tables (2015: S1NA generation mortality tables) with improvements in line with the projection model prepared by the Continuous Mortality Investigation of the UK actuarial profession, with +0.2 years age rating for male non-pensioners, -0.2 years age rating for male pensioners (2015: no male rating adjustments) and -0.1 years age rating for all females (2015: +0.6 years age rating for all females), with a long term underpin of 1.25%. These mortality assumptions take account of experience to date and assumptions for further improvements in the life expectancy of scheme members. The Group estimates the average duration of the UK Plan’s liabilities to be 19 years (2015: 18 years).
130 Compass Group PLC Annual Report 2016

20 POST EMPLOYMENT BENEFIT OBLIGATIONS CONTINUEDExamples of the resulting life expectancies are as follows:
2016 2015
LIFE EXPECTANCY AT AGE 65 MALE FEMALE MALE FEMALE
Member aged 65 in 2016 (2015) 22.4 24.3 22.6 24.5Member aged 65 in 2041 (2040) 24.7 26.7 24.8 27.0
The other demographic assumptions have been set having regard to the latest trends in scheme experience and other relevant data. The assumptions are reviewed and updated as necessary as part of the periodic actuarial valuation of pension schemes.
For the overseas schemes, regionally appropriate assumptions have been used where recommended by local actuaries. The mortality assumptions used to value USA schemes are derived from the RP2014 combined healthy table, generational MP2015 scale. Examples of the resulting life expectancies are as follows:
2016 2015
LIFE EXPECTANCY AT AGE 65 MALE FEMALE MALE FEMALE
Member aged 65 in 2016 (2015) 21.3 23.3 21.7 23.9Member aged 65 in 2041 (2040) 23.4 25.4 23.8 26.0
SENSITIVITIES OF PRINCIPAL ASSUMPTIONSMeasurement of the Group’s defined benefit obligations is particularly sensitive to changes in key assumptions, including discount rate, life expectancy and inflation. The sensitivities of the principal assumptions used to measure the defined benefit obligations of the schemes are set out below:
ASSUMPTION CHANGE IN ASSUMPTION IMPACT ON SCHEME DEFICIT 2016 IMPACT ON SCHEME DEFICIT 2015
UKDiscount rate Increase by 0.5% Decrease by £227 million Decrease by £168 million
Decrease by 0.5% Increase by £244 million Increase by £179 millionInflation Increase by 0.5% Increase by £154 million Increase by £120 million
Decrease by 0.5% Decrease by £126 million Decrease by £98 millionCPI Inflation Increase by 0.5% Increase by £41 million Increase by £33 million
Decrease by 0.5% Decrease by £31 million Decrease by £28 millionLife expectations from age 65 Increase by 1 year Increase by £98 million Increase by £61 millionLife expectations – annual improvement rate Increase by 0.25% per annum Increase by £43 million Increase by £27 millionUSA AND OTHERSDiscount rate Increase by 0.5% Decrease by £22 million Decrease by £20 million
Decrease by 0.5% Increase by £23 million Increase by £17 millionInflation Increase by 0.5% Increase by £5 million Increase by £5 million
Decrease by 0.5% Decrease by £5 million Decrease by £3 millionLife expectations from age 65 Increase by 1 year Increase by £9 million Increase by £6 million
The sensitivities above consider the impact of the single change shown, with the other assumptions assumed to be unchanged. The sensitivity analyses have been determined based on a method that extrapolates the impact on the defined benefit obligations as a result of reasonable changes in key assumptions occurring at the end of the reporting period. In practice, changes in one assumption may be accompanied by offsetting changes in another assumption (although this is not always the case). The impact of a change in the UK inflation rate shown above includes the impact of a change in both the RPI and CPI inflation rates.
The Group’s net pension deficit is the difference between the schemes’ liabilities and the schemes’ assets. Changes in the assumptions may occur at the same time as changes in the market value of scheme assets. These may or may not offset the changes in assumptions. For example, a fall in interest rates will increase the schemes’ liabilities but may also trigger an offsetting increase in the market value of certain assets so there is no effect on the Group’s liability.
FINAN
CIAL STATEMEN
TS
Compass Group PLC Annual Report 2016 131
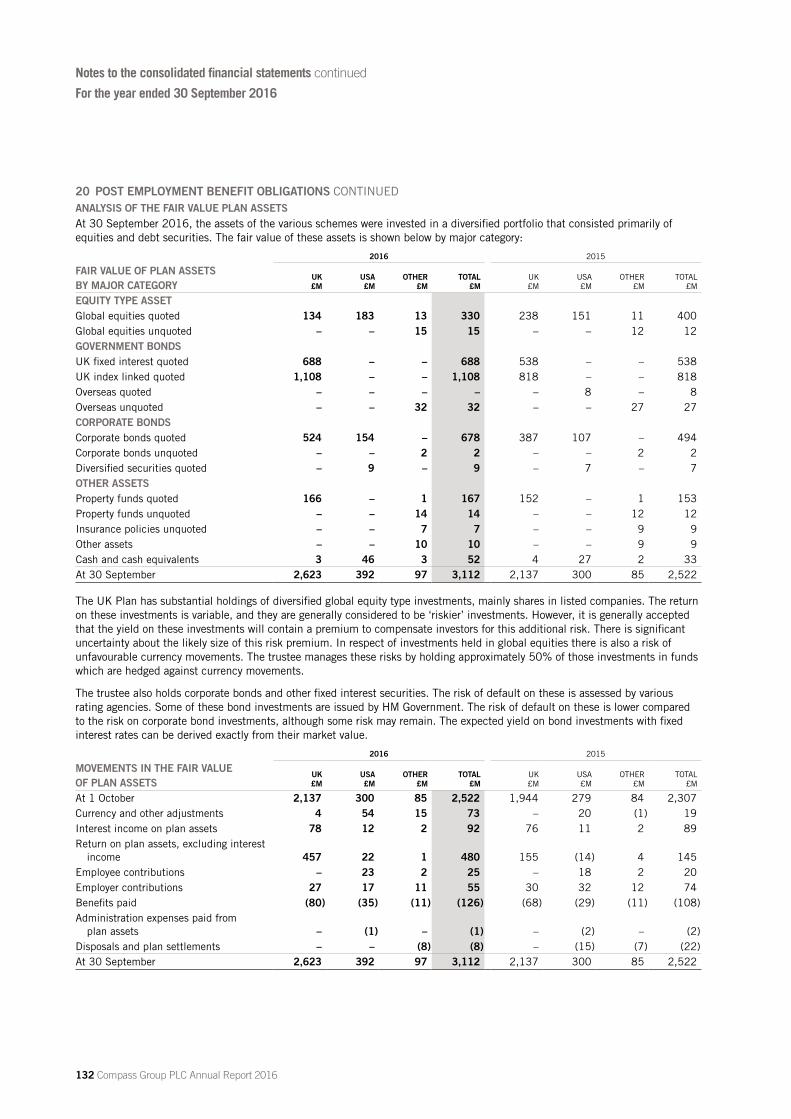
20 POST EMPLOYMENT BENEFIT OBLIGATIONS CONTINUEDANALYSIS OF THE FAIR VALUE PLAN ASSETSAt 30 September 2016, the assets of the various schemes were invested in a diversified portfolio that consisted primarily of equities and debt securities. The fair value of these assets is shown below by major category:
2016 2015
FAIR VALUE OF PLAN ASSETS BY MAJOR CATEGORY
UK £M
USA £M
OTHER £M
TOTAL £M
UK £M
USA £M
OTHER £M
TOTAL £M
EQUITY TYPE ASSETGlobal equities quoted 134 183 13 330 238 151 11 400Global equities unquoted – – 15 15 – – 12 12GOVERNMENT BONDSUK fixed interest quoted 688 – – 688 538 – – 538UK index linked quoted 1,108 – – 1,108 818 – – 818Overseas quoted – – – – – 8 – 8Overseas unquoted – – 32 32 – – 27 27CORPORATE BONDSCorporate bonds quoted 524 154 – 678 387 107 – 494Corporate bonds unquoted – – 2 2 – – 2 2Diversified securities quoted – 9 – 9 – 7 – 7OTHER ASSETSProperty funds quoted 166 – 1 167 152 – 1 153Property funds unquoted – – 14 14 – – 12 12Insurance policies unquoted – – 7 7 – – 9 9Other assets – – 10 10 – – 9 9Cash and cash equivalents 3 46 3 52 4 27 2 33At 30 September 2,623 392 97 3,112 2,137 300 85 2,522
The UK Plan has substantial holdings of diversified global equity type investments, mainly shares in listed companies. The return on these investments is variable, and they are generally considered to be ‘riskier’ investments. However, it is generally accepted that the yield on these investments will contain a premium to compensate investors for this additional risk. There is significant uncertainty about the likely size of this risk premium. In respect of investments held in global equities there is also a risk of unfavourable currency movements. The trustee manages these risks by holding approximately 50% of those investments in funds which are hedged against currency movements.
The trustee also holds corporate bonds and other fixed interest securities. The risk of default on these is assessed by various rating agencies. Some of these bond investments are issued by HM Government. The risk of default on these is lower compared to the risk on corporate bond investments, although some risk may remain. The expected yield on bond investments with fixed interest rates can be derived exactly from their market value.
2016 2015
MOVEMENTS IN THE FAIR VALUE OF PLAN ASSETS
UK £M
USA £M
OTHER £M
TOTAL £M
UK £M
USA £M
OTHER £M
TOTAL £M
At 1 October 2,137 300 85 2,522 1,944 279 84 2,307Currency and other adjustments 4 54 15 73 – 20 (1) 19Interest income on plan assets 78 12 2 92 76 11 2 89Return on plan assets, excluding interest
income 457 22 1 480 155 (14) 4 145Employee contributions – 23 2 25 – 18 2 20Employer contributions 27 17 11 55 30 32 12 74Benefits paid (80) (35) (11) (126) (68) (29) (11) (108)Administration expenses paid from
plan assets – (1) – (1) – (2) – (2)Disposals and plan settlements – – (8) (8) – (15) (7) (22)At 30 September 2,623 392 97 3,112 2,137 300 85 2,522
Notes to the consolidated financial statements continued
For the year ended 30 September 2016
132 Compass Group PLC Annual Report 2016

20 POST EMPLOYMENT BENEFIT OBLIGATIONS CONTINUED2016 2015
MOVEMENT IN THE PRESENT VALUE OF DEFINED BENEFIT OBLIGATIONS
UK £M
USA £M
OTHER £M
TOTAL £M
UK £M
USA £M
OTHER £M
TOTAL £M
At 1 October 1,966 404 161 2,531 1,920 390 167 2,477Currency adjustment 2 70 30 102 (1) 27 (6) 20Current service cost 2 8 7 17 2 8 6 16Past service cost – (1) – (1) – – – –Interest expense on benefit obligations 73 16 4 93 75 15 4 94Remeasurements – demographic
assumptions (19) (3) (3) (25) – 3 2 5Remeasurements – financial assumptions 585 25 16 626 38 (11) 3 30Remeasurements – experience (98) (3) – (101) – – 2 2Employee contributions – 23 2 25 – 18 2 20Benefits paid (80) (35) (11) (126) (68) (29) (11) (108)Disposals and plan settlements – – (8) (8) – (17) (8) (25)At 30 September 2,431 504 198 3,133 1,966 404 161 2,531
2016 2015
PRESENT VALUE OF DEFINED BENEFIT OBLIGATIONS
UK £M
USA £M
OTHER £M
TOTAL £M
UK £M
USA £M
OTHER £M
TOTAL £M
Funded obligations 2,379 391 123 2,893 1,924 310 105 2,339 Unfunded obligations 52 113 75 240 42 94 56 192Total obligations 2,431 504 198 3,133 1,966 404 161 2,531
2016
POST EMPLOYMENT BENEFIT OBLIGATIONS RECOGNISED IN THE BALANCE SHEET
UK £M
USA £M
OTHER £M
TOTAL £M
Present value of defined benefit obligations 2,431 504 198 3,133Fair value of plan assets (2,623) (392) (97) (3,112)Post employment benefit obligations recognised in the balance sheet (192) 112 101 21
2015
POST EMPLOYMENT BENEFIT OBLIGATIONS RECOGNISED IN THE BALANCE SHEET
UK £M
USA £M
OTHER £M
TOTAL £M
Present value of defined benefit obligations 1,966 404 161 2,531Fair value of plan assets (2,137) (300) (85) (2,522)Post employment benefit obligations recognised in the balance sheet (171) 104 76 9
Certain Group companies have taken out life insurance policies and invested in mutual funds which will be used to meet unfunded pension obligations. The current value of these policies and other assets, £38 million (2015: £29 million), may not be offset against pension obligations under IAS 19 and is reported within note 12.
FINAN
CIAL STATEMEN
TS
Compass Group PLC Annual Report 2016 133
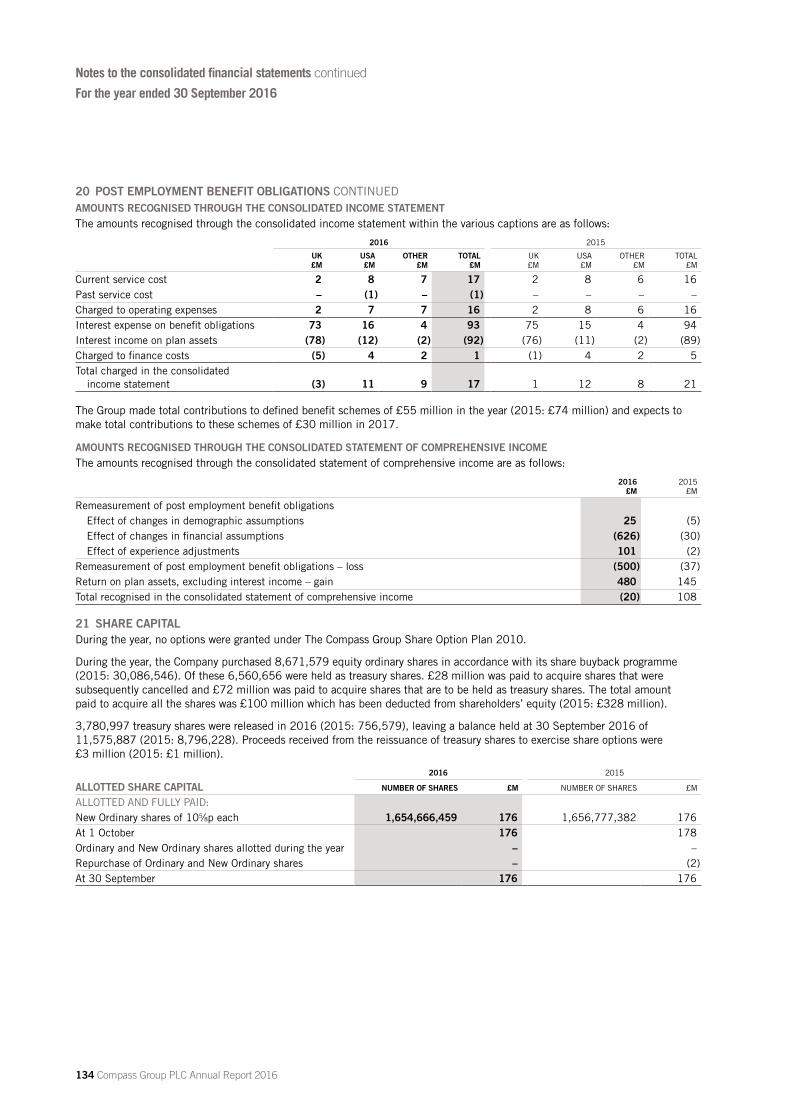
20 POST EMPLOYMENT BENEFIT OBLIGATIONS CONTINUEDAMOUNTS RECOGNISED THROUGH THE CONSOLIDATED INCOME STATEMENTThe amounts recognised through the consolidated income statement within the various captions are as follows:
2016 2015
UK £M
USA £M
OTHER £M
TOTAL £M
UK £M
USA £M
OTHER £M
TOTAL £M
Current service cost 2 8 7 17 2 8 6 16Past service cost – (1) – (1) – – – –Charged to operating expenses 2 7 7 16 2 8 6 16Interest expense on benefit obligations 73 16 4 93 75 15 4 94Interest income on plan assets (78) (12) (2) (92) (76) (11) (2) (89)Charged to finance costs (5) 4 2 1 (1) 4 2 5Total charged in the consolidated
income statement (3) 11 9 17 1 12 8 21
The Group made total contributions to defined benefit schemes of £55 million in the year (2015: £74 million) and expects to make total contributions to these schemes of £30 million in 2017.
AMOUNTS RECOGNISED THROUGH THE CONSOLIDATED STATEMENT OF COMPREHENSIVE INCOMEThe amounts recognised through the consolidated statement of comprehensive income are as follows:
2016 £M
2015 £M
Remeasurement of post employment benefit obligationsEffect of changes in demographic assumptions 25 (5)Effect of changes in financial assumptions (626) (30)Effect of experience adjustments 101 (2)
Remeasurement of post employment benefit obligations – loss (500) (37)Return on plan assets, excluding interest income – gain 480 145Total recognised in the consolidated statement of comprehensive income (20) 108
21 SHARE CAPITALDuring the year, no options were granted under The Compass Group Share Option Plan 2010.
During the year, the Company purchased 8,671,579 equity ordinary shares in accordance with its share buyback programme (2015: 30,086,546). Of these 6,560,656 were held as treasury shares. £28 million was paid to acquire shares that were subsequently cancelled and £72 million was paid to acquire shares that are to be held as treasury shares. The total amount paid to acquire all the shares was £100 million which has been deducted from shareholders’ equity (2015: £328 million).
3,780,997 treasury shares were released in 2016 (2015: 756,579), leaving a balance held at 30 September 2016 of 11,575,887 (2015: 8,796,228). Proceeds received from the reissuance of treasury shares to exercise share options were £3 million (2015: £1 million).
2016 2015
ALLOTTED SHARE CAPITAL NUMBER OF SHARES £M NUMBER OF SHARES £M
ALLOTTED AND FULLY PAID:New Ordinary shares of 105⁄8p each 1,654,666,459 176 1,656,777,382 176At 1 October 176 178Ordinary and New Ordinary shares allotted during the year – –Repurchase of Ordinary and New Ordinary shares – (2)At 30 September 176 176
Notes to the consolidated financial statements continued
For the year ended 30 September 2016
134 Compass Group PLC Annual Report 2016

21 SHARE CAPITAL CONTINUEDNUMBER OF SHARES 2016 2015
ALLOTTED SHARE CAPITAL
ORDINARY SHARES OF 105⁄8P EACH
ORDINARY SHARES OF 105⁄8P EACH
At 1 October 1,656,777,382 1,673,886,784 Ordinary and New Ordinary shares allotted during the year on exercise of share options – 1,821,725 Ordinary shares allotted during the year on release of Long Term Incentive Plan awards – 1,602,612 Repurchase of Ordinary and New Ordinary shares (2,110,923) (20,533,739)At 30 September 1,654,666,459 1,656,777,382
At 30 September 2016, employees held options over a total of 3,880,166 New Ordinary shares under the Group’s Executive and Management Share Option Plans as follows:
EXECUTIVE AND MANAGEMENT SHARE OPTION PLANS EXERCISABLE NUMBER OF SHARES OPTION PRICE PER SHARE PENCE
DATE OF GRANT:30 March 2007 30 March 2010 – 29 March 2017 35,258 335.7528 September 2007 28 September 2010 – 27 September 2017 28,660 310.7528 March 2008 28 March 2011 – 27 March 2018 127,606 321.5031 March 2009 31 March 2012 – 30 March 2019 285,097 319.0030 September 2009 30 September 2012 – 29 September 2019 2,310 372.4013 May 2010 13 May 2013 – 12 May 2020 360,016 557.5025 November 2010 25 November 2013 – 24 November 2020 1,555 566.0019 May 2011 19 May 2014 – 18 May 2021 453,000 575.0025 November 2011 25 November 2014 – 24 November 2021 1,500 545.5017 May 2012 17 May 2015 – 16 May 2022 1,057,596 627.0022 November 2012 22 November 2015 – 21 November 2022 63,197 699.5016 May 2013 16 May 2016 – 15 May 2023 1,363,596 878.0029 November 2013 29 November 2016 – 28 November 2023 100,775 922.00
3,880,166
Options granted after 3 February 2011 under the terms of The Compass Group Share Option Plan 2010 may be net settled at the discretion of the Company on exercise by the option holders, sufficient New Ordinary shares being issued and/or treasury shares used to satisfy the profit realised during the period of the option.
At 30 September 2016, employees also held awards under The Compass Group PLC Long Term Incentive Plan 2010 (LTIP 2010) as follows:
VESTING DATE NUMBER OF SHARES PERFORMANCE TARGET
DATE OF AWARD:29 November 2013 1 October 2016 771,791 33% TSR/33% AFCF/33%ROCE29 November 2013 1 October 2016 13,556 50% AFCF/50%ROCE9 July 2014 1 October 2016 1,265,406 50% AFCF/50%ROCE27 November 2014 1 October 2017 99,312 50% AFCF/50%ROCE6 February 2015 1 October 2017 728,799 33% TSR/33% AFCF/33%ROCE14 May 2015 1 October 2017 1,269,574 50% AFCF/50%ROCE25 November 2015 1 October 2018 48,922 50% AFCF/50%ROCE25 November 2015 1 October 2018 740,667 33% TSR/33% AFCF/33%ROCE12 May 2016 1 October 2018 1,484,607 50% AFCF/50%ROCE12 May 2016 1 October 2018 50,544 33% TSR/33% AFCF/33%ROCE
6,473,178
The performance and vesting conditions are described in more detail in note 22.
FINAN
CIAL STATEMEN
TS
Compass Group PLC Annual Report 2016 135
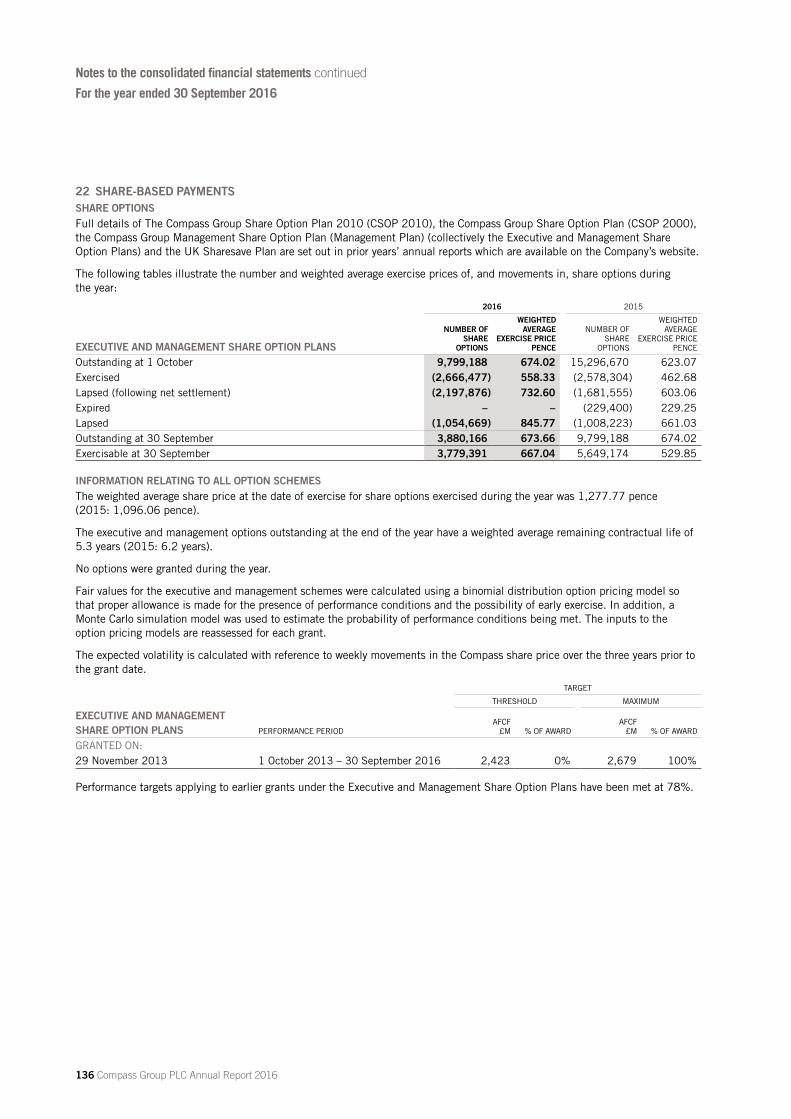
22 SHARE-BASED PAYMENTSSHARE OPTIONSFull details of The Compass Group Share Option Plan 2010 (CSOP 2010), the Compass Group Share Option Plan (CSOP 2000), the Compass Group Management Share Option Plan (Management Plan) (collectively the Executive and Management Share Option Plans) and the UK Sharesave Plan are set out in prior years’ annual reports which are available on the Company’s website.
The following tables illustrate the number and weighted average exercise prices of, and movements in, share options during the year:
2016 2015
EXECUTIVE AND MANAGEMENT SHARE OPTION PLANS
NUMBER OF SHARE
OPTIONS
WEIGHTED AVERAGE
EXERCISE PRICE PENCE
NUMBER OF SHARE
OPTIONS
WEIGHTED AVERAGE
EXERCISE PRICE PENCE
Outstanding at 1 October 9,799,188 674.02 15,296,670 623.07Exercised (2,666,477) 558.33 (2,578,304) 462.68Lapsed (following net settlement) (2,197,876) 732.60 (1,681,555) 603.06Expired – – (229,400) 229.25Lapsed (1,054,669) 845.77 (1,008,223) 661.03Outstanding at 30 September 3,880,166 673.66 9,799,188 674.02Exercisable at 30 September 3,779,391 667.04 5,649,174 529.85
INFORMATION RELATING TO ALL OPTION SCHEMESThe weighted average share price at the date of exercise for share options exercised during the year was 1,277.77 pence (2015: 1,096.06 pence).
The executive and management options outstanding at the end of the year have a weighted average remaining contractual life of 5.3 years (2015: 6.2 years).
No options were granted during the year.
Fair values for the executive and management schemes were calculated using a binomial distribution option pricing model so that proper allowance is made for the presence of performance conditions and the possibility of early exercise. In addition, a Monte Carlo simulation model was used to estimate the probability of performance conditions being met. The inputs to the option pricing models are reassessed for each grant.
The expected volatility is calculated with reference to weekly movements in the Compass share price over the three years prior to the grant date.
TARGET
THRESHOLD MAXIMUM
EXECUTIVE AND MANAGEMENT SHARE OPTION PLANS PERFORMANCE PERIOD
AFCF £M % OF AWARD
AFCF £M % OF AWARD
GRANTED ON:29 November 2013 1 October 2013 – 30 September 2016 2,423 0% 2,679 100%
Performance targets applying to earlier grants under the Executive and Management Share Option Plans have been met at 78%.
Notes to the consolidated financial statements continued
For the year ended 30 September 2016
136 Compass Group PLC Annual Report 2016

22 SHARE-BASED PAYMENTS CONTINUEDLONG TERM INCENTIVE PLANSFull details of The Compass Group PLC Long Term Incentive Plan 2010 can be found in the Directors’ Remuneration Report on pages 58 to 79.
The following table shows the movement in share awards during the year:
LONG TERM INCENTIVE PLANS
2016 NUMBER OF
SHARES
2015 NUMBER OF
SHARES
Outstanding at 1 October 5,621,322 5,176,571Awarded 2,324,740 2,352,851Released (866,640) (1,602,612)Lapsed (606,244) (305,488)Outstanding at 30 September 6,473,178 5,621,322
PERFORMANCE TARGETS – LONG TERM INCENTIVE PLANS
2016 NUMBER OF
SHARES
2015 NUMBER OF
SHARES
Total Shareholder Return (TSR) 763,934 909,028Cumulative three year Adjusted Free Cash Flow (AFCF) 2,854,622 2,356,147Return On Capital Employed (ROCE) 2,854,622 2,356,147Outstanding at 30 September 6,473,178 5,621,322
Vesting of a proportion of LTIP awards is dependent on the Group’s Total Shareholder Return (TSR) performance relative to a comparator group of non-financial companies included within the FTSE 100 Index. This performance condition is treated as a market based condition for valuation purposes and an assessment of the vesting probability is built into the grant date fair value calculations. This assessment was calculated using a Monte Carlo simulation option pricing model.
Vesting of a proportion of LTIP awards is dependent on the achievement of the cumulative three year AFCF target. 100% of that element of the award will vest if the maximum AFCF target is met, and a proportion of the award will vest if the threshold AFCF target is met, as set out in the table below. Awards vest on a straight line basis between these two points.
TARGET
THRESHOLD MAXIMUM
LONG TERM INCENTIVE PLANS PERFORMANCE PERIODAFCF
£M % OF AWARDAFCF
£M % OF AWARD
AWARDED DURING THE YEAR COMMENCING:1 October 2013 1 October 2013 – 30 September 2016 2,423 0% 2,679 100%1 October 2014 1 October 2014 – 30 September 2017 2,231 0% 2,465 100%1 October 2015 1 October 2015 – 30 September 2018 2,220 0% 2,454 100%
Vesting of a proportion of LTIP awards is dependent on the achievement of the ROCE target over the performance period. 100% of that element of the award will vest if the maximum ROCE target is met, and a proportion of the award will vest if the threshold growth target is met, as set out in the table below. Awards vest on a straight line basis between these two points.
TARGET
THRESHOLD MAXIMUM
LONG TERM INCENTIVE PLANS PERFORMANCE PERIODROCE
% % OF AWARDROCE
% % OF AWARD
AWARDED DURING THE YEAR COMMENCING:1 October 2013 1 October 2013 – 30 September 2016 18.4% 0% 20.1% 100%1 October 2014 1 October 2014 – 30 September 2017 19.0% 0% 20.4% 100%1 October 2015 1 October 2015 – 30 September 2018 18.7% 0% 19.7% 100%
FINAN
CIAL STATEMEN
TS
Compass Group PLC Annual Report 2016 137
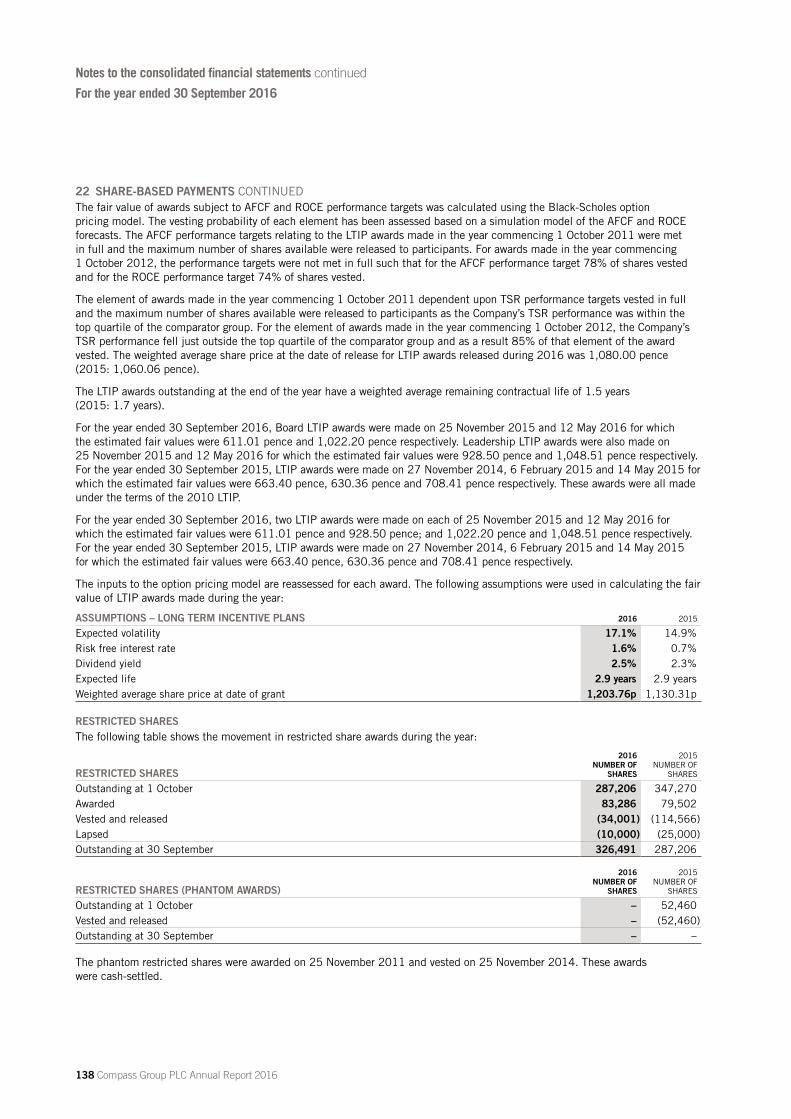
22 SHARE-BASED PAYMENTS CONTINUEDThe fair value of awards subject to AFCF and ROCE performance targets was calculated using the Black-Scholes option pricing model. The vesting probability of each element has been assessed based on a simulation model of the AFCF and ROCE forecasts. The AFCF performance targets relating to the LTIP awards made in the year commencing 1 October 2011 were met in full and the maximum number of shares available were released to participants. For awards made in the year commencing 1 October 2012, the performance targets were not met in full such that for the AFCF performance target 78% of shares vested and for the ROCE performance target 74% of shares vested.
The element of awards made in the year commencing 1 October 2011 dependent upon TSR performance targets vested in full and the maximum number of shares available were released to participants as the Company’s TSR performance was within the top quartile of the comparator group. For the element of awards made in the year commencing 1 October 2012, the Company’s TSR performance fell just outside the top quartile of the comparator group and as a result 85% of that element of the award vested. The weighted average share price at the date of release for LTIP awards released during 2016 was 1,080.00 pence (2015: 1,060.06 pence).
The LTIP awards outstanding at the end of the year have a weighted average remaining contractual life of 1.5 years (2015: 1.7 years).
For the year ended 30 September 2016, Board LTIP awards were made on 25 November 2015 and 12 May 2016 for which the estimated fair values were 611.01 pence and 1,022.20 pence respectively. Leadership LTIP awards were also made on 25 November 2015 and 12 May 2016 for which the estimated fair values were 928.50 pence and 1,048.51 pence respectively. For the year ended 30 September 2015, LTIP awards were made on 27 November 2014, 6 February 2015 and 14 May 2015 for which the estimated fair values were 663.40 pence, 630.36 pence and 708.41 pence respectively. These awards were all made under the terms of the 2010 LTIP.
For the year ended 30 September 2016, two LTIP awards were made on each of 25 November 2015 and 12 May 2016 for which the estimated fair values were 611.01 pence and 928.50 pence; and 1,022.20 pence and 1,048.51 pence respectively. For the year ended 30 September 2015, LTIP awards were made on 27 November 2014, 6 February 2015 and 14 May 2015 for which the estimated fair values were 663.40 pence, 630.36 pence and 708.41 pence respectively.
The inputs to the option pricing model are reassessed for each award. The following assumptions were used in calculating the fair value of LTIP awards made during the year:
ASSUMPTIONS – LONG TERM INCENTIVE PLANS 2016 2015
Expected volatility 17.1% 14.9%Risk free interest rate 1.6% 0.7%Dividend yield 2.5% 2.3%Expected life 2.9 years 2.9 yearsWeighted average share price at date of grant 1,203.76p 1,130.31p
RESTRICTED SHARESThe following table shows the movement in restricted share awards during the year:
RESTRICTED SHARES
2016 NUMBER OF
SHARES
2015 NUMBER OF
SHARES
Outstanding at 1 October 287,206 347,270Awarded 83,286 79,502Vested and released (34,001) (114,566)Lapsed (10,000) (25,000)Outstanding at 30 September 326,491 287,206
RESTRICTED SHARES (PHANTOM AWARDS)
2016 NUMBER OF
SHARES
2015 NUMBER OF
SHARES
Outstanding at 1 October – 52,460Vested and released – (52,460)Outstanding at 30 September – –
The phantom restricted shares were awarded on 25 November 2011 and vested on 25 November 2014. These awards were cash-settled.
Notes to the consolidated financial statements continued
For the year ended 30 September 2016
138 Compass Group PLC Annual Report 2016
22 SHARE-BASED PAYMENTS CONTINUEDThe fair value of restricted shares awarded in the year was calculated using the Black-Scholes option pricing model, using the following assumptions.
ASSUMPTIONS – RESTRICTED SHARES 2016 2015
Expected volatility 16.6% 14.8%Risk free interest rate 1.6% 0.5%Dividend yield 2.5% 2.5%Expected life 2.2 years 1.8 yearsWeighted average share price at date of grant 1,184.40p 1,064.00p
The weighted average share price at the date of release for restricted share awards released during 2016 was 1,209.19 pence (2015: 1,093.05 pence).
DEFERRED ANNUAL BONUS PLANCertain senior executives participate in the Deferred Annual Bonus Plan. Awards made before 30 September 2014 comprised two elements. Payment of a portion of the annual bonus awarded to these executives is deferred for three years. The amount released on expiry of the deferral period may be increased subject to achievement of organic revenue and profit growth. Any amount paid in cash must be immediately reinvested in ordinary shares of the Company which must then be held for a qualifying period.
The second element of the award reflects the growth in the Company’s share price over the deferral period assuming that the deferred element of the annual bonus had been invested in ordinary shares of the Company at the start of the deferral period. The fair value of the awards is determined by using the Black-Scholes option pricing model. Any sum payable at the end of the deferral period is paid in cash. The Group has recorded a liability of £0.1 million (2015: £0.8 million) in respect of awards made before 30 September 2013 under this plan.
The terms of the plan were revised in 2014. Payment of a portion of the annual bonus awarded to certain executives is converted into shares. Subject to the achievement of organic revenue growth and either cumulative PBIT or unit profit over the three year deferral period, the number of deferred shares may be increased. Deferred shares are only released to the participants if minimum threshold performance levels are met. A total of 570,678 (2015: 491,588) deferred shares have been awarded which will vest in full if the maximum performance targets are met. 75% of the awards will vest if minimum threshold performance levels are met. Awards vest on a straight line basis between these two points.
The fair value of these awards has been calculated using the Black-Scholes option pricing model, using the following assumptions:
ASSUMPTIONS – DEFERRED ANNUAL BONUS PLAN 2016 2015
Expected volatility 16.3% 14.8%Risk free interest rate 1.8% 0.6%Dividend yield 2.6% 2.5%Expected life 3.0 years 3.0 yearsWeighted average share price at date of grant 1,117.00p 1,060.00p
FINAN
CIAL STATEMEN
TS
Compass Group PLC Annual Report 2016 139

22 SHARE-BASED PAYMENTS CONTINUEDACCELERATED GROWTH PLANContingent share awards under this plan have been awarded to the leadership team in certain countries in order to reward and encourage the growth of those businesses. Vesting of these awards is subject to the achievement of local organic revenue growth and cumulative PBIT over the three year period. 50% of the awards will vest if minimum threshold performance levels are met. Awards vest on a straight line basis between these two points.
The fair value of these awards has been calculated using the Black-Scholes option pricing model.
The following table illustrates the movement in the number of awards during the year:
ACCELERATED GROWTH PLAN
2016 NUMBER OF
SHARES
2015 NUMBER OF
SHARES
Outstanding at 1 October 615,614 563,070Awarded – 108,494Lapsed (17,415) (55,950)Outstanding at 30 September 598,199 615,614
LONG TERM BONUS PLANCertain executives participating in the Long Term Bonus Plan in prior years received an award of deferred Compass Group PLC shares. The award of bonus shares is subject to performance conditions and matching shares may be released by the Company following the completion of a further period of service. The terms of the Plan require that these shares are purchased in the market, rather than being issued by the Company. The shares are purchased and distributed by the ESOP and LTIPT.
The following table illustrates the movement in the number of awards during the year:
LONG TERM BONUS PLAN
2016 NUMBER OF
SHARES
2015 NUMBER OF
SHARES
Outstanding at 1 October 161,002 277,466Released (41,733) (88,528)Lapsed – (27,936)Outstanding at 30 September 119,269 161,002
The fair value of bonus shares awarded is calculated using the Black-Scholes option pricing model; however, no new awards were made in either 2016 or 2015.
The weighted average share price at the date of release for share bonus awards released during 2016 was 1,152.34 pence. No awards were released during 2015. The share bonus awards have all vested, although certain executives have elected to defer taking their entitlements for a further period of up to 1.0 years (2015: 1.3 years), the weighted average deferral period being 0.7 years (2015: 1.0 years).
INCOME STATEMENT EXPENSEThe Group recognised an expense of £16 million (2015: £15 million) in respect of equity-settled share-based payment transactions and £nil (2015: £nil) in respect of cash-settled share-based payment transactions.
23 BUSINESS COMBINATIONSThe Group has completed a number of infill acquisitions in several countries for a total consideration of £186 million, of which £155 million was paid in the year. In addition, the Group paid a further £30 million deferred consideration relating to prior years.
Acquisition transaction costs expensed in the year ended 30 September 2016 were £2 million (2015: £2 million).
In the period from acquisition to 30 September 2016, the acquisitions contributed revenue of £129 million and operating profit of £8 million to the Group’s results.
If the acquisitions had occurred on 1 October 2015, it is estimated that the combined sales of Group and equity accounted joint ventures for the period would have been £19,947 million and total Group operating profit (including associates) would have been £1,410 million.
Notes to the consolidated financial statements continued
For the year ended 30 September 2016
140 Compass Group PLC Annual Report 2016
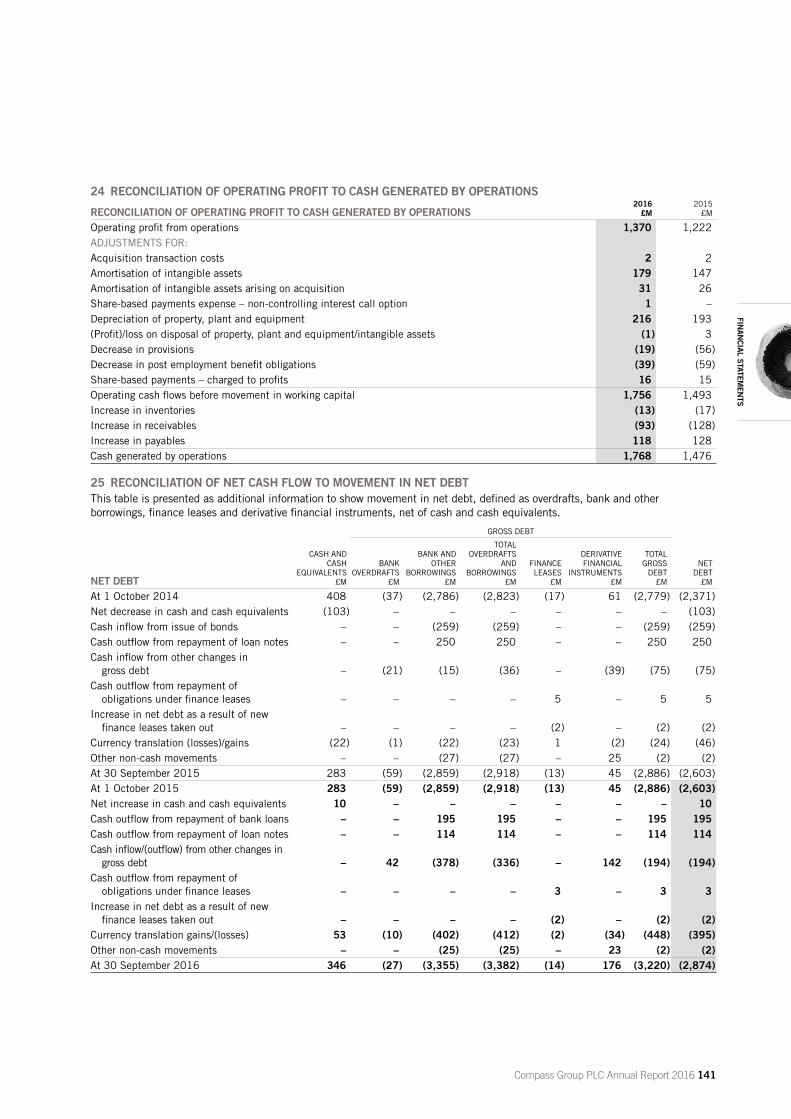
24 RECONCILIATION OF OPERATING PROFIT TO CASH GENERATED BY OPERATIONS
RECONCILIATION OF OPERATING PROFIT TO CASH GENERATED BY OPERATIONS2016
£M2015
£M
Operating profit from operations 1,370 1,222ADJUSTMENTS FOR: Acquisition transaction costs 2 2Amortisation of intangible assets 179 147Amortisation of intangible assets arising on acquisition 31 26Share-based payments expense – non-controlling interest call option 1 –Depreciation of property, plant and equipment 216 193(Profit)/loss on disposal of property, plant and equipment/intangible assets (1) 3Decrease in provisions (19) (56)Decrease in post employment benefit obligations (39) (59)Share-based payments – charged to profits 16 15Operating cash flows before movement in working capital 1,756 1,493Increase in inventories (13) (17)Increase in receivables (93) (128)Increase in payables 118 128Cash generated by operations 1,768 1,476
25 RECONCILIATION OF NET CASH FLOW TO MOVEMENT IN NET DEBTThis table is presented as additional information to show movement in net debt, defined as overdrafts, bank and other borrowings, finance leases and derivative financial instruments, net of cash and cash equivalents.
GROSS DEBT
NET DEBT
CASH AND CASH
EQUIVALENTS £M
BANK OVERDRAFTS
£M
BANK AND OTHER
BORROWINGS £M
TOTAL OVERDRAFTS
AND BORROWINGS
£M
FINANCE LEASES
£M
DERIVATIVE FINANCIAL
INSTRUMENTS £M
TOTAL GROSS
DEBT £M
NET DEBT
£M
At 1 October 2014 408 (37) (2,786) (2,823) (17) 61 (2,779) (2,371)Net decrease in cash and cash equivalents (103) – – – – – – (103)Cash inflow from issue of bonds – – (259) (259) – – (259) (259)Cash outflow from repayment of loan notes – – 250 250 – – 250 250Cash inflow from other changes in
gross debt – (21) (15) (36) – (39) (75) (75)Cash outflow from repayment of
obligations under finance leases – – – – 5 – 5 5Increase in net debt as a result of new
finance leases taken out – – – – (2) – (2) (2)Currency translation (losses)/gains (22) (1) (22) (23) 1 (2) (24) (46)Other non-cash movements – – (27) (27) – 25 (2) (2)At 30 September 2015 283 (59) (2,859) (2,918) (13) 45 (2,886) (2,603)At 1 October 2015 283 (59) (2,859) (2,918) (13) 45 (2,886) (2,603)Net increase in cash and cash equivalents 10 – – – – – – 10Cash outflow from repayment of bank loans – – 195 195 – – 195 195Cash outflow from repayment of loan notes – – 114 114 – – 114 114Cash inflow/(outflow) from other changes in
gross debt – 42 (378) (336) – 142 (194) (194)Cash outflow from repayment of
obligations under finance leases – – – – 3 – 3 3Increase in net debt as a result of new
finance leases taken out – – – – (2) – (2) (2)Currency translation gains/(losses) 53 (10) (402) (412) (2) (34) (448) (395)Other non-cash movements – – (25) (25) – 23 (2) (2)At 30 September 2016 346 (27) (3,355) (3,382) (14) 176 (3,220) (2,874)
FINAN
CIAL STATEMEN
TS
Compass Group PLC Annual Report 2016 141
25 RECONCILIATION OF NET CASH FLOW TO MOVEMENT IN NET DEBT CONTINUEDOther non-cash movements are comprised as follows:
OTHER NON-CASH MOVEMENTS IN NET DEBT2016
£M2015
£M
Amortisation of fees and discount on issuance (1) (1)Changes in the fair value of bank and other borrowings in a designated fair value hedge (24) (26)Bank and other borrowings (25) (27)Changes in the value of derivative financial instruments including accrued income 23 25Other non-cash movements (2) (2)
26 CONTINGENT LIABILITIES
PERFORMANCE BONDS, GUARANTEES AND INDEMNITIES2016
£M2015
£M
Performance bonds, guarantees and indemnities (including those of associated undertakings)1 366 349
1. Excludes bonds, guarantees and indemnities in respect of self-insurance liabilities, post employment obligations and borrowings (including finance and operating leases) recorded on the balance sheet or disclosed in note 28.
PERFORMANCE BONDS, GUARANTEES AND INDEMNITIESThe Company and certain subsidiary undertakings have, in the normal course of business, given guarantees and entered into counter-indemnities in respect of such guarantees relating to the Group’s own contracts and/or the Group’s share of certain contractual obligations of joint arrangements and associates. Where the Group enters into such arrangements, it does so in order to provide assurance to the beneficiary that it will fulfil its existing contractual obligations. The issue of such guarantees and indemnities does not therefore increase the Group’s overall exposure and the disclosure of such performance bonds, guarantees and indemnities is given for information purposes only.
EUREST SUPPORT SERVICESOn 21 October 2005, the Company announced that it had instructed Freshfields Bruckhaus Deringer to conduct an investigation into the relationships between Eurest Support Services (ESS) (a member of the Group), IHC Services Inc. (IHC) and the United Nations (UN). Ernst & Young assisted Freshfields Bruckhaus Deringer in this investigation. On 1 February 2006, it was announced that the investigation had concluded.
The investigation established serious irregularities in connection with contracts awarded to ESS by the UN. The work undertaken by Freshfields Bruckhaus Deringer and Ernst & Young gave no reason to believe that these issues extended beyond a few individuals within ESS to other parts of ESS or the wider Compass Group of companies.
The Group settled all outstanding civil litigation against it in relation to this matter in October 2006, but litigation continues between competitors of ESS, IHC and other parties involved in UN procurement.
IHC’s relationship with the UN and ESS was part of a wider investigation into UN procurement activity being conducted by the United States Attorney’s Office for the Southern District of New York, and with which the Group co-operated fully. The current status of that investigation is uncertain and a matter for the US authorities. Those investigators could have had access to sources unavailable to the Group, Freshfields Bruckhaus Deringer or Ernst & Young, and further information may yet emerge which is inconsistent with, or additional to, the findings of the Freshfields Bruckhaus Deringer investigation, which could have an adverse impact on the Group. The Group has, however, not been contacted by, or received further requests for information from, the United States Attorney’s Office for the Southern District of New York in connection with these matters since January 2006. The Group has co-operated fully with the UN throughout.
OTHER LITIGATION AND CLAIMSThe Group is also involved in various other legal proceedings incidental to the nature of its business and maintains insurance cover to reduce financial risk associated with claims related to these proceedings. Where appropriate, provisions are made to cover any potential uninsured losses.
In addition, the Group is subject to periodic tax audits and challenges with/by various fiscal authorities covering corporate, employee and sales taxes in the various jurisdictions in which it operates. None of these are currently expected to have a material impact on the Group’s financial position.
OUTCOMEAlthough it is not possible to predict the outcome or quantify the financial effect of these proceedings, or any claim against the Group related thereto, in the opinion of the directors, any uninsured losses resulting from the ultimate resolution of these matters will not have a material effect on the financial position of the Group. The timing of the settlement of these proceedings or claims is uncertain.
Notes to the consolidated financial statements continued
For the year ended 30 September 2016
142 Compass Group PLC Annual Report 2016
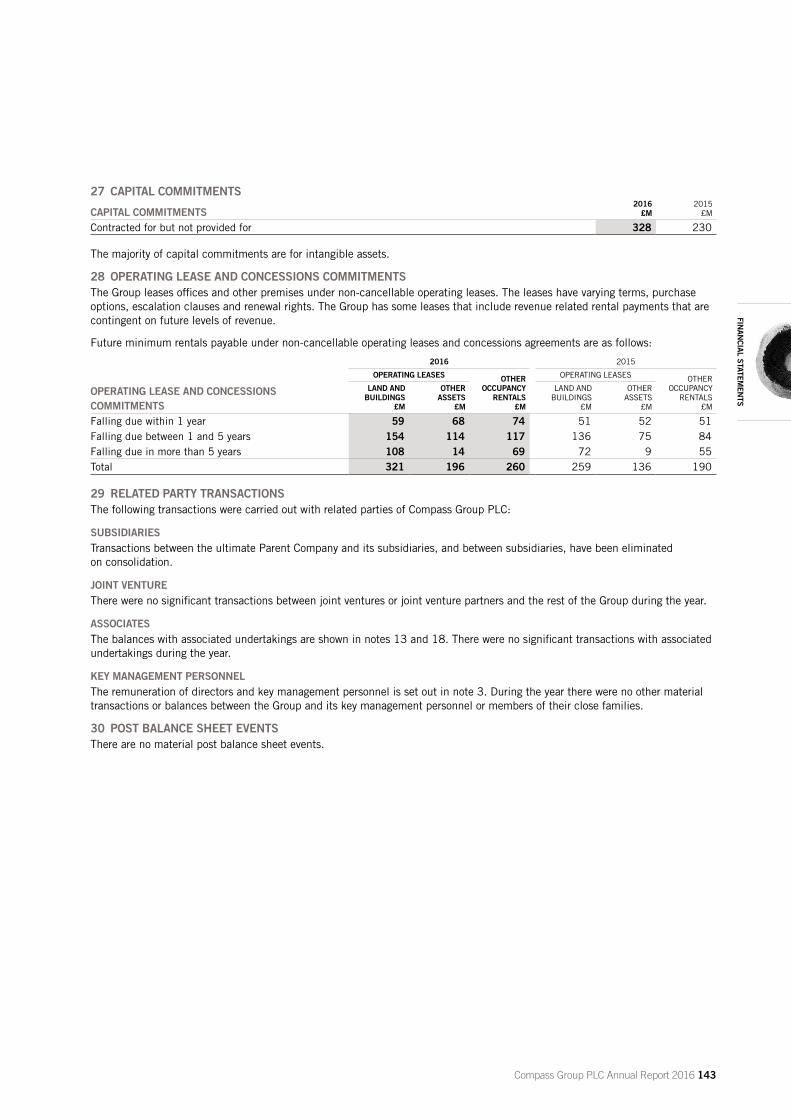
27 CAPITAL COMMITMENTS
CAPITAL COMMITMENTS2016
£M2015
£M
Contracted for but not provided for 328 230
The majority of capital commitments are for intangible assets.
28 OPERATING LEASE AND CONCESSIONS COMMITMENTSThe Group leases offices and other premises under non-cancellable operating leases. The leases have varying terms, purchase options, escalation clauses and renewal rights. The Group has some leases that include revenue related rental payments that are contingent on future levels of revenue.
Future minimum rentals payable under non-cancellable operating leases and concessions agreements are as follows:
2016 2015
OPERATING LEASES OTHER OCCUPANCY
RENTALS £M
OPERATING LEASES OTHER OCCUPANCY
RENTALS £M
OPERATING LEASE AND CONCESSIONS COMMITMENTS
LAND AND BUILDINGS
£M
OTHER ASSETS
£M
LAND AND BUILDINGS
£M
OTHER ASSETS
£M
Falling due within 1 year 59 68 74 51 52 51Falling due between 1 and 5 years 154 114 117 136 75 84Falling due in more than 5 years 108 14 69 72 9 55Total 321 196 260 259 136 190
29 RELATED PARTY TRANSACTIONSThe following transactions were carried out with related parties of Compass Group PLC:
SUBSIDIARIESTransactions between the ultimate Parent Company and its subsidiaries, and between subsidiaries, have been eliminated on consolidation.
JOINT VENTUREThere were no significant transactions between joint ventures or joint venture partners and the rest of the Group during the year.
ASSOCIATESThe balances with associated undertakings are shown in notes 13 and 18. There were no significant transactions with associated undertakings during the year.
KEY MANAGEMENT PERSONNELThe remuneration of directors and key management personnel is set out in note 3. During the year there were no other material transactions or balances between the Group and its key management personnel or members of their close families.
30 POST BALANCE SHEET EVENTSThere are no material post balance sheet events.
FINAN
CIAL STATEMEN
TS
Compass Group PLC Annual Report 2016 143
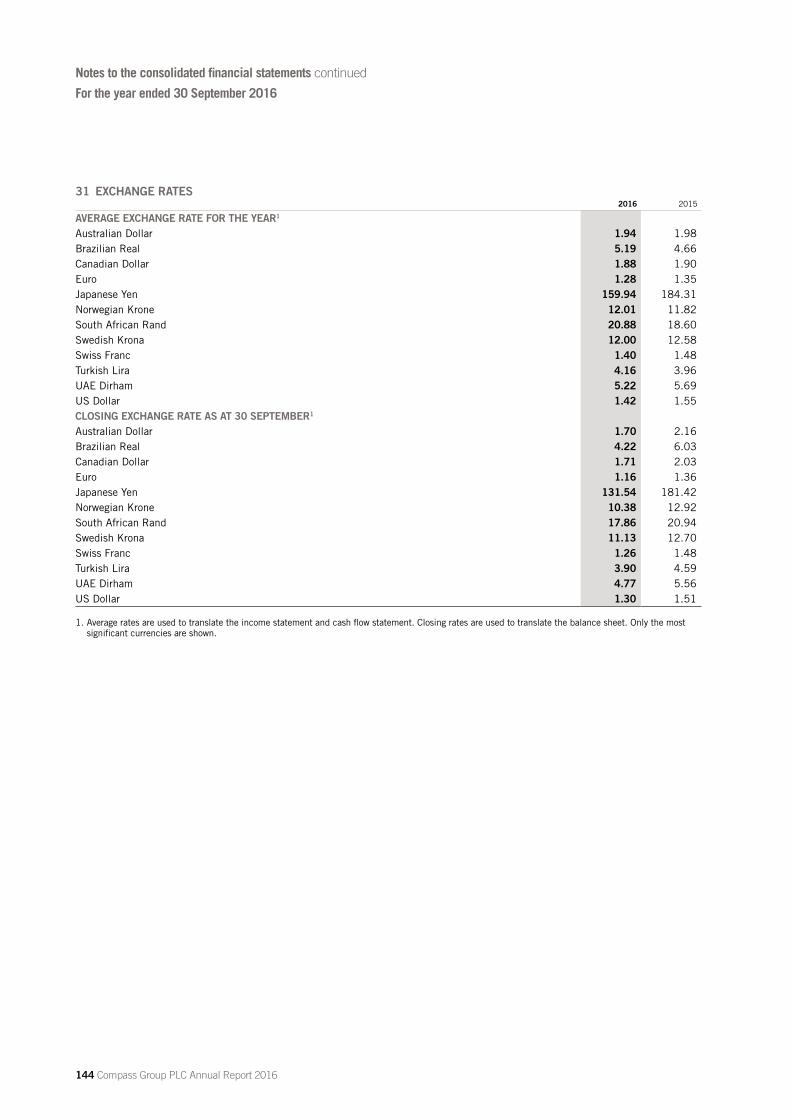
31 EXCHANGE RATES2016 2015
AVERAGE EXCHANGE RATE FOR THE YEAR1
Australian Dollar 1.94 1.98Brazilian Real 5.19 4.66Canadian Dollar 1.88 1.90Euro 1.28 1.35Japanese Yen 159.94 184.31Norwegian Krone 12.01 11.82South African Rand 20.88 18.60Swedish Krona 12.00 12.58Swiss Franc 1.40 1.48Turkish Lira 4.16 3.96UAE Dirham 5.22 5.69US Dollar 1.42 1.55CLOSING EXCHANGE RATE AS AT 30 SEPTEMBER1
Australian Dollar 1.70 2.16Brazilian Real 4.22 6.03Canadian Dollar 1.71 2.03Euro 1.16 1.36Japanese Yen 131.54 181.42Norwegian Krone 10.38 12.92South African Rand 17.86 20.94Swedish Krona 11.13 12.70Swiss Franc 1.26 1.48Turkish Lira 3.90 4.59UAE Dirham 4.77 5.56US Dollar 1.30 1.51
1. Average rates are used to translate the income statement and cash flow statement. Closing rates are used to translate the balance sheet. Only the most significant currencies are shown.
Notes to the consolidated financial statements continued
For the year ended 30 September 2016
144 Compass Group PLC Annual Report 2016
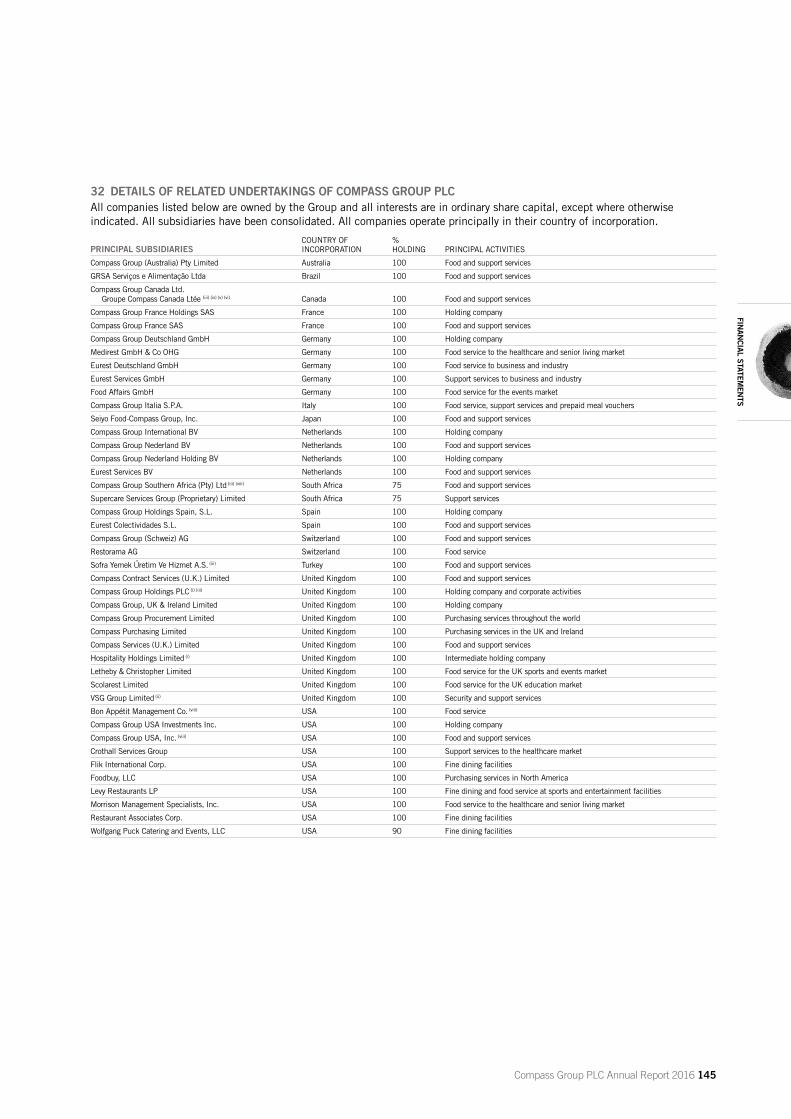
32 DETAILS OF RELATED UNDERTAKINGS OF COMPASS GROUP PLCAll companies listed below are owned by the Group and all interests are in ordinary share capital, except where otherwise indicated. All subsidiaries have been consolidated. All companies operate principally in their country of incorporation.
PRINCIPAL SUBSIDIARIESCOUNTRY OF INCORPORATION
% HOLDING PRINCIPAL ACTIVITIES
Compass Group (Australia) Pty Limited Australia 100 Food and support services
GRSA Serviços e Alimentação Ltda Brazil 100 Food and support services
Compass Group Canada Ltd. Groupe Compass Canada Ltée (iii) (iv) (v) (vi) Canada 100 Food and support services
Compass Group France Holdings SAS France 100 Holding company
Compass Group France SAS France 100 Food and support services
Compass Group Deutschland GmbH Germany 100 Holding company
Medirest GmbH & Co OHG Germany 100 Food service to the healthcare and senior living market
Eurest Deutschland GmbH Germany 100 Food service to business and industry
Eurest Services GmbH Germany 100 Support services to business and industry
Food Affairs GmbH Germany 100 Food service for the events market
Compass Group Italia S.P.A. Italy 100 Food service, support services and prepaid meal vouchers
Seiyo Food-Compass Group, Inc. Japan 100 Food and support services
Compass Group International BV Netherlands 100 Holding company
Compass Group Nederland BV Netherlands 100 Food and support services
Compass Group Nederland Holding BV Netherlands 100 Holding company
Eurest Services BV Netherlands 100 Food and support services
Compass Group Southern Africa (Pty) Ltd (iii) (viii) South Africa 75 Food and support services
Supercare Services Group (Proprietary) Limited South Africa 75 Support services
Compass Group Holdings Spain, S.L. Spain 100 Holding company
Eurest Colectividades S.L. Spain 100 Food and support services
Compass Group (Schweiz) AG Switzerland 100 Food and support services
Restorama AG Switzerland 100 Food service
Sofra Yemek Űretim Ve Hizmet A.S. (iii) Turkey 100 Food and support services
Compass Contract Services (U.K.) Limited United Kingdom 100 Food and support services
Compass Group Holdings PLC (i) (iii) United Kingdom 100 Holding company and corporate activities
Compass Group, UK & Ireland Limited United Kingdom 100 Holding company
Compass Group Procurement Limited United Kingdom 100 Purchasing services throughout the world
Compass Purchasing Limited United Kingdom 100 Purchasing services in the UK and Ireland
Compass Services (U.K.) Limited United Kingdom 100 Food and support services
Hospitality Holdings Limited (i) United Kingdom 100 Intermediate holding company
Letheby & Christopher Limited United Kingdom 100 Food service for the UK sports and events market
Scolarest Limited United Kingdom 100 Food service for the UK education market
VSG Group Limited (ii) United Kingdom 100 Security and support services
Bon Appétit Management Co. (viii) USA 100 Food service
Compass Group USA Investments Inc. USA 100 Holding company
Compass Group USA, Inc. (viii) USA 100 Food and support services
Crothall Services Group USA 100 Support services to the healthcare market
Flik International Corp. USA 100 Fine dining facilities
Foodbuy, LLC USA 100 Purchasing services in North America
Levy Restaurants LP USA 100 Fine dining and food service at sports and entertainment facilities
Morrison Management Specialists, Inc. USA 100 Food service to the healthcare and senior living market
Restaurant Associates Corp. USA 100 Fine dining facilities
Wolfgang Puck Catering and Events, LLC USA 90 Fine dining facilities
FINAN
CIAL STATEMEN
TS
Compass Group PLC Annual Report 2016 145

OTHER WHOLLY OWNED SUBSIDIARIESCOUNTRY OF INCORPORATION
% HOLDING
Eurest Algerie SPA (ii) Algeria 100
Servicios Compass de Argentina S.A. Argentina 100
Compass Australia PTY Ltd (ii) Australia 100
Compass (Australia) Catering & Services PTY Ltd Australia 100
Compass Group B&I Hospitality Services PTY Ltd Australia 100
Compass Group Defence Hospitality Services PTY Ltd Australia 100
Compass Group Education Hospitality Services PTY Ltd Australia 100
Compass Group Healthcare Hospitality Services PTY Ltd Australia 100
Compass Group Management Services PTY Ltd Australia 100
Compass Group Relief Hospitality Services PTY Ltd Australia 100
Compass Group Remote Hospitality Services PTY Ltd Australia 100
Delta Facilities Management PTY Ltd Australia 100
Delta FM Australia PTY Ltd Australia 100
Delta Force Personnel Pty Ltd Australia 100
Compass Group Retail Services Pty Ltd Australia 100
Eurest (Australia) Food Servides – NSW Pty Ltd Australia 100
Eurest (Australia) Food Services – Wollongong PTY Ltd Australia 100
Eurest (Australia) Food Services PTY Ltd Australia 100
Eurest (Australia) Licence Holdings PTY Ltd Australia 100
Eurest (Australia) PTY Ltd Australia 100
Eurest (Australia) – Victoria PTY Ltd Australia 100
Heritage Catering & Services PTY Ltd Australia 100
LAPG Education PTY Ltd Australia 100
LAPG PTY Ltd Australia 100
Life’s A Party Group PTY Ltd Australia 100
Life’s A Party PTY Ltd Australia 100
MBM Integrated Services Pty (ii) Australia 100
Omega Security Services PTY Ltd Australia 100
Restaurant Associates (Australia) PTY Ltd Australia 100
Sargem PTY Ltd Australia 100
Compass Group Austria Holdings One GmbH (xii) Austria 100
Compass Group Austria Holdings Two GmbH (xii) Austria 100
Eurest Restaurationbetriebs GmbH (xii) Austria 100
Kunz Gebäudereinigung GmbH (xii) Austria 100
Select Service Partner Gastronomiebetrieb GmbH (ii) Austria 100
C.A.P.S. (Bangladesh) Limited (ii) Bangladesh 100
Compass Group Belgilux S.A. Belgium 100
Compass Group Service Solutions S.A. Belgium 100
F.L.R. Holding S.A. Belgium 100
Clean Mall Serviços Ltda Brazil 100
GRA Serviços LTDA Brazil 100
Compass Group Holdings (BVI) Limited British Virgin Islands 100
Compass Group (Cambodia) Co Ltd (ii) Cambodia 100
Eurest Cameroun SARL (ii) Cameroon 100
Eurest Camp Logistics Cameroun SARL (ii) Cameroon 100
2529541 Ontario Inc. Canada 100
Canteen of Canada Ltd Canada 100
Compass Canada Support Services Ltd (iii) (iv) (v) (vi) Canada 100
Compass Group Ontario Ltd Canada 100
Crothall Services Canada Inc (iii) (iv) Canada 100
East Coast Catering (NS) Limited Canada 100
East Coast Catering Limited (iii) (iv) (viii) Canada 100
Great West Catering Ltd Canada 100
Groupe Compass (Québec) Ltée (iii) (iv) (v) (vi) Canada 100
Long Harbour Catering LP (xi) Canada 100
Long Harbour Catering Ltd Canada 100
Tamarack Catering Ltd Canada 100
Town Square Food Services Ltd Canada 100
Heriot Limited (ii) Cayman Islands 100
Cadelsur SA Chile 100
OTHER WHOLLY OWNED SUBSIDIARIESCOUNTRY OF INCORPORATION
% HOLDING
Compass Catering SA Chile 100
Compass Catering y Servicios Chile Limitada Chile 100
Compass Servicios SA Chile 100
Scolarest SA Chile 100
Compass (China) Management Services Co., Ltd China 100
Shanghai Eurest Food Technologies Service Co., Ltd. China 100
Compass Group Services Colombia S.A. Colombia 100
Eurest Services Congo SARL (ii) Congo 100
ESS Design & Build Ltd (ii) Cyprus 100
Eurest (Cyprus) Ltd (ii) Cyprus 100
Eurest Support Services (Cyprus) International Ltd Cyprus 100
Eurest, spol. s.r.o Czech Republic 100
Scolarest-Zařízení Školního Stravování spol. s.r.o Czech Republic 100
Compass Group Danmark A/S Denmark 100
Compass Group Finland OY Finland 100
7000 Set Meal SAS France 100
Academie Formation Groupe Compass SAS France 100
Caterine Restauration SAS France 100
Compass Food Trucks France SAS France 100
Centrale Restauration Martel SAS France 100
Culinaire Des Pays de L’Adour SAS France 100
Eurest International SNC France 100
Eurest Sports & Loisirs SAS France 100
Evhrest SAS France 100
Levy Restaurants France SAS France 100
Mediance SAS France 100
Memonett SAS France 100
Occitanie Restauration SAS France 100
Oceane de Restauration SAS France 100
Servirest SAS France 100
SHRM Angola SA (ii) France 100
Société De Prestations En Gestion Immobiliere SAS France 100
Société International D’Assistance SA (ii) France 100
Société Nouvelle Lecocq SAS France 100
Sogirest SAS France 100
Sud Est Traiteur SAS France 100
Eurest Support Services Gabon SA (ii) Gabon 100
Eurest Bremen GmbH Germany 100
Eurest Sűd GmbH Germany 100
Eurest West GmbH & Co. KG Germany 100
LPS Event Gastronomie GmbH Germany 100
Menke Menue GmbH Germany 100
M.S.G. Frucht GmbH Germany 100
Orgamed Betriebsgesellschaft fűr Zentralsterilisationen GmbH Germany 100
Plural Gebäudemanagement GmbH Germany 100
Plural Personalservice GmbH Germany 100
Plural Servicepool GmbH Germany 100
SB Verwaltungs GmbH (ii) Germany 100
Compass Group Finance Ltd Guernsey 100
Compass Group Hong Kong Ltd Hong Kong 100
Encore Catering Ltd Hong Kong 100
Shing Hin Catering Group Ltd Hong Kong 100
Eurest Étteremüzemeltető Korlátolt Felelősségű Társaság (ii) Hungary 100
Compass Group (India) Support Services Pvt Ltd India 100
Compass India Support Services Private Limited India 100
Amstel Limited (ii) Ireland 100
Catering Management Ireland Ltd (ii) Ireland 100
Cheyenne Ltd (ii) Ireland 100
Notes to the consolidated financial statements continued
For the year ended 30 September 2016
32 DETAILS OF RELATED UNDERTAKINGS OF COMPASS GROUP PLC CONTINUED
146 Compass Group PLC Annual Report 2016

OTHER WHOLLY OWNED SUBSIDIARIESCOUNTRY OF INCORPORATION
% HOLDING
Compass Catering Services Ireland Ltd Ireland 100
Drumburgh Ltd (ii) Ireland 100
Management Catering Services Ltd Ireland 100
National Catering Ltd (ii) Ireland 100
Rushmore Investment Company Ltd (ii) (viii) Ireland 100
Sutcliffe Ireland Ltd (ii) Ireland 100
Zadca Ltd (ii) Ireland 100
Consolidated Services Ltd Isle of Man 100
Queens Wharf Insurance Services Ltd (viii) Isle of Man 100
Eishoku-Medix, Inc. Japan 100
Eurest Japan, Inc. Japan 100
Fuyo Inc Japan 100
Marunouchi Polestar Co., Ltd Japan 100
MFS, Inc. Japan 100
Nihon Kyushoku Service, Inc. Japan 100
Seiyo Food-Compass Group Holdings, Inc. Japan 100
Sun Food, Inc. Japan 100
Malakand Unlimited Jersey 100
Too ESS Support Services LLP Kazakhstan 100
Too Eurest Support Services Kazakhstan LLP Kazakhstan 100
Kenya Oilfield Services Ltd (ii) Kenya 100
Automat’ Services SARL Luxembourg 100
Eurest Luxembourg SA Luxembourg 100
IMMO Capellen SA Luxembourg 100
Innoclean SA Luxembourg 100
Novelia Senior Services SA Luxembourg 100
Compass Group Malaysia Sdn Bhd Malaysia 100
S.H.R.M. Sdn Bhd (ii) Malaysia 100
Compass Group Mauritius Ltd Mauritius 100
Eurest Proper Meals de Mexico S.A. de C.V. (iii) (iv) Mexico 100
Eurest S.A. de C.V. (iii) (iv) Mexico 100
Food Works of Mexico, S. de R.L. de C.V. (ii) (iii) (iv) Mexico 100
Food Works Services of Mexico, S. de R.L. De C.V. (ii) (iii) (iv) Mexico 100
Servicios Corporativos Eurest-Proper Meals de Mexico S.A. De C.V. (iii) (iv) Mexico 100
Aurora Holdco B.V. Netherlands 100
CGI Holdings (2) B.V. Netherlands 100
Compass Group Holding B.V. (ii) Netherlands 100
Compass Group International 10 B.V. (ii) Netherlands 100
Compass Group International 2 B.V. Netherlands 100
Compass Group International 3 B.V. Netherlands 100
Compass Group International 4 B.V. Netherlands 100
Compass Group International 5 B.V. Netherlands 100
Compass Group International 6 B.V. (ii) Netherlands 100
Compass Group International 9 B.V. Netherlands 100
Compass Group International ESS Shanghai B.V. Netherlands 100
Compass Group International Finance 1 B.V. Netherlands 100
Compass Group International Finance 2 B.V. Netherlands 100
Compass Group Shanghai Eurest B.V. (ii) Netherlands 100
Compass Group Vending Holding B.V. Netherlands 100
Compass Hotels Chertsey B.V. Netherlands 100
Eurest Support Services (ESS) B.V. Netherlands 100
Eurest Support Services Sakhalin B.V. (ii) Netherlands 100
Famous Flavours B.V. Netherlands 100
Stitching Forte International Netherlands 100
Xandrion B.V. Netherlands 100
Eurest Caledonie SARL (ii) New Caledonia 100
Compass Group New Zealand Ltd New Zealand 100
Crothall Services Group Ltd (ii) New Zealand 100
Eurest NZ Ltd (ii) New Zealand 100
OTHER WHOLLY OWNED SUBSIDIARIESCOUNTRY OF INCORPORATION
% HOLDING
Compass Holding Norge A/S Norway 100
ESS Mobile Offshore Units A/S Norway 100
ESS Support Services A/S Norway 100
Eurest A/S Norway 100
Eurest (PNG) Catering & Services Ltd (ii) Papua New Guinea 100
Compass Group Philippines Inc (ii) Philippines 100
Eurest Poland Sp. z.o.o. Poland 100
Eurest (Portugal) – Sociedade Europeia de Restaurantes, Lda Portugal 100
Eurest Catering & Services Group Portugal, Restaurantes Lda Portugal 100
Eurest Holding, SGPS, Unipessoal Lda Portugal 100
Eurest ROM SRL Romania 100
Aurora Rusco OOO Russia 100
Compass Group Rus OOO Russia 100
Compass Group (Singapore) PTE Ltd (iii) (iv) Singapore 100
Compass Group Asia Pacific PTE Ltd Singapore 100
Consolidated Service (SE Asia) PTE Ltd Singapore 100
SHRM Far East Pte Ltd (ii) Singapore 100
Eurest spol. s.r.o Slovakia 100
Firhold (Proprietary) Ltd (ii) South Africa 100
Makhugiso Investments (Proprietary) Ltd (viii) South Africa 100
Asistentes Escolares, S.L. Spain 100
Eurest Catalunya, S.L.U. Spain 100
Eurest Club de Campo, S.L.U. Spain 100
Eurest Euskadi S.L.U. Spain 100
Eurest Servicios Feriales, S.L.U. Spain 100
Levy-Compass Group Holdings S.L. Spain 100
Medirest Social Residencias, S.L.U. Spain 100
Compass Group AB Sweden 100
Compass Group Sweden AB Sweden 100
Creative New Food Dream Steam GmbH Switzerland 100
Eurest Services (Switzerland) AG Switzerland 100
Sevita AG Switzerland 100
Sevita Group AG Switzerland 100
Compass Group Services Co., Ltd (viii) Thailand 100
Eurasia Holdings Co., Ltd Thailand 100
Eurasia Services Co., Ltd Thailand 100
Eurasia Management (Thailand) Co., Ltd Thailand 100
Euroserve Gűvenlik A.ş. Turkey 100
Euroserve Hizmet ve işletmecilik A.ş. Turkey 100
Compass Camea FZE UAE 100
14Forty Limited (ii) United Kingdom 100
3 Gates Services Limited (ii) United Kingdom 100
A.C.M.S. Limited (x) United Kingdom 100
Audrey (London) Limited (ii) United Kingdom 100
Audrey Investments Limited (ii) United Kingdom 100
Bateman Catering Limited (ii) (vii) United Kingdom 100
Bateman Healthcare Services Limited (ii) United Kingdom 100
Bateman Services Limited (ii) United Kingdom 100
Baxter and Platts Limited (iii) (iv) (v) (x) United Kingdom 100
Bromwich Catering Limited (ii) United Kingdom 100
Business Clean Limited (ii) United Kingdom 100
Capitol Catering Management Services Limited (x) United Kingdom 100
Carlton Catering Partnership Limited (ii) (iii) (x) United Kingdom 100
Castle Independent Limited (x) United Kingdom 100
Cataforce Limited (ii) United Kingdom 100
Caterexchange Limited (ii) United Kingdom 100
Caterskill Group Limited (ii) United Kingdom 100
Caterskill Management Limited (ii) United Kingdom 100
32 DETAILS OF RELATED UNDERTAKINGS OF COMPASS GROUP PLC CONTINUED
FINAN
CIAL STATEMEN
TS
Compass Group PLC Annual Report 2016 147
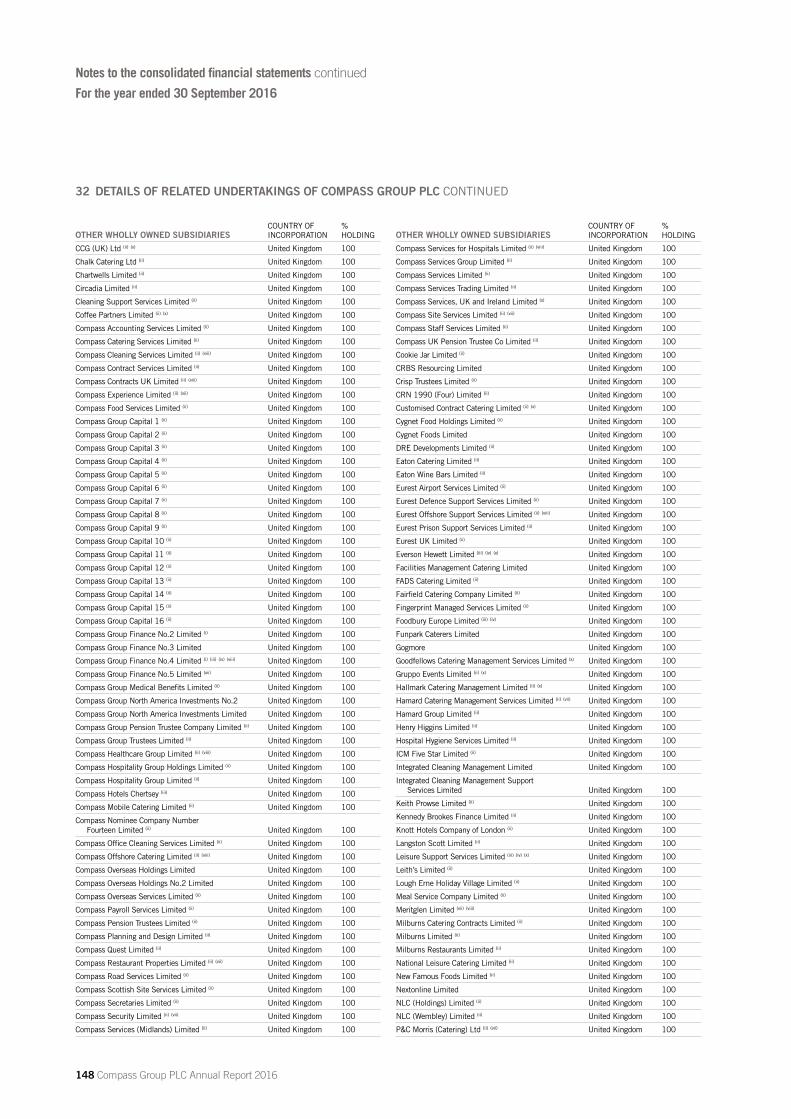
Notes to the consolidated financial statements continued
For the year ended 30 September 2016
OTHER WHOLLY OWNED SUBSIDIARIESCOUNTRY OF INCORPORATION
% HOLDING
Compass Services for Hospitals Limited (ii) (viii) United Kingdom 100
Compass Services Group Limited (ii) United Kingdom 100
Compass Services Limited (ii) United Kingdom 100
Compass Services Trading Limited (ii) United Kingdom 100
Compass Services, UK and Ireland Limited (x) United Kingdom 100
Compass Site Services Limited (ii) (vii) United Kingdom 100
Compass Staff Services Limited (ii) United Kingdom 100
Compass UK Pension Trustee Co Limited (ii) United Kingdom 100
Cookie Jar Limited (ii) United Kingdom 100
CRBS Resourcing Limited United Kingdom 100
Crisp Trustees Limited (ii) United Kingdom 100
CRN 1990 (Four) Limited (ii) United Kingdom 100
Customised Contract Catering Limited (ii) (x) United Kingdom 100
Cygnet Food Holdings Limited (ii) United Kingdom 100
Cygnet Foods Limited United Kingdom 100
DRE Developments Limited (ii) United Kingdom 100
Eaton Catering Limited (ii) United Kingdom 100
Eaton Wine Bars Limited (ii) United Kingdom 100
Eurest Airport Services Limited (ii) United Kingdom 100
Eurest Defence Support Services Limited (ii) United Kingdom 100
Eurest Offshore Support Services Limited (ii) (viii) United Kingdom 100
Eurest Prison Support Services Limited (ii) United Kingdom 100
Eurest UK Limited (ii) United Kingdom 100
Everson Hewett Limited (iii) (iv) (x) United Kingdom 100
Facilities Management Catering Limited United Kingdom 100
FADS Catering Limited (ii) United Kingdom 100
Fairfield Catering Company Limited (ii) United Kingdom 100
Fingerprint Managed Services Limited (ii) United Kingdom 100
Foodbury Europe Limited (iii) (iv) United Kingdom 100
Funpark Caterers Limited United Kingdom 100
Gogmore United Kingdom 100
Goodfellows Catering Management Services Limited (x) United Kingdom 100
Gruppo Events Limited (ii) (x) United Kingdom 100
Hallmark Catering Management Limited (ii) (x) United Kingdom 100
Hamard Catering Management Services Limited (ii) (vii) United Kingdom 100
Hamard Group Limited (ii) United Kingdom 100
Henry Higgins Limited (ii) United Kingdom 100
Hospital Hygiene Services Limited (ii) United Kingdom 100
ICM Five Star Limited (ii) United Kingdom 100
Integrated Cleaning Management Limited United Kingdom 100
Integrated Cleaning Management Support Services Limited United Kingdom 100
Keith Prowse Limited (ii) United Kingdom 100
Kennedy Brookes Finance Limited (ii) United Kingdom 100
Knott Hotels Company of London (ii) United Kingdom 100
Langston Scott Limited (ii) United Kingdom 100
Leisure Support Services Limited (iii) (iv) (x) United Kingdom 100
Leith’s Limited (ii) United Kingdom 100
Lough Erne Holiday Village Limited (ii) United Kingdom 100
Meal Service Company Limited (ii) United Kingdom 100
Meritglen Limited (vii) (viii) United Kingdom 100
Milburns Catering Contracts Limited (ii) United Kingdom 100
Milburns Limited (ii) United Kingdom 100
Milburns Restaurants Limited (ii) United Kingdom 100
National Leisure Catering Limited (ii) United Kingdom 100
New Famous Foods Limited (ii) United Kingdom 100
Nextonline Limited United Kingdom 100
NLC (Holdings) Limited (ii) United Kingdom 100
NLC (Wembley) Limited (ii) United Kingdom 100
P&C Morris (Catering) Ltd (ii) (vii) United Kingdom 100
OTHER WHOLLY OWNED SUBSIDIARIESCOUNTRY OF INCORPORATION
% HOLDING
CCG (UK) Ltd (ii) (x) United Kingdom 100
Chalk Catering Ltd (ii) United Kingdom 100
Chartwells Limited (ii) United Kingdom 100
Circadia Limited (ii) United Kingdom 100
Cleaning Support Services Limited (ii) United Kingdom 100
Coffee Partners Limited (ii) (x) United Kingdom 100
Compass Accounting Services Limited (ii) United Kingdom 100
Compass Catering Services Limited (ii) United Kingdom 100
Compass Cleaning Services Limited (ii) (viii) United Kingdom 100
Compass Contract Services Limited (ii) United Kingdom 100
Compass Contracts UK Limited (ii) (viii) United Kingdom 100
Compass Experience Limited (ii) (vii) United Kingdom 100
Compass Food Services Limited (ii) United Kingdom 100
Compass Group Capital 1 (ii) United Kingdom 100
Compass Group Capital 2 (ii) United Kingdom 100
Compass Group Capital 3 (ii) United Kingdom 100
Compass Group Capital 4 (ii) United Kingdom 100
Compass Group Capital 5 (ii) United Kingdom 100
Compass Group Capital 6 (ii) United Kingdom 100
Compass Group Capital 7 (ii) United Kingdom 100
Compass Group Capital 8 (ii) United Kingdom 100
Compass Group Capital 9 (ii) United Kingdom 100
Compass Group Capital 10 (ii) United Kingdom 100
Compass Group Capital 11 (ii) United Kingdom 100
Compass Group Capital 12 (ii) United Kingdom 100
Compass Group Capital 13 (ii) United Kingdom 100
Compass Group Capital 14 (ii) United Kingdom 100
Compass Group Capital 15 (ii) United Kingdom 100
Compass Group Capital 16 (ii) United Kingdom 100
Compass Group Finance No.2 Limited (i) United Kingdom 100
Compass Group Finance No.3 Limited United Kingdom 100
Compass Group Finance No.4 Limited (i) (iii) (iv) (viii) United Kingdom 100
Compass Group Finance No.5 Limited (xii) United Kingdom 100
Compass Group Medical Benefits Limited (ii) United Kingdom 100
Compass Group North America Investments No.2 United Kingdom 100
Compass Group North America Investments Limited United Kingdom 100
Compass Group Pension Trustee Company Limited (ii) United Kingdom 100
Compass Group Trustees Limited (ii) United Kingdom 100
Compass Healthcare Group Limited (ii) (viii) United Kingdom 100
Compass Hospitality Group Holdings Limited (ii) United Kingdom 100
Compass Hospitality Group Limited (ii) United Kingdom 100
Compass Hotels Chertsey (iii) United Kingdom 100
Compass Mobile Catering Limited (ii) United Kingdom 100
Compass Nominee Company Number Fourteen Limited (ii) United Kingdom 100
Compass Office Cleaning Services Limited (ii) United Kingdom 100
Compass Offshore Catering Limited (ii) (viii) United Kingdom 100
Compass Overseas Holdings Limited United Kingdom 100
Compass Overseas Holdings No.2 Limited United Kingdom 100
Compass Overseas Services Limited (ii) United Kingdom 100
Compass Payroll Services Limited (ii) United Kingdom 100
Compass Pension Trustees Limited (ii) United Kingdom 100
Compass Planning and Design Limited (ii) United Kingdom 100
Compass Quest Limited (ii) United Kingdom 100
Compass Restaurant Properties Limited (ii) (vii) United Kingdom 100
Compass Road Services Limited (ii) United Kingdom 100
Compass Scottish Site Services Limited (ii) United Kingdom 100
Compass Secretaries Limited (ii) United Kingdom 100
Compass Security Limited (ii) (vii) United Kingdom 100
Compass Services (Midlands) Limited (ii) United Kingdom 100
32 DETAILS OF RELATED UNDERTAKINGS OF COMPASS GROUP PLC CONTINUED
148 Compass Group PLC Annual Report 2016

OTHER WHOLLY OWNED SUBSIDIARIESCOUNTRY OF INCORPORATION
% HOLDING
CGSC Capital, Inc. USA 100
Coastal Food Service, Inc. USA 100
Coffee Distributing Corp. USA 100
Compass 2K12 Services, LLC USA 100
Compass HE Services, LLC USA 100
Compass Independent Corp. USA 100
Compass LCS, LLC USA 100
Compass LV, LLC USA 100
Compass One, LLC USA 100
Compass Paramount, LLC USA 100
Compass Two, LLC USA 100
Compass Vermont, Inc. USA 100
Concierge Consulting Services, LLC USA 100
Convenience Foods International, Inc. USA 100
Crothall Facilities Management, Inc. USA 100
Crothall Healthcare Inc. USA 100
Crothall Laundry Services Inc. USA 100
CulinArt Group Inc. USA 100
CulinArt, Inc. USA 100
CulinArt of California,Inc. USA 100
Curiology, LLC USA 100
Custom Management Corporation Of Pennsylvania (ii) USA 100
Cuyahoga Dining Services, Inc. USA 100
E15, LLC USA 100
Eurest Services, Inc. USA 100
Facilities Holdings, LLC USA 100
Flik Lifestyles, LLC USA 100
Flik One, LLC USA 100
Food Services Management By Mgr, LLC USA 100
Gourmet Dining, LLC USA 100
Inter Pacific Management, Inc. USA 100
Levy (Events) Limited Partnership USA 100
Levy (IP) Limited Partnership (ii) USA 100
Levy Food Service Limited Partnership USA 100
Levy GP Corporation USA 100
Levy Holdings GP, Inc. USA 100
Levy Illinois Limited Partnership USA 100
Levy Oklahoma, Inc. USA 100
Levy Premium Foodservice Limited Partnership USA 100
Levy Premium Foodservice, Inc. (ii) USA 100
Levy Premium Foodservice, LLC USA 100
Levy Prom Golf, LLC USA 100
Levy R & H Limited Partnership USA 100
Levy Retail, LLC USA 100
Levy Sports & Entertainment, Inc. USA 100
Levy World Limited Partnership USA 100
Morrison Alumni Association, Inc. USA 100
Morrison Investment Company, Inc. USA 100
Morrison’s Custom Management Corporation of Pennsylvania (ii) USA 100
Morrison’s Health Care of Texas, Inc. (ii) USA 100
Newport Food Service, Inc. USA 100
PFM Kansas, Inc. USA 100
Prodine, Inc. USA 100
Professional Sports Catering, LLC USA 100
Quality Food Management, Inc. USA 100
RAC Holdings Corp. USA 100
Rainbow Vending, Inc. USA 100
RA Tennis Corp USA 100
Ranyst, Inc. USA 100
OTHER WHOLLY OWNED SUBSIDIARIESCOUNTRY OF INCORPORATION
% HOLDING
P&C Morris Catering Group Limited (x) United Kingdom 100
Payne & Gunter Limited (x) United Kingdom 100
PDM Training and Compliance Services Limited (ii) United Kingdom 100
Pennine Services Limited (ii) United Kingdom 100
Peter Parfitt Leisure Overseas Tavel Limited United Kingdom 100
Peter Parfitt Sport Limited (ii) (vii) (x) United Kingdom 100
PPP Infrastructure Management Limited United Kingdom 100
Prideoak Limited (ii) United Kingdom 100
QCL Limited (ii) (x) United Kingdom 100
Quaglino’s Limited United Kingdom 100
Reliable Refreshments Limited (ii) United Kingdom 100
Rhine Four Limited (ii) (vii) United Kingdom 100
Riversdell United Kingdom 100
Roux Fine Dining Limited (ii) United Kingdom 100
Security Office Cleaners Limited (ii) United Kingdom 100
Selkirk House (CVH) Limited (ii) (iii) (iv) (v) United Kingdom 100
Selkirk House (FP) Limited (ii) (viii) United Kingdom 100
Selkirk House (GHPL) Limited (ii) United Kingdom 100
Selkirk House (GTP) Limited (ii) United Kingdom 100
Selkirk House (WBRK) Limited (ii) United Kingdom 100
Sevita (UK) Limited United Kingdom 100
Shaw Catering Company Limited (x) United Kingdom 100
Ski Class Limited (ii) United Kingdom 100
Solutions on Systems Ltd (ii) United Kingdom 100
Summit Catering Limited (x) United Kingdom 100
Sunway Contract Services Limited (x) United Kingdom 100
Sutcliffe Catering Midlands Limited (ii) United Kingdom 100
Sutcliffe Catering South East Limited (ii) United Kingdom 100
Sycamore Newco Limited (ii) (viii) United Kingdom 100
The Bateman Catering Organization Limited (ii) United Kingdom 100
The Cuisine Centre Limited (ii) (x) United Kingdom 100
The Excelsior Insurance Company Limited United Kingdom 100
THF Oil Limited (ii) United Kingdom 100
Tunco (1999) 103 Limited (ii) United Kingdom 100
Vendepac Holdings Limited (ii) (viii) United Kingdom 100
Vision Security Group Limited United Kingdom 100
Vision Security Group Systems Limited United Kingdom 100
VSG Holdings Limited (ii) United Kingdom 100
VSG Investments Limited (ii) United Kingdom 100
VSG Payroll Services Limited (ii) United Kingdom 100
VSG Staff Hire Limited (ii) United Kingdom 100
VSG Systems Direct Limited (ii) United Kingdom 100
Waseley (CVI) Limited (ii) United Kingdom 100
Waseley (CVS) Limited (ii) United Kingdom 100
Waseley Fifteen Limited (ii) United Kingdom 100
Waseley Nominees Limited (ii) United Kingdom 100
Wembley Sports Arena Limited (ii) United Kingdom 100
Wheeler’s Restaurants Limited (ii) (vii) United Kingdom 100
Woodin & Johns Limited (x) United Kingdom 100
Ace Foods, Inc. USA 100
Affiliated Purchasing Services, Inc. (ii) USA 100
Bamco Restaurants of Texas LLC USA 100
Best Vendors Consolidation Services, LLC USA 100
Best Vendors Management Company, Inc. USA 100
Best Vendors Management, Inc. USA 100
Best Vendors, LLC USA 100
Bistro Restaurant Limited Partnership USA 100
Bon Appétit Management Company Foundation USA 100
Bon Appétit Maryland, LLC USA 100
Cataforce, Inc. USA 100
32 DETAILS OF RELATED UNDERTAKINGS OF COMPASS GROUP PLC CONTINUED
FINAN
CIAL STATEMEN
TS
Compass Group PLC Annual Report 2016 149

OTHER WHOLLY OWNED SUBSIDIARIESCOUNTRY OF INCORPORATION
% HOLDING
Restaurant Associates Events Corp. USA 100
Restaurant Associates LLC USA 100
Restaurant Associates, Inc. USA 100
Restaurant One Limited Partnership USA 100
Restaurant Services Inc USA 100
Sacco Dining Services, Inc. USA 100
S.H.R.M. Catering Services, Inc. USA 100
Southeast Service Corporation USA 100
Statewide Services, Inc. USA 100
Street Eats Limited USA 100
Superior Limited Partnership USA 100
The M-Power Foundation, Inc. USA 100
Touchpoint Support Services, LLC USA 100
University Food Services, Inc. USA 100
University Food Services, LLC USA 100
Vendlink, LLC USA 100
Visinity, LLC USA 100
Williamson Hospitality Services, Inc. USA 100
Yorkmont Four, Inc. USA 100
OTHER SUBSIDIARIES, JOINT ARRANGEMENTS, MEMBERSHIPS, ASSOCIATES AND OTHER SIGNIFICANT HOLDINGS
COUNTRY OF INCORPORATION OR ESTABLISHMENT
% HOLDING
Express Support Services, Limitada Angola 49
ESS Eastern Guruma PTY Ltd Australia 60
ESS Gumala PTY Ltd Australia 60
ESS Kokatha PTY Ltd (ii) Australia 60
ESS NYFL PTY Ltd Australia 60
ESS Thalanyji PTY Ltd Australia 60
ESS Larrakia PTY Ltd Australia 50
Convention Centre Management PTY Ltd Australia 40
ESS-AZ LLC Azerbaijan 50
Compass Botswana (PTY) Ltd Botswana 45
Compass Group Sports and Entertainment (xi) Canada 67
ECC – ESS Support Services (xi) Canada 50
2265668 Ontario Limited (iv) Canada 49
ECC – Mi’kmaq Support Services (xi) Canada 49
Popular Point Camp Services (xi) Canada 49
Amik Catering LP (xi) Canada 49
Clearwater Catering Limited (vi) Canada 49
Dene West Limited Partnership (xi) Canada 49
ESS – DNDC Support Services (xi) Canada 49
ESS – Duncan’s and Paddle Prairie Support Services (xi) Canada 49
ESS – East Arm Camp Services (xi) Canada 49
ESS – Kaatodh Camp Services (xi) Canada 49
ESS – Loon River Support Services (xi) Canada 49
ESS – Na Cho Nyak Dun Camp Services (xi) Canada 49
ESS – Ochapowace Support Services (xi) Canada 49
ESS – Pessamit Camp Services (xi) Canada 49
ESS – Wapan Manawan Services de Soutien (xi) Canada 49
ESS/Dease River Development Corporation (xi) Canada 49
ESS Duncan’s Support Services (xi) Canada 49
ESS Haisla Support Services (xi) Canada 49
ESS HLFN Support Services (xi) Canada 49
ESS KNRA Support Services (xi) Canada 49
ESS Komatik Support Services (xi) Canada 49
ESS Liard First Nation Support Services (xi) Canada 49
ESS McKenzie Support Services (xi) Canada 49
ESS Okanagan Indian Band Support Services (xi) Canada 49
OTHER SUBSIDIARIES, JOINT ARRANGEMENTS, MEMBERSHIPS, ASSOCIATES AND OTHER SIGNIFICANT HOLDINGS
COUNTRY OF INCORPORATION OR ESTABLISHMENT
% HOLDING
ESS Tataskweyak Camp Services (xi) Canada 49
ESS/Bushmaster Camp Services (xi) Canada 49
ESS/Fort a la Corne Support Services (xi) Canada 49
ESS/McLeod Lake Indian Band Support Services (ix) Canada 49
ESS/Mosakahiken Cree Nation Support Services (ix) Canada 49
ESS/Nuvumiut Support Services (xi) Canada 49
ESS/Takla Lake Support Services (xi) Canada 49
ESS/WEDC Support Services (xi) Canada 49
First North Catering (xi) Canada 49
Labrador Catering Inc Canada 49
Labrador Catering LP (xi) Canada 49
Naskapi Catering Inc (iii) Canada 24
Naskapi Catering Inc LP (xi) Canada 24
Shanghai ESS Support Services Co Ltd (ii) China 83
PF Eurest Føroyar Denmark 51
Compass Egypt for Hotel & Food Services Egypt 50
Sopregim SAS France 80
Akzente Catering Offenburg GmbH Germany 74
Klinik Gastronomie Eppendorf GmbH Germany 49
HSW Hausirtschaftsdienste Sűd-West GmbH Germany 49
Lubinis – orgaMed Steriglut GmbH Germany 49
Chiyoda Kyushoku Services Co., Ltd Japan 90
Seiyo General Food Co., Ltd Japan 50
KazMunaiGas Service – Compass LLP Kazakhstan 60
Too Eurest Support Services Company B LLP Kazakhstan 50
Compass Lesotho (PTY) Ltd Lesotho 75
Geria SA Luxembourg 25
Compass Group (PTY) Ltd Malawi 75
Compass Malawi (Pty) Ltd (ii) Malawi 75
Restomas Sdn Bhd (ii) Malaysia 70
Em-ssis Services Sdn Bhd (ii) Malaysia 60
Urusan Bakti Sdn Bhd (ii) Malaysia 50
Eurest (Malta) Ltd (ii) Malta 51
Eurest Support Services (Mauritius) (Pty) Ltd (ii) Mauritius 75
Eurest Monaco S.A. Monaco 99.99
Eurest Support Services Mozambique Ltda (ii) Mozambique 45
Compass Group International Coöperatief W.A. (xi) Netherlands 100
Compass Group International Finance C.V. (xi) Netherlands 100
Forplejningstjenester A/S Norway 33.33
Gress-Gruppen A/S Norway 33.33
Eurest OKAS Catering Ltd (ii) Papua New Guinea 55
Eurest Lotic (PNG) JV Ltd (ii) Papua New Guinea 50
Compass Catering Service LLC Qatar 20
Compass Arabia LLC Saudi Arabia 30
Compass Game Park Services (Proprietary) Ltd South Africa 75
Eurest Support Services Africa (Proprietary) Ltd (ii) South Africa 75
Hlanganani Fidelity Joint Venture (Proprietary) Limited (ii) South Africa 75
Isikhonyane Cleaning (Proprietary) Ltd South Africa 75
Lwezi Cleaning (Proprietary) Limited (ii) South Africa 75
Macand Enterprises 008 (Proprietary) Ltd (ii) South Africa 75
Ramiweb (Proprietary) Ltd South Africa 75
Siyeza Cleaning Services (Proprietary) Limited (ii) South Africa 75
Siyeza Contract Cleaning Services (Proprietary) Limited (ii) South Africa 75
Siyeza Labour Outsourcing Services (Proprietary) Limited (ii) South Africa 75
Success Valet & Cleaning Services (Proprietary) Limited (ii) South Africa 75
Supercare Financial Services (Pty) Ltd South Africa 75
Supercare Hygiene (Pty) Ltd South Africa 75
32 DETAILS OF RELATED UNDERTAKINGS OF COMPASS GROUP PLC CONTINUED
Notes to the consolidated financial statements continued
For the year ended 30 September 2016
150 Compass Group PLC Annual Report 2016

OTHER SUBSIDIARIES, JOINT ARRANGEMENTS, MEMBERSHIPS, ASSOCIATES AND OTHER SIGNIFICANT HOLDINGS
COUNTRY OF INCORPORATION OR ESTABLISHMENT
% HOLDING
Convention Hospitality Partners USA 80
KIJIK/ESS, LLC USA 80
Wolfgang Puck Catering at the Capital Wheel, LLC USA 67.5
110 East Pearson Limited Partnership USA 67
Levy LA Concessions, LLC USA 62
Eversource LLC USA 51
Atlanta Sports Catering USA 50
Learfield Levy Foodservice, LLC USA 50
Orlando Foodservice Partners USA 50
Park Concession Management, LLC USA 50
Park Foodservice, LLC USA 50
RA Patina, LLC USA 50
RA Patina Management LLC USA 50
Restaurant Services I, LLC USA 50
Statewide/Gana-a’Yoo Joint Venture USA 50
AEG Facilities, LLC USA 49
Thompson Facilities Services LLC USA 49
Thompson Hospitality Services, LLC USA 49
WP Casual Catering, LLC USA 45
Chicago Resturant Partners, LLC USA 42
Kimco Facilities Holdings, LLC USA 20
Kimco Facility Services LLC USA 20
Kimco Holdings, LLC USA 20
Eurest Support Services Zambia Ltd (ii) Zambia 75
Kagiso Khulani Supervision Zambia Ltd (ii) Zambia 74
CLASSIFICATIONS KEY
(i) Directly owned by Compass Group PLC
(ii) Dormant/non-trading
(iii) A Ordinary shares
(iv) B Ordinary shares
(v) C Ordinary and/or Special shares
(vi) D and/or E Ordinary shares
(vii) Deferred shares
(viii) Preference including cumulative, non-cumulative and redeemable shares
(ix) Redeemable shares
(x) Agent
(xi) No share capital, share of profits
(xii) Limited by guarantee
OTHER SUBSIDIARIES, JOINT ARRANGEMENTS, MEMBERSHIPS, ASSOCIATES AND OTHER SIGNIFICANT HOLDINGS
COUNTRY OF INCORPORATION OR ESTABLISHMENT
% HOLDING
Supercare Services (Pty) Ltd (iii) (iv) South Africa 75
Supercare Training Solutions (Proprietary) Limited (ii) South Africa 75
Supervision Food Services (Boputhatswana) Pty Ltd (ii) South Africa 75
Supervision Food Services (Gaznkulu) (Pty) Ltd (ii) South Africa 75
Gourmet Prepared Foods (Proprietary) Ltd (ii) South Africa 56
All Leisure Travel (Proprietary) Ltd South Africa 52
ESS Oil & Gas Support Service Partners (Proprietary) Ltd (ii) South Africa 52
Eurest Support Services Coega (Proprietary) Ltd (ii) South Africa 52
Gourmet Fresh (Pty) Ltd South Africa 52
Main Street 917 (Proprietary) Ltd South Africa 41
Comet (Pty) Limited (ii) South Africa 38
Maabokgoro-KSS Catering Services (Proprietary) Ltd (ii) South Africa 38
Women’s Sunshine (Pty) Ltd (ii) South Africa 38
Bafokeng Hospitality Services (Pty) Ltd (ii) South Africa 37
KKS Daluxolo Food Services (Proprietary) Ltd South Africa 37
UJU ESS Services (Pty) Ltd South Africa 37
Gourmet on Wheels, S.L.U. Spain 60
Compass Swaziland (Pty) Limited Swaziland 75
Compass Group Tanzania Ltd (ii) Tanzania 75
Abu Dhabi National Hotels – Compass LLC UAE 50
Abu Dhabi National Hotels Compass Caterers LLC UAE 50
Abu Dhabi National Hotels – Compass Emirates LLC UAE 50
Abu Dhabi National Hotels Compass Middle East LLC UAE 50
Compass LLC UAE 50
Chartwells Hounslow (Feeding Futures) Limited (iii) (iv) United Kingdom 75
Eat Dot Limited (ii) (iii) United Kingdom 57.05
Quadrant Catering Limited (iii) (iv) United Kingdom 49
Edgbaston Experience Limited (iii) (iv) United Kingdom 25
Oval Events Holdings Limited United Kingdom 25
Oval Events Limited (iii) (iv) (v) (vi) United Kingdom 25
IEC Experience Limited (iii) (iv) United Kingdom 23
Millennium Stadium Experience Limited (iii) (iv) United Kingdom 16.5
Twickenham Experience Limited (iii) (iv) (v) United Kingdom 16
B & I Catering, LLC USA 90
C&B Holdings, LLC USA 90
CMCA Catering, LLC USA 90
GLV Restaurant Management Associates, LLC USA 90
H & H Catering LP USA 90
PCHI Catering, LLC USA 90
Wolfgang Puck Catering & Events of Texas, LLC USA 90
WPL, LLC USA 90
32 DETAILS OF RELATED UNDERTAKINGS OF COMPASS GROUP PLC CONTINUED
FINAN
CIAL STATEMEN
TS
Compass Group PLC Annual Report 2016 151

NOTES TO THE PARENT COMPANY FINANCIAL STATEMENTS157 Profit and loss account disclosures157 Investments in subsidiary undertakings157 Debtors158 Creditors159 Provisions for liabilities and charges159 Maturity of financial liabilities, other creditors and
derivative financial instruments159 Derivative financial instruments159 Share capital159 Contingent liabilities
PARENT COMPANY FINANCIAL STATEMENTS153 Parent Company balance sheet154 Parent Company statement of changes in equity155 Parent Company accounting policies
PARENT COMPANY FINANCIAL STATEMENTS
152 Compass Group PLC Annual Report 2016
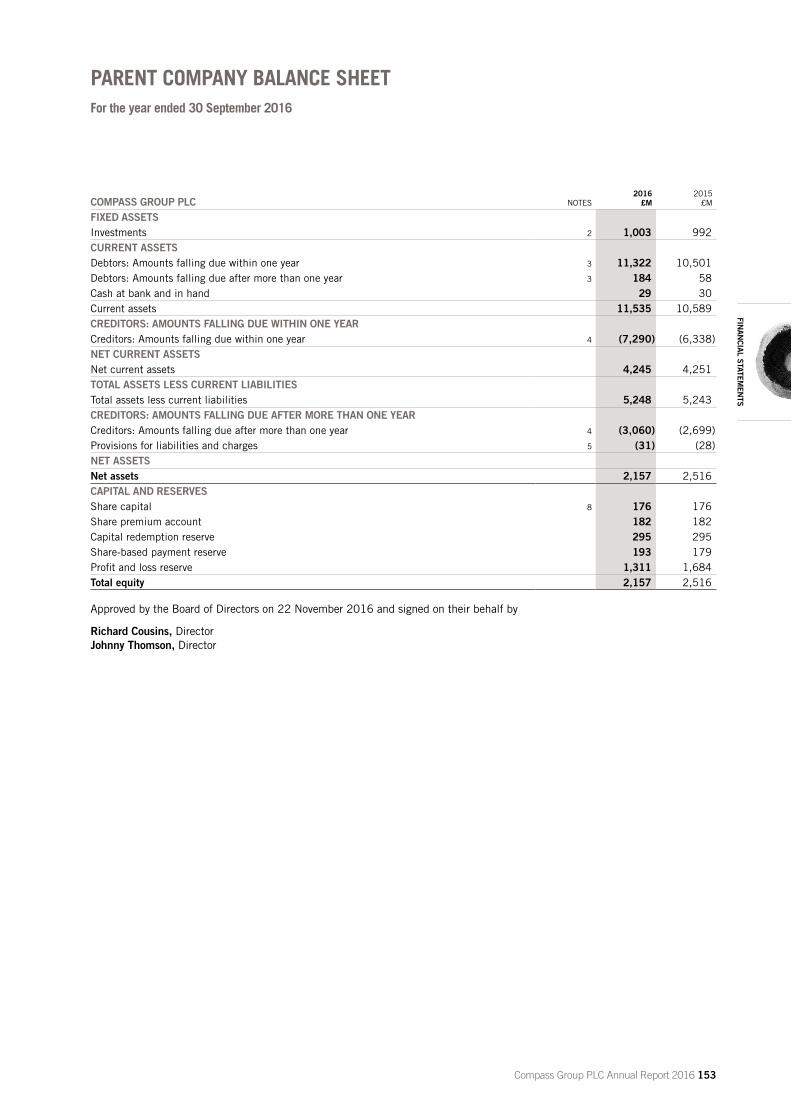
COMPASS GROUP PLC NOTES 2016
£M2015
£M
FIXED ASSETSInvestments 2 1,003 992CURRENT ASSETSDebtors: Amounts falling due within one year 3 11,322 10,501Debtors: Amounts falling due after more than one year 3 184 58Cash at bank and in hand 29 30Current assets 11,535 10,589CREDITORS: AMOUNTS FALLING DUE WITHIN ONE YEARCreditors: Amounts falling due within one year 4 (7,290) (6,338)NET CURRENT ASSETSNet current assets 4,245 4,251TOTAL ASSETS LESS CURRENT LIABILITIESTotal assets less current liabilities 5,248 5,243CREDITORS: AMOUNTS FALLING DUE AFTER MORE THAN ONE YEARCreditors: Amounts falling due after more than one year 4 (3,060) (2,699)Provisions for liabilities and charges 5 (31) (28)NET ASSETSNet assets 2,157 2,516CAPITAL AND RESERVESShare capital 8 176 176Share premium account 182 182Capital redemption reserve 295 295Share-based payment reserve 193 179Profit and loss reserve 1,311 1,684Total equity 2,157 2,516
Approved by the Board of Directors on 22 November 2016 and signed on their behalf by
Richard Cousins, Director Johnny Thomson, Director
PARENT COMPANY BALANCE SHEETFor the year ended 30 September 2016
FINAN
CIAL STATEMEN
TS
Compass Group PLC Annual Report 2016 153

PARENT COMPANY STATEMENT OF CHANGES IN EQUITYFor the year ended 30 September 2016
CAPITAL AND RESERVES
SHARE CAPITAL
£M
SHARE PREMIUM ACCOUNT
£M
CAPITAL REDEMPTION
RESERVE £M
SHARE-BASED PAYMENT RESERVE
£M
PROFIT AND LOSS RESERVE
£MTOTAL
£M
At 1 October 2014 178 174 293 170 1,135 1,950Issue of shares (for cash) – 2 – – – 2Repurchase of ordinary and new ordinary share capital (2) – 2 – (328) (328)Issue of treasury shares to satisfy employee scheme
awards exercised – – – – 1 1Fair value of share-based payments – – – 15 – 15Release of LTIP award settled by issue of new shares – 6 – (6) – –Dividends paid to Compass shareholders – – – – (457) (457)Profit for the financial year – – – – 1,333 1,333At 30 September 2015 176 182 295 179 1,684 2,516At 1 October 2015 176 182 295 179 1,684 2,516Share buyback1 – – – – (100) (100)Fair value of share-based payments – – – 16 – 16Release of LTIP award settled by issue of shares – – – (2) – (2)Issue of treasury shares to satisfy employee scheme
awards exercised – – – – 3 3Dividends paid to Compass shareholders – – – – (496) (496)Profit for the financial year – – – – 220 220At 30 September 2016 176 182 295 193 1,311 2,157
1. Including stamp duty and brokers’ commission.
154 Compass Group PLC Annual Report 2016
INTRODUCTIONThe significant accounting policies adopted in the preparation of the separate financial statements of the Parent Company (the Company) are set out below:
A ACCOUNTING CONVENTION AND BASIS OF PREPARATIONThese financial statements are prepared in accordance with the historical cost convention, except as described in the accounting policy on financial instruments, Financial Reporting Standard 101 Reduced Disclosure Framework (FRS 101), and in accordance with applicable United Kingdom laws. In preparing these financial statements, the Company applies the recognition, measurement and disclosure requirements of International Financial Reporting Standards as adopted by the EU (Adopted IFRSs), but makes amendments where necessary in order to comply with the Companies Act 2006 and has set out below where advantage of the FRS 101 disclosure exemptions has been taken. These financial statements thus present information about the Company as an individual undertaking, not as a Group undertaking. In the transition to FRS 101, the Company has applied IFRS 1 whilst ensuring that its assets and liabilities are measured in compliance with FRS 101.
These financial statements have been prepared on a going concern basis. This is discussed in the Finance Director’s statement on page 25.
B EXEMPTIONSThe Company’s financial statements are included in the Compass Group PLC consolidated financial statements for the year ended 30 September 2016. As permitted by section 408 of the Companies Act 2006, the Company has not presented its own profit and loss account.
In these financial statements, the Company has applied the exemptions under FRS 101 in respect of the following disclosures:
• a cash flow statement and related notes• transactions with wholly owned subsidiaries• capital management• as required by IFRS 13 ‘Fair Value Measurement’ and
IFRS 7 ‘Financial Instrument Disclosures’• the effect of new but not yet effective IFRSs• compensation of key management personnel
C CHANGE IN ACCOUNTING POLICIESAs stated above, these are the Company’s first financial statements prepared in accordance with FRS 101.
The Company has adopted the accounting requirements of the reduced disclosure framework under FRS 101 in these financial statements, with a transition date of 1 October 2014. Given the Company previously applied the fair value provisions of historic UK GAAP, the adoption of FRS 101 had no material impact to previously reported amounts in profit or equity and as such, in line with the requirements of FRS 101, the Company has not prepared a statement of transition.
The Company’s financial statements still meet the requirements of the Companies Act 2006 including giving a true and fair view of the Company’s assets, liabilities, financial position and profit or loss.
The Company has informed its shareholders and has received no objections to the use of FRS 101.
With the exception of the adoption of FRS 101, the Company has not applied any accounting standards for the first time in the year ended 30 September 2016.
D INVESTMENTS IN SUBSIDIARY UNDERTAKINGSInvestments are stated at cost less provision for any impairment. In the opinion of the directors, the value of such investments is not less than shown at the balance sheet date.
E FOREIGN CURRENCYAssets and liabilities in foreign currencies are translated into sterling at the rates of exchange ruling at the year end. Gains and losses arising on retranslation are included in the income statement for the period.
F BORROWINGSBorrowings are recognised initially at fair value, net of transaction costs incurred. Borrowings are subsequently stated at amortised cost unless they are part of a fair value hedge accounting relationship. Borrowings that are part of a fair value hedge accounting relationship are measured at amortised cost plus or minus the fair value attributable to the risk being hedged.
PARENT COMPANY ACCOUNTING POLICIESFor the year ended 30 September 2016
FINAN
CIAL STATEMEN
TS
Compass Group PLC Annual Report 2016 155

Parent Company Accounting policies continued
For the year ended 30 September 2016
G DERIVATIVES AND OTHER FINANCIAL INSTRUMENTSThe Company uses derivative financial instruments to manage its exposure to fluctuations in foreign exchange rates and interest rates. Derivative instruments utilised include interest rate swaps, currency swaps and forward currency contracts. The Company and Group policy is disclosed in the accounting policies to the consolidated financial statements.
Financial assets and financial liabilities are recognised when the Company becomes party to the contractual provisions and derecognised when it ceases to be party to such provisions. Such assets and liabilities are classified as current if they are expected to be realised or settled within 12 months of the balance sheet date. If not, they are recognised as non-current.
H DIVIDENDSDividends are recognised in the Company’s financial statements in the year in which they are approved in general meeting by the Company’s shareholders. Interim dividends are recognised when paid.
I DEFERRED TAXDeferred tax is provided at the anticipated rates on temporary differences arising from the inclusion of items of income and expenditure in tax computations in periods different from those in which they are included in the financial statements. Deferred tax assets are recognised to the extent that it is regarded as more likely than not that they will be recovered.
J SHARE-BASED PAYMENTSThe Group issues equity-settled and cash-settled share-based payments to certain employees. Equity-settled share-based payments are measured at fair value (excluding the effect of non-market based vesting conditions) at the date of grant. The fair value determined at the grant date of the equity-settled share-based payments is expensed on a straight line basis over the vesting period, based on the Group’s estimate of the shares that will eventually vest and adjusted for the effect of the non-market based vesting conditions.
Fair value is measured using either the binomial distribution or Black-Scholes option pricing models as is most appropriate for each scheme. The expected life used in the models has been adjusted, based on management’s best estimate, for the effects of exercise restrictions and behavioural considerations.
For cash-settled share-based payments, a liability equal to the portion of the goods or services received is recognised at the current fair value determined at each balance sheet date.
The issue of share incentives by the Company to employees of its subsidiaries represents additional capital contributions. An addition to the Company’s investment in Group undertakings is reported with a corresponding increase in shareholders’ funds. For details of the charge see note 22 to the consolidated financial statements.
156 Compass Group PLC Annual Report 2016

1 PROFIT AND LOSS ACCOUNT DISCLOSURESThe Company profit on ordinary activities after tax was £220 million (2015: £1,333 million).
The Company had no direct employees in the course of the year (2015: none).
AUDIT SERVICES2016
£M2015
£M
Fees payable to the Company’s auditor for the audit of the Company’s annual financial statements 1 1Fees payable for other services – –
2 INVESTMENTS IN SUBSIDIARY UNDERTAKINGS
INVESTMENTS IN SUBSIDIARY UNDERTAKINGS2016
£M2015
£M
COSTAt 1 October 993 986Share-based payments to employees of subsidiaries 16 15Recharged to subsidiaries during the year (5) (8)At 30 September 1,004 993PROVISIONSAt 1 October and 30 September 1 1NET BOOK VALUEAt 30 September 1,003 992
The principal subsidiary undertakings are listed in note 32 to the consolidated financial statements.
3 DEBTORS2016 2015
DEBTORS
FALLING DUE WITHIN 1 YEAR
£M
FALLING DUE AFTER MORE THAN 1 YEAR
£MTOTAL
£M
FALLING DUE WITHIN 1 YEAR
£M
FALLING DUE AFTER MORE THAN 1 YEAR
£MTOTAL
£M
Amounts owed by subsidiary undertakings 11,319 – 11,319 10,480 – 10,480Other debtors – – – 1 – 1Derivative financial instruments (note 7) 2 184 186 19 58 77Deferred taxation 1 – 1 1 – 1Total 11,322 184 11,506 10,501 58 10,559
MOVEMENT IN DEFERRED TAX ASSET
2016 NET
SHORT TERM TEMPORARY
DIFFERENCES £M
2015 NET
SHORT TERM TEMPORARY
DIFFERENCES £M
At 1 October 1 –Credit to profit and loss account – 1At 30 September 1 1
The deferred taxation asset arises on certain derivative financial instruments and will be recovered no later than the maturity dates of these instruments.
NOTES TO THE PARENT COMPANY FINANCIAL STATEMENTSFor the year ended 30 September 2016
FINAN
CIAL STATEMEN
TS
Compass Group PLC Annual Report 2016 157

4 CREDITORS2016 2015
CREDITORS
FALLING DUE WITHIN 1 YEAR
£M
FALLING DUE AFTER MORE THAN 1 YEAR
£MTOTAL
£M
FALLING DUE WITHIN 1 YEAR
£M
FALLING DUE AFTER MORE THAN 1 YEAR
£MTOTAL
£M
Bank overdrafts 80 – 80 34 – 34Bank loans 250 281 531 50 251 301Bank overdrafts and loans (note 6) 330 281 611 84 251 335
Loan notes 35 1,525 1,560 107 1,330 1,437Bonds – 1,253 1,253 – 1,093 1,093Loan notes and bonds (note 6) 35 2,778 2,813 107 2,423 2,530
Derivative financial instruments (note 7) 9 1 10 7 25 32Accruals and deferred income 45 – 45 49 – 49Current taxation 32 – 32 22 – 22Amounts owed to subsidiary undertakings 6,839 – 6,839 6,069 – 6,069Total 7,290 3,060 10,350 6,338 2,699 9,037
The Company has fixed term, fixed interest private placements denominated in US dollar and sterling.
LOAN NOTESNOMINAL
VALUE REDEEMABLE INTEREST
2016 CARRYING
VALUE £M
2015 CARRYING
VALUE £M
US$ private placement $162m Oct 2015 6.72% – 107Sterling private placement £35m Oct 2016 7.55% 35 36US$ private placement $250m Oct 2018 3.31% 196 170US$ private placement $200m Sep 2020 3.09% 154 132US$ private placement $398m Oct 2021 3.98% 306 262US$ private placement $352m Oct 2023 4.12% 301 250US$ private placement $100m Dec 2024 3.54% 107 66US$ private placement $300m Sep 2025 3.81% 231 216US$ private placement $300m Dec 2026 3.64% 230 198Total 1,560 1,437
The Company also has sterling and euro denominated Eurobonds.
BONDS NOMINAL
VALUE REDEEMABLE INTEREST
2016 CARRYING
VALUE £M
2015 CARRYING
VALUE £M
Euro Eurobond €600m Feb 2019 3.13% 537 458 Euro Eurobond €500m Jan 2023 1.88% 469 386 Sterling Eurobond £250m Jun 2026 3.85% 247 249 Total 1,253 1,093
Notes to the Parent Company financial statements continued
For the year ended 30 September 2016
158 Compass Group PLC Annual Report 2016

5 PROVISIONS FOR LIABILITIES AND CHARGES
PROVISIONS
LEGAL AND OTHER CLAIMS
£M
At 1 October 2014 and 30 September 2015 28At 1 October 2015 28Charged to profit and loss account 3At 30 September 2016 31
Provisions for legal and other claims relates to provisions for the estimated cost of litigation and other sundry claims. The timing of the settlement of these claims is uncertain.
6 MATURITY OF FINANCIAL LIABILITIES, OTHER CREDITORS AND DERIVATIVE FINANCIAL INSTRUMENTSThe maturity of financial liabilities, other creditors and derivative financial instruments as at 30 September is as follows:
2016 2015
MATURITY
BANK OVERDRAFTS
AND LOANS(NOTE 4)
£M
LOAN NOTES AND BONDS
(NOTE 4)£M
OTHER1
(NOTE 7)£M
TOTAL £M
BANK OVERDRAFTS
AND LOANS(NOTE 4)
£M
LOAN NOTES AND BONDS
(NOTE 4)£M
OTHER1
(NOTE 7)£M
TOTAL £M
Between 1 and 2 years 281 – (3) 278 251 36 1 288Between 2 and 5 years – 887 (35) 852 – 760 – 760In more than 5 years – 1,891 (145) 1,746 – 1,627 (34) 1,593In more than 1 year 281 2,778 (183) 2,876 251 2,423 (33) 2,641Within 1 year, or on demand 330 35 7 372 84 107 (12) 179Total 611 2,813 (176) 3,248 335 2,530 (45) 2,820
1. Other includes the debtor and creditor amounts associated with derivative financial instruments (note 7).
7 DERIVATIVE FINANCIAL INSTRUMENTS2016 2015
DERIVATIVE FINANCIAL INSTRUMENTS
FINANCIAL ASSETS(NOTE 3)
£M
FINANCIAL LIABILITIES
(NOTE 4)£M
FINANCIAL ASSETS(NOTE 3)
£M
FINANCIAL LIABILITIES
(NOTE 4)£M
INTEREST RATE SWAPSFair value hedges 74 – 60 –Not in a hedging relationship – (4) – (4)OTHERForward currency contracts and cross currency swaps 112 (6) 17 (28)Derivative financial instruments 186 (10) 77 (32)
8 SHARE CAPITALDetails of the share capital, share option schemes and share-based payments of Compass Group PLC are shown in notes 21 and 22 to the consolidated financial statements.
9 CONTINGENT LIABILITIES
CONTINGENT LIABILITIES2016
£M2015
£M
Guarantees and indemnities (including subsidiary undertakings’ overdrafts) 440 387
Details regarding certain contingent liabilities which involve the Company are set out in note 26 to the consolidated financial statements.
FINAN
CIAL STATEMEN
TS
Compass Group PLC Annual Report 2016 159
160 Compass Group PLC Annual Report 2016
REGISTRARAll matters relating to the administration of shareholdings in the Company should be directed to Capita Asset Services, The Registry, 34 Beckenham Road, Beckenham, Kent BR3 4TU; telephone within the UK: Freephone 0800 280 2545 and from overseas: +44 333 300 1568; email: [email protected].
Shareholders can register online to view their Compass Group PLC shareholding details using the Share Portal, a service offered by Capita Asset Services (the registrar), at www.capitashareportal.com. Shareholders registering for the Share Portal will require their investor code which is shown on share certificates. The service enables shareholders to:
• Check their shareholdings in Compass Group PLC 24 hours a day
• Gain easy access to a range of shareholder information including indicative valuation and payment instruction details
• Appoint a proxy to attend general meetings of Compass Group PLC
ELECTRONIC COMMUNICATIONSThe Company’s Annual Report and all other shareholder communications can be found on our website. The Company can, at shareholders’ request, send shareholders an email notification each time a new shareholder report or other shareholder communication is placed on our website. This enables shareholders to read and/or download the information at their leisure.
The provision of a facility to communicate with shareholders electronically does not discriminate between registered shareholders of the same class. The facility is available to all registered shareholders on equal terms and participation is made as simple as possible. Please note that it is the shareholder’s responsibility to notify the registrar (through www.capitashareportal.com or by post) of any change to their email address. Before electing for electronic communication, shareholders should ensure that they have the appropriate computer capabilities. The Company takes all reasonable precautions to ensure no viruses are present in any communication it sends out, but cannot accept any responsibility for loss or damage arising from the opening or use of any email or attachments from the Company and recommends that shareholders subject all messages to virus checking procedures prior to use. Please note that any electronic communication sent by a shareholder to the Company or the registrar containing a computer virus will not be accepted.
The Company’s obligation is satisfied when it transmits an electronic message. It cannot be held responsible for a failure in transmission beyond its control. In the event that the Company becomes aware that an electronic transmission is not successful, a paper notification will be sent to the shareholder at their registered address. Shareholders wishing to continue to receive shareholder information in the traditional paper format should confirm this via www.capitashareportal.com or write to Capita Asset Services.
PUBLISHED INFORMATIONIf you would like to receive a hard copy of this Annual Report and/or a copy of the Notice of Annual General Meeting in an appropriate alternative format such as large print, Braille or an audio version on CD, please contact the Group Company Secretariat at Compass Group PLC, Compass House, Guildford Street, Chertsey, Surrey KT16 9BQ. Our 2016 Annual Report and the Notice of Meeting are available at www.compass-group.com.
CASH DIVIDENDSThe Company normally pays a dividend twice each year. We encourage UK resident ordinary shareholders to elect to have their dividends paid directly into their bank or building society account. This is a more secure method of payment and avoids delays or the cheques being lost. Most ordinary shareholders resident outside the UK can also have any dividends in excess of £10 paid into their bank account directly via Capita Asset Services’ global payments service. Details and terms and conditions may be viewed at http://international.capitaregistrars.com.
DIVIDEND REINVESTMENT PLAN (DRIP)A DRIP service is provided by Capita IRG Trustees Limited. The DRIP allows eligible shareholders to use the whole of their cash dividend to buy additional shares in the Company, thereby increasing their shareholding. Additional information, including details of how to sign up, can be obtained from the Company’s website at www.compass-group.com and from Capita IRG Trustees Limited; telephone within the UK: Freephone 0800 280 2545 and from overseas: +44 333 300 1568; email: [email protected].
The latest date for receipt of new applications to participate in the DRIP in respect of the 2016 final dividend is 26 January 2017.
SHARE PRICE INFORMATIONThe price of the Company’s shares is available on the Company’s website at www.compass-group.com. This is supplied with a 15 minute delay to real time.
SHAREHOLDER INFORMATION

Compass Group PLC Annual Report 2016 161
SHARE DEALINGThe Company’s shares can be traded through most banks, building societies, stockbrokers or ‘share shops’. In addition, the Company’s registrar offers online and telephone dealing services to buy or sell Compass Group PLC shares. The service is only available to private shareholders aged 18 or over, resident in the UK, EEA, Channel Islands or Isle of Man. Full details can be obtained from www.capitadeal.com or by telephoning within the UK: Freephone 0800 280 2545.
SHAREGIFTShareGift, the charity share donation scheme, is a free service for shareholders wishing to give shares to charitable causes. It is particularly useful for those shareholders who may wish to dispose of a small quantity of shares where the market value makes it uneconomic to sell on a commission basis. Further information can be obtained from ShareGift’s website at www.sharegift.org; telephone within the UK: 020 7930 3737 and from overseas: +44 20 7930 3737, by email: [email protected] or from the registrar.
AMERICAN DEPOSITARY RECEIPTSBNY Mellon (BNY) maintains the Company’s American Depositary Receipt register. If you have any enquiries about your holding of Compass American Depositary Shares, you should contact BNY Mellon, Shareowner Services, Computershare, P.O. Box 30170, College Station TX 77842-3170, USA. Further information can be found on BNY’s website at www.adrbnymellon.com using the symbol CMPGY and on the Company’s website at www.compass-group.com.
UNSOLICITED MAILWe are legally obliged to make our register of members available to the public, subject to a proper purpose test. As a consequence of this, some shareholders might receive unsolicited mail. Shareholders wishing to limit the amount of such mail should write to the Mailing Preference Service, MPS FREEPOST LON20771, London W1E 0ZT. Shareholders can also register online at www.mpsonline.org.uk or request an application form by calling from within the UK: 0845 703 4599 or by email: [email protected].
IDENTITY THEFTAdvice on protecting your Compass Group PLC shares:
• Keep all Compass correspondence in a safe place, or destroy correspondence by shredding
• When changing address, inform the registrar, Capita Asset Services. If a letter from Capita Asset Services is received regarding a change of address and you have not moved, contact the registrar immediately
• Consider having your dividends paid directly into your bank or building society account. This will reduce the risk of the cheque being intercepted or lost in the post. You can complete a Request for Payment of Interest or Dividends form available from www.compass-group.com and send it to the registrar or register online at www.capitashareportal.com using the Share Portal service. Additional information can be obtained from the registrar
• On changing your bank or building society account, inform the registrar of the details of the new account and respond to any letters Capita Asset Services send you about this
• When buying or selling shares, deal only with brokers registered in your country of residence or the UK
WARNING ABOUT SHARE FRAUDFraudsters use persuasive and high pressure tactics to lure investors into scams. They may offer to sell shares that turn out to be worthless or non-existent, or to buy shares at an inflated price in return for an upfront payment.
Whilst high profits are promised, if you buy or sell shares in this way, you will probably lose your money.
HOW TO AVOID SHARE FRAUD• Keep in mind that firms authorised by the Financial Conduct
Authority (FCA) are unlikely to contact you out of the blue with an offer to buy or sell shares
• Do not get into a conversation. Note the name of the person and firm contacting you and then end the call
• Check the Financial Services Register at www.fca.org.uk to see if the person and firm contacting you are authorised by the FCA
• Beware of fraudsters claiming to be from an authorised firm, copying its website or giving you false contact details
• Use the firm’s contact details listed on the Register if you want to call it back
• Call the FCA on 0800 111 6768 if the firm does not have contact details on the Register or if you are told they are out of date
• Search the list of unauthorised firms to avoid at www.fca.org.uk• Consider that if you buy or sell shares from an unauthorised
firm you will not have access to the Financial Ombudsman Service or the Financial Services Compensation Scheme
• Think about getting independent financial and professional advice before you hand over any money
• Remember: if it sounds too good to be true, it probably is!
REPORT A SCAMIf you are approached by fraudsters, please tell the FCA using the share fraud reporting form at www.fca.org.uk, where you can find out more about investment scams, or call the FCA Consumer Helpline on 0800 111 6768.
If you have already paid money to share fraudsters, you should contact Action Fraud on 0300 123 2040 or online at www.actionfraud.police.uk.
SHAR
EHO
LDER
INFO
RM
ATION

162 Compass Group PLC Annual Report 2016
ADOPTION OF FINANCIAL REPORTING STANDARD (FRS) 101: REDUCED DISCLOSURE FRAMEWORKAs notified to shareholders in the Company’s 2015 Annual Report, following the publication of FRS 100 Application of Financial Reporting Requirements by the Financial Reporting Council, the Company was required to change its accounting framework for its Company financial statements, previously UK GAAP, for the financial year commencing 1 October 2015. No written objections to the proposed use of disclosure exemptions for the financial year commencing 1 October 2015 were received from a shareholder or shareholders holding in aggregate 5% or more of the total allotted shares in Compass Group PLC. The directors therefore implemented FRS 101 for the financial year commencing 1 October 2015.
The Board considers that it continues to be in the best interests of the Group for Compass Group PLC to continue to adopt FRS 101 Reduced Disclosure Framework for the financial year commencing 1 October 2016.
A shareholder or shareholders holding in aggregate 5% or more of the total allotted shares in Compass Group PLC may serve objections to the use of the disclosure exemptions on Compass Group PLC in writing to its registered office, Compass House, Guildford Street, Chertsey, Surrey, KT16 9BQ, no later than 12.00 noon on 31 January 2017.
FINANCIAL CALENDAR
Ex-dividend date for 2016 final dividend 19 January 2017Record date for 2016 final dividend 20 January 20172017 Annual General Meeting 2 February 20172016 final dividend payment 20 February 2017Half year financial results 10 May 2017*Ex-dividend date for 2017 interim dividend 22 June 2017*Record date for 2017 interim dividend 23 June 2017*2017 interim dividend payment 24 July 2017*
* Provisional dates.
Shareholder information continued
RETURN OF CASH AND SHARE CAPITAL CONSOLIDATION – BASE COST APPORTIONMENT FOR UK TAX PURPOSESOn 11 June 2014, shareholders approved a Return of Cash of 56 pence per Existing Ordinary Share, which resulted in approximately £1 billion being returned through the issue of one B or C Share to shareholders for each Existing Ordinary Share held at 6.00pm on 7 July 2014. The Return of Cash was accompanied by a consolidation of the Existing Ordinary Shares in the ratio of 16 New Ordinary Shares for every 17 Existing Ordinary Shares. The New Ordinary Shares were admitted to trading on 8 July 2014. The B and C shares were not admitted to trading.
The Base Cost Apportionment is in general terms based on respective market values on the first day after the reorganisation on which a price for the New Ordinary Shares was quoted on the London Stock Exchange. Based on the New Ordinary Share price of 1024.50 pence and the market value of a B Share and of a C Share of 56 pence, and calculated using the ratio of 16 New Ordinary Shares and 17 B or 17 C Shares for every 17 Existing Ordinary Shares previously held, 94.51% of the base cost of the Existing Ordinary Shares is apportioned to the New Ordinary Shares and 5.49% to the B and/or C Shares.
The information provided above is only intended to provide general guidance to UK shareholders and is not intended to be, and should not be construed to be, legal or taxation advice to any particular UK shareholder. It states the position as of 9 July 2014. If you are in any doubt as to your tax position, you are recommended to seek your own tax advice from an independent professional adviser. This note must be read in conjunction with the Circular to Shareholders dated 19 May 2014, where certain terms are defined.

Compass Group PLC Annual Report 2016 163
THIS DOCUMENT IS IMPORTANT AND REQUIRES YOUR IMMEDIATE ATTENTIONIf you are in any doubt as to the action you should take, you should immediately consult your stockbroker, bank manager, solicitor, accountant or other independent financial adviser authorised under the Financial Services and Markets Act 2000. If you have sold or otherwise transferred all your shares in Compass Group PLC, please send this Notice and the accompanying documents to the purchaser or transferee, or to the stockbroker, bank or other agent through whom the sale or transfer was effected for transmission to the purchaser or transferee.
16. To authorise the Audit Committee to agree the auditor’s remuneration.
17. That the authority conferred by Article 138 of the Company’s Articles of Association be and is hereby increased from £1,500,000 to £2,250,000.
18. To authorise the Company and any company which is, or becomes, a subsidiary of the Company during the period to which this Resolution relates, to:
18.1 make donations to political parties or independent election candidates;
18.2 make donations to political organisations other than political parties; and
18.3 incur political expenditure,
during the period commencing on the date of this Resolution and ending on the date of the Company’s next Annual General Meeting, provided that any such donations and expenditure made by the Company, or by any such subsidiary, shall not exceed £100,000 per company and, together with those made by any such subsidiary and the Company, shall not exceed in aggregate £100,000.
Any terms used in this Resolution which are defined in Part 14 of the Companies Act 2006 shall bear the same meaning for the purposes of this Resolution 18.
19. 19.1 To renew the power conferred on the directors by Article 12 of the Company’s Articles of Association for a period expiring at the end of the next Annual General Meeting of the Company after the date on which this Resolution is passed or, if earlier, 1 May 2018; and for that period the section 551 amount shall be £58,236,688.
19.2 In addition, the section 551 amount shall be increased by £58,236,688, for a period expiring at the end of the next Annual General Meeting of the Company after the date on which this Resolution is passed, provided that the directors’ power in respect of such latter amount shall only be used in connection with a rights issue:
19.2.1 to holders of ordinary shares in proportion (as nearly as may be practicable) to their existing holdings; and
19.2.2 to holders of other equity securities as required by the rights of those securities or as the Board otherwise considers necessary,
and that the directors may impose any limits or restrictions and make any arrangements which they consider necessary to deal with fractional entitlements, legal or practical problems under the laws of, or the requirements of, any relevant regulatory body or stock exchange, any territory, or any matter whatsoever.
NOTICE OF ANNUAL GENERAL MEETING
Notice is hereby given that the sixteenth Annual General Meeting of Compass Group PLC (the Company) will be held at 12 noon on Thursday 2 February 2017 at the Live Room, Rugby Football Union, Rugby House, Twickenham Stadium, 200 Whitton Road, Twickenham, Middlesex TW2 7BA in order to transact the following business:
To consider and, if thought fit, to pass the following Resolutions, of which Resolutions 20 to 23 will be proposed as special resolutions and all other Resolutions will be proposed as ordinary resolutions.
1. To receive and adopt the Directors’ Annual Report and Accounts and the Auditor’s Report thereon for the financial year ended 30 September 2016.
2. To receive and adopt the Directors’ Remuneration Report for the financial year ended 30 September 2016.
3. To declare a final dividend of 21.1 pence per ordinary share in respect of the financial year ended 30 September 2016.
4. To elect Stefan Bomhard as a director of the Company.
5. To re-elect Dominic Blakemore as a director of the Company.
6. To re-elect Richard Cousins as a director of the Company.
7. To re-elect Gary Green as a director of the Company.
8. To re-elect Johnny Thomson as a director of the Company.
9. To re-elect Carol Arrowsmith as a director of the Company.
10. To re-elect John Bason as a director of the Company.
11. To re-elect Don Robert as a director of the Company.
12. To re-elect Nelson Silva as a director of the Company.
13. To re-elect Ireena Vittal as a director of the Company.
14. To re-elect Paul Walsh as a director of the Company.
15. To reappoint KPMG LLP as the Company’s auditor until the conclusion of the next Annual General Meeting of the Company.
SHAR
EHO
LDER
INFO
RM
ATION
164 Compass Group PLC Annual Report 2016
SPECIAL RESOLUTIONS20. To authorise the directors, subject to the passing of
Resolution 19, and in accordance with the power conferred on the directors by Article 13 of the Company’s Articles of Association, such authority to apply until the conclusion of the next Annual General Meeting of the Company after the date on which this Resolution is passed or, if earlier, 1 May 2018 to allot equity securities (as defined in the Companies Act 2006) for cash under the authority given by that resolution and/or to sell ordinary shares held by the Company as treasury shares for cash as if section 561 of the Companies Act 2006 did not apply to any such allotment or sale, such authority to be limited:
20.1 to allotments for rights issues and other pre-emptive issues; and
20.2 to the allotment of equity securities or sale of treasury shares (otherwise than under paragraph 20.1 above) up to a nominal amount of £8,735,344 being not more than 5% of the issued ordinary share capital (excluding treasury shares) of the Company as at 1 December 2016, being the last practicable date prior to the publication of this Notice,
such authority to expire at the end of the next Annual General Meeting of the Company, or, if earlier, at the close of business on 1 May 2018, but in each case, prior to the expiry the Company may make offers, and enter into agreements, which would, or might require equity securities to be allotted (and treasury shares to be sold) after the authority expires and the Board may allot equity securities (and sell treasury shares) under any such offer or agreement as if the authority had not expired.
21. To authorise the directors, subject to the passing of Resolution 19, and in accordance with the power conferred on the directors by Article 13 of the Company’s Articles of Association and in addition to any authority granted under Resolution 20 to allot equity securities (as defined in the Companies Act 2006) for cash under the authority given by that Resolution and/or to sell ordinary shares held by the Company as treasury shares for cash as if section 561 of the Companies Act 2006 did not apply to any such allotment or sale, such authority to be:
21.1 limited to the allotment of equity shares or sale of treasury shares up to a nominal amount of £8,735,344 being not more than 5% of the issued ordinary share capital (excluding treasury shares) of the Company as at 1 December 2016, being the last practicable date prior to the publication of this Notice;
21.2 used only for the purposes of financing (or refinancing, if the authority is to be used within six months after the original transaction) a transaction which the Board of the Company determines to be an acquisition or other capital investment of a kind contemplated by the Statement of Principles on Disapplying Pre-Emption Rights most recently published by the Pre-Emption Group prior to the date of this Notice,
such authority to expire at the end of the next Annual General Meeting of the Company or, if earlier, on 1 May 2018, but in each case, prior to its expiry the Company may make offers, and enter into agreements, which would, or might require equity securities to be allotted (and treasury shares to be sold) after the authority expires and the Board may allot equity securities (and sell treasury shares) under any such offer or agreement as if the authority had not expired.
22. To generally and unconditionally authorise the Company, pursuant to and in accordance with section 701 of the Companies Act 2006, to make market purchases (within the meaning of section 693(4) of that Act) of ordinary shares of 105⁄8 pence each in the capital of the Company subject to the following conditions:
22.1 the maximum aggregate number of ordinary shares hereby authorised to be purchased is 164,430,000;
22.2 the minimum price (excluding expenses) which may be paid for each ordinary share is 105⁄8 pence;
22.3 the maximum price (excluding expenses) which may be paid for each ordinary share in respect of a share contracted to be purchased on any day, does not exceed the higher of (1) an amount equal to 105% of the average of the middle market quotations for an ordinary share as derived from the London Stock Exchange Daily Official List for the five business days immediately preceding the day on which the purchase is made and (2) the higher of the price of the last independent trade and the highest current independent bid for an ordinary share as derived from the London Stock Exchange Trading System; and
22.4 this authority shall expire, unless previously renewed, varied or revoked by the Company, at the conclusion of the next Annual General Meeting of the Company or 1 August 2018, whichever is the earlier (except in relation to the purchase of ordinary shares, the contract for which was concluded prior to the expiry of this authority and which will or may be executed wholly or partly after the expiry of this authority).
Notice of Annual General Meeting continued

Compass Group PLC Annual Report 2016 165
23. To authorise the directors to call a general meeting of the Company, other than an Annual General Meeting, on not less than 14 clear working days’ notice, provided that this authority shall expire at the conclusion of the next Annual General Meeting of the Company after the date of the passing of this Resolution.
Voting on all Resolutions will be by way of a poll.
By Order of the Board
Mark WhiteGeneral Counsel and Company Secretary 21 December 2016 Registered Office: Compass House Guildford Street Chertsey Surrey KT16 9BQ
Registered in England and Wales No. 4083914
EXPLANATORY NOTES TO THE RESOLUTIONSRESOLUTION 1 – ANNUAL REPORT AND ACCOUNTSThe directors are required to present to the Annual General Meeting (AGM) (the Meeting) the audited Accounts and the Directors’ and Auditor’s Reports for the financial year ended 30 September 2016.
RESOLUTION 2 – DIRECTORS’ REMUNERATION REPORTIn accordance with section 439 of the Companies Act 2006 (CA 2006), shareholders are requested to approve the Directors’ Remuneration Report. The Directors’ Remuneration Report is set out on pages 58 to 79 of the 2016 Annual Report and Accounts. The vote is advisory.
In accordance with section 439A of the CA 2006, a separate resolution on the Remuneration Policy (the Policy) part of the Directors’ Remuneration Report must be put to the vote and approved by shareholders at least every three years, unless during that time it is to be changed. The Policy was approved by shareholders at the 2015 AGM. The directors do not propose any changes to the Policy this year and as such, it is not necessary for the directors to submit a resolution on the Policy to shareholders for approval at the 2017 AGM. A copy of the Remuneration Policy in force is set out on pages 62 to 68 of the 2016 Annual Report. To the extent that changes have been made to the Policy since last year, these are merely to ensure that the content of the Policy remains relevant to the financial year under review; in all other respects, the Policy remains unchanged.
RESOLUTION 3 – FINAL DIVIDENDThe final dividend for the year ended 30 September 2016 will be paid on 20 February 2017 to shareholders on the register at the close of business on 20 January 2017, subject to shareholder approval.
RESOLUTIONS 4 TO 14 – ELECTION AND RE-ELECTION OF DIRECTORSBiographical details of all the directors standing for election or re-election appear on pages 38 to 40 of the 2016 Annual Report.
In line with the provisions of the Company’s Articles of Association, Stefan Bomhard, who was appointed by the Board since the date of the last AGM, will submit himself for election by shareholders. Details of his appointment are given on page 55.
The Company’s Articles of Association require one third of the directors to retire by rotation each year and no director may serve for more than three years without being re-elected by shareholders. However, in accordance with the UK Corporate Governance Code (the Code), all the directors will submit themselves for annual re-election by shareholders.
Having conducted an external evaluation during the year, it is the view of the external facilitators and the Chairman that the performance of each of the directors continues to be effective and that each director demonstrates commitment to the role and has sufficient time to meet his or her commitment to the Company.
SHAR
EHO
LDER
INFO
RM
ATION

166 Compass Group PLC Annual Report 2016
RESOLUTIONS 15 AND 16 – AUDITORThe auditor is appointed at every general meeting at which accounts are presented to shareholders. The current appointment of KPMG LLP as the Company’s auditor will end at the conclusion of the AGM and it has advised of its willingness to stand for reappointment. In accordance with provisions of the Code, it is recommended practice for the Audit Committee to be authorised to agree how much the auditor should be paid and Resolution 16 grants this authority to the Audit Committee. KPMG LLP were first appointed by shareholders as the Company’s auditor at the 2015 AGM.
RESOLUTION 17 – ARTICLE 138 AUTHORITYThe Company’s Articles of Association provide that the ordinary remuneration of non-executive directors (including the Chairman) shall not exceed in aggregate £1,500,000 per annum or such higher amount as the Company may from time to time determine by ordinary resolution. To ensure that the directors do not inadvertently breach the existing £1,500,000 aggregate (which was first set in 2008) and to ensure that the Company is able to continue to recruit and retain suitable candidates, it is proposed that the authority granted to the directors by Article 138 be increased to £2,250,000.
RESOLUTION 18 – DONATIONS TO POLITICAL PARTIESIt is not Group policy to make donations to political parties. However, it is possible that certain routine activities undertaken by the Company and its subsidiaries might unintentionally fall within the wide definition of matters constituting political donations and expenditure in the CA 2006. Any expenditure that is regulated under the CA 2006 must first be approved by shareholders and will be disclosed in next year’s Annual Report. This Resolution, if passed, will renew the directors’ authority until the AGM to be held in 2018 (2018 AGM) (when the directors intend to renew this authority) to make donations and incur expenditure which might otherwise be caught by the terms of the CA 2006, up to an aggregate amount of £100,000 for the Company and for subsidiary companies.
RESOLUTION 19 – DIRECTORS’ AUTHORITY TO ALLOT SHARESThe purpose of Resolution 19 is to renew the directors’ power to allot shares. Resolution 19.1 seeks to grant the directors authority to allot, pursuant to Article 12 of the Company’s Articles of Association and section 551 of the CA 2006, relevant securities with a maximum nominal amount of £58,236,688. This represents 548,110,000 ordinary shares of 105⁄8 pence each in the capital of the Company, which is approximately one third of the Company’s issued ordinary share capital (excluding treasury shares) as at 1 December 2016 (being the last practicable date prior to the publication of this Notice). The Company currently holds 9,856,681 shares in treasury. The authority would, unless previously renewed, revoked or varied by shareholders, remain in force up to the conclusion of the 2018 AGM of the Company or 1 May 2018, whichever is earlier.
In accordance with the Investment Association Share Capital Management Guidelines (the Guidelines), Resolution 19.2 seeks to grant the directors authority to allot approximately a further one third of the Company’s issued ordinary share capital (excluding treasury shares) in connection with a rights issue in favour of ordinary shareholders with a nominal value of up to £58,236,688 (representing 548,110,000 ordinary shares of 105⁄8 pence each). Such additional authority will be valid until the conclusion of the 2018 AGM.
If the Company uses any of the additional one third authority permitted by the Guidelines, the Company will ensure that all directors stand for re-election. The Company’s current practice is that all directors submit themselves for re-election each year in accordance with the Code, notwithstanding the provisions set out in the Guidelines.
The total authorisation sought by Resolution 19 is equal to approximately two thirds of the issued ordinary share capital of the Company (excluding treasury shares) as at 1 December 2016, being the last practicable date prior to publication of this Notice.
Resolutions 1 to 19 will be proposed as ordinary resolutions and require that more than half of the votes cast must be in favour of a resolution for it to be passed.
RESOLUTIONS 20 AND 21 – DISAPPLICATION OF PRE-EMPTION RIGHTSIf the Company issues new shares, or sells treasury shares, for cash (other than in connection with an employee share scheme), it must first offer them to existing shareholders in proportion to their existing holdings. In accordance with investor guidelines, approval is sought by the directors to issue a limited number of ordinary shares for cash without offering them to existing shareholders.
In 2015, the Pre-Emption Group (which represents the Investment Association and the Pension and Lifetime Savings Association) published a revised statement of principles for the disapplication of pre-emption rights (the Principles). The Principles provide that a general authority for the disapplication of pre-emption rights over approximately 5% of the Company’s issued ordinary share capital should be treated as routine. This general authority, which the directors have sought and received in previous years, is dealt with under Resolution 20.
Subject to the passing of Resolution 19, Resolution 20 seeks to replace the authority conferred on the directors at the 2016 AGM to allot ordinary shares, or grant rights to subscribe for, or convert securities into, ordinary shares or sell treasury shares for cash (other than pursuant to an employee equity incentive share scheme) up to an aggregate nominal value of approximately 5% of the Company’s issued ordinary share capital without application of pre-emption rights pursuant to Article 13 of the Company’s Articles of Association and section 561 of the CA 2006. Other than in connection with a rights, scrip dividend, or other similar issue, the authority contained in this Resolution 20 would be limited to a maximum nominal amount of £8,735,344.
Notice of Annual General Meeting continued
Compass Group PLC Annual Report 2016 167
The Pre-Emption Group further provides that the Company may, as a routine, seek to disapply pre-emption rights over the equivalent of approximately an additional 5% of the issued ordinary share capital of the Company, so long as certain criteria are met.
Subject to the passing of Resolution 19, Resolution 21 seeks to replace the authority conferred on the directors at the 2016 AGM to allot ordinary shares, or grant rights to subscribe for, or convert securities into, ordinary shares or sell treasury shares for cash (other than pursuant to an employee equity incentive share scheme) up to an aggregate nominal value of approximately 5% of the Company’s issued ordinary share capital without application of pre-emption rights pursuant to Article 13 of the Company’s Articles of Association and section 561 of the CA 2006, provided that this authority will only be used for the purpose of:
(i) an acquisition; or(ii) a specified capital investment in respect of which sufficient
information regarding the effect of the investment on the Company, the assets that are the subject of the investment and (where appropriate) the profits attributable to those assets is made available to shareholders to enable them to reach an assessment of the potential return on the investment
which is announced contemporaneously with the issue or which has taken place in the preceding six month period and is disclosed in the announcement of the issue.
Other than in connection with a rights, scrip dividend, or other similar issue, the authority contained in this Resolution 21 would be limited to a maximum nominal amount of £8,735,344.
These together represent 164,430,000 ordinary shares of 105⁄8 pence each in the capital of the Company, which is approximately 10% of the Company’s issued ordinary share capital (excluding treasury shares) as at 1 December 2016 (being the last practicable date prior to the publication of this Notice). The authority would, unless previously renewed, revoked or varied by shareholders, expire at the conclusion of the AGM of the Company to be held in 2018 or on 1 May 2018, if earlier.
Save for issues of shares in respect of various employee share schemes and any share dividend alternatives, the directors have no current plans to utilise the authorities sought by Resolutions 19, 20 and 21, although they consider their renewal appropriate in order to retain maximum flexibility to take advantage of business opportunities as they arise. In addition, and in line with best practice, the Company has not issued more than 7.5% of its issued share capital on a non-pro rata basis over the last three years. The limit also applies to shares issued from treasury. A renewal of this authority will be proposed at each subsequent AGM and the Board confirms its intention to follow best practice set out in the Principles which provides that usage of this authority in excess of 7.5% of the Company’s issued share capital in a rolling three year period would not take place without prior consultation with shareholders.
RESOLUTION 22 – PURCHASE OF OWN SHARESThis Resolution authorises the directors to make limited on market purchases of the Company’s ordinary shares. The power is limited to a maximum of 164,430,000 shares ( just under 10% of the issued ordinary share capital as at 1 December 2016, being the last practicable date prior to the publication of this Notice) and details the minimum and maximum prices that can be paid, exclusive of expenses. The authority conferred by this Resolution will expire at the conclusion of the Company’s next AGM or 18 months from the passing of this Resolution, whichever is the earlier.
The CA 2006 permits the Company to hold shares repurchased as treasury shares. Treasury shares may be cancelled, sold for cash or used for the purpose of employee equity incentive schemes. The authority to be sought by this Resolution is intended to apply equally to shares to be held by the Company as treasury shares. No dividends will be paid on shares which are held as treasury shares and no voting rights will be attached to them. Shares held as treasury shares will normally be used to satisfy the Company’s obligations under the Company’s employee equity incentive schemes.
From 1 October 2015 to 31 March 2016, the Company repurchased 6,560,656 ordinary shares of 105⁄8 pence for a consideration of £72.7 million (including expenses). These shares were subsequently transferred to be held in treasury for the purpose of satisfying the Company’s obligations under employee equity incentive schemes. From 1 April 2016 to 30 September 2016 and from 1 October 2016 up to the date of this Notice, 2,110,923 and 376,622 ordinary 105⁄8 pence shares were repurchased for a consideration of £27.5 million and £5.2 million (including expenses) respectively, and subsequently cancelled. Shares held in treasury are not eligible to participate in dividends and do not carry any voting rights.
As at 1 December 2016 (being the last practicable date prior to the publication of this Notice), there were options to subscribe for ordinary shares issued by the Company outstanding over approximately 9,500,000 shares which represent 0.57% of the Company’s issued ordinary share capital (excluding treasury shares) at that date. If the authority to purchase the Company’s ordinary shares was exercised in full, these options would represent 0.64% of the Company’s issued ordinary share capital (excluding treasury shares).
SHAR
EHO
LDER
INFO
RM
ATION

168 Compass Group PLC Annual Report 2016
RESOLUTION 23 – NOTICE OF MEETINGS OTHER THAN ANNUAL GENERAL MEETINGSThe Company’s Articles of Association allow the directors to call general meetings, other than AGMs, on 14 clear working days’ notice. However, under the Companies (Shareholders’ Rights) Regulations 2009 (the Regulations), all general meetings must be held on 21 days’ notice, unless shareholders agree to a shorter notice period, and the Company has met the requirements for electronic voting under the Regulations. This Resolution seeks to renew the authority granted by shareholders at last year’s AGM which preserved the Company’s ability to call general meetings, other than AGMs, on 14 clear working days’ notice, such authority to be effective until the Company’s next AGM, when a similar resolution will be proposed. The directors confirm that the shorter notice period would not be used as a matter of routine, but only where flexibility is merited by the business of the meeting and it is thought to be to the advantage of shareholders as a whole. An electronic voting facility will be made available to all shareholders for any meeting held on such notice.
Resolutions 20 to 23 will be proposed as special resolutions and require that at least three quarters of the votes cast must be in favour of a resolution for it to be passed.
RECOMMENDATIONThe directors consider that each of the Resolutions is in the best interests of the Company and the shareholders as a whole and, accordingly, recommend that all shareholders vote in favour of all Resolutions, as the directors intend to do in respect of their own holdings.
IMPORTANT INFORMATIONPROXIES(i) A shareholder entitled to attend and vote at the AGM may
appoint a proxy or proxies (who need not be a shareholder of the Company) to exercise all or any of his or her rights to attend, speak and vote at the AGM. Where more than one proxy is appointed, each proxy must be appointed for different shares.
Proxies may only be appointed by:
• Completing and returning the Form of Proxy enclosed with this Notice to PXS1, 34 Beckenham Road, Beckenham, Kent BR3 4ZF
• Going to www.capitashareportal.com and following the instructions for electronic submission provided there; or
• Having an appropriate CREST message transmitted, if you are a user of the CREST system (including CREST personal members). Please refer to the CREST manual on the Euroclear website (www.euroclear.com/CREST) for further information
Return of the Form of Proxy will not prevent a shareholder from attending the Meeting and voting in person. However, if you do attend the Meeting, any proxy appointment will be treated as revoked.
The electronic addresses provided in this Notice are provided solely for the purpose of enabling shareholders to register the appointment of a proxy or proxies for the Meeting or to submit their voting directions electronically. You may not use any electronic address provided in the Notice of this Meeting to communicate with the Company for any purposes other than those expressly stated.
(ii) To be effective, the Form of Proxy must be completed in accordance with the instructions and received by the Company’s registrar by 12 noon on Tuesday 31 January 2017.
To appoint a proxy or to give an instruction to a previously appointed proxy via the CREST system, the CREST message must be received by the issuer’s agent (ID RA10) by 12 noon on Tuesday 31 January 2017. Please note, however, that proxy messages cannot be sent through CREST on weekends, public holidays or after 8.00pm on any other day. For the purpose of this deadline, the time of receipt will be taken to be the time (as determined by the timestamp applied to the message by the CREST Applications Host) from which the issuer’s agent is able to retrieve the message. CREST personal members or other CREST sponsored members and those CREST members that have appointed voting service provider(s) should contact their CREST sponsor or voting service provider(s) for assistance with appointing proxies via CREST.
Notice of Annual General Meeting continued

Compass Group PLC Annual Report 2016 169
For further information on CREST procedures, limitations and system timings, please refer to the CREST manual. We may treat as invalid a proxy appointment sent by CREST in the circumstances set out in Regulation 35(5)(a) of the Uncertificated Securities Regulations 2001, as amended.
(iii) Pursuant to Regulation 41 of the Uncertificated Securities Regulations 2001 and section 360B(2) of the CA 2006, the Company specifies that only those shareholders registered in the Register of Members of the Company as at close of business on Tuesday 31 January 2017 or, in the event that the Meeting is adjourned, in the Register of Members at the close of business two days before the time of any adjourned meeting, shall be entitled to attend or vote at the Meeting in respect of the number of shares registered in their name at the relevant time. Changes to entries on the Register of Members after close of business on Tuesday 31 January 2017 or, in the event that the Meeting is adjourned, at close of business two days before the time of any adjourned meeting, shall be disregarded in determining the rights of any person to attend or vote at the Meeting.
NOMINATED PERSONSAny person to whom a copy of this Notice is sent who is a person nominated under section 146 of the CA 2006 to enjoy information rights (Nominated Person) may, under an agreement between him or her and the shareholder by whom he or she was nominated, have a right to be appointed (or to have someone else appointed) as a proxy for the AGM. If a Nominated Person has no such proxy appointment right or does not wish to exercise it, he or she may, under any such agreement, have a right to give instructions to the shareholder as to the exercise of voting rights.
The statement of the rights of shareholders in relation to the appointment of proxies in note (i) above does not apply to Nominated Persons. The rights described in that note can only be exercised by shareholders of the Company.
SHAREHOLDER RIGHTS AND AGM BUSINESSUnder sections 338 and section 338A of the CA 2006, shareholders meeting the threshold requirements which, broadly, requires a minimum of 100 shareholders holding an average of 941 ordinary shares each or shareholders holding at least 5% of the Company’s issued share capital, have the right to require the Company (i) to give to shareholders of the Company entitled to receive notice of the AGM notice of a resolution which may properly be moved and is intended to be moved at the AGM and/or (ii) to include in the business to be dealt with at the AGM any matter (other than a proposed resolution) which may be properly included in the business. A resolution may properly be moved or a matter may properly be included in the business unless (a) (in the case of a resolution only) it would, if passed, be ineffective (whether by reason of inconsistency with any enactment or the Company’s constitution or otherwise), (b) it
is defamatory, or (c) it is frivolous or vexatious. Such a request may be in hard copy or electronic form and must identify the resolution of which notice is to be given or the matter to be included in the business, must be authorised by the person or persons making it, must be received by the Company not later than Wednesday 21 December 2016, being the date six clear weeks before the AGM, and (in the case of a matter to be included in the business only) must be accompanied by a statement setting out the grounds for the request.
RIGHT TO ASK QUESTIONSUnder section 319A of the CA 2006, shareholders have the right to ask questions at the AGM relating to the business of the Meeting and for these to be answered, unless such answer would interfere unduly with the business of the Meeting, involve the disclosure of confidential information, if the answer has already been published on the Company’s website; or if it is not in the interests of the Company or the good order of the Meeting that the question be answered.
WEBSITE PUBLICATION OF AUDIT CONCERNSUnder section 527 of the CA 2006, shareholders have a right to request publication of any concerns that they propose to raise at the AGM relating to the audit of the Company’s Accounts (including the Auditor’s Report and the conduct of the audit) that are to be submitted to the Meeting or any circumstances connected to the Company’s auditor who ceased to hold office since the last AGM. The Company will publish the statement if sufficient requests have been received in accordance with section 527(2) of the CA 2006 which, broadly, requires a minimum of 100 shareholders holding an average of 941 ordinary shares each or shareholders holding at least 5% of the Company’s issued ordinary share capital to make the request. The Company may not require the members requesting any such website publication to pay its expenses in complying with such request. Where a statement is published, the Company will forward the statement to the Company’s auditor not later than the time when it makes the statement available on the website. The business which may be dealt with at the AGM includes any statement that the Company has been required under section 527 of the CA 2006 to publish on its website.
DOCUMENTS AVAILABLE FOR INSPECTIONCopies of the service agreements of the executive directors, the letters of appointment of the non-executive directors, the directors’ deeds of indemnity, the Register of Directors’ Interests and the Company’s Articles of Association will be available for inspection during normal business hours from the date of dispatch of this Notice until the date of the AGM (Saturdays, Sundays and public holidays excepted) at the registered office of the Company, Compass House, Guildford Street, Chertsey, Surrey KT16 9BQ, and will also be made available at the Meeting for a period of 15 minutes prior to and during the continuance of the Meeting.
SHAR
EHO
LDER
INFO
RM
ATION

170 Compass Group PLC Annual Report 2016
TOTAL VOTING RIGHTSAs at 1 December 2016 (being the last practicable date prior to the publication of this Notice), the Company’s issued share capital comprised 1,644,334,486 ordinary shares (excluding treasury shares). The holders of ordinary shares are entitled to attend and vote at general meetings of the Company. On a vote by show of hands, every ordinary shareholder who is present has one vote and every proxy present who has been duly appointed by a shareholder entitled to vote has one vote. On a vote by poll, every ordinary shareholder who is present in person or by proxy has one vote for every ordinary share held. It is proposed that all votes on the Resolutions at the AGM will be taken by way of a poll.
The total voting rights in the Company as at 1 December 2016 were 1,644,334,486 (excluding treasury shares).
INFORMATION AVAILABLE ON WEBSITEThe following information is available on the Company’s website at www.compass-group.com:
(i) the matters set out in this Notice of Meeting;(ii) the total voting rights and number of shares of each class in
respect of which shareholders are entitled to exercise voting rights at the AGM;
(iii) shareholders’ rights to include business to be dealt with at the AGM; and
(iv) shareholders’ statements, resolutions and matters of business received by the Company after 21 December 2016.
THE AGMThe doors of the Live Room at Twickenham RFU Stadium will open at 10.30am and the AGM will start promptly at 12 noon. Please see the map on the next page for the location of Twickenham RFU Stadium. Car parking is available for shareholders as indicated on the map. For more information of how to get to the venue, go to www.twickenhamexperience.com.
ATTENDING THE AGMIf you are coming to the AGM, please bring your attendance card with you. It authenticates your right to attend, speak and vote at the AGM and will speed your admission. You may also find it useful to bring this Notice of AGM and the Annual Report 2016 so that you can refer to them at the Meeting. All joint shareholders may attend and speak at the AGM. However, only the first shareholder listed on the Register of Members is entitled to vote. At the discretion of the Company, and subject to sufficient seating capacity, a shareholder may enter with one guest, provided that the shareholder and their guest register to enter the AGM at the same time.
Notice of Annual General Meeting continued
QUESTIONSAll shareholders or their proxies will have the opportunity to ask questions at the AGM. When invited by the Chairman, if you wish to ask a question, please wait for a Company representative to bring you a microphone. It would be helpful if you could state your name before you ask your question. A question may not be answered at the Meeting if it is not considered to be in the interests of the Company or the good order of the Meeting or if it would involve the disclosure of sensitive information. The Chairman may also nominate a representative to answer a specific question after the Meeting or refer the questioner to the Company’s website.
VOTING AT THE AGMThe Company confirms that all Resolutions to be proposed at the AGM will be put to the vote on a poll. This will result in a more accurate reflection of the views of all of the Company’s shareholders by ensuring that every vote is recognised, including the votes of shareholders who are unable to attend the Meeting but who have appointed a proxy for the Meeting. On a poll, each shareholder has one vote for each share held.
After each Resolution is put to the Meeting, you will be asked to cast your vote. All of the votes of the shareholders present will be counted, and added to those received by proxy, and the provisional final votes will be displayed at the Meeting.
The voting results, which will include all votes cast for and against each Resolution at the Meeting, and all proxies lodged prior to the Meeting, will be announced at the Meeting and published on the Company’s website as soon as practicable after the Meeting. The Company will also disclose the number of votes withheld.
If you have already voted by proxy, you will still be able to vote at the Meeting and your vote on the day will replace your previously lodged proxy vote.
Whomever you appoint as a proxy can vote or abstain from voting as he or she decides on any other business which may validly come before the AGM. This includes proxies appointed using the CREST service. Details of how to complete the appointment of a proxy either electronically or on paper are given in the notes to this Notice.

Compass Group PLC Annual Report 2016 171
VENUE ARRANGEMENTSFor your personal safety and security, all hand baggage may be subject to examination. Please note that electronic devices such as recording equipment may not be brought into the AGM. A cloakroom will be available to deposit coats and bulky items.
A sign language interpreter will attend the AGM and a sound amplification/hearing loop will be available in the meeting room.
There is wheelchair access. Anyone accompanying a shareholder in need of assistance will be admitted to the AGM. If any shareholder with a disability has any questions regarding attendance at the AGM, please contact the Group Company Secretariat at Compass Group PLC, Compass House, Guildford Street, Chertsey, Surrey KT16 9BQ by 25 January 2017.
Security staff will be on duty to assist shareholders. The Company will not permit behaviour that may interfere with another person’s security, safety or the good order of the AGM.
Please ensure that all electronic equipment is switched off throughout the AGM.
Tea and coffee will be available before the Meeting and light refreshments will be served afterwards.
SHAREHOLDER ENQUIRIESCapita Asset Services maintain the Company’s share register. If you have any enquiries about the AGM or about your shareholding, you should contact Capita Asset Services, The Registry, 34 Beckenham Road, Beckenham, Kent BR3 4TU.
AMERICAN DEPOSITARY RECEIPT ENQUIRIESBNY Mellon maintains the Company’s American Depositary Receipt register. If you have any enquiries about your holding of Compass American Depositary Shares, you should contact BNY Mellon, Shareowner Services, Computershare, P.O. Box 30170, College Station TX 77842-3170, USA.
DATA PROTECTION STATEMENTYour personal data includes all data provided by you, or on your behalf, which relates to you as a shareholder, including your name and contact details, the votes you cast and your Reference Number (attributed to you by the Company). The Company determines the purposes for which and the manner in which your personal data is to be processed. The Company and any third party to which it discloses the data (including the Company’s registrar) may process your personal data for the purposes of compiling and updating the Company’s records, fulfilling its legal obligations and processing the shareholder rights you exercise.
PUBLISHED INFORMATIONIf you would like to receive this Notice and/or a copy of the Annual Report 2016 in an appropriate alternative format, such as large print, Braille or an audio version on CD, please contact the Group Company Secretariat at Compass Group PLC, Compass House, Guildford Street, Chertsey, Surrey KT16 9BQ.
Our 2016 Annual Report and this Notice are available at www.compass-group.com.
NORTH
STAND
SOUTH
STAND
EAST
STAND
WEST
STAND
WHITTON ROAD
A316 CHERTSEY ROAD
CHU
DLEIG
H R
OAD
PALMER
STON
RO
AD
WH
ITTON ROAD
RUGBY ROAD
WH
ITTON ROAD
TALMA G
ARD
ENS
WHITTONSTATION
TWICKENHAMSTATION
CENTRALLONDON/
RICHMOND
THE LIVE ROOMCAR PARK ENTRANCE
MAIN CAR PARK (PARKING FOR SHAREHOLDERS)
RFU RUGBY STORE
MARRIOTT HOTEL
CARDEALERSHIP
TRADINGESTATE
WEBB ELLISHOUSE
CAR PARK ENTRANCE FOR SHAREHOLDERS
DU
KE
OF
NO
RTH
UM
BER
LAN
D’S
RIV
ER
M25 M3THE WEST
TAYBEN
AVEN
UE
WHITTON DENE MOGDEN LANE
RS 1
MP
RS
1
M
P
E
EG
ER
TON
RO
AD
E
For more information of how to get to the AGM venue go to www.twickenhamexperience.com.
SHAR
EHO
LDER
INFO
RM
ATION

172 Compass Group PLC Annual Report 2016
Constant currency Restates the prior year results to the current year’s average exchange rates.Underlying revenue The combined sales of Group and share of equity accounted joint ventures.Underlying operating profit – Group Includes share of profit after tax of associates and profit before tax of joint ventures
but excludes the specific adjusting items, as listed below.Underlying operating profit – Region Includes share of profit before tax of joint ventures but excludes the specific
adjusting items, as listed below, profit after tax of associates and EM & OR restructuring.
Underlying operating margin – Group Based on underlying revenue and underlying operating profit excluding share of profit after tax of associates.
Underlying operating margin – Region Based on underlying revenue and underlying operating profit excluding share of profit after tax of associates and EM & OR restructuring.
Underlying net finance cost Excludes specific adjusting items.Underlying profit before tax Excludes specific adjusting items.Underlying basic earnings per share Excludes specific adjusting items and the tax attributable to those items.Underlying depreciation and amortisation Excludes specific adjusting items.Underlying EBITDA Based on underlying operating profit, adding back underlying depreciation
and amortisation.Underlying tax Excludes tax attributable to specific adjusting items.Underlying effective tax rate Based on underlying tax charge and underlying profit before tax.Underlying cash tax Tax payments made in respect of underlying tax.Underlying cash tax rate Based on underlying cash tax and underlying profit before tax.Underlying free cash flow Adjusted for cash restructuring costs in the year relating to the 2012 and 2013
European exceptional programme.Underlying gross capex Includes Group and share of equity accounted joint ventures’ capex spend.Organic revenue growth Calculated by adjusting underlying revenue for acquisitions (excluding current
year acquisitions and including a full period in respect of prior year acquisitions), disposals (excluded from both periods) and exchange rate movements (translating the prior period at current year exchange rates) and compares the current year results against the prior year. In addition, where applicable, a 53rd week has been excluded from the current year underlying revenue.
Organic operating profit growth Calculated by adjusting underlying operating profit for acquisitions (excluding current year acquisitions and including a full period in respect of prior year acquisitions), disposals (excluded from both periods) and exchange rate movements (translating the prior period at current year exchange rates) and compares the current year results against the prior year. In addition, where applicable, a 53rd week has been excluded from the current year underlying operating profit.
Like for like revenue growth Calculated by adjusting organic revenue growth for new business wins and lost business.
Specific adjusting items • amortisation of intangibles arising on acquisition• acquisition transaction costs• adjustment to contingent consideration on acquisition• share-based payments expense relating to non-controlling interest call options• tax on share of profit of joint ventures• profit/(loss) on disposal of businesses• other financing items
EM & OR restructuring Emerging Markets and Offshore & Remote restructuring.ROCE ROCE divides the net operating profit after tax (NOPAT) by the 12 month average
capital employed.NOPAT Calculated as underlying operating profit from continuing operations less operating
profit of non-controlling interests before tax, net of income tax at the underlying rate of the year.
Capital employed Based on the 12 month average net assets adjusted for net debt, post employment benefit obligations net of associated deferred tax, amortised intangibles arising on acquisition, impaired goodwill and excluding the Group’s non-controlling partners’ share of net assets and net assets of discontinued operations.
Net debt Overdrafts, bank and other borrowings, finance leases and derivative financial instruments, net of cash and cash equivalents.
GLOSSARY OF TERMS

Certain information included in this Annual Report and Accounts is forward looking and involves risks, assumptions and uncertainties that could cause actual results to differ materially from those expressed or implied by forward looking statements.
Forward looking statements cover all matters which are not historical facts and include, without limitation, projections relating to results of operations and financial conditions and the Company’s plans and objectives for future operations, including, without limitation, discussions of expected future revenues, financing plans, expected expenditures and divestments, risks associated with changes in economic conditions, the strength of the food and support services markets in the jurisdictions in which the Group operates, fluctuations in food and other product costs and prices and changes in exchange and interest rates. Forward looking statements can be identified by the use of forward looking terminology, including terms such as ‘believes’, ‘estimates’, ‘anticipates’, ‘expects’, ‘forecasts’, ‘intends’, ‘plans’, ‘projects’, ‘goal’, ‘target’, ‘aim’, ‘may’, ‘will’, ‘would’, ‘could’ or ‘should’ or, in each case, their negative or other variations or comparable terminology. Forward looking statements in this Annual Report and Accounts are not guarantees of future performance. All forward looking statements in this Annual Report and Accounts are based upon information known to the Company on the date of this Annual Report and Accounts. Accordingly, no assurance can be given that any particular expectation will be met and readers are cautioned not to place undue reliance on forward looking statements, which speak only at their respective dates.
Additionally, forward looking statements regarding past trends or activities should not be taken as a representation that such trends or activities will continue in the future. Other than in accordance with its legal or regulatory obligations (including under the UK Listing Rules and the Disclosure Guidance and Transparency Rules of the Financial Conduct Authority), the Company undertakes no obligation to publicly update or revise any forward looking statement, whether as a result of new information, future events or otherwise.
Nothing in this Annual Report and Accounts shall exclude any liability under applicable laws that cannot be excluded in accordance with such laws.
FORWARD LOOKING STATEMENTS
This Report is printed on a combination of Amadeus 100 Silk and Amadeus 100 Offset. Amadeus 100 Silk is produced using 100% recycled waste, the pulp is bleached using a Totally Chlorine Free (TCF) process. Amadeus 100 Offset is produced using 100% post-consumer waste, the pulp is bleached using an Elemental Chlorine Free (ECF) process. Both materials are Forest Stewardship Council® (FSC) certified and are produced at mills that hold the ISO 14001 environmental management standard.Printed in the UK by Pureprint Group using vegetable inks printing technology. Pureprint Group is ISO 9001:2000, ISO 14001, EMAS and FSC certified.
The images in this document are representative of the services provided by Compass Group PLC and its subsidiaries and partners.
Designed and produced by Black Sun Plc.

COMPASS GROUP PLCCompass House Guildford Street Chertsey Surrey KT16 9BQ United Kingdom
Registered in England and Wales No. 4083914
T +44 1932 573 000 F +44 1932 569 956FIND THIS REPORT ONLINE AT WWW.COMPASS-GROUP.COM
COM
PASS GR
OU
P PLC ANN
UAL R
EPOR
T 2016


