Embed Size (px)
Citation preview
2008ANNUAL REPORT 2008

Mineral Resources Limited ANNUAL REPORT 2008
CORPORATE DIRECTORY
Corporate Calendar
Final dividend:-
- Ex dividend date 16 September 2008
- Record date 22 September 2008
- Payment date 18 November 2008
Annual General Meeting 18 November 2008
- To be held at Pamelia Hilton Mill Street, Perth
DirectorsPeter Wade Chris Ellison Joe Ricciardo Mark Dutton
Company SecretaryBruce Goulds
Registered Office25 Wellard Street Bibra Lake WA 6163
Telephone: +61 8 9437 7000 Facsimile: +61 8 9434 4955
Websitewww.mineralresources.com.au
AuditorsRSM Bird Cameron Partners 8 St Georges Terrace Perth WA 6000
Share RegistryComputershare Investor Services Pty Limited Level 2, Reserve Bank Building 45 St Georges Terrace Perth WA 6000
Telephone: +61 8 9323 2000 Facsimile: +61 8 9322 2033
BankersNational Australia Bank Limited 50 St George’s Terrace Perth WA 6000
1
CONTENTS
Group Financial Highlights
Chairman’s Report
Managing Director’s Report
Review of Operations
Our Sustainable Future
Financials
Directors’ Report
Auditor’s Independence Declaration
Corporate Governance Statement
Income Statement
Balance Sheet
Statement of Changes in Equity
Cash Flow Statement
Notes to the Financial Statements
Directors’ Declaration
Independent Audit Report
Shareholder Information
Mineral Resources is a
leading service provider to
the mining, resource and
infrastructure industries.
Our services encompass
services, goods, processing
and general contracting
operations that add value to
clients and shareholders.
2
3
4
5
7
9
11
19
20
22
23
24
25
26
60
61
63

2 Mineral Resources Limited ANNUAL REPORT 2008
GrOup fiNaNCial HIGHLIGHTS
The result was earned on Group revenue of $245.0 million being an increase of 65% over the 2007 revenue of $148.8 million.
The EBITDA result was $88.8 million being an increase of 129% over the 2007 EBITDA of $38.7 million.
The full year net profit after tax was $47.1 million being an increase of 133% over the 2007 net profit of $20.2 million.
revenue 2008 EBiTDa 2008 NpaT 2008
Summary of Group performance 2004 – 2008
$M 2004* 2005* 2006* 2007 2008 Growth %Group Revenue 63.1 91.6 103.4 148.8 245.0 65%
EBITDA 12.7 13.4 23.0 38.7 88.8 129%
EBIT 4.5 4.9 14.3 27.9 69.2 148%
NPAT 3.4 3.7 10.3 20.2 47.1 133%
NPAT Margin 5.4% 4.0% 10.0% 13.6% 19.2%
ROE 17.1% 17.5% 23.7% 26.7% 40.6%
EPS (basic) (cents) n/a n/a 9.8 16.9 38.7 129%
Interest Cover (times) 4.8 3.8 7.3 11.9 31.4 164%
Net Debt (4.2) 19.7 33.5 8.9 (21.5)
Dividend (cents per share) n/a n/a n/a 8.3 19.35 133%
* on aggregated basis
0
50
100
150
200
250
2004 2005 2006 2007 2008
63.1
91.6 10
3.4
148.
8
245.
0
2004 2005 2006 2007 20080
20
40
60
80
100
2004 2005 2006 2007 20080
10
20
30
40
50
3
CHairMaN’S MESSAGE
Dear Shareholder, The 2008 year has been our strongest performance since inception with net profit after tax increasing by 133% from $20.2 million in 2007 to a record $47.1 million this year.
We have consolidated our reputation as a contractor of choice within the mining services sector through the delivery of outstanding value for our clients, and by exceeding our targeted goals for ‘growing our future’ for all of our shareholders and the Mineral Resources team.
That is an outstanding performance and, on behalf of the Board of Mineral Resources Limited (ASX:MIN), I am pleased to present this Annual Report for 2007/08.
The year was characterised by strong organic growth across all of our operations with strong revenue expansion up to $245 million, strong margin growth and strong growth in earnings per share to 38.7 cents. For the year ended 30 June 2008, Mineral Resources achieved a net profit after tax of $47.1 million and directors have declared a final, fully franked dividend of 13.35 cents payable on 18 November 2008, which, together with the interim 6 cents dividend, complies with the Board nominated policy of 50% of earnings being distributed as dividends. That policy is proposed to continue for the 2009 year results.
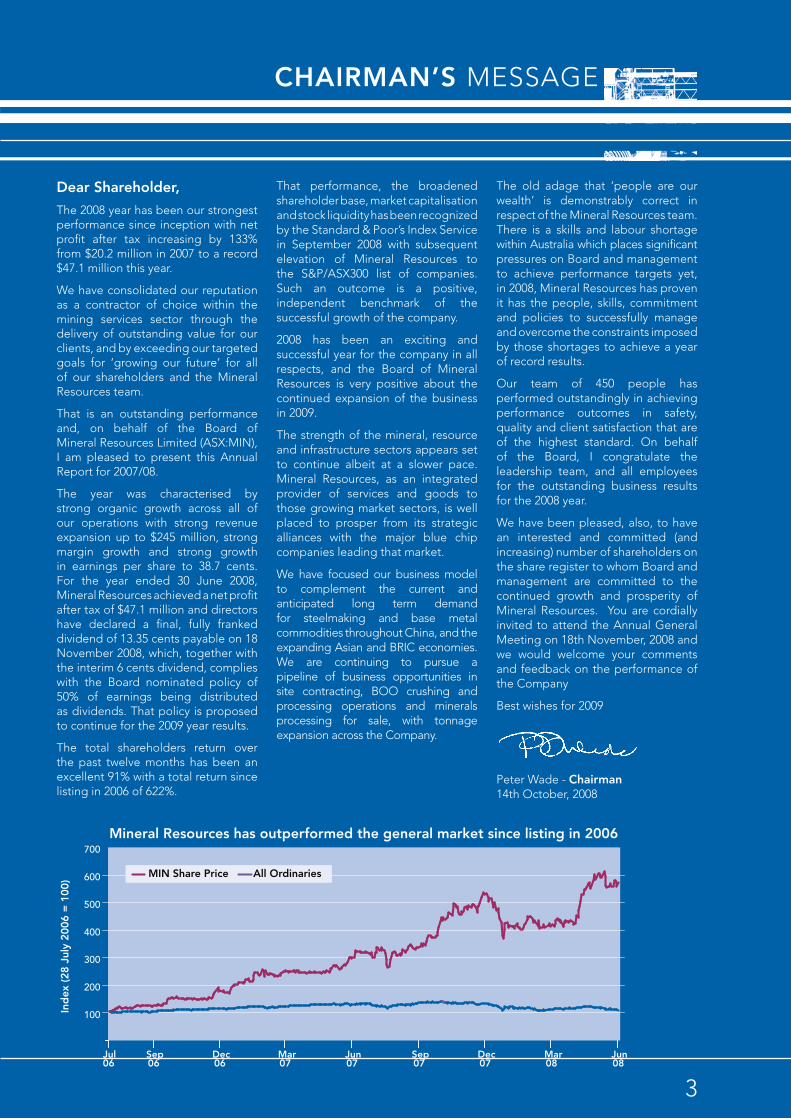
The total shareholders return over the past twelve months has been an excellent 91% with a total return since listing in 2006 of 622%.
That performance, the broadened shareholder base, market capitalisation and stock liquidity has been recognized by the Standard & Poor’s Index Service in September 2008 with subsequent elevation of Mineral Resources to the S&P/ASX300 list of companies. Such an outcome is a positive, independent benchmark of the successful growth of the company.
2008 has been an exciting and successful year for the company in all respects, and the Board of Mineral Resources is very positive about the continued expansion of the business in 2009.
The strength of the mineral, resource and infrastructure sectors appears set to continue albeit at a slower pace. Mineral Resources, as an integrated provider of services and goods to those growing market sectors, is well placed to prosper from its strategic alliances with the major blue chip companies leading that market.
We have focused our business model to complement the current and anticipated long term demand for steelmaking and base metal commodities throughout China, and the expanding Asian and BRIC economies. We are continuing to pursue a pipeline of business opportunities in site contracting, BOO crushing and processing operations and minerals processing for sale, with tonnage expansion across the Company.
The old adage that ‘people are our wealth’ is demonstrably correct in respect of the Mineral Resources team. There is a skills and labour shortage within Australia which places significant pressures on Board and management to achieve performance targets yet, in 2008, Mineral Resources has proven it has the people, skills, commitment and policies to successfully manage and overcome the constraints imposed by those shortages to achieve a year of record results.
Our team of 450 people has performed outstandingly in achieving performance outcomes in safety, quality and client satisfaction that are of the highest standard. On behalf of the Board, I congratulate the leadership team, and all employees for the outstanding business results for the 2008 year.
We have been pleased, also, to have an interested and committed (and increasing) number of shareholders on the share register to whom Board and management are committed to the continued growth and prosperity of Mineral Resources. You are cordially invited to attend the Annual General Meeting on 18th November, 2008 and we would welcome your comments and feedback on the performance of the Company
Best wishes for 2009
Peter Wade - Chairman 14th October, 2008
Mineral Resources has outperformed the general market since listing in 2006
Ind
ex (2
8 Ju
ly 2
006
= 1
00)
100
200
300
400
500
600
700
Jul06
Sep06
Dec06
Mar07
Jun07
Sep07
Dec07
Mar08
Jun08
All OrdinariesMIN Share Price

4 Mineral Resources Limited ANNUAL REPORT 2008
MaNaGiNG DirECTOr’S REPORT
The performance of the Mineral Resources team throughout 2008 has been outstanding and it is with much pride and pleasure we deliver a record financial result for our shareholders. The mining services sector within which we operate has exhibited a high level of volatility towards the end of the 2008 year but our reputation and pipeline of project opportunities continues to drive a strong and increasing demand for our services.
The operating result is exceptional and reflects the success of the focused approach of management to the consolidation of the operational basis of the Company and the pursuit of organic growth across the Company’s operations.
We ended the year with our reputation enhanced by the great performance of our management team and the successful implementation of our culture, values and commitment to excellence by the 450 company employees.
Subsequent to year end, the growth of our business and the market increase in share value and market capitalisation has been recognised by the elevation of Mineral Resources (ASX: MIN) to the ASX 300. This is a strong performance and endorsement of the company after only two years of being a public listed company.
We believe that the success of 2008 will be repeated in 2009 with organic growth across all of our operations expected to continue supported by favorable market conditions in the resource and infrastructure sectors.
Growth will be supplemented by an expanded focus on mineral tonnes for processing and export in collaborative relationships with major bluechip mining companies.
Throughout the year we have been exposed to significant local pressures on project delivery as well as the global pressures of foreign exchange and freight markets and the volatility in credit availability, impacting business confidence. We have been pleased with our ability to manage the local issues of skills shortages, staff recruitment and retention, cost increases and extended delivery times for capital equipment to the extent that the business practices have been strengthened and our project delivery systems enhanced.
All of our operations have been successfully integrated into a single, consolidated mining services group with a complete integration of engineering, labour, plant and equipment and technical support forging a single business entity, albeit with retention of the three strong brand names – CSI, PIHA, PMI – from the original private ownership structure. Throughout the year increased revenue and earnings have been driven by organic growth in all operating businesses and that growth has been continued at the start of 2009, with expectations that 2009 will provide further and expanded business opportunities.
We have maintained our focus on the continued expansion of our strong research and development history to lead the mining services market in innovation and development of
technology advances in our pipelining, crushing and processing operations. This innovation has been the catalyst for an entrepreneurial focus that drives the expanding range of business and process expansions within the Company and is a significant point of difference in our ability to add value to our client operations.
Within the last year, the development of our processing technology for recovery and upgrading of low grade iron ore and manganese to export quality product has added significant value to our results reflecting strengthening demand and substantial growth in those commodity prices. Our targets for these two commodities are increased tonnages in 2009 with ongoing substantial further tonnage improvements in 2010 predicated on expanded export facilities in Port Hedland being commissioned.
The vision of Mineral Resources to be the contractor of choice within the mining services industry remains unchanged and our operational growth and success in 2008 reflects the progressive achievement of that goal. We are well positioned to respond to the exciting range of opportunities that exist within the mining services sector and are on target to make 2009 another positive year.
The Board of Mineral Resources has been proactive in establishing the vision and strategy for the future growth of the business and management has accepted the challenge to implement operational policies and structures to maintain the long term sustainable returns for all of our stakeholders.

5
REvIEW OF OpEraTiONS
Geographical Coverage of Operations The Mineral Resources business is an integrated supplier of goods and services to the mining sector with a predominant focus within Australia and an expanding presence in overseas markets.
Within Australia, our home base is Western Australia, which accounts for in excess of 90% of our 2008 business operations supplemented by a long term gold crushing operation in the Northern Territory and ongoing pipelining contracts within South Australia.
Throughout 2008, the company has also undertaken a range of contracting, supply and engineering activities in Brunei, New Caledonia, Indonesia, Myanmar and the Philippines. Of particular interest is the preparatory drilling and sampling work being undertaken on the iron sands tenement in the Philippines island of Luzon, which we intend to continue to progress, with the expectation of the development of a processing and export operation in the following years.
Site Contracting performance The existing site contracting operations, comprising our Build, Own, Operate crushing circuits and our resources and infrastructure services contracts, have achieved outstanding results driven by committed site teams that have achieved all of the challenging customer productions targets.
The BOO model for contract crushing and screening has been expanded on the Windimurra vanadium project to encompass the enhanced operations of milling and magnetic separation that delivers product to the clients final stage kiln and process plant for extraction of high grade product.
The Windimurra project was awarded to Mineral Resources in October 2007 and construction is well advanced to achieve the commissioning of the circuit in October 2008. The project is on time and on budget and, against the backdrop of cost inflation, critical skill shortages and significant industry over runs, this performance is exceptional.
As a result of the proven delivery performance of the Company for the crushing and processing elements of the project, the client subsequently also awarded Mineral Resources the design and installation contract for the borefield pipeline to supply water to the Windimurra operation. That project workscope, comprising installation of 13 kilometres of HDPE pipelines, is also ahead of time and will be complete in October 2008.
The award of these two contracts emphasizes the success of the horizontal integration of the previously separate businesses within the listed entity and the beneficial synergies that can flow from the linked operations within the business.
On all of the crushing and processing sites, customers have increased production output targets to meet the increased demand for commodities in this strong demand driven stage of the resource cycle. Our business model pre-empts likely customer demand for increased output of product, by designing an inbuilt excess capacity within the circuit. Such an additional design capacity with increased capital costs can be incorporated into a BOO supply concept. Such an approach by Mineral Resources adds further value for customers, which in turn enhances our recognition, reputation and capacity to be awarded long term relationship driven contracts.
6 Mineral Resources Limited ANNUAL REPORT 2008
REvIEW OF OpEraTiONS
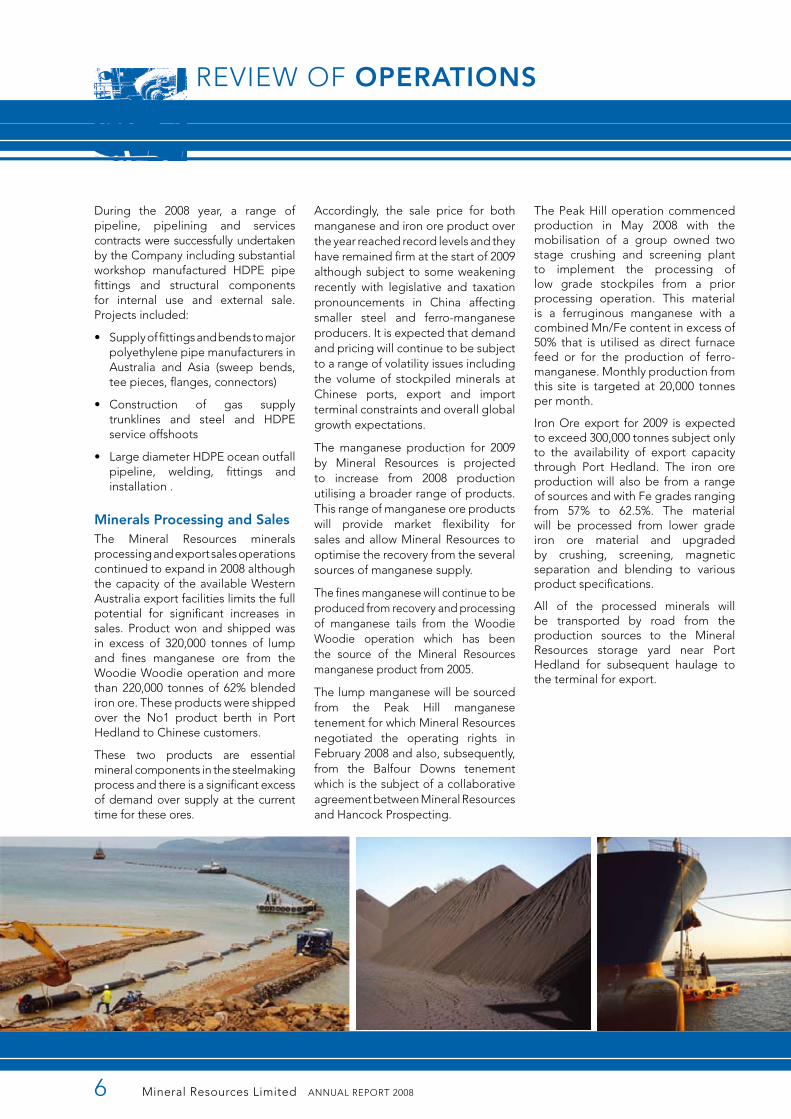
During the 2008 year, a range of pipeline, pipelining and services contracts were successfully undertaken by the Company including substantial workshop manufactured HDPE pipe fittings and structural components for internal use and external sale. Projects included:
• Supplyoffittingsandbendstomajorpolyethylene pipe manufacturers in Australia and Asia (sweep bends, tee pieces, flanges, connectors)
• Construction of gas supplytrunklines and steel and HDPE service offshoots
• LargediameterHDPEoceanoutfallpipeline, welding, fittings and installation .
Minerals processing and Sales The Mineral Resources minerals processing and export sales operations continued to expand in 2008 although the capacity of the available Western Australia export facilities limits the full potential for significant increases in sales. Product won and shipped was in excess of 320,000 tonnes of lump and fines manganese ore from the Woodie Woodie operation and more than 220,000 tonnes of 62% blended iron ore. These products were shipped over the No1 product berth in Port Hedland to Chinese customers.
These two products are essential mineral components in the steelmaking process and there is a significant excess of demand over supply at the current time for these ores.
Accordingly, the sale price for both manganese and iron ore product over the year reached record levels and they have remained firm at the start of 2009 although subject to some weakening recently with legislative and taxation pronouncements in China affecting smaller steel and ferro-manganese producers. It is expected that demand and pricing will continue to be subject to a range of volatility issues including the volume of stockpiled minerals at Chinese ports, export and import terminal constraints and overall global growth expectations.
The manganese production for 2009 by Mineral Resources is projected to increase from 2008 production utilising a broader range of products. This range of manganese ore products will provide market flexibility for sales and allow Mineral Resources to optimise the recovery from the several sources of manganese supply.
The fines manganese will continue to be produced from recovery and processing of manganese tails from the Woodie Woodie operation which has been the source of the Mineral Resources manganese product from 2005.
The lump manganese will be sourced from the Peak Hill manganese tenement for which Mineral Resources negotiated the operating rights in February 2008 and also, subsequently, from the Balfour Downs tenement which is the subject of a collaborative agreement between Mineral Resources and Hancock Prospecting.
The Peak Hill operation commenced production in May 2008 with the mobilisation of a group owned two stage crushing and screening plant to implement the processing of low grade stockpiles from a prior processing operation. This material is a ferruginous manganese with a combined Mn/Fe content in excess of 50% that is utilised as direct furnace feed or for the production of ferro-manganese. Monthly production from this site is targeted at 20,000 tonnes per month.
Iron Ore export for 2009 is expected to exceed 300,000 tonnes subject only to the availability of export capacity through Port Hedland. The iron ore production will also be from a range of sources and with Fe grades ranging from 57% to 62.5%. The material will be processed from lower grade iron ore material and upgraded by crushing, screening, magnetic separation and blending to various product specifications.
All of the processed minerals will be transported by road from the production sources to the Mineral Resources storage yard near Port Hedland for subsequent haulage to the terminal for export.

7
OUR SUSTAINABLE fuTurE
Our Sustainable future The Mineral Resources strategy encompasses the old fashioned values of trust, support and respect applied to the modern business world. It is a strategy that works by bringing the goals and objectives of all stakeholders together to achieve a common good.
That strategy is unchanged and has enabled the company to grow over the past fifteen years, initially as a private company and since 2006 as a company listed on the ASX with the goal “to be the best we can”.
We propose that 2009 will continue that strategy and our values and culture will support us in expanding our operations through organic growth of existing site and client operations as well as the award of substantial additional contracts across all of our activities.
Sustainable long term contracting operations based around the crushing, processing and handling of significant mineral tonnages is the ongoing strategic path of Mineral Resources to effectively ‘drought proof’ the profitability of the Company.
While we are confident about the immediate term strength of the mineral pricing market, the mining and mineral sector generally is a cyclical industry. The demand outlook continues to be strong and, over the period, Mineral Resources will focus on expanding its long term operational bases through increased tonnage production to maintain performance outcomes.
As a pre-eminent mining services company, our future growth and performance will continue to be driven by our focus on tonnage and volume.
people One of the substantial challenges facing the business is the recruitment and retention of quality management and staff. We recognise that skills shortages and the concurrent increase in labour costs pose a significant threat to the continued success of the Mineral Resources growth story and have focused strategies in place to manage this threat.
The Board and management have developed and supported a range of outcomes based policies, which are central to the success of our strategies to recruit, retain and develop our future team including a broadening of the sources of people, remuneration approaches that enhance ownership, a preference for internal promotion, succession planning and training opportunities.
Mineral Resources’ continued success reflects the outstanding effort, skills and commitment to performance of our 450 strong team. We foreshadow that the operating environment will continue to demand constant scrutiny of labour availability and employment arrangements to ensure the historical people strength of our business is maintained. Mineral Resources is extremely well placed to meet this challenge and continue to grow through the full range of resources industry economic cycles.
The current mining services sector within Australia remains buoyant as a result of the ‘China Story’ and the demands for specific minerals with which Australia is richly endowed. In particular, the steel making minerals of iron ore, coal, manganese and, to a lesser extent, vanadium are all tonnage driven commodities and there will be a continuing challenge of competition for skilled people across this sector.
We have increased our focus on personnel development and training to achieve the demands of today and gain the rewards from the opportunities of tomorrow through a dedicated and talented partnering that add value to our clients by timely, cost effective and continuing support to their objectives.
Collaborative partnershipsMineral Resources commits to adding value in its dealings with all stakeholders through a collaborative approach to employment, contracts, construction and services provision.
The collaborative approach across the board embraces the concepts of mutual obligations, mutual support and shared outcomes; concepts which by definition, if successful, provide a win-win outcome for the participants.
A growing proportion of the Company’s activities are generated from a list of bluechip resource clients that has developed over many years and are characterized by long term contracting and commercial relationships which reflect the success of the value adding arrangement of our business model
We have a proven history across our long term contract crushing and processing operations, and the maintenance and site support services provision, of understanding customer’s specific needs and developing and implementing operation specific solutions with outstanding results.
Through 2008, we have formalised contract extensions on two of our long term crushing operations and, on both sites, have been requested to incorporate plant additions to increase tonnage production to take advantage of the prevailing market demand opportunity. These plant upgrades will be operable in October 2008.
Subsequent to the year end, Mineral Resources has entered into a collaborative agreement with Hancock Prospecting for the development of a manganese operation at the Balfour Downs tenement in the Murchinson Region of Western Australia. Under this agreement, the parties shall work together to mine, transport, market and export an initial annual production of 350,000 tonnes of ferroginous manganese to markets in China; planned upgrades of production capacity to more than 800,000 tonnes per annum will be progressively implemented.
8 Mineral Resources Limited ANNUAL REPORT 2008
OUR SUSTAINABLE fuTurE
Safety performanceSafety is a fundamental element in the business process and has priority over all other business functions. Our goal of zero harm is the core focus of our operating environment and we actively promote the achievement of this target through management policies, systems, support and by the engagement of management, staff and contractors in the culture of our business.
The achievement of zero harm is a challenge to be won. We build safety procedures and safe working practices into all of our operations and engineering solutions as a means of achieving our client’s goals and expectations in an environment of reliable, secure and safe construction and operational outcomes.
Throughout 2008, the Company maintained a world’s best practice safety performance as measured by lost time injury frequency rate (LTIFR) with a corporate outcome of one lost time injury per million man hours worked. While this safety performance measure is significantly better than comparable industry sector performance, Mineral Resources will actively configure an enhanced HSE management drive to achieve our zero harm goal.
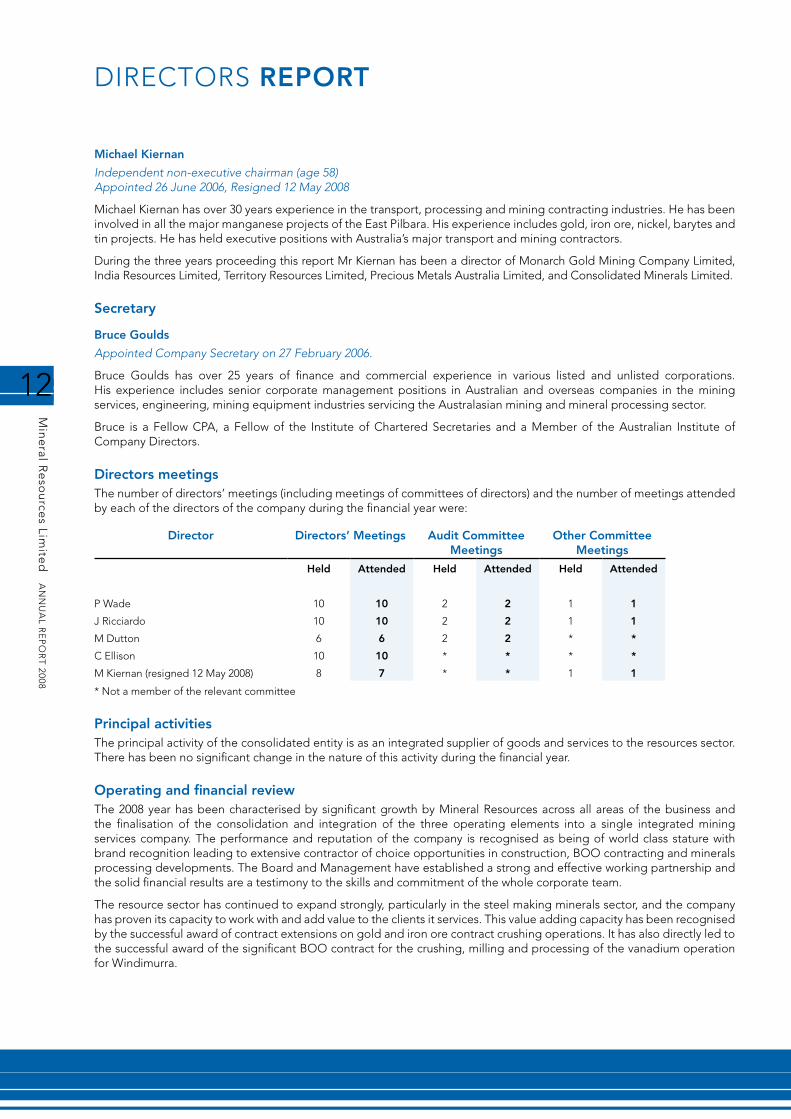
Markets and Outlook The global outlook for minerals remains positive with the strength of demand for steelmaking minerals, such as iron ore and manganese, projected to facilitate substantial contracting, crushing and processing opportunities for Mineral Resources. The Company is focusing on providing a mining services capability to secure projects and exposure for Mineral Resources to the ongoing minerals opportunities within Australia and the local region.
The China story continues to be the driver of the world growth and it is expected that China’s rapid population and GDP growth will continue to drive significant infrastructure-led resource demand. China’s per capita consumption of minerals is well below that of developed countries and every five years, approximately 75 million people are expected to move to Chinese cities highlighting the need for significant additional infrastructure.
Chinese imports of iron ore are projected to double during the six year period to 2013 to 760 million tonne which equates to a 12% CAGR. Concurrently, global iron production is projected to grow at 5.6% per annum to 2.7 billion tonnes by 2013 with substantial increases in Australian production (82% increase to 523 million tonnes) providing the opportunity for increased outsourcing contract works for all of the Mineral Resources operations.
Tota
l Po
pul
atio
n (%
)
(b) Orange dashed lines represents change in China’s urban population over preceding five yearsSource: UN Department of Economics & Social Affairs, Population Division
1980 1985
Urban Population
China
Rural Population
1990 2000 2005 2010 2015 2020
25%
50%
75%
100%
76.3m 76.6m 76.2m 72.9m
Chinas Urbanisation (b)
Fore
cast
GD
P g
row
th
2008F 2009F 2010F 2011F
USA Source: bloombergJapan Euroland Australia China India
0
2%
4%
6%
8%
10%
12%
14% Regional Growth Forecast
Cap
ital
exp
end
itur
e (U
S $b
n)
2002 2003 2004 2005 2006
Capital Expenditure
2007 2008F 2009F 20010F0
10
20
30
40
50
60
Trend
Source: Company announcements, broker consesus estimates
Historical and near term capital expenditure profile (Top 10 global miners)

9

FINANCIAL INFORMATION
Min
eral R
eso
urce
s Limite
d A
NN
UA
L RE
PO
RT
2008

11
DIRECTORS REPORT
The directors present their report together with the financial statements of Mineral Resources Limited and of the consolidated entity, being the company and its subsidiaries for the period 1 July 2007 to 30 June 2008 and the independent audit thereon.
DirectorsThe directors of the company at any time during or since the end of the financial year are:
Peter Wade
Executive chairman and managing director (age 58) Appointed 27 February 2006
Peter Wade has over 35 years experience in engineering, construction, project management and mining and infrastructure services.
Peter started his career in the NSW Public Service and managed the construction of the Port Kembla coal loader, grain terminals at Newcastle and Wollongong and was the Deputy Director for the Darling Harbour Redevelopment construction project.
As an executive of the Transfield Group in the 1980s and 1990s he was general manager of Sabemo Pty Ltd, Transfield Construction Pty Ltd, Transfield Power Technologies and then Transfield Chief Operations Officer (Southern) responsible for major build, own, operate projects including Melbourne City Link, Airport Link, Northside Storage Tunnel and Collinsville and Smithfield Power Plants.
Joe Ricciardo
Independent non-executive director (age 53) Appointed 26 June 2006
Joe Ricciardo has 28 years experience in feasibility studies, design, construction, maintenance and operation of mineral processing facilities and associated infrastructure.
In January 1986, he became the founding member and managing director of J R Engineering Services Pty Ltd until its acquisition by the Downer EDI/Roche Group in 2001. Joe continued to lead the company, Roche Mining (JR) Pty Ltd in the capacity of general manager and director up to April 2006.
During his 20 year stewardship of JR, the company consistently grew to become a successful and major engineering services provider to the resources and mineral processing industry. Joe’s experience covers the commodities of gold, nickel, copper, lead, zinc, iron ore, coal, mineral sands, tantalum and talc for both major and junior mining companies.
Joe is currently the Managing Director of GR Engineering Services Pty Ltd.
Chris Ellison
Executive director (age 51) Appointed 27 February 2006
Chris Ellison is the founding shareholder of each of the Mineral Resources companies and has over 25 years experience in the mining contracting, engineering and resource processing industries.
Chris has been the managing director of Monadelphous Pty Ltd, KCUT Pty Ltd and the CSI Group and was instrumental in developing the build, own, operate concept of contract crushing in the resource and mining sector.
Mark Dutton
Independent non-executive director (age 40) Appointed 8 November 2007
Mark has 13 years experience acting as a non-executive director of a range of growth businesses across Europe, Asia and Australia. He started his career at Price Waterhouse in England in 1991 where he qualified as a chartered accountant, subsequently working in Moscow in their Corporate Finance division.
Mark has worked in the private equity industry since the mid 1990s. He started with BancBoston Capital in the UK before being appointed Managing Director Asia-Pacific.
In 2003, he joined Foundation Capital in Perth to manage their later-stage investment fund. He is presently a director of Banksia Capital a WA-focussed private equity manager and an adviser to Navis Capital who manage US$1.5 billion in private equity targeted for investment across the Asia Pacific region.
12
Min
eral R
eso
urce
s Limite
d A
NN
UA
L RE
PO
RT
2008
DIRECTORS REPORT
Michael Kiernan
Independent non-executive chairman (age 58) Appointed 26 June 2006, Resigned 12 May 2008
Michael Kiernan has over 30 years experience in the transport, processing and mining contracting industries. He has been involved in all the major manganese projects of the East Pilbara. His experience includes gold, iron ore, nickel, barytes and tin projects. He has held executive positions with Australia’s major transport and mining contractors.
During the three years proceeding this report Mr Kiernan has been a director of Monarch Gold Mining Company Limited, India Resources Limited, Territory Resources Limited, Precious Metals Australia Limited, and Consolidated Minerals Limited.
Secretary
Bruce Goulds
Appointed Company Secretary on 27 February 2006.
Bruce Goulds has over 25 years of finance and commercial experience in various listed and unlisted corporations. His experience includes senior corporate management positions in Australian and overseas companies in the mining services, engineering, mining equipment industries servicing the Australasian mining and mineral processing sector.
Bruce is a Fellow CPA, a Fellow of the Institute of Chartered Secretaries and a Member of the Australian Institute of Company Directors.
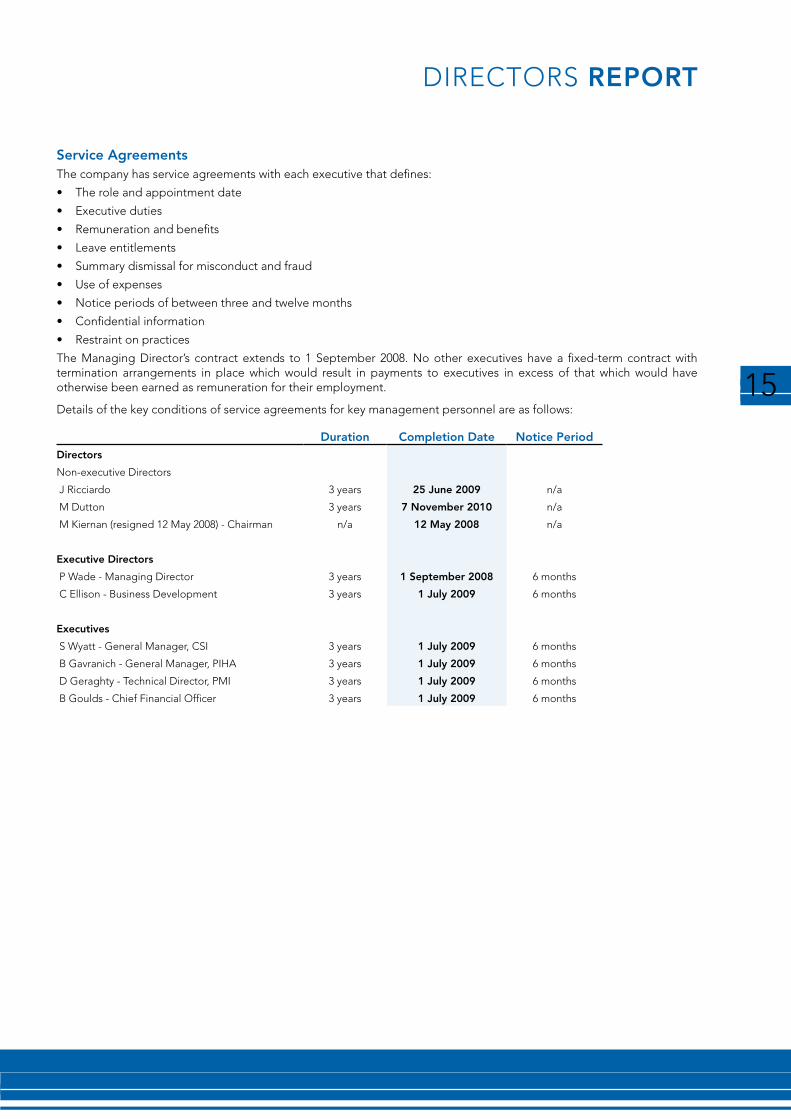
Directors meetingsThe number of directors’ meetings (including meetings of committees of directors) and the number of meetings attended by each of the directors of the company during the financial year were:
Director Directors’ Meetings Audit Committee Meetings
Other Committee Meetings
Held Attended Held Attended Held Attended
P Wade 10 10 2 2 1 1
J Ricciardo 10 10 2 2 1 1
M Dutton 6 6 2 2 * *
C Ellison 10 10 * * * *
M Kiernan (resigned 12 May 2008) 8 7 * * 1 1
* Not a member of the relevant committee
Principal activitiesThe principal activity of the consolidated entity is as an integrated supplier of goods and services to the resources sector. There has been no significant change in the nature of this activity during the financial year.
Operating and financial reviewThe 2008 year has been characterised by significant growth by Mineral Resources across all areas of the business and the finalisation of the consolidation and integration of the three operating elements into a single integrated mining services company. The performance and reputation of the company is recognised as being of world class stature with brand recognition leading to extensive contractor of choice opportunities in construction, BOO contracting and minerals processing developments. The Board and Management have established a strong and effective working partnership and the solid financial results are a testimony to the skills and commitment of the whole corporate team.
The resource sector has continued to expand strongly, particularly in the steel making minerals sector, and the company has proven its capacity to work with and add value to the clients it services. This value adding capacity has been recognised by the successful award of contract extensions on gold and iron ore contract crushing operations. It has also directly led to the successful award of the significant BOO contract for the crushing, milling and processing of the vanadium operation for Windimurra.

13
DIRECTORS REPORT
The consolidated entity recorded a net profit after income tax of $47.095 million for the full year ended 30th June, 2008. That is a record performance based upon a record revenue of $245 million.
The year end result is an increase of 133% over the actual aggregated result for financial year 2007 as presented in the 2007 annual report and is reported after the expensing of over $5 million of share based payments in accordance with AASB2, Share Based Payments.
That is an outstanding result and reflects the solid performance of all parts of the company and in particular, the marked improvement in the manganese and iron ore prices over the past 12 months. The pricing of manganese for export is not transparent and not subject to LME or annual contract negotiation exposure as exists for iron ore and a range of base metal prices. Accordingly, it is not possible to provide a soundly based projection of manganese pricing for the next 12 months although market indications are for a continuing strong demand through calendar 2008.
The overall focus of the business has been, and remains, to establish long term sustainable business operations that can grow across business cycles. In that regard, the business focus on safety, recruitment and retention, and development of personnel are critical elements in creating a culture of performance that will drive the continued success of the company.
The financial performance of the contracting, crushing and processing operations has substantially exceeded budget targets and reflects the significant acceptance of Mineral Resources as a proven services provider across the resource and infrastructure sectors. The supply growth across the resource industry, and the role of China in continued demand for Australian minerals, provides the key drivers for continued profitability and reputation growth for Mineral Resources. Those drivers underpin the demand for steel making materials from Australia and Mineral Resources is well placed to assist in directly and indirectly fulfilling that demand requirement.
The company is operating across a diverse range of sites and products with a range of blue chip clients and is exposed to the market volatility arising from global credit stress and cost inflation pressures that are impacting the industry. In the export of our processed minerals, the strength of the AUD and the increased shipping costs are the prime impacts on increased profitability while across all of our operations, skills shortages and materials availability and cost increases impact our results. The major focus of management is to implement effective cost control mechanisms in all of our business operations and, over the past 12 months, that has been successfully achieved. The Board is confident that management has in place effective policies and procedures that will continue to provide the base for increased profitability and growth in market share.
Significantly, the business has had an exceptional year in the management of cash flow and optimisation of capital expenditure to the extent that the company remains net cash positive in an environment where ‘cash is king’. The Company is well placed with proven performance, an outstanding reputation and a strengthening balance sheet to pursue even larger contracting and processing operations that will maintain the growth trajectory over the next few years. The Directors commend the management and staff for their commitment and performance over the past year.
Significant changes in the state of affairsThere were no other significant changes in the state of affairs of the company or the consolidated entity during the past financial year other than as disclosed in the financial statements.
Dividends Paid or RecommendedDividends paid or declared for payment in the year are as follows:
• FinalOrdinaryDividendfor2006/07of6.3centspershare,frankedatataxrateof30%,paidon15November2007amounting to $7,671,174;
• InterimOrdinaryDividendfor2007/08of6.0centspershare,frankedatataxrateof30%,paidon4April2008amountingto $7,326,046; and
• FinalOrdinaryDividendfor2007/08of13.35centspershare,frankedatataxrateof30%,hasbeenrecommendedbyDirectors amounting to $16,263,577.
Events subsequent to reporting dateNo matters or circumstances have arisen since the end of the financial year which significantly affect the operations of the consolidated entity.

14
Min
eral R
eso
urce
s Limite
d A
NN
UA
L RE
PO
RT
2008
DIRECTORS REPORT
Environmental IssuesThe consolidated group’s operations are subject to significant environmental regulation under the laws of the Commonwealth and State. During the year the consolidated entity met all reporting requirements under relevant legislation. There were no incidents which required reporting.
Likely developmentsDisclosure of information relating to the future developments in the operations of the consolidated entity which would not, in the opinion of the directors, be prejudicial to the consolidated entity’s interests is contained in this Directors’ Report.
Non-audit servicesDuring the year, RSM Bird Cameron Partners, the Company’s auditor, has performed certain other services in addition to their statutory duties. Details of the amounts paid to the auditors are disclosed in the notes to the financial statements.
The Board has considered the non-audit services provided during the year by the auditor and is satisfied that the provision of those non-audit services during the year by the auditor is compatible with and did not compromise, the auditor independence requirements of the Corporations Act 2001 for the following reasons:
• Allnon-auditservicesweresubjecttothecorporategovernanceproceduresadoptedbytheCompanyandhavebeenreviewed by the Audit Committee to ensure they do not impact the integrity and objectivity of the auditor; and
• Thenon-auditservicesprovideddonotunderminethegeneralprinciplesrelatingtoauditorindependenceassetoutinAPES 110: Code of Ethics for Professional Accountants, as they did not involve reviewing or auditing the auditor’s own work, acting in a management or decision making capacity for the Company, acting as an advocate for the Company or jointly sharing risks and rewards.
Auditor’s Independence DeclarationThe auditor’s independence declaration as required under Section 307C of the Corporations Act 2001 has been included as part of the financial statements.
Remuneration ReportThis remuneration report details the policy for determining the remuneration of directors and executives and provides specific detail of their remuneration.
Remuneration of non-executive directors
The Board policy is to remunerate non-executive directors at market rates for comparable companies for time, commitment and responsibilities. The Remuneration Committee determines payments to the non-executive directors and reviews their remuneration annually, based on market practice, duties and accountability. Independent external advice is sought when required.
Shareholder approval must be obtained in relation to the overall limit set for directors’ fees. The Remuneration Committee shall set individual Board fees within the limit approved by shareholders. Shareholders must also approve the framework for any equity based compensation schemes and if a recommendation is made for a director to participate in an equity scheme, that participation must be approved by the shareholders
Remuneration of executives
The Company’s remuneration policy for executive directors and key management personnel is designed to promote superior performance and long term commitment to the Company. Executives receive a base remuneration which is market related. Overall remuneration policies are subject to the discretion of the Board and can be changed to reflect competitive market and business conditions where it is in the interests of the Company and shareholders to do so. Executive remuneration and other terms of employment are reviewed annually by the Remuneration Committee having regard to performance, relevant comparative information and expert advice. The Committee’s reward policy reflects its obligation to align executive’s remuneration with shareholders’ interests and to retain appropriately qualified executive talent for the benefit of the Company.
15
DIRECTORS REPORT
Service AgreementsThe company has service agreements with each executive that defines:
• Theroleandappointmentdate
• Executiveduties
• Remunerationandbenefits
• Leaveentitlements
• Summarydismissalformisconductandfraud
• Useofexpenses
• Noticeperiodsofbetweenthreeandtwelvemonths
• Confidentialinformation
• Restraintonpractices
The Managing Director’s contract extends to 1 September 2008. No other executives have a fixed-term contract with termination arrangements in place which would result in payments to executives in excess of that which would have otherwise been earned as remuneration for their employment.
Details of the key conditions of service agreements for key management personnel are as follows:
Duration Completion Date Notice PeriodDirectors
Non-executive Directors
J Ricciardo 3 years 25 June 2009 n/a
M Dutton 3 years 7 November 2010 n/a
M Kiernan (resigned 12 May 2008) - Chairman n/a 12 May 2008 n/a
Executive Directors
P Wade - Managing Director 3 years 1 September 2008 6 months
C Ellison - Business Development 3 years 1 July 2009 6 months
Executives
S Wyatt - General Manager, CSI 3 years 1 July 2009 6 months
B Gavranich - General Manager, PIHA 3 years 1 July 2009 6 months
D Geraghty - Technical Director, PMI 3 years 1 July 2009 6 months
B Goulds - Chief Financial Officer 3 years 1 July 2009 6 months

16
Min
eral R
eso
urce
s Limite
d A
NN
UA
L RE
PO
RT
2008
DIRECTORS REPORT
Details and amounts of remuneration
2008 Short-term Benefits Post Employment
Benefits
Long-term Benefits Total
Cash, salary & commissions
Non-cash benefits
Superannuation Share-based Payments
Equity Options
$ $ $ $ $ $
Directors
P. Wade 323,846 48,020 104,953 - - 476,819
J. Ricciardo 93,462 - 8,411 - 134,094 235,967
C. Ellison 323,845 44,370 29,146 - - 397,361
M. Dutton 59,523 - 5,358 - - 64,881
M. Kiernan* 136,154 - 12,254 1,115,833 67,155 1,331,396
936,830 92,390 160,122 1,115,833 201,249 2,506,424
*resigned 12 May 2008
Key Management Personnel
B. Gavranich 323,846 23,689 29,146 - - 376,681
S. Wyatt 323,846 38,712 29,146 - - 391,704
D. Geraghty 206,500 24,712 31,509 - 451,941 714,662
B. Goulds 166,914 12,696 33,300 - 67,047 279,957
1,021,106 99,809 123,101 - 518,988 1,763,004
2007 Short-term Benefits Post Employment
Benefits
Long-term Benefits Total
Cash, salary & commissions
Non-cash benefits
Superannuation Share-based Payments
Equity Options
$ $ $ $ $ $
Directors
P. Wade 299,984 47,598 50,000 - - 397,582
J. Ricciardo 79,615 - 7,165 - 163,010 249,790
C. Ellison 289,615 15,377 22,846 - - 327,838
M. Dutton - - - - - -
M. Kiernan* 132,692 - 11,942 1,187,083 163,010 1,494,727
801,906 62,975 91,953 1,187,083 326,020 2,469,937
*resigned 12 May 2008
Key Management Personnel
B.Gavranich 299,999 23,688 26,550 - - 350,237
S.Wyatt 294,229 25,637 26,481 - - 346,347
D.Geraghty 192,898 22,372 32,186 - - 247,456
B.Goulds 147,590 6,982 18,385 - 81,504 254,461
934,716 78,679 103,602 - 81,504 1,198,501
17
DIRECTORS REPORT
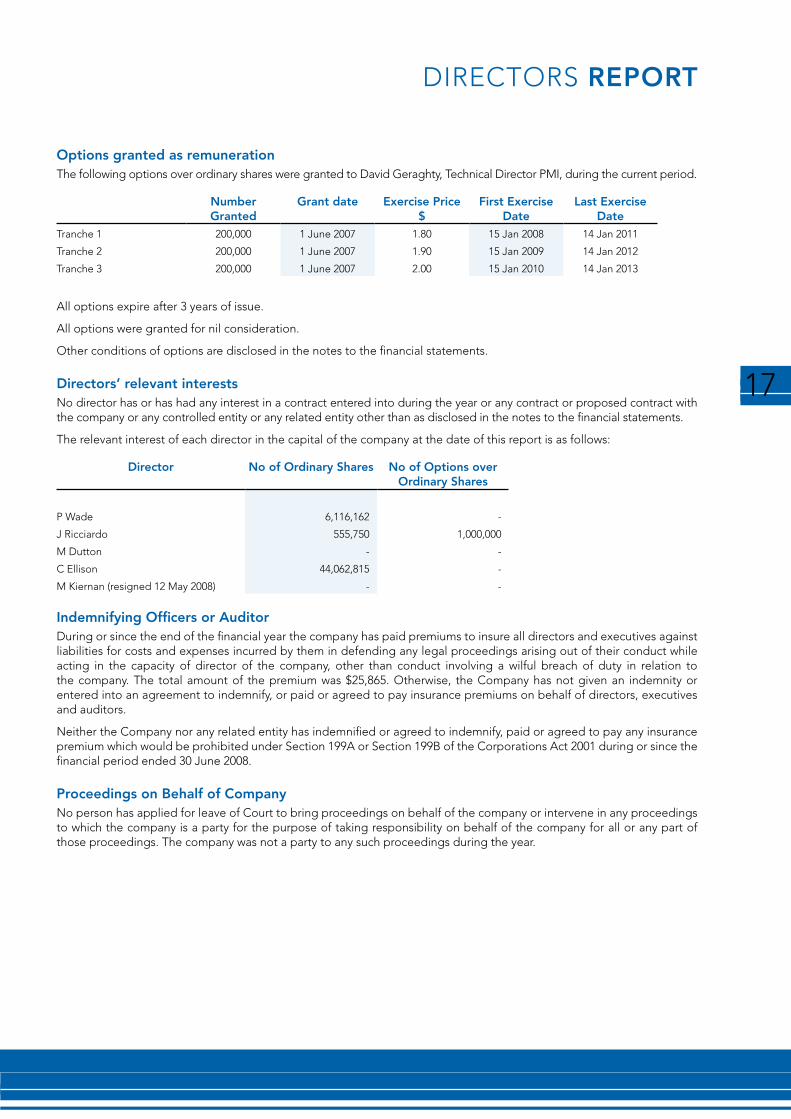
Options granted as remunerationThe following options over ordinary shares were granted to David Geraghty, Technical Director PMI, during the current period.
Number Granted
Grant date Exercise Price $
First Exercise Date
Last Exercise Date
Tranche 1 200,000 1 June 2007 1.80 15 Jan 2008 14 Jan 2011
Tranche 2 200,000 1 June 2007 1.90 15 Jan 2009 14 Jan 2012
Tranche 3 200,000 1 June 2007 2.00 15 Jan 2010 14 Jan 2013
All options expire after 3 years of issue.
All options were granted for nil consideration.
Other conditions of options are disclosed in the notes to the financial statements.
Directors’ relevant interestsNo director has or has had any interest in a contract entered into during the year or any contract or proposed contract with the company or any controlled entity or any related entity other than as disclosed in the notes to the financial statements.
The relevant interest of each director in the capital of the company at the date of this report is as follows:
Director No of Ordinary Shares No of Options over Ordinary Shares
P Wade 6,116,162 -
J Ricciardo 555,750 1,000,000
M Dutton - -
C Ellison 44,062,815 -
M Kiernan (resigned 12 May 2008) - -
Indemnifying Officers or AuditorDuring or since the end of the financial year the company has paid premiums to insure all directors and executives against liabilities for costs and expenses incurred by them in defending any legal proceedings arising out of their conduct while acting in the capacity of director of the company, other than conduct involving a wilful breach of duty in relation to the company. The total amount of the premium was $25,865. Otherwise, the Company has not given an indemnity or entered into an agreement to indemnify, or paid or agreed to pay insurance premiums on behalf of directors, executives and auditors.
Neither the Company nor any related entity has indemnified or agreed to indemnify, paid or agreed to pay any insurance premium which would be prohibited under Section 199A or Section 199B of the Corporations Act 2001 during or since the financial period ended 30 June 2008.
Proceedings on Behalf of CompanyNo person has applied for leave of Court to bring proceedings on behalf of the company or intervene in any proceedings to which the company is a party for the purpose of taking responsibility on behalf of the company for all or any part of those proceedings. The company was not a party to any such proceedings during the year.
18
Min
eral R
eso
urce
s Limite
d A
NN
UA
L RE
PO
RT
2008
DIRECTORS REPORT
Rounding of AmountsThe company is an entity to which ASIC Class Order 98/100 applies and, accordingly, amounts in the financial statements and directors’ report have been rounded to the nearest thousand dollars.
Signed on behalf of the Board in accordance with a resolution of the directors.
Peter Wade Executive Chairman / Managing Director
Dated this 20th day of August 2008

19
AUDITOR’S INDEPENDENCE DECLARATION
8 St Georges Terrace Perth WA 6000GPO Box R1253 Perth 6844T +61 8 9261 9100 F +61 8 9261 9101www.rsmi.com.au
Liability limited by ascheme approved underProfessional StandardsLegislation
Major Offices in:Perth, Sydney, Melbourne,Adelaide and CanberraABN 36 965 185 036
RSM Bird Cameron Partners is anindependent member firm of RSMInternational, an affiliation of independentaccounting and consulting firms.
Chartered Accountants
ISO 9001 Lic 5600SAI Global
AUDITOR INDEPENDENCE DECLARATION
I declare that, to the best of my knowledge and belief, in relation to the audit of the financial statements of Mineral Resources Limited for the financial year ended 30 June 2008 there have been no contraventions of:
(i) the auditor independence requirements as set out in the Corporations Act 2001 in relation to the audit; and
(ii) any applicable code of professional conduct in relation to the audit.
RSM BIRD CAMERON PARTNERS Chartered Accountants
Perth, WA S C CUBITT Dated: 20 August 2008 Partner
20
Min
eral R
eso
urce
s Limite
d A
NN
UA
L RE
PO
RT
2008
CORPORATE GOvERNANCE STATEMENT
This statement outlines the Company’s main corporate governance practices which have been in place throughout the financial year.
The Board considers it essential that directors and staff of Mineral Resources Limited employ sound corporate governance practices in carrying out their duties and responsibilities. Accordingly, a code of conduct has been issued to detail the expected behaviour required to ensure the company acts with integrity and objectivity.
A number of committees, which operate in accordance with their respective charters, have been established to assist the board in carrying out its responsibilities.
The Company has posted its corporate governance practices to its website: www.mineralresources.com.au. The code of conduct, committee charters and various policies are available on this website.
The ASX Corporate Governance Council released the second edition of its “Principles of Good Corporate Governance and Best Practice Recommendations” (“Recommendations”) in August 2007. The directors of Mineral Resources Limited support the thrust of the Recommendations and whilst the Recommendations are not prescriptive, the ASX Listing Rules require listed companies to identify those recommendations that have not been followed and the reasons for not following them.
Unless disclosed below, all Recommendations have been applied for the entire financial year ended 30 June 2008.
Statement of Non-Compliance with RecommendationsThe Company uses alternative methods of good corporate governance to those included in the ASX Corporate Governance Council’s “Principles of Good Corporate Governance and Best Practice Recommendations” second edition.
Recommendation 2.1 The majority of the board should be independent directors.As at the date of this report, the Company has four directors, two of which are considered to be independent. A third independent director resigned on 12 May 2008. An additional independent director will be appointed to the board when a suitable candidate is identified.
Recommendation 2.2 The chair should be an independent director. Recommendation 2.3 The roles of chair and chief executive officer should not be exercised by the same individual.From 12 May 2008, the Chairman of the Company, Peter Wade, also holds the position of Managing Director and is considered not to be independent. This change to the board structure was made after due consideration to the strategy of the Company and the board considers Mr Wade the best person to lead the company from the combined position at this time.
Board of directorsThe Board is accountable to shareholders for the performance of the Company. It oversees the activities and performance of management and provides an independent and objective view to the Company’s performance.
The Board is comprised of two (2) non-executive directors and two (2) executive directors with a mix of skills and considerable experience in the resources and mining industry.
The details of the directors, their experience, qualifications, term of office, and independent status are set out in the Directors’ Report.
The Recommendations state that to be considered independent, directors must be “independent of management and free from any business or other relationship that could materially interfere with (or could reasonably be perceived to materially interfere with) the exercise of their unfettered and independent judgement.”
Messrs Ricciardo and Dutton would satisfy all the tests of the Recommendations and are considered as being independent.
In accordance with the Corporations Act 2001, any director who has an interest of any kind in relation to any matter dealt with at a board or committee meeting is required to advise the meeting and abstain from participation in the decision process.
All non-executive directors are subject to re-election at least every three years.
Independent professional advice may be sought by a director at the company’s expense with the prior approval of the chairman. A copy of advice received by the director is made available to the chairman to be dealt with at his discretion.
The Board meets regularly to review management reports on the operational and financial performance of Mineral Resources Limited.

21
CORPORATE GOvERNANCE STATEMENT
Board committeesThe Board has established committees to assist it in carrying out its responsibilities. The charters that identify the roles and responsibilities of the various committees have been approved by the board and are available on the Company’s web site.
The Audit Committee, consisting of two (2) non-executive directors and one (1) executive director, reviews the effectiveness of the risk management and other internal controls, the reliability of financial information and the effectiveness of the external audit function. To assist in this function the committee may invite the external auditor and senior executives to report to meetings. Any significant non-audit services to be provided by the external auditors must be approved in advance by the Audit Committee. The Audit Committee considers that the provision of those non-audit services provided to date by the external auditor would not affect the auditor’s independence.
The Remuneration Committee, consisting of two (2) non-executive directors and one (1) executive director, advises the board on remuneration policies and practices generally, and makes specific recommendations to the board on remuneration packages and other terms of employment for senior executives and directors.
The Nomination Committee consists of two (2) non-executive directors and one (1) executive director. This committee reviews the composition of the board and makes recommendations on the appropriate skill mix, personal qualities, expertise and diversity.
Share trading guidelinesDirectors and officers are encouraged to have a personal financial interest in Mineral Resources Limited by acquiring and holding shares on a long term basis.
The buying or selling of shares in Mineral Resources Limited is not permitted by any director or any officer of the company or their associates when that person is in possession of price sensitive information not available to the market in relation to those shares. Apart from that, the directors or their associates may buy or sell shares in Mineral Resources Limited at any time during the year other than for one (1) month prior to the date of lodgement of announcements regarding the results of the company.
Directors, officers and their associates are required to inform the chairman of any intention to sell shares.
Continuous disclosure and shareholder communicationThe secretary has been nominated as the person responsible for communications with the Australian Stock Exchange (“ASX”). This role includes responsibility for ensuring compliance with the continuous disclosure requirements in the ASX listing rules.
The Company has established a website to enhance communication with its shareholders and potential investors. The website contains historical information, copies of all information disclosed to the ASX and a corporate governance section that includes details of the various committee charters and policies. Shareholders, who have advised the Company of their email addresses, are notified by email of all announcements to the ASX.
Risk managementThe Managing Director and Chief Financial Officer report annually to the Audit Committee on the Company’s risk management system.
The Board considers an internal audit function is not necessary due to the nature and size of the Company’s operations. The external auditors report to the Audit Committee on risk management issues identified during the course of the audit.
22
Min
eral R
eso
urce
s Limite
d A
NN
UA
L RE
PO
RT
2008
INCOME STATEMENT For the year to 30 June 2008
Note Consolidated Parent
2008 2007 2008 2007
$’000 $’000 $’000 $’000
Revenue
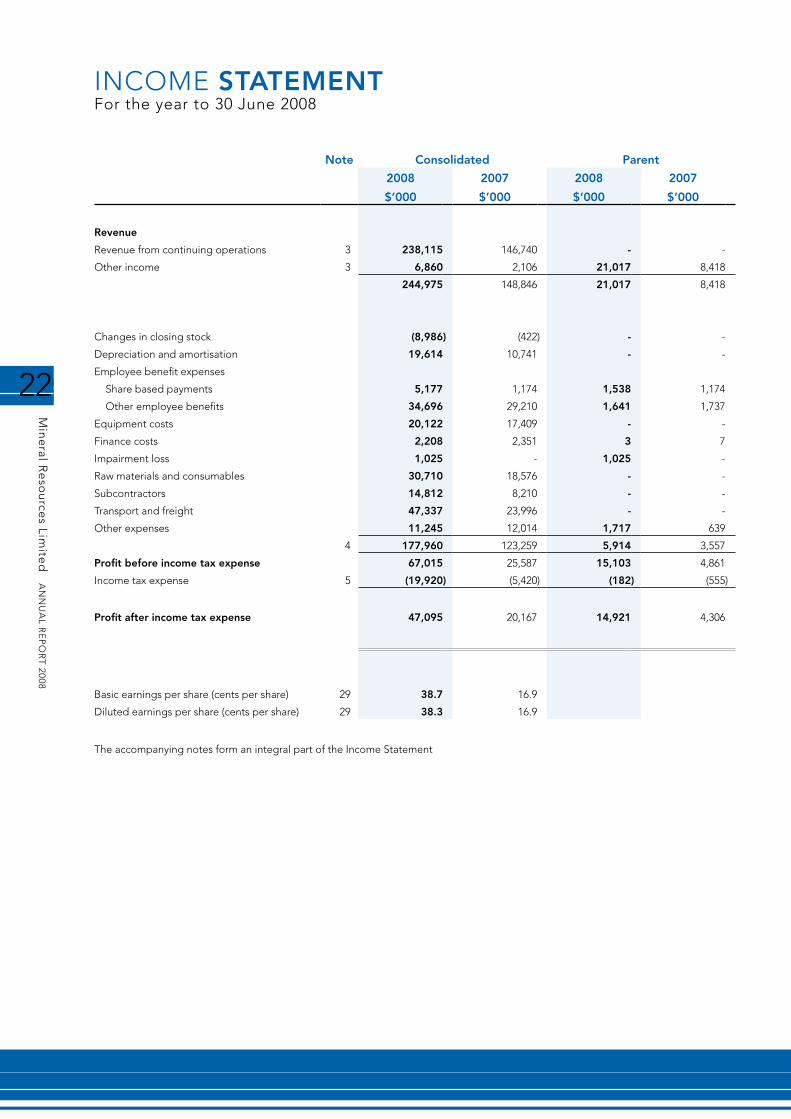
Revenue from continuing operations 3 238,115 146,740 - -
Other income 3 6,860 2,106 21,017 8,418
244,975 148,846 21,017 8,418
Changes in closing stock (8,986) (422) - -
Depreciation and amortisation 19,614 10,741 - -
Employee benefit expenses
Share based payments 5,177 1,174 1,538 1,174
Other employee benefits 34,696 29,210 1,641 1,737
Equipment costs 20,122 17,409 - -
Finance costs 2,208 2,351 3 7
Impairment loss 1,025 - 1,025 -
Raw materials and consumables 30,710 18,576 - -
Subcontractors 14,812 8,210 - -
Transport and freight 47,337 23,996 - -
Other expenses 11,245 12,014 1,717 639
4 177,960 123,259 5,914 3,557
Profit before income tax expense 67,015 25,587 15,103 4,861
Income tax expense 5 (19,920) (5,420) (182) (555)
Profit after income tax expense 47,095 20,167 14,921 4,306
Basic earnings per share (cents per share) 29 38.7 16.9
Diluted earnings per share (cents per share) 29 38.3 16.9
The accompanying notes form an integral part of the Income Statement

23
BALANCE SHEETAs at 30 June 2008
Note Consolidated Parent
2008 2007 2008 2007
$’000 $’000 $’000 $’000
Current assets
Cash and cash equivalents 6 49,577 19,461 2,184 9,691
Trade and other receivables 7 19,378 24,090 34,022 7,781
Inventories 8 14,252 4,843 -
Financial Assets 10 605 - - -
Other assets 9 516 346 2 -
Total current assets 84,328 48,740 36,208 17,472
Non current assets
Trade and other receivables 7 1,539 5,577 - -
Investment in subsidiaries - - 47,372 43,732
Investments accounted using the equity method 11 189 121 - -
Financial assets 10 2,555 78 2,555 -
Plant and equipment 12 120,353 89,318 - -
Intangible assets 13 10,235 10,235 - -
Deferred tax assets 14 4,442 3,660 975 678
Total non current assets 139,313 108,989 50,902 44,410
Total assets 223,641 157,729 87,110 61,882
Current liabilities
Trade and other payables 15 39,007 21,529 20,831 2,429
Finance lease liabilities 16 11,355 10,325 - -
Secured loans - 1,650 - -
Income tax payable 16,068 2,991 479 749
Provisions 17 7,719 6,553 1,261 971
Total current liabilities 74,149 43,048 22,571 4,149
Non current liabilities
Trade and other payables 15 15 8,428 - -
Finance lease liabilities 16 16,766 16,341 - -
Deferred tax liabilities 14 13,385 14,252 - -
Provisions 17 3,304 - - -
Total non current liabilities 33,470 39,021 - -
Total liabilities 107,619 82,069 22,571 4,149
Net assets 116,022 75,660 64,539 57,733
Equity
Issued capital 18 64,161 57,278 64,161 57,278
Reserves 19 3,448 2,066 - -
Retained earnings 48,413 16,316 378 455
Total equity 116,022 75,660 64,539 57,733
The accompanying notes form an integral part of the Balance Sheet

24
Min
eral R
eso
urce
s Limite
d A
NN
UA
L RE
PO
RT
2008
STATEMENT OF CHANGES IN EquITyFor the year to 30 June 2008
Share Capital Retained Earnings
Reserves Total
$’000 $’000 $’000 $’000Consolidated 2008
Balance at 1 July 2007 57,278 16,316 2,066 75,660
Net proceeds of share issues from exercise of options
1,706 - - 1,706
Share based payments 5,177 - - 5,177
Dividends paid - (14,998) - (14,998)
Revaluation increment - - 504 504
Deferred tax asset - - 878 878
Net profit - 47,095 - 47,095
Balance at 30 June 2008 64,161 48,413 3,448 116,022
Parent Entity 2008
Balance at 1 July 2007 57,278 455 - 57,733
Net proceeds of share issues from exercise of options
1,706 - - 1,706
Share based payments 5,177 - - 5,177
Dividends paid - (14,998) - (14,998)
Net profit - 14,921 - 14,921
Balance at 30 June 2008 64,161 378 - 64,539
Consolidated 2007
Balance at 1 July 2006 43,732 - - 43,732
Net proceeds of share issues from IPO 13,500 - - 13,500
Share issue costs (net of income tax) (1,128) - - (1,128)
Share based payments 1,174 - - 1,174
Dividends paid - (3,851) - (3,851)
Revaluation increment - - 1,481 1,481
Deferred tax asset - - 585 585
Net profit - 20,167 - 20,167
Balance at 30 June 2007 57,278 16,316 2,066 75,660
Parent Entity 2007
Balance at 1 July 2006 43,732 - - 43,732
Net proceeds of share issues from IPO 13,500 - - 13,500
Share issue costs (net of income tax) (1,128) - - (1,128)
Share based payments 1,174 - - 1,174
Dividends paid - (3,851) - (3,851)
Net profit - 4,306 - 4,306
Balance at 30 June 2007 57,278 455 - 57,733
The accompanying notes form an integral part of the Statement of Changes in Equity

25
CASH FLOW STATEMENTFor the year to 30 June 2008
Note Consolidated Parent
2008 2007 2008 2007
$’000 $’000 $’000 $’000
Cash flows from operating activities
Cash receipts from customers 250,823 138,053 3,894 -
Cash payments to suppliers and employees (145,980) (104,607) (3,279 ) (3,066)
Interest received 1,754 804 602 539
Interest and other costs of finance paid (2,208 ) (2,351) (3 ) (7)
Income taxes paid (7,613) (1,794) (749 ) -
Net cash flows from operating activities 20(b) 96,786 30,105 465 (2,534)
Cash flows from investing activities
Payments for property, plant and equipment (38,376 ) (7,945) - -
Proceeds from the sale of fixed assets 591 1,652 - -
Payments for available for sale investments (4,057) - (4,057 ) -
Proceeds on disposal of available for sale investments 707 - 707 -
Dividends received - - 16,031 4,187
Net cash flows from investing activities (41,135 ) (6,293) 12,681 4,187
Cash flows from financing activities
Proceeds from share issue - 13,500 - 13,500
Proceeds from exercise of share options 1,706 - 1,706 -
Costs of share issue - (1,611) - (1,611)
Proceeds from borrowings - 1,150 - -
Repayment of borrowings (12,244) (12,282) - -
Financing of related entities - - (7,362) -
Dividends paid (14,997) (3,851) (14,997) (3,851)
Net cash flows from financing activities (25,535) (3,094) (20,653 ) 8,038
Net increase in cash and cash equivalents 30,116 20,718 (7,507) 9,691
Cash and cash equivalents at the beginning of the financial period 19,461 (1,257) 9,691 -
Cash and cash equivalents at the end of the financial period 20(a) 49,577 19,461 2,184 9,691
The accompanying notes form an integral part of the Cash Flow Statement
26
Min
eral R
eso
urce
s Limite
d A
NN
UA
L RE
PO
RT
2008
NOTES TO THE FINANCIAL STATEMENTSFor the year to 30 June 2008
Note 1: Significant accounting policiesThis financial report includes the consolidated financial statements and notes of Mineral Resources Limited and controlled entities ("Consolidated Entity"), and the separate financial statements and notes of Mineral Resources Limited as an individual parent entity (‘Parent Entity’).
The financial report was authorised for issue on 20 August 2008.
(i) Basis of Preparation
The financial report is a general purpose financial report that has been prepared in accordance with Australian Accounting Standards, Australian Accounting Interpretations, other authoritative pronouncements of the Australian Accounting Standards Board and the Corporations Act 2001.
Australian Accounting Standards set out accounting policies that the AASB has concluded would result in a financial report containing relevant and reliable information about transactions, events and conditions to which they apply. Compliance with Australian Accounting Standards ensures that the financial statements and notes also comply with International Financial Reporting Standards. Material accounting policies adopted in the preparation of this financial report are presented below. They have been consistently applied unless otherwise stated.
The financial report has been prepared on an accruals basis and is based on historical costs, modified, where applicable, by the measurement at fair value of selected non-current assets, financial assets and financial liabilities.
(ii) Basis of consolidation
A controlled entity is any entity Mineral Resources Limited has the power to control the financial and operating policies of so as to obtain benefits from its activities. All controlled entities have a June financial year-end.
All inter-company balances and transactions between entities in the consolidated group, including any unrealised profits or losses, have been eliminated on consolidation. Accounting policies of subsidiaries have been changed where necessary to ensure consistencies with those policies applied by the parent entity.
Where controlled entities have entered or left the consolidated group during the year, their operating results have been included/excluded from the date control was obtained or until the date control ceased.
(iii) Income tax
The charge for current income tax expense is based on the profit for the year adjusted for any non-assessable or disallowed items. It is calculated using the tax rates that have been enacted or are substantially enacted by the balance sheet date.
Deferred tax is accounted for using the balance sheet liability method in respect of temporary differences arising between the tax bases of assets and liabilities and their carrying amounts in the financial statements. No deferred income tax will be recognised from the initial recognition of an asset or liability, excluding a business combination, where there is no effect on accounting or taxable profit or loss.
Deferred tax is calculated at the tax rates that are expected to apply to the period when the asset is realised or liability is settled. Deferred tax is credited in the income statement except where it relates to items that may be credited directly to equity, in which case the deferred tax is adjusted directly against equity.
Deferred income tax assets are recognised to the extent that it is probable that future tax profits will be available against which deductible temporary differences can be utilised.
The amount of benefits brought to account or which may be realised in the future is based on the assumption that no adverse change will occur in income taxation legislation and the anticipation that each company in the consolidated entity will derive sufficient future assessable income to enable the benefit to be realised and comply with the conditions of deductibility imposed by the law.
(iv) Inventories
Inventories are stated at the lower of cost and net realisable value. Net realisable value is the estimated selling price in the ordinary course of business, less the estimated costs of completion and selling expenses. Cost is assigned on a standard cost basis with the exception of contract specific requirements to use an average cost basis.
27
NOTES TO THE FINANCIAL STATEMENTSFor the year to 30 June 2008
Note 1: Significant accounting policies (continued)Construction work in progressConstruction work in progress is stated at the aggregate of contracts costs incurred to date plus recognised profits less recognised losses and progress billings. If there are contracts where billings exceed the aggregate costs incurred including profit margins, the net amounts are presented under trade and other payables.
Contract costs include all costs directly related to specific contracts, costs that are specifically chargeable to the customer under the terms and conditions of the contract and an allocation of overhead expenses incurred in connection with the consolidated entity’s construction activities based on normal operating capacity.
(v) Intangibles
GoodwillGoodwill and goodwill on consolidation are initially recorded at the amount by which the purchase price for a business or for an ownership interest in a controlled entity exceeds the fair value attributed to its net assets at date of acquisition. Goodwill on acquisitions of subsidiaries is included in intangible assets. Goodwill on acquisition of associates is included in investments in associates. Goodwill is tested annually for impairment and carried at cost less accumulated impairment losses. Gains and losses on the disposal of an entity include the carrying amount of goodwill relating to the entity sold.
(vi) Revenue recognition
Goods soldRevenue from sale of goods is recognised in the income statement when the significant risks and rewards of ownership have been transferred to the buyer.
Revenue from bulk products exported from Australia, ownership in the goods transfers to the buyer after a clean bill of lading has been issued for the shipment, the preliminary payment is received and in accordance with any other specific terms of the contract of sale.
Services renderedRevenue from services rendered is recognised in the income statement in proportion to the stage of completion of the transaction at balance sheet date. The stage of completion is assessed by reference to work performed.
No revenue is recognised if there are significant uncertainties regarding recovery of the consideration due or if the costs incurred or to be incurred cannot be measured reliably.
Construction contractsContract revenue and expenses are generally recognised on an individual contract basis using percentage of completion method when the stage or contract completion can be reliably determined, costs to date can be clearly identified, and total contract revenue and costs to complete can be reliably estimated. Two or more contracts are treated as a single contract where the contracts are negotiated as a single package, are closely interrelated and are performed concurrently or in a continuous sequence.
Profit recognition for lump sum fixed price contracts does not commence until cost to completion can be reliably measured.
Stage of contract completion is generally measured by reference to physical completion. An assessment of total labour hours and other costs incurred to date as a percentage of estimated total costs for each contract is used if it is an appropriate proxy for physical completion. Task-lists, milestones, etc are also used to calculate or confirm the percentage of completion if appropriate.
Where the outcome of a contract cannot be reliably estimated, contract costs are expensed as incurred. Where it is probable that the costs will be recovered, revenue is recognised to the extent of costs incurred. An expected loss is recognised immediately as an expense.
Interest revenueInterest revenue is recognised on a proportional basis taking into account the interest rates applicable to the financial assets.
DividendsRevenue from distributions from controlled entities is recognised by the parent entity when they are declared by the controlled entities.
28
Min
eral R
eso
urce
s Limite
d A
NN
UA
L RE
PO
RT
2008
NOTES TO THE FINANCIAL STATEMENTSFor the year to 30 June 2008
Note 1: Significant accounting policies (continued)
(vii) Cash and cash equivalents
Cash and cash equivalents comprise cash balances and call deposits with an original maturity of three months or less.
Bank overdrafts that are repayable on demand and form an integral part of the consolidated entity’s cash management are included as a component of cash and cash equivalents for the purpose of the cash flow statement.
(viii) Plant and equipment
Owned assetsItems of plant and equipment are stated at cost less accumulated depreciation and impairment losses. The cost of self constructed assets includes the cost of materials, direct labour and an appropriate portion of production overheads. The cost of self constructed and acquired assets includes (i) the initial estimate at the time of installation and during the period of use, when relevant, of the costs of dismantling and removing the items and restoring the site on which they are located, and (ii) changes in the measurement of existing liabilities recognised for these costs resulting from changes in the timing or outflow of resources required to settle the obligation or from changes in the discount rate.
Where parts of an item of plant and equipment have different useful lives, they are accounted for as separate items of plant and equipment.
Leased assetsLeases in terms of which the consolidated entity assumes substantially all of the risks and rewards of ownership are classified as finance leases. Finance leases are stated at an amount equal to the lower of fair value and the present value of minimum lease payment at inception of the lease, less accumulated depreciation and impairment losses.
Sale of non-current assetsThe net gain or loss on disposal is included in the income statement at the date control of the asset passes to the buyer, usually when an unconditional contract for sale is signed.
The gain or loss on disposal is calculated as the difference between the carrying amount of the asset at the time of disposal and the net proceeds on disposal (including incidental costs).
Subsequent costsThe consolidated entity recognises in the carrying amount of an item of plant and equipment the cost of replacing part of such an item when that cost is incurred if it is probable that the future economic benefits embodied within the item will flow to the consolidated entity and the cost of the item can be measured reliably. All other costs are recognised in the income statement as an expense as incurred.
RevaluationIncreases in the carrying amount arising on the revaluation of plant and equipment are credited to a revaluation reserve in equity. Decreases that offset previous increases of the same asset are charged against fair value reserves directly in equity; all other decreases are charged to the income statement.
DepreciationThe depreciable amount of plant and equipment is depreciated over their useful lives on a straight line basis commencing from the time the asset is ready for use. Crushing plant and certain associated plant and equipment is depreciated on the usage method of depreciation.
Class Life Buildings 20 years Plant and equipment - other 3-20 years or the term of the lease Tracking plant and equipment 6 years
(ix) Impairment
Financial InstrumentsAt each reporting date, the consolidated entity assesses whether there is objective evidence that a financial instrument has been impaired. In the case of available-for-sale financial instruments, a prolonged decline in the value of the instrument is considered to determine whether an impairment has arisen. Impairment losses are recognised in the income statement.
29
NOTES TO THE FINANCIAL STATEMENTSFor the year to 30 June 2008
Note 1: Significant accounting policies (continued)
Other Assets
At each reporting date, the consolidated entity reviews the carrying values of its tangible and intangible assets to determine whether there is any indication that those assets have been impaired. If such an indication exists, the recoverable amount of the asset, being the higher of the asset’s fair value less costs to sell and value in use, is compared to the asset’s carrying value. Any excess of the asset’s carrying value over its recoverable amount is expensed to the income statement.Impairment testing is performed annually for goodwill and intangible assets with indefinite lives.
Where it is not possible to estimate the recoverable amount of an individual asset, the consolidated entity estimates the recoverable amount of the cash-generating unit to which the asset belongs.
(x) Investments
Investments in controlled entities are carried at cost. Cost includes the purchase price of the entity as well as directly attributable costs associated with the acquisition. Directly attributable costs are capitalised only once there is written agreement to acquire the entity.
(xi) Financial Instruments
Recognition and Initial MeasurementFinancial instruments, incorporating financial assets and financial liabilities, are recognised when the consolidated entity becomes a party to the contractual provisions of the instrument. Trade date accounting is adopted for financial assets that are delivered within timeframes established by marketplace convention.
Financial instruments are initially measured at fair value plus transactions costs where the instrument is not classified as at fair value through profit or loss. Transaction costs related to instruments classified at fair value through profit or loss are expensed to profit or loss immediately. Financial instruments are classified and measured as set out below.
DerecognitionFinancial assets are derecognised where the contractual rights to receipt of cash flows expires or the asset is transferred to another party whereby the entity is no longer has any significant continuing involvement in the risks and benefits associated with the asset. Financial liabilities are derecognised where the related obligations are either discharged, cancelled or expire. The difference between the carrying value of the financial liability extinguished or transferred to another party and the fair value of consideration paid, including the transfer of non-cash assets or liabilities assumed, is recognised in profit or loss.
Classification and Subsequent Measurement
Financial assets at fair value through profit or lossFinancial assets are classified at fair value through profit or loss when they are held for trading for the purpose of short term profit taking, where they are derivatives not held for hedging purposes. Realised and unrealised gains and losses arising from changes in fair value are included in profit or loss in the period in which they arise.
Loans and receivables Loans and receivables are non-derivative financial assets with fixed or determinable payments that are not quoted in an active market and are subsequently measured at amortised cost using the effective interest rate method.
Held-to-maturity investments Held-to-maturity investments are non-derivative financial assets that have fixed maturities and fixed or determinable payments, and it is the consolidated entity’s intention to hold these investments to maturity. They are subsequently measured at amortised cost using the effective interest rate method.
Available-for-sale financial assetsAvailable-for-sale financial assets are non-derivative financial assets that are either designated as such or that are not classified in any of the other categories. They comprise investments in the equity of other entities where there is neither a fixed maturity nor fixed or determinable payments.
30
Min
eral R
eso
urce
s Limite
d A
NN
UA
L RE
PO
RT
2008
NOTES TO THE FINANCIAL STATEMENTSFor the year to 30 June 2008
Note 1: Significant accounting policies (continued)Financial LiabilitiesNon-derivative financial liabilities (excluding financial guarantees) are subsequently measured at amortised cost using the effective interest rate method.
Derivative instrumentsDerivative instruments are measured at fair value. Gains and losses arising from changes in fair value are taken to the income statement unless they are designated as hedges. Assessments are made by the consolidated entity both at hedge inception and on an ongoing basis, of whether the derivatives that are used in hedging transactions have been and will continue to be highly effective in offsetting changes in fair values or cash flows of hedged items.
Fair value hedgeChanges in the fair value of derivatives that are designated and qualify as fair value hedges are recorded in the income statement, together with any changes in the fair value of hedged assets or liabilities that are attributable to the hedged risk.
Cash flow hedgeThe effective portion of changes in the fair value of derivatives that are designated and qualify as cash flow hedges is deferred to a hedge reserve in equity. The gain or loss relating to the ineffective portion is recognised immediately in the income statement. Amounts accumulated in the hedge reserve in equity are transferred to the income statement in the periods when the hedged item will affect profit or loss.
Fair value Fair value is determined based on current bid prices for all quoted investments.
Impairment At each reporting date, the consolidated entity assesses whether there is objective evidence that a financial instrument has been impaired. In the case of available-for-sale financial instruments, a prolonged decline in the value of the instrument is considered to determine whether an impairment has arisen. Impairment losses are recognised in the income statement.
Trade and other receivablesTrade receivables and other receivables are stated at cost less impairment losses.
Trade and other payablesLiabilities are recognised for amounts to be paid in the future for goods or services received. Trade accounts payable are normally settled within 60 days.
Interest bearing loans and borrowingsInterest bearing borrowings are recognised initially at fair value less attributable transaction costs. Subsequent to initial recognition, interest bearing borrowings are stated at amortised cost with any difference between cost and redemption value being recognised in the income statement over the period of the borrowing on an effective interest basis.
Finance costsFinance costs comprise interest payable on borrowings calculated using the effective interest rate method, foreign exchange gains or losses and gains or losses on hedging instruments that are recognised in the income statement. The interest expense component of finance lease payments is recognised in the income statement using the effective interest method.
Foreign Currency Transactions and Balances
Functional and presentation currencyThe functional currency of entity is measured using the currency of the primary economic environment in which it operates. The consolidated financial statements are presented in Australian dollars which is the consolidated entity’s functional and presentation currency.
Transaction and balancesForeign currency transactions are translated into functional currency using the exchange rates prevailing at the date of the transaction. Foreign currency monetary items are translated at the year-end exchange rate. Non-monetary items measured at historical cost continue to be carried at the exchange rate at the date of the transaction. Non-monetary items measured at fair value are reported at the exchange rate at the date when fair values were determined. Exchange differences arising on the translation of monetary items are recognised in the income statement, except where deferred in equity as a qualifying cash flow or net investment hedge. Exchange differences arising on the translation of non-monetary items are recognised directly in equity to the extent that the gain or loss is directly recognised in equity, otherwise the exchange difference is recognised in the income statement.

31
NOTES TO THE FINANCIAL STATEMENTSFor the year to 30 June 2008
Note 1: Significant accounting policies (continued)
(xii) Lease payments
Operating lease paymentsPayments made under operating leases are recognised in the income statement on a straight-line basis over the term of the lease. Lease incentives received are recognised in the income statement as an integral part of the total lease expense and spread over the lease term.
Finance lease paymentsMinimum lease payments are apportioned between the finance charge and reduction of the outstanding liability. The finance charge is allocated to each period during the lease term so as to produce a constant periodic rate of interest on the remaining balance of the liability.
(xiii) Employee benefits
Provision has been made in the financial statements for benefits accruing to employees in relation to annual leave, long service leave, workers’ compensation and vested sick leave. No provision is made for non-vesting sick leave.
All on-costs, including payroll tax, workers’ compensation premiums, superannuation and fringe benefits tax are included in the determination of provisions. vested sick leave, and the current portion of annual leave, long service leave and workers’ compensation provisions are measured at the amount of the expected payment to the employee.
The portions of annual leave, long service leave and workers’ compensation provisions expected to be settled later than one year, are discounted using interest rates on national government guaranteed securities with terms to maturity that match, as closely as possible, the estimated future cash outflows.
Obligations for contributions to defined contribution pension plans are recognised as an expense in the income statement as incurred.
(xiv) Share based payments
Certain employees may be entitled to participate in option ownership schemes. The fair value of options granted is recognised as an expense with a corresponding increase in equity. The fair value is measured at grant date and recognised over the vesting period being the period during which the employees become unconditionally entitled to the options. The fair value of options granted is measured using a recognised valuation model, taking into account the terms and conditions upon which the options were granted. The amount recognised in expense is adjusted to reflect the actual number of share options that vest except where forfeiture is only due to share prices not achieving the threshold for vesting.
(xv) Provisions
Provisions are recognised when the consolidated entity has a legal or constructive obligation, as a result of past events, for which it is probable that an outflow of economic benefits will result and that outflow can be reliably measured.
WarrantiesProvision is made in respect of the consolidated entity’s estimated liability on all products and services under warranty at balance date. The provision is measured as the present value of future cash flows estimated to be required to settle the warranty obligation. The future cash flows have been estimated by reference to the consolidated entity’s history of warranty claims.
Project closureAt the completion of some projects the consolidated entity has a liability for redundancy and the cost of relocating crushing and other mobile plant. An assessment is undertaken on the probability that such expenses will be incurred in the normal business of contracting services and is provided for in the financial statements.
RehabilitationIn accordance with the consolidated entity’s legal requirements, provision is made for the anticipated costs of future restoration and rehabilitation of areas from which natural resources have been extracted. The provision includes costs associated with dismantling of assets, reclamation, plant closure, waste site closure, monitoring, demolition and decontamination. The provision is based upon current costs and has been determined on a discounted basis with reference to current legal requirements and current technology.

32
Min
eral R
eso
urce
s Limite
d A
NN
UA
L RE
PO
RT
2008
NOTES TO THE FINANCIAL STATEMENTSFor the year to 30 June 2008
Note 1: Significant accounting policies (continued)Each period the impact of the un-wind of discounting is recognised in the income statement as a financing cost. Any change in the restoration provision is recorded against the carrying value of the provision and the related asset, only to the extent that it is probable that future economic benefits associated with the restoration expenditure will flow to the entity, with the effect being recognised in the income statement on a prospective basis over the remaining life of the relevant operation. The restoration provision is separated into current (estimated costs arising within 12 months) and non-current components based on the expected timing of these cash flows.
Onerous contractsA provision for onerous contracts is recognised when the expected benefits to be derived by the consolidated entity from a contract are lower than the unavoidable cost of meeting its obligations under the contract.
(xvi) Earnings per share
Basic earnings per shareBasic earnings per share is determined by dividing net profit after income tax attributable to ordinary shareholders of the company, excluding any costs of servicing equity other than ordinary shares, by the weighted average number of ordinary shares outstanding during the financial year, adjusted for bonus elements in ordinary shares issued during the year.
Diluted earnings per shareDiluted earnings per share adjusts the figures used in the determination of basic earnings per share to take into account the after income tax effect of interest and other financing costs associated with dilutive potential ordinary shares and the weighted average number of shares assumed to have been issued for no consideration in relation to dilutive potential ordinary shares.
(xvii) Australian goods and services tax
Revenues, expenses and assets are recognised net of the amount of goods and services tax (GST), except where the amount of GST incurred is not recoverable from the taxation authority. In these circumstances, the GST is recognised as part of the cost of acquisition of the asset or as part of the expense.
Receivables and payables are stated with the amount of GST included.
The net amount of GST recoverable from, or payable to, the ATO is included as a current asset or liability in the balance sheet.
Cash flows are included in the cash flow statement on a gross basis. The GST components of cash flows arising from investing and financing activities which are recoverable from, or payable to, the ATO are classified as operating cash flows.
(xviii) Share Capital
Dividends are recognised as a liability in the period on which they are declared.
Transaction costs of an equity transaction are accounted for as a deduction from equity, net of any related income tax benefit.
(ixx) Comparatives
Where required by Australian Accounting Standards, comparative information has been adjusted to conform with changes in presentation for the current financial year.
(xx) Rounding of Amounts
The parent entity has applied the relief available to it under ASIC Class Order 98/100 and accordingly, amounts in the financial report and directors’ report have been rounded off to the nearest $1,000.
(xxi) Critical accounting estimates and judgements
ProvisionsRefer to note 1 (xv).
Impairment of goodwill and intangibles with indefinite useful livesThe consolidated entity assesses goodwill and intangibles with indefinite useful lives for impairment at least annually. These calculations involve an estimation of the recoverable amount of the cash-generating units to which the goodwill and intangibles with indefinite useful lives are allocated.

33
NOTES TO THE FINANCIAL STATEMENTSFor the year to 30 June 2008
Note 1: Significant accounting policies (continued)Impairment of available for sale assetsThe consolidated entity assesses available for sale assets for impairment annually. The fair value of shares held in listed companies is assessed at the last price traded on ASX on the balance date. Note 10 discloses the fair value of available for sale assets and impairment adjustments as necessary.
Useful lives of plant and equipmentThe consolidated entity assesses the useful life of plant and equipment assets annually. The useful life is assessed with reference to the assets operational activity and commitments and adjustments made to reflect the duty expected of the plant and equipment. Adjustments to depreciation rates of plant and equipment where the expected useful life is deemed to have changed is reflected in the notes to this financial report.
During the year, the estimated useful lives of certain items of plant and equipment were revised. The financial effect of the change in an accounting estimate on the year was an increase in depreciation expense of the consolidated entity of $3,300,000.
The financial effect of this change in estimates on future financial years can not be disclosed as the future estimated life of the assets involved cannot be reliably estimated.
Note 2: Statement of operations by segments
Business
Mineral Resources Limited operates in the single business segment. The group is an integrated supplier of goods and services to the resources sector.
The directors believe this to be the case for the following reasons:
• Theconsolidatedentityperformsservicesforacommonindustrysectorbeingtheresourcessector,
• The consolidated entity operates with a centralized pool of management, engineering, operational labour andadministrative and shared services personnel,
• Thecommonuseofplant,equipmentandconsumableinventory,
• Operationsareconductedwithinasingleregulatoryenvironment,and
• Commoncustomersexistwithinthedivisionsoftheintegratedbusinessthatisexposedtosimilaroperationalrisksandrewards.
Geographical
Mineral Resources Limited operates in a single secondary reporting segment being Australia.

34
Min
eral R
eso
urce
s Limite
d A
NN
UA
L RE
PO
RT
2008
NOTES TO THE FINANCIAL STATEMENTSFor the year to 30 June 2008
Note 3: Revenue
Consolidated Parent
2008 2007 2008 2007
$’000 $’000 $’000 $’000Revenue from continuing operations
Contract and operational revenue 100,244 92,771 - -
Sale of goods and equipment 135,197 48,200 - -
Equipment rental 2,674 5,769 - -
238,115 146,740 - -
Other Income
Interest income 1,754 804 602 539
Administration charges - 36 4,153 3,692
Dividends received - - 16,031 4,187
Profit on sale of fixed assets 313 462 - -
Profit on sale of shares in listed companies 230 - 230 -
Costs recovered 3,490 - - -
Other income 1,073 804 1 -
6,860 2,106 21,017 8,418
Note 4: Profit before income tax
Consolidated Parent
2008 2007 2008 2007
$’000 $’000 $’000 $’000Profit before income tax includes the following specific expenses not disclosed separately on the face of the income statement:
Rental expenses relating to operating leases 1,767 1,034 - -
Foreign exchange gains and losses
Net foreign exchange gain 1,852 530 - -
Unrealised foreign exchange loss (840) (132) - -
1,012 398 - -
Provision for impairment of receivable 687 - - -
Provision for rehabilitation 3,500 - - -
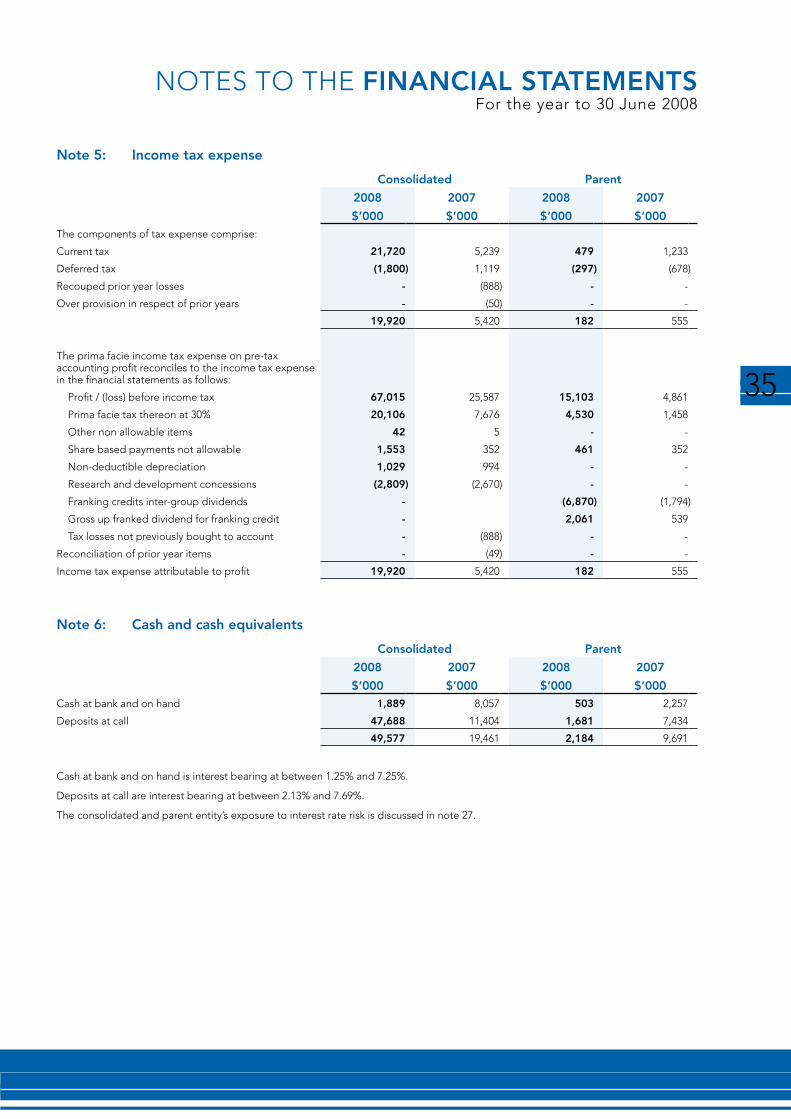
35
NOTES TO THE FINANCIAL STATEMENTSFor the year to 30 June 2008
Note 5: Income tax expense
Consolidated Parent
2008 2007 2008 2007
$’000 $’000 $’000 $’000The components of tax expense comprise:
Current tax 21,720 5,239 479 1,233
Deferred tax (1,800) 1,119 (297) (678)
Recouped prior year losses - (888) - -
Over provision in respect of prior years - (50) - -
19,920 5,420 182 555
The prima facie income tax expense on pre-tax accounting profit reconciles to the income tax expense in the financial statements as follows:
Profit / (loss) before income tax 67,015 25,587 15,103 4,861
Prima facie tax thereon at 30% 20,106 7,676 4,530 1,458
Other non allowable items 42 5 - -
Share based payments not allowable 1,553 352 461 352
Non-deductible depreciation 1,029 994 - -
Research and development concessions (2,809) (2,670) - -
Franking credits inter-group dividends - (6,870) (1,794)
Gross up franked dividend for franking credit - 2,061 539
Tax losses not previously bought to account - (888) - -
Reconciliation of prior year items - (49) - -
Income tax expense attributable to profit 19,920 5,420 182 555
Note 6: Cash and cash equivalents
Consolidated Parent
2008 2007 2008 2007
$’000 $’000 $’000 $’000Cash at bank and on hand 1,889 8,057 503 2,257
Deposits at call 47,688 11,404 1,681 7,434
49,577 19,461 2,184 9,691
Cash at bank and on hand is interest bearing at between 1.25% and 7.25%.
Deposits at call are interest bearing at between 2.13% and 7.69%.
The consolidated and parent entity’s exposure to interest rate risk is discussed in note 27.
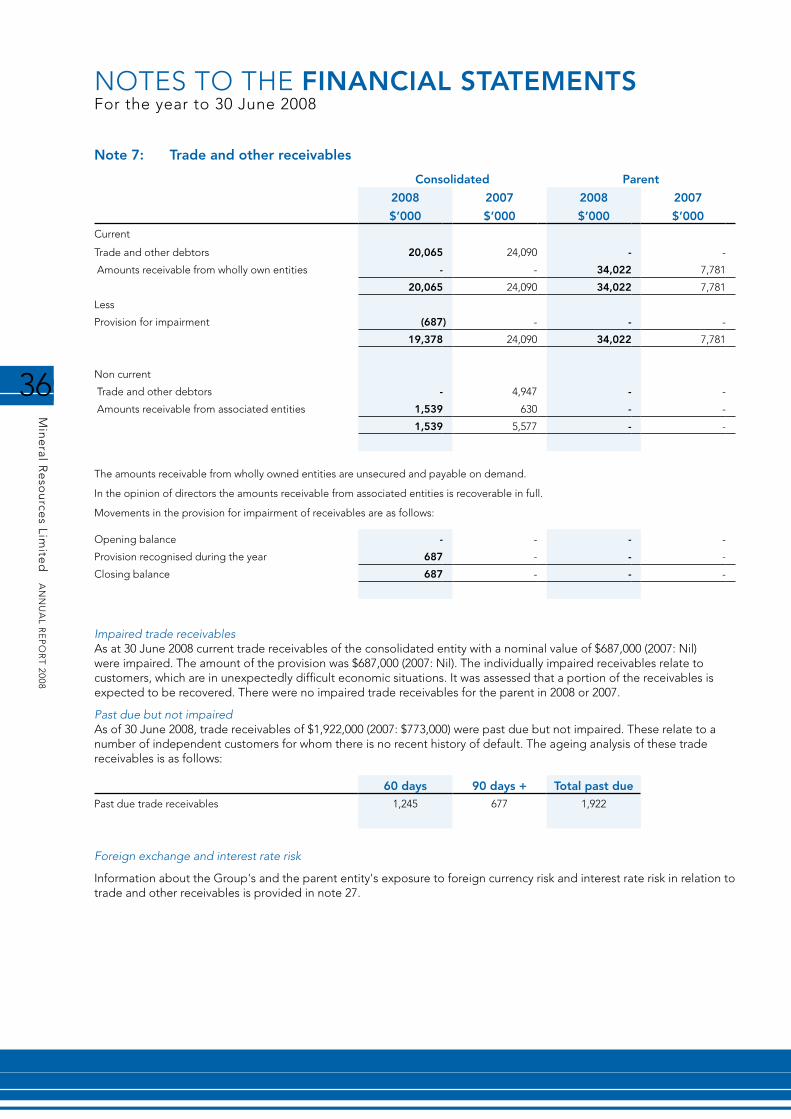
36
Min
eral R
eso
urce
s Limite
d A
NN
UA
L RE
PO
RT
2008
NOTES TO THE FINANCIAL STATEMENTSFor the year to 30 June 2008
Note 7: Trade and other receivables
Consolidated Parent
2008 2007 2008 2007
$’000 $’000 $’000 $’000Current
Trade and other debtors 20,065 24,090 - -
Amounts receivable from wholly own entities - - 34,022 7,781
20,065 24,090 34,022 7,781
Less
Provision for impairment (687) - - -
19,378 24,090 34,022 7,781
Non current
Trade and other debtors - 4,947 - -
Amounts receivable from associated entities 1,539 630 - -
1,539 5,577 - -
The amounts receivable from wholly owned entities are unsecured and payable on demand.
In the opinion of directors the amounts receivable from associated entities is recoverable in full.
Movements in the provision for impairment of receivables are as follows:
Opening balance - - - -
Provision recognised during the year 687 - - -
Closing balance 687 - - -
Impaired trade receivables As at 30 June 2008 current trade receivables of the consolidated entity with a nominal value of $687,000 (2007: Nil) were impaired. The amount of the provision was $687,000 (2007: Nil). The individually impaired receivables relate to customers, which are in unexpectedly difficult economic situations. It was assessed that a portion of the receivables is expected to be recovered. There were no impaired trade receivables for the parent in 2008 or 2007.
Past due but not impaired As of 30 June 2008, trade receivables of $1,922,000 (2007: $773,000) were past due but not impaired. These relate to a number of independent customers for whom there is no recent history of default. The ageing analysis of these trade receivables is as follows:
60 days 90 days + Total past duePast due trade receivables 1,245 677 1,922
Foreign exchange and interest rate risk
Information about the Group's and the parent entity's exposure to foreign currency risk and interest rate risk in relation to trade and other receivables is provided in note 27.

37
NOTES TO THE FINANCIAL STATEMENTSFor the year to 30 June 2008
Note 8: Inventories
Consolidated Parent
2008 2007 2008 2007
$’000 $’000 $’000 $’000Current
Raw materials and stores 12,995 2,871 - -
Work in progress 1,257 1,972 - -
14,252 4,843 - -
Note 9: Other assets
Consolidated Parent
2008 2007 2008 2007
$’000 $’000 $’000 $’000Current
Prepayments and other 516 346 2 -
Note 10: Financial assets
Consolidated Parent
2008 2007 2008 2007
$’000 $’000 $’000 $’000Available-for-sale financial assets 2,555 78 2,555 -
Held for trading financial assets 605 - - -
3,160 78 2,555 -
Current portion 605 - - -
Non-current portion 2,555 - 2,555 -
Available-for-sale Financial Assets Comprise
Listed investments, at fair value shares in listed corporations
3,580 - 3,580 -
Less: Impairment provision (1,025) - (1,025) -
Total available-for-sale financial assets 2,555 78 2,555 -
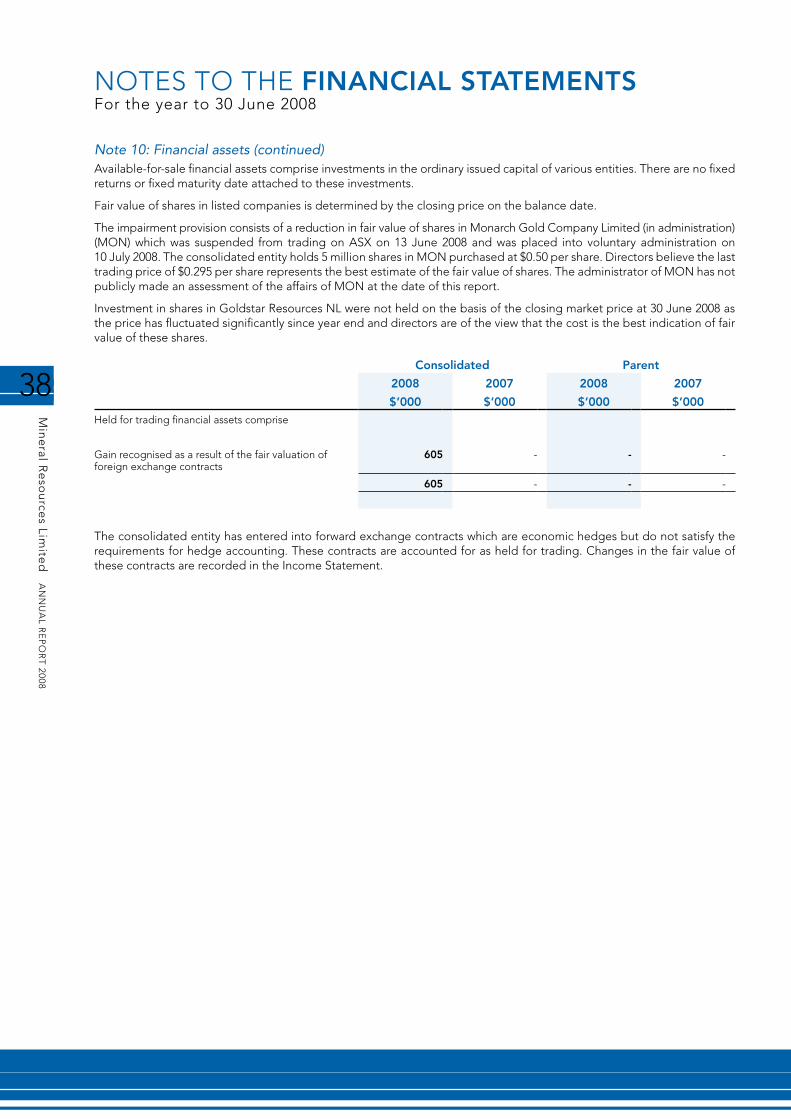
38
Min
eral R
eso
urce
s Limite
d A
NN
UA
L RE
PO
RT
2008
NOTES TO THE FINANCIAL STATEMENTSFor the year to 30 June 2008
Note 10: Financial assets (continued)Available-for-sale financial assets comprise investments in the ordinary issued capital of various entities. There are no fixed returns or fixed maturity date attached to these investments.
Fair value of shares in listed companies is determined by the closing price on the balance date.
The impairment provision consists of a reduction in fair value of shares in Monarch Gold Company Limited (in administration) (MON) which was suspended from trading on ASX on 13 June 2008 and was placed into voluntary administration on 10 July 2008. The consolidated entity holds 5 million shares in MON purchased at $0.50 per share. Directors believe the last trading price of $0.295 per share represents the best estimate of the fair value of shares. The administrator of MON has not publicly made an assessment of the affairs of MON at the date of this report.
Investment in shares in Goldstar Resources NL were not held on the basis of the closing market price at 30 June 2008 as the price has fluctuated significantly since year end and directors are of the view that the cost is the best indication of fair value of these shares.
Consolidated Parent
2008 2007 2008 2007
$’000 $’000 $’000 $’000Held for trading financial assets comprise
Gain recognised as a result of the fair valuation of foreign exchange contracts
605 - - -
605 - - -
The consolidated entity has entered into forward exchange contracts which are economic hedges but do not satisfy the requirements for hedge accounting. These contracts are accounted for as held for trading. Changes in the fair value of these contracts are recorded in the Income Statement.

39
NOTES TO THE FINANCIAL STATEMENTSFor the year to 30 June 2008
Note 11: Investments accounted for using the equity methodInterests are held in the following unlisted associated companies
Name Principal Activities Country of Incorporation
Shares Ownership Interest Carry amount of investment
2008 %
2007 %
2008 $000
2007 $000
Minprocess Group Inc. Mineral processing Philippines Ord 40 40 66 66
Iron Processing Group Inc. Mineral processing Philippines Ord 40 40 54 55
Process Minerals International Pty Ltd Inc.
Mineral processing Philippines Ord 40 40 69 -
189 121
Consolidated Parent
2008 2007 2008 2007
$’000 $’000 $’000 $’000Assets, Liabilities and Performance of Associates
Current assets 155 96 - -
Non-current assets 341 164 - -
Total assets 496 260 - -
Current liabilities (72) (11) - -
Non-current liabilities (678) (584) - -
Total liabilities (750) (595) - -
Net assets (254) (335) - -
Revenues 92 - - -
Profit after income tax of associates (172) (215) - -
Ownership interest in Minprocess Group Inc. Iron Processing Group Inc and Process Minerals International Pty Ltd Inc, at the company’s balance date was 40% of ordinary shares. The reporting date of the associates is 31st December.

40
Min
eral R
eso
urce
s Limite
d A
NN
UA
L RE
PO
RT
2008
NOTES TO THE FINANCIAL STATEMENTSFor the year to 30 June 2008
Note 12: Plant and equipment
Consolidated Parent
2008 2007 2008 2007
$’000 $’000 $’000 $’000Plant and equipment owned
Cost
Opening balance 23,329 16,485 - -
Category adjustment 567 - - -
Additions 38,835 7,945 - -
Disposals (674) (1,101) - -
Closing balance 62,057 23,329 - -
Accumulated depreciation
Opening balance (6,646) (3,095) - -
Category adjustment 440 - - -
Disposals 249 332 - -
Depreciation expense (3,471) (3,883) - -
Closing balance (9,428) (6,646) - -
Assets completing lease contract - transfer 8,250 2,035 - -
Net book value 60,879 18,718 - -
Plant and equipment under lease
Cost
Opening balance 82,883 79,425 - -
Category adjustment (577) - - -
Additions 11,303 4,029 - -
Disposals (571) - -
Closing balance 93,609 82,883 - -
Accumulated depreciation
Opening balance (13,373) (7,392) - -
Category adjustment (445) - - -
Disposals - 152 - -
Depreciation Expense (15,194) (6,133) - -
Closing balance (29,012) (13,373) - -
Assets completing lease contract (8,250) (2,035) - -
Net book value 56,347 67,475 - -

41
NOTES TO THE FINANCIAL STATEMENTSFor the year to 30 June 2008
Note 12: Plant and equipment (continued)Consolidated Parent
2008 2007 2008 2007
$’000 $’000 $’000 $’000
Tracking plant and equipment
Fair value
Opening balance 3,851 1,692 - -
Category adjustment - -
Additions 447 637 - -
Disposals - - - -
Revaluation increments 503 1,522 - -
Closing balance 4,801 3,851 - -
Accumulated depreciation
Opening balance (726) - - -
Category adjustment - -
Disposals - - - -
Depreciation Expense (948) (726) - -
Closing balance (1,674) (726) - -
Net book value 3,127 3,125 - -
Total property, plant and equipment 160,467 110,063 - -
Total plant and equipment accumulated depreciation (40,114) (20,745) - -
Total, plant and equipment net 120,353 89,318 - -
The basis of revaluation of track plant and equipment is an independent valuation by a qualified valuer or directors’ valuation.
Assets in the course of construction The carrying amounts of the assets disclosed above includes $32,109,000 (2007: $3,791,000) recognised in relation to property, plant and equipment in the course of construction.
Note 13: Intangible assets
Consolidated Parent
2008 2007 2008 2007
$’000 $’000 $’000 $’000Goodwill - Cost
Opening balance 10,235 10,235 - -
Additions from the acquisition of controlled entities - - - -
Impairment losses of goodwill - - - -
Closing balance 10,235 10,235 - -
Impairment tests for cash generating units containing goodwill
The following cash generating units have significant carrying amounts of goodwill.
PIHA Pty Ltd 8,817 8,817 - -
Process Minerals International Pty Ltd 1,418 1,418 - -
10,235 10,235 - -
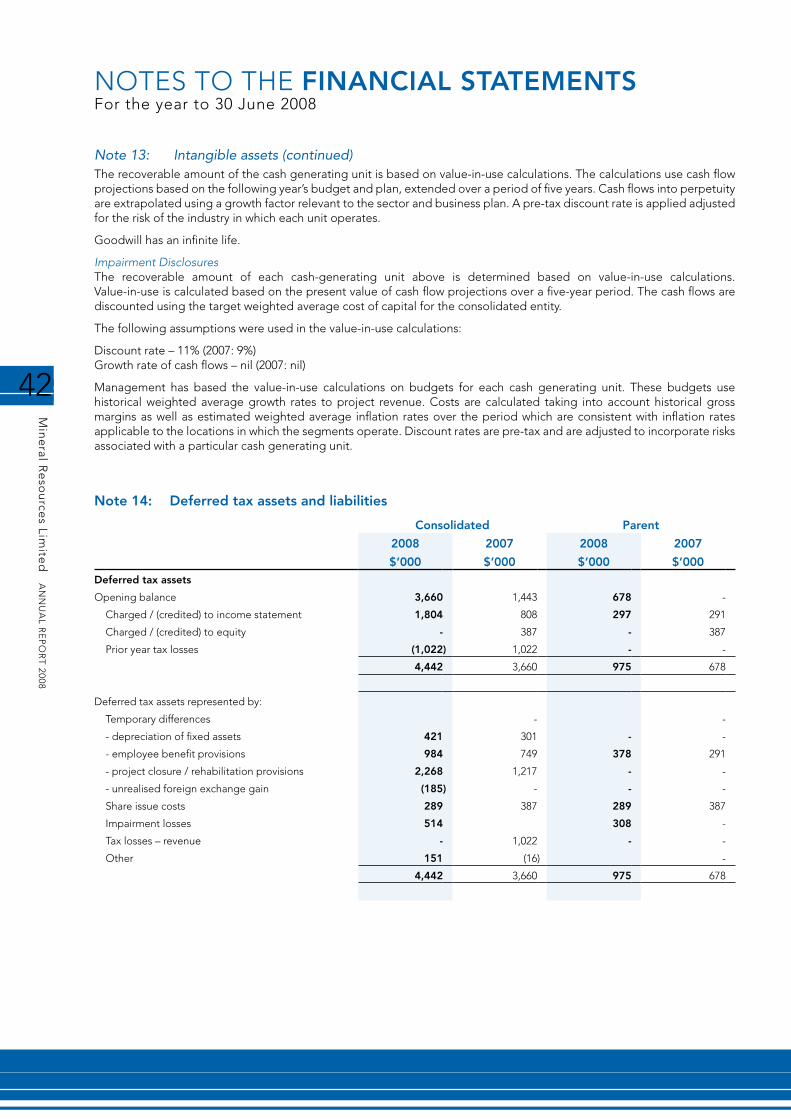
42
Min
eral R
eso
urce
s Limite
d A
NN
UA
L RE
PO
RT
2008
NOTES TO THE FINANCIAL STATEMENTSFor the year to 30 June 2008
Note 13: Intangible assets (continued)The recoverable amount of the cash generating unit is based on value-in-use calculations. The calculations use cash flow projections based on the following year’s budget and plan, extended over a period of five years. Cash flows into perpetuity are extrapolated using a growth factor relevant to the sector and business plan. A pre-tax discount rate is applied adjusted for the risk of the industry in which each unit operates.
Goodwill has an infinite life.
Impairment DisclosuresThe recoverable amount of each cash-generating unit above is determined based on value-in-use calculations. value-in-use is calculated based on the present value of cash flow projections over a five-year period. The cash flows are discounted using the target weighted average cost of capital for the consolidated entity.
The following assumptions were used in the value-in-use calculations:
Discount rate – 11% (2007: 9%) Growth rate of cash flows – nil (2007: nil)
Management has based the value-in-use calculations on budgets for each cash generating unit. These budgets use historical weighted average growth rates to project revenue. Costs are calculated taking into account historical gross margins as well as estimated weighted average inflation rates over the period which are consistent with inflation rates applicable to the locations in which the segments operate. Discount rates are pre-tax and are adjusted to incorporate risks associated with a particular cash generating unit.
Note 14: Deferred tax assets and liabilities
Consolidated Parent
2008 2007 2008 2007
$’000 $’000 $’000 $’000Deferred tax assets
Opening balance 3,660 1,443 678 -
Charged / (credited) to income statement 1,804 808 297 291
Charged / (credited) to equity - 387 - 387
Prior year tax losses (1,022) 1,022 - -
4,442 3,660 975 678
Deferred tax assets represented by:
Temporary differences - -
- depreciation of fixed assets 421 301 - -
- employee benefit provisions 984 749 378 291
- project closure / rehabilitation provisions 2,268 1,217 - -
- unrealised foreign exchange gain (185) - - -
Share issue costs 289 387 289 387
Impairment losses 514 308 -
Tax losses – revenue - 1,022 - -
Other 151 (16) -
4,442 3,660 975 678
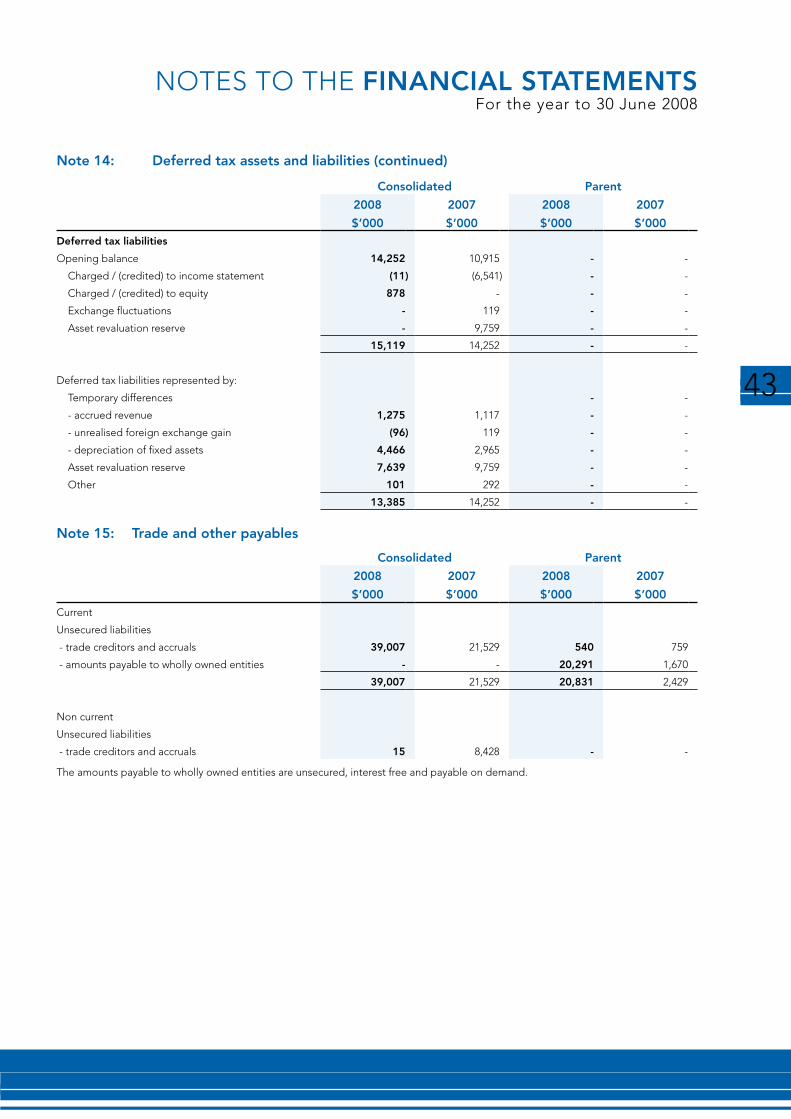
43
NOTES TO THE FINANCIAL STATEMENTSFor the year to 30 June 2008
Note 14: Deferred tax assets and liabilities (continued)
Consolidated Parent
2008 2007 2008 2007
$’000 $’000 $’000 $’000Deferred tax liabilities
Opening balance 14,252 10,915 - -
Charged / (credited) to income statement (11) (6,541) - -
Charged / (credited) to equity 878 - - -
Exchange fluctuations - 119 - -
Asset revaluation reserve - 9,759 - -
15,119 14,252 - -
Deferred tax liabilities represented by:
Temporary differences - -
- accrued revenue 1,275 1,117 - -
- unrealised foreign exchange gain (96) 119 - -
- depreciation of fixed assets 4,466 2,965 - -
Asset revaluation reserve 7,639 9,759 - -
Other 101 292 - -
13,385 14,252 - -
Note 15: Trade and other payables
Consolidated Parent
2008 2007 2008 2007
$’000 $’000 $’000 $’000Current
Unsecured liabilities
- trade creditors and accruals 39,007 21,529 540 759
- amounts payable to wholly owned entities - - 20,291 1,670
39,007 21,529 20,831 2,429
Non current
Unsecured liabilities
- trade creditors and accruals 15 8,428 - -
The amounts payable to wholly owned entities are unsecured, interest free and payable on demand.

44
Min
eral R
eso
urce
s Limite
d A
NN
UA
L RE
PO
RT
2008
NOTES TO THE FINANCIAL STATEMENTSFor the year to 30 June 2008
Note 16: Financial Liabilities
Consolidated Parent
2008 2007 2008 2007
$’000 $’000 $’000 $’000Current
Secured liabilities
- secured loans - 1,650 - -
- finance lease liabilities 11,355 10,325 - -
11,355 11,975 - -
Non current
Secured liabilities
- finance lease liabilities 16,766 16,341 - -
16,766 16,341 - -
Details of the security held is as follows:
Bank facilities are secured by:
• Registeredmortgagedebenturesoverthewholeoftheassetsandundertakingsofeachoftheparententityanditscontrolled entities;
• Negativepledgeswithrespecttofinancialcovenants;and
• Interlockingguarantees.
Finance lease liabilities are secured over individual assets financed in the normal operation of a finance lease agreement, in the first instance and then by the bank security described above.
Finance facilitiesThe consolidated entity has access to the following lines of credit:
Bank overdraft
Limit 3,600 3,600 - -
Amount utilised - - - -
Unused facility 3,600 3,600 - -
Overseas bills purchasing line of credit
Limit 1,533 1,533 - -
Amount utilised - - - -
Unused facility 1,533 1,533 - -
Finance lease liabilities
Limit 40,376 28,367 - -
Amount utilised (28,121) (26,666) - -
Unused facility 12,255 1,701 - -
Bank loans
Limit 50,000 1,650 - -
Amount utilised - (1,650) - -
Unused facility 50,000 - - -

45
NOTES TO THE FINANCIAL STATEMENTSFor the year to 30 June 2008
Note 16: Financial Liabilities (continued)
Facility use, expiry and interest rates:
Bank OverdraftThis facility is an overdraft offset facility that can be drawn to a maximum of $3,600,000. The facility is renewable on an annual basis and is due for renewal on 31 December 2008. Interest is charged on this account at the National Australia Bank Indicator Rate plus a margin of 1.75%. At the balance date this rate was 12.43% per annum. This rate can vary.
Overseas Bill Purchasing LineThis facility allows for disbursements in US dollars to supplies of ocean shipping services to the consolidated entity. The facility is renewable on an annual basis and is currently due for renewal on 31 December 2008. Interest is charged at the National Australia Bank Cost of Funds Rate plus a margin of 1.6%. The annual rate at the time of this report is 2.875% per annum.
Finance Lease FacilitiesFinance lease contracts are utilised to finance the acquisition of plant and equipment. The consolidated group has a combination of a revolving limit and separately approved finance lease contracts. The contracts are negotiated on current interest rates and terms depending on the particular equipment purchased and the contract expires on completion of the payment schedule. Average interest rates and the unexpired terms of the contracts are disclosed in note 27.
Bank LoanThe consolidated entity has a special purpose loan facility to fund the construction of certain plant. This facility was entered into during the year. No drawings have been made against this facility at year end.

46
Min
eral R
eso
urce
s Limite
d A
NN
UA
L RE
PO
RT
2008
NOTES TO THE FINANCIAL STATEMENTSFor the year to 30 June 2008
Note 17: Provisions
Consolidated Parent
2008 2007 2008 2007
$’000 $’000 $’000 $’000Current portion 7,719 6,553 1,261 971
Non-current portion 3,304 - - -
11,023 6,553 1,261 971
Employee entitlements 3,465 2,495 1,261 971
Warranty provision - - -
Project closure provision 4,058 4,058 -
Site rehabilitation provision 3,500 - -
11,023 6,553 1,261 971
Employee entitlements
Opening balance 2,496 1,768 971 -
Additional amounts provided for 2,460 2,396 344 971
Amounts used (1,491) (1,669) (54) -
Closing balance 3,465 2,495 1,261 971
Warranty provision movement
Opening balance - 246 - -
Amounts used - (246) - -
Closing balance - - - -
Project closure provision movement
Opening balance 4,058 2,648 - -
Additional amounts provided for - 1,410 - -
Closing balance 4,058 4,058 - -
Current portion 3,254 4,058
Non-current portion 804 -
Site rehabilitation movement
Opening balance - - - -
Additional amounts provided for 3,500 - - -
Closing balance 3,500 - - -
Current portion 1,000 - - -
Non-current portion 2,500 - - -

47
NOTES TO THE FINANCIAL STATEMENTSFor the year to 30 June 2008
Note 18: Share Capital
(a) Issued and paid up capital
Issued and paid up capital of the company is 122,882,776 ordinary shares (2007: 120,348,000).
Holders of ordinary shares are entitled to receive dividends as declared from time to time and are entitled to one vote per share at shareholders’ meetings.
(b) Movements in share capital
2008 2007 2008 2007
Number Number $’000 $’000Opening balance 120,348,000 105,348,000 57,278 43,732
Shares issued to directors in conjunction with a contract of service
1,166,666 - - -
Share options exercised by directors 500,000 - 450 -
Employee share options exercised 868,110 - 1,256 -
Initial public offering - 25,000,000 - 22,500
Sell down of owners shares in conjunction with the initial public offering
- (10,000,000) - (9,000)
Share issue costs (net of income tax benefit) - - - (1,128)
Share-based payments - - 5,177 1,174
Closing balance 122,882,776 120,348,000 64,161 57,278
(c) Options
For information relating to the Mineral Resources Limited employee share option plan, including details of options issued, exercised and lapsed during the financial year and the options outstanding at year end, refer to note 25 Share based payments.
For information relating to share options issued to key management personnel during the financial year, refer to note 25 Share based payments.
(d) Capital management
The consolidated entity manages its capital to ensure that entities in the group will be able to continue as a going concern while maximising the return to stakeholders through the optimisation of the debt and equity balance.
The capital structure of the consolidated entity consists of debt, which includes the borrowings disclosed in note 20, cash and cash equivalents and equity attributable to equity holders of the parent, comprising issued share capital, reserves and retained earnings. Management and the Board balances the capital structure through payment of dividends, issue of new shares, repayment of existing debt and the acquisition of new debt.
The consolidated entity's overall capital management strategy remains unchanged from 2007.

48
Min
eral R
eso
urce
s Limite
d A
NN
UA
L RE
PO
RT
2008
NOTES TO THE FINANCIAL STATEMENTSFor the year to 30 June 2008
Note 19: ReservesAsset Revaluation ReserveThe asset revaluation reserve records the revaluations of plant and equipment.
Movement in the asset revaluation reserve:
Consolidated Parent
2008 2007 2008 2007
$’000 $’000 $’000 $’000Opening balance 2,066 - - -
Revaluation 504 1,481 - -
Deferred tax 878 585 - -
Closing balance 3,448 2,066 - -
Note 20: Cashflow Information
Consolidated Parent
2008 2007 2008 2007
$’000 $’000 $’000 $’000(a) Reconciliation of cash
Cash at bank and on hand 49,577 19,461 2,184 9,691
Bank overdraft - - - -
49,577 19,461 2,184 9,691
(b) Cash flows from operations
Profit after tax 47,094 20,167 14,921 4,307
Non-cash flows in profit
Depreciation 19,614 10,741 - -
Share based payments expense 5,177 1,174 1,538 1,174
Dividends received - - (16,031) (4,187)
Net gain on disposal of plant and equipment (313) (462) - -
Net gain on disposal of available for sale investments (230) - (230) -
Impairment of available for sale investments 1,025 - 1,025 -
Changes in assets and liabilities:
Trade receivables 8,760 (9,177) (260) (7,570)
Inventories (9,408 ) (2,600) - -
Trade payables and accruals 9,065 4,412 (219) 2,216
Provisions 4,470 1,892 290 971
Other current assets (170) 456 (2) -
Financial assets (605) (121) -
Income taxes payable 13,077 1,478 (270) -
Deferred taxes payables (770) 2,145 (297) 555
Cash flows from operations 96,786 30,105 465 (2,534)
For the purposes of the cash flow statement, cash includes cash on hand and in banks and deposits at call, net of overdrafts and investments in money market instruments with less than 90 days to maturity.
During the year, the consolidated group acquired plant and equipment with an aggregate value of $12,048,000 (2007: $4,667,000) by means of finance leases. These acquisitions are not reflected in the cash flow statement.
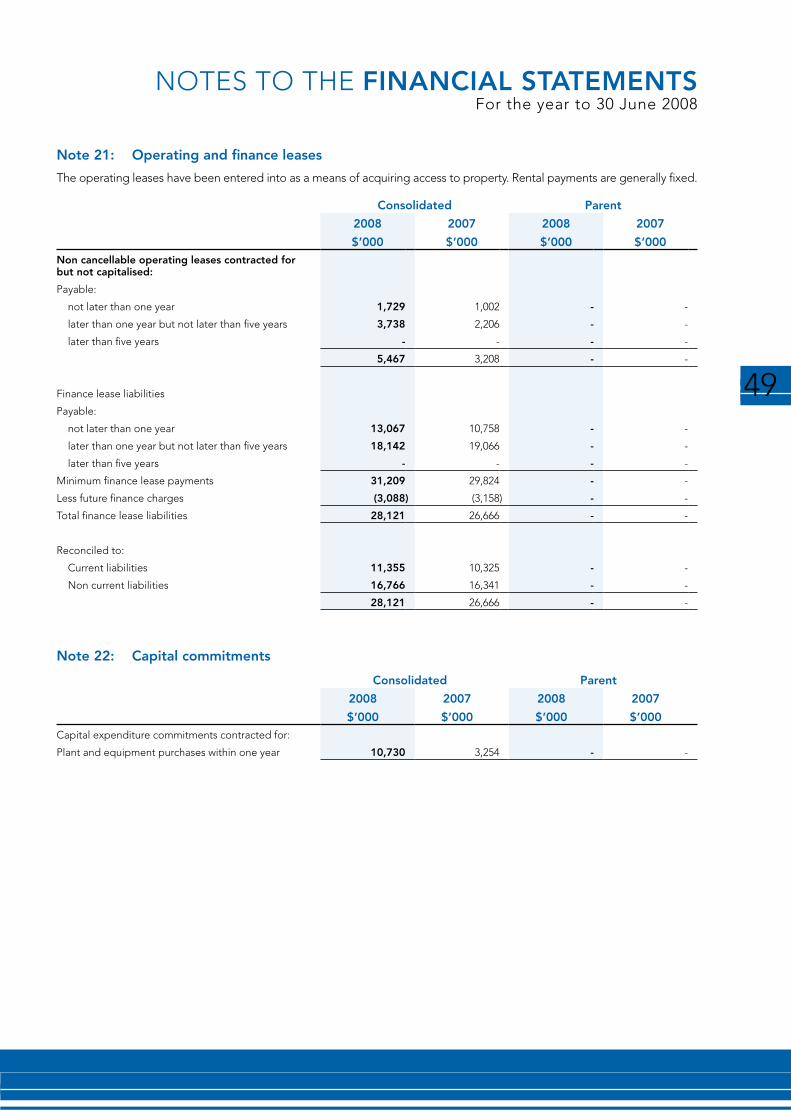
49
NOTES TO THE FINANCIAL STATEMENTSFor the year to 30 June 2008
Note 21: Operating and finance leases
The operating leases have been entered into as a means of acquiring access to property. Rental payments are generally fixed.
Consolidated Parent
2008 2007 2008 2007
$’000 $’000 $’000 $’000Non cancellable operating leases contracted for but not capitalised:
Payable:
not later than one year 1,729 1,002 - -
later than one year but not later than five years 3,738 2,206 - -
later than five years - - - -
5,467 3,208 - -
Finance lease liabilities
Payable:
not later than one year 13,067 10,758 - -
later than one year but not later than five years 18,142 19,066 - -
later than five years - - - -
Minimum finance lease payments 31,209 29,824 - -
Less future finance charges (3,088) (3,158) - -
Total finance lease liabilities 28,121 26,666 - -
Reconciled to:
Current liabilities 11,355 10,325 - -
Non current liabilities 16,766 16,341 - -
28,121 26,666 - -
Note 22: Capital commitments
Consolidated Parent
2008 2007 2008 2007
$’000 $’000 $’000 $’000Capital expenditure commitments contracted for:
Plant and equipment purchases within one year 10,730 3,254 - -
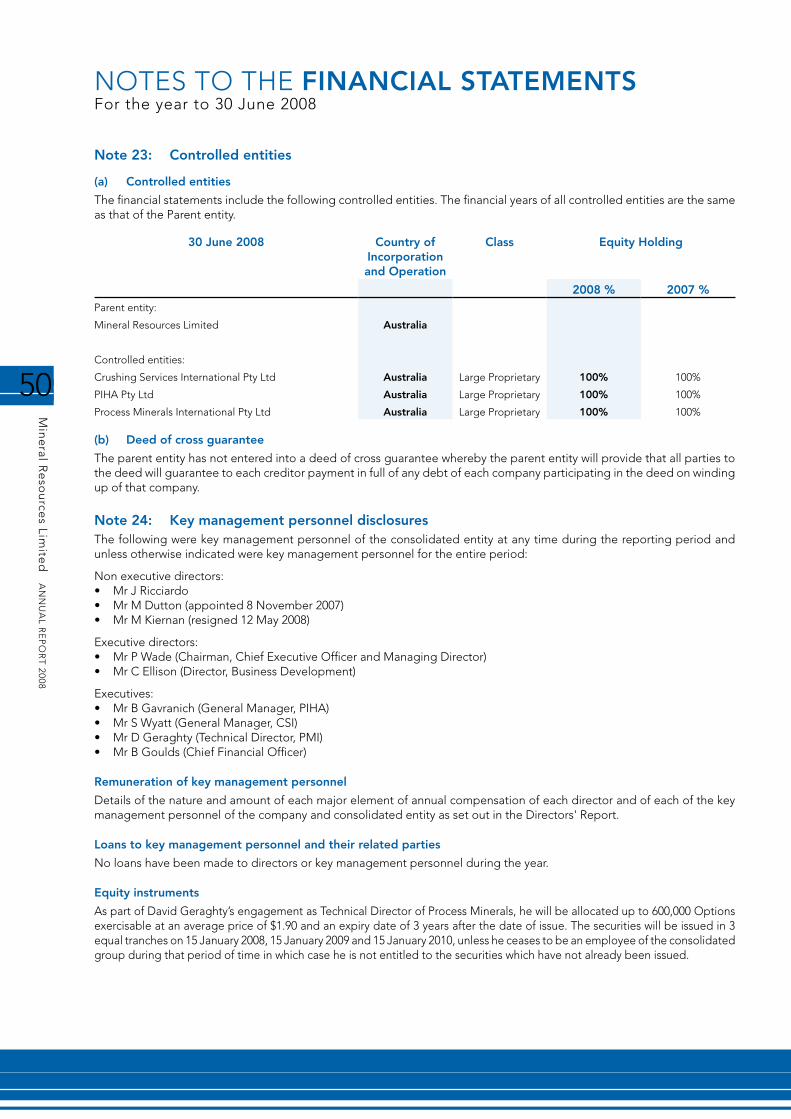
50
Min
eral R
eso
urce
s Limite
d A
NN
UA
L RE
PO
RT
2008
NOTES TO THE FINANCIAL STATEMENTSFor the year to 30 June 2008
Note 23: Controlled entities
(a) Controlled entities
The financial statements include the following controlled entities. The financial years of all controlled entities are the same as that of the Parent entity.
30 June 2008 Country of Incorporation and Operation
Class Equity Holding
2008 % 2007 %Parent entity:
Mineral Resources Limited Australia
Controlled entities:
Crushing Services International Pty Ltd Australia Large Proprietary 100% 100%
PIHA Pty Ltd Australia Large Proprietary 100% 100%
Process Minerals International Pty Ltd Australia Large Proprietary 100% 100%
(b) Deed of cross guarantee
The parent entity has not entered into a deed of cross guarantee whereby the parent entity will provide that all parties to the deed will guarantee to each creditor payment in full of any debt of each company participating in the deed on winding up of that company.
Note 24: Key management personnel disclosuresThe following were key management personnel of the consolidated entity at any time during the reporting period and unless otherwise indicated were key management personnel for the entire period:
Non executive directors:• MrJRicciardo• MrMDutton(appointed8November2007)• MrMKiernan(resigned12May2008)
Executive directors:• MrPWade(Chairman,ChiefExecutiveOfficerandManagingDirector)• MrCEllison(Director,BusinessDevelopment)
Executives:• MrBGavranich(GeneralManager,PIHA)• MrSWyatt(GeneralManager,CSI)• MrDGeraghty(TechnicalDirector,PMI)• MrBGoulds(ChiefFinancialOfficer)
Remuneration of key management personnel
Details of the nature and amount of each major element of annual compensation of each director and of each of the key management personnel of the company and consolidated entity as set out in the Directors' Report.
Loans to key management personnel and their related parties
No loans have been made to directors or key management personnel during the year.
Equity instruments
As part of David Geraghty’s engagement as Technical Director of Process Minerals, he will be allocated up to 600,000 Options exercisable at an average price of $1.90 and an expiry date of 3 years after the date of issue. The securities will be issued in 3 equal tranches on 15 January 2008, 15 January 2009 and 15 January 2010, unless he ceases to be an employee of the consolidated group during that period of time in which case he is not entitled to the securities which have not already been issued.

51
NOTES TO THE FINANCIAL STATEMENTSFor the year to 30 June 2008
Note 24: Key management personnel disclosures (continued)
Exercise of options granted as remuneration
There were no amounts unpaid on the shares issued as a result of the exercise of options.
Option holdings
Opening Balance Granted as Remuneration
Closing Balance Vested unvested
Directors
Peter Wade - - - - -
Joe Ricciardo 1,500,000 - 1,500,000 500,000 1,000,000
Chris Ellison - - - - -
Mark Dutton - - - - -
Michael Kiernan* 900,000 - 900,000 500,000 400,000
Key Management
Steve Wyatt - - - - -
Bob Gavranich - - - - -
David Geraghty - 600,000 600,000 200,000 400,000
Bruce Goulds 750,000 - 750,000 250,000 500,000
*resigned 12 May 2008
Equity holdings and transactions
The movement during the current year in the number of ordinary shares of Mineral Resources Limited held directly or indirectly by each key management person, including their related parties is as follows:
Opening Balance Shares Acquired as Remuneration
Options Exercised Sales on open market
Closing Balance
Directors
Peter Wade 8,116,162 - - (2,000,000) 6,116,162
Joe Ricciardo 555,750 - - - 555,750
Chris Ellison 49,062,815 - - (5,000,000) 44,062,815
Mark Dutton - - - - -
Michael Kiernan* 100,000 1,166,666 500,000 (1,766,666) -
Key Management
Steve Wyatt 16,757,344 - (3,000,000) 13,757,344
Bob Gavranich 14,132,768 - (3,000,000) 11,132,768
David Geraghty 1,267,487 - - - 1,267,487
Bruce Goulds - - 250,000 - 250,000
*resigned 12 May 2008
Note 25: Share Based PaymentsThe following share based payment arrangements existed at 30 June 2008.
As part of Michael Kiernan’s engagement as non-executive chairman of the Company, he will be allocated 2,166,666 Shares and 900,000 Options exercisable at $0.90 with varying expiry dates not exceeding 3 years after the date of grant.
As part of Joe Ricciardo’s engagement as non-executive director of the Company, he will be allocated up to 1,500,000 Options exercisable at $0.90 and an expiry date of 3 years after the date of grant. The securities will be issued in 3 equal tranches (of 500,000 Options) on the dates that are 1, 2 and 3 years after the date the Company was admitted to the Official List, unless he ceases to be a director during that period of time in which case he is not entitled to the securities which have not already been issued.

52
Min
eral R
eso
urce
s Limite
d A
NN
UA
L RE
PO
RT
2008
NOTES TO THE FINANCIAL STATEMENTSFor the year to 30 June 2008
Note 25: Share Based Payments (continued)As part of Mark Dutton’s engagement as non-executive director of the Company, he will be allocated up to 1,500,000 Options exercisable at $3.50 and an expiry date of 3 years after the date of grant. The issue of securities are subject to shareholder approval after which he would be entitled to the grant of the initial tranche.
As part of Bruce Goulds’ engagement as Chief Financial Officer of the Company, he will be allocated up to 750,000 Options under the terms of the Employee Share Option Plan exercisable at $0.90 and an expiry date of 3 years after the date of grant. The securities will be issued in 3 equal tranches (of 250,000 Options) on the dates that are 1, 2 and 3 years after the date the Company was admitted to the Official List, unless he ceases to be an employee during that period of time in which case he is not entitled to the securities which have not already been issued.
As part of David Geraghty’s engagement as Technical Director of Process Minerals, he will be allocated up to 600,000 Options exercisable at an average price of $1.90 and an expiry date of 3 years after the date of issue. The securities will be issued in 3 equal tranches on 15 January 2008, 15 January 2009 and 15 January 2010, unless he ceases to be an employee of the consolidated group during that period of time in which case he is not entitled to the securities which have not already been issued.
Senior staff members have been granted up to 4,575,000 share options as part of their remuneration package. Options are exercisable at an average price of $1.90 and an expiry date of 3 years after the date of issue. The securities will be issued in 3 equal tranches on 15 January 2008, 15 January 2009 and 15 January 2010, unless the staff member ceases to be an employee of the consolidated group during that period of time in which case they are not entitled to the securities which have not already been issued.
Options
Number of Options Weighted Average Exercise Price $
Outstanding at the beginning of the year 3,750,000 0.9000
Granted 5,175,000 1.9000
Forfeited (600,000) 0.9000
Exercised (1,368,110) 1.3065
Expired - -
Outstanding at year-end 6,956,890 1.5639
Exercisable at year-end 1,106,890 1.8000
The fair value of the options granted during the year was calculated by using a Black-Scholes option pricing model applying the following inputs:
Tranche 1 Tranche 2 Tranche 3Exercise price $1.80 $1.90 $2.00
Life of the option 3 years from issue 3 years from issue 3 years from issue
Underlying share price $2.96 $2.96 $2.96
Expected share volatility 0.4 0.4 0.4
Risk free interest rate 6.75% 6.75% 6.75%
Fair value per option $1.604 $1.544 $1.486
volatility of similar stocks in the market place has been the basis for determining expected share price volatility. The life of the options is based on an estimate of exercise patterns, which may not eventuate in the future.
Shares
No shares were granted.
Share Based Payment expenseIncluded under employee benefits expense in the income statement is $5,177,000 and relates, in full, to equity-settled share-based payment transactions.
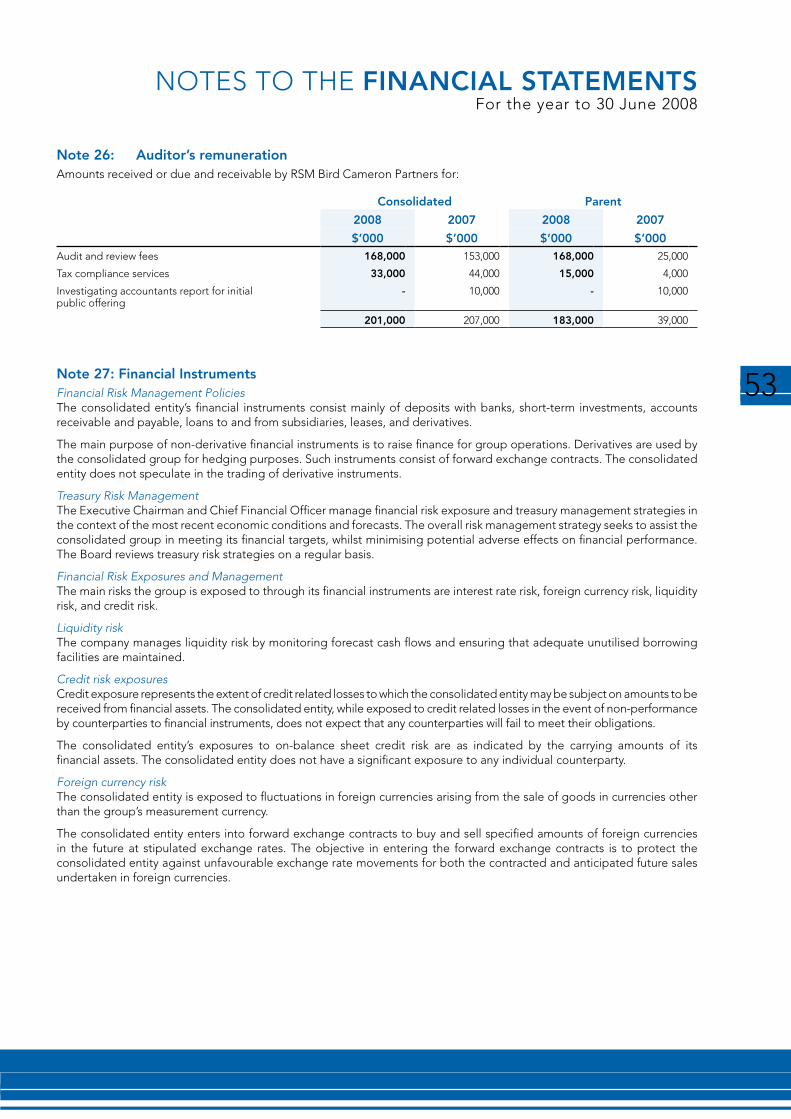
53
NOTES TO THE FINANCIAL STATEMENTSFor the year to 30 June 2008
Note 26: Auditor’s remunerationAmounts received or due and receivable by RSM Bird Cameron Partners for:
Consolidated Parent
2008 2007 2008 2007
$’000 $’000 $’000 $’000Audit and review fees 168,000 153,000 168,000 25,000
Tax compliance services 33,000 44,000 15,000 4,000
Investigating accountants report for initial public offering
- 10,000 - 10,000
201,000 207,000 183,000 39,000
Note 27: Financial InstrumentsFinancial Risk Management PoliciesThe consolidated entity’s financial instruments consist mainly of deposits with banks, short-term investments, accounts receivable and payable, loans to and from subsidiaries, leases, and derivatives.
The main purpose of non-derivative financial instruments is to raise finance for group operations. Derivatives are used by the consolidated group for hedging purposes. Such instruments consist of forward exchange contracts. The consolidated entity does not speculate in the trading of derivative instruments.
Treasury Risk ManagementThe Executive Chairman and Chief Financial Officer manage financial risk exposure and treasury management strategies in the context of the most recent economic conditions and forecasts. The overall risk management strategy seeks to assist the consolidated group in meeting its financial targets, whilst minimising potential adverse effects on financial performance. The Board reviews treasury risk strategies on a regular basis.
Financial Risk Exposures and Management The main risks the group is exposed to through its financial instruments are interest rate risk, foreign currency risk, liquidity risk, and credit risk.
Liquidity riskThe company manages liquidity risk by monitoring forecast cash flows and ensuring that adequate unutilised borrowing facilities are maintained.
Credit risk exposuresCredit exposure represents the extent of credit related losses to which the consolidated entity may be subject on amounts to be received from financial assets. The consolidated entity, while exposed to credit related losses in the event of non-performance by counterparties to financial instruments, does not expect that any counterparties will fail to meet their obligations.
The consolidated entity’s exposures to on-balance sheet credit risk are as indicated by the carrying amounts of its financial assets. The consolidated entity does not have a significant exposure to any individual counterparty.
Foreign currency riskThe consolidated entity is exposed to fluctuations in foreign currencies arising from the sale of goods in currencies other than the group’s measurement currency.
The consolidated entity enters into forward exchange contracts to buy and sell specified amounts of foreign currencies in the future at stipulated exchange rates. The objective in entering the forward exchange contracts is to protect the consolidated entity against unfavourable exchange rate movements for both the contracted and anticipated future sales undertaken in foreign currencies.

54
Min
eral R
eso
urce
s Limite
d A
NN
UA
L RE
PO
RT
2008
NOTES TO THE FINANCIAL STATEMENTSFor the year to 30 June 2008
Note 27: Financial Instruments (continued)At balance date, the details of outstanding forward exchange contracts are:
Sell united States Dollars Settlement Buy Australian Dollars Exchange Rate
2008 2007 2008 2007
$000 $000Sell USD $5,000,000 5,482 - 0.9120 -
Sell USD $5,000,000 5,338 - 0.9367 -
Sell USD $2,500,000 2,671 - 0.9358 -
Sell USD $5,000,000 5,303 - 0.9429 -
Sell USD $10,000,000 - 12,195 - 0.8200
Contracts above relates to the period – 11 July 2008 to 1 August 2008.
Interest rate riskInterest rate risk is managed fixed rate debt. At 30 June 2008 all group debt is fixed. It is the policy of the group to keep all debt on fixed interest rates unless funding plants constructions that are drawn down using flexible rate equipment loans that are converted to fixed rate instruments on completion of the project.
The consolidated entity is exposed to interest rate risk as follows:
Effective Interest Rate
Total Floating Interest Rate
1 year or less Over 1 year to 5 years
Consolidated 2008
Cash and cash equivalents 4.25% 49,577 49,577 - -
Interest bearing liabilities – current* 7.55% 11,355 - 11,355 -
Interest bearing liabilities – non current* 7.87% 16,766 - - 16,766
Consolidated 2007
Cash and cash equivalents 6.24% 19,461 19,461 - -
Interest bearing liabilities – current* 7.20% 11,975 - 11,975 -
Interest bearing liabilities – non current* 7.10% 16,341 - - 16,341
* These assets / liabilities bear interest at a fixed rate
Fair Values
Consolidated Parent
Carrying amount Fair value Carrying amount Fair value 2008
Trade and other receivables 21,584 21,584 13,739 13,739
Cash and cash equivalents 49,577 49,577 2,184 2,184
Interest bearing liabilities – current 11,355 11,355 - -
Interest bearing liabilities – non current 16,766 16,766 - -
Trade and other payables 39,022 39,022 544 544
2007
Trade and other receivables 29,667 29,667 7,782 7,782
Cash and cash equivalents 19,461 19,461 9,691 9,691
Interest bearing liabilities – current 11,975 11,975 - -
Interest bearing liabilities – non current 16,341 16,341 - -
Trade and other payables 29,957 29,957 2,429 2,429
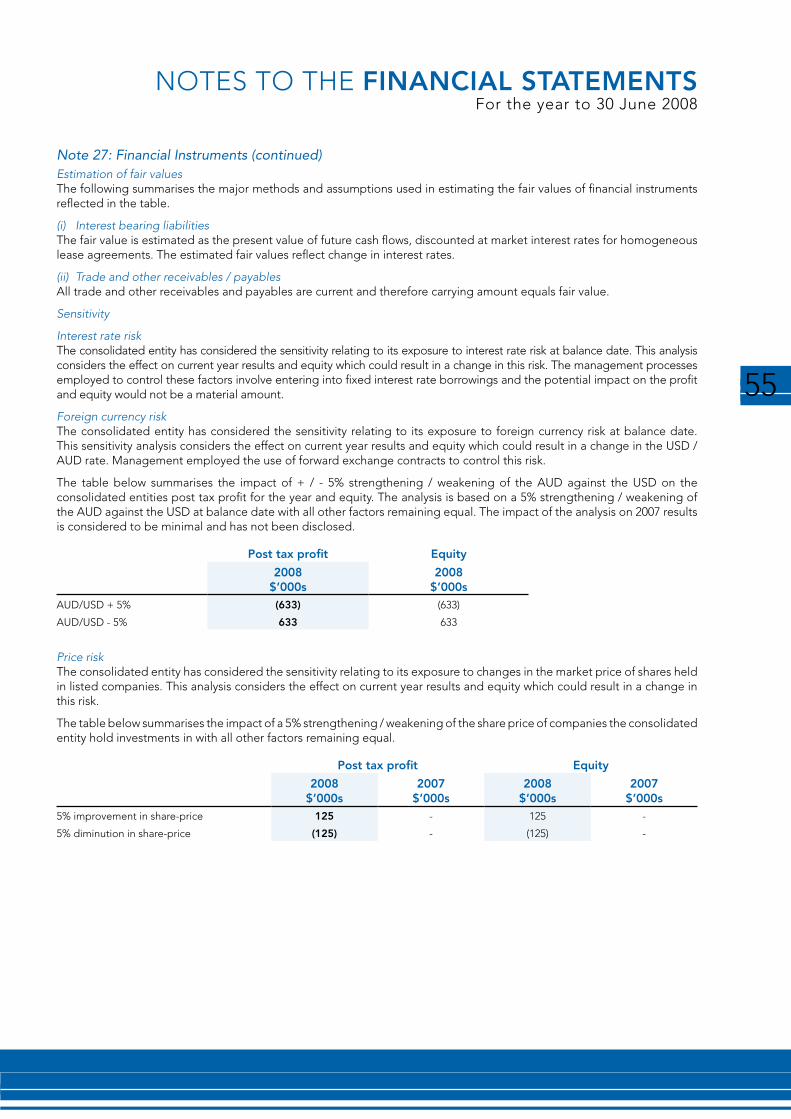
55
NOTES TO THE FINANCIAL STATEMENTSFor the year to 30 June 2008
Note 27: Financial Instruments (continued)Estimation of fair valuesThe following summarises the major methods and assumptions used in estimating the fair values of financial instruments reflected in the table.
(i) Interest bearing liabilitiesThe fair value is estimated as the present value of future cash flows, discounted at market interest rates for homogeneous lease agreements. The estimated fair values reflect change in interest rates.
(ii) Trade and other receivables / payablesAll trade and other receivables and payables are current and therefore carrying amount equals fair value.
Sensitivity
Interest rate riskThe consolidated entity has considered the sensitivity relating to its exposure to interest rate risk at balance date. This analysis considers the effect on current year results and equity which could result in a change in this risk. The management processes employed to control these factors involve entering into fixed interest rate borrowings and the potential impact on the profit and equity would not be a material amount.
Foreign currency riskThe consolidated entity has considered the sensitivity relating to its exposure to foreign currency risk at balance date. This sensitivity analysis considers the effect on current year results and equity which could result in a change in the USD / AUD rate. Management employed the use of forward exchange contracts to control this risk.
The table below summarises the impact of + / - 5% strengthening / weakening of the AUD against the USD on the consolidated entities post tax profit for the year and equity. The analysis is based on a 5% strengthening / weakening of the AUD against the USD at balance date with all other factors remaining equal. The impact of the analysis on 2007 results is considered to be minimal and has not been disclosed.
Post tax profit Equity
2008 $’000s
2008 $’000s
AUD/USD + 5% (633) (633)
AUD/USD - 5% 633 633
Price riskThe consolidated entity has considered the sensitivity relating to its exposure to changes in the market price of shares held in listed companies. This analysis considers the effect on current year results and equity which could result in a change in this risk.
The table below summarises the impact of a 5% strengthening / weakening of the share price of companies the consolidated entity hold investments in with all other factors remaining equal.
Post tax profit Equity
2008 $’000s
2007 $’000s
2008 $’000s
2007 $’000s
5% improvement in share-price 125 - 125 -
5% diminution in share-price (125) - (125) -
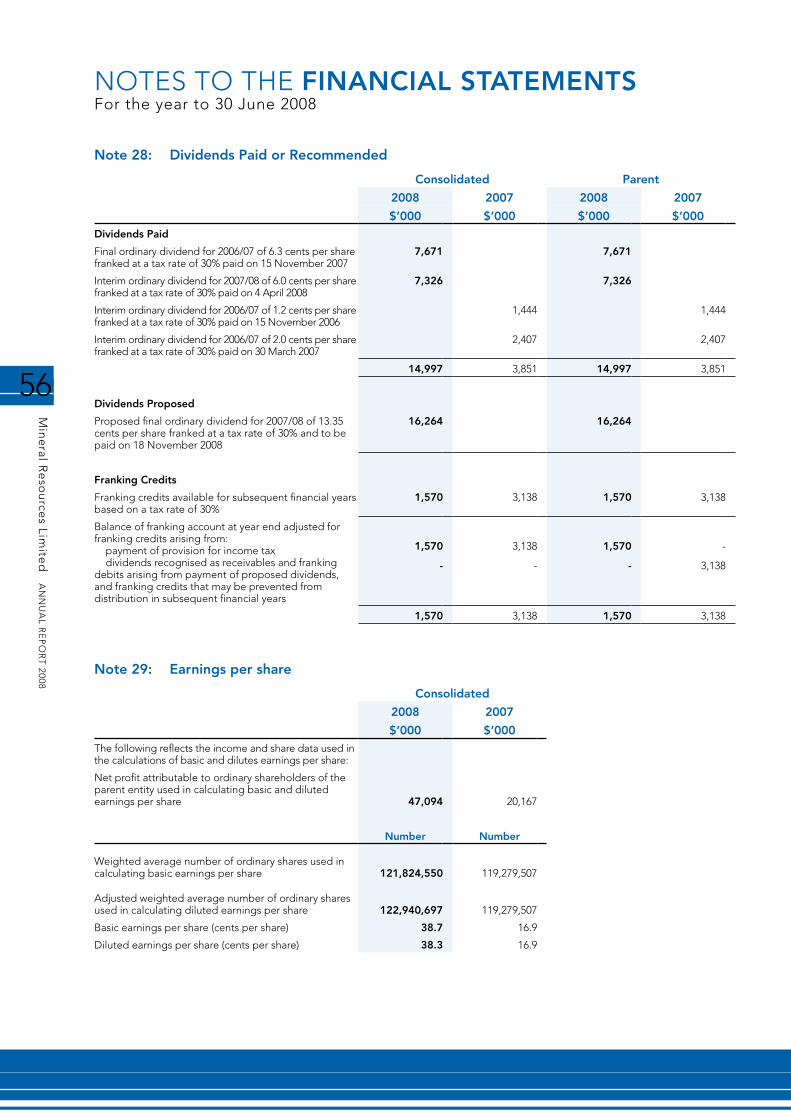
56
Min
eral R
eso
urce
s Limite
d A
NN
UA
L RE
PO
RT
2008
NOTES TO THE FINANCIAL STATEMENTSFor the year to 30 June 2008
Note 28: Dividends Paid or Recommended
Consolidated Parent
2008 2007 2008 2007
$’000 $’000 $’000 $’000Dividends Paid
Final ordinary dividend for 2006/07 of 6.3 cents per share franked at a tax rate of 30% paid on 15 November 2007
7,671 7,671
Interim ordinary dividend for 2007/08 of 6.0 cents per share franked at a tax rate of 30% paid on 4 April 2008
7,326 7,326
Interim ordinary dividend for 2006/07 of 1.2 cents per share franked at a tax rate of 30% paid on 15 November 2006
1,444 1,444
Interim ordinary dividend for 2006/07 of 2.0 cents per share franked at a tax rate of 30% paid on 30 March 2007
2,407 2,407
14,997 3,851 14,997 3,851
Dividends Proposed
Proposed final ordinary dividend for 2007/08 of 13.35 cents per share franked at a tax rate of 30% and to be paid on 18 November 2008
16,264 16,264
Franking Credits
Franking credits available for subsequent financial years based on a tax rate of 30%
1,570 3,138 1,570 3,138
Balance of franking account at year end adjusted for franking credits arising from: payment of provision for income tax dividends recognised as receivables and franking debits arising from payment of proposed dividends, and franking credits that may be prevented from distribution in subsequent financial years
1,570
-
3,138
-
1,570
-
-
3,138
1,570 3,138 1,570 3,138
Note 29: Earnings per share
Consolidated
2008 2007
$’000 $’000The following reflects the income and share data used in the calculations of basic and dilutes earnings per share:
Net profit attributable to ordinary shareholders of the parent entity used in calculating basic and diluted earnings per share 47,094 20,167
Number Number
Weighted average number of ordinary shares used in calculating basic earnings per share 121,824,550 119,279,507
Adjusted weighted average number of ordinary shares used in calculating diluted earnings per share 122,940,697 119,279,507
Basic earnings per share (cents per share) 38.7 16.9
Diluted earnings per share (cents per share) 38.3 16.9

57
NOTES TO THE FINANCIAL STATEMENTSFor the year to 30 June 2008
Note 30: Related Party Transactions and BalancesRelated Party TransactionsTransactions between group entities are on normal commercial terms and conditions no more favourable than those available to other parties unless otherwise stated. All services provided by group entities are at arms length transactions. Transactions for the period between group entities relate to the provision of goods and services, including shared resources, in relation to the ongoing business activities of the company.
2008
Balance Receivable by
$’000s
Balance Payable by
$’000s
Sales to group companies
$’000s
Purchases from group companies
$’000sMineral Resources Ltd 34,022 20,443 4,154 1,050
PIHA Pty Ltd 5,192 15,036 9,210 1,105
Crushing Services International Pty Ltd 2,008 9,576 9,953 2,792
Process Minerals International Pty Ltd 21,266 17,433 1,328 18,221
Minprocess Group Inc - 709 - -
Iron Process Group Inc - 13 - -
Process Minerals International Pty Ltd Inc 63 - - -
2007
Balance Receivable by
$’000s
Balance Payable by
$’000s
Sales to group companies
$’000s
Purchases from group companies
$’000sMineral Resources Ltd 7,782 1,799 3,963 128
PIHA Pty Ltd 828 6,149 379 1,903
Crushing Services International Pty Ltd 1,829 3,257 897 6,197
Process Minerals International Pty Ltd 6,200 8,166 3,778 788
Minprocess Group Inc - 575 - -
Iron Process Group Inc - 55 - -
Process Minerals International Pty Ltd Inc - - - -
Transactions between related and associated parties are on normal commercial terms and conditions no more favourable than those available to other parties unless otherwise stated. All services provided by related and associated parties are at arms length transactions.
Properties from which the company’s operations are performed are rented from parties related to Chris Ellison and Peter Wade. The rent paid during the year was $1,358,000 (2007: $570,000).
Certain plant and equipment utilised by the group is rented from Crushing Services Group Pty Ltd as trustee for the Crushing Services International Unit Trust and Plastic Technology Development Pty Ltd as trustee for the Plastic Technology Development Unit Trust which are related to Chris Ellison and Peter Wade. The rent paid during the year was $189,000 (2007: $382,000).

58
Min
eral R
eso
urce
s Limite
d A
NN
UA
L RE
PO
RT
2008
NOTES TO THE FINANCIAL STATEMENTSFor the year to 30 June 2008
Note 30: Related Party Transactions and Balances (continued)
Related Party Balances
Associated Director Balance at 30 June 2008
$’000
Balance at 30 June 2007
$’000Receivable by the Consolidated Entity
Wellard Properties Pty Ltd P Wade, C Ellison 12 6
Crushing Services International Unit Trust P Wade, C Ellison 864 1,921
Sandini Pty Ltd C Ellison 3
Plastic Technology Development Unit Trust - 306
Payable by the Consolidated Entity
World Wide Infrastructure Pty Ltd P Wade, C Ellison - 1,740
Sandini Pty Ltd C Ellison 15 14
Note 31: Non-director related partiesTransactions with wholly owned subsidiaries that are not on normal terms and conditions are disclosed in the financial report. All other transactions with non-director related parties are on normal terms and conditions.
Note 32: Subsequent EventsNo matters or circumstances have arisen since the end of the financial year which significantly affect the operations of the consolidated entity.
Note 33: Contingent LiabilitiesThe consolidated entity has provided guarantees to third parties in relation to the performance of contracts and against warranty obligations for a defects liability period after completion of the work. Defects liability period are usually from 12 to 18 months duration. Bank guarantees are issued as security for these obligations.
Consolidated Parent
2008 2007 2008 2007
$’000 $’000 $’000 $’000Bank guarantees facility 5,320 4,630 - -
Amount utilised (4,032) (3,541) - -
Unused guarantee limit 1,288 1,089 - -

59
Note 34: New Accounting Standards issued but not yet effective
The following Australian Accounting Standards have been issued or amended and are applicable to the parent and consolidated entity but are not yet effective. They have not been adopted in preparation of the financial statements at reporting date.
AASB Amendment
Standards Affected Outline of Amendment Application Date of
Standard
Application Date for
GroupAASB 2007-3 Amendments to Australian Accounting Standards
AASB 5 Non-current Assets Held for Sale and Discontinued Operations
The disclosure requirements of AASB 114: Segment Reporting have been replaced due to the issuing of AASB 8: Segment Reporting in February 2007. These amendments will involve changes to segment reporting disclosures within the financial report. However, it is anticipated there will be no direct impact on recognition and measurement criteria amounts included in the financial report.
1 January 2009 1 July 2009
AASB 6 Exploration for and Evaluation of Mineral
AASB 102 Inventories
AASB 107 Cash Flow Statements
AASB 119 Employee Benefits
AASB 127 Consolidated and Separate Financial Statements
AASB 134 Interim Financial Reporting
AASB 136 Impairment of Assets
AASB 1023 General Insurance Contracts
AASB 1038 Life Insurance Contracts
AASB 8 Operating Segments
AASB 114 Segment Reporting
AASB 2007–6 Amendments to Australian Accounting Standards
AASB 1 First time adoption of AIFRS The revised AASB 123: Borrowing Costs issued in June 2007 has removed the option to expense all borrowing costs. This amendment will require the capitalisation of all borrowing costs directly attributable to the acquisition, construction or production of a qualifying asset. However, there will be no direct impact to the amounts included in the financial group as they already capitalise borrowing costs related to qualifying assets.
1 January 2009 1 July 2009
AASB 101 Presentation of Financial Statements
AASB 107 Cash Flow Statements
AASB 111 Construction Contracts
AASB 116 Property, Plant and Equipment
AASB 138 Intangible Assets
AASB 123 Borrowing Costs
AASB 2007–8 Amendments to Australian Accounting Standards
AASB 101 Presentation of Financial Statements
The revised AASB 101: Presentation of Financial Statements issued in September 2007 requires the presentation of a statement of comprehensive income and makes changes to the statement of changes in equity.
1 January 2009 1 July 2009
NOTES TO THE FINANCIAL STATEMENTSFor the year to 30 June 2008

60
Min
eral R
eso
urce
s Limite
d A
NN
UA
L RE
PO
RT
2008
1. In the opinion of the directors of Mineral Resources Limited (“company”)
(a) the financial statements and notes are in accordance with the Corporations Act 2001, including:
(i) giving a true and fair view of the financial position of the company and consolidated entity as at 30 June 2008 and of their performance, as represented by the results of their operations and their cash flows, for the year ended 30 June 2008; and
(ii) complying with Accounting Standards and the Corporations Regulations 2001; and
(b) there are reasonable grounds to believe the company will be able to pay its debts as and when they become due and payable.
2. The Chief Executive Officer and Chief Finance Officer have each declared that:
(a) the financial records of the company for the financial period have been properly maintained in accordance with section 286 of the Corporations Act 2001;
(b) the financial statements and notes for the financial period comply with the Accounting Standards; and
(c) the financial statements and notes for the financial year give a true and fair view.
This declaration is made in accordance with a resolution of the Board of directors and is signed for and on behalf of the directors by:
Peter Wade Executive Chairman / Managing Director
Dated this 20th day of August 2008
DIRECTORS DECLARATION
61
8 St Georges Terrace Perth WA 6000GPO Box R1253 Perth 6844T +61 8 9261 9100 F +61 8 9261 9101www.rsmi.com.au
Liability limited by ascheme approved underProfessional StandardsLegislation
Major Offices in:Perth, Sydney, Melbourne,Adelaide and CanberraABN 36 965 185 036
RSM Bird Cameron Partners is anindependent member firm of RSMInternational, an affiliation of independentaccounting and consulting firms.
Chartered Accountants
ISO 9001 Lic 5600SAI Global
INDEPENDENT AUDITOR’S REPORT
TO THE MEMBERS OF
MINERAL RESOURCES LIMITED
Report on the Financial Report
We have audited the accompanying financial report of Mineral Resources Limited (“the company”), which comprises the balance sheet as at 30 June 2008 and the income statement, statement of changes in equity and cash flow statement for the year ended on that date, a summary of significant accounting policies, other explanatory notes and the directors’ declaration of the consolidated entity comprising the company and the entities it controlled at the year’s end or from time to time during the financial year.
Directors’ Responsibility for the Financial Report
The directors of the company are responsible for the preparation and fair presentation of the financial report in accordance with Australian Accounting Standards (including the Australian Accounting Interpretations) and the Corporations Act 2001. This responsibility includes establishing and maintaining internal control relevant to the preparation and fair presentation of the financial report that is free from material misstatement, whether due to fraud or error; selecting and applying appropriate accounting policies; and making accounting estimates that are reasonable in the circumstances. In Note 1(i), the directors also state, in accordance with Accounting Standard AASB 101 Presentation of Financial Statements, that compliance with the Australian equivalents to International Financial Reporting Standards ensures that the financial report, comprising the financial statements and notes, complies with International Financial Reporting Standards.
Auditor’s Responsibility
Our responsibility is to express an opinion on the financial report based on our audit. We conducted our audit in accordance with Australian Auditing Standards. These Auditing Standards require that we comply with relevant ethical requirements relating to audit engagements and plan and perform the audit to obtain reasonable assurance whether the financial report is free from material misstatement.
An audit involves performing procedures to obtain audit evidence about the amounts and disclosures in the financial report. The procedures selected depend on the auditor’s judgement, including the assessment of the risks of material misstatement of the financial report, whether due to fraud or error. In making those risk assessments, the auditor considers internal control relevant to the entity’s preparation and fair presentation of the financial report in order to design audit procedures that are appropriate in the circumstances, but not for the purpose of expressing an opinion on the effectiveness of the entity’s internal control. An audit also includes evaluating the appropriateness of accounting policies used and the reasonableness of accounting estimates made by the directors, as well as evaluating the overall presentation of the financial report.
We believe that the audit evidence we have obtained is sufficient and appropriate to provide a basis for our audit opinions.
INDEPENDENT AUDITORS REPORT
62
Min
eral R
eso
urce
s Limite
d A
NN
UA
L RE
PO
RT
2008
Independence
In conducting our audit, we have complied with the independence requirements of the Corporations Act 2001.
Auditor’s Opinion
In our opinion:
(a) the financial report of Mineral Resources Limited is in accordance with the Corporations Act 2001, including:
(i) giving a true and fair view of the company’s and consolidated entity’s financial position as at 30 June 2008 and of their performance for the year ended on that date; and
(ii) complying with Australian Accounting Standards (including the Australian Accounting Interpretations) and the Corporations Regulations 2001; and
(a) the financial report also complies with International Financial Reporting Standards as disclosed in Note 1(i).
Report on the Remuneration Report
We have audited the Remuneration Report included in pages 14 to 17 of the directors’ report for the financial year ended 30 June 2008. The directors of the company are responsible for the preparation and presentation of the Remuneration Report in accordance with section 300A of the Corporations Act 2001. Our responsibility is to express an opinion on the Remuneration Report, based on our audit conducted in accordance with Australian Auditing Standards.
Auditor’s Opinion
In our opinion the Remuneration Report of Mineral Resources Limited for the financial year ended 30 June 2008 complies with section 300A of the Corporations Act 2001.
RSM BIRD CAMERON PARTNERS Chartered Accountants
Perth, WA S C CUBITT Dated: 20 August 2008 Partner
INDEPENDENT AUDITORS REPORT
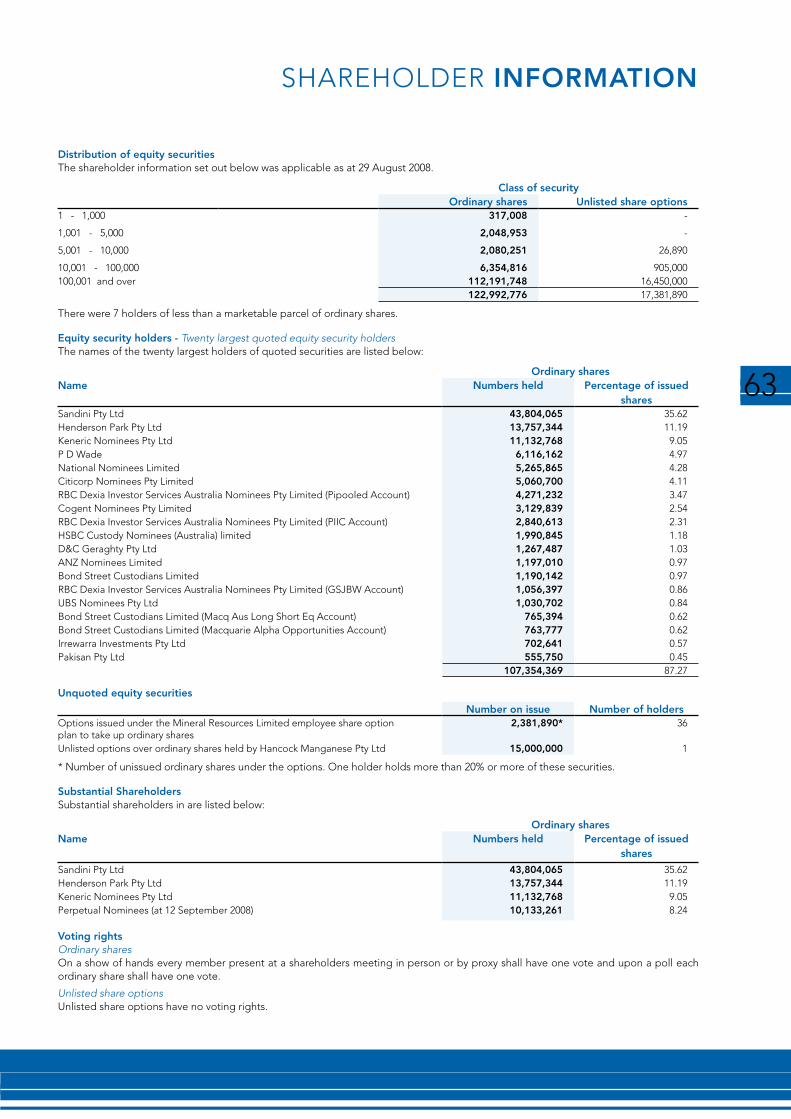
63
Distribution of equity securities The shareholder information set out below was applicable as at 29 August 2008.
Class of securityOrdinary shares unlisted share options
1 - 1,000 317,008 -
1,001 - 5,000 2,048,953 -
5,001 - 10,000 2,080,251 26,890
10,001 - 100,000 6,354,816 905,000100,001 and over 112,191,748 16,450,000
122,992,776 17,381,890
There were 7 holders of less than a marketable parcel of ordinary shares.
Equity security holders - Twenty largest quoted equity security holders The names of the twenty largest holders of quoted securities are listed below:
Ordinary sharesName Numbers held Percentage of issued
sharesSandini Pty Ltd 43,804,065 35.62Henderson Park Pty Ltd 13,757,344 11.19Keneric Nominees Pty Ltd 11,132,768 9.05P D Wade 6,116,162 4.97National Nominees Limited 5,265,865 4.28Citicorp Nominees Pty Limited 5,060,700 4.11RBC Dexia Investor Services Australia Nominees Pty Limited (Pipooled Account) 4,271,232 3.47Cogent Nominees Pty Limited 3,129,839 2.54RBC Dexia Investor Services Australia Nominees Pty Limited (PIIC Account) 2,840,613 2.31HSBC Custody Nominees (Australia) limited 1,990,845 1.18D&C Geraghty Pty Ltd 1,267,487 1.03ANZ Nominees Limited 1,197,010 0.97Bond Street Custodians Limited 1,190,142 0.97RBC Dexia Investor Services Australia Nominees Pty Limited (GSJBW Account) 1,056,397 0.86UBS Nominees Pty Ltd 1,030,702 0.84Bond Street Custodians Limited (Macq Aus Long Short Eq Account) 765,394 0.62Bond Street Custodians Limited (Macquarie Alpha Opportunities Account) 763,777 0.62Irrewarra Investments Pty Ltd 702,641 0.57Pakisan Pty Ltd 555,750 0.45
107,354,369 87.27
unquoted equity securities
Number on issue Number of holdersOptions issued under the Mineral Resources Limited employee share option plan to take up ordinary shares
2,381,890* 36
Unlisted options over ordinary shares held by Hancock Manganese Pty Ltd 15,000,000 1
* Number of unissued ordinary shares under the options. One holder holds more than 20% or more of these securities.
Substantial Shareholders Substantial shareholders in are listed below:
Ordinary sharesName Numbers held Percentage of issued
shares
Sandini Pty Ltd 43,804,065 35.62Henderson Park Pty Ltd 13,757,344 11.19Keneric Nominees Pty Ltd 11,132,768 9.05Perpetual Nominees (at 12 September 2008) 10,133,261 8.24
Voting rights Ordinary sharesOn a show of hands every member present at a shareholders meeting in person or by proxy shall have one vote and upon a poll each ordinary share shall have one vote.
Unlisted share optionsUnlisted share options have no voting rights.
SHAREHOLDER INFORMATION
64
www.mineralresources.com.au
Min
eral R
eso
urce
s Limite
d A
NN
UA
L RE
PO
RT
2008
Design by JAZ Creative ww
w.jazcreative.com
www.mineralresources.com.au200825 Wellard Street
BIBRA LAKE WA 6163
Telephone: +61 8 9437 7000 Facsimile: +61 8 9434 4955
MINERAL RESOURCES LIMITED


