Embed Size (px)
Citation preview
Annual Report2013–14
Published by the Clean Energy Regulator
ISSN 2200–937X
© Commonwealth of Australia 2014
This work is licensed under the Creative Commons Attribution 3.0 Australia Licence. To view a copy of this licence, visithttp://creativecommons.org/licenses/by/3.0/au.
The Clean Energy Regulator asserts the right to be recognised as author of the original material in the following manner.
© Commonwealth of Australia (Clean Energy Regulator) 2014
Edited by WordsWorth WritingDesign and typesetting by CRE8IVEPrinted by CanPrint Communications Pty Limited
Contact usMail GPO Box 621
Canberra ACT 2601
Phone 1300 553 542 if calling within Australia+61 2 6159 3100 if calling from overseas13 14 50 translating and interpreting service133 677 TTY service 1300 555 727 speak and listen service
Email [email protected]
Website www.cleanenergyregulator.gov.au
More information about the reportEnquiries regarding this report may be directed to: Manager, Governance, Strategy and Reporting Operations Division Clean Energy Regulator Phone: 02 6159 3100 Email: [email protected]
GPO 621 Canberra ACT 2601 T 02 6159 3640 E [email protected] W www.cleanenergyregulator.gov.au
The Hon Greg Hunt MP Minister for the Environment Parliament House CANBERRA ACT 2600
Dear Minister
I am pleased to submit the Annual Report for the Clean Energy Regulator in accordance with subsection 40(1) of the Clean Energy Regulator Act 2011 for presentation to the Parliament.
The report covers the operations of the Clean Energy Regulator for the financial year ended 30 June 2014. It was prepared in accordance with the Requirements for
Annual Reports for Departments, Executive Agencies and FMA Act Bodies approved by the Joint Committee of Public Accounts in May 2014.
The report includes the Clean Energy Regulator’s audited financial statements as required by section 57 of the Financial Management and Accountability Act 1997.
In addition, I certify that the Clean Energy Regulator had in place fraud control measures that were appropriate to its functions during the reporting period and complied with the Commonwealth Fraud Control Guidelines.
Yours sincerely
Chloe Munro
Chair, Clean Energy Regulator
October 2014

Annual Report 2013–14 v
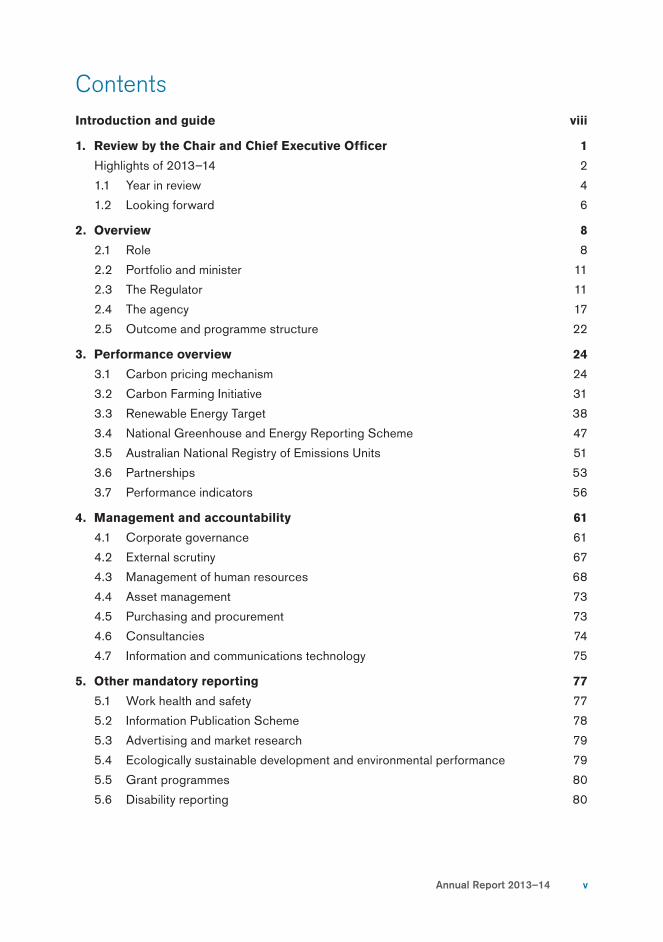
ContentsIntroduction and guide viii
1. Review by the Chair and Chief Executive Offi cer 1
Highlights of 2013–14 2
1.1 Year in review 4
1.2 Looking forward 6
2. Overview 8
2.1 Role 8
2.2 Portfolio and minister 11
2.3 The Regulator 11
2.4 The agency 17
2.5 Outcome and programme structure 22
3. Performance overview 24
3.1 Carbon pricing mechanism 24
3.2 Carbon Farming Initiative 31
3.3 Renewable Energy Target 38
3.4 National Greenhouse and Energy Reporting Scheme 47
3.5 Australian National Registry of Emissions Units 51
3.6 Partnerships 53
3.7 Performance indicators 56
4. Management and accountability 61
4.1 Corporate governance 61
4.2 External scrutiny 67
4.3 Management of human resources 68
4.4 Asset management 73
4.5 Purchasing and procurement 73
4.6 Consultancies 74
4.7 Information and communications technology 75
5. Other mandatory reporting 77
5.1 Work health and safety 77
5.2 Information Publication Scheme 78
5.3 Advertising and market research 79
5.4 Ecologically sustainable development and environmental performance 79
5.5 Grant programmes 80
5.6 Disability reporting 80
vi
6. Financial statements 82
6.1 Financial summary 82
6.2 Financial statements 83
7. Appendices 162
Appendix A Workforce profi le 162
Appendix B Legal expenditure 168
Appendix C Resource statements 170
References 173
Glossary and abbreviations list 173
List of requirements 175
Index 178
List of fi guresFigure 2.1: Senior management structure 18
Figure 2.2: Outcome and programme objective 22
Figure 3.1: ACCUs issued under the Carbon Farming Initiative in 2012–13 and 2013–14, by methodology category 35
Figure 3.2: Cumulative number of accredited renewable energy power stations since 2001 39
Figure 3.3: Accredited renewable energy power stations, by renewable energy source 40
Figure 3.4: Average days between creation and audit of small-scale technology certifi cates 44
List of tablesTable 2.1: Regulatory schemes 9
Table 2.2: Meetings of the Regulator in 2013–14 17
Table 3.1: Results of the 2012–13 fi nal surrender period under the carbon pricing mechanism 26
Table 3.2: Results of the 2013–14 provisional surrender period under the carbon pricing mechanism 26
Table 3.3: Number of applications received and/or processed under the Carbon Farming Initiative in 2013–14 32
Table 3.4: Number of projects declared eligible under the Carbon Farming Initiative in 2013–14, by methodology category 33
Table 3.5: Number of ACCUs issued under the Carbon Farming Initiative in 2013–14, by methodology category 35
Table 3.6: Number of applications for registered persons and registered agents 39
Table 3.7: Valid small-scale system installations 42
Clean Energy Regulator
Annual Report 2013–14 vii
Table 3.8: Renewable Energy Target inspections programme results 43
Table 3.9: Number of partial exemptions processed in 2013–14 44
Table 3.10: Renewable Energy Target liabilities discharged for 2012 and 2013 45
Table 3.11: Australian National Registry of Emissions Units transactions in 2013–14 52
Table 3.12: Results against portfolio budget statements performance indicators 56
Table A.1: Salary ranges—Department of Climate Change and Energy Effi ciency Enterprise Agreement 2011–14 162
Table A.2: Salary ranges—Offi ce of the Renewable Energy Regulator Enterprise Agreement 2011–14 163
Table A.3: Senior executive salary ranges 163
Table A.4: Ongoing offi cers by level and gender 164
Table A.5: Non-ongoing offi cers by level and gender 165
Table A.6: Employment type by level 166
Table A.7: Employment type by gender 167
Table A.8: Representation of diversity groups 167
Table B.1: Legal services expenditure summary for 2013–14 168
Table C.1: Resource statement 170
Table C.2: Expenses and resources for Outcome 1 171
viii
Introduction and guide
This report describes the Clean Energy Regulator’s performance for the period from 1 July 2013 to 30 June 2014, in accordance with the Requirements for Annual Reports for
Departments, Executive Agencies and FMA Act Bodies (May 2014).
Guide to the report
The report has six main sections and a set of appendices:
1 a review of signifi cant developments during the reporting period and the outlook for the year ahead, by the Chair and Chief Executive Offi cer
2 an overview of the Clean Energy Regulator’s role, organisation and reporting approach
3 an analysis of performance against the outcome and programme framework set out for the Clean Energy Regulator in the Industry, Innovation, Climate Change, Science,
Research and Tertiary Education Portfolio Budget Statements 2013–14
4 a report on management and accountability
5 other reporting as required under legislation and the Requirements for Annual
Reports for Departments, Executive Agencies and FMA Act Bodies
6 audited fi nancial statements
7 appendices containing the workforce profi le, legal expenditure and resource statements.
The report concludes with a glossary and list of abbreviations, details of how the report complies with the reporting requirements, and an index.
Other information
The Clean Energy Regulator releases information on its activities through the website, publications, media releases, speeches and reports. The Clean Energy Regulator’s publications, including this annual report, are available at www.cleanenergyregulator.gov.au.
Clean Energy Regulator
Section 1
Review by the Chair and Chief Executive Offi cer
Highlights of 2013–14 2
1.1 Year in review 4
1.2 Looking forward 6
2
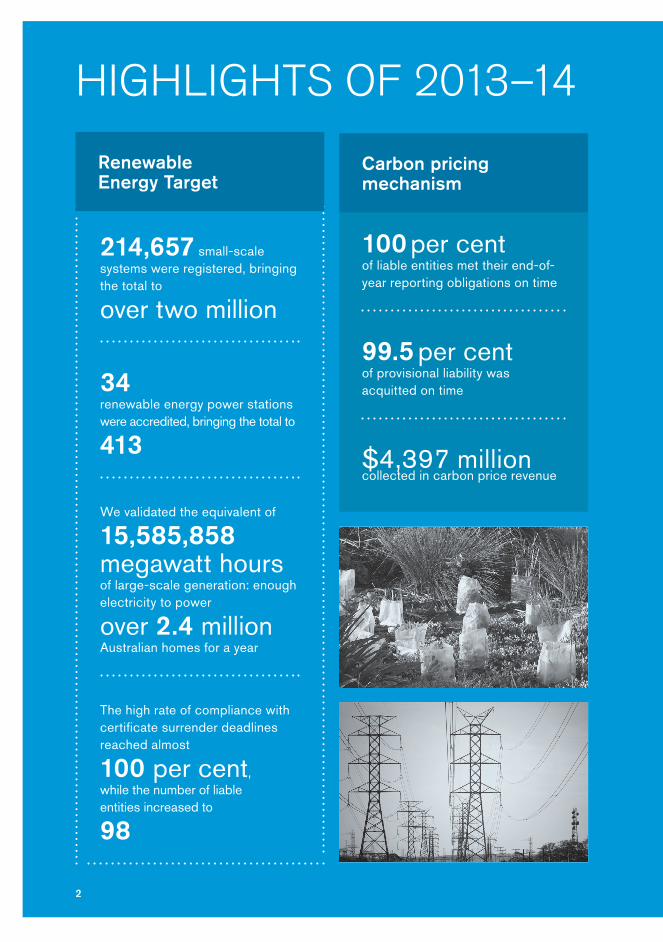
214,657 small-scalesystems were registered, bringing the total to
over two million
34renewable energy power stations were accredited, bringing the total to
413
We validated the equivalent of
15,585,858 megawatt hoursof large-scale generation: enough electricity to power
over 2.4 millionAustralian homes for a year
The high rate of compliance with certifi cate surrender deadlines reached almost
100 per cent,while the number of liable entities increased to
98
HIGHLIGHTS OF 2013–14
100 per centof liable entities met their end-of-year reporting obligations on time
99.5 per centof provisional liability was acquitted on time
$4,397 million collected in carbon price revenue
Carbon pricing mechanism
Renewable Energy Target
3
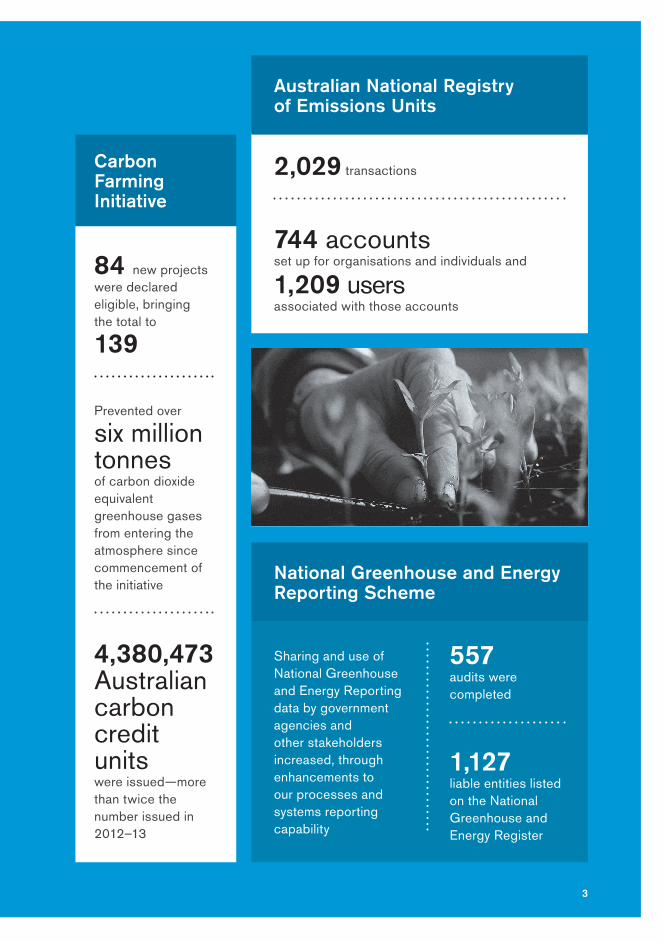
2,029 transactions
744 accounts set up for organisations and individuals and
1,209 users associated with those accounts
Australian National Registry of Emissions Units
Sharing and use of National Greenhouse and Energy Reporting data by government agencies and other stakeholders increased, through enhancements to our processes and systems reporting capability
557 audits were completed
1,127 liable entities listed on the National Greenhouse and Energy Register
National Greenhouse and Energy Reporting Scheme
84 new projects were declared eligible, bringing the total to
139
Prevented over
six million tonnes of carbon dioxide equivalent greenhouse gases from entering the atmosphere since commencement of the initiative
4,380,473 Australian carbon credit units were issued—more than twice the number issued in 2012–13
Carbon Farming Initiative
4
1.1 Year in review
Agency developmentOur second year of operations saw the rapid maturing of our business. We grew through an intensive set-up period to become a competent and responsive regulatory authority. We continued to bed down newly developed systems and processes and, at the same time, turned our attention to new challenges.
With the change of government, preparations for the fi rst auctions of carbon units were put on hold. Instead, we worked closely with our new portfolio department to advise on the implementation of new
government policy. This included the repeal of the carbon tax, which occurred shortly after the end of the year in review; the development of the Emissions Reduction Fund; and the review of the Renewable Energy Target.
Our commitment to client engagement paid off with exceptional compliance levels and a sound reputation in the business community for responsive service and decisions that are even-handed, fair and based on the facts and the law. We will continue to work with our stakeholders and clients, including Australian Government departments and agencies, industry bodies, liable entities and market participants, to administer our legislated schemes to the highest standard.
Major investments in systems development to meet legislative and client needs included the new Emissions and Energy Reporting System and a signifi cant update to the Renewable Energy Certifi cate Registry. This work continues in 2014–15.
1.1
Review by the Chair and Chief Executive Offi cer
1
I am pleased to present the Clean Energy Regulator’s Annual Report for 2013–14.
Clean Energy Regulator
Annual Report 2013–14 5
1 R
evie
w b
y th
e C
hair
and
Chi
ef E
xecu
tive
Offi
cer
These investments support our continuous drive to fi nd new and more streamlined ways to operate. We welcome changes to the National Greenhouse and Energy Reporting (NGER) legislation that will allow many reporters to reduce the compliance costs of their reporting obligations without reducing the integrity of NGER data for their users. We have reduced the time it takes to make administrative decisions in the Carbon Farming Initiative, and we communicate earlier to clients about the quality of applications and eligibility of proposed projects.
We are also taking a risk-based approach, based on experience, to reduce the amount of internal checking of work. Our risk-based approach also requires an effective investigations and enforcement capability to control risks such as fraud. While our goal is to achieve voluntary compliance, we will take enforcement action when the circumstances warrant. As a result of investigations this year, seven clients agreed to enforceable undertakings under the Renewable Energy Target. The Clean Energy Regulator has also referred two cases to the Commonwealth Director of Public Prosecutions to consider prosecution action for alleged fraudulent conduct under the Criminal Code Act 1995 and Renewable Energy (Electricity) Act
2000 (the Act).
Scheme resultsThe Clean Energy Regulator administers Australia’s primary market mechanisms to measure and reduce carbon emissions. Each of our fi ve legislated schemes has performed well against its own objectives.
Data collected through the NGER scheme were made available to inform government policy, assist the states and territories and meet Australia’s international reporting obligations. We continue to publish new data and look for opportunities to add value through our publications. For example, in February 2014 we released information showing state and territory and industry breakdowns of reported greenhouse gas emissions for 2012–13.
As evidenced in our annual administrative report on the Renewable Energy Target, the target continues to meet the objectives of the Act: additional generation of electricity from renewable sources, reduced emissions of greenhouse gases in the electricity sector, and generation of electricity from ecologically sustainable renewable energy sources.
The Carbon Farming Initiative is increasing carbon abatement in ways consistent with the protection of Australia’s environment, with more than 84 projects declared in the past year.
The high level of compliance observed in the fi rst year of the carbon pricing mechanism continued in 2013–14, with 99.5 per cent of liability acquitted on time for the provisional surrender period. Final acquittal for the full compliance year is not due until 1 February 2015.
The Australian National Registry of Emissions Units provided an effective vehicle for trade in carbon units; 64,665,411 free units issued under the Jobs and Competitiveness Program and 8,761,935 Australian carbon credit units issued under the Carbon Farming Initiative
6
changed hands in the course of the year. The Australian National Registry of Emissions Units also performs an important function in tracking Australia’s international obligations through the holding of Kyoto units under the United Nations Framework Convention on Climate Change.
1.2 Looking forward
The agency has proved itself to be agile and responsive while maintaining high standards of compliance with the legislation for which we are responsible.
We face another year of considerable change, with the repeal of the carbon tax, the introduction of the Emissions Reduction Fund and a fundamental review of the Renewable Energy Target underway. Our responsibilities to administer the fi nal acquittal of carbon tax obligations will continue throughout most of 2014–15; at the same time we will be investing in new capabilities in anticipation of passage of the enabling legislation for the Emissions Reduction Fund.
Fortunately, the Government has recognised the value of retaining existing capabilities in this agency so that we can build on our strong foundations rather than start entirely anew. The Emissions Reduction Fund takes advantage of the existing infrastructure of the Carbon Farming Initiative, Australian National Registry of Emissions Units and NGER. We are also building on our successful approach to client engagement in our consultative approach to developing Emissions Reduction Fund processes.
Taking into account the Government’s policy intent (articulated in both the Emissions Reduction Fund white paper and the red tape reduction agenda), and budgetary constraints, we will have to adjust our risk tolerances and fi nd new operating effi ciencies. We will need to build capacity to service an expanding client base. We will need to be informative and objective in our dealings with clients who are uncertain about policy outcomes through this transitional period. As always, we can do no other than administer the law as it stands.
We will continue to assist the Department of the Environment in providing practical advice and factual information to the Government on its climate change policies. The effectiveness of the proposed safeguard mechanism in the Emissions Reduction Fund and of any potential changes to the Renewable Energy Target will depend on how they can be administered. We offer dispassionate observations on the operation of these instruments based on an extensive body of experience.
I am confi dent that we are well equipped to respond to government and client expectations as we look forward to another busy year. We have built invaluable knowledge and infrastructure that will continue to play an important role in carrying out Australia’s climate change policies.
Our agency has achieved a great deal in the past 12 months. I thank everyone in the agency for their service and commitment.
Chloe MunroChair, Clean Energy Regulator
1.2
Clean Energy Regulator
Section 2
Overview
2.1 Role 8
2.2 Portfolio and minister 11
2.3 The Regulator 11
2.4 The agency 17
2.5 Outcome and programme structure 22
8
The Clean Energy Regulator was established as an independent statutory authority by the Clean Energy Regulator Act 2011 (the Act).
The name ‘Clean Energy Regulator’ refers to both the body corporate and the public service agency established under the Act.
The body corporate, also known as the Regulator, consists of the Chair and between two and four other Members. The Members set the strategic direction, risk appetite and delegation framework for the Clean Energy Regulator to administer the regulatory schemes for which it is responsible.
The public service agency, known as the agency, comprises the Chair and offi cers of the Clean Energy Regulator and is a statutory agency under the Public Service Act 1999. The Chair of the Regulator is the Chief Executive Offi cer of the agency. The agency supports the Regulator in the performance of its responsibilities.
In 2013–14, the Clean Energy Regulator was a prescribed agency under the Financial
Management and Accountability Act 1997.
2.1 Role
The Clean Energy Regulator has administrative responsibilities for the:
• carbon pricing mechanism, under the Clean Energy Act 2011
• Carbon Farming Initiative, under the Carbon Credits (Carbon Farming Initiative) Act 2011
• Renewable Energy Target, under the Renewable Energy (Electricity) Act 2000
• National Greenhouse and Energy Reporting Scheme, under the National Greenhouse and Energy Reporting Act 2007
• Australian National Registry of Emissions Units, under the Australian National Registry of Emissions Units Act 2011.
In addition, the Clean Energy Regulator is preparing to take responsibility for administering the Emissions Reduction Fund. Legislation to enable the Emissions Reduction Fund, the Carbon Farming Initiative Amendment Bill 2014, was introduced in the Australian Parliament on 18 June 2014. The agency has been working closely with the Department of the Environment to consult with stakeholders and advise government on the development of the fund.
2.1
Overview2
Clean Energy Regulator
Annual Report 2013–14 9
2 O
verv
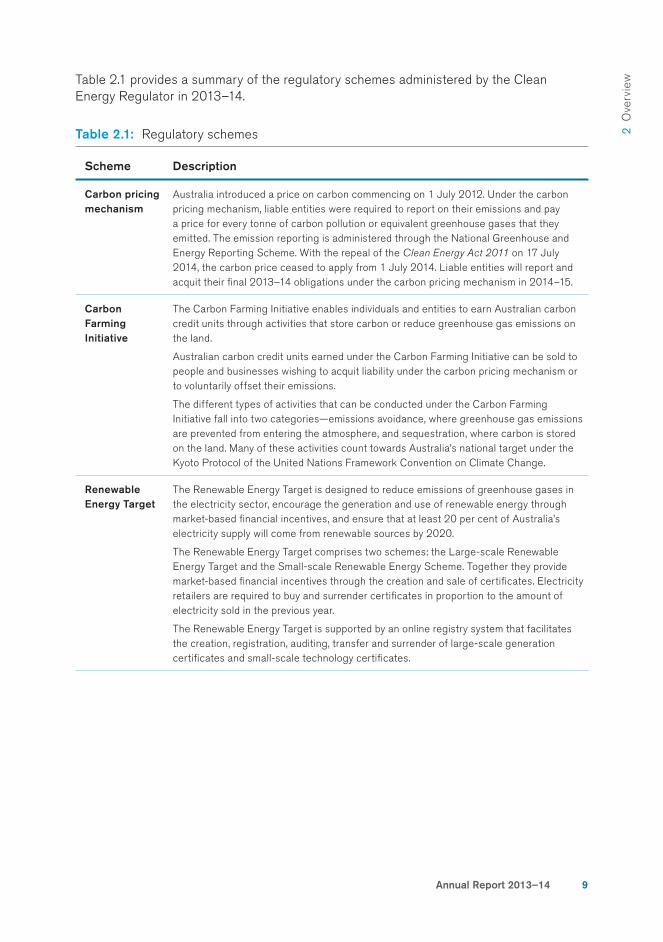
iewTable 2.1 provides a summary of the regulatory schemes administered by the Clean
Energy Regulator in 2013–14.
Table 2.1: Regulatory schemes
Scheme Description
Carbon pricing mechanism
Australia introduced a price on carbon commencing on 1 July 2012. Under the carbon pricing mechanism, liable entities were required to report on their emissions and pay a price for every tonne of carbon pollution or equivalent greenhouse gases that they emitted. The emission reporting is administered through the National Greenhouse and Energy Reporting Scheme. With the repeal of the Clean Energy Act 2011 on 17 July 2014, the carbon price ceased to apply from 1 July 2014. Liable entities will report and acquit their fi nal 2013–14 obligations under the carbon pricing mechanism in 2014–15.
Carbon Farming Initiative
The Carbon Farming Initiative enables individuals and entities to earn Australian carbon credit units through activities that store carbon or reduce greenhouse gas emissions on the land.
Australian carbon credit units earned under the Carbon Farming Initiative can be sold to people and businesses wishing to acquit liability under the carbon pricing mechanism or to voluntarily offset their emissions.
The different types of activities that can be conducted under the Carbon Farming Initiative fall into two categories—emissions avoidance, where greenhouse gas emissions are prevented from entering the atmosphere, and sequestration, where carbon is stored on the land. Many of these activities count towards Australia’s national target under the Kyoto Protocol of the United Nations Framework Convention on Climate Change.
Renewable Energy Target
The Renewable Energy Target is designed to reduce emissions of greenhouse gases in the electricity sector, encourage the generation and use of renewable energy through market-based fi nancial incentives, and ensure that at least 20 per cent of Australia’s electricity supply will come from renewable sources by 2020.
The Renewable Energy Target comprises two schemes: the Large-scale Renewable Energy Target and the Small-scale Renewable Energy Scheme. Together they provide market-based fi nancial incentives through the creation and sale of certifi cates. Electricity retailers are required to buy and surrender certifi cates in proportion to the amount of electricity sold in the previous year.
The Renewable Energy Target is supported by an online registry system that facilitates the creation, registration, auditing, transfer and surrender of large-scale generation certifi cates and small-scale technology certifi cates.
10
Scheme Description
National Greenhouse and Energy Reporting Scheme
The National Greenhouse and Energy Reporting Scheme is a single, national framework under which corporations must report on greenhouse gas emissions, energy use and energy production. Corporations that meet a specifi ed emissions or energy threshold must register under the scheme and provide a report each year.
The data reported under the scheme are a key input to Australia’s National Greenhouse Gas Inventory, projections and reporting under the Kyoto Protocol and the United Nations Framework Convention on Climate Change. The data are used in Australian energy statistics, analysis and reporting to the International Energy Agency.
Information collected through the scheme is also a critical input to policy development relating to greenhouse gas emissions and energy production and consumption, for both the Australian Government and, increasingly, the governments of the states and territories. It also provides the basis for assessing liable entities under the carbon pricing mechanism.
Australian National Registry of Emissions Units
The Australian National Registry of Emissions Units is a secure electronic system designed to accurately track the location and ownership of:
• emissions units issued under the Kyoto Protocol
• Australian carbon credit units issued under the Carbon Farming Initiative
• carbon units issued under the carbon pricing mechanism.
Any organisation or individual that is required to or wishes to hold, transfer, cancel, surrender or relinquish units must have an Australian National Registry of Emissions Units account.
The responsibilities of the Clean Energy Regulator include:
• providing education and information on the fi ve regulatory schemes
• monitoring, facilitating and enforcing compliance with each regulatory scheme
• collecting, analysing, assessing, providing and publishing information and data
• managing the validity of the supply of renewable energy certifi cates and carbon units, and maintaining the secure registry systems in which their ownership is recorded
• accrediting auditors for the National Greenhouse and Energy Reporting Scheme, the carbon pricing mechanism and the Carbon Farming Initiative
• working with other law enforcement and regulatory bodies.
Clean Energy Regulator
Annual Report 2013–14 11
2 O
verv
iew2.2 Portfolio and minister
From 1 July to 17 September 2013, the Clean Energy Regulator operated within the then Industry, Innovation, Climate Change, Science, Research and Tertiary Education portfolio. During that period, the minister responsible for the Clean Energy Regulator was the Hon Mark Butler MP.
From 18 September 2013, as a result of a change of government and machinery of government changes, the Clean Energy Regulator became part of the Environment portfolio. The Minister for the Environment from that date was the Hon Greg Hunt MP.
2.3 The Regulator
A body corporate, known as the Regulator, is responsible for decision-making under the schemes which the Clean Energy Regulator administers, and guides the Clean Energy Regulator’s strategic direction and objectives.
Members of the RegulatorMembers of the Regulator are appointed by the responsible minister under the Clean Energy Regulator Act 2011, and are required to have substantial experience or knowledge in fi elds relevant to the Clean Energy Regulator. The Chair holds offi ce on a full-time basis. All other Members hold offi ce on a part-time basis.
At 30 June 2014, the Regulator had fi ve Members, including the Chair. The appointments of Ms Chloe Munro (Chair) and Dr Michael Sargent commenced on 2 April 2012; Ms Anne T Brown and Ms Virginia Malley were appointed on 4 June 2012; and Mr Michael D’Ascenzo was appointed on 2 April 2013.
In addition to their collective responsibilities, Members of the Regulator each apply their expertise to a specifi c area of focus. This adds depth to the Regulator’s appreciation of its operating environment and enables agency offi cers to draw directly on Members’ knowledge and experience. Members provide an update on their area of focus at each Regulator meeting.
2.2
2.3
12
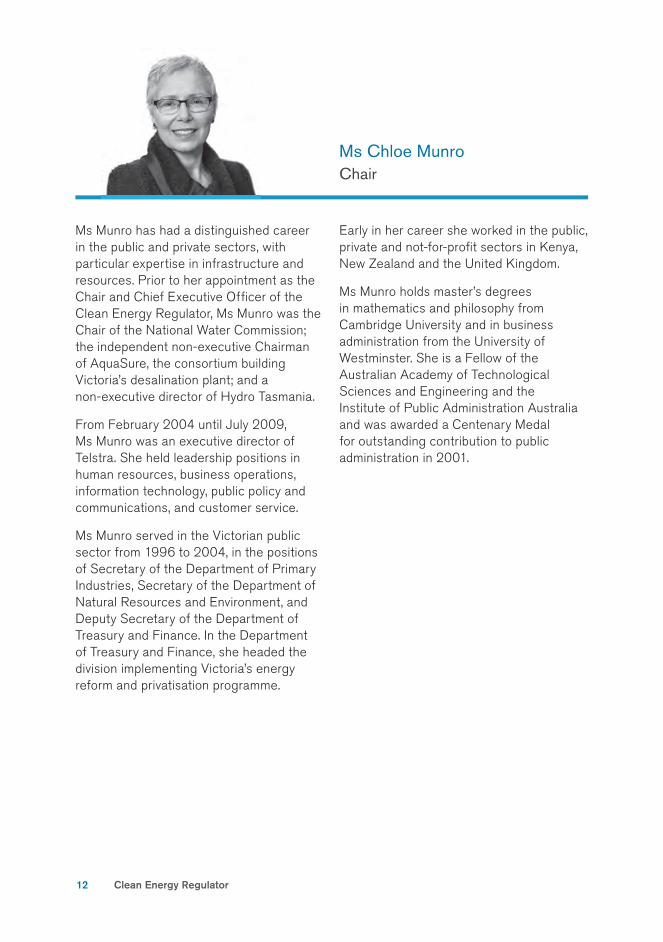
Ms Munro has had a distinguished career in the public and private sectors, with particular expertise in infrastructure and resources. Prior to her appointment as the Chair and Chief Executive Offi cer of the Clean Energy Regulator, Ms Munro was the Chair of the National Water Commission; the independent non-executive Chairman of AquaSure, the consortium building Victoria’s desalination plant; and a non-executive director of Hydro Tasmania.
From February 2004 until July 2009, Ms Munro was an executive director of Telstra. She held leadership positions in human resources, business operations, information technology, public policy and communications, and customer service.
Ms Munro served in the Victorian public sector from 1996 to 2004, in the positions of Secretary of the Department of Primary Industries, Secretary of the Department of Natural Resources and Environment, and Deputy Secretary of the Department of Treasury and Finance. In the Department of Treasury and Finance, she headed the division implementing Victoria’s energy reform and privatisation programme.
Early in her career she worked in the public, private and not-for-profi t sectors in Kenya, New Zealand and the United Kingdom.
Ms Munro holds master’s degrees in mathematics and philosophy from Cambridge University and in business administration from the University of Westminster. She is a Fellow of the Australian Academy of Technological Sciences and Engineering and the Institute of Public Administration Australia and was awarded a Centenary Medal for outstanding contribution to public administration in 2001.
Ms Chloe Munro Chair
Clean Energy Regulator
Annual Report 2013–14 13
2 O
verv
iew
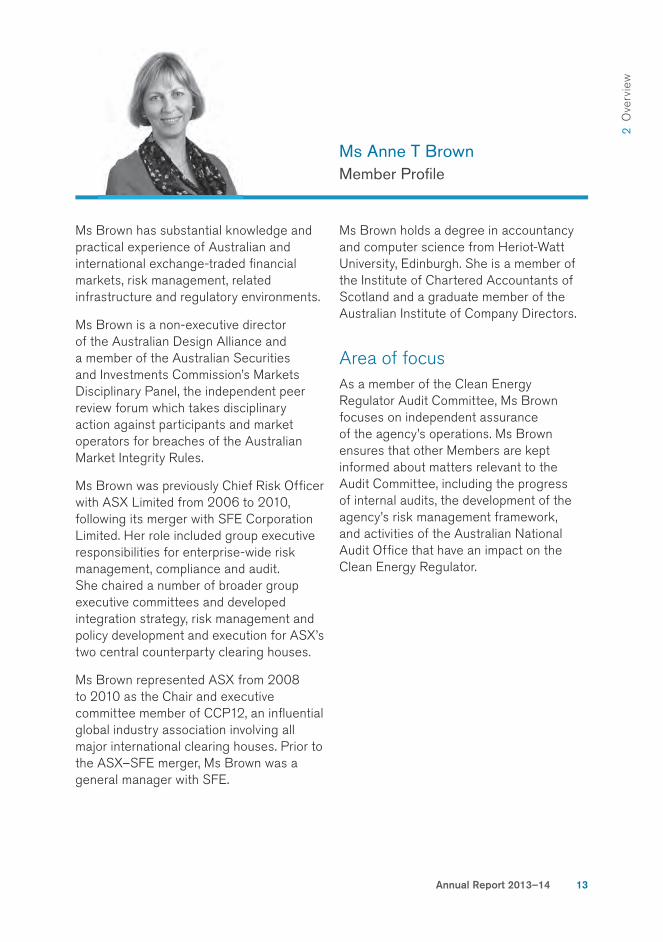
Ms Brown has substantial knowledge and practical experience of Australian and international exchange-traded fi nancial markets, risk management, related infrastructure and regulatory environments.
Ms Brown is a non-executive director of the Australian Design Alliance and a member of the Australian Securities and Investments Commission’s Markets Disciplinary Panel, the independent peer review forum which takes disciplinary action against participants and market operators for breaches of the Australian Market Integrity Rules.
Ms Brown was previously Chief Risk Offi cer with ASX Limited from 2006 to 2010, following its merger with SFE Corporation Limited. Her role included group executive responsibilities for enterprise-wide risk management, compliance and audit. She chaired a number of broader group executive committees and developed integration strategy, risk management and policy development and execution for ASX’s two central counterparty clearing houses.
Ms Brown represented ASX from 2008 to 2010 as the Chair and executive committee member of CCP12, an infl uential global industry association involving all major international clearing houses. Prior to the ASX–SFE merger, Ms Brown was a general manager with SFE.
Ms Brown holds a degree in accountancy and computer science from Heriot-Watt University, Edinburgh. She is a member of the Institute of Chartered Accountants of Scotland and a graduate member of the Australian Institute of Company Directors.
Area of focusAs a member of the Clean Energy Regulator Audit Committee, Ms Brown focuses on independent assurance of the agency’s operations. Ms Brown ensures that other Members are kept informed about matters relevant to the Audit Committee, including the progress of internal audits, the development of the agency’s risk management framework, and activities of the Australian National Audit Offi ce that have an impact on the Clean Energy Regulator.
Ms Anne T Brown Member Profi le
14
Mr D’Ascenzo is recognised internationally for his leadership and expertise in administration, strategy and governance, and for his technical and design skills in tax law and superannuation.
Mr D’Ascenzo is a member of the Foreign Investment Review Board and is on the International Monetary Fund’s panel of experts. He is a non-executive director of Australia Post, an adjunct professor of the University of New South Wales and a professorial fellow of Melbourne University.
Mr D’Ascenzo’s previous roles include Commissioner of Taxation (from 2006 to 2012) and vice-chair of the Organisation for Economic Co-operation and Development’s Forum on Tax Administration.
Mr D’Ascenzo holds degrees in economics and law from the Australian National University. He is also a graduate of the Harvard Business School Program for Management Development, the Australian Institute of Company Directors, and the University of Cambridge Programme for Sustainability Leadership. He is a member of the Institute of Chartered Accountants Australia, honorary life member of CPA Australia, Fellow of the Australian Institute of Company Directors, and Honorary Fellow of the Association of Taxation and Management Accountants.
In 2010, Mr D’Ascenzo was appointed an Offi cer of the Order of Australia for service to public administration, particularly through reform and innovative engagement with the taxation profession and government agencies. In 2012, he was named the Institute of Chartered Accountants Australia’s Federal Government Leader of the Year.
Area of focusMr D’Ascenzo focuses on compliance and enforcement under the schemes administered by the Clean Energy Regulator. In particular, Mr D’Ascenzo focuses on the integration and effectiveness of the Clean Energy Regulator’s intelligence and compliance capabilities. In addition, Mr D’Ascenzo is a member of the joint agency steering committee in relation to the Emissions Reduction Fund.
Mr Michael D’Ascenzo AO Member Profi le
Clean Energy Regulator
Annual Report 2013–14 15
2 O
verv
iew
Ms Malley has 27 years’ experience in the investment and banking sectors, including 14 years’ experience as a company director. Her areas of expertise are regulatory compliance, fi nancial and environmental markets, risk management, corporate governance, custody and trusteeship.
Ms Malley is a non-executive director of Perpetual Superannuation Limited; a member of several Perpetual compliance committees and the Sydney Airport Trust Compliance Committee; and a director of the Nature Conservation Trust of New South Wales.
Ms Malley was previously the Chief Risk Offi cer at Macquarie Funds Management Group, and a member of a number of committees at Macquarie, with focuses on clean technology, the Asia Pacifi c, private equity and global advisory investment. She also served on the boards of Macquarie Investment Management Limited and Bond Street Custodians Limited and was a member-elected trustee of the Macquarie Bank Staff Superannuation Fund. She oversaw the risk management of portfolios, worth more than $85 billion, investing in clean technologies, publicly traded debt securities, listed equities, derivatives, currencies and private equity. She also managed industry regulator and ratings agency relationships.
Ms Malley is a graduate of the Australian Institute of Company Directors. She holds a Bachelor of Arts and a Master of Applied Finance from Macquarie University, a Graduate Diploma in Environmental Law from the University of Sydney, and a Juris Doctor from the University of Technology, Sydney.
Area of focusMs Malley focuses on the development and operation of the carbon market. This requires consideration of activities in both the primary and secondary markets. Through observation of market activities and liaison with the Clean Energy Regulator’s stakeholders, including liable entities, secondary market participants and brokers, Ms Malley strengthens the Clean Energy Regulator Members’ understanding of the dynamics of the carbon market.
Ms Virginia Malley Member Profi le
16
Dr Sargent has more than 50 years’ experience in the energy and utility industries in Australia, Canada and the United States.
Dr Sargent is Chair of Epicorp Seed Fund Pty Ltd, Deputy Chairman of Epicorp Limited, and a member of the Australian Renewable Energy Agency Advisory Panel. His previous roles include Chief Executive of Transfi eld Services Energy Group and Chief Executive Offi cer of ACTEW Corporation. Until recently, he was a director of the Australian Solar Institute and the Australian Energy Market Operator.
Dr Sargent is active in professional and community matters. He is a director of the National Heart Foundation ACT and a past president of the Institution of Engineers Australia.
Dr Sargent holds a degree in electrical engineering and a Doctor of Philosophy from the University of Queensland. In recognition of his service to engineering he was made a Member of the Order of Australia in 1993 and was awarded a Centenary Medal in 2003.
Area of focus
Dr Sargent’s area of focus is renewable technology and the market for renewable energy. In addition to closely observing the national electricity market, Dr Sargent monitors trends in renewable technology and investment, both in Australia and globally. Dr Sargent keeps Members informed regarding developments in wind and solar technology and market interest in biofuels, as well as trends in the National Electricity Market.
Dr Michael Sargent AM Member Profi le
Clean Energy Regulator
Annual Report 2013–14 17
2 O
verv
iewRegulator meetings
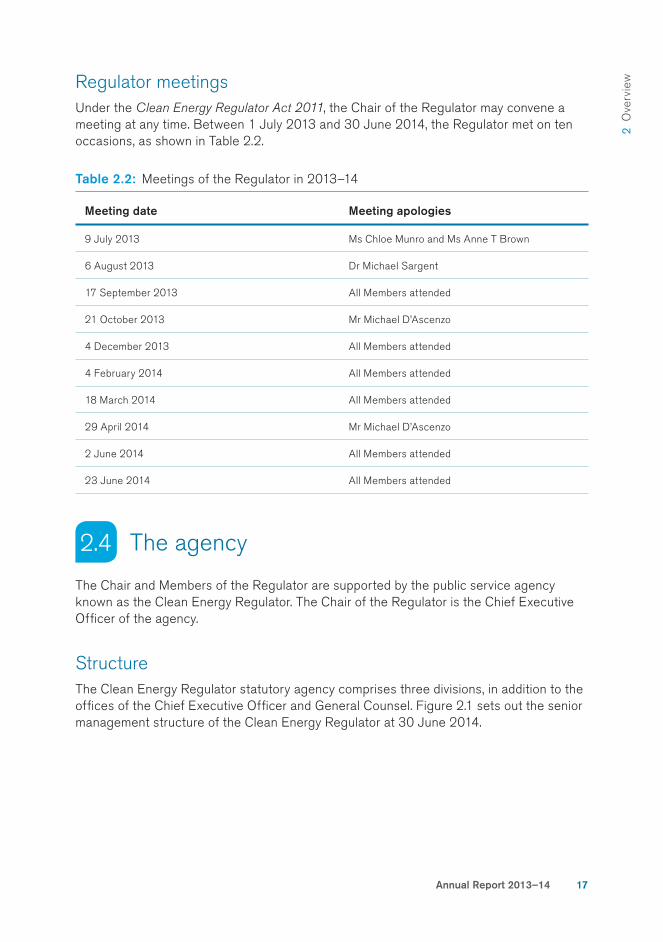
Under the Clean Energy Regulator Act 2011, the Chair of the Regulator may convene a meeting at any time. Between 1 July 2013 and 30 June 2014, the Regulator met on ten occasions, as shown in Table 2.2.
Table 2.2: Meetings of the Regulator in 2013–14
Meeting date Meeting apologies
9 July 2013 Ms Chloe Munro and Ms Anne T Brown
6 August 2013 Dr Michael Sargent
17 September 2013 All Members attended
21 October 2013 Mr Michael D’Ascenzo
4 December 2013 All Members attended
4 February 2014 All Members attended
18 March 2014 All Members attended
29 April 2014 Mr Michael D’Ascenzo
2 June 2014 All Members attended
23 June 2014 All Members attended
2.4 The agency
The Chair and Members of the Regulator are supported by the public service agency known as the Clean Energy Regulator. The Chair of the Regulator is the Chief Executive Offi cer of the agency.
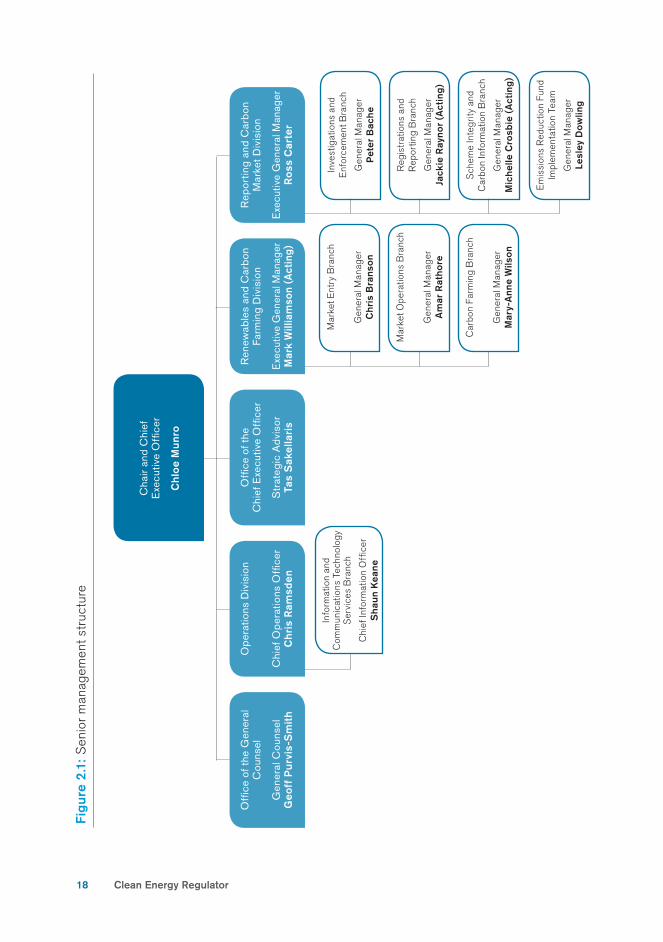
StructureThe Clean Energy Regulator statutory agency comprises three divisions, in addition to the offi ces of the Chief Executive Offi cer and General Counsel. Figure 2.1 sets out the senior management structure of the Clean Energy Regulator at 30 June 2014.
2.4
18
Fig
ure
2.1
: S
enio
r m
anag
emen
t str
uctu
re
Cha
ir an
d C
hief
E
xecu
tive
Offi
cer
Chl
oe
Mu
nro
Ren
ewab
les
and
Car
bon
Farm
ing
Div
isio
n
Exe
cutiv
e G
ener
al M
anag
erM
ark
Will
iam
son
(Act
ing)
Info
rmat
ion
and
Com
mun
icat
ions
Tec
hnol
ogy
Ser
vice
s B
ranc
h
Chi
ef In
form
atio
n O
ffi c
erS
haun
Kea
ne
Offi
ce o
f the
C
hief
Exe
cutiv
e O
ffi ce
r
Str
ateg
ic A
dvis
orTa
s S
akel
lari
s
Rep
ortin
g an
d C
arbo
n M
arke
t Div
isio
n
Exe
cutiv
e G
ener
al M
anag
erR
oss
Car
ter
Ope
ratio
ns D
ivis
ion
Chi
ef O
pera
tions
Offi
cer
Chr
is R
amsd
en
Offi
ce o
f the
Gen
eral
C
ouns
el
Gen
eral
Cou
nsel
Geo
ff P
urvi
s-S
mit
h
Inve
stig
atio
ns a
nd
Enf
orce
men
t Bra
nch
Gen
eral
Man
ager
Pet
er B
ache
Reg
istr
atio
ns a
nd
Rep
ortin
g B
ranc
h
Gen
eral
Man
ager
Jack
ie R
ayno
r (A
ctin
g)
Sch
eme
Inte
grity
and
C
arbo
n In
form
atio
n B
ranc
h
Gen
eral
Man
ager
Mic
helle
Cro
sbie
(A
ctin
g)
Em
issi
ons
Red
uctio
n Fu
nd
Impl
emen
tatio
n Te
am
Gen
eral
Man
ager
Lesl
ey D
owlin
g
Mar
ket E
ntry
Bra
nch
Gen
eral
Man
ager
Chr
is B
rans
on
Mar
ket O
pera
tions
Bra
nch
Gen
eral
Man
ager
Am
ar R
atho
re
Car
bon
Farm
ing
Bra
nch
Gen
eral
Man
ager
Mar
y-A
nne
Wils
on
Clean Energy Regulator

Annual Report 2013–14 19
2 O
verv
iewSenior executives
Ms Chloe MunroChief Executive Offi cer
Mr Geoff Purvis-SmithGeneral Counsel
Profi leThe Chair of the Regulator is also the head of the statutory agency for the purposes of the Public Service Act 1999. The Chair had the responsibilities of chief executive offi cer under the Financial Management and Accountability Act
1997 until 30 June 2014.
Ms Munro’s experience and qualifi cations are described in her profi le as Chair of the Regulator in the previous section.
RoleThe Chief Executive Offi cer has an important role in providing advice, implementing the Regulator’s decisions and meeting regulatory objectives within a whole-of-government context. She directs the offi cers of the Clean Energy Regulator and is entrusted to lead the agency to support the Regulator in administering the regulatory schemes for which it is responsible.
Profi leBefore Mr Purvis-Smith joined the Clean Energy Regulator, he was a Principal Lawyer and Acting General Counsel at the Australian Customs and Border Protection Service.
Mr Purvis-Smith has also had extensive regulatory experience with the Australian Competition and Consumer Commission and the Australian Communications and Media Authority. Before joining the Australian Public Service in 2001, Mr Purvis-Smith was a private sector lawyer in national and local fi rms, where he specialised in litigation.
Mr Purvis-Smith holds degrees in arts and law and a master’s degree in international law
RoleThe General Counsel is responsible for the delivery and procurement of legal services, the coordination of legislative proposals and consultation, and the coordination of the agency’s deregulation agenda. His offi ce also administers freedom of information, ombudsman and privacy matters on behalf of the agency.
20
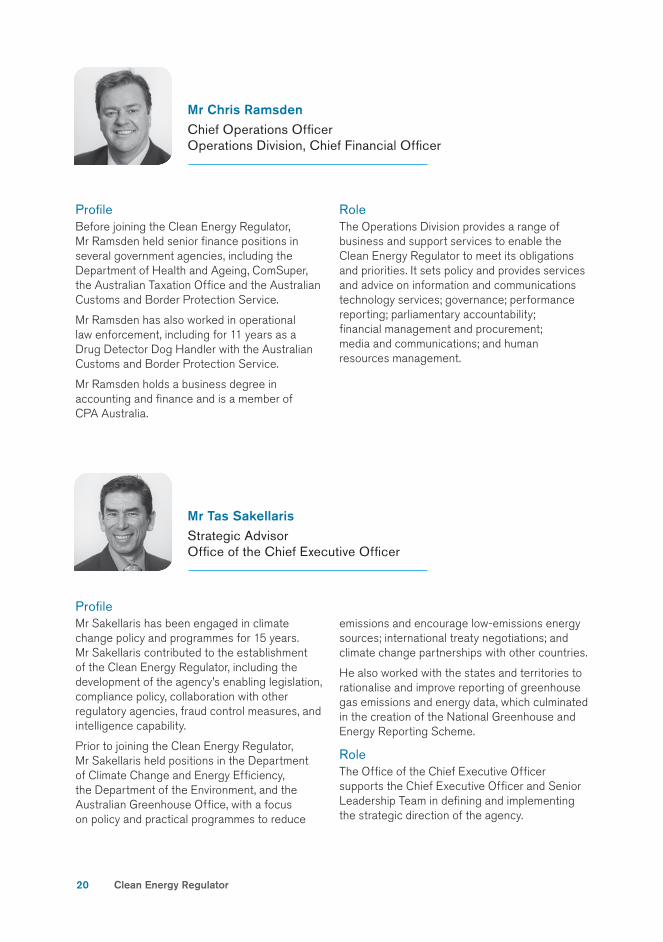
Profi leMr Sakellaris has been engaged in climate change policy and programmes for 15 years. Mr Sakellaris contributed to the establishment of the Clean Energy Regulator, including the development of the agency’s enabling legislation, compliance policy, collaboration with other regulatory agencies, fraud control measures, and intelligence capability.
Prior to joining the Clean Energy Regulator, Mr Sakellaris held positions in the Department of Climate Change and Energy Effi ciency, the Department of the Environment, and the Australian Greenhouse Offi ce, with a focus on policy and practical programmes to reduce
emissions and encourage low-emissions energy sources; international treaty negotiations; and climate change partnerships with other countries.
He also worked with the states and territories to rationalise and improve reporting of greenhouse gas emissions and energy data, which culminated in the creation of the National Greenhouse and Energy Reporting Scheme.
RoleThe Offi ce of the Chief Executive Offi cer supports the Chief Executive Offi cer and Senior Leadership Team in defi ning and implementing the strategic direction of the agency.
Mr Tas SakellarisStrategic AdvisorOffi ce of the Chief Executive Offi cer
Mr Chris RamsdenChief Operations Offi cerOperations Division, Chief Financial Offi cer
Profi leBefore joining the Clean Energy Regulator, Mr Ramsden held senior fi nance positions in several government agencies, including the Department of Health and Ageing, ComSuper, the Australian Taxation Offi ce and the Australian Customs and Border Protection Service.
Mr Ramsden has also worked in operational law enforcement, including for 11 years as a Drug Detector Dog Handler with the Australian Customs and Border Protection Service.
Mr Ramsden holds a business degree in accounting and fi nance and is a member of CPA Australia.
RoleThe Operations Division provides a range of business and support services to enable the Clean Energy Regulator to meet its obligations and priorities. It sets policy and provides services and advice on information and communications technology services; governance; performance reporting; parliamentary accountability; fi nancial management and procurement; media and communications; and human resources management.
Clean Energy Regulator

Annual Report 2013–14 21
2 O
verv
iew
Profi leMr Williamson joined the Clean Energy Regulator in August 2012, following an extensive career which included senior executive roles in the private sector and state and local government. He commenced acting as Executive General Manager in January 2014.
Mr Williamson previously held a national commercial and technical position in an ASX 200 company and was Executive Director of the Queensland Environmental Protection Agency, leading that agency’s regulatory operations across a diverse range of environmental legislation. His initial position in the Clean Energy Regulator was General Manager Carbon Price Operations.
Mr Williamson has qualifi cations in applied science and postgraduate qualifi cations in management.
RoleThe Renewables and Carbon Farming Division administers the Carbon Farming Initiative, the Renewable Energy Target and elements of the carbon pricing mechanism. This includes educating participants, assessing applications, monitoring compliance, issuing carbon units and partial exemption certifi cates, managing scheme liability, and maintaining registries.
Note: Mr Andrew Livingston held the position of Executive General Manager up to January 2014.
Mr Mark WilliamsonExecutive General Manager (Acting) Renewables and Carbon Farming Division
Mr Ross CarterExecutive General ManagerReporting and Carbon Market Division
Profi leMr Carter has worked across the spectrum of climate change related policy, regulation and programmes. Prior to the formation of the Clean Energy Regulator, he was responsible for administering the National Greenhouse and
Energy Reporting Act 2007 as the Greenhouse and Energy Data Offi cer.
Mr Carter began working in the Australian Greenhouse Offi ce in 2006, joining the Australian Public Service after a 20-year career spanning regulatory and policy aspects of environment protection and natural resource management, including at the executive director level, in the New South Wales public sector.
RoleThe Reporting and Carbon Market Division administers the National Greenhouse and Energy Reporting Scheme, the Australian National Registry of Emissions Units and aspects of the carbon pricing mechanism. This includes developing and implementing capabilities associated with registration and reporting; compliance monitoring; audit and auditor registration; management, publication and disclosure of greenhouse and energy information; liability determination and acquittal; and client engagement.
22
2.5 Outcome and programme structure
This annual report covers the Clean Energy Regulator’s performance from 1 July 2013 to 30 June 2014.
All Australian Government entities are required to report on their performance in accordance with the outcomes and programmes framework established in the relevant portfolio budget statements.
This annual report addresses the outcome and programme framework set out for the Clean Energy Regulator in the Industry, Innovation, Climate Change, Science, Research
and Tertiary Education Portfolio Budget Statements 2013–14. The framework includes performance indicators and deliverables, which are addressed in the performance overview section of this annual report.
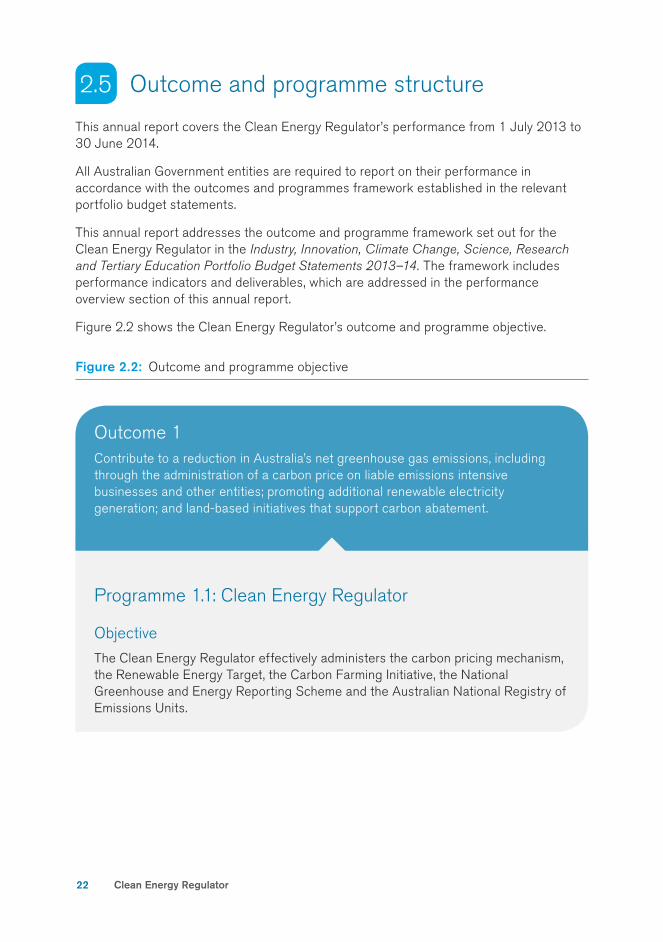
Figure 2.2 shows the Clean Energy Regulator’s outcome and programme objective.
Figure 2.2: Outcome and programme objective
2.5
Outcome 1Contribute to a reduction in Australia’s net greenhouse gas emissions, including through the administration of a carbon price on liable emissions intensive businesses and other entities; promoting additional renewable electricity generation; and land-based initiatives that support carbon abatement.
Programme 1.1: Clean Energy Regulator
Objective
The Clean Energy Regulator effectively administers the carbon pricing mechanism, the Renewable Energy Target, the Carbon Farming Initiative, the National Greenhouse and Energy Reporting Scheme and the Australian National Registry of Emissions Units.
Clean Energy Regulator
Section 3
Performance overview
3.1 Carbon pricing mechanism 24
3.2 Carbon Farming Initiative 31
3.3 Renewable Energy Target 38
3.4 National Greenhouse and Energy Reporting Scheme 47
3.5 Australian National Registry of Emissions Units 51
3.6 Partnerships 53
3.7 Performance indicators 56
24
This section of the report describes the Clean Energy Regulator’s achievements against the deliverables for Programme 1.1: Clean Energy Regulator, as published in the Industry, Innovation, Climate Change, Science, Research and Tertiary Education Portfolio Budget
Statements 2013–14.
The Clean Energy Regulator’s achievements in meeting the performance indicators are outlined in Table 3.12 on page 56 of this annual report.
3.1 Carbon pricing mechanism
DeliverableAdministration of the carbon pricing mechanism.
Provision of industry assistance arrangements under the carbon pricing mechanism, including the Jobs and Competitiveness Program and the Energy Security Fund Coal Fired Generators Assistance—Free Carbon Units.
Maintenance of the Liable Entities Public Information Database.
3.1
Performance overview3
Snapshot
The carbon pricing mechanism puts a price on Australia’s carbon pollution. It was introduced by the Clean Energy Act
2011 and applies to Australia’s largest carbon emitters.
Under the carbon pricing mechanism, Australia’s largest carbon emitters, called ‘liable entities’, must report and pay for the carbon emissions they produce each year. They must purchase and surrender one eligible emissions unit for each tonne of carbon dioxide equivalent emissions produced.
If a liable entity does not surrender enough units, it must pay a shortfall charge.
The carbon pricing mechanism applies to approximately 60 per cent of Australia’s carbon emissions, including carbon emissions from electricity generation, stationary energy, landfi lls, wastewater and industrial processes and from fugitive gas emissions.
The carbon pricing mechanism covers a range of large business and industrial facilities.
Clean Energy Regulator
3 P
erfo
rman
ce o
verv
iew
Annual Report 2013–14 25
Reporting of emissions and surrender of unitsLiable entities must report on their interim and fi nal emissions under the National
Greenhouse and Energy Reporting Act 2007.
Generally, if a facility meets or exceeds the threshold of emissions covered by the carbon pricing mechanism, with a carbon dioxide equivalence of 25,000 tonnes in a fi nancial year, the person responsible for the facility will be liable under the carbon pricing mechanism.
Liable entities must surrender one carbon unit for every tonne of carbon dioxide equivalent emissions that they have produced in a compliance year. If a liable entity does not surrender any or enough units, it must pay a unit shortfall charge.
The unit shortfall charge is set at 130 per cent of the fi xed price for the relevant fi nancial year multiplied by the number of shortfall units. The unit shortfall charge creates an incentive to surrender units under the carbon pricing mechanism rather than pay the higher unit shortfall charge.
2012–13 compliance period
Those liable entities with an interim emissions number for the 2012–13 compliance period were required to report and surrender suffi cient emissions units to meet their provisional liability by 17 June 2013. A liable entity’s provisional liability is equal to approximately 75 per cent of their emissions for the full 2012–13 year.
All liable entities were required to report a fi nal emissions number for the 2012–13 compliance period by 31 October 2013. The 2012–13 compliance period runs from 1 July 2012 until 30 June 2013. Liable entities were required to surrender suffi cient emissions units to meet their fi nal liability by 3 February 2014.
The Clean Energy Regulator provided education and training support to clients during 2012–13. As a result, the 2012–13 compliance rate was very high: 100 per cent of liable entities required to do so reported their interim emission numbers and 100 per cent of liable entities reported their fi nal emissions number. The total liability acquitted on time was 99.6 per cent.
Feedback from industry about the performance of our agency is consistently positive, particularly around the professionalism of the staff.
- Virginia Malley
Four liable entities did not meet the fi nal deadline for 2012–13 and incurred a fi nal unit shortfall charge. Fourteen liable entities incurred an estimation error shortfall charge as a result of reporting an interim estimate of 75 per cent of their 2012–13 emissions, in June 2013, which subsequently proved to be a low estimate compared to their full-year report in October 2013.
26
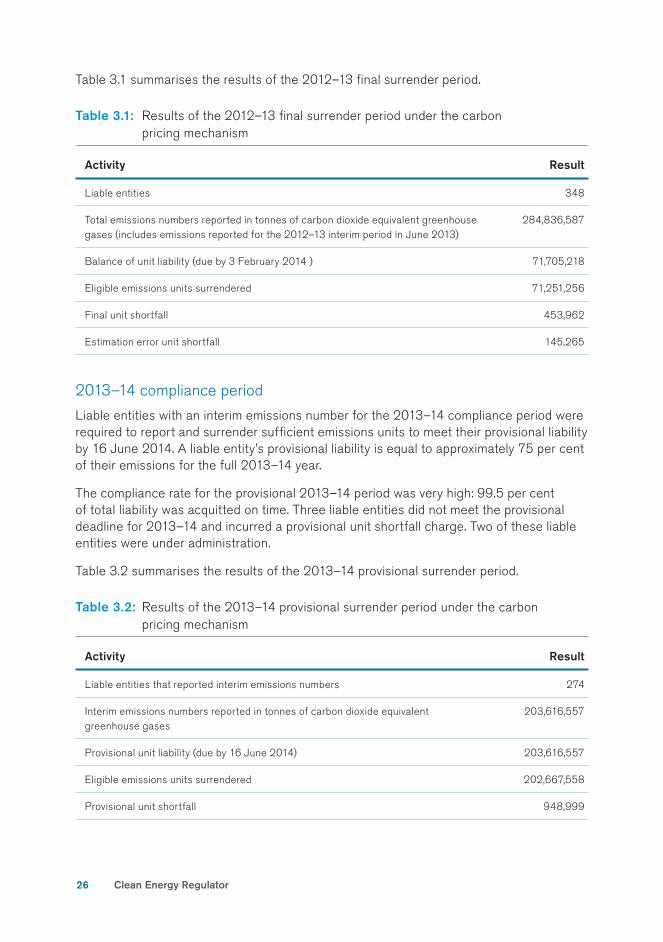
Table 3.1 summarises the results of the 2012–13 fi nal surrender period.
Table 3.1: Results of the 2012–13 fi nal surrender period under the carbon pricing mechanism
Activity Result
Liable entities 348
Total emissions numbers reported in tonnes of carbon dioxide equivalent greenhouse gases (includes emissions reported for the 2012–13 interim period in June 2013)
284,836,587
Balance of unit liability (due by 3 February 2014 ) 71,705,218
Eligible emissions units surrendered 71,251,256
Final unit shortfall 453,962
Estimation error unit shortfall 145,265
2013–14 compliance period
Liable entities with an interim emissions number for the 2013–14 compliance period were required to report and surrender suffi cient emissions units to meet their provisional liability by 16 June 2014. A liable entity’s provisional liability is equal to approximately 75 per cent of their emissions for the full 2013–14 year.
The compliance rate for the provisional 2013–14 period was very high: 99.5 per cent of total liability was acquitted on time. Three liable entities did not meet the provisional deadline for 2013–14 and incurred a provisional unit shortfall charge. Two of these liable entities were under administration.
Table 3.2 summarises the results of the 2013–14 provisional surrender period.
Table 3.2: Results of the 2013–14 provisional surrender period under the carbon pricing mechanism
Activity Result
Liable entities that reported interim emissions numbers 274
Interim emissions numbers reported in tonnes of carbon dioxide equivalent greenhouse gases
203,616,557
Provisional unit liability (due by 16 June 2014) 203,616,557
Eligible emissions units surrendered 202,667,558
Provisional unit shortfall 948,999
Clean Energy Regulator
3 P
erfo
rman
ce o
verv
iew
Annual Report 2013–14 27
Outstanding shortfalls charges
For the 2013–14 compliance year, three liable entities (two of these liable entities had outstanding debts from 2012–13) incurred provisional unit shortfall charges totalling $29.8 million, and these debts plus late payment penalties of $0.1 million remained outstanding at 30 June 2014. The Clean Energy Regulator continues to work with these three liable entities to recover the outstanding shortfall charges and penalties for 2013–14, as well as recover all outstanding debts from 2012–13.
Establishing point of liability
Direct emissions
Under the Clean Energy Act 2011, the measures available to enable direct emitters to manage liability include liability transfer certifi cates that transfer liability for a facility from one liable entity to another, and a range of sharing options for joint ventures.
During 2013–14, the Clean Energy Regulator assessed ten applications from direct emitters seeking to transfer liability for facilities via liability transfer certifi cates. There were no new applications from joint venture participants seeking to share liability. Joint venture participants who shared liability in 2012–13 retained those arrangements in 2013–14.
Embodied emissions
Obligation transfer numbers are used to transfer carbon price liability for the potential greenhouse gas emissions embodied in certain fuels from the supplier of the fuel to the recipient of the fuel.
In 2013–14, following an amendment to the legislation, obligation transfer number arrangements were extended from covering natural gas to include liquefi ed petroleum gas and liquefi ed natural gas.
During 2013–14, the Clean Energy Regulator managed obligation transfer number applications and maintained the obligation transfer number register, which is published on the agency’s website. The obligation transfer number register contains information regarding current and previous obligation transfer number holders, as well as gaseous fuel suppliers that have requested to be entered. At 30 June 2014, 129 obligation transfer number holders were listed on the register.
28
Liquid fuel Opt-in SchemeThe liquid fuel Opt-in Scheme commenced on 1 July 2013. The scheme allows large users of specifi ed taxable liquid fuels to choose to manage their carbon price liability through the carbon pricing mechanism, rather than through the fuel tax or excise systems administered by the Australian Taxation Offi ce. For 2013–14, 27 applicants were declared to be designated opt-in persons and had the same obligations as other liable entities under the carbon pricing mechanism.
Liable Entities Public Information DatabaseThe Clean Energy Regulator published updates to the 2012–13 Liable Entities Public Information Database during 2013–14. At 30 June 2014, a total of 348 liable entities, representing reported total emissions numbers of 284,836,587, were listed on the database for 2012–13.
On 21 March 2014, the Clean Energy Regulator published the 2013–14 Liable Entities Public Information Database. The Clean Energy Regulator identifi ed liable entities for the 2013–14 database by contacting entities listed on the 2012–13 database to check whether they had continued to be liable, adding new entities through the liable entity registration process, and approving liability transfers for 2013–14. At 30 June 2014, 371 entities were listed on the 2013–14 Liable Entities Public Information Database.
Information on the numbers and types of units surrendered by liable entities and any shortfall charges was also published on the database.
Jobs and Competitiveness ProgramThe Jobs and Competitiveness Program provides ongoing assistance to entities that face high carbon pricing mechanism costs and are constrained in their capacity to pass through these costs in markets. The program issues free carbon units to eligible applicants.
2012–13 compliance period
The Clean Energy Regulator received fi ve Jobs and Competitiveness Program applications during 2013–14 (in addition to the 127 applications received during 2012–13). Of those, four were approved and one was pending decision at 30 June 2014. All were processed within legislated timeframes. In addition, four outstanding applications from 2012–13 (out of the 127 applications received during that year) were approved during 2013–14.
A total of 416,559 free carbon units were issued in 2013–14 in respect of the approved applications for the 2012–13 compliance period.
Clean Energy Regulator
3 P
erfo
rman
ce o
verv
iew
Annual Report 2013–14 29
2013–14 compliance period
The Clean Energy Regulator received 128 Jobs and Competitiveness Program applications during 2013–14. Of those, 121 were approved, two were refused, and fi ve were pending decision at 30 June 2014, and 90 per cent were processed within legislated timeframes. The applications that were processed outside of legislative timeframes generally involved case-specifi c and/or legislative complexities.
A total of 84,226,608 free carbon units were issued in the fi rst allocation of free carbon units in respect of the approved applications. The second allocation will occur in 2014–15.
Energy Security FundThe Energy Security Fund Coal Fired Generators Assistance—Free Carbon Units scheme (Energy Security Fund) provides assistance to highly emissions-intensive, coal-fi red electricity generators. To receive free carbon units under the Energy Security Fund, an eligible electricity generator must pass an annual power system reliability test and give an annual clean energy investment plan to the responsible minister by 15 August each year. All eligible generators complied with those requirements during 2013–14.
The Clean Energy Regulator issued 41,705,000 free carbon units on 2 September 2013, apportioned on the basis of the annual assistance factor shown on each generator’s certifi cate of eligibility. In accordance with legislation, the Clean Energy Regulator published details of the issue of free carbon units on its website.
30
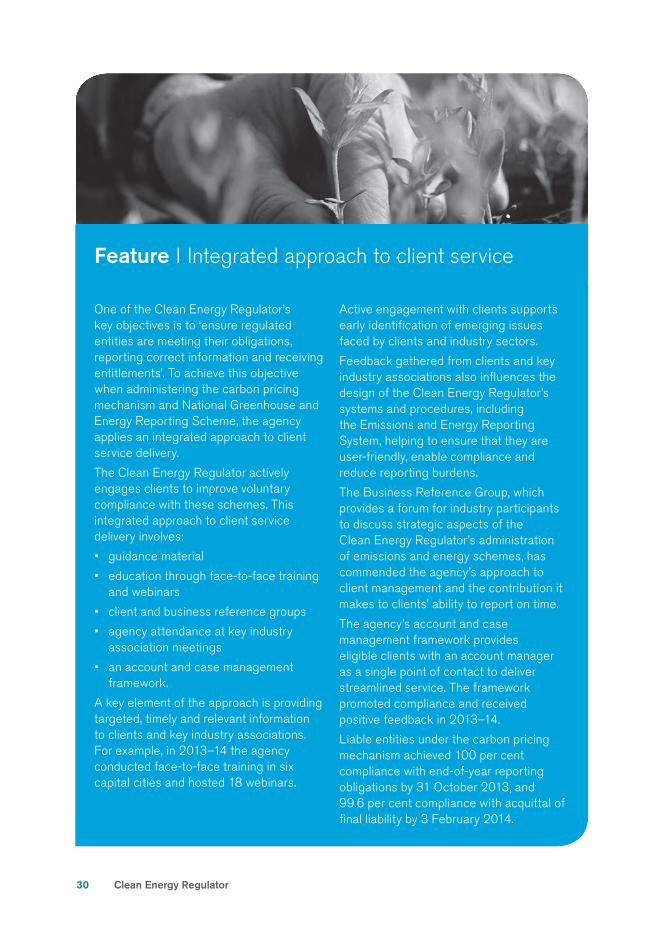
One of the Clean Energy Regulator’s key objectives is to ‘ensure regulated entities are meeting their obligations, reporting correct information and receiving entitlements’. To achieve this objective when administering the carbon pricing mechanism and National Greenhouse and Energy Reporting Scheme, the agency applies an integrated approach to client service delivery.
The Clean Energy Regulator actively engages clients to improve voluntary compliance with these schemes. This integrated approach to client service delivery involves:
• guidance material
• education through face-to-face training and webinars
• client and business reference groups
• agency attendance at key industry association meetings
• an account and case management framework.
A key element of the approach is providing targeted, timely and relevant information to clients and key industry associations. For example, in 2013–14 the agency conducted face-to-face training in six capital cities and hosted 18 webinars.
Active engagement with clients supports early identifi cation of emerging issues faced by clients and industry sectors.
Feedback gathered from clients and key industry associations also infl uences the design of the Clean Energy Regulator’s systems and procedures, including the Emissions and Energy Reporting System, helping to ensure that they are user-friendly, enable compliance and reduce reporting burdens.
The Business Reference Group, which provides a forum for industry participants to discuss strategic aspects of the Clean Energy Regulator’s administration of emissions and energy schemes, has commended the agency’s approach to client management and the contribution it makes to clients’ ability to report on time.
The agency’s account and case management framework provides eligible clients with an account manager as a single point of contact to deliver streamlined service. The framework promoted compliance and received positive feedback in 2013–14.
Liable entities under the carbon pricing mechanism achieved 100 per cent compliance with end-of-year reporting obligations by 31 October 2013, and 99.6 per cent compliance with acquittal of fi nal liability by 3 February 2014.
Feature I Integrated approach to client service
Clean Energy Regulator
3 P
erfo
rman
ce o
verv
iew
Annual Report 2013–14 31
3.2 Carbon Farming Initiative
DeliverableAdministration of the mechanism for crediting domestic land sector offsets through the Carbon Farming Initiative.
3.2
Snapshot
The Carbon Farming Initiative enables individuals and entities to earn Australian carbon credit units through a change in activities on the land to store carbon or reduce greenhouse emissions. It is enacted through the Carbon Credits
(Carbon Farming Initiative) Act 2011.
Activities are conducted as offsets projects in accordance with a
methodology determination, which sets out the rules for undertaking, monitoring and reporting on a project and generating Australian carbon credit units. Once issued, Australian carbon credit units can be sold to individuals and businesses wishing to offset a liability under the carbon pricing mechanism or to offset their emissions voluntarily.
ApplicationsThe number of applications submitted to the Clean Energy Regulator under the Carbon Farming Initiative increased in all areas in 2013–14. The number of applications for:
• recognition as an offsets entity rose to 98 in 2013–14, compared to 82 in 2012–13
• declaration of an eligible offsets project rose to 100 in 2013–14, compared to 97 in 2012–13
• certifi cates of entitlement to be issued with Australian carbon credit units (ACCUs) rose to 85 in 2013–14, compared to 29 in 2012–13.
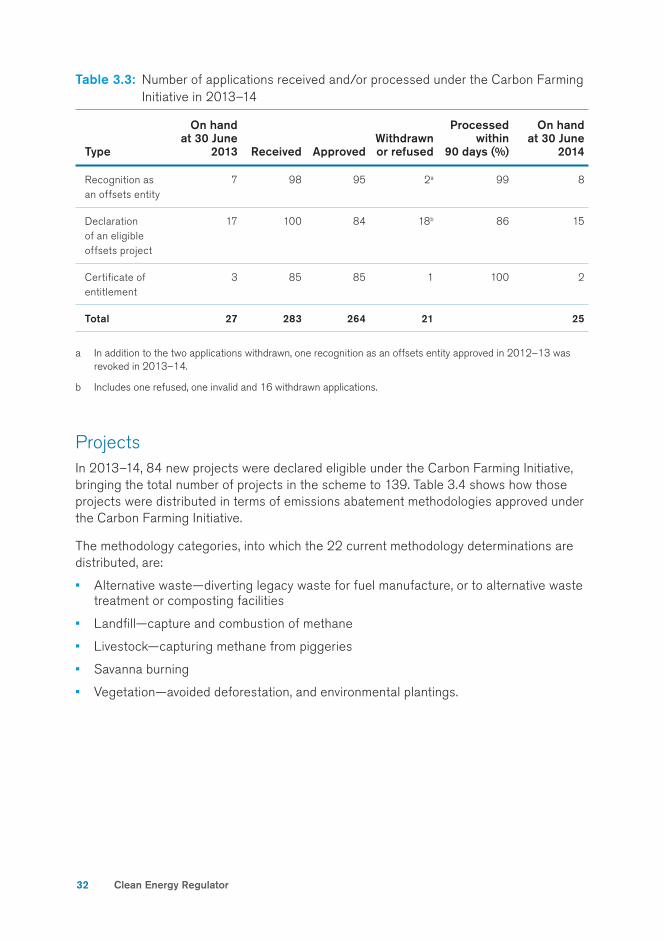
Table 3.3 summarises the processing of applications in 2013–14.
32
Table 3.3: Number of applications received and/or processed under the Carbon Farming Initiative in 2013–14
Type
On hand at 30 June
2013 Received ApprovedWithdrawn or refused
Processed within
90 days (%)
On hand at 30 June
2014
Recognition as an offsets entity
7 98 95 2a 99 8
Declaration of an eligible offsets project
17 100 84 18b 86 15
Certifi cate of entitlement
3 85 85 1 100 2
Total 27 283 264 21 25
a In addition to the two applications withdrawn, one recognition as an offsets entity approved in 2012–13 was revoked in 2013–14.
b Includes one refused, one invalid and 16 withdrawn applications.
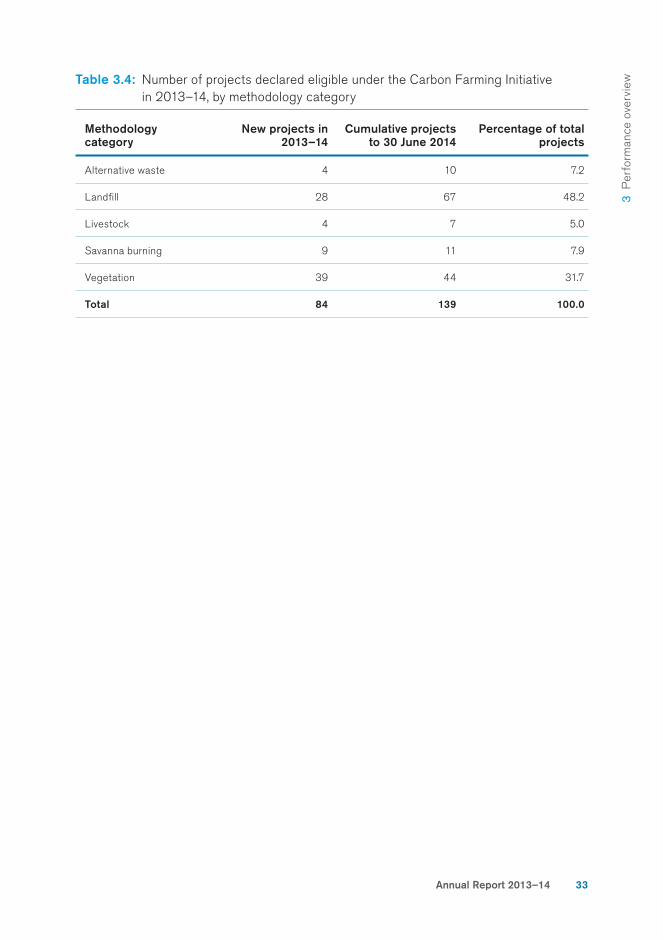
ProjectsIn 2013–14, 84 new projects were declared eligible under the Carbon Farming Initiative, bringing the total number of projects in the scheme to 139. Table 3.4 shows how those projects were distributed in terms of emissions abatement methodologies approved under the Carbon Farming Initiative.
The methodology categories, into which the 22 current methodology determinations are distributed, are:
• Alternative waste—diverting legacy waste for fuel manufacture, or to alternative waste treatment or composting facilities
• Landfi ll—capture and combustion of methane
• Livestock—capturing methane from piggeries
• Savanna burning
• Vegetation—avoided deforestation, and environmental plantings.
Clean Energy Regulator
3 P
erfo
rman
ce o
verv
iew
Annual Report 2013–14 33
Table 3.4: Number of projects declared eligible under the Carbon Farming Initiative in 2013–14, by methodology category
Methodology category
New projects in 2013–14
Cumulative projects to 30 June 2014
Percentage of total projects
Alternative waste 4 10 7.2
Landfi ll 28 67 48.2
Livestock 4 7 5.0
Savanna burning 9 11 7.9
Vegetation 39 44 31.7
Total 84 139 100.0
34
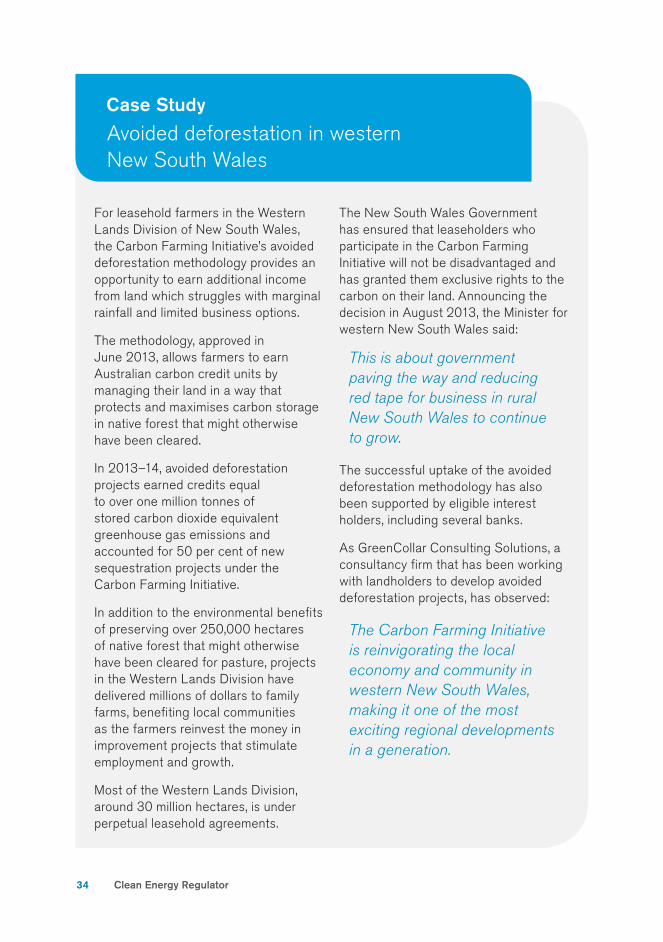
Avoided deforestation in western New South Wales
Case Study
For leasehold farmers in the Western Lands Division of New South Wales, the Carbon Farming Initiative’s avoided deforestation methodology provides an opportunity to earn additional income from land which struggles with marginal rainfall and limited business options.
The methodology, approved in June 2013, allows farmers to earn Australian carbon credit units by managing their land in a way that protects and maximises carbon storage in native forest that might otherwise have been cleared.
In 2013–14, avoided deforestation projects earned credits equal to over one million tonnes of stored carbon dioxide equivalent greenhouse gas emissions and accounted for 50 per cent of new sequestration projects under the Carbon Farming Initiative.
In addition to the environmental benefi ts of preserving over 250,000 hectares of native forest that might otherwise have been cleared for pasture, projects in the Western Lands Division have delivered millions of dollars to family farms, benefi ting local communities as the farmers reinvest the money in improvement projects that stimulate employment and growth.
Most of the Western Lands Division, around 30 million hectares, is under perpetual leasehold agreements.
The New South Wales Government has ensured that leaseholders who participate in the Carbon Farming Initiative will not be disadvantaged and has granted them exclusive rights to the carbon on their land. Announcing the decision in August 2013, the Minister for western New South Wales said:
This is about government
paving the way and reducing
red tape for business in rural
New South Wales to continue
to grow.
The successful uptake of the avoided deforestation methodology has also been supported by eligible interest holders, including several banks.
As GreenCollar Consulting Solutions, a consultancy fi rm that has been working with landholders to develop avoided deforestation projects, has observed:
The Carbon Farming Initiative
is reinvigorating the local
economy and community in
western New South Wales,
making it one of the most
exciting regional developments
in a generation.
Clean Energy Regulator
3 P
erfo
rman
ce o
verv
iew
Annual Report 2013–14 35
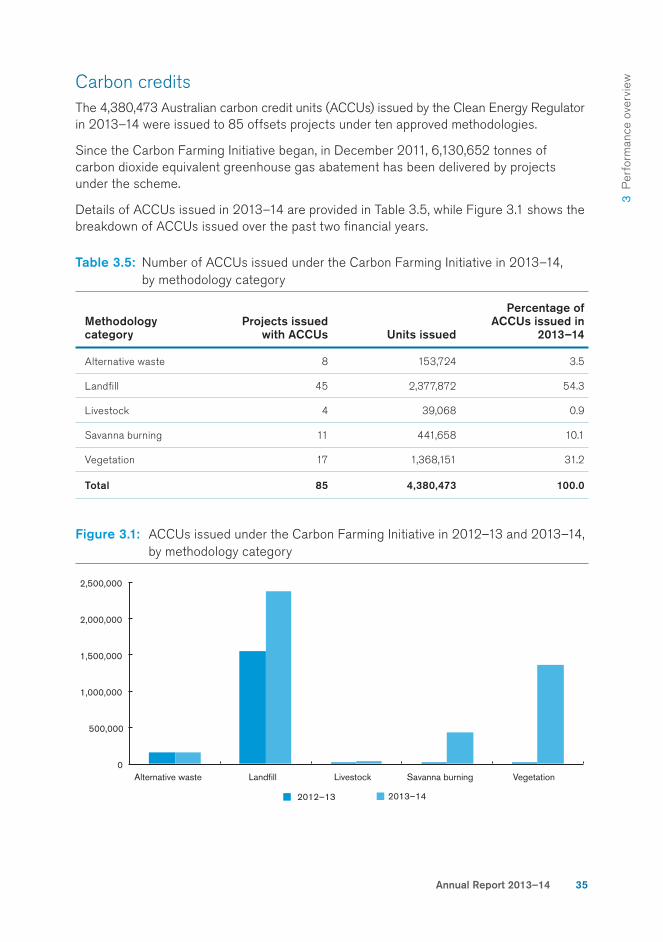
Carbon creditsThe 4,380,473 Australian carbon credit units (ACCUs) issued by the Clean Energy Regulator in 2013–14 were issued to 85 offsets projects under ten approved methodologies.
Since the Carbon Farming Initiative began, in December 2011, 6,130,652 tonnes of carbon dioxide equivalent greenhouse gas abatement has been delivered by projects under the scheme.
Details of ACCUs issued in 2013–14 are provided in Table 3.5, while Figure 3.1 shows the breakdown of ACCUs issued over the past two fi nancial years.
Table 3.5: Number of ACCUs issued under the Carbon Farming Initiative in 2013–14, by methodology category
Methodology category
Projects issued with ACCUs Units issued
Percentage of ACCUs issued in
2013–14
Alternative waste 8 153,724 3.5
Landfi ll 45 2,377,872 54.3
Livestock 4 39,068 0.9
Savanna burning 11 441,658 10.1
Vegetation 17 1,368,151 31.2
Total 85 4,380,473 100.0
Figure 3.1: ACCUs issued under the Carbon Farming Initiative in 2012–13 and 2013–14, by methodology category
0
500,000
1,000,000
1,500,000
2,000,000
2,500,000
Alternative waste Landfill Livestock Savanna burning Vegetation
2012–13 2013–14
36
Stakeholder communicationThe Clean Energy Regulator worked with stakeholders and clients to support participation in the Carbon Farming Initiative, with a focus on improving the quality of applications and reports.
Activities in 2013–14 included conducting a Darwin-based workshop for savanna burning project proponents; coordinating an auditors’ workshop in Canberra; and participating in fi ve industry events, including the Pan Pacifi c Pork Expo held in Broadbeach, Queensland.
In 2013–14, the Clean Energy Regulator handled 365 complex enquiries dealing with scheme entry, project management, reporting, and methodology determination interpretation. This was less than half the number of complex enquiries handled in 2012–13 (753), refl ecting the newness of the scheme in 2012–13 and the Clean Energy Regulator’s provision of publicly available information relating to the scheme.
The Clean Energy Regulator’s site visit and monitoring programme aims to educate clients on their obligations under the Carbon Farming Initiative and to improve compliance with the requirements of the Carbon Credits (Carbon Farming Initiative) Act 2011. It also assists the Clean Energy Regulator to gather business intelligence and inform risk and client engagement strategies. Offi cers from the Clean Energy Regulator conducted site visits to ten eligible offsets projects across Australia in 2013–14.
The approach of the Clean Energy Regulator in developing a finely grained understanding of its clients is the key to operating effectively.
– Michael D’Ascenzo
Clean Energy Regulator
3 P
erfo
rman
ce o
verv
iew
Annual Report 2013–14 37
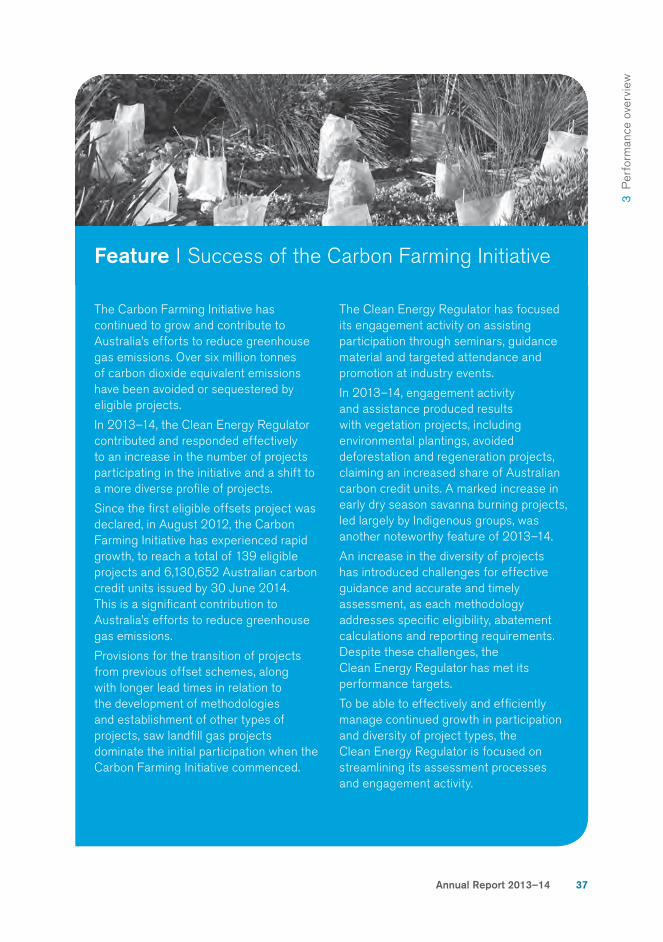
Feature I Success of the Carbon Farming Initiative
The Carbon Farming Initiative has continued to grow and contribute to Australia’s efforts to reduce greenhouse gas emissions. Over six million tonnes of carbon dioxide equivalent emissions have been avoided or sequestered by eligible projects.
In 2013–14, the Clean Energy Regulator contributed and responded effectively to an increase in the number of projects participating in the initiative and a shift to a more diverse profi le of projects.
Since the fi rst eligible offsets project was declared, in August 2012, the Carbon Farming Initiative has experienced rapid growth, to reach a total of 139 eligible projects and 6,130,652 Australian carbon credit units issued by 30 June 2014. This is a signifi cant contribution to Australia’s efforts to reduce greenhouse gas emissions.
Provisions for the transition of projects from previous offset schemes, along with longer lead times in relation to the development of methodologies and establishment of other types of projects, saw landfi ll gas projects dominate the initial participation when the Carbon Farming Initiative commenced.
The Clean Energy Regulator has focused its engagement activity on assisting participation through seminars, guidance material and targeted attendance and promotion at industry events.
In 2013–14, engagement activity and assistance produced results with vegetation projects, including environmental plantings, avoided deforestation and regeneration projects, claiming an increased share of Australian carbon credit units. A marked increase in early dry season savanna burning projects, led largely by Indigenous groups, was another noteworthy feature of 2013–14.
An increase in the diversity of projects has introduced challenges for effective guidance and accurate and timely assessment, as each methodology addresses specifi c eligibility, abatement calculations and reporting requirements. Despite these challenges, the Clean Energy Regulator has met its performance targets.
To be able to effectively and effi ciently manage continued growth in participation and diversity of project types, the Clean Energy Regulator is focused on streamlining its assessment processes and engagement activity.
38
3.3 Renewable Energy Target
Deliverable
Support for increased investment in renewable electricity generation through administration of the Renewable Energy Target.
Maintenance of public registers of renewable energy certifi cates, registered persons, power stations and eligible solar water heaters.
Inspection of a statistically signifi cant number of small generation units installed in a given year.
3.3
Snapshot
The Renewable Energy Target is designed to encourage investment in renewable energy systems and ensure that at least 20 per cent of Australia’s electricity supply will come from renewable sources by 2020.
The Renewable Energy Target comprises two schemes, the Large-scale Renewable Energy Target
and the Small-scale Renewable Energy Scheme. Together they provide a market-based fi nancial incentive to increase the contribution of electricity generated from renewable sources to Australia’s energy market. The Clean Energy Regulator is responsible for administering both schemes in accordance with the Renewable Energy
(Electricity) Act 2000.
Registered persons and agentsIn order to create large-scale generation certifi cates or small-scale technology certifi cates, an individual or company must apply to become a registered person or registered agent. Table 3.6 details the numbers of applications processed and timeliness for processing in 2013–14.
Clean Energy Regulator
3 P
erfo
rman
ce o
verv
iew
Annual Report 2013–14 39
Table 3.6: Number of applications for registered persons and registered agents
ProcessedProcessed within
standard (%)Cumulative total to
30 June 2014a
Registered agents 88 100 1,469
Registered persons 204 100 7,365
a Total from the commencement of the Renewable Energy Target to 30 June 2014.
Note: In the 2012–13 Annual Report, results for registered agents and registered persons were unintentionally reversed. The correct results were 507 applications processed, making a total of 7,161 registered persons, and 154 applications processed, making a total of 1,381 registered agents.
Large-scale Renewable Energy Target
Renewable energy power stations
Growth in numbers of renewable energy power stations was refl ected in the 34 applications for accreditation as a renewable energy power station that the Clean Energy Regulator received and approved during 2013–14. These applications were all processed within the legislated six-week timeframe.
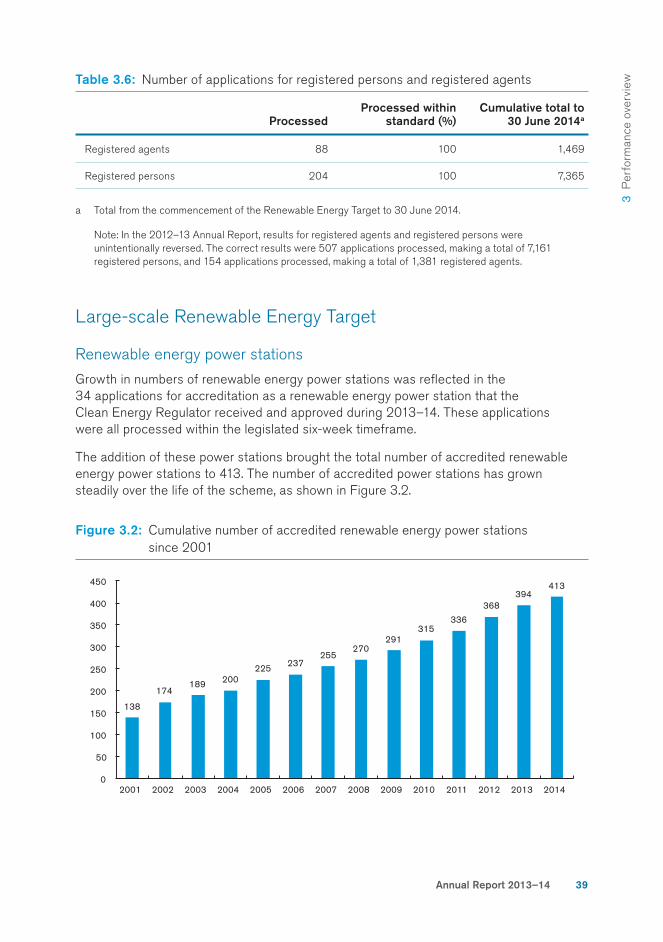
The addition of these power stations brought the total number of accredited renewable energy power stations to 413. The number of accredited power stations has grown steadily over the life of the scheme, as shown in Figure 3.2.
Figure 3.2: Cumulative number of accredited renewable energy power stations since 2001
138
174 189 200
225 237 255
270 291
315 336
368 394
413
0
50
100
150
200
250
300
350
400
450
2001 2002 2003 2004 2005 2006 2007 2008 2009 2010 2011 2012 2013 2014
40
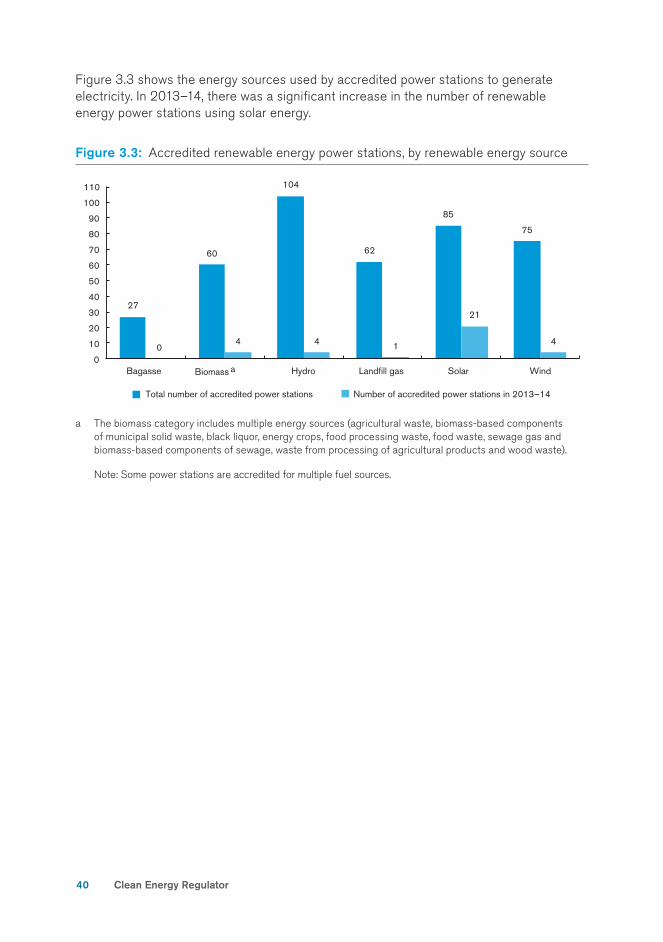
Figure 3.3 shows the energy sources used by accredited power stations to generate electricity. In 2013–14, there was a signifi cant increase in the number of renewable energy power stations using solar energy.
Figure 3.3: Accredited renewable energy power stations, by renewable energy source
a The biomass category includes multiple energy sources (agricultural waste, biomass-based components of municipal solid waste, black liquor, energy crops, food processing waste, food waste, sewage gas and biomass-based components of sewage, waste from processing of agricultural products and wood waste).
Note: Some power stations are accredited for multiple fuel sources.
27
60
104
62
85
75
0 4 4 1
21
4
0
10
20
30
40
50
60
70
80
90
100
110
Bagasse Hydro Landfill gas Solar Wind
Total number of accredited power stations Number of accredited power stations in 2013–14
Biomass a
Clean Energy Regulator
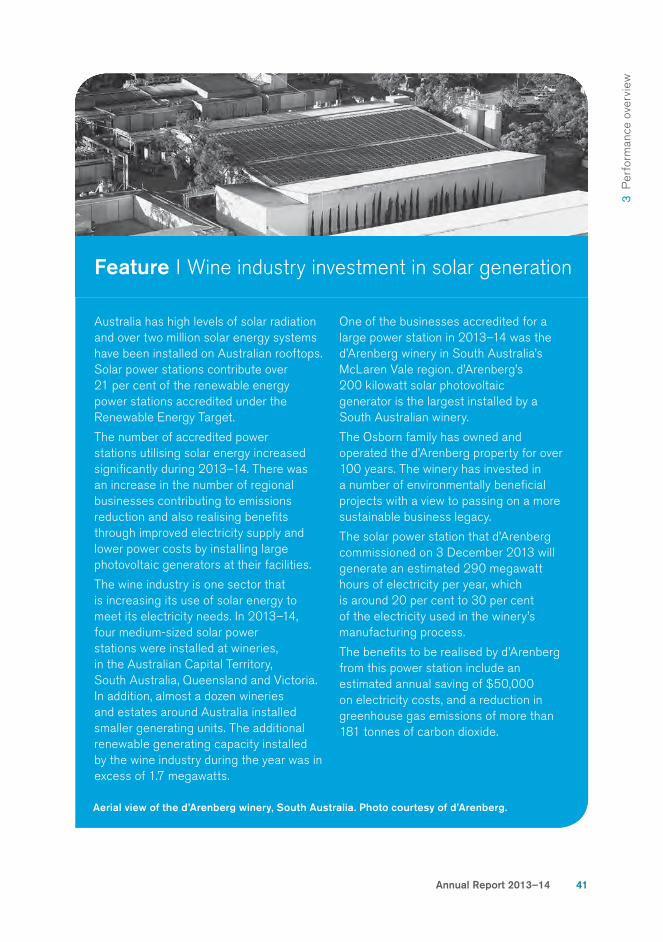
3 P
erfo
rman
ce o
verv
iew
Annual Report 2013–14 41
Feature I Wine industry investment in solar generation
Australia has high levels of solar radiation and over two million solar energy systems have been installed on Australian rooftops. Solar power stations contribute over 21 per cent of the renewable energy power stations accredited under the Renewable Energy Target.
The number of accredited power stations utilising solar energy increased signifi cantly during 2013–14. There was an increase in the number of regional businesses contributing to emissions reduction and also realising benefi ts through improved electricity supply and lower power costs by installing large photovoltaic generators at their facilities.
The wine industry is one sector that is increasing its use of solar energy to meet its electricity needs. In 2013– 14, four medium-sized solar power stations were installed at wineries, in the Australian Capital Territory, South Australia, Queensland and Victoria. In addition, almost a dozen wineries and estates around Australia installed smaller generating units. The additional renewable generating capacity installed by the wine industry during the year was in excess of 1.7 megawatts.
One of the businesses accredited for a large power station in 2013–14 was the d’Arenberg winery in South Australia’s McLaren Vale region. d’Arenberg’s 200 kilowatt solar photovoltaic generator is the largest installed by a South Australian winery.
The Osborn family has owned and operated the d’Arenberg property for over 100 years. The winery has invested in a number of environmentally benefi cial projects with a view to passing on a more sustainable business legacy.
The solar power station that d’Arenberg commissioned on 3 December 2013 will generate an estimated 290 megawatt hours of electricity per year, which is around 20 per cent to 30 per cent of the electricity used in the winery’s manufacturing process.
The benefi ts to be realised by d’Arenberg from this power station include an estimated annual saving of $50,000 on electricity costs, and a reduction in greenhouse gas emissions of more than 181 tonnes of carbon dioxide.
Aerial view of the d’Arenberg winery, South Australia. Photo courtesy of d’Arenberg.
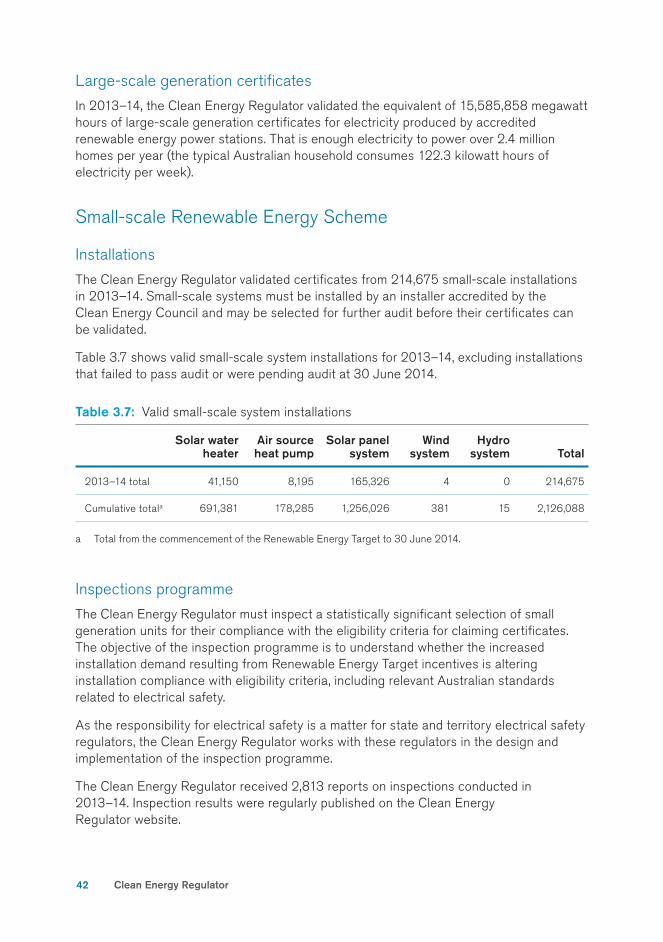
42
Large-scale generation certifi cates
In 2013–14, the Clean Energy Regulator validated the equivalent of 15,585,858 megawatt hours of large-scale generation certifi cates for electricity produced by accredited renewable energy power stations. That is enough electricity to power over 2.4 million homes per year (the typical Australian household consumes 122.3 kilowatt hours of electricity per week).
Small-scale Renewable Energy Scheme
Installations
The Clean Energy Regulator validated certifi cates from 214,675 small-scale installations in 2013–14. Small-scale systems must be installed by an installer accredited by the Clean Energy Council and may be selected for further audit before their certifi cates can be validated.
Table 3.7 shows valid small-scale system installations for 2013–14, excluding installations that failed to pass audit or were pending audit at 30 June 2014.
Table 3.7: Valid small-scale system installations
Solar water heater
Air source heat pump
Solar panel system
Wind system
Hydro system Total
2013–14 total 41,150 8,195 165,326 4 0 214,675
Cumulative totala 691,381 178,285 1,256,026 381 15 2,126,088
a Total from the commencement of the Renewable Energy Target to 30 June 2014.
Inspections programme
The Clean Energy Regulator must inspect a statistically signifi cant selection of small generation units for their compliance with the eligibility criteria for claiming certifi cates. The objective of the inspection programme is to understand whether the increased installation demand resulting from Renewable Energy Target incentives is altering installation compliance with eligibility criteria, including relevant Australian standards related to electrical safety.
As the responsibility for electrical safety is a matter for state and territory electrical safety regulators, the Clean Energy Regulator works with these regulators in the design and implementation of the inspection programme.
The Clean Energy Regulator received 2,813 reports on inspections conducted in 2013–14. Inspection results were regularly published on the Clean Energy Regulator website.
Clean Energy Regulator
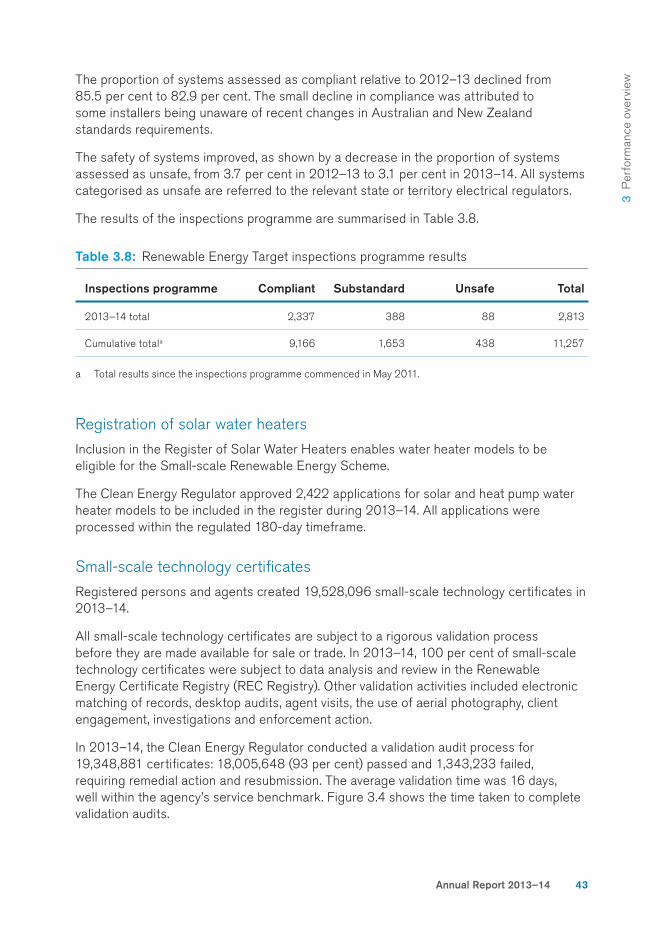
3 P
erfo
rman
ce o
verv
iew
Annual Report 2013–14 43
The proportion of systems assessed as compliant relative to 2012–13 declined from 85.5 per cent to 82.9 per cent. The small decline in compliance was attributed to some installers being unaware of recent changes in Australian and New Zealand standards requirements.
The safety of systems improved, as shown by a decrease in the proportion of systems assessed as unsafe, from 3.7 per cent in 2012–13 to 3.1 per cent in 2013–14. All systems categorised as unsafe are referred to the relevant state or territory electrical regulators.
The results of the inspections programme are summarised in Table 3.8.
Table 3.8: Renewable Energy Target inspections programme results
Inspections programme Compliant Substandard Unsafe Total
2013–14 total 2,337 388 88 2,813
Cumulative totala 9,166 1,653 438 11,257
a Total results since the inspections programme commenced in May 2011.
Registration of solar water heaters
Inclusion in the Register of Solar Water Heaters enables water heater models to be eligible for the Small-scale Renewable Energy Scheme.
The Clean Energy Regulator approved 2,422 applications for solar and heat pump water heater models to be included in the register during 2013–14. All applications were processed within the regulated 180-day timeframe.
Small-scale technology certifi cates
Registered persons and agents created 19,528,096 small-scale technology certifi cates in 2013–14.
All small-scale technology certifi cates are subject to a rigorous validation process before they are made available for sale or trade. In 2013–14, 100 per cent of small-scale technology certifi cates were subject to data analysis and review in the Renewable Energy Certifi cate Registry (REC Registry). Other validation activities included electronic matching of records, desktop audits, agent visits, the use of aerial photography, client engagement, investigations and enforcement action.
In 2013–14, the Clean Energy Regulator conducted a validation audit process for 19,348,881 certifi cates: 18,005,648 (93 per cent) passed and 1,343,233 failed, requiring remedial action and resubmission. The average validation time was 16 days, well within the agency’s service benchmark. Figure 3.4 shows the time taken to complete validation audits.
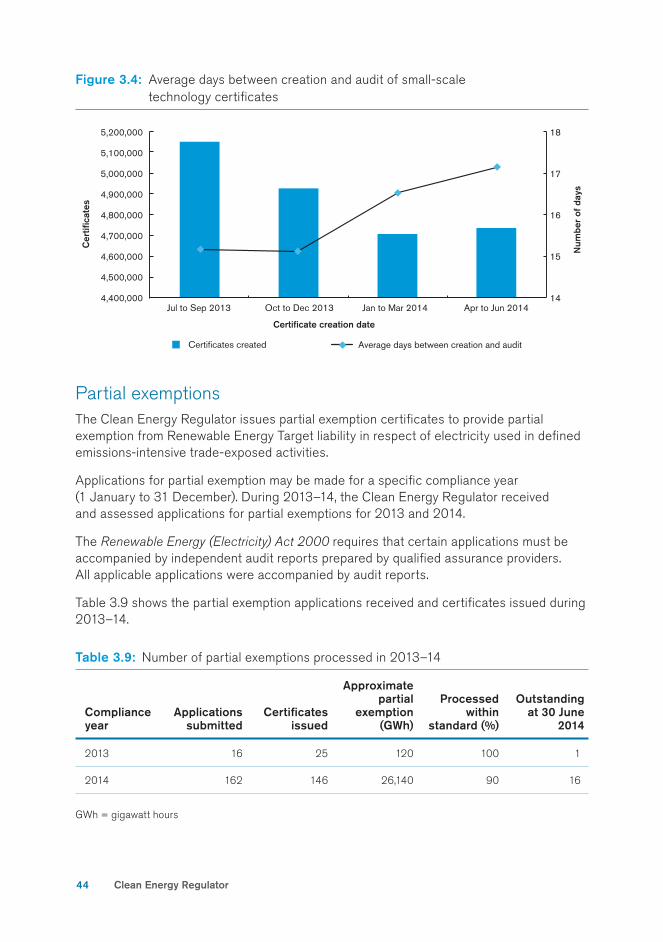
44
Figure 3.4: Average days between creation and audit of small-scale technology certifi cates
Partial exemptionsThe Clean Energy Regulator issues partial exemption certifi cates to provide partial exemption from Renewable Energy Target liability in respect of electricity used in defi ned emissions-intensive trade-exposed activities.
Applications for partial exemption may be made for a specifi c compliance year (1 January to 31 December). During 2013–14, the Clean Energy Regulator received and assessed applications for partial exemptions for 2013 and 2014.
The Renewable Energy (Electricity) Act 2000 requires that certain applications must be accompanied by independent audit reports prepared by qualifi ed assurance providers. All applicable applications were accompanied by audit reports.
Table 3.9 shows the partial exemption applications received and certifi cates issued during 2013–14.
Table 3.9: Number of partial exemptions processed in 2013–14
Compliance year
Applications submitted
Certifi cates issued
Approximate partial
exemption (GWh)
Processed within
standard (%)
Outstanding at 30 June
2014
2013 16 25 120 100 1
2014 162 146 26,140 90 16
GWh = gigawatt hours
14
15
16
17
18
4,400,000
4,500,000
4,600,000
4,700,000
4,800,000
4,900,000
5,000,000
5,100,000
5,200,000
Jul to Sep 2013 Oct to Dec 2013 Jan to Mar 2014 Apr to Jun 2014
Num
ber
of d
ays
Cer
tifica
tes
Certificate creation date
Certificates created Average days between creation and audit
Clean Energy Regulator
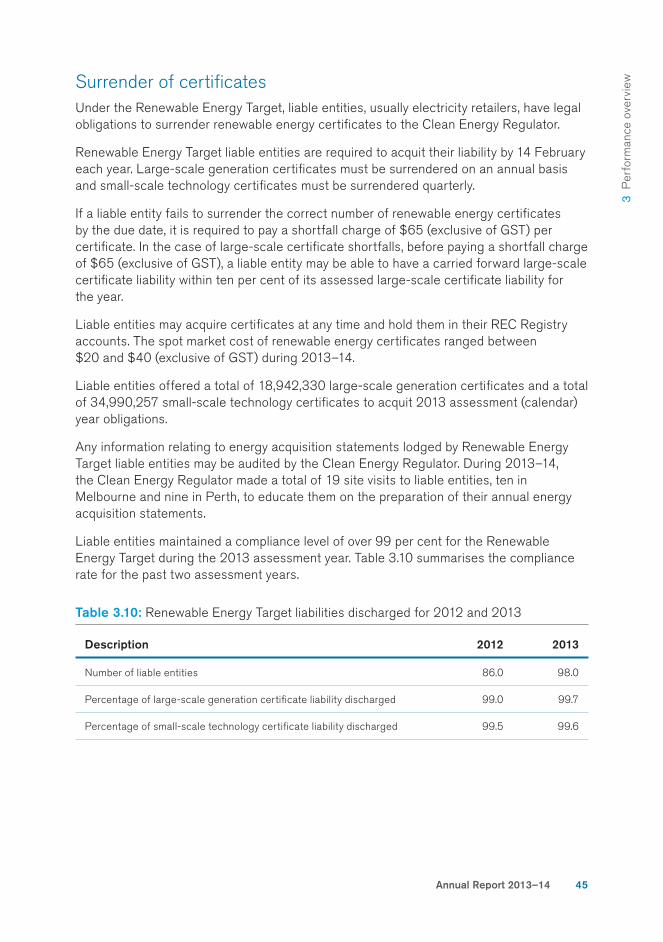
3 P
erfo
rman
ce o
verv
iew
Annual Report 2013–14 45
Surrender of certifi catesUnder the Renewable Energy Target, liable entities, usually electricity retailers, have legal obligations to surrender renewable energy certifi cates to the Clean Energy Regulator.
Renewable Energy Target liable entities are required to acquit their liability by 14 February each year. Large-scale generation certifi cates must be surrendered on an annual basis and small-scale technology certifi cates must be surrendered quarterly.
If a liable entity fails to surrender the correct number of renewable energy certifi cates by the due date, it is required to pay a shortfall charge of $65 (exclusive of GST) per certifi cate. In the case of large-scale certifi cate shortfalls, before paying a shortfall charge of $65 (exclusive of GST), a liable entity may be able to have a carried forward large-scale certifi cate liability within ten per cent of its assessed large-scale certifi cate liability for the year.
Liable entities may acquire certifi cates at any time and hold them in their REC Registry accounts. The spot market cost of renewable energy certifi cates ranged between $20 and $40 (exclusive of GST) during 2013–14.
Liable entities offered a total of 18,942,330 large-scale generation certifi cates and a total of 34,990,257 small-scale technology certifi cates to acquit 2013 assessment (calendar) year obligations.
Any information relating to energy acquisition statements lodged by Renewable Energy Target liable entities may be audited by the Clean Energy Regulator. During 2013–14, the Clean Energy Regulator made a total of 19 site visits to liable entities, ten in Melbourne and nine in Perth, to educate them on the preparation of their annual energy acquisition statements.
Liable entities maintained a compliance level of over 99 per cent for the Renewable Energy Target during the 2013 assessment year. Table 3.10 summarises the compliance rate for the past two assessment years.
Table 3.10: Renewable Energy Target liabilities discharged for 2012 and 2013
Description 2012 2013
Number of liable entities 86.0 98.0
Percentage of large-scale generation certifi cate liability discharged 99.0 99.7
Percentage of small-scale technology certifi cate liability discharged 99.5 99.6
46
REC RegistryThe REC Registry is a secure online application that facilitates the creation, sale, trade and surrender of large-scale generation certifi cates and small-scale technology certifi cates. It also maintains public registers as set out under the Renewable Energy
(Electricity) Act 2000.
The Small-scale Technology Certifi cate Clearing House (STC Clearing House) is a facility within the REC Registry that allows for the sale of small-scale technology certifi cates at a price of $40 (exclusive of GST) per certifi cate. This is not a government guaranteed price but rather is the fi xed price for the sale of small-scale technology certifi cates within the STC Clearing House.
The REC Registry and STC Clearing House are regularly tested and audited to maintain security certifi cation.
The Clean Energy Regulator is working to redesign the REC Registry to improve the user interface, reduce the administrative burden for both clients and the Clean Energy Regulator, and provide a fl exible framework that can adapt to peak workloads and changes in legislative requirements. The redesign project commenced in 2013 and was substantially complete by 30 June 2014. The new system was implemented on 15 September 2014.
Our risk-based approach to improving efficiency in our operations will continue to pay dividends to our clients and ourselves.
– Chloe Munro
Clean Energy Regulator
3 P
erfo
rman
ce o
verv
iew
Annual Report 2013–14 47
3.4 National Greenhouse and Energy Reporting Scheme
Deliverable
Administration of the National Greenhouse and Energy Reporting Scheme, a national reporting framework, for the reporting and dissemination of information related to greenhouse gas emissions, energy consumption and energy production, to:
• inform government policy formulation and the Australian public
• meet Australia’s international reporting obligations
• assist Commonwealth, state and territory government programmes and activities
• underpin the carbon pricing mechanism.
3.4
Snapshot
The National Greenhouse and Energy Reporting Scheme is a single, national framework for corporations that meet thresholds for reporting on greenhouse gas emissions, energy use and energy production (at the facility or corporate group levels).
Information reported under the National Greenhouse and Energy Reporting Scheme informs government and the
general public about emissions and energy fl ows across Australia. It also provides the basis for assessing liability under the carbon pricing mechanism.
The Clean Energy Regulator’s effective administration of the scheme includes expanding the amount of reported data made publically available, improving how data are disseminated, and enhancing the new online reporting system.
Publications The Clean Energy Regulator published an extract of the National Greenhouse and Energy Register for 2012–13 on 28 February 2014. All controlling corporations and reporting transfer certifi cate holders registered during 2012–13 were included in the extract.
The National Greenhouse and Energy Register for 2012–13 includes the names of all entities that were registered under the National Greenhouse and Energy Reporting Scheme as a result of applications for registration as a liable entity. In total, 1,127 entities (including controlling corporations, liable entities and reporting transfer certifi cate holders) were listed on the National Greenhouse and Energy Register as being required to report in 2012–13.
48
The Clean Energy Regulator also published the National Greenhouse and Energy Reporting Scheme data for 2012–13 on 28 February 2014. The published data included the total scope 1 and scope 2 greenhouse gas emissions and net energy consumption data for 409 corporations that met the publication threshold (of 50 kilotonnes of carbon dioxide equivalent greenhouse gas emissions). It also included information on liabilities under the carbon pricing mechanism.
Facility-level data for all facilities with a principal activity of electricity generation were made publicly available for the fi rst time in 2013–14. This information will help to inform the community about the performance of electricity generators.
In addition, in 2013–14, the Clean Energy Regulator was required to publish data on ‘net’ energy consumption. In previous years, the Clean Energy Regulator was required to publish data on ‘total’ energy consumption, and chose to publish a net total where clients voluntarily provided that information. The legislative requirement was amended in response to feedback from those listed on the National Greenhouse and Energy Register.
Reporting systemUnder the National Greenhouse and Energy Reporting Scheme, clients were able to prepare and submit their fi nal reports for 2012–13 through the Clean Energy Regulator’s Emissions and Energy Reporting System.
The Emissions and Energy Reporting System seeks to minimise the compliance burden for reporting organisations by improving and streamlining the user experience. It also provides a fl exible framework for the implementation of annual changes to National Greenhouse and Energy Reporting measurement rules.
The system, which was launched in April 2013, was enhanced during 2013–14 to align with new legislative requirements and take into account feedback received from clients.
AuditsThe National Greenhouse and Energy Reporting Audit Framework underpins the integrity of data reported to the Clean Energy Regulator under the various schemes that it administers, including the National Greenhouse and Energy Reporting Scheme.
During 2013–14, 557 audits were completed under this framework. This included 51 audits initiated by the agency as part of the annual National Greenhouse and Energy Reporting audit programme. The audits gave confi dence in submitted data and helped the Clean Energy Regulator to prioritise report assessment, intelligence and educational activities.
The Clean Energy Regulator registers greenhouse and energy auditors and monitors their performance. At 30 June 2014, there were 178 registered auditors, 108 of whom had been assessed as part of routine registration reviews over the previous 12 months.
Clean Energy Regulator
3 P
erfo
rman
ce o
verv
iew
Annual Report 2013–14 49
As a result of self-nomination, or as a consequence of not meeting ongoing requirements, 38 auditors were deregistered during 2013–14.
The agency’s annual Audit and Assurance workshops are an important forum for the agency to engage with National Greenhouse and Energy Reporting auditors and have provided constructive, two-way information sharing and networking. Hearing directly from the auditors highlighted the complexity and significance of the greenhouse, energy and scheme audits that the agency oversees.
– Anne T Brown
Information sharingThe Clean Energy Regulator shared information reported under the National Greenhouse and Energy Reporting Scheme and improved information-sharing processes to assist Commonwealth, state and territory government programmes and activities.
On 20 June 2014, the Clean Energy Regulator executed a memorandum of understanding with the Western Australian Government to enable the sharing of National Greenhouse and Energy Reporting data. This meant that all Australian jurisdictions have now signed such a memorandum of understanding and are able to use the National Greenhouse and Energy Reporting data relevant to their jurisdiction.
The Clean Energy Regulator facilitated high levels of engagement with Commonwealth agencies and was successful in strengthening data-sharing arrangements through the Clean Energy Regulator Commonwealth Information Sharing Network. The strengthened network and the Clean Energy Regulator’s Strategic Information Framework support Commonwealth agencies’ efforts to reduce regulatory burdens by sharing data more effectively and effi ciently.
In March 2014, the Clean Energy Regulator hosted the inaugural meeting of the Information Sharing Network for states and territories. The network was established to improve information sharing between the Clean Energy Regulator and state and territory data users, and to identify opportunities to streamline reporting. Feedback from attendees was positive and showed high levels of interest in the National Greenhouse and Energy Reporting data.
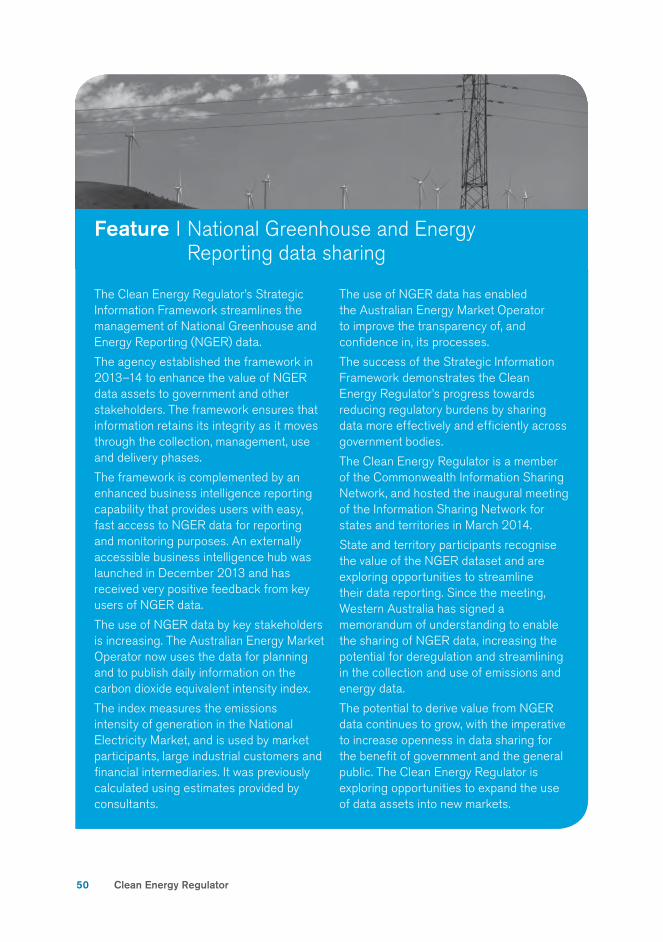
50
Feature I National Greenhouse and Energy Reporting data sharing
The Clean Energy Regulator’s Strategic Information Framework streamlines the management of National Greenhouse and Energy Reporting (NGER) data.
The agency established the framework in 2013–14 to enhance the value of NGER data assets to government and other stakeholders. The framework ensures that information retains its integrity as it moves through the collection, management, use and delivery phases.
The framework is complemented by an enhanced business intelligence reporting capability that provides users with easy, fast access to NGER data for reporting and monitoring purposes. An externally accessible business intelligence hub was launched in December 2013 and has received very positive feedback from key users of NGER data.
The use of NGER data by key stakeholders is increasing. The Australian Energy Market Operator now uses the data for planning and to publish daily information on the carbon dioxide equivalent intensity index.
The index measures the emissions intensity of generation in the National Electricity Market, and is used by market participants, large industrial customers and fi nancial intermediaries. It was previously calculated using estimates provided by consultants.
The use of NGER data has enabled the Australian Energy Market Operator to improve the transparency of, and confi dence in, its processes.
The success of the Strategic Information Framework demonstrates the Clean Energy Regulator’s progress towards reducing regulatory burdens by sharing data more effectively and effi ciently across government bodies.
The Clean Energy Regulator is a member of the Commonwealth Information Sharing Network, and hosted the inaugural meeting of the Information Sharing Network for states and territories in March 2014.
State and territory participants recognise the value of the NGER dataset and are exploring opportunities to streamline their data reporting. Since the meeting, Western Australia has signed a memorandum of understanding to enable the sharing of NGER data, increasing the potential for deregulation and streamlining in the collection and use of emissions and energy data.
The potential to derive value from NGER data continues to grow, with the imperative to increase openness in data sharing for the benefi t of government and the general public. The Clean Energy Regulator is exploring opportunities to expand the use of data assets into new markets.
Clean Energy Regulator
3 P
erfo
rman
ce o
verv
iew
Annual Report 2013–14 51
3.5 Australian National Registry of Emissions Units
Deliverable
Administration of the Australian National Registry of Emissions Units.
3.5
Snapshot
The Australian National Registry of Emissions Units is an online electronic system designed to meet one of Australia’s commitments under the Kyoto Protocol. The protocol requires each country that has an emissions reduction target to establish a national registry to ensure the accurate accounting of the issuance, holding, transfer, acquisition, cancellation, retirement and carry-over of eligible Kyoto units.
In addition to performing this international function, the Australian
National Registry of Emissions Units supports the issuance, holding, transfer, surrender and relinquishment of Australian carbon credit units issued under the Carbon Farming Initiative.
It also supports the issuance, holding, transfer, surrender, buy-back and relinquishment of carbon units issued under the Jobs and Competitiveness Program and the Energy Security Fund, and the purchase and surrender of carbon units by liable entities under the carbon pricing mechanism.
The Australian National Registry of Emissions Units was developed and implemented in accordance with the technical and security standards required of all national registries under the Kyoto Protocol, which ensures that it complies with the international emissions unit trading framework established under the protocol.
An entity that has a liability under the carbon pricing mechanism is required to have an Australian National Registry of Emissions Units account to purchase and surrender units to acquit that liability. In 2013–14, the Australian National Registry of Emissions Units was linked to the Emissions and Energy Reporting System so that emissions information reported by an entity is refl ected as a liability in the entity’s Australian National Registry of Emissions Units account. A liability position is also displayed in each liable entity’s account, refl ecting surrender transactions that have occurred and the net unit liability that still needs to be acquitted.
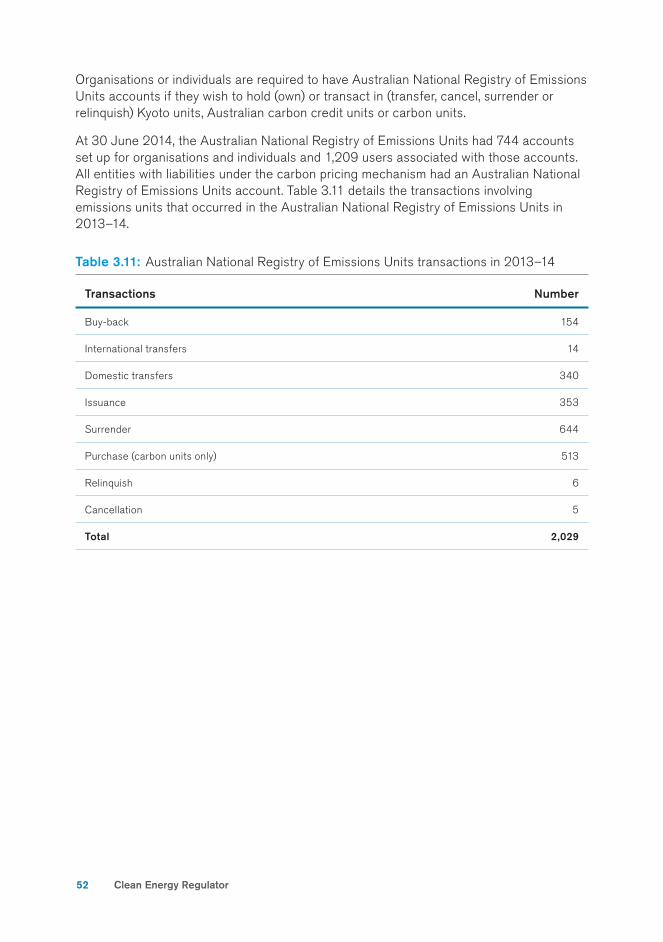
52
Organisations or individuals are required to have Australian National Registry of Emissions Units accounts if they wish to hold (own) or transact in (transfer, cancel, surrender or relinquish) Kyoto units, Australian carbon credit units or carbon units.
At 30 June 2014, the Australian National Registry of Emissions Units had 744 accounts set up for organisations and individuals and 1,209 users associated with those accounts. All entities with liabilities under the carbon pricing mechanism had an Australian National Registry of Emissions Units account. Table 3.11 details the transactions involving emissions units that occurred in the Australian National Registry of Emissions Units in 2013–14.
Table 3.11: Australian National Registry of Emissions Units transactions in 2013–14
Transactions Number
Buy-back 154
International transfers 14
Domestic transfers 340
Issuance 353
Surrender 644
Purchase (carbon units only) 513
Relinquish 6
Cancellation 5
Total 2,029
Clean Energy Regulator
3 P
erfo
rman
ce o
verv
iew
Annual Report 2013–14 53
3.6 Partnerships
Deliverable
Enhancement and further development of strong partnerships with other national and international regulatory and law enforcement agencies.
3.6
Snapshot
The Clean Energy Regulator works in partnership with other Australian Government agencies that have regulatory responsibilities under the schemes to reduce greenhouse gas emissions. This includes sharing relevant information, gathering intelligence and referring matters for law enforcement.
The Clean Energy Regulator also supplies information to Commonwealth, state and territory government organisations to enable them to perform their functions or exercise their powers, including advising ministers, administering programmes and collecting statistics.
Australian regulatory partnershipsThe Clean Energy Regulator’s partnerships with other regulators in Australia are underpinned by a range of formal agreements and lawful disclosure arrangements. These mechanisms allow the partners to exchange information and discharge their collective regulatory responsibilities effectively, including by referring matters that require enforcement to the appropriate body.
Signifi cant achievements during 2013–14 included:
• establishing memorandums of understanding to support information sharing and cooperation with the Australian Crime Commission, the Australian Energy Market Operator, the Australian Federal Police and the Australian Transaction Reports and Analysis Centre
• sharing information with the Australian Securities and Investments Commission to support regulation of emissions units as fi nancial products under the Corporations Act 2001 and Australian Securities and Investments Commission Act 2001
• assisting the Australian Competition and Consumer Commission to undertake its price-monitoring role in accordance with the Competition and Consumer Act 2010
• working with the Australian Taxation Offi ce to apply an equivalent carbon price to specifi c fuels under the Fuel Tax Act 2006 and ensure that appropriate income tax and goods and services tax treatments arise from carbon pricing mechanism liabilities.
54
The Clean Energy Regulator also co-chairs the Heads of Commonwealth Operational Law Enforcement Agencies working group on carbon pricing, which facilitates the exchange of information relating to fraud in the carbon market.
When necessary, in 2013–14 the Clean Energy Regulator referred matters relating to Commonwealth, state or territory legislation to other agencies, including police services, environmental regulators, consumer protection agencies and electrical licensing authorities.
The Clean Energy Regulator also participated in a number of interagency forums to maximise regulatory capability or address broad issues affecting many government agencies.
Close interaction between the Clean Energy Regulator and the bodies that oversee the National Energy Market brings a closer understanding of the demands and demand responses that affect energy markets in Australia. We all benefit from sharing formal and informal data and experience gained in developing and regulating markets and systems.
– Michael Sargent
International partnershipsThe Clean Energy Regulator works with an expanding international community of regulators in the fi elds of renewable energy and greenhouse gas emissions reduction, learning from the experiences of other agencies while sharing its own expertise.
The Clean Energy Regulator also communicates with INTERPOL and Europol through the Australian Federal Police, particularly where its work relates to addressing crime risks associated with carbon trading under the INTERPOL Environmental Crime Programme.
Clean Energy Regulator
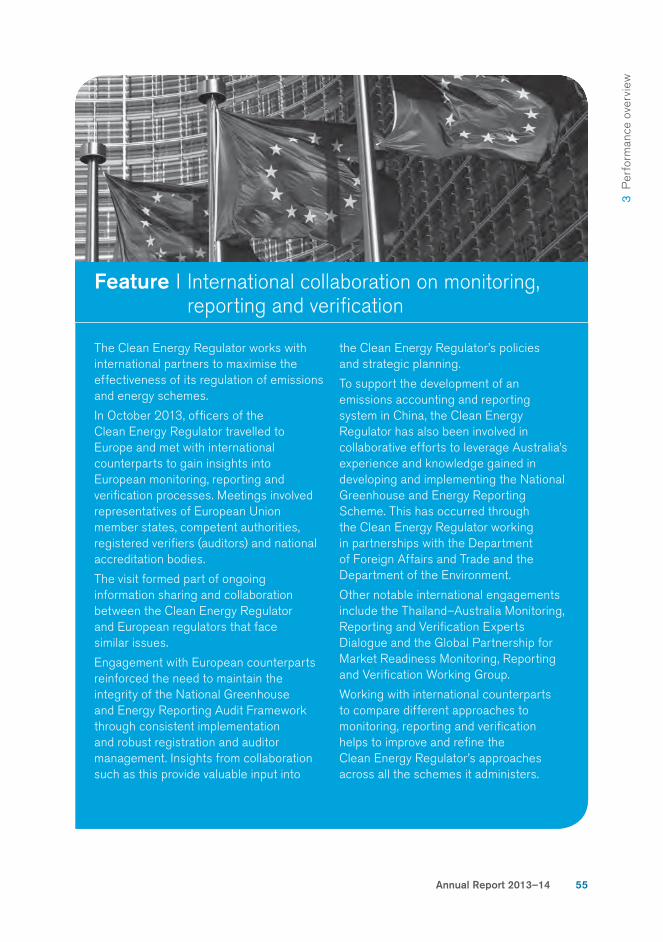
3 P
erfo
rman
ce o
verv
iew
Annual Report 2013–14 55
Feature I International collaboration on monitoring, reporting and verifi cation
The Clean Energy Regulator works with international partners to maximise the effectiveness of its regulation of emissions and energy schemes.
In October 2013, offi cers of the Clean Energy Regulator travelled to Europe and met with international counterparts to gain insights into European monitoring, reporting and verifi cation processes. Meetings involved representatives of European Union member states, competent authorities, registered verifi ers (auditors) and national accreditation bodies.
The visit formed part of ongoing information sharing and collaboration between the Clean Energy Regulator and European regulators that face similar issues.
Engagement with European counterparts reinforced the need to maintain the integrity of the National Greenhouse and Energy Reporting Audit Framework through consistent implementation and robust registration and auditor management. Insights from collaboration such as this provide valuable input into
the Clean Energy Regulator’s policies and strategic planning.
To support the development of an emissions accounting and reporting system in China, the Clean Energy Regulator has also been involved in collaborative efforts to leverage Australia’s experience and knowledge gained in developing and implementing the National Greenhouse and Energy Reporting Scheme. This has occurred through the Clean Energy Regulator working in partnerships with the Department of Foreign Affairs and Trade and the Department of the Environment.
Other notable international engagements include the Thailand–Australia Monitoring, Reporting and Verifi cation Experts Dialogue and the Global Partnership for Market Readiness Monitoring, Reporting and Verifi cation Working Group.
Working with international counterparts to compare different approaches to monitoring, reporting and verifi cation helps to improve and refi ne the Clean Energy Regulator’s approaches across all the schemes it administers.
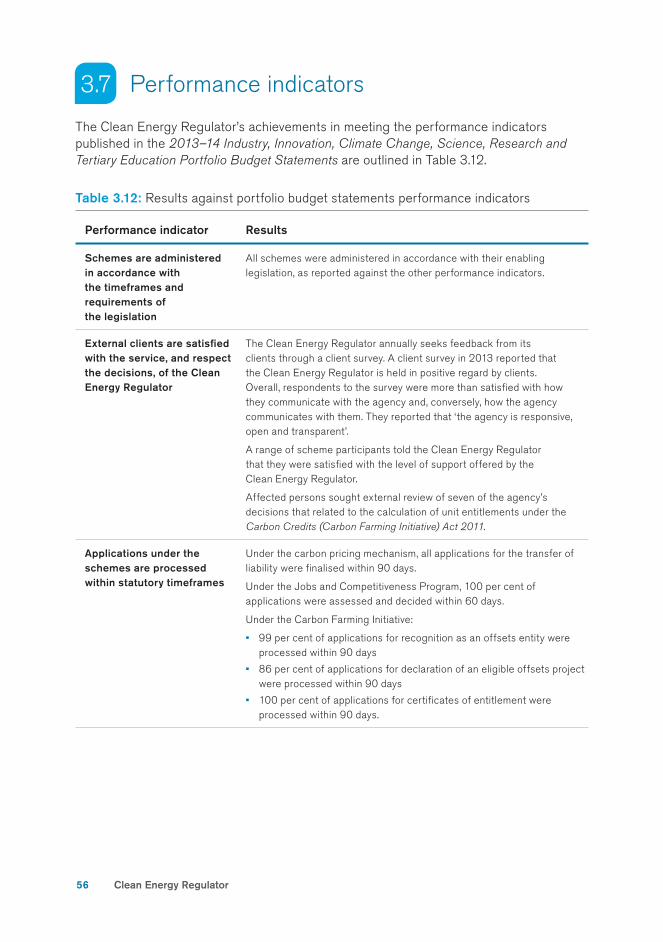
56
3.7 Performance indicators
The Clean Energy Regulator’s achievements in meeting the performance indicators published in the 2013–14 Industry, Innovation, Climate Change, Science, Research and
Tertiary Education Portfolio Budget Statements are outlined in Table 3.12.
Table 3.12: Results against portfolio budget statements performance indicators
Performance indicator Results
Schemes are administered in accordance with the timeframes and requirements of the legislation
All schemes were administered in accordance with their enabling legislation, as reported against the other performance indicators.
External clients are satisfi ed with the service, and respect the decisions, of the Clean Energy Regulator
The Clean Energy Regulator annually seeks feedback from its clients through a client survey. A client survey in 2013 reported that the Clean Energy Regulator is held in positive regard by clients. Overall, respondents to the survey were more than satisfi ed with how they communicate with the agency and, conversely, how the agency communicates with them. They reported that ‘the agency is responsive, open and transparent’.
A range of scheme participants told the Clean Energy Regulator that they were satisfi ed with the level of support offered by the Clean Energy Regulator.
Affected persons sought external review of seven of the agency’s decisions that related to the calculation of unit entitlements under the Carbon Credits (Carbon Farming Initiative) Act 2011.
Applications under the schemes are processed within statutory timeframes
Under the carbon pricing mechanism, all applications for the transfer of liability were fi nalised within 90 days.
Under the Jobs and Competitiveness Program, 100 per cent of applications were assessed and decided within 60 days.
Under the Carbon Farming Initiative:
• 99 per cent of applications for recognition as an offsets entity were processed within 90 days
• 86 per cent of applications for declaration of an eligible offsets project were processed within 90 days
• 100 per cent of applications for certifi cates of entitlement were processed within 90 days.
3.7
Clean Energy Regulator
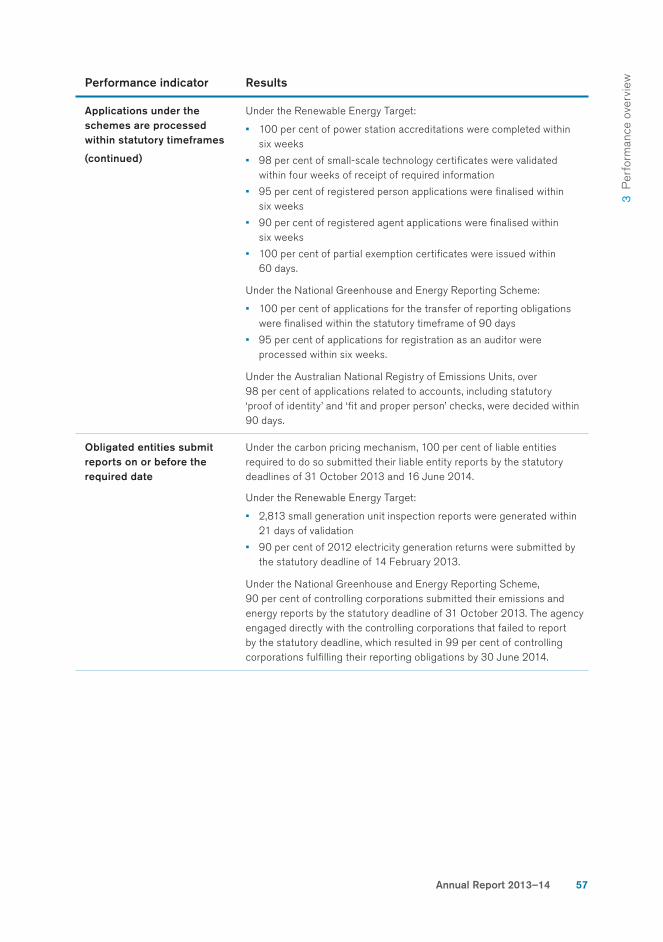
3 P
erfo
rman
ce o
verv
iew
Annual Report 2013–14 57
Performance indicator Results
Applications under the schemes are processed within statutory timeframes
(continued)
Under the Renewable Energy Target:
• 100 per cent of power station accreditations were completed within six weeks
• 98 per cent of small-scale technology certifi cates were validated within four weeks of receipt of required information
• 95 per cent of registered person applications were fi nalised within six weeks
• 90 per cent of registered agent applications were fi nalised within six weeks
• 100 per cent of partial exemption certifi cates were issued within 60 days.
Under the National Greenhouse and Energy Reporting Scheme:
• 100 per cent of applications for the transfer of reporting obligations were fi nalised within the statutory timeframe of 90 days
• 95 per cent of applications for registration as an auditor were processed within six weeks.
Under the Australian National Registry of Emissions Units, over 98 per cent of applications related to accounts, including statutory ‘proof of identity’ and ‘fi t and proper person’ checks, were decided within 90 days.
Obligated entities submit reports on or before the required date
Under the carbon pricing mechanism, 100 per cent of liable entities required to do so submitted their liable entity reports by the statutory deadlines of 31 October 2013 and 16 June 2014.
Under the Renewable Energy Target:
• 2,813 small generation unit inspection reports were generated within 21 days of validation
• 90 per cent of 2012 electricity generation returns were submitted by the statutory deadline of 14 February 2013.
Under the National Greenhouse and Energy Reporting Scheme, 90 per cent of controlling corporations submitted their emissions and energy reports by the statutory deadline of 31 October 2013. The agency engaged directly with the controlling corporations that failed to report by the statutory deadline, which resulted in 99 per cent of controlling corporations fulfi lling their reporting obligations by 30 June 2014.
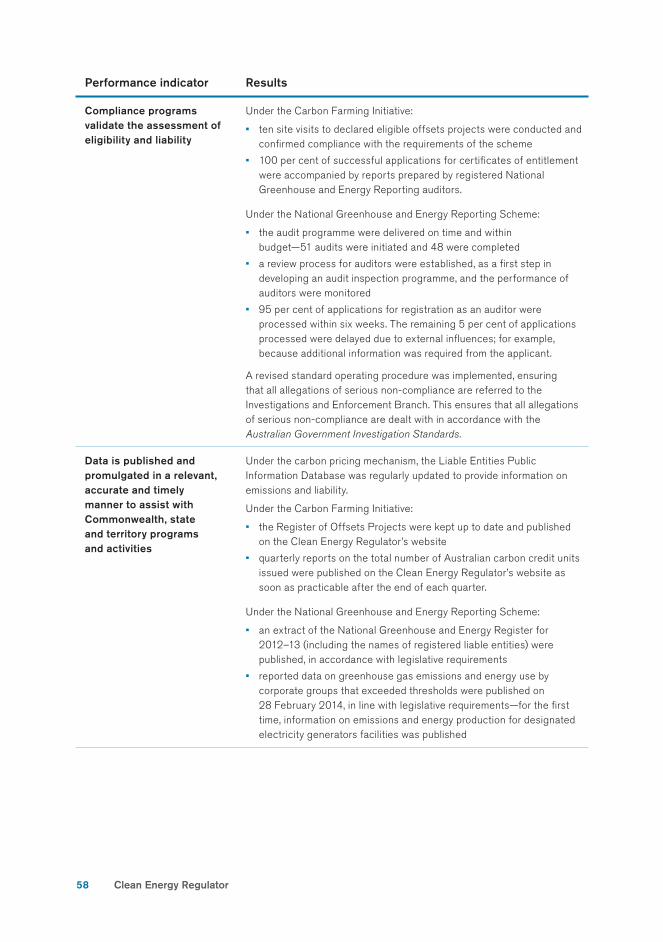
58
Performance indicator Results
Compliance programs validate the assessment of eligibility and liability
Under the Carbon Farming Initiative:
• ten site visits to declared eligible offsets projects were conducted and confi rmed compliance with the requirements of the scheme
• 100 per cent of successful applications for certifi cates of entitlement were accompanied by reports prepared by registered National Greenhouse and Energy Reporting auditors.
Under the National Greenhouse and Energy Reporting Scheme:
• the audit programme were delivered on time and within budget—51 audits were initiated and 48 were completed
• a review process for auditors were established, as a fi rst step in developing an audit inspection programme, and the performance of auditors were monitored
• 95 per cent of applications for registration as an auditor were processed within six weeks. The remaining 5 per cent of applications processed were delayed due to external infl uences; for example, because additional information was required from the applicant.
A revised standard operating procedure was implemented, ensuring that all allegations of serious non-compliance are referred to the Investigations and Enforcement Branch. This ensures that all allegations of serious non-compliance are dealt with in accordance with the Australian Government Investigation Standards.
Data is published and promulgated in a relevant, accurate and timely manner to assist with Commonwealth, state and territory programs and activities
Under the carbon pricing mechanism, the Liable Entities Public Information Database was regularly updated to provide information on emissions and liability.
Under the Carbon Farming Initiative:
• the Register of Offsets Projects were kept up to date and published on the Clean Energy Regulator’s website
• quarterly reports on the total number of Australian carbon credit units issued were published on the Clean Energy Regulator’s website as soon as practicable after the end of each quarter.
Under the National Greenhouse and Energy Reporting Scheme:
• an extract of the National Greenhouse and Energy Register for 2012–13 (including the names of registered liable entities) were published, in accordance with legislative requirements
• reported data on greenhouse gas emissions and energy use by corporate groups that exceeded thresholds were published on 28 February 2014, in line with legislative requirements—for the fi rst time, information on emissions and energy production for designated electricity generators facilities was published
Clean Energy Regulator
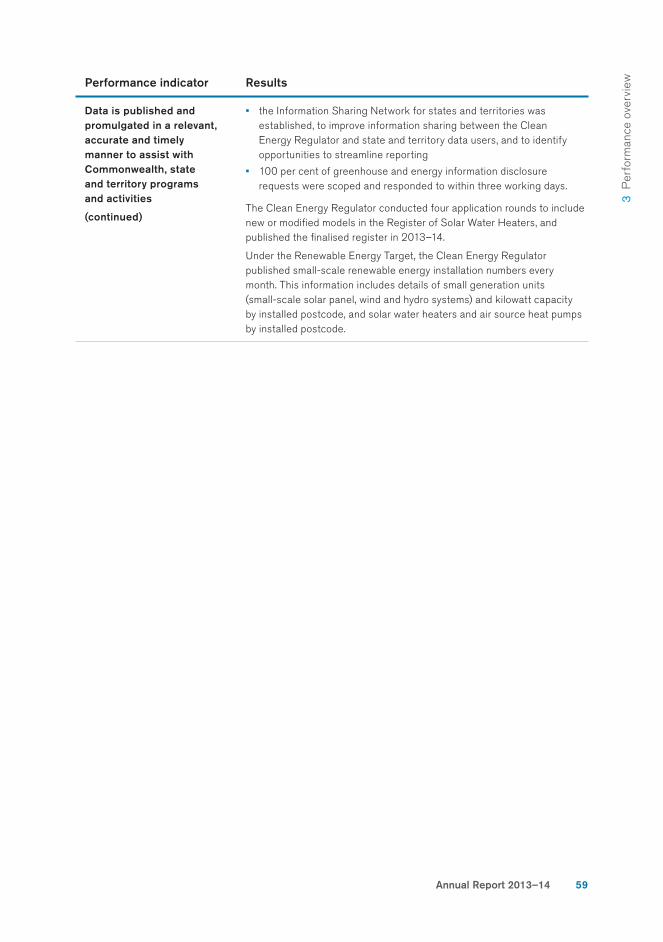
3 P
erfo
rman
ce o
verv
iew
Annual Report 2013–14 59
Performance indicator Results
Data is published and promulgated in a relevant, accurate and timely manner to assist with Commonwealth, state and territory programs and activities
(continued)
• the Information Sharing Network for states and territories was established, to improve information sharing between the Clean Energy Regulator and state and territory data users, and to identify opportunities to streamline reporting
• 100 per cent of greenhouse and energy information disclosure requests were scoped and responded to within three working days.
The Clean Energy Regulator conducted four application rounds to include new or modifi ed models in the Register of Solar Water Heaters, and published the fi nalised register in 2013–14.
Under the Renewable Energy Target, the Clean Energy Regulator published small-scale renewable energy installation numbers every month. This information includes details of small generation units (small-scale solar panel, wind and hydro systems) and kilowatt capacity by installed postcode, and solar water heaters and air source heat pumps by installed postcode.
Management and accountabilitySection 4
4.1 Corporate governance 61
4.2 External scrutiny 67
4.3 Management of human resources 68
4.4 Asset management 73
4.5 Purchasing and procurement 73
4.6 Consultancies 74
4.7 Information and communications technology 75
Annual Report 2013–14 61
4 M
anag
emen
t and
acc
ount
abili
ty
Management and accountability
4
This section of the report describes the Clean Energy Regulator’s approach to corporate governance and the management of human resources, as required by the Requirements
for Annual Reports for Departments, Executive Agencies and FMA Act Bodies.
4.1 Corporate governance
Corporate governance provides the framework of authority, accountability, direction and control through which the Clean Energy Regulator delivers its outcomes in a controlled, transparent and accountable manner. It is designed to ensure that all offi cers understand their accountabilities as employees under the Public Service Act 1999 and, where applicable, as delegates of the Clean Energy Regulator.
The Clean Energy Regulator’s governance processes and policies include:
• risk management
• business planning and performance reporting
• performance agreements
• audit
• fraud prevention
• Chief Executive Directions and Chief Executive Instructions.
This framework supports the Clean Energy Regulator’s culture, which promotes and upholds the Australian Public Service Values and Code of Conduct. It enables the Clean Energy Regulator to monitor and improve its performance and ensures compliance with relevant legislation.
We continue to build leadership capability and an agile and responsive culture that enables us to respond effectively as and when new requirements are placed on us.
– Chloe Munro
4.1
62
CommitteesThe Clean Energy Regulator’s committee structure supports the governance of the agency and provides leadership and oversight of the agency’s operations and performance.
Executive Board
The Executive Board comprises the Chief Executive Offi cer (Chair), the General Counsel, and all executive general managers. It is responsible for planning and reviewing matters that will be referred to the Regulator for information and decision-making.
The Executive Board meets monthly before each meeting of the Regulator.
Senior Leadership Team
The Senior Leadership Team has the same membership as the Executive Board, but a different mandate. The Senior Leadership Team leads the strategic direction of the agency through policy setting and allocation of resources. It makes decisions on the business of the Clean Energy Regulator and issues relating to fi nance, people and operations management.
The Senior Leadership Team meets at least fortnightly.
Extended Leadership Team
The Extended Leadership Team comprises the Chief Operations Offi cer (Chair), the General Counsel, all executive general managers, and all general managers. The Extended Leadership Team enables divisions to share information and collaborate and focuses on the operational concerns of line managers.
The Extended Leadership Team meets fortnightly.
Audit Committee
The Audit Committee consists of an independent member (Chair), a member of the Regulator, and two senior executive offi cers. It provides independent assurance and assistance to the Chief Executive Offi cer on the agency’s risk, control and compliance framework, and the agency’s external accountability responsibilities under legislation. The Audit Committee provides assurance on the preparation of the annual fi nancial statements and oversights the internal audit work programme.
The Audit Committee meets quarterly.
Clean Energy Regulator

Annual Report 2013–14 63
4 M
anag
emen
t and
acc
ount
abili
ty
Procurement Review Committee
The Procurement Review Committee comprised the Manager Finance and Procurement Section (Chair), the General Counsel, and two senior executive offi cers. The committee’s role was to:
• ensure that major procurement activities were conducted in accordance with the Australian Government’s fi nancial and procurement policies
• review the establishment of any standing offer, multi-use list or memorandum of understanding related to sourcing goods or services from an Australian Government department.
In December 2013, the Procurement Review Committee was disbanded and its role was integrated into business practices within the Finance and Procurement Section, Operations Division. The Procurement Team provides guidance to offi cers to ensure that procurements are conducted in accordance with the Australian Government’s fi nancial and procurement policies.
Security Management Committee
The Security Management Committee consists of the Agency Security Executive (Chair), the Chief Information Security Offi cer, the Chief Information Offi cer, the General Manager Investigations and Enforcement, the Information Technology Security Advisor, the Agency Security Advisor, and the Assistant Agency Security Advisor.
The committee is a centralised source of strategic direction and advice on the Clean Energy Regulator’s protective security and information technology policies and practices. It ensures that the agency is compliant with relevant statutory obligations, including the Protective Security Policy Framework and the Australian Government
Information Security Manual.
The Security Management Committee meets quarterly.
Project Portfolio Board
The Project Portfolio Board consists of the Chief Operations Offi cer (Chair), executive general managers, the Chief Information Offi cer, the Financial Controller, the Manager Portfolio Management Offi ce, and the Manager Project Delivery.
The Project Portfolio Board is accountable to the Senior Leadership Team to ensure the agency’s investment in projects is achieved. The Project Portfolio Board supports the Senior Leadership Team in providing assurance to government and other key stakeholders that projects will achieve the agreed outcomes of the agency.
The Project Portfolio Board meets every three weeks.

64
Managers Forum
The Managers Forum consists of the Chief Operations Offi cer (Chair) and all Executive Level 2 managers. The forum provides an opportunity for information sharing and consultation on business and operational priorities.
The Managers Forum meets monthly.
Staff Consultative Committee
The Staff Consultative Committee consists of the Chief Operations Offi cer, the Manager People, Performance and Support Section (Chair), and representatives from management, each division, the Community and Public Sector Union and the Media, Entertainment and Arts Alliance. The committee provides a forum for consultation on workplace issues, and allows the views of offi cers to be sought in the decision-making process.
The Staff Consultative Committee meets monthly.
Work Health and Safety Committee
The Work Health and Safety Committee consists of the Chief Operations Offi cer, the Manager People, Performance and Support Section (Chair), seven health and safety representatives, and representatives from management, each division, the Community and Public Sector Union and the Media, Entertainment and Arts Alliance. The committee provides for a participatory approach to the prevention of work-related injury and illness and considers any matter relevant to workers’ health and safety raised by managers, health and safety representatives or other offi cers.
The Work Health and Safety Committee meets quarterly.
Planning and performanceThe Clean Energy Regulator’s planning framework integrates a number of interdependent activities, including the development of portfolio budget statements; investment and internal budget allocations; strategic and business planning; annual reporting; and monthly and quarterly performance management.
The agency undertakes an annual business-planning process at the branch and division levels, centred on agency-wide and divisional objectives, human resources allocation, investment, and risk management and performance measurement.
The Clean Energy Regulator measures and reviews its performance to evaluate its progress in achieving objectives throughout the year. Performance measures are based on the annual business plans, and focus on achievement of legislated milestones, organisational priorities, resource usage, and the administration of schemes. The reporting approach refl ects the different phases in the life cycle of each of the schemes and enables the agency to identify trends and provide comparisons across reporting periods.
Clean Energy Regulator
Annual Report 2013–14 65
4 M
anag
emen
t and
acc
ount
abili
ty
Risk managementThe Clean Energy Regulator’s risk management framework is based on the Australian–New Zealand standard for risk management, AS/NZS ISO 31000:2009. In 2013–14, the agency reviewed the framework to ensure that it was tailored to the Clean Energy Regulator’s operating environment.
Management of strategic risks is undertaken by the Executive Board, reporting to the members of the Regulator. These risks shape the Clean Energy Regulator’s business priorities and its identifi cation and management of operational risk.
Fraud prevention and controlThe Clean Energy Regulator released an updated fraud control plan in March 2014, to ensure continued legislative compliance and refl ect changes to the agency structure and the implementation of a new fraud control structure.
The revised fraud control plan provides information on:
• preventing, detecting and responding to fraud
• the ongoing alignment of risk management with business planning
• agency roles and responsibilities.
The plan also integrates improvements to fraud controls, such as:
• a fraud governance framework
• an investigations manual with supporting processes
• templates and procedures
• security management principles for information and communications technology.
The Clean Energy Regulator has several means of receiving allegations of fraud from internal or external sources. The Clean Energy Regulator treats all allegations of fraud seriously and is committed to maintaining confi dentiality and protecting those who provide information concerning alleged fraud. Any alleged, apparent or potential fraud and non-compliance incidents are recorded and addressed in accordance with the Australian Government Investigations Standards.
Providing feedback and education to scheme participants and industry is an important part of the Clean Energy Regulator’s commitment to a culture of compliance. Online resources are regularly updated and include statistics and enforceable undertakings along with extensive assistance materials.
To avoid confl icts of interest, a direction under the Public Service Act 1999 requires offi cers to refrain from acquiring or disposing of interests in an organisation when the Clean Energy Regulator is considering making a decision that affects that organisation.
66
Business continuity managementThe Clean Energy Regulator has developed a business continuity framework which includes policies, processes and responsibilities to assist business areas and the agency to respond and recover from a business disruption.
The implementation of the business continuity arrangements, including test exercises, is overseen by the Management Response Team, which consists of the Chief Operations Offi cer (Chair), the Chief Information Offi cer, and executives from each division. The team assesses the outcomes of the exercise programme to monitor the agency’s level of preparedness.
Internal auditThe Chief Internal Auditor is responsible for the effi cient and effective operation of the Clean Energy Regulator’s internal audit function, reporting directly to the Chief Executive Offi cer and the Audit Committee.
Details of the Audit Committee’s role and membership are provided on page 62. During 2013–14, the Audit Committee held quarterly meetings in September, December, March and June, and a fi nancial statements meeting in August 2014. The committee endorsed the internal work programme and internal audit reports on performance and compliance issues, and reviewed the Clean Energy Regulator’s fraud control plan, risk management framework, business continuity plan, fi nancial statements and certifi cate of compliance.
Oakton Services Pty Ltd provides internal audit services to the Clean Energy Regulator. During 2013–14, Oakton Services completed nine internal audits. The internal audit reports were:
• protective security and unauthorised information disclosure
• fraud prevention and detection
• risk management
• Clean Energy Regulator access controls
• Australian National Registry of Emissions Units implementation
• Financial Management Information Systems implementation and agency fi nancial reporting
• Clean Energy Regulator contact centre operations
• small-scale technology certifi cates validation
• Clean Energy Regulator record keeping.
Audit fi ndings include recommendations that are categorised according to the level of operational risk associated with them. The Chief Internal Auditor is responsible for monitoring and reporting on the actions arising from the recommendations.
Clean Energy Regulator
Annual Report 2013–14 67
4 M
anag
emen
t and
acc
ount
abili
ty
Regulatory reformThe Australian Government is implementing a comprehensive reform agenda to reduce the burden of regulation. The agenda aims to reduce the costs of clients engaging with government as well as the costs imposed on suppliers through procurement and cost-recovery frameworks; improve transparency; and enhance effi ciency in administering regulations. The reforms require additional levels of rigour in the assessment of the impact of proposed legislation and routine audits of feedback from clients and suppliers about their experiences of doing business with government.
The reform agenda will not signifi cantly affect the Clean Energy Regulator’s practices, because a majority of the regulatory principles are already part of the agency’s day-to-day operations.
In everyday scheme administration, the agency assesses the potential burden on clients and implements practical, fl exible solutions which appropriately balance the needs of both parties. Whenever possible, the agency engages with clients early and effectively.
During 2013–14, the agency proactively contributed to the Environment portfolio’s audit of its legislative footprint and associated client burden; introduced activities associated with the Government’s regulatory reform agenda into its business planning process; and incorporated clients’ feedback on their experiences of doing business with the agency as part of the client communications survey. Work is ongoing to ensure that the agency collects appropriate data for reporting against the goals of the Government’s reform agenda.
4.2 External scrutiny
In 2013–14, no judicial decisions or decisions made by administrative tribunals or the Australian Information Commissioner had a signifi cant impact on the operations of the Clean Energy Regulator.
The operations of the Clean Energy Regulator were not the subject of any reports by the Auditor-General (other than the report on fi nancial statements), a parliamentary committee or the Commonwealth Ombudsman.
In 2013–14, the Clean Energy Regulator appeared before the Senate Environment and Communications Legislation Committee on three occasions. The Clean Energy Regulator responded to 278 questions on notice from the committee, including whole-of-portfolio questions on corporate matters as well as questions on the operations of the schemes that the Clean Energy Regulator administers. Matters covered included liabilities under the carbon pricing mechanism and the assessment and compliance arrangements for renewable energy power stations accredited under the Renewable Energy Target.
The Clean Energy Regulator also responded to one parliamentary question on notice concerning entities with outstanding liabilities under the carbon pricing mechanism. Responses to all questions on notice are published on the Parliament of Australia’s website.
4.2
68
4.3 Management of human resources
The Clean Energy Regulator’s human resources management strategies cover:
• workforce planning
• skills and capability
• career and talent
• wellbeing
• performance management
• recruitment
• learning and development
• security
• accommodation and facilities.
These strategies provide an effective framework for attracting, developing and managing staff to achieve the agency’s objectives.
Key people management outcomes for 2013–14 included:
• implementing a workforce planning framework to drive actions to attract, retain and develop a targeted, skilled and diverse workforce
• commencing the development of a health and safety management framework incorporating all relevant policies and guidelines, in line with the agency’s commitment to the objectives of the Work, Health and Safety Act 2011
• piloting a management and leadership development programme to be undertaken by Executive Level and Senior Executive Service offi cers
• implementing a new capability framework and an enhanced performance management system
• facilitating behavioural, organisational and cultural change by progressing the recommendations from the 2013 staff survey.
Employment conditionsTerms and conditions for all Clean Energy Regulator offi cers are governed by enterprise agreements, individual section 24(1) determinations in accordance with the Public Service
Act 1999, and decisions of the Remuneration Tribunal.
4.3
Clean Energy Regulator
Annual Report 2013–14 69
4 M
anag
emen
t and
acc
ount
abili
ty
Enterprise agreements
At 30 June 2014, the Clean Energy Regulator had 333 offi cers engaged under two enterprise agreements:
• 295 offi cers engaged under the Department of Climate Change and Energy Effi ciency Enterprise Agreement 2011–14
• 38 offi cers engaged under the Offi ce of the Renewable Energy Regulator Enterprise Agreement 2011–14.
The Clean Energy (Consequential Amendments) Act 2011 makes provision for both enterprise agreements to remain in operation until 30 June 2014. The Clean Energy Regulator formally commenced enterprise bargaining for a new agency enterprise agreement on 12 June 2014.
Appendix A provides details of the salary ranges available under the enterprise agreements in 2012–13 and 2013–14. Progression through the available salary points was determined by the results of annual performance assessments.
Non-salary benefi ts available under the enterprise agreements included:
• individual fl exibility agreements
• health and wellbeing programmes
• coaching and mentoring
• support for carers who are required to travel for work-related purposes
• learning and development opportunities
• fi rst aid certifi cate and fi re warden training
• options for fl exible hours and time off in lieu
• fl exible working conditions such as part-time employment, job sharing and working from home.
Determinations
Terms and conditions for the nine Senior Executive Service offi cers of the Clean Energy Regulator are contained in individual section 24(1) determinations made by the secretary of the department that originally engaged the offi cer or by the Chief Executive Offi cer of the Clean Energy Regulator. Appendix A provides details of the salary ranges available for Senior Executive Service offi cers in 2012–13 and 2013–14.
The position of Chief Executive Offi cer is a statutory appointment with conditions of employment determined by the Remuneration Tribunal.
Performance pay
In 2013–14, no performance pay in the form of one-off bonuses was awarded to the Clean Energy Regulator’s Senior Executive Service offi cers.

70
For non-Senior Executive Service offi cers, ‘fully effective’ or ‘superior’ performance was rewarded by advancement through the pay points available under the agency’s enterprise agreements.
Performance managementThe Clean Energy Regulator’s performance management approach embeds performance management into the agency’s everyday operations, supporting effective performance management practices across the agency, alleviating the stress associated with formal performance discussions, and preventing surprises at the end of the performance cycle.
By linking individual performance agreements to the agency’s organisational objectives and business plans, the approach also achieves greater alignment between individual performance and the achievement of the agency’s outcomes.
In 2013–14, the end-of-performance-cycle process was revised to ensure consistency in the recognition of performance and transparency in decision-making. This was achieved by:
• reviewing and establishing performance expectations across the agency in line with the Australian Public Service Commission Integrated Leadership System
• introducing a process whereby ratings to recognise exceptional performance throughout the year are supported by a business case that is scrutinised by a review panel, and the review panel’s outcomes are communicated to offi cers in writing.
The revised process resulted in more consistent application of the performance ratings and performance-related pay progression while recognising exceptional performance.
Workforce profi leAt 30 June 2014, the Clean Energy Regulator had a total of 343 offi cers: 329 ongoing and 14 non-ongoing. Appendix A provides details of the Clean Energy Regulator’s workforce profi le for 2012–13 and 2013–14.
Learning and developmentTo assist offi cers from across the agency to build their skills, knowledge and capability, the Clean Energy Regulator developed and delivered several internal training courses during 2013–14. The courses focused on priority areas identifi ed through feedback from offi cers, survey results and input from managers.
Topics included:
• effective communication
• performance management
• confl ict resolution
• emotional intelligence
Clean Energy Regulator

Annual Report 2013–14 71
4 M
anag
emen
t and
acc
ount
abili
ty
• engaging with diffi cult clients
• resilience
• preparing for a new position within the agency
• the Australian Public Service Values and Code of Conduct
• project management
• writing skills
• teamwork.
In addition, all offi cers and contractors undertook mandatory training on protective security, fraud and ethics, work health and safety, and record keeping, through an online training system.
A management and leadership development programme was piloted from March to June 2014 and will now be rolled out in the second part of 2014. All Clean Energy Regulator supervisors and managers will be required to complete the programme, which is aimed at developing skills and knowledge that support people management, capability development, output management, judgement, and risk and change management.
The Clean Energy Regulator is committed to supporting external opportunities for development that ensure the agency’s offi cers are well equipped to perform their roles and develop their careers. In 2013–14, the agency provided fi nancial support and study leave to offi cers completing tertiary qualifi cations and supported participation in external workshops, seminars and conferences.
Recognising the importance of developing the skills, knowledge and networks required to lead at the agency, cross-agency, national and global levels, four of the agency’s executive offi cers took part in executive learning and development programmes in 2013–14:
• two participated in the Australian Public Service Commission Career Development Assessment Centre
• one participated in the Australian Public Service Commission Senior Executive Service Band 1 Leadership Program
• one participated in the Australia and New Zealand School of Government Executive Master of Public Administration.
Graduate development programmeThe Clean Energy Regulator’s graduate development programme provides graduates with a range of professional and personal development opportunities. The programme benefi ts the agency by developing offi cers who have qualifi cations and experience that are highly relevant to the work of the Clean Energy Regulator.
Over a period of ten months, graduates gain valuable experience through three workplace rotations, and participate in learning and development that includes courses tailored to the work of the agency and courses related to working in the broader Australian Public Service.
72
The graduates complete a Diploma of Government through the Australian Public Service Commission’s whole-of-government graduate development programme. This includes undertaking a major project on a topic specifi c to the Clean Energy Regulator’s business.
After completing the programme, graduates are placed in permanent positions with the Clean Energy Regulator.
Access and equity The Clean Energy Regulator is committed to ensuring access and equity in all aspects of its business.
The Clean Energy Regulator website offers access to translating and interpreting services and to the National Relay Service for people with hearing or sight impairment. The Clean Energy Regulator is working towards meeting Level AA conformance with the Australian Government’s Web Content Accessibility Guidelines by 31 December 2014.
The Clean Energy Regulator’s Multicultural Plan for 2013–15 demonstrates the agency’s commitment to delivering equitable outcomes for all Australians, regardless of their cultural and linguistic backgrounds. In 2013–14, the agency had fact sheets for the Small-scale Renewable Energy Scheme translated into community languages. Two fact sheets are now available online:
• Agent’s Guide to Creating and Selling Small-scale Technology Certifi cates, in Arabic, Chinese (simplifi ed and traditional), Hindi and Urdu
• Financial Benefi ts for Installing Solar Water Heaters or Solar Panels, in Arabic, Chinese (simplifi ed and traditional), Greek and Italian.
The Clean Energy Regulator is also committed to encouraging diversity in its workforce. Appendix A shows how equal opportunity employment target groups were represented in the Clean Energy Regulator’s workforce profi le in 2012–13 and 2013–14.
Excellence awardsThe Clean Energy Regulator Awards of Excellence were held in April 2014 to recognise and award offi cers who have excelled in achieving the objectives of the Clean Energy Regulator.
The awards are held annually to celebrate the achievements of offi cers and teams who have excelled in one of the following fi ve categories:
• client service delivery
• markets, including Australia’s carbon market and the Renewable Energy Target market
• innovation in compliance, awareness, education and regulation
• data provision, integrity and reporting
• the Clean Energy Regulator values (accountability, integrity, professionalism, responsiveness and empowerment) in the delivery of work on a day-to-day basis.
Clean Energy Regulator
Annual Report 2013–14 73
4 M
anag
emen
t and
acc
ount
abili
ty
An additional Chief Executive Offi cer Award is presented to teams or offi cers who exemplify the Australian Public Service values and have made a signifi cant contribution to the work of the Clean Energy Regulator. The 2014 Chief Executive Offi cer Award was presented to an offi cer of the Finance and Procurement Section, Operations Division.
The Clean Energy Regulator Awards highlight the collective efforts across the agency and the commitment to excellence that makes us well positioned to support our clients and stakeholders into the future.
– Anne T Brown
4.4 Asset management
The Clean Energy Regulator manages current and non-current assets in accordance with the Chief Executive Instructions and relevant accounting standards.
During 2013–14, the Clean Energy Regulator undertook a full stocktake of its asset base and engaged a contractor to conduct a valuation of the Clean Energy Regulator’s assets (excluding intangibles) in accordance with the requirements of AASB 13 ‘Fair Value
Measurement’. The results of the stocktake are reported in the fi nancial statements in Section 6 of this annual report.
4.5 Purchasing and procurement
The Clean Energy Regulator’s purchasing and procurement policies and practices are consistent with:
• all relevant Commonwealth legislation
• the Australian Government fi nancial framework, including the Commonwealth Procurement Rules
• the Chief Executive Instructions and relevant Clean Energy Regulator policies.
Offi cers of the Clean Energy Regulator may seek advice from the Operations Division on procedural compliance, adherence to the Chief Executive Instructions, government policies or the tendering process. Procurement policies, procedures, processes and templates are available through the Clean Energy Regulator’s intranet.
4.4
4.5
74
All open tender opportunities of $80,000 and above (inclusive of GST) are advertised on the AusTender website. All procurements of $50,000 and above (inclusive of GST) and those of $10,000 and above (inclusive of GST) that are undertaken using a limited tender procurement method are considered by the Procurement Team, Operations Division, to ensure that they are conducted in accordance with the procurement framework. The procurement methods aim not to discriminate against small and medium-sized enterprises.
The Clean Energy Regulator’s Annual Procurement Plan is updated quarterly and is available on the AusTender website. The plan outlines the planned procurement for the forthcoming year, giving prospective suppliers the opportunity to prepare for potential work with the Clean Energy Regulator.
Exempt contractsIn 2013–14, the Chief Executive Offi cer did not exempt any standing offer or contract in excess of $10,000 (inclusive of GST) from being published on the AusTender website, www.tenders.gov.au.
Australian National Audit Offi ce access clausesDuring 2013–14, all contracts of $100,000 (inclusive of GST) or more included a provision for the Auditor-General to have access to the contractor’s premises.
4.6 Consultancies
The Clean Energy Regulator procures consultancy services in accordance with the agency’s procurement framework.
During 2013–14, nine new consultancy contracts were entered into, involving total actual expenditure of $208,764 (inclusive of GST). One ongoing consultancy contract, involving total actual expenditure of $5,665 (inclusive of GST), was active in 2013–14.
All new consultancy contracts entered into in 2013–14 valued at $10,000 (inclusive of GST) or more are published on the AusTender website, www.tenders.gov.au.
This annual report contains information about actual expenditure on contracts for consultancies. Information on the value of contracts for consultancies is available on the AusTender website, www.tenders.gov.au.
4.6
Clean Energy Regulator
Annual Report 2013–14 75
4 M
anag
emen
t and
acc
ount
abili
ty
4.7 Information and communications technology
The Clean Energy Regulator’s Information and Communications Technology Services Branch was established in 2013–14, creating an agency-wide capability to ensure the effi cient and effective use of information and communications technology (ICT) resources for the agency. The agency is now fi nalising a strategy that will align the future direction of ICT with the agency’s regulatory responsibilities and strategic objectives.
To gain effi ciencies from its ICT investments, in agency performance and ICT asset development and maintenance, the Clean Energy Regulator will combine industry, whole-of-government and international services and solutions where appropriate. Importantly, the Clean Energy Regulator will continue to comply with its obligations as a Commonwealth entity.
To ensure that it has the fl exible and dependable ICT services it needs to respond quickly to the challenges of a changing regulatory environment, the Clean Energy Regulator has partnered with industry to procure infrastructure as a service. This will increase the agency’s control over its business platform while minimising the cost of maintaining and developing infrastructure into the future.
Improvements achieved in 2013–14 included redesigning the Renewable Energy Certifi cate Registry, to ensure scheme compliance and more responsive services for Renewable Energy Target participants and clients. Other improvements included enhancements made to the mechanisms for reporting under the National Greenhouse and Energy Reporting Scheme through the Emissions and Energy Reporting System, to ensure a reliable service for reporting entities.
The Clean Energy Regulator will build on these achievements by expanding the use of online services and system-supported internal processes to reduce the regulatory burden on the agency’s clients and stakeholders.
We received significantly fewer calls and enquiries about the Emissions and Energy Reporting System compared to last year. Several of our clients have commented to me how much easier it was to report through the system this year.
– Chloe Munro
4.7
Other mandatory reportingSection 5
5.1 Work health and safety 77
5.2 Information Publication Scheme 78
5.3 Advertising and market research 79
5.4 Ecologically sustainable development and environmental performance 79
5.5 Grant programmes 80
5.6 Disability reporting 80
Annual Report 2013–14 77
Other mandatory reporting5
This section of the report provides the Clean Energy Regulator’s responses to annual reporting requirements that apply to all Australian Public Service agencies.
5.1 Work health and safety
InitiativesAs part of ongoing work to align the Clean Energy Regulator with the requirements of the Work Health and Safety Act 2011, in 2013–14 the agency reviewed and revised the following elements of its work health and safety and rehabilitation framework:
• bullying and harassment policy
• client-initiated abuse guideline
• early intervention and injury management policy
• ergonomics and offi ce safety guideline
• fi rst aid guideline
• fi tness for duty guideline
• incident and hazard reporting guideline
• risk assessment and control form
• risk management guideline
• work health and safety policy
• workers compensation claims guideline
• working from home and out of offi ce guideline.
The Senior Leadership Team pays close attention to health and safety in the agency and considers a work health and safety report each month. In addition, the monthly performance report prepared for the Senior Leadership Team includes a section on case management and workers compensation.
The Work Health and Safety Committee develops and monitors the agency’s health, safety and wellbeing programmes, providing for a participatory approach to the prevention of work-related injury and illness. Details of the committee’s role and membership are provided on page 64.
5.1
5 O
ther
man
dato
ry r
epor
ting
78
In 2013–14, members of the Work Health and Safety Committee received training from Comcare on Effective Work Health and Safety Committees and the Work Health and
Safety Act 2011. All health and safety representatives completed the Comcare-approved Health and Safety Representative Training Course.
Other important elements of the Clean Energy Regulator’s commitment to a safe working environment include:
• Identifying and training fi rst aid offi cers. In 2013–14, the Clean Energy Regulator had six qualifi ed fi rst aid offi cers and three fully equipped fi rst aid rooms.
• Maintaining the Workplace Harassment Contact Offi cer Network, which provides confi dential support and information concerning bullying or harassment. In 2013–14, the agency engaged three new contact offi cers. The agency assessed the nominees through specifi c psychometric assessments that were interpreted by a psychologist to ensure that the best candidates were selected.
• Offering counselling to all offi cers and their immediate family members through the employee assistance programme (EAP). In 2013–14, the agency reviewed the requirements of the EAP service and engaged a new provider, Optimise Corporate Health, a division of Injury Treatment Pty Ltd. The provider has a strong proven background in providing EAP services to both private and government organisations, and is committed to engaging with the workforce to provide the highest level of service to meet the needs of the agency.
• Offering health and wellbeing programmes to all offi cers. In 2013–14, these included information sessions and workshops on building resilience, mindfulness, and posture and fl exibility.
OutcomesDuring 2013–14, 16 non-notifi able incidents occurred within the Clean Energy Regulator. Two notifi able incidents were required to be reported to Comcare. No directions or notices were given to the Clean Energy Regulator and no investigations were conducted during this period.
Four workers compensation claims were lodged. Two were accepted by Comcare. Two were rejected by Comcare and are subject to appeal.
5.2 Information Publication Scheme
Agencies subject to the Freedom of Information Act 1982 (the Act) are required to make certain information available to the public as part of the Information Publication Scheme established by Part II of that Act. The Information Publication Scheme has replaced the former requirement to publish a section 8 freedom of information statement in annual reports.
5.2
Clean Energy Regulator
Annual Report 2013–14 79
5 O
ther
man
dato
ry r
epor
ting Information published as part of the Information Publication Scheme is accessible
via the Clean Energy Regulator’s website. That information includes details of the Clean Energy Regulator’s functions, information about statutory appointments, and operational information such as guidelines used by the Clean Energy Regulator to make decisions or recommendations that affect members of the public.
5.3 Advertising and market research
Section 311A of the Commonwealth Electoral Act 1918 requires agencies to report on expenditure to advertising agencies, market research organisations, polling organisations, direct mail organisations and media advertising organisations. Expenditures of less than $12,400 are not required to be reported for 2013–14.
During 2013–14, no market research was undertaken by the Clean Energy Regulator.
5.4 Ecologically sustainable development and environmental performance
The Clean Energy Regulator manages the environmental impact of its operations in accordance with the Australian National Audit Offi ce’s better practice guide Public Sector
Environmental Management.
Initiatives include:
• contracting services to recycle organic waste, paper and cardboard
• reducing electricity use through staff actions such as turning off lights in unused rooms and turning off computer monitors at night
• purchasing electricity from 100 per cent renewable sources.
In 2013–14, the Clean Energy Regulator building at 5 Farrell Place, Canberra, had an energy rating of 6 stars under the National Australian Built Environment Rating System—the highest possible rating under the system, and an improvement on the rating of 4.5 stars in 2012–13.
5.3
5.4

80
5.5 Grant programmes
The Clean Energy Regulator does not administer grant programmes.
5.6 Disability reporting
Since 1994, Commonwealth departments and agencies have reported on their performance as policy adviser, purchaser, employer, regulator and provider under the Commonwealth Disability Strategy. In 2007–08, reporting on the employer role was transferred to the Australian Public Service Commission’s State of the Service Report and the APS Statistical Bulletin. These reports are available at www.apsc.gov.au. Since 2010–11, departments and agencies have no longer been required to report on these functions.
The Commonwealth Disability Strategy has been overtaken by the National Disability Strategy 2010–2020, which sets out a ten-year national policy framework to improve the lives of people with disabilities, promote participation and create a more inclusive society. A high-level two-yearly report will track progress against each of the six outcome areas of the strategy and present a picture of how people with disability are faring. The fi rst of these reports will be available in late 2014, and can be found at www.dss.gov.au.
5.5
5.6
Clean Energy Regulator
Financial statementsSection 6
6.1 Financial summary 82
6.2 Financial statements 83
Independent auditor’s report 84
Statement by Chief Executive and Chief Financial Offi cer 86
Statement of comprehensive income 87
Statement of fi nancial position 88
Statement of changes in equity 89
Cash fl ow statement 90
Schedule of commitments 91
Administered schedule of comprehensive income 92
Administered schedule of assets and liabilities 93
Administered reconciliation schedule 94
Administered cash fl ow statement 95
Schedule of administered commitments 96
Notes to and forming part of the fi nancial statements 97
82
Financial statements6
6.1 Financial summary
The Clean Energy Regulator received an unqualifi ed audit report from the Australian National Audit Offi ce for its 2013–14 fi nancial statements.
Departmental fi nancesIn 2013–14 the Clean Energy Regulator reported total comprehensive income of $5.117 million prior to the recognition of $16.585 million for unfunded depreciation and amortisation expenses.
Income
In 2013–14 the Clean Energy Regulator received revenue from government totalling $81.353 million and recognised own-source income of $1.407 million.
Expenses
The Clean Energy Regulator expenses in 2013–14 totalled $94.530 million. These included employee expenses of $39.684 million, supplier expenses of $37.477 million, depreciation and amortisation expenses of $16.585 million and other expenses of $0.784 million.
Administered fi nances
Administered income
The Clean Energy Regulator recognised $4.411 billion in administered revenue during 2013–14. This included a carbon price revenue of $4.346 billion; carbon price revenue shortfall charges and penalties of $50.875 million; renewable energy fees of $13.265 million; renewable energy shortfall charges and interest of $0.389 million; and other fees of $0.032 million.
Administered expenses
The Clean Energy Regulator administered expenses in 2013–14 totalled $1.344 billion. This included subsidies expenses of $1.297 billion; supplier expenses of $3.232 million; and $43.166 million in impaired receivables.
6.1
Clean Energy Regulator
Annual Report 2013–14 83
6 Fi
nanc
ial s
tate
men
ts6.2 Financial statements
The 2013–14 fi nancial statements for the Clean Energy Regulator commence on page 87, following the independent auditor’s report and statement by the Chief Executive and Chief Financial Offi cer.
6.2
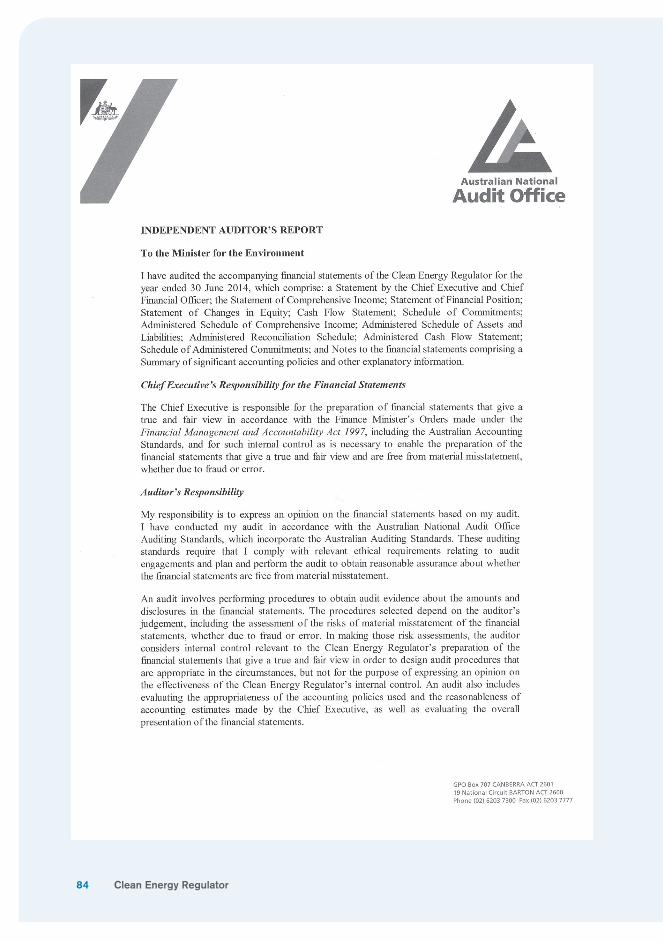
84 Clean Energy Regulator
Annual Report 2013–14 85
6 Fi
nanc
ial s
tate
men
ts
86 Clean Energy Regulator
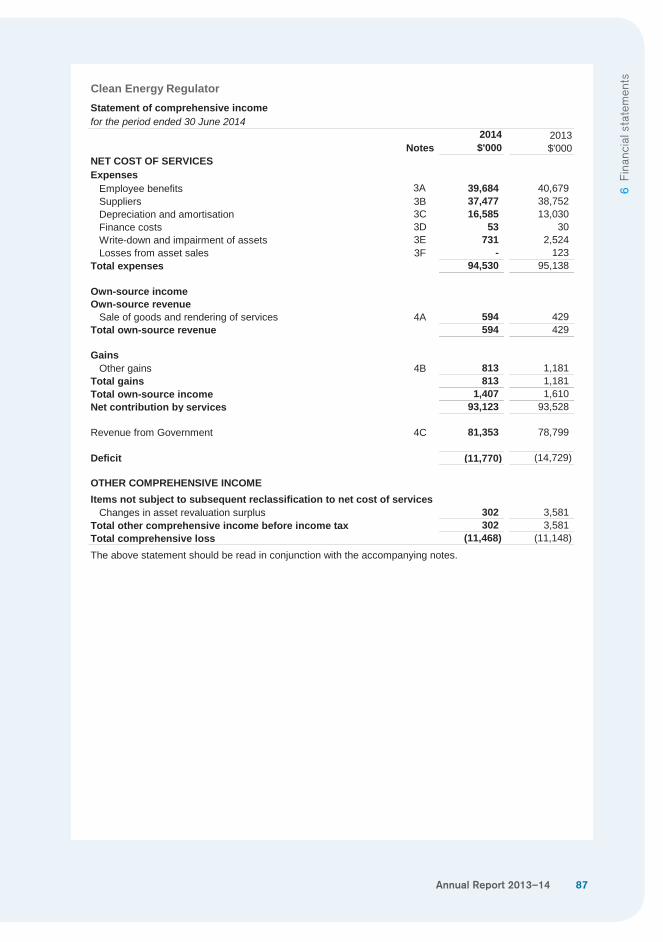
Annual Report 2013–14 87
6 Fi
nanc
ial s
tate
men
ts
Clean Energy RegulatorStatement of comprehensive incomefor the period ended 30 June 2014
Notes2014$'000
2013$'000
NET COST OF SERVICESExpenses
Employee benefits 3A 39,684 40,679 Suppliers 3B 37,477 38,752 Depreciation and amortisation 3C 16,585 13,030 Finance costs 3D 53 30Write-down and impairment of assets 3E 731 2,524 Losses from asset sales 3F - 123
Total expenses 94,530 95,138
Own-source incomeOwn-source revenue
Sale of goods and rendering of services 4A 594 429Total own-source revenue 594 429
GainsOther gains 4B 813 1,181
Total gains 813 1,181 Total own-source income 1,407 1,610 Net contribution by services 93,123 93,528
Revenue from Government 4C 81,353 78,799
Deficit (11,770) (14,729)
OTHER COMPREHENSIVE INCOMEItems not subject to subsequent reclassification to net cost of services
Changes in asset revaluation surplus 302 3,581 Total other comprehensive income before income tax 302 3,581 Total comprehensive loss (11,468) (11,148)
The above statement should be read in conjunction with the accompanying notes.
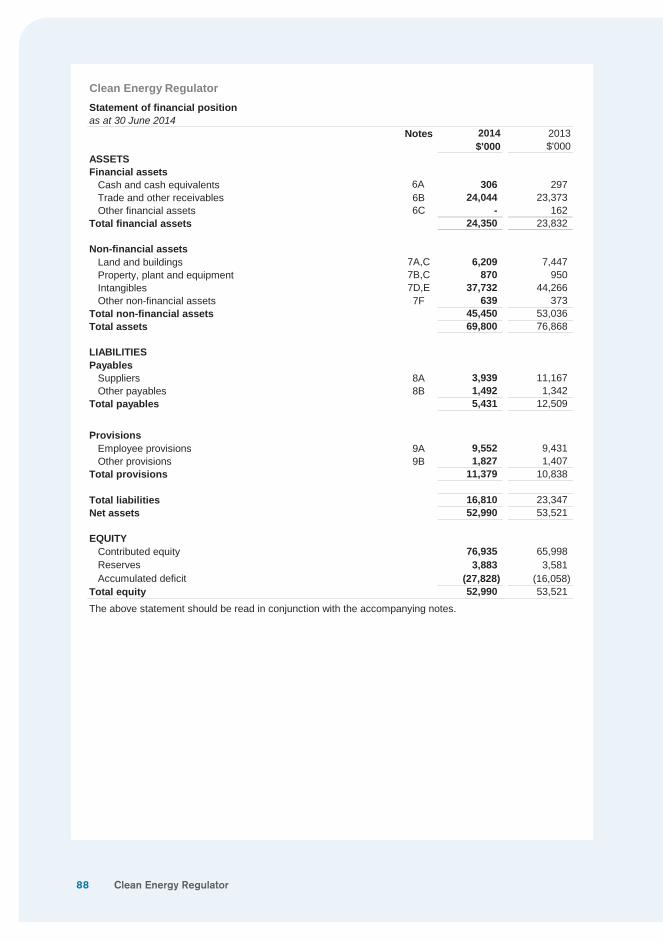
88
Clean Energy RegulatorStatement of financial positionas at 30 June 2014
Notes 2014$'000
2013$'000
ASSETSFinancial assets
Cash and cash equivalents 6A 306 297Trade and other receivables 6B 24,044 23,373 Other financial assets 6C - 162
Total financial assets 24,350 23,832
Non-financial assetsLand and buildings 7A,C 6,209 7,447 Property, plant and equipment 7B,C 870 950Intangibles 7D,E 37,732 44,266 Other non-financial assets 7F 639 373
Total non-financial assets 45,450 53,036 Total assets 69,800 76,868
LIABILITIESPayables
Suppliers 8A 3,939 11,167 Other payables 8B 1,492 1,342
Total payables 5,431 12,509
ProvisionsEmployee provisions 9A 9,552 9,431 Other provisions 9B 1,827 1,407
Total provisions 11,379 10,838
Total liabilities 16,810 23,347 Net assets 52,990 53,521
EQUITYContributed equity 76,935 65,998 Reserves 3,883 3,581 Accumulated deficit (27,828) (16,058)
Total equity 52,990 53,521
The above statement should be read in conjunction with the accompanying notes.
Clean Energy Regulator
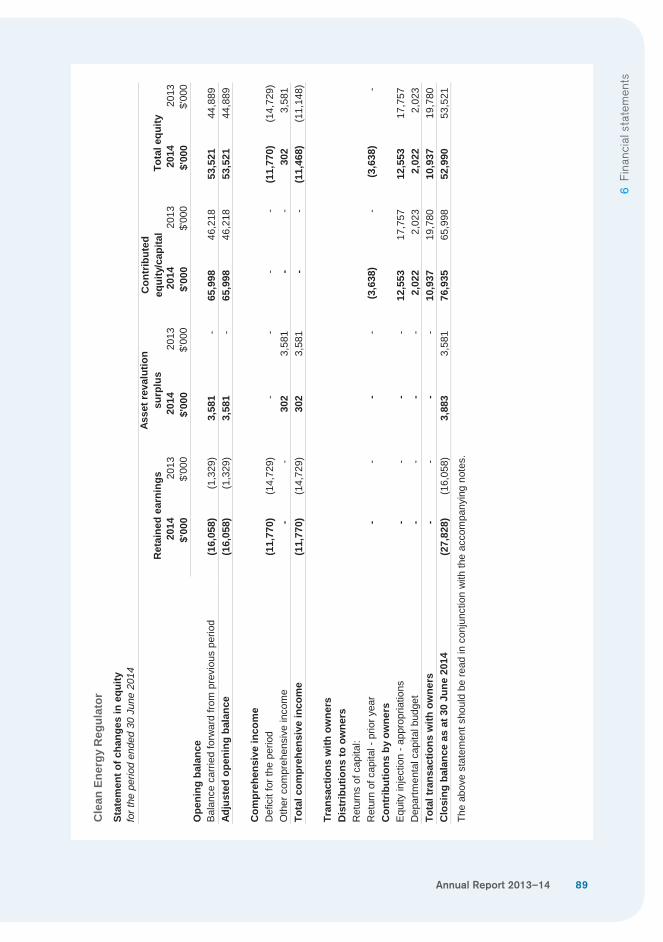
Annual Report 2013–14 89
6 Fi
nanc
ial s
tate
men
ts
Cle
an E
nerg
y R
egul
ator
Stat
emen
t of c
hang
es in
equ
ity
Ope
ning
bal
ance
Bal
ance
car
ried
forw
ard
from
pre
viou
s pe
riod
(16,
058)
(1,3
29)
3,58
1 -
65,9
98
46,2
18
53,5
21
44,8
89
Adju
sted
ope
ning
bal
ance
(16,
058)
(1,3
29)
3,58
1 -
65,9
98
46,2
18
53,5
21
44,8
89
Com
preh
ensi
ve in
com
eD
efic
it fo
r the
per
iod
(11,
770)
(14,
729)
- -
- -
(11,
770)
(14,
729)
Oth
er c
ompr
ehen
sive
inco
me
- -
302
3,58
1 -
- 30
23,
581
Tota
l com
preh
ensi
ve in
com
e(1
1,77
0)(1
4,72
9)30
23,
581
- -
(11,
468)
(11,
148)
Tran
sact
ions
with
ow
ners
Dis
trib
utio
ns to
ow
ners
Ret
urns
of c
apita
l:R
etur
n of
cap
ital -
prio
r yea
r -
- -
- (3
,638
) -
(3,6
38)
- C
ontr
ibut
ions
by
owne
rsE
quity
inje
ctio
n - a
ppro
pria
tions
- -
- -
12,5
53
17,7
57
12,5
53
17,7
57
Dep
artm
enta
l cap
ital b
udge
t -
- -
- 2,
022
2,02
3 2,
022
2,02
3 To
tal t
rans
actio
ns w
ith o
wne
rs -
- -
- 10
,937
19
,780
10
,937
19
,780
C
losi
ng b
alan
ce a
s at
30
June
201
4(2
7,82
8)(1
6,05
8)3,
883
3,58
1 76
,935
65
,998
52
,990
53
,521
The
abov
e st
atem
ent s
houl
d be
read
in c
onju
nctio
n w
ith th
e ac
com
pany
ing
note
s.
for t
he p
erio
d en
ded
30 J
une
2014
Ret
aine
d ea
rnin
gsC
ontr
ibut
ed
equi
ty/c
apita
lTo
tal e
quity
Asse
t rev
alut
ion
surp
lus
2014
$'00
020
13$'
000
2014
$'00
020
13$'
000
2014
$'00
020
13$'
000
2014
$'00
020
13$'
000
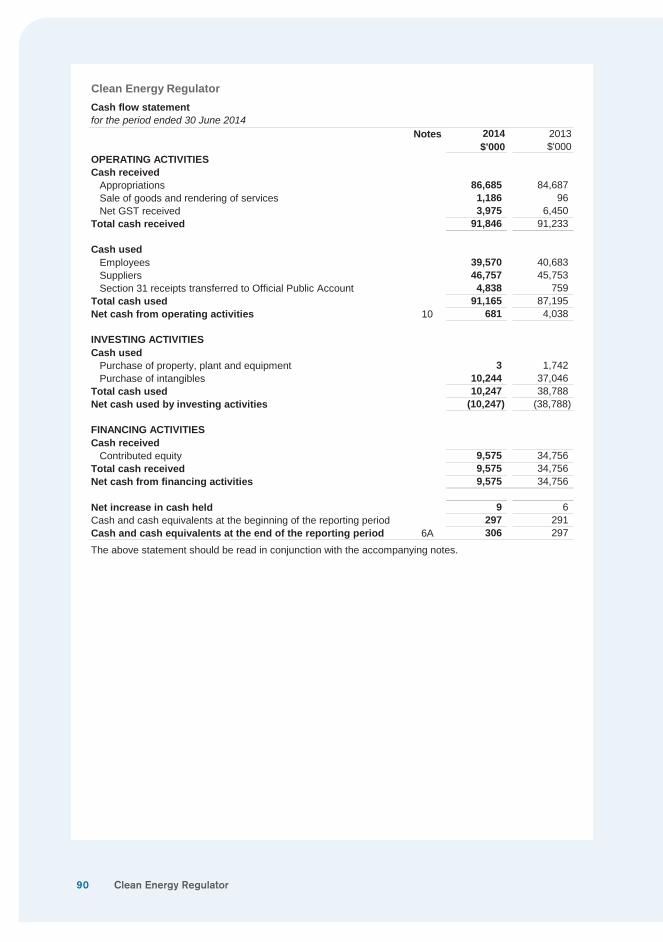
90
Clean Energy Regulator
Notes 2014$'000
2013$'000
OPERATING ACTIVITIESCash received
Appropriations 86,685 84,687 Sale of goods and rendering of services 1,186 96Net GST received 3,975 6,450
Total cash received 91,846 91,233
Cash usedEmployees 39,570 40,683 Suppliers 46,757 45,753 Section 31 receipts transferred to Official Public Account 4,838 759
Total cash used 91,165 87,195 Net cash from operating activities 10 681 4,038
INVESTING ACTIVITIESCash used
Purchase of property, plant and equipment 3 1,742 Purchase of intangibles 10,244 37,046
Total cash used 10,247 38,788 Net cash used by investing activities (10,247) (38,788)
FINANCING ACTIVITIESCash received
Contributed equity 9,575 34,756 Total cash received 9,575 34,756 Net cash from financing activities 9,575 34,756
Net increase in cash held 9 6Cash and cash equivalents at the beginning of the reporting period 297 291Cash and cash equivalents at the end of the reporting period 6A 306 297
The above statement should be read in conjunction with the accompanying notes.
Cash flow statementfor the period ended 30 June 2014
Clean Energy Regulator
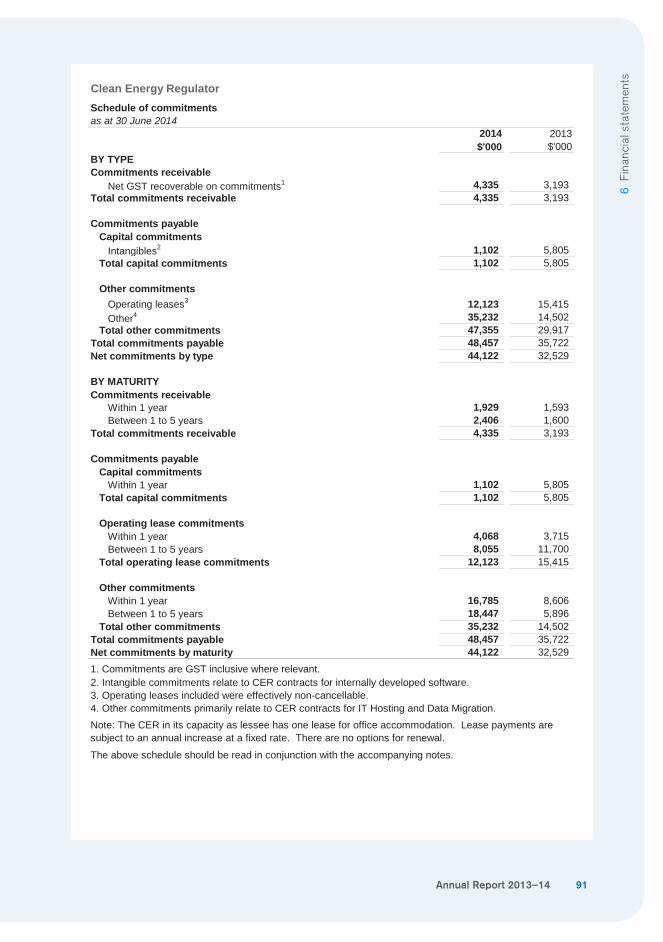
Annual Report 2013–14 91
6 Fi
nanc
ial s
tate
men
ts
Clean Energy RegulatorSchedule of commitmentsas at 30 June 2014
2014$'000
2013$'000
BY TYPECommitments receivable
Net GST recoverable on commitments1 4,335 3,193 Total commitments receivable 4,335 3,193
Commitments payableCapital commitments
Intangibles2 1,102 5,805 Total capital commitments 1,102 5,805
Other commitmentsOperating leases3 12,123 15,415 Other4 35,232 14,502
Total other commitments 47,355 29,917 Total commitments payable 48,457 35,722 Net commitments by type 44,122 32,529
BY MATURITYCommitments receivable
Within 1 year 1,929 1,593 Between 1 to 5 years 2,406 1,600
Total commitments receivable 4,335 3,193
Commitments payableCapital commitments
Within 1 year 1,102 5,805 Total capital commitments 1,102 5,805
Operating lease commitmentsWithin 1 year 4,068 3,715 Between 1 to 5 years 8,055 11,700
Total operating lease commitments 12,123 15,415
Other commitmentsWithin 1 year 16,785 8,606 Between 1 to 5 years 18,447 5,896
Total other commitments 35,232 14,502 Total commitments payable 48,457 35,722 Net commitments by maturity 44,122 32,529 1. Commitments are GST inclusive where relevant.2. Intangible commitments relate to CER contracts for internally developed software.3. Operating leases included were effectively non-cancellable.
The above schedule should be read in conjunction with the accompanying notes.
4. Other commitments primarily relate to CER contracts for IT Hosting and Data Migration.Note: The CER in its capacity as lessee has one lease for office accommodation. Lease payments are subject to an annual increase at a fixed rate. There are no options for renewal.
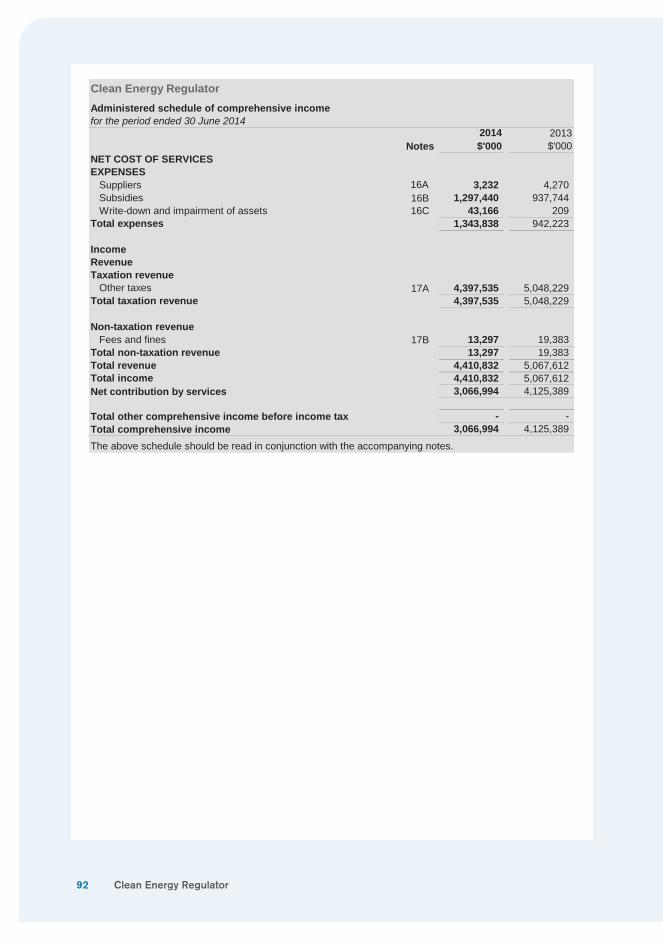
92
Clean Energy RegulatorAdministered schedule of comprehensive incomefor the period ended 30 June 2014
Notes2014$'000
2013$'000
NET COST OF SERVICESEXPENSES
Suppliers 16A 3,232 4,270 Subsidies 16B 1,297,440 937,744 Write-down and impairment of assets 16C 43,166 209
Total expenses 1,343,838 942,223
IncomeRevenueTaxation revenue
Other taxes 17A 4,397,535 5,048,229 Total taxation revenue 4,397,535 5,048,229
Non-taxation revenueFees and fines 17B 13,297 19,383
Total non-taxation revenue 13,297 19,383 Total revenue 4,410,832 5,067,612 Total income 4,410,832 5,067,612 Net contribution by services 3,066,994 4,125,389
Total other comprehensive income before income tax - - Total comprehensive income 3,066,994 4,125,389
The above schedule should be read in conjunction with the accompanying notes.
Clean Energy Regulator
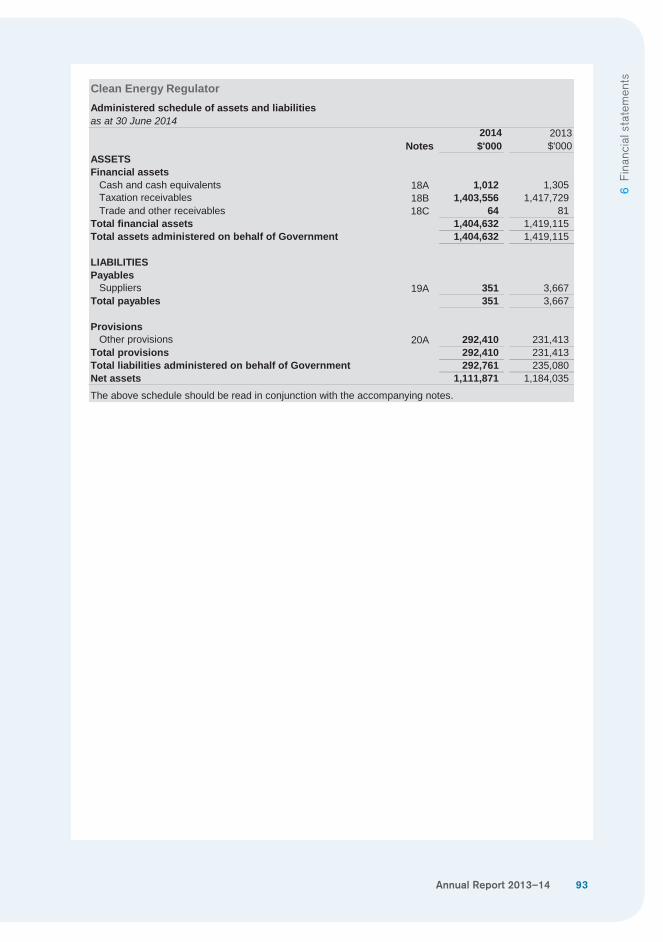
Annual Report 2013–14 93
6 Fi
nanc
ial s
tate
men
ts
Clean Energy RegulatorAdministered schedule of assets and liabilitiesas at 30 June 2014
Notes2014$'000
2013$'000
ASSETSFinancial assets
Cash and cash equivalents 18A 1,012 1,305 Taxation receivables 18B 1,403,556 1,417,729 Trade and other receivables 18C 64 81
Total financial assets 1,404,632 1,419,115 Total assets administered on behalf of Government 1,404,632 1,419,115
LIABILITIESPayables
Suppliers 19A 351 3,667 Total payables 351 3,667
ProvisionsOther provisions 20A 292,410 231,413
Total provisions 292,410 231,413 Total liabilities administered on behalf of Government 292,761 235,080 Net assets 1,111,871 1,184,035
The above schedule should be read in conjunction with the accompanying notes.
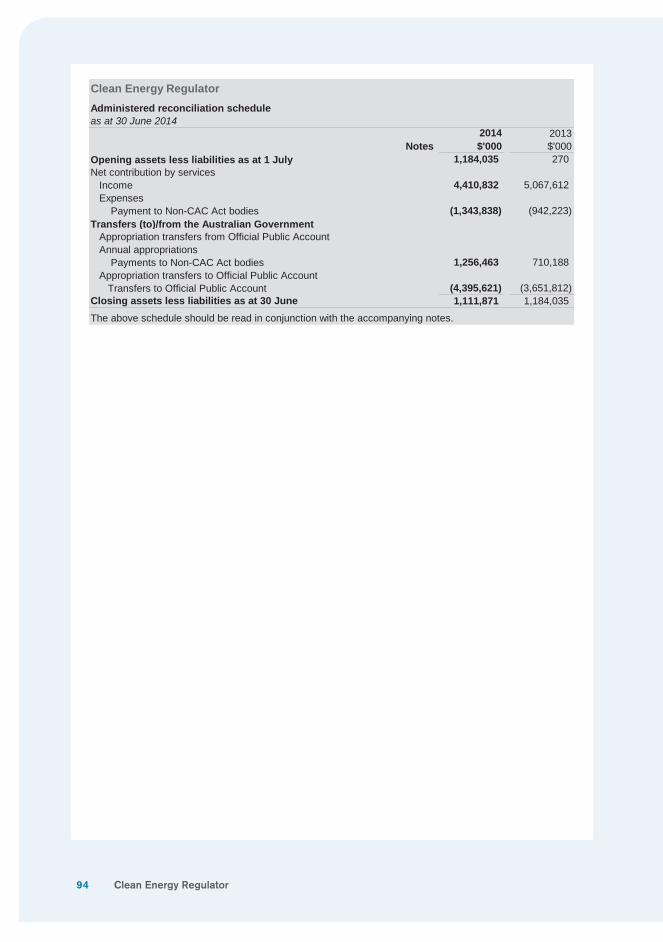
94
Clean Energy RegulatorAdministered reconciliation scheduleas at 30 June 2014
2013$'000
Opening assets less liabilities as at 1 July 1,184,035 270Net contribution by services
Income 4,410,832 5,067,612 Expenses Payment to Non-CAC Act bodies (1,343,838) (942,223)
Transfers (to)/from the Australian GovernmentAppropriation transfers from Official Public AccountAnnual appropriations Payments to Non-CAC Act bodies 1,256,463 710,188 Appropriation transfers to Official Public Account
Transfers to Official Public Account (4,395,621) (3,651,812)Closing assets less liabilities as at 30 June 1,111,871 1,184,035
The above schedule should be read in conjunction with the accompanying notes.
2014$'000Notes
Clean Energy Regulator
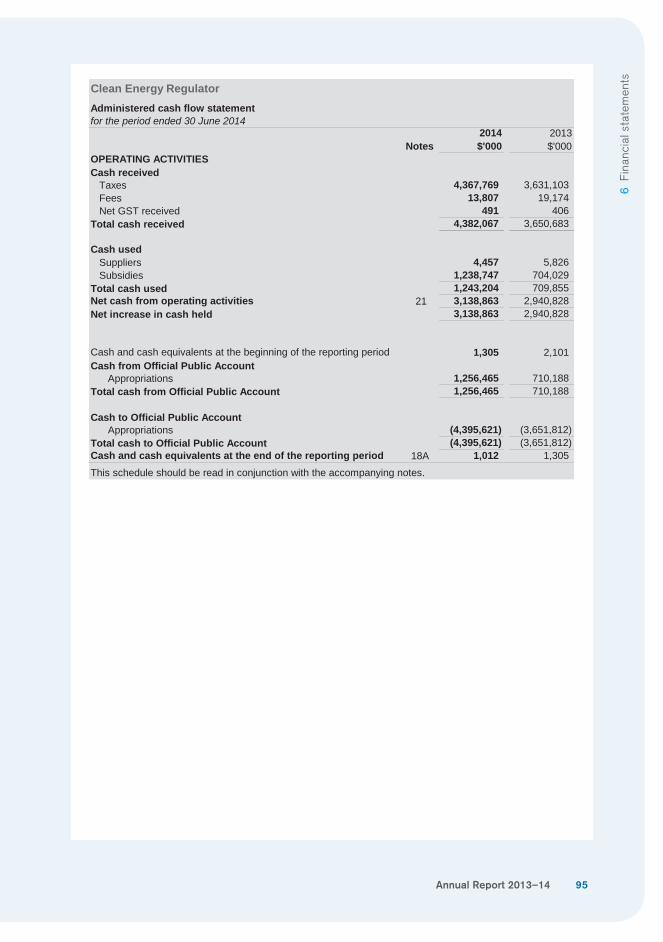
Annual Report 2013–14 95
6 Fi
nanc
ial s
tate
men
ts
Clean Energy RegulatorAdministered cash flow statementfor the period ended 30 June 2014
2013$'000
OPERATING ACTIVITIESCash received
Taxes 4,367,769 3,631,103 Fees 13,807 19,174 Net GST received 491 406
Total cash received 4,382,067 3,650,683
Cash usedSuppliers 4,457 5,826 Subsidies 1,238,747 704,029
Total cash used 1,243,204 709,855 Net cash from operating activities 21 3,138,863 2,940,828 Net increase in cash held 3,138,863 2,940,828
Cash and cash equivalents at the beginning of the reporting period 1,305 2,101 Cash from Official Public Account
Appropriations 1,256,465 710,188 Total cash from Official Public Account 1,256,465 710,188
Cash to Official Public AccountAppropriations (4,395,621) (3,651,812)
Total cash to Official Public Account (4,395,621) (3,651,812)Cash and cash equivalents at the end of the reporting period 18A 1,012 1,305
This schedule should be read in conjunction with the accompanying notes.
2014$'000Notes
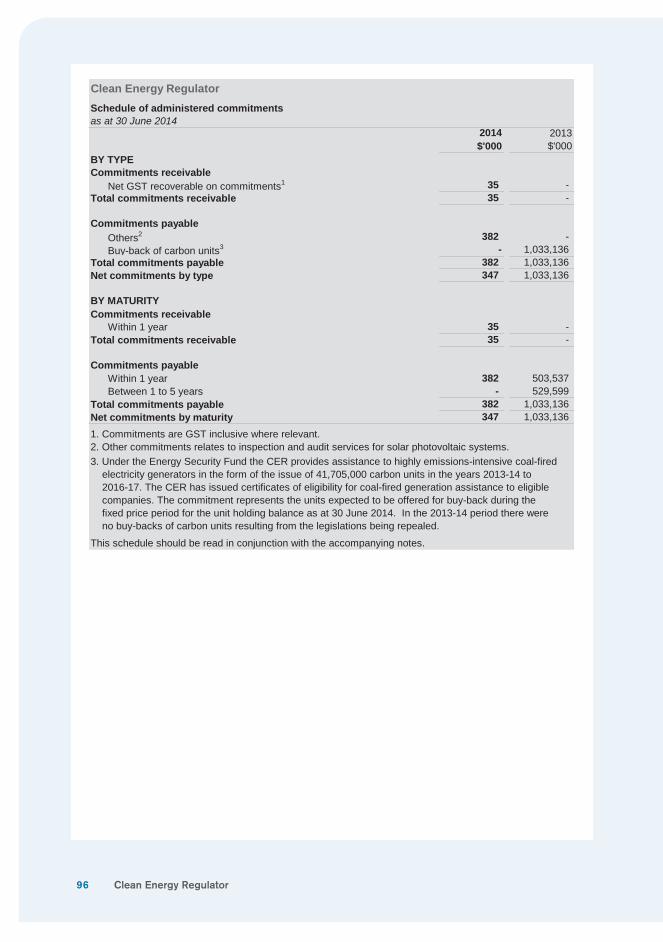
96
Clean Energy RegulatorSchedule of administered commitmentsas at 30 June 2014
2014$'000
2013$'000
BY TYPECommitments receivable
Net GST recoverable on commitments1 35 - Total commitments receivable 35 -
Commitments payableOthers2 382 - Buy-back of carbon units3 - 1,033,136
Total commitments payable 382 1,033,136 Net commitments by type 347 1,033,136
BY MATURITYCommitments receivable
Within 1 year 35 - Total commitments receivable 35 -
Commitments payableWithin 1 year 382 503,537 Between 1 to 5 years - 529,599
Total commitments payable 382 1,033,136 Net commitments by maturity 347 1,033,136
1. Commitments are GST inclusive where relevant.2. Other commitments relates to inspection and audit services for solar photovoltaic systems.
This schedule should be read in conjunction with the accompanying notes.
3. Under the Energy Security Fund the CER provides assistance to highly emissions-intensive coal-fired electricity generators in the form of the issue of 41,705,000 carbon units in the years 2013-14 to 2016-17. The CER has issued certificates of eligibility for coal-fired generation assistance to eligible companies. The commitment represents the units expected to be offered for buy-back during the fixed price period for the unit holding balance as at 30 June 2014. In the 2013-14 period there were no buy-backs of carbon units resulting from the legislations being repealed.
Clean Energy Regulator
Annual Report 2013–14 97
6 Fi
nanc
ial s
tate
men
ts
Clean Energy Regulator
Table of contents - notes
Note 1: Summary of significant accounting policies
Note 2: Events after the reporting period
Note 3: Expenses
Note 4: Own-source income
Note 5: Fair value measurements
Note 6: Financial assets
Note 7: Non-financial assets
Note 8: Payables
Note 9: Provisions
Note 10: Cash flow reconciliation
Note 11: Contingent assets and liabilities
Note 12: Senior executive remuneration
Note 13: Remuneration of auditors
Note 14: Financial instruments
Note 15: Financial assets reconciliation
Note 16: Administered - expenses
Note 17: Administered - income
Note 18: Administered - financial assets
Note 19: Administered - payables
Note 20: Administered - provisions
Note 21: Administered - cash flow reconciliation
Note 22: Administered - contingent assets and liabilities
Note 23: Administered - financial instruments
Note 24: Administered - financial assets reconciliation
Note 25: Appropriations
Note 26: Special accounts
Note 27: Compliance with statutory conditions for payments from the Consolidated Revenue Fund
Note 28: Compensation and debt relief
Note 29: Reporting of outcomes
Note 30: Cost recovery
Note 31: Net cash appropriation arrangements
98 Clean Energy Regulator
Annual Report 2013–14 99
6 Fi
nanc
ial s
tate
men
ts
100 Clean Energy Regulator
Annual Report 2013–14 101
6 Fi
nanc
ial s
tate
men
ts
102 Clean Energy Regulator
Annual Report 2013–14 103
6 Fi
nanc
ial s
tate
men
ts
104 Clean Energy Regulator
Annual Report 2013–14 105
6 Fi
nanc
ial s
tate
men
ts
106 Clean Energy Regulator
Annual Report 2013–14 107
6 Fi
nanc
ial s
tate
men
ts
108
Clean Energy RegulatorStatement of financial positionas at 30 June 2014
Notes 2014$'000
2013$'000
ASSETSFinancial assets
Cash and cash equivalents 6A 306 297Trade and other receivables 6B 24,044 23,373 Other financial assets 6C - 162
Total financial assets 24,350 23,832
Non-financial assetsLand and buildings 7A,C 6,209 7,447 Property, plant and equipment 7B,C 870 950Intangibles 7D,E 37,732 44,266 Other non-financial assets 7F 639 373
Total non-financial assets 45,450 53,036 Total assets 69,800 76,868
LIABILITIESPayables
Suppliers 8A 3,939 11,167 Other payables 8B 1,492 1,342
Total payables 5,431 12,509
ProvisionsEmployee provisions 9A 9,552 9,431 Other provisions 9B 1,827 1,407
Total provisions 11,379 10,838
Total liabilities 16,810 23,347 Net assets 52,990 53,521
EQUITYContributed equity 76,935 65,998 Reserves 3,883 3,581 Accumulated deficit (27,828) (16,058)
Total equity 52,990 53,521
The above statement should be read in conjunction with the accompanying notes.
Clean Energy RegulatorNote 2: Events after the reporting period
Administered
Carbon pricing mechanism
The Clean Energy Legislation (carbon tax repeal) Bill 2014 was passed on 17 July 2014. This abolishes the
carbon pricing mechanism from 1 July 2014.
Liable entities must still meet their carbon price obligations for the 2013-14 financial year. These obligations
include reporting their emissions number to the CER under section 22A of the National Greenhouse and
Energy Reporting Act 2007 by 31 October 2014, and acquitting their final carbon price liability for 2013-14 by
2 February 2015.
The repeal has no effect on reporting obligations for controlling corporations, reporting transfer certificate
holders and responsible members under sections 19, 22G and 22X of the National Greenhouse and Energy
Reporting Act 2007.
The repeal of this legislation will have a significant impact on associated administered revenue, expenses,
assets and liabilities. Transactions associated with the carbon pricing mechanism for 2013-14 will continue to
be processed into the 2014-15 financial year. At the end of the 2014-15 financial year there will be no assets
or liabilities associated with the carbon pricing mechanism, however, some revenues and expenses will be
recognised in relation to the wrap up of accrued revenues, shortfall liabilities, fines and penalties which the
CER is unable to reliably estimate at this time (in accordance with accounting principles and policies outlined
in Note 1.20).
The CER utilises various intangible assets in the administration of the carbon pricing mechanism. The CER
is not in a position to estimate the impact of the repeal on these assets at this stage. An impairment
assessment will be undertaken during 2014-15 as planning for future requirements is finalised and the
possibility of redeploying the assets to another scheme is determined.
There is no impact on staffing levels.
Due to the nature and timing of the repeal, this event has been disclosed here but does not have any other
impact on the Financial Statements for the 2013-14 financial year.
Emissions Reduction Fund
The Emissions Reduction Fund (ERF) is a Government election commitment that will purchase lowest cost
abatement (in the form of Australian carbon credit units) from a wide range of sources, providing an incentive
to businesses, households and landowners to proactively reduce their emissions. On 18 June 2014 the
Government introduced the Carbon Credits (Carbon Farming Initiative) Amendment Bill 2014 (the Bill) into
Parliament.
The ERF will be administered by the Clean Energy Regulator and has been provided for in the Portfolio
Budget Statements for 2014-15. The Government has identified funds of $1,146 million over the forward
estimates for its establishment.
Clean Energy Regulator
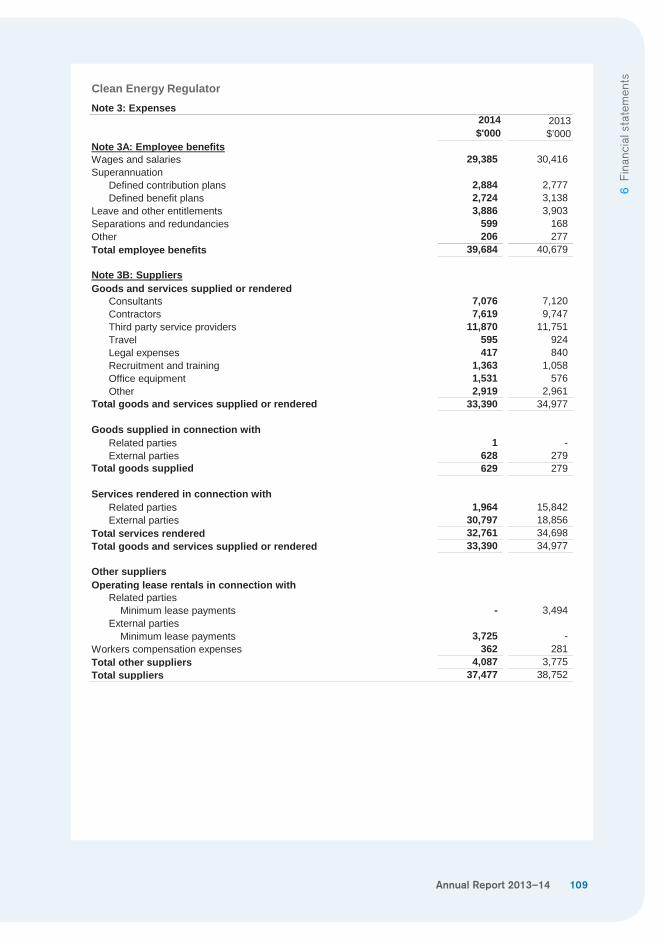
Annual Report 2013–14 109
6 Fi
nanc
ial s
tate
men
ts
Clean Energy RegulatorStatement of financial positionas at 30 June 2014
Notes 2014$'000
2013$'000
ASSETSFinancial assets
Cash and cash equivalents 6A 306 297Trade and other receivables 6B 24,044 23,373 Other financial assets 6C - 162
Total financial assets 24,350 23,832
Non-financial assetsLand and buildings 7A,C 6,209 7,447 Property, plant and equipment 7B,C 870 950Intangibles 7D,E 37,732 44,266 Other non-financial assets 7F 639 373
Total non-financial assets 45,450 53,036 Total assets 69,800 76,868
LIABILITIESPayables
Suppliers 8A 3,939 11,167 Other payables 8B 1,492 1,342
Total payables 5,431 12,509
ProvisionsEmployee provisions 9A 9,552 9,431 Other provisions 9B 1,827 1,407
Total provisions 11,379 10,838
Total liabilities 16,810 23,347 Net assets 52,990 53,521
EQUITYContributed equity 76,935 65,998 Reserves 3,883 3,581 Accumulated deficit (27,828) (16,058)
Total equity 52,990 53,521
The above statement should be read in conjunction with the accompanying notes.
Clean Energy RegulatorNote 3: Expenses
2014$'000
2013$’000
Note 3A: Employee benefitsWages and salaries 29,385 30,416 Superannuation
Defined contribution plans 2,884 2,777 Defined benefit plans 2,724 3,138
Leave and other entitlements 3,886 3,903 Separations and redundancies 599 168Other 206 277Total employee benefits 39,684 40,679
Note 3B: SuppliersGoods and services supplied or rendered
Consultants 7,076 7,120 Contractors 7,619 9,747 Third party service providers 11,870 11,751 Travel 595 924Legal expenses 417 840Recruitment and training 1,363 1,058 Office equipment 1,531 576Other 2,919 2,961
Total goods and services supplied or rendered 33,390 34,977
Goods supplied in connection withRelated parties 1 - External parties 628 279
Total goods supplied 629 279
Services rendered in connection withRelated parties 1,964 15,842 External parties 30,797 18,856
Total services rendered 32,761 34,698 Total goods and services supplied or rendered 33,390 34,977
Other suppliersOperating lease rentals in connection with
Related parties Minimum lease payments - 3,494 External parties Minimum lease payments 3,725 -
Workers compensation expenses 362 281Total other suppliers 4,087 3,775 Total suppliers 37,477 38,752
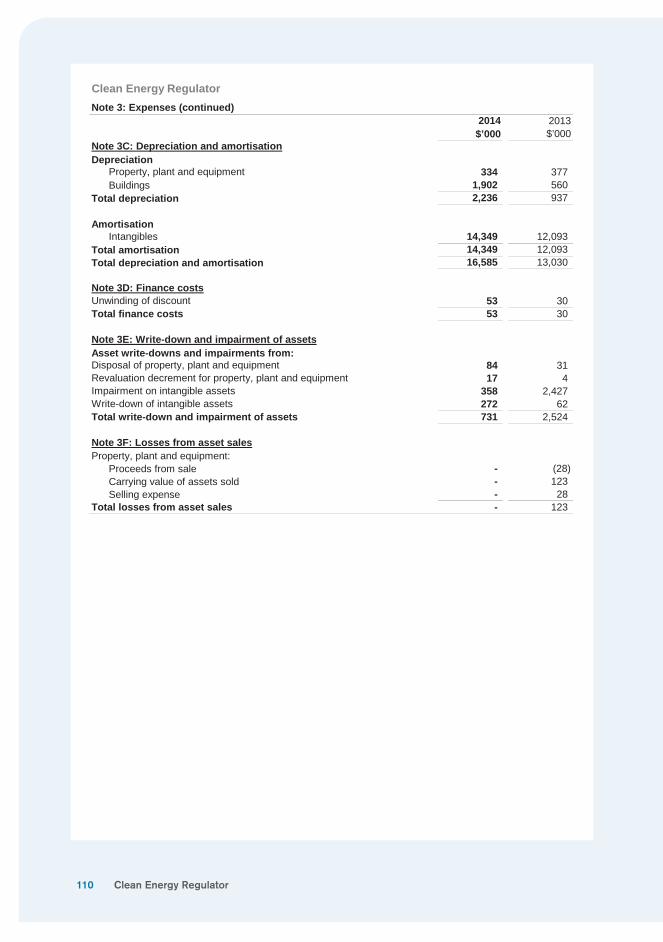
110
Clean Energy RegulatorStatement of financial positionas at 30 June 2014
Notes 2014$'000
2013$'000
ASSETSFinancial assets
Cash and cash equivalents 6A 306 297Trade and other receivables 6B 24,044 23,373 Other financial assets 6C - 162
Total financial assets 24,350 23,832
Non-financial assetsLand and buildings 7A,C 6,209 7,447 Property, plant and equipment 7B,C 870 950Intangibles 7D,E 37,732 44,266 Other non-financial assets 7F 639 373
Total non-financial assets 45,450 53,036 Total assets 69,800 76,868
LIABILITIESPayables
Suppliers 8A 3,939 11,167 Other payables 8B 1,492 1,342
Total payables 5,431 12,509
ProvisionsEmployee provisions 9A 9,552 9,431 Other provisions 9B 1,827 1,407
Total provisions 11,379 10,838
Total liabilities 16,810 23,347 Net assets 52,990 53,521
EQUITYContributed equity 76,935 65,998 Reserves 3,883 3,581 Accumulated deficit (27,828) (16,058)
Total equity 52,990 53,521
The above statement should be read in conjunction with the accompanying notes.
Clean Energy RegulatorNote 3: Expenses (continued)
2014$’000
2013$’000
Note 3C: Depreciation and amortisationDepreciation
Property, plant and equipment 334 377Buildings 1,902 560
Total depreciation 2,236 937
AmortisationIntangibles 14,349 12,093
Total amortisation 14,349 12,093 Total depreciation and amortisation 16,585 13,030
Note 3D: Finance costsUnwinding of discount 53 30Total finance costs 53 30
Note 3E: Write-down and impairment of assetsAsset write-downs and impairments from:Disposal of property, plant and equipment 84 31Revaluation decrement for property, plant and equipment 17 4Impairment on intangible assets 358 2,427 Write-down of intangible assets 272 62Total write-down and impairment of assets 731 2,524
Note 3F: Losses from asset salesProperty, plant and equipment:
Proceeds from sale - (28)Carrying value of assets sold - 123Selling expense - 28
Total losses from asset sales - 123
Clean Energy Regulator
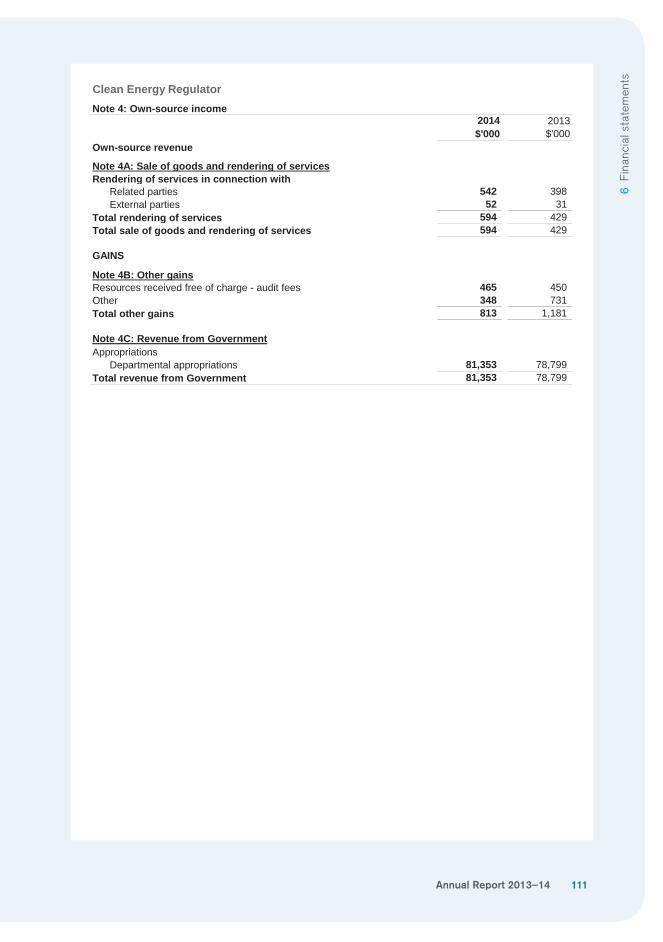
Annual Report 2013–14 111
6 Fi
nanc
ial s
tate
men
ts
Clean Energy RegulatorStatement of financial positionas at 30 June 2014
Notes 2014$'000
2013$'000
ASSETSFinancial assets
Cash and cash equivalents 6A 306 297Trade and other receivables 6B 24,044 23,373 Other financial assets 6C - 162
Total financial assets 24,350 23,832
Non-financial assetsLand and buildings 7A,C 6,209 7,447 Property, plant and equipment 7B,C 870 950Intangibles 7D,E 37,732 44,266 Other non-financial assets 7F 639 373
Total non-financial assets 45,450 53,036 Total assets 69,800 76,868
LIABILITIESPayables
Suppliers 8A 3,939 11,167 Other payables 8B 1,492 1,342
Total payables 5,431 12,509
ProvisionsEmployee provisions 9A 9,552 9,431 Other provisions 9B 1,827 1,407
Total provisions 11,379 10,838
Total liabilities 16,810 23,347 Net assets 52,990 53,521
EQUITYContributed equity 76,935 65,998 Reserves 3,883 3,581 Accumulated deficit (27,828) (16,058)
Total equity 52,990 53,521
The above statement should be read in conjunction with the accompanying notes.
Clean Energy RegulatorNote 4: Own-source income
2014$'000
2013$'000
Own-source revenue
Note 4A: Sale of goods and rendering of servicesRendering of services in connection with
Related parties 542 398External parties 52 31
Total rendering of services 594 429Total sale of goods and rendering of services 594 429
GAINS
Note 4B: Other gainsResources received free of charge - audit fees 465 450Other 348 731Total other gains 813 1,181
Note 4C: Revenue from GovernmentAppropriations
Departmental appropriations 81,353 78,799 Total revenue from Government 81,353 78,799
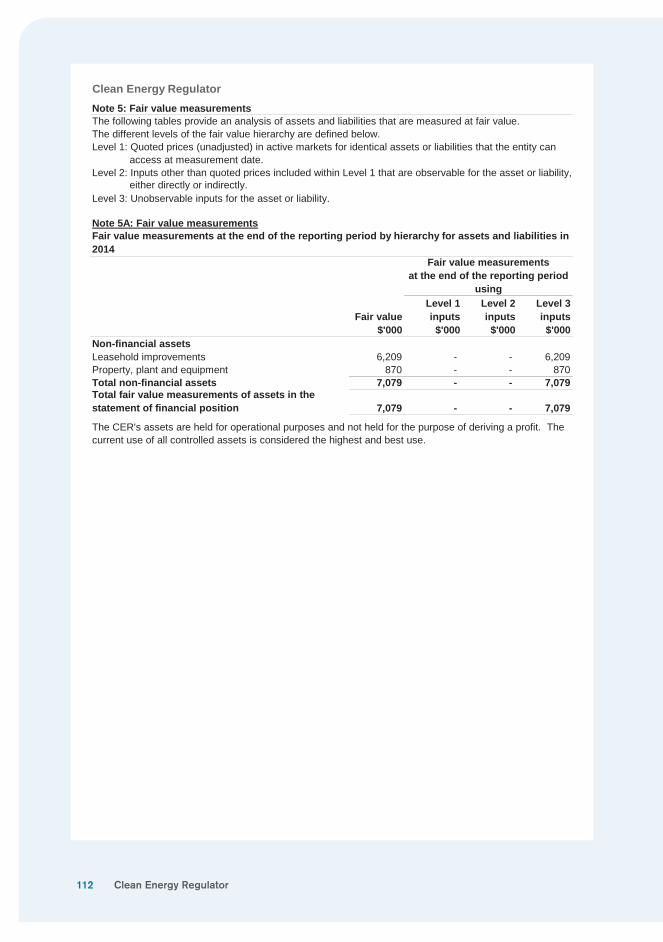
112
Clean Energy RegulatorStatement of financial positionas at 30 June 2014
Notes 2014$'000
2013$'000
ASSETSFinancial assets
Cash and cash equivalents 6A 306 297Trade and other receivables 6B 24,044 23,373 Other financial assets 6C - 162
Total financial assets 24,350 23,832
Non-financial assetsLand and buildings 7A,C 6,209 7,447 Property, plant and equipment 7B,C 870 950Intangibles 7D,E 37,732 44,266 Other non-financial assets 7F 639 373
Total non-financial assets 45,450 53,036 Total assets 69,800 76,868
LIABILITIESPayables
Suppliers 8A 3,939 11,167 Other payables 8B 1,492 1,342
Total payables 5,431 12,509
ProvisionsEmployee provisions 9A 9,552 9,431 Other provisions 9B 1,827 1,407
Total provisions 11,379 10,838
Total liabilities 16,810 23,347 Net assets 52,990 53,521
EQUITYContributed equity 76,935 65,998 Reserves 3,883 3,581 Accumulated deficit (27,828) (16,058)
Total equity 52,990 53,521
The above statement should be read in conjunction with the accompanying notes.
Clean Energy RegulatorNote 5: Fair value measurementsThe following tables provide an analysis of assets and liabilities that are measured at fair value.The different levels of the fair value hierarchy are defined below.Level 1: Quoted prices (unadjusted) in active markets for identical assets or liabilities that the entity can access at measurement date.Level 2: Inputs other than quoted prices included within Level 1 that are observable for the asset or liability,
Level 3: Unobservable inputs for the asset or liability.
Note 5A: Fair value measurements
Non-financial assetsLeasehold improvements 6,209 - - 6,209Property, plant and equipment 870 - - 870Total non-financial assets 7,079 - - 7,079Total fair value measurements of assets in the statement of financial position 7,079 - - 7,079
either directly or indirectly.
Fair value measurements at the end of the reporting period by hierarchy for assets and liabilities in 2014
The CER's assets are held for operational purposes and not held for the purpose of deriving a profit. The current use of all controlled assets is considered the highest and best use.
Fair value measurementsat the end of the reporting period
using
Fair value$'000
Level 1 inputs$'000
Level 2 inputs$'000
Level 3 inputs$'000
Clean Energy Regulator
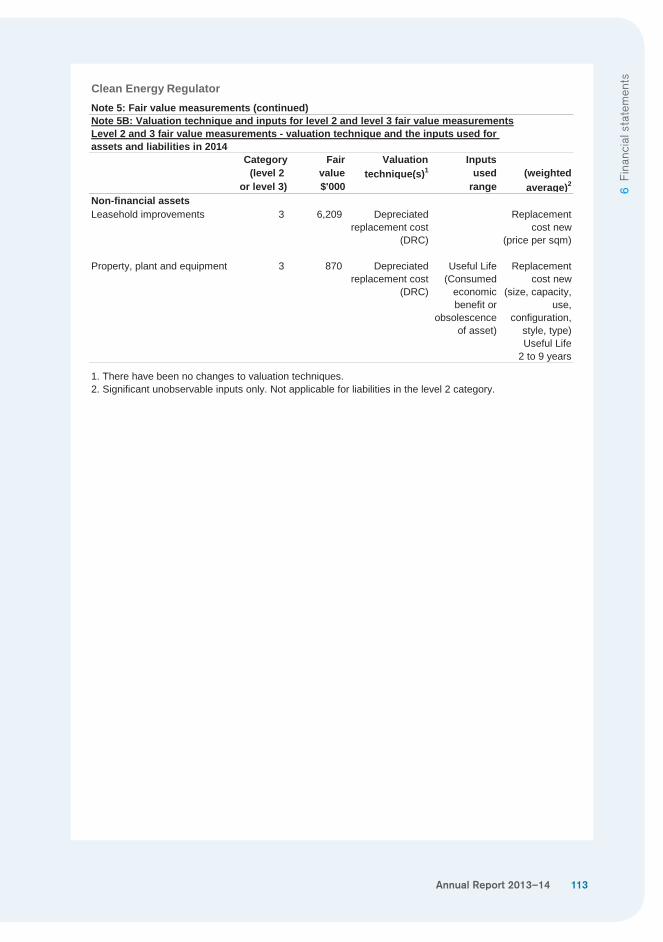
Annual Report 2013–14 113
6 Fi
nanc
ial s
tate
men
ts
Clean Energy RegulatorStatement of financial positionas at 30 June 2014
Notes 2014$'000
2013$'000
ASSETSFinancial assets
Cash and cash equivalents 6A 306 297Trade and other receivables 6B 24,044 23,373 Other financial assets 6C - 162
Total financial assets 24,350 23,832
Non-financial assetsLand and buildings 7A,C 6,209 7,447 Property, plant and equipment 7B,C 870 950Intangibles 7D,E 37,732 44,266 Other non-financial assets 7F 639 373
Total non-financial assets 45,450 53,036 Total assets 69,800 76,868
LIABILITIESPayables
Suppliers 8A 3,939 11,167 Other payables 8B 1,492 1,342
Total payables 5,431 12,509
ProvisionsEmployee provisions 9A 9,552 9,431 Other provisions 9B 1,827 1,407
Total provisions 11,379 10,838
Total liabilities 16,810 23,347 Net assets 52,990 53,521
EQUITYContributed equity 76,935 65,998 Reserves 3,883 3,581 Accumulated deficit (27,828) (16,058)
Total equity 52,990 53,521
The above statement should be read in conjunction with the accompanying notes.
Clean Energy RegulatorNote 5: Fair value measurements (continued)Note 5B: Valuation technique and inputs for level 2 and level 3 fair value measurementsLevel 2 and 3 fair value measurements - valuation technique and the inputs used for assets and liabilities in 2014
Category Fair Valuation Inputs(level 2 value technique(s)1 used (weighted
or level 3) $'000 range average)2
Non-financial assets3 6,209 Depreciated
replacement cost (DRC)
Replacement cost new
(price per sqm)
Property, plant and equipment 3 870 Depreciated replacement cost
(DRC)
Useful Life (Consumed
economic benefit or
obsolescence of asset)
Replacement cost new
(size, capacity, use,
configuration, style, type) Useful Life
2 to 9 years
1. There have been no changes to valuation techniques.2. Significant unobservable inputs only. Not applicable for liabilities in the level 2 category.
Leasehold improvements
114
Clean Energy RegulatorStatement of financial positionas at 30 June 2014
Notes 2014$'000
2013$'000
ASSETSFinancial assets
Cash and cash equivalents 6A 306 297Trade and other receivables 6B 24,044 23,373 Other financial assets 6C - 162
Total financial assets 24,350 23,832
Non-financial assetsLand and buildings 7A,C 6,209 7,447 Property, plant and equipment 7B,C 870 950Intangibles 7D,E 37,732 44,266 Other non-financial assets 7F 639 373
Total non-financial assets 45,450 53,036 Total assets 69,800 76,868
LIABILITIESPayables
Suppliers 8A 3,939 11,167 Other payables 8B 1,492 1,342
Total payables 5,431 12,509
ProvisionsEmployee provisions 9A 9,552 9,431 Other provisions 9B 1,827 1,407
Total provisions 11,379 10,838
Total liabilities 16,810 23,347 Net assets 52,990 53,521
EQUITYContributed equity 76,935 65,998 Reserves 3,883 3,581 Accumulated deficit (27,828) (16,058)
Total equity 52,990 53,521
The above statement should be read in conjunction with the accompanying notes.
Clean Energy Regulator
Note 5: Fair value measurements (continued)Note 5B: Valuation technique and inputs for level 2 and level 3 fair value measurements (continued)Recurring and non-recurring level 3 fair value measurements - valuation processes
Depreciated replacement cost valuation
Recurring level 3 fair value measurements - sensitivity of inputs Leasehold improvements, property, plant and equipment - depreciated replacement cost valuation
Assets that do not transact with enough frequency or transparency to develop objective opinions of the value from observable market evidence have been measured using the Depreciated Replacement Cost (DRC). Under the DRC approach the estimated cost to replace the asset is calculated and then adjusted to take account of its economic useful life and obsolescence (accumulated depreciation). The economic useful lives and asset obsolescence has been determined based on professional judgement regarding physical, economic and external obsolescence factors relevant to the asset.The weighted average is determined by assessing the fair value measurement as a proportion of the total fair value for the class against the total useful life of each asset.
The CER engaged Preston Rowe Paterson to do a comprehensive valuation of all departmental non-financial assets (with the exception of Intangibles) as at 30 June 2014. The CER has a policy to conduct valuations with sufficient frequency to ensure that the carrying amounts of assets do not differ materiality from the assets' fair values as at reporting date. The regularity of independent valuations depend upon the volatility of movements in market values for the relevant assets. Preston Rowe Paterson provided written assurance to the CER the valuation method is in compliance with AASB 13.There is no change in the valuation technique since the prior year.There were no significant inter-relationships between unobservable inputs that materiality affect the fair value.
The following valuation techniques and inputs were applied to the CER's non-financial assets:
The significant unobservable inputs used in the fair value measurement of the CER's leasehold improvements and property, plant and equipment asset classes relate to the economic useful life and asset obsolescence (accumulated depreciation). A significant increase (decrease) in this input would result in a significant lower (higher) fair value measurement. The expected economic useful life may be greater than the CER's useful life for assets and this can contribute to the uncertainty of the unobservable inputs.
Clean Energy Regulator
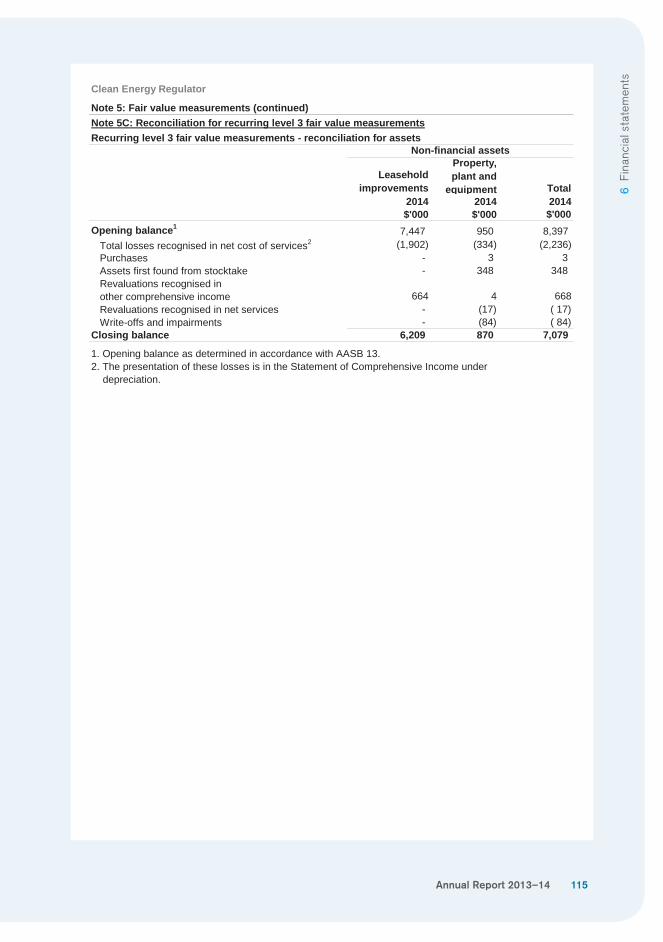
Annual Report 2013–14 115
6 Fi
nanc
ial s
tate
men
ts
Clean Energy RegulatorStatement of financial positionas at 30 June 2014
Notes 2014$'000
2013$'000
ASSETSFinancial assets
Cash and cash equivalents 6A 306 297Trade and other receivables 6B 24,044 23,373 Other financial assets 6C - 162
Total financial assets 24,350 23,832
Non-financial assetsLand and buildings 7A,C 6,209 7,447 Property, plant and equipment 7B,C 870 950Intangibles 7D,E 37,732 44,266 Other non-financial assets 7F 639 373
Total non-financial assets 45,450 53,036 Total assets 69,800 76,868
LIABILITIESPayables
Suppliers 8A 3,939 11,167 Other payables 8B 1,492 1,342
Total payables 5,431 12,509
ProvisionsEmployee provisions 9A 9,552 9,431 Other provisions 9B 1,827 1,407
Total provisions 11,379 10,838
Total liabilities 16,810 23,347 Net assets 52,990 53,521
EQUITYContributed equity 76,935 65,998 Reserves 3,883 3,581 Accumulated deficit (27,828) (16,058)
Total equity 52,990 53,521
The above statement should be read in conjunction with the accompanying notes.
Clean Energy Regulator
Note 5: Fair value measurements (continued)Note 5C: Reconciliation for recurring level 3 fair value measurementsRecurring level 3 fair value measurements - reconciliation for assets
Leasehold improvements
Property, plant and
equipment Total2014 2014 2014$'000 $'000 $'000
Opening balance1 7,447 950 8,397 Total losses recognised in net cost of services2 (1,902) (334) (2,236)Purchases - 3 3Assets first found from stocktake - 348 348Revaluations recognised in other comprehensive income 664 4 668 Revaluations recognised in net services - (17) ( 17)Write-offs and impairments - (84) ( 84)
Closing balance 6,209 870 7,079
1. Opening balance as determined in accordance with AASB 13.2. The presentation of these losses is in the Statement of Comprehensive Income under depreciation.
Non-financial assets
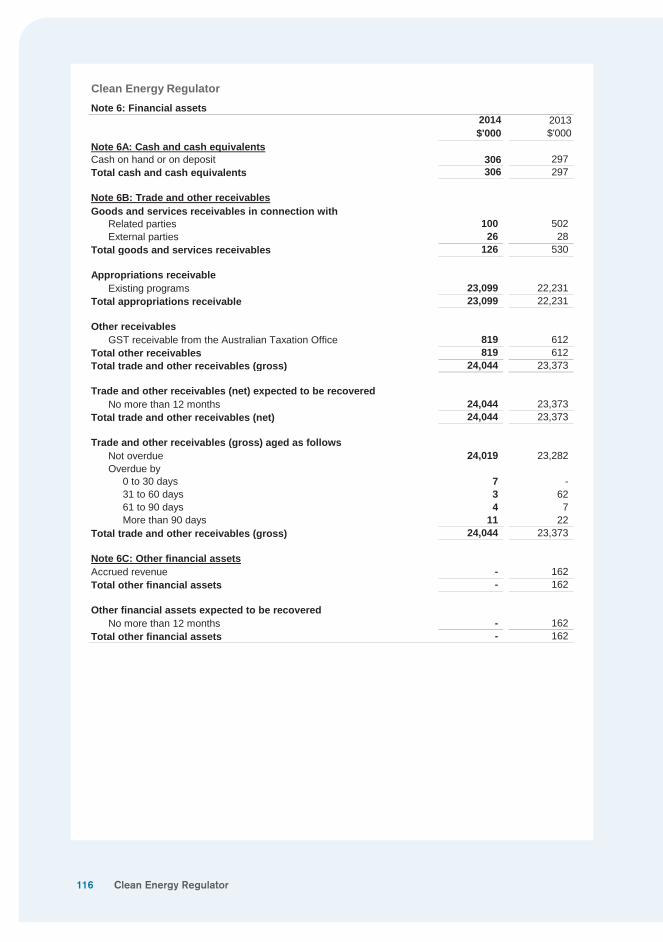
116
Clean Energy RegulatorStatement of financial positionas at 30 June 2014
Notes 2014$'000
2013$'000
ASSETSFinancial assets
Cash and cash equivalents 6A 306 297Trade and other receivables 6B 24,044 23,373 Other financial assets 6C - 162
Total financial assets 24,350 23,832
Non-financial assetsLand and buildings 7A,C 6,209 7,447 Property, plant and equipment 7B,C 870 950Intangibles 7D,E 37,732 44,266 Other non-financial assets 7F 639 373
Total non-financial assets 45,450 53,036 Total assets 69,800 76,868
LIABILITIESPayables
Suppliers 8A 3,939 11,167 Other payables 8B 1,492 1,342
Total payables 5,431 12,509
ProvisionsEmployee provisions 9A 9,552 9,431 Other provisions 9B 1,827 1,407
Total provisions 11,379 10,838
Total liabilities 16,810 23,347 Net assets 52,990 53,521
EQUITYContributed equity 76,935 65,998 Reserves 3,883 3,581 Accumulated deficit (27,828) (16,058)
Total equity 52,990 53,521
The above statement should be read in conjunction with the accompanying notes.
Clean Energy RegulatorNote 6: Financial assets
2014$'000
2013$'000
Note 6A: Cash and cash equivalentsCash on hand or on deposit 306 297Total cash and cash equivalents 306 297
Note 6B: Trade and other receivablesGoods and services receivables in connection with
Related parties 100 502External parties 26 28
Total goods and services receivables 126 530
Appropriations receivableExisting programs 23,099 22,231
Total appropriations receivable 23,099 22,231
Other receivablesGST receivable from the Australian Taxation Office 819 612
Total other receivables 819 612Total trade and other receivables (gross) 24,044 23,373
Trade and other receivables (net) expected to be recoveredNo more than 12 months 24,044 23,373
Total trade and other receivables (net) 24,044 23,373
Trade and other receivables (gross) aged as followsNot overdue 24,019 23,282 Overdue by 0 to 30 days 7 - 31 to 60 days 3 62 61 to 90 days 4 7 More than 90 days 11 22
Total trade and other receivables (gross) 24,044 23,373
Note 6C: Other financial assetsAccrued revenue - 162Total other financial assets - 162
Other financial assets expected to be recoveredNo more than 12 months - 162
Total other financial assets - 162
Clean Energy Regulator
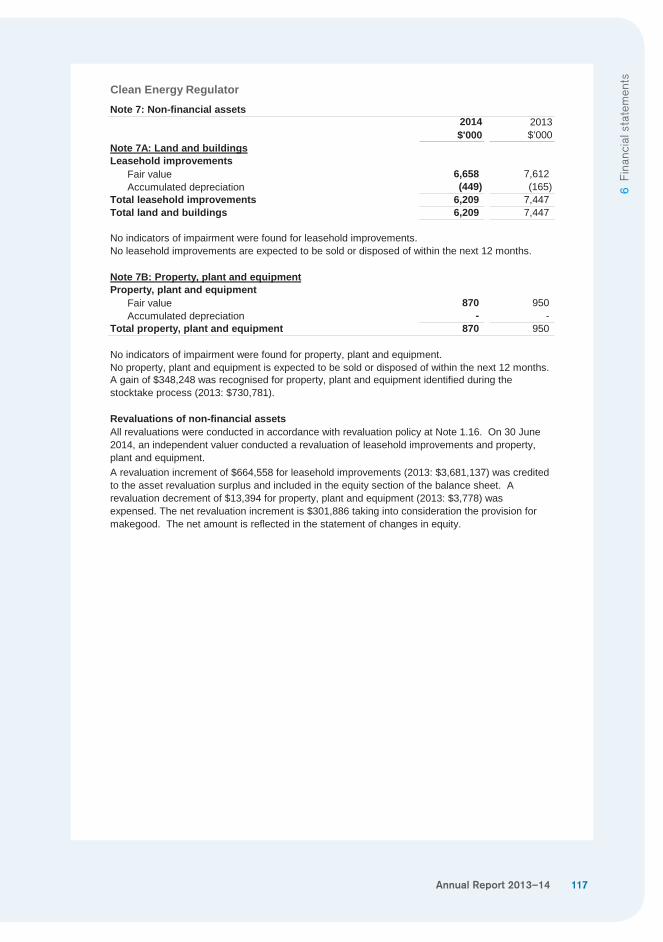
Annual Report 2013–14 117
6 Fi
nanc
ial s
tate
men
ts
Clean Energy RegulatorStatement of financial positionas at 30 June 2014
Notes 2014$'000
2013$'000
ASSETSFinancial assets
Cash and cash equivalents 6A 306 297Trade and other receivables 6B 24,044 23,373 Other financial assets 6C - 162
Total financial assets 24,350 23,832
Non-financial assetsLand and buildings 7A,C 6,209 7,447 Property, plant and equipment 7B,C 870 950Intangibles 7D,E 37,732 44,266 Other non-financial assets 7F 639 373
Total non-financial assets 45,450 53,036 Total assets 69,800 76,868
LIABILITIESPayables
Suppliers 8A 3,939 11,167 Other payables 8B 1,492 1,342
Total payables 5,431 12,509
ProvisionsEmployee provisions 9A 9,552 9,431 Other provisions 9B 1,827 1,407
Total provisions 11,379 10,838
Total liabilities 16,810 23,347 Net assets 52,990 53,521
EQUITYContributed equity 76,935 65,998 Reserves 3,883 3,581 Accumulated deficit (27,828) (16,058)
Total equity 52,990 53,521
The above statement should be read in conjunction with the accompanying notes.
Clean Energy RegulatorNote 7: Non-financial assets
2014$'000
2013$’000
Note 7A: Land and buildingsLeasehold improvements
Fair value 6,658 7,612 Accumulated depreciation (449) (165)
Total leasehold improvements 6,209 7,447 Total land and buildings 6,209 7,447
Note 7B: Property, plant and equipmentProperty, plant and equipment
Fair value 870 950Accumulated depreciation - -
Total property, plant and equipment 870 950
No indicators of impairment were found for property, plant and equipment.No property, plant and equipment is expected to be sold or disposed of within the next 12 months.
No indicators of impairment were found for leasehold improvements.No leasehold improvements are expected to be sold or disposed of within the next 12 months.
All revaluations were conducted in accordance with revaluation policy at Note 1.16. On 30 June 2014, an independent valuer conducted a revaluation of leasehold improvements and property, plant and equipment.A revaluation increment of $664,558 for leasehold improvements (2013: $3,681,137) was credited to the asset revaluation surplus and included in the equity section of the balance sheet. A revaluation decrement of $13,394 for property, plant and equipment (2013: $3,778) was expensed. The net revaluation increment is $301,886 taking into consideration the provision for makegood. The net amount is reflected in the statement of changes in equity.
Revaluations of non-financial assets
A gain of $348,248 was recognised for property, plant and equipment identified during the stocktake process (2013: $730,781).
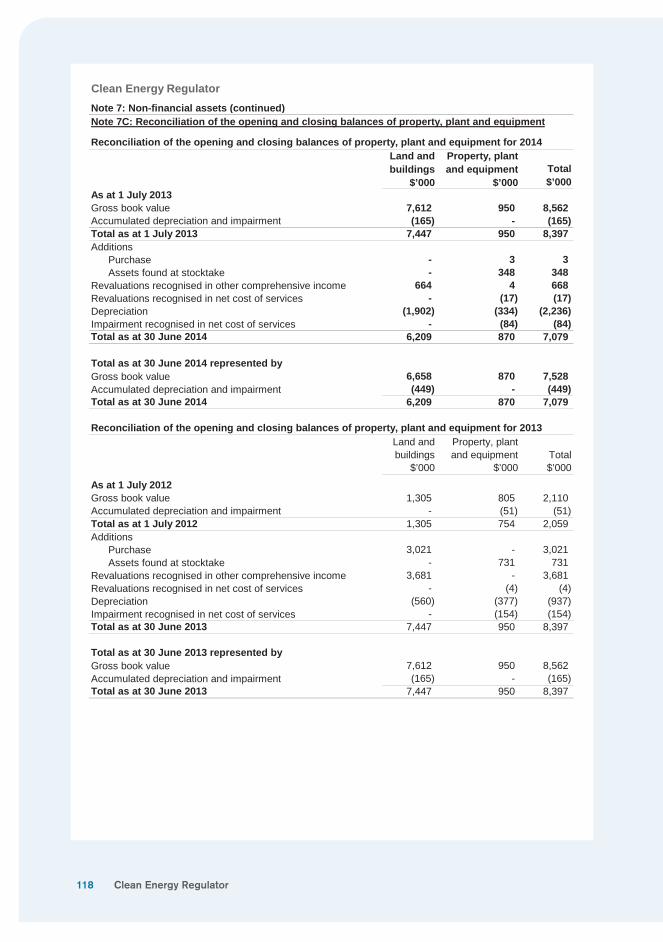
118
Clean Energy RegulatorStatement of financial positionas at 30 June 2014
Notes 2014$'000
2013$'000
ASSETSFinancial assets
Cash and cash equivalents 6A 306 297Trade and other receivables 6B 24,044 23,373 Other financial assets 6C - 162
Total financial assets 24,350 23,832
Non-financial assetsLand and buildings 7A,C 6,209 7,447 Property, plant and equipment 7B,C 870 950Intangibles 7D,E 37,732 44,266 Other non-financial assets 7F 639 373
Total non-financial assets 45,450 53,036 Total assets 69,800 76,868
LIABILITIESPayables
Suppliers 8A 3,939 11,167 Other payables 8B 1,492 1,342
Total payables 5,431 12,509
ProvisionsEmployee provisions 9A 9,552 9,431 Other provisions 9B 1,827 1,407
Total provisions 11,379 10,838
Total liabilities 16,810 23,347 Net assets 52,990 53,521
EQUITYContributed equity 76,935 65,998 Reserves 3,883 3,581 Accumulated deficit (27,828) (16,058)
Total equity 52,990 53,521
The above statement should be read in conjunction with the accompanying notes.
Clean Energy RegulatorNote 7: Non-financial assets (continued)Note 7C: Reconciliation of the opening and closing balances of property, plant and equipment
Reconciliation of the opening and closing balances of property, plant and equipment for 2014Land and buildings
$’000
Property, plant and equipment
$’000Total $’000
As at 1 July 2013Gross book value 7,612 950 8,562 Accumulated depreciation and impairment (165) - (165)Total as at 1 July 2013 7,447 950 8,397 Additions
Purchase - 3 3Assets found at stocktake - 348 348
Revaluations recognised in other comprehensive income 664 4 668Revaluations recognised in net cost of services - (17) (17)Depreciation (1,902) (334) (2,236)Impairment recognised in net cost of services - (84) (84)Total as at 30 June 2014 6,209 870 7,079
Total as at 30 June 2014 represented byGross book value 6,658 870 7,528 Accumulated depreciation and impairment (449) - (449)Total as at 30 June 2014 6,209 870 7,079
Land and buildings
$’000
Property, plantand equipment
$’000Total$’000
As at 1 July 2012Gross book value 1,305 805 2,110 Accumulated depreciation and impairment - (51) (51)Total as at 1 July 2012 1,305 754 2,059 Additions
Purchase 3,021 - 3,021 Assets found at stocktake - 731 731
Revaluations recognised in other comprehensive income 3,681 - 3,681 Revaluations recognised in net cost of services - (4) (4)Depreciation (560) (377) (937)Impairment recognised in net cost of services - (154) (154)Total as at 30 June 2013 7,447 950 8,397
Total as at 30 June 2013 represented byGross book value 7,612 950 8,562 Accumulated depreciation and impairment (165) - (165)Total as at 30 June 2013 7,447 950 8,397
Reconciliation of the opening and closing balances of property, plant and equipment for 2013
Clean Energy Regulator
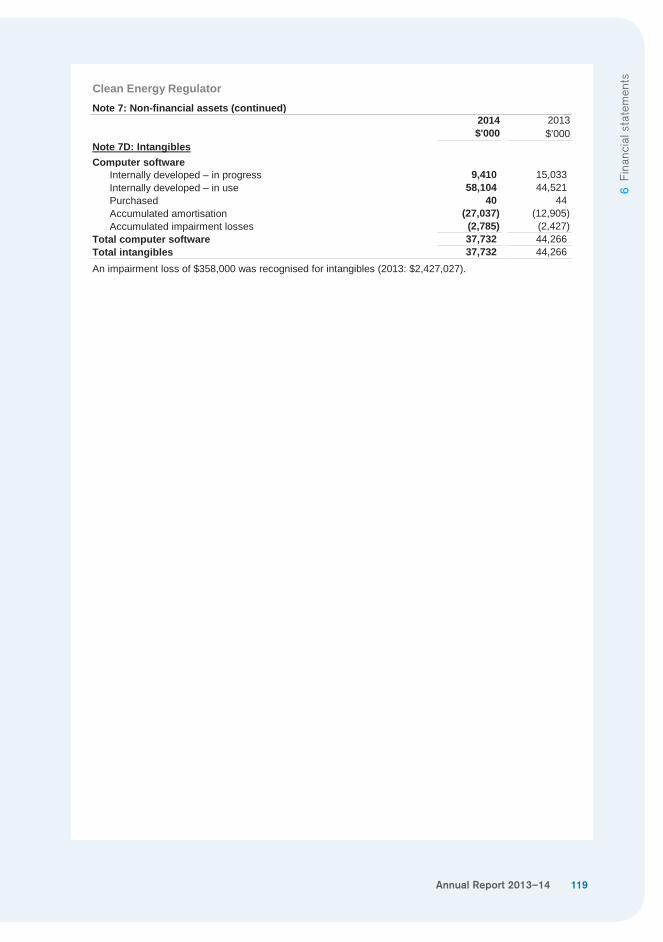
Annual Report 2013–14 119
6 Fi
nanc
ial s
tate
men
ts
Clean Energy RegulatorNote 7: Non-financial assets (continued)
2014 2013$'000 $’000
Note 7D: IntangiblesComputer software
Internally developed – in progress 9,410 15,033 Internally developed – in use 58,104 44,521 Purchased 40 44Accumulated amortisation (27,037) (12,905)Accumulated impairment losses (2,785) (2,427)
Total computer software 37,732 44,266 Total intangibles 37,732 44,266 An impairment loss of $358,000 was recognised for intangibles (2013: $2,427,027).
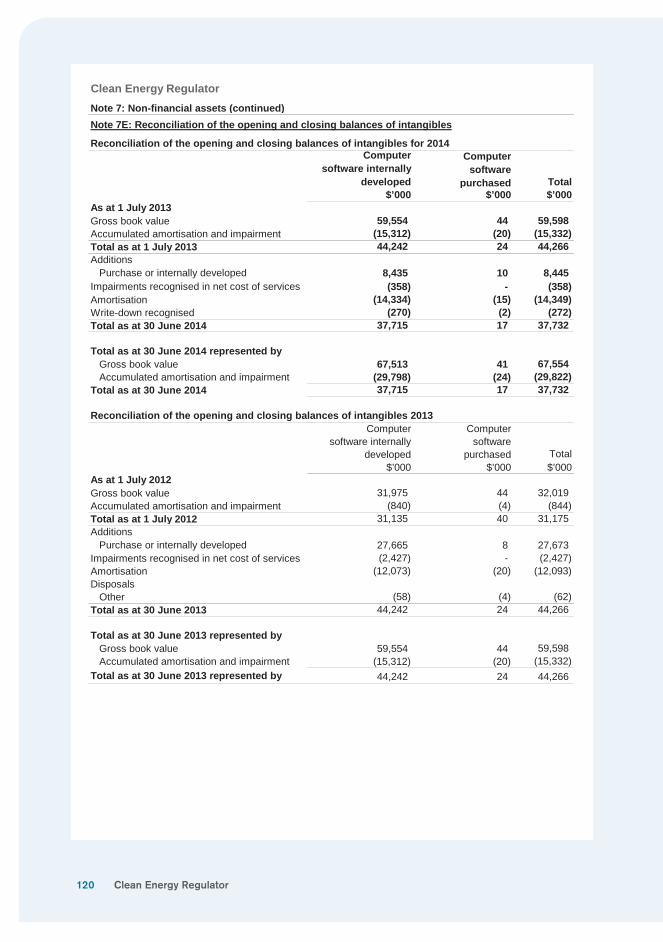
120
Clean Energy RegulatorNote 7: Non-financial assets (continued)Note 7E: Reconciliation of the opening and closing balances of intangibles
Reconciliation of the opening and closing balances of intangibles for 2014Computer
software internally developed
Computersoftware
purchased Total$’000 $’000 $’000
As at 1 July 2013Gross book value 59,554 44 59,598 Accumulated amortisation and impairment (15,312) (20) (15,332)Total as at 1 July 2013 44,242 24 44,266 Additions
Purchase or internally developed 8,435 10 8,445 Impairments recognised in net cost of services (358) - (358)Amortisation (14,334) (15) (14,349)Write-down recognised (270) (2) (272)Total as at 30 June 2014 37,715 17 37,732
Total as at 30 June 2014 represented byGross book value 67,513 41 67,554 Accumulated amortisation and impairment (29,798) (24) (29,822)
Total as at 30 June 2014 37,715 17 37,732
Reconciliation of the opening and closing balances of intangibles 2013Computer
software internally developed
Computersoftware
purchased Total$’000 $’000 $’000
As at 1 July 2012Gross book value 31,975 44 32,019 Accumulated amortisation and impairment (840) (4) (844)Total as at 1 July 2012 31,135 40 31,175 Additions
Purchase or internally developed 27,665 8 27,673 Impairments recognised in net cost of services (2,427) - (2,427)Amortisation (12,073) (20) (12,093)Disposals Other (58) (4) (62)Total as at 30 June 2013 44,242 24 44,266
Total as at 30 June 2013 represented byGross book value 59,554 44 59,598 Accumulated amortisation and impairment (15,312) (20) (15,332)
Total as at 30 June 2013 represented by 44,242 24 44,266
Clean Energy Regulator
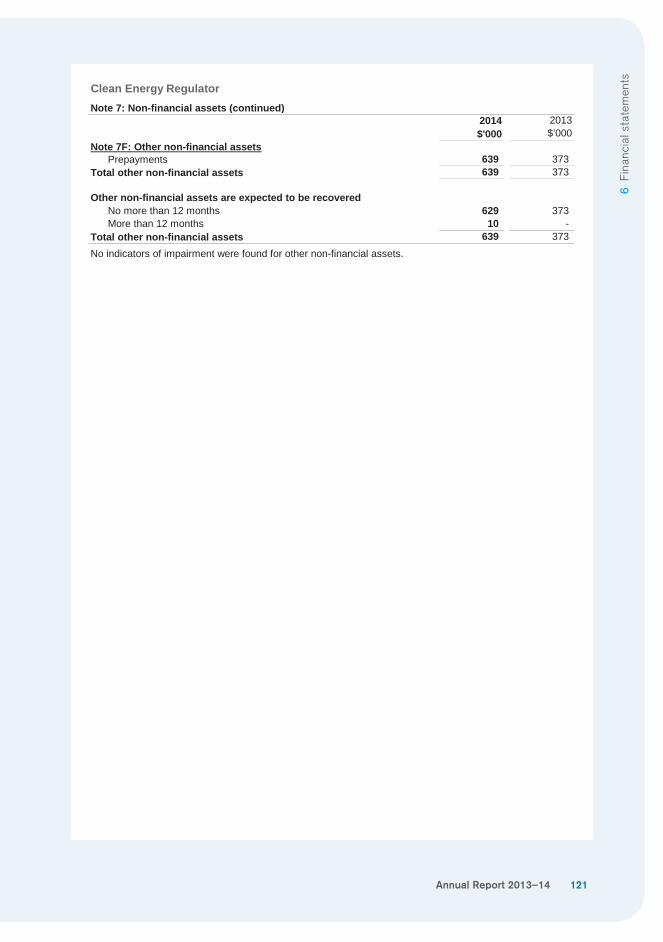
Annual Report 2013–14 121
6 Fi
nanc
ial s
tate
men
ts
Clean Energy RegulatorNote 7: Non-financial assets (continued)
2014$'000
2013$’000
Note 7F: Other non-financial assetsPrepayments 639 373
Total other non-financial assets 639 373
Other non-financial assets are expected to be recoveredNo more than 12 months 629 373More than 12 months 10 -
Total other non-financial assets 639 373
No indicators of impairment were found for other non-financial assets.
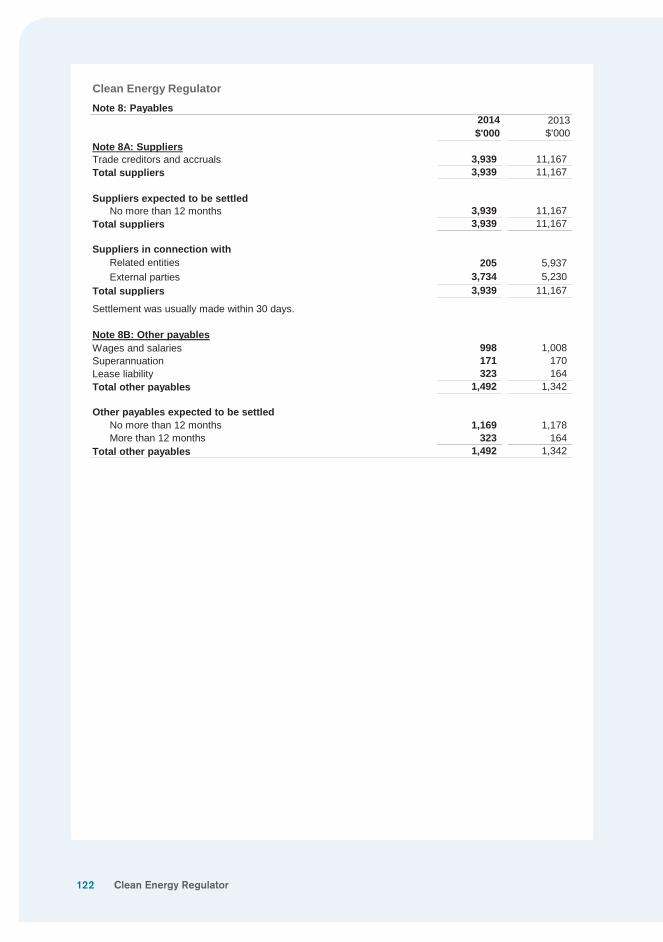
122
Clean Energy RegulatorNote 8: Payables
2014$'000
2013$’000
Note 8A: SuppliersTrade creditors and accruals 3,939 11,167 Total suppliers 3,939 11,167
Suppliers expected to be settledNo more than 12 months 3,939 11,167
Total suppliers 3,939 11,167
Suppliers in connection withRelated entities 205 5,937 External parties 3,734 5,230
Total suppliers 3,939 11,167
Settlement was usually made within 30 days.
Note 8B: Other payablesWages and salaries 998 1,008 Superannuation 171 170Lease liability 323 164Total other payables 1,492 1,342
Other payables expected to be settledNo more than 12 months 1,169 1,178 More than 12 months 323 164
Total other payables 1,492 1,342
Clean Energy Regulator
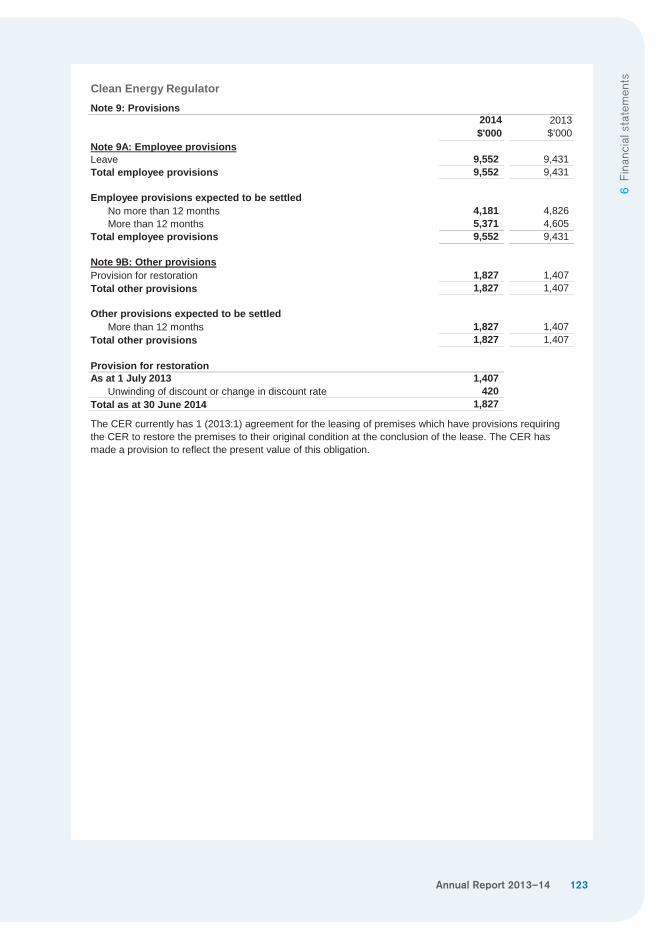
Annual Report 2013–14 123
6 Fi
nanc
ial s
tate
men
ts
Clean Energy RegulatorNote 9: Provisions
2014$'000
2013$’000
Note 9A: Employee provisionsLeave 9,552 9,431 Total employee provisions 9,552 9,431
Employee provisions expected to be settledNo more than 12 months 4,181 4,826 More than 12 months 5,371 4,605
Total employee provisions 9,552 9,431
Note 9B: Other provisionsProvision for restoration 1,827 1,407 Total other provisions 1,827 1,407
Other provisions expected to be settledMore than 12 months 1,827 1,407
Total other provisions 1,827 1,407
Provision for restorationAs at 1 July 2013 1,407
Unwinding of discount or change in discount rate 420Total as at 30 June 2014 1,827
The CER currently has 1 (2013:1) agreement for the leasing of premises which have provisions requiring the CER to restore the premises to their original condition at the conclusion of the lease. The CER has made a provision to reflect the present value of this obligation.
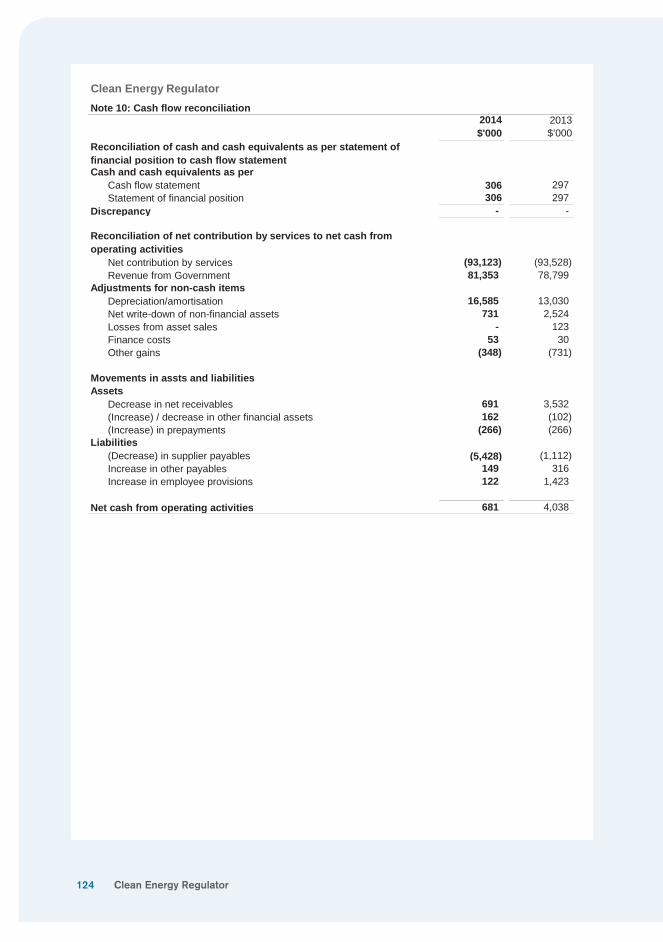
124
Clean Energy RegulatorNote 10: Cash flow reconciliation
2014$'000
2013$’000
Reconciliation of cash and cash equivalents as per statement of financial position to cash flow statementCash and cash equivalents as per
Cash flow statement 306 297Statement of financial position 306 297
Discrepancy - -
Reconciliation of net contribution by services to net cash from operating activities
Net contribution by services (93,123) (93,528)Revenue from Government 81,353 78,799
Adjustments for non-cash itemsDepreciation/amortisation 16,585 13,030 Net write-down of non-financial assets 731 2,524 Losses from asset sales - 123Finance costs 53 30Other gains (348) (731)
Movements in assts and liabilitiesAssets
Decrease in net receivables 691 3,532 (Increase) / decrease in other financial assets 162 (102)(Increase) in prepayments (266) (266)
Liabilities(Decrease) in supplier payables (5,428) (1,112)Increase in other payables 149 316Increase in employee provisions 122 1,423
Net cash from operating activities 681 4,038
Clean Energy Regulator
Annual Report 2013–14 125
6 Fi
nanc
ial s
tate
men
ts
Clean Energy RegulatorNote 11: Contingent assets and liabilitiesQuantifiable contingenciesThere were no quantifiable contingent assets or liabilities as at 30 June 2014 (2013: Nil).
Unquantifiable contingenciesThere were no unquantifiable contingent assets or liabilities as at 30 June 2014 (2013: Nil).
Significant remote contingenciesThere were no significant remote contingent assets or liabilities as at 30 June 2014 (2013: Nil).
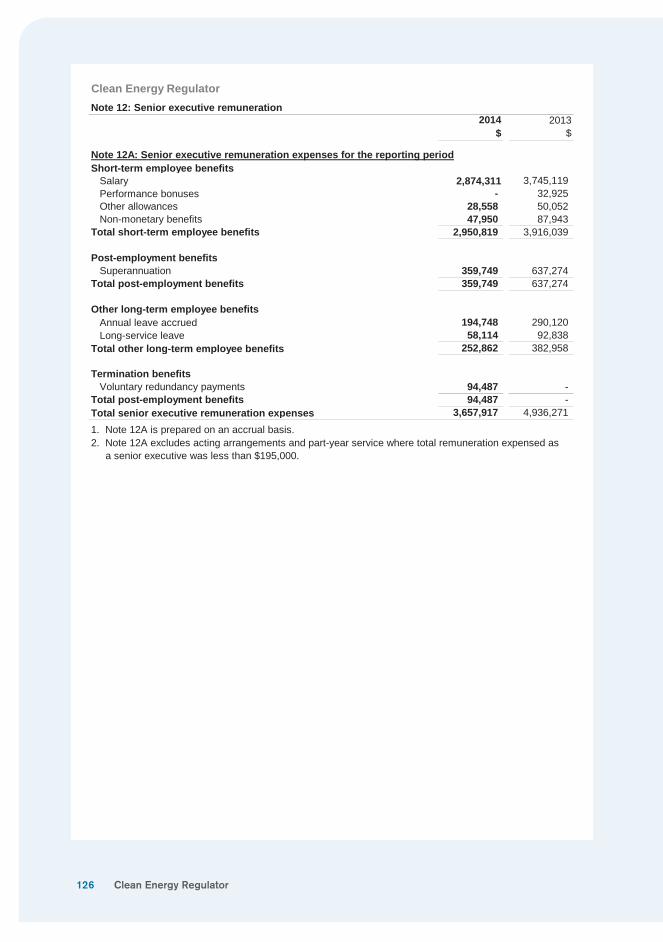
126
Clean Energy RegulatorNote 12: Senior executive remuneration
2014$
2013$
Note 12A: Senior executive remuneration expenses for the reporting periodShort-term employee benefits
Salary 2,874,311 3,745,119 Performance bonuses - 32,925 Other allowances 28,558 50,052 Non-monetary benefits 47,950 87,943
Total short-term employee benefits 2,950,819 3,916,039
Post-employment benefitsSuperannuation 359,749 637,274
Total post-employment benefits 359,749 637,274
Other long-term employee benefitsAnnual leave accrued 194,748 290,120 Long-service leave 58,114 92,838
Total other long-term employee benefits 252,862 382,958
Termination benefitsVoluntary redundancy payments 94,487 -
Total post-employment benefits 94,487 - Total senior executive remuneration expenses 3,657,917 4,936,271
1. Note 12A is prepared on an accrual basis.2. Note 12A excludes acting arrangements and part-year service where total remuneration expensed as a senior executive was less than $195,000.
Clean Energy Regulator
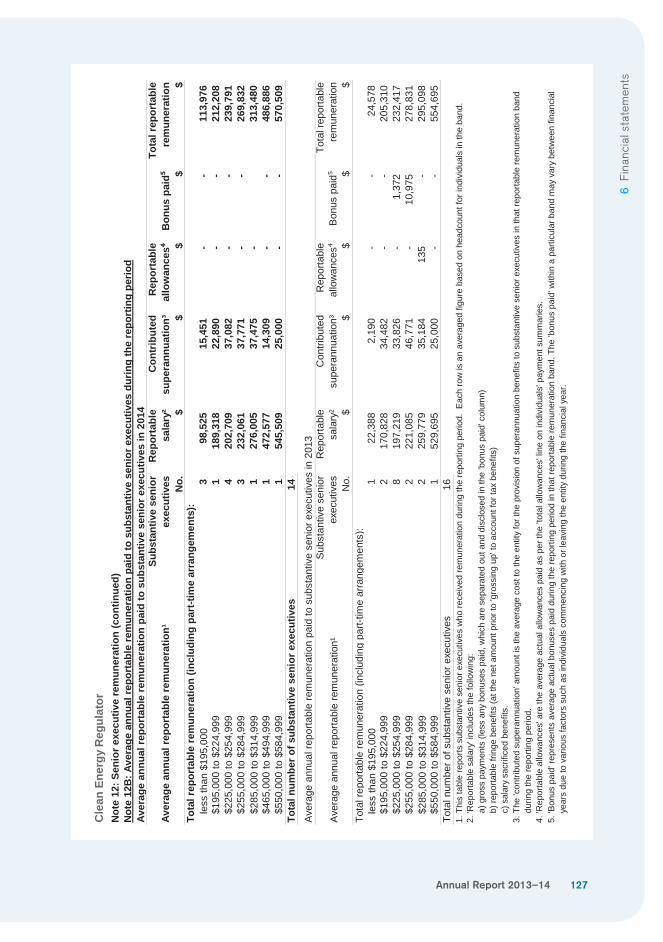
Annual Report 2013–14 127
6 Fi
nanc
ial s
tate
men
ts
Cle
an E
nerg
y R
egul
ator
Not
e 12
B: A
vera
ge a
nnua
l rep
orta
ble
rem
uner
atio
n pa
id to
sub
stan
tive
seni
or e
xecu
tives
dur
ing
the
repo
rtin
g pe
riod
Aver
age
annu
al re
port
able
rem
uner
atio
n pa
id to
sub
stan
tive
seni
or e
xecu
tives
in 2
014
Aver
age
annu
al re
port
able
rem
uner
atio
n¹Su
bsta
ntiv
e se
nior
exec
utiv
es No.
Rep
orta
ble
sala
ry² $
Con
trib
uted
su
pera
nnua
tion³ $
Rep
orta
ble
allo
wan
ces $
Bon
us p
aid $
Tota
l rep
orta
ble
rem
uner
atio
n $To
tal r
epor
tabl
e re
mun
erat
ion
(incl
udin
g pa
rt-ti
me
arra
ngem
ents
):le
ss th
an $
195,
000
398
,525
15
,451
-
- 11
3,97
6 $1
95,0
00 to
$22
4,99
91
189,
318
22,8
90
- -
212,
208
$225
,000
to $
254,
999
420
2,70
9 37
,082
-
- 23
9,79
1 $2
55,0
00 to
$28
4,99
93
232,
061
37,7
71
- -
269,
832
$285
,000
to $
314,
999
127
6,00
5 37
,475
-
313,
480
$465
,000
to $
494,
999
147
2,57
7 14
,309
-
- 48
6,88
6 $5
50,0
00 to
$58
4,99
91
545,
509
25,0
00
- -
570,
509
Tota
l num
ber o
f sub
stan
tive
seni
or e
xecu
tives
14A
vera
ge a
nnua
l rep
orta
ble
rem
uner
atio
n pa
id to
sub
stan
tive
seni
or e
xecu
tives
in 2
013
Ave
rage
ann
ual r
epor
tabl
e re
mun
erat
ion¹
Sub
stan
tive
seni
orex
ecut
ives No.
Rep
orta
ble
sala
ry² $
Con
tribu
ted
supe
rann
uatio
n³ $
Rep
orta
ble
allo
wan
ces $
Bon
us p
aid $
Tota
l rep
orta
ble
rem
uner
atio
n $To
tal r
epor
tabl
e re
mun
erat
ion
(incl
udin
g pa
rt-tim
e ar
rang
emen
ts):
less
than
$19
5,00
01
22,3
88
2,19
0 -
- 24
,578
$1
95,0
00 to
$22
4,99
92
170,
828
34,4
82
- -
205,
310
$225
,000
to $
254,
999
819
7,21
9 33
,826
-
1,37
2 23
2,41
7 $2
55,0
00 to
$28
4,99
92
221,
085
46,7
71
- 10
,975
27
8,83
1 $2
85,0
00 to
$31
4,99
92
259,
779
35,1
84
135
- 29
5,09
8 $5
50,0
00 to
$58
4,99
91
529,
695
25,0
00
- -
554,
695
Tota
l num
ber o
f sub
stan
tive
seni
or e
xecu
tives
16
5. 'B
onus
pai
d' re
pres
ents
ave
rage
act
ual b
onus
es p
aid
durin
g th
e re
porti
ng p
erio
d in
that
repo
rtabl
e re
mun
erat
ion
band
. The
'bon
us p
aid'
with
in a
par
ticul
ar b
and
may
var
y be
twee
n fin
anci
al
y
ears
due
to v
ario
us fa
ctor
s su
ch a
s in
divi
dual
s co
mm
enci
ng w
ith o
r lea
ving
the
entit
y du
ring
the
finan
cial
yea
r.
Not
e 12
: Sen
ior e
xecu
tive
rem
uner
atio
n (c
ontin
ued)
1. T
his
tabl
e re
ports
sub
stan
tive
seni
or e
xecu
tives
who
rece
ived
rem
uner
atio
n du
ring
the
repo
rting
per
iod.
Eac
h ro
w is
an
aver
aged
figu
re b
ased
on
head
coun
t for
indi
vidu
als
in th
e ba
nd.
2. 'R
epor
tabl
e sa
lary
' inc
lude
s th
e fo
llow
ing:
a) g
ross
pay
men
ts (l
ess
any
bonu
ses
paid
, whi
ch a
re s
epar
ated
out
and
dis
clos
ed in
the
'bon
us p
aid'
col
umn)
b
) rep
orta
ble
fring
e be
nefit
s (a
t the
net
am
ount
prio
r to
'gro
ssin
g up
' to
acco
unt f
or ta
x be
nefit
s)
c) s
alar
y sa
crifi
ced
bene
fits.
3. T
he 'c
ontri
bute
d su
pera
nnua
tion'
am
ount
is th
e av
erag
e co
st to
the
entit
y fo
r the
pro
visi
on o
f sup
eran
nuat
ion
bene
fits
to s
ubst
antiv
e se
nior
exe
cutiv
es in
that
repo
rtabl
e re
mun
erat
ion
band
dur
ing
the
repo
rting
per
iod.
4.
'Rep
orta
ble
allo
wan
ces'
are
the
aver
age
actu
al a
llow
ance
s pa
id a
s pe
r the
'tot
al a
llow
ance
s' li
ne o
n in
divi
dual
s' p
aym
ent s
umm
arie
s.
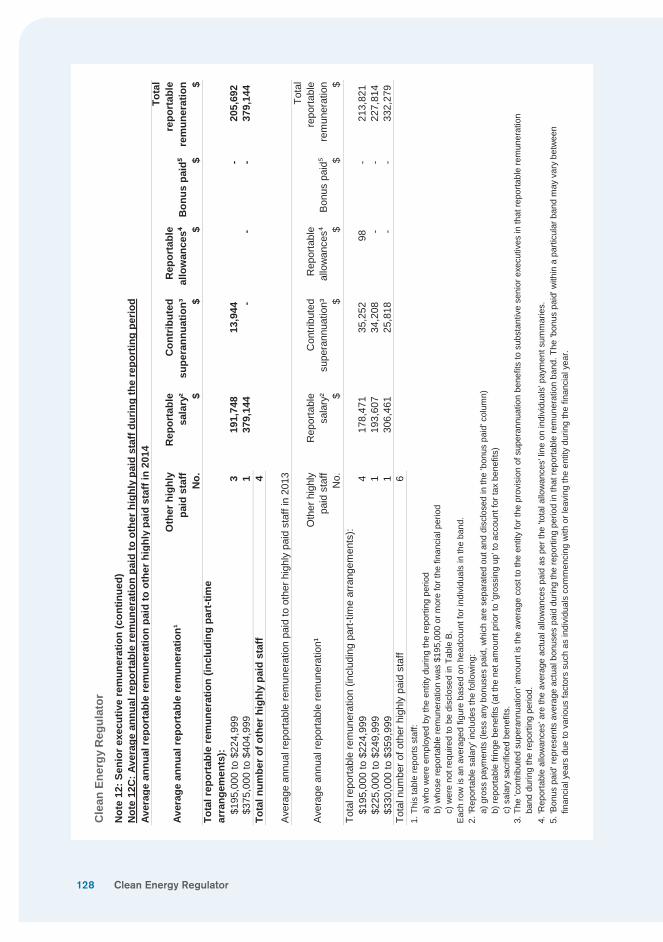
128
Cle
an E
nerg
y R
egul
ator
Not
e 12
: Sen
ior e
xecu
tive
rem
uner
atio
n (c
ontin
ued)
Not
e 12
C: A
vera
ge a
nnua
l rep
orta
ble
rem
uner
atio
n pa
id to
oth
er h
ighl
y pa
id s
taff
durin
g th
e re
port
ing
perio
dAv
erag
e an
nual
repo
rtab
le re
mun
erat
ion
paid
to o
ther
hig
hly
paid
sta
ff in
201
4
Aver
age
annu
al re
port
able
rem
uner
atio
n¹O
ther
hig
hly
paid
sta
ffN
o.
Rep
orta
ble
sala
ry² $
Con
trib
uted
su
pera
nnua
tion³ $
Rep
orta
ble
allo
wan
ces $
Bon
us p
aid $
Tota
l re
port
able
re
mun
erat
ion $
Tota
l rep
orta
ble
rem
uner
atio
n (in
clud
ing
part
-tim
e ar
rang
emen
ts):
$195
,000
to $
224,
999
319
1,74
8 13
,944
-
205,
692
$375
,000
to $
404,
999
137
9,14
4 -
- -
379,
144
Tota
l num
ber o
f oth
er h
ighl
y pa
id s
taff
4
Ave
rage
ann
ual r
epor
tabl
e re
mun
erat
ion
paid
to o
ther
hig
hly
paid
sta
ff in
201
3
Ave
rage
ann
ual r
epor
tabl
e re
mun
erat
ion¹
Oth
er h
ighl
y pa
id s
taff
No.
Rep
orta
ble
sala
ry² $
Con
tribu
ted
supe
rann
uatio
n³ $
Rep
orta
ble
allo
wan
ces $
Bon
us p
aid $
Tota
lre
porta
ble
rem
uner
atio
n $To
tal r
epor
tabl
e re
mun
erat
ion
(incl
udin
g pa
rt-tim
e ar
rang
emen
ts):
$195
,000
to $
224,
999
417
8,47
1 35
,252
98
- 21
3,82
1 $2
25,0
00 to
$24
9,99
91
193,
607
34,2
08
- -
227,
814
$330
,000
to $
359,
999
130
6,46
1 25
,818
-
- 33
2,27
9 To
tal n
umbe
r of o
ther
hig
hly
paid
sta
ff6
3. T
he 'c
ontri
bute
d su
pera
nnua
tion'
am
ount
is th
e av
erag
e co
st to
the
entit
y fo
r the
pro
visi
on o
f sup
eran
nuat
ion
bene
fits
to s
ubst
antiv
e se
nior
exe
cutiv
es in
that
repo
rtabl
e re
mun
erat
ion
b
and
durin
g th
e re
porti
ng p
erio
d.
4. 'R
epor
tabl
e al
low
ance
s' a
re th
e av
erag
e ac
tual
allo
wan
ces
paid
as
per t
he 't
otal
allo
wan
ces'
line
on
indi
vidu
als'
pay
men
t sum
mar
ies.
5. 'B
onus
pai
d' re
pres
ents
ave
rage
act
ual b
onus
es p
aid
durin
g th
e re
porti
ng p
erio
d in
that
repo
rtabl
e re
mun
erat
ion
band
. The
'bon
us p
aid'
with
in a
par
ticul
ar b
and
may
var
y be
twee
n
fina
ncia
l yea
rs d
ue to
var
ious
fact
ors
such
as
indi
vidu
als
com
men
cing
with
or l
eavi
ng th
e en
tity
durin
g th
e fin
anci
al y
ear.
1. T
his
tabl
e re
ports
sta
ff:
a
) who
wer
e em
ploy
ed b
y th
e en
tity
durin
g th
e re
porti
ng p
erio
d
b) w
hose
repo
rtabl
e re
mun
erat
ion
was
$19
5,00
0 or
mor
e fo
r the
fina
ncia
l per
iod
c
) wer
e no
t req
uire
d to
be
disc
lose
d in
Tab
le B
.E
ach
row
is a
n av
erag
ed fi
gure
bas
ed o
n he
adco
unt f
or in
divi
dual
s in
the
band
.2.
'Rep
orta
ble
sala
ry' i
nclu
des
the
follo
win
g:
a
) gro
ss p
aym
ents
(les
s an
y bo
nuse
s pa
id, w
hich
are
sep
arat
ed o
ut a
nd d
iscl
osed
in th
e 'b
onus
pai
d' c
olum
n)
b) r
epor
tabl
e fri
nge
bene
fits
(at t
he n
et a
mou
nt p
rior t
o 'g
ross
ing
up' t
o ac
coun
t for
tax
bene
fits)
c
) sal
ary
sacr
ifice
d be
nefit
s.
Clean Energy Regulator
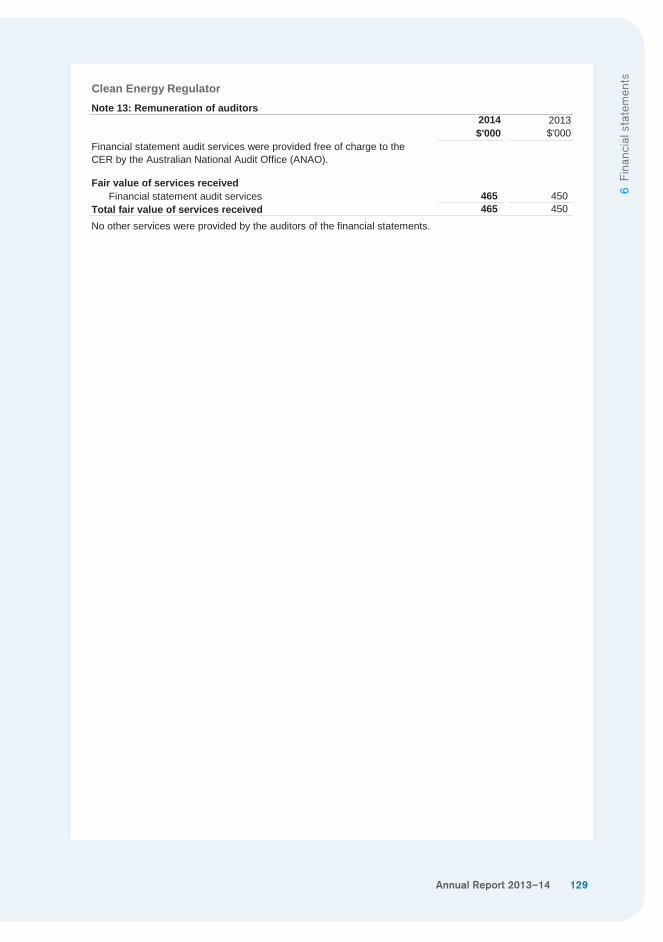
Annual Report 2013–14 129
6 Fi
nanc
ial s
tate
men
ts
Clean Energy RegulatorNote 13: Remuneration of auditors
2014$'000
2013$'000
Financial statement audit services were provided free of charge to theCER by the Australian National Audit Office (ANAO).
Fair value of services receivedFinancial statement audit services 465 450
Total fair value of services received 465 450
No other services were provided by the auditors of the financial statements.
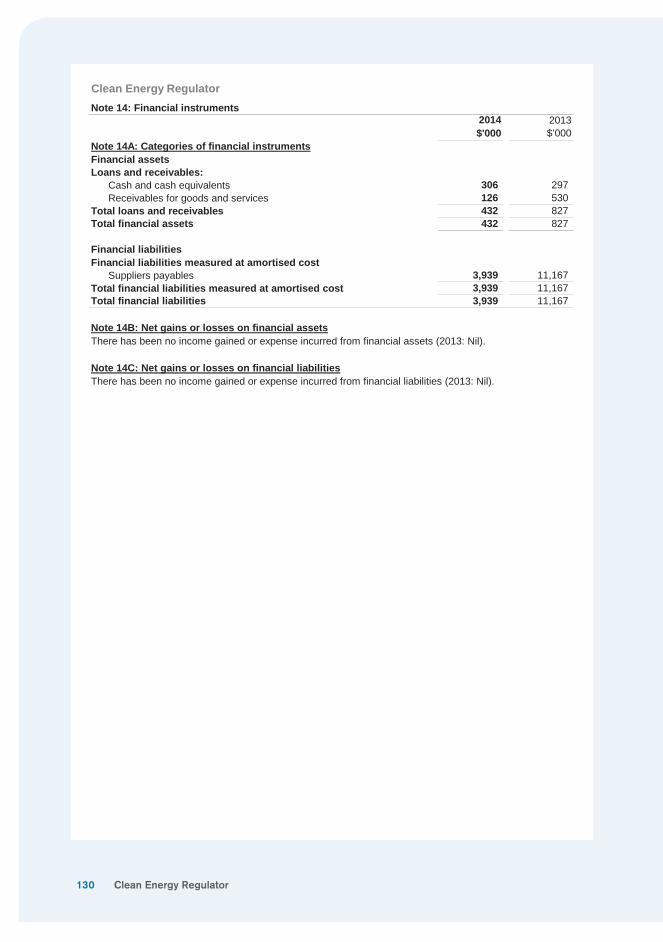
130
Clean Energy RegulatorNote 14: Financial instruments
2014$'000
2013$’000
Note 14A: Categories of financial instrumentsFinancial assetsLoans and receivables:
Cash and cash equivalents 306 297Receivables for goods and services 126 530
Total loans and receivables 432 827Total financial assets 432 827
Financial liabilitiesFinancial liabilities measured at amortised cost
Suppliers payables 3,939 11,167 Total financial liabilities measured at amortised cost 3,939 11,167 Total financial liabilities 3,939 11,167
Note 14B: Net gains or losses on financial assetsThere has been no income gained or expense incurred from financial assets (2013: Nil).
Note 14C: Net gains or losses on financial liabilitiesThere has been no income gained or expense incurred from financial liabilities (2013: Nil).
Clean Energy Regulator
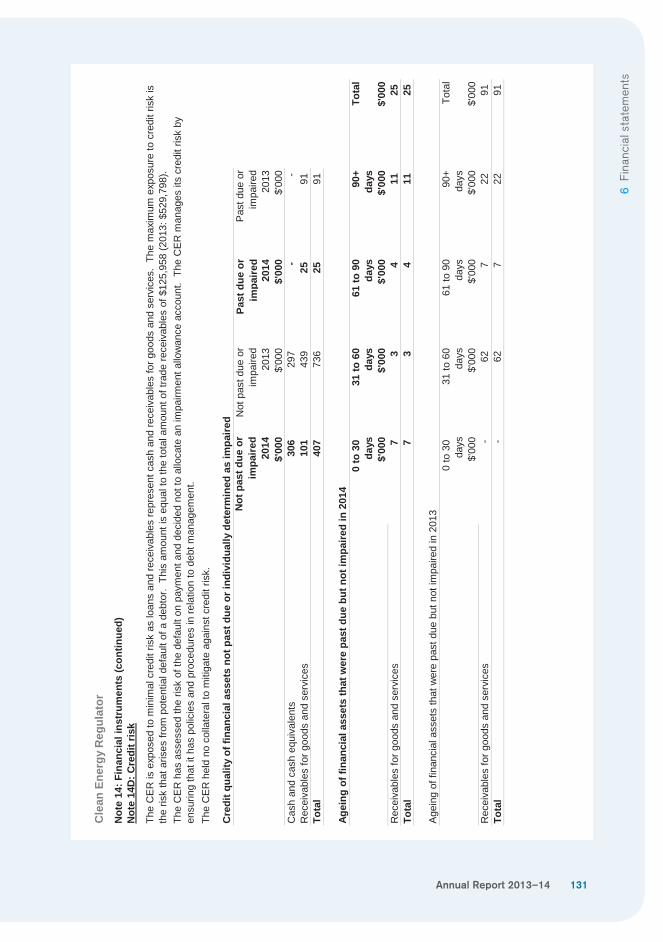
Annual Report 2013–14 131
6 Fi
nanc
ial s
tate
men
ts
Cle
an E
nerg
y R
egul
ator
Not
e 14
: Fin
anci
al in
stru
men
ts (c
ontin
ued)
Not
e 14
D: C
redi
t ris
k
The
CE
R h
eld
no c
olla
tera
l to
miti
gate
aga
inst
cre
dit r
isk.
Cre
dit q
ualit
y of
fina
ncia
l ass
ets
not p
ast d
ue o
r ind
ivid
ually
det
erm
ined
as
impa
ired
Not
pas
t due
or
impa
ired
Not
pas
t due
or
impa
ired
Past
due
or
impa
ired
Pas
t due
or
impa
ired
2014
2013
2014
2013
$'00
0$'
000
$'00
0$'
000
Cas
h an
d ca
sh e
quiv
alen
ts30
629
7 -
- R
ecei
vabl
es fo
r goo
ds a
nd s
ervi
ces
101
439
2591
Tota
l40
773
625
91
Agei
ng o
f fin
anci
al a
sset
s th
at w
ere
past
due
but
not
impa
ired
in 2
014
0 to
30
31 to
60
61 to
90
90+
Tota
lda
ysda
ysda
ysda
ys$'
000
$'00
0$'
000
$'00
0$'
000
Rec
eiva
bles
for g
oods
and
ser
vice
s7
34
1125
Tota
l7
34
1125
Age
ing
of fi
nanc
ial a
sset
s th
at w
ere
past
due
but
not
impa
ired
in 2
013
0 to
30
31 to
60
61 to
90
90+
Tota
lda
ysda
ysda
ysda
ys$'
000
$'00
0$'
000
$'00
0$'
000
Rec
eiva
bles
for g
oods
and
ser
vice
s -
627
2291
Tota
l -
627
2291
The
CE
R is
exp
osed
to m
inim
al c
redi
t ris
k as
loan
s an
d re
ceiv
able
s re
pres
ent c
ash
and
rece
ivab
les
for g
oods
and
ser
vice
s. T
he m
axim
um e
xpos
ure
to c
redi
t ris
k is
th
e ris
k th
at a
rises
from
pot
entia
l def
ault
of a
deb
tor.
Thi
s am
ount
is e
qual
to th
e to
tal a
mou
nt o
f tra
de re
ceiv
able
s of
$12
5,95
8 (2
013:
$52
9,79
8).
The
CE
R h
as a
sses
sed
the
risk
of th
e de
faul
t on
paym
ent a
nd d
ecid
ed n
ot to
allo
cate
an
impa
irmen
t allo
wan
ce a
ccou
nt.
The
CE
R m
anag
es it
s cr
edit
risk
by
ensu
ring
that
it h
as p
olic
ies
and
proc
edur
es in
rela
tion
to d
ebt m
anag
emen
t.
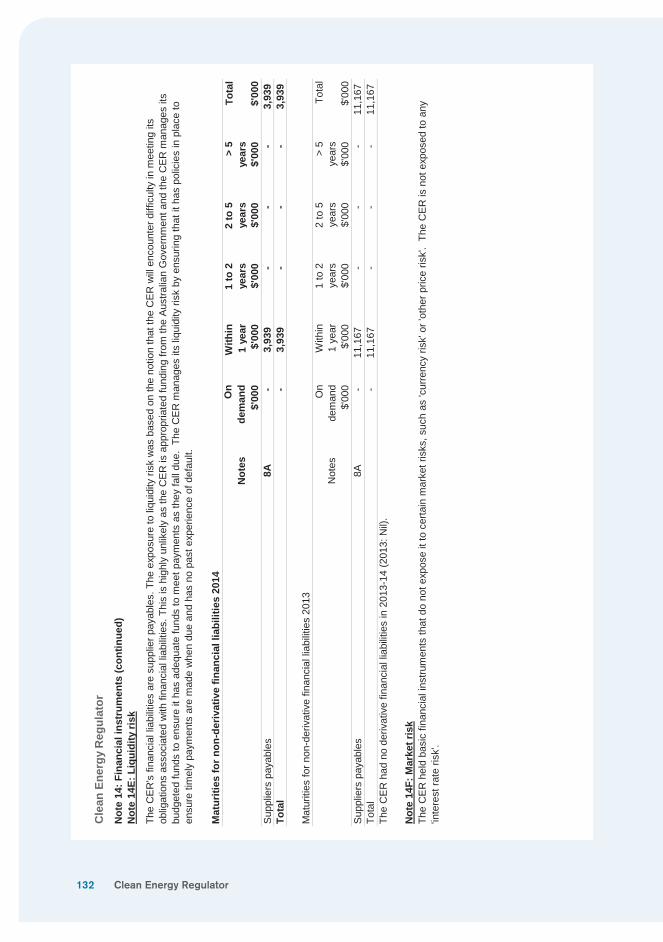
132
Cle
an E
nerg
y R
egul
ator
Not
e 14
: Fin
anci
al in
stru
men
ts (c
ontin
ued)
Not
e 14
E: L
iqui
dity
risk
Mat
uriti
es fo
r non
-der
ivat
ive
finan
cial
liab
ilitie
s 20
14
Not
esO
nde
man
dW
ithin
1 ye
ar1
to 2
year
s2
to 5
year
s>
5ye
ars
Tota
l
$'00
0$'
000
$'00
0$'
000
$'00
0$'
000
Sup
plie
rs p
ayab
les
8A -
3,93
9 -
- -
3,93
9 To
tal
- 3,
939
- -
- 3,
939
Mat
uriti
es fo
r non
-der
ivat
ive
finan
cial
liab
ilitie
s 20
13
Not
esO
nde
man
dW
ithin
1 ye
ar1
to 2
year
s2
to 5
year
s>
5ye
ars
Tota
l
$'00
0$'
000
$'00
0$'
000
$'00
0$'
000
Sup
plie
rs p
ayab
les
8A -
11,1
67
- -
- 11
,167
To
tal
- 11
,167
-
- -
11,1
67
The
CE
R h
ad n
o de
rivat
ive
finan
cial
liab
ilitie
s in
201
3-14
(201
3: N
il).
Not
e 14
F: M
arke
t ris
kTh
e C
ER
hel
d ba
sic
finan
cial
inst
rum
ents
that
do
not e
xpos
e it
to c
erta
in m
arke
t ris
ks, s
uch
as 'c
urre
ncy
risk'
or '
othe
r pric
e ris
k'.
The
CE
R is
not
exp
osed
to a
ny
'inte
rest
rate
risk
'.
The
CE
R's
fina
ncia
l lia
bilit
ies
are
supp
lier p
ayab
les.
The
exp
osur
e to
liqu
idity
risk
was
bas
ed o
n th
e no
tion
that
the
CE
R w
ill e
ncou
nter
diff
icul
ty in
mee
ting
its
oblig
atio
ns a
ssoc
iate
d w
ith fi
nanc
ial l
iabi
litie
s. T
his
is h
ighl
y un
likel
y as
the
CE
R is
app
ropr
iate
d fu
ndin
g fro
m th
e A
ustra
lian
Gov
ernm
ent a
nd th
e C
ER
man
ages
its
budg
eted
fund
s to
ens
ure
it ha
s ad
equa
te fu
nds
to m
eet p
aym
ents
as
they
fall
due.
The
CE
R m
anag
es it
s liq
uidi
ty ri
sk b
y en
surin
g th
at it
has
pol
icie
s in
pla
ce to
en
sure
tim
ely
paym
ents
are
mad
e w
hen
due
and
has
no p
ast e
xper
ienc
e of
def
ault.
Clean Energy Regulator
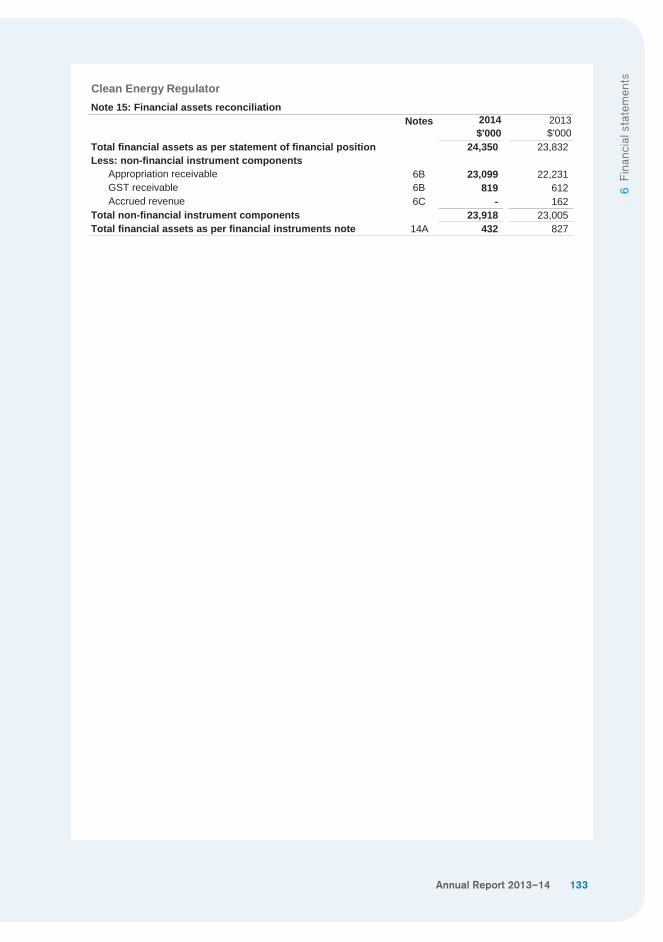
Annual Report 2013–14 133
6 Fi
nanc
ial s
tate
men
ts
Clean Energy Regulator
Notes 2014$'000
2013$'000
Total financial assets as per statement of financial position 24,350 23,832 Less: non-financial instrument components
Appropriation receivable 6B 23,099 22,231 GST receivable 6B 819 612Accrued revenue 6C - 162
Total non-financial instrument components 23,918 23,005 Total financial assets as per financial instruments note 14A 432 827
Note 15: Financial assets reconciliation
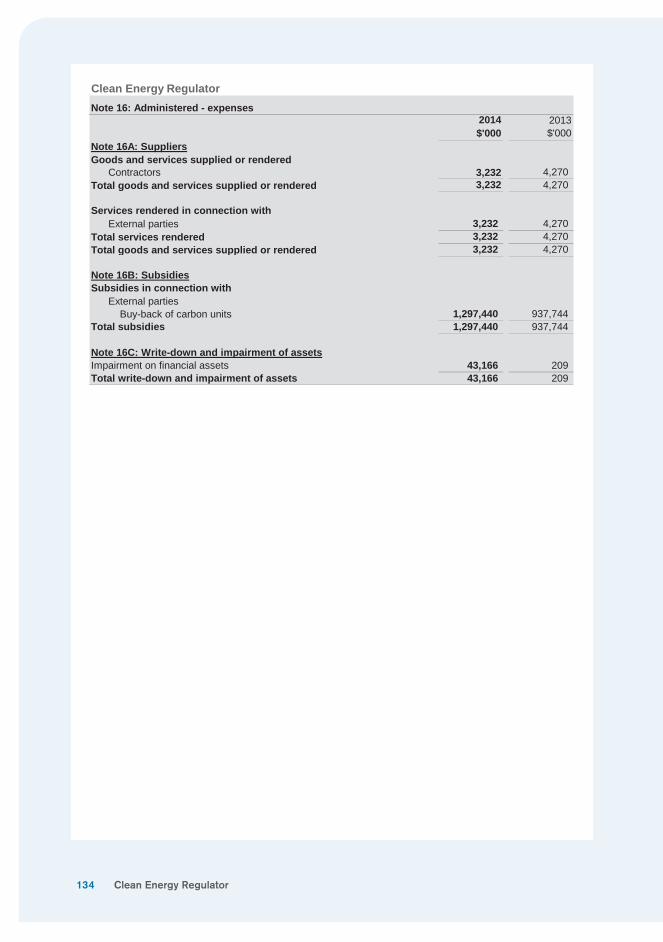
134
Clean Energy RegulatorNote 16: Administered - expenses
2014$'000
2013$'000
Note 16A: SuppliersGoods and services supplied or rendered
Contractors 3,232 4,270 Total goods and services supplied or rendered 3,232 4,270
Services rendered in connection withExternal parties 3,232 4,270
Total services rendered 3,232 4,270 Total goods and services supplied or rendered 3,232 4,270
Note 16B: SubsidiesSubsidies in connection with
External parties Buy-back of carbon units 1,297,440 937,744
Total subsidies 1,297,440 937,744
Note 16C: Write-down and impairment of assetsImpairment on financial assets 43,166 209Total write-down and impairment of assets 43,166 209
Clean Energy Regulator
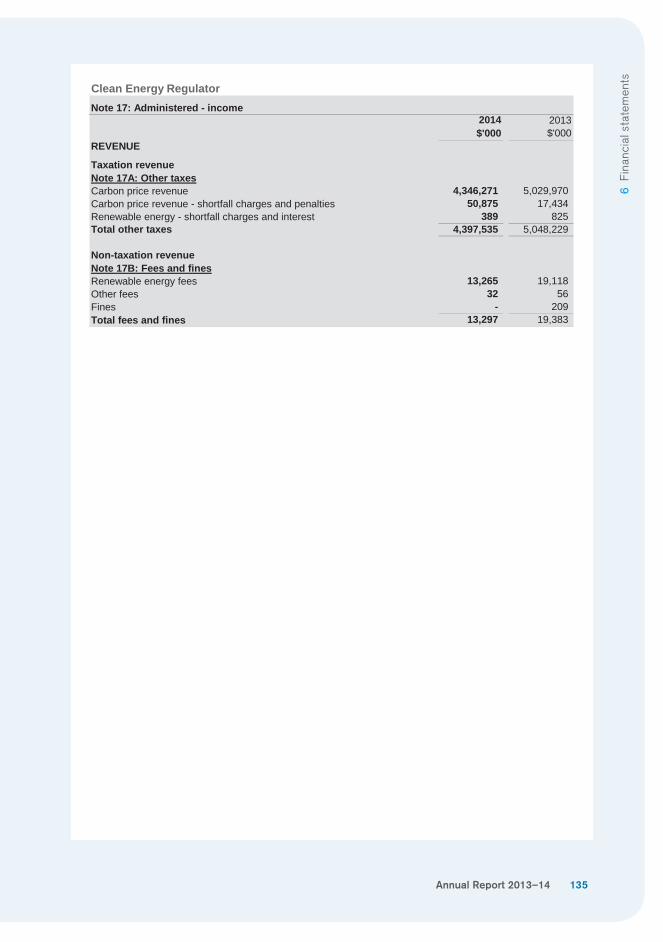
Annual Report 2013–14 135
6 Fi
nanc
ial s
tate
men
ts
Clean Energy RegulatorNote 17: Administered - income
2014$'000
2013$'000
REVENUE
Taxation revenueNote 17A: Other taxesCarbon price revenue 4,346,271 5,029,970 Carbon price revenue - shortfall charges and penalties 50,875 17,434 Renewable energy - shortfall charges and interest 389 825Total other taxes 4,397,535 5,048,229
Non-taxation revenueNote 17B: Fees and finesRenewable energy fees 13,265 19,118 Other fees 32 56Fines - 209Total fees and fines 13,297 19,383
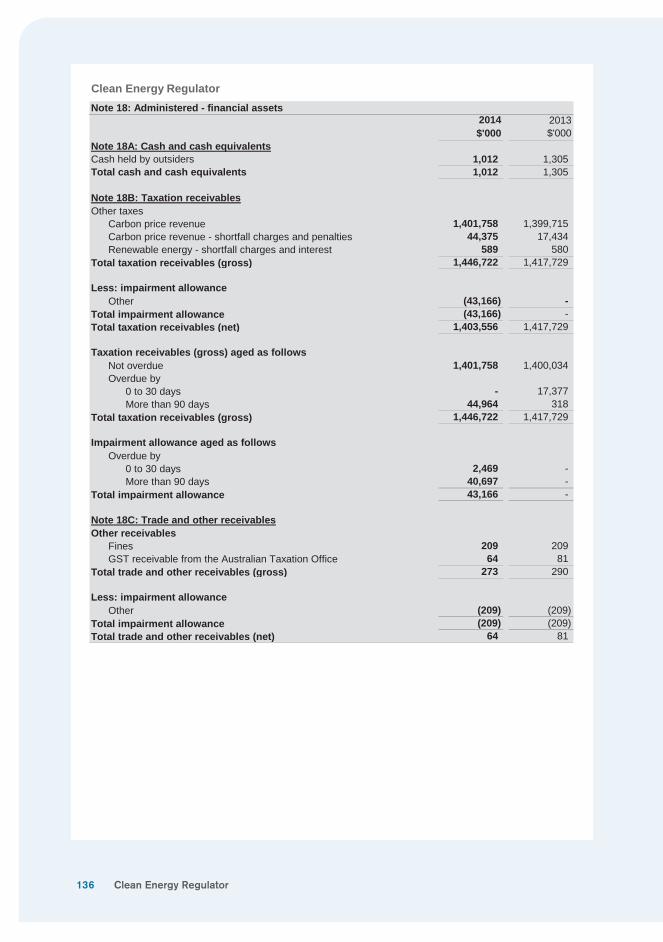
136
Clean Energy RegulatorNote 18: Administered - financial assets
2014$'000
2013$'000
Note 18A: Cash and cash equivalentsCash held by outsiders 1,012 1,305 Total cash and cash equivalents 1,012 1,305
Note 18B: Taxation receivablesOther taxes
Carbon price revenue 1,401,758 1,399,715 Carbon price revenue - shortfall charges and penalties 44,375 17,434 Renewable energy - shortfall charges and interest 589 580
Total taxation receivables (gross) 1,446,722 1,417,729
Less: impairment allowanceOther (43,166) -
Total impairment allowance (43,166) - Total taxation receivables (net) 1,403,556 1,417,729
Taxation receivables (gross) aged as followsNot overdue 1,401,758 1,400,034 Overdue by
0 to 30 days - 17,377 More than 90 days 44,964 318
Total taxation receivables (gross) 1,446,722 1,417,729
Impairment allowance aged as followsOverdue by
0 to 30 days 2,469 - More than 90 days 40,697 -
Total impairment allowance 43,166 -
Note 18C: Trade and other receivablesOther receivables
Fines 209 209GST receivable from the Australian Taxation Office 64 81
Total trade and other receivables (gross) 273 290
Less: impairment allowanceOther (209) (209)
Total impairment allowance (209) (209)Total trade and other receivables (net) 64 81
Clean Energy Regulator
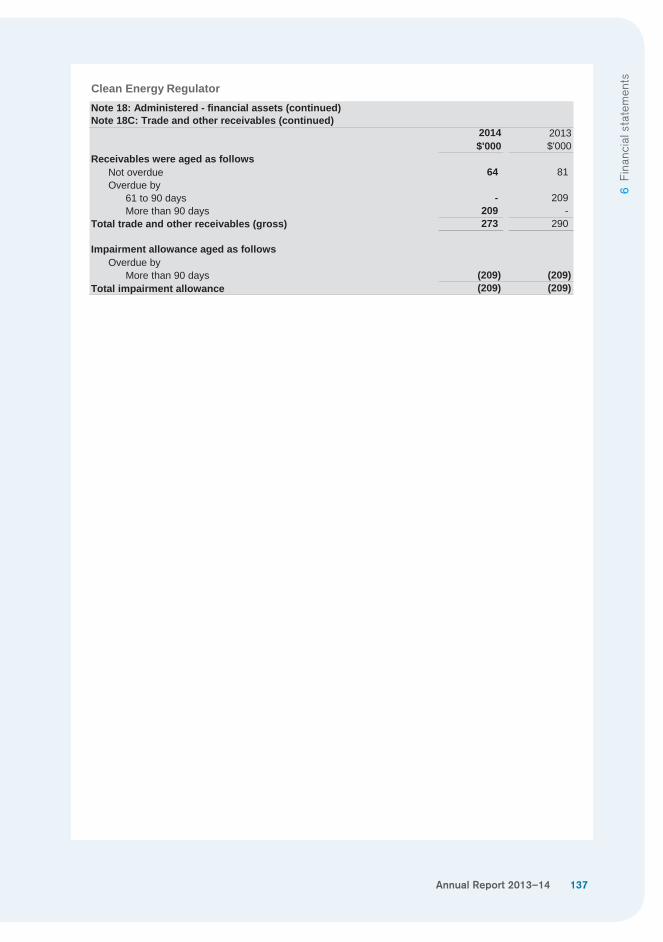
Annual Report 2013–14 137
6 Fi
nanc
ial s
tate
men
ts
Clean Energy RegulatorNote 18: Administered - financial assets (continued)Note 18C: Trade and other receivables (continued)
2014$'000
2013$'000
Receivables were aged as followsNot overdue 64 81Overdue by
61 to 90 days - 209More than 90 days 209 -
Total trade and other receivables (gross) 273 290
Impairment allowance aged as followsOverdue by
More than 90 days (209) (209)Total impairment allowance (209) (209)
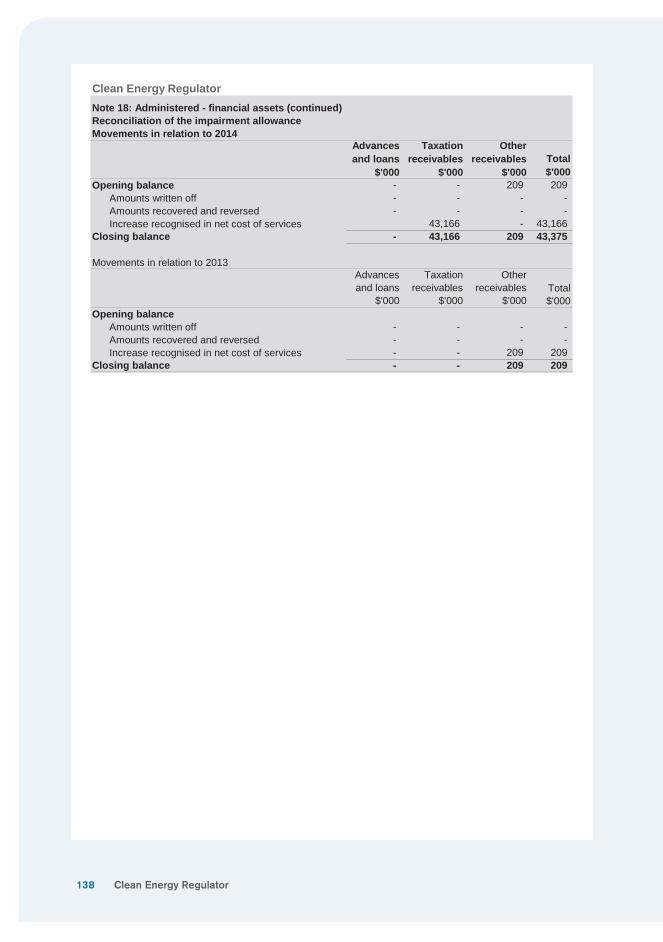
138
Clean Energy RegulatorNote 18: Administered - financial assets (continued)Reconciliation of the impairment allowanceMovements in relation to 2014
Opening balance - - 209 209Amounts written off - - - - Amounts recovered and reversed - - - - Increase recognised in net cost of services 43,166 - 43,166
Closing balance - 43,166 209 43,375
Movements in relation to 2013
Opening balanceAmounts written off - - - - Amounts recovered and reversed - - - - Increase recognised in net cost of services - - 209 209
Closing balance - - 209 209
Total$'000
Advancesand loans
$'000
Taxation receivables
$'000
Other receivables
$'000Total$'000
Advances and loans
$'000
Taxation receivables
$'000
Other receivables
$'000
Clean Energy Regulator
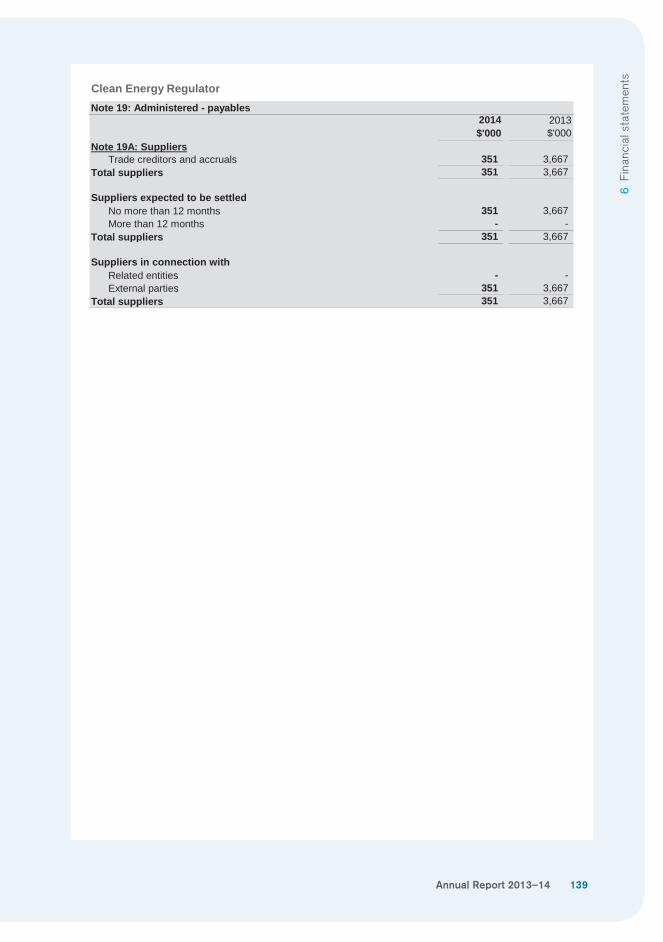
Annual Report 2013–14 139
6 Fi
nanc
ial s
tate
men
ts
Clean Energy RegulatorNote 19: Administered - payables
2014$'000
2013$'000
Note 19A: SuppliersTrade creditors and accruals 351 3,667
Total suppliers 351 3,667
Suppliers expected to be settledNo more than 12 months 351 3,667 More than 12 months - -
Total suppliers 351 3,667
Suppliers in connection withRelated entities - - External parties 351 3,667
Total suppliers 351 3,667
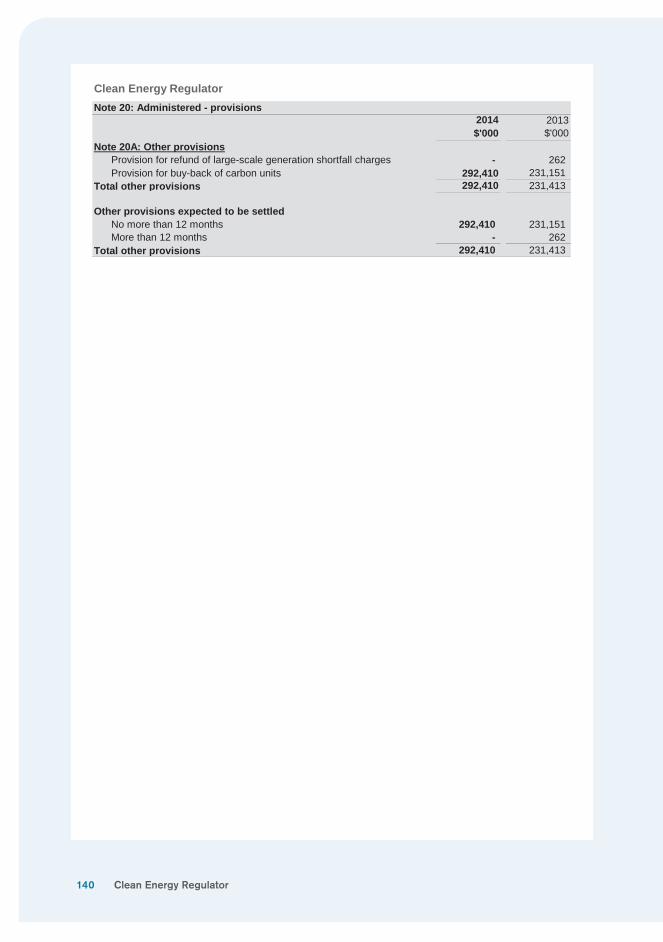
140
Clean Energy RegulatorNote 20: Administered - provisions
2014$'000
2013$'000
Note 20A: Other provisionsProvision for refund of large-scale generation shortfall charges - 262Provision for buy-back of carbon units 292,410 231,151
Total other provisions 292,410 231,413
Other provisions expected to be settledNo more than 12 months 292,410 231,151 More than 12 months - 262
Total other provisions 292,410 231,413
Clean Energy Regulator
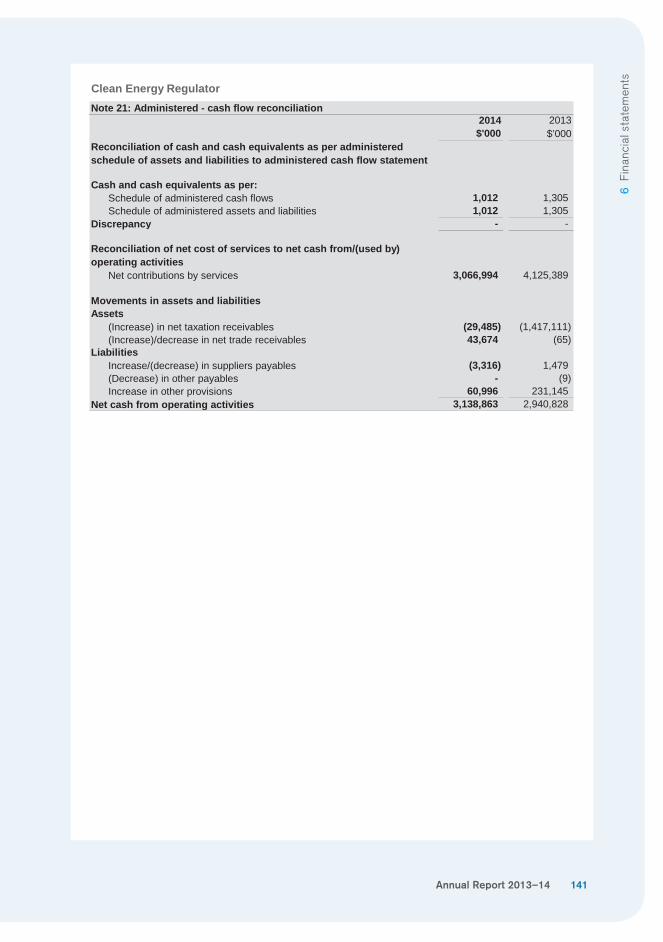
Annual Report 2013–14 141
6 Fi
nanc
ial s
tate
men
ts
Clean Energy RegulatorStatement of financial positionas at 30 June 2014
Notes 2014$'000
2013$'000
ASSETSFinancial assets
Cash and cash equivalents 6A 306 297Trade and other receivables 6B 24,044 23,373 Other financial assets 6C - 162
Total financial assets 24,350 23,832
Non-financial assetsLand and buildings 7A,C 6,209 7,447 Property, plant and equipment 7B,C 870 950Intangibles 7D,E 37,732 44,266 Other non-financial assets 7F 639 373
Total non-financial assets 45,450 53,036 Total assets 69,800 76,868
LIABILITIESPayables
Suppliers 8A 3,939 11,167 Other payables 8B 1,492 1,342
Total payables 5,431 12,509
ProvisionsEmployee provisions 9A 9,552 9,431 Other provisions 9B 1,827 1,407
Total provisions 11,379 10,838
Total liabilities 16,810 23,347 Net assets 52,990 53,521
EQUITYContributed equity 76,935 65,998 Reserves 3,883 3,581 Accumulated deficit (27,828) (16,058)
Total equity 52,990 53,521
The above statement should be read in conjunction with the accompanying notes.
Clean Energy RegulatorNote 21: Administered - cash flow reconciliation
2014 2013$'000 $’000
Reconciliation of cash and cash equivalents as per administered schedule of assets and liabilities to administered cash flow statement
Cash and cash equivalents as per:Schedule of administered cash flows 1,012 1,305 Schedule of administered assets and liabilities 1,012 1,305
Discrepancy - -
Reconciliation of net cost of services to net cash from/(used by) operating activities
Net contributions by services 3,066,994 4,125,389
Movements in assets and liabilitiesAssets
(Increase) in net taxation receivables (29,485) (1,417,111)(Increase)/decrease in net trade receivables 43,674 (65)
LiabilitiesIncrease/(decrease) in suppliers payables (3,316) 1,479 (Decrease) in other payables - (9)Increase in other provisions 60,996 231,145
Net cash from operating activities 3,138,863 2,940,828
142
Clean Energy RegulatorStatement of financial positionas at 30 June 2014
Notes 2014$'000
2013$'000
ASSETSFinancial assets
Cash and cash equivalents 6A 306 297Trade and other receivables 6B 24,044 23,373 Other financial assets 6C - 162
Total financial assets 24,350 23,832
Non-financial assetsLand and buildings 7A,C 6,209 7,447 Property, plant and equipment 7B,C 870 950Intangibles 7D,E 37,732 44,266 Other non-financial assets 7F 639 373
Total non-financial assets 45,450 53,036 Total assets 69,800 76,868
LIABILITIESPayables
Suppliers 8A 3,939 11,167 Other payables 8B 1,492 1,342
Total payables 5,431 12,509
ProvisionsEmployee provisions 9A 9,552 9,431 Other provisions 9B 1,827 1,407
Total provisions 11,379 10,838
Total liabilities 16,810 23,347 Net assets 52,990 53,521
EQUITYContributed equity 76,935 65,998 Reserves 3,883 3,581 Accumulated deficit (27,828) (16,058)
Total equity 52,990 53,521
The above statement should be read in conjunction with the accompanying notes.
Clean Energy RegulatorNote 22: Administered - Contingent assets and liabilities
Quantifiable contingenciesThere were no quantifiable contingent assets or liabilities as at 30 June 2014 (2013: Nil).
Unquantifiable contingenciesThere were no unquantifiable contingent assets or liabilities as at 30 June 2014 (2013: Nil).
Significant remote contingenciesThere were no significant remote contingent assets or liabilities as at 30 June 2014 (2013: Nil).
Clean Energy Regulator
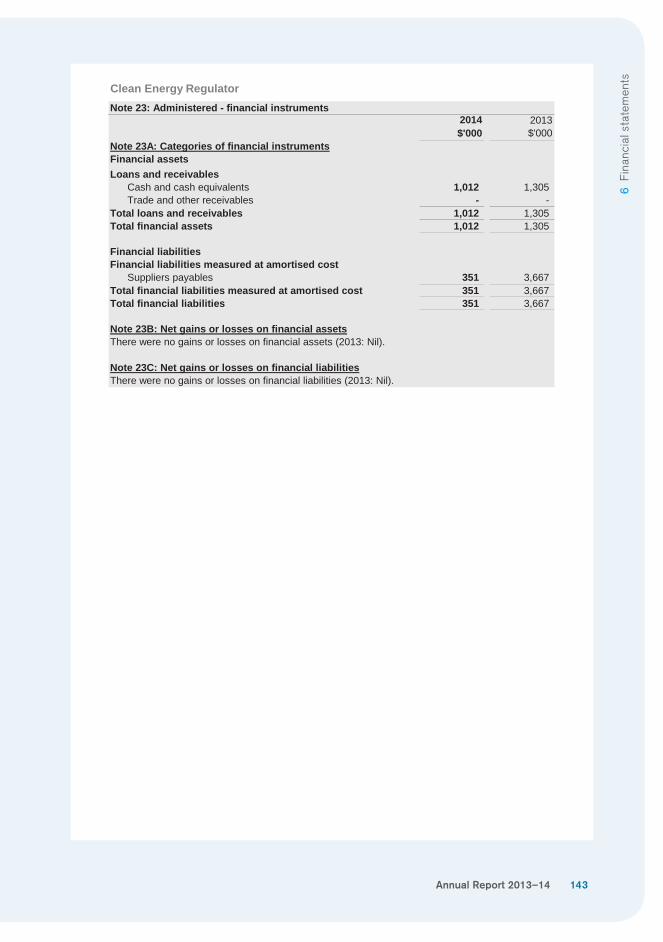
Annual Report 2013–14 143
6 Fi
nanc
ial s
tate
men
ts
Clean Energy RegulatorStatement of financial positionas at 30 June 2014
Notes 2014$'000
2013$'000
ASSETSFinancial assets
Cash and cash equivalents 6A 306 297Trade and other receivables 6B 24,044 23,373 Other financial assets 6C - 162
Total financial assets 24,350 23,832
Non-financial assetsLand and buildings 7A,C 6,209 7,447 Property, plant and equipment 7B,C 870 950Intangibles 7D,E 37,732 44,266 Other non-financial assets 7F 639 373
Total non-financial assets 45,450 53,036 Total assets 69,800 76,868
LIABILITIESPayables
Suppliers 8A 3,939 11,167 Other payables 8B 1,492 1,342
Total payables 5,431 12,509
ProvisionsEmployee provisions 9A 9,552 9,431 Other provisions 9B 1,827 1,407
Total provisions 11,379 10,838
Total liabilities 16,810 23,347 Net assets 52,990 53,521
EQUITYContributed equity 76,935 65,998 Reserves 3,883 3,581 Accumulated deficit (27,828) (16,058)
Total equity 52,990 53,521
The above statement should be read in conjunction with the accompanying notes.
Clean Energy RegulatorNote 23: Administered - financial instruments
2014$'000
2013$'000
Note 23A: Categories of financial instrumentsFinancial assetsLoans and receivables
Cash and cash equivalents 1,012 1,305 Trade and other receivables - -
Total loans and receivables 1,012 1,305 Total financial assets 1,012 1,305
Financial liabilitiesFinancial liabilities measured at amortised cost
Suppliers payables 351 3,667 Total financial liabilities measured at amortised cost 351 3,667 Total financial liabilities 351 3,667
Note 23B: Net gains or losses on financial assetsThere were no gains or losses on financial assets (2013: Nil).
Note 23C: Net gains or losses on financial liabilitiesThere were no gains or losses on financial liabilities (2013: Nil).
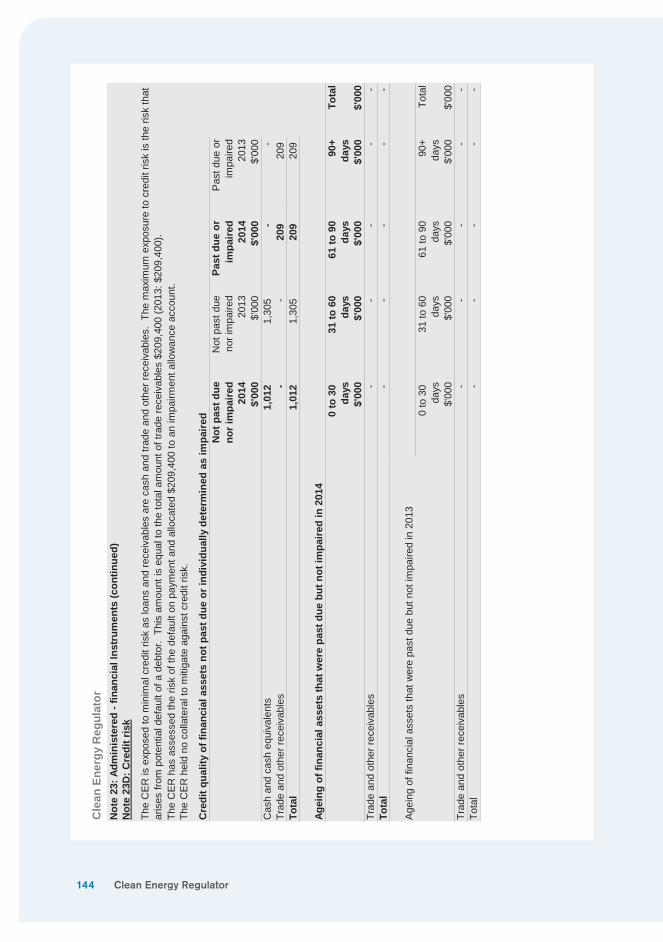
144
Clean Energy RegulatorStatement of financial positionas at 30 June 2014
Notes 2014$'000
2013$'000
ASSETSFinancial assets
Cash and cash equivalents 6A 306 297Trade and other receivables 6B 24,044 23,373 Other financial assets 6C - 162
Total financial assets 24,350 23,832
Non-financial assetsLand and buildings 7A,C 6,209 7,447 Property, plant and equipment 7B,C 870 950Intangibles 7D,E 37,732 44,266 Other non-financial assets 7F 639 373
Total non-financial assets 45,450 53,036 Total assets 69,800 76,868
LIABILITIESPayables
Suppliers 8A 3,939 11,167 Other payables 8B 1,492 1,342
Total payables 5,431 12,509
ProvisionsEmployee provisions 9A 9,552 9,431 Other provisions 9B 1,827 1,407
Total provisions 11,379 10,838
Total liabilities 16,810 23,347 Net assets 52,990 53,521
EQUITYContributed equity 76,935 65,998 Reserves 3,883 3,581 Accumulated deficit (27,828) (16,058)
Total equity 52,990 53,521
The above statement should be read in conjunction with the accompanying notes.
Cle
an E
nerg
y R
egul
ator
Not
e 23
: Adm
inis
tere
d - f
inan
cial
Inst
rum
ents
(con
tinue
d)N
ote
23D
: Cre
dit r
isk
The
CE
R h
eld
no c
olla
tera
l to
miti
gate
aga
inst
cre
dit r
isk.
Cre
dit q
ualit
y of
fina
ncia
l ass
ets
not p
ast d
ue o
r ind
ivid
ually
det
erm
ined
as
impa
ired
Not
pas
t due
no
r im
paire
dN
ot p
ast d
ue
nor i
mpa
ired
Past
due
or
impa
ired
Pas
t due
or
impa
ired
2014
2013
2014
2013
$'00
0$'
000
$'00
0$'
000
Cas
h an
d ca
sh e
quiv
alen
ts1,
012
1,30
5 -
- Tr
ade
and
othe
r rec
eiva
bles
- -
209
209
Tota
l1,
012
1,30
5 20
920
9
Agei
ng o
f fin
anci
al a
sset
s th
at w
ere
past
due
but
not
impa
ired
in 2
014
0 to
30
31 to
60
61 to
90
90+
Tota
lda
ysda
ysda
ysda
ys$'
000
$'00
0$'
000
$'00
0$'
000
Trad
e an
d ot
her r
ecei
vabl
es -
- -
- -
Tota
l -
- -
- -
Age
ing
of fi
nanc
ial a
sset
s th
at w
ere
past
due
but
not
impa
ired
in 2
013
0 to
30
31 to
60
61 to
90
90+
Tota
lda
ysda
ysda
ysda
ys$'
000
$'00
0$'
000
$'00
0$'
000
Trad
e an
d ot
her r
ecei
vabl
es -
- -
- -
Tota
l -
- -
- -
The
CE
R is
exp
osed
to m
inim
al c
redi
t ris
k as
loan
s an
d re
ceiv
able
s ar
e ca
sh a
nd tr
ade
and
othe
r rec
eiva
bles
. Th
e m
axim
um e
xpos
ure
to c
redi
t ris
k is
the
risk
that
ar
ises
from
pot
entia
l def
ault
of a
deb
tor.
Thi
s am
ount
is e
qual
to th
e to
tal a
mou
nt o
f tra
de re
ceiv
able
s $2
09,4
00 (2
013:
$20
9,40
0).
The
CE
R h
as a
sses
sed
the
risk
of th
e de
faul
t on
paym
ent a
nd a
lloca
ted
$209
,400
to a
n im
pairm
ent a
llow
ance
acc
ount
.
Clean Energy Regulator
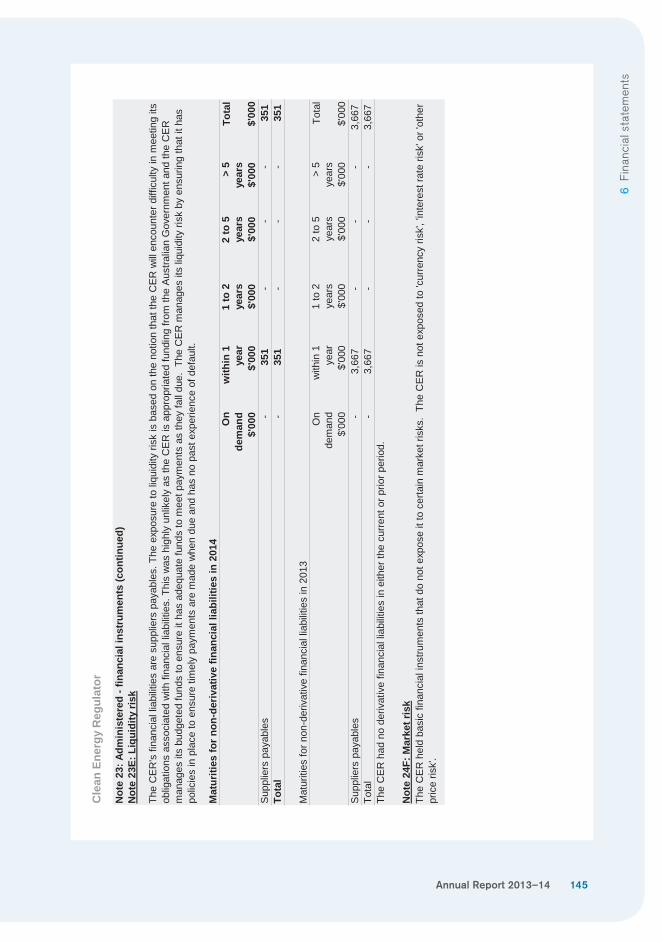
Annual Report 2013–14 145
6 Fi
nanc
ial s
tate
men
ts
Clean Energy RegulatorStatement of financial positionas at 30 June 2014
Notes 2014$'000
2013$'000
ASSETSFinancial assets
Cash and cash equivalents 6A 306 297Trade and other receivables 6B 24,044 23,373 Other financial assets 6C - 162
Total financial assets 24,350 23,832
Non-financial assetsLand and buildings 7A,C 6,209 7,447 Property, plant and equipment 7B,C 870 950Intangibles 7D,E 37,732 44,266 Other non-financial assets 7F 639 373
Total non-financial assets 45,450 53,036 Total assets 69,800 76,868
LIABILITIESPayables
Suppliers 8A 3,939 11,167 Other payables 8B 1,492 1,342
Total payables 5,431 12,509
ProvisionsEmployee provisions 9A 9,552 9,431 Other provisions 9B 1,827 1,407
Total provisions 11,379 10,838
Total liabilities 16,810 23,347 Net assets 52,990 53,521
EQUITYContributed equity 76,935 65,998 Reserves 3,883 3,581 Accumulated deficit (27,828) (16,058)
Total equity 52,990 53,521
The above statement should be read in conjunction with the accompanying notes.
Cle
an E
nerg
y R
egul
ator
Not
e 23
: Adm
inis
tere
d - f
inan
cial
inst
rum
ents
(con
tinue
d)N
ote
23E:
Liq
uidi
ty ri
sk
Mat
uriti
es fo
r non
-der
ivat
ive
finan
cial
liab
ilitie
s in
201
4O
nw
ithin
11
to 2
2 to
5>
5To
tal
dem
and
year
year
sye
ars
year
s$'
000
$'00
0$'
000
$'00
0$'
000
$'00
0S
uppl
iers
pay
able
s -
351
- -
- 35
1To
tal
- 35
1 -
- -
351
Mat
uriti
es fo
r non
-der
ivat
ive
finan
cial
liab
ilitie
s in
201
3O
nw
ithin
11
to 2
2 to
5>
5To
tal
dem
and
year
year
sye
ars
year
s$'
000
$'00
0$'
000
$'00
0$'
000
$'00
0S
uppl
iers
pay
able
s -
3,66
7 -
- -
3,66
7 To
tal
- 3,
667
- -
- 3,
667
The
CE
R h
ad n
o de
rivat
ive
finan
cial
liab
ilitie
s in
eith
er th
e cu
rrent
or p
rior p
erio
d.
Not
e 24
F: M
arke
t ris
kTh
e C
ER
hel
d ba
sic
finan
cial
inst
rum
ents
that
do
not e
xpos
e it
to c
erta
in m
arke
t ris
ks.
The
CE
R is
not
exp
osed
to 'c
urre
ncy
risk'
, 'in
tere
st ra
te ri
sk' o
r 'ot
her
pric
e ris
k'.
The
CE
R's
fina
ncia
l lia
bilit
ies
are
supp
liers
pay
able
s. T
he e
xpos
ure
to li
quid
ity ri
sk is
bas
ed o
n th
e no
tion
that
the
CE
R w
ill en
coun
ter d
iffic
ulty
in m
eetin
g its
ob
ligat
ions
ass
ocia
ted
with
fina
ncia
l lia
bilit
ies.
Thi
s w
as h
ighl
y un
likel
y as
the
CE
R is
app
ropr
iate
d fu
ndin
g fro
m th
e A
ustra
lian
Gov
ernm
ent a
nd th
e C
ER
m
anag
es it
s bu
dget
ed fu
nds
to e
nsur
e it
has
adeq
uate
fund
s to
mee
t pay
men
ts a
s th
ey fa
ll du
e. T
he C
ER
man
ages
its
liqui
dity
risk
by
ensu
ring
that
it h
as
polic
ies
in p
lace
to e
nsur
e tim
ely
paym
ents
are
mad
e w
hen
due
and
has
no p
ast e
xper
ienc
e of
def
ault.
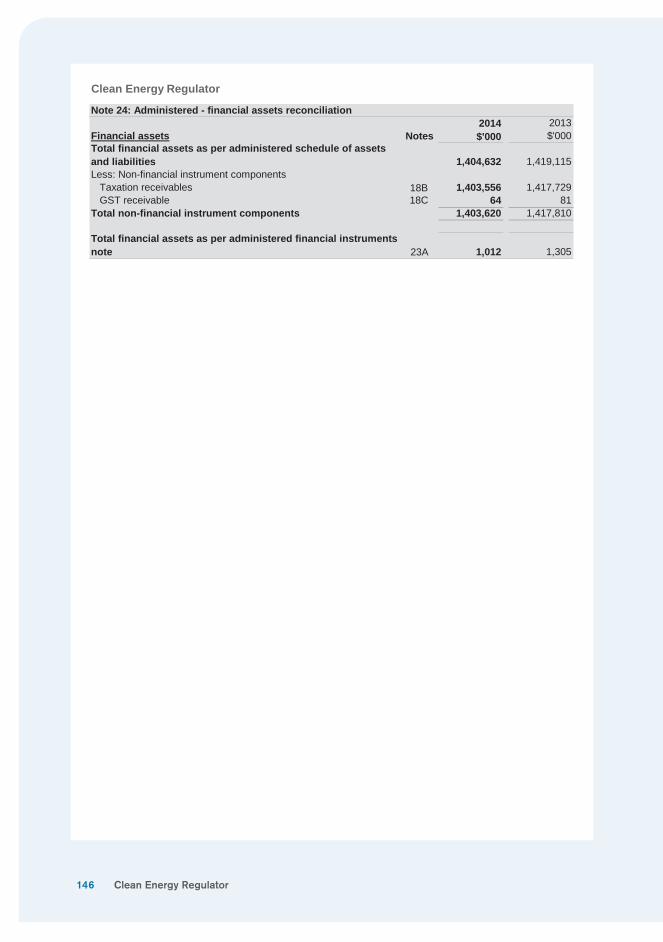
146
Clean Energy RegulatorStatement of financial positionas at 30 June 2014
Notes 2014$'000
2013$'000
ASSETSFinancial assets
Cash and cash equivalents 6A 306 297Trade and other receivables 6B 24,044 23,373 Other financial assets 6C - 162
Total financial assets 24,350 23,832
Non-financial assetsLand and buildings 7A,C 6,209 7,447 Property, plant and equipment 7B,C 870 950Intangibles 7D,E 37,732 44,266 Other non-financial assets 7F 639 373
Total non-financial assets 45,450 53,036 Total assets 69,800 76,868
LIABILITIESPayables
Suppliers 8A 3,939 11,167 Other payables 8B 1,492 1,342
Total payables 5,431 12,509
ProvisionsEmployee provisions 9A 9,552 9,431 Other provisions 9B 1,827 1,407
Total provisions 11,379 10,838
Total liabilities 16,810 23,347 Net assets 52,990 53,521
EQUITYContributed equity 76,935 65,998 Reserves 3,883 3,581 Accumulated deficit (27,828) (16,058)
Total equity 52,990 53,521
The above statement should be read in conjunction with the accompanying notes.
Clean Energy Regulator
Financial assets Notes2014$'000
2013$'000
Total financial assets as per administered schedule of assets and liabilities 1,404,632 1,419,115 Less: Non-financial instrument components
Taxation receivables 18B 1,403,556 1,417,729 GST receivable 18C 64 81
Total non-financial instrument components 1,403,620 1,417,810
Total financial assets as per administered financial instruments note 23A 1,012 1,305
Note 24: Administered - financial assets reconciliation
Clean Energy Regulator
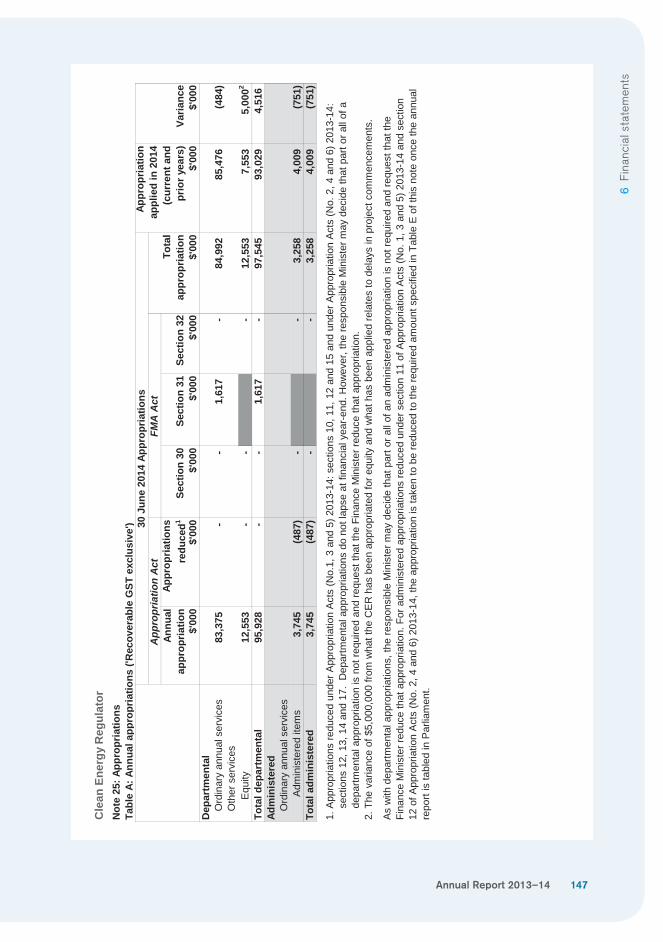
Annual Report 2013–14 147
6 Fi
nanc
ial s
tate
men
ts
Cle
an E
nerg
y R
egul
ator
Tabl
e A:
Ann
ual a
ppro
pria
tions
('R
ecov
erab
le G
ST e
xclu
sive
')
Annu
al
appr
opria
tion
Appr
opria
tions
re
duce
d1Se
ctio
n 30
Sect
ion
31Se
ctio
n 32
$'00
0$'
000
$'00
0$'
000
$'00
0$'
000
$'00
0$'
000
Dep
artm
enta
lO
rdin
ary
annu
al s
ervi
ces
83,3
75
- -
1,61
7 -
84,9
92
85,4
76
(484
)O
ther
ser
vice
s
Equ
ity12
,553
-
- -
12,5
53
7,55
3 5,
0002
Tota
l dep
artm
enta
l95
,928
-
- 1,
617
- 97
,545
93
,029
4,
516
Adm
inis
tere
dO
rdin
ary
annu
al s
ervi
ces
A
dmin
iste
red
item
s3,
745
(487
) -
- 3,
258
4,00
9 (7
51)
Tota
l adm
inis
tere
d3,
745
(487
) -
- 3,
258
4,00
9 (7
51)
1. A
ppro
pria
tions
redu
ced
unde
r App
ropr
iatio
n A
cts
(No.
1, 3
and
5) 2
013-
14: s
ectio
ns 1
0, 1
1, 1
2 an
d 15
and
und
er A
ppro
pria
tion
Act
s (N
o. 2
, 4 a
nd 6
) 201
3-14
:
sec
tions
12,
13,
14
and
17.
Dep
artm
enta
l app
ropr
iatio
ns d
o no
t lap
se a
t fin
anci
al y
ear-e
nd. H
owev
er, t
he re
spon
sibl
e M
inis
ter m
ay d
ecid
e th
at p
art o
r all
of a
d
epar
tmen
tal a
ppro
pria
tion
is n
ot re
quire
d an
d re
ques
t tha
t the
Fin
ance
Min
iste
r red
uce
that
app
ropr
iatio
n.
As
with
dep
artm
enta
l app
ropr
iatio
ns, t
he re
spon
sibl
e M
inis
ter m
ay d
ecid
e th
at p
art o
r all
of a
n ad
min
iste
red
appr
opria
tion
is n
ot re
quire
d an
d re
ques
t tha
t the
Fi
nanc
e M
inis
ter r
educ
e th
at a
ppro
pria
tion.
For
adm
inis
tere
d ap
prop
riatio
ns re
duce
d un
der s
ectio
n 11
of A
ppro
pria
tion
Act
s (N
o. 1
, 3 a
nd 5
) 201
3-14
and
sec
tion
12 o
f App
ropr
iatio
n A
cts
(No.
2, 4
and
6) 2
013-
14, t
he a
ppro
pria
tion
is ta
ken
to b
e re
duce
d to
the
requ
ired
amou
nt s
peci
fied
in T
able
E o
f thi
s no
te o
nce
the
annu
al
repo
rt is
tabl
ed in
Par
liam
ent.
Not
e 25
: App
ropr
iatio
ns
30 J
une
2014
App
ropr
iatio
nsAp
prop
riatio
n ap
plie
d in
201
4 (c
urre
nt a
nd
prio
r yea
rs)
Varia
nce
App
ropr
iatio
n A
ctFM
A A
ctTo
tal
appr
opria
tion
2. T
he v
aria
nce
of $
5,00
0,00
0 fro
m w
hat t
he C
ER
has
bee
n ap
prop
riate
d fo
r equ
ity a
nd w
hat h
as b
een
appl
ied
rela
tes
to d
elay
s in
pro
ject
com
men
cem
ents
.
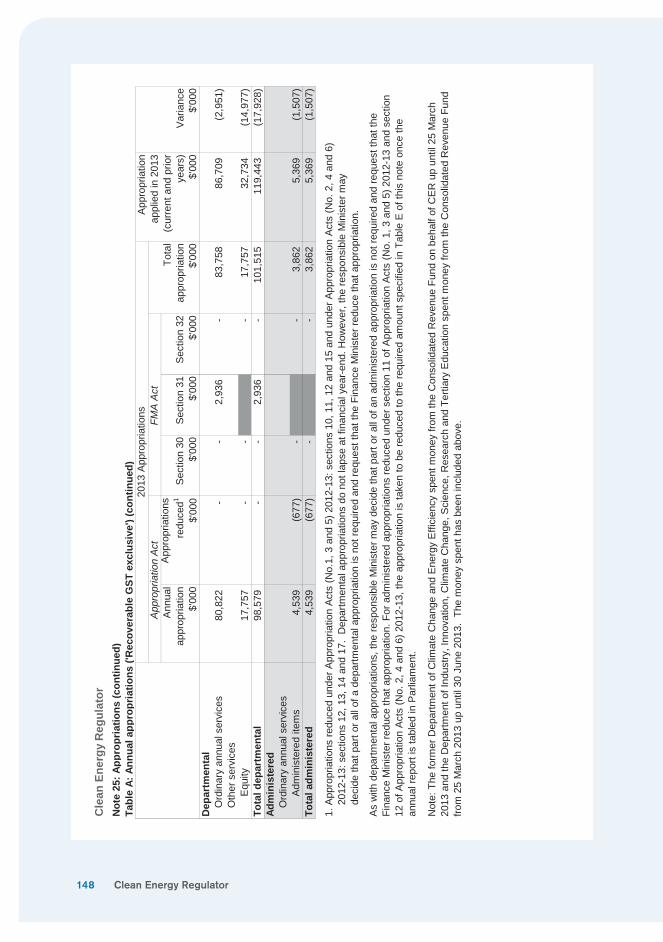
148
Cle
an E
nerg
y R
egul
ator
Not
e 25
: App
ropr
iatio
ns (c
ontin
ued)
Tabl
e A:
Ann
ual a
ppro
pria
tions
('R
ecov
erab
le G
ST e
xclu
sive
') (c
ontin
ued)
Ann
ual
appr
opria
tion
App
ropr
iatio
ns
redu
ced1
Sec
tion
30S
ectio
n 31
Sec
tion
32$'
000
$'00
0$'
000
$'00
0$'
000
$'00
0$'
000
$'00
0D
epar
tmen
tal
Ord
inar
y an
nual
ser
vice
s80
,822
-
- 2,
936
- 83
,758
86
,709
(2
,951
)O
ther
ser
vice
s E
quity
17,7
57
- -
- 17
,757
32
,734
(1
4,97
7)To
tal d
epar
tmen
tal
98,5
79
- -
2,93
6 -
101,
515
119,
443
(17,
928)
Adm
inis
tere
dO
rdin
ary
annu
al s
ervi
ces
A
dmin
iste
red
item
s4,
539
(677
) -
- 3,
862
5,36
9 (1
,507
)To
tal a
dmin
iste
red
4,53
9 (6
77)
- -
3,86
2 5,
369
(1,5
07)
Not
e: T
he fo
rmer
Dep
artm
ent o
f Clim
ate
Cha
nge
and
Ene
rgy
Effi
cien
cy s
pent
mon
ey fr
om th
e C
onso
lidat
ed R
even
ue F
und
on b
ehal
f of C
ER
up
until
25
Mar
ch
2013
and
the
Dep
art m
ent o
f Ind
ustry
, Inn
ovat
ion,
Clim
ate
Cha
nge,
Sci
ence
, Res
earc
h an
d Te
rtiar
y E
duca
tion
spen
t mon
ey fr
om th
e C
onso
lidat
ed R
even
ue F
und
from
25
Mar
ch 2
013
up u
ntil
30 J
une
2013
. Th
e m
oney
spe
nt h
as b
een
incl
uded
abo
ve.
App
ropr
iatio
n A
ctFM
A A
ctTo
tal
appr
opria
tion
2013
App
ropr
iatio
nsA
ppro
pria
tion
appl
ied
in 2
013
(cur
rent
and
prio
r ye
ars)
Var
ianc
e
1. A
ppro
pria
tions
redu
ced
unde
r App
ropr
iatio
n A
cts
(No.
1, 3
and
5) 2
012-
13: s
ectio
ns 1
0, 1
1, 1
2 an
d 15
and
und
er A
ppro
pria
tion
Act
s (N
o. 2
, 4 a
nd 6
)
201
2-13
: sec
tions
12,
13,
14
and
17.
Dep
artm
enta
l app
ropr
iatio
ns d
o no
t lap
se a
t fin
anci
al y
ear-e
nd. H
owev
er, t
he re
spon
sibl
e M
inis
ter m
ay
d
ecid
e th
at p
art o
r all
of a
dep
artm
enta
l app
ropr
iatio
n is
not
requ
ired
and
requ
est t
hat t
he F
inan
ce M
inis
ter r
educ
e th
at a
ppro
pria
tion.
As
with
dep
artm
enta
l app
ropr
iatio
ns, t
he re
spon
sibl
e M
inis
ter m
ay d
ecid
e th
at p
art o
r all
of a
n ad
min
iste
red
appr
opria
tion
is n
ot re
quire
d an
d re
ques
t tha
t the
Fi
nanc
e M
inis
ter r
educ
e th
at a
ppro
pria
tion.
For
adm
inis
tere
d ap
prop
riatio
ns re
duce
d un
der s
ectio
n 11
of A
ppro
pria
tion
Act
s (N
o. 1
, 3 a
nd 5
) 201
2-13
and
sec
tion
12 o
f App
ropr
iatio
n A
cts
(No.
2, 4
and
6) 2
012-
13, t
he a
ppro
pria
tion
is ta
ken
to b
e re
duce
d to
the
requ
ired
amou
nt s
peci
fied
in T
able
E o
f thi
s no
te o
nce
the
annu
al re
port
is ta
bled
in P
arlia
men
t.
Clean Energy Regulator
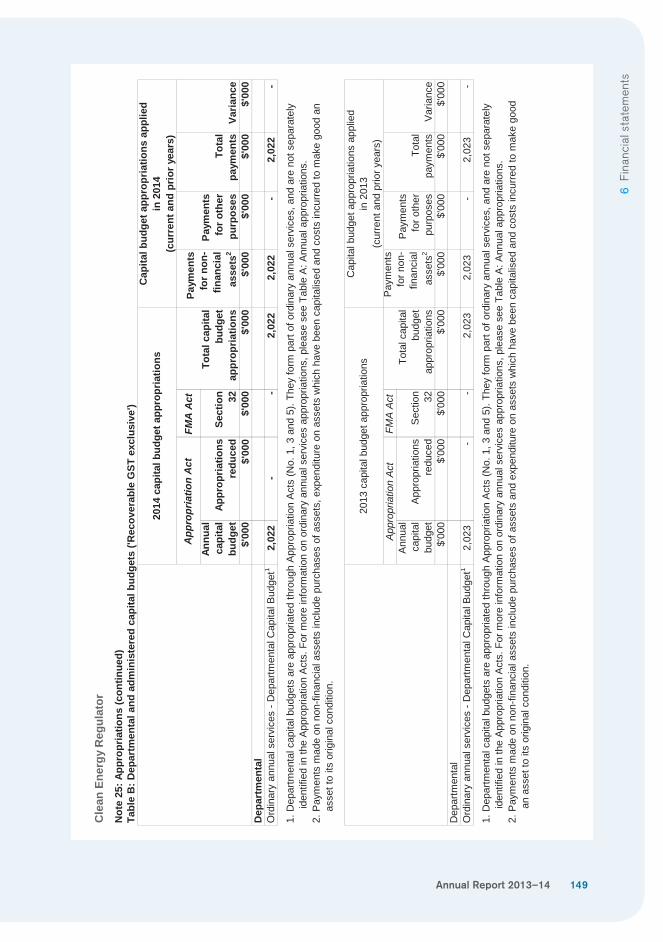
Annual Report 2013–14 149
6 Fi
nanc
ial s
tate
men
ts
Cle
an E
nerg
y R
egul
ator
Not
e 25
: App
ropr
iatio
ns (c
ontin
ued)
Tabl
e B
: Dep
artm
enta
l and
adm
inis
tere
d ca
pita
l bud
gets
('R
ecov
erab
le G
ST e
xclu
sive
')
FMA
Act
Annu
al
capi
tal
budg
etAp
prop
riatio
ns
redu
ced
Sect
ion 32
$'00
0$'
000
$'00
0$'
000
$'00
0$'
000
$'00
0$'
000
Dep
artm
enta
lO
rdin
ary
annu
al s
ervi
ces
- Dep
artm
enta
l Cap
ital B
udge
t12,
022
- -
2,02
2 2,
022
- 2,
022
-
FMA
Act
Ann
ual
capi
tal
budg
etA
ppro
pria
tions
re
duce
dS
ectio
n 32$'
000
$'00
0$'
000
$'00
0$'
000
$'00
0$'
000
$'00
0D
epar
tmen
tal
Ord
inar
y an
nual
ser
vice
s - D
epar
tmen
tal C
apita
l Bud
get1
2,02
3 -
-2,
023
2,02
3 -
2,02
3 -
2014
cap
ital b
udge
t app
ropr
iatio
ns
App
ropr
iatio
n A
ct
Tota
l cap
ital
budg
et
appr
opria
tions
Paym
ents
fo
r non
-fin
anci
al
asse
ts2
Paym
ents
fo
r oth
er
purp
oses
Tota
l pa
ymen
ts
1. D
epar
tmen
tal c
apita
l bud
gets
are
app
ropr
iate
d th
roug
h A
ppro
pria
tion
Act
s (N
o. 1
, 3 a
nd 5
). Th
ey fo
rm p
art o
f ord
inar
y an
nual
ser
vice
s, a
nd a
re n
ot s
epar
atel
y
ide
ntifi
ed in
the
App
ropr
iatio
n A
cts.
For
mor
e in
form
atio
n on
ord
inar
y an
nual
ser
vice
s ap
prop
riatio
ns, p
leas
e se
e Ta
ble
A: A
nnua
l app
ropr
iatio
ns.
2. P
aym
ents
mad
e on
non
-fina
ncia
l ass
ets
incl
ude
purc
hase
s of
ass
ets,
exp
endi
ture
on
asse
ts w
hich
hav
e be
en c
apita
lised
and
cos
ts in
curre
d to
mak
e go
od a
n
ass
et to
its
orig
inal
con
ditio
n.
Varia
nce
Cap
ital b
udge
t app
ropr
iatio
ns a
pplie
din
201
4(c
urre
nt a
n d p
rior y
ears
)
1. D
epar
tmen
tal c
apita
l bud
gets
are
app
ropr
iate
d th
roug
h A
ppro
pria
tion
Act
s (N
o. 1
, 3 a
nd 5
). Th
ey fo
rm p
art o
f ord
inar
y an
nual
ser
vice
s, a
nd a
re n
ot s
epar
atel
y
ide
ntifi
ed in
the
App
ropr
iatio
n A
cts.
For
mor
e in
form
atio
n on
ord
inar
y an
nual
ser
vice
s ap
prop
riatio
ns, p
leas
e se
e Ta
ble
A: A
nnua
l app
ropr
iatio
ns.
2. P
aym
ents
mad
e on
non
-fina
ncia
l ass
ets
incl
ude
purc
hase
s of
ass
ets
and
expe
nditu
re o
n as
sets
whi
ch h
ave
been
cap
italis
ed a
nd c
osts
incu
rred
to m
ake
good
an
asse
t to
its o
rigin
al c
ondi
tion.
Cap
ital b
udge
t app
ropr
iatio
ns a
pplie
d in
201
3(c
urre
nt a
nd p
rior y
ears
)A
ppro
pria
tion
Act
Tota
l cap
ital
budg
et
appr
opria
tions
Pay
men
ts
for n
on-
finan
cial
as
sets
2
Pay
men
ts
for o
ther
pu
rpos
esTo
tal
paym
ents
V
aria
nce
2013
cap
ital b
udge
t app
ropr
iatio
ns
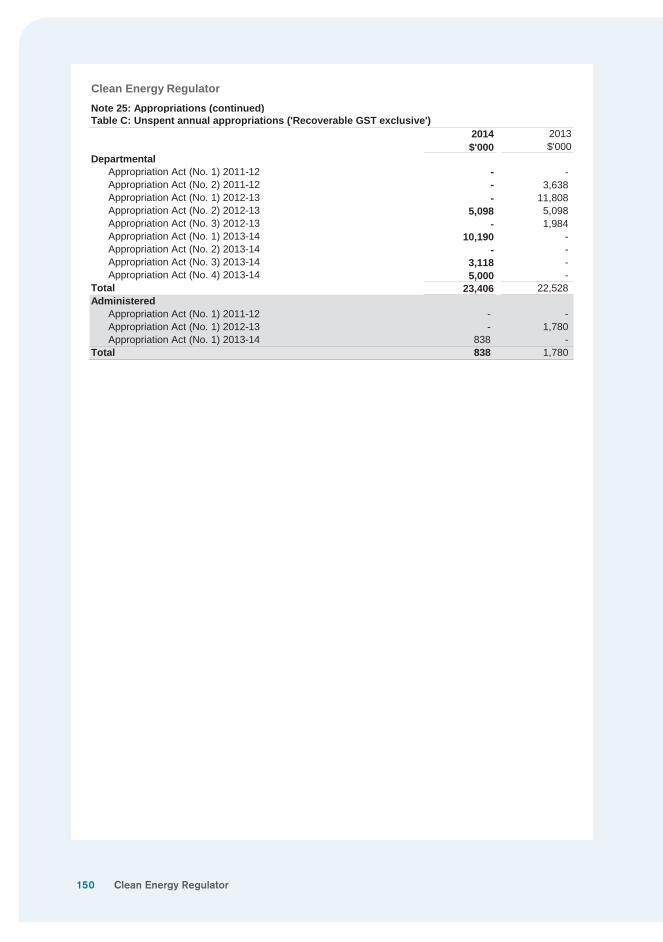
150
Clean Energy RegulatorNote 25: Appropriations (continued)Table C: Unspent annual appropriations ('Recoverable GST exclusive')
2014$'000
2013$'000
DepartmentalAppropriation Act (No. 1) 2011-12 - - Appropriation Act (No. 2) 2011-12 - 3,638 Appropriation Act (No. 1) 2012-13 - 11,808 Appropriation Act (No. 2) 2012-13 5,098 5,098 Appropriation Act (No. 3) 2012-13 - 1,984 Appropriation Act (No. 1) 2013-14 10,190 - Appropriation Act (No. 2) 2013-14 - - Appropriation Act (No. 3) 2013-14 3,118 - Appropriation Act (No. 4) 2013-14 5,000 -
Total 23,406 22,528 Administered
Appropriation Act (No. 1) 2011-12 - - Appropriation Act (No. 1) 2012-13 - 1,780 Appropriation Act (No. 1) 2013-14 838 -
Total 838 1,780
Clean Energy Regulator
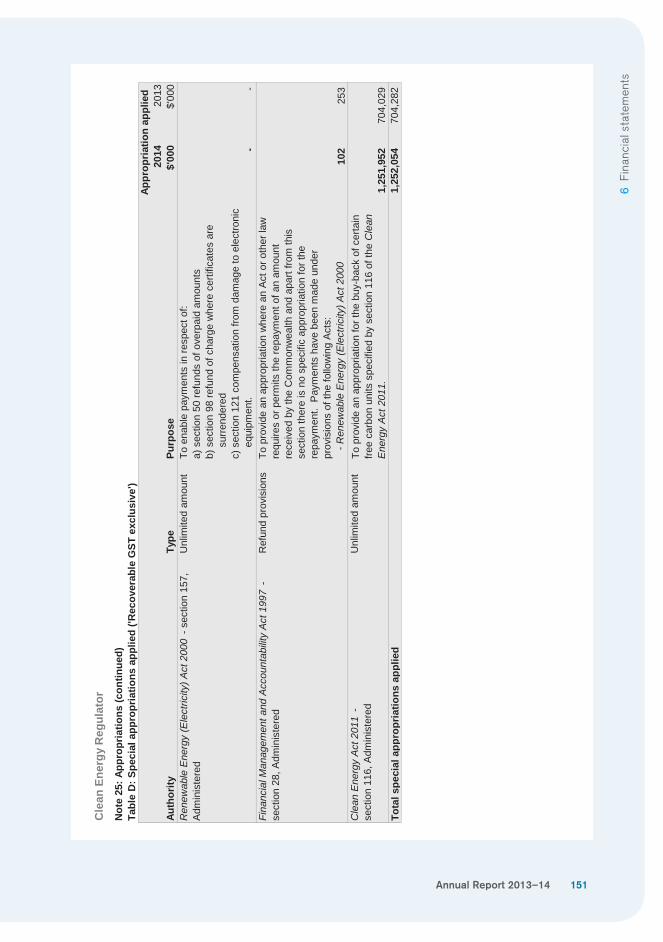
Annual Report 2013–14 151
6 Fi
nanc
ial s
tate
men
ts
Cle
an E
nerg
y R
egul
ator
Not
e 25
: App
ropr
iatio
ns (c
ontin
ued)
Tabl
e D
: Spe
cial
app
ropr
iatio
ns a
pplie
d ('R
ecov
erab
le G
ST e
xclu
sive
')
2014
2013
Type
Purp
ose
$'00
0$'
000
Ren
ewab
le E
nerg
y (E
lect
ricity
) Act
200
0 -
sect
ion
157,
A
dmin
iste
red
Unl
imite
d am
ount
- -
Fina
ncia
l Man
agem
ent a
nd A
ccou
ntab
ility
Act
199
7 -
sect
ion
28, A
dmin
iste
red
Ref
und
prov
isio
ns
102
253
Cle
an E
nerg
y A
ct 2
011
-se
ctio
n 11
6, A
dmin
iste
red
Unl
imite
d am
ount
1,25
1,95
2 70
4,02
9 To
tal s
peci
al a
ppro
pria
tions
app
lied
1,25
2,05
4 70
4,28
2
Auth
ority
To p
rovi
de a
n ap
prop
riatio
n w
here
an
Act
or o
ther
law
re
quire
s or
per
mits
the
repa
ymen
t of a
n am
ount
re
ceiv
ed b
y th
e C
omm
onw
ealth
and
apa
rt fro
m th
is
sect
ion
ther
e is
no
spec
ific
appr
opria
tion
for t
he
repa
ymen
t. P
aym
ents
hav
e be
en m
ade
unde
r pr
ovis
ions
of t
he fo
llow
ing
Act
s:
- Ren
ewab
le E
nerg
y (E
lect
ricity
) Act
200
0To
pro
vide
an
appr
opria
tion
for t
he b
uy-b
ack
of c
erta
in
free
carb
on u
nits
spe
cifie
d by
sec
tion
116
of th
e C
lean
E
nerg
y A
ct 2
011.
Appr
opria
tion
appl
ied
To e
nabl
e pa
ymen
ts in
resp
ect o
f:a)
sec
tion
50 re
fund
s of
ove
rpai
d am
ount
sb)
sec
tion
98 re
fund
of c
harg
e w
here
cer
tific
ates
are
s
urre
nder
edc)
sec
tion
121
com
pens
atio
n fro
m d
amag
e to
ele
ctro
nic
e
quip
men
t.
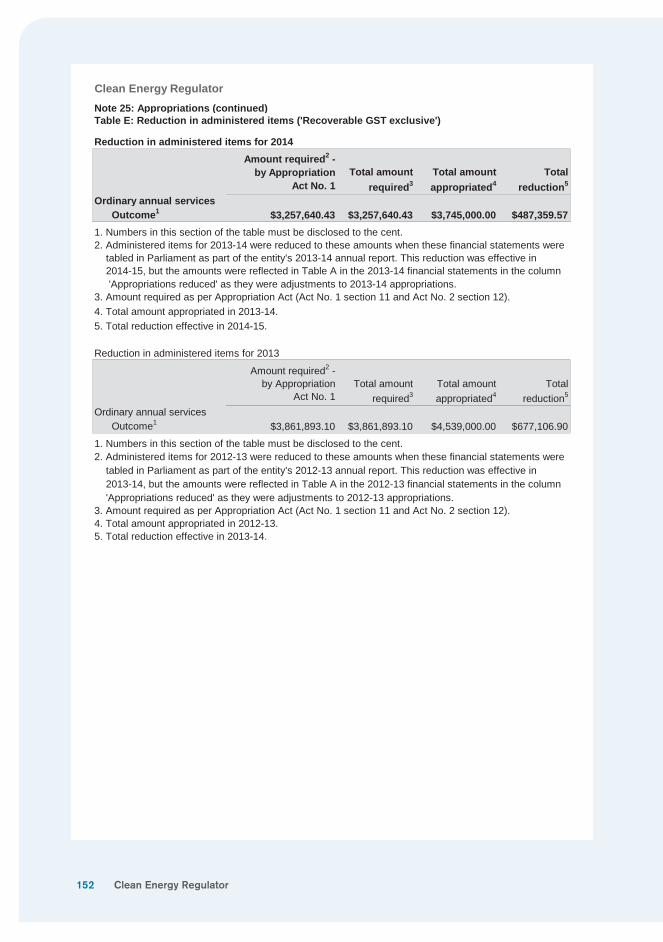
152
Clean Energy RegulatorNote 25: Appropriations (continued)Table E: Reduction in administered items ('Recoverable GST exclusive')
Reduction in administered items for 2014Amount required2 -
by Appropriation Act No. 1
Total amount required3
Total amount appropriated4
Total reduction5
Ordinary annual servicesOutcome1 $3,257,640.43 $3,257,640.43 $3,745,000.00 $487,359.57
1. Numbers in this section of the table must be disclosed to the cent.2. Administered items for 2013-14 were reduced to these amounts when these financial statements were tabled in Parliament as part of the entity's 2013-14 annual report. This reduction was effective in 2014-15, but the amounts were reflected in Table A in the 2013-14 financial statements in the column 'Appropriations reduced' as they were adjustments to 2013-14 appropriations.3. Amount required as per Appropriation Act (Act No. 1 section 11 and Act No. 2 section 12).4. Total amount appropriated in 2013-14.5. Total reduction effective in 2014-15.
Reduction in administered items for 2013
Amount required2 - by Appropriation
Act No. 1Total amount
required3Total amount appropriated4
Totalreduction5
Ordinary annual servicesOutcome1 $3,861,893.10 $3,861,893.10 $4,539,000.00 $677,106.90
1. Numbers in this section of the table must be disclosed to the cent.2. Administered items for 2012-13 were reduced to these amounts when these financial statements were tabled in Parliament as part of the entity's 2012-13 annual report. This reduction was effective in 2013-14, but the amounts were reflected in Table A in the 2012-13 financial statements in the column 'Appropriations reduced' as they were adjustments to 2012-13 appropriations.3. Amount required as per Appropriation Act (Act No. 1 section 11 and Act No. 2 section 12).4. Total amount appropriated in 2012-13.5. Total reduction effective in 2013-14.
Clean Energy Regulator
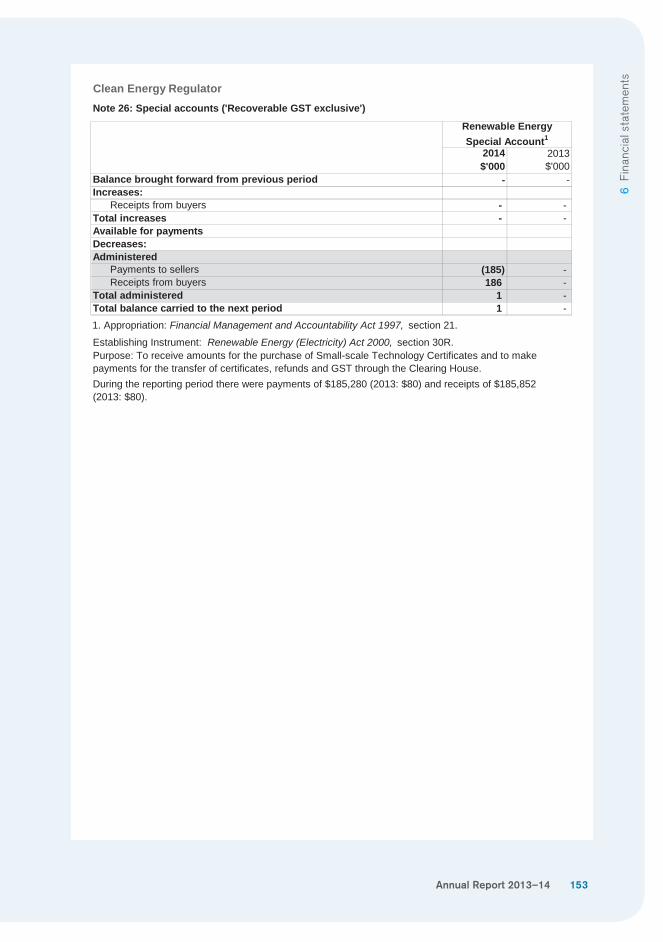
Annual Report 2013–14 153
6 Fi
nanc
ial s
tate
men
ts
Clean Energy Regulator
2014$'000
2013$'000
Balance brought forward from previous period - -Increases:
Receipts from buyers - - Total increases - - Available for paymentsDecreases:Administered
Payments to sellers (185) - Receipts from buyers 186 -
Total administered 1 - Total balance carried to the next period 1 - 1. Appropriation: Financial Management and Accountability Act 1997, section 21.
Establishing Instrument: Renewable Energy (Electricity) Act 2000, section 30R.
Note 26: Special accounts ('Recoverable GST exclusive')
Renewable EnergySpecial Account1
Purpose: To receive amounts for the purchase of Small-scale Technology Certificates and to make payments for the transfer of certificates, refunds and GST through the Clearing House.During the reporting period there were payments of $185,280 (2013: $80) and receipts of $185,852(2013: $80).
154
Clean Energy RegulatorNote 27: Compliance with statutory conditions for payments from the Consolidated Revenue FundSection 83 of the Constitution provides that no amount may be paid out of the Consolidated Revenue Fund except under an appropriation made by law. The Department of Finance provided information to all agencies in 2011-12 and 2012-13 regarding the need for risk assessments to be conducted in relation to compliance with statutory requirements on payments from Special Appropriations, including Special Accounts. During 2013-14, the CER reviewed its exposure to risks of not complying with statutory requirements on payments from appropriations. The following payment types were reviewed: • Special Account payments • Special Appropriation payments • Long service leave payments • Goods and services tax (GST) payments • Payments under determinations of the Remuneration Tribunal
Special AccountsThe CER identified the following Special Accounts which contain statutory requirements for payments: • Renewable Energy Special Account - established under the Renewable Energy (Electricity) Act 2000Payments from this Special Account during 2013-14 totalled $185,280, with payments assessed as low risk. No breaches were identified.
Special AppropriationsThe CER identified the following legislation as having Special Appropriations involving statutory requirements for payment: • Renewable Energy (Electricity) Act 2000 • Clean Energy Act 2011
• Carbon Credits (Carbon Farming Initiative) Act 2011Payments from these Special Appropriations during 2013-14 totalled $1,251,952,370. Payments from these Special Appropriations were initially assessed as medium risk, however, existing controls and processes in place reduce the assessed risk to low. No breaches were identified.
Long Service Leave PaymentsThe CER is required to review complaince with section 83 of the Constitution and the Long Service Leave (Commonwealth Employees) Act 1976 (LSL Act).In relation to the CER's Long Service Leave (LSL) payments, the review concluded a risk rating of low. No breaches were identified.
Goods and Service Tax PaymentsA breach of s83 due to GST payment would only occur if the following two conditions are met: • the correct amount of the total departmental and administered appropriation has been exhausted, and • that there was no other appropriation which would support the withdrawal.
As the CER has not exhausted any of its appropriations and written to the Department of Finance requesting more funds to be appropriated, no s83 breaches were identified. The risk rating is low.
Determinations of the Remuneration TribunalLegal advice confirmed that the Financial Framework Legislation Amendment Act (No. 2) 2013 (FFLA Act) has materially affected the preparation of section 83 on determinations made by the Remunerations Tribunal and reduced the circumstances in which a payment under the Remuneration Tribunal Act 1973 in respect of a 'benefit' as defined in ss16A(6) and 16B(6) of the FFLA Act would involve a breach of section 83. No breaches were identified. The risk rating is low.
Other appropriationsThe CER identified the following legislation as having an Other Appropriation involving statutory requirements for payment: • Financial Management and Accountability Act 1997 - section 28.Payments from these Other Appropriations during 2013-14 totalled $102,430, with payments being assessed as low risk. No breaches were identified.
Clean Energy Regulator
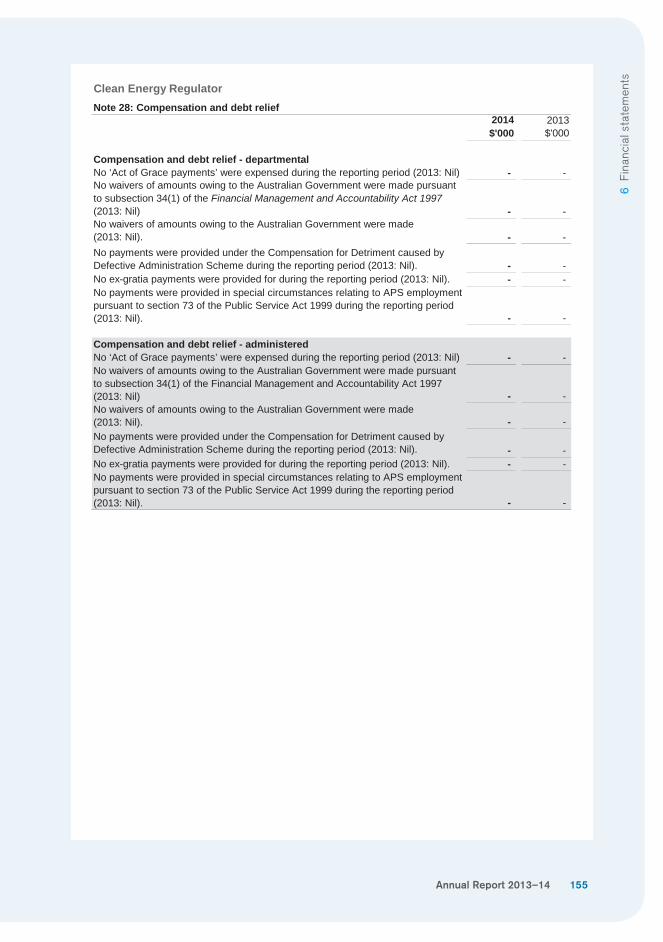
Annual Report 2013–14 155
6 Fi
nanc
ial s
tate
men
ts
Clean Energy RegulatorNote 28: Compensation and debt relief
2014$'000
2013$'000
Compensation and debt relief - departmentalNo ‘Act of Grace payments’ were expensed during the reporting period (2013: Nil) - - No waivers of amounts owing to the Australian Government were made pursuant to subsection 34(1) of the Financial Management and Accountability Act 1997 (2013: Nil) - - No waivers of amounts owing to the Australian Government were made(2013: Nil). - - No payments were provided under the Compensation for Detriment caused by Defective Administration Scheme during the reporting period (2013: Nil). - - No ex-gratia payments were provided for during the reporting period (2013: Nil). - - No payments were provided in special circumstances relating to APS employment pursuant to section 73 of the Public Service Act 1999 during the reporting period (2013: Nil). - -
Compensation and debt relief - administeredNo ‘Act of Grace payments’ were expensed during the reporting period (2013: Nil) - - No waivers of amounts owing to the Australian Government were made pursuant to subsection 34(1) of the Financial Management and Accountability Act 1997 (2013: Nil) - - No waivers of amounts owing to the Australian Government were made(2013: Nil). - - No payments were provided under the Compensation for Detriment caused by Defective Administration Scheme during the reporting period (2013: Nil). - - No ex-gratia payments were provided for during the reporting period (2013: Nil). - - No payments were provided in special circumstances relating to APS employment pursuant to section 73 of the Public Service Act 1999 during the reporting period (2013: Nil). - -
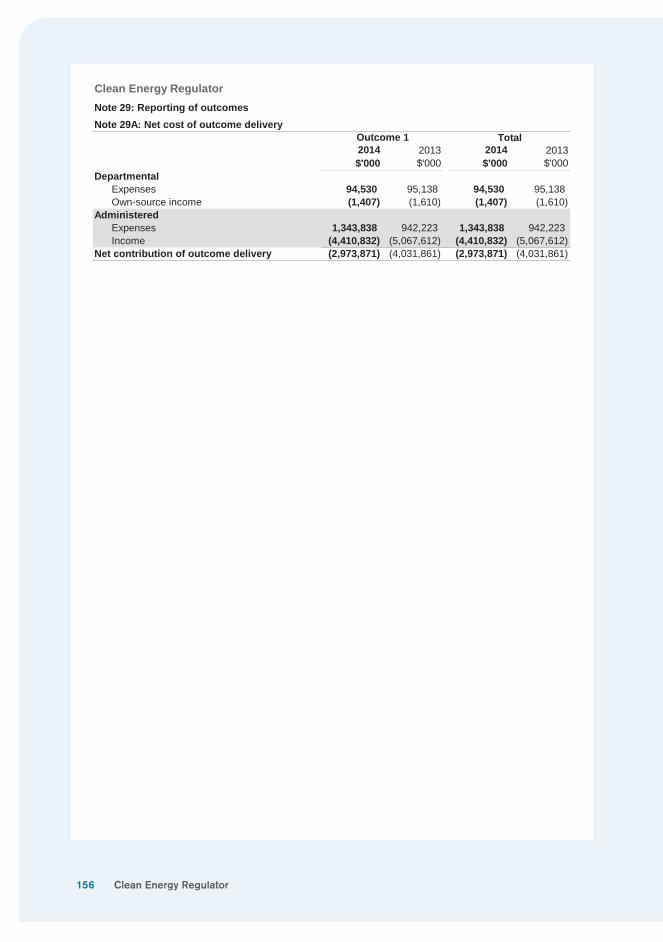
156
Clean Energy RegulatorNote 29: Reporting of outcomesNote 29A: Net cost of outcome delivery
2014$'000
2013$'000
2014$'000
2013$'000
DepartmentalExpenses 94,530 95,138 94,530 95,138 Own-source income (1,407) (1,610) (1,407) (1,610)
AdministeredExpenses 1,343,838 942,223 1,343,838 942,223 Income (4,410,832) (5,067,612) (4,410,832) (5,067,612)
Net contribution of outcome delivery (2,973,871) (4,031,861) (2,973,871) (4,031,861)
TotalOutcome 1
Clean Energy Regulator
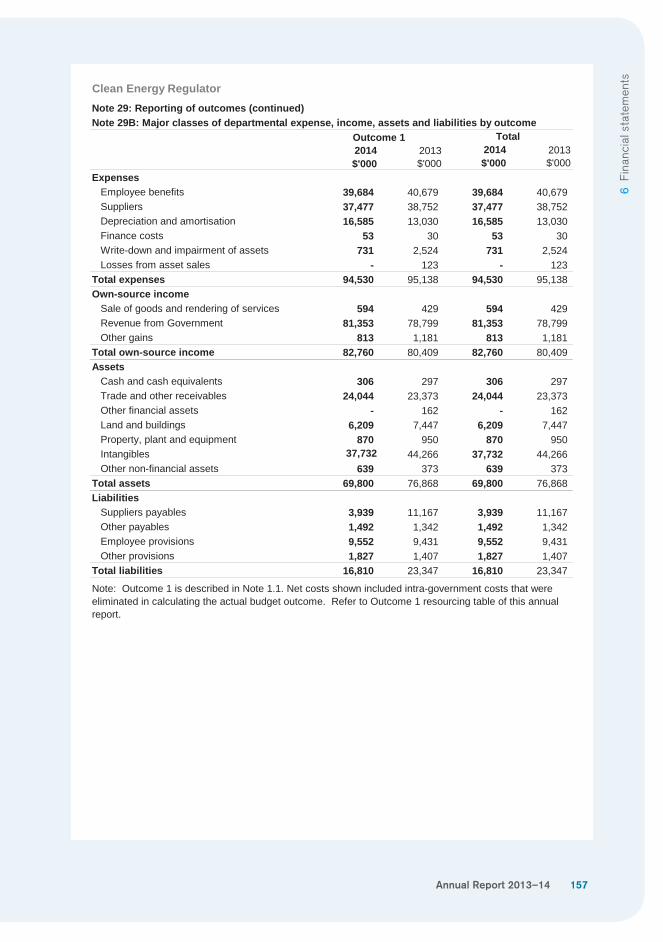
Annual Report 2013–14 157
6 Fi
nanc
ial s
tate
men
ts
Clean Energy Regulator
Note 29B: Major classes of departmental expense, income, assets and liabilities by outcome
2014$'000
2013$'000
2014$'000
2013$'000
ExpensesEmployee benefits 39,684 40,679 39,684 40,679 Suppliers 37,477 38,752 37,477 38,752 Depreciation and amortisation 16,585 13,030 16,585 13,030 Finance costs 53 30 53 30Write-down and impairment of assets 731 2,524 731 2,524 Losses from asset sales - 123 - 123
Total expenses 94,530 95,138 94,530 95,138 Own-source income
Sale of goods and rendering of services 594 429 594 429Revenue from Government 81,353 78,799 81,353 78,799 Other gains 813 1,181 813 1,181
Total own-source income 82,760 80,409 82,760 80,409 Assets
Cash and cash equivalents 306 297 306 297Trade and other receivables 24,044 23,373 24,044 23,373 Other financial assets - 162 - 162Land and buildings 6,209 7,447 6,209 7,447 Property, plant and equipment 870 950 870 950Intangibles 37,732 44,266 37,732 44,266 Other non-financial assets 639 373 639 373
Total assets 69,800 76,868 69,800 76,868 Liabilities
Suppliers payables 3,939 11,167 3,939 11,167 Other payables 1,492 1,342 1,492 1,342 Employee provisions 9,552 9,431 9,552 9,431 Other provisions 1,827 1,407 1,827 1,407
Total liabilities 16,810 23,347 16,810 23,347
TotalOutcome 1
Note 29: Reporting of outcomes (continued)
Note: Outcome 1 is described in Note 1.1. Net costs shown included intra-government costs that were eliminated in calculating the actual budget outcome. Refer to Outcome 1 resourcing table of this annual report.
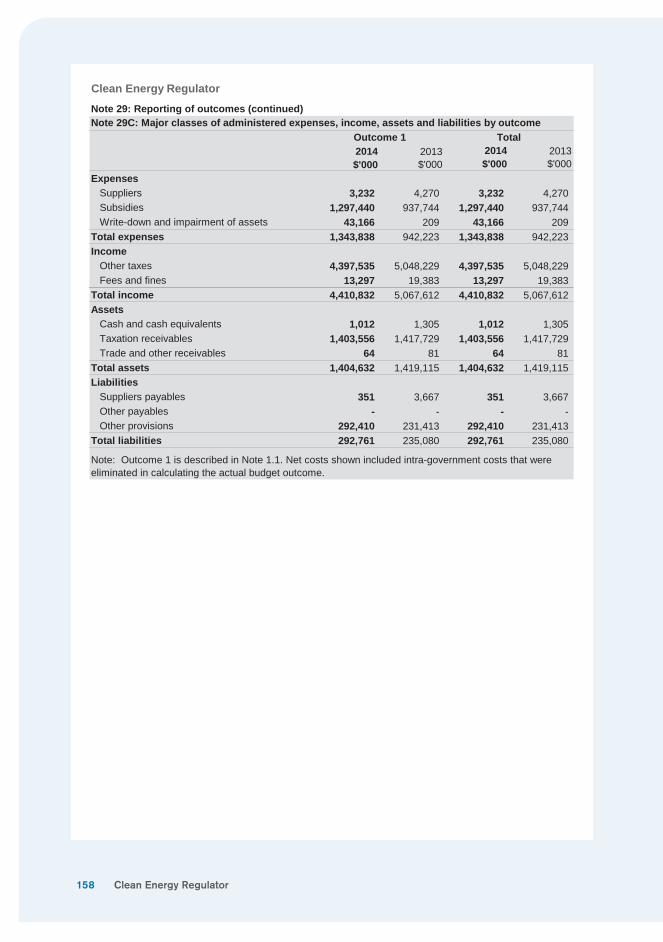
158
Clean Energy Regulator
Note 29: Reporting of outcomes (continued)Note 29C: Major classes of administered expenses, income, assets and liabilities by outcome
2014$'000
2013$'000
2014$'000
2013$'000
ExpensesSuppliers 3,232 4,270 3,232 4,270 Subsidies 1,297,440 937,744 1,297,440 937,744 Write-down and impairment of assets 43,166 209 43,166 209
Total expenses 1,343,838 942,223 1,343,838 942,223 Income
Other taxes 4,397,535 5,048,229 4,397,535 5,048,229 Fees and fines 13,297 19,383 13,297 19,383
Total income 4,410,832 5,067,612 4,410,832 5,067,612 Assets
Cash and cash equivalents 1,012 1,305 1,012 1,305 Taxation receivables 1,403,556 1,417,729 1,403,556 1,417,729 Trade and other receivables 64 81 64 81
Total assets 1,404,632 1,419,115 1,404,632 1,419,115 Liabilities
Suppliers payables 351 3,667 351 3,667 Other payables - - - - Other provisions 292,410 231,413 292,410 231,413
Total liabilities 292,761 235,080 292,761 235,080
Note: Outcome 1 is described in Note 1.1. Net costs shown included intra-government costs that were eliminated in calculating the actual budget outcome.
Outcome 1 Total
Clean Energy Regulator
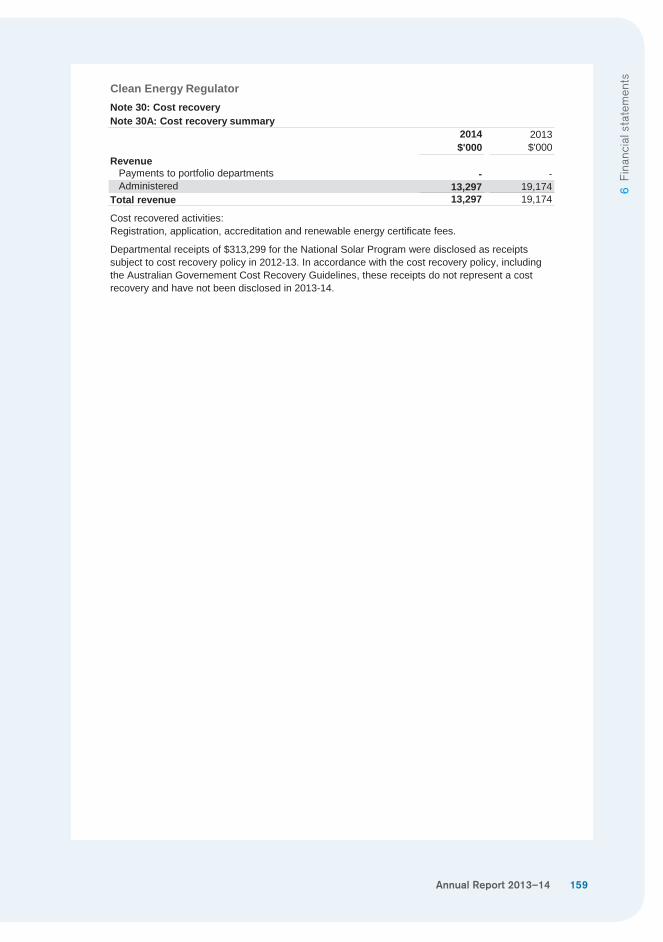
Annual Report 2013–14 159
6 Fi
nanc
ial s
tate
men
ts
Clean Energy Regulator
Note 30A: Cost recovery summary2014$'000
2013$'000
RevenuePayments to portfolio departments - -Administered 13,297 19,174
Total revenue 13,297 19,174
Cost recovered activities:Registration, application, accreditation and renewable energy certificate fees.
Note 30: Cost recovery
Departmental receipts of $313,299 for the National Solar Program were disclosed as receipts subject to cost recovery policy in 2012-13. In accordance with the cost recovery policy, including the Australian Governement Cost Recovery Guidelines, these receipts do not represent a cost recovery and have not been disclosed in 2013-14.
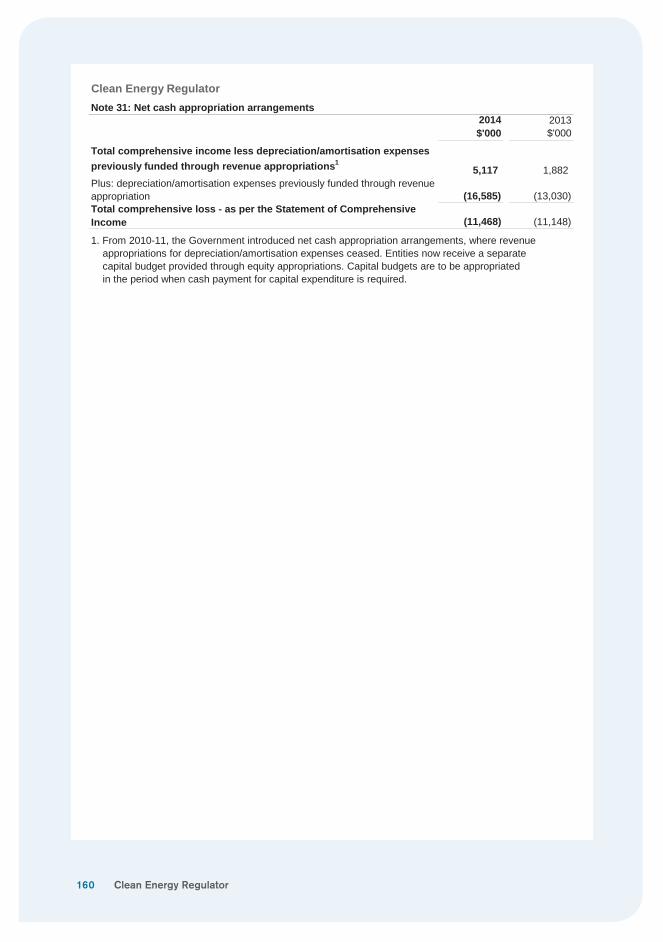
160
Clean Energy RegulatorNote 31: Net cash appropriation arrangements
2014$'000
2013$'000
Total comprehensive income less depreciation/amortisation expenses previously funded through revenue appropriations1
5,117 1,882 Plus: depreciation/amortisation expenses previously funded through revenue appropriation (16,585) (13,030)Total comprehensive loss - as per the Statement of Comprehensive Income (11,468) (11,148)
1. From 2010-11, the Government introduced net cash appropriation arrangements, where revenue appropriations for depreciation/amortisation expenses ceased. Entities now receive a separate capital budget provided through equity appropriations. Capital budgets are to be appropriated in the period when cash payment for capital expenditure is required.
Clean Energy Regulator
A Workforce profi le 162
B Legal expenditure 168
C Resource statements 170
AppendicesSection 7
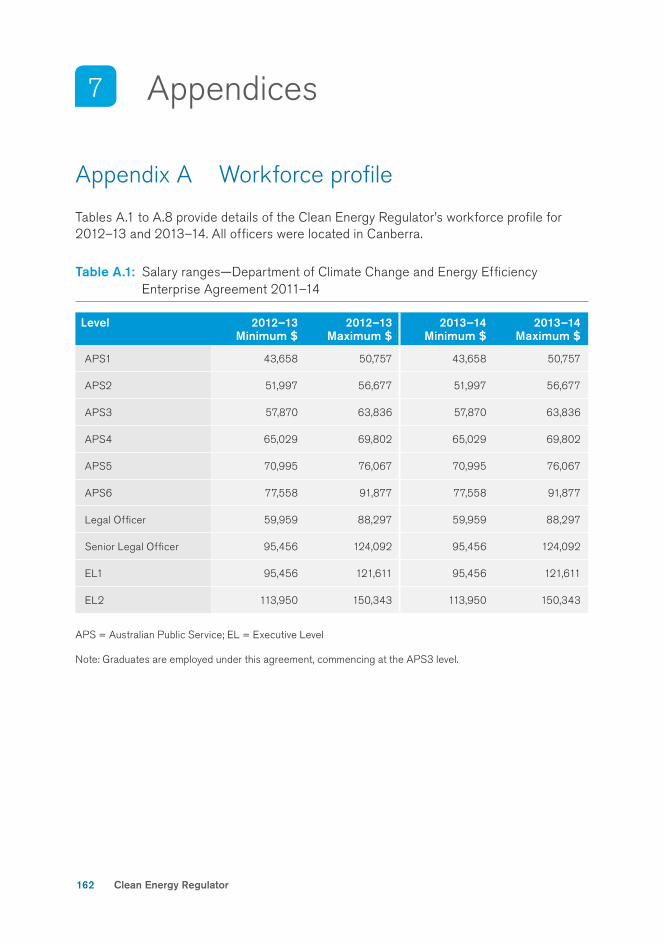
162
Appendices7
Appendix A Workforce profi le
Tables A.1 to A.8 provide details of the Clean Energy Regulator’s workforce profi le for 2012–13 and 2013–14. All offi cers were located in Canberra.
Table A.1: Salary ranges—Department of Climate Change and Energy Effi ciency Enterprise Agreement 2011–14
Level 2012–13 Minimum $
2012–13 Maximum $
2013–14 Minimum $
2013–14 Maximum $
APS1 43,658 50,757 43,658 50,757
APS2 51,997 56,677 51,997 56,677
APS3 57,870 63,836 57,870 63,836
APS4 65,029 69,802 65,029 69,802
APS5 70,995 76,067 70,995 76,067
APS6 77,558 91,877 77,558 91,877
Legal Offi cer 59,959 88,297 59,959 88,297
Senior Legal Offi cer 95,456 124,092 95,456 124,092
EL1 95,456 121,611 95,456 121,611
EL2 113,950 150,343 113,950 150,343
APS = Australian Public Service; EL = Executive Level
Note: Graduates are employed under this agreement, commencing at the APS3 level.
Clean Energy Regulator
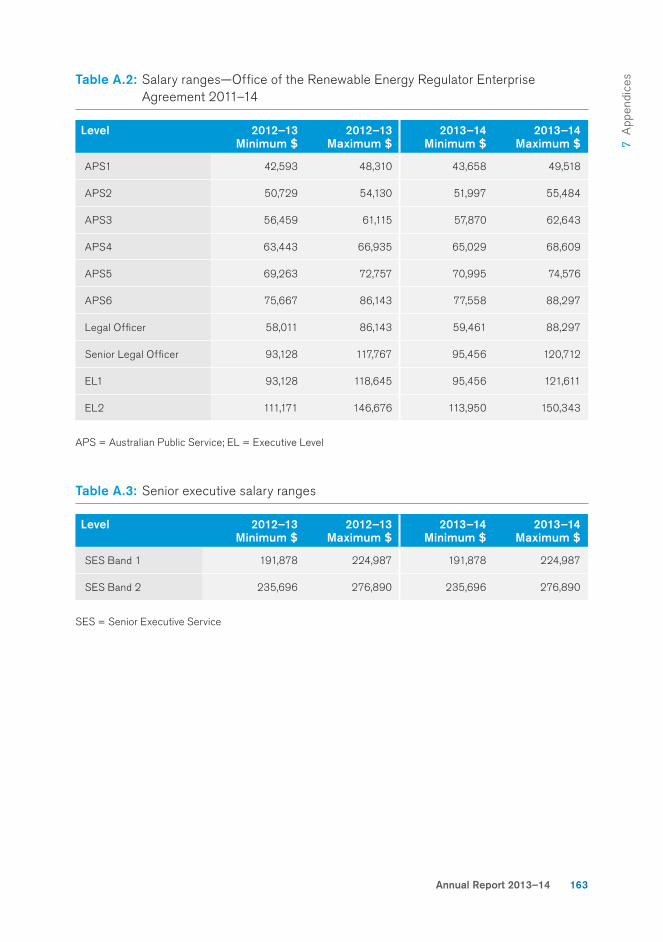
Annual Report 2013–14 163
7 A
ppen
dice
sTable A.2: Salary ranges—Offi ce of the Renewable Energy Regulator Enterprise Agreement 2011–14
Level 2012–13 Minimum $
2012–13 Maximum $
2013–14 Minimum $
2013–14 Maximum $
APS1 42,593 48,310 43,658 49,518
APS2 50,729 54,130 51,997 55,484
APS3 56,459 61,115 57,870 62,643
APS4 63,443 66,935 65,029 68,609
APS5 69,263 72,757 70,995 74,576
APS6 75,667 86,143 77,558 88,297
Legal Offi cer 58,011 86,143 59,461 88,297
Senior Legal Offi cer 93,128 117,767 95,456 120,712
EL1 93,128 118,645 95,456 121,611
EL2 111,171 146,676 113,950 150,343
APS = Australian Public Service; EL = Executive Level
Table A.3: Senior executive salary ranges
Level 2012–13 Minimum $
2012–13 Maximum $
2013–14 Minimum $
2013–14 Maximum $
SES Band 1 191,878 224,987 191,878 224,987
SES Band 2 235,696 276,890 235,696 276,890
SES = Senior Executive Service
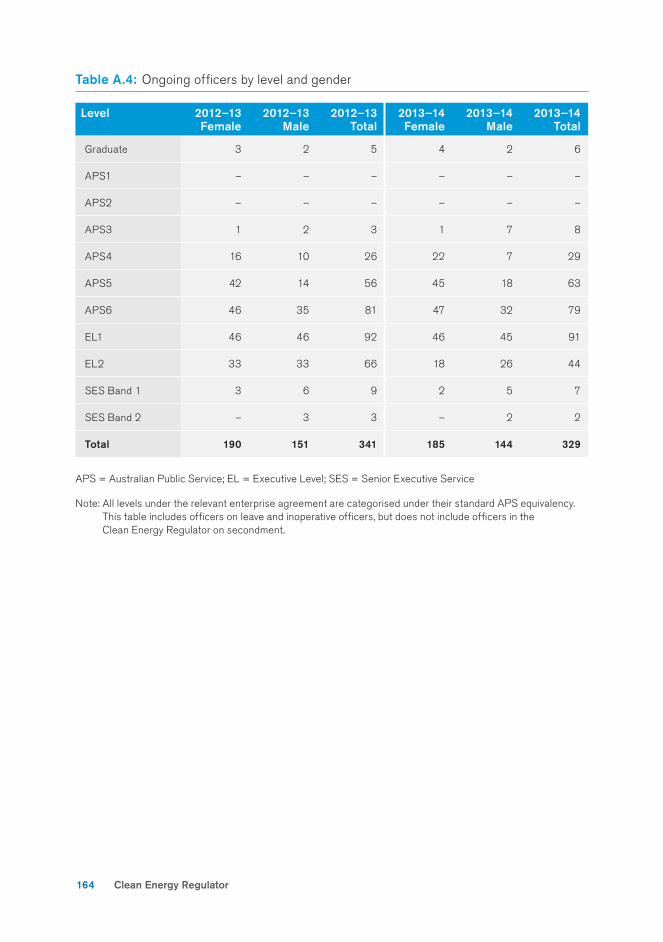
164
Table A.4: Ongoing offi cers by level and gender
Level 2012–13 Female
2012–13 Male
2012–13 Total
2013–14 Female
2013–14 Male
2013–14 Total
Graduate 3 2 5 4 2 6
APS1 – – – – – –
APS2 – – – – – –
APS3 1 2 3 1 7 8
APS4 16 10 26 22 7 29
APS5 42 14 56 45 18 63
APS6 46 35 81 47 32 79
EL1 46 46 92 46 45 91
EL2 33 33 66 18 26 44
SES Band 1 3 6 9 2 5 7
SES Band 2 – 3 3 – 2 2
Total 190 151 341 185 144 329
APS = Australian Public Service; EL = Executive Level; SES = Senior Executive Service
Note: All levels under the relevant enterprise agreement are categorised under their standard APS equivalency. This table includes offi cers on leave and inoperative offi cers, but does not include offi cers in the Clean Energy Regulator on secondment.
Clean Energy Regulator
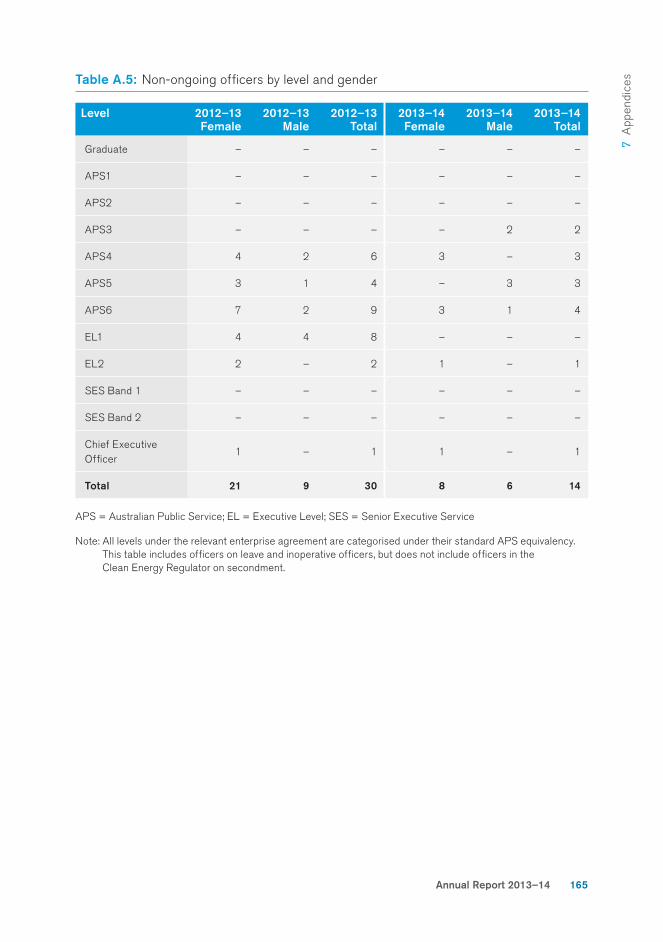
Annual Report 2013–14 165
7 A
ppen
dice
s Table A.5: Non-ongoing offi cers by level and gender
Level 2012–13 Female
2012–13 Male
2012–13 Total
2013–14 Female
2013–14 Male
2013–14 Total
Graduate – – – – – –
APS1 – – – – – –
APS2 – – – – – –
APS3 – – – – 2 2
APS4 4 2 6 3 – 3
APS5 3 1 4 – 3 3
APS6 7 2 9 3 1 4
EL1 4 4 8 – – –
EL2 2 – 2 1 – 1
SES Band 1 – – – – – –
SES Band 2 – – – – – –
Chief Executive Offi cer
1 – 1 1 – 1
Total 21 9 30 8 6 14
APS = Australian Public Service; EL = Executive Level; SES = Senior Executive Service
Note: All levels under the relevant enterprise agreement are categorised under their standard APS equivalency. This table includes offi cers on leave and inoperative offi cers, but does not include offi cers in the Clean Energy Regulator on secondment.
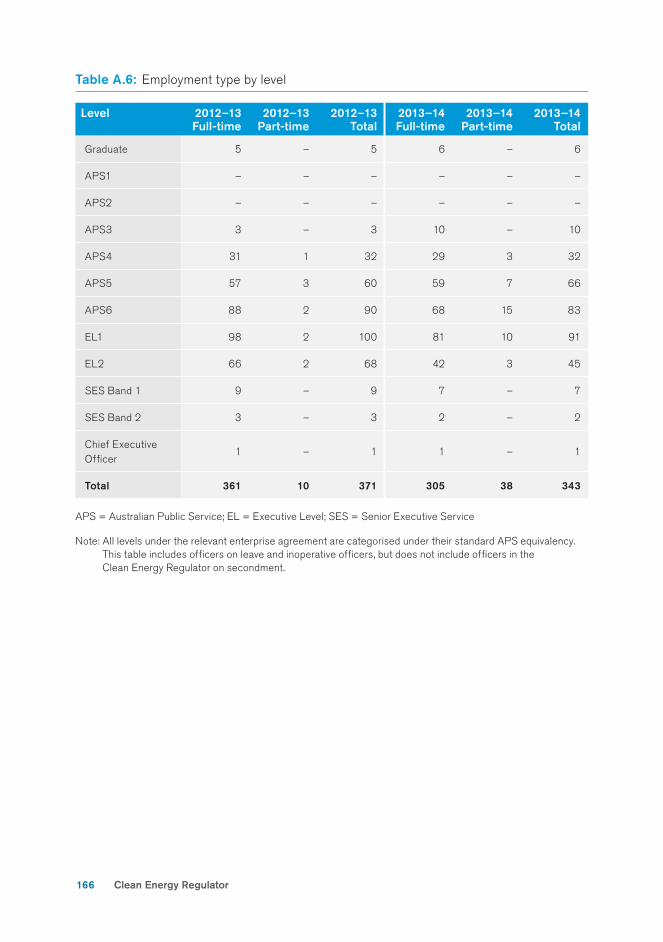
166
Table A.6: Employment type by level
Level 2012–13 Full-time
2012–13 Part-time
2012–13 Total
2013–14 Full-time
2013–14 Part-time
2013–14 Total
Graduate 5 – 5 6 – 6
APS1 – – – – – –
APS2 – – – – – –
APS3 3 – 3 10 – 10
APS4 31 1 32 29 3 32
APS5 57 3 60 59 7 66
APS6 88 2 90 68 15 83
EL1 98 2 100 81 10 91
EL2 66 2 68 42 3 45
SES Band 1 9 – 9 7 – 7
SES Band 2 3 – 3 2 – 2
Chief Executive Offi cer
1 – 1 1 – 1
Total 361 10 371 305 38 343
APS = Australian Public Service; EL = Executive Level; SES = Senior Executive Service
Note: All levels under the relevant enterprise agreement are categorised under their standard APS equivalency. This table includes offi cers on leave and inoperative offi cers, but does not include offi cers in the Clean Energy Regulator on secondment.
Clean Energy Regulator
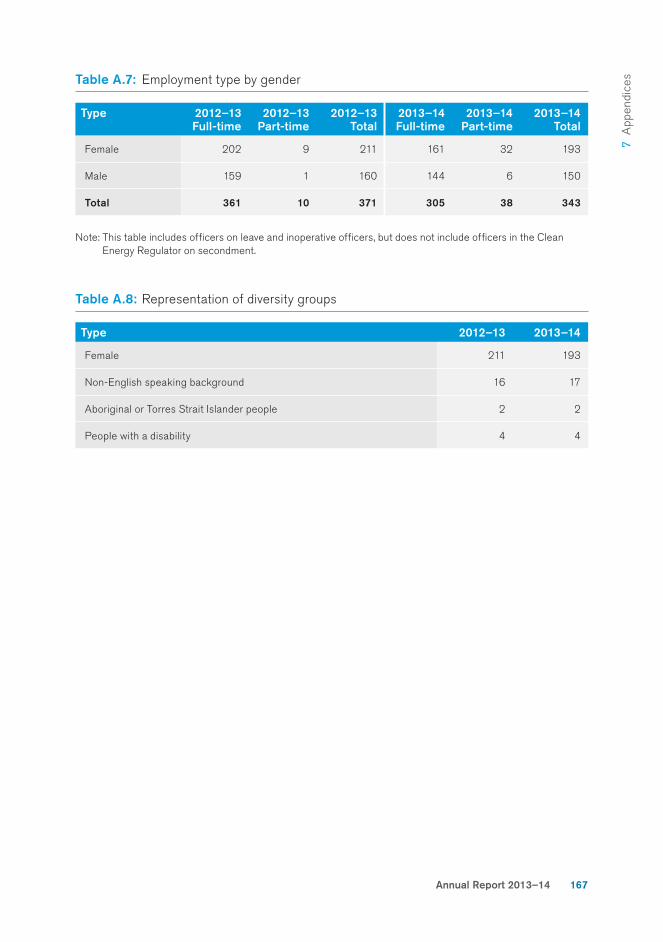
Annual Report 2013–14 167
7 A
ppen
dice
sTable A.7: Employment type by gender
Type 2012–13 Full-time
2012–13 Part-time
2012–13 Total
2013–14 Full-time
2013–14 Part-time
2013–14 Total
Female 202 9 211 161 32 193
Male 159 1 160 144 6 150
Total 361 10 371 305 38 343
Note: This table includes offi cers on leave and inoperative offi cers, but does not include offi cers in the Clean Energy Regulator on secondment.
Table A.8: Representation of diversity groups
Type 2012–13 2013–14
Female 211 193
Non-English speaking background 16 17
Aboriginal or Torres Strait Islander people 2 2
People with a disability 4 4
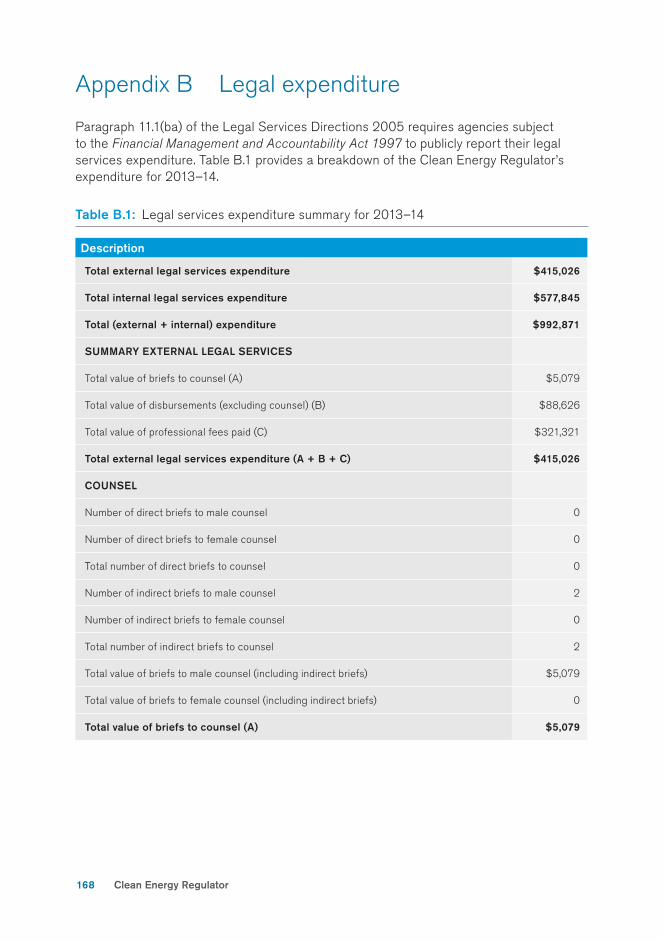
168
Appendix B Legal expenditure
Paragraph 11.1(ba) of the Legal Services Directions 2005 requires agencies subject to the Financial Management and Accountability Act 1997 to publicly report their legal services expenditure. Table B.1 provides a breakdown of the Clean Energy Regulator’s expenditure for 2013–14.
Table B.1: Legal services expenditure summary for 2013–14
Description
Total external legal services expenditure $415,026
Total internal legal services expenditure $577,845
Total (external + internal) expenditure $992,871
SUMMARY EXTERNAL LEGAL SERVICES
Total value of briefs to counsel (A) $5,079
Total value of disbursements (excluding counsel) (B) $88,626
Total value of professional fees paid (C) $321,321
Total external legal services expenditure (A + B + C) $415,026
COUNSEL
Number of direct briefs to male counsel 0
Number of direct briefs to female counsel 0
Total number of direct briefs to counsel 0
Number of indirect briefs to male counsel 2
Number of indirect briefs to female counsel 0
Total number of indirect briefs to counsel 2
Total value of briefs to male counsel (including indirect briefs) $5,079
Total value of briefs to female counsel (including indirect briefs) 0
Total value of briefs to counsel (A) $5,079
Clean Energy Regulator
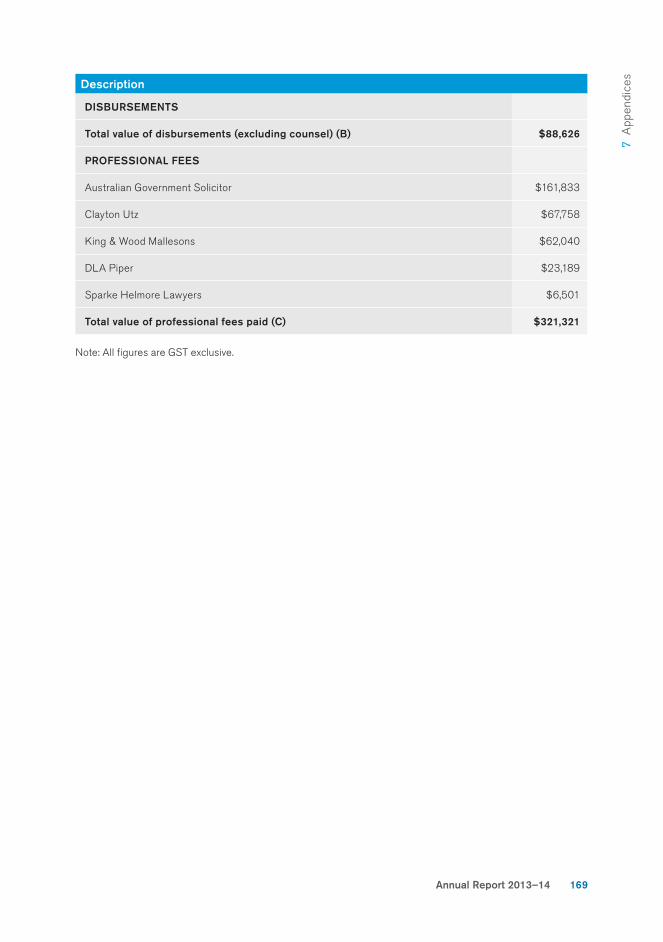
Annual Report 2013–14 169
7 A
ppen
dice
s
Description
DISBURSEMENTS
Total value of disbursements (excluding counsel) (B) $88,626
PROFESSIONAL FEES
Australian Government Solicitor $161,833
Clayton Utz $67,758
King & Wood Mallesons $62,040
DLA Piper $23,189
Sparke Helmore Lawyers $6,501
Total value of professional fees paid (C) $321,321
Note: All fi gures are GST exclusive.
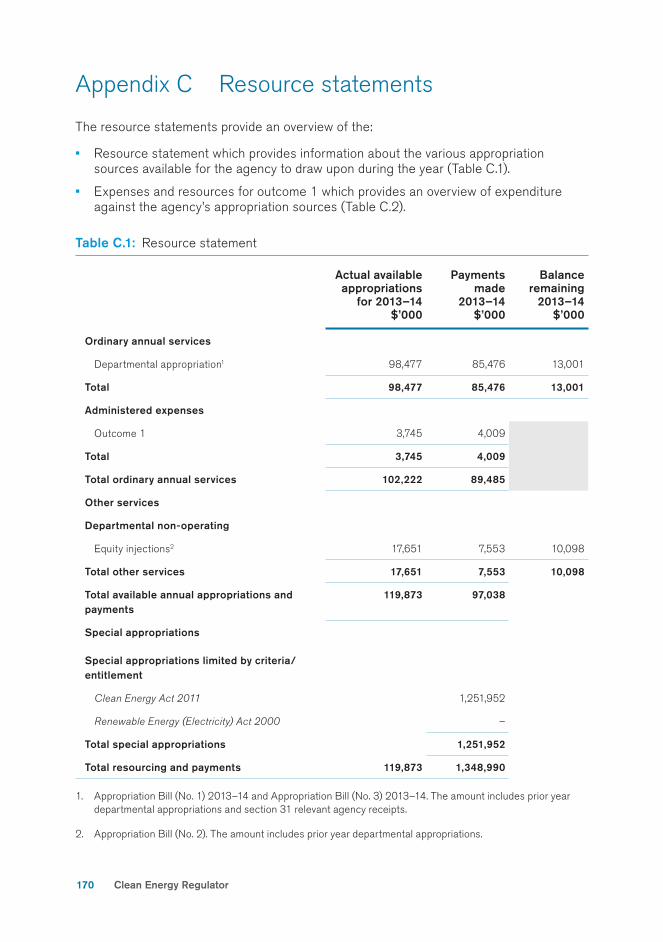
170
Appendix C Resource statements
The resource statements provide an overview of the:
• Resource statement which provides information about the various appropriation sources available for the agency to draw upon during the year (Table C.1).
• Expenses and resources for outcome 1 which provides an overview of expenditure against the agency’s appropriation sources (Table C.2).
Table C.1: Resource statement
Actual availableappropriations
for 2013–14$’000
Payments made
2013–14$’000
Balanceremaining
2013–14$’000
Ordinary annual services
Departmental appropriation1 98,477 85,476 13,001
Total 98,477 85,476 13,001
Administered expenses
Outcome 1 3,745 4,009
Total 3,745 4,009
Total ordinary annual services 102,222 89,485
Other services
Departmental non-operating
Equity injections2 17,651 7,553 10,098
Total other services 17,651 7,553 10,098
Total available annual appropriations and payments
119,873 97,038
Special appropriations
Special appropriations limited by criteria/entitlement
Clean Energy Act 2011 1,251,952
Renewable Energy (Electricity) Act 2000 –
Total special appropriations 1,251,952
Total resourcing and payments 119,873 1,348,990
1. Appropriation Bill (No. 1) 2013–14 and Appropriation Bill (No. 3) 2013–14. The amount includes prior year departmental appropriations and section 31 relevant agency receipts.
2. Appropriation Bill (No. 2). The amount includes prior year departmental appropriations.
Clean Energy Regulator
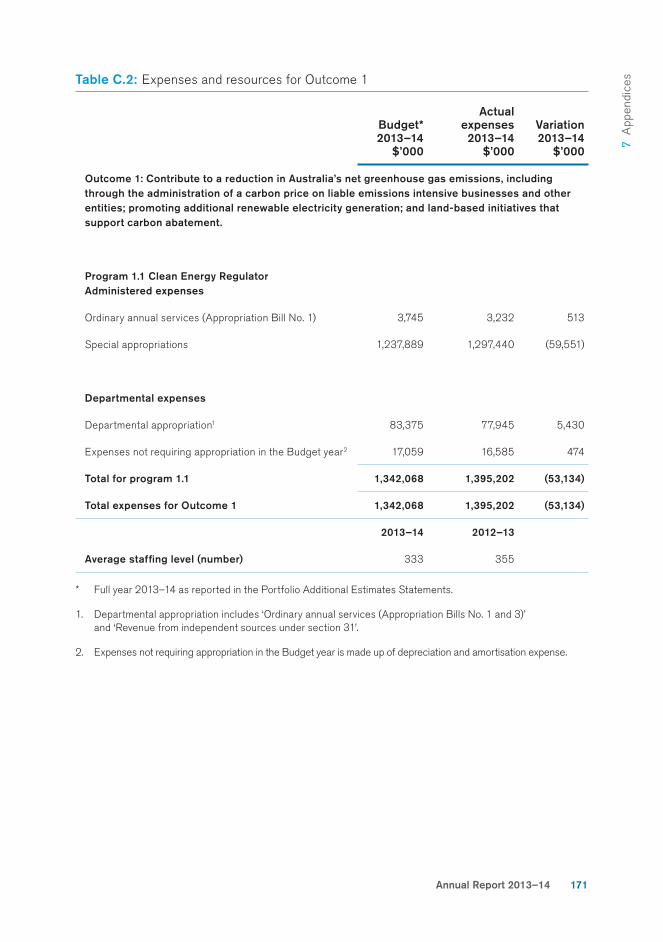
Annual Report 2013–14 171
7 A
ppen
dice
sTable C.2: Expenses and resources for Outcome 1
Budget*2013–14
$’000
Actual expenses2013–14
$’000
Variation2013–14
$’000
Outcome 1: Contribute to a reduction in Australia’s net greenhouse gas emissions, including through the administration of a carbon price on liable emissions intensive businesses and other entities; promoting additional renewable electricity generation; and land-based initiatives that support carbon abatement.
Program 1.1 Clean Energy RegulatorAdministered expenses
Ordinary annual services (Appropriation Bill No. 1) 3,745 3,232 513
Special appropriations 1,237,889 1,297,440 (59,551)
Departmental expenses
Departmental appropriation1 83,375 77,945 5,430
Expenses not requiring appropriation in the Budget year2 17,059 16,585 474
Total for program 1.1 1,342,068 1,395,202 (53,134)
Total expenses for Outcome 1 1,342,068 1,395,202 (53,134)
2013–14 2012–13
Average staffi ng level (number) 333 355
* Full year 2013–14 as reported in the Portfolio Additional Estimates Statements.
1. Departmental appropriation includes ‘Ordinary annual services (Appropriation Bills No. 1 and 3)’ and ‘Revenue from independent sources under section 31’.
2. Expenses not requiring appropriation in the Budget year is made up of depreciation and amortisation expense.

Glossary and abbreviations list 173
List of requirements 175
Index 178
References
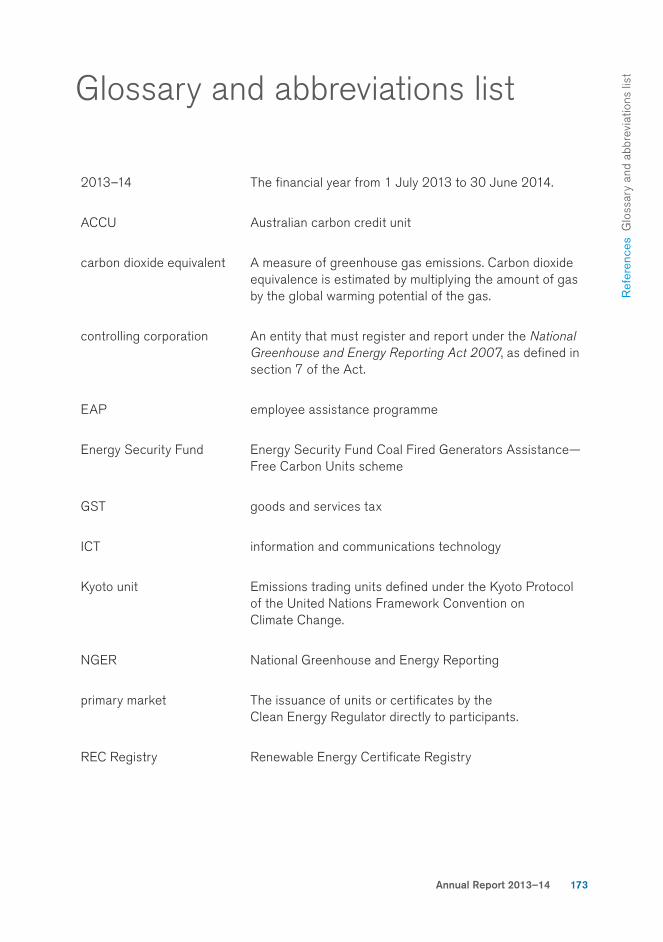
Annual Report 2013–14 173
Ref
eren
ces
Glo
ssar
y an
d ab
brev
iatio
ns li
stGlossary and abbreviations list
2013–14 The fi nancial year from 1 July 2013 to 30 June 2014.
ACCU Australian carbon credit unit
carbon dioxide equivalent A measure of greenhouse gas emissions. Carbon dioxide equivalence is estimated by multiplying the amount of gas by the global warming potential of the gas.
controlling corporation An entity that must register and report under the National
Greenhouse and Energy Reporting Act 2007, as defi ned in section 7 of the Act.
EAP employee assistance programme
Energy Security Fund Energy Security Fund Coal Fired Generators Assistance—Free Carbon Units scheme
GST goods and services tax
ICT information and communications technology
Kyoto unit Emissions trading units defi ned under the Kyoto Protocol of the United Nations Framework Convention on Climate Change.
NGER National Greenhouse and Energy Reporting
primary market The issuance of units or certifi cates by the Clean Energy Regulator directly to participants.
REC Registry Renewable Energy Certifi cate Registry
174
scope 1 emissions The release of greenhouse gas into the atmosphere as a direct result of an activity or series of activities (including ancillary activities) that constitute the facility. For example, the emissions produced when coal is burned at a power station are scope 1 emissions.
scope 2 emissions The release of greenhouse gas into the atmosphere as a direct result of one or more activities that generate electricity, heating cooling or steam that is consumed by the facility but that do not form part of the facility.
secondary market The market for units or certifi cates issued by the Clean Energy Regulator that occurs between two entities not including the Clean Energy Regulator.
section 24(1) determination A legislative instrument made by an authorised person, under section 24(1) of the Public Service Act 1999, which sets out terms and conditions of employment. A determination may apply to an individual employee or a group of employees.
STC Clearing House Small-scale Technology Certifi cate Clearing House
Clean Energy Regulator
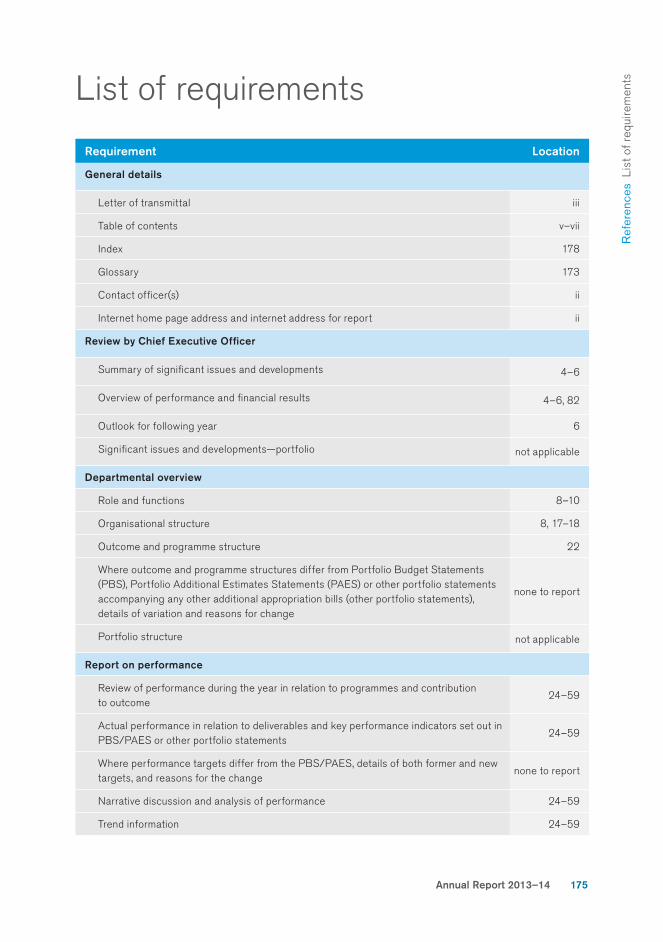
Annual Report 2013–14 175
Ref
eren
ces
Lis
t of
requ
irem
ents
List of requirements
Requirement Location
General details
Letter of transmittal iii
Table of contents v–vii
Index 178
Glossary 173
Contact offi cer(s) ii
Internet home page address and internet address for report ii
Review by Chief Executive Offi cer
Summary of signifi cant issues and developments 4–6
Overview of performance and fi nancial results 4–6, 82
Outlook for following year 6
Signifi cant issues and developments—portfolio not applicable
Departmental overview
Role and functions 8–10
Organisational structure 8, 17–18
Outcome and programme structure 22
Where outcome and programme structures differ from Portfolio Budget Statements (PBS), Portfolio Additional Estimates Statements (PAES) or other portfolio statements accompanying any other additional appropriation bills (other portfolio statements), details of variation and reasons for change
none to report
Portfolio structure not applicable
Report on performance
Review of performance during the year in relation to programmes and contribution to outcome
24–59
Actual performance in relation to deliverables and key performance indicators set out in PBS/PAES or other portfolio statements
24–59
Where performance targets differ from the PBS/PAES, details of both former and new targets, and reasons for the change
none to report
Narrative discussion and analysis of performance 24–59
Trend information 24–59
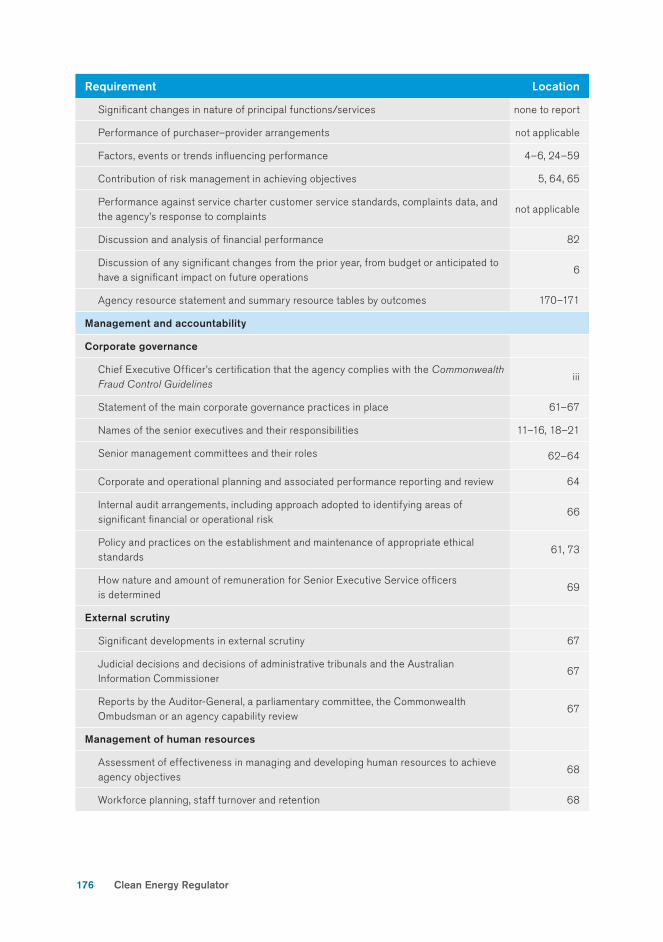
176
Requirement Location
Signifi cant changes in nature of principal functions/services none to report
Performance of purchaser–provider arrangements not applicable
Factors, events or trends infl uencing performance 4–6, 24–59
Contribution of risk management in achieving objectives 5, 64, 65
Performance against service charter customer service standards, complaints data, and the agency’s response to complaints
not applicable
Discussion and analysis of fi nancial performance 82
Discussion of any signifi cant changes from the prior year, from budget or anticipated to have a signifi cant impact on future operations
6
Agency resource statement and summary resource tables by outcomes 170–171
Management and accountability
Corporate governance
Chief Executive Offi cer’s certifi cation that the agency complies with the Commonwealth
Fraud Control Guidelinesiii
Statement of the main corporate governance practices in place 61–67
Names of the senior executives and their responsibilities 11–16, 18–21
Senior management committees and their roles 62–64
Corporate and operational planning and associated performance reporting and review 64
Internal audit arrangements, including approach adopted to identifying areas of signifi cant fi nancial or operational risk
66
Policy and practices on the establishment and maintenance of appropriate ethical standards
61, 73
How nature and amount of remuneration for Senior Executive Service offi cers is determined
69
External scrutiny
Signifi cant developments in external scrutiny 67
Judicial decisions and decisions of administrative tribunals and the Australian Information Commissioner
67
Reports by the Auditor-General, a parliamentary committee, the Commonwealth Ombudsman or an agency capability review
67
Management of human resources
Assessment of effectiveness in managing and developing human resources to achieve agency objectives
68
Workforce planning, staff turnover and retention 68
Clean Energy Regulator
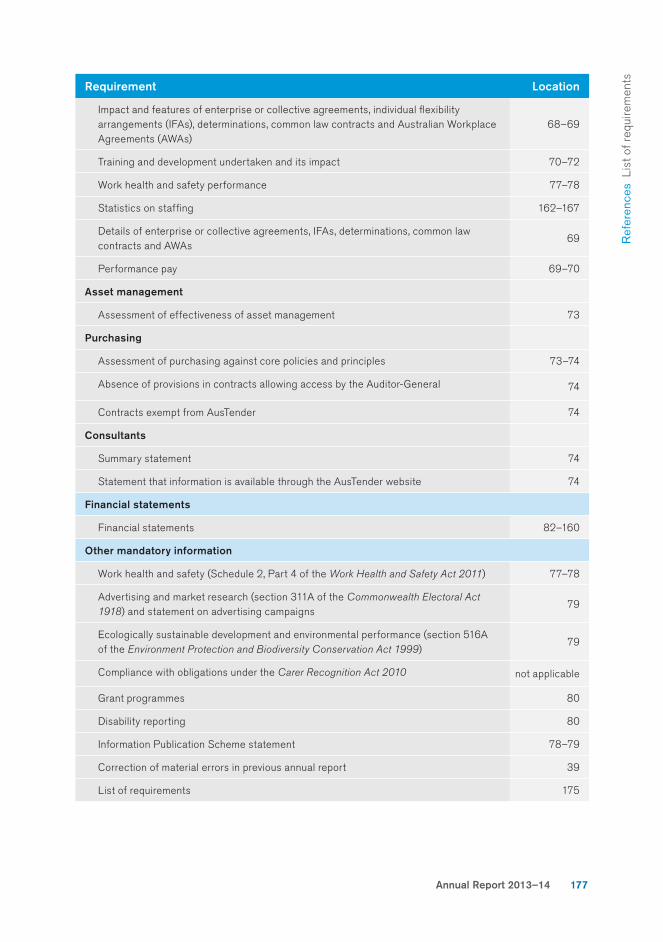
Annual Report 2013–14 177
Ref
eren
ces
Lis
t of
requ
irem
ents
Requirement Location
Impact and features of enterprise or collective agreements, individual fl exibility arrangements (IFAs), determinations, common law contracts and Australian Workplace Agreements (AWAs)
68–69
Training and development undertaken and its impact 70–72
Work health and safety performance 77–78
Statistics on staffi ng 162–167
Details of enterprise or collective agreements, IFAs, determinations, common law contracts and AWAs
69
Performance pay 69–70
Asset management
Assessment of effectiveness of asset management 73
Purchasing
Assessment of purchasing against core policies and principles 73–74
Absence of provisions in contracts allowing access by the Auditor-General 74
Contracts exempt from AusTender 74
Consultants
Summary statement 74
Statement that information is available through the AusTender website 74
Financial statements
Financial statements 82–160
Other mandatory information
Work health and safety (Schedule 2, Part 4 of the Work Health and Safety Act 2011) 77–78
Advertising and market research (section 311A of the Commonwealth Electoral Act
1918) and statement on advertising campaigns79
Ecologically sustainable development and environmental performance (section 516A of the Environment Protection and Biodiversity Conservation Act 1999)
79
Compliance with obligations under the Carer Recognition Act 2010 not applicable
Grant programmes 80
Disability reporting 80
Information Publication Scheme statement 78–79
Correction of material errors in previous annual report 39
List of requirements 175
178
IndexAabbreviations and glossary, 173–174
Aboriginal and Torres Strait Islander people, staff, 167
access and equity, 72
accidents and incidents, staff, 78
accountability and management, 61–75
acquittal rates, liabilities, 2, 5, 25, 26, 30, 45, 57; see also compliance rates
administered fi nances, 82; see also fi nancial statements; resource statements
administrative tribunals, 67
advertising and market research, 79
agency
establishment of, 8
role, 5, 8–10
agents applications, processing, 38–39, 57
Agent’s Guide to Creating and Selling Small-scale
Technology Certifi cates (translation of), 72
alternative waste, methodology category, 32
Annual Procurement Plan, 74
annual report contact, ii
annual reporting requirements, iii, viii, 61
APS Statistical Bulletin, 80
asset management, 73; see also fi nancial statements
audit, internal, 61, 62, 66
Audit Committee, 62, 66
Auditor-General, 67; see also Australian National Audit Offi ce
auditors, registered, 10, 48–49, 57, 58
workshop, 36
audits and inspections, 5
National Greenhouse and Energy Reporting Scheme program, 3, 48, 58
offsets projects, 36, 58
Renewable Energy Certifi cate Registry, 46
Renewable Energy Target, 5, 45
small generation units, 38, 42–43, 57
Small-scale Renewable Energy Scheme, 42, 43–44
see also compliance functions, agency
AusTender, 74
Australia and New Zealand School of Government Executive Master of Public Administration, 71
Australian carbon credit units, 3, 5–6, 9, 10, 31, 34, 35, 37, 51, 58
trading of (see Australian National Registry of Emissions Units)
see also Carbon Farming Initiative
Australian Competition and Consumer Commission, 53
Australian Crime Commission, 53
Australian Energy Market Operator, 50, 53
Australian Federal Police, 53, 54; see also law enforcement agencies, collaboration with
Australian Government Information Security Manual, 63
Australian Government Investigations Standards, 58, 65
Australian Information Commissioner, 67
Australian National Audit Offi ce, 79
access clause, 74
independent audit report, 84–85
Australian National Registry of Emissions Units, 5, 6, 8, 10, 22, 51–52, 57, 66
highlights, 3
Australian National Registry of Emissions Units Act
2011, 8
Australian Public Service Code of Conduct, 61, 71
Australian Public Service Commission Career Development Assessment Centre, 71
Australian Public Service Commission Integrated Leadership System, 70
Australian Public Service Commission Senior Executive Service Band 1 Leadership Program, 71
Australian Public Service Values, 61, 71
Australian Securities and Investments Commission, 53
Australian Securities and Investments Commission
Act 2001, 53
Australian Taxation Offi ce, 53
Australian Transaction Reports and Analysis Centre, 53
avoided deforestation, 32, 37
case study, 34
see also Carbon Farming Initiative
Awards of Excellence, 72–73
Clean Energy Regulator
Annual Report 2013–14 179
Ref
eren
ces
Inde
xBbullying and harassment policy, 77, 78
business continuity arrangements, 66
business planning, 61, 64
Business Reference Group, 30
Ccarbon credit units; see Australian carbon credit units
Carbon Credits (Carbon Farming Initiative) Act 2011, 8, 31, 36, 56
Carbon Farming Initiative, 5, 6, 8, 9, 10, 22, 31–37, 51, 56, 58
audits and inspections, 36, 58
case study, 34
feature story, 37
highlights, 3
methodologies, 32, 34, 35, 36, 37
Carbon Farming Initiative Amendment Bill 2014, 8
carbon pricing mechanism, 5, 8, 9, 10, 22, 24–30, 56
compliance, 5, 25, 26, 30, 57
feature story, 30
highlights, 2
liabilities under, 25–27, 31, 47, 48, 51, 52, 53, 58, 67 (see also liabilities)
carbon tax, repeal of, 4, 6
carbon units, free, 5, 28, 29, 51; see also Energy Security Fund Coal Fired Generators Assistance–Free Carbon Units; Jobs and Competitiveness Program
case study
Avoided deforestation in western New South Wales, 34
see also feature stories
certifi cates
of entitlement, 31, 56, 58
large-scale generation, 2, 9, 42, 45, 46
liability transfer, 27, 47
partial exemption, 44
renewable energy certifi cates, 2, 38, 45 (see also large-scale generation certifi cates; small-scale technology certifi cates)
small-scale technology, 2, 9, 42, 43–44, 45, 46, 57, 66
Chair’s review, 4–6
Chief Executive Directions, 61
Chief Executive Instructions, 61, 73
Chief Executive Offi cer
fi nancial statement declaration, 86
review, 4–6
Chief Executive Offi cer Award, 73
Chief Financial Offi cer, fi nancial statement declaration, 86
China, collaboration with, 55
classifi cation, staff, 162–166; see also workforce profi le
Clean Energy Act 2011, 8, 24, 27
repeal, 9
Clean Energy (Consequential Amendments) Act 2011, 69
Clean Energy Regulator
establishment of, 8
Members, 11–17
role, 5, 8–10
Clean Energy Regulator Act 2011, iii, 8, 11, 17
Clean Energy Regulator Commonwealth Information Sharing Network, 49
client engagement activities, 4, 6, 8, 36, 43, 47
feature story, 30
see also education activities
coal-fi red electricity generators, arrangements for, 29; see also Energy Security Fund Coal Fired Generators Assistance–Free Carbon Units
Comcare, 78
committees, management, 62–64
Commonwealth Director of Public Prosecutions
referral of cases to, 5
Commonwealth Disability Strategy (former), 80
Commonwealth Information Sharing Network, Clean Energy Regulator, 49
Commonwealth Ombudsman, 67
Commonwealth Procurement Rules, 73
Competition and Consumer Act 2010, 53
compliance functions, agency, 4, 5, 10, 57, 58; see also audits and inspections
compliance rates, 4
carbon pricing mechanism, 5, 25, 26, 30, 57
Renewable Energy Target, 2, 43, 45
see also acquittal rates, liabilities
confl icts of interest, prevention of, 65
consultancies, 74
consultative arrangements, staff, 64
contact centre operations, internal audit of, 66
180
contact details, agency, ii
controlling corporations, 47, 57
corporate governance, 61–67
Corporations Act 2001, 53
counselling, staff, 78
Criminal Code Act 1995, 5
culture, organisational, 61, 68
Ddeforestation, avoided, 32, 34, 37; see also
Carbon Farming Initiative
delegation framework, 8
deliverables, 24, 31, 38, 47, 51, 53; see also performance indicators
demographics, staff, 164–167
Department of Climate Change and Energy Effi ciency Enterprise Agreement 2011–14, 69
Department of Foreign Affairs and Trade, 55
Department of the Environment, 6, 8, 55
departmental fi nances, 82; see also fi nancial statements; resource statements
Diploma of Government, 72
disability reporting, 80
diversity, staff, 68, 72, 167
Eecologically sustainable development report,
agency, 79
education activities, 25, 30, 36, 37, 45, 48, 65
responsibility to undertake, 10
see also client engagement activities; learning and development, staff; training, staff
Effective Work Health and Safety Committees (training course), 78
embodied emissions, 27
Emissions and Energy Reporting System, 4, 30, 48, 51, 75
Emissions Reduction Fund, introduction of, 4, 6, 8
emissions reporting mechanisms; see Emissions and Energy Reporting System; National Greenhouse and Energy Reporting Scheme
emissions units registration; see Australian National Registry of Emissions Units
emissions-intensive industries, arrangements for, 29, 44
employee assistance program, 78
employment conditions, 68; see also enterprise agreements
energy acquisition statements, 45
Energy Security Fund Coal Fired Generators Assistance–Free Carbon Units, 24, 29, 51
enforceable undertakings, 5, 65
enforcement role; see compliance functions, agency
enterprise agreements, 68, 69
Environment portfolio, 11
equity and access, 72
ethical standards, 71; see also Australian Public Service Code of Conduct; Australian Public Service Values
European regulators, collaboration with, 55
Europol, 54
excellence awards, 72–73
Executive Board, 62
exempt contracts, 74
expenses, 82; see also fi nancial statements; resource statements
Extended Leadership Team, 62
external scrutiny, 67
Ffact sheets, translation of, 72
farmers, access to carbon markets; see Carbon Farming Initiative
feature stories
Integrated approach to client service, 30
International collaboration on monitoring and reporting verifi cation, 55
National Greenhouse and Energy Reporting data sharing, 50
Success of the Carbon Farming Initiative, 37
Wine industry investment in solar generation, 41see also case study
feedback, client, 30, 48, 49, 50, 67; see also surveys
female staff, 164, 165, 167
Financial Benefi ts for Installing Solar Water Heaters or
Solar Panels (translation of), 72
Financial Management and Accountability Act 1997, iii, 8, 168
fi nancial processing, internal audit of, 66
fi nancial statements, 87–160
summary report, 82
see also resource statements
Clean Energy Regulator
Annual Report 2013–14 181
Ref
eren
ces
Inde
xfi rst aid offi cers, 78; see also work health and safety
fraud control, 5, 54, 61, 65, 66, 71; see also audits and inspections; National Greenhouse and Energy Reporting Audit Framework
free carbon units, 5, 28, 29, 51; see also Energy Security Fund Coal Fired Generators Assistance–Free Carbon Units; Jobs and Competitiveness Program
Freedom of Information Act 1982, 78
Fuel Tax Act 2006, 53
full-time staff, 166, 167
Ggender, staff, 164, 165, 167
Global Partnership for Market Readiness Monitoring, Reporting and Verifi cation Working Group, 55
glossary and abbreviations, 173–174
governance framework, 61–67
governing legislation, 8
government agencies, cooperation with, 4, 49, 53–54; see also state and territory governments
government policy, implementation of, 4, 6
graduate development programme, 71–72
grant programmes, 80
guide to the report, viii
Hharassment contact offi cer network, 78
Heads of Commonwealth Operational Law Enforcement Agencies working group, 54
health and safety, work, 68, 71, 77–78
Health and Safety Representative Training Course, 78
highlights of 2013–14, 2–3; see also review, CEO’s
human resources management, 68–73
Iincidents and accidents, staff, 78
income, 82; see also fi nancial statements; resource statements
independent audit report, Australian National Audit Offi ce, 84–85
Industry, Innovation, Climate Change, Science, Research and Tertiary Education portfolio, 11
Industry, Innovation, Climate Change, Science,
Research and Tertiary Education Portfolio Budget
Statements 2013–14, viii, 22, 24, 56; see also portfolio budget statements
industry assistance schemes, 24; see also Carbon Farming Initiative; emissions-intensive industries, arrangements for; Energy Security Fund Coal Fired Generators Assistance–Free Carbon Units; Jobs and Competitiveness Program
industry consultation; see client engagement activities; reference group, business
information and communications technology, 63, 75
Information Publication Scheme, 78–79
information sharing arrangements, 49, 50, 53–54, 59
Information Sharing Network (Commonwealth), 49
Information Sharing Network (states and territories), 49, 50, 59
Injury Treatment Pty Ltd, 78
inspections and audits; see audits and inspections
intelligence capabilities, 53; see also law enforcement agencies, collaboration with
intergovernmental cooperation, 53–54; see also information sharing arrangements; international collaboration; memorandums of understanding; state and territory governments
interim emissions numbers, 25, 26
internal audit, 61, 62, 66
international collaboration, 53, 54, 55; see also Kyoto Protocol
International Energy Agency, 10
INTERPOL Environmental Crime Programme, 54
introduction and guide, annual report, viii
JJobs and Competitiveness Program, 5, 24, 51, 56
eligibility for free carbon units, 28–29
joint ventures, liability sharing options, 27
judicial decisions, 67
KKyoto Protocol, 9, 10, 51
Kyoto units, 6, 51, 52
Llandfi ll, methodology category, 32, 37
landholders, access to carbon markets; see Carbon Farming Initiative
large-scale generation certifi cates, 2, 9, 42, 45, 46; see also Large-scale Renewable Energy Target
Large-scale Renewable Energy Target, 9, 38, 39–40; see also large-scale generation certifi cates
182
law enforcement agencies, collaboration with, 10, 53, 54
leadership development programme, 68, 71
learning and development, staff, 70–71; see also training, staff
legal expenditure, 168–169
legislative framework, 8
letter of transmittal, iii
liabilities, 48, 65
acquittal rates, 2, 5, 25, 26, 30, 45, 57 (see also compliance rates)
determination of, 10, 25, 27, 47
management systems (see Australian National Registry of Emissions Units; National Greenhouse and Energy Reporting Scheme)
see also carbon pricing mechanism; liability transfer certifi cates; Liable Entities Public Information Database
liability transfer certifi cates, 27, 47
Liable Entities Public Information Database, 24, 28, 58
liquid fuel Opt-in Scheme, 28
livestock, methodology category, 32
Mmachinery of government changes, 11
male staff, 164, 165, 167
management and accountability, 61–75
management committees, 62–64
Management Response Team, 66
Managers Forum, 64
market research and advertising, 79
meetings, Regulator, 17
Members, Regulator, 11–17
memorandums of understanding, 49, 53
methodologies, Carbon Farming Initiatives, 32, 34, 35, 36, 37
Minister, responsible, 11
monitoring role, agency, 10; see also compliance functions, agency
Multicultural Plan for 2013–15, 72
NNational Disability Strategy 2010–2020, 80
National Electricity Market, 50
National Greenhouse and Energy Register, 3, 47, 48; see also National Greenhouse and Energy Reporting Scheme
National Greenhouse and Energy Reporting Act 2007, 8, 25
National Greenhouse and Energy Reporting Audit Framework, 48–49, 55
National Greenhouse and Energy Reporting Scheme, 5, 8, 9, 10, 22, 47–50, 55, 57, 75
audits and compliance monitoring, 3, 48, 58
feature story, 50
highlights, 3
see also National Greenhouse and Energy Reporting Audit Framework
National Greenhouse Gas Inventory, 10; see also National Greenhouse and Energy Reporting Scheme
non-English speaking background staff, 167
non-ongoing staff, 70, 165
non-salary benefi ts, 69
notifi able incidents, 78
OOakton Services Pty Ltd, 66
objective, programme, 22
obligation transfer number arrangements, 27, 57
occupational health and safety; see work health and safety
Offi ce of the Renewable Energy Regulator Enterprise Agreement 2011–14, 69
offsets entities, recognition of, 31, 56; see also offsets projects
offsets projects, 31, 32–33, 35, 36, 37, 56, 58
Ombudsman, Commonwealth, 67
ongoing staff, 70, 164
online reporting system, emissions and energy; see Emissions and Energy Reporting System; National Greenhouse and Energy Reporting Scheme
Optimise Corporate Health, 78
Opt-in Scheme, liquid fuel, 28
organisational role, 5, 8–10
organisational structure, 18
outcome and programme objectives, 22
outreach activities; see client engagement activities; education activities
overview, 8–22
performance, 24–59
Clean Energy Regulator
Annual Report 2013–14 183
Ref
eren
ces
Inde
xPPan Pacifi c Pork Expo, 36
parliamentary committees, 67
partial exemption certifi cates, 44
partnerships, 53–55; see also information sharing arrangements; intergovernmental cooperation; memorandums of understanding
part-time staff, 166, 167
people management, 68–73
people with disability, 80, 167
performance agreements, 61, 70
performance indicators, 56–59
performance management, staff, 70
performance pay, 69–70
performance report, 24–59
planning processes, 61, 64
portfolio budget statements, viii, 22, 24, 56
power stations, renewable energy; see renewable energy power stations, accreditation of
procurement procedures, 63, 73–74
Procurement Review Committee, 63
Project Portfolio Board, 63
protective security, 63, 66, 71
Protective Security Policy Framework, 63
provisional liabilities, 2, 5, 25, 26; see also liabilities; shortfall charges
Public Sector Environmental Management
(ANAO guide), 79
Public Service Act 1999, 8, 61, 65, 68
publication of information and data, viii, 5, 10, 27, 28, 29, 42, 47–48, 58–59; see also Information Publication Scheme
purchasing procedures, 68, 73–74
Qquestions on notice, 67
Rrecord keeping, agency, 66, 71
red tape reduction agenda, government’s, 6; see also regulatory burden reduction measures
reference group, business, 30
Register of Offsets Projects, 58
Register of Solar Water Heaters, 43
registered persons or agents, applications processing, 38–39, 57
Regulator; see Clean Energy Regulator
regulatory burden reduction measures, 30, 46, 48, 49, 50, 67, 75
remuneration
non-executive staff, 162–163
senior executive service offi cers, 163 (see also fi nancial statements)
Remuneration Tribunal, 68, 69
renewable energy certifi cates, 2, 38, 45; see also large-scale generation certifi cates; Renewable Energy Certifi cate Registry; small-scale technology certifi cates
Renewable Energy Certifi cate Registry, 4, 43, 46, 75
Renewable Energy (Electricity) Act 2000, 5, 8, 38, 44, 46
renewable energy power stations, accreditation of, 2, 39–40, 41, 67; see also Large-scale Renewable Energy Target; Renewable Energy Target; Small-scale Renewable Energy Scheme
Renewable Energy Target, 8, 9, 22, 38–46, 57, 59, 67
audits and compliance monitoring, 5, 38, 42–43, 43–44, 45, 57
feature story, 41
highlights, 2
review of, 4, 6
see also Large-scale Renewable Energy Target; Small-scale Renewable Energy Scheme
reporting obligations, international, 10, 47
Requirements for Annual Reports for Departments,
Executive Agencies and FMA Act Bodies, iii, viii, 61
resource statements, 170–171; see also fi nancial statements
responsible Minister, 11
revenue; see fi nancial statements; income
review, CEO’s, 4–6
risk management, 5, 8, 61, 62, 65, 66; see also internal audit
role, agency, 5, 8–10
Ssafety, staff; see work health and safety salaries
non-executive staff, 162–163
senior executive service offi cers, 163 (see also fi nancial statements)
savanna burning, methodology category, 32, 36, 37
section 24(1) determinations, 68, 69
Security Management Committee, 63
184
Senate Environment and Communications Legislation Committee, 67
senior executive service offi cers salaries, 163; see also fi nancial statements
Senior Leadership Team, 62, 77
senior management
committees, 62–64
remuneration, 163 (see also fi nancial statements)
roles and responsibilities, 18–21
shortfall charges, 25, 26, 27, 28, 45, 82
small generation units, 59
audits and inspections, 42–43, 57
see also Small-scale Renewable Energy Scheme; small-scale technology certifi cates
Small-scale Renewable Energy Scheme, 9, 38, 42–44, 72; see also small-scale technology certifi cates
Small-scale Technology Certifi cate Clearing House, 46
small-scale technology certifi cates, 2, 9, 42, 43–44, 45, 46, 57, 66; see also Small-scale Renewable Energy Scheme
snapshots
Australian National Registry of Emissions Units, 51
Carbon Farming Initiative, 31
carbon pricing mechanism, 24
National Greenhouse and Energy Reporting Scheme, 47
partnerships, 53
Renewable Energy Target, 38
solar energy systems, 40, 41
solar water heaters register, 43, 59
Staff Consultative Committee, 64
staff statistics, 70, 162–167
stakeholder communication; see client engagement activities
state and territory governments
information sharing arrangements, 49, 50, 53, 54, 59 (see also information sharing arrangements; intergovernmental cooperation)
memorandums of understanding with, 49
State of the Service Report, 80
stocktake, assets, 73; see also fi nancial statements
Strategic Information Framework, 49, 50
strategic planning, 55, 64
structure, agency, 18
study assistance, 71
surveys
client, 56, 67 (see also feedback, client)
staff, 68, 70
Ttenders, 74
territory and state governments
information sharing arrangements, 49, 50, 53, 54, 59
memorandums of understanding with, 49
see also information sharing arrangements
Thailand–Australia Monitoring, Reporting and Verifi cation Experts Dialogue, 55
Torres Strait Islander people, staff, 167
trade-exposed industries, arrangements for, 44
training, staff, 71, 78; see also learning and development, staff
transfer certifi cates, 27, 47
transmittal letter, iii
UUnited Nations Framework Convention on Climate
Change, 6, 9, 10; see also Kyoto Protocol; Kyoto units
Vvalidation audits; see audits and inspections
vegetation, methodology category, 32, 37
WWeb Content Accessibility Guidelines, 72
Western Australian Government, MOU with, 49
Western Lands Division, New South Wales, 34
wine industry, investment in solar power, 41
women staff, 164, 165, 167
work health and safety, 68, 71, 77–78
Work Health and Safety Act 2011, 68, 77, 78
Work Health and Safety Committee, 64, 68
workers compensation claims, 78
workforce planning, 68
workforce profi le, 70, 162–167
workplace diversity, 68, 72, 167
Workplace Harassment Contact Offi cer Network, 78
Yyear ahead, 6
year in review, 4–6; see also highlights of 2013–14
Clean Energy Regulator


