Embed Size (px)
Citation preview

PROCEEDINGS Open Access
Annotation analysis for testing drug safety signalsusing unstructured clinical notesPaea LePendu1*, Srinivasan V Iyer1, Cédrick Fairon2, Nigam H Shah1
From Bio-Ontologies 2011Vienna, Austria. 15-16 July 2011
* Correspondence:[email protected] Center for BiomedicalInformatics Research, StanfordUniversity, USA
Abstract
Background: The electronic surveillance for adverse drug events is largely basedupon the analysis of coded data from reporting systems. Yet, the vast majority ofelectronic health data lies embedded within the free text of clinical notes and is notgathered into centralized repositories. With the increasing access to large volumes ofelectronic medical data—in particular the clinical notes—it may be possible tocomputationally encode and to test drug safety signals in an active manner.
Results: We describe the application of simple annotation tools on clinical text andthe mining of the resulting annotations to compute the risk of getting a myocardialinfarction for patients with rheumatoid arthritis that take Vioxx. Our analysis clearlyreveals elevated risks for myocardial infarction in rheumatoid arthritis patients takingVioxx (odds ratio 2.06) before 2005.
Conclusions: Our results show that it is possible to apply annotation analysismethods for testing hypotheses about drug safety using electronic medical records.
BackgroundThe case for post-approval drug safety
Adverse drug events currently result in significant costs: researchers estimate that adverse
events occur in over 30% of hospital stays and 50% of these are drug-related events [1]
that result in tens of billions of dollars in associated costs per year [2]. In 2004, Vioxx
(rofecoxib) was taken off the market because of the increased risk of heart attack and
stroke in patients who were taking the drug as a treatment for rheumatoid arthritis (RA)
[3]. This case in particular generated public outcry and an appeal for better adverse drug
event (ADE) detection mechanisms largely because Vioxx was on the market for four
years despite murmurings of its side effects. In the past, Fen-Phen (fenfluramine/phenter-
mine) was on the market with serious side effects for more than 24 years and resulted in
one of the largest legal settlements ($14 billion) in US history [4].
To improve post-market drug safety, the U.S. Congress passed the U.S. Food and
Drug Administration (FDA) Amendments Act of 2007, which mandated that the FDA
develop a national system for using health care data to identify risks of marketed drugs
and other medical products. The FDA subsequently launched the Sentinel Initiative in
2008 to create mechanisms that integrate a broader range of healthcare data and
LePendu et al. Journal of Biomedical Semantics 2012, 3(Suppl 1):S5http://www.jbiomedsem.com/supplements/3/S1/S5 JOURNAL OF
BIOMEDICAL SEMANTICS
© 2012 LePendu et al; licensee BioMed Central Ltd. This is an Open Access article distributed under the terms of the CreativeCommons Attribution License (http://creativecommons.org/licenses/by/2.0), which permits unrestricted use, distribution, andreproduction in any medium, provided the original work is properly cited.

augment the agency’s current capability to detect ADEs on a national scale [5]. In
related efforts, organizations like the Observational Medical Outcomes Partnership [6]
have been established to address the use of observational data for active drug safety
surveillance.
Detecting adverse drug events
The current paradigm of drug safety surveillance is based on spontaneous reporting
systems, which are databases containing voluntarily submitted reports of suspected
adverse drug events encountered during clinical practice. In the USA, the primary
database for such reports is the Adverse Event Reporting System (AERS) database at
the FDA [7]. The largest of such systems is the World Health Organization’s Pro-
gramme for International Drug Monitoring [8]. Researchers typically mine the reports
for drug-event associations via statistical methods based on disproportionality mea-
sures, which quantify the magnitude of difference between observed and expected rates
of particular drug-event pairs [9].
Partly in response to the biases [10] inherent in data sources like the AERS, or billing
and claims databases, researchers are increasingly incorporating observational data
directly from hospital electronic health record (EHR) databases [11-14] as well as pub-
lished research from Medline abstracts to detect ADEs [15,16]. Recent advances on
these methods include identifying combinations of drugs [17] that may lead to combi-
nations of adverse events [12,18-21], and more closely address the real-life situation of
patients taking multiple drugs concomitantly. Given advances in detecting (i.e., disco-
vering or inferring) drug safety signals from the AERS, it becomes crucial to develop
methods for testing (i.e. searching for or applying) these signals throughout the EHR.
Gaps: mining clinical text and using terminologies
Despite the potential impact on improving patient safety, the full benefit of the EHR
remains largely unrealized because the detailed clinical descriptions buried within the
clinical text noted by doctors, nurses, and technicians in their daily practice are not
accessible to data-mining methods [22-25]. Methods that rely on data encoded manu-
ally could be missing more than 90% of the adverse events that actually occur [1]. For-
tunately, given advances in text processing tools [26-28], researchers can now
computationally annotate and encode clinical text rapidly and accurately enough [29]
to address real-world medical problems like ADE detection.
Using biomedical terminologies goes hand-in-hand with making the most of clinical
text. Terminologies contain sets of strings for millions of terms that can be used as a
lexicon to match against clinical text. Moreover, each terminology specifies relation-
ships among terms and often includes a classification hierarchy. For example, the
National Center for Biomedical Ontology (NCBO) BioPortal repository [30] contains
about 300 terminologies and 5.4 million terms, including many from the Unified Medi-
cal Language System (UMLS) [31]. By linking patients and their clinical text to multi-
ple terminologies via these lexical matches, researchers can make inferences that are
not possible ordinarily when using a single classification hierarchy alone. Researchers
could improve the predictive ability of surveillance efforts by making use of automated
inference over drug families, diseases hierarchies, and their known relationships such
as indications and adverse events for drugs [22]. For example, Baycol (cerivastatin), a
LePendu et al. Journal of Biomedical Semantics 2012, 3(Suppl 1):S5http://www.jbiomedsem.com/supplements/3/S1/S5
Page 2 of 12

drug for treating patients with high-cholesterol, was recalled in 2001 for increased risk
of rhabdomyolysis, a muscle disorder that can lead to kidney failure and possibly
death. By reasoning over the known relationship between myopathy and rhabdomyoly-
sis that is encoded in standard biomedical terminologies like MedDRA and SNOMED-
CT, researchers could have automatically inferred the adverse relationship between
myopathy and cerivastatin and prevented 2 years of unmitigated risk for other patients
[9]. In other words, terminologies can make it possible to integrate and to aggregate
resources automatically not only by providing a lexicon of terms from many different
vocabularies, but also by assimilating information at different levels of specificity
among those vocabularies.
We hypothesize that simple methods can be used to annotate and to mine the clini-
cal text of a large number of patients for testing drug safety signals. To validate this
hypothesis, we tested a well-known signal by annotating the clinical text of more than
one million patients from the Stanford Clinical Data Warehouse (STRIDE) and com-
puting the risk of getting a myocardial infarction for rheumatoid arthritis patients who
took Vioxx [3].
ResultsGraham et al. showed that patients having rheumatoid arthritis (RA) who took Vioxx
(rofecoxib) showed significantly elevated risk (odds ratio=1.34) for myocardial infarc-
tion (MI), which resulted in the drug being taken off the market in 2004 [3]. To repro-
duce this risk, we identify patients in the EHR who have the given condition (RA), who
are taking the drug, and who suffer the adverse event (Figure 1) by using automated
annotation analysis. We call each condition–drug–event being tested a hypothesized
drug safety signal “triplet.”
Our main result is that the annotated notes clearly show an elevated risk for Vioxx.
In addition, the risk is not present using ICD-9 discharge codes alone, which demon-
strates the importance of using the notes for testing drug safety signals. The key fea-
ture of our analysis that differentiates our methods from all others that we know about
is the simplicity and speed of our annotation workflow, which can be installed in min-
utes and run overnight on an entire clinical data warehouse having millions of patients.
Moreover, once the annotation data is compiled, it takes 10 seconds to test a single
signal. To demonstrate the point that we can enable testing drug safety signals in gen-
eral—on a massive scale—as a result of this workflow, we also recapitulate two other
well-known signals and report those results below as well. We have also tested over
10,000 other triplets (some known signals, some hypothesized signals, and some cho-
sen at random)—those results will be validated and reported as separate works.
Annotating 9 million clinical notes overnight
We extract data on the conditions, drugs, and events present in over one million
patients’ histories directly from their clinical reports by using an automated annotation
workflow. The annotation workflow is packaged on a USB stick and can be installed
on a basic Linux machine (4 CPUs, 16GB RAM, 50GB hard disk) in minutes to run
within the HIPAA secured environment of the clinical data warehouse. Overnight, in
approximately 7 hours (a little more than 1 million notes per hour), the annotator will
have matched a lexicon of over 2.8 million terms to all 9 million clinical notes. It
LePendu et al. Journal of Biomedical Semantics 2012, 3(Suppl 1):S5http://www.jbiomedsem.com/supplements/3/S1/S5
Page 3 of 12

returns a compressed, de-identified patient feature matrix having 9 million rows (one
for every clinical note) and 2.8 million columns, which is small enough to be saved
back on the USB stick for analysis outside the secure environment. It takes approxi-
mately 12 hours of post-processing to normalize and index the annotation data for
analysis (also on a single, basic Linux machine). After using the ontologies to normal-
ize the terms, the number of columns in the patient feature matrix reduces to the
order of 30,000 clinical concepts, which makes analysis more tractable.
Identifying patients of interest
From the full patient feature matrix, the subset of all rows matching either a condition,
drug, or event of interest constitutes the set of all patient notes relevant for testing a
drug safety signal. The rows, which denote clinical notes, are sorted by patient and
then by time. The sorted rows essentially constitute a timeline-view for all patients of
interest. To recapitulate the Vioxx risk signal, we constructed a timeline-view for all
patients matching RA, Vioxx, or MI at any point in time, which consists of 550,000
rows (notes) for 154,000 patients. This process takes anywhere between 5-30 seconds
depending on how many patients are matched.
Constructing the Vioxx contingency table
From the timeline-view of all patients matching any portion of the Vioxx triplet, we
remove all records before 1999 and after 2005, since Vioxx was only on the market
Figure 1 The NCBO Annotator Workflow extracts terms from the clinical notes of patients: (1) We obtaina lexicon of over 2.8-million terms from the NCBO BioPortal library. (2) We use the NCBO Annotator torapidly find those terms in clinical notes—which we call annotations. (3) We apply NegEx trigger rules toseparate negated terms. (4) We compile terms (both positive and negative) into a temporally orderedseries of sets for each patient and combine them with coded and structured data when possible. (5) Wereason over the structure of the ontologies to normalize and to aggregate terms for further analysis.
LePendu et al. Journal of Biomedical Semantics 2012, 3(Suppl 1):S5http://www.jbiomedsem.com/supplements/3/S1/S5
Page 4 of 12
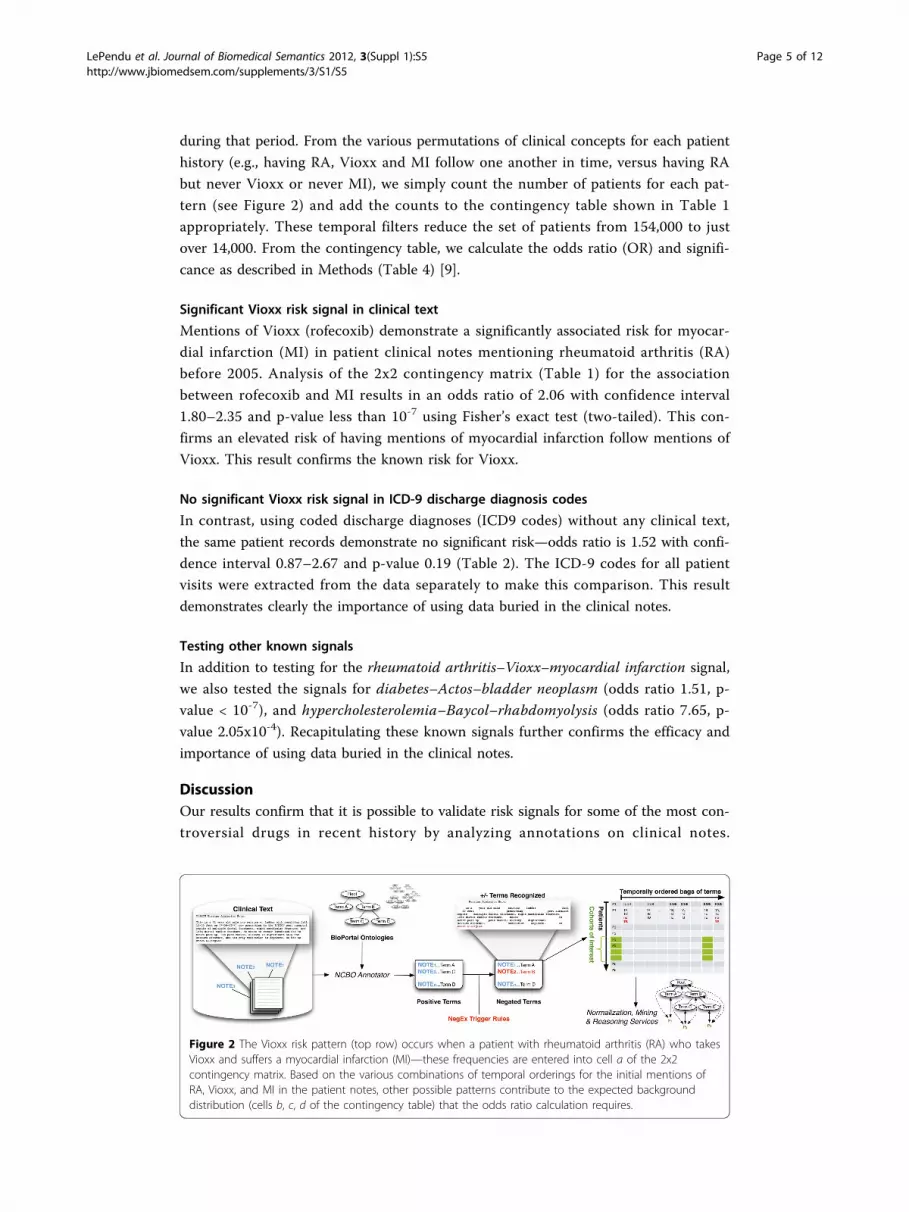
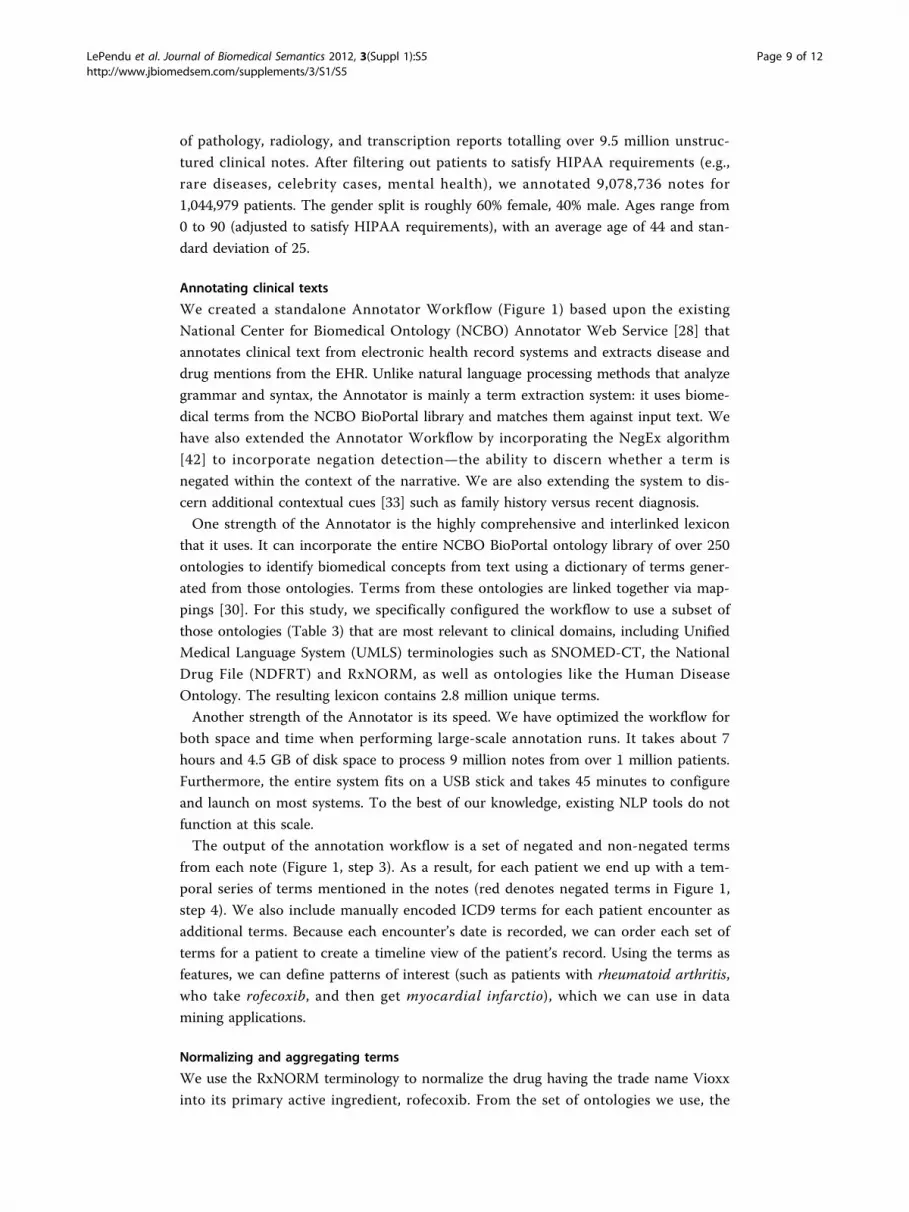
during that period. From the various permutations of clinical concepts for each patient
history (e.g., having RA, Vioxx and MI follow one another in time, versus having RA
but never Vioxx or never MI), we simply count the number of patients for each pat-
tern (see Figure 2) and add the counts to the contingency table shown in Table 1
appropriately. These temporal filters reduce the set of patients from 154,000 to just
over 14,000. From the contingency table, we calculate the odds ratio (OR) and signifi-
cance as described in Methods (Table 4) [9].
Significant Vioxx risk signal in clinical text
Mentions of Vioxx (rofecoxib) demonstrate a significantly associated risk for myocar-
dial infarction (MI) in patient clinical notes mentioning rheumatoid arthritis (RA)
before 2005. Analysis of the 2x2 contingency matrix (Table 1) for the association
between rofecoxib and MI results in an odds ratio of 2.06 with confidence interval
1.80–2.35 and p-value less than 10-7 using Fisher’s exact test (two-tailed). This con-
firms an elevated risk of having mentions of myocardial infarction follow mentions of
Vioxx. This result confirms the known risk for Vioxx.
No significant Vioxx risk signal in ICD-9 discharge diagnosis codes
In contrast, using coded discharge diagnoses (ICD9 codes) without any clinical text,
the same patient records demonstrate no significant risk—odds ratio is 1.52 with confi-
dence interval 0.87–2.67 and p-value 0.19 (Table 2). The ICD-9 codes for all patient
visits were extracted from the data separately to make this comparison. This result
demonstrates clearly the importance of using data buried in the clinical notes.
Testing other known signals
In addition to testing for the rheumatoid arthritis–Vioxx–myocardial infarction signal,
we also tested the signals for diabetes–Actos–bladder neoplasm (odds ratio 1.51, p-
value < 10-7), and hypercholesterolemia–Baycol–rhabdomyolysis (odds ratio 7.65, p-
value 2.05x10⁻⁴). Recapitulating these known signals further confirms the efficacy and
importance of using data buried in the clinical notes.
DiscussionOur results confirm that it is possible to validate risk signals for some of the most con-
troversial drugs in recent history by analyzing annotations on clinical notes.
Figure 2 The Vioxx risk pattern (top row) occurs when a patient with rheumatoid arthritis (RA) who takesVioxx and suffers a myocardial infarction (MI)—these frequencies are entered into cell a of the 2x2contingency matrix. Based on the various combinations of temporal orderings for the initial mentions ofRA, Vioxx, and MI in the patient notes, other possible patterns contribute to the expected backgrounddistribution (cells b, c, d of the contingency table) that the odds ratio calculation requires.
LePendu et al. Journal of Biomedical Semantics 2012, 3(Suppl 1):S5http://www.jbiomedsem.com/supplements/3/S1/S5
Page 5 of 12

Furthermore, our methods are easy to deploy within the protected HIPPA environ-
ments of most hospitals, our methods produce de-identified data that can be exported
and analyzed on more robust platforms if necessary, and our methods scale to millions
of patients without any complicated infrastructure or configuration.
Term extraction versus natural language processing
Clearly, our results hinge upon the efficacy of the annotation mechanism. We have
conducted a comparative evaluation of two concept recognizers used in the biomedical
domain—Mgrep and MetaMap—and found that Mgrep has clear advantages in large-
scale, service-oriented applications specifically addressing flexibility, speed and scalabil-
ity [28]. The NCBO Annotator uses Mgrep. The precision of concept recognition var-
ies depending on the text in each resource and type of entity being recognized: from
87% for recognizing disease terms in descriptions of clinical trials to 23% for PubMed
abstracts, with an average of 68% across four different sources of text. We are currently
conducting evaluations in collaboration with outside groups and early results from
researchers at the University of Pittsburgh (Richard Boyce, personal communication)
show that using RxNORM gives 93% recall for detecting drug mentions in clinical text.
For the current work, we assume a similar level of performance. In the future we will
manually examine samples of patient records to validate the ability to recognize dis-
eases in clinical notes. We have previously employed such sampling based strategies to
evaluate the accuracy of annotation workflows applied to very large datasets [32].
Our goal is to explore methods that work for detecting signals at the population-
level, and not necessarily at an individual level. Therefore, in contrast with using a full-
featured natural language processing (NLP) tool, our goal is to develop simple, fast,
and good-enough term recognition methods that can be used on very large datasets. To
the best of our knowledge, NLP tools do not function at the scale of tens of millions
of clinical notes. However, when they do reach the necessary level of scalability, we
can use their more advanced capabilities to improve our methods. In the meantime,
we have begun to include contextual cues (e.g., family history) by incorporating tools
like ConText [33] as a means of improving the precision with which we determine
whether drug is prescribed or a disease is diagnosed. We are also investigating regular
expression based tools like Unitex [34] that demonstrate the kind of speed and scal-
ability required while adding more powerful pattern recognition features like mor-
pheme-based matching.
Table 1 Two-by-two contingency table for rofecoxib and myocardial infarction withinthe STRIDE dataset for patients with rheumatoid arthritis before 2005 using NCBOannotations.
myocardial infarction no myocardial infarction
rofecoxib a=339 b=1221
no rofecoxib c=1488 d=11031
Table 2 Two-by-two contingency table for rofecoxib and myocardial infarction withinthe STRIDE dataset for patients with rheumatoid arthritis before 2005 using mainlyICD9 coded data.
myocardial infarction no myocardial infarction
rofecoxib a=16 b=487
no rofecoxib c=61 d=2831
LePendu et al. Journal of Biomedical Semantics 2012, 3(Suppl 1):S5http://www.jbiomedsem.com/supplements/3/S1/S5
Page 6 of 12

False discovery rates in signal detection
Given the level of noise we might expect with automated annotation, signal detection
as we have described remains quite robust. For example, cell a in the contingency
table (Table 4) must be as accurate as possible. Assuming a 20% false positive rate, the
likelihood of getting cell a wrong is very low (0.8%) because we would need to over-
estimate all three annotations at the same time, which is very unlikely. Adjusting all
cells in the 2x2 table for a 20% false positive rate still yields a significant odds ratio of
1.43 (confidence interval 1.21–1.68, p-value 4.3x10⁻⁵). On the other hand, ICD9 coding
likely results in no signal in our dataset because it severely underestimates the actual
likelihood—a patient who has RA may only get coded for treating, say, an ulcer
because of the nature of the billing and discharge diagnosis mechanism, but notes on
their history will clearly show that they have RA. Therefore, we are still reasonably
confident that we are seeing true signals despite some degree of noise.
Another disproportionality measure that we have explored is the use of enrichment
analysis techniques adapted from high-throughput analysis of genes [35]. What makes
the use of enrichment analysis interesting is that the use of ontologies and the handling
of false discovery rates is well studied [36]. As with using propensity score adjustments
[37], one of the key issues is to choose an appropriate background distribution from
which to infer that an unlikely scenario has occurred. In some cases, researchers use a
control group, such as patients having minor complications [38]. In our case, we limit
the background by restricting the cohort to patients with the given indication (e.g., RA).
Given that we have successfully tested three well-known drug safety signals, the
focus of our ongoing work will be to detect new drug safety signals given patterns that
have not yet been reported. Two key challenges we are currently addressing include: 1)
controlling for the false discovery rate of new signals, 2) prioritizing new signals worth
Table 3 Ontologies chosen for Annotation Workflow configuration as well as overallterm frequency counts per ontology.
Ontology Name Source Abbreviation Frequency
Current Procedural Terminology UMLS CPT 17243153
Human Disease Ontology OBO DO 122035173
International Classification of Disease (ICD-10) UMLS ICD10 55572189
International Classification of Disease (ICD-9) UMLS ICD9 58334369
Logical Observation Identifier Names and Codes UMLS LNC 1208284117
Medical Dictionary for Regulatory Activities UMLS MDR 361398956
Medical Subject Headings UMLS MSH 643026014
National Drug File UMLS NDFRT 232557746
NCI Thesaurus UMLS NCI 2498591490
Online Mendelian Inheritance in Man UMLS OMIM 262747872
Systematized Nomenclature of Medicine–Clinical Terms UMLS SNOMEDCT 2369959351
Table 4 Odds Ratio: For a given pair (x,y), the reporting odds ratio provides the“unexpectedness of y, given x” via the simple calculation (ad) ÷ (bc) as defined in thecontingency table below. For example, the cell marked as a denotes the number ofpatients that took drug x (e.g., Vioxx), and experienced condition y (e.g., myocardialinfarction). The other cells help to establish the likelihood.
y not y
x a b
not x c d
LePendu et al. Journal of Biomedical Semantics 2012, 3(Suppl 1):S5http://www.jbiomedsem.com/supplements/3/S1/S5
Page 7 of 12

testing. In addition to manually reviewing patient records for annotation accuracy, we
will also be using a combination of data sources like AERS and the Medicare Provider
Analysis and Review data for cross-validation. To prioritize signals worth testing, we
have begun investigating methods to automatically generate “triplets” (e.g., RA-Vioxx-
MI ) for drugs that are used frequently, have inadequate supporting evidence such as
drugs used off-label [39], and that are likely to be associated with severe adverse events
[40].
The role of ontologies and mappings
Ontologies play two vital roles in our workflow: 1) they contribute a vast and useful
lexicon; 2) they define complex relationships and mappings that can be used to
enhance analysis. Although using ontologies for normalization and aggregation are
clearly beneficial, they also present a key challenge that arises when using large and
complex ontologies, let alone many of them simultaneously. The challenge is to deter-
mine which abstraction level to use for reporting results. In enrichment analysis, this
issue has been well studied with respect to the Gene Ontology [36] and the methods
have been extended to use other ontologies [35]. For drugs, it may be obvious to nor-
malize all mentions to either active ingredients or generics. However, with diseases and
conditions, it is not always clear what level of abstraction makes the most sense for any
given analysis. For example, counting patients with bladder papillary urothelial carci-
noma as persons with bladder cancer in the Actos study is probably more useful than
aggregating up to the level of urinary system disorder. But if we also want to know
what diseases are most frequently co-morbid with patients having bladder cancer, then
the sheer number of related diseases and all of their more specific kinds creates an
exponential explosion of combinations to consider. To address this problem, we are
investigating the use of information theory—specifically, information content—to parti-
tion the space of possible abstraction levels into bins that represent similar levels of
specificity across the board [41], which should make the aggregation of results at simi-
lar levels of specificity more tractable.
ConclusionsWe analyzed the automatically created annotations on clinical notes and recapitulated
three different drug safety signals. We found that the risk is far more perceptible when
the unstructured data in the EHR is used versus using coded data alone. We recapitu-
lated the risk by means of the odds ratio—a widely used disproportionality metric—
applied to annotations of unstructured clinical text and demonstrated the potential for
annotation analysis methods.
Our results establish the feasibility of using annotations created from clinical notes as
a source for testing as well as possibly detecting drug safety signals. We believe that
analysis of the clinical text can be used to bolster detection mechanisms for finding
serious side effects of post-market drugs and thus improve patient safety.
MethodsClinical data
We use data from the Stanford Clinical Data Warehouse (STRIDE), which is a reposi-
tory of 17-years worth of patient data at Stanford. It contains data from 1.6 million
patients, 15 million encounters, 25 million coded ICD9 diagnoses, and a combination
LePendu et al. Journal of Biomedical Semantics 2012, 3(Suppl 1):S5http://www.jbiomedsem.com/supplements/3/S1/S5
Page 8 of 12
of pathology, radiology, and transcription reports totalling over 9.5 million unstruc-
tured clinical notes. After filtering out patients to satisfy HIPAA requirements (e.g.,
rare diseases, celebrity cases, mental health), we annotated 9,078,736 notes for
1,044,979 patients. The gender split is roughly 60% female, 40% male. Ages range from
0 to 90 (adjusted to satisfy HIPAA requirements), with an average age of 44 and stan-
dard deviation of 25.
Annotating clinical texts
We created a standalone Annotator Workflow (Figure 1) based upon the existing
National Center for Biomedical Ontology (NCBO) Annotator Web Service [28] that
annotates clinical text from electronic health record systems and extracts disease and
drug mentions from the EHR. Unlike natural language processing methods that analyze
grammar and syntax, the Annotator is mainly a term extraction system: it uses biome-
dical terms from the NCBO BioPortal library and matches them against input text. We
have also extended the Annotator Workflow by incorporating the NegEx algorithm
[42] to incorporate negation detection—the ability to discern whether a term is
negated within the context of the narrative. We are also extending the system to dis-
cern additional contextual cues [33] such as family history versus recent diagnosis.
One strength of the Annotator is the highly comprehensive and interlinked lexicon
that it uses. It can incorporate the entire NCBO BioPortal ontology library of over 250
ontologies to identify biomedical concepts from text using a dictionary of terms gener-
ated from those ontologies. Terms from these ontologies are linked together via map-
pings [30]. For this study, we specifically configured the workflow to use a subset of
those ontologies (Table 3) that are most relevant to clinical domains, including Unified
Medical Language System (UMLS) terminologies such as SNOMED-CT, the National
Drug File (NDFRT) and RxNORM, as well as ontologies like the Human Disease
Ontology. The resulting lexicon contains 2.8 million unique terms.
Another strength of the Annotator is its speed. We have optimized the workflow for
both space and time when performing large-scale annotation runs. It takes about 7
hours and 4.5 GB of disk space to process 9 million notes from over 1 million patients.
Furthermore, the entire system fits on a USB stick and takes 45 minutes to configure
and launch on most systems. To the best of our knowledge, existing NLP tools do not
function at this scale.
The output of the annotation workflow is a set of negated and non-negated terms
from each note (Figure 1, step 3). As a result, for each patient we end up with a tem-
poral series of terms mentioned in the notes (red denotes negated terms in Figure 1,
step 4). We also include manually encoded ICD9 terms for each patient encounter as
additional terms. Because each encounter’s date is recorded, we can order each set of
terms for a patient to create a timeline view of the patient’s record. Using the terms as
features, we can define patterns of interest (such as patients with rheumatoid arthritis,
who take rofecoxib, and then get myocardial infarctio), which we can use in data
mining applications.
Normalizing and aggregating terms
We use the RxNORM terminology to normalize the drug having the trade name Vioxx
into its primary active ingredient, rofecoxib. From the set of ontologies we use, the
LePendu et al. Journal of Biomedical Semantics 2012, 3(Suppl 1):S5http://www.jbiomedsem.com/supplements/3/S1/S5
Page 9 of 12

Annotator identifies all notes containing any string denoting this term as either its pri-
mary label or synonym. We use all other ontologies to normalize strings denoting
rheumatoid arthritis or myocardial infarction and the Annotator identifies all notes
containing them.
As an option, we can also enable reasoning to infer all subsumed terms, which
increases the number of notes that we can identify beyond pure string matches. For
example, patients with Caplan’s or Felty’s syndrome may also fit the cohort of patients
with rheumatoid arthritis. Therefore, notes that mention these diseases can automati-
cally be included as well—even though their associated strings look nothing alike. We
did not use such reasoning for results reported in this specific study.
Obtaining ICD9 discharge codes
Patient visits include in some cases the discharge diagnosis in the form of an ICD9
code. The ICD9 codes for rheumatoid arthritis begin with 714 and the ICD9 code for
myocardial infarction begins with 410. We include these manually encoded terms as
part of the analysis as a comparison against what we can find in the text itself.
Computing the risk of adverse drug events
The odds ratio (OR) is one measure commonly used to estimate the relative risk of
drug adverse events [9]. The ratio gives one measure of disproportionality—the unex-
pectedness of a particular association occurring given the all other observations. The
method for calculating the OR is summarized in Table 4.
We adopt the OR measure to infer the likelihood of an outcome like myocardial
infarction when we compare the population exposed to a drug like Vioxx versus those
who are not exposed. Rather than use the entire set of one million patients as the
background population, we restrict the analysis to the subset of patients who demon-
strate the usual indication, which for Vioxx would be rheumatoid arthritis. Applying
this restriction ensures that patients who have zero propensity to be exposed to Vioxx
do not get included in the analysis and thus avoids biasing the result [37].
We consider patients to be exposed (cells a and b in Table 4) only if their record
demonstrates that the very first mention of Vioxx follows a mention of rheumatoid
arthritis based on the ordering of timestamps for the notes in which the terms were
found. The idea is that the patient should most likely be receiving Vioxx as a treatment
for arthritis. Likewise, we consider patients to be experiencing the adverse event (cells
c and d in Table 4) if myocardial infarction follows mentions of arthritis. Finally, those
patients who potentially get myocardial infarction as a result of taking Vioxx (cell a in
Table 4) requires that myocardial infarction follows Vioxx (which follows arthritis) in
the notes. Figure 2 illustrates several of the patterns of interest that contribute to each
cell of the contingency table.
AcknowledgementsNHS, SVI and PL acknowledge funding from U54 HG004028 for the National Center for Biomedical Ontology. We aregrateful to Tanya Podchiyska and Todd Ferris from STRIDE for their assistance with accessing and obtaining thepatient records. This work was conducted with the appropriate IRB approval from Stanford University. Weacknowledge Stephen A. Racunas and Yi Liu for technical discussions.This article has been published as part of Journal of Biomedical Semantics Volume 3 Supplement 1, 2012: Proceedingsof the Bio-ontologies Special Interest Group 2011. The full contents of the supplement are available online at http://www.jbiomedsem.com/supplements/3/S1
LePendu et al. Journal of Biomedical Semantics 2012, 3(Suppl 1):S5http://www.jbiomedsem.com/supplements/3/S1/S5
Page 10 of 12

Author details1Stanford Center for Biomedical Informatics Research, Stanford University, USA. 2Institut Langage et Communication,Centre de traitement automatique du langage, Université catholique de Louvain, Belgium.
Authors’ contributionsNHS led the study and provided research mentoring to PL and SVI. PL designed and executed the study, and directedSVI’s efforts. SVI and PL worked together to implement the algorithms necessary for extracting lexicons, producingannotations, and analyzing results. CF designed an alternative annotation workflow based on Unitex and suggestedusing ICD9 codes as a comparison metric.
Competing interestsThe authors declare there are no competing interests.
Published: 24 April 2012
References1. Classen D, Resar R, Griffin F, Federico F, Frankel T, Kimmel N, Whittington J, Frankel A, Seger A, James B: ’Global trigger
tool’ shows that adverse events in hospitals may be ten times greater than previously measured. Health affairs(Project Hope) 2011, 30(4):581-589.
2. Bates DW, Spell N, Cullen DJ, Burdick E, Laird N, Petersen LA, Small SD, Sweitzer BJ, Leape LL: The costs of adversedrug events in hospitalized patients. Adverse Drug Events Prevention Study Group. JAMA : the journal of theAmerican Medical Association 1997, 277(4):307-311.
3. Graham D, Campen D, Hui R, Spence M, Cheetham C, Levy G, Shoor S, Ray W: Risk of acute myocardial infarction andsudden cardiac death in patients treated with cyclo-oxygenase 2 selective and non-selective non-steroidal anti-inflammatory drugs: nested case-control study. The Lancet 2005, 365(9458):475-481.
4. The Ten Worst Drug Recalls In The History Of The FDA. [http://247wallst.com/2010/12/10/the-ten-worst-drug-recalls-in-the-history-of-the-fda].
5. The Sentinel Initiative July 2010 Report. FDA; 2010.6. Stang P, Ryan P, Racoosin J, Overhage M, Hartzema A, Reich C, Welebob E, Scarnecchia T, Woodcock J: Advancing the
science for active surveillance: rationale and design for the Observational Medical Outcomes Partnership. Annals ofinternal medicine 2010, 153(9):600-606.
7. Weiss-Smith S, Deshpande G, Chung S, Gogolak V: The FDA drug safety surveillance program: adverse eventreporting trends. Arch Intern Med 2011, 171(6):591-593.
8. The Uppsala Monitoring Centre (UMC). [http://www.who-umc.org/].9. Bate A, Evans SJW: Quantitative signal detection using spontaneous ADR reporting. Pharmacoepidemiol Drug Saf
2009, 18(6):427-436.10. Schneeweiss S, Avorn J: A review of uses of health care utilization databases for epidemiologic research on
therapeutics. J Clin Epidemiol 2005, 58(4):323-337.11. Reisinger SJ, Ryan PB, O’Hara DJ, Powell GE, Painter JL, Pattishall EN, Morris JA: Development and evaluation of a
common data model enabling active drug safety surveillance using disparate healthcare databases. J Am MedInform Assoc 2010, 17(6):652-662.
12. Harpaz R, Haerian K, Chase HS, Friedman C: Mining electronic health records for adverse drug effects usingregression based methods. Proceedings of the 1st ACM International Health Informatics Symposium 2010, 100-107.
13. Wang X, Hripcsak G, Markatou M, Friedman C: Active computerized pharmacovigilance using natural languageprocessing, statistics, and electronic health records: a feasibility study. AMIA 2009, 16(3):328-337.
14. Coloma PM, Schuemie MJ, Trifirò G, Gini R, Herings R, Hippisley-Cox J, Mazzaglia G, Giaquinto C, Corrao G, Pedersen L,et al: Combining electronic healthcare databases in Europe to allow for large-scale drug safety monitoring: the EU-ADR Project. Pharmacoepidemiol Drug Saf 2011, 20(1):1-11.
15. Tari L, Anwar S, Liang S, Cai J, Baral C: Discovering drug–drug interactions: a text-mining and reasoning approachbased on properties of drug metabolism. Bioinformatics 2010, 26(18):i547.
16. Shetty KD, Dalal S: Using information mining of the medical literature to improve drug safety. Journal of theAmerican Medical Informatics Association: JAMIA 2011.
17. Tatonetti N, Fernald G, Altman RB: A novel signal detection algorithm to identify hidden drug-drug interactions inthe FDA Adverse Event Reporting System. AMIA TBI 2009, 18(6):427-436.
18. Harpaz R, Chase HS, Friedman C: Mining multi-item drug adverse effect associations in spontaneous reportingsystems. BMC Bioinformatics 2010, 11(Suppl 9):S7.
19. Harpaz R, Perez H, Chase HS, Rabadan R, Hripcsak G, Friedman C: Biclustering of adverse drug events in the FDA’sspontaneous reporting system. Clin Pharmacol Ther 2011, 89(2):243-250.
20. Dore D, Seeger J, Arnold Chan K: Use of a claims-based active drug safety surveillance system to assess the risk ofacute pancreatitis with exenatide or sitagliptin compared to metformin or glyburide. Current medical research andopinion 2009, 25(4):1019-1027.
21. Cao H, Hripcsak G, Markatou M: A statistical methodology for analyzing co-occurrence data from a large sample.Journal of Biomedical Informatics 2007, 40(3):343-352.
22. Nadkarni PM: Drug safety surveillance using de-identified EMR and claims data: issues and challenges. J Am MedInform Assoc 2010, 17(6):671-674.
23. Ohno-Machado L: Realizing the full potential of electronic health records: the role of natural language processing.J Am Med Inform Assoc 2011, 18(5):539.
24. Chapman WW, Nadkarni PM, Hirschman L, D’Avolio LW, Savova GK, Uzuner O: Overcoming barriers to NLP for clinicaltext: the role of shared tasks and the need for additional creative solutions. J Am Med Inform Assoc 2011,18(5):540-543.
LePendu et al. Journal of Biomedical Semantics 2012, 3(Suppl 1):S5http://www.jbiomedsem.com/supplements/3/S1/S5
Page 11 of 12

25. Radecki RP, Sittig DF: Application of electronic health records to the Joint Commission’s 2011 National PatientSafety Goals. JAMA 2011, 306(1):92-93.
26. Friedman C, Johnson S, Forman B, Starren J: Architectural requirements for a multipurpose natural languageprocessor in the clinical environment. Proceedings of the Annual Symposium on Computer Application in Medical Care1995, 347.
27. Savova GK, Masanz JJ, Ogren PV, Zheng J, Sohn S, Kipper-Schuler KC, Chute CG: Mayo clinical Text Analysis andKnowledge Extraction System (cTAKES): architecture, component evaluation and applications. Journal of theAmerican Medical Informatics Association 2010, 17(5):507-513.
28. Shah NH, Bhatia N, Jonquet C, Rubin D, Chiang AP, Musen MA: Comparison of concept recognizers for building theOpen Biomedical Annotator. BMC Bioinformatics 2009, 10(Suppl 9):S14.
29. Chapman WW, Cooper GF, Hanbury P, Chapman BE, Harrison LH, Wagner MM: Creating a text classifier to detectradiology reports describing mediastinal findings associated with inhalational anthrax and other disorders. J AmMed Inform Assoc 2003, 10(5):494-503.
30. Noy NF, Shah NH, Whetzel PL, Dai B, Dorf M, Griffith N, Jonquet C, Rubin DL, Storey MA, Chute CG, et al: BioPortal:ontologies and integrated data resources at the click of a mouse. Nucleic Acids Res 2009, 37(Web Server issue):W170-173.
31. Bodenreider O: The Unified Medical Language System (UMLS): integrating biomedical terminology. Nucleic Acids Res2004, 32(Database issue):D267-270.
32. Shah NH, Jonquet C, Chiang AP, Butte AJ, Chen R, Musen MA: Ontology-driven indexing of public datasets fortranslational bioinformatics. BMC Bioinformatics 2009, 10(Suppl 2):S1.
33. Chapman W, Chu D, Dowling J: ConText: an algorithm for identifying contextual features from clinical text.Proceedings of the Workshop on BioNLP 2007: Biological, Translational, and Clinical Language Processing: 2007; Prague,Czech Republic: Association for Computational Linguistics 2007, 81-88.
34. Paumier S: De la reconnaissance de formes linguistiques à l’analyse syntaxique. Université de Marne-la-Vallée; 2003.35. LePendu P, Shah N, Musen M: Enabling Enrichment Analysis Using the Human Disease Ontology. Journal of
Biomedical Informatics 2011, (to appear).36. Khatri P, Draghici S: Ontological analysis of gene expression data: current tools, limitations, and open problems.
Bioinformatics 2005, 21(18):3587-3595.37. Schneeweiss S, Rassen JA, Glynn RJ, Avorn J, Mogun H, Brookhart MA: High-dimensional propensity score adjustment
in studies of treatment effects using health care claims data. Epidemiology 2009, 20(4):512-522.38. Goldacre MJ, Wotton CJ, Yeates DG: Cancer and immune-mediated disease in people who have had meningococcal
disease: record-linkage studies. Epidemiol Infect 2009, 137(5):681-687.39. LePendu P, Liu Y, Iyer S, Udell M, SN H: Analyzing Patterns of Drug Use in Clinical Notes for Patient Safety. AMIA
Summit on Clinical Research Informatics: March 21-23, 2012 2012; San Francisco, CA 2012.40. Liu Y, LePendu P, Iyer S, Udell M, SN H: Using Temporal Patterns in Medical Records to Discern Adverse Drug
Events from Indications. AMIA Summit on Clinical Research Informatics: March 21-23, 2012 2012; San Francisco, CA 2012.41. Alterovitz G, Xiang M, Mohan M, Ramoni MF: GO PaD: the Gene Ontology Partition Database. Nucleic acids research
2007, 35(Database issue):D322-327.42. Chapman WW, Bridewell W, Hanbury P, Cooper GF, Buchanan BG: A simple algorithm for identifying negated
findings and diseases in discharge summaries. Journal of Biomedical Informatics 2001, 34(5):301-310.
doi:10.1186/2041-1480-3-S1-S5Cite this article as: LePendu et al.: Annotation analysis for testing drug safety signals using unstructured clinicalnotes. Journal of Biomedical Semantics 2012 3(Suppl 1):S5.
Submit your next manuscript to BioMed Centraland take full advantage of:
• Convenient online submission
• Thorough peer review
• No space constraints or color figure charges
• Immediate publication on acceptance
• Inclusion in PubMed, CAS, Scopus and Google Scholar
• Research which is freely available for redistribution
Submit your manuscript at www.biomedcentral.com/submit
LePendu et al. Journal of Biomedical Semantics 2012, 3(Suppl 1):S5http://www.jbiomedsem.com/supplements/3/S1/S5
Page 12 of 12


