Embed Size (px)
Citation preview
Anesthesia And Analgesia Contents: Volume 100, Issue 2 (February 2005)
CARDIOVASCULAR ANESTHESIA PEDIATRIC ANESTHESIA AMBULATORY ANESTHESIA ANESTHETIC PHARMACOLOGY TECHNOLOGY, COMPUTING, AND SIMULATION PAIN MEDICINE ECONOMICS, EDUCATION, AND HEALTH SYSTEMS RESEARCH CRITICAL CARE AND TRAUMA NEUROSURGICAL ANESTHESIA OBSTETRIC ANESTHESIA REGIONAL ANESTHESIA GENERAL ARTICLES LETTER TO THE EDITOR BOOK AND MULTIMEDIA REVIEWS
CARDIOVASCULAR ANESTHESIA:
S. Mierdl, C. Byhahn, V. Lischke, T. Aybek, G. Wimmer-Greinecker, S. Dogan, S. Viehmeyer, P. Kessler, and Klaus Westphal
Segmental Myocardial Wall Motion During Minimally Invasive Coronary Artery Bypass Grafting Using Open and Endoscopic Surgical Techniques Anesth Analg 2005 100: 306-314.
IMPLICATIONS: Beating heart procedures without cardiopulmonary bypass (CPB) via minithoracotomy and totally endoscopic robot-assisted techniques (TECAB) with CPB for coronary revascularization cause intraoperative segmental wall motion abnormalities (SWMA) that resolved after bypass in both groups. Robotic procedures had more intraoperative SWMA in the right ventricle, suggesting a higher risk for right ventricular dysfunction during TECAB procedures.
Mikael Persson and Jan van der Linden Can Wound Desiccation Be Averted During Cardiac Surgery? An Experimental Study Anesth Analg 2005 100: 315-320.
IMPLICATIONS: Desiccation of a cardiothoracic wound model was studied with and without CO2 delivered via two different devices at 10 L/min. Humidified CO2 insufflated through a gas diffuser decreased the desiccation rate by more than 90%. Conversely, when humidified CO2 was supplied via an open-ended tube it increased the desiccation rate.
Crina L. Burlacu, David Healy, Donal J. Buggy, Ciaran Twomey, David Veerasingam, Andrew Tierney, and Denis C. Moriarty
Continuous Gastric Decompression for Postoperative Nausea and Vomiting After Coronary Revascularization Surgery Anesth Analg 2005 100: 321-326.
IMPLICATIONS: Continuous gastric decompression during cardiac surgery does not reduce the risk of postoperative vomiting or nausea, although, in this prospective cohort study, its incidence was less frequent than previously reported.
Manabu Kakinohana, Osamu Kakinohana, Jong Hun Jun, Martin Marsala, Kenneth J. Davison, and Kazuhiro Sugahara
The Activation of Spinal N-Methyl-d-Aspartate Receptors May Contribute to Degeneration of Spinal Motor Neurons Induced by Neuraxial Morphine After a Noninjurious Interval of Spinal Cord Ischemia Anesth Analg 2005 100: 327-334.
IMPLICATIONS: On the basis of the results from a rodent spinal ischemic model, degeneration of {alpha}-motoneurons might be aggravated by the neuraxial administration of opioids after spinal cord ischemia.
Konrad Schwarzkopf, Torsten Schreiber, Elke Gaser, Niels-Peter Preussler, Lars Hueter, Harald Schubert, Helga Rek, and Waheedullah Karzai
The Effects of Xenon or Nitrous Oxide Supplementation on Systemic Oxygenation and Pulmonary Perfusion During One-Lung Ventilation in Pigs Anesth Analg 2005 100: 335-339.
IMPLICATIONS: Supplementation of 60% xenon or nitrous oxide (N2O) does not affect oxygenation or lung perfusion during one-lung anesthesia with propofol in pigs. Xenon, a more potent anesthetic than N2O, can therefore safely replace N2O during one-lung ventilation.
Rainer Meierhenrich, Albrecht Gauss, Peter Vandenesch, Michael Georgieff, Bertram Poch, and Wolfram Schütz
The Effects of Intraabdominally Insufflated Carbon Dioxide on Hepatic Blood Flow During Laparoscopic Surgery Assessed by Transesophageal Echocardiography Anesth Analg 2005 100: 340-347.
IMPLICATIONS: Blood flow in the right and middle hepatic veins was studied by use of transesophageal echocardiography in 24 patients undergoing laparoscopic surgery. CO2 pneumoperitoneum induced a significant increase in hepatic venous blood flow. This finding is in contrast to results of experimental studies suggesting that CO2 pneumoperitoneum may be harmful to liver function as a result of impaired perfusion.
C. A. Volta, V. Alvisi, S. Petrini, S. Zardi, E. Marangoni, R. Ragazzi, M. Capuzzo, and R. Alvisi
The Effect of Volatile Anesthetics on Respiratory System Resistance in Patients with Chronic Obstructive Pulmonary Disease Anesth Analg 2005 100: 348-353.
IMPLICATIONS: Isoflurane and sevoflurane produce bronchodilation in patients with chronic obstructive pulmonary disease (COPD) who are undergoing lung surgery. COPD does not alter responsiveness to volatile anesthetics, but rather increases the possibility that patients will not respond to either sevoflurane or isoflurane.
Thomas M. Hemmerling, Jean-François Olivier, Fadi Basile, Nien Le, and Ignatio Prieto
Bispectral Index as an Indicator of Cerebral Hypoperfusion During Off-Pump Coronary Artery Bypass Grafting (Case Report) Anesth Analg 2005 100: 354-356.
IMPLICATIONS: We present a case of possible cerebral hypoperfusion during beating heart surgery as shown by processed electroencephalographic monitoring of the bispectral index.
PEDIATRIC ANESTHESIA:
A. von Goedecke, J. Brimacombe, C. Hörmann, H. -C. Jeske, A. Kleinsasser, and C. Keller
Pressure Support Ventilation Versus Continuous Positive Airway Pressure Ventilation with the ProSealTM Laryngeal Mask Airway: A Randomized Crossover Study of Anesthetized Pediatric Patients Anesth Analg 2005 100: 357-360.
IMPLICATIONS: Pressure support ventilation improves gas exchange and reduces work of breathing compared with continuous positive airway pressure ventilation in anesthetized ASA physical status I children aged 1-7 yr using the ProSealTM laryngeal mask airway.
Erik Shank, Naveen Manohar, and Ulrich Schmidt Anesthetic Management for Thoracopagus Twins with Complex Cyanotic Heart Disease in the Magnetic Resonance Imaging Suite (Case Report) Anesth Analg 2005 100: 361-364.
IMPLICATIONS: In this article we discuss the approach to and management of conjoined twins in the magnetic resonance imaging scanner. The twins shared a complex cardiac circulation, making the choice of anesthetic technique very important. In addition, their position--facing each other and attached chest to chest--made airway management difficult.
Darryl Berkowitz, Robin D. Kaye, Scott D. Markowitz, and Scott D. Cook-Sather Inadvertent Extra-Epidural Catheter Placement in an Infant (Case Report) Anesth Analg 2005 100: 365-366.
IMPLICATIONS: Epidural catheters threaded from the caudal space in infants may exit the vertebral canal. Radiographic confirmation of proper catheter position is recommended.
AMBULATORY ANESTHESIA:
Paul F. White, Mohamed A. Hamza, Alejandro Recart, Jayne E. Coleman, Amy R. Macaluso, Lyndsey Cox, Omar Jaffer, Dajun Song, and Rod Rohrich
Optimal Timing of Acustimulation for Antiemetic Prophylaxis as an Adjunct to Ondansetron in Patients Undergoing Plastic Surgery Anesth Analg 2005 100: 367-372.
IMPLICATIONS: Acustimulation was more effective when applied after (versus before) plastic surgery for antiemetic prophylaxis in combination with ondansetron. Application of acustimulation both before and after surgery offered little additional advantage compared with postoperative administration alone.
Tricia A. Meyer, Charles R. Roberson, Mohammed H. Rajab, Jad Davis, and Charles H. McLeskey
Dolasetron Versus Ondansetron for the Treatment of Postoperative Nausea and Vomiting Anesth Analg 2005 100: 373-377.
IMPLICATIONS: We compared the two leading antiemetic drugs (ondansetron and dolasetron) from the 5-hydroxytryptamine-3 receptor antagonist class of drugs for the treatment of nausea and vomiting after surgery. We conclude that dolasetron, when used for the treatment of nausea and vomiting, is as effective as ondansetron and at a reduced cost.
Yunan Zhang, Paul F. White, Larry Thornton, Lisa Perdue, and Michael Downing The Use of Nicardipine for Electroconvulsive Therapy: A Dose-Ranging Study (Brief Report) Anesth Analg 2005 100: 378-381
IMPLICATIONS: A single bolus dose of nicardipine (40 {micro}g/kg IV) is effective in attenuating the acute autonomic response that occurs after electroconvulsive therapy (ECT) without producing residual hypotensive effects when it is administered immediately before application of the ECT stimulus.
ANESTHETIC PHARMACOLOGY:
Georg A. Petroianu, Mohammed Y. Hasan, Syed M. Nurulain, Kholoud Arafat, Rajan Sheen, Ayman Saleh, and Andrea Schmitt
Protective Drugs in Acute Large-Dose Exposure to Organophosphates: A Comparison of Metoclopramide and Tiapride with Pralidoxime in Rats Anesth Analg 2005 100: 382-386.
IMPLICATIONS: Tiapride, but not metoclopramide, significantly reduces mortality in rats after organophosphate exposure. The protection conferred by tiapride is comparable to that of the "gold standard," pralidoxime.
Grigory Chernyak, Papiya Sengupta, Rainer Lenhardt, Edwin Liem, Anthony G. Doufas, Daniel I. Sessler, and Ozan Akça
The Timing of Acupuncture Stimulation Does Not Influence Anesthetic Requirement Anesth Analg 2005 100: 387-392.
IMPLICATIONS: Electro-stimulation of the Zusanli (St36), Sanyinjiao (Sp6), Liangqiu (Sp34), and Hegu (LI4) acupuncture points, whether initiated 30 min before or at the induction of anesthesia, did not reduce desflurane requirements in healthy volunteers. This type of acupuncture is thus unlikely to facilitate general anesthesia or decrease the requirement for anesthetic drugs.
Marie-Josée Caron, François Girard, Dominique C. Girard, Daniel Boudreault, Bernard Brais, Edgard Nassif, Philippe Chouinard, Monique Ruel, and André Duranceau
Cisatracurium Pharmacodynamics in Patients with Oculopharyngeal Muscular Dystrophy Anesth Analg 2005 100: 393-397
IMPLICATIONS: Oculopharyngeal muscular dystrophy does not affect the recovery profile of cisatracurium-induced neuromuscular block.
Carmen Dominguez, Earl Carstens, and Joseph F. Antognini Carbon Dioxide Depresses the F Wave by a Central, Not Peripheral, Mechanism During Isoflurane Anesthesia Anesth Analg 2005 100: 398-403.
IMPLICATIONS: The F wave, a measure of motoneuron excitability, is depressed when CO2 is selectively delivered to the torso, but not when CO2 is delivered to the hindlimb. CO2 depression of the F wave during isoflurane anesthesia is the result of CO2 action in the central nervous system and not in the periphery.
Martín Santos, Viviana Kuncar, Fernando Martínez-Taboada, and Francisco J. Tendillo
Large Concentrations of Nitrous Oxide Decrease the Isoflurane Minimum Alveolar Concentration Sparing Effect of Morphine in the Rat Anesth Analg 2005 100: 404-408.
IMPLICATIONS: At zero or small nitrous oxide concentrations, morphine reduces isoflurane's minimum alveolar anesthetic concentration but not at large nitrous oxide concentrations.
Wei Lan, Dominic C. Harmon, Jiang H. Wang, George D. Shorten, and Paul H. Redmond
Activated Endothelial Interleukin-1ß, -6, and -8 Concentrations and Intercellular Adhesion Molecule-1 Expression Are Attenuated by Lidocaine Anesth Analg 2005 100: 409-412.
IMPLICATIONS: Ischemia reperfusion injury is an important cause of perioperative morbidity. Endothelial cells play a key role in ischemia reperfusion injury. Lidocaine, at larger clinically relevant plasma concentrations, decreased in vitro endothelial intercellular adhesion molecule-1 expression and cytokine concentrations. This may be a protective mechanism of lidocaine at sites of increased concentrations in ischemia reperfusion injury.
Shirley M.E. Wong, Sarah M. Sweitzer, Michael C. Peters, and Joan J. Kendig Hyperresponsiveness on Washout of Volatile Anesthetics from Isolated Spinal Cord Compared to Withdrawal from Ethanol Anesth Analg 2005 100: 413-436.
IMPLICATIONS: Emergence from inhaled anesthesia is accompanied by symptoms suggesting heightened nervous excitability. A spinal neuronal response increases after halothane, isoflurane, and ethanol. For the inhaled anesthetics this is an excitatory effect different from ethanol withdrawal hyperresponsiveness and, unlike the latter, independent of protein kinase C.
Mikiyo Yamaguchi, Yoshinobu Tomiyama, Toshiko Katayama, Hiroshi Kitahata, and Shuzo Oshita
Involvement of Adenosine Triphosphate-Sensitive Potassium Channels in the Response of Membrane Potential to Hyperosmolality in Cultured Human Aorta Endothelial Cells Anesth Analg 2005 100: 419-426.
IMPLICATIONS: Adenosine triphosphate-sensitive potassium channels participate in hyperosmotic mannitol- and hyperosmotic sucrose-induced membrane hyperpolarization and do not participate in hypertonic saline-induced membrane hyperpolarization in human aorta endothelial cells.
TECHNOLOGY, COMPUTING, AND SIMULATION:
Takahiro Suzuki, Ichiro Uchida, and Takashi Mashimo Sorptive Loss of Volatile and Gaseous Anesthetics from In Vitro Drug Application Systems Anesth Analg 2005 100: 427-430.
IMPLICATIONS: In in vitro experimental settings, the delivered anesthetic concentration in solutions can decrease to the extent that one cannot determine exact effective concentration values. We observed the dissolved anesthetic concentrations decreased after passing through polyvinyl chloride and silicon tubes but not through tubes made of glass, Teflon, or polyethylene.
Jonathan S. Jahr, Stephen Osgood, Stephen J. Rothenberg, Qiao-Ling Li, Anthony W. Butch, Robert Gunther, Anthony Cheung, and Bernd Driessen
Lactate Measurement Interference by Hemoglobin-Based Oxygen Carriers (Oxyglobin®, Hemopure®, and HemolinkTM) Anesth Analg 2005 100: 431-436.
IMPLICATIONS: Three blood substitutes were analyzed to determine if they interfere with the accuracy of lactate, and we found them to be underestimated in most cases.
Stephen L. Osgood, Jonathan S. Jahr, Poonam Desai, Jessica Tsukamoto, and Bernd Driessen
Does Methemoglobin from Oxidized Hemoglobin-Based Oxygen Carrier (Hemoglobin Glutamer-200) Interfere with Lactate Measurement (YSI 2700 SELECTTM Biochemistry Analyzer)? Anesth Analg 2005 100: 437-439.
IMPLICATIONS: Hemoglobin glutamer-200 (Oxyglobin(R)), a hemoglobin-based oxygen carrier, interferes with the accuracy of measured lactate levels when using the YSI 2700 SELECTTM Biochemisty Analyzer.
Kai M. Scheufler, Peter C. Reinacher, Winfried Blumrich, Josef Zentner, and Hans-Joachim Priebe
The Modifying Effects of Stimulation Pattern and Propofol Plasma Concentration on Motor-Evoked Potentials Anesth Analg 2005 100: 440-447.
IMPLICATIONS: The reliability of intraoperative motor-evoked potentials (MEP) recorded during propofol and remifentanil anesthesia depends mainly on the stimulation pattern. Increases in stimulation frequency, stimulus intensity, and number of stimuli improve MEP amplitude and recording success. Variation of target-controlled propofol plasma concentrations between 2 and 6 {micro}g/mL allows stable intraoperative recording of MEP.
PAIN MEDICINE:
Ching-Tang Wu, Cecil O Borel, Meei-Shyuan Lee, Jyh-Cherng Yu, Hang-Seng Liou, Haun-De Yi, and Chih-Ping Yang
The Interaction Effect of Perioperative Cotreatment with Dextromethorphan and Intravenous Lidocaine on Pain Relief and Recovery of Bowel Function After Laparoscopic Cholecystectomy Anesth Analg 2005 100: 448-453.
IMPLICATIONS: The combination of preincisional intramuscular injection of dextromethorphan (DM) 40 mg and IV lidocaine (3 mg {middle dot} kg-1 {middle dot} h-1) enhances the analgesic effect and facilitates recovery of bowel function after laparoscopic cholecystectomy. This result might be due to an additional effect of lidocaine at the N-methyl-d-aspartate receptors already targeted by DM.
T. Philip Malan, Jr, Stephen Gordon, Richard Hubbard, and Michael Snabes The Cyclooxygenase-2-Specific Inhibitor Parecoxib Sodium Is as Effective as 12 mg of Morphine Administered Intramuscularly for Treating Pain After Gynecologic Laparotomy Surgery Anesth Analg 2005 100: 454-460.
IMPLICATIONS: Parecoxib sodium 40 mg as a single dose provides effective analgesia that is superior to a single dose of morphine 6 mg and is comparable to a single dose of morphine 12 mg in patients after major gynecologic surgery.
Jai-Hyun Hwang, Gyu-Sam Hwang, Sung-Kang Cho, and Sung-Min Han Morphine Can Enhance the Antiallodynic Effect of Intrathecal R-PIA in Rats with Nerve Ligation Injury Anesth Analg 2005 100: 461-468.
IMPLICATIONS: Using isobolographic analysis, the antiallodynic interaction between intrathecal morphine and adenosine A1 receptor agonist, N6-(2-phenylisopropyl)-adenosine R-(-)isomer (R-PIA), was examined in a rat model of nerve ligation injury. Intrathecal morphine produced a synergistic interaction with R-PIA when administered concurrently.
Thi Aurore Marcou, Sophie Marque, Jean-Xavier Mazoit, and Dan Benhamou The Median Effective Dose of Tramadol and Morphine for Postoperative Patients: A Study of Interactions Anesth Analg 2005 100: 469-474.
IMPLICATIONS: The pharmacologic interaction between tramadol and morphine was studied in the postoperative period. Their potency ratio was 10:3 (morphine:tramadol) and the combination showed infra-additivity. We do not recommend the combination of morphine and tramadol for postoperative analgesia.
Frédéric Adam, Marcel Chauvin, Bertrand Du Manoir, Mathieu Langlois, Daniel I. Sessler, and Dominique Fletcher
Small-Dose Ketamine Infusion Improves Postoperative Analgesia and Rehabilitation After Total Knee Arthroplasty Anesth Analg 2005 100: 475-480.
IMPLICATIONS: Adding an IV infusion of small-dose ketamine to a continuous femoral block for 48 h after surgery decreased morphine consumption by 35% and improved early rehabilitation with a similar incidence of adverse effects.
Michael A. Frölich, Donald D. Price, Michael E. Robinson, Jonathan J. Shuster, Douglas W. Theriaque, and Marc W. Heft
The Effect of Propofol on Thermal Pain Perception Anesth Analg 2005 100: 481-486.
IMPLICATIONS: The effect of sedative-hypnotic drugs on pain perception is controversial. We studied the effects of propofol, a commonly used sedative-hypnotic drug, on pain perception in volunteers. Subjects rated both pain intensity and unpleasantness higher under sedation when compared to no sedation.
ECONOMICS, EDUCATION, AND HEALTH SYSTEMS RESEARCH: Ronald D. Miller
Academic Anesthesia Faculty Salaries: Incentives, Availability, and Productivity (Editorial) Anesth Analg 2005 100: 487-489.
David A. Lubarsky
Incentivize Everything, Incentivize Nothing (Editorial) Anesth Analg 2005 100: 490-492.
Amr E. Abouleish, Jeffrey L. Apfelbaum, Donald S. Prough, John P. Williams, Jay A. Roskoph, William E. Johnston, and Charles W. Whitten
The Prevalence and Characteristics of Incentive Plans for Clinical Productivity Among Academic Anesthesiology Programs Anesth Analg 2005 100: 493-501.
IMPLICATIONS: Administrators of academic medical centers advocate changing compensation for academic physicians from straight salaries to productivity-based incentive programs. The results of this survey characterize current incentive programs in academic anesthesiology departments.
David G. Metro, Joseph F. Talarico, Rita M. Patel, and Amy L. Wetmore The Resident Application Process and Its Correlation to Future Performance as a Resident Anesth Analg 2005 100: 502-505.
IMPLICATIONS: Given the amount of time, money, and effort spent on resident recruitment, interviewing, and selection, we should be able to select the best applicants who apply to our programs. We compared how applicants were rated after the interview process to how they later performed within our residency.
Alexander Avidan, Charles Weissman, and Charles L. Sprung An Internet Web Site as a Data Collection Platform for Multicenter Research Anesth Analg 2005 100: 506-511.
IMPLICATIONS: A Web site for data collection of a large-scale, international multicenter study on ethical decision-making was built using an inexpensive commercially available web authoring tool.
CRITICAL CARE AND TRAUMA:
James M. Riopelle, Darren P. Ruiz, John P. Hunt, Mark R. Mitchell, J. Carlos Mena, Jason A. Rigol, Bruno C. Jubelin, Arthur J. Riopelle, Valeriy V. Kozmenko, and Matthew K. Miller
Circumferential Adjustment of Ultrasound Probe Position to Determine the Optimal Approach to the Internal Jugular Vein: A Noninvasive Geometric Study in Adults Anesth Analg 2005 100: 512-519.
IMPLICATIONS: Circumferential adjustment of a two-dimensional ultrasonic imaging device's probe position permits identification of an approach to the internal jugular vein that minimizes venoarterial overlap, maximizes venous target angular width, or optimizes a combination of the two.
Nicola A. Horn, Denisa M. Anastase, Klaus E. Hecker, Jan H. Baumert, Tilo Robitzsch, and Rolf Rossaint
Epinephrine Enhances Platelet-Neutrophil Adhesion in Whole Blood In Vitro Anesth Analg 2005 100: 520-526.
IMPLICATIONS: Catecholamines have immunomodulatory side effects. We showed, by means of flow cytometry, that epinephrine enhances platelet-neutrophil adhesion. Our data show that epinephrine-induced immunomodulation affects platelet-neutrophil interactions, which could increase organ dysfunction in critically ill patients.
Gordon S. Doig, Fiona Simpson, and Anthony Delaney A Review of the True Methodological Quality of Nutritional Support Trials Conducted in the Critically Ill: Time for Improvement Anesth Analg 2005 100: 527-533.
IMPLICATIONS: The true methodological quality of feeding studies conducted in critically ill patients was assessed. The quality of feeding studies was consistently rated worse than sepsis trials, which have previously been described as "poor." To reliably detect differences in clinically meaningful outcomes, the quality of future feeding studies must be improved.
Virendra K. Arya, Arun Kumar, Surinder S. Makkar, and Ramesh K. Sharma Retrograde Submental Intubation by Pharyngeal Loop Technique in a Patient with Faciomaxillary Trauma and Restricted Mouth Opening (Case Report) Anesth Analg 2005 100: 534-537.
IMPLICATIONS: Submental intubation is useful for airway management during maxillofacial surgery, especially to avoid tracheostomy. It has never been reported in a patient with inability to open the mouth. We describe the technique of retrograde submental intubation with the help of a pharyngeal loop assembly in a patient with maxillofacial trauma in whom oral and nasal intubations were not possible.
NEUROSURGICAL ANESTHESIA:
Anouk Richard, François Girard, Dominique C. Girard, Daniel Boudreault, Philippe Chouinard, Robert Moumdjian, Alain Bouthilier, Monique Ruel, Johanne Couture, and France Varin
Cisatracurium-Induced Neuromuscular Blockade Is Affected by Chronic Phenytoin or Carbamazepine Treatment in Neurosurgical Patients Anesth Analg 2005 100: 538-544.
IMPLICATIONS: Patients treated with anticonvulsants need a more rapid speed of infusion of cisatracurium to steadily maintain a given twitch depression. Changes in pharmacokinetics (increased clearance) and pharmacodynamics (reduced sensitivity) are equally responsible for this phenomenon.
Ehab Farag, Amgad Abdou, Ihab Riad, Sam R. Borsellino, and Armin Schubert Cerebellar Hemorrhage Caused by Cerebrospinal Fluid Leak After Spine Surgery (Case Report) Anesth Analg 2005 100: 545-546.
IMPLICATIONS: This report describes a rare case of cerebellar hemorrhage after spine surgery. Postoperative vigilance and early management are the most important factors for avoiding adverse outcomes.
OBSTETRIC ANESTHESIA:
Gary Peters and Nigel P. Hinds Inherited Neuropathy Can Cause Postpartum Foot Drop (Case Report) Anesth Analg 2005 100: 547-548.
IMPLICATIONS: Anesthesiologists are often blamed for neurological complications after anesthetic procedures during childbirth, with medicolegal implications. A genetically determined predisposition to compression-induced neuropathies is not rare and is probably underdiagnosed, but a clinical history can provide clues.
REGIONAL ANESTHESIA: Kenneth Drasner
Chloroprocaine Spinal Anesthesia: Back to the Future? (Editorial) Anesth Analg 2005 100: 549-552.
Jessica R. Yoos and Dan J. Kopacz Spinal 2-Chloroprocaine for Surgery: An Initial 10-Month Experience Anesth Analg 2005 100: 553-558.
IMPLICATIONS: Spinal 2-chloroprocaine is an effective alternative to spinal lidocaine and procaine for ambulatory procedures in this review of the first 122 patients at our institution. All patients tolerated short operations (mean, <40 min), and none described symptoms of transient neurologic symptoms.
Brad R. Davis and Dan J. Kopacz Spinal 2-Chloroprocaine: The Effect of Added Clonidine Anesth Analg 2005 100: 559-565.
IMPLICATIONS: Spinal 2-chloroprocaine (2-CP) (30 mg) provides rapid-onset anesthesia and reliable blockade without signs of transient neurological symptoms and thereby possesses characteristics ideal for ambulatory surgery. The addition of small-dose clonidine (15 {micro}g) increases the duration and improves the quality of 2-CP spinal anesthesia without producing side effects.
Jessica R. Yoos and Dan J. Kopacz Spinal 2-Chloroprocaine: A Comparison with Small-Dose Bupivacaine in Volunteers Anesth Analg 2005 100: 566-572.
IMPLICATIONS: Spinal 2-chloroprocaine (2-CP) (40 mg) provides rapid onset, and reliable blockade, without signs of transient neurologic symptoms. Compared with spinal bupivacaine (7.5 mg), 2-CP produces more reliable motor blockade and faster block resolution. Spinal 2-CP is an excellent choice for outpatient procedures in which rapid fulfillment of discharge criteria is desired.
Aaron F. Gonter and Dan J. Kopacz Spinal 2-Chloroprocaine: A Comparison with Procaine in Volunteers Anesth Analg 2005 100: 573-579.
IMPLICATIONS: Spinal 2-chloroprocaine (2-CP; 30 mg) provides rapid onset and reliable spinal anesthesia blockade. Compared with spinal procaine (80 mg), 2-CP may be a better choice for short outpatient procedures because it provides similar efficacy but more rapid fulfillment of discharge criteria.
GENERAL ARTICLES:
Sylvain Gander, Philippe Frascarolo, Michel Suter, Donat R. Spahn, and Lennart Magnusson
Positive End-Expiratory Pressure During Induction of General Anesthesia Increases Duration of Nonhypoxic Apnea in Morbidly Obese Patients Anesth Analg 2005 100: 580-584.
IMPLICATIONS: Application of positive end-expiratory pressure during induction of general anesthesia in morbidly obese patients increases nonhypoxic apnea duration by 50%.
Andranik Ovassapian, Meltem Tuncbilek, Erik K. Weitzel, and Chandrashekhar W. Joshi
Airway Management in Adult Patients with Deep Neck Infections: A Case Series and Review of the Literature Anesth Analg 2005 100: 585-589.
IMPLICATIONS: Securing the airway in patients with advanced upper airway infections is challenging and dangerous. This report demonstrates the value and success of the flexible bronchoscope in airway management in these patients.
Sarah Doneley, Joseph Brimacombe, Christian Keller, and Achim von Goedecke The ProSealTM Has a Shorter Life-Span than the ClassicTM Laryngeal Mask Airway Anesth Analg 2005 100: 590-593
IMPLICATIONS: The life-span of the ProSealTM laryngeal mask airway is shorter than the ClassicTM laryngeal mask airway. Reusable laryngeal mask airway devices should be discarded when they fail the pre-use check tests rather than after a specific number of uses.
Janet B. Quinn, Lex W. Schultheis, and Gary E. Schumacher A Tooth Broken After Laryngoscopy: Unlikely to Be Caused by the Force Applied by the Anesthesiologist (Case Report) Anesth Analg 2005 100: 594-596.
IMPLICATIONS: This case report suggests that some tooth fractures attributed to the intubation procedure might actually be the result of biting on the endotracheal tube during the recovery period. Precautions such as the use of protective mouth guards or increased monitoring may be prudent for susceptible patients, such as bruxers.
LETTER TO THE EDITOR: Jacques E. Chelly and Laurent Delaunay
Block of the Posterior Femoral Cutaneous Nerve Anesth Analg 2005 100: 597.
Carole Barbero, Régis Fuzier, and Kamran Samii Block of the Posterior Femoral Cutaneous Nerve Anesth Analg 2005 100: 597.
W. John Russell Anaphylaxis Is Not a Dose/Response Effect Anesth Analg 2005 100: 597-598.
Juraj Sprung, Damir Matesic, and James R. Hebl Anaphylaxis Is Not a Dose/Response Effect Anesth Analg 2005 100: 598.
James P. Zacny Differential Effects of Morphine and Codeine on Pupil Size: Dosing Issues Anesth Analg 2005 100: 598.
Gregory J. Hobbs and Roger D. Knaggs Differential Effects of Morphine and Codeine on Pupil Size: Dosing Issues Anesth Analg 2005 100: 598.
Xuan Au-Truong and M. Ramez Salem Radiologic-Assisted Endotracheal Intubation Anesth Analg 2005 100: 598-599.
Charles E. Reier and Allan R. Reier Radiologic-Assisted Endotracheal Intubation Anesth Analg 2005 100: 599.
Govind R. Rajan Fiberoptic Wire-Guided Transoral and Through the LMA Intubation Technique Using Modified Gum Elastic Bougie Anesth Analg 2005 100: 599-600
Gordon T. Linklater and Lisa Macaulay Epidural Analgesia in Advanced Cancer Patients Anesth Analg 2005 100: 600.
Matthias Eikermann and Jürgen Peters Epidural Analgesia in Advanced Cancer Patients Anesth Analg 2005 100: 600-601.
Aaron A. Tebbs and Paul F. Lennon Visualization of Pulmonary Thromboemboli Using Epicardial Ultrasound Anesth Analg 2005 100: 601.
Peter Rosenberger, Stanton K. Shernan, Simon C. Body, and Holger K. Eltzschig Visualization of Pulmonary Thromboemboli Using Epicardial Ultrasound Anesth Analg 2005 100: 601.
Babita Ghai, A. Naik, S. Rupal, and R. Madan Toe Gangrene in an Infant Subsequent to Use of Pulse Oximeter for Short Duration Anesth Analg 2005 100: 602.
James F. Mayhew Caudal Morphine for Pain Relief in Pediatric Liver Transplantation: Did It Help? Anesth Analg 2005 100: 602-603.
Tae W. Kim Caudal Morphine for Pain Relief in Pediatric Liver Transplantation: Did It Help? Anesth Analg 2005 100: 603.
J. Brimacombe and C. Keller The Elisha Airway Device: Supraglottic and Infraglottic, or Simply Extraglottic? Anesth Analg 2005 100: 603.
Luis A. Gaitini, Sonia J. Vaida, and Carin A. Hagberg The Elisha Airway Device: Supraglottic and Infraglottic, or Simply Extraglottic? Anesth Analg 2005 100: 603.
Gail A. Van Norman, Susan K. Palmer, and Stephen H. Jackson The Ethical Role of Medical Journal Editors Anesth Analg 2005 100: 603-604.
Sheng K. Lin More on the Dilemma of Intrathecal Midazolam Anesth Analg 2005 100: 604.
Ronald D. Miller More on the Dilemma of Intrathecal Midazolam Anesth Analg 2005 100: 604.
Louise Walker Intrathecal Midazolam: Adverse Effects and Sources of Bias Anesth Analg 2005 100: 604-605.
Adam P. Tucker, Joseph Mezzatesta, Raymond Nadeson, and Colin S. Goodchild Intrathecal Midazolam: Adverse Effects and Sources of Bias Anesth Analg 2005 100: 605.
BOOK AND MULTIMEDIA REVIEWS: Elizabeth Sinz
Textbook of Neurointensive Care. Anesth Analg 2005 100: 606.
Adam R. Burkey and Dell R. Burkey Neurosurgical Pain Management. Anesth Analg 2005 100: 606.
Robert E. Johnstone Evidence-Based Practice of Anesthesiology. Anesth Analg 2005 100: 606-607.
Copyright © 2005 by the International Anesthesia Research Society.
CARDIOVASCULAR ANESTHESIA SOCIETY OF CARDIOVASCULAR ANESTHESIOLOGISTSSECTION EDITOR
KENNETH J. TUMAN
Segmental Myocardial Wall Motion During Minimally InvasiveCoronary Artery Bypass Grafting Using Open and EndoscopicSurgical Techniques
S. Mierdl, MD*, C. Byhahn, MD*, V. Lischke, MD*, T. Aybek, MD†,G. Wimmer-Greinecker, MD†, S. Dogan, MD†, S. Viehmeyer*, P. Kessler, MD*, andKlaus Westphal, MD*
*Department of Anesthesiology, Intensive Care Medicine and Pain Control, †Department of Thoracic and CardiovascularSurgery, J.W. Goethe-University Hospital, Frankfurt, Germany
Current options for minimally invasive surgical treat-ment of single-vessel coronary artery disease includebeating heart procedures without cardiopulmonary by-pass (CPB) via mini-thoracotomy (MIDCAB) and to-tally endoscopic robot-assisted techniques (TECAB)with CPB. Both procedures are associated with poten-tial myocardial stress before revascularization, such assingle-lung ventilation (SLV), temporary coronary ar-tery occlusion, cardiac luxation, intrathoracic carbondioxide insufflation, and extended CPB and operatingtime. In this echocardiographic study we sought toevaluate the extent of intraoperative segmental wallmotion abnormalities (SWMA) during MIDCAB andTECAB surgery and to identify factors affectingSWMA. Forty-six patients with single-vessel coronaryartery disease were studied. Sixteen patients were oper-ated using the MIDCAB technique and 30 patients withTECAB. In both groups sequential transesophagealechocardiograms were recorded during the entire
procedure. Hemodynamic data and oxygenation vari-ables were acquired simultaneously. In both groups, mildbut obvious perioperative SWMA were identified andnotedto increaseduringthecourseof theoperation.TheseSWMA were more pronounced in the TECAB group. In-dependent of operating time, these changes disappearedcompletely after revascularization. No significant hemo-dynamic compromise was observed. We conclude thatMIDCAB and TECAB techniques are associated with sig-nificant perioperative SWMA. The appearance of moreprofound SWMA in the TECAB group compared with theMIDCAB patients might have been the result of intratho-racic CO2 insufflation, as SLV was used in both groups.No persistent SWMA or post-CPB SWMA were apparentin either group. More extensive intraoperative ventricularSWMA was detected in the TECAB group, suggestingthat a more frequent risk for right ventricular dysfunctionmay exist during TECAB procedures.
(Anesth Analg 2005;100:306–14)
T he surgical treatment of the single-vessel coro-nary artery disease unsuitable for catheter inter-vention has changed in recent years towards less
invasive procedures. These new techniques aim toreduce surgical trauma by limited incisions and avoidcardiopulmonary bypass (CPB) by using beating hearttechniques. Grafting of the internal thoracic artery(ITA) onto the left anterior descending artery (LAD)through a small, left anterior thoracotomy (minimallyinvasive direct vision coronary artery bypass,
MIDCAB) without CPB has been demonstrated to be asafe alternative to standard coronary artery bypassgrafting (CABG) with sternotomy and CPB (1). Themost recent development has been robot-assisted to-tally endoscopic techniques (totally endoscopic coro-nary artery bypass; TECAB) (2) usually performedusing CPB.
Although both procedures require single-lung ven-tilation (SLV) during ITA dissection and coronaryanastomosis to ensure adequate exposure of the sur-gical field, the additional carbon dioxide (CO2) insuf-flation is required for TECAB to improve exposureand instrument movements.
The adverse effects of CPB, artificially augmentedintrathoracic pressure, and SLV have been describedin several studies (3–6). However, no data are yetavailable regarding potential adverse effects of thesevariables or their combination on myocardial wall
Accepted for publication August 13, 2004.Address correspondence and reprint requests to Klaus Westphal,
MD, Department of Anesthesiology and Intensive Care Medicine,Katharina-Kasper-Kliniken, Richard-Wagner-Str. 14, D-60318 Frank-furt, Germany. Address e-Mail to [email protected].
DOI: 10.1213/01.ANE.0000143565.18784.54
©2005 by the International Anesthesia Research Society306 Anesth Analg 2005;100:306–14 0003-2999/05
motion in patients with coronary artery disease.Therefore, biventricular segmental myocardial wallmotion was analyzed in patients who underwentMIDCAB or TECAB procedures using transesopha-geal echocardiography (TEE). Furthermore, creatinekinase (CK), CK-MB, ST segment analysis, oxygen-ation, and outcome were assessed.
The aim was to identify potential adverse effects onmyocardial function and to compare the influence ofthe MIDCAB technique on the beating heart with theTECAB closed chest technique using CPB and in-trathoracic CO2 insufflation. Our hypothesis was thatthe combination of SLV and intrathoracic CO2 insuf-flation during TECAB should cause more profoundintraoperative segmental wall motion abnormalities(SWMA) than SLV without intrathoracic CO2 insuffla-tion during MIDCAB.
MethodsAfter approval by the IRB and with informed writtenconsent, 50 consecutive patients with symptomaticcoronary disease of the LAD scheduled for minimallyinvasive revascularization were studied during a 1-yrperiod. After extensive consideration about MIDCABand TECAB procedures, including benefits and risks,the surgeon chose one of these methods of revascular-ization. Twenty patients were operated on the beatingheart with the MIDCAB technique, whereas 30 pa-tients underwent TECAB surgery using the DaVincitelemanipulation system (Intuitive Surgical, MountainView, CA) and the Port Access system (Heartport,Redwood City, CA) for CPB. All patients received astandard initial volume loading of 1000 mL of lactatedRinger’s solution and another 1,000 mL of hydroxy-ethyl starch 6% prior to the initiation of SLV.
MIDCAB was performed on the beating heart withCPB standby. SLV was started immediately beforeskin incision. A 7–8 cm anterolateral minithoracotomywas then performed in the left fourth intercostal spacefor preparation of the left ITA and its end to sidegrafting onto the LAD. Double-lung ventilation (DLV)was resumed after surgical hemostasis was ensured.
For TECAB, the patients were placed supine withthe left chest slightly elevated for TECAB. Once SLVwas started, the procedure was performed endoscop-ically through 3 left-sided 1–2 cm incisions. Undercontinuous CO2 insufflation, the left ITA was dis-sected, followed by institution of CPB via the fem-oral vessels. After occlusion of the ascending aortawith an endoaortic balloon catheter and applicationof antegrade cardioplegia, the left ITA was graftedend-to-side onto the LAD by continuous suture.
Separation from CPB was achieved under SLV aftercoronary reperfusion and rewarming. DLV was re-instituted after surgical hemostasis and CO2 releasefrom the thoracic cavity.
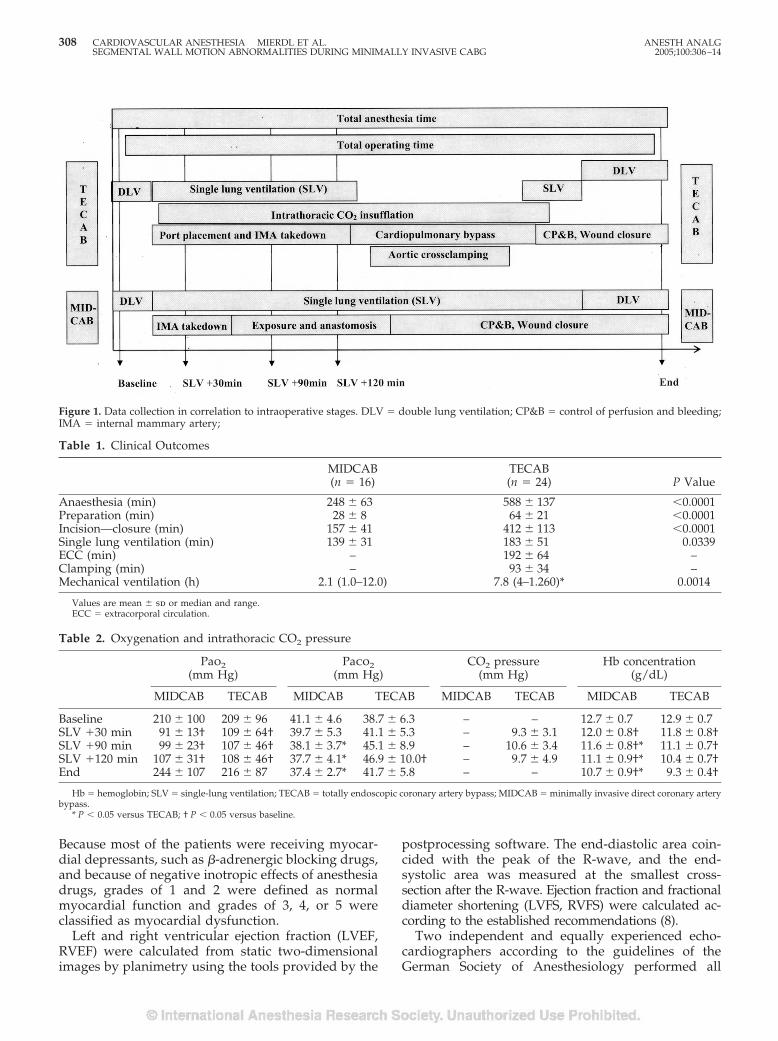
Baseline arterial blood gas tension analysis for Po2and Pco2 assessments were performed immediatelybefore skin incision and then at 30, 90, and 120 minafter institution of SLV and 5 min after DLV wasresumed. Simultaneously, intrathoracic CO2 pressureswere recorded during TECAB (Fig. 1). Automated STsegment analysis at J � 60 ms for leads I, II, and V5were recorded (Hellige Marquette Solar 7000/8000Patient Monitor; Marquette Medical Systems, Milwau-kee, WI). ST segment alterations of �1 mm (0.1 mV)from baseline, persisting for more than 60 s wereconsidered an indication of ischemia.
All echocardiographic examinations were per-formed in the transgastric mid short axis view of theleft and right ventricles (LV, RV) at the level of mid-papillary muscles and the insertion of tricuspid valveapparatus respectively. A Vingmed System Five echo-cardiography device with a multiplane 5–7 MHz TEEprobe was used (GE Vingmed, Horten, Norway). De-vice settings included frequency, 6.7 MHz; power,4 dB; depth, 14 cm; frame rate, 70–80/min. An elec-trocardiogram (ECG) triggered cine-loop of 3 cardiaccycles of each ventricle was acquired at the above-mentioned intervals and directly stored on the imageprocessing system (Echo PAC v. 6.1, Vingmed, HortenNorway) for off-line analysis. During data acquisition,the patient was disconnected from ventilation at end-expiration. Analysis of segmental wall motion wasperformed off-line after surgery by dividing the LV in6 segments according to the guidelines of the Ameri-can Society of Echocardiography and the Society ofCardiovascular Anaesthesiologists (7). Because no es-tablished model for segmentation of the RV exists, theRV was divided into two segments. The posteriorsegment adjacent to the liver and diaphragm waslabeled “diaphragmatic,” whereas the anterior seg-ment with no contact to structures other than pericar-dium was labeled “free.” The tricuspid apparatus wasused as a landmark for the RV cross-section. Theventricular septum was considered a component ofthe LV.
Analysis of LV and RV function was based on aqualitative visual assessment of the motion and thick-ening of a given segment during systole and gradedaccording to a scale for wall motion that has been usedextensively in the echocardiography literature. Thequalitative grading for wall motion is: 1 � normal(�30% thickening), 2 � mildly hypokinetic (10% to30% thickening), 3 � severely hypokinetic (�10%thickening), 4 � akinetic (no thickening), and 5 �dyskinetic (paradox movements during systole).
ANESTH ANALG CARDIOVASCULAR ANESTHESIA MIERDL ET AL. 3072005;100:306–14 SEGMENTAL WALL MOTION ABNORMALITIES DURING MINIMALLY INVASIVE CABG
Because most of the patients were receiving myocar-dial depressants, such as �-adrenergic blocking drugs,and because of negative inotropic effects of anesthesiadrugs, grades of 1 and 2 were defined as normalmyocardial function and grades of 3, 4, or 5 wereclassified as myocardial dysfunction.
Left and right ventricular ejection fraction (LVEF,RVEF) were calculated from static two-dimensionalimages by planimetry using the tools provided by the
postprocessing software. The end-diastolic area coin-cided with the peak of the R-wave, and the end-systolic area was measured at the smallest cross-section after the R-wave. Ejection fraction and fractionaldiameter shortening (LVFS, RVFS) were calculated ac-cording to the established recommendations (8).
Two independent and equally experienced echo-cardiographers according to the guidelines of theGerman Society of Anesthesiology performed all
Figure 1. Data collection in correlation to intraoperative stages. DLV � double lung ventilation; CP&B � control of perfusion and bleeding;IMA � internal mammary artery;
Table 1. Clinical Outcomes
MIDCAB(n � 16)
TECAB(n � 24) P Value
Anaesthesia (min) 248 � 63 588 � 137 �0.0001Preparation (min) 28 � 8 64 � 21 �0.0001Incision—closure (min) 157 � 41 412 � 113 �0.0001Single lung ventilation (min) 139 � 31 183 � 51 0.0339ECC (min) – 192 � 64 –Clamping (min) – 93 � 34 –Mechanical ventilation (h) 2.1 (1.0–12.0) 7.8 (4–1.260)* 0.0014
Values are mean � sd or median and range.ECC � extracorporal circulation.
Table 2. Oxygenation and intrathoracic CO2 pressure
Pao2(mm Hg)
Paco2(mm Hg)
CO2 pressure(mm Hg)
Hb concentration(g/dL)
MIDCAB TECAB MIDCAB TECAB MIDCAB TECAB MIDCAB TECAB
Baseline 210 � 100 209 � 96 41.1 � 4.6 38.7 � 6.3 – – 12.7 � 0.7 12.9 � 0.7SLV �30 min 91 � 13† 109 � 64† 39.7 � 5.3 41.1 � 5.3 – 9.3 � 3.1 12.0 � 0.8† 11.8 � 0.8†SLV �90 min 99 � 23† 107 � 46† 38.1 � 3.7* 45.1 � 8.9 – 10.6 � 3.4 11.6 � 0.8†* 11.1 � 0.7†SLV �120 min 107 � 31† 108 � 46† 37.7 � 4.1* 46.9 � 10.0† – 9.7 � 4.9 11.1 � 0.9†* 10.4 � 0.7†End 244 � 107 216 � 87 37.4 � 2.7* 41.7 � 5.8 – – 10.7 � 0.9†* 9.3 � 0.4†
Hb � hemoglobin; SLV � single-lung ventilation; TECAB � totally endoscopic coronary artery bypass; MIDCAB � minimally invasive direct coronary arterybypass.
* P � 0.05 versus TECAB; † P � 0.05 versus baseline.
308 CARDIOVASCULAR ANESTHESIA MIERDL ET AL. ANESTH ANALGSEGMENTAL WALL MOTION ABNORMALITIES DURING MINIMALLY INVASIVE CABG 2005;100:306–14
examinations. The first echocardiographer performedthe intraoperative TEE monitoring and therefore wasnot blinded to the patient’s identity and clinical data.The second echocardiographer had no informationregarding hemodynamic or clinical data of the pa-tients and was blinded to the time points but not to thestudy purpose. Derived from a study by Rouine-Rappet al. (9), agreement between the investigators wasdefined as independently assigned grades within thenormal (grades 1 and 2) or abnormal (grades 3–5)ranges. When the echocardiographers independentlyagreed, the classification assigned to segments wasconsidered final. When one investigator classifiedfunction as normal and the other abnormal or whenthe classification was different by 2 or more points, theinvestigators met and assigned a class of function byconsensus. If the investigators could not agree on aconsensus classification, the respective segment wasexamined by a third echocardiographer, and classifiedaccording to the majority opinion of all 3 investigators.
All data are presented as mean � sd. Calculationand data analysis were performed by using a statisti-cal package (GraphPad InStat 3.0, GraphPad Software,San Diego, CA). Data were compared to baseline val-ues, and statistical significance was determined withFriedman test and Dunn’s posttest, one-way analysisof variance with Bonferroni adjustment, or Wilcoxon’smatched pairs test, as appropriate. Differences wereconsidered to be statistically significant if P was �0.05.
ResultsAll patients had isolated coronary single-vessel dis-ease with a proximal subtotal stenosis of the LAD thatwas not suitable for angioplasty. All patients receivedcontinuous medication with �-adrenergic blockingdrugs preoperatively. No patient had a history ofmyocardial infarction. There were no significant dif-ferences between groups regarding age and gender(Table 1).
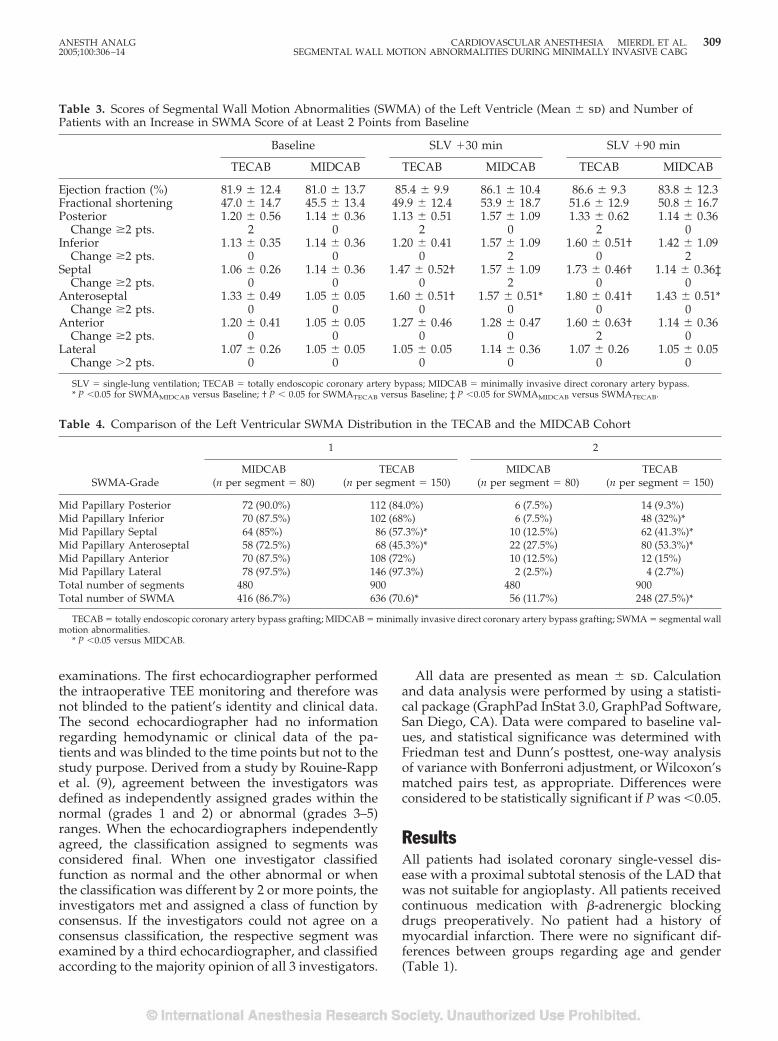
Table 3. Scores of Segmental Wall Motion Abnormalities (SWMA) of the Left Ventricle (Mean � sd) and Number ofPatients with an Increase in SWMA Score of at Least 2 Points from Baseline
Baseline SLV �30 min SLV �90 min
TECAB MIDCAB TECAB MIDCAB TECAB MIDCAB
Ejection fraction (%) 81.9 � 12.4 81.0 � 13.7 85.4 � 9.9 86.1 � 10.4 86.6 � 9.3 83.8 � 12.3Fractional shortening 47.0 � 14.7 45.5 � 13.4 49.9 � 12.4 53.9 � 18.7 51.6 � 12.9 50.8 � 16.7Posterior 1.20 � 0.56 1.14 � 0.36 1.13 � 0.51 1.57 � 1.09 1.33 � 0.62 1.14 � 0.36
Change �2 pts. 2 0 2 0 2 0Inferior 1.13 � 0.35 1.14 � 0.36 1.20 � 0.41 1.57 � 1.09 1.60 � 0.51† 1.42 � 1.09
Change �2 pts. 0 0 0 2 0 2Septal 1.06 � 0.26 1.14 � 0.36 1.47 � 0.52† 1.57 � 1.09 1.73 � 0.46† 1.14 � 0.36‡
Change �2 pts. 0 0 0 2 0 0Anteroseptal 1.33 � 0.49 1.05 � 0.05 1.60 � 0.51† 1.57 � 0.51* 1.80 � 0.41† 1.43 � 0.51*
Change �2 pts. 0 0 0 0 0 0Anterior 1.20 � 0.41 1.05 � 0.05 1.27 � 0.46 1.28 � 0.47 1.60 � 0.63† 1.14 � 0.36
Change �2 pts. 0 0 0 0 2 0Lateral 1.07 � 0.26 1.05 � 0.05 1.05 � 0.05 1.14 � 0.36 1.07 � 0.26 1.05 � 0.05
Change �2 pts. 0 0 0 0 0 0
SLV � single-lung ventilation; TECAB � totally endoscopic coronary artery bypass; MIDCAB � minimally invasive direct coronary artery bypass.* P �0.05 for SWMAMIDCAB versus Baseline; † P � 0.05 for SWMATECAB versus Baseline; ‡ P �0.05 for SWMAMIDCAB versus SWMATECAB.
Table 4. Comparison of the Left Ventricular SWMA Distribution in the TECAB and the MIDCAB Cohort
SWMA-Grade
1 2
MIDCAB(n per segment � 80)
TECAB(n per segment � 150)
MIDCAB(n per segment � 80)
TECAB(n per segment � 150)
Mid Papillary Posterior 72 (90.0%) 112 (84.0%) 6 (7.5%) 14 (9.3%)Mid Papillary Inferior 70 (87.5%) 102 (68%) 6 (7.5%) 48 (32%)*Mid Papillary Septal 64 (85%) 86 (57.3%)* 10 (12.5%) 62 (41.3%)*Mid Papillary Anteroseptal 58 (72.5%) 68 (45.3%)* 22 (27.5%) 80 (53.3%)*Mid Papillary Anterior 70 (87.5%) 108 (72%) 10 (12.5%) 12 (15%)Mid Papillary Lateral 78 (97.5%) 146 (97.3%) 2 (2.5%) 4 (2.7%)Total number of segments 480 900 480 900Total number of SWMA 416 (86.7%) 636 (70.6)* 56 (11.7%) 248 (27.5%)*
TECAB � totally endoscopic coronary artery bypass grafting; MIDCAB � minimally invasive direct coronary artery bypass grafting; SWMA � segmental wallmotion abnormalities.
* P �0.05 versus MIDCAB.
ANESTH ANALG CARDIOVASCULAR ANESTHESIA MIERDL ET AL. 3092005;100:306–14 SEGMENTAL WALL MOTION ABNORMALITIES DURING MINIMALLY INVASIVE CABG
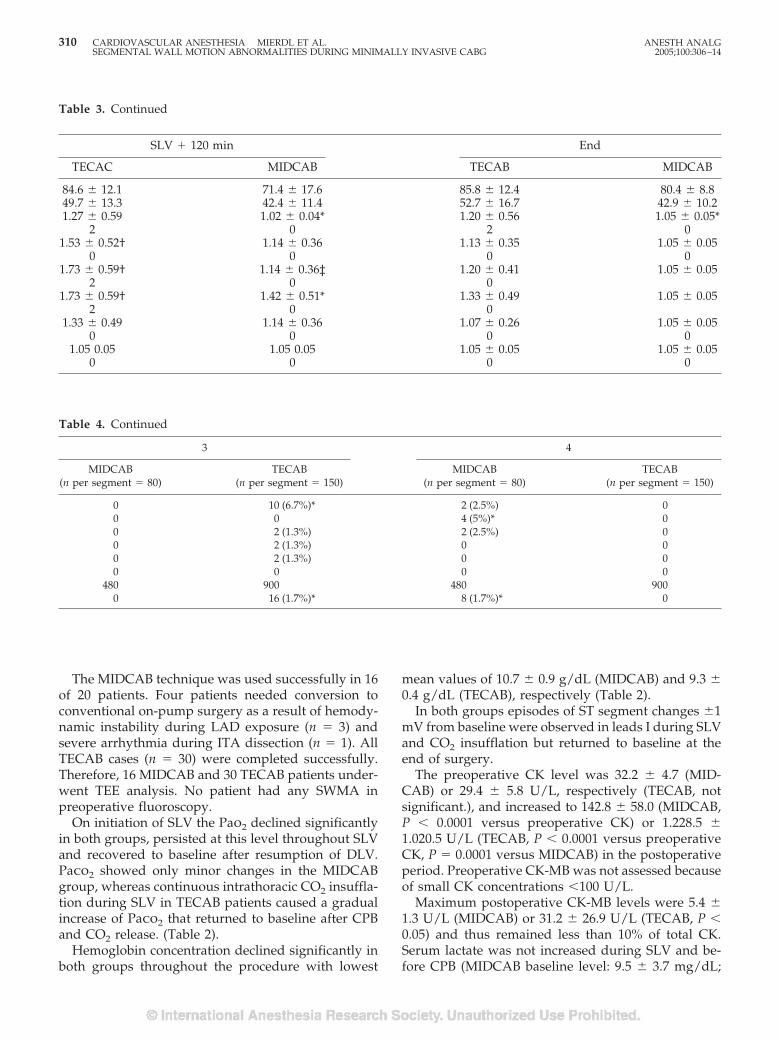
The MIDCAB technique was used successfully in 16of 20 patients. Four patients needed conversion toconventional on-pump surgery as a result of hemody-namic instability during LAD exposure (n � 3) andsevere arrhythmia during ITA dissection (n � 1). AllTECAB cases (n � 30) were completed successfully.Therefore, 16 MIDCAB and 30 TECAB patients under-went TEE analysis. No patient had any SWMA inpreoperative fluoroscopy.
On initiation of SLV the Pao2 declined significantlyin both groups, persisted at this level throughout SLVand recovered to baseline after resumption of DLV.Paco2 showed only minor changes in the MIDCABgroup, whereas continuous intrathoracic CO2 insuffla-tion during SLV in TECAB patients caused a gradualincrease of Paco2 that returned to baseline after CPBand CO2 release. (Table 2).
Hemoglobin concentration declined significantly inboth groups throughout the procedure with lowest
mean values of 10.7 � 0.9 g/dL (MIDCAB) and 9.3 �0.4 g/dL (TECAB), respectively (Table 2).
In both groups episodes of ST segment changes �1mV from baseline were observed in leads I during SLVand CO2 insufflation but returned to baseline at theend of surgery.
The preoperative CK level was 32.2 � 4.7 (MID-CAB) or 29.4 � 5.8 U/L, respectively (TECAB, notsignificant.), and increased to 142.8 � 58.0 (MIDCAB,P � 0.0001 versus preoperative CK) or 1.228.5 �1.020.5 U/L (TECAB, P � 0.0001 versus preoperativeCK, P � 0.0001 versus MIDCAB) in the postoperativeperiod. Preoperative CK-MB was not assessed becauseof small CK concentrations �100 U/L.
Maximum postoperative CK-MB levels were 5.4 �1.3 U/L (MIDCAB) or 31.2 � 26.9 U/L (TECAB, P �0.05) and thus remained less than 10% of total CK.Serum lactate was not increased during SLV and be-fore CPB (MIDCAB baseline level: 9.5 � 3.7 mg/dL;
Table 3. Continued
SLV � 120 min End
TECAC MIDCAB TECAB MIDCAB
84.6 � 12.1 71.4 � 17.6 85.8 � 12.4 80.4 � 8.849.7 � 13.3 42.4 � 11.4 52.7 � 16.7 42.9 � 10.21.27 � 0.59 1.02 � 0.04* 1.20 � 0.56 1.05 � 0.05*
2 0 2 01.53 � 0.52† 1.14 � 0.36 1.13 � 0.35 1.05 � 0.05
0 0 0 01.73 � 0.59† 1.14 � 0.36‡ 1.20 � 0.41 1.05 � 0.05
2 0 01.73 � 0.59† 1.42 � 0.51* 1.33 � 0.49 1.05 � 0.05
2 0 01.33 � 0.49 1.14 � 0.36 1.07 � 0.26 1.05 � 0.05
0 0 0 01.05 0.05 1.05 0.05 1.05 � 0.05 1.05 � 0.05
0 0 0 0
Table 4. Continued
3 4
MIDCAB(n per segment � 80)
TECAB(n per segment � 150)
MIDCAB(n per segment � 80)
TECAB(n per segment � 150)
0 10 (6.7%)* 2 (2.5%) 00 0 4 (5%)* 00 2 (1.3%) 2 (2.5%) 00 2 (1.3%) 0 00 2 (1.3%) 0 00 0 0 0
480 900 480 9000 16 (1.7%)* 8 (1.7%)* 0
310 CARDIOVASCULAR ANESTHESIA MIERDL ET AL. ANESTH ANALGSEGMENTAL WALL MOTION ABNORMALITIES DURING MINIMALLY INVASIVE CABG 2005;100:306–14
TECAB baseline level: 11.4 � 2.7 mg/dL; not signifi-cant) but was 11.1 � 4.6 (MIDCAB, not significantversus Baseline) and 32.3 � 26.7 mg/dL (TECAB, P �0.0106 versus Baseline; P � 0.0033 versus MIDCAB)after revascularization and weaning from CPB in theTECAB group, respectively.
Except for a continuous dopamine infusion (3�g · kg�1 · min�1) as standard treatment started at thebeginning of the procedure in any patient undergoingCABG, no patient needed additional inotropic or va-sopressor support or antiischemic treatment either in-traoperatively or postoperatively.
The postoperative course was uneventful in allTECAB patients but one who underwent reexplora-tion of the chest to control postoperative bleeding anddeveloped respiratory failure with prolonged artificialventilation. There was no significant difference in thepostoperative need for analgesia (Dipyrone, nonste-roidal antirheumatics, or opioids) between MIDCABor TECAB patients. All patients of both groups exceptthe one mentioned above were discharged from theintensive care unit within the first 24 h afteradmission.
A total of 1840 segments were assessed. In the MID-CAB group, 160 RV segments (two segments analyzedat each of the five measurement points in 16 patients)and 480 LV segments (six segments analyzed at eachpoint) were recorded and analyzed. In the TECABgroup, 300 RV and 900 LV segments underwent TEEanalysis.
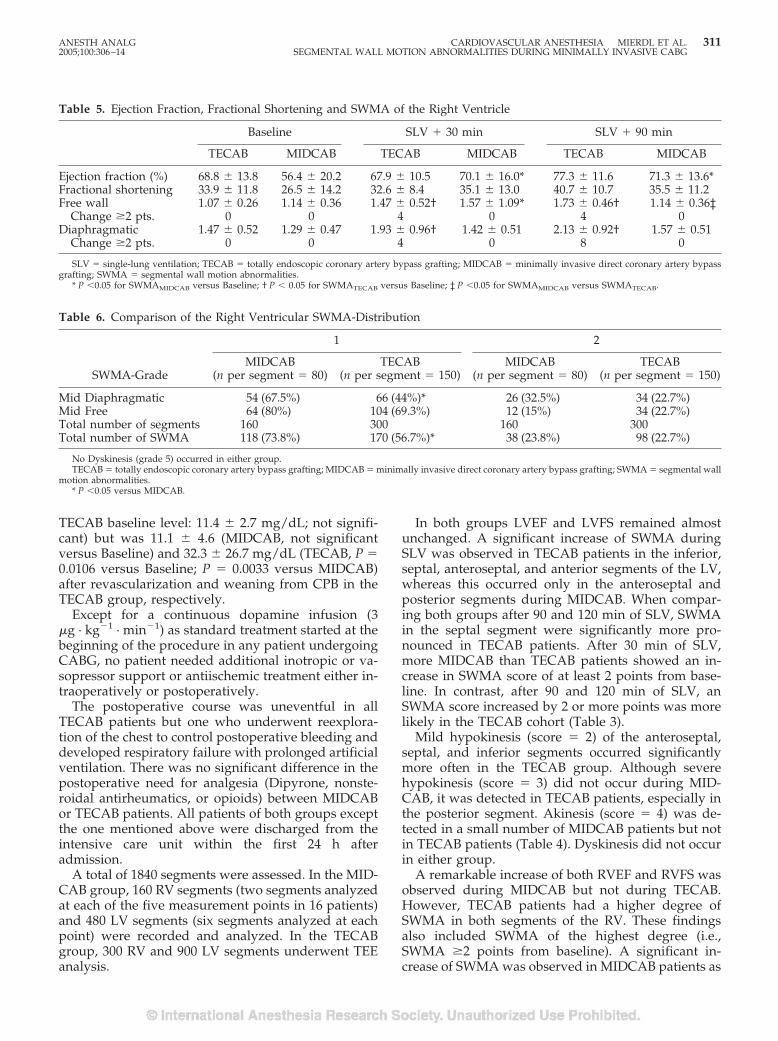
In both groups LVEF and LVFS remained almostunchanged. A significant increase of SWMA duringSLV was observed in TECAB patients in the inferior,septal, anteroseptal, and anterior segments of the LV,whereas this occurred only in the anteroseptal andposterior segments during MIDCAB. When compar-ing both groups after 90 and 120 min of SLV, SWMAin the septal segment were significantly more pro-nounced in TECAB patients. After 30 min of SLV,more MIDCAB than TECAB patients showed an in-crease in SWMA score of at least 2 points from base-line. In contrast, after 90 and 120 min of SLV, anSWMA score increased by 2 or more points was morelikely in the TECAB cohort (Table 3).
Mild hypokinesis (score � 2) of the anteroseptal,septal, and inferior segments occurred significantlymore often in the TECAB group. Although severehypokinesis (score � 3) did not occur during MID-CAB, it was detected in TECAB patients, especially inthe posterior segment. Akinesis (score � 4) was de-tected in a small number of MIDCAB patients but notin TECAB patients (Table 4). Dyskinesis did not occurin either group.
A remarkable increase of both RVEF and RVFS wasobserved during MIDCAB but not during TECAB.However, TECAB patients had a higher degree ofSWMA in both segments of the RV. These findingsalso included SWMA of the highest degree (i.e.,SWMA �2 points from baseline). A significant in-crease of SWMA was observed in MIDCAB patients as
Table 5. Ejection Fraction, Fractional Shortening and SWMA of the Right Ventricle
Baseline SLV � 30 min SLV � 90 min
TECAB MIDCAB TECAB MIDCAB TECAB MIDCAB
Ejection fraction (%) 68.8 � 13.8 56.4 � 20.2 67.9 � 10.5 70.1 � 16.0* 77.3 � 11.6 71.3 � 13.6*Fractional shortening 33.9 � 11.8 26.5 � 14.2 32.6 � 8.4 35.1 � 13.0 40.7 � 10.7 35.5 � 11.2Free wall 1.07 � 0.26 1.14 � 0.36 1.47 � 0.52† 1.57 � 1.09* 1.73 � 0.46† 1.14 � 0.36‡
Change �2 pts. 0 0 4 0 4 0Diaphragmatic 1.47 � 0.52 1.29 � 0.47 1.93 � 0.96† 1.42 � 0.51 2.13 � 0.92† 1.57 � 0.51
Change �2 pts. 0 0 4 0 8 0
SLV � single-lung ventilation; TECAB � totally endoscopic coronary artery bypass grafting; MIDCAB � minimally invasive direct coronary artery bypassgrafting; SWMA � segmental wall motion abnormalities.
* P �0.05 for SWMAMIDCAB versus Baseline; † P � 0.05 for SWMATECAB versus Baseline; ‡ P �0.05 for SWMAMIDCAB versus SWMATECAB.
Table 6. Comparison of the Right Ventricular SWMA-Distribution
SWMA-Grade
1 2
MIDCAB(n per segment � 80)
TECAB(n per segment � 150)
MIDCAB(n per segment � 80)
TECAB(n per segment � 150)
Mid Diaphragmatic 54 (67.5%) 66 (44%)* 26 (32.5%) 34 (22.7%)Mid Free 64 (80%) 104 (69.3%) 12 (15%) 34 (22.7%)Total number of segments 160 300 160 300Total number of SWMA 118 (73.8%) 170 (56.7%)* 38 (23.8%) 98 (22.7%)
No Dyskinesis (grade 5) occurred in either group.TECAB � totally endoscopic coronary artery bypass grafting; MIDCAB � minimally invasive direct coronary artery bypass grafting; SWMA � segmental wall
motion abnormalities.* P �0.05 versus MIDCAB.
ANESTH ANALG CARDIOVASCULAR ANESTHESIA MIERDL ET AL. 3112005;100:306–14 SEGMENTAL WALL MOTION ABNORMALITIES DURING MINIMALLY INVASIVE CABG
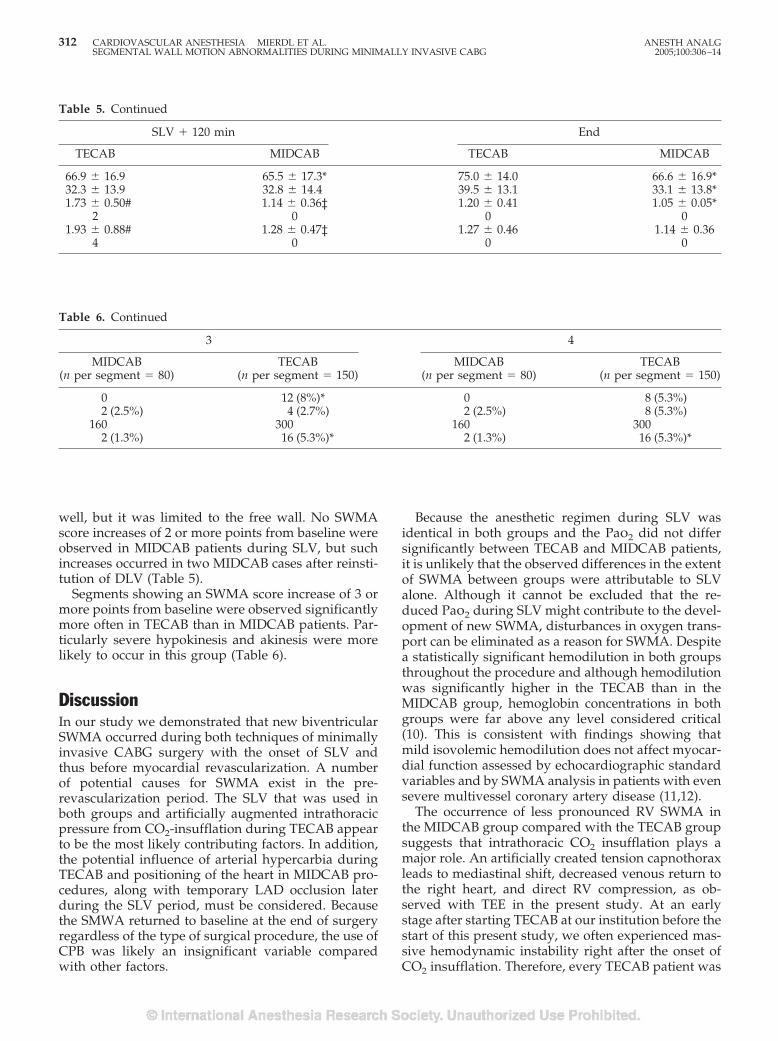
well, but it was limited to the free wall. No SWMAscore increases of 2 or more points from baseline wereobserved in MIDCAB patients during SLV, but suchincreases occurred in two MIDCAB cases after reinsti-tution of DLV (Table 5).
Segments showing an SWMA score increase of 3 ormore points from baseline were observed significantlymore often in TECAB than in MIDCAB patients. Par-ticularly severe hypokinesis and akinesis were morelikely to occur in this group (Table 6).
DiscussionIn our study we demonstrated that new biventricularSWMA occurred during both techniques of minimallyinvasive CABG surgery with the onset of SLV andthus before myocardial revascularization. A numberof potential causes for SWMA exist in the pre-revascularization period. The SLV that was used inboth groups and artificially augmented intrathoracicpressure from CO2-insufflation during TECAB appearto be the most likely contributing factors. In addition,the potential influence of arterial hypercarbia duringTECAB and positioning of the heart in MIDCAB pro-cedures, along with temporary LAD occlusion laterduring the SLV period, must be considered. Becausethe SMWA returned to baseline at the end of surgeryregardless of the type of surgical procedure, the use ofCPB was likely an insignificant variable comparedwith other factors.
Because the anesthetic regimen during SLV wasidentical in both groups and the Pao2 did not differsignificantly between TECAB and MIDCAB patients,it is unlikely that the observed differences in the extentof SWMA between groups were attributable to SLValone. Although it cannot be excluded that the re-duced Pao2 during SLV might contribute to the devel-opment of new SWMA, disturbances in oxygen trans-port can be eliminated as a reason for SWMA. Despitea statistically significant hemodilution in both groupsthroughout the procedure and although hemodilutionwas significantly higher in the TECAB than in theMIDCAB group, hemoglobin concentrations in bothgroups were far above any level considered critical(10). This is consistent with findings showing thatmild isovolemic hemodilution does not affect myocar-dial function assessed by echocardiographic standardvariables and by SWMA analysis in patients with evensevere multivessel coronary artery disease (11,12).
The occurrence of less pronounced RV SWMA inthe MIDCAB group compared with the TECAB groupsuggests that intrathoracic CO2 insufflation plays amajor role. An artificially created tension capnothoraxleads to mediastinal shift, decreased venous return tothe right heart, and direct RV compression, as ob-served with TEE in the present study. At an earlystage after starting TECAB at our institution before thestart of this present study, we often experienced mas-sive hemodynamic instability right after the onset ofCO2 insufflation. Therefore, every TECAB patient was
Table 6. Continued
3 4
MIDCAB(n per segment � 80)
TECAB(n per segment � 150)
MIDCAB(n per segment � 80)
TECAB(n per segment � 150)
0 12 (8%)* 0 8 (5.3%)2 (2.5%) 4 (2.7%) 2 (2.5%) 8 (5.3%)
160 300 160 3002 (1.3%) 16 (5.3%)* 2 (1.3%) 16 (5.3%)*
Table 5. Continued
SLV � 120 min End
TECAB MIDCAB TECAB MIDCAB
66.9 � 16.9 65.5 � 17.3* 75.0 � 14.0 66.6 � 16.9*32.3 � 13.9 32.8 � 14.4 39.5 � 13.1 33.1 � 13.8*1.73 � 0.50# 1.14 � 0.36‡ 1.20 � 0.41 1.05 � 0.05*
2 0 0 01.93 � 0.88# 1.28 � 0.47‡ 1.27 � 0.46 1.14 � 0.36
4 0 0 0
312 CARDIOVASCULAR ANESTHESIA MIERDL ET AL. ANESTH ANALGSEGMENTAL WALL MOTION ABNORMALITIES DURING MINIMALLY INVASIVE CABG 2005;100:306–14
initially administered at least 1000 mL of lactatedRinger’s solution and another 1000 mL of hydroxy-ethyl starch 6% before the start of insufflation. Formethodical reasons, this intravascular fluid adminis-tration was also performed in the MIDCAB cohort inthe present setting. Improved cardiac preload mayexplain the hemodynamic stability during CO2 insuf-flation in the present cohort despite significantSWMA. Because the SWMA were of no clinical signif-icance and regressed completely after revasculariza-tion, we consider intrathoracic CO2 insufflation with apressure of approximately 10 mm Hg safe in patientswith LAD disease.
In contrast to MIDCAB procedures, significant arte-rial hypercarbia occurred and progressed during thecourse of CO2 insufflation in TECAB patients. Anexperimental study disclosed coronary steal phenom-ena resulting from arterial hypercarbia in swine withartificially created chronic LAD stenosis (13). In ourstudy we could not see any lasting effects fromhypercarbia.
The heart is exposed to substantial stress duringMIDCAB surgery. To gain optimal exposure of theLAD, mechanical positioning, along with pericardialsutures, is essential. During the suturing of the coro-nary anastomosis, the surgical field must be kept sta-ble. In addition, the target vessel must be occludedtemporarily. Myocardial ischemia as reflected bySWMA seems highly likely during these manipula-tions. The first SWMA were observed immediatelyafter the onset of SLV in the MIDCAB group (i.e.,before the heart was positioned). Interestingly, weobserved new akinetic segments in significant numberin the LV of four MIDCAB patients. These SWMAdeveloped in the inferior and septal segments 30 min-utes after the onset of SLV. In two patients, SWMApersisted over the next hour. This corresponds withthe end of internal mammary artery dissection andsurgical exposure for coronary anastomosis. We con-clude that the exposure and immobilization of themyocardial surgical site led to these alterations. This isin contrast to another study reporting only minor LVhemodynamic changes during surgical exposure forLAD revascularization (14). The patients in that studysuffered from multivessel coronary artery disease andwere operated on via median sternotomy, whereasour MIDCAB patients had a small anterolateral thora-cotomy. The latter approach requires deep pericardialsutures and an important rightward rotation of theLV. TEE data provided by Mathison et al. (14) de-scribed RV and LV compression but did not provide asystematic analysis of SWMA. We explain the ob-served akinetic events with the important changes incardiac topography during myocardial stabilizationfor anastomosis.
There was no change in biventricular EF and FS inpatients who underwent TECAB. In MIDCAB pa-tients, RVEF and RVFS increased significantly duringthe operation, even when SWMA became more andmore apparent. This is consistent with findings fromother studies of patients undergoing conventionalCABG. We agree with other investigators that changesin EF and FS do not adequately reflect acute myocar-dial ischemia (15).
Although we observed statistically significant SWMAin both groups of patients, these were not accompaniedby specific ST segment changes. This agrees with studiesdemonstrating that these ST segment changes rarely cor-relate with intraoperative SWMA and therefore may notalways reflect myocardial ischemia even associated withhemodynamic changes. The influence of the observedSWMA in both groups on the outcome might be small oreven nonexistent, as it has been shown that only newSWMA after revascularization are significantly associ-ated with adverse clinical outcome (16,17). We considerthe SWMA as highly sensitive markers of myocardialischemia that precede ST segment alterations. Thereforewe cannot exclude that these statistically significantSWMA reflected intermittent myocardial ischemia un-detected by ECG (18).
Serum lactate concentration as evidence of tissue hyp-oxia or ischemia remained stable throughout the obser-vation period despite occasional low Pao2 during SLV. Itincreased only in TECAB patients after weaning fromCPB. Twelve hours postsurgery a significant increase ofthe CK was observed in both groups but no accompa-nying increase in CK-MB was observed, therefore ex-cluding relevant myocardial damage. The large increasein CK after TECAB procedures was probably a result oflimb ischemia after femoral cannulation for CPB with thePort Access system (19).
The study was not designed in randomized fashionbecause the surgical approach was decided individuallyfor each patient by the surgeon. Another important lim-itation was that no invasive hemodynamic data wereobtained. However, placement of a pulmonary arterycatheter is almost impossible during TECAB because ofthe pulmonary vent required for CPB. In MIDCAB pro-cedures, an insertion of a pulmonary artery catheterposes significant additional risk to an otherwise low riskpopulation suffering from single vessel disease and wasnot approved by the IRB.
Although the accuracy of SWMA is based on inter-disciplinary guidelines, allowing an exact interpreta-tion of the extent of SWMA as an indirect scale ofischemia (7), it is a subjective method that is depen-dent on the observer’s experience and has the risk offalse positives or negatives. Furthermore, nonischemiccauses of SWMA have been described. Conductionabnormalities, anesthetics, acute changes in adrener-gic tone, or hypovolemia can cause false positive re-sults (20). In addition, the hibernating or stunned
ANESTH ANALG CARDIOVASCULAR ANESTHESIA MIERDL ET AL. 3132005;100:306–14 SEGMENTAL WALL MOTION ABNORMALITIES DURING MINIMALLY INVASIVE CABG
myocardium can show impaired systolic functioneven though the ischemic event is over (21). Moresensitive and specific methods for the assessment ofmyocardial function are technically complicated andtime-consuming and therefore not feasible in the peri-operative setting of cardiac surgery.
To assess SWMA, we only performed the transgas-tric mid short axis view. Rouine-Rapp et al. (9) foundthat 43% of SWMA might be missed by using thisview alone without additional transverse or longitu-dinal planes. We were aware of this problem, butkeeping the probe in stable position during the entirestudy period was thought to generate the most reliableTEE results. Furthermore, the transgastric mid-shortaxis view allows the evaluation of all myocardial re-gions perfused by each of the major coronary arteries.
Only CK/CK-MB, but not Troponin T, known asone of the most sensitive markers of myocardial ische-mia, was examined in our study. However, it has beenshown in patients undergoing cardiac surgery that nomarker can distinguish injury resulting from acuteinfarction from the obligatory injury associated withthe procedure itself (22). Therefore, we did not con-sider Troponin T levels essential to the study.
ConclusionWe conclude that MIDCAB and TECAB proceduresare accompanied by significant SWMA before myo-cardial revascularization. However, as SWMA rapidlyreturn to baseline after revascularization and do notcause persistent hemodynamic instability requiringinotropic or vasopressor support, the perioperativepatient risk for myocardial ischemia can be estimatedto be minimal in both methods. Nevertheless, the RVimpact of intrathoracic CO2 pressure on SWMA inTECAB procedures is more important than the me-chanical exposure of the LAD in the MIDCAB ap-proach. There might have been a higher risk of limbischemia in the TECAB group because of the specificendovascular CPB access in addition to other compli-cations associated with the endovascular system asdiscussed elsewhere (23). Finally, TECAB may be as-sociated with a higher risk for perioperative RV dys-function when compared with MIDCAB procedures.
References1. Bonatti J, Ladurner R, Antretter H, et al. Single coronary artery
bypass grafting: a comparison between minimally invasive “offpump” techniques and conventional procedures. Eur J Cardio-thorac Surg 1998;14(Suppl. 1):S7–12.
2. Falk V, Diegeler A, Walther T, et al. Total endoscopic computerenhanced coronary artery bypass grafting. Eur J CardiothoracSurg 2000;17:38–45.
3. Brock H, Rieger R, Gabriel C, et al. Haemodynamic changesduring thoracoscopic surgery: the effects of one-lung ventilationcompared with carbon dioxide insufflation. Anaesthesia 2000;55:10–6.
4. Byhahn C, Mierdl S, Meininger D, et al. Hemodynamics and gasexchange during carbon dioxide insufflation for totally endoscopiccoronary artery bypass grafting. Ann Thorac Surg 2001;71:1496–502.
5. Ascione R, Lloyd CT, Underwood MJ, et al. Inflammatory re-sponse after coronary revascularization with or without cardio-pulmonary bypass. Ann Thorac Surg 2000;69:1198–204.
6. Lischke V, Westphal K, Behne M, et al. Thoracoscopic micro-surgical technique for vertebral surgery-anesthetic consider-ations. Acta Anaesthesiol Scand 1998;42:1199–204.
7. Shanewise JS, Cheung AT, Aronson S, et al. ASE/SCA guidelines forperforming a comprehensive intraoperative multiplane transesopha-geal echocardiography examination: recommendations of the Amer-ican Society of Echocardiography, Council for Intraoperative Echocar-diography. J Am Soc Echocardiogr 1999;12:884–900.
8. American Society of Echocardiography Committee on Stan-dards, Subcommittee on Quantitation of Two-DimensionalEchocardiograms. Recommendations for quantitation of the leftventricle by two-dimensional echocardiography. J Am SocEchocardiogr 1989;2:358–67.
9. Rouine-Rapp K, Ionescu P, Balea M, et al. Detection of intraop-erative segmental wall-motion abnormalities by transesopha-geal echocardiography: the incremental value of additionalcross sections in the transverse and longitudinal planes. AnesthAnalg 1996;83:1141–8.
10. Habler O, Messmer K. The physiology of oxygen transport.Transfus Sci 1997;18:425–35.
11. Licker M, Sierra J, Tassaux D et al. Continuous haemodynamicmonitoring using transesophageal Doppler during acute nor-movolemic haemodilution in patients with coronary artery dis-ease. Anaesthesia 2004;59:108–15.
12. Catoire P, Saada M, Liu N et al. Effect of preoperative normo-volemic hemodilution on left ventricular segmental wall motionduring abdominal aortic surgery. Anesth Analg 2004;75:654–9.
13. Arellano R, Jiang MT, O’Brien W, et al. Acute graded hypercap-nia increases collateral coronary blood flow in a swine model ofchronic coronary artery obstruction. Crit Care Med 1999;27:2729–34.
14. Mathieson M, Edgerton JR, Horswell JL, et al. Analysis of he-modynamic changes during beating heart surgical procedures.Ann Thorac Surg 2000;70:1355–61.
15. London MJ, Tubau JF, Wong MG, et al. The natural history ofsegmental wall motion abnormalities in patients undergoingnoncardiac surgery. Anesthesiology 1990;73:644–55.
16. Leung JM, O’Kelly MB, Browner WS, et al. Prognostic impor-tance of postbypass regional wall-motion abnormalities in pa-tients undergoing coronary artery bypass grafting. SPI ResearchGroup. Anesthesiology 1989;71:16–25.
17. Leung JM, O’Kelly, Mangano DT. Relationship of regional wallmotion abnormalities to hemodynamic indices of myocardialoxygen supply, and demand in patients undergoing CABGsurgery. Anesthesiology 1990;73:802–14.
18. Kolev N, Ihra G, Swanevelder J, et al. Biplane transesophagealechocardiographic detection of myocardial ischemia in patientswith coronary artery disease undergoing non-cardiac surgery:segmental wall motion vs. electrocardiography and haemody-namic performance. Eur J Anaesthesiol 1997;14:412–20.
19. Glower DD, Komtebedde J, Clements FM, et al. Direct aorticcannulation for port-access mitral or coronary artery bypassgrafting. Ann Thorac Surg 1999;68:1878–80.
20. Seeberger M, Cahalan MK, Rouine-Rapp K, et al. Acute hypo-volemia may cause segmental wall motion abnormalities in theabsence of myocardial ischemia. Anesth Analg 1997;85:1252–7.
21. Jeroudi MO, Cheirif J, Habib G, Bolli R. Prolonged wall motionabnormalities after chest pain at rest in patients with unstableangina: a possible manifestation of myocardial stunning. AmHeart J 1994;127:1241–50.
22. Jaffe AS, Ravkilde J, Roberts R, et al. It’s time for a change to aTroponin standard. Circulation 2000;102:1216–20.
23. Damiano RJ Jr., Ehrman WJ, Ducko CT, et al. Initial UnitedStates clinical trial of robotically assisted endoscopic coronaryartery bypass grafting. J Thorac Cardiovasc Surg 2000;119:77–82.
314 CARDIOVASCULAR ANESTHESIA MIERDL ET AL. ANESTH ANALGSEGMENTAL WALL MOTION ABNORMALITIES DURING MINIMALLY INVASIVE CABG 2005;100:306–14
Can Wound Desiccation Be Averted During Cardiac Surgery?An Experimental StudyMikael Persson, PhD, and Jan van der Linden, MD PhD
Division of Medical Engineering, Department of Laboratory Medicine, and Department of Cardiothoracic Surgery &Anesthesiology; Karolinska University Hospital, Karolinska Institute, Stockholm, Sweden
During cardiac surgery the wound is exposed to desicca-tion, especially as a result of operating room ventilationand the insufflation of dry carbon dioxide (CO2) for de-airing. We compared the gas humidity and desiccationrates in an in vitro model of a cardiothoracic wound dur-ing these conditions and during insufflation of humidi-fied CO2. To assess the influence of flow velocity, CO2 wasinsufflated at 10 L/min via two devices, a standard open-ended tube and a low-velocity gas diffuser. The treatmentarms were compared with a control without insufflation.When insufflated via the open-ended tube the humidityin the model was almost equal to the control, both withdry and humidified CO2. However, the total desiccation
rate was more rapid than the control (P � 0.001), espe-cially in the area exposed to the gas jet where the desicca-tion rate was three times more rapid (P � 0.001). With thegas diffuser, dry CO2 caused almost zero humidity and adesiccation rate that was almost equal to the control. Hu-midified CO2 increased humidity in comparison with thecontrol (P � 0.001) and decreased the desiccation rate by�90% (P � 0.001). Humidified CO2 may be used to avertdesiccation of the cardiothoracic wound. The humidifiedgas is effective only when delivered via a low-velocityoutlet device.
(Anesth Analg 2005;100:315–20)
W hen the thoracic cavity is opened the clinicianseldom considers that this will abruptly ex-pose the internal tissues to a totally new en-
vironment, ambient air, characterized by less humid-ity. Although the implications of this sudden changehave so far not been studied very extensively, it hasbecome clear that desiccation during surgery leads totissue damage (1) and that the risk of such damageincreases with time (2). Moreover, injury of mesothe-lial layers may cause postoperative adhesions (1,3),which not only make reoperations more difficult butalso may lead to right ventricular dysfunction (4). Theeffect of desiccation is of special interest in cardiacsurgery where gas exchange, i.e., convection, occursnot only as a result of standard operating room (OR)ventilation. CO2 gas is also insufflated into the cardio-thoracic wound to prevent arterial air embolism. The
question of whether such CO2 de-airing might initiatedesiccation effects is relevant because CO2 has to beinsufflated continuously throughout the open-heartoperation (5), and because the insufflated CO2 is com-pletely dry.
Whereas cell damage and the ensuing adhesion for-mation may be estimated semi-quantitatively, moredirect information about desiccation effects can beobtained by measuring humidity and actual water lossduring surgery. To obtain these types of data we mustresort to an experimental model. In the present studywe investigated whether humidity and rate of waterloss in an in vitro model of a cardiothoracic wound areinfluenced by insufflation of dry and humidified CO2via a standard open-ended tube (6,7) and a low-velocity outlet device (5,8,9), respectively. We alsotested whether cardiotomy suction and hand move-ments influence water loss rate.
MethodsWound desiccation was studied in a model of a car-diothoracic wound cavity that contained 2 standard9-cm diameter Petri dishes (Fig. 1). Each plate con-tained a layer of blood agar representing fresh woundtissue. The dimensions of the model were based onmeasurements of the open wound cavity of five adult
Supported, in part, by Karolinska Institute, and Cardia Innova-tion AB, Stockholm, Sweden.
Accepted for publication July 9, 2004.Address correspondence and reprint requests to Mikael Persson,
Department of Laboratory Medicine, Karolinska University Hospi-tal, Karolinska Institute, SE-141 86 Stockholm, Sweden and Jan vander Linden, Department of Cardiothoracic Surgery & Anesthesiol-ogy, Karolinska University Hospital, Karolinska Institute, SE-141 86Stockholm, Sweden. Address e-mail to [email protected] [email protected].
DOI: 10.1213/01.ANE.0000140243.97570.DE
©2005 by the International Anesthesia Research Society0003-2999/05 Anesth Analg 2005;100:315–20 315
patients undergoing cardiac surgery through a com-plete median sternotomy and during cardiopulmo-nary bypass (CPB) with an empty heart (8). The modelwas elliptically shaped with a length, width, anddepth of 20, 12, and 8 cm, respectively. It was placedon the operating table of a fully ventilated OR forcardiac surgery (laminar airflow of approximately2500 m3/h from the ceiling downward).
Two insufflation devices were studied. They were astandard open-ended tube with an inner diameter of1/4 inch and a gas diffuser (Cardia Innovation AB,Stockholm, Sweden) consisting of a thin fixable tubewith a diffuser of polyurethane foam at the end (5).The insufflation devices were positioned at the acuteend of the wound cavity model. The open-ended tubewas pointed towards the center of the cavity with theorifice positioned a few centimeters inside the brim(Fig. 1), whereas the gas diffuser, which produces amultidirectional gas flow with a low outlet velocity,was pointed downwards and positioned at half thedepth of the cavity.
Medical CO2 was delivered at a flow of 10 L/minfrom a pressurized gas cylinder consisting of a flowregulator with a backpressure compensated flowme-ter (AGA Gas AB, Stockholm, Sweden). The flowmeterand the used calibration procedure have been de-scribed in detail (5,8). The CO2 was humidified with abubble humidifier containing sterile water (Aquapak340 mL; Hudson Respiratory Care Inc., Temecula,CA). A pilot study showed that for the humidity of theadministered gas to remain constant, the humidifierhad to be maintained at a constant temperature. Thus,during the experiment the humidifier was warmed ina heat-regulated water bath (Haake D8/L; HaakeMess-Technik GmbH u. CO, Karlsruhe, Germany) thatwas maintained at room temperature. We took carenot to exceed this temperature to prevent condensa-tion in the gas delivery system and the wound model,which would have interfered with our measurements.
Humidity and water loss in the wound model werestudied under five different conditions: without insuf-flation (control) and during insufflation of dry and
humidified CO2 that was delivered via the open-ended tube and the gas diffuser, respectively.
After gas insufflation had been started (if used),room temperature (20.2 � 0.3°C, mean � sd) andrelative humidity inside the model were measured atsteady state, i.e., when values fluctuated around aconstant value over 30 s. To avoid interferencethrough evaporation from the agar plates, humiditywas measured without them. We used a digital hy-grometer (HygroPalm 3; Rotronic AG, Bassersdorf,Switzerland) that has a resolution of 0.1% relativehumidity and 0.1°C, with an accuracy of �1.5% rela-tive humidity and �0.3°C, respectively. The instru-ment is claimed to be suitable for measurements inboth air and CO2. During measurements the sensor(Hygro Clip, Rotronic AG, Bassersdorf, Switzerland)was positioned in the middle of the cavity (just abovethe bottom). The sensor was kept close to the wall toavoid interference with the CO2 flow.
Two agar plates were then weighed one by one,temporarily without their lids, on a digital precisionscale (Sartorius L420S, Satrorius Gmbh, Gottingen,Germany). This instrument has a resolution of 1 mgand an accuracy of �2 mg. Then, while gas was stillflowing (if used), the agar plates were placed into thewound model (Fig. 1), the lids were removed, and atimer was started. After 30 min of exposure the lidswere put back on the agar plates while the gas waskept flowing. They were then removed from themodel and weighed again (without their lids). In ev-ery experiment a fresh pair of agar plates kept at roomtemperature was used, and the lids were kept freefrom condensation water. The 5 experiments wererepeated 10 times in a random order, resulting in aseries of 50 measurements. Random assignment wasdone with the help of unmarked envelopes, each ofwhich contained a card indicating type of experimen-tal group.
The possible influence of cardiotomy suction andhand movements was investigated in an additionalstudy during insufflation of humidified CO2 with agas diffuser, the condition found to cause the slowestdesiccation rate in the main study. The desiccation ratewas measured with the same set-up as in the mainstudy. Three experiments were repeated 10 times, ren-dering a total of 30 measurements that were per-formed in random order. One group was assigned toinsufflation with continuous cardiotomy suction incombination with hand movements, a second group toinsufflation without suction and hand movements,and a third group (control) without either insufflationor suction and hand movements. A standard cardiot-omy suction device was placed in the middle of thewound cavity model with the orifice 1 cm above thebottom close to the wall. The suction rate was keptconstant at 1.5 L/min. Every 10 seconds an investiga-tor placed his hands into the wound cavity model,
Figure 1. A cardiothoracic wound cavity model with an ellipticshape and a length, width, and depth of 20, 12, and 8 cm respec-tively. Two standard 9-cm blood agar plates were positioned at thebottom simulating fresh wound surface. The figure also shows howeach insufflation device was positioned during the experiment. Thedevices were positioned at the same side of the model but not at thesame time.
316 CARDIOVASCULAR ANESTHESIA PERSSON AND VAN DER LINDEN ANESTH ANALGWOUND DESICCATION DURING CARDIAC SURGERY 2005;100:315–20
simulated surgical suturing and knotting, and re-moved them again. This was done throughout the30-min experiment.
Data are presented as medians with ranges. TheMann-Whitney U-test and Wilcoxon’s tests were usedwhen appropriate. The total values (n � 10) of bothagar plates combined were used for comparison ofdesiccation rates among the groups. In the main studywe also compared the desiccation rate between theagar plate proximal and distal to the insufflation de-vice. As there were no proximal and distal plates to bedefined in the control group, the proximal (n � 10)and distal plates (n � 10) of the insufflation groupswere compared with all plates of the control group (n� 20). Differences were considered statistically signif-icant if P � 0.05.
ResultsWithout insufflation the relative humidity was 45.1%(Fig. 2). When the open-ended tube was used, insuf-flation of dry CO2 resulted in a decrease of the relativehumidity to 42.4% (P � 0.04), whereas insufflation ofhumidified CO2 increased it to 49.2% (P � 0.02). Whenthe gas diffuser was used, the effect was much moremarked. Insufflation of dry CO2 decreased the relativehumidity to 1.8%, which was the smallest value of allgroups (P � 0.001). By contrast, when humidified CO2was insufflated via the gas diffuser, the relative hu-midity increased to 75.8%, which was the largest valueof all groups (P � 0.001).
When the open-ended tube was used for insuffla-tion of dry as well as of humidified CO2, the desicca-tion rate, expressed as water loss in mg/cm2/min, wasmuch more rapid on the distal plate than on the prox-imal one (P � 0.001), where the rate was slightly fasterthan the control (P � 0.001, Fig. 3). When the gasdiffuser was used the differences were in the oppositedirection; the distal plate had the slower desiccationrate (P � 0.001). With dry CO2, the desiccation rate onthe proximal plate was just faster than the control (P �0.001), whereas the desiccation rate on the distal platewas slightly less than the control (P � 0.001). Withhumidified CO2, the proximal and distal desiccationrates were approximately 87% and 95% less than thecontrol (P � 0.001), respectively.
The total desiccation rate in the control group was0.17 (0.15–0.20) mg/cm2/min. When the open-endedtube was used for insufflation of dry CO2, the desic-cation rate was 0.47 (0.46–0.52) mg/cm2/min, almostthree times that of the control (P � 0.001). Whenhumidified CO2 was insufflated with the same device,the desiccation rate was still rapid, 0.38 (0.34–0.39)mg/cm2/min, more than twice that of the control (P �0.001). With the gas diffuser, insufflation of dry CO2resulted in a slightly more rapid desiccation rate, 0.21
(0.18–0.22) mg/cm2/min, compared with the control(P � 0.001). However, when humidified CO2 wasinsufflated the rate decreased to 0.015 (0.012–0.021)mg/cm2/min, more than 90% less than the control (P� 0.001).
During the additional study, the temperature andrelative humidity in the OR was 20.0 � 0.2°C and 16.4� 0.9 (mean � sd), respectively. The total desiccationrate in the control group was 0.25 (0.21–0.28) mg/cm2/min. When humidified CO2 was insufflated thedesiccation rate decreased to 0.013 (0.010–0.019) mg/cm2/min without suction and hand movements (95%less than the control, P � 0.001). With suction andhand movements the desiccation rate increased to0.020 (0.015–0.027) mg/cm2/min. This value wasmore than without suction and hand movements (P �0.001), but still 92% less than the control (P � 0.001).
DiscussionIn the present study humidified CO2 insufflatedthrough a gas diffuser decreased the desiccation ratemore than 90%. Conversely, when humidified CO2was supplied via an open-ended tube it increased thedesiccation rate.
Nkere et al. (2) have shown that during conven-tional cardiac surgery with a sternotomy the pericar-dium undergoes inflammatory changes with concom-itant damage to the mesothelium. In the presence ofshed blood such damage may result in extensive ad-hesion formation (1,3), which, apart from complicat-ing reoperation, can even lead to right ventriculardysfunction (4). Although the possible desiccation ef-fect of CO2 insufflation for de-airing in open-heartsurgery has not yet been addressed, it is a recognizedproblem in other surgical areas where CO2 is insuf-flated for other purposes. In laparoscopic surgery, for
Figure 2. Median and range of relative humidity during steady statein a cardiothoracic wound cavity model (without agar plates), with-out insufflation (control), or with insufflation of dry or humidifiedcarbon dioxide at 10 L/min via a standard 1/4 inch open-endedtube or a gas diffuser.
ANESTH ANALG CARDIOVASCULAR ANESTHESIA PERSSON AND VAN DER LINDEN 3172005;100:315–20 WOUND DESICCATION DURING CARDIAC SURGERY
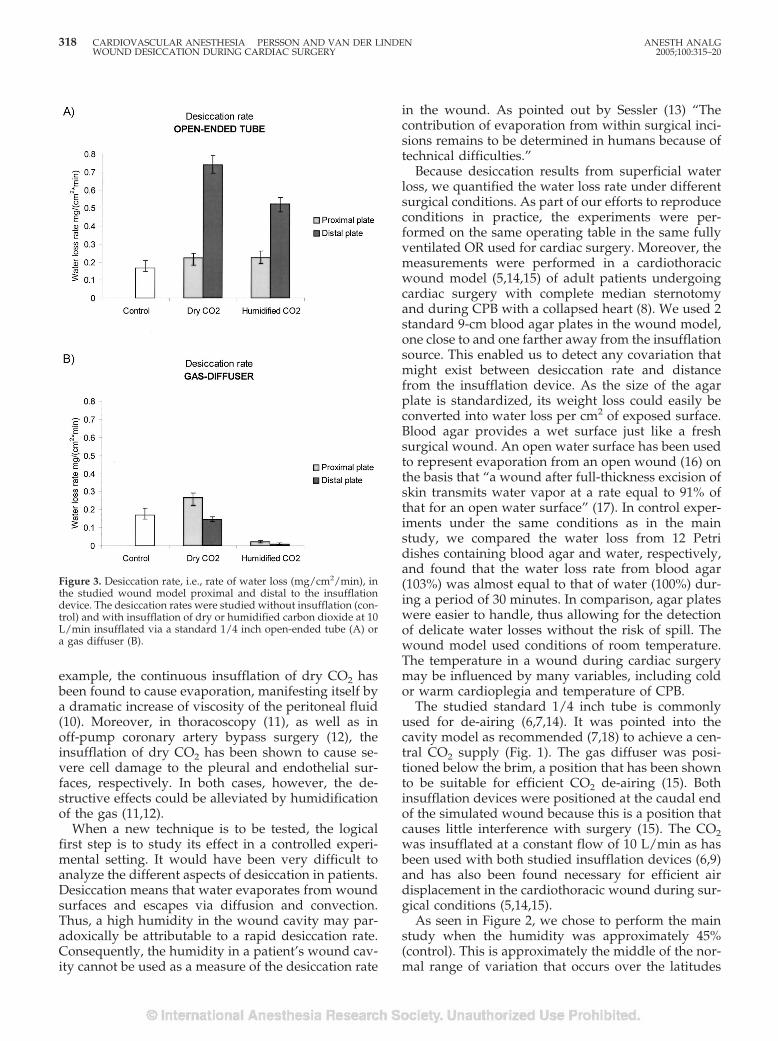
example, the continuous insufflation of dry CO2 hasbeen found to cause evaporation, manifesting itself bya dramatic increase of viscosity of the peritoneal fluid(10). Moreover, in thoracoscopy (11), as well as inoff-pump coronary artery bypass surgery (12), theinsufflation of dry CO2 has been shown to cause se-vere cell damage to the pleural and endothelial sur-faces, respectively. In both cases, however, the de-structive effects could be alleviated by humidificationof the gas (11,12).
When a new technique is to be tested, the logicalfirst step is to study its effect in a controlled experi-mental setting. It would have been very difficult toanalyze the different aspects of desiccation in patients.Desiccation means that water evaporates from woundsurfaces and escapes via diffusion and convection.Thus, a high humidity in the wound cavity may par-adoxically be attributable to a rapid desiccation rate.Consequently, the humidity in a patient’s wound cav-ity cannot be used as a measure of the desiccation rate
in the wound. As pointed out by Sessler (13) “Thecontribution of evaporation from within surgical inci-sions remains to be determined in humans because oftechnical difficulties.”
Because desiccation results from superficial waterloss, we quantified the water loss rate under differentsurgical conditions. As part of our efforts to reproduceconditions in practice, the experiments were per-formed on the same operating table in the same fullyventilated OR used for cardiac surgery. Moreover, themeasurements were performed in a cardiothoracicwound model (5,14,15) of adult patients undergoingcardiac surgery with complete median sternotomyand during CPB with a collapsed heart (8). We used 2standard 9-cm blood agar plates in the wound model,one close to and one farther away from the insufflationsource. This enabled us to detect any covariation thatmight exist between desiccation rate and distancefrom the insufflation device. As the size of the agarplate is standardized, its weight loss could easily beconverted into water loss per cm2 of exposed surface.Blood agar provides a wet surface just like a freshsurgical wound. An open water surface has been usedto represent evaporation from an open wound (16) onthe basis that “a wound after full-thickness excision ofskin transmits water vapor at a rate equal to 91% ofthat for an open water surface” (17). In control exper-iments under the same conditions as in the mainstudy, we compared the water loss from 12 Petridishes containing blood agar and water, respectively,and found that the water loss rate from blood agar(103%) was almost equal to that of water (100%) dur-ing a period of 30 minutes. In comparison, agar plateswere easier to handle, thus allowing for the detectionof delicate water losses without the risk of spill. Thewound model used conditions of room temperature.The temperature in a wound during cardiac surgerymay be influenced by many variables, including coldor warm cardioplegia and temperature of CPB.
The studied standard 1/4 inch tube is commonlyused for de-airing (6,7,14). It was pointed into thecavity model as recommended (7,18) to achieve a cen-tral CO2 supply (Fig. 1). The gas diffuser was posi-tioned below the brim, a position that has been shownto be suitable for efficient CO2 de-airing (15). Bothinsufflation devices were positioned at the caudal endof the simulated wound because this is a position thatcauses little interference with surgery (15). The CO2was insufflated at a constant flow of 10 L/min as hasbeen used with both studied insufflation devices (6,9)and has also been found necessary for efficient airdisplacement in the cardiothoracic wound during sur-gical conditions (5,14,15).
As seen in Figure 2, we chose to perform the mainstudy when the humidity was approximately 45%(control). This is approximately the middle of the nor-mal range of variation that occurs over the latitudes
Figure 3. Desiccation rate, i.e., rate of water loss (mg/cm2/min), inthe studied wound model proximal and distal to the insufflationdevice. The desiccation rates were studied without insufflation (con-trol) and with insufflation of dry or humidified carbon dioxide at 10L/min insufflated via a standard 1/4 inch open-ended tube (A) ora gas diffuser (B).
318 CARDIOVASCULAR ANESTHESIA PERSSON AND VAN DER LINDEN ANESTH ANALGWOUND DESICCATION DURING CARDIAC SURGERY 2005;100:315–20
and seasons. When CO2 was insufflated with a gasdiffuser the humidity in the model was close to 0% andreached more than 75% after humidification. Because thegas diffuser can provide CO2 concentrations larger than99.5% in a cardiothoracic wound (5,8,14,15), these valuesmost likely represent the true humidity of the insufflatedgas. The fact that the model’s relative humidity did notreach 0% with dry CO2 we attribute to the limitation ofthe measuring instrument. The fact that 100% was notreached with humidified CO2 was possibly attributableto a suboptimal humidification technique. In sharp con-trast, when insufflated via the open-ended tube, dry CO2decreased the model’s median relative humidity by only3%, whereas the humidified gas increased it by 4%.Admittedly, the differences are statistically significantbut they can hardly be claimed to be of any clinicalvalue.
When looking at the resulting desiccation rates (Fig.3), the finding that blowing dry CO2 through an open-ended tube increased the desiccation was not surpris-ing. The desiccation rate was most marked on thedistal plate towards which the jet was directed (Fig. 1),where the desiccation rate was more than four timesthe control value. It was also not surprising that whenCO2 was delivered via the same tube, humidificationof the gas did not help very much to reduce thedesiccation rate. The desiccation rate was again mostrapid in the area exposed to the gas jet, where the ratewas somewhat slower but still more than three timesthe control value. The probable explanation for thislack of effect is that the CO2 jet drags down ambientair by ejector effects and also causes turbulence insidethe model that mixes the supplied gas with air (8).
The results obtained with the gas diffuser are, how-ever, more difficult to explain. Although insufflationof untreated CO2 via the gas diffuser produced almostzero humidity in the model, the total desiccation ratewas only slightly more than the control with 45%relative humidity. In fact, on the agar plate furthestfrom the gas diffuser the desiccation rate was even lessthan the control. A potential explanation is that waterloss from a surface occurs through diffusion (i.e., mo-lecular movements from the surface) in the directiontowards less humidity, and the diffusion rate from thesurface may increase in the presence of convection(i.e., gas movements at the surface). When the relativehumidity is �100%, the latter process is the dominantfactor for desiccation, and when the gas diffuser isused, its very low outflow velocity reduces turbulenceto a minimum (8). Under those conditions CO2, whichis heavier than air, will gravitate in the cavity andcover it almost like a protective layer. This also ex-plains the dramatic decrease in the desiccation rate toapproximately 1/10 of the control when the humidi-fied CO2 was insufflated. Again, the CO2 gravitated inthe cavity but this time the gas layer contained water.
Thus, if the insufflated CO2 would have had a humid-ity close to 100% the desiccation rate could probablyhave been averted completely.
Continuous cardiotomy suction and surgical handmovements in the wound model had a statisticallysignificant but marginal influence on the desiccationrate, during insufflation of humidified CO2 with thegas diffuser. The small increase (3%) was most likelycaused by a slightly increased convection in the modeland not by introduction of ambient air. We have pre-viously found that the CO2 concentration in the car-diothoracic wound remains close to 100% during ac-tive surgery with CO2 insufflation at 10 L/minthrough a gas diffuser (14,15).
Assuming that evaporation from blood agar can beextrapolated to tissue in a surgical wound, the resultshave several implications. In an OR with standardventilation the surgical wound is subjected to desicca-tion, which starts immediately after exposure to am-bient air. CO2 insufflation with an open-ended tubedramatically increases the desiccation rate in the re-gion that is exposed to the jet, even if the CO2 ishumidified. Accordingly, humidified CO2 still causesendothelial damage during high-flow gas insufflationto facilitate the suturing of a precise coronary anasto-mosis (12). By contrast, when being insufflated via alow-velocity outlet device, use of dry CO2 will, con-trary to expectation, not lead to an increased desicca-tion in the cardiothoracic wound.
The optimal way to protect tissue against desicca-tion would be to enclose it in a plastic bag (19), thusproviding it with a fully humidified environmentwithout convection. This is possible only with tissuesthat are easily externalized such as intestines duringabdominal surgery. Furthermore, it cannot be done inareas where the surgery takes place. Instead, somesurgeons irrigate the open wound to protect it againstdesiccation. This can of course only be done intermit-tently to avoid interfering with surgery. As a result,the wound will be subjected to desiccation betweenthe irrigations. Moreover, even as a spray, the irriga-tion will not reach hidden recesses. In contrast, hu-midified CO2 can be insufflated continuously into acardiothoracic wound cavity without interfering withsurgery, thus preventing evaporation from all surfacesof the wound throughout the operation.
The present study showed that this could beachieved by insufflating the wound with humidifiedCO2 through a gas diffuser. Because the gas diffusercan provide a cardiothoracic surgical wound with a100% CO2 atmosphere (15), the slow desiccation ratewill be independent of the OR’s air humidity, as indi-cated by the almost equal desiccation rates in the mainand additional studies, despite a large difference inambient air humidity. However, the implications ofhumidified CO2 insufflation will be most evident in adry climate or when air conditioning is used. Future
ANESTH ANALG CARDIOVASCULAR ANESTHESIA PERSSON AND VAN DER LINDEN 3192005;100:315–20 WOUND DESICCATION DURING CARDIAC SURGERY
clinical studies will show whether humidified CO2insufflation via a gas diffuser prevents tissue damageand postoperative adhesions caused by desiccationand whether solutions other than water are useful forwound protection via this system (1,20,21).
In conclusion, humidified CO2 may be used to avertdesiccation of the cardiothoracic wound. The humid-ified gas is effective only when delivered via a low-velocity outlet device.
We thank Mattias Ohman, MSc in mathematical statistics at UmeåUniversity, Umeå, Sweden, for reviewing the statistical analysis andProf. Em. Willem van der Linden for help with the preparation ofthe manuscript.
References1. Seeger JM, Kaelin LD, Staples EM, et al. Prevention of postop-
erative pericardial adhesions using tissue-protective solutions.J Surg Res 1997;68:63–6.
2. Nkere UU, Whawell SA, Sarraf CE et al. Perioperative histologicand ultrastructural changes in the pericardium and adhesions.Ann Thorac Surg 1994;58:437–44.
3. Ryan GB, Grobety J, Majno G. Mesothelial injury and recovery.Am J Pathol 1973;71:93–112.
4. Bailey LL, Ze-jian L, Schulz E, et al. A cause of right ventriculardysfunction after cardiac operations. J Thorac Cardiovasc Surg1984;87:539–42.
5. Svenarud P, Persson M, van der Linden J. Intermittent or con-tinuous carbon dioxide insufflation for de-airing of the cardio-thoracic wound cavity? An experimental study with a newgas-diffuser. Anesth Analg 2003;96:321–7.
6. Nadolny EM, Svensson LG. Carbon dioxide field flooding tech-niques for open heart surgery: monitoring and minimizing po-tential adverse effects. Perfusion 2000;15:151–3.
7. Ng SW, Rosen M. Carbon dioxide in the prevention of airembolism during open-heart surgery. Thorax 1968;23:194–6.
8. Persson M, van der Linden J. De-airing of a cardiothoracicwound cavity model with carbon dioxide: theory and compar-ison of a gas diffuser with conventional tubes. J CardiothoracVasc Anesth 2003;17:329–35.
9. Svenarud P, Persson M, van der Linden J. Effect of CO2 insuf-flation on the number and behavior of air microemboli in open-heart surgery: a randomized clinical trial. Circulation 2004;109:1127–32.
10. Ott DE. Laparoscopy and tribology: the effect of laparoscopicgas on peritoneal fluid. J Am Assoc Gynecol Laparosc 2001;8:117–23.
11. Mouton WG, Bessell JR, Pfitzner J, et al. A randomized con-trolled trial to determine the effects of humidified carbon diox-ide insufflation during thoracoscopy. Surg Endosc 1999;13:382–5.
12. Okazaki Y, Takarabe K, Murayama J, et al. Coronary endothelialdamage during off-pump CABG related to coronary-clampingand gas insufflation. Eur J Cardiothorac Surg 2001;19:834–9.
13. Sessler DI. Perioperative heat balance. Anesthesiology 2000;92:578–96.
14. Svenarud P, Persson M, van der Linden J. Efficiency of a gas-diffuser and influence of suction in carbon dioxide de-airing ofa cardiothoracic wound cavity model. J Thorac Cardiovasc Surg2003;125:1043–9.
15. Persson M, Svenarud P, van der Linden J. What is the optimaldevice for carbon dioxide de-airing of the cardiothoracic woundand how should it be positioned? J Cardiothorac Vasc Anesth2004;18:180–4.
16. Bowker P, Martin CJ, Fulton D, Muir IF. The use of infraredradiation to reduce heat loss in burned patients: experimentswith a phantom. Clin Phys Physiol Meas 1981;2:257–70.
17. Larkin JM, Moylan JA. Evaporative water losses in patientstreated in a laminar flow burn unit. J Surg Res 1978;24:65–9.
18. Rosen M. Replacement of air by carbon dioxide. Anesthesiology1998;89:1036.
19. Rowe MI, Taylor M, Sheehan K. Prevention of water and heatlosses from the exposed intestine. J Pediatr Surg 1982;17:608–10.
20. Persson M, Flock JI, van der Linden J. Antiseptic wound venti-lation with a gas diffuser: a new intraoperative method toprevent surgical wound infection? J Hosp Infect 2003;54:294–9.
21. Persson M, van der Linden J. A simple system for intraoperativeantiseptic wound ventilation. J Hosp Infect 2003;55:152–3.
320 CARDIOVASCULAR ANESTHESIA PERSSON AND VAN DER LINDEN ANESTH ANALGWOUND DESICCATION DURING CARDIAC SURGERY 2005;100:315–20
Continuous Gastric Decompression for Postoperative Nauseaand Vomiting After Coronary Revascularization SurgeryCrina L. Burlacu, FCAI*, David Healy, MRCSI†, Donal J. Buggy, MD, MSc, DME, FRCPI, FCAI, FRCA*‡,Ciaran Twomey, FCAI*, David Veerasingam, FRCSI†, Andrew Tierney, FCAI*,Denis C. Moriarty, FCAI, FRCA*
* Department of Anaesthesia and Intensive Care Medicine, and †Department of Cardiothoracic Surgery, Mater MisericordiaeUniversity Hospital, Dublin, Ireland, and ‡Outcomes Research Institute™, University of Louisville, Louisville, Kentucky
Postoperative nausea and vomiting is common aftercardiac surgery and may contribute to significant mor-bidity. Gastric decompression during anesthesia hasbeen used for postoperative nausea and vomiting pro-phylaxis in shorter duration noncardiac surgery withconflicting results. We tested the hypothesis that gastricdecompression during elective coronary revasculariza-tion surgery with cardiopulmonary bypass and contin-ued afterwards until tracheal extubation would reducethe incidence of vomiting or retching and nausea. In aprospective, randomized, cohort study, 104 patientswith at least 2 Apfel’s risk factors for postoperative nau-sea and vomiting were allocated to receive a gastrictube on free gravity drainage after induction of anesthe-sia (n � 52) or to a control group (n � 52). The gastrictube was removed simultaneously with tracheal extu-bation postoperatively. The primary outcome measure
was the incidence of vomiting or retching. Secondaryoutcomes included the incidence and severity of nauseameasured on a visual analog scale. The incidence ofvomiting or retching was 13.4% in patients with gastricdecompression, compared with 11.5% in the controlgroup (P � 0.7). Similarly, there was no statistically sig-nificant difference between the two groups in the inci-dence of nausea (32.7% versus 25.0%, P � 0.6), medianseverity of nausea on a visual analog scale at 12 h (25;range, 0–55 mm versus 30; range, 0–60 mm, P � 0.4), orantiemetics administration (38.5% versus 28.8%, P �0.3). Continuous gastric decompression during coro-nary revascularization surgery and afterwards untiltracheal extubation did not reduce the incidence ofvomiting or retching or the incidence and severity ofnausea in these patients.
(Anesth Analg 2005;100:321–6)
P ostoperative nausea and vomiting (PONV) isone of the most common complications afteranesthesia and surgery, with an overall inci-
dence of 20%–30% that has remained relatively con-stant over the past 4 decades despite the developmentof a number of antiemetic drugs (1). The reportedincidence in cardiac surgery patients is more frequent,up to 42%–47% (2–4). However, there is still no reliable,effective, standard medication for the prevention ofPONV. It is a major determinant of patient satisfactionwith anesthesia (5,6) even though PONV is usually notcaused by anesthesia per se. Not only are nausea andvomiting unpleasant for patients, this “minor” compli-cation may, rarely, result in significant morbidity (7,8)
and cost escalation: electrolyte disturbance, wound de-hiscence, aspiration, surgical emphysema, postoperativebleeding, and, hence, delayed recovery may all contrib-ute to delayed hospital discharge.
A nonpharmacological strategy for prevention ofPONV is gastric decompression and evacuation of gas-tric content during the surgical intervention. Gastric dis-tension increases intragastric pressure and predisposesto vomiting especially if the intragastric gas mixturecontains elements of volatile anesthetics inadvertentlyintroduced into the stomach during manual ventilation(9). Studies assessing the role of gastric decompression inthe prevention of PONV after various types of surgeryhave reported conflicting results (10–12).
The potential role of gastric decompression as prophy-laxis for PONV in cardiac surgery has never been as-sessed. Therefore, we tested the hypothesis that gastricdecompression during elective coronary revasculariza-tion surgery with cardiopulmonary bypass (CPB) andcontinued afterwards until tracheal extubation wouldreduce the incidence of vomiting or retching and nauseain a prospective, randomized, cohort clinical study.
Supported entirely by the clinical service of the Division of An-aesthesia, Mater Misericordiae Hospital.
Accepted for publication August 13, 2004.Address correspondence and reprint requests to D. J. Buggy,
Department of Anaesthesia & Intensive Care Medicine, Mater Mi-sericordiae Hospital, Eccles Street, Dublin 7, Ireland. Address emailto [email protected] or [email protected].
DOI: 10.1213/01.ANE.0000143567.51304.1A
©2005 by the International Anesthesia Research Society0003-2999/05 Anesth Analg 2005;100:321–6 321
MethodsAfter obtaining approval from the Hospital ResearchEthics Committee and written, informed consent frompatients, we enrolled 107 patients undergoing electivecoronary artery bypass graft surgery (CABG) with CPB.In the inclusion criteria, we used the simplified risk scoredescribed by Apfel et al. (13,14) to identify patients withincreased preexisting risk of PONV and to ensure ade-quate case matching between the cohorts. According tothis score, the following risk factors for PONV are eachascribed one point: female gender, nonsmoking status,history of PONV and/or motion sickness, and use ofpostoperative opioids. The risk of PONV increases withincreasing number of risk factors. Patients with at least 2Apfel risk factors (40% risk of PONV) were recruited forthis study. Exclusion criteria were patients with preex-isting renal and liver function impairment, patients whowere on antiemetic medication within 24 h before theprocedure, patients who were not tracheally extubatedwithin 48 h after the end of surgery, emergency coronaryrevascularization surgery, and emergency re-sternotomy.
Patients were randomly assigned (using a sequen-tially numbered sealed envelope technique) to receiveor not receive a gastric tube at induction of anesthesia.All patients were premedicated 1–2 h before surgerywith lorazepam 1–3 mg or diazepam 10–15 mg. Afterestablishment of peripheral venous and arterial access,anesthesia was induced with fentanyl 5–20 �g/kg IV,midazolam 1–10 mg IV, and a mixture of O2/air/sevoflurane (0.75–1.0 MAC) as required. Pancuronium0.1–0.15 mg/kg IV was administered to facilitate tra-cheal intubation.
After endotracheal intubation, a nasogastric tubewas inserted in patients randomized to receive oneand the gastric content was aspirated and recorded.The nasogastric tube was then connected to a freedrainage bag for the duration of the observation pe-riod. The tube was removed at the same time as thetracheal tube postoperatively in the intensive care unit(ICU) to avoid any pharyngeal stimulation-inducedvomiting. Anesthesia maintenance was based on avolatile anesthetic-opioid technique at the discretionof the anesthesiologist responsible for the case. DuringCPB, the patient received a further dose of midazolam4–10 mg and pancuronium 0.05–0.1 mg/kg. Arterialblood pressure was maintained within 20% of baselinethroughout induction and maintenance of anesthesiausing vasopressors or vasodilators as indicated. Intra-operatively, fluid administration aimed to maintain acentral venous pressure of 5–15 mm Hg. A mixture ofO2 and air allowed for O2 concentrations of 30% to50%. Ventilation was adjusted to maintain normocap-nia (end-tidal CO2, 4.0–5.0 kPa). Neuromuscular blockwas not antagonized at the end of the surgicalprocedure.
Postoperatively, patients received IV infusion offentanyl (0.5–2 �g · kg�1 · h�1) for analgesia. Bolusesof morphine (1–2 mg IV) were allowed as supplemen-tary analgesia. Midazolam boluses (1–2 mg IV) wereused for sedation as required. The administration ofpostoperative fluids and hemodynamic therapy wasaimed to maintain adequate organ perfusion and wasat the discretion of the attending anesthesiologist.Weaning from ventilation and tracheal extubationwere conducted as rapidly as possible within ourunit’s established protocols. We used the Ramsay Se-dation Scale to assess sedation level (15). A score of 6indicates unconsciousness whereas a score of 1 indi-cates that the patient is awake but anxious, agitated, orrestless. A score of 2 is ideal and implies that thepatient is awake, cooperative, orientated, and tranquil.In our study, patients were asked to rate their nauseasensation when the sedation score was 2 or less.
Data collection included patient age, gender,weight, height, smoking status, preoperative historyof nausea and vomiting/motion sickness, indicationof surgery, duration of anesthesia, duration of CPB,aortic cross-clamping time, total cumulative dose ofopioids, duration of mechanical ventilation, and timeto discharge from ICU. The EuroSCORE was also cal-culated preoperatively. EuroSCORE is a score basedon patient, cardiac, and operation-related risk factors(16) and is used to assess the risk of mortality inpatients undergoing heart surgery.
The primary end point of this study was the inci-dence of vomiting or retching, which are objectiveevents. Secondary end points were the incidence andseverity of nausea on the visual analog scale (VAS).Vomiting was defined as expulsive efforts followed byelimination of gastric content. Retching was defined asexpulsive efforts not followed by any expulsion ofgastric content. Nausea was defined as a subjectivesensation: the desire to vomit without any expulsivemuscular movements.
Time zero was the time when the patient was awakeenough to respond (Ramsay score of 2 or less) and indi-cate the level of nausea on the VAS, ranging from nonausea to the worst nausea imaginable (17). The timeinterval for the assessment of nausea or vomiting or bothwas every 1 h for the first 4 h after time zero, then every4 h until the patient was discharged from ICU or until a48-h period had elapsed since the first assessment. Aninvestigator who was not involved in anesthetic carecollected data. Data collection sheets were prepared foreach time interval of observation. The investigator vis-ited the patients at these times, noting the outcomes byreference to the patient and the ICU nurse.
Vomiting or retching and a score of 40 mm or morerecorded on the nausea VAS triggered rescue anti-emetic therapy in the form of ondansetron 4 mg IV.The number of doses of antiemetic given was alsorecorded.
322 CARDIOVASCULAR ANESTHESIA BURLACU ET AL. ANESTH ANALGPONV AFTER CABG 2005;100:321–6
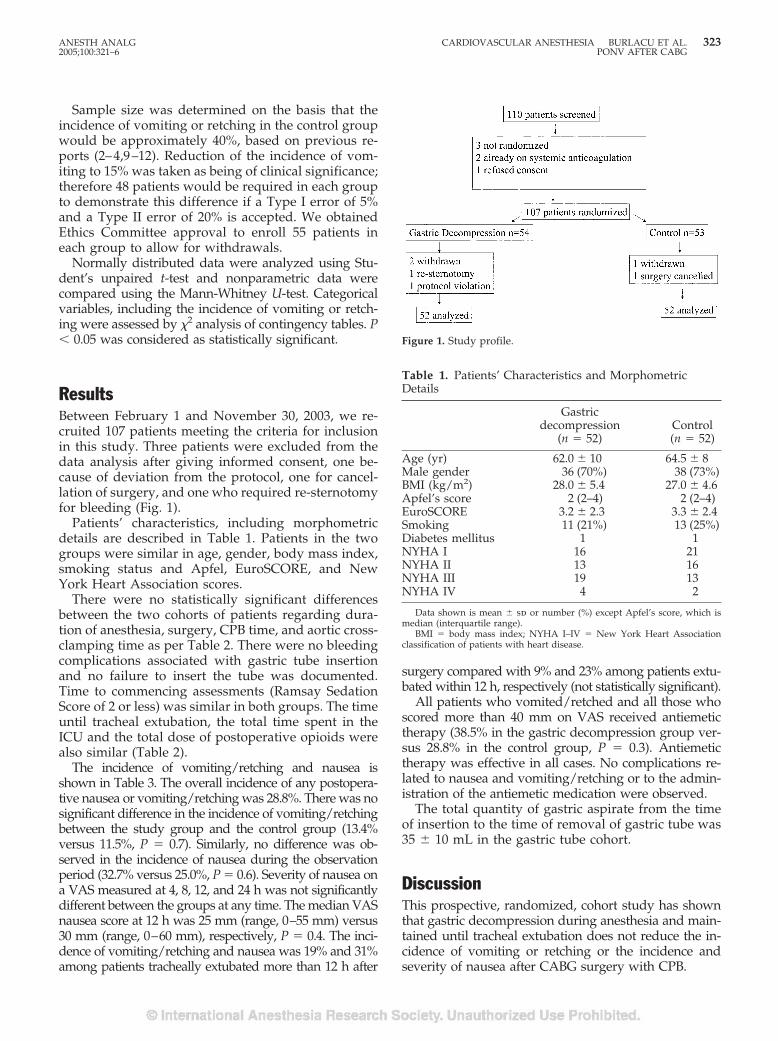
Sample size was determined on the basis that theincidence of vomiting or retching in the control groupwould be approximately 40%, based on previous re-ports (2–4,9–12). Reduction of the incidence of vom-iting to 15% was taken as being of clinical significance;therefore 48 patients would be required in each groupto demonstrate this difference if a Type I error of 5%and a Type II error of 20% is accepted. We obtainedEthics Committee approval to enroll 55 patients ineach group to allow for withdrawals.
Normally distributed data were analyzed using Stu-dent’s unpaired t-test and nonparametric data werecompared using the Mann-Whitney U-test. Categoricalvariables, including the incidence of vomiting or retch-ing were assessed by �2 analysis of contingency tables. P� 0.05 was considered as statistically significant.
ResultsBetween February 1 and November 30, 2003, we re-cruited 107 patients meeting the criteria for inclusionin this study. Three patients were excluded from thedata analysis after giving informed consent, one be-cause of deviation from the protocol, one for cancel-lation of surgery, and one who required re-sternotomyfor bleeding (Fig. 1).
Patients’ characteristics, including morphometricdetails are described in Table 1. Patients in the twogroups were similar in age, gender, body mass index,smoking status and Apfel, EuroSCORE, and NewYork Heart Association scores.
There were no statistically significant differencesbetween the two cohorts of patients regarding dura-tion of anesthesia, surgery, CPB time, and aortic cross-clamping time as per Table 2. There were no bleedingcomplications associated with gastric tube insertionand no failure to insert the tube was documented.Time to commencing assessments (Ramsay SedationScore of 2 or less) was similar in both groups. The timeuntil tracheal extubation, the total time spent in theICU and the total dose of postoperative opioids werealso similar (Table 2).
The incidence of vomiting/retching and nausea isshown in Table 3. The overall incidence of any postopera-tive nausea or vomiting/retching was 28.8%. There was nosignificant difference in the incidence of vomiting/retchingbetween the study group and the control group (13.4%versus 11.5%, P � 0.7). Similarly, no difference was ob-served in the incidence of nausea during the observationperiod (32.7% versus 25.0%, P � 0.6). Severity of nausea ona VAS measured at 4, 8, 12, and 24 h was not significantlydifferent between the groups at any time. The median VASnausea score at 12 h was 25 mm (range, 0–55 mm) versus30 mm (range, 0–60 mm), respectively, P � 0.4. The inci-dence of vomiting/retching and nausea was 19% and 31%among patients tracheally extubated more than 12 h after
surgery compared with 9% and 23% among patients extu-bated within 12 h, respectively (not statistically significant).
All patients who vomited/retched and all those whoscored more than 40 mm on VAS received antiemetictherapy (38.5% in the gastric decompression group ver-sus 28.8% in the control group, P � 0.3). Antiemetictherapy was effective in all cases. No complications re-lated to nausea and vomiting/retching or to the admin-istration of the antiemetic medication were observed.
The total quantity of gastric aspirate from the timeof insertion to the time of removal of gastric tube was35 � 10 mL in the gastric tube cohort.
DiscussionThis prospective, randomized, cohort study has shownthat gastric decompression during anesthesia and main-tained until tracheal extubation does not reduce the in-cidence of vomiting or retching or the incidence andseverity of nausea after CABG surgery with CPB.
Table 1. Patients’ Characteristics and MorphometricDetails
Gastricdecompression
(n � 52)Control(n � 52)
Age (yr) 62.0 � 10 64.5 � 8Male gender 36 (70%) 38 (73%)BMI (kg/m2) 28.0 � 5.4 27.0 � 4.6Apfel’s score 2 (2–4) 2 (2–4)EuroSCORE 3.2 � 2.3 3.3 � 2.4Smoking 11 (21%) 13 (25%)Diabetes mellitus 1 1NYHA I 16 21NYHA II 13 16NYHA III 19 13NYHA IV 4 2
Data shown is mean � sd or number (%) except Apfel’s score, which ismedian (interquartile range).
BMI � body mass index; NYHA I–IV � New York Heart Associationclassification of patients with heart disease.
Figure 1. Study profile.
ANESTH ANALG CARDIOVASCULAR ANESTHESIA BURLACU ET AL. 3232005;100:321–6 PONV AFTER CABG
Coronary revascularization surgery represents amajor procedure requiring a variable period of me-chanical ventilation in the stressful environment ofan ICU. It is associated with many risk factors fornausea and vomiting, including prolonged durationof the surgical procedure (13), catecholamine adminis-tration (18), and large doses of opioids (19). It may becharacterized by perioperative hemodynamic instabilityand gut mucosal hypoperfusion, which may representother risk factors for increased incidence of PONV aftercardiac surgery (20,21). It is obviously desirable to avoidthe possible complications associated with PONV in car-diac surgery. Furthermore, the use of antiemetic drugs to
treat PONV in cardiac surgery patients can be followedby potentially harmful arrhythmogenic effects (22). Nodifference in the incidence of dysrhythmia was observedin this study.
Our observed incidence of PONV was less thanexpected from previous publications (2– 4,9 –12). Ina study of 398 patients after heart surgery with CPBGrebenik and Allman (2) reported an incidence ofpostoperative nausea of 37% and an incidence ofvomiting of 47% in the first 24 hours. Similar datawere reported by Woodward et al. (3) in 216 pa-tients, the incidence of nausea being 42% and vom-iting 34%. In a more recent study, Halvorsen et al.(4), looking at the effect of dexamethasone on sideeffects after coronary revascularization procedures,reported that 42% of patients in the control groupneeded antiemetic rescue therapy on the first post-operative day, similar to the incidence of PONVquoted in earlier articles.
In our study the overall incidence of vomiting/retching and nausea among our patients was only12.5% and 28.8%, respectively, despite avoidingprophylactic antiemetics. This could have occurredas a result of our care to avoid the use of drugs witha proemetic profile including N2O, neostigmine, oretomidate. Special care was provided to control thehemodynamic characteristics with IV fluids and va-sopressors or vasodilators aiming to maintain a nor-mal organ perfusion pressure. Although it was notpossible to avoid the use of opioids for postopera-tive analgesia, the total amount of intraoperativeand postoperative opioid use was similar in the twogroups.
It is possible that reducing the time to tracheal ex-tubation reduces the incidence of PONV. Indeed, inour own study, the incidence of vomiting/retchingand nausea was 19% and 31% among patients extu-bated more than 12 hours after surgery, comparedwith 9% and 23% among patients extubated within12 hours, respectively (not statistically significant).The presence of gastric decompression had no influ-ence on these figures. In a recent study Kogan et al.(23) reported an overall incidence of PONV duringICU stay after fast-track cardiac anesthesia of only22%. They defined fast-track anesthesia as periopera-tive anesthetic management aimed at facilitating tra-cheal extubation within 8–10 hours after surgery anddischarge from the ICU on postoperative day 1. Inter-estingly, they also used a gastric tube in all patients intheir study population. In our study, there was nosignificant difference between the two cohorts in theduration of tracheal intubation or ICU length of stay;however, the duration and the length of stay in ICUfor both groups was longer than that observed insimilar studies (2,3,23).
Table 3. Incidence of Vomiting, Nausea, and AntiemeticsUse
Gastricdecompression
(n � 52)Control(n � 52)
Nausea 4 h 10 (19.2%) 8 (15.4%)Nausea 12 h 9 (17.3%) 8 (15.4%)Nausea 24 h 5 (9.6%) 1 (1.9%)Nausea 48 h 1 (1.9%) 0Any nausea (any time) 17 (32.7%) 13 (25.0%)Vomit 4 h 3 (5.8%) 4 (7.7%)Vomit 12 h 5 (9.6%) 3 (5.8%)Vomit 24 h 2 (3.84%) 1 (1.9%)Vomit 48 h 0 0Any vomiting (any time) 7 (13.4%) 6 (11.5%)Either nausea or vomiting,
any time17 (32.7%) 13 (25.0%)
Antiemetic 4 h 7 (13.4%) 6 (11.5%)Antiemetic 12 h 8 (15.4%) 8 (15.4%)Antiemetic 24 h 5 (9.6%) 1 (1.9%)Total receiving antiemetic 20 (38.5%) 15 (28.8%)
Data shown are n (%).
Table 2. Details of Anesthesia, Operative Procedure andICU Characteristics
Gastricdecompression
(n � 52)Control(n � 52)
Anesthesia duration (min) 277 � 55 297 � 41Surgery duration (min) 228 � 49 222 � 31CPB time (min) 106 � 32 111 � 28Aortic cross-clamp time
(min)80 � 29 87 � 23
Time to Ramsay SedationScore of 2 or less (h)
8.0 � 3.7 8.4 � 4.2
Time to extubation (h) 16.3 � 4.9 17.2 � 5.4Time in ICU (h) 30.3 � 16.0 26.1 � 11.9Fentanyl intraoperative
(�g)890 � 244 829 � 305
Fentanyl postoperative(�g)
750 � 538 764 � 469
Morphine postoperative(mg)
3.4 � 1.0 4.2 � 1.7
Data shown is mean � sd.CPB � cardiopulmonary bypass; ICU � intensive care unit.
324 CARDIOVASCULAR ANESTHESIA BURLACU ET AL. ANESTH ANALGPONV AFTER CABG 2005;100:321–6
Previous studies have shown that the use of opioidsand the stress of surgery can be associated with de-creased gastric emptying in cardiac surgery assessedon Day 1 postoperatively (24). However, Wattwil et al.(25) found no association between delayed postoper-ative gastric emptying and PONV in patients under-going laparoscopic cholecystectomy, suggesting thatgastric emptying may be not a predictor of PONV. Inour study the total quantity of gastric aspirate fromthe time of insertion to the time of removal of gastrictube was only 35 � 10 mL in the gastric tube cohort.Indeed, this small quantity of gastric aspirate suggeststhat there is no delayed gastric emptying in the im-mediate postoperative period in cardiac surgery pa-tients. In correlation with the lack of statistically sig-nificant difference in the incidence of vomiting/retching and nausea between the two groups ofpatients, the above finding therefore suggests that gas-tric decompression may be of no use for this categoryof patients.
In retrospect, because our incidence of PONV aftercardiac surgery was less than that reported in theliterature, our study was effectively underpowered todetect a difference in PONV despite our prospectivepower calculation. If anything, our data suggest atrend towards a more frequent incidence of PONVwith gastric decompression. There are previous sug-gestions in the literature that the presence of the gas-tric tube may stimulate mechanoreceptors in the pha-ryngeal area followed by an increase of the afferentinput to the “vomiting” center (26). The introductionof the nasogastric tube was atraumatic in all our pa-tients. Also, the gastric tube was removed in ICU atthe same time as tracheal extubation to avoid anypharyngeal-induced stimulation of the vomiting orretching.
By choosing an observational design for this study(i.e., gastric decompression tubes were left in place onfree drainage until tracheal extubation), potential forpatient and observer bias exists. It is difficult to trulyblind a study testing the value of gastric decompres-sion tubes. We could have evaluated solely intraoper-ative use of gastric decompression by removing thetube before transfer to ICU, but because patients typ-ically remain ventilated for 6–24 hr postoperatively,we believed that such early removal might have ob-viated any benefit in terms of reducing PONV.
It is interesting that our observed incidence ofPONV was 28.8%, significantly lower than the 40%calculated according to Apfel’s score (13,14). This sug-gests that this score, validated in noncardiac surgicalprocedures, may overestimate the incidence of PONVin cardiac surgery patients.
In conclusion, in this prospective, randomized, co-hort study, gastric decompression with a nasogastric
tube left in situ until tracheal extubation did not re-duce the incidence of vomiting or retching or theincidence and severity of nausea in patients undergo-ing CABG surgery with CPB.
References1. Heffernan AM, Rowbotham DJ. Postoperative nausea and
vomiting: time for balanced antiemesis? Br J Anaesth 2000;85:675–7.
2. Grebenik CR, Allman C. Nausea and vomiting after cardiacsurgery. Br J Anaesth 1996;77:356–9.
3. Woodward DK, Sherry KM, Harrison D. Antiemetic prophy-laxis in cardiac surgery: comparison of metoclopramide andondansetron. Br J Anaesth 1999;83:933–57.
4. Halvorsen P, Raeder J, White PF, et al. The effect of dexameth-asone on side effects after coronary revascularization proce-dures. Anesth Analg 2003;96:1578–83.
5. Macario A, Weinger M, Carney S, Kim A. Which clinical anaes-thesia outcomes are important to avoid? Anesth Analg 1999;89:652–8.
6. Gan T, Sloan F, Dear G, et al. How much are patients willing topay to avoid postoperative nausea and vomiting? Anesth Analg2001;92:393–400.
7. Schumann R, Polaner DM. Massive subcutaneous emphysemaand sudden airway compromise after postoperative vomiting.Anesth Analg 1999;89:796–7.
8. Col C, Soran A, Col M. Can postoperative abdominal wounddehiscence be predicted? J Exp Clin Med 1998;23:123–7.
9. Hovorka J, Kortilla K, Erkola O. The experience of the personventilating the lung does influence postoperative nausea andvomiting. Acta Anaesthesiol Scand 1990;34:203–5.
10. Jones JE, Tabaee A, Glasgold R, Gomillion MC. Efficacy ofgastric aspiration in reducing post-tonsillectomy vomiting. ArchOtolaryngol Head Neck Surg 2001;127:980–4.
11. Hovorka J, Korttila K, Erkola O. Gastric aspiration at the end ofanaesthesia does not decrease postoperative nausea and vomit-ing. Anaesth Intensive Care 1990;18:58–61.
12. Trepanier CA, Isabel L. Perioperative gastric aspiration in-creases postoperative nausea and vomiting in outpatients. CanJ Anaesth 1993;40:325–8.
13. Apfel C, Greim CA, Haubitz I, et al. The discriminating powerof a risk score for postoperative vomiting in adults undergoingvarious types of surgery. Acta Anaesthesiol Scand 1998;42:502–9.
14. Apfel CC, Laara E, Koivuranta M, et al. A simplified risk scorefor predicting postoperative nausea and vomiting. Anesthesiol-ogy 1999;91:693–700.
15. Ramsay MAE, Savege TM, Simpson BRY, Goodwin R. Con-trolled sedation with alphaxolone/alpadolone. BMJ 1974;2:656–9.
16. Nashef SAM, Roques F, Michel P, et al. European system forcardiac operative risk evaluation. Eur J Cardiothorac Surg 1999;16:9–13.
17. Boogaerts JG, Vanacker E, Seidel L, et al. Assessment of post-operative nausea using a visual analogue score. Acta Anaesthe-siol Scand 2000;44:470–4.
18. Fredikson M, Hursti TJ, Steineck G, et al. Delayed chemotherapy-induced nausea is augmented by high levels of endogenous nor-adrenaline. Br J Cancer 1994;70:642–5.
19. Thorn SE, Wattwil M, Lindberg G, Sawe J. Systemic and centraleffects of morphine on gastro-duodenal motility. Acta Anaes-thesiol Scand 1996;40:177–86.
20. Pusch F, Berger A, Wildling E, et al. The effects of systolic bloodpressure variations on postoperative nausea and vomiting.Anesth Analg 2002;94:1652–5.
21. Gan TJ, Mythen MG. Does preoperative gut-mucosa hypoper-fusion cause postoperative nausea and vomiting? Lancet 1995;345:1123–4.
ANESTH ANALG CARDIOVASCULAR ANESTHESIA BURLACU ET AL. 3252005;100:321–6 PONV AFTER CABG

22. Miller DR. Arrhythmogenic potential of antiemetics: perspec-tive on risk-benefits. Can J Anaesth 2003;50:215–20.
23. Kogan A, Eidelman LA, Raanani E, et al. Nausea and vomitingafter fast-track cardiac anaesthesia. Br J Anaesth 2003;91:214–7.
24. Berger MM, Berger-Gryllaki M, Wiesel P, et al. Intestinal ab-sorption in patients after cardiac surgery. Crit Care Med 2000;28:2217–23.
25. Wattwil M, Thorn SE, Lovqvist A, et al. Perioperative gastricemptying is not a predictor of early postoperative nausea andvomiting in patients undergoing laparoscopic cholecystectomy.Anesth Analg 2002;95:476–9.
26. Lerman J. Surgical and patient factors involved in postoperativenausea and vomiting. Br J Anaesth 1992;69 (Suppl 1):24S–32
326 CARDIOVASCULAR ANESTHESIA BURLACU ET AL. ANESTH ANALGPONV AFTER CABG 2005;100:321–6
The Activation of Spinal N-Methyl-D-Aspartate Receptors MayContribute to Degeneration of Spinal Motor Neurons Inducedby Neuraxial Morphine After a Noninjurious Interval ofSpinal Cord IschemiaManabu Kakinohana, MD, PhD*, Osamu Kakinohana, PhD†, Jong Hun Jun, MD, PhD‡,Martin Marsala, MD†, Kenneth J. Davison, MD§, and Kazuhiro Sugahara, MD, PhD*
*Department of Anesthesiology, Faculty of Medicine, University of the Ryukyus, Okinawa, Japan; †Department ofAnesthesiology, University of California, San Diego, California; ‡Department of Anesthesiology, Hanyang UniversityCollege of Medicine, Seoul, Korea; and §Department of Anesthesiology, Massachusetts General Hospital, Boston,Massachusetts
We investigated the relationship between the degenera-tion of spinal motor neurons and activation of N-methyl-d-aspartate (NMDA) receptors after neuraxial morphinefollowing a noninjurious interval of aortic occlusion inrats. Spinal cord ischemia was induced by aortic occlusionfor 6 min with a balloon catheter. In a microdialysis study,10 �L of saline (group C; n � 8) or 30 �g of morphine(group M; n � 8) was injected intrathecally (IT) 0.5 h afterreflow, and 30 �g of morphine (group SM; n � 8) or 10 �Lof saline (group SC; n � 8) was injected IT 0.5 h after shamoperation. Microdialysis samples were collected preische-mia, before IT injection, and at 2, 4, 8, 24, and 48 h of reper-fusion (after IT injection). Second, we investigated the ef-fect of IT MK-801 (30 �g) on the histopathologic changes
in the spinal cord after morphine-induced spastic parapa-resis.After ITmorphine, thecerebrospinal fluid(CSF)glu-tamate concentration was increased in group M relative toboth baseline and group C (P � 0.05). This increase per-sisted for 8 hrs. IT MK-801 significantly reduced the num-ber of dark-stained �-motoneurons after morphine-induced spastic paraparesis compared with the salinegroup. These data indicate that IT morphine induces spas-tic paraparesis with a concomitant increase in CSF gluta-mate,which is involvedinNMDAreceptoractivation.Wesuggest that opioids may be neurotoxic in the setting ofspinal cord ischemia via NMDA receptor activation.
(Anesth Analg 2005;100:327–34)
O piates are often injected into intrathecal (IT) orepidural spaces to produce analgesia in thepostoperative period. IT morphine has been
used for pain control after thoracoabdominal aorticaneurysm surgery (1) in which spinal cord ischemiacould be a complication of aortic cross-clamping. Ina previous case report (2), we showed that spasticparaparesis was induced by 4 mg of epidural mor-phine used for postoperative pain relief after thora-coabdominal aneurysm surgery. We demonstrated
that neuraxial morphine, after a noninjurious inter-val of spinal cord ischemia in the rat, can inducetransient spastic paraparesis and degeneration ofselective �-motoneurons in spinal cord (2,3). Inaddition, Fuchigami et al. (4) demonstrated thatrepetitive administration of IT morphine, after anoninjurious interval of spinal cord ischemia in rats,gave rise to irreversible paraplegia and selective�-motoneuron death.
In the rat brain, large-dose alfentanil (5), fentanyl(6), and remifentanil (7) produce an increased met-abolic rate in the limbic system, seizures, and histo-logic damage by activation of glutamate receptors(8). Neurological deficit, as a result of neuronaldamage after reversible brain and spinal cord ische-mia, is thought to be mediated in part by excessiveexcitatory amino acid (EAA) accumulation (9). Glu-tamate is believed to be the primary EAA neuro-transmitter of the spinal cord, and direct excitotoxiceffects by glutamate are thought to be mediated
This study was supported in part by a grant-in-aid for scientificresearch (No. 14571454).
Accepted for publication July 27, 2004.Address correspondence and reprint requests to Manabu Kaki-
nohana, MD, PhD, Department of Anesthesiology, University of theRyukyus, 207 Uehara, Nishihara-cho, Okinawa, 903-0215, Japan.Address e-mail to [email protected].
DOI: 10.1213/01.ANE.0000142123.63543.A6
©2005 by the International Anesthesia Research Society0003-2999/05 Anesth Analg 2005;100:327–34 327
through excessive N-methyl-d-aspartate (NMDA) and�-amino-3-hydroxy-5-methyl-4-isoxazolepropionatereceptor activation, leading to intracellular Ca2� over-load (10).
It is unknown whether selective �-motoneurondeath, induced by neuraxial morphine after a shortperiod of spinal cord ischemia, would be associatedwith excessive release of EAAs from the spinal cord.In this study, we used the IT loop microdialysis tech-nique (11), which is sufficiently robust to permit con-tinuous or repetitive dialysate collection from the lum-bar IT space at intervals for 2 days in unanesthetizedand unrestricted rats to characterize the time-dependent release of glutamate following IT adminis-tration of morphine after a noninjurious interval ofspinal ischemia. In addition, we investigated the effectof MK-801, a NMDA receptor antagonist, on the de-generation of spinal motor neurons induced byneuraxial morphine after a noninjurious interval ofspinal cord ischemia in rats.
MethodsAll studies were performed in accordance with a pro-tocol approved by the Animal Subjects Committee ofUniversity of the Ryukyus. To place the IT and micro-dialysis catheters, we used a technique similar to thatpreviously described for the placement of IT catheters(11,12). Male Sprague-Dawley rats (320–380 g) wereanesthetized in an acrylic box with 5% isoflurane in anoxygen and room air mixture (1:1). After anestheticinduction, rats were maintained with 2.5% isofluranedelivered by mask, and the back of the head and neckwas shaved. The animals were then placed in a ste-reotaxic headholder with the head flexed forward. Amidline incision was made on the back of the neck.The muscle was freed at the point of attachment to theskull and retracted with a flat elevator, thus exposingthe cisternal membrane. The membrane was openedwith a stab blade and modestly retracted with a smalldural hook. The loop portion of the catheter was in-serted through the cisternal opening and passed 9 cmcaudal into the IT space. This placed the dialysis mem-brane at the L3 to L5 spinal segments. After that, an ITcatheter was placed for IT drug injection. To accom-plish this, an 8.5-cm length of polyethylene (PE)-10tubing that previously had been stretched to reduce itsdiameter was inserted after the loop catheter was po-sitioned. The wounds were closed with sutures, andanesthesia was discontinued. Unless otherwise stated,all animals were allowed to recover for a minimum of5 days before experimentation. Rats that showed mo-tor weakness or signs of paresis upon recovery fromanesthesia were euthanized.
On the fifth postimplantation day, rats were anes-thetized in an acrylic box with 5% isoflurane in an
oxygen and room air mixture (1:1), and anesthesia wasmaintained with 1.5%–2.5% isoflurane delivered bymask. Rats were prepared for the induction of revers-ible spinal cord ischemia by a previously describedtechnique (13). To control paravertebral muscle tem-perature (38.0°C–38.3°C) during anesthesia, a thermo-couple was placed into those muscles. Warmed water(38.5°C) was perfused at 100 mL/min through a heatexchanger constructed from metal tubing, and theheat exchanger was placed on the back in a subcuta-neous tunnel (T4 to S2). Subsequently, a 2F Fogartycatheter was placed into the descending thoracic aortathrough the left femoral artery so that the tip of theballoon catheter reached the level of the left subcla-vian artery. To control proximal arterial blood pres-sure at 40 mm Hg during aortic occlusion, the leftcarotid artery was cannulated with a 22G Teflon cath-eter, and blood was allowed to flow into an externalreservoir during aortic occlusion. Immediately afterthe completion of arterial cannulation, all animals re-ceived 200 U of heparin injected into the tail artery. Toinduce spinal cord ischemia, the balloon was inflatedwith 0.05 mL of saline. At 6 min after the induction oftransient spinal cord ischemia, the balloon was de-flated, and blood was reinfused over 60 s. All catheterswere then removed, the wounds were sutured, anes-thesia was discontinued, and all animals were allowedto recover. In sham-operated animals, the experimen-tal procedure described above was performed; how-ever, the balloon catheter was not inflated, and hypo-tension was not induced by withdrawal of blood.
Study 1: Morphine-Induced Paraparesis andGlutamate Release from the Spinal Cord
The animals were assigned to one of the followingfour groups according to the injection administered30 min after recovery from anesthesia (n � 8 pergroup): group C (control), IT saline injection (10 �L);group M, IT injection of morphine (30 �g); group SM,sham-operated and IT injection of morphine (30 �g);and group SC, sham-operated and IT injection of sa-line (10 �L).
Study 2: The Effect of MK-801 onHistopathologic Changes in the Spinal CordAfter IT Morphine Injection
The animals were assigned to one of the followingtwo groups according to IT injection 1 h after ITmorphine (30 �g) at 30 min of reperfusion (n � 6 pergroup): control, IT saline injection (10 �L) 1 h afterIT morphine; or MK-801, IT injection of MK-801 (30�g) 1 h after IT morphine. Histopathologic analysisof the spinal cord was performed 48 h after spinalcord ischemia.
328 CARDIOVASCULAR ANESTHESIA KAKINOHANA ET AL. ANESTH ANALGMORPHINE AND ISCHEMIC SPINAL CORD 2005;100:327–34
During reperfusion, the recovery of motor functionwas quantified by assessment of ambulation and plac-ing and stepping responses (2,14). Ambulation (walk-ing with the lower extremities) was graded as follows:0, normal; 1, toes flat under the body when walking,but ataxia present; 2, knuckle walking; 3, movement oflower extremities but unable to knuckle walk; or 4, nomovement, drags lower extremities. The placing/stepping reflex was assessed by dragging the dorsumof the hindpaw over the edge of a surface. This nor-mally evokes a coordinating lifting and placing re-sponse (e.g., stepping), which was graded as follows:0, normal; 1, weak; or 2, no stepping. A motor deficitindex (MDI) was calculated for each rat at each timeinterval. The final MDI was the sum of the scores(ambulation plus placing/stepping reflex).
To initiate dialysis, one of the externalized PE-10 con-nections was attached to a 60-cm length of PE-50 tubing(inflow), and the other arm was attached to a 90-cmlength of PE-10 (outflow). A syringe pump (HarvardCompact Infusion Pump, Model 975, with a 10-mL plas-tic syringe) was connected, and the dialysis tubing wasperfused with artificial cerebrospinal fluid (ACSF) con-taining 151.1 mM Na�, 2.6 mM K�, 0.9 mM Mg2�, 1.3mM Ca2�, 122.7 mM Cl�, 21 mM HCO3
�, 2.5 mMHPO4
�, and 3.5 mM dextrose. The ACSF was bubbledby CO2, with a final pH of 7.4. After a 30-min washout,the microdialysis samples were collected as follows: twobaseline samples (30 min each) before ischemia, followedby samples collected after 30 min of reperfusion (beforeIT injection) and at 2, 4, 8, 24, and 48 h of reperfusion.
Dialysate samples were collected on ice and frozen at�70°C until analysis for glutamate. Analysis was accom-plished by the phenyl isothiocyanate derivatization pro-cedure with a Waters high-performance liquid chro-matograph with a reverse-phase C18 column (3.9 �300 mm; 4-�m particle) and an ultraviolet detector. Theglutamate content was measured from single 25-�L ali-quots. Methionine sulfone was added to the glutamatesample and used as an internal standard. Sensitivity was5–10 pmol per injection. Amino acid peak heights wereinitially normalized to the methionine sulfone peak andthen quantified on the basis of a linear relationship be-tween the peak height and amounts of correspondingstandards. All values are expressed as picomoles per25-�L tube. External standards were run daily.
At the end of the survival period, rats were killedwith pentobarbital (100 mg/kg intraperitoneally) andphenytoin (25 mg/kg intraperitoneally). The rats werethen transcardially perfused with 100 mL of heparin-ized saline followed by 150 mL of 4% paraformalde-hyde in phosphate buffer (pH 7.4). Twenty-four hourslater, the spinal cords were removed and postfixed inthe same fixative for 2–14 days. The L3, L4, and L5spinal nerves and the L3, L4, and L5 spinal segmentswere then dissected and cryoprotected in 30% sucrosesolution. Frozen transverse sections (20–30 �m) were
prepared and stained by the Kluver-Barrera or Nisslmethod. For systematic analysis, 10 representative sec-tions taken from segments L3 to L5 (a total of 30sections from each spinal cord) were coded for eachanimal and then subjected to a systematic examina-tion. The number of normal-appearing and dark-stained �-motoneurons was counted by the observerwithout knowledge of the treatment group (MK).
Drugs were purchased as follows: morphine sulfatefrom Dainihon Pharm (Tokyo, Japan) and MK-801from Research Biochemicals (Natick, MA). Drugswere dissolved in saline for injections. Doses for spinaldelivery were delivered in a volume of 10 �L. Each ITinjection was followed by an injection of 10 �L ofsaline to flush the catheter.
Results of MDI are expressed as the median. CSFglutamate concentrations are expressed as mean � sd.Statistical analyses of physiologic data were performedby one-way analysis of variance (ANOVA) for multiplecomparisons followed by the Dunnett post hoc test. Foranalysis of neurological outcome in the individualgroups, significant overall values were obtained by theFriedman test followed by Wilcoxon’s signed rank test.Specific comparisons between experimental groups atindividual time points after reflow were made with theKruskal-Wallis test followed by the Tukey-Kramer test.Comparison of CSF glutamate levels was made by one-way repeated-measures ANOVA followed by the Dun-nett test, and the difference among groups at each timewas examined by one-way ANOVA followed by Fish-er’s least squares difference test. The Pearson’s correla-tion coefficients (r) between the area under the curve forglutamate (AUCGLU) and the percentage of dark-stained�-motoneurons were determined. A P value of �0.05was considered significant. Statistical analyses were per-formed with SPSS 8.0.1 for Windows (SPSS Institute,Chicago, IL).
ResultsStudy 1
During the pre-, intra-, and postischemic periods,there were no significant differences in any variableamong the groups except for the intraischemic distalblood pressure in the sham-operation groups (groupsSM and SC) (Table 1). In group S (IT saline), all ani-mals had modest and transient motor weakness (me-dian MDI of 3) 30 min after reperfusion (before ITinjection), followed by gradual recovery over 24–48 hof reflow. During the initial 8 h of reperfusion, themotor deficit was manifested as the presence of ataxia(but with a preserved ability to walk) and partialweakness in the placing/stepping reflex. At 48 h, nosignificant motor deficit was seen, and all animals hadcomplete recovery. In group M, IT injection of mor-phine (30 �g) resulted in a gradual development of
ANESTH ANALG CARDIOVASCULAR ANESTHESIA KAKINOHANA ET AL. 3292005;100:327–34 MORPHINE AND ISCHEMIC SPINAL CORD
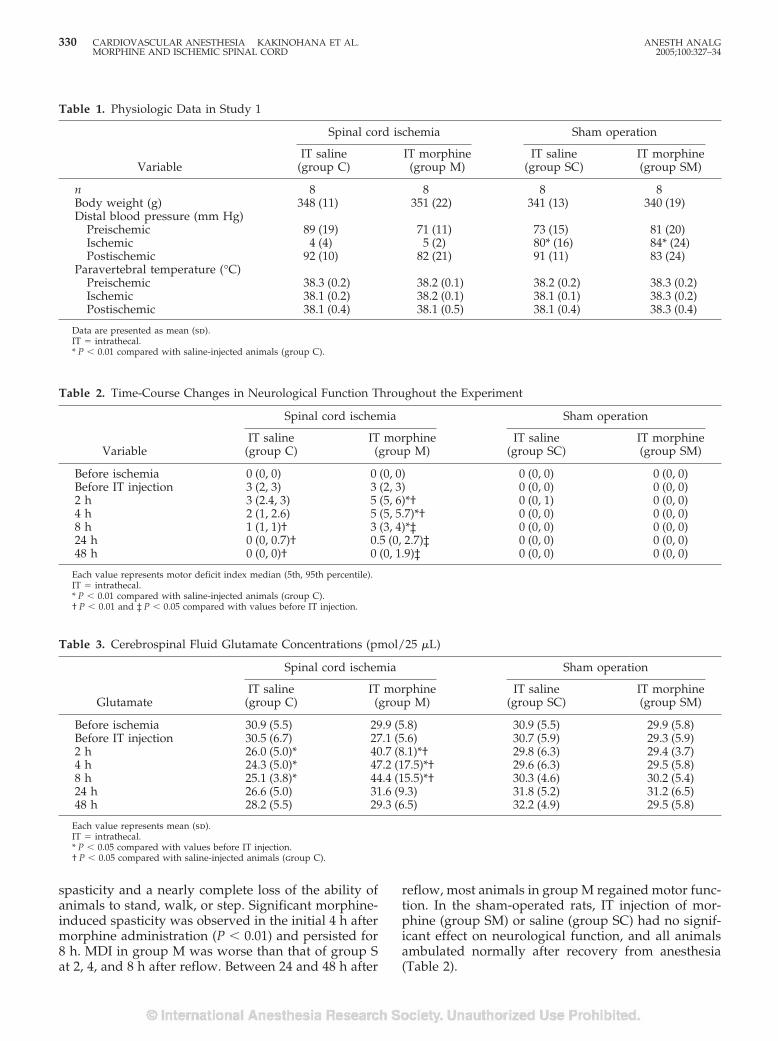
spasticity and a nearly complete loss of the ability ofanimals to stand, walk, or step. Significant morphine-induced spasticity was observed in the initial 4 h aftermorphine administration (P � 0.01) and persisted for8 h. MDI in group M was worse than that of group Sat 2, 4, and 8 h after reflow. Between 24 and 48 h after
reflow, most animals in group M regained motor func-tion. In the sham-operated rats, IT injection of mor-phine (group SM) or saline (group SC) had no signif-icant effect on neurological function, and all animalsambulated normally after recovery from anesthesia(Table 2).
Table 1. Physiologic Data in Study 1
Variable
Spinal cord ischemia Sham operation
IT saline(group C)
IT morphine(group M)
IT saline(group SC)
IT morphine(group SM)
n 8 8 8 8Body weight (g) 348 (11) 351 (22) 341 (13) 340 (19)Distal blood pressure (mm Hg)
Preischemic 89 (19) 71 (11) 73 (15) 81 (20)Ischemic 4 (4) 5 (2) 80* (16) 84* (24)Postischemic 92 (10) 82 (21) 91 (11) 83 (24)
Paravertebral temperature (°C)Preischemic 38.3 (0.2) 38.2 (0.1) 38.2 (0.2) 38.3 (0.2)Ischemic 38.1 (0.2) 38.2 (0.1) 38.1 (0.1) 38.3 (0.2)Postischemic 38.1 (0.4) 38.1 (0.5) 38.1 (0.4) 38.3 (0.4)
Data are presented as mean (sd).IT � intrathecal.* P � 0.01 compared with saline-injected animals (group C).
Table 2. Time-Course Changes in Neurological Function Throughout the Experiment
Variable
Spinal cord ischemia Sham operation
IT saline(group C)
IT morphine(group M)
IT saline(group SC)
IT morphine(group SM)
Before ischemia 0 (0, 0) 0 (0, 0) 0 (0, 0) 0 (0, 0)Before IT injection 3 (2, 3) 3 (2, 3) 0 (0, 0) 0 (0, 0)2 h 3 (2.4, 3) 5 (5, 6)*† 0 (0, 1) 0 (0, 0)4 h 2 (1, 2.6) 5 (5, 5.7)*† 0 (0, 0) 0 (0, 0)8 h 1 (1, 1)† 3 (3, 4)*‡ 0 (0, 0) 0 (0, 0)24 h 0 (0, 0.7)† 0.5 (0, 2.7)‡ 0 (0, 0) 0 (0, 0)48 h 0 (0, 0)† 0 (0, 1.9)‡ 0 (0, 0) 0 (0, 0)
Each value represents motor deficit index median (5th, 95th percentile).IT � intrathecal.* P � 0.01 compared with saline-injected animals (group C).† P � 0.01 and ‡ P � 0.05 compared with values before IT injection.
Table 3. Cerebrospinal Fluid Glutamate Concentrations (pmol/25 �L)
Glutamate
Spinal cord ischemia Sham operation
IT saline(group C)
IT morphine(group M)
IT saline(group SC)
IT morphine(group SM)
Before ischemia 30.9 (5.5) 29.9 (5.8) 30.9 (5.5) 29.9 (5.8)Before IT injection 30.5 (6.7) 27.1 (5.6) 30.7 (5.9) 29.3 (5.9)2 h 26.0 (5.0)* 40.7 (8.1)*† 29.8 (6.3) 29.4 (3.7)4 h 24.3 (5.0)* 47.2 (17.5)*† 29.6 (6.3) 29.5 (5.8)8 h 25.1 (3.8)* 44.4 (15.5)*† 30.3 (4.6) 30.2 (5.4)24 h 26.6 (5.0) 31.6 (9.3) 31.8 (5.2) 31.2 (6.5)48 h 28.2 (5.5) 29.3 (6.5) 32.2 (4.9) 29.5 (5.8)
Each value represents mean (sd).IT � intrathecal.* P � 0.05 compared with values before IT injection.† P � 0.05 compared with saline-injected animals (group C).
330 CARDIOVASCULAR ANESTHESIA KAKINOHANA ET AL. ANESTH ANALGMORPHINE AND ISCHEMIC SPINAL CORD 2005;100:327–34
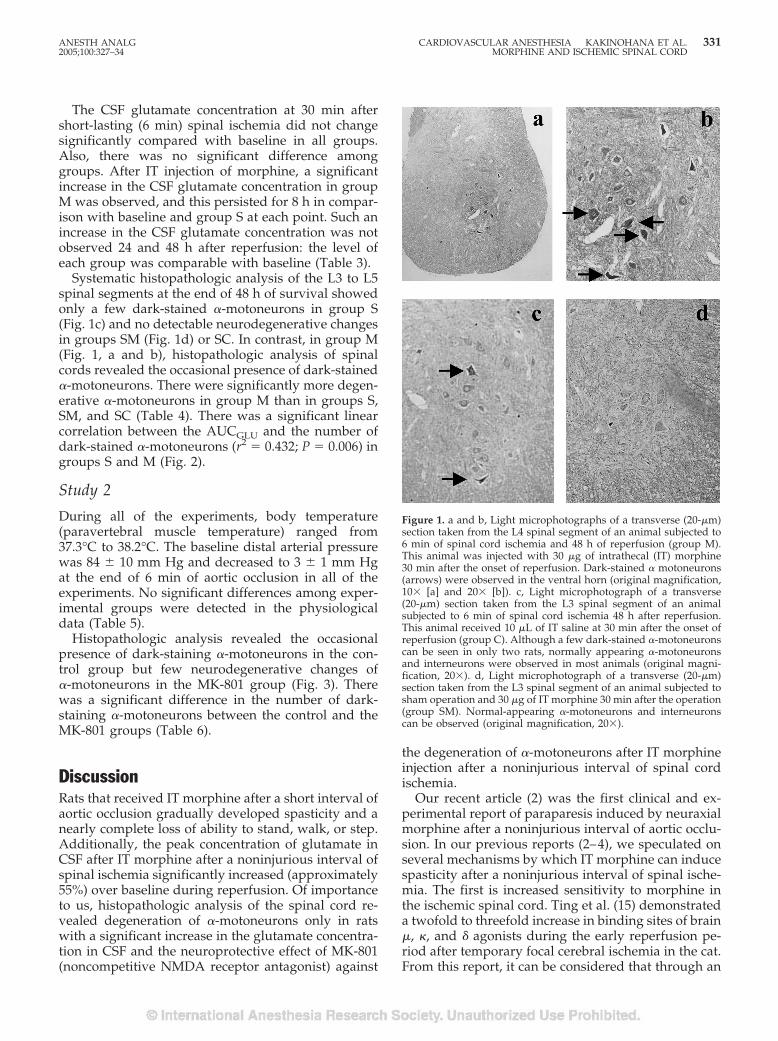
The CSF glutamate concentration at 30 min aftershort-lasting (6 min) spinal ischemia did not changesignificantly compared with baseline in all groups.Also, there was no significant difference amonggroups. After IT injection of morphine, a significantincrease in the CSF glutamate concentration in groupM was observed, and this persisted for 8 h in compar-ison with baseline and group S at each point. Such anincrease in the CSF glutamate concentration was notobserved 24 and 48 h after reperfusion: the level ofeach group was comparable with baseline (Table 3).
Systematic histopathologic analysis of the L3 to L5spinal segments at the end of 48 h of survival showedonly a few dark-stained �-motoneurons in group S(Fig. 1c) and no detectable neurodegenerative changesin groups SM (Fig. 1d) or SC. In contrast, in group M(Fig. 1, a and b), histopathologic analysis of spinalcords revealed the occasional presence of dark-stained�-motoneurons. There were significantly more degen-erative �-motoneurons in group M than in groups S,SM, and SC (Table 4). There was a significant linearcorrelation between the AUCGLU and the number ofdark-stained �-motoneurons (r2 � 0.432; P � 0.006) ingroups S and M (Fig. 2).
Study 2
During all of the experiments, body temperature(paravertebral muscle temperature) ranged from37.3°C to 38.2°C. The baseline distal arterial pressurewas 84 � 10 mm Hg and decreased to 3 � 1 mm Hgat the end of 6 min of aortic occlusion in all of theexperiments. No significant differences among exper-imental groups were detected in the physiologicaldata (Table 5).
Histopathologic analysis revealed the occasionalpresence of dark-staining �-motoneurons in the con-trol group but few neurodegenerative changes of�-motoneurons in the MK-801 group (Fig. 3). Therewas a significant difference in the number of dark-staining �-motoneurons between the control and theMK-801 groups (Table 6).
DiscussionRats that received IT morphine after a short interval ofaortic occlusion gradually developed spasticity and anearly complete loss of ability to stand, walk, or step.Additionally, the peak concentration of glutamate inCSF after IT morphine after a noninjurious interval ofspinal ischemia significantly increased (approximately55%) over baseline during reperfusion. Of importanceto us, histopathologic analysis of the spinal cord re-vealed degeneration of �-motoneurons only in ratswith a significant increase in the glutamate concentra-tion in CSF and the neuroprotective effect of MK-801(noncompetitive NMDA receptor antagonist) against
the degeneration of �-motoneurons after IT morphineinjection after a noninjurious interval of spinal cordischemia.
Our recent article (2) was the first clinical and ex-perimental report of paraparesis induced by neuraxialmorphine after a noninjurious interval of aortic occlu-sion. In our previous reports (2–4), we speculated onseveral mechanisms by which IT morphine can inducespasticity after a noninjurious interval of spinal ische-mia. The first is increased sensitivity to morphine inthe ischemic spinal cord. Ting et al. (15) demonstrateda twofold to threefold increase in binding sites of brain�, �, and � agonists during the early reperfusion pe-riod after temporary focal cerebral ischemia in the cat.From this report, it can be considered that through an
Figure 1. a and b, Light microphotographs of a transverse (20-�m)section taken from the L4 spinal segment of an animal subjected to6 min of spinal cord ischemia and 48 h of reperfusion (group M).This animal was injected with 30 �g of intrathecal (IT) morphine30 min after the onset of reperfusion. Dark-stained � motoneurons(arrows) were observed in the ventral horn (original magnification,10� [a] and 20� [b]). c, Light microphotograph of a transverse(20-�m) section taken from the L3 spinal segment of an animalsubjected to 6 min of spinal cord ischemia 48 h after reperfusion.This animal received 10 �L of IT saline at 30 min after the onset ofreperfusion (group C). Although a few dark-stained �-motoneuronscan be seen in only two rats, normally appearing �-motoneuronsand interneurons were observed in most animals (original magni-fication, 20�). d, Light microphotograph of a transverse (20-�m)section taken from the L3 spinal segment of an animal subjected tosham operation and 30 �g of IT morphine 30 min after the operation(group SM). Normal-appearing �-motoneurons and interneuronscan be observed (original magnification, 20�).
ANESTH ANALG CARDIOVASCULAR ANESTHESIA KAKINOHANA ET AL. 3312005;100:327–34 MORPHINE AND ISCHEMIC SPINAL CORD
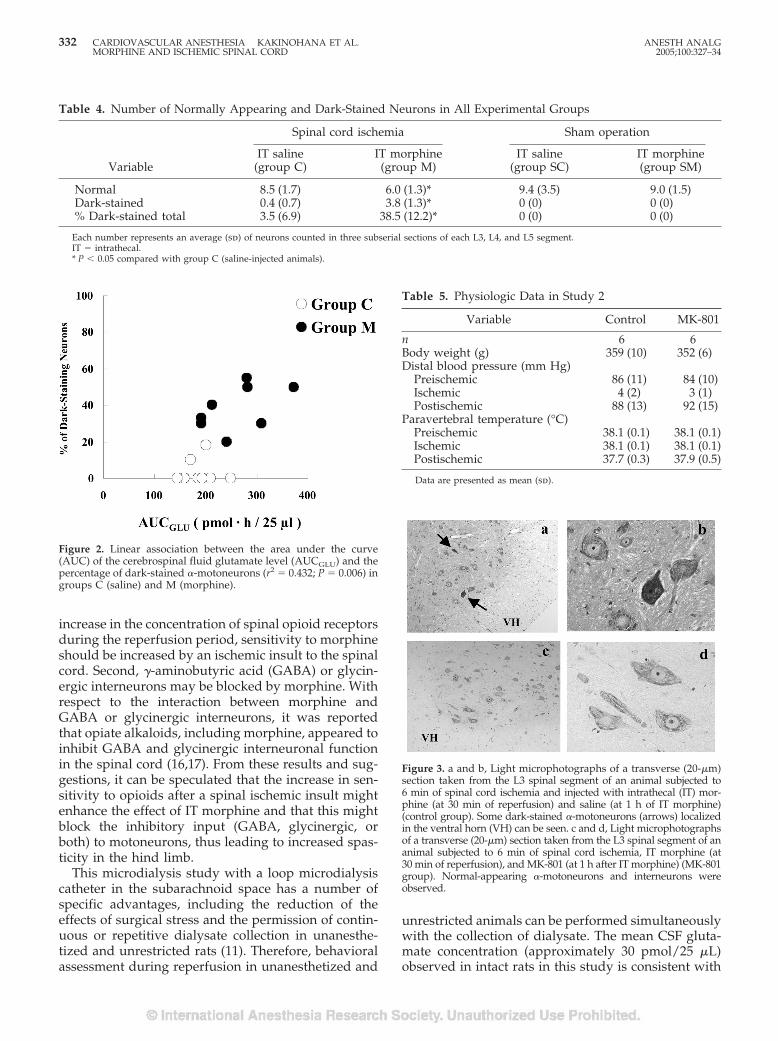
increase in the concentration of spinal opioid receptorsduring the reperfusion period, sensitivity to morphineshould be increased by an ischemic insult to the spinalcord. Second, �-aminobutyric acid (GABA) or glycin-ergic interneurons may be blocked by morphine. Withrespect to the interaction between morphine andGABA or glycinergic interneurons, it was reportedthat opiate alkaloids, including morphine, appeared toinhibit GABA and glycinergic interneuronal functionin the spinal cord (16,17). From these results and sug-gestions, it can be speculated that the increase in sen-sitivity to opioids after a spinal ischemic insult mightenhance the effect of IT morphine and that this mightblock the inhibitory input (GABA, glycinergic, orboth) to motoneurons, thus leading to increased spas-ticity in the hind limb.
This microdialysis study with a loop microdialysiscatheter in the subarachnoid space has a number ofspecific advantages, including the reduction of theeffects of surgical stress and the permission of contin-uous or repetitive dialysate collection in unanesthe-tized and unrestricted rats (11). Therefore, behavioralassessment during reperfusion in unanesthetized and
unrestricted animals can be performed simultaneouslywith the collection of dialysate. The mean CSF gluta-mate concentration (approximately 30 pmol/25 �L)observed in intact rats in this study is consistent with
Figure 2. Linear association between the area under the curve(AUC) of the cerebrospinal fluid glutamate level (AUCGLU) and thepercentage of dark-stained �-motoneurons (r2 � 0.432; P � 0.006) ingroups C (saline) and M (morphine).
Figure 3. a and b, Light microphotographs of a transverse (20-�m)section taken from the L3 spinal segment of an animal subjected to6 min of spinal cord ischemia and injected with intrathecal (IT) mor-phine (at 30 min of reperfusion) and saline (at 1 h of IT morphine)(control group). Some dark-stained �-motoneurons (arrows) localizedin the ventral horn (VH) can be seen. c and d, Light microphotographsof a transverse (20-�m) section taken from the L3 spinal segment of ananimal subjected to 6 min of spinal cord ischemia, IT morphine (at30 min of reperfusion), and MK-801 (at 1 h after IT morphine) (MK-801group). Normal-appearing �-motoneurons and interneurons wereobserved.
Table 4. Number of Normally Appearing and Dark-Stained Neurons in All Experimental Groups
Variable
Spinal cord ischemia Sham operation
IT saline(group C)
IT morphine(group M)
IT saline(group SC)
IT morphine(group SM)
Normal 8.5 (1.7) 6.0 (1.3)* 9.4 (3.5) 9.0 (1.5)Dark-stained 0.4 (0.7) 3.8 (1.3)* 0 (0) 0 (0)% Dark-stained total 3.5 (6.9) 38.5 (12.2)* 0 (0) 0 (0)
Each number represents an average (sd) of neurons counted in three subserial sections of each L3, L4, and L5 segment.IT � intrathecal.* P � 0.05 compared with group C (saline-injected animals).
Table 5. Physiologic Data in Study 2
Variable Control MK-801
n 6 6Body weight (g) 359 (10) 352 (6)Distal blood pressure (mm Hg)
Preischemic 86 (11) 84 (10)Ischemic 4 (2) 3 (1)Postischemic 88 (13) 92 (15)
Paravertebral temperature (°C)Preischemic 38.1 (0.1) 38.1 (0.1)Ischemic 38.1 (0.1) 38.1 (0.1)Postischemic 37.7 (0.3) 37.9 (0.5)
Data are presented as mean (sd).
332 CARDIOVASCULAR ANESTHESIA KAKINOHANA ET AL. ANESTH ANALGMORPHINE AND ISCHEMIC SPINAL CORD 2005;100:327–34
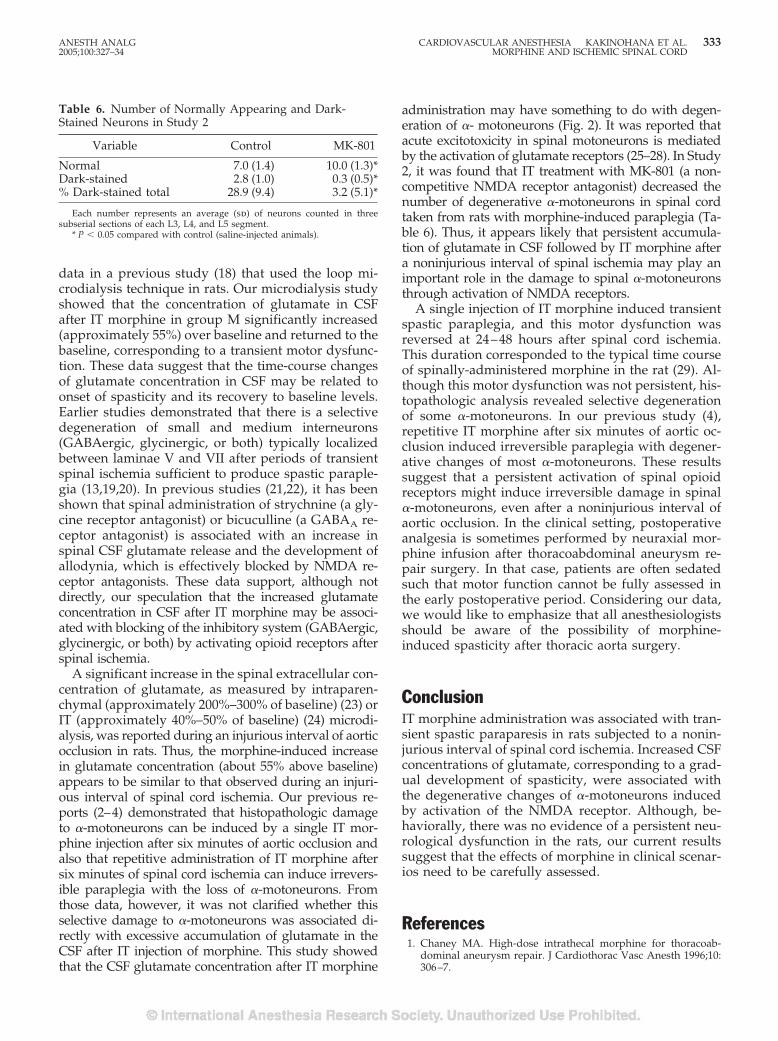
data in a previous study (18) that used the loop mi-crodialysis technique in rats. Our microdialysis studyshowed that the concentration of glutamate in CSFafter IT morphine in group M significantly increased(approximately 55%) over baseline and returned to thebaseline, corresponding to a transient motor dysfunc-tion. These data suggest that the time-course changesof glutamate concentration in CSF may be related toonset of spasticity and its recovery to baseline levels.Earlier studies demonstrated that there is a selectivedegeneration of small and medium interneurons(GABAergic, glycinergic, or both) typically localizedbetween laminae V and VII after periods of transientspinal ischemia sufficient to produce spastic paraple-gia (13,19,20). In previous studies (21,22), it has beenshown that spinal administration of strychnine (a gly-cine receptor antagonist) or bicuculline (a GABAA re-ceptor antagonist) is associated with an increase inspinal CSF glutamate release and the development ofallodynia, which is effectively blocked by NMDA re-ceptor antagonists. These data support, although notdirectly, our speculation that the increased glutamateconcentration in CSF after IT morphine may be associ-ated with blocking of the inhibitory system (GABAergic,glycinergic, or both) by activating opioid receptors afterspinal ischemia.
A significant increase in the spinal extracellular con-centration of glutamate, as measured by intraparen-chymal (approximately 200%–300% of baseline) (23) orIT (approximately 40%–50% of baseline) (24) microdi-alysis, was reported during an injurious interval of aorticocclusion in rats. Thus, the morphine-induced increasein glutamate concentration (about 55% above baseline)appears to be similar to that observed during an injuri-ous interval of spinal cord ischemia. Our previous re-ports (2–4) demonstrated that histopathologic damageto �-motoneurons can be induced by a single IT mor-phine injection after six minutes of aortic occlusion andalso that repetitive administration of IT morphine aftersix minutes of spinal cord ischemia can induce irrevers-ible paraplegia with the loss of �-motoneurons. Fromthose data, however, it was not clarified whether thisselective damage to �-motoneurons was associated di-rectly with excessive accumulation of glutamate in theCSF after IT injection of morphine. This study showedthat the CSF glutamate concentration after IT morphine
administration may have something to do with degen-eration of �- motoneurons (Fig. 2). It was reported thatacute excitotoxicity in spinal motoneurons is mediatedby the activation of glutamate receptors (25–28). In Study2, it was found that IT treatment with MK-801 (a non-competitive NMDA receptor antagonist) decreased thenumber of degenerative �-motoneurons in spinal cordtaken from rats with morphine-induced paraplegia (Ta-ble 6). Thus, it appears likely that persistent accumula-tion of glutamate in CSF followed by IT morphine aftera noninjurious interval of spinal ischemia may play animportant role in the damage to spinal �-motoneuronsthrough activation of NMDA receptors.
A single injection of IT morphine induced transientspastic paraplegia, and this motor dysfunction wasreversed at 24–48 hours after spinal cord ischemia.This duration corresponded to the typical time courseof spinally-administered morphine in the rat (29). Al-though this motor dysfunction was not persistent, his-topathologic analysis revealed selective degenerationof some �-motoneurons. In our previous study (4),repetitive IT morphine after six minutes of aortic oc-clusion induced irreversible paraplegia with degener-ative changes of most �-motoneurons. These resultssuggest that a persistent activation of spinal opioidreceptors might induce irreversible damage in spinal�-motoneurons, even after a noninjurious interval ofaortic occlusion. In the clinical setting, postoperativeanalgesia is sometimes performed by neuraxial mor-phine infusion after thoracoabdominal aneurysm re-pair surgery. In that case, patients are often sedatedsuch that motor function cannot be fully assessed inthe early postoperative period. Considering our data,we would like to emphasize that all anesthesiologistsshould be aware of the possibility of morphine-induced spasticity after thoracic aorta surgery.
ConclusionIT morphine administration was associated with tran-sient spastic paraparesis in rats subjected to a nonin-jurious interval of spinal cord ischemia. Increased CSFconcentrations of glutamate, corresponding to a grad-ual development of spasticity, were associated withthe degenerative changes of �-motoneurons inducedby activation of the NMDA receptor. Although, be-haviorally, there was no evidence of a persistent neu-rological dysfunction in the rats, our current resultssuggest that the effects of morphine in clinical scenar-ios need to be carefully assessed.
References1. Chaney MA. High-dose intrathecal morphine for thoracoab-
dominal aneurysm repair. J Cardiothorac Vasc Anesth 1996;10:306–7.
Table 6. Number of Normally Appearing and Dark-Stained Neurons in Study 2
Variable Control MK-801
Normal 7.0 (1.4) 10.0 (1.3)*Dark-stained 2.8 (1.0) 0.3 (0.5)*% Dark-stained total 28.9 (9.4) 3.2 (5.1)*
Each number represents an average (sd) of neurons counted in threesubserial sections of each L3, L4, and L5 segment.
* P � 0.05 compared with control (saline-injected animals).
ANESTH ANALG CARDIOVASCULAR ANESTHESIA KAKINOHANA ET AL. 3332005;100:327–34 MORPHINE AND ISCHEMIC SPINAL CORD
2. Kakinohana M, Marsala M, Carter C, et al. Neuraxial morphinemay trigger transient spasticity after a non-injurious interval ofspinal cord ischemia: a clinical and experimental study. Anes-thesiology 2003;98:862–70.
3. Kakinohana M, Fuchigami T, Nakamura S, et al. Intrathecaladministration of morphine, but not small dose, induced spasticparaparesis after a noninjurious interval of aortic occlusion inrats. Anesth Analg 2003;96:769–75.
4. Fuchigami T, Taira Y, Kakinohana M, et al. Repetitive intrathe-cal administration of morphine induces irreversible paraplegiaafter non-injurious interval of spinal cord ischemia in the rat.Biologia 1999;54(Suppl 6):51–60.
5. Kofke WA, Garman RH, Tom WC, et al. Alfentanil-inducedhypermetabolism, seizure, and histopathology in rat brain.Anesth Analg 1992;75:953–64.
6. Kofke WA, Garman RH, Stiller RL, et al. Opioid neurotoxicity:fentanyl dose response effects in rats. Anesth Analg 1996;83:1298–306.
7. Kofke WA, Attaallah AF, Kuwabara H, et al. The neuropatho-logic effects in rats and neurometabolic effect in humans oflarge-dose remifentanil. Anesth Analg 2002;94:1229–36.
8. Kofke WA, Garman RH, Garman R, et al. Opioid neurotoxicity:role of neurotransmitter system. Neurol Res 2000;22:733–7.
9. Siejo BK. Mechanisms of ischemic brain damage. Crit Care Med1988;16:954–63.
10. Randall RD, Thayer SA. Glutamate-induced calcium transienttriggers delayed calcium overload and neurotoxicity in rat hip-pocampal neurons. J Neurosci 1992;12:1882–95.
11. Marsala M. Loop dialysis catheter: a technology for chronic spinaldialysis in a freely moving rat. Methods Mol Med 2004;99:99–108.
12. Yaksh TL, Rudy T. Chronic catheterization of the spinal sub-arachnoid space. Physiol Behav 1976;17:1031–6.
13. Taira Y, Marsala M. Effect of proximal arterial perfusion pres-sure on function, spinal cord blood flow, and histopathologicchanges after increasing intervals of aortic occlusion in the rat.Stroke 1996;27:1850–8.
14. Kakinohana M, Taira Y, Marsala M. The effect of graded post-ischemic spinal cord hypothermia on neurological outcome andhistopathology after transient spinal ischemia in rat. Anesthesi-ology 1999;90:789–98.
15. Ting P, Xu S, Krumins S. Endogenous opioid system activityfollowing temporary focal cerebral ischemia. Acta NeurochirSuppl 1994;60:253–6.
16. Curtis DR, Duggan AW. The depression of spinal inhibition bymorphine. Agents Actions 1969;1:14–9.
17. Werz MA, Macdonald RL. Opiate alkaloids antagonized postsyn-aptic glycine and GABA responses: correlation with convulsantaction. Brain Res 1982;236:107–19.
18. Sasara T, Cizkova D, Mestril R, et al. Spinal heat shock protein(70) expression: effect of spinal ischemia, hyperthermia (42°C)/hypothermia (27°C), NMDA receptor activation and potassiumevoked depolarization on the induction. Neurochem Int 2004;44:53–64.
19. Marsala J, Sulla I, Santa M, et al. Mapping of the canine lum-bosacral spinal cord neurons by Nauta method at the end of theearly phase of paraplegia induced by ischemia and reperfusion.Neuroscience 1991;45:479–94.
20. Homma S, Suzuki T, Murayama S. Amino acid and substance Pcontents in spinal cord of cats with experimental hind-limbrigidity produced by occlusion of spinal cord supply. J Neuro-chem 1979;32:691–8.
21. Yaksh TL. Behavioral and autonomic correlates of the tactileevoked allodynia produced by spinal glycine inhibition: effectsof modulatory receptor systems and excitatory amino acid an-tagonists. Pain 1989;37:111–23.
22. Yamamoto T, Yaksh TL. Effects of intrathecal strychnine andbicuculline on nerve compression-induced thermal hyperalge-sia and selective antagonism by MK-801. Pain 1993;54:79–84.
23. Marsala M, Sorkin LS, Yaksh TL. Transient spinal cord ischemiain rat: characterization of spinal cord blood flow, extracellularamino acid release, and concurrent histopathological damage.J Cereb Blood Flow Metab 1994;14:604–14.
24. Ishikawa T, Marsala M. Hypothermia prevents biphasic gluta-mate release and corresponding neuronal degeneration aftertransient spinal cord ischemia in the rat. Cell Mol Neurobiol1999;19:199–208.
25. Urushitani M, Nakamizo T, Inoue R, et al. N-Methyl-d-aspartatereceptor-mediated mitochondrial Ca2� overload in acute exci-totoxic motor neuron death: a mechanism distinct from chronicneurotoxicity after Ca2� influx. J Neurosci Res 2001;63:377–87.
26. Urushitani M, Shimohama S, Kihara T, et al. Mechanism ofselective motor neuronal death after exposure of spinal cord toglutamate: involvement of glutamate-induced nitric oxide inmotor neuron toxicity and nonmotor neuron protection. AnnNeurol 1998;44:796–807.
27. Garriedo SG, Yin HZ, Weiss JH. Motor neurons are selectivelyvulnerable to AMPA/kainate receptor-mediated injury in vitro.J Neurosci 1996;16:4069–79.
28. Van Damme P, Van Den Bosch L, Van Houtte E, et al. GluR2-dependent properties of AMPA receptors determine the selec-tive vulnerability of motor neurons to excitotoxicity. J Neuro-physiol 2002;88:1279–87.
29. Yaksh TL, Rudy TA. Analgesia mediated by a direct spinalaction of narcotics. Science 1976;192:1357–8.
334 CARDIOVASCULAR ANESTHESIA KAKINOHANA ET AL. ANESTH ANALGMORPHINE AND ISCHEMIC SPINAL CORD 2005;100:327–34
The Effects of Xenon or Nitrous Oxide Supplementation onSystemic Oxygenation and Pulmonary Perfusion DuringOne-Lung Ventilation in Pigs
Konrad Schwarzkopf, MD*, Torsten Schreiber, MD*, Elke Gaser, MD*,Niels-Peter Preussler, MD*, Lars Hueter, MD*, Harald Schubert, DVM†, Helga Rek*,and Waheedullah Karzai, MD‡
*Department of Anesthesiology and Intensive Care Medicine and †Institute for Experimental Animals, University of Jena;and ‡Department of Anesthesiology and Intensive Care Medicine, Zentralklinik Bad Berka, Germany
During experimental one-lung ventilation (OLV), thetype of anesthesia may alter systemic hemodynamics,lung perfusion, and oxygenation. We studied whether xe-non (Xe) or nitrous oxide (N2O) added to propofol anes-thesia would affect oxygenation, lung perfusion, and sys-temic and pulmonary hemodynamics during OLV in apig model. Nine pigs were anesthetized, tracheally intu-bated, and mechanically ventilated. After placement of ar-terial and pulmonary artery catheters, a left-sided double-lumen tube was placed via tracheotomy. IV anesthesiawith propofol was supplemented in random order withN2O/O2 60:40 or Xe/O2 60:40 or N2/O2 60:40. Allmeasurements were made after stabilization at each con-centration. Differential lung perfusion was measured
with colored microspheres. Oxygenation (Pao2: 90 � 17,95 � 20, and 94 � 20 mm Hg for N2/O2, N2O/O2, andXe/O2) and left lung perfusion (16%�5%, 14%�6%, and18.8% for N2/O2, N2O/O2, and Xe/O2) during OLV didnot differ among the 3 groups. However, mean arterialblood pressure (78 � 25, 62 � 23, and 66 � 23 mm Hg forN2/O2, N2O/O2, and Xe/O2) and mixed venous satura-tion (55% � 12%, 48% � 12%, and 50% � 12% for N2/O2,N2O/O2, and Xe/O2) were reduced during N2O/O2 ascompared with the control group (N2/O2). Supplementa-tion of IV anesthesia with Xe or N2O does not impair oxy-genation nor alter lung perfusion during experimentalOLV.
(Anesth Analg 2005;100:335–9)
T he effects of anesthetics on oxygenation duringlung collapse or one-lung ventilation (OLV) de-pends on direct and indirect effects of anesthetics
on the perfusion of the nonventilated lung. During OLV,hypoxic pulmonary vasoconstriction (HPV) divertsblood flow from the nonventilated to the ventilated lung,thereby reducing perfusion of the nonventilated lung,decreasing shunt fraction, and ameliorating the decreasein arterial oxygen (O2) tension (Pao2) (1). Direct effects ofanesthetics on hypoxic lung perfusion can be shown in invitro studies where typically volatile anesthetics directlydepress HPV in a dose-dependent manner (2–4). Indi-rect affects of anesthetics on HPV and lung perfusion can
be appreciated in in vivo models, where decreases incardiac output (CO) and decreases in mixed venousoxygenation (Svo2) through volatile anesthetics maystrengthen HPV and decrease perfusion in collapsedlung regions (5–7).
An important question related to the use of anestheticsduring OLV is, therefore, how direct and indirect effectsinteract and affect oxygenation and lung perfusion. Theproperties of the inert gas xenon (Xe) as an almost idealinhaled anesthetic are well known (8,9). Improvementsin the development of fully closed, low-flow anestheticbreathing circuits may reduce the costs of Xe anesthesiaso that Xe may become a potential anesthetic, especiallyin hemodynamically compromised patients who maybenefit from the systemic hemodynamic stability pro-vided by Xe anesthesia. Nitrous oxide (N2O) and Xe maybe used to supplement volatile or IV anesthesia duringlung collapse or OLV requiring higher fractions of oxy-gen (10). The effect of Xe on HPV and on lung perfusionduring regional lung collapse are not well known. In aclinically relevant animal model, we studied how Xe and
Presented, in part, at the 10th Annual Meeting of the EuropeanSociety of Anaesthesiologists, Nice, France, 2002.
Accepted for publication July 27, 2004.Address correspondence and reprint requests to Konrad Schwar-
zkopf, MD, Department of Anesthesiology and Intensive Care Med-icine, University Hospital, 07740 Jena, Germany. Address e-mail [email protected].
DOI: 10.1213/01.ANE.0000142118.84049.80
©2005 by the International Anesthesia Research Society0003-2999/05 Anesth Analg 2005;100:335–9 335
N2O as supplemental anesthetics affect systemic hemo-dynamics, perfusion of the nonventilated lung, and ox-ygenation during OLV.
MethodsThe study design was approved by the local AnimalProtection Committee and by the governmental AnimalCare Office (Landesverwaltungsamt Thueringen, Ger-many). The study was conducted in animals specificallybred for scientific use and were parasite free (Germanland race, bred by Charles River Laboratories, Sulzfeld,Germany). After overnight fasting with free access towater, 9 female pigs (25–35 kg) were premedicated withketamine (500 mg IM) to allow placement of an IV line,pulse oximetry, and continuous electrocardiogram mon-itoring. General anesthesia was induced with propofol(2–3 mg/kg IV) and rocuronium (0.9–1.2 mg/kg IV).Then the trachea was orally intubated with a 6.5–8.0 IDendotracheal tube. Mechanical ventilation was adjustedduring preparation to maintain arterial CO2 tension(Paco2) at approximately 34–40 mm Hg. Anesthesia wasmaintained with a 1:1 mixture of N2O and O2 and con-tinuous infusions of propofol (20–35 mg · kg�1 · h�1),remifentanil (10–20 �g · kg�1 · h�1), and pancuronium(0.1–0.2 mg · kg�1 · h�1). Using the sterile technique, afemoral arterial catheter was advanced 20–25 cm to bepositioned in the abdominal aorta via a 5F percutaneoussheath introducer set for hemodynamic monitoring andarterial blood gas sampling. A flow-directed thermodi-lution pulmonary artery catheter was passed through a8.5F introducer through the right external jugular vein.The tip of the pulmonary artery catheter was positionedjust beyond the pulmonary valve to ensure placement inthe main pulmonary artery (i.e., the catheter was notadvanced to the wedge-position). The catheter was con-nected to a CO device (M-COPSv; Datex, Helsinki, Fin-land). CO measurements were performed in triplicatewith 10 mL of cold saline (1°C–5°C) and averaged foreach time point. A central venous catheter was placed inthe right internal jugular vein. Subsequently, a tracheot-omy was performed, and the orotracheal tube was re-placed under fiberoptic control by a left-sided, speciallydesigned 39 Ch double-lumen tube (DLT). This DLTensured that the right upper bronchus of the pigs couldalso be ventilated or accessed through the tracheal limb.After DLT placement, the animals were positioned in theleft decubitus position, and a 8.5 ID endotracheal tubewas passed through a right-sided mini-thoracotomy intothe right pleural space. Ventilation to the right lung wasthen discontinued, and lung collapse was verified byfiberoptic control of the right pleural space via the tube.
During the study, correct DLT placement was veri-fied by continuous dual capnography. Fiberopticbronchoscopy and thoracoscopy were repeated at theend of each of the three study phases, followed by a
recruitment maneuver of the ventilated lung. Recruit-ment was performed manually with a pressure ofapproximately 50 cm H2O and duration of 20 s.
After preparation, remifentanil was discontinued,and IV anesthesia was continued with propofol(25 mg · kg�1 · h�1) without changing the dosagethroughout the experiment. The lungs of the pigs wereventilated by a closed-system ventilator modified toprovide Xe application. We ventilated the pigs in apressure-control mode at 26–30 cm H2O driving pres-sure and 5 cm H2O end-expiratory pressure. Ventila-tion pressures were kept constant during the threephases of the experiment for each pig. Inspired andend-tidal N2O, O2, end-tidal CO2, and Xe were ana-lyzed using the machine-integrated monitor of thePhysioflex™ ventilator (Draeger, Luebeck, Germany).In a crossover design, the pigs were ventilated withN2O/O2 (60:40), Xe/O2 (60:40), and N2/O2 (60:40) inrandom order. Equilibration times were at least 40 minduring each phase. After recording stable cardiorespi-ratory variables for at least 20 min (no more than 10%variation), respiratory and hemodynamic variableswere noted (mean arterial blood pressure [MAP],heart rate, end-tidal CO2 concentration, and O2 satu-ration via pulse oximetry [all monitoring by Datex,Helsinki, Finland]). Arterial blood and mixed venousblood were analyzed immediately after blood sam-pling by using an automated blood gas analyzer. Atthe end of each time period, colored microspheres (seebelow) were administered over 2 min through a cen-tral venous line.
The pigs were kept in the left lateral decubitusposition throughout the experiment. Body tempera-ture (38.0°C � 1°C) was maintained by covering thepigs with a Warmtouch blanket and was continuouslymonitored by the thermistor of the thermodilutioncatheter. The pigs received 15 mL/kg of body-warmbalanced electrolyte solutions during the inductionand preparation, which was continued at a rate of10 mL · kg�1 · h�1 during the study period.
Application and methodological consideration ofmicrosphere measurements in pigs have been pre-sented and discussed in detail elsewhere (11). Briefly,for measurements of regional pulmonary perfusion,1.2 � 106 colored microspheres (Dye-Trak, TritonTechnology, San Diego, CA) with a nominal diameterof 15 �m and suspended in Tween 80 (Fluka, Neu-Ulm, Germany) were mixed for 3 min by sonification(Transsonic T 310, Bender and Hobein, Singen, Ger-many) and injected slowly over 120 s via the centralvenous catheter into the superior vena cava. The in-jection was followed by flushing the catheter with10 mL of saline. Microsphere injections were repeatedat the end of the three experimental phases usingdifferent colored microspheres (white, blue, eosin, or-ange, and yellow) in random sequence. At the end ofthe experiment, the pigs were euthanized and the
336 CARDIOVASCULAR ANESTHESIA SCHWARZKOPF ET AL. ANESTH ANALGEFFECTS OF XENON DURING ONE-LUNG VENTILATION 2005;100:335–9
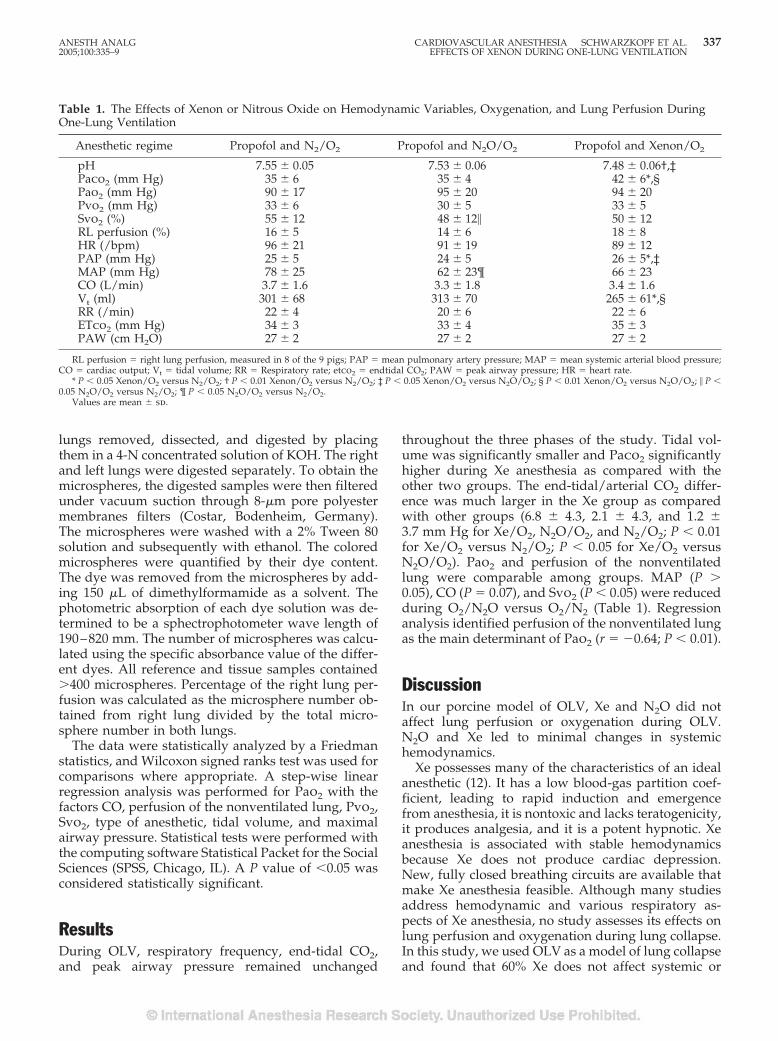
lungs removed, dissected, and digested by placingthem in a 4-N concentrated solution of KOH. The rightand left lungs were digested separately. To obtain themicrospheres, the digested samples were then filteredunder vacuum suction through 8-�m pore polyestermembranes filters (Costar, Bodenheim, Germany).The microspheres were washed with a 2% Tween 80solution and subsequently with ethanol. The coloredmicrospheres were quantified by their dye content.The dye was removed from the microspheres by add-ing 150 �L of dimethylformamide as a solvent. Thephotometric absorption of each dye solution was de-termined to be a sphectrophotometer wave length of190–820 mm. The number of microspheres was calcu-lated using the specific absorbance value of the differ-ent dyes. All reference and tissue samples contained�400 microspheres. Percentage of the right lung per-fusion was calculated as the microsphere number ob-tained from right lung divided by the total micro-sphere number in both lungs.
The data were statistically analyzed by a Friedmanstatistics, and Wilcoxon signed ranks test was used forcomparisons where appropriate. A step-wise linearregression analysis was performed for Pao2 with thefactors CO, perfusion of the nonventilated lung, Pvo2,Svo2, type of anesthetic, tidal volume, and maximalairway pressure. Statistical tests were performed withthe computing software Statistical Packet for the SocialSciences (SPSS, Chicago, IL). A P value of �0.05 wasconsidered statistically significant.
ResultsDuring OLV, respiratory frequency, end-tidal CO2,and peak airway pressure remained unchanged
throughout the three phases of the study. Tidal vol-ume was significantly smaller and Paco2 significantlyhigher during Xe anesthesia as compared with theother two groups. The end-tidal/arterial CO2 differ-ence was much larger in the Xe group as comparedwith other groups (6.8 � 4.3, 2.1 � 4.3, and 1.2 �3.7 mm Hg for Xe/O2, N2O/O2, and N2/O2; P � 0.01for Xe/O2 versus N2/O2; P � 0.05 for Xe/O2 versusN2O/O2). Pao2 and perfusion of the nonventilatedlung were comparable among groups. MAP (P �0.05), CO (P � 0.07), and Svo2 (P � 0.05) were reducedduring O2/N2O versus O2/N2 (Table 1). Regressionanalysis identified perfusion of the nonventilated lungas the main determinant of Pao2 (r � �0.64; P � 0.01).
DiscussionIn our porcine model of OLV, Xe and N2O did notaffect lung perfusion or oxygenation during OLV.N2O and Xe led to minimal changes in systemichemodynamics.
Xe possesses many of the characteristics of an idealanesthetic (12). It has a low blood-gas partition coef-ficient, leading to rapid induction and emergencefrom anesthesia, it is nontoxic and lacks teratogenicity,it produces analgesia, and it is a potent hypnotic. Xeanesthesia is associated with stable hemodynamicsbecause Xe does not produce cardiac depression.New, fully closed breathing circuits are available thatmake Xe anesthesia feasible. Although many studiesaddress hemodynamic and various respiratory as-pects of Xe anesthesia, no study assesses its effects onlung perfusion and oxygenation during lung collapse.In this study, we used OLV as a model of lung collapseand found that 60% Xe does not affect systemic or
Table 1. The Effects of Xenon or Nitrous Oxide on Hemodynamic Variables, Oxygenation, and Lung Perfusion DuringOne-Lung Ventilation
Anesthetic regime Propofol and N2/O2 Propofol and N2O/O2 Propofol and Xenon/O2
pH 7.55 � 0.05 7.53 � 0.06 7.48 � 0.06†,‡Paco2 (mm Hg) 35 � 6 35 � 4 42 � 6*,§Pao2 (mm Hg) 90 � 17 95 � 20 94 � 20Pvo2 (mm Hg) 33 � 6 30 � 5 33 � 5Svo2 (%) 55 � 12 48 � 12� 50 � 12RL perfusion (%) 16 � 5 14 � 6 18 � 8HR (/bpm) 96 � 21 91 � 19 89 � 12PAP (mm Hg) 25 � 5 24 � 5 26 � 5*,‡MAP (mm Hg) 78 � 25 62 � 23¶ 66 � 23CO (L/min) 3.7 � 1.6 3.3 � 1.8 3.4 � 1.6Vt (ml) 301 � 68 313 � 70 265 � 61*,§RR (/min) 22 � 4 20 � 6 22 � 6ETco2 (mm Hg) 34 � 3 33 � 4 35 � 3PAW (cm H2O) 27 � 2 27 � 2 27 � 2
RL perfusion � right lung perfusion, measured in 8 of the 9 pigs; PAP � mean pulmonary artery pressure; MAP � mean systemic arterial blood pressure;CO � cardiac output; Vt � tidal volume; RR � Respiratory rate; etco2 � endtidal CO2; PAW � peak airway pressure; HR � heart rate.
* P � 0.05 Xenon/O2 versus N2/O2; † P � 0.01 Xenon/O2 versus N2/O2; ‡ P � 0.05 Xenon/O2 versus N2O/O2; § P � 0.01 Xenon/O2 versus N2O/O2; � P �0.05 N2O/O2 versus N2/O2; ¶ P � 0.05 N2O/O2 versus N2/O2.
Values are mean � sd.
ANESTH ANALG CARDIOVASCULAR ANESTHESIA SCHWARZKOPF ET AL. 3372005;100:335–9 EFFECTS OF XENON DURING ONE-LUNG VENTILATION
pulmonary hemodynamics, does not affect perfusionof the collapsed lung, and does not affect oxygenation.Although our study was not designed to report onHPV, the fact that systemic and pulmonary hemody-namics and lung perfusion did not differ between thecontrol and Xe phases suggests that HPV was notaffected.
Xe has a higher density and viscosity than N2O ornitrogen (13,14). Resistance to airflow is greater inXe/O2 mixtures as compared with N2O/O2 or N2/O2.In one study in pigs, the airway resistance duringXe/O2 (70:30) was 4.0 � 1.7 cm H2O · s�1 · L�1 whencompared with N2/O2 (2.6 � 1.1; P � 0.01) andN2O/O2 (2.9 � 0.8; P � 0.01) (13). Because of this,using volume-controlled ventilation would have ledto an increase in airway pressure, which would haveaffected lung perfusion. Because our main objectivewas to study lung perfusion and oxygenation, wechose to use pressure-controlled ventilation thatwould ensure comparable airway pressures amongthe three groups. For this reason, tidal volumes aresignificantly smaller and CO2 significantly higher, al-beit within the normal range during Xe anesthesia, ascompared with the other two groups. There was norelationship between tidal volume or Paco2 and oxy-genation in the regression analysis. This suggests thatthe reduction in tidal volume did not affect the find-ings of our study.
How N2O would affect lung perfusion and oxygen-ation during OLV has not been studied adequately,and early studies suggested an inhibition of HPVthrough N2O (15,16). We now show that, comparedwith N2, N2O decreases CO, Svo2, and MAP but doesnot affect Pao2 or perfusion of the nonventilated lung.The reduction in hemodynamics may be a result ofcardiodepressive effects of N2O or a consequence of adeepened level of anesthesia (17). The small but insig-nificant (P � 0.17) decrease in perfusion of the non-ventilated lung may be the result of strengthened HPVthrough reduced CO and Svo2 (5,18).
One problem with Xe and N2O during OLV is theirhigh minimum alveolar anesthetic concentration(MAC) value that makes it necessary to administer atleast 50 vol% to achieve a reasonable anesthetic effect.The MAC of Xe in the pig is approximately 119%(103%–135%), whereas the MAC of N2O is approxi-mately 277% (19,20). Despite this difference in MAC,we used an inspiratory concentration of 60% of theseanesthetics during OLV. Using equipotent levels of Xeand N2O would have lead to different levels of frac-tion of inspire O2, which would have then affectedlung perfusion and oxygenation during OLV. Further-more, our main objective was to study the affects ofthese gases on lung perfusion and oxygenation, andwe felt it was appropriate to use the highest possibleconcentration compatible with OLV.
This study has a number of limitations. The design ofour study does not allow separation of direct and indi-rect effects of the anesthetics on lung perfusion or oxy-genation. The effects of Xe or N2O on HPV cannot bediscerned from our results. Furthermore, those who ad-vocate using pure oxygen during OLV may question theneed and rationale of supplementing anesthesia withN2O or Xe. A number of studies show that the risk ofhypoxemia is reduced while using pure O2 during OLV(21). However, using pure O2 during anesthesia may beassociated with postoperative atelectasis (22). Further-more, the risk of hypoxemia while using 50% O2 may beunfounded. We have shown that using 50% O2 is safeduring OLV (23). In conclusion, 60% Xe or N2O did notaffect oxygenation nor lung perfusion when adminis-tered during propofol anesthesia.
Xenon was generously supplied by Messer Griesheim GmbH, Duis-burg, Germany.
References1. Benumof JL. One-lung ventilation and hypoxic pulmonary
vasoconstriction: implications for anesthetic management.Anesth Analg 1985;64:821–33.
2. Ishibe Y, Gui X, Uno H, et al. Effect os sevoflurane on hypoxicpulmonary vasoconstriction in isolated rabbit lungs. Anesthesi-ology 1993;79:1348–53.
3. Loer SA, Scheeren TW, Tarnow J. Desflurane inhibits pulmo-nary hypoxic vasoconstriction in isolated rabbit lungs. Anesthe-siology 1995;83:552–6.
4. Marshall C, Lindgren L, Marshall BE. Effects of halothane, en-flurane, and isoflurane on hypoxic pulmonary vasoconstrictionin rat lungs in vitro. Anesthesiology 1984;60:304–8.
5. Eisenkraft JB. Effects of anaesthetics on pulmonary circulation.Br J Anaesth 1990;65:63–78.
6. Karzai W, Haberstroh J, Priebe HJ. The effects of increasingconcentrations of desflurane on systemic oxygenation duringone-lung ventilation in pigs. Anesth Analg 1999;89:215–7.
7. Lesitsky MA, Davis S, Murray PA. Preservation of hypoxicpulmonary vasoconstriction during sevoflurane and desfluraneanesthesia compared to the conscious state in chronically instru-mented dogs. Anesthesiology 1998;89:1501–8.
8. Lachmann B, Armbruster S, Schairer W, et al. Safety and efficacyof xenon in routine use as an inhalational anesthetic. Lancet1990;335:1413–5.
9. Rossaint R, Reyle-Hahn M, Schulte am Esch J, et al. Multicenterrandomized comparison of the efficacy and safety of xenon andisoflurane in patients undergoing elective surgery. Anesthesiol-ogy 2003;98:6–13.
10. Hecker KE, Reyle-Hahn M, Baumert JH, et al. Minimum alveo-lar anesthetic concentration of isoflurane with different xenonconcentrations in swine. Anesth Analg 2003;96:119–24.
11. Walter B, Bauer R, Gaser E, Zwiener U. Validation of the mul-tiple colored microsphere technique for regional blood flowmeasurements in newborn piglets. Basic Res Cardiol 1997;92:191–200.
12. Goto T, Nakata Y, Morita S. Will xenon be a stranger or a friend:the cost, benefit, and future of xenon anesthesia. Anesthesiology2003;98:1–2.
13. Calzia E, Stahl W, Handschuh T, et al. Respiratory mechanismduring xenon anesthesia in pigs: comparison with nitrous oxide.Anesthesiology 1999;91:1378–86.
338 CARDIOVASCULAR ANESTHESIA SCHWARZKOPF ET AL. ANESTH ANALGEFFECTS OF XENON DURING ONE-LUNG VENTILATION 2005;100:335–9
14. Zhang P, Ohara A, Mashimo T, et al. Pulmonary resistance indogs: a comparison of xenon with nitrous oxide. Can J Anaesth1995;42:547–53.
15. Hurtig JB, Tait AR, Loh L, Sykes MK. Reduction of hypoxicpulmonary vasoconstriction by nitrous oxide administration inthe isolated perfused cat lung. Can Anaesth Soc J 1977;24:540–9.
16. Benumof JL, Wahrenbrock EA. Local effects of anesthetics onregional hypoxic pulmonary vasoconstriction. Anesthesiology1975;43:525–32.
17. Pagel PS, Kampine JP, Schmelling WT, Warltier DC. Effects ofnitrous oxide on myocardial contractility as evaluated by thepreload recruitable stroke work relationship in chronically in-strumented dogs. Anesthesiology 1990;73:1148–57.
18. Domino KB, Wetstein L, Glasser SA, et al. Influence of mixedvenous oxygen tension (PvO2) on blood flow to atelectatic lung.Anesthesiology 1983;59:428–34.
19. Hecker KE, Horn N, Baumert JH, et al. Minimum alveolarconcentration (MAC) of xenon in intubated swine. Br J Anaesth2004;92:421–4.
20. Weiskopf RB, Bogetz MS. Minimum alveolar concentrations(MAC) of halothane and nitrous oxide in swine. Anesth Analg1984;63:529–32.
21. Torda TA, McCulloch CH, O’Brian HD, et al. Pulmonary venousadmixture during one-lung anesthesia: the effect of inhaledoxygen tension and respiration rate. Anaesthesia 1974;29:272–9.
22. Rothen HU, Sporre B, Englberg G, et al. Influence of gas com-position on recurrence of atelectasis after a reexpansion maneu-ver during general anesthesia. Anesthesiology 1995;82:832–42.
23. Schwarzkopf K, Klein U, Schreiber T, et al. Oxygenation duringone-lung ventilation: the effects of inhaled nitric oxide andincreasing levels of inspired fraction of oxygen. Anesth Analg2001;92:842–7.
ANESTH ANALG CARDIOVASCULAR ANESTHESIA SCHWARZKOPF ET AL. 3392005;100:335–9 EFFECTS OF XENON DURING ONE-LUNG VENTILATION
The Effects of Intraabdominally Insufflated Carbon Dioxideon Hepatic Blood Flow During Laparoscopic SurgeryAssessed by Transesophageal EchocardiographyRainer Meierhenrich, MD, Albrecht Gauss, MD, Peter Vandenesch, MD,Michael Georgieff, MD, Bertram Poch, MD*, and Wolfram Schutz, MD
Departments of Anesthesiology and *General Surgery, University of Ulm, Germany
Conflicting results have been published about the ef-fects of carbon dioxide (CO2) pneumoperitoneum onsplanchnic and liver perfusion. Several experimentalstudies described a pressure-related reduction in he-patic blood flow, whereas other investigators reportedan increase as long as the intraabdominal pressure(IAP) remained less than 16 mm Hg. Our goal in thepresent study was to investigate the effects of insuf-flated CO2 on hepatic blood flow during laparoscopicsurgery in healthy adults. Blood flow in the right andmiddle hepatic veins was assessed in 24 patients under-going laparoscopic surgery by use of transesophagealDoppler echocardiography. Hepatic venous blood flowwas recorded before and after 5, 10, 20, 30, and 40 min ofpneumoperitoneum, as well as 1 and 5 min after defla-tion. Twelve patients undergoing conventional herniarepair served as the control group. The induction ofpneumoperitoneum produced a significant increase in
blood flow of the right and middle hepatic veins. Fiveminutes after insufflation of CO2 the median right he-patic blood flow index increased from 196 mL/min/m2
(95% confidence interval (CI), 140–261 mL/min/m2) to392 mL/min/m2 (CI, 263–551 mL/min/m2) (P � 0.05)and persisted during maintenance of pneumoperito-neum. In the middle hepatic vein the blood flow indexincreased from 105 mL/min/m2 (CI, 71–136 mL/min/m2) to 159 mL/min/m2 (CI, 103–236 mL/min/m2)20 min after insufflation of CO2. After deflation bloodflow returned to baseline values in both hepatic veins.Conversely, in the control group hepatic blood flow re-mained unchanged over the entire study period. Weconclude that induction of CO2 pneumoperitoneumwith an IAP of 12 mm Hg is associated with an increasein hepatic perfusion in healthy adults.
(Anesth Analg 2005;100:340–7)
T here has been a considerable increase in laparo-scopic surgery during the last decade. It is pre-dicted that in the next few years, laparoscopic
techniques will be used in 50%–60% of all intraab-dominal procedures (1). The induction of a pneumo-peritoneum is necessary for most laparoscopic proce-dures. In general, pneumoperitoneum is created byinsufflation of carbon dioxide (CO2) into the perito-neal space. A number of investigators have demon-strated significant alterations in the cardiovascularsystem after peritoneal insufflation of CO2 (2–4).
There is still controversy regarding the effects ofpneumoperitoneum on splanchnic and hepatic perfu-sion. Several animal studies have demonstrated that
insufflation of any gas may cause marked reduction insplanchnic and liver perfusion and may even induceintestinal ischemia associated with oxygen free radicalproduction and bacterial translocation (5–9). Further-more, approximately 50% of patients undergoinglaparoscopic cholecystectomy react with a slight in-crease in liver enzymes and it has been speculated thatthis increase is attributable to impaired liver perfusion(10,11). Thus, intermittent deflation or even gas-freeabdominal wall shift has been recommended in pa-tients with compromised liver function or in criticallyill patients (9). Conversely, Blobner et al. (12) havedemonstrated in a pig model, that insufflation of CO2with intraabdominal pressure (IAP) levels less than16 mm Hg induces an increase in splanchnic perfu-sion. The increase in splanchnic perfusion was ex-plained by the possible local vasodilative effects ofCO2 on splanchnic vessels.
Currently very limited data on the effects of intra-abdominally insufflated CO2 on splanchnic and he-patic perfusion in humans are available. The objective
Accepted for publication August 13, 2004.Address correspondence and reprint requests to Dr. Rainer
Meierhenrich, Department of Anesthesiology, University of Ulm,Steinhovelstr. 9, 89075 Ulm, Germany. Address e-mail [email protected].
DOI: 10.1213/01.ANE.0000143566.60213.0A
©2005 by the International Anesthesia Research Society340 Anesth Analg 2005;100:340–7 0003-2999/05
of the present study was to investigate the effects ofinsufflated CO2 on hepatic venous blood flow duringlaparoscopic surgery.
MethodsEighteen consecutive patients undergoing laparo-scopic cholecystectomy and 15 patients undergoinglaparoscopic inguinal hernia repair were prospec-tively enrolled in this study. A group of 12 patientsundergoing conventional hernia repair served as acontrol group. Exclusion criteria were atrial fibrilla-tion or any other known cardiovascular disease aswell as diseases of the esophagus or stomach. Patientswith atrial fibrillation were excluded because bloodflow measurements were performed over two cardiaccycles requiring a constant RR-interval. The study wasapproved by the ethics committee of the UniversityUlm. Written informed consent was obtained from allpatients before inclusion in the study.
All patients received oral premedication with clo-razepate dipotassium (Tranxilium®) (20 mg) in theevening and 1 h before induction of general anesthe-sia. In all patients standard clinical monitoring wasapplied, including continuous electrocardiogram(ECG), noninvasive oscillometric blood pressure,pulse oximetry, continuous airway pressure, and end-tidal CO2 partial pressure. Anesthesia was inducedfollowing a standardized regime of target controlledinfusion of propofol (initial target plasma concentra-tion, 3–4 �g/mL), continuous infusion of remifentanil(0.25–0.30 �g · kg�1 · min�1), and a bolus of mivacu-rium (0.25 mg/kg) (13). As routinely performed in ourclinic, propofol was delivered via a commerciallyavailable syringe pump (Graseby 3500®; Graseby,Watford, UK), incorporating the Diprifusor® moduleto deliver propofol by target controlled infusion. Afterlaryngoscopy and tracheal intubation total IV anesthe-sia was maintained with target controlled infusion ofpropofol (target plasma concentration, 2–3 �g/mL),continuous infusion of remifentanil (0.10–0.25�g · kg�1 · min�1), and mivacurium (4–6 �g/kg/min). Inspired oxygen fraction was kept between 0.30and 0.35 without use of nitrous oxide. All patientswere ventilated on a pressure controlled mode with apositive end-expiratory pressure (PEEP) of 5 cm H2Oand a respiratory rate of 8–10 breaths/min. End-tidalCO2 (ETco2) was kept constant between 35 and 40 mmHg by adjusting respiratory rate and inspiratory pres-sure levels.
Blood flow of the right and middle hepatic vein wasassessed by use of multiplane transesophageal echo-cardiography (TEE). After induction of general anes-thesia a 5.0/3.7 MHz multiplane transesophagealprobe (Omniplane I, Hewlett-Packard Inc., Andover,MA) was introduced. The probe was connected to a
Hewlett-Packard Sonos 5500 echocardiograph. For vi-sualization of the hepatic veins the tip of the probewas advanced into the antrum of the stomach andflexed anteriorly. We (14) described in detail how tovisualize the right and middle hepatic veins by mul-tiplane TEE and how to acquire Doppler sonographycurves. At the different times the diameter and theDoppler signal of the right and middle hepatic veinwere obtained and stored on a magneto-optical disk.The Doppler signal was attained by pulsed waveDoppler technique (PW mode). The sample volumewas placed in the center of the vessel at exactly thelocation that was used for measuring the diameter.Correction of the angle between the Doppler beamand the flow axis was performed for each Dopplermeasurement. In all measurements the angle betweenflow axis and Doppler beam was below 60 degrees.Both the vessel diameter and the Doppler signal wereobtained at end-expiration. To verify the end of expi-ration an external breathing circuit pressure gauge(Fa. Draeger, Lubeck, Germany) was connected to theechocardiograph to visualize the airway pressure onthe screen. Blood flow in the right and middle hepaticvein was calculated using the following formula:
Blood flow � k � VTI � � � r2 � HR
where VTI � time velocity integral, � r2 � cross-sectional area of the vessel, HR � heart rate, and k �0.7) (15,16). The VTI is the area under the Dopplercurve over one cardiac cycle and represents the dis-tance the blood travels during one cardiac cycle. Thecorrection factor k is derived from an experimentalstudy in pigs and takes into account that the bloodflow is not flat but has a parabolic velocity profile (17).
Blood flow index of the right and middle hepaticveins was calculated by dividing the blood flow by thebody surface area.
Echocardiographic measurements were analyzedoff-line using the HP Sonos 5500 ultrasound systemsoftware. HR was derived from the ECG on the echo-cardiogram. Hepatic vein diameters were measuredaccording to the leading edge to leading edge method.The VTI was determined by manual tracing of theouter shape of the Doppler curve and calculated bythe integrated software of the echocardiograph. Twocardiac cycles were evaluated and averaged. AllDoppler curves were evaluated by the same non-blinded observer (WS).
Measurements of the blood flow in the right andmiddle hepatic veins were performed at baseline(Tbase) and 5, 10, 20, 30, 40 min after insufflation ofCO2 (T5, T10, T20, T30, T40) as well as 1 and 5 minafter deflation (TE, TE5). At the same time, the hemo-dynamic variables (HR, mean arterial blood pressure)
ANESTH ANALG CARDIOVASCULAR ANESTHESIA MEIERHENRICH ET AL. 3412005;100:340–7 PNEUMOPERITONEUM AND HEPATIC BLOOD FLOW
and ventilatory variables (minute ventilation, maxi-mum inspiration pressure, PEEP, ETco2) were re-corded. In all patients CO2 pneumoperitoneum wasmaintained at a pressure level of 12 mm Hg. For thecontrol group opening and closure of the abdominalfascia was set equal with the beginning and end ofpneumoperitoneum, respectively.
For assessment of the reproducibility of hepaticblood flow determination in 6 randomly selected pa-tients the measurements at all 8 times were repeatedmore than 6 mo later by the same observer (WS) andindependently by a second observer (RM). Thus as-sessment of intraobserver and interobserver reproduc-ibility was based on 48 measurements. As accurateblood flow measurements depend on a constant RR-interval the variability of two consecutive RR-intervalsin 187 measurements was evaluated.
All data are presented as median and 95% confi-dence intervals of the median unless otherwise stated.Intragroup changes in hemodynamic and echocardio-graphic variables over time were analyzed using anal-ysis of variance on ranks for repeated measurements(Friedmann) and, if significant, Dunn’s method wasused to compare the variables with the baseline value.Intergroup differences between patients undergoinglaparoscopic surgery and the control group at thedifferent times were analyzed using the Mann-Whitney rank sum test. Statistical significance wasassumed when P values were �0.05.
Reproducibility of hepatic blood flow measure-ments was analyzed by intraobserver and interob-server variability, simple regression analysis and biasanalysis according to Bland and Altman (18). As ameasure of intraobserver and interobserver variabil-ity, the mean percentage error was calculated as theabsolute difference between two measurements di-vided by the mean of the two observed values. Themean difference and repeatability coefficient were cal-culated according to Bland and Altman. The repeat-ability coefficient is defined as two standard devia-tions of the differences between two repeatedmeasurements (19).
ResultsNine patients undergoing laparoscopic surgery (sixcholecystectomy, three inguinal hernia repair) wereexcluded from analysis because of poor quality echo-cardiographic images after insufflation of CO2. Thusthe final evaluation was based on 24 patients under-going laparoscopic surgery (12 cholecystectomy, 12inguinal hernia repair) and 12 patients undergoingconventional hernia repair (control group). The meanage of the laparoscopic group was 44 yr (range, 21–79yr) and of the control Group 51 yr (range, 32–73 yr).The difference was not statistically significant (P � 0.17).
As shown in Table 1 insufflation of CO2 resulted ina significant increase in mean arterial blood pressure,whereas HR was not affected by insufflation of CO2.The control group revealed a slight but significantdecrease in heart rate after baseline measurement. Af-ter induction of pneumoperitoneum a significantlyhigher inspiration pressure was necessary to maintainnormocapnia. Despite a significant increase in ETco2after insufflation of CO2, ETco2 was maintained withinnormal range throughout the study period (Table 1).
Five minutes after insufflation of CO2 the diameterof the middle hepatic vein was significantly reducedin comparison with the baseline value and in compar-ison with the control group (Table 2). The diameter ofthe right hepatic vein was less affected by the in-creased IAP with a tendency to decrease that did notreach statistical significance. CO2 pneumoperitoneuminduced a significant increase in VTI of the right andmiddle hepatic vein. The increase in VTI remainedconstant during pneumoperitoneum and was signifi-cant in comparison to the control group. Conversely,in the control group the diameters and VTIs did notchange over the entire study period (Table 2).
Insufflation of CO2 produced a marked and signif-icant increase in blood flow index of the right hepaticvein (Table 3). The increase persisted during the entireperiod of pneumoperitoneum and was significant incomparison with the control group. In contrast thecontrol group revealed a constant blood flow index inthe right hepatic vein over the whole study period(Table 3).
After induction of pneumoperitoneum the increasein blood flow index of the middle hepatic vein wasless pronounced but also reached significance (Table3). Ten to 40 min after insufflation of CO2 the bloodflow index in the middle hepatic vein was signifi-cantly higher in comparison with the baseline value.The control group showed a constant blood flow indexin the middle hepatic vein. However, comparison be-tween groups did not reveal significant differences atthe different times.
As demonstrated in Table 4 the increase in hepaticblood flow could be observed in patients undergoinglaparoscopic cholecystectomy as well as in patientsundergoing laparoscopic inguinal hernia repair evenif the increase in the middle hepatic vein did not reachsignificance in the cholecystectomy group (P � 0.054).
An example for the increase in blood flow of themiddle hepatic vein after induction of CO2 pneumo-peritoneum is shown in Figure 1.
Intraobserver and interobserver variability and re-sults of the linear regression and bias analysis forassessment of the reproducibility of hepatic bloodflow measurements are displayed in Table 5. The ob-served increase in blood flow of the right and middlehepatic veins was markedly larger than the repeatabil-ity coefficient, indicating that this observation was not
342 CARDIOVASCULAR ANESTHESIA MEIERHENRICH ET AL. ANESTH ANALGPNEUMOPERITONEUM AND HEPATIC BLOOD FLOW 2005;100:340–7
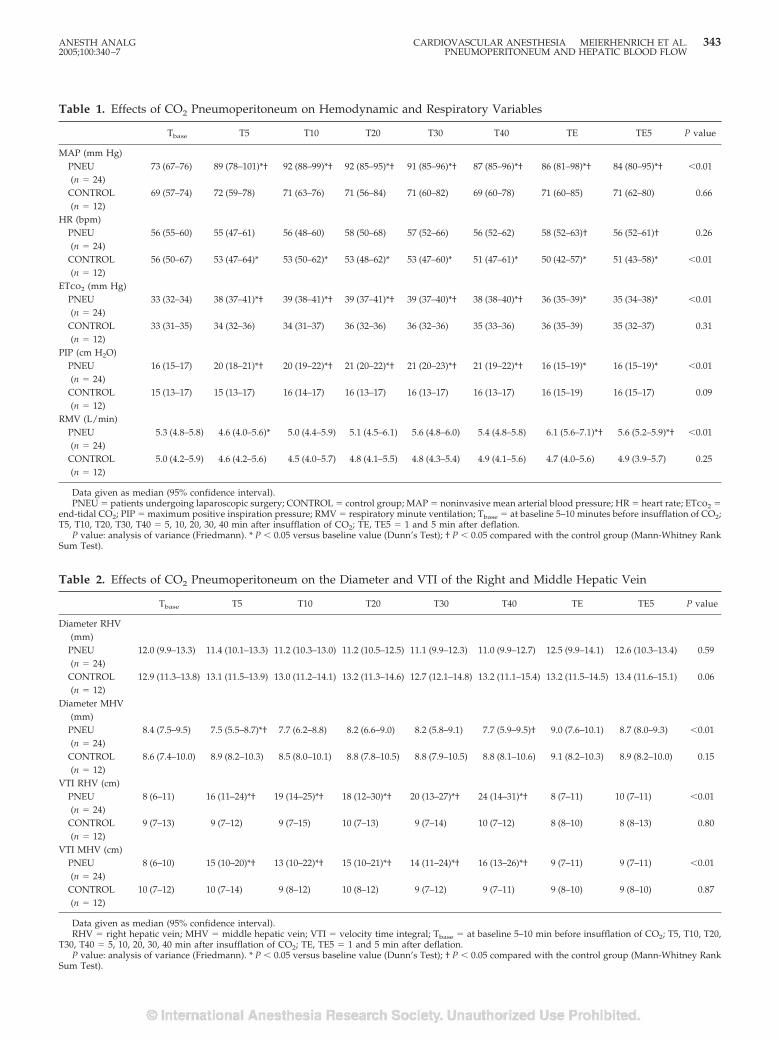
Table 1. Effects of CO2 Pneumoperitoneum on Hemodynamic and Respiratory Variables
Tbase T5 T10 T20 T30 T40 TE TE5 P value
MAP (mm Hg)PNEU(n � 24)
73 (67–76) 89 (78–101)*† 92 (88–99)*† 92 (85–95)*† 91 (85–96)*† 87 (85–96)*† 86 (81–98)*† 84 (80–95)*† �0.01
CONTROL(n � 12)
69 (57–74) 72 (59–78) 71 (63–76) 71 (56–84) 71 (60–82) 69 (60–78) 71 (60–85) 71 (62–80) 0.66
HR (bpm)PNEU(n � 24)
56 (55–60) 55 (47–61) 56 (48–60) 58 (50–68) 57 (52–66) 56 (52–62) 58 (52–63)† 56 (52–61)† 0.26
CONTROL(n � 12)
56 (50–67) 53 (47–64)* 53 (50–62)* 53 (48–62)* 53 (47–60)* 51 (47–61)* 50 (42–57)* 51 (43–58)* �0.01
ETco2 (mm Hg)PNEU(n � 24)
33 (32–34) 38 (37–41)*† 39 (38–41)*† 39 (37–41)*† 39 (37–40)*† 38 (38–40)*† 36 (35–39)* 35 (34–38)* �0.01
CONTROL(n � 12)
33 (31–35) 34 (32–36) 34 (31–37) 36 (32–36) 36 (32–36) 35 (33–36) 36 (35–39) 35 (32–37) 0.31
PIP (cm H2O)PNEU(n � 24)
16 (15–17) 20 (18–21)*† 20 (19–22)*† 21 (20–22)*† 21 (20–23)*† 21 (19–22)*† 16 (15–19)* 16 (15–19)* �0.01
CONTROL(n � 12)
15 (13–17) 15 (13–17) 16 (14–17) 16 (13–17) 16 (13–17) 16 (13–17) 16 (15–19) 16 (15–17) 0.09
RMV (L/min)PNEU(n � 24)
5.3 (4.8–5.8) 4.6 (4.0–5.6)* 5.0 (4.4–5.9) 5.1 (4.5–6.1) 5.6 (4.8–6.0) 5.4 (4.8–5.8) 6.1 (5.6–7.1)*† 5.6 (5.2–5.9)*† �0.01
CONTROL(n � 12)
5.0 (4.2–5.9) 4.6 (4.2–5.6) 4.5 (4.0–5.7) 4.8 (4.1–5.5) 4.8 (4.3–5.4) 4.9 (4.1–5.6) 4.7 (4.0–5.6) 4.9 (3.9–5.7) 0.25
Data given as median (95% confidence interval).PNEU � patients undergoing laparoscopic surgery; CONTROL � control group; MAP � noninvasive mean arterial blood pressure; HR � heart rate; ETco2 �
end-tidal CO2; PIP � maximum positive inspiration pressure; RMV � respiratory minute ventilation; Tbase � at baseline 5–10 minutes before insufflation of CO2;T5, T10, T20, T30, T40 � 5, 10, 20, 30, 40 min after insufflation of CO2; TE, TE5 � 1 and 5 min after deflation.
P value: analysis of variance (Friedmann). * P � 0.05 versus baseline value (Dunn’s Test); † P � 0.05 compared with the control group (Mann-Whitney RankSum Test).
Table 2. Effects of CO2 Pneumoperitoneum on the Diameter and VTI of the Right and Middle Hepatic Vein
Tbase T5 T10 T20 T30 T40 TE TE5 P value
Diameter RHV(mm)
PNEU(n � 24)
12.0 (9.9–13.3) 11.4 (10.1–13.3) 11.2 (10.3–13.0) 11.2 (10.5–12.5) 11.1 (9.9–12.3) 11.0 (9.9–12.7) 12.5 (9.9–14.1) 12.6 (10.3–13.4) 0.59
CONTROL(n � 12)
12.9 (11.3–13.8) 13.1 (11.5–13.9) 13.0 (11.2–14.1) 13.2 (11.3–14.6) 12.7 (12.1–14.8) 13.2 (11.1–15.4) 13.2 (11.5–14.5) 13.4 (11.6–15.1) 0.06
Diameter MHV(mm)
PNEU(n � 24)
8.4 (7.5–9.5) 7.5 (5.5–8.7)*† 7.7 (6.2–8.8) 8.2 (6.6–9.0) 8.2 (5.8–9.1) 7.7 (5.9–9.5)† 9.0 (7.6–10.1) 8.7 (8.0–9.3) �0.01
CONTROL(n � 12)
8.6 (7.4–10.0) 8.9 (8.2–10.3) 8.5 (8.0–10.1) 8.8 (7.8–10.5) 8.8 (7.9–10.5) 8.8 (8.1–10.6) 9.1 (8.2–10.3) 8.9 (8.2–10.0) 0.15
VTI RHV (cm)PNEU(n � 24)
8 (6–11) 16 (11–24)*† 19 (14–25)*† 18 (12–30)*† 20 (13–27)*† 24 (14–31)*† 8 (7–11) 10 (7–11) �0.01
CONTROL(n � 12)
9 (7–13) 9 (7–12) 9 (7–15) 10 (7–13) 9 (7–14) 10 (7–12) 8 (8–10) 8 (8–13) 0.80
VTI MHV (cm)PNEU(n � 24)
8 (6–10) 15 (10–20)*† 13 (10–22)*† 15 (10–21)*† 14 (11–24)*† 16 (13–26)*† 9 (7–11) 9 (7–11) �0.01
CONTROL(n � 12)
10 (7–12) 10 (7–14) 9 (8–12) 10 (8–12) 9 (7–12) 9 (7–11) 9 (8–10) 9 (8–10) 0.87
Data given as median (95% confidence interval).RHV � right hepatic vein; MHV � middle hepatic vein; VTI � velocity time integral; Tbase � at baseline 5–10 min before insufflation of CO2; T5, T10, T20,
T30, T40 � 5, 10, 20, 30, 40 min after insufflation of CO2; TE, TE5 � 1 and 5 min after deflation.P value: analysis of variance (Friedmann). * P � 0.05 versus baseline value (Dunn’s Test); † P � 0.05 compared with the control group (Mann-Whitney Rank
Sum Test).
ANESTH ANALG CARDIOVASCULAR ANESTHESIA MEIERHENRICH ET AL. 3432005;100:340–7 PNEUMOPERITONEUM AND HEPATIC BLOOD FLOW
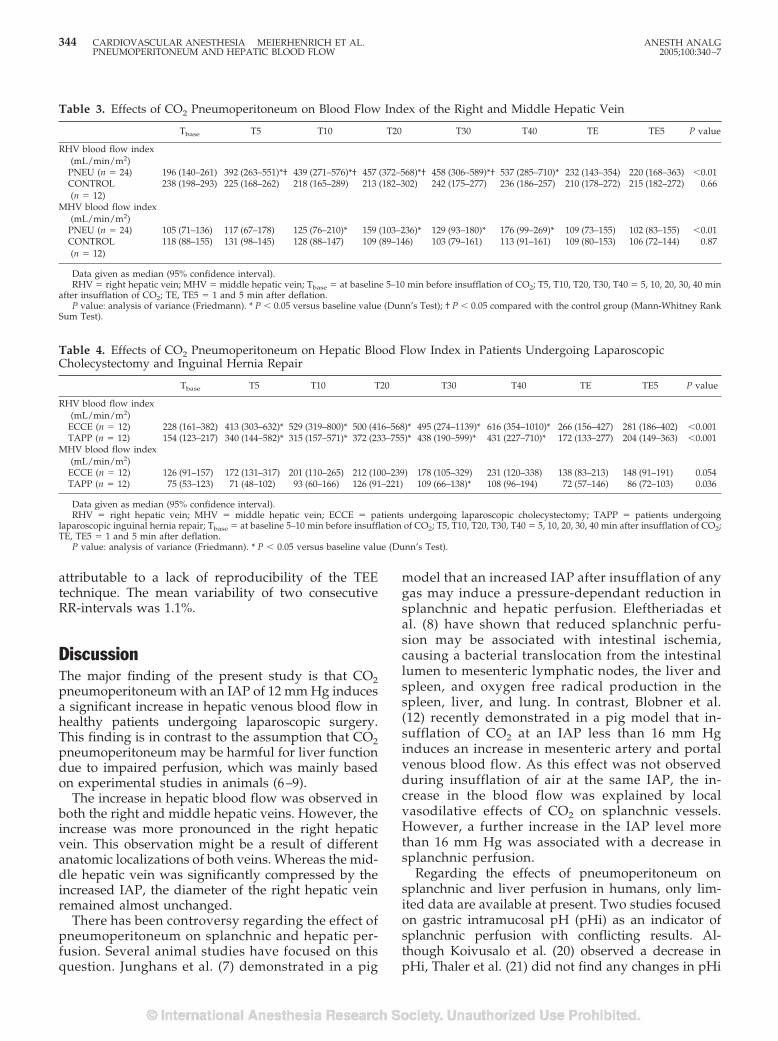
attributable to a lack of reproducibility of the TEEtechnique. The mean variability of two consecutiveRR-intervals was 1.1%.
DiscussionThe major finding of the present study is that CO2pneumoperitoneum with an IAP of 12 mm Hg inducesa significant increase in hepatic venous blood flow inhealthy patients undergoing laparoscopic surgery.This finding is in contrast to the assumption that CO2pneumoperitoneum may be harmful for liver functiondue to impaired perfusion, which was mainly basedon experimental studies in animals (6–9).
The increase in hepatic blood flow was observed inboth the right and middle hepatic veins. However, theincrease was more pronounced in the right hepaticvein. This observation might be a result of differentanatomic localizations of both veins. Whereas the mid-dle hepatic vein was significantly compressed by theincreased IAP, the diameter of the right hepatic veinremained almost unchanged.
There has been controversy regarding the effect ofpneumoperitoneum on splanchnic and hepatic per-fusion. Several animal studies have focused on thisquestion. Junghans et al. (7) demonstrated in a pig
model that an increased IAP after insufflation of anygas may induce a pressure-dependant reduction insplanchnic and hepatic perfusion. Eleftheriadas etal. (8) have shown that reduced splanchnic perfu-sion may be associated with intestinal ischemia,causing a bacterial translocation from the intestinallumen to mesenteric lymphatic nodes, the liver andspleen, and oxygen free radical production in thespleen, liver, and lung. In contrast, Blobner et al.(12) recently demonstrated in a pig model that in-sufflation of CO2 at an IAP less than 16 mm Hginduces an increase in mesenteric artery and portalvenous blood flow. As this effect was not observedduring insufflation of air at the same IAP, the in-crease in the blood flow was explained by localvasodilative effects of CO2 on splanchnic vessels.However, a further increase in the IAP level morethan 16 mm Hg was associated with a decrease insplanchnic perfusion.
Regarding the effects of pneumoperitoneum onsplanchnic and liver perfusion in humans, only lim-ited data are available at present. Two studies focusedon gastric intramucosal pH (pHi) as an indicator ofsplanchnic perfusion with conflicting results. Al-though Koivusalo et al. (20) observed a decrease inpHi, Thaler et al. (21) did not find any changes in pHi
Table 3. Effects of CO2 Pneumoperitoneum on Blood Flow Index of the Right and Middle Hepatic Vein
Tbase T5 T10 T20 T30 T40 TE TE5 P value
RHV blood flow index(mL/min/m2)
PNEU (n � 24) 196 (140–261) 392 (263–551)*† 439 (271–576)*† 457 (372–568)*† 458 (306–589)*† 537 (285–710)* 232 (143–354) 220 (168–363) �0.01CONTROL(n � 12)
238 (198–293) 225 (168–262) 218 (165–289) 213 (182–302) 242 (175–277) 236 (186–257) 210 (178–272) 215 (182–272) 0.66
MHV blood flow index(mL/min/m2)
PNEU (n � 24) 105 (71–136) 117 (67–178) 125 (76–210)* 159 (103–236)* 129 (93–180)* 176 (99–269)* 109 (73–155) 102 (83–155) �0.01CONTROL(n � 12)
118 (88–155) 131 (98–145) 128 (88–147) 109 (89–146) 103 (79–161) 113 (91–161) 109 (80–153) 106 (72–144) 0.87
Data given as median (95% confidence interval).RHV � right hepatic vein; MHV � middle hepatic vein; Tbase � at baseline 5–10 min before insufflation of CO2; T5, T10, T20, T30, T40 � 5, 10, 20, 30, 40 min
after insufflation of CO2; TE, TE5 � 1 and 5 min after deflation.P value: analysis of variance (Friedmann). * P � 0.05 versus baseline value (Dunn’s Test); † P � 0.05 compared with the control group (Mann-Whitney Rank
Sum Test).
Table 4. Effects of CO2 Pneumoperitoneum on Hepatic Blood Flow Index in Patients Undergoing LaparoscopicCholecystectomy and Inguinal Hernia Repair
Tbase T5 T10 T20 T30 T40 TE TE5 P value
RHV blood flow index(mL/min/m2)
ECCE (n � 12) 228 (161–382) 413 (303–632)* 529 (319–800)* 500 (416–568)* 495 (274–1139)* 616 (354–1010)* 266 (156–427) 281 (186–402) �0.001TAPP (n � 12) 154 (123–217) 340 (144–582)* 315 (157–571)* 372 (233–755)* 438 (190–599)* 431 (227–710)* 172 (133–277) 204 (149–363) �0.001
MHV blood flow index(mL/min/m2)
ECCE (n � 12) 126 (91–157) 172 (131–317) 201 (110–265) 212 (100–239) 178 (105–329) 231 (120–338) 138 (83–213) 148 (91–191) 0.054TAPP (n � 12) 75 (53–123) 71 (48–102) 93 (60–166) 126 (91–221) 109 (66–138)* 108 (96–194) 72 (57–146) 86 (72–103) 0.036
Data given as median (95% confidence interval).RHV � right hepatic vein; MHV � middle hepatic vein; ECCE � patients undergoing laparoscopic cholecystectomy; TAPP � patients undergoing
laparoscopic inguinal hernia repair; Tbase � at baseline 5–10 min before insufflation of CO2; T5, T10, T20, T30, T40 � 5, 10, 20, 30, 40 min after insufflation of CO2;TE, TE5 � 1 and 5 min after deflation.
P value: analysis of variance (Friedmann). * P � 0.05 versus baseline value (Dunn’s Test).
344 CARDIOVASCULAR ANESTHESIA MEIERHENRICH ET AL. ANESTH ANALGPNEUMOPERITONEUM AND HEPATIC BLOOD FLOW 2005;100:340–7
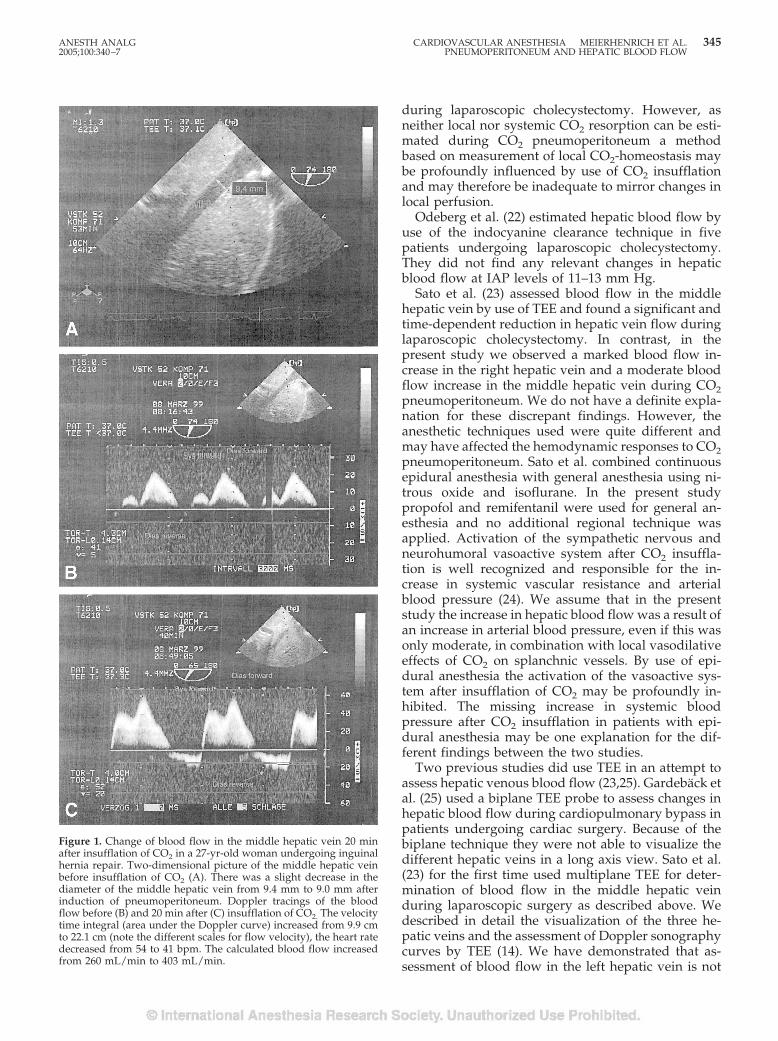
during laparoscopic cholecystectomy. However, asneither local nor systemic CO2 resorption can be esti-mated during CO2 pneumoperitoneum a methodbased on measurement of local CO2-homeostasis maybe profoundly influenced by use of CO2 insufflationand may therefore be inadequate to mirror changes inlocal perfusion.
Odeberg et al. (22) estimated hepatic blood flow byuse of the indocyanine clearance technique in fivepatients undergoing laparoscopic cholecystectomy.They did not find any relevant changes in hepaticblood flow at IAP levels of 11–13 mm Hg.
Sato et al. (23) assessed blood flow in the middlehepatic vein by use of TEE and found a significant andtime-dependent reduction in hepatic vein flow duringlaparoscopic cholecystectomy. In contrast, in thepresent study we observed a marked blood flow in-crease in the right hepatic vein and a moderate bloodflow increase in the middle hepatic vein during CO2pneumoperitoneum. We do not have a definite expla-nation for these discrepant findings. However, theanesthetic techniques used were quite different andmay have affected the hemodynamic responses to CO2pneumoperitoneum. Sato et al. combined continuousepidural anesthesia with general anesthesia using ni-trous oxide and isoflurane. In the present studypropofol and remifentanil were used for general an-esthesia and no additional regional technique wasapplied. Activation of the sympathetic nervous andneurohumoral vasoactive system after CO2 insuffla-tion is well recognized and responsible for the in-crease in systemic vascular resistance and arterialblood pressure (24). We assume that in the presentstudy the increase in hepatic blood flow was a result ofan increase in arterial blood pressure, even if this wasonly moderate, in combination with local vasodilativeeffects of CO2 on splanchnic vessels. By use of epi-dural anesthesia the activation of the vasoactive sys-tem after insufflation of CO2 may be profoundly in-hibited. The missing increase in systemic bloodpressure after CO2 insufflation in patients with epi-dural anesthesia may be one explanation for the dif-ferent findings between the two studies.
Two previous studies did use TEE in an attempt toassess hepatic venous blood flow (23,25). Gardeback etal. (25) used a biplane TEE probe to assess changes inhepatic blood flow during cardiopulmonary bypass inpatients undergoing cardiac surgery. Because of thebiplane technique they were not able to visualize thedifferent hepatic veins in a long axis view. Sato et al.(23) for the first time used multiplane TEE for deter-mination of blood flow in the middle hepatic veinduring laparoscopic surgery as described above. Wedescribed in detail the visualization of the three he-patic veins and the assessment of Doppler sonographycurves by TEE (14). We have demonstrated that as-sessment of blood flow in the left hepatic vein is not
Figure 1. Change of blood flow in the middle hepatic vein 20 minafter insufflation of CO2 in a 27-yr-old woman undergoing inguinalhernia repair. Two-dimensional picture of the middle hepatic veinbefore insufflation of CO2 (A). There was a slight decrease in thediameter of the middle hepatic vein from 9.4 mm to 9.0 mm afterinduction of pneumoperitoneum. Doppler tracings of the bloodflow before (B) and 20 min after (C) insufflation of CO2. The velocitytime integral (area under the Doppler curve) increased from 9.9 cmto 22.1 cm (note the different scales for flow velocity), the heart ratedecreased from 54 to 41 bpm. The calculated blood flow increasedfrom 260 mL/min to 403 mL/min.
ANESTH ANALG CARDIOVASCULAR ANESTHESIA MEIERHENRICH ET AL. 3452005;100:340–7 PNEUMOPERITONEUM AND HEPATIC BLOOD FLOW
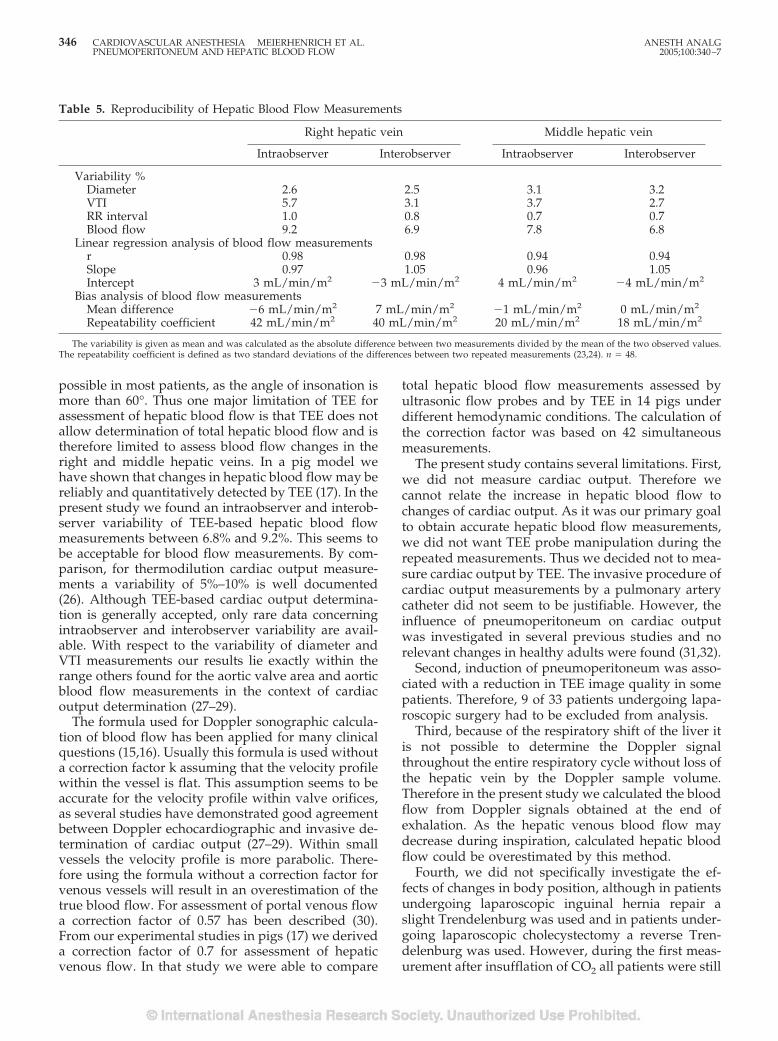
possible in most patients, as the angle of insonation ismore than 60°. Thus one major limitation of TEE forassessment of hepatic blood flow is that TEE does notallow determination of total hepatic blood flow and istherefore limited to assess blood flow changes in theright and middle hepatic veins. In a pig model wehave shown that changes in hepatic blood flow may bereliably and quantitatively detected by TEE (17). In thepresent study we found an intraobserver and interob-server variability of TEE-based hepatic blood flowmeasurements between 6.8% and 9.2%. This seems tobe acceptable for blood flow measurements. By com-parison, for thermodilution cardiac output measure-ments a variability of 5%–10% is well documented(26). Although TEE-based cardiac output determina-tion is generally accepted, only rare data concerningintraobserver and interobserver variability are avail-able. With respect to the variability of diameter andVTI measurements our results lie exactly within therange others found for the aortic valve area and aorticblood flow measurements in the context of cardiacoutput determination (27–29).
The formula used for Doppler sonographic calcula-tion of blood flow has been applied for many clinicalquestions (15,16). Usually this formula is used withouta correction factor k assuming that the velocity profilewithin the vessel is flat. This assumption seems to beaccurate for the velocity profile within valve orifices,as several studies have demonstrated good agreementbetween Doppler echocardiographic and invasive de-termination of cardiac output (27–29). Within smallvessels the velocity profile is more parabolic. There-fore using the formula without a correction factor forvenous vessels will result in an overestimation of thetrue blood flow. For assessment of portal venous flowa correction factor of 0.57 has been described (30).From our experimental studies in pigs (17) we deriveda correction factor of 0.7 for assessment of hepaticvenous flow. In that study we were able to compare
total hepatic blood flow measurements assessed byultrasonic flow probes and by TEE in 14 pigs underdifferent hemodynamic conditions. The calculation ofthe correction factor was based on 42 simultaneousmeasurements.
The present study contains several limitations. First,we did not measure cardiac output. Therefore wecannot relate the increase in hepatic blood flow tochanges of cardiac output. As it was our primary goalto obtain accurate hepatic blood flow measurements,we did not want TEE probe manipulation during therepeated measurements. Thus we decided not to mea-sure cardiac output by TEE. The invasive procedure ofcardiac output measurements by a pulmonary arterycatheter did not seem to be justifiable. However, theinfluence of pneumoperitoneum on cardiac outputwas investigated in several previous studies and norelevant changes in healthy adults were found (31,32).
Second, induction of pneumoperitoneum was asso-ciated with a reduction in TEE image quality in somepatients. Therefore, 9 of 33 patients undergoing lapa-roscopic surgery had to be excluded from analysis.
Third, because of the respiratory shift of the liver itis not possible to determine the Doppler signalthroughout the entire respiratory cycle without loss ofthe hepatic vein by the Doppler sample volume.Therefore in the present study we calculated the bloodflow from Doppler signals obtained at the end ofexhalation. As the hepatic venous blood flow maydecrease during inspiration, calculated hepatic bloodflow could be overestimated by this method.
Fourth, we did not specifically investigate the ef-fects of changes in body position, although in patientsundergoing laparoscopic inguinal hernia repair aslight Trendelenburg was used and in patients under-going laparoscopic cholecystectomy a reverse Tren-delenburg was used. However, during the first meas-urement after insufflation of CO2 all patients were still
Table 5. Reproducibility of Hepatic Blood Flow Measurements
Right hepatic vein Middle hepatic vein
Intraobserver Interobserver Intraobserver Interobserver
Variability %Diameter 2.6 2.5 3.1 3.2VTI 5.7 3.1 3.7 2.7RR interval 1.0 0.8 0.7 0.7Blood flow 9.2 6.9 7.8 6.8
Linear regression analysis of blood flow measurementsr 0.98 0.98 0.94 0.94Slope 0.97 1.05 0.96 1.05Intercept 3 mL/min/m2 �3 mL/min/m2 4 mL/min/m2 �4 mL/min/m2
Bias analysis of blood flow measurementsMean difference �6 mL/min/m2 7 mL/min/m2 �1 mL/min/m2 0 mL/min/m2
Repeatability coefficient 42 mL/min/m2 40 mL/min/m2 20 mL/min/m2 18 mL/min/m2
The variability is given as mean and was calculated as the absolute difference between two measurements divided by the mean of the two observed values.The repeatability coefficient is defined as two standard deviations of the differences between two repeated measurements (23,24). n � 48.
346 CARDIOVASCULAR ANESTHESIA MEIERHENRICH ET AL. ANESTH ANALGPNEUMOPERITONEUM AND HEPATIC BLOOD FLOW 2005;100:340–7
in a supine position. Furthermore the increase in he-patic blood flow was observed in both groups.
In summary we have demonstrated that establish-ment of a pneumoperitoneum with CO2 at low IAPlevels is associated with an increase in hepatic bloodflow in healthy patients.
References1. Soper NJ. Laparoscopic general surgery: past, present and fu-
ture. Surgery 1993;113:1–3.2. Wahba RWM, Beique F, Kleiman SJ. Cardiopulmonary function
and laparoscopic cholecystectomy. Can J Anaesth 1995;42:51–63.
3. Joris JL, Noirot DP, Legrand MJ, et al. Hemodynamic changesduring laparoscopic cholecystectomy. Anesth Analg 1993;76:1067–71.
4. Harris SN, Ballantyne GH, Luther MA, Perrino AC. Alterationsof cardiovascular performance during laparoscopic colectomy: acombined hemodynamic and echocardiographic analysis.Anesth Analg 1996;83:482–7.
5. Ishizaki Y, Bandai Y, Shimomura K, et al. Safe intraabdominalpressure of carbon dioxide pneumoperitoneum during laparo-scopic surgery. Surgery 1993;114:549–54.
6. Diebel LN, Wilson RF, Dulchavasky SA, Saxe J. Effect of in-creased intraabdominal pressure on hepatic arterial, portal ve-nous, and hepatic microcirculatory blood flow. J Trauma 1992;33:279–82.
7. Junghans T, Bohm B, Grundel K, et al. Does pneumoperitoneumwith different gases, body positions, and intraperitoneal pres-sures influence renal and hepatic blood flow? Surgery 1997;121:206–11.
8. Eleftheriadas E, Kotzampassi K, Papanotas K. Gut ischemia,oxidative stress, and bacterial translocation in elevated abdom-inal pressure in rats. World J Surg 1996;20:11–6.
9. Richter S, Olinger A, Hildebrand U, et al. Loss of physiologichepatic blood flow control (“hepatic arterial buffer response”)during CO2-pneumoperitoneum in the rat. Anesth Analg 2001;93:872–7.
10. Saber AA, Laraja RD, Nalbandian HI, et al. Changes in liverfunctions tests after laparoscopic cholecystectomy: not so rare,not always ominous. Am Surg 2000;66:699–702.
11. Andrei VE, Schein M, Margolis M, et al. Liver enzymes arecommonly elevated following laparoscopic cholecystectomy: iselevated intra-abdominal pressure the cause? Dig Surg 1998;15:256–9.
12. Blobner M, Bogdanski R, Kochs E, et al. Effects of intraabdomi-nally insufflated carbon dioxide and elevated intraabdominalpressure on splanchnic circulation. Anesthesiology 1998;89:475–82.
13. Vuyk J, Mertens MJ, Olofsen E, et al. Propofol anesthesia andrational opioid selection: determination of optimal EC50-EC95propofol-opioid concentrations that assure adequate anesthesiaand a rapid return of consciousness. Anesthesiology 1997;87:1549–62.
14. Meierhenrich R, Gauss A, Georgieff M, Schutz W. Use of multi-plane transoesophageal echocardiography in the visualizationof the main hepatic veins and acquisition of Doppler sonogra-phy curves. Comparison with the transabdominal approach.Br J Anaesth 2001;87:711–7.
15. Feigenbaum H. Hemodynamic information derived from echo-cardiography. In: Feigenbaum H, ed. Echocardiography.Philadelphia: Lea & Febiger, 1994:181–4.
16. Gill RW. Measurement of blood flow by ultrasound: accuracyand sources of error. Ultrasound Med Biol 1985;11:625–41.
17. Schutz W, Meierhenrich R, Traeger K, et al. Is it feasible tomonitor total hepatic blood flow by use of transesophagealechography? An experimental study in pigs. Intensive CareMed 2001;27:580–5.
18. Bland JM, Altman DG. Statistical methods of assessing agree-ment between two methods of clinical measurement. Lancet1986;I:307–10.
19. British Standards Institution. Precision of test methods I: Guidefor the determination and reproducibility for a standard testmethod (BS 5497, part1). London: BSI, 1979.
20. Koivusalo AM, Kellokumpu I, Ristkari S, Lindgren L. Splanch-nic and renal deterioration during and after laparoscopiccholecystectomy: a comparison of the carbon dioxide pneumo-peritoneum and the abdominal wall lift method. Anesth Analg1997;85:886–91.
21. Thaler W, Frey L, Marzoli P, Messmer K. Assessment ofsplanchnic tissue oxygenation by gastric tonometry in patientsundergoing laparoscopic and open cholecystectomy. Br J Sur-gery 1996;83:620–4.
22. Odeberg S, Ljungqvist O, Sollevi A. Pneumoperitoneum forlaparoscopic cholecystectomy is not associated with compro-mised splanchnic circulation. Eur J Surg 1998;164:843–8.
23. Sato K, Kawamura T, Wakusawa R. Hepatic blood flow andfunction in elderly patients undergoing laparoscopic cholecys-tectomy. Anesth Analg 2000;90:1198–202.
24. Koivusalo AM, Lindgren L. Effects of carbon dioxide pneumo-peritoneum for laparoscopic cholecystectomy. Acta Anaesthe-siol Scand 2000;44:834–41.
25. Gardeback M, Settergren G, Brodin LA. Hepatic blood flow andright ventricular function during cardiac surgery assessed bytransesophageal echocardiography. J Cardiothorac and VascAnesth 1996;10:318–22.
26. Stevens JH, Raffin TA, Mihm FG, et al. Thermodilution cardiacoutput measurement: effects of respiratory cycle on its repro-ducibility. JAMA 1985;253:2240–2.
27. Perrino AC, Harris SN, Luther MA. Intraoperative determina-tion of cardiac output using multiplane transesophagealechocardiography: a comparison to thermodilution. Anesthesi-ology 1998;89:350–7.
28. Feinberg MS, Hopkins WE, Davila-Roman VG, Barzilai B. Mul-tiplane transesophageal echocardiographic Doppler imaging ac-curately determines cardiac output measurements in criticallyill patients. Chest 1995;107:769–73.
29. Descorps-Declere A, Smail N, Vigue B, et al. Transgastric,pulsed Doppler echocardiographic determination of cardiacoutput. Intensive Care Med 1996;22:34–8.
30. Moriyasu F, Ban N, Nishida O, et al. Clinical application of anultrasonic Duplex system in quantitative measurement of portalblood flow. J Clin Ultrasound 1986;14:579–88.
31. Gannedahl P, Odeberg S, Brodin LA, Sollevi A. Effects of pos-ture and pneumoperitoneum during anaesthesia on the indicesof left ventricular filling. Acta Anaesthesiol Scand 1996;40:160–6.
32. Backlund M, Kellokumpu I, Scheinin T, et al. Effect of temper-ature of insufflated CO2 during and after prolonged laparo-scopic surgery. Surg Endosc 1998;12:1126–130.
ANESTH ANALG CARDIOVASCULAR ANESTHESIA MEIERHENRICH ET AL. 3472005;100:340–7 PNEUMOPERITONEUM AND HEPATIC BLOOD FLOW
The Effect of Volatile Anesthetics on Respiratory SystemResistance in Patients with Chronic ObstructivePulmonary DiseaseC. A. Volta, MD, V. Alvisi, MD, S. Petrini, MD, S. Zardi, MD, E. Marangoni, MD,R. Ragazzi, MD, M. Capuzzo, MD, and R. Alvisi, MD
Department of Surgical, Anesthesiological and Radiological Science, Section of Anesthesia and Intensive Care, S. AnnaHospital, University of Ferrara, Ferrara, Italy
We examined the effect of isoflurane and sevofluraneon respiratory system resistance (Rmin,rs) in patientswith chronic obstructive pulmonary disease (COPD).The diagnosis of COPD rests on the presence of airwayobstruction, which is only partially reversible afterbronchodilator treatment. Ninety-six consecutive pa-tients undergoing thoracic surgery for peripheral lungcancer were enrolled. They were divided into twogroups: preoperative forced expiratory volume in 1s/forced vital capacity ratio �70% or �70%. Rmin,rswas measured after 5 and 10 min of maintenance anes-thesia by using the constant flow/rapid occlusionmethod. Maintenance of anesthesia was randomized to
thiopental 0.30 mg · kg�1 · min�1 or 1.1 minimum alve-olar anesthetic concentration end-tidal isoflurane orsevoflurane. Eleven patients were excluded: two be-cause anesthesia was erroneously induced with propo-fol and nine because of an incorrect tube position. Main-tenance with thiopental failed to decrease Rmin,rs,whereas both volatile anesthetics were able to decreaseRmin,rs in patients with COPD. The percentage of pa-tients who did not respond to volatile anesthetics waslarger in those with COPD as well. In conclusion, wehave demonstrated that isoflurane and sevofluraneproduce bronchodilation in patients with COPD.
(Anesth Analg 2005;100:348–53)
T he volatile anesthetics, such as halothane, isoflu-rane, and sevoflurane, have been proposed fortreating bronchospasm induced by endotracheal
intubation in humans (1). This could be relevant to themanagement of intraoperative bronchospasm, forwhich treatment could include inhaled anesthetics,either by themselves or in conjunction with otherdrugs, such as �2-adrenergic drugs. Olsson (2) dem-onstrated that the most important risk factors for de-veloping bronchospasm during anesthesia were age(i.e., �10 yr old), perioperative respiratory infection,and chronic obstructive pulmonary disease (COPD).Other studies (3,4) have emphasized the role played
by endotracheal intubation as a major trigger for bron-chospasm during general anesthesia.
Thoracic surgery is made possible by the use of adouble-lumen endobronchial tube (DLTs), the diame-ter of which is much larger than that of a normalsingle-lumen endotracheal tube; DLTs probably causemore trauma (5). However, despite their larger exter-nal diameter, the resistance of flow (V') of DLTs isincreased because they are essentially two small-diameter tubes in parallel. Moreover, patients under-going thoracic surgery frequently exhibit chronic air-flow obstruction due to a smoking history, which hasbeen shown to increase the rate of bronchospasm (6).Although bronchodilating drugs are often inhaled inmechanically-ventilated patients with COPD, the im-provement in respiratory resistance is, in general, ex-tremely variable (7–10). This may be because perma-nent structural features lead to a net decrease inbronchial diameter or because patients with COPDexhibit small-airway closure and gas trapping (11).
Hence, we hypothesized that patients with COPDundergoing thoracic surgery cannot respond to vola-tile anesthetics and theoretically have an increasedrisk of bronchospasm and pulmonary complication
This study was supported in part by a grant from Ministero Dell’Universita e Ricerca Scientifica e Technologica.
Presented at the 12th World Congress of Anesthesiologists, Mon-treal, Canada, June 2000.
Accepted for publication July 9, 2004.Address correspondence and reprint requests to Carlo Alberto
Volta, MD, Department of Surgical, Anesthesiological and Radio-logical Science, Section of Anesthesia and Intensive Care, S. AnnaHospital, University of Ferrara, Corso Giovecca 203, 44100 Ferrara,Italy. Address e-mail to [email protected].
DOI: 10.1213/01.ANE.0000140240.83236.AC
©2005 by the International Anesthesia Research Society348 Anesth Analg 2005;100:348–53 0003-2999/05
due to pulmonary hyperinflation than patients withnormal respiratory function. The aim of this study wasto verify the bronchodilating effect of different volatileanesthetics in patients with COPD undergoing tho-racic surgery.
MethodsNinety-six consecutive patients undergoing thoracicsurgery for peripheral lung cancer were enrolled.They were divided into two groups, based on a pre-operative forced expiratory volume in 1 s/forced vitalcapacity (FEV1/FVC) ratio �70% or �70%, the latterbeing the value that implies the presence of chronicairflow obstruction (12). Their clinical characteristicsare given in Tables 1 and 2. Exclusion criteria werelung atelectasis diagnosed with computed tomogra-phy and treatment with (a) a �2-adrenergic agonist oranticholinergic inhaler 12 h before anesthesia induc-tion, (b) corticosteroids, or (c) theophylline. The re-search was approved by our institutional ethics com-mittee, and written, informed consent was obtainedfrom all subjects. Baseline lung function tests wereperformed before surgery (13).
With the patients lying supine, anesthesia was in-duced with 4 mg/kg thiopental, 4–5 �g/kg fentanyl,and 0.1 mg/kg vecuronium. The trachea was intu-bated with a cuffed DLT (37–41F) for exclusion of theright or left lung (Table 1 and 2). The appropriate sizeof the DLT was based on the anatomical characteristicsof the patients.
Immediately after tracheal intubation, ventilationwas controlled (Servo 900B; Siemens, Elema) at 12breaths/min, with a tidal volume (Vt) of approxi-mately 8 mL/kg, a constant inspiratory V' rate of 0.5L/s, and an inspiratory time percentage of 25%, withan end-inspiratory pause of 10%. The ventilator wasset to deliver a Vt with a square-wave V'-time profile.This setting remained constant throughout the study.Extrinsic positive end-expiratory pressure was set to 0.
V' was measured with a heated pneumotachographconnected to a differential pressure transducer. Theresponse of the pneumotachograph was linear overthe experimental range of V'. Vt was calculated byintegration of the V' signal. Pressure at the airwayopening was measured through a side port on theconnector between the respiratory circuit and the en-dotracheal tube by using a differential pressure trans-ducer. The transducer was calibrated before and aftereach study. Special care was taken to avoid gas leak-age in the equipment and around the tracheal andbronchial cuffs.
The V' and pressure signals were amplified, low-pass-filtered at 50 Hz, and digitized at 100 Hz by a16-bit analog-to-digital converter. The digitized datawere stored on computer hard disk for subsequent
analysis. Data was analyzed with the Anadat data-analysis software (Version 5.1; RMT-InfoDat Inc.,Montreal, Quebec, Canada).
Respiratory mechanics were assessed by the con-stant V'/rapid occlusion method previously describedin detail (14). The end-inspiratory occlusion, obtainedby increasing the end-inspiratory pause on the venti-lator to 30%, lasted a mean of 1.5 s. This allowedmeasurement of the inspiratory resistance of the re-spiratory system. After end-inspiratory airway occlu-sion, the pressure at the airway opening exhibited aninitial rapid decrease from the maximum pressure(Pmax) to the pressure registered at the point of zero V'(P1). During this period, the contribution of reductionin pressure due to volume loss by continuing gasexchange is generally considered negligible. By divid-ing airway opening Pmax � P1 by the V' immediatelypreceding the occlusion, the V' resistance of the endo-tracheal tube plus that of the total respiratory system(Rtot,rs) was obtained. By subtracting the V' resistanceof the endotracheal tube, the minimal (Rmin,rs) in-spiratory resistances of the respiratory system (upperairways not included) were obtained. In general, theV' resistance of the endotracheal tube is curvilinearand depends on the size of the tubes used. In the caseof endotracheal tubes for thoracic surgery, there aretwo lumens to be considered in computation of resis-tance. Hence it is necessary to measure the pressure/V'relationships of both lumens, and this is best describedby Rohrer’s equation:
P � K1V� � K2V�2 ,
where P represents the pressure decrease across eachtube and K1 and K2 are constants related, respectively,to the laminar and turbulent V' (15). Both constantswere determined for the gas mixture normally usedduring anesthesia (oxygen 40% in air). These meas-urements were taken with the V' of the gas mixtureinjected in the experimental inspiratory direction. Thetotal resistance of the DLT (tracheal and bronchiallumen) was calculated accordng to
1/Rmin,rs � 1/tracheal Rmin,rs
� 1/bronchial Rmin,rs
(16) and then subtracted from the calculated value ofRtot,rs. Finally, dynamic positive end expiratory pres-sure was calculated as the value of airway pressureregistered at zero V�.
Measurements of Rmin,rs began within 2 min aftertracheal intubation, as soon as mechanical ventilationwas established according to existing guidelines. Oncompletion of the measurements (�30 s), patients wererandomized by using sequentially numbered, opaque,sealed envelopes to one of three anesthetic maintenanceoptions: 1) thiopental infusion at 0.30 mg · kg�1 · min�1,
ANESTH ANALG CARDIOVASCULAR ANESTHESIA VOLTA ET AL. 3492005;100:348–53 VOLATILE ANESTHETICS AND CHRONIC AIRWAY OBSTRUCTION
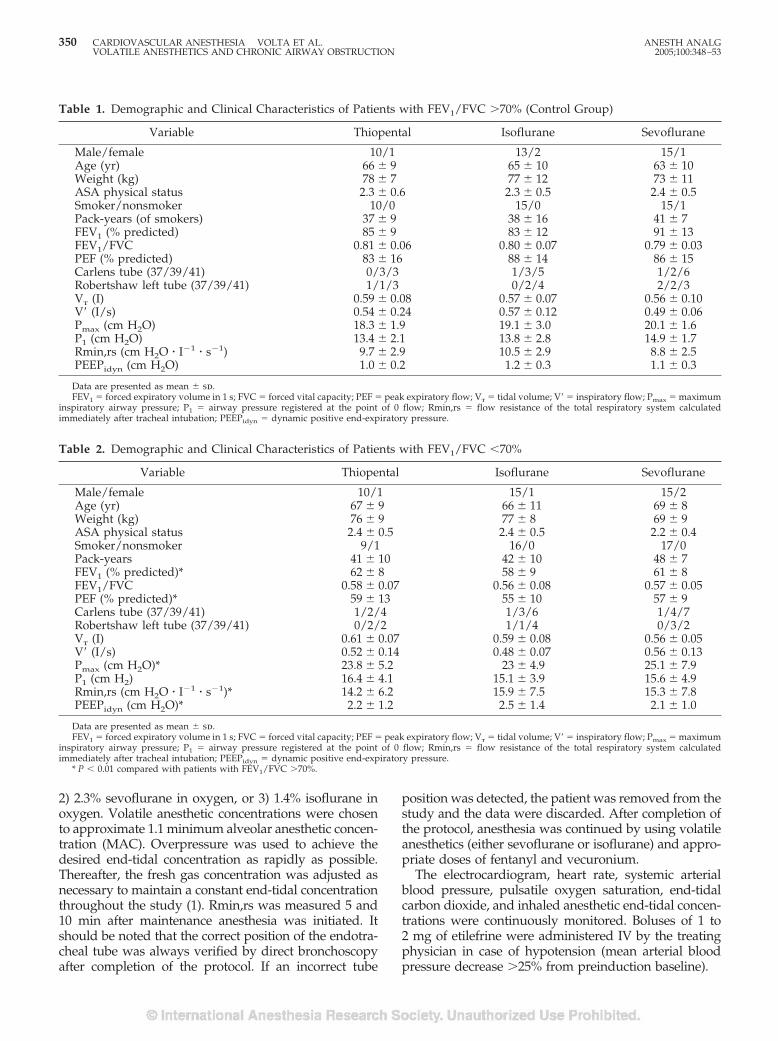
2) 2.3% sevoflurane in oxygen, or 3) 1.4% isoflurane inoxygen. Volatile anesthetic concentrations were chosento approximate 1.1 minimum alveolar anesthetic concen-tration (MAC). Overpressure was used to achieve thedesired end-tidal concentration as rapidly as possible.Thereafter, the fresh gas concentration was adjusted asnecessary to maintain a constant end-tidal concentrationthroughout the study (1). Rmin,rs was measured 5 and10 min after maintenance anesthesia was initiated. Itshould be noted that the correct position of the endotra-cheal tube was always verified by direct bronchoscopyafter completion of the protocol. If an incorrect tube
position was detected, the patient was removed from thestudy and the data were discarded. After completion ofthe protocol, anesthesia was continued by using volatileanesthetics (either sevoflurane or isoflurane) and appro-priate doses of fentanyl and vecuronium.
The electrocardiogram, heart rate, systemic arterialblood pressure, pulsatile oxygen saturation, end-tidalcarbon dioxide, and inhaled anesthetic end-tidal concen-trations were continuously monitored. Boluses of 1 to2 mg of etilefrine were administered IV by the treatingphysician in case of hypotension (mean arterial bloodpressure decrease �25% from preinduction baseline).
Table 1. Demographic and Clinical Characteristics of Patients with FEV1/FVC �70% (Control Group)
Variable Thiopental Isoflurane Sevoflurane
Male/female 10/1 13/2 15/1Age (yr) 66 � 9 65 � 10 63 � 10Weight (kg) 78 � 7 77 � 12 73 � 11ASA physical status 2.3 � 0.6 2.3 � 0.5 2.4 � 0.5Smoker/nonsmoker 10/0 15/0 15/1Pack-years (of smokers) 37 � 9 38 � 16 41 � 7FEV1 (% predicted) 85 � 9 83 � 12 91 � 13FEV1/FVC 0.81 � 0.06 0.80 � 0.07 0.79 � 0.03PEF (% predicted) 83 � 16 88 � 14 86 � 15Carlens tube (37/39/41) 0/3/3 1/3/5 1/2/6Robertshaw left tube (37/39/41) 1/1/3 0/2/4 2/2/3Vt (I) 0.59 � 0.08 0.57 � 0.07 0.56 � 0.10V� (I/s) 0.54 � 0.24 0.57 � 0.12 0.49 � 0.06Pmax (cm H2O) 18.3 � 1.9 19.1 � 3.0 20.1 � 1.6P1 (cm H2O) 13.4 � 2.1 13.8 � 2.8 14.9 � 1.7Rmin,rs (cm H2O � I�1 � s�1) 9.7 � 2.9 10.5 � 2.9 8.8 � 2.5PEEPidyn (cm H2O) 1.0 � 0.2 1.2 � 0.3 1.1 � 0.3
Data are presented as mean � sd.FEV1 � forced expiratory volume in 1 s; FVC � forced vital capacity; PEF � peak expiratory flow; Vt � tidal volume; V� � inspiratory flow; Pmax � maximum
inspiratory airway pressure; P1 � airway pressure registered at the point of 0 flow; Rmin,rs � flow resistance of the total respiratory system calculatedimmediately after tracheal intubation; PEEPidyn � dynamic positive end-expiratory pressure.
Table 2. Demographic and Clinical Characteristics of Patients with FEV1/FVC �70%
Variable Thiopental Isoflurane Sevoflurane
Male/female 10/1 15/1 15/2Age (yr) 67 � 9 66 � 11 69 � 8Weight (kg) 76 � 9 77 � 8 69 � 9ASA physical status 2.4 � 0.5 2.4 � 0.5 2.2 � 0.4Smoker/nonsmoker 9/1 16/0 17/0Pack-years 41 � 10 42 � 10 48 � 7FEV1 (% predicted)* 62 � 8 58 � 9 61 � 8FEV1/FVC 0.58 � 0.07 0.56 � 0.08 0.57 � 0.05PEF (% predicted)* 59 � 13 55 � 10 57 � 9Carlens tube (37/39/41) 1/2/4 1/3/6 1/4/7Robertshaw left tube (37/39/41) 0/2/2 1/1/4 0/3/2Vt (I) 0.61 � 0.07 0.59 � 0.08 0.56 � 0.05V� (I/s) 0.52 � 0.14 0.48 � 0.07 0.56 � 0.13Pmax (cm H2O)* 23.8 � 5.2 23 � 4.9 25.1 � 7.9P1 (cm H2) 16.4 � 4.1 15.1 � 3.9 15.6 � 4.9Rmin,rs (cm H2O � I�1 � s�1)* 14.2 � 6.2 15.9 � 7.5 15.3 � 7.8PEEPidyn (cm H2O)* 2.2 � 1.2 2.5 � 1.4 2.1 � 1.0
Data are presented as mean � sd.FEV1 � forced expiratory volume in 1 s; FVC � forced vital capacity; PEF � peak expiratory flow; Vt � tidal volume; V� � inspiratory flow; Pmax � maximum
inspiratory airway pressure; P1 � airway pressure registered at the point of 0 flow; Rmin,rs � flow resistance of the total respiratory system calculatedimmediately after tracheal intubation; PEEPidyn � dynamic positive end-expiratory pressure.
* P � 0.01 compared with patients with FEV1/FVC �70%.
350 CARDIOVASCULAR ANESTHESIA VOLTA ET AL. ANESTH ANALGVOLATILE ANESTHETICS AND CHRONIC AIRWAY OBSTRUCTION 2005;100:348–53
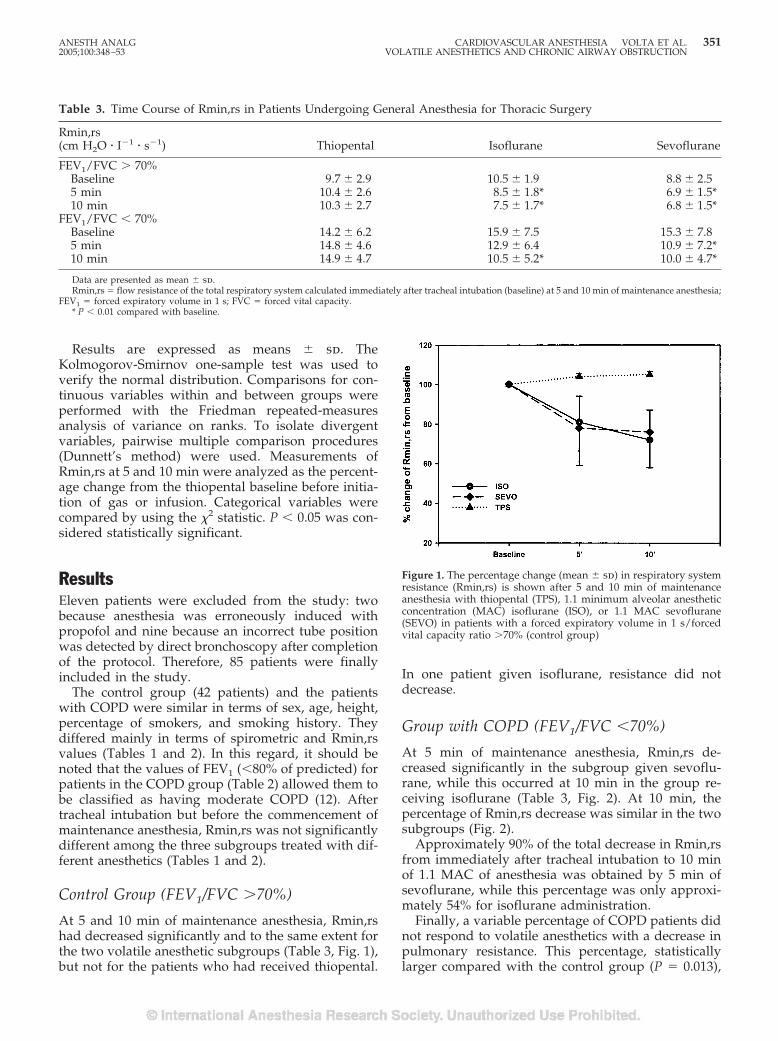
Results are expressed as means � sd. TheKolmogorov-Smirnov one-sample test was used toverify the normal distribution. Comparisons for con-tinuous variables within and between groups wereperformed with the Friedman repeated-measuresanalysis of variance on ranks. To isolate divergentvariables, pairwise multiple comparison procedures(Dunnett’s method) were used. Measurements ofRmin,rs at 5 and 10 min were analyzed as the percent-age change from the thiopental baseline before initia-tion of gas or infusion. Categorical variables werecompared by using the �2 statistic. P � 0.05 was con-sidered statistically significant.
ResultsEleven patients were excluded from the study: twobecause anesthesia was erroneously induced withpropofol and nine because an incorrect tube positionwas detected by direct bronchoscopy after completionof the protocol. Therefore, 85 patients were finallyincluded in the study.
The control group (42 patients) and the patientswith COPD were similar in terms of sex, age, height,percentage of smokers, and smoking history. Theydiffered mainly in terms of spirometric and Rmin,rsvalues (Tables 1 and 2). In this regard, it should benoted that the values of FEV1 (�80% of predicted) forpatients in the COPD group (Table 2) allowed them tobe classified as having moderate COPD (12). Aftertracheal intubation but before the commencement ofmaintenance anesthesia, Rmin,rs was not significantlydifferent among the three subgroups treated with dif-ferent anesthetics (Tables 1 and 2).
Control Group (FEV1/FVC �70%)
At 5 and 10 min of maintenance anesthesia, Rmin,rshad decreased significantly and to the same extent forthe two volatile anesthetic subgroups (Table 3, Fig. 1),but not for the patients who had received thiopental.
In one patient given isoflurane, resistance did notdecrease.
Group with COPD (FEV1/FVC �70%)
At 5 min of maintenance anesthesia, Rmin,rs de-creased significantly in the subgroup given sevoflu-rane, while this occurred at 10 min in the group re-ceiving isoflurane (Table 3, Fig. 2). At 10 min, thepercentage of Rmin,rs decrease was similar in the twosubgroups (Fig. 2).
Approximately 90% of the total decrease in Rmin,rsfrom immediately after tracheal intubation to 10 minof 1.1 MAC of anesthesia was obtained by 5 min ofsevoflurane, while this percentage was only approxi-mately 54% for isoflurane administration.
Finally, a variable percentage of COPD patients didnot respond to volatile anesthetics with a decrease inpulmonary resistance. This percentage, statisticallylarger compared with the control group (P � 0.013),
Table 3. Time Course of Rmin,rs in Patients Undergoing General Anesthesia for Thoracic Surgery
Rmin,rs(cm H2O � I�1 � s�1) Thiopental Isoflurane Sevoflurane
FEV1/FVC � 70%Baseline 9.7 � 2.9 10.5 � 1.9 8.8 � 2.55 min 10.4 � 2.6 8.5 � 1.8* 6.9 � 1.5*10 min 10.3 � 2.7 7.5 � 1.7* 6.8 � 1.5*
FEV1/FVC � 70%Baseline 14.2 � 6.2 15.9 � 7.5 15.3 � 7.85 min 14.8 � 4.6 12.9 � 6.4 10.9 � 7.2*10 min 14.9 � 4.7 10.5 � 5.2* 10.0 � 4.7*
Data are presented as mean � sd.Rmin,rs � flow resistance of the total respiratory system calculated immediately after tracheal intubation (baseline) at 5 and 10 min of maintenance anesthesia;
FEV1 � forced expiratory volume in 1 s; FVC � forced vital capacity.* P � 0.01 compared with baseline.
Figure 1. The percentage change (mean � sd) in respiratory systemresistance (Rmin,rs) is shown after 5 and 10 min of maintenanceanesthesia with thiopental (TPS), 1.1 minimum alveolar anestheticconcentration (MAC) isoflurane (ISO), or 1.1 MAC sevoflurane(SEVO) in patients with a forced expiratory volume in 1 s/forcedvital capacity ratio �70% (control group)
ANESTH ANALG CARDIOVASCULAR ANESTHESIA VOLTA ET AL. 3512005;100:348–53 VOLATILE ANESTHETICS AND CHRONIC AIRWAY OBSTRUCTION
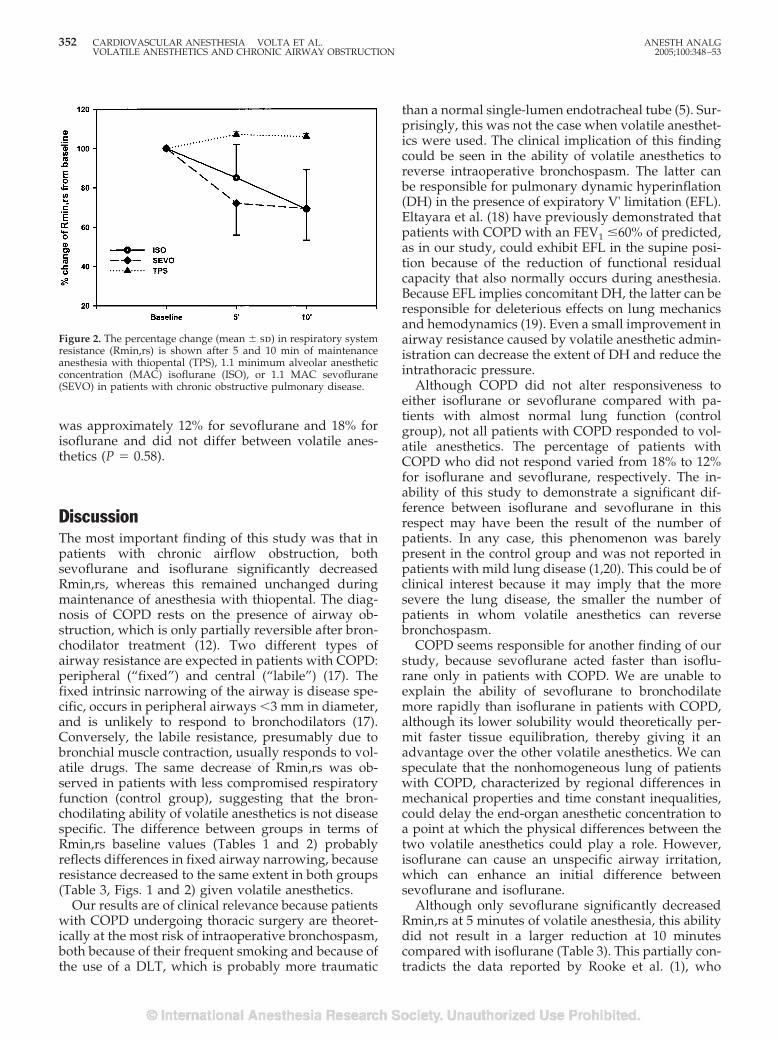
was approximately 12% for sevoflurane and 18% forisoflurane and did not differ between volatile anes-thetics (P � 0.58).
DiscussionThe most important finding of this study was that inpatients with chronic airflow obstruction, bothsevoflurane and isoflurane significantly decreasedRmin,rs, whereas this remained unchanged duringmaintenance of anesthesia with thiopental. The diag-nosis of COPD rests on the presence of airway ob-struction, which is only partially reversible after bron-chodilator treatment (12). Two different types ofairway resistance are expected in patients with COPD:peripheral (“fixed”) and central (“labile”) (17). Thefixed intrinsic narrowing of the airway is disease spe-cific, occurs in peripheral airways �3 mm in diameter,and is unlikely to respond to bronchodilators (17).Conversely, the labile resistance, presumably due tobronchial muscle contraction, usually responds to vol-atile drugs. The same decrease of Rmin,rs was ob-served in patients with less compromised respiratoryfunction (control group), suggesting that the bron-chodilating ability of volatile anesthetics is not diseasespecific. The difference between groups in terms ofRmin,rs baseline values (Tables 1 and 2) probablyreflects differences in fixed airway narrowing, becauseresistance decreased to the same extent in both groups(Table 3, Figs. 1 and 2) given volatile anesthetics.
Our results are of clinical relevance because patientswith COPD undergoing thoracic surgery are theoret-ically at the most risk of intraoperative bronchospasm,both because of their frequent smoking and because ofthe use of a DLT, which is probably more traumatic
than a normal single-lumen endotracheal tube (5). Sur-prisingly, this was not the case when volatile anesthet-ics were used. The clinical implication of this findingcould be seen in the ability of volatile anesthetics toreverse intraoperative bronchospasm. The latter canbe responsible for pulmonary dynamic hyperinflation(DH) in the presence of expiratory V' limitation (EFL).Eltayara et al. (18) have previously demonstrated thatpatients with COPD with an FEV1 �60% of predicted,as in our study, could exhibit EFL in the supine posi-tion because of the reduction of functional residualcapacity that also normally occurs during anesthesia.Because EFL implies concomitant DH, the latter can beresponsible for deleterious effects on lung mechanicsand hemodynamics (19). Even a small improvement inairway resistance caused by volatile anesthetic admin-istration can decrease the extent of DH and reduce theintrathoracic pressure.
Although COPD did not alter responsiveness toeither isoflurane or sevoflurane compared with pa-tients with almost normal lung function (controlgroup), not all patients with COPD responded to vol-atile anesthetics. The percentage of patients withCOPD who did not respond varied from 18% to 12%for isoflurane and sevoflurane, respectively. The in-ability of this study to demonstrate a significant dif-ference between isoflurane and sevoflurane in thisrespect may have been the result of the number ofpatients. In any case, this phenomenon was barelypresent in the control group and was not reported inpatients with mild lung disease (1,20). This could be ofclinical interest because it may imply that the moresevere the lung disease, the smaller the number ofpatients in whom volatile anesthetics can reversebronchospasm.
COPD seems responsible for another finding of ourstudy, because sevoflurane acted faster than isoflu-rane only in patients with COPD. We are unable toexplain the ability of sevoflurane to bronchodilatemore rapidly than isoflurane in patients with COPD,although its lower solubility would theoretically per-mit faster tissue equilibration, thereby giving it anadvantage over the other volatile anesthetics. We canspeculate that the nonhomogeneous lung of patientswith COPD, characterized by regional differences inmechanical properties and time constant inequalities,could delay the end-organ anesthetic concentration toa point at which the physical differences between thetwo volatile anesthetics could play a role. However,isoflurane can cause an unspecific airway irritation,which can enhance an initial difference betweensevoflurane and isoflurane.
Although only sevoflurane significantly decreasedRmin,rs at 5 minutes of volatile anesthesia, this abilitydid not result in a larger reduction at 10 minutescompared with isoflurane (Table 3). This partially con-tradicts the data reported by Rooke et al. (1), who
Figure 2. The percentage change (mean � sd) in respiratory systemresistance (Rmin,rs) is shown after 5 and 10 min of maintenanceanesthesia with thiopental (TPS), 1.1 minimum alveolar anestheticconcentration (MAC) isoflurane (ISO), or 1.1 MAC sevoflurane(SEVO) in patients with chronic obstructive pulmonary disease.
352 CARDIOVASCULAR ANESTHESIA VOLTA ET AL. ANESTH ANALGVOLATILE ANESTHETICS AND CHRONIC AIRWAY OBSTRUCTION 2005;100:348–53
showed that sevoflurane decreased Rmin,rs more thanisoflurane. However, a different effect from volatileanesthetic administration could have been expected inour study because it has been characterized by a pa-tient population with more severe lung disease and bythe use of a more traumatic DLT.
In conclusion, we have demonstrated that bothsevoflurane and isoflurane can bronchodilate patientswith COPD. Although the results are superimposedafter 10 minutes of volatile anesthesia, sevofluraneacts faster than isoflurane. COPD does not alter theindividual’s responsiveness to volatile anesthetics, butrather increases the possibility that patients will notrespond to either sevoflurane or isoflurane.
References1. Rooke GA, Choi JH, Bishop MJ. The effect of isoflurane, halo-
thane, sevoflurane, and thiopental/nitrous oxide on respiratorysystem resistance after tracheal intubation. Anesthesiology1997;86:1294–9.
2. Olsson GL. Bronchospasm during anaesthesia: a computer-aided incidence study of 136,929 patients. Acta AnaesthesiolScand 1987;31:244–52.
3. Gal TJ, Suratt PM. Resistance to breathing in healthy subjectsfollowing endotracheal intubation under topical anesthesia.Anesth Analg 1980;59:270–4.
4. Hirshman CA, Bergman NA. Factors influencing intrapulmo-nary airway calibre during anesthesia. Br J Anaesth 1990;65:30–42.
5. Benomof JL, Alfery DD. Anesthesia for thoracic surgery. In:Miller RD, ed. Anesthesia. 5th ed. Philadelphia: Churchill Liv-ingstone, 2000:1700.
6. Sunyer J, Anto JM, Kogevinas M, et al. Smoking and bronchialresponsiveness in nonatopic and atopic young adults: SpanishGroup of the European Study of Asthma. Thorax 1997;52:235–8.
7. Fernandez A, Lazaro A, Garcia A, et al. Bronchodilators inpatients with chronic obstructive pulmonary disease on me-chanical ventilation. Am Rev Respir Dis 1990;141:164–8.
8. Guerin C, Chevre A, Dessirier P, et al. Inhaled fenoterol-ipratropium bromide in mechanically ventilated patients withchronic obstructive pulmonary disease. Am J Respir Crit CareMed 1999;159:1036–42.
9. Dhand R, Jubran A, Tobin MJ. Bronchodilator delivery bymetered-dose inhaler in ventilator-supported patients. Am JRespir Crit Care Med 1995;151:1827–33.
10. Mouloudi E, Katsanoulas K, Anastasaki M, et al. Bronchodilatordelivery by metered-dose inhaler in mechanically ventilatedCOPD patients: influence of end-inspiratory pause. Eur Respir J1998;12:165–9.
11. Guerin C, LeMasson S, de Varax R, et al. Small airway closureand positive end-expiratory pressure in mechanically ventilatedpatients with chronic obstructive pulmonary disease. Am J Re-spir Crit Care Med 1997;155:1949–56.
12. Pauwels RA, Buist AS, Calverly PMA, et al. Global strategy forthe diagnosis, management, and prevention of chronic obstruc-tive pulmonary disease: NHLBI/WHO Global Initiative forChronic Obstructive Lung Disease (GOLD) Workshop sum-mary. Am J Respir Crit Care Med 2001;163:1256–76.
13. Morris JF, Koski A, Johnson LC. Spirometric standards forhealthy nonsmoking adults. Am Rev Respir Dis 1971;103:57–67.
14. Bates JHT, Rossi A, Milic-Emili J. Analysis of the behavior of therespiratory system with constant inspiratory flow. J ApplPhysiol 1985;58:1840–8.
15. Behrakis PK, Higgs BD, Baydur A, et al. Respiratory mechanicsduring halothane anesthesia and anesthesia-paralysis in hu-mans. J Appl Physiol 1983;55:1085–92.
16. Chiaranda M, Rossi A, Manani G, et al. Measurement of theflow-resistive properties of double-lumen bronchial tubes invitro. Anaesthesia 1989;44:335–40.
17. Pride NB, Macklem PT. Lung mechanics in disease. In: MacklemPT, Mead J, eds. Handbook of physiology: the respiratory sys-tem. Bethesda, MD: American Physiological Society, 1986:664–70.
18. Eltayara L, Becklake MR, Volta CA, et al. Relationship betweenchronic dyspnea and expiratory flow limitation in patients withchronic obstructive pulmonary disease. Am J Respir Crit CareMed 1996;154:1726–34.
19. Rossi A, Polese G, Brandi G, et al. Intrinsic positive end-expiratory pressure (PEEPi). Intensive Care Med 1995;21:522–36.
20. Goff MJ, Shahbaz RA, Arain MD, et al. Absence of bronchodi-lation during desflurane anesthesia. Anesthesiology 2000;93:404–8.
ANESTH ANALG CARDIOVASCULAR ANESTHESIA VOLTA ET AL. 3532005;100:348–53 VOLATILE ANESTHETICS AND CHRONIC AIRWAY OBSTRUCTION
CASE REPORT
Bispectral Index as an Indicator of Cerebral HypoperfusionDuring Off-Pump Coronary Artery Bypass GraftingThomas M. Hemmerling, MD, DEAA, Jean-Francois Olivier, MD, Fadi Basile, MD, FRCP(S)*,Nien Le, and Ignatio Prieto, MD, FRCP(S)*
From the Perioperative Cardiac Research Group (PECARG), Departments of Anesthesiology and *Cardiac Surgery, CentreHospitalier de l’Universite de Montreal (CHUM), Hotel-Dieu, Universite de Montreal, Montreal, Quebec, Canada
Bradycardia and hypotension are common during off-pump coronary artery bypass grafting (OPCAB). Wepresent a case of possible reversible global cerebral hy-poperfusion during distal grafting of the left circumflexcoronary artery. The bispectral index (BIS) suddenlydecreased from values of 45–50 to 0 during distal graft-ing. Neurologic evaluation after immediate tracheal ex-tubation in the operating room was normal and the 58
yr old patient did not suffer any neurologic sequelae.Postoperative recovery was uneventful and the patientwas discharged 5 days after surgery. Cerebral hypoper-fusion is a possible complication during OPCAB. BISmonitoring in OPCAB could be an indicator of cerebralhypoperfusion.
(Anesth Analg 2005;100:354–6)
O ff-pump coronary artery bypass grafting (OP-CAB) is becoming increasingly popular. In ourinstitution 88% of all coronary artery bypass
grafting has been performed as off-pump surgery overthe past year. Advantages of OPCAB in comparison toon-pump surgery have been reported as a decrease inneurological complications, such as ischemic neuro-logic sequelae (1), and a decrease in the general post-operative morbidity (2–4).
Whereas monitoring of the cardiac ischemic compli-cations during OPCAB is readily achieved using trans-esophageal echocardiography (TEE) and 5-lead elec-trocardiography (ECG), monitoring cerebral ischemiais neither easy nor routine. Measurement of cerebralperfusion (pressure) would be the most direct methodof assessing for potential cerebral ischemia. However,this is invasive and not applicable during routine car-diac surgery. Monitoring based on 16-channel electro-encephalography (EEG) has been advocated to iden-tify focal ischemic changes (5). However, for routineuse in cardiac theaters, this is not practical. We presenta case of severe depression of the cortical EEG asnoted on bispectral index (BIS) monitoring during theperiod of myocardial compromise during OPCAB.
Case ReportA 58-year-old male patient with stable angina was sched-uled for elective OPCAB. The patient suffered from three-vessel disease with a stenosis of the left anterior descendingcoronary artery (70%), left circumflex artery (70%), and rightcoronary artery (100%). Global ventricular function wasgood, with an ejection fraction of 60% and no hypokineticarea. The patient had a history of smoking (30 pack-years)with no other medical history.
At arrival in the operating room, a high thoracic epidural(TEA) catheter was inserted at the T3 dermatome for intra-operative and postoperative analgesia. Monitoring includedinvasive femoral artery blood pressure, 5-lead ECG, pulseoximetry, end-tidal carbon dioxide, TEE, and BIS using theA-2000 monitoring system (software version 2.10, updaterate: 1 s to BIS/10 s to trend/DSA, bispectral smoothing �15 s; BIS classic sensor, Aspect Medical, Newton, MA). TheBIS sensor was applied to the forehead and left temporalarea; the initial impedance test showed a very good imped-ance of less than 2 k� at all three sites. After anestheticinduction with fentanyl 3 �g/kg and propofol 1.5 mg/kg,endotracheal intubation was facilitated using rocuronium0.6 mg/kg. Anesthesia was maintained with sevofluranedelivered in 50% oxygen. Analgesia was provided by TEAwith bupivacaine 0.125% at 10 mL/h and one bolus of 8 mLof bupivacaine 0.25% 10–15 min before midline sternotomyand 10–15 min before the end of surgery. Sevoflurane wastitrated to maintain BIS between 40 and 50. Maintenance ofbody temperature was achieved by means of a heated op-erating room (more than 22°C) and a warming blanket forthe lower body. The initial bladder temperature was 36.5°C;it stayed above 35.8°C throughout surgery. Surgery com-menced with hemodynamic stability throughout sternotomyand during preparation of the left internal mammary arteryfor grafting of the left anterior descending coronary artery.
Accepted for publication July 6, 2004.Address correspondence and reprint requests to Thomas M.
Hemmerling, MD, DEAA, Centre Hospitalier de l’Universite deMontreal (CHUM), Hotel-Dieu, Universite de Montreal, 3840, rueSaint-Urbain, Montreal, Quebec, Canada. Address e-mail [email protected].
DOI: 10.1213/01.ANE.0000140245.44494.12
©2005 by the International Anesthesia Research Society354 Anesth Analg 2005;100:354–6 0003-2999/05
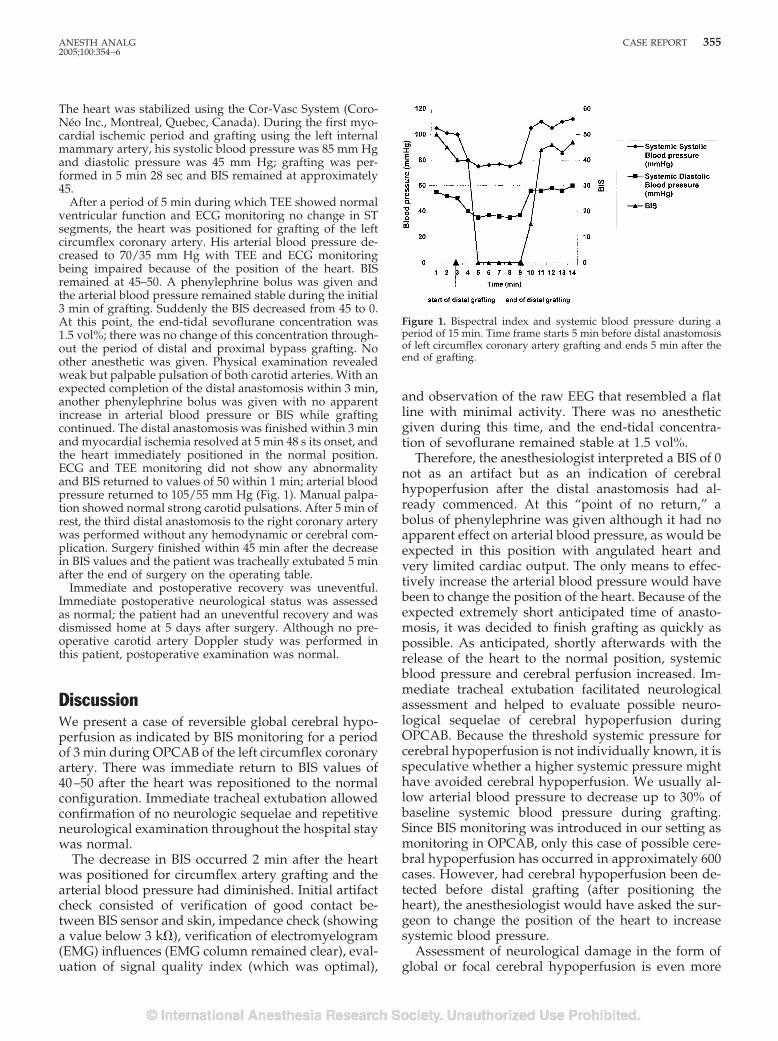
The heart was stabilized using the Cor-Vasc System (Coro-Neo Inc., Montreal, Quebec, Canada). During the first myo-cardial ischemic period and grafting using the left internalmammary artery, his systolic blood pressure was 85 mm Hgand diastolic pressure was 45 mm Hg; grafting was per-formed in 5 min 28 sec and BIS remained at approximately45.
After a period of 5 min during which TEE showed normalventricular function and ECG monitoring no change in STsegments, the heart was positioned for grafting of the leftcircumflex coronary artery. His arterial blood pressure de-creased to 70/35 mm Hg with TEE and ECG monitoringbeing impaired because of the position of the heart. BISremained at 45–50. A phenylephrine bolus was given andthe arterial blood pressure remained stable during the initial3 min of grafting. Suddenly the BIS decreased from 45 to 0.At this point, the end-tidal sevoflurane concentration was1.5 vol%; there was no change of this concentration through-out the period of distal and proximal bypass grafting. Noother anesthetic was given. Physical examination revealedweak but palpable pulsation of both carotid arteries. With anexpected completion of the distal anastomosis within 3 min,another phenylephrine bolus was given with no apparentincrease in arterial blood pressure or BIS while graftingcontinued. The distal anastomosis was finished within 3 minand myocardial ischemia resolved at 5 min 48 s its onset, andthe heart immediately positioned in the normal position.ECG and TEE monitoring did not show any abnormalityand BIS returned to values of 50 within 1 min; arterial bloodpressure returned to 105/55 mm Hg (Fig. 1). Manual palpa-tion showed normal strong carotid pulsations. After 5 min ofrest, the third distal anastomosis to the right coronary arterywas performed without any hemodynamic or cerebral com-plication. Surgery finished within 45 min after the decreasein BIS values and the patient was tracheally extubated 5 minafter the end of surgery on the operating table.
Immediate and postoperative recovery was uneventful.Immediate postoperative neurological status was assessedas normal; the patient had an uneventful recovery and wasdismissed home at 5 days after surgery. Although no pre-operative carotid artery Doppler study was performed inthis patient, postoperative examination was normal.
DiscussionWe present a case of reversible global cerebral hypo-perfusion as indicated by BIS monitoring for a periodof 3 min during OPCAB of the left circumflex coronaryartery. There was immediate return to BIS values of40–50 after the heart was repositioned to the normalconfiguration. Immediate tracheal extubation allowedconfirmation of no neurologic sequelae and repetitiveneurological examination throughout the hospital staywas normal.
The decrease in BIS occurred 2 min after the heartwas positioned for circumflex artery grafting and thearterial blood pressure had diminished. Initial artifactcheck consisted of verification of good contact be-tween BIS sensor and skin, impedance check (showinga value below 3 k�), verification of electromyelogram(EMG) influences (EMG column remained clear), eval-uation of signal quality index (which was optimal),
and observation of the raw EEG that resembled a flatline with minimal activity. There was no anestheticgiven during this time, and the end-tidal concentra-tion of sevoflurane remained stable at 1.5 vol%.
Therefore, the anesthesiologist interpreted a BIS of 0not as an artifact but as an indication of cerebralhypoperfusion after the distal anastomosis had al-ready commenced. At this “point of no return,” abolus of phenylephrine was given although it had noapparent effect on arterial blood pressure, as would beexpected in this position with angulated heart andvery limited cardiac output. The only means to effec-tively increase the arterial blood pressure would havebeen to change the position of the heart. Because of theexpected extremely short anticipated time of anasto-mosis, it was decided to finish grafting as quickly aspossible. As anticipated, shortly afterwards with therelease of the heart to the normal position, systemicblood pressure and cerebral perfusion increased. Im-mediate tracheal extubation facilitated neurologicalassessment and helped to evaluate possible neuro-logical sequelae of cerebral hypoperfusion duringOPCAB. Because the threshold systemic pressure forcerebral hypoperfusion is not individually known, it isspeculative whether a higher systemic pressure mighthave avoided cerebral hypoperfusion. We usually al-low arterial blood pressure to decrease up to 30% ofbaseline systemic blood pressure during grafting.Since BIS monitoring was introduced in our setting asmonitoring in OPCAB, only this case of possible cere-bral hypoperfusion has occurred in approximately 600cases. However, had cerebral hypoperfusion been de-tected before distal grafting (after positioning theheart), the anesthesiologist would have asked the sur-geon to change the position of the heart to increasesystemic blood pressure.
Assessment of neurological damage in the form ofglobal or focal cerebral hypoperfusion is even more
Figure 1. Bispectral index and systemic blood pressure during aperiod of 15 min. Time frame starts 5 min before distal anastomosisof left circumflex coronary artery grafting and ends 5 min after theend of grafting.
ANESTH ANALG CASE REPORT 3552005;100:354–6
difficult and cumbersome. Jugular bulb venous oxy-gen saturation has been used as a sensitive marker forcerebral oxygenation in cardiac surgery (6) but is in-vasive and not used in clinical routine; transcranialDoppler monitoring detecting high intensity transientsignals does detect microemboli but does not reflectcerebral hypoperfusion or clinical neurocognitive out-comes (7). Near-infrared spectrometry might be analternative and has been shown to be useful in carotidartery surgery but has not been systematically evalu-ated in cardiac surgery (8–9). However, one study (10)has already doubted its interchangeable use with jug-ular bulb venous oxygen saturation in cardiac surgery.BIS monitoring has been described for a variety ofindications other than routine monitoring of anes-thetic depth or sedation. The use of BIS during carotidartery surgery to monitor the effects of clamping oncerebral perfusion (3), during resuscitation to monitorthe successfulness of resuscitation in terms of cerebraloutcome (11,12), and during hypotensive periods as amonitor of cerebral hypoperfusion (3) have been doc-umented. A recent study has presented a small seriesof 10 consecutive cases of children undergoing cardiacsurgery in which a reduction of cerebral oxygen satu-ration was accompanied by simultaneous BIS de-creases in five children (13). This might indicate thatBIS monitoring could be an easily applicable monitorof cerebral hypoperfusion and might be an interestingmethod for a multimodal approach of neurologicmonitoring in cardiac surgery (14).
Cerebral hypoperfusion is a risk during OPCAB.Bradycardia and systemic hypotension are commonduring distal grafting and because of positioning theheart using stabilizers. Although TEE and ECG mon-itoring are useful to detect cardiac ischemia (thoughboth are limited by the extreme cardiac positioning),detection of cerebral hypoperfusion remains a chal-lenge. BIS monitoring in OPCAB could help to titratedepth of anesthesia and, in addition, might be a useful
indicator for cerebral hypoperfusion during distal cor-onary artery grafting.
References1. Lee JD, Lee SJ, Tsushima W, et al. Benefits of off-pump bypass
on neurologic and clinical morbidity: a prospective randomizedtrial. Ann Thorac Surg 2003;76:18–26.
2. Al-Ruzzeh S, Ambler G, Asimakopoulos G, et al. Off-PumpCoronary Artery Bypass (OPCAB) surgery reduces risk-stratified morbidity and mortality: a United Kingdom Multi-Center Comparative Analysis of Early Clinical Outcome. Circu-lation 2003;108 Suppl 1:II 1–8.
3. Merat S, Levecque JP, Le Gulluche Y, et al. BIS monitoring mayallow the detection of severe cerebral ischemia. Can J Anaesth2001;48:1066–9.
4. Potger KC, McMillan D, Connolly T, et al. Coronary arterybypass grafting: an off-pump versus on pump review. J ExtraCorpor Technol 2002;34:260–6.
5. Blume WT, Sharbrough FW. EEG monitoring during carotidendarterectomy and open heart surgery. In: Niedermeyer E,Lopes da Silva F, eds. Encephalography, 4th ed. Philadelphia:Lippincott Williams & Wilkins, 1999:797–808.
6. Kadoi Y, Saito S, Kunimoto F, et al. Comparative effects ofpropofol versus fentanyl on cerebral oxygenation state duringnormothermic cardiopulmonary bypass and postoperative cog-nitive dysfunction. Ann Thorac Surg 2003;75:840–6.
7. Nadareishvili ZG, Beletsky V, Black SE, et al. Is cerebral micro-embolism in mechanical prosthetic heart valve clinically rele-vant? J Neuroimaging 2002;12:310–5.
8. Tsuji M, du Plessis A, Taylor G, et al. Near infrared spectros-copy detects cerebral ischemia during hypotension in piglets.Pediatr Res 1998;44:591–5.
9. Roberts IG, Fallon P, Kirkham FJ, et al. Measurement of cerebralblood flow during cardiopulmonary bypass with near-infraredspectroscopy. J Thorac Cardiovasc Surg 1998;115:94–102.
10. Ali MS, Harmer M, Vaughan RS, et al. Spatially resolved spec-troscopy (NIRO-300) does not agree with jugular bulb oxygensaturation in patients undergoing warm bypass surgery. Can JAnaesth 2001;48:497–501.
11. Szekely B, Saint-Marc T, Degremont AC, et al. Value of bispec-tral index monitoring during cardiopulmonary resuscitation.Br J Anaesth 2002;88:443–4.
12. Kluger MT. The bispectral index during an anaphylactic circu-latory arrest. Anaesth Intensive Care 2001;29:544–7.
13. Hayashida M, Chinzei M, Komatsu K, et al. Detection of cere-bral hypoperfusion with bispectral index during paediatric car-diac surgery. Br J Anaesth 2003;90:694–8.
14. Edmonds HL Jr. Multi-modality neurophysiologic monitoringfor cardiac surgery. Heart Surg Forum 2002;5:225–8.
356 CASE REPORT ANESTH ANALG2005;100:354–6
PEDIATRIC ANESTHESIA SOCIETY FOR PEDIATRIC ANESTHESIASECTION EDITOR
PETER J. DAVIS
Pressure Support Ventilation Versus Continuous PositiveAirway Pressure Ventilation with the ProSeal™ LaryngealMask Airway: A Randomized Crossover Study of AnesthetizedPediatric PatientsA. von Goedecke, MD*, J. Brimacombe, MB, ChB, FRCA, MD†, C. Hormann, MD*,H.-C. Jeske, MD*, A. Kleinsasser, MD*, and C. Keller, MD*
*Department of Anaesthesia and Intensive Care Medicine, Leopold-Franzens University, Innsbruck, Austria; and†James Cook University, Cairns Base Hospital, Australia
Continuous positive airway pressure (CPAP) and pres-sure support ventilation (PSV) improve gas exchange inadults, but there are little published data regarding chil-dren. We compared the efficacy of PSV with CPAP inanesthetized children managed with the ProSeal™ laryn-geal mask airway. Patients were randomized into twoequal-sized crossover groups and data were collected be-fore surgery. In Group 1, patients underwent CPAP, PSV,and CPAP in sequence. In Group 2, patients underwentPSV, CPAP, and PSV in sequence. PSV comprised posi-tive end-expiratory pressure set at 3 cm H2O and inspira-tory pressure support set at 10 cm H2O above positiveend-expiratory pressure. CPAP was set at 3 cm H2O. Eachventilatory mode was maintained for 5 min. The follow-ing data were recorded at each ventilatory mode: ETco2,Spo2, expired tidal volume, peak airway pressure, workof breathing patient (WOB), � esophageal pressure, pres-sure time product, respiratory drive, inspiratory timefraction, respiratory rate, noninvasive mean arterial blood
pressure, and heart rate. In Group 1, measurements forCPAP were similar before and after PSV. In Group 2, mea-surements for PSV were similar before and after CPAP.When compared with CPAP, PSV had lower ETco2 (46 �6 versus 52 � 7 mm Hg; P � 0.001), slower respiratory rate(24 � 6 versus 30 � 6 min�1; P � 0.001), lower WOB (0.54� 0.54 versus 0.95 � 0.72 JL�1; P � 0.05), lower pressuretime product (94 � 88 versus 150 � 90 cm H2O s�1min�1;P � 0.001), lower � esophageal pressure (10.6 � 7.4 versus14.1 � 8.9 cm H2O; P � 0.05), lower inspiratory time frac-tion (29% � 3% versus 34% � 5%; P � 0.001), and higherexpired tidal volume (179 � 50 versus 129 � 44 mL; P �0.001). There were no differences in Spo2, respiratorydrive, mean arterial blood pressure, and heart rate. Weconclude that PSV improves gas exchange and reducesWOB during ProSeal™ laryngeal mask airway anesthesiacompared with CPAP in ASA physical status I childrenaged 1–7 yr.
(Anesth Analg 2005;100:357–60)
S pontaneous breathing (SB) is a popular mode ofventilation with the classic laryngeal mask airway(LMA) in children (1–3), but it is frequently asso-
ciated with inadequate gas exchange, particularly hyper-capnia. Studies of children managed with a tracheal tube(4,5) have shown that pressure support ventilation (PSV)improves gas exchange and/or work of breathing(WOB) during SB. A study of children aged 2 � 2 yr
managed with the classic LMA showed that continuouspositive airway pressure (CPAP) reduces WOB duringSB (6). There are no publications comparing the efficacyof PSV and CPAP with any LMA device in children. TheProSeal™ LMA (PLMA) is a new LMA with a modifiedcuff to improve the seal and a drain tube that preventsgastric insufflation when correctly positioned (7–9), butthere are no published data about its use in children. Inthe following randomized, crossover study, we com-pared the efficacy of PSV with CPAP in healthy anesthe-tized pediatric patients aged 1–7 yr undergoing routinesurgery managed with the PLMA.
MethodsTwenty consecutive children (ASA physical status I,aged 1–7 yr) undergoing general or urologic surgery
This project was supported solely by departmental resources.JB and CK have worked as consultants for The Laryngeal Mask
Company, who manufacture the ProSeal™ laryngeal mask airway.Accepted for publication August 11, 2004.Address correspondence and reprint requests to Professor J. Bri-
macombe, Department of Anesthesia and Intensive Care, CairnsBase Hospital, The Esplanade, Cairns 4870, Australia. Addresse-mail to [email protected].
DOI: 10.1213/01.ANE.0000143563.39519.FD
©2005 by the International Anesthesia Research Society0003-2999/05 Anesth Analg 2005;100:357–60 357
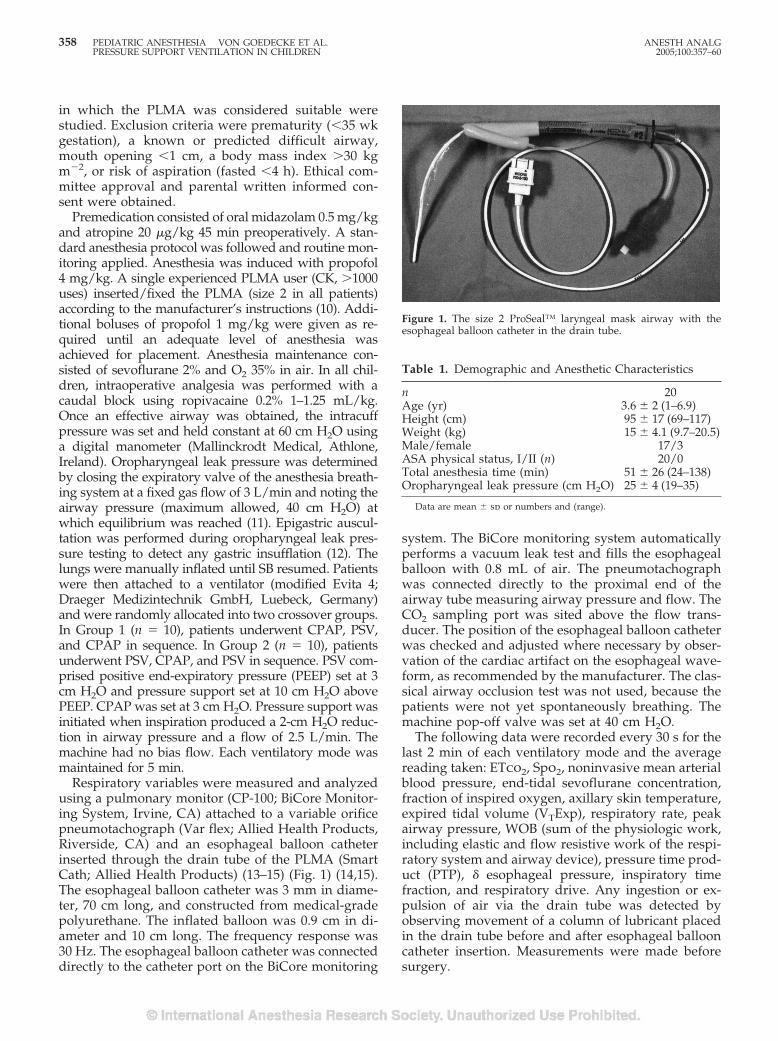
in which the PLMA was considered suitable werestudied. Exclusion criteria were prematurity (�35 wkgestation), a known or predicted difficult airway,mouth opening �1 cm, a body mass index �30 kgm�2, or risk of aspiration (fasted �4 h). Ethical com-mittee approval and parental written informed con-sent were obtained.
Premedication consisted of oral midazolam 0.5 mg/kgand atropine 20 �g/kg 45 min preoperatively. A stan-dard anesthesia protocol was followed and routine mon-itoring applied. Anesthesia was induced with propofol4 mg/kg. A single experienced PLMA user (CK, �1000uses) inserted/fixed the PLMA (size 2 in all patients)according to the manufacturer’s instructions (10). Addi-tional boluses of propofol 1 mg/kg were given as re-quired until an adequate level of anesthesia wasachieved for placement. Anesthesia maintenance con-sisted of sevoflurane 2% and O2 35% in air. In all chil-dren, intraoperative analgesia was performed with acaudal block using ropivacaine 0.2% 1–1.25 mL/kg.Once an effective airway was obtained, the intracuffpressure was set and held constant at 60 cm H2O usinga digital manometer (Mallinckrodt Medical, Athlone,Ireland). Oropharyngeal leak pressure was determinedby closing the expiratory valve of the anesthesia breath-ing system at a fixed gas flow of 3 L/min and noting theairway pressure (maximum allowed, 40 cm H2O) atwhich equilibrium was reached (11). Epigastric auscul-tation was performed during oropharyngeal leak pres-sure testing to detect any gastric insufflation (12). Thelungs were manually inflated until SB resumed. Patientswere then attached to a ventilator (modified Evita 4;Draeger Medizintechnik GmbH, Luebeck, Germany)and were randomly allocated into two crossover groups.In Group 1 (n � 10), patients underwent CPAP, PSV,and CPAP in sequence. In Group 2 (n � 10), patientsunderwent PSV, CPAP, and PSV in sequence. PSV com-prised positive end-expiratory pressure (PEEP) set at 3cm H2O and pressure support set at 10 cm H2O abovePEEP. CPAP was set at 3 cm H2O. Pressure support wasinitiated when inspiration produced a 2-cm H2O reduc-tion in airway pressure and a flow of 2.5 L/min. Themachine had no bias flow. Each ventilatory mode wasmaintained for 5 min.
Respiratory variables were measured and analyzedusing a pulmonary monitor (CP-100; BiCore Monitor-ing System, Irvine, CA) attached to a variable orificepneumotachograph (Var flex; Allied Health Products,Riverside, CA) and an esophageal balloon catheterinserted through the drain tube of the PLMA (SmartCath; Allied Health Products) (13–15) (Fig. 1) (14,15).The esophageal balloon catheter was 3 mm in diame-ter, 70 cm long, and constructed from medical-gradepolyurethane. The inflated balloon was 0.9 cm in di-ameter and 10 cm long. The frequency response was30 Hz. The esophageal balloon catheter was connecteddirectly to the catheter port on the BiCore monitoring
system. The BiCore monitoring system automaticallyperforms a vacuum leak test and fills the esophagealballoon with 0.8 mL of air. The pneumotachographwas connected directly to the proximal end of theairway tube measuring airway pressure and flow. TheCO2 sampling port was sited above the flow trans-ducer. The position of the esophageal balloon catheterwas checked and adjusted where necessary by obser-vation of the cardiac artifact on the esophageal wave-form, as recommended by the manufacturer. The clas-sical airway occlusion test was not used, because thepatients were not yet spontaneously breathing. Themachine pop-off valve was set at 40 cm H2O.
The following data were recorded every 30 s for thelast 2 min of each ventilatory mode and the averagereading taken: ETco2, Spo2, noninvasive mean arterialblood pressure, end-tidal sevoflurane concentration,fraction of inspired oxygen, axillary skin temperature,expired tidal volume (VTExp), respiratory rate, peakairway pressure, WOB (sum of the physiologic work,including elastic and flow resistive work of the respi-ratory system and airway device), pressure time prod-uct (PTP), � esophageal pressure, inspiratory timefraction, and respiratory drive. Any ingestion or ex-pulsion of air via the drain tube was detected byobserving movement of a column of lubricant placedin the drain tube before and after esophageal ballooncatheter insertion. Measurements were made beforesurgery.
Table 1. Demographic and Anesthetic Characteristics
n 20Age (yr) 3.6 � 2 (1–6.9)Height (cm) 95 � 17 (69–117)Weight (kg) 15 � 4.1 (9.7–20.5)Male/female 17/3ASA physical status, I/II (n) 20/0Total anesthesia time (min) 51 � 26 (24–138)Oropharyngeal leak pressure (cm H2O) 25 � 4 (19–35)
Data are mean � sd or numbers and (range).
Figure 1. The size 2 ProSeal™ laryngeal mask airway with theesophageal balloon catheter in the drain tube.
358 PEDIATRIC ANESTHESIA VON GOEDECKE ET AL. ANESTH ANALGPRESSURE SUPPORT VENTILATION IN CHILDREN 2005;100:357–60
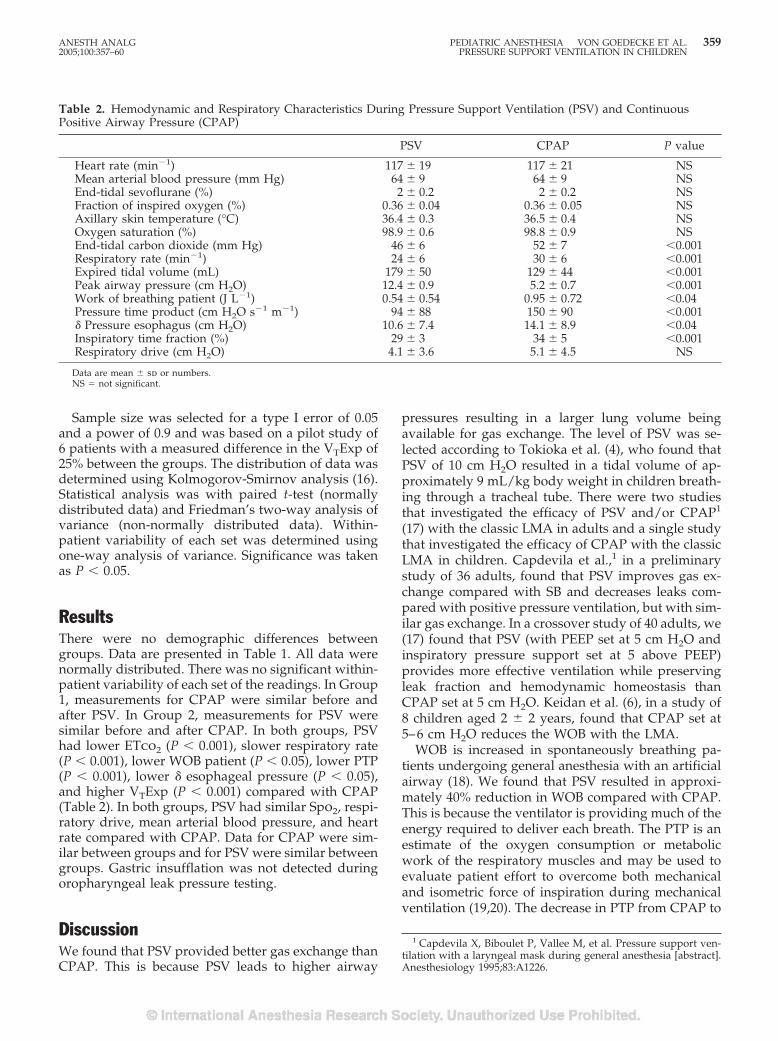
Sample size was selected for a type I error of 0.05and a power of 0.9 and was based on a pilot study of6 patients with a measured difference in the VTExp of25% between the groups. The distribution of data wasdetermined using Kolmogorov-Smirnov analysis (16).Statistical analysis was with paired t-test (normallydistributed data) and Friedman’s two-way analysis ofvariance (non-normally distributed data). Within-patient variability of each set was determined usingone-way analysis of variance. Significance was takenas P � 0.05.
ResultsThere were no demographic differences betweengroups. Data are presented in Table 1. All data werenormally distributed. There was no significant within-patient variability of each set of the readings. In Group1, measurements for CPAP were similar before andafter PSV. In Group 2, measurements for PSV weresimilar before and after CPAP. In both groups, PSVhad lower ETco2 (P � 0.001), slower respiratory rate(P � 0.001), lower WOB patient (P � 0.05), lower PTP(P � 0.001), lower � esophageal pressure (P � 0.05),and higher VTExp (P � 0.001) compared with CPAP(Table 2). In both groups, PSV had similar Spo2, respi-ratory drive, mean arterial blood pressure, and heartrate compared with CPAP. Data for CPAP were sim-ilar between groups and for PSV were similar betweengroups. Gastric insufflation was not detected duringoropharyngeal leak pressure testing.
DiscussionWe found that PSV provided better gas exchange thanCPAP. This is because PSV leads to higher airway
pressures resulting in a larger lung volume beingavailable for gas exchange. The level of PSV was se-lected according to Tokioka et al. (4), who found thatPSV of 10 cm H2O resulted in a tidal volume of ap-proximately 9 mL/kg body weight in children breath-ing through a tracheal tube. There were two studiesthat investigated the efficacy of PSV and/or CPAP1
(17) with the classic LMA in adults and a single studythat investigated the efficacy of CPAP with the classicLMA in children. Capdevila et al.,1 in a preliminarystudy of 36 adults, found that PSV improves gas ex-change compared with SB and decreases leaks com-pared with positive pressure ventilation, but with sim-ilar gas exchange. In a crossover study of 40 adults, we(17) found that PSV (with PEEP set at 5 cm H2O andinspiratory pressure support set at 5 above PEEP)provides more effective ventilation while preservingleak fraction and hemodynamic homeostasis thanCPAP set at 5 cm H2O. Keidan et al. (6), in a study of8 children aged 2 � 2 years, found that CPAP set at5–6 cm H2O reduces the WOB with the LMA.
WOB is increased in spontaneously breathing pa-tients undergoing general anesthesia with an artificialairway (18). We found that PSV resulted in approxi-mately 40% reduction in WOB compared with CPAP.This is because the ventilator is providing much of theenergy required to deliver each breath. The PTP is anestimate of the oxygen consumption or metabolicwork of the respiratory muscles and may be used toevaluate patient effort to overcome both mechanicaland isometric force of inspiration during mechanicalventilation (19,20). The decrease in PTP from CPAP to
1 Capdevila X, Biboulet P, Vallee M, et al. Pressure support ven-tilation with a laryngeal mask during general anesthesia [abstract].Anesthesiology 1995;83:A1226.
Table 2. Hemodynamic and Respiratory Characteristics During Pressure Support Ventilation (PSV) and ContinuousPositive Airway Pressure (CPAP)
PSV CPAP P value
Heart rate (min�1) 117 � 19 117 � 21 NSMean arterial blood pressure (mm Hg) 64 � 9 64 � 9 NSEnd-tidal sevoflurane (%) 2 � 0.2 2 � 0.2 NSFraction of inspired oxygen (%) 0.36 � 0.04 0.36 � 0.05 NSAxillary skin temperature (°C) 36.4 � 0.3 36.5 � 0.4 NSOxygen saturation (%) 98.9 � 0.6 98.8 � 0.9 NSEnd-tidal carbon dioxide (mm Hg) 46 � 6 52 � 7 �0.001Respiratory rate (min�1) 24 � 6 30 � 6 �0.001Expired tidal volume (mL) 179 � 50 129 � 44 �0.001Peak airway pressure (cm H2O) 12.4 � 0.9 5.2 � 0.7 �0.001Work of breathing patient (J L�1) 0.54 � 0.54 0.95 � 0.72 �0.04Pressure time product (cm H2O s�1 m�1) 94 � 88 150 � 90 �0.001� Pressure esophagus (cm H2O) 10.6 � 7.4 14.1 � 8.9 �0.04Inspiratory time fraction (%) 29 � 3 34 � 5 �0.001Respiratory drive (cm H2O) 4.1 � 3.6 5.1 � 4.5 NS
Data are mean � sd or numbers.NS � not significant.
ANESTH ANALG PEDIATRIC ANESTHESIA VON GOEDECKE ET AL. 3592005;100:357–60 PRESSURE SUPPORT VENTILATION IN CHILDREN
PSV reflects the reduced respiratory muscle workloadand the increased ventilator workload.
We found that that the oropharyngeal leak pressurewas 25 cm H2O. This is 13 cm H2O higher than withthe classic LMA using the same methodology in chil-dren of similar age (21). This suggests that the size 2PLMA forms a better seal that the classic LMA, but acomparative study between the 2 devices is requiredto confirm this. We detected no episodes of gastricinsufflation during oropharyngeal leak pressure test-ing. PSV and CPAP should be safer with the PLMAthan the classic LMA, because the efficacy of the sealwith the hypopharynx is probably greater (22) andany esophageal leaks should be vented from the draintube if it is correctly positioned. We detected no dif-ferences in cardiovascular effects between PSV andCPAP. This is not surprising, because intrathoracicpressure changes were only 7 cm H2O higher for PSV.
Our study has a number of limitations. First, onlyhealthy ASA physical status I children without under-lying respiratory disease or obesity were enrolled inthe study and our results may not be applicable toother patient populations. Second, we did not meas-ure the arterial partial pressure of oxygen, which is amore sensitive test of oxygenation than oxygen satu-ration, and it is possible that subtle differences inoxygenation went undetected. Third, the data werecollected over a short period before commencement ofsurgery and, in principle, our results may not be ap-plicable to prolonged SB. However, if anything, thedifferences between PSV and CPAP are likely to in-crease with duration because of greater respiratoryfatigue with CPAP.
We conclude that PSV improves gas exchange andreduces WOB during PLMA anesthesia comparedwith CPAP in ASA physical status I children aged 1–7years.
References1. Moylan SL, Luce MA. The reinforced laryngeal mask airway in
paediatric radiotherapy. Br J Anaesth 1993;71:172.2. St Claire Logan A, Morris P. Complications following use of the
laryngeal mask airway in children. Paediatr Anaesth 1993;3:297–300.
3. Lopez-Gil M, Brimacombe J, Alvarez M. Safety and efficacy ofthe laryngeal mask airway: a prospective survey of 1400 chil-dren. Anaesthesia 1996;51:969–72.
4. Tokioka H, Kinjo M, Hirakawa M. The effectiveness of pressuresupport ventilation for mechanical ventilatory support in chil-dren. Anesthesiology 1993;78:880–4.
5. Jarreau PH, Moriette G, Mussat P, et al. Patient-triggered ven-tilation decreases the work of breathing in neonates. Am JRespir Crit Care Med 1996;153:1176–81.
6. Keidan I, Fine GF, Kagawa T, et al. Work of breathing duringspontaneous ventilation in anesthetized children: a comparativestudy among the face mask, laryngeal mask airway and endo-tracheal tube. Anesth Analg 2000;91:1381–8.
7. Brain AIJ, Verghese C, Strube PJ. The LMA ‘ProSeal’: a laryngealmask with an oesophageal vent. Br J Anaesth 2000;84:650–4.
8. Brimacombe J, Keller C. The ProSeal laryngeal mask airway: arandomized, crossover study with the standard laryngeal maskairway in paralyzed, anesthetized patients. Anesthesiology2000;93:104–9.
9. Brimacombe J, Keller C, Fullekrug B, et al. A multicenter studycomparing the ProSeal with the Classic laryngeal mask airwayin anesthetized, nonparalyzed patients. Anesthesiology 2002;96:289–95.
10. Verghese C. LMA-Classic™, LMAFlexible™, LMAUnique™: in-struction manual. Henley-on-Thames: The Laryngeal MaskCompany, 1999.
11. Keller C, Brimacombe J, Keller K, Morris R. A comparison offour methods for assessing airway sealing pressure with thelaryngeal mask airway in adult patients. Br J Anaesth 1999;82:286–7.
12. Brimacombe J, Keller C, Kurian S, Myles J. Reliability of epigas-tric auscultation to detect gastric insufflation. Br J Anaesth 2002;88:127–9.
13. Petros AJ, Lamond CT, Bennett D. The Bicore pulmonarymonitor: a device to assess the work of breathing while weaningfrom mechanical ventilation. Anaesthesia 1993;48:985–8.
14. Banner MJ, Kirby RR, Blanch PB, Layon AJ. Decreasing imposedwork of the breathing apparatus to zero using pressure-supportventilation. Crit Care Med 1993;21:1333–8.
15. Thomas AM, Turner RE, Tenholder MF. Esophageal pressuremeasurements in cardiopulmonary exercise testing. Chest 1997;112:829–32.
16. Gaddis GM, Gaddis ML. Introduction to biostatistics. Part 5.Statistical inference techniques for hypothesis testing with non-parametric data. Ann Emerg Med 1990;19:1054–9.
17. Brimacombe J, Keller C, Hormann C. Pressure support ventila-tion versus continuous positive airway pressure with the laryn-geal mask airway: a randomized crossover study of anesthe-tized adult patients. Anesthesiology 2000;92:1621–3.
18. Westbrook PR, Stubbs SE, Sessler AD, et al. Effects of anesthesiaand muscle paralysis on respiratory mechanics in normal man.J Appl Physiol 1973;34:81–6.
19. Collett PW, Perry C, Englel LA. Pressure-time product, flow,and oxygen cost of resistive breathing in humans. J ApplPhysiol 1985;58:1263–72.
20. Sassoon CS, Light RW, Lodia R, et al. Pressure-time productduring continuous positive airway pressure, pressure supportventilation and T-piece during weaning from mechanical ven-tilation. Am Rev Respir Dis 1991;143:469–75.
21. Lopez-Gil M, Brimacombe J, Keller C. A comparison of fourmethods for assessing oropharyngeal leak pressure with thelaryngeal mask airway in paediatric patients. Paediatr Anaesth2000;11:319–21.
22. Keller C, Brimacombe J, Kleinsasser A, Loeckinger A. Does theProSeal laryngeal mask airway prevent aspiration of regurgi-tated fluid? Anesth Analg 2000;91:1017–20.
360 PEDIATRIC ANESTHESIA VON GOEDECKE ET AL. ANESTH ANALGPRESSURE SUPPORT VENTILATION IN CHILDREN 2005;100:357–60
CASE REPORTS
Anesthetic Management for Thoracopagus Twins withComplex Cyanotic Heart Disease in the Magnetic ResonanceImaging SuiteErik Shank, MD, Naveen Manohar, MD, and Ulrich Schmidt, MD
Department of Anesthesia and Critical Care, Massachusetts General Hospital, Boston, Massachusetts
We report a case of thoracopagus twins undergoingmagnetic resonance imaging (MRI) studies undergeneral anesthesia. The twins had a complex sharedcardiac anatomy that posed additional challenges to
an already-difficult anesthesia care area. This reportemphasizes the approach to anesthetic managementof conjoined twins in the MRI environment.
(Anesth Analg 2005;100:361–4)
W e report an unusual case of thoracopagus con-joined twins requiring general anesthesia formagnetic resonance imaging (MRI) angiog-
raphy of complex cardiac anatomy. The delivery ofanesthesia to conjoined twins itself presents uniquechallenges, and these are intensified in the difficultenvironment of the MRI scanner.
Case ReportA pair of female thoracopagus twins were delivered bycesarean delivery at �26 wk gestational age. They weighed3.95 kg. Apgar scores were 7 for Twin 1 and 8 for Twin 2.They were observed for a week in the neonatal intensivecare unit (ICU), where they displayed no issues with feed-ing, voiding, or bowel movements. Both twins had oxygensaturations of 70%–80% on 4 L/min of blow-by oxygen.Diagnostic computed tomographic studies indicated twosets of lungs, kidneys, intestines, and gallbladders. Thereappeared to be one shared liver and one pericardial saccontaining two hearts and four chambers.
They were transferred to our hospital for further evalua-tion for potential separation surgery. On arrival, they were1.5 mo old. Their combined weight was 4.75 kg. Besidesblow-by oxygen supplementation at �4 L/min, neither twinwas receiving any medications. Both twins were tachypneicwith transient respiratory rates as frequent as 80 breaths/min. Vital signs were as follows: Twin 1 had an arterialblood pressure of 79/41 mm Hg, a heart rate of 125 bpm, arespiratory rate of 60–80 breaths/min, and an oxygen satu-ration of 85% and was afebrile. Twin 2 had an arterial blood
pressure of 65/29 mm Hg, a heart rate of 125 bpm, a respi-ratory rate of 60–80 breaths/min, and an oxygen saturationof 78% and was also afebrile. Visually, their electrocardio-grams (ECGs) appeared identical. Both twins would desatu-rate into the mid 60s with feeding.
Echocardiography of the twins revealed the followingcomplex circulation (Fig. 1): the twins were anatomicallyjoined at the atrial and ventricular level but maintainedindependent inflow and outflow tracts. The systemic venousreturn from both infants pooled in a common atrium. Therewas mixing of pulmonary venous return from both twinswith their systemic venous return at the shared atrial level.Twin 1’s left ventricle and Twin 2’s right ventricle werefused to form a common shared ventricle. The commonventricle ejected through Twin 2’s pulmonary artery andTwin 1’s slightly hypoplastic aorta. Twin 1’s outflow tractwas proximal to her mitral inflow tract, which enabled her tomaintain a higher saturation than her sister.
Cardiac angiography and hepatic cholangiography wereplanned via MRI in anticipation of future surgical separa-tion. Because of the expected length of the procedure (�5 h)and the need for relative immobility of the patients, generalanesthesia was requested.
The setup for anesthesia consisted of two In Vivo Millen-nia (In Vivo Research, Orlando, FL) MRI monitors and twoMRI-compatible Narkomed MRI-2 anesthesia machines(Drager Medical AG, Lubeck, Germany) (Fig. 2). Addition-ally, two Harvard 2 infusion pumps (Harvard Clinical, Bos-ton, MA) were used. Because pumps are not MRI compati-ble, they remained outside the MRI room, and tubing wasrun through ports in the wall. The In Vivo monitors displaypulse oximetry, end-tidal capnography, ECG, and noninva-sive blood pressure.
Routine noninvasive monitors (noninvasive blood pres-sure, ECG, and pulse oximetry) were applied to each twin,and 24-gauge peripheral IV access was established in one ofeach twin’s lower extremities. Each twin was administeredoxygen (fraction of inspired oxygen [Fio2], 1.0) via facemask. Atropine 40 �g was administered simultaneously toeach twin, followed by 10 mg of ketamine IV (4 mg/kg), also
Accepted for publication July 16, 2004.Address correspondence and reprint requests to Erik Shank, MD,
Department of Anesthesia and Critical Care, Massachusetts GeneralHospital, Boston, MA 02114. Address e-mail to [email protected].
DOI: 10.1213/01.ANE.0000140952.35504.4D
©2005 by the International Anesthesia Research Society0003-2999/05 Anesth Analg 2005;100:361–4 361
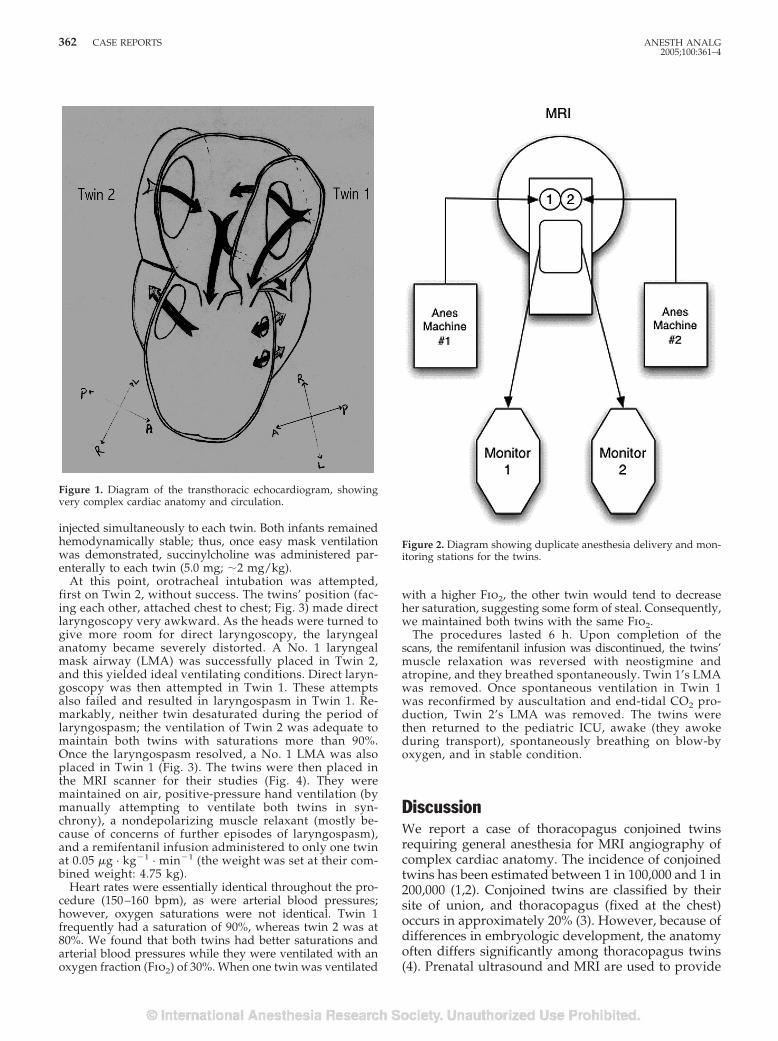
injected simultaneously to each twin. Both infants remainedhemodynamically stable; thus, once easy mask ventilationwas demonstrated, succinylcholine was administered par-enterally to each twin (5.0 mg; �2 mg/kg).
At this point, orotracheal intubation was attempted,first on Twin 2, without success. The twins’ position (fac-ing each other, attached chest to chest; Fig. 3) made directlaryngoscopy very awkward. As the heads were turned togive more room for direct laryngoscopy, the laryngealanatomy became severely distorted. A No. 1 laryngealmask airway (LMA) was successfully placed in Twin 2,and this yielded ideal ventilating conditions. Direct laryn-goscopy was then attempted in Twin 1. These attemptsalso failed and resulted in laryngospasm in Twin 1. Re-markably, neither twin desaturated during the period oflaryngospasm; the ventilation of Twin 2 was adequate tomaintain both twins with saturations more than 90%.Once the laryngospasm resolved, a No. 1 LMA was alsoplaced in Twin 1 (Fig. 3). The twins were then placed inthe MRI scanner for their studies (Fig. 4). They weremaintained on air, positive-pressure hand ventilation (bymanually attempting to ventilate both twins in syn-chrony), a nondepolarizing muscle relaxant (mostly be-cause of concerns of further episodes of laryngospasm),and a remifentanil infusion administered to only one twinat 0.05 �g · kg�1 · min�1 (the weight was set at their com-bined weight: 4.75 kg).
Heart rates were essentially identical throughout the pro-cedure (150–160 bpm), as were arterial blood pressures;however, oxygen saturations were not identical. Twin 1frequently had a saturation of 90%, whereas twin 2 was at80%. We found that both twins had better saturations andarterial blood pressures while they were ventilated with anoxygen fraction (Fio2) of 30%. When one twin was ventilated
with a higher Fio2, the other twin would tend to decreaseher saturation, suggesting some form of steal. Consequently,we maintained both twins with the same Fio2.
The procedures lasted 6 h. Upon completion of thescans, the remifentanil infusion was discontinued, the twins’muscle relaxation was reversed with neostigmine andatropine, and they breathed spontaneously. Twin 1’s LMAwas removed. Once spontaneous ventilation in Twin 1was reconfirmed by auscultation and end-tidal CO2 pro-duction, Twin 2’s LMA was removed. The twins werethen returned to the pediatric ICU, awake (they awokeduring transport), spontaneously breathing on blow-byoxygen, and in stable condition.
DiscussionWe report a case of thoracopagus conjoined twinsrequiring general anesthesia for MRI angiography ofcomplex cardiac anatomy. The incidence of conjoinedtwins has been estimated between 1 in 100,000 and 1 in200,000 (1,2). Conjoined twins are classified by theirsite of union, and thoracopagus (fixed at the chest)occurs in approximately 20% (3). However, because ofdifferences in embryologic development, the anatomyoften differs significantly among thoracopagus twins(4). Prenatal ultrasound and MRI are used to provide
Figure 1. Diagram of the transthoracic echocardiogram, showingvery complex cardiac anatomy and circulation.
Figure 2. Diagram showing duplicate anesthesia delivery and mon-itoring stations for the twins.
362 CASE REPORTS ANESTH ANALG2005;100:361–4
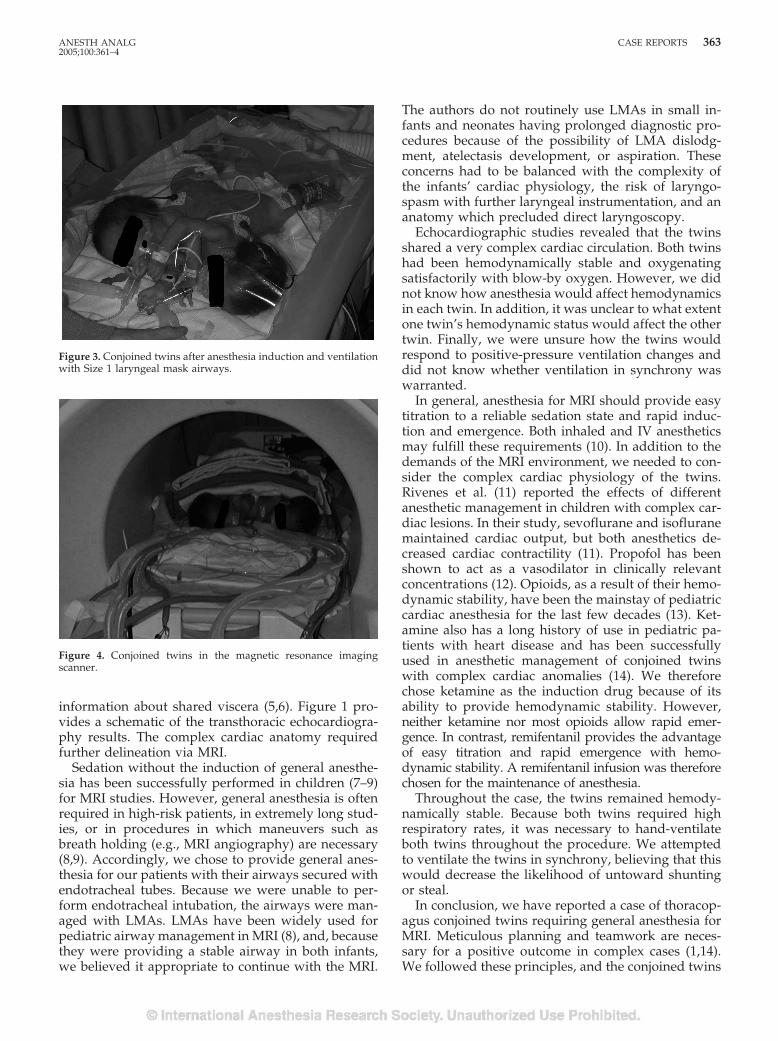
information about shared viscera (5,6). Figure 1 pro-vides a schematic of the transthoracic echocardiogra-phy results. The complex cardiac anatomy requiredfurther delineation via MRI.
Sedation without the induction of general anesthe-sia has been successfully performed in children (7–9)for MRI studies. However, general anesthesia is oftenrequired in high-risk patients, in extremely long stud-ies, or in procedures in which maneuvers such asbreath holding (e.g., MRI angiography) are necessary(8,9). Accordingly, we chose to provide general anes-thesia for our patients with their airways secured withendotracheal tubes. Because we were unable to per-form endotracheal intubation, the airways were man-aged with LMAs. LMAs have been widely used forpediatric airway management in MRI (8), and, becausethey were providing a stable airway in both infants,we believed it appropriate to continue with the MRI.
The authors do not routinely use LMAs in small in-fants and neonates having prolonged diagnostic pro-cedures because of the possibility of LMA dislodg-ment, atelectasis development, or aspiration. Theseconcerns had to be balanced with the complexity ofthe infants’ cardiac physiology, the risk of laryngo-spasm with further laryngeal instrumentation, and ananatomy which precluded direct laryngoscopy.
Echocardiographic studies revealed that the twinsshared a very complex cardiac circulation. Both twinshad been hemodynamically stable and oxygenatingsatisfactorily with blow-by oxygen. However, we didnot know how anesthesia would affect hemodynamicsin each twin. In addition, it was unclear to what extentone twin’s hemodynamic status would affect the othertwin. Finally, we were unsure how the twins wouldrespond to positive-pressure ventilation changes anddid not know whether ventilation in synchrony waswarranted.
In general, anesthesia for MRI should provide easytitration to a reliable sedation state and rapid induc-tion and emergence. Both inhaled and IV anestheticsmay fulfill these requirements (10). In addition to thedemands of the MRI environment, we needed to con-sider the complex cardiac physiology of the twins.Rivenes et al. (11) reported the effects of differentanesthetic management in children with complex car-diac lesions. In their study, sevoflurane and isofluranemaintained cardiac output, but both anesthetics de-creased cardiac contractility (11). Propofol has beenshown to act as a vasodilator in clinically relevantconcentrations (12). Opioids, as a result of their hemo-dynamic stability, have been the mainstay of pediatriccardiac anesthesia for the last few decades (13). Ket-amine also has a long history of use in pediatric pa-tients with heart disease and has been successfullyused in anesthetic management of conjoined twinswith complex cardiac anomalies (14). We thereforechose ketamine as the induction drug because of itsability to provide hemodynamic stability. However,neither ketamine nor most opioids allow rapid emer-gence. In contrast, remifentanil provides the advantageof easy titration and rapid emergence with hemo-dynamic stability. A remifentanil infusion was thereforechosen for the maintenance of anesthesia.
Throughout the case, the twins remained hemody-namically stable. Because both twins required highrespiratory rates, it was necessary to hand-ventilateboth twins throughout the procedure. We attemptedto ventilate the twins in synchrony, believing that thiswould decrease the likelihood of untoward shuntingor steal.
In conclusion, we have reported a case of thoracop-agus conjoined twins requiring general anesthesia forMRI. Meticulous planning and teamwork are neces-sary for a positive outcome in complex cases (1,14).We followed these principles, and the conjoined twins
Figure 3. Conjoined twins after anesthesia induction and ventilationwith Size 1 laryngeal mask airways.
Figure 4. Conjoined twins in the magnetic resonance imagingscanner.
ANESTH ANALG CASE REPORTS 3632005;100:361–4
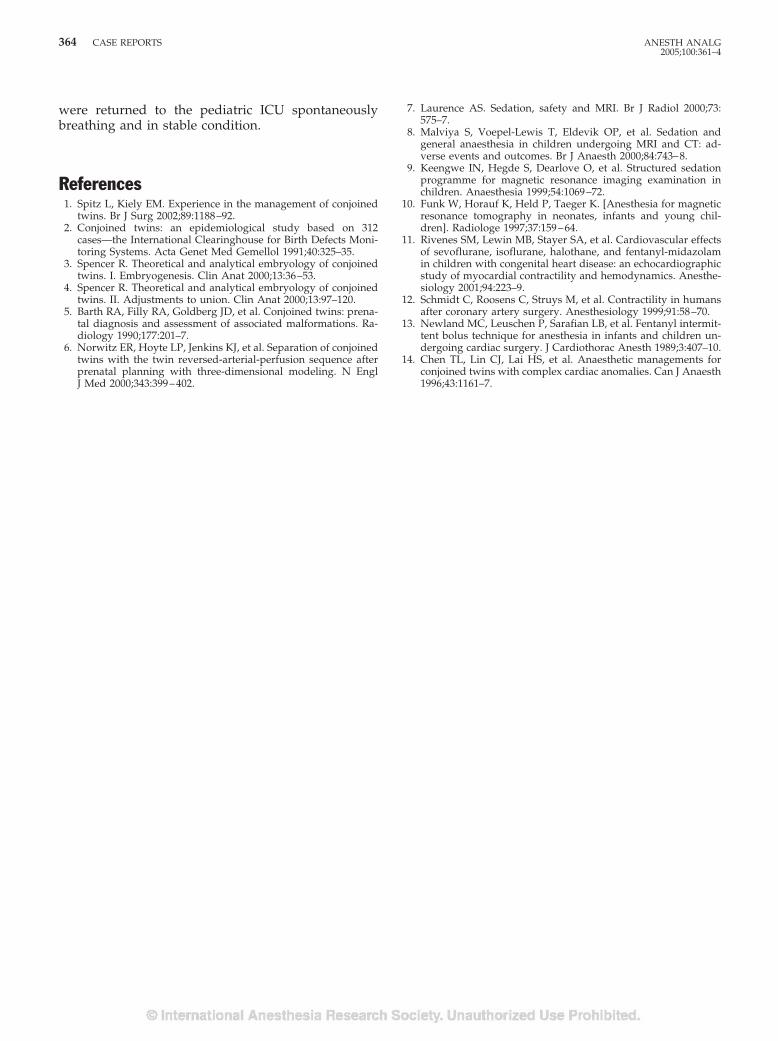
were returned to the pediatric ICU spontaneouslybreathing and in stable condition.
References1. Spitz L, Kiely EM. Experience in the management of conjoined
twins. Br J Surg 2002;89:1188–92.2. Conjoined twins: an epidemiological study based on 312
cases—the International Clearinghouse for Birth Defects Moni-toring Systems. Acta Genet Med Gemellol 1991;40:325–35.
3. Spencer R. Theoretical and analytical embryology of conjoinedtwins. I. Embryogenesis. Clin Anat 2000;13:36–53.
4. Spencer R. Theoretical and analytical embryology of conjoinedtwins. II. Adjustments to union. Clin Anat 2000;13:97–120.
5. Barth RA, Filly RA, Goldberg JD, et al. Conjoined twins: prena-tal diagnosis and assessment of associated malformations. Ra-diology 1990;177:201–7.
6. Norwitz ER, Hoyte LP, Jenkins KJ, et al. Separation of conjoinedtwins with the twin reversed-arterial-perfusion sequence afterprenatal planning with three-dimensional modeling. N EnglJ Med 2000;343:399–402.
7. Laurence AS. Sedation, safety and MRI. Br J Radiol 2000;73:575–7.
8. Malviya S, Voepel-Lewis T, Eldevik OP, et al. Sedation andgeneral anaesthesia in children undergoing MRI and CT: ad-verse events and outcomes. Br J Anaesth 2000;84:743–8.
9. Keengwe IN, Hegde S, Dearlove O, et al. Structured sedationprogramme for magnetic resonance imaging examination inchildren. Anaesthesia 1999;54:1069–72.
10. Funk W, Horauf K, Held P, Taeger K. [Anesthesia for magneticresonance tomography in neonates, infants and young chil-dren]. Radiologe 1997;37:159–64.
11. Rivenes SM, Lewin MB, Stayer SA, et al. Cardiovascular effectsof sevoflurane, isoflurane, halothane, and fentanyl-midazolamin children with congenital heart disease: an echocardiographicstudy of myocardial contractility and hemodynamics. Anesthe-siology 2001;94:223–9.
12. Schmidt C, Roosens C, Struys M, et al. Contractility in humansafter coronary artery surgery. Anesthesiology 1999;91:58–70.
13. Newland MC, Leuschen P, Sarafian LB, et al. Fentanyl intermit-tent bolus technique for anesthesia in infants and children un-dergoing cardiac surgery. J Cardiothorac Anesth 1989;3:407–10.
14. Chen TL, Lin CJ, Lai HS, et al. Anaesthetic managements forconjoined twins with complex cardiac anomalies. Can J Anaesth1996;43:1161–7.
364 CASE REPORTS ANESTH ANALG2005;100:361–4
Inadvertent Extra-Epidural Catheter Placement in an InfantDarryl Berkowitz, MD*, Robin D. Kaye, MD‡, Scott D. Markowitz, MD*†, andScott D. Cook-Sather, MD*†
*Department of Anesthesia, Hospital of the University of Pennsylvania; and Departments of †Anesthesiology and CriticalCare Medicine and ‡Radiology, The Children’s Hospital of Philadelphia, University of Pennsylvania School of Medicine,Philadelphia, Pennsylvania
We report the inadvertent passage of an epidural cath-eter threaded from the caudal space out of a lumbarintervertebral foramen and into the lower thoracic
paravertebral space in an infant. We identified the er-rant catheter by radiography and removed it withoutsequelae.
(Anesth Analg 2005;100:365–6)
I nfants undergoing major thoracic surgery may ben-efit from epidural catheters. Citing greater ease andsafety in these young patients, anesthesiologists of-
ten favor catheter placement via a caudal approachover direct thoracic-level entry (1). Thoracic-levelplacement may be thwarted, however, if the catheterenters an epidural vein, coils after encountering anobstruction, or exits the epidural space entirely (1–6).We report the inadvertent passage of an infant caudalcatheter out of the epidural space and into the lowerthoracic paravertebral space through a lumbar inter-vertebral foramen.
Case ReportA 5-wk-old, 4.9-kg male with a left congenital cystic adeno-matous malformation presented for elective resection via leftthoracotomy. He had been diagnosed in utero and deliveredby cesarian section at 38 wk. After a 24-h elective trachealintubation, he had been tracheally extubated and then dis-charged to home. On the day of surgery, his physical exam-ination was unremarkable: breath sounds were equal andclear bilaterally and his sacral region appeared normal. Pre-operative laboratory values included a platelet count of556,000/mm3.
Routine monitors were applied and a mask placed forinhaled induction with O2, N2O, and sevoflurane. IV accesswas secured, vecuronium administered, and the trachea in-tubated. The infant was placed left side up and the caudalarea was prepared with povidone-iodine solution anddraped. An 18-gauge IV Insyte catheter (Becton-Dickinson,
Sandy, UT) was introduced into the caudal epidural spacevia the sacral hiatus and the needle withdrawn. A styletted,open-end 20-gauge nylon epidural catheter (Portex, Keene,NH) was easily advanced 13 cm through the 18-gauge in-troducer catheter, although some transient, mild resistancewas noted mid-placement. The introducer and stylet wereremoved and, after negative aspiration for cerebrospinalfluid and blood, the epidural catheter was incrementallydosed with 2.5 mL of 1.5% lidocaine with 1:200,000 epineph-rine. No changes in heart rate (HR) or electrocardiogramconfiguration were noted under a maintenance anesthetic ofO2/air/desflurane. The epidural catheter was bolused with2 mL of 0.25% bupivacaine with 1:200,000 epinephrine andsurgery begun. Apart from a brief increase in HR and arte-rial blood pressure at incision, prompting us to increase thevolatile anesthetic concentration, vital signs remained stablewith HR 150–155 bpm and systolic blood pressure 80–90 mm Hg. At the end of surgery, the neuromuscular block-ade was reversed, desflurane was discontinued, and theinfant was safely extubated. The infant was mildly irritable,but both legs were slow to move to stimulation. A routinethoracoabdominal radiograph was taken after 0.3 mL ofpreservative-free Omnipaque 180 (iohexol, 180 mg iodine/mL; Amershamhealth, Princeton, NJ) was injected into theepidural catheter. We were surprised to see that the epiduralcatheter had exited via a left L4/5 intervertebral foramenand that the catheter tip was in the left paravertebral spaceat the T11/12 level. Figure 1) We removed the catheter andadministered IV ketorolac for postoperative analgesia. Neu-rologic examination revealed an apparent bilateral leg weak-ness that resolved within hours. The infant was made com-fortable with an IV morphine infusion.
DiscussionMalposition of epidural catheters is described in boththe adult and pediatric anesthesia literature (1–7). Al-though lumbar epidural catheter exit through an in-tervertebral foramen has been reported in adults and
Accepted for publication August 12, 2004.Address correspondence to Scott D. Cook-Sather, MD, Depart-
ment of Anesthesiology and Critical Care Medicine, The Children’sHospital of Philadelphia, 34th St. and Civic Center Blvd., Philadel-phia, PA 19104-4399. Address e-mail to [email protected].
DOI: 10.1213/01.ANE.0000143562.88730.0C
©2005 by the International Anesthesia Research Society0003-2999/05 Anesth Analg 2005;100:365–6 365

adolescents (7), we believe ours to be the first report ofa caudal catheter exiting an intervertebral foramen inan infant. Only one other case of a catheter outside thevertebral canal—one found in the presacral space—has been reported in the infant population (4). In thislatter case, it is likely that the introducer angiocatheterpenetrated the sacrum and delivered the “epidural”catheter into the presacral space directly.
Why might the epidural catheter have left the lum-bar vertebral canal and lodged in the paravertebralspace of our infant? Two possibly interrelated mech-anisms may be involved. First, anatomic obstructionin the epidural space may have caused the catheter todeviate from its initial axial trajectory. Adhesions (lesslikely here in an otherwise normal infant withoutprior instrumentation), nerve roots, and epidural dor-somedian septa may impede both drug and catheter
passage (1,2,4). Second, a stiff styletted catheter maybe more likely to penetrate soft tissues and to allowexit along the dural sleeve projecting with a nerve rootout an intervertebral foramen. The lateral decubitusposition, at least as far as gravity is concerned, wouldnot have seemed to contribute to catheter exit, becausethe catheter left the vertebral canal on the nondepen-dent side.
Could we have prevented this? Some practitionersrecommend replacing the catheter if the slightest re-sistance is felt during placement, but in the Bosenberget al. (1) series, 14 of 20 cases had some “slight resis-tance” during passage of the catheter even as 19 of 20reached the desired level. Furthermore, ease of cathe-ter advancement, such as that described in the presa-cral catheter (4), does not ensure proper placement(2,3). Although we believe that catheters should bereplaced if resistance is felt early in the attemptedpassage, or if the resistance is persistent, we would nothave changed our management in this case. Recentlydeveloped techniques for catheter placement may,with nerve stimulation guidance (8), or may not, in thecase of electrocardiogram trace comparison (9), havehelped us to avoid extradural placement. We agreewith Valairucha et al. (6) and recommend obtainingconfirmatory radiographs.
References1. Bosenberg AT, Bland BAR, Schulte-Steinberg O, Downing J. Tho-
racic epidural anesthesia via caudal route in infants. Anesthesi-ology 1988;69:265–9.
2. Blanco D, Llamazares J, Martinez-Mora J, Vidal F. Thoracic epi-dural anesthesia by the caudal route in pediatric anesthesia: ageis a limiting factor [Article in Spanish]. Rev Esp Anestesiol Re-anim 1994;41:214–6.
3. Blanco D, Llamazares J, Rincon R, et al. Thoracic epidural anes-thesia via the lumbar approach in infants and children. Anesthe-siology 1996;84:1312–6.
4. Casta A. Attempted placement of a thoracic epidural catheter viathe caudal route in a newborn. Anesthesiology 1999;91:1965–6.
5. Finkel JC. The epidural dorsomedian septum as a possible causefor unilateral anaesthesia in an infant. Paediatr Anaesth 1999;9:456–9.
6. Valairucha S, Seefelder C, Houck CS. Thoracic epidural cathetersplaced by the caudal route in infants: the importance of radio-graphic confirmation. Paediatr Anaesth 2002;12:424–8.
7. Shanks CA. Four cases of unilateral epidural analgesia. Br JAnaesth 1968;40:999–1002.
8. Tsui CH, Seal R, Koller J, et al. Thoracic epidural analgesia via thecaudal approach in pediatric patients undergoing fundoplicationusing nerve stimulation guidance. Anesth Analg 2001;93:1152–5.
9. Tsui BC, Seal R, Koller J. Thoracic epidural catheter placementvia the caudal approach in infants by using electrocardiographicguidance. Anesth Analg 2002;95:326–30.
Figure 1. A thoracoabdominal radiograph demonstrates the epi-dural catheter exiting the vertebral canal at L4/5 (lower arrow) andextending with a plume of contrast to the T11/12 level (upperarrow) in the left paravertebral space.
366 CASE REPORT ANESTH ANALG2005;100:365–6
AMBULATORY ANESTHESIA SOCIETY FOR AMBULATORY ANESTHESIASECTION EDITOR
PAUL F. WHITE
Optimal Timing of Acustimulation for Antiemetic Prophylaxisas an Adjunct to Ondansetron in Patients UndergoingPlastic SurgeryPaul F. White, MD, PhD*, Mohamed A. Hamza, MD*, Alejandro Recart, MD*,Jayne E. Coleman, MD*, Amy R. Macaluso, MD*, Lyndsey Cox, MS*, Omar Jaffer, MS*,
Dajun Song, MD, PhD*, and Rod Rohrich, MD†
Departments of *Anesthesiology & Pain Management and †Plastic Surgery, University of Texas Southwestern MedicalCenter at Dallas, Dallas, Texas
We designed this study to evaluate the antiemetic efficacyof transcutaneous electrical acupoint stimulation in com-bination with ondansetron when applied before, after, orboth before and after plastic surgery. A randomized,double-blind, sham-controlled study design was used tocompare three prophylactic acustimulation treatmentschedules: preoperative—an active device was appliedfor 30 min before and a sham device for 72 h after surgery;postoperative—a sham device was applied for 30 min be-fore and an active device for 72 h after surgery; and peri-operative—an active device was applied for 30 min beforeand 72 h after surgery (n � 35 per group). All patientsreceived a standardized general anesthetic, and ondanse-tron 4 mg IV was administered at the end of surgery. Theincidence of vomiting/retching and the need for rescueantiemetics were determined at specific time intervals forup to 72 h after surgery. Nausea scores were recordedwith an 11-point verbal rating scale. Other outcome vari-ables assessed included discharge times (for outpatients),resumption of normal activities of daily living, completeantiemetic response rate, and patient satisfaction withantiemetic therapy and quality of recovery. Perioperative
use of the ReliefBand® significantly increased completeresponses (68%) compared with use of the device beforesurgery only (43%). Median postoperative nausea scoreswere significantly reduced in the peri- and post-operative (versus preoperative) treatment groups.Finally, patient satisfaction with the quality of re-covery (83 � 16 and 85 � 13 vs 72 � 18) andantiemetic management (96 � 9 and 94 � 10 vs 86 �13) on an arbitrary scale from 0 � worst to 100 �best was significantly higher in the groups receivingperi- or postoperative (versus preoperative)acustimulation therapy. For patients discharged onthe day of surgery, the time to home readiness wassignificantly reduced (114 � 41 min versus 164 �50 min; P � 0.05) when acustimulation was admin-istered perioperatively (versus preoperatively). Inconclusion, acustimulation with the ReliefBand®
was most effective in reducing postoperative nauseaand vomiting and improving patients’ satisfactionwith their antiemetic therapy when it was adminis-tered after surgery.
(Anesth Analg 2005;100:367–72)
T here is still controversy concerning the best ap-proach to managing postoperative nausea andvomiting (PONV) (1). Clinical studies suggest
that the use of a combination of prophylactic anti-emetic therapies improves patients’ satisfaction with
their quality of recovery and facilitates resumption ofnormal activities (2–4). Although small-dose droperi-dol is a highly cost-effective antiemetic for routineprophylaxis (4–6), concerns regarding the side effectsassociated with larger doses (e.g., dysphoria, restless-ness, and cardiac arrhythmias) (7,8) have limited itsclinical use (9). As a result, ondansetron has becomeincreasingly popular for routine antiemetic prophy-laxis and appears to be most effective when adminis-tered at the end of surgery (10,11).
An earlier study demonstrated that the combinationof ondansetron and acustimulation was more effectivethan ondansetron alone in preventing PONV (3). Al-though a meta-analysis by Lee and Done (12) con-firmed that acustimulation was effective in preventing
The active and sham ReliefBand® devices were provided byWoodside Biomedical Systems, Inc. (Carlsbad, CA). Support forPFW’s research and educational activities was provided by theMargaret Milam McDermott Distinguished Chair in Anesthesiologyand the White Mountain Institute (Los Altos, CA).
Accepted for publication August 23, 2004.Address correspondence and reprint requests to Paul F. White, MD,
PhD, Department of Anesthesiology & Pain Management, Universityof Texas Southwestern Medical Center, 5323 Harry Hines Blvd., Dallas,TX 75390-9068. Address e-mail to [email protected].
DOI: 10.1213/01.ANE.0000144425.16116.0A
©2005 by the International Anesthesia Research Society0003-2999/05 Anesth Analg 2005;100:367–72 367
PONV, the optimal use of this nonpharmacologictechnique has not been studied (13). In a preliminarymulticenter study, use of transcutaneous electricalacustimulation reduced nausea but not vomitingwhen administered as the sole prophylactic therapyafter laparoscopic surgery (14). However, more recentstudies have reported a reduction in both nausea andemesis (3,15). Although it was suggested that preop-erative versus postoperative acupoint stimulationmade no difference in the incidence of vomitingwithin the first 6 h after major gynecologic surgery(16), this study was terminated prematurely.
Therefore, we designed a sham-controlled study totest the hypothesis that the timing of acustimulationwith the ReliefBand® (Woodside Biomedical Systems,Inc., Carlsbad, CA) during the perioperative period in-fluenced its efficacy when used as part of a multimodalregimen for antiemetic prophylaxis. The primary objec-tive was to compare stimulation with the ReliefBand®
before and/or after major plastic surgery procedureswith respect to its effect in preventing PONV. Secondaryobjectives were to assess the effect of acustimulationtherapy on the need for rescue antiemetic drugs andresumption of normal activities of daily living.
MethodsAfter we obtained IRB approval and written informedconsent, 105 adults scheduled for elective plastic sur-gery (e.g., abdominoplasty, breast reductions, or facialcosmetic procedures) under general anesthesia wereenrolled in this clinical study. Patients were randomlyassigned to one of three acustimulation treatmentgroups by using a computer-generated random num-ber table: 1) the preoperative group received an activeReliefBand® for 30 min before entering the operatingroom (OR) and a sham ReliefBand® for up to 72 h aftersurgery; 2) the postoperative group received a shamdevice for 30 min before surgery and an active Relief-Band® for up to 72 h after surgery; and 3) the periop-erative group received an active ReliefBand® for30 min before surgery and for up to 72 h after surgery.One patient in the perioperative group did not com-plete the entire study.
Patients who had taken any antiemetic medicationwithin 24 h before the operation, were pregnant ormenstruating, had a permanent cardiac pacemaker,had previous experience with acustimulation therapy,or had experienced nausea, vomiting, or retchingwithin 24 h before surgery were excluded. Any historyof PONV or motion sickness or active smoking wasnoted. In the day-surgery unit (DSU), patients com-pleted a preoperative verbal rating scale (VRS) fornausea, with 0 � none to 10 � worst imaginable. Anactive (Groups 1 and 3) or sham (Group 2) Relief-Band® device was applied at the P6 acupoint of the
nondominant arm for 30 min before the patient wastransferred from the DSU to the OR. Patients wereinstructed in the correct placement of the device and toldto apply it snugly around the wrist to avoid inadvertentdisplacement. Although the ReliefBand® devices used inall three groups were identical in appearance, the shamdevices were electronically altered by the manufacturerto allow them to simulate the active unit without actuallydelivering electrical current to the metal electrodes incontact with the surface of the skin.
Before either the active or sham device was applied,the P6 placement area on the plantar aspect of thewrist was carefully cleaned with an alcohol swab,followed by the application of a hypoallergenic con-ductivity gel. The controller setting on the device wasinitially turned to Setting 3 unless the patient com-plained of discomfort at the P6 acupoint, in which caseit was reduced to Setting 2. To minimize bias resultingfrom the presence or absence of the electrical stimula-tion, patients were told that the acustimulation deviceproduces a tingling sensation that they “might ormight not feel.” The device was removed when thepatient entered the OR.
All patients received a standardized general anes-thetic technique consisting of propofol 1.5–2.5 mg/kgand sufentanil 0.3 �g/kg IV for induction, rocuronium0.6 mg/kg IV for tracheal intubation, and sevoflurane0.75%–3% end-tidal concentration in an air/oxygenmixture in combination with a sufentanil infusion(0.1–0.2 �g · kg�1 · h�1) and rocuronium 0.075–0.15 mg · kg�1 · h�1 for maintenance of anesthesia. Re-sidual neuromuscular blockade at the end of surgerywas reversed with a combination of neostigmine40–60 �g/kg and glycopyrrolate 5–10 �g/kg IV. Allpatients also received antiemetic prophylaxis with on-dansetron 4 mg IV at the end of surgery. Upon pa-tients’ arrival in the postanesthesia care unit (PACU),a nurse specifically trained in the proper positioningof the ReliefBand® placed an active (Groups 2 and 3)or sham (Group 1) device at the P6 acupoint of thenondominant arm at the same setting that was usedbefore surgery. All patients were instructed to wearthe acustimulation device for 72 h after surgery exceptwhen bathing and sleeping. It was recommended thatthe device be activated every 2–4 h during the awakehours and before consumption of opioid-containinganalgesic medication. An antiemetic rescue drug (met-oclopramide 10 mg IV) was administered only if thepatient complained of persistent nausea (with a nau-sea VRS �3) lasting longer than 15 min or experiencedrepeated episodes of vomiting or retching.
The type and duration of the plastic surgery proce-dures, as well as the length of stay in the PACU andDSU, were recorded. All inpatients were started onpatient-controlled analgesia with morphine (1-mg IVboluses) before discharge from the PACU. Postopera-tive nausea was assessed by a blinded observer with
368 AMBULATORY ANESTHESIA WHITE ET AL. ANESTH ANALGEFFECT OF TIMING OF ACUSTIMULATION ON PONV 2005;100:367–72
the 11-point VRS upon admission to the PACU, at 15and 30 min after the device was reapplied, and sub-sequently at 30-min intervals until the patient wasdischarged from the PACU. VRS nausea scores �3 on2 consecutive assessments were considered to indicateclinically significant nausea. All episodes of vomitingand retching, as well as the need for rescue antiemeticmedications, were recorded in a patient diary duringthe 72-h postoperative follow-up period. Completeresponses were defined as no vomiting or retching(i.e., emesis) or need for a rescue antiemetic to treatpersistent nausea (VRS �3) within the first 24 h aftersurgery.
For the outpatients (n � 30), home discharge criteria(home readiness) required that the patient be fullyawake and oriented, have stable vital signs whilestanding, be able to walk without assistance, and notbe experiencing any active side effects (e.g., pain, diz-ziness, or emetic symptoms) (5,10). Postoperative painmanagement consisted of oral opioid-containing anal-gesics. Follow-up visits to the postsurgical wardand/or telephone calls were performed at 24- and 72-hintervals after surgery by an investigator (who wasunaware of the treatment group to which the patientwas assigned) to inquire about any emetic symptomsand to evaluate the patient’s satisfaction with the qual-ity of recovery and antiemetic management by using aVRS, with 0 � poor recovery to 100 � excellent recov-ery and 0 � very dissatisfied to 100 � highly satisfied,respectively. At the time of the 24- and 72-h follow-upevaluations, patients were queried about their contin-ued use of the acustimulation device, as well as theirresumption of a normal diet, physical activities (e.g.,ambulating and lifting), and a regular sleep pattern.
Assuming that 50% of these patients would developnausea, vomiting, or both after plastic surgery undergeneral anesthesia with ondansetron (4 mg IV) alonefor antiemetic prophylaxis (3), a minimum sample sizeof 30 patients was determined by an a priori poweranalysis to provide an 80% power of detecting anabsolute difference of 25% between treatment groups(i.e., a reduction from 50% to 25%) with an � of 0.05.Nonparametric analysis was used to compare nauseaVRS scores, number of emetic episodes, and anti-emetic use among the three study groups. The �2 testwas used to compare the proportion of patients com-plaining of nausea (i.e., consecutive VRS nausea scores�3), having one or more emetic episodes, and receiv-ing rescue antiemetic medication. In cases in whichexpected frequencies were small, Fisher’s exact testwas used. The times to the first emetic event and torescue medication were analyzed with log-rank teststatistics. The times to when 25% of the patients ineach group were judged to have failed the prophylac-tic antiemetic therapy (i.e., required a rescue anti-emetic drug for persistent nausea or repeated emesis)were determined by the Kaplan-Meier method. Data
analysis was performed with NCSS Version 6.0(NCSS, Kaysville, UT). Data are presented as means �sd, medians (interquartile ranges), numbers, or per-centages, with P values �0.05 considered statisticallysignificant.
ResultsThe three groups were not significantly different withrespect to demographic characteristics (and types ofsurgery procedures), preexisting risk factors for devel-oping PONV, preoperative nausea scores, and intra-operative dosages of propofol, sevoflurane, and sufen-tanil (Table 1). Postoperative opioid use was alsosimilar among the three treatment groups in thePACU, on the postsurgical ward, and during the post-discharge period (Table 1). During the predischargeperiod (�4 h), the need for rescue antiemetics wassignificantly reduced in the perioperative (versus pre-operative) group (Table 2). In addition, the medianVRS nausea scores were significantly lower in both thepostoperative and perioperative (versus preopera-tive) groups during the predischarge period and atthe 24-h follow-up (Table 2). The overall incidencesof PONV within 24 h after surgery were 57%, 46%,and 32% in the pre-, and post-, and perioperativegroups, respectively.
The complete response rate was significantly higherin the perioperative (versus preoperative) group dur-ing the 4 to 24 h after surgery (Table 2). The percent-ages of patients who were able to resume a normaldiet and sleep pattern on the first postoperative daydid not differ significantly among the three groups.However, more patients in the perioperative groupwere able to resume physical activities at 24 h aftersurgery (21%, versus 3% in the preoperative group).Of note, a larger proportion of the patients undergoingplastic surgery procedures in the perioperative groupwere discharged home on the day of surgery (41%,versus 20% in the preoperative group). None of thepatients were readmitted to the hospital because ofintractable PONV. In the subset of patients dischargedhome on the day of surgery, the average length of stayin the DSU was significantly reduced in the perioper-ative (versus preoperative) group (114 � 41 min ver-sus 164 � 50 min, respectively) (Table 2). Finally, thepostoperative and perioperative groups had im-proved patient satisfaction with their quality of recov-ery and antiemetic therapy compared with the preop-erative group (Table 2).
The Kaplan-Meier estimates (Fig. 1) suggested thatthe median time intervals for 25% of the patients todevelop symptoms requiring antiemetic rescue therapywere 30, �240, and �240 min in Groups 1, 2, and 3,respectively. No local (cutaneous) side effects were re-ported at the acustimulation site by any patient in thethree treatment groups during the 72-h study period.
ANESTH ANALG AMBULATORY ANESTHESIA WHITE ET AL. 3692005;100:367–72 EFFECT OF TIMING OF ACUSTIMULATION ON PONV
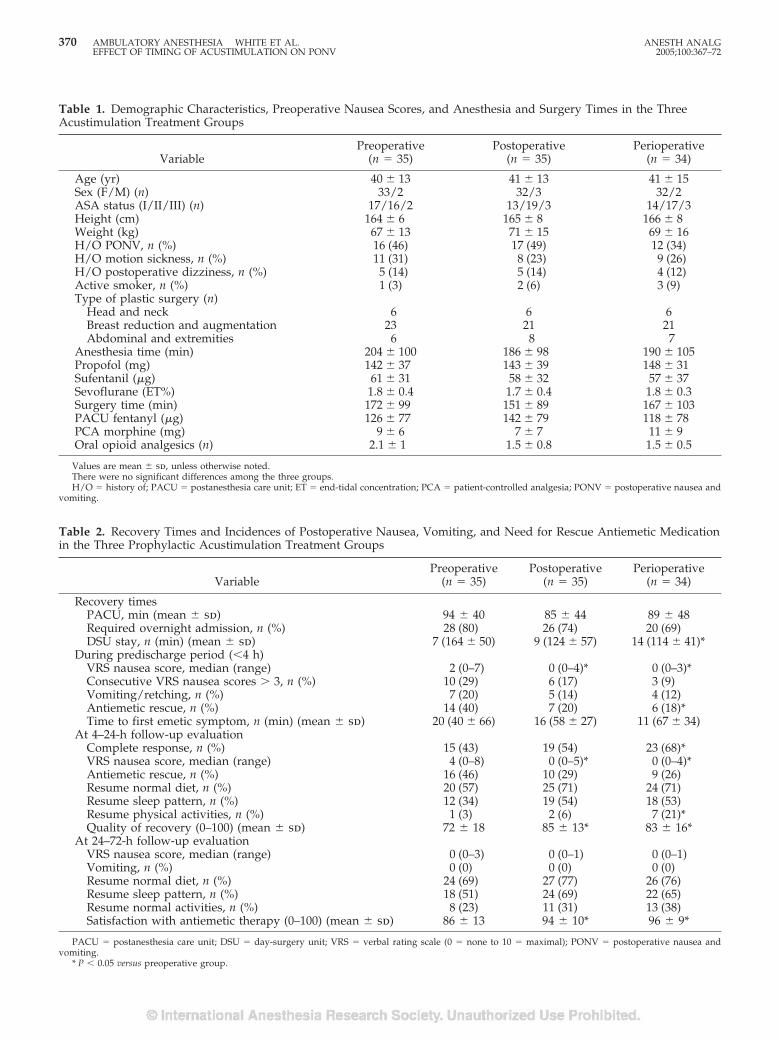
Table 1. Demographic Characteristics, Preoperative Nausea Scores, and Anesthesia and Surgery Times in the ThreeAcustimulation Treatment Groups
VariablePreoperative
(n � 35)Postoperative
(n � 35)Perioperative
(n � 34)
Age (yr) 40 � 13 41 � 13 41 � 15Sex (F/M) (n) 33/2 32/3 32/2ASA status (I/II/III) (n) 17/16/2 13/19/3 14/17/3Height (cm) 164 � 6 165 � 8 166 � 8Weight (kg) 67 � 13 71 � 15 69 � 16H/O PONV, n (%) 16 (46) 17 (49) 12 (34)H/O motion sickness, n (%) 11 (31) 8 (23) 9 (26)H/O postoperative dizziness, n (%) 5 (14) 5 (14) 4 (12)Active smoker, n (%) 1 (3) 2 (6) 3 (9)Type of plastic surgery (n)
Head and neck 6 6 6Breast reduction and augmentation 23 21 21Abdominal and extremities 6 8 7
Anesthesia time (min) 204 � 100 186 � 98 190 � 105Propofol (mg) 142 � 37 143 � 39 148 � 31Sufentanil (�g) 61 � 31 58 � 32 57 � 37Sevoflurane (ET%) 1.8 � 0.4 1.7 � 0.4 1.8 � 0.3Surgery time (min) 172 � 99 151 � 89 167 � 103PACU fentanyl (�g) 126 � 77 142 � 79 118 � 78PCA morphine (mg) 9 � 6 7 � 7 11 � 9Oral opioid analgesics (n) 2.1 � 1 1.5 � 0.8 1.5 � 0.5
Values are mean � sd, unless otherwise noted.There were no significant differences among the three groups.H/O � history of; PACU � postanesthesia care unit; ET � end-tidal concentration; PCA � patient-controlled analgesia; PONV � postoperative nausea and
vomiting.
Table 2. Recovery Times and Incidences of Postoperative Nausea, Vomiting, and Need for Rescue Antiemetic Medicationin the Three Prophylactic Acustimulation Treatment Groups
VariablePreoperative
(n � 35)Postoperative
(n � 35)Perioperative
(n � 34)
Recovery timesPACU, min (mean � sd) 94 � 40 85 � 44 89 � 48Required overnight admission, n (%) 28 (80) 26 (74) 20 (69)DSU stay, n (min) (mean � sd) 7 (164 � 50) 9 (124 � 57) 14 (114 � 41)*
During predischarge period (�4 h)VRS nausea score, median (range) 2 (0–7) 0 (0–4)* 0 (0–3)*Consecutive VRS nausea scores � 3, n (%) 10 (29) 6 (17) 3 (9)Vomiting/retching, n (%) 7 (20) 5 (14) 4 (12)Antiemetic rescue, n (%) 14 (40) 7 (20) 6 (18)*Time to first emetic symptom, n (min) (mean � sd) 20 (40 � 66) 16 (58 � 27) 11 (67 � 34)
At 4–24-h follow-up evaluationComplete response, n (%) 15 (43) 19 (54) 23 (68)*VRS nausea score, median (range) 4 (0–8) 0 (0–5)* 0 (0–4)*Antiemetic rescue, n (%) 16 (46) 10 (29) 9 (26)Resume normal diet, n (%) 20 (57) 25 (71) 24 (71)Resume sleep pattern, n (%) 12 (34) 19 (54) 18 (53)Resume physical activities, n (%) 1 (3) 2 (6) 7 (21)*Quality of recovery (0–100) (mean � sd) 72 � 18 85 � 13* 83 � 16*
At 24–72-h follow-up evaluationVRS nausea score, median (range) 0 (0–3) 0 (0–1) 0 (0–1)Vomiting, n (%) 0 (0) 0 (0) 0 (0)Resume normal diet, n (%) 24 (69) 27 (77) 26 (76)Resume sleep pattern, n (%) 18 (51) 24 (69) 22 (65)Resume normal activities, n (%) 8 (23) 11 (31) 13 (38)Satisfaction with antiemetic therapy (0–100) (mean � sd) 86 � 13 94 � 10* 96 � 9*
PACU � postanesthesia care unit; DSU � day-surgery unit; VRS � verbal rating scale (0 � none to 10 � maximal); PONV � postoperative nausea andvomiting.
* P � 0.05 versus preoperative group.
370 AMBULATORY ANESTHESIA WHITE ET AL. ANESTH ANALGEFFECT OF TIMING OF ACUSTIMULATION ON PONV 2005;100:367–72
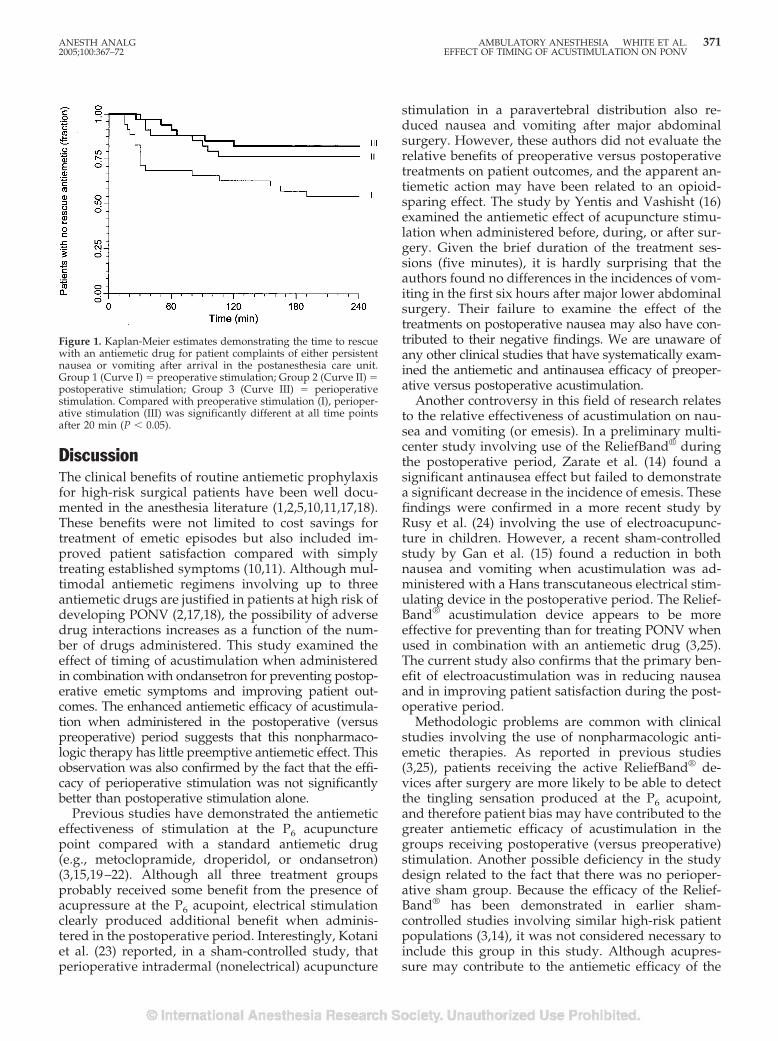
DiscussionThe clinical benefits of routine antiemetic prophylaxisfor high-risk surgical patients have been well docu-mented in the anesthesia literature (1,2,5,10,11,17,18).These benefits were not limited to cost savings fortreatment of emetic episodes but also included im-proved patient satisfaction compared with simplytreating established symptoms (10,11). Although mul-timodal antiemetic regimens involving up to threeantiemetic drugs are justified in patients at high risk ofdeveloping PONV (2,17,18), the possibility of adversedrug interactions increases as a function of the num-ber of drugs administered. This study examined theeffect of timing of acustimulation when administeredin combination with ondansetron for preventing postop-erative emetic symptoms and improving patient out-comes. The enhanced antiemetic efficacy of acustimula-tion when administered in the postoperative (versuspreoperative) period suggests that this nonpharmaco-logic therapy has little preemptive antiemetic effect. Thisobservation was also confirmed by the fact that the effi-cacy of perioperative stimulation was not significantlybetter than postoperative stimulation alone.
Previous studies have demonstrated the antiemeticeffectiveness of stimulation at the P6 acupuncturepoint compared with a standard antiemetic drug(e.g., metoclopramide, droperidol, or ondansetron)(3,15,19–22). Although all three treatment groupsprobably received some benefit from the presence ofacupressure at the P6 acupoint, electrical stimulationclearly produced additional benefit when adminis-tered in the postoperative period. Interestingly, Kotaniet al. (23) reported, in a sham-controlled study, thatperioperative intradermal (nonelectrical) acupuncture
stimulation in a paravertebral distribution also re-duced nausea and vomiting after major abdominalsurgery. However, these authors did not evaluate therelative benefits of preoperative versus postoperativetreatments on patient outcomes, and the apparent an-tiemetic action may have been related to an opioid-sparing effect. The study by Yentis and Vashisht (16)examined the antiemetic effect of acupuncture stimu-lation when administered before, during, or after sur-gery. Given the brief duration of the treatment ses-sions (five minutes), it is hardly surprising that theauthors found no differences in the incidences of vom-iting in the first six hours after major lower abdominalsurgery. Their failure to examine the effect of thetreatments on postoperative nausea may also have con-tributed to their negative findings. We are unaware ofany other clinical studies that have systematically exam-ined the antiemetic and antinausea efficacy of preoper-ative versus postoperative acustimulation.
Another controversy in this field of research relatesto the relative effectiveness of acustimulation on nau-sea and vomiting (or emesis). In a preliminary multi-center study involving use of the ReliefBand® duringthe postoperative period, Zarate et al. (14) found asignificant antinausea effect but failed to demonstratea significant decrease in the incidence of emesis. Thesefindings were confirmed in a more recent study byRusy et al. (24) involving the use of electroacupunc-ture in children. However, a recent sham-controlledstudy by Gan et al. (15) found a reduction in bothnausea and vomiting when acustimulation was ad-ministered with a Hans transcutaneous electrical stim-ulating device in the postoperative period. The Relief-Band® acustimulation device appears to be moreeffective for preventing than for treating PONV whenused in combination with an antiemetic drug (3,25).The current study also confirms that the primary ben-efit of electroacustimulation was in reducing nauseaand in improving patient satisfaction during the post-operative period.
Methodologic problems are common with clinicalstudies involving the use of nonpharmacologic anti-emetic therapies. As reported in previous studies(3,25), patients receiving the active ReliefBand® de-vices after surgery are more likely to be able to detectthe tingling sensation produced at the P6 acupoint,and therefore patient bias may have contributed to thegreater antiemetic efficacy of acustimulation in thegroups receiving postoperative (versus preoperative)stimulation. Another possible deficiency in the studydesign related to the fact that there was no perioper-ative sham group. Because the efficacy of the Relief-Band® has been demonstrated in earlier sham-controlled studies involving similar high-risk patientpopulations (3,14), it was not considered necessary toinclude this group in this study. Although acupres-sure may contribute to the antiemetic efficacy of the
Figure 1. Kaplan-Meier estimates demonstrating the time to rescuewith an antiemetic drug for patient complaints of either persistentnausea or vomiting after arrival in the postanesthesia care unit.Group 1 (Curve I) � preoperative stimulation; Group 2 (Curve II) �postoperative stimulation; Group 3 (Curve III) � perioperativestimulation. Compared with preoperative stimulation (I), perioper-ative stimulation (III) was significantly different at all time pointsafter 20 min (P � 0.05).
ANESTH ANALG AMBULATORY ANESTHESIA WHITE ET AL. 3712005;100:367–72 EFFECT OF TIMING OF ACUSTIMULATION ON PONV
ReliefBand® device, this effect would have minimizedthe differences among the three treatment groups.Because differences in postoperative opioid analgesicuse can also contribute to differences in PONV, thepain management regimen was standardized for allpatients. A final criticism of our study design relatedto the mix of plastic surgery procedures included inthis study. Although the distribution of cases was similarin all three treatment groups (Table 1), the ability of morepatients in the perioperative group to resume physicalactivities at 24 hours after surgery may reflect the factthat more patients in this treatment group were dis-charged home on the day of surgery.
As a result of the traditionally frequent incidence ofPONV in this plastic surgery population, ondansetron(4 mg IV) was administered to all patients (1,12). Eth-ical concerns raised by the surgical and anesthesiastaff prevented us from including a study group re-ceiving no antiemetic prophylaxis. Increasing interestin the use of acustimulation techniques is related inpart to the recent controversy regarding the use ofsmall-dose droperidol for antiemetic prophylaxis(6,8,9). Analogous to earlier P6 acupoint stimulationstudies in children (19,20,24) and adults (3,15,21,22), thisclinical investigation confirms that the ReliefBand® is aneffective adjunct to antiemetic drugs for preventingsymptoms related to PONV when administered aftersurgery. Although the ReliefBand® device has been re-ported to enhance the antiemetic efficacy of ondansetronwhen administered in the postoperative period (3), 18%–20% of these high-risk patients still required a rescueantiemetic to control their emetic symptoms after sur-gery. These data would suggest that the addition of asecond antiemetic drug (e.g., droperidol or dexametha-sone) is probably indicated to minimize PONV afterthese highly emetogenic surgical procedures (26).
In conclusion, use of the ReliefBand® acustimula-tion device after plastic surgery appeared to enhancethe antiemetic efficacy of ondansetron. However, thedevice is significantly less effective when applied onlyin the preoperative period.
References1. White PF, Watcha MF. Postoperative nausea and vomiting:
prophylaxis versus treatment [editorial]. Anesth Analg 1999;89:1337–9.
2. Scuderi PE, James RL, Harris L, Mims GR. Multimodal anti-emetic management prevents early postoperative vomiting afteroutpatient laparoscopy. Anesth Analg 2000;91:1408–14.
3. White PF, Issioui T, Hu J, et al. Comparative efficacy ofacustimulation (ReliefBand®) versus ondansetron (Zofran®) incombination with droperidol for preventing nausea and vomit-ing. Anesthesiology 2002;97:1075–81.
4. Tang J, Watcha MF, White PF. A comparison of costs andefficacy of ondansetron and droperidol as prophylactic anti-emetic therapy for elective outpatient gynecologic procedures.Anesth Analg 1996;83:304–13.
5. Tang J, Chen X, White PF, et al. Antiemetic prophylaxis foroffice-based surgery: are the 5-HT3 receptor antagonists benefi-cial? Anesthesiology 2003;98:293–8.
6. White PF. Droperidol: a cost-effective antiemetic for over thirtyyears. Anesth Analg 2002;95:789–90.
7. Melnick B, Sawyer R, Karambelkar D, et al. Delayed side effectsof droperidol after ambulatory general anesthesia. AnesthAnalg 1989;69:748–51.
8. Scuderi PE. Droperidol: many questions, few answers. Anesthe-siology 2000;98:289–90.
9. Bailey P, White PF. Droperidol editorial: making a mountain outof a mole hill! Anesthesiology 2003;99:760–1.
10. Tang J, Wang B, White PF, et al. The effect of timing of ondan-setron administration on its efficacy, cost-effectiveness, andcost-benefit as a prophylactic antiemetic in the ambulatory set-ting. Anesth Analg 1998;86:274–82.
11. Sadhasivam S, Saxena A, Kathirvel S, et al. The safety andefficacy of prophylactic ondansetron in patients undergoingmodified radical mastectomy. Anesth Analg 1999;89:1340–45.
12. Lee A, Done ML. The use of nonpharmacologic techniques toprevent postoperative nausea and vomiting: a meta-analysis.Anesth Analg 1999;88:1362–9.
13. White PF. Are nonpharmacologic techniques useful alternativesto antiemetic drugs for the prevention of nausea and vomiting[editorial]? Anesth Analg 1997;84:712–4.
14. Zarate E, Mingus M, White PF, et al. The use of transcutaneousacupoint electrical stimulation for preventing nausea and vom-iting after laparoscopic surgery. Anesth Analg 2001;92:629–35.
15. Gan TJ, Jiao KR, Zenn M, Georgiade G. A randomized con-trolled comparison of electro-acupoint stimulation or ondanse-tron versus placebo for the prevention of postoperative nauseaand vomiting. Anesth Analg 2004;99:1070–5.
16. Yentis SM, Vashisht S. The effect of timing of P6 acupuncture onpostoperative vomiting following major gynaecological sur-gery. Acupunct Med 1998;16:10–3.
17. Gupta A, Wu CL, Elkassabany N, et al. Does the routine pro-phylactic use of antiemetics affect the incidence of postdis-charge nausea and vomiting following ambulatory surgery?Anesthesiology 2003;99:488–95.
18. Apfel CC, Korttila K, Abdalla M, et al. A factorial trial of sixinterventions for the prevention of postoperative nausea andvomiting. N Engl J Med 2004;350:2441–51.
19. Somri M, Vaida SJ, Sabo E, et al. Acupuncture versus ondansetronin the prevention of postoperative vomiting: a study of childrenundergoing dental surgery. Anaesthesia 2001;56:927–32.
20. Wang SM, Kain ZN. P6 acupoint injections are as effective asdroperidol in controlling early postoperative nausea and vom-iting in children. Anesthesiology 2002;97:359–66.
21. Stein DJ, Birnbach DJ, Danzer BI, et al. Acupressure versusintravenous metoclopramide to prevent nausea and vomitingduring spinal anesthesia for cesarean section. Anesth Analg1997;84:342–5.
22. Agarwal A, Bose N, Gaur A, et al. Acupressure and ondansetronfor postoperative nausea and vomiting after laparoscopic cho-lecystectomy. Can J Anaesth 2002;49:554–60.
23. Kotani N, Hashimoto H, Sato Y, et al. Preoperative intradermalacupuncture reduces postoperative pain, nausea and vomiting,analgesic requirement, and sympathoadrenal responses. Anes-thesiology 2001;95:349–56.
24. Rusy LM, Hoffman GM, Weisman SJ. Electroacupuncture pro-phylaxis of postoperative nausea and vomiting following pedi-atric tonsillectomy with or without adenoidectomy. Anesthesi-ology 2002;96:300–5.
25. Coloma M, White PF, Ogunnaike BO, et al. Comparison ofacustimulation and ondansetron for the treatment of establishedpostoperative nausea and vomiting. Anesthesiology 2002;97:1387–92.
26. White PF. Prevention of postoperative nausea and vomiting: amultimodal solution to a persistent problem [editorial]. N EnglJ Med 2004;350:2511–2.
372 AMBULATORY ANESTHESIA WHITE ET AL. ANESTH ANALGEFFECT OF TIMING OF ACUSTIMULATION ON PONV 2005;100:367–72
Dolasetron Versus Ondansetron for the Treatment ofPostoperative Nausea and VomitingTricia A. Meyer, MS, FASHP*†, Charles R. Roberson, MD†, Mohammed H. Rajab, PhD‡,Jad Davis, MD†, and Charles H. McLeskey, MD*
From the Departments of *Pharmacy, †Anesthesiology, and ‡Biostatistics, Scott and White Memorial Hospital and Clinic,Scott, Sherwood and Brindley Foundation, The Texas A&M University System Health Science Center College of Medicine,Temple, Texas
The management of postoperative nausea and vomit-ing (PONV) remains a persistent problem. Despite theuse of prophylactic antiemetics, breakthrough nauseaand vomiting still frequently occur. There have been nopublished studies comparing dolasetron and ondanse-tron for the treatment of PONV. This was a prospective,randomized, double-blind, active-controlled study inadult outpatient surgery patients. We screened 559 con-secutive adult surgery patients, with 92 patients ran-domized to either ondansetron or dolasetron. The ob-jectives of the study were 1) to determine whethertreatment of PONV with ondansetron 4 mg IV or dola-setron 12.5 mg IV would result in better outcomes inpatients undergoing day surgery and 2) to compare the
cost of drugs used for treating PONV. Thirty-three(70%) of 47 patients given ondansetron required rescuemedication, compared with 18 (40%) of 45 patientsgiven dolasetron (P � 0.004). Dolasetron was approxi-mately 40% less expensive than ondansetron, and thecosts of the study drug plus rescue antiemetics were30% less in the dolasetron group than in the ondanse-tron group. Dolasetron provided greater efficacy for an-tiemetic treatment because of the need for less rescuetherapy. Because of the decreased use of rescue anti-emetics and acquisition cost at our hospital, costs in thedolasetron group were less than costs in the ondanse-tron group.
(Anesth Analg 2005;100:373–7)
N ausea and vomiting are two of the most fre-quently experienced postoperative side effects,and patients rank them as main concerns in the
postoperative period (1–4). Postoperative nausea andvomiting (PONV) can cause unanticipated hospitaladmission in patients undergoing ambulatory surgery(5,6). The etiology of PONV is complicated and mul-tifactorial (4). Its overall incidence is approximately30%, although some surgical procedures have an 80%incidence (1,4,7). With the current trend of increasingambulatory surgeries and discharging patients earlier,the need for an effective treatment antiemetic thatprovides the best patient outcome at the most reason-able cost becomes critical. The 5-hydroxytryptamine-3(5-HT3) receptor antagonist drugs provide an effectivetreatment for PONV with fewer clinically significantside effects (8,9). The purpose of this study was todetermine the effectiveness of dolasetron 12.5 mg IVversus ondansetron 4 mg IV for treatment of PONV.
MethodsThis was a prospective, randomized, double-blind,active-controlled, single-site study in adult outpatientsurgery patients scheduled for procedures requiringgeneral anesthesia during a 5-mo period. This studywas conducted as part of the Scott & White Effective-ness Registry, a program for performing prospectiverandomized trials comparing the effectiveness of dif-ferent treatments in the course of usual clinical care(10,11). Studies conducted under the EffectivenessRegistry are designed to evaluate outcomes of care inrealistic practice situations, in contrast to efficacy stud-ies performed in highly selected populations underideal conditions.
All adult patients scheduled for outpatient surgeryunder general anesthesia (inhalation based with fen-tanyl for pain) were considered for enrollment in thestudy. Patients were excluded for any of the followingreasons: 1) the patient declined participation, 2) thephysician responsible for patient care considered thestudy not to be in the best interest of the patient forany reason, 3) the patient was allergic to either pri-mary study drug, or 4) the patient was unable tounderstand the study.
Accepted for publication August 23, 2004.Address correspondence and reprint requests to Tricia Meyer,
MS, FASHP, Scott & White Memorial Hospital, 2401 S. 31st St.,Temple, TX 76508. Address e-mail to [email protected].
DOI: 10.1213/01.ANE.0000144421.96275.D1
©2005 by the International Anesthesia Research Society0003-2999/05 Anesth Analg 2005;100:373–7 373
The study received IRB approval, and informedconsent was obtained from all participants. Patientswere eligible if they experienced PONV. Inclusioncriteria were patients 1) �18 yr of age, 2) scheduled forday surgery, and 3) having general anesthesia. Con-secutive eligible patients were interviewed by andgave consent to a research nurse coordinator in theAnesthesia Assessment Unit before surgery. A ran-domization schedule was provided by the Depart-ment of Biostatistics to Pharmacy Investigational DrugServices (IDS). The subset of consented patients whoexperienced PONV were entered into the treatmentgroup and randomized to a single IV dose of eitherondansetron 4 mg or dolasetron 12.5 mg. The randomassignments were made sequentially from a confiden-tial, computer-generated list of permuted blocks ofvarying size. This list provided equal probabilities forpatients to receive one of the two study drugs treatingPONV. None of the clinical personnel involved in thestudy had access to the randomization list other thanthe unblinded pharmacist from the IDS. The IDS la-beled and prepared the blinded study syringes. Theblinding was achieved by drawing up the contents ofthe dolasetron 12.5-mg/0.625-mL ampule and addingdiluent to make a volume of 2 mL. This was placed ina 3-mL syringe. The ondansetron 4 mg was drawn toa volume of 2 mL (4 mg/2 mL) and placed in a 3-mLsyringe. IDS delivered the blinded syringe containingthe study drug to the postanesthesia care unit (PACU)or day-surgery step-down unit for the study partici-pants experiencing nausea, vomiting, or both. Theneed for rescue medication was determined by pa-tients experiencing one emetic episode or one nauseaepisode longer than 5 min or both. If patients did notexperience PONV, they did not receive study drugand were not included in the analysis.
The primary outcome measurement in this studywas the need for antiemetic rescue therapy in patientsreceiving either ondansetron or dolasetron as the ini-tial treatment for PONV. Determination of the needfor rescue antiemetic was assessed by the nurse in thePhase I or Phase II unit. The selection of the rescueantiemetic was at the discretion of the anesthesia careprovider. Patients experiencing one emetic episode orone nausea episode longer than 5 min or both wereallocated to receive postoperative treatment (a mini-mum of 20 min after study drug administration) untildischarge. An additional objective was to determinethe cost of the study drugs and rescue drugs used.Other additional outcome measurements included re-covery time (defined as the time from the end ofanesthesia until discharge criteria were met from thePACU and day-surgery unit) and episodes of PONVoccurring within 24 h of surgery. Discharge criteriawere based on the Aldreti score. In addition to the24-h PONV follow-up, patients were queried for sat-isfaction outcomes.
Baseline characteristics included age, sex, number ofprior surgeries, and history of PONV. Categorical vari-ables including sex, history of PONV, receipt of prophy-lactic antiemetics, the need for rescue medication, typeand dose of rescue medication, episodes of nausea andvomiting, and patient satisfaction with PONV treatmentwere compared by using Fisher’s exact test or the �2 test,as appropriate. Continues variables including age andrecovery time were compared by using Student’s t-test.The Wilcoxon nonparametric test was used to comparemedians for continuous variables that were not normallydistributed. P values �0.05 were considered statisticallysignificant.
Sample size computation assumed a difference inproportion of 0.25 (specifically, 0.50 vs 0.25). On thebasis of previous experience, the proportion of pa-tients treated with ondansetron who were expected tocontinue vomiting and to need another rescue anti-emetic, or another dose of ondansetron, was estimatedto be approximately 25%. The sample size was ex-pected to provide 80% power to show a statisticallysignificant result if the proportion of patients whosetreatment with dolasetron failed was �50%.
Additional assumptions used in estimating samplesize included a criterion for significance (�) of 0.05 andan equal number in each study arm. With these as-sumptions, 92 (46 per group) randomized patientswere required.
ResultsA total of 559 patients were scheduled for outpatientsurgery during the study period. Of these patients, 351(63%) satisfied inclusion and exclusion criteria, pro-vided informed consent, and were qualified for treat-ment under protocol guidelines. One-hundred-forty-three of these patients experienced PONV. Of thepatients who experienced PONV, 47 patients did notreceive blinded study drug, and 4 patients chose not toparticipate. Ninety-two patients consented to random-ized treatment (ondansetron, n � 47; dolasetron, n �45) (Fig. 1).
For patients who received either ondansetron ordolasetron, the proportion of men and women en-rolled was similar between treatment groups (Table 1).Although the median age of patients treated withdolasetron was 10 yr older than those treated withondansetron, this difference was not statistically sig-nificant. There were no statistically significant differ-ences in baseline variables (prior surgery, history ofPONV, postoperative vomiting, receipt of prophylac-tic drug, or admission to the hospital). Patient demo-graphics and baseline characteristics are summarizedin Table 1. Types of surgical procedures were similarin both groups (Table 2).
There were no significant differences in the numberof patients who actually vomited (11 [23%] of 47 for
374 AMBULATORY ANESTHESIA MEYER ET AL. ANESTH ANALGDOLASETRON VS ONDANSETRON FOR TREATMENT OF PONV 2005;100:373–7
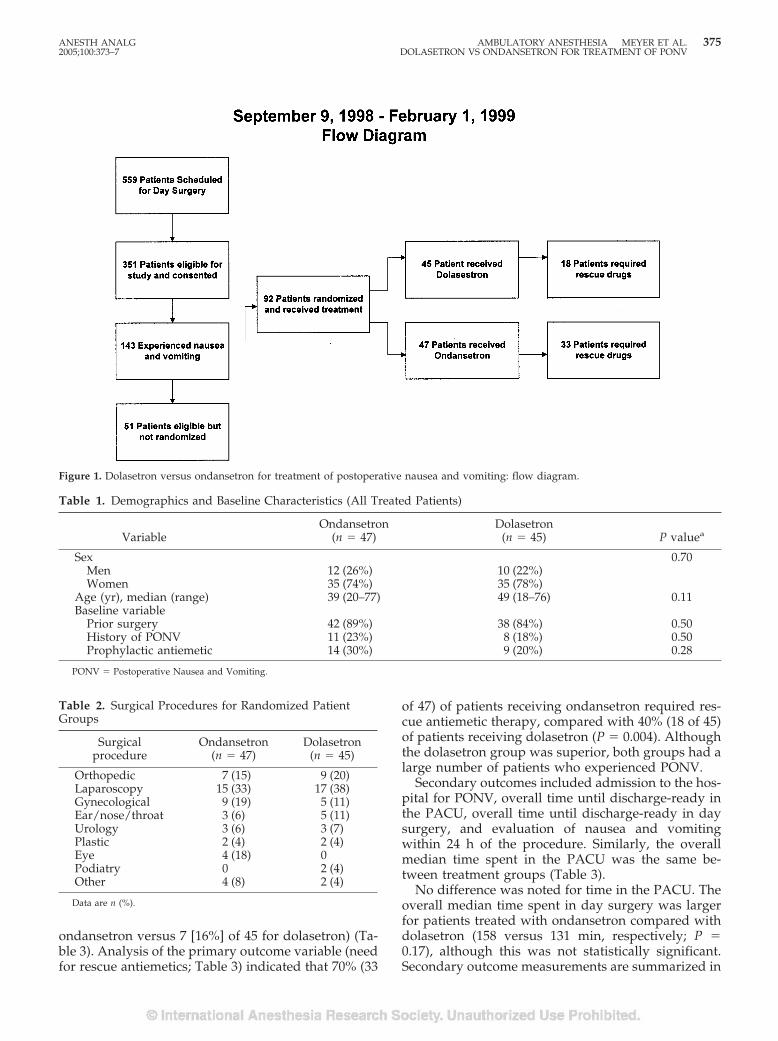
ondansetron versus 7 [16%] of 45 for dolasetron) (Ta-ble 3). Analysis of the primary outcome variable (needfor rescue antiemetics; Table 3) indicated that 70% (33
of 47) of patients receiving ondansetron required res-cue antiemetic therapy, compared with 40% (18 of 45)of patients receiving dolasetron (P � 0.004). Althoughthe dolasetron group was superior, both groups had alarge number of patients who experienced PONV.
Secondary outcomes included admission to the hos-pital for PONV, overall time until discharge-ready inthe PACU, overall time until discharge-ready in daysurgery, and evaluation of nausea and vomitingwithin 24 h of the procedure. Similarly, the overallmedian time spent in the PACU was the same be-tween treatment groups (Table 3).
No difference was noted for time in the PACU. Theoverall median time spent in day surgery was largerfor patients treated with ondansetron compared withdolasetron (158 versus 131 min, respectively; P �0.17), although this was not statistically significant.Secondary outcome measurements are summarized in
Figure 1. Dolasetron versus ondansetron for treatment of postoperative nausea and vomiting: flow diagram.
Table 1. Demographics and Baseline Characteristics (All Treated Patients)
VariableOndansetron
(n � 47)Dolasetron
(n � 45) P valuea
Sex 0.70Men 12 (26%) 10 (22%)Women 35 (74%) 35 (78%)
Age (yr), median (range) 39 (20–77) 49 (18–76) 0.11Baseline variable
Prior surgery 42 (89%) 38 (84%) 0.50History of PONV 11 (23%) 8 (18%) 0.50Prophylactic antiemetic 14 (30%) 9 (20%) 0.28
PONV � Postoperative Nausea and Vomiting.
Table 2. Surgical Procedures for Randomized PatientGroups
Surgicalprocedure
Ondansetron(n � 47)
Dolasetron(n � 45)
Orthopedic 7 (15) 9 (20)Laparoscopy 15 (33) 17 (38)Gynecological 9 (19) 5 (11)Ear/nose/throat 3 (6) 5 (11)Urology 3 (6) 3 (7)Plastic 2 (4) 2 (4)Eye 4 (18) 0Podiatry 0 2 (4)Other 4 (8) 2 (4)
Data are n (%).
ANESTH ANALG AMBULATORY ANESTHESIA MEYER ET AL. 3752005;100:373–7 DOLASETRON VS ONDANSETRON FOR TREATMENT OF PONV
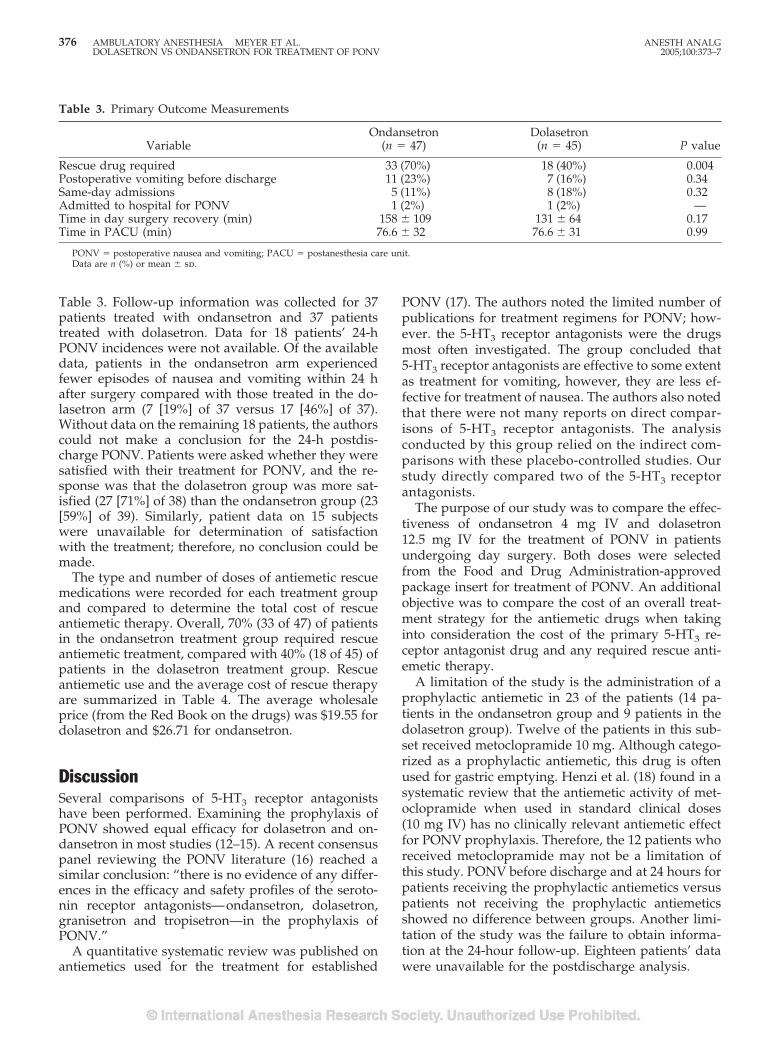
Table 3. Follow-up information was collected for 37patients treated with ondansetron and 37 patientstreated with dolasetron. Data for 18 patients’ 24-hPONV incidences were not available. Of the availabledata, patients in the ondansetron arm experiencedfewer episodes of nausea and vomiting within 24 hafter surgery compared with those treated in the do-lasetron arm (7 [19%] of 37 versus 17 [46%] of 37).Without data on the remaining 18 patients, the authorscould not make a conclusion for the 24-h postdis-charge PONV. Patients were asked whether they weresatisfied with their treatment for PONV, and the re-sponse was that the dolasetron group was more sat-isfied (27 [71%] of 38) than the ondansetron group (23[59%] of 39). Similarly, patient data on 15 subjectswere unavailable for determination of satisfactionwith the treatment; therefore, no conclusion could bemade.
The type and number of doses of antiemetic rescuemedications were recorded for each treatment groupand compared to determine the total cost of rescueantiemetic therapy. Overall, 70% (33 of 47) of patientsin the ondansetron treatment group required rescueantiemetic treatment, compared with 40% (18 of 45) ofpatients in the dolasetron treatment group. Rescueantiemetic use and the average cost of rescue therapyare summarized in Table 4. The average wholesaleprice (from the Red Book on the drugs) was $19.55 fordolasetron and $26.71 for ondansetron.
DiscussionSeveral comparisons of 5-HT3 receptor antagonistshave been performed. Examining the prophylaxis ofPONV showed equal efficacy for dolasetron and on-dansetron in most studies (12–15). A recent consensuspanel reviewing the PONV literature (16) reached asimilar conclusion: “there is no evidence of any differ-ences in the efficacy and safety profiles of the seroto-nin receptor antagonists—ondansetron, dolasetron,granisetron and tropisetron—in the prophylaxis ofPONV.”
A quantitative systematic review was published onantiemetics used for the treatment for established
PONV (17). The authors noted the limited number ofpublications for treatment regimens for PONV; how-ever. the 5-HT3 receptor antagonists were the drugsmost often investigated. The group concluded that5-HT3 receptor antagonists are effective to some extentas treatment for vomiting, however, they are less ef-fective for treatment of nausea. The authors also notedthat there were not many reports on direct compar-isons of 5-HT3 receptor antagonists. The analysisconducted by this group relied on the indirect com-parisons with these placebo-controlled studies. Ourstudy directly compared two of the 5-HT3 receptorantagonists.
The purpose of our study was to compare the effec-tiveness of ondansetron 4 mg IV and dolasetron12.5 mg IV for the treatment of PONV in patientsundergoing day surgery. Both doses were selectedfrom the Food and Drug Administration-approvedpackage insert for treatment of PONV. An additionalobjective was to compare the cost of an overall treat-ment strategy for the antiemetic drugs when takinginto consideration the cost of the primary 5-HT3 re-ceptor antagonist drug and any required rescue anti-emetic therapy.
A limitation of the study is the administration of aprophylactic antiemetic in 23 of the patients (14 pa-tients in the ondansetron group and 9 patients in thedolasetron group). Twelve of the patients in this sub-set received metoclopramide 10 mg. Although catego-rized as a prophylactic antiemetic, this drug is oftenused for gastric emptying. Henzi et al. (18) found in asystematic review that the antiemetic activity of met-oclopramide when used in standard clinical doses(10 mg IV) has no clinically relevant antiemetic effectfor PONV prophylaxis. Therefore, the 12 patients whoreceived metoclopramide may not be a limitation ofthis study. PONV before discharge and at 24 hours forpatients receiving the prophylactic antiemetics versuspatients not receiving the prophylactic antiemeticsshowed no difference between groups. Another limi-tation of the study was the failure to obtain informa-tion at the 24-hour follow-up. Eighteen patients’ datawere unavailable for the postdischarge analysis.
Table 3. Primary Outcome Measurements
VariableOndansetron
(n � 47)Dolasetron
(n � 45) P value
Rescue drug required 33 (70%) 18 (40%) 0.004Postoperative vomiting before discharge 11 (23%) 7 (16%) 0.34Same-day admissions 5 (11%) 8 (18%) 0.32Admitted to hospital for PONV 1 (2%) 1 (2%) —Time in day surgery recovery (min) 158 � 109 131 � 64 0.17Time in PACU (min) 76.6 � 32 76.6 � 31 0.99
PONV � postoperative nausea and vomiting; PACU � postanesthesia care unit.Data are n (%) or mean � sd.
376 AMBULATORY ANESTHESIA MEYER ET AL. ANESTH ANALGDOLASETRON VS ONDANSETRON FOR TREATMENT OF PONV 2005;100:373–7
In conclusion, treatment trials are more difficult toconduct than prevention trials. This may account forthe lack of publications in this area. Our intent was tocompare the most widely used 5-HT3 receptor antag-onists in the United States for treatment of establishedPONV. Results of this trial suggest that, althoughdolasetron provides similar or greater efficacy com-pared with ondansetron for the treatment of PONV,the average cost of dolasetron therapy presents con-siderable cost incentives in the consideration of ther-apy strategies.
References1. Kovac Al. Prevention and treatment of postoperative nausea
and vomiting. Drugs 2000;59:213–43.2. Macario A, Weinger M, Carney S, Kim A. Which clinical anes-
thesia outcomes are important to avoid? The perspective ofpatients. Anesth Analg 1999;89:652–8.
3. Gan T, Sloan F, de L Dear G, et al. How much are patientswilling to pay to avoid postoperative nausea and vomiting?Anesth Analg 2001;92:393–400.
4. Watcha MF, White PF. Postoperative nausea and vomiting.Anesthesiology 1992;77:162–84.
5. Gold BS, Kitz DS, Lecky JH, Neuhaus JM. Unanticipated admis-sion to the hospital following ambulatory surgery. JAMA 1989;262:3008–10.
6. Fortier J, Chung F, Su J. Unanticipated admission after ambu-latory surgery: a prospective study. Can J Anaesth 1998;45:612–9.
7. Apfel CC, Laara E, Koivuranta M, et al. A simplified risk scorefor predicting postoperative nausea and vomiting: conclusionsfrom cross-validations between two centers. Anesthesiology1999;91:693–700.
8. Kovac AL, Scuderi PE, Boerner TF, et al. Treatment of postop-erative nausea and vomiting with single intravenous doses ofdolasetron mesylate: a multicenter trial—Dolasetron MesylatePONV Treatment Study Group. Anesth Analg 1997;85:546–52.
9. Scuderi P, Wetchler B, Sung YF, et al. Treatment of postopera-tive nausea and vomiting after outpatient surgery with the5-HT3 antagonist ondansetron. Anesthesiology 1993;78:15–20.
10. Anderson C. Measuring what works in health care. Science1994;263:1080–2.
11. Hillis A, Rajab MH, Baisden CE, et al. Three years of experiencewith prospective randomized effectiveness studies. Control ClinTrials 1998;19:419–26.
12. Zarate E, Watcha MF, White PF, et al. A comparison of the costsand efficacy of ondansetron versus dolasetron for antiemeticprophylaxis. Anesth Analg 2000;90:1352–8.
13. Walker JB. Efficacy of single-dose intravenous dolasetron versusondansetron in the prevention of postoperative nausea andvomiting. Clin Ther 2001;23:932–8.
14. Sukhani R, Pappas AL, Lurie J, et al. Ondansetron and dolas-etron provide equivalent postoperative vomiting control afterambulatory tonsillectomy in dexamethasone-pretreated chil-dren. Anesth Analg 2002;95:1230–5.
15. Olutye O, Jantzen E, Alexis R, et al. A comparison of the costand efficacy of ondansetron and dolasetron in the prophylaxisof postoperative vomiting in pediatric patients undergoing am-bulatory surgery. Anesth Analg 2003;97:390–6.
16. Gan TJ, Meyer TA, Apfel CC, et al. Consensus guidelines formanaging postoperative nausea and vomiting. Anesth Analg2003;97:62–71.
17. Kazemi-Kjellberg F, Henzi I, Tramer MR. Treatment of estab-lished postoperative nausea and vomiting: a quantitative sys-tematic review. BMC Anesthesiol 2001;1:2.
18. Henzi I, Walder B, Tramer MR. Metoclopramide in the preven-tion of postoperative nausea and vomiting: a quantitative sys-tematic review of randomized, placebo-controlled studies. Br JAnaesth 1999;83:761–7.
Table 4. Total Doses of Rescue Therapy and Cost
Rescue antiemeticaOndansetron
(n � 33)Dolasetron
(n � 18)
Droperidol 6 5Metoclopramide 16 6Promethazine 4 4Ondansetron 15 6Dolasetron 6 5Total rescue doses 47 26
Average cost of study drug plus rescue therapy (US$) 26.52 18.72a A patient may have received more than one dose of rescue antiemetic.
ANESTH ANALG AMBULATORY ANESTHESIA MEYER ET AL. 3772005;100:373–7 DOLASETRON VS ONDANSETRON FOR TREATMENT OF PONV
BRIEF REPORT
The Use of Nicardipine for Electroconvulsive Therapy:A Dose-Ranging StudyYunan Zhang, MD*, Paul F. White, MD, PhD, FANZCA*, Larry Thornton, MD†, Lisa Perdue, MD†,and Michael Downing, MD*
Departments of *Anesthesiology and Pain Management and †Psychiatry, University of Texas Southwestern MedicalCenter, Dallas, Texas
A wide variety of vasoactive drugs have been used to treatthe acute hypertensive response to electroconvulsivetherapy (ECT). We designed this randomized, double-blind, saline-controlled, crossover study to compare threedifferent doses of nicardipine when administered beforethe ECT stimulus. Twenty-five patients undergoing a se-ries of 4 ECT treatments received bolus injections of eithersaline or nicardipine 20, 40, or 80 �g/kg IV in a randomsequence during a standardized methohexital (1 mg/kg)and succinylcholine (1 mg/kg) anesthetic technique. Themean arterial blood pressure (MAP) and heart rate valueswere recorded at specific time intervals, as were the dura-tion of seizure activity and the need for rescue labetalol.Both the 40 and 80 �g/kg doses of nicardipine reducedthe percentage increase in MAP above the baseline value
compared with the saline group (7% and 7% versus 30%,respectively). Nicardipine 40 and 80 �g/kg were also as-sociated with a significant reduction in the need for labe-talol (7 � 3 mg and 5 � 0 mg versus 22 � 10 mg in thesaline group). Compared with the 40 �g/kg dose, nicardi-pine 80 �g/kg was associated with a more rapid heart rateat the time the ECT stimulus was applied. The 80 �g/kgdose was also associated with a reduced MAP value onawakening compared with the baseline value (91 �12 mm Hg versus 102 � 8 mm Hg). We conclude that abolus injection of nicardipine 40 �g/kg IV immediatelybefore the ECT stimulus was optimal for controlling theacute hemodynamic response to ECT treatments.
(Anesth Analg 2005;100:378–81)
E lectroconvulsive therapy (ECT) is routinely asso-ciated with significant hypertension and tachy-cardia (1). A cardiovascular mortality rate of
0.03% has been reported with ECT (2). In patients withpreexisting cardiovascular disease, the acute hemody-namic response to ECT may increase the risks of myo-cardial ischemia and infarction and even cardiac rup-ture (3,4). Many antihypertensive drugs (includingtrimethaphan, nitroprusside, nitroglycerin, proprano-lol, alprenolol, esmolol, clonidine, dexmedetomidine,and nicardipine) have been administered in an at-tempt to attenuate the acute autonomic response toECT treatments (5–16). However, the ideal pretreat-ment regimen to attenuate the acute hemodynamicresponse after ECT has not been identified.
Nicardipine, a dihydropyridine calcium antago-nist, was introduced into clinical practice for use byIV infusion. Therefore, the acute cardiovascular ef-fects of IV bolus doses of nicardipine have not beenextensively studied. In a preliminary study involv-ing the administration of nicardipine before the in-duction of anesthesia for ECT (13), hypotension andtachycardia were observed before application of theECT stimulus. A subsequent study by Saito et al.(16) suggested that a 20 �g/kg IV bolus dose ofnicardipine could control the acute hemodynamicresponse when administered immediately beforeapplication of the ECT stimulus.
We hypothesized that the optimal bolus dose ofnicardipine would attenuate the acute hemody-namic effects of ECT without producing either pre-or posttreatment reductions in the patient’s meanarterial blood pressure (MAP). Therefore, the pri-mary objective of this placebo-controlled study wasto evaluate the efficacy of three different bolusdoses of nicardipine in attenuating the acute hyper-tensive response to ECT. The secondary objective ofthe study was to evaluate the effect of nicardipineon the duration of seizure activity.
Supported by departmental clinical research funds and endow-ment funds from the Margaret McDermott Distinguished Chair inAnesthesiology.
Accepted for publication August 23, 2004.Address correspondence and reprint requests to Paul F. White, MD,
PhD, FANZCA, Department of Anesthesiology and Pain Manage-ment, UT Southwestern Medical Center, 5323 Harry Hines Blvd., Dal-las, TX 75390-9068. Address e-mail to [email protected].
DOI: 10.1213/01.ANE.0000144419.44481.59
©2005 by the International Anesthesia Research Society378 Anesth Analg 2005;100:378–81 0003-2999/05
MethodsAfter IRB approval, 25 consenting patients (ASA phys-ical status I to III) aged 33 to 87 yr who were under-going a series of �4 ECT procedures were involved inthis study. Patients with clinically significant cardio-vascular, respiratory, or hepatic disease; angina; re-cent (�6 mo) myocardial infarction; or concurrent useof antihypertensive medications and women of child-bearing potential were excluded. According to a cross-over randomization scheme, each patient was givensaline (control) or nicardipine 20, 40, or 80 �g/kg as anIV bolus injection as part of a standardized anesthetictechnique at different ECT treatment sessions.
All patients were premedicated with glycopyrrolate3 �g/kg IV, and anesthesia was induced with metho-hexital 1 mg/kg IV, followed by succinylcholine1 mg/kg IV and labetalol 0.15 mg/kg IV at subsequent1-min intervals. All patients were ventilated with aface mask and 100% oxygen to maintain an end-expiratory CO2 value between 30 and 32 mm Hg. Thestudy medication (saline or nicardipine 20, 40, or 80�g/kg IV) was administered 1 min later in a totalvolume of 2.5 mL (approximately 30–60 s before ap-plication of the ECT stimulus). MAP and heart rate(HR) were recorded at 1- to 2-min intervals through-out the periotreatment period. Electroencephalo-graphic (EEG) bispectral index (BIS) values were alsorecorded at similar intervals. Rescue treatment forincreases in MAP �25% of the preanesthesia baselinevalues consisted of supplemental labetalol (5-mg IVboluses).
A power analysis based on the expected 50% reduc-tion in the need for supplemental labetalol in thelargest nicardipine dosage group and the variabilityobserved in a similar study (13) suggested that agroup size of 25 should be adequate to demonstratesignificant differences from the saline control group.Data were analyzed by using repeated-measures ofanalysis of variance for continuous variables, withBonferroni’s correction for multiple comparisons be-tween dosage groups. Data are expressed as mean �sd. A P value �0.05 was considered statisticallysignificant.
ResultsThe four treatment groups were comparable with re-spect to age, weight, height, and durations of motorand EEG seizure activity (Table 1). On the basis oftheir hemodynamic responses during the stimulus ti-tration treatment before entrance into the study, wedecided not to give one patient the saline treatment,and two patients did not receive the 80 �g/kg dose ofnicardipine because of concerns regarding the possi-bility of clinically significant hypertensive or hypoten-sive responses after the ECT stimulus, respectively.
Baseline hemodynamic variables were similar in thefour treatment groups (Table 2). The EEG BIS valuesduring the periprocedural period did not differ amongthe four groups (data not reported). These data weresimilar to previously published data with the sameanesthetic technique (17).
In the control group, the MAP and HR were bothincreased significantly after the ECT stimulus (97 �9 mm Hg to 126 � 23 mm Hg and 81 � 12 bpm to 124� 16 bpm, respectively) (Table 2). In the nicardipine 20�g/kg group, the MAP increased from 99 � 10 mmHg to 120 � 12 mm Hg, and the HR increased from 78� 8 bpm to 120 � 15 bpm after the ECT stimulus. Inthe nicardipine 40 �g/kg group, the peak MAP (106 �10 mm Hg) and HR (105 � 20 bpm) after the ECTstimulus were less than in the other three treatmentgroups (Table 2). In the nicardipine 80 �g/kg group,the peak MAP value was also significantly decreasedcompared with that in the control group (109 � 12 mmHg versus 126 � 23 mm Hg). However, the MAPvalue was also significantly decreased on awakeningcompared with the baseline value (91 � 12 mm Hgversus 102 � 8 mm Hg). Finally, there was more needfor supplemental labetalol in the control group than inthe nicardipine 40 and 80 �g/kg treatment groups (22� 10 mg versus 7 � 3 and 5 � 0 mg, respectively).
DiscussionThe current dose-ranging study found that as the ni-cardipine IV bolus dose was increased from 20 to 80�g/kg, it produced a dose-dependent decrease inthe requirement for labetalol to control the acutehemodynamic response to the ECT stimulus. Thesmallest dose of nicardipine (20 �g/kg) has beenreported to attenuate the acute hemodynamic re-sponse after the ECT stimulus (16). However, nicar-dipine 40 �g/kg IV appeared to be the optimal dosebecause it was more effective in controlling theacute hypertensive response than the smaller (20�g/kg) dose and was associated with a lesser in-crease in HR during the ECT treatments and a lesserdecrease in MAP on awakening compared with the80 �g/kg dose. Presumably, the greater increase inHR in the large-dose nicardipine group was relatedin part to activation of the baroreflex mechanism asa result of the prominent vasodilatory properties ofthis calcium channel blocker. The residual hypoten-sive effects of the larger dose of nicardipine wereminimized because this dose was not administeredto two patients who had demonstrated enhancedsensitivity to the MAP-decreasing action of nicardipineduring the prestudy stimulus-titration treatment.
Many antihypertensive drugs have been adminis-tered in an attempt to attenuate the acute circulatoryresponse to ECT (5–16). Although these drugs can
ANESTH ANALG BRIEF REPORT 3792005;100:378–81
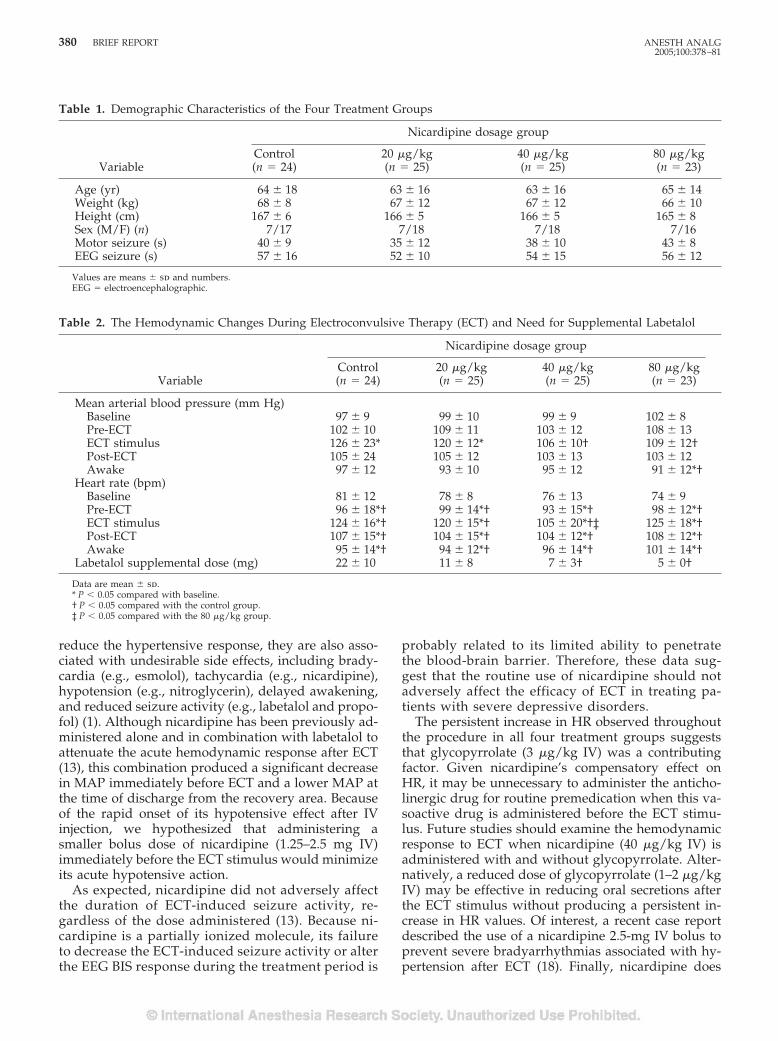
reduce the hypertensive response, they are also asso-ciated with undesirable side effects, including brady-cardia (e.g., esmolol), tachycardia (e.g., nicardipine),hypotension (e.g., nitroglycerin), delayed awakening,and reduced seizure activity (e.g., labetalol and propo-fol) (1). Although nicardipine has been previously ad-ministered alone and in combination with labetalol toattenuate the acute hemodynamic response after ECT(13), this combination produced a significant decreasein MAP immediately before ECT and a lower MAP atthe time of discharge from the recovery area. Becauseof the rapid onset of its hypotensive effect after IVinjection, we hypothesized that administering asmaller bolus dose of nicardipine (1.25–2.5 mg IV)immediately before the ECT stimulus would minimizeits acute hypotensive action.
As expected, nicardipine did not adversely affectthe duration of ECT-induced seizure activity, re-gardless of the dose administered (13). Because ni-cardipine is a partially ionized molecule, its failureto decrease the ECT-induced seizure activity or alterthe EEG BIS response during the treatment period is
probably related to its limited ability to penetratethe blood-brain barrier. Therefore, these data sug-gest that the routine use of nicardipine should notadversely affect the efficacy of ECT in treating pa-tients with severe depressive disorders.
The persistent increase in HR observed throughoutthe procedure in all four treatment groups suggeststhat glycopyrrolate (3 �g/kg IV) was a contributingfactor. Given nicardipine’s compensatory effect onHR, it may be unnecessary to administer the anticho-linergic drug for routine premedication when this va-soactive drug is administered before the ECT stimu-lus. Future studies should examine the hemodynamicresponse to ECT when nicardipine (40 �g/kg IV) isadministered with and without glycopyrrolate. Alter-natively, a reduced dose of glycopyrrolate (1–2 �g/kgIV) may be effective in reducing oral secretions afterthe ECT stimulus without producing a persistent in-crease in HR values. Of interest, a recent case reportdescribed the use of a nicardipine 2.5-mg IV bolus toprevent severe bradyarrhythmias associated with hy-pertension after ECT (18). Finally, nicardipine does
Table 1. Demographic Characteristics of the Four Treatment Groups
Variable
Nicardipine dosage group
Control(n � 24)
20 �g/kg(n � 25)
40 �g/kg(n � 25)
80 �g/kg(n � 23)
Age (yr) 64 � 18 63 � 16 63 � 16 65 � 14Weight (kg) 68 � 8 67 � 12 67 � 12 66 � 10Height (cm) 167 � 6 166 � 5 166 � 5 165 � 8Sex (M/F) (n) 7/17 7/18 7/18 7/16Motor seizure (s) 40 � 9 35 � 12 38 � 10 43 � 8EEG seizure (s) 57 � 16 52 � 10 54 � 15 56 � 12
Values are means � sd and numbers.EEG � electroencephalographic.
Table 2. The Hemodynamic Changes During Electroconvulsive Therapy (ECT) and Need for Supplemental Labetalol
Variable
Nicardipine dosage group
Control(n � 24)
20 �g/kg(n � 25)
40 �g/kg(n � 25)
80 �g/kg(n � 23)
Mean arterial blood pressure (mm Hg)Baseline 97 � 9 99 � 10 99 � 9 102 � 8Pre-ECT 102 � 10 109 � 11 103 � 12 108 � 13ECT stimulus 126 � 23* 120 � 12* 106 � 10† 109 � 12†Post-ECT 105 � 24 105 � 12 103 � 13 103 � 12Awake 97 � 12 93 � 10 95 � 12 91 � 12*†
Heart rate (bpm)Baseline 81 � 12 78 � 8 76 � 13 74 � 9Pre-ECT 96 � 18*† 99 � 14*† 93 � 15*† 98 � 12*†ECT stimulus 124 � 16*† 120 � 15*† 105 � 20*†‡ 125 � 18*†Post-ECT 107 � 15*† 104 � 15*† 104 � 12*† 108 � 12*†Awake 95 � 14*† 94 � 12*† 96 � 14*† 101 � 14*†
Labetalol supplemental dose (mg) 22 � 10 11 � 8 7 � 3† 5 � 0†
Data are mean � sd.* P � 0.05 compared with baseline.† P � 0.05 compared with the control group.‡ P � 0.05 compared with the 80 �g/kg group.
380 BRIEF REPORT ANESTH ANALG2005;100:378–81
not decrease the normal increase in cerebral bloodflow velocity after ECT, in contrast to the more com-monly used �-adrenergic blockers (19). This may be animportant factor in reducing the risk of cerebral dam-age due to the seizure-induced increase in cerebralmetabolism (20) and hyperemia (16).
In conclusion, nicardipine (40 �g/kg IV bolus) ad-ministered immediately before the ECT stimulus inthe presence of labetalol (0.15 �g/kg IV) is an effectivetechnique for minimizing the acute hemodynamic re-sponse to ECT without adversely affecting the dura-tion of seizure activity or producing undesirable pre-or post-ECT hypotensive effects.
References1. Ding Z, White PF. Anesthesia for electroconvulsive therapy.
Anesth Analg 2002;94:1351–64.2. Selvin BL. Electroconvulsive therapy. Anesthesiology 1987;67:
367–85.3. Steiner LA, Drop LJ, Castelli I, et al. Diagnosis of myocardial
injury by real time recording of ST segments of the electrocar-diogram in a patient receiving general anesthesia for electrocon-vulsive therapy. Anesthesiology 1993;79:383–8.
4. Ali PB, Tidmarsh MD. Cardiac rupture during electroconvul-sive therapy. Anaesthesia 1997;52:884–6.
5. Tewfik GI, Wells BG. The use of Arfonad for the alleviationof cardiovascular stress following electroconvulsive therapy.J Ment Sci 1975;10:636 – 44.
6. Ciraulo D, Lind L, Salzman C, et al. Sodium nitroprussidetreatment of ECT-induced blood pressure elevations. Am J Psy-chiatry 1978;135:1105–6.
7. Liu WS, Petty WC, Jeppsen A, et al. Attenuation of hemody-namic and hormonal responses to ECT with propranolol, Xylo-caine, sodium nitroprusside or clonidine [abstract]. AnesthAnalg 1984;63:244.
8. Lee JT, Erbguth PH, Stevens WC, Sack RL. Modification ofelectroconvulsive therapy-induced hypertension with nitroglyc-erin ointment. Anesthesiology 1985;62:793–6.
9. London SW, Glass DD. Prevention of electroconvulsive therapyinduced dysrhythmias with atropine and propranolol. Anesthe-siology 1985;62:819–22.
10. Kovac AL, Goto H, Pardo MP, Arakawa K. Comparison of twoesmolol bolus doses on the haemodynamic response and sei-zure duration during electroconvulsive therapy. Can J Anaesth1991;38:204–9.
11. Howie MB, Black HA, Zvara D, et al. Esmolol reduces auto-nomic hypersensitivity and length of seizures induced by elec-troconvulsive therapy. Anesth Analg 1990;71:384–8.
12. Weinger MB, Partridge BL, Hauger R, Mirow A. Prevention ofthe cardiovascular and neuroendocrine response to electrocon-vulsive therapy. I. Effectiveness of pretreatment regimens onhemodynamics. Anesth Analg 1991;73:556–62.
13. Avramov MN, Stool LA, White PF, Husain MM. Effects ofnicardipine and labetalol on the acute hemodynamic responseto electroconvulsive therapy. J Clin Anesth 1998;10:394–400.
14. Fu W, White PF. Dexmedetomidine failed to block the acutehyperdynamic response to electroconvulsive therapy. Anesthe-siology 1999;90:422–4.
15. Castelli I, Steiner LA, Kaufman MA, et al. Comparative effects ofesmolol and labetalol to attenuate hyperdynamic states afterelectroconvulsive therapy. Anesth Analg 1995;80:557–61.
16. Saito S, Kadoi Y, Iriuchijima N, et al. Reduction of cerebralhyperemia with antihypertensive medication after electrocon-vulsive therapy. Can J Anaesth 2000;47:767–74.
17. White PF, Rawal S, Recart A, et al. Can the bispectral index beused to predict seizure time and awakening after electroconvul-sive therapy? Anesth Analg 2003;96:1636–9.
18. White PF, Perdue L, Downing M, et al. Use of a bolus injectionof nicardipine to prevent severe ECT-induced bradycardia.J Clin Anesth. In press.
19. Kawaguchi M, Furuya H, Kurchara K, Yamada M. Effects ofnicardipine on cerebral vascular responses to hypocapnia andblood flow velocity in the middle cerebral artery. Stroke 1991;22:1170–2.
20. Posner JB, Plum E, Van Poznak A. Cerebral metabolism duringelectrically-induced seizures in man. Arch Neurol 1969;20:388–95.
ANESTH ANALG BRIEF REPORT 3812005;100:378–81
ANESTHETIC PHARMACOLOGY INTERNATIONAL SOCIETY FOR ANAESTHETIC PHARMACOLOGYSECTION EDITOR
JAMES G. BOVILL
Protective Drugs in Acute Large-Dose Exposure toOrganophosphates: A Comparison of Metoclopramide andTiapride with Pralidoxime in RatsGeorg A. Petroianu, MD, PhD, FCP*, Mohammed Y. Hasan, PhD, DABT*,Syed M. Nurulain, Mphil*, Kholoud Arafat, MSc*, Rajan Sheen, MSc*, Ayman Saleh, PhD†, andAndrea Schmitt, MD‡
Departments of *Pharmacology and †Biochemistry, Faculty of Medicine & Health Sciences, UAE University, Al-Ain,United Arab Emirates; and ‡Central Institute of Mental Health, Mannheim, Germany
Weak and reversible inhibitors of cholinesterase(s), whencoadministered in excess with a more potent inhibitorsuch as organophosphates, can act in a protective manner.The benzamide compound, metoclopramide, conferssome protection (putatively via this mechanism) for cho-linesterases against inhibition by paraoxon both in vitroand in vivo, after chronic small-dose exposure. Tiapride isa related benzamide. In this study, we compared the pro-tection by metoclopramide and tiapride in rats acutely ex-posed to large doses of paraoxon with the therapeutic“gold standard,” pralidoxime. Group 1 received 1 �molparaoxon (approximately 75% lethal dose), Group 2 re-ceived 50 �mol metoclopramide, Group 3 received 50�mol tiapride, Group 4 received 50 �mol pralidoxime,Group 5 received 1 �mol paraoxon � 50 �mol metoclo-pramide, Group 6 1 �mol paraoxon � 50 �mol tiapride,andGroup71�molparaoxon�50�molpralidoxime.Allsubstances were administered intraperitoneally. The ani-mals were monitored for 48 h and mortality was recordedat 30 min, 1, 2, 3, 4, 24, and 48 h. Blood was taken for red
blood cell acetylcholinesterase measurements at baseline,30 min, 24, and 48 h. With the exception of Group 7, inwhich some late mortality was observed, mortality oc-curred mainly in the first 30 min after paraoxon adminis-tration with minimal changes occurring thereafter. Mor-tality at 30 min was 0% in the metoclopramide, tiapride,and pralidoxime groups and 73 � 20 (paraoxon), 65 � 15(paraoxon � metoclopramide), 38 � 14 (paraoxon � tia-pride), and 13 � 19 (paraoxon � pralidoxime). Mortalityat 48 h was 75 � 18 (paraoxon), 67 � 17 (paraoxon � met-oclopramide), 42 � 16 (paraoxon � tiapride), and 27 � 24(paraoxon � pralidoxime). Metoclopramide does not sig-nificantly influence mortality after acute large-dose para-oxon exposure. Both tiapride and pralidoxime signifi-cantly decreased mortality in our model. The protectionconferred by tiapride was significantly less than that con-ferred by pralidoxime at 30 min, but was not significantlydifferent at 24 and 48 h.
(Anesth Analg 2005;100:382–6)
O rganophosphorous compounds are widely used.Death by accident and suicide exposure is fre-quent. Organophosphates were also involved in
a terrorist attack in the Tokyo subway in 1995. Theinhibition of esterases (butyrylcholine: 3.1.1.8 and ace-tylcholine: 3.1.1.7) by these substances results from acovalent reaction with the active center serine, by
phosphorylation (1). The effects of poisoning with or-ganophosphorous compounds have been describedextensively (2). Paraoxon is a prototypical nonneuro-pathic organophosphorous compound.
Oximes are a class of organic compounds containingthe group OCANOH. Pralidoxime is such an oxime.Oximes attach to the organophosphate that is inhibitingthe cholinesterase and remove and bind the offendingphosphoryl group attached to the enzyme to restore thenormal activity of (reactivate) the enzyme.
Clinically, this is noticeable in those organs withnicotinic receptors. Abnormal activity in skeletal mus-cle decreases and normal strength returns. The effectsof an oxime are not apparent in organs with musca-rinic receptors; oximes do not cause a decrease insecretions, for example. Oximes are the only enzymereactivators clinically available (3,4).
This work was funded by UAE University FMHS Research Grant18/2002.
Accepted for publication August 10, 2004.Address correspondence and reprint requests to Georg A.
Petroianu, MD, PhD, Department of Pharmacology & Therapeutics,Faculty of Medicine & Health Sciences, UAE University, PO Box17666, Al-Ain, United Arab Emirates. Address e-mail [email protected].
DOI: 10.1213/01.ANE.0000143349.17443.91
©2005 by the International Anesthesia Research Society382 Anesth Analg 2005;100:382–6 0003-2999/05
Clinical experience with oximes, however, is disap-pointing and therefore the search for alternatives iscontinuing (5).
Metoclopramide, a benzamide compound, is a peri-pherally-acting dopamine D2-receptor antagonist. It alsohas agonistic effects at serotonin receptors (5-HT4). It isused clinically for its gastric prokinetic and antiemetic ef-fects. Prokinetic effects might be enhanced through theinhibition of cholinesterase(s) (6,7).
Metoclopramide confers some degree of protectionto cholinesterases against inhibition by organophos-phates both in vitro and in vivo in chronic small-doseexposure (8–10).
Tiapride, also a benzamide derivative, is a centrally-acting selective D2-receptor antagonist used for the treat-ment of agitation and aggressiveness in elderly patients(11). Similar to metoclopramide, it is a weak inhibitor ofcholinesterases; the 50% inhibitory concentration ratio ofthe 2 substances for red blood cell acetylcholinesterase(RBC-AChE) is approximately tiapride/metoclopramide8 (95% confidence interval � 6.3–10.5) (unpublished datafrom our laboratory).
In this prospective, nonblinded animal study in rats,we evaluated protection by metoclopramide and tia-pride after acute large-dose exposure to the cholines-terase inhibitor, paraoxon, and compared them withthe therapeutic “gold standard,” pralidoxime.
MethodsThis work was performed with approval of the Facultyof Medicine & Health Sciences Animal Research EthicsCommittee (FMHS-AE/03/16). The animals (Wistar ratsbred in our own facility, weight �200 but �250 g) wereseparated according to sex and kept in cages, with foodand water ad libitum. Each group contained six rats. Allsubstances were administered intraperitoneally. Group 1(G1) received 1 �mol paraoxon (MW � 275; 1 �mol �75% lethal dose), Group 2 (G2) received 50 �mol meto-clopramide (MW � 336), Group 3 (G3) received 50 �moltiapride (MW � 364), Group 4 (G4) received 50�mol pralidoxime (MW � 172), Group 5 (G5) received1 �mol paraoxon � 50 �mol metoclopramide, Group 6(G6) 1 �mol paraoxon � 50 �mol tiapride, and Group7 (G7) 1 �mol paraoxon � 50 �mol pralidoxime. Theanimals were monitored for 48 h and mortality was re-corded at 30 min, 1, 2, 3, 4, 24, and 48 h. When more thanone substance was administered, paraoxon was injectedfirst, and the second substance was injected at a differentsite within 1 min from the organophosphate. The intraperi-toneal administration was repeated using new batches ofanimals 10 times, so that a total of 60 rats (half females andhalf males) were exposed to each treatment regimen.
For measurements of RBC-AChE, blood was takenfrom the tail vein at baseline, 30 min, 24, and 48 h.Sampling was continued until blood from six animals
surviving the observation period in each treatment reg-imen (half females and half males) could be determined.
The freshly drawn venous blood was diluted 1:100 in0.1 mol/L phosphate buffer with a pH 7.4 and immedi-ately frozen. Aliquots were kept at �20°C until analysis.The enzyme activity and total hemoglobin (Hb) contentwere measured using a Milton Roy Spectronics 301 spec-trophotometer (Milton Roy, Ivyland, PA). RBC-AChEactivity was determined in the whole blood samples inthe presence of the selective butyryl-cholinesterase in-hibitor ethopropazine (Sigma-Aldrich Chemie, Stein-heim, Germany) as described by Worek et al. (12).
The assay, which is based on Ellman’s method, meas-ures the reduction of the chromogenic dithio-nitrobenzoate (DTNB) to the yellow dianion nitroben-zoic acid (TNBA) by thiocholine, the product ofacetylthiocholine hydrolysis. To achieve temperatureequilibration and complete reaction of sample matrixOSH groups, the reaction mixture was incubated for20 min at 37°C, with DTNB (10 mM) and ethopropazine(6 mM) before the addition of substrate. The change inthe absorbance of DTNB was followed up at � � 436 nmduring 5 min.
AChE activity was calculated using an absorptioncoefficient of TNBA � � 10.6/mmol/cm and ex-pressed as �mol/L/min (13). Normalization of theRBC-AChE activity to Hb was used to eliminate dilu-tion errors. Determination of Hb was performed toexpress enzyme activity as IU/gHb. For this spectro-photometric end-point reaction, Drabkin’s reagentwas added to diluted erythrocytes and absorbance ofcyanmethemoglobin measured at � � 546 nm (14).Corrected RBC-AChE activity (normalized to the Hbcontent), was expressed as mU/�mol/Hb. All en-zyme activities were expressed as percentage of base-line activities (100%).
Paraoxon stock solution (100 mmol/L) was pre-pared in dry acetone. Working solution for intraperi-toneal application was prepared ex tempore by dilutingstock solution with saline. Metoclopramide and tia-pride 100 mmol/L solution in saline was used. Prali-doxime 100 mM/L solution was prepared fresh daily.Paraoxon, metoclopramide, tiapride, and pralidoximewere purchased from Sigma-Aldrich Chemie.
Statistical analysis was performed on the mortalitydata and on enzyme activities in individual animals at30 min, 24, and 48 h using the Mann-Whitney rankorder test. A Bonferroni correction of 6 for multiplecomparisons was applied, and � was set at �0.05.
ResultsMortality
All animals receiving metoclopramide, tiapride, andpralidoxime only survived the 48-h observation pe-riod. Table 1 summarizes the mortality results in the
ANESTH ANALG ANESTHETIC PHARMACOLOGY PETROIANU ET AL. 3832005;100:382–6 BENZAMIDES VERSUS PRALIDOXIME IN ACUTE ORGANOPHOSPHATE EXPOSURE
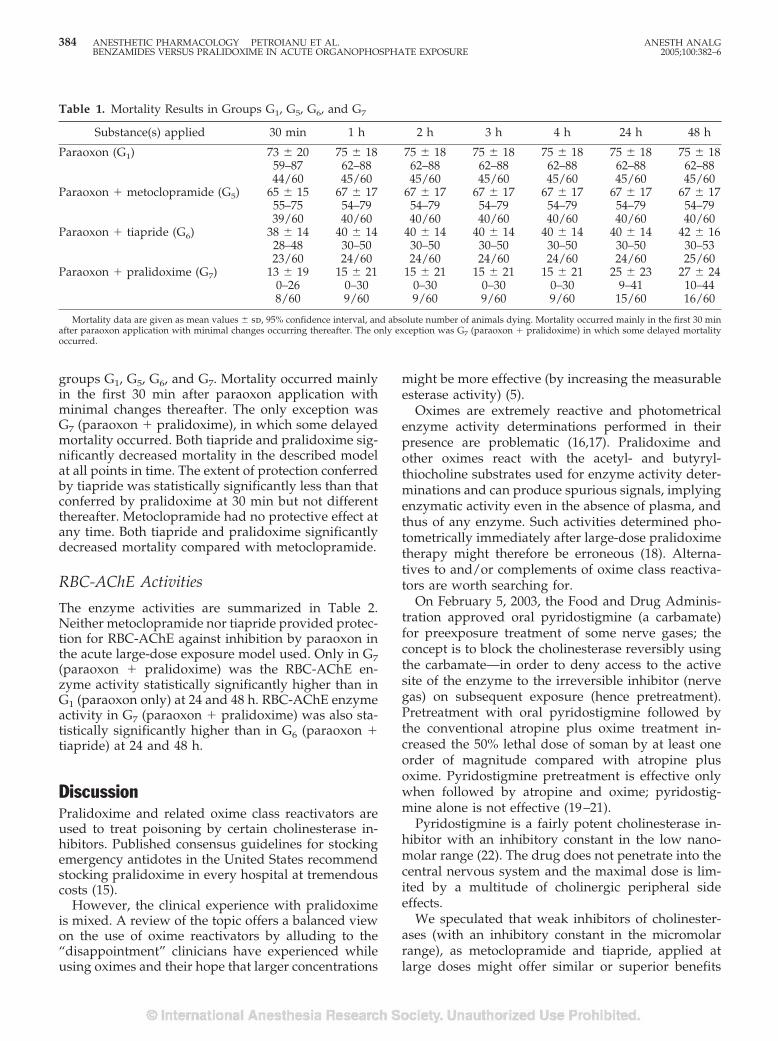
groups G1, G5, G6, and G7. Mortality occurred mainlyin the first 30 min after paraoxon application withminimal changes thereafter. The only exception wasG7 (paraoxon � pralidoxime), in which some delayedmortality occurred. Both tiapride and pralidoxime sig-nificantly decreased mortality in the described modelat all points in time. The extent of protection conferredby tiapride was statistically significantly less than thatconferred by pralidoxime at 30 min but not differentthereafter. Metoclopramide had no protective effect atany time. Both tiapride and pralidoxime significantlydecreased mortality compared with metoclopramide.
RBC-AChE Activities
The enzyme activities are summarized in Table 2.Neither metoclopramide nor tiapride provided protec-tion for RBC-AChE against inhibition by paraoxon inthe acute large-dose exposure model used. Only in G7(paraoxon � pralidoxime) was the RBC-AChE en-zyme activity statistically significantly higher than inG1 (paraoxon only) at 24 and 48 h. RBC-AChE enzymeactivity in G7 (paraoxon � pralidoxime) was also sta-tistically significantly higher than in G6 (paraoxon �tiapride) at 24 and 48 h.
DiscussionPralidoxime and related oxime class reactivators areused to treat poisoning by certain cholinesterase in-hibitors. Published consensus guidelines for stockingemergency antidotes in the United States recommendstocking pralidoxime in every hospital at tremendouscosts (15).
However, the clinical experience with pralidoximeis mixed. A review of the topic offers a balanced viewon the use of oxime reactivators by alluding to the“disappointment” clinicians have experienced whileusing oximes and their hope that larger concentrations
might be more effective (by increasing the measurableesterase activity) (5).
Oximes are extremely reactive and photometricalenzyme activity determinations performed in theirpresence are problematic (16,17). Pralidoxime andother oximes react with the acetyl- and butyryl-thiocholine substrates used for enzyme activity deter-minations and can produce spurious signals, implyingenzymatic activity even in the absence of plasma, andthus of any enzyme. Such activities determined pho-tometrically immediately after large-dose pralidoximetherapy might therefore be erroneous (18). Alterna-tives to and/or complements of oxime class reactiva-tors are worth searching for.
On February 5, 2003, the Food and Drug Adminis-tration approved oral pyridostigmine (a carbamate)for preexposure treatment of some nerve gases; theconcept is to block the cholinesterase reversibly usingthe carbamate—in order to deny access to the activesite of the enzyme to the irreversible inhibitor (nervegas) on subsequent exposure (hence pretreatment).Pretreatment with oral pyridostigmine followed bythe conventional atropine plus oxime treatment in-creased the 50% lethal dose of soman by at least oneorder of magnitude compared with atropine plusoxime. Pyridostigmine pretreatment is effective onlywhen followed by atropine and oxime; pyridostig-mine alone is not effective (19–21).
Pyridostigmine is a fairly potent cholinesterase in-hibitor with an inhibitory constant in the low nano-molar range (22). The drug does not penetrate into thecentral nervous system and the maximal dose is lim-ited by a multitude of cholinergic peripheral sideeffects.
We speculated that weak inhibitors of cholinester-ases (with an inhibitory constant in the micromolarrange), as metoclopramide and tiapride, applied atlarge doses might offer similar or superior benefits
Table 1. Mortality Results in Groups G1, G5, G6, and G7
Substance(s) applied 30 min 1 h 2 h 3 h 4 h 24 h 48 h
Paraoxon (G1) 73 � 20 75 � 18 75 � 18 75 � 18 75 � 18 75 � 18 75 � 1859–87 62–88 62–88 62–88 62–88 62–88 62–8844/60 45/60 45/60 45/60 45/60 45/60 45/60
Paraoxon � metoclopramide (G5) 65 � 15 67 � 17 67 � 17 67 � 17 67 � 17 67 � 17 67 � 1755–75 54–79 54–79 54–79 54–79 54–79 54–7939/60 40/60 40/60 40/60 40/60 40/60 40/60
Paraoxon � tiapride (G6) 38 � 14 40 � 14 40 � 14 40 � 14 40 � 14 40 � 14 42 � 1628–48 30–50 30–50 30–50 30–50 30–50 30–5323/60 24/60 24/60 24/60 24/60 24/60 25/60
Paraoxon � pralidoxime (G7) 13 � 19 15 � 21 15 � 21 15 � 21 15 � 21 25 � 23 27 � 240–26 0–30 0–30 0–30 0–30 9–41 10–448/60 9/60 9/60 9/60 9/60 15/60 16/60
Mortality data are given as mean values � sd, 95% confidence interval, and absolute number of animals dying. Mortality occurred mainly in the first 30 minafter paraoxon application with minimal changes occurring thereafter. The only exception was G7 (paraoxon � pralidoxime) in which some delayed mortalityoccurred.
384 ANESTHETIC PHARMACOLOGY PETROIANU ET AL. ANESTH ANALGBENZAMIDES VERSUS PRALIDOXIME IN ACUTE ORGANOPHOSPHATE EXPOSURE 2005;100:382–6
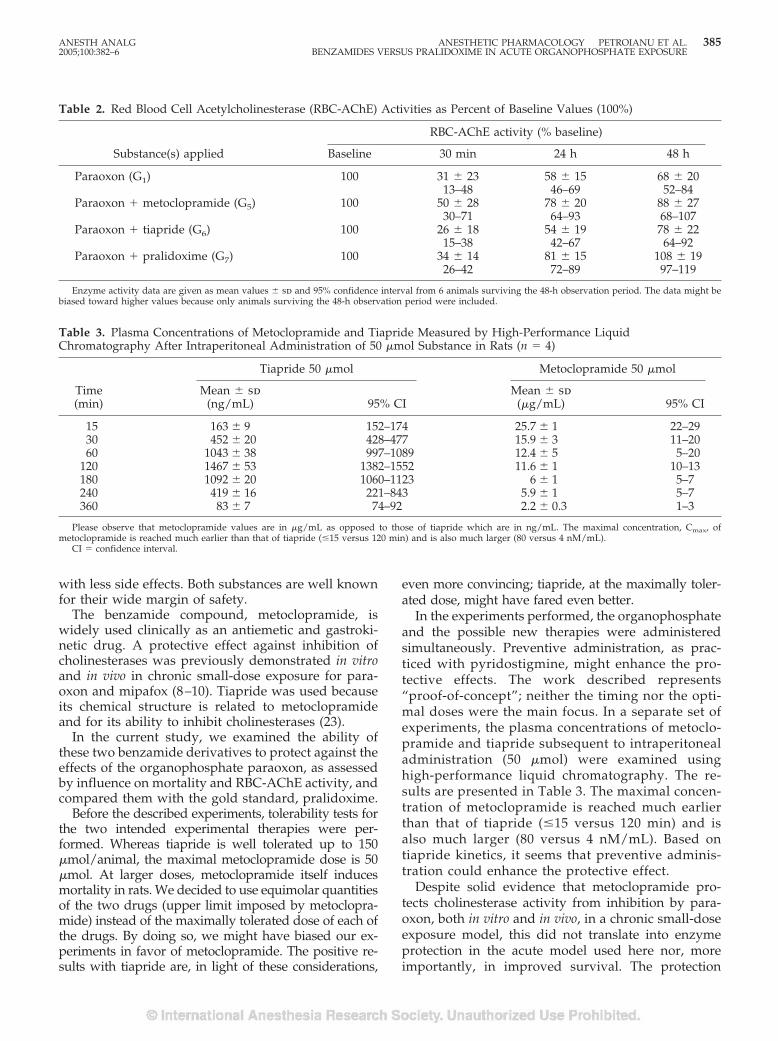
with less side effects. Both substances are well knownfor their wide margin of safety.
The benzamide compound, metoclopramide, iswidely used clinically as an antiemetic and gastroki-netic drug. A protective effect against inhibition ofcholinesterases was previously demonstrated in vitroand in vivo in chronic small-dose exposure for para-oxon and mipafox (8–10). Tiapride was used becauseits chemical structure is related to metoclopramideand for its ability to inhibit cholinesterases (23).
In the current study, we examined the ability ofthese two benzamide derivatives to protect against theeffects of the organophosphate paraoxon, as assessedby influence on mortality and RBC-AChE activity, andcompared them with the gold standard, pralidoxime.
Before the described experiments, tolerability tests forthe two intended experimental therapies were per-formed. Whereas tiapride is well tolerated up to 150�mol/animal, the maximal metoclopramide dose is 50�mol. At larger doses, metoclopramide itself inducesmortality in rats. We decided to use equimolar quantitiesof the two drugs (upper limit imposed by metoclopra-mide) instead of the maximally tolerated dose of each ofthe drugs. By doing so, we might have biased our ex-periments in favor of metoclopramide. The positive re-sults with tiapride are, in light of these considerations,
even more convincing; tiapride, at the maximally toler-ated dose, might have fared even better.
In the experiments performed, the organophosphateand the possible new therapies were administeredsimultaneously. Preventive administration, as prac-ticed with pyridostigmine, might enhance the pro-tective effects. The work described represents“proof-of-concept”; neither the timing nor the opti-mal doses were the main focus. In a separate set ofexperiments, the plasma concentrations of metoclo-pramide and tiapride subsequent to intraperitonealadministration (50 �mol) were examined usinghigh-performance liquid chromatography. The re-sults are presented in Table 3. The maximal concen-tration of metoclopramide is reached much earlierthan that of tiapride (�15 versus 120 min) and isalso much larger (80 versus 4 nM/mL). Based ontiapride kinetics, it seems that preventive adminis-tration could enhance the protective effect.
Despite solid evidence that metoclopramide pro-tects cholinesterase activity from inhibition by para-oxon, both in vitro and in vivo, in a chronic small-doseexposure model, this did not translate into enzymeprotection in the acute model used here nor, moreimportantly, in improved survival. The protection
Table 2. Red Blood Cell Acetylcholinesterase (RBC-AChE) Activities as Percent of Baseline Values (100%)
Substance(s) applied
RBC-AChE activity (% baseline)
Baseline 30 min 24 h 48 h
Paraoxon (G1) 100 31 � 23 58 � 15 68 � 2013–48 46–69 52–84
Paraoxon � metoclopramide (G5) 100 50 � 28 78 � 20 88 � 2730–71 64–93 68–107
Paraoxon � tiapride (G6) 100 26 � 18 54 � 19 78 � 2215–38 42–67 64–92
Paraoxon � pralidoxime (G7) 100 34 � 14 81 � 15 108 � 1926–42 72–89 97–119
Enzyme activity data are given as mean values � sd and 95% confidence interval from 6 animals surviving the 48-h observation period. The data might bebiased toward higher values because only animals surviving the 48-h observation period were included.
Table 3. Plasma Concentrations of Metoclopramide and Tiapride Measured by High-Performance LiquidChromatography After Intraperitoneal Administration of 50 �mol Substance in Rats (n � 4)
Time(min)
Tiapride 50 �mol Metoclopramide 50 �mol
Mean � sd(ng/mL) 95% CI
Mean � sd(�g/mL) 95% CI
15 163 � 9 152–174 25.7 � 1 22–2930 452 � 20 428–477 15.9 � 3 11–2060 1043 � 38 997–1089 12.4 � 5 5–20
120 1467 � 53 1382–1552 11.6 � 1 10–13180 1092 � 20 1060–1123 6 � 1 5–7240 419 � 16 221–843 5.9 � 1 5–7360 83 � 7 74–92 2.2 � 0.3 1–3
Please observe that metoclopramide values are in �g/mL as opposed to those of tiapride which are in ng/mL. The maximal concentration, Cmax, ofmetoclopramide is reached much earlier than that of tiapride (�15 versus 120 min) and is also much larger (80 versus 4 nM/mL).
CI � confidence interval.
ANESTH ANALG ANESTHETIC PHARMACOLOGY PETROIANU ET AL. 3852005;100:382–6 BENZAMIDES VERSUS PRALIDOXIME IN ACUTE ORGANOPHOSPHATE EXPOSURE

against death by tiapride is much more encourag-ing, comparable to our results with pralidoxime,despite tiapride’s inability to protect enzyme activ-ity. The results confirm the impression that enzymeactivity and mortality are not strongly correlated,even raising the possibility that tiapride-conferredprotection is not, or not only, related to the assumedeffect on cholinesterases.
We conclude that metoclopramide is of no clinicaluse in reducing mortality after acute large-dose or-ganophosphate exposure but that the related benz-amide tiapride could be a complement to pralidoximewell worth investigating. Further in vivo work willhave to address the issue of both optimal dose andtiming.
References1. Levine R. Recognized and possible effects of pesticides in hu-
mans. In: Hayes WJ, Laws ER, eds. Handbook of pesticidetoxicology: general principles. Vol. 1. San Diego: AcademicPress, 1991:275–360.
2. Petroianu G, Toomes LM, Petroianu A, et al. Control of bloodpressure, heart rate and haematocrit during high-dose intrave-nous Paraoxon exposure in mini pigs. J Appl Toxicol 1998;18:293–8.
3. Dawson RM. Review of oximes available for treatment of nerveagent poisoning. J Appl Toxicol 1994;14:317–31.
4. Kassa J. Review of oximes in the antidotal treatment of poison-ing by organophosphorous nerve agents. J Toxicol Clin Toxicol2002;40:803–16.
5. Johnson MK, Jacobsen D, Meredith TJ, et al. Evaluation ofantidotes for poisoning by organophosphorous pesticides.Emerg Med 2000;12:22–37.
6. Graham SG, Crossley AWA. The characteristics of the inhibitionof serum cholinesterase by metoclopramide. Eur J Clin Pharma-col 1995;48:225–8.
7. Chemnitius JM, Haselmeyer KH, Gonska BD, et at. Indirectparasympathomimetic activity of metoclopramide: reversibleinhibition of cholinesterases from human central nervous sys-tem and blood. Pharmacol Res 1996;34:65–72.
8. Petroianu G, Arafat K, Kosanovic M, et al. In vitro protection ofRBC acetylcholinesterase by metoclopramide from inhibition byorganophosphates (paraoxon and mipafox). J Appl Toxicol2003;23:447–51.
9. Petroianu G, Kuhn F, Thyes C, et al. In vitro protection ofplasma cholinesterases by metoclopramide from inhibition byparaoxon. J Appl Toxicol 2003;23:75–9.
10. Petroianu G, Hassan MY, Kosanovic M, et al. Metoclopramideprotection of cholinesterase from paraoxon inhibition. Vet HumToxicol 2003;45:251–3.
11. Steele JW, Faulds D, Sorkin EM. Tiapride: a review of its phar-macodynamic and pharmacokinetic properties, and therapeuticpotential in geriatric agitation. Drugs Aging 1993;3:460–78.
12. Worek F, Mast U, Kiderlen D, et al. Improved determination ofacetylcholinesterase activity in human whole blood. Clin ChimActa 1999;288:73–90.
13. Ellman GL, Courtney KD, Andres V Jr, Feather-Stone RM. Anew and rapid colorimetric determination of acetylcholinester-ase activity. Biochem Pharmacol 1961;7:88–95.
14. Van Kampen EJ, Zijlstra WG. Standardization of hemoglobi-nometry. II. The hemoglobincyanide method. Clin Chim Acta1961;6:538–44.
15. Dart RC, Goldfrank LR, Chyka PA, et al. Combined evidence-based literature analysis and consensus guidelines for stockingof emergency antidotes in the United States. Ann Emerg Med2000;36:126–32.
16. Geldmacher-von Mallinkrodt M, Urbach HJ, Kittel H, et al. ZurMessung der in vivo und in vitro Reaktivierbarkeit alkylphosphat-vergifteter Serumcholinesterase durch 2-PAM und Toxogonin mitverschiedenen Substanzen. Z Klin Chem Klin Biochem 1969;7:480–5.
17. Pannbacker RG, Oehme FW. Pralidoxime hydrolysis of thiocho-line esters. Vet Hum Toxicol 2003;45:39–40.
18. Petroianu GA, Missler A, Zuleger K, et al. Enzyme reactivatortreatment in organophosphate exposure: the clinical relevanceof thiocholine-esteratic activity of pralidoxime. J Appl Toxicol2004;24:429–35.
19. Tuovinen K, Kaliste-Korhonen E, Raushel FM, et al. Success ofpyridostigmine, physostigmine, eptastigmine and phosphotri-esterase treatments in acute sarin intoxication. Toxicology 1999;134:169–78.
20. Heyl WC, Harris LW, Stitcher DL. Effects of carbamates onwhole blood cholinesterase activity: chemical protection againstsoman. Drug Chem Toxicol 1980;3:319–32.
21. Stitcher DL, Harris LW, Heyl WC, et al. Effects of pyridostig-mine and cholinolytics on cholinesterase and acetylcholine insoman poisoned rats. Drug Chem Toxicol 1978;1:355–62.
22. Laine-Cessac P, Turcant A, Premel-Cabic A, et al. Inhibition ofcholinesterases by histamine 2 receptor antagonist drugs. ResCommun Chem Pathol Pharmacol 1993;79:185–93.
23. Fontaine J, Reuse J. The effects of substituted benzamides onfrog rectus abdominis. Eur J Pharmacol 1980;68:55–60.
386 ANESTHETIC PHARMACOLOGY PETROIANU ET AL. ANESTH ANALGBENZAMIDES VERSUS PRALIDOXIME IN ACUTE ORGANOPHOSPHATE EXPOSURE 2005;100:382–6
The Timing of Acupuncture Stimulation Does Not InfluenceAnesthetic RequirementGrigory Chernyak, MD*, Papiya Sengupta, MD†, Rainer Lenhardt, MD*†, Edwin Liem, MD*†,Anthony G. Doufas, MD, PhD*†, Daniel I. Sessler, MD*†, and Ozan Akca, MD*†
*Department of Anesthesiology and Perioperative Medicine and †Outcomes Research™ Institute, University of Louisville,Kentucky
Studies suggest that acupuncture is more effective wheninduced before the induction of general anesthesia thanafterwards. We tested the hypothesis that electro-acupuncture initiated 30 min before the induction reducesanesthetic requirement more than acupuncture initiatedafter the induction. Seven volunteers were each anesthe-tized with desflurane on 3 study days. Needles were in-sertedpercutaneouslyat fouracupuncturepoints thoughtto produce analgesia in the upper abdominal area andprovide generalized sedative and analgesic effects: Zu-sanli (St36), Sanyinjiao (Sp6), Liangqiu (Sp34), and Hegu(LI4). Needles were stimulated at 2 Hz and 10 Hz, withfrequencies alternating at 2-s intervals. On Preinductionday, electro-acupuncture was started 30 min before theinduction of anesthesia and maintained throughout thestudy. On At-induction day, needles were positioned be-fore the induction of anesthesia, but electro-acupuncture
stimulation was not initiated until after the induction. OnControl day, electrodes were positioned near the acu-points, but needles were not inserted. Noxious electricalstimulationwasadministeredvia25-gaugeneedlesontheupperabdomen(70mA;100Hz;10s).Thedesfluranecon-centration was increased 0.5% when movement occurredand decreased 0.5% when it did not. These up-and-downsequences continued until volunteers crossed from move-ment to no movement four times. The P50 of logistic re-gression identified desflurane requirement. Desfluranerequirement was similar on the Control (mean � sd; 5.2%� 0.6%), Preinduction (5.0% � 0.8%), and At-induction(4.7% � 0.3%; P � 0.125) days. This type of acupuncture isthus unlikely to facilitate general anesthesia or decreasethe requirement for anesthetic drugs.
(Anesth Analg 2005;100:387–92)
A cupuncture may alleviate postoperative nauseaand vomiting (1), improve postoperative anal-gesia (2), and reduce intraoperative opioid re-
quirement (3). Three studies have evaluated the use ofacupuncture to reduce volatile anesthetic require-ments. The first used electro-acupuncture of a singleauricular acupoint and identified a statistically signif-icant 11% reduction in anesthetic requirement (4). Thesecond used needles at 4 auricular acupoints and iden-tified a statistically significant 8% reduction in anes-thetic requirement (5). The third study, which stimu-lated 3 acupoints on the leg, failed to reduce anesthetic
requirement (6). In each of the 3 studies, (4–6) acu-puncture was initiated after the induction of generalanesthesia to maintain complete double blinding.(These studies were arguably the first fully double-blind acupuncture trials.) Nonetheless, aspects of thisdesign might have obscured the potential influence ofacupuncture on anesthetic requirement.
De-Qi is a typical sensation that is associated withproper acupuncture needle positioning. Patients vari-ously report it as a soreness, numbness, warmth,heaviness, or distention around the area where theneedle is inserted. De-Qi seems to be a slow painsensation conducted by nonmyelinated c fibers. Manypractitioners consider this sensation to be crucial inachieving the effect of acupuncture (7). Because theDe-Qi sensation cannot be elicited during anesthesia,the first limitation of previous studies of acupunctureand anesthetic requirement is that the needles mayhave been suboptimally positioned.
The endorphin hypothesis suggests that acupunc-ture activates type II muscle afferents that send signalsto sites in the brain to release endorphins (8). Theseendorphins then suppress pain signals in the dorsal
Supported, in part, by NIH Grants GM 061655 and DE 14879(Bethesda, MD), the Jewish Hospital Foundation (Louisville, KY),the Gheens Foundation (Louisville, KY), the Joseph Drown Foun-dation (Los Angeles, CA), and the Commonwealth of KentuckyResearch Challenge Trust Fund (Louisville, KY). Dr. Akca is therecipient of a Research Training Grant from the Foundation forAnesthesia Education and Research.
Accepted for publication July 28, 2004.Address correspondence and reprint requests to Daniel I. Sessler,
MD, Outcomes Research™ Institute, 501 East Broadway, Louisville,KY 40202. Address e-mail to [email protected].
DOI: 10.1213/01.ANE.0000142114.72117.E0
©2005 by the International Anesthesia Research Society0003-2999/05 Anesth Analg 2005;100:387–92 387
horn of the spinal cord. Emotional aspects of pain arealso suppressed by endorphins acting in the limbicsystem. General anesthesia can block or attenuatethese pathways (9,10), thus reducing the efficacy ofsubsequent acupuncture. There is considerable evi-dence to support this theory. For example, stimulationof the P6 acupuncture point reduces the risk of post-operative nausea and vomiting (11–13), except whenacupuncture is started after the induction of anesthe-sia (14–16).
The second limitation of previous studies of acu-puncture and anesthetic requirement is that preexist-ing general anesthesia may itself reduce the efficacy ofacupuncture. Initiation of acupuncture after the induc-tion of general anesthesia has the advantage of per-mitting fully double-blind trials. However, availableevidence suggests that the efficacy of acupuncture—whether for analgesia or antiemetic effect—may bediminished when it is initiated after the induction ofgeneral anesthesia. Therefore, we tested the hypothe-sis that acupuncture started 30 min before the induc-tion of anesthesia reduces anesthetic requirementmore than acupuncture started at the induction ofanesthesia. We chose 30 min before the induction be-cause it takes �20 min after needle insertion to achievemaximum acupuncture analgesia (17).
MethodsWith approval from the Human Studies Committee atthe University of Louisville, KY, and written informedconsent, we recruited 13 healthy volunteers aged18–35 yr. Exclusion criteria included a history of drugaddiction or use of drugs other than oral contracep-tives or a history of chronic pain. Menstrual cycle wasnot controlled because cycle status has little or noinfluence on perception of electrical pain (18).
All volunteers underwent a needling test before theywere included in the study with the aim of excludingpotential subjects who were resistant to acupuncture andto familiarize the volunteers with the acupuncture pro-cedure and the resulting De-Qi sensation.
The volunteers fasted and refrained from smokingfor at least 8 h before arriving at the laboratory. Nopremedication was given. The volunteers who com-pleted the trial participated on 3 study days, separatedat least 72 h (8 � 5 days). Each set of studies began atthe same time of day because circadian rhythms caninfluence anesthetic requirement (19), as well as acu-puncture efficacy (20).
On each study day, anesthesia was induced with ap-proximately 3.5 mg/kg IV of propofol. A laryngeal maskairway (Laryngeal Mask Company Limited, Henley-on-Thames, United Kingdom) or perilaryngeal airway (Co-braPLA, Engineered Medical Systems, Indianapolis, IN)was inserted. Ventilation was assisted until spontaneous
breathing was re-established. Anesthesia was initiallymaintained with desflurane (5.0 vol%) in 80% oxygenand 20% air. Before the induction of anesthesia on theinitial study day, volunteers were randomly assigned to30 min of electro-acupuncture before the anesthesia in-duction (Preinduction day), electro-acupuncture at anes-thesia induction acupuncture (At-induction day), or notreatment (Control day). We used a crossover studydesign: each volunteer was thus given alternative treat-ments on subsequent study days.
We stimulated the Zusanli (St36), Sanyinjiao (Sp6),Liangqiu (Sp34), and Hegu (LI4) points. Zusanli (St36)is approximately 6 cm below the lower margin of thepatella and 2 cm lateral to the tibia. Sanyinjiao (Sp6) isapproximately 7 cm above the highest portion of themedial malleolus at the posterior border of tibia. Li-angqiu (Sp34) is approximately 4.5 cm above thesuperior-lateral border of the patella. Hegu (LI4) is inthe middle of the second metacarpal bone on theprominence of the first inner ossei dorsales, slightlytowards the index finger (21). These points arethought to produce a generalized sedative and anal-gesic effect and to be effective for surgical procedureson the upper abdomen (22,23). Another advantage ofthese four points is that they are safe to needle becausethey are not adjacent to critical structures.
An acupuncturist (GC) with 15 yr experience in-serted AcuMaster acupuncture needles, which have adiameter of 0.22 mm and are 50-mm long (Helio Med-ical Supplies, Inc, San Jose, CA). The needles wereconnected to an IC-4107 stimulator (ITO, Ltd, Tokyo,Japan). The stimulating frequency was set to 2 Hz and10 Hz, with the frequencies being alternated at 2-sintervals (24). Pulse shape was bipolar and asymmet-ric. The appropriate intensity was determined duringthe needling test before the first randomized studyday. Stimulation intensity was set at the highest levelthat was well tolerated by the volunteers without pro-voking muscular twitching that might have unblindedthe study. This stimulation intensity was then main-tained for the duration of the study. The averagestimulator output was 8 V at a current of 8 mA.
The acupuncture needles were inserted percutane-ously (on appropriate days), and an unblinded inves-tigator connected the electrodes. On the Preinductionday, needles were inserted in appropriate points andthe De-Qi sensation confirmed; electro-acupuncturestimulation was then initiated 30 min before the anes-thetic induction and maintained throughout the study.On the At-induction day, needles were inserted im-mediately before the induction of general anesthesia,again eliciting the De-Qi sensation. But in this case,electro-stimulation of the acupuncture points was ini-tiated only after the induction of anesthesia. On theControl days, electrodes were insulated and taped tothe skin without acupuncture needles having beeninserted at all.
388 ANESTHETIC PHARMACOLOGY CHERNYAK ET AL. ANESTH ANALGTIMING OF ACUPUNCTURE 2005;100:387–92
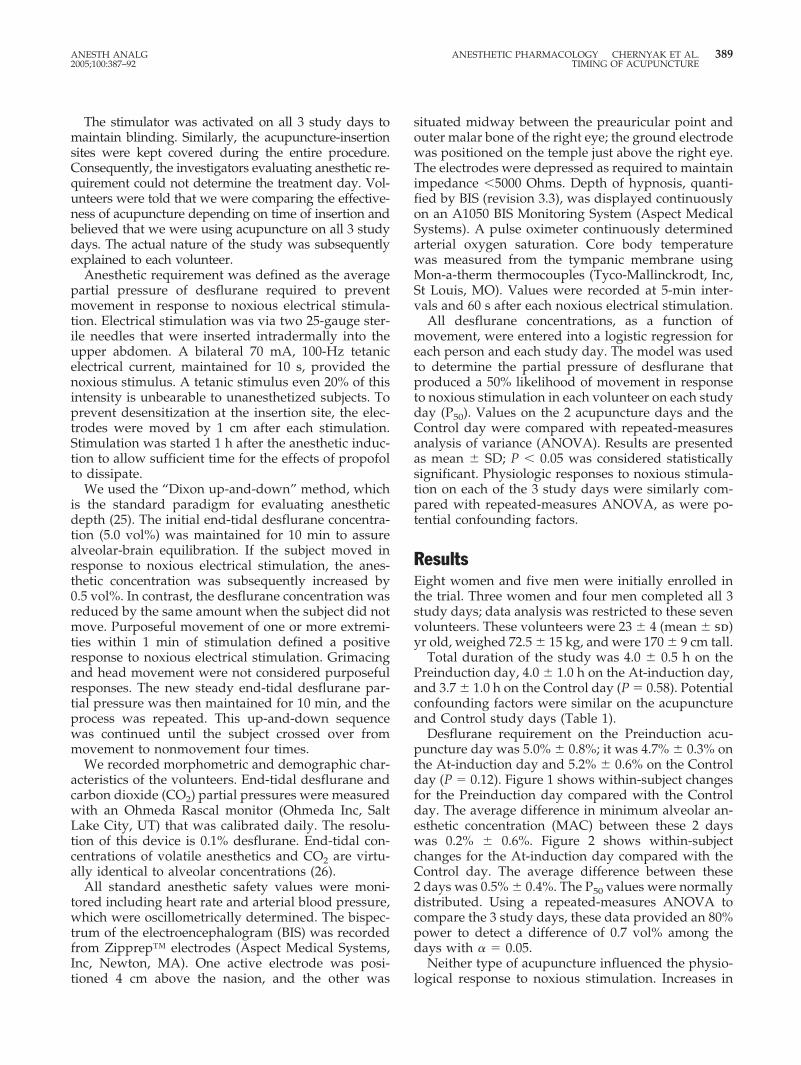
The stimulator was activated on all 3 study days tomaintain blinding. Similarly, the acupuncture-insertionsites were kept covered during the entire procedure.Consequently, the investigators evaluating anesthetic re-quirement could not determine the treatment day. Vol-unteers were told that we were comparing the effective-ness of acupuncture depending on time of insertion andbelieved that we were using acupuncture on all 3 studydays. The actual nature of the study was subsequentlyexplained to each volunteer.
Anesthetic requirement was defined as the averagepartial pressure of desflurane required to preventmovement in response to noxious electrical stimula-tion. Electrical stimulation was via two 25-gauge ster-ile needles that were inserted intradermally into theupper abdomen. A bilateral 70 mA, 100-Hz tetanicelectrical current, maintained for 10 s, provided thenoxious stimulus. A tetanic stimulus even 20% of thisintensity is unbearable to unanesthetized subjects. Toprevent desensitization at the insertion site, the elec-trodes were moved by 1 cm after each stimulation.Stimulation was started 1 h after the anesthetic induc-tion to allow sufficient time for the effects of propofolto dissipate.
We used the “Dixon up-and-down” method, whichis the standard paradigm for evaluating anestheticdepth (25). The initial end-tidal desflurane concentra-tion (5.0 vol%) was maintained for 10 min to assurealveolar-brain equilibration. If the subject moved inresponse to noxious electrical stimulation, the anes-thetic concentration was subsequently increased by0.5 vol%. In contrast, the desflurane concentration wasreduced by the same amount when the subject did notmove. Purposeful movement of one or more extremi-ties within 1 min of stimulation defined a positiveresponse to noxious electrical stimulation. Grimacingand head movement were not considered purposefulresponses. The new steady end-tidal desflurane par-tial pressure was then maintained for 10 min, and theprocess was repeated. This up-and-down sequencewas continued until the subject crossed over frommovement to nonmovement four times.
We recorded morphometric and demographic char-acteristics of the volunteers. End-tidal desflurane andcarbon dioxide (CO2) partial pressures were measuredwith an Ohmeda Rascal monitor (Ohmeda Inc, SaltLake City, UT) that was calibrated daily. The resolu-tion of this device is 0.1% desflurane. End-tidal con-centrations of volatile anesthetics and CO2 are virtu-ally identical to alveolar concentrations (26).
All standard anesthetic safety values were moni-tored including heart rate and arterial blood pressure,which were oscillometrically determined. The bispec-trum of the electroencephalogram (BIS) was recordedfrom Zipprep™ electrodes (Aspect Medical Systems,Inc, Newton, MA). One active electrode was posi-tioned 4 cm above the nasion, and the other was
situated midway between the preauricular point andouter malar bone of the right eye; the ground electrodewas positioned on the temple just above the right eye.The electrodes were depressed as required to maintainimpedance �5000 Ohms. Depth of hypnosis, quanti-fied by BIS (revision 3.3), was displayed continuouslyon an A1050 BIS Monitoring System (Aspect MedicalSystems). A pulse oximeter continuously determinedarterial oxygen saturation. Core body temperaturewas measured from the tympanic membrane usingMon-a-therm thermocouples (Tyco-Mallinckrodt, Inc,St Louis, MO). Values were recorded at 5-min inter-vals and 60 s after each noxious electrical stimulation.
All desflurane concentrations, as a function ofmovement, were entered into a logistic regression foreach person and each study day. The model was usedto determine the partial pressure of desflurane thatproduced a 50% likelihood of movement in responseto noxious stimulation in each volunteer on each studyday (P50). Values on the 2 acupuncture days and theControl day were compared with repeated-measuresanalysis of variance (ANOVA). Results are presentedas mean � SD; P � 0.05 was considered statisticallysignificant. Physiologic responses to noxious stimula-tion on each of the 3 study days were similarly com-pared with repeated-measures ANOVA, as were po-tential confounding factors.
ResultsEight women and five men were initially enrolled inthe trial. Three women and four men completed all 3study days; data analysis was restricted to these sevenvolunteers. These volunteers were 23 � 4 (mean � sd)yr old, weighed 72.5 � 15 kg, and were 170 � 9 cm tall.
Total duration of the study was 4.0 � 0.5 h on thePreinduction day, 4.0 � 1.0 h on the At-induction day,and 3.7 � 1.0 h on the Control day (P � 0.58). Potentialconfounding factors were similar on the acupunctureand Control study days (Table 1).
Desflurane requirement on the Preinduction acu-puncture day was 5.0% � 0.8%; it was 4.7% � 0.3% onthe At-induction day and 5.2% � 0.6% on the Controlday (P � 0.12). Figure 1 shows within-subject changesfor the Preinduction day compared with the Controlday. The average difference in minimum alveolar an-esthetic concentration (MAC) between these 2 dayswas 0.2% � 0.6%. Figure 2 shows within-subjectchanges for the At-induction day compared with theControl day. The average difference between these2 days was 0.5% � 0.4%. The P50 values were normallydistributed. Using a repeated-measures ANOVA tocompare the 3 study days, these data provided an 80%power to detect a difference of 0.7 vol% among thedays with � � 0.05.
Neither type of acupuncture influenced the physio-logical response to noxious stimulation. Increases in
ANESTH ANALG ANESTHETIC PHARMACOLOGY CHERNYAK ET AL. 3892005;100:387–92 TIMING OF ACUPUNCTURE
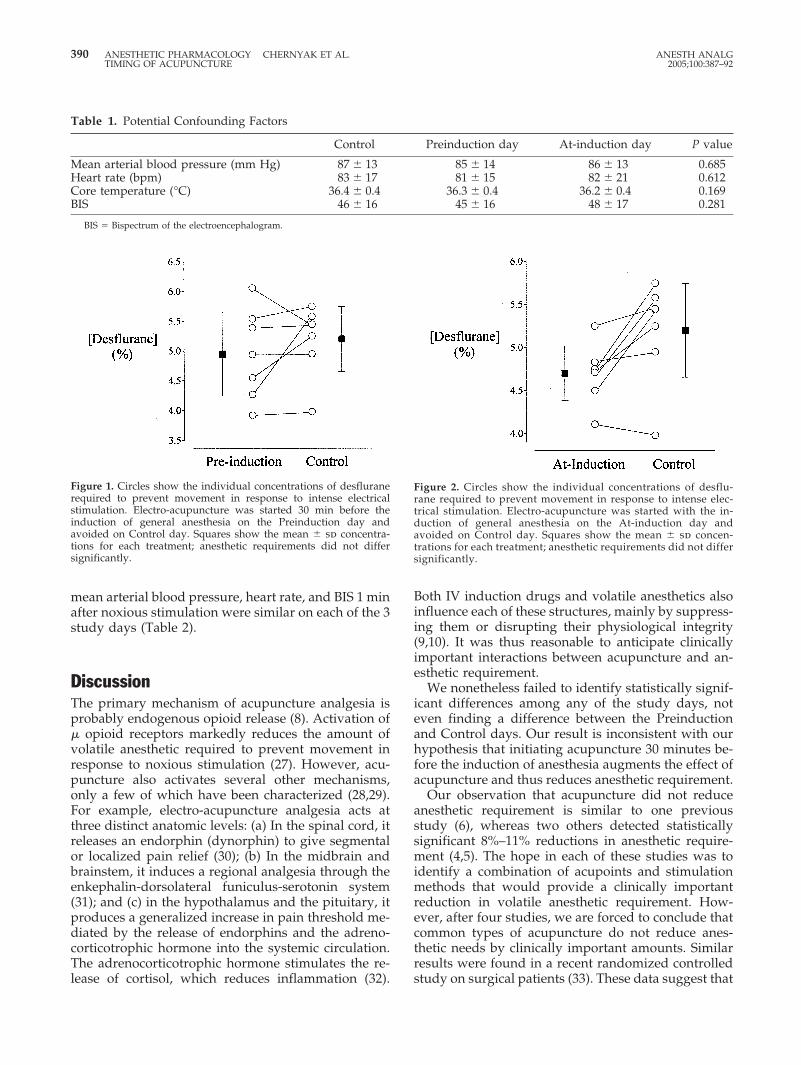
mean arterial blood pressure, heart rate, and BIS 1 minafter noxious stimulation were similar on each of the 3study days (Table 2).
DiscussionThe primary mechanism of acupuncture analgesia isprobably endogenous opioid release (8). Activation of� opioid receptors markedly reduces the amount ofvolatile anesthetic required to prevent movement inresponse to noxious stimulation (27). However, acu-puncture also activates several other mechanisms,only a few of which have been characterized (28,29).For example, electro-acupuncture analgesia acts atthree distinct anatomic levels: (a) In the spinal cord, itreleases an endorphin (dynorphin) to give segmentalor localized pain relief (30); (b) In the midbrain andbrainstem, it induces a regional analgesia through theenkephalin-dorsolateral funiculus-serotonin system(31); and (c) in the hypothalamus and the pituitary, itproduces a generalized increase in pain threshold me-diated by the release of endorphins and the adreno-corticotrophic hormone into the systemic circulation.The adrenocorticotrophic hormone stimulates the re-lease of cortisol, which reduces inflammation (32).
Both IV induction drugs and volatile anesthetics alsoinfluence each of these structures, mainly by suppress-ing them or disrupting their physiological integrity(9,10). It was thus reasonable to anticipate clinicallyimportant interactions between acupuncture and an-esthetic requirement.
We nonetheless failed to identify statistically signif-icant differences among any of the study days, noteven finding a difference between the Preinductionand Control days. Our result is inconsistent with ourhypothesis that initiating acupuncture 30 minutes be-fore the induction of anesthesia augments the effect ofacupuncture and thus reduces anesthetic requirement.
Our observation that acupuncture did not reduceanesthetic requirement is similar to one previousstudy (6), whereas two others detected statisticallysignificant 8%–11% reductions in anesthetic require-ment (4,5). The hope in each of these studies was toidentify a combination of acupoints and stimulationmethods that would provide a clinically importantreduction in volatile anesthetic requirement. How-ever, after four studies, we are forced to conclude thatcommon types of acupuncture do not reduce anes-thetic needs by clinically important amounts. Similarresults were found in a recent randomized controlledstudy on surgical patients (33). These data suggest that
Figure 2. Circles show the individual concentrations of desflu-rane required to prevent movement in response to intense elec-trical stimulation. Electro-acupuncture was started with the in-duction of general anesthesia on the At-induction day andavoided on Control day. Squares show the mean � sd concen-trations for each treatment; anesthetic requirements did not differsignificantly.
Table 1. Potential Confounding Factors
Control Preinduction day At-induction day P value
Mean arterial blood pressure (mm Hg) 87 � 13 85 � 14 86 � 13 0.685Heart rate (bpm) 83 � 17 81 � 15 82 � 21 0.612Core temperature (°C) 36.4 � 0.4 36.3 � 0.4 36.2 � 0.4 0.169BIS 46 � 16 45 � 16 48 � 17 0.281
BIS � Bispectrum of the electroencephalogram.
Figure 1. Circles show the individual concentrations of desfluranerequired to prevent movement in response to intense electricalstimulation. Electro-acupuncture was started 30 min before theinduction of general anesthesia on the Preinduction day andavoided on Control day. Squares show the mean � sd concentra-tions for each treatment; anesthetic requirements did not differsignificantly.
390 ANESTHETIC PHARMACOLOGY CHERNYAK ET AL. ANESTH ANALGTIMING OF ACUPUNCTURE 2005;100:387–92
the analgesic effect of acupuncture is comparativelyweak and largely overshadowed by the effects of vol-atile anesthetics. Acupuncture in the perioperative set-ting might thus better be directed at providing post-operative analgesia (2) and ameliorating nausea andvomiting (1), both of which are better-documentedeffects.
The conventional measure of volatile anesthetic po-tency is the MAC (34), which can most efficiently bedetermined by using the Dixon up-and-down method(25). MAC for a population is conventionally definedas the volatile anesthetic concentration preventingmovement in response to surgical skin incision. Ananalogous concentration can be determined in indi-viduals using repeated noxious electrical stimulation(35). The resulting partial pressures are uniformlylower than those obtained with skin incision (36), butelectrical stimulation nonetheless provides a reason-able measure of anesthetic need and has been used inprevious studies (37).
We used this technique in the current study becauseit has the advantage of allowing crossover study de-signs that are especially sensitive for detectingtreatment-induced changes in anesthetic requirement.Consequently, we had an 80% power to detect differ-ences among the groups of only 0.7-vol% desflurane.
One might argue that the acupoints we used in ourvolunteers were suboptimal. However, the points wechose were located on the stomach, large intestine,and spleen meridians; all are closely related to eachother, and all four points are routinely used for pain inthe epigastric area (where we positioned our noxiousstimulation) and are recommended for abdominal sur-gery (22).
In conclusion, acupuncture initiated 30 minutes be-fore the induction of general anesthesia was no moreeffective than acupuncture initiated immediately be-fore the induction of general anesthesia. More impor-tantly, neither was more effective than no treatmentwhatsoever. This result is consistent with three previ-ous studies in which acupuncture induced after theinduction of general anesthesia produced little or noreduction in anesthetic requirement. We thus con-clude that the effects of volatile anesthetics over-shadow the analgesic effect of acupuncture. Conse-quently, acupuncture in the perioperative setting
would more appropriately be directed at better-documented treatments, including postoperative an-algesia and ameliorating nausea and vomiting.
References1. White PF, Issioui T, Hu J, et al. Comparative efficacy of
acustimulation (ReliefBand) versus ondansetron (Zofran) incombination with droperidol for preventing nausea and vomit-ing. Anesthesiology 2002;97:1075–81.
2. Kotani N, Hashimoto H, Sato Y, et al. Preoperative intradermalacupuncture reduces postoperative pain, nausea and vomiting,analgesic requirement, and sympathoadrenal responses. Anes-thesiology 2001;95:349–56.
3. Sim CK, Xu PC, Pua HL, et al. Effects of electroacupuncture onintraoperative and postoperative analgesic requirement. Acu-punct Med 2002;20:56–65.
4. Greif R, Laciny S, Mokhtarani M, et al. Transcutaneous electricalstimulation of an auricular acupuncture point decreases anes-thetic requirement. Anesthesiology 2002;96:306–12.
5. Taguchi A, Sharma N, Ali SZ, et al. The effect of auricularacupuncture on anaesthesia with desflurane. Anaesthesia 2002;57:1159–63.
6. Morioka N, Akca O, Doufas AG, et al. Electro-acupuncture atthe Zusanli, Yanglingquan, and Kunlun points does not reduceanesthetic requirement. Anesth Analg 2002;95:98–102.
7. Vincent CA, Richardson PH, Black JJ, Pither CE. The signifi-cance of needle placement site in acupuncture. J Psychosom Res1989;33:489–96.
8. Pomeranz B. Acupuncture research related to pain, drug addic-tion and nerve regeneration. In: Stux G, ed. Scientific bases ofacupuncture. Berlin: Springer Verlag, 1987:35–52.
9. Ogasawara H, Takahashi S, Kudo T, et al. Effects of sevofluraneanesthesia on serotonin metabolism in rat brain. Masui 1993;42:1412–7.
10. Kakinohana M, Fuchigami T, Nakamura S, et al. Propofol re-duces spinal motor neuron excitability in humans. AnesthAnalg 2002;94:1586–8.
11. al-Sadi M, Newman B, Julious SA. Acupuncture in the preven-tion of postoperative nausea and vomiting. Anaesthesia 1997;52:658–61.
12. Ho RT, Jawan B, Fung ST, et al. Electro-acupuncture and post-operative emesis. Anaesthesia 1990;45:327–9.
13. Vickers AJ. Can acupuncture have specific effects on health: asystematic review of acupuncture antiemesis trials. J R Soc Med1996;89:303–11.
14. Weightman WM, Zacharias M, Herbison P. Traditional Chineseacupuncture as an antiemetic. BMJ (Clin Res Ed) 1987;295:1379–80.
15. Yentis SM, Bissonnette B. P6 acupuncture and postoperativevomiting after tonsillectomy in children. Br J Anaesth 1991;67:779–80.
16. Shenkman Z, Holzman RS, Kim C, et al. Acupressure-acupuncture antiemetic prophylaxis in children undergoingtonsillectomy. Anesthesiology 1999;90:1311–6.
17. Ulett GA, Han S, Han JS. Electroacupuncture: mechanisms andclinical application. Biol Psychiatry 1998;44:129–38.
Table 2. Physiologic Response to Noxious Stimulation
Control Preinduction day At-induction day P value
Increase in mean arterial blood pressure (mm Hg) 15.8 � 12.0 13.3 � 14.6 17.3 � 11.2 0.148Increase in heart rate (bpm) 24 � 12 23 � 13 25 � 13 0.394Increase in BIS 9 � 16 6 � 14 7 � 18 0.502
BIS � Bispectrum of the electroencephalogram. The increase in mean arterial blood pressure, heart rate, and BIS during the first minute after noxious electricalstimulation.
ANESTH ANALG ANESTHETIC PHARMACOLOGY CHERNYAK ET AL. 3912005;100:387–92 TIMING OF ACUPUNCTURE
18. Riley J 3rd, Robinson M, Wise E, Price D. A meta-analyticreview of pain perception across the menstrual cycle. Pain 1999;81:225–35.
19. Halberg J, Halberg E, Halberg F, Munson E. Chronobiologic mon-itoring and analysis for anesthesiologists: another look at a chro-noanesthetic index. In: Puly JE, Scheving LE, eds. Advances inchronobiology, part B. New York: Alan R. Liss, Inc, 1985:315–22.
20. Quan L. Optimum time for acupuncture: a collection of tradi-tional chinese chronotherapeutics. Jinan, China: Shandong Sci-ence and Technology, 1988.
21. Cheng J. Anatomical atlas of Chinese acupuncture points. Jinan,China: Shandong Science and Technology Press, 1990.
22. Acupuncture anesthesia (a translation of a Chinese publicationof the same title): Reproduced in limited quantities by theGeographic Health Studies Program of the John E. FogartyInternational Center for Advanced Study in the Health Sciences1975. US Department of Health Education and Welfare Publichealth service. National Institute of Health. DHEW PublicationNo. (NIH)75–784, 1975.
23. Benzon HT, Cheng SC, Avram MJ, Molloy RE. Sign of completesympathetic blockade: sweat test or sympathogalvanic re-sponse? Anesth Analg 1985;64:415–9.
24. Han Z, Jiang YH, Wan Y, et al. Endomorphin-1 mediates 2 Hzbut not 100 Hz electroacupuncture analgesia in the rat. NeurosciLett 1999;274:75–8.
25. Dixon WJ. Quantal-response variable experimentation: the up-and-down method. In: McArthur JW, Colton T, eds. Statistics inendocrinology. Cambridge: MIT Press, 1970:251–67.
26. Lockhart SH, Cohen Y, Yasuda N, et al. Absence of abundantbinding sites for anesthetics in rabbit brain: an in vivo NMRstudy. Anesthesiology 1990;73:455–60.
27. Inagaki Y, Kuzukawa A. Effects of epidural and intravenousbuprenorphine on halothane minimum alveolar anesthetic con-centration and hemodynamic responses. Anesth Analg 1997;84:100–5.
28. Langevin HM, Yandow JA. Relationship of acupuncture pointsand meridians to connective tissue planes. Anat Rec 2002;269:257–65.
29. Biella G, Sotgiu ML, Pellegata G, et al. Acupuncture producescentral activations in pain regions. Neuroimage 2001;14:60–6.
30. Chen XH, Geller EB, Adler MW. Electrical stimulation at tradi-tional acupuncture sites in periphery produces brain opioid-receptor-mediated antinociception in rats. J Pharmacol Exp Ther1996;277:654–60.
31. Hsieh JC, Tu CH, Chen FP, et al. Activation of the hypothalamuscharacterizes the acupuncture stimulation at the analgesic pointin human: a positron emission tomography study. Neurosci Lett2001;307:105–8.
32. Pan B, Castro-Lopes JM, Coimbra A. Activation of anterior lobecorticotrophs by electroacupuncture or noxious stimulation inthe anaesthetized rat, as shown by colocalization of Fos proteinwith ACTH and beta-endorphin and increased hormone re-lease. Brain Res Bull 1996;40:175–82.
33. Kvorning N, Christiansson C, Beskow A, et al. Acupuncturefails to reduce but increases anaesthetic gas required to preventmovement in response to surgical incision. Acta AnaesthesiolScand 2003;47:818–22.
34. Quasha AL, Eger EI 2nd, Tinker JH. Determination and appli-cations of MAC. Anesthesiology 1980;53:315–34.
35. Laster MJ, Liu J, Eger EI 2nd, Taheri S. Electrical stimulation asa substitute for the tail clamp in the determination of minimumalveolar concentration. Anesth Analg 1993;76:1310–2.
36. Zbinden AM, Petersen-Felix S, Thomson DA. Anesthetic depthdefined using multiple noxious stimuli during isoflurane/oxygen anesthesia. II. Hemodynamic responses. Anesthesiology1994;80:261–7.
37. Hodgson PS, Liu SS, Gras TW. Does epidural anesthesia havegeneral anesthetic effects: a prospective, randomized, double-blind, placebo-controlled trial. Anesthesiology 1999;91:1687–92.
392 ANESTHETIC PHARMACOLOGY CHERNYAK ET AL. ANESTH ANALGTIMING OF ACUPUNCTURE 2005;100:387–92
Cisatracurium Pharmacodynamics in Patients withOculopharyngeal Muscular DystrophyMarie-Josee Caron, MD*, Francois Girard, MD, FRCPC*, Dominique C. Girard, MD, FRCPC*,Daniel Boudreault, MD, FRCPC*, Bernard Brais, MD, MPhil, PhD†, Edgard Nassif, MD, FRCSC‡,Philippe Chouinard, MD, FRCPC*, Monique Ruel, RN, CCRP*, and Andre Duranceau, MD, FRCSC‡
Departments of *Anesthesiology, †Medicine, and ‡Surgery, Centre Hospitalier de l’Universite de Montreal, Hopital Notre-Dame, Montreal, Quebec, Canada
The pharmacodynamics of muscle relaxants in patientswith oculopharyngeal muscular dystrophy (OPMD) havenever been studied. We designed this study to comparethe pharmacodynamics of cisatracurium in OPMD pa-tients versus a control group. Forty patients were en-rolled: 20 OPMD patients requiring general anesthesia forcricopharyngeal myotomy and 20 age-matched controlsundergoing an operation of similar duration and ex-pected blood loss. Anesthesia was standardized, and bothgroups received a bolus of cisatracurium 0.1 mg/kg. On-set time, time to 10% T1 recovery, and the intervals 10%–25% and 25%–75% were calculated for both groups. A
subgroup analysis was performed in patients with a moresevere form of OPMD. Demographic and intraoperativedata were similar. Onset time was significantly longer inOPMD patients compared with the control group (4.6 �1.5 min versus 3.4 � 1.0 min; P � 0.001). There was nodifference in recovery times or indices between groups,regardless of the severity of the disease. In conclusion,there was no difference in the duration of a cisatracurium-induced neuromuscular block between OPMD patientsand a control group. A delayed onset of action of the drugmay occur.
(Anesth Analg 2005;100:393–7)
O culopharyngeal muscular dystrophy (OPMD)was first described by Taylor in 1915 (1). Thisinherited disease is present all over the world,
but the most frequent prevalence is found in the prov-ince of Quebec, Canada, where the carrier frequencyof the OPMD mutation is estimated to be 1 in 1000people (2). Physiopathologically, OPMD consists ofintranuclear infiltration in the muscle fiber with non-degradable nuclear filaments. Clinically, the diseaseusually begins with bilateral eyelid ptosis or dyspha-gia during the fifth or sixth decade of life and evolvestoward proximal limb weakness later on. OPMD canalso appear earlier in life, depending on the genotype(2). The ptosis has to be corrected when it interfereswith vision or when cervical pain appears secondaryto constant dorsiflexion of the neck. A cricopharyngealmyotomy becomes necessary when there is dysphagiaaccompanied by marked weight loss, near-fatal chok-ing, or recurrent pneumonia (3,4).
The literature regarding the anesthesia managementof patients with OPMD is scarce. Only two case re-ports have documented the safe use of vecuronium (5)and mivacurium (6) for affected individuals, but in-formation regarding the duration of action of the mus-cle relaxant cannot be obtained from these two cases.
We therefore conducted a prospective, open, andcontrolled study to assess cisatracurium pharmacody-namics in patients with OPMD. We hypothesized, onthe basis of both the clinical manifestations of thedisease and our clinical experience, that the durationof action of the muscle relaxant would be prolongedby 25% in OPMD patients. We also hypothesized thatthis prolongation of action would be proportional tothe severity of the disease.
MethodsAfter IRB approval and signed informed consent, 20patients with OPMD who were scheduled for crico-pharyngeal myotomy under general anesthesia wereenrolled in the study. They were matched for age(within 10 yr) to a control group of 20 patients under-going surgery of similar duration and expected bloodloss. The diagnosis of OPMD was genetically con-firmed in all affected individuals by standard methods
Supported by a grant from the Canadian Anesthesiologists’ Society.Accepted for publication July 14, 2004.Address correspondence and reprint requests to Francois Girard,
MD, FRCPC, Department of Anesthesiology, CHUM, HopitalNotre-Dame, 1560 Sherbrooke E., Montreal, Quebec, Canada, H2L4M1. Address e-mail to [email protected].
DOI: 10.1213/01.ANE.0000140783.39597.FD
©2005 by the International Anesthesia Research Society0003-2999/05 Anesth Analg 2005;100:393–7 393
(2). Exclusion criteria were renal, hepatic, or cardiacinsufficiency; patients taking drugs affecting neuro-muscular junction (aminoglycosides, tetracyclines,clindamycin, procainamide, quinidine, calcium antag-onists, magnesium sulfate, lithium, phenytoin, andcarbamazepine); and morbid obesity (body mass in-dex �35 kg/m2).
The patients were not premedicated. Standard mon-itoring was applied. A normal saline (0.9%) solutionwas infused through an IV catheter located on the armopposite to the neurostimulator at a rate sufficient toreplace fluid loss.
This study was conducted in accordance with theguidelines of “Good Clinical Research Practice(GCRP) in Pharmacodynamic Studies of Neuromus-cular Blocking Agents” (7). Neuromuscular transmis-sion was monitored with the Datex-Engstrom neuro-muscular transmission module with five surfaceelectrodes (Datex-Ohmeda, Helsinki, Finland). Thearea where the electrodes were to be placed wascleaned to ensure adequate contact. The electrodeswere placed in the following manner: two stimulatingelectrodes on the ulnar nerve trajectory; two recordingelectrodes, one on the thenar eminence and the secondon the lateral face of the index; and the last electrode,which served as a ground, between the stimulatingand the recording electrodes, at the level of the wrist.The stimulated arm was then comfortably positionedon an arm board, swathed in a bandage and protectedwith a padded metal box. This arm was kept warmthroughout the study period by wrapping the protec-tive metal box in a cotton blanket.
Anesthetic induction was standardized and con-sisted of the administration of 100% oxygen, sufen-tanil 0.25–0.5 �g/kg, and propofol 0.5–3 mg/kg ti-trated to loss of consciousness. Under stable isofluraneanesthesia (end-tidal concentration 0.5%–1.0%), abaseline supramaximal train-of-four (TOF) stimula-tion was obtained. The neuromuscular transmissionmodule automatically searches for the supramaximalstimulation by increments of 5 mA, starting at 10 mA,with 2-Hz, 200-�s stimuli. Once obtained, this supra-maximal TOF stimulus was then administered every12 s for 2 min to obtain a stable baseline. The OPMDpatients included in this study all had severe dyspha-gia and were therefore considered as having a fullstomach. Accordingly, the stabilization period waslimited to 2 min in both groups, and OPMD patientswere ventilated with a cricoid pressure applied duringthis period. Cisatracurium (0.1 mg/kg) was then givenover 5 s. Throughout the study, we used the pharma-cological weight for dosage calculation. The pharma-cological weight was obtained according to the for-mula developed by Egan et al. (8) and discussed indetail in the accompanying editorial (9). This value iscorrected for the patient’s sex, height, total bodyweight, lean body mass, and ideal body weight. The
trachea was intubated when twitch suppression at-tained 95%. Anesthesia maintenance consisted of 50%oxygen in nitrous oxide and a stable end-tidal concen-tration of isoflurane (0.3%–0.7%). Increases of arterialblood pressure and tachycardia (20% increase frombaseline) were treated with IV boluses of sufentanil 5�g or propofol 10 mg as often as needed. During thesurgery, oral temperature was monitored and main-tained �35°C with a warming blanket. At the end ofthe recovery period, we waited until the T1 remainedat the same value (no further spontaneous increase ofthe T1 value) for at least 3 min before giving neostig-mine 0.04 mg/kg and glycopyrrolate 0.01 mg/kg toobtain the final T1 value. Intraoperative data werecollected on a computer by using Datex-OhmedaAS/3 PC data collection software.
The variables were obtained with supramaximalTOF stimulations administered every 12 s and weredefined as follows:
1. Lag time: time from the beginning of cisatra-curium administration until the first measurableeffect of neuromuscular block.
2. Onset time: time from the beginning of cisatra-curium administration until 95% T1 suppression.
3. Duration 10%: time from the beginning of cisa-tracurium administration until 10% T1 recovery.
4. Interval 10%–25%: time from 10% to 25% T1recovery.
5. Interval 25%–75%: time from 25% to 75% T1recovery.
The data recorded during the recovery period werenormalized to the final T1 value.
The severity of OPMD was assessed by using a scalethat was previously developed by Duranceau (10).This scale is based on an evaluation of the severity ofthe oropharyngeal dysphagia: it gives a score accord-ing to the frequency, duration, and severity of thedysphagia (Appendix 1).
Data were stored in an Excel database (MicrosoftCorp., Redmond, WA). Demographic and ordinal datawere compared by using Fisher’s exact test. Continu-ous data were compared by using Student’s t-test orWilcoxon’s ranked sum test in case of a nonnormaldistribution. Results are expressed as means � sdexcept when stated otherwise. P � 0.05 was consid-ered significant.
ResultsDemographic and intraoperative data are summarizedin Table 1. The two groups were comparable regard-ing age, pharmacologic weight, height, and ASA phys-ical status. There was a difference in the sex distribu-tion that resulted in significantly more women in thecontrol group. Thyroid-stimulating hormone was nor-mal for all patients. The average body temperature
394 ANESTHETIC PHARMACOLOGY CARON ET AL. ANESTH ANALGCISATRACURIUM IN OCULOPHARYNGEAL MUSCULAR DYSTROPHY 2005;100:393–7
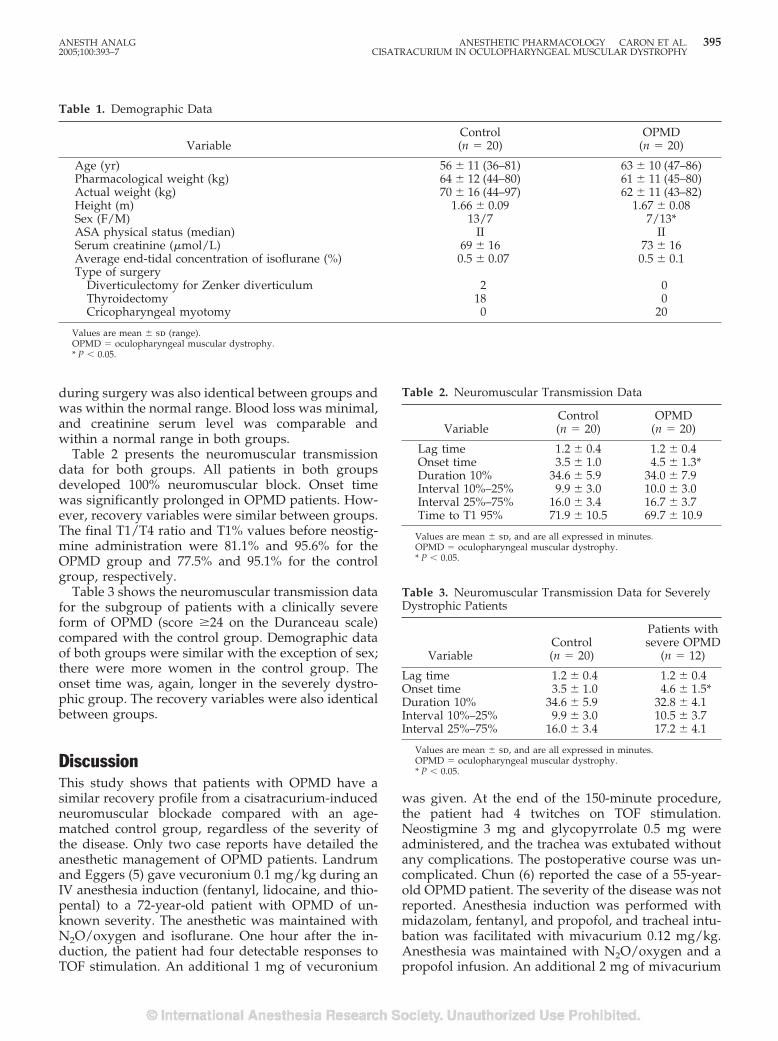
during surgery was also identical between groups andwas within the normal range. Blood loss was minimal,and creatinine serum level was comparable andwithin a normal range in both groups.
Table 2 presents the neuromuscular transmissiondata for both groups. All patients in both groupsdeveloped 100% neuromuscular block. Onset timewas significantly prolonged in OPMD patients. How-ever, recovery variables were similar between groups.The final T1/T4 ratio and T1% values before neostig-mine administration were 81.1% and 95.6% for theOPMD group and 77.5% and 95.1% for the controlgroup, respectively.
Table 3 shows the neuromuscular transmission datafor the subgroup of patients with a clinically severeform of OPMD (score �24 on the Duranceau scale)compared with the control group. Demographic dataof both groups were similar with the exception of sex;there were more women in the control group. Theonset time was, again, longer in the severely dystro-phic group. The recovery variables were also identicalbetween groups.
DiscussionThis study shows that patients with OPMD have asimilar recovery profile from a cisatracurium-inducedneuromuscular blockade compared with an age-matched control group, regardless of the severity ofthe disease. Only two case reports have detailed theanesthetic management of OPMD patients. Landrumand Eggers (5) gave vecuronium 0.1 mg/kg during anIV anesthesia induction (fentanyl, lidocaine, and thio-pental) to a 72-year-old patient with OPMD of un-known severity. The anesthetic was maintained withN2O/oxygen and isoflurane. One hour after the in-duction, the patient had four detectable responses toTOF stimulation. An additional 1 mg of vecuronium
was given. At the end of the 150-minute procedure,the patient had 4 twitches on TOF stimulation.Neostigmine 3 mg and glycopyrrolate 0.5 mg wereadministered, and the trachea was extubated withoutany complications. The postoperative course was un-complicated. Chun (6) reported the case of a 55-year-old OPMD patient. The severity of the disease was notreported. Anesthesia induction was performed withmidazolam, fentanyl, and propofol, and tracheal intu-bation was facilitated with mivacurium 0.12 mg/kg.Anesthesia was maintained with N2O/oxygen and apropofol infusion. An additional 2 mg of mivacurium
Table 2. Neuromuscular Transmission Data
VariableControl(n � 20)
OPMD(n � 20)
Lag time 1.2 � 0.4 1.2 � 0.4Onset time 3.5 � 1.0 4.5 � 1.3*Duration 10% 34.6 � 5.9 34.0 � 7.9Interval 10%–25% 9.9 � 3.0 10.0 � 3.0Interval 25%–75% 16.0 � 3.4 16.7 � 3.7Time to T1 95% 71.9 � 10.5 69.7 � 10.9
Values are mean � sd, and are all expressed in minutes.OPMD � oculopharyngeal muscular dystrophy.* P � 0.05.
Table 3. Neuromuscular Transmission Data for SeverelyDystrophic Patients
VariableControl(n � 20)
Patients withsevere OPMD
(n � 12)
Lag time 1.2 � 0.4 1.2 � 0.4Onset time 3.5 � 1.0 4.6 � 1.5*Duration 10% 34.6 � 5.9 32.8 � 4.1Interval 10%–25% 9.9 � 3.0 10.5 � 3.7Interval 25%–75% 16.0 � 3.4 17.2 � 4.1
Values are mean � sd, and are all expressed in minutes.OPMD � oculopharyngeal muscular dystrophy.* P � 0.05.
Table 1. Demographic Data
VariableControl(n � 20)
OPMD(n � 20)
Age (yr) 56 � 11 (36–81) 63 � 10 (47–86)Pharmacological weight (kg) 64 � 12 (44–80) 61 � 11 (45–80)Actual weight (kg) 70 � 16 (44–97) 62 � 11 (43–82)Height (m) 1.66 � 0.09 1.67 � 0.08Sex (F/M) 13/7 7/13*ASA physical status (median) II IISerum creatinine (�mol/L) 69 � 16 73 � 16Average end-tidal concentration of isoflurane (%) 0.5 � 0.07 0.5 � 0.1Type of surgery
Diverticulectomy for Zenker diverticulum 2 0Thyroidectomy 18 0Cricopharyngeal myotomy 0 20
Values are mean � sd (range).OPMD � oculopharyngeal muscular dystrophy.* P � 0.05.
ANESTH ANALG ANESTHETIC PHARMACOLOGY CARON ET AL. 3952005;100:393–7 CISATRACURIUM IN OCULOPHARYNGEAL MUSCULAR DYSTROPHY
was given 20 minutes after induction. The neuromuscu-lar blockade was successfully reversed with edropho-nium and atropine after an undefined time period. Thesame patient came back 2 months later and received alarger dose of mivacurium (0.2 mg/kg) with an effectiveduration of action of 25 minutes. Even though these tworeports show a recovery pattern that appears to be closeto normal, the absence of data regarding the severity ofthe disease and the absence of a control group precludea valid assessment of the duration of action of musclerelaxants in OPMD patients.
Although this remains poorly studied, variable re-sponses to muscle relaxants are reported for varioustypes of muscular dystrophy. In a prospective andcontrolled study, Ririe et al. (11) showed that patientswith Duchenne’s muscular dystrophy had a signifi-cantly prolonged recovery time after a bolus of vecu-ronium when compared with healthy controls (28 ver-sus 20 minutes, respectively; P � 0.03). Only one casereport (12) has described the anesthetic managementof a patient with facioscapulohumeral muscular dys-trophy. The authors found that the sensitivity to atra-curium was similar to that of the healthy population,but a more rapid recovery was observed: 16.5 and6.5 minutes compared with 28.8 and 12.3 minutes forthe 5%–95% and 25%–75% recovery indices, respec-tively, in the affected individuals and the controls.Two case reports have presented the response to non-depolarizing muscle relaxants in patients with nema-line rod muscular dystrophy, a form of dystrophycharacterized by nonprogressive symmetric skeletalmuscle weakness that principally affects the proximalskeletal muscles. In both cases, the authors docu-mented a normal response (13,14).
In this study, we obtained a significant prolongationof the onset of action of cisatracurium in the OPMDgroup. The onset of action of muscle relaxants ishighly dependent on the blood flow irrigating theneuromuscular junction: a more rapid blood flow isassociated with a decrease in onset time (15). BecauseOPMD does not affect the myocardium, the cardiacoutput of affected individuals should not be de-creased. A hypothesis to explain the delayed onsetcould be that the blood flow is impaired at the mus-cular level in OPMD patients. However, this is purespeculation, because no evidence of this can be foundin the literature.
Nondepolarizing muscle relaxants are competitiveantagonists of acetylcholine that bind to pre- andpostsynaptic cholinergic receptors and induce muscu-lar relaxation. The neuromuscular junction is not in-volved in the pathophysiologic process of OPMD
(3,16,17). This supports our finding that no differencesin recovery times were observed between groups. Inaddition, patients with OPMD will typically presentproximal limb weakness at some time, with a sparingof distal muscles. In this study, neuromuscular stim-ulation was performed on the trajectory of the ulnarnerve, and evoked potentials were recorded at thelevel of the adductor pollici muscle, a muscle probablynot affected by the dystrophia. This could be anotherexplanation for the absence of a difference in recoverytimes for OPMD patients compared with the controlgroup. Because OPMD predominantly affects oculo-pharyngeal muscles, assessment of the neuromuscularblockade at the laryngeal level could have yieldeddifferent results.
This study has some limitations. The control groupcontained more women than the OPMD group. In ourcenter, the surgery that most closely resembles crico-pharyngeal myotomy is thyroidectomy for a thyroidnodule. As a group, thyroid diseases are more preva-lent in female patients, and the opposite is true forOPMD. Some data in the literature show that sexaffects the time-course and dose-response relationshipof muscle relaxants, with a right shift for men, mean-ing that a larger dose is necessary for men to obtainthe same neuromuscular response as women (18–20).In these studies, however, steroidal muscle relaxantswere used. For cisatracurium, one group has found nopharmacodynamic difference imputable to sex (21). Inaddition, the pharmacological weight we used for dos-age calculation in this study already considers sex.
The score of severity we used to stratify the OPMDpatients is a clinical score (Appendix 1). OPMD is aninherited disease, and its severity also depends on thekind of mutation the patient has (2,17). This impliesthat with a more severe mutation form, clinical symp-toms will appear earlier in life. Our group of OPMDpatients shared the same (GCG)9 size of PABPN1 mu-tation. However, we believe that the neuromuscularsymptoms presented by the patient are the most sig-nificant factor affecting the recovery of neuromuscularblockade. In addition, genetic testing is not a verypractical tool for the clinician to evaluate the severityof a disease in the perioperative period.
In conclusion, this study shows no difference inrecovery times from a cisatracurium-induced neuro-muscular blockade between OPMD patients and acontrol group undergoing surgery of similar durationand expected blood loss. In a subgroup analysis, wealso showed that theduration of action of cisatra-curium was not affected by the severity of the neuro-muscular disease.
396 ANESTHETIC PHARMACOLOGY CARON ET AL. ANESTH ANALGCISATRACURIUM IN OCULOPHARYNGEAL MUSCULAR DYSTROPHY 2005;100:393–7
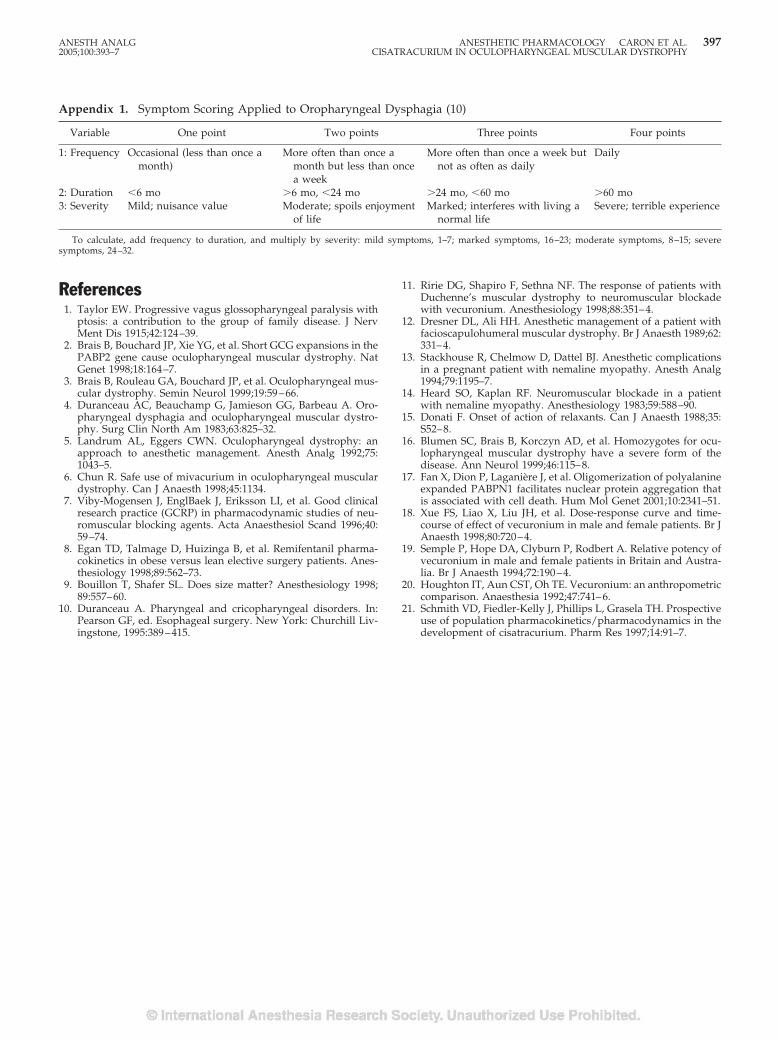
References1. Taylor EW. Progressive vagus glossopharyngeal paralysis with
ptosis: a contribution to the group of family disease. J NervMent Dis 1915;42:124–39.
2. Brais B, Bouchard JP, Xie YG, et al. Short GCG expansions in thePABP2 gene cause oculopharyngeal muscular dystrophy. NatGenet 1998;18:164–7.
3. Brais B, Rouleau GA, Bouchard JP, et al. Oculopharyngeal mus-cular dystrophy. Semin Neurol 1999;19:59–66.
4. Duranceau AC, Beauchamp G, Jamieson GG, Barbeau A. Oro-pharyngeal dysphagia and oculopharyngeal muscular dystro-phy. Surg Clin North Am 1983;63:825–32.
5. Landrum AL, Eggers CWN. Oculopharyngeal dystrophy: anapproach to anesthetic management. Anesth Analg 1992;75:1043–5.
6. Chun R. Safe use of mivacurium in oculopharyngeal musculardystrophy. Can J Anaesth 1998;45:1134.
7. Viby-Mogensen J, EnglBaek J, Eriksson LI, et al. Good clinicalresearch practice (GCRP) in pharmacodynamic studies of neu-romuscular blocking agents. Acta Anaesthesiol Scand 1996;40:59–74.
8. Egan TD, Talmage D, Huizinga B, et al. Remifentanil pharma-cokinetics in obese versus lean elective surgery patients. Anes-thesiology 1998;89:562–73.
9. Bouillon T, Shafer SL. Does size matter? Anesthesiology 1998;89:557–60.
10. Duranceau A. Pharyngeal and cricopharyngeal disorders. In:Pearson GF, ed. Esophageal surgery. New York: Churchill Liv-ingstone, 1995:389–415.
11. Ririe DG, Shapiro F, Sethna NF. The response of patients withDuchenne’s muscular dystrophy to neuromuscular blockadewith vecuronium. Anesthesiology 1998;88:351–4.
12. Dresner DL, Ali HH. Anesthetic management of a patient withfacioscapulohumeral muscular dystrophy. Br J Anaesth 1989;62:331–4.
13. Stackhouse R, Chelmow D, Dattel BJ. Anesthetic complicationsin a pregnant patient with nemaline myopathy. Anesth Analg1994;79:1195–7.
14. Heard SO, Kaplan RF. Neuromuscular blockade in a patientwith nemaline myopathy. Anesthesiology 1983;59:588–90.
15. Donati F. Onset of action of relaxants. Can J Anaesth 1988;35:S52–8.
16. Blumen SC, Brais B, Korczyn AD, et al. Homozygotes for ocu-lopharyngeal muscular dystrophy have a severe form of thedisease. Ann Neurol 1999;46:115–8.
17. Fan X, Dion P, Laganiere J, et al. Oligomerization of polyalanineexpanded PABPN1 facilitates nuclear protein aggregation thatis associated with cell death. Hum Mol Genet 2001;10:2341–51.
18. Xue FS, Liao X, Liu JH, et al. Dose-response curve and time-course of effect of vecuronium in male and female patients. Br JAnaesth 1998;80:720–4.
19. Semple P, Hope DA, Clyburn P, Rodbert A. Relative potency ofvecuronium in male and female patients in Britain and Austra-lia. Br J Anaesth 1994;72:190–4.
20. Houghton IT, Aun CST, Oh TE. Vecuronium: an anthropometriccomparison. Anaesthesia 1992;47:741–6.
21. Schmith VD, Fiedler-Kelly J, Phillips L, Grasela TH. Prospectiveuse of population pharmacokinetics/pharmacodynamics in thedevelopment of cisatracurium. Pharm Res 1997;14:91–7.
Appendix 1. Symptom Scoring Applied to Oropharyngeal Dysphagia (10)
Variable One point Two points Three points Four points
1: Frequency Occasional (less than once amonth)
More often than once amonth but less than oncea week
More often than once a week butnot as often as daily
Daily
2: Duration �6 mo �6 mo, �24 mo �24 mo, �60 mo �60 mo3: Severity Mild; nuisance value Moderate; spoils enjoyment
of lifeMarked; interferes with living a
normal lifeSevere; terrible experience
To calculate, add frequency to duration, and multiply by severity: mild symptoms, 1–7; marked symptoms, 16–23; moderate symptoms, 8–15; severesymptoms, 24–32.
ANESTH ANALG ANESTHETIC PHARMACOLOGY CARON ET AL. 3972005;100:393–7 CISATRACURIUM IN OCULOPHARYNGEAL MUSCULAR DYSTROPHY
Carbon Dioxide Depresses the F Wave by a Central, NotPeripheral, Mechanism During Isoflurane AnesthesiaCarmen Dominguez, MD*, Earl Carstens, PhD†, and Joseph F. Antognini, MD*†
*Department of Anesthesiology and Pain Medicine and †Section of Neurobiology, Physiology and Behavior, University ofCalifornia, Davis
Carbon dioxide (CO2) has anesthetic properties and hasbeen reported to depress the F wave of the evoked electro-myogram; the F wave is thought to reflect motoneuronexcitability. Anesthetics such as isoflurane also depressthe F wave. Because CO2 can depress muscle contractilefunction, as well as spinal cord neurons, it is unclearwhether CO2 depresses the F wave via a central or periph-eral mechanism. We anesthetized rabbits with isoflurane(1.4%) and prepared for hindlimb bypass (with a mem-brane oxygenator) whereby the partial pressures of CO2in the hindlimb muscle and torso could be independentlyadjusted. The F wave was recorded from the hindlimb
plantar muscles when the CO2 was normal to the hind-limb and torso, and when it was increased (to �90 mmHg) in the hindlimb, the torso, or both. Increasing the CO2to just thehindlimbhadnosignificanteffectontheF-waveamplitude, but increasing the CO2 to the torso depressedthe F wave to 52% � 32% of control; adding CO2 to thehindlimb during torso hypercarbia did not result in anyadditional depression of the F wave. CO2 depressed the Fwave via a central, not peripheral, mechanism, althoughthe precise mechanism is unknown.
(Anesth Analg 2005;100:398–403)
I nhaled anesthetics such as isoflurane and halothanemight produce immobility in part by inhibition ofspinal motor neurons (1–4). This effect has been
observed in animals (1) and humans (2) by usinganalysis of the F wave, which is the myopotential thatoccurs when a peripheral nerve is electrically stimu-lated and impulses travel antidromically to the mo-toneuron, which then “backfires,” thereby sending im-pulses to the muscle (5). The F wave is thought toreflect motoneuron excitability (5). Carbon dioxide hasa central nervous system (CNS) depressant effect (6),and prior studies have shown that the F wave isdepressed by CO2 (1,2). At partial pressures more than245 mm Hg, CO2 behaves as a complete anesthetic;i.e., its MAC (minimum alveolar anesthetic concentra-tion that produces immobility in 50% of subjects) isapproximately 30% (7). However, the effect of CO2 onthe F wave appears to be out of proportion to theMAC-sparing effect of CO2. For example, arterial CO2partial pressures of 70–80 mm Hg significantly de-press the F wave (1) but have no effect on MAC, and,
in fact, MAC does not begin to decrease until CO2 ismore than 100 mm Hg (7). Because CO2 has a welldescribed depressant effect on muscle (8,9), we spec-ulated that part of the effect of CO2 on the F wavecould be the result of peripheral action in the muscleand, hence, that F-wave depression by CO2 would notnecessarily reflect decreased motoneuron excitability.In this study, we examined in rabbits how the F waveis affected by CO2 administered systemically (via thelungs) and locally to the muscle, the latter accom-plished by isolating the blood flow to the rabbit’shindlimb by using an oxygenator/roller pump systemthat permitted control of the hindlimb CO2 partialpressure independent of the systemic CO2. We hy-pothesized that the effect of CO2 on the F wave wasdue in part to a direct peripheral effect in muscle.
MethodsThis study was approved by the institutional animalcare and use committee. Nine female New ZealandWhite rabbits (3.9 � 0.2 kg) were anesthetized indi-vidually in a Plexiglas chamber with isoflurane, ni-trous oxide (N2O), and oxygen. Once rabbits wereunconscious, the trachea was intubated with an un-cuffed pediatric endotracheal tube (inside diameter,4 mm). The N2O administration was discontinued,and anesthesia was maintained with isoflurane. A 24-gauge catheter was inserted into an ear vein for the
Supported in part by National Institutes of Health GrantsGM61283 and GM57970 (JFA).
Accepted for publication July 20, 2004.Address correspondence to Joseph F. Antognini, MD, TB-170, UC
Davis, Davis, CA 95616. Address e-mail to [email protected] will not be available.
DOI: 10.1213/01.ANE.0000141677.16224.AD
©2005 by the International Anesthesia Research Society398 Anesth Analg 2005;100:398–403 0003-2999/05
administration of lactated Ringer’s solution, and a22-gauge arterial catheter was inserted into the centralear artery for hemodynamic monitoring. Systemictemperature was measured via a rectal probe and wasmaintained at 37.4°C � 0.8°C with a heating blanketand lamp.
Hindlimb bypass was achieved by draining sys-temic blood from a carotid artery, passing it through amembrane oxygenator, and infusing it into an iliacartery (Fig. 1) by using a modification of a lower torsobypass preparation (10). In brief, a neck incision wasmade, and a carotid artery was dissected, isolated, andcannulated with a 16-gauge catheter. An incision wasmade in the lower flank to dissect and isolate the iliacartery. In preparation for hindlimb bypass, heparin300 mg/kg was administered IV, and 150 mg/kg wasgiven every 2–3 h thereafter. Exogenous rabbit blood(250 mL) was used to prime a bypass membrane ox-ygenator (Neonato; Braile Biomedica, Sao Jose do RioPreto, Brazil). A 16-gauge catheter was inserted intothe iliac artery and directed distally. Systemic bloodwas drained from the carotid artery into the oxygen-ator and, via the roller pump, infused into the hind-limb circulation. The period of ischemia to the hind-limb (e.g., from artery ligation to initiation of bypass)was usually �10 min. Initial gas flow into the oxygen-ator consisted of carbogen (95% oxygen/5% CO2) at aflow rate of 3–4 L/min. An isoflurane vaporizer wasplaced in line with the gas flow to the oxygenator. Theisoflurane and CO2 concentrations in the bypass cir-cuit and the systemic circulation were measured by acalibrated agent analyzer (Rascal II; Ohmeda, SaltLake City, UT) from samples collected from the oxy-genator exhaust and the endotracheal tube, respec-tively (4). Hindlimb temperature was monitored viaan IM thermocoupler probe (BAT-12; IITC Inc., LifeScience Instruments, Woodland Hills, CA). The hind-limb temperature was maintained at 36.7°C � 1.1°Cby adjusting the water bath temperature of the oxy-genator. Systemic blood pressure was maintained at73 � 10 mm Hg.
Hindlimb bypass was initiated at �40 mL/min.Before changes in the arterial CO2 were made, thebaseline normal partial pressure of CO2 was verifiedby collecting blood samples from the hindlimb circu-lation (iliac arterial cannula of oxygenator) and thesystemic circulation (carotid cannula). The partialpressure of oxygen was maintained at 456 � 92 mmHg and 532 � 65 mm Hg in the systemic and hindlimb(oxygenator) circulation, respectively, throughout theentire study period.
Two needle electrodes (E-2; Grass Instruments,West Warwick, RI) were percutaneously inserted intothe plantar muscles (interossei and digiti) of the hind-paw to record the F wave by using the F-wave proto-col (11) of an Excel® neurophysiologic machine (Cad-well, Kennewick, WA). In brief, the tibial nerve was
stimulated with two percutaneous needle electrodes.The evoked electromyographic activity was filtered(10 Hz to 10 kHz) and recorded. The stimulation cur-rent (square-wave pulse; duration, 0.1 ms) was grad-ually increased until maximal M-wave amplitude wasobtained; the electrical current used to obtain the Fwaves was 2–3 times the current that evoked the max-imal M wave. The electrical stimuli were deliveredevery 3–4 s; 2 sets of 10 artifact-free F-wave tracingswere obtained at each experimental manipulation, and�1% of tracings were rejected. The F wave was deter-mined on the basis of three criteria: stimulus thresholdmore than M-wave threshold, variable morphology,and plateau of F-wave amplitude with increasingstimulus current (1,11).
Before determining the effects of CO2 on the F wave,we determined whether isoflurane had a peripheral(muscle) effect on the F wave. The isoflurane in thetorso was kept at 1.4% while the F wave was recordedwith limited isoflurane delivery to the hindlimb orwith isoflurane 1.4% to the hindlimb. The bypasspreparation removes �80% of the isoflurane that ispresent in the systemic arterial blood (10); thus, theisoflurane concentration in the hindlimb was approx-imately 0.2%–0.3%, on the basis of the isoflurane con-centration in the exhaust of the oxygenator.
For the CO2 studies, the isoflurane concentration inthe systemic and hindlimb circulations was main-tained at 1.4%, which, according to our pilot studies,was approximately 0.8 MAC. We used a sub-MACconcentration because in pilot studies we had deter-mined that isoflurane concentrations larger than 1MAC significantly depressed the F wave, as previ-ously described (1). The M-wave and F-wave ampli-tudes (maximal distance between peak and trough),ratio of F-wave amplitude and M-wave amplitude,and F-wave latency (time between stimulation andonset of F wave) were determined during each of thefollowing interventions: 1) normal CO2 to torso andhindlimb; 2) high CO2 to torso and normal CO2 tohindlimb; 3) high CO2 to torso and hindlimb; 4) nor-mal CO2 to torso and high CO2 to hindlimb; and 5)return to normal CO2 to hindlimb and torso. The orderof interventions 2–4 was alternated from experimentto experiment. F-wave persistence was also deter-mined for each intervention and equaled the numberof tracings with a detectable F wave (�20 �V) dividedby total number of tracings. The concentration of CO2in the hindlimb and in the systemic arterial circulationwas adjusted by administering additional CO2 to theoxygenator gas flow and gas flow to the anesthesiacircuit, respectively. When adjusting the CO2 flows,we sought to achieve Pco2 �90 mm Hg in the respec-tive circulation; this usually required �15% CO2. Wechose a Pco2 that we believed should have resulted inF-wave depression, but not MAC alterations, on thebasis of the data reported by King and Rampil (1) and
ANESTH ANALG ANESTHETIC PHARMACOLOGY DOMINGUEZ ET AL. 3992005;100:398–403 CARBON DIOXIDE AND ISOFLURANE
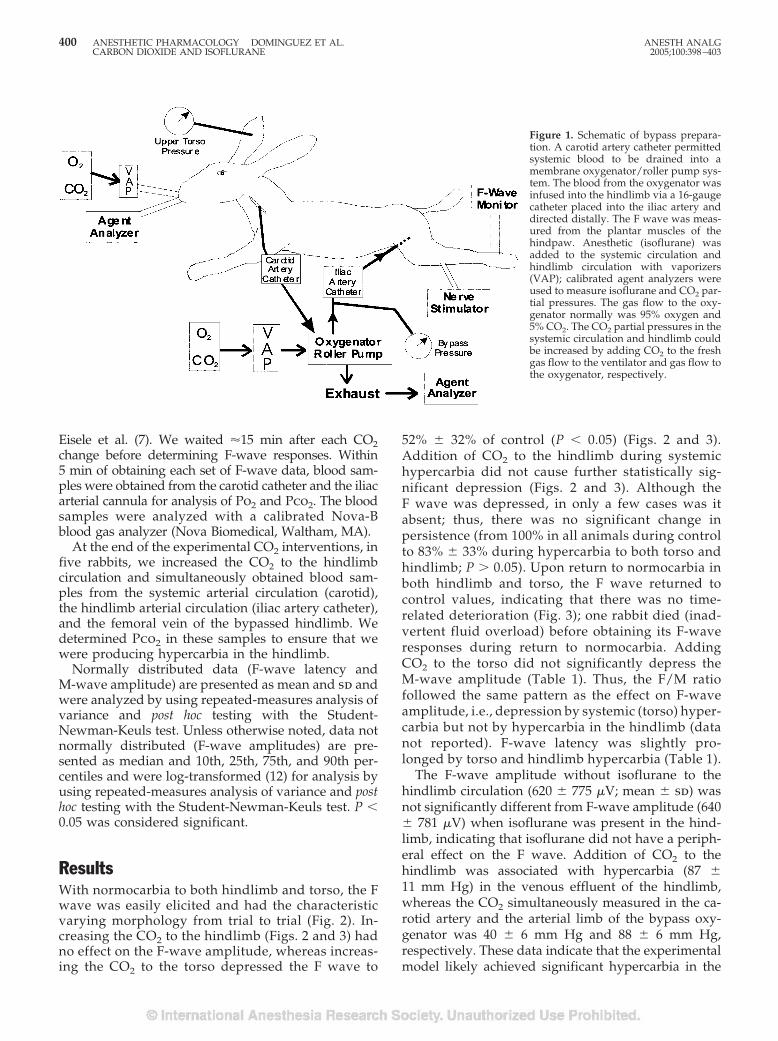
Eisele et al. (7). We waited �15 min after each CO2change before determining F-wave responses. Within5 min of obtaining each set of F-wave data, blood sam-ples were obtained from the carotid catheter and the iliacarterial cannula for analysis of Po2 and Pco2. The bloodsamples were analyzed with a calibrated Nova-Bblood gas analyzer (Nova Biomedical, Waltham, MA).
At the end of the experimental CO2 interventions, infive rabbits, we increased the CO2 to the hindlimbcirculation and simultaneously obtained blood sam-ples from the systemic arterial circulation (carotid),the hindlimb arterial circulation (iliac artery catheter),and the femoral vein of the bypassed hindlimb. Wedetermined Pco2 in these samples to ensure that wewere producing hypercarbia in the hindlimb.
Normally distributed data (F-wave latency andM-wave amplitude) are presented as mean and sd andwere analyzed by using repeated-measures analysis ofvariance and post hoc testing with the Student-Newman-Keuls test. Unless otherwise noted, data notnormally distributed (F-wave amplitudes) are pre-sented as median and 10th, 25th, 75th, and 90th per-centiles and were log-transformed (12) for analysis byusing repeated-measures analysis of variance and posthoc testing with the Student-Newman-Keuls test. P �0.05 was considered significant.
ResultsWith normocarbia to both hindlimb and torso, the Fwave was easily elicited and had the characteristicvarying morphology from trial to trial (Fig. 2). In-creasing the CO2 to the hindlimb (Figs. 2 and 3) hadno effect on the F-wave amplitude, whereas increas-ing the CO2 to the torso depressed the F wave to
52% � 32% of control (P � 0.05) (Figs. 2 and 3).Addition of CO2 to the hindlimb during systemichypercarbia did not cause further statistically sig-nificant depression (Figs. 2 and 3). Although theF wave was depressed, in only a few cases was itabsent; thus, there was no significant change inpersistence (from 100% in all animals during controlto 83% � 33% during hypercarbia to both torso andhindlimb; P � 0.05). Upon return to normocarbia inboth hindlimb and torso, the F wave returned tocontrol values, indicating that there was no time-related deterioration (Fig. 3); one rabbit died (inad-vertent fluid overload) before obtaining its F-waveresponses during return to normocarbia. AddingCO2 to the torso did not significantly depress theM-wave amplitude (Table 1). Thus, the F/M ratiofollowed the same pattern as the effect on F-waveamplitude, i.e., depression by systemic (torso) hyper-carbia but not by hypercarbia in the hindlimb (datanot reported). F-wave latency was slightly pro-longed by torso and hindlimb hypercarbia (Table 1).
The F-wave amplitude without isoflurane to thehindlimb circulation (620 � 775 �V; mean � sd) wasnot significantly different from F-wave amplitude (640� 781 �V) when isoflurane was present in the hind-limb, indicating that isoflurane did not have a periph-eral effect on the F wave. Addition of CO2 to thehindlimb was associated with hypercarbia (87 �11 mm Hg) in the venous effluent of the hindlimb,whereas the CO2 simultaneously measured in the ca-rotid artery and the arterial limb of the bypass oxy-genator was 40 � 6 mm Hg and 88 � 6 mm Hg,respectively. These data indicate that the experimentalmodel likely achieved significant hypercarbia in the
Figure 1. Schematic of bypass prepara-tion. A carotid artery catheter permittedsystemic blood to be drained into amembrane oxygenator/roller pump sys-tem. The blood from the oxygenator wasinfused into the hindlimb via a 16-gaugecatheter placed into the iliac artery anddirected distally. The F wave was meas-ured from the plantar muscles of thehindpaw. Anesthetic (isoflurane) wasadded to the systemic circulation andhindlimb circulation with vaporizers(VAP); calibrated agent analyzers wereused to measure isoflurane and CO2 par-tial pressures. The gas flow to the oxy-genator normally was 95% oxygen and5% CO2. The CO2 partial pressures in thesystemic circulation and hindlimb couldbe increased by adding CO2 to the freshgas flow to the ventilator and gas flow tothe oxygenator, respectively.
400 ANESTHETIC PHARMACOLOGY DOMINGUEZ ET AL. ANESTH ANALGCARBON DIOXIDE AND ISOFLURANE 2005;100:398–403
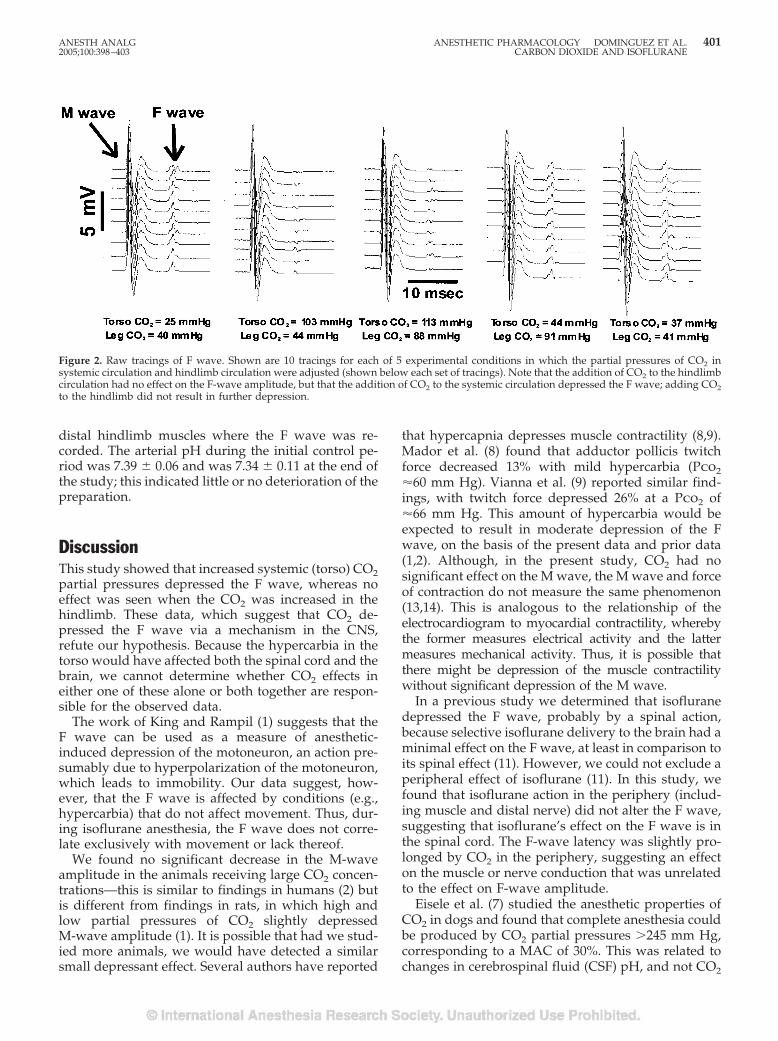
distal hindlimb muscles where the F wave was re-corded. The arterial pH during the initial control pe-riod was 7.39 � 0.06 and was 7.34 � 0.11 at the end ofthe study; this indicated little or no deterioration of thepreparation.
DiscussionThis study showed that increased systemic (torso) CO2partial pressures depressed the F wave, whereas noeffect was seen when the CO2 was increased in thehindlimb. These data, which suggest that CO2 de-pressed the F wave via a mechanism in the CNS,refute our hypothesis. Because the hypercarbia in thetorso would have affected both the spinal cord and thebrain, we cannot determine whether CO2 effects ineither one of these alone or both together are respon-sible for the observed data.
The work of King and Rampil (1) suggests that theF wave can be used as a measure of anesthetic-induced depression of the motoneuron, an action pre-sumably due to hyperpolarization of the motoneuron,which leads to immobility. Our data suggest, how-ever, that the F wave is affected by conditions (e.g.,hypercarbia) that do not affect movement. Thus, dur-ing isoflurane anesthesia, the F wave does not corre-late exclusively with movement or lack thereof.
We found no significant decrease in the M-waveamplitude in the animals receiving large CO2 concen-trations—this is similar to findings in humans (2) butis different from findings in rats, in which high andlow partial pressures of CO2 slightly depressedM-wave amplitude (1). It is possible that had we stud-ied more animals, we would have detected a similarsmall depressant effect. Several authors have reported
that hypercapnia depresses muscle contractility (8,9).Mador et al. (8) found that adductor pollicis twitchforce decreased 13% with mild hypercarbia (Pco2�60 mm Hg). Vianna et al. (9) reported similar find-ings, with twitch force depressed 26% at a Pco2 of�66 mm Hg. This amount of hypercarbia would beexpected to result in moderate depression of the Fwave, on the basis of the present data and prior data(1,2). Although, in the present study, CO2 had nosignificant effect on the M wave, the M wave and forceof contraction do not measure the same phenomenon(13,14). This is analogous to the relationship of theelectrocardiogram to myocardial contractility, wherebythe former measures electrical activity and the lattermeasures mechanical activity. Thus, it is possible thatthere might be depression of the muscle contractilitywithout significant depression of the M wave.
In a previous study we determined that isofluranedepressed the F wave, probably by a spinal action,because selective isoflurane delivery to the brain had aminimal effect on the F wave, at least in comparison toits spinal effect (11). However, we could not exclude aperipheral effect of isoflurane (11). In this study, wefound that isoflurane action in the periphery (includ-ing muscle and distal nerve) did not alter the F wave,suggesting that isoflurane’s effect on the F wave is inthe spinal cord. The F-wave latency was slightly pro-longed by CO2 in the periphery, suggesting an effecton the muscle or nerve conduction that was unrelatedto the effect on F-wave amplitude.
Eisele et al. (7) studied the anesthetic properties ofCO2 in dogs and found that complete anesthesia couldbe produced by CO2 partial pressures �245 mm Hg,corresponding to a MAC of 30%. This was related tochanges in cerebrospinal fluid (CSF) pH, and not CO2
Figure 2. Raw tracings of F wave. Shown are 10 tracings for each of 5 experimental conditions in which the partial pressures of CO2 insystemic circulation and hindlimb circulation were adjusted (shown below each set of tracings). Note that the addition of CO2 to the hindlimbcirculation had no effect on the F-wave amplitude, but that the addition of CO2 to the systemic circulation depressed the F wave; adding CO2to the hindlimb did not result in further depression.
ANESTH ANALG ANESTHETIC PHARMACOLOGY DOMINGUEZ ET AL. 4012005;100:398–403 CARBON DIOXIDE AND ISOFLURANE
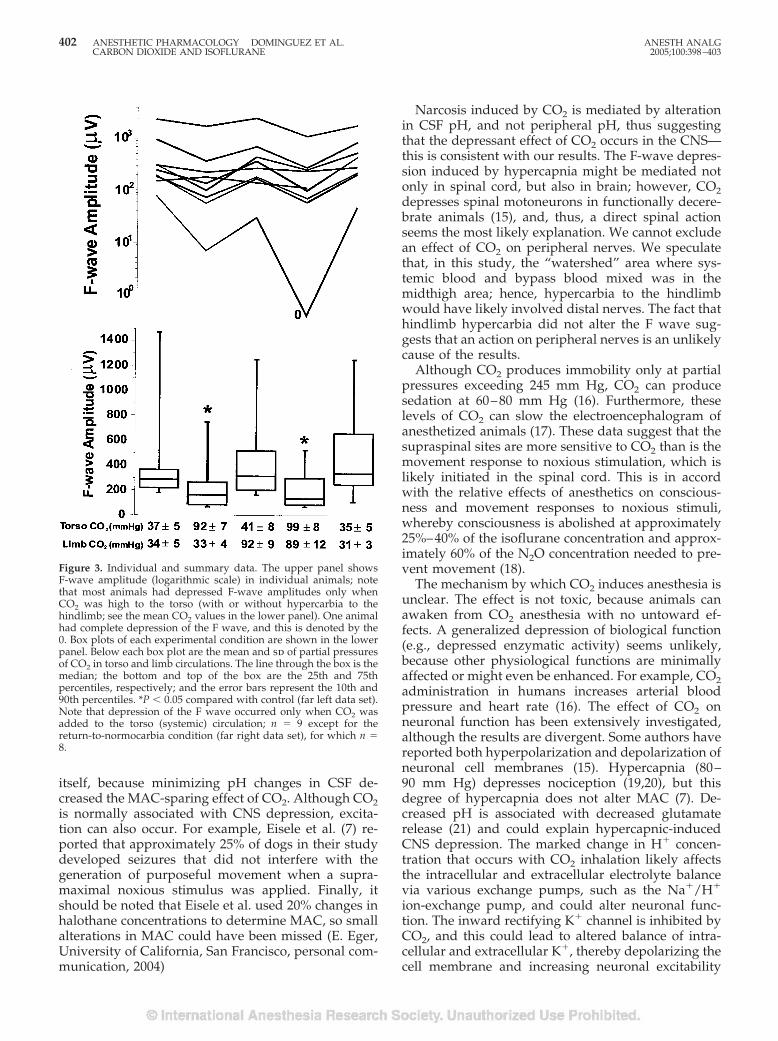
itself, because minimizing pH changes in CSF de-creased the MAC-sparing effect of CO2. Although CO2is normally associated with CNS depression, excita-tion can also occur. For example, Eisele et al. (7) re-ported that approximately 25% of dogs in their studydeveloped seizures that did not interfere with thegeneration of purposeful movement when a supra-maximal noxious stimulus was applied. Finally, itshould be noted that Eisele et al. used 20% changes inhalothane concentrations to determine MAC, so smallalterations in MAC could have been missed (E. Eger,University of California, San Francisco, personal com-munication, 2004)
Narcosis induced by CO2 is mediated by alterationin CSF pH, and not peripheral pH, thus suggestingthat the depressant effect of CO2 occurs in the CNS—this is consistent with our results. The F-wave depres-sion induced by hypercapnia might be mediated notonly in spinal cord, but also in brain; however, CO2depresses spinal motoneurons in functionally decere-brate animals (15), and, thus, a direct spinal actionseems the most likely explanation. We cannot excludean effect of CO2 on peripheral nerves. We speculatethat, in this study, the “watershed” area where sys-temic blood and bypass blood mixed was in themidthigh area; hence, hypercarbia to the hindlimbwould have likely involved distal nerves. The fact thathindlimb hypercarbia did not alter the F wave sug-gests that an action on peripheral nerves is an unlikelycause of the results.
Although CO2 produces immobility only at partialpressures exceeding 245 mm Hg, CO2 can producesedation at 60–80 mm Hg (16). Furthermore, theselevels of CO2 can slow the electroencephalogram ofanesthetized animals (17). These data suggest that thesupraspinal sites are more sensitive to CO2 than is themovement response to noxious stimulation, which islikely initiated in the spinal cord. This is in accordwith the relative effects of anesthetics on conscious-ness and movement responses to noxious stimuli,whereby consciousness is abolished at approximately25%–40% of the isoflurane concentration and approx-imately 60% of the N2O concentration needed to pre-vent movement (18).
The mechanism by which CO2 induces anesthesia isunclear. The effect is not toxic, because animals canawaken from CO2 anesthesia with no untoward ef-fects. A generalized depression of biological function(e.g., depressed enzymatic activity) seems unlikely,because other physiological functions are minimallyaffected or might even be enhanced. For example, CO2administration in humans increases arterial bloodpressure and heart rate (16). The effect of CO2 onneuronal function has been extensively investigated,although the results are divergent. Some authors havereported both hyperpolarization and depolarization ofneuronal cell membranes (15). Hypercapnia (80–90 mm Hg) depresses nociception (19,20), but thisdegree of hypercapnia does not alter MAC (7). De-creased pH is associated with decreased glutamaterelease (21) and could explain hypercapnic-inducedCNS depression. The marked change in H� concen-tration that occurs with CO2 inhalation likely affectsthe intracellular and extracellular electrolyte balancevia various exchange pumps, such as the Na�/H�
ion-exchange pump, and could alter neuronal func-tion. The inward rectifying K� channel is inhibited byCO2, and this could lead to altered balance of intra-cellular and extracellular K�, thereby depolarizing thecell membrane and increasing neuronal excitability
Figure 3. Individual and summary data. The upper panel showsF-wave amplitude (logarithmic scale) in individual animals; notethat most animals had depressed F-wave amplitudes only whenCO2 was high to the torso (with or without hypercarbia to thehindlimb; see the mean CO2 values in the lower panel). One animalhad complete depression of the F wave, and this is denoted by the0. Box plots of each experimental condition are shown in the lowerpanel. Below each box plot are the mean and sd of partial pressuresof CO2 in torso and limb circulations. The line through the box is themedian; the bottom and top of the box are the 25th and 75thpercentiles, respectively; and the error bars represent the 10th and90th percentiles. *P � 0.05 compared with control (far left data set).Note that depression of the F wave occurred only when CO2 wasadded to the torso (systemic) circulation; n � 9 except for thereturn-to-normocarbia condition (far right data set), for which n �8.
402 ANESTHETIC PHARMACOLOGY DOMINGUEZ ET AL. ANESTH ANALGCARBON DIOXIDE AND ISOFLURANE 2005;100:398–403
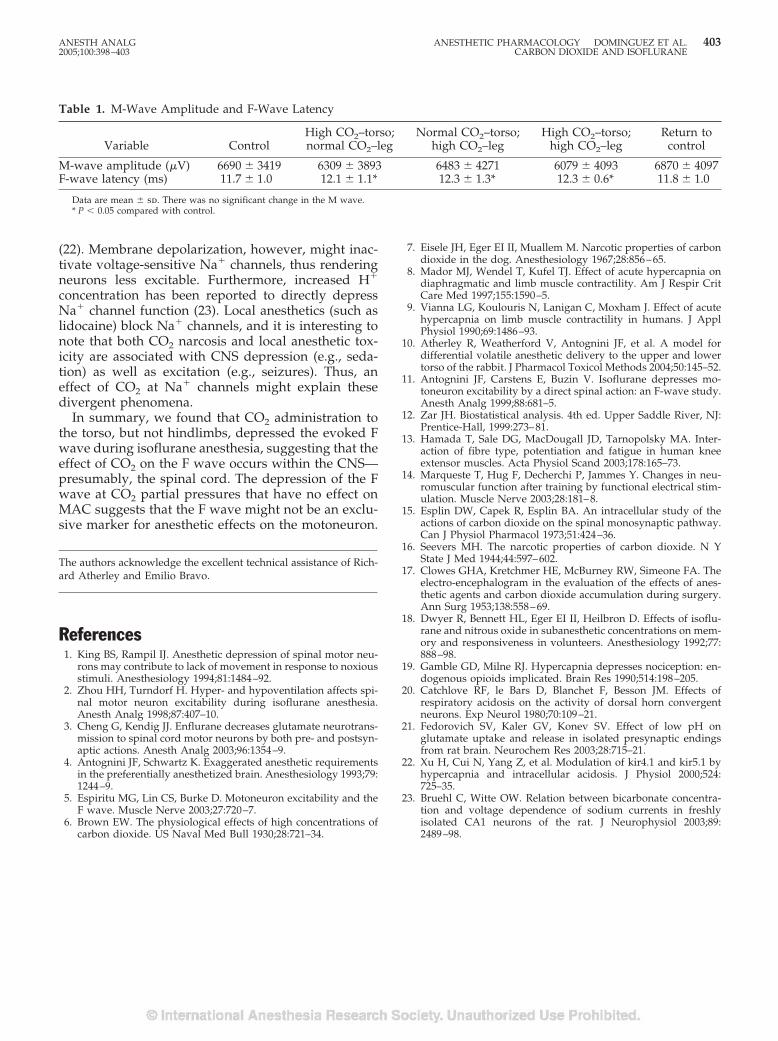
(22). Membrane depolarization, however, might inac-tivate voltage-sensitive Na� channels, thus renderingneurons less excitable. Furthermore, increased H�
concentration has been reported to directly depressNa� channel function (23). Local anesthetics (such aslidocaine) block Na� channels, and it is interesting tonote that both CO2 narcosis and local anesthetic tox-icity are associated with CNS depression (e.g., seda-tion) as well as excitation (e.g., seizures). Thus, aneffect of CO2 at Na� channels might explain thesedivergent phenomena.
In summary, we found that CO2 administration tothe torso, but not hindlimbs, depressed the evoked Fwave during isoflurane anesthesia, suggesting that theeffect of CO2 on the F wave occurs within the CNS—presumably, the spinal cord. The depression of the Fwave at CO2 partial pressures that have no effect onMAC suggests that the F wave might not be an exclu-sive marker for anesthetic effects on the motoneuron.
The authors acknowledge the excellent technical assistance of Rich-ard Atherley and Emilio Bravo.
References1. King BS, Rampil IJ. Anesthetic depression of spinal motor neu-
rons may contribute to lack of movement in response to noxiousstimuli. Anesthesiology 1994;81:1484–92.
2. Zhou HH, Turndorf H. Hyper- and hypoventilation affects spi-nal motor neuron excitability during isoflurane anesthesia.Anesth Analg 1998;87:407–10.
3. Cheng G, Kendig JJ. Enflurane decreases glutamate neurotrans-mission to spinal cord motor neurons by both pre- and postsyn-aptic actions. Anesth Analg 2003;96:1354–9.
4. Antognini JF, Schwartz K. Exaggerated anesthetic requirementsin the preferentially anesthetized brain. Anesthesiology 1993;79:1244–9.
5. Espiritu MG, Lin CS, Burke D. Motoneuron excitability and theF wave. Muscle Nerve 2003;27:720–7.
6. Brown EW. The physiological effects of high concentrations ofcarbon dioxide. US Naval Med Bull 1930;28:721–34.
7. Eisele JH, Eger EI II, Muallem M. Narcotic properties of carbondioxide in the dog. Anesthesiology 1967;28:856–65.
8. Mador MJ, Wendel T, Kufel TJ. Effect of acute hypercapnia ondiaphragmatic and limb muscle contractility. Am J Respir CritCare Med 1997;155:1590–5.
9. Vianna LG, Koulouris N, Lanigan C, Moxham J. Effect of acutehypercapnia on limb muscle contractility in humans. J ApplPhysiol 1990;69:1486–93.
10. Atherley R, Weatherford V, Antognini JF, et al. A model fordifferential volatile anesthetic delivery to the upper and lowertorso of the rabbit. J Pharmacol Toxicol Methods 2004;50:145–52.
11. Antognini JF, Carstens E, Buzin V. Isoflurane depresses mo-toneuron excitability by a direct spinal action: an F-wave study.Anesth Analg 1999;88:681–5.
12. Zar JH. Biostatistical analysis. 4th ed. Upper Saddle River, NJ:Prentice-Hall, 1999:273–81.
13. Hamada T, Sale DG, MacDougall JD, Tarnopolsky MA. Inter-action of fibre type, potentiation and fatigue in human kneeextensor muscles. Acta Physiol Scand 2003;178:165–73.
14. Marqueste T, Hug F, Decherchi P, Jammes Y. Changes in neu-romuscular function after training by functional electrical stim-ulation. Muscle Nerve 2003;28:181–8.
15. Esplin DW, Capek R, Esplin BA. An intracellular study of theactions of carbon dioxide on the spinal monosynaptic pathway.Can J Physiol Pharmacol 1973;51:424–36.
16. Seevers MH. The narcotic properties of carbon dioxide. N YState J Med 1944;44:597–602.
17. Clowes GHA, Kretchmer HE, McBurney RW, Simeone FA. Theelectro-encephalogram in the evaluation of the effects of anes-thetic agents and carbon dioxide accumulation during surgery.Ann Surg 1953;138:558–69.
18. Dwyer R, Bennett HL, Eger EI II, Heilbron D. Effects of isoflu-rane and nitrous oxide in subanesthetic concentrations on mem-ory and responsiveness in volunteers. Anesthesiology 1992;77:888–98.
19. Gamble GD, Milne RJ. Hypercapnia depresses nociception: en-dogenous opioids implicated. Brain Res 1990;514:198–205.
20. Catchlove RF, le Bars D, Blanchet F, Besson JM. Effects ofrespiratory acidosis on the activity of dorsal horn convergentneurons. Exp Neurol 1980;70:109–21.
21. Fedorovich SV, Kaler GV, Konev SV. Effect of low pH onglutamate uptake and release in isolated presynaptic endingsfrom rat brain. Neurochem Res 2003;28:715–21.
22. Xu H, Cui N, Yang Z, et al. Modulation of kir4.1 and kir5.1 byhypercapnia and intracellular acidosis. J Physiol 2000;524:725–35.
23. Bruehl C, Witte OW. Relation between bicarbonate concentra-tion and voltage dependence of sodium currents in freshlyisolated CA1 neurons of the rat. J Neurophysiol 2003;89:2489–98.
Table 1. M-Wave Amplitude and F-Wave Latency
Variable ControlHigh CO2–torso;normal CO2–leg
Normal CO2–torso;high CO2–leg
High CO2–torso;high CO2–leg
Return tocontrol
M-wave amplitude (�V) 6690 � 3419 6309 � 3893 6483 � 4271 6079 � 4093 6870 � 4097F-wave latency (ms) 11.7 � 1.0 12.1 � 1.1* 12.3 � 1.3* 12.3 � 0.6* 11.8 � 1.0
Data are mean � sd. There was no significant change in the M wave.* P � 0.05 compared with control.
ANESTH ANALG ANESTHETIC PHARMACOLOGY DOMINGUEZ ET AL. 4032005;100:398–403 CARBON DIOXIDE AND ISOFLURANE
Large Concentrations of Nitrous Oxide Decrease theIsoflurane Minimum Alveolar Concentration Sparing Effect ofMorphine in the RatMartın Santos, DVM, PhD*†, Viviana Kuncar, DVM*, Fernando Martınez-Taboada, DVM*,and Francisco J. Tendillo, DVM, PhD, DipECVA*†
*Department of Experimental Surgery, University Hospital Puerta de Hierro; and †Department of Anesthesiology,Complutense University Veterinary School, Madrid, Spain
Many adjuvant drugs have demonstrated anesthetic-sparingpropertieswhencombinedwithvolatileanesthet-ics. Nitrous oxide is combined with volatile anesthetics toreduce the concentrations of volatile anesthetics requiredto produce anesthesia. Analgesic doses of opioids clearlyreduce the requirement for inhaled anesthetics in both hu-man patients and experimental animals. We performedthis study to determine whether the combination of ni-trous oxide and morphine decreased isoflurane mini-mum alveolar anesthetic concentration (MAC) even fur-ther in the rat. Fifty-eight female rats were used. The ratswere divided into 8 groups: isoflurane in 4 possible ni-trous oxide concentrations (0%, 30%, 50%, or 70%) with
saline or morphine (1 mg/kg). Then the MAC of isoflu-rane(MACISO)wasdeterminedfromalveolargassamplesat the time of tail clamp. The MAC of isoflurane was sig-nificantly different at each nitrous oxide concentration,and increasing nitrous oxide concentrations reduced an-esthetic requirements for isoflurane. The administrationof morphine reduced the MACISO when used with 0% or30% nitrous oxide. This MACISO by morphine reductionwas less with 50% nitrous oxide and nonexistent at 70%nitrous oxide. However, with morphine present theMACISO was independent of the nitrous oxide concentra-tion in the 30%–70% range.
(Anesth Analg 2005;100:404–8)
M any adjuvant drugs have demonstratedanesthetic-sparing properties when combinedwith volatile anesthetics. Nitrous oxide (N2O)
has formed the basis for more general anesthetic tech-niques than any other inhaled anesthetic. Its wide-spread use resulted from many desirable properties,including low solubility, limited cardiovascular andrespiratory system depression, and minimal toxicity(1). It is often combined with volatile anesthetics toreduce the concentrations of volatile anesthetics re-quired to produce anesthesia (2–4). Analgesic doses ofopioids clearly reduce the requirement for inhaledanesthetics in both human patients and experimentalanimals (5).
Based on the evidence that N2O analgesia is medi-ated, at least in part, by the endogenous opioid system(6–8), the purpose of the current study was to deter-mine whether the combination of N2O and morphine
decreased isoflurane MAC (MACISO) even further inthe rat.
MethodsFifty-eight female Wistar rats with a mean bodyweight of 200 � 10 g (range, 190–210 g) were allowedto acclimatize for at least 1 wk before the experimentalprocedure. Rats were housed in groups of 8–10 inPlexiglas cages, with free access to food and water,and maintained on a 12 h light:12 h dark cycle (lighton at 7 am) under controlled environmental condi-tions (relative humidity, 50%–70%; Temperature, 20°C� 2°C). To control for known diurnal fluctuations inresponsiveness to nociceptive stimuli, experimentswere performed during the morning (9 am to 12 pm).All rats were handled according to the guidelines setin the Guide for the Care and Use of Laboratory Animalspublished by the National Institutes of Health. Theinstitutional animal care and use committee approvedthe study.
The unmedicated rats were placed in an inductionchamber to which 5% isoflurane in a continuous oxy-gen flow of 3 L/min was directed. Once the rats were
Accepted for publication August 2, 2004.Address correspondence and reprint requests to Francisco J. Ten-
dillo, DVM, PhD, DipECVA, Servicio de Cirugıa Experimental, Hos-pital Universitario Puerta de Hierro, San Martın de Porres 4, 28035Madrid, Spain. Address e-mail to [email protected].
DOI: 10.1213/01.ANE.0000142423.87593.CE
©2005 by the International Anesthesia Research Society404 Anesth Analg 2005;100:404–8 0003-2999/05
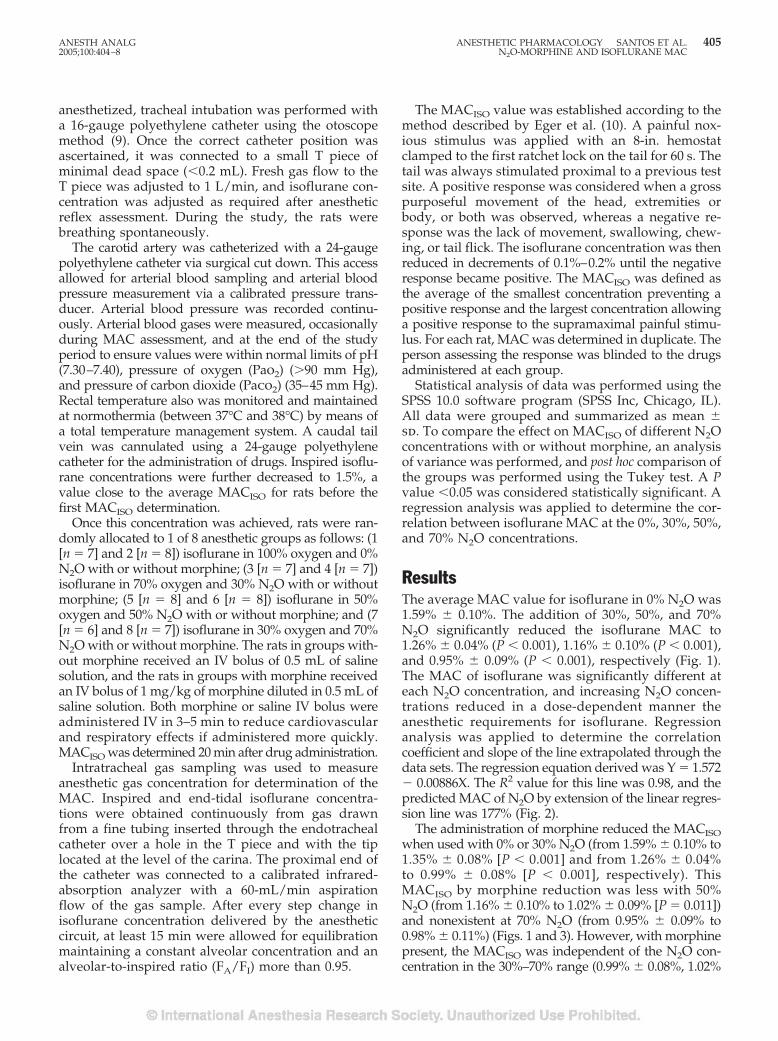
anesthetized, tracheal intubation was performed witha 16-gauge polyethylene catheter using the otoscopemethod (9). Once the correct catheter position wasascertained, it was connected to a small T piece ofminimal dead space (�0.2 mL). Fresh gas flow to theT piece was adjusted to 1 L/min, and isoflurane con-centration was adjusted as required after anestheticreflex assessment. During the study, the rats werebreathing spontaneously.
The carotid artery was catheterized with a 24-gaugepolyethylene catheter via surgical cut down. This accessallowed for arterial blood sampling and arterial bloodpressure measurement via a calibrated pressure trans-ducer. Arterial blood pressure was recorded continu-ously. Arterial blood gases were measured, occasionallyduring MAC assessment, and at the end of the studyperiod to ensure values were within normal limits of pH(7.30–7.40), pressure of oxygen (Pao2) (�90 mm Hg),and pressure of carbon dioxide (Paco2) (35–45 mm Hg).Rectal temperature also was monitored and maintainedat normothermia (between 37°C and 38°C) by means ofa total temperature management system. A caudal tailvein was cannulated using a 24-gauge polyethylenecatheter for the administration of drugs. Inspired isoflu-rane concentrations were further decreased to 1.5%, avalue close to the average MACISO for rats before thefirst MACISO determination.
Once this concentration was achieved, rats were ran-domly allocated to 1 of 8 anesthetic groups as follows: (1[n � 7] and 2 [n � 8]) isoflurane in 100% oxygen and 0%N2O with or without morphine; (3 [n � 7] and 4 [n � 7])isoflurane in 70% oxygen and 30% N2O with or withoutmorphine; (5 [n � 8] and 6 [n � 8]) isoflurane in 50%oxygen and 50% N2O with or without morphine; and (7[n � 6] and 8 [n � 7]) isoflurane in 30% oxygen and 70%N2O with or without morphine. The rats in groups with-out morphine received an IV bolus of 0.5 mL of salinesolution, and the rats in groups with morphine receivedan IV bolus of 1 mg/kg of morphine diluted in 0.5 mL ofsaline solution. Both morphine or saline IV bolus wereadministered IV in 3–5 min to reduce cardiovascularand respiratory effects if administered more quickly.MACISO was determined 20 min after drug administration.
Intratracheal gas sampling was used to measureanesthetic gas concentration for determination of theMAC. Inspired and end-tidal isoflurane concentra-tions were obtained continuously from gas drawnfrom a fine tubing inserted through the endotrachealcatheter over a hole in the T piece and with the tiplocated at the level of the carina. The proximal end ofthe catheter was connected to a calibrated infrared-absorption analyzer with a 60-mL/min aspirationflow of the gas sample. After every step change inisoflurane concentration delivered by the anestheticcircuit, at least 15 min were allowed for equilibrationmaintaining a constant alveolar concentration and analveolar-to-inspired ratio (FA/FI) more than 0.95.
The MACISO value was established according to themethod described by Eger et al. (10). A painful nox-ious stimulus was applied with an 8-in. hemostatclamped to the first ratchet lock on the tail for 60 s. Thetail was always stimulated proximal to a previous testsite. A positive response was considered when a grosspurposeful movement of the head, extremities orbody, or both was observed, whereas a negative re-sponse was the lack of movement, swallowing, chew-ing, or tail flick. The isoflurane concentration was thenreduced in decrements of 0.1%–0.2% until the negativeresponse became positive. The MACISO was defined asthe average of the smallest concentration preventing apositive response and the largest concentration allowinga positive response to the supramaximal painful stimu-lus. For each rat, MAC was determined in duplicate. Theperson assessing the response was blinded to the drugsadministered at each group.
Statistical analysis of data was performed using theSPSS 10.0 software program (SPSS Inc, Chicago, IL).All data were grouped and summarized as mean �sd. To compare the effect on MACISO of different N2Oconcentrations with or without morphine, an analysisof variance was performed, and post hoc comparison ofthe groups was performed using the Tukey test. A Pvalue �0.05 was considered statistically significant. Aregression analysis was applied to determine the cor-relation between isoflurane MAC at the 0%, 30%, 50%,and 70% N2O concentrations.
ResultsThe average MAC value for isoflurane in 0% N2O was1.59% � 0.10%. The addition of 30%, 50%, and 70%N2O significantly reduced the isoflurane MAC to1.26% � 0.04% (P � 0.001), 1.16% � 0.10% (P � 0.001),and 0.95% � 0.09% (P � 0.001), respectively (Fig. 1).The MAC of isoflurane was significantly different ateach N2O concentration, and increasing N2O concen-trations reduced in a dose-dependent manner theanesthetic requirements for isoflurane. Regressionanalysis was applied to determine the correlationcoefficient and slope of the line extrapolated through thedata sets. The regression equation derived was Y � 1.572� 0.00886X. The R2 value for this line was 0.98, and thepredicted MAC of N2O by extension of the linear regres-sion line was 177% (Fig. 2).
The administration of morphine reduced the MACISOwhen used with 0% or 30% N2O (from 1.59% � 0.10% to1.35% � 0.08% [P � 0.001] and from 1.26% � 0.04%to 0.99% � 0.08% [P � 0.001], respectively). ThisMACISO by morphine reduction was less with 50%N2O (from 1.16% � 0.10% to 1.02% � 0.09% [P � 0.011])and nonexistent at 70% N2O (from 0.95% � 0.09% to0.98% � 0.11%) (Figs. 1 and 3). However, with morphinepresent, the MACISO was independent of the N2O con-centration in the 30%–70% range (0.99% � 0.08%, 1.02%
ANESTH ANALG ANESTHETIC PHARMACOLOGY SANTOS ET AL. 4052005;100:404–8 N2O-MORPHINE AND ISOFLURANE MAC
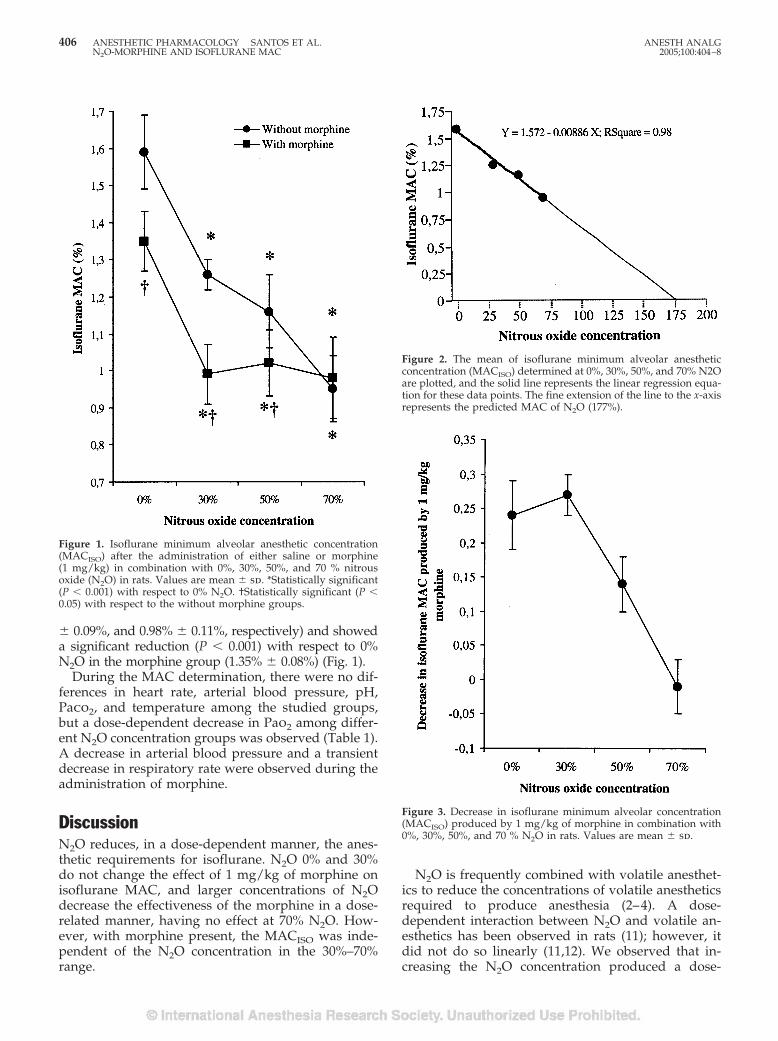
� 0.09%, and 0.98% � 0.11%, respectively) and showeda significant reduction (P � 0.001) with respect to 0%N2O in the morphine group (1.35% � 0.08%) (Fig. 1).
During the MAC determination, there were no dif-ferences in heart rate, arterial blood pressure, pH,Paco2, and temperature among the studied groups,but a dose-dependent decrease in Pao2 among differ-ent N2O concentration groups was observed (Table 1).A decrease in arterial blood pressure and a transientdecrease in respiratory rate were observed during theadministration of morphine.
DiscussionN2O reduces, in a dose-dependent manner, the anes-thetic requirements for isoflurane. N2O 0% and 30%do not change the effect of 1 mg/kg of morphine onisoflurane MAC, and larger concentrations of N2Odecrease the effectiveness of the morphine in a dose-related manner, having no effect at 70% N2O. How-ever, with morphine present, the MACISO was inde-pendent of the N2O concentration in the 30%–70%range.
N2O is frequently combined with volatile anesthet-ics to reduce the concentrations of volatile anestheticsrequired to produce anesthesia (2–4). A dose-dependent interaction between N2O and volatile an-esthetics has been observed in rats (11); however, itdid not do so linearly (11,12). We observed that in-creasing the N2O concentration produced a dose-
Figure 1. Isoflurane minimum alveolar anesthetic concentration(MACISO) after the administration of either saline or morphine(1 mg/kg) in combination with 0%, 30%, 50%, and 70 % nitrousoxide (N2O) in rats. Values are mean � sd. *Statistically significant(P � 0.001) with respect to 0% N2O. †Statistically significant (P �0.05) with respect to the without morphine groups.
Figure 2. The mean of isoflurane minimum alveolar anestheticconcentration (MACISO) determined at 0%, 30%, 50%, and 70% N2Oare plotted, and the solid line represents the linear regression equa-tion for these data points. The fine extension of the line to the x-axisrepresents the predicted MAC of N2O (177%).
Figure 3. Decrease in isoflurane minimum alveolar concentration(MACISO) produced by 1 mg/kg of morphine in combination with0%, 30%, 50%, and 70 % N2O in rats. Values are mean � sd.
406 ANESTHETIC PHARMACOLOGY SANTOS ET AL. ANESTH ANALGN2O-MORPHINE AND ISOFLURANE MAC 2005;100:404–8
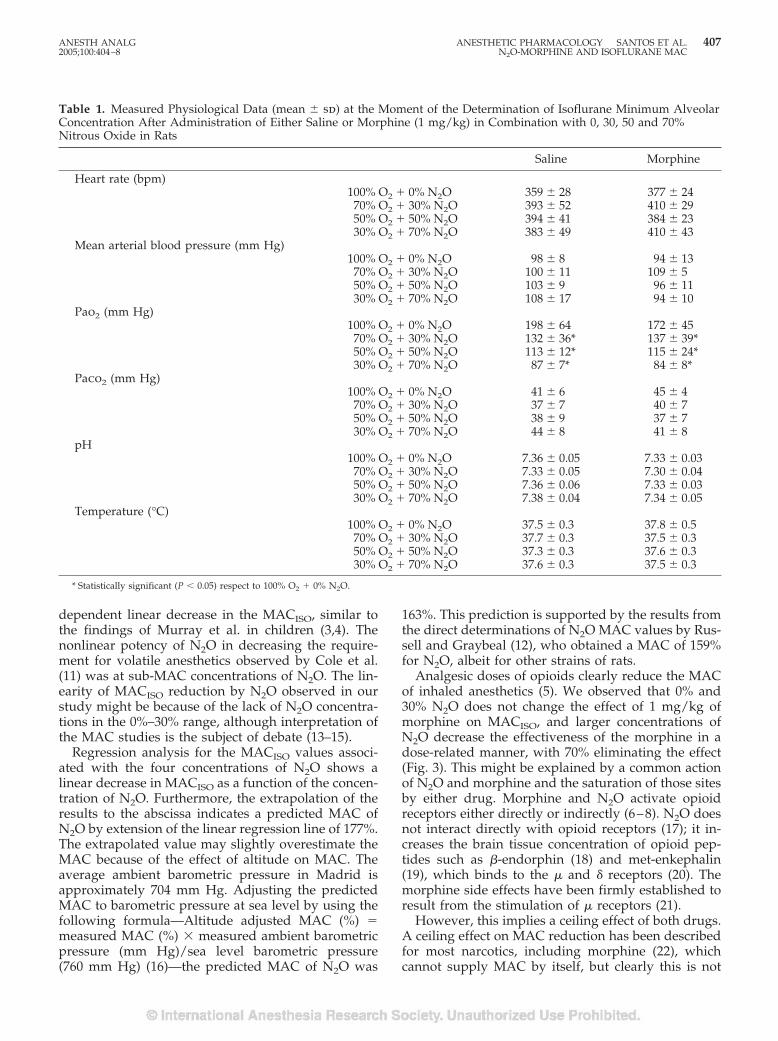
dependent linear decrease in the MACISO, similar tothe findings of Murray et al. in children (3,4). Thenonlinear potency of N2O in decreasing the require-ment for volatile anesthetics observed by Cole et al.(11) was at sub-MAC concentrations of N2O. The lin-earity of MACISO reduction by N2O observed in ourstudy might be because of the lack of N2O concentra-tions in the 0%–30% range, although interpretation ofthe MAC studies is the subject of debate (13–15).
Regression analysis for the MACISO values associ-ated with the four concentrations of N2O shows alinear decrease in MACISO as a function of the concen-tration of N2O. Furthermore, the extrapolation of theresults to the abscissa indicates a predicted MAC ofN2O by extension of the linear regression line of 177%.The extrapolated value may slightly overestimate theMAC because of the effect of altitude on MAC. Theaverage ambient barometric pressure in Madrid isapproximately 704 mm Hg. Adjusting the predictedMAC to barometric pressure at sea level by using thefollowing formula—Altitude adjusted MAC (%) �measured MAC (%) � measured ambient barometricpressure (mm Hg)/sea level barometric pressure(760 mm Hg) (16)—the predicted MAC of N2O was
163%. This prediction is supported by the results fromthe direct determinations of N2O MAC values by Rus-sell and Graybeal (12), who obtained a MAC of 159%for N2O, albeit for other strains of rats.
Analgesic doses of opioids clearly reduce the MACof inhaled anesthetics (5). We observed that 0% and30% N2O does not change the effect of 1 mg/kg ofmorphine on MACISO, and larger concentrations ofN2O decrease the effectiveness of the morphine in adose-related manner, with 70% eliminating the effect(Fig. 3). This might be explained by a common actionof N2O and morphine and the saturation of those sitesby either drug. Morphine and N2O activate opioidreceptors either directly or indirectly (6–8). N2O doesnot interact directly with opioid receptors (17); it in-creases the brain tissue concentration of opioid pep-tides such as �-endorphin (18) and met-enkephalin(19), which binds to the � and � receptors (20). Themorphine side effects have been firmly established toresult from the stimulation of � receptors (21).
However, this implies a ceiling effect of both drugs.A ceiling effect on MAC reduction has been describedfor most narcotics, including morphine (22), whichcannot supply MAC by itself, but clearly this is not
Table 1. Measured Physiological Data (mean � sd) at the Moment of the Determination of Isoflurane Minimum AlveolarConcentration After Administration of Either Saline or Morphine (1 mg/kg) in Combination with 0, 30, 50 and 70%Nitrous Oxide in Rats
Saline Morphine
Heart rate (bpm)100% O2 � 0% N2O 359 � 28 377 � 24
70% O2 � 30% N2O 393 � 52 410 � 2950% O2 � 50% N2O 394 � 41 384 � 2330% O2 � 70% N2O 383 � 49 410 � 43
Mean arterial blood pressure (mm Hg)100% O2 � 0% N2O 98 � 8 94 � 13
70% O2 � 30% N2O 100 � 11 109 � 550% O2 � 50% N2O 103 � 9 96 � 1130% O2 � 70% N2O 108 � 17 94 � 10
Pao2 (mm Hg)100% O2 � 0% N2O 198 � 64 172 � 45
70% O2 � 30% N2O 132 � 36* 137 � 39*50% O2 � 50% N2O 113 � 12* 115 � 24*30% O2 � 70% N2O 87 � 7* 84 � 8*
Paco2 (mm Hg)100% O2 � 0% N2O 41 � 6 45 � 4
70% O2 � 30% N2O 37 � 7 40 � 750% O2 � 50% N2O 38 � 9 37 � 730% O2 � 70% N2O 44 � 8 41 � 8
pH100% O2 � 0% N2O 7.36 � 0.05 7.33 � 0.0370% O2 � 30% N2O 7.33 � 0.05 7.30 � 0.0450% O2 � 50% N2O 7.36 � 0.06 7.33 � 0.0330% O2 � 70% N2O 7.38 � 0.04 7.34 � 0.05
Temperature (°C)100% O2 � 0% N2O 37.5 � 0.3 37.8 � 0.570% O2 � 30% N2O 37.7 � 0.3 37.5 � 0.350% O2 � 50% N2O 37.3 � 0.3 37.6 � 0.330% O2 � 70% N2O 37.6 � 0.3 37.5 � 0.3
* Statistically significant (P � 0.05) respect to 100% O2 � 0% N2O.
ANESTH ANALG ANESTHETIC PHARMACOLOGY SANTOS ET AL. 4072005;100:404–8 N2O-MORPHINE AND ISOFLURANE MAC
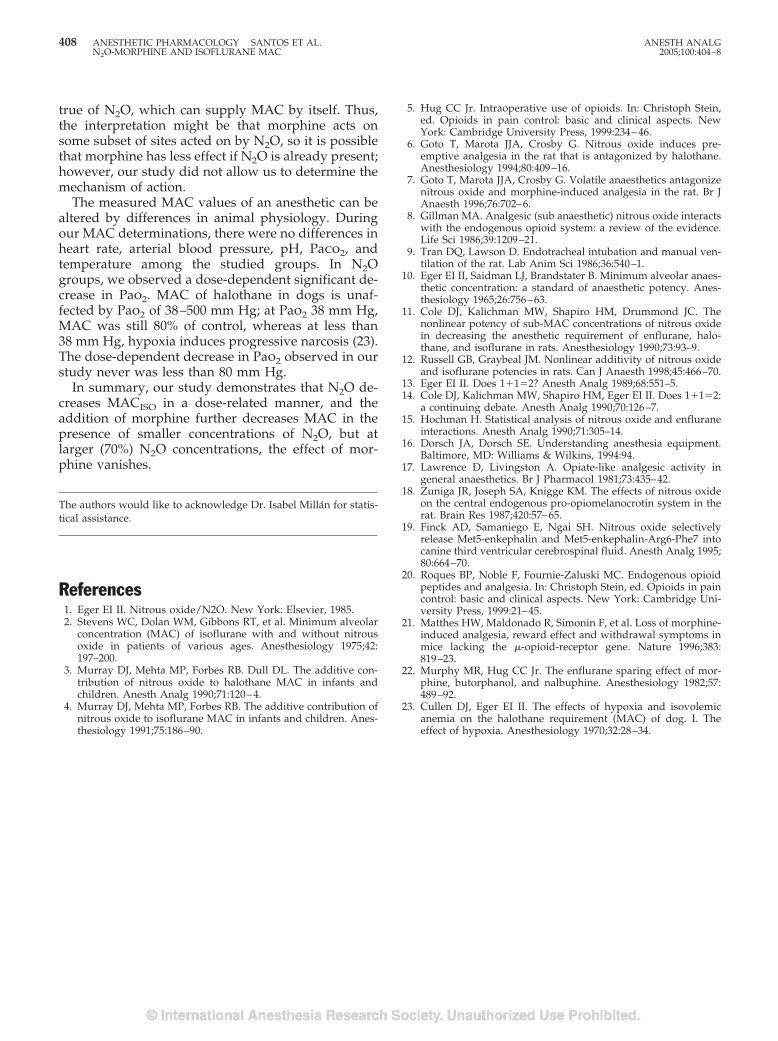
true of N2O, which can supply MAC by itself. Thus,the interpretation might be that morphine acts onsome subset of sites acted on by N2O, so it is possiblethat morphine has less effect if N2O is already present;however, our study did not allow us to determine themechanism of action.
The measured MAC values of an anesthetic can bealtered by differences in animal physiology. Duringour MAC determinations, there were no differences inheart rate, arterial blood pressure, pH, Paco2, andtemperature among the studied groups. In N2Ogroups, we observed a dose-dependent significant de-crease in Pao2. MAC of halothane in dogs is unaf-fected by Pao2 of 38–500 mm Hg; at Pao2 38 mm Hg,MAC was still 80% of control, whereas at less than38 mm Hg, hypoxia induces progressive narcosis (23).The dose-dependent decrease in Pao2 observed in ourstudy never was less than 80 mm Hg.
In summary, our study demonstrates that N2O de-creases MACISO in a dose-related manner, and theaddition of morphine further decreases MAC in thepresence of smaller concentrations of N2O, but atlarger (70%) N2O concentrations, the effect of mor-phine vanishes.
The authors would like to acknowledge Dr. Isabel Millan for statis-tical assistance.
References1. Eger EI II. Nitrous oxide/N2O. New York: Elsevier, 1985.2. Stevens WC, Dolan WM, Gibbons RT, et al. Minimum alveolar
concentration (MAC) of isoflurane with and without nitrousoxide in patients of various ages. Anesthesiology 1975;42:197–200.
3. Murray DJ, Mehta MP, Forbes RB. Dull DL. The additive con-tribution of nitrous oxide to halothane MAC in infants andchildren. Anesth Analg 1990;71:120–4.
4. Murray DJ, Mehta MP, Forbes RB. The additive contribution ofnitrous oxide to isoflurane MAC in infants and children. Anes-thesiology 1991;75:186–90.
5. Hug CC Jr. Intraoperative use of opioids. In: Christoph Stein,ed. Opioids in pain control: basic and clinical aspects. NewYork: Cambridge University Press, 1999:234–46.
6. Goto T, Marota JJA, Crosby G. Nitrous oxide induces pre-emptive analgesia in the rat that is antagonized by halothane.Anesthesiology 1994;80:409–16.
7. Goto T, Marota JJA, Crosby G. Volatile anaesthetics antagonizenitrous oxide and morphine-induced analgesia in the rat. Br JAnaesth 1996;76:702–6.
8. Gillman MA. Analgesic (sub anaesthetic) nitrous oxide interactswith the endogenous opioid system: a review of the evidence.Life Sci 1986;39:1209–21.
9. Tran DQ, Lawson D. Endotracheal intubation and manual ven-tilation of the rat. Lab Anim Sci 1986;36:540–1.
10. Eger EI II, Saidman LJ, Brandstater B. Minimum alveolar anaes-thetic concentration: a standard of anaesthetic potency. Anes-thesiology 1965;26:756–63.
11. Cole DJ, Kalichman MW, Shapiro HM, Drummond JC. Thenonlinear potency of sub-MAC concentrations of nitrous oxidein decreasing the anesthetic requirement of enflurane, halo-thane, and isoflurane in rats. Anesthesiology 1990;73:93–9.
12. Russell GB, Graybeal JM. Nonlinear additivity of nitrous oxideand isoflurane potencies in rats. Can J Anaesth 1998;45:466–70.
13. Eger EI II. Does 1�1�2? Anesth Analg 1989;68:551–5.14. Cole DJ, Kalichman MW, Shapiro HM, Eger EI II. Does 1�1�2:
a continuing debate. Anesth Analg 1990;70:126–7.15. Hochman H. Statistical analysis of nitrous oxide and enflurane
interactions. Anesth Analg 1990;71:305–14.16. Dorsch JA, Dorsch SE. Understanding anesthesia equipment.
Baltimore, MD: Williams & Wilkins, 1994:94.17. Lawrence D, Livingston A. Opiate-like analgesic activity in
general anaesthetics. Br J Pharmacol 1981;73:435–42.18. Zuniga JR, Joseph SA, Knigge KM. The effects of nitrous oxide
on the central endogenous pro-opiomelanocrotin system in therat. Brain Res 1987;420:57–65.
19. Finck AD, Samaniego E, Ngai SH. Nitrous oxide selectivelyrelease Met5-enkephalin and Met5-enkephalin-Arg6-Phe7 intocanine third ventricular cerebrospinal fluid. Anesth Analg 1995;80:664–70.
20. Roques BP, Noble F, Fournie-Zaluski MC. Endogenous opioidpeptides and analgesia. In: Christoph Stein, ed. Opioids in paincontrol: basic and clinical aspects. New York: Cambridge Uni-versity Press, 1999:21–45.
21. Matthes HW, Maldonado R, Simonin F, et al. Loss of morphine-induced analgesia, reward effect and withdrawal symptoms inmice lacking the �-opioid-receptor gene. Nature 1996;383:819–23.
22. Murphy MR, Hug CC Jr. The enflurane sparing effect of mor-phine, butorphanol, and nalbuphine. Anesthesiology 1982;57:489–92.
23. Cullen DJ, Eger EI II. The effects of hypoxia and isovolemicanemia on the halothane requirement (MAC) of dog. I. Theeffect of hypoxia. Anesthesiology 1970;32:28–34.
408 ANESTHETIC PHARMACOLOGY SANTOS ET AL. ANESTH ANALGN2O-MORPHINE AND ISOFLURANE MAC 2005;100:404–8
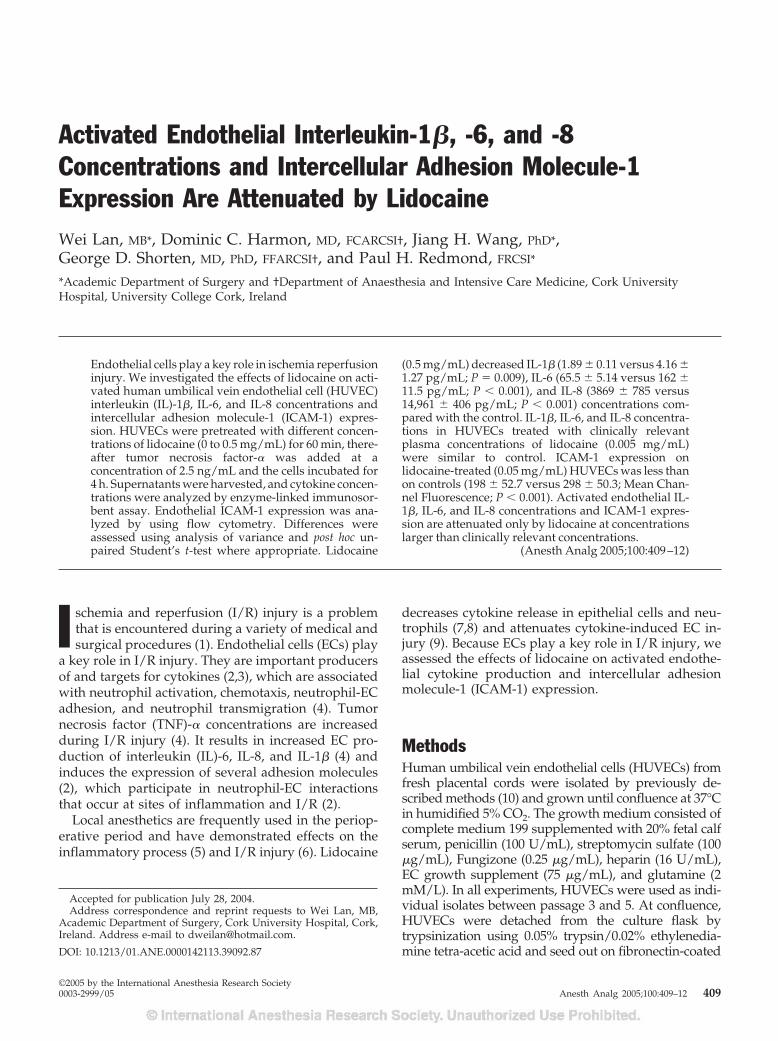
Activated Endothelial Interleukin-1�, -6, and -8Concentrations and Intercellular Adhesion Molecule-1Expression Are Attenuated by LidocaineWei Lan, MB*, Dominic C. Harmon, MD, FCARCSI†, Jiang H. Wang, PhD*,George D. Shorten, MD, PhD, FFARCSI†, and Paul H. Redmond, FRCSI*
*Academic Department of Surgery and †Department of Anaesthesia and Intensive Care Medicine, Cork UniversityHospital, University College Cork, Ireland
Endothelial cells play a key role in ischemia reperfusioninjury. We investigated the effects of lidocaine on acti-vated human umbilical vein endothelial cell (HUVEC)interleukin (IL)-1�, IL-6, and IL-8 concentrations andintercellular adhesion molecule-1 (ICAM-1) expres-sion. HUVECs were pretreated with different concen-trations of lidocaine (0 to 0.5 mg/mL) for 60 min, there-after tumor necrosis factor-� was added at aconcentration of 2.5 ng/mL and the cells incubated for4 h. Supernatants were harvested, and cytokine concen-trations were analyzed by enzyme-linked immunosor-bent assay. Endothelial ICAM-1 expression was ana-lyzed by using flow cytometry. Differences wereassessed using analysis of variance and post hoc un-paired Student’s t-test where appropriate. Lidocaine
(0.5 mg/mL) decreased IL-1� (1.89 � 0.11 versus 4.16 �1.27 pg/mL; P � 0.009), IL-6 (65.5 � 5.14 versus 162 �11.5 pg/mL; P � 0.001), and IL-8 (3869 � 785 versus14,961 � 406 pg/mL; P � 0.001) concentrations com-pared with the control. IL-1�, IL-6, and IL-8 concentra-tions in HUVECs treated with clinically relevantplasma concentrations of lidocaine (0.005 mg/mL)were similar to control. ICAM-1 expression onlidocaine-treated (0.05 mg/mL) HUVECs was less thanon controls (198 � 52.7 versus 298 � 50.3; Mean Chan-nel Fluorescence; P � 0.001). Activated endothelial IL-1�, IL-6, and IL-8 concentrations and ICAM-1 expres-sion are attenuated only by lidocaine at concentrationslarger than clinically relevant concentrations.
(Anesth Analg 2005;100:409–12)
I schemia and reperfusion (I/R) injury is a problemthat is encountered during a variety of medical andsurgical procedures (1). Endothelial cells (ECs) play
a key role in I/R injury. They are important producersof and targets for cytokines (2,3), which are associatedwith neutrophil activation, chemotaxis, neutrophil-ECadhesion, and neutrophil transmigration (4). Tumornecrosis factor (TNF)-� concentrations are increasedduring I/R injury (4). It results in increased EC pro-duction of interleukin (IL)-6, IL-8, and IL-1� (4) andinduces the expression of several adhesion molecules(2), which participate in neutrophil-EC interactionsthat occur at sites of inflammation and I/R (2).
Local anesthetics are frequently used in the periop-erative period and have demonstrated effects on theinflammatory process (5) and I/R injury (6). Lidocaine
decreases cytokine release in epithelial cells and neu-trophils (7,8) and attenuates cytokine-induced EC in-jury (9). Because ECs play a key role in I/R injury, weassessed the effects of lidocaine on activated endothe-lial cytokine production and intercellular adhesionmolecule-1 (ICAM-1) expression.
MethodsHuman umbilical vein endothelial cells (HUVECs) fromfresh placental cords were isolated by previously de-scribed methods (10) and grown until confluence at 37°Cin humidified 5% CO2. The growth medium consisted ofcomplete medium 199 supplemented with 20% fetal calfserum, penicillin (100 U/mL), streptomycin sulfate (100�g/mL), Fungizone (0.25 �g/mL), heparin (16 U/mL),EC growth supplement (75 �g/mL), and glutamine (2mM/L). In all experiments, HUVECs were used as indi-vidual isolates between passage 3 and 5. At confluence,HUVECs were detached from the culture flask bytrypsinization using 0.05% trypsin/0.02% ethylenedia-mine tetra-acetic acid and seed out on fibronectin-coated
Accepted for publication July 28, 2004.Address correspondence and reprint requests to Wei Lan, MB,
Academic Department of Surgery, Cork University Hospital, Cork,Ireland. Address e-mail to [email protected].
DOI: 10.1213/01.ANE.0000142113.39092.87
©2005 by the International Anesthesia Research Society0003-2999/05 Anesth Analg 2005;100:409–12 409
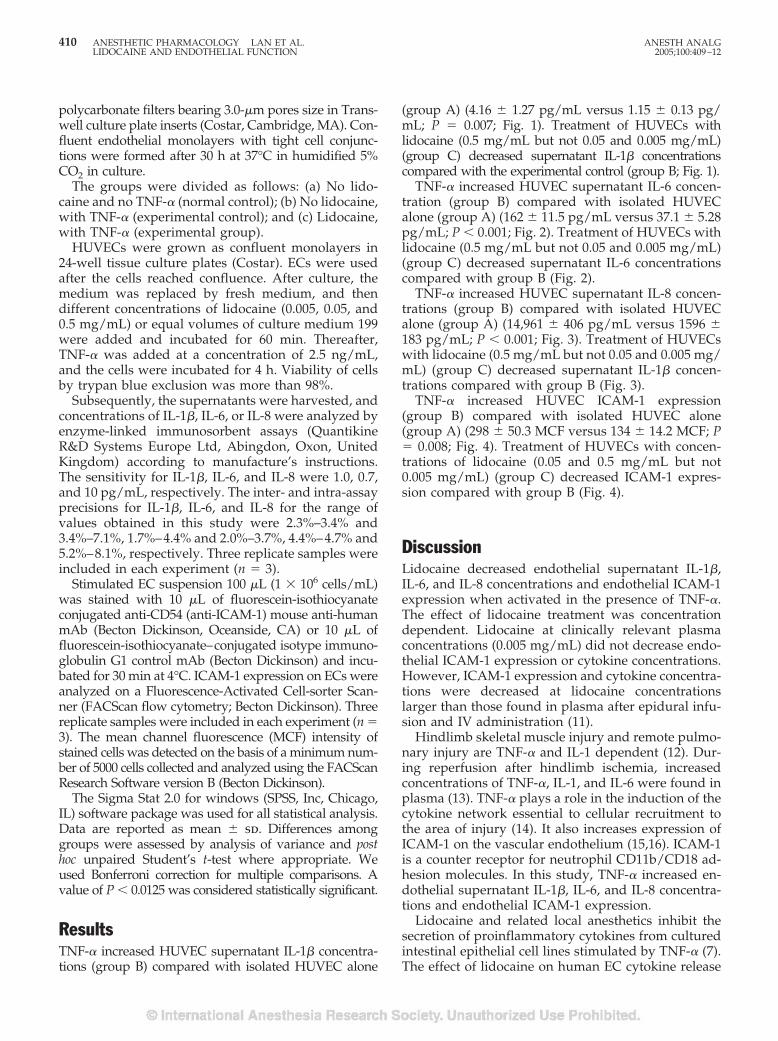
polycarbonate filters bearing 3.0-�m pores size in Trans-well culture plate inserts (Costar, Cambridge, MA). Con-fluent endothelial monolayers with tight cell conjunc-tions were formed after 30 h at 37°C in humidified 5%CO2 in culture.
The groups were divided as follows: (a) No lido-caine and no TNF-� (normal control); (b) No lidocaine,with TNF-� (experimental control); and (c) Lidocaine,with TNF-� (experimental group).
HUVECs were grown as confluent monolayers in24-well tissue culture plates (Costar). ECs were usedafter the cells reached confluence. After culture, themedium was replaced by fresh medium, and thendifferent concentrations of lidocaine (0.005, 0.05, and0.5 mg/mL) or equal volumes of culture medium 199were added and incubated for 60 min. Thereafter,TNF-� was added at a concentration of 2.5 ng/mL,and the cells were incubated for 4 h. Viability of cellsby trypan blue exclusion was more than 98%.
Subsequently, the supernatants were harvested, andconcentrations of IL-1�, IL-6, or IL-8 were analyzed byenzyme-linked immunosorbent assays (QuantikineR&D Systems Europe Ltd, Abingdon, Oxon, UnitedKingdom) according to manufacture’s instructions.The sensitivity for IL-1�, IL-6, and IL-8 were 1.0, 0.7,and 10 pg/mL, respectively. The inter- and intra-assayprecisions for IL-1�, IL-6, and IL-8 for the range ofvalues obtained in this study were 2.3%–3.4% and3.4%–7.1%, 1.7%–4.4% and 2.0%–3.7%, 4.4%–4.7% and5.2%–8.1%, respectively. Three replicate samples wereincluded in each experiment (n � 3).
Stimulated EC suspension 100 �L (1 � 106 cells/mL)was stained with 10 �L of fluorescein-isothiocyanateconjugated anti-CD54 (anti-ICAM-1) mouse anti-humanmAb (Becton Dickinson, Oceanside, CA) or 10 �L offluorescein-isothiocyanate–conjugated isotype immuno-globulin G1 control mAb (Becton Dickinson) and incu-bated for 30 min at 4°C. ICAM-1 expression on ECs wereanalyzed on a Fluorescence-Activated Cell-sorter Scan-ner (FACScan flow cytometry; Becton Dickinson). Threereplicate samples were included in each experiment (n �3). The mean channel fluorescence (MCF) intensity ofstained cells was detected on the basis of a minimum num-ber of 5000 cells collected and analyzed using the FACScanResearch Software version B (Becton Dickinson).
The Sigma Stat 2.0 for windows (SPSS, Inc, Chicago,IL) software package was used for all statistical analysis.Data are reported as mean � sd. Differences amonggroups were assessed by analysis of variance and posthoc unpaired Student’s t-test where appropriate. Weused Bonferroni correction for multiple comparisons. Avalue of P � 0.0125 was considered statistically significant.
ResultsTNF-� increased HUVEC supernatant IL-1� concentra-tions (group B) compared with isolated HUVEC alone
(group A) (4.16 � 1.27 pg/mL versus 1.15 � 0.13 pg/mL; P � 0.007; Fig. 1). Treatment of HUVECs withlidocaine (0.5 mg/mL but not 0.05 and 0.005 mg/mL)(group C) decreased supernatant IL-1� concentrationscompared with the experimental control (group B; Fig. 1).
TNF-� increased HUVEC supernatant IL-6 concen-tration (group B) compared with isolated HUVECalone (group A) (162 � 11.5 pg/mL versus 37.1 � 5.28pg/mL; P � 0.001; Fig. 2). Treatment of HUVECs withlidocaine (0.5 mg/mL but not 0.05 and 0.005 mg/mL)(group C) decreased supernatant IL-6 concentrationscompared with group B (Fig. 2).
TNF-� increased HUVEC supernatant IL-8 concen-trations (group B) compared with isolated HUVECalone (group A) (14,961 � 406 pg/mL versus 1596 �183 pg/mL; P � 0.001; Fig. 3). Treatment of HUVECswith lidocaine (0.5 mg/mL but not 0.05 and 0.005 mg/mL) (group C) decreased supernatant IL-1� concen-trations compared with group B (Fig. 3).
TNF-� increased HUVEC ICAM-1 expression(group B) compared with isolated HUVEC alone(group A) (298 � 50.3 MCF versus 134 � 14.2 MCF; P� 0.008; Fig. 4). Treatment of HUVECs with concen-trations of lidocaine (0.05 and 0.5 mg/mL but not0.005 mg/mL) (group C) decreased ICAM-1 expres-sion compared with group B (Fig. 4).
DiscussionLidocaine decreased endothelial supernatant IL-1�,IL-6, and IL-8 concentrations and endothelial ICAM-1expression when activated in the presence of TNF-�.The effect of lidocaine treatment was concentrationdependent. Lidocaine at clinically relevant plasmaconcentrations (0.005 mg/mL) did not decrease endo-thelial ICAM-1 expression or cytokine concentrations.However, ICAM-1 expression and cytokine concentra-tions were decreased at lidocaine concentrationslarger than those found in plasma after epidural infu-sion and IV administration (11).
Hindlimb skeletal muscle injury and remote pulmo-nary injury are TNF-� and IL-1 dependent (12). Dur-ing reperfusion after hindlimb ischemia, increasedconcentrations of TNF-�, IL-1, and IL-6 were found inplasma (13). TNF-� plays a role in the induction of thecytokine network essential to cellular recruitment tothe area of injury (14). It also increases expression ofICAM-1 on the vascular endothelium (15,16). ICAM-1is a counter receptor for neutrophil CD11b/CD18 ad-hesion molecules. In this study, TNF-� increased en-dothelial supernatant IL-1�, IL-6, and IL-8 concentra-tions and endothelial ICAM-1 expression.
Lidocaine and related local anesthetics inhibit thesecretion of proinflammatory cytokines from culturedintestinal epithelial cell lines stimulated by TNF-� (7).The effect of lidocaine on human EC cytokine release
410 ANESTHETIC PHARMACOLOGY LAN ET AL. ANESTH ANALGLIDOCAINE AND ENDOTHELIAL FUNCTION 2005;100:409–12
and adhesion molecule expression has not been stud-ied. These effects are particularly relevant in under-standing the possible protective role of local anesthet-ics in I/R injury. In this study, HUVECs were used toexamine the effect of lidocaine on endothelial cytokinerelease and adhesion molecule expression. HUVECsare the most frequently used EC culture model, al-though there are few studies comparing their responsewith other human EC types from the adult organism.Klein et al. (17) have reported similar in vitro cytokineeffects on the expression of adhesion molecules byHUVEC, saphenous vein, and femoral artery ECs.
Lidocaine, at clinically relevant plasma concentra-tions (0.005 mg/mL), did not decrease activated HUVECICAM-1 expression or supernatant cytokine concentra-tions. ICAM-1 expression and cytokine concentrationswere decreased at lidocaine concentrations of 0.05 mg/mLand 0.5 mg/mL. These concentrations can be achieved intissues at or near the site of injection (18).
Lidocaine inhibits cytokine-signaling pathways by de-creasing protein kinase C activity and protein phosphor-ylation (19). It also prevents the increase in intracellularCa2� concentrations during ischemia (20). An increase infree cytosolic Ca2� in ECs is an important early signalingevent in neutrophil-endothelial adhesion (21). Lidocainemay thus decrease TNF-�–activated endothelial cyto-kine production and ICAM-1 expression by inhibitingsignals of activation.
Figure 1. The effect of lidocaine on the endothelial supernatantinterleukin(IL)-1� concentration after stimulation by tumor necrosisfactor-� (TNF-�). The experimental groups are represented on thex-axis: A � normal control, human umbilical vein endothelial cells(HUVECs) with culture medium, no TNF-�, and no lidocaine; B �experimental control, HUVECs with TNF-�, and no lidocaine; C1,C2, and C3 � experimental groups, HUVECs with TNF-�, andtreatment with 0.005, 0.05, and 0.5 mg/mL of lidocaine, respec-tively. †P � 0.0125 compared with normal control; *P � 0.0125compared with experimental control.
Figure 2. The effect of lidocaine on the endothelial supernatantinterleukin(IL)-6 concentration after stimulation by tumor necrosisfactor-� (TNF-�). The experimental groups are represented on thex-axis: A � normal control, human umbilical vein endothelial cells(HUVECs) with culture medium, no TNF-�, and no lidocaine; B �experimental control, HUVECs with TNF-�, and no lidocaine; C1,C2, and C3 � experimental groups, HUVECs with TNF-�, andtreatment with 0.005, 0.05, and 0.5 mg/mL of lidocaine, respec-tively. †P � 0.0125 compared with normal control; *P � 0.0125compared with experimental control.
Figure 3. The effect of lidocaine on the endothelial supernatantinterleukin(IL)-8 concentration after stimulation by tumor necrosisfactor-� (TNF-�). The experimental groups are represented on thex-axis: A � normal control, human umbilical vein endothelial cells(HUVECs) with culture medium, no TNF-�, and no lidocaine; B �experimental control, HUVECs with TNF-�, and no lidocaine; C1,C2, and C3 � experimental groups, HUVECs with TNF-�, andtreatment with 0.005, 0.05, and 0.5 mg/mL of lidocaine, respec-tively. †P � 0.0125 compared with normal control; *P � 0.0125compared with experimental control.
ANESTH ANALG ANESTHETIC PHARMACOLOGY LAN ET AL. 4112005;100:409–12 LIDOCAINE AND ENDOTHELIAL FUNCTION
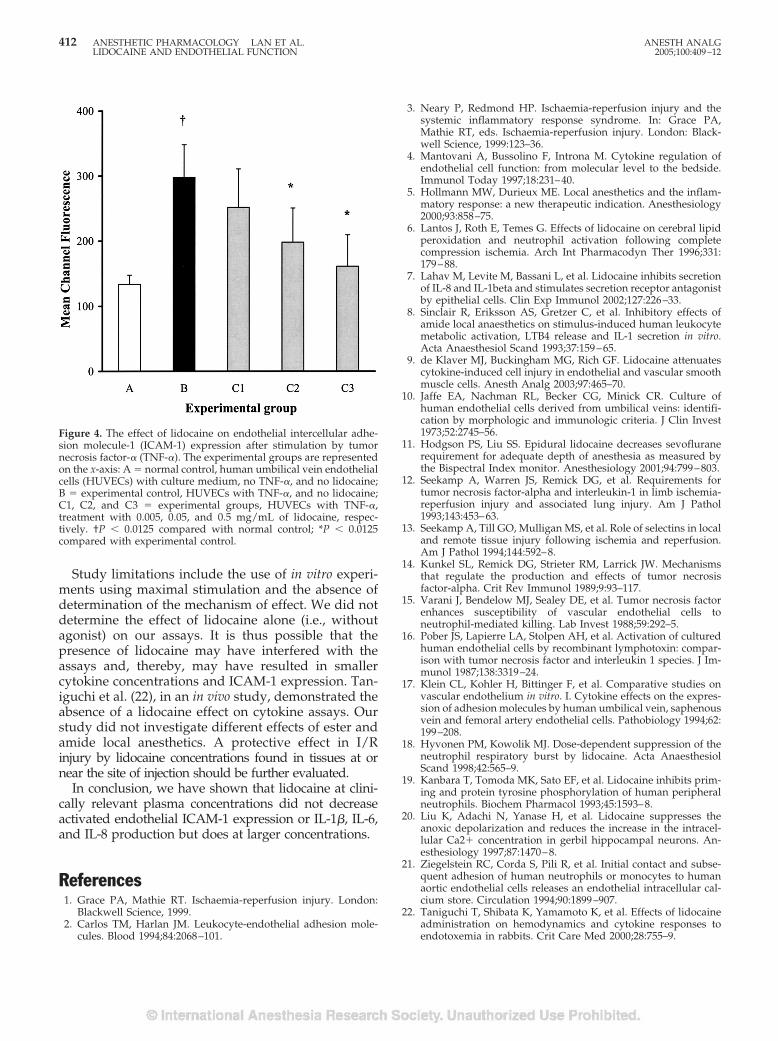
Study limitations include the use of in vitro experi-ments using maximal stimulation and the absence ofdetermination of the mechanism of effect. We did notdetermine the effect of lidocaine alone (i.e., withoutagonist) on our assays. It is thus possible that thepresence of lidocaine may have interfered with theassays and, thereby, may have resulted in smallercytokine concentrations and ICAM-1 expression. Tan-iguchi et al. (22), in an in vivo study, demonstrated theabsence of a lidocaine effect on cytokine assays. Ourstudy did not investigate different effects of ester andamide local anesthetics. A protective effect in I/Rinjury by lidocaine concentrations found in tissues at ornear the site of injection should be further evaluated.
In conclusion, we have shown that lidocaine at clini-cally relevant plasma concentrations did not decreaseactivated endothelial ICAM-1 expression or IL-1�, IL-6,and IL-8 production but does at larger concentrations.
References1. Grace PA, Mathie RT. Ischaemia-reperfusion injury. London:
Blackwell Science, 1999.2. Carlos TM, Harlan JM. Leukocyte-endothelial adhesion mole-
cules. Blood 1994;84:2068–101.
3. Neary P, Redmond HP. Ischaemia-reperfusion injury and thesystemic inflammatory response syndrome. In: Grace PA,Mathie RT, eds. Ischaemia-reperfusion injury. London: Black-well Science, 1999:123–36.
4. Mantovani A, Bussolino F, Introna M. Cytokine regulation ofendothelial cell function: from molecular level to the bedside.Immunol Today 1997;18:231–40.
5. Hollmann MW, Durieux ME. Local anesthetics and the inflam-matory response: a new therapeutic indication. Anesthesiology2000;93:858–75.
6. Lantos J, Roth E, Temes G. Effects of lidocaine on cerebral lipidperoxidation and neutrophil activation following completecompression ischemia. Arch Int Pharmacodyn Ther 1996;331:179–88.
7. Lahav M, Levite M, Bassani L, et al. Lidocaine inhibits secretionof IL-8 and IL-1beta and stimulates secretion receptor antagonistby epithelial cells. Clin Exp Immunol 2002;127:226–33.
8. Sinclair R, Eriksson AS, Gretzer C, et al. Inhibitory effects ofamide local anaesthetics on stimulus-induced human leukocytemetabolic activation, LTB4 release and IL-1 secretion in vitro.Acta Anaesthesiol Scand 1993;37:159–65.
9. de Klaver MJ, Buckingham MG, Rich GF. Lidocaine attenuatescytokine-induced cell injury in endothelial and vascular smoothmuscle cells. Anesth Analg 2003;97:465–70.
10. Jaffe EA, Nachman RL, Becker CG, Minick CR. Culture ofhuman endothelial cells derived from umbilical veins: identifi-cation by morphologic and immunologic criteria. J Clin Invest1973;52:2745–56.
11. Hodgson PS, Liu SS. Epidural lidocaine decreases sevofluranerequirement for adequate depth of anesthesia as measured bythe Bispectral Index monitor. Anesthesiology 2001;94:799–803.
12. Seekamp A, Warren JS, Remick DG, et al. Requirements fortumor necrosis factor-alpha and interleukin-1 in limb ischemia-reperfusion injury and associated lung injury. Am J Pathol1993;143:453–63.
13. Seekamp A, Till GO, Mulligan MS, et al. Role of selectins in localand remote tissue injury following ischemia and reperfusion.Am J Pathol 1994;144:592–8.
14. Kunkel SL, Remick DG, Strieter RM, Larrick JW. Mechanismsthat regulate the production and effects of tumor necrosisfactor-alpha. Crit Rev Immunol 1989;9:93–117.
15. Varani J, Bendelow MJ, Sealey DE, et al. Tumor necrosis factorenhances susceptibility of vascular endothelial cells toneutrophil-mediated killing. Lab Invest 1988;59:292–5.
16. Pober JS, Lapierre LA, Stolpen AH, et al. Activation of culturedhuman endothelial cells by recombinant lymphotoxin: compar-ison with tumor necrosis factor and interleukin 1 species. J Im-munol 1987;138:3319–24.
17. Klein CL, Kohler H, Bittinger F, et al. Comparative studies onvascular endothelium in vitro. I. Cytokine effects on the expres-sion of adhesion molecules by human umbilical vein, saphenousvein and femoral artery endothelial cells. Pathobiology 1994;62:199–208.
18. Hyvonen PM, Kowolik MJ. Dose-dependent suppression of theneutrophil respiratory burst by lidocaine. Acta AnaesthesiolScand 1998;42:565–9.
19. Kanbara T, Tomoda MK, Sato EF, et al. Lidocaine inhibits prim-ing and protein tyrosine phosphorylation of human peripheralneutrophils. Biochem Pharmacol 1993;45:1593–8.
20. Liu K, Adachi N, Yanase H, et al. Lidocaine suppresses theanoxic depolarization and reduces the increase in the intracel-lular Ca2� concentration in gerbil hippocampal neurons. An-esthesiology 1997;87:1470–8.
21. Ziegelstein RC, Corda S, Pili R, et al. Initial contact and subse-quent adhesion of human neutrophils or monocytes to humanaortic endothelial cells releases an endothelial intracellular cal-cium store. Circulation 1994;90:1899–907.
22. Taniguchi T, Shibata K, Yamamoto K, et al. Effects of lidocaineadministration on hemodynamics and cytokine responses toendotoxemia in rabbits. Crit Care Med 2000;28:755–9.
Figure 4. The effect of lidocaine on endothelial intercellular adhe-sion molecule-1 (ICAM-1) expression after stimulation by tumornecrosis factor-� (TNF-�). The experimental groups are representedon the x-axis: A � normal control, human umbilical vein endothelialcells (HUVECs) with culture medium, no TNF-�, and no lidocaine;B � experimental control, HUVECs with TNF-�, and no lidocaine;C1, C2, and C3 � experimental groups, HUVECs with TNF-�,treatment with 0.005, 0.05, and 0.5 mg/mL of lidocaine, respec-tively. †P � 0.0125 compared with normal control; *P � 0.0125compared with experimental control.
412 ANESTHETIC PHARMACOLOGY LAN ET AL. ANESTH ANALGLIDOCAINE AND ENDOTHELIAL FUNCTION 2005;100:409–12
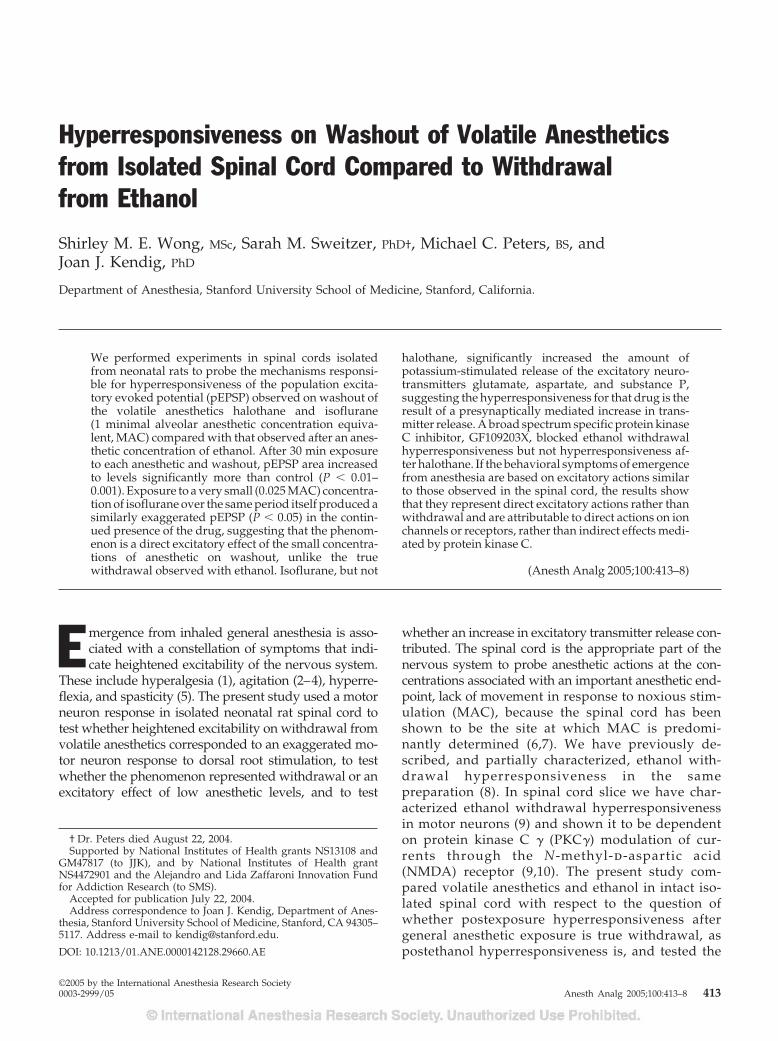
Hyperresponsiveness on Washout of Volatile Anestheticsfrom Isolated Spinal Cord Compared to Withdrawalfrom Ethanol
Shirley M. E. Wong, MSc, Sarah M. Sweitzer, PhD†, Michael C. Peters, BS, andJoan J. Kendig, PhD
Department of Anesthesia, Stanford University School of Medicine, Stanford, California.
We performed experiments in spinal cords isolatedfrom neonatal rats to probe the mechanisms responsi-ble for hyperresponsiveness of the population excita-tory evoked potential (pEPSP) observed on washout ofthe volatile anesthetics halothane and isoflurane(1 minimal alveolar anesthetic concentration equiva-lent, MAC) compared with that observed after an anes-thetic concentration of ethanol. After 30 min exposureto each anesthetic and washout, pEPSP area increasedto levels significantly more than control (P � 0.01–0.001). Exposure to a very small (0.025 MAC) concentra-tion of isoflurane over the same period itself produced asimilarly exaggerated pEPSP (P � 0.05) in the contin-ued presence of the drug, suggesting that the phenom-enon is a direct excitatory effect of the small concentra-tions of anesthetic on washout, unlike the truewithdrawal observed with ethanol. Isoflurane, but not
halothane, significantly increased the amount ofpotassium-stimulated release of the excitatory neuro-transmitters glutamate, aspartate, and substance P,suggesting the hyperresponsiveness for that drug is theresult of a presynaptically mediated increase in trans-mitter release. A broad spectrum specific protein kinaseC inhibitor, GF109203X, blocked ethanol withdrawalhyperresponsiveness but not hyperresponsiveness af-ter halothane. If the behavioral symptoms of emergencefrom anesthesia are based on excitatory actions similarto those observed in the spinal cord, the results showthat they represent direct excitatory actions rather thanwithdrawal and are attributable to direct actions on ionchannels or receptors, rather than indirect effects medi-ated by protein kinase C.
(Anesth Analg 2005;100:413–8)
Emergence from inhaled general anesthesia is asso-ciated with a constellation of symptoms that indi-cate heightened excitability of the nervous system.
These include hyperalgesia (1), agitation (2–4), hyperre-flexia, and spasticity (5). The present study used a motorneuron response in isolated neonatal rat spinal cord totest whether heightened excitability on withdrawal fromvolatile anesthetics corresponded to an exaggerated mo-tor neuron response to dorsal root stimulation, to testwhether the phenomenon represented withdrawal or anexcitatory effect of low anesthetic levels, and to test
whether an increase in excitatory transmitter release con-tributed. The spinal cord is the appropriate part of thenervous system to probe anesthetic actions at the con-centrations associated with an important anesthetic end-point, lack of movement in response to noxious stim-ulation (MAC), because the spinal cord has beenshown to be the site at which MAC is predomi-nantly determined (6,7). We have previously de-scribed, and partially characterized, ethanol with-drawal hyperresponsiveness in the samepreparation (8). In spinal cord slice we have char-acterized ethanol withdrawal hyperresponsivenessin motor neurons (9) and shown it to be dependenton protein kinase C � (PKC�) modulation of cur-rents through the N-methyl-d-aspartic acid(NMDA) receptor (9,10). The present study com-pared volatile anesthetics and ethanol in intact iso-lated spinal cord with respect to the question ofwhether postexposure hyperresponsiveness aftergeneral anesthetic exposure is true withdrawal, aspostethanol hyperresponsiveness is, and tested the
† Dr. Peters died August 22, 2004.Supported by National Institutes of Health grants NS13108 and
GM47817 (to JJK), and by National Institutes of Health grantNS4472901 and the Alejandro and Lida Zaffaroni Innovation Fundfor Addiction Research (to SMS).
Accepted for publication July 22, 2004.Address correspondence to Joan J. Kendig, Department of Anes-
thesia, Stanford University School of Medicine, Stanford, CA 94305–5117. Address e-mail to [email protected].
DOI: 10.1213/01.ANE.0000142128.29660.AE
©2005 by the International Anesthesia Research Society0003-2999/05 Anesth Analg 2005;100:413–8 413
involvement of PKC in the hyperresponsiveness as-sociated with each class of drug.
MethodsAs we have previously described (8), spinal cords wereisolated from halothane-anesthetized Sprague-Dawleyrat pups 1–4 days old in a protocol approved by Stan-ford University’s Institutional Animal Care and UseCommittee. Cords were superfused with artificial cere-brospinal fluid (ACSF) of the following composition (inmM): NaCl 123, KCl 5, NaH2PO4 1.2, MgSO4 1.3,NaHCO3 26, CaCl2 2, dextrose 30. The ACSF was equil-ibrated with 95% O2-5% CO2, yielding a stable pH of7.3–7.4. Temperature was recorded by a thermistor in thechamber close to the cord and maintained at 27°C–28°C,a temperature in the physiological range for rats of thisage when not incubated by the mother.
A suction stimulating electrode was placed on a lum-bar dorsal root 4–5 mm distal to the entrance of the rootinto the cord. A suction recording electrode was placedon an ipsilateral ventral root 1–3 segments away torecord the population excitatory postsynaptic potential(pEPSP), which underlies the monosynaptic reflex with-out contamination by the compound action potential.Stimuli to the dorsal root were square wave pulses 0.4ms in duration, nominal intensity 9.8 V, given at a con-stant frequency of 0.02 s�1. After the responses of thepreparation were observed to be stable, control record-ings were taken over a 30-min period. Responses wereaveraged in groups of 5 and digitally recorded.
Volatile anesthetics were prepared as saturated solu-tions and diluted to the desired concentration in theACSF; ethanol was diluted to the desired concentration(100 mM) in the ACSF. This is an anesthetic concentra-tion for adult rats (11). Most experiments with volatileanesthetics were also done at 1 minimal alveolar anes-thetic concentration (MAC) equivalents. These were inaccord with published MAC equivalents for rats as freeaqueous concentrations as reported in an article thatfinds these an appropriate benchmark for in vitro exper-iments even uncorrected for temperature (12). To probefor an excitatory action of small anesthetic concentra-tions, some isoflurane experiments were done at 0.025MAC. Concentrations in the superfusate were measuredby gas chromatography of the vapor phase in equilib-rium with the solution. Anesthetics were administeredfor 30 min followed by washout for 1 h. The broadspectrum PKC antagonist GF109203� (Sigma, St. Louis,MO) was dissolved in the ACSF and applied to thepreparation for 30–60 min before and during anestheticor drug exposure.
Area under the curve of the pEPSP was measured andnormalized to the average area in the control period. Thetime course of anesthetic and ethanol actions was fol-lowed, and comparisons of withdrawal hyperrespon-siveness were made at 60 min washout. Control studies
were made with untreated preparations over the sametime period as the experimental studies. Significance ofdifferences was assessed by analysis of variance fol-lowed by a Bonferroni posttest for multiple compari-sons, with significance set at a P level of 0.05.
To test the role of enhanced excitatory transmitterrelease in exaggerated responses, superfusate was col-lected at the end of the washout period and also after10-min exposure to large potassium concentrations(30 mM). Superfusate samples were obtained from4–5 different cords for each transmitter, and sampleswere run in duplicate. Glutamate and aspartate wereassayed by high-performance liquid chromatography.Substance P and calcitonin gene-related peptide (CGRP)were assayed by enzyme-linked immunosorbent assay.
High-performance liquid chromatography methodswere derived from Graser et al. (13). Samples (20 �L)were reacted with 1.0 �L of o-phthaldialdehyde/3-mercaptoproprionic acid reagent (Sigma) for deriviti-zation. After 1 min, a 20-�L sample was injected intothe high-performance liquid chromatography, whichuses a reversed-phase C18 column (3.9 � 150 mm,Waters, Milford, MA). Glutamate and aspartate werequantitated at absorbance of 340 nm (Waters 2487).The samples were separated with a mobile phase gra-dient using the following solutions: 12.5 mMNaH2PO4, pH 7.2, and a 50% v/v mixture of 12.5 mMNaH2PO4 and acetonitrile. The aspartate peak appearsat 3.3 min and the glutamate peak at 4.9 min aftersample application when the mobile phase is isocraticphosphate buffer. The column was flushed by using asteep gradient (ending in 50% acetonitrile) before thenext sample. This procedure allowed for the detectionof glutamate and aspartate at a sensitivity of 0.5–2.0ng/sample. A dose-response curve was generated oneach day of sampling. A personal computer-baseddata acquisition and analysis system (Millennium,Waters) was used to quantify amino acid contentbased on the area under the curves.
For substance P and CGRP ELISA analysis, sampleswere analyzed using the rat CGRP enzyme immuno-assay kit (SPI-Bio, Massy Cedex, France) or the Sub-stance P enzyme immunoassay kit (Assay Designs,Inc., Ann Arbor, MI). Each sample was performed induplicate as directed in the instructions. CGRP orSubstance P concentrations were determined by refer-ence to the sample absorbances of the standard curvesgenerated using the recombinant rat CGRP or Sub-stance P supplied with the kits.
ResultsAn example of halothane’s effects on the pEPSP isshown in Figure 1A, and the time courses of halo-thane, isoflurane, and ethanol depression and recov-ery on washout are shown in Figure 1B. In each case,
414 ANESTHETIC PHARMACOLOGY WONG ET AL. ANESTH ANALGVOLATILE ANESTHETIC-INDUCED HYPERRESPONSIVENESS 2005;100:413–8
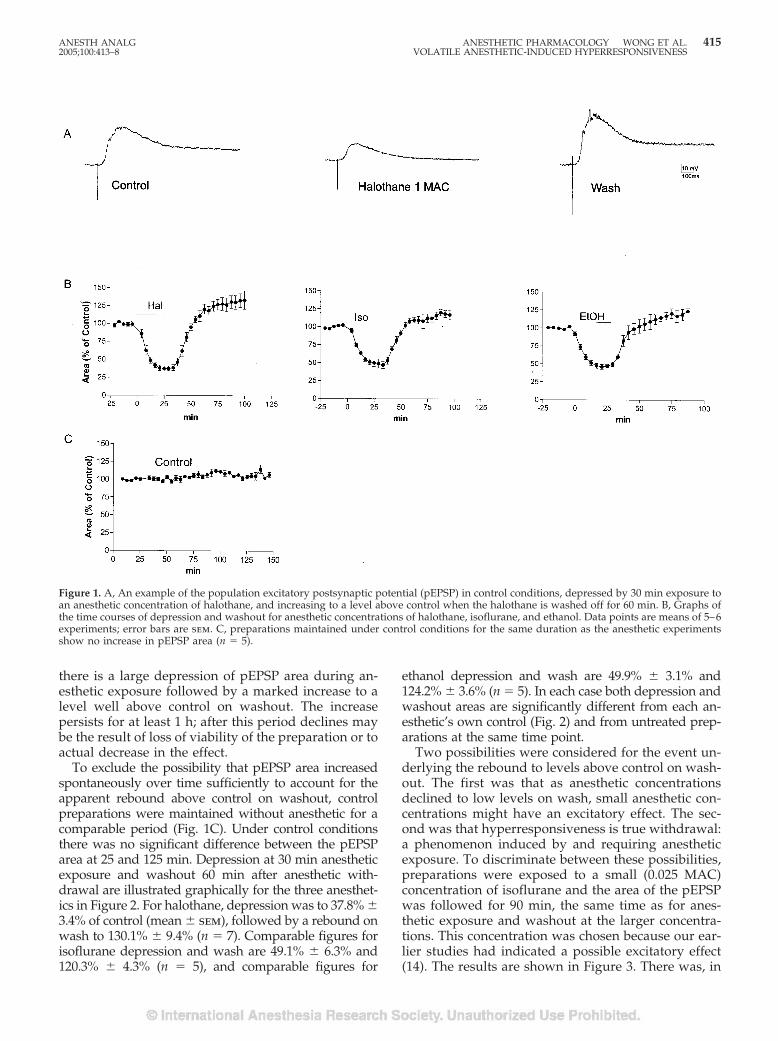
there is a large depression of pEPSP area during an-esthetic exposure followed by a marked increase to alevel well above control on washout. The increasepersists for at least 1 h; after this period declines maybe the result of loss of viability of the preparation or toactual decrease in the effect.
To exclude the possibility that pEPSP area increasedspontaneously over time sufficiently to account for theapparent rebound above control on washout, controlpreparations were maintained without anesthetic for acomparable period (Fig. 1C). Under control conditionsthere was no significant difference between the pEPSParea at 25 and 125 min. Depression at 30 min anestheticexposure and washout 60 min after anesthetic with-drawal are illustrated graphically for the three anesthet-ics in Figure 2. For halothane, depression was to 37.8% �3.4% of control (mean � sem), followed by a rebound onwash to 130.1% � 9.4% (n � 7). Comparable figures forisoflurane depression and wash are 49.1% � 6.3% and120.3% � 4.3% (n � 5), and comparable figures for
ethanol depression and wash are 49.9% � 3.1% and124.2% � 3.6% (n � 5). In each case both depression andwashout areas are significantly different from each an-esthetic’s own control (Fig. 2) and from untreated prep-arations at the same time point.
Two possibilities were considered for the event un-derlying the rebound to levels above control on wash-out. The first was that as anesthetic concentrationsdeclined to low levels on wash, small anesthetic con-centrations might have an excitatory effect. The sec-ond was that hyperresponsiveness is true withdrawal:a phenomenon induced by and requiring anestheticexposure. To discriminate between these possibilities,preparations were exposed to a small (0.025 MAC)concentration of isoflurane and the area of the pEPSPwas followed for 90 min, the same time as for anes-thetic exposure and washout at the larger concentra-tions. This concentration was chosen because our ear-lier studies had indicated a possible excitatory effect(14). The results are shown in Figure 3. There was, in
Figure 1. A, An example of the population excitatory postsynaptic potential (pEPSP) in control conditions, depressed by 30 min exposure toan anesthetic concentration of halothane, and increasing to a level above control when the halothane is washed off for 60 min. B, Graphs ofthe time courses of depression and washout for anesthetic concentrations of halothane, isoflurane, and ethanol. Data points are means of 5–6experiments; error bars are sem. C, preparations maintained under control conditions for the same duration as the anesthetic experimentsshow no increase in pEPSP area (n � 5).
ANESTH ANALG ANESTHETIC PHARMACOLOGY WONG ET AL. 4152005;100:413–8 VOLATILE ANESTHETIC-INDUCED HYPERRESPONSIVENESS
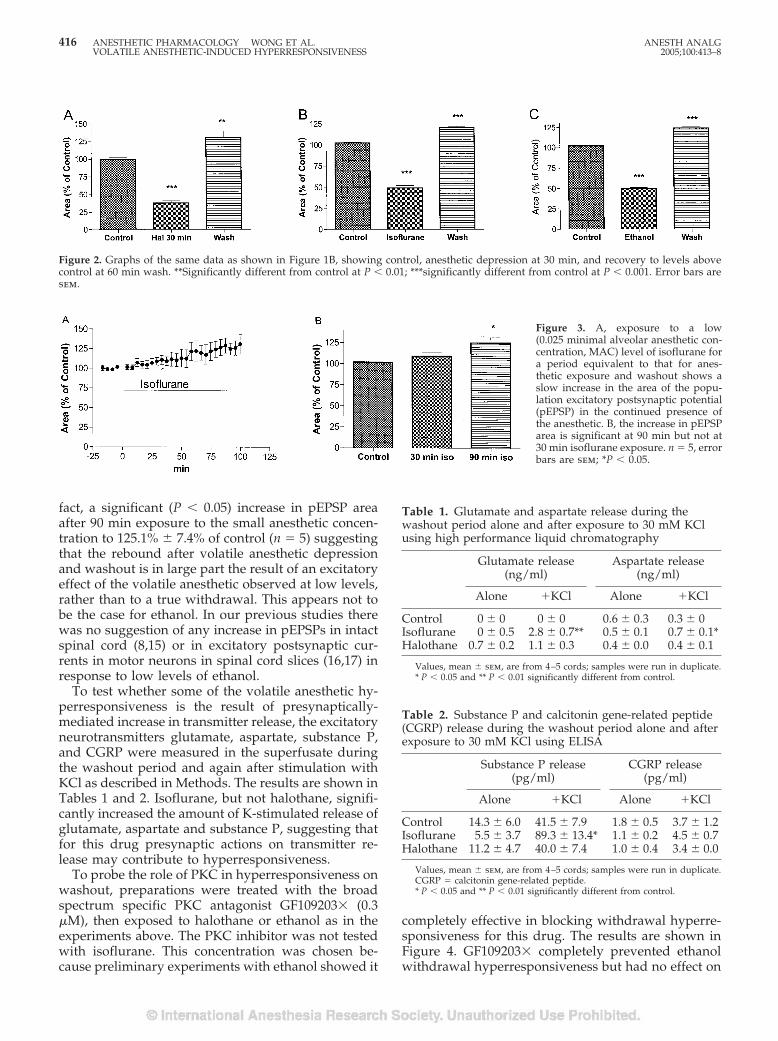
fact, a significant (P � 0.05) increase in pEPSP areaafter 90 min exposure to the small anesthetic concen-tration to 125.1% � 7.4% of control (n � 5) suggestingthat the rebound after volatile anesthetic depressionand washout is in large part the result of an excitatoryeffect of the volatile anesthetic observed at low levels,rather than to a true withdrawal. This appears not tobe the case for ethanol. In our previous studies therewas no suggestion of any increase in pEPSPs in intactspinal cord (8,15) or in excitatory postsynaptic cur-rents in motor neurons in spinal cord slices (16,17) inresponse to low levels of ethanol.
To test whether some of the volatile anesthetic hy-perresponsiveness is the result of presynaptically-mediated increase in transmitter release, the excitatoryneurotransmitters glutamate, aspartate, substance P,and CGRP were measured in the superfusate duringthe washout period and again after stimulation withKCl as described in Methods. The results are shown inTables 1 and 2. Isoflurane, but not halothane, signifi-cantly increased the amount of K-stimulated release ofglutamate, aspartate and substance P, suggesting thatfor this drug presynaptic actions on transmitter re-lease may contribute to hyperresponsiveness.
To probe the role of PKC in hyperresponsiveness onwashout, preparations were treated with the broadspectrum specific PKC antagonist GF109203� (0.3�M), then exposed to halothane or ethanol as in theexperiments above. The PKC inhibitor was not testedwith isoflurane. This concentration was chosen be-cause preliminary experiments with ethanol showed it
completely effective in blocking withdrawal hyperre-sponsiveness for this drug. The results are shown inFigure 4. GF109203� completely prevented ethanolwithdrawal hyperresponsiveness but had no effect on
Figure 2. Graphs of the same data as shown in Figure 1B, showing control, anesthetic depression at 30 min, and recovery to levels abovecontrol at 60 min wash. **Significantly different from control at P � 0.01; ***significantly different from control at P � 0.001. Error bars aresem.
Figure 3. A, exposure to a low(0.025 minimal alveolar anesthetic con-centration, MAC) level of isoflurane fora period equivalent to that for anes-thetic exposure and washout shows aslow increase in the area of the popu-lation excitatory postsynaptic potential(pEPSP) in the continued presence ofthe anesthetic. B, the increase in pEPSParea is significant at 90 min but not at30 min isoflurane exposure. n � 5, errorbars are sem; *P � 0.05.
Table 1. Glutamate and aspartate release during thewashout period alone and after exposure to 30 mM KClusing high performance liquid chromatography
Glutamate release(ng/ml)
Aspartate release(ng/ml)
Alone �KCl Alone �KCl
Control 0 � 0 0 � 0 0.6 � 0.3 0.3 � 0Isoflurane 0 � 0.5 2.8 � 0.7** 0.5 � 0.1 0.7 � 0.1*Halothane 0.7 � 0.2 1.1 � 0.3 0.4 � 0.0 0.4 � 0.1
Values, mean � sem, are from 4–5 cords; samples were run in duplicate.* P � 0.05 and ** P � 0.01 significantly different from control.
Table 2. Substance P and calcitonin gene-related peptide(CGRP) release during the washout period alone and afterexposure to 30 mM KCl using ELISA
Substance P release(pg/ml)
CGRP release(pg/ml)
Alone �KCl Alone �KCl
Control 14.3 � 6.0 41.5 � 7.9 1.8 � 0.5 3.7 � 1.2Isoflurane 5.5 � 3.7 89.3 � 13.4* 1.1 � 0.2 4.5 � 0.7Halothane 11.2 � 4.7 40.0 � 7.4 1.0 � 0.4 3.4 � 0.0
Values, mean � sem, are from 4–5 cords; samples were run in duplicate.CGRP � calcitonin gene-related peptide.* P � 0.05 and ** P � 0.01 significantly different from control.
416 ANESTHETIC PHARMACOLOGY WONG ET AL. ANESTH ANALGVOLATILE ANESTHETIC-INDUCED HYPERRESPONSIVENESS 2005;100:413–8
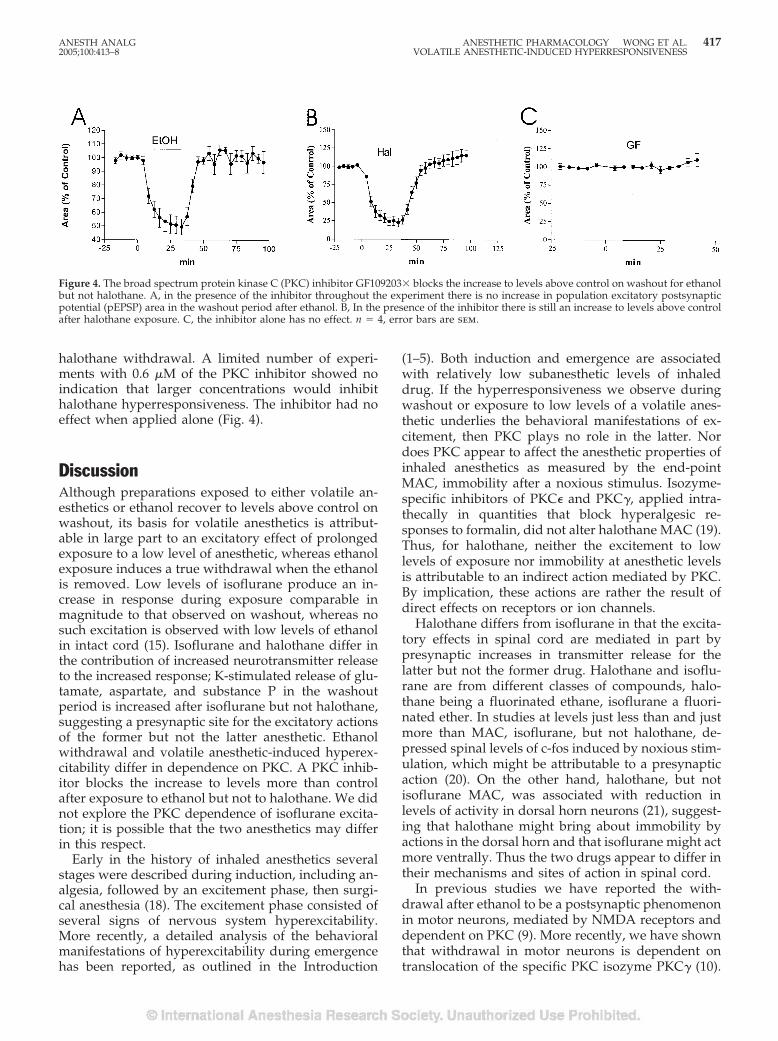
halothane withdrawal. A limited number of experi-ments with 0.6 �M of the PKC inhibitor showed noindication that larger concentrations would inhibithalothane hyperresponsiveness. The inhibitor had noeffect when applied alone (Fig. 4).
DiscussionAlthough preparations exposed to either volatile an-esthetics or ethanol recover to levels above control onwashout, its basis for volatile anesthetics is attribut-able in large part to an excitatory effect of prolongedexposure to a low level of anesthetic, whereas ethanolexposure induces a true withdrawal when the ethanolis removed. Low levels of isoflurane produce an in-crease in response during exposure comparable inmagnitude to that observed on washout, whereas nosuch excitation is observed with low levels of ethanolin intact cord (15). Isoflurane and halothane differ inthe contribution of increased neurotransmitter releaseto the increased response; K-stimulated release of glu-tamate, aspartate, and substance P in the washoutperiod is increased after isoflurane but not halothane,suggesting a presynaptic site for the excitatory actionsof the former but not the latter anesthetic. Ethanolwithdrawal and volatile anesthetic-induced hyperex-citability differ in dependence on PKC. A PKC inhib-itor blocks the increase to levels more than controlafter exposure to ethanol but not to halothane. We didnot explore the PKC dependence of isoflurane excita-tion; it is possible that the two anesthetics may differin this respect.
Early in the history of inhaled anesthetics severalstages were described during induction, including an-algesia, followed by an excitement phase, then surgi-cal anesthesia (18). The excitement phase consisted ofseveral signs of nervous system hyperexcitability.More recently, a detailed analysis of the behavioralmanifestations of hyperexcitability during emergencehas been reported, as outlined in the Introduction
(1–5). Both induction and emergence are associatedwith relatively low subanesthetic levels of inhaleddrug. If the hyperresponsiveness we observe duringwashout or exposure to low levels of a volatile anes-thetic underlies the behavioral manifestations of ex-citement, then PKC plays no role in the latter. Nordoes PKC appear to affect the anesthetic properties ofinhaled anesthetics as measured by the end-pointMAC, immobility after a noxious stimulus. Isozyme-specific inhibitors of PKC� and PKC�, applied intra-thecally in quantities that block hyperalgesic re-sponses to formalin, did not alter halothane MAC (19).Thus, for halothane, neither the excitement to lowlevels of exposure nor immobility at anesthetic levelsis attributable to an indirect action mediated by PKC.By implication, these actions are rather the result ofdirect effects on receptors or ion channels.
Halothane differs from isoflurane in that the excita-tory effects in spinal cord are mediated in part bypresynaptic increases in transmitter release for thelatter but not the former drug. Halothane and isoflu-rane are from different classes of compounds, halo-thane being a fluorinated ethane, isoflurane a fluori-nated ether. In studies at levels just less than and justmore than MAC, isoflurane, but not halothane, de-pressed spinal levels of c-fos induced by noxious stim-ulation, which might be attributable to a presynapticaction (20). On the other hand, halothane, but notisoflurane MAC, was associated with reduction inlevels of activity in dorsal horn neurons (21), suggest-ing that halothane might bring about immobility byactions in the dorsal horn and that isoflurane might actmore ventrally. Thus the two drugs appear to differ intheir mechanisms and sites of action in spinal cord.
In previous studies we have reported the with-drawal after ethanol to be a postsynaptic phenomenonin motor neurons, mediated by NMDA receptors anddependent on PKC (9). More recently, we have shownthat withdrawal in motor neurons is dependent ontranslocation of the specific PKC isozyme PKC� (10).
Figure 4. The broad spectrum protein kinase C (PKC) inhibitor GF109203� blocks the increase to levels above control on washout for ethanolbut not halothane. A, in the presence of the inhibitor throughout the experiment there is no increase in population excitatory postsynapticpotential (pEPSP) area in the washout period after ethanol. B, In the presence of the inhibitor there is still an increase to levels above controlafter halothane exposure. C, the inhibitor alone has no effect. n � 4, error bars are sem.
ANESTH ANALG ANESTHETIC PHARMACOLOGY WONG ET AL. 4172005;100:413–8 VOLATILE ANESTHETIC-INDUCED HYPERRESPONSIVENESS
In whole animal behavioral studies of ethanol with-drawal, we have shown that hyperalgesia during thewithdrawal period after a single injection of ethanol isthe result of both PKC� and PKC� isozymes (Shumillaet al., unpublished data). In early studies in isolatedspinal cord, we observed an increase in evoked re-sponse at the smallest isoflurane concentration tested(14) but the actions of ethanol appear purely depres-sant (8,15). However, in the case of ethanol there is anacute tolerance that is manifested as a partial recoverytoward control levels in the continued presence ofethanol and differing from ethanol withdrawal in thatit is dependent on metabotropic glutamate receptors(22).
The results of the present study show that inhaledanesthetics differ from ethanol in several respects. Onwash, recovery to levels above control representswithdrawal from ethanol, whereas, for halothane, it isa direct excitatory action of the anesthetic. Further-more, ethanol withdrawal, but not halothane excita-tion, is attributable to actions mediated by PKC. Halo-thane and isoflurane differ in the role played bypresynaptic increase in excitatory neurotransmitter re-lease in hyperresponsiveness.
We are indebted to the laboratory of E. I. Eger II at the University ofCalifornia, San Francisco, for the measurement of ethanol and vol-atile anesthetic concentrations.
References1. Flood P, Daniel D. Pronociceptive actions of isoflurane: a pro-
tective role for estrogen. Anesthesiology 2003;99:476–9.2. Cohen IT, Hannallah RS, Hummer KA. The incidence of emer-
gence agitation associated with desflurane anesthesia in chil-dren is reduced by fentanyl. Anesth Analg 2001;93:88–91.
3. Cravero JP, Beach M, Dodge CP, Whalen K. Emergence charac-teristics of sevoflurane compared to halothane in pediatric pa-tients undergoing bilateral pressure equalization tube insertion.J Clin Anesth 2000;12:397–401.
4. Voepel-Lewis T, Malviya S, Tait AR. A prospective cohort studyof emergence agitation in the pediatric postanesthesia care unit.Anesth Analg 2003;96:1625–30.
5. McCulloch PR, Milne B. Neurological phenomena during emer-gence from enflurane or isoflurane anaesthesia. Can J Anaesth1990;37:739–42.
6. Rampil IJ, Mason P, Singh H. Anesthetic potency (MAC) isindependent of forebrain structures in the rat. Anesthesiology1993;78:707–12.
7. Antognini JF, Schwartz K. Exaggerated anesthetic requirementsin the preferentially anesthetized brain. Anesthesiology 1993;79:1244–9.
8. Wong SM, Tauck DL, Fong EG, Kendig JJ. Glutamate receptor-mediated hyperexcitability after ethanol exposure in isolatedneonatal rat spinal cord. J Pharmacol Exp Ther 1998;285:201–7.
9. Li HF, Kendig JJ. Ethanol withdrawal hyper-responsivenessmediated by NMDA receptors in spinal cord motor neurons.Br J Pharmacol 2003;139:73–80.
10. Li HF, Kendig JJ. Protein kinase C� mediates ethanol with-drawal hyperresponsiveness of NMDA receptor currents in spi-nal cord motor neurons. Br J Pharmacol. In press.
11. Fang Z, Gong D, Ionescu P, et al. Maturation decreases ethanolminimum alveolar anesthetic concentration (MAC) more thandesflurane MAC in rats. Anesth Analg 1997;84:852–8.
12. Franks NP, Lieb WR. Temperature dependence of the potencyof volatile general anesthetics: implications for in vitro experi-ments. Anesthesiology 1996;84:716–20.
13. Graser TA, Godel HG, Albers S, et al. An ultra rapid andsensitive high-performance liquid chromatographic method fordetermination of tissue and plasma free amino acids. AnalBiochem 1985;151:142–52.
14. Savola MK, Woodley SJ, Maze M, Kendig JJ. Isoflurane and analpha 2-adrenoceptor agonist suppress nociceptive neurotrans-mission in neonatal rat spinal cord. Anesthesiology 1991;75:489–98.
15. Wong SM, Fong E, Tauck DL, Kendig JJ. Ethanol as a generalanesthetic: actions in spinal cord. Eur J Pharmacol 1997;329:121–7.
16. Wang MY, Rampil IJ, Kendig JJ. Ethanol directly depressesAMPA and NMDA glutamate currents in spinal cord motorneurons independent of actions on GABAA or glycine recep-tors. J Pharmacol Exp Ther 1999;290:362–7.
17. Wang MY, Kendig JJ. Patch clamp studies of motor neurons inspinal cord slices: a tool for high-resolution analysis of drugactions. Acta Pharmacol Sin 2000;21:507–15.
18. Guedel AE. Inhalation anesthesia: a fundamental guide. NewYork: The MacMillan Company, 1937.
19. Shumilla JA, Sweitzer SM, Eger EI II, et al. Inhibition of spinalprotein kinase cepsilon or gamma isozymes does not affecthalothane MAC in rats. Anesth Analg 2004;99:82–4.
20. Jinks SL, Antognini JF, Martin JT, et al. Isoflurane, but nothalothane, depresses c-fos expression in rat spinal cord at con-centrations that suppress reflex movement after supramaximalnoxious stimulation. Anesth Analg 2002;95:1622–8.
21. Jinks SL, Martin JT, Carstens E, et al. Peri-MAC depression of anociceptive withdrawal reflex is accompanied by reduced dor-sal horn activity with halothane but not isoflurane. Anesthesi-ology 2003;98:1128–38.
22. Li HF, Wang MY, Knape J, Kendig JJ. Ethanol tachyphylaxis inspinal cord motorneurons: role of metabotropic glutamate re-ceptors. Br J Pharmacol 2003;138:1417–24.
418 ANESTHETIC PHARMACOLOGY WONG ET AL. ANESTH ANALGVOLATILE ANESTHETIC-INDUCED HYPERRESPONSIVENESS 2005;100:413–8
Involvement of Adenosine Triphosphate-Sensitive PotassiumChannels in the Response of Membrane Potential toHyperosmolality in Cultured Human Aorta Endothelial CellsMikiyo Yamaguchi, MD, Yoshinobu Tomiyama, MD, Toshiko Katayama, MD,Hiroshi Kitahata, MD, and Shuzo Oshita, MD
Department of Anesthesiology, Tokushima University School of Medicine, Tokushima, Japan
The membrane potential of endothelial cells is an impor-tant determinant of endothelial functions, including regu-lation of vascular tone. We investigated whether adeno-sine triphosphate-sensitive potassium (KATP) channelswere involved in the response of membrane potential tohyperosmolality in cultured human aorta endothelialcells. The voltage-sensitive fluorescent dye, bis-(1,3-dieth-ylthiobarbiturate)trimethine oxonol, was used to assessrelative changes in membrane potential semiquantita-tively. To investigate the effect of mannitol-, sucrose-, andNaCl-induced hyperosmolality on membrane potential,cells were continuously perfused with Earle’s balancedsalt solution (285 mOsm/kg H2O) containing 200 nM bis-(1,3-diethylthiobarbiturate)trimethine oxonol and ex-posed to 315 and 345 mOsm/kg H2O hyperosmotic me-dium sequentially in the presence and absence of 1 �M
glibenclamide, a well-known KATP channel blocker. Hy-perosmotic mannitol significantly induced hyperpolar-ization of the endothelial cells, which was prevented by 1�M glibenclamide (n � 6). Estimated changes of mem-brane potential at 315 and 345 mOsm/kg H2O were 13�8and 21 � 8 mV, respectively. Hypertonic sucrose inducedsimilar changes. However, although hypertonic salinealso significantly induced hyperpolarization of the endo-thelial cells (n � 6), the hyperpolarization was not pre-vented by 1 �M glibenclamide. In conclusion, KATP chan-nels may participate in hyperosmotic mannitol- andsucrose-induced hyperpolarization, but not in hypertonicsaline-induced hyperpolarization in cultured humanaorta endothelial cells.
(Anesth Analg 2005;100:419–26)
H yperosmotic mannitol (1,2) and hypertonic saline(3) are often used clinically for the management ofincreased intracranial pressure and hypovolemic
shock, respectively. In addition, tissue osmolality in-creases during ischemia and exercise (4,5). Infusion ofosmotic agents can cause vasodilation (3,6). Increasedtissue osmolality also has an important role in regionalvasodilation (4,5). There is evidence to suggest that theresponse could be mediated by membrane hyperpolar-ization of vascular endothelial cells (4). Endothelial hy-perpolarization may cause vasodilation by transferringthe membrane hyperpolarization to the underlying
smooth muscle cells via gap junctions (4,7–9) or by stim-ulating the Ca2�-dependent release of vasoactive com-pounds, such as nitric oxide and prostacyclin, from en-dothelial cells (3,8–10). Mechanisms of hyperosmolality-induced endothelial hyperpolarization have not yet beenelucidated. Some evidence suggests that hyperosmolarglucose or sucrose solution may activate adenosinetriphosphate-sensitive potassium (KATP) channels lead-ing to hyperpolarization of vascular endothelial cells(4,5). However, direct evidence for the participation ofKATP channels in hyperosmolality-induced endothelialhyperpolarization has not yet been obtained. Indeed,another report suggests that KATP channel activatingagents may cause hyperpolarization of endothelial cells,which may occur through gap junction-mediated trans-fer of smooth muscle hyperpolarization to the endothe-lium (11). We investigated a relationship between acti-vation of the KATP channels and hyperpolarization in theabsence of vascular smooth muscle. Furthermore, al-though both hypertonic saline and hyperosmotic sucroseincrease myocardial contractility, the mechanisms aredifferent (12). The sodium ion itself has a key role in this
This study was supported by a Grant-in Aid (12671476) for Sci-entific Research (C) from the Japan Society for the Promotion ofScience, Tokyo, Japan.
Accepted for publication August 10, 2004.Address correspondence and reprint requests to Dr. Yoshinobu
Tomiyama, Department of Anesthesiology, Tokushima UniversitySchool of Medicine, 3-18-15 Kuramoto, Tokushima 770-8503, Japan.Address e-mail to [email protected].
DOI: 10.1213/01.ANE.0000143350.82645.5B
©2005 by the International Anesthesia Research Society0003-2999/05 Anesth Analg 2005;100:419–26 419
improvement of myocardial contractility through a spe-cific mechanism involving Na�-Ca2� exchange (12).Na�-Ca2� exchange is not involved in the sucrose-induced improvement of contractility (12). To better un-derstand the mechanism by which hyperosmolality af-fects membrane potential, we investigated the effects ofmannitol-, sucrose-, and NaCl-induced hyperosmolalityon membrane potential in the presence or absence ofglibenclamide, a well known KATP channel blocker, incultured human aorta endothelial cells.
MethodsCell Culture
Human aorta endothelial cells, which were certified tobe virus-free and pure cell populations on the basis ofstaining patterns for �-actin, were obtained from CellApplication, Inc. (San Diego, CA). The cells were rou-tinely maintained in cell culture medium (Cell Applica-tion) at 37°C in a humidified atmosphere containing 5%CO2. The third to sixth passage cultures were thenseeded onto glass-bottom culture dishes (MatTek Corp.,Ashford, MA) and allowed to reach subconfluence in5–7 days.
Reagents
Earle’s balanced salt solution (measured osmolality, 285� 1 mOsm/kg H2O) was used and its composition wasas follows (in mM): NaCl 116.4, KCl 5.4, CaCl2 1.8,MgSO4 0.8, NaHCO3 26.2, NaH2PO4 1, and d-glucose 5.6with pH adjusted to 7.3. Hyperosmotic solutions wereobtained by adding mannitol, sucrose, or NaCl to theEarle’s balanced salt solution. Measured osmolality val-ues of the hyperosmolality solutions were 315 � 2mOsm/kg H2O in 315 mOsm/kg H2O conditions and344 � 3 mOsm/kg H2O in 345 mOsm/kg H2O condi-tions, respectively. Osmolality was measured by thefreezing point technique (Osmostat OM-6040; Kyoto Dii-chi Kagaku, Kyoto, Japan). The pH of the solutions waskept at 7.35 throughout the study by bubbling the solu-tions with 5% CO2 and 95% O2. Glibenclamide, a KATPchannel blocker, levcromakalim, a KATP channel opener,and a voltage-sensitive fluorescent dye, bis-(1,3-diethylthiobarbiturate)trimethine oxonol (bis-oxonol)were dissolved in Earle’s balanced salt solution fromstock solutions in dimethyl sulfoxide (the final solventconcentration was 0.02%, 0.001%, and 0.001%,respectively).
Cell Perfusion System
A cell perfusion system was designed to measure cellfluorescence in response to rapid solution changes.The system used an inverted epifluorescence micro-scope (Eclipse TS100; Nikon, Tokyo, Japan). Solutions
were infused and aspirated through stainless steeltubing onto the glass bottom of the culture dishes. Theexchange volume of the glass bottom was approxi-mately 150 �L. Cell perfusion solutions were main-tained at a constant temperature by enclosing the per-fusion tubing in a circulating water jacket.
Measurement of Membrane Potential
We used bis-oxonol to assess relative changes in themembrane potential of single (subconfluent) cells semi-qualitatively as described in our previous report (13).This dye has been used previously to determinechanges in membrane potential, including endothelialcells (8,14,15). When the cell membrane is depolarized,the dye partitions into the membrane leading to an in-crease in the measured fluorescence. In brief, the cellswere continuously superfused with Earle’s balanced saltsolution containing 200 nM bis-oxonol at 36°–37°C. Ex-citation of bis-oxonol was obtained from a Xenon lamp(50 W; Nikon) filtered at 450–490 nm and reflected onthe microscope objective (�10, CFI Plan Fluor ELWD 10� C; Nikon). Cell fluorescence was collected by theobjective, passed to a 520-nm-long path filter, and di-rected to a cooled digital black-and-white charge cou-pled device camera (ORCA; Hamamatsu Photonics,Hamamatsu, Japan). Fluorescence images were acquiredat 60-s intervals by means of a computer-controlled shut-ter (Filter Exchanger; Hamamatsu Photonics) and animage processing system (Aquacosmos; HamamatsuPhotonics). Fluorescence images were analyzed for av-erage pixel intensities of regions of interest. Each regionof interest contained 1–6 cells. These regions were se-lected manually with a maximum of 6 regions per field.The responses of all selected cells were averaged to yieldone response per dish. Background values (windows ofidentical area placed beside the cells) were always sub-tracted. Once bis-oxonol fluorescence attained equilib-rium (approximately 30 min), the effects of the pharma-cological agents and osmolality on membrane potentialwere determined. Bis-oxonol fluorescence was normal-ized relative to the value approximately 30 min afterinitiation of superfusion (baseline; in percent).
Experimental Protocols
To investigate the effects of 1 �M glibenclamide on theresponse of membrane potential to mannitol-inducedhyperosmolality, 18 dishes were randomly assigned to3 experimental protocols: 1) cells were superfusedwith isosmotic solution throughout the experiments(isosmotic time control, n � 6), 2) cells were sequen-tially exposed to 315 and 345 mOsm/kg H2O solutionin the absence of glibenclamide (hyperosmolality, n �6), and 3) cells were sequentially exposed to 315 and345 mOsm/kg H2O solution in the presence of glib-enclamide (hyperosmolality � glibenclamide, n � 6).Dimethyl sulfoxide concentration in solutions in the
420 ANESTHETIC PHARMACOLOGY YAMAGUCHI ET AL. ANESTH ANALGHYPEROSMOLALITY AND HYPERPOLARIZATION 2005;100:419–26
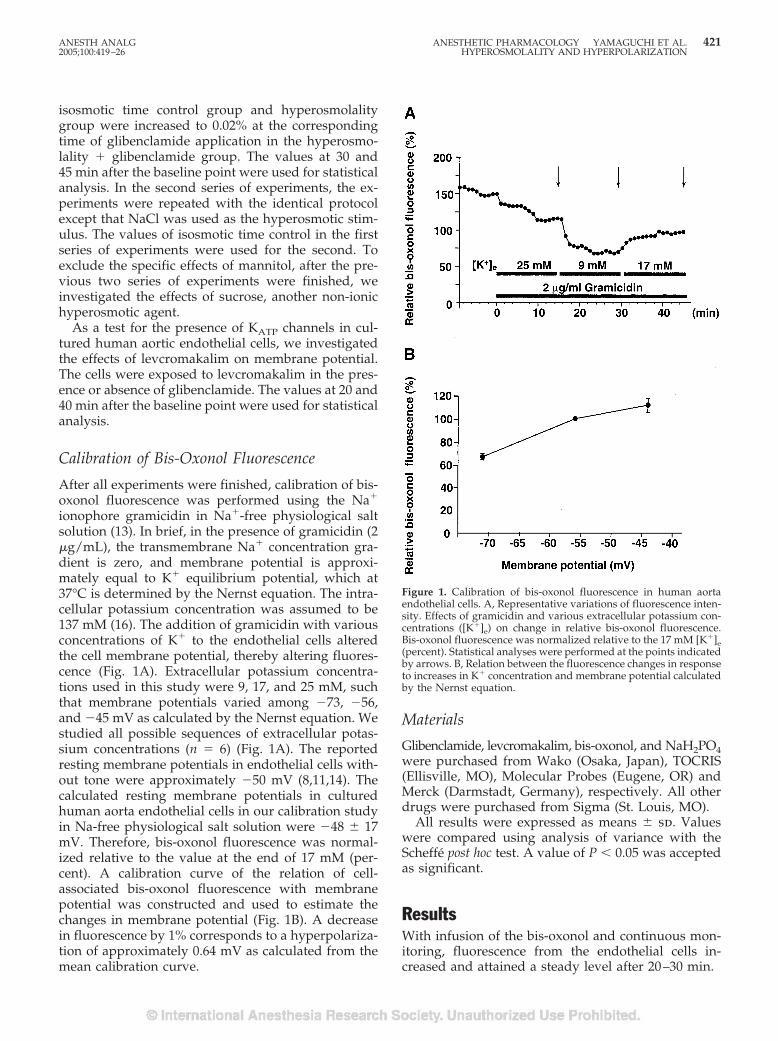
isosmotic time control group and hyperosmolalitygroup were increased to 0.02% at the correspondingtime of glibenclamide application in the hyperosmo-lality � glibenclamide group. The values at 30 and45 min after the baseline point were used for statisticalanalysis. In the second series of experiments, the ex-periments were repeated with the identical protocolexcept that NaCl was used as the hyperosmotic stim-ulus. The values of isosmotic time control in the firstseries of experiments were used for the second. Toexclude the specific effects of mannitol, after the pre-vious two series of experiments were finished, weinvestigated the effects of sucrose, another non-ionichyperosmotic agent.
As a test for the presence of KATP channels in cul-tured human aortic endothelial cells, we investigatedthe effects of levcromakalim on membrane potential.The cells were exposed to levcromakalim in the pres-ence or absence of glibenclamide. The values at 20 and40 min after the baseline point were used for statisticalanalysis.
Calibration of Bis-Oxonol Fluorescence
After all experiments were finished, calibration of bis-oxonol fluorescence was performed using the Na�
ionophore gramicidin in Na�-free physiological saltsolution (13). In brief, in the presence of gramicidin (2�g/mL), the transmembrane Na� concentration gra-dient is zero, and membrane potential is approxi-mately equal to K� equilibrium potential, which at37°C is determined by the Nernst equation. The intra-cellular potassium concentration was assumed to be137 mM (16). The addition of gramicidin with variousconcentrations of K� to the endothelial cells alteredthe cell membrane potential, thereby altering fluores-cence (Fig. 1A). Extracellular potassium concentra-tions used in this study were 9, 17, and 25 mM, suchthat membrane potentials varied among �73, �56,and �45 mV as calculated by the Nernst equation. Westudied all possible sequences of extracellular potas-sium concentrations (n � 6) (Fig. 1A). The reportedresting membrane potentials in endothelial cells with-out tone were approximately �50 mV (8,11,14). Thecalculated resting membrane potentials in culturedhuman aorta endothelial cells in our calibration studyin Na-free physiological salt solution were �48 � 17mV. Therefore, bis-oxonol fluorescence was normal-ized relative to the value at the end of 17 mM (per-cent). A calibration curve of the relation of cell-associated bis-oxonol fluorescence with membranepotential was constructed and used to estimate thechanges in membrane potential (Fig. 1B). A decreasein fluorescence by 1% corresponds to a hyperpolariza-tion of approximately 0.64 mV as calculated from themean calibration curve.
Materials
Glibenclamide, levcromakalim, bis-oxonol, and NaH2PO4were purchased from Wako (Osaka, Japan), TOCRIS(Ellisville, MO), Molecular Probes (Eugene, OR) andMerck (Darmstadt, Germany), respectively. All otherdrugs were purchased from Sigma (St. Louis, MO).
All results were expressed as means � sd. Valueswere compared using analysis of variance with theScheffe post hoc test. A value of P � 0.05 was acceptedas significant.
ResultsWith infusion of the bis-oxonol and continuous mon-itoring, fluorescence from the endothelial cells in-creased and attained a steady level after 20–30 min.
Figure 1. Calibration of bis-oxonol fluorescence in human aortaendothelial cells. A, Representative variations of fluorescence inten-sity. Effects of gramicidin and various extracellular potassium con-centrations ([K�]e) on change in relative bis-oxonol fluorescence.Bis-oxonol fluorescence was normalized relative to the 17 mM [K�]e(percent). Statistical analyses were performed at the points indicatedby arrows. B, Relation between the fluorescence changes in responseto increases in K� concentration and membrane potential calculatedby the Nernst equation.
ANESTH ANALG ANESTHETIC PHARMACOLOGY YAMAGUCHI ET AL. 4212005;100:419–26 HYPEROSMOLALITY AND HYPERPOLARIZATION
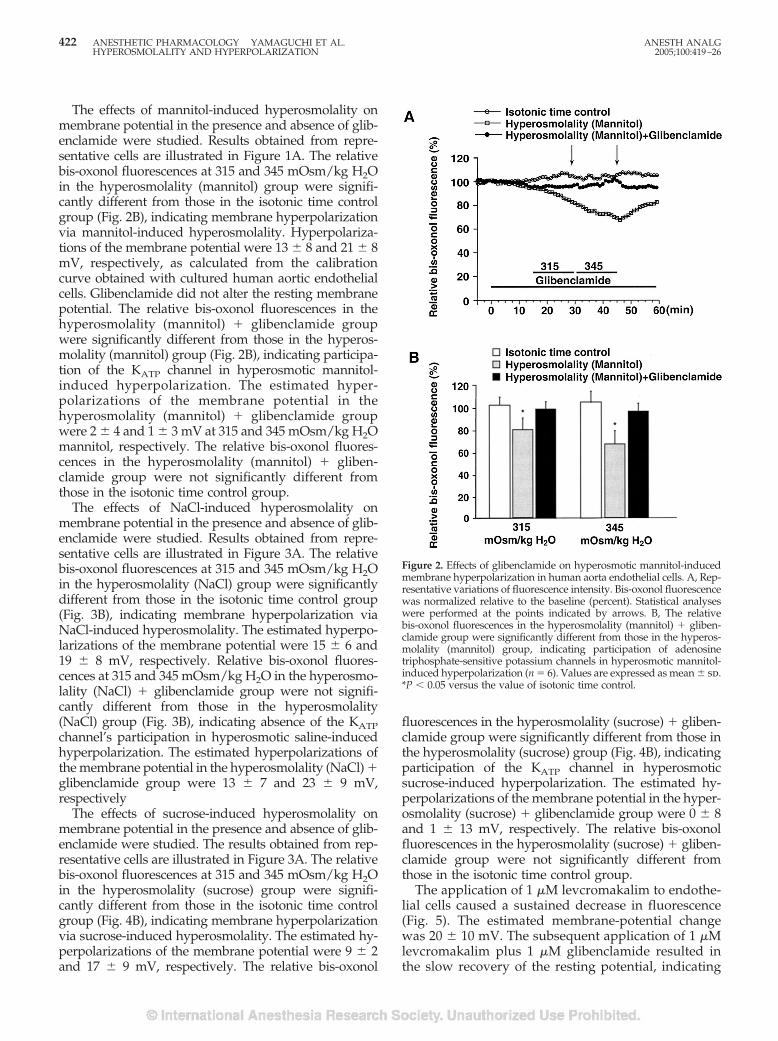
The effects of mannitol-induced hyperosmolality onmembrane potential in the presence and absence of glib-enclamide were studied. Results obtained from repre-sentative cells are illustrated in Figure 1A. The relativebis-oxonol fluorescences at 315 and 345 mOsm/kg H2Oin the hyperosmolality (mannitol) group were signifi-cantly different from those in the isotonic time controlgroup (Fig. 2B), indicating membrane hyperpolarizationvia mannitol-induced hyperosmolality. Hyperpolariza-tions of the membrane potential were 13 � 8 and 21 � 8mV, respectively, as calculated from the calibrationcurve obtained with cultured human aortic endothelialcells. Glibenclamide did not alter the resting membranepotential. The relative bis-oxonol fluorescences in thehyperosmolality (mannitol) � glibenclamide groupwere significantly different from those in the hyperos-molality (mannitol) group (Fig. 2B), indicating participa-tion of the KATP channel in hyperosmotic mannitol-induced hyperpolarization. The estimated hyper-polarizations of the membrane potential in thehyperosmolality (mannitol) � glibenclamide groupwere 2 � 4 and 1 � 3 mV at 315 and 345 mOsm/kg H2Omannitol, respectively. The relative bis-oxonol fluores-cences in the hyperosmolality (mannitol) � gliben-clamide group were not significantly different fromthose in the isotonic time control group.
The effects of NaCl-induced hyperosmolality onmembrane potential in the presence and absence of glib-enclamide were studied. Results obtained from repre-sentative cells are illustrated in Figure 3A. The relativebis-oxonol fluorescences at 315 and 345 mOsm/kg H2Oin the hyperosmolality (NaCl) group were significantlydifferent from those in the isotonic time control group(Fig. 3B), indicating membrane hyperpolarization viaNaCl-induced hyperosmolality. The estimated hyperpo-larizations of the membrane potential were 15 � 6 and19 � 8 mV, respectively. Relative bis-oxonol fluores-cences at 315 and 345 mOsm/kg H2O in the hyperosmo-lality (NaCl) � glibenclamide group were not signifi-cantly different from those in the hyperosmolality(NaCl) group (Fig. 3B), indicating absence of the KATPchannel’s participation in hyperosmotic saline-inducedhyperpolarization. The estimated hyperpolarizations ofthe membrane potential in the hyperosmolality (NaCl) �glibenclamide group were 13 � 7 and 23 � 9 mV,respectively
The effects of sucrose-induced hyperosmolality onmembrane potential in the presence and absence of glib-enclamide were studied. The results obtained from rep-resentative cells are illustrated in Figure 3A. The relativebis-oxonol fluorescences at 315 and 345 mOsm/kg H2Oin the hyperosmolality (sucrose) group were signifi-cantly different from those in the isotonic time controlgroup (Fig. 4B), indicating membrane hyperpolarizationvia sucrose-induced hyperosmolality. The estimated hy-perpolarizations of the membrane potential were 9 � 2and 17 � 9 mV, respectively. The relative bis-oxonol
fluorescences in the hyperosmolality (sucrose) � gliben-clamide group were significantly different from those inthe hyperosmolality (sucrose) group (Fig. 4B), indicatingparticipation of the KATP channel in hyperosmoticsucrose-induced hyperpolarization. The estimated hy-perpolarizations of the membrane potential in the hyper-osmolality (sucrose) � glibenclamide group were 0 � 8and 1 � 13 mV, respectively. The relative bis-oxonolfluorescences in the hyperosmolality (sucrose) � gliben-clamide group were not significantly different fromthose in the isotonic time control group.
The application of 1 �M levcromakalim to endothe-lial cells caused a sustained decrease in fluorescence(Fig. 5). The estimated membrane-potential changewas 20 � 10 mV. The subsequent application of 1 �Mlevcromakalim plus 1 �M glibenclamide resulted inthe slow recovery of the resting potential, indicating
Figure 2. Effects of glibenclamide on hyperosmotic mannitol-inducedmembrane hyperpolarization in human aorta endothelial cells. A, Rep-resentative variations of fluorescence intensity. Bis-oxonol fluorescencewas normalized relative to the baseline (percent). Statistical analyseswere performed at the points indicated by arrows. B, The relativebis-oxonol fluorescences in the hyperosmolality (mannitol) � gliben-clamide group were significantly different from those in the hyperos-molality (mannitol) group, indicating participation of adenosinetriphosphate-sensitive potassium channels in hyperosmotic mannitol-induced hyperpolarization (n � 6). Values are expressed as mean � sd.*P � 0.05 versus the value of isotonic time control.
422 ANESTHETIC PHARMACOLOGY YAMAGUCHI ET AL. ANESTH ANALGHYPEROSMOLALITY AND HYPERPOLARIZATION 2005;100:419–26
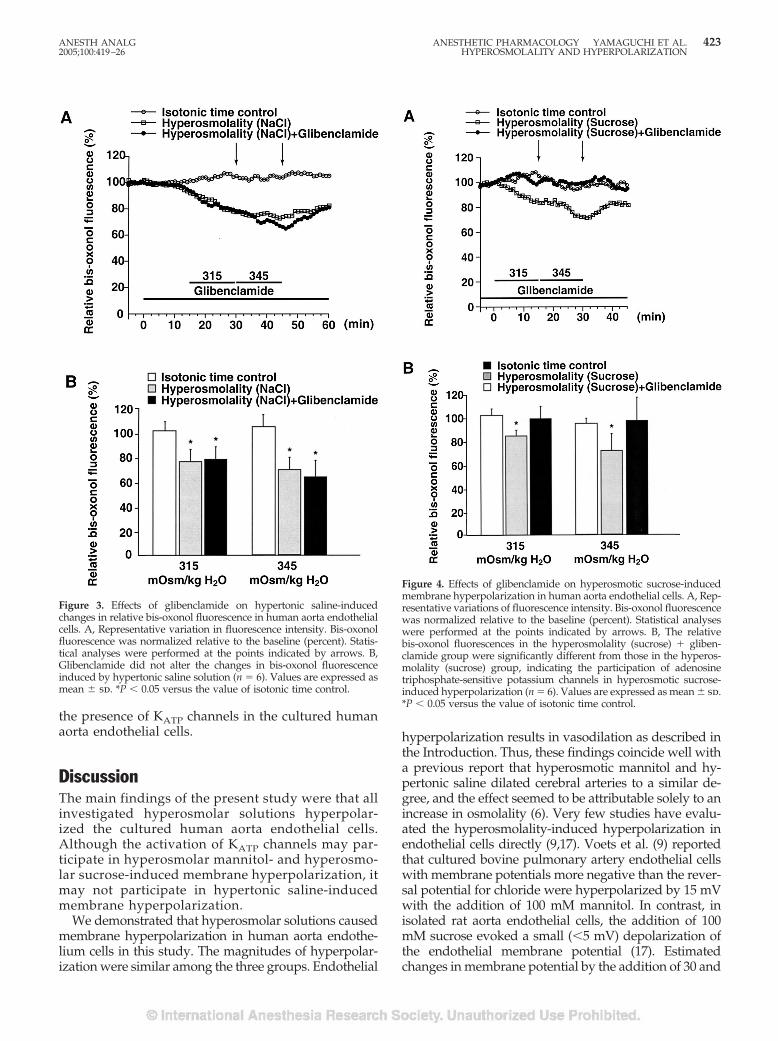
the presence of KATP channels in the cultured humanaorta endothelial cells.
DiscussionThe main findings of the present study were that allinvestigated hyperosmolar solutions hyperpolar-ized the cultured human aorta endothelial cells.Although the activation of KATP channels may par-ticipate in hyperosmolar mannitol- and hyperosmo-lar sucrose-induced membrane hyperpolarization, itmay not participate in hypertonic saline-inducedmembrane hyperpolarization.
We demonstrated that hyperosmolar solutions causedmembrane hyperpolarization in human aorta endothe-lium cells in this study. The magnitudes of hyperpolar-ization were similar among the three groups. Endothelial
hyperpolarization results in vasodilation as described inthe Introduction. Thus, these findings coincide well witha previous report that hyperosmotic mannitol and hy-pertonic saline dilated cerebral arteries to a similar de-gree, and the effect seemed to be attributable solely to anincrease in osmolality (6). Very few studies have evalu-ated the hyperosmolality-induced hyperpolarization inendothelial cells directly (9,17). Voets et al. (9) reportedthat cultured bovine pulmonary artery endothelial cellswith membrane potentials more negative than the rever-sal potential for chloride were hyperpolarized by 15 mVwith the addition of 100 mM mannitol. In contrast, inisolated rat aorta endothelial cells, the addition of 100mM sucrose evoked a small (�5 mV) depolarization ofthe endothelial membrane potential (17). Estimatedchanges in membrane potential by the addition of 30 and
Figure 3. Effects of glibenclamide on hypertonic saline-inducedchanges in relative bis-oxonol fluorescence in human aorta endothelialcells. A, Representative variation in fluorescence intensity. Bis-oxonolfluorescence was normalized relative to the baseline (percent). Statis-tical analyses were performed at the points indicated by arrows. B,Glibenclamide did not alter the changes in bis-oxonol fluorescenceinduced by hypertonic saline solution (n � 6). Values are expressed asmean � sd. *P � 0.05 versus the value of isotonic time control.
Figure 4. Effects of glibenclamide on hyperosmotic sucrose-inducedmembrane hyperpolarization in human aorta endothelial cells. A, Rep-resentative variations of fluorescence intensity. Bis-oxonol fluorescencewas normalized relative to the baseline (percent). Statistical analyseswere performed at the points indicated by arrows. B, The relativebis-oxonol fluorescences in the hyperosmolality (sucrose) � gliben-clamide group were significantly different from those in the hyperos-molality (sucrose) group, indicating the participation of adenosinetriphosphate-sensitive potassium channels in hyperosmotic sucrose-induced hyperpolarization (n � 6). Values are expressed as mean � sd.*P � 0.05 versus the value of isotonic time control.
ANESTH ANALG ANESTHETIC PHARMACOLOGY YAMAGUCHI ET AL. 4232005;100:419–26 HYPEROSMOLALITY AND HYPERPOLARIZATION
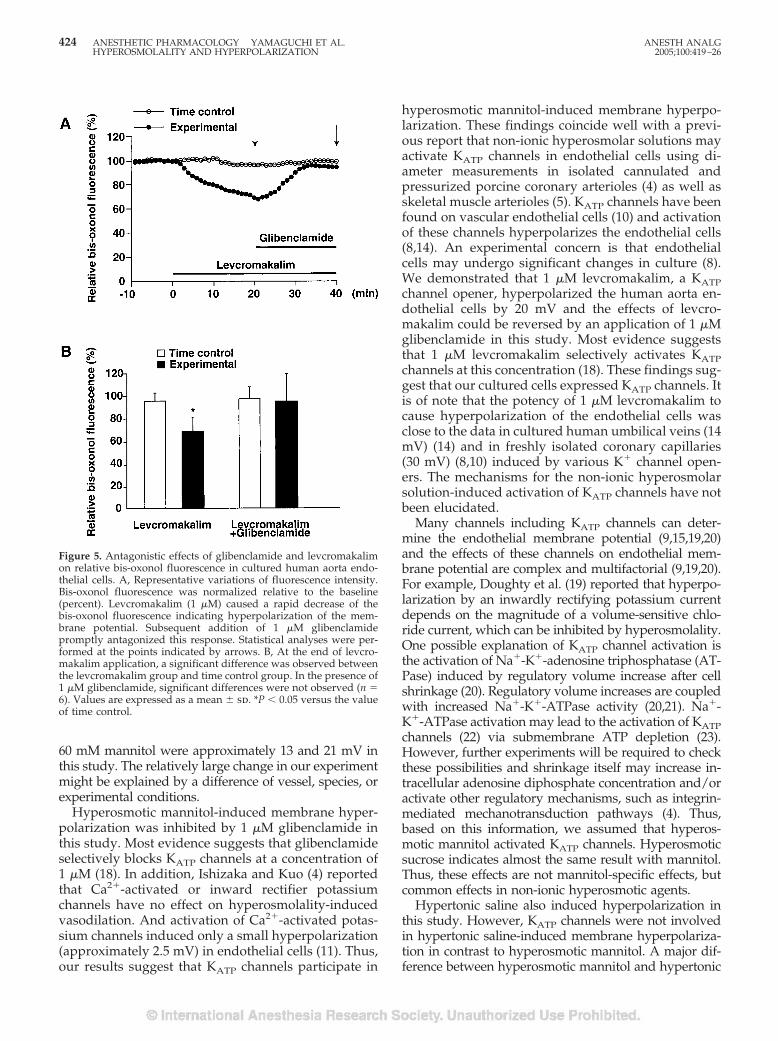
60 mM mannitol were approximately 13 and 21 mV inthis study. The relatively large change in our experimentmight be explained by a difference of vessel, species, orexperimental conditions.
Hyperosmotic mannitol-induced membrane hyper-polarization was inhibited by 1 �M glibenclamide inthis study. Most evidence suggests that glibenclamideselectively blocks KATP channels at a concentration of1 �M (18). In addition, Ishizaka and Kuo (4) reportedthat Ca2�-activated or inward rectifier potassiumchannels have no effect on hyperosmolality-inducedvasodilation. And activation of Ca2�-activated potas-sium channels induced only a small hyperpolarization(approximately 2.5 mV) in endothelial cells (11). Thus,our results suggest that KATP channels participate in
hyperosmotic mannitol-induced membrane hyperpo-larization. These findings coincide well with a previ-ous report that non-ionic hyperosmolar solutions mayactivate KATP channels in endothelial cells using di-ameter measurements in isolated cannulated andpressurized porcine coronary arterioles (4) as well asskeletal muscle arterioles (5). KATP channels have beenfound on vascular endothelial cells (10) and activationof these channels hyperpolarizes the endothelial cells(8,14). An experimental concern is that endothelialcells may undergo significant changes in culture (8).We demonstrated that 1 �M levcromakalim, a KATPchannel opener, hyperpolarized the human aorta en-dothelial cells by 20 mV and the effects of levcro-makalim could be reversed by an application of 1 �Mglibenclamide in this study. Most evidence suggeststhat 1 �M levcromakalim selectively activates KATPchannels at this concentration (18). These findings sug-gest that our cultured cells expressed KATP channels. Itis of note that the potency of 1 �M levcromakalim tocause hyperpolarization of the endothelial cells wasclose to the data in cultured human umbilical veins (14mV) (14) and in freshly isolated coronary capillaries(30 mV) (8,10) induced by various K� channel open-ers. The mechanisms for the non-ionic hyperosmolarsolution-induced activation of KATP channels have notbeen elucidated.
Many channels including KATP channels can deter-mine the endothelial membrane potential (9,15,19,20)and the effects of these channels on endothelial mem-brane potential are complex and multifactorial (9,19,20).For example, Doughty et al. (19) reported that hyperpo-larization by an inwardly rectifying potassium currentdepends on the magnitude of a volume-sensitive chlo-ride current, which can be inhibited by hyperosmolality.One possible explanation of KATP channel activation isthe activation of Na�-K�-adenosine triphosphatase (AT-Pase) induced by regulatory volume increase after cellshrinkage (20). Regulatory volume increases are coupledwith increased Na�-K�-ATPase activity (20,21). Na�-K�-ATPase activation may lead to the activation of KATPchannels (22) via submembrane ATP depletion (23).However, further experiments will be required to checkthese possibilities and shrinkage itself may increase in-tracellular adenosine diphosphate concentration and/oractivate other regulatory mechanisms, such as integrin-mediated mechanotransduction pathways (4). Thus,based on this information, we assumed that hyperos-motic mannitol activated KATP channels. Hyperosmoticsucrose indicates almost the same result with mannitol.Thus, these effects are not mannitol-specific effects, butcommon effects in non-ionic hyperosmotic agents.
Hypertonic saline also induced hyperpolarization inthis study. However, KATP channels were not involvedin hypertonic saline-induced membrane hyperpolariza-tion in contrast to hyperosmotic mannitol. A major dif-ference between hyperosmotic mannitol and hypertonic
Figure 5. Antagonistic effects of glibenclamide and levcromakalimon relative bis-oxonol fluorescence in cultured human aorta endo-thelial cells. A, Representative variations of fluorescence intensity.Bis-oxonol fluorescence was normalized relative to the baseline(percent). Levcromakalim (1 �M) caused a rapid decrease of thebis-oxonol fluorescence indicating hyperpolarization of the mem-brane potential. Subsequent addition of 1 �M glibenclamidepromptly antagonized this response. Statistical analyses were per-formed at the points indicated by arrows. B, At the end of levcro-makalim application, a significant difference was observed betweenthe levcromakalim group and time control group. In the presence of1 �M glibenclamide, significant differences were not observed (n �6). Values are expressed as a mean � sd. *P � 0.05 versus the valueof time control.
424 ANESTHETIC PHARMACOLOGY YAMAGUCHI ET AL. ANESTH ANALGHYPEROSMOLALITY AND HYPERPOLARIZATION 2005;100:419–26
saline is their effect on intra- and/or extracellular elec-trolyte concentrations (12,20). If extracellular osmolalityis made hypertonic by increased extracellular NaCl con-centration, the increase of intracellular Cl� activity couldimpede a regulatory volume increase (20,21). This inhi-bition may result in the failure of KATP channel activa-tion, as described in the early part of this discussion.However, KATP channel-independent hyperosmolality-induced membrane hyperpolarization is possible. Hy-pertonic saline causes hyperchloridemia. Cl� removalfrom the extracellular space or low Cl� leads to depo-larization (15). Thus, although mechanisms remain to beclarified, these effects of electrolytes may participate inthe difference in mechanisms.
Mannitol is used to reduce intracranial pressure anddecrease brain bulk in neurosurgical patients (1,2). Theadministration of 2 mg/kg of 20% mannitol infused at arate of 15 mL/min and 1 mg/kg infused over 4 minutesincreases the plasma osmolality by 30 (1) and 36mOsm/kg H2O (2), respectively. The interstitial osmola-lity of the myocardium increases by 20 and 40 mOsm/kgH2O within 10 and 50 minutes, respectively, after coro-nary occlusion in porcine hearts (24). Therefore, the os-molalities of 315 and 345 mOsm/kg H2O chosen in thisstudy are clinically relevant.
The bis-oxonol dye system semiquantitatively cap-tures the behavior of cell membrane-potential respon-siveness to various stimuli. The bis-oxonol dye re-sponse time is relatively slow (a few seconds), whichprevents measurements of precise physiological timeconstants associated with membrane-potential change(15). However, conventional direct measurement ofmembrane potential with a patch electrode or glassmicroelectrode has the risk of electrical and mechani-cal perturbation. The minimal invasiveness of the dyeto the cells makes this technique attractive (15). Fur-thermore, the recording of the membrane potentialwith bis-oxonol could be especially useful for indi-rectly testing KATP channel activities, because thewashout of cytosolic constitutes occurring during con-ventional whole cell measurements is avoided (8).
Limitations of this study should be clarified. Physio-logical blood vessels are exposed to flow (15) and in-traluminal pressure (7). Those factors might alterthe membrane potential of endothelial cells (15). Restingmembrane potentials are important for the responsein membrane potential to various stimuli in endothelialcells (19). Therefore, the response to hyperosmolality inphysiological conditions might differ. We used aorticendothelial cells. We should explore findings in endo-thelial cells in other organs with caution. However, themaintenance of normal aorta endothelial function itself isimportant. The aorta is a dynamic organ, capable ofalmost instantaneous changes in size and elasticity (25).The elastic properties of the aorta are an important de-terminant of left ventricular function and coronary bloodflow (25). The decrease of fluorescence with application
of hyperosmolar mannitol did not reach a plateau at 315mOsm/kg H2O. Therefore, we might underestimate thehyperpolarization at 315 mOsm/kg H2O. However, thispossible underestimation does not have a major effect onthe findings. Despite some limitations, our results mayexplain in part the mechanism by which hyperosmolal-ity affects membrane potential and vascular tone.
In conclusion, all hyperosmotic agents induced mem-brane depolarization in cultured human aorta endothe-lial cells. Our results suggest that KATP channels partic-ipate in hyperosmotic mannitol- and sucrose-inducedmembrane hyperpolarization in cultured human aortaendothelial cells. Different mechanisms may participatein hypertonic saline-induced hyperpolarization.
References1. Manninen PH, Lam AM, Gelb AW, Brown SC. The effect of
high-dose mannitol on serum and urine electrolytes and osmo-lality in neurosurgical patients. Can J Anaesth 1987;34:442–6.
2. Ravussin P, Abou-Madi M, Archer D, et al. Changes in CSFpressure after mannitol in patients with and without elevatedCSF pressure. J Neurosurg 1988;69:869–76.
3. Vacca G, Papillo B, Battaglia A, et al. The effects of hypertonicsaline solution on coronary blood flow in anaesthetized pigs.J Physiol 1996;491:843–51.
4. Ishizaka H, Kuo L. Endothelial ATP-sensitive potassium chan-nels mediate coronary microvascular dilation to hyperosmolar-ity. Am J Physiol 1997;273:H104–12.
5. Massett MP, Koller A, Kaley G. Hyperosmolality dilates ratskeletal muscle arterioles: role of endothelial KATP channels anddaily exercise. J Appl Physiol 2000;89:2227–34.
6. Wahl M, Kuschinsky W, Bosse O, Thurau K. Dependency of pialarterial and arteriolar diameter on perivascular osmolarity inthe cat: a microapplication study. Circ Res 1973;32:162–9.
7. Emerson GG, Segal SS. Electrical coupling between endothelialcells and smooth muscle cells in hamster feed arteries: role invasomotor control. Circ Res 2000;87:474–9.
8. Langheinrich U, Daut J. Hyperpolarization of isolated capillar-ies from guinea-pig heart induced by K� channel openers andglucose deprivation. J Physiol 1997;502:397–408.
9. Voets T, Droogmans G, Nilius B. Membrane currents and theresting membrane potential in cultured bovine pulmonary ar-tery endothelial cells. J Physiol 1996;497:95–107.
10. Schnitzler MM, Derst C, Daut J, Preisig-Muller R. ATP-sensitivepotassium channels in capillaries isolated from guinea-pigheart. J Physiol 2000;525:307–17.
11. White R, Hiley CR. Hyperpolarization of rat mesenteric endo-thelial cells by ATP-sensitive K� channel openers. Eur J Phar-macol 2000;397:279–90.
12. Mouren S, Delayance S, Mion G, et al. Mechanisms of increasedmyocardial contractility with hypertonic saline solution in iso-lated blood-perfused rabbit hearts. Anesth Analg 1995;1995:777–82.
13. Masuda T, Tomiyama Y, Kitahata H, et al. Effect of propofol onhypotonic swelling-induced membrane depolarization in hu-man coronary artery smooth muscle cells. Anesthesiology 2004;100:648–56.
14. Sohn H, Keller M, Gloe T, et al. The small G-protein Rac medi-ates depolarization-induced superoxide formation in humanendothelial cells. J Biol Chem 2000;275:18745–50.
15. Barakat AI, Leaver EV, Pappone PA, Davies PF. A flow-activated chloride-selective membrane current in vascular en-dothelial cells. Circ Res 1999;85:820–8.
16. Neylon CB, Avdonin PV, Dilley RJ, et al. Different electricalresponses to vasoactive agonists in morphological distinctsmooth muscle cell types. Circ Res 1994;75:733–41.
ANESTH ANALG ANESTHETIC PHARMACOLOGY YAMAGUCHI ET AL. 4252005;100:419–26 HYPEROSMOLALITY AND HYPERPOLARIZATION
17. Marchenko S, Sage S. Hyperosmotic but not hyposmotic stressevokes a rise in cytosolic Ca2� concentration in endothelium ofintact rat aorta. Exp Physiol 2000;85:151–7.
18. Quayle JM, Nelson MT, Standen NB. ATP-sensitive and in-wardly rectifying potassium channels in smooth muscle.Physiol Rev 1997;77:1165–232.
19. Doughty JM, Boyle JP, Langton PD. Blockade of chloride chan-nels reveals relaxations of rat small mesenteric arteries to raisedpotassium. Br J Pharmacol 2001;132:293–301.
20. Lang F, Busch GL, Ritter M, et al. Functional significance of cellvolume regulatory mechanisms. Physiol Rev 1998;78:247–306.
21. Petronini P, Alfieri R, Losio M, et al. Induction of BGT-1 andamino acid system A transport activities in endothelial cellsexposed to hyperosmolarity. Am J Physiol 2000;279:R1580–9.
22. Tricarico D, Montanari L, Conte Camerino D. Involvement of3Na�/2K� ATP-ase and Pi-3 kinase in the response of skeletalmuscle ATP-sensitive K� channels to insulin. Neuromuscul Dis-ord 2003;13:712–9.
23. Kabakov A. Activation of KATP channels by Na/K pump inisolated cardiac myocytes and giant membrane patches. Bio-phys J 1998;75:2858–67.
24. Tranum-Jensen J, Janse MJ, Fiolet JWT, et al. Tissue osmola-lity, cell swelling, and reperfusion in acute regional myocar-dial ischemia in the isolated porcine heart. Circ Res 1981;49:368 – 81.
25. Stefanadis C, Tsiamis E, Dernellis J, Toutouzas P. Effect ofestrogen on aortic function in postmenopausal women. Am JPhysiol 1999;276:H658–62.
426 ANESTHETIC PHARMACOLOGY YAMAGUCHI ET AL. ANESTH ANALGHYPEROSMOLALITY AND HYPERPOLARIZATION 2005;100:419–26
TECHNOLOGY, COMPUTING, AND SIMULATION SOCIETY FOR TECHNOLOGY IN ANESTHESIASECTION EDITOR
STEVEN J. BARKER
Sorptive Loss of Volatile and Gaseous Anesthetics from InVitro Drug Application SystemsTakahiro Suzuki, MD, Ichiro Uchida, MD, PhD, and Takashi Mashimo, MD, PhD
Department of Anesthesiology, Osaka University Medical School, Japan
In invitropharmacologicalexperiments,determinationofef-fective concentration values for various anesthetics dependson understanding the exact concentration of the drugs dis-solved in physiological solutions. Actual anesthetic concen-trationmaydifferfromexpectationsbecauseofdrugadsorp-tion, absorption or other loss, especially in tubing. We testedthe hypothesis that delivered concentrations of anestheticsdecreasewhensolutionspassthroughlaboratorytubingandinvestigatedsuchlossbymeasuringtheenteringandexitingdissolved concentrations of two volatile (sevoflurane andisoflurane)andtwogaseous(nitrousoxideandxenon)anes-thetics. We tested solutions passed through tubes (1 m �2mmID�4mmOD)madeoffivedifferentmaterials(glass,
Teflon, polyethylene (PE), polyvinyl chloride (PVC), and sil-icon rubber). Exiting concentrations of anesthetics were sig-nificantly reduced when they were passed through PVC(�33%) and silicon (�43%) tubes. There were no decreasesin anesthetic concentrations with glass, Teflon, or PE tubes.When sevoflurane solution flowed through PVC and silicontubes, it took 20 and 30 min, respectively, after start of flowuntil the anesthetic loss became negligible. These results in-dicate that frequently used PVC and silicon tubes, whereasflexible and easy to handle, have serious drawbacks whenused in inhaled anesthetic pharmacology experiments.
(Anesth Analg 2005;100:427–30)
A number of reports on the electrophysiologicalaction of inhaled anesthetics, including gaseousanesthetics, such as xenon (Xe) and nitrous ox-
ide (N2O), have been published. Some of these proto-cols have used bubbling systems to dissolve inhaledanesthetics in physiologic solutions and have mea-sured the anesthetic concentration in the bubbled so-lution (1–3). In a previous in vitro electrophysiologicalstudy (3), we noticed discrepancies in the concentra-tions of anesthetics before and after passage throughtubing. Some anesthetic loss occurred from solutionsflowing through tubes. Although physicians are awarethat some anesthetics are soluble in rubber and variousplastics (4) and that anesthetics are liable to be lost toadsorption during flow through tubing (5), there havebeen no reports comparing the effects of tubing materials
used in laboratory inhaled anesthetic application sys-tems. It is possible that the anesthetic concentration, dur-ing administration, may vary according to the tubingmaterial used and that this variation may influence phar-macological evaluation, including the determination ofeffective concentration (EC) values.
Here we report how tubing material affects deliv-ered anesthetic concentrations in solution. We evalu-ated the loss of two volatile anesthetics (sevofluraneand isoflurane) and two gaseous anesthetics (Xe andN2O) in an in vitro experimental system made of glass,Teflon, polyethylene (PE), polyvinyl chloride (PVC),and silicon tubes, which are frequently used for ad-ministering anesthetics in the laboratory.
MethodsThe following anesthetics were used: isoflurane (Ab-bott Laboratories Ltd, Chicago, IL), sevoflurane (Ma-ruishi Pharmaceutical Co, Ltd, Osaka, Japan), N2O(Teisan Ltd, Tokyo, Japan), and Xe (99.995%) (AirWaterCo Ltd, Wakayama, Japan).
The following tubes (each 1 m � 2 mm ID � 4 mmOD) were evaluated: hard glass (Minamirika Glass Co,Ltd, Osaka, Japan), Teflon (Chukoh Chemical Indus-tries, Ltd, Osaka, Japan), PE (Yamaichi Chemical Co,Ltd, Osaka, Japan), PVC As One Co, Osaka, Japan),and silicon (Tigers Polymer Co, Osaka, Japan).
Presented, in part, at the Sixth International Conference on Mo-lecular and Basic Mechanisms of Anesthesia, Bonn, Germany, 28–30June 2001.
Supported, in part, by Grants-in-Aid for Scientific Research fromthe Ministry of Education, Science and Culture of Japan, and aresearch grant from Maruishi Pharmaceutical Co, Ltd, of Japan.
Accepted for publication July 28, 2004.Address correspondence and reprint requests to Takahiro Suzuki,
MD, Department of Anesthesiology, Osaka University MedicalSchool, 2-2 Yamadaoka, Suita, Osaka, Japan 565-0871. Addresse-mail to [email protected].
DOI: 10.1213/01.ANE.0000142112.30807.5C
©2005 by the International Anesthesia Research Society0003-2999/05 Anesth Analg 2005;100:427–30 427
Anesthetic concentrations in solutions were measuredby gas chromatography (GC) (Trace™ GC2000; Thermo-Quest, CE Instruments, Austin, TX)/mass spectrometry(MS) (GCQ™ plus; ThermoQuest). A sample introduc-tion into the GC was done by headspace sampling usingan automatic gas sampler (Combi Pal; CTC AnalyticsAG, Zwingen, Switzerland). Mass/charge values (m/z)of 51 for isoflurane and sevoflurane, 30 for N2O, and 129for Xe were used for MS.
A reservoir consisting of a hard glass bottle filledwith 500 mL of distilled water was incubated in awater bath (Thermo Minder Mini-80; Taitec Corp,Tokyo, Japan) at 25°C (D641; Takara ThermistorInstruments Co Ltd, Kanagawa, Japan) and contin-uously bubbled with anesthetic gases. The bubbledgas flow rate was set at 500 mL/min. For volatileanesthetics, air was passed through calibrated va-porizers: Sevotec 3 for sevoflurane (Ohmeda,Steeton, West Yorkshire, United Kingdom) andForawick for isoflurane (Murako Medical, Tokyo,Japan). The concentrations of sevoflurane andisoflurane were set at 3%, whereas N2O and Xe wereset at 100%. The concentrations of the gas mixtureswere monitored using a Capnomac Ultima (DatexInstrumentarium Corp, Helsinki, Finland) and Xemeter (Riken, Tokyo, Japan). The solution wasdrawn by suction with a roller-pump (MasterFlex,Cole-Parmer Instrument Co, Vernon Hills, IL)passed through the test tubing and returned to thereservoir bottle. The flow rate of the solutions wasadjusted to 20 mL/min. Twenty minutes after thestart of bubbling, before sampling, the anestheticsolutions were allowed to flow through the tubes for1 min for the initial study and 0, 1, 2, 3, 5, 10, 20, 30,60, 90, 120, and 180 min for the next study. Controlsamples were obtained directly from the reservoirbottle, and the test samples were drawn from athree-way metal stopcock placed immediately distalto the test tubing. Fifty-microliter samples of thesolutions were drawn into a 50-�L gas tight syringe(Gastight #1805; Hamilton, Reno, NV) and intro-duced into 20-mL glass vials (Headspace Vial; Na-tional Scientific Company Ltd, Jeddah, Kingdom ofSaudi Arabia) sealed by an aluminum cap with aTeflon sheet and a rubber septum (Magnetic Cap,National Scientific Company). The vials were thenset in the headspace portion of the GC/MS system.To extract most of the volatile and gaseous anesthet-ics from the liquid phase, the head space tempera-ture was set at 70°C for 15 min, which is sufficientlyin excess of the boiling points of sevoflurane(58.5°C) (6) and isoflurane (48.5°C) (7). After that,1 mL of the gas phase was, using automatic gassampling equipment, drawn from the headspace ofthe incubated vial and injected into the injectionport of the GC/MS system.
To evaluate loss of the anesthetic after passagethrough different tubing materials, the relative anes-thetic concentration (R) was calculated using the fol-lowing equation: R � AUCTube/AUCReservoir, whereAUCTube is the area under the curve of the peak spec-trum obtained by GC/MS for the sample drawn afterpassage through the tube, and AUCReservoir representsthe equivalent data for the sample obtained directlyfrom the reservoir bottle.
To determine statistically significant differences inresults for different tubing materials, we used analy-ses of variance. A probability value of P � 0.05 wasconsidered statistically significant. All data were ex-pressed as mean � sem.
ResultsFor each anesthetic, AUCReservoir rapidly increased af-ter bubbling started, reached a plateau within 5 min,and remained stable thereafter (data not shown).
Figure 1 shows R 1 min after passing through var-ious tubing materials. No loss was apparent when theanesthetic solutions passed through glass, Teflon, orPE tubes. With PVC, there was no significant changein R for Xe, but R significantly decreased to 0.750 �0.023 for sevoflurane, 0.670 � 0.017 for isoflurane, and0.885 � 0.003 for N2O. With a silicon tube, R signifi-cantly decreased to 0.570 � 0.020 for sevoflurane,0.633 � 0.014 for isoflurane, 0.687 � 0.013 for N2O,and 0.715 � 0.019 for Xe. With silicon tubing, thedecrease in R for sevoflurane and N2O was more thanwith PVC tubing.
Because anesthetic concentration significantly de-creased 1 min after start of flow at a flow rate of20 mL/min, we examined how long it would takeuntil the anesthetic concentration reached a plateau.Figure 2 shows time course change of sevofluraneconcentration 0, 1, 2, 3, 5, 10, 20, 30, 60, 90, 120, and180 min after passing through PVC and silicon tubes(n � 3). The smallest anesthetic concentration wasobserved at the start of flow (0 min), and then anes-thetic concentration gradually increased until 20 minafter the start of flow for PVC tube and 30 min forsilicon tube.
DiscussionThe possibility of adsorption of many drugs, includinganesthetics, by plastic materials has been a source ofconcern in both basic experimental and clinical settings(8–14). Clinically, anesthetic uptake has been docu-mented in anesthetic circuits composed of rubber, PVC,PE, and polypropylene (8,11,12). In in vitro experimentalsystems, it is quite likely that the most frequently usedplastic tubing material in the experimental apparatus hasbeen PVC. Because some drugs are prone to be adsorbed
428 TECHONOLOGY, COMPUTING, AND SIMULATION SUZUKI ET AL. ANESTH ANALGANESTHETIC LOSS FROM IN VITRO DRUG APPLICATION SYSTEMS 2005;100:427–30
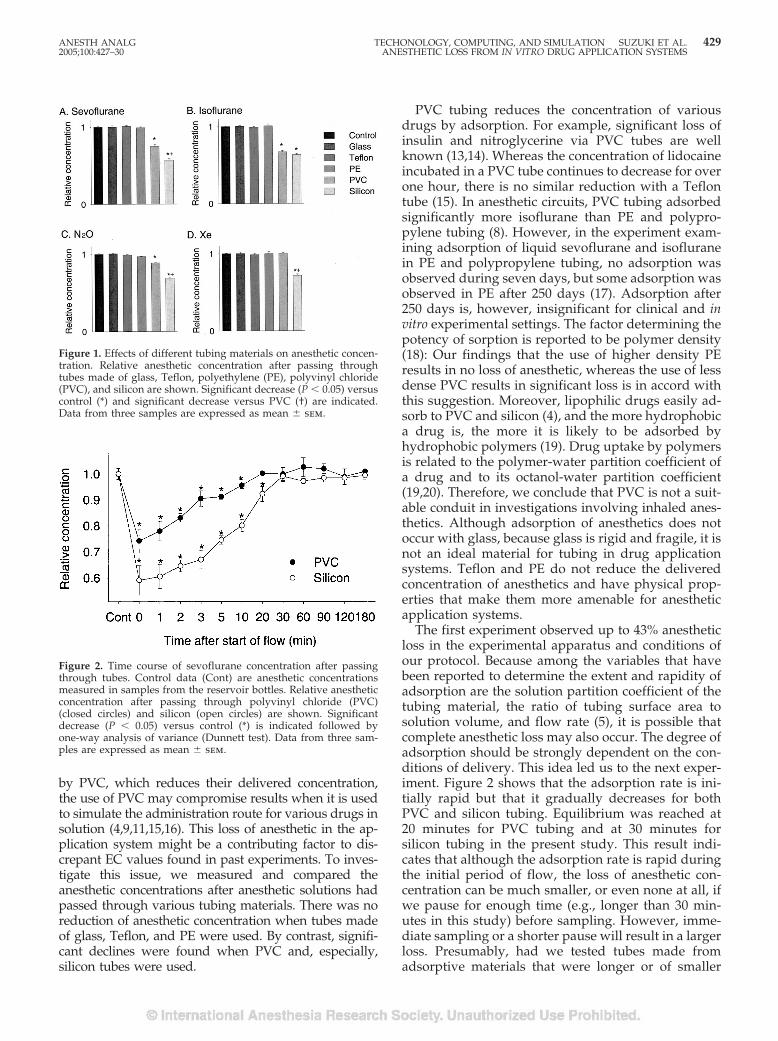
by PVC, which reduces their delivered concentration,the use of PVC may compromise results when it is usedto simulate the administration route for various drugs insolution (4,9,11,15,16). This loss of anesthetic in the ap-plication system might be a contributing factor to dis-crepant EC values found in past experiments. To inves-tigate this issue, we measured and compared theanesthetic concentrations after anesthetic solutions hadpassed through various tubing materials. There was noreduction of anesthetic concentration when tubes madeof glass, Teflon, and PE were used. By contrast, signifi-cant declines were found when PVC and, especially,silicon tubes were used.
PVC tubing reduces the concentration of variousdrugs by adsorption. For example, significant loss ofinsulin and nitroglycerine via PVC tubes are wellknown (13,14). Whereas the concentration of lidocaineincubated in a PVC tube continues to decrease for overone hour, there is no similar reduction with a Teflontube (15). In anesthetic circuits, PVC tubing adsorbedsignificantly more isoflurane than PE and polypro-pylene tubing (8). However, in the experiment exam-ining adsorption of liquid sevoflurane and isofluranein PE and polypropylene tubing, no adsorption wasobserved during seven days, but some adsorption wasobserved in PE after 250 days (17). Adsorption after250 days is, however, insignificant for clinical and invitro experimental settings. The factor determining thepotency of sorption is reported to be polymer density(18): Our findings that the use of higher density PEresults in no loss of anesthetic, whereas the use of lessdense PVC results in significant loss is in accord withthis suggestion. Moreover, lipophilic drugs easily ad-sorb to PVC and silicon (4), and the more hydrophobica drug is, the more it is likely to be adsorbed byhydrophobic polymers (19). Drug uptake by polymersis related to the polymer-water partition coefficient ofa drug and to its octanol-water partition coefficient(19,20). Therefore, we conclude that PVC is not a suit-able conduit in investigations involving inhaled anes-thetics. Although adsorption of anesthetics does notoccur with glass, because glass is rigid and fragile, it isnot an ideal material for tubing in drug applicationsystems. Teflon and PE do not reduce the deliveredconcentration of anesthetics and have physical prop-erties that make them more amenable for anestheticapplication systems.
The first experiment observed up to 43% anestheticloss in the experimental apparatus and conditions ofour protocol. Because among the variables that havebeen reported to determine the extent and rapidity ofadsorption are the solution partition coefficient of thetubing material, the ratio of tubing surface area tosolution volume, and flow rate (5), it is possible thatcomplete anesthetic loss may also occur. The degree ofadsorption should be strongly dependent on the con-ditions of delivery. This idea led us to the next exper-iment. Figure 2 shows that the adsorption rate is ini-tially rapid but that it gradually decreases for bothPVC and silicon tubing. Equilibrium was reached at20 minutes for PVC tubing and at 30 minutes forsilicon tubing in the present study. This result indi-cates that although the adsorption rate is rapid duringthe initial period of flow, the loss of anesthetic con-centration can be much smaller, or even none at all, ifwe pause for enough time (e.g., longer than 30 min-utes in this study) before sampling. However, imme-diate sampling or a shorter pause will result in a largerloss. Presumably, had we tested tubes made fromadsorptive materials that were longer or of smaller
Figure 1. Effects of different tubing materials on anesthetic concen-tration. Relative anesthetic concentration after passing throughtubes made of glass, Teflon, polyethylene (PE), polyvinyl chloride(PVC), and silicon are shown. Significant decrease (P � 0.05) versuscontrol (*) and significant decrease versus PVC (†) are indicated.Data from three samples are expressed as mean � sem.
Figure 2. Time course of sevoflurane concentration after passingthrough tubes. Control data (Cont) are anesthetic concentrationsmeasured in samples from the reservoir bottles. Relative anestheticconcentration after passing through polyvinyl chloride (PVC)(closed circles) and silicon (open circles) are shown. Significantdecrease (P � 0.05) versus control (*) is indicated followed byone-way analysis of variance (Dunnett test). Data from three sam-ples are expressed as mean � sem.
ANESTH ANALG TECHONOLOGY, COMPUTING, AND SIMULATION SUZUKI ET AL. 4292005;100:427–30 ANESTHETIC LOSS FROM IN VITRO DRUG APPLICATION SYSTEMS
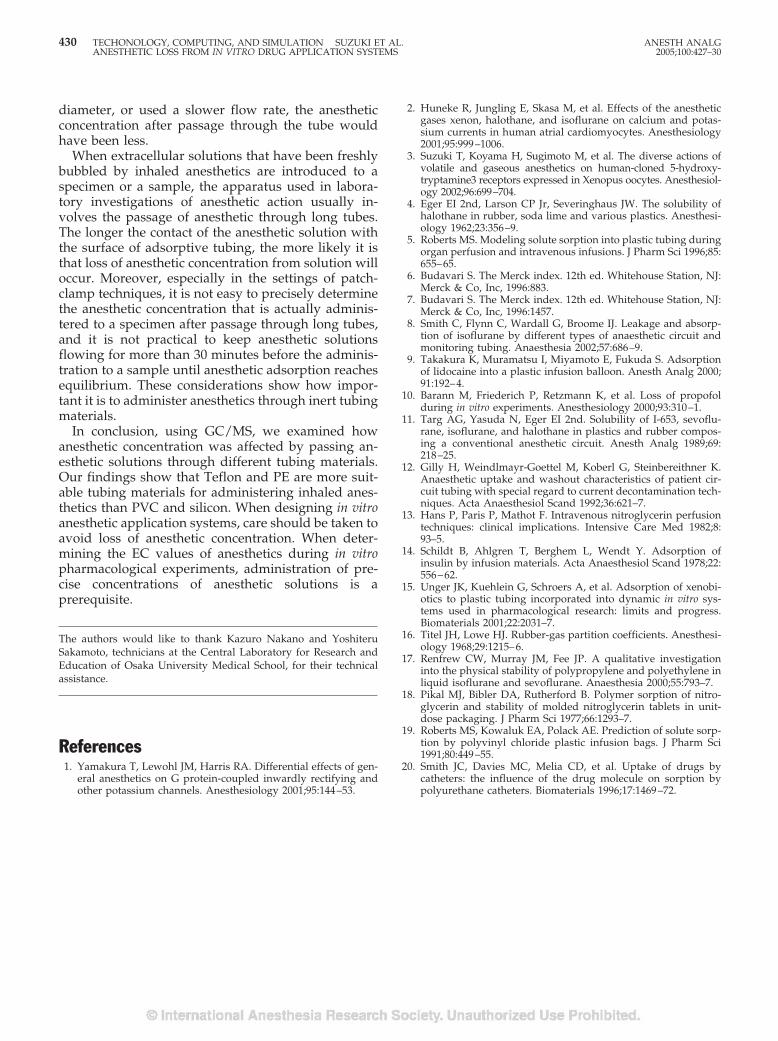
diameter, or used a slower flow rate, the anestheticconcentration after passage through the tube wouldhave been less.
When extracellular solutions that have been freshlybubbled by inhaled anesthetics are introduced to aspecimen or a sample, the apparatus used in labora-tory investigations of anesthetic action usually in-volves the passage of anesthetic through long tubes.The longer the contact of the anesthetic solution withthe surface of adsorptive tubing, the more likely it isthat loss of anesthetic concentration from solution willoccur. Moreover, especially in the settings of patch-clamp techniques, it is not easy to precisely determinethe anesthetic concentration that is actually adminis-tered to a specimen after passage through long tubes,and it is not practical to keep anesthetic solutionsflowing for more than 30 minutes before the adminis-tration to a sample until anesthetic adsorption reachesequilibrium. These considerations show how impor-tant it is to administer anesthetics through inert tubingmaterials.
In conclusion, using GC/MS, we examined howanesthetic concentration was affected by passing an-esthetic solutions through different tubing materials.Our findings show that Teflon and PE are more suit-able tubing materials for administering inhaled anes-thetics than PVC and silicon. When designing in vitroanesthetic application systems, care should be taken toavoid loss of anesthetic concentration. When deter-mining the EC values of anesthetics during in vitropharmacological experiments, administration of pre-cise concentrations of anesthetic solutions is aprerequisite.
The authors would like to thank Kazuro Nakano and YoshiteruSakamoto, technicians at the Central Laboratory for Research andEducation of Osaka University Medical School, for their technicalassistance.
References1. Yamakura T, Lewohl JM, Harris RA. Differential effects of gen-
eral anesthetics on G protein-coupled inwardly rectifying andother potassium channels. Anesthesiology 2001;95:144–53.
2. Huneke R, Jungling E, Skasa M, et al. Effects of the anestheticgases xenon, halothane, and isoflurane on calcium and potas-sium currents in human atrial cardiomyocytes. Anesthesiology2001;95:999–1006.
3. Suzuki T, Koyama H, Sugimoto M, et al. The diverse actions ofvolatile and gaseous anesthetics on human-cloned 5-hydroxy-tryptamine3 receptors expressed in Xenopus oocytes. Anesthesiol-ogy 2002;96:699–704.
4. Eger EI 2nd, Larson CP Jr, Severinghaus JW. The solubility ofhalothane in rubber, soda lime and various plastics. Anesthesi-ology 1962;23:356–9.
5. Roberts MS. Modeling solute sorption into plastic tubing duringorgan perfusion and intravenous infusions. J Pharm Sci 1996;85:655–65.
6. Budavari S. The Merck index. 12th ed. Whitehouse Station, NJ:Merck & Co, Inc, 1996:883.
7. Budavari S. The Merck index. 12th ed. Whitehouse Station, NJ:Merck & Co, Inc, 1996:1457.
8. Smith C, Flynn C, Wardall G, Broome IJ. Leakage and absorp-tion of isoflurane by different types of anaesthetic circuit andmonitoring tubing. Anaesthesia 2002;57:686–9.
9. Takakura K, Muramatsu I, Miyamoto E, Fukuda S. Adsorptionof lidocaine into a plastic infusion balloon. Anesth Analg 2000;91:192–4.
10. Barann M, Friederich P, Retzmann K, et al. Loss of propofolduring in vitro experiments. Anesthesiology 2000;93:310–1.
11. Targ AG, Yasuda N, Eger EI 2nd. Solubility of I-653, sevoflu-rane, isoflurane, and halothane in plastics and rubber compos-ing a conventional anesthetic circuit. Anesth Analg 1989;69:218–25.
12. Gilly H, Weindlmayr-Goettel M, Koberl G, Steinbereithner K.Anaesthetic uptake and washout characteristics of patient cir-cuit tubing with special regard to current decontamination tech-niques. Acta Anaesthesiol Scand 1992;36:621–7.
13. Hans P, Paris P, Mathot F. Intravenous nitroglycerin perfusiontechniques: clinical implications. Intensive Care Med 1982;8:93–5.
14. Schildt B, Ahlgren T, Berghem L, Wendt Y. Adsorption ofinsulin by infusion materials. Acta Anaesthesiol Scand 1978;22:556–62.
15. Unger JK, Kuehlein G, Schroers A, et al. Adsorption of xenobi-otics to plastic tubing incorporated into dynamic in vitro sys-tems used in pharmacological research: limits and progress.Biomaterials 2001;22:2031–7.
16. Titel JH, Lowe HJ. Rubber-gas partition coefficients. Anesthesi-ology 1968;29:1215–6.
17. Renfrew CW, Murray JM, Fee JP. A qualitative investigationinto the physical stability of polypropylene and polyethylene inliquid isoflurane and sevoflurane. Anaesthesia 2000;55:793–7.
18. Pikal MJ, Bibler DA, Rutherford B. Polymer sorption of nitro-glycerin and stability of molded nitroglycerin tablets in unit-dose packaging. J Pharm Sci 1977;66:1293–7.
19. Roberts MS, Kowaluk EA, Polack AE. Prediction of solute sorp-tion by polyvinyl chloride plastic infusion bags. J Pharm Sci1991;80:449–55.
20. Smith JC, Davies MC, Melia CD, et al. Uptake of drugs bycatheters: the influence of the drug molecule on sorption bypolyurethane catheters. Biomaterials 1996;17:1469–72.
430 TECHONOLOGY, COMPUTING, AND SIMULATION SUZUKI ET AL. ANESTH ANALGANESTHETIC LOSS FROM IN VITRO DRUG APPLICATION SYSTEMS 2005;100:427–30
Lactate Measurement Interference by Hemoglobin-BasedOxygen Carriers (Oxyglobin®, Hemopure®, and Hemolink™)Jonathan S. Jahr, MD, Stephen Osgood, MD, Stephen J. Rothenberg, PhD,Qiao-Ling Li, MD, PhD, Anthony W. Butch, PhD, Robert Gunther, PhD,Anthony Cheung, PhD, and Bernd Driessen, DVM, PhD
Departments of Anesthesiology and Pathology and Laboratory Medicine, David Geffen School of Medicine at UCLA,Los Angeles, California, and Department of Anesthesiology, Charles R. Drew University of Medicine and Science,Martin Luther King, Jr./Drew Medical Center, Los Angeles, California; Johns Hopkins University School of Medicine,Baltimore, Maryland; National Institute of Public Health, Cuernavaca, Mexico; Departments of Surgery and MedicalPathology, UC Davis School of Medicine; and Department of Clinical Studies, New Bolton Center, School of VeterinaryMedicine, University of Pennsylvania, Philadelphia, Pennsylvania
We sought to determine whether hemoglobin-basedoxygen carriers (HBOCs), hemoglobin glutamer-200[bovine] (HBOC-200, Oxyglobin®), hemoglobinglutamer-250 [bovine] (HBOC-201, Hemopure®), andhemoglobin raffimer (Hemolink™) interfere with theaccuracy of lactate measurements. Combinations ofconcentrated L-lactate solution, HBOC, and blood orplasma with added PlasmaLyte-A™ were added tosample tubes to make a linear and constant increase inlactate concentration in consecutive samples. Samplelactate concentrations ranged from 5–110 mg/dL(0.6–12 mM) (physiological reference range: 5–20 mg/dL[0.56–2.2 mM]). Comparisons were made between ma-chine measured lactate concentrations and calculated lac-tate concentrations. For Hb glutamer-250, the average dif-ference between measured and calculated lactateconcentrations was �5.1 mg/dL (�0.57 mM) (LX-20®),
with greater underestimation at larger lactate concentra-tions. For Hb raffimer, the average difference was�2.2 mg/dL (�0.24 mM) (LX-20®). The veterinary prod-uct, Hb glutamer-200, was tested on 3 analyzers (LX-20®,YSI 1500, and YSI 2300). The YSI 1500 was the most accu-rate instrument with the mean difference between meas-ured minus calculated lactate being �1.3 mg/dL versus�2.6 mg/dL (YSI 2300) and �8.4 mg/dL (LX-20®). Theclinical implications of this study are that with increasinglevels of an HBOC in plasma, lactate interpretation maybecome inaccurate, especially at larger lactate concentra-tions, causingunderestimationofmeasured lactatevaluesand possible under-treatment of the patient. Therefore,caution must be exercised when interpreting lactate re-sults when a HBOC is present in plasma.
(Anesth Analg 2005;100:431–6)
H emoglobin-based oxygen carriers (HBOCs) aresolutions of cell-free hemoglobin (Hb) that havebeen developed for treatment of anemia or re-
suscitation from hemorrhagic shock. They combineoxygen transport with volume-expanding propertiesand thus may be ideal candidates for resuscitation,
superior to traditional plasma expanders (e.g., hy-droxyethyl starch solutions) (1–8). The HBOCs used inthis study, hemoglobin glutamer-200 [bovine] (HBOC-200, Oxyglobin®), hemoglobin glutamer-250 [bovine](HBOC-201, Hemopure®; Biopure Corporation, Cam-bridge, MA), and hemoglobin raffimer (Hemolink™;Hemosol Inc., Toronto, ON), have not been tested forinterference with lactate measurements (9–15). We hy-pothesized that these three blood substitutes may in-terfere with the accuracy of lactate determination. Itshould be noted that the University of California LosAngeles (UCLA) Clinical Laboratory reference rangesof plasma lactate are 5–20 mg/dL (0.56–2.2 mM).
We further hypothesized that one of the reasons forunderestimation of accurate lactate levels in the lactateanalyzers may be scavenging of hydrogen peroxide,an intermediary, by the cell-free HBOC molecules inthe sample. In fact, all Hbs, including modified Hbs in
Supported by institutional funding from UCLA and UC Davis.Dr. Jahr has served as principal investigator on two Biopure Corp.
and two Hemosol Inc. Clinical Phase II and III trials. He is on theSpeakers Bureau for both Biopure Corp. and Hemosol Inc.; how-ever, no funding was received from either manufacturer for thisstudy.
Accepted for publication July 27, 2004.Address correspondence and reprint requests to Jonathan S. Jahr,
MD, Department of Anesthesiology, David Geffen School of Med-icine at UCLA, PO Box 951778, Los Angeles, CA, 90095–1778. Ad-dress e-mail to [email protected].
DOI: 10.1213/01.ANE.0000142116.42938.82
©2005 by the International Anesthesia Research Society0003-2999/05 Anesth Analg 2005;100:431–6 431
particular, have more of a propensity to react in anenzymatic fashion with peroxide than unmodifiedHbs (16–19). Because the analyzers use hydrogen per-oxide as a means to detect lactate concentration, thisprocess could be interfered with by HBOCs.
The lactate measurements were made by three clin-ical lactate analyzers (Synchron LX-20®, BeckmanCoulter, Fullerton, CA; YSI 1500 SPORT and YSI 2300STAT; YSI Inc., Yellow Springs, OH) in combinationwith three HBOCs, one approved veterinary product(Hb glutamer-200) and two experimental human ther-apeutics (Hb glutamer-250 and Hb raffimer).
MethodsTo study three lactate analyzers and three HBOCs, aseries of experiments were performed: 1) validatingthe veterinary HBOC (Hb glutamer-200) with the an-alyzers used for our published veterinary shock andresuscitation experiments (6–8), the YSI 1500 and YSI2300 with bovine blood, 2) testing the HBOCs under-going human trials (Hb glutamer-250 and Hb raf-fimer) with a currently used clinical lactate analyzer,LX-20®, with human plasma diluted in Plasma-LyteA™ (Baxter, Deerfield, IL), and 3) an external valida-tion of the LX-20® without HBOCs at clinically in-creased concentrations of lactate. Despite performingan external validation series on the LX-20® at a widerrange of lactate concentrations, all three analyzers con-tinually self-calibrate for lactate in either blood orplasma accurately during routine use.
The correlation between machine-measured lactateand calculated lactate concentrations was studied,testing for interference by HBOCs. Because HBOCsthemselves contain lactate in their initial preparation,the calculated final lactate concentration in each testsample was the sum of baseline lactate in humanplasma or bovine blood, lactate contained in theHBOC solution itself, and lactate added to the testsample from a known concentrated stock solution.
This series of experiments was conducted at ourlaboratories at the University of California (UC) Davisusing the YSI 1500 and 2300 lactate analyzers. The YSI1500 and 2300 instruments report lactate concentra-tions in mM; however we converted all data to mg/dL(mg/dL is the unit clinically reported at UCLA andrecorded by the LX-20®). The conversion factor be-tween units for lactic acid is 1.00 mg/dL � 0.111 mM(MW lactic acid � 90.079 Daltons). Lithium L-lactate(Sigma, St. Louis, MO) was dissolved in Plasma-LyteA™, a lactate-free, balanced salt solution. From thisconcentrated stock lactate solution, specific amountswere added to 5 identical sample sets to create a linearand constant increase in lactate concentration in con-secutive samples. Final lactate concentrations ranged
from 5 to 70 mg/dL. Bovine whole blood was col-lected from a healthy live animal (these were remain-der samples of collected bovine blood for other exper-iments, not requiring veterinary institutional approvalat UC Davis), in gray-top tubes (Becton Dickinson,Franklin Lakes, NJ) and aliquots were added to eachof the samples (therefore, a veterinary HBOC wasmatched with blood from an animal source). Finally,Hb glutamer-200 was added to make each sample sethave a different final HBOC concentration (0.13, 1.3,2.6, 3.6, and 5 mg/dL), with each set still having theidentical range of lactate concentrations. We wantedto test to whether larger concentrations of HBOC hada greater interference effect. The final sample volumewas 1.5 mL. Single measurements for each samplewere performed on both YSI instruments.
IRB exemption at UCLA for the use of remaindersample human plasma for routine lactate concentra-tion measurements was obtained. Discard humanplasma samples from the clinical laboratory werepooled (human plasma was donated by the ChemistryLaboratory at UCLA from non-expired lactate samplesin gray top tubes). We studied all 3 HBOCs on theLX-20®: Hb glutamer-200, Hb-250 (0.13, 1.3, 2.6, 3.9,and 6.5 g/dL), and Hb raffimer (0.1, 1, 2, 3, and 5g/dL). Five sample sets were made for each HBOC atthe above concentrations in a similar manner as for theYSI series. The difference being the use of humanplasma instead of bovine blood (we wanted to matchproducts intended for human use with humanplasma) and a slightly larger lactate concentrationrange. Final calculated lactate concentrations rangedfrom 10 to 110 mg/dL. Single measurements wereperformed on the LX-20®.
Lithium L-lactate was dissolved in saline andadded to a human plasma pool, obtained from theUCLA Medical Center Clinical Laboratory. Dilu-tions were made to yield target lactate concentra-tions of 20, 40, 60, 80, and 100 mg/dL (designed tofit high normal and increased plasma lactate con-centrations, the same dilutions used by the UCLAclinical laboratory for periodic validation of theiranalyzers). Each sample was analyzed in triplicateon the LX® 20 analyzer (see Table 2). This externalvalidation was only designed for the LX-20®, as thisis the only clinically used analyzer at UCLA. Thisadditional series was presented to sample widerranges of lactate without HBOCs present to deter-mine if simply high lactate levels would cause theanalyzer to become inaccurate, as the internal auto-matic calibration on this analyzer does not test atsuch large lactate concentrations.
The differences between measured (Y)-minus-calculated (X) lactate were quantified by the meandifference and by the root mean square error (RMSE)defined as RMSE � � ([mean of calculated minusmeasured difference]2 � [standard deviation of the
432 TECHNOLOGY, COMPUTING, AND SIMULATION JAHR ET AL. ANESTH ANALGHEMOGLOBIN-BASED OXYGEN CARRIERS AND LACTATE INTERFERENCE 2005;100:431–6
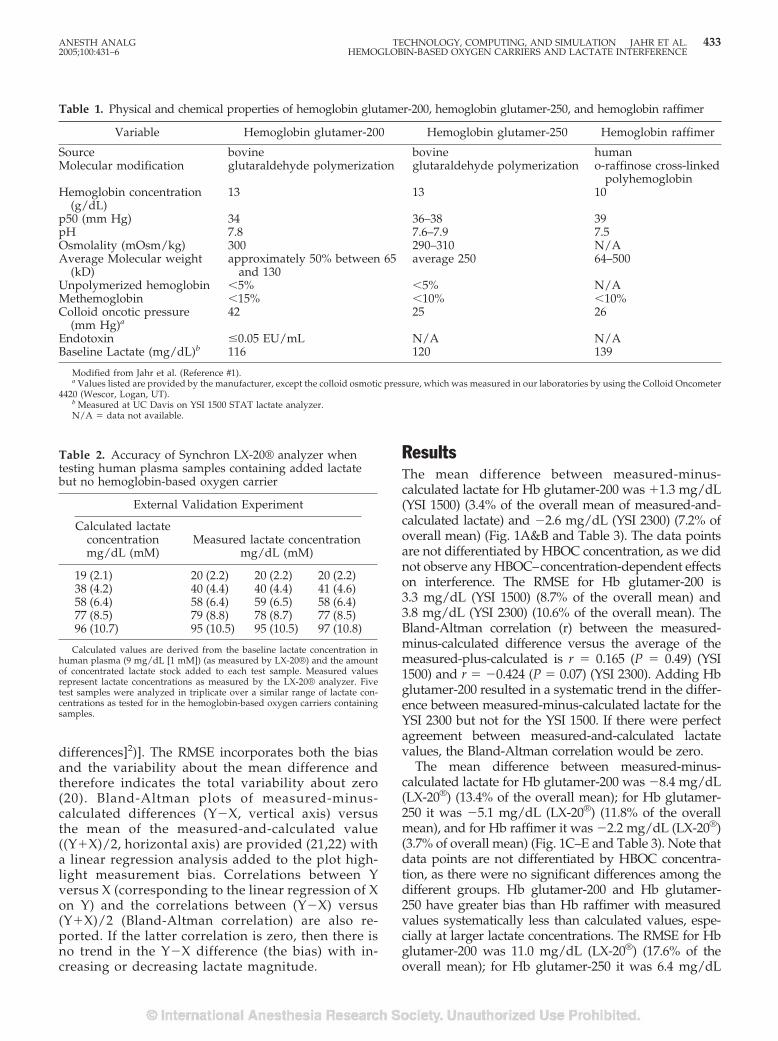
differences]2)]. The RMSE incorporates both the biasand the variability about the mean difference andtherefore indicates the total variability about zero(20). Bland-Altman plots of measured-minus-calculated differences (Y�X, vertical axis) versusthe mean of the measured-and-calculated value((Y�X)/2, horizontal axis) are provided (21,22) witha linear regression analysis added to the plot high-light measurement bias. Correlations between Yversus X (corresponding to the linear regression of Xon Y) and the correlations between (Y�X) versus(Y�X)/2 (Bland-Altman correlation) are also re-ported. If the latter correlation is zero, then there isno trend in the Y�X difference (the bias) with in-creasing or decreasing lactate magnitude.
ResultsThe mean difference between measured-minus-calculated lactate for Hb glutamer-200 was �1.3 mg/dL(YSI 1500) (3.4% of the overall mean of measured-and-calculated lactate) and �2.6 mg/dL (YSI 2300) (7.2% ofoverall mean) (Fig. 1A&B and Table 3). The data pointsare not differentiated by HBOC concentration, as we didnot observe any HBOC–concentration-dependent effectson interference. The RMSE for Hb glutamer-200 is3.3 mg/dL (YSI 1500) (8.7% of the overall mean) and3.8 mg/dL (YSI 2300) (10.6% of the overall mean). TheBland-Altman correlation (r) between the measured-minus-calculated difference versus the average of themeasured-plus-calculated is r � 0.165 (P � 0.49) (YSI1500) and r � �0.424 (P � 0.07) (YSI 2300). Adding Hbglutamer-200 resulted in a systematic trend in the differ-ence between measured-minus-calculated lactate for theYSI 2300 but not for the YSI 1500. If there were perfectagreement between measured-and-calculated lactatevalues, the Bland-Altman correlation would be zero.
The mean difference between measured-minus-calculated lactate for Hb glutamer-200 was �8.4 mg/dL(LX-20®) (13.4% of the overall mean); for Hb glutamer-250 it was �5.1 mg/dL (LX-20®) (11.8% of the overallmean), and for Hb raffimer it was �2.2 mg/dL (LX-20®)(3.7% of overall mean) (Fig. 1C–E and Table 3). Note thatdata points are not differentiated by HBOC concentra-tion, as there were no significant differences among thedifferent groups. Hb glutamer-200 and Hb glutamer-250 have greater bias than Hb raffimer with measuredvalues systematically less than calculated values, espe-cially at larger lactate concentrations. The RMSE for Hbglutamer-200 was 11.0 mg/dL (LX-20®) (17.6% of theoverall mean); for Hb glutamer-250 it was 6.4 mg/dL
Table 1. Physical and chemical properties of hemoglobin glutamer-200, hemoglobin glutamer-250, and hemoglobin raffimer
Variable Hemoglobin glutamer-200 Hemoglobin glutamer-250 Hemoglobin raffimer
Source bovine bovine humanMolecular modification glutaraldehyde polymerization glutaraldehyde polymerization o-raffinose cross-linked
polyhemoglobinHemoglobin concentration
(g/dL)13 13 10
p50 (mm Hg) 34 36–38 39pH 7.8 7.6–7.9 7.5Osmolality (mOsm/kg) 300 290–310 N/AAverage Molecular weight
(kD)approximately 50% between 65
and 130average 250 64–500
Unpolymerized hemoglobin �5% �5% N/AMethemoglobin �15% �10% �10%Colloid oncotic pressure
(mm Hg)a42 25 26
Endotoxin �0.05 EU/mL N/A N/ABaseline Lactate (mg/dL)b 116 120 139
Modified from Jahr et al. (Reference #1).a Values listed are provided by the manufacturer, except the colloid osmotic pressure, which was measured in our laboratories by using the Colloid Oncometer
4420 (Wescor, Logan, UT).b Measured at UC Davis on YSI 1500 STAT lactate analyzer.N/A � data not available.
Table 2. Accuracy of Synchron LX-20® analyzer whentesting human plasma samples containing added lactatebut no hemoglobin-based oxygen carrier
External Validation Experiment
Calculated lactateconcentrationmg/dL (mM)
Measured lactate concentrationmg/dL (mM)
19 (2.1) 20 (2.2) 20 (2.2) 20 (2.2)38 (4.2) 40 (4.4) 40 (4.4) 41 (4.6)58 (6.4) 58 (6.4) 59 (6.5) 58 (6.4)77 (8.5) 79 (8.8) 78 (8.7) 77 (8.5)96 (10.7) 95 (10.5) 95 (10.5) 97 (10.8)
Calculated values are derived from the baseline lactate concentration inhuman plasma (9 mg/dL [1 mM]) (as measured by LX-20®) and the amountof concentrated lactate stock added to each test sample. Measured valuesrepresent lactate concentrations as measured by the LX-20® analyzer. Fivetest samples were analyzed in triplicate over a similar range of lactate con-centrations as tested for in the hemoglobin-based oxygen carriers containingsamples.
ANESTH ANALG TECHNOLOGY, COMPUTING, AND SIMULATION JAHR ET AL. 4332005;100:431–6 HEMOGLOBIN-BASED OXYGEN CARRIERS AND LACTATE INTERFERENCE
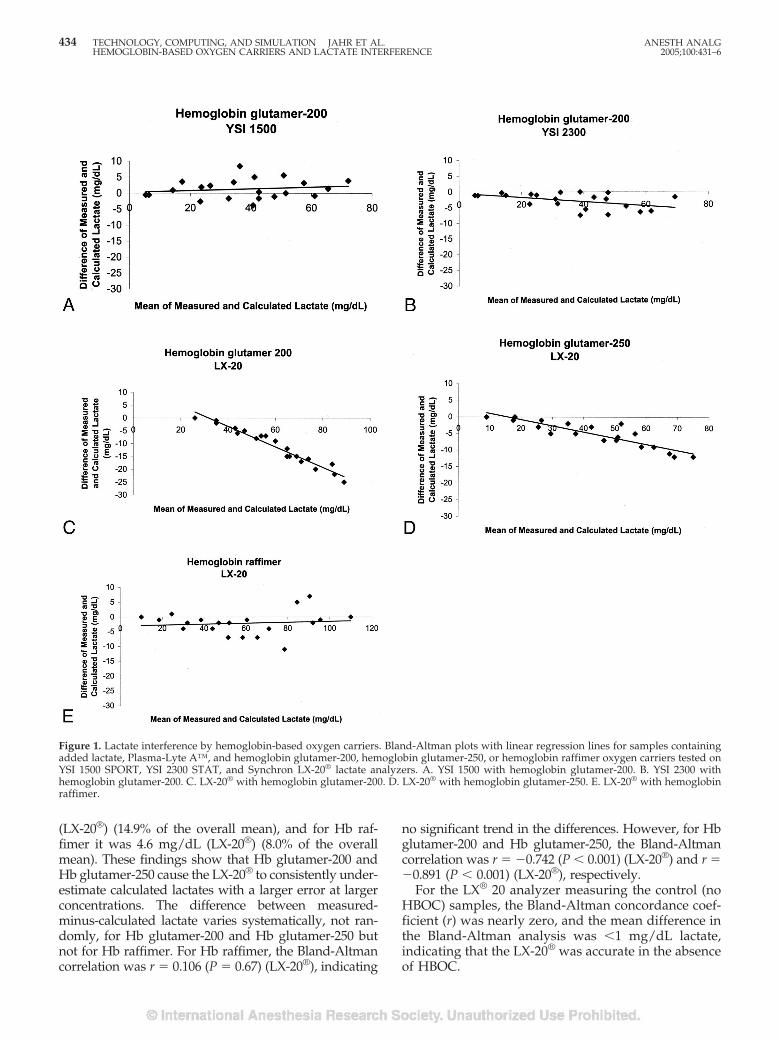
(LX-20®) (14.9% of the overall mean), and for Hb raf-fimer it was 4.6 mg/dL (LX-20®) (8.0% of the overallmean). These findings show that Hb glutamer-200 andHb glutamer-250 cause the LX-20® to consistently under-estimate calculated lactates with a larger error at largerconcentrations. The difference between measured-minus-calculated lactate varies systematically, not ran-domly, for Hb glutamer-200 and Hb glutamer-250 butnot for Hb raffimer. For Hb raffimer, the Bland-Altmancorrelation was r � 0.106 (P � 0.67) (LX-20®), indicating
no significant trend in the differences. However, for Hbglutamer-200 and Hb glutamer-250, the Bland-Altmancorrelation was r � �0.742 (P � 0.001) (LX-20®) and r ��0.891 (P � 0.001) (LX-20®), respectively.
For the LX® 20 analyzer measuring the control (noHBOC) samples, the Bland-Altman concordance coef-ficient (r) was nearly zero, and the mean difference inthe Bland-Altman analysis was �1 mg/dL lactate,indicating that the LX-20® was accurate in the absenceof HBOC.
Figure 1. Lactate interference by hemoglobin-based oxygen carriers. Bland-Altman plots with linear regression lines for samples containingadded lactate, Plasma-Lyte A™, and hemoglobin glutamer-200, hemoglobin glutamer-250, or hemoglobin raffimer oxygen carriers tested onYSI 1500 SPORT, YSI 2300 STAT, and Synchron LX-20® lactate analyzers. A. YSI 1500 with hemoglobin glutamer-200. B. YSI 2300 withhemoglobin glutamer-200. C. LX-20® with hemoglobin glutamer-200. D. LX-20® with hemoglobin glutamer-250. E. LX-20® with hemoglobinraffimer.
434 TECHNOLOGY, COMPUTING, AND SIMULATION JAHR ET AL. ANESTH ANALGHEMOGLOBIN-BASED OXYGEN CARRIERS AND LACTATE INTERFERENCE 2005;100:431–6
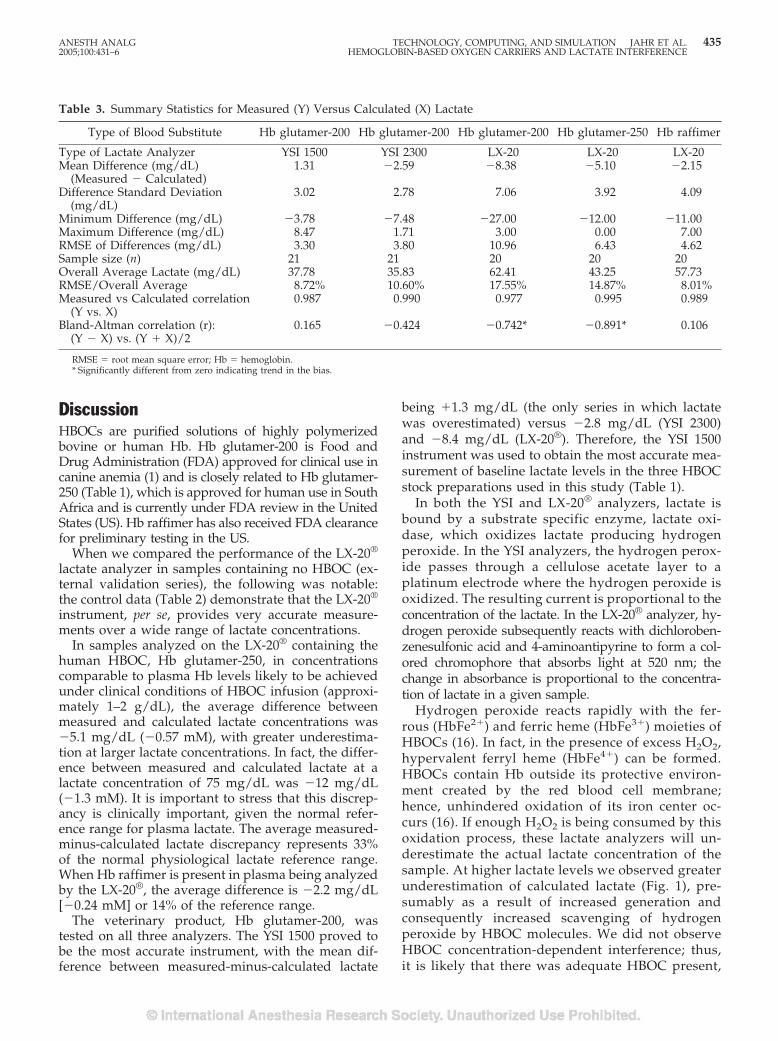
DiscussionHBOCs are purified solutions of highly polymerizedbovine or human Hb. Hb glutamer-200 is Food andDrug Administration (FDA) approved for clinical use incanine anemia (1) and is closely related to Hb glutamer-250 (Table 1), which is approved for human use in SouthAfrica and is currently under FDA review in the UnitedStates (US). Hb raffimer has also received FDA clearancefor preliminary testing in the US.
When we compared the performance of the LX-20®
lactate analyzer in samples containing no HBOC (ex-ternal validation series), the following was notable:the control data (Table 2) demonstrate that the LX-20®
instrument, per se, provides very accurate measure-ments over a wide range of lactate concentrations.
In samples analyzed on the LX-20® containing thehuman HBOC, Hb glutamer-250, in concentrationscomparable to plasma Hb levels likely to be achievedunder clinical conditions of HBOC infusion (approxi-mately 1–2 g/dL), the average difference betweenmeasured and calculated lactate concentrations was�5.1 mg/dL (�0.57 mM), with greater underestima-tion at larger lactate concentrations. In fact, the differ-ence between measured and calculated lactate at alactate concentration of 75 mg/dL was �12 mg/dL(�1.3 mM). It is important to stress that this discrep-ancy is clinically important, given the normal refer-ence range for plasma lactate. The average measured-minus-calculated lactate discrepancy represents 33%of the normal physiological lactate reference range.When Hb raffimer is present in plasma being analyzedby the LX-20®, the average difference is �2.2 mg/dL[�0.24 mM] or 14% of the reference range.
The veterinary product, Hb glutamer-200, wastested on all three analyzers. The YSI 1500 proved tobe the most accurate instrument, with the mean dif-ference between measured-minus-calculated lactate
being �1.3 mg/dL (the only series in which lactatewas overestimated) versus �2.8 mg/dL (YSI 2300)and �8.4 mg/dL (LX-20®). Therefore, the YSI 1500instrument was used to obtain the most accurate mea-surement of baseline lactate levels in the three HBOCstock preparations used in this study (Table 1).
In both the YSI and LX-20® analyzers, lactate isbound by a substrate specific enzyme, lactate oxi-dase, which oxidizes lactate producing hydrogenperoxide. In the YSI analyzers, the hydrogen perox-ide passes through a cellulose acetate layer to aplatinum electrode where the hydrogen peroxide isoxidized. The resulting current is proportional to theconcentration of the lactate. In the LX-20® analyzer, hy-drogen peroxide subsequently reacts with dichloroben-zenesulfonic acid and 4-aminoantipyrine to form a col-ored chromophore that absorbs light at 520 nm; thechange in absorbance is proportional to the concentra-tion of lactate in a given sample.
Hydrogen peroxide reacts rapidly with the fer-rous (HbFe2�) and ferric heme (HbFe3�) moieties ofHBOCs (16). In fact, in the presence of excess H2O2,hypervalent ferryl heme (HbFe4�) can be formed.HBOCs contain Hb outside its protective environ-ment created by the red blood cell membrane;hence, unhindered oxidation of its iron center oc-curs (16). If enough H2O2 is being consumed by thisoxidation process, these lactate analyzers will un-derestimate the actual lactate concentration of thesample. At higher lactate levels we observed greaterunderestimation of calculated lactate (Fig. 1), pre-sumably as a result of increased generation andconsequently increased scavenging of hydrogenperoxide by HBOC molecules. We did not observeHBOC concentration-dependent interference; thus,it is likely that there was adequate HBOC present,
Table 3. Summary Statistics for Measured (Y) Versus Calculated (X) Lactate
Type of Blood Substitute Hb glutamer-200 Hb glutamer-200 Hb glutamer-200 Hb glutamer-250 Hb raffimer
Type of Lactate Analyzer YSI 1500 YSI 2300 LX-20 LX-20 LX-20Mean Difference (mg/dL)
(Measured � Calculated)1.31 �2.59 �8.38 �5.10 �2.15
Difference Standard Deviation(mg/dL)
3.02 2.78 7.06 3.92 4.09
Minimum Difference (mg/dL) �3.78 �7.48 �27.00 �12.00 �11.00Maximum Difference (mg/dL) 8.47 1.71 3.00 0.00 7.00RMSE of Differences (mg/dL) 3.30 3.80 10.96 6.43 4.62Sample size (n) 21 21 20 20 20Overall Average Lactate (mg/dL) 37.78 35.83 62.41 43.25 57.73RMSE/Overall Average 8.72% 10.60% 17.55% 14.87% 8.01%Measured vs Calculated correlation
(Y vs. X)0.987 0.990 0.977 0.995 0.989
Bland-Altman correlation (r):(Y � X) vs. (Y � X)/2
0.165 �0.424 �0.742* �0.891* 0.106
RMSE � root mean square error; Hb � hemoglobin.* Significantly different from zero indicating trend in the bias.
ANESTH ANALG TECHNOLOGY, COMPUTING, AND SIMULATION JAHR ET AL. 4352005;100:431–6 HEMOGLOBIN-BASED OXYGEN CARRIERS AND LACTATE INTERFERENCE
even at the smallest concentrations we tested, tocause interference.
Other possible mechanisms of interference in spec-trophotometric analyzers by HBOCs have been pro-posed, including light scattering by HBOC aggregatesor particles and altered optical absorbance by the mo-lecular alterations to Hb in HBOCs (13).
Based on the samples tested in this study, our re-sults indicate that calculated lactate levels in the pres-ence of HBOCs are underestimated most of the timewhen measured by a lactate analyzer. The clinicalimplications of this study are that with increasinglevels of a HBOC in plasma, lactate interpretation maybecome inaccurate, especially at larger lactate concen-trations, causing underestimation of measured lactatevalues and possible under-treatment of the patient.Therefore, caution must be exercised when interpret-ing lactate results when a HBOC is present in plasma.
We thank Jeffrey Gornbein, Dr. PH, UCLA Department of Biomath-ematics, for his statistical support and Jessica Tsukamoto for hertechnical assistance in the experiments. The authors thank BiopureCorp. and Hemosol Inc. for donating Hemopure® and Hemolink™for study in our laboratories. Oxyglobin® was purchased at a vet-erinary pharmacy. We also thank Drs. Egil Steien and VatcheBezdikian for their valuable assistance in the design and implemen-tation of the study.
References1. Jahr JS, Nesargi SB, Lewis K, et al. Blood substitutes and oxygen
therapeutics: an overview and current status. Am J Ther 2002;9:437–43.
2. Winslow, RM. Current status of blood substitute research: to-wards a paradigm. J Int Med 2003;253:508–17.
3. Stowell CP. Hemoglobin-based oxygen carriers. Curr Opin He-matol 2002;9:537–43.
4. Standl T. Haemoglobin-based erythrocyte transfusion substi-tutes. Expert Opin Biol Ther 2001;1:831–43.
5. Winslow RM. Alternative oxygen therapeutics: products, statusof clinical trials, and future prospects. Curr Hematol Rep 2003;2:503–10.
6. Cheung ATW, Jahr JS, Driessen B, et al. Effects of a hemoglobin-based oxygen carrier (HBOC, Hemoglobin glutamer-200 [bo-vine]) on the microcirculation in a canine hypovolemia model: anon-invasive, computer-assisted intravital microscopy studyAnesth Analg 2001;93:832–8.
7. Driessen B, Jahr JS, Lurie F, et al. Arterial oxygenation andoxygen delivery after hemoglobin-based oxygen carrier infusionin canine hypovolemic shock: a dose-response study. Crit CareMed 2003;31:1771–9.
8. Driessen B, Jahr JS, Lurie F, et al. Effects of hemoglobin-basedoxygen carrier Hemoglobin glutamer-200 (bovine) on intestinalperfusion and oxygenation in a canine hypovolemia model. Br JAnaesth 2001;86:683–92.
9. Jahr JS, Lurie F, Gosselin R, et al. Effects of hemoglobinglutamer-250 (bovine) (HBOC-201, Hemopure) on coagulationtesting. Am J Ther 2002;9:431–6.
10. Wolthuis A, Peek D, Scholten R, et al. Effect of the hemoglobin-based oxygen carrier HBOC-201 on laboratory instrumentation:cobas integra, chiron blood gas analyzer 840, Sysmex SE-9000and BCT. Clin Chem Lab Med 1999;37:71–6.
11. Callas DD, Clark TL, Moreira PL, et al. In vitro effects of a novelhemoglobin-based oxygen carrier on routine chemistry, thera-peutic drug, coagulation, hematology, and blood bank assays.Clin Chem 1997;43:1744–8.
12. Ma Z, Monk TG, Goodnough LT, et al. Effect of hemoglobin-and Perflubron-based oxygen carriers on common clinical lab-oratory tests. Clin Chem 1997;43:1732–7.
13. Ali AA, Ali GS, Steinke JM, Shepherd AP. Co-oximetry inter-ference by hemoglobin-based blood substitutes. Anesth Analg2001;92:863–9.
14. Chance JJ, Norris EJ, Kroll MH. Mechanism of interference of apolymerized hemoglobin blood substitute in an alkaline phos-phatase method. Clin Chem 2000;46:1331–7.
15. Kazmierczak SC, Cartrou PG, Best AE, et al. Multiple regressionanalysis of interference effects from a hemoglobin-based oxygencarrier solution. Clin Chem Lab Med 1999;37:453–64.
16. Yeh LH, Alayash AI. Redox side reactions of haemoglobin andcell signalling mechanisms. J Int Med 2003;253:518–26.
17. Alayash AI. Oxidative mechanisms of hemoglobin-based bloodsubstitutes. Art Cells Blood Subs Immob Biotech 2001;29:415–25.
18. Alayash AI. Hemoglobin-based blood substitutes and the haz-ards of blood radicals. Free Radic Res 2000;33:341–8.
19. Alayash AI. Hemoglobin-based blood substitutes: oxygen car-riers, pressor agents, or oxidants? Nat Biotechnol 1999;17:545–9.
20. Neter J, Wasserman W, Kutner M, eds. Applied linear statisticalmodels, 2nd ed. Homewood: Richard Irwin Inc., 1985: 395–6.
21. Bland JM, Altman DG. Statistical methods for assessing agree-ment between two methods of clinical measurement. Lancet1986;1:307–10.
22. Mantha S, Roizen MF, Fleisher LA, et al. Comparing methods ofclinical measurement: reporting standards for Bland-Altmananalysis. Anesth Analg 2000;90:593–602.
436 TECHNOLOGY, COMPUTING, AND SIMULATION JAHR ET AL. ANESTH ANALGHEMOGLOBIN-BASED OXYGEN CARRIERS AND LACTATE INTERFERENCE 2005;100:431–6
Does Methemoglobin from Oxidized Hemoglobin-BasedOxygen Carrier (Hemoglobin Glutamer-200) Interfere withLactate Measurement (YSI 2700 SELECT™Biochemistry Analyzer)?Stephen L. Osgood, MD*, Jonathan S. Jahr, MD*†, Poonam Desai*, Jessica Tsukamoto*,and Bernd Driessen, DVM, PhD*‡
*Department of Anesthesiology, David Geffen School of Medicine at University of California Los Angeles; †Charles R.Drew University of Medicine and Science, Martin Luther King Jr./Drew Medical Center, Los Angeles, California; and‡Department of Clinical Studies, University of Pennsylvania School of Veterinary Medicine, Philadelphia
In this study, we validated the accuracy of lactate mea-surements (YSI 2700 SELECT™ glucose/lactate ana-lyzer) in the presence of methemoglobin from anoxidized bag of hemoglobin-based oxygen carrier(Met-HBOC), hemoglobin glutamer-200 (Oxyglobin®;Biopure Corp). Different combinations of concentratedl-lactate solution, pooled canine plasma, and PlasmalyteA™ were added to 4 sample groups (1%, 10%, 20%, and40% Met-HBOC [1.3 g/dL]) to yield linear increases inlactate concentration in consecutive samples. The meandifference between measured and calculated lactate was�5.1 mg/dL (1% Met-HBOC), �5.8 mg/dL (10% Met-HBOC), �4.6 mg (20% Met-HBOC), and �8.5 mg/dL(40% Met-HBOC). The root mean square error was
6.5 mg/dL, 7.4 mg/dL, 6.8 mg/dL, and 10.3 mg/dL,respectively. The Bland-Altman correlation (r) was r ��0.94 (P � 0.01), r � �0.91 (P � 0.001), r � �0.90 (P �0.001), and r � �0.94 (P � 0.001), respectively, where r� 0 for perfect agreement between measured and calcu-lated values. Results indicate that true lactate levels inthe presence of Met-HBOC are underestimated whenmeasured by an YSI 2700 analyzer independent of theamount of Met-HBOC present. When interpreting lac-tate concentrations from a patient with a HBOC presentin plasma, underestimation of true lactate levels mayoccur unrelated to methemoglobin concentrations.
(Anesth Analg 2005;100:437–9)
H emoglobin-based oxygen carriers (HBOCs) arenovel solutions of cell-free hemoglobin that ef-fectively transport and deliver oxygen to the
periphery, thereby serving as alternatives to allogenicred blood cells for use in blood transfusions (1,2).HBOCs have been targeted for use in cases of severeblood loss and hemorrhagic shock secondary to trau-matic injury or to treat perioperative anemia duringelective surgery. Other investigators have studied in-terference effects from HBOCs on routine chemistries,therapeutic drugs, coagulation, hematology, andblood bank analysis, but none have looked specificallyat oxidized HBOCs in these settings (3–5).
Because cell-free hemoglobin is an avid oxygen scav-enger in the absence of reducing enzymes containedwithin red blood cells, HBOCs exposed to air becomerapidly oxidized, increasing the amount of methemoglo-bin compared with oxyhemoglobin (6). This studyvalidated the accuracy of lactate measurementsusing a YSI 2700 SELECT™ Biochemistry Analyzer(YSI Inc, Yellow Springs, OH) in the presence ofmethemoglobin from oxidized HBOC (Met-HBOC)and hemoglobin glutamer-200 (Oxyglobin®; BiopureCorp, Cambridge, MA). The correlation betweenanalyzer-measured lactate and calculated or actuallactate concentration was studied (reference rangefor lactate [venous] is 4.5–20 mg/dL). We hypothe-sized that the presence of Met-HBOC would inter-fere with the accuracy of measured lactate valuesbecause Met-HBOC undergoes a rapid redox reac-tion with hydrogen peroxide that the YSI 2700 uses,in part, to measure lactate. With less hydrogen per-oxide reaching the electrode in the analyzer, a smaller
Accepted for publication August 10, 2004.Address correspondence and reprint requests to Jonathan S. Jahr,
MD, Department of Anesthesiology, David Geffen School of Med-icine at UCLA, PO Box 951778, Los Angeles, CA 90095-1778. Ad-dress e-mail to [email protected].
DOI: 10.1213/01.ANE.0000143337.05366.CD
©2005 by the International Anesthesia Research Society0003-2999/05 Anesth Analg 2005;100:437–9 437
current is generated, and underestimation of actuallactate concentrations could occur.
MethodsWe used remainder canine plasma from the Univer-sity of California at Davis, where Animal Use andCare Administrative Advisory Committee approvalwas obtained. Different combinations of 80% Met-HBOC and 1% Met-HBOC were mixed to yield 4groups containing 1%, 10%, 20%, and 40% Met-HBOC.Different combinations of concentrated l-lactate solu-tion (Sigma, St Louis, MO), pooled canine plasma, andPlasmalyte A™ (Baxter, Deerfield, IL), a balanced saltsolution (Plasmalyte A™ does not contain any lactate),were added to the Met-HBOC groups to make a linearand constant increase in lactate concentration in con-secutive samples (15 mg/dL to 99 mg/dL; 15 totalsamples per group except for the 1% Met-HBOCgroup, which had 8 samples because of a shortage ofcanine plasma). The final HBOC concentration in eachsample was 1.3 g/dL (Table 1).
A previously opened bag and a new sealed bag ofhemoglobin glutamer-200 were determined to be 80%and 1% methemoglobin, respectively, by co-oximetry(Radiometer ABL 700 Series, Copenhagen, Denmark)on the experiment day. The 80% Met-HBOC had abaseline lactate concentration of 97.8 mg/dL, and the1% Met-HBOC contained 96.5 mg/dL. Baseline lactatepresent in canine plasma was 16.6 mg/dL. Duplicatelactate measurements were taken by the YSI 2700, and
the average was used for statistical analysis. The datawere analyzed using root mean square error of thedifferences (RMSE; RMSE � �[(mean of calculated �measured difference)2 � [sd of the differences)2]) andBland-Altman statistical analysis to compare the cal-culated values to the measured values (7,8).
ResultsThe mean differences between measured minus calcu-lated lactate were �5.1 mg/dL, (9.5% of the overallmean of measured and calculated lactate values) for1% Met-HBOC, �5.8 mg/dL (10.7% overall mean) for10% Met-HBOC, �4.6 mg (8.5% overall mean) for 20%Met-HBOC, and �8.5 mg/dL (16.1% overall mean) for40% Met-HBOC (Fig. 1). The RMSE was 6.5 mg/dL(12% of overall mean), 7.4 mg/dL (13.7% overall mean),6.8 mg/dL (12.6% overall mean), and 10.3 mg/dL (19.5%overall mean), respectively. The Bland-Altman correla-tion (r) between measured minus calculated differenceversus the average of the measured and calculated lac-tate was r � �0.94 (P � 0.01), r � �0.91 (P � 0.001), r ��0.90 (P � 0.001), and r � �0.94 (P � 0.001), respec-tively, where Bland-Altman r � 0 for perfect agreementbetween measured and calculated values.
DiscussionCalculated lactate was the term we used for what thetrue lactate level should be, taking into considerationeverything containing lactate that was added to the
Table 1. Protocol for Lactate Samples
Sample
Added l-lactatefrom
150 mg/dLstock(�L)
Plasmalyte A™a
(�L)
HBOCb finalconcentration� 1.3 g/dL
(�L)
Canineplasma
(�L)
Final samplevolume
(�L)
Final calculated[lactate](mg/dL)
1 0 600 100 300 1000 152 40 560 100 300 1000 213 80 520 100 300 1000 274 120 480 100 300 1000 335 160 440 100 300 1000 396 200 400 100 300 1000 457 240 360 100 300 1000 518 280 320 100 300 1000 579 320 280 100 300 1000 63
10 360 240 100 300 1000 6911 400 200 100 300 1000 7512 440 160 100 300 1000 8113 480 120 100 300 1000 8714 520 80 100 300 1000 9315 560 40 100 300 1000 99
Each sample contained varying amounts of concentrated L-lactate solution, Plasmalyte A™, either 1%, 10%, 20%, or 40% methemoglobin-hemoglobinglutamer-200, and canine plasma. The amount of solution added to each sample is shown. Final calculated lactate values are given.
a A balanced salt solution.b Hemoglobin-based oxygen carrier (HBOC), hemoglobin glutamer-200 [bovine] was made to have either 1%, 10%, 20%, or 40% methemoglobin for all
samples.
438 TECHNOLOGY, COMPUTING, AND SIMULATION OSGOOD ET AL. ANESTH ANALGMETHEMOGLOBIN HBOC AND LACTATE INTERFERENCE 2005;100:437–9
test samples. This included the baseline lactate levelscontained in the initial preparation of hemoglobinglutamer-200, the lactate present in canine plasma,and different amounts of lactate added from a concen-trated stock solution. Measured lactate was the valuegiven by the YSI 2700 after analyzing a given testsample.
In comparing measured to calculated values for ev-ery test sample for each concentration of Met-HBOC,results indicate that actual lactate levels in the pres-ence of Met-HBOC were consistently underestimated(mean differences were all negative) independent ofthe amount of Met-HBOC present. Although the 20%Met-HBOC group had the most accurate measuredvalues (mean difference and Bland-Altman correlationcoefficient statistic) and the 40% Met-HBOC grouphad the most negative mean difference and greatestmeasurement error (RMSE), neither was significantlydifferent from the 1% and 10% Met-HBOC groups.However, all groups significantly underestimated ac-tual lactate concentrations (P � 0.01).
All hemoglobins, including modified hemoglobins(i.e., HBOCs) in particular, have a propensity to reactwith hydrogen peroxide (i.e., oxidation of heme Fe) inan enzymatic fashion (6). Biopure Corp. double packshemoglobin glutamer-200 in airtight containers to pre-vent oxidation. Usual methemoglobin concentrationin an unopened bag is approximately 1%. However,some clinical trials and studies using a similar producthave detected increased methemoglobin levels in newproducts (4).
In the YSI analyzers, lactate is bound by a substrate-specific enzyme, lactate oxidase, which oxidizes lac-tate, generating an amount of hydrogen peroxide thatis directly proportional to the amount of lactatepresent in the sample. It seems that the HBOCs likelyscavenged enough hydrogen peroxide to cause themachine to report a smaller lactate concentration than
it should have. Diaspirin cross-linked hemoglobin hasbeen shown to interfere with l-lactate measurementusing the Dade ACA IV analyzer (Dade Behring Inc,Wilmington, DE) (5).
Therefore, when interpreting lactate concentrationsfrom a patient with a HBOC present in plasma, un-derestimation of true lactate levels may occur unre-lated to methemoglobin concentrations but as a resultof the redox reaction between HBOC and hydrogenperoxide in the lactate analyzer.
The authors thank Mohammed Saad, MD, FRCP, for use of hislaboratory and Rima Boyadjian for her superior technical assistance.We also thank Jeffrey Gornbein, Dr PH, UCLA Department ofBiomathematics, for his insightful statistical support. For access tothe clinical laboratory at UCLA, we thank Anthony Butch, PhD.
References1. Winslow RM. Current status of blood substitute research: to-
wards a paradigm. J Intern Med 2003;253:508–17.2. Winslow RM. Alternative oxygen therapeutics: products, status
of clinical trials, and future prospects. Curr Hematol Rep 2003;2:503–10.
3. Jahr JS, Lurie F, Gosselin R, et al. Effects of hemoglobin glutamer-250 (bovine) (HBOC-201, Hemopure) on coagulation testing.Am J Ther 2002;9:431–6.
4. Ali AA, Ali GS, Steinke JM, Shepherd AP. Co-oximetry interfer-ence by hemoglobin-based blood substitutes. Anesth Analg 2001;92:863–9.
5. Kazmierczak SC, Cartrou PG, Best AE, et al. Multiple regressionanalysis of interference effects from a hemoglobin-based oxygencarrier solution. Clin Chem Lab Med 1999;37:453–64.
6. Yeh LH, Alayash AI. Redox side reactions of haemoglobin andcell signalling mechanisms. J Intern Med 2003;253:518–26.
7. Bland JM, Altman DG. Statistical methods for assessing agree-ment between two methods of clinical measurement. Lancet1986;1:307–10.
8. Mantha S, Roizen MF, Fleischer LA, et al. Comparing methods ofclinical measurement: reporting standards for Bland-Altmananalysis. Anesth Analg 2000;90:593–602.
Figure 1. Lactate interference by oxidized hemoglobin-based oxygen carriers (HBOCs). Bland-Altman plots for samples containing hemo-globin glutamer-200 (Oxyglobin®), added l-lactate, Plasmalyte A™, and canine plasma tested on a YSI 2700 SELECT™ glucose/lactateanalyzer. The difference between analyzer-measured and calculated lactate concentration versus the average of measured and calculatedlactate for each different series of methemoglobin (MetHb) concentration (1%, 10%, 20%, and 40%) is plotted. The reference range for lactate(venous) is 4.5–20 mg/dL.
ANESTH ANALG TECHNOLOGY, COMPUTING, AND SIMULATION OSGOOD ET AL. 4392005;100:437–9 METHEMOGLOBIN HBOC AND LACTATE INTERFERENCE
The Modifying Effects of Stimulation Pattern and PropofolPlasma Concentration on Motor-Evoked PotentialsKai M. Scheufler, MD*, Peter C. Reinacher, MD†, Winfried Blumrich, MD‡, Josef Zentner, MD*,and Hans-Joachim Priebe, MD†
rsity
ariancetimula-uli on
litudesh three0 V. AmL) onordingd fromdrupleges insignif-
pattern
:440–7)
the effect oflation pat-
P recordingrther define(induced byd intensity)centrations
transcranialneurosurgi-ariations inuld modifystimulationrgical anes-the clinical
claration ofnal Medicaled written,
8 women;II, n � 5; III,eight: mean,
Research Society0003-2999/05
*Department of Neurosurgery, University Hospital, Freiburg, Germany; †Department of Neurosurgery, UniveHospital, Aachen, Germany; and ‡Department of Anesthesiology, University Hospital, Freiburg, Germany
The quality of intraoperative motor-evoked potentials(MEPs) largely depends on the stimulation pattern andanesthetic technique. Further improvement in intraop-erative MEP recording requires exact knowledge of themodifying effects of each of these factors. Accordingly,we designed this study to characterize the modifyingeffect of different stimulation patterns during differentpropofol target plasma concentrations (PTPCs) on in-traoperatively recorded transcranial electrical MEPs. In12 patients undergoing craniotomy, stimulation pat-terns (300–500 V; 100–1000 Hz; 1–5 stimuli) were variedrandomly at different PTPCs (2, 4, and 6 �g/mL).Remifentanil was administered unchanged at 0.2�g · kg�1 · min�1. MEPs were recorded from the thenarand hypothenar muscles. Analysis of MEPs was
blinded to the PTPC. Three-way analysis of vrevealed significant main effects of increasing stion intensity, frequency, and number of stimMEP amplitude (P � 0.05). Maximum MEP ampand recording success rates were observed witor more stimuli delivered at 1000 Hz and �15significant main effect of PTPC (2 vs 4 and 6 �g/MEP amplitude was observed at the thenar recsite only (P � 0.05). An amplitude ratio calculatecorresponding MEPs evoked by double and quastimulation proved to be insensitive to chanPTPC. In conclusion, MEP characteristics variedicantly in response to changes in stimulationand less to changes in PTPC.
(Anesth Analg 2005;100
I ntraoperative assessment of motor-evoked poten-tials (MEPs) has gained increasing popularity inroutine clinical practice. Although the clinical value
of intraoperative MEP monitoring in detecting im-pending iatrogenic lesions in the motor system at anearly, reversible stage is well documented, its intraop-erative usefulness has been improved by the introduc-tion of total IV anesthesia protocols (1,2) and repetitivehigh-frequency stimulation devices (3,4). Despite suchtechnical advances, meaningful interpretation of intra-operative MEP changes relies on suitable recordingconditions that minimize alterations in neuronal im-pulse generation and conduction and that generatereproducible signals. This, in turn, requires detailedknowledge of the effect of anesthetic technique andstimulation pattern on MEP characteristics.
Previous investigations have examinedvarious anesthetic techniques and stimuterns on the quality of intraoperative ME(1,2,5–9). This study was designed to futhe effect of different stimulation patternschanges in stimulus number, frequency, anand various propofol target plasma con(PTPCs) on MEPs evoked by repetitiveelectrical stimulation during intracranialcal procedures. We hypothesized that vboth stimulation pattern and PTPC woMEPs. By analyzing the effect of differentpatterns on MEP characteristics under suthesia, this study aimed to further improveutility of intraoperative MEP monitoring.
MethodsThe study protocol complies with the DeHelsinki. After approval by the institutioEthics Review Board and after we obtaininformed consent, 12 patients (4 men andASA physical status classification: I, n � 2;n � 5; age: mean, 49 yr; range, 22–67 yr; w
Supported by Grant Ze 267/3-2 from the German ResearchFoundation.
Accepted for publication July 20, 2004.Address correspondence and reprint requests to Kai M. Scheufler,
MD, Abt. Allgemeine Neurochirurgie, UniversitatsklinikumFreiburg, Breisacher Str. 64, D-79106 Freiburg, Germany. Addresse-mail to [email protected].
DOI: 10.1213/01.ANE.0000141678.04200.86
©2005 by the International Anesthesia440 Anesth Analg 2005;100:440–7
73 kg; range, 50–105 kg) admitted for supratentorialintracranial procedures were studied prospectively.Impairment of the muscle groups targeted for intra-operative investigation was excluded by preoperativeclinical and neurophysiological assessment, includingelectromyography.
To minimize the possibility of intraoperative aware-ness at small PTPCs (see below), all patients werepremedicated with 7.5 mg of midazolam by mouth 1 hbefore the induction of anesthesia. No other centrallyacting drugs were administered. On arrival in theoperating room, catheters were inserted in peripheralveins and the radial artery on the arm opposite to theMEP recording site for the administration of fluidsand IV anesthetics, continuous recording of mean ar-terial blood pressure (MAP), and regular blood sam-pling for blood gas analysis (ABL®; Radiometer,Copenhagen, Denmark), respectively. Peripheral oxy-gen saturation (Spo2) and depth of anesthesia weremonitored continuously via pulse oximetry (Siemens,Erlangen, Germany) and electroencephalographicbispectral index (BIS) (10) (BIS-Monitor; Aspect Med-ical Systems, Newton, MA), respectively.
Anesthesia was induced by continuous IV infusionof remifentanil (0.2–0.5 �g · kg�1 · min�1) and ofpropofol administered to achieve PTPCs of 4 �g/mL(Alaris TCI/TIVA 9000, incorporating the Diprifu-sor™ module; Zeneca Pharmaceuticals, Cheshire,UK). Cisatracurium (0.1 mg/kg) was administered tofacilitate endotracheal intubation. Oxygenation, venti-lation, body temperature, and systemic perfusionpressure were continuously monitored and kept con-stant. To ensure systemic arterial oxygen partial pres-sures (Pao2) of �100 mm Hg at all times, fractionalinspired oxygen concentration was administered at aminimum of 0.5 in air and was adjusted to maintainSpo2 at �99% throughout the investigation. To ensurea systemic arterial CO2 partial pressure (Paco2) of30–40 mm Hg, minute ventilation was adjusted tomaintain end-tidal partial pressure of CO2 (Petco2)between 25 and 35 mm Hg throughout the investiga-tion. A warming/cooling blanket was used to main-tain rectal temperature between 35°C and 37°C. Hy-potension (MAP �60 mm Hg in normotensive or�70 mm Hg in hypertensive patients) was treated by IVadministration of 1–2 mL of Akrinor® (Cafedrin-HCl/Theodrenalin-HCl) diluted 2:8 with normal saline so-lution. All vital variables were recorded continuously(SC 9000®; Siemens). Fluid administration was guidedby central venous pressure and urine output. All an-esthetics were administered by two of the investiga-tors (WB and H-JP). In each patient, PTPCs were var-ied randomly among 2, 4, and 6 �g/mL (sealed-envelope technique). Throughout the investigation,remifentanil was administered unchanged at 0.2�g · kg�1 · min�1. After equilibration of each of thePTPCs, the continuously monitored MAP and heart
rate values had to have remained within a 5% rangefor at least 10 min before MEPs were recorded.
MEPs were recorded by standard neurophysiologi-cal equipment (Spirit® evoked-potential system; Nico-let Biomedical, Madison, WI). Compound muscle ac-tion potentials were derived from hypodermic needleelectrodes placed in the abductor pollicis brevis (the-nar) and abductor digiti minimi (hypothenar) musclesby using a belly-tendon montage. Electrode imped-ances �5 k� were accepted (mean electrode imped-ance, �1 k�). The high- and low-pass filters were setat 30 Hz and 3 kHz, respectively. The notch filter wasdeactivated. The stimulating device (Digitimer™D185; Digitimer Ltd., Welwyn Garden City, Hertford-shire, UK) was connected to the Spirit™ evoked po-tential system and served as an external triggeringdevice. It was capable of delivering trains of constant-voltage rectangular electrical stimuli with a durationof 200 �s at frequencies ranging from 100 to 1000 Hzand stimulating intensities of 1–1000 V. Stimuli weredelivered transcranially via hypodermic needle elec-trodes placed ipsilaterally to the craniotomy site at Cz(cathode) and C3 or C4 (anode) according to the in-ternational 10/20 system. After craniotomy and duralopening, the study protocol was started.
Each recording cycle assessed MEPs in response to(a) variation in stimulation current (100, 150, 200, 250,or 300 V) at a constant stimulation frequency (500 Hz)and a constant number of stimuli (n � 4), (b) variationin stimulation frequency (100, 200, 500, or 1000 Hz) ata constant stimulation intensity (300 V) and a constantnumber of stimuli (n � 4), or (c) variation in thenumber of stimuli (n � 1–5) at a constant stimulationintensity (300 V) and a constant stimulation frequency(500 Hz). Thus, different stimulation patterns wereinvestigated at each of the 3 PTPCs. Two consecutiveMEP recordings (separated by 30 s) were performedafter each change in stimulation pattern (i.e., 12 � 2measurements per PTPC). To exclude conditioningeffects of repetitive stimulation on MEP characteris-tics, the stimulation pattern was varied randomly.
Amplitudes were measured from peak to baseline.Latencies were defined as the interval between theonset of the stimulation artifact and the onset of theMEP. MEP amplitudes and latencies were indepen-dently reviewed by two investigators blinded to thePTPCs (PCR and KMS). Data evaluated by two inves-tigators were averaged before further processing.
The sample size required to obtain statistical signif-icance was calculated on the basis of MEP amplitudechanges during previous studies (2) and the standardthreshold for significant MEP amplitude changes (50%of baseline values). Because assessment of all possiblecombinations between the various stimulation vari-ables (voltage, frequency, and number of stimuli) andPTPCs was not feasible, our study protocol compriseda reduced factorial design. The individual effects of
ANESTH ANALG TECHNOLOGY, COMPUTING, AND SIMULATION SCHEUFLER ET AL. 4412005;100:440–7 STIMULATION PATTERN, PROPOFOL, AND MOTOR-EVOKED POTENTIALS
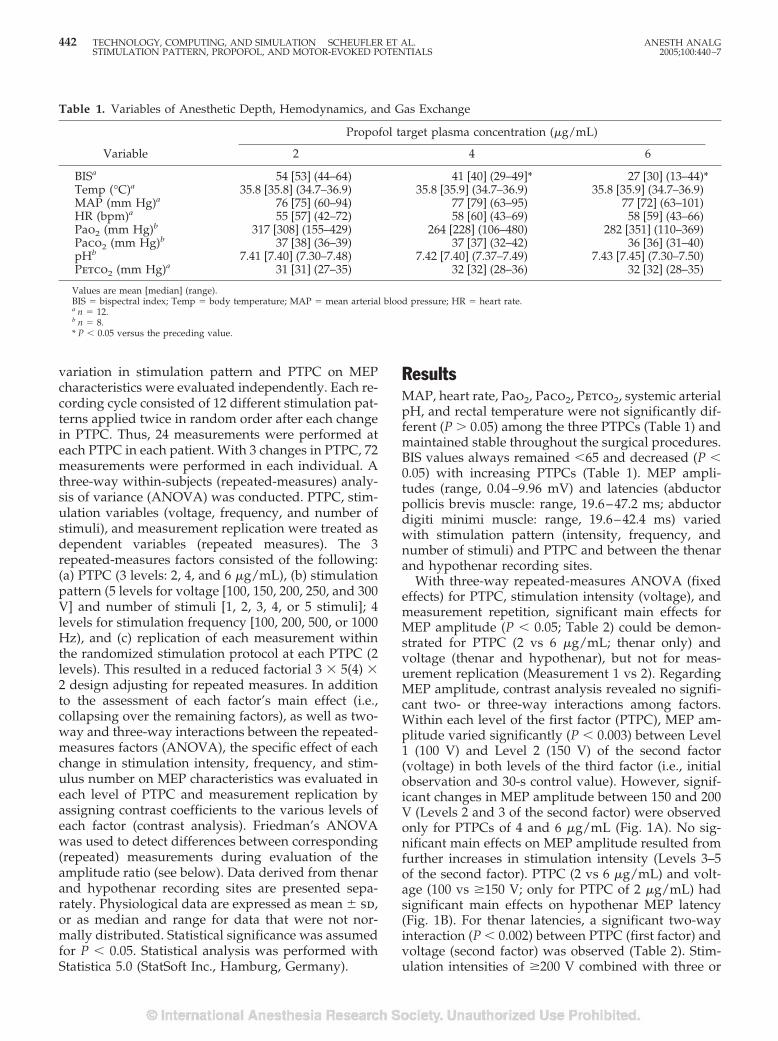
variation in stimulation pattern and PTPC on MEPcharacteristics were evaluated independently. Each re-cording cycle consisted of 12 different stimulation pat-terns applied twice in random order after each changein PTPC. Thus, 24 measurements were performed ateach PTPC in each patient. With 3 changes in PTPC, 72measurements were performed in each individual. Athree-way within-subjects (repeated-measures) analy-sis of variance (ANOVA) was conducted. PTPC, stim-ulation variables (voltage, frequency, and number ofstimuli), and measurement replication were treated asdependent variables (repeated measures). The 3repeated-measures factors consisted of the following:(a) PTPC (3 levels: 2, 4, and 6 �g/mL), (b) stimulationpattern (5 levels for voltage [100, 150, 200, 250, and 300V] and number of stimuli [1, 2, 3, 4, or 5 stimuli]; 4levels for stimulation frequency [100, 200, 500, or 1000Hz), and (c) replication of each measurement withinthe randomized stimulation protocol at each PTPC (2levels). This resulted in a reduced factorial 3 � 5(4) �2 design adjusting for repeated measures. In additionto the assessment of each factor’s main effect (i.e.,collapsing over the remaining factors), as well as two-way and three-way interactions between the repeated-measures factors (ANOVA), the specific effect of eachchange in stimulation intensity, frequency, and stim-ulus number on MEP characteristics was evaluated ineach level of PTPC and measurement replication byassigning contrast coefficients to the various levels ofeach factor (contrast analysis). Friedman’s ANOVAwas used to detect differences between corresponding(repeated) measurements during evaluation of theamplitude ratio (see below). Data derived from thenarand hypothenar recording sites are presented sepa-rately. Physiological data are expressed as mean � sd,or as median and range for data that were not nor-mally distributed. Statistical significance was assumedfor P � 0.05. Statistical analysis was performed withStatistica 5.0 (StatSoft Inc., Hamburg, Germany).
ResultsMAP, heart rate, Pao2, Paco2, Petco2, systemic arterialpH, and rectal temperature were not significantly dif-ferent (P � 0.05) among the three PTPCs (Table 1) andmaintained stable throughout the surgical procedures.BIS values always remained �65 and decreased (P �0.05) with increasing PTPCs (Table 1). MEP ampli-tudes (range, 0.04–9.96 mV) and latencies (abductorpollicis brevis muscle: range, 19.6–47.2 ms; abductordigiti minimi muscle: range, 19.6–42.4 ms) variedwith stimulation pattern (intensity, frequency, andnumber of stimuli) and PTPC and between the thenarand hypothenar recording sites.
With three-way repeated-measures ANOVA (fixedeffects) for PTPC, stimulation intensity (voltage), andmeasurement repetition, significant main effects forMEP amplitude (P � 0.05; Table 2) could be demon-strated for PTPC (2 vs 6 �g/mL; thenar only) andvoltage (thenar and hypothenar), but not for meas-urement replication (Measurement 1 vs 2). RegardingMEP amplitude, contrast analysis revealed no signifi-cant two- or three-way interactions among factors.Within each level of the first factor (PTPC), MEP am-plitude varied significantly (P � 0.003) between Level1 (100 V) and Level 2 (150 V) of the second factor(voltage) in both levels of the third factor (i.e., initialobservation and 30-s control value). However, signif-icant changes in MEP amplitude between 150 and 200V (Levels 2 and 3 of the second factor) were observedonly for PTPCs of 4 and 6 �g/mL (Fig. 1A). No sig-nificant main effects on MEP amplitude resulted fromfurther increases in stimulation intensity (Levels 3–5of the second factor). PTPC (2 vs 6 �g/mL) and volt-age (100 vs �150 V; only for PTPC of 2 �g/mL) hadsignificant main effects on hypothenar MEP latency(Fig. 1B). For thenar latencies, a significant two-wayinteraction (P � 0.002) between PTPC (first factor) andvoltage (second factor) was observed (Table 2). Stim-ulation intensities of �200 V combined with three or
Table 1. Variables of Anesthetic Depth, Hemodynamics, and Gas Exchange
Variable
Propofol target plasma concentration (�g/mL)
2 4 6
BISa 54 [53] (44–64) 41 [40] (29–49]* 27 [30] (13–44)*Temp (°C)a 35.8 [35.8] (34.7–36.9) 35.8 [35.9] (34.7–36.9) 35.8 [35.9] (34.7–36.9)MAP (mm Hg)a 76 [75] (60–94) 77 [79] (63–95) 77 [72] (63–101)HR (bpm)a 55 [57] (42–72) 58 [60] (43–69) 58 [59] (43–66)Pao2 (mm Hg)b 317 [308] (155–429) 264 [228] (106–480) 282 [351] (110–369)Paco2 (mm Hg)b 37 [38] (36–39) 37 [37] (32–42) 36 [36] (31–40)pHb 7.41 [7.40] (7.30–7.48) 7.42 [7.40] (7.37–7.49) 7.43 [7.45] (7.30–7.50)Petco2 (mm Hg)a 31 [31] (27–35) 32 [32] (28–36) 32 [32] (28–35)
Values are mean [median] (range).BIS � bispectral index; Temp � body temperature; MAP � mean arterial blood pressure; HR � heart rate.a n � 12.b n � 8.* P � 0.05 versus the preceding value.
442 TECHNOLOGY, COMPUTING, AND SIMULATION SCHEUFLER ET AL. ANESTH ANALGSTIMULATION PATTERN, PROPOFOL, AND MOTOR-EVOKED POTENTIALS 2005;100:440–7
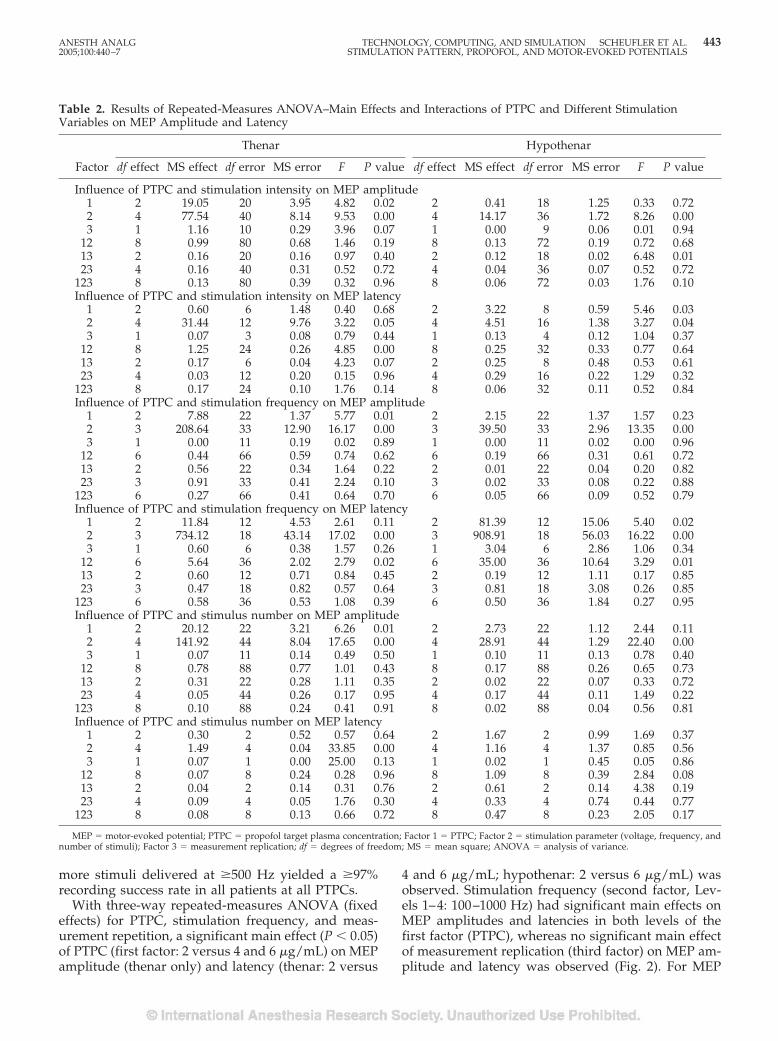
more stimuli delivered at �500 Hz yielded a �97%recording success rate in all patients at all PTPCs.
With three-way repeated-measures ANOVA (fixedeffects) for PTPC, stimulation frequency, and meas-urement repetition, a significant main effect (P � 0.05)of PTPC (first factor: 2 versus 4 and 6 �g/mL) on MEPamplitude (thenar only) and latency (thenar: 2 versus
4 and 6 �g/mL; hypothenar: 2 versus 6 �g/mL) wasobserved. Stimulation frequency (second factor, Lev-els 1–4: 100–1000 Hz) had significant main effects onMEP amplitudes and latencies in both levels of thefirst factor (PTPC), whereas no significant main effectof measurement replication (third factor) on MEP am-plitude and latency was observed (Fig. 2). For MEP
Table 2. Results of Repeated-Measures ANOVA–Main Effects and Interactions of PTPC and Different StimulationVariables on MEP Amplitude and Latency
Factor
Thenar Hypothenar
df effect MS effect df error MS error F P value df effect MS effect df error MS error F P value
Influence of PTPC and stimulation intensity on MEP amplitude1 2 19.05 20 3.95 4.82 0.02 2 0.41 18 1.25 0.33 0.722 4 77.54 40 8.14 9.53 0.00 4 14.17 36 1.72 8.26 0.003 1 1.16 10 0.29 3.96 0.07 1 0.00 9 0.06 0.01 0.94
12 8 0.99 80 0.68 1.46 0.19 8 0.13 72 0.19 0.72 0.6813 2 0.16 20 0.16 0.97 0.40 2 0.12 18 0.02 6.48 0.0123 4 0.16 40 0.31 0.52 0.72 4 0.04 36 0.07 0.52 0.72
123 8 0.13 80 0.39 0.32 0.96 8 0.06 72 0.03 1.76 0.10Influence of PTPC and stimulation intensity on MEP latency
1 2 0.60 6 1.48 0.40 0.68 2 3.22 8 0.59 5.46 0.032 4 31.44 12 9.76 3.22 0.05 4 4.51 16 1.38 3.27 0.043 1 0.07 3 0.08 0.79 0.44 1 0.13 4 0.12 1.04 0.37
12 8 1.25 24 0.26 4.85 0.00 8 0.25 32 0.33 0.77 0.6413 2 0.17 6 0.04 4.23 0.07 2 0.25 8 0.48 0.53 0.6123 4 0.03 12 0.20 0.15 0.96 4 0.29 16 0.22 1.29 0.32
123 8 0.17 24 0.10 1.76 0.14 8 0.06 32 0.11 0.52 0.84Influence of PTPC and stimulation frequency on MEP amplitude
1 2 7.88 22 1.37 5.77 0.01 2 2.15 22 1.37 1.57 0.232 3 208.64 33 12.90 16.17 0.00 3 39.50 33 2.96 13.35 0.003 1 0.00 11 0.19 0.02 0.89 1 0.00 11 0.02 0.00 0.96
12 6 0.44 66 0.59 0.74 0.62 6 0.19 66 0.31 0.61 0.7213 2 0.56 22 0.34 1.64 0.22 2 0.01 22 0.04 0.20 0.8223 3 0.91 33 0.41 2.24 0.10 3 0.02 33 0.08 0.22 0.88
123 6 0.27 66 0.41 0.64 0.70 6 0.05 66 0.09 0.52 0.79Influence of PTPC and stimulation frequency on MEP latency
1 2 11.84 12 4.53 2.61 0.11 2 81.39 12 15.06 5.40 0.022 3 734.12 18 43.14 17.02 0.00 3 908.91 18 56.03 16.22 0.003 1 0.60 6 0.38 1.57 0.26 1 3.04 6 2.86 1.06 0.34
12 6 5.64 36 2.02 2.79 0.02 6 35.00 36 10.64 3.29 0.0113 2 0.60 12 0.71 0.84 0.45 2 0.19 12 1.11 0.17 0.8523 3 0.47 18 0.82 0.57 0.64 3 0.81 18 3.08 0.26 0.85
123 6 0.58 36 0.53 1.08 0.39 6 0.50 36 1.84 0.27 0.95Influence of PTPC and stimulus number on MEP amplitude
1 2 20.12 22 3.21 6.26 0.01 2 2.73 22 1.12 2.44 0.112 4 141.92 44 8.04 17.65 0.00 4 28.91 44 1.29 22.40 0.003 1 0.07 11 0.14 0.49 0.50 1 0.10 11 0.13 0.78 0.40
12 8 0.78 88 0.77 1.01 0.43 8 0.17 88 0.26 0.65 0.7313 2 0.31 22 0.28 1.11 0.35 2 0.02 22 0.07 0.33 0.7223 4 0.05 44 0.26 0.17 0.95 4 0.17 44 0.11 1.49 0.22
123 8 0.10 88 0.24 0.41 0.91 8 0.02 88 0.04 0.56 0.81Influence of PTPC and stimulus number on MEP latency
1 2 0.30 2 0.52 0.57 0.64 2 1.67 2 0.99 1.69 0.372 4 1.49 4 0.04 33.85 0.00 4 1.16 4 1.37 0.85 0.563 1 0.07 1 0.00 25.00 0.13 1 0.02 1 0.45 0.05 0.86
12 8 0.07 8 0.24 0.28 0.96 8 1.09 8 0.39 2.84 0.0813 2 0.04 2 0.14 0.31 0.76 2 0.61 2 0.14 4.38 0.1923 4 0.09 4 0.05 1.76 0.30 4 0.33 4 0.74 0.44 0.77
123 8 0.08 8 0.13 0.66 0.72 8 0.47 8 0.23 2.05 0.17
MEP � motor-evoked potential; PTPC � propofol target plasma concentration; Factor 1 � PTPC; Factor 2 � stimulation parameter (voltage, frequency, andnumber of stimuli); Factor 3 � measurement replication; df � degrees of freedom; MS � mean square; ANOVA � analysis of variance.
ANESTH ANALG TECHNOLOGY, COMPUTING, AND SIMULATION SCHEUFLER ET AL. 4432005;100:440–7 STIMULATION PATTERN, PROPOFOL, AND MOTOR-EVOKED POTENTIALS
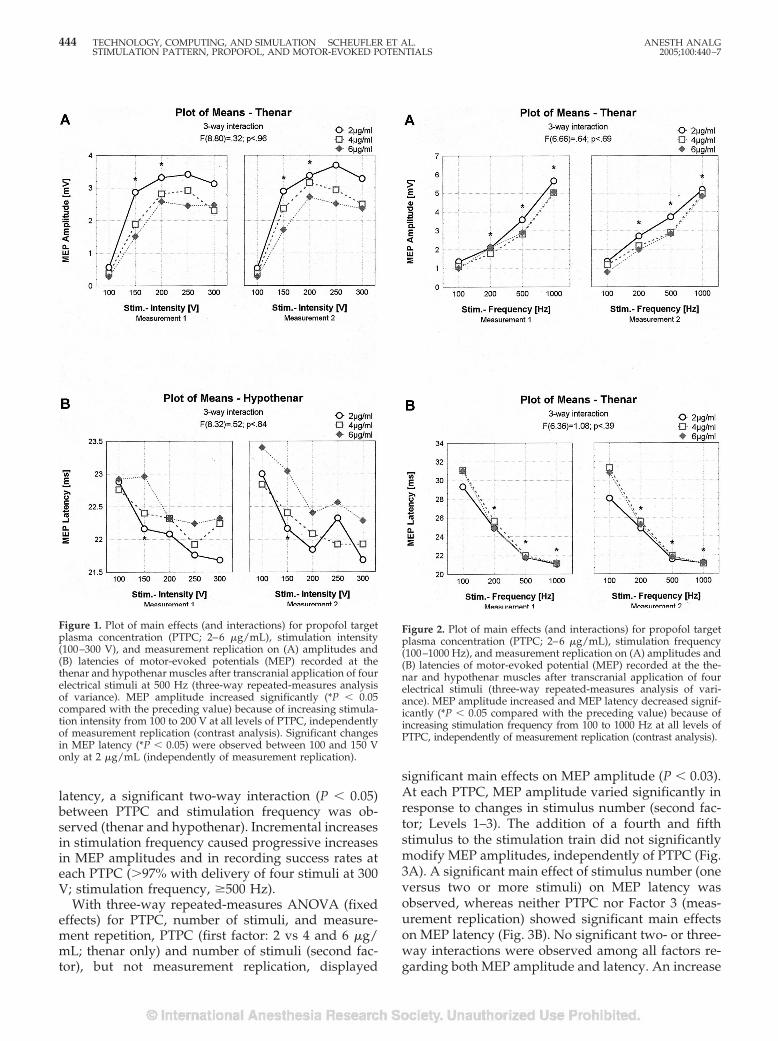
latency, a significant two-way interaction (P � 0.05)between PTPC and stimulation frequency was ob-served (thenar and hypothenar). Incremental increasesin stimulation frequency caused progressive increasesin MEP amplitudes and in recording success rates ateach PTPC (�97% with delivery of four stimuli at 300V; stimulation frequency, �500 Hz).
With three-way repeated-measures ANOVA (fixedeffects) for PTPC, number of stimuli, and measure-ment repetition, PTPC (first factor: 2 vs 4 and 6 �g/mL; thenar only) and number of stimuli (second fac-tor), but not measurement replication, displayed
significant main effects on MEP amplitude (P � 0.03).At each PTPC, MEP amplitude varied significantly inresponse to changes in stimulus number (second fac-tor; Levels 1–3). The addition of a fourth and fifthstimulus to the stimulation train did not significantlymodify MEP amplitudes, independently of PTPC (Fig.3A). A significant main effect of stimulus number (oneversus two or more stimuli) on MEP latency wasobserved, whereas neither PTPC nor Factor 3 (meas-urement replication) showed significant main effectson MEP latency (Fig. 3B). No significant two- or three-way interactions were observed among all factors re-garding both MEP amplitude and latency. An increase
Figure 1. Plot of main effects (and interactions) for propofol targetplasma concentration (PTPC; 2–6 �g/mL), stimulation intensity(100–300 V), and measurement replication on (A) amplitudes and(B) latencies of motor-evoked potentials (MEP) recorded at thethenar and hypothenar muscles after transcranial application of fourelectrical stimuli at 500 Hz (three-way repeated-measures analysisof variance). MEP amplitude increased significantly (*P � 0.05compared with the preceding value) because of increasing stimula-tion intensity from 100 to 200 V at all levels of PTPC, independentlyof measurement replication (contrast analysis). Significant changesin MEP latency (*P � 0.05) were observed between 100 and 150 Vonly at 2 �g/mL (independently of measurement replication).
Figure 2. Plot of main effects (and interactions) for propofol targetplasma concentration (PTPC; 2–6 �g/mL), stimulation frequency(100–1000 Hz), and measurement replication on (A) amplitudes and(B) latencies of motor-evoked potential (MEP) recorded at the the-nar and hypothenar muscles after transcranial application of fourelectrical stimuli (three-way repeated-measures analysis of vari-ance). MEP amplitude increased and MEP latency decreased signif-icantly (*P � 0.05 compared with the preceding value) because ofincreasing stimulation frequency from 100 to 1000 Hz at all levels ofPTPC, independently of measurement replication (contrast analysis).
444 TECHNOLOGY, COMPUTING, AND SIMULATION SCHEUFLER ET AL. ANESTH ANALGSTIMULATION PATTERN, PROPOFOL, AND MOTOR-EVOKED POTENTIALS 2005;100:440–7
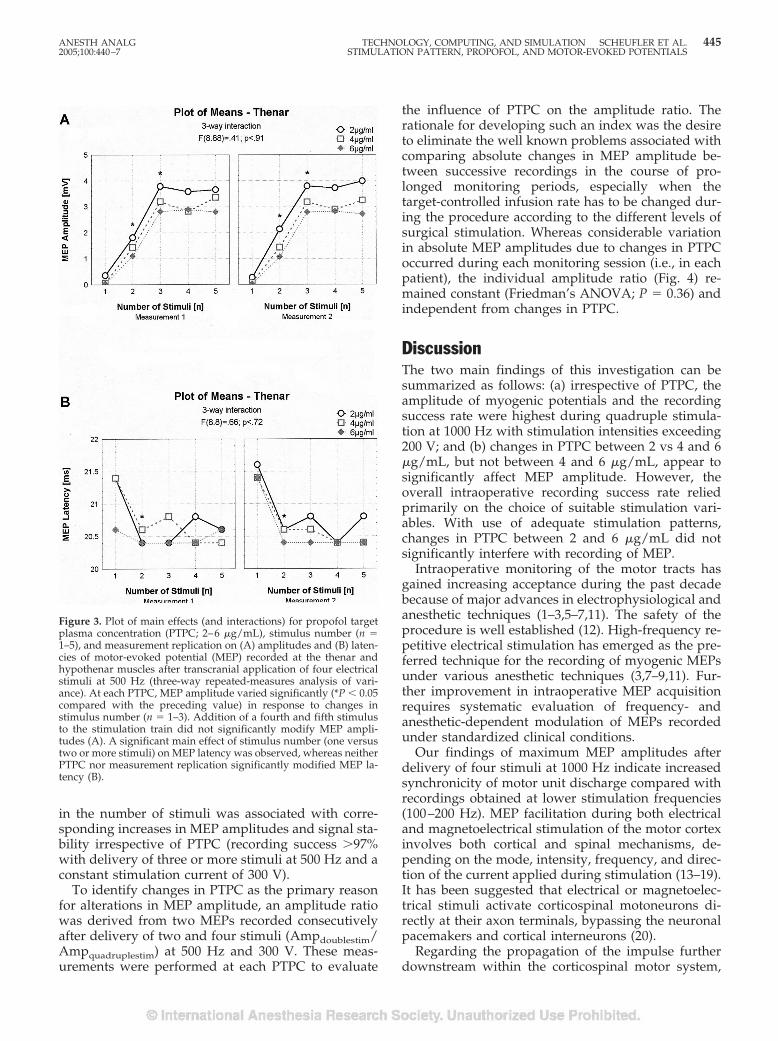
in the number of stimuli was associated with corre-sponding increases in MEP amplitudes and signal sta-bility irrespective of PTPC (recording success �97%with delivery of three or more stimuli at 500 Hz and aconstant stimulation current of 300 V).
To identify changes in PTPC as the primary reasonfor alterations in MEP amplitude, an amplitude ratiowas derived from two MEPs recorded consecutivelyafter delivery of two and four stimuli (Ampdoublestim/Ampquadruplestim) at 500 Hz and 300 V. These meas-urements were performed at each PTPC to evaluate
the influence of PTPC on the amplitude ratio. Therationale for developing such an index was the desireto eliminate the well known problems associated withcomparing absolute changes in MEP amplitude be-tween successive recordings in the course of pro-longed monitoring periods, especially when thetarget-controlled infusion rate has to be changed dur-ing the procedure according to the different levels ofsurgical stimulation. Whereas considerable variationin absolute MEP amplitudes due to changes in PTPCoccurred during each monitoring session (i.e., in eachpatient), the individual amplitude ratio (Fig. 4) re-mained constant (Friedman’s ANOVA; P � 0.36) andindependent from changes in PTPC.
DiscussionThe two main findings of this investigation can besummarized as follows: (a) irrespective of PTPC, theamplitude of myogenic potentials and the recordingsuccess rate were highest during quadruple stimula-tion at 1000 Hz with stimulation intensities exceeding200 V; and (b) changes in PTPC between 2 vs 4 and 6�g/mL, but not between 4 and 6 �g/mL, appear tosignificantly affect MEP amplitude. However, theoverall intraoperative recording success rate reliedprimarily on the choice of suitable stimulation vari-ables. With use of adequate stimulation patterns,changes in PTPC between 2 and 6 �g/mL did notsignificantly interfere with recording of MEP.
Intraoperative monitoring of the motor tracts hasgained increasing acceptance during the past decadebecause of major advances in electrophysiological andanesthetic techniques (1–3,5–7,11). The safety of theprocedure is well established (12). High-frequency re-petitive electrical stimulation has emerged as the pre-ferred technique for the recording of myogenic MEPsunder various anesthetic techniques (3,7–9,11). Fur-ther improvement in intraoperative MEP acquisitionrequires systematic evaluation of frequency- andanesthetic-dependent modulation of MEPs recordedunder standardized clinical conditions.
Our findings of maximum MEP amplitudes afterdelivery of four stimuli at 1000 Hz indicate increasedsynchronicity of motor unit discharge compared withrecordings obtained at lower stimulation frequencies(100–200 Hz). MEP facilitation during both electricaland magnetoelectrical stimulation of the motor cortexinvolves both cortical and spinal mechanisms, de-pending on the mode, intensity, frequency, and direc-tion of the current applied during stimulation (13–19).It has been suggested that electrical or magnetoelec-trical stimuli activate corticospinal motoneurons di-rectly at their axon terminals, bypassing the neuronalpacemakers and cortical interneurons (20).
Regarding the propagation of the impulse furtherdownstream within the corticospinal motor system,
Figure 3. Plot of main effects (and interactions) for propofol targetplasma concentration (PTPC; 2–6 �g/mL), stimulus number (n �1–5), and measurement replication on (A) amplitudes and (B) laten-cies of motor-evoked potential (MEP) recorded at the thenar andhypothenar muscles after transcranial application of four electricalstimuli at 500 Hz (three-way repeated-measures analysis of vari-ance). At each PTPC, MEP amplitude varied significantly (*P � 0.05compared with the preceding value) in response to changes instimulus number (n � 1–3). Addition of a fourth and fifth stimulusto the stimulation train did not significantly modify MEP ampli-tudes (A). A significant main effect of stimulus number (one versustwo or more stimuli) on MEP latency was observed, whereas neitherPTPC nor measurement replication significantly modified MEP la-tency (B).
ANESTH ANALG TECHNOLOGY, COMPUTING, AND SIMULATION SCHEUFLER ET AL. 4452005;100:440–7 STIMULATION PATTERN, PROPOFOL, AND MOTOR-EVOKED POTENTIALS
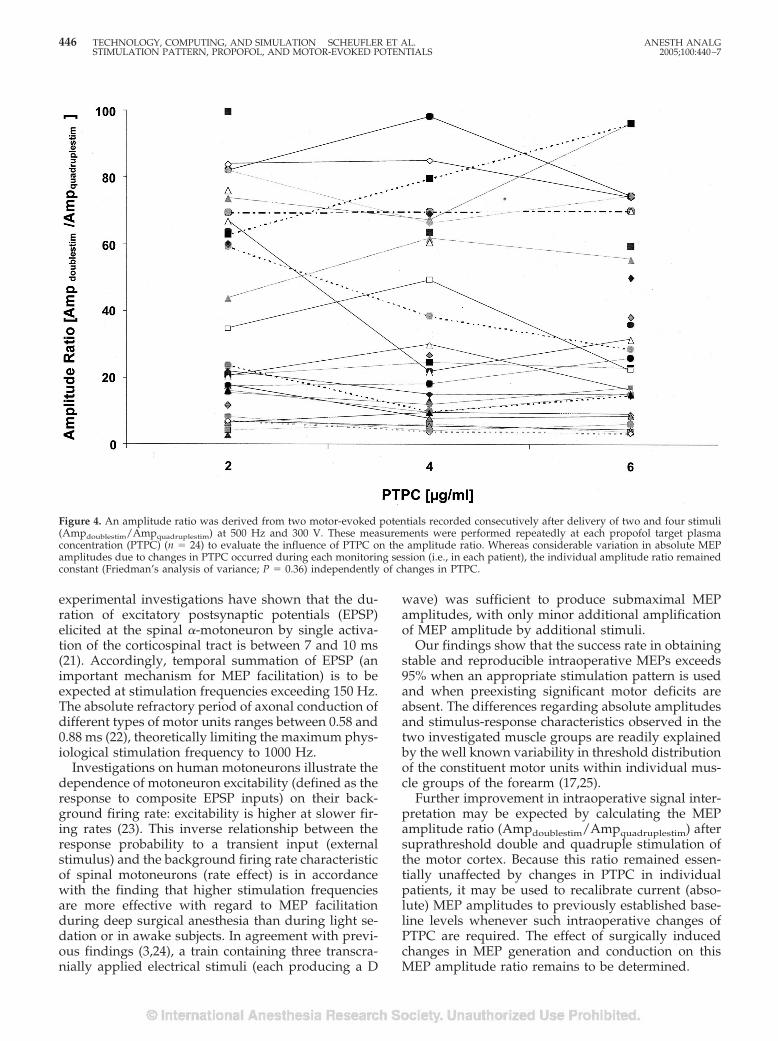
experimental investigations have shown that the du-ration of excitatory postsynaptic potentials (EPSP)elicited at the spinal �-motoneuron by single activa-tion of the corticospinal tract is between 7 and 10 ms(21). Accordingly, temporal summation of EPSP (animportant mechanism for MEP facilitation) is to beexpected at stimulation frequencies exceeding 150 Hz.The absolute refractory period of axonal conduction ofdifferent types of motor units ranges between 0.58 and0.88 ms (22), theoretically limiting the maximum phys-iological stimulation frequency to 1000 Hz.
Investigations on human motoneurons illustrate thedependence of motoneuron excitability (defined as theresponse to composite EPSP inputs) on their back-ground firing rate: excitability is higher at slower fir-ing rates (23). This inverse relationship between theresponse probability to a transient input (externalstimulus) and the background firing rate characteristicof spinal motoneurons (rate effect) is in accordancewith the finding that higher stimulation frequenciesare more effective with regard to MEP facilitationduring deep surgical anesthesia than during light se-dation or in awake subjects. In agreement with previ-ous findings (3,24), a train containing three transcra-nially applied electrical stimuli (each producing a D
wave) was sufficient to produce submaximal MEPamplitudes, with only minor additional amplificationof MEP amplitude by additional stimuli.
Our findings show that the success rate in obtainingstable and reproducible intraoperative MEPs exceeds95% when an appropriate stimulation pattern is usedand when preexisting significant motor deficits areabsent. The differences regarding absolute amplitudesand stimulus-response characteristics observed in thetwo investigated muscle groups are readily explainedby the well known variability in threshold distributionof the constituent motor units within individual mus-cle groups of the forearm (17,25).
Further improvement in intraoperative signal inter-pretation may be expected by calculating the MEPamplitude ratio (Ampdoublestim/Ampquadruplestim) aftersuprathreshold double and quadruple stimulation ofthe motor cortex. Because this ratio remained essen-tially unaffected by changes in PTPC in individualpatients, it may be used to recalibrate current (abso-lute) MEP amplitudes to previously established base-line levels whenever such intraoperative changes ofPTPC are required. The effect of surgically inducedchanges in MEP generation and conduction on thisMEP amplitude ratio remains to be determined.
Figure 4. An amplitude ratio was derived from two motor-evoked potentials recorded consecutively after delivery of two and four stimuli(Ampdoublestim/Ampquadruplestim) at 500 Hz and 300 V. These measurements were performed repeatedly at each propofol target plasmaconcentration (PTPC) (n � 24) to evaluate the influence of PTPC on the amplitude ratio. Whereas considerable variation in absolute MEPamplitudes due to changes in PTPC occurred during each monitoring session (i.e., in each patient), the individual amplitude ratio remainedconstant (Friedman’s analysis of variance; P � 0.36) independently of changes in PTPC.
446 TECHNOLOGY, COMPUTING, AND SIMULATION SCHEUFLER ET AL. ANESTH ANALGSTIMULATION PATTERN, PROPOFOL, AND MOTOR-EVOKED POTENTIALS 2005;100:440–7
Changes in PTPC had little effect on MEP charac-teristics or the recording success rate. This finding is ofconsiderable clinical interest because it suggests thatadjustments in the depth of propofol hypnosis accord-ing to surgical requirements do not necessarily lead toclinically relevant problems in the interpretation ofintraoperative signal changes. The seeming discrepan-cies between our results and previous findings of anonlinear electrophysiological effect of changing PT-PCs between 1 and 6 �g/mL on intracortical MEPfacilitation/inhibition (2) may be attributed to differ-ences in stimulation technique (magnetoelectrical ver-sus electrical stimulation), anesthetic depth (the ad-ministration of propofol alone versus the combinationof propofol and remifentanil), or both. We providedadequate surgical analgesia by constant infusion ofremifentanil, which has only minimal effects on MEPs(2). Adverse events related to transcranial electricalstimulation (e.g., intraoperative convulsions) did notoccur. No patient complained of transient intraopera-tive awareness, and this was consistent with BIS val-ues of �65 throughout this study.
In conclusion, constant-current transcranial electri-cal stimulation with multiple stimuli at high fre-quency and high intensity during total IV anesthesiawith target-controlled propofol infusion and constant-rate remifentanil infusion proved to be well suited forintraoperative MEP monitoring. Varying PTPCs hadno clinically relevant effect on MEP characteristics orrecording success rate. The anesthetic protocol andstimulation patterns presented in this study allow sta-ble recording of myogenic responses under a varietyof surgical and anesthetic conditions; are thus wellsuited for intraoperative MEP monitoring; and havebecome routine procedure in our institution. The MEPamplitude ratio may provide a new and useful tool forintraoperative MEP baseline amplitude recalibrationafter necessary intraoperative adjustments in PTPC.
We gratefully acknowledge the considerable contribution to thestatistical data analysis of Dr. J. Schulte-Monting, Professor of Bi-ometry and Statistics, University of Freiburg.
References1. Kalkman CJ, Drummond JC, Ribberink AA. Effects of propofol,
etomidate, midazolam and fentanyl on motor evoked responsesto transcranial electric or magnetic stimulation in humans. An-esthesiology 1992;76:502–9.
2. Scheufler KM, Zentner J. Total intravenous anesthesia for intra-operative monitoring of the motor pathways: an integral viewcombining clinical and experimental data. J Neurosurg 2002;96:571–9.
3. Pechstein U, Nadstawek J, Zentner J, Schramm J. Isoflurane plusnitrous oxide versus propofol for recording of motor evokedpotentials after high frequency repetitive electric stimulation.Electroencephalogr Clin Neurophysiol 1998;108:175–81.
4. Taniguchi M, Cedzich C, Schramm J. Modification of corticalstimulation for motor evoked potentials under generalanesthesia: technical description. Neurosurgery 1993;32:219–26.
5. Burke D, Hicks R, Gandevia SC, et al. Direct comparison ofcorticospinal volleys in human subjects to transcranial magneticand electrical stimulation. J Physiol 1993;470:383–93.
6. Burke D, Hicks RG. Surgical monitoring of motor pathways.J Clin Neurophysiol 1998;15:194–205.
7. Calancie B, Harris W, Brindle GF, et al. Threshold-level repeti-tive transcranial electrical stimulation for intraoperative moni-toring of central motor conduction. J Neurosurg 2001;95:161–8.
8. Pelosi L, Stevenson M, Hobbs GJ, et al. Intraoperative motorevoked potentials to transcranial electrical stimulation duringtwo anesthetic regimens. Clin Neurophysiol 2001;112:1076–87.
9. Zhou HH, Kelly PJ. Transcranial electrical motor evoked poten-tial monitoring for brain tumor resection. Neurosurgery 2001;48:1075–80.
10. Lehmann A, Boldt J, Thaler E, et al. Bispectral index in patientswith target-controlled or manually-controlled infusion ofpropofol. Anesth Analg 2002;95:639–44.
11. Kombos T, Suess O, Ciklatekerlio O, Brock M. Monitoring ofintraoperative motor evoked potentials to increase the safety ofsurgery in and around the motor cortex. J Neurosurg 2001;95:608–14.
12. MacDonald DB. Safety of intraoperative transcranial electricalstimulation motor evoked potential monitoring. J Clin Neuro-physiol 2002;19:416–29.
13. Day BL, Dressler D, Maertens de Noordhout A, et al. Electricand magnetic stimulation of human motor cortex: surface EMGand single motor unit responses. J Physiol 1989;412:449–73.
14. Di Lazzaro V, Oliviero A, Profice P, et al. Direct recordings ofdescending volleys after transcranial magnetic and electric mo-tor cortex stimulation in conscious humans. ElectroencephalogrClin Neurophysiol 1999;51:120–6.
15. Nakamura H, Kitagawa H, Kawaguchi Y, et al. Intracorticalfacilitation and inhibition after paired magnetic stimulation inhumans under anesthesia. Neurosci Lett 1995;199:155–7.
16. Rothwell JC, Burke D, Hicks R, et al. Transcranial electricalstimulation of the motor cortex in man: further evidence for thesite of activation. J Physiol 1994;481:243–50.
17. Taylor JL, Allen GB, Butler JE, Gandevia SC. Effect of contrac-tion strength on responses in biceps brachii and adductor pol-licis to transcranial magnetic stimulation. Exp Brain Res 1997;117:472–8.
18. Valls-Sole J, Pascual-Leone A, Wassermann EM, Hallett M. Hu-man motor evoked responses to paired transcranial magneticstimuli. Electroencephalogr Clin Neurophysiol 1992;85:355–64.
19. Ziemann U, Rothwell JC, Ridding MC. Interaction betweenintracortical inhibition and facilitation in human motor cortex.J Physiol 1996;496:873–81.
20. Matthews PBC. The effect of firing on the excitability of a modelmotoneurone and its implications for cortical stimulation.J Physiol 1999;518:867–82.
21. Landgren S, Phillips CG, Porter R. Minimal synaptic actions ofpyramidal impulses on some alpha-motoneurons of the ba-boon’s hand and forearm. J Physiol 1962;161:91–111.
22. Horcholle-Bossavit G, Jami L, Petit J, Scott JJ. Activation of catmotor units by paired stimuli at short intervals. J Physiol 1987;387:385–99.
23. Jones KE, Bawa P. Computer simulation of the responses ofhuman motoneurons to composite Ia EPSPs: effects of back-ground firing rate. J Neurophysiol 1997;77:405–20.
24. Ubags LH, Kalkman CJ, Been HD. Influence of isoflurane onmyogenic motor evoked potentials to single and multiple trans-cranial stimuli during nitrous oxide/opioid anesthesia. Neuro-surgery 1998;43:90–4.
25. Abbruzzese G, Assini A, Buccolieri A, et al. Comparison ofintracortical inhibition and facilitation in distal and proximalarm muscles in humans. J Physiol 1999;514:895–903.
ANESTH ANALG TECHNOLOGY, COMPUTING, AND SIMULATION SCHEUFLER ET AL. 4472005;100:440–7 STIMULATION PATTERN, PROPOFOL, AND MOTOR-EVOKED POTENTIALS
PAIN MEDICINESECTION EDITOR
CHRISTOPH STEIN
The Interaction Effect of Perioperative Cotreatment withDextromethorphan and Intravenous Lidocaine on PainRelief and Recovery of Bowel Function AfterLaparoscopic CholecystectomyChing-Tang Wu, MD*, Cecil O Borel, MD¶, Meei-Shyuan Lee, MPH‡, Jyh-Cherng Yu, MD†,Hang-Seng Liou, MD§, Haun-De Yi, MD�, and Chih-Ping Yang, MD�
Department of *Anesthesiology and †General Surgery, Tri-Service General Hospital; ‡Department of Public Health,National Defense Medical Center, National Defense University, Taipei; Division of §Obstetrics and Gynecology and�Anesthesiology, Armed Forces Taoyuan General Hospital, Taiwan, Republic of China; and ¶Department ofAnesthesiology, Duke University Medical Center, Durham, North Carolina
Both dextromethorphan (DM) and IV lidocaine im-prove postoperative pain relief. In the present study,we evaluated the interaction of DM and IV lidocaine onpain management after laparoscopic cholecystectomy(LC). One-hundred ASA physical status I or II patientsscheduled for LC were randomized into four equalgroups to receive either: (a) chlorpheniramine maleate(CPM) intramuscular injection (IM) 20 mg and IV nor-mal saline (N/S) (group C); (b) DM 40 mg IM and IVN/S (group DM); (c) CPM 20 mg IM and IV lidocaine3 mg · kg�1 · h�1 (group L); or (d) DM 40 mg IM and IVlidocaine (group DM�L). All treatments were adminis-tered 30 min before skin incision. Analgesic effects were
evaluated using visual analog scale pain scores at restand during coughing, time to meperidine request, totalmeperidine consumption, and the time to first passageof flatus after surgery. Patients of the DM�L group ex-hibited the best pain relief and fastest recovery of bowelfunction among groups. Patients in the DM and Lgroups had significantly better pain relief than those inthe C group. The results showed an additional effect onpain relief and a synergistic effect on recovery of bowelfunction when DM was combined with IV lidocaine af-ter LC.
(Anesth Analg 2005;100:448–53)
M any patients still suffer from moderate to severepain after laparoscopic cholecystectomy (LC) (1).Different treatments have been used to relieve
pain, including nonsteroidal antiinflammatory drugs,opioids, and local anesthetics, but none has been consis-tently satisfactory. This may be because post-LC painresults from a combination of inflammatory, incisionalsomatic, and visceral components (2).
In previous studies, we had found that preincisionalIM treatment with 40 mg of dextromethorphan (DM)provided good pain management in patients who un-derwent upper abdominal surgery, LC, and modified
radical mastectomy by diminishing central sensitization(3–5). Multimodal analgesia has become a current trendin postoperative pain management (6). This implies thata single antagonist may not be sufficient to prevent post-operative pain if other pathways are not blocked.
Lidocaine may provide a multimodal approach to painmanagement for the post-LC patient. Groudine et al. (7)studied IV lidocaine administration (3 mg · kg�1 · h�1) inpatients undergoing radical retropubic prostatectomyand concluded that lidocaine reduced the neural re-sponse to pain by blockade or inhibition of nerve con-duction. In addition to blocking nerve transmission, li-docaine has significant antiinflammatory properties (8).Moreover, Ness (9) found that IV lidocaine might be aneffective modality for treating visceral pain. Therefore,lidocaine is also a potential drug for treating the complexpain property after LC.
The aim of the present study was to evaluate theinteraction effect of combination preincisional DMand IV lidocaine on pain management after LC.
Supported, in part, by grants from Armed Forces Taoyuan Gen-eral Hospital (AFTYGH-9327).
Accepted for publication July 27, 2004.Address correspondence and reprint requests to Chih-Ping Yang,
MD, Division of Anesthesiology, Armed Forces Taoyuan GeneralHospital, #168 Chongshin Rd., Lungtan 325, Taoyuan, Taiwan, Re-public of China. Address e-mail to [email protected].
DOI: 10.1213/01.ANE.0000142551.92340.CC
©2005 by the International Anesthesia Research Society448 Anesth Analg 2005;100:448–53 0003-2999/05
MethodsThis study was approved by our IRB. Written in-formed consent was obtained from all patients in thestudy. One-hundred ASA physical status I or II pa-tients scheduled for elective LC were included andrandomly divided into four groups. The study wasdouble-blind and randomized with a computer pro-gram. The study drugs (chlorpheniramine maleate[CPM], DM, lidocaine, and normal saline [N/S])wereprepared by the hospital pharmacy in identical con-tainers marked with the name of the project, the in-vestigator’s name, administer routes, and consecutivenumbers. Patients were excluded if they had clinicallydiagnosed acute pancreatitis, were scheduled to un-dergo any surgical procedure expected to producemore trauma than LC alone, had acute preoperativepain other than biliary colic, required chronic paintreatment, or had current or recent cancer or any con-dition that would contraindicate participation in asurgical study of this nature. Patients with contrain-dications for lidocaine or who had received opioids ornonsteroidal antiinflammatory drugs within 1 wkwere excluded. Patients were assessed for eligibilitywithin 14 days before surgery, provided a full medicalhistory, and underwent complete physical examina-tion and laboratory tests. Preoperatively, all patientswere instructed in the use of a visual analog scale(VAS) to measure pain scores for pain assessment.
Based on retrospective data from our institution inthe same surgical population, a power analysis wasperformed using reduction in meperidine consump-tion as the primary outcome variable. It is clinicallymeaningful because reduced opioid consumption im-plied that patients exhibited lower pain scores and lessopioid-related side effects. We calculated a samplesize so that a between-group mean difference in me-peridine consumption of 25 mg would permit a one-tailed type I error rate of � � 0.05 with a power of 80%.This analysis indicated that a sample size of at least 20patients per group was required.
The doses of IV lidocaine (3 mg · kg�1 · h�1) andDM were chosen on the basis of previous studies(7,10,11). The dose of 40 mg of DM containing 20 mgof CPM was used (3–5) because of the available for-mulation of DM so that 1 ampoule of DM (10 mg)contains 5 mg of CPM. DM was given IM because thebioavailability of oral DM is only 10% (12), whereasthe bioavailability after an IM injection is similar tothat after an IV injection, with almost the same rapidonset. Dextrorphan, the liver metabolite of DM, maybe responsible for most of the side effects attributed toDM, although a large dose of IV DM leads to hypo-tension and tachycardia. Therefore, IM administrationmay provide a better alternative to an oral or IV ad-ministration route, with rapid onset in acute pain
states, fewer side effects, and decreased risk of aspi-ration in patients undergoing general anesthesia.
Patients in the group DM�L received DM IM andIV lidocaine; patients in the group DM received DMIM and an equal IV volume of N/S; patients of thegroup L received 20 mg of CPM IM and IV lidocaine;patients of the group C received 20 mg of CPM IM andan equal IV volume of N/S. All treatments were ad-ministered 30 min before skin incision, and lidocaineor N/S was infused with a pump throughout thesurgery.
For all patients, general anesthesia was inducedwith IV fentanyl (2 �g/kg), atracurium (5 mg), andthiopental (3–5 mg/kg). Tracheal intubation was facil-itated with succinylcholine (1.5 mg/kg). Anesthesiawas maintained with desflurane in oxygen (300 mL/min) via a total closed-circuit system. Atracurium wasused for muscle relaxation. The end-tidal desfluraneconcentration was controlled to maintain the systolicblood pressure within the range of 20% of the basalsystolic blood pressure. End-tidal desflurane concen-trations were monitored continuously and recorded at30 min after the induction, 30 min after skin incision,and at the end of the surgical procedure. Respiratoryfrequency and tidal volume were adjusted to maintainthe end-tidal carbon dioxide level at 35–45 mm Hg.Esophageal temperature was maintained at 35°C–37°C. No additional opioids were given during theoperation. At the end of surgery, residual neuromus-cular blockade was antagonized with edrophonium(0.8 mg/kg) and atropine (0.01 mg/kg), and the en-dotracheal tube was removed when the patient startedto breathe spontaneously and smoothly.
A meperidine (1 mg/kg) IM injection was used forpostoperative pain relief, if requested, because it hasbeen widely used for pain relief after LC in our coun-try. In most LC patients, one or two doses of meperi-dine can provide adequate pain relief, so this treat-ment was preferable to patient-controlled analgesia. A10-cm VAS (with end-points labeled “no pain” and“worst possible pain”) was used to assess pain inten-sity at rest and during coughing at 1, 2, 4, 12, 24, and48 h after completion of surgery. We recorded the timeto first meperidine injection, total meperidine con-sumption, the first time to the passage of flatus bypatients’ self-report, and side effects related to meper-idine (drowsiness, dizziness, nausea, and vomiting),CPM (vertigo, drowsiness, headache, nausea, blurredvision, and weakness), DM (nausea, vomiting, dizzi-ness, hot flashes, drowsiness, heartburn, and head-ache), and lidocaine (cardiac arrhythmia, light headed,drowsiness, perioral numbness, metal taste, dryness ofthe mouth, nausea, muscular twitch, tinnitus, and vi-sual disturbances) for 48 h after the operation. Allobservations were made by a study nurse. Side effectswere treated as required.
ANESTH ANALG PAIN MEDICINE WU ET AL. 4492005;100:448–53 INTERACTION OF DEXTROMETHORPHAN AND LIDOCAINE ON POST-LAPAROSCOPIC CHOLECYSTECTOMY
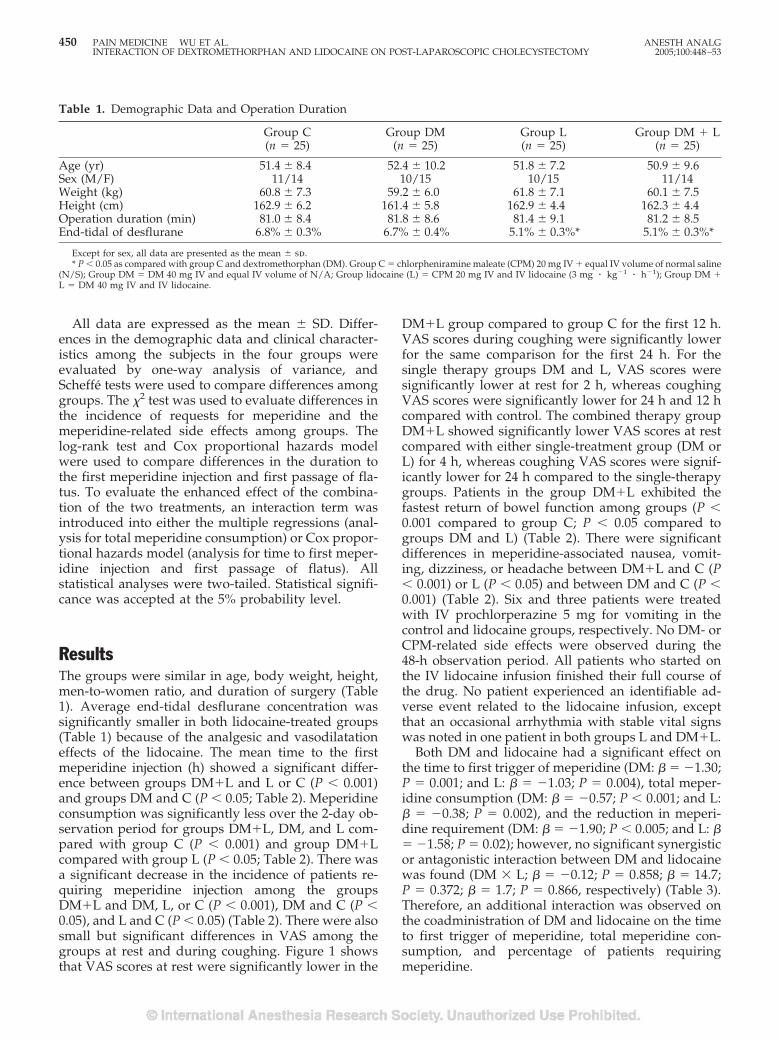
All data are expressed as the mean � SD. Differ-ences in the demographic data and clinical character-istics among the subjects in the four groups wereevaluated by one-way analysis of variance, andScheffe tests were used to compare differences amonggroups. The �2 test was used to evaluate differences inthe incidence of requests for meperidine and themeperidine-related side effects among groups. Thelog-rank test and Cox proportional hazards modelwere used to compare differences in the duration tothe first meperidine injection and first passage of fla-tus. To evaluate the enhanced effect of the combina-tion of the two treatments, an interaction term wasintroduced into either the multiple regressions (anal-ysis for total meperidine consumption) or Cox propor-tional hazards model (analysis for time to first meper-idine injection and first passage of flatus). Allstatistical analyses were two-tailed. Statistical signifi-cance was accepted at the 5% probability level.
ResultsThe groups were similar in age, body weight, height,men-to-women ratio, and duration of surgery (Table1). Average end-tidal desflurane concentration wassignificantly smaller in both lidocaine-treated groups(Table 1) because of the analgesic and vasodilatationeffects of the lidocaine. The mean time to the firstmeperidine injection (h) showed a significant differ-ence between groups DM�L and L or C (P � 0.001)and groups DM and C (P � 0.05; Table 2). Meperidineconsumption was significantly less over the 2-day ob-servation period for groups DM�L, DM, and L com-pared with group C (P � 0.001) and group DM�Lcompared with group L (P � 0.05; Table 2). There wasa significant decrease in the incidence of patients re-quiring meperidine injection among the groupsDM�L and DM, L, or C (P � 0.001), DM and C (P �0.05), and L and C (P � 0.05) (Table 2). There were alsosmall but significant differences in VAS among thegroups at rest and during coughing. Figure 1 showsthat VAS scores at rest were significantly lower in the
DM�L group compared to group C for the first 12 h.VAS scores during coughing were significantly lowerfor the same comparison for the first 24 h. For thesingle therapy groups DM and L, VAS scores weresignificantly lower at rest for 2 h, whereas coughingVAS scores were significantly lower for 24 h and 12 hcompared with control. The combined therapy groupDM�L showed significantly lower VAS scores at restcompared with either single-treatment group (DM orL) for 4 h, whereas coughing VAS scores were signif-icantly lower for 24 h compared to the single-therapygroups. Patients in the group DM�L exhibited thefastest return of bowel function among groups (P �0.001 compared to group C; P � 0.05 compared togroups DM and L) (Table 2). There were significantdifferences in meperidine-associated nausea, vomit-ing, dizziness, or headache between DM�L and C (P� 0.001) or L (P � 0.05) and between DM and C (P �0.001) (Table 2). Six and three patients were treatedwith IV prochlorperazine 5 mg for vomiting in thecontrol and lidocaine groups, respectively. No DM- orCPM-related side effects were observed during the48-h observation period. All patients who started onthe IV lidocaine infusion finished their full course ofthe drug. No patient experienced an identifiable ad-verse event related to the lidocaine infusion, exceptthat an occasional arrhythmia with stable vital signswas noted in one patient in both groups L and DM�L.
Both DM and lidocaine had a significant effect onthe time to first trigger of meperidine (DM: � � �1.30;P � 0.001; and L: � � �1.03; P � 0.004), total meper-idine consumption (DM: � � �0.57; P � 0.001; and L:� � �0.38; P � 0.002), and the reduction in meperi-dine requirement (DM: � � �1.90; P � 0.005; and L: �� �1.58; P � 0.02); however, no significant synergisticor antagonistic interaction between DM and lidocainewas found (DM � L; � � �0.12; P � 0.858; � � 14.7;P � 0.372; � � 1.7; P � 0.866, respectively) (Table 3).Therefore, an additional interaction was observed onthe coadministration of DM and lidocaine on the timeto first trigger of meperidine, total meperidine con-sumption, and percentage of patients requiringmeperidine.
Table 1. Demographic Data and Operation Duration
Group C(n � 25)
Group DM(n � 25)
Group L(n � 25)
Group DM � L(n � 25)
Age (yr) 51.4 � 8.4 52.4 � 10.2 51.8 � 7.2 50.9 � 9.6Sex (M/F) 11/14 10/15 10/15 11/14Weight (kg) 60.8 � 7.3 59.2 � 6.0 61.8 � 7.1 60.1 � 7.5Height (cm) 162.9 � 6.2 161.4 � 5.8 162.9 � 4.4 162.3 � 4.4Operation duration (min) 81.0 � 8.4 81.8 � 8.6 81.4 � 9.1 81.2 � 8.5End-tidal of desflurane 6.8% � 0.3% 6.7% � 0.4% 5.1% � 0.3%* 5.1% � 0.3%*
Except for sex, all data are presented as the mean � sd.* P � 0.05 as compared with group C and dextromethorphan (DM). Group C � chlorpheniramine maleate (CPM) 20 mg IV � equal IV volume of normal saline
(N/S); Group DM � DM 40 mg IV and equal IV volume of N/A; Group lidocaine (L) � CPM 20 mg IV and IV lidocaine (3 mg � kg�1 � h�1); Group DM �L � DM 40 mg IV and IV lidocaine.
450 PAIN MEDICINE WU ET AL. ANESTH ANALGINTERACTION OF DEXTROMETHORPHAN AND LIDOCAINE ON POST-LAPAROSCOPIC CHOLECYSTECTOMY 2005;100:448–53
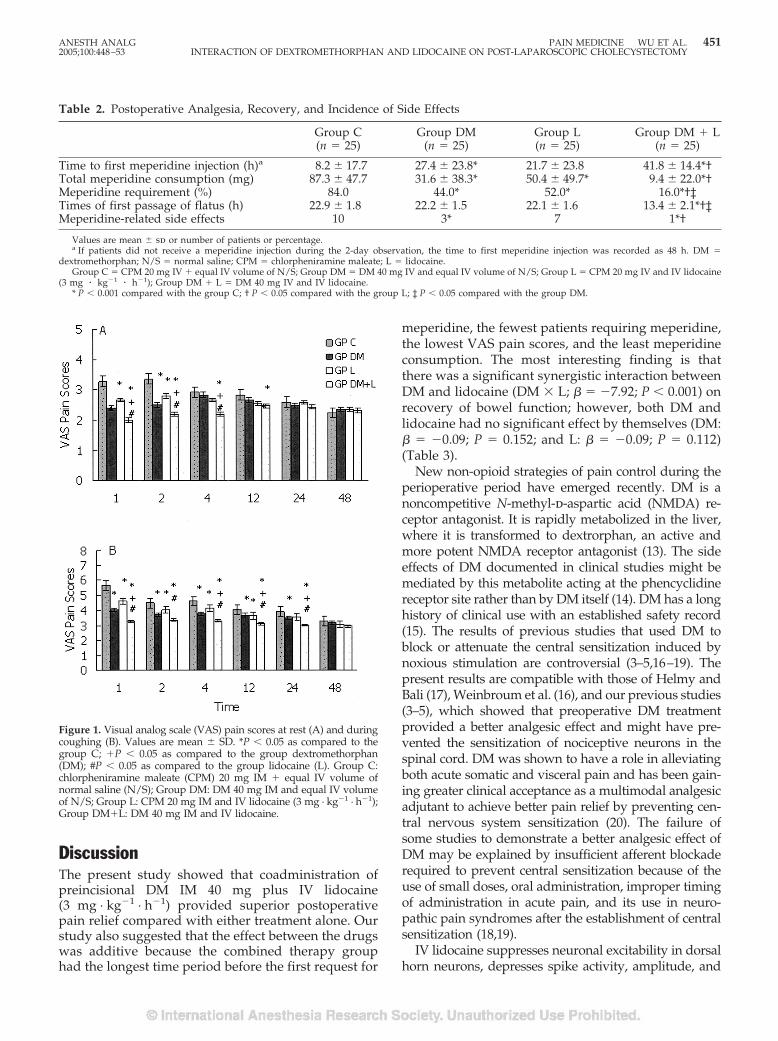
DiscussionThe present study showed that coadministration ofpreincisional DM IM 40 mg plus IV lidocaine(3 mg · kg�1 · h�1) provided superior postoperativepain relief compared with either treatment alone. Ourstudy also suggested that the effect between the drugswas additive because the combined therapy grouphad the longest time period before the first request for
meperidine, the fewest patients requiring meperidine,the lowest VAS pain scores, and the least meperidineconsumption. The most interesting finding is thatthere was a significant synergistic interaction betweenDM and lidocaine (DM � L; � � �7.92; P � 0.001) onrecovery of bowel function; however, both DM andlidocaine had no significant effect by themselves (DM:� � �0.09; P � 0.152; and L: � � �0.09; P � 0.112)(Table 3).
New non-opioid strategies of pain control during theperioperative period have emerged recently. DM is anoncompetitive N-methyl-d-aspartic acid (NMDA) re-ceptor antagonist. It is rapidly metabolized in the liver,where it is transformed to dextrorphan, an active andmore potent NMDA receptor antagonist (13). The sideeffects of DM documented in clinical studies might bemediated by this metabolite acting at the phencyclidinereceptor site rather than by DM itself (14). DM has a longhistory of clinical use with an established safety record(15). The results of previous studies that used DM toblock or attenuate the central sensitization induced bynoxious stimulation are controversial (3–5,16–19). Thepresent results are compatible with those of Helmy andBali (17), Weinbroum et al. (16), and our previous studies(3–5), which showed that preoperative DM treatmentprovided a better analgesic effect and might have pre-vented the sensitization of nociceptive neurons in thespinal cord. DM was shown to have a role in alleviatingboth acute somatic and visceral pain and has been gain-ing greater clinical acceptance as a multimodal analgesicadjutant to achieve better pain relief by preventing cen-tral nervous system sensitization (20). The failure ofsome studies to demonstrate a better analgesic effect ofDM may be explained by insufficient afferent blockaderequired to prevent central sensitization because of theuse of small doses, oral administration, improper timingof administration in acute pain, and its use in neuro-pathic pain syndromes after the establishment of centralsensitization (18,19).
IV lidocaine suppresses neuronal excitability in dorsalhorn neurons, depresses spike activity, amplitude, and
Table 2. Postoperative Analgesia, Recovery, and Incidence of Side Effects
Group C(n � 25)
Group DM(n � 25)
Group L(n � 25)
Group DM � L(n � 25)
Time to first meperidine injection (h)a 8.2 � 17.7 27.4 � 23.8* 21.7 � 23.8 41.8 � 14.4*†Total meperidine consumption (mg) 87.3 � 47.7 31.6 � 38.3* 50.4 � 49.7* 9.4 � 22.0*†Meperidine requirement (%) 84.0 44.0* 52.0* 16.0*†‡Times of first passage of flatus (h) 22.9 � 1.8 22.2 � 1.5 22.1 � 1.6 13.4 � 2.1*†‡Meperidine-related side effects 10 3* 7 1*†
Values are mean � sd or number of patients or percentage.a If patients did not receive a meperidine injection during the 2-day observation, the time to first meperidine injection was recorded as 48 h. DM �
dextromethorphan; N/S � normal saline; CPM � chlorpheniramine maleate; L � lidocaine.Group C � CPM 20 mg IV � equal IV volume of N/S; Group DM � DM 40 mg IV and equal IV volume of N/S; Group L � CPM 20 mg IV and IV lidocaine
(3 mg � kg�1 � h�1); Group DM � L � DM 40 mg IV and IV lidocaine.* P � 0.001 compared with the group C; † P � 0.05 compared with the group L; ‡ P � 0.05 compared with the group DM.
Figure 1. Visual analog scale (VAS) pain scores at rest (A) and duringcoughing (B). Values are mean � SD. *P � 0.05 as compared to thegroup C; �P � 0.05 as compared to the group dextromethorphan(DM); #P � 0.05 as compared to the group lidocaine (L). Group C:chlorpheniramine maleate (CPM) 20 mg IM � equal IV volume ofnormal saline (N/S); Group DM: DM 40 mg IM and equal IV volumeof N/S; Group L: CPM 20 mg IM and IV lidocaine (3 mg · kg�1 · h�1);Group DM�L: DM 40 mg IM and IV lidocaine.
ANESTH ANALG PAIN MEDICINE WU ET AL. 4512005;100:448–53 INTERACTION OF DEXTROMETHORPHAN AND LIDOCAINE ON POST-LAPAROSCOPIC CHOLECYSTECTOMY
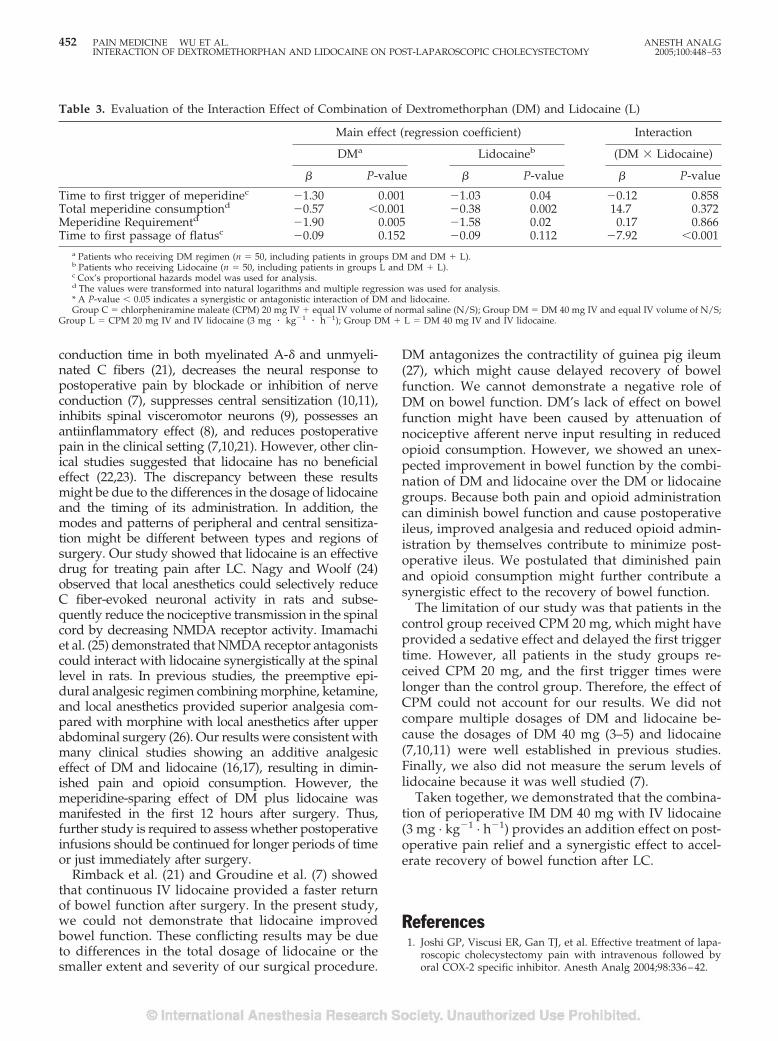
conduction time in both myelinated A-� and unmyeli-nated C fibers (21), decreases the neural response topostoperative pain by blockade or inhibition of nerveconduction (7), suppresses central sensitization (10,11),inhibits spinal visceromotor neurons (9), possesses anantiinflammatory effect (8), and reduces postoperativepain in the clinical setting (7,10,21). However, other clin-ical studies suggested that lidocaine has no beneficialeffect (22,23). The discrepancy between these resultsmight be due to the differences in the dosage of lidocaineand the timing of its administration. In addition, themodes and patterns of peripheral and central sensitiza-tion might be different between types and regions ofsurgery. Our study showed that lidocaine is an effectivedrug for treating pain after LC. Nagy and Woolf (24)observed that local anesthetics could selectively reduceC fiber-evoked neuronal activity in rats and subse-quently reduce the nociceptive transmission in the spinalcord by decreasing NMDA receptor activity. Imamachiet al. (25) demonstrated that NMDA receptor antagonistscould interact with lidocaine synergistically at the spinallevel in rats. In previous studies, the preemptive epi-dural analgesic regimen combining morphine, ketamine,and local anesthetics provided superior analgesia com-pared with morphine with local anesthetics after upperabdominal surgery (26). Our results were consistent withmany clinical studies showing an additive analgesiceffect of DM and lidocaine (16,17), resulting in dimin-ished pain and opioid consumption. However, themeperidine-sparing effect of DM plus lidocaine wasmanifested in the first 12 hours after surgery. Thus,further study is required to assess whether postoperativeinfusions should be continued for longer periods of timeor just immediately after surgery.
Rimback et al. (21) and Groudine et al. (7) showedthat continuous IV lidocaine provided a faster returnof bowel function after surgery. In the present study,we could not demonstrate that lidocaine improvedbowel function. These conflicting results may be dueto differences in the total dosage of lidocaine or thesmaller extent and severity of our surgical procedure.
DM antagonizes the contractility of guinea pig ileum(27), which might cause delayed recovery of bowelfunction. We cannot demonstrate a negative role ofDM on bowel function. DM’s lack of effect on bowelfunction might have been caused by attenuation ofnociceptive afferent nerve input resulting in reducedopioid consumption. However, we showed an unex-pected improvement in bowel function by the combi-nation of DM and lidocaine over the DM or lidocainegroups. Because both pain and opioid administrationcan diminish bowel function and cause postoperativeileus, improved analgesia and reduced opioid admin-istration by themselves contribute to minimize post-operative ileus. We postulated that diminished painand opioid consumption might further contribute asynergistic effect to the recovery of bowel function.
The limitation of our study was that patients in thecontrol group received CPM 20 mg, which might haveprovided a sedative effect and delayed the first triggertime. However, all patients in the study groups re-ceived CPM 20 mg, and the first trigger times werelonger than the control group. Therefore, the effect ofCPM could not account for our results. We did notcompare multiple dosages of DM and lidocaine be-cause the dosages of DM 40 mg (3–5) and lidocaine(7,10,11) were well established in previous studies.Finally, we also did not measure the serum levels oflidocaine because it was well studied (7).
Taken together, we demonstrated that the combina-tion of perioperative IM DM 40 mg with IV lidocaine(3 mg · kg�1 · h�1) provides an addition effect on post-operative pain relief and a synergistic effect to accel-erate recovery of bowel function after LC.
References1. Joshi GP, Viscusi ER, Gan TJ, et al. Effective treatment of lapa-
roscopic cholecystectomy pain with intravenous followed byoral COX-2 specific inhibitor. Anesth Analg 2004;98:336–42.
Table 3. Evaluation of the Interaction Effect of Combination of Dextromethorphan (DM) and Lidocaine (L)
Main effect (regression coefficient) Interaction
DMa Lidocaineb (DM � Lidocaine)
� P-value � P-value � P-value
Time to first trigger of meperidinec �1.30 0.001 �1.03 0.04 �0.12 0.858Total meperidine consumptiond �0.57 �0.001 �0.38 0.002 14.7 0.372Meperidine Requirementd �1.90 0.005 �1.58 0.02 0.17 0.866Time to first passage of flatusc �0.09 0.152 �0.09 0.112 �7.92 �0.001
a Patients who receiving DM regimen (n � 50, including patients in groups DM and DM � L).b Patients who receiving Lidocaine (n � 50, including patients in groups L and DM � L).c Cox’s proportional hazards model was used for analysis.d The values were transformed into natural logarithms and multiple regression was used for analysis.* A P-value � 0.05 indicates a synergistic or antagonistic interaction of DM and lidocaine.Group C � chlorpheniramine maleate (CPM) 20 mg IV � equal IV volume of normal saline (N/S); Group DM � DM 40 mg IV and equal IV volume of N/S;
Group L � CPM 20 mg IV and IV lidocaine (3 mg � kg�1 � h�1); Group DM � L � DM 40 mg IV and IV lidocaine.
452 PAIN MEDICINE WU ET AL. ANESTH ANALGINTERACTION OF DEXTROMETHORPHAN AND LIDOCAINE ON POST-LAPAROSCOPIC CHOLECYSTECTOMY 2005;100:448–53
2. Neudecker J, Sauerland S, Neugebauer E, et al. The EuropeanAssociation for Endoscopic Surgery clinical practice guidelineon the pneumoperitoneum for laparoscopic surgery. Surg En-dosc 2002;16:1121–43.
3. Wu CT, Yu JC, Liu ST, et al. Preincisional dextromethorphantreatment for postoperative pain management after upper ab-dominal surgery. World J Surg 2000;24:512–7.
4. Wu CT, Yu JC, Yeh CC, et al. Preincisional dextromethorphantreatment decreases postoperative pain and opioid requirementafter laparoscopic cholecystectomy. Anesth Analg 1999;88:1331–4.
5. Wong CS, Wu CT, Yu JC, et al. Preincisional dextromethorphandecreases postoperative pain and opioid requirement aftermodified radical mastectomy. Can J Anaesth 1999;46:1122–6.
6. Kehlet H, Wilmore DW. Multimodal strategies to improve sur-gical outcome. Am J Surg 2002;183:630–41.
7. Groudine SB, Fisher HA, Kaufman RP Jr, et al. Intravenouslidocaine speeds the return of bowel function, decreases post-operative pain, and shortens hospital stay in patients undergo-ing radical retropubic prostatectomy. Anesth Analg 1998;86:235–9.
8. Hollmann MW, Durieux ME. Local anesthetics and the inflam-matory response: a new therapeutic indication? Anesthesiology2000;93:858–75.
9. Ness TJ. Intravenous lidocaine inhibits visceral nociceptive re-flexes and spinal neurons in the rat. Anesthesiology 2000;92:1685–91.
10. Kawamata M, Takahashi T, Kozuka Y, et al. Experimentalincision-induced pain in human skin: effects of systemic lido-caine on flare formation and hyperalgesia. Pain 2002;100:77–89.
11. Dirks J, Fabricius P, Petersen KL, et al. The effect of systemiclidocaine on pain and secondary hyperalgesia associated withthe heat/capsaicin sensitization model in healthy volunteers.Anesth Analg 2000;91:967–72.
12. Wills RJ, Martin KS. Dextromethorphan/dextrorphan disposi-tion in rat plasma and brain. Pharm Res 1988;5:S193.
13. Church J, Lodge D, Berry SC. Differential effects of dextrorphanand levorphanol on the excitation of rat spinal neurons byamino acids. Eur J Pharmacol 1985;111:185–90.
14. Musacchio JM, Klein M, Canoll PD. Dextromethorphan andsigma ligands: common sites but diverse effects. Life Sci 1989;45:1721–32.
15. Bem JL, Peck R. Dextromethorphan: an overview of safety is-sues. Drug Saf 1992;7:190–9.
16. Weinbroum AA, Bender B, Nirkin A, et al. Dextromethorphan-associated epidural patient-controlled analgesia provides betterpain- and analgesics-sparing effects than dextromethorphan-associated intravenous patient-controlled analgesia afterbone-malignancy resection: a randomized, placebo-controlled,double-blinded study. Anesth Analg 2004;98:714–22.
17. Helmy SA, Bali A. The effect of the preemptive use of theNMDA receptor antagonist dextromethorphan on postopera-tive analgesic requirements. Anesth Analg 2001;92:739–44.
18. Kawamata T, Omote K, Kawamata M, Namiki A. Premedicationwith oral dextromethorphan reduces postoperative pain aftertonsillectomy. Anesth Analg 1998;86:594–7.
19. McConaghy PM, McSorley P, McCaughey W, Campbell WI.Dextromethorphan and pain after total abdominal hysterec-tomy. Br J Anaesth 1998;81:731–6.
20. Weinbroum AA, Rudick V, Paret G, Ben-Abraham R. The role ofdextromethorphan in pain control. Can J Anaesth 2000;47:585–96.
21. Rimback G, Cassuto J, Tollesson PO. Treatment of postoperativeparalytic ileus by intravenous lidocaine infusion. Anesth Analg1990;70:414–9.
22. Birch K, Jorgensen J, Chraemmer-Jorgensen B, Kehlet H. Effectof i.v. lignocaine on pain and the endocrine metabolic responsesafter surgery. Br J Anaesth 1987;59:721–4.
23. Insler SR, O’Connor M, Samonte AF, Bazaral MG. Lidocaineand the inhibition of postoperative pain in coronary arterybypass patients. J Cardiothorac Vasc Anesth 1995;9:541–6.
24. Nagy I, Woolf CJ. Lignocaine selectively reduces C fibre-evokedneuronal activity in rat spinal cord in vitro by decreasingN-methyl-D-aspartate and neurokinin receptor-mediated post-synaptic depolarizations: implications for the development ofnovel centrally acting analgesics. Pain 1996;64:59–70.
25. Imamachi N, Saito Y, Hara K, et al. The non-NMDA glutamatereceptor antagonist CNQX augments lidocaine antinociceptionthrough a spinal action in rats. Anesth Analg 1999;89:416–21.
26. Wu CT, Yeh CC, Yu JC, et al. Pre-incisional epidural ketamine,morphine and bupivacaine combined with epidural and generalanaesthesia provides pre-emptive analgesia for upper abdomi-nal surgery. Acta Anaesthesiol Scand 2000;44:63–8.
27. Kachur JF, Morgan DW, Gaginella TS. Effect of dextromethor-phan on guinea pig ileal contractility in vitro: comparison withlevomethorphan, loperamide and codeine. J Pharmacol ExpTher 1986;239:661–7.
ANESTH ANALG PAIN MEDICINE WU ET AL. 4532005;100:448–53 INTERACTION OF DEXTROMETHORPHAN AND LIDOCAINE ON POST-LAPAROSCOPIC CHOLECYSTECTOMY
The Cyclooxygenase-2-Specific Inhibitor Parecoxib Sodium Isas Effective as 12 mg of Morphine AdministeredIntramuscularly for Treating Pain After GynecologicLaparotomy SurgeryT. Philip Malan, Jr., MD, PhD*, Stephen Gordon, MD†, Richard Hubbard, MD‡, andMichael Snabes, MD‡
*Department of Anesthesiology, The University of Arizona, Tucson, Arizona; †Comprehensive NeuroScience Inc., Atlanta,Georgia; and ‡Pfizer Global Pharmaceuticals, Skokie, Illinois
Parecoxib sodium, the injectable prodrug of valde-coxib, is a cyclooxygenase-2-specific inhibitor that is ef-fective in the treatment of postoperative pain. In thisrandomized, double-blind, placebo-controlled study,we compared the efficacy of a single dose of parecoxibsodium 40 mg IM with single doses of morphine 6 and12 mg IM in treating postoperative pain after gyneco-logic surgery requiring a laparotomy incision. Bynearly all efficacy measures (including total pain reliefand patient’s global evaluation of study medication),parecoxib sodium 40 mg IM demonstrated pain reliefand a decrease in pain intensity that was statistically
similar to that with morphine 12 mg IM and superior tothat with morphine 6 mg IM. Parecoxib sodium 40 mgIM-treated patients also demonstrated a longer time touse of rescue medication than patients treated withboth morphine doses, and this dose provided sustainedpain relief over the 12-h study period. The incidence ofadverse events in the active treatment groups was sim-ilar to that observed with placebo. Parecoxib sodium,40 mg IM, has been shown to be as effective as clinicallyrelevant doses of morphine in patients after gyneco-logic laparotomy surgery.
(Anesth Analg 2005;100:454–60)
O pioids and nonsteroidal antiinflammatorydrugs (NSAIDs) are commonly used analgesicsfor the treatment of postoperative pain (1,2).
Opioids are effective analgesics; however, they havebeen shown to be associated with adverse events(AEs) such as respiratory depression, dizziness, som-nolence, nausea, and vomiting, and these delay recov-ery after surgery (3). A multimodal drug treatmentstrategy that combines two or more analgesics withdifferent modes of action has been used to reduce therequirement for opioids and is now an acceptedmethod of treating pain after surgery (4). This strategytakes advantage of the decrease in side effects associ-ated with any single drug in addition to providingimproved analgesic efficacy.
Nonspecific NSAIDs, which inhibit both cyclooxy-genase (COX)-1 and COX-2, are also effective in thetreatment of postoperative pain and have been used totreat many painful conditions and in multimodal ther-apy. The AEs associated with nonspecific NSAIDs aredue to inhibition of COX-1, whereas their antiinflam-matory and analgesic properties are mediated throughthe action of COX-2. Nonspecific NSAID-associatedAEs include blockade of platelet function, which inturn increases the risk of postoperative bleeding, andgastrointestinal (GI) toxicity (5,6). In contrast, COX-2-specific inhibitors are effective antiinflammatory anal-gesics that do not block platelet inhibition. COX-2-specific inhibitors also greatly reduce the risk of GIside effects that are characteristic of nonspecificNSAIDs.
Parecoxib sodium is an injectable prodrug formula-tion of the orally administered COX-2-specific inhibi-tor valdecoxib, which is available in more than 20countries for management of postoperative pain. Pare-coxib sodium has been shown to be effective for thetreatment of postoperative pain after oral, orthopedicjoint replacement, and gynecologic surgery; it has a
Supported by Pfizer Inc.Accepted for publication August 10, 2004.Address correspondence and reprint requests to T. Philip Malan,
Jr., MD, PhD, Department of Anesthesiology, The University ofArizona, 1501 N. Campbell Ave., PO Box 245114, Tucson, AZ 85724-5114. Address e-mail to [email protected].
DOI: 10.1213/01.ANE.0000143355.52418.CF
©2005 by the International Anesthesia Research Society454 Anesth Analg 2005;100:454–60 0003-2999/05
rapid onset and long duration of action (7–9). A singledose of parecoxib sodium 40 mg has been shown incontrolled studies to provide superior analgesic effi-cacy and a longer duration of action compared with asingle dose of morphine 4 mg (7,10). Parecoxib sodium40 mg also has significant opioid-sparing effects of upto 39% as part of a multimodal treatment strategy inorthopedic surgery patients (11,12). As a consequence,patients receiving parecoxib sodium plus morphinediscontinued patient-controlled analgesia (PCA) mor-phine more rapidly and reported improved globalevaluation of study medication scores compared withpatients receiving morphine alone (11,12).
Although parecoxib sodium, 40 mg, has previouslybeen shown to provide superior analgesic efficacy tomorphine 4 mg IV, we decided to examine the efficacyof parecoxib 40 mg against larger doses of morphinethat might be more clinically relevant. Therefore, weevaluated the analgesic efficacy of a single dose ofparecoxib sodium, 40 mg IM, compared with singledoses of morphine, 6 and 12 mg IM, and placebo forthe treatment of pain after gynecologic surgery requir-ing a standard laparotomy incision.
MethodsThis study was a multicenter, randomized, double-blind, placebo-controlled, single-dose trial to evaluatethe efficacy of parecoxib sodium 40 mg IM comparedwith morphine 6 and 12 mg IM after gynecologicsurgery. All eligible patients were women who werenot lactating, who were of legal age of consent, andwho had undergone elective lower abdominal gyne-cologic surgery through a standard transverse orlower midline incision under general anesthesia. Pa-tients were treated for pain immediately after surgeryby using morphine delivered by standard PCA, whichwas continued until the morning after surgery. If,between 30 min and 6 h after discontinuation of PCAthe morning after surgery, patients developed a painintensity that was moderate to severe on a four-pointcategorical scale (none, mild, moderate, or severe) andwas �50 mm on the visual analog scale (VAS;0–100 mm) (after performing an aggravated “log roll”movement), they were randomized to receive one ofthe following IM treatments: parecoxib sodium 40 mg,morphine 6 mg, morphine 12 mg, or placebo. Patientrandomization was determined with a random-number generator computed by the sponsor.
Eligible patients underwent a physical examination,including vital signs and clinical laboratory assess-ment, during a 14-day pretreatment period. The studywas approved by an IRB at all sites and was con-ducted in accordance with the ethical principles thathave their origins in the Declaration of Helsinki. Writ-ten informed consent was obtained from all patients.
Patients were excluded from the study if they werescheduled to undergo any other surgical procedurethat was expected to produce more pain than standardelective gynecologic surgery with a laparotomy inci-sion. Patients were excluded if they took medicationsthat might interfere with pain assessments, includingother analgesics, tricyclic antidepressant drugs (newstarts), NSAIDs, or corticosteroids, during the 6 hpreceding surgery. Midazolam was also allowed as apreoperative medication.
In the postsurgical period, rescue medication waspermitted at any time when requested by the patient.Patients who took rescue medication before the com-pletion of the 12-h study period completed no addi-tional pain measurements, although they remained atthe study site for the entire 12-h study period.
During the 12-h treatment period, pain-intensity as-sessments (categorical scale and VAS) were performedat 0 h (baseline assessment taken immediately beforereceiving study medication and after performing anaggravated movement), 30 min, and 1, 2, 3, 4, 5, 6, 7, 8,10, and 12 h or until rescue medication was requested.Pain intensity was evaluated on a 0- to 100-mm VAS,where 0 mm was no pain and 100 mm was the worstimaginable pain, and the categorical pain-intensity as-sessment used a four-point scale (0 � no pain, 1 �mild pain, 2 � moderate pain, and 3 � severe pain).Pain-intensity difference (PID) was calculated by sub-tracting patients’ pain-intensity scores at each timepoint from their baseline pain-intensity scores. Painrelief was assessed with a five-point categorical scale,where 0 � no pain relief, 1 � a little, 2 � some, 3 � alot, and 4 � complete pain relief. Patients completed aglobal evaluation of study medication at the last as-sessment period (12 h after the administration of studymedication) or immediately before rescue medicationon a scale of 1 to 4, where 1 � poor, 2 � fair, 3 � good,and 4 � excellent.
Efficacy was assessed by recording the time-weighted sum of total pain relief scores (TOTPAR)through the first 4, 6, 8, and 12 h after the administra-tion of study medication (TOTPAR-4, -6, -8, and -12);PID; time to rescue medication; the proportion of pa-tients who required rescue medication; and the pa-tient’s global evaluation of study medication. Generalclinical safety was monitored by the incidence oftreatment-emergent AEs, serious AEs, physical exam-ination, vital signs, and clinical laboratory analysis.
The sample size was calculated by using TOTPAR-8for the comparison of parecoxib sodium 40 mg witheach dose of morphine (6 and 12 mg). According to theresults of a previous post-gynecologic surgery painstudy, a mean TOTPAR-8 of 15.0 in the parecoxibsodium 40 mg group was assumed. A sample size of62 patients per treatment group was required to detecta difference between parecoxib sodium 40 mg andeach dose of morphine (6 and 12 mg) of at least 4.5 U
ANESTH ANALG PAIN MEDICINE MALAN ET AL. 4552005;100:454–60 PARECOXIB SODIUM TREATS LAPAROTOMY PAIN
with a power of at least 80% and a two-sided signifi-cance of 0.025 (on a two-sided test adjusted for twocomparisons).
Baseline characteristics were compared across treat-ment groups by using two-way analysis of variancewith treatment and center as factors or by using theCochran-Mantel-Haenszel test for categoric variables.All efficacy analyses were performed on the modifiedintention-to-treat (ITT) population. The ITT cohortconsisted of all patients who completed the surgeryand received study medication but did not take rescuemedication before the 1-h pain assessment, did nottake a prohibited medication, and did not have aprotocol violation. All patients who received a dose ofstudy medication were included in the safety analysis.
The “last observation carried forward” approachwas used in the efficacy analyses to account formissing pain-intensity and pain-relief values or fordata missing as a result of patients taking rescuemedication or withdrawing from the study. Thebaseline scores for PID and pain relief were, bydefinition, 0. The time-specific variables PID andpain relief and the time-weighted variable TOTPARwere analyzed with a general linear model withtreatment and center as factors. Time to rescue med-ication was calculated by subtracting the time res-cue medication was requested from the time thedose of study drug was taken, and data were ana-lyzed with Kaplan-Meier survival estimates. Themethod of Simon and Lee (13) was used to calculate95% confidence intervals for the median time toevents. The patient’s global evaluation of studymedication at the end of the study was analyzedwith the Cochran-Mantel-Haenszel test, stratifiedby center. The incidence of treatment-emergent AEswas compared between groups by using Fisher’sexact test.
ResultsA total of 264 patients were randomized; 70 patientseach were randomized to receive placebo or morphine6 mg, and 62 patients each were randomized to receivemorphine 12 mg or parecoxib sodium 40 mg. Baselinedemographics and baseline pain-intensity scores (cat-egorical scale or VAS) were not significantly differentacross the treatment groups (Table 1). Approximately40% of patients in each treatment group reported se-vere pain at the time of randomization, and mostreported moderate pain at baseline.
Fourteen patients were excluded from the ITT pop-ulation: five in the placebo group, two in the morphine6 mg group, three in the morphine 12 mg group, andfour in the parecoxib sodium 40 mg group. The rea-sons for exclusion were protocol violation, failed in-clusion and exclusion criteria, rescue medication taken
before the 1-h assessment, missing consecutive painrelief scores, and study medication administered 12 hafter PCA was stopped.
Treatment with parecoxib sodium 40 mg providedsignificantly greater pain relief, as assessed with meantime-weighted TOTPAR, than morphine 6 or 12 mg orplacebo at nearly all times measured (Table 2). At 8 h,the TOTPAR-8 score in the parecoxib sodium 40 mggroup (17.0) was significantly higher than the meanscores in the morphine 12 mg (13.5), morphine 6 mg(11.9), and placebo (6.9) groups (P � 0.02). In addition,the TOTPAR-4 score in the parecoxib sodium 40 mggroup (9.0) was significantly greater compared withthe mean scores in the placebo (4.4) and morphine6 mg (7.0) groups (P � 0.01), although it was notsignificantly greater than in the morphine 12 mggroup (8.1).
Parecoxib sodium 40 mg treatment provided a de-crease in pain intensity that was similar to that withmorphine 12 mg and superior to that with morphine6 mg (Fig. 1). Compared with morphine 6 mg, treat-ment with parecoxib sodium 40 mg provided signifi-cantly better PID scores (VAS [Fig. 1] and categoricalscale) within 4 h of dosing, and these were maintainedover the 12-h study period (P � 0.001). Furthermore,compared with morphine 12 mg, parecoxib sodium40 mg provided greater improvements in mean PIDscores (VAS) from 4 to 10 h (P � 0.001), whereas thecategorical scale analysis showed parecoxib sodium40 mg to be numerically different from morphine12 mg IM.
The median time to rescue medication was longerfor patients treated with parecoxib sodium 40 mg (5 h53 min) than for patients treated with placebo (2 h14 min), morphine 6 mg (3 h 59 min), or morphine12 mg (4 h 22 min) (Fig. 2). The proportion of patientsreceiving rescue medication over the 12-h study pe-riod was similar in each of the active treatmentgroups: morphine 6 mg (88%), morphine 12 mg (88%),and parecoxib sodium 40 mg (79%).
Patients receiving either parecoxib sodium 40 mg ormorphine 12 mg reported significantly higher pa-tient’s global evaluation scores with their study med-ication than those receiving morphine 6 mg or placebo(P � 0.01) (Fig. 3). The proportion of patients whorated their treatment as “excellent” was larger in theparecoxib sodium 40 mg group (47%) than in themorphine 12 mg (33%), morphine 6 mg (23%), andplacebo (11%) groups.
The incidence of AEs reported by at least 5% of pa-tients in any treatment group is summarized in Table 3.There were no statistically significant differences in theincidences of AEs among treatment groups, except forheadache, which was significantly less frequent in theparecoxib sodium 40 mg group. Most AEs were typicalof the postoperative setting. Overall, 28 (40.0%) patientsin the placebo group, 19 (30.6%) patients in the parecoxib
456 PAIN MEDICINE MALAN ET AL. ANESTH ANALGPARECOXIB SODIUM TREATS LAPAROTOMY PAIN 2005;100:454–60
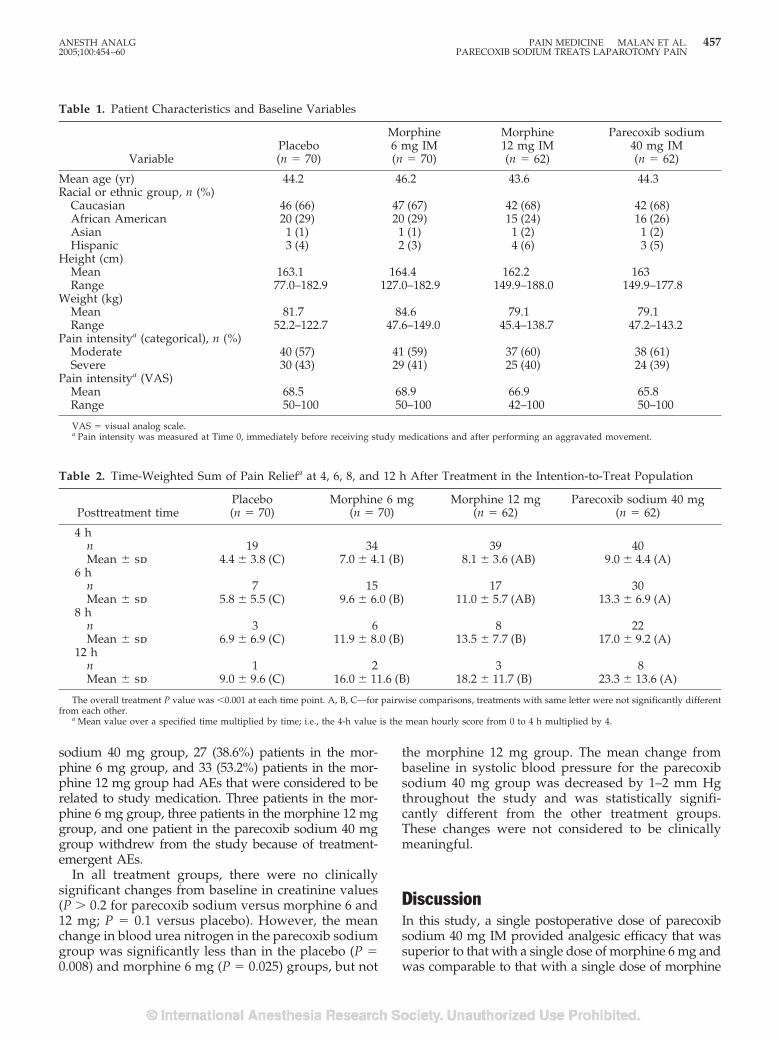
sodium 40 mg group, 27 (38.6%) patients in the mor-phine 6 mg group, and 33 (53.2%) patients in the mor-phine 12 mg group had AEs that were considered to berelated to study medication. Three patients in the mor-phine 6 mg group, three patients in the morphine 12 mggroup, and one patient in the parecoxib sodium 40 mggroup withdrew from the study because of treatment-emergent AEs.
In all treatment groups, there were no clinicallysignificant changes from baseline in creatinine values(P � 0.2 for parecoxib sodium versus morphine 6 and12 mg; P � 0.1 versus placebo). However, the meanchange in blood urea nitrogen in the parecoxib sodiumgroup was significantly less than in the placebo (P �0.008) and morphine 6 mg (P � 0.025) groups, but not
the morphine 12 mg group. The mean change frombaseline in systolic blood pressure for the parecoxibsodium 40 mg group was decreased by 1–2 mm Hgthroughout the study and was statistically signifi-cantly different from the other treatment groups.These changes were not considered to be clinicallymeaningful.
DiscussionIn this study, a single postoperative dose of parecoxibsodium 40 mg IM provided analgesic efficacy that wassuperior to that with a single dose of morphine 6 mg andwas comparable to that with a single dose of morphine
Table 1. Patient Characteristics and Baseline Variables
VariablePlacebo(n � 70)
Morphine6 mg IM(n � 70)
Morphine12 mg IM(n � 62)
Parecoxib sodium40 mg IM(n � 62)
Mean age (yr) 44.2 46.2 43.6 44.3Racial or ethnic group, n (%)
Caucasian 46 (66) 47 (67) 42 (68) 42 (68)African American 20 (29) 20 (29) 15 (24) 16 (26)Asian 1 (1) 1 (1) 1 (2) 1 (2)Hispanic 3 (4) 2 (3) 4 (6) 3 (5)
Height (cm)Mean 163.1 164.4 162.2 163Range 77.0–182.9 127.0–182.9 149.9–188.0 149.9–177.8
Weight (kg)Mean 81.7 84.6 79.1 79.1Range 52.2–122.7 47.6–149.0 45.4–138.7 47.2–143.2
Pain intensitya (categorical), n (%)Moderate 40 (57) 41 (59) 37 (60) 38 (61)Severe 30 (43) 29 (41) 25 (40) 24 (39)
Pain intensitya (VAS)Mean 68.5 68.9 66.9 65.8Range 50–100 50–100 42–100 50–100
VAS � visual analog scale.a Pain intensity was measured at Time 0, immediately before receiving study medications and after performing an aggravated movement.
Table 2. Time-Weighted Sum of Pain Reliefa at 4, 6, 8, and 12 h After Treatment in the Intention-to-Treat Population
Posttreatment timePlacebo(n � 70)
Morphine 6 mg(n � 70)
Morphine 12 mg(n � 62)
Parecoxib sodium 40 mg(n � 62)
4 hn 19 34 39 40Mean � sd 4.4 � 3.8 (C) 7.0 � 4.1 (B) 8.1 � 3.6 (AB) 9.0 � 4.4 (A)
6 hn 7 15 17 30Mean � sd 5.8 � 5.5 (C) 9.6 � 6.0 (B) 11.0 � 5.7 (AB) 13.3 � 6.9 (A)
8 hn 3 6 8 22Mean � sd 6.9 � 6.9 (C) 11.9 � 8.0 (B) 13.5 � 7.7 (B) 17.0 � 9.2 (A)
12 hn 1 2 3 8Mean � sd 9.0 � 9.6 (C) 16.0 � 11.6 (B) 18.2 � 11.7 (B) 23.3 � 13.6 (A)
The overall treatment P value was �0.001 at each time point. A, B, C—for pairwise comparisons, treatments with same letter were not significantly differentfrom each other.
a Mean value over a specified time multiplied by time; i.e., the 4-h value is the mean hourly score from 0 to 4 h multiplied by 4.
ANESTH ANALG PAIN MEDICINE MALAN ET AL. 4572005;100:454–60 PARECOXIB SODIUM TREATS LAPAROTOMY PAIN
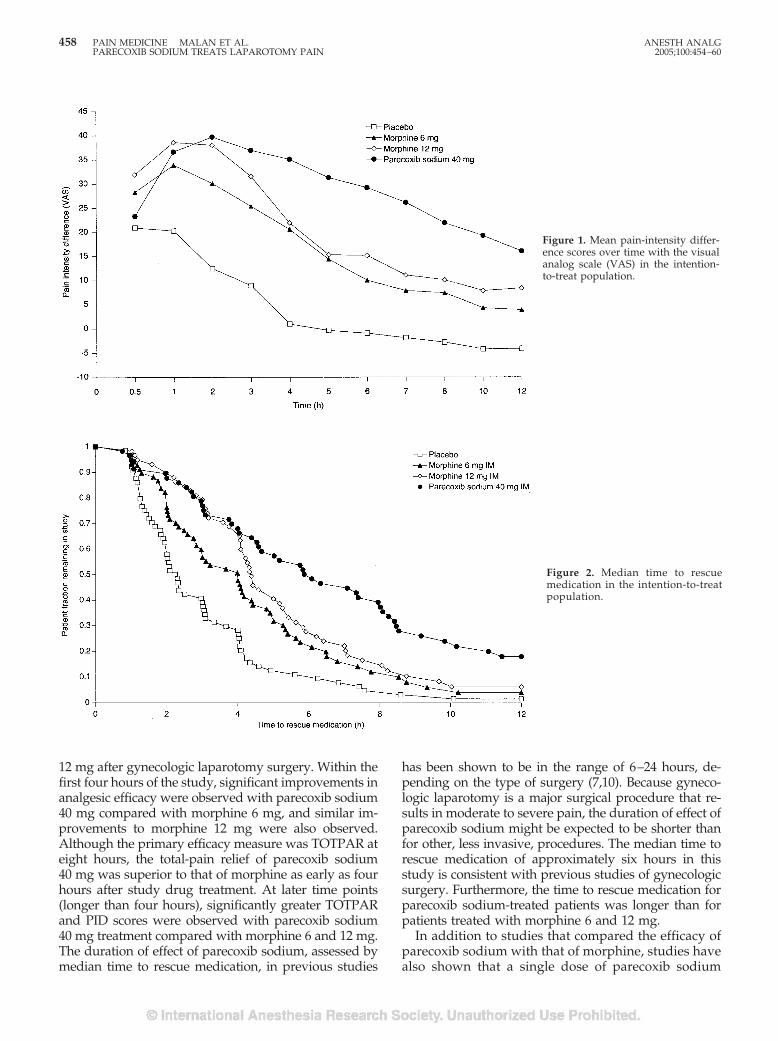
12 mg after gynecologic laparotomy surgery. Within thefirst four hours of the study, significant improvements inanalgesic efficacy were observed with parecoxib sodium40 mg compared with morphine 6 mg, and similar im-provements to morphine 12 mg were also observed.Although the primary efficacy measure was TOTPAR ateight hours, the total-pain relief of parecoxib sodium40 mg was superior to that of morphine as early as fourhours after study drug treatment. At later time points(longer than four hours), significantly greater TOTPARand PID scores were observed with parecoxib sodium40 mg treatment compared with morphine 6 and 12 mg.The duration of effect of parecoxib sodium, assessed bymedian time to rescue medication, in previous studies
has been shown to be in the range of 6–24 hours, de-pending on the type of surgery (7,10). Because gyneco-logic laparotomy is a major surgical procedure that re-sults in moderate to severe pain, the duration of effect ofparecoxib sodium might be expected to be shorter thanfor other, less invasive, procedures. The median time torescue medication of approximately six hours in thisstudy is consistent with previous studies of gynecologicsurgery. Furthermore, the time to rescue medication forparecoxib sodium-treated patients was longer than forpatients treated with morphine 6 and 12 mg.
In addition to studies that compared the efficacy ofparecoxib sodium with that of morphine, studies havealso shown that a single dose of parecoxib sodium
Figure 1. Mean pain-intensity differ-ence scores over time with the visualanalog scale (VAS) in the intention-to-treat population.
Figure 2. Median time to rescuemedication in the intention-to-treatpopulation.
458 PAIN MEDICINE MALAN ET AL. ANESTH ANALGPARECOXIB SODIUM TREATS LAPAROTOMY PAIN 2005;100:454–60
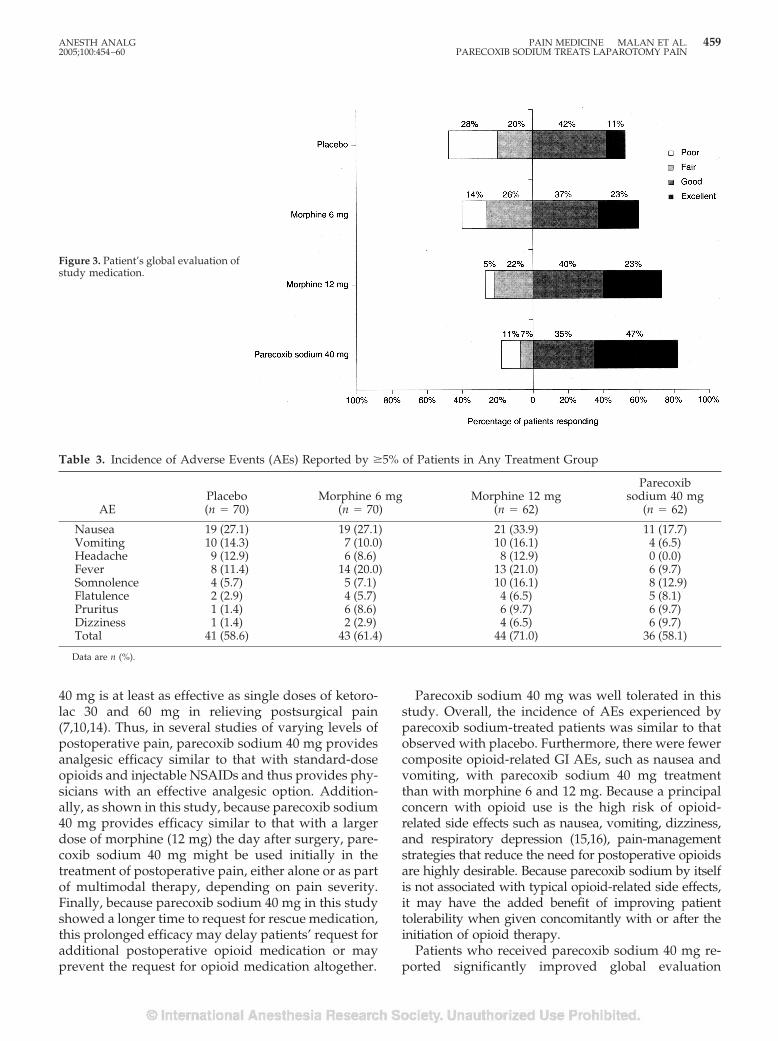
40 mg is at least as effective as single doses of ketoro-lac 30 and 60 mg in relieving postsurgical pain(7,10,14). Thus, in several studies of varying levels ofpostoperative pain, parecoxib sodium 40 mg providesanalgesic efficacy similar to that with standard-doseopioids and injectable NSAIDs and thus provides phy-sicians with an effective analgesic option. Addition-ally, as shown in this study, because parecoxib sodium40 mg provides efficacy similar to that with a largerdose of morphine (12 mg) the day after surgery, pare-coxib sodium 40 mg might be used initially in thetreatment of postoperative pain, either alone or as partof multimodal therapy, depending on pain severity.Finally, because parecoxib sodium 40 mg in this studyshowed a longer time to request for rescue medication,this prolonged efficacy may delay patients’ request foradditional postoperative opioid medication or mayprevent the request for opioid medication altogether.
Parecoxib sodium 40 mg was well tolerated in thisstudy. Overall, the incidence of AEs experienced byparecoxib sodium-treated patients was similar to thatobserved with placebo. Furthermore, there were fewercomposite opioid-related GI AEs, such as nausea andvomiting, with parecoxib sodium 40 mg treatmentthan with morphine 6 and 12 mg. Because a principalconcern with opioid use is the high risk of opioid-related side effects such as nausea, vomiting, dizziness,and respiratory depression (15,16), pain-managementstrategies that reduce the need for postoperative opioidsare highly desirable. Because parecoxib sodium by itselfis not associated with typical opioid-related side effects,it may have the added benefit of improving patienttolerability when given concomitantly with or after theinitiation of opioid therapy.
Patients who received parecoxib sodium 40 mg re-ported significantly improved global evaluation
Figure 3. Patient’s global evaluation ofstudy medication.
Table 3. Incidence of Adverse Events (AEs) Reported by �5% of Patients in Any Treatment Group
AEPlacebo(n � 70)
Morphine 6 mg(n � 70)
Morphine 12 mg(n � 62)
Parecoxibsodium 40 mg
(n � 62)
Nausea 19 (27.1) 19 (27.1) 21 (33.9) 11 (17.7)Vomiting 10 (14.3) 7 (10.0) 10 (16.1) 4 (6.5)Headache 9 (12.9) 6 (8.6) 8 (12.9) 0 (0.0)Fever 8 (11.4) 14 (20.0) 13 (21.0) 6 (9.7)Somnolence 4 (5.7) 5 (7.1) 10 (16.1) 8 (12.9)Flatulence 2 (2.9) 4 (5.7) 4 (6.5) 5 (8.1)Pruritus 1 (1.4) 6 (8.6) 6 (9.7) 6 (9.7)Dizziness 1 (1.4) 2 (2.9) 4 (6.5) 6 (9.7)Total 41 (58.6) 43 (61.4) 44 (71.0) 36 (58.1)
Data are n (%).
ANESTH ANALG PAIN MEDICINE MALAN ET AL. 4592005;100:454–60 PARECOXIB SODIUM TREATS LAPAROTOMY PAIN
scores with their study medication compared withpatients who received morphine 6 mg and reportedsimilar scores to patients who received morphine12 mg. This result is likely due to the combination ofeffective pain control, a long duration of analgesia,and improved tolerability.
The results from this study support the conclusionthat a single dose of parecoxib sodium 40 mg is aseffective as a single dose of morphine 12 mg IM giventhe day after laparotomy surgery. These findings sug-gest that parecoxib sodium 40 mg can be used suc-cessfully in the management of postoperative pain,either alone or as part of multimodal therapy aftermajor surgery. Improved pain scores and an earlierreturn of bowel function should assist in patient re-covery and earlier discharge planning after inpatientsurgery.
References1. Moote C. Efficacy of nonsteroidal anti-inflammatory drugs in
the management of postoperative pain. Drugs 1992;44(Suppl5):14–29.
2. Ahmad N, Grad HA, Haas DA, et al. The efficacy of nonopioidanalgesics for postoperative dental pain: a meta-analysis.Anesth Prog 1997;44:119–26.
3. Kehlet H, Rung GW, Callesen T. Postoperative opioid analgesia:time for a reconsideration? J Clin Anesth 1996;8:441–5.
4. Kehlet H, Dahl JB. The value of “multimodal” or “balancedanalgesia” in postoperative pain treatment. Anesth Analg 1993;77:1048–56.
5. Garcia Rodriguez LA, Cattaruzzi C, Troncon MG, Agostinis L.Risk of hospitalization for upper gastrointestinal tract bleedingassociated with ketorolac, other nonsteroidal anti-inflammatorydrugs, calcium antagonists, and other antihypertensive drugs.Arch Intern Med 1998;158:33–9.
6. Strom BL, Berlin JA, Kinman JL, et al. Parenteral ketorolac andrisk of gastrointestinal and operative site bleeding: a postmar-keting surveillance study. JAMA 1996;275:376–82.
7. Rasmussen GL, Steckner K, Hogue C, et al. Intravenous pare-coxib sodium for acute pain after orthopedic knee surgery. Am JOrthop 2002;31:336–43.
8. Wender RH, Desai PM, Snabes MC, et al. Parecoxib sodiumdemonstrates opioid sparing effects in post-laparotomy surgicalpatients. Fertil Steril 2001;76:S218–9.
9. Stulberg B, Torri S, Kuss M, et al. The injectable COX-2 specificinhibitor parecoxib sodium, is effective in treating post-operative pain in total hip arthroplasty patients [abstract]. An-esthesiology 2001;95:A807.
10. Barton SF, Langeland FF, Snabes MC, et al. Efficacy and safetyof intravenous parecoxib sodium in relieving acute postopera-tive pain following gynecologic laparotomy surgery. Anesthe-siology 2002;97:306–14.
11. Malan TP Jr, Marsh G, Hakki SI, et al. Parecoxib sodium, aparenteral cyclooxygenase 2 selective inhibitor, improves mor-phine analgesia and is opioid-sparing following total hip arthro-plasty. Anesthesiology 2003;98:950–6.
12. Hubbard RC, Naumann TM, Traylor L, Dhadda S. Parecoxibsodium has opioid-sparing effects in patients undergoing totalknee arthroplasty under spinal anaesthesia. Br J Anaesth 2003;90:166–72.
13. Simon R, Lee YJ. Nonparametric confidence limits for survivalprobabilities and median survival time. Cancer Treat Rep 1982;66:37–42.
14. Daniels SE, Grossman EH, Kuss ME, et al. A double-blind,randomized comparison of intramuscularly and intravenouslyadministered parecoxib sodium versus ketorolac and placebo ina post-oral surgery pain model. Clin Ther 2001;23:1018–31.
15. Jain S, Datta S. Postoperative pain management. Chest Surg ClinNorth Am 1997;7:773–99.
16. Wheeler M, Oderda G, Ashburn M, Lipman A. Adverse eventsassociated with postoperative opioid analgesia: a systematicreview. J Pain 2002;3:159–80.
460 PAIN MEDICINE MALAN ET AL. ANESTH ANALGPARECOXIB SODIUM TREATS LAPAROTOMY PAIN 2005;100:454–60
Morphine Can Enhance the Antiallodynic Effect ofIntrathecal R-PIA in Rats with Nerve Ligation InjuryJai-Hyun Hwang, MD, Gyu-Sam Hwang, MD, Sung-Kang Cho, MD, and Sung-Min Han, MD
Department of Anesthesia and Pain Medicine, Asan Medical Center, Seoul, Korea
Nerve ligation injury may produce a tactile allo-dynia. Intrathecal adenosine receptor agonists ormorphine have an antiallodynic effect. In this study,we examined the effect of intrathecal morphine onthe antiallodynic state induced by the adenosine A1receptor agonist, N6-(2-phenylisopropyl)-adenosineR-(�)isomer (R-PIA), in a rat model of nerve ligationinjury. Rats were prepared with ligation of left L5–6spinal nerves and intrathecal catheter implantation.Tactile allodynia was measured by applying von Freyfilaments to the lesioned hindpaw. Thresholds forwithdrawal response were assessed. Morphine andR-PIA were administered to obtain the dose-responsecurve and the 50% effective dose (ED50). Fractions ofED50s were administered concurrently to establish theED50 of the drug combination. The drug interaction
was analyzed using the isobolographic method. Intra-thecal 8-cyclopentyl-1,3-dipropylxanthine (DPCPX),an A1 receptor antagonist, and naloxone were admin-istered to examine the reversal of the antiallodyniceffect. Side effects were also observed. Intrathecalmorphine and R-PIA and their combination produceda dose-dependent antagonism without severe side ef-fects. Intrathecal morphine synergistically enhancedthe antiallodynic effect of R-PIA when coadminis-tered. Intrathecal naloxone and DPCPX reversed themaximal antiallodynic effect in the combinationgroup. These results suggest that activation of�-opioid and A1 receptors at the spinal level is re-quired for the synergistic interaction on tactileallodynia.
(Anesth Analg 2005;100:461–8)
P eripheral nerve injury may result in a condition ofextreme cutaneous sensitivity to normally innocu-ous mechanical stimuli, termed “tactile allodynia.”
Unilateral ligation of L5 and L6 spinal nerves producessome signs that seem representative of neuropathic pain(1,2). Signs of tactile allodynia were most evident in thenerve ligation model among several experimental ani-mal models (3). The spinal pharmacology at spinal nerveligation-induced allodynia has been shown to be distinctfrom that associated with acute nociceptive input. Ingeneral, the intrathecal administration of adenosine re-ceptor agonists has an antiallodynic effect, which is me-diated by the spinal adenosine A1 receptor system in adose-dependent manner, in rats with nerve ligation in-jury (4–6). Many experimental studies suggest that mor-phine induces the release of adenosine (7–10). However,
a previous study reported that reduced morphine-induced spinal release of adenosine may be attributed toa dipyridamole-sensitive disruption in the opioid-adenosine link in the spinal cord of neuropathic rats (11).The adenosine A1 receptor is mainly involved in antino-ciception and antiallodynia without severe motor weak-ness (4,12).
N6-(2-phenylisopropyl)-adenosine R-(�)isomer (R-PIA), a selective adenosine A1 agonist, has an antial-lodynic effect (4,13–16), which is antagonized by8-cyclopentyl-1,3-dipropylxanthine (DPCPX), an A1receptor antagonist (6). In experimental animal mod-els, R-PIA has shown a dose-dependent antiallodyniceffect to light touch (14,16). Although the synergisticanalgesic interaction of spinal adenosine with opioidshas been demonstrated in a mouse model of nocicep-tive pain (17), there is no study on the antiallodynicinteraction of morphine and the adenosine A1 recep-tor agonist, R-PIA, in the spinal nerve ligation ratmodel. In addition, a previous study suggested thatminimal reduction in allodynia by spinal morphine isenhanced in an additive manner by spinal adenosinein rats with spinal nerve ligation (5). However, aden-osine simultaneously acts on three adenosine receptorsubtypes. As the administered dose increases, eachdrug alone may have side effects other than its own
This study was supported by Grant 01-153 from Asan Institute forLife Sciences, Seoul, Korea.
Accepted for publication August 12, 2004.Address correspondence and reprint requests to Jai-Hyun
Hwang, MD, Department of Anesthesia and Pain Medicine, Uni-versity of Ulsan, College of Medicine, Asan Medical Center, 388-1Pungnap-Dong, Songpa-Gu, Seoul 138-736, Korea. Address e-mailto [email protected].
DOI: 10.1213/01.ANE.0000143561.68417.70
©2005 by the International Anesthesia Research Society0003-2999/05 Anesth Analg 2005;100:461–8 461
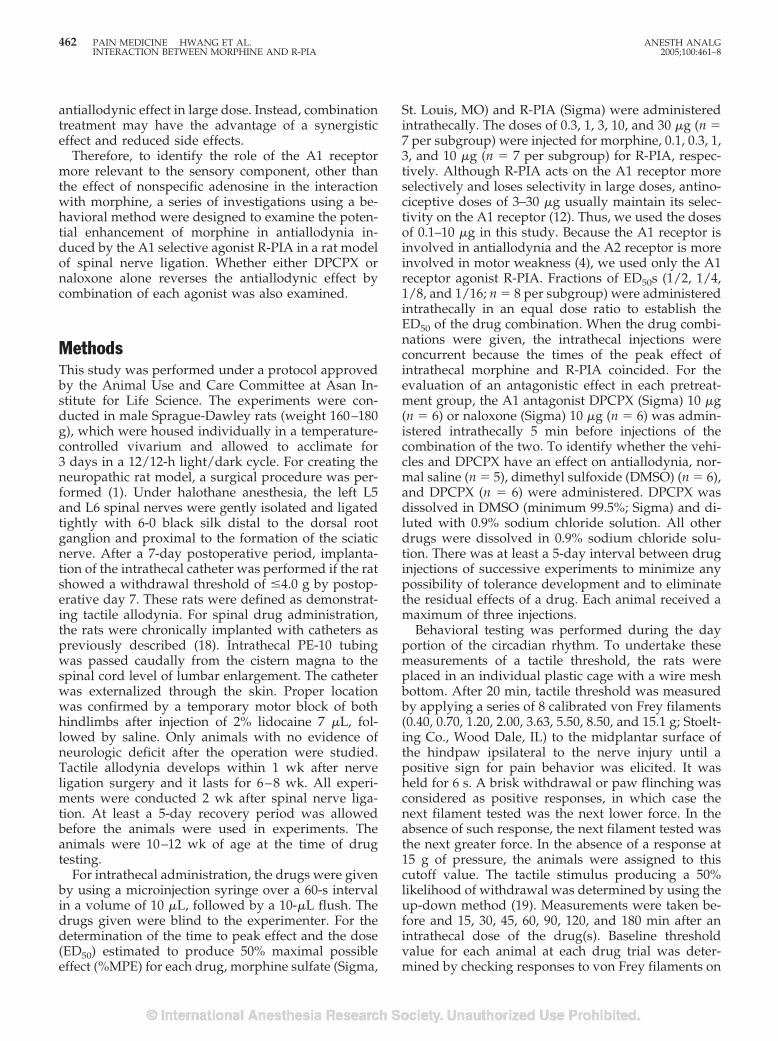
antiallodynic effect in large dose. Instead, combinationtreatment may have the advantage of a synergisticeffect and reduced side effects.
Therefore, to identify the role of the A1 receptormore relevant to the sensory component, other thanthe effect of nonspecific adenosine in the interactionwith morphine, a series of investigations using a be-havioral method were designed to examine the poten-tial enhancement of morphine in antiallodynia in-duced by the A1 selective agonist R-PIA in a rat modelof spinal nerve ligation. Whether either DPCPX ornaloxone alone reverses the antiallodynic effect bycombination of each agonist was also examined.
MethodsThis study was performed under a protocol approvedby the Animal Use and Care Committee at Asan In-stitute for Life Science. The experiments were con-ducted in male Sprague-Dawley rats (weight 160–180g), which were housed individually in a temperature-controlled vivarium and allowed to acclimate for3 days in a 12/12-h light/dark cycle. For creating theneuropathic rat model, a surgical procedure was per-formed (1). Under halothane anesthesia, the left L5and L6 spinal nerves were gently isolated and ligatedtightly with 6-0 black silk distal to the dorsal rootganglion and proximal to the formation of the sciaticnerve. After a 7-day postoperative period, implanta-tion of the intrathecal catheter was performed if the ratshowed a withdrawal threshold of �4.0 g by postop-erative day 7. These rats were defined as demonstrat-ing tactile allodynia. For spinal drug administration,the rats were chronically implanted with catheters aspreviously described (18). Intrathecal PE-10 tubingwas passed caudally from the cistern magna to thespinal cord level of lumbar enlargement. The catheterwas externalized through the skin. Proper locationwas confirmed by a temporary motor block of bothhindlimbs after injection of 2% lidocaine 7 �L, fol-lowed by saline. Only animals with no evidence ofneurologic deficit after the operation were studied.Tactile allodynia develops within 1 wk after nerveligation surgery and it lasts for 6–8 wk. All experi-ments were conducted 2 wk after spinal nerve liga-tion. At least a 5-day recovery period was allowedbefore the animals were used in experiments. Theanimals were 10–12 wk of age at the time of drugtesting.
For intrathecal administration, the drugs were givenby using a microinjection syringe over a 60-s intervalin a volume of 10 �L, followed by a 10-�L flush. Thedrugs given were blind to the experimenter. For thedetermination of the time to peak effect and the dose(ED50) estimated to produce 50% maximal possibleeffect (%MPE) for each drug, morphine sulfate (Sigma,
St. Louis, MO) and R-PIA (Sigma) were administeredintrathecally. The doses of 0.3, 1, 3, 10, and 30 �g (n �7 per subgroup) were injected for morphine, 0.1, 0.3, 1,3, and 10 �g (n � 7 per subgroup) for R-PIA, respec-tively. Although R-PIA acts on the A1 receptor moreselectively and loses selectivity in large doses, antino-ciceptive doses of 3–30 �g usually maintain its selec-tivity on the A1 receptor (12). Thus, we used the dosesof 0.1–10 �g in this study. Because the A1 receptor isinvolved in antiallodynia and the A2 receptor is moreinvolved in motor weakness (4), we used only the A1receptor agonist R-PIA. Fractions of ED50s (1/2, 1/4,1/8, and 1/16; n � 8 per subgroup) were administeredintrathecally in an equal dose ratio to establish theED50 of the drug combination. When the drug combi-nations were given, the intrathecal injections wereconcurrent because the times of the peak effect ofintrathecal morphine and R-PIA coincided. For theevaluation of an antagonistic effect in each pretreat-ment group, the A1 antagonist DPCPX (Sigma) 10 �g(n � 6) or naloxone (Sigma) 10 �g (n � 6) was admin-istered intrathecally 5 min before injections of thecombination of the two. To identify whether the vehi-cles and DPCPX have an effect on antiallodynia, nor-mal saline (n � 5), dimethyl sulfoxide (DMSO) (n � 6),and DPCPX (n � 6) were administered. DPCPX wasdissolved in DMSO (minimum 99.5%; Sigma) and di-luted with 0.9% sodium chloride solution. All otherdrugs were dissolved in 0.9% sodium chloride solu-tion. There was at least a 5-day interval between druginjections of successive experiments to minimize anypossibility of tolerance development and to eliminatethe residual effects of a drug. Each animal received amaximum of three injections.
Behavioral testing was performed during the dayportion of the circadian rhythm. To undertake thesemeasurements of a tactile threshold, the rats wereplaced in an individual plastic cage with a wire meshbottom. After 20 min, tactile threshold was measuredby applying a series of 8 calibrated von Frey filaments(0.40, 0.70, 1.20, 2.00, 3.63, 5.50, 8.50, and 15.1 g; Stoelt-ing Co., Wood Dale, IL) to the midplantar surface ofthe hindpaw ipsilateral to the nerve injury until apositive sign for pain behavior was elicited. It washeld for 6 s. A brisk withdrawal or paw flinching wasconsidered as positive responses, in which case thenext filament tested was the next lower force. In theabsence of such response, the next filament tested wasthe next greater force. In the absence of a response at15 g of pressure, the animals were assigned to thiscutoff value. The tactile stimulus producing a 50%likelihood of withdrawal was determined by using theup-down method (19). Measurements were taken be-fore and 15, 30, 45, 60, 90, 120, and 180 min after anintrathecal dose of the drug(s). Baseline thresholdvalue for each animal at each drug trial was deter-mined by checking responses to von Frey filaments on
462 PAIN MEDICINE HWANG ET AL. ANESTH ANALGINTERACTION BETWEEN MORPHINE AND R-PIA 2005;100:461–8
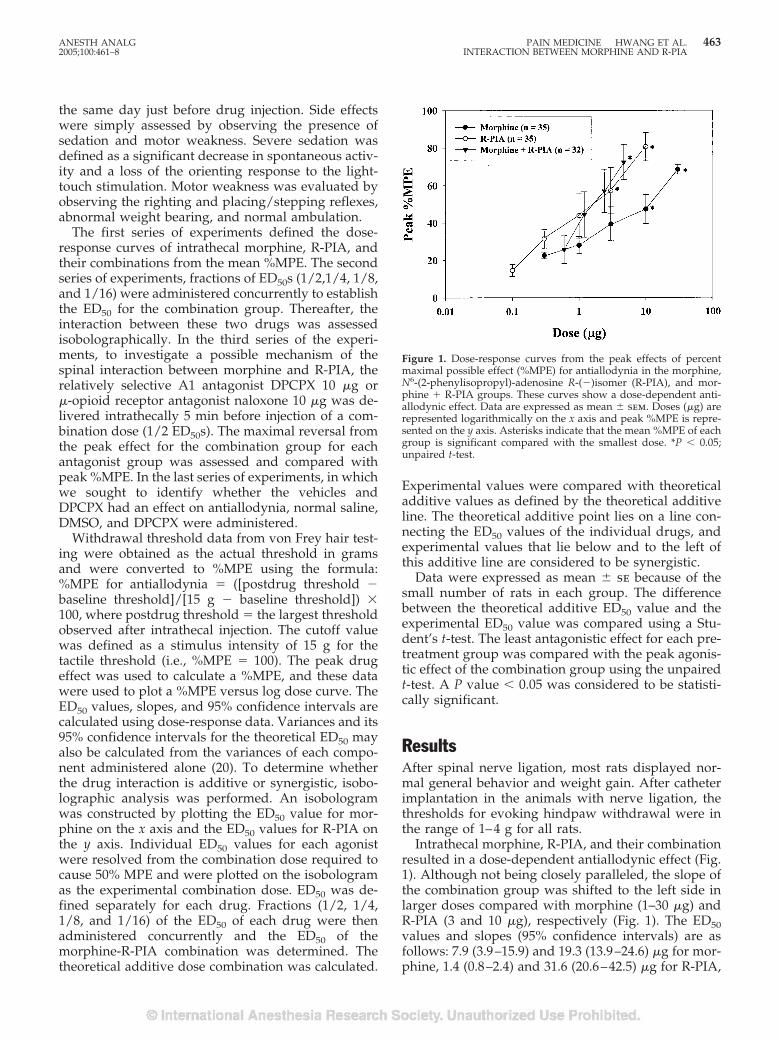
the same day just before drug injection. Side effectswere simply assessed by observing the presence ofsedation and motor weakness. Severe sedation wasdefined as a significant decrease in spontaneous activ-ity and a loss of the orienting response to the light-touch stimulation. Motor weakness was evaluated byobserving the righting and placing/stepping reflexes,abnormal weight bearing, and normal ambulation.
The first series of experiments defined the dose-response curves of intrathecal morphine, R-PIA, andtheir combinations from the mean %MPE. The secondseries of experiments, fractions of ED50s (1/2,1/4, 1/8,and 1/16) were administered concurrently to establishthe ED50 for the combination group. Thereafter, theinteraction between these two drugs was assessedisobolographically. In the third series of the experi-ments, to investigate a possible mechanism of thespinal interaction between morphine and R-PIA, therelatively selective A1 antagonist DPCPX 10 �g or�-opioid receptor antagonist naloxone 10 �g was de-livered intrathecally 5 min before injection of a com-bination dose (1/2 ED50s). The maximal reversal fromthe peak effect for the combination group for eachantagonist group was assessed and compared withpeak %MPE. In the last series of experiments, in whichwe sought to identify whether the vehicles andDPCPX had an effect on antiallodynia, normal saline,DMSO, and DPCPX were administered.
Withdrawal threshold data from von Frey hair test-ing were obtained as the actual threshold in gramsand were converted to %MPE using the formula:%MPE for antiallodynia � ([postdrug threshold �baseline threshold]/[15 g � baseline threshold]) �100, where postdrug threshold � the largest thresholdobserved after intrathecal injection. The cutoff valuewas defined as a stimulus intensity of 15 g for thetactile threshold (i.e., %MPE � 100). The peak drugeffect was used to calculate a %MPE, and these datawere used to plot a %MPE versus log dose curve. TheED50 values, slopes, and 95% confidence intervals arecalculated using dose-response data. Variances and its95% confidence intervals for the theoretical ED50 mayalso be calculated from the variances of each compo-nent administered alone (20). To determine whetherthe drug interaction is additive or synergistic, isobo-lographic analysis was performed. An isobologramwas constructed by plotting the ED50 value for mor-phine on the x axis and the ED50 values for R-PIA onthe y axis. Individual ED50 values for each agonistwere resolved from the combination dose required tocause 50% MPE and were plotted on the isobologramas the experimental combination dose. ED50 was de-fined separately for each drug. Fractions (1/2, 1/4,1/8, and 1/16) of the ED50 of each drug were thenadministered concurrently and the ED50 of themorphine-R-PIA combination was determined. Thetheoretical additive dose combination was calculated.
Experimental values were compared with theoreticaladditive values as defined by the theoretical additiveline. The theoretical additive point lies on a line con-necting the ED50 values of the individual drugs, andexperimental values that lie below and to the left ofthis additive line are considered to be synergistic.
Data were expressed as mean � se because of thesmall number of rats in each group. The differencebetween the theoretical additive ED50 value and theexperimental ED50 value was compared using a Stu-dent’s t-test. The least antagonistic effect for each pre-treatment group was compared with the peak agonis-tic effect of the combination group using the unpairedt-test. A P value � 0.05 was considered to be statisti-cally significant.
ResultsAfter spinal nerve ligation, most rats displayed nor-mal general behavior and weight gain. After catheterimplantation in the animals with nerve ligation, thethresholds for evoking hindpaw withdrawal were inthe range of 1–4 g for all rats.
Intrathecal morphine, R-PIA, and their combinationresulted in a dose-dependent antiallodynic effect (Fig.1). Although not being closely paralleled, the slope ofthe combination group was shifted to the left side inlarger doses compared with morphine (1–30 �g) andR-PIA (3 and 10 �g), respectively (Fig. 1). The ED50values and slopes (95% confidence intervals) are asfollows: 7.9 (3.9–15.9) and 19.3 (13.9–24.6) �g for mor-phine, 1.4 (0.8–2.4) and 31.6 (20.6–42.5) �g for R-PIA,
Figure 1. Dose-response curves from the peak effects of percentmaximal possible effect (%MPE) for antiallodynia in the morphine,N6-(2-phenylisopropyl)-adenosine R-(�)isomer (R-PIA), and mor-phine � R-PIA groups. These curves show a dose-dependent anti-allodynic effect. Data are expressed as mean � sem. Doses (�g) arerepresented logarithmically on the x axis and peak %MPE is repre-sented on the y axis. Asterisks indicate that the mean %MPE of eachgroup is significant compared with the smallest dose. *P � 0.05;unpaired t-test.
ANESTH ANALG PAIN MEDICINE HWANG ET AL. 4632005;100:461–8 INTERACTION BETWEEN MORPHINE AND R-PIA
and 1.7 (1.1–2.7) and 51.2 (20.6–81.9) �g for theircombination, respectively. The high slope value of thecombination group could reflect an increased efficacy.
The time-effect courses as a function of the intrathecaldoses of these two agonist groups and their combina-tion groups were similar in general (Fig. 2). The max-
Figure 2. Time course of antiallodynic effects byintrathecal injection of morphine (7 rats pereach dose), N6-(2-phenylisopropyl)-adenosineR-(�)isomer (R-PIA) (7 rats per each dose), andR-PIA � morphine (8 rats per each dose). Thesecurves show a dose-dependent antiallodyniceffect in each group. Data are expressed asmean � sem. Asterisks indicate that mean per-cent maximal possible effect (%MPE) of eachgroup for antiallodynia at that time point issignificant compared with baseline value. *P �0.05; one-way repeated-measures analysis ofvariance followed by multiple comparisons(Dunnett’s method).
464 PAIN MEDICINE HWANG ET AL. ANESTH ANALGINTERACTION BETWEEN MORPHINE AND R-PIA 2005;100:461–8
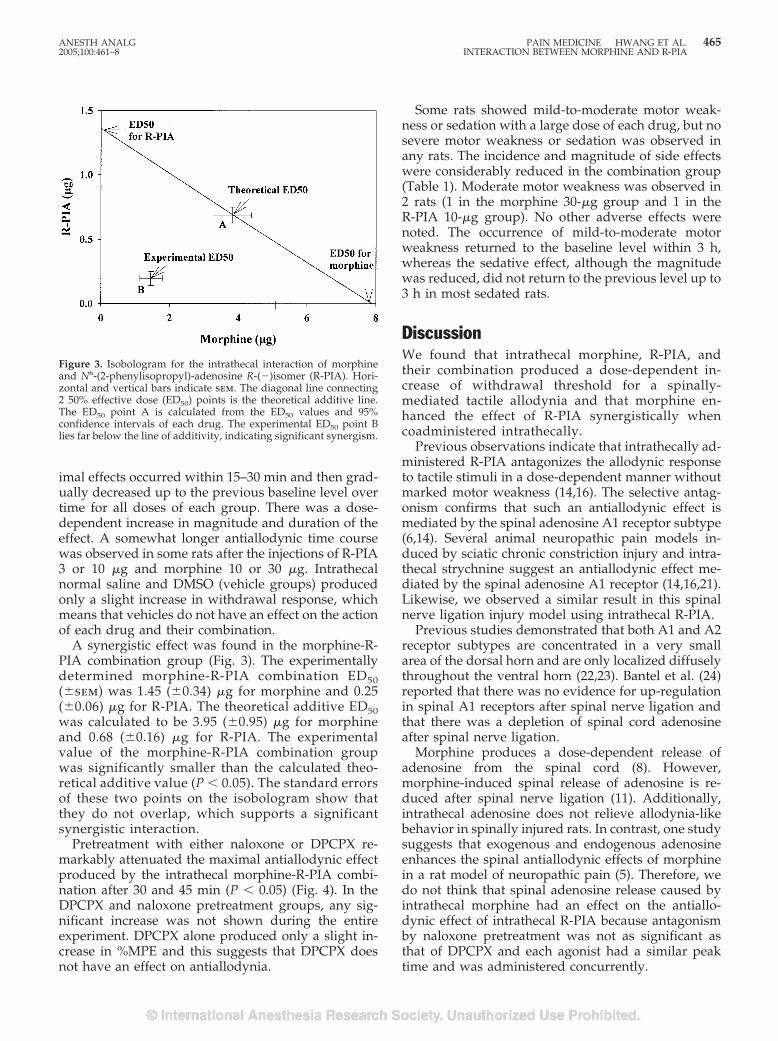
imal effects occurred within 15–30 min and then grad-ually decreased up to the previous baseline level overtime for all doses of each group. There was a dose-dependent increase in magnitude and duration of theeffect. A somewhat longer antiallodynic time coursewas observed in some rats after the injections of R-PIA3 or 10 �g and morphine 10 or 30 �g. Intrathecalnormal saline and DMSO (vehicle groups) producedonly a slight increase in withdrawal response, whichmeans that vehicles do not have an effect on the actionof each drug and their combination.
A synergistic effect was found in the morphine-R-PIA combination group (Fig. 3). The experimentallydetermined morphine-R-PIA combination ED50(�sem) was 1.45 (�0.34) �g for morphine and 0.25(�0.06) �g for R-PIA. The theoretical additive ED50was calculated to be 3.95 (�0.95) �g for morphineand 0.68 (�0.16) �g for R-PIA. The experimentalvalue of the morphine-R-PIA combination groupwas significantly smaller than the calculated theo-retical additive value (P � 0.05). The standard errorsof these two points on the isobologram show thatthey do not overlap, which supports a significantsynergistic interaction.
Pretreatment with either naloxone or DPCPX re-markably attenuated the maximal antiallodynic effectproduced by the intrathecal morphine-R-PIA combi-nation after 30 and 45 min (P � 0.05) (Fig. 4). In theDPCPX and naloxone pretreatment groups, any sig-nificant increase was not shown during the entireexperiment. DPCPX alone produced only a slight in-crease in %MPE and this suggests that DPCPX doesnot have an effect on antiallodynia.
Some rats showed mild-to-moderate motor weak-ness or sedation with a large dose of each drug, but nosevere motor weakness or sedation was observed inany rats. The incidence and magnitude of side effectswere considerably reduced in the combination group(Table 1). Moderate motor weakness was observed in2 rats (1 in the morphine 30-�g group and 1 in theR-PIA 10-�g group). No other adverse effects werenoted. The occurrence of mild-to-moderate motorweakness returned to the baseline level within 3 h,whereas the sedative effect, although the magnitudewas reduced, did not return to the previous level up to3 h in most sedated rats.
DiscussionWe found that intrathecal morphine, R-PIA, andtheir combination produced a dose-dependent in-crease of withdrawal threshold for a spinally-mediated tactile allodynia and that morphine en-hanced the effect of R-PIA synergistically whencoadministered intrathecally.
Previous observations indicate that intrathecally ad-ministered R-PIA antagonizes the allodynic responseto tactile stimuli in a dose-dependent manner withoutmarked motor weakness (14,16). The selective antag-onism confirms that such an antiallodynic effect ismediated by the spinal adenosine A1 receptor subtype(6,14). Several animal neuropathic pain models in-duced by sciatic chronic constriction injury and intra-thecal strychnine suggest an antiallodynic effect me-diated by the spinal adenosine A1 receptor (14,16,21).Likewise, we observed a similar result in this spinalnerve ligation injury model using intrathecal R-PIA.
Previous studies demonstrated that both A1 and A2receptor subtypes are concentrated in a very smallarea of the dorsal horn and are only localized diffuselythroughout the ventral horn (22,23). Bantel et al. (24)reported that there was no evidence for up-regulationin spinal A1 receptors after spinal nerve ligation andthat there was a depletion of spinal cord adenosineafter spinal nerve ligation.
Morphine produces a dose-dependent release ofadenosine from the spinal cord (8). However,morphine-induced spinal release of adenosine is re-duced after spinal nerve ligation (11). Additionally,intrathecal adenosine does not relieve allodynia-likebehavior in spinally injured rats. In contrast, one studysuggests that exogenous and endogenous adenosineenhances the spinal antiallodynic effects of morphinein a rat model of neuropathic pain (5). Therefore, wedo not think that spinal adenosine release caused byintrathecal morphine had an effect on the antiallo-dynic effect of intrathecal R-PIA because antagonismby naloxone pretreatment was not as significant asthat of DPCPX and each agonist had a similar peaktime and was administered concurrently.
Figure 3. Isobologram for the intrathecal interaction of morphineand N6-(2-phenylisopropyl)-adenosine R-(�)isomer (R-PIA). Hori-zontal and vertical bars indicate sem. The diagonal line connecting2 50% effective dose (ED50) points is the theoretical additive line.The ED50 point A is calculated from the ED50 values and 95%confidence intervals of each drug. The experimental ED50 point Blies far below the line of additivity, indicating significant synergism.
ANESTH ANALG PAIN MEDICINE HWANG ET AL. 4652005;100:461–8 INTERACTION BETWEEN MORPHINE AND R-PIA
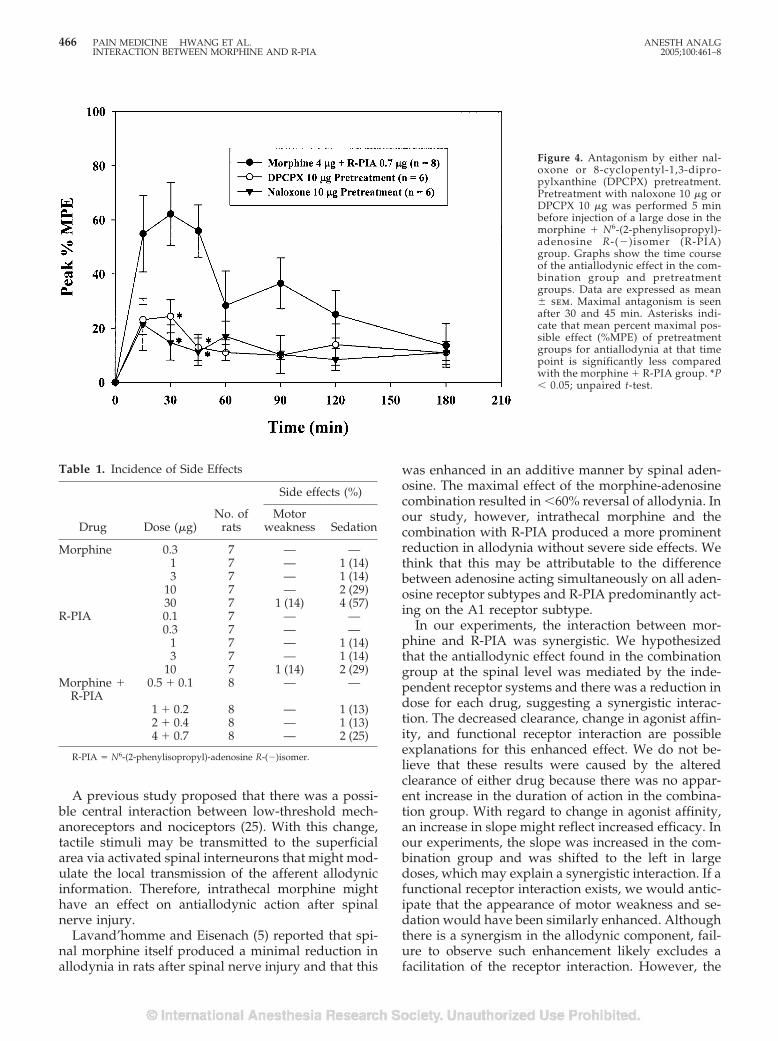
A previous study proposed that there was a possi-ble central interaction between low-threshold mech-anoreceptors and nociceptors (25). With this change,tactile stimuli may be transmitted to the superficialarea via activated spinal interneurons that might mod-ulate the local transmission of the afferent allodynicinformation. Therefore, intrathecal morphine mighthave an effect on antiallodynic action after spinalnerve injury.
Lavand’homme and Eisenach (5) reported that spi-nal morphine itself produced a minimal reduction inallodynia in rats after spinal nerve injury and that this
was enhanced in an additive manner by spinal aden-osine. The maximal effect of the morphine-adenosinecombination resulted in �60% reversal of allodynia. Inour study, however, intrathecal morphine and thecombination with R-PIA produced a more prominentreduction in allodynia without severe side effects. Wethink that this may be attributable to the differencebetween adenosine acting simultaneously on all aden-osine receptor subtypes and R-PIA predominantly act-ing on the A1 receptor subtype.
In our experiments, the interaction between mor-phine and R-PIA was synergistic. We hypothesizedthat the antiallodynic effect found in the combinationgroup at the spinal level was mediated by the inde-pendent receptor systems and there was a reduction indose for each drug, suggesting a synergistic interac-tion. The decreased clearance, change in agonist affin-ity, and functional receptor interaction are possibleexplanations for this enhanced effect. We do not be-lieve that these results were caused by the alteredclearance of either drug because there was no appar-ent increase in the duration of action in the combina-tion group. With regard to change in agonist affinity,an increase in slope might reflect increased efficacy. Inour experiments, the slope was increased in the com-bination group and was shifted to the left in largedoses, which may explain a synergistic interaction. If afunctional receptor interaction exists, we would antic-ipate that the appearance of motor weakness and se-dation would have been similarly enhanced. Althoughthere is a synergism in the allodynic component, fail-ure to observe such enhancement likely excludes afacilitation of the receptor interaction. However, the
Figure 4. Antagonism by either nal-oxone or 8-cyclopentyl-1,3-dipro-pylxanthine (DPCPX) pretreatment.Pretreatment with naloxone 10 �g orDPCPX 10 �g was performed 5 minbefore injection of a large dose in themorphine � N6-(2-phenylisopropyl)-adenosine R-(�)isomer (R-PIA)group. Graphs show the time courseof the antiallodynic effect in the com-bination group and pretreatmentgroups. Data are expressed as mean� sem. Maximal antagonism is seenafter 30 and 45 min. Asterisks indi-cate that mean percent maximal pos-sible effect (%MPE) of pretreatmentgroups for antiallodynia at that timepoint is significantly less comparedwith the morphine � R-PIA group. *P� 0.05; unpaired t-test.
Table 1. Incidence of Side Effects
Drug Dose (�g)No. of
rats
Side effects (%)
Motorweakness Sedation
Morphine 0.3 7 — —1 7 — 1 (14)3 7 — 1 (14)
10 7 — 2 (29)30 7 1 (14) 4 (57)
R-PIA 0.1 7 — —0.3 7 — —
1 7 — 1 (14)3 7 — 1 (14)
10 7 1 (14) 2 (29)Morphine �
R-PIA0.5 � 0.1 8 — —
1 � 0.2 8 — 1 (13)2 � 0.4 8 — 1 (13)4 � 0.7 8 — 2 (25)
R-PIA � N6-(2-phenylisopropyl)-adenosine R-(�)isomer.
466 PAIN MEDICINE HWANG ET AL. ANESTH ANALGINTERACTION BETWEEN MORPHINE AND R-PIA 2005;100:461–8
fact that the receptors for the sensory component aremainly located in the dorsal horn of spinal cord andthat there may be an interaction of the A1 receptorwith the opioid receptor increases the possibility of afunctional receptor interaction. Although two recep-tors share common second-messenger systems andpain-signaling mechanism at the cellular level (26), thedifference in action site and receptor number andfunction changes after nerve injury may affect theresults. Despite all these possible explanations, theexact mechanisms are not yet known.
To investigate the reversal effect, we performed anantagonistic study with pretreatment of either nalox-one or DPCPX in the combination subgroup present-ing maximal effect. In our experiment, we chose onlythe A1 antagonist DPCPX because the A1 receptorsubtype was most effective in the reversal of tactileallodynia in the nerve ligation injury model (6). Pre-treatment with either naloxone or DPCPX remarkablyattenuated the maximal antiallodynic effect in thecombination group. These findings may suggest thatspinal morphine is independently necessary for theoptimal function of R-PIA in producing a synergisticeffect.
Although not systematically quantified, intrathecalmorphine or R-PIA resulted in a dose-dependent re-duction in spontaneous activity. The effect on motorperformance is particularly crucial in studies of spinalA1 receptor agonists because of the possible action ofa large dose of R-PIA in the motor neuron area of thespinal cord (23). Although the A1 receptor is presenteven in the ventral horn, there was only mild motorweakness in this experiment. Several studies reportedthat motor weakness is mediated through the adeno-sine A2 receptor and no significant motor weaknesscould be seen in R-PIA doses of �10 �g (4,12). Weconsidered that each test used here was a relativelygross test without any quantification and that sideeffects in animal studies are difficult to evaluate with-out blinded objective scoring and quantification.Therefore, we simply assessed the motor weakness byonly checking the presence of each component. Al-though the incidence of rats showing sedation in thecombination group was less than that of the morphinegroup, there may be a synergistic interaction in pro-ducing sedation. More worrisome is that the majorside effects of morphine in humans are nausea andvomiting, which cannot be evaluated in the rat.Briefly, with respect to reduced side effect and syner-gistic effect, a combination therapy administering asmaller dose of each drug and a target-specific treat-ment using the A1 receptor agonist R-PIA may bebeneficial to the management of allodynia.
In conclusion, morphine and R-PIA produced adose-dependent antiallodynia without severe side ef-fects and intrathecal morphine produced a synergisticinteraction with R-PIA in a rat model of nerve ligation
injury. Thus, these results suggest that activation ofboth �-opioid and adenosine A1 receptors is requiredfor the synergistic interaction between morphine andR-PIA in reducing tactile allodynia.
References1. Kim SH, Chung JM. An experimental model for peripheral
neuropathy produced by segmental spinal nerve ligation in therat. Pain 1992;50:355–63.
2. Sheen K, Chung JM. Signs of neuropathic pain depend onsignals from injured nerve fibers in a rat model. Brain Res1993;610:62–8.
3. Kim KJ, Yoon YW, Chung JM. Comparison of three rodentneuropathic pain models. Exp Brain Res 1997;113:200–6.
4. Lee YW, Yaksh TL. Pharmacology of the spinal adenosine re-ceptor, which mediates the antiallodynic action of intrathecaladenosine agonists. J Pharmacol Exp Ther 1996;277:1642–8.
5. Lavand’homme PM, Eisenach JC. Exogenous and endogenousadenosine enhances the spinal antiallodynic effects of morphinein a rat model of neuropathic pain. Pain 1999;80:31–6.
6. Pan H-L, Xu Z, Leung E, Eisenach JC. Allosteric adenosinemodulation to reduce allodynia. Anesthesiology 2001;95:416–20.
7. Sweeny MI, White TD, Jhamandas KH, Sawynok J. Morphinereleases endogenous adenosine from the spinal cord in vivo.Eur J Pharmacol 1987;141:169–70.
8. Sawynok J, Sweeney MI, White TD. Adenosine release maymediate spinal analgesia by morphine. Trends Pharmacol Sci1989;10:186–9.
9. Crain SM, Shen K-F. Opioids can evoke direct receptor-mediated excitatory effects on sensory neurons. Trends Phar-macol Sci 1990;11:77–81.
10. Sweeney MI, White TD, Sawynok J. Intracerebroventricularmorphine releases adenosine and adenosine 3',5'-cyclic mono-phosphate from the spinal cord via a serotonergic mechanism.J Pharmacol Exp Ther 1991;259:1013–8.
11. Sandner-Kiesling A, Li X, Eisenach JC. Morphine-induced spi-nal release of adenosine is reduced in neuropathic rats. Anes-thesiology 2001;95:1455–9.
12. Karlsten R, Gordh T Jr, Hartvig P, Post C. Effects of intrathecalinjection of the adenosine receptor agonists R-phenylisopropyl-adenosine and N-ethylcarboxamide-adenosine on nociceptionand motor function in the rat. Anesth Analg 1990;71:60–4.
13. Karlsten R, Gordh T Jr. An A1-selective adenosine agonist abol-ishes allodynia elicited by vibration and touch after intrathecalinjection. Anesth Analg 1995;80:844–7.
14. Cui J-G, Sollevi A, Linderoth B, Meyerson BA. Adenosine re-ceptor activation suppresses tactile hypersensitivity and poten-tiates spinal cord stimulation in mononeuropathic rats. Neuro-sci Lett 1997;223:173–6.
15. Heijne M, Hao JX, Yu W, et al. Reduced anti-allodynic effect ofthe adenosine A1-receptor agonist R-phenylisopropyladenosineon repeated intrathecal administration and lack of cross-tolerance with morphine in a rat model of central pain. AnesthAnalg 1998;87:1367–71.
16. Heijne M, Hao JX, Sollevi A, et al. Marked enhancement ofanti-allodynic effect by combined intrathecal administration ofthe adenosine A1-receptor agonist R-phenylisopropyladenosineand morphine in a rat model of central pain. Acta AnaesthesiolScand 2000;44:665–71.
17. DeLander GE, Keil GJ. Antinociception induced by intrathecalcoadministration of selective adenosine receptor and selectiveopioid receptor agonists in mice. J Pharmacol Exp Ther 1993;268:943–51.
18. Yaksh TL, Rudy TA. Chronic catheterization of the spinal sub-arachnoid space. Physiol Behav 1976;17:1031–6.
19. Chaplan SR, Bach FW, Pogrel JW, et al. Quantitative assessmentof tactile allodynia in the rat paw. J Neurosci Methods 1994;53:55–63.
ANESTH ANALG PAIN MEDICINE HWANG ET AL. 4672005;100:461–8 INTERACTION BETWEEN MORPHINE AND R-PIA
20. Tallarida RJ, Porreca F, Cowan A. Statistical analysis of drug-drug and site-site interactions with isobolograms. Life Sci 1989;45:947–61.
21. Sosnowski M, Yaksh TL. Role of spinal adenosine receptors inmodulating the hyperesthesia produced by spinal glycine re-ceptor antagonism. Anesth Analg 1989;69:587–92.
22. Choca JI, Proudfit HK, Green RD. Identification of A1 and A2adenosine receptors in the rat spinal cord. J Pharmacol Exp Ther1987;242:905–10.
23. Choca JI, Green RD, Rroudfit HK. Adenosine A1 and A2 recep-tors of the substantia gelatinosa are located predominantly onintrinsic neurons: an autoradiography study. J Pharmacol ExpTher 1988;247:757–64.
24. Bantel C, Tobin JR, Li X, et al. Intrathecal adenosine followingspinal nerve ligation in rat. Anesthesiology 2002;96:103–8.
25. Cervero F, Laird JMA. Mechanisms of touch-evoked pain(allodynia): a new model. Pain 1996;68:13–23.
26. Dougherty PM, Staats PS. Intrathecal drug therapy for chronicpain. Anesthesiology 1999;91:1891–918.
468 PAIN MEDICINE HWANG ET AL. ANESTH ANALGINTERACTION BETWEEN MORPHINE AND R-PIA 2005;100:461–8
The Median Effective Dose of Tramadol and Morphine forPostoperative Patients: A Study of InteractionsThi Aurore Marcou, MD, Sophie Marque, MD, Jean-Xavier Mazoit, MD, PhD, andDan Benhamou, MD
Department of Anesthesiology, Hopital Bicetre, Assistance Publique-Hopitaux de Paris, F-94275 Le Kremlin-Bicetre andAnesthesia Laboratory UPRES EA 3540, Faculte de Medecine du Kremlin-Bicetre, Universite de Paris-Sud, F-94276 LeKremlin-Bicetre, France
Tramadol is a centrally-acting analgesic drug. In asearch of an effective balanced analgesia techniquewith a morphine-sparing component, we studied themedian effective analgesic doses (ED50) of tramadol,morphine, and their combination to determine the na-ture of their interaction using an isobolographic analy-sis. In this double-blind, randomized, two-stage pro-spective study, 90 postoperative patients were enrolledin one of three groups. The dose of tramadol and mor-phine received by a particular patient was determinedusing an up-down allocation technique. Initial dosesand increments were, respectively, 100 mg and 10 mg inthe tramadol group and 5 mg and 1 mg in the morphine
group. In the second part, a 40:3 tramadol:morphinedosing ratio was used. The threshold of effective anal-gesia was defined as 3 or less on a numerical pain score(0–10). Isobolographic analysis was subsequently ap-plied. The ED50 values (95% confidence interval) of tra-madol and morphine were, respectively, 86 mg (57–115 mg) and 5.7 mg (4.2–7.2 mg). The ED50 of thecombination was 72 mg (62–82 mg) for tramadol and5.4 mg (4–6.6.2 mg) for morphine. The combination oftramadol and morphine was infra-additive and thusnot recommended for postoperative analgesia.
(Anesth Analg 2005;100:469–74)
B alanced analgesia is a validated concept in thepostoperative period and is now recommendedby national guidelines and publications (1,2).
The association of analgesic drugs is expected to im-prove pain relief and limit the incidence and the se-verity of the side effects of each drug (3,4). Moreover,optimal pain relief demonstrates clinically significantadvantages for surgical outcome. Pain relief acceler-ates postoperative surgical recovery and rehabilitationand contributes to reducing the duration of hospitalstay (5). Morphine remains the standard referencedrug for managing postoperative pain. AdministeredIV, it has both supraspinal and spinal actions and atsmall doses, it activates the descending analgesic path-way, inhibiting nociceptive signal transduction. At
large doses, it decreases directly the nociceptive trans-duction across the synapse in the spinal cord by in-hibiting the release of substance P or by hyperpolar-izing postsynaptic interneurons (6). Because morphineexerts a global inhibitory effect on the central nervoussystem, its analgesic activity cannot be dissociatedfrom its numerous adverse effects, in particular, respi-ratory depression (respiratory rate, tidal volume, andcarbon dioxide sensitivity), nausea and vomiting,urine retention, and constipation (7,8). Balanced anal-gesia combining morphine with other analgesics hasbeen encouraged to “spare” doses of morphine and tolimit its adverse effects.
Tramadol is a centrally-acting analgesic with twodistinct mechanisms of action: One enantiomer exertsa predominantly weak � opioid effect, whereas theother inhibits norepinephrine and serotonin reuptake,activating descending monoaminergic inhibitory path-ways (9). These complementary actions are thought toenhance the analgesic efficacy of tramadol by improvingits tolerability profile. Parenteral and oral tramadol hasproven effective and well tolerated in the managementof moderate to severe acute postoperative pain in adults(10). Unlike other opioids, tramadol has no clinicallyrelevant effect on respiratory or cardiovascular variablesat recommended doses. On a weight basis, the analgesic
Supported by grants from the French Ministry of Research andthe Association MAPAR.
Presented in an abstract form at the European Society of Anaes-thesiologists congress Glasgow, June, 2003, and the French Societyof Anesthesia and Intensive Care Congress Paris, September, 2003.
Accepted for publication July 27, 2004.Address correspondence to Pr. Dan Benhamou, Department of
Anesthesiology, Hopital de Bicetre, F-94275 Le Kremlin Bicetre Ce-dex, France. Address e-mail to [email protected].
DOI: 10.1213/01.ANE.0000142121.24052.25
©2005 by the International Anesthesia Research Society0003-2999/05 Anesth Analg 2005;100:469–74 469
potency of tramadol is 1/10 that of IV morphine and1/13 epidurally (11). At the usually recommended dos-age, the lack of full analgesic efficacy limits tramadol asa sole drug for treating severe pain after surgery. Itssafety, however, suggests a place in combination withother drugs or with a regional anesthetic technique. TheED50, defined as the clinical dose for which 50% of thepatients had their pain adequately relieved, has neverbeen reported. The association of morphine and tram-adol reported in one study suggests an eventual benefitfrom the combination of the two substances (12), but theratio of the combination was not based on pharmacolog-ical evidence. Synergy between different opioids hasbeen reported in animal studies (13). This synergy, withdifferent receptor affinities and different pharmacoki-netic properties, is also proposed as a rationale for theconcept of opioid rotation (14). Thus, the aim of thisstudy was 1) to define the ED50 of tramadol by using anup-down sequential allocation technique and 2) to com-pare it with the ED50 of morphine by isobolographicanalysis to define the nature of their interaction (15).
MethodsAfter Ethics Committee approval and written in-formed consent were obtained, 90 ASA physical statusI–II patients were enrolled and allocated to threegroups. All patients were scheduled for surgery con-sidered as slightly to moderately painful. Exclusioncriteria were age �18 yr, contraindications to the useof tramadol or morphine, pregnancy, intraoperativeregional anesthesia, any anticipated need for pro-found postoperative analgesia, postoperative pain �3on a numeric pain scale (NPS; 0 � no pain; 10 � theworst possible pain).
The evening before surgery, patients were in-structed how to use the NPS. All patients received astandard anesthetic technique consisting of IV induc-tion with propofol or thiopental and remifentanil orsufentanil. Anesthesia was maintained with either anIV infusion of propofol or nitrous oxide and desflu-rane. Intraoperative analgesia was provided withremifentanil or sufentanil. At the end of surgery, IVdroperidol (1 mg) was administrated systematically asan antiemetic in prevention of nausea and vomiting.Pain intensity was assessed using NPS, immediatelyon patient arrival in the postanesthesia care unit(PACU), and then every 5 min or when the patientcomplained of pain. As soon as the NPS score reached3 (time defined as “T0”), patients were included andreceived analgesia as defined by the protocol.
In the first part of the study, 60 patients were ran-domized to receive either IV morphine (group M) ortramadol (group T), in a double-blind, randomizeddesign using computer generated assignment. Thedose of morphine or tramadol received by a particular
patient was determined by the response of the previ-ous patient within the same group using an up-downsequential allocation technique (16). In group T, thefirst patient received 100 mg of tramadol, and subse-quent increments were 10 mg. In group M, the firstpatient received 5 mg of morphine and the incrementwas 1 mg. In the second part of the study, 30 otherpatients received a mixture of tramadol and morphinein a 40:3 dose ratio, corresponding to the calculatedequianalgesic ratio. The first patient received 3 mg ofmorphine and 40 mg of tramadol. The increment was6.67 mg for tramadol and 0.5 mg for morphine. Blind-ing was ensured by using blinded syringes preparedby an anesthesiologist who was not involved in pa-tient pain assessment.
The efficacy of study drugs was assessed using theNPS 20 min after T0 (T20). Two outcomes were con-sidered: 1) NPS �3 at T20: effective analgesia. Thenext patient received a smaller dose, i.e., 10 mg ingroup T, 1 mg in group M, 6.67 mg of tramadol and0.5 mg of morphine in group M�T. 2) NPS �3 at T20:ineffective analgesia. The next patient received an in-creased dose with the same increment as above. Inaddition to NPS measurements, heart rate, arterialblood pressure, and oxygen saturation were recorded.Adverse effects of both tramadol and morphine (nau-sea, vomiting, dizziness, sweating, dry mouth, seda-tion, and respiratory depression) were recorded at T20and thereafter at 30-min intervals until discharge fromthe PACU.
The three groups were compared for demographicdata and side effects using �2 or analysis of variance.NPS was compared among groups at T0 and at T20using the Kruskal-Wallis test. ED50, the median doseleading to the probability of 0.5 for a patient of havinga NPS �3 was calculated using the up-and-downmethod (16). A classical isobolographic technique wasused in a second stage to assess the possible interac-tion between the two drugs (15). The 95% confidencecontours of the joint action were drawn by joining the95% confidence intervals in each axis of the isobolo-gram. The combination was considered additive ifthese contours overlap, and as supra-additive or infra-additive otherwise. Results are reported as the mean� sd or as the median (interquartile range) for contin-uous variables and as the frequency and 95% confi-dence interval (CI) for dichotomous variables.
ResultsThe demographic data (age, sex ratio, weight, andtype and duration of surgery) of the three groups weresimilar (Table 1). The number of patients givenremifentanil was similar (7 of 30, 5 of 30, and 11 of 30in the T, M, and T�M groups, respectively). On arrivalin the PACU at T0, patient intensity of pain assessed
470 PAIN MEDICINE MARCOU ET AL. ANESTH ANALGPOSTOPERATIVE TRAMADOL AND MORPHINE 2005;100:469–74
by NPS was similar in the three groups with a medianvalue of 5 (Table 2 and Fig. 1).
No difference was observed in the occurrence ofside effects among the three groups, except for theincidence of dry mouth, which occurred significantlymore frequently in the T�M group than in the othertwo groups (Table 2). Respiratory depression occurredin three patients in group M.
The ED50 (95% CI) of tramadol and morphine alonewere, respectively, 86 mg (57–115 mg) and 5.7 mg(4.2–7.2 mg). The sequences of effective and ineffectiveanalgesia are shown in Figure 2. The ED50 (95% CI) ofthe drug combination was 72 mg (62–82 mg) of tram-adol and 5.4 mg (4.6–6.2 mg) of morphine. This ED50was infra-additive (Fig. 3).
DiscussionThis study is the first to define the IV median effectiveanalgesic dose of tramadol in postoperative patients.The ED50 of tramadol was 86 mg (57–115 mg), whereasmorphine had an ED50 of 5.7 mg (4.2–7.2 mg). Anisobolographic analysis demonstrated that tramadoland morphine were infra-additive when adminis-trated in combination.
Tramadol has proved to be an effective and well tol-erated analgesic in the management of moderate to se-vere acute postoperative pain in adults (10). Recommen-dations for the use of tramadol for postoperative pain arenot well defined and vary among countries. A slow IVbolus of 100 mg followed by titration (50 mg every 10 to20 minutes, to a total dose of 250 mg) is usually recom-mended as the initial dosing scheme. Maintenance isusually achieved with additional doses of 50 to 100 mgevery 4 to 6 hours, to a maximum dose of 600 mg per day
(10). Administration of tramadol by patient-controlledanalgesia (PCA) also proved to be effective in manytrials (17,18). However, the rational basis for these rec-ommendations for postoperative pain management isunclear and the ED50 has not been reported. We calcu-lated an ED50 of 86 mg (57–115 mg), which is close to thebolus recommended by the manufacturer. Clinically,this first dose, relieving only 50% of patients, may beinsufficient in acute pain management. For morphine, anED50 of 5.7 mg (4.2–7.2 mg) was found, confirming ourprevious results (19).
The pharmacodynamic and pharmacokinetic prop-erties of tramadol and morphine are well documented(11). The onset of the action of tramadol after paren-teral administration is in the range of minutes; themaximum effect is reached after 15–30 minutes, andthe duration of its effect is 3–6 hours. Because rapidonset of analgesia is required in the postoperativeperiod, a short interval of 10 to 20 minutes is recom-mended to assess the efficacy of the bolus and tofurther the titration, although the maximum analgesiceffect is not reached yet. For morphine, the recom-mended interval is 5 to 10 minutes. A preliminarystudy found that the onset time of IV tramadol 100 mgor of morphine 10 mg boluses were actually compa-rable and estimated as 13 and 10 minutes, respectively(20). Thus, the 20-minute interval chosen to assess theefficacy of both drugs in our study appears adequateboth to measure the full effect of the drugs and toadequately compare them.
We did not observe any significant difference in theincidence of adverse effects, except for dry mouth,which occurred significantly more frequently with thecombination. Mouth dryness was reported by 17%and 13% of the patients in group T or M, respectively,whereas 50% of the patients receiving the combination
Table 1. Patients characteristics
Tramadol Morphine Tramadol � Morphine
GenderMale 15 (50%) 17 (57%) 11 (37%)Female 15 (50%) 13 (43%) 19 (63%)
Age (yr) 48 � 18 44 � 16 51 � 17Weight (kg) 66 � 20 74 � 13 71 � 19Surgery
Urogenital 7 (23%) 3 (10%) 8 (27%)95% CI 10–42% 2–27% 12–46%Orthopedic 7 (23%) 6 (20%) 1 (3%)95% CI 10–42% 8–39 0–17%Ear-nose-throat 9 (31%) 12 (40%) 11 (37%)95% CI 15–49% 23–59% 20–56%Abdominal 7 (23%) 9 (30%) 10 (33%)95% CI 10–42% 15–49% 17–53%
Duration of surgery (min) 103 � 52 113 � 70 132 � 74
Continuous variables are reported as the mean � SD or as the median (interquartile range) and dichotomous variables as the number of patients (percentage).CI � confidence interval.
ANESTH ANALG PAIN MEDICINE MARCOU ET AL. 4712005;100:469–74 POSTOPERATIVE TRAMADOL AND MORPHINE
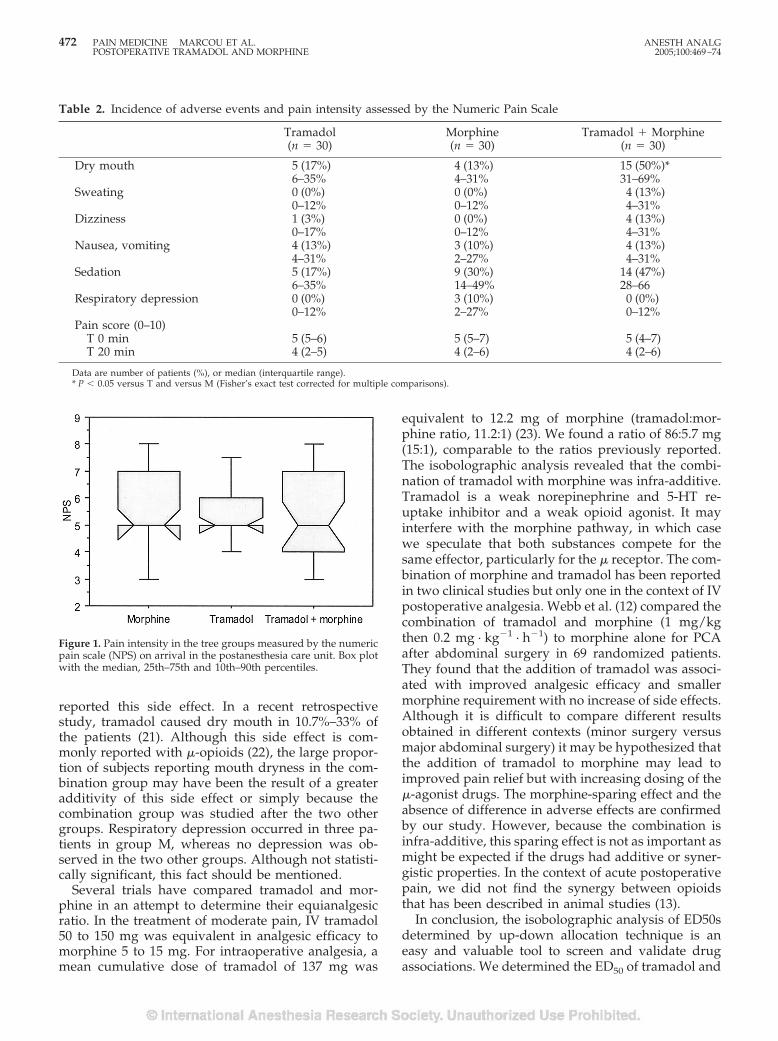
reported this side effect. In a recent retrospectivestudy, tramadol caused dry mouth in 10.7%–33% ofthe patients (21). Although this side effect is com-monly reported with �-opioids (22), the large propor-tion of subjects reporting mouth dryness in the com-bination group may have been the result of a greateradditivity of this side effect or simply because thecombination group was studied after the two othergroups. Respiratory depression occurred in three pa-tients in group M, whereas no depression was ob-served in the two other groups. Although not statisti-cally significant, this fact should be mentioned.
Several trials have compared tramadol and mor-phine in an attempt to determine their equianalgesicratio. In the treatment of moderate pain, IV tramadol50 to 150 mg was equivalent in analgesic efficacy tomorphine 5 to 15 mg. For intraoperative analgesia, amean cumulative dose of tramadol of 137 mg was
equivalent to 12.2 mg of morphine (tramadol:mor-phine ratio, 11.2:1) (23). We found a ratio of 86:5.7 mg(15:1), comparable to the ratios previously reported.The isobolographic analysis revealed that the combi-nation of tramadol with morphine was infra-additive.Tramadol is a weak norepinephrine and 5-HT re-uptake inhibitor and a weak opioid agonist. It mayinterfere with the morphine pathway, in which casewe speculate that both substances compete for thesame effector, particularly for the � receptor. The com-bination of morphine and tramadol has been reportedin two clinical studies but only one in the context of IVpostoperative analgesia. Webb et al. (12) compared thecombination of tramadol and morphine (1 mg/kgthen 0.2 mg · kg�1 · h�1) to morphine alone for PCAafter abdominal surgery in 69 randomized patients.They found that the addition of tramadol was associ-ated with improved analgesic efficacy and smallermorphine requirement with no increase of side effects.Although it is difficult to compare different resultsobtained in different contexts (minor surgery versusmajor abdominal surgery) it may be hypothesized thatthe addition of tramadol to morphine may lead toimproved pain relief but with increasing dosing of the�-agonist drugs. The morphine-sparing effect and theabsence of difference in adverse effects are confirmedby our study. However, because the combination isinfra-additive, this sparing effect is not as important asmight be expected if the drugs had additive or syner-gistic properties. In the context of acute postoperativepain, we did not find the synergy between opioidsthat has been described in animal studies (13).
In conclusion, the isobolographic analysis of ED50sdetermined by up-down allocation technique is aneasy and valuable tool to screen and validate drugassociations. We determined the ED50 of tramadol and
Figure 1. Pain intensity in the tree groups measured by the numericpain scale (NPS) on arrival in the postanesthesia care unit. Box plotwith the median, 25th–75th and 10th–90th percentiles.
Table 2. Incidence of adverse events and pain intensity assessed by the Numeric Pain Scale
Tramadol(n � 30)
Morphine(n � 30)
Tramadol � Morphine(n � 30)
Dry mouth 5 (17%) 4 (13%) 15 (50%)*6–35% 4–31% 31–69%
Sweating 0 (0%) 0 (0%) 4 (13%)0–12% 0–12% 4–31%
Dizziness 1 (3%) 0 (0%) 4 (13%)0–17% 0–12% 4–31%
Nausea, vomiting 4 (13%) 3 (10%) 4 (13%)4–31% 2–27% 4–31%
Sedation 5 (17%) 9 (30%) 14 (47%)6–35% 14–49% 28–66
Respiratory depression 0 (0%) 3 (10%) 0 (0%)0–12% 2–27% 0–12%
Pain score (0–10)T 0 min 5 (5–6) 5 (5–7) 5 (4–7)T 20 min 4 (2–5) 4 (2–6) 4 (2–6)
Data are number of patients (%), or median (interquartile range).* P � 0.05 versus T and versus M (Fisher’s exact test corrected for multiple comparisons).
472 PAIN MEDICINE MARCOU ET AL. ANESTH ANALGPOSTOPERATIVE TRAMADOL AND MORPHINE 2005;100:469–74
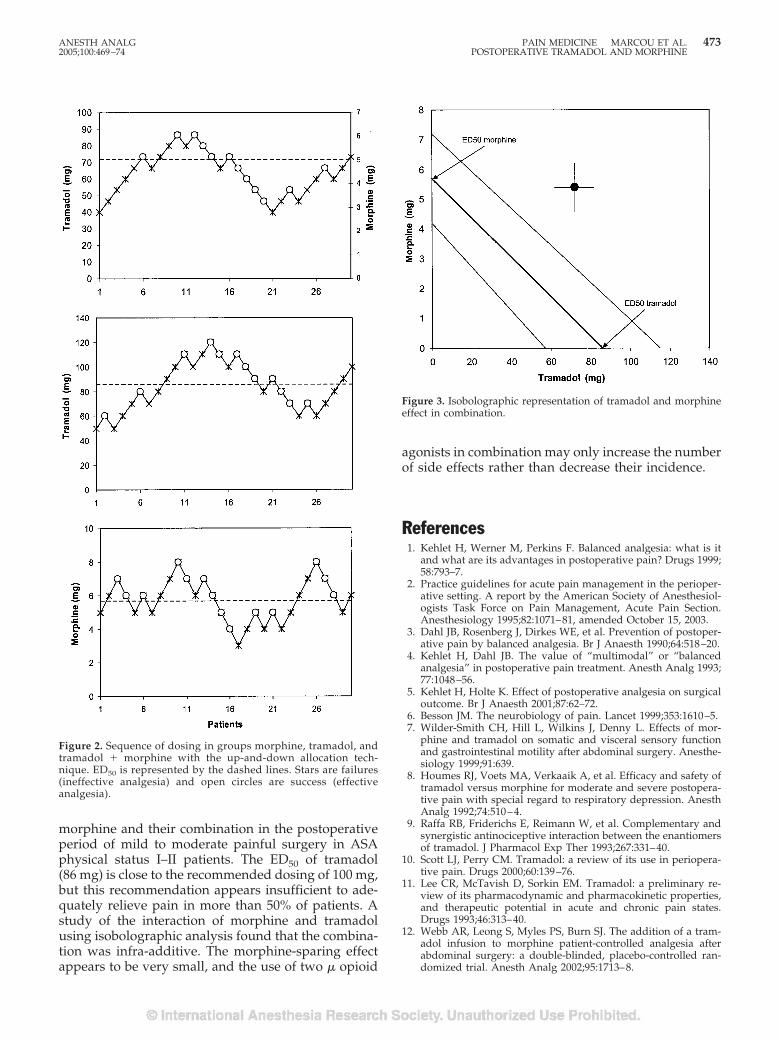
morphine and their combination in the postoperativeperiod of mild to moderate painful surgery in ASAphysical status I–II patients. The ED50 of tramadol(86 mg) is close to the recommended dosing of 100 mg,but this recommendation appears insufficient to ade-quately relieve pain in more than 50% of patients. Astudy of the interaction of morphine and tramadolusing isobolographic analysis found that the combina-tion was infra-additive. The morphine-sparing effectappears to be very small, and the use of two � opioid
agonists in combination may only increase the numberof side effects rather than decrease their incidence.
References1. Kehlet H, Werner M, Perkins F. Balanced analgesia: what is it
and what are its advantages in postoperative pain? Drugs 1999;58:793–7.
2. Practice guidelines for acute pain management in the perioper-ative setting. A report by the American Society of Anesthesiol-ogists Task Force on Pain Management, Acute Pain Section.Anesthesiology 1995;82:1071–81, amended October 15, 2003.
3. Dahl JB, Rosenberg J, Dirkes WE, et al. Prevention of postoper-ative pain by balanced analgesia. Br J Anaesth 1990;64:518–20.
4. Kehlet H, Dahl JB. The value of “multimodal” or “balancedanalgesia” in postoperative pain treatment. Anesth Analg 1993;77:1048–56.
5. Kehlet H, Holte K. Effect of postoperative analgesia on surgicaloutcome. Br J Anaesth 2001;87:62–72.
6. Besson JM. The neurobiology of pain. Lancet 1999;353:1610–5.7. Wilder-Smith CH, Hill L, Wilkins J, Denny L. Effects of mor-
phine and tramadol on somatic and visceral sensory functionand gastrointestinal motility after abdominal surgery. Anesthe-siology 1999;91:639.
8. Houmes RJ, Voets MA, Verkaaik A, et al. Efficacy and safety oftramadol versus morphine for moderate and severe postopera-tive pain with special regard to respiratory depression. AnesthAnalg 1992;74:510–4.
9. Raffa RB, Friderichs E, Reimann W, et al. Complementary andsynergistic antinociceptive interaction between the enantiomersof tramadol. J Pharmacol Exp Ther 1993;267:331–40.
10. Scott LJ, Perry CM. Tramadol: a review of its use in periopera-tive pain. Drugs 2000;60:139–76.
11. Lee CR, McTavish D, Sorkin EM. Tramadol: a preliminary re-view of its pharmacodynamic and pharmacokinetic properties,and therapeutic potential in acute and chronic pain states.Drugs 1993;46:313–40.
12. Webb AR, Leong S, Myles PS, Burn SJ. The addition of a tram-adol infusion to morphine patient-controlled analgesia afterabdominal surgery: a double-blinded, placebo-controlled ran-domized trial. Anesth Analg 2002;95:1713–8.
Figure 2. Sequence of dosing in groups morphine, tramadol, andtramadol � morphine with the up-and-down allocation tech-nique. ED50 is represented by the dashed lines. Stars are failures(ineffective analgesia) and open circles are success (effectiveanalgesia).
Figure 3. Isobolographic representation of tramadol and morphineeffect in combination.
ANESTH ANALG PAIN MEDICINE MARCOU ET AL. 4732005;100:469–74 POSTOPERATIVE TRAMADOL AND MORPHINE
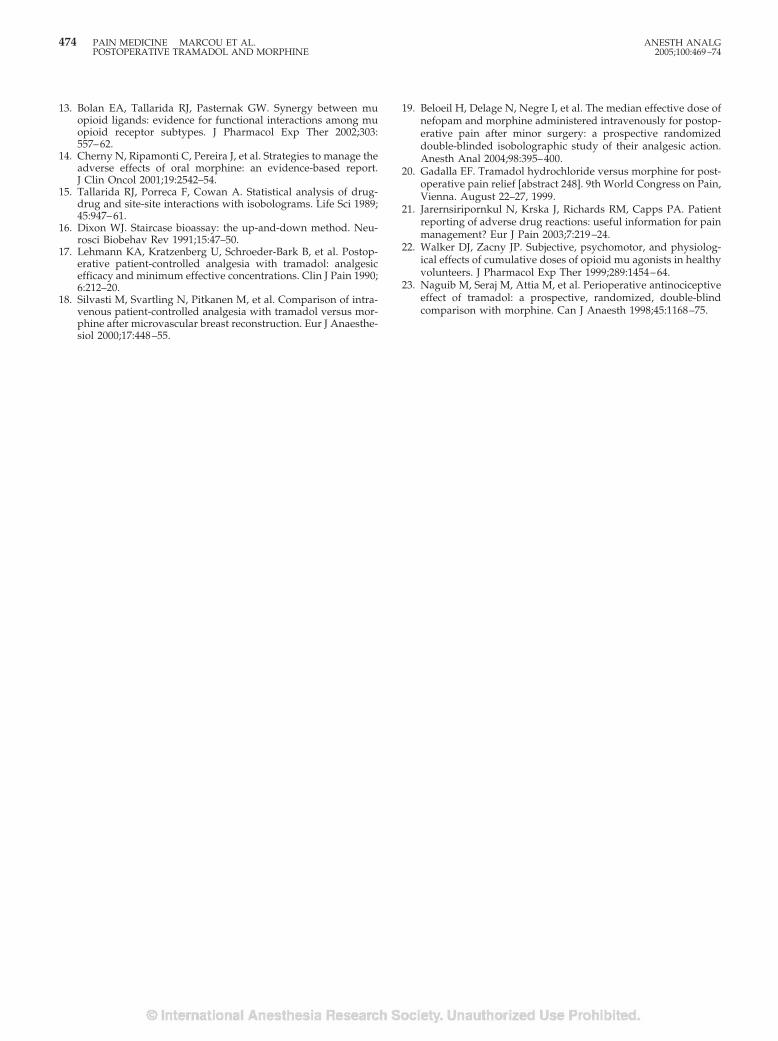
13. Bolan EA, Tallarida RJ, Pasternak GW. Synergy between muopioid ligands: evidence for functional interactions among muopioid receptor subtypes. J Pharmacol Exp Ther 2002;303:557–62.
14. Cherny N, Ripamonti C, Pereira J, et al. Strategies to manage theadverse effects of oral morphine: an evidence-based report.J Clin Oncol 2001;19:2542–54.
15. Tallarida RJ, Porreca F, Cowan A. Statistical analysis of drug-drug and site-site interactions with isobolograms. Life Sci 1989;45:947–61.
16. Dixon WJ. Staircase bioassay: the up-and-down method. Neu-rosci Biobehav Rev 1991;15:47–50.
17. Lehmann KA, Kratzenberg U, Schroeder-Bark B, et al. Postop-erative patient-controlled analgesia with tramadol: analgesicefficacy and minimum effective concentrations. Clin J Pain 1990;6:212–20.
18. Silvasti M, Svartling N, Pitkanen M, et al. Comparison of intra-venous patient-controlled analgesia with tramadol versus mor-phine after microvascular breast reconstruction. Eur J Anaesthe-siol 2000;17:448–55.
19. Beloeil H, Delage N, Negre I, et al. The median effective dose ofnefopam and morphine administered intravenously for postop-erative pain after minor surgery: a prospective randomizeddouble-blinded isobolographic study of their analgesic action.Anesth Anal 2004;98:395–400.
20. Gadalla EF. Tramadol hydrochloride versus morphine for post-operative pain relief [abstract 248]. 9th World Congress on Pain,Vienna. August 22–27, 1999.
21. Jarernsiripornkul N, Krska J, Richards RM, Capps PA. Patientreporting of adverse drug reactions: useful information for painmanagement? Eur J Pain 2003;7:219–24.
22. Walker DJ, Zacny JP. Subjective, psychomotor, and physiolog-ical effects of cumulative doses of opioid mu agonists in healthyvolunteers. J Pharmacol Exp Ther 1999;289:1454–64.
23. Naguib M, Seraj M, Attia M, et al. Perioperative antinociceptiveeffect of tramadol: a prospective, randomized, double-blindcomparison with morphine. Can J Anaesth 1998;45:1168–75.
474 PAIN MEDICINE MARCOU ET AL. ANESTH ANALGPOSTOPERATIVE TRAMADOL AND MORPHINE 2005;100:469–74
Small-Dose Ketamine Infusion Improves PostoperativeAnalgesia and Rehabilitation After Total Knee ArthroplastyFrederic Adam, MD, Marcel Chauvin, MD, Bertrand Du Manoir, MD, Mathieu Langlois, MD,Daniel I. Sessler, MD, and Dominique Fletcher, MD
Departments of Anesthesia and INSERM E 332, Hopital Ambroise Pare, Assistance Publique-Hopitaux de Paris, 92100Boulogne, France; Hopital Raymond Poincare, Assistance Publique Hopitaux de Paris, 92428 Garches, France; and theOutcomes Research™ Institute and Departments of Anesthesiology and Pharmacology, University of Louisville,Louisville, Kentucky
We designed this study to evaluate the effect of small-dose IV ketamine in combination with continuous fem-oral nerve block on postoperative pain and rehabilita-tion after total knee arthroplasty. Continuous femoralnerve block was started with 0.3 mL/kg of 0.75% ropi-vacaine before surgery and continued in the surgicalward for 48 h with 0.2% ropivacaine at a rate of0.1 mL · kg�1 · h�1. Patients were randomly assigned toreceive an initial bolus of 0.5 mg/kg ketamine followedby a continuous infusion of 3 �g · kg�1 · min�1 duringsurgery and 1.5 �g · kg�1 · min�1 for 48 h (ketaminegroup) or an equal volume of saline (control group).Additional postoperative analgesia was provided bypatient-controlled IV morphine. Pain scores and mor-phine consumption were recorded over 48 h. The max-imal degree of active knee flexion tolerated was re-corded daily until hospital discharge. Follow-up was
performed 6 wk and 3 mo after surgery. The ketaminegroup required significantly less morphine than thecontrol group (45 � 20 mg versus 69 � 30 mg; P �0.02). Patients in the ketamine group reached 90° ofactive knee flexion more rapidly than those in thecontrol group (at 7 [5–11] versus 12 [8 – 45] days, me-dian [25%–75% interquartile range]; P � 0.03). Out-comes at 6 wk and 3 mo were similar in each group.These results confirm that ketamine is a useful anal-gesic adjuvant in perioperative multimodal analgesiawith a positive impact on early knee mobilization. Nopatient in either group reported sedation, hallucina-tions, nightmares, or diplopia, and no differenceswere noted in the incidence of nausea and vomitingbetween the two groups.
(Anesth Analg 2005;100:475–80)
T he concept of multimodal analgesia refers to thesimultaneous use of multiple analgesic methods ordrugs. Because acute pain is an integrated process
that is mediated by activation of numerous biochemicaland anatomical pathways (1), administration of analge-sics acting on different targets is a rational postoperativeanalgesic strategy. Among the receptors implicated inthe nociceptive transmission, the N-methyl-d-aspartate(NMDA) receptor plays a critical role in neuronal plas-ticity leading to central sensitization and, therefore, inthe intensity of perceived postoperative pain (2).
There is a growing body of evidence that ketamine,a noncompetitive antagonist at NMDA receptors (3),can facilitate postoperative pain management (4). Ket-amine also alleviates provoked pain by preventingpostoperative hyperalgesia (5). Furthermore, a singleintraoperative injection of 0.15 mg/kg ketamine im-proves passive knee mobilization 24 hours after ar-throscopic anterior ligament repair (6) and improvespostoperative functional outcome after outpatientknee arthroscopy (7).
Total knee arthroplasty generates substantial post-operative pain. Peripheral nerve blocks produce betteranalgesia than patient-controlled IV opioids, therebyaccelerating rehabilitation (8,9). However, continuousisolated femoral nerve blocks provide insufficient an-algesia; patients given continuous femoral nerveblocks alone thus usually require rescue treatmentwith opioids (10,11). Combining a continuous femoralnerve block with small-dose ketamine may be an al-ternative to concomitant opioid administration. Thebenefit of adjunctive small-dose ketamine in patients
Supported by National Institutes of Health Grant GM 061655(Bethesda, MD), the Gheens Foundation (Louisville, KY), the JosephDrown Foundation (Los Angeles, CA), and the Commonwealth ofKentucky Research Challenge Trust Fund (Louisville, KY).
None of the authors has a personal financial interest in thisresearch.
Accepted for publication July 27, 2004.Address correspondence and reprint requests to Marcel Chauvin,
MD, Publique-Hopitaux de Paris, 92100 Boulogne, France. Addresse-mail to [email protected].
DOI: 10.1213/01.ANE.0000142117.82241.DC
©2005 by the International Anesthesia Research Society0003-2999/05 Anesth Analg 2005;100:475–80 475
with peripheral nerve blocks has yet to be determined.We therefore tested the hypothesis that small-doseketamine reduces postoperative pain and speeds re-habilitation after total knee arthroplasty in patientswith a continuous femoral nerve block.
MethodsWith approval of the local ethics committee and in-formed consent, we studied ASA physical status I–IIIpatients. All were scheduled to undergo elective totalknee arthroplasty with general anesthesia. Exclusioncriteria included age younger than 18 yr or older than80 yr, weight exceeding 100 kg, inability to usepatient-controlled analgesia (PCA), contraindicationsto continuous femoral nerve block (i.e., coagulationdefects, infection at puncture site), previous total orunilateral knee arthroplasty, diabetes, severe respira-tory insufficiency, renal impairment; psychiatric dis-orders, chronic opioid use, and history of chronic painsyndromes.
Previous studies (8,9) and our own experience indi-cate that PCA morphine use over 48 h to be 67 �30 mg (mean � sd) in patients having total kneearthroplasty and regional analgesia. Twenty patientsper group thus provided an 80% power for detectinga 40% difference in morphine consumption at an �level of 0.05. We thus made an a priori decision toevaluate 20 patients per group.
Patients were assigned randomly, in a double-blindfashion, to one of two groups (n � 20 per group): acontrol group and a ketamine group. Before the studybegan, a random-number table was generated, speci-fying the group to which each patient would be as-signed on entry into the trial. For each patient, anopaque envelope containing the group assignmentwas prepared, sealed, and sequentially numbered. Onthe morning of surgery, a nurse not involved in theevaluation of the patient opened the envelope andprepared two syringes: one 5 mL syringe for the bolusdose and a 50 mL syringe for the continuous infusioncontaining either saline or 10 mg/mL of ketamine.Moreover, at the end of the study, the nurse confirmedthat the treatment matched the randomization. Noneof the other investigators involved in patient manage-ment and data collection was aware of the groupassignment. In case of emergency, the anesthesiologistin charge of the patient had ready access to the infor-mation about the drugs given.
All patients were premedicated with hydroxyzine1–2 mg/kg orally 1–2 h before surgery. The patientswere taken to a preoperative block room and vitalsigns were monitored. Midazolam (0.025 mg/kg IV)was given for sedation. A continuous femoral nerveblock was performed using the landmarks suggestedby Winnie et al. (12), and a catheter was advanced
10–15 cm into the nerve sheaf. Patients were given0.3 mL/kg ropivacaine 0.75% through the catheter.Absence of sensory response to cold in the area of thefemoral nerve confirmed that the catheter was prop-erly positioned.
Anesthesia was subsequently induced with 3–5 mg/kgthiopental, 0.3 �g/kg sufentanil, and 0.5 mg/kg atra-curium. The trachea was intubated and controlledventilation began. Anesthesia was maintained withsufentanil infused at a rate of 0.15 �g · kg�1 · h�1,which was stopped when the surgeon cemented theknee prosthesis (i.e., approximately 30 min before skinclosure) and sevoflurane (0.6%–1.5%) in a mixture ofnitrous oxide (50%) with oxygen.
In patients assigned to the ketamine group,0.05 mL/kg of the blinded test solution (i.e., ketamine0.5 mg/kg) was given IV over 2 min just after theorotracheal intubation and before the skin incision.The initial bolus was followed by a maintenance IVinfusion of 3 �g · kg�1 · min�1 of ketamine that wascontinued until the patient emerged from anesthesia.Subsequently, the infusion rate was reduced to 1.5�g · kg�1 · min�1 and maintained for 48 h. Patientsallocated to the control group were given identicalvolumes of saline.
After tracheal extubation, patients were transferredto the postanesthesia care unit (PACU). The continu-ous femoral nerve block was maintained by a contin-uous infusion of 0.1 mL · kg�1 · h�1 of 0.2% ropiva-caine. Adequacy of the femoral nerve block wasassessed daily by evaluating the sensory response tocold in the distribution of femoral nerve.
Pain was initially controlled in the PACU by titrat-ing boluses of 3 mg morphine every 5 min until thevisual analog rating scale (VAS) score was �30 mm.Titration was stopped if the sedation score was �2 orthe respiratory rate was �12 breaths per min. Addi-tionally, patients were given access to a PCA deviceset to deliver 1-mg boluses of IV morphine with alockout period of 5 min and no background infusionor limits. This PCA regimen was continued for 48 h;no other analgesics were given.
Immediately after surgery, all patients started iden-tical physical therapy regimens. During the initial 48–72 h postoperatively, a continuous passive motionmachine was used (Kinetec, Tournes, France), with arange of motion set at levels tolerated by the patient.From the day after surgery until hospital discharge,patients also performed assisted and active knee flex-ion and extension exercises against gravity.
After 48 h, PCA and continuous infusion of ket-amine or saline solution were discontinued and thefemoral catheter was removed. At this time, theanalgesic regimen was standardized to 2 tablets ofDi-antalvic (400 mg acetaminophen and 30 mg dex-tropropoxyphene; Aventis, Inc., Montrouge, France)every 6 h and naproxen sodium 550 mg twice daily.
476 PAIN MEDICINE ADAM ET AL. ANESTH ANALGKETAMINE IMPROVES ANALGESIA AND REHABILITATION 2005;100:475–80
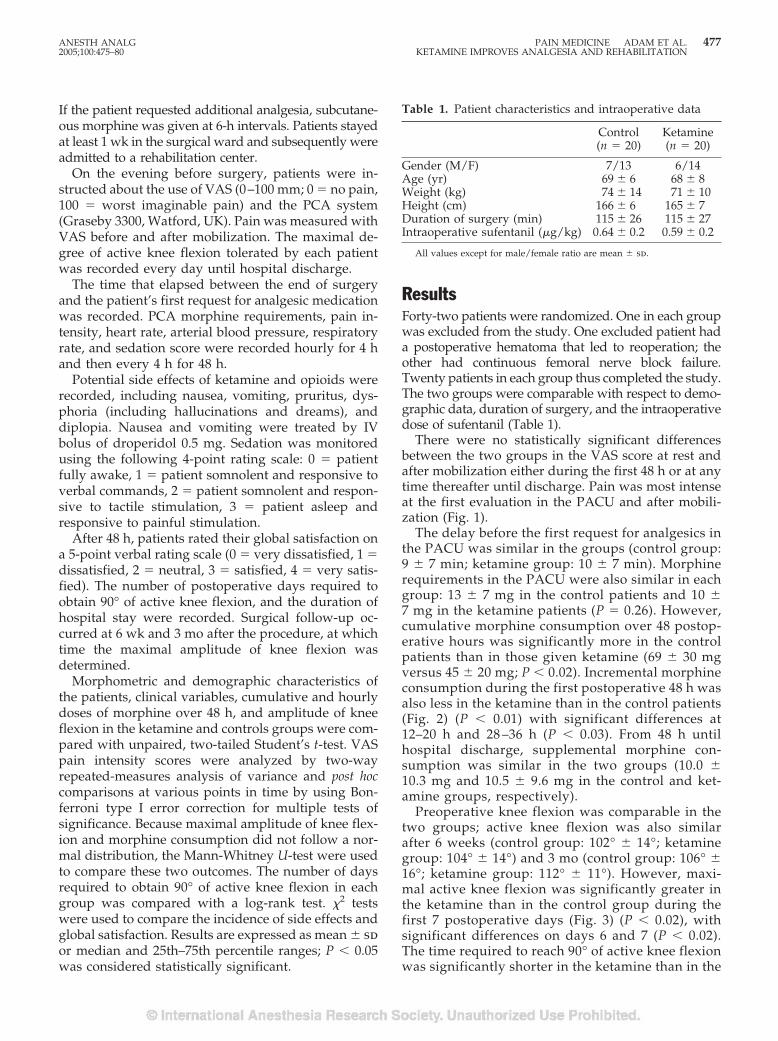
If the patient requested additional analgesia, subcutane-ous morphine was given at 6-h intervals. Patients stayedat least 1 wk in the surgical ward and subsequently wereadmitted to a rehabilitation center.
On the evening before surgery, patients were in-structed about the use of VAS (0–100 mm; 0 � no pain,100 � worst imaginable pain) and the PCA system(Graseby 3300, Watford, UK). Pain was measured withVAS before and after mobilization. The maximal de-gree of active knee flexion tolerated by each patientwas recorded every day until hospital discharge.
The time that elapsed between the end of surgeryand the patient’s first request for analgesic medicationwas recorded. PCA morphine requirements, pain in-tensity, heart rate, arterial blood pressure, respiratoryrate, and sedation score were recorded hourly for 4 hand then every 4 h for 48 h.
Potential side effects of ketamine and opioids wererecorded, including nausea, vomiting, pruritus, dys-phoria (including hallucinations and dreams), anddiplopia. Nausea and vomiting were treated by IVbolus of droperidol 0.5 mg. Sedation was monitoredusing the following 4-point rating scale: 0 � patientfully awake, 1 � patient somnolent and responsive toverbal commands, 2 � patient somnolent and respon-sive to tactile stimulation, 3 � patient asleep andresponsive to painful stimulation.
After 48 h, patients rated their global satisfaction ona 5-point verbal rating scale (0 � very dissatisfied, 1 �dissatisfied, 2 � neutral, 3 � satisfied, 4 � very satis-fied). The number of postoperative days required toobtain 90° of active knee flexion, and the duration ofhospital stay were recorded. Surgical follow-up oc-curred at 6 wk and 3 mo after the procedure, at whichtime the maximal amplitude of knee flexion wasdetermined.
Morphometric and demographic characteristics ofthe patients, clinical variables, cumulative and hourlydoses of morphine over 48 h, and amplitude of kneeflexion in the ketamine and controls groups were com-pared with unpaired, two-tailed Student’s t-test. VASpain intensity scores were analyzed by two-wayrepeated-measures analysis of variance and post hoccomparisons at various points in time by using Bon-ferroni type I error correction for multiple tests ofsignificance. Because maximal amplitude of knee flex-ion and morphine consumption did not follow a nor-mal distribution, the Mann-Whitney U-test were usedto compare these two outcomes. The number of daysrequired to obtain 90° of active knee flexion in eachgroup was compared with a log-rank test. �2 testswere used to compare the incidence of side effects andglobal satisfaction. Results are expressed as mean � sdor median and 25th–75th percentile ranges; P � 0.05was considered statistically significant.
ResultsForty-two patients were randomized. One in each groupwas excluded from the study. One excluded patient hada postoperative hematoma that led to reoperation; theother had continuous femoral nerve block failure.Twenty patients in each group thus completed the study.The two groups were comparable with respect to demo-graphic data, duration of surgery, and the intraoperativedose of sufentanil (Table 1).
There were no statistically significant differencesbetween the two groups in the VAS score at rest andafter mobilization either during the first 48 h or at anytime thereafter until discharge. Pain was most intenseat the first evaluation in the PACU and after mobili-zation (Fig. 1).
The delay before the first request for analgesics inthe PACU was similar in the groups (control group:9 � 7 min; ketamine group: 10 � 7 min). Morphinerequirements in the PACU were also similar in eachgroup: 13 � 7 mg in the control patients and 10 �7 mg in the ketamine patients (P � 0.26). However,cumulative morphine consumption over 48 postop-erative hours was significantly more in the controlpatients than in those given ketamine (69 � 30 mgversus 45 � 20 mg; P � 0.02). Incremental morphineconsumption during the first postoperative 48 h wasalso less in the ketamine than in the control patients(Fig. 2) (P � 0.01) with significant differences at12–20 h and 28 –36 h (P � 0.03). From 48 h untilhospital discharge, supplemental morphine con-sumption was similar in the two groups (10.0 �10.3 mg and 10.5 � 9.6 mg in the control and ket-amine groups, respectively).
Preoperative knee flexion was comparable in thetwo groups; active knee flexion was also similarafter 6 weeks (control group: 102° � 14°; ketaminegroup: 104° � 14°) and 3 mo (control group: 106° �16°; ketamine group: 112° � 11°). However, maxi-mal active knee flexion was significantly greater inthe ketamine than in the control group during thefirst 7 postoperative days (Fig. 3) (P � 0.02), withsignificant differences on days 6 and 7 (P � 0.02).The time required to reach 90° of active knee flexionwas significantly shorter in the ketamine than in the
Table 1. Patient characteristics and intraoperative data
Control(n � 20)
Ketamine(n � 20)
Gender (M/F) 7/13 6/14Age (yr) 69 � 6 68 � 8Weight (kg) 74 � 14 71 � 10Height (cm) 166 � 6 165 � 7Duration of surgery (min) 115 � 26 115 � 27Intraoperative sufentanil (�g/kg) 0.64 � 0.2 0.59 � 0.2
All values except for male/female ratio are mean � sd.
ANESTH ANALG PAIN MEDICINE ADAM ET AL. 4772005;100:475–80 KETAMINE IMPROVES ANALGESIA AND REHABILITATION
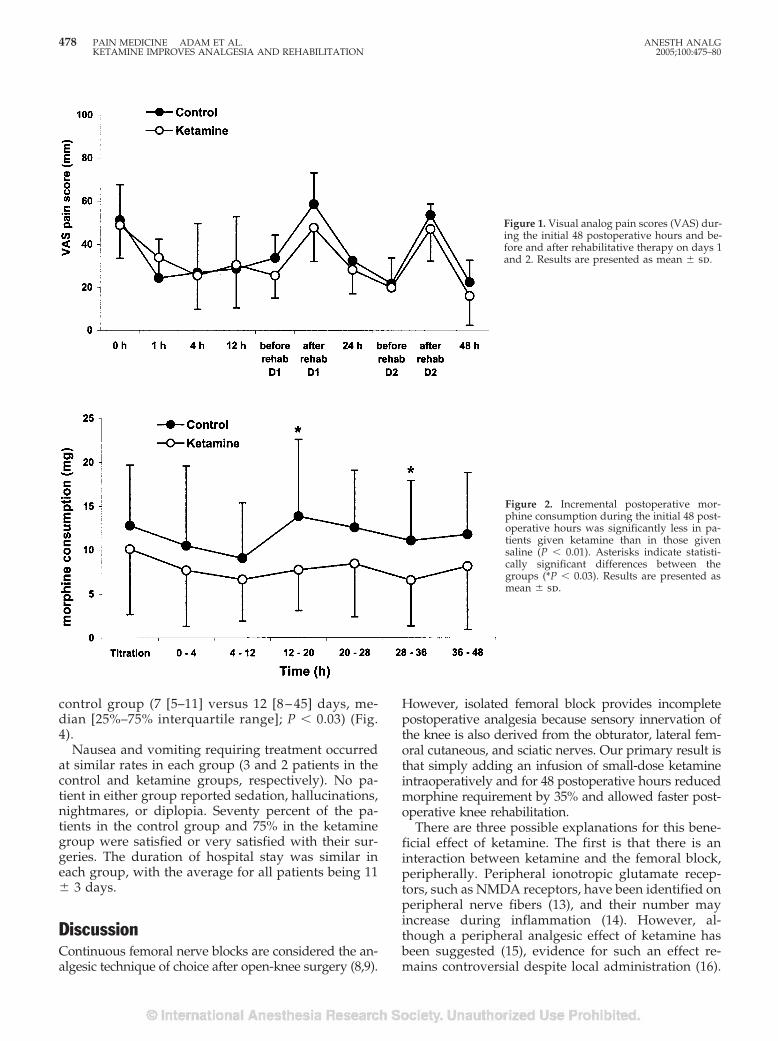
control group (7 [5–11] versus 12 [8 – 45] days, me-dian [25%–75% interquartile range]; P � 0.03) (Fig.4).
Nausea and vomiting requiring treatment occurredat similar rates in each group (3 and 2 patients in thecontrol and ketamine groups, respectively). No pa-tient in either group reported sedation, hallucinations,nightmares, or diplopia. Seventy percent of the pa-tients in the control group and 75% in the ketaminegroup were satisfied or very satisfied with their sur-geries. The duration of hospital stay was similar ineach group, with the average for all patients being 11� 3 days.
DiscussionContinuous femoral nerve blocks are considered the an-algesic technique of choice after open-knee surgery (8,9).
However, isolated femoral block provides incompletepostoperative analgesia because sensory innervation ofthe knee is also derived from the obturator, lateral fem-oral cutaneous, and sciatic nerves. Our primary result isthat simply adding an infusion of small-dose ketamineintraoperatively and for 48 postoperative hours reducedmorphine requirement by 35% and allowed faster post-operative knee rehabilitation.
There are three possible explanations for this bene-ficial effect of ketamine. The first is that there is aninteraction between ketamine and the femoral block,peripherally. Peripheral ionotropic glutamate recep-tors, such as NMDA receptors, have been identified onperipheral nerve fibers (13), and their number mayincrease during inflammation (14). However, al-though a peripheral analgesic effect of ketamine hasbeen suggested (15), evidence for such an effect re-mains controversial despite local administration (16).
Figure 1. Visual analog pain scores (VAS) dur-ing the initial 48 postoperative hours and be-fore and after rehabilitative therapy on days 1and 2. Results are presented as mean � sd.
Figure 2. Incremental postoperative mor-phine consumption during the initial 48 post-operative hours was significantly less in pa-tients given ketamine than in those givensaline (P � 0.01). Asterisks indicate statisti-cally significant differences between thegroups (*P � 0.03). Results are presented asmean � sd.
478 PAIN MEDICINE ADAM ET AL. ANESTH ANALGKETAMINE IMPROVES ANALGESIA AND REHABILITATION 2005;100:475–80
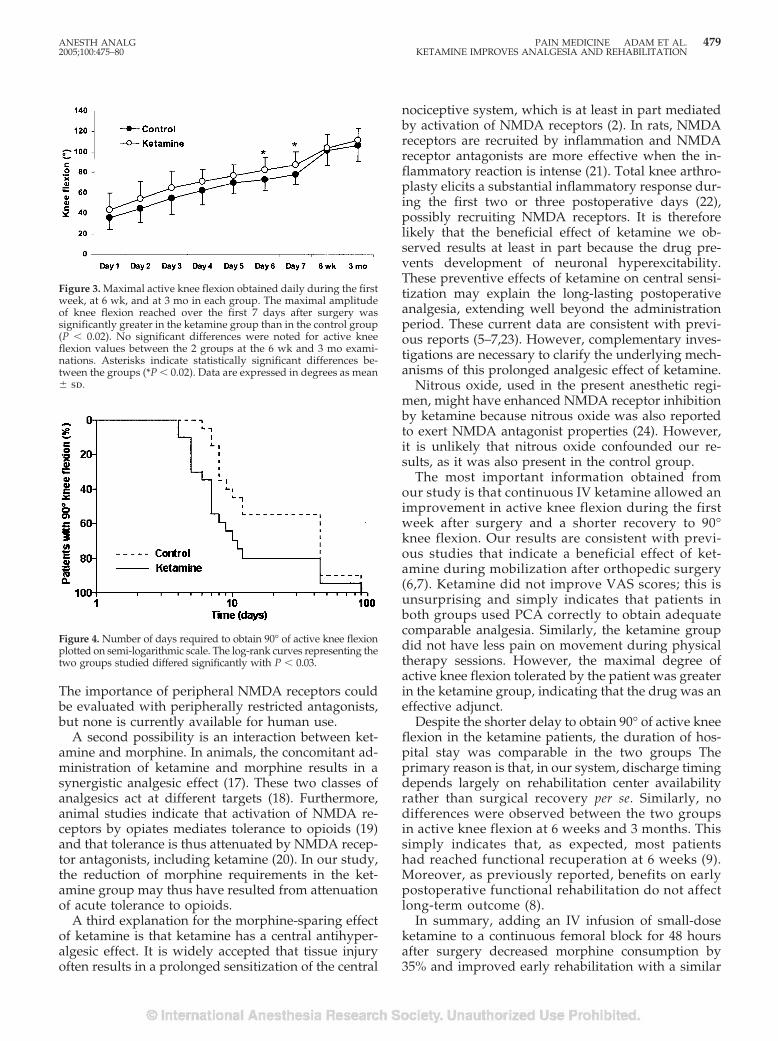
The importance of peripheral NMDA receptors couldbe evaluated with peripherally restricted antagonists,but none is currently available for human use.
A second possibility is an interaction between ket-amine and morphine. In animals, the concomitant ad-ministration of ketamine and morphine results in asynergistic analgesic effect (17). These two classes ofanalgesics act at different targets (18). Furthermore,animal studies indicate that activation of NMDA re-ceptors by opiates mediates tolerance to opioids (19)and that tolerance is thus attenuated by NMDA recep-tor antagonists, including ketamine (20). In our study,the reduction of morphine requirements in the ket-amine group may thus have resulted from attenuationof acute tolerance to opioids.
A third explanation for the morphine-sparing effectof ketamine is that ketamine has a central antihyper-algesic effect. It is widely accepted that tissue injuryoften results in a prolonged sensitization of the central
nociceptive system, which is at least in part mediatedby activation of NMDA receptors (2). In rats, NMDAreceptors are recruited by inflammation and NMDAreceptor antagonists are more effective when the in-flammatory reaction is intense (21). Total knee arthro-plasty elicits a substantial inflammatory response dur-ing the first two or three postoperative days (22),possibly recruiting NMDA receptors. It is thereforelikely that the beneficial effect of ketamine we ob-served results at least in part because the drug pre-vents development of neuronal hyperexcitability.These preventive effects of ketamine on central sensi-tization may explain the long-lasting postoperativeanalgesia, extending well beyond the administrationperiod. These current data are consistent with previ-ous reports (5–7,23). However, complementary inves-tigations are necessary to clarify the underlying mech-anisms of this prolonged analgesic effect of ketamine.
Nitrous oxide, used in the present anesthetic regi-men, might have enhanced NMDA receptor inhibitionby ketamine because nitrous oxide was also reportedto exert NMDA antagonist properties (24). However,it is unlikely that nitrous oxide confounded our re-sults, as it was also present in the control group.
The most important information obtained fromour study is that continuous IV ketamine allowed animprovement in active knee flexion during the firstweek after surgery and a shorter recovery to 90°knee flexion. Our results are consistent with previ-ous studies that indicate a beneficial effect of ket-amine during mobilization after orthopedic surgery(6,7). Ketamine did not improve VAS scores; this isunsurprising and simply indicates that patients inboth groups used PCA correctly to obtain adequatecomparable analgesia. Similarly, the ketamine groupdid not have less pain on movement during physicaltherapy sessions. However, the maximal degree ofactive knee flexion tolerated by the patient was greaterin the ketamine group, indicating that the drug was aneffective adjunct.
Despite the shorter delay to obtain 90° of active kneeflexion in the ketamine patients, the duration of hos-pital stay was comparable in the two groups Theprimary reason is that, in our system, discharge timingdepends largely on rehabilitation center availabilityrather than surgical recovery per se. Similarly, nodifferences were observed between the two groupsin active knee flexion at 6 weeks and 3 months. Thissimply indicates that, as expected, most patientshad reached functional recuperation at 6 weeks (9).Moreover, as previously reported, benefits on earlypostoperative functional rehabilitation do not affectlong-term outcome (8).
In summary, adding an IV infusion of small-doseketamine to a continuous femoral block for 48 hoursafter surgery decreased morphine consumption by35% and improved early rehabilitation with a similar
Figure 3. Maximal active knee flexion obtained daily during the firstweek, at 6 wk, and at 3 mo in each group. The maximal amplitudeof knee flexion reached over the first 7 days after surgery wassignificantly greater in the ketamine group than in the control group(P � 0.02). No significant differences were noted for active kneeflexion values between the 2 groups at the 6 wk and 3 mo exami-nations. Asterisks indicate statistically significant differences be-tween the groups (*P � 0.02). Data are expressed in degrees as mean� sd.
Figure 4. Number of days required to obtain 90° of active knee flexionplotted on semi-logarithmic scale. The log-rank curves representing thetwo groups studied differed significantly with P � 0.03.
ANESTH ANALG PAIN MEDICINE ADAM ET AL. 4792005;100:475–80 KETAMINE IMPROVES ANALGESIA AND REHABILITATION
incidence of adverse effects. However, there were nolong-term improvements in the recovery of functionaloutcome.
References1. Carr DB, Goudas LC. Acute pain. Lancet 1999;353:2051–8.2. Petrenko AB, Yamakura T, Baba H, Shimoji K. The role of
N-methyl-d-aspartate (NMDA) receptors in pain: a review.Anesth Analg 2003;97:1108–16.
3. Kohrs R, Durieux ME. Ketamine: teaching an old drug newtricks. Anesth Analg 1998;87:1186–93.
4. Schmid RL, Sandler AN, Katz J. Use and efficacy of low-doseketamine in management of acute postoperative pain: a reviewof current techniques and outcomes. Pain 1999;82:111–25.
5. Stubhaug A, Breivik H, Eide PK, et al. Mapping of punctuatehyperalgesia around a surgical incision demonstrates that ket-amine is a powerful suppressor of central sensitization to painfollowing surgery. Acta Anaesthesiol Scand 1997;41:1124–32.
6. Menigaux C, Fletcher D, Dupont X, et al. The benefits of intra-operative small-dose ketamine on postoperative pain after an-terior cruciate ligament repair. Anesth Analg 2000;90:129–35.
7. Menigaux C, Guignard B, Fletcher D, et al. Intraoperative small-dose ketamine enhances analgesia after outpatient knee arthro-scopy. Anesth Analg 2001;93:606–12.
8. Singelyn FJ, Deyaert M, Joris D, et al. Effects of intravenouspatient-controlled analgesia with morphine, continuous epi-dural analgesia, and continuous three-in-one block on postop-erative pain and knee rehabilitation after unilateral total kneearthroplasty. Anesth Analg 1998;87:88–92.
9. Capdevila X, Barthelet Y, Biboulet P, et al. Effects of perioper-ative analgesic technique on the surgical outcome and durationof rehabilitation after major knee surgery. Anesthesiology 1999;91:8–15.
10. McNamee DA, Parks L, Milligan KR. Postoperative analgesiafollowing total knee replacement: an evaluation of the additionof an obturator nerve block to combined femoral and sciaticnerve block. Acta Anaesthesiol Scand 2002;46:95–9.
11. Ben-David B, Schmalenberger K, Chelly JE. Analgesia after totalknee arthroplasty: is continuous sciatic blockade needed in ad-dition to continuous femoral blockade? Anesth Analg 2004;98:747–9.
12. Winnie AP, Ramamurthy S, Durrani Z. The inguinal paravas-cular technic of lumbar plexus anesthesia: the “3-in-1 block”.Anesth Analg 1973;52:989–96.
13. Coggeshall RE, Carlton SM. Ultrastructural analysis of NMDA,AMPA, and kainate receptors on unmyelinated and myelinatedaxons in the periphery. J Comp Neurol 1998;391:78–86.
14. Carlton SM, Coggeshall RE. Inflammation-induced changes inperipheral glutamate receptor populations. Brain Res 1999;820:63–70.
15. Tverskoy M, Oren M, Vaskovich M, et al. Ketamine enhanceslocal anesthetic and analgesic effects of bupivacaine by periph-eral mechanism: a study in postoperative patients. Neurosci Lett1996;215:5–8.
16. Pedersen JL, Galle TS, Kehlet H. Peripheral analgesic effects ofketamine in acute inflammatory pain. Anesthesiology 1998;89:58–66.
17. Alvarez P, Saavedra G, Hernandez A, et al. Synergistic antino-ciceptive effects of ketamine and morphine in the orofacialcapsaicin test in the rat. Anesthesiology 2003;99:969–75.
18. Dickenson AH. NMDA receptor antagonists: interactions withopioids. Acta Anaesthesiol Scand 1997;41:112–5.
19. Mao J, Price DD, Mayer DJ. Mechanisms of hyperalgesia andmorphine tolerance: a current view of their possible interac-tions. Pain 1995;62:259–74.
20. Kissin I, Bright CA, Bradley EL Jr. The effect of ketamine onopioid-induced acute tolerance: can it explain reduction of opi-oid consumption with ketamine-opioid analgesic combination?Anesth. Analg 2000;91:1483–8.
21. Ren K, Hylden JL, Williams GM, et al. The effects of a non-competitive NMDA receptor antagonist, MK-801, on behavioralhyperalgesia and dorsal horn neuronal activity in rats withunilateral inflammation. Pain 1992;50:331–44.
22. Andres BM, Taub DD, Gurkan I, Wenz JF. Postoperative feverafter total knee arthroplasty: the role of cytokines. Clin Orthop2003;415:221–31.
23. Fu ES, Miguel R, Scharf JE. Preemptive ketamine decreasespostoperative narcotic requirements in patients undergoing ab-dominal surgery. Anesth Analg 1997;84:1086–90.
24. Jevtovic-Todorovic V, Todorovic SM, Mennerick S, et al. Nitrousoxide (laughing gas) is an NMDA antagonist, neuroprotectantand neurotoxin. Nature Med 1998;4:460–3.
480 PAIN MEDICINE ADAM ET AL. ANESTH ANALGKETAMINE IMPROVES ANALGESIA AND REHABILITATION 2005;100:475–80
The Effect of Propofol on Thermal Pain PerceptionMichael A. Frolich, MD, MS, Donald D. Price, PhD, Michael E. Robinson, PhD,Jonathan J. Shuster, PhD, Douglas W. Theriaque, MS, and Marc W. Heft, DMD, PhD
From the Department of Anesthesiology, University of Alabama at Birmingham, Birmingham, Alabama, the Departmentof Oral and Maxillofacial Surgery and Diagnostic Sciences, University of Florida College of Dentistry, and Department ofClinical Health and Psychology, University of Florida College of Health Related Professions, Gainesville, Florida
We studied the effect of propofol, a widely used sedative-hypnotic drug, on pain perception. Eighteen subjects re-ceived propofol in two sedative concentrations that werebalanced and randomized in order. Painful (45°C, 47°C,and 49°C) stimulation temperatures were presented inrandom order, and nonpainful 31°C stimuli were pre-sented on alternate trials. We used a target-controlledinfusion and chose effect site concentrations of 0.5�g/mL for mild sedation and 1.0 �g/mL for moder-ate sedation. Using a visual analog scale, subjectsrated both pain intensity and unpleasantness higher
when sedated with propofol. The average pain inten-sity was 28/100 for placebo, 35/100 for mild, and 40/100 for moderate sedation. Pain unpleasantness was23/100 for placebo, 29/100 for mild, and 33/100 formoderate sedation. This effect was unexpected andmay be explained by a difference of subjective painexperience by a patient and the perceived level of an-algesia by a health care provider in sedated patients.This finding calls further attention to the need for ad-equate analgesia in patients sedated with propofol.
(Anesth Analg 2005;100:481–6)
T he use of propofol as an IV sedative for moni-tored anesthesia care is widespread. It is used inthe emergency room as a sedative for many short
but painful procedures such as anoscopy, fracture re-duction, abscess incision, or cervical dilation and cu-rettage (1,2). It is used extensively for sedation oftracheally intubated patients in the intensive care unit(3). Other applications include various nonsurgicaldiagnostic procedures, such as gastrointestinal endos-copy and bronchoscopy, which require sedation (4).Although the sedative- pharmacokinetic profile ofpropofol is well described, there is only sparse andsomewhat conflicting literature on the effect of propo-fol on pain perception.
A discussion in the anesthesiology literature illus-trates that this is not just an academic question (5,6).Authors discussed whether inadequate analgesia, of-ten manifested as restlessness in the sedated patient,should be treated with supplemental bolus doses ofpropofol or analgesic medication. The widespread use
of propofol for many medical and surgical proceduresand for sedation in the intensive care environmentunderscores the clinical relevance of this question. Wetherefore decided to assess the effect of propofol se-dation on pain perception using a well establishedmodel that is reliable, reproducible, and accurately pre-dictive of changes and intensities of clinical pain (7).
MethodsAfter approval by the institutional review board 18healthy subjects were recruited by public advertise-ment. Each subject was scheduled for a screening ap-pointment. After informed consent was obtained, sub-ject history, physical examination, and a completeblood count and chemistry panel were obtained. Fe-male subjects were scheduled for a urine pregnancytest on the day of the study. The study procedure wasexplained in detail to volunteers. Several thermal painstimuli were given and subjects were asked to rate thepain intensity and unpleasantness on a visual analogscale (VAS). Volunteers were included if their medicalscreening was unremarkable and they were able tofollow study instructions. Exclusion criteria were anymedical condition that could affect the study proce-dure or potentially put the subject at risk. Examples ofexclusion conditions are obesity, sleep apnea, moder-ate or severe bronchial asthma, and cardiovascularproblems such as hypertension. Subjects taking any
Supplemental material available at anesthesia-analgesia.org.Supported, in part, by funds of National Institutes of Health K-30
and GCRC MO1-RR00082 at the University of Florida.Accepted for publication July 26, 2004.Address correspondence and reprint requests to Michael A.
Frolich, MD, MS, Department of Anesthesiology, 619 South 19thStreet, Birmingham, AL 35249-6810. Address e-mail to [email protected].
DOI: 10.1213/01.ANE.0000142125.61206.7A
©2005 by the International Anesthesia Research Society0003-2999/05 Anesth Analg 2005;100:481–6 481
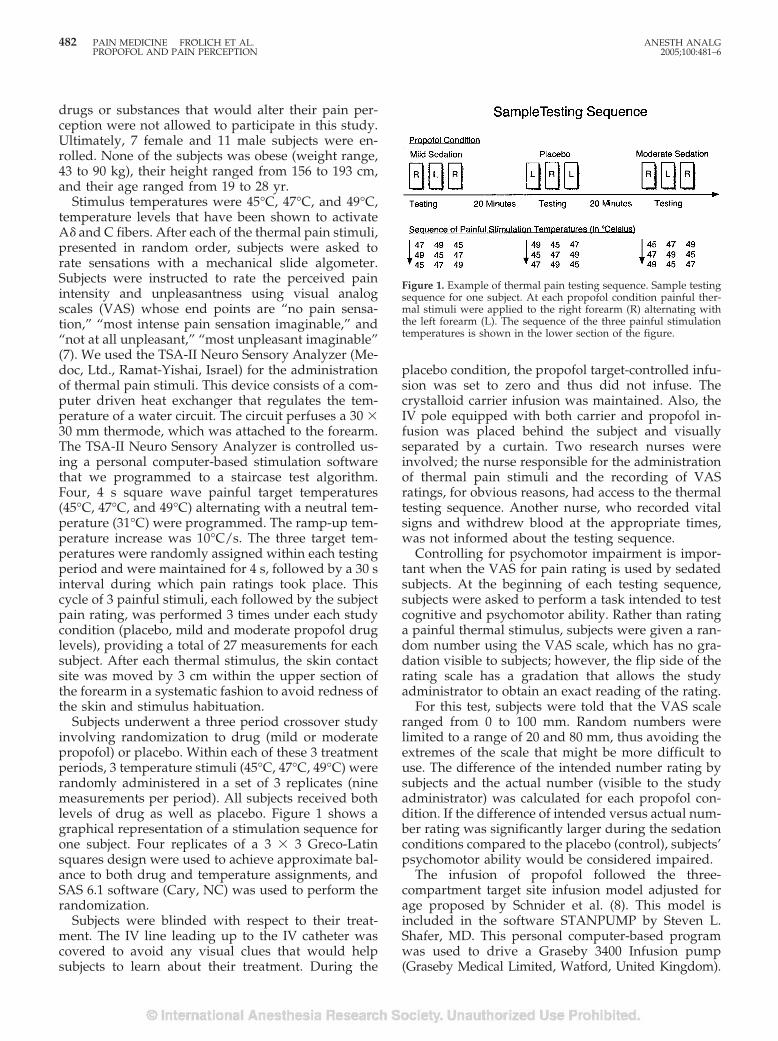
drugs or substances that would alter their pain per-ception were not allowed to participate in this study.Ultimately, 7 female and 11 male subjects were en-rolled. None of the subjects was obese (weight range,43 to 90 kg), their height ranged from 156 to 193 cm,and their age ranged from 19 to 28 yr.
Stimulus temperatures were 45°C, 47°C, and 49°C,temperature levels that have been shown to activateA� and C fibers. After each of the thermal pain stimuli,presented in random order, subjects were asked torate sensations with a mechanical slide algometer.Subjects were instructed to rate the perceived painintensity and unpleasantness using visual analogscales (VAS) whose end points are “no pain sensa-tion,” “most intense pain sensation imaginable,” and“not at all unpleasant,” “most unpleasant imaginable”(7). We used the TSA-II Neuro Sensory Analyzer (Me-doc, Ltd., Ramat-Yishai, Israel) for the administrationof thermal pain stimuli. This device consists of a com-puter driven heat exchanger that regulates the tem-perature of a water circuit. The circuit perfuses a 30 �30 mm thermode, which was attached to the forearm.The TSA-II Neuro Sensory Analyzer is controlled us-ing a personal computer-based stimulation softwarethat we programmed to a staircase test algorithm.Four, 4 s square wave painful target temperatures(45°C, 47°C, and 49°C) alternating with a neutral tem-perature (31°C) were programmed. The ramp-up tem-perature increase was 10°C/s. The three target tem-peratures were randomly assigned within each testingperiod and were maintained for 4 s, followed by a 30 sinterval during which pain ratings took place. Thiscycle of 3 painful stimuli, each followed by the subjectpain rating, was performed 3 times under each studycondition (placebo, mild and moderate propofol druglevels), providing a total of 27 measurements for eachsubject. After each thermal stimulus, the skin contactsite was moved by 3 cm within the upper section ofthe forearm in a systematic fashion to avoid redness ofthe skin and stimulus habituation.
Subjects underwent a three period crossover studyinvolving randomization to drug (mild or moderatepropofol) or placebo. Within each of these 3 treatmentperiods, 3 temperature stimuli (45°C, 47°C, 49°C) wererandomly administered in a set of 3 replicates (ninemeasurements per period). All subjects received bothlevels of drug as well as placebo. Figure 1 shows agraphical representation of a stimulation sequence forone subject. Four replicates of a 3 � 3 Greco-Latinsquares design were used to achieve approximate bal-ance to both drug and temperature assignments, andSAS 6.1 software (Cary, NC) was used to perform therandomization.
Subjects were blinded with respect to their treat-ment. The IV line leading up to the IV catheter wascovered to avoid any visual clues that would helpsubjects to learn about their treatment. During the
placebo condition, the propofol target-controlled infu-sion was set to zero and thus did not infuse. Thecrystalloid carrier infusion was maintained. Also, theIV pole equipped with both carrier and propofol in-fusion was placed behind the subject and visuallyseparated by a curtain. Two research nurses wereinvolved; the nurse responsible for the administrationof thermal pain stimuli and the recording of VASratings, for obvious reasons, had access to the thermaltesting sequence. Another nurse, who recorded vitalsigns and withdrew blood at the appropriate times,was not informed about the testing sequence.
Controlling for psychomotor impairment is impor-tant when the VAS for pain rating is used by sedatedsubjects. At the beginning of each testing sequence,subjects were asked to perform a task intended to testcognitive and psychomotor ability. Rather than ratinga painful thermal stimulus, subjects were given a ran-dom number using the VAS scale, which has no gra-dation visible to subjects; however, the flip side of therating scale has a gradation that allows the studyadministrator to obtain an exact reading of the rating.
For this test, subjects were told that the VAS scaleranged from 0 to 100 mm. Random numbers werelimited to a range of 20 and 80 mm, thus avoiding theextremes of the scale that might be more difficult touse. The difference of the intended number rating bysubjects and the actual number (visible to the studyadministrator) was calculated for each propofol con-dition. If the difference of intended versus actual num-ber rating was significantly larger during the sedationconditions compared to the placebo (control), subjects’psychomotor ability would be considered impaired.
The infusion of propofol followed the three-compartment target site infusion model adjusted forage proposed by Schnider et al. (8). This model isincluded in the software STANPUMP by Steven L.Shafer, MD. This personal computer-based programwas used to drive a Graseby 3400 Infusion pump(Graseby Medical Limited, Watford, United Kingdom).
Figure 1. Example of thermal pain testing sequence. Sample testingsequence for one subject. At each propofol condition painful ther-mal stimuli were applied to the right forearm (R) alternating withthe left forearm (L). The sequence of the three painful stimulationtemperatures is shown in the lower section of the figure.
482 PAIN MEDICINE FROLICH ET AL. ANESTH ANALGPROPOFOL AND PAIN PERCEPTION 2005;100:481–6
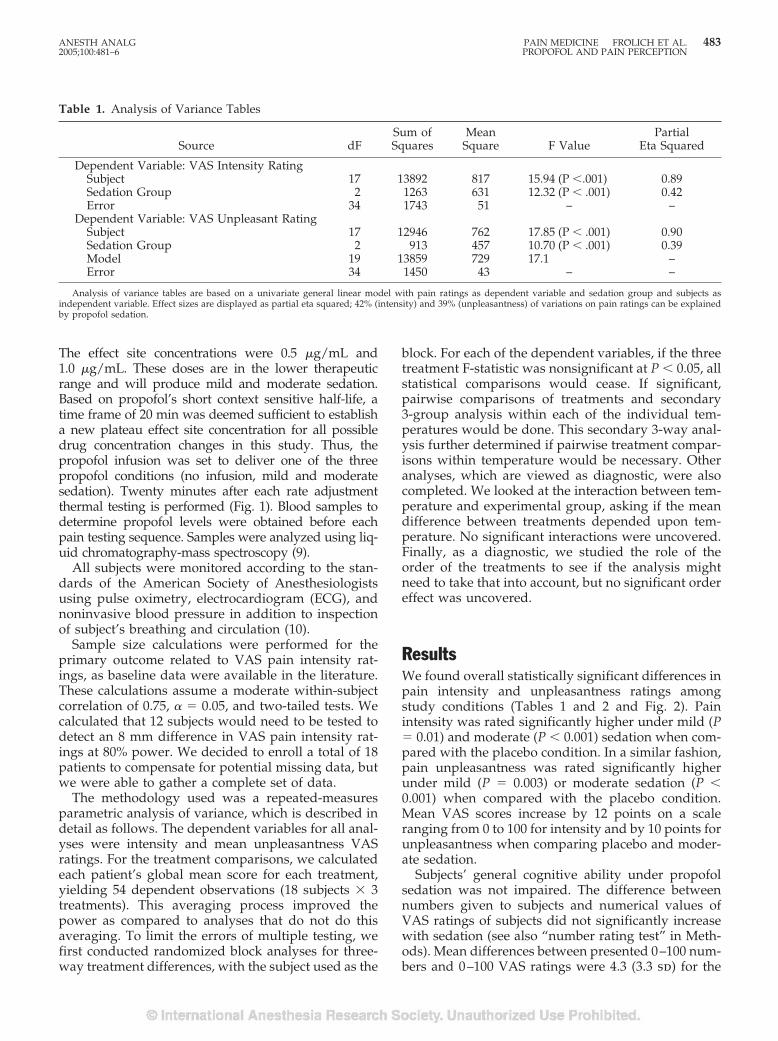
The effect site concentrations were 0.5 �g/mL and1.0 �g/mL. These doses are in the lower therapeuticrange and will produce mild and moderate sedation.Based on propofol’s short context sensitive half-life, atime frame of 20 min was deemed sufficient to establisha new plateau effect site concentration for all possibledrug concentration changes in this study. Thus, thepropofol infusion was set to deliver one of the threepropofol conditions (no infusion, mild and moderatesedation). Twenty minutes after each rate adjustmentthermal testing is performed (Fig. 1). Blood samples todetermine propofol levels were obtained before eachpain testing sequence. Samples were analyzed using liq-uid chromatography-mass spectroscopy (9).
All subjects were monitored according to the stan-dards of the American Society of Anesthesiologistsusing pulse oximetry, electrocardiogram (ECG), andnoninvasive blood pressure in addition to inspectionof subject’s breathing and circulation (10).
Sample size calculations were performed for theprimary outcome related to VAS pain intensity rat-ings, as baseline data were available in the literature.These calculations assume a moderate within-subjectcorrelation of 0.75, � � 0.05, and two-tailed tests. Wecalculated that 12 subjects would need to be tested todetect an 8 mm difference in VAS pain intensity rat-ings at 80% power. We decided to enroll a total of 18patients to compensate for potential missing data, butwe were able to gather a complete set of data.
The methodology used was a repeated-measuresparametric analysis of variance, which is described indetail as follows. The dependent variables for all anal-yses were intensity and mean unpleasantness VASratings. For the treatment comparisons, we calculatedeach patient’s global mean score for each treatment,yielding 54 dependent observations (18 subjects � 3treatments). This averaging process improved thepower as compared to analyses that do not do thisaveraging. To limit the errors of multiple testing, wefirst conducted randomized block analyses for three-way treatment differences, with the subject used as the
block. For each of the dependent variables, if the threetreatment F-statistic was nonsignificant at P � 0.05, allstatistical comparisons would cease. If significant,pairwise comparisons of treatments and secondary3-group analysis within each of the individual tem-peratures would be done. This secondary 3-way anal-ysis further determined if pairwise treatment compar-isons within temperature would be necessary. Otheranalyses, which are viewed as diagnostic, were alsocompleted. We looked at the interaction between tem-perature and experimental group, asking if the meandifference between treatments depended upon tem-perature. No significant interactions were uncovered.Finally, as a diagnostic, we studied the role of theorder of the treatments to see if the analysis mightneed to take that into account, but no significant ordereffect was uncovered.
ResultsWe found overall statistically significant differences inpain intensity and unpleasantness ratings amongstudy conditions (Tables 1 and 2 and Fig. 2). Painintensity was rated significantly higher under mild (P� 0.01) and moderate (P � 0.001) sedation when com-pared with the placebo condition. In a similar fashion,pain unpleasantness was rated significantly higherunder mild (P � 0.003) or moderate sedation (P �0.001) when compared with the placebo condition.Mean VAS scores increase by 12 points on a scaleranging from 0 to 100 for intensity and by 10 points forunpleasantness when comparing placebo and moder-ate sedation.
Subjects’ general cognitive ability under propofolsedation was not impaired. The difference betweennumbers given to subjects and numerical values ofVAS ratings of subjects did not significantly increasewith sedation (see also “number rating test” in Meth-ods). Mean differences between presented 0–100 num-bers and 0–100 VAS ratings were 4.3 (3.3 sd) for the
Table 1. Analysis of Variance Tables
Source dFSum ofSquares
MeanSquare F Value
PartialEta Squared
Dependent Variable: VAS Intensity RatingSubject 17 13892 817 15.94 (P �.001) 0.89Sedation Group 2 1263 631 12.32 (P � .001) 0.42Error 34 1743 51 – –
Dependent Variable: VAS Unpleasant RatingSubject 17 12946 762 17.85 (P � .001) 0.90Sedation Group 2 913 457 10.70 (P � .001) 0.39Model 19 13859 729 17.1 –Error 34 1450 43 – –
Analysis of variance tables are based on a univariate general linear model with pain ratings as dependent variable and sedation group and subjects asindependent variable. Effect sizes are displayed as partial eta squared; 42% (intensity) and 39% (unpleasantness) of variations on pain ratings can be explainedby propofol sedation.
ANESTH ANALG PAIN MEDICINE FROLICH ET AL. 4832005;100:481–6 PROPOFOL AND PAIN PERCEPTION
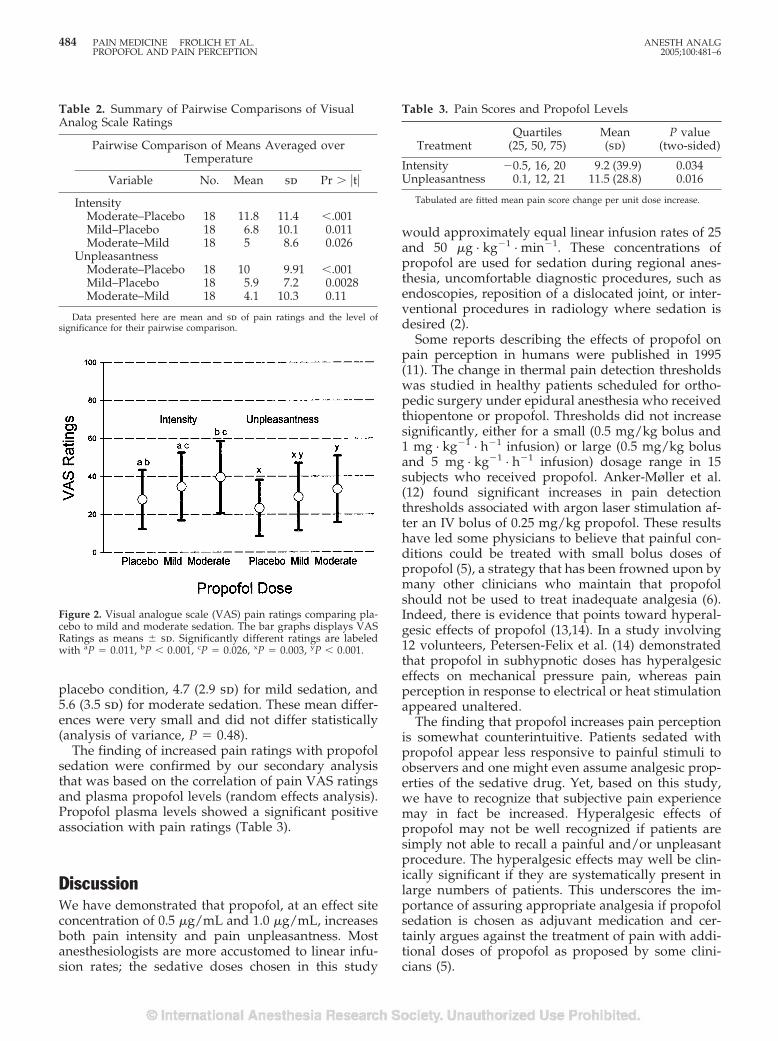
placebo condition, 4.7 (2.9 sd) for mild sedation, and5.6 (3.5 sd) for moderate sedation. These mean differ-ences were very small and did not differ statistically(analysis of variance, P � 0.48).
The finding of increased pain ratings with propofolsedation were confirmed by our secondary analysisthat was based on the correlation of pain VAS ratingsand plasma propofol levels (random effects analysis).Propofol plasma levels showed a significant positiveassociation with pain ratings (Table 3).
DiscussionWe have demonstrated that propofol, at an effect siteconcentration of 0.5 �g/mL and 1.0 �g/mL, increasesboth pain intensity and pain unpleasantness. Mostanesthesiologists are more accustomed to linear infu-sion rates; the sedative doses chosen in this study
would approximately equal linear infusion rates of 25and 50 �g · kg�1 · min�1. These concentrations ofpropofol are used for sedation during regional anes-thesia, uncomfortable diagnostic procedures, such asendoscopies, reposition of a dislocated joint, or inter-ventional procedures in radiology where sedation isdesired (2).
Some reports describing the effects of propofol onpain perception in humans were published in 1995(11). The change in thermal pain detection thresholdswas studied in healthy patients scheduled for ortho-pedic surgery under epidural anesthesia who receivedthiopentone or propofol. Thresholds did not increasesignificantly, either for a small (0.5 mg/kg bolus and1 mg · kg�1 · h�1 infusion) or large (0.5 mg/kg bolusand 5 mg · kg�1 · h�1 infusion) dosage range in 15subjects who received propofol. Anker-Møller et al.(12) found significant increases in pain detectionthresholds associated with argon laser stimulation af-ter an IV bolus of 0.25 mg/kg propofol. These resultshave led some physicians to believe that painful con-ditions could be treated with small bolus doses ofpropofol (5), a strategy that has been frowned upon bymany other clinicians who maintain that propofolshould not be used to treat inadequate analgesia (6).Indeed, there is evidence that points toward hyperal-gesic effects of propofol (13,14). In a study involving12 volunteers, Petersen-Felix et al. (14) demonstratedthat propofol in subhypnotic doses has hyperalgesiceffects on mechanical pressure pain, whereas painperception in response to electrical or heat stimulationappeared unaltered.
The finding that propofol increases pain perceptionis somewhat counterintuitive. Patients sedated withpropofol appear less responsive to painful stimuli toobservers and one might even assume analgesic prop-erties of the sedative drug. Yet, based on this study,we have to recognize that subjective pain experiencemay in fact be increased. Hyperalgesic effects ofpropofol may not be well recognized if patients aresimply not able to recall a painful and/or unpleasantprocedure. The hyperalgesic effects may well be clin-ically significant if they are systematically present inlarge numbers of patients. This underscores the im-portance of assuring appropriate analgesia if propofolsedation is chosen as adjuvant medication and cer-tainly argues against the treatment of pain with addi-tional doses of propofol as proposed by some clini-cians (5).
Table 2. Summary of Pairwise Comparisons of VisualAnalog Scale Ratings
Pairwise Comparison of Means Averaged overTemperature
Variable No. Mean sd Pr � �t�
IntensityModerate–Placebo 18 11.8 11.4 �.001Mild–Placebo 18 6.8 10.1 0.011Moderate–Mild 18 5 8.6 0.026
UnpleasantnessModerate–Placebo 18 10 9.91 �.001Mild–Placebo 18 5.9 7.2 0.0028Moderate–Mild 18 4.1 10.3 0.11
Data presented here are mean and sd of pain ratings and the level ofsignificance for their pairwise comparison.
Figure 2. Visual analogue scale (VAS) pain ratings comparing pla-cebo to mild and moderate sedation. The bar graphs displays VASRatings as means � sd. Significantly different ratings are labeledwith aP � 0.011, bP � 0.001, cP � 0.026, xP � 0.003, yP � 0.001.
Table 3. Pain Scores and Propofol Levels
TreatmentQuartiles
(25, 50, 75)Mean(sd)
P value(two-sided)
Intensity �0.5, 16, 20 9.2 (39.9) 0.034Unpleasantness 0.1, 12, 21 11.5 (28.8) 0.016
Tabulated are fitted mean pain score change per unit dose increase.
484 PAIN MEDICINE FROLICH ET AL. ANESTH ANALGPROPOFOL AND PAIN PERCEPTION 2005;100:481–6
Additional evidence for hyperalgesic properties ofsedative-hypnotic medications is provided by animalstudies. Ewen et al. (13) describe the hyperalgesiceffects of barbiturates and propofol in the rat, thusindicating that hyperalgesia may be a property ofdifferent anesthetics when administered in subhyp-notic doses. A proposed mechanism for this effect isthe modulation of the central gamma aminobutyricacid (GABA)A ionophore by drugs such as barbitu-rates (15) This modulation of GABAA receptors maywell be the pathophysiologic mechanism for a centralsensitization of noxious stimuli by propofol. This fac-tor might play a major role for the development ofpain after medical procedures performed with propo-fol sedation and may help to explain why sedatedcritically ill patients report frequent unpleasantevents, which they thought had taken place beforethey regained consciousness (16). In fact, more thanhalf of the patients in the intensive care unit activelyrecall pain (17). Similar considerations apply for manyendoscopic procedures, procedures in interventionalradiology, the emergency room, and some office-based surgical procedures performed under local an-esthesia with sedation.
The proposed mechanism leading to central mech-anism of noxious stimuli by propofol may also bepresent at larger, hypnotic doses of propofol. Al-though pain is considered the unpleasant sensory andemotional experience associated with actual or poten-tial tissue damage, there may be important implica-tions of enhanced processing of noxious stimuli dur-ing propofol anesthesia as a state during which thesubjective experience of such a stimulus is presumablysuppressed. The study of this hypothesis might be aninteresting area of future research.
A potential limitation of our study is the variation insedation levels among subjects. However, the prospec-tive randomized and balanced treatment assignmentshould have helped to minimize these differences aswell as minor pharmacokinetic differences in drugwashout among subjects. We were also concernedabout oversedation that might affect the subjects’ abil-ity to perform pain rating. Unfortunately, some inves-tigators do not attempt to address this potential con-founding variable (12). We have used the “numberrating test” to compare our subjects’ ability to use themechanical slide algometer under different sedationconditions. We believe that this test, although not wellestablished, has reasonable face validity.
We observed a significant variability in subjects’pain rating when exposed to identical stimulationtemperatures. Based on this finding, one might arguethat stimuli should be normalized using pain thresh-old measurements. However, there are important ad-vantages of using unadjusted suprathreshold pain;first, normal variability in pain sensitivity is captured,
and second, suprathreshold pain is the more relevantto assess clinical pain.
A potential confounding factor for the assessment ofpain in patients receiving propofol is its ability tocause burning on injection. Fortunately, none of oursubjects reported propofol injection pain, a fact thatwe attributed to the careful selection of the injectionsite at a large caliber vein. We also changed forearmstwo times and received consistent rating within sub-jects. Thus, pain rating appeared to be unaffected bythe possible local irritant effects of propofol.
The reason for the conflicting results in studies eval-uating the effect of propofol on pain perception may,at least in part, be attributed to study design andmethods. We therefore chose an experimental modelof pain and rating scale that have been extensivelyused in both clinical and experimental contexts (7,18–20). In particular, the combined use of mechanicalVAS and contact heat-induced pain has been shown toprovide ratio scale measures of pain and internallyconsistent measures of experimental and clinical painwhen both forms of pain are rated by pain patients(7,18,20). This method is also predictive of changes inclinical pain intensity. For example, conventional an-algesic treatments such as opioid administration havebeen shown to produce similar magnitudes of painreduction in both clinical and this form of experimen-tal pain (20).
In summary, our findings indicate that propofol inmild to moderate sedative doses increases pain inten-sity and unpleasantness. This finding calls attention tothe need for adequate analgesia in sedated patientsand stimulates the continuing discussion about thepharmacologic profile of anesthetic drugs and theirmechanism of action. Further research is necessary todetermine the effects of larger, hypnotic doses on painexperience.
References1. Havel CJ Jr., Strait RT, Hennes H. A clinical trial of propofol vs
midazolam for procedural sedation in a pediatric emergencydepartment. Acad Emerg Med 1999;6:989–97.
2. Swanson ER, Seaberg DC, Mathias S. The use of propofol forsedation in the emergency department. Acad Emerg Med 1996;3:234–8.
3. Chamorro C, de Latorre FJ, Montero A, et al. Comparative studyof propofol versus midazolam in the sedation of critically illpatients: results of a prospective, randomized, multicenter trial.Crit Care Med 1996;24:932–9.
4. Carlsson U, Grattidge P. Sedation for upper gastrointestinalendoscopy: a comparative study of propofol and midazolam.Endoscopy 1995;27:240–3.
5. Lau WC, Green CR, Faerber GJ, et al. Determination of theeffective therapeutic dose of intrathecal sufentanil for extracor-poreal shock wave lithotripsy. Anesth Analg 1999;89:889–92.
6. TerRiet MF, Jacobs JS, Lewis MC, DeSouza GJ. Propofol andanalgesia. Anesth Analg 2000;90:1455.
7. Price DD, Long S, Harkins SW. A comparison of pain meas-urement characteristics of mechanical visual analogue and sim-ple numerical rating scales of pain. Pain 1994;56:217–26.
ANESTH ANALG PAIN MEDICINE FROLICH ET AL. 4852005;100:481–6 PROPOFOL AND PAIN PERCEPTION
8. Schnider TW, Minto CF, Gambus PL, et al. The influence ofmethod of administration and covariates on the pharmacokinet-ics of propofol in adult volunteers. Anesthesiology 1998;88:1170–82.
9. Lim CK, Lord G. Current developments in LC-MS for pharma-ceutical analysis. Biol Pharm Bull 2002;25:547–57.
10. Basic anesthetic monitoring. Standards, guidelines and state-ments. Park Ridge, IL: American Society of Anesthesiologists,2003.
11. Wilder-Smith OH, Kolletzki M, Wilder-Smith CH. Sedationwith intravenous infusions of propofol or thiopentone: effectson pain perception. Anaesthesia 1995;50:218–22.
12. Anker-Moller E, Spangsberg N, Arendt-Nielsen L, et al. Sub-hypnotic doses of thiopentone and propofol cause analgesia toexperimentally induced acute pain. Br J Anaesth 1991;66:185–58.
13. Ewen A, Archer DP, Samanani N, Roth SH. Hyperalgesia dur-ing sedation: effects of barbiturates in the rat. Can J Anaesth1995;42:532–40.
14. Petersen-Felix S, Arendt-Nielsen L, Bak P, et al. Psychophysicaland electrophysiological responses to experimental pain may beinfluenced by sedation: comparison of the effects of a hypnotic(propofol) and an analgesic (alfentanil). Br J Anaesth 1996;77:165–71.
15. Staley K. Enhancement of the excitatory actions of GABA bybarbiturates and benzodiazepines. Neurosci Lett 1992;146:105–7.
16. Rundshagen I, Schnabel K, Wegner C, am Esch S. Incidence ofrecall, nightmares, and hallucinations during analgosedation inintensive care. Intensive Care Med 2002;28:38–43.
17. Puntillo KA. Pain experiences of intensive care unit patients.Heart Lung 1990;19:526–33.
18. Price DD, Harkins SW. Combined use of experimental pain andvisual analogue scales in providing standardized measurementof clinical pain. Clin J Pain 1987;3:18.
19. Price DD, Harkins SW, Baker C. Sensory-affective relationshipsamong different types of clinical and experimental pain. Pain1987;28:297–300.
20. Price DD, Harkins SW, Rafii A, Price CA. Simultaneous com-parison of fentanyl’s analgesic effects on experimental and clin-ical pain. Pain 1986;24:197–203.
486 PAIN MEDICINE FROLICH ET AL. ANESTH ANALGPROPOFOL AND PAIN PERCEPTION 2005;100:481–6
ECONOMICS, EDUCATION, AND HEALTH SYSTEMS RESEARCHSECTION EDITOR
RONALD D. MILLER
EDITORIALS
Academic Anesthesia Faculty Salaries: Incentives,Availability, and ProductivityRonald D. Miller, MD
Anesthesia and Perioperative Care, University of California, San Francisco, California
I n the United States, financial compensation for ac-ademic anesthesiologists has usually been based onrank and/or clinical time. Typically, faculty salaries
would increase with seniority and the associated in-creases in rank (i.e., assistant professor3associateprofessor3full professor). Since most of the actualfinancial compensation is derived from clinical activ-ity, a certain clinical expectation (i.e., usually numberof days per week in the operating room plus call)would be expected. If a faculty member has researchgrants, money from the grant may be used to help paya faculty member’s salary and increase his or hernonclinical time. These are the principles by whichacademic departments have for years compensatedtheir faculty, although there have undoubtedly beenmany variations.
Over the past 10 to 15 years, many American aca-demic anesthesia departments have increasingly hadproblems with recruiting and retaining faculty (espe-cially junior faculty), making it difficult to provideclinical coverage for all of the activities usually asso-ciated with operating room anesthesia and call. In-creasingly, hospital administrators—and even sur-geons—have been critical of anesthesia departments’salary structures because they are not based on clinicalincentives and/or productivity. In the article pub-lished in this month’s issue of Anesthesia & Analgesia,Abouleish et al. (1) found that of 83 departments,nearly 70% had some type of incentive by which fac-ulty could earn extra money. Abouleish et al. have alsoattempted to assess the current state of affairs withregard to incentive-based compensation in academicdepartments and its effectiveness.
A more precise definition of an “incentive” is nec-essary. One definition might be “the implementationof some measure to stimulate faculty to increasedquality and/or quantity of performance.” Obviously,
incentives come in many forms. Fundamentally, as faras anesthesia departments are concerned, incentivescan be divided into those based on availability versusthose based on productivity. Examples of availabilitywould be number of days in the operating room,number of calls, and their duration. For example, ifone is expected to be in the operating room one par-ticular day, the amount of anesthesia actually deliv-ered would probably vary extensively among facultymembers. However, independent of their individualclinical productivity, they would receive the samecredit (i.e., 1 day in the operating room). Should onereceive the same credit when they are on call, whetheror not they actually deliver clinical care? Conversely,another form of an incentive is productivity, which isbased on the amount of anesthesia given. Should afaculty member’s salary be based on the expectedamount of productivity (e.g., amount of clinical workperformed) versus availability during which anesthe-sia may not be given? Studies in our department havedetermined that when someone is in the same spe-cialty, has the same call, and has the same number ofdays in the operating room, his or her clinical produc-tivity can vary widely (2). This probably relates to theindividual variation in enthusiasm for volunteeringfor extra cases, seeking relief from their current day’sactivities, and the vigor with which they pursue othercases when their own are canceled.
Although this author is extremely biased, it is myopinion that only productivity-based incentives actu-ally achieve the goals and aspirations of academicanesthesia departments and medical centers and en-hance the anesthesia faculty’s relationship with otherspecialties, such as surgery. In the Abouleish et al.survey, only 17% of the departments used a produc-tivity measure. Nine departments based their ap-proach on charges (financial charges), and the remain-ing five based it on time that clinical care was actuallydelivered. One could argue that a system based oncharges is inappropriate because of the unevenness ofcharges for various medical plans and surgical proce-dures in anesthesia. Using time or quantity of clinicalcare avoids the inequalities of the compensation
Accepted for publication September 17, 2004.Address correspondence and reprint requests to Ronald D. Miller,
MD, Anesthesia and Perioperative Care, University of California,San Francisco, CA 94143. Address e-mail to [email protected].
DOI: 10.1213/01.ANE.0000146945.70996.7E
©2005 by the International Anesthesia Research Society0003-2999/05 Anesth Analg 2005;100:487–9 487
schemes. This system defines the actual time spentdelivering clinical care as the prime basis for incen-tives. Nevertheless, the majority of departments in theUnited States clearly do not use such productivity-based compensation. To have an effective clinical pro-ductivity incentive, pain clinics and critical care unitsneed to be included in most anesthesia departments.While a specific productivity may be difficult to definein pain clinics and critical care units, a fundamentalbasic requirement is that the incentive should be basedon the actual quantity of clinical care delivered. Inother words, clinicians who take care of a larger num-ber of patients should be defined as being more pro-ductive than those who take care of fewer patients.Therefore, it is entirely possible (and we do it in ourdepartment) to have productivity measures in everyclinical activity that exists in anesthesia departments.
The Abouleish et al. study nicely describes the dif-ferent forms of incentives in academic anesthesia de-partments. However, to state that a department hasincentives is, in itself, not very informative. For exam-ple, incentives need to be defined as being based onavailability or productivity. Furthermore, are the in-centives voluntary? An example of an involuntaryincentive would be the department’s decision to pro-vide extra compensation for extra call over and abovethat which was expected by the faculty member fromhis or her salary alone. An example of a voluntaryincentive would be to have a certain amount of callthat needs to be provided and for which faculty mem-bers can volunteer. The advantage of a voluntary in-centive is that it allows faculty members to influencethe total compensation they receive.
Productivity-based incentives are dependent on thetotal amount of clinical care derived. Such an incentivemay be based on the amount of money that is gener-ated by the faculty or the amount of clinical produc-tivity based on time, with or without concurrency.Our experience at the University of California, SanFrancisco, is that the productivity measure (i.e., theamount of time giving anesthesia) is tremendouslybeneficial in many respects. First, it rewards thosewho actually give more anesthesia. Second, facultymembers tend to want to spend their time actuallyadministering anesthesia instead of, in some cases,trying to avoid it. Knowing that the faculty receivecompensation for actually giving anesthesia individuallyplaces confidence in the hospital that the anesthesia de-partment has a “hands-on” assessment of clinical effi-ciency. To be able to tell the hospital administrator thathis or her surgical service is difficult to cover for anes-thesia because of its inefficiency is powerful. Not onlythat, but to be able to tell surgeons that their inefficiencyor unavailability costs the anesthesia department incomeis reversing the typical role of surgeons. Likewise, sur-geons typically complain when they cannot do cases,and it therefore hurts their productivity and income.
Abouleish et al. state that a likely assumption on thepart of hospital administrators is that incentive plansfor anesthesiologists would increase the number ofsurgical cases. I am not sure of the basis for thisconclusion. Most certainly, the hospital administratorswith whom I have interacted do not have that expec-tation, since the surgeons are the ones who bring thecases to the hospital. On the other hand, my experi-ence is that hospital administrators are extremely wor-ried about the capability of anesthetizing the availablecases in a timely manner. It is common for academicanesthesia departments to be unable to run all of therooms necessary for surgery because of an inadequatenumber of faculty.
Abouleish et al. conclude that “academic depart-ments implicitly assign value to nonclinical activities.”There are some departments, including ours, to whichthat conclusion does not apply. Only clinical activitiesare directly financially rewarded by our productivitysystem. In fact, an interesting study would be to createfinancial productivity measures for clinical productiv-ity only and not for education and research. Perhapsextra nonclinical time is the proper incentive for indi-viduals who provide valuable research and educationactivities. One might argue that if there were no finan-cial incentives for researchers versus clinicians, thenresearch productivity would decrease. About 10 yearsago, our department had significant clinical coverageproblems because of which our productivity incentiveprogram was established strictly for the clinicians.Since then, we have had a dramatic increase in thenumber of National Institutes of Health (NIH) grantsand total NIH funding. The classic satement (i.e., whydon’t the researchers come out of their labs to help usout?) are no longer heard. The educational programcan be incentivized by extra nonclinical time ratherthan by direct financial incentives.
There is an inherent tendency to want to maintainthe status quo, which, according to Abouleish et al., isexhibited in many departments (i.e., those withoutproductivity-driven plans). Furthermore, even if anew incentive plan is initiated, how should its efficacybe determined? Even if a new productivity plan iscompared with the old availability or salary-basedplan, other conditions may account for the differencerather than the system itself. This makes it virtuallyimpossible to study in a manner that would warrantpublication in a peer-reviewed journal. Faculty mem-bers who have a vested interest in the nonincentive-based compensation may demand that the chairper-son “prove” the new plan’s efficacy; this is difficult todo.
Our experience is overwhelmingly in favor of aclinical productivity incentive plan. It rewards clinicalproductivity and penalizes availability that is not clin-ically productive. It also sends a strong message to theadministration and surgeons that clinical productivity
488 EDITORIALS ANESTH ANALG2005;100:487–9
is the measure by which the anesthesia department ismotivated and financed. This is very powerful whenresources are needed. It also allows objective analysisbased on data regarding individual productivity andadverse financial impact when the hospital decides toinitiate or sustain clinical services that are not busy orefficient. Also, the need for anesthesia departments toprovide nonproductive coverage puts appropriatepressure on the hospital for compensation.
Anesthesia departments have decreased personnelexpenses when there is a productivity-based incentiveplan. When we were entirely salary based, the depart-ment was expected to have enough faculty to cover allclinical situations. When the faculty had to work morethan their expectations, they complained. When theydid not have to work to their commitment, but wereavailable, they were content. We now run our depart-ment about 90% of control. Frequently when I hireadditional faculty to meet the 100% coverage, facultywill ask me not to do so because it would interferewith their additional income. Finally, although wecannot prove it with objective studies, there seems tobe no doubt that having the power to change one’sincome, especially for junior faculty, is extremely help-ful in retaining young clinical faculty.
One might argue that in writing this editorial en-couraging the use of clinical productivity methods forcompensation in an anesthesia department, I am tak-ing advantage of my role as Editor-in-Chief; I amguilty as charged. My opinions are based on depart-mental experience, on being a Chair for 21 years, on
conversations with other Chairs of excellent anesthe-sia programs, on analysis of departments in which theChairs were involuntarily terminated, and on havingbeen a consultant at many academic institutions, ei-ther by invitation of the Chair, the medical school,and/or a medical center seeking consultation regard-ing problems associated with their anesthesia depart-ments. Most frequently, these problems are related tothe inability to cover operating rooms. Incentives areincreasingly used by companies and universities andeven for departmental Chairs. The pressure for anes-thetic departments to be incentive based will probablyincrease. Abouleish et al. have well demonstrated thatalthough many anesthesia departments do use incen-tives, they rarely use clinical productivity as a mea-sure of financial compensation. Productivity measuresreward faculty independent of their rank and en-hance individual power. Compensation, such as fi-nancial incentives, may help to retain junior facultyand may provide fertile ground for powerful rela-tionships among anesthesiologists, surgeons, andhospital administrators.
References1. Abouleish AE, Apfelbaum JL, Prough DS, et al. The prevalence
and characteristics of incentive plans for clinical productivityamong academic anesthesiology programs. Anesth Analg 2005;100:493–501.
2. Feiner JR, Miller RD, Hickey RF. Productivity versus availabilityas a measure of faculty clinical responsibility. Anesth Analg2001;93:313–8.
ANESTH ANALG EDITORIALS 4892005;100:487–9
Incentivize Everything, Incentivize NothingDavid A. Lubarsky, MD, MBA
Department of Anesthesiology, Perioperative Medicine and Pain Management, University of Miami School of Medicine,Miami, Florida
I f everything in life is of equal value, people willchoose what they do based solely on personal pref-erence. If you want people to do something that is
at odds with their personal preference, you must pro-vide incentives that outweigh the personal satisfactionof just doing whatever they please. That is why we arepaid to go to work. Our salary is a regular incentive toget up at 5:45 am and drive to work, instead of loung-ing late in the morning in a warm bed, and headingout even later to a soft white sand beach.
In this issue, Abouleish et al. (1) have provided afascinating glimpse into how academic anesthesia de-partments induce their faculty to work harder in theclinical arena. They characterized the construct of clin-ical incentive plans among 83 responding academicprograms. Most (69%) did not pay incentives based onwork performed during normal working hours.Ninety percent did not alter total salary by more than25%. They note that many comments on the surveysuggested total departmental productivity did notchange with the introduction of an incentive plan. Thisis not surprising, in that anesthesiologists have little orno control over booking and performing surgeriesduring their working hours. Now that we know howacademic chairs are crafting clinical incentive pro-grams, can we analyze those comparative data to helpus all do it better? That remains to be seen. It isinteresting that 64% of respondents have had theirplans in place less than 5 years, so many of us are ona steep learning curve. This well-timed article mayallow us to learn from each other and better serve bothour faculty and facility. Furthermore, we may now beable to summarize these data and thus respond moreintelligently to our group practice plan managers whoinsist on productivity-based compensation.
While we now know how everyone else is doing it,what more should we know about incentives in gen-eral to help gauge whether we are all doing it right?Incentives motivate people to perform in a certain way(more, better, quicker). The key to a working incentivesystem requires the following: 1) The individual be-lieves that the desired behavior will lead to the desiredoutcomes (i.e., the incentive is guaranteed to be paid;it is not contingent on profits or anything else outsidetheir control), 2) the individual believes that theseoutcomes have positive value for him or her (i.e., anoble purpose or a sufficient sum of money), and 3)the individual believes that he or she is able to per-form at the desired level (the lack of control over whatis booked into one’s room combined with a lack ofincentives for daily scheduled work in most plans area reflection of this reality).
It is a basic truth that people always act in theirrational self-interest. Therefore, incentives almost al-ways work perfectly to provide the behavior that isrewarded, assuming the incentive is large enough. Theonly problem is that we often fail to understand whatbehavior we really want, how to measure what wewant (a metric), and how to link the incentive clearlyto that metric without introducing new problems.There is a classic article, “The Folly of Rewarding Aand Hoping for B,” (2) that details the problems thatcan occur with poorly designed incentive systems thatcreate perverse results. An example is when an aca-demic department starts to reward clinical billings inan effort to “get everyone to bill more” and all of asudden finds there are no volunteers for off site cases,the IRB, the preoperative screening clinic, or the med-ical school Admission’s Committee. Reluctance to getinvolved in these nonbillable activities is even greaterwhen they require evening or weekend time.
The ideal incentive has several characteristics. First,there should be a target of expected performance be-low which there is no incentive. A number of depart-ments described by Abouleish et al. base their incen-tives on total dollars or total work. This degrades thedifferences between those with exceptional productiv-ity and average productivity. If one wants marginalproductivity (productivity above that which already
Accepted for publication November 12, 2004.Address correspondence and reprint requests to David A. Lubar-
sky, Professor and Chairman, Department of Anesthesiology, Peri-operative Medicine and Pain Management, University of MiamiSchool of Medicine, 1611 NW 12th Avenue, Central 300, Miami,Florida 33136. Address e-mail to [email protected].
DOI: 10.1213/01.ANE.0000152011.01993.8C
©2005 by the International Anesthesia Research Society490 Anesth Analg 2005;100:490–2 0003-2999/05
exists), then that is what should be rewarded. Second,an unrestricted bonus pool is important. This is easy todo with dollars collected. If one collects more, thereare more dollars to include in the incentive. It is muchmore difficult to do this when financially rewardingthe publication of peer-reviewed papers, since one canrun out of money with too much success! That is whyit is much easier (better?) to create incentives forgrants and salary support.
Third, the incentive programs should be noncom-petitive. Why? Take a pharmaceutical company, forexample, that wants to reward superior sales. It couldoffer to take the top salesperson to Miami Beach for awonderful sun-filled January 3-day weekend, or itcould offer to take every salesperson who sells morethan a million dollars of goods. The latter is morelikely to yield a greater number of superior salespeo-ple. Why? Imagine Jones has 2 million in sales already,Koogan has 1.9 million, and you have $800,000 with 1month to go. Do you work hard to hit that million-dollar mark when there is no hope of attaining thecoveted reward? Of course not. Furthermore, whenKoogan gets a sales lead that might increase sales inJones’ district, his self-interest is not to help if only thetop salesperson is getting rewarded. An ability to rec-ognize team (department, division) success is a natu-ral corollary to this rule.
A fourth characteristic of the ideal incentive adds avariable component. A simple target (as in this sce-nario, 1 million dollars in sales) is not as good as atarget with a volume adjustment (the incentive in-creases for each $100,000 more you sell). Imagine onceagain that you are a salesman striving to hit themillion-dollar mark. Once you get to that, if there is nofurther incentive to book sales, you might just hold offclosing a sale until next year or you might just relax,take some time off, and congratulate yourself on hit-ting the goal. However, knowing that an extra vaca-tion day in Miami awaits every $100,000 more in salesabove $1 million means you continue to strive on yourjob until December 31st.
The article published by Abouleish et al. is enlight-ening, in that it allows us to compare our clinicalincentive programs to those of many other academicprograms. It provides a great start to begin the discus-sion of how to best structure incentives in an academicdepartment, allowing us to see how close we are to theideal within our specialty. According to this survey,most academic institutions have chosen to rewardextra clinical shift work rather than billings overall.The collective wisdom is just that. Most departmentshave now recognized that since anesthesiologists usu-ally do not make their own assignments, it is pointlessto offer an incentive based on something the individ-ual cannot control. (This specifically does not apply toareas like a pain clinic, where relative value units andcollections are controllable, based on the types and
number of patients the practitioner chooses to see). So,the majority of the larger academic departments areusing a system that pays for marginal productivityand that yields the desired result—getting more clin-ical work out of faculty members who are willing towork more. While this system clearly works, it encour-ages the faculty to spend more time pursuing dollarsrather than academic success. While there may besome marginal improvements to total faculty produc-tivity for working an extra clinical day, some of thatextra clinical productivity is simply effort switchedaway from academics. Only for faculty with a 100%clinical assignment is this incentive system reallyyielding all the extra productivity you think you arepaying for. Thinking otherwise, you will be engagingin the folly of hoping for A while rewarding B. Aca-demic faculty have only so much time and effort togive to their job. If more is spent on clinical tasks, it isprobable that less will be spent on other tasks. Even-tually, if too much time is spent on purely clinicalwork, there is little to distinguish the academic clini-cian from his better paid private practice counterpart,and that may lead to faculty attrition.
While Abouleish et al. concentrated on clinical in-centive systems, some departments use a much morecomplex system involving both clinical and academicactivities. We would all be well served by a similarstudy that characterized academic productivity incen-tive plans. While this is not discussed in detail in theAbouleish et al. article, it is discussed in detail everytime two academic chairs have a conversation. Thosewho have this system attempt to reward the academicproductivity that might otherwise be reduced by extraclinical assignments. However, if these academic in-centive systems grow too complex, as they often do,they run afoul of the principles that the incentive beclearly related to the pursued activity, that the incen-tive be clearly understandable to the worker, and thatthere be only a few rather than many goals. A goodreview of current literature regarding incentives waspresented at the 2004 International Anesthesia Re-search Society meeting by Kratz et al. (3,4); thosefindings reflect well my own understanding and ex-perience in these matters. As these nonclinical systemsgrow in complexity, many nonclinical activities arerecognized, and anything more than doing nothing isconsidered valuable. Frankly, while recognizing thevalue of many academic activities, rewarding themequally with dollars brings us back to our point in thefirst paragraph—we are paid to do something otherthan that which we might otherwise choose. If every-thing academic is of equal value, we just do what wewish, rather than focusing our efforts on those initia-tives that the leadership requires to move a depart-ment forward. In a “starter” department, just gettingeveryone focused on writing abstracts might be ap-propriate. In a more developing department, moving
ANESTH ANALG EDITORIALS 4912005;100:490–2
to only rewarding for papers published might be rea-sonable. In mature academic departments there is somuch rich activity that an administrator might say, “Idon’t have just one focus anymore.” That may be true,which is why incentives at that point need to be aboutpersonal contracts with measurable activity and deliv-erables—focusing that individual on incremental ef-fort that the chair thinks will be that faculty member’smost valuable contribution.
Recognizing the value the department places on avariety of academic contributions can be done with-out dollars and accomplished by assigning appro-priate academic time to pursue that activity. (Ofcourse, time is money, and a chair might choose tomore heavily invest that limited resource in thesame manner as cash incentives to promote a par-ticular type of productivity.) If someone is on 10committees (good), giving 10 lectures (good), andwriting 10 abstracts (good), but never finishes onepaper (bad), under an incentivize everythingscheme, they might do quite well. If the departmentwants published papers, it has to clearly concentrateits academic incentive plan so that it is clear that
reward is reserved only for the effort of planning,executing, and writing up a research project thatleads to a peer-reviewed publication.
Incentives should be about superior performance asdefined by those paying the incentive, or about chang-ing focus or attitude, not about glorifying anythingand everything that an academician might choose todo. If everything is incentivized, you really incentivizenothing. You might as well go to the beach.
References1. Abouleish AE, Apfelbaum JL, Prough DS, et al. The prevalence
and characteristics of incentive plans for clinical productivityamong academic anesthesiology programs. Anesth Analg 2005;100:493–501.
2. Kerr S. On the folly of rewarding A, while hoping for B. Academyof Management Journal 1975;18:769–83.
3. Kratz RD, Development of a goal-based incentive plan for moti-vating academic anesthesiology departments. Abstract presenta-tion at the IARS 2004 Clinical and Scientific Congress, March2004, Tampa, Florida.
4. Kratz RD, Orkin FK, Mets B. Assessing Faculty Satisfaction witha Faculty Incentive Plan. Abstract presentation at the IARS 2004Clinical and Scientific Congress, March 2004, Tampa, Florida.
492 EDITORIALS ANESTH ANALG2005;100:490–2
The Prevalence and Characteristics of Incentive Plansfor Clinical Productivity Among AcademicAnesthesiology ProgramsAmr E. Abouleish, MD, MBA*, Jeffrey L. Apfelbaum, MD†, Donald S. Prough, MD*,John P. Williams, MD‡, Jay A. Roskoph, MD, MBA‡, William E. Johnston, MD§, andCharles W. Whitten, MD§
*Department of Anesthesiology, University of Texas Medical Branch, Galveston, Texas; †Department of Anesthesia andCritical Care, The University of Chicago, Chicago, Illinois; ‡Department of Anesthesiology, The University of Pittsburgh,Pittsburgh, Pennsylvania; and §Department of Anesthesiology and Pain Management, University of Texas SouthwesternMedical Center at Dallas, Dallas, Texas
Performance-based compensation is encouraged in med-ical schools to improve faculty productivity. Medical spe-cialties other than anesthesiology have used financial in-centives for clinical work. The goal of this study was todetermine the prevalence and the types of clinical incen-tive plans among academic anesthesiology departments.We performed an electronic survey of the members of theSociety of Academic Anesthesiology Chairs and the Asso-ciation of Anesthesiology Program Directors in the springof 2003. The survey included questions about departmen-tal size, presence of a clinical incentive plan, characteris-tics of existing incentive plans, primary quantifiers ofproductivity, and factors used to modify productivitymeasurements. An incentive plan was considered to bepresent if the department measured clinical productiv-ity and varied compensation according to the measure-ments. The plans were grouped by the primary mea-sure used into the following categories: None, Charges,Time, Shift, Late/Call (only late rooms and call), andOther. Eighty-eight (64%) of 138 programs respondedto the survey, and 5 were excluded for incomplete data.Of the responding programs, 29% had no system, 30%
used a Late/Call system, 20% used a Shift system, 11%used a Charges system, 6% used a Time system, and 3%fit in the Other category. Larger groups (�40 facultymembers) had a significantly more frequent prevalenceof incentive plans compared with smaller groups (�20faculty members). Incentives were paid monthly orquarterly in 85% of the groups. In 90% of groups, incen-tive payments accounted for �25% of total compensa-tion. Adjustments for operating room schedule super-visors, personally performed cases, day surgerypreoperative clinics, pain-management services, andcritical care services were included in less than half ofthe programs that reported incentive plans. Call andlate room compensation was based on varied formulas.Sixty-nine percent of academic anesthesiology depart-ments did not vary compensation according to clinicalactivity during regular hours. Most did vary paymentson the basis of call and/or late rooms worked. Largerdepartments were more likely to use clinical incentiveplans.
(Anesth Analg 2005;100:493–501)
P erformance-based compensation and mission-based management advocate variable compen-sation based on productivity measurements. In
recent years, medical schools have begun using pro-ductivity measurements to determine variable faculty
compensation for both clinical work and nonclinicalactivities (e.g., research, education, and administra-tion) (1–4). In contrast to other specialties, in whichindividual physicians partially control numbers of pa-tient visits or procedures, the productivity of individ-ual anesthesiologists (or anesthesiology groups) isconstrained by multiple factors, including surgical du-ration, operating room (OR) scheduling and utiliza-tion, and differences in concurrency (or staffing ratios)(5–9). In addition, academic anesthesiology groupsmust assign faculty members to cover a range of clin-ical areas that vary greatly in terms of the hours ofclinical care that can be provided or the charges thatcan be generated per unit of time. Despite these
Presented at the annual meeting of the American Association ofClinical Directors, San Francisco, CA, October 12, 2003.
Accepted for publication September 16, 2004.Address correspondence and reprint requests to Amr E.
Abouleish, MD, MBA, Department of Anesthesiology, University ofTexas Medical Branch, Galveston, TX 77555-0591. Address e-mail [email protected].
DOI: 10.1213/01.ANE.0000146944.39874.02
©2005 by the International Anesthesia Research Society0003-2999/05 Anesth Analg 2005;100:493–501 493
obstacles, many anesthesiology departments have im-plemented, drafted, or are considering incentiveplans. The purpose of this study was to determine theprevalence, types, characteristics, and components ofincentive plans for clinical productivity among aca-demic anesthesiology programs in 2003.
MethodsIn April and May 2003, a survey was sent via e-mail tomembers of the Society of Academic AnesthesiologyChairs and the Association of Anesthesiology ProgramDirectors (SAAC/AAPD). Follow-up e-mails were sentto respondents to clarify and complete the surveys.
The survey included sections on demographics ofthe department, types of incentive plans, and structureof plans. Requested demographic information in-cluded the numbers of faculty members, residents,certified registered nurse anesthetists, and hospitalswhere care was provided. For the number of residents,the number of resident positions available in the 2003National Resident Match Program (Match) was notedfor each group (including groups that did not re-spond) (10). An incentive plan for clinical productivitywas considered to be present if 1) clinical productivitywas measured and 2) compensation was varied on thebasis of the measured productivity. If there was noincentive plan, the respondent was asked if the de-partment was considering a plan and, if so, the rea-sons for consideration.
For the departments that reported an incentive plan,additional information was collected, including thenumber of years the plan had been in place and, forthose plans in existence �5 yr, whether a previousplan had been replaced and, if so, why the plan hadbeen replaced. Respondents were asked to estimatethe percentage of total compensation that was produc-tivity based and variable for a typical clinical facultymember as �5%, 5%–10%, 11%–25%, 26%–50%, or�50%. The intervals for paying clinical incentives andfor evaluating the incentive plan were determined asmonthly, quarterly, semiannually, or annually. If thedepartment provided anesthesia services in more thanone hospital, the respondent was asked if incentiveswere paid differently for different facilities and, if so,why. Respondents indicated if and what kind of qual-ity measurements were used in the incentive plan.Finally, the existence of an incentive plan for nonclini-cal work was noted.
Clinical incentive plans were grouped according tothe primary measure of productivity in the followingcategories: Charges, total charges or total ASA unitsbilled; Time, time units or minutes billed; Shift, shiftsworked or available; and Other, which includes reve-nue collected (Table 1). Each respondent was asked tocomplete only the section of the survey that character-ized the primary measure of productivity used in his or
her incentive system. Follow-up communications withrespondents who initially reported no incentive planidentified a fifth category, subsequently termed Late/Call, as distinct from the Shift category. The Shift cate-gory included plans that measured all clinical activityduring regular hours, evenings (late rooms), and nightsand weekends (call). The Late/Call category includedplans that did not quantify shifts worked during regularhours but measured late rooms or calls and paid facultyadditional compensation for working at those times.Many departments that originally stated that they hadno incentive plan revised their response to indicate thatthey used a Late/Call system.
For each category of incentive plan, specific data tai-lored to the primary measure were collected. For theCharges category, the respondent was asked to definethe primary unit of measure; to note whether the planmodified the measurements on the basis of concurrency(i.e., staffing ratios), daily OR schedule management (i.e.,OR schedule supervisor), mentoring new residents, orassignment to the preoperative day surgery clinic; and tonote whether and how the plan measured clinical careprovided in remote sites outside the OR, obstetricalsuites, pain-management services, or intensive careunits. Finally, the respondents were asked to notewhether clinical activity in late rooms or on call wasgiven extra credit beyond charges or billed ASA units.The survey allowed for separate treatment of specialtycalls (e.g., transplantation, cardiac, pediatric, pain man-agement, and critical care).
Similarly, respondents who reported that they usedthe Time category were asked to define the primaryunit of measure used; to note whether the plan mod-ified the measurement for concurrency (i.e., staffingratios) or personally performed cases; to note whetherand how the plan gave credit for non-time-billableservices (specifically, OR schedule supervisor, the pre-operative day surgery clinic, turnover time, and baseunits �6); and to note whether and how the planincorporated clinical care provided outside the OR(billed with or without time), including remote sites,obstetrical suites, pain-management services, and in-tensive care units. Finally, the respondents were askedto note whether clinical activity in late rooms or oncall was given extra credit beyond the time billed.The survey allowed for separate treatment of spe-cialty calls.
Respondents who reported that they used the Shiftcategory were asked to define the primary unit ofmeasure used; to note whether the plan modified themeasurements for personally performed cases; and tonote whether and how the plan gave credit for ORschedule supervisor or mentor to new residents. Therespondents were asked whether (and how) the as-signed value of shifts worked differed by different
494 ECONOMICS, EDUCATION, AND HEALTH SYSTEMS RESEARCH ABOULEISH ET AL. ANESTH ANALGANESTHESIOLOGY CLINICAL INCENTIVE PLANS 2005;100:493–501
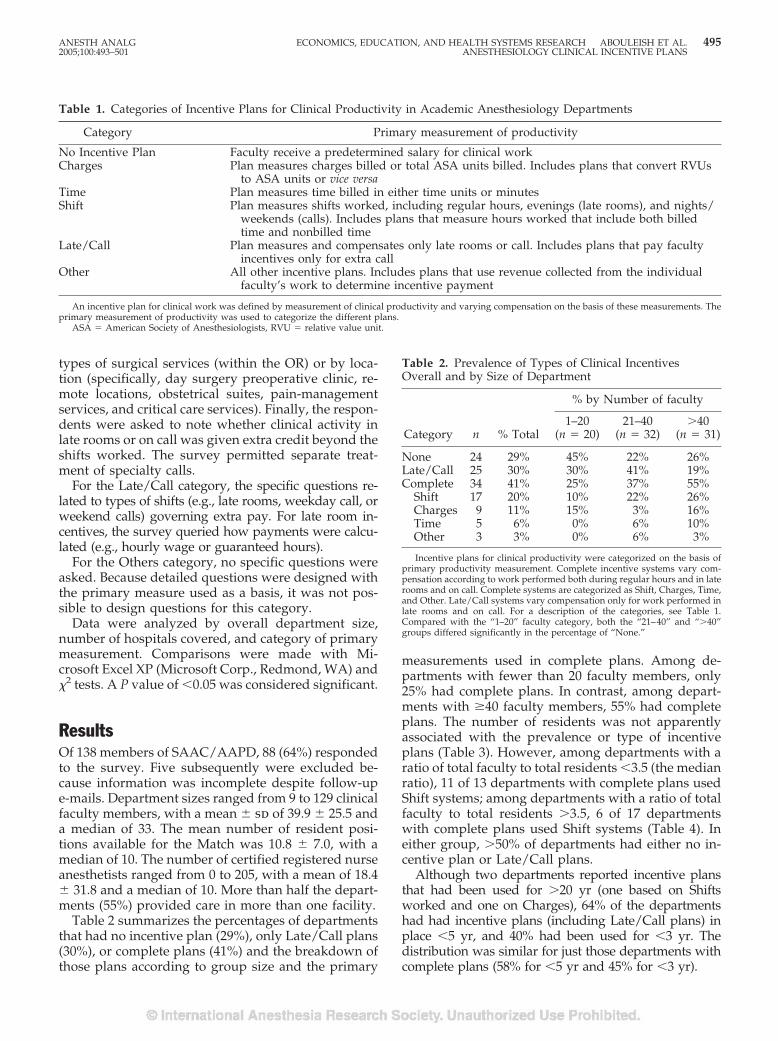
types of surgical services (within the OR) or by loca-tion (specifically, day surgery preoperative clinic, re-mote locations, obstetrical suites, pain-managementservices, and critical care services). Finally, the respon-dents were asked to note whether clinical activity inlate rooms or on call was given extra credit beyond theshifts worked. The survey permitted separate treat-ment of specialty calls.
For the Late/Call category, the specific questions re-lated to types of shifts (e.g., late rooms, weekday call, orweekend calls) governing extra pay. For late room in-centives, the survey queried how payments were calcu-lated (e.g., hourly wage or guaranteed hours).
For the Others category, no specific questions wereasked. Because detailed questions were designed withthe primary measure used as a basis, it was not pos-sible to design questions for this category.
Data were analyzed by overall department size,number of hospitals covered, and category of primarymeasurement. Comparisons were made with Mi-crosoft Excel XP (Microsoft Corp., Redmond, WA) and�2 tests. A P value of �0.05 was considered significant.
ResultsOf 138 members of SAAC/AAPD, 88 (64%) respondedto the survey. Five subsequently were excluded be-cause information was incomplete despite follow-upe-mails. Department sizes ranged from 9 to 129 clinicalfaculty members, with a mean � sd of 39.9 � 25.5 anda median of 33. The mean number of resident posi-tions available for the Match was 10.8 � 7.0, with amedian of 10. The number of certified registered nurseanesthetists ranged from 0 to 205, with a mean of 18.4� 31.8 and a median of 10. More than half the depart-ments (55%) provided care in more than one facility.
Table 2 summarizes the percentages of departmentsthat had no incentive plan (29%), only Late/Call plans(30%), or complete plans (41%) and the breakdown ofthose plans according to group size and the primary
measurements used in complete plans. Among de-partments with fewer than 20 faculty members, only25% had complete plans. In contrast, among depart-ments with �40 faculty members, 55% had completeplans. The number of residents was not apparentlyassociated with the prevalence or type of incentiveplans (Table 3). However, among departments with aratio of total faculty to total residents �3.5 (the medianratio), 11 of 13 departments with complete plans usedShift systems; among departments with a ratio of totalfaculty to total residents �3.5, 6 of 17 departmentswith complete plans used Shift systems (Table 4). Ineither group, �50% of departments had either no in-centive plan or Late/Call plans.
Although two departments reported incentive plansthat had been used for �20 yr (one based on Shiftsworked and one on Charges), 64% of the departmentshad had incentive plans (including Late/Call plans) inplace �5 yr, and 40% had been used for �3 yr. Thedistribution was similar for just those departments withcomplete plans (58% for �5 yr and 45% for �3 yr).
Table 1. Categories of Incentive Plans for Clinical Productivity in Academic Anesthesiology Departments
Category Primary measurement of productivity
No Incentive Plan Faculty receive a predetermined salary for clinical workCharges Plan measures charges billed or total ASA units billed. Includes plans that convert RVUs
to ASA units or vice versaTime Plan measures time billed in either time units or minutesShift Plan measures shifts worked, including regular hours, evenings (late rooms), and nights/
weekends (calls). Includes plans that measure hours worked that include both billedtime and nonbilled time
Late/Call Plan measures and compensates only late rooms or call. Includes plans that pay facultyincentives only for extra call
Other All other incentive plans. Includes plans that use revenue collected from the individualfaculty’s work to determine incentive payment
An incentive plan for clinical work was defined by measurement of clinical productivity and varying compensation on the basis of these measurements. Theprimary measurement of productivity was used to categorize the different plans.
ASA � American Society of Anesthesiologists, RVU � relative value unit.
Table 2. Prevalence of Types of Clinical IncentivesOverall and by Size of Department
Category n % Total
% by Number of faculty
1–20(n � 20)
21–40(n � 32)
�40(n � 31)
None 24 29% 45% 22% 26%Late/Call 25 30% 30% 41% 19%Complete 34 41% 25% 37% 55%
Shift 17 20% 10% 22% 26%Charges 9 11% 15% 3% 16%Time 5 6% 0% 6% 10%Other 3 3% 0% 6% 3%
Incentive plans for clinical productivity were categorized on the basis ofprimary productivity measurement. Complete incentive systems vary com-pensation according to work performed both during regular hours and in laterooms and on call. Complete systems are categorized as Shift, Charges, Time,and Other. Late/Call systems vary compensation only for work performed inlate rooms and on call. For a description of the categories, see Table 1.Compared with the “1–20” faculty category, both the “21–40” and “�40”groups differed significantly in the percentage of “None.”
ANESTH ANALG ECONOMICS, EDUCATION, AND HEALTH SYSTEMS RESEARCH ABOULEISH ET AL. 4952005;100:493–501 ANESTHESIOLOGY CLINICAL INCENTIVE PLANS
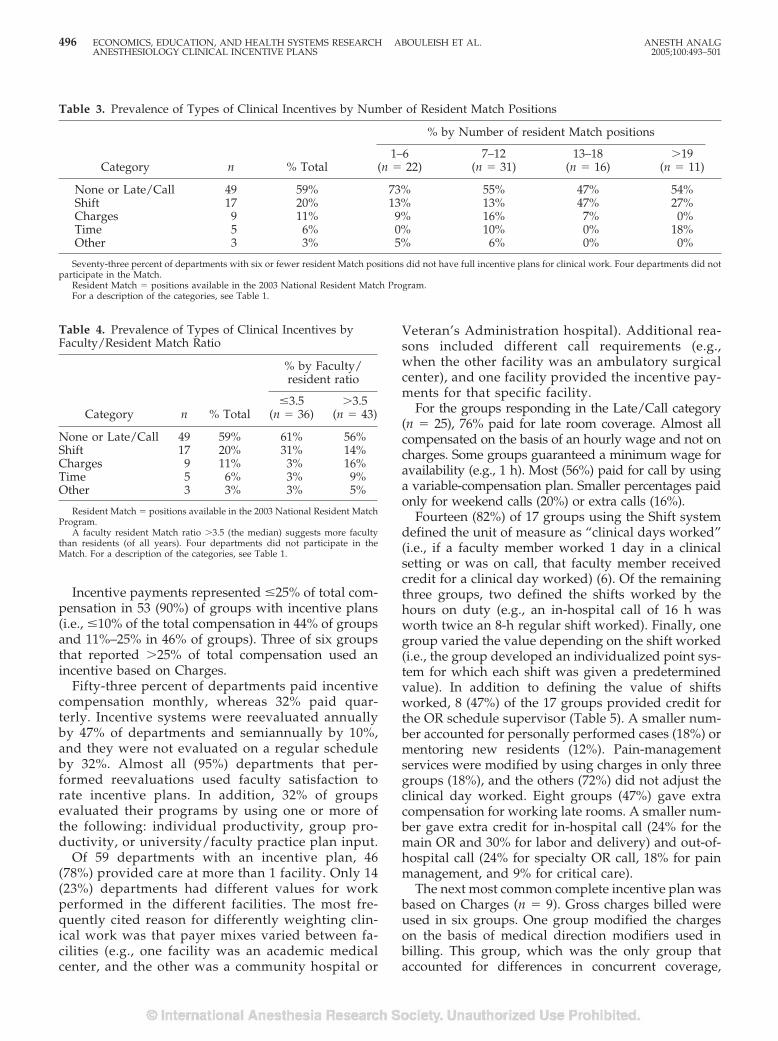
Incentive payments represented �25% of total com-pensation in 53 (90%) of groups with incentive plans(i.e., �10% of the total compensation in 44% of groupsand 11%–25% in 46% of groups). Three of six groupsthat reported �25% of total compensation used anincentive based on Charges.
Fifty-three percent of departments paid incentivecompensation monthly, whereas 32% paid quar-terly. Incentive systems were reevaluated annuallyby 47% of departments and semiannually by 10%,and they were not evaluated on a regular scheduleby 32%. Almost all (95%) departments that per-formed reevaluations used faculty satisfaction torate incentive plans. In addition, 32% of groupsevaluated their programs by using one or more ofthe following: individual productivity, group pro-ductivity, or university/faculty practice plan input.
Of 59 departments with an incentive plan, 46(78%) provided care at more than 1 facility. Only 14(23%) departments had different values for workperformed in the different facilities. The most fre-quently cited reason for differently weighting clin-ical work was that payer mixes varied between fa-cilities (e.g., one facility was an academic medicalcenter, and the other was a community hospital or
Veteran’s Administration hospital). Additional rea-sons included different call requirements (e.g.,when the other facility was an ambulatory surgicalcenter), and one facility provided the incentive pay-ments for that specific facility.
For the groups responding in the Late/Call category(n � 25), 76% paid for late room coverage. Almost allcompensated on the basis of an hourly wage and not oncharges. Some groups guaranteed a minimum wage foravailability (e.g., 1 h). Most (56%) paid for call by usinga variable-compensation plan. Smaller percentages paidonly for weekend calls (20%) or extra calls (16%).
Fourteen (82%) of 17 groups using the Shift systemdefined the unit of measure as “clinical days worked”(i.e., if a faculty member worked 1 day in a clinicalsetting or was on call, that faculty member receivedcredit for a clinical day worked) (6). Of the remainingthree groups, two defined the shifts worked by thehours on duty (e.g., an in-hospital call of 16 h wasworth twice an 8-h regular shift worked). Finally, onegroup varied the value depending on the shift worked(i.e., the group developed an individualized point sys-tem for which each shift was given a predeterminedvalue). In addition to defining the value of shiftsworked, 8 (47%) of the 17 groups provided credit forthe OR schedule supervisor (Table 5). A smaller num-ber accounted for personally performed cases (18%) ormentoring new residents (12%). Pain-managementservices were modified by using charges in only threegroups (18%), and the others (72%) did not adjust theclinical day worked. Eight groups (47%) gave extracompensation for working late rooms. A smaller num-ber gave extra credit for in-hospital call (24% for themain OR and 30% for labor and delivery) and out-of-hospital call (24% for specialty OR call, 18% for painmanagement, and 9% for critical care).
The next most common complete incentive plan wasbased on Charges (n � 9). Gross charges billed wereused in six groups. One group modified the chargeson the basis of medical direction modifiers used inbilling. This group, which was the only group thataccounted for differences in concurrent coverage,
Table 3. Prevalence of Types of Clinical Incentives by Number of Resident Match Positions
Category n % Total
% by Number of resident Match positions
1–6(n � 22)
7–12(n � 31)
13–18(n � 16)
�19(n � 11)
None or Late/Call 49 59% 73% 55% 47% 54%Shift 17 20% 13% 13% 47% 27%Charges 9 11% 9% 16% 7% 0%Time 5 6% 0% 10% 0% 18%Other 3 3% 5% 6% 0% 0%
Seventy-three percent of departments with six or fewer resident Match positions did not have full incentive plans for clinical work. Four departments did notparticipate in the Match.
Resident Match � positions available in the 2003 National Resident Match Program.For a description of the categories, see Table 1.
Table 4. Prevalence of Types of Clinical Incentives byFaculty/Resident Match Ratio
Category n % Total
% by Faculty/resident ratio
�3.5(n � 36)
�3.5(n � 43)
None or Late/Call 49 59% 61% 56%Shift 17 20% 31% 14%Charges 9 11% 3% 16%Time 5 6% 3% 9%Other 3 3% 3% 5%
Resident Match � positions available in the 2003 National Resident MatchProgram.
A faculty resident Match ratio �3.5 (the median) suggests more facultythan residents (of all years). Four departments did not participate in theMatch. For a description of the categories, see Table 1.
496 ECONOMICS, EDUCATION, AND HEALTH SYSTEMS RESEARCH ABOULEISH ET AL. ANESTH ANALGANESTHESIOLOGY CLINICAL INCENTIVE PLANS 2005;100:493–501
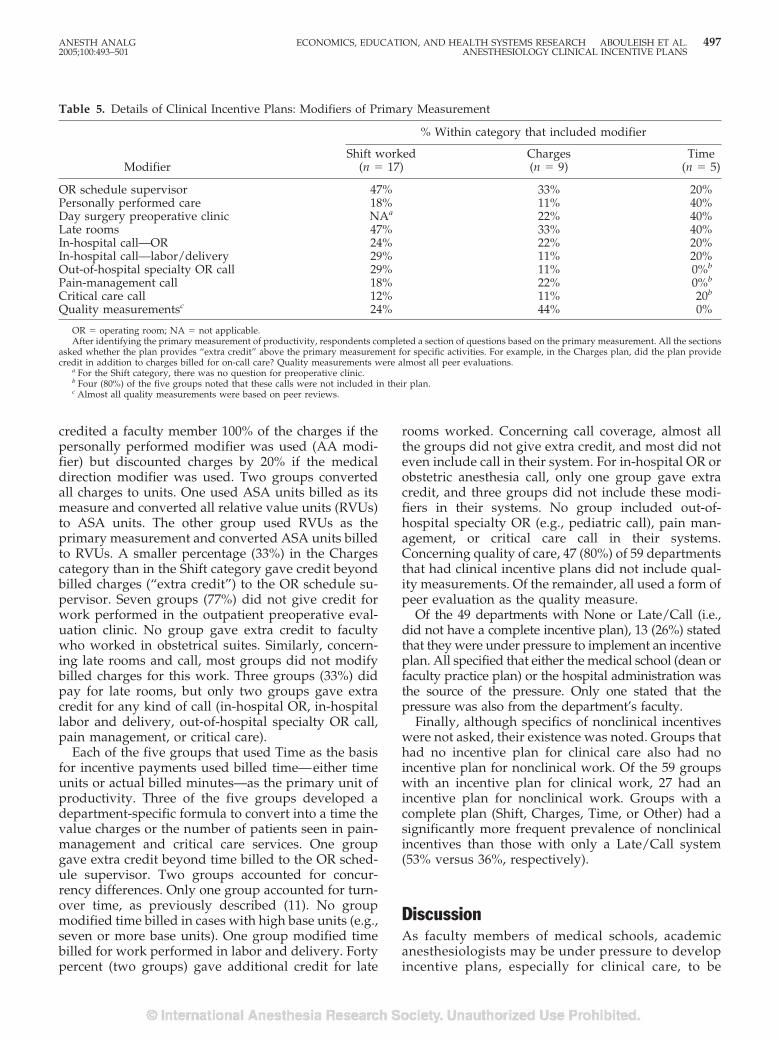
credited a faculty member 100% of the charges if thepersonally performed modifier was used (AA modi-fier) but discounted charges by 20% if the medicaldirection modifier was used. Two groups convertedall charges to units. One used ASA units billed as itsmeasure and converted all relative value units (RVUs)to ASA units. The other group used RVUs as theprimary measurement and converted ASA units billedto RVUs. A smaller percentage (33%) in the Chargescategory than in the Shift category gave credit beyondbilled charges (“extra credit”) to the OR schedule su-pervisor. Seven groups (77%) did not give credit forwork performed in the outpatient preoperative eval-uation clinic. No group gave extra credit to facultywho worked in obstetrical suites. Similarly, concern-ing late rooms and call, most groups did not modifybilled charges for this work. Three groups (33%) didpay for late rooms, but only two groups gave extracredit for any kind of call (in-hospital OR, in-hospitallabor and delivery, out-of-hospital specialty OR call,pain management, or critical care).
Each of the five groups that used Time as the basisfor incentive payments used billed time—either timeunits or actual billed minutes—as the primary unit ofproductivity. Three of the five groups developed adepartment-specific formula to convert into a time thevalue charges or the number of patients seen in pain-management and critical care services. One groupgave extra credit beyond time billed to the OR sched-ule supervisor. Two groups accounted for concur-rency differences. Only one group accounted for turn-over time, as previously described (11). No groupmodified time billed in cases with high base units (e.g.,seven or more base units). One group modified timebilled for work performed in labor and delivery. Fortypercent (two groups) gave additional credit for late
rooms worked. Concerning call coverage, almost allthe groups did not give extra credit, and most did noteven include call in their system. For in-hospital OR orobstetric anesthesia call, only one group gave extracredit, and three groups did not include these modi-fiers in their systems. No group included out-of-hospital specialty OR (e.g., pediatric call), pain man-agement, or critical care call in their systems.Concerning quality of care, 47 (80%) of 59 departmentsthat had clinical incentive plans did not include qual-ity measurements. Of the remainder, all used a form ofpeer evaluation as the quality measure.
Of the 49 departments with None or Late/Call (i.e.,did not have a complete incentive plan), 13 (26%) statedthat they were under pressure to implement an incentiveplan. All specified that either the medical school (dean orfaculty practice plan) or the hospital administration wasthe source of the pressure. Only one stated that thepressure was also from the department’s faculty.
Finally, although specifics of nonclinical incentiveswere not asked, their existence was noted. Groups thathad no incentive plan for clinical care also had noincentive plan for nonclinical work. Of the 59 groupswith an incentive plan for clinical work, 27 had anincentive plan for nonclinical work. Groups with acomplete plan (Shift, Charges, Time, or Other) had asignificantly more frequent prevalence of nonclinicalincentives than those with only a Late/Call system(53% versus 36%, respectively).
DiscussionAs faculty members of medical schools, academicanesthesiologists may be under pressure to developincentive plans, especially for clinical care, to be
Table 5. Details of Clinical Incentive Plans: Modifiers of Primary Measurement
Modifier
% Within category that included modifier
Shift worked(n � 17)
Charges(n � 9)
Time(n � 5)
OR schedule supervisor 47% 33% 20%Personally performed care 18% 11% 40%Day surgery preoperative clinic NAa 22% 40%Late rooms 47% 33% 40%In-hospital call—OR 24% 22% 20%In-hospital call—labor/delivery 29% 11% 20%Out-of-hospital specialty OR call 29% 11% 0%b
Pain-management call 18% 22% 0%b
Critical care call 12% 11% 20b
Quality measurementsc 24% 44% 0%
OR � operating room; NA � not applicable.After identifying the primary measurement of productivity, respondents completed a section of questions based on the primary measurement. All the sections
asked whether the plan provides “extra credit” above the primary measurement for specific activities. For example, in the Charges plan, did the plan providecredit in addition to charges billed for on-call care? Quality measurements were almost all peer evaluations.
a For the Shift category, there was no question for preoperative clinic.b Four (80%) of the five groups noted that these calls were not included in their plan.c Almost all quality measurements were based on peer reviews.
ANESTH ANALG ECONOMICS, EDUCATION, AND HEALTH SYSTEMS RESEARCH ABOULEISH ET AL. 4972005;100:493–501 ANESTHESIOLOGY CLINICAL INCENTIVE PLANS
consistent with the management and compensationplans of other departments. The results of this sur-vey provide a snapshot of information about thestatus of clinical incentives, the types of measuresused, and some of the components of plans amongacademic anesthesiology departments. Most aca-demic anesthesiology departments have not devel-oped comprehensive incentive plans for clinicalcare. Only 40% of responding academic depart-ments have a complete incentive plan that includesclinical services during both regular hours andafter-hours (late rooms and call). Another 30% ofdepartments provide some additional compensationfor clinical services during late rooms or on call.Thirty percent of departments offer no clinical in-centive and pay their faculty members a predeter-mined salary independent of clinical activity.
Although the method of a survey limits the infor-mation collected and the conclusions that can bedrawn, the results provide important backgroundinformation for the development and refinement ofincentive plans in academic anesthesiology depart-ments. The response rate of 64% for this study wassimilar to that for a previous survey of SAAC/AAPD concerning financial and management issues(11) and was two to three times more than in na-tional surveys used for benchmarking productivityand compensation (12). Using positions available inthe Match as a demographic measurement, we com-pared responders and nonresponders. The mean �sd numbers of positions for responders and nonre-sponders were 11.2 � 6.0 and 8.2 � 4.9, respectively(not significant). Although nonresponders includeda larger proportion (36%) of smaller departments(fewer than seven positions) than responders, ofwhich only 25% were smaller departments, wedoubt that this difference was sufficient to bias ourresults.
As noted by some of the respondents in the commentsection of the survey, clinical incentives have not beenshown to increase clinical activity by anesthesiology de-partments. The prevailing impression is that clinical in-centive plans for anesthesiologists can minimally influ-ence overall OR productivity because the clinicalproductivity of an anesthesiology department is depen-dent on factors that anesthesiologists do not control,such as OR case scheduling, block allocation, surgicalduration, transportation, turnover time, and determina-tion of the number of ORs to staff (6,8,9,13,14). However,one department (of two of our authors) has successfullyargued to hospital administration that, as part of theimplementation of a clinical incentive plan for anesthe-siologists, anesthesiologists should have more controlover OR management issues because these issuesdirectly influence overall OR and anesthesiologists’productivity.
As seen in our results, some departments without aclinical incentive plan are being encouraged by hospi-tal or medical school administrators to consider im-plementing clinical incentive plans. One likely as-sumption on the part of institutional administrators isthat an incentive plan for anesthesiologists will in-crease the number of surgical cases. It is not clear thatincentive plans can generate this effect, although clin-ical incentive plans have been shown to better aligncompensation with clinical activity (15). As an exam-ple, if covering late rooms is compensated in additionto the base salary, then compensation will increase forfaculty who work more late rooms.
Another likely reason for administrative pressure toimplement clinical incentive plans is that many of thedepartments are receiving financial support from thehospital or medical school (11). We identified 51 de-partments that responded to the present survey and tothe previous survey of SAAC/AAPD concerning fi-nancial and management issues (Tremper KK, Depart-ment of Anesthesiology, University of Michigan, per-sonal communication, 2004). Forty-five (89%) of the51 departments replied that they receive extradepart-mental stipends for staffing costs. When comparingthis subset of 51 departments with the entire group ofrespondents, similar percentages (55% of the 52 de-partments versus 59% of the entire 83-department co-hort) had None or Late/Call, and the same percentage(29%) had no incentive plan for clinical work.
Incentive plans can also influence compensation astotal clinical faculty numbers change. If faculty num-bers decrease, either overall department productivitygoes down (e.g., when ORs are closed), or the remain-ing faculty increase individual productivity to con-tinue to produce the same overall output (16,17).Compared with a straight-salary system, a clinicalincentive system allows compensation to vary. Forexample, if there are 365 in-hospital calls per year,under a clinical incentive system for call, the compen-sation per faculty member will increase when thenumber of faculty members sharing call responsibili-ties decreases. In a straight-salary system, the compen-sation would not change. The purpose of the incentivesystem is to align compensation with clinical activityand not to necessarily increase the overall work per-formed by a department (i.e., to perform more cases).This study suggests that larger departments perceive agreater need than smaller departments for variablecompensation plans. A larger proportion of larger de-partments had complete or Late/Call incentive planscompared with smaller departments. A possible ex-planation is that larger groups may have greater dif-ficulties with equitable work distribution because ofspecialization, multiple facilities, and more facultymembers.
The fact that most academic groups do not measurethe clinical productivity of individuals is consistent
498 ECONOMICS, EDUCATION, AND HEALTH SYSTEMS RESEARCH ABOULEISH ET AL. ANESTH ANALGANESTHESIOLOGY CLINICAL INCENTIVE PLANS 2005;100:493–501
with private-practice business models. In private-practice anesthesiology groups, the most commonmethod of measuring clinical productivity is a subsetof the shifts-worked category. Two thirds of private-practice groups responding to a survey in 2002 by theAnesthesia Administrator Assembly of the MedicalGroup Management Association (Scott SJ, BrevardAnesthesia Services, Melbourne, FL, and Blough GG,G. Blough Associates, Mobile, AL, personal commu-nication, 2003) used “equal share” compensation plansin which the revenues of groups were split equallyamong partners regardless of any individual produc-tivity measurement. The equal-share model assumesthat all partners work an equal number of shifts and,hence, equally distributes revenue among the part-ners. Similar to straight-salary systems in academics,the equal-share model does not measure continuingproductivity but assumes that the work will be equallydistributed. However, in contrast to straight-salaryplans, individual compensation will vary dependingon a group’s overall productivity (overall revenue)and the number of individuals in a group.
As in our survey, the Anesthesia Administrator As-sembly survey showed that the larger private-practicegroups (�40 providers) used productivity-based com-pensation more often than the smaller groups (�20providers). This result is consistent with the assump-tion that larger groups have more difficulty distribut-ing work equally.
Furthermore, we found the absolute number of res-idents (via Match positions) was not as important asthe ratio of faculty to residents. The implication is thatthe larger ratio would represent a department thatfunctioned in part as private practice. Although thepercentage of departments that had complete clinicalincentive plans (Shift, Charges, or Time) did notchange, the type of incentive plan was different. In thelarger-ratio departments, the prevalence of Chargesand Time was significantly more frequent (Table 4).
The purpose of this study was to determine not onlythe prevalence of clinical incentive plans, but alsosome of the details. In almost 90% of the groups thatoffer incentive payments, those payments account for�25% of total compensation. This model contrastswith the equal-share compensation plans most oftenused in private-practice anesthesiology, in which100% of compensation is variable and no base salary isused for partners.
These differences in compensation models are notsurprising, considering that academic departmentsnot only must provide clinical care, but also must meeteducational, research, and administrative commit-ments. Hence, base salary is partly intended to pay forthese types of activities that may not be as easilymeasured as clinical activities. In this study, only 33%
of the groups had an incentive for nonclinical activi-ties. Even with a nonclinical incentive plan, a basesalary plus incentive is the predominant model.
Another perspective on the differences betweenprivate-practice groups and academic departments isthat, although clinical activities represent mostrevenue-generating activities, academic departmentshave been hesitant to reflect this fact in incentiveplans. Almost 90% of the groups had incentive pay-ments accounting for �25% of total compensation.This suggests that academic departments implicitlyassign value to nonclinical activities. In contrast, aclinical incentive plan that highly values daily ORwork without assigning implicit or explicit value tononclinical activities likely encourages faculty toforego nonclinical work in favor of clinical activities.This antiacademic incentive even applies to researchgrants from the National Institutes of Health, whichhas a maximum individual compensation level that iswell below starting salaries in many academic anes-thesiology departments.
Even inclusion of incentives for nonclinical activi-ties may fail to offset the tendency to favor clinicalactivities. Unlike clinical work, which can be fre-quently quantified and converted into incentive pay-ments, incentives for academic activities such as pub-lications, presentations, grant applications, and grantsreceived necessarily must encompass a much longertime frame than the monthly or quarterly incentivesprovided for clinical activities in this survey. Incentiveplans may therefore make clinical activities more at-tractive to faculty, especially junior faculty with alarge debt burden.
Our survey results revealed a spectrum of systemcomplexity. The Late/Call systems are simple incen-tive systems that do not include regular work hours.Faculty can simply choose whether to accept assign-ment to late rooms or call. In contrast, the other cate-gories also show a spectrum of simple to complexsystems. In all categories, most groups did not modifytheir primary measure for additional factors (Table 5).The only exceptions were the extra value given to thework performed by the OR schedule supervisor andthe work performed in late rooms. The day surgerypreoperative clinic was included in a large percentageof the Charges and Time systems, apparently in rec-ognition of the value of this nonbillable work.
Because no studies have been performed to deter-mine the efficacy of incentive plans, it is not possibleto decide whether a simple or complex plan is betteror whether any plan exerts positive effects on revenueor efficiency. Because it is impossible to state fromcurrent information which, if any, primary productiv-ity measurement is most effective (6,15), it is alsoimpossible to recommend a specific way to calculateor evaluate a clinical incentive. The most importantconsideration for a department that is considering
ANESTH ANALG ECONOMICS, EDUCATION, AND HEALTH SYSTEMS RESEARCH ABOULEISH ET AL. 4992005;100:493–501 ANESTHESIOLOGY CLINICAL INCENTIVE PLANS
instituting a clinical incentive plan or altering an ex-isting plan is to determine what specific clinical activ-ities require incentives. Any measurement of produc-tivity values and devalues certain clinical services andactivities (6). For instance, the Charges model valuestotal billed charges and favors anesthesia care given tofast surgeons and specialty care (high base units) anddevalues anesthesia provided in ORs that are poorlyutilized, care provided for patients undergoing pro-longed surgery, and unbilled services (e.g., day sur-gery preoperative clinic, OR schedule runner, andmentoring). The Time model values billed time andanesthesia care given to slower surgeons (less turn-over time) and devalues specialty care, nonbilled time(turnovers, poor OR utilization, and day surgery pre-operative clinic), and obstetric care (in states that useface-to-face time or set limits on time billed). Both theCharges and Time models can be confounded if con-currency or staffing ratios differ among faculty mem-bers. In addition, work performed on call may varydepending on utilization. The shifts-worked modelvalues availability and devalues charges or time billedand specialty care. A Shift system is not confoundedby differences in concurrency or OR utilization butdoes require the OR schedule supervisor to managestaffing and equality of work. In Time and Shift sys-tems, specialty anesthesiologists may want credit forcases with high base units. The Late/Call system paysfor work performed after hours (late rooms and call).The Late/Call system assumes that regular workdayincentives do not influence group productivity andthat the base salary provides compensation for thatwork. As with the Late/Call system, any of the othersystems could pay extra beyond the primary measurefor late rooms and calls. In contrast to None (straightsalary), all four systems increase compensation forfaculty when total faculty numbers are decreased, be-cause the same amount of work is accomplished withfewer people.
In contrast to the OR work noted previously, pain-management services and critical care services aredifficult to incorporate and equate with OR work. Forinstance, in the Charges system, if billed charges areused, then all OR care billed with ASA units can becompared. If one faculty member bills twice as muchas another faculty member, one can safely assume thatthe first faculty member billed twice as many ASAunits. Even when non-ASA units are included (e.g.,line placement), the approximation still can be used.However, the charge structure for pain-managementprocedures (both evaluation and management andsurgical procedures) may not be based on RVUs andmay not be easily equated to ASA units. For instance,although one pain-management specialist may billtwice as much as another, one cannot assume that thatthe first specialist billed twice as many total RVUs orwork RVUs, because charges are not well correlated
with RVUs. If ASA units are used, then using RVUsbecomes more appropriate. In this case, a departmentmust develop a conversion factor to change RVUs toASA units or vice versa, as was done by two of thesurveyed groups (18). In the Time system, pain-management and critical care services are not billed byusing time for all pain procedures and most criticalservices. If these services are to be incorporated, thenthe department must determine time spent on eachprocedure billed and credit the faculty member thetime, as was done by two of the surveyed groups. Thisconversion can be based on a departmental reviewand arbitrary values or can be based on time used bythe Centers for Medicare and Medicaid Services toestimate work RVUs (19). In the Shift system, pain-management and critical care services are incorpo-rated by giving credit for the shift-worked value forany clinical work. A department may choose to equal-ize regular hour shifts independently of facility orspecialization or can develop different values for each(as done by one department in the study). The value ofindividual shifts must be established by eachdepartment.
As with values for shifts worked, valuing out-of-hospital specialty call is a challenge facing all depart-ments. The results of the study provide few detailsabout how departments have resolved this issue.Some departments add additional credit to workingthis call (Table 3). However, some departments do notinclude this type of call in the incentive plan (espe-cially Time) and may deal with it in another way.
For both academic and private-practice anesthesiol-ogy groups, the important factor in designing or eval-uating an incentive plan is to determine the goals thatthe department considers essential to success, includ-ing nonclinical goals. Even when two departmentschoose the same primary measure, the details of eachincentive system will differ. Some departments maydecide that no financial incentive plan is necessary tosucceed in meeting their mission.
The authors thank Juliane M. Tarr in the Department of Anesthesiaand Critical Care at the University of Chicago for her work indistributing the electronic survey and managing the responses. Theauthors also thank Jordan Kicklighter, BA, and Christy Perry in theeditorial office of the Department of Anesthesiology at the Univer-sity of Texas Medical Branch, Galveston, TX, for preparing andediting this manuscript.
References1. D’Alessandri RM, Albertsen P, Atkinson BF, et al. Measuring
contributions to the clinical mission of medical schools andteaching hospitals. Acad Med 2000;75:1231–7.
2. Jones RF, Gold JS. The present and future of appointment,tenure, and compensation policies for medical school clinicalfaculty. Acad Med 2001;76:993–1004.
500 ECONOMICS, EDUCATION, AND HEALTH SYSTEMS RESEARCH ABOULEISH ET AL. ANESTH ANALGANESTHESIOLOGY CLINICAL INCENTIVE PLANS 2005;100:493–501
3. Tarquinio GT, Dittus RS, Byrne DW, et al. Effects ofperformance-based compensation and faculty track on the clin-ical activity, research portfolio, and teaching mission of a largeacademic department of medicine. Acad Med 2003;78:690–701.
4. Zun LS, Moss D. Bonus/incentive programs to increase physi-cian productivity in academic emergency medicine. Am J EmergMed 1996;14:334–6.
5. Abouleish AE, Prough DS, Whitten CW, et al. Comparing clin-ical productivity of anesthesiology groups. Anesthesiology2002;97:608–15.
6. Abouleish AE, Zornow MH, Levy RS, et al. Measurement ofindividual clinical productivity in an academic anesthesiologydepartment. Anesthesiology 2000;93:1509–16.
7. Abouleish AE, Prough DS, Zornow MH, et al. Designing mean-ingful industry metrics for clinical productivity for anesthesiol-ogy departments. Anesth Analg 2001;93:309–12.
8. Abouleish AE, Prough DS, Barker SJ, et al. Organizational fac-tors affect comparisons of clinical productivity of academicanesthesiology departments. Anesth Analg 2003;96:802–12.
9. Abouleish AE, Prough DS, Whitten CW, Zornow MH. Theeffects of surgical case duration and type of surgery on hourlyclinical productivity of anesthesiologists. Anesth Analg 2003;97:833–8.
10. Grogono A. NRMP anesthesiology match results for programs2003 (ranked by state). Available at: http://www.grogono.com/nrmp/index.php. Accessed: April 15, 2004.
11. Tremper KK, Barker SJ, Gelman S, Reeves J. A demographic,service and financial survey of anesthesia training programs inthe United States. Anesth Analg 2003;96:1432–46.
12. Medical Group Management Association. Academic practice com-pensation and production survey for faculty and management:2002 report based on 2001 data. Englewood, CO: Medical GroupManagement Association, 2002:17.
13. Dexter F, Macario A. Decrease in case duration required tocomplete an additional case during regularly scheduled hoursin an operating room suite: a computer simulation study.Anesth Analg 1999;88:72–6.
14. Dexter F, Macario A. Changing allocations of operating roomtime from a system based on historical utilization to one wherethe aim is to schedule as many surgical cases as possible. AnesthAnalg 2002;94:1272–9.
15. Feiner JR, Miller RD, Hickey RF. Productivity versus availabilityas a measure of faculty clinical responsibility. Anesth Analg2001;93:313–8.
16. Posner KL, Freund PR. Trends in quality of anesthesia careassociated with changing staffing patterns, productivity, andconcurrency of case supervision in a teaching hospital. Anes-thesiology 1999;91:839–47.
17. Freund PR, Posner KL. Sustained increases in productivity withmaintenance of quality in an academic practice. Anesth Analg2003;96:1104–8.
18. Jablonski VN, Marshall WK. A methodology for calculation ofanesthesia relative value units. ASA Newslett 2000;64:19–23.
19. Centers for Medicare and Medicaid Services. Physician timeassociated with work RVUs used in creating 2002 practice ex-pense relative values. Available at: http://www.cms.hhs.gov/physicians/pfs/resource.asp. Accessed: December 18, 2003.
ANESTH ANALG ECONOMICS, EDUCATION, AND HEALTH SYSTEMS RESEARCH ABOULEISH ET AL. 5012005;100:493–501 ANESTHESIOLOGY CLINICAL INCENTIVE PLANS
The Resident Application Process and Its Correlation toFuture Performance as a ResidentDavid G. Metro, MD, Joseph F. Talarico, DO, Rita M. Patel, MD, and Amy L. Wetmore, BA
Department of Anesthesiology, University of Pittsburgh School of Medicine, Pittsburgh, Pennsylvania
Many authors have attempted to determine predictorsfor success within a residency program. There is verylittle agreement about what is useful. We hypothesizedthat our residency selection process is effective in deter-mining which resident applicants would be most likelyto excel in our program. To test this hypothesis, we re-viewed the scores that applicants received after theirinterview day to determine if there was a correlationwith any measures used to evaluate residents once theyentered residency training. Our results determined that
the score given to an applicant fails to correlate with anyof the areas that are evaluated throughout their resi-dency. The only statistically significant correlation wasbetween the scores assigned by the selection committeeto applicants and the applicant scores on their first yearin training examination. We concluded that our resi-dency selection process score does not accurately pre-dict which applicants will excel in our program.
(Anesth Analg 2005;100:502–5)
T he ability of the resident selection process topredict future performance of applicants hasbeen controversial. Wood et al. (1) found that
cognitive indicators, such as National Board of Medi-cal Examiners (NBME) scores, correlated well withsubsequent cognitive measures of performance butcorrelated negatively with manual dexterity, interper-sonal skills, and confidence. George et al. (2) consid-ered class rank, grades in four major clinical clerk-ships, NBME part 1 scores, Alpha Omega Alpha(AOA) membership, and numerical ranking by theselection committee and found that only the last cri-terion correlated with subsequent house staff perfor-mance. Crane and Ferraro (3) determined that emer-gency medicine rotation grade, interview, clinicalgrades, and recommendations were better indicatorsof future performance than United States Medical Li-censing Examination (USMLE) results. Despite thepoor correlation between cognitive indicators andsubsequent performance, Clark et al. (4) found that anNBME part 1 score of over 500, class rank in the top40%, and membership in AOA honor society corre-lated with an increased rate of acceptance in orthope-dic residency programs. Warrick and Crumrine (5)
determined that although no significant correlationswere found among resident in training examination(ITE) scores and undergraduate grade point averages(GPA), resident ages, or parents’ level of education,interview scores, and composite residency GPA had astrong positive relationship. Bell et al. (6) concludedthat although USMLE scores correlated positivelywith ITE scores, they did not correlate with subse-quent faculty evaluations of resident performance.The purpose of this study was to test the hypothesisthat the resident selection process in the University ofPittsburgh Anesthesiology Residency Program is ef-fective in predicting which applicants will excel in ourprogram.
Given the magnitude of time, money, and effort thatare invested in the resident selection process, it wouldbe useful to know that the best applicants available areselected. We reviewed the University of Pittsburgh’sanesthesiology resident selection process to determinethe correlation between the selection committee scorefrom this process and future performance within theresidency program.
MethodsThe process to be invited for an interview to ourprogram includes a review of USMLE scores, medicalschool performance, dean’s letter, personal statement,and letters of recommendation. The formal interviewprocess consists of a dinner with residents the nightbefore applicants undergo 4–5 faculty interviews the
Supported by the University of Pittsburgh Department ofAnesthesiology.
Accepted for publication September 2, 2004.Address correspondence and reprint requests to David G. Metro,
MD, UPMC Montefiore, Suite 463, 200 Lothrop Street, Pittsburgh,PA 15213. Address e-mail to [email protected].
DOI: 10.1213/01.ANE.0000154583.47236.5F
©2005 by the International Anesthesia Research Society502 Anesth Analg 2005;100:502–5 0003-2999/05
next day. Faculty interviewers are given applicant filesto review at least 1 day before interviews to preparefor individual applicants. After the interview processthe applicants are ranked 1–5 on a Likert scale (1 �poor, 5 � outstanding) in the following areas by eachinterviewer:
Credentials• Grades and honors• NBME/USMLE test scores• Dean’s letter• Letters of reference
Interview• Personality aspects• Enthusiasm, energy, liveliness• Drive, motivation to excel• Assertiveness• Warmth, friendliness, humor• Poise, composure• Maturity• Intellectual aspects• Intelligence and problem solving skills• Articulateness, communication skills• Critical or analytical skills• Quality of answers• Quality of questions• Strength and appropriateness of goals• Knowledge of anesthesia as a specialty• Knowledge of Pitt program
Interviewers are also asked:
• Comment on any other aspects of the interviewstrengths and weaknesses.
• How will this person compare with our presentaverage resident?
• On the basis of credentials and interview thiscandidate is: (Outstanding, Very Desirable, Ac-ceptable, Marginal, Undesirable).
After the completion of all resident applicant inter-views, the entire resident education committee (approx-imately 50 members) meets to determine the “rank list”for the National Residency Matching Program (NRMP).At this meeting, each applicant is evaluated includinggrades, USMLE/NBME scores, research experience, andextracurricular activities. Physicians who interviewedthe applicant and resident representatives who spenttime with the applicant the night before the interviewcomment regarding suitability for admission. At the endof the presentation, each person on the committee isasked to rank the applicant on a scale from 1 (undesir-able) to 5 (outstanding) on the basis of information pre-sented during this meeting. This ranking is completed byclosed ballot.
A “selection committee score” of 1–5 is determinedby taking the average of all scores assigned to that
person by the resident education committee. Scoresfrom all individual members of the committee aretreated equally regardless of role in the training pro-gram. The rank list is determined in decreasing orderof selection committee scores and submitted to theNRMP. Residents may also gain acceptance to theresidency outside of this process after their first post-graduate year. These applicants are accepted to fillempty slots on the recommendation of their programdirectors or other personal contacts.
Eighteen residents who were in the process outlinedabove were included in the study. Data were obtainedfor a 2-yr period and compared with applicant perfor-mances during residency in our program. We evalu-ated resident performance in two manners. The firstindicator considered was faculty year-end evaluationsof residents in the following areas:
• Knowledge (basic science and clinical, facts,applications)
• Judgment (data collection, evaluation, problemsolving, decision making)
• Motor skills (regional anesthesia, general anesthe-sia, monitoring)
• Preanesthetic assessment and planning (patientevaluation, anesthetic plan, presentation to faculty)
• Work habits (organized, neat, efficient, punctual,charting)
• Intrapersonal attitudes (courteous, cooperative,reliable, accepts criticism, communicates well,good rapport)
• Intrapersonal attributes (motivated, industrious,flexible, ethical, takes initiative, functions well un-der stress)
• Overall impression
These areas are evaluated on a daily basis by attend-ing physicians working with the residents, and ourscores represent the first year average of these scoresin each of these areas. The second indicator of residentperformance we decided to evaluate was ITE results.Each resident in the program is required to take theITE on an annual basis. The scores used were thenational percentile ranking from the ITE taken duringtheir first year.
Resident faculty evaluation scores were comparedwith the selection committee score the resident re-ceived during his or her interview process. The selec-tion committee score was also correlated to their per-formance on their first year ITE. All correlations weredone using Pearson correlation and confirmed withSpearman correlation.
ResultsThere was no statistically significant correlationamong the selection committee scores and any of the
ANESTH ANALG ECONOMICS, EDUCATION, AND HEALTH SYSTEMS RESEARCH METRO ET AL. 5032005;100:502–5 PREDICTION OF PERFORMANCE AS A RESIDENT
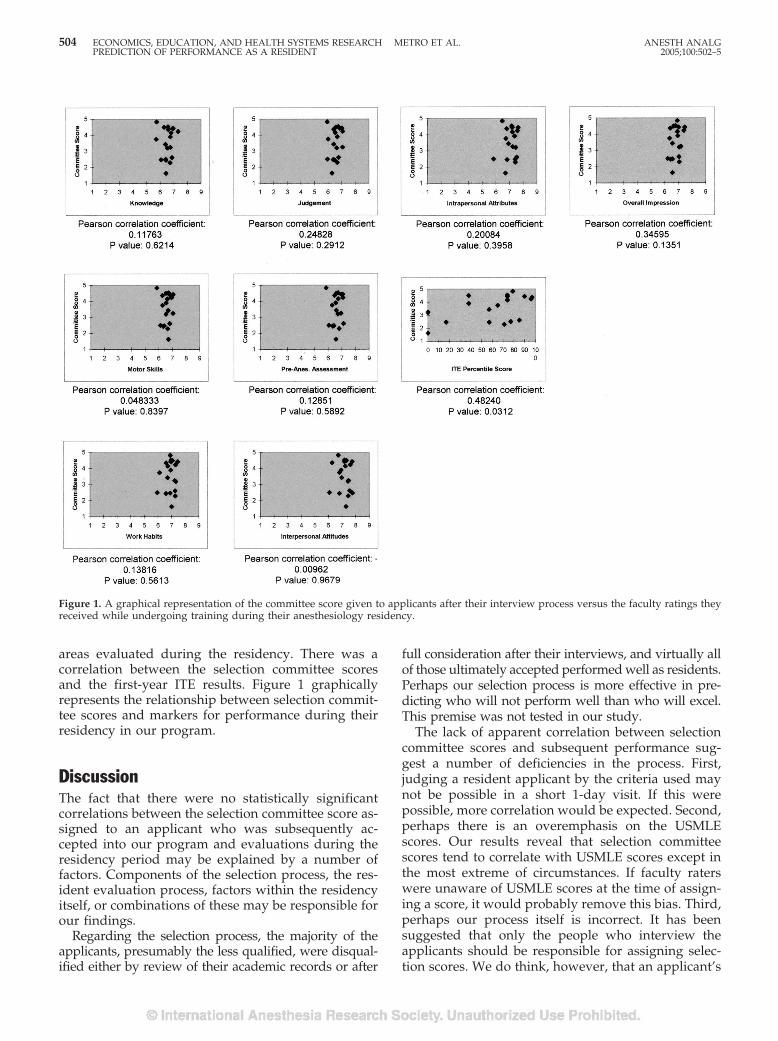
areas evaluated during the residency. There was acorrelation between the selection committee scoresand the first-year ITE results. Figure 1 graphicallyrepresents the relationship between selection commit-tee scores and markers for performance during theirresidency in our program.
DiscussionThe fact that there were no statistically significantcorrelations between the selection committee score as-signed to an applicant who was subsequently ac-cepted into our program and evaluations during theresidency period may be explained by a number offactors. Components of the selection process, the res-ident evaluation process, factors within the residencyitself, or combinations of these may be responsible forour findings.
Regarding the selection process, the majority of theapplicants, presumably the less qualified, were disqual-ified either by review of their academic records or after
full consideration after their interviews, and virtually allof those ultimately accepted performed well as residents.Perhaps our selection process is more effective in pre-dicting who will not perform well than who will excel.This premise was not tested in our study.
The lack of apparent correlation between selectioncommittee scores and subsequent performance sug-gest a number of deficiencies in the process. First,judging a resident applicant by the criteria used maynot be possible in a short 1-day visit. If this werepossible, more correlation would be expected. Second,perhaps there is an overemphasis on the USMLEscores. Our results reveal that selection committeescores tend to correlate with USMLE scores except inthe most extreme of circumstances. If faculty raterswere unaware of USMLE scores at the time of assign-ing a score, it would probably remove this bias. Third,perhaps our process itself is incorrect. It has beensuggested that only the people who interview theapplicants should be responsible for assigning selec-tion scores. We do think, however, that an applicant’s
Figure 1. A graphical representation of the committee score given to applicants after their interview process versus the faculty ratings theyreceived while undergoing training during their anesthesiology residency.
504 ECONOMICS, EDUCATION, AND HEALTH SYSTEMS RESEARCH METRO ET AL. ANESTH ANALGPREDICTION OF PERFORMANCE AS A RESIDENT 2005;100:502–5
4 years of medical school are far more important thana 1-day interview and that even people who have notmet an applicant can add valuable insight based solelyon their transcript.
Regarding the evaluation process, much more thanintelligence and clinical abilities enter into measure-ment of resident performance. Despite a wide range ofscores and ITE results, our evaluations collectedthroughout the year have very little difference amongthem. It is possible that applicants with higher selec-tion committee scores do end up being better resi-dents, but the evaluation process does not show this.However, the “stronger” residents in our program dotend to receive higher evaluation scores as well asfaculty comments that reflect this.
Of note, the study design resulted in considerationof primarily general rotations where residents wereperforming relatively undemanding cases on lesscomplicated patients and had more limited contactwith a large number of faculty. We have found thatresident skills tend to be more clearly differentiated oninitiation of specialty rotations, where there is moreextensive contact with a limited number of facultymembers while performing more complex cases. Per-haps extending the study to the CA-3 yr would resultin a better correlation.
Factors within the residency itself may also play arole in our findings. Residents who have trouble dur-ing their training often are singled out for additionalhelp during this time. This can include the use ofspecial mentors, reading schedules and reviews, testtaking and study technique training, and individual-ized assignments to help the resident succeed. Per-haps these programs within the residency that areavailable to all trainees (but not used by all trainees)cause a minimization of differences between residentevaluation scores.
The statistically significant correlation between thefirst year ITE and selection committee score (P � 0.05)is more easily explained. Our evaluation processheavily weights didactic indicators (USMLE score,grades, AOA membership) in establishing the pro-spective resident rank. Berner et al. (7) determinedthat USMLE scores and performance as a medicalstudent were a factor in determining subsequent per-formance, but were not justified as the sole criterionfor selection. The reasoning for this conclusion wasthat clinical performance is multidimensional, andUSMLE solely evaluates cognitive knowledge. It hasbeen shown that USMLE scores and performance onITEs are correlated, (6) but this has not been consis-tently replicated (5).
Our selection process was designed to evaluate ap-plicants using the same areas evaluated during resi-dency training. Multiple interviews with many facultymembers as well as a confidential committee approachto assigning the final score were chosen to avoid per-sonal bias of an individual. However, even with thisprocess, future performance in the residency programwas not predicted.
The correlation between the selection committeescore and future performance as a resident is far fromconcrete (1–7). Why, then do we continue this processand spend hours arguing whether someone should beranked at the seventh or 15th position? It seems fromthese numbers that we do not really know. This year,with the changes to include the core competency intothe residency evaluation process, we changed our in-terview evaluation criteria to match these. We believeat this point we can assume that these changes will notgreatly affect the success rate of predicting perfor-mance in our program.
The interview process is an important part ofshowing potential applicants information on what aprogram has to offer. We question, however, if itplays much of a role in allowing a program toevaluate applicants that will fit best into their resi-dency program. Perhaps in the future, tools such asquestionnaires, human simulation, away “audition”electives, and more direct communication betweenprograms will allow better matches to be made. It isalso possible that entirely different measurements,such as personality surveys, would more accuratelypredict resident performance. These measurementsare commonly used to evaluate interviewees inother disciplines, such as business, but are not com-monly used in medicine.
References1. Wood PS, Smith WL, Altmaier EM, et al. A prospective study of
cognitive and noncognitive selection criteria as predictors ofresident performance. Invest Radiol 1990;25:761–2.
2. George JM, Young D, Metz EN. Evaluating selected internshipcandidates and their subsequent performances. Acad Med 1989;64:480–2.
3. Crane JT, Ferraro CM. Selection criteria for emergency medicineresidency applicants. Acad Emerg Med 2000;7:54–60.
4. Clark R, Evans EB, Ivey FM, et al. Characteristics of successfuland unsuccessful applicants to orthopedic residency programs.Clin Orthop 1989;241:257–6.
5. Warrick SS, Crumrine RS. Predictors of success in an anesthesi-ology residency. J Med Educ 1986;61:591–5.
6. Bell JG, Kanellitsas I, Shaffer L. Selection of obstetrics and gyne-cology residents on the basis of medical school performance.Am J Obstet Gynecol 2002;186:1091–4.
7. Berner ES, Brooks CM, Erdmann JB. Use of USMLE to selectresidents. Acad Med 1993;68:778.
ANESTH ANALG ECONOMICS, EDUCATION, AND HEALTH SYSTEMS RESEARCH METRO ET AL. 5052005;100:502–5 PREDICTION OF PERFORMANCE AS A RESIDENT
An Internet Web Site as a Data Collection Platform forMulticenter ResearchAlexander Avidan, MD, Charles Weissman, MD, and Charles L. Sprung, MD
Department of Anesthesiology and Critical Care Medicine, Hadassah - Hebrew University Medical Center, Jerusalem, EinKarem, POB 12000, Jerusalem, 91120, Israel
The Internet can be an effective alternative for data collec-tion for multicenter studies. It has major advantages overthe “classical” method of using paper and traditional(“snail”) mail. We developed an Internet site and imple-mented collection of data for a multicenter study of ethicaldecision-making. The Web site was built with MicrosoftFrontPage as the authoring tool. Database managementwas performed with Microsoft Access. Security issueswere the major concerns for the web design. Thirty-seven
European centers enrolled 4248 patients during 1.5 yr us-ing the Internet site. The use of this Internet site for dataacquisition was highly effective, and the investigatorswere able to use the system without training. Overall sat-isfaction of the investigators was high. After security is-sues, interactivity and user-friendly design are the maincornerstones for the success of such a system.
(Anesth Analg 2005;100:506–11)
D ata collection and validation are critical corner-stones in every research project. With the tre-mendous developments in computer technology
it seems logical to move from traditional media of datacommunications and storage (paper and “snail” mail)to electronic systems. The Internet (World Wide Weband e-mail) provides what appears to be the idealplatform to collect and transmit research data. How-ever, using an Internet platform for data collection hassome drawbacks. Security is the most critical issue,especially for personal and confidential data that maybe collected as part of medical investigations. Further-more, building and maintaining of an Internet site fordata collection may be expensive (1) and requirespersonnel or consultants with extensive knowledgeand experience in various programming languagesand software platforms.
The challenge was to collect data for a multicenterstudy of ethics and decision-making in intensive careunits (2). The study was expected to continue for 2years and include between 3000 and 5000 patients.Realizing that it could be impossible to cope with vastamounts of data using classic data acquisition meth-ods, we built an Internet site to facilitate data entryand communications with the participating centers.
This article examines the problems and issues facedduring the design, implementation and operation ofthis Internet data collection scheme. The aim was toidentify problems that arose during this endeavor andpropose solutions for future use of the Internet fordata collection.
MethodsThe data collection system should allow easy dataentry for 30 to 50 centers located in Europe. It wasanticipated that 3000 to 5000 patients would be en-rolled over a 1- to 2-year period. For each patient,the investigators were required to fill out a ques-tionnaire containing 19 detailed multipart questionswith 194 different data items. The data were to besent automatically to the coordinating center lo-cated in Jerusalem, Israel, where they were to bereviewed by the coordinating center. Queries formissing or incomplete data were to be sent to theinvestigators for their corrections and additions.The system was also to be used as a communication
The present study was funded as part of the European ConcertedAction project ETHICUS “End of Life Decision Making and LifeEnding Procedures in European Intensive Care Units” funded bythe European Commission (Contract No. PL 963733), in part bygrant no. 4226 from the Chief Scientist’s Office of the Ministry ofHealth, Israel, in part by the European Society of Intensive CareMedicine, and in part by the Walter F. and Alice Gorham Founda-tion, Inc. The authors are solely responsible for the publication, itdoes not represent the opinion of the European Commission and theCommission is not responsible for any use of the published data.
Accepted for publication July 26, 2004.Address correspondence to Alexander Avidan, MD, Department
of Anesthesiology and Critical Care Medicine, Hadassah - HebrewUniversity Medical Center, Jerusalem, Ein Karem, POB 12000,Jerusalem, 91120, Israel. Address e-mail to [email protected].
DOI: 10.1213/01.ANE.0000142124.62227.0F
©2005 by the International Anesthesia Research Society506 Anesth Analg 2005;100:506–11 0003-2999/05
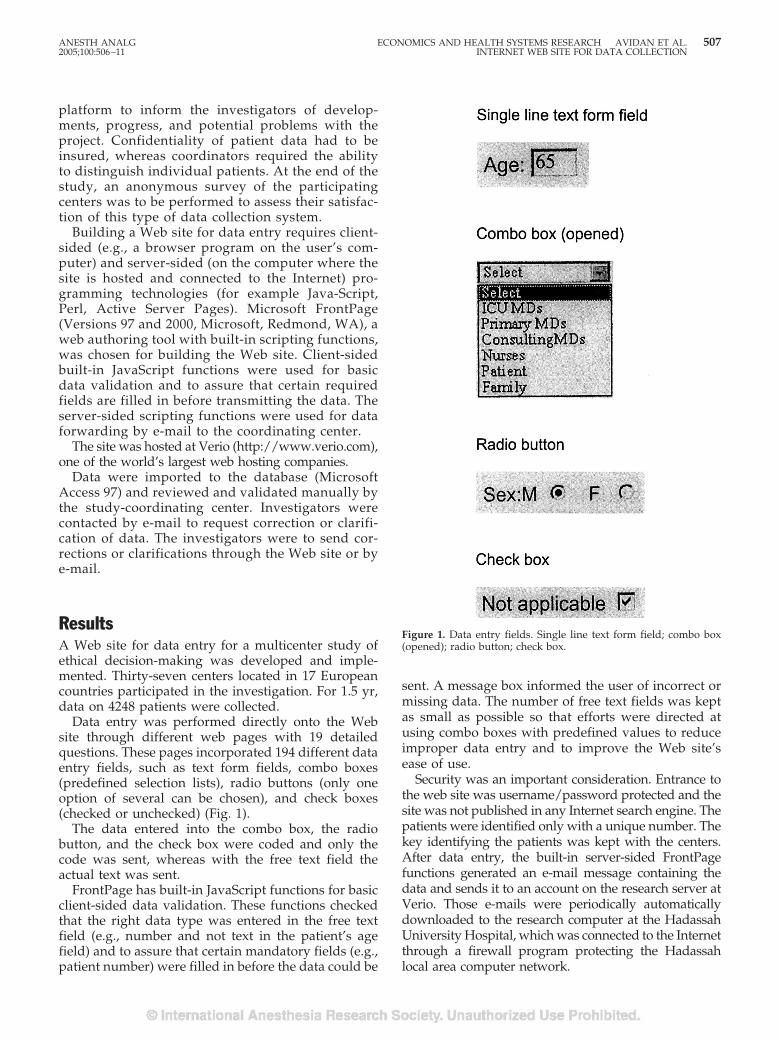
platform to inform the investigators of develop-ments, progress, and potential problems with theproject. Confidentiality of patient data had to beinsured, whereas coordinators required the abilityto distinguish individual patients. At the end of thestudy, an anonymous survey of the participatingcenters was to be performed to assess their satisfac-tion of this type of data collection system.
Building a Web site for data entry requires client-sided (e.g., a browser program on the user’s com-puter) and server-sided (on the computer where thesite is hosted and connected to the Internet) pro-gramming technologies (for example Java-Script,Perl, Active Server Pages). Microsoft FrontPage(Versions 97 and 2000, Microsoft, Redmond, WA), aweb authoring tool with built-in scripting functions,was chosen for building the Web site. Client-sidedbuilt-in JavaScript functions were used for basicdata validation and to assure that certain requiredfields are filled in before transmitting the data. Theserver-sided scripting functions were used for dataforwarding by e-mail to the coordinating center.
The site was hosted at Verio (http://www.verio.com),one of the world’s largest web hosting companies.
Data were imported to the database (MicrosoftAccess 97) and reviewed and validated manually bythe study-coordinating center. Investigators werecontacted by e-mail to request correction or clarifi-cation of data. The investigators were to send cor-rections or clarifications through the Web site or bye-mail.
ResultsA Web site for data entry for a multicenter study ofethical decision-making was developed and imple-mented. Thirty-seven centers located in 17 Europeancountries participated in the investigation. For 1.5 yr,data on 4248 patients were collected.
Data entry was performed directly onto the Website through different web pages with 19 detailedquestions. These pages incorporated 194 different dataentry fields, such as text form fields, combo boxes(predefined selection lists), radio buttons (only oneoption of several can be chosen), and check boxes(checked or unchecked) (Fig. 1).
The data entered into the combo box, the radiobutton, and the check box were coded and only thecode was sent, whereas with the free text field theactual text was sent.
FrontPage has built-in JavaScript functions for basicclient-sided data validation. These functions checkedthat the right data type was entered in the free textfield (e.g., number and not text in the patient’s agefield) and to assure that certain mandatory fields (e.g.,patient number) were filled in before the data could be
sent. A message box informed the user of incorrect ormissing data. The number of free text fields was keptas small as possible so that efforts were directed atusing combo boxes with predefined values to reduceimproper data entry and to improve the Web site’sease of use.
Security was an important consideration. Entrance tothe web site was username/password protected and thesite was not published in any Internet search engine. Thepatients were identified only with a unique number. Thekey identifying the patients was kept with the centers.After data entry, the built-in server-sided FrontPagefunctions generated an e-mail message containing thedata and sends it to an account on the research server atVerio. Those e-mails were periodically automaticallydownloaded to the research computer at the HadassahUniversity Hospital, which was connected to the Internetthrough a firewall program protecting the Hadassahlocal area computer network.
Figure 1. Data entry fields. Single line text form field; combo box(opened); radio button; check box.
ANESTH ANALG ECONOMICS AND HEALTH SYSTEMS RESEARCH AVIDAN ET AL. 5072005;100:506–11 INTERNET WEB SITE FOR DATA COLLECTION
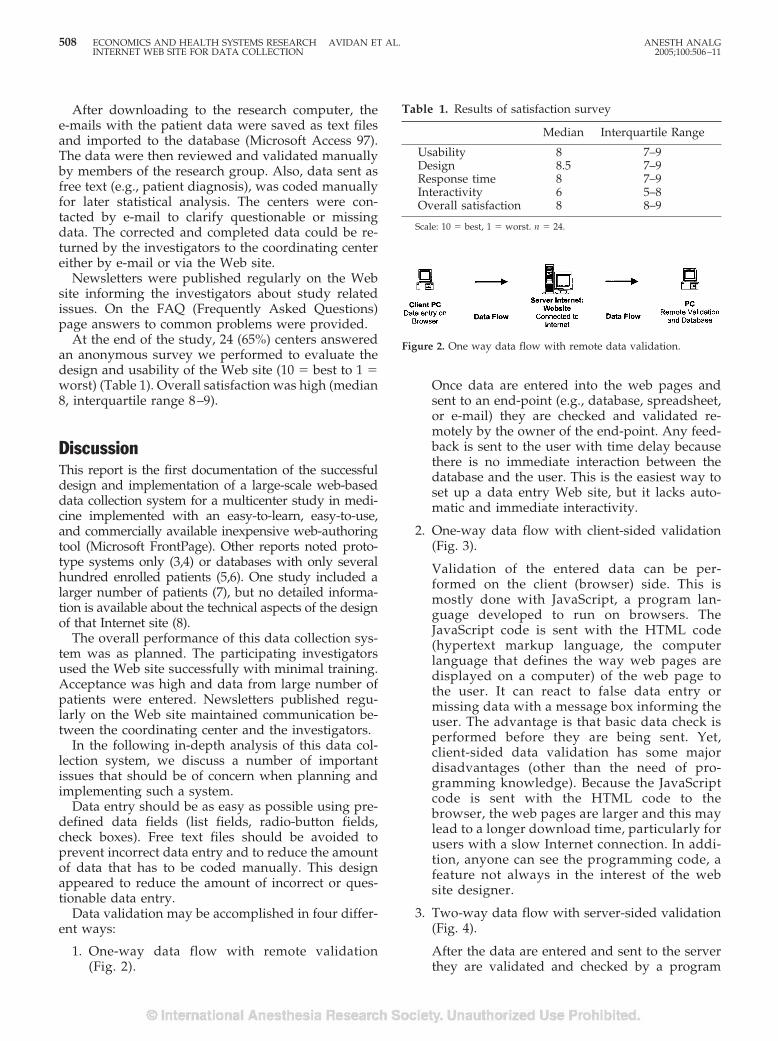
After downloading to the research computer, thee-mails with the patient data were saved as text filesand imported to the database (Microsoft Access 97).The data were then reviewed and validated manuallyby members of the research group. Also, data sent asfree text (e.g., patient diagnosis), was coded manuallyfor later statistical analysis. The centers were con-tacted by e-mail to clarify questionable or missingdata. The corrected and completed data could be re-turned by the investigators to the coordinating centereither by e-mail or via the Web site.
Newsletters were published regularly on the Website informing the investigators about study relatedissues. On the FAQ (Frequently Asked Questions)page answers to common problems were provided.
At the end of the study, 24 (65%) centers answeredan anonymous survey we performed to evaluate thedesign and usability of the Web site (10 � best to 1 �worst) (Table 1). Overall satisfaction was high (median8, interquartile range 8–9).
DiscussionThis report is the first documentation of the successfuldesign and implementation of a large-scale web-baseddata collection system for a multicenter study in medi-cine implemented with an easy-to-learn, easy-to-use,and commercially available inexpensive web-authoringtool (Microsoft FrontPage). Other reports noted proto-type systems only (3,4) or databases with only severalhundred enrolled patients (5,6). One study included alarger number of patients (7), but no detailed informa-tion is available about the technical aspects of the designof that Internet site (8).
The overall performance of this data collection sys-tem was as planned. The participating investigatorsused the Web site successfully with minimal training.Acceptance was high and data from large number ofpatients were entered. Newsletters published regu-larly on the Web site maintained communication be-tween the coordinating center and the investigators.
In the following in-depth analysis of this data col-lection system, we discuss a number of importantissues that should be of concern when planning andimplementing such a system.
Data entry should be as easy as possible using pre-defined data fields (list fields, radio-button fields,check boxes). Free text files should be avoided toprevent incorrect data entry and to reduce the amountof data that has to be coded manually. This designappeared to reduce the amount of incorrect or ques-tionable data entry.
Data validation may be accomplished in four differ-ent ways:
1. One-way data flow with remote validation(Fig. 2).
Once data are entered into the web pages andsent to an end-point (e.g., database, spreadsheet,or e-mail) they are checked and validated re-motely by the owner of the end-point. Any feed-back is sent to the user with time delay becausethere is no immediate interaction between thedatabase and the user. This is the easiest way toset up a data entry Web site, but it lacks auto-matic and immediate interactivity.
2. One-way data flow with client-sided validation(Fig. 3).
Validation of the entered data can be per-formed on the client (browser) side. This ismostly done with JavaScript, a program lan-guage developed to run on browsers. TheJavaScript code is sent with the HTML code(hypertext markup language, the computerlanguage that defines the way web pages aredisplayed on a computer) of the web page tothe user. It can react to false data entry ormissing data with a message box informing theuser. The advantage is that basic data check isperformed before they are being sent. Yet,client-sided data validation has some majordisadvantages (other than the need of pro-gramming knowledge). Because the JavaScriptcode is sent with the HTML code to thebrowser, the web pages are larger and this maylead to a longer download time, particularly forusers with a slow Internet connection. In addi-tion, anyone can see the programming code, afeature not always in the interest of the website designer.
3. Two-way data flow with server-sided validation(Fig. 4).
After the data are entered and sent to the serverthey are validated and checked by a program
Figure 2. One way data flow with remote data validation.
Table 1. Results of satisfaction survey
Median Interquartile Range
Usability 8 7–9Design 8.5 7–9Response time 8 7–9Interactivity 6 5–8Overall satisfaction 8 8–9
Scale: 10 � best, 1 � worst. n � 24.
508 ECONOMICS AND HEALTH SYSTEMS RESEARCH AVIDAN ET AL. ANESTH ANALGINTERNET WEB SITE FOR DATA COLLECTION 2005;100:506–11

residing on that server. Depending on the vali-dation result, a new web page is generated by theweb server and sent to the user with, for exam-ple, a request to reenter incorrect data or to con-firm that all data have been correctly entered.With this technique, there is no extra load on theweb pages and the programming code is notvisible to the user. The main disadvantage (otherthan the need for extensive programming knowl-edge) is that the data first have to be sent to theserver and a response has to be sent back to theuser, the so-called “client-server-client roundtrip.” This may lead to a higher traffic workload,which can be annoying, especially to the userwith a slow Internet connection.
4. Two-way data flow with server and client-sidedvalidation (Fig. 5).
The combination of the server and client-sideinteraction seems to be the ideal solution from thepoint of user friendliness. Simple data validationis performed using client-side scripting, and morecomplex tasks are performed on the server side.Yet its implementation is time consuming andcomplex.
Data entered through the Web site had to be stored ina database. This can be done indirectly or directly. Withthe indirect approach, the server-sided programs gener-ate an e-mail including all the data entered and send it tothe owner of the database for further processing into aremote-sided database. This approach is easy to imple-ment, but requires the additional task to enter the data tothe database. With the direct data entry approach, dataare sent directly into a server-sided database. Combined
with advanced server-sided technologies (such asMicrosoft’s Active Server Pages) more complex datavalidation may be performed and the investigatorcan be informed immediately through a webpageabout incorrect or missing data.
Remote-sided databases lack interactivity and are lessuser-friendly compared to server-sided databases. Onthe other hand, security is easier to handle on a remote-sided database (i.e., a computer behind a firewall pro-gram or even without direct connection to the Internet)than server-sided ones (i.e., a computer connected to theInternet). Server-sided databases may be prone to hack-ing, which is less possible with a remote-sided database.Backing up data is easier and safer for remote-sided thanserver-sided databases. When backing-up a server-sideddatabase to a local backup system the data have to betransported over the Internet (with encryption technol-ogy). Depending on the speed of the Internet connection,this can be time consuming.
It is possible to set up one’s own server, whichresides physically in the coordinator’s location. Thisallows the study coordinator to have more controlover a server-sided database. But this approach re-quires considerable experience and investment inhardware, software, and manpower.
Microsoft FrontPage allows building and designingWeb site without any knowledge in HTML. With its“What you see is what you get” approach, the user caneasily design a webpage and Microsoft FrontPage im-mediately creates the corresponding HTML code. Fur-thermore, no knowledge in any programming lan-guage is needed to use the built-in client and server-sided scripting functions for data validation andhandling. Microsoft FrontPage is an inexpensive, easy-to-learn, and easy-to-use web-authoring tool.
The web site implemented in the current report hadone-way data flow and combined client-sided andremote data validation. Although FrontPage hasbuilt-in functions for server-sided database handling,for security reasons we preferred to choose a remote-sided database approach and to have the databasereside physically on a computer at Hadassah.
The lack of interactivity between the user and thedatabase resulted in a large workload, as for every in-correct or missing piece of data that slipped through the
Figure 3. One way data flow with client-sided data validation andserver-sided data storage.
Figure 4. Two way data flow with server-sided data validation.
Figure 5. Two way data flow with client-sided data validation.
ANESTH ANALG ECONOMICS AND HEALTH SYSTEMS RESEARCH AVIDAN ET AL. 5092005;100:506–11 INTERNET WEB SITE FOR DATA COLLECTION
initial client-sided check, the investigators had to be con-tacted by e-mail and the corrected data had to be enteredmanually. To reduce the workload, the use of free-textfields should be minimized or even avoided.
After the data were entered through the Web site,server-sided FrontPage functions (so called “Front-Page Server Extensions”) sent the data by e-mail to anaccount on the server. Although the e-mails were thendownloaded automatically to the research computerat Hadassah, the rest of the data importing process(opening the e-mail, saving it as a text file, and im-porting the data into the database) was done manu-ally. This was a very time consuming process, whichcan now be done automatically using various com-mercially available add-in programs for automatice-mail handling.
During implementation and use of the system, severalproblems were encountered. Among the main problemswas the web site’s lack of interactive features.
1. Data entry could be done only once the patientreached the end of the study protocol becausethere was no possibility of successive data entry.The time span of patient observation rangedfrom hours to several months so the data had tofirst be collected using hard copy versions of thevarious forms.
2. If data entered on the Web site were lost beforebeing sent to the server, they had to be reentered.There was no possibility of saving a web page,including the data entered on the client-side, forlater use.
3. Investigators did not receive immediate confir-mation of their data’s safe arrival.
4. Several investigators complained that some oftheir data “got lost” in cyberspace. Unfortu-nately, this was impossible to verify. It is possiblethat data got lost on the way from the investiga-tor’s computer to the server when poor or slowInternet connections were used. But it is impos-sible to exclude incorrect data processing by theserver-side FrontPage extension. These data hadto be re-entered.
5. Investigators had no ability to review the datasent via the web site.
Security, next to user friendliness, is the most im-portant issue when building a web site for data entry(1,9). Although there are several techniques to ensuredata safety (e.g., usernames, passwords, data encryp-tion, firewall programs), no system is foolproof. Be-sides technical issues, other precautions have to beconsidered, e.g., patient data should be depersonal-ized using a coding system to prevent patient identi-fication by unauthorized persons.
For data safety reasons we decided to use a remote-sided database concept. Our database resided on apersonal computer connected directly to the Internet
and protected by a firewall program, and it was there-fore “invisible” to the Internet community and poten-tial hackers. The down side of this security feature islack of interactivity between the person entering dataand the database. This led to a large workload for thecoordinating center, which had to manage and vali-date incoming data. With the technologies for dataencryption available today, secure database manage-ment can be done over the Internet, probably as safelyas with older paper systems (1).
Transport of the data (from the client to the serverand from the server by e-mail to the coordinationcenter in Jerusalem) was done over the Internet in anunsecured manner (without data encryption). It wasassumed that the chance of somebody hacking thesee-mails (which contained almost only numbers with-out any information about the nature of the data ordetails identifying the patients) and breaking confi-dentiality was very remote.
The results of the anonymous survey of investigatorsshowed a very good acceptance of this Web site design(Table 1). Only the interactivity of the Web site was ratedlower (median 6, interquartile range 5–8) than the over-all satisfaction (median 8, interquartile range 8–9). Asdiscussed above, the lack of almost any interactivity isthe major drawback in choosing a one-way data flowsystem with remote data validation. Unfortunately only65% of the centers replied to the survey, so it is possiblethat some nonresponders disliked this design. Oral feed-back received at several meetings with the investigatorswas generally very positive.
ConclusionsThe Internet is an excellent tool for collecting andtransmitting data for multicenter studies. It is possibleto build a Web site for data entry without much pro-gramming experience using commercially availableprograms. Such a Web site allowed rapid, inexpensiveand easy transfer of data between researchers and thecoordinating center. It also permitted easy communi-cations between the coordinating center and the inves-tigators. Many technical and practical lessons werelearned from this experience so that further systemsmay be more efficient and reliable.
References1. Marshall WW, Haley RW. Use of a secure Internet Web site for
collaborative medical research. JAMA 2000;284:1843–9.2. Sprung CL, Cohen SL, Sjokvist P, et al. End-of-life practices in Euro-
pean intensive care units: the Ethicus Study. JAMA 2003;290:790–7.3. Sippel H, Eich HP, Ohmann C. Data collection in multicenter
clinical trials via Internet: a generic system in Java. Medinfo1998;9:93–7.
4. Mezzana P, Madonna Terracina FS, Valeriani M. Use of a website in a multicenter plastic surgery trial: a new option for dataacquisition. Plast Reconstr Surg 2002;109:1658–61.
510 ECONOMICS AND HEALTH SYSTEMS RESEARCH AVIDAN ET AL. ANESTH ANALGINTERNET WEB SITE FOR DATA COLLECTION 2005;100:506–11

5. Dorman K, Saade GR, Smith H, Moise KJ Jr. Use of the WorldWide Web in research: randomization in a multicenter clinicaltrial of treatment for twin-twin transfusion syndrome. ObstetGynecol 2000;96:636–9.
6. Siegel RM, Kiely M, Bien JP, et al. Treatment of otitis media withobservation and a safety-net antibiotic prescription. Pediatrics2003;112:527–31.
7. Marks R, Bristol H, Conlon M, Pepine CJ. Enhancing clinicaltrials on the internet: lessons from INVEST. Clin Cardiol 2001;24:V17–23.
8. Pepine CJ, Handberg-Thurmond E, Marks RG, et al. Rationaleand design of the International Verapamil SR/TrandolaprilStudy (INVEST): an Internet-based randomized trial in coronaryartery disease patients with hypertension. J Am Coll Cardiol1998;32:1228–37.
9. Norifusa M. Internet security: difficulties and solutions. Int J MedInf 1998;49:69–74.
ANESTH ANALG ECONOMICS AND HEALTH SYSTEMS RESEARCH AVIDAN ET AL. 5112005;100:506–11 INTERNET WEB SITE FOR DATA COLLECTION
CSE
JU
CDVJaJ.VDN
Ftepninpsteinh
clcipuniogin
MN
D
51
RITICAL CARE AND TRAUMACTION EDITOR
KKA TAKALA
ircumferential Adjustment of Ultrasound Probe Position toetermine the Optimal Approach to the Internal Jugularein: A Noninvasive Geometric Study in Adultsmes M. Riopelle, MD*, Darren P. Ruiz, MD*, John P. Hunt, MD†, Mark R. Mitchell, MD*,Carlos Mena, MD¶, Jason A. Rigol, MD*, Bruno C. Jubelin, PhD‡, Arthur J. Riopelle, PhD§,aleriy V. Kozmenko, MD*, and Matthew K. Miller, MD*
epartments of *Anesthesiology, †Surgery, ¶Radiology, and ‡Medicine, Louisiana State University Health Sciences Center atew Orleans, New Orleans, Louisiana; and §Department of Psychology, Louisiana State University, Baton Rouge, Louisiana
Circumferential adjustment of the position of a two-dimensional ultrasound (US) probe around the neckhas been recommended as a strategy for reducing thepotential for unintentional common carotid arterypuncture during internal jugular venous (IJV) cannula-tion. We obtained multiple high-resolution US imagesbilaterally from the necks of 107 adult subjects and an-alyzed these to determine the degree to which this strat-egy permits identification of a pathway from the skin tothe IJV that minimizes venoarterial overlap while max-imizing venous target (angular) width. The methodconsistently permitted identification of an approach to
the IJV superior to that obtainable with any one of fourpopular surface anatomy-based (“blind”) approachesand was even more powerful if used in concert with aUS-guided 1) adjustment of the degree of head rotation,2) choice between a high and low approach, and 3)choice between the right and left IJV. Use of a high-resolution US imaging device also permitted identifica-tion of the precise boundaries of additional cervical an-atomic structures (nontarget vessels, lymph nodes, andthe thyroid gland) potentially relevant to selection of anoptimal approach to the IJV.
(Anesth Analg 2005;100:512–9)
our recent reviews of the pertinent medical liter-ature concluded that the use of real-time two-dimensional ultrasound (US) imaging during in-
rnal jugular vein (IJV) cannulation improves therocedural success rate, reduces the need for multipleeedle advances, and decreases the rate of inadvertentjury to the common carotid artery (CCA) (1–4) (and,
resumably, the attendant risks of hematoma androke) (5,6). Our own early (disappointing) experi-
nce using US imaging to prevent CCA puncture dur-g US-guided IJV cannulation clearly demonstrated,
owever, that obtaining full benefit from US imaging
entails a learning process that is partly technical (7) butalso partly conceptual; i.e., one must develop an under-standing of how to make optimal use of the individual-ized anatomic information being provided (8).
An important mechanism by which CCA puncturecan occur despite US guidance of IJV cannulationarises from the coincidence of two factors (9–12): 1)anatomic variation or pathologic change placing someportion of the CCA on the line of needle advancementjust beyond the IJV (venoarterial overlap) and 2)through-and-through puncture of the IJV (double-wallpuncture or venous transfixation) due to the advancingneedle tip traversing the entire IJV rather than enter-ing its lumen. The first of these factors occurs in up to78% of patients (10) and depends on such variables aspatient age (9,13,14), the degree of contralateral headrotation (15), the indication for central venous cannu-lation (16), and the operator’s approach to the IJV(9,10,13). The incidence of the second factor may de-pend on needle gauge (11,17), needle bevel,1 speed of
Supplemental data available at www.anesthesia-analgesia.org.The investigators performed this study during the course of their
inical duties supplemented with personal time. There were no finan-al incentives for participation from any source. During the 6-montheriod of data collection, SonoSite Inc. (Bothell, WA) provided theltrasound imaging device, multifrequency solid-state probe, and tech-cal support. The Medical Center of Louisiana-New Orleans Radiol-y Department provided unrestricted access to their ultrasonic imag-g resources.Accepted for publication July 28, 2004.Address correspondence and reprint requests to James Riopelle,D, Anesthesia Department, Charity Hospital, 1532 Tulane Ave.,ew Orleans, LA 70112. Address e-mail to [email protected].
OI: 10.1213/01.ANE.0000142115.94440.6C
1 Ukranian anesthesiologists sometimes substitute a sharper-beveled needle to cannulate the IJV than is customarily included ina standard central venous cannulation kit (V. V. Kozmenko, MD,personal communication, 2004).
©2005 by the International Anesthesia Research Society2 Anesth Analg 2005;100:512–9 0003-2999/05
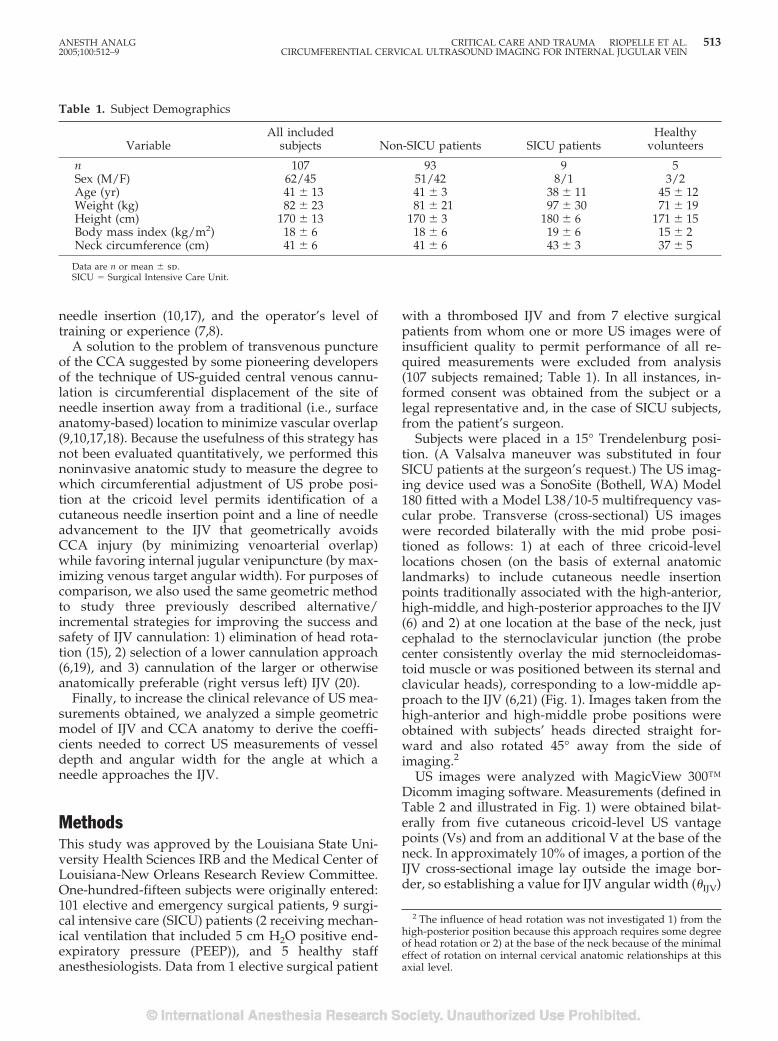
needle insertion (10,17), and the operator’s level oftraining or experience (7,8).
A solution to the problem of transvenous punctureof the CCA suggested by some pioneering developersof the technique of US-guided central venous cannu-lation is circumferential displacement of the site ofneedle insertion away from a traditional (i.e., surfaceanatomy-based) location to minimize vascular overlap(9,10,17,18). Because the usefulness of this strategy hasnot been evaluated quantitatively, we performed thisnoninvasive anatomic study to measure the degree towhich circumferential adjustment of US probe posi-tion at the cricoid level permits identification of acutaneous needle insertion point and a line of needleadvancement to the IJV that geometrically avoidsCCA injury (by minimizing venoarterial overlap)while favoring internal jugular venipuncture (by max-imizing venous target angular width). For purposes ofcomparison, we also used the same geometric methodto study three previously described alternative/incremental strategies for improving the success andsafety of IJV cannulation: 1) elimination of head rota-tion (15), 2) selection of a lower cannulation approach(6,19), and 3) cannulation of the larger or otherwiseanatomically preferable (right versus left) IJV (20).
Finally, to increase the clinical relevance of US mea-surements obtained, we analyzed a simple geometricmodel of IJV and CCA anatomy to derive the coeffi-cients needed to correct US measurements of vesseldepth and angular width for the angle at which aneedle approaches the IJV.
MethodsThis study was approved by the Louisiana State Uni-versity Health Sciences IRB and the Medical Center ofLouisiana-New Orleans Research Review Committee.One-hundred-fifteen subjects were originally entered:101 elective and emergency surgical patients, 9 surgi-cal intensive care (SICU) patients (2 receiving mechan-ical ventilation that included 5 cm H2O positive end-expiratory pressure (PEEP)), and 5 healthy staffanesthesiologists. Data from 1 elective surgical patient
with a thrombosed IJV and from 7 elective surgicalpatients from whom one or more US images were ofinsufficient quality to permit performance of all re-quired measurements were excluded from analysis(107 subjects remained; Table 1). In all instances, in-formed consent was obtained from the subject or alegal representative and, in the case of SICU subjects,from the patient’s surgeon.
Subjects were placed in a 15° Trendelenburg posi-tion. (A Valsalva maneuver was substituted in fourSICU patients at the surgeon’s request.) The US imag-ing device used was a SonoSite (Bothell, WA) Model180 fitted with a Model L38/10-5 multifrequency vas-cular probe. Transverse (cross-sectional) US imageswere recorded bilaterally with the mid probe posi-tioned as follows: 1) at each of three cricoid-levellocations chosen (on the basis of external anatomiclandmarks) to include cutaneous needle insertionpoints traditionally associated with the high-anterior,high-middle, and high-posterior approaches to the IJV(6) and 2) at one location at the base of the neck, justcephalad to the sternoclavicular junction (the probecenter consistently overlay the mid sternocleidomas-toid muscle or was positioned between its sternal andclavicular heads), corresponding to a low-middle ap-proach to the IJV (6,21) (Fig. 1). Images taken from thehigh-anterior and high-middle probe positions wereobtained with subjects’ heads directed straight for-ward and also rotated 45° away from the side ofimaging.2
US images were analyzed with MagicView 300™Dicomm imaging software. Measurements (defined inTable 2 and illustrated in Fig. 1) were obtained bilat-erally from five cutaneous cricoid-level US vantagepoints (Vs) and from an additional V at the base of theneck. In approximately 10% of images, a portion of theIJV cross-sectional image lay outside the image bor-der, so establishing a value for IJV angular width (�IJV)
2 The influence of head rotation was not investigated 1) from thehigh-posterior position because this approach requires some degreeof head rotation or 2) at the base of the neck because of the minimaleffect of rotation on internal cervical anatomic relationships at thisaxial level.
Table 1. Subject Demographics
VariableAll included
subjects Non-SICU patients SICU patientsHealthy
volunteers
n 107 93 9 5Sex (M/F) 62/45 51/42 8/1 3/2Age (yr) 41 � 13 41 � 3 38 � 11 45 � 12Weight (kg) 82 � 23 81 � 21 97 � 30 71 � 19Height (cm) 170 � 13 170 � 3 180 � 6 171 � 15Body mass index (kg/m2) 18 � 6 18 � 6 19 � 6 15 � 2Neck circumference (cm) 41 � 6 41 � 6 43 � 3 37 � 5
Data are n or mean � sd.SICU � Surgical Intensive Care Unit.
ANESTH ANALG CRITICAL CARE AND TRAUMA RIOPELLE ET AL. 5132005;100:512–9 CIRCUMFERENTIAL CERVICAL ULTRASOUND IMAGING FOR INTERNAL JUGULAR VEIN
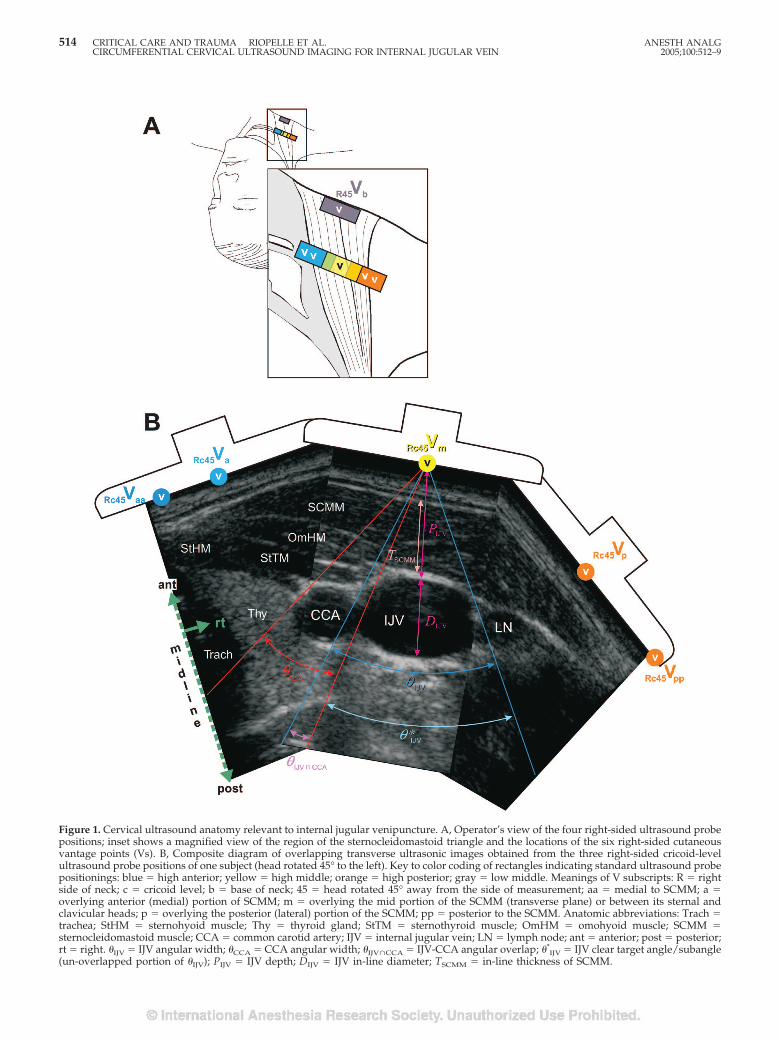
Figure 1. Cervical ultrasound anatomy relevant to internal jugular venipuncture. A, Operator’s view of the four right-sided ultrasound probepositions; inset shows a magnified view of the region of the sternocleidomastoid triangle and the locations of the six right-sided cutaneousvantage points (Vs). B, Composite diagram of overlapping transverse ultrasonic images obtained from the three right-sided cricoid-levelultrasound probe positions of one subject (head rotated 45° to the left). Key to color coding of rectangles indicating standard ultrasound probepositionings: blue � high anterior; yellow � high middle; orange � high posterior; gray � low middle. Meanings of V subscripts: R � rightside of neck; c � cricoid level; b � base of neck; 45 � head rotated 45° away from the side of measurement; aa � medial to SCMM; a �overlying anterior (medial) portion of SCMM; m � overlying the mid portion of the SCMM (transverse plane) or between its sternal andclavicular heads; p � overlying the posterior (lateral) portion of the SCMM; pp � posterior to the SCMM. Anatomic abbreviations: Trach �trachea; StHM � sternohyoid muscle; Thy � thyroid gland; StTM � sternothyroid muscle; OmHM � omohyoid muscle; SCMM �sternocleidomastoid muscle; CCA � common carotid artery; IJV � internal jugular vein; LN � lymph node; ant � anterior; post � posterior;rt � right. �IJV � IJV angular width; �CCA � CCA angular width; �IJV�CCA � IJV-CCA angular overlap; �*
IJV � IJV clear target angle/subangle(un-overlapped portion of �IJV); PIJV � IJV depth; DIJV � IJV in-line diameter; TSCMM � in-line thickness of SCMM.
514 CRITICAL CARE AND TRAUMA RIOPELLE ET AL. ANESTH ANALGCIRCUMFERENTIAL CERVICAL ULTRASOUND IMAGING FOR INTERNAL JUGULAR VEIN 2005;100:512–9
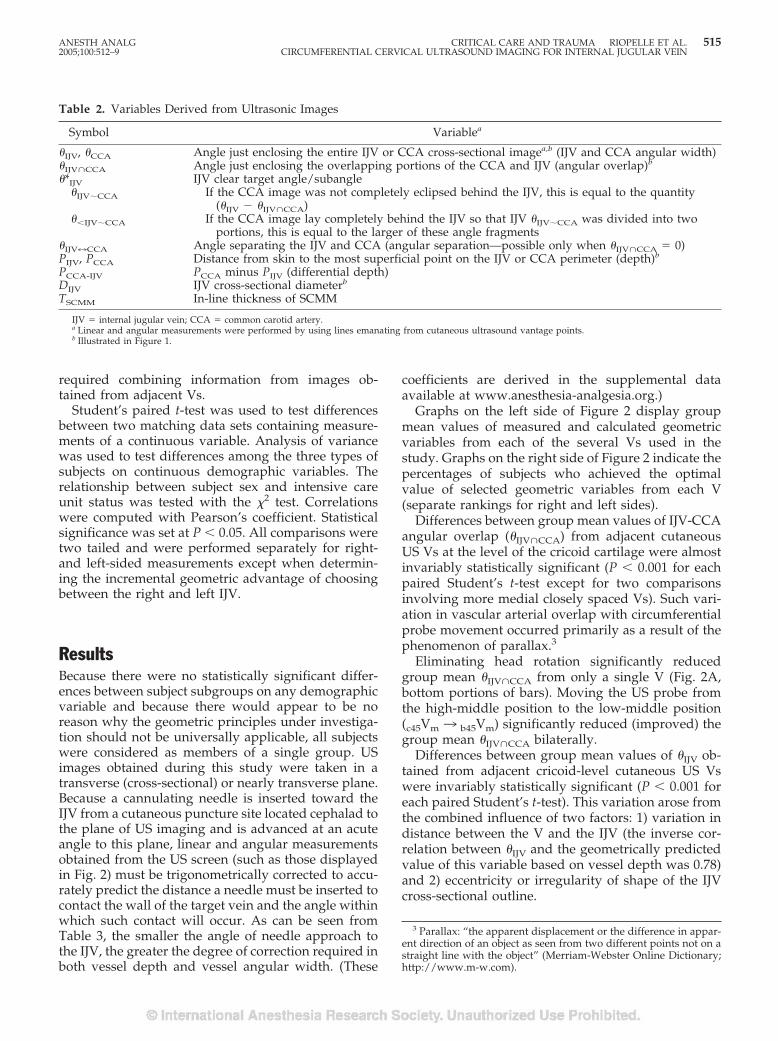
required combining information from images ob-tained from adjacent Vs.
Student’s paired t-test was used to test differencesbetween two matching data sets containing measure-ments of a continuous variable. Analysis of variancewas used to test differences among the three types ofsubjects on continuous demographic variables. Therelationship between subject sex and intensive careunit status was tested with the �2 test. Correlationswere computed with Pearson’s coefficient. Statisticalsignificance was set at P � 0.05. All comparisons weretwo tailed and were performed separately for right-and left-sided measurements except when determin-ing the incremental geometric advantage of choosingbetween the right and left IJV.
ResultsBecause there were no statistically significant differ-ences between subject subgroups on any demographicvariable and because there would appear to be noreason why the geometric principles under investiga-tion should not be universally applicable, all subjectswere considered as members of a single group. USimages obtained during this study were taken in atransverse (cross-sectional) or nearly transverse plane.Because a cannulating needle is inserted toward theIJV from a cutaneous puncture site located cephalad tothe plane of US imaging and is advanced at an acuteangle to this plane, linear and angular measurementsobtained from the US screen (such as those displayedin Fig. 2) must be trigonometrically corrected to accu-rately predict the distance a needle must be inserted tocontact the wall of the target vein and the angle withinwhich such contact will occur. As can be seen fromTable 3, the smaller the angle of needle approach tothe IJV, the greater the degree of correction required inboth vessel depth and vessel angular width. (These
coefficients are derived in the supplemental dataavailable at www.anesthesia-analgesia.org.)
Graphs on the left side of Figure 2 display groupmean values of measured and calculated geometricvariables from each of the several Vs used in thestudy. Graphs on the right side of Figure 2 indicate thepercentages of subjects who achieved the optimalvalue of selected geometric variables from each V(separate rankings for right and left sides).
Differences between group mean values of IJV-CCAangular overlap (�IJV�CCA) from adjacent cutaneousUS Vs at the level of the cricoid cartilage were almostinvariably statistically significant (P � 0.001 for eachpaired Student’s t-test except for two comparisonsinvolving more medial closely spaced Vs). Such vari-ation in vascular arterial overlap with circumferentialprobe movement occurred primarily as a result of thephenomenon of parallax.3
Eliminating head rotation significantly reducedgroup mean �IJV�CCA from only a single V (Fig. 2A,bottom portions of bars). Moving the US probe fromthe high-middle position to the low-middle position(c45Vm 3 b45Vm) significantly reduced (improved) thegroup mean �IJV�CCA bilaterally.
Differences between group mean values of �IJV ob-tained from adjacent cricoid-level cutaneous US Vswere invariably statistically significant (P � 0.001 foreach paired Student’s t-test). This variation arose fromthe combined influence of two factors: 1) variation indistance between the V and the IJV (the inverse cor-relation between �IJV and the geometrically predictedvalue of this variable based on vessel depth was 0.78)and 2) eccentricity or irregularity of shape of the IJVcross-sectional outline.
3 Parallax: “the apparent displacement or the difference in appar-ent direction of an object as seen from two different points not on astraight line with the object” (Merriam-Webster Online Dictionary;http://www.m-w.com).
Table 2. Variables Derived from Ultrasonic Images
Symbol Variablea
�IJV, �CCA Angle just enclosing the entire IJV or CCA cross-sectional imagea,b (IJV and CCA angular width)�IJV�CCA Angle just enclosing the overlapping portions of the CCA and IJV (angular overlap)b
�*IJV IJV clear target angle/subangle�IJV�CCA If the CCA image was not completely eclipsed behind the IJV, this is equal to the quantity
(�IJV � �IJV�CCA)��IJV�CCA If the CCA image lay completely behind the IJV so that IJV �IJV�CCA was divided into two
portions, this is equal to the larger of these angle fragments�IJV7CCA Angle separating the IJV and CCA (angular separation—possible only when �IJV�CCA � 0)PIJV, PCCA Distance from skin to the most superficial point on the IJV or CCA perimeter (depth)b
PCCA-IJV PCCA minus PIJV (differential depth)DIJV IJV cross-sectional diameterb
TSCMM In-line thickness of SCMM
IJV � internal jugular vein; CCA � common carotid artery.a Linear and angular measurements were performed by using lines emanating from cutaneous ultrasound vantage points.b Illustrated in Figure 1.
ANESTH ANALG CRITICAL CARE AND TRAUMA RIOPELLE ET AL. 5152005;100:512–9 CIRCUMFERENTIAL CERVICAL ULTRASOUND IMAGING FOR INTERNAL JUGULAR VEIN
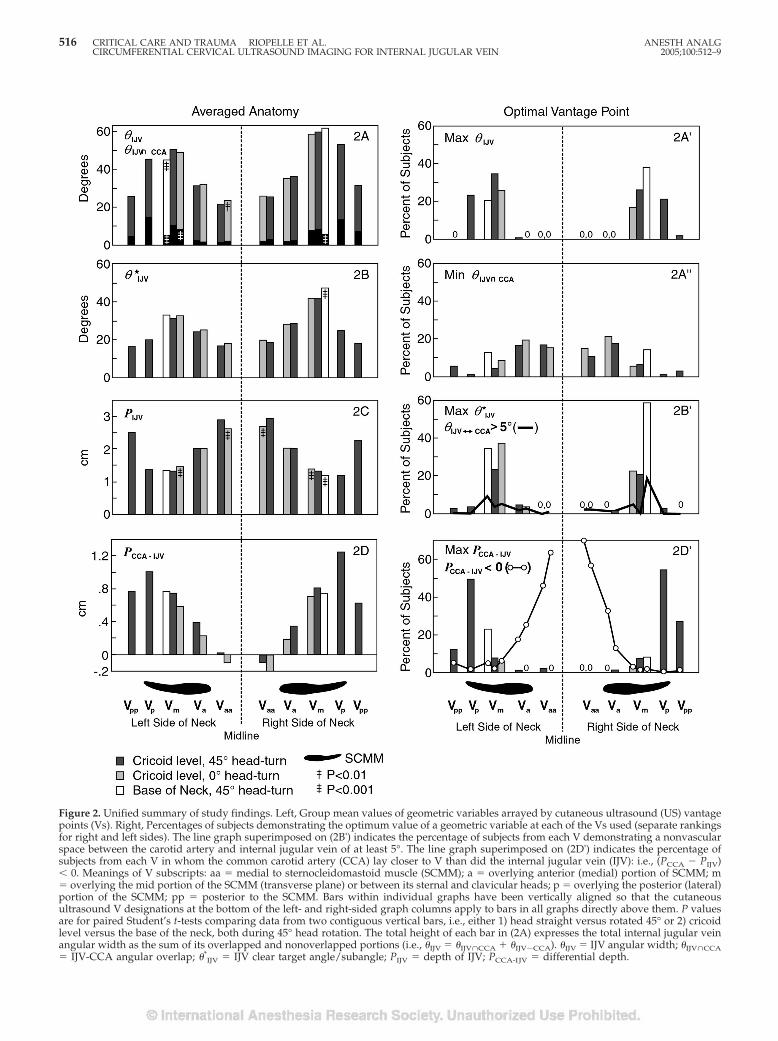
Figure 2. Unified summary of study findings. Left, Group mean values of geometric variables arrayed by cutaneous ultrasound (US) vantagepoints (Vs). Right, Percentages of subjects demonstrating the optimum value of a geometric variable at each of the Vs used (separate rankingsfor right and left sides). The line graph superimposed on (2B') indicates the percentage of subjects from each V demonstrating a nonvascularspace between the carotid artery and internal jugular vein of at least 5°. The line graph superimposed on (2D') indicates the percentage ofsubjects from each V in whom the common carotid artery (CCA) lay closer to V than did the internal jugular vein (IJV): i.e., (PCCA � PIJV)� 0. Meanings of V subscripts: aa � medial to sternocleidomastoid muscle (SCMM); a � overlying anterior (medial) portion of SCMM; m� overlying the mid portion of the SCMM (transverse plane) or between its sternal and clavicular heads; p � overlying the posterior (lateral)portion of the SCMM; pp � posterior to the SCMM. Bars within individual graphs have been vertically aligned so that the cutaneousultrasound V designations at the bottom of the left- and right-sided graph columns apply to bars in all graphs directly above them. P valuesare for paired Student’s t-tests comparing data from two contiguous vertical bars, i.e., either 1) head straight versus rotated 45° or 2) cricoidlevel versus the base of the neck, both during 45° head rotation. The total height of each bar in (2A) expresses the total internal jugular veinangular width as the sum of its overlapped and nonoverlapped portions (i.e., �IJV � �IJV�CCA � �IJV�CCA). �IJV � IJV angular width; �IJV�CCA� IJV-CCA angular overlap; �*
IJV � IJV clear target angle/subangle; PIJV � depth of IJV; PCCA-IJV � differential depth.
516 CRITICAL CARE AND TRAUMA RIOPELLE ET AL. ANESTH ANALGCIRCUMFERENTIAL CERVICAL ULTRASOUND IMAGING FOR INTERNAL JUGULAR VEIN 2005;100:512–9
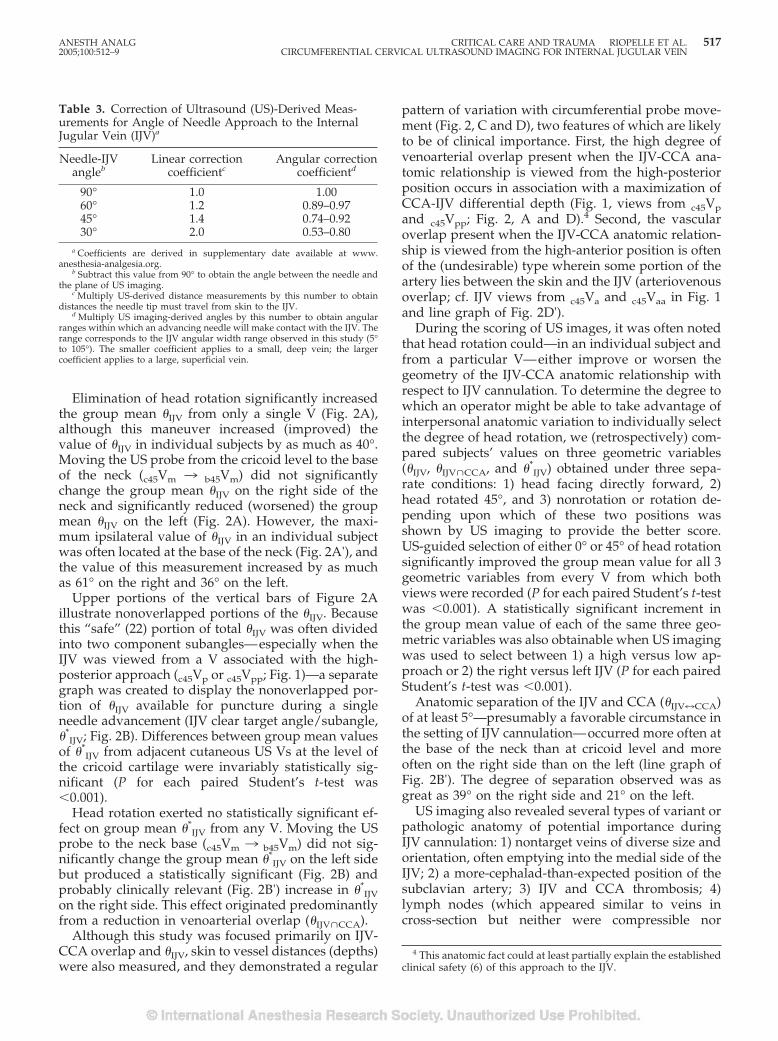
Elimination of head rotation significantly increasedthe group mean �IJV from only a single V (Fig. 2A),although this maneuver increased (improved) thevalue of �IJV in individual subjects by as much as 40°.Moving the US probe from the cricoid level to the baseof the neck (c45Vm 3 b45Vm) did not significantlychange the group mean �IJV on the right side of theneck and significantly reduced (worsened) the groupmean �IJV on the left (Fig. 2A). However, the maxi-mum ipsilateral value of �IJV in an individual subjectwas often located at the base of the neck (Fig. 2A'), andthe value of this measurement increased by as muchas 61° on the right and 36° on the left.
Upper portions of the vertical bars of Figure 2Aillustrate nonoverlapped portions of the �IJV. Becausethis “safe” (22) portion of total �IJV was often dividedinto two component subangles—especially when theIJV was viewed from a V associated with the high-posterior approach (c45Vp or c45Vpp; Fig. 1)—a separategraph was created to display the nonoverlapped por-tion of �IJV available for puncture during a singleneedle advancement (IJV clear target angle/subangle,�*
IJV; Fig. 2B). Differences between group mean valuesof �*
IJV from adjacent cutaneous US Vs at the level ofthe cricoid cartilage were invariably statistically sig-nificant (P for each paired Student’s t-test was�0.001).
Head rotation exerted no statistically significant ef-fect on group mean �*
IJV from any V. Moving the USprobe to the neck base (c45Vm 3 b45Vm) did not sig-nificantly change the group mean �*
IJV on the left sidebut produced a statistically significant (Fig. 2B) andprobably clinically relevant (Fig. 2B') increase in �*
IJVon the right side. This effect originated predominantlyfrom a reduction in venoarterial overlap (�IJV�CCA).
Although this study was focused primarily on IJV-CCA overlap and �IJV, skin to vessel distances (depths)were also measured, and they demonstrated a regular
pattern of variation with circumferential probe move-ment (Fig. 2, C and D), two features of which are likelyto be of clinical importance. First, the high degree ofvenoarterial overlap present when the IJV-CCA ana-tomic relationship is viewed from the high-posteriorposition occurs in association with a maximization ofCCA-IJV differential depth (Fig. 1, views from c45Vpand c45Vpp; Fig. 2, A and D).4 Second, the vascularoverlap present when the IJV-CCA anatomic relation-ship is viewed from the high-anterior position is oftenof the (undesirable) type wherein some portion of theartery lies between the skin and the IJV (arteriovenousoverlap; cf. IJV views from c45Va and c45Vaa in Fig. 1and line graph of Fig. 2D').
During the scoring of US images, it was often notedthat head rotation could—in an individual subject andfrom a particular V—either improve or worsen thegeometry of the IJV-CCA anatomic relationship withrespect to IJV cannulation. To determine the degree towhich an operator might be able to take advantage ofinterpersonal anatomic variation to individually selectthe degree of head rotation, we (retrospectively) com-pared subjects’ values on three geometric variables(�IJV, �IJV�CCA, and �*
IJV) obtained under three sepa-rate conditions: 1) head facing directly forward, 2)head rotated 45°, and 3) nonrotation or rotation de-pending upon which of these two positions wasshown by US imaging to provide the better score.US-guided selection of either 0° or 45° of head rotationsignificantly improved the group mean value for all 3geometric variables from every V from which bothviews were recorded (P for each paired Student’s t-testwas �0.001). A statistically significant increment inthe group mean value of each of the same three geo-metric variables was also obtainable when US imagingwas used to select between 1) a high versus low ap-proach or 2) the right versus left IJV (P for each pairedStudent’s t-test was �0.001).
Anatomic separation of the IJV and CCA (�IJV7CCA)of at least 5°—presumably a favorable circumstance inthe setting of IJV cannulation—occurred more often atthe base of the neck than at cricoid level and moreoften on the right side than on the left (line graph ofFig. 2B'). The degree of separation observed was asgreat as 39° on the right side and 21° on the left.
US imaging also revealed several types of variant orpathologic anatomy of potential importance duringIJV cannulation: 1) nontarget veins of diverse size andorientation, often emptying into the medial side of theIJV; 2) a more-cephalad-than-expected position of thesubclavian artery; 3) IJV and CCA thrombosis; 4)lymph nodes (which appeared similar to veins incross-section but neither were compressible nor
4 This anatomic fact could at least partially explain the establishedclinical safety (6) of this approach to the IJV.
Table 3. Correction of Ultrasound (US)-Derived Meas-urements for Angle of Needle Approach to the InternalJugular Vein (IJV)a
Needle-IJVangleb
Linear correctioncoefficientc
Angular correctioncoefficientd
90° 1.0 1.0060° 1.2 0.89–0.9745° 1.4 0.74–0.9230° 2.0 0.53–0.80
a Coefficients are derived in supplementary date available at www.anesthesia-analgesia.org.
b Subtract this value from 90° to obtain the angle between the needle andthe plane of US imaging.
c Multiply US-derived distance measurements by this number to obtaindistances the needle tip must travel from skin to the IJV.
d Multiply US imaging-derived angles by this number to obtain angularranges within which an advancing needle will make contact with the IJV. Therange corresponds to the IJV angular width range observed in this study (5°to 105°). The smaller coefficient applies to a small, deep vein; the largercoefficient applies to a large, superficial vein.
ANESTH ANALG CRITICAL CARE AND TRAUMA RIOPELLE ET AL. 5172005;100:512–9 CIRCUMFERENTIAL CERVICAL ULTRASOUND IMAGING FOR INTERNAL JUGULAR VEIN
formed confluences with true blood vessels); and 5)goiter.
Finally, although the color Doppler function on theUS imaging device used did not indicate the directionof blood flow, its display of flow speed and flowpattern (pulsatility and respiratory variation) was oc-casionally helpful in confirming vessel type (arteryversus vein) and patency.
DiscussionData obtained during this study provide strong geo-metric confirmation of the value of circumferentialcervical adjustment of US probe position to identify ahigh approach to IJV cannulation that minimizesvenoarterial overlap (parallax effect), maximizes tar-get venous angular width (proximity effect), or opti-mizes a combination of the two. Elimination of headrotation generally did little to improve the view of theIJV-CCA anatomic relationship, although individual-ized adjustment of head position was found to be auseful incremental strategy. Changing from a high-middle to a low-middle approach to the IJV decreasedvenoarterial overlap bilaterally and increased �IJV onthe right side. Any geometric benefit gained fromselection of a low approach to IJV cannulation, how-ever, must be weighed against its potentially greaterrisk of pneumothorax (6) or needle injury to the sub-clavian artery.
Collecting and analyzing geometric data necessitatethe use of precise mathematical definitions and carefulperformance of linear and angular measurements.Fortunately, the method of using the principles ofparallax and proximity to optimize the view of theIJV-CCA anatomic relationship before IJV cannulationis no more complex than the method used by a wed-ding photographer to get a good picture of the faces ofboth newlyweds. At the chosen axial level, the oper-ator 1) transversely images the IJV-CCA relationship,2) identifies the point along the probe-skin interfacefrom which he or she projects there will be no orminimal venoarterial overlap (preferably close to theIJV to maximize venous angular width), and then 3)moves the US probe circumferentially around the neckso that its center lies over this point, meanwhile keep-ing the IJV cross-sectional image in the center of theUS screen. The geometrically optimized line of needleadvancement will then cross the viewing screen’s ver-tical midline, and the probe’s longitudinal axis canserve as a needle-aiming guide.5
Should a satisfactory approach to the IJV not beidentifiable with this method, the operator can adjustthe degree of patient head rotation or expand thesearch for a safe path from the skin to the IJV proximaland distal to the original axial plane of US imaging.With experience, one learns to mentally compile ana-tomic information obtained from multiple axial levels,generate a three-dimensional model of relevant cervi-cal anatomic structures, and then analyze this modelto identify a line of needle advancement to the IJV thatwill miss nontarget vessels, lymph nodes, and thethyroid gland and/or minimize needle (and subse-quent catheter) passage through superficial cervicalmusculature. Should the IJV initially selected for can-nulation be found to be thrombosed or of very smalldiameter, US imaging can be used to assess the con-tralateral IJV (and also the subclavian and femoralveins).
Provided an acceptable line of needle advancementis found to either the right or the left IJV, the operatorcan augment a patient’s intrathoracic pressure to en-hance IJV distention and resistance to compression bythe advancing needle tip (Valsalva maneuver, sighbreath, or PEEP) and then advance the (finder orcannulating) needle toward the target vessel. He orshe can then select the angle of needle approach to theIJV after considering 1) the proximity of the cutaneouspuncture site to the subclavian artery and/or lung, 2)the influence of this angle on skin-to-vessel distanceand angular venous target size, and 3) any perceivedadvantage from having the cannulating needle (and,later, the central venous cannula or introducer) enterthe IJV at an acute (rather than right) angle.
Unfortunately, this method of using US imaging tofacilitate IJV cannulation cannot, by itself, eliminate allpossibility of needle injury to the CCA or guaranteesuccessful IJV cannulation. At least the following tech-nical and conceptual pitfalls of US-guided vascularcannulation must also be avoided: 1) mistaking theCCA for the IJV and so targeting the wrong bloodvessel, 2) failing to properly aim the needle along awell chosen line of needle advancement, 3) falselyassuming that the anatomic relationship between theIJV and CCA at the level of venipuncture is identicalto that at the axial level of (transverse) US imaging,6 4)confusing the needle shaft for its tip on the US screen(23), and 5) paying insufficient attention to the USdevice screen (relative to the puncture site) duringneedle advancement.
5 The needle can be advanced through a physical guide attached tothe US probe to ensure a consistent line of needle advancement withrespect to the US probe central axis (7), but at the cost of some loss inthe ability to make fine adjustments in the line of needle advancementand to adjust the angle of the needle approach to the IJV.
6 That is, a geometrical model (such as that in the supplementaldata available at www.anesthesia-analgesia.org.) describing theneck as a cylinder containing smaller, parallel IJV and CCA cylin-ders is only approximately true.
518 CRITICAL CARE AND TRAUMA RIOPELLE ET AL. ANESTH ANALGCIRCUMFERENTIAL CERVICAL ULTRASOUND IMAGING FOR INTERNAL JUGULAR VEIN 2005;100:512–9
In summary, this noninvasive US study of cervicalanatomy confirms a geometric advantage of circum-ferential cervical adjustment of the position of a two-dimensional US imaging probe for identifying an op-timal cutaneous puncture site and line of needleadvancement to the IJV (especially in a patient withunsuspected cervical variant anatomy or pathology).This circumferential searching strategy appears to beeven more powerful, moreover, if used in concert withUS-guided selection of the side of cannulation, choicebetween a high and low approach, and individualizedadjustment of the degree of head rotation. Determina-tion of this method’s true value during US-guided IJVcannulation, however, will require performance of acontrolled clinical study.
The authors appreciate the loan of the US imaging device used inthis study by Mike Vega of Sonosite, Inc., and Sonosite technicalsupport from Jason Hysom, Scott Temonia, and Lee Word. Acquir-ing and processing of US images were facilitated by Diane Benavids,Rebeca Mercer, RT, Irma Cordova, LRT, Lisa Lemen, PhD, SusheelaViswanathan, MD, Dawn Galliano, MD, Jane Clayton, MD, JoAnnTierney, RT, Debbi Sibley, Amanda Walker, Joyce Adams, and RoseJones. Karen Grady and Eugene New (Louisiana State UniversityHealth Sciences Center Department of Learning Resources) createdthe figures. Jane Eyrich, MD, and Jean LaCour, MD, helped withmanuscript preparation. Andrew Jones (Department of Mathemat-ics, Kings College, London, UK) checked the trigonometry in theAppendix. W. J. Hansche, PhD (Tulane University emeritus profes-sor of psychology and statistics), advised regarding the perfor-mance and interpretation of statistical correlation. The authors alsowish to express their appreciation to the journal reviewers andeditors whose many helpful suggestions greatly improved this ar-ticle’s readability.
References1. Randolph AG, Cook DJ, Gonzales CA, Pribble CG. Ultrasound
guidance for placement of central venous catheters: a meta-analysis of the literature. Crit Care Med 1996;24:2053–8.
2. Keenan SP. Use of ultrasound to place central lines. J Crit Care2002;17:126–37.
3. Rothschild JM. Ultrasound guidance of central vein catheteriza-tion. Evidence report/technology assessment No. 43. Makinghealth care safer. A critical analysis of patient safety practices.Agency for Healthcare Research and Quality Publication No.01-E508. 2001:245–53. Available at: http://www.ahrq.gov/clinic/ptsafety/chap21.htm.
4. Hind D, Calvert N, McWilliams R, et al. Ultrasonic locatingdevices for central venous cannulation: meta-analysis. BMJ2003;327:361–7.
5. Reuber M, Dunkley LA, Turton EPL, et al. Stroke after internaljugular venous cannulation. Acta Neurol Scand 2002;105:235–9.
6. Latto IP. The internal jugular vein. In: Latto IP, Ng WS, JonesPL, Jenkins B, eds. Percutaneous central venous and arterialcatheterization. 3rd ed. London: WB Saunders, 2000:135–95.
7. Augoustides JG, Diaz D, Weiner J, et al. Current practice ofinternal jugular venous cannulation in a university anesthesiadepartment: influence of operator experience on success of can-nulation and arterial injury. J Cardiothorac Vasc Anesth 2002;16:567–71.
8. Jobes DR. The element of experience in internal jugular veincatheterization. Anesth Analg 1992;75:643.
9. Troianos CA, Kuwik RJ, Pasqual JR, et al. Internal jugular veinand carotid artery anatomic relation as determined by ultra-sonography. Anesthesiology 1996;85:43–8.
10. Gordon AC, Saliken JC, Johns D, et al. US-guided puncture ofthe internal jugular vein: complications and anatomic consider-ations. J Vasc Interv Radiol 1998;9:333–8.
11. Koski EMJ, Suhonen M, Mattila MA. Ultrasound-facilitated cen-tral venous cannulation. Crit Care Med 1992;20:424–6.
12. Mangar D, Turnage WS, Mohamed SA. Is the internal jugularvein cannulated during insertion or withdrawal of the needleduring central venous cannulation? Anesth Analg 1993;76:1375.
13. Mallinson C, Bennett J, Hodgson P, Petros AJ. Position of theinternal jugular vein in children: a study of the anatomy usingultrasonography. Paediatr Anaesth 1999;9:111–4.
14. Alderson PJ, Burrows FA, Stemp LI, Holtby HM. Use of ultra-sound to evaluate internal jugular vein anatomy and to facilitatecentral venous cannulation in paediatric patients. Br J Anaesth1993;70:145–8.
15. Sulek CA, Gravenstein N, Blackshear RH, Weiss L. Head rota-tion during internal jugular vein cannulation and the risk ofcarotid artery puncture. Anesth Analg 1996;82:125–8.
16. Lin BS, Kong CW, Tarng DC, et al. Anatomical variation of theinternal jugular vein and its impact on temporary haemodialy-sis vascular access: an ultrasonographic survey in uraemic pa-tients. Nephrol Dial Transplant 1998;13:134–8.
17. Mauro MA, Jaques PF. Radiologic placement of long-term cen-tral venous catheters: a review. J Vasc Interv Radiol 1993;4:127–37.
18. Denys BG, Uretsky BF, Reddy PS. Ultrasound-assisted cannu-lation of the internal jugular vein: a prospective comparison tothe external landmark-guided technique. Circulation 1993;87:1557–62.
19. Silberzweig JE, Mitty HA. Central venous access: low internaljugular vein approach using imaging guidance. AJR Am JRoentgenol 1998;170:1617–20.
20. Lichtenstein D, Saifi R, Augarde R, et al. The internal jugularveins are asymmetric: usefulness of ultrasound before catheter-ization. Crit Care Med 2001;27:301–5.
21. Oshima E, Ishizu K, Urabe N. A newly designed curved needlefor percutaneous cannulation of the internal jugular vein. An-esthesiology 1993;78:792–3.
22. Daniel M. Head rotation during internal jugular vein cannula-tion and risk of carotid artery puncture. Anesth Analg 1996;83:660.
23. Hull JE, Hunter CS, Luiken GA. The Groshong catheter: initialexperience and early results of imaging-guided placement. Ra-diology 1992;185:803–7.
ANESTH ANALG CRITICAL CARE AND TRAUMA RIOPELLE ET AL. 5192005;100:512–9 CIRCUMFERENTIAL CERVICAL ULTRASOUND IMAGING FOR INTERNAL JUGULAR VEIN
Epinephrine Enhances Platelet-Neutrophil Adhesion in WholeBlood In VitroNicola A. Horn, MD*, Denisa M. Anastase, MD†, Klaus E. Hecker, MD*, Jan H. Baumert, MD*,Tilo Robitzsch, MD‡, and Rolf Rossaint, MD, PhD*
*Department of Anesthesiology, Rheinisch-Westfalische Technische Hochschule, Aachen, Germany; †Department ofAnesthesiology, Spitalul Clinic de Ortopedie Foisor, Bucuresti, Romania; and ‡Institute of Transfusion Medicine,Rheinisch-Westfalische Technische Hochschule, Aachen, Germany
Previous studies showed that �- or �-adrenoceptorstimulation by catecholamines influenced neutrophilfunction, cytokine liberation, and platelet aggregabil-ity. We investigated whether adrenergic stimulationwith epinephrine also alters platelet-neutrophil adhe-sion. This might be of specific interest in the critically ill,because the increased association of platelets and neu-trophils has been shown to be of key importance in in-flammation and thrombosis. For this purpose, wholeblood was incubated with increasing concentrations ofepinephrine (10 nM, 100 nM, and 1 �M). To distinguishreceptor-specific effects, a subset of samples was incu-bated with propranolol (10 �M) or phentolamine (10�M) before exposure to epinephrine. After incubation,another subset of samples was also stimulated with 100nM of N-formyl-methionyl-leucyl-phenylalanine. Allsamples were stained, and platelet-neutrophil adhe-sion and CD45, L-selectin, CD11b, P-selectin glycopro-tein ligand-1, glycoprotein IIb/IIIa, and P-selectin ex-pression were measured by two-color flow cytometry.
Epinephrine significantly enhanced platelet-neutrophiladhesion and P-selectin and glycoprotein IIb/IIIa ex-pression on platelets. CD11b and L-selectin expressionon unstimulated neutrophils remained unchanged,whereas N-formyl-methionyl-leucyl-phenylalanine-induced upregulation of CD11b and downregulationof L-selectin were suppressed by epinephrine.�-Adrenergic blockade before incubation with epi-nephrine increased platelet-neutrophil aggregates andadhesion molecule expression (CD11b, P-selectin, andglycoprotein IIb/IIIa) even further. These results dem-onstrate that epinephrine enhances platelet-neutrophiladhesion. The �-adrenergic receptor-mediated increasein P-selectin and glycoprotein IIb/IIIa expression onplatelets may contribute substantially to this effect. Ourstudy shows that inotropic support enhances theplatelet-neutrophil interaction, which might be crucialfor critically ill patients.
(Anesth Analg 2005;100:520–6)
A n increased association of activated plateletswith leukocytes contributes to the pathophysi-ology of unstable angina, myocardial infarction,
cardiopulmonary bypass, thrombosis, and sepsis (1–3). There is evidence that cells involved in such het-erotypic conjugates perform intercellular communica-tion and facilitate thrombin generation and leukocyterolling and migration, thus contributing to the courseof the pathologic process (4–7). Catecholamine con-centrations are increased as an early stress responseafter cardiac arrest, myocardial infarction, andtrauma. Therapeutically, they are used in critically ill
patients to treat low cardiac output and severe hypo-tension. Previous studies have shown that epineph-rine modulates the unspecific immune response. Itdecreases neutrophil adherence, chemotaxis, andphagocytic capacity (8–10). Epinephrine also inhibitstumor necrosis factor (TNF)-� and interleukin (IL)-1�production but enhances IL-8 and IL-10 productionand L-selectin expression in monocytes (11–14). Epi-nephrine also enhances P-selectin expression in plate-lets and the opening of glycoprotein (GP)IIb/IIIabinding sites for fibrinogen, and it favors platelet ag-gregation (15–17).
Little is known about the effects of epinephrine onplatelet-neutrophil adhesion at concentrations ob-served during therapeutic inotropic support or majorinjury. Knowledge of such effects may have implica-tions not only for understanding endogenous stresshormone influences during injury, but also for thetherapeutic use of catecholamines in patients with
Accepted for publication July 21, 2004.Address correspondence and reprint requests to Nicola A. Horn,
MD, Department of Anesthesiology, Rheinisch-Westfalische Tech-nische Hochschule Aachen, Pauwelsstra�e 30, 52074 Aachen, Ger-many. Address e-mail to [email protected].
DOI: 10.1213/01.ANE.0000141527.60441.B7
©2005 by the International Anesthesia Research Society520 Anesth Analg 2005;100:520–6 0003-2999/05
septic shock or cardiac failure. Considering the above-described changes in leukocyte and platelet function,we hypothesized that epinephrine could enhanceplatelet-neutrophil conjugate formation because ofchanges in adhesion molecule expression. Hence, wefirst studied the effects of epinephrine on platelet-neutrophil adhesion and adhesion molecule expres-sion by using an established whole-blood modeland two-color flow cytometry. Because epinephrineexhibits both � and � effects and platelets and neu-trophils possess adrenoceptors, in a second step weused �- and �-adrenergic receptor-blocking drugs toidentify the adrenergic receptors possibly involvedin epinephrine-induced immunomodulation.
MethodsThe following were purchased from BD Pharmingen(San Jose, CA): anti-CD41a-phycoerythrin (PE; cloneHIP8) monoclonal antibody (mAb) recognizing plate-let GPIIb/IIIa complex; anti-CD62P-fluorescein iso-thiocyanate (FITC; clone AK-4) mAb directed againstP-selectin expressed on platelet surface; anti-CD45-FITC (clone HI30) mAb for leukocyte common anti-gen; anti-CD62L-PE (clone Dreg 56) L-selectin-bindingmAb; anti-CD11b-PE (clone ICRF44) CD11b-bindingmAb; anti-CD162 (clone KPL-1) mAb recognizingP-selectin GP ligand-1 (PSGL-1); anti-negative immu-noglobulin G1-FITC and immunoglobulin G1-PE an-tibodies (clone MOPC-21); antibodies for nonspecificbinding; and FACSlysing solution. Dulbecco’sphosphate-buffered saline (PBS) without Ca2� andMg2�, bovine serum albumin (BSA), epinephrine,paraformaldehyde, and N-formyl-methionyl-leucyl-phenylalanine (FMLP) were obtained from SigmaChemicals (St. Louis, MO). FMLP is a physiologicalagonist of the FMLP receptor on the neutrophil cellsurface. Activation of the FMLP receptor results indownregulation of PSGL-1 and L-selectin, whereasCD11b expression is increased.
After we obtained informed written consent fromsubjects and approval from the local ethics committee,blood samples were taken from 10 healthy volunteerswho had not received any medication for at least 2 wk.Venous blood was carefully collected without a tour-niquet from a cubital vein by using a 20-gauge butter-fly needle. The first 3 mL of blood was used to per-form a hemogram and was then discarded; the nextsamples were drawn into polypropylene tubes con-taining sodium citrate. Nine parts of blood were anti-coagulated with one part of 3.8% trisodium citrate. Allblood samples were immediately diluted 1:1 with37°C prewarmed PBS, placed in sterile polypropylenetissue culture dishes (Sarstedt, Nuermbrecht, Ger-many), and incubated with 10 nM/L, 100 nM/L, or 1�M/L (final concentrations) epinephrine. These con-centrations approximately represent, respectively, a
small therapeutic and a large therapeutic dose and arather supramaximal concentration, although such aconcentration might be achieved in case of cardiopul-monary resuscitation. For the experiments with anti-adrenergic drugs, the samples were incubated withpropranolol (10 �M) or phentolamine (10 �M) beforeexposure to epinephrine. The tubes were gently mixedand placed in an incubator for 15 min.
Stimulation, immunofluorescence staining, and flowcytometric analysis were performed as previously de-scribed with minor modifications (1). After incubation, asubset of blood samples were stimulated with FMLP(final concentration, 100 nM). After 10 min, 100 �L ofstimulated or unstimulated whole blood was added tosaturating concentrations of fluorochrome-conjugatedantibodies and stained for 15 min in the dark. The stain-ing procedure was stopped by adding 1.5 mL of lysingsolution for 10 min. The samples were then centrifuged(350g at 4°C for 5 min), washed with PBS containing 1%BSA, and centrifuged again. The remaining pellet wasresuspended in 500 �L of PBS containing 1% BSA and1% paraformaldehyde. Flow cytometric “two color”analyses were performed on a FACSCalibur flow cytom-eter and analyzed with CellQuest 3.1 software (BectonDickinson, San Jose, CA). Before each measurement, theflow cytometer was calibrated with fluorescence mi-crobeads (Calibrite Beads; Becton Dickinson).
To determine platelet-leukocyte aggregates, the leu-kocyte subpopulations were differentiated by cell size(forward scatter), granularity (side scatter), and bind-ing of anti-CD45-FITC by using linear scaling. Foreach sample, 40,000 leukocytes were collected. Theleukocyte subgroups were separately gated, andplatelet-leukocyte aggregates were defined as cellspositive for CD41a and CD45 in these subgroups. Thepercentage of CD41a-positive conjugates representsthe percentage of leukocytes with at least one boundplatelet (18).
After incubation, a subset of blood samples wasstimulated with FMLP (final concentration, 100 nM),washed, and stained as described above. To determineadhesion molecule expression, the leukocyte sub-populations were differentiated by cell size (forwardscatter), granularity (side scatter), and binding of anti-CD45-FITC by using linear scaling. For each sample,40,000 leukocytes were collected. The leukocyte sub-groups were separately gated, and the expression ofadhesion molecules was measured as mean fluores-cence intensity of the specific antibody on neutrophils.
To determine P-selectin and CD41a expression, theplatelet population was adjusted to 20 � 109/L beforethe staining procedure and was defined in flow cy-tometry by using size and in CD41a-PE immunofluo-rescence by using logarithmic scaling. For each sam-ple, 10,000 platelets were measured. The percentage of
ANESTH ANALG CRITICAL CARE AND TRAUMA HORN ET AL. 5212005;100:520–6 EPINEPHRINE AND CONJUGATE FORMATION

platelets positive for P-selectin and the mean fluores-cence intensity of P-selectin and CD41a were meas-ured (19).
The Kolmogorov-Smirnov test showed that the datawere mainly normally distributed. Thus, data are pre-sented as means and sd. Differences between the con-trol samples and the samples exposed to increasingconcentrations of epinephrine were evaluated withStudent’s t-test (NCSS 6.0.7; NCSS, Kaysville, UT). P �0.05 was considered significant.
ResultsAlmost all concentrations of epinephrine significantlyenhanced the binding of platelets to neutrophils inunstimulated and FMLP-stimulated whole blood (Fig.1). The enhancing effect of epinephrine on neutrophil-platelet conjugate formation was markedly increasedby �-adrenergic blockade. Interestingly, �-adrenergicblockade also led to a small increase in epinephrine-induced platelet-neutrophil adhesion (Fig. 2).
Epinephrine did not modify CD11b or L-selectinexpression on unstimulated neutrophils. Neverthe-less, after �-adrenergic blockade, the incubation withepinephrine caused a significant increase in CD11b ex-pression on unstimulated neutrophils. �-Adrenergicblockade also caused a small increase in CD11b expres-sion (Fig. 2). In FMLP-stimulated neutrophils, epineph-rine inhibited the FMLP-induced increase in CD11bexpression. This inhibition was completely reversedby �-adrenergic blockade but not by �-adrenergicblockade (Table 1).
L-selectin expression in unstimulated blood was notmodified by epinephrine. FMLP-stimulated neutro-phils showed an increased expression or reducedshedding of L-selectin after incubation with epineph-rine. Preincubation with propranolol abolished thiseffect almost completely, whereas phentolaminecaused only a partial decline in L-selectin expression(Table 1). PSGL-1 did not show any significantchanges in surface expression (Table 1).
Epinephrine enhanced the expression of P-selectinand GPIIb/IIIa on unstimulated platelets. �-Adrenergicblockade with phentolamine before incubation with epi-nephrine abolished this increase almost completely,whereas �-adrenergic blockade caused a marked in-crease in both P-selectin and GPIIb/IIIa expression(Table 1, Fig. 3).
Because �-adrenergic blockade with phentolaminepreceding incubation with epinephrine also led to asmall increase in platelet-neutrophil adhesion andCD11b expression, we added some measurements withphentolamine only. Interestingly, phentolamine alonealso enhanced CD11b expression and, concomitantly,platelet-neutrophil aggregate formation, whereas allother platelet and neutrophil adhesion molecules re-mained unchanged (Table 2). The other measurements
with epinephrine alone and epinephrine plus phentol-amine corresponded to the results described above.
DiscussionThis study demonstrates that platelet-neutrophil con-jugate formation is enhanced by epinephrine. Thisincreased adhesion was accompanied by an alteredadhesion molecule pattern and was modified by �-and �-adrenergic blockade.
Several in vitro and in vivo studies suggest thatadrenergic receptor stimulation on immune cells cansubstantially alter a variety of cellular activities, aswell as the release of inflammatory mediators. Epi-nephrine increases neutrophil recruitment into pe-ripheral blood by an �-adrenergic stimulus. There isalso evidence that epinephrine decreases neutrophiladherence, chemotaxis, and phagocytic capacity (8–10). �-Adrenergic agonists inhibit the production ofproinflammatory mediators such as TNF-�, IL-1, andIL-12, but they augment L-selectin expression and therelease of the antiinflammatory substances IL-10 andIL-6. Stimulation of �2-adrenoceptors increases the re-lease of TNF-� and IL-1�, whereas inhibition of �2-adrenoceptors enhances the release of the antiinflam-matory molecules IL-6 and IL-10 and suppresses theproduction of TNF-� and IL-12 (20–22). In platelets, ithas also been shown that epinephrine can potentiateplatelet activation and aggregation by activating plate-let �2-adrenoceptors (17).
On the basis of these findings, we hypothesized thatepinephrine also influences the regulation of the cell-to-cell interaction between platelets and neutrophils.We first evaluated the effect of epinephrine on the
Figure 1. Percentage of platelet-neutrophil conjugates in unstimu-lated and N-formyl-methionyl-leucyl-phenylalanine (FMLP)-stimulated (100 nM) whole blood after incubation with increasingconcentrations of epinephrine (10 nM, 100 nM, and 1 �M). Meanand sd are given. *Significantly different (P � 0.05) from control.
522 CRITICAL CARE AND TRAUMA HORN ET AL. ANESTH ANALGEPINEPHRINE AND CONJUGATE FORMATION 2005;100:520–6
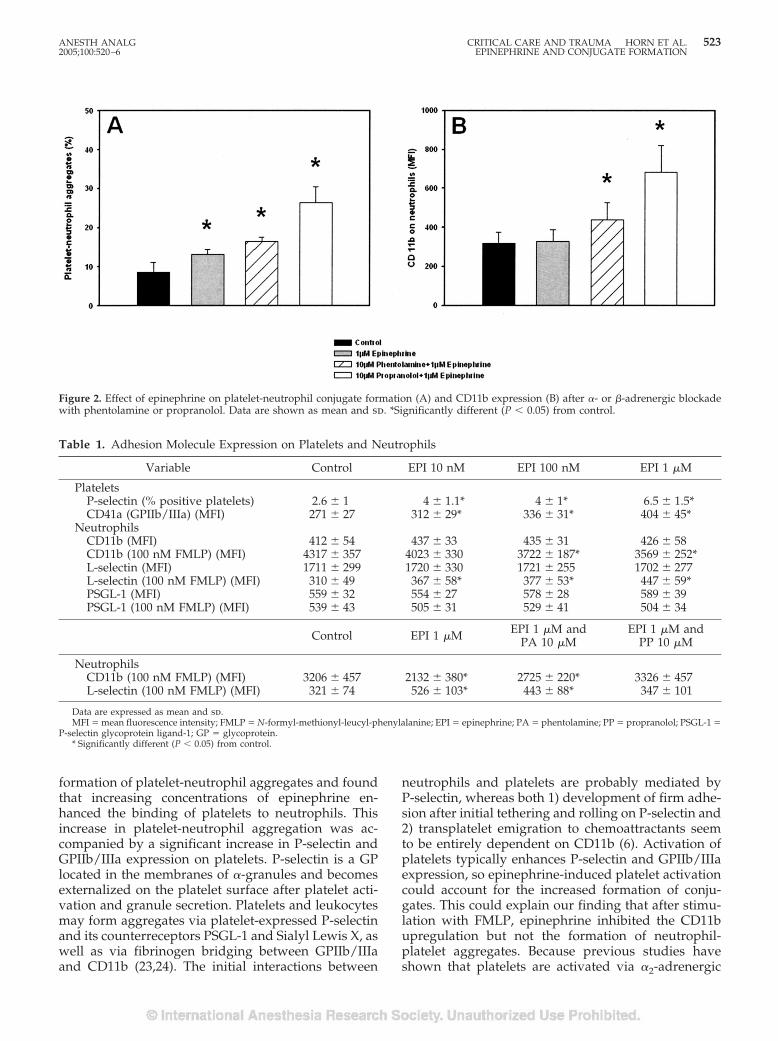
formation of platelet-neutrophil aggregates and foundthat increasing concentrations of epinephrine en-hanced the binding of platelets to neutrophils. Thisincrease in platelet-neutrophil aggregation was ac-companied by a significant increase in P-selectin andGPIIb/IIIa expression on platelets. P-selectin is a GPlocated in the membranes of �-granules and becomesexternalized on the platelet surface after platelet acti-vation and granule secretion. Platelets and leukocytesmay form aggregates via platelet-expressed P-selectinand its counterreceptors PSGL-1 and Sialyl Lewis X, aswell as via fibrinogen bridging between GPIIb/IIIaand CD11b (23,24). The initial interactions between
neutrophils and platelets are probably mediated byP-selectin, whereas both 1) development of firm adhe-sion after initial tethering and rolling on P-selectin and2) transplatelet emigration to chemoattractants seemto be entirely dependent on CD11b (6). Activation ofplatelets typically enhances P-selectin and GPIIb/IIIaexpression, so epinephrine-induced platelet activationcould account for the increased formation of conju-gates. This could explain our finding that after stimu-lation with FMLP, epinephrine inhibited the CD11bupregulation but not the formation of neutrophil-platelet aggregates. Because previous studies haveshown that platelets are activated via �2-adrenergic
Figure 2. Effect of epinephrine on platelet-neutrophil conjugate formation (A) and CD11b expression (B) after �- or �-adrenergic blockadewith phentolamine or propranolol. Data are shown as mean and sd. *Significantly different (P � 0.05) from control.
Table 1. Adhesion Molecule Expression on Platelets and Neutrophils
Variable Control EPI 10 nM EPI 100 nM EPI 1 �M
PlateletsP-selectin (% positive platelets) 2.6 � 1 4 � 1.1* 4 � 1* 6.5 � 1.5*CD41a (GPIIb/IIIa) (MFI) 271 � 27 312 � 29* 336 � 31* 404 � 45*
NeutrophilsCD11b (MFI) 412 � 54 437 � 33 435 � 31 426 � 58CD11b (100 nM FMLP) (MFI) 4317 � 357 4023 � 330 3722 � 187* 3569 � 252*L-selectin (MFI) 1711 � 299 1720 � 330 1721 � 255 1702 � 277L-selectin (100 nM FMLP) (MFI) 310 � 49 367 � 58* 377 � 53* 447 � 59*PSGL-1 (MFI) 559 � 32 554 � 27 578 � 28 589 � 39PSGL-1 (100 nM FMLP) (MFI) 539 � 43 505 � 31 529 � 41 504 � 34
Control EPI 1 �M EPI 1 �M andPA 10 �M
EPI 1 �M andPP 10 �M
NeutrophilsCD11b (100 nM FMLP) (MFI) 3206 � 457 2132 � 380* 2725 � 220* 3326 � 457L-selectin (100 nM FMLP) (MFI) 321 � 74 526 � 103* 443 � 88* 347 � 101
Data are expressed as mean and sd.MFI � mean fluorescence intensity; FMLP � N-formyl-methionyl-leucyl-phenylalanine; EPI � epinephrine; PA � phentolamine; PP � propranolol; PSGL-1 �
P-selectin glycoprotein ligand-1; GP � glycoprotein.* Significantly different (P � 0.05) from control.
ANESTH ANALG CRITICAL CARE AND TRAUMA HORN ET AL. 5232005;100:520–6 EPINEPHRINE AND CONJUGATE FORMATION
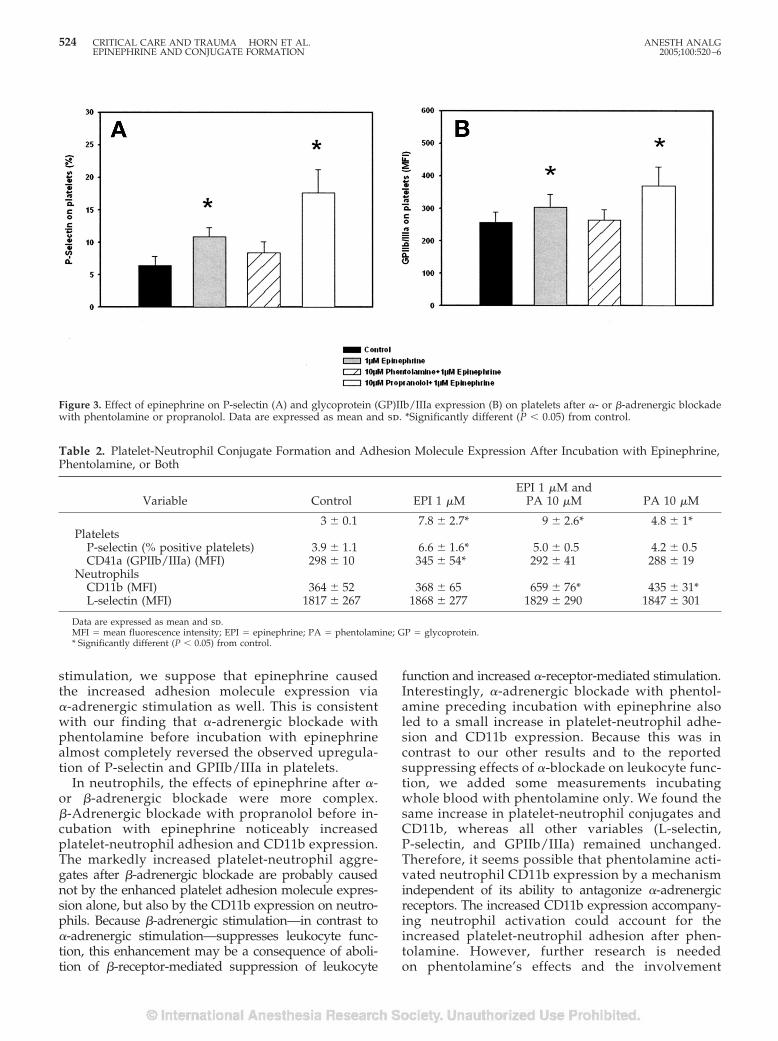
stimulation, we suppose that epinephrine causedthe increased adhesion molecule expression via�-adrenergic stimulation as well. This is consistentwith our finding that �-adrenergic blockade withphentolamine before incubation with epinephrinealmost completely reversed the observed upregula-tion of P-selectin and GPIIb/IIIa in platelets.
In neutrophils, the effects of epinephrine after �-or �-adrenergic blockade were more complex.�-Adrenergic blockade with propranolol before in-cubation with epinephrine noticeably increasedplatelet-neutrophil adhesion and CD11b expression.The markedly increased platelet-neutrophil aggre-gates after �-adrenergic blockade are probably causednot by the enhanced platelet adhesion molecule expres-sion alone, but also by the CD11b expression on neutro-phils. Because �-adrenergic stimulation—in contrast to�-adrenergic stimulation—suppresses leukocyte func-tion, this enhancement may be a consequence of aboli-tion of �-receptor-mediated suppression of leukocyte
function and increased �-receptor-mediated stimulation.Interestingly, �-adrenergic blockade with phentol-amine preceding incubation with epinephrine alsoled to a small increase in platelet-neutrophil adhe-sion and CD11b expression. Because this was incontrast to our other results and to the reportedsuppressing effects of �-blockade on leukocyte func-tion, we added some measurements incubatingwhole blood with phentolamine only. We found thesame increase in platelet-neutrophil conjugates andCD11b, whereas all other variables (L-selectin,P-selectin, and GPIIb/IIIa) remained unchanged.Therefore, it seems possible that phentolamine acti-vated neutrophil CD11b expression by a mechanismindependent of its ability to antagonize �-adrenergicreceptors. The increased CD11b expression accompany-ing neutrophil activation could account for theincreased platelet-neutrophil adhesion after phen-tolamine. However, further research is neededon phentolamine’s effects and the involvement
Figure 3. Effect of epinephrine on P-selectin (A) and glycoprotein (GP)IIb/IIIa expression (B) on platelets after �- or �-adrenergic blockadewith phentolamine or propranolol. Data are expressed as mean and sd. *Significantly different (P � 0.05) from control.
Table 2. Platelet-Neutrophil Conjugate Formation and Adhesion Molecule Expression After Incubation with Epinephrine,Phentolamine, or Both
Variable Control EPI 1 �MEPI 1 �M and
PA 10 �M PA 10 �M
3 � 0.1 7.8 � 2.7* 9 � 2.6* 4.8 � 1*Platelets
P-selectin (% positive platelets) 3.9 � 1.1 6.6 � 1.6* 5.0 � 0.5 4.2 � 0.5CD41a (GPIIb/IIIa) (MFI) 298 � 10 345 � 54* 292 � 41 288 � 19
NeutrophilsCD11b (MFI) 364 � 52 368 � 65 659 � 76* 435 � 31*L-selectin (MFI) 1817 � 267 1868 � 277 1829 � 290 1847 � 301
Data are expressed as mean and sd.MFI � mean fluorescence intensity; EPI � epinephrine; PA � phentolamine; GP � glycoprotein.* Significantly different (P � 0.05) from control.
524 CRITICAL CARE AND TRAUMA HORN ET AL. ANESTH ANALGEPINEPHRINE AND CONJUGATE FORMATION 2005;100:520–6
of �-adrenergic receptors in neutrophil integrinexpression.
The different immunomodulatory effects of �- or�-adrenergic stimulation are probably due to activa-tion of different intracellular pathways. On the molec-ular level, �-adrenergic stimulation most likely resultsin an activation of nuclear factor-�B through activa-tion of protein kinase C and increased intracellularCa2�, whereas �-adrenergic stimulation leads to anincrease of cyclic adenosine monophosphate, whichactivates protein kinase A. Activated protein kinase Ais translocated to the nucleus and blocks nuclearfactor-�B while activating the cyclic adenosinemonophosphate-responsive element-binding protein.Therefore, �- or �-adrenergic stimulation can havemarkedly different downstream effects (25–28).
Our study showed that epinephrine enhancedplatelet-neutrophil adhesion, probably through�-adrenergic stimulation of both cell types. Consid-ering the proinflammatory potential of platelet-neutrophil aggregates, our study supports previousstudies, which could show that ligation to the�-adrenergic receptor is associated with predomi-nantly immunostimulating effects, whereas stimu-lation of the �-adrenergic receptor mostly hasimmunosuppressive effects (29,30). Whereas in thecase of cytokine liberation, the �-adrenoceptor-mediated effects usually override those inducedby �-adrenoceptor stimulation, it seems that inplatelet-neutrophil conjugation, the enhancing �-adrenergic effects—predominantly on platelets—outweighed the �-adrenergic effects. The adhesionbetween platelets and neutrophils is a key event inthrombosis and inflammation (31). Binding of acti-vated platelets to neutrophils induces respiratoryburst and mediates initial neutrophil attachmentand rolling, which may lead to neutrophil accumulationat sites of injury (32,33). Therefore, enhanced adhesionafter the administration of epinephrine could be crucialfor patients with myocardial infarction, trauma, or sep-sis. Gawaz et al. (3) also showed that in septic patients,platelet-neutrophil adhesion was an independent pre-dictor for poor clinical outcome. We studied epinephrineconcentrations ranging from small therapeutic tosupramaximal concentrations, and although thelargest amount of conjugates was observed afterstimulation with the rather supramaximal epineph-rine concentration, it should be noticed that evensmaller therapeutic concentrations significantly en-hanced platelet-neutrophil adhesion. Nevertheless,the clinical aspects and therapeutic consequences ofthe enhancing effects of epinephrine on platelet-neutrophil adhesion and adhesion molecule expres-sion in our study remain speculative. First, the ther-apeutic use of epinephrine is normally required bythe hemodynamic state of the patients, which often
does not leave much choice for therapeutic alterna-tives. Second, considering the complex immuno-modulatory effects of �-or �-adrenergic stimulation,there are still no data available indicating potentialbeneficial or detrimental consequences at differentstages of disease.
Finally, there are limitations to our study. In con-trast to previous studies, we used whole blood insteadof isolated neutrophils or platelet-rich plasma, whichhas the advantages that possibly important influencesand interactions of other blood cells and plasma com-ponents are not neglected and that artificial cell acti-vation caused by the isolation process is avoided.However, the value of this system is limited by itsstatic condition and the lack of endothelial cells.Therefore, additional in vivo studies or studies with adynamic model are necessary to further define the roleof epinephrine in modulating platelet-neutrophil in-teraction and adhesion molecule expression and theclinical relevance of our findings. Nonetheless, ourstudy adds another aspect to the understanding of theimmunological side effects of endogenous or thera-peutically increased catecholamine levels.
The authors thank Nicole Heussen, Department of Biometry andStatistics, Rheinisch-Westfalische Technische Hochschule Aachen,for her statistical advice.
References1. Ott I, Neumann FJ, Gawaz M, et al. Increased neutrophil-
platelet adhesion in patients with unstable angina. Circulation1996;94:1239–46.
2. Rinder CS, Bonan JL, Rinder HM, et al. Cardiopulmonary by-pass induces leukocyte-platelet adhesion. Blood 1992;79:1201–5.
3. Gawaz M, Dickfeld T, Bogner C, et al. Platelet function in septicmultiple organ dysfunction syndrome. Intensive Care Med1997;23:379–85.
4. Losche W, Dressel M, Krause S, et al. Contact-induced modu-lation of neutrophil elastase secretion and phagocytic activity byplatelets. Blood Coagul Fibrinolysis 1996;7:210–3.
5. Neumann FJ, Marx N, Gawaz M, et al. Induction of cytokineexpression in leukocytes by binding of thrombin-stimulatedplatelets. Circulation 1997;95:2387–94.
6. Diacovo TG, Roth SJ, Buccola JM, et al. Neutrophil rolling,arrest, and transmigration across activated, surface-adherentplatelets via sequential action of P-selectin and the beta2-integrin CD11b/CD18. Blood 1996;88:146–57.
7. Weyrich AS, Elstad MR, McEver RP, et al. Activated plateletssignal chemokine synthesis by human monocytes. J Clin Invest1996;97:1525–34.
8. Boxer LA, Allen JM, Baehner RL. Diminished polymorphonu-clear leukocyte adherence: function dependent on release ofcyclic AMP by endothelial cells after stimulation of beta-receptors by epinephrine. J Clin Invest 1980;66:268–74.
9. Davis JM, Albert JD, Tracy KJ, et al. Increased neutrophil mo-bilization and decreased chemotaxis during cortisol and epi-nephrine infusions. J Trauma 1991;31:725–31.
10. Wenisch C, Parschalk B, Weiss A, et al. High-dose catechol-amine treatment decreases polymorphonuclear leukocytephagocytic capacity and reactive oxygen production. Clin DiagnLab Immunol 1996;3:423–8.
ANESTH ANALG CRITICAL CARE AND TRAUMA HORN ET AL. 5252005;100:520–6 EPINEPHRINE AND CONJUGATE FORMATION
11. Van der Poll T, Coyle SM, Barbosa K, et al. Epinephrine inhibitstumor necrosis factor-alpha and potentiates interleukin 10 pro-duction during human endotoxemia. J Clin Invest 1996;97:713–9.
12. Englstad CS, Lund T, Osterud B. Epinephrine promotes IL-8production in human leukocytes via an effect on platelets.Thromb Haemost 1999;81:139–45.
13. Severn A, Rapson NT, Hunter CA, Liew FY. Regulation oftumor necrosis factor production by adrenaline and beta-adrenergic agonists. J Immunol 1992;148:3441–5.
14. Rainer TH, Lam N, Cocks RA. Adrenaline upregulates mono-cyte L-selectin in vitro. Resuscitation 1999;43:47–55.
15. Hjemdahl P, Chronos NA, Wilson DJ, et al. Epinephrine sensi-tizes human platelets in vivo and in vitro as studied by fibrin-ogen binding and P-selectin expression. Arterioscler Thromb1994;14:77–84.
16. Wang JS, Cheng LJ. Effect of strenuous, acute exercise onalpha2-adrenergic agonist-potentiated platelet activation. Arte-rioscler Thromb Vasc Biol 1999;19:1559–65.
17. Shattil SJ, Budzynski A, Scrutton MC. Epinephrine inducesplatelet fibrinogen receptor expression, fibrinogen binding, andaggregation in whole blood in the absence of other excitatoryagonists. Blood 1989;73:150–8.
18. Rinder HM, Bonan JL, Rinder CS, et al. Activated and unacti-vated platelet adhesion to monocytes and neutrophils. Blood1991;78:1760–9.
19. Schmitz G, Rothe G, Ruf A, et al. European Working Group onClinical Cell Analysis: consensus protocol for the flow cytomet-ric characterisation of platelet function. Thromb Haemost 1998;79:885–96.
20. Elenkov IJ, Wilder RL, Chrousos GP, Vizi ES. The sympatheticnerve: an integrative interface between two supersystems—thebrain and the immune system. Pharmacol Rev 2000;52:595–638.
21. Guirao X, Kumar A, Katz J, et al. Catecholamines increasemonocyte TNF receptors and inhibit TNF through beta2-adrenoreceptor activation. Am J Physiol 1997;273:1203–8.
22. Hasko G. Receptor-mediated interaction between the sympa-thetic nervous system and immune system in inflammation.Neurochem Res 2001;26:1039–44.
23. Brown KK, Henson PM, Maclouf J, et al. Neutrophil-plateletadhesion: relative roles of platelet P-selectin and neutrophilbeta2 (DC18) integrins. Am J Respir Cell Mol Biol 1998;18:100–10.
24. Evangelista V, Manarini S, Rotondo S, et al. Platelet/polymorphonuclear leukocyte interaction in dynamic conditions:evidence of adhesion cascade and cross talk between P-selectinand the beta 2 integrin CD11b/CD18. Blood 1996;88:4183–94.
25. Exton JH. Mechanisms involved in alpha-adrenergic phenom-ena. Am J Physiol 1985;248:633–47.
26. Shirakawa F, Mizel SB. In vitro activation and nuclear translo-cation of NF-kappa B catalyzed by cyclic AMP-dependent pro-tein kinase and protein kinase C. Mol Cell Biol 1989;9:2424–30.
27. Le Tulzo Y, Shenkar R, Kaneko D, et al. Hemorrhage increasescytokine expression in lung mononuclear cells in mice: involve-ment of catecholamines in nuclear factor-kappaB regulation andcytokine expression. J Clin Invest 1997;99:1516–24.
28. Barnes PJ. Beta-adrenergic receptors and their regulation. Am JRespir Crit Care Med 1995;152:838–60.
29. Bergmann M, Sautner T. Immunomodulatory effects of vasoac-tive catecholamines. Wien Klin Wochenschr 2002;114:752–61.
30. Bazzoni G, Dejana E, Del Maschio A. Adrenergic modulation ofhuman polymorphonuclear leukocyte activation: potentiatingeffect of adenosine. Blood 1991;77:2042–8.
31. Peters MJ, Dixon G, Kotowicz KT, et al. Circulating platelet-neutrophil complexes represent a subpopulation of activatedneutrophils primed for adhesion, phagocytosis and intracellularkilling. Br J Haematol 1999;106:391–9.
32. Ruf A, Patscheke H. Platelet-induced neutrophil activation:platelet-expressed fibrinogen induces the oxidative burst inneutrophils by an interaction with CD11C/CD18. Br J Haematol1995;90:791–6.
33. Weber C, Springer TA. Neutrophil accumulation on activated,surface-adherent platelets in flow is mediated by interaction ofMac-1 with fibrinogen bound to alphaIIbbeta3 and stimulatedby platelet-activating factor. J Clin Invest 1997;100:2085–93.
526 CRITICAL CARE AND TRAUMA HORN ET AL. ANESTH ANALGEPINEPHRINE AND CONJUGATE FORMATION 2005;100:520–6
A Review of the True Methodological Quality of NutritionalSupport Trials Conducted in the Critically Ill:Time for ImprovementGordon S. Doig, PhD, Fiona Simpson, MSc, and Anthony Delaney, MBBS
From the Northern Clinical School, University of Sydney, Department of Intensive Care, Royal North Shore Hospital,Sydney, Australia, the Department of Nutrition, Royal North Shore Hospital, Sydney, Australia and Foothills MedicalCentre, Calgary, Alberta, Canada
In this review we sought to appraise the true method-ological quality of nutritional support studies con-ducted in critically ill patients and to compare thesefindings to the methodological quality of sepsis trials.An extensive literature search revealed 111 randomizedcontrolled trials conducted in critically ill patients eval-uating the impact of nutritional support interventionson clinically meaningful outcomes. Compared withsepsis trials, nutritional support studies were signifi-cantly less likely to use blinding (32 of 40 versus 35 of111, P � 0.001) or present an intention-to-treat analysis(37 of 40 versus 64 of 111, P � 0.001). There was a trendtoward the less frequent use of randomization methodsthat are known to maintain allocation concealment (12of 40 versus 19 of 111, P � 0.10). Although nutritional
support studies demonstrated a significant increasein the use of blinding after the publication of theCONSORT statement in 1996 (9 of 47 versus 26 of 64post-CONSORT, P � 0.023), there were no improve-ments in other key areas. Previous publications havedescribed the overall methodological quality of sep-sis trials as “poor.” Nutritional support studies weresignificantly worse than sepsis trials in all aspects ofmethodological quality, and there were few improve-ments noted over time. To detect important differ-ences in clinically meaningful outcomes in criticalcare, the methodological quality of future studiesmust be improved.
(Anesth Analg 2005;100:527–33)
N utritional support is an important aspect of themanagement of all hospitalized patients. How-ever, the provision of nutritional support to the
critically ill patient is highly variable and often sub-optimal (1). One possible way to reduce the variabilityand improve the appropriateness of nutritional sup-port practices is to promote the availability of high-quality evidence (2,3).
A problem that faces clinicians when examining theliterature is how to discern which trials are of sufficientmethodological quality to merit changes to clinicalpractice. Previous systematic reviews of nutritionalsupport studies (4,5) have identified high-quality tri-als using composite methodological quality scales (6).Research suggests that composite quality scales may
actually mask important differences in true method-ological quality (7).
In an evaluation of a 25-item composite qualityscale based on the 1996 Consolidated Standardsof Reporting Trials (CONSORT) statement (8),Huwiler-Muntener et al. found that “the true qual-ity of a substantial portion of well conducted trialsand of trials of low methodological quality will bemisjudged.” True methodological quality was de-fined using three key criteria: 1) concealment ofrandom treatment allocation, 2) appropriate use ofblinding, and 3) presentation of an intention-to-treat(ITT) analysis. These three key criteria are relevantto all types of clinical trials, and when they are notaddressed, estimates of benefit (or harm) obtainedfrom any randomized controlled trial (RCT) aremore likely to be biased (9).
The purpose of this review is to use the three keycriteria of true methodological quality to assess nutri-tional support studies conducted in the critically ill andto determine if true quality is improving over time. Toprovide a benchmark reference, the true methodologicalquality of nutritional support studies will be compared
Supplemental material available at anesthesia-analgesia.org.Supported, in part, by grants from the Australian and New Zea-
land Intensive Care Foundation and the NorthCare Foundation.Accepted for publication July 20, 2004.Address correspondence to Gordon S. Doig, PhD, Royal North
Shore Hospital, Pacific Highway, St. Leonards, NSW, Australia2065. Address e-mail to [email protected].
DOI: 10.1213/01.ANE.0000141676.12552.D0
©2005 by the International Anesthesia Research Society0003-2999/05 Anesth Analg 2005;100:527–33 527
with results obtained from a previously published re-view of clinical trials of sepsis therapies (10).
MethodsA comprehensive literature search was conducted todetect all primary nutritional support studies performedin critically ill patient populations. A MEDLINE search(from 1966) using the PubMed search engine (www.PubMed.org) was cross-referenced with an EMBASEsearch (from 1980) undertaken using the Ovid searchengine (www.Ovid.com). Extensive search statementswere developed specific to each search engine (PubMedand Ovid) to detect all possible primary nutritional sup-port studies, overviews of primary nutritional supportstudies, and evidence-based guidelines. The referencelists of retrieved overviews and guidelines were hand-searched for additional studies. Experts in the field andin industry were contacted to contribute any papers thatmay have been missed. The final closeout date for thesearch process was April 30, 2003.
All RCTs comparing primary nutritional supportinterventions, conducted in adult critically ill patientpopulations, and reporting clinically meaningful out-comes (11) were eligible for consideration. Publica-tions based on subgroups of patients from larger pub-lished trials and studies reporting only surrogateoutcomes (12) were not eligible. Detailed appraisalwas restricted to manuscripts published in the Englishlanguage (13).
A study was determined to have been conducted ina critically ill patient population if the manuscriptreported any of the following:
1) the patients were recruited in an intensive careunit (ICU),
2) the inclusion criteria described were such thatthe patients would normally be cared for in anICU (e.g., all patients were receiving invasivemechanical ventilatory support), or
3) the patients were suffering from a condition thatusually requires care in an ICU (e.g., severe ther-mal burns of �40%–50% total body surface area,multiple trauma that required urgent laparot-omy), or
4) the patients had an average ICU length of stay ofmore than 2 days, or
5) a majority of the patients received a therapy thatis delivered in the ICU (e.g., invasive mechanicalventilation), or
6) a severity of illness score was reported that wascommensurate with the patient being criticallyill.
A study was judged not to involve a critically illpatient population if none of the above criteria weremet and:
1) the patients had simple operative proceduresthat would not normally require admission to anICU (e.g., simple gastrectomy or hemicolecto-mies) or
2) the exclusion criteria were such that patientswith complicating medical conditions that mightrequire admission to an ICU, such as cardiacfailure, renal failure, diabetes, or liver impair-ment, were not enrolled, or
3) the course of the patients’ care was reported asuncomplicated (e.g., routine surgery, oral intakeday 1 and then discharge from hospital on day 5or 6).
We used a broad definition of trials of nutritionalsupport to include any comparison of the process ofproviding, or provision of, macronutrients, micronu-trients, vitamins, and/or minerals. Parenteral nutri-tion was defined as an IV solution containing proteinand a source of nonprotein energy with or withoutlipids.
Manuscripts of all included trials were assessed forthe presence of three key criteria: 1) maintenance ofallocation concealment in the randomization process,2) use of blinding at any level (e.g., blinding of re-search personnel, health care workers, data collectors,outcome adjudicators, biostatistician), and 3) presen-tation of data such that an ITT analysis could beperformed.
In addition to the three key criteria listed above,each manuscript was also assessed on the overall ad-equacy of the statement describing the randomizationprocess, and, if loss to follow-up was present, whethermissing outcomes were reported by treatment arm.Additionally, loss to follow-up was quantified andjudged as to whether it was excessive. Excessive lossto follow-up was defined a priori as missing outcomeson more than 10% of all randomized patients (10).
The appraisal of nutritional support studies wasconducted independently by all three authors. Anydifferences of opinion were resolved by discussion.
The original CONSORT statement was published in1996 (8). To determine whether methodological qual-ity changed over time, trials published in 1996 orearlier were compared with trials published after 1996(post-CONSORT).
The nature of the literature search, study selection,appraisal process, and methodological quality of theincluded sepsis trials has been reported elsewhere(10). Sepsis trials reporting clinically meaningful out-comes (11) were eligible for comparison. All sepsistrials were originally graded using an extensive 57-item composite scale, which included an assessment ofthe key domains of true methodological quality listedabove. Primary comparisons between nutritional sup-port studies and sepsis trials were restricted to thesekey domains.
528 CRITICAL CARE AND TRAUMA DOIG ET AL. ANESTH ANALGMETHODOLOGICAL QUALITY OF NUTRITIONAL SUPPORT RANDOMIZED CONTROLLED TRIALS 2005;100:527–33
All P values reported for dichotomous outcomeswere obtained using Fisher’s exact test. A P value �0.05 was considered to indicate statistical significance.A P value � 0.10 but more than 0.05 was considered toindicated a trend towards statistical significance.
ResultsThe initial MEDLINE/EMBASE electronic search re-trieved 2,287 abstracts. Hand-searching of abstractsand reference lists of all overviews and guidelines(GSD and FS) resulted in the retrieval of 465 papers.Of these 465 papers, 337 appeared to be primarynutritional support studies and were identified fordetailed review (GSD, FS, and AD). On detailedreview 103 studies were found not to report anyclinically meaningful outcomes, 42 were not con-ducted in critically ill patients, 27 were not primarynutritional support studies (i.e., evaluations of recombi-nant human growth hormone, insulin), 15 were cross-over studies, 12 evaluated preoperative interventions, 8were true observational studies (not controlled trials), 7were non-English-language studies, 6 were pseudo-randomized, 5 were based on subgroups of patientsfrom a larger published trial, and 1 was a postoperativeintervention (oral intake for 10 weeks postsurgery). Theremaining 111 articles were found to be primary nutri-tional support studies reporting clinically meaningfuloutcomes (11) conducted in critically ill patient popula-tions. A complete listing of all 111 articles is presented inAppendix A.
Eight-thousand-three-hundred-one patients wererandomized into the 111 eligible nutritional supportstudies. The median number of patients randomizedper study was 51, with a range from 12 to 398. Only 3of the 111 nutritional support studies adequately ad-dressed all 3 domains of true quality. Nine of the 111studies failed to address any of the 3 key criteria. Withregard to the maintenance of allocation concealmentand presentation of results in an ITT format, 12 of 111studies addressed both and 40 of 111 failed to addresseither.
Forty sepsis trials reporting clinically meaningfuloutcomes were eligible for primary comparison. Theeligible sepsis trials randomized 13,240 patients, witha median of 121 patients per trial and a range from 22to 2,199 patients. Further details on the eligible sepsistrials are presented elsewhere (10).
Seventeen percent (19 of 111) of nutritional supportstudies used a randomization approach that is knownto adequately maintain concealment of the allocationprocess. Twenty-seven percent (30 of 111) of studiesadequately described the approach used to randomlyallocate patients into treatment arms.
Compared to sepsis trials, there was a trend to-wards the more frequent use of randomization
methods that are less likely to maintain allocationconcealment (12 of 40 versus 19 of 111, P � 0.10).Nutritional support studies were also significantlyless likely to provide an adequate overall descrip-tion of the method of random allocation used (26 of40 versus 30 of 111, P � 0.001).
Nutritional support investigators reported the useof blinding, at any level, in 31% of studies (35 of 111).Sepsis trials used blinding at any level significantlymore often than nutritional support studies (32 of 40versus 35 of 111, P � 0.001).
Nutritional support studies presented results in anITT format (outcomes reported on all randomized pa-tients) 57% of the time (64 of 111). This was signifi-cantly less often than sepsis trials (37 of 40 versus 64 of111, P � 0.001).
Eighteen percent of all nutritional support studieshad an excessive degree of loss to follow-up (20 of111). Compared to sepsis trials, nutritional supportstudies were significantly more likely to have exces-sive loss to follow-up (0 of 40 versus 20 of 111, P �0.001).
Seventy percent of nutritional support studies with�10% loss to follow-up reported patient loss by allo-cated treatment arm, whereas only 25% of nutritionalsupport studies with excessive loss to follow-up (morethan 10%) reported losses by treatment arm (19 of 27versus 5 of 20, P � 0.001). In nutritional supportstudies that failed to report patient outcomes, the me-dian loss to follow-up was 9.5%, with a range of �1%to 34%.
Sixty-four of the 111 nutritional support studieswere published after the dissemination of the CON-SORT statement in 1996 (post-CONSORT). There wasno significant improvement over time in the mainte-nance of allocation concealment (5 of 47 versus 14 of64 post-CONSORT, P � 0.14). However, significantlymore post-CONSORT trials provided an adequate de-scription of the method of random allocation actuallyused to assign patients to treatment groups (7 of 47versus 23 of 64, P � 0.017).
Although there was a significant increase in the useof blinding in the post-CONSORT period (9 of 47versus 26 of 64, P � 0.023), there was no significantimprovement in the presentation of ITT results (29 of47 versus 35 of 64, P � 0.56). In the 47 trials withdocumented loss to follow-up, there was no signifi-cant improvement in the reporting of losses by studyarm (10 of 18 versus 14 of 29 post-CONSORT, P �0.766).
DiscussionCompared to clinical trials of sepsis therapies, nutri-tional support studies consistently performed worse
ANESTH ANALG CRITICAL CARE AND TRAUMA DOIG ET AL. 5292005;100:527–33 METHODOLOGICAL QUALITY OF NUTRITIONAL SUPPORT RANDOMIZED CONTROLLED TRIALS
in all three key domains of true methodological qual-ity: maintenance of allocation concealment, appropri-ate use of blinding, and presentation of results usingan ITT analysis. Although nutritional support studiespublished after the 1996 CONSORT statement weremore likely to use blinding, there were no improve-ments over time in the other two key measures of truemethodological quality.
It is possible that sepsis trials do not represent astandard for the conduct of clinical trials to whichnutritional support studies should be held. Based onthe findings of a previously published review (10), theoverall methodological quality of sepsis trials has beendescribed as “poor” (14). Indeed, an informal compar-ison to other multidisciplinary trials suggests thatthere is much room for improvement in sepsis trials(15). For these reasons, it is possible that sepsis trialsprovide an unreasonably low standard with whichnutritional support studies have been compared.
There are many reasons that could explain the cur-rent disparity in methodological quality between sep-sis trials and nutritional support studies. It is possiblethat the more stringent licensing requirements thatmust be addressed by most sepsis therapies results inbetter designs. It is also possible that sepsis trialsreceive better funding, are more often peer reviewed,or are more likely to have a collaborative approach totheir design. Any of these explanations is possible;however, none justifies the continued poor conduct offuture nutritional support studies. An increase in theuse of blinding by nutritional support investigatorssince the publication of the CONSORT statement sug-gests that improvements in other domains are possi-ble. The use of sealed, opaque, sequentially numberedenvelopes is an inexpensive and effective way tomaintain allocation concealment in any clinical trial.Similarly, complete follow-up and reporting on allrandomized patients, especially if outcomes arereadily available, is all that is required to present anITT analysis.
Despite the existence of excellent resources to guidethe trialist in the conduct (16,17) and reporting (18) ofRCTs, methodological deficiencies have been reportedin many areas of medical research (19–24). Althoughthere is evidence to suggest that methodological qual-ity is improving over time (15,10), objective researchspecifically evaluating intensive care-based clinical tri-als suggests “that more consideration to the method-ological quality” (25) is needed.
The majority of methodological appraisals use acomposite scale to assess overall quality; however,there has been controversy in the literature over theappropriateness of this approach (14). The goal of acomposite scale is to numerically combine informationon different features of a trial into an overall score.Many different published scales exist and they “differfrom one another in almost every respect: how and
why the items were selected for inclusion, the numberof items, reliability, approximate time to complete,and scoring range. Little attention has been given tothe construct that the scales are assessing. With oneexception, the scales are uniformly weak in how theywere developed” (26).
Although there may be disagreement over the rela-tive importance of many items included in compositescales, extensive reviews of the methodological litera-ture consistently agree on the importance of threecriteria: 1) the maintenance of allocation concealment(9), 2) the presentation of results from all randomizedpatients in the form of an ITT analysis (27), and 3) theappropriate use of blinding (28). Appropriate applica-tion of these three design features consistently resultsin a more unbiased estimate of treatment effect. Be-cause methodological research has demonstrated thatoverall scores based on composite scales may not ad-equately reflect the presence of these three key criteria(7), it has been recommended that an assessment oftrue methodological quality should be based on anappraisal of these three key criteria separately (9).
The term allocation concealment is used to describea process of randomizing patients into a clinical trialthat protects researchers, clinicians, and patients frompredicting upcoming group assignments. Concealingthe knowledge of upcoming group assignments “pre-vents researchers from (unconsciously or otherwise)influencing which participants are assigned to a givenintervention group” (29). As early as 1898, medicalinvestigators realized the importance of removing“subjective judgement” from the process used to as-sign patients to treatment groups (30). Indeed, al-though many believe that the 1948 Medical ResearchCouncil trial of streptomycin in tuberculosis (31) is alandmark trial because it was the first to use randomallocation, it was truly innovative because it was thefirst trial to use sealed envelops to maintain allocationconcealment (32).
An extensive review of 148 trials published in theBritish Medical Journal, Journal of the American MedicalAssociation and the Lancet found that 50% of the trialsused a randomization technique that maintains allo-cation concealment; however the reporting of alloca-tion concealment improved significantly, from 39% to61%, in all 3 journals after the publication of the orig-inal CONSORT statement (15). We found that only17% of published nutritional support studies used aprocess for allocating patients to treatment groupsthat maintained allocation concealment, which wasapproximately half as often as sepsis trials (30%). Nu-merous reviews have demonstrated that trials withinadequate or unclear allocation concealment can pro-duce up to 40% larger estimates of treatment effects(33).
530 CRITICAL CARE AND TRAUMA DOIG ET AL. ANESTH ANALGMETHODOLOGICAL QUALITY OF NUTRITIONAL SUPPORT RANDOMIZED CONTROLLED TRIALS 2005;100:527–33
In general, it is very difficult to maintain allocationconcealment if some form of alternating group alloca-tion process (pseudo-randomization) is used (32). Ex-amples of sentences describing the randomizationprocess obtained from nutritional support studies in-clude: “Patients were randomized into one of twonutritional subgroups (Total Parenteral Nutrition orNaso-Gastric feeding) based on their date of admis-sion” (34) and “Patient selection was carried out in arandom fashion, patients being assigned alternately toone or the other group according to the order in whichthey were admitted to the ICU” (35). Although both ofthese trials clearly assign patients to treatment basedon an alternating group allocation process (pseudo-randomization), both also incorrectly claim to be “ran-domized.” These examples serve to illustrate that, todetermine whether allocation concealment was main-tained, it is extremely important for trials to include asentence adequately describing the randomizationprocess (32).
The simplest randomization process that maintainsallocation concealment is the use of “sequentiallynumbered, opaque, sealed envelopes” that are openedafter a patient is recruited into a trial (33). Likewise, acentrally controlled randomization process, whereby arandomization center is contacted by phone, fax,e-mail, or via the web after a patient is recruited intothe trial, is also an excellent way to maintain allocationconcealment (33). The use of either approach requiresonly one sentence to describe adequately; however, itshould be noted that the minimum description of ei-ther approach includes the statement that randomiza-tion occurred after the patient was screened as trulyeligible and recruited into the trial.
The term “double-blind” is frequently used to referto a process whereby both the patient and the healthcare team are unaware of which study treatment thepatient is actually receiving. Because it may be impor-tant to understand whether the researchers, outcomeadjudicators, data collectors, and even the analystswere also blinded, use of the term double-blind isdiscouraged and an explicit list of exactly who wasblinded is preferable (36).
Our appraisal found that nutritional support studiesused blinding significantly less often than sepsis trials(31% versus 80%, P � 0.001). Although there has beena significant increase in the use of blinding in thenutritional support literature since the publication ofthe CONSORT statement (19% versus 40%, P � 0.023),blinding was still used half as often as it was in sepsistrials.
We appreciate that it may be easier to achieve blind-ing in a trial that compares simple IV infusions, suchas many sepsis trials. Although some are quick toclaim that blinding is not possible when interventionsare more complex, the critical care literature is replete
with examples where trialists have been able to de-velop novel and innovative processes for establishingblinding of complex interventions (37,38). Indeed, theappropriate use of blinding may decrease over-optimistic estimates of treatment effect by up to 26%(39). Regardless of the intervention evaluated in a trial,if a subjective outcome such as ventilator-associatedpneumonia or suspected infection is important, it isalways possible to blind outcome adjudicators. Like-wise, to ensure that the accuracy and completeness offollow-up and data collection are equivalent in bothgroups, it is usually possible to blind the primary datacollectors.
An ITT analysis compares outcomes obtained fromall patients enrolled and randomized into a clinicaltrial. Inclusion in an ITT analysis does not depend onwhether patients actually satisfied the study entry orexclusion criteria, whether they actually receivedtreatment, whether a protocol violation was recorded,or whether treatment was discontinued (27). To con-duct an ITT analysis, full and complete follow-up isrequired on all patients randomized into the trial. Ascompared to an ITT analysis, an efficacy subset anal-ysis may include only patients who received an ade-quate dose of the study treatment, who were trulyeligible for study enrollment (met all eligibility criteriaand none of the exclusion criteria), or who did nothave any protocol violations.
Although the study protocol may identify the crite-ria used to define the efficacy subset analysis beforethe trial begins, because the subset of patients them-selves cannot be identified until after randomization,it cannot be claimed that the properties of randomiza-tion apply or that the subset provides an unbiasedassessment of treatment effects (40). An efficacy subsetanalysis is more susceptible to bias than many inves-tigators believe.
For example, consider an efficacy subset analysisconducted on 80% of patients selected from a 200-patient study, with 20 patients excluded from eacharm. Because the exclusion rate is similar in each arm,it might appear that there is very little chance of bias.Simulation studies conducted under reasonable as-sumptions have demonstrated that with as little as10% loss to follow-up in each arm, the chance ofobtaining a false positive result can easily double (40).The only way to ensure that bias has not entered anefficacy subset analysis and resulted in a false positiveresult is to report the actual outcomes for each patientnot included in the analysis. In essence, this requirescomplete follow-up on all randomized patients until“the death of the patient. . .or the end of the study”(40).
Fifty-seven percent of nutritional support studiespresented results in an ITT format. Because patientsmay withdraw informed consent after randomization,which leads to true loss to follow-up, it may not be
ANESTH ANALG CRITICAL CARE AND TRAUMA DOIG ET AL. 5312005;100:527–33 METHODOLOGICAL QUALITY OF NUTRITIONAL SUPPORT RANDOMIZED CONTROLLED TRIALS
reasonable to expect 100% follow-up from every singletrial. However, 92% of sepsis trials presented a trueITT analysis.
The majority of nutritional support studies thatfailed to report outcomes on randomized patients pre-sented an efficacy subset analysis in preference to anITT analysis. In such a situation, it is always possiblethat outcomes were available on the missing patientsand that investigators simply chose not to report out-comes on patients who did not qualify for the efficacysubset analysis. Failure to record or report an outcomeon a patient who is not truly lost to follow-up shouldbe strongly discouraged. The only way to determinewhether an efficacy subset analysis is biased is tocompare the results to those obtained in the ITT anal-ysis (40). This requires full follow-up on all random-ized patients.
SummaryAlthough others have emphasized that many aspectsof methodology—such as issues of power and samplesize (41) and the use of explicit, repeatable eligibilitycriteria to define target patient populations—need tobe addressed to obtain reliable results from nutritionalsupport studies (42), we evaluated three key method-ological quality criteria that are universally acceptedto reduce bias. Compared with clinical trials of sepsis,nutritional support studies were significantly lesslikely to use blinding or present an ITT analysis. Therewas a statistical trend towards the less frequent use ofa randomization process that prevents researchersfrom predicting the group assignment sequence(maintenance of allocation concealment). Althoughnutritional support studies published after the 1996CONSORT statement were more likely to use blind-ing, there were no improvements over time in theother two key criteria of true quality.
The use of three simple design features can improvethe reliability of the results obtained from any clinicaltrial. Sealed, opaque, sequentially numbered enve-lopes are an inexpensive and effective way to maintainallocation concealment. There are many different lev-els at which blinding can be used to improve thereliability of any trial, and reporting of outcomes of allrandomized patients, regardless of whether an effi-cacy subset analysis is conducted, should be consid-ered mandatory. If appropriate nutritional support ofthe critically ill truly can improve mortality by 10% to13% (3), the only way clinical trials will be able todetect an improvement of this magnitude is by imple-menting key design criteria that reduce bias.
In the absence of definitive (Level I) evidence (43),systematic reviews and evidence-based guidelines
based on high-quality trials can support clinical deci-sion making (44). However, the strength of the con-clusions reached by overviews and guidelines is inti-mately related to the quality of the individual trialsincluded (39). Because trials that assign patients totreatment based on an alternating group allocationprocess (pseudo-randomization) and those that con-tain excessive (�10%) loss to follow-up are prone tosevere bias, we strongly recommend that these trialsnot be included in systematic reviews and evidence-based guidelines. In addition, wherever possible,methodologists should also conduct sensitivity analy-ses to determine if clinical recommendations differwhen they are based on high versus low quality evi-dence as determined by the three key measures of truemethodological quality.
References1. Heyland DK, Schroter-Noppe D, Drover JW, et al. Nutrition
support in the critical care setting: current practice in CanadianICUs—opportunities for improvement? J Parenter Enteral Nutr2003;27:74–83.
2. Linton AL, Peachey DK. Guidelines for medical practice: 1. Thereasons why. CMAJ 1990;143:485–90.
3. Martin CM, Doig GS, Heyland DK, et al. Cluster randomizedclinical trial of Algorithms for Critical Care Enteral and Paren-teral Therapy (ACCEPT). CMAJ 2004;170:197–204.
4. Heyland DK, MacDonald S, Keefe L, Drover JW. Total paren-teral nutrition in the critically ill patient: a meta-analysis. JAMA1998;280:2013–9.
5. Heyland DK, Novak F, Drover JW, et al. Should immunonutri-tion become routine in critically ill patients? A systematic re-view of the evidence. JAMA 2001;286:944–53.
6. Jadad AR, Moore RA, Carroll D, et al. Assessing the quality ofreports of randomized clinical trials: is blinding necessary? Con-trol Clin Trials 1996;17:1–12.
7. Huwiler-Muntener K, Juni P, Junker C, Egger M. Quality ofreporting of randomized trials as a measure of methodologicquality. JAMA 2002;287:2801–4.
8. Begg C, Cho M, Eastwood S, et al. Improving the quality ofreporting of randomized controlled trials. The CONSORT state-ment. JAMA 1996;276:637–9.
9. Egger M, Juni P, Bartlett C, et al. How important are compre-hensive literature searches and the assessment of trial quality insystematic reviews? Empirical study. Health Technol Assess2003;7:1–76.
10. Graf J, Doig GS, Cook DJ, et al. Randomized, controlled clinicaltrials in sepsis: has methodological quality improved over time?Crit Care Med 2002;30:461–72.
11. Prentice RL. Surrogate endpoints in clinical trials: definition andoperational criteria. Stat Med 1989;8:431–40.
12. Novak F, Heyland DK, Avenell A, et al. Glutamine supplemen-tation in serious illness: a systematic review of the evidence. CritCare Med 2002;30:2022–9.
13. Juni P, Holenstein F, Sterne J, et al. Direction and impact oflanguage bias in meta-analyses of controlled trials: empiricalstudy. Int J Epidemiol 2002;31:115–23.
14. Dhingra V, Chittock DR, Ronco JJ. Assessing methodologicalquality of clinical trials in sepsis: searching for the right tool.Crit Care Med 2002;30:487–8.
15. Moher D, Jones A, Lepage L. Use of the CONSORT statementand quality of reports of randomized trials: a comparativebefore-and-after evaluation. JAMA 2001;285:1992–5.
16. Meinart CL. Clinical trials: design, conduct and analysis. NewYork: Oxford University Press, 1986.
532 CRITICAL CARE AND TRAUMA DOIG ET AL. ANESTH ANALGMETHODOLOGICAL QUALITY OF NUTRITIONAL SUPPORT RANDOMIZED CONTROLLED TRIALS 2005;100:527–33
17. Pocock SJ. Clinical trials: a practical approach. Chichester: JohnWiley & Sons, 1983.
18. Moher D, Schulz KF, Altman DG. The CONSORT statement:revised recommendations for improving the quality of reportsof parallel-group randomised trials. Lancet 2001;357:1191–4.
19. Sanchez-Thorin JC, Cortes MC, Montenegro M, Villate N. Thequality of reporting of randomized clinical trials published inOphthalmology. Ophthalmology 2001;108:410–15.
20. Koes BW, Bouter LM, van der Heijden GJ. Methodologicalquality of randomized clinical trials on treatment efficacy in lowback pain. Spine 1995;20:228–35.
21. Junker CA. Adherence to published standards of reporting: acomparison of placebo-controlled trials published in English orGerman. JAMA 1998;280:247–9.
22. Adetugbo K, Williams H. How well are randomized controlledtrials reported in the dermatology literature? Arch Dermatol2000;136:381–5.
23. Zhang B, Schmidt B. Do we measure the right end points? Asystematic review of primary outcomes in recent neonatal ran-domized clinical trials. J Pediatr 2001;138:76–80.
24. Linde K, Jonas WB, Melchart D, Willich S. The methodologicalquality of randomized controlled trials of homeopathy, herbalmedicines and acupuncture. Int J Epidemiol 2001;30:526–31.
25. Latronico N, Botteri M, Minelli C, et al. Quality of reporting ofrandomised controlled trials in the intensive care literature. Asystematic analysis of papers published in Intensive Care Medi-cine over 26 years. Intensive Care Med 2002;28:1316–23.
26. Moher D, Jadad AR, Nichol G, et al. Assessing the quality ofrandomized controlled trials: an annotated bibliography ofscales and checklists. Control Clin Trials 1995;16:62–73.
27. Hollis S, Campbell F. What is meant by intention to treat anal-ysis? Survey of published randomised controlled trials. BMJ1999;319:670–4.
28. Kaptchuk TJ. The double-blind, randomized, placebo-controlledtrial: gold standard or golden calf? J Clin Epidemiol 2001;54:541–9.
29. CONSORT Statement website. Definition of allocation conceal-ment. Available at: http://www.consort-statement.org/allocationconcealment.htm. Accessed January 13, 2004.
30. Hrobjartsson A, Gotzsche PC, Gluud C. The controlled clinicaltrial turns 100 years: Fibiger’s trial of serum treatment of diph-theria. BMJ 1998;317:1243–5.
31. Medical Research Council. Streptomycin treatment of pulmo-nary tuberculosis: a Medical Research Council investigation.BMJ 1948;ii:769–82.
32. Chalmers I. Comparing like with like: some historical mile-stones in the evolution of methods to create unbiased compar-ison groups in therapeutic experiments. Int J Epidemiol 2001;30:1156–64.
33. Schulz KF, Grimes DA. Allocation concealment in randomisedtrials: defending against deciphering. Lancet 2002;359:614–8.
34. Hadley MN, Grahm TW, Harrington T, et al. Nutritional sup-port and neurotrauma: a critical review of early nutrition inforty-five acute head injury patients. Neurosurgery 1986;19:367–73.
35. Jimenez Jimenez FJ, Ortiz LC, Morales MS, et al. Prospectivestudy on the efficacy of branched-chain amino acids in septicpatients. J Parenter Enteral Nutr 1991;15:252–61.
36. Schulz KF, Chalmers I, Altman DG. The landscape and lexiconof blinding in randomized trials. Ann Intern Med 2002;136:254–9.
37. Dellinger RP, Zimmerman JL, Taylor RW, et al. Effects of in-haled nitric oxide in patients with acute respiratory distresssyndrome: results of a randomized phase II trial. Inhaled NitricOxide in ARDS Study Group. Crit Care Med 1998;26:15–23.
38. Finfer S, Bellomo R, Myburgh J, Norton R. Efficacy of albuminin critically ill patients. BMJ 2003;326:559–60.
39. Juni P, Altman DG, Egger M. Systematic reviews in health care:Assessing the quality of controlled clinical trials. BMJ 2001;323:42–6.
40. Lachin JM. Statistical considerations in the intent-to-treat prin-ciple. Control Clin Trials 2000;21:167–89.
41. Halpern SD, Karlawish JH, Berlin JA. The continuing unethicalconduct of underpowered clinical trials. JAMA 2002;288:358–62.
42. Preiser JC, Chiolero R, Wernerman J. Nutritional papers in ICUpatients: what lies between the lines? Intensive Care Med 2003;29:156–66.
43. LeLorier J, Gregoire G, Benhaddad A, et al. Discrepancies be-tween meta-analyses and subsequent large randomized, con-trolled trials. N Engl J Med 1997;337:536–42.
44. Smith R, Chalmers I. Britain’s gift: a “Medline” of synthesisedevidence. BMJ 2001;323:1437–8.
ANESTH ANALG CRITICAL CARE AND TRAUMA DOIG ET AL. 5332005;100:527–33 METHODOLOGICAL QUALITY OF NUTRITIONAL SUPPORT RANDOMIZED CONTROLLED TRIALS
CASE REPORT
Retrograde Submental Intubation by Pharyngeal LoopTechnique in a Patient with Faciomaxillary Trauma andRestricted Mouth Opening
Virendra K. Arya, MD*, Arun Kumar, MD*, Surinder S. Makkar, MS, MCh†, andRamesh K. Sharma, MS, MCh†
*Departments of Anaesthesia & Intensive Care and †Plastic Surgery, Postgraduate Institute of Medical Education andResearch, Chandigarh, India
Submental intubation is useful for airway managementduring maxillofacial surgery when both nasal and oro-tracheal intubation are deemed unsuitable and to avoida tracheostomy, especially when long-term ventilatorysupport is not required in the postoperative period. Ad-equate mouth opening is a prerequisite for all the tech-niques described for submental intubation, as the initialstep is orotracheal intubation. Hence, this procedurehas never been reported in a patient with the inability toopen the mouth. We describe the technique of retrograde
submental intubation with the help of a pharyngeal loopassembly for the first time in a patient with maxillofacialtrauma and restricted mouth opening in whom oral andnasal intubations were not possible and tracheostomywas the only alternative. In this case report, with success-ful retrograde submental intubation, the potential compli-cations associated with a short-term tracheostomy wereavoided, as there was no indication for keeping a trache-ostomy during the postoperative period.
(Anesth Analg 2005;100:534–7)
T he anesthetic management of a patient with acompromised and traumatized airway presentsthe anesthesiologist with formidable challenges in
the perioperative period. Maxillofacial trauma can causeserious disruption of the soft tissue, bony, and cartilag-inous components of the upper airway, often with littleexternal evidence of deformation. Nasal intubation inthese patients is controversial, particularly if performedwithout the benefits of a fiberoptic bronchoscope, be-cause of potential complications (1–3). Further resto-ration of dental occlusion by means of intraoperativemaxillomandibular fixation precludes conventional oro-tracheal intubation. The technique of submental intuba-tion has been established as a suitable alternative to ashort-term tracheostomy in such situations (4–8).
Case ReportA 32-year-old male patient (70 kg, 160 cm, ASA physicalstatus I) was scheduled for plastic reconstruction of faci-omaxillary injuries sustained 1 wk earlier in a motorcycle
accident. His injuries included a depressed fracture frontalbone left side, bilateral fracture zygoma, fractured nasalbones, LeFort II fracture, midpalatal split, and symphysealmandibular fracture with bilateral temporomandibular jointdislocation leading to immobility of the lower jaw (Fig. 1).There was also a history of cerebrospinal fluid rhinorrheathat had resolved by this time. The airway examinationrevealed that the patient was unable to open his mouth as aresult of a locked jaw and inter-incisor distance of �0.5 cm(Fig. 2). However, the retromolar space was patent andallowed passage of a 14F disposable suction catheter into theoropharyngeal cavity. The laryngeal anatomy and neckmovements were normal.
In view of the surgical considerations (i.e., the presence ofLeFort II fracture, palatal split and history of cerebrospinalfluid rhinorrhea) nasal intubation was excluded. Orotra-cheal intubation was not possible because of the locked jawand the need for intraoperative maxillomandibular fixationto check dental occlusion. Tracheostomy would have beenan appropriate option to secure the airway under thesecircumstances if multistage reconstructive surgery wasplanned, with challenges of a difficult airway each time andsignificant risk of prolonged postoperative airway compro-mise resulting from soft tissue edema. However, our surgi-cal team planned a single-stage corrective procedure, as theyfelt that this would normalize mouth opening, improveairway caliber, and provide a better supportive frameworkto the soft tissues. Moreover, edema associated with traumahad subsided at this time and application of internal fixatorsto the fractured bones did not involve much tissue handling.
Accepted for publication July 22, 2004.Address correspondence and reprint requests to Virendra K.
Arya, MD, Assistant Professor, Department of Anesthesia & Inten-sive Care, PGIMER Chandigarh-160012, India. Address e-mail [email protected].
DOI: 10.1213/01.ANE.0000142126.86492.7D
©2005 by the International Anesthesia Research Society534 Anesth Analg 2005;100:534–7 0003-2999/05
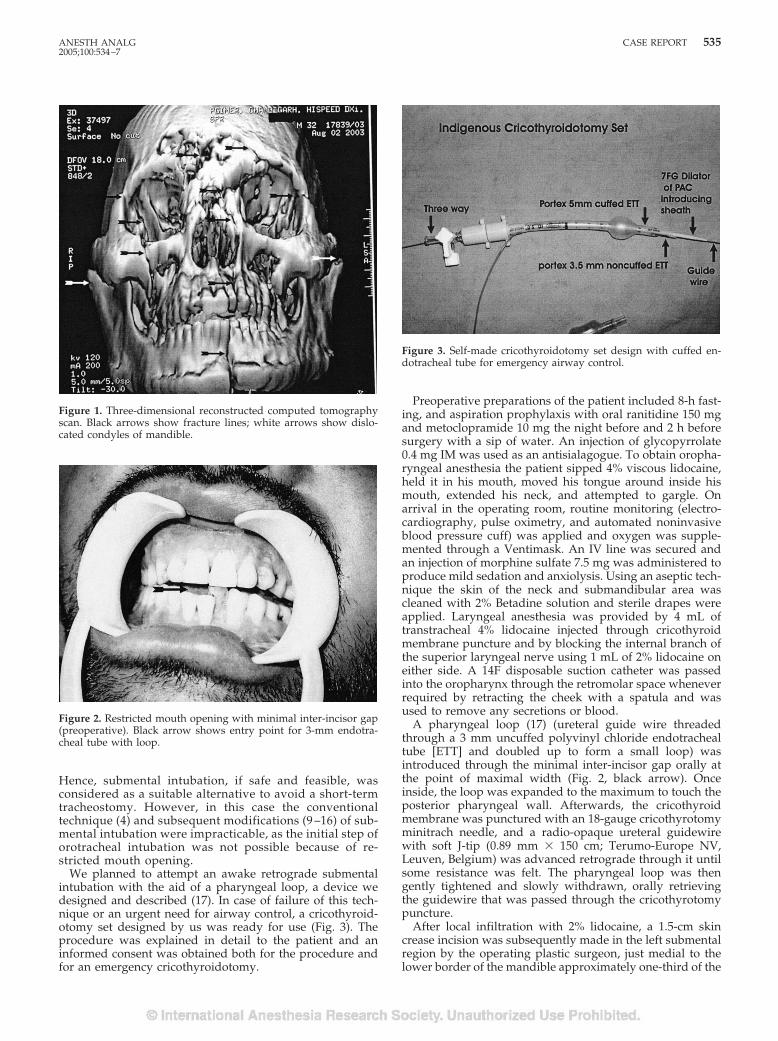
Hence, submental intubation, if safe and feasible, wasconsidered as a suitable alternative to avoid a short-termtracheostomy. However, in this case the conventionaltechnique (4) and subsequent modifications (9 –16) of sub-mental intubation were impracticable, as the initial step oforotracheal intubation was not possible because of re-stricted mouth opening.
We planned to attempt an awake retrograde submentalintubation with the aid of a pharyngeal loop, a device wedesigned and described (17). In case of failure of this tech-nique or an urgent need for airway control, a cricothyroid-otomy set designed by us was ready for use (Fig. 3). Theprocedure was explained in detail to the patient and aninformed consent was obtained both for the procedure andfor an emergency cricothyroidotomy.
Preoperative preparations of the patient included 8-h fast-ing, and aspiration prophylaxis with oral ranitidine 150 mgand metoclopramide 10 mg the night before and 2 h beforesurgery with a sip of water. An injection of glycopyrrolate0.4 mg IM was used as an antisialagogue. To obtain oropha-ryngeal anesthesia the patient sipped 4% viscous lidocaine,held it in his mouth, moved his tongue around inside hismouth, extended his neck, and attempted to gargle. Onarrival in the operating room, routine monitoring (electro-cardiography, pulse oximetry, and automated noninvasiveblood pressure cuff) was applied and oxygen was supple-mented through a Ventimask. An IV line was secured andan injection of morphine sulfate 7.5 mg was administered toproduce mild sedation and anxiolysis. Using an aseptic tech-nique the skin of the neck and submandibular area wascleaned with 2% Betadine solution and sterile drapes wereapplied. Laryngeal anesthesia was provided by 4 mL oftranstracheal 4% lidocaine injected through cricothyroidmembrane puncture and by blocking the internal branch ofthe superior laryngeal nerve using 1 mL of 2% lidocaine oneither side. A 14F disposable suction catheter was passedinto the oropharynx through the retromolar space wheneverrequired by retracting the cheek with a spatula and wasused to remove any secretions or blood.
A pharyngeal loop (17) (ureteral guide wire threadedthrough a 3 mm uncuffed polyvinyl chloride endotrachealtube [ETT] and doubled up to form a small loop) wasintroduced through the minimal inter-incisor gap orally atthe point of maximal width (Fig. 2, black arrow). Onceinside, the loop was expanded to the maximum to touch theposterior pharyngeal wall. Afterwards, the cricothyroidmembrane was punctured with an 18-gauge cricothyrotomyminitrach needle, and a radio-opaque ureteral guidewirewith soft J-tip (0.89 mm � 150 cm; Terumo-Europe NV,Leuven, Belgium) was advanced retrograde through it untilsome resistance was felt. The pharyngeal loop was thengently tightened and slowly withdrawn, orally retrievingthe guidewire that was passed through the cricothyrotomypuncture.
After local infiltration with 2% lidocaine, a 1.5-cm skincrease incision was subsequently made in the left submentalregion by the operating plastic surgeon, just medial to thelower border of the mandible approximately one-third of the
Figure 1. Three-dimensional reconstructed computed tomographyscan. Black arrows show fracture lines; white arrows show dislo-cated condyles of mandible.
Figure 2. Restricted mouth opening with minimal inter-incisor gap(preoperative). Black arrow shows entry point for 3-mm endotra-cheal tube with loop.
Figure 3. Self-made cricothyroidotomy set design with cuffed en-dotracheal tube for emergency airway control.
ANESTH ANALG CASE REPORT 5352005;100:534–7
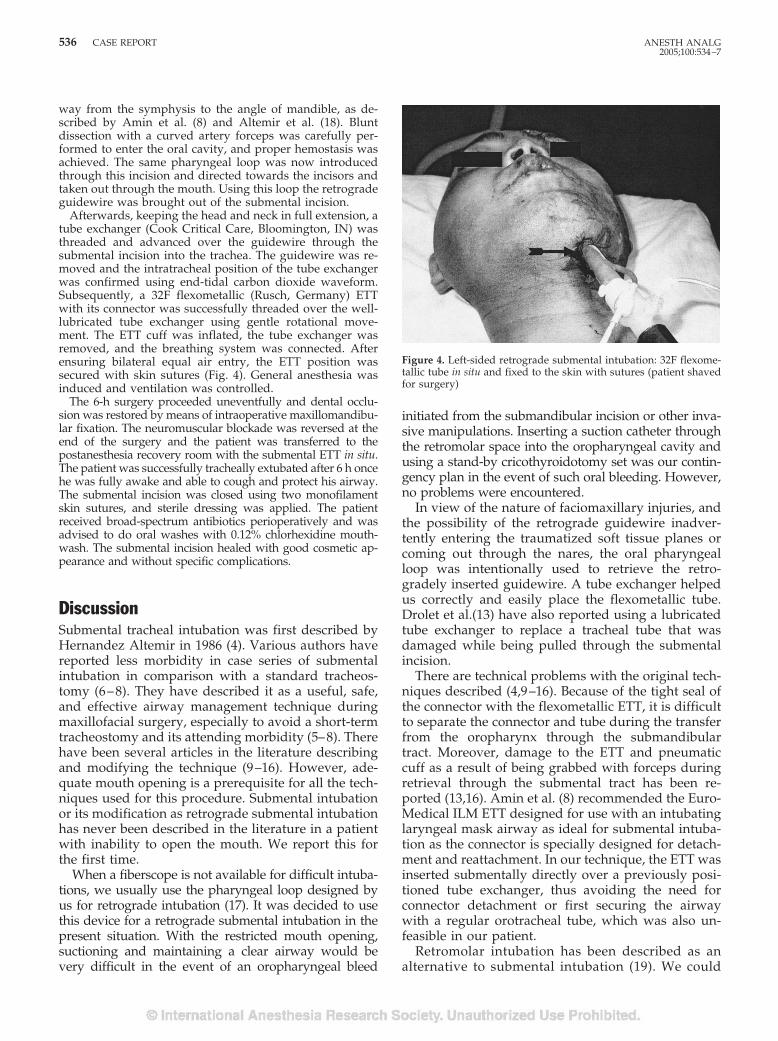
way from the symphysis to the angle of mandible, as de-scribed by Amin et al. (8) and Altemir et al. (18). Bluntdissection with a curved artery forceps was carefully per-formed to enter the oral cavity, and proper hemostasis wasachieved. The same pharyngeal loop was now introducedthrough this incision and directed towards the incisors andtaken out through the mouth. Using this loop the retrogradeguidewire was brought out of the submental incision.
Afterwards, keeping the head and neck in full extension, atube exchanger (Cook Critical Care, Bloomington, IN) wasthreaded and advanced over the guidewire through thesubmental incision into the trachea. The guidewire was re-moved and the intratracheal position of the tube exchangerwas confirmed using end-tidal carbon dioxide waveform.Subsequently, a 32F flexometallic (Rusch, Germany) ETTwith its connector was successfully threaded over the well-lubricated tube exchanger using gentle rotational move-ment. The ETT cuff was inflated, the tube exchanger wasremoved, and the breathing system was connected. Afterensuring bilateral equal air entry, the ETT position wassecured with skin sutures (Fig. 4). General anesthesia wasinduced and ventilation was controlled.
The 6-h surgery proceeded uneventfully and dental occlu-sion was restored by means of intraoperative maxillomandibu-lar fixation. The neuromuscular blockade was reversed at theend of the surgery and the patient was transferred to thepostanesthesia recovery room with the submental ETT in situ.The patient was successfully tracheally extubated after 6 h oncehe was fully awake and able to cough and protect his airway.The submental incision was closed using two monofilamentskin sutures, and sterile dressing was applied. The patientreceived broad-spectrum antibiotics perioperatively and wasadvised to do oral washes with 0.12% chlorhexidine mouth-wash. The submental incision healed with good cosmetic ap-pearance and without specific complications.
DiscussionSubmental tracheal intubation was first described byHernandez Altemir in 1986 (4). Various authors havereported less morbidity in case series of submentalintubation in comparison with a standard tracheos-tomy (6–8). They have described it as a useful, safe,and effective airway management technique duringmaxillofacial surgery, especially to avoid a short-termtracheostomy and its attending morbidity (5–8). Therehave been several articles in the literature describingand modifying the technique (9–16). However, ade-quate mouth opening is a prerequisite for all the tech-niques used for this procedure. Submental intubationor its modification as retrograde submental intubationhas never been described in the literature in a patientwith inability to open the mouth. We report this forthe first time.
When a fiberscope is not available for difficult intuba-tions, we usually use the pharyngeal loop designed byus for retrograde intubation (17). It was decided to usethis device for a retrograde submental intubation in thepresent situation. With the restricted mouth opening,suctioning and maintaining a clear airway would bevery difficult in the event of an oropharyngeal bleed
initiated from the submandibular incision or other inva-sive manipulations. Inserting a suction catheter throughthe retromolar space into the oropharyngeal cavity andusing a stand-by cricothyroidotomy set was our contin-gency plan in the event of such oral bleeding. However,no problems were encountered.
In view of the nature of faciomaxillary injuries, andthe possibility of the retrograde guidewire inadver-tently entering the traumatized soft tissue planes orcoming out through the nares, the oral pharyngealloop was intentionally used to retrieve the retro-gradely inserted guidewire. A tube exchanger helpedus correctly and easily place the flexometallic tube.Drolet et al.(13) have also reported using a lubricatedtube exchanger to replace a tracheal tube that wasdamaged while being pulled through the submentalincision.
There are technical problems with the original tech-niques described (4,9–16). Because of the tight seal ofthe connector with the flexometallic ETT, it is difficultto separate the connector and tube during the transferfrom the oropharynx through the submandibulartract. Moreover, damage to the ETT and pneumaticcuff as a result of being grabbed with forceps duringretrieval through the submental tract has been re-ported (13,16). Amin et al. (8) recommended the Euro-Medical ILM ETT designed for use with an intubatinglaryngeal mask airway as ideal for submental intuba-tion as the connector is specially designed for detach-ment and reattachment. In our technique, the ETT wasinserted submentally directly over a previously posi-tioned tube exchanger, thus avoiding the need forconnector detachment or first securing the airwaywith a regular orotracheal tube, which was also un-feasible in our patient.
Retromolar intubation has been described as analternative to submental intubation (19). We could
Figure 4. Left-sided retrograde submental intubation: 32F flexome-tallic tube in situ and fixed to the skin with sutures (patient shavedfor surgery)
536 CASE REPORT ANESTH ANALG2005;100:534–7
have positioned the thin guidewire in the retromo-lar space after its successful oral retrieval. However,we deferred this, as the subsequent steps of negoti-ating the tube exchanger and ETT through this tractcould have been difficult and very painful for thepatient because of his dislocated jaw and his inabil-ity to open his mouth.
We did not tracheally extubate our patient in thepostoperative period until he was fully awake andable to protect his airway, considering the maxillo-mandibular fixation and the possibility of soft tissueedema. During ETT suction, difficulty was encoun-tered in negotiating the suction catheter because of theacute curvature of the ETT. This was overcome byextension of the patient’s head and lubricating thesuction catheter.
Gordon and Tolstunov (20) have reported a case inwhich the submental tube was left in place for 3 dayswithout complications. In the series of 25 submentalintubations reported by Caron et al. (6), two patientshad their tubes maintained postoperatively for ap-proximately 30 hours.
The indications and contraindications for conven-tional submental intubation are outlined by Chandu etal. (7) and Meyer et al. (21). They described this tech-nique as contraindicated when long-term control ofthe airway is required postoperatively. In our casethere was no indication for prolonged postoperativeairway control or risk of losing the airway; hence,preventing a short-term tracheostomy by retrogradesubmental intubation was justified. The modificationof submental intubation to the retrograde techniquewith the use of a pharyngeal loop saved our patientfrom the morbidity associated with a short-term tra-cheostomy. The indications and contraindications for
retrograde submental intubation technique are out-lined in Table 1.
In conclusion, the successful use of a pharyngealloop assembly made it possible to perform retrogradesubmental tracheal intubation in a patient in whomoral and nasal intubations were either contraindicatedor not possible, thus broadening its utility as an im-portant aid to difficult airway situations.
References1. Junsanto T, Chira T. Perimortem intracranial orogastric tube in
pediatric trauma patient with a basilar skull fracture. J Trauma1997;42:746–7.
2. Schade K, Borzotta A, Michaels A. Intracranial malposition ofnasopharyngeal airway. J Trauma 2000;49:967–8.
3. Zmyslowski WP, Maloney PL. Nasotracheal intubation in thepresence of facial fractures. JAMA 1989;262:1327–8.
4. Altemir FH. The submental route for endotracheal intubation: anew technique. J Maxillofac Surg 1986;14:64–5.
5. Waldron J, Padgham ND, Hurley SE. Complications of emer-gency and elective tracheostomy: a retrospective study of 150consecutive cases. Ann R Coll Surg Engl 1990;72:218–20.
6. Caron G, Paquin R, Lessard MR, et al. Submental endotrachealintubation: an alternative to tracheostomy in patients with mid-facial and panfacial fractures. J Trauma 2000;48:235–40.
7. Chandu A, Smith ACH, Gebert R. Submental intubation: analternative to short-term tracheostomy. Anaesth Intensive Care2000;28:193–5.
8. Amin M, Dill-Russell P, Manisalr M, et al. Facial fractures andsubmental tracheal intubation. Anaesthesia 2002;57:1195–212.
9. Stoll P, Galli C, Wachter R, Bahr W. Submandibular endotra-cheal intubation in panfacial fractures. J Clin Anaesth 1994;6:83–6.
10. Prochno T, Dornberger I, Esser U. Management of panfacialfractures: also an intubation problem [in German]. HNO 1996;44:19–21.
11. Green JD, Moore UJ. A modification of sub-mental intubation.Br J Anaesth 1996;77:789–91.
12. MacInnis E, Baig M. A modified submental approach for oralendotracheal intubation. Int J Oral Maxillofac Surg 1999;28:344–6.
13. Drolet P, Girard M, Poirier J, Grenier Y. Facilitating submentalendotracheal intubation with an endotracheal tube exchanger.Anesth Analg 2000;90:222–3.
14. Altemir FH, Montero SH. The submental route revisited usingthe laryngeal mask airway: a technical note. J CraniomaxillofacSurg 2000;28:343–4.
15. Bale DR, Clark M, Jefferson P, Stewart T. Improved submentalintubation. Anaesthesia 2003;58:189.
16. Malhotra SK, Malhotra N, Sharma RK. Submental intubation:another problem and its solution. Anesth Analg 2002;95:1127.
17. Arya VK, Dutta A, Chari P, Sharma RK. Difficult retrogradeendotracheal intubation: the utility of a pharyngeal loop. AnesthAnalg 2002;94:470–3.
18. Altemir FH, Montero SH, Pena MM. About submental intuba-tion. Anaesthesia 2003;58:496–7.
19. Martinez-Lage JL, Eslava JM, Cebrecos AI, Marcos O. Retromo-lar intubation. J Oral Maxillofac Surg 1998;56:302–6.
20. Gordon NC, Tulstunov L. Submental approach to oro-endotracheal intubation in patients with midfacial fractures.Oral Surg Oral Med Oral Path Oral Radiol Endod 1995;79:269–72.
21. Meyer C, Valfrey J, Kjartansdottir T, et al. Indication for andtechnical refinements of submental intubation. J Craniomaxillo-fac Surg 2003;31:383–8.
Table 1. Indications and contraindications for retrogradesubmental intubation
Indications:1. Maxillofacial injuries where oral and nasal
intubation are not possible2. Restricted mouth opening expected to become
normal after surgery3. No indication for prolonged postoperative
airway controlContraindications:
1. Uncooperative patient2. Bleeding diathesis3. Disrupted laryngotracheal anatomy4. Restricted retromolar space to allow suctioning5. Inability to pass pharyngeal loop assembly6. Gun-shot injuries of face7. Fresh maxillofacial trauma with soft tissue
edema8. Need for prolonged postoperative airway
control
ANESTH ANALG CASE REPORT 5372005;100:534–7
NEUROSURGICAL ANESTHESIASECTION EDITOR
DAVID S. WARNER
Cisatracurium-Induced Neuromuscular Blockade Is Affectedby Chronic Phenytoin or Carbamazepine Treatment inNeurosurgical PatientsAnouk Richard, MD, FRCPC*, Francois Girard, MD, FRCPC*, Dominique C. Girard, MD, FRCPC*,Daniel Boudreault, MD, FRCPC*, Philippe Chouinard, MD, FRCPC*,Robert Moumdjian, MD, FRCS†, Alain Bouthilier, MD, FRCS†, Monique Ruel, RN, CCRP*,Johanne Couture, RT‡, and France Varin, Bpharm, PhD‡
*Department of Anesthesiology and †Neurosurgery Division, CHUM, Hopital Notre-Dame; and ‡Faculty of Pharmacy,Universite de Montreal, Montreal, Canada
The effect of chronic anticonvulsant therapy (CAT)on the maintenance and recovery profiles ofcisatracurium-induced neuromuscular blockade hasnot been adequately studied. In this study, we com-pared the pharmacokinetics and pharmacodynam-ics of cisatracurium after a prolonged infusion inpatients with or without CAT. Thirty patients un-dergoing intracranial surgery were enrolled in thestudy: 15 patients under CAT (carbamazepine andphenytoin, Group A) and 15 controls receiving noanticonvulsant therapy (Group C). Anesthesia wasstandardized and both groups received a bolus ofcisatracurium followed by an infusion to maintain a95% twitch depression. A steady-state was obtainedand the infusion was kept constant for 2 additionalhours. Neuromuscular blockade was then allowedto spontaneously recover. Blood samples were takenfor measurement of cisatracurium plasma concen-tration during the steady-state period (Cpss95) and
at various times during recovery. Demographic andintraoperative data were similar. CAT resulted infaster 25% and 75% recovery of the first twitch. Therate of infusion of cisatracurium needed to maintaina 95% twitch depression at steady-state was 44%faster in Group A (P � 0.001). The clearance ofcisatracurium was significantly faster in Group Awhen compared with Group C (7.12 � 1.87 versus5.72 � 0.70 L · kg�1 · min�1, P � 0.01). The Cpss95was also significantly larger in Group A (191 � 45versus 159 � 36 ng/mL, P � 0.04). In addition,patients receiving CAT had a 20% increase in theclearance of cisatracurium that, in turn, resulted in afaster recovery of neuromuscular blockade after aninfusion of the drug. Also, patients under CAT hada 20% increase in their Cpss95, indicating an in-creased resistance to the effect of cisatracurium.
(Anesth Analg 2005;100:538 –44)
L arger doses of nondepolarizing steroidal neuro-muscular blocking drugs such as pancuronium,vecuronium, and rocuronium (1–3) are required
to maintain paralysis during surgical procedures inpatients receiving chronic anticonvulsant therapy(CAT) (carbamazepine or phenytoin). These patientsrecover quicker from neuromuscular blockade, whichcould put them at risk if movement occurred during a
delicate neurosurgical procedure. The mechanism be-hind this faster recovery is not well understood. Phar-macokinetic (PK) as well as pharmacodynamic (PD)factors could be implicated, including hepatic enzymeinduction, greater plasma protein binding, increasednumber or decreased sensitivity of the acetylcholinereceptors, or direct competition for binding sites(4–6).
With the exception of one study (7), recovery fromthe neuromuscular blockade induced by atracurium, aneuromuscular blocking drug of the benzylisoquino-linium class, does not seem to be affected by anticon-vulsants (8,9). In contrast to atracurium, plasma ester-ases are not involved in the in vitro degradation ofcisatracurium and Hofmann hydrolysis is the rate-limiting step (10). In a retrospective analysis of threePK studies in patients (11–13), Kisor et al. (14) have
This study was supported by grants from the Canadian Anesthe-siologist Society and from Abbott Laboratories, Ltd., Canada.
Accepted for publication August 10, 2004.Address correspondence and reprint requests to Francois Girard,
MD, FRCPC, Department of Anesthesiology, CHUM, HopitalNotre-Dame, 1560 Sherbrooke East, Montreal, Canada, H2L 4M1.Address e-mail to [email protected].
DOI: 10.1213/01.ANE.0000143333.84988.50
©2005 by the International Anesthesia Research Society538 Anesth Analg 2005;100:538–44 0003-2999/05
estimated that only 23% of cisatracurium would beeliminated in an organ-dependent manner, 16% ofwhich being through renal clearance. Consequently, itshould be less susceptible to enzymatic induction or toother factors that influence neuromuscular blockaderecovery. Cisatracurium could therefore be an inter-esting alternative to steroidal drugs to maintain neu-romuscular blockade in patients receiving anticonvul-sant therapy. Furthermore, its cardiovascular stabilityand the absence of histamine liberation are assets thatdifferentiate it from atracurium, making it more suit-able for use in neurosurgery. In fact, Koenig and Ed-wards (15) have found that the duration of action of abolus of cisatracurium was not affected by anticonvul-sants. However, they observed that the 10%–25% re-covery index was shorter in the group chronicallytreated with carbamazepine or phenytoin than in acontrol group. This study could not conclude whatcaused this faster recovery because neither PD nor PKprofiles were characterized.
We hypothesized that the faster recovery of theneuromuscular blockade in patients receiving CAToriginates from PD factors and, concurrently, fromsmaller effect compartment concentrations. In addi-tion, no data are available in the literature to predict ifthe speed of infusion needed to maintain a neuromus-cular block at 5% of T1 will be different between ananticonvulsant-treated group and a control group.
This study was therefore designed to compare thePK/PD of cisatracurium after a prolonged infusion inpatients treated with and without anticonvulsanttherapy.
MethodsAfter IRB approval and written informed consent, 30ASA physical status I–III patients, aged 18–70 yr,needing general anesthesia of at least 5 h of durationfor elective neurosurgery in the dorsal decubitus po-sition were enrolled in the study. Patients in the anti-convulsant group (n � 15) had been taking anticon-vulsants (carbamazepine or phenytoin) for at least 4wk. The blood concentrations of the anticonvulsantsused were within the therapeutic range before sur-gery. Patients in the control group (n � 15) had nevertaken any anticonvulsant medication. Exclusion crite-ria included patients with cardiac, renal, hepatic, orneuromuscular impairment, and history of alcohol ordrug abuse. Patients with a body mass index �30, andpatients that had taken medications known to inter-fere with neuromuscular blockade (aminoglycosides,tetracyclines, clindamycine, procainamide, quinidine,magnesium sulfate, or calcium channel blockers) werealso excluded.
This study was conducted in compliance with thegood clinical research practice in PK/PD studies ofneuromuscular blocking drugs (16,17).
Anesthesia was standardized for all patients. Theattending anesthesiologist was not blinded to thestudy groups. One hour before surgery, the patientswere premedicated with midazolam 0.07 mg/kg(maximum 5 mg) IM. Upon arrival in the operatingroom, standard monitoring equipment was appliedand two IV lines were inserted, one of which was setat a constant flow rate and exclusively reserved forcisatracurium infusion. An arterial canula was in-serted for direct measurement of arterial blood pres-sure and blood sampling. Rectal temperature wasmaintained above 35.5°C using a warming blanket.Ventilation was adjusted to maintain end-tidal CO2between 30 and 35 mm Hg at the beginning of thesurgery and no further change of ventilation was al-lowed during the study period. No IV or arterial cath-eters were inserted on the arm used for the neuromus-cular monitoring.
Anesthesia was induced with propofol (0.5–3.0 mg/kg) and sufentanil (0.25–1.0 �g/kg). Supramaximalstimulation was then obtained and a 5-min equilibra-tion period was allowed while maintaining anesthesiawith 0.5%–1.0% end-tidal isoflurane with mask venti-lation. A single bolus of cisatracurium (0.1 mg/kg)was then injected in the dedicated IV line over 5 s.After tracheal intubation, anesthesia consisted of 50%N2O in oxygen, 0.5%–1.0% end-tidal isoflurane, andsufentanil infusion (0.1–0.5 �g · kg�1 · h�1) to main-tain mean arterial blood pressure within 20% of thebaseline preinduction value.
Neuromuscular function was monitored using aDatex-Engstrom Neuromuscular Transmission Mod-ule (M-NMT) (Datex-Engstrom, Helsinki, Finland).The electromyogram of the adductor pollicis was re-corded using five disposable Ag/AgCl electrodesplaced as follows: two stimulating electrodes alongthe ulnar nerve at the wrist, two recording electrodes,one on the adductor pollicis and the second on thelateral surface of the index finger, and one groundelectrode between the stimulating and the recordingelectrodes. The skin was cleaned with alcohol be-fore electrodes were applied. The outstretched armwas enveloped in a cotton blanket to minimize heatloss and stabilized in a protective frame to preventmovement and interference during anesthesia. TheM-NMT system was calibrated after induction butbefore administration of cisatracurium with pulses of200 �s, at a rate of 2 Hz, starting from 10 mA withincrements of 5 mA. The maximal current obtainedwas then increased by 15%, yielding the supramaxi-mal stimulation. The system was set to deliver supra-maximal train-of-four (TOF) stimulations (200 �s, at 2Hz) every 12 s for an equilibration period of 5 min(18). After complete suppression of T1, the TOF stim-ulations were executed every minute. On the return ofthe first twitch (T1% � 0), an infusion of cisatracuriumwas started at 1.4 �g · kg�1 · min�1 (Harvard pump;
ANESTH ANALG NEUROSURGICAL ANESTHESIA RICHARD ET AL. 5392005;100:538–44 CISATRACURIUM AND ANTICONVULSANT THERAPY
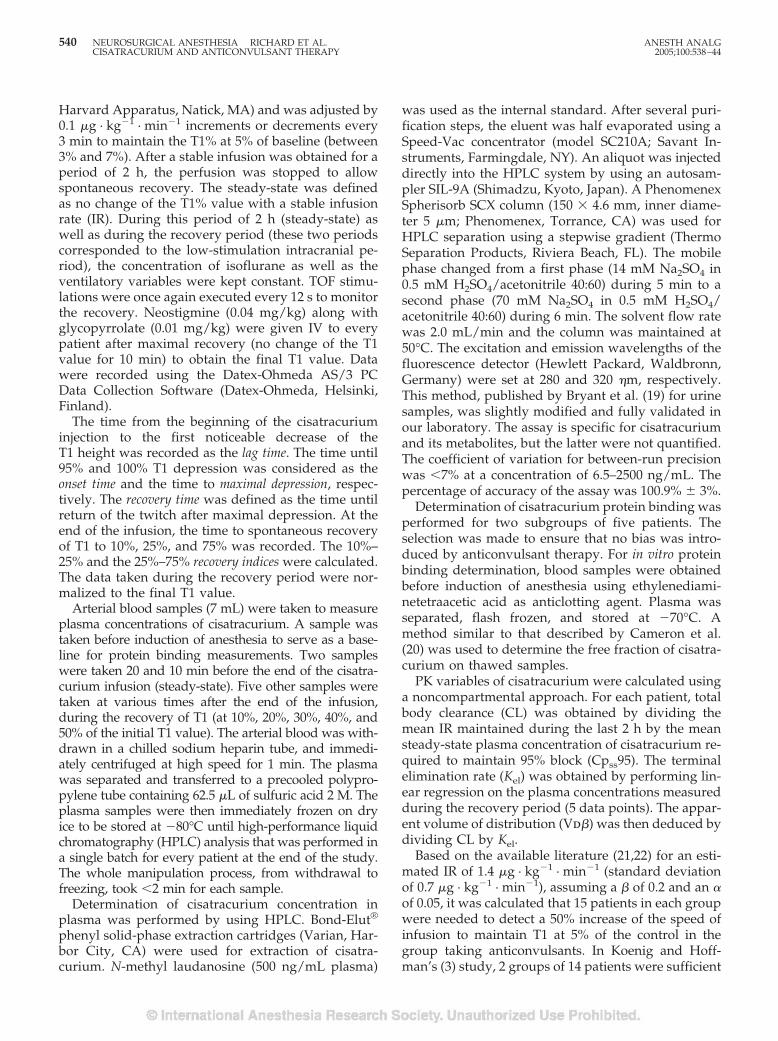
Harvard Apparatus, Natick, MA) and was adjusted by0.1 �g · kg�1 · min�1 increments or decrements every3 min to maintain the T1% at 5% of baseline (between3% and 7%). After a stable infusion was obtained for aperiod of 2 h, the perfusion was stopped to allowspontaneous recovery. The steady-state was definedas no change of the T1% value with a stable infusionrate (IR). During this period of 2 h (steady-state) aswell as during the recovery period (these two periodscorresponded to the low-stimulation intracranial pe-riod), the concentration of isoflurane as well as theventilatory variables were kept constant. TOF stimu-lations were once again executed every 12 s to monitorthe recovery. Neostigmine (0.04 mg/kg) along withglycopyrrolate (0.01 mg/kg) were given IV to everypatient after maximal recovery (no change of the T1value for 10 min) to obtain the final T1 value. Datawere recorded using the Datex-Ohmeda AS/3 PCData Collection Software (Datex-Ohmeda, Helsinki,Finland).
The time from the beginning of the cisatracuriuminjection to the first noticeable decrease of theT1 height was recorded as the lag time. The time until95% and 100% T1 depression was considered as theonset time and the time to maximal depression, respec-tively. The recovery time was defined as the time untilreturn of the twitch after maximal depression. At theend of the infusion, the time to spontaneous recoveryof T1 to 10%, 25%, and 75% was recorded. The 10%–25% and the 25%–75% recovery indices were calculated.The data taken during the recovery period were nor-malized to the final T1 value.
Arterial blood samples (7 mL) were taken to measureplasma concentrations of cisatracurium. A sample wastaken before induction of anesthesia to serve as a base-line for protein binding measurements. Two sampleswere taken 20 and 10 min before the end of the cisatra-curium infusion (steady-state). Five other samples weretaken at various times after the end of the infusion,during the recovery of T1 (at 10%, 20%, 30%, 40%, and50% of the initial T1 value). The arterial blood was with-drawn in a chilled sodium heparin tube, and immedi-ately centrifuged at high speed for 1 min. The plasmawas separated and transferred to a precooled polypro-pylene tube containing 62.5 �L of sulfuric acid 2 M. Theplasma samples were then immediately frozen on dryice to be stored at �80°C until high-performance liquidchromatography (HPLC) analysis that was performed ina single batch for every patient at the end of the study.The whole manipulation process, from withdrawal tofreezing, took �2 min for each sample.
Determination of cisatracurium concentration inplasma was performed by using HPLC. Bond-Elut®
phenyl solid-phase extraction cartridges (Varian, Har-bor City, CA) were used for extraction of cisatra-curium. N-methyl laudanosine (500 ng/mL plasma)
was used as the internal standard. After several puri-fication steps, the eluent was half evaporated using aSpeed-Vac concentrator (model SC210A; Savant In-struments, Farmingdale, NY). An aliquot was injecteddirectly into the HPLC system by using an autosam-pler SIL-9A (Shimadzu, Kyoto, Japan). A PhenomenexSpherisorb SCX column (150 � 4.6 mm, inner diame-ter 5 �m; Phenomenex, Torrance, CA) was used forHPLC separation using a stepwise gradient (ThermoSeparation Products, Riviera Beach, FL). The mobilephase changed from a first phase (14 mM Na2SO4 in0.5 mM H2SO4/acetonitrile 40:60) during 5 min to asecond phase (70 mM Na2SO4 in 0.5 mM H2SO4/acetonitrile 40:60) during 6 min. The solvent flow ratewas 2.0 mL/min and the column was maintained at50°C. The excitation and emission wavelengths of thefluorescence detector (Hewlett Packard, Waldbronn,Germany) were set at 280 and 320 �m, respectively.This method, published by Bryant et al. (19) for urinesamples, was slightly modified and fully validated inour laboratory. The assay is specific for cisatracuriumand its metabolites, but the latter were not quantified.The coefficient of variation for between-run precisionwas �7% at a concentration of 6.5–2500 ng/mL. Thepercentage of accuracy of the assay was 100.9% � 3%.
Determination of cisatracurium protein binding wasperformed for two subgroups of five patients. Theselection was made to ensure that no bias was intro-duced by anticonvulsant therapy. For in vitro proteinbinding determination, blood samples were obtainedbefore induction of anesthesia using ethylenediami-netetraacetic acid as anticlotting agent. Plasma wasseparated, flash frozen, and stored at �70°C. Amethod similar to that described by Cameron et al.(20) was used to determine the free fraction of cisatra-curium on thawed samples.
PK variables of cisatracurium were calculated usinga noncompartmental approach. For each patient, totalbody clearance (CL) was obtained by dividing themean IR maintained during the last 2 h by the meansteady-state plasma concentration of cisatracurium re-quired to maintain 95% block (Cpss95). The terminalelimination rate (Kel) was obtained by performing lin-ear regression on the plasma concentrations measuredduring the recovery period (5 data points). The appar-ent volume of distribution (Vd�) was then deduced bydividing CL by Kel.
Based on the available literature (21,22) for an esti-mated IR of 1.4 �g · kg�1 · min�1 (standard deviationof 0.7 �g · kg�1 · min�1), assuming a � of 0.2 and an �of 0.05, it was calculated that 15 patients in each groupwere needed to detect a 50% increase of the speed ofinfusion to maintain T1 at 5% of the control in thegroup taking anticonvulsants. In Koenig and Hoff-man’s (3) study, 2 groups of 14 patients were sufficient
540 NEUROSURGICAL ANESTHESIA RICHARD ET AL. ANESTH ANALGCISATRACURIUM AND ANTICONVULSANT THERAPY 2005;100:538–44
to demonstrate a 50% difference in the 10%–25% re-covery index between patients treated with or withoutanticonvulsants.
Nonparametric variables were analyzed using theFisher’s exact test. Parametric variables were analyzedusing the t-test and analysis of variance. The between-group difference between the onset time and the var-ious recovery times and indices were analyzed withtwo-factor analysis of variance (two-way analysis ofvariance). PK parameters were compared using theStudent’s t-test for unpaired data. A P value � 0.05was considered significant.
ResultsDemographic and intraoperative data are presented inTable 1. The two groups were comparable regardingage, gender distribution, body mass index, and ASAphysical status. No patients had preoperative motordeficit. Intraoperative data were also comparable be-tween the two groups. Both groups had a similar andnegative intraoperative fluid balance and the doses ofmannitol given to provide brain relaxation were notdifferent between the two groups. The average bodytemperature during the surgery was also identical inboth groups and well within the normal range.
Table 2 presents the neuromuscular transmissiondata. CAT did not result in prolonged onset times (lagtime, onset, and time to obtain maximal suppressionof T1). However, when compared with the controlgroup, CAT resulted in faster recovery times. Therecovery, after the initial bolus, as well as time toobtain T1 25% and T1 75% after the termination of the
cisatracurium infusion were significantly shorter inthe anticonvulsant group. The recovery indices T10%–25% and T1 25%–75% were also significantly de-creased in the anticonvulsant group. The speed ofinfusion of cisatracurium needed to maintain a 95%depression of T1 at steady-state was significantly morerapid in the anticonvulsant group.
Individual plasma concentrations were normalizedby dividing them by their corresponding steady-stateIR (Fig. 1). This normalization disclosed the increasedinterpatient variability in the CAT group. For illustra-tion purposes, plasma concentration was then sortedby sampling time, and subsets of 13–15 data pointswere averaged. The midtime of the correspondingperiod was used for sampling time.
Table 2. Neuromuscular Transmission Data
Controlgroup
Anticonvulsantgroup
Lag time 0.9 � 0.4 16.2 � 0.4Onset 3.6 � 0.9 3.5 � 0.7Maximal suppression 4.4 � 1.4 4.7 � 2.55Recovery 26.3 � 11.1 21.1 � 5.2 (0.06)T1 10% 10.3 � 3.8 10.2 � 4.6T1 25% 20.0 � 4.4 16.6 � 5.0 (0.028)T1 75% 41.0 � 8.5 32.5 � 7.6 (0.006)T1 0%–25% recovery
index10.4 � 2.1 8.7 � 1.1 (0.01)
T1 25%–75% recoveryindex
21.2 � 5.1 16.2 � 3.7 (0.004)
T1% final, not corrected 71.0 � 10.1 69.5 � 6.6
Data are means � sd; P values are in parentheses. All values are expressedin minutes.
Recovery � recovery from the initial bolus of cisatracurium. Other recov-ery parameters were obtained after termination of the infusion.
Table 1. Demographics and Intraoperative Data of the Study Population
Patient characteristics Control group With anticonvulsants
Age (yr) 46 � 11 48 � 14Female/male (n) 8/7 8/7BMI 25.5 � 3.3 24.3 � 2.8ASA physical status
I 3 0II 9 14III 3 1
Phenytoin/carbamazepine (n) 0:0 5:10Intraoperative body temperature (°C) 36.6 � 0.3 36.8 � 0.5Fluid status (mL)
Blood loss 346 � 180 356 � 234Insensible losses 2018 � 761 1938 � 929Diuresis 1515 � 855 973 � 535Crystalloids 3280 � 941 2800 � 1263Colloids (mL) 100 � 280 0Balance (mL intake � mL losses) �964 � 1390 �1122 � 1024
Mannitol (g) 41.5 � 19.9 33.7 � 6.1Furosemide (mg) 10 � 0 (n � 6) 15 � 7.1 (n � 2)Dexamethasone (mg) 9 � 2.4 (n � 6) 9 � 2.4 (n � 2)
Values are expressed as mean � sd, except when stated otherwise.BMI � body mass index, ASA � American Society of Anesthesiologists.
ANESTH ANALG NEUROSURGICAL ANESTHESIA RICHARD ET AL. 5412005;100:538–44 CISATRACURIUM AND ANTICONVULSANT THERAPY
Table 3 presents the PK variables derived from thenoncompartmental analysis. The protein binding ofcisatracurium did not differ between both subsets offive patients. The CL of cisatracurium for the last 2 hof perfusion (steady-state) was significantly faster inthe anticonvulsant group when compared with thecontrol group. However, no differences were observedfor the apparent Vd� and Kel. The Cpss95 was signif-icantly larger in the anticonvulsant group.
Subgroup analysis revealed that patients receivingphenytoin alone had similar PK/PD profiles to thosereceiving carbamazepine alone.
DiscussionThis study shows that treatment with phenytoin orcarbamazepine affects the PK/PD of cisatracurium inpatients undergoing lengthy intracranial procedures.The major findings of the study are that patientstreated with anticonvulsants need a more rapid IR ofcisatracurium to steadily maintain a given twitch de-pression during a neurosurgical procedure and thatthey have a faster recovery of cisatracurium-inducedneuromuscular blockade after an infusion of the drug.The increase in CL, although mostly responsible forthe faster recovery, cannot account for the larger doserequired in patients receiving CAT. The larger Cpss95observed in patients treated with anticonvulsants sug-gests a resistance to the effect of cisatracurium, indi-cating that almost 50% of the changes would be of PDorigin.
These results confirm the findings obtained byKoenig and Edwards (15) in a similar population of
neurosurgical patients treated with phenytoin orcarbamazepine either chronically (�2 weeks) oracutely (�2 weeks). Those authors administered asingle bolus (4 � 95% effective dose) of cisatra-curium and compared the onset and recovery pro-files with a control group not taking any anticon-vulsant. They found that the T1 0%–25% recoveryindex was halved in the anticonvulsant-treatedgroup when compared with the controls, with nodifference between the acutely and chronicallytreated patients. There was no difference betweenthe two groups in the times to obtain a T1 10% anda T1 25%, but the authors did not look at late recov-ery variables such as times to obtain a T1 50% andT1 75% recovery. In our study, the patients wereallowed to completely recover from the neuromus-cular blockade while under a stable plane of generalanesthesia and the recovery variables were studiedafter a lengthy infusion of cisatracurium and notonly after a single bolus (with the exception ofrecovery). The time to obtain a T1 10% was notaltered in the anticonvulsant group, but the time torecovery and the times to obtain a T1 25% and 75%were shortened by 25%, 20%, and 26%, respectively.We showed proportional reduction for the T1 0%–25% and 25%–75% recovery indices.
Koenig and Edwards (15) did not conduct PD pro-files in their study; therefore, they could not providean explanation as to why this increased speed of re-covery occurred.
In the present study, the patients in the anticonvul-sant group showed a significant increase in the CL ofcisatracurium. The CL obtained for our control group,5.7 mL · kg�1 · min�1, is within the range already pub-lished (4.6–5.7 mL · kg�1 · min�1) (9,11,12). Thus, theCL observed for the anticonvulsant pretreated group(7.1 mL · kg�1 · min�1) represents a 25% increase. Sim-ilar protein binding and intraoperative fluid balancein both groups are in agreement with the lack ofdifference in cisatracurium Vd�. The increased CLwould be mostly attributable to an enhanced contri-bution of biliary excretion to the overall Kel ofcisatracurium.
Kisor et al. (14) have estimated that 23% of the Kel ofcisatracurium would result from biliary excretion. Inpatients chronically taking anticonvulsants, enzymaticinduction could possibly increase both the speed ofthe hepatic metabolism/biliary excretion and the per-centage of the drug eliminated via these pathways.Maximal induction has been shown to occur after 1–3weeks of treatment for both drugs (23). In fact, Pirt-tiaho et al. (24,25) have observed that liver weight wasincreased by 30% in patients treated with anticonvul-sants when compared with normal patients, whichwas accompanied by a proportional increase of he-patic blood flow. The 25% increase in CL observed inour study would be compatible with such an increase
Figure 1. Cisatracurium dose-normalized plasma concentration-time curves are expressed as mean � sd for control patients (filledcircles) and patients taking anticonvulsant therapy (open circles).Individual plasma concentrations were normalized by dividingthem by their corresponding steady-state infusion rate. The dose-normalized concentrations obtained during a 5- to 10-min intervalare represented.
542 NEUROSURGICAL ANESTHESIA RICHARD ET AL. ANESTH ANALGCISATRACURIUM AND ANTICONVULSANT THERAPY 2005;100:538–44
in blood flow and, in turn, biliary excretion. In com-parison, Alloul et al. (6) have found that the CL ofvecuronium was more than doubled (increase of135%) in neurosurgical patients treated with carbam-azepine. This much larger increase of CL correlateswell with the predominantly hepatic uptake and Kel ofvecuronium in humans.
In contrast, however, De Wolf et al. (11) have shownthat patients undergoing liver transplantation for end-stage liver disease had a slightly larger CL of cisatra-curium. This was attributed to an increase in the Vd�,when compared with normal control. The urinary CLof the drug was not increased in this group of patients.
The Cpss95 observed in our control group is withinthe range (135–205 ng/mL) of the 95% effective con-centration (EC95) calculated from data published byother groups of investigators (11,26,27) after correctionfor the potentiating effect of isoflurane. Correction forthe free fraction was not deemed necessary becausethe results for the two subsets of patients were notdifferent.
In our study, patients in the anticonvulsant pre-treated group needed an IR 44% faster than the controlgroup to maintain a 95% twitch depression understeady-state conditions. This, together with a 20% in-crease of the Cpss95, indicates a clear resistance to theeffect of cisatracurium. Our study design did not pro-vide the usual variables required to describe PK/PDrelationships (EC50, �, and keo values) and performsimulations. Our approach was meant to reproducethe clinical setting. In PK/PD studies, conclusions re-garding sensitivity are often drawn from EC50 valuesonly. This may not be appropriate because all threevariables contribute to the concentration-effect rela-tionship. Similar EC50 values do not necessarily meansimilar sensitivity because changes in � can alter theshape of the sigmoid and lead to different EC90 orEC95 values. These values are even more clinicallyrelevant because endotracheal intubation, mainte-nance of adequate surgical relaxation, or pharmaco-logical reversal of blockade take place at the extremesof the sigmoid. This is why, in our opinion, the Cpss95is a valid indicator of the patient’s sensitivity tocisatracurium.
Alderdice and Trommer (28) have shown, using anin vitro frog sciatic nerve sartorius muscle preparation,that carbamazepine depresses postjunctional sensitiv-ity to released acetylcholine producing a parallel de-crease of amplitude of miniature end-plate potentials.They could not elucidate the mechanism of this in-crease of resistance. In a similar in vitro model usingphenytoin in mouse, Gage et al. (29) have demon-strated that the reduction of amplitude was caused bya reduction both in the quantal content of end-platepotentials (presynaptic effect) and in the amplitude ofthe voltage response to quanta of acetylcholine(postsynaptic effect). This up-regulation of the acetyl-choline receptor could be explained by the knownneuromuscular blockade enhancing effect of phenyt-oin and carbamazepine (30,31). A prolonged antago-nism of acetylcholine receptor by the anticonvulsantwould likely cause this increased resistance at thereceptor level.
In conclusion, patients chronically treated withanticonvulsants are resistant to the effect of cisatra-curium and have an increased CL of the drug. Thesepatients need a more rapid speed of infusion tosteadily maintain a given twitch depression andshow a faster recovery from neuromuscular block-ade after a prolonged infusion. This increase is,however, not as rapid as that required for aminos-teroidal drugs. Cisatracurium could then be a viablechoice to maintain neuromuscular blockade in pa-tients taking anticonvulsants.
References1. Spacek A, Neiger FX, Krenn CG, et al. Rocuronium-induced
neuromuscular block is affected by chronic carbamazepine ther-apy. Anesthesiology 1999;90:109–12.
2. Hickey DR, Sangwan S, Bevan JC. Phenytoin-induced resistanceto pancuronium. Anesthesia 1988;43:757–9.
3. Koenig HM, Hoffman WE. The effect of anticonvulsant therapyon two doses of rocuronium-induced neuromuscular blockade.J Neurosurg Anesthesiol 1999;2:86–9.
4. Roth S, Ebrahim ZY. Resistance to pancuronium in patientsreceiving carbamazepine. Anesthesiology 1987;66:691–3.
5. Kim CS, Ardnold FJ, Iani MS, et al. Decreased sensitivity tometocurine during long-term phenytoin therapy may be attrib-utable to protein binding and acetylcholine receptor changes.Anesthesiology 1992;77:500–6.
Table 3. Noncompartmental Pharmacokinetic Analysis of Cisatracurium
Control group Anticonvulsant group
Unbound fraction (%)a 49 � 7 53 � 10Cpss95 (ng/mL) 159 � 36 191 � 45 (0.04)CL (L � kg�1 � min�1) 5.72 � 0.70 7.12 � 1.87 (0.01)Steady-state infusion rate (�g � kg�1 � min�1)b 0.9 � 0.3 1.3 � 0.2 (�0.001)Kel (min�1) 0.036 � 0.006 0.041 � 0.009Vd� (L/kg) 0.166 � 0.034 0.175 � 0.030
a Unbound fraction � fraction of cisatracurium not bound to plasma protein; five patients randomly chosen per group.b Infusion rate required to maintain 95% twitch suppression.Values are expressed as mean � sd; P values are in parentheses.Cpss � plasma concentration at steady-state, CL � total body clearance, Kel � terminal elimination rate constant, Vd� � apparent volume of distribution.
ANESTH ANALG NEUROSURGICAL ANESTHESIA RICHARD ET AL. 5432005;100:538–44 CISATRACURIUM AND ANTICONVULSANT THERAPY
6. Alloul K, Whalley DG, Shutway, et al. Pharmacokinetic origin ofcarbamazepine-induced resistance to vecuronium neuromuscu-lar blockade in anesthetized patients. Anesthesiology 1996;84:330–9.
7. Tempolhoff R, Modica PA, Jellish WS, Spitznagel EL. Resistanceto atracurium-induced neuromuscular blockade in patients withintractable seizure disorders treated with anticonvulsants.Anesth Analg 1990;71:665–9.
8. Spacek A, Neiger FX, Spiss CK, Kress HG. Atracurium-inducedneuromuscular block is not affected by chronic anticonvulsanttherapy with carbamazepine. Acta Anesthesiol Scand 1997;41:1308–11.
9. Ornstein E, Atteo RS, Schwartz AE, et al. The effect of phenytoinon the magnitude and duration of neuromuscular block follow-ing atracurium or vecuronium. Anesthesiology 1987;67:191–6.
10. Welch RM, Brown A, Ravitch J, Dahl R. The in vitro degradationof cisatracurium, the R, cis-R1-isomer of atracurium, in humanand rat plasma. Clin Pharmacol Ther 1995;58:132–42.
11. De Wolf AM, Freeman JA, Scott VL, et al. Pharmacokinetics andpharmacodynamics of cisatracurium in patients with end-stageliver disease undergoing liver transplantation. Br J Anaesth1996;76:624–8.
12. Lien CA, Schmith VD, Belmont MR, et al. Pharmacokinetics ofcisatracurium in patients receiving nitrous oxide/opioid/barbiturate anesthesia. Anesthesiology 1996;84:300–8.
13. Ornstein E, Lien CA, Matteo RS, et al. Pharmacodynamics andpharmacokinetics of cisatracurium in geriatric surgical patients.Anesthesiology 1996;84:520–5.
14. Kisor DF, Schimth VD, Wargin WA, et al. Importance of theorgan-independent elimination of cis-atracurium. Anesth Analg1996;83:1065–71.
15. Koenig HM, Edwards TL. Cis-atracurium-induced neuromus-cular blockade in anticonvulsant treated neurosurgical patients.J Neurosurg Anesthesiol 2000;12:314–8.
16. Viby-Mogensen J, Englbaek J, Eriksson LI, et al. Good clinicalresearch practice (GCRP) in pharmacodynamic studies of neu-romuscular blocking agents. Acta Anaesthesiol Scand 1996;40:59–74.
17. Viby-Mogensen J, Ostergaard D, Donati F, et al. Pharmacoki-netic studies of neuromuscular blocking agents: good clinicalresearch practice (GCRP). Acta Anaesthesiol Scand 2000;44:1169–90.
18. Lee GC, Lyengar S, Szenohradszky J, el at. Improving the designof muscle relaxant studies. Anesthesiology 1997;86:48–54.
19. Bryant BJ, James CD, Cook DR, Harrelson JC. High performanceliquid chromatography assay for cisatracurium and its metabo-lites in human urine. J Liq Chromatogr Relat Technol 1997;20:2041–51.
20. Cameron M, Donati F, Varin F. In vitro plasma protein bindingof neuromuscular blocking agents in different subpopulationsof patients. Anesth Analg 1995;81:1019–25.
21. Belmont MR, Lien CA, Quessy S, et al. The clinical neuromus-cular pharmacology of 51W89 in patients receiving nitrousoxide/opioid/barbiturate anesthesia. Anesthesiology 1995;82:1139–45.
22. Eastwood NB, Boyd AH, Parker CJR, Hunter JM. Pharmacoki-netics of 1R-cis 1'R-cis atracurium besylate (51W89) and plasmalaudanosine concentrations in health and chronic renal failure.Br J Anaesth 1995;75:431–5.
23. Anderson GD. A mechanistic approach to antiepileptic druginteractions. Ann Pharmacother 1998;32:554–63.
24. Pirttiaho HI, Sotaniemi EA, Pelkonen RO, Pitkanen U. Hepaticblood flow and drug metabolism in patients on enzyme-inducing anticonvulsants. Eur J Clin Pharmacol 1982;22:441–5.
25. Pirttiaho HI, Sotaniemi EA, Ahokas JT, Pitkanen U. Liver sizeand indices of drug metabolism in epileptics. Br J Clin Pharma-col 1978;6:273–8.
26. Tran VT, Fiset P, Varin F. Pharmacokinetics and pharmacody-namics of cisatracurium after a short infusion in patients underpropofol anesthesia. Anesth Analg 1998;87:1158–63.
27. Bergeron L, Bevan DR, Berrill A, et al. Concentration-effectrelationship of cisatracurium at three different dose levels in theanesthetized patient. Anesthesiology 2001;95:314–23.
28. Alderdice MT, Trommer BA. Differential effects of the anticon-vulsants phenobarbital, ethosuximide and carbamazepine onneuromuscular transmission. J Pharmacol Exp Ther 1980;215:92–6.
29. Gage PW, Lonergan M, Torda TA. Presynaptic and postsynapticdepressant effects of phenytoin sodium at the neuromuscularjunction. Br J Pharmacol 1980;69:119–21.
30. Nguyen A, Ramzan I. Acute in vitro neuromuscular effects ofcarbamazepine and carbamazepine-10,11-epoxide. Anesth Analg1997;84:886–90.
31. Cammu G. Interactions of neuromuscular blocking drugs. ActaAnaesthesiol Belg 2001;52:357–63.
544 NEUROSURGICAL ANESTHESIA RICHARD ET AL. ANESTH ANALGCISATRACURIUM AND ANTICONVULSANT THERAPY 2005;100:538–44
CASE REPORT
Cerebellar Hemorrhage Caused by Cerebrospinal Fluid LeakAfter Spine SurgeryEhab Farag, MD, FRCA*, Amgad Abdou, MD‡, Ihab Riad, MD‡, Sam R. Borsellino, MD†, andArmin Schubert, MD, MBA*§
Departments of *General Anesthesiology and †Neurosurgery, and ‡Division of Anesthesiology and Critical CareMedicine, Cleveland Clinic Foundation; and §Cleveland Clinic Lerner College of Medicine of Case Western ReserveUniversity, Cleveland, Ohio
Spine surgery is associated with a wide range of surgi-cal and anesthetic complications. Excessive cerebrospi-nal fluid leak can be a cause of cerebellar hemorrhagepostoperatively. We report a 43-yr-old patient who hadlumbar spine reexploration surgery complicated by a
cerebrospinal fluid leak which led to cerebellar hemor-rhage manifested by postoperative mental statuschanges. Early detection and proper management re-sulted in full recovery.
(Anesth Analg 2005;100:545–6)
S pine surgery is associated with a wide range ofperioperative complications. The adverse circu-latory and compressive sequelae related to the
prone position have been well described (1). However,intracranial bleeding after spine surgery is rare withfew published case reports (2–5). None mention thatpostoperative opioids may mask diagnostically im-portant changes in mental status. In the current report,we describe the occurrence of cerebellar hemorrhageafter complex lumbar spine surgery, summarize pur-ported mechanisms, and call attention to the earlyidentification and treatment of this complication toavoid or minimize permanent neurological injury.
Case ReportA 43-yr-old woman, height 1.67 m, weight 68 kg, had anL5-S1 fusion using pedicle screw fixation for low back pain.Her symptoms resolved until 2 months later when she wasinvolved in a motor vehicle accident at which time her backpain recurred. She was readmitted for surgical reexplorationbased on magnetic resonance imaging (MRI) and computer-ized tomographic (CT) scan investigations. Her medical his-tory revealed a 30-pack-year exposure to cigarettes and mi-graine headaches. Her medications were oxycodone,bupropion, tizanidine, and esomeprazole. She was sched-uled for spinal reexploration of L4-S1 and lateral fusion with
iliac crest autograft. Anesthesia was induced with 200 mg ofpropofol IV; tracheal intubation was facilitated with 50 mgof rocuronium IV. Anesthesia was maintained with aremifentanil infusion and sevoflurane in an air oxygen mix-ture and muscle relaxation with boluses of rocuronium.Arterial blood pressure ranged from 130/70 to 140/90 mmHg. Her preoperative arterial blood pressure was 115/64 mm Hg. During her 7-h surgery, the patient received400 mL of cell salvage blood, 1500 mL of colloid, and7000 mL of crystalloid. The estimated blood loss was1300 mL at the end of the surgery. Her hemoglobin was 9.2g/dL, prothrombin time 13 s, international normalizationratio 1.14, and partial thromboplastin time 27.6 s. She wastransferred to the postanesthesia care unit awake, hemody-namically stable, and neurologically intact. The patient usedIV patient-controlled analgesia (PCA) with a 0.2-mg hydro-morphone demand dose limited to 10 doses/h with a basalrate of 0.2 mg/h, but required additional boluses of hydro-morphone. Over the first 36 h after surgery, the patientbecame increasingly drowsy, but was obeying commandsand moving all limbs. This was attributed to opioid over-medication; the PCA basal rate was discontinued and PCAuse eventually stopped, all without improvement in mentalstatus. She had received a total of 12 mg of hydromorphoneover 36 h. A CT scan was obtained showing cerebral edemaand evidence of a posterior fossa lesion. The patient wastracheally intubated and transferred to intensive care. BrainMRI and magnetic resonance angiography showed bilateralsymmetric cerebellar hemorrhages (Fig. 1). A right internalcarotid artery aneurysm measuring 9 mm in diameter wasnoted incidentally. A ventricular catheter was placed via thefrontal approach with an opening pressure of 5–6 mm Hg,and brain-dehydrating measures were begun. On postoper-ative day 18 she was discharged to an acute rehabilitationfacility. The patient recovered completely except for persis-tent bouts of lower back pain and right lower extremity pain.Diplopia was present on far lateral gaze bilaterally. Two
Accepted for publication August 10, 2004.Address correspondence and reprint requests to Armin Schubert,
MD, MBA, Department of General Anesthesiology/E-31, The Cleve-land Clinic Foundation, 9500 Euclid Ave., Cleveland, OH 44195.Address e-mail to [email protected].
DOI: 10.1213/01.ANE.0000143340.51813.6A
©2005 by the International Anesthesia Research Society0003-2999/05 Anesth Analg 2005;100:545–6 545
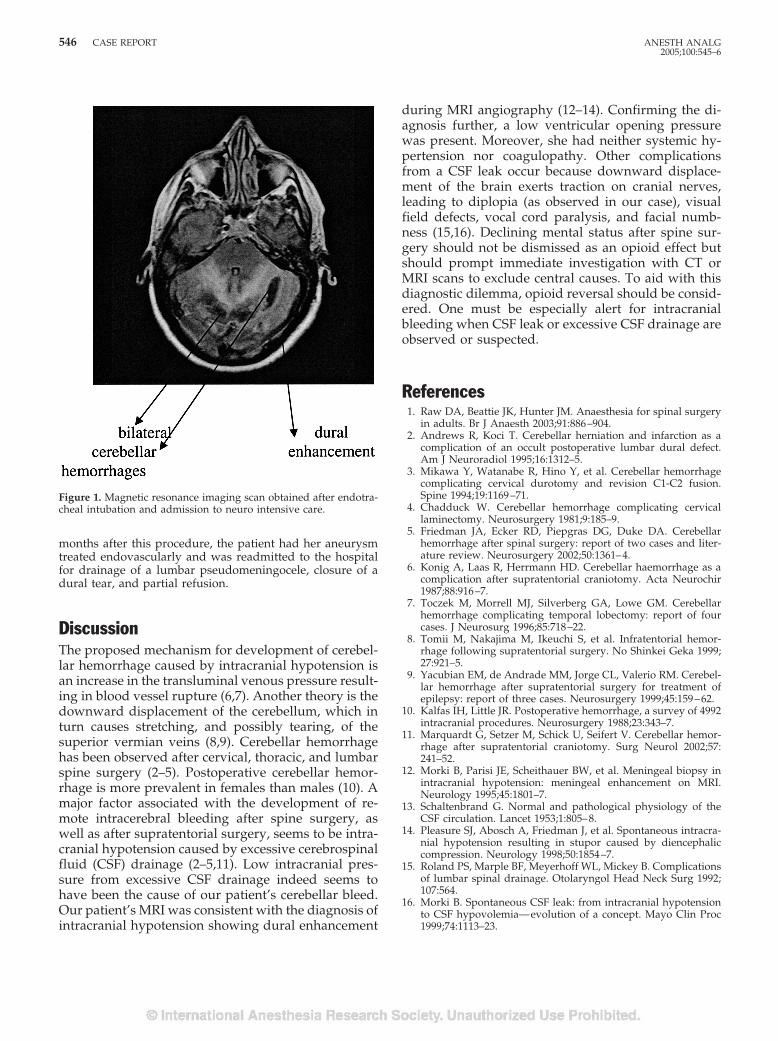
months after this procedure, the patient had her aneurysmtreated endovascularly and was readmitted to the hospitalfor drainage of a lumbar pseudomeningocele, closure of adural tear, and partial refusion.
DiscussionThe proposed mechanism for development of cerebel-lar hemorrhage caused by intracranial hypotension isan increase in the transluminal venous pressure result-ing in blood vessel rupture (6,7). Another theory is thedownward displacement of the cerebellum, which inturn causes stretching, and possibly tearing, of thesuperior vermian veins (8,9). Cerebellar hemorrhagehas been observed after cervical, thoracic, and lumbarspine surgery (2–5). Postoperative cerebellar hemor-rhage is more prevalent in females than males (10). Amajor factor associated with the development of re-mote intracerebral bleeding after spine surgery, aswell as after supratentorial surgery, seems to be intra-cranial hypotension caused by excessive cerebrospinalfluid (CSF) drainage (2–5,11). Low intracranial pres-sure from excessive CSF drainage indeed seems tohave been the cause of our patient’s cerebellar bleed.Our patient’s MRI was consistent with the diagnosis ofintracranial hypotension showing dural enhancement
during MRI angiography (12–14). Confirming the di-agnosis further, a low ventricular opening pressurewas present. Moreover, she had neither systemic hy-pertension nor coagulopathy. Other complicationsfrom a CSF leak occur because downward displace-ment of the brain exerts traction on cranial nerves,leading to diplopia (as observed in our case), visualfield defects, vocal cord paralysis, and facial numb-ness (15,16). Declining mental status after spine sur-gery should not be dismissed as an opioid effect butshould prompt immediate investigation with CT orMRI scans to exclude central causes. To aid with thisdiagnostic dilemma, opioid reversal should be consid-ered. One must be especially alert for intracranialbleeding when CSF leak or excessive CSF drainage areobserved or suspected.
References1. Raw DA, Beattie JK, Hunter JM. Anaesthesia for spinal surgery
in adults. Br J Anaesth 2003;91:886–904.2. Andrews R, Koci T. Cerebellar herniation and infarction as a
complication of an occult postoperative lumbar dural defect.Am J Neuroradiol 1995;16:1312–5.
3. Mikawa Y, Watanabe R, Hino Y, et al. Cerebellar hemorrhagecomplicating cervical durotomy and revision C1-C2 fusion.Spine 1994;19:1169–71.
4. Chadduck W. Cerebellar hemorrhage complicating cervicallaminectomy. Neurosurgery 1981;9:185–9.
5. Friedman JA, Ecker RD, Piepgras DG, Duke DA. Cerebellarhemorrhage after spinal surgery: report of two cases and liter-ature review. Neurosurgery 2002;50:1361–4.
6. Konig A, Laas R, Herrmann HD. Cerebellar haemorrhage as acomplication after supratentorial craniotomy. Acta Neurochir1987;88:916–7.
7. Toczek M, Morrell MJ, Silverberg GA, Lowe GM. Cerebellarhemorrhage complicating temporal lobectomy: report of fourcases. J Neurosurg 1996;85:718–22.
8. Tomii M, Nakajima M, Ikeuchi S, et al. Infratentorial hemor-rhage following supratentorial surgery. No Shinkei Geka 1999;27:921–5.
9. Yacubian EM, de Andrade MM, Jorge CL, Valerio RM. Cerebel-lar hemorrhage after supratentorial surgery for treatment ofepilepsy: report of three cases. Neurosurgery 1999;45:159–62.
10. Kalfas IH, Little JR. Postoperative hemorrhage, a survey of 4992intracranial procedures. Neurosurgery 1988;23:343–7.
11. Marquardt G, Setzer M, Schick U, Seifert V. Cerebellar hemor-rhage after supratentorial craniotomy. Surg Neurol 2002;57:241–52.
12. Morki B, Parisi JE, Scheithauer BW, et al. Meningeal biopsy inintracranial hypotension: meningeal enhancement on MRI.Neurology 1995;45:1801–7.
13. Schaltenbrand G. Normal and pathological physiology of theCSF circulation. Lancet 1953;1:805–8.
14. Pleasure SJ, Abosch A, Friedman J, et al. Spontaneous intracra-nial hypotension resulting in stupor caused by diencephaliccompression. Neurology 1998;50:1854–7.
15. Roland PS, Marple BF, Meyerhoff WL, Mickey B. Complicationsof lumbar spinal drainage. Otolaryngol Head Neck Surg 1992;107:564.
16. Morki B. Spontaneous CSF leak: from intracranial hypotensionto CSF hypovolemia—evolution of a concept. Mayo Clin Proc1999;74:1113–23.
Figure 1. Magnetic resonance imaging scan obtained after endotra-cheal intubation and admission to neuro intensive care.
546 CASE REPORT ANESTH ANALG2005;100:545–6
OBSTETRIC ANESTHESIASECTION EDITOR
DAVID J. BIRNBACH
CASE REPORT
Inherited Neuropathy Can Cause Postpartum Foot DropGary Peters, MRCP, and Nigel P. Hinds, MRCP
Department of Neurology, Walton Centre for Neurology and Neurosurgery, Fazakerley, Liverpool, UK
Postpartum neurological complications occur in upto 1% of deliveries. Often prior anesthetic proceduresare blamed, with medicolegal implications. We de-scribe a young woman who presented with postpar-tum foot drop diagnosed as an iatrogenic L5 root le-sion after uncomplicated epidural anesthesia. Afterneurological assessment some 5 mo later she testedpositive for the common hereditary neuropathy with
liability to pressure palsies mutation that was a likelycontributing factor in the development of her post-partum neuropathy. Anesthesiologists should con-sider hereditary neuropathies in the differential diag-nosis of postpartum or postsurgical neurologicaldeficits if there is a suggestive clinical history.
(Anesth Analg 2005;100:547–8)
T he incidence of neurological complications aris-ing in the peripartum period may be as frequentas 0.92% (1). Epidural or spinal analgesia/
anesthesia is commonly performed during deliveryand can cause inadvertent spinal cord or nerve rootinjury as a result of direct trauma, hematoma, or in-fection (2). Early (3) and more recent (4–6) reportshave concluded that postpartum foot drop can also bea result of compression of the lumbosacral trunk bythe fetal head at the pelvic brim in short women orresult from proximal sciatic or peroneal nerve injuries.Postpartum neurological injuries often resolve spon-taneously, and neurological assessment may not benecessary. The available literature seems to have over-looked an obvious contributory factor present in arecent case seen at our unit, and it seems likely thatanesthetic procedures may be unnecessarily blamedfor a proportion of neurological deficits with potentialmedicolegal implications.
Case ReportA 28-yr-old woman presented 5 mo after undergoing atransverse cesarean section delivery under epidural anesthe-sia for failure of descent during stage two of her first deliv-ery. There were no acute complications after this procedurebut in the immediate postpartum period she noticed a rightfoot drop causing her to trip and lateral right foot numbness.
A diagnosis of iatrogenic L5 root injury after epidural anes-thesia was made by the attending anesthesiologist after neu-rological examination. She was referred to the neurologyclinic, but after a few weeks she began to improve and hadfully recovered when first seen in clinic 5 mo later. A historyobtained in the clinic revealed that 8 yr previously her leftleg was similarly affected, and she also reported paresthesiain the ulnar fingers of her left hand. There was no familyhistory of neurological disease and a full neurological exam-ination at the present visit was normal.
Nerve conduction studies of the right leg revealed patho-logically small sural and peroneal sensory potentials. Theright radial sensory potential was also reduced and all rightarm motor conduction velocities were slightly reduced (me-dian conduction velocity was 41 m/s and ulnar conductionvelocity was 46 m/s; normal upper limb motor conductionvelocity, �49 m/s). Right ulnar motor conduction was mod-erately reduced around the elbow. An electromyelogram(EMG) of the right gastrocnemius and both tibialis anteriormuscles was normal.
The combination of a suggestive clinical history and elec-trophysiological evidence of a sensory neuropathy withmild slowing of motor conduction across the elbow led togenetic testing for the presence of a deletion at 17p11.2 bySTS dosage polymerase chain reaction, which detected thecommon 1.5 megabase deletion in the peripheral myelinprotein-22 gene (PMP22) associated with hereditary neurop-athy with liability to pressure palsies (HNPP).
DiscussionAlthough our patient was not examined neurologi-cally and did not undergo neurophysiological testingat the time of her maximal neurological deficit, itseems highly probable that she had a postpartum footdrop caused by an intrapartum lumbosacral plexopa-thy or high sciatic neuropathy resulting from fetalhead compression causing segmental demyelination.
Accepted for publication August 27, 2004.Address correspondence and reprint requests to Gary Peters,
MRCP, Department of Neurology, Walton Centre for Neurologyand Neurosurgery, Lower Lane, Fazakerley, Liverpool, UK L9 7LJ.Address e-mail to gary.peters@ thewaltoncentre.nhs.uk.
DOI: 10.1213/01.ANE.0000144776.51550.47
©2005 by the International Anesthesia Research Society0003-2999/05 Anesth Analg 2005;100:547–8 547
Our patient did not describe direct external compres-sion on the peroneal nerve, from inappropriate legpositioning in stirrups, or from hand pressure duringprolonged pushing with knee hyperflexion.
De Jong (7,8) originally described HNPP in a Dutchcoal miner and in 4 relatives from 3 generations. Asingle epidemiological study has estimated the prev-alence of HNPP to be 16 per 100,000 population (9). Itis an autosomal dominant condition with variablepenetrance that can present at any age, although mostpatients develop symptoms during the second or thirddecade (10). HNPP typically presents as painless focalneuropathies at common entrapment sites after minortrauma or compression. Some patients develop achronic sensorimotor neuropathy and rarer manifes-tations include painless brachial plexus palsy and cen-tral nervous system demyelination (10,11). The neuro-logical deficits typically resolve over days to months,although recovery can be delayed or incomplete. Thefamily history may be unrevealing and there is nospecific treatment. Most patients have a 1.5 megabasedeletion of the PMP22 gene, although up to 25% ofpatients have other PMP22 mutations (11). Studiesusing PMP22 transgenic animals suggest that PMP22deficiency leads to the formation of unstable neuronalmature myelin, which predisposes to demyelination(12). Diagnosing HNPP in the peripartum period hasimportant implications for mother and baby as unnec-essary investigations can be avoided.
Hereditary Neuralgic Amyotrophy (HNA) is an-other inherited neuropathy that can cause transientepisodes of painful brachial plexopathy after infec-tions or childbirth. HNA may be associated with dys-morphic features such as epicanthic folds and hypo-telorism but no confirmatory genetic test is routinelyavailable (12).
A history suggestive of recurrent entrapment neu-ropathies, particularly after minor trauma or compres-sion, should prompt anesthesiologists to consider he-reditary neuropathies in the differential diagnosis ofpostpartum neurological complications and to seekneurological advice if necessary.
References1. Wong CA, Scavone BM, Dugan S, et al. Incidence of postpartum
lumbosacral spine and lower extremity nerve injuries. ObstetGynecol 2003;101:279–88.
2. De Tommaso O, Caporuscio A, Tagariello V. Neurological com-plications following central neuraxial blocks: are there predic-tive factors? Eur J Anaesthesiol 2002;19:705–16.
3. Hunerman. Uber nervenlahmung im gebiete des nervus ischia-dicus infolge von entbingungen. Arch Gynaekkol 1892;42:489–512.
4. Gibbs MA, Beydoun SR. Obstetrical lumbosacral plexus injury.Muscle Nerve 1993;16:801.
5. Katirji B, Wilbourn AJ, Scarberry SL, Preston DC. Intrapartummaternal lumbosacral plexopathy. Muscle Nerve 2002;26:340–7.
6. Feasby TE, Burton SR, Hahn AF. Obstetrical lumbosacral plexusinjury. Muscle Nerve 1992;15:937–40.
7. De Jong JGY. Over families met hereditaire dispositie tot hetoptreden van neuritiden, gecorreleerd met migraine. Psychiatrischeen Neurologische Bladen 1947;50:60–76.
8. Koehler PJ. Hereditary neuropathy with liability to pressurepalsies: the first publication (1947). Neurology 2003;60:1211–3.
9. Meretoja P, Silander K, Kalimo H, et al. Epidemiology of hered-itary neuropathy with liability to pressure palsies (HNPP) insouthwestern Finland. Neuromuscul Disord 1997;8:529–32.
10. Tyson J, Malcolm S, Thomas PK, Harding AE. Deletions ofchromosome 17p11.2 in multifocal neuropathies. Ann Neurol1996;39:180–6.
11. Mouton P, Tardieu S, Gouider R, et al. Spectrum of clinical andelectrophysiological features in HNPP patients with the17p11.2 deletion. Neurology 1999;52:1440–6.
12. Stogbauer F, Young P, Kuhlenbaumer G, et al. Hereditaryrecurrent focal neuropathies: clinical and molecular features.Neurology 2000;54:546 –51.
548 CASE REPORT ANESTH ANALG2005;100:547–8
REGIONAL ANESTHESIASECTION EDITOR
TERESE T. HORLOCKER
EDITORIAL
Chloroprocaine Spinal Anesthesia: Back to the Future?Kenneth Drasner, MD
Department of Anesthesia and Perioperative Care, San Francisco General Hospital, San Francisco, California
A decade ago, reports of neurologic deficits asso-ciated with spinally administered lidocaine gen-erated concern regarding the potential toxicity
of this anesthetic (1–3). Adding to this concern hasbeen the recognition that transient neurologic symp-toms (TNS), i.e., pain and/or dysesthesia in the but-tocks and lower extremities, frequently follow spinaladministration of lidocaine (4–7). The etiology andsignificance of these transient symptoms are unknownand a relationship to rare but more serious complica-tions such as cauda equina syndrome remains highlyspeculative. Nonetheless, their common occurrencehas heightened dissatisfaction with lidocaine and hasgenerated interest in alternative anesthetics for spinalanesthesia. Where appropriate, most clinicians havesubstituted bupivacaine, a rational decision based onits infrequent incidence of TNS (5–7), experimentaldata indicating less toxicity (8), and the suggestion ofless risk of clinical injury (2,3). However, identificationof an alternative to lidocaine suitable for short surgicalprocedures has been more problematic. Althoughthere are reports describing the use of small-dose bu-pivacaine combined with fentanyl (9), many practitio-ners report frequent failure with this technique, andcomplete recovery may still be delayed. Of other avail-able options, neither procaine (10) nor mepivacaine(11) appears to offer a substantial advantage withrespect to TNS. Although prilocaine may have prom-ise—limited data suggest a less frequent, althoughperhaps not insignificant, incidence of TNS (12,13)—there is no formulation in the United States appropri-ate for intrathecal administration. Despite a ratherblemished past, considerable attention is now focusedon the possibility of using chloroprocaine to fill thisanesthetic void.
Introduced into clinical practice more than 50 yearsago, chloroprocaine quickly gained widespread pop-ularity as an epidural drug, particularly in obstetrics,where its rapid hydrolysis by pseudocholinesterase
virtually eliminated concern for systemic toxicity andfetal exposure. In 1952, shortly after it became avail-able for clinical anesthesia, Foldes and McNall (14)reported a series of 214 cases in which chloroprocainewas used intrathecally for surgical anesthesia. Ade-quate block was achieved with doses ranging from82.5 to 100 mg, and the duration of sensory anesthesia(defined as regression of pinprick anesthesia to theinguinal fold) was relatively brief: 82 � 2.8 min withplain chloroprocaine and 121 � 3.0 min with anepinephrine-containing solution. Despite these dataand the lack of apparent adverse effects, chloropro-caine never evolved as a spinal anesthetic, perhapsbecause of the development and marketing of theamide lidocaine. In any case, reports in the early 1980sof neurologic deficits associated with possible intra-thecal injection of epidural chloroprocaine raised con-cern regarding the potential neurotoxicity of this an-esthetic (15–17), which, until recently, would havesubdued any enthusiasm for deliberate intrathecaladministration.
In this issue of Anesthesia & Analgesia, four articlesnow reexplore the use of spinal chloroprocaine: threereport data from volunteer studies that examined theeffect of adding clonidine (18) and compared chloro-procaine with small-dose bupivacaine (19) and withprocaine (20), and the remaining article contains aretrospective review of a clinical experience encom-passing 122 patients over 10 months (21). These re-ports are a logical extension of work by this groupwhich was previously published in a volley of fivearticles in this journal (22–25). Taken together, the dataand clinical experience reinforce and greatly extendthe findings of Foldes and McNall (14) suggesting thatchloroprocaine can produce effective spinal anesthesiawith little, if any, risk of TNS (18–25). The duration ofeffect was shorter with chloroprocaine than with anequal dose of lidocaine (22), and institutional dis-charge criteria were achieved more rapidly with chlo-roprocaine than with lidocaine (22), procaine (20), orsmall-dose bupivacaine (19). As expected, anesthesiacould be prolonged or enhanced by the coadministra-tion of fentanyl (24), epinephrine (23), or clonidine(18). Somewhat surprisingly, reliable anesthesia couldbe achieved with doses of chloroprocaine as small as
Accepted for publication August 10, 2004.Address correspondence and reprint requests to Kenneth Dras-
ner, MD, Department of Anesthesia and Perioperative Care, SanFrancisco General Hospital, Room 3C-38, San Francisco, CA 94110.Address e-mail to [email protected].
DOI: 10.1213/01.ANE.0000143382.89888.C3
©2005 by the International Anesthesia Research Society0003-2999/05 Anesth Analg 2005;100:549–52 549
30 to 40 mg (21), and the duration of anesthesia with a60-mg dose was longer than that reported by Foldesand McNall despite the use of larger doses (82.5–100 mg) by these earlier investigators (14,23). Anotherunexpected, and potentially important, finding is theoccurrence of “flu-like” symptoms in volunteers re-ceiving chloroprocaine containing epinephrine (23),the implications of which we will return to shortly.
It is a bit ironic—to say the least—that chloropro-caine, the one-time poster child for anesthetic neuro-toxicity, is now a candidate to replace lidocaine, ananesthetic that stood as the “gold standard” of safetyfor half a century over the course of 75 million spinalanesthetics. To understand the rationale for usingchloroprocaine requires an appreciation of the natureof the early clinical injuries and the experimental in-vestigations that have sought to understand theiretiology.
As noted earlier, concern for neurotoxicity emergedtwo decades ago with a series of eight cases of neuro-logic injury associated with the use of Nesacaine-CE, achloroprocaine solution containing the antioxidant so-dium bisulfite (15–17). Review of these cases sug-gested that injury resulted because large volumes ofanesthetic solution intended for the epidural spacewere inadvertently administered intrathecally, andthis analysis inspired a number of studies directed atthe relative toxicity of chloroprocaine and bisulfite. Ofthese, the most widely recognized were experimentsconducted by Gissen et al. (26,27) in which exposure ofisolated rabbit vagus nerve to the commercial solutionof 3% chloroprocaine (containing 0.2% sodium bisul-fite, pH 3) produced irreversible block, but exposureto the same solution buffered to pH 7.3 resulted incomplete recovery. Additional experiments in thismodel demonstrated irreversible block with exposureto bisulfite without chloroprocaine, but only at a lowpH, leading these investigators to suggest that libera-tion of sulfur dioxide was the etiology of injury.
On the basis of the foregoing material, the followingconsiderations might lend support to clinical investi-gation of spinal chloroprocaine: 1) dosages used forspinal anesthesia are an order of magnitude lowerthan those used for epidural anesthesia; 2) there wereno reported adverse neurologic effects in Foldes andMcNall’s series of 214 chloroprocaine spinal anesthet-ics; and 3) bisulfite-free formulations of chloropro-caine are currently available. Unfortunately, the mat-ter is a bit more complicated. First, although it hasbeen assumed that injuries associated with chloropro-caine were the result of intrathecal injection of dosesintended for the epidural space, not all of the reportedcases contained strong evidence for inadvertent intra-thecal injection (15–17). Second, although chloropro-caine was used for spinal anesthesia in more than 200
patients without neurologic sequelae in the 1950s (14),the early literature is replete with examples of appar-ently safe techniques that later proved to be otherwise.Finally, although data from several studies (28–31)supported Gissen et al.’s findings, data from otherssharply conflicted (32–34). Moreover, recent in vivodata (published after the current volunteer studieswere completed) not only conflict with Gissen et al.’sfindings but, surprisingly, also suggest that bisulfitemight be neuroprotective (35). Although it is not clearwhat accounts for such divergent findings, differencesin the relative dosing of chloroprocaine and bisulfiteand the susceptibility of the various model systems tosulfur dioxide are likely critical factors. The latter mayarise from a disparity in levels or the activity of sulfiteoxidase, the protective enzyme that catalyzes oxida-tion of sulfites to less toxic sulfates (36).
Despite the importance and relevance of the data,reviewer opinion was mixed regarding publication ofthe present clinical studies because of issues of processand consent. Some questioned whether the preclinicaldata and the historical information provided adequatesupport of chloroprocaine’s safety to justify clinicalinvestigations and expressed concern that studieswere initiated without resolution of the conflictingexperimental toxicity data. Further, statements in thepresent publication and prior publications raised con-cern that uncertainties regarding the etiology of priorinjuries might not have been adequately conveyed inthe consent process. An additional issue of concernwas the routine use of spinal chloroprocaine at theauthors’ institution, which began in September 2002(21). At that time, their experience with spinal chloro-procaine was apparently limited to a few dozen spinalanesthetics performed in volunteers (21)—a numberbarely sufficient to draw conclusions about a minorcommon problem like TNS and clearly inadequate tomake meaningful statements regarding an acceptableincidence of rare major complications such as neuro-logic injury (e.g., a series of 3000 patients would berequired to rule out an incidence of more than 1 in1000 cases with a 95% confidence interval) (37). In thepresentation of the data from their initial volunteerstudies, the authors themselves comment on the lim-ited number of subjects who received spinal chloro-procaine and the need for further study to establishsafety (22–25).
It is noteworthy that publication of the current ar-ticles follows on the heels of similar controversy re-garding studies investigating intrathecal administra-tion of midazolam. In one of the two accompanyingeditorials, Cousins and Miller (38) comment on theneed to ensure a logical development of candidates forintrathecal drug delivery and state that publication ofthe material was not meant to condone the process by
550 EDITORIAL ANESTH ANALG2005;100:549–52
which it occurred. It is hoped that publication of thepresent material will serve to foster discussion ratherthan decrease the preclinical threshold for human tri-als of intrathecal drugs.
The issues surrounding the use of spinal chloropro-caine highlight substantial gaps in current knowledgeand underscore the need for additional research re-garding the toxicity of the anesthetics and bisulfite, theimplications of which go well beyond the use of spinalchloroprocaine. This objective will require a betterunderstanding of the strengths, limitations, andunique characteristics of the various experimentalmodels, including species-dependent factors that mayaccount for divergent findings. The current observa-tion that epinephrine-containing solutions were asso-ciated with significant systemic side effects is puzzlingand of considerable interest (23). The authors hypoth-esize that this might reflect a chemical meningitis in-duced by the combination of the low pH and the smallamount of bisulfite present in the epinephrine solu-tion. This cannot be ruled out and, if correct, wouldindicate a remarkable sensitivity—the amount ofbisulfite that was administered is one tenth of thatcontained in just 1 mL of the current Abbott formula-tion of epidural chloroprocaine (Abbott Laboratories,North Chicago, IL). Such sensitivity would imply arisk of injury should even small or modest volumes ofthis anesthetic solution reach the subarachnoid space.Although this issue remains to be settled, there is littledoubt that large doses of subarachnoid chloroprocaine(such as that achieved with inadvertent injection of a“full” epidural dose) can induce permanent neuro-toxic injury. However, this toxicity is not unique tochloroprocaine. It has occurred clinically with lido-caine (39) and it is likely to occur with any of thecurrently available local anesthetics.
Although the process by which these studies wereconducted will no doubt be the subject of much de-bate, the availability of the present data now place usbeyond this issue. Although experience with bisulfite-free chloroprocaine as a spinal anesthetic remains lim-ited, the rigorous systematic investigations of Kopaczet al. have gone far toward defining the characteristicsof a drug that appears particularly well suited foroutpatient spinal anesthesia. While there are many,myself included, who see the need for additional datacollected under the umbrella of institutional approvaland written informed consent, the safety profile ofspinal chloroprocaine will likely be defined by off-label use in clinical practice. In any event, after 50years on the bench, chloroprocaine may soon have animportant position in clinical anesthesia as an intra-thecal drug. Perhaps Yogi Berra wasn’t quite rightwhen he lamented that “the future ain’t what it usedto be.”
References1. Rigler ML, Drasner K, Krejcie TC, et al. Cauda equina syndrome
after continuous spinal anesthesia. Anesth Analg 1991;72:275–81.
2. Auroy Y, Narchi P, Messiah A, et al. Serious complicationsrelated to regional anesthesia: results of a prospective survey inFrance. Anesthesiology 1997;87:479–86.
3. Drasner K. Lidocaine spinal anesthesia: a vanishing therapeuticindex? Anesthesiology 1997;87:469–72.
4. Schneider M, Ettlin T, Kaufmann M, et al. Transient neurologictoxicity after hyperbaric subarachnoid anesthesia with 5% lido-caine. Anesth Analg 1993;76:1154–7.
5. Hampl KF, Schneider MC, Ummenhofer W, Drewe J. Transientneurologic symptoms after spinal anesthesia. Anesth Analg1995;81:1148–53.
6. Pollock JE, Neal JM, Stephenson CA, Wiley CE. Prospectivestudy of the incidence of transient radicular irritation in patientsundergoing spinal anesthesia. Anesthesiology 1996;84:1361–7.
7. Freedman JM, Li DK, Drasner K, et al. Transient neurologicsymptoms after spinal anesthesia: an epidemiologic study of1,863 patients. Anesthesiology 1998;89:633–41.
8. Lambert LA, Lambert DH, Strichartz GR. Irreversible conduc-tion block in isolated nerve by high concentrations of localanesthetics. Anesthesiology 1994;80:1082–93.
9. Ben-David B, Solomon E, Levin H, et al. Intrathecal fentanylwith small-dose dilute bupivacaine: better anesthesia withoutprolonging recovery. Anesth Analg 1997;85:560–5.
10. Hodgson PS, Liu SS, Batra MS, et al. Procaine compared withlidocaine for incidence of transient neurologic symptoms. RegAnesth Pain Med 2000;25:218–22.
11. Hiller A, Rosenberg PH. Transient neurological symptoms afterspinal anaesthesia with 4% mepivacaine and 0.5% bupivacaine.Br J Anaesth 1997;79:301–5.
12. Konig W, Ruzicic D. Absence of transient radicular irritationafter 5000 spinal anaesthetics with prilocaine. Anaesthesia 1997;52:182–3.
13. Hampl KF, Heinzmann-Wiedmer S, Luginbuehl I, et al. Tran-sient neurologic symptoms after spinal anesthesia: a lower in-cidence with prilocaine and bupivacaine than with lidocaine.Anesthesiology 1998;88:629–33.
14. Foldes FF, McNall PG. 2-Chloroprocaine: a new local anestheticagent. Anesthesiology 1952;13:287–96.
15. Ravindran RS, Bond VK, Tasch MD, et al. Prolonged neuralblockade following regional analgesia with 2-chloroprocaine.Anesth Analg 1980;59:447–51.
16. Reisner LS, Hochman BN, Plumer MH. Persistent neurologic deficitand adhesive arachnoiditis following intrathecal 2-chloroprocaineinjection. Anesth Analg 1980;59:452–4.
17. Moore D, Spierkijk J, van Kleef J, et al. Chloroprocaineneurotoxicity: four additional cases. Anesth Analg l982;61:155–9.
18. Davis BR, Kopacz DJ. Spinal 2-chloroprocaine: the effect ofadded clonidine. Anesth Analg 2005;100:559–65.
19. Yoos JR, Kopacz DJ. Spinal 2-chloroprocaine: a comparisonto low dose bupivacaine. Anesth Analg 2005;100:566–72.
20. Gonter AF, Kopacz DJ. Spinal 2-chloroprocaine: a comparison toprocaine in human volunteers. Anesth Analg 2005;100:573–9.
21. Yoos JR, Kopacz DJ. Spinal 2-chloroprocaine for surgery: aninitial 10-month experience. Anesth Analg 2005;100:553–8.
22. Kouri ME, Kopacz DJ. Spinal 2-chloroprocaine: a comparisonwith lidocaine in volunteers. Anesth Analg 2004;98:75–80.
23. Smith KN, Kopacz DJ, McDonald SB. Spinal 2-chloroprocaine: adose-ranging study and the effect of added epinephrine. AnesthAnalg 2004;98:81–8.
24. Vath JS, Kopacz DJ. Spinal 2-chloroprocaine: the effect of addedfentanyl. Anesth Analg 2004;98:89–94.
25. Warren DT, Kopacz DJ. Spinal 2-chloroprocaine: the effect ofadded dextrose. Anesth Analg 2004;98:95–101.
26. Gissen A, Datta S, Lambert D. The chloroprocaine controversy.II. Is chloroprocaine neurotoxic? Reg Anesth 1984;9:135–44.
ANESTH ANALG EDITORIAL 5512005;100:549–52
27. Gissen A. Toxicity of local anesthetics in obstetrics. II.Chloroprocaine: research and clinical aspects. Clin Anesthesiol1986;4:101–8.
28. Wang BC, Hillman DE, Spielholz NI, Turndorf H. Chronicneurological deficits and Nesacaine-CE: an effect of the anes-thetic, 2-chloroprocaine, or the antioxidant, sodium bisulfite?Anesth Analg 1984;63:445–7.
29. Ready LB, Plumer MH, Haschke RH, et al. Neurotoxicity ofintrathecal local anesthetics in rabbits. Anesthesiology 1985;63:364–70.
30. Ford DJ, Raj PP. Peripheral neurotoxicity of 2-chloroprocaineand bisulfite in the cat. Anesth Analg 1987;66:719–22.
31. Hersh EV, Condouris GA, Havelin D. Actions of intrathecalchloroprocaine and sodium bisulfite on rat spinal reflex func-tion utilizing a noninvasive technique. Anesthesiology 1990;72:1077–82.
32. Barsa J, Batra M, Fink B, Sumi S. A comparative in vivo study oflocal neurotoxicity of lidocaine, bupivacaine, 2-chloroprocaine,and a mixture of 2-chloroprocaine and bupivacaine. AnesthAnalg 1982;61:961–7.
33. Kalichman MW, Powell HC, Reisner LS, Myers RR. The role of2-chloroprocaine and sodium bisulfite in rat sciatic nerveedema. J Neuropathol Exp Neurol 1986;45:566–75.
34. Seravalli EP, Lear E, Cottrell JE. Cell membrane fusion by chlo-roprocaine. Anesth Analg 1984;63:985–90.
35. Taniguchi M, Bollen AW, Drasner K. Sodium bisulfite: scape-goat for chloroprocaine neurotoxicity? Anesthesiology 2004;100:85–91.
36. Cabre F, Marin C, Cascante M, Canela EI. Occurrence andcomparison of sulfite oxidase activity in mammalian tissues.Biochem Med Metab Biol 1990;43:159–62.
37. Hanley J, Lippman-Hand A. If nothing goes wrong, is every-thing all right? Interpreting zero numerators. JAMA 1983;249:1743–5.
38. Cousins MJ, Miller RD. Intrathecal midazolam: an ethical edi-torial dilemma. Anesth Analg 2004;98:1507–8.
39. Drasner K, Rigler ML, Sessler DI, Stoller ML. Cauda equinasyndrome following intended epidural anesthesia. Anesthesiol-ogy 1992;77:582–5.
552 EDITORIAL ANESTH ANALG2005;100:549–52
Spinal 2-Chloroprocaine for Surgery: An Initial 10-MonthExperienceJessica R. Yoos, MD, and Dan J. Kopacz, MD
Department of Anesthesiology, Virginia Mason Clinic, Seattle, Washington
Spinal 2-chloroprocaine (2-CP) is currently being inves-tigated as a short-acting alternative to lidocaine, whichfrequently causes transient neurologic symptoms(TNS) in surgical patients. TNS has not been reportedwith 2-CP in volunteers in doses ranging from 30 to60 mg and appears to provide an excellent level of sur-gical anesthesia. In this retrospective study, we de-scribe the experience with spinal 2-CP in surgical pa-tients during its first 10 mo of clinical use at ourinstitution. Most patients had ambulatory surgery, in-cluding 39 orthopedic, 30 general surgical, 18 gyneco-logic, and 34 genitourinary procedures. Chloropro-caine 30 or 40 mg, with or without fentanyl (10–20 �g),
was the most common (92%) dose combination used.Mean peak block height averaged T6 to T8. The surgicalprocedure time was 32.3 � 18.4 min. Time from place-ment of the block to the end of the surgical procedurewas 53.1 � 20.7 min. Times to ambulation and dis-charge were 155.1 � 34.7 min and 207.9 � 69.4 min,respectively. 2-CP spinal anesthesia has proven to be asafe and effective alternative to lidocaine and procainefor ambulatory surgical procedures of �1 h, with a pre-dictable regression of block height. No patients re-ported TNS after surgery.
(Anesth Analg 2004;99:553–8)
T he search for an ideal local anesthetic for spinalanesthesia in the ambulatory surgical patient hasspanned decades. Lidocaine has been a routine
choice because of its predictable onset time and dura-tion, as well as its dependable surgical anesthesia.However, it is often associated with transient neuro-logic symptoms (TNS), which is a non-life-threateningbut short-term quality of life-diminishing side effect(1). Procaine is another short-acting alternative, but itis reportedly ineffective in 17% of cases and is associ-ated with frequent nausea (2–4). Although bupiva-caine spinal anesthesia is rarely associated with TNS,its use in the ambulatory surgical population is con-troversial. In larger doses (�9 mg), its duration isunpredictable, and the return of bladder function canbe a limiting factor for a timely discharge (5). Insmaller doses (�7.5 mg), block failure is unacceptablycommon (6).
In 1952, Foldes and McNall (7) reported 214 patientswho received preservative-free 2-chloroprocaine (2-CP) spinal anesthesia. Subsequently, the antioxidantsodium bisulfite was added to 2-CP, and this combi-nation was used extensively for epidural anesthesia,particularly in obstetrics. Case reports in the 1980sdescribed inadvertent large-volume subarachnoid in-jection of 2-CP, which led to lower-extremity paralysisand sacral nerve dysfunction in 8 patients (8–11). Thecombination of the antioxidant sodium bisulfite andlow pH (�3.3) was thought to be the cause of theapparent neurotoxicity. Two new formulations of2-CP, both preservative and antioxidant free, havebeen released (Nesacaine-MPF, Astra Pharmaceuti-cals, Wilmington, DE; and generic chloroprocaine,Bedford Pharmaceuticals, Bedford, OH). Until re-cently, the anesthesia community has been reluctant touse these new formulations for spinal anesthesia be-cause of the previous cases of bisulfite-associatedneurotoxicity.
In early 2002, volunteer studies commenced at ourinstitution investigating the use of preservative-free2-CP for spinal anesthesia. Four separate randomized,controlled trials were performed to establish an ap-propriate dose range and to compare 1) plain 2-CPversus 2-CP with added epinephrine, 2) plain 2-CPversus 2-CP with fentanyl, and 3) plain 2-CP versus2-CP with dextrose (12–14). The fourth study com-pared 40 mg of spinal 2-CP and 40 mg of lidocaine
Although 2-chloroprocaine is approved by the Food and DrugAdministration, it is not specifically indicated for spinal anesthesia.Its use for spinal anesthesia is thus considered off-label. Manufac-turers of 2-chloroprocaine distinctly label the product “not for spi-nal anesthesia.”
Accepted for publication February 20, 2004.Address correspondence to Dan J. Kopacz, MD, Department of
Anesthesiology, Virginia Mason Clinic, 1100 Ninth Ave., B2-AN, POBox 900, Seattle, WA 98111. Address e-mail to [email protected] will not be available.
DOI: 10.1213/01.ANE.0000130397.38849.4A
©2004 by the International Anesthesia Research Society0003-2999/04 Anesth Analg 2004;99:553–8 553
(15). No volunteers reported TNS with spinal 2-CP,and all volunteers developed anesthesia of adequateduration and density for surgery in a simulated am-bulatory setting.
Beginning in September of 2002, anesthesiologists atthe Virginia Mason Medical Center began using 2-CPspinal anesthesia for clinical ambulatory proceduresas a replacement to the aforementioned drugs. Thepurpose of this report was to review perioperativerecords from our initial 10-month clinical experiencewith the use of spinal 2-CP in surgical patients.
MethodsAfter IRB approval, the hospital records of all patientswho received 2-CP spinal anesthesia at the VirginiaMason Medical Center from September 2002 throughJune 2003 were retrospectively reviewed. Data fromintraoperative anesthesia records and postanesthesiacare unit (PACU) records were collected by a singlereviewer and were recorded manually onto a data-collection template. Multiple data points were col-lected, including the anesthesiologist administeringthe anesthetic; the patient’s ASA class, age, height,weight, and sex; the surgical procedure; spinal 2-CPdose and adjuvant drugs added; route of administra-tion (spinal or combined spinal/epidural); time of in-jection; patient position during injection; block heightover time; surgical position, surgical start and endtimes; sedation and vasopressors given; IV fluid ad-ministration; time of first recorded ambulation; sideeffects in the PACU; and discharge time. All patientsreceived a follow-up phone call the day after surgeryby the PACU nursing team, and a report note wasplaced in the chart.
For comparison, the number of patients who under-went spinal anesthesia with lidocaine and procaine atour institution during this same time period was tal-lied. Data are expressed as mean � sd, unless other-wise specified. The incidence of side effects was eval-uated by using �2 analysis, with P � 0.05 accepted assignificant.
ResultsDuring this 10-mo period, 122 patients received 2-CPspinal anesthesia, of which 27 were ASA class I, 73ASA class II, 21 ASA class III, and 1 ASA class IV.There were 52 male and 70 female patients (age, 55 �16 yr; weight, 79 � 20 kg; height, 173 � 20 cm). Mostpatients had ambulatory procedures, including 40 or-thopedic, 30 general surgical, 18 gynecologic, and 34genitourinary procedures (Table 1). One patient re-ceived spinal 2-CP on 2 occasions for separate proce-dures. Surgery was performed in the lithotomy posi-tion in 56 patients (46%), the supine position in 53
patients (43%), the prone jackknife position in 12 pa-tients (10%), and the lateral position in 1 patient (1%).
All blocks were conducted at L2-3, L3-4, or L4-5with a 25-gauge Sprotte® needle (B. Braun MedicalInc., Bethlehem, PA), with the choice of level and doseof spinal 2-CP at the discretion of the administeringanesthesiologist. Both formulations of preservative-and antioxidant-free 2-CP were used. Spinal anesthe-sia was most often (82%) performed in the lateraldecubitus position, with 14% performed in the sittingposition and 4% performed in the prone jackknifeposition. The dose of chloroprocaine ranged from 20to 60 mg; 40 mg (2 mL of 2% plain 2-CP) was mostcommon (80%). Fentanyl (10 or 20 �g) was the mostcommon additive (33 patients), whereas dextrose wasadded to increase baricity in 3 patients and sterilewater was added to make a hypobaric solution in 1patient (Table 1).
Most patients (n � 98) received midazolam andfentanyl sedation before the administration of spinalanesthesia, and 57 patients received intraoperativepropofol sedation (�100 �g · kg�1 · min�1). Fifty ofthese patients received a combination of propofol, mi-dazolam, and/or fentanyl. Twenty-four percent of pa-tients received vasoactive drugs. Twenty-two patientsrequired intraoperative treatment with ephedrine forsystolic blood pressure (SBP) �90 mm Hg in dosesranging from 5 to 30 mg. Five patients received 100–300 �g of phenylephrine, and 4 patients received 0.4–0.8 mg of atropine for heart rate (HR) �50 bpm. Twopatients received both ephedrine and phenylephrine,and one patient received both ephedrine and atropine.Two patients received ephedrine 10 mg in the PACUfor SBP �90 mm Hg, and 1 patient received 0.4 mg ofatropine in the PACU for HR �50 bpm. The require-ment for vasopressors was associated with doseslarger than 40 mg (P � 0.04) but was not associatedwith the addition of fentanyl (P � 0.45). IntraoperativeIV fluid administration was uniformly provided to allpatients, with a mean quantity of 710 � 293 mL oflactated Ringer’s solution.
Block height data were collected from operativerecords (n � 82) when recorded by the clinician orPACU nursing staff. Sufficient data were availableonly for the 30- and 40-mg doses to plot dose of 2-CP(plain or with adjuncts) versus block height (Fig. 1).Mean block height was more than T10 for all groupswithin 20 min and peaked between T6 and T8. Der-matomal regression tended to occur more rapidlywith the smaller dose (30 mg).
Surgical time was longer than anticipated in 4 cases(99 � 12 min), and conversion to general anesthesiawas necessary to complete the procedure. Three pa-tients had combined spinal/epidural anesthesia, allwith 2-CP spinal anesthetic before catheter placement,and two of these patients required dosing through theepidural catheter because of prolonged surgical time.
554 REGIONAL ANESTHESIA YOOS AND KOPACZ ANESTH ANALGSPINAL CHLOROPROCAINE FOR SURGERY 2004;99:553–8
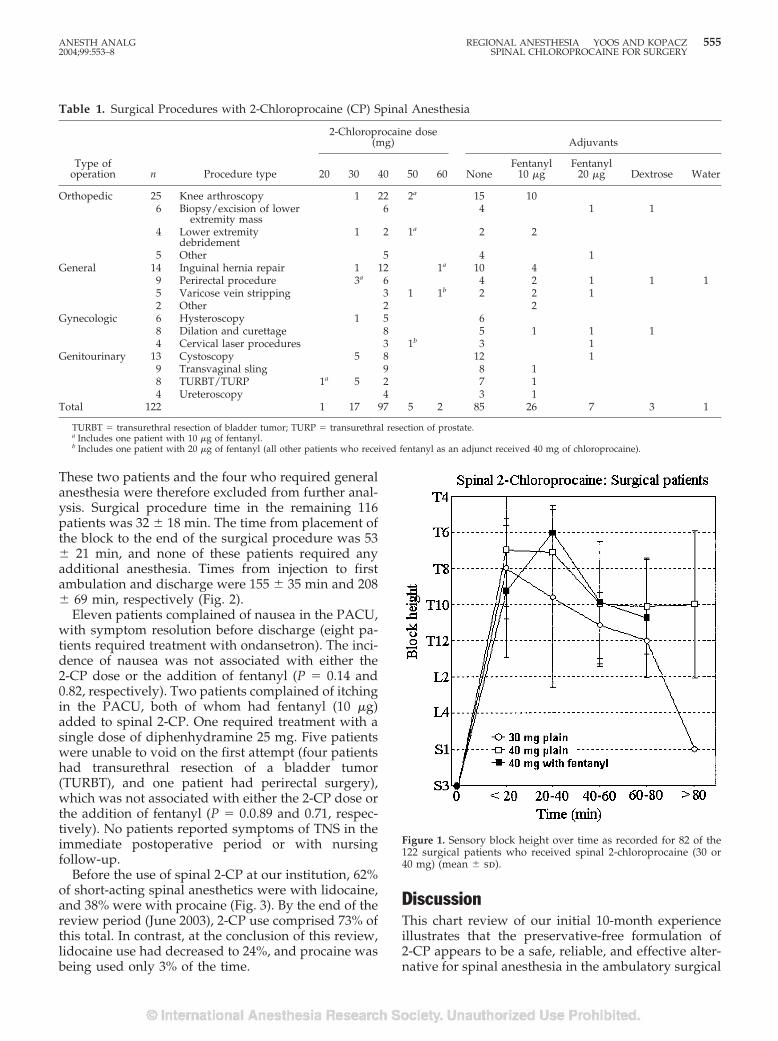
These two patients and the four who required generalanesthesia were therefore excluded from further anal-ysis. Surgical procedure time in the remaining 116patients was 32 � 18 min. The time from placement ofthe block to the end of the surgical procedure was 53� 21 min, and none of these patients required anyadditional anesthesia. Times from injection to firstambulation and discharge were 155 � 35 min and 208� 69 min, respectively (Fig. 2).
Eleven patients complained of nausea in the PACU,with symptom resolution before discharge (eight pa-tients required treatment with ondansetron). The inci-dence of nausea was not associated with either the2-CP dose or the addition of fentanyl (P � 0.14 and0.82, respectively). Two patients complained of itchingin the PACU, both of whom had fentanyl (10 �g)added to spinal 2-CP. One required treatment with asingle dose of diphenhydramine 25 mg. Five patientswere unable to void on the first attempt (four patientshad transurethral resection of a bladder tumor(TURBT), and one patient had perirectal surgery),which was not associated with either the 2-CP dose orthe addition of fentanyl (P � 0.0.89 and 0.71, respec-tively). No patients reported symptoms of TNS in theimmediate postoperative period or with nursingfollow-up.
Before the use of spinal 2-CP at our institution, 62%of short-acting spinal anesthetics were with lidocaine,and 38% were with procaine (Fig. 3). By the end of thereview period (June 2003), 2-CP use comprised 73% ofthis total. In contrast, at the conclusion of this review,lidocaine use had decreased to 24%, and procaine wasbeing used only 3% of the time.
DiscussionThis chart review of our initial 10-month experienceillustrates that the preservative-free formulation of2-CP appears to be a safe, reliable, and effective alter-native for spinal anesthesia in the ambulatory surgical
Figure 1. Sensory block height over time as recorded for 82 of the122 surgical patients who received spinal 2-chloroprocaine (30 or40 mg) (mean � sd).
Table 1. Surgical Procedures with 2-Chloroprocaine (CP) Spinal Anesthesia
Type ofoperation n Procedure type
2-Chloroprocaine dose(mg) Adjuvants
20 30 40 50 60 NoneFentanyl
10 �gFentanyl
20 �g Dextrose Water
Orthopedic 25 Knee arthroscopy 1 22 2a 15 106 Biopsy/excision of lower
extremity mass6 4 1 1
4 Lower extremitydebridement
1 2 1a 2 2
5 Other 5 4 1General 14 Inguinal hernia repair 1 12 1a 10 4
9 Perirectal procedure 3a 6 4 2 1 1 15 Varicose vein stripping 3 1 1b 2 2 12 Other 2 2
Gynecologic 6 Hysteroscopy 1 5 68 Dilation and curettage 8 5 1 1 14 Cervical laser procedures 3 1b 3 1
Genitourinary 13 Cystoscopy 5 8 12 19 Transvaginal sling 9 8 18 TURBT/TURP 1a 5 2 7 14 Ureteroscopy 4 3 1
Total 122 1 17 97 5 2 85 26 7 3 1
TURBT � transurethral resection of bladder tumor; TURP � transurethral resection of prostate.a Includes one patient with 10 �g of fentanyl.b Includes one patient with 20 �g of fentanyl (all other patients who received fentanyl as an adjunct received 40 mg of chloroprocaine).
ANESTH ANALG REGIONAL ANESTHESIA YOOS AND KOPACZ 5552004;99:553–8 SPINAL CHLOROPROCAINE FOR SURGERY
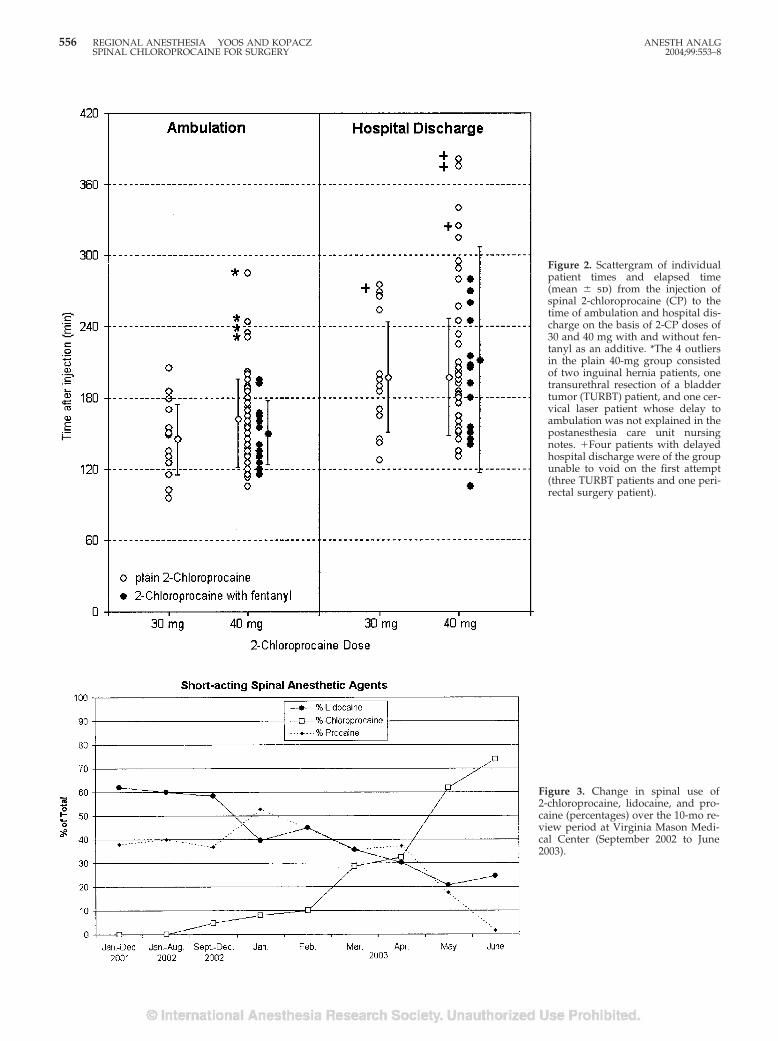
Figure 2. Scattergram of individualpatient times and elapsed time(mean � sd) from the injection ofspinal 2-chloroprocaine (CP) to thetime of ambulation and hospital dis-charge on the basis of 2-CP doses of30 and 40 mg with and without fen-tanyl as an additive. *The 4 outliersin the plain 40-mg group consistedof two inguinal hernia patients, onetransurethral resection of a bladdertumor (TURBT) patient, and one cer-vical laser patient whose delay toambulation was not explained in thepostanesthesia care unit nursingnotes. �Four patients with delayedhospital discharge were of the groupunable to void on the first attempt(three TURBT patients and one peri-rectal surgery patient).
Figure 3. Change in spinal use of2-chloroprocaine, lidocaine, and pro-caine (percentages) over the 10-mo re-view period at Virginia Mason Medi-cal Center (September 2002 to June2003).
556 REGIONAL ANESTHESIA YOOS AND KOPACZ ANESTH ANALGSPINAL CHLOROPROCAINE FOR SURGERY 2004;99:553–8
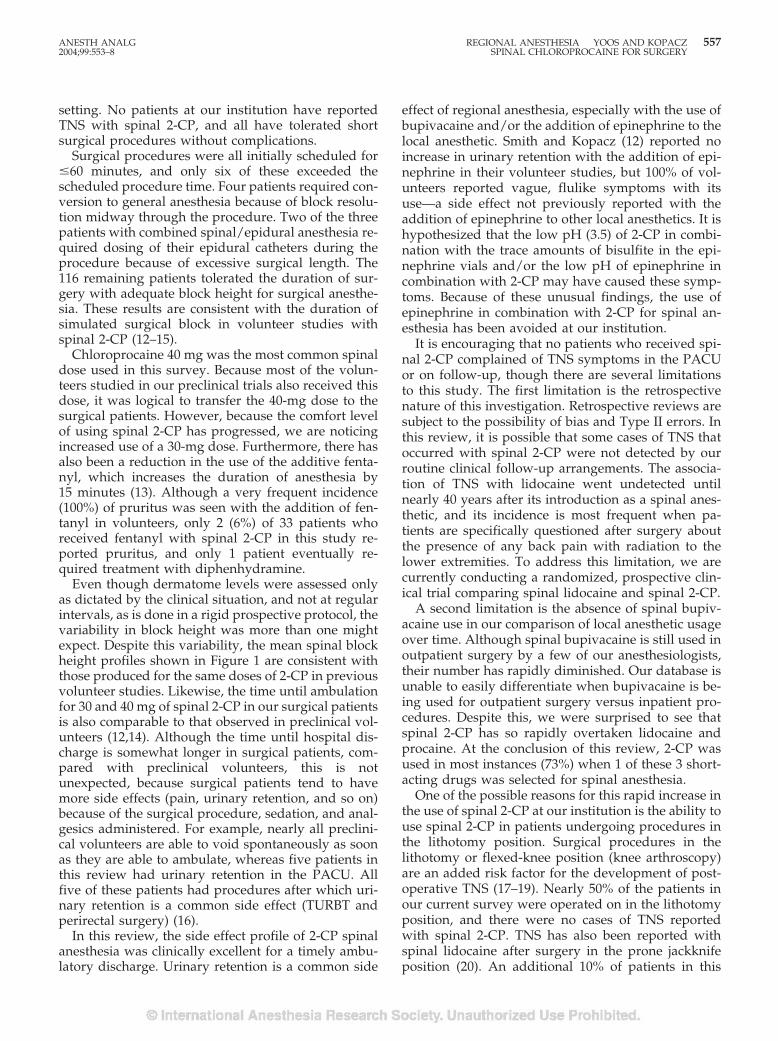
setting. No patients at our institution have reportedTNS with spinal 2-CP, and all have tolerated shortsurgical procedures without complications.
Surgical procedures were all initially scheduled for�60 minutes, and only six of these exceeded thescheduled procedure time. Four patients required con-version to general anesthesia because of block resolu-tion midway through the procedure. Two of the threepatients with combined spinal/epidural anesthesia re-quired dosing of their epidural catheters during theprocedure because of excessive surgical length. The116 remaining patients tolerated the duration of sur-gery with adequate block height for surgical anesthe-sia. These results are consistent with the duration ofsimulated surgical block in volunteer studies withspinal 2-CP (12–15).
Chloroprocaine 40 mg was the most common spinaldose used in this survey. Because most of the volun-teers studied in our preclinical trials also received thisdose, it was logical to transfer the 40-mg dose to thesurgical patients. However, because the comfort levelof using spinal 2-CP has progressed, we are noticingincreased use of a 30-mg dose. Furthermore, there hasalso been a reduction in the use of the additive fenta-nyl, which increases the duration of anesthesia by15 minutes (13). Although a very frequent incidence(100%) of pruritus was seen with the addition of fen-tanyl in volunteers, only 2 (6%) of 33 patients whoreceived fentanyl with spinal 2-CP in this study re-ported pruritus, and only 1 patient eventually re-quired treatment with diphenhydramine.
Even though dermatome levels were assessed onlyas dictated by the clinical situation, and not at regularintervals, as is done in a rigid prospective protocol, thevariability in block height was more than one mightexpect. Despite this variability, the mean spinal blockheight profiles shown in Figure 1 are consistent withthose produced for the same doses of 2-CP in previousvolunteer studies. Likewise, the time until ambulationfor 30 and 40 mg of spinal 2-CP in our surgical patientsis also comparable to that observed in preclinical vol-unteers (12,14). Although the time until hospital dis-charge is somewhat longer in surgical patients, com-pared with preclinical volunteers, this is notunexpected, because surgical patients tend to havemore side effects (pain, urinary retention, and so on)because of the surgical procedure, sedation, and anal-gesics administered. For example, nearly all preclini-cal volunteers are able to void spontaneously as soonas they are able to ambulate, whereas five patients inthis review had urinary retention in the PACU. Allfive of these patients had procedures after which uri-nary retention is a common side effect (TURBT andperirectal surgery) (16).
In this review, the side effect profile of 2-CP spinalanesthesia was clinically excellent for a timely ambu-latory discharge. Urinary retention is a common side
effect of regional anesthesia, especially with the use ofbupivacaine and/or the addition of epinephrine to thelocal anesthetic. Smith and Kopacz (12) reported noincrease in urinary retention with the addition of epi-nephrine in their volunteer studies, but 100% of vol-unteers reported vague, flulike symptoms with itsuse—a side effect not previously reported with theaddition of epinephrine to other local anesthetics. It ishypothesized that the low pH (3.5) of 2-CP in combi-nation with the trace amounts of bisulfite in the epi-nephrine vials and/or the low pH of epinephrine incombination with 2-CP may have caused these symp-toms. Because of these unusual findings, the use ofepinephrine in combination with 2-CP for spinal an-esthesia has been avoided at our institution.
It is encouraging that no patients who received spi-nal 2-CP complained of TNS symptoms in the PACUor on follow-up, though there are several limitationsto this study. The first limitation is the retrospectivenature of this investigation. Retrospective reviews aresubject to the possibility of bias and Type II errors. Inthis review, it is possible that some cases of TNS thatoccurred with spinal 2-CP were not detected by ourroutine clinical follow-up arrangements. The associa-tion of TNS with lidocaine went undetected untilnearly 40 years after its introduction as a spinal anes-thetic, and its incidence is most frequent when pa-tients are specifically questioned after surgery aboutthe presence of any back pain with radiation to thelower extremities. To address this limitation, we arecurrently conducting a randomized, prospective clin-ical trial comparing spinal lidocaine and spinal 2-CP.
A second limitation is the absence of spinal bupiv-acaine use in our comparison of local anesthetic usageover time. Although spinal bupivacaine is still used inoutpatient surgery by a few of our anesthesiologists,their number has rapidly diminished. Our database isunable to easily differentiate when bupivacaine is be-ing used for outpatient surgery versus inpatient pro-cedures. Despite this, we were surprised to see thatspinal 2-CP has so rapidly overtaken lidocaine andprocaine. At the conclusion of this review, 2-CP wasused in most instances (73%) when 1 of these 3 short-acting drugs was selected for spinal anesthesia.
One of the possible reasons for this rapid increase inthe use of spinal 2-CP at our institution is the ability touse spinal 2-CP in patients undergoing procedures inthe lithotomy position. Surgical procedures in thelithotomy or flexed-knee position (knee arthroscopy)are an added risk factor for the development of post-operative TNS (17–19). Nearly 50% of the patients inour current survey were operated on in the lithotomyposition, and there were no cases of TNS reportedwith spinal 2-CP. TNS has also been reported withspinal lidocaine after surgery in the prone jackknifeposition (20). An additional 10% of patients in this
ANESTH ANALG REGIONAL ANESTHESIA YOOS AND KOPACZ 5572004;99:553–8 SPINAL CHLOROPROCAINE FOR SURGERY
study were operated on in the prone jackknife positionwithout the development of TNS.
In our clinical experience, the preservative-free for-mulation of 2-CP for spinal anesthesia appears to be asafe and effective alternative to lidocaine and procainefor short ambulatory procedures. The 8 cases of neu-rotoxicity reported in the 1980s occurred with inad-vertent subarachnoid injection of 2-CP formulationsthat contained sodium bisulfite as a preservative.These cases have been extensively reviewed, and mostclinicians have concluded that the neurotoxicity wasthe result of the aforementioned preservative in com-bination with the low pH of 2-CP. A formulation of2-CP with large amounts of bisulfite is still commer-cially available (Abbott Laboratories, Chicago, IL;bisulfite 1.8 mg/mL) and should be avoided for spinalanesthesia. The clinician can easily distinguish thisformulation from the preservative-free formulationsbecause it is packaged in a clear vial, whereas thepreservative-free formulations are packaged in abrown vial designed to prevent photodegradation. Atour institution, both of the bisulfite-free formulationsof 2-CP have been safely used for spinal anesthesiaclinically and in volunteer studies.
In conclusion, the preservative-free formulation of2-CP appears to be an excellent alternative for short-acting spinal anesthesia in the ambulatory surgicalpopulation. It has been well tolerated and effective involunteer studies and clinically, as evidenced by thisreview of its first 10 months in use at our institution.We have had no cases of TNS-like symptoms or neu-rotoxicity, and 2-CP has become the short-acting localanesthetic of choice at our institution.
References1. Pollock JE. Transient neurologic symptoms: etiology, risk fac-
tors, and management. Reg Anesth Pain Med 2002;27:581–6.2. Le Truong JJ, Girard M, Drolet P, et al. Spinal anesthesia: a
comparison of procaine and lidocaine. Can J Anaesth 2001;48:470–3.
3. Hodgson PS, Liu SS, Batra MS, et al. Procaine compared withlidocaine for incidence of transient neurologic symptoms. RegAnesth Pain Med 2000;25:218–22.
4. Bergeron L, Girard M, Drolet P, et al. Spinal procaine with andwithout epinephrine and its relation to transient radicular irri-tation. Can J Anaesth 1999;46:846–9.
5. Kamphuis ET, Ionescu TI, Kuipers PWG, et al. Recovery ofstorage and emptying functions of the urinary bladder afterspinal anesthesia with lidocaine and with bupivacaine in men.Anesthesiology 1998;88:310–6.
6. Ben-David B, Solomon E, Levin H, et al. Intrathecal fentanylwith small-dose dilute bupivacaine: better anesthesia withoutprolonging recovery. Anesth Analg 1997;85:560–5.
7. Foldes FF, McNall PG. 2-Chloroprocaine: a new local anestheticagent. Anesthesiology 1952;13:287–96.
8. Winnie AP, Nadar AM. Santayana’s prophecy fulfilled. RegAnesth Pain Med 2001;26:558–64.
9. Ravindran RS, Bond VK, Tasch MD, et al. Prolonged neuralblockade following regional anesthesia with 2-chloroprocaine.Anesth Analg 1980;59:447–51.
10. Reisner LS, Hochman BN, Plumer MH. Persistent neurologicdeficit and adhesive arachnoiditis following intrathecal2-chloroprocaine. Anesth Analg 1980;59:452–4.
11. Moore DC, Spierdijk J, van Kleef JD, et al. Chloroprocainetoxicity: four additional cases. Anesth Analg 1982;61:158–9.
12. Smith KN, Kopacz DJ. Spinal 2-chloroprocaine: a dose-rangingstudy and the effect of added epinephrine. Anesth Analg 2004;98:81–8.
13. Vath JS, Kopacz DJ. Spinal 2-chloroprocaine: the effect of addedfentanyl. Anesth Analg 2004;98:89–94.
14. Warren DT, Kopacz DJ. Spinal 2-chloroprocaine: the effect ofadded dextrose. Anesth Analg 2004;98:95–101.
15. Kouri M, Kopacz DJ. Spinal 2-chloroprocaine: a comparisonwith lidocaine in volunteers. Anesth Analg 2004;98:75–80.
16. Pavlin JD, Pavlin EG, Fitzgibbons DR, et al. Management ofbladder function after outpatient surgery. Anesthesiology 1999;91:42–50.
17. Schneider M, Ettlin T, Kaufmann M, et al. Transient neurologictoxicity after hyperbaric subarachnoid anesthesia with 5% lido-caine. Anesth Analg 1993;76:1154–7.
18. Pollack JE, Neal JM, Stephenson CA, Wiley CA. Prospectivestudy of the incidence of transient radicular irritation in patientsundergoing spinal anesthesia. Anesthesiology 1996;84:1361–7.
19. Freedman J, Li D, Drasner K, et al. Risk factors for transientneurologic symptoms after spinal anesthesia. Anesthesiology1998;89:633–41.
20. Alley EA, Pollock JE. Transient neurologic symptoms in a pa-tient receiving hypobaric lidocaine in the prone jack-knife po-sition. Anesth Analg 2002;95:757–9.
558 REGIONAL ANESTHESIA YOOS AND KOPACZ ANESTH ANALGSPINAL CHLOROPROCAINE FOR SURGERY 2004;99:553–8
SBD
Iwepdutototioduknfoco
co
29
AnBoRe
AdanAlprmw
DO
©200
pinal 2-Chloroprocaine: The Effect of Added Clonidinerad R. Davis, MD, and Dan J. Kopacz, MD
epartment of Anesthesiology, Virginia Mason Medical Center, Seattle, Washington
Preservative-free 2-chloroprocaine (2-CP) is being in-vestigated for short-acting spinal anesthesia. Clonidineimproves the quality of spinal bupivacaine and ropiva-caine, but in traditional doses (1–2 �g/kg) it producessystemic side effects. It has not been studied in combi-nation with 2-CP. In this double-blind, randomizedcrossover study, we compared spinal 2-CP (30 mg) withand without clonidine (15 �g) in eight volunteers. Pin-prick anesthesia, motor strength, tolerance to electricalstimulation and thigh tourniquet, and time to ambula-tion were assessed. Peak block height was similar be-tween 2-CP (T8 [range, T6 to L2]) and 2-CP withclonidine (T8 [range, T4 to T11]) (P � 0.57). Sensory an-esthesia was prolonged with clonidine at L1 (51 �23 min versus 76 � 11 min; P � 0.002), as was complete
block regression (99 � 18 min versus 131 � 15 min; P �0.001). Lower extremity motor blockade was increasedwith clonidine (return to baseline Bromage score: 65 �13 min versus 79 � 19 min, P � 0.004; return to 90%gastrocnemius strength: P � 0.003). Clonidine in-creased tourniquet tolerance from 33 to 45 min (P �0.06) and increased time to ambulation, spontaneousvoiding, and discharge (99 � 18 min versus 131 �15 min for all; P � 0.001). There were no differences inhemodynamic measurements, and no subject reportedtransient neurologic symptoms. We conclude thatsmall-dose clonidine increases the duration and im-proves the quality of 2-CP spinal anesthesia withoutsystemic side effects.
(Anesth Analg 2005;100:559–65)
n 1952, Foldes and McNall (1) first described2-chloroprocaine (2-CP) spinal anesthesia in 214patients without neurologic complications. 2-CP
as used extensively over the next three decades foridural anesthesia because of its fast onset time, shortration of action, and small potential for systemic
xicity. From 1980 to 1982, nine patients were foundhave persistent motor, sensory, or sphincter func-n deficits after injection of large volumes of epi-ral 2-CP (2–4). Four of the nine patients wereown to have accidental intrathecal injections. The
rmulation of 2-CP used at that time (Nesacaine-CE)ntained 0.2% sodium bisulfite as an antioxidant.Wang et al. (5) and Gissen et al. (6) determined that thembination with sodium bisulfite at a low pH was the
cause of the persistent neurologic deficits, although re-cent studies have disputed their conclusions (7,8). So-dium bisulfite was subsequently removed from most2-CP preparations, but it is again being used for spinalanesthesia in surgical patients (9,10).
Lidocaine has been under scrutiny as a spinal anes-thetic for outpatients since Schneider et al. (11) re-ported patient complaints of pain radiating to thebuttocks and lower extremities after receiving sub-arachnoid lidocaine. This phenomenon, called “tran-sient neurologic symptoms” (TNS), is most often seenwith lidocaine; outpatient surgery and surgery in thelithotomy position are two other primary risk factors(12). Several studies have found preservative-free2-CP to be a suitable alternative to lidocaine for spinalanesthesia, without signs or symptoms of neurologicimpairment or TNS (13–15).
The addition of adjuncts to local anesthetics hasbeen used to improve the quality of spinal anesthesia.Clonidine, an �2-adrenergic agonist, prolongs both thesensory and motor blockade produced by spinal lido-caine, bupivacaine, and ropivacaine (16–20). Intrathe-cal clonidine has traditionally been used in doseslarger than 100 �g and has been associated with hy-potension, bradycardia, and sedation. However, dosesof clonidine as small as 15 �g have been shown toimprove the quality of ropivacaine (17) and bupiva-caine (19) spinal anesthesia without producing thesesystemic effects.
Presented in part at the American Society of Regional Anesthesiath Spring Meeting, Orlando, FL, March 2004.Accepted for publication August 10, 2004.Address correspondence to Dan J. Kopacz, MD, Department ofesthesiology, Virginia Mason Clinic, 1100 Ninth Ave., B2-AN, POx 900, Seattle, WA 98111. Address e-mail to [email protected] will not be available from the authors.Although 2-chloroprocaine is approved by the Food and Drugministration, it is not specifically indicated for use in spinal
esthesia. Its use for spinal anesthesia is thus considered off-label.l current manufacturers of 2-chloroprocaine distinctly label theoduct “not for spinal anesthesia.” All subjects in this study wereade aware of this information, which was also included in theirritten informed consent.
I: 10.1213/01.ANE.0000143381.30409.62
005 by the International Anesthesia Research Society03-2999/05 Anesth Analg 2005;100:559–65 559
Clonidine has not been studied in conjunction withspinal 2-CP. The aim of this study was to evaluatewhether adding small-dose clonidine changes the du-ration of spinal anesthesia, independently alters eithersensory or motor blockade, or has no effect on sub-arachnoid 2-CP in a volunteer model.
MethodsAfter IRB approval and written informed consent, eighthealthy volunteers were enrolled in this randomized,double-blind, crossover study. All subjects were madeaware in their consent that the 2-CP manufacturing labelspecifically states “not for spinal anesthesia.” All partic-ipants received two spinal anesthetics separated by atleast 48 h. One spinal anesthetic contained 2-CP (30 mg;1.5 mL of 2.0%) with 15 �g of clonidine (0.15 mL), andthe other contained 2-CP (30 mg) with saline (0.15 mL)in a comparable volume (total volume, 1.65 mL). Acommercially available preservative- and bisulfite-freeformulation of 2-CP (Nesacaine-MPF; AstraZenecaPharmaceuticals, Worchester, MA) was used in thisstudy, and because the long-term stability of 2-CP andclonidine is unknown, solutions were prepared imme-diately before injection. A random-number generatorwas used to determine the order of drug administra-tion. All subjects received nothing by mouth for morethan 6 h for solids and 2 h for liquids and wereinstructed to void before each session. A 20-gaugeperipheral IV catheter was placed, and lactated Ring-er’s solution was administered at 8 mL/kg for the firsthour and 2 mL/kg thereafter. No sedatives were usedduring the study.
Each volunteer was placed in the left lateral decub-itus position, and the L2-3 interspace was preparedand draped in a sterile fashion. By using a midlineapproach, the subarachnoid space was entered by us-ing a 24-gauge Sprotte needle with the orifice facingcephalad. Cerebrospinal fluid (CSF) 0.2 mL was with-drawn before injection of the study drug to confirmneedle placement. The study solution was then in-jected, and after completion, 0.2 mL of CSF was againaspirated and reinjected to confirm placement. Sub-jects were immediately placed supine for the remain-der of the study.
Vital signs were monitored, including noninvasiveblood pressure, pulse oximetry, and electrocardio-gram. Arterial blood pressure and heart rate wererecorded at baseline and then every 5 min thereafter.Sensory anesthesia was assessed with pinprick by us-ing the lateral forearm as a control. Measurementswere made every 5 min for the first 60 min and thenevery 10 min until regression to the S2 dermatome.
Transcutaneous electrical stimulation (TES) wasused to simulate surgical stimulation and was testedat six sites: lateral ankle bilaterally (S1), medial knee
bilaterally (L3), midline pubis (T12), and umbilicus(T10). TES was performed with a peripheral nervestimulator (Model NSS25; Fisher and Paykel, Auck-land, New Zealand) by using a 50-Hz tetanus for 5 s.This was initially tested at 10 mA and was increasedby 10 mA to a maximum of 60 mA according to subjecttolerance. The maximum limit of 60 mA was used inthis study because previous studies have shown TESat 60 mA to be comparable to the intensity of stimu-lation caused by surgical skin incision (21). TES wastested in a caudad to cephalad fashion and was per-formed 4 min after spinal anesthetic administrationand then every 10 min until 2 consecutive measure-ments of �60 mA were obtained. If tolerance to 60 mAwas never obtained, testing was continued for at least34 min at that site.
Thirty minutes after spinal administration, a 34-in.tourniquet was placed on the left thigh. The leg waspassively exsanguinated by gravity, and the tourni-quet was inflated to 300 mm Hg. Subjects were in-structed to request removal of the tourniquet whenthey believed that they would need supplemental an-algesia to tolerate it any longer.
Muscle strength of the right lower extremity wasmeasured by using a commercially available isometricforce dynamometer (Micro FET; Hoggan Health In-dustries, Draper, UT). This was performed during a5-s maximal force contraction of the right gastrocne-mius (plantar flexion against resistance) and the rightquadriceps muscle (straight leg lift against resistance).Measurements were repeated three times and aver-aged. They were measured first at baseline and then at10-min intervals after injection until �90% of baselinestrength returned. The ability to move the lower ex-tremities was assessed by using a modified Bromagescale (0 � no block, 1 � able to bend the knee, 2 � ableto dorsiflex the foot, and 3 � complete motor block)and was recorded every 10 min until resolution ofmotor blockade.
Each subject also underwent a simulated dischargepathway. Once recovery of the S2 dermatome oc-curred, prevoid bladder volumes were recorded witha commercially available bladder ultrasound machine.The subjects then attempted to ambulate without as-sistance, and if successful, they were instructed tovoid. Postvoid residual bladder volume was remeas-ured with the bladder ultrasound machine. Uponcompletion of the study, volunteers were questioneddaily for the following 72 h for symptoms includingbackache, headache, inability to void, or other residualsymptoms, and they were recontacted after 6 mo forlong-term follow-up.
By using a difference of 15 min to complete sensoryresolution, an sd of 10 min, and an � � 0.05 with � �0.80, 8 subjects were required. Peak block height com-parisons were made with the Mann-Whitney U-test.
560 REGIONAL ANESTHESIA DAVIS AND KOPACZ ANESTH ANALGSPINAL CHLOROPROCAINE: ADDED CLONIDINE 2005;100:559–65
Comparisons of dermatome regression over time, iso-metric force dynamometry, and hemodynamic datawere made with repeated-measures analysis of vari-ance with Bonferroni-Dunn tests for post hoc analysis.Paired Student’s t-tests were used to determine differ-ences between anesthetics for all other measurements.Unless otherwise stated, data are mean � sd, andsignificance was defined as P � 0.05.
ResultsSuccessful spinal anesthesia was obtained in all sub-jects (four men and four women). Subjects’ agesranged from 27 to 60 yr (34 � 11 [sd] yr), height from157 to 183 cm (171 � 8 [sd] cm), and weight from 54 to93 kg (74 � 17 [sd] kg). Sensory and motor blockcharacteristics are described in Table 1.
With the addition of clonidine, sensory anesthesiawas significantly prolonged as measured by regres-sion to L1 and complete sensory regression (Fig. 1,Table 1). Tolerance to the thigh tourniquet was pro-longed with the addition of clonidine, but this did notreach statistical significance (P � 0.0571; Fig. 2). Motorblockade, measured by the return of lower extremitymovement according to modified Bromage scores (Ta-ble 1) and time for the return of gastrocnemius musclestrength (Fig. 3, Table 1), was significantly prolonged.Although the addition of clonidine improved the qual-ity of quadriceps muscle blockade (Fig. 4), the time tocomplete recovery of quadriceps strength was unaf-fected (Table 1). Peak block height was not affected bythe addition of clonidine (Fig. 1, Table 1). Times totwo-segment regression and TES to the T12 andT10 dermatomes, as well as the right (nondependent)S1 dermatome, were also not significantly differentbetween groups (Table 1). Tolerance to TES at theL3 dermatomes bilaterally and the left (dependent)S1 dermatome was prolonged significantly with theaddition of clonidine. One subject achieved a peakblock height of only L2, and two subjects experiencedsacral sparing with 2-CP 30 mg alone. This was notseen with the addition of clonidine.
Baseline heart rate and arterial blood pressure mea-surements for both groups were similar, and, as ex-pected with spinal anesthesia, there was a significantdecrease in both heart rate and arterial blood pressurefrom baseline with the administration of spinal 2-CPwith and without clonidine. However, there were nosignificant differences in the change in heart rate orarterial blood pressure when comparing spinal 2-CPalone and spinal 2-CP with clonidine (P � 0.69 and0.57, respectively). One subject in the clonidine grouprequired ephedrine 5 mg for a symptomatic systolicblood pressure of 83 mm Hg (“queasy,” block heightT4 bilaterally). No further vasopressors were required.
All subjects were able to ambulate and void success-fully after the return of sensation to the S2 dermatome,
but there was a significant increase in the time toambulate and void with the addition of clonidine (P �0.0009; Fig. 2). There was no significant difference inpostvoid residual bladder volumes between groups (P� 0.05). One subject reported feeling tired during thesession after the injection of clonidine, but no residualeffects were noted, and discharge was not delayed. Noother reports of sedation were noted in either group.No subject reported any adverse symptoms—includ-ing TNS or other neurologic symptoms—immediatelyafter either spinal anesthetic, through the 72-h obser-vation period, or after 6 mo of follow-up.
DiscussionThis study demonstrates that 30 mg of preservative-free 2-CP alone produces adequate spinal anesthesiafor outpatient surgical procedures of the lower ex-tremities and that the addition of 15 �g of clonidineprolongs and improves both sensory and motor block-ade. Block regression to L1 was increased by 25 min-utes and complete regression by 31 minutes in thegroups that received clonidine as an adjunct. Previousstudies combining 15 �g of clonidine with bupiva-caine (19) and ropivacaine (17) demonstrated in-creased block height compared with each drug alone.In contrast, in our study, the addition of small-doseclonidine did not increase the peak block of 2-CPspinal anesthesia. Several measurements were used toevaluate the return of motor function. These includedthe modified Bromage scale and isometric force dyna-mometry of the quadriceps and gastrocnemius mus-cles. All tests showed a significant prolongation ofmotor blockade with the addition of clonidine, exceptfor the time to return of quadriceps strength. Thismotor block prolongation coincides with the prolon-gation of sensory anesthesia.
Intrathecal clonidine has been shown to improve thequality of spinal anesthesia, but in doses of 1–2 �g/kg,significant systemic side effects were seen, includingsedation, hypotension, and bradycardia (16,18,20). Re-cent studies have evaluated the effects of clonidine indoses as small as 15 �g and have found it to beeffective and without these unwanted side effects(17,19). Our findings were consistent with these stud-ies in that there was no significant difference betweengroups with regard to changes in systolic blood pres-sure and heart rate. Although this study was con-ducted in young healthy volunteers, the previousstudies were in patients of all ages. One subject didreport feeling tired, starting approximately 30 minutesafter injection, during the session with intrathecalclonidine. These symptoms resolved with completeregression of spinal anesthesia, and the attainment ofdischarge criteria was not delayed.
Although the addition of fentanyl and clonidine tospinal 2-CP has not been directly studied, a previous
ANESTH ANALG REGIONAL ANESTHESIA DAVIS AND KOPACZ 5612005;100:559–65 SPINAL CHLOROPROCAINE: ADDED CLONIDINE
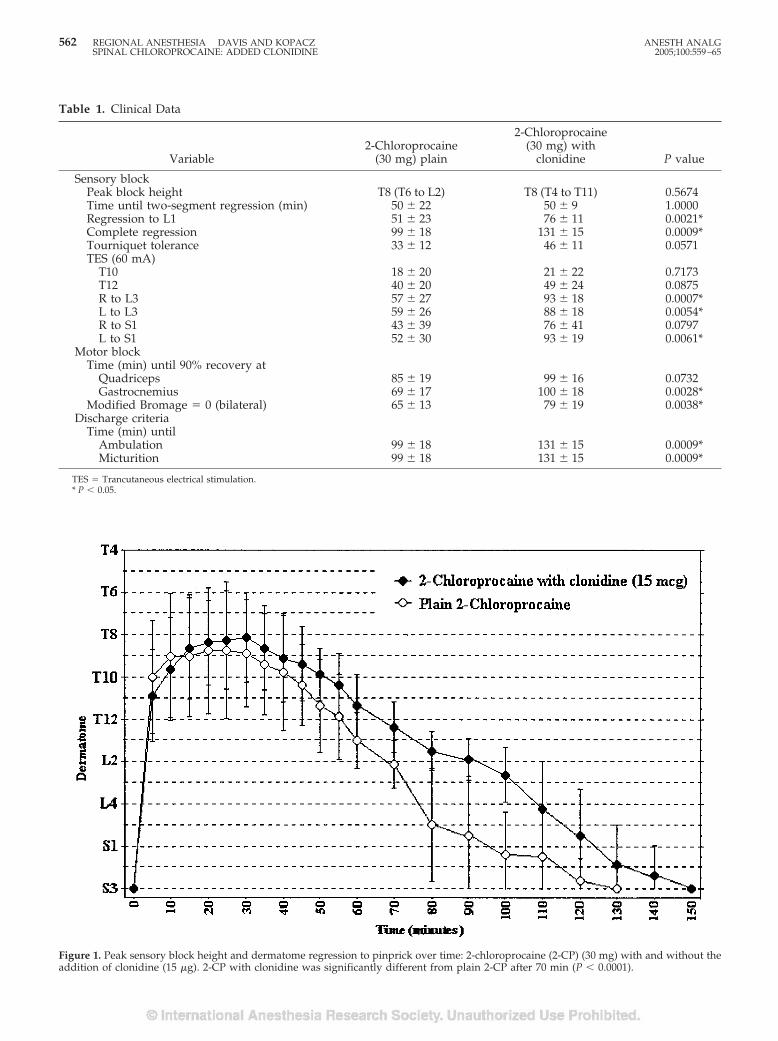
Table 1. Clinical Data
Variable2-Chloroprocaine
(30 mg) plain
2-Chloroprocaine(30 mg) with
clonidine P value
Sensory blockPeak block height T8 (T6 to L2) T8 (T4 to T11) 0.5674Time until two-segment regression (min) 50 � 22 50 � 9 1.0000Regression to L1 51 � 23 76 � 11 0.0021*Complete regression 99 � 18 131 � 15 0.0009*Tourniquet tolerance 33 � 12 46 � 11 0.0571TES (60 mA)
T10 18 � 20 21 � 22 0.7173T12 40 � 20 49 � 24 0.0875R to L3 57 � 27 93 � 18 0.0007*L to L3 59 � 26 88 � 18 0.0054*R to S1 43 � 39 76 � 41 0.0797L to S1 52 � 30 93 � 19 0.0061*
Motor blockTime (min) until 90% recovery at
Quadriceps 85 � 19 99 � 16 0.0732Gastrocnemius 69 � 17 100 � 18 0.0028*
Modified Bromage � 0 (bilateral) 65 � 13 79 � 19 0.0038*Discharge criteria
Time (min) untilAmbulation 99 � 18 131 � 15 0.0009*Micturition 99 � 18 131 � 15 0.0009*
TES � Trancutaneous electrical stimulation.* P � 0.05.
Figure 1. Peak sensory block height and dermatome regression to pinprick over time: 2-chloroprocaine (2-CP) (30 mg) with and without theaddition of clonidine (15 �g). 2-CP with clonidine was significantly different from plain 2-CP after 70 min (P � 0.0001).
562 REGIONAL ANESTHESIA DAVIS AND KOPACZ ANESTH ANALGSPINAL CHLOROPROCAINE: ADDED CLONIDINE 2005;100:559–65
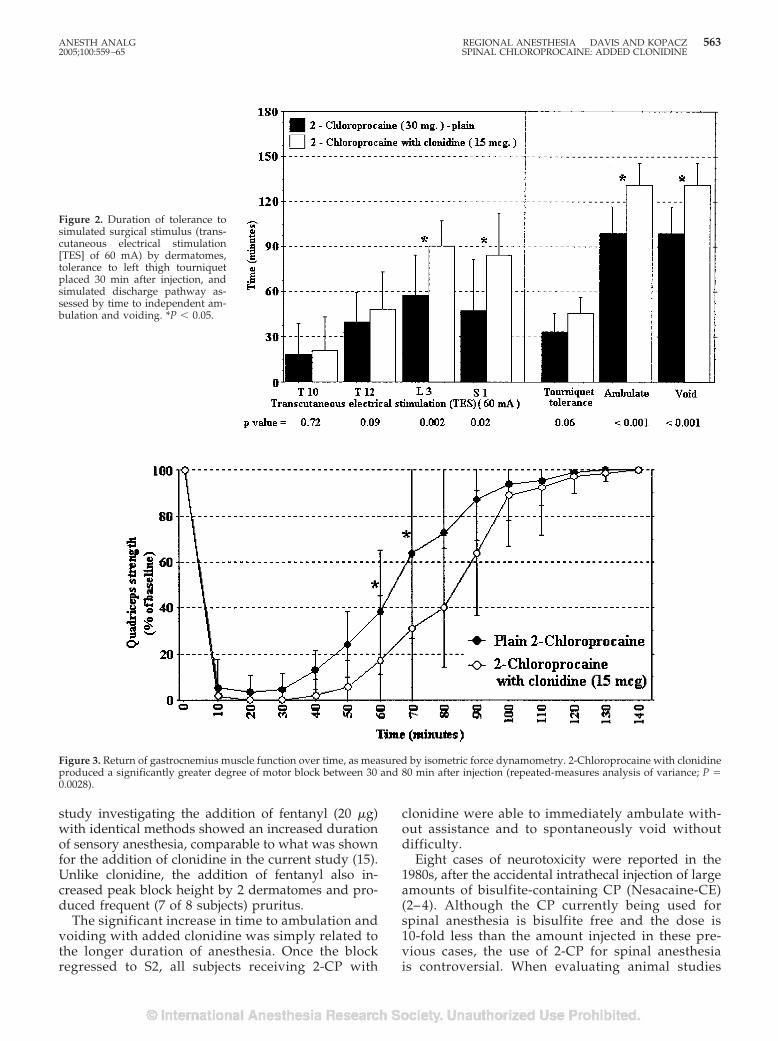
study investigating the addition of fentanyl (20 �g)with identical methods showed an increased durationof sensory anesthesia, comparable to what was shownfor the addition of clonidine in the current study (15).Unlike clonidine, the addition of fentanyl also in-creased peak block height by 2 dermatomes and pro-duced frequent (7 of 8 subjects) pruritus.
The significant increase in time to ambulation andvoiding with added clonidine was simply related tothe longer duration of anesthesia. Once the blockregressed to S2, all subjects receiving 2-CP with
clonidine were able to immediately ambulate with-out assistance and to spontaneously void withoutdifficulty.
Eight cases of neurotoxicity were reported in the1980s, after the accidental intrathecal injection of largeamounts of bisulfite-containing CP (Nesacaine-CE)(2– 4). Although the CP currently being used forspinal anesthesia is bisulfite free and the dose is10-fold less than the amount injected in these pre-vious cases, the use of 2-CP for spinal anesthesiais controversial. When evaluating animal studies
Figure 2. Duration of tolerance tosimulated surgical stimulus (trans-cutaneous electrical stimulation[TES] of 60 mA) by dermatomes,tolerance to left thigh tourniquetplaced 30 min after injection, andsimulated discharge pathway as-sessed by time to independent am-bulation and voiding. *P � 0.05.
Figure 3. Return of gastrocnemius muscle function over time, as measured by isometric force dynamometry. 2-Chloroprocaine with clonidineproduced a significantly greater degree of motor block between 30 and 80 min after injection (repeated-measures analysis of variance; P �0.0028).
ANESTH ANALG REGIONAL ANESTHESIA DAVIS AND KOPACZ 5632005;100:559–65 SPINAL CHLOROPROCAINE: ADDED CLONIDINE
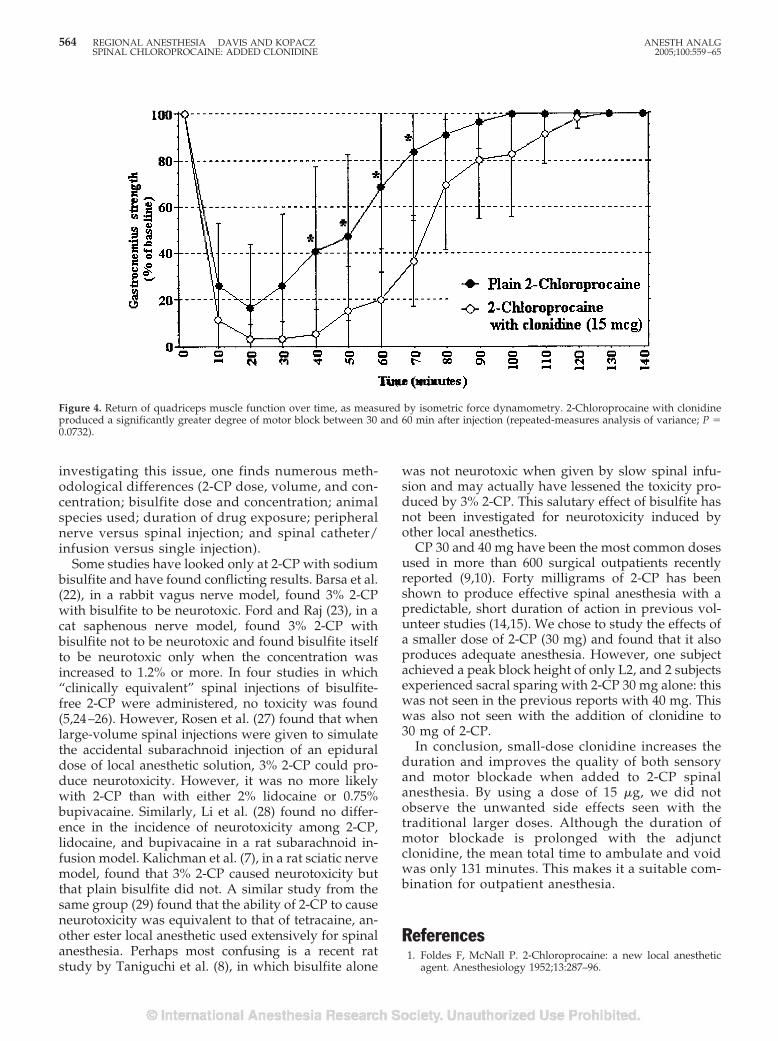
investigating this issue, one finds numerous meth-odological differences (2-CP dose, volume, and con-centration; bisulfite dose and concentration; animalspecies used; duration of drug exposure; peripheralnerve versus spinal injection; and spinal catheter/infusion versus single injection).
Some studies have looked only at 2-CP with sodiumbisulfite and have found conflicting results. Barsa et al.(22), in a rabbit vagus nerve model, found 3% 2-CPwith bisulfite to be neurotoxic. Ford and Raj (23), in acat saphenous nerve model, found 3% 2-CP withbisulfite not to be neurotoxic and found bisulfite itselfto be neurotoxic only when the concentration wasincreased to 1.2% or more. In four studies in which“clinically equivalent” spinal injections of bisulfite-free 2-CP were administered, no toxicity was found(5,24–26). However, Rosen et al. (27) found that whenlarge-volume spinal injections were given to simulatethe accidental subarachnoid injection of an epiduraldose of local anesthetic solution, 3% 2-CP could pro-duce neurotoxicity. However, it was no more likelywith 2-CP than with either 2% lidocaine or 0.75%bupivacaine. Similarly, Li et al. (28) found no differ-ence in the incidence of neurotoxicity among 2-CP,lidocaine, and bupivacaine in a rat subarachnoid in-fusion model. Kalichman et al. (7), in a rat sciatic nervemodel, found that 3% 2-CP caused neurotoxicity butthat plain bisulfite did not. A similar study from thesame group (29) found that the ability of 2-CP to causeneurotoxicity was equivalent to that of tetracaine, an-other ester local anesthetic used extensively for spinalanesthesia. Perhaps most confusing is a recent ratstudy by Taniguchi et al. (8), in which bisulfite alone
was not neurotoxic when given by slow spinal infu-sion and may actually have lessened the toxicity pro-duced by 3% 2-CP. This salutary effect of bisulfite hasnot been investigated for neurotoxicity induced byother local anesthetics.
CP 30 and 40 mg have been the most common dosesused in more than 600 surgical outpatients recentlyreported (9,10). Forty milligrams of 2-CP has beenshown to produce effective spinal anesthesia with apredictable, short duration of action in previous vol-unteer studies (14,15). We chose to study the effects ofa smaller dose of 2-CP (30 mg) and found that it alsoproduces adequate anesthesia. However, one subjectachieved a peak block height of only L2, and 2 subjectsexperienced sacral sparing with 2-CP 30 mg alone: thiswas not seen in the previous reports with 40 mg. Thiswas also not seen with the addition of clonidine to30 mg of 2-CP.
In conclusion, small-dose clonidine increases theduration and improves the quality of both sensoryand motor blockade when added to 2-CP spinalanesthesia. By using a dose of 15 �g, we did notobserve the unwanted side effects seen with thetraditional larger doses. Although the duration ofmotor blockade is prolonged with the adjunctclonidine, the mean total time to ambulate and voidwas only 131 minutes. This makes it a suitable com-bination for outpatient anesthesia.
References1. Foldes F, McNall P. 2-Chloroprocaine: a new local anesthetic
agent. Anesthesiology 1952;13:287–96.
Figure 4. Return of quadriceps muscle function over time, as measured by isometric force dynamometry. 2-Chloroprocaine with clonidineproduced a significantly greater degree of motor block between 30 and 60 min after injection (repeated-measures analysis of variance; P �0.0732).
564 REGIONAL ANESTHESIA DAVIS AND KOPACZ ANESTH ANALGSPINAL CHLOROPROCAINE: ADDED CLONIDINE 2005;100:559–65
2. Ravindran R, Bond V, Tasch M, et al. Prolonged neural blockadefollowing regional analgesia with 2-chloroprocaine. AnesthAnalg 1980;59:447–51.
3. Reisner L, Hochman B, Plumer M. Persistent neurologic deficit andadhesive arachnoiditis following intrathecal 2-chloroprocaine in-jection. Anesth Analg 1980;59:452–4.
4. Moore D, Spierdijk J, van Kleef J, et al. Chloroprocaineneurotoxicity: four additional cases. Anesth Analg 1982;61:155–9.
5. Wang BC, Hillman DE, Spielholz NI, Turndorf H. Chronicneurological deficits and Nesacaine-CE: an effect of the anes-thetic, 2-chloroprocaine, or the antioxidant, sodium bisulfite?Anesth Analg 1984;63:445–7.
6. Gissen A, Datta S, Lambert D. The chloroprocaine controversy.Reg Anesth Pain Med 1984;9:124–45.
7. Kalichman M, Powell H, Reisner LS, Myers R. The role of2-chloroprocaine and sodium bisulfite in rat sciatic nerveedema. J Neuropathol Exp Neurol 1986;45:566–75.
8. Taniguchi M, Bollen A, Drasner K. Sodium bisulfite: scapegoatfor chloroprocaine neurotoxicity? Anesthesiology 2004;100:85–91.
9. Yoos J, Kopacz D. Spinal 2-chloroprocaine for surgery: an initial10-month experience. Anesth Analg 2005;100:553–8.
10. Palas T. 1% chloroprocaine for spinal anesthesia [abstract]. RegAnesth Pain Med 2003;28:A52.
11. Schneider M, Ettlin T, Kaufmann M, et al. Transient neurologictoxicity after hyperbaric subarachnoid anesthesia with 5% lido-caine. Anesth Analg 1993;76:1154–7.
12. Freedman J, Li D, Drasner K, et al. Risk factors for transientneurologic symptoms after spinal anesthesia. Anesthesiology1998;89:633–41.
13. Smith K, Kopacz D. Spinal 2-chloroprocaine: a dose rangingstudy and the effect of added epinephrine. Anesth Analg 2004;98:81–8.
14. Kouri M, Kopacz D. Spinal 2-chloroprocaine: a comparison withlidocaine in volunteers. Anesth Analg 2004;98:75–80.
15. Vath J, Kopacz D. Spinal 2-chloroprocaine: the effect of addedfentanyl. Anesth Analg 2004;98:89–94.
16. Bonnet F, Brun Buisson V, Francois Y, et al. Effects of oral andsubarachnoid clonidine on spinal anesthesia with bupivacaine.Reg Anesth Pain Med 1990;15:211–4.
17. De Kock M, Gautier P, Fanard L, et al. Intrathecal ropivacaineand clonidine for ambulatory knee arthroscopy. Anesthesiology2001;94:574–8.
18. Dobrydnjov I, Samarutel J. Enhancement of intrathecal lidocaineby addition of local and systemic clonidine. Acta AnaesthesiolScand 1999;43:556–62.
19. Dobrydnjov I, Axelsson K, Thorn S-E, et al. Clonidine combinedwith small-dose bupivacaine during spinal anesthesia for ingui-nal herniorrhaphy: a randomized double-blinded study. AnesthAnalg 2003;96:1496–503.
20. Niemi L. Effects of intrathecal clonidine on duration of bupiv-acaine spinal anaesthesia, haemodynamics, and postoperativeanalgesia in patients undergoing knee arthroscopy. Acta Anaes-thesiol Scand 1994;38:724–8.
21. Petersen-Felix S, Zbinden A, Fischer M, et al. Isoflurane mini-mum alveolar concentration decreases during anesthesia andsurgery. Anesthesiology 1993;79:959–65.
22. Barsa J, Batra M, Fink B, Sumi S. A comparative in vivo study oflocal neurotoxicity of lidocaine, bupivacaine, 2-chloroprocaine,and a mixture of 2-chloroprocaine and bupivacaine. AnesthAnalg 1982;61:961–7.
23. Ford D, Raj P. Peripheral neurotoxicity of 2-chloroprocaine andbisulfite in the cat. Anesth Analg 1987;66:719–22.
24. Ready L, Plumer M, Haschke R, et al. Neurotoxicity of intrathe-cal local anesthetics in rabbits. Anesthesiology 1985;63:364–70.
25. Hersh EV, Condouris G, Havelin D. Actions of intrathecal chlo-roprocaine and sodium bisulfite on rat spinal reflex functionutilizing a noninvasive technique. Anesthesiology 1990;72:1077–82.
26. Feldman H, Covino B. A chronic model for investigation ofexperimental spinal anesthesia in the dog. Anesthesiology 1981;54:148–52.
27. Rosen M, Baysinger C, Shnider S, et al. Evaluation of neurotox-icity after subarachnoid injection of large volumes of local an-esthetic solutions. Anesth Analg 1983;62:802–8.
28. Li D, Bahar M, Cole G, Rosen M. Neurological toxicity ofthe subarachnoid infusion of bupivacaine, lignocaine, or2-chloroprocaine in the rat. Br J Anaesth 1985;57:424–9.
29. Myers R, Kalichman M, Reisner L, Powell H. Neurotoxicity oflocal anesthetics: altered perineurial permeability, edema, andnerve fiber injury. Anesthesiology 1986;64:29–35.
ANESTH ANALG REGIONAL ANESTHESIA DAVIS AND KOPACZ 5652005;100:559–65 SPINAL CHLOROPROCAINE: ADDED CLONIDINE
Spinal 2-Chloroprocaine: A Comparison with Small-DoseBupivacaine in VolunteersJessica R. Yoos, MD, and Dan J. Kopacz, MD
Department of Anesthesiology, Virginia Mason Clinic, Seattle, Washington
Ambulatory surgery continues to increase nationwide.Because spinal lidocaine is associated with transientneurologic symptoms, many clinicians have switchedto small-dose bupivacaine for outpatient spinal anes-thesia. However, bupivacaine often produces inade-quate surgical anesthesia and has an unpredictable du-ration. Preservative-free 2-chloroprocaine (2-CP) hasreemerged as an alternative for outpatient spinal anes-thesia. We designed this double-blind, randomized,crossover, volunteer study to compare 40 mg of 2-CPwith small-dose (7.5 mg) bupivacaine with measures ofpinprick anesthesia, motor strength, tolerance to tour-niquet and electrical stimulation, and simulated dis-charge criteria. Peak block height (2-CP average T7[range T3–10]; bupivacaine average T9 [range T4–L1]),
regression to L1 (2-CP 64 � 10 versus bupivacaine 87 �41 min), and tourniquet tolerance (2-CP 52 � 11 versusbupivacaine 60 � 27 min) did not differ between drugs(P � 0.15, 0.12, and 0.40, respectively). However, time tosimulated discharge (including time to complete blockregression, ambulation, and spontaneous voiding) wassignificantly longer with bupivacaine (2-CP 113 � 14,bupivacaine 191 � 30 min, P � 0.0009). No subjects re-ported transient neurologic symptoms or other side ef-fects. We conclude that spinal 2-CP provides adequateduration and density of block for ambulatory surgicalprocedures, and has significantly faster resolution ofblock and return to ambulation compared with 7.5 mgof bupivacaine.
(Anesth Analg 2005;100:566–72)
Ambulatory surgical procedures are steadily in-creasing nationwide, and anesthesiologists aredriven to provide fast turnover, predictable an-
esthesia, and time-efficient discharge of patients (1).Many clinicians are selecting general anesthesia be-cause of its relative predictability and to avoid unde-sirable side effects associated with spinal anesthesia(2). For example, lidocaine is frequently associatedwith transient neurologic symptoms (TNS), procaineis often unpredictable in duration and is associatedwith a frequent incidence of nausea, and bupivacainecauses frequent urinary retention, prolonged dis-charge time, and unpredictable levels of anesthesiadependent on dose (3–6). Recently, 2-chloroprocaine
(2-CP) has been evaluated for use in the subarachnoidspace and seems to be a predictable drug, ideal forclinicians working in fast-paced ambulatory surgicalsettings.
Preservative-free 2-CP was first introduced in 1952and was used successfully for spinal anesthesia (7).Preservatives and antioxidants were subsequentlyadded, and the drug was primarily used as an epi-dural anesthetic in the obstetric population. After sev-eral reports of severe neurotoxicity after inadvertentsubarachnoid injection of large volumes of 2-CP, thedrug was no longer used for spinal anesthesia (8–10).Subsequently, the antioxidant sodium bisulfite, in anacidic environment, was often accepted to be the cul-prit in these cases. Although all preservatives andantioxidants have been removed from 2 of the 3 cur-rently available preparations of 2-CP, until recently,the anesthesia community was reluctant to reintro-duce 2-CP as a spinal anesthetic.
The use of 2-CP for spinal anesthesia has been stud-ied as a short-acting drug with a favorable profile foroutpatient surgery. Four randomized controlled pre-clinical trials have investigated spinal 2-CP in healthyvolunteers (11–14) finding a predictable onset, blockheight, and time to complete regression. In addition, arecent chart review of the first 122 patients at ourinstitution, and a description of the first 500 patients
This work was supported by the Department of Anesthesiology,Virginia Mason Medical Center.
Portions of this work were presented at the American Society ofRegional Anesthesia 29th Spring Meeting, Orlando, FL, March 2004.
Although 2-chloroprocaine is approved by the FDA, it is not specif-ically indicated for spinal anesthesia. Its use for spinal anesthesia isthus considered “off-label.” Manufacturers of 2-chloroprocaine dis-tinctly label product “Not for Spinal Anesthesia.”
Accepted for publication August 10, 2004.Address correspondence to Dr. Dan J. Kopacz, Department of
Anesthesiology, Virginia Mason Clinic, 1100 Ninth Ave., B2-AN,Seattle, WA 98111. Address e-mail to [email protected].
DOI: 10.1213/01.ANE.0000143356.17013.A1
©2005 by the International Anesthesia Research Society566 Anesth Analg 2005;100:566–72 0003-2999/05
from another institution, have demonstrated 2-CP tobe free of apparent neurotoxicity or TNS (15,16).
Small-dose bupivacaine (5–7.5 mg) has also beenused by some practitioners for spinal anesthesia inattempts to avoid side effects associated with lido-caine and procaine.
Disadvantages with small-dose bupivacaine also ex-ist, including inadequate block height for the surgicalprocedure, urinary retention, or an excessively longtime-course to block resolution which delays dis-charge (17). Ben-David et al. (18) demonstrated that7.5 mg of 0.5% bupivacaine with dextrose provided anacceptable spinal anesthetic for ambulatory surgerywhen compared with both smaller and larger doses ofplain bupivacaine.
Although the clinical characteristics of spinal 2-CPhave been shown to be similar to lidocaine (11), directcomparison to small-dose spinal bupivacaine has notbeen performed. This randomized, double-blind studywas designed to compare 2-CP (40 mg) to small-dosebupivacaine (7.5 mg) in 8 healthy volunteers using acrossover design.
MethodsAfter written informed consent and IRB approvalwere obtained, eight healthy volunteers were enrolledin the crossover study. All volunteers were informedthat the preservative-free formulation of 2-CP for spi-nal anesthesia was an off-label use of the drug. Arandom number generator was used to determine theorder of local anesthetic to be used and all solutionswere prepared by Virginia Mason anesthesiologistswho did not reveal the identity of the solution tothe investigators. The two spinal anesthetics wereseparated by at least 96 h. The two local anestheticsolutions were diluted to a total volume of 2.25 mL,calculated to be of comparable baricity (slightly hy-perbaric, density approximately 1.00100 g/mL)(19,20): 1) preservative-free 2-CP (40 mg: 2 mL 2%with 0.25 mL preservative-free normal saline), and 2)preservative-free bupivacaine (7.5 mg: 1.5 mL 0.5%,0.5 mL sterile saline, and 0.25 mL dextrose). Twopreservative- and bisulfite-free formulations of 2-CPare now available commercially: Nesacaine-MPF(AstraZeneca Pharmaceuticals, Worchester, MA), andgeneric CP (Bedford Laboratories, Bedford, OH). TheAstraZeneca formulation (Nesacaine-MPF) (pH 2.7–4.0) was used in this study. No sedatives were admin-istered and all subjects had fasted for 8 h before en-rollment. A 20-gauge peripheral IV catheter wasplaced and a bolus of lactated Ringer’s solution wasadministered (approximately 5 mL/kg) before sub-arachnoid injection of local anesthetic. All subjectswere placed in the left lateral decubitus position and aprep solution was applied to the skin of the lumbar
region. Using a 30-gauge needle, a skin wheel wasraised with 1% lidocaine over the L2–3 interspace. Thesubarachnoid space was entered via the midline ap-proach using a 20-gauge introducer and a 24-gaugeSprotte needle. The rate of injection of the study med-ication was approximately 0.25 mL/s with the spinalorifice of the needle facing in the cephalad direction.After administration of the drug, approximately0.2 mL of cerebrospinal fluid was aspirated to confirmposition in the subarachnoid space. Subjects were im-mediately placed in the supine position where theyremained for the duration of the study.
Bilateral sensory block to pinprick was tested by ablinded assessor in a cephalad-to-caudad directionwith a disposable dermatome tester every 5 min afterinjection for the first 60 min, then every 10 min untilcomplete resolution of sensory anesthesia. The rightC5–6 dermatome was used as an unblocked referencepoint. Tolerance to transcutaneous electrical stimula-tion (TES) was determined at 6 common surgical sites:bilaterally at the lateral ankle (S1), medial knee (L3),and at the midline pubis (T12) and midline umbilicus(T10). TES was performed with a peripheral nervestimulator (model NS252; Fisher & Paykel, Auckland,New Zealand) using 50-Hz tetanus for 5 s, initially at10 milliampere (mA) followed by increasing incre-ments of 10 mA to a maximum of 60 mA. Previousstudies have shown TES of 60 mA is equivalent to theintensity of surgical incision supporting a maximumof 60 mA of stimulation for this study (21). TES wasperformed in a cephalad-to-caudad direction begin-ning at 4 min after injection and proceeding at 10-minintervals thereafter until the subject was no longer ableto tolerate the 60-mA stimulation on 2 successive tests.If the subject was never able to tolerate 60 mA, thetesting was terminated at 34 min.
Thigh tourniquet tolerance time was assessed for allsubjects using a 34-in. pneumatic cuff inflated to300 mm Hg after exsanguination of the left leg bygravity. The cuff was routinely inflated 30 min afterinjection of local anesthetic. Cuff pressure in this studywas similar to that used in orthopedic proceduresperformed at our institution. When the pain scorereached 5 of 10 on the visual analog scale scoringsystem for subjects, the tourniquet was deflated andtotal tourniquet time was recorded.
Motor block of the lower extremity was assessedusing a Bromage scale of 0–3 (0 � full straight legraise, 1 � able to bend knee, 2 � unable to bend knee,able to dorsiflex ankle, 3 � no motor movement).Measurements were taken every 10 min after injectionof local anesthetic until bilateral scores of “0” wereregained. In addition, isometric force dynamometry(Micro FET; Hoggan Health Industries, Draper, UT)was used to assess motor blockade of the right lowerextremity. Data were collected for both quadricepsstrength (dynamometry at inferior thigh with straight
ANESTH ANALG REGIONAL ANESTHESIA YOOS AND KOPACZ 5672005;100:566–72 SPINAL CHLOROPROCAINE VERSUS BUPIVACAINE
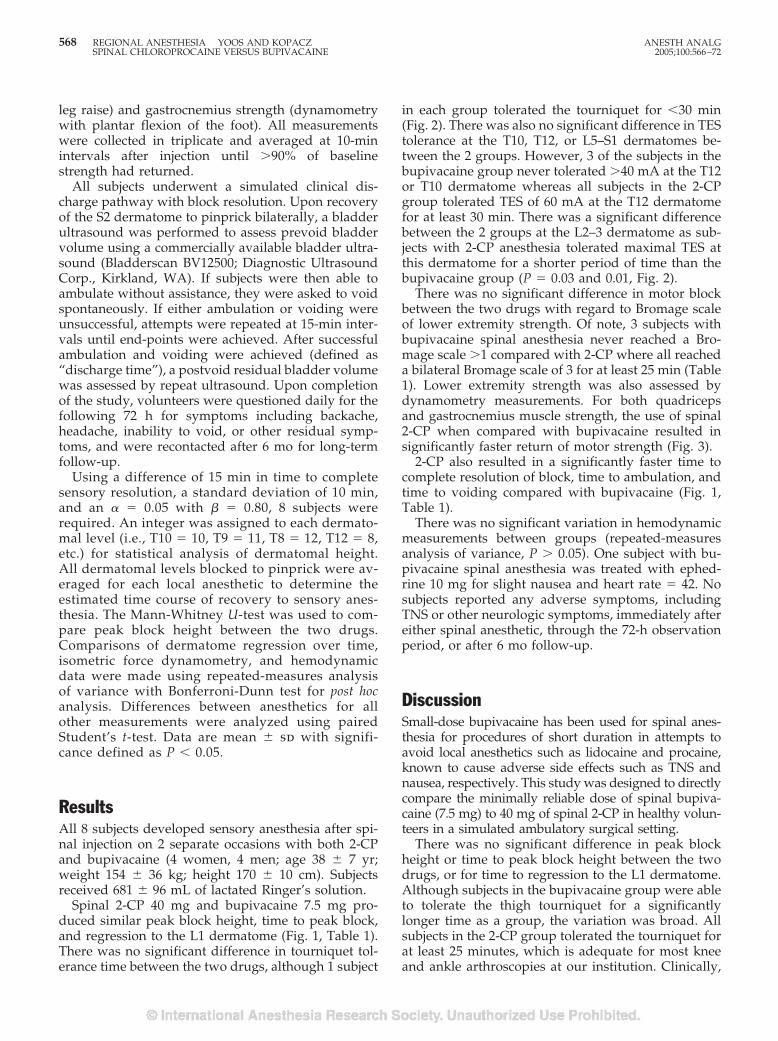
leg raise) and gastrocnemius strength (dynamometrywith plantar flexion of the foot). All measurementswere collected in triplicate and averaged at 10-minintervals after injection until �90% of baselinestrength had returned.
All subjects underwent a simulated clinical dis-charge pathway with block resolution. Upon recoveryof the S2 dermatome to pinprick bilaterally, a bladderultrasound was performed to assess prevoid bladdervolume using a commercially available bladder ultra-sound (Bladderscan BV12500; Diagnostic UltrasoundCorp., Kirkland, WA). If subjects were then able toambulate without assistance, they were asked to voidspontaneously. If either ambulation or voiding wereunsuccessful, attempts were repeated at 15-min inter-vals until end-points were achieved. After successfulambulation and voiding were achieved (defined as“discharge time”), a postvoid residual bladder volumewas assessed by repeat ultrasound. Upon completionof the study, volunteers were questioned daily for thefollowing 72 h for symptoms including backache,headache, inability to void, or other residual symp-toms, and were recontacted after 6 mo for long-termfollow-up.
Using a difference of 15 min in time to completesensory resolution, a standard deviation of 10 min,and an � � 0.05 with � � 0.80, 8 subjects wererequired. An integer was assigned to each dermato-mal level (i.e., T10 � 10, T9 � 11, T8 � 12, T12 � 8,etc.) for statistical analysis of dermatomal height.All dermatomal levels blocked to pinprick were av-eraged for each local anesthetic to determine theestimated time course of recovery to sensory anes-thesia. The Mann-Whitney U-test was used to com-pare peak block height between the two drugs.Comparisons of dermatome regression over time,isometric force dynamometry, and hemodynamicdata were made using repeated-measures analysisof variance with Bonferroni-Dunn test for post hocanalysis. Differences between anesthetics for allother measurements were analyzed using pairedStudent’s t-test. Data are mean � sd with signifi-cance defined as P � 0.05.
ResultsAll 8 subjects developed sensory anesthesia after spi-nal injection on 2 separate occasions with both 2-CPand bupivacaine (4 women, 4 men; age 38 � 7 yr;weight 154 � 36 kg; height 170 � 10 cm). Subjectsreceived 681 � 96 mL of lactated Ringer’s solution.
Spinal 2-CP 40 mg and bupivacaine 7.5 mg pro-duced similar peak block height, time to peak block,and regression to the L1 dermatome (Fig. 1, Table 1).There was no significant difference in tourniquet tol-erance time between the two drugs, although 1 subject
in each group tolerated the tourniquet for �30 min(Fig. 2). There was also no significant difference in TEStolerance at the T10, T12, or L5–S1 dermatomes be-tween the 2 groups. However, 3 of the subjects in thebupivacaine group never tolerated �40 mA at the T12or T10 dermatome whereas all subjects in the 2-CPgroup tolerated TES of 60 mA at the T12 dermatomefor at least 30 min. There was a significant differencebetween the 2 groups at the L2–3 dermatome as sub-jects with 2-CP anesthesia tolerated maximal TES atthis dermatome for a shorter period of time than thebupivacaine group (P � 0.03 and 0.01, Fig. 2).
There was no significant difference in motor blockbetween the two drugs with regard to Bromage scaleof lower extremity strength. Of note, 3 subjects withbupivacaine spinal anesthesia never reached a Bro-mage scale �1 compared with 2-CP where all reacheda bilateral Bromage scale of 3 for at least 25 min (Table1). Lower extremity strength was also assessed bydynamometry measurements. For both quadricepsand gastrocnemius muscle strength, the use of spinal2-CP when compared with bupivacaine resulted insignificantly faster return of motor strength (Fig. 3).
2-CP also resulted in a significantly faster time tocomplete resolution of block, time to ambulation, andtime to voiding compared with bupivacaine (Fig. 1,Table 1).
There was no significant variation in hemodynamicmeasurements between groups (repeated-measuresanalysis of variance, P � 0.05). One subject with bu-pivacaine spinal anesthesia was treated with ephed-rine 10 mg for slight nausea and heart rate � 42. Nosubjects reported any adverse symptoms, includingTNS or other neurologic symptoms, immediately aftereither spinal anesthetic, through the 72-h observationperiod, or after 6 mo follow-up.
DiscussionSmall-dose bupivacaine has been used for spinal anes-thesia for procedures of short duration in attempts toavoid local anesthetics such as lidocaine and procaine,known to cause adverse side effects such as TNS andnausea, respectively. This study was designed to directlycompare the minimally reliable dose of spinal bupiva-caine (7.5 mg) to 40 mg of spinal 2-CP in healthy volun-teers in a simulated ambulatory surgical setting.
There was no significant difference in peak blockheight or time to peak block height between the twodrugs, or for time to regression to the L1 dermatome.Although subjects in the bupivacaine group were ableto tolerate the thigh tourniquet for a significantlylonger time as a group, the variation was broad. Allsubjects in the 2-CP group tolerated the tourniquet forat least 25 minutes, which is adequate for most kneeand ankle arthroscopies at our institution. Clinically,
568 REGIONAL ANESTHESIA YOOS AND KOPACZ ANESTH ANALGSPINAL CHLOROPROCAINE VERSUS BUPIVACAINE 2005;100:566–72
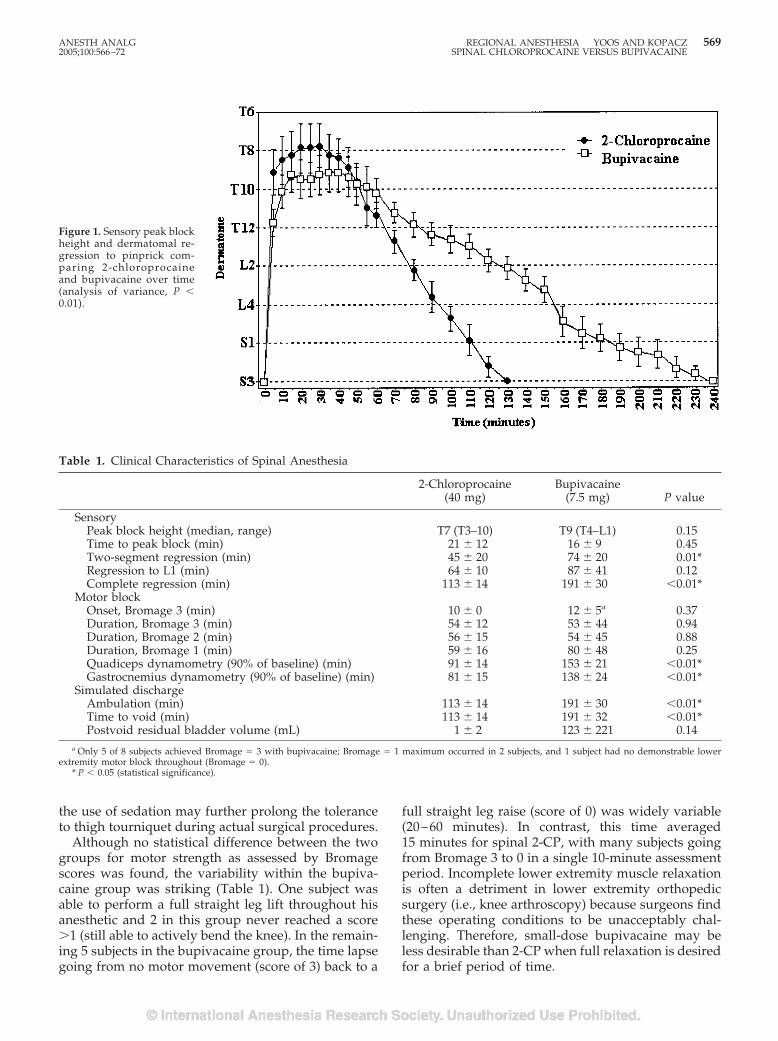
the use of sedation may further prolong the toleranceto thigh tourniquet during actual surgical procedures.
Although no statistical difference between the twogroups for motor strength as assessed by Bromagescores was found, the variability within the bupiva-caine group was striking (Table 1). One subject wasable to perform a full straight leg lift throughout hisanesthetic and 2 in this group never reached a score�1 (still able to actively bend the knee). In the remain-ing 5 subjects in the bupivacaine group, the time lapsegoing from no motor movement (score of 3) back to a
full straight leg raise (score of 0) was widely variable(20–60 minutes). In contrast, this time averaged15 minutes for spinal 2-CP, with many subjects goingfrom Bromage 3 to 0 in a single 10-minute assessmentperiod. Incomplete lower extremity muscle relaxationis often a detriment in lower extremity orthopedicsurgery (i.e., knee arthroscopy) because surgeons findthese operating conditions to be unacceptably chal-lenging. Therefore, small-dose bupivacaine may beless desirable than 2-CP when full relaxation is desiredfor a brief period of time.
Table 1. Clinical Characteristics of Spinal Anesthesia
2-Chloroprocaine(40 mg)
Bupivacaine(7.5 mg) P value
SensoryPeak block height (median, range) T7 (T3–10) T9 (T4–L1) 0.15Time to peak block (min) 21 � 12 16 � 9 0.45Two-segment regression (min) 45 � 20 74 � 20 0.01*Regression to L1 (min) 64 � 10 87 � 41 0.12Complete regression (min) 113 � 14 191 � 30 �0.01*
Motor blockOnset, Bromage 3 (min) 10 � 0 12 � 5a 0.37Duration, Bromage 3 (min) 54 � 12 53 � 44 0.94Duration, Bromage 2 (min) 56 � 15 54 � 45 0.88Duration, Bromage 1 (min) 59 � 16 80 � 48 0.25Quadiceps dynamometry (90% of baseline) (min) 91 � 14 153 � 21 �0.01*Gastrocnemius dynamometry (90% of baseline) (min) 81 � 15 138 � 24 �0.01*
Simulated dischargeAmbulation (min) 113 � 14 191 � 30 �0.01*Time to void (min) 113 � 14 191 � 32 �0.01*Postvoid residual bladder volume (mL) 1 � 2 123 � 221 0.14
a Only 5 of 8 subjects achieved Bromage � 3 with bupivacaine; Bromage � 1 maximum occurred in 2 subjects, and 1 subject had no demonstrable lowerextremity motor block throughout (Bromage � 0).
* P � 0.05 (statistical significance).
Figure 1. Sensory peak blockheight and dermatomal re-gression to pinprick com-paring 2-chloroprocaineand bupivacaine over time(analysis of variance, P �0.01).
ANESTH ANALG REGIONAL ANESTHESIA YOOS AND KOPACZ 5692005;100:566–72 SPINAL CHLOROPROCAINE VERSUS BUPIVACAINE
The reintroduction of 2-CP as a spinal anesthetic hasprogressed with caution given its history. As previ-ously stated, when the formulation containing preser-vatives in a low pH was inadvertently injected into thesubarachnoid space in large doses, significant morbid-ity resulted for a least 8 patients (8–10). Subsequentlaboratory studies have been somewhat contradictoryas to the cause of neurotoxicity. Early laboratory stud-ies demonstrated the antioxidant bisulfite at a low pHas a cause, whereas a more recent study has ques-tioned this mechanism (22–24).
Within the last year, 4 randomized-controlled trials inhealthy volunteers illustrated that preservative-free for-mulations of 2-CP provide predictable and dense spinalanesthesia for short, ambulatory procedures (11–14). Theclinical use of a preservative-free formulation of 2-CP in122 patients over a 10-month period at our institutionhas been recently reported, with all patients having ex-cellent anesthesia for procedures of �60 minutes and noreports of TNS or neurotoxicity (15).
One criticism of the current study could be thevariables of the simulated discharge. Although it isthe current standard of care to wait until sensory
anesthesia has completely resolved before discharg-ing a patient after spinal anesthesia, the results mayhave been different if sensory block regression wasnot used as a prerequisite for ambulation and spon-taneous voiding. Because bupivacaine has an espe-cially variable course in terms of recovery of motorblock, the results may have been biased toward theCP group.
An additional criticism of the current study de-sign could be that the dose of bupivacaine chosen(7.5 mg) was too large. Ideally, thorough dose-response curves (3� doses) would be generated foreach drug, which would preclude the use of ourcrossover design and require a much larger numberof subjects. We instead chose to study the smallestdose of each drug believed to be clinically reliablewithout the addition of additives. Ben-David et al.(18) have shown that 7.5 mg of plain bupivacaineprovides adequate spinal anesthesia for lower ex-tremity surgery. Plain bupivacaine in doses �7.5 mghas been shown to be unreliable for surgical proce-dures of the lower extremity or abdomen. Failurerates for smaller doses (5– 6 mg) of plain spinal
Figure 2. Thigh tourniquettolerance time (placed 30 minafter injection) and durationof tolerance to simulated sur-gical stimulus (transcutane-ous electrical stimulation of60 mA).
570 REGIONAL ANESTHESIA YOOS AND KOPACZ ANESTH ANALGSPINAL CHLOROPROCAINE VERSUS BUPIVACAINE 2005;100:566–72
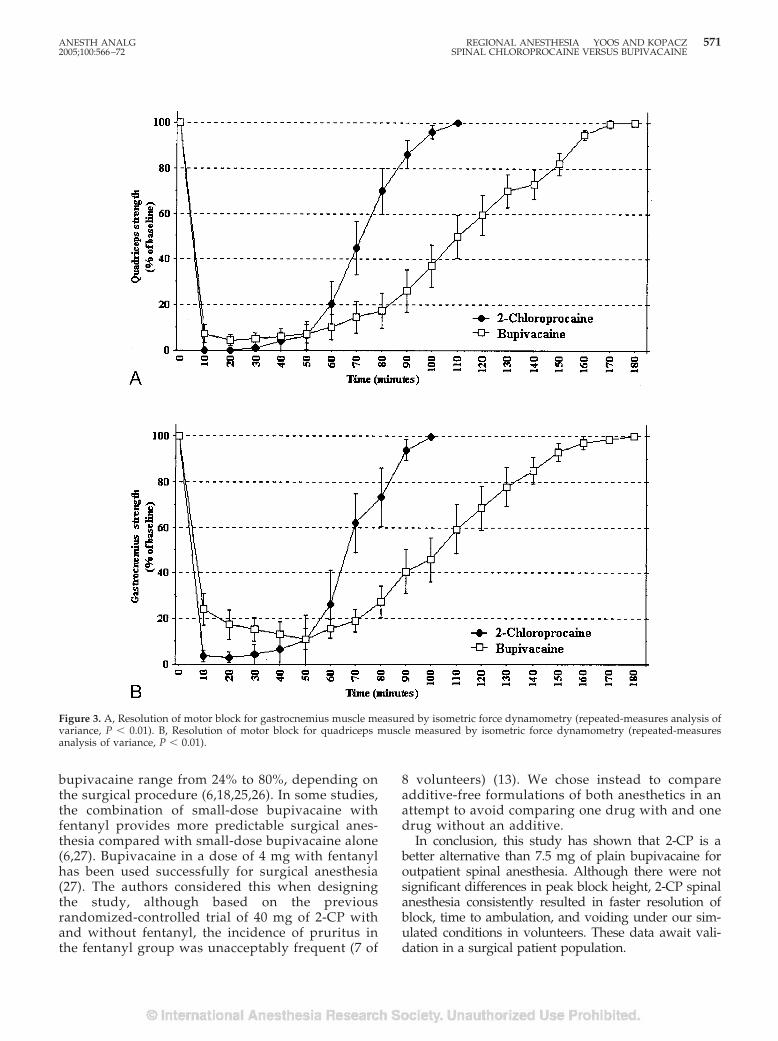
bupivacaine range from 24% to 80%, depending onthe surgical procedure (6,18,25,26). In some studies,the combination of small-dose bupivacaine withfentanyl provides more predictable surgical anes-thesia compared with small-dose bupivacaine alone(6,27). Bupivacaine in a dose of 4 mg with fentanylhas been used successfully for surgical anesthesia(27). The authors considered this when designingthe study, although based on the previousrandomized-controlled trial of 40 mg of 2-CP withand without fentanyl, the incidence of pruritus inthe fentanyl group was unacceptably frequent (7 of
8 volunteers) (13). We chose instead to compareadditive-free formulations of both anesthetics in anattempt to avoid comparing one drug with and onedrug without an additive.
In conclusion, this study has shown that 2-CP is abetter alternative than 7.5 mg of plain bupivacaine foroutpatient spinal anesthesia. Although there were notsignificant differences in peak block height, 2-CP spinalanesthesia consistently resulted in faster resolution ofblock, time to ambulation, and voiding under our sim-ulated conditions in volunteers. These data await vali-dation in a surgical patient population.
Figure 3. A, Resolution of motor block for gastrocnemius muscle measured by isometric force dynamometry (repeated-measures analysis ofvariance, P � 0.01). B, Resolution of motor block for quadriceps muscle measured by isometric force dynamometry (repeated-measuresanalysis of variance, P � 0.01).
ANESTH ANALG REGIONAL ANESTHESIA YOOS AND KOPACZ 5712005;100:566–72 SPINAL CHLOROPROCAINE VERSUS BUPIVACAINE
References1. Dexter F, Abouleish A, Epstein R, et al. Use of operating room
information system data to predict the impact of reducing turn-over times on staffing costs. Anesth Analg. 2003;9:1119–26.
2. Mulroy M, Larkin K, Hodgson P, et al. A comparison of spinal,epidural, and general anesthesia for outpatient knee arthros-copy. Anesth Analg 2000;91:860–4.
3. Pollock JE. Transient neurologic symptoms: etiology, risk fac-tors, and management. Reg Anesth Pain Med 2002;27:581–6.
4. Le Truong JJ, Girard M, Drolet P, et al. Spinal anesthesia: acomparison of procaine and lidocaine. Can J Anaesth 2001;48:470–3.
5. Kamphuis ET, Ionescu TI, Kuipers PWG, et al. Recovery ofstorage and emptying functions of the urinary bladder afterspinal anesthesia with lidocaine and with bupivacaine in men.Anesthesiology 1998;88:210–6.
6. Ben-David B, Solomon E, Levin H, et al. Intrathecal fentanylwith small-dose dilute bupivacaine: better anesthesia withoutprolonged recovery. Anesth Analg 1997;85:560–5.
7. Foldes FF, McNall PG. 2-Chloroprocaine: a new local anestheticagent. Anesthesiology 1952;13:287–96.
8. Winnie AP, Nadar AM. Santayana’s prophecy fulfilled. RegAnesth Pain Med 2001;26:558–64.
9. Reisner LS, Hochman BN, Plumer MH. Persistent neurologicdeficit and adhesive arachnoiditis following intrathecal2-chloroprocaine. Anesth Analg 1980;59:452–4.
10. Moore DC, Spierdijk J, van Kleef JD, et al. Chloroprocainetoxicity: four additional cases. Anesth Analg 1982;61:158–9.
11. Kouri ME, Kopacz DJ. Spinal 2-chloroprocaine: a comparisonwith lidocaine in volunteers. Anesth Analg 2004;98:75–80.
12. Smith KN, Kopacz DJ, McDonald SB. Spinal 2-chloroprocaine: adose-ranging study and the effect of added epinephrine. AnesthAnalg 2004;98:81–8.
13. Vath JS, Kopacz DJ. Spinal 2-chloroprocaine: the effect of addedfentanyl. Anesth Analg 2004;98:89–94.
14. Warren DT, Kopacz DJ. Spinal 2-chloroprocaine: the effect ofadded dextrose. Anesth Analg 2004;98:95–101.
15. Yoos JR, Kopacz DJ. Spinal 2-chloroprocaine for surgery: aninitial 10-month experience. Anesth Analg 2005;100:553–8.
16. Palas T. 1% chloroprocaine for spinal anesthesia. Reg AnesthPain Med 2003;28:A52.
17. Gupta A, Axelsson K, Thorn SE, et al. Low-dose bupivacaineplus fentanyl for spinal anesthesia during ambulatory inguinalherniorrhaphy: a comparison between 6 mg and 7.5 mg ofbupivacaine. Acta Anaesthesiol Scand 2003;47:13–9.
18. Ben-David B, Levin H, Solomon E, et al. Spinal bupivacaine inambulatory surgery: the effect of saline dilution. Anesth Analg1996;83:716–20.
19. Na K, Kopacz D. Spinal chloroprocaine solutions: density at37 degrees C and pH titration. Anesth Analg 2004;98:70–4.
20. Horlocker T, Wedel D. Density, specific gravity, and baricity ofspinal anesthetic solutions at body temperature. Anesth Analg1993;76:1015–8.
21. Petersen-Felix S, Zbinden AM, Fischer M, et al. Isoflurane min-imum alveolar concentration decreases during anesthesia andsurgery. Anesthesiology 1993;79:959–65.
22. Gissen A, Datta S, Lambert D. The chloroprocaine controversy.Reg Anesth Pain Med 1984;9:124–45.
23. Wang BC, Hillman DE, Spielholz NI, Turndorf H. Chronicneurological deficits and Nesacaine-CE: an effect of the anes-thetic, 2-chloroprocaine, or the antioxidant, sodium bisulfite?Anesth Analg 1984;63:445–7.
24. Taniguchi M, Bollen A, Drasner K. Sodium bisulfite: scapegoatfor chloroprocaine neurotoxicity? Anesthesiology 2004;100:85–91.
25. Huffnagle SL, Norris MC, Huffnagle HJ, et al. Intrathecal hy-perbaric bupivacaine dose response in postpartum tubal liga-tion patients. Reg Anesth Pain Med 2002;27:284–8.
26. Dobrydnjov I, Axelsson K, Thorn SE, et al. Clonidine combinedwith small-dose bupivacaine during spinal anesthesia for ingui-nal herniorrhaphy: a randomized double-blinded study. AnesthAnalg 2003;96:1496–503.
27. Kararmaz A, Kaya S, Turhanoglu S, et al. Low-dosebupivacaine-fentanyl spinal anaesthesia for transurethralprostatectomy. Anaesthesia 2003;58:526 –30.
572 REGIONAL ANESTHESIA YOOS AND KOPACZ ANESTH ANALGSPINAL CHLOROPROCAINE VERSUS BUPIVACAINE 2005;100:566–72
Spinal 2-Chloroprocaine: A Comparison with Procainein VolunteersAaron F. Gonter, MD, and Dan J. Kopacz, MD
Department of Anesthesiology, Virginia Mason Medical Center, Seattle, Washington
Recent studies using preservative-free 2-chloroprocaine(2-CP) for spinal anesthesia have shown it to be a reliableshort-acting drug that provides similar anesthesia to li-docaine. In this randomized, double-blind, crossoverstudy, we compared the characteristics of spinal 2-CP(30 mg) with those of procaine (80 mg) in eight volun-teers to determine whether either drug produces spinalanesthetic characteristics ideal for outpatient surgery. Byusing sensation to pinprick, transcutaneous electricalstimulation, tolerance to thigh tourniquet, and motorblockade as surrogates for surgical efficacy, 2-CP com-pared similarly to procaine. Peak block height (T9[range, T6 to T12] versus T6 [T4 to T8]; P � 0.0796), timeto two-segment regression (51 � 17 min versus 53 �10 min; P � 0.7434), tourniquet time tolerance (37 � 16versus 49 min � 17 min; P � 0.1755), and time to return
of motor strength (Bromage scale: 54 � 23 min versus 55� 44 min, P � 0.9366; return of 90% quadriceps strength:78 � 9 min versus 98 � 30 min; P � 0.0721) were allsimilar. Procaine did produce overall longer sensoryblockade (P � 0.0011) and motor blockade at the gas-trocnemius (P � 0.0004) and quadriceps (P � 0.0146)muscles. Times until the resolution of sensory blockade(103 � 12 min versus 151 � 26 min; P � 0.0003), ambu-lation (103 � 12 min versus 151 � 26 min; P � 0.0003),and micturition (103 � 12 min versus 156 � 23 min; P �0.0001) were all prolonged after procaine. In conclusion,at the doses tested, spinal 2-CP (30 mg) may be a betterchoice for short outpatient procedures because it pro-vides anesthesia with similar efficacy as procaine (80 mg)but with more rapid fulfillment of discharge criteria.
(Anesth Analg 2005;100:573–9)
A s the popularity of regional anesthesia and out-patient surgery has grown, so has the search fora short-acting spinal anesthetic with a predict-
able duration, quick resolution, and lack of side ef-fects. Efforts to find the ideal intrathecal doses oflidocaine, bupivacaine, and procaine for outpatientsurgery have only uncovered these drugs’ shortcom-ings. Lidocaine is associated with a 27%–30% risk oftransient neurologic symptoms (TNS) (1,2). Bupiva-caine, even in doses as small as 5 mg with fentanyl,can cause a prolonged time until voiding and dis-charge (3). Procaine, considered the shortest-actingdrug, has the most frequent incidence of nausea andinadequate anesthesia (1,2,4–6).
Recent studies have shown that spinal 2-chloroprocaine (2-CP) has characteristics ideal forshort outpatient procedures such as knee arthros-copy (7–9). 2-CP was first described as a spinalanesthetic in 1952 and was considered a reliable andsafe anesthetic because of its potency, rapid onset,and rapid hydrolysis by plasma esterase (10). Overthe next 30 yr, it became popular as an epiduralanesthetic, especially in obstetrics. In the 1980s,there were reports of neurologic deficits in eightpatients after epidural anesthesia with 2-CP (11–13).Several investigations conducted at that time con-cluded that these injuries were caused by the com-bination of low pH and the antioxidant sodiumbisulfite in the 2-CP preparation, although a recentanimal study debated these results (14 –16). 2-CP iscurrently available in a preparation that is bothpreservative and antioxidant free. This preparationis similar to the one used in 1952, and its availabilityhas renewed interest in 2-CP as a spinal anesthetic.
Procaine, the predecessor to 2-CP, has been usedextensively for spinal anesthesia. It is considered analternative to lidocaine because of its short durationand less frequent incidence of TNS (0%–3%) (1,2,17).However, prospective randomized trials of procainein the 1990s showed that it is an unreliable drug with
Presented in part at the American Society of Regional Anesthesia29th Spring Meeting, Orlando, FL, March 2004.
Accepted for publication August 10, 2004.Address correspondence to Dan J. Kopacz, MD, Department of
Anesthesiology, Virginia Mason Clinic, 1100 Ninth Ave., B2-AN,Seattle, WA 98111. Address e-mail to [email protected]. Re-prints will not be available.
Although 2-chloroprocaine is approved by the Food and DrugAdministration, it is not specifically indicated for spinal anesthesia.Its use for spinal anesthesia is thus considered off-label. Manufac-turers of 2-chloroprocaine distinctly label the product “not for spi-nal anesthesia.”
DOI: 10.1213/01.ANE.0000143380.36298.4A
©2005 by the International Anesthesia Research Society0003-2999/05 Anesth Analg 2005;100:573–9 573
a frequent incidence of side effects (1,2,4,5,17). Theincidence of inadequate anesthesia was 14%–17%, andthe incidence of nausea was 10%–17%, compared withlidocaine, which has a 3% incidence for both (1,2).Even though 2-CP is a derivative of procaine, their usein the subarachnoid space has never been comparedprospectively. This randomized, double-blind, cross-over study was designed to compare the characteris-tics of spinal anesthesia after 30 mg of 2-CP and 80 mgof procaine in an established volunteer model.
MethodsEight healthy volunteers were enrolled after IRB ap-proval and written informed consent. All subjectswere informed that 2-CP is labeled by manufacturersas “not for spinal anesthesia.” Each subject received 2spinal anesthetics, 1 with 30 mg of 2-CP and anotherwith 80 mg of procaine, separated by at least 48 h. The2-CP was prepared by diluting 1 mL of 3% 2-CP with1 mL of saline to yield of a 1.5% solution. Twopreservative- and bisulfite-free formulations of 2-CPare now available commercially: Nesacaine-MPF(AstraZeneca Pharmaceuticals, Worchester, MA) andgeneric CP (Bedford Laboratories, Bedford, OH). TheAstraZeneca formulation (Nesacaine-MPF) was usedin this study. The procaine was prepared by mixing0.8 mL of 10% procaine with 1.2 mL of saline to yielda 4% solution. Although the densities of these 2-CPand procaine mixtures were not directly measured,extrapolating from previous measurements, we be-lieve they are both slightly hyperbaric and of compa-rable density. A random-number generator was usedto determine the order of drug administration for eachsubject. All volunteers received nothing by mouth formore than 6 h for solids and 2 h for liquids. Eachvoided before the administration of the spinal anes-thetic. A 20-gauge peripheral IV cannula was placed,and lactated Ringer’s solution was administered at8 mL/kg for 1 h, followed by 2 mL · kg�1 · h�1. Nosedatives were used, and vasopressors were availableto treat symptomatic decreases in heart rate or arterialblood pressure, if needed.
Each spinal anesthetic was performed with the sub-ject in the left lateral position by using an aseptictechnique. A 24-gauge Sprotte needle was inserted atthe L2-3 interspace with the orifice pointing cephalad.Cerebrospinal fluid 0.2 mL was aspirated to confirmneedle placement, followed by injection of 2 mL of thestudy solution over approximately 10 s. After injec-tion, another 0.2 mL of cerebrospinal fluid was aspi-rated to again confirm placement. The subjects wereimmediately turned supine for the rest of the study.
Noninvasive arterial blood pressure, pulse oxime-try, and electrocardiogram were monitored. Arterialblood pressure and heart rate were recorded at base-line and at 5-min intervals during the study. Sensory
anesthesia was assessed with pinprick by using theforearm as a control. Dermatome levels to pinprickwere recorded every 5 min for the first 60 min andevery 10 min thereafter until regression to S2.
To simulate surgical stimulation, transcutaneouselectrical stimulation (TES) was tested midline at theumbilicus (T10) and pubis (T12), as well as bilaterallyat the medial knee (L3) and lateral ankle (S1). This wasperformed with a peripheral nerve stimulator (ModelNSS25; Fisher and Paykel, Auckland, New Zealand)with a 50-Hz tetanus for 5 s. Each site was initiallytested with 10 mA. The current was then increased inincrements of 10 mA until either the subject reporteddiscomfort or the maximum of 60 mA was attained. Inprevious studies, this maximum limit has been shownto be of comparable intensity to skin incision (18). TESwas performed 4 min after the administration of theanesthetic and every 10 min thereafter until two con-secutive measurements of �60 mA were recorded. Ifthis maximum current was not tolerated at any site,then that site was stimulated with the highest tolerablecurrent at the same interval for a minimum of 34 min.
Tolerance to a left thigh tourniquet was assessed30 min after placement of the spinal anesthetic. The legwas passively exsanguinated by gravity before infla-tion of the tourniquet to 300 mm Hg. It was deflatedwhen requested by the subject, and the duration frominflation to deflation was recorded.
Motor strength was measured by using an isometricforce dynamometer (Micro FET; Hoggan Health In-dustries, Draper, UT) at the right knee and ankle.Subjects were instructed to perform 3 5-s maximalforce straight-leg lifts (quadriceps), followed by 3 5-smaximal force plantar flexions of the foot (gastrocne-mius). The average of the 3 measurements was re-corded at baseline and at 10-min intervals until morethan 90% of baseline strength returned. Lower-extremity movement was also assessed every 10 minby using the modified Bromage scale (0 � no block, 1� able to bend knee, 2 � able to dorsiflex the foot, and3 � complete motor block).
To simulate discharge criteria, each subject receiveda bladder ultrasound when recovery of sensation atthe S2 level occurred. The prevoid bladder volumewas recorded, and subjects were allowed to ambulate.If they successfully ambulated without assistance,then they were instructed to void. After they voided, asecond bladder ultrasound was performed to deter-mine the postvoid residual bladder volume.
By using an estimated difference of 15 min for thetime to complete sensory resolution between drugs, ansd of 10 min, and an � � 0.05 with � � 0.80, 8 subjectswere required. All data are reported as mean � sdunless otherwise noted, and a P value �0.05 wasconsidered significant. All bilateral measurementswere averaged. Paired Student’s t-tests were used todetermine differences between anesthetics in each
574 REGIONAL ANESTHESIA GONTER AND KOPACZ ANESTH ANALGSPINAL CHLOROPROCAINE VERSUS PROCAINE 2005;100:573–9
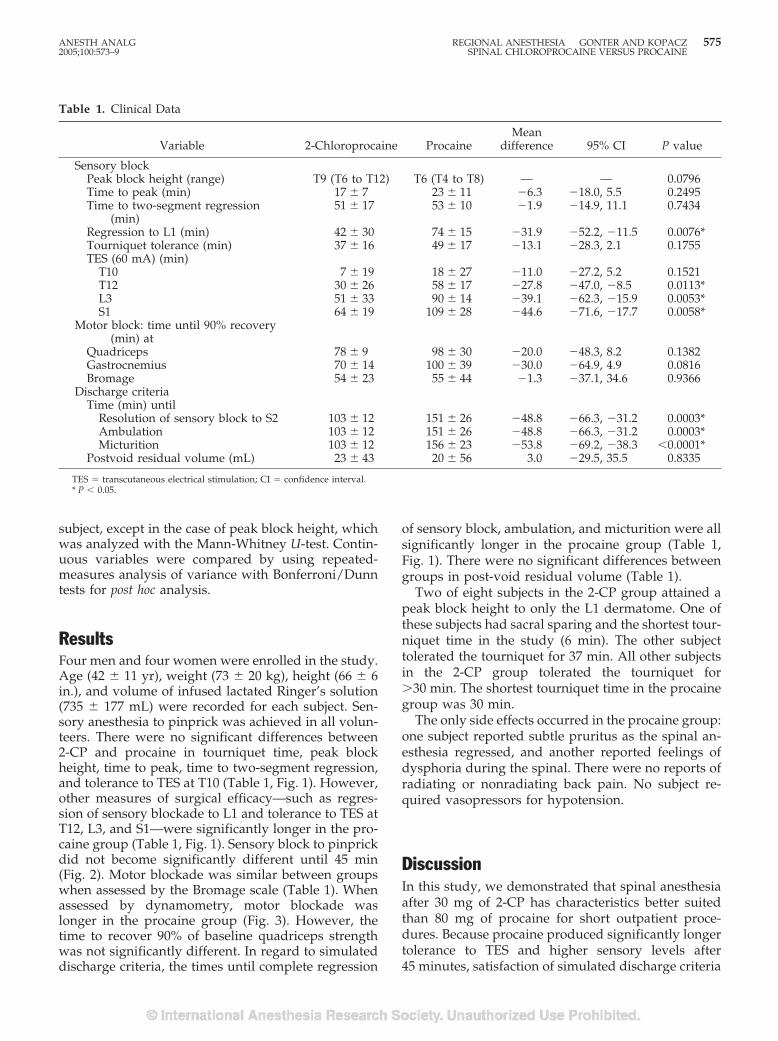
subject, except in the case of peak block height, whichwas analyzed with the Mann-Whitney U-test. Contin-uous variables were compared by using repeated-measures analysis of variance with Bonferroni/Dunntests for post hoc analysis.
ResultsFour men and four women were enrolled in the study.Age (42 � 11 yr), weight (73 � 20 kg), height (66 � 6in.), and volume of infused lactated Ringer’s solution(735 � 177 mL) were recorded for each subject. Sen-sory anesthesia to pinprick was achieved in all volun-teers. There were no significant differences between2-CP and procaine in tourniquet time, peak blockheight, time to peak, time to two-segment regression,and tolerance to TES at T10 (Table 1, Fig. 1). However,other measures of surgical efficacy—such as regres-sion of sensory blockade to L1 and tolerance to TES atT12, L3, and S1—were significantly longer in the pro-caine group (Table 1, Fig. 1). Sensory block to pinprickdid not become significantly different until 45 min(Fig. 2). Motor blockade was similar between groupswhen assessed by the Bromage scale (Table 1). Whenassessed by dynamometry, motor blockade waslonger in the procaine group (Fig. 3). However, thetime to recover 90% of baseline quadriceps strengthwas not significantly different. In regard to simulateddischarge criteria, the times until complete regression
of sensory block, ambulation, and micturition were allsignificantly longer in the procaine group (Table 1,Fig. 1). There were no significant differences betweengroups in post-void residual volume (Table 1).
Two of eight subjects in the 2-CP group attained apeak block height to only the L1 dermatome. One ofthese subjects had sacral sparing and the shortest tour-niquet time in the study (6 min). The other subjecttolerated the tourniquet for 37 min. All other subjectsin the 2-CP group tolerated the tourniquet for�30 min. The shortest tourniquet time in the procainegroup was 30 min.
The only side effects occurred in the procaine group:one subject reported subtle pruritus as the spinal an-esthesia regressed, and another reported feelings ofdysphoria during the spinal. There were no reports ofradiating or nonradiating back pain. No subject re-quired vasopressors for hypotension.
DiscussionIn this study, we demonstrated that spinal anesthesiaafter 30 mg of 2-CP has characteristics better suitedthan 80 mg of procaine for short outpatient proce-dures. Because procaine produced significantly longertolerance to TES and higher sensory levels after45 minutes, satisfaction of simulated discharge criteria
Table 1. Clinical Data
Variable 2-Chloroprocaine ProcaineMean
difference 95% CI P value
Sensory blockPeak block height (range) T9 (T6 to T12) T6 (T4 to T8) — — 0.0796Time to peak (min) 17 � 7 23 � 11 �6.3 �18.0, 5.5 0.2495Time to two-segment regression
(min)51 � 17 53 � 10 �1.9 �14.9, 11.1 0.7434
Regression to L1 (min) 42 � 30 74 � 15 �31.9 �52.2, �11.5 0.0076*Tourniquet tolerance (min) 37 � 16 49 � 17 �13.1 �28.3, 2.1 0.1755TES (60 mA) (min)
T10 7 � 19 18 � 27 �11.0 �27.2, 5.2 0.1521T12 30 � 26 58 � 17 �27.8 �47.0, �8.5 0.0113*L3 51 � 33 90 � 14 �39.1 �62.3, �15.9 0.0053*S1 64 � 19 109 � 28 �44.6 �71.6, �17.7 0.0058*
Motor block: time until 90% recovery(min) at
Quadriceps 78 � 9 98 � 30 �20.0 �48.3, 8.2 0.1382Gastrocnemius 70 � 14 100 � 39 �30.0 �64.9, 4.9 0.0816Bromage 54 � 23 55 � 44 �1.3 �37.1, 34.6 0.9366
Discharge criteriaTime (min) until
Resolution of sensory block to S2 103 � 12 151 � 26 �48.8 �66.3, �31.2 0.0003*Ambulation 103 � 12 151 � 26 �48.8 �66.3, �31.2 0.0003*Micturition 103 � 12 156 � 23 �53.8 �69.2, �38.3 �0.0001*
Postvoid residual volume (mL) 23 � 43 20 � 56 3.0 �29.5, 35.5 0.8335
TES � transcutaneous electrical stimulation; CI � confidence interval.* P � 0.05.
ANESTH ANALG REGIONAL ANESTHESIA GONTER AND KOPACZ 5752005;100:573–9 SPINAL CHLOROPROCAINE VERSUS PROCAINE
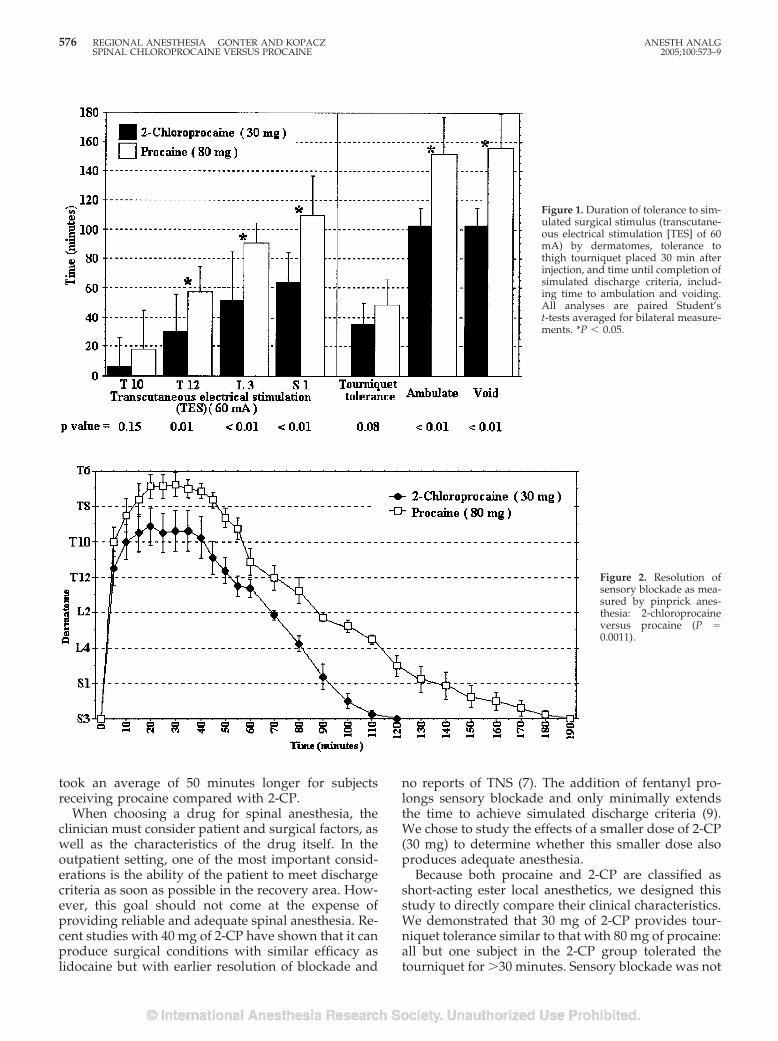
took an average of 50 minutes longer for subjectsreceiving procaine compared with 2-CP.
When choosing a drug for spinal anesthesia, theclinician must consider patient and surgical factors, aswell as the characteristics of the drug itself. In theoutpatient setting, one of the most important consid-erations is the ability of the patient to meet dischargecriteria as soon as possible in the recovery area. How-ever, this goal should not come at the expense ofproviding reliable and adequate spinal anesthesia. Re-cent studies with 40 mg of 2-CP have shown that it canproduce surgical conditions with similar efficacy aslidocaine but with earlier resolution of blockade and
no reports of TNS (7). The addition of fentanyl pro-longs sensory blockade and only minimally extendsthe time to achieve simulated discharge criteria (9).We chose to study the effects of a smaller dose of 2-CP(30 mg) to determine whether this smaller dose alsoproduces adequate anesthesia.
Because both procaine and 2-CP are classified asshort-acting ester local anesthetics, we designed thisstudy to directly compare their clinical characteristics.We demonstrated that 30 mg of 2-CP provides tour-niquet tolerance similar to that with 80 mg of procaine:all but one subject in the 2-CP group tolerated thetourniquet for �30 minutes. Sensory blockade was not
Figure 1. Duration of tolerance to sim-ulated surgical stimulus (transcutane-ous electrical stimulation [TES] of 60mA) by dermatomes, tolerance tothigh tourniquet placed 30 min afterinjection, and time until completion ofsimulated discharge criteria, includ-ing time to ambulation and voiding.All analyses are paired Student’st-tests averaged for bilateral measure-ments. *P � 0.05.
Figure 2. Resolution ofsensory blockade as mea-sured by pinprick anes-thesia: 2-chloroprocaineversus procaine (P �0.0011).
576 REGIONAL ANESTHESIA GONTER AND KOPACZ ANESTH ANALGSPINAL CHLOROPROCAINE VERSUS PROCAINE 2005;100:573–9
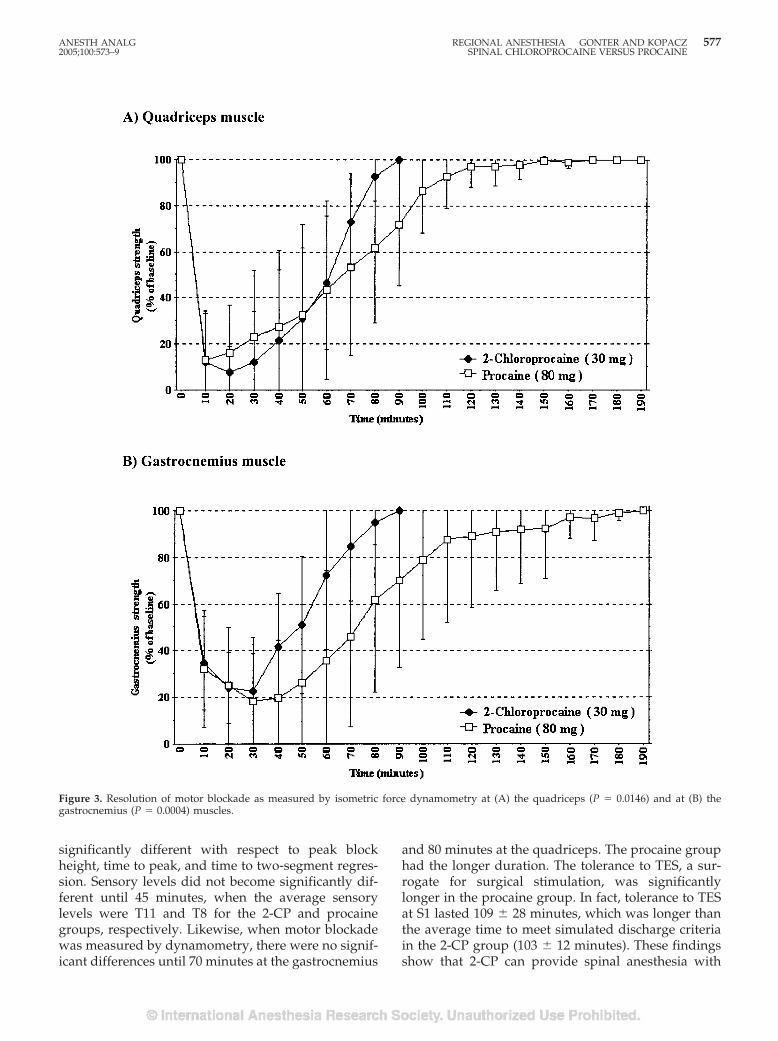
significantly different with respect to peak blockheight, time to peak, and time to two-segment regres-sion. Sensory levels did not become significantly dif-ferent until 45 minutes, when the average sensorylevels were T11 and T8 for the 2-CP and procainegroups, respectively. Likewise, when motor blockadewas measured by dynamometry, there were no signif-icant differences until 70 minutes at the gastrocnemius
and 80 minutes at the quadriceps. The procaine grouphad the longer duration. The tolerance to TES, a sur-rogate for surgical stimulation, was significantlylonger in the procaine group. In fact, tolerance to TESat S1 lasted 109 � 28 minutes, which was longer thanthe average time to meet simulated discharge criteriain the 2-CP group (103 � 12 minutes). These findingsshow that 2-CP can provide spinal anesthesia with
Figure 3. Resolution of motor blockade as measured by isometric force dynamometry at (A) the quadriceps (P � 0.0146) and at (B) thegastrocnemius (P � 0.0004) muscles.
ANESTH ANALG REGIONAL ANESTHESIA GONTER AND KOPACZ 5772005;100:573–9 SPINAL CHLOROPROCAINE VERSUS PROCAINE
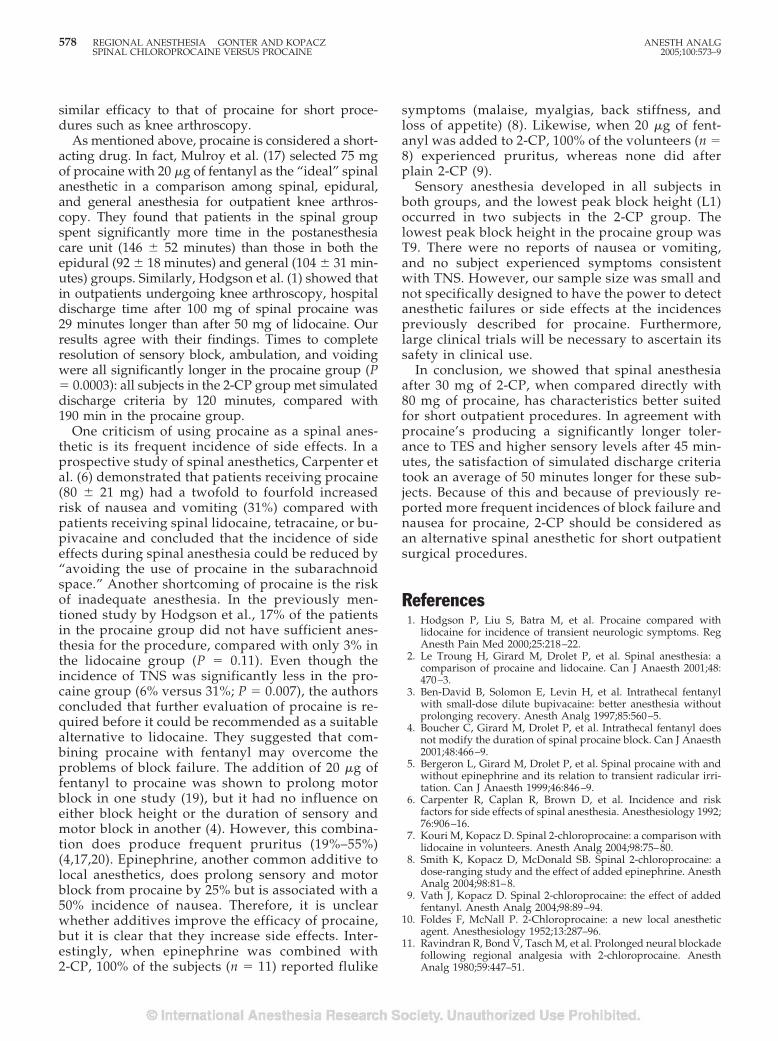
similar efficacy to that of procaine for short proce-dures such as knee arthroscopy.
As mentioned above, procaine is considered a short-acting drug. In fact, Mulroy et al. (17) selected 75 mgof procaine with 20 �g of fentanyl as the “ideal” spinalanesthetic in a comparison among spinal, epidural,and general anesthesia for outpatient knee arthros-copy. They found that patients in the spinal groupspent significantly more time in the postanesthesiacare unit (146 � 52 minutes) than those in both theepidural (92 � 18 minutes) and general (104 � 31 min-utes) groups. Similarly, Hodgson et al. (1) showed thatin outpatients undergoing knee arthroscopy, hospitaldischarge time after 100 mg of spinal procaine was29 minutes longer than after 50 mg of lidocaine. Ourresults agree with their findings. Times to completeresolution of sensory block, ambulation, and voidingwere all significantly longer in the procaine group (P� 0.0003): all subjects in the 2-CP group met simulateddischarge criteria by 120 minutes, compared with190 min in the procaine group.
One criticism of using procaine as a spinal anes-thetic is its frequent incidence of side effects. In aprospective study of spinal anesthetics, Carpenter etal. (6) demonstrated that patients receiving procaine(80 � 21 mg) had a twofold to fourfold increasedrisk of nausea and vomiting (31%) compared withpatients receiving spinal lidocaine, tetracaine, or bu-pivacaine and concluded that the incidence of sideeffects during spinal anesthesia could be reduced by“avoiding the use of procaine in the subarachnoidspace.” Another shortcoming of procaine is the riskof inadequate anesthesia. In the previously men-tioned study by Hodgson et al., 17% of the patientsin the procaine group did not have sufficient anes-thesia for the procedure, compared with only 3% inthe lidocaine group (P � 0.11). Even though theincidence of TNS was significantly less in the pro-caine group (6% versus 31%; P � 0.007), the authorsconcluded that further evaluation of procaine is re-quired before it could be recommended as a suitablealternative to lidocaine. They suggested that com-bining procaine with fentanyl may overcome theproblems of block failure. The addition of 20 �g offentanyl to procaine was shown to prolong motorblock in one study (19), but it had no influence oneither block height or the duration of sensory andmotor block in another (4). However, this combina-tion does produce frequent pruritus (19%–55%)(4,17,20). Epinephrine, another common additive tolocal anesthetics, does prolong sensory and motorblock from procaine by 25% but is associated with a50% incidence of nausea. Therefore, it is unclearwhether additives improve the efficacy of procaine,but it is clear that they increase side effects. Inter-estingly, when epinephrine was combined with2-CP, 100% of the subjects (n � 11) reported flulike
symptoms (malaise, myalgias, back stiffness, andloss of appetite) (8). Likewise, when 20 �g of fent-anyl was added to 2-CP, 100% of the volunteers (n �8) experienced pruritus, whereas none did afterplain 2-CP (9).
Sensory anesthesia developed in all subjects inboth groups, and the lowest peak block height (L1)occurred in two subjects in the 2-CP group. Thelowest peak block height in the procaine group wasT9. There were no reports of nausea or vomiting,and no subject experienced symptoms consistentwith TNS. However, our sample size was small andnot specifically designed to have the power to detectanesthetic failures or side effects at the incidencespreviously described for procaine. Furthermore,large clinical trials will be necessary to ascertain itssafety in clinical use.
In conclusion, we showed that spinal anesthesiaafter 30 mg of 2-CP, when compared directly with80 mg of procaine, has characteristics better suitedfor short outpatient procedures. In agreement withprocaine’s producing a significantly longer toler-ance to TES and higher sensory levels after 45 min-utes, the satisfaction of simulated discharge criteriatook an average of 50 minutes longer for these sub-jects. Because of this and because of previously re-ported more frequent incidences of block failure andnausea for procaine, 2-CP should be considered asan alternative spinal anesthetic for short outpatientsurgical procedures.
References1. Hodgson P, Liu S, Batra M, et al. Procaine compared with
lidocaine for incidence of transient neurologic symptoms. RegAnesth Pain Med 2000;25:218–22.
2. Le Troung H, Girard M, Drolet P, et al. Spinal anesthesia: acomparison of procaine and lidocaine. Can J Anaesth 2001;48:470–3.
3. Ben-David B, Solomon E, Levin H, et al. Intrathecal fentanylwith small-dose dilute bupivacaine: better anesthesia withoutprolonging recovery. Anesth Analg 1997;85:560–5.
4. Boucher C, Girard M, Drolet P, et al. Intrathecal fentanyl doesnot modify the duration of spinal procaine block. Can J Anaesth2001;48:466–9.
5. Bergeron L, Girard M, Drolet P, et al. Spinal procaine with andwithout epinephrine and its relation to transient radicular irri-tation. Can J Anaesth 1999;46:846–9.
6. Carpenter R, Caplan R, Brown D, et al. Incidence and riskfactors for side effects of spinal anesthesia. Anesthesiology 1992;76:906–16.
7. Kouri M, Kopacz D. Spinal 2-chloroprocaine: a comparison withlidocaine in volunteers. Anesth Analg 2004;98:75–80.
8. Smith K, Kopacz D, McDonald SB. Spinal 2-chloroprocaine: adose-ranging study and the effect of added epinephrine. AnesthAnalg 2004;98:81–8.
9. Vath J, Kopacz D. Spinal 2-chloroprocaine: the effect of addedfentanyl. Anesth Analg 2004;98:89–94.
10. Foldes F, McNall P. 2-Chloroprocaine: a new local anestheticagent. Anesthesiology 1952;13:287–96.
11. Ravindran R, Bond V, Tasch M, et al. Prolonged neural blockadefollowing regional analgesia with 2-chloroprocaine. AnesthAnalg 1980;59:447–51.
578 REGIONAL ANESTHESIA GONTER AND KOPACZ ANESTH ANALGSPINAL CHLOROPROCAINE VERSUS PROCAINE 2005;100:573–9
12. Reisner L, Hochman B, Plumer M. Persistent neurologic def-icit and adhesive arachnoiditis following intrathecal2-chloroprocaine injection. Anesth Analg 1980;59:452– 4.
13. Moore D, Spierdijk J, van Kleef J, et al. Chloroprocaine neuro-toxicity: four additional cases. Anesth Analg 1982;61:155–9.
14. Scally D. Review and evaluation of clinical data: special sum-mary of adverse experiences for review by FDA Anesthetic LifeSupport Drug Advisory Committee, 1980.
15. Gissen A, Datta S, Lambert D. The chloroprocaine controversy.Reg Anesth Pain Med 1984;9:124–45.
16. Taniguchi M, Bollen A, Drasner K. Sodium bisulfite: scapegoatfor chloroprocaine toxicity? Anesthesiology 2004;100:85–91.
17. Mulroy M, Larkin K, Hodgson P, et al. A comparison of spinal,epidural, and general anesthesia for outpatient knee arthros-copy. Anesth Analg 2000;91:860–4.
18. Peterson-Felix S, Zbinden A, Fischer M, et al. Isoflurane mini-mum alveolar concentration decreases during anesthesia andsurgery. Anesthesiology 1993;79:959–65.
19. Axelrod E, Alexander G, Brown M, et al. Procaine spinalanesthesia: a pilot study of the incidence of transient neurologicsymptoms. J Clin Anesth 1998;10:404–9.
20. Mulroy M, Larkin K, Siddiqui A. Intrathecal fentanyl-induced pruritus is more severe in combination with pro-caine than with lidocaine or bupivacaine. Reg Anesth PainMed 2001;26:252– 6.
ANESTH ANALG REGIONAL ANESTHESIA GONTER AND KOPACZ 5792005;100:573–9 SPINAL CHLOROPROCAINE VERSUS PROCAINE
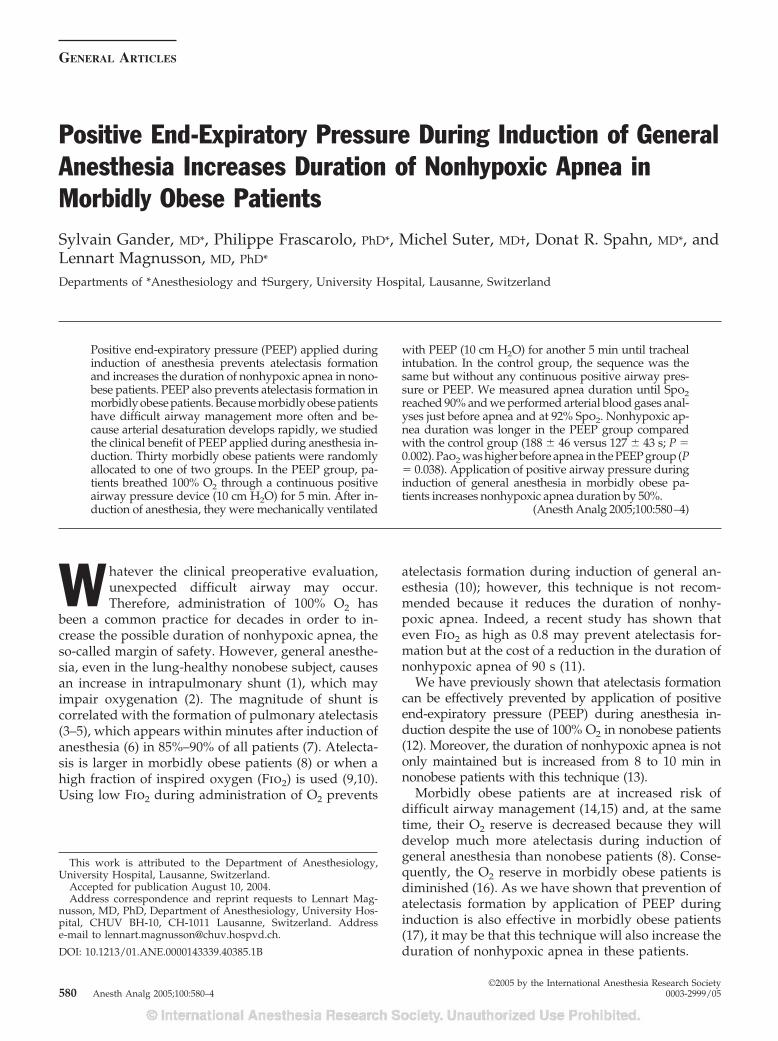
GENERAL ARTICLES
Positive End-Expiratory Pressure During Induction of GeneralAnesthesia Increases Duration of Nonhypoxic Apnea inMorbidly Obese PatientsSylvain Gander, MD*, Philippe Frascarolo, PhD*, Michel Suter, MD†, Donat R. Spahn, MD*, andLennart Magnusson, MD, PhD*
Departments of *Anesthesiology and †Surgery, University Hospital, Lausanne, Switzerland
Positive end-expiratory pressure (PEEP) applied duringinduction of anesthesia prevents atelectasis formationand increases the duration of nonhypoxic apnea in nono-bese patients. PEEP also prevents atelectasis formation inmorbidly obese patients. Because morbidly obese patientshave difficult airway management more often and be-cause arterial desaturation develops rapidly, we studiedthe clinical benefit of PEEP applied during anesthesia in-duction. Thirty morbidly obese patients were randomlyallocated to one of two groups. In the PEEP group, pa-tients breathed 100% O2 through a continuous positiveairway pressure device (10 cm H2O) for 5 min. After in-duction of anesthesia, they were mechanically ventilated
with PEEP (10 cm H2O) for another 5 min until trachealintubation. In the control group, the sequence was thesame but without any continuous positive airway pres-sure or PEEP. We measured apnea duration until Spo2reached 90% and we performed arterial blood gases anal-yses just before apnea and at 92% Spo2. Nonhypoxic ap-nea duration was longer in the PEEP group comparedwith the control group (188 � 46 versus 127 � 43 s; P �0.002). Pao2 was higher before apnea in the PEEP group (P� 0.038). Application of positive airway pressure duringinduction of general anesthesia in morbidly obese pa-tients increases nonhypoxic apnea duration by 50%.
(Anesth Analg 2005;100:580–4)
W hatever the clinical preoperative evaluation,unexpected difficult airway may occur.Therefore, administration of 100% O2 has
been a common practice for decades in order to in-crease the possible duration of nonhypoxic apnea, theso-called margin of safety. However, general anesthe-sia, even in the lung-healthy nonobese subject, causesan increase in intrapulmonary shunt (1), which mayimpair oxygenation (2). The magnitude of shunt iscorrelated with the formation of pulmonary atelectasis(3–5), which appears within minutes after induction ofanesthesia (6) in 85%–90% of all patients (7). Atelecta-sis is larger in morbidly obese patients (8) or when ahigh fraction of inspired oxygen (Fio2) is used (9,10).Using low Fio2 during administration of O2 prevents
atelectasis formation during induction of general an-esthesia (10); however, this technique is not recom-mended because it reduces the duration of nonhy-poxic apnea. Indeed, a recent study has shown thateven Fio2 as high as 0.8 may prevent atelectasis for-mation but at the cost of a reduction in the duration ofnonhypoxic apnea of 90 s (11).
We have previously shown that atelectasis formationcan be effectively prevented by application of positiveend-expiratory pressure (PEEP) during anesthesia in-duction despite the use of 100% O2 in nonobese patients(12). Moreover, the duration of nonhypoxic apnea is notonly maintained but is increased from 8 to 10 min innonobese patients with this technique (13).
Morbidly obese patients are at increased risk ofdifficult airway management (14,15) and, at the sametime, their O2 reserve is decreased because they willdevelop much more atelectasis during induction ofgeneral anesthesia than nonobese patients (8). Conse-quently, the O2 reserve in morbidly obese patients isdiminished (16). As we have shown that prevention ofatelectasis formation by application of PEEP duringinduction is also effective in morbidly obese patients(17), it may be that this technique will also increase theduration of nonhypoxic apnea in these patients.
This work is attributed to the Department of Anesthesiology,University Hospital, Lausanne, Switzerland.
Accepted for publication August 10, 2004.Address correspondence and reprint requests to Lennart Mag-
nusson, MD, PhD, Department of Anesthesiology, University Hos-pital, CHUV BH-10, CH-1011 Lausanne, Switzerland. Addresse-mail to [email protected].
DOI: 10.1213/01.ANE.0000143339.40385.1B
©2005 by the International Anesthesia Research Society580 Anesth Analg 2005;100:580–4 0003-2999/05
The aim of this study was therefore to evaluate theclinical benefit, in terms of duration of nonhypoxicapnea, of PEEP applied during the induction period ofgeneral anesthesia in morbidly obese patients.
MethodsAfter local ethics committee approval and written in-formed consent, 30 ASA physical status II–III patientsaged 18–60 yr, with a body mass index (BMI)�35 kg/m2 and scheduled for elective surgery wereenrolled in this prospective, single-blinded study andrandomly assigned to 1 of 2 groups. The estimation ofthe sample size was based on previous studies (16).This size was calculated to detect a difference of 60 s ofnonhypoxic apnea duration, accepting a type I error of5% and type II error of 20%. Exclusion criteria werepregnancy, cardiac or pulmonary disease, and Spo2 atambient air �94%. Patients were also excluded if theyhad known carotid stenosis, pulmonary hypertension,or a history of neurological disorder. Sleep apnea syn-drome was not considered to be an exclusion criterion.
No patients received premedication before surgery.In the operating room, patients were positioned withpillows or towels under their shoulders, with theirhead elevated and neck extended. Routine monitoringwas initiated and the same pulse oximetry (typeF-CU8-22-05; Datex-Engstrom, Helsinki, Finland) wasused for all patients. General anesthesia was inducedwith propofol (effect site target: 4 �g/mL), remifen-tanil (effect site target: 6 ng/mL), and cisatracurium(0.2 mg/kg). For maintenance, drugs were adjusted toobtain a clinically adequate depth of anesthesia andbispectral index between 40 and 50.
In the PEEP group, awake patients were adminis-tered 100% O2 through a continuous positive airwaypressure (CPAP) device (Drager CF800; Dragerwerk,Lubeck, Germany) set at 10 cm H2O for 5 min. Afterinduction of anesthesia, patients were mechanicallyventilated with the pressure-controlled mode (typeA-ELEC 00; Datex-Engstrom 5/5, Bromma, Sweden)(pressure-controlled ventilation at 14 cm H2O, PEEP10 cm H2O, respiratory rate 8/') for another 5 minuntil tracheal intubation.
In the control group, patients had the same induc-tion technique but without any PEEP or CPAP. Theybreathed spontaneously through the CPAP devicewithout any positive pressure. After induction of gen-eral anesthesia, they were mechanically ventilatedwith the same settings but without any PEEP.
After tracheal intubation, no pressure was appliedto the airway and correct placement of the endotra-cheal tube was confirmed by fibroscopy. The endotra-cheal tube was left open to air at atmospheric pressureand the patient was left apneic until Spo2 reached90%. Capnography was used to monitor involuntary
breathing. Patients were then administered 100% O2and the recruitment maneuver (increasing airwaypressure to 40 cm H2O for 15 s) was applied until Spo2reached initial values.
Nonhypoxic apnea was defined as the time neededto reach 90% Spo2 from the end of mechanical venti-lation. Arterial blood gases were measured twice: first,just before the beginning of the period of apnea and,second, when Spo2 decreased to 92%.
Values were expressed as mean � sd. Paired andunpaired Student’s t-test was used for comparisonswithin and between groups. �2 was used to comparediscrete variables. The Pearson product-moment cor-relation coefficient was calculated to assess the rela-tionship between the duration of nonhypoxic apneaand other variables. P value � 0.05 was consideredsignificant. The statistical package used was JMP (ver-sion 5.01; SAS Institute, Cary, NC).
ResultsThree patients of the PEEP group were excluded afterrandomization because of an Spo2 at ambient air�94% in the operating room and, because of technicaldifficulties, only 11 arterial catheters could be insertedin each group (PEEP group: 12 patients, 11 patientswith blood gases analysis; control group: 15 patients,11 patients with blood gases analysis). The two studygroups did not differ with respect to age, sex, BMI,smoking, and Spo2 at ambient air (Table 1). No pa-tients had a difficult intubation, only one attempt wasnecessary, and the duration of intubation did not ex-ceed 1 min in any patient.
Nonhypoxic apnea duration was significantlylonger in the PEEP group than in the control group(188 � 46 versus 127 � 43 s; P � 0.002) (Fig. 1).
Just before apnea, Pao2 was higher in the PEEPgroup than in the control group (376 � 145 versus 243� 136 mm Hg, respectively; P � 0.038) (Fig. 1). Nodifference was seen for Paco2 before apnea (Table 2).At 92% Spo2, there was no difference for Pao2 orPaco2 between the two groups (Table 2).
We found a negative correlation between BMI andnonhypoxic apnea duration in the control group (R2 �
Table 1. Patient Demographics
Control group(n � 15)
PEEP group(n � 12)
Pvalue
Age (yr) 38 � 12 35 � 8 0.49Sex (male/female) 2/13 3/9 0.44Smoking (yes/no) 3/12 3/9 0.76BMI (kg/m2) 47 � 6 46 � 7 0.57Spo2 AA (%) 98 � 2 98 � 2 0.64
Values are expressed as mean � sd.PEEP � positive end-expiratory pressure, BMI � body mass index, Spo2
AA � oxygen saturation at ambient air.
ANESTH ANALG GANDER ET AL. 5812005;100:580–4 DURATION OF NONHYPOXIC APNEA IN THE OBESE
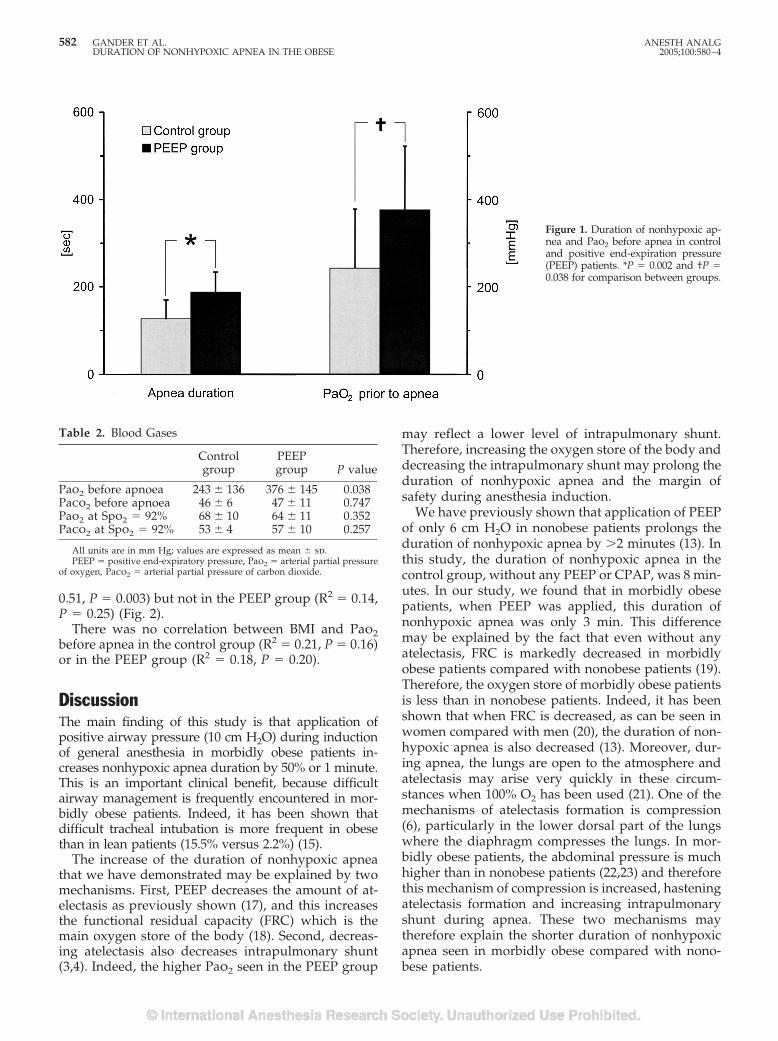
0.51, P � 0.003) but not in the PEEP group (R2 � 0.14,P � 0.25) (Fig. 2).
There was no correlation between BMI and Pao2before apnea in the control group (R2 � 0.21, P � 0.16)or in the PEEP group (R2 � 0.18, P � 0.20).
DiscussionThe main finding of this study is that application ofpositive airway pressure (10 cm H2O) during inductionof general anesthesia in morbidly obese patients in-creases nonhypoxic apnea duration by 50% or 1 minute.This is an important clinical benefit, because difficultairway management is frequently encountered in mor-bidly obese patients. Indeed, it has been shown thatdifficult tracheal intubation is more frequent in obesethan in lean patients (15.5% versus 2.2%) (15).
The increase of the duration of nonhypoxic apneathat we have demonstrated may be explained by twomechanisms. First, PEEP decreases the amount of at-electasis as previously shown (17), and this increasesthe functional residual capacity (FRC) which is themain oxygen store of the body (18). Second, decreas-ing atelectasis also decreases intrapulmonary shunt(3,4). Indeed, the higher Pao2 seen in the PEEP group
may reflect a lower level of intrapulmonary shunt.Therefore, increasing the oxygen store of the body anddecreasing the intrapulmonary shunt may prolong theduration of nonhypoxic apnea and the margin ofsafety during anesthesia induction.
We have previously shown that application of PEEPof only 6 cm H2O in nonobese patients prolongs theduration of nonhypoxic apnea by �2 minutes (13). Inthis study, the duration of nonhypoxic apnea in thecontrol group, without any PEEP or CPAP, was 8 min-utes. In our study, we found that in morbidly obesepatients, when PEEP was applied, this duration ofnonhypoxic apnea was only 3 min. This differencemay be explained by the fact that even without anyatelectasis, FRC is markedly decreased in morbidlyobese patients compared with nonobese patients (19).Therefore, the oxygen store of morbidly obese patientsis less than in nonobese patients. Indeed, it has beenshown that when FRC is decreased, as can be seen inwomen compared with men (20), the duration of non-hypoxic apnea is also decreased (13). Moreover, dur-ing apnea, the lungs are open to the atmosphere andatelectasis may arise very quickly in these circum-stances when 100% O2 has been used (21). One of themechanisms of atelectasis formation is compression(6), particularly in the lower dorsal part of the lungswhere the diaphragm compresses the lungs. In mor-bidly obese patients, the abdominal pressure is muchhigher than in nonobese patients (22,23) and thereforethis mechanism of compression is increased, hasteningatelectasis formation and increasing intrapulmonaryshunt during apnea. These two mechanisms maytherefore explain the shorter duration of nonhypoxicapnea seen in morbidly obese compared with nono-bese patients.
Figure 1. Duration of nonhypoxic ap-nea and Pao2 before apnea in controland positive end-expiration pressure(PEEP) patients. *P � 0.002 and †P �0.038 for comparison between groups.
Table 2. Blood Gases
Controlgroup
PEEPgroup P value
Pao2 before apnoea 243 � 136 376 � 145 0.038Paco2 before apnoea 46 � 6 47 � 11 0.747Pao2 at Spo2 � 92% 68 � 10 64 � 11 0.352Paco2 at Spo2 � 92% 53 � 4 57 � 10 0.257
All units are in mm Hg; values are expressed as mean � sd.PEEP � positive end-expiratory pressure, Pao2 � arterial partial pressure
of oxygen, Paco2 � arterial partial pressure of carbon dioxide.
582 GANDER ET AL. ANESTH ANALGDURATION OF NONHYPOXIC APNEA IN THE OBESE 2005;100:580–4
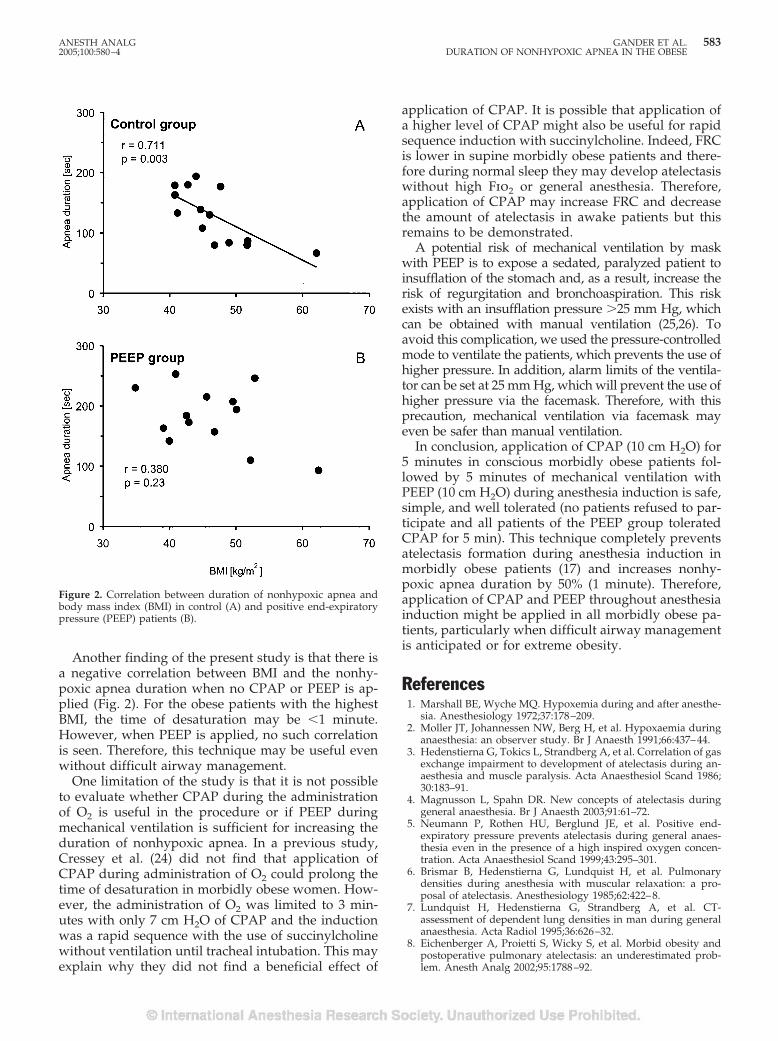
Another finding of the present study is that there isa negative correlation between BMI and the nonhy-poxic apnea duration when no CPAP or PEEP is ap-plied (Fig. 2). For the obese patients with the highestBMI, the time of desaturation may be �1 minute.However, when PEEP is applied, no such correlationis seen. Therefore, this technique may be useful evenwithout difficult airway management.
One limitation of the study is that it is not possibleto evaluate whether CPAP during the administrationof O2 is useful in the procedure or if PEEP duringmechanical ventilation is sufficient for increasing theduration of nonhypoxic apnea. In a previous study,Cressey et al. (24) did not find that application ofCPAP during administration of O2 could prolong thetime of desaturation in morbidly obese women. How-ever, the administration of O2 was limited to 3 min-utes with only 7 cm H2O of CPAP and the inductionwas a rapid sequence with the use of succinylcholinewithout ventilation until tracheal intubation. This mayexplain why they did not find a beneficial effect of
application of CPAP. It is possible that application ofa higher level of CPAP might also be useful for rapidsequence induction with succinylcholine. Indeed, FRCis lower in supine morbidly obese patients and there-fore during normal sleep they may develop atelectasiswithout high Fio2 or general anesthesia. Therefore,application of CPAP may increase FRC and decreasethe amount of atelectasis in awake patients but thisremains to be demonstrated.
A potential risk of mechanical ventilation by maskwith PEEP is to expose a sedated, paralyzed patient toinsufflation of the stomach and, as a result, increase therisk of regurgitation and bronchoaspiration. This riskexists with an insufflation pressure �25 mm Hg, whichcan be obtained with manual ventilation (25,26). Toavoid this complication, we used the pressure-controlledmode to ventilate the patients, which prevents the use ofhigher pressure. In addition, alarm limits of the ventila-tor can be set at 25 mm Hg, which will prevent the use ofhigher pressure via the facemask. Therefore, with thisprecaution, mechanical ventilation via facemask mayeven be safer than manual ventilation.
In conclusion, application of CPAP (10 cm H2O) for5 minutes in conscious morbidly obese patients fol-lowed by 5 minutes of mechanical ventilation withPEEP (10 cm H2O) during anesthesia induction is safe,simple, and well tolerated (no patients refused to par-ticipate and all patients of the PEEP group toleratedCPAP for 5 min). This technique completely preventsatelectasis formation during anesthesia induction inmorbidly obese patients (17) and increases nonhy-poxic apnea duration by 50% (1 minute). Therefore,application of CPAP and PEEP throughout anesthesiainduction might be applied in all morbidly obese pa-tients, particularly when difficult airway managementis anticipated or for extreme obesity.
References1. Marshall BE, Wyche MQ. Hypoxemia during and after anesthe-
sia. Anesthesiology 1972;37:178–209.2. Moller JT, Johannessen NW, Berg H, et al. Hypoxaemia during
anaesthesia: an observer study. Br J Anaesth 1991;66:437–44.3. Hedenstierna G, Tokics L, Strandberg A, et al. Correlation of gas
exchange impairment to development of atelectasis during an-aesthesia and muscle paralysis. Acta Anaesthesiol Scand 1986;30:183–91.
4. Magnusson L, Spahn DR. New concepts of atelectasis duringgeneral anaesthesia. Br J Anaesth 2003;91:61–72.
5. Neumann P, Rothen HU, Berglund JE, et al. Positive end-expiratory pressure prevents atelectasis during general anaes-thesia even in the presence of a high inspired oxygen concen-tration. Acta Anaesthesiol Scand 1999;43:295–301.
6. Brismar B, Hedenstierna G, Lundquist H, et al. Pulmonarydensities during anesthesia with muscular relaxation: a pro-posal of atelectasis. Anesthesiology 1985;62:422–8.
7. Lundquist H, Hedenstierna G, Strandberg A, et al. CT-assessment of dependent lung densities in man during generalanaesthesia. Acta Radiol 1995;36:626–32.
8. Eichenberger A, Proietti S, Wicky S, et al. Morbid obesity andpostoperative pulmonary atelectasis: an underestimated prob-lem. Anesth Analg 2002;95:1788–92.
Figure 2. Correlation between duration of nonhypoxic apnea andbody mass index (BMI) in control (A) and positive end-expiratorypressure (PEEP) patients (B).
ANESTH ANALG GANDER ET AL. 5832005;100:580–4 DURATION OF NONHYPOXIC APNEA IN THE OBESE
9. Reber A, Englberg G, Wegenius G, Hedenstierna G. Lungaeration: the effect of pre-oxygenation and hyperoxygenationduring total intravenous anaesthesia. Anaesthesia 1996;51:733–7.
10. Rothen HU, Sporre B, Englberg G, et al. Prevention of atelectasisduring general anaesthesia. Lancet 1995;345:1387–91.
11. Edmark L, Kostova-Aherdan K, Enlund M, Hedenstierna G.Optimal oxygen concentration during induction of general an-esthesia. Anesthesiology 2003;98:28–33.
12. Rusca M, Proietti S, Schnyder P, et al. Prevention of atelectasisformation during induction of general anesthesia. Anesth Analg2003;97:1835–9.
13. Herriger A, Frascarolo P, Spahn DR, Magnusson L. The effect ofpositive airway pressure during pre-oxygenation and inductionof anaesthesia upon duration of non-hypoxic apnoea. Anaesthe-sia 2004;59:243–7.
14. Hood DD, Dewan DM. Anesthetic and obstetric outcome inmorbidly obese parturients. Anesthesiology 1993;79:1210–8.
15. Juvin P, Lavaut E, Dupont H, et al. Difficult tracheal intubationis more common in obese than in lean patients. Anesth Analg2003;97:595–600.
16. Berthoud MC, Peacock JE, Reilly CS. Effectiveness of preoxy-genation in morbidly obese patients. Br J Anaesth 1991;67:464–6.
17. Coussa M, Proietti S, Schnyder P, et al. Prevention of atelectasisformation during the induction of general anesthesia in mor-bidly obese patients. Anesth Analg 2004;98:1491–5.
18. Lumb AD. Oxygen. In: Nunn’s applied respiratory physiology.Oxford: Butterworth-Heinemann, 2000:288–90.
19. Pelosi P, Croci M, Ravagnan I, et al. The effects of body mass onlung volumes, respiratory mechanics, and gas exchange duringgeneral anesthesia. Anesth Analg 1998;87:654–60.
20. Lumb AD. Elastic forces and lung volumes. In: Nunn’s appliedrespiratory physiology. Oxford: Butterworth-Heinemann, 2000:37–57.
21. Rothen HU, Sporre B, Englberg G, et al. Influence of gas com-position on recurrence of atelectasis after a reexpansion maneu-ver during general anesthesia. Anesthesiology 1995;82:832–42.
22. Pelosi P, Croci M, Ravagnan I, et al. Total respiratory system,lung, and chest wall mechanics in sedated-paralyzed postoper-ative morbidly obese patients. Chest 1996;109:144–51.
23. Pelosi P, Croci M, Ravagnan I, et al. Respiratory system me-chanics in sedated, paralyzed, morbidly obese patients. J ApplPhysiol 1997;82:811–8.
24. Cressey DM, Berthoud MC, Reilly CS. Effectiveness of contin-uous positive airway pressure to enhance pre-oxygenation inmorbidly obese women. Anaesthesia 2001;56:680–4.
25. Ho-Tai LM, Devitt JH, Noel AG, O’Donnell MP. Gas leak andgastric insufflation during controlled ventilation: face mask ver-sus laryngeal mask airway. Can J Anaesth 1998;45:206–11.
26. Vyas H, Milner AD, Hopkin IE. Face mask resuscitation: does itlead to gastric distension? Arch Dis Child 1983;58:373–5.
584 GANDER ET AL. ANESTH ANALGDURATION OF NONHYPOXIC APNEA IN THE OBESE 2005;100:580–4
Airway Management in Adult Patients with Deep NeckInfections: A Case Series and Review of the LiteratureAndranik Ovassapian, MD*, Meltem Tuncbilek, MD†, Erik K. Weitzel, MD‡, andChandrashekhar W. Joshi, MD†
*Department of Anesthesia and Critical Care, the University of Chicago, Chicago Illinois; †Department of Anesthesiology,Northwestern University, Chicago, Illinois, and ‡Department of Otolaryngology and Communication Sciences, BaylorCollege of Medicine, Houston, Texas
Patients with deep neck infections, especially those withLudwig’s angina, may die as a result of airway manage-ment mishaps. Skillful airway management is critical, buta safe method of airway control in these patients is yet tobe established. We subjected patients with deep neck in-fections to fiberoptic tracheal intubation by using topicalanesthesia to provide general anesthesia for surgical inter-ventions. Patient characteristics and techniques for intu-bations were recorded on a special data-collection form.Of the 26 patients, 17 had Ludwig’s angina, and 9 hadother types of deep neck infections. Three patients weretracheally intubated while in the sitting position, 2 inFowler’s position, and 21 in the supine position with thehead up 10°–15°. Tracheal intubations were successful in
25 patients: 19 nasally and 6 orally. After surgery, sevenpatients were kept tracheally intubated, and five patientshad tracheostomies. Complications were limited to threecases of mild epistaxis and four oversedations with tran-sient hypoxemia. Twelve patients remembered part of theprocedure, and two considered it unpleasant. Tracheal in-tubation with a flexible bronchoscope by using topical an-esthesia is highly successful in adult patients with deepneck infections. Tracheostomy using local anesthesia isrecommended if fiberoptic intubation is not feasible, if theclinician is not skillful in the use of awake fiberoptic intu-bation, or if intubation attempts have failed.
(Anesth Analg 2005;100:585–9)
P atients with deep neck infections present chal-lenging airways for an anesthesiologist. Theseinfectious processes are not common but, un-
treated, may progress rapidly to airway obstructionthat could be lethal (1–5). A common cause of death inpatients with deep neck infections is acute loss of theairway during interventions to control it (6,7). Varioustechniques are available to secure the airway, but thesuccess and safety of these techniques in patients withdeep neck infections have not yet been established.
Tracheostomy using local anesthesia has been con-sidered the “gold standard” of airway management inpatients with deep neck infections, but it may be dif-ficult or impossible in advanced cases of infectionbecause of the position needed for tracheostomy orbecause of anatomical distortion of the anterior neck(1,8). Tracheal intubation using a rigid laryngoscope
under general anesthesia, awake blind nasal intuba-tion (BNI), and awake fiberoptic intubation have beenreported, but with disappointingly frequent failure(9,10). This article summarizes our experience withfiberoptic intubation using topical anesthesia in 26patients with deep neck infections.
MethodsApproval for retrospective review, analysis, and pub-lication of these prospectively collected data was ob-tained from the IRB of the University of Chicago.Details of difficult airway management and fiberoptictracheal intubations were recorded by the anesthesi-ologist on a special data-collection form. Items listedon the form were patient demographics, ASA physicalstatus classification, diagnosis, procedure performed,medications used for sedation and topical anesthesia,effectiveness of topical anesthesia, ease of laryngealexposure and tube passage (11), intubation time, andcomplications. Reviewing these forms collected from1978 to 2003, we identified 26 patients with deep neckinfections who had fiberoptic tracheal intubation fol-lowed by general anesthesia for surgical intervention.
Accepted for publication July 21, 2004.Address correspondence and reprint requests to Andranik Ovas-
sapian, MD, Department of Anesthesia and Critical Care, Universityof Chicago Hospitals, MC 4028, 5841 S. Maryland Ave., Chicago, IL60637. Address e-mail to [email protected].
DOI: 10.1213/01.ANE.0000141526.32741.CF
©2005 by the International Anesthesia Research Society0003-2999/05 Anesth Analg 2005;100:585–9 585
Eight patients treated before 1986 were premedi-cated with IM morphine 5–10 mg and atropine 0.4 mg.Eighteen patients received atropine 0.4 mg or glyco-pyrrolate 0.2 mg IV 15–30 min before application oftopical anesthesia. All patients were given supplemen-tal oxygen through a nasal cannula and had IV lineplacement. In the operating room after routine moni-tors were attached, baseline vital signs were recorded.Sedation was begun with IV titration of diazepam ormidazolam with or without fentanyl before applica-tion of topical anesthesia. The goals of sedation wereto have a calm patient able to respond to verbal com-mands, to depress airway reflexes, and to minimizeunpleasant recall. The surgical team was in the oper-ating room ready for emergency cricothyrotomy incase of airway loss.
For nasotracheal intubation, the nasal passage wasprepared with 4% cocaine (2–3 mL) or 3% lidocaineand a 0.25% phenylephrine mixture (2–3 mL) by usingcotton-tip applicators. For orotracheal intubation, thebase of the tongue and the pharyngeal walls wereanesthetized with a 10% or 4% lidocaine spray (aver-age, 150 mg). Topical anesthesia of the larynx andtrachea was achieved in 13 patients by a spray-as-you-go technique and in 10 patients with translaryn-geal injection of 3–4 mL of 4% lidocaine (120–160 mg).If the suction channel of the fiberoptic bronchoscope(FB) was more than 1.5 mm, an epidural catheter waspassed through the channel so that a fine spray of localanesthetic could be injected through the catheter (12).In two patients, the planned spray-as-you go tech-nique for topical laryngotracheal anesthesia was notused because airway reflexes were depressed and pa-tients did not react to advancement of the FB. Fornasal intubation, the tube-first technique was used,except in four patients with pharyngeal abscesses, inwhom the scope-first technique was applied. The en-dotracheal tube, which was placed in a warm waterbath to make it more pliable, was lubricated andpassed through the prepared nostril into the pharynx.The FB was passed through the endotracheal tube, theglottis was identified, and the FB, followed by theendotracheal tube, was advanced into the trachea. Fororotracheal intubation, an Ovassapian intubating air-way was placed, and the lubricated endotracheal tubewas positioned inside the airway, followed by the FB.Intubations were attempted in 3 patients in the sittingposition, 2 in Fowler’s position, and 21 in the supinehead-up (10°–15°) position. Patients were interviewedafter surgery about the overall experience and recall ofthe events.
ResultsOf the 26 patients, 25 were men and 1 was a woman.The preponderance of male patients came from the
Veterans Administration Medical Center, where thesenior author (AO) practiced from 1978 to 1998. Theaverage age was 44.5 yr (range, 28–65 yr); weight,85.5 kg (range, 55–159 kg); and height, 175.6 cm(range, 165–188 cm). For 17 patients the operationswere emergencies. Sixteen patients were classified asASA physical status III and one as status IV; the restwere status I or II. Seventeen (65%) patients had Lud-wig’s angina: 13 of odontogenic origin, 3 from a com-pound mandibular fracture, and 1 from a malignanttumor of the tongue complicated with infection. Ninepatients had parapharyngeal infections and abscesses.The average doses for sedation were diazepam0.1 mg/kg, midazolam 23 �g/kg, and fentanyl 1.6�g/kg. Two patients received no sedation because ofthe severity of the compromised airway. All patientshad signs and symptoms of a compromised airway; 11were in respiratory distress (Table 1).
Tracheal intubations were successful in 25 patients:19 nasally and 6 orally. In one patient, tracheostomyusing local anesthesia was performed because narrownasal passages prevented the passage of an endotra-cheal tube.
The specifics of fiberoptic intubation, including thedegree of difficulty for vocal cord exposure and intu-bation times, are summarized in Table 2. Eleven pa-tients were tracheally extubated and cared for in thepostanesthesia care unit before discharge to the inten-sive care unit. Nine patients were kept intubated from10 h to 5 days. Six patients ultimately required atracheostomy.
Ten patients (40%) developed complications: mildepistaxis in three, hypertension and tachycardia in six,cough during intubation in nine, and oversedationand transient hypoxemia (Spo2 �90%) in four. Twelvepatients remembered part of the procedure, and twoconsidered it unpleasant. For four patients this infor-mation was missing. Loss of airway, the most fearedcomplication, was not encountered.
Two patients with a severely compromised airwaypresented a special problem. One patient, treated in1978, developed Ludwig’s angina because of an infectedmalignant tumor of the tongue complicated with cellu-litis, edema, and engorged veins of the anterior neckregion. The patient could not open his mouth, and airexchange was possible only in a sitting position leaningto his left side. Because of the patient’s inability to liedown and the distorted anterior neck anatomy, the sur-geon requested that the airway be secured before trache-ostomy. Intubation was achieved nasally with the pa-tient in the sitting position. Tracheostomy was achievedwith difficulty and with 700 mL of blood loss.
In the second patient, treated in 1979, Ludwig’sangina was of odontogenic origin. The patient—who was obese, with a short, thick neck and amouth opening of �1 cm— could breathe air only in
586 OVASSAPIAN ET AL. ANESTH ANALGAIRWAY MANAGEMENT IN DEEP NECK INFECTIONS 2005;100:585–9
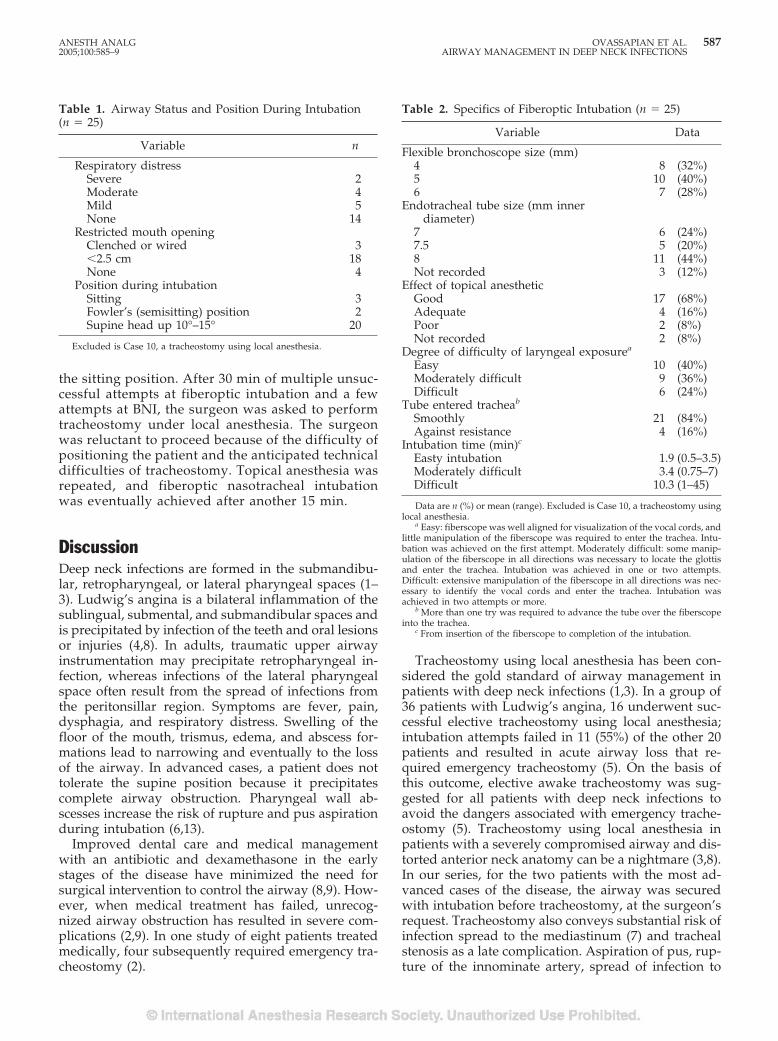
the sitting position. After 30 min of multiple unsuc-cessful attempts at fiberoptic intubation and a fewattempts at BNI, the surgeon was asked to performtracheostomy under local anesthesia. The surgeonwas reluctant to proceed because of the difficulty ofpositioning the patient and the anticipated technicaldifficulties of tracheostomy. Topical anesthesia wasrepeated, and fiberoptic nasotracheal intubationwas eventually achieved after another 15 min.
DiscussionDeep neck infections are formed in the submandibu-lar, retropharyngeal, or lateral pharyngeal spaces (1–3). Ludwig’s angina is a bilateral inflammation of thesublingual, submental, and submandibular spaces andis precipitated by infection of the teeth and oral lesionsor injuries (4,8). In adults, traumatic upper airwayinstrumentation may precipitate retropharyngeal in-fection, whereas infections of the lateral pharyngealspace often result from the spread of infections fromthe peritonsillar region. Symptoms are fever, pain,dysphagia, and respiratory distress. Swelling of thefloor of the mouth, trismus, edema, and abscess for-mations lead to narrowing and eventually to the lossof the airway. In advanced cases, a patient does nottolerate the supine position because it precipitatescomplete airway obstruction. Pharyngeal wall ab-scesses increase the risk of rupture and pus aspirationduring intubation (6,13).
Improved dental care and medical managementwith an antibiotic and dexamethasone in the earlystages of the disease have minimized the need forsurgical intervention to control the airway (8,9). How-ever, when medical treatment has failed, unrecog-nized airway obstruction has resulted in severe com-plications (2,9). In one study of eight patients treatedmedically, four subsequently required emergency tra-cheostomy (2).
Tracheostomy using local anesthesia has been con-sidered the gold standard of airway management inpatients with deep neck infections (1,3). In a group of36 patients with Ludwig’s angina, 16 underwent suc-cessful elective tracheostomy using local anesthesia;intubation attempts failed in 11 (55%) of the other 20patients and resulted in acute airway loss that re-quired emergency tracheostomy (5). On the basis ofthis outcome, elective awake tracheostomy was sug-gested for all patients with deep neck infections toavoid the dangers associated with emergency trache-ostomy (5). Tracheostomy using local anesthesia inpatients with a severely compromised airway and dis-torted anterior neck anatomy can be a nightmare (3,8).In our series, for the two patients with the most ad-vanced cases of the disease, the airway was securedwith intubation before tracheostomy, at the surgeon’srequest. Tracheostomy also conveys substantial risk ofinfection spread to the mediastinum (7) and trachealstenosis as a late complication. Aspiration of pus, rup-ture of the innominate artery, spread of infection to
Table 1. Airway Status and Position During Intubation(n � 25)
Variable n
Respiratory distressSevere 2Moderate 4Mild 5None 14
Restricted mouth openingClenched or wired 3�2.5 cm 18None 4
Position during intubationSitting 3Fowler’s (semisitting) position 2Supine head up 10°–15° 20
Excluded is Case 10, a tracheostomy using local anesthesia.
Table 2. Specifics of Fiberoptic Intubation (n � 25)
Variable Data
Flexible bronchoscope size (mm)4 8 (32%)5 10 (40%)6 7 (28%)
Endotracheal tube size (mm innerdiameter)
7 6 (24%)7.5 5 (20%)8 11 (44%)Not recorded 3 (12%)
Effect of topical anestheticGood 17 (68%)Adequate 4 (16%)Poor 2 (8%)Not recorded 2 (8%)
Degree of difficulty of laryngeal exposurea
Easy 10 (40%)Moderately difficult 9 (36%)Difficult 6 (24%)
Tube entered tracheab
Smoothly 21 (84%)Against resistance 4 (16%)
Intubation time (min)c
Easty intubation 1.9 (0.5–3.5)Moderately difficult 3.4 (0.75–7)Difficult 10.3 (1–45)
Data are n (%) or mean (range). Excluded is Case 10, a tracheostomy usinglocal anesthesia.
a Easy: fiberscope was well aligned for visualization of the vocal cords, andlittle manipulation of the fiberscope was required to enter the trachea. Intu-bation was achieved on the first attempt. Moderately difficult: some manip-ulation of the fiberscope in all directions was necessary to locate the glottisand enter the trachea. Intubation was achieved in one or two attempts.Difficult: extensive manipulation of the fiberscope in all directions was nec-essary to identify the vocal cords and enter the trachea. Intubation wasachieved in two attempts or more.
b More than one try was required to advance the tube over the fiberscopeinto the trachea.
c From insertion of the fiberscope to completion of the intubation.
ANESTH ANALG OVASSAPIAN ET AL. 5872005;100:585–9 AIRWAY MANAGEMENT IN DEEP NECK INFECTIONS
the thorax, airway loss, and death have been reported(7,14,15).
Tracheal intubation in patients with deep neck in-fections is challenging. The distorted airway anatomy,tissue immobility, and limited access to the mouthmake orotracheal intubation with rigid laryngoscopydifficult (1,6,10,13). In the early stages of the disease,general anesthesia may overcome trismus and allowthe mouth to be opened for rigid laryngoscopy (10).One series reported a 90% success rate for trachealintubations among 10 patients with Ludwig’s anginaafter the induction of general anesthesia (10). In ad-vanced cases, the induction of general anesthesia isdangerous, because it may precipitate complete air-way closure and make face mask ventilation and tra-cheal intubation impossible, thus necessitating emer-gency tracheostomy (1,6,13). Rupture of an abscessand aspiration of pus have been reported during anattempted orotracheal intubation under general anes-thesia (6,13).
The reported success of awake BNI in patients withupper airway infection is infrequent: two (50%) of fourcases in one series (9). BNI is a simple technique withtwo major drawbacks: infrequent success on the firstpass and increased trauma with repeated attempts,precipitating complete airway obstruction that neces-sitates emergent cricothyrotomy (5,9,14). The first suc-cessful fiberoptic nasotracheal intubation in a patientwith Ludwig’s angina was reported in 1974 (16); how-ever, subsequent reports of awake fiberoptic nasotra-cheal intubations were associated with frequent fail-ure: two (66%) of three in one report (9,17).
Tissue edema and immobility, a distorted airway,and copious secretions, common in patients with deepneck infections, contribute to the difficulty of fiberop-tic intubation. However, more often, the failure tointubate is caused by inadequate preparation of thepatient, use of a poor-quality FB, and inadequate ex-perience with the procedure (9,18–20). In our series,all 25 attempted intubations were successful withoutmajor complications. The success is attributed to awell organized approach to awake intubation andexpertise in flexible bronchoscopy. Avoiding airwayirritation and laryngeal spasm is critical to preventsudden airway loss (18,19). Application of topicalanesthesia before sedation is unpleasant to the pa-tient and precipitates cough and laryngeal spasm(19). Instrumentation of the airway with poor topi-cal anesthesia also precipitates laryngeal spasm andairway loss. Our experience with 3000 tracheal in-tubations using topical anesthesia during the past 26years has convinced us that narcotic-induced de-pression of the airway reflexes complements thetopical anesthesia produced by local anesthetic.Two patients in this series were tracheally intubated
without application of topical anesthesia to the lar-ynx and trachea, and we attribute this to the pro-found effect of fentanyl on airway reflexes. Thecombination of midazolam and fentanyl increasesthe risk of respiratory depression (21); therefore,these drugs must be titrated carefully.
An anesthesiologist well trained in awake fiberopticintubation can intubate most patients with deep neckinfections smoothly, expeditiously, and with minimaldiscomfort to the patient. The FB does not induce pain,can be applied through oral or nasal routes, and can beused in any position comfortable to the patient. Topicalanesthesia of the larynx and trachea can be achievedwith the spray-as-you-go technique. The topical anesthe-sia of the larynx is achieved within 1 minute after lido-caine spray followed by tracheal intubation. The patientis at risk for aspiration if regurgitation or vomiting takesplace after topical anesthesia and before the airway issecured. A shorter time interval between application oftopical anesthesia and tracheal intubation lessens thepotential of aspiration (22).
Awake fiberoptic intubation has been recommendedfor airway management in patients with an airway com-promised by infections and tumors (8,12,23). Othershave challenged the value of awake fiberoptic intubationin patients with upper airway tumors associated withstridor (20). This report confirms that, in experiencedhands, awake fiberoptic intubation can be performedsafely in patients with a compromised airway.
The shortcomings of this study are threefold. First, allpatients with deep neck infections treated in two hospi-tals during the study period were not included; onlypatients with advanced disease for whom the seniorauthor was the anesthesiologist or consultant were in-cluded. Second, most cases in this group represent anadvanced form of the disease and, therefore, more com-plicated airways. Third, delayed complications were notknown because of the lack of long-term follow-up.
In summary, death from loss of an airway still occursin patients with advanced deep neck infections. Securingsuch an airway is challenging and dangerous. Soundclinical judgment is critical for timing and for selectingthe method for airway intervention. Tracheostomy usinglocal anesthesia is safe in most patients but is impracticalor risky in others. On the basis of our experience, wesuggest fiberoptic intubation using topical anesthesia asthe first choice for airway control in adult patients withdeep neck infections. Tracheotomy under local anesthe-sia is a good choice if an FB is not available, if theclinician is not skilled with awake fiberoptic intubation,or if attempts at intubation have failed.
References1. Irani BS, Martin-Hirsch D, Lannigan F. Infection of the neck
spaces: a present day complication. J Laryngol Otol 1992;106:455–8.
588 OVASSAPIAN ET AL. ANESTH ANALGAIRWAY MANAGEMENT IN DEEP NECK INFECTIONS 2005;100:585–9
2. Har-El G, Aroesty JH, Shaha A, Lucente FE. Changing trends indeep neck abscess: a retrospective study of 110 patients. OralSurg Oral Med Oral Pathol 1994;77:446–50.
3. Sethi DS, Stanley RE. Deep neck abscesses: changing trends.J Laryngol Otol 1994;108:138 – 43.
4. Marple BF. Ludwig angina: a review of current airway manage-ment. Arch Otolaryngol Head Neck Surg 1999;125:596–9.
5. Parhiscar A, Har-El G. Deep neck abscess: a retrospective re-view of 210 cases. Ann Otol Rhinol Laryngol 2001;110:1051–4.
6. Heindel DJ. Deep neck abscesses in adults: management of adifficult airway. Anesth Analg 1987;66:774–6.
7. Potter JK, Herford AS, Ellis E III. Tracheotomy versus endotra-cheal intubation for airway management in deep neck spaceinfections. J Oral Maxillofac Surg 2002;60:349–54.
8. Busch RF, Shah D. Ludwig’s angina: improved treatment. Oto-laryngol Head Neck Surg 1997;117:S172–5.
9. Patterson HC, Kelly JH, Strome M. Ludwig’s angina: an update.Laryngoscope 1982;92:370–8.
10. Loughnan TE, Allen DE. Ludwig’s angina: the anaesthetic man-agement of nine cases. Anaesthesia 1985;40:295–7.
11. Ovassapian A, Yelich SJ, Dykes MH, Brunner EE. Fiberopticnasotracheal intubation: incidence and causes of failure. AnesthAnalg 1983;62:692–5.
12. Ovassapian A. Topical anesthesia of the airway. In: OvassapianA, ed. Fiberoptic endoscopy and the difficult airway. 2nd ed.Philadelphia: Lippincott-Raven, 1996:47–60.
13. Neff SP, Merry AF, Anderson B. Airway management in Lud-wig’s angina. Anaesth Intensive Care 1999;27:659–61.
14. Colmenero Ruiz C, Labajo AD, Yanez Vilas I, Paniagua J. Tho-racic complications of deeply situated serous neck infections.J Craniomaxillofac Surg 1993;21:76–81.
15. McGuire G, El-Beheiry H, Brown D. Loss of airway duringtracheostomy: rescue oxygenation and re-establishment of theairway. Can J Anaesth 2001;48:697–700.
16. Schwartz HC, Bauer RA, Davis NJ, Guralnick WC. Ludwig’sangina: use of fiberoptic laryngoscopy to avoid tracheostomy.J Oral Surg 1974;32:608–11.
17. Spitalnic SJ, Sucov A. Ludwig’s angina: case report and review.J Emerg Med 1995;13:499–503.
18. McGuire G, El-Beheiry H. Complete upper airway obstructionduring awake fiberoptic intubation in patients with unstablecervical spine fractures. Can J Anaesth 1999;46:176–8.
19. Shaw IC, Welchew EA, Harrison BJ, Michael S. Complete air-way obstruction during awake fiberoptic intubation. Anaesthe-sia 1997;52:582–5.
20. Mason RA, Fielder CP. The obstructed airway in head and necksurgery [editorial]. Anaesthesia 1999;54:625–8.
21. Bailey PL, Pace NL, Ashburn MA, et al. Frequent hypoxemiaand apnea after sedation with midazolam and fentanyl. Anes-thesiology 1990;73:826–30.
22. Ovassapian A, Krejcie TC, Yelich SJ, Dykes MH. Awake fibre-optic intubation in the patient at high risk of aspiration. Br JAnaesth 1989;62:13–6.
23. Gray AJG, Hoile RW, Ingram GS, Sherry K. The report of theNational Confidential Enquiry into Perioperative Deaths 1996/1997. London: National CPED, 1998.
ANESTH ANALG OVASSAPIAN ET AL. 5892005;100:585–9 AIRWAY MANAGEMENT IN DEEP NECK INFECTIONS
The ProSeal™ Has a Shorter Life-Span than the Classic™Laryngeal Mask AirwaySarah Doneley, MB BS*, Joseph Brimacombe, MB ChB, FRCA, MD†, Christian Keller, MD‡, andAchim von Goedecke, MD‡
*Department of Anaesthesia and Intensive Care, Cairns Base Hospital, Australia; †James Cook University, Department ofAnaesthesia and Intensive Care, Cairns Base Hospital, Australia; ‡Department of Anaesthesia and Intensive CareMedicine, Leopold-Franzens University, Innsbruck, Austria
We tested the hypothesis that the life-span of theProSeal™ laryngeal mask airway (LMA) is shorter thanthe Classic™ LMA. We also compared residual cuff vol-umes and changes in elastance and permeability with use.Six new size 4 ProSeal™ LMAs and 6 new size 4 Classic™LMAs were tested. Each LMA underwent a simulatedclinical use cycle until it failed the pre-use check tests. Thesimulated clinical use cycle comprised: i) inflating the cuffto the maximum recommended volume for 1 h; ii) immer-sion in an enzymatic solution for 3 min; iii) washing theexternal and internal surfaces; iv) automatic washing for14 min (�85°C); v) drying for 30 min (�75°C); and vi)autoclaving at 134°C for 4 min at 206 kPa. Before the firstcycle and every 10 subsequent cycles, the cuff was inflatedwith 40 mL air and the intracuff pressure was measuredimmediately and 3 h later. The initial intracuff pressurewas taken to be an inverse measure of the elastance orresistance to deformation, and the intracuff pressurechange were taken as a measure of the permeability. The
residual cuff volume was determined for 10 Classic™ and10 ProSeal™ size 4 LMAs using a gas dilution technique.The mean � sd (range) longevity for the ProSeal™ LMAand Classic™ LMA was 82 � 23 (45–109) uses and 133 �35 (76–176) uses, respectively. The ProSeal™ LMA has ashorter life-span than the Classic™ LMA (P � 0.01). Forthe ProSeal™ LMA, there was no change in elastance orpermeability with use. For the Classic™ LMA, there was adecrease in elastance (P � 0.0001) and an increase in per-meability (P � 0.0001) with use. The residual cuff volumewas higher for the ProSeal™ LMA (2.6�1.3 mL versus 1.5� 0.9, P � 0.04). We conclude that the life-span of theProSeal™ LMA is shorter than the Classic™ LMA, butboth exceed the manufacturer’s recommendations of 40uses. We recommend that reusable LMA devices be dis-carded when they fail the pre-use check tests, rather thanafter a specific number of uses.
(Anesth Analg 2005;100:590–3)
R eusable laryngeal mask airway (LMA) devicesare constructed from medical grade silicone, as ithas an indefinite shelf life, is heat resistant to
180°C, and has excellent elastic properties (1). How-ever, repeated sterilization produces degradation ofthe silicone polymer chains, which manifests as a de-crease in elastance or resistance to deformation, anincrease in permeability, and hardening/discolorationof the tube (2). Autoclaving also damages the bond be-tween the connector and tube, although this does notaffect the airtightness of the junction (3). The clinical
consequences of device failure include airway obstruc-tion, loss of seal, aspiration of tube fragments, and failureto identify regurgitation early (1). The manufacturer rec-ommends that all reusable LMA devices be discardedafter 40 uses (4–6), but for the Classic™ LMA there is invitro evidence that the physical properties do not altersubstantially until after 80 uses (2) and in vivo evidencethat there is no change in clinical performance for at least60 uses (7). The ProSeal™ LMA is the newest and mostcomplex of the reusable LMA devices and differs fromthe Classic™ LMA in that it has a larger ventral cuff, adorsal cuff, a drain tube, and a built-in bite block (8,9).An audit of our institute suggested that many of theProSeal™ LMAs were not lasting for 40 uses, despitestrict adherence to the manufacturer’s guidelines forcleaning and sterilization. In the following study, we testthe hypothesis that the life-span of the ProSeal™ LMA isshorter than the Classic™ LMA. We also compare resid-ual cuff volumes and changes in elastance and perme-ability with use.
Accepted for publication August 18, 2004.Address correspondence to Prof. J Brimacombe, Department of An-
aesthesia and Intensive Care, Cairns Base Hospital, The Esplanade,Cairns 4870, Australia. Address e-mail to [email protected] project was supported solely by departmental resources. DrsBrimacombe and Keller have worked as a consultants for the Laryn-geal Mask Company, manufacturer of the ProSeal™ and Classic™laryngeal mask airways.
DOI: 10.1213/01.ANE.0000144068.26632.B7
©2005 by the International Anesthesia Research Society590 Anesth Analg 2005;100:590–3 0003-2999/05
MethodsSix new size 4 ProSeal™ LMAs and 6 new size 4Classic™ LMAs were tested. Each LMA was ran-domly assigned a number that was marked on theproximal connector with an indelible pen. Each LMAunderwent a simulated clinical use cycle until it failedthe manufacturer’s pre-use check tests (4,6). The sim-ulated clinical use cycle comprised the followingsteps: i) inflating the cuff to the maximum recom-mended volume for 1 h in vitro; ii) immersion in anenzymatic solution for 3 min; iii) washing the externalsurfaces with a cloth; iv) washing the airway and/ordrain tube with an appropriate sized soft bristledbrush; v) placing the LMA in an automatic washer for14 min, which included warm washing at 55°C with adisinfectant and hot washing at 85°C; vi) placing in adryer for 30 min at 75°C; vii) autoclaving at 134°C for4 min at 206 kPa. Before each of the last three steps, thecuff was fully evacuated using a syringe.
Before the first simulated clinical use cycle and ev-ery 10 simulated clinical use cycles thereafter, the cuffwas fully deflated and then reinflated with 40 mL airfrom a calibrated plastic syringe and intracuff pres-sure was measured both immediately and 3 h later.The initial intracuff pressure was taken to be an inversemeasure of the elastance or resistance to deformation,and the pressure change was taken as a measure of thepermeability. Intracuff pressure measurements weremade by attaching the pilot balloon to a pressure trans-ducer via a three-way tap. The reason for failing thepre-use test was documented. All tests were performedat in room air at 20°C. A maximum of three simulatedclinical use cycles was conducted each day.
The residual volume was calculated using a gasdilution technique. Ten size 4 Classic™ LMAs and 10size 4 ProSeal™ LMAs matched for number of useswere assessed. These LMA devices were not used inthe simulated clinical use tests. All were in clinical use,had passed the pre-use check tests and had no macroor micro leaks, as assessed by spontaneous deflationcharacteristics. Each device was flushed with oxygen,placed in the deflation tool, and then evacuated to apressure of �25 mm Hg. The cuff was then immedi-ately inflated with 40 mL air and the oxygen concen-tration measured using a Datex AS/3 gas analyzer(Datex-Ohmeda, Helsinki, Finland) that had been ze-roed and calibrated. This was repeated on 5 occasionsfor each device and the average taken.
Sample size for the life-span study was based on aprevious study about the Classic™ LMA by Figueredo(2) and our own audit data about the ProSeal™ LMA.The distribution of data was determined usingKolmogorov-Smirnov analysis (10). Statistical analysiswas with paired and nonpaired Student’s t-tests (nor-mally distributed data), one-way analysis of variancewith post hoc Bonferroni correction and Friedman’s
two-way analysis of variance (non-normally distrib-uted data). The relationship between number of usesand other variables was determined using Pearson’sproduct-moment correlation coefficient (PPCC). Un-less otherwise stated data are presented as mean � sd(range). Significance was taken as P � 0.05.
ResultsThe mean� sd (range) longevity for the ProSeal™LMA and Classic™ LMA was 82 � 23 (45–109) usesand 133 � 35 (76–176) uses, respectively. TheProSeal™ LMA had a shorter life-span than the Clas-sic™ LMA (P � 0.01). All the ProSeal™ LMAs failedthe pre-use tests because of tears in the cuff. TwoClassic™ LMAs failed because of tears in the pilotballoon, three failed as the result of a defect in the pilotballoon valve, and one failed because of a tear in thecuff. Data for the initial intracuff pressure (inverselyrelated to elastance) and the intracuff pressure change(related to permeability) are presented in Table 1. Theelastance and permeability was always greater for theClassic™ LMA (both P � 0.0001). For the ProSeal™LMA, there was no change in elastance or permeabil-ity with use. For the Classic™ LMA, there was adecrease in elastance (PPCC � �0.64, P � 0.0001) andan increase in permeability (PPCC � 0.603, P � 0.0001)with use. For the Classic™ LMA, there was a signifi-cant decrease in the elastance (P � 0.01) and a signif-icant increase in the permeability (P � 0.004) between80–90 uses. The mean (range) number of uses of theProSeal™ LMA and Classic™ LMA for residual vol-ume testing was 18 (0–36) and 20 (0–39) uses, respec-tively. The residual cuff volume was higher for theProSeal™ LMA than and Classic™ LMA (2.6 � 1.3 mLversus 1.5 � 0.9, P � 0.04).
DiscussionThe life-span of the ProSeal™ LMA is shorter than theClassic™ LMA. This is probably because the ProSeal™LMA cuff has a more complex shape with more foldsand seams; in any inflatable structure, these are theareas that are most likely to fail. In addition, the cuffwall may be subject to greater stresses during auto-claving because of the larger residual volume; how-ever, to some extent this will be mitigated by thelarger cuff. A removable plug has recently been addedto the pilot balloon of the ProSeal™ LMA (Red Plug™)to prevent damage from any residual air or fluid.After completion of the current study, we tested 3ProSeal™ LMAs fitted with the Red Plug™ and foundthat the life-spans were roughly similar to those with-out, at 69, 87, and 102 simulated use cycles.
There was no change in the elastance and permeabilityof the ProSeal™ LMA, but there was a decrease in elas-tance and an increase in permeability of the Classic™
ANESTH ANALG DONELEY ET AL. 5912005;100:590–3 LIFESPAN OF LMAS
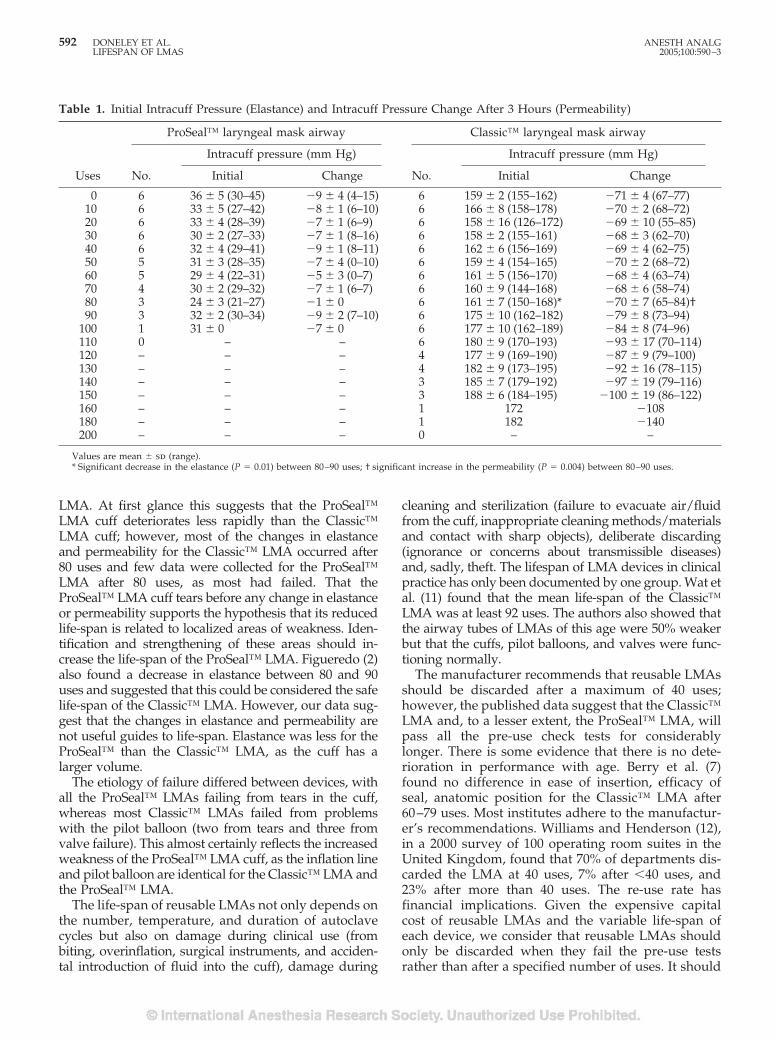
LMA. At first glance this suggests that the ProSeal™LMA cuff deteriorates less rapidly than the Classic™LMA cuff; however, most of the changes in elastanceand permeability for the Classic™ LMA occurred after80 uses and few data were collected for the ProSeal™LMA after 80 uses, as most had failed. That theProSeal™ LMA cuff tears before any change in elastanceor permeability supports the hypothesis that its reducedlife-span is related to localized areas of weakness. Iden-tification and strengthening of these areas should in-crease the life-span of the ProSeal™ LMA. Figueredo (2)also found a decrease in elastance between 80 and 90uses and suggested that this could be considered the safelife-span of the Classic™ LMA. However, our data sug-gest that the changes in elastance and permeability arenot useful guides to life-span. Elastance was less for theProSeal™ than the Classic™ LMA, as the cuff has alarger volume.
The etiology of failure differed between devices, withall the ProSeal™ LMAs failing from tears in the cuff,whereas most Classic™ LMAs failed from problemswith the pilot balloon (two from tears and three fromvalve failure). This almost certainly reflects the increasedweakness of the ProSeal™ LMA cuff, as the inflation lineand pilot balloon are identical for the Classic™ LMA andthe ProSeal™ LMA.
The life-span of reusable LMAs not only depends onthe number, temperature, and duration of autoclavecycles but also on damage during clinical use (frombiting, overinflation, surgical instruments, and acciden-tal introduction of fluid into the cuff), damage during
cleaning and sterilization (failure to evacuate air/fluidfrom the cuff, inappropriate cleaning methods/materialsand contact with sharp objects), deliberate discarding(ignorance or concerns about transmissible diseases)and, sadly, theft. The lifespan of LMA devices in clinicalpractice has only been documented by one group. Wat etal. (11) found that the mean life-span of the Classic™LMA was at least 92 uses. The authors also showed thatthe airway tubes of LMAs of this age were 50% weakerbut that the cuffs, pilot balloons, and valves were func-tioning normally.
The manufacturer recommends that reusable LMAsshould be discarded after a maximum of 40 uses;however, the published data suggest that the Classic™LMA and, to a lesser extent, the ProSeal™ LMA, willpass all the pre-use check tests for considerablylonger. There is some evidence that there is no dete-rioration in performance with age. Berry et al. (7)found no difference in ease of insertion, efficacy ofseal, anatomic position for the Classic™ LMA after60–79 uses. Most institutes adhere to the manufactur-er’s recommendations. Williams and Henderson (12),in a 2000 survey of 100 operating room suites in theUnited Kingdom, found that 70% of departments dis-carded the LMA at 40 uses, 7% after �40 uses, and23% after more than 40 uses. The re-use rate hasfinancial implications. Given the expensive capitalcost of reusable LMAs and the variable life-span ofeach device, we consider that reusable LMAs shouldonly be discarded when they fail the pre-use testsrather than after a specified number of uses. It should
Table 1. Initial Intracuff Pressure (Elastance) and Intracuff Pressure Change After 3 Hours (Permeability)
Uses
ProSeal™ laryngeal mask airway Classic™ laryngeal mask airway
No.
Intracuff pressure (mm Hg)
No.
Intracuff pressure (mm Hg)
Initial Change Initial Change
0 6 36 � 5 (30–45) �9 � 4 (4–15) 6 159 � 2 (155–162) �71 � 4 (67–77)10 6 33 � 5 (27–42) �8 � 1 (6–10) 6 166 � 8 (158–178) �70 � 2 (68–72)20 6 33 � 4 (28–39) �7 � 1 (6–9) 6 158 � 16 (126–172) �69 � 10 (55–85)30 6 30 � 2 (27–33) �7 � 1 (8–16) 6 158 � 2 (155–161) �68 � 3 (62–70)40 6 32 � 4 (29–41) �9 � 1 (8–11) 6 162 � 6 (156–169) �69 � 4 (62–75)50 5 31 � 3 (28–35) �7 � 4 (0–10) 6 159 � 4 (154–165) �70 � 2 (68–72)60 5 29 � 4 (22–31) �5 � 3 (0–7) 6 161 � 5 (156–170) �68 � 4 (63–74)70 4 30 � 2 (29–32) �7 � 1 (6–7) 6 160 � 9 (144–168) �68 � 6 (58–74)80 3 24 � 3 (21–27) �1 � 0 6 161 � 7 (150–168)* �70 � 7 (65–84)†90 3 32 � 2 (30–34) �9 � 2 (7–10) 6 175 � 10 (162–182) �79 � 8 (73–94)
100 1 31 � 0 �7 � 0 6 177 � 10 (162–189) �84 � 8 (74–96)110 0 – – 6 180 � 9 (170–193) �93 � 17 (70–114)120 – – – 4 177 � 9 (169–190) �87 � 9 (79–100)130 – – – 4 182 � 9 (173–195) �92 � 16 (78–115)140 – – – 3 185 � 7 (179–192) �97 � 19 (79–116)150 – – – 3 188 � 6 (184–195) �100 � 19 (86–122)160 – – – 1 172 �108180 – – – 1 182 �140200 – – – 0 – –
Values are mean � sd (range).* Significant decrease in the elastance (P � 0.01) between 80–90 uses; † significant increase in the permeability (P � 0.004) between 80–90 uses.
592 DONELEY ET AL. ANESTH ANALGLIFESPAN OF LMAS 2005;100:590–3
also be discarded if it has been exposed to nonap-proved chemicals or has been used in a patient withprion disease (13).
Our study has a number of limitations. First, ourfindings reflect the maximum life-span of reusableLMA devices, as our study was conducted in vitro andunder optimal conditions. Second, the frequency ofdamage might be different for the Classic™ andProSeal™ LMA in clinical practice; for example, thelarger cuff of the ProSeal™ LMA is more likely to getdamaged by teeth than the Classic™ LMA. Third, ourfindings may be less applicable in situations wheredifferent cleaning and sterilization procedures are fol-lowed. Finally, our data may be less applicable toProSeal™ LMAs that have been fitted with the RedPlug™; however, our additional work suggests thatthis is not the case.
We conclude that the lifespan of the ProSeal™ LMAis shorter than the Classic™ LMA, but both exceed themanufacturer’s recommendations of 40 uses. We rec-ommend that reusable LMA devices be discardedwhen they fail the pre-use check tests rather than aftera specific number of uses.
References1. Brimacombe J. Laryngeal mask anesthesia: principles and prac-
tice, 2nd ed. London: WB Saunders, 2004.
2. Figueredo E. Changes in the intracuff pressure of the laryngealmask airway caused by repeated use. Can J Anaesth 2001;48:409–12.
3. Preis C, Hartmann T, Preic I, et al. Autoclaving impairs theconnector-tube bond of the laryngeal mask airway but not itsairtightness. Br J Anaesth 1998;81:795–6.
4. Verghese C. LMA-Classic™, LMA-Flexible™ LMA-Unique™.Instruction Manual. Henley-on-Thames: The Laryngeal MaskCompany Ltd., 1999.
5. Verghese C. LMA-Fastrach™ Instruction Manual. Henley-on-Thames: Laryngeal Mask Company Ltd., 2000.
6. LMA ProSeal™ Instruction manual, 1st ed. San Diego: LMANorth America Inc., 2000.
7. Berry AM, Brimacombe J, McManus KF, Goldblatt M. An eval-uation of the factors influencing selection of the optimal size oflaryngeal mask airway in normal adults. Anaesthesia 1998;53:565–70.
8. Brain AIJ, Verghese C, Strube PJ. The LMA “ProSeal”: a laryn-geal mask with an oesophageal vent. Br J Anaesth 2000;84:650–4.
9. Brimacombe J, Keller C. The ProSeal laryngeal mask airway. arandomized, crossover study with the standard laryngeal maskairway in paralyzed, anesthetized patients. Anesthesiology2000;93:104–9.
10. Gaddis GM, Gaddis ML. Introduction to biostatistics. Part 5:statistical inference techniques for hypothesis testing with non-parametric data. Ann Emerg Med 1990;19:1054–9.
11. Wat LI, Brimacombe JR, White PF, et al. Use of the laryngealmask airway in the ambulatory setting. J Clin Anesth 1998;10:386–8.
12. Williams S, Henderson K. A survey into the number of timeslaryngeal masks are used. Anaesthesia 2000;55:700–1.
13. Clery G, Brimacombe J, Stone T, et al. Routine cleaning andautoclaving does not remove protein deposits from re-usablelaryngeal mask devices. Anesth Analg 2003;97:1189–91.
ANESTH ANALG DONELEY ET AL. 5932005;100:590–3 LIFESPAN OF LMAS
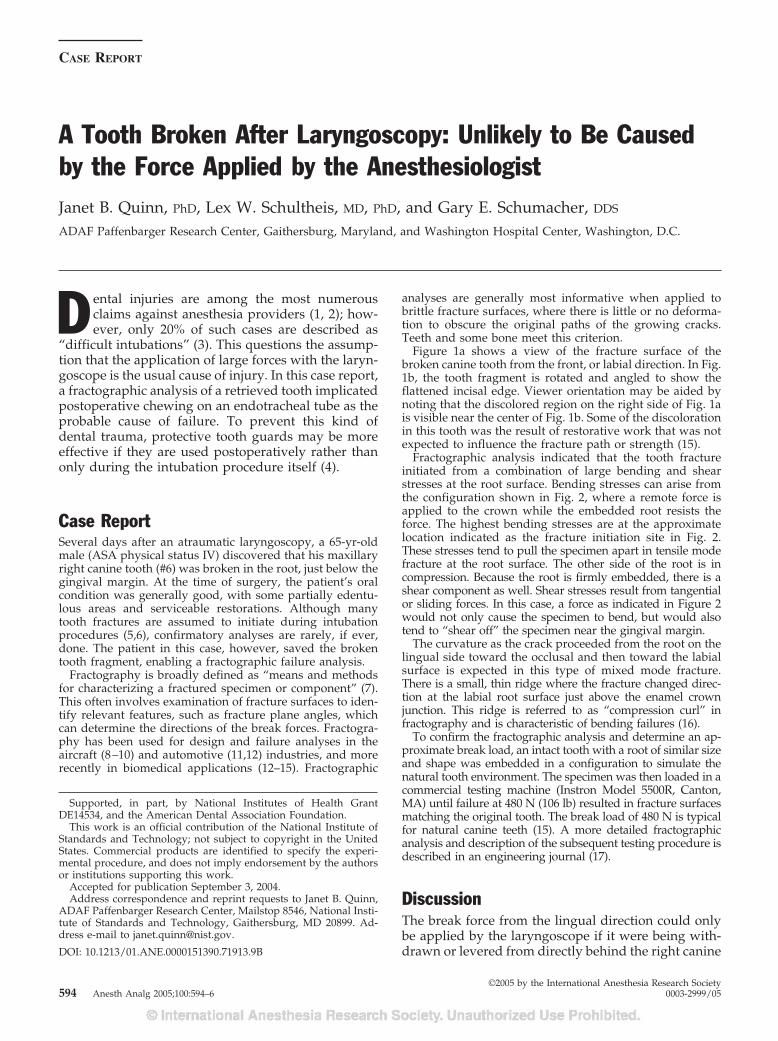
CASE REPORT
A Tooth Broken After Laryngoscopy: Unlikely to Be Causedby the Force Applied by the AnesthesiologistJanet B. Quinn, PhD, Lex W. Schultheis, MD, PhD, and Gary E. Schumacher, DDS
ADAF Paffenbarger Research Center, Gaithersburg, Maryland, and Washington Hospital Center, Washington, D.C.
D ental injuries are among the most numerousclaims against anesthesia providers (1, 2); how-ever, only 20% of such cases are described as
“difficult intubations” (3). This questions the assump-tion that the application of large forces with the laryn-goscope is the usual cause of injury. In this case report,a fractographic analysis of a retrieved tooth implicatedpostoperative chewing on an endotracheal tube as theprobable cause of failure. To prevent this kind ofdental trauma, protective tooth guards may be moreeffective if they are used postoperatively rather thanonly during the intubation procedure itself (4).
Case ReportSeveral days after an atraumatic laryngoscopy, a 65-yr-oldmale (ASA physical status IV) discovered that his maxillaryright canine tooth (#6) was broken in the root, just below thegingival margin. At the time of surgery, the patient’s oralcondition was generally good, with some partially edentu-lous areas and serviceable restorations. Although manytooth fractures are assumed to initiate during intubationprocedures (5,6), confirmatory analyses are rarely, if ever,done. The patient in this case, however, saved the brokentooth fragment, enabling a fractographic failure analysis.
Fractography is broadly defined as “means and methodsfor characterizing a fractured specimen or component” (7).This often involves examination of fracture surfaces to iden-tify relevant features, such as fracture plane angles, whichcan determine the directions of the break forces. Fractogra-phy has been used for design and failure analyses in theaircraft (8–10) and automotive (11,12) industries, and morerecently in biomedical applications (12–15). Fractographic
analyses are generally most informative when applied tobrittle fracture surfaces, where there is little or no deforma-tion to obscure the original paths of the growing cracks.Teeth and some bone meet this criterion.
Figure 1a shows a view of the fracture surface of thebroken canine tooth from the front, or labial direction. In Fig.1b, the tooth fragment is rotated and angled to show theflattened incisal edge. Viewer orientation may be aided bynoting that the discolored region on the right side of Fig. 1ais visible near the center of Fig. 1b. Some of the discolorationin this tooth was the result of restorative work that was notexpected to influence the fracture path or strength (15).
Fractographic analysis indicated that the tooth fractureinitiated from a combination of large bending and shearstresses at the root surface. Bending stresses can arise fromthe configuration shown in Fig. 2, where a remote force isapplied to the crown while the embedded root resists theforce. The highest bending stresses are at the approximatelocation indicated as the fracture initiation site in Fig. 2.These stresses tend to pull the specimen apart in tensile modefracture at the root surface. The other side of the root is incompression. Because the root is firmly embedded, there is ashear component as well. Shear stresses result from tangentialor sliding forces. In this case, a force as indicated in Figure 2would not only cause the specimen to bend, but would alsotend to “shear off” the specimen near the gingival margin.
The curvature as the crack proceeded from the root on thelingual side toward the occlusal and then toward the labialsurface is expected in this type of mixed mode fracture.There is a small, thin ridge where the fracture changed direc-tion at the labial root surface just above the enamel crownjunction. This ridge is referred to as “compression curl” infractography and is characteristic of bending failures (16).
To confirm the fractographic analysis and determine an ap-proximate break load, an intact tooth with a root of similar sizeand shape was embedded in a configuration to simulate thenatural tooth environment. The specimen was then loaded in acommercial testing machine (Instron Model 5500R, Canton,MA) until failure at 480 N (106 lb) resulted in fracture surfacesmatching the original tooth. The break load of 480 N is typicalfor natural canine teeth (15). A more detailed fractographicanalysis and description of the subsequent testing procedure isdescribed in an engineering journal (17).
DiscussionThe break force from the lingual direction could onlybe applied by the laryngoscope if it were being with-drawn or levered from directly behind the right canine
Supported, in part, by National Institutes of Health GrantDE14534, and the American Dental Association Foundation.
This work is an official contribution of the National Institute ofStandards and Technology; not subject to copyright in the UnitedStates. Commercial products are identified to specify the experi-mental procedure, and does not imply endorsement by the authorsor institutions supporting this work.
Accepted for publication September 3, 2004.Address correspondence and reprint requests to Janet B. Quinn,
ADAF Paffenbarger Research Center, Mailstop 8546, National Insti-tute of Standards and Technology, Gaithersburg, MD 20899. Ad-dress e-mail to [email protected].
DOI: 10.1213/01.ANE.0000151390.71913.9B
©2005 by the International Anesthesia Research Society594 Anesth Analg 2005;100:594–6 0003-2999/05
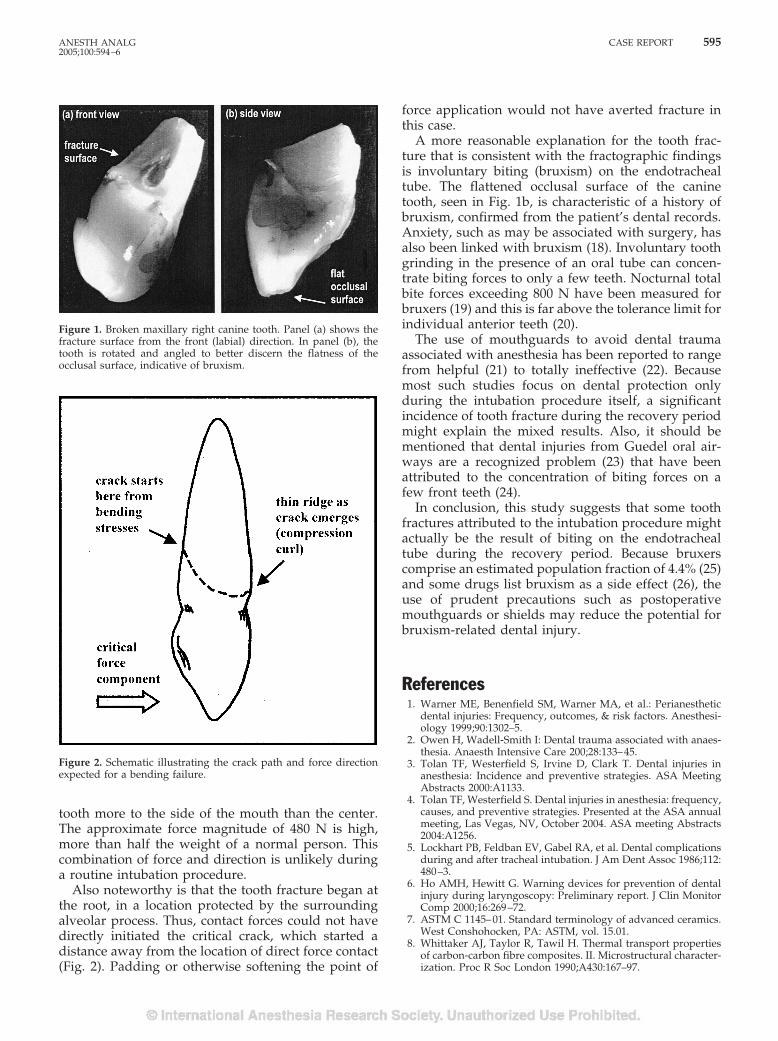
tooth more to the side of the mouth than the center.The approximate force magnitude of 480 N is high,more than half the weight of a normal person. Thiscombination of force and direction is unlikely duringa routine intubation procedure.
Also noteworthy is that the tooth fracture began atthe root, in a location protected by the surroundingalveolar process. Thus, contact forces could not havedirectly initiated the critical crack, which started adistance away from the location of direct force contact(Fig. 2). Padding or otherwise softening the point of
force application would not have averted fracture inthis case.
A more reasonable explanation for the tooth frac-ture that is consistent with the fractographic findingsis involuntary biting (bruxism) on the endotrachealtube. The flattened occlusal surface of the caninetooth, seen in Fig. 1b, is characteristic of a history ofbruxism, confirmed from the patient’s dental records.Anxiety, such as may be associated with surgery, hasalso been linked with bruxism (18). Involuntary toothgrinding in the presence of an oral tube can concen-trate biting forces to only a few teeth. Nocturnal totalbite forces exceeding 800 N have been measured forbruxers (19) and this is far above the tolerance limit forindividual anterior teeth (20).
The use of mouthguards to avoid dental traumaassociated with anesthesia has been reported to rangefrom helpful (21) to totally ineffective (22). Becausemost such studies focus on dental protection onlyduring the intubation procedure itself, a significantincidence of tooth fracture during the recovery periodmight explain the mixed results. Also, it should bementioned that dental injuries from Guedel oral air-ways are a recognized problem (23) that have beenattributed to the concentration of biting forces on afew front teeth (24).
In conclusion, this study suggests that some toothfractures attributed to the intubation procedure mightactually be the result of biting on the endotrachealtube during the recovery period. Because bruxerscomprise an estimated population fraction of 4.4% (25)and some drugs list bruxism as a side effect (26), theuse of prudent precautions such as postoperativemouthguards or shields may reduce the potential forbruxism-related dental injury.
References1. Warner ME, Benenfield SM, Warner MA, et al.: Perianesthetic
dental injuries: Frequency, outcomes, & risk factors. Anesthesi-ology 1999;90:1302–5.
2. Owen H, Wadell-Smith I: Dental trauma associated with anaes-thesia. Anaesth Intensive Care 200;28:133–45.
3. Tolan TF, Westerfield S, Irvine D, Clark T. Dental injuries inanesthesia: Incidence and preventive strategies. ASA MeetingAbstracts 2000:A1133.
4. Tolan TF, Westerfield S. Dental injuries in anesthesia: frequency,causes, and preventive strategies. Presented at the ASA annualmeeting, Las Vegas, NV, October 2004. ASA meeting Abstracts2004:A1256.
5. Lockhart PB, Feldban EV, Gabel RA, et al. Dental complicationsduring and after tracheal intubation. J Am Dent Assoc 1986;112:480–3.
6. Ho AMH, Hewitt G. Warning devices for prevention of dentalinjury during laryngoscopy: Preliminary report. J Clin MonitorComp 2000;16:269–72.
7. ASTM C 1145–01. Standard terminology of advanced ceramics.West Conshohocken, PA: ASTM, vol. 15.01.
8. Whittaker AJ, Taylor R, Tawil H. Thermal transport propertiesof carbon-carbon fibre composites. II. Microstructural character-ization. Proc R Soc London 1990;A430:167–97.
Figure 1. Broken maxillary right canine tooth. Panel (a) shows thefracture surface from the front (labial) direction. In panel (b), thetooth is rotated and angled to better discern the flatness of theocclusal surface, indicative of bruxism.
Figure 2. Schematic illustrating the crack path and force directionexpected for a bending failure.
ANESTH ANALG CASE REPORT 5952005;100:594–6
9. Fuller ER, Freiman SW Jr, Quinn JB, et al. Fracture mechanicsapproach to the design of glass aircraft windows: A case study.Window and Dome Technologies and Materials IV, SPIE 1994;2286:419–30.
10. Peel CJ, Jones A. Analysis of failures in aircraft structures. MetMater 1990;6:496–502.
11. Danzer R, Hangl M, Paar R. How to design with brittle materialsagainst edge flaking. Sixth International Symposium on Ce-ramic Materials for Engines. Tokyo: Japan Fine Ceramics Asso-ciation, 1997:658–62.
12. Frechette V. Failure analysis of brittle materials. In: Advances inceramics. Westerville, OH: American Ceramics Society, 1990:28.
13. Morrell R, Byrne WP, Murray M. Fractography of ceramic fem-oral heads. Ceramic Transactions 2001;122:253–66.
14. Oberholzer TG, Rossouw RJ. Unusual fracture of a mandibularsecond premolar: A case report. Quintessence Int 2001;32:299–302.
15. Ho HHW, Chu FCS, Stokes AN. Fracture behavior of humanmandibular incisors following endodontic treatment and porce-lain veneer restoration. Int J Prosthod 2001;14:260–4.
16. ASTM C 1322–02. Standard practice for fractography and char-acterization of fracture origins in advanced ceramics. West Con-shohocken, PA: ASTM, vol. 15.01.
17. Quinn JB, Schultheis LW. Failure analysis of a broken tooth.JFAP 2004;4:41–6.
18. Pingitore G, Chrobak V, Petrie J. The social and psychologicalfactors of bruxism. J Prosth Dent 1991;65:443–6.
19. Nishigawa K, Bando E, Nakano M: Quantitative study of biteforce during sleep associated bruxism. J Oral Rehab 2001;28:485–91.
20. Misch C. Implant dentistry. St. Louis: Mosby, 1999.21. Skeie A, Schwartz O. Traumatic injuries of the teeth in connec-
tion with general anaesthesia and the effect of use of mouth-guards. Endod Dent Traumatol 1999;15:33–6.
22. Nakahashi K, Yamamoto K, Tsuzuki M, et al. Effect of teethprotector on dental injuries during general anesthesia [in Japa-nese]. Masui 2003;52:26–31.
23. Vogel C. Dental injuries during general anaesthesia and theirforensic consequences. Anaesthesist 1979;28:347–9.
24. Star EG. Damage of teeth by oral airways [in German]. PraktAnaesth 1976;11:347–8.
25. Ohayon MM, Li KK, Guilleminault C. Risk factors for sleepbruxism in the general population. Chest 2001;119:53–61.
26. Romanelli F, Adler DA, Bungay KM. Possible paroxetine-induced bruxism. Ann Pharmacother 1996;30:1246–8.
596 CASE REPORT ANESTH ANALG2005;100:594–6
Letters to the Editor
Block of the Posterior Femoral CutaneousNerveTo the Editor:
The article by Barbero et al. (1) provided interesting data complement-ing our original description of an anterior approach to the sciatic nerve(2). However, their interpretation of our previously published datadeserves the following comments: 1) the authors’ representation of ourpublished landmarks was incorrect. Our landmarks are based on theuse of the inferior border of the anterosuperior iliac spine (AIS) and thesuperior angle of the pubic symphysis tubercle. These are the same asthose described by the authors. Therefore the AIS-TS lines presented inFigure 1 in their article should be changed. 2) The posterior femoralcutaneous nerve (PFCN) is a branch of the sacral plexus, not a branchof the sciatic nerve. More importantly, it is a sensory nerve (3). Con-trary to the authors’ belief, the PFCN does not innervate the glutealmuscle! Therefore, the PFCN block while performing a sciatic nerveblock should be considered a consequence of the local anesthetic dif-fusion toward the PFCN and does not reflect the intensity of the sciaticblock. 3) In the Introduction of their article, the authors indicate thatwith our technique the block of the PFCN was inadequate (?) in 45% ofpatients, while in the Discussion they refer to a 50% success rate! Doesthis 5% difference refer to the difference between inadequacy andfailure? 4) In our original description (2), we did not report on theextension of this block to the PFCN. After our original publication, atechnical description was indeed published (4). In this technical paper,we reported a complete block of PFCN in 9 of 16 patients, and a partialblock of PFCN in 6 of 16 (37%). The failure to block the PFCN in thestudy by Barbero et al. (1) and our studies led to the need for supple-mental anesthesia. As indicated in our technical description (4), there isno doubt that the block of the PFCN is important for surgery in theposterior aspect of the thigh, but evidence supporting the need for acomplete PFCN block for surgery at the knee and below without andwithout a tourniquet remains to be established. Thus, in 60 patientsundergoing foot surgery with the use of a tourniquet under a femoraland a posterior popliteal block, a supplemental dose of sufentanil (5–10�g) was required only in one patient (5).
Further studies are required to determine the conditions in whichthe block of PFCN is required in the presence of a tourniquet forsurgery at the knee or below.Jacques E. Chelly, MD, PhD, MBAUPMC Shadyside-Presbyterian HospitalPittsburgh, [email protected]
Laurent Delaunay, MDClinique GeneraleAnnecy, France
References1. Barbero C, Fuzier, R, Samii K. Anterior approach to the sciatic nerve block: adaptation
to the patient’s height. Anesth Analg 2004;98:1785–8.2. Chelly JE, Delaunay L. A new anterior approach to the sciatic nerve block. Anesthe-
siology 1999;91:1655–60.3. McMinn RMH, Hutchings RT. Color atlas of human anatomy: right gluteal region—
branches of the sacral plexus. Weert, The Netherlands: Smeets-Weert, 1977:293.4. Delaunay L, Chelly JE. Nouvelle approche anterieure du nerf sciatique. Ann Fr Anesth
Reanim 2000;19:121–2.5. Singelyn FJ, Aye F, Gouverneur JM. Continuous popliteal sciatic nerve block: an
original technique to provide postoperative analgesia after foot surgery. Anesth Analg1997;84:383–6.
DOI: 10.1213/01.ANE.0000143460.12017.40
In Response:
We would like to thank Drs. Chelly and Delaunay for their com-ments. There is in fact an error in the abstract of our paper in
describing the anatomic landmarks: the inguinal line described isidentical to that of Chelly and Delaunay (1). The correct descriptionis developed in the Methods, locating the medial limit of the ingui-nal line on the superior border of the pubic symphysis, and thepuncture site is in a more medial position than that described byChelly and Delaunay (1).
Studies will perhaps soon demonstrate that this nerve is notnecessary to tolerate a thigh tourniquet but, as described in Figure3 in our article, posterior femoral cutaneous nerve (PFCN) anesthe-sia is necessary for surgery of the thigh, the knee, and the superiorposterior part of the leg.
The PFCN is effectively a purely sensitive nerve, but it is oftenjoined to the inferior gluteal nerve (60% of cases) from the sacralroots to the gluteal area (2). When stimulating the PFCN, a motorresponse can therefore be found by stimulating the associatedinferior gluteal nerve. Setting aside the trivial slip that allowed a5% difference to appear in the success rate of a study on 16patients, our technique of including the patient’s height as avariable to determine the landmarks seems to be useful to get acorrect anesthesia of the PFCN (92% success rate for 53 patientsstudied).
Carole Barbero, MDRegis Fuzier, MDKamran Samii, MDService d’Anesthesie ReanimationChu Rangueil, Toulouse, [email protected]
References1. Delaunay L, Chelly JE. Nouvelle approche anterieure du nerf sciatique. Ann Fr Anest
Reanim 2000;19:121–2.2. Netter FH. Atlas of human anatomy. 3rd ed. Teterboro, NJ: 2002.
Anaphylaxis Is Not a Dose/Response EffectTo the Editor:
The case report (1) on latex anaphylaxis illustrates well the problemof identifying the trigger agent when there are two or more coinci-dental potential triggers such as, in this report, the administration ofan antibiotic and the beginning of surgery.
However, it is important to understand that the anaphylacticreaction is the result of a specific IgE immunoglobulin binding intoa receptor site and triggering a cascade. This releases many activeagents, including tyrosine kinases, histamine, tryptases, proteogly-cans, and leukotrienes (2,3) This process consumes both the IgE andthe active agents, which is why at least 4 weeks delay is recom-mended before the provocative testing of suspected triggeringagents (4).
It was therefore disturbing to read that the authors consideredthat it was “important to convert to a latex-free environment duringthe resuscitation.” This is illogical, as the initial event has almostcertainly depleted both the triggering antibody and the vasoactiveagents. Any attempt to guess and remove the possible triggers isfutile and may interfere with the appropriate treatment.
If a major anaphylaxis occurs, prompt active resuscitation is re-quired. Removing the possible triggers is unnecessary, and evengiving more of the triggering agent is not contraindicated, as this isnot a phenomenon with a therapeutic dose/response curve, and theassociated depletion of the IgE and mast cells means that there willnot be any progression of the anaphylactic reaction if additionalagent is given. This is a crucial difference from an adverse responsewith a dose relationship.
©2005 by the International Anesthesia Research Society Anesth Analg 2005;100:597–605 597
W. John Russell, MDDepartment of Anaesthesia and Intensive CareRoyal Adelaide HospitalNorth Terrace, AdelaideSouth Australia, [email protected]
References1. Hebl JR, Hall BA, Sprung J. Prolonged cardiovascular collapse due to unrecognized
latex anaphylaxis. Anesth Analg 2004;98:1124–6.2. Hefner DL, Castells MC. Anaphylaxis during the perioperative period. Anesth Analg
2003;97:1381–95.3. Kay AB. Allergy and allergic diseases. New Engl J Med 2001;344:30–7.4. Fisher MM. Intradermal testing after anaphylactoid reactions to anaesthetic drugs:
practical aspects of performance and interpretation. Anaesth Intensive Care 1984;12:115–20.
DOI: 10.1213/01.ANE.0000143462.92889.6D
In Response:
We would like to thank Dr. Russell for his interest in our recentcase report addressing unrecognized latex anaphylaxis in a pa-tient undergoing revision of total elbow arthroplasty (1). In hisLetter to the Editor, Dr. Russell accurately discussed the physi-ologic foundations of anaphylaxis. However, we respectfullydisagree with his contention of not having to remove and/ordiscontinue the suspected triggering agent(s) as a component ofthe resuscitative efforts. Anaphylaxis is indeed an IgE-mediatedphenomenon based on mast cell degranulation and the release ofpotent vasoactive substances. However, one has to keep in mindthat these reactions are far from uniform and represent a ratherwide spectrum of pathology ranging from very mild to poten-tially lethal. In other words, despite the well-known fact that“anaphylaxis is not a dose-response effect,” there is some corre-lation between the severity of anaphylaxis and the magnitude ofantigen exposure—albeit not linear. There is also a strong corre-lation between serum tryptase levels and the reported severity ofanaphylaxis (2). This suggests that in some patients, a largeproportion of mast cells undergo activation and subsequent de-granulation, while in other patients they do not. Although it istrue that once a single mast cell has been activated by an allergen,it becomes desensitized for a period of 24 hours. However, theprompt removal of a triggering allergen would further diminishthe chance of activating those mast cells not yet sensitized (per-sonal communication, 2004, Lawrence B. Schwartz, MD, Rich-mond, VA). This is the physiologic basis—and current founda-tion of medical practice—to promptly discontinue all offendingmedication and/or agents believed to be triggering an anaphy-lactic reaction.
In brief, we strongly believe that most clinicians would agreethat removal of an offending allergen during an anaphylacticreaction is prudent medical practice. Most would not rely on thehypothesis that the entire body has been acutely desensitized—thus making removal of offending agents unnecessary. Unfortu-nately, there is no definitive evidence within the literature tosupport our recommendations. However, these recommenda-tions are considered “current medical practice” by many of ourallergy colleagues.
Juraj Sprung, MD, PhDDepartment of [email protected] Matesic, MDDivision of Allergic DiseasesDepartment of Internal MedicineJames R. Hebl, MDDepartment of AnesthesiologyMayo Clinic College of MedicineRochester, MN
References1. Hebl JR, Sprung J, Hall BH. Protracted cardiovascular collapse due to unrecognized
latex anaphylaxis. Anesth Analg 2004;98:1124–6.2. Haeberli G, Bronnimann M, Hunziker T, Muller U. Elevated basal serum tryptase and
hymenoptera venom allergy: relation to severity of sting reactions and to safety andefficacy of venom immunotherapy. Clin Exp Allergy 2003;33:1216–20.
Differential Effects of Morphine andCodeine on Pupil Size: Dosing IssuesTo the Editor:
The article by Knaggs et al. (1) showing that different opioids havedifferent profiles and durations of effect on the measure of pupilsize is interesting, in that tramadol had a delayed effect relative tomorphine and codeine. However, there appears to be a problem inthe design of the study. The authors found that morphine had amore marked effect on miosis than did codeine, and posited thatthis was due to codeine’s weaker affinity than morphine for mu-opioid receptors. However, equianalgesic doses of the two drugswere not tested, and this certainly could be an alternative explana-tion for the results obtained. The dose of morphine used in the studywas 0.125 mg/kg, and according to analgesic potency tables (2), anequianalgesic dose of codeine would be 1.63 mg/kg. Rather, acodeine dose of 1 mg/kg was tested. Therefore, it is not surprisingthat morphine generated a larger magnitude of effect. The authorsalso made a comment that there is limited data on the duration ofopioid-induced miosis in the literature. In fact, the Knaggs et al. (1)study is preceded by many studies, some conducted over 25 yearsago, examining the time course (up to 6 hours and longer) andmagnitude of miotic effects of different opioids, both in opioidabusers (3) and in volunteers with a limited history of recreationaldrug usage (4).James P. Zacny, PhDDepartment of Anesthesia and Critical CareUniversity of ChicagoChicago, [email protected]
References1. Knaggs RD, Crighton IM, Cobby TF, et al. The pupillary effects of intravenous
morphine, codeine and tramadol in volunteers. Anesth Analg 2004;99:108–12.2. Reisine T, Pasternak G. Opioid analgesics and antagonists. In: Hardman JG, Gilman
AG, Limbird LE, eds. Goodman and Gilman’s The Pharmacological Basis of Thera-peutics, 9th ed. New York: Pergamon Press, 1996:521–55.
3. Fraser HF, Van Horn GD, Martin WR, et al. Methods for evaluating addiction liability:(A) “Attitude” of opiate addicts toward opiate-like drugs. (B) a short-term “direct”addiction test. J Pharmacol Exp Ther 1961;33:371–87.
4. Zacny JP, Lichtor JL, Binstock W, et al. Subjective, behavioral and physiologicalresponses to intravenous meperidine in healthy volunteers. Psychopharmacology1993;111:306–14.
DOI: 10.1213/01.ANE.0000143464.56986.40
In Response:
We thank James Zacny for his letter pointing out a potential prob-lem in the design of the study. We agree that an equianalgesic doseof codeine was not tested. Rather, we decided to use doses of opioidthat approximated those actually used in clinical practice. Althoughthis may have underestimated the magnitude of effect of codeine onpupil size, our aim was to provide information that may be ofpractical value. We apologize that this was not made clear in ourpaper.
We are also grateful for the two additional references that add tothe relevant literature.Gregory J. Hobbs, MDRoger D. Knaggs, MDPain Management CentreQueen’s Medical CentreUniversity HospitalNottingham, United [email protected]
Radiologic-Assisted EndotrachealIntubationTo the Editor:
The recently published case report by Reier and Reier (1) describesan elegant use of radiologic-assisted tracheal intubation in a patientwith a compromised cervical spine. Successful tracheal intubation
598 LETTERS TO THE EDITOR ANESTH ANALG2005;100:597–605
was accomplished over a multipurpose angiographic catheterguided by fluoroscopic lateral views, which were mandated by thepatient’s cervical spine pathology requiring a motionless technique.
We would like to comment on the accuracy of radiologic imagingin distinguishing placement of a catheter (or a tube) in the tracheafrom placement in the esophagus. Studies indicate that unless thecatheter (or a tube) is located in a mainstem bronchus or in the loweresophagus (beyond the carina), radiologic imaging may not be afail-safe technique for confirmation of correct placement. (2–4) Be-cause a tube in the esophagus is often projected over the tracheal aircolumn on anteroposterior chest radiographs, the radiologic fea-tures of esophageal intubation are usually difficult to assess. (2–4) Astudy of chest radiographs of the tracheal tube position relative tonasogastric tube position provided evidence that the tube locationcould be identified correctly in 92% of cases with the patient in a25-degree right posterior oblique position with the head turned tothe right side. (3) Because the esophagus is located slightly to the leftand behind the trachea, this projection presents the relationship enface with respect to the radiologic beam, resulting in avoidance ofsuperimposition of the trachea over the esophagus. (3) Although alateral view could precisely reveal esophageal or tracheal place-ment, there are no such studies to document that this technique isfail-safe or even near fail-safe. Until such information is available,we should be cautious about the validity of radiologic-assistedtracheal intubation.
Xuan Au-Truong, MDM. Ramez Salem, MDDepartment of AnesthesiologyAdvocate Illinois Masonic Medical CenterChicago, [email protected]
References1. Reier CE, Reier AR. Radiologic-assisted endotracheal intubation. Anesth Analg 2004;
98:1496–8.2. Batra AK, Cohn MA. Uneventful prolonged misdiagnosis of esophageal intubation.
Crit Care Med 1983;11:763–4.3. Smith GM, Reed JC, Choplin RC. Radiologic detection of esophageal malpositioning of
endotracheal tubes. AJR Am J Roentgenol 1990;154:23–6.4. Salem MR, Baraka AS. Confirmation of tracheal intubation. In: Benumof JL, ed. Airway
management: principles and practice. St. Louis: CV Mosby, 1996;555–7.
DOI: 10.1213/01.ANE.0000143466.92655.E4
In Response:
We devised the technique of radiologic-assisted endotracheal intu-bation (RAI) (1) for the purpose stated in the article (1). We concurwith the statement by Drs. Xuan Au-Truong and M. Ramez Salem:“. . .describes an elegant use of radiologic assisted tracheal intuba-tion in a patient with a compromised cervical spine. Successfulintubation was accomplished over a multipurpose angiographiccatheter guided by fluoroscopic lateral views, which were man-dated by the patient’s cervical spine pathology requiring a motion-less technique.”
They later state, “Although a lateral view could precisely revealesophageal or tracheal placement, there are no such studies todocument that this technique is fail-safe or even near fail-safe.” Thiscomment suggests that they may have misconstrued the purpose ofRAI, which is a method of endotracheal tube placement in an awakepatient without significant motion of the cervical spine (or temporo-mandibular joint) or airway trauma associated with all other meth-ods of endotracheal intubation.
After placing the multipurpose angiographic catheter in the tra-chea, fluoroscopy is usually discontinued and the endotracheal tubeis advanced through the glottis into the trachea. Proper placement isconfirmed by 1) loss of phonation, 2) air exchange and capnogra-phy, and 3) bilateral auscultation, respectively. This sequence makesthe nuances of radiologic interpretation that they discussed irrele-vant. Also, both radiologic and fiberoptic confirmation of endotra-cheal tube placement are adjunctive and only accurate at the time ofobservation, since subsequent patient movement can result in eithermainstem intubation or extubation. Patient safety rests on funda-mentals of airway management, i.e., continuous capnography, pe-riodic auscultation, and observation of the depth of the tubeplacement.
Charles E. Reier, MDDepartment of AnesthesiologyThe Ohio State UniversityColumbus, OHJay County HospitalPortland, [email protected]
Allan R. Reier, MDDepartment of RadiologyMarion General HospitalMarion, OH
Reference1. Reier CE, Reier AR. Radiologic-assisted endotracheal intubation. Anesth Analg 2004;
98:1496–8.
Fiberoptic Wire-Guided Transoral andThrough the LMA Intubation TechniqueUsing Modified Gum Elastic BougieTo the Editor:
Transoral wire-guided endotracheal intubation is possible, how-ever, very few reports exist in the literature (1). Most reports (2,3)describe the use of guidewire in the pediatric population for man-aging difficult intubation, but under certain circumstances, theguidewire intubation could be lifesaving. For example, this tech-nique could offer an alternative mechanism in the event of loss ofairway control to promptly reintubate patients while switchingendotracheal tubes, during percutaneous bedside tracheostomy ordifficult fiberoptic bronchoscopy-guided intubation (4). A numberof solutions have been offered to solve the problem with flexiblebronchoscope (FOB)-guided switching of Laryngeal Mask Airway(LMA) with a conventional endotracheal tube (ETT), especially theproblem of removing the LMA/Fastrach LMA over the ETT (6).Most tubes are too short to allow for the removal of the LMAwithout risking extubation. The LMA also restricts the size and typeof the ETT that could be placed through it (5). Wire-guided switch-ing of ETT tubes for an LMA offers a promising alternative. Unfor-tunately, there is currently no reliable introducer guide availablethat can be used to accomplish wire-guided intubation. Here wedescribe a technique that is particularly useful in accomplishingFOB guided through the LMA (or LMA Fastrach) intubation that isinserted during the management of inadvertent difficult intubation.This technique not only overcomes all the problems cited but offersthe choice of switching the LMA for a wide variety of endotrachealtubes, including double lumen tubes of the appropriate size.
A 5F 60-cm Tracheal Tube Introducer (TTI) (SIMS Portex Inc.,Keene, NH) or its disposable version (Sun Med, Largo, FL) ismodified by perforating the distal tip of the introducer with a16-gauge needle and cutting away the proximal 1 cm (Fig. 1). A0.35-mm diameter stiff guidewire with softer distal tip that is at least140 cm is preferred. Depending on the clinical situation, the guide-wire could be placed into the trachea either through the suction portof FOB or through an endotracheal tube already in place. Next, theFOB is removed leaving the guidewire in the trachea. A repeat FOBto reconfirm the guidewire placement is recommended especiallywhen this technique is utilized during the course of switching anETT for a LMA. Next, a well-lubricated modified TTI is gentlythreaded over the guidewire into the trachea. While threading, oneshould ensure that the wire remains stationary while the TTI isbeing pushed distally into the trachea. The TTI is introduced to thedesired depth and the guidewire is removed. Following this, thedesired well-lubricated endotracheal tube is threaded over the TTIinto the trachea. Sometimes resistance is encountered while thread-ing the ETT over the TTI, a problem that is easily overcome byswitching to either a well-lubricated regular reinforced ETT or thespecialized reinforced ETT with modified tip (supplied with theFastrach LMA) (7). If this technique is used while switching an ETTfor a LMA, then after the TTI has been placed in the trachea, theLMA is gently removed leaving the TTI in place. The desired ETTtube is then threaded over the modified TTI and secured into
ANESTH ANALG LETTERS TO THE EDITOR 5992005;100:597–605
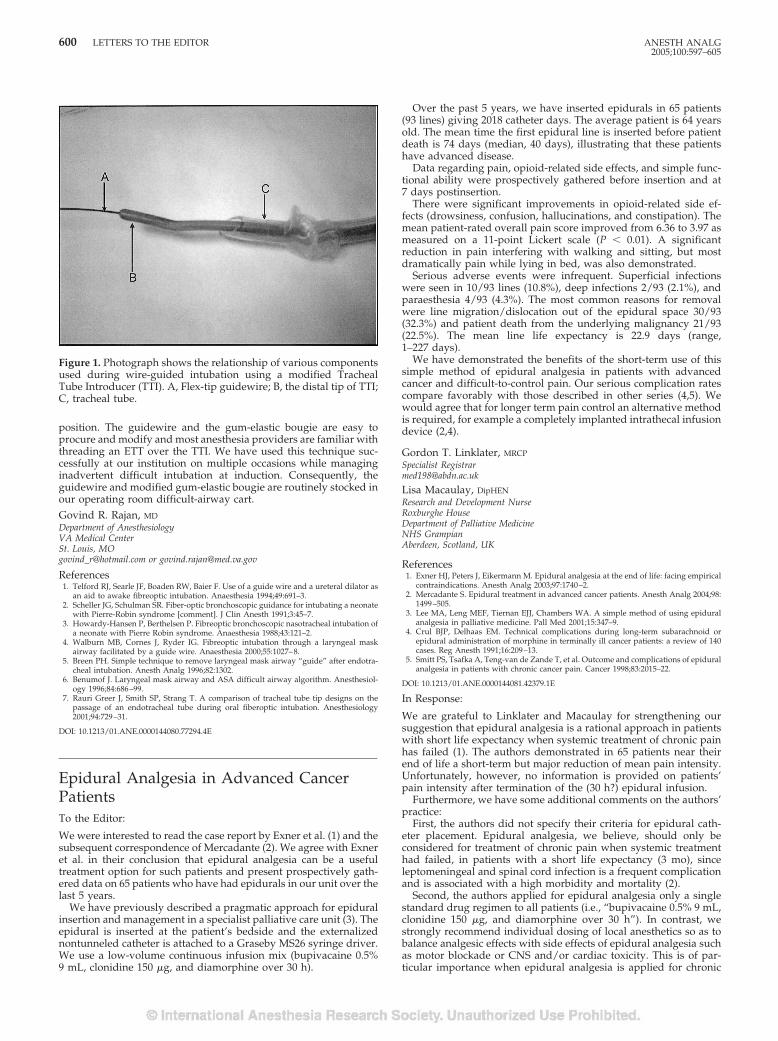
position. The guidewire and the gum-elastic bougie are easy toprocure and modify and most anesthesia providers are familiar withthreading an ETT over the TTI. We have used this technique suc-cessfully at our institution on multiple occasions while managinginadvertent difficult intubation at induction. Consequently, theguidewire and modified gum-elastic bougie are routinely stocked inour operating room difficult-airway cart.Govind R. Rajan, MDDepartment of AnesthesiologyVA Medical CenterSt. Louis, [email protected] or [email protected]
References1. Telford RJ, Searle JF, Boaden RW, Baier F. Use of a guide wire and a ureteral dilator as
an aid to awake fibreoptic intubation. Anaesthesia 1994;49:691–3.2. Scheller JG, Schulman SR. Fiber-optic bronchoscopic guidance for intubating a neonate
with Pierre-Robin syndrome [comment]. J Clin Anesth 1991;3:45–7.3. Howardy-Hansen P, Berthelsen P. Fibreoptic bronchoscopic nasotracheal intubation of
a neonate with Pierre Robin syndrome. Anaesthesia 1988;43:121–2.4. Walburn MB, Cornes J, Ryder IG. Fibreoptic intubation through a laryngeal mask
airway facilitated by a guide wire. Anaesthesia 2000;55:1027–8.5. Breen PH. Simple technique to remove laryngeal mask airway “guide” after endotra-
cheal intubation. Anesth Analg 1996;82:1302.6. Benumof J. Laryngeal mask airway and ASA difficult airway algorithm. Anesthesiol-
ogy 1996;84:686–99.7. Rauri Greer J, Smith SP, Strang T. A comparison of tracheal tube tip designs on the
passage of an endotracheal tube during oral fiberoptic intubation. Anesthesiology2001;94:729–31.
DOI: 10.1213/01.ANE.0000144080.77294.4E
Epidural Analgesia in Advanced CancerPatientsTo the Editor:
We were interested to read the case report by Exner et al. (1) and thesubsequent correspondence of Mercadante (2). We agree with Exneret al. in their conclusion that epidural analgesia can be a usefultreatment option for such patients and present prospectively gath-ered data on 65 patients who have had epidurals in our unit over thelast 5 years.
We have previously described a pragmatic approach for epiduralinsertion and management in a specialist palliative care unit (3). Theepidural is inserted at the patient’s bedside and the externalizednontunneled catheter is attached to a Graseby MS26 syringe driver.We use a low-volume continuous infusion mix (bupivacaine 0.5%9 mL, clonidine 150 �g, and diamorphine over 30 h).
Over the past 5 years, we have inserted epidurals in 65 patients(93 lines) giving 2018 catheter days. The average patient is 64 yearsold. The mean time the first epidural line is inserted before patientdeath is 74 days (median, 40 days), illustrating that these patientshave advanced disease.
Data regarding pain, opioid-related side effects, and simple func-tional ability were prospectively gathered before insertion and at7 days postinsertion.
There were significant improvements in opioid-related side ef-fects (drowsiness, confusion, hallucinations, and constipation). Themean patient-rated overall pain score improved from 6.36 to 3.97 asmeasured on a 11-point Lickert scale (P � 0.01). A significantreduction in pain interfering with walking and sitting, but mostdramatically pain while lying in bed, was also demonstrated.
Serious adverse events were infrequent. Superficial infectionswere seen in 10/93 lines (10.8%), deep infections 2/93 (2.1%), andparaesthesia 4/93 (4.3%). The most common reasons for removalwere line migration/dislocation out of the epidural space 30/93(32.3%) and patient death from the underlying malignancy 21/93(22.5%). The mean line life expectancy is 22.9 days (range,1–227 days).
We have demonstrated the benefits of the short-term use of thissimple method of epidural analgesia in patients with advancedcancer and difficult-to-control pain. Our serious complication ratescompare favorably with those described in other series (4,5). Wewould agree that for longer term pain control an alternative methodis required, for example a completely implanted intrathecal infusiondevice (2,4).
Gordon T. Linklater, MRCPSpecialist [email protected]
Lisa Macaulay, DipHENResearch and Development NurseRoxburghe HouseDepartment of Palliative MedicineNHS GrampianAberdeen, Scotland, UK
References1. Exner HJ, Peters J, Eikermann M. Epidural analgesia at the end of life: facing empirical
contraindications. Anesth Analg 2003;97:1740–2.2. Mercadante S. Epidural treatment in advanced cancer patients. Anesth Analg 2004;98:
1499–505.3. Lee MA, Leng MEF, Tiernan EJJ, Chambers WA. A simple method of using epidural
analgesia in palliative medicine. Pall Med 2001;15:347–9.4. Crul BJP, Delhaas EM. Technical complications during long-term subarachnoid or
epidural administration of morphine in terminally ill cancer patients: a review of 140cases. Reg Anesth 1991;16:209–13.
5. Smitt PS, Tsafka A, Teng-van de Zande T, et al. Outcome and complications of epiduralanalgesia in patients with chronic cancer pain. Cancer 1998;83:2015–22.
DOI: 10.1213/01.ANE.0000144081.42379.1E
In Response:
We are grateful to Linklater and Macaulay for strengthening oursuggestion that epidural analgesia is a rational approach in patientswith short life expectancy when systemic treatment of chronic painhas failed (1). The authors demonstrated in 65 patients near theirend of life a short-term but major reduction of mean pain intensity.Unfortunately, however, no information is provided on patients’pain intensity after termination of the (30 h?) epidural infusion.
Furthermore, we have some additional comments on the authors’practice:
First, the authors did not specify their criteria for epidural cath-eter placement. Epidural analgesia, we believe, should only beconsidered for treatment of chronic pain when systemic treatmenthad failed, in patients with a short life expectancy (3 mo), sinceleptomeningeal and spinal cord infection is a frequent complicationand is associated with a high morbidity and mortality (2).
Second, the authors applied for epidural analgesia only a singlestandard drug regimen to all patients (i.e., “bupivacaine 0.5% 9 mL,clonidine 150 �g, and diamorphine over 30 h”). In contrast, westrongly recommend individual dosing of local anesthetics so as tobalance analgesic effects with side effects of epidural analgesia suchas motor blockade or CNS and/or cardiac toxicity. This is of par-ticular importance when epidural analgesia is applied for chronic
Figure 1. Photograph shows the relationship of various componentsused during wire-guided intubation using a modified TrachealTube Introducer (TTI). A, Flex-tip guidewire; B, the distal tip of TTI;C, tracheal tube.
600 LETTERS TO THE EDITOR ANESTH ANALG2005;100:597–605
pain therapy, since inter- and intraindividual variability of plasmabupivacaine concentrations with continuous infusion is very high(3). Moreover, since cancer pain is characterized by variable painstates (4), dosing should be adjusted during follow-up visits.
Third, the authors did not use a tunnelized epidural system.However, when using tunnelized epidural systems, which is stan-dard in our department for long-term pain treatment, dislocationrates of epidural catheters are definitely lower than the 32.3% ob-served by Linklater and Macaulay. In fact, disclocation has a fre-quency of approximately 2 per 1000 catheter days when tunnelizedsystems are used (2).
Epidural analgesia is a viable method for providing persistentreduction of unbearable cancer pain without impairment of con-sciousness. However, sufficient patient selection and individualizedtreatment are required to achieve persistent beneficial effects onpatients’ quality of life.Matthias Eikermann, MDKlinik fur Anasthesiologie und [email protected]
Jurgen Peters, MDProfessor of Anesthesiology and Intensive Care TherapyKlinik fur Anasthesiologie und IntensivmedizinUniversitatsklinikum EssenEssen, Germany
References1. Exner HJ, Peters J, Eikermann M. Epidural analgesia at the end of life: facing empirical
contraindications. Anesth Analg 2003;97:1740–2.2. Sillevis Smitt P, Tsafka A, van de Zande FT, et al. Outcome and complications of
epidural analgesia in patients with chronic cancer pain. Cancer 1998;83:2015–22.3. Du Pen SL, Kharasch ED, Williams A, et al. Chronic epidural bupivacaine-opioid
infusion in intractable cancer pain. Pain 1992;49:293–300.4. Caraceni A, Weinstein SM. Classification of cancer pain syndromes. Oncology 2001;
15:1627–40.
Visualization of Pulmonary ThromboemboliUsing Epicardial UltrasoundTo the Editor:
A recent study by Rosenberger et al. (1) reported a relatively lowsensitivity (26%) for direct visualization of pulmonary thrombo-emboli using intraoperative transesophageal echocardiograpy(TEE). The authors conclude that “TEE is not reliable for directlyvisualizing pulmonary emboli in the intraoperative setting ofpulmonary embolectomy.” In such cases, we suggest an addi-tional, complimentary technique: examination of the proximalpulmonary vasculature with an epicardial echocardiographicprobe placed directly on the proximal pulmonary arterial system.Such use of an epicardial echocardiographic probe may permitvisualization of pulmonary thromboemboli that are not visual-ized by TEE and may be used to guide surgery (2). It is importantthat anesthesiologists providing intraoperative care for cardiacsurgical patients be cognizant that intraoperative epicardial andepiaortic echocardiographic examination yield information inaddition to that obtained by TEE and can be accomplished in areasonably timely fashion (3).Aaron A. Tebbs, MDPaul F. Lennon, MDDepartment of Anesthesia and Pain ManagementMaine Medical CenterPortland, [email protected]
References1. Rosenberger P, Shernan SK, Body SC, Eltzschig HK. Utility of intraoperative trans-
esophageal echocardiography for diagnosis of pulmonary embolism. Anesth Analg2004;99:12–6.
2. Zlotnick AY, Lennon, PF, Goldhaber SZ, Aranki SF. Intraoperative Detection ofpulmonary thromboemboli with epicardial echocardiography. Chest 1999;115:1749 –51.
3. Eltzschig HK, Kallmeyer IJ, Mihaljevic T, et al. A practical approach to a comprehen-sive epicardial and epiaortic echocardiographic examination. J Cardiothorac VascAnesth 2003;17:19–21.
DOI: 10.1213/01.ANE.0000144083.84034.46
In Response:
We thank Drs. Tebbs and Lennon for emphasizing the role ofepicardial echocardiography as a supplement to transesophagealechocardiography (TEE) to improve the sensitivity of ultrasoundvisualization of thromboemboli within the pulmonary artery(PA). Epicardial echocardiography is routinely used during car-diac surgery for scanning the ascending aorta prior to cannula-tion or cross-clamping, as it is more sensitive than TEE fordetecting aortic plaques (1). In addition, epicardial echocardiog-raphy can be used as an alternate imaging modality for patientsin whom TEE is contraindicated (2), or probe insertion cannot beachieved (3). Epicardial echocardiography is particularly usefulfor visualizing anterior structures of the heart, due to the prox-imity of the transducer to the cardiac surface and availability oftransducers with high ultrasound frequencies, permitting supe-rior resolution (4,5). Finally, left pulmonary artery visualizationfrom an esophageal probe position is often limited due to inter-position of the left mainstem bronchus (6). Thus, echocardio-graphic examination of the pulmonary artery using an epicardialapproach may provide superior echocardiographic windows andimaging quality compared to TEE.
Although we agree with Drs. Tebbs and Lennon that in com-parison to TEE epicardial echocardiography may be a superiortechnique for visualizing thromboemboli within the proximalpulmonary artery circulation, the sensitivity and specificity ofepicardial echocardiography for this indication has not beenthoroughly investigated (7). Furthermore, the epicardial echocar-diographic approach to visualizing the heart and great vesselsrequires a sternotomy or thoracotomy, and therefore has practi-cal limitations as a preoperative diagnostic modality. Finally,TEE may still be useful for imaging extrapulmonary thromboem-boli in the right heart and caval veins in patients presenting forpulmonary embolectomy (8). Nonetheless, epicardial echocardi-ography should still be available to the perioperative echocardi-ographer as an essential diagnostic technique (9)
Peter Rosenberger, MDStanton K. Shernan, MD*Simon C. Body, MB, ChB, MPH*Holger K. Eltzschig, MD*†*Department of AnesthesiologyPerioperative and Pain MedicineHarvard Medical SchoolBrigham and Women’s HospitalBoston, MA†Department of Anesthesiology and Intensive Care MedicineTubingen University HospitalTubingen, [email protected]
References1. Konstadt SN, Reich DL, Quintana C, Levy M. The ascending aorta: how much does
transesophageal echocardiography see? Anesth Analg 1994;78:240–4.2. Edrich T, Felbinger TW, Rosenberger P, et al. Epicardial echocardiography intraoper-
ative diagnostic utility to assess valve function. Anaesthesist 2003;52:1152–7.3. Frenk VE, Shernan SK, Eltzschig HK. Epicardial echocardiography: diagnostic utility
for evaluating aortic valve disease during coronary surgery. J Clin Anesth 2003;15:271–4.
4. Edrich T, Shernan SK, Smith B, Eltzschig HK. Usefulness of intraoperative epiaorticechocardiography to resolve discrepancy between transthoracic and transesopha-geal measurements of aortic valve gradient: a case report. Can J Anaesth 2003;50:293– 6.
5. Eltzschig HK, Kallmeyer IJ, Mihaljevic T, et al. A practical approach to a comprehen-sive epicardial and epiaortic echocardiographic examination. J Cardiothorac VascAnesth 2003;17:422–9.
6. Rosenberger P, Shernan SK, Body SC, Eltzschig HK. Utility of intraoperative trans-esophageal echocardiography for diagnosis of pulmonary embolism. Anesth Analg2004;99:12–6.
7. Zlotnick AY, Lennon PF, Goldhaber SZ, Aranki SF. Intraoperative detection ofpulmonary thromboemboli with epicardial echocardiography. Chest 1999;115:1749 –51.
8. Rosenberger P, Shernan SK, Mihaljevic T, Eltzschig HK. Transesophageal echocardi-ography for detecting extrapulmonary thrombi during pulmonary embolectomy. AnnThorac Surg 2004;78:862–6.
9. Cahalan MK, Abel M, Goldman M, et al. American Society of Echocardiography andSociety of Cardiovascular Anesthesiologists task force guidelines for training in peri-operative echocardiography. Anesth Analg 2002;94:1384–8.
ANESTH ANALG LETTERS TO THE EDITOR 6012005;100:597–605
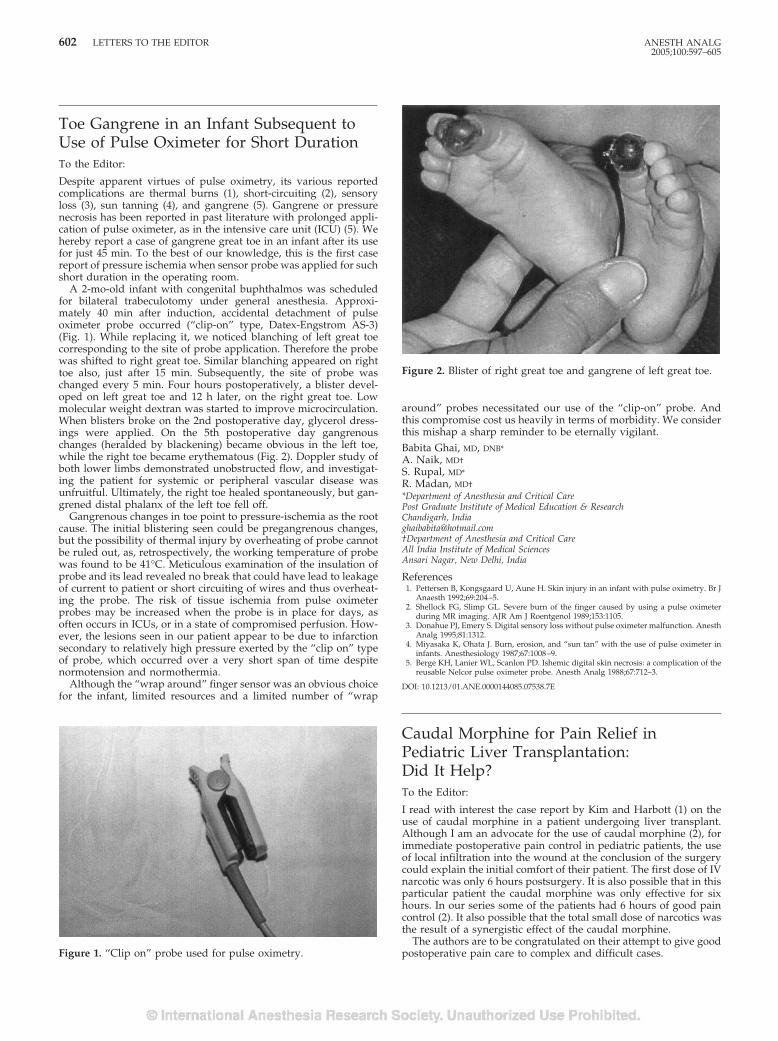
Toe Gangrene in an Infant Subsequent toUse of Pulse Oximeter for Short DurationTo the Editor:
Despite apparent virtues of pulse oximetry, its various reportedcomplications are thermal burns (1), short-circuiting (2), sensoryloss (3), sun tanning (4), and gangrene (5). Gangrene or pressurenecrosis has been reported in past literature with prolonged appli-cation of pulse oximeter, as in the intensive care unit (ICU) (5). Wehereby report a case of gangrene great toe in an infant after its usefor just 45 min. To the best of our knowledge, this is the first casereport of pressure ischemia when sensor probe was applied for suchshort duration in the operating room.
A 2-mo-old infant with congenital buphthalmos was scheduledfor bilateral trabeculotomy under general anesthesia. Approxi-mately 40 min after induction, accidental detachment of pulseoximeter probe occurred (“clip-on” type, Datex-Engstrom AS-3)(Fig. 1). While replacing it, we noticed blanching of left great toecorresponding to the site of probe application. Therefore the probewas shifted to right great toe. Similar blanching appeared on righttoe also, just after 15 min. Subsequently, the site of probe waschanged every 5 min. Four hours postoperatively, a blister devel-oped on left great toe and 12 h later, on the right great toe. Lowmolecular weight dextran was started to improve microcirculation.When blisters broke on the 2nd postoperative day, glycerol dress-ings were applied. On the 5th postoperative day gangrenouschanges (heralded by blackening) became obvious in the left toe,while the right toe became erythematous (Fig. 2). Doppler study ofboth lower limbs demonstrated unobstructed flow, and investigat-ing the patient for systemic or peripheral vascular disease wasunfruitful. Ultimately, the right toe healed spontaneously, but gan-grened distal phalanx of the left toe fell off.
Gangrenous changes in toe point to pressure-ischemia as the rootcause. The initial blistering seen could be pregangrenous changes,but the possibility of thermal injury by overheating of probe cannotbe ruled out, as, retrospectively, the working temperature of probewas found to be 41°C. Meticulous examination of the insulation ofprobe and its lead revealed no break that could have lead to leakageof current to patient or short circuiting of wires and thus overheat-ing the probe. The risk of tissue ischemia from pulse oximeterprobes may be increased when the probe is in place for days, asoften occurs in ICUs, or in a state of compromised perfusion. How-ever, the lesions seen in our patient appear to be due to infarctionsecondary to relatively high pressure exerted by the “clip on” typeof probe, which occurred over a very short span of time despitenormotension and normothermia.
Although the “wrap around” finger sensor was an obvious choicefor the infant, limited resources and a limited number of “wrap
around” probes necessitated our use of the “clip-on” probe. Andthis compromise cost us heavily in terms of morbidity. We considerthis mishap a sharp reminder to be eternally vigilant.Babita Ghai, MD, DNB*A. Naik, MD†S. Rupal, MD*R. Madan, MD†*Department of Anesthesia and Critical CarePost Graduate Institute of Medical Education & ResearchChandigarh, [email protected]†Department of Anesthesia and Critical CareAll India Institute of Medical SciencesAnsari Nagar, New Delhi, India
References1. Pettersen B, Kongsgaard U, Aune H. Skin injury in an infant with pulse oximetry. Br J
Anaesth 1992;69:204–5.2. Shellock FG, Slimp GL. Severe burn of the finger caused by using a pulse oximeter
during MR imaging. AJR Am J Roentgenol 1989;153:1105.3. Donahue PJ, Emery S. Digital sensory loss without pulse oximeter malfunction. Anesth
Analg 1995;81:1312.4. Miyasaka K, Ohata J. Burn, erosion, and “sun tan” with the use of pulse oximeter in
infants. Anesthesiology 1987;67:1008–9.5. Berge KH, Lanier WL, Scanlon PD. Ishemic digital skin necrosis: a complication of the
reusable Nelcor pulse oximeter probe. Anesth Analg 1988;67:712–3.
DOI: 10.1213/01.ANE.0000144085.07538.7E
Caudal Morphine for Pain Relief inPediatric Liver Transplantation:Did It Help?To the Editor:
I read with interest the case report by Kim and Harbott (1) on theuse of caudal morphine in a patient undergoing liver transplant.Although I am an advocate for the use of caudal morphine (2), forimmediate postoperative pain control in pediatric patients, the useof local infiltration into the wound at the conclusion of the surgerycould explain the initial comfort of their patient. The first dose of IVnarcotic was only 6 hours postsurgery. It is also possible that in thisparticular patient the caudal morphine was only effective for sixhours. In our series some of the patients had 6 hours of good paincontrol (2). It also possible that the total small dose of narcotics wasthe result of a synergistic effect of the caudal morphine.
The authors are to be congratulated on their attempt to give goodpostoperative pain care to complex and difficult cases.Figure 1. “Clip on” probe used for pulse oximetry.
Figure 2. Blister of right great toe and gangrene of left great toe.
602 LETTERS TO THE EDITOR ANESTH ANALG2005;100:597–605
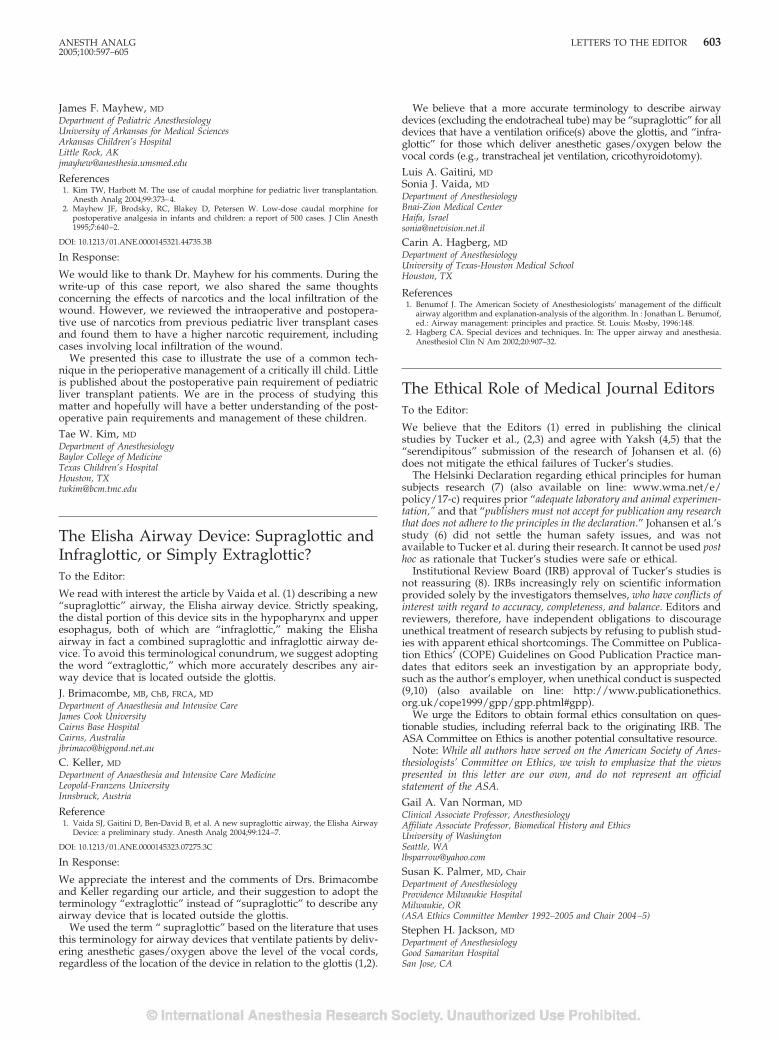
ANESTH ANALG LETTERS TO THE EDITOR 6032005;100:597–605
James F. Mayhew, MDDepartment of Pediatric AnesthesiologyUniversity of Arkansas for Medical SciencesArkansas Children’s HospitalLittle Rock, [email protected]
References1. Kim TW, Harbott M. The use of caudal morphine for pediatric liver transplantation.
Anesth Analg 2004;99:373–4.2. Mayhew JF, Brodsky, RC, Blakey D, Petersen W. Low-dose caudal morphine for
postoperative analgesia in infants and children: a report of 500 cases. J Clin Anesth1995;7:640–2.
DOI: 10.1213/01.ANE.0000145321.44735.3B
In Response:
We would like to thank Dr. Mayhew for his comments. During thewrite-up of this case report, we also shared the same thoughtsconcerning the effects of narcotics and the local infiltration of thewound. However, we reviewed the intraoperative and postopera-tive use of narcotics from previous pediatric liver transplant casesand found them to have a higher narcotic requirement, includingcases involving local infiltration of the wound.
We presented this case to illustrate the use of a common tech-nique in the perioperative management of a critically ill child. Littleis published about the postoperative pain requirement of pediatricliver transplant patients. We are in the process of studying thismatter and hopefully will have a better understanding of the post-operative pain requirements and management of these children.Tae W. Kim, MDDepartment of AnesthesiologyBaylor College of MedicineTexas Children’s HospitalHouston, [email protected]
The Elisha Airway Device: Supraglottic andInfraglottic, or Simply Extraglottic?To the Editor:
We read with interest the article by Vaida et al. (1) describing a new“supraglottic” airway, the Elisha airway device. Strictly speaking,the distal portion of this device sits in the hypopharynx and upperesophagus, both of which are “infraglottic,” making the Elishaairway in fact a combined supraglottic and infraglottic airway de-vice. To avoid this terminological conundrum, we suggest adoptingthe word “extraglottic,” which more accurately describes any air-way device that is located outside the glottis.J. Brimacombe, MB, ChB, FRCA, MDDepartment of Anaesthesia and Intensive CareJames Cook UniversityCairns Base HospitalCairns, [email protected]
C. Keller, MDDepartment of Anaesthesia and Intensive Care MedicineLeopold-Franzens UniversityInnsbruck, Austria
Reference1. Vaida SJ, Gaitini D, Ben-David B, et al. A new supraglottic airway, the Elisha Airway
Device: a preliminary study. Anesth Analg 2004;99:124–7.
DOI: 10.1213/01.ANE.0000145323.07275.3C
In Response:
We appreciate the interest and the comments of Drs. Brimacombeand Keller regarding our article, and their suggestion to adopt theterminology “extraglottic” instead of “supraglottic” to describe anyairway device that is located outside the glottis.
We used the term “ supraglottic” based on the literature that usesthis terminology for airway devices that ventilate patients by deliv-ering anesthetic gases/oxygen above the level of the vocal cords,regardless of the location of the device in relation to the glottis (1,2).
We believe that a more accurate terminology to describe airwaydevices (excluding the endotracheal tube) may be “supraglottic” for alldevices that have a ventilation orifice(s) above the glottis, and “infra-glottic” for those which deliver anesthetic gases/oxygen below thevocal cords (e.g., transtracheal jet ventilation, cricothyroidotomy).Luis A. Gaitini, MDSonia J. Vaida, MDDepartment of AnesthesiologyBnai-Zion Medical CenterHaifa, [email protected]
Carin A. Hagberg, MDDepartment of AnesthesiologyUniversity of Texas-Houston Medical SchoolHouston, TX
References1. Benumof J. The American Society of Anesthesiologists’ management of the difficult
airway algorithm and explanation-analysis of the algorithm. In : Jonathan L. Benumof,ed.: Airway management: principles and practice. St. Louis: Mosby, 1996:148.
2. Hagberg CA. Special devices and techniques. In: The upper airway and anesthesia.Anesthesiol Clin N Am 2002;20:907–32.
The Ethical Role of Medical Journal EditorsTo the Editor:
We believe that the Editors (1) erred in publishing the clinicalstudies by Tucker et al., (2,3) and agree with Yaksh (4,5) that the“serendipitous” submission of the research of Johansen et al. (6)does not mitigate the ethical failures of Tucker’s studies.
The Helsinki Declaration regarding ethical principles for humansubjects research (7) (also available on line: www.wma.net/e/policy/17-c) requires prior “adequate laboratory and animal experimen-tation,” and that “publishers must not accept for publication any researchthat does not adhere to the principles in the declaration.” Johansen et al.’sstudy (6) did not settle the human safety issues, and was notavailable to Tucker et al. during their research. It cannot be used posthoc as rationale that Tucker’s studies were safe or ethical.
Institutional Review Board (IRB) approval of Tucker’s studies isnot reassuring (8). IRBs increasingly rely on scientific informationprovided solely by the investigators themselves, who have conflicts ofinterest with regard to accuracy, completeness, and balance. Editors andreviewers, therefore, have independent obligations to discourageunethical treatment of research subjects by refusing to publish stud-ies with apparent ethical shortcomings. The Committee on Publica-tion Ethics’ (COPE) Guidelines on Good Publication Practice man-dates that editors seek an investigation by an appropriate body,such as the author’s employer, when unethical conduct is suspected(9,10) (also available on line: http://www.publicationethics.org.uk/cope1999/gpp/gpp.phtml#gpp).
We urge the Editors to obtain formal ethics consultation on ques-tionable studies, including referral back to the originating IRB. TheASA Committee on Ethics is another potential consultative resource.
Note: While all authors have served on the American Society of Anes-thesiologists’ Committee on Ethics, we wish to emphasize that the viewspresented in this letter are our own, and do not represent an officialstatement of the ASA.
Gail A. Van Norman, MDClinical Associate Professor, AnesthesiologyAffiliate Associate Professor, Biomedical History and EthicsUniversity of WashingtonSeattle, [email protected]
Susan K. Palmer, MD, ChairDepartment of AnesthesiologyProvidence Milwaukie HospitalMilwaukie, OR(ASA Ethics Committee Member 1992–2005 and Chair 2004–5)
Stephen H. Jackson, MDDepartment of AnesthesiologyGood Samaritan HospitalSan Jose, CA
References1. Cousins MJ, Miller RD. Intrathecal midazolam: an ethical editorial dilemma. Anesth
Analg 2004;98:1507–8.2. Tucker AP, Lai C, Nadeson R, Goodchild CS. Intrathecal midazolam: I. A cohort study
investigating safety. Anesth Analg 2004;98:1512–20.3. Tucker AP, Mezzatesta J, Nadeson R, Goodchild CS. Intrathecal midazolam: II. Com-
bination with intrathecal fentanyl for labor pain. Anesth Analg 2004;98:1521–7.4. Yash T, Allen J. Preclinical insights into the implementation of intrathecal midazolam:
a cautionary tale. Anesth Analg 2004;98:1509–11.5. Yaksh T, Allen J. The use of intrathecal midazolam in humans: a case study of process.
Anesth Analg 2004;98:1536–45.6. Johansen MJ, Gradert TL, Satterfield WC, et al. Safety of continuous intrathecal
midazolam infusion in the sheep model. Anesth Analg 2004;98:1528–35.7. World Medical Association Declaration of Helsinki: Ethical Principles for Medical
Research Involving Human Subjects. Last Amended by the 52nd WMA GeneralAssembly, Edinburgh, Scotland, October 2000. WMA The World Medical Association.Ferney-Voltaire, France.
8. Weingarten MA, Paul M, Leibovici L. Assessing ethics of trials in systematic reviews.BMJ 2004;328:1013–4.
9. Committee on Publication Ethics. Guidelines on good publication practice. London:BMJ Publishing Group, 2003.
10. Giles J. Medical editors urged to accept ethical code. Nature 2004;428:3
DOI: 10.1213/01.ANE.0000145325.01892.71
More on the Dilemma of IntrathecalMidazolamTo the Editor:
I read with interest the six articles on intrathecal midazolam (1–6) inthe June 2004 issue of Anesthesia & Analgesia. Tucker et al. (1)assessed the symptomatology of neurological damage of intrathecalmidazolam in 547 patients and found no increased occurrences ofneurological or urological symptoms in these patients. Tucker et al.(2) also found that intrathecal midazolam potentiated the analgesiceffect of intrathecal fentanyl in laboring parturients. These twoclinical studies of intrathecal midazolam by Tucker et al. wereperformed despite the lack of a systematic study of toxicology ofintrathecal midazolam in animals or humans (4,5). These two stud-ies were also conducted despite the toxicity findings of intrathecalmidazolam administration in rabbits by Malinovsky et al. (7) andErdine et al. (8). Therefore an ethical dilemma was created for theEditors of this journal regarding whether to publish the clinicalfindings of Tucker et al. (6). Having worked in academia, thepharmaceutical industry, and the Food and Drug Administration(FDA), I would like to offer my fair and objective assessment of theabove dilemma:
Academicians spend a great deal of time researching the literatureand writing grant proposals for possible research projects. Theythen spend a great deal of time, and frequently for a lengthy period,to carry out their studies. The main hope of doing all of this is to beable to publish the findings of their studies and, hopefully, tocontribute to the advancement of science. Therefore, I really have alot of sympathy for academicians in their endeavor to publish theirresearch findings.
I do not believe that it is the duty of the editor of a journal toensure that a drug is safe and efficacious. The editor can ascertainthat a manuscript be reviewed by the experts to ensure that thestudy design is scientifically sound and that the conclusion reflectsthe study findings. The editor can also encourage the publications ofarticles that can stimulate further research in the subject of interest.It is the responsibility of the Institutional Review Board to ensurethat the human trials undertaken in their institution are safe andethical. It is the responsibility of the FDA to ensure that a drug issafe and efficacious. The FDA has a relatively large staff to reviewthe new drug applications of a drug submitted by the pharmaceu-tical companies to determine if a drug is safe and efficacious. Inaddition, they have the option of assembling an advisory panelconsisting of experts to help them determine of the safety andefficacy of a drug. Therefore, Tucker et al. are entitled to publishtheir findings. However, I believe it might be prudent for them toinclude in the conclusion of those two studies that the systemicstudies of toxicology of intrathecal midazolam have not been per-formed on animals or human beings. They may also indicate thatthe lack of neurological symptoms in their patients does not rule out
long-term tissue toxicity of intrathecal midazolam administration inhumans. It is then up to the readers or the clinicians to draw theirown conclusion regarding the safety and efficacy of the intrathecaladministration of midazolam in humans.
Sheng K. Lin, PhD, MDBrandywine Valley Pain Control CenterCoatesville, [email protected]
References1. Tucker AP, Lai C, Nadeson R, Goodchild CS. Intrathecal midazolam: I. A cohort study
investigating safety Anesth Analg 2004;98:1512–20.2. Tucker AP, Mezzatesta J, Nadeson R, Goodchild CS. Intrathecal midazolam: II. Com-
bination with intrathecal fentanyl for labour pain Anesth Analg 2004;98:1521–7.3. Johansen MJ, Gradert TL, Satterfiled WC, et al. Safety and efficacy of continuous
intrathecal midazolam infusion in the sheep model. Anesth Analg 2004;98:1528–35.4. Yaksh TL, Allen JW. The use of intrathecal midazolam in humans: a case study of
process. Anesth Analg 2004;98:1536–45.5. Yaksh TL. Spinal systems and pain processing: development of novel analgesic drugs
with mechanistically defined models. Trends Pharmacol Sci 1999;20:239–37.6. Cousins MJ, Miller RD. Intrathecal midazolam: an ethical editorial dilemma. Anesth
Analg 2004;98:1507–8.7. Malinovsky JM, Cozian A, Lepage JY, et al. Ketamine and midazolam neurotoxicity in
the rabbit. Anesthesiology 1991;75:91–7.8. Erdine S, Yucel A, Ozyalcin S, et al. Neurotoxicity of midazolam in the rabbit. Pain
1999;80:419–23.
DOI: 10.1213/01.ANE.0000145326.45693.39
In Response:
I have taken the liberty of responding to the Van Norman, Palmer,and Jackson and the Lin Letters to the Editor. I believe that all theissues raised in both letters have already been addressed in one wayor another by Drs. Cousins, Yaksh, and me in our editorials. Thereason for publishing these two letters is to illustrate the widediversity of opinions that exist regarding these papers. Our edito-rials clearly reflect concerns with our own decisions that were againexpressed by these authors. Dr. Cousins and I hope our editorialreflects the plaguing deliberations that we endured.Ronald D. Miller, MDDepartment of Anesthesiology and Perioperative CareUniversity of CaliforniaSan Francisco, CA
Intrathecal Midazolam: Adverse Effects andSources of BiasTo the Editor:
I was interested to read the paper by Tucker et al. (1), which aims toassess the efficacy of intrathecal midazolam in potentiating theeffect of intrathecal fentanyl without causing adverse effects. Un-fortunately, as stated in the Discussion in their article, given thesample sizes used it was not possible to make valid comments aboutthe incidence of adverse effects. Therefore, while it is reasonable tocomment on analgesic effects, it is not feasible to subsequently drawany conclusions about the relationship between adverse effects andthe study drugs as mentioned in their discussion.
In addition, I feel that two other aspects of the study requirefurther clarification, both of which might have introduced bias, andwhich could invalidate the findings of an enhanced analgesic effect.First, informing patients that the injection may take up to 15 minutesto work could have exerted considerable influence on the time torequest for supplemental analgesia, an important potential source ofbias.
Second, the authors imply that only those requesting furtheranalgesia more than 15 minutes after intrathecal injection wereconsidered to have “participated completely” in the study. Werethose requesting analgesia before this time specifically excludedfrom the trial, again potentially skewing results?
Louise Walker, MBBS, FRCADepartment of AnaesthesiaRoyal Brompton HospitalLondon, [email protected]
604 LETTERS TO THE EDITOR ANESTH ANALG2005;100:597–605
Reference1. Tucker AP, Mezzatesta J, Nadeson R, Goodchild CS. Intrathecal midazolam: II. Com-
bination with intrathecal fentanyl for labor pain. Anesth Analg 2004;98:1521–7.
DOI: 10.1213/01.ANE.0000145328.98283.CE
In Response:
We appreciate the interest shown in our paper by Dr. Walker. Thesingular aim of this study—as stated in the introduction—was toinvestigate the efficacy of intrathecal midazolam (1). The monitor-ing of adverse effects was performed as a routine. Dr. Walker isquite correct in stating that this study was underpowered as aninvestigation of potential neurotoxicity; however, this was not theaim of the study. We direct Dr. Walker to the accompanying study,which addresses the issue of neurotoxicity; this is a cohort studyassessing the safety of intrathecal midazolam in a large number ofpatients (2). Clearly the incidence of neurological sequelae, if it isassociated with intrathecal midazolam at all, is better described bythis larger study.
The effect of informing patients that the analgesia might take15 minutes to work was a requirement of our ethics committee. Itis unlikely that this introduced any bias, as this was appliedequally to all groups, and as the observers and patients wereunaware of the nature of the intrathecal injection, this would not
have prolonged the duration of the active study groups in com-parison to the placebo group. For this reason, the comparisonbetween groups remains valid. Furthermore, we think that arequest for analgesia at 30 or 90 minutes is unlikely to have beenaffected by an expectation of 15 minutes without analgesia. Fi-nally, there were no patients that withdrew from the study, eitherbefore 15 minutes or later. The authors acknowledge that thisshould have been stated in the article and are grateful for theopportunity to clarify this point.
Adam P. Tucker, MDJoseph Mezzatesta, MDRaymond Nadeson, MDColin S. Goodchild, MDDepartment of AnaesthesiaMonash Medical CentreMonash UniversityVictoria, [email protected]
References1. Tucker AP, Mezzatesta J, Nadeson R, Goodchild CS. Intrathecal midazolam: II. Com-
bination with intrathecal fentanyl for labor pain. Anesth. Analg. 2004;98:1521–7.2. Tucker AP, Lai C, Nadeson R, Goodchild CS. Intrathecal midazolam: I. A cohort study
investigating safety. Anesth. Analg. 2004;98:1512–20.
ANESTH ANALG LETTERS TO THE EDITOR 6052005;100:597–605
SECTION EDITOR
NORIG ELLISON
Book and Multimedia Reviews
Textbook of Neurointensive Care.Layon AJ, Gabrielli A, Friedman WA, eds. Philadelphia:Saunders, 2004. ISBN 0-7216-9418-7. 907 pp, $ 110.00.
As a subspecialty of critical care, neurointensive care has receivedincreasing attention as evidence mounts that specialty-specific criticalcare of neurologically damaged patients improves outcome. This is oneof several new or revised texts on neurointensive care to appear in thepast year. The 907-page hardcover textbook is divided into four majorsections and subdivided into a total 32 chapters. The editors andapproximately half of the 70 contributors are from the University ofFlorida College of Medicine, but there are also notable national andinternational contributors. Included is a fascinating chapter on cerebralresuscitation after cardiac arrest written by the recently deceased Dr.Peter Safar spanning his more than four decades of research on thetopic. Each chapter is formatted to include a summary list of “Pearls”followed by a list of references. The entire textbook is indexed in thetraditional manner to locate specific topics by page number.
Basic neuroanatomy is reviewed beautifully in the first two chapters,with helpful photographs of anatomic specimens, diagrams, and ra-diologic images. The following chapters review basic neurophysiology,the neurologic examination, neurologic injury and disease, and specifictreatment modalities. A portion of this section explains many of theexpected and common complications of surgical procedures and othertraumatic injuries as well as associated physiologic implications. Pre-hospital and in-hospital resuscitation issues are covered next. The focusis on the impact that airway, cardiac, pulmonary, fluid and electrolytes,and nutritional issues may have to cause or exacerbate neurologicinjury. This section tacitly acknowledges that avoidance of neurologicinjury is of paramount importance due to its propensity for rapiddeterioration and limited regeneration potential. Specific neuropathol-ogy such as increased intracranial pressure and seizures are covered asare other issues including neuromonitoring and mental status changes.The textbook ends with a comprehensive discussion of ethical issues inneurologically injured patients, specifically addressing their somewhatunique dilemma where survival may be a worse outcome than death.The intriguing final two chapters underscore our rapidly increasingunderstanding of neurologic injury and hopes for future care despiteour lack of good evidence supporting specific targeted therapies. Thusthe book appropriately captures the juxtaposition of our current ap-proach to neurointensive care: patient outcomes continue to improveoverall, but it has been difficult to identify the specific interventionsthat have caused this.
This book does not cover all aspects of critical care medicine, butrather gives a broad view of critical care principles specifically orientedto neurologically compromised patients. As in many textbooks, someof the newer medications and approaches are not covered. However, itdelivers a summary of what is commonly known and practiced. By itsomissions, the book directs us to where more research is needed toadvance our knowledge. As such it will prove useful to any practitio-ner hoping to advance their understanding of neurointensive care.
Elizabeth Sinz, MD
Associate Professor of Anesthesiology, Critical Care Medicine, and NeurosurgeryPenn State Milton S. Hershey Medical CenterHershey, PA
Neurosurgical Pain Management.Follett KA, ed. Philadelphia: Elsevier Saunders, 2004. ISBN0-7216-9241. 287 pages, $110.00.
Neurosurgical Pain Management provides an overview of surgicaland, more broadly, interventional pain management techniques.The book opens with a consideration of pain pathophysiology andthe standard medical, psychological, and rehabilitative approachestowards the treatment of chronic pain, as the neurosurgeon shouldbe careful to select those patients who have exhausted more con-servative management before proceeding with the interventions thebook goes on to detail. At its end, the text addresses multidisci-plinary pain management, impairment and physical medicine, andpractice management.
For the anesthesiology-trained pain management specialist this bookprovides some information not easily found elsewhere. Indeed, thereare no fewer than four brief separate chapters describing surgicalapproaches to the relief of trigeminal pain. This points to the book’score weakness. Although this text provides familiarity with the differ-ent surgical modalities, it provides little guidance. Surely this is, in part,a function of the dearth of controlled trials and outcome studies in theneurosurgical pain literature. Nevertheless, it is not clear to this re-viewer whether one should choose radiofrequency rhizotomy, glycerolinjection, surgical neurectomy, or percutaneous trigeminal nerve com-pression for refractory tic douloureux.
For the anesthesia interventionalist this text does provide enoughinformation to raise issues that one might address with his or herneurosurgical colleague. This text would most likely be helpful inthe cancer and palliative care arena, where cordotomy, midlinemyelotomy, or radiosurgery are very real considerations. In thosesituations where intrathecal or percutaneous ablative therapies havefailed, neurosurgery may be all that is left to improve the quality oflife at the end of life. The remainder of the text provides a sketchieroverview of techniques like spinal cord stimulation and implantableneuraxial analgesia better described in anesthesia-based texts suchas Waldman’s Interventional Pain Management.
Adam R. Burkey, MD
Dell R. Burkey, MDDepartment of AnesthesiaUniversity of Pennsylvania Health SystemPhiladelphia, PA
Evidence-Based Practice of Anesthesiology.Fleisher LA, ed. Philadelphia: Saunders, 2004. ISBN 0-7216-9409-8.476 pp, $79.95.
This book systematically reviews the medical literature, also knownas evidence, to describe the most effective treatments for clinicalsituations that anesthesiologists encounter. Thus it applies the rel-atively new, but widespread, concept of evidence-based medicine tothe practice of anesthesiology.
A total of 108 authors from 44 institutions address 70 specifictopics of care. Each topic is generally posed as a clinical question,and ranges from the broad, e.g., “what is the best strategy to preventpostoperative nausea and vomiting,” to the narrow, e.g., “shouldspinal anesthesia be performed in patients with multiple sclerosis?”Topic authors use an intuitive format that facilitates finding infor-mation quickly. This format includes the background to the clinicalquestion, the treatment options, pertinent evidence, existing guide-lines, and the author’s recommendations. The introductory chapterexplains the evidence-based process of developing clinical guide-lines. The clinical questions are ones every busy anesthesiologistposes. The answers average six pages and 40 references, and containup-to-date and useful information. Reading them I learned a lot,and I’ve now recommended the book to both residents and faculty
606 Anesth Analg 2005;100:606–7 ©2005 by the International Anesthesia Research Society
in our department. Anesthesiologists preparing for their oral boardexams may especially find this book helpful.
Lee Fleisher, MD, book editor and the chair of a busy academicdepartment, described the goal for authors as “to provide the readerwith a basis upon which they can formulate their own perioperativeapproach to complex literature.” The authors substantially met thatgoal.
The main limit of this book is that although it answers 70 goodquestions, busy anesthesiologists can ask many others too. Here arethree that clinicians asked me today, for instance, that are notincluded in this textbook: How do we best prevent dental injuries?Should a patient for minor plastic surgery who has a recent trache-ostomy be done in an ambulatory surgery center? What urineoutput is too low during anesthesia? One suspects that all clinicalpractice questions could never be asked, nor at six pages apiece
answered, in this evidence-based format, no matter how expandedthe book. So book purchasers will still need their traditional andcomprehensive chapter-oriented and subspecialty tomes.
This paperback of 476 pages costs $85 at the university bookstore,a reasonable price for such a good educational source. It does not“explore all of the latest clinical issues” as the back cover states. Itdoes use an evidence-based approach to explore important andrelevant clinical topics in a practical and consistent format. Readerswill learn a lot and enjoy it.
Robert E. Johnstone, MD
Professor and ChairDepartment of AnesthesiologyWest Virginia UniversityMorgantown, WV
ANESTH ANALG BOOK AND MULTIMEDIA REVIEWS 6072005;100:606–7


