Embed Size (px)
Citation preview
St. John Fisher College St. John Fisher College
Fisher Digital Publications Fisher Digital Publications
Education Doctoral Ralph C. Wilson, Jr. School of Education
8-2012
The Relationship between Pre- and Post-Matriculation Factors The Relationship between Pre- and Post-Matriculation Factors
and College Student Retention in a Small, Technical, Public and College Student Retention in a Small, Technical, Public
Institution Institution
Tara Hisert Winter St. John Fisher College
Follow this and additional works at: https://fisherpub.sjfc.edu/education_etd
Part of the Education Commons
How has open access to Fisher Digital Publications benefited you?
Recommended Citation Recommended Citation Winter, Tara Hisert, "The Relationship between Pre- and Post-Matriculation Factors and College Student Retention in a Small, Technical, Public Institution" (2012). Education Doctoral. Paper 125.
Please note that the Recommended Citation provides general citation information and may not be appropriate for your discipline. To receive help in creating a citation based on your discipline, please visit http://libguides.sjfc.edu/citations.
This document is posted at https://fisherpub.sjfc.edu/education_etd/125 and is brought to you for free and open access by Fisher Digital Publications at St. John Fisher College. For more information, please contact [email protected].
The Relationship between Pre- and Post-Matriculation Factors and College The Relationship between Pre- and Post-Matriculation Factors and College Student Retention in a Small, Technical, Public Institution Student Retention in a Small, Technical, Public Institution
Abstract Abstract Despite the volume of research on college retention, additional investigation is warranted as many institutions continue to be plagued by poor retention rates. This study investigated the impact of pre- and post-matriculation factors on student retention at SUNY Cobleskill. The focus of the study was on the associate degree students and includes variables such as financial aid type and amount, and college choice. Statistical procedures such as Chi Square, Kendall’s Tau and Cramer’s V were employed during the data analysis. This research adds to the existing body of research by studying a small, regional, state-assisted institution that focuses on teaching. Most of the currently available studies have been conducted at large or mid-size research-based institutions. The researcher did not find statistically significant findings when analyzing relationships between college choice, type of financial aid and expected family contribution, and college student retention. A significant relationship was found when looking at the total amount of aid received and college student retention. This relationship warrants further research into the ability to pay versus willingness to pay, as well as how financial aid packaging may impact college student retention.
Document Type Document Type Dissertation
Degree Name Degree Name Doctor of Education (EdD)
Department Department Executive Leadership
First Supervisor First Supervisor Jerry Willis
Second Supervisor Second Supervisor Edward Sullivan
Subject Categories Subject Categories Education
This dissertation is available at Fisher Digital Publications: https://fisherpub.sjfc.edu/education_etd/125
The Relationship between Pre- and Post-Matriculation Factors and College Student
Retention in a Small, Technical, Public Institution
By
Tara Hisert Winter
Submitted in partial fulfillment
of the requirements for the degree
Ed.D. in Executive Leadership
Supervised by
Dr. Jerry Willis
Committee Member
Dr. Edward Sullivan
Ralph C. Wilson, Jr. School of Education
St. John Fisher College
August 2012
ii
Biographical Sketch
Tara Hisert Winter is currently the Dean of Academic Services at SUNY Cobleskill. Mrs.
Winter attended Hartwick College from 1991 to 1995 and graduated with a Bachelor of
Arts Degree in 1995. She attended Ithaca College from 1995 to1996 and graduated with a
Master of Science Degree in 1996 and also attended the College of St. Rose and
graduated with a Master of Science Degree in 2003. She enrolled in St. John Fisher
College in the summer of 2010 and began doctoral studies in the Ed.D. Program in
Executive Leadership. Mrs. Winter pursued her research in college student retention
under the direction of Dr. Jerry Willis and Dr. Edward Sullivan and received the Ed.D.
degree in 2012.
iii
Abstract
Despite the volume of research on college retention, additional investigation is
warranted as many institutions continue to be plagued by poor retention rates. This study
investigated the impact of pre- and post-matriculation factors on student retention at
SUNY Cobleskill. The focus of the study was on the associate degree students and
includes variables such as financial aid type and amount, and college choice. Statistical
procedures such as Chi Square, Kendall’s Tau and Cramer’s V were employed during the
data analysis. This research adds to the existing body of research by studying a small,
regional, state-assisted institution that focuses on teaching. Most of the currently
available studies have been conducted at large or mid-size research-based institutions.
The researcher did not find statistically significant findings when analyzing relationships
between college choice, type of financial aid and expected family contribution, and
college student retention. A significant relationship was found when looking at the total
amount of aid received and college student retention. This relationship warrants further
research into the ability to pay versus willingness to pay, as well as how financial aid
packaging may impact college student retention.
iv
Table of Contents
Biographical Sketch ...................................................................................................................... ii
Abstract .......................................................................................................................................... iii
Table of Contents ......................................................................................................................... iv
List of Tables ................................................................................................................................ vi
List of Figures .............................................................................................................................. vii
Chapter 1: Introduction ................................................................................................................. 1
Problem Statement .................................................................................................. 1
Theoretical Rationale .............................................................................................. 6
Significance of Study .............................................................................................. 9
Research Questions ............................................................................................... 10
Purpose of the Study ............................................................................................. 11
Definition of Terms for This Study ...................................................................... 13
Chapter Summary ................................................................................................. 14
Chapter 2: Review of the Literature ......................................................................................... 16
Introduction and Purpose ...................................................................................... 16
Theoretical Orientation ......................................................................................... 18
Empirical Findings ................................................................................................ 24
Summary ............................................................................................................... 32
Chapter 3: Research Design Methodology .............................................................................. 34
General Perspective .............................................................................................. 34
Research Context .................................................................................................. 35
Research Participants ............................................................................................ 36
v
Instruments to be Used in Data Collection ........................................................... 36
Data Analysis ........................................................................................................ 37
Summary ............................................................................................................... 40
Chapter 4: Results ....................................................................................................................... 42
Research Questions ............................................................................................... 42
Data Analysis and Findings .................................................................................. 44
Summary ............................................................................................................... 60
Chapter 5: Discussion ................................................................................................................. 62
Introduction ........................................................................................................... 62
Implications of Findings ....................................................................................... 63
Limitations and Strengths ..................................................................................... 68
Recommendations ................................................................................................. 69
Conclusion ............................................................................................................ 71
References .................................................................................................................................... 75
Appendix A ....................................................................................................................... 80
Appendix B ....................................................................................................................... 81
Appendix C .................................................................................................................................... 82
vi
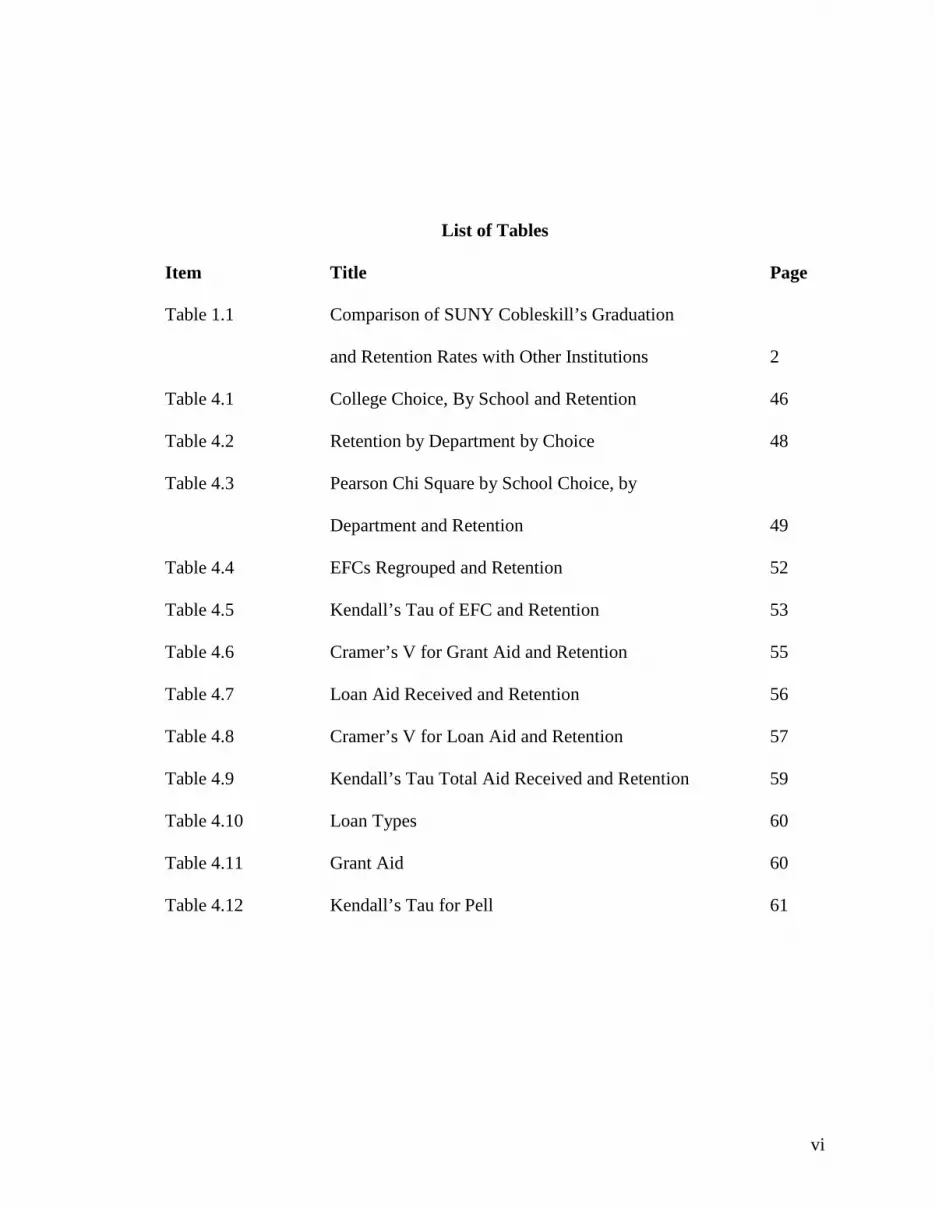
List of Tables Item Title Page
Table 1.1 Comparison of SUNY Cobleskill’s Graduation
and Retention Rates with Other Institutions 2
Table 4.1 College Choice, By School and Retention 46
Table 4.2 Retention by Department by Choice 48
Table 4.3 Pearson Chi Square by School Choice, by
Department and Retention 49
Table 4.4 EFCs Regrouped and Retention 52
Table 4.5 Kendall’s Tau of EFC and Retention 53
Table 4.6 Cramer’s V for Grant Aid and Retention 55
Table 4.7 Loan Aid Received and Retention 56
Table 4.8 Cramer’s V for Loan Aid and Retention 57
Table 4.9 Kendall’s Tau Total Aid Received and Retention 59
Table 4.10 Loan Types 60
Table 4.11 Grant Aid 60
Table 4.12 Kendall’s Tau for Pell 61
vii
List of Figures
Item Title Page
Figure 4.1 Retention by School Choice 44
Figure 4.2 Percent Returning by School, by Choice Level 45
Figure 4.3 EFC and Retention Rate 50
Figure 4.4 Type of Aid Received and Retention 54
Figure 4.5 Receiving Grant Aid and Retention 55
Figure 4.6 Total Aid Received and Retention 58
1
Chapter 1: Introduction
This dissertation was a quantitative research study that evaluated whether or not
there was a statistically significant relationship between selected pre- and post-
matriculation factors and retention of students from the first year to the second year in
associate degree seeking programs in a public institution of higher education in New
York State. SUNY Cobleskill is one of 64 campuses in the State University of New York
system. It is further categorized as one of the five colleges that are part of the technology
sector. These colleges offer both associate and baccalaureate degrees. The college is
situated in upstate New York, approximately 35 miles from Albany. This study
examined a number of factors about individual students and attempted to answer the
question about whether any of the factors under study were correlated with the student’s
likelihood of continuing from the first to the second year of college. Chapter 1 introduces
the study beginning with the problem statement. Chapter 2 reviews the relevant literature
and expands on the theoretical rationale. Chapter 3 provides a description of the proposed
methodology. Chapter 4 reviews the findings and Chapter 5 analyzes the findings,
provides recommendations for further studies, and summarizes this study.
Problem Statement
The changing nature of today’s college-bound students, better known as the
millennials (Elam, Stratton & Gibson, 2007), calls for renewed attention to the factors
associated with, and predictive of, retention. In addition, the specifics of the institution at
2
which the research was conducted provided a unique lens through which to examine
factors associated with retention from the first to the second year of college.
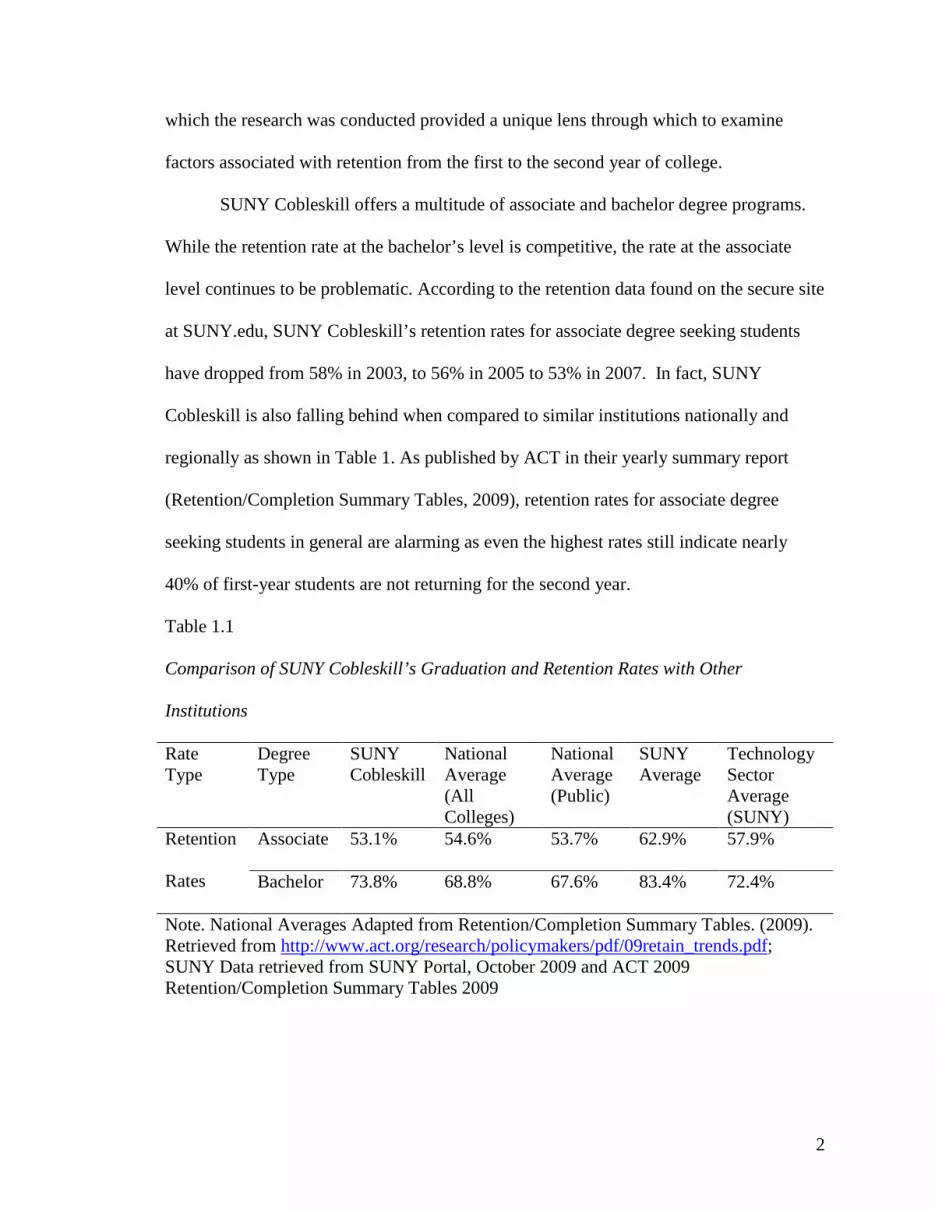
SUNY Cobleskill offers a multitude of associate and bachelor degree programs.
While the retention rate at the bachelor’s level is competitive, the rate at the associate
level continues to be problematic. According to the retention data found on the secure site
at SUNY.edu, SUNY Cobleskill’s retention rates for associate degree seeking students
have dropped from 58% in 2003, to 56% in 2005 to 53% in 2007. In fact, SUNY
Cobleskill is also falling behind when compared to similar institutions nationally and
regionally as shown in Table 1. As published by ACT in their yearly summary report
(Retention/Completion Summary Tables, 2009), retention rates for associate degree
seeking students in general are alarming as even the highest rates still indicate nearly
40% of first-year students are not returning for the second year.
Table 1.1
Comparison of SUNY Cobleskill’s Graduation and Retention Rates with Other
Institutions
Rate Type
Degree Type
SUNY Cobleskill
National Average (All Colleges)
National Average (Public)
SUNY Average
Technology Sector Average (SUNY)
Retention
Rates
Associate 53.1% 54.6% 53.7% 62.9% 57.9%
Bachelor 73.8% 68.8% 67.6% 83.4% 72.4%
Note. National Averages Adapted from Retention/Completion Summary Tables. (2009). Retrieved from http://www.act.org/research/policymakers/pdf/09retain_trends.pdf; SUNY Data retrieved from SUNY Portal, October 2009 and ACT 2009 Retention/Completion Summary Tables 2009
3
Students are required to select a major when applying to SUNY Cobleskill, with
the small exception of a one semester exploratory studies program through which less
than 10% of the population chooses to enter. This is important to note as the admission
standards vary by major as do retention rates and graduation rates. It was important for
some of the research to be grouped by academic program to account for the already
established differences in the requirements. Likewise, these differences presented a need
to understand factors outside of admissions’ requirements to help explore relationships to
retention rates.
In an attempt to address retention issues, the college applied for and was awarded
a Title III grant through the US Department of Education in 2008. The five-year grant
project, Improving Student Engagement and Retention, focused on assessment and
engagement efforts (Foster, 2008).The engagement portion focused on enhancing
advisement services, as well as implementing a required first-year course. The course,
Foundations for College Success (FFCS), was initiated in the fall of 2010 and is required
of all freshmen. Embedded in the curriculum for the course are opportunities for service
learning, greater engagement with campus offices, and increased familiarity with the
services and programs offered on campus, as well as career planning. The career planning
element of the course is directly linked with building personal academic plans in the
course; this is done in collaboration with the academic advisors.
In establishing the need for the grant, the proposal stated that large numbers of
SUNY Cobleskill students, nearly a third, transfer to other SUNY schools. Of those
students, 61% transferred at the associate level before earning an associate degree due to
lack of engagement and poor advisement (Foster, 2008). The developers of the course
4
hoped to address these two important aspects of student attrition. Increased retention, as a
by-product of better advisement, and increased student engagement, has financial
implications for the college, as well.
As a public institution in New York, state financial support continues to drop as
the state faces dire economic times. According to the State University of New York’s
Financial Fact book (2010), the SUNY system faced a $97 million decrease in state
appropriations for the 2009-2010 fiscal years. Projections and analyses of state financial
conditions suggest that state funding for SUNY may continue to decline for several years.
In the face of this economic crisis, all institutions are challenged to find ways to do more
with less, which includes retaining students. Retaining students at a higher rate controls
recruitment costs and provides more meaningful learning experiences for students.
Furthermore, students who leave before graduation are not likely to become donors for
that institution (Jamelske, 2008).
Just as the SUNY system is facing financial crises, so are the families who wish to
send their children to college. Because colleges and universities are seeing greater
numbers of applicants with financial need, the financial aid packages have become an
important variable in retention studies. While discussed in the literature as early as the
1980s (Earl, 1989), contemporary researchers continue to recognize the importance of
financial aid and its impact on student retention (Walke, 2010; Braunstein, McGrath &
Pescatrice, 1999).
Federal regulations in financial aid packaging allow colleges and universities to
offer non-need based loans, such as the Parent Loan for Undergraduate Students (PLUS),
to students to off-set the calculated contribution of the family as determined by the Free
5
Application for Federal Student Aid (FAFSA). The school determines the cost of
education, and the expected family contribution (EFC) is calculated by the FAFSA.
Students who qualify are first offered grant based aid, which consists of money that does
not need to be paid back, then federal subsidized loans, and then federal unsubsidized
loans. After those resources are exhausted, there is an option to offer alternative loans,
such as PLUS. Alternative loans are available to close the gap between need-based
financial aid and the cost of education. SUNY Cobleskill has chosen to offer PLUS loans
to help off-set the cost assumed to be covered by the family through the calculations of
the expected family contribution (EFC) on the FAFSA. While this results in larger
financial aid packages, it provides options to families for whom the calculation of the
EFC is not a realistic portrayal of what the family can afford to spend out of pocket
towards the student’s education. The families are under no obligation to accept the
alternative loans but they are made aware of the option. This approach is meant to assist
in providing access to all students, regardless of whether or not they can afford to pay
$500 per year or $15,000 per year.
While the results of the research are important to SUNY Cobleskill, they also are
relevant to a broader audience. As institutions lose nearly 50% of the incoming associate
degree seeking cohort between the first- and second-year of college, this is a serious issue
for enrollment management professionals. Finding ways to better define who is likely to
leave before it happens and to institute college-wide programs to address the reasons for
leaving are important for enrollment professionals to explore. The higher the rate of
attrition, the more resources an institution needs to invest in recruiting a large incoming
6
class. From a broader perspective, the declining persistence of students in postsecondary
education has larger societal implications.
Entering and persisting to graduation in college is a topic of considerable
discussion at the national level, as well. Obtaining a college degree has been linked to a
higher quality of life, more civic engagement, and increased earnings (Baum, Ma &
Payea, 2010; Pennington, 2004). The more educated our society is in general, the higher
the potential is of a more civically engaged, health-minded, self-sufficient society (Baum,
Ma & Payea, 2010).
The undercurrents of the causes and effects of poor retention rates are discussed
in the next section on the theoretical basis for the research. No one theory captures the
intricacies of all of the issues surrounding student retention but there are a number of
theories that provide insights. Therefore, this study made use of a range of theories and
its outcome further informs the field of retention research.
Theoretical Rationale
The study was theory-informed, rather than theory-centric, as no one theory
encapsulates the convergence of both pre- and post-matriculation factors related to
retention. There are two schools of thought from which conventional theories are derived.
In some theories, student engagement is a core factor in retention. The foundational
suppositions of this view can be traced back to the sociological theory of structural
functionalism, better known as functionalism (Maryanski & Turner, 1992). On the other
hand, both the issues of college choice, and to some extent the role of financial aid, can
be explained and interpreted through behaviorism. Both of these theoretical perspectives
were used in this research. No single piece of research reviewed to date viewed the
7
retention issues through the dual lenses of behaviorism and functionalism, though there
are elements of both schools of thought in any exploration of the practical aspects of
college student retention. In order to fully understand the tenets of the contemporary
theories discussed in the literature reviewed, it was important to first understand the
underpinning of the grand theories on which they are based.
Foundational theories. The tenets of both functionalism and behaviorism are
applicable to the issues surrounding student retention. Both look closely at how
individuals interact with society – functionalism from the viewpoint of how the
institutions meet the social needs of individuals and behaviorism from the perspective of
how those interactions will influence outcomes.
Functionalism. Functionalism is based on how social institutions meet social
needs of individuals. “It emerged in the nineteenth century as the result of an analogy:
Society is like a biological organism, and hence, its parts can be analyzed in terms of
their functions for maintaining the ‘body social’” (Maryanski & Turner, 1992, p. 730).
Emile Durkheim applied this theory and used it in such a way that it focused on the need
for social integration. That led to his seminal work, Suicide, in 1851. He theorized that
individuals commit suicide when they do not feel integrated into society. Simply put,
when this isolation occurs, those individuals then commit suicide. It is analogous to
students who do not engage or integrate in their educational institution and then drop out
of college. This is applied in the mini-theories as summarized below.
The basic notions of functionalism can be seen in the ideas behind many
contemporary theorists who seek to understand the factors that influence retention in
higher education. Many theorize that social integration into the college experience,
8
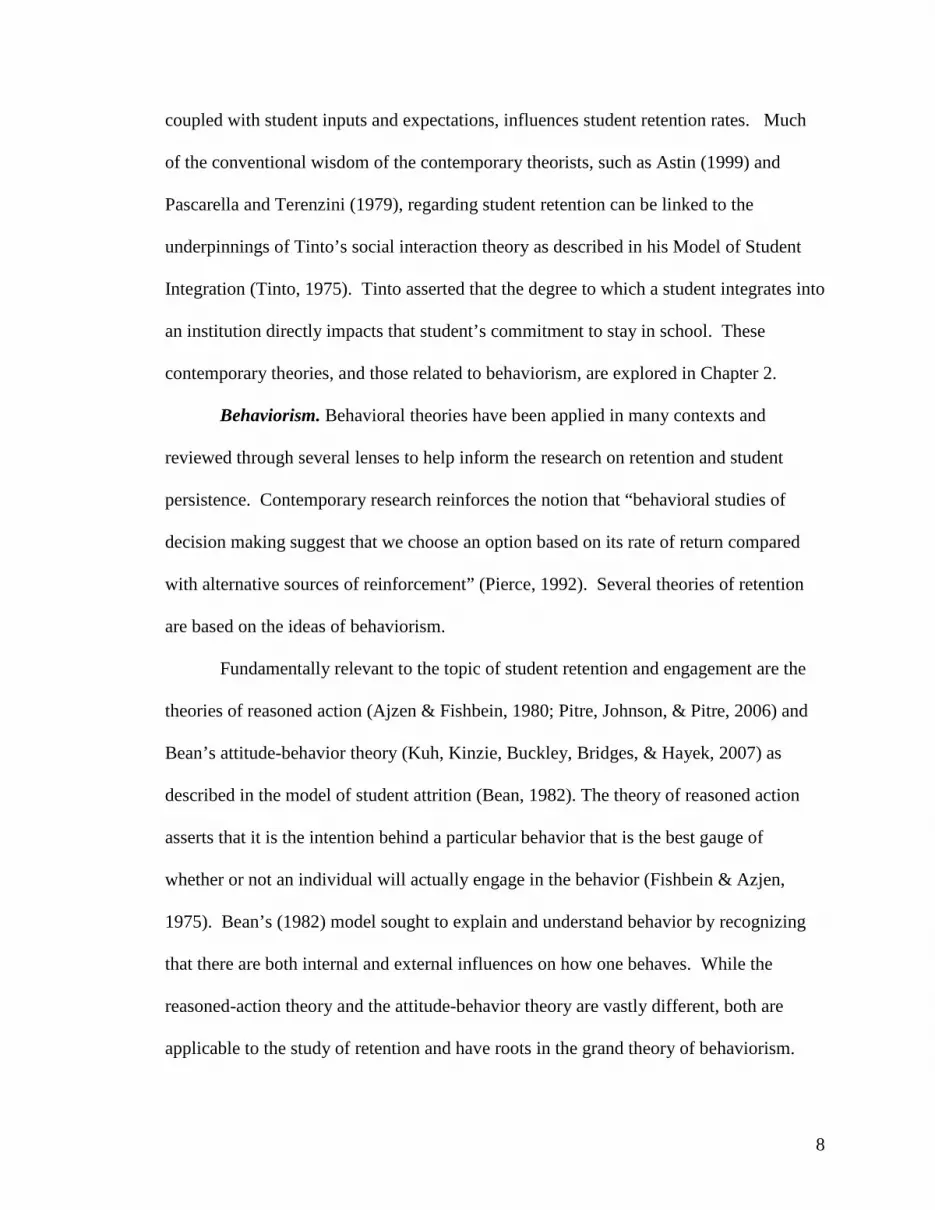
coupled with student inputs and expectations, influences student retention rates. Much
of the conventional wisdom of the contemporary theorists, such as Astin (1999) and
Pascarella and Terenzini (1979), regarding student retention can be linked to the
underpinnings of Tinto’s social interaction theory as described in his Model of Student
Integration (Tinto, 1975). Tinto asserted that the degree to which a student integrates into
an institution directly impacts that student’s commitment to stay in school. These
contemporary theories, and those related to behaviorism, are explored in Chapter 2.
Behaviorism. Behavioral theories have been applied in many contexts and
reviewed through several lenses to help inform the research on retention and student
persistence. Contemporary research reinforces the notion that “behavioral studies of
decision making suggest that we choose an option based on its rate of return compared
with alternative sources of reinforcement” (Pierce, 1992). Several theories of retention
are based on the ideas of behaviorism.
Fundamentally relevant to the topic of student retention and engagement are the
theories of reasoned action (Ajzen & Fishbein, 1980; Pitre, Johnson, & Pitre, 2006) and
Bean’s attitude-behavior theory (Kuh, Kinzie, Buckley, Bridges, & Hayek, 2007) as
described in the model of student attrition (Bean, 1982). The theory of reasoned action
asserts that it is the intention behind a particular behavior that is the best gauge of
whether or not an individual will actually engage in the behavior (Fishbein & Azjen,
1975). Bean’s (1982) model sought to explain and understand behavior by recognizing
that there are both internal and external influences on how one behaves. While the
reasoned-action theory and the attitude-behavior theory are vastly different, both are
applicable to the study of retention and have roots in the grand theory of behaviorism.
9
Significance of Study
Enrollment managers need to gain a better understanding of the variety of factors
that influence student attrition. The student cycle in higher education that is under the
purview of enrollment managers begins with the recruitment process and ends with
graduation. The number of students lost to attrition during the cycle then influences the
amount of effort that needs to go into the recruitment cycle and, of course, plays a
significant role in graduation rates. The more positive influence enrollment managers
have over student attrition, the better able they will be to manage the enrollment cycles of
students at their universities. This study added to the literature by investigating the effects
certain pre- and post-matriculation factors have on student retention.
In a time of limited resources and increased recruitment demands, enrollment
professionals may be able to better target their yield efforts. The answers to the research
questions helped identify which applicants should be the focus of more intensive follow-
up and support efforts. This provided new insights that may help enrollment professionals
uncover new ways of increasing retention rates. In this research, the focus was on
assessment of the relationship between three independent variables - student’s college
choice, expected family contribution, and type and amounts of financial aid awarded -
and one dependent variable - retention.
The study was also significant as it was applied and practitioner based. It sought
to answer an important, timely issue at SUNY Cobleskill. The results helped inform
policy and provided direction for further research, as well as revised practice, at SUNY
Cobleskill. As federal regulations allow campuses to determine how to use non-need
based loans, such as the Parent Loans for Undergraduate Students (PLUS), in their
10
financial aid packaging strategies, the inclusion of this variable is important. Additional
data about the students’ financial situation and their ranked choice of the institution at the
time of application yielded insights that will help direct and focus future retention efforts.
The particular variables studied have been identified as important through a
review of the literature by the researcher. She had oversight of the enrollment service
areas at the college. Furthermore, the researcher had 15 years of experience in higher
education having held a variety of positions in and out of the classroom. The importance
of retaining students is patently obvious. Through the findings of the study, she hopes to
be able to make a significant and immediate impact on retention efforts at the college.
From a theoretical perspective, the study did not seek to test any one theory.
Instead, the study used the collective knowledge proposed by several theorists in an effort
to better understand the problem in a very pragmatic fashion.
Research Questions
The dissertation attempted to answer the question of how pre- and post-
matriculation factors relate to retention of students from the first year to the second year
in associate degree programs at SUNY Cobleskill. The essential questions that guided the
research were as follows.
1. Is there a significant relationship between students’ college choice and their
retention at SUNY Cobleskill?
2. What is the relationship between students’ college choice, students’
matriculated major field of study, and their retention at SUNY Cobleskill?
3. Is there a significant relationship between the students’ level of Expected
Family Contribution (EFC) and their retention at SUNY Cobleskill?
11
4. Is there a significant relationship between students’ type of aid and their
retention at SUNY Cobleskill?
a. Is there a significant relationship between grant aid and their retention at
SUNY Cobleskill?
b. Is there a significant relationship between loan aid and their retention at
SUNY Cobleskill?
c. Is there a significant relationship between scholarship aid and their
retention at SUNY Cobleskill?
5. Is there a significant relationship between total aid received by students’ and
their retention at SUNY Cobleskill?
Purpose of the Study
The purpose of this study was to explore possible relationships between pre- and
post-matriculation factors and retention at SUNY Cobleskill. The factors included the
ranked choice of the institution prior to enrollment as reported on the students’ Free
Application for Federal Student Aid (FAFSA) [pre-matriculation data], the level of
financial need as calculated by the expected family contribution (EFC) [pre-matriculation
data], and financial aid type and amount [post-matriculation] and retention. Several of
the reasons why the topic is of importance include nationally low persistence rates, the
changing nature of the college-bound student and the characteristics of the institution
where the research was conducted.
The study explored the statistical relationships between pre- and post-
matriculation factors (independent variables) and retention (the dependent variable). The
quantitative nature of the study did not attempt to address the underlying reasons behind
12
those factors. For example, college choice was viewed as a variable; however, the reasons
behind why a student ranked the institution as their first or second choice was not
explored. In addition, the data analysis was based on statistical analyses from the family
of correlation and regression methods that can be used with data that is primarily ordinal
in nature. Some statistical procedures required data that were at least interval in nature.
That is, the numbers have similar meaning across the range – a difference of 10 units
between 90 and 100 has the same meaning as the difference between 12 and 22. Some
procedures even required the data be ratio – which means it must meet all of the
requirements of interval data plus have a meaningful 0. With the exception of height and
weight, few types of data used in the social sciences are ratio and many are not even
interval in nature. In this study, many of the variables of interest were ordinal, which
means that the numbers were more than indicators of categories (such as Group 1, Group
2, and Group 3); they were indications of “order.” For example, in this study the
dependent variable of SUNY Cobleskill’s ranking in the student’s stated preference (e.g.
1st Choice, 2nd Choice, and 3rd Choice) was ordinal, but not interval or ratio. Because
many of the important variables in this study were ordinal, the statistical analysis was
limited to correlation and regression procedures that are appropriate to ordinal data.
The study is limited in that it addressed one cohort at one institution because the
purpose was to better understand an issue within a specific, local context. Because of this,
the results were not considered universal and were not automatically generalizable to
other institutions. Instead, readers interested in the results obtained at this institution will
need to factor in their local contexts and needs before accepting the findings or adopting
the recommendations resulting from this study at their institution. Furthermore, the same
13
study conducted at the same institution at a different point in time might yield different
results. This study was conducted during an era of financial and economic crisis in the
nation, the state, and the SUNY system.
While analyzing the impact over several years might provide richer results, the
accelerated nature of the doctoral program in which the researcher is enrolled, combined
with only one year of retention data due to the newly implemented first-year course, were
factors in deciding that only one year of data was analyzed. The introduction of the first
year course is noteworthy and should be acknowledged as an important setting effect for
this study. With that in mind, conclusive judgments of the effectiveness of the new
required first-year course were not made in the dissertation research. There is a need to
conduct the effectiveness research again at another point in time to better assess the
potential gains of the first-year course as it was not one of the variables in this study.
Definition of Terms for This Study
Attrition. First-time college students who do not return for a second year to the same
college at which they began their first year of study.
Cohort. According to the Merriam-Webster on-line dictionary, a cohort can be defined as
“a group of individuals having a statistical factor (as age or class membership) in
common in a demographic study” (2011). For the purposes of this study, the cohort refers
to the group of students who are enrolled at the time of the college’s census as first-time,
full-time students.
College Choice. The study refers to college choice as the self-disclosed ranking of
colleges in terms of preference that students declare at the time of application for federal
student aid.
14
Expected Family Contribution (EFC). According to the federal government , the
Expected Family Contribution (EFC) “is a measure of your family’s financial strength
and is calculated according to a formula established by law” (“Expected Family
Contribution”, n.d. para 1.).
FAFSA. This is the Free Application for Federal Student Aid. In order to participate in
any federal funding programs, students must file this application. This is true of all
institutions in the United States that award federal funds.
Grant. Grant is financial aid funding that does not need to be repaid and is need-based.
Matriculation. Students must apply for admission, be accepted and declare a major to be
considered matriculated.
Retention. This term refers to students who enter college as freshman and then return the
following fall to continue their education at the same institution. Throughout the study,
the term will be used interchangeably with persistence.
Scholarship. Scholarship funds are awarded on several factors. Some scholarships at
SUNY Cobleskill are related to demographics, such as county of residence or major field
of study. Other scholarships are merit-based or based on a combination of factors.
Yield. For the purposes of enrollment management, yield is the difference between those
who are accepted and those who actually enroll in the institution.
Chapter Summary
Trying to gain insight into the reasons why students do not persist in higher
education has been the subject of much research. The research questions for this
dissertation were posed to examine the relationship between specific factors, such as
financial aid type and amounts, and college choice, and retention in associate degree
15
programs offered at SUNY Cobleskill. By understanding how pre- and post-matriculation
factors influence student persistence, the college may be able to better manage and
predict the retention of its incoming student population. This will allow for new or
refined interventions to be implemented.
Chapter 2 outlines a broader review of the theories discussed in Chapter 1. It
outlines models of college choice and retention. That chapter also includes a discussion
of the literature which speaks to both the theoretical rationale and the problems of student
retention.
Chapter 3 presents the research methodology. It includes a synopsis of the
research context and describes the research population. The particulars of the proposed
methodology are also discussed. In Chapter 4, the data analysis is presented. The
dissertation concludes with a discussion of the findings in Chapter 5.
16
Chapter 2: Review of the Literature
Introduction and Purpose
Chapter 2 provides a deeper understanding of the theoretical rationale behind the
proposed topic and examines the findings of the relevant empirical research. This
information is presented after the research questions are reviewed and the relevance of
the study is summarized.
The dissertation attempted to answer the question of how pre- and post-
matriculation factors related to retention of students from the first year to the second year
in associate degree programs at SUNY Cobleskill. The essential questions that guided the
research were:
1. Is there a significant relationship between students’ college choice and their
retention at SUNY Cobleskill?
2. What is the relationship between students’ college choice, students’
matriculated major field of study, and their retention at SUNY Cobleskill?
3. Is there a significant relationship between the students’ level of Expected
Family Contribution (EFC) and their retention at SUNY Cobleskill?
4. Is there a significant relationship between students’ type of aid and their
retention at SUNY Cobleskill?
a. Is there a significant relationship between grant aid and their retention at
SUNY Cobleskill?
17
b. Is there a significant relationship between loan aid and their retention at
SUNY Cobleskill?
c. Is there a significant relationship between scholarship aid and their
retention at SUNY Cobleskill?
5. Is there a significant relationship between total aid received by students’ and
their retention at SUNY Cobleskill?
Institutions work diligently to recruit students; and students lost to attrition
require more resources to be infused into recruitment initiatives. Furthermore, students
who leave before graduation are not likely to become donors for that institution
(Jamelske, 2008). Retention, therefore, impacts the fiscal health of an institution in many
ways. The students’ ability to be successful in society at large is of primary importance.
From the students’ perspective, completing a college degree has significant
implications on their potential earnings and their contributions to society. Baum, Ma and
Payea (2010) completed a comprehensive report for the College Board Advocacy and
Policy Center that described in great detail many of the implications for individuals and
society with regards to higher education. Aside from figures related to potential earnings
based on education level, which are important, there are a number of other factors related
to quality of life and civic engagement. Their findings are summarized as follows:
Federal, state, and local governments enjoy increased tax revenues from college
graduates and spend less on income support programs for them, providing a direct
financial return from investments in postsecondary education. College-educated
adults are more likely than others to receive health insurance and pension benefits
18
from their employers and be satisfied with their jobs. Adults with higher levels of
education are more active citizens than others. College education leads to
healthier lifestyles, reducing health care costs for individuals and for society.
College-educated parents engage in more educational activities with their
children, who are better prepared for school than other children. (p. 4-5)
These findings confirmed Pennington’s (2004) article which pointed out that civic
engagement is linked to educational attainment, as well as being associated with higher
potential earnings. While the disparity is exacerbated by race and income, Pennington
painted a grim picture of the future of the United States if postsecondary degrees
attainment levels decrease instead of increase.
After a review of the theoretical research, the empirical research is discussed as it
relates to financial need, college choice and first-year programming. Recommendations
found in the literature for further research are also presented.
Theoretical Orientation
The tenets of both functionalism and behaviorism are applicable to the issues
surrounding student retention. Both look closely at how individuals interact with society
– functionalism from the viewpoint of how the institutions meet the social needs of
individuals and behaviorism from the perspective of how those interactions will influence
outcomes.
Of the growing body of literature on student retention, most is typically organized
around one or more of the major theories in the field. Much of the available research, in
fact, is structured around the theories reported on by Kuh, Kinzie, Buckley, Bridges, and
Hayek (2007). They summarized the work of the major theorists, including Tinto, Bean,
19
Astin, and Pascarella and Terenzini. While all of the theories speak to retention issues in
higher education, it is Tinto’s latest revision (2006) to his 1975 interactionalist theory that
helps to identify significant areas of research which remain underdeveloped.
Theories grounded in functionalism. Tinto (1975) proposed that the problem of
college dropout is directly related to the level of interaction students have with the
campus on both a social and academic level. He also pointed out that it is important for
researchers to differentiate between academic dismissal and voluntary withdrawal. Tinto
focused his theory on students who withdrew voluntarily from college. He further
clarified why this distinction was important by explaining that a student’s background
directly affects his or her ability and desire to commit to a college. In turn, the student’s
background directly influences the level of student interaction with the institution. Tinto
refers to these as the individual’s “educational goal commitment” and the individual’s
“institutional commitment”. The “educational goal commitment” speaks to the degree to
which the student is invested in pursuing higher education in general. The “institutional
commitment” is the degree the student is dedicated to pursuing a specific type of
education (private, public, prestigious, etc.). Both of these factors play an important role
in understanding how deeply committed the student may be to interacting and engaging
in the college environment once enrolled in college. Tinto’s interactionalist theory is
based on Durkheim’s (1951) theory of suicide. Durkheim relates suicide to a lack of
engagement on the part of an individual to society. Tinto asserts that this is related to
student drop out by postulating that the level of interaction a student has with the
institution is linked to the likelihood of the student dropping out (Tinto, 1975).
20
Pascarella and Terenzini (1979) further developed and tested Tinto’s
interactionalist theory in a longitudinal, quantitative study through a random sampling of
nearly 2,000 students in large, independent, residential universities in New York State.
They statistically controlled for a number of variables, most of which related to the
students’ demographic profiles, i.e. gender, race, high school achievement. They
developed a Likert-item questionnaire designed to further assess the students’ level of
engagement on campus. They focused on those students who voluntarily withdrew and
excluded from their study students who were academically dismissed from school. While
their study confirmed the findings of Tinto’s earlier work on the “complex pattern of
social-psychological relationships” (Pascarella & Terenzini, 1979, p. 208), it further
suggested that the main effects on persistence were most importantly found in the
freshman year. Alexander Astin also speaks to the importance of student involvement.
Astin’s (1999) student involvement theory highlights the importance of
engagement on the part of the student with the campus. Astin defined the construct of
involvement as “the amount of physical and psychological energy that the student
devotes to the academic experience” (p. 518). He focused on how students can become
more involved with campus, not necessarily for the purposes of retention, but on the
assumption that higher retention would result as a natural by-product of increased student
involvement. This theory, based on his initial research which was conducted as a
longitudinal study (Astin, 1975), encouraged higher education institutions to review their
policies and procedures which positively influence students to become more involved.
Nearly thirty years later, Tinto reflected on his foundational findings and offered
suggestions for continued, refined research in the area of student retention. Tinto (2006)
21
summarized his findings, and those of his colleagues, by stating, “We learned that
involvement matters and that it matters most during the critical first year of college” (p.
3). More importantly, he pointed out that there are significant gaps in the theories as few
speak to the question of whether the variety of institutional types is an important variable.
Furthermore, few theories address the combination of the background of a student who
typically pursues higher education coupled with institutional types. He posited that while
research can effectively identify the outcomes - which students tend to leave and why - it
does little to provide guidance for building solid programs and policies that will actually
prevent student attrition from happening.
Given the findings of the driving theorists, there has been a focus on
programming for the first year of college over the past twenty years. There are specific
organizations, such as the John F. Gardner Institute for Excellence in Undergraduate
Education (www.fyfoundations.org), devoted to assisting colleges with developing
programs and practices aimed at the first year of college for the specific purpose of
positively influencing retention rates. In addition to the ideas and theories regarding
student engagement presented, the grand theory of behaviorism also informed the
research through its influence on the theory of reasoned action (Fishbein & Ajzen, 1980)
and Bean’s Model of Student Attrition (Bean, 1982).
Theories grounded in behaviorism. Fishbein and Ajzen (1975) proposed in the
theory of reasoned action that the intention behind a particular behavior of an individual
is the best way to quantify whether or not an individual will actually engage in the
behavior. This is directly applicable in the research as it relates to college choice. How
does a student make the decision about which college to attend? What are the
22
consequences of selecting a particular college? What are the consequences of intending to
pursue college? How does financial award packaging affect student choice and
persistence? The theory of reasoned action has the potential to help inform the answers to
those questions.
The theory of reasoned action attaches considerable importance to intention when
weighing behavior and behavioral change (Ajzen, 1985). Ajzen (1985) asserted that an
individual’s perceived impressions of society, together with the individual’s perceptions
of behaviors, helps to shape the consideration behind whether or not to perform a
particular behavior. While the literature reviewed to date did not reveal the use of the
theory to a great extent outside of consumerist applications, there is potential
applicability to the issues surrounding student engagement and college choice. It is
possible that student behaviors and the intentions behind them directly influence the
degree to which they persist in college. For some individuals, the behaviors leading up to
selecting a college and the intention to enroll could be better understood through the use
of reasoned action theory. Ajzen’s theory is one behaviorally-based theory of college
choice. Pitre, Johnson, and Pitre (2006) used this theory along with general choice
models. They proposed a more consumerist approach that hopes to inform the field and
provide a new direction for how enrollment managers should consider student behaviors
as they relate to the college choice process.
Another theory that has its roots in behaviorism is Bean’s Model of Student
Attrition (1982). Bean sought to provide an alternative view to Tinto through his Model
of Student Attrition (1982). This model built on an attitude-behavior theory (Cabrera,
Castaneda, Nora & Hengstler, 1992). Unlike Tinto’s theory, Bean’s model recognized
23
influences on behavior from both inside and outside an organization and he factored
those influences into behaviors. For example, he proposed that beliefs shape attitudes. If a
student believes that s/he has family approval, his/her attitude towards college would be
different. Furthermore, if the student has a positive experience at the institution, that
would also assist in shaping the attitude towards persisting in college and therefore
influence the student’s behavior. In that example, a student would more likely persist in
college if s/he had both a positive experience at the institution and familial approval to
attend that institution. In essence, positive influences internal and external to the
institution would then be predictors of student retention.
Criticisms and convergence of the theories. The many relevant theories
typically focus on some of the same factors affecting student retention. However, where
they diverge greatly is whether those factors are inputs or outputs. For example, where
Tinto might view the level of a student’s academic engagement through grades earned,
Bean may look at the grades as an outcome of a student’s belief or attitude towards
his/her ability to succeed academically. Both theorists view grades as important, but how
they are used and understood in the theory is strikingly different.
Whether the theories originate from the sociological standpoint of functionalism
or the social-psychological perspectives of behaviorism, they all recognize that student
persistence is as complex as the variables are vast. Cabrera et al. (1992) summarized the
overarching themes when comparing and contrasting Tinto and Bean’s perspectives by
stating, “as to the question of what model portrays a better representation of the college
persistence process, the answer depends on the specific criterion under consideration” (p.
158).
24
Empirical Findings
The section on empirical findings is organized to provide relevant research on the
variables in the proposed research questions. Rarely is one variable the subject of
research. For example, the variables of college choice and financial aid are frequently
combined in research studies. Another example is research on first-year programming.
Discussion on future research that is suggested in the literature reviewed follows the
summary of the empirical findings.
Attitude and behavior as they relate to college choice through the lens of college
cost was discussed by Paulsen and St. John. In their article, Social Class and College
Costs (2002), they address the question of “how college costs affect the college-choice
and persistence decisions of students in four different income groups” (p. 189). These
researchers uncovered a difference in college persistence among social classes based
upon attitudes toward the costs of higher education. They discussed two distinct ways in
which college costs influence the pursuit of a college education. More importantly, their
findings describe how those influences are not universal, but apply differently based upon
social class. Little to no positive effect on college persistence was found when reviewing
low-income students’ college choices based upon college costs. However, middle- and
high-income students’ patterns of persistence tended to increase when their college
choice was based upon a conscious decision related to college costs. This finding of the
study was explained by linking the rising cost of college attendance to declining grant
support over the past two decades. It further emphasized the role that financial factors
play in students’ decision making and the choices they make regarding college.
25
Earl (1989) reported in his retrospective of the impact of aid in the 1970s and
cautioned universities of the impending predicted decline in financial aid and high school
population. His words of caution are as relevant today, twenty-two years later. His
analyses occurred at the birth of declining state appropriations, the affects of which
colleges are fully feeling today in the face of continued cuts. He noted the importance of
financial aid and socioeconomic status in college retention and demonstrated the effects
these factors play in both attracting, admitting and retaining students. While dated, his
research continues to inform and be reinforced by more contemporary studies, such as
Walke’s 2010 dissertation.
Walke (2010) conducted his research at Norfolk University using a sample of
approximately one-third of the fall 2006 entering cohort, roughly 400 students. He
explored the relationship between college choice and freshman retention by studying a
variety of factors, including pre-matriculation perceptions, college search measures, type
and amount of aid received, and retention. Primarily using regression analysis, financial
aid emerged as a factor in student retention. He found that increased amounts of aid
awards “were associated with increased odds of a student being retained” (p. 72). The
variable, receiving aid, however, was differentiated among types of aid in Singell’s
(2001) report.
Singell’s report reviewed the decision to enroll and re-enroll using a yielded a
bivariate probit regression model. His concept of re-enrolling links directly to the idea
behind retention. What he presented differently was the impact that aid has on a student’s
decision to re-enroll or, to even file an application for federal student aid. He reviewed a
number of demographic statistics from students attending a large public university,
26
coupled with data regarding student choice. The results confirmed that financial aid does
have an impact on student enrollment and retention. The research specifically found that
different types of aid have differing impacts on different students. For example, he found
that all types of need-based aid have a positive impact on enrollment, but not to the same
degree. Likewise, merit-based aid was found to have the greatest impact on students who
were from relatively low-need, high achieving families.
While initially, Braunstein, McGrath, and Pescatrice (1999) found financial aid to
have an impact on student persistence, their follow-up study published in 2000
contradicted their initial findings. Their initial study was conducted in 1992-1993 at a
single institution of higher education. They chose to expand this research by including
1991-1992 and 1993-1994 at the same institution and conducted a regression analysis on
the findings (Braunstein, McGrath, & Pescatrice, 2000).The results of this expanded
research indicated that no significant impact resulted for the type and amount of financial
aid awarded. The researchers made a point of noting that logistic regression, unlike path
analysis, does not account for possible indirect effects. It is therefore possible that
financial aid does play a role as indicated in their earlier study, but that the statistical
measures used in their complementary research did not attempt to account for indirect
effects. Not surprisingly, the major findings indicated that students who were at the
highest achievement levels and the highest socio-economic status persisted at higher rates
than those who entered at the bottom 25% of their class and had greater financial need.
An important factor that emerged in this and other studies reviewed was that academic
success and engagement in the first year of enrollment supersedes many secondary
factors when trying to understand retention.
27
Braunstein et al. (2000) concluded that it is important for future research to be
conducted at singular institutions with the involvement of admissions and financial aid
professionals and that it be contemporary – focused on students in the moment rather than
looking at past data. As the fiscal health of the nation changes and continues to impact
many families, conducting research that analyzes what is happening on a campus in the
present day, rather than retrospectively, will be more valuable and more relevant to
enrollment professionals who are addressing retention issues on those campuses.
Not unlike the findings of Braunstein et al. (2000), Wessel, Bell, McPherson,
Costello and Jones (2006) found that those with a greater financial need persisted at
lower rates. However, their longitudinal study of 21,243 students at a midsize public
research-intensive institution in the Midwest did find that academic ability overcame the
persistence on average over students classified in financial aid categories alone. When the
financial aid categories were stratified by academic abilities, the need became less of a
factor in persistence. For their study, financial aid was defined based on the amount of
Pell grant received. Pell grants are awarded based on family financial need and are
federally funded. The Pell grant program was initiated by the federal government as a
way to ensure that students who were qualified to enter higher education would have
additional financial help regardless of their financial backgrounds (Baime & Mullin,
2010). It is designed to assist low-income undergraduate students and is determined
based on a formula that considers a multitude of factors.
Academic ability was defined by SAT scores and high school percentile ranks for
the study. The analyses run by the Wessel et al. consisted of averages and percentiles as
they wanted the findings to best represent general trends in the data and be useful to
28
practitioners on campus. While an analysis on financial aid alone found the neediest
dropped out of school at the highest rates, inclusion of academic ability suggested
different conclusions. Students who had academic ability above the median persisted at
higher rates than the average of all students in all financial aid categories. Likewise,
students who had academic abilities below the median persisted at lower rates than the
average in each financial aid category. This research notes the importance of reviewing
multiple factors and suggests further research of this type be conducted. Pell grant data
was also used in the research reported in 2011 by Goldrick-Rab, Harris, Benson and
Kelchen.
Goldrick-Rab et al. (2011) discussed the findings of their research conducted on
the Wisconsin Scholars Program. The Wisconsin Scholars Grant program provided
additional grant funds to a randomized sample of first-time, traditional-aged students who
were already receiving the Federal Pell grant across 13 of Wisconsin public universities.
These students were tracked for three years, and through quantitative methods, their
progress towards degree completion was measured. The parameters of the participation in
the program mirrored the requirements of the Pell grant as students had to maintain C or
better averages, qualify financially and enroll in at least 12 credits per semester. The
results of this research found that while retention to graduation as a whole was not
significantly affected, the number of credits earned was positively affected. This affect
was found only for those students who were traditionally less likely to persist.
Students who were initially categorized as more likely to persist were found to be
negatively impacted by the additional funds. The researchers hypothesized that for these
students, the funds were not used to enhance their education, while for the most needy,
29
the funds were used to support their families and their educational experiences. As a
result of being able to support their families, the families could then be more supportive
of the student’s desire to pursue an education. The authors noted that this is an area where
more research is needed and that more qualitative measures would be appropriate to
explore. These findings were not unlike other studies which have found that the greatest
impact of increased aid is found among those who need it the most. While the researchers
based much of their work on consumerist theories, it is appropriate to also review their
work through the lens of behaviorism and Bean’s work (1982). In this view, one can see
how providing support to the students, which enhances familial support, would result in a
positive impact on student retention. Environmental inputs, among others, were discussed
in the research of Wohlgemuth, Whalen, Sullivan, Nading, Shelley and Wang (2006).
Regression analysis was used in Wohlgemuth et al.’s (2006) research on retention
and graduation rates. They reviewed the fall 1996 entering cohort at a research university
located in the Midwest. The purpose of the study was to determine “what identifiable
student input characteristics and environmental includes can be used to predict year-by-
year retention, and graduation, within six years” (p. 462). The analysis was framed using
Astin’s I-E-O model (1993). The environmental variables were categorized as: honors
students, student athletes and major field of study, as well as financial aid awarded. The
inputs included age, ethnicity, gender, state residency, first generation, high school rank,
and ACT scores. Of the multitude of findings discussed, the most relevant to this
dissertation were the findings related to financial aid. Wohlgemuth et al.’s (2006) study
found that aid in any form led to higher retention. They hypothesized that “increased aid
reduces the current financial resources required to complete the degree and makes staying
30
in college more feasible financially” (p. 472). However, as discussed in previous studies
reviewed (Goldrick-Rab et al., 2000; Wessel, 2006), this was not a universal finding and
is an area where further research is merited.
Edward St. John (2000) captured the discussion surrounding student aid,
recruitment and retention very succinctly:
The cumulative body of research on the impact of student aid on persistence
indicates that there is an implied contract between institutions and students. The
implied contract is formed in the recruitment process (forming initial
expectations) and influences subsequent decisions about the commitment to
continue enrollment. (p. 71)
He pointed out that because aid is linked with persistence, it cannot be ignored during the
recruitment cycle. He encouraged further research in this area to help inform public
policy and to provide results on how declining government grant-based funding has
impacted student access and persistence in higher education. St. John also mentioned that
the foundational suppositions of Tinto’s original theory excluded financial aid as a factor.
While more recent studies, such as St. John’s, raised awareness around the importance of
aid, there was a gap in the literature with regard to this factor as it relates to persistence.
A relatively new model of student departure was suggested in Mary Ann Irwin’s
dissertation (2010). Her qualitative study focused on students who were involved in a
program at a public university designed to promote success and access for low-income
students. She coined her model the Decision-Making Process Model of Student Departure
(p. 84) and framed the process by which students decided to withdraw as a push-pull
model that consists of a number of institutional ‘pushes’ (i.e. financial aid, academic
31
difficulties) and ‘pulls’ (i.e. homesickness, family financial problems). It is the
negotiation of these ‘pushes’ and ‘pulls’ that then affected the process by which they
decided to withdraw. Irwin built upon several of the theories discussed in the literature to
date, including Tinto and Bean. Her outlook is unique in that is has resulted in a new
framework which is meant to raise the awareness of student affairs professionals assisting
students who may be on the verge of withdrawing. As with other studies, financial aid
and college choice played a role in the process; however, the framework was different as
it linked the original reasons for enrolling directly to the reasons for withdrawing. She, as
others, noted the importance of the first year of college in the overall impact on retention.
College choice and financial aid were a few of the many variables analyzed in the
Cooperative Institutional Research Program (CIRP) at the Higher Education Research
Institute (HERI) at UCLA. Every year, HERI surveys freshmen across the nation,
compiles its findings and releases them in its annual publication. “The American
Freshman: National Norms Fall 2011” (Pryor, DeAngelo, Palucki Blake, Hurtado, &
Tran, 2011) reported that fewer students are receiving appreciable scholarships while the
number of students using loans and accumulating indebtedness is growing substantially.
Compared to 2010 when 5.6% of students anticipated using $10,000 for the first year of
college, 13.3% report using $10,000 in 2011, more than doubling the rate from 10 years
ago (Pryor et al., 2011).
The 2011 CIRP report also looked at trends regarding choice and found a gap
between “acceptances at first-choice institutions and actual attendance at those schools”
(Pryor et al., 2011, p 12). Interestingly, this gap was most apparent among first
generation students. According to Pryor et al., the importance of being closer to home
32
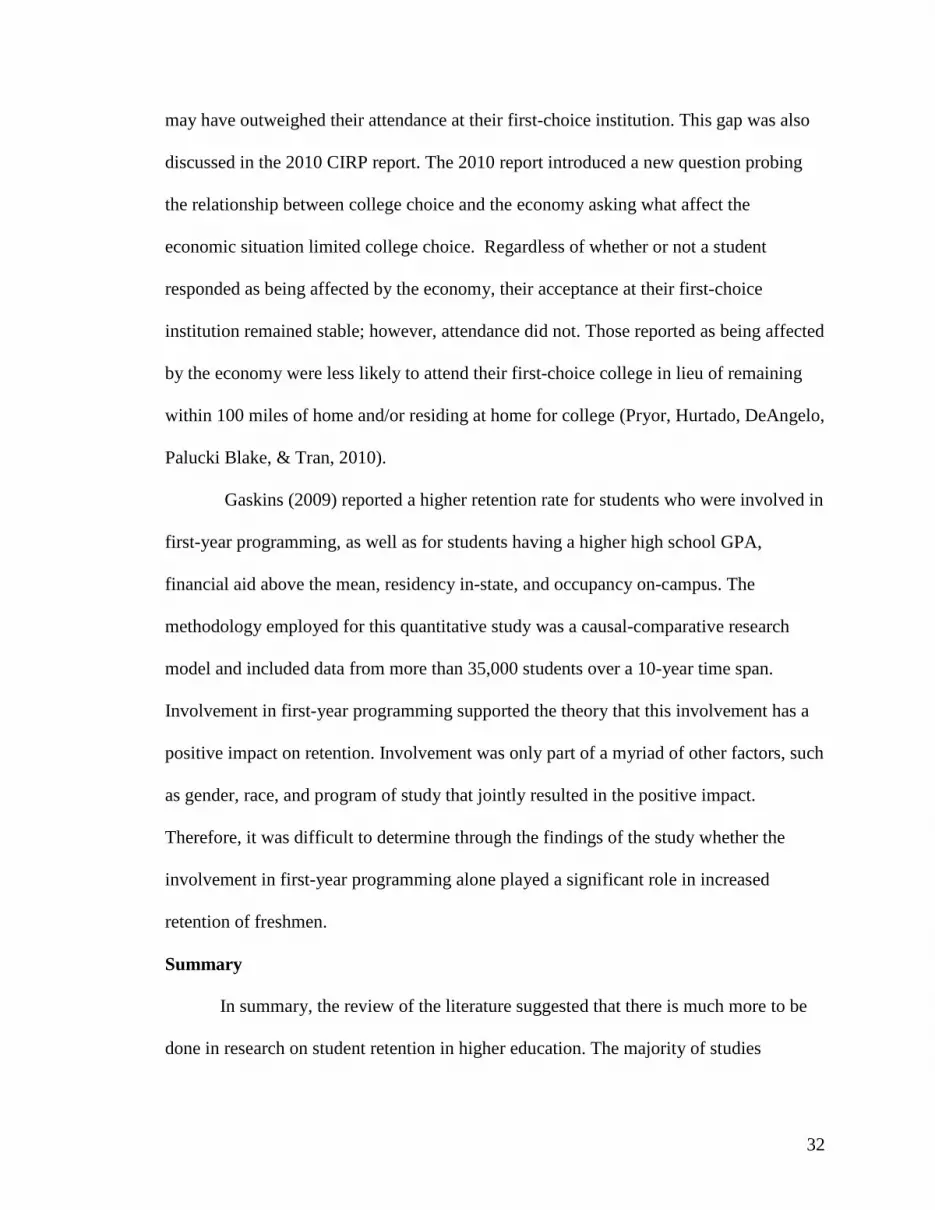
may have outweighed their attendance at their first-choice institution. This gap was also
discussed in the 2010 CIRP report. The 2010 report introduced a new question probing
the relationship between college choice and the economy asking what affect the
economic situation limited college choice. Regardless of whether or not a student
responded as being affected by the economy, their acceptance at their first-choice
institution remained stable; however, attendance did not. Those reported as being affected
by the economy were less likely to attend their first-choice college in lieu of remaining
within 100 miles of home and/or residing at home for college (Pryor, Hurtado, DeAngelo,
Palucki Blake, & Tran, 2010).
Gaskins (2009) reported a higher retention rate for students who were involved in
first-year programming, as well as for students having a higher high school GPA,
financial aid above the mean, residency in-state, and occupancy on-campus. The
methodology employed for this quantitative study was a causal-comparative research
model and included data from more than 35,000 students over a 10-year time span.
Involvement in first-year programming supported the theory that this involvement has a
positive impact on retention. Involvement was only part of a myriad of other factors, such
as gender, race, and program of study that jointly resulted in the positive impact.
Therefore, it was difficult to determine through the findings of the study whether the
involvement in first-year programming alone played a significant role in increased
retention of freshmen.
Summary
In summary, the review of the literature suggested that there is much more to be
done in research on student retention in higher education. The majority of studies
33
reviewed were conducted using either quantitative methods or mixed-methods and the
context was often large research-based universities. While the literature does speak to
college choice, much of it is examined from a qualitative perspective as to how students
select colleges, rather than whether or not that choice correlates with an increased
likelihood of a student to persist in college. Gaps exist in the research on financial need
and social class, as well.
The empirical research on financial need and social class is often limited. Studies
which focus on these factors are often researched through a particular ethnicity or social
class. Few of the articles reviewed view social class holistically as one factor as opposed
to the baseline for discussion. As the nation faces even more dire economic times, and the
predictions regarding the increasing social divide unfold, the implications for a greater
understanding as to how financial need affects college retention will only increase.
As indicated in the findings section of the literature reviewed, there is still much
to learn about retention of students in higher education. This study added to the available
literature, with a focus on closing the gaps found in the literature reviewed regarding
institution type and factor combination. The analysis of the factors discussed in the
literature, specifically financial need as calculated by a student’s EFC, financial aid
amount and type, college choice and retention were the focus of this research. The
methodology used in the research is described in Chapter 3.
34
Chapter 3: Research Design Methodology
General Perspective
This study examined the relationship between pre- and post-matriculation factors
and retention from the first year to the second year in associate degree programs at
SUNY Cobleskill. The essential questions that guided the research were:
1. Is there a significant relationship between students’ college choice and their
retention at SUNY Cobleskill?
2. What is the relationship between students’ college choice, students’
matriculated major field of study, and their retention at SUNY Cobleskill?
3. Is there a significant relationship between the students’ level of Expected
Family Contribution (EFC) and their retention at SUNY Cobleskill?
4. Is there a significant relationship between students’ type of aid and their
retention at SUNY Cobleskill?
a. Is there a significant relationship between grant aid and their retention at
SUNY Cobleskill?
b. Is there a significant relationship loan aid and their retention at SUNY
Cobleskill?
c. Is there a significant relationship between scholarship aid and their
retention at SUNY Cobleskill?
5. Is there a significant relationship between total aid received by the students
and their retention at SUNY Cobleskill?
35
The purpose of the research was multi-faceted as it attempted to look at both pre-
and post-matriculation data. For the purpose of the study, those data were limited to:
• the ranked choice of the institution prior to enrollment as reported on the
student’s Free Application for Federal Student Aid (FAFSA) (pre-
matriculation data),
• the students’ financial aid (pre-matriculation data),
• the type and amount of aid a student received (post-matriculation data), and
• retention.
Quantitative methodologies were employed to carry out the proposed research.
The majority of the previous empirical studies used quantitative methodologies, although
some used mixed methods. Specifically, regression analysis, path analysis, Chi Square,
and t-tests were most common in the literature. Analyzing the research questions through
statistical measures was appropriate for larger samples and well structured quantitative
data that represent a limited set of variables.
Research Context
The research was conducted at SUNY Cobleskill. The college offers
baccalaureate and associate degrees in over 50 programs housed among 12 departments
in three distinct schools – the School of Agriculture, the School of Business, and the
School of Liberal Arts and Sciences. One of 64 campuses that comprise the SUNY
system, SUNY Cobleskill is classified as one of five SUNY Colleges of Technology.
Most of the associate degree programs at SUNY Cobleskill are applied and technical in
nature. The campus is situated approximately 35 miles from Albany and in a rural
environment. Approximately 2,600 students attend SUNY Cobleskill, and typically 65%
36
of that population seeks an associate degree. The College is situated in the village of
Cobleskill, which has fewer than 7,000 residents.
In an attempt to address retention issues, the College instituted a required
freshman year course, Foundations for College Success (FFCS) in the fall of 2010. Due
to the applied nature of the research and the addition of the FFCS course as a
requirement, the research followed one entering cohort for two years. While not directly
relevant to the research, but important to understanding the environment at the College,
several changes in the administration occurred during this same time period. These
changes included a college president in his third year on campus who retired
unexpectedly in the summer of 2011, a new college president, a new college provost and
consolidation of responsibilities at the dean’s level, as well as shifting responsibility for
enrollment services and oversight of first-year programming.
Research Participants
The research participants were the incoming fall 2010 cohort of full-time students
attending college for the first time. The entire cohort of 785 students was reduced to only
those that were associate degree candidates. This resulted in approximately 570 students
who served as the research sample. This cohort was tracked to the fall 2011 official
census conducted in the third week of the fall 2011 semester. An analysis of the variables
described in the research questions was then conducted in the fall of 2011.
Instruments Used in Data Collection
Official student data is housed in the college’s data management system referred
to as Banner. Official grades for courses, as well as all demographic information and
financial aid information are also housed in Banner. The variables identified in the
37
research questions, as well as data to provide descriptive statistics of the sample were
extracted directly from the Banner system through the use of existing programs that were
already used by the college for official reporting purposes. The demographic information
was obtained directly from the student applications that were received electronically from
the SUNY Application Processing Center. The financial aid data in the system was
received directly from the information that is placed on the FAFSA by the student and
verified through the financial aid office. All information pertaining to student grades and
schedules were placed directly in the system via the Registrar’s Office or by the
instructors of record for the courses in which the students were enrolled. The validity and
reliability of this information is considered extremely high. It is the official record for the
college.
Data Analysis
There were several steps to the data analysis. The data was first retrieved from
Banner and then extracted into a database. Once in a database, it was further defined and
analyzed using the Statistical Package for the Social Sciences (SPSS) software.
Several types of statistical analysis have been used in studies of factors that impact
student retention, student satisfaction, and student success in college. The procedures
used are often somewhat restricted because the type of quantitative data collected is
typically nominal and ordinal rather than interval or ratio. Analysis of nominal and
ordinal data calls for different statistical procedures than those that can be used, for
example, with interval data. The most common statistical analyses used in retention
research are:
38
Chi Square. Chi Square is a non-parametric statistic often used to compare
patterns or distributions of data from two or more groups such as students who remained
in college versus those who dropped out. An example of the use of Chi Square analysis is
Malik’s (2011) dissertation study of the impact of a first- year seminar designed to
increase the retention rate of college students. He used a Chi Square statistic to compare
the retention rate of two groups of first-year college students. One group attended five or
fewer sessions of the seminar while the other group attended six sessions or more.
Although the retention rates for the two groups were in favor of the group that attended
more sessions (76% versus 65%), the Chi Square was not significant.
t-tests and Analysis of Variance (ANOVA). Where it is important to compare
the retention or satisfaction rates between two or more groups of students, statistics such
as t-tests (for comparisons between two groups) and Analysis of Variance (for
comparisons between three or more groups) are also frequently used. For example,
Malik (2011) used t-tests to compare the scores of the low and high attendance students
mentioned above on measures such as critical thinking and connections with faculty.
Neither of these comparisons was significant.
In another dissertation, Stewart (2010) used ANOVAs to “examine student
demographic, family characteristics, pre-college, and college academic factors that
predict persistence between freshmen students who were placed or not placed in
remediation courses.” For example, Stewart used a 2 X 2 analysis of variance to study
whether gender (Male or Female) and Remediation Status (placed in remedial courses
versus not placed in remedial courses) had a statistically significant impact on retention.
There were no significant differences in retention attributable to gender but there were for
39
remediation status (students taking remediation courses actually had significantly lower
retention rates). Also, the interaction between gender and remediation status was not
significant.
Kendall’s Tau and Cramer’s V. Kendall’s Tau is a measure of correlation that
measures the strength of the relationship between two variables (Crichton, 2001). In a
dissertation by Miles (2009), Kendall’s Tau was used to test the correlation “between the
degree to which mothers have a clear idea about careers that would suit their daughter
and the degree to which participants have discussed career options or plans with their
mother” (p. 112). Miles’ dissertation was exploring the factors which may contribute to
females pursuing degrees in the information technology field. The Kendall’s Tau for this
particular question resulted in a statistically significant finding leading to the notion that
“the more participants agreed that their mother had a clear idea, the more often
participants discussed career options with them” (p. 122).
In Hulela’s (2007) research on Iowa teachers’ perceptions and agricultural
education, a variety of analyses were utilized, including Cramer’s V. “The extent of
association between the participants’ place of graduation and the level of perceived
effectiveness of programs was calculated using Cramer’s V. There was a positive
substantial association (V= .648) between the two variables” (p. 82). For this study, the
strong relationship indicated that teachers who did not graduate from Iowa State
University perceived their preparation was more effective (Hulela, 2007). The use of
Cramer’s V in this situation was appropriate as it tested the strength of the relationship
between nominal data sets.
40
In this research study on the relationship between pre- and post-matriculations
factors and college student retention, most of the research questions were addressed using
a Chi Square test, while others involving group comparisons required Kendall’s Tau or
Cramer’s V. The Chi Square test was appropriate as the researcher was evaluating
whether or not a relationship existed between several different nominal variables within a
single sample of subjects (Huck, 2008). As the size of data set was important when using
Chi Square tests, the entire population of 570 students was used rather than an extracted
sample. For each research question, the appropriate variables were arranged in a
contingency table, and then a Chi Square test was run. The results determined whether or
not a statistically significant relationship existed between the variables. Because of the
size and nature of the data, the Chi Square was the most appropriate statistical measure.
However, the researcher must be careful not to draw conclusions without further analysis
when a statistically significant outcome is achieved when comparing three or more
samples. Chi Square was used for research questions one, two and five. For the third and
fourth research questions, Kendall’s Tau and Cramer’s V were used.
Summary
As part of the college’s standard operating procedures, the official census data is
run from the Banner system at the end of the third week of every semester and is kept on
file at the Office of Institutional Research, as well as being submitted to SUNY system
administration. Official financial aid data is also housed in Banner and maintained by the
Office of Financial Aid and is also submitted to SUNY system administration. Official
grades are in the Office of the Registrar and housed in the banner system. The files for
both falls 2010 and fall 2011 were obtained from these offices. The official census date
41
for fall 2011 was September 16, 2011 and the files were obtained shortly after that date.
The files contained information with all relevant variables for the entire population of
students in attendance at the college at the point of census. The research population of
first time, full time, associate degree seeking students who applied for financial aid for
fall 2010 was extracted and placed into an Access database. Data on the same population
was extracted from the financial aid database and placed in the same Access database. A
query was performed to combine the variables held in each separate table and place them
into one table. This combined table was placed into SPSS to allow statistical tests to be
conducted.
Once in SPSS, descriptive statistics, including gender, ethnicity, average family
expected family contribution, state of residence, average high school gpa, major field of
study school, average total aid package, total receiving grant aid and average amount, and
total receiving loans and average amount, were run. The summary results of the
descriptive statistics were reported in a narrative form and can be found in Appendix B.
Once the descriptive statistics were run and documented, the appropriate
statistical procedures were run to analyze relevant data for each research question. As
noted, Chi Square, Kendall’s Tau and Cramer’s V were used. The results were explained
in narrative form and the raw data was depicted in tables where appropriate.
42
Chapter 4: Results
This chapter presents each research question identified in Chapter 1, along with a
synopsis of relevant findings. Each research question is then presented with the relevant
data analysis. This includes a graphical presentation of the descriptive data that led to the
findings, followed by inferential statistics and post hoc analyses of questions that arose
during the analysis process.
Research Questions
The essential questions and synopsis of findings are:
1. Is there a significant relationship between students’ college choice and their
retention at SUNY Cobleskill? The findings suggested that the pattern of
retention/non retention was the same across three levels of school choice.
2. What is the relationship between students’ college choice, students’
matriculated major field of study, and their retention at SUNY Cobleskill?
The rate at which students did or did not return was not predicted by the
particular field of study they selected when analyzed through the lens of
school choice.
3. Is there a significant relationship between the students’ level of Expected
Family Contribution (EFC) and their retention at SUNY Cobleskill? There
was not a statistically significant relationship between expected family
contribution and retention at SUNY Cobleskill.
43
4. Is there a significant relationship between students’ type of aid and their
retention at SUNY Cobleskill? When grouped by type of aid received, the
differences in the rate at which students returned was not statistically
significant.
a. Is there a significant relationship between grant aid and their retention at
SUNY Cobleskill? A weak relationship existed that was not statistically
significant (.08). This approached statistical significance, but the
relationship was so weak that it has little, if any, practical significance in
terms of predicting retention.
b. Is there a significant relationship between loan aid and their retention at
SUNY Cobleskill? When analyzed against retention, the receipt of loan
aid was not statistically significant.
c. Is there a significant relationship between scholarship aid and their
retention at SUNY Cobleskill? Because of the small number of affected
students and the limited amount of scholarship funding, there was no
further statistical analysis of this sub-question.
5. Is there a significant relationship between the total aid received by students
and their retention at SUNY Cobleskill? The Kendall’s Tau showed a
statistically significant relationship beyond the .0001 level. The practical
significance of this finding suggested that student aid amounts may be
predictive of persistence rates.
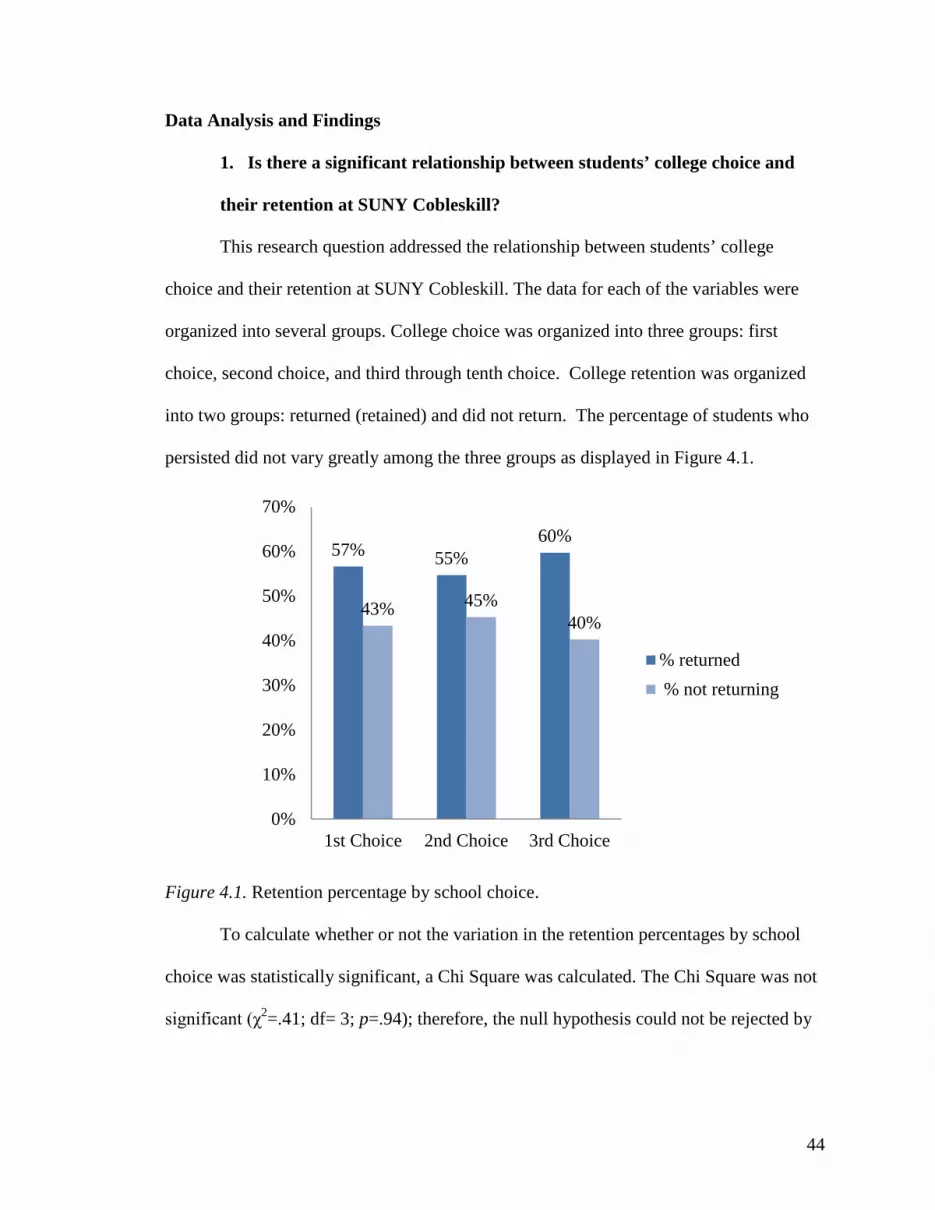
44
Data Analysis and Findings
1. Is there a significant relationship between students’ college choice and
their retention at SUNY Cobleskill?
This research question addressed the relationship between students’ college
choice and their retention at SUNY Cobleskill. The data for each of the variables were
organized into several groups. College choice was organized into three groups: first
choice, second choice, and third through tenth choice. College retention was organized
into two groups: returned (retained) and did not return. The percentage of students who
persisted did not vary greatly among the three groups as displayed in Figure 4.1.
Figure 4.1. Retention percentage by school choice.
To calculate whether or not the variation in the retention percentages by school
choice was statistically significant, a Chi Square was calculated. The Chi Square was not
significant (χ2=.41; df= 3; p=.94); therefore, the null hypothesis could not be rejected by
57% 55% 60%
43% 45% 40%
0%
10%
20%
30%
40%
50%
60%
70%
1st Choice 2nd Choice 3rd Choice
% returned % not returning
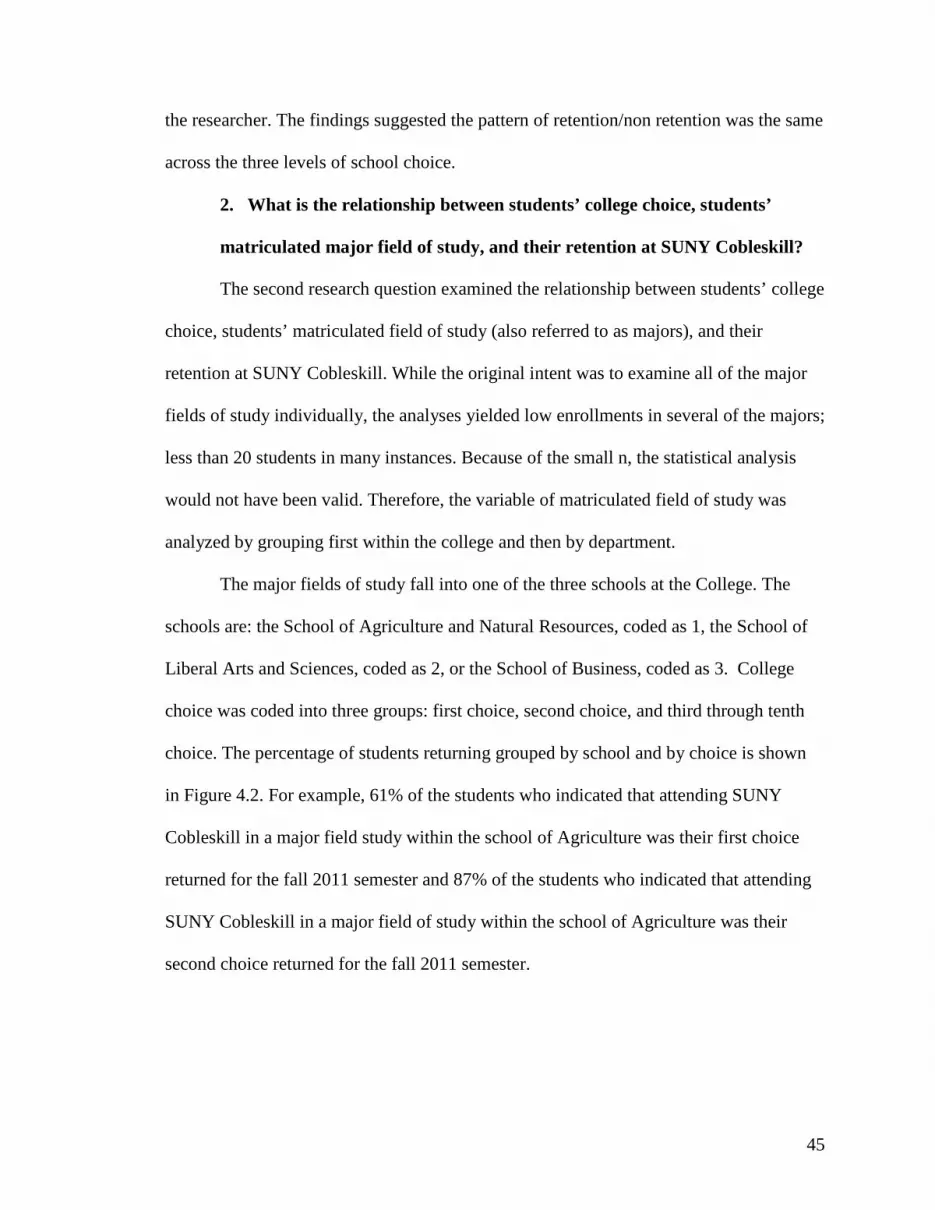
45
the researcher. The findings suggested the pattern of retention/non retention was the same
across the three levels of school choice.
2. What is the relationship between students’ college choice, students’
matriculated major field of study, and their retention at SUNY Cobleskill?
The second research question examined the relationship between students’ college
choice, students’ matriculated field of study (also referred to as majors), and their
retention at SUNY Cobleskill. While the original intent was to examine all of the major
fields of study individually, the analyses yielded low enrollments in several of the majors;
less than 20 students in many instances. Because of the small n, the statistical analysis
would not have been valid. Therefore, the variable of matriculated field of study was
analyzed by grouping first within the college and then by department.
The major fields of study fall into one of the three schools at the College. The
schools are: the School of Agriculture and Natural Resources, coded as 1, the School of
Liberal Arts and Sciences, coded as 2, or the School of Business, coded as 3. College
choice was coded into three groups: first choice, second choice, and third through tenth
choice. The percentage of students returning grouped by school and by choice is shown
in Figure 4.2. For example, 61% of the students who indicated that attending SUNY
Cobleskill in a major field study within the school of Agriculture was their first choice
returned for the fall 2011 semester and 87% of the students who indicated that attending
SUNY Cobleskill in a major field of study within the school of Agriculture was their
second choice returned for the fall 2011 semester.
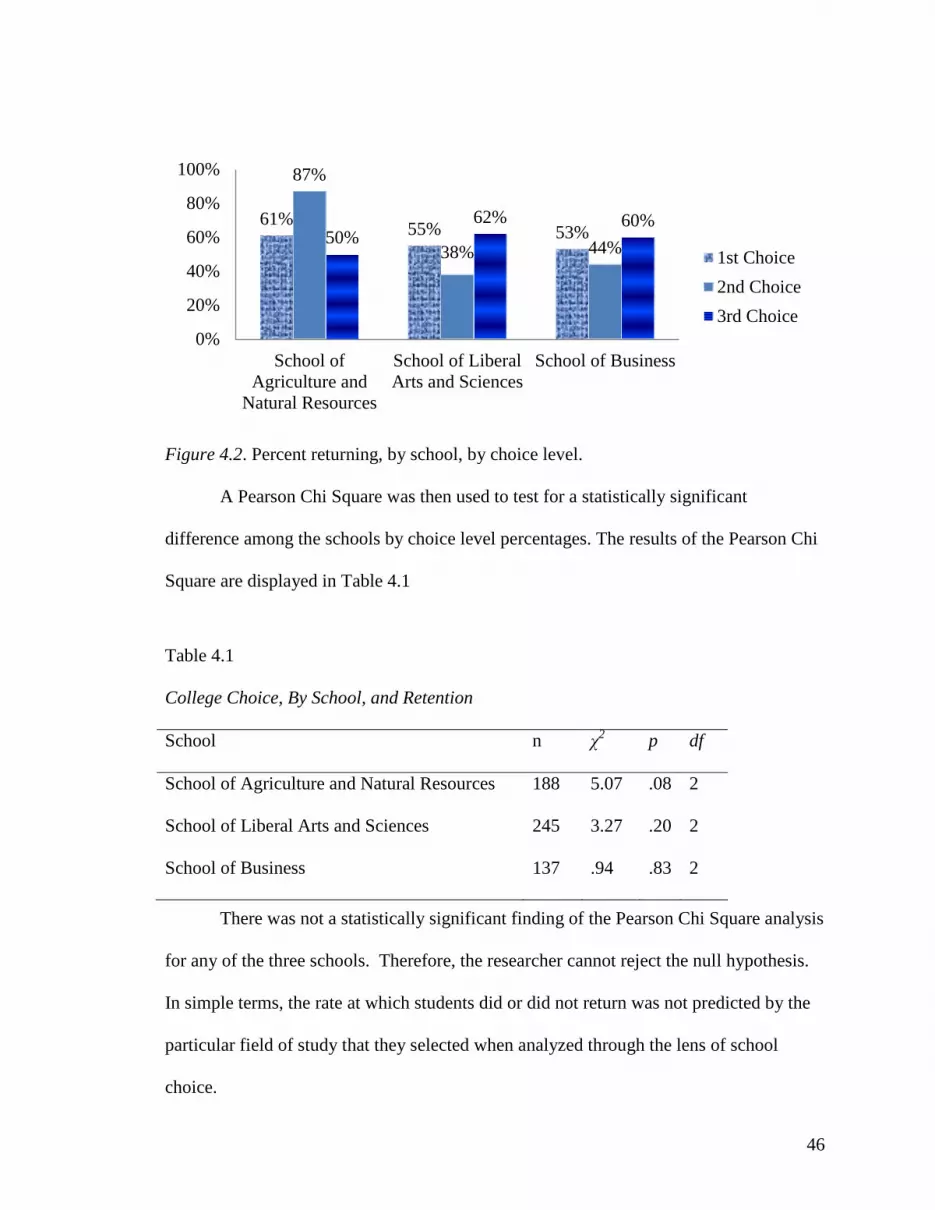
46
Figure 4.2. Percent returning, by school, by choice level.
A Pearson Chi Square was then used to test for a statistically significant
difference among the schools by choice level percentages. The results of the Pearson Chi
Square are displayed in Table 4.1
There was not a statistically significant finding of the Pearson Chi Square analysis
for any of the three schools. Therefore, the researcher cannot reject the null hypothesis.
In simple terms, the rate at which students did or did not return was not predicted by the
particular field of study that they selected when analyzed through the lens of school
choice.
61% 55% 53%
87%
38% 44% 50% 62% 60%
0%
20%
40%
60%
80%
100%
School ofAgriculture and
Natural Resources
School of LiberalArts and Sciences
School of Business
1st Choice2nd Choice3rd Choice
Table 4.1
College Choice, By School, and Retention
School n χ2 p df
School of Agriculture and Natural Resources 188 5.07 .08 2
School of Liberal Arts and Sciences 245 3.27 .20 2
School of Business 137 .94 .83 2
47
In a further analysis, the major fields of study were grouped by the departments in
which they were housed. For example, all the majors offered through the School of
Agriculture and Natural Resources fell within the departments of Agricultural Business,
Agricultural Engineering, Animal Science, Plant Science, or Fisheries and Wildlife. The
rates of retention by school choice by department are displayed in Table 4.2. For
example, for the Agricultural Business Department, 80% of those who did not return
indicated their major field of study in that department was their first choice, while 79% of
those who did return indicated that their major field of study in that department was their
first choice. For those who did not return who had a major field of study in the
department of Agricultural Engineering, 80% indicated that as their first choice, while
89% of those who did return indicated it as their first choice.
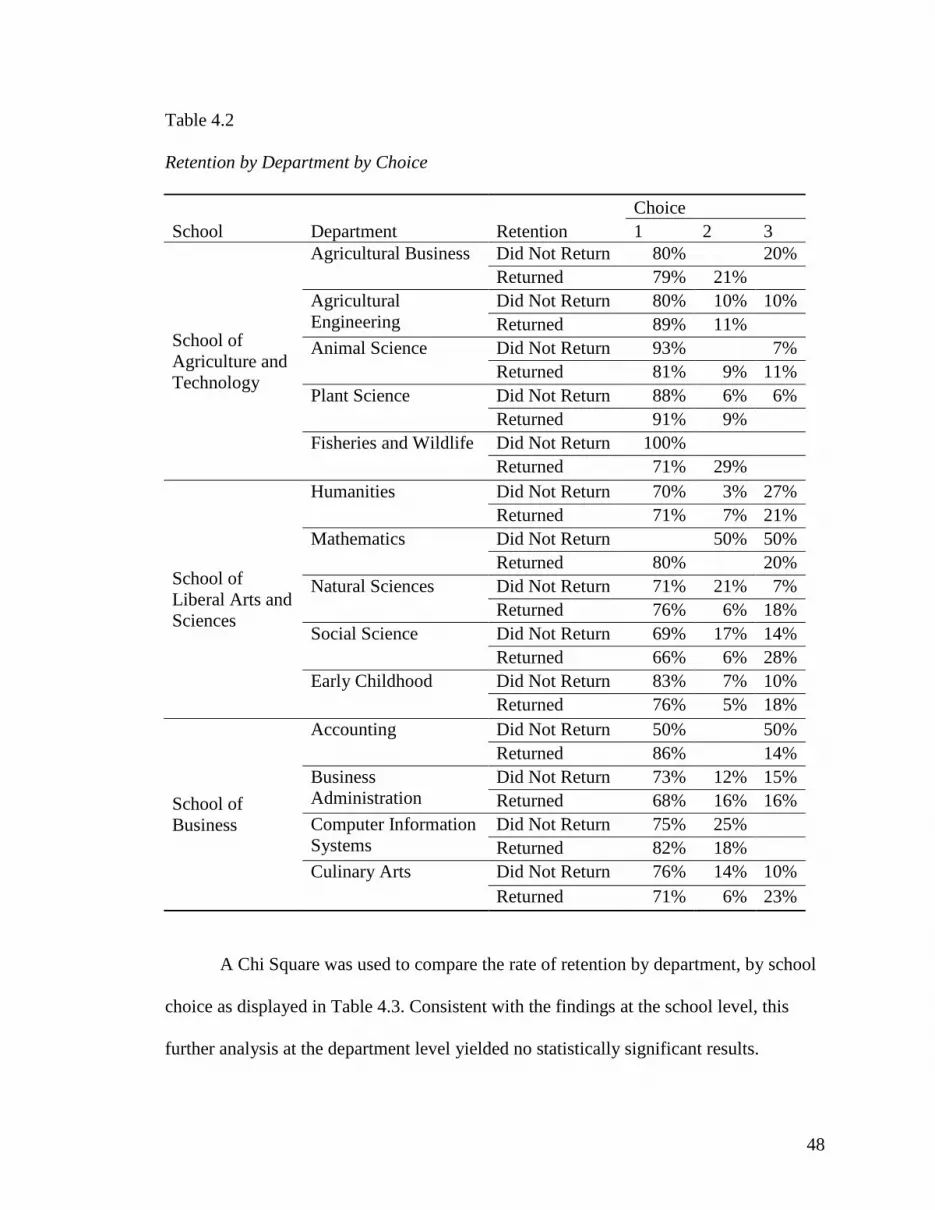
48
Table 4.2
Retention by Department by Choice
School Department Retention Choice 1 2 3
School of Agriculture and Technology
Agricultural Business Did Not Return 80% 20% Returned 79% 21%
Agricultural Engineering
Did Not Return 80% 10% 10% Returned 89% 11%
Animal Science Did Not Return 93% 7% Returned 81% 9% 11%
Plant Science Did Not Return 88% 6% 6% Returned 91% 9%
Fisheries and Wildlife Did Not Return 100% Returned 71% 29%
School of Liberal Arts and Sciences
Humanities Did Not Return 70% 3% 27% Returned 71% 7% 21%
Mathematics Did Not Return 50% 50% Returned 80% 20%
Natural Sciences Did Not Return 71% 21% 7% Returned 76% 6% 18%
Social Science Did Not Return 69% 17% 14% Returned 66% 6% 28%
Early Childhood Did Not Return 83% 7% 10% Returned 76% 5% 18%
School of Business
Accounting Did Not Return 50% 50% Returned 86% 14%
Business Administration
Did Not Return 73% 12% 15% Returned 68% 16% 16%
Computer Information Systems
Did Not Return 75% 25% Returned 82% 18%
Culinary Arts Did Not Return 76% 14% 10% Returned 71% 6% 23%
A Chi Square was used to compare the rate of retention by department, by school
choice as displayed in Table 4.3. Consistent with the findings at the school level, this
further analysis at the department level yielded no statistically significant results.
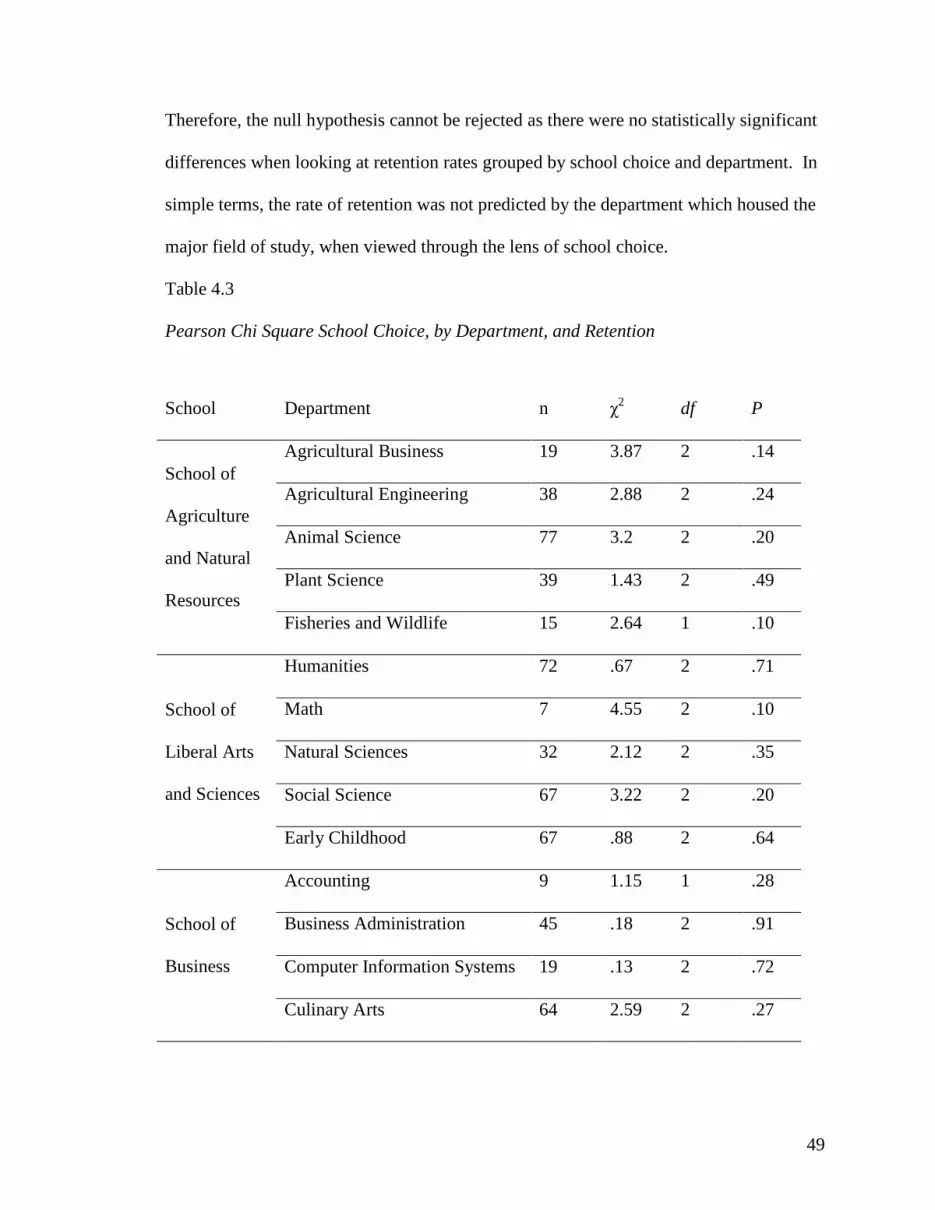
49
Therefore, the null hypothesis cannot be rejected as there were no statistically significant
differences when looking at retention rates grouped by school choice and department. In
simple terms, the rate of retention was not predicted by the department which housed the
major field of study, when viewed through the lens of school choice.
Table 4.3
Pearson Chi Square School Choice, by Department, and Retention
School Department n χ2 df P
School of
Agriculture
and Natural
Resources
Agricultural Business 19 3.87 2 .14
Agricultural Engineering 38 2.88 2 .24
Animal Science 77 3.2 2 .20
Plant Science 39 1.43 2 .49
Fisheries and Wildlife 15 2.64 1 .10
School of
Liberal Arts
and Sciences
Humanities 72 .67 2 .71
Math 7 4.55 2 .10
Natural Sciences 32 2.12 2 .35
Social Science 67 3.22 2 .20
Early Childhood 67 .88 2 .64
School of
Business
Accounting 9 1.15 1 .28
Business Administration 45 .18 2 .91
Computer Information Systems 19 .13 2 .72
Culinary Arts 64 2.59 2 .27
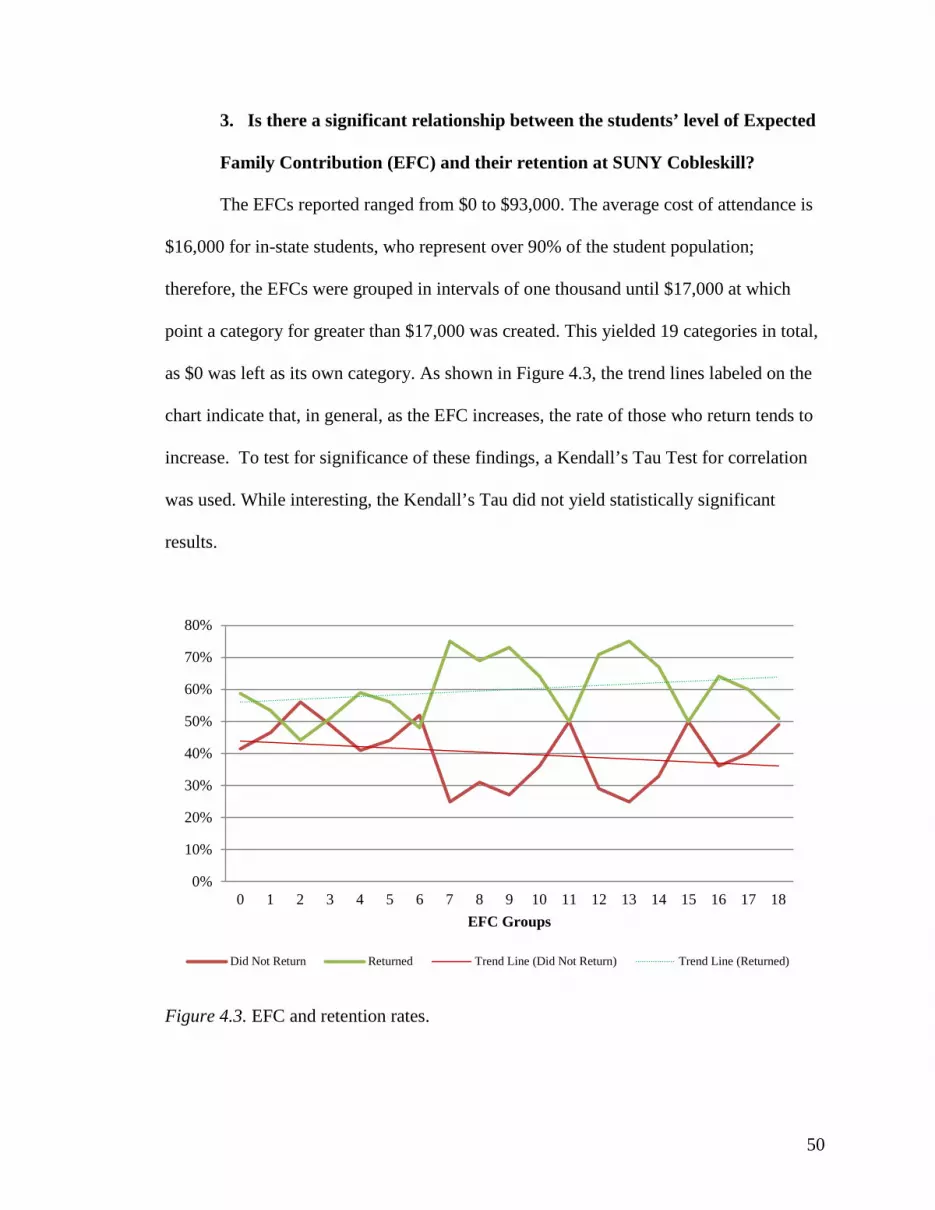
50
3. Is there a significant relationship between the students’ level of Expected
Family Contribution (EFC) and their retention at SUNY Cobleskill?
The EFCs reported ranged from $0 to $93,000. The average cost of attendance is
$16,000 for in-state students, who represent over 90% of the student population;
therefore, the EFCs were grouped in intervals of one thousand until $17,000 at which
point a category for greater than $17,000 was created. This yielded 19 categories in total,
as $0 was left as its own category. As shown in Figure 4.3, the trend lines labeled on the
chart indicate that, in general, as the EFC increases, the rate of those who return tends to
increase. To test for significance of these findings, a Kendall’s Tau Test for correlation
was used. While interesting, the Kendall’s Tau did not yield statistically significant
results.
Figure 4.3. EFC and retention rates.
0%
10%
20%
30%
40%
50%
60%
70%
80%
0 1 2 3 4 5 6 7 8 9 10 11 12 13 14 15 16 17 18EFC Groups
Did Not Return Returned Trend Line (Did Not Return) Trend Line (Returned)
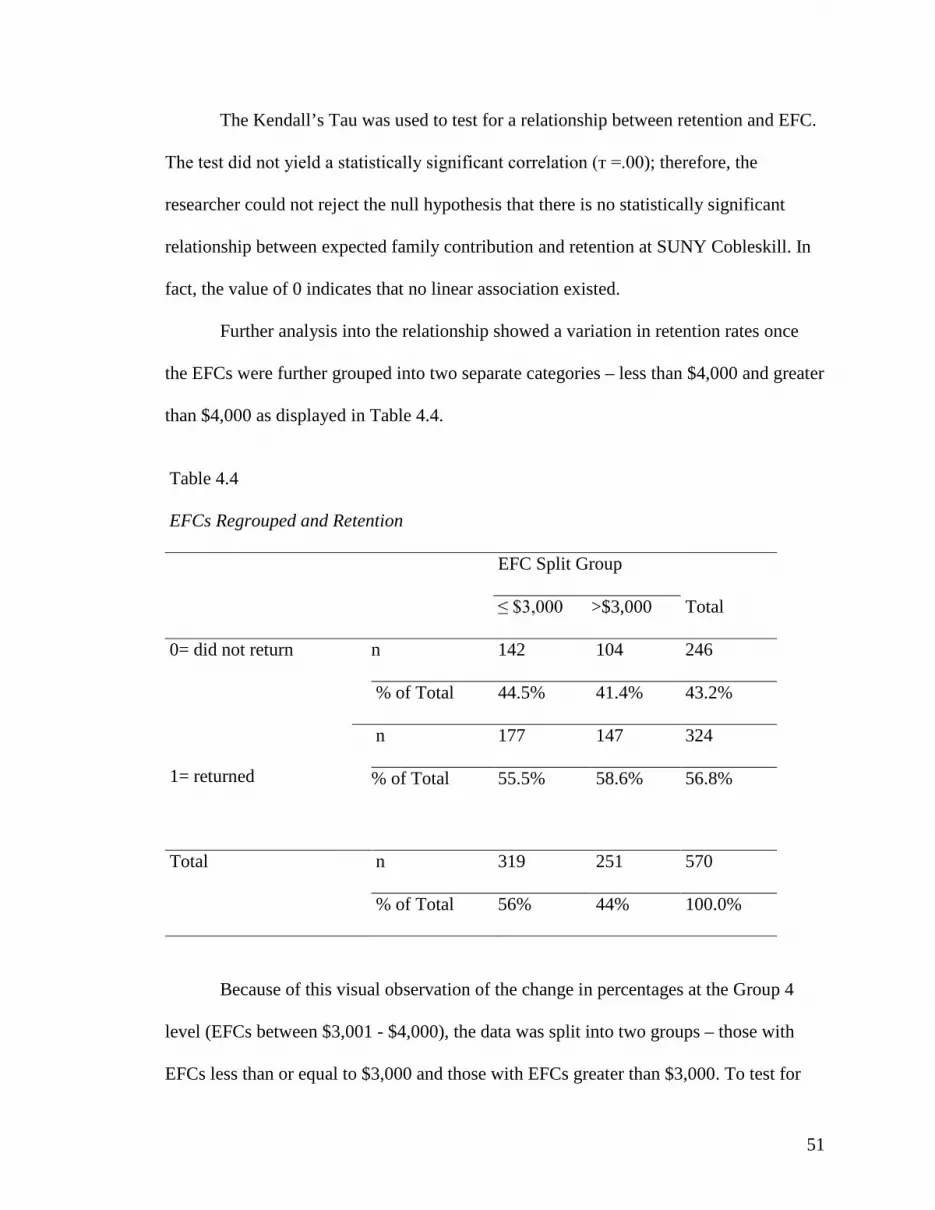
51
The Kendall’s Tau was used to test for a relationship between retention and EFC.
The test did not yield a statistically significant correlation (т =.00); therefore, the
researcher could not reject the null hypothesis that there is no statistically significant
relationship between expected family contribution and retention at SUNY Cobleskill. In
fact, the value of 0 indicates that no linear association existed.
Further analysis into the relationship showed a variation in retention rates once
the EFCs were further grouped into two separate categories – less than $4,000 and greater
than $4,000 as displayed in Table 4.4.
Table 4.4
EFCs Regrouped and Retention
EFC Split Group
Total ≤ $3,000 >$3,000
0= did not return
1= returned
n 142 104 246
% of Total 44.5% 41.4% 43.2%
n 177 147 324
% of Total 55.5% 58.6% 56.8%
Total n 319 251 570
% of Total 56% 44% 100.0%
Because of this visual observation of the change in percentages at the Group 4
level (EFCs between $3,001 - $4,000), the data was split into two groups – those with
EFCs less than or equal to $3,000 and those with EFCs greater than $3,000. To test for
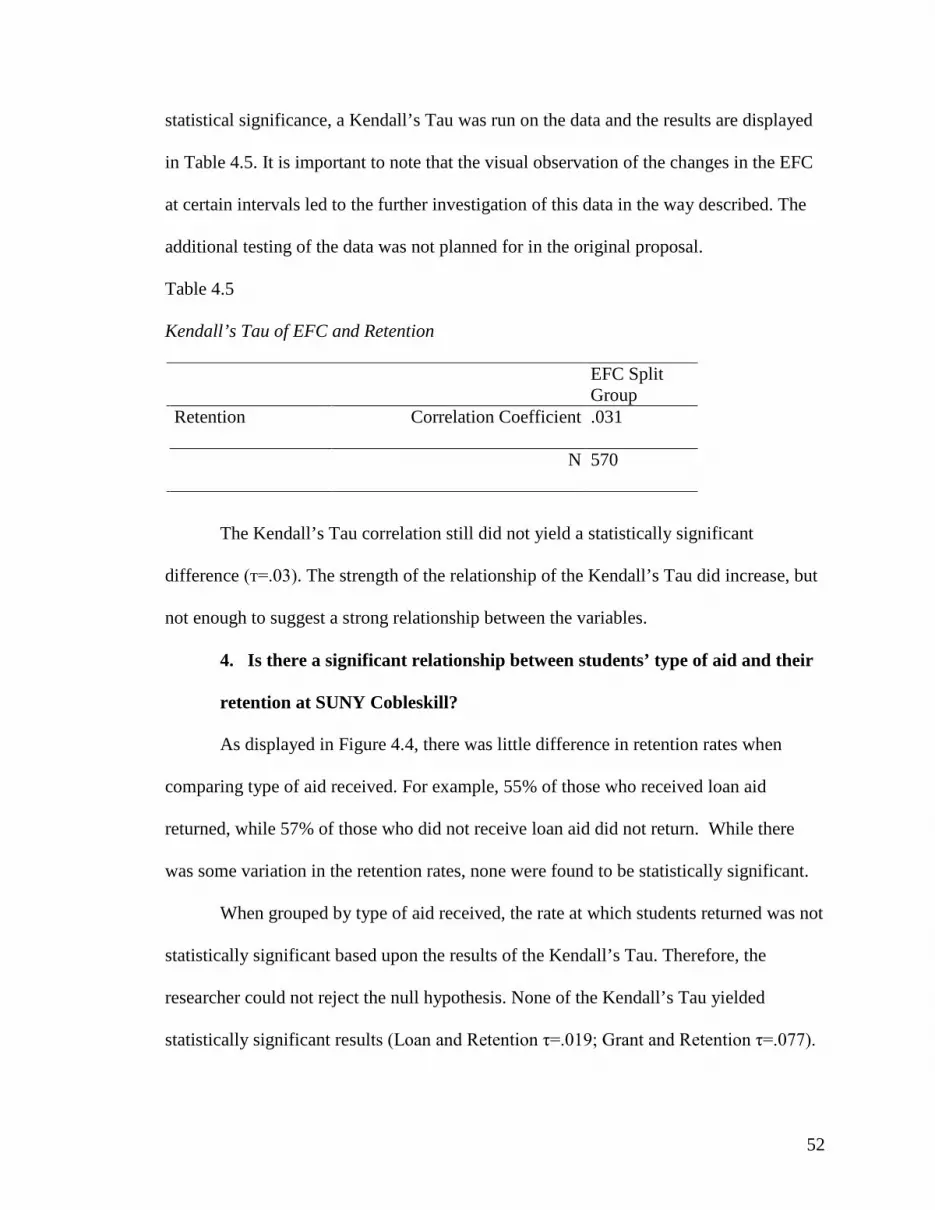
52
statistical significance, a Kendall’s Tau was run on the data and the results are displayed
in Table 4.5. It is important to note that the visual observation of the changes in the EFC
at certain intervals led to the further investigation of this data in the way described. The
additional testing of the data was not planned for in the original proposal.
Table 4.5
Kendall’s Tau of EFC and Retention
EFC Split Group
Retention Correlation Coefficient .031
N 570
The Kendall’s Tau correlation still did not yield a statistically significant
difference (т=.03). The strength of the relationship of the Kendall’s Tau did increase, but
not enough to suggest a strong relationship between the variables.
4. Is there a significant relationship between students’ type of aid and their
retention at SUNY Cobleskill?
As displayed in Figure 4.4, there was little difference in retention rates when
comparing type of aid received. For example, 55% of those who received loan aid
returned, while 57% of those who did not receive loan aid did not return. While there
was some variation in the retention rates, none were found to be statistically significant.
When grouped by type of aid received, the rate at which students returned was not
statistically significant based upon the results of the Kendall’s Tau. Therefore, the
researcher could not reject the null hypothesis. None of the Kendall’s Tau yielded
statistically significant results (Loan and Retention τ=.019; Grant and Retention τ=.077).
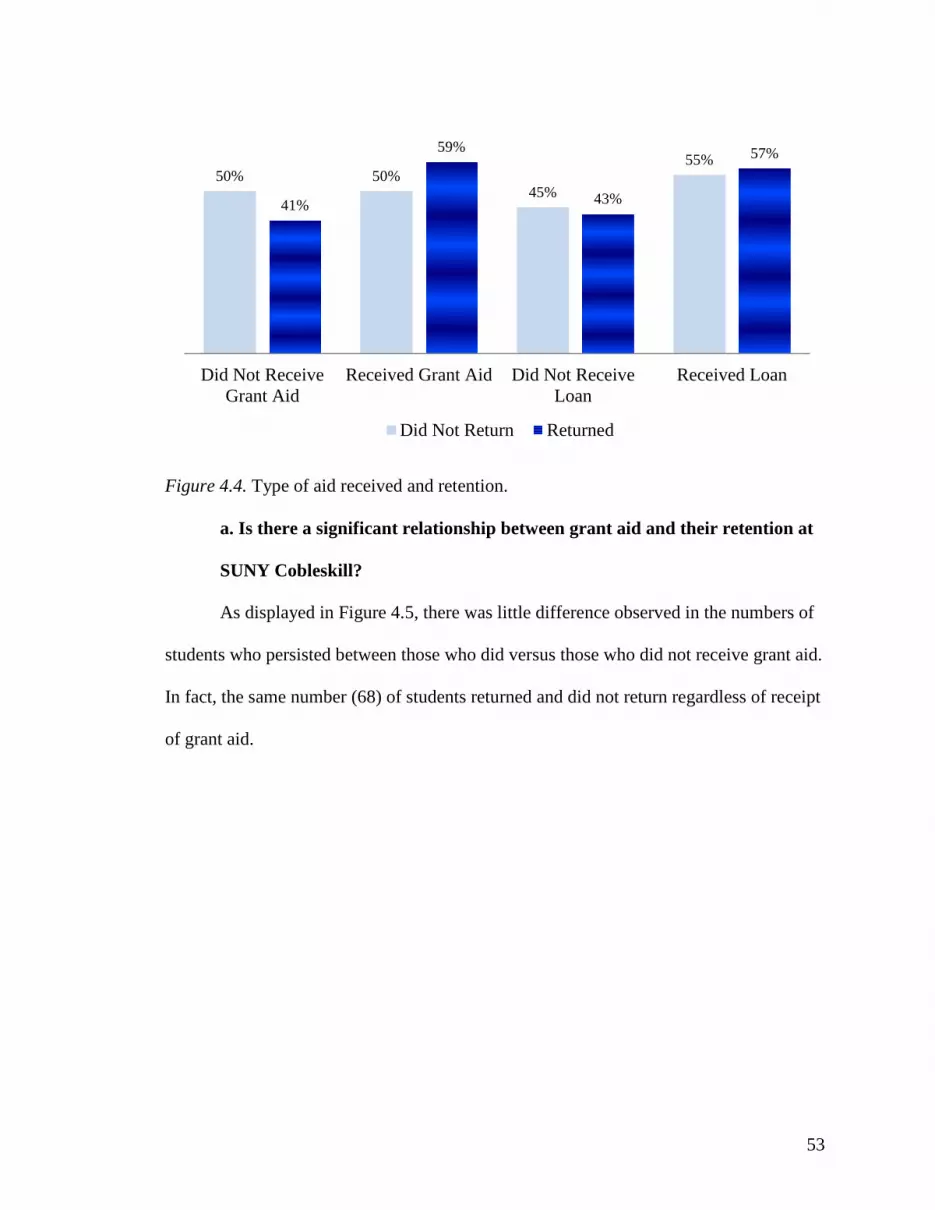
53
Figure 4.4. Type of aid received and retention.
a. Is there a significant relationship between grant aid and their retention at
SUNY Cobleskill?
As displayed in Figure 4.5, there was little difference observed in the numbers of
students who persisted between those who did versus those who did not receive grant aid.
In fact, the same number (68) of students returned and did not return regardless of receipt
of grant aid.
50% 50% 45%
55%
41%
59%
43%
57%
Did Not ReceiveGrant Aid
Received Grant Aid Did Not ReceiveLoan
Received Loan
Did Not Return Returned
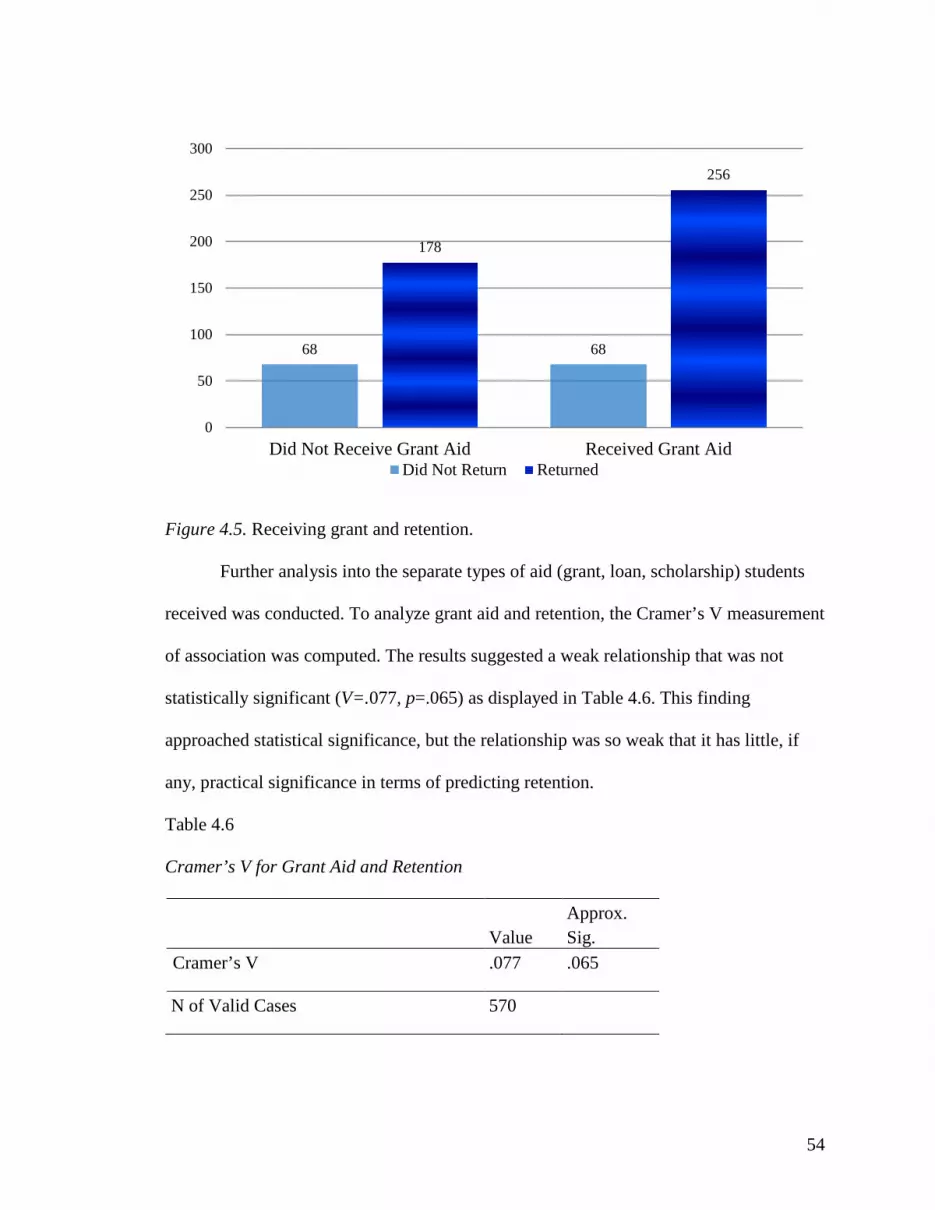
54
Figure 4.5. Receiving grant and retention.
Further analysis into the separate types of aid (grant, loan, scholarship) students
received was conducted. To analyze grant aid and retention, the Cramer’s V measurement
of association was computed. The results suggested a weak relationship that was not
statistically significant (V=.077, p=.065) as displayed in Table 4.6. This finding
approached statistical significance, but the relationship was so weak that it has little, if
any, practical significance in terms of predicting retention.
Table 4.6
Cramer’s V for Grant Aid and Retention
Value
Approx. Sig.
Cramer’s V .077 .065
N of Valid Cases 570
68 68
178
256
0
50
100
150
200
250
300
Did Not Receive Grant Aid Received Grant AidDid Not Return Returned
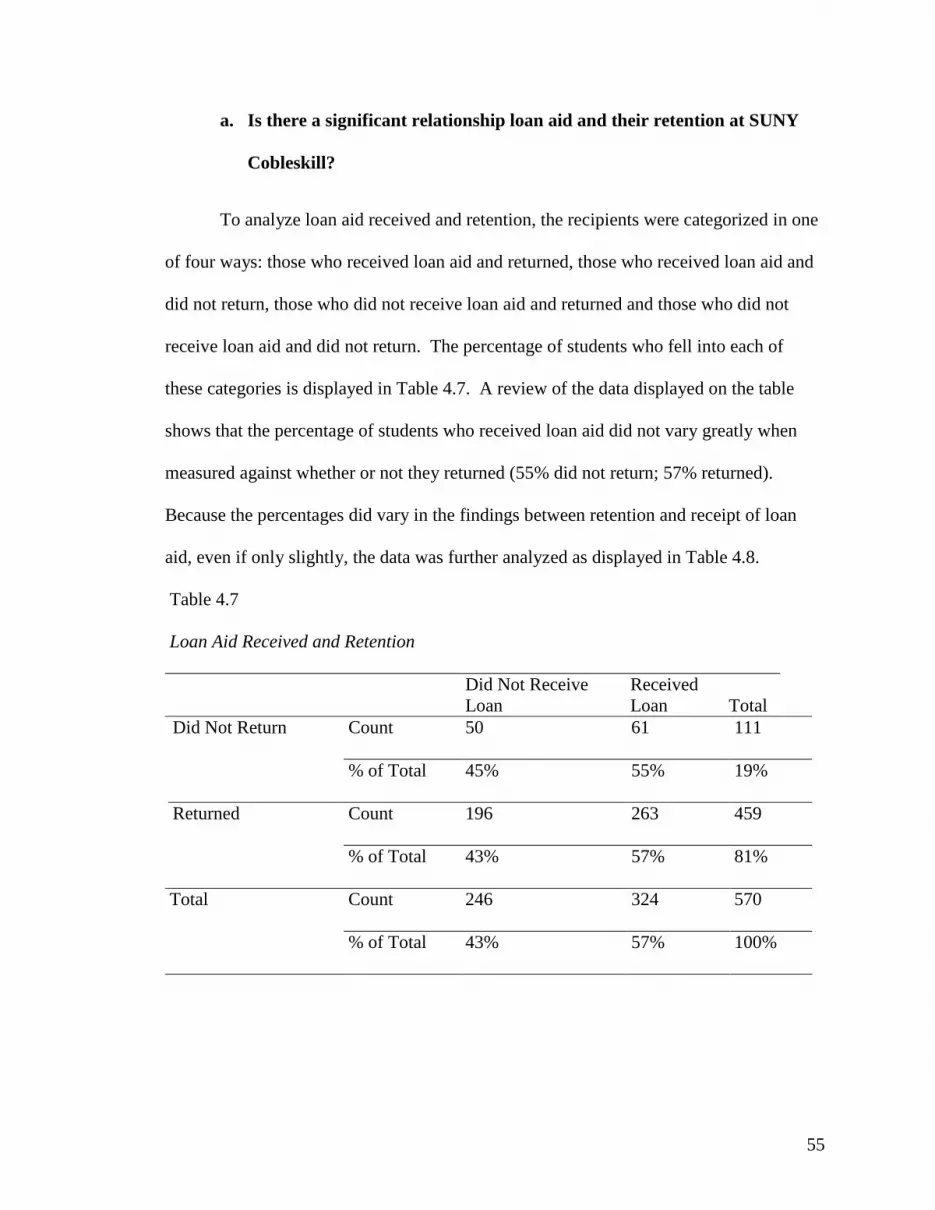
55
a. Is there a significant relationship loan aid and their retention at SUNY
Cobleskill?
To analyze loan aid received and retention, the recipients were categorized in one
of four ways: those who received loan aid and returned, those who received loan aid and
did not return, those who did not receive loan aid and returned and those who did not
receive loan aid and did not return. The percentage of students who fell into each of
these categories is displayed in Table 4.7. A review of the data displayed on the table
shows that the percentage of students who received loan aid did not vary greatly when
measured against whether or not they returned (55% did not return; 57% returned).
Because the percentages did vary in the findings between retention and receipt of loan
aid, even if only slightly, the data was further analyzed as displayed in Table 4.8.
Table 4.7
Loan Aid Received and Retention
Did Not Receive Loan
Received Loan Total
Did Not Return Count 50 61 111
% of Total 45% 55% 19%
Returned Count 196 263 459
% of Total 43% 57% 81%
Total Count 246 324 570
% of Total 43% 57% 100%
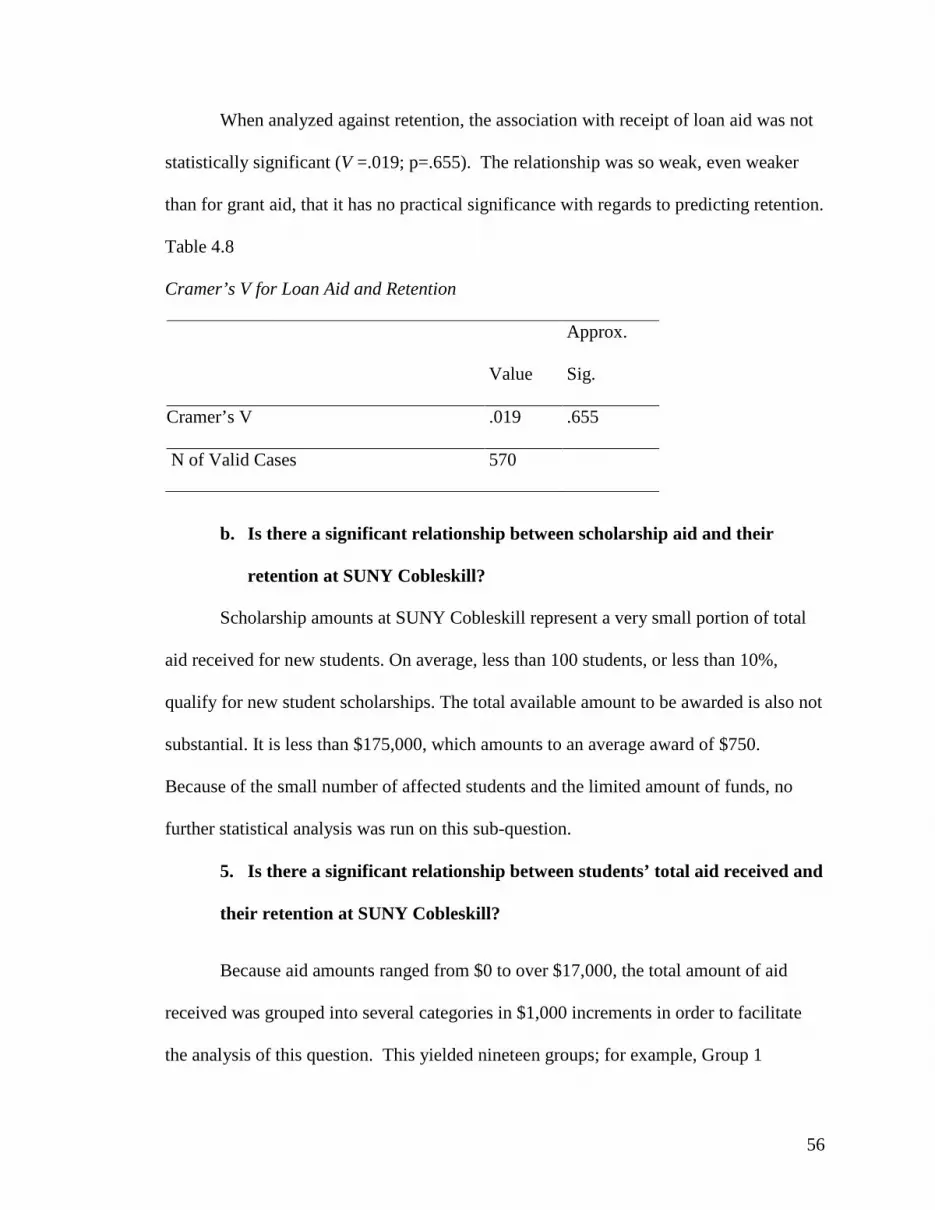
56
When analyzed against retention, the association with receipt of loan aid was not
statistically significant (V =.019; p=.655). The relationship was so weak, even weaker
than for grant aid, that it has no practical significance with regards to predicting retention.
Table 4.8
Cramer’s V for Loan Aid and Retention
Value
Approx.
Sig.
Cramer’s V .019 .655
N of Valid Cases 570
b. Is there a significant relationship between scholarship aid and their
retention at SUNY Cobleskill?
Scholarship amounts at SUNY Cobleskill represent a very small portion of total
aid received for new students. On average, less than 100 students, or less than 10%,
qualify for new student scholarships. The total available amount to be awarded is also not
substantial. It is less than $175,000, which amounts to an average award of $750.
Because of the small number of affected students and the limited amount of funds, no
further statistical analysis was run on this sub-question.
5. Is there a significant relationship between students’ total aid received and
their retention at SUNY Cobleskill?
Because aid amounts ranged from $0 to over $17,000, the total amount of aid
received was grouped into several categories in $1,000 increments in order to facilitate
the analysis of this question. This yielded nineteen groups; for example, Group 1
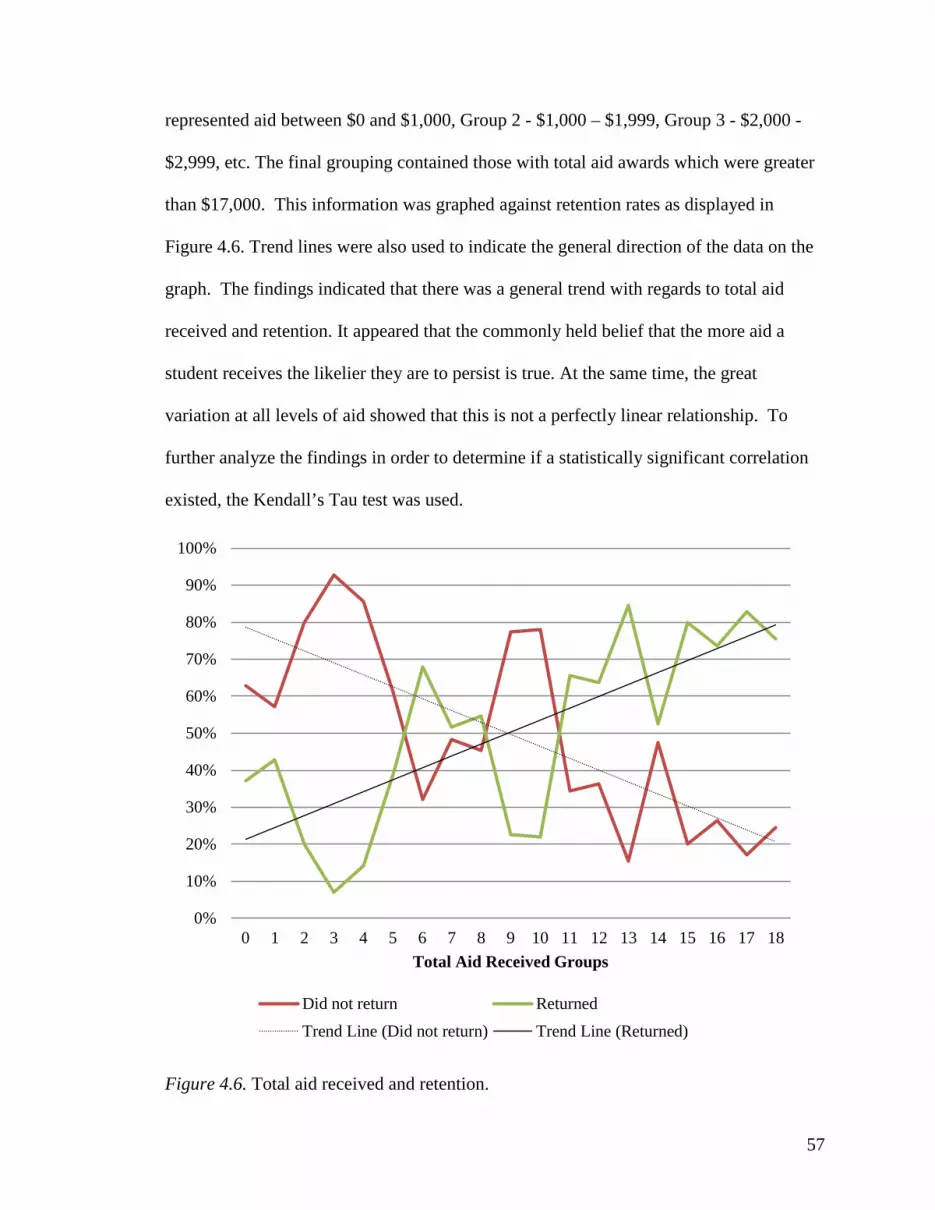
57
represented aid between $0 and $1,000, Group 2 - $1,000 – $1,999, Group 3 - $2,000 -
$2,999, etc. The final grouping contained those with total aid awards which were greater
than $17,000. This information was graphed against retention rates as displayed in
Figure 4.6. Trend lines were also used to indicate the general direction of the data on the
graph. The findings indicated that there was a general trend with regards to total aid
received and retention. It appeared that the commonly held belief that the more aid a
student receives the likelier they are to persist is true. At the same time, the great
variation at all levels of aid showed that this is not a perfectly linear relationship. To
further analyze the findings in order to determine if a statistically significant correlation
existed, the Kendall’s Tau test was used.
Figure 4.6. Total aid received and retention.
0%
10%
20%
30%
40%
50%
60%
70%
80%
90%
100%
0 1 2 3 4 5 6 7 8 9 10 11 12 13 14 15 16 17 18Total Aid Received Groups
Did not return ReturnedTrend Line (Did not return) Trend Line (Returned)
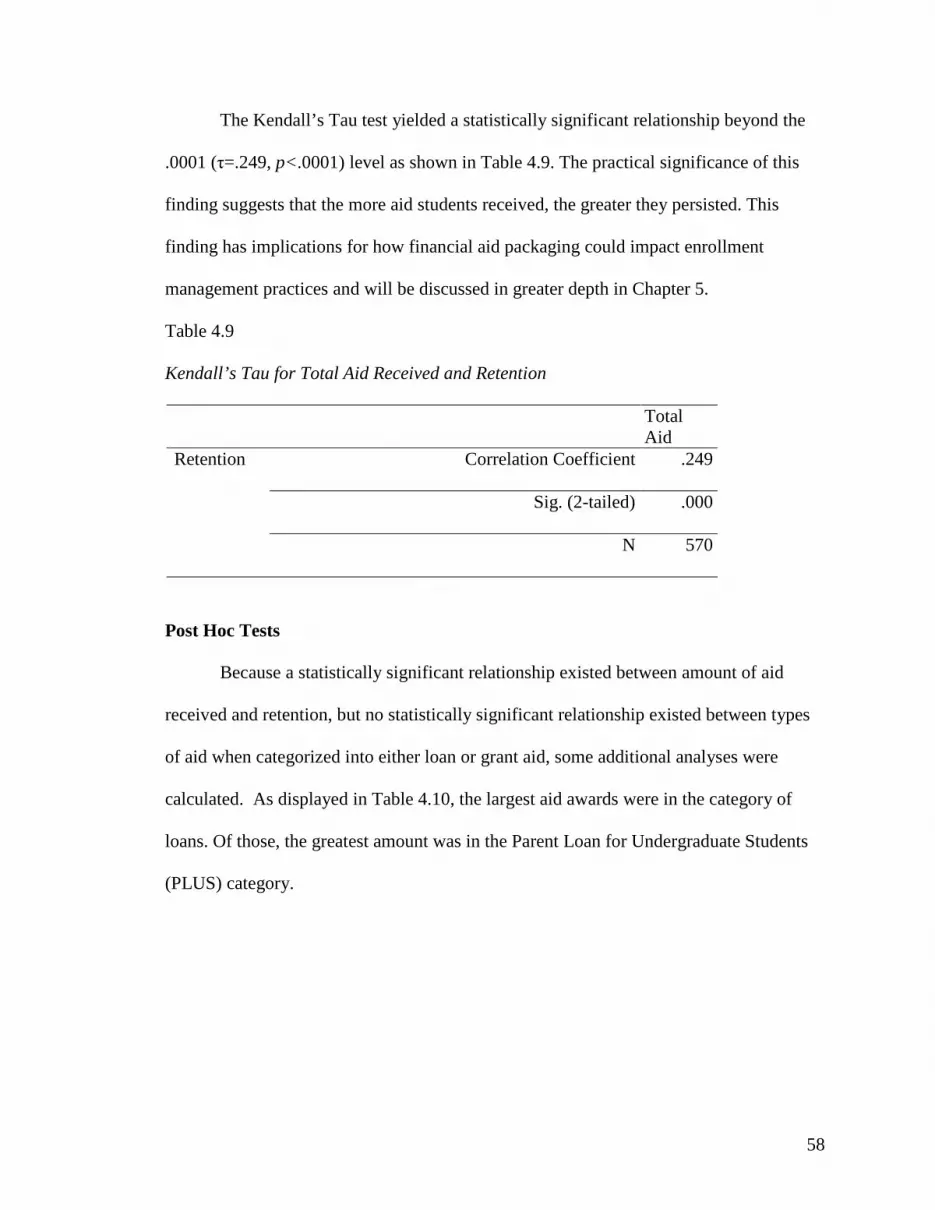
58
The Kendall’s Tau test yielded a statistically significant relationship beyond the
.0001 (τ=.249, p<.0001) level as shown in Table 4.9. The practical significance of this
finding suggests that the more aid students received, the greater they persisted. This
finding has implications for how financial aid packaging could impact enrollment
management practices and will be discussed in greater depth in Chapter 5.
Table 4.9
Kendall’s Tau for Total Aid Received and Retention
Total Aid
Retention Correlation Coefficient .249
Sig. (2-tailed) .000
N 570
Post Hoc Tests
Because a statistically significant relationship existed between amount of aid
received and retention, but no statistically significant relationship existed between types
of aid when categorized into either loan or grant aid, some additional analyses were
calculated. As displayed in Table 4.10, the largest aid awards were in the category of
loans. Of those, the greatest amount was in the Parent Loan for Undergraduate Students
(PLUS) category.
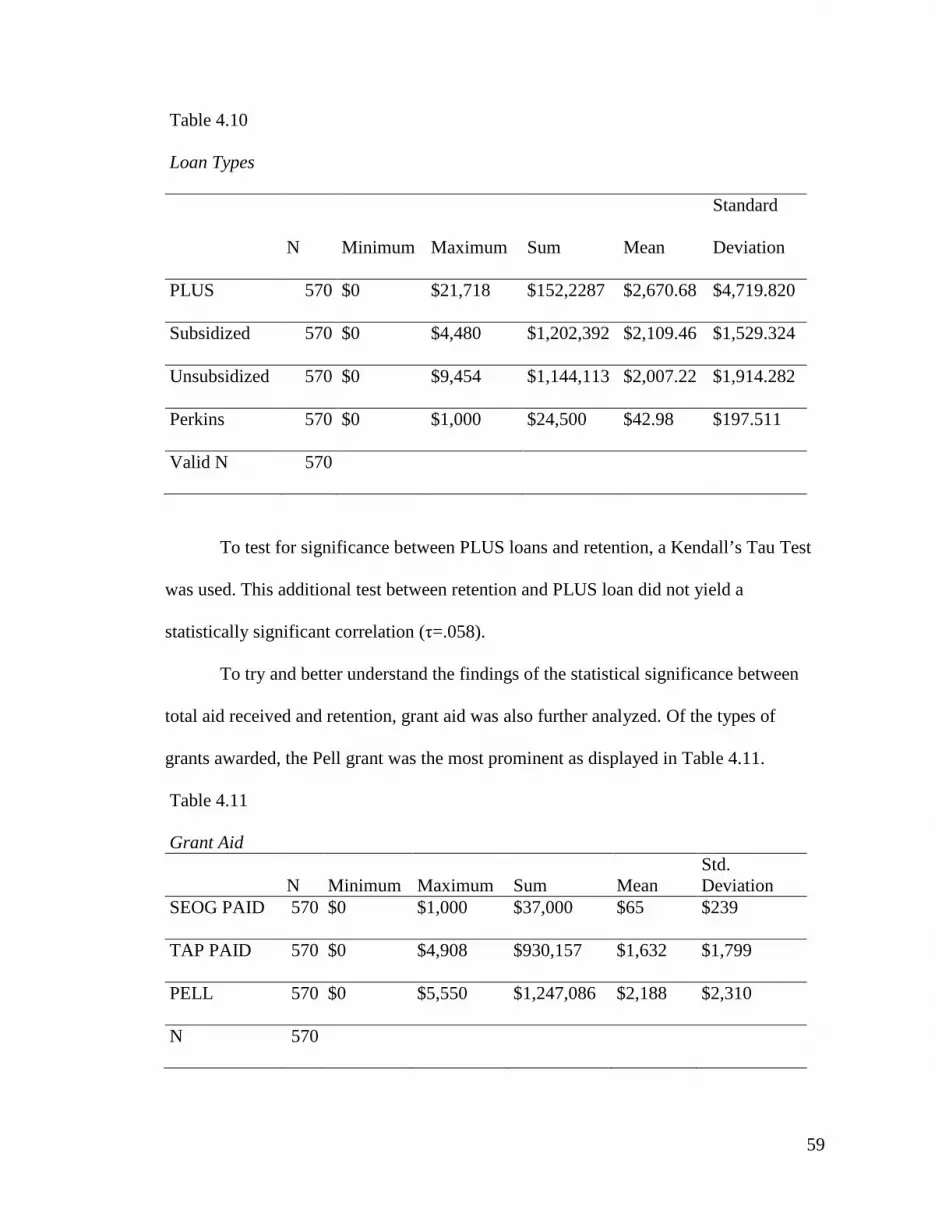
59
Table 4.10
Loan Types
N Minimum Maximum Sum Mean
Standard
Deviation
PLUS 570 $0 $21,718 $152,2287 $2,670.68 $4,719.820
Subsidized 570 $0 $4,480 $1,202,392 $2,109.46 $1,529.324
Unsubsidized 570 $0 $9,454 $1,144,113 $2,007.22 $1,914.282
Perkins 570 $0 $1,000 $24,500 $42.98 $197.511
Valid N 570
To test for significance between PLUS loans and retention, a Kendall’s Tau Test
was used. This additional test between retention and PLUS loan did not yield a
statistically significant correlation (τ=.058).
To try and better understand the findings of the statistical significance between
total aid received and retention, grant aid was also further analyzed. Of the types of
grants awarded, the Pell grant was the most prominent as displayed in Table 4.11.
Table 4.11 Grant Aid
N Minimum Maximum Sum Mean Std. Deviation
SEOG PAID 570 $0 $1,000 $37,000 $65 $239
TAP PAID 570 $0 $4,908 $930,157 $1,632 $1,799
PELL 570 $0 $5,550 $1,247,086 $2,188 $2,310
N 570
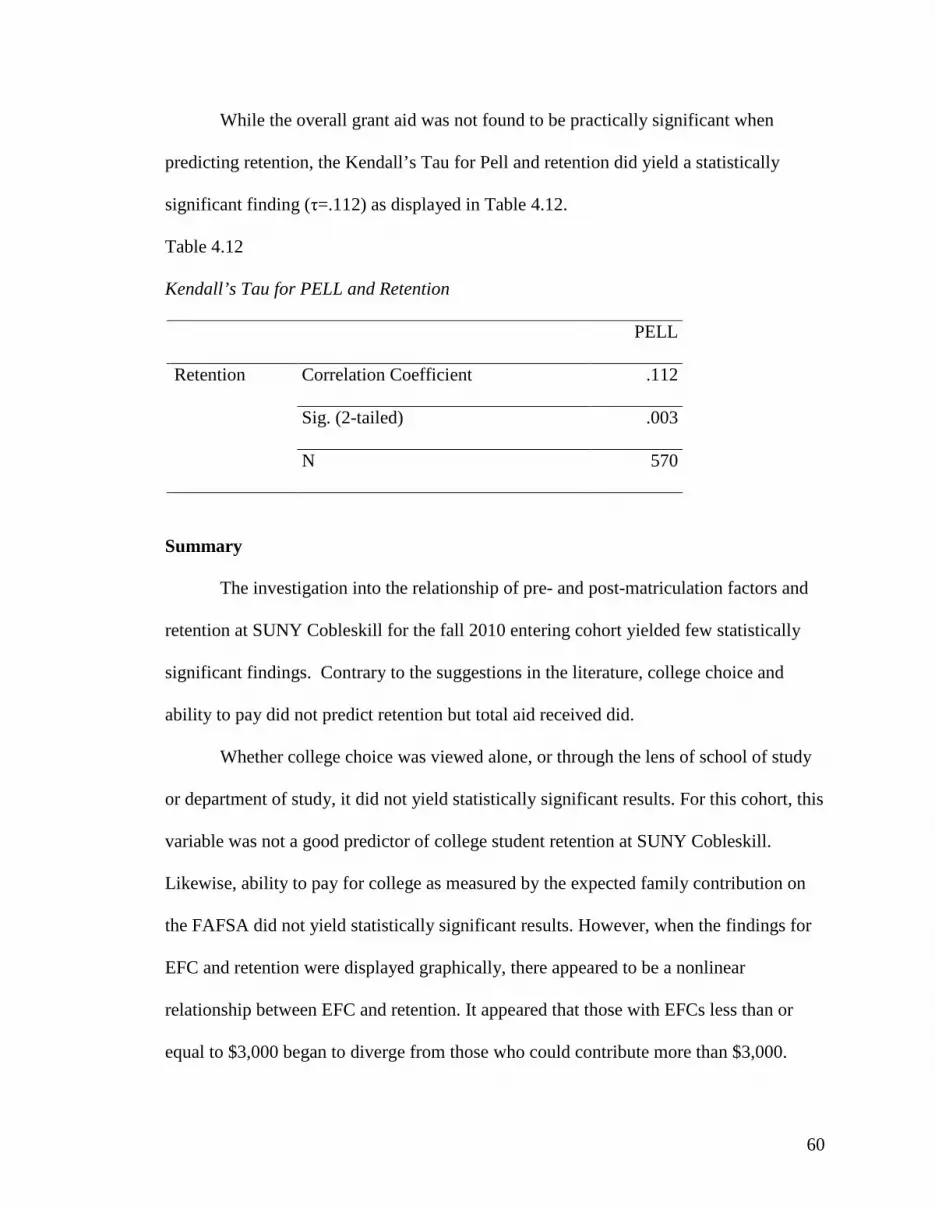
60
While the overall grant aid was not found to be practically significant when
predicting retention, the Kendall’s Tau for Pell and retention did yield a statistically
significant finding (τ=.112) as displayed in Table 4.12.
Table 4.12
Kendall’s Tau for PELL and Retention
PELL
Retention Correlation Coefficient .112
Sig. (2-tailed) .003
N 570
Summary
The investigation into the relationship of pre- and post-matriculation factors and
retention at SUNY Cobleskill for the fall 2010 entering cohort yielded few statistically
significant findings. Contrary to the suggestions in the literature, college choice and
ability to pay did not predict retention but total aid received did.
Whether college choice was viewed alone, or through the lens of school of study
or department of study, it did not yield statistically significant results. For this cohort, this
variable was not a good predictor of college student retention at SUNY Cobleskill.
Likewise, ability to pay for college as measured by the expected family contribution on
the FAFSA did not yield statistically significant results. However, when the findings for
EFC and retention were displayed graphically, there appeared to be a nonlinear
relationship between EFC and retention. It appeared that those with EFCs less than or
equal to $3,000 began to diverge from those who could contribute more than $3,000.
61
While further analysis did yield a stronger relationship, it was not enough to suggest a
practically meaningful relationship between the two variables.
The type of financial aid students received also did not yield statistically
significant results. In this cohort of students, type of aid was not found to be a predictor
of college student retention. This question was further analyzed by comparing those who
received a particular type of aid, for example grant aid, against those who did not. This
analysis did not yield a statistically significant correlation. The same test was run on
students who received loan aid as compared to those who did not and again the same
conclusion was drawn. Amount of aid received, however, did yield a statistically
significant finding.
The Kendall’s Tau correlation showed a statistically significant relationship
beyond the .0001 level between college student retention and total aid received. This
finding indicated that the more aid students received, the more likely they were to persist.
While not a perfectly linear relationship, it was significant and its implications will be
further explored in Chapter 5.
62
Chapter 5: Discussion
Introduction
In this chapter, the implications of the findings are discussed, along with the
limitations of the research. Recommendations for future research are also provided along
with a summary of the study. To aid the reader, a review and synopsis of the problem
statement is also provided.
SUNY Cobleskill offers a multitude of associate and bachelor degree programs.
While the retention rate at the bachelor’s level is competitive, the rate at the associate
level continues to be problematic. SUNY Cobleskill’s retention rates for associate degree
seeking students dropped from 58% in 2003, to 56% in 2005 to 53% in 2007. In fact,
SUNY Cobleskill is also falling behind when compared to similar institutions nationally
and regionally. As published by ACT (Retention/Completion Summary Tables, 2009) in
their yearly summary report, retention rates for associate degree seeking students in
general are alarmingly low. Even the highest rates still indicate nearly 40% of first year
associate degree students are not returning for the second year.
Using data gathered from SUNY Cobleskill, this study looked at some of the
variables reported in the existing literature as relevant to retention. The specific variables
included whether SUNY Cobleskill was the first, second, or lower college choice, the
expected family contribution (EFC), and the type as well as amount of financial aid
awards. Those were the predictor variables. The single variable to be
63
predicted was retention at SUNY Cobleskill for the entering fall 2010 cohort of students.
Retention was defined as whether or not a student returned to the institution for the
second year. This annual cohort was specifically chosen because a required first-year
seminar which was developed to help address retention issues was implemented in the
fall of 2010. Therefore, this study also measured the impact of this particular intervention
in its first year of implementation. The available research, which was reviewed in
Chapter 2, varied considerably in its findings about what predicts retention. And, as the
report of the data analysis in Chapter 4 indicated, so do the results of this study.
Implications of Findings
College choice. The findings in this study related to college choice offer a
different perspective than a synthesis of the existing literature leads us to expect. If
anything, the results of this study led to additional questions rather than definitive
answers to unsettled questions. If students elected SUNY Cobleskill as their first choice,
and those students do not return at a statistically significant higher rate than those who
elected the College as third choice, then what value does the ranking of college choice
hold when trying to implement new yield or retention initiatives? Choice has influenced
admissions yield practices in the past by pre-qualifying candidates based upon where
SUNY Cobleskill falls within their selection of potential colleges to attend. If a student
indicated that SUNY Cobleskill was their first choice, it was assumed that student would
more likely attend and stay versus someone who indicated Cobleskill as their third
choice. Additional resources and outreach efforts would then be targeted at those students
who ranked Cobleskill lower than their first choice, but higher than their fourth choice.
Based on the findings for this cohort, it would seem that college choice is not related to
64
retention in the case of SUNY Cobleskill and may not be a variable on which to focus
retention efforts. One important implication of this surprising finding is that colleges and
universities should not automatically assume summary data from students at other
institutions, or even in a national sample, will reflect the behaviors, decisions, and
patterns of their students. Each institution has a unique history, a unique context in
which it operates, and presents students with a unique set of strengths and weaknesses
that may influence both college choice and retention rates. Verifying what appear to be
national patterns using local data seems well advised.
The findings on college choice and retention also add to the literature as much of
the empirical research reviewed did not examine college choice as it relates to retention.
Instead, the empirical findings (Paulsen and St. John, 2002; Singell, 2001) examined
choice from a behavioral perspective as to how students select a college rather than
correlating it with retention.
Further analysis into how college choice may or may not be related to retention
rates was investigated in the second research question. This question examined the
relationship between students’ college choice, their matriculated major field of study, and
retention. The question first examined student retention percentages by grouping all of
the major fields of study into one of the three schools – Agriculture and Natural
Resources, Liberal Arts and Sciences, and Business. While the retention percentages did
not vary greatly among the schools at the first or third choice groupings, those who
ranked the School of Agriculture and Natural Resources as their second choice returned
at a higher rate than the same ranking for the other two schools. However, the Pearson
65
Chi Square did not yield a statistically significant finding for college choice, by school
and retention.
The second question was then further analyzed by examining college choice and
retention rates at a more specific level - departments. This analysis at the departmental
level did not yield any statistically significant results. This finding is particularly
interesting because of the wide variability among the major fields of study offered at
SUNY Cobleskill and the differences in admission requirements among the major fields
of study. The general retention rates by field of study do vary greatly according to the
official data provided by the Office of Institutional Research. However, when viewed
through the lens of college choice, there was not a statistically significant difference in
retention rates for this cohort relative to whether the students selected SUNY Cobleskill
as their first, second, or lower choice. One possible implication of the findings for the
questions which consider college choice as one of the variables is that focusing on
college choice to target yield activities would not be a good use of college resources for
enrollment management purposes. Further research into college choice would be helpful.
This should include a longitudinal study after the first-year experience course has been in
place for several years.
The findings related to college choice and retention are not totally unknown in the
literature. They actually reinforce the findings of the 2011 Cooperative Institutional
Research Program (CIRP) report which discussed how acceptance to first choice colleges
did not necessarily result in attendance at that college (Pryor et al., 2011). While the
economy is thought to have a role in this finding, it is interesting to note that the finding
66
for this cohort did not suggest that attendance at a college (in this case SUNY Cobleskill)
which was not the student’s first choice negatively impacted his or her retention rate.
Still, the pattern of school choice and retention rate runs counter to logic. SUNY
Cobleskill has an interesting and somewhat unusual range of majors and specialty fields.
It is not a “typical” state assisted undergraduate institution nor does it fall into familiar
categories such as “private liberal arts college.” The unexpected findings, such as fewer
students retained who selected SUNY Cobleskill as their first choice, may be related to
the institution’s different character. Perhaps students did not understand the nature of the
institution and assumed that what they had learned about colleges in general applied
equally to SUNY Cobleskill. If that were the case, the students might be making the
same error just discussed about generalizing student data from other institutions to SUNY
Cobleskill students.
Family contribution and financial aid. Unexpected results also occurred
concerning expected family contribution and financial aid type. The assumption that
students who can more easily afford college are more likely to stay in college was not a
finding for this cohort. In fact, no association was found between expected family
contribution and retention. In other words, if one family could afford $20,000 a year
while another could not afford to contribute anything to a student’s college expenses, the
retention rates were not statistically significantly different. Since expected family
contribution determines the level of financial need, this finding contradicts the initial
findings by Wessel, Bell, McPherson, Costello, and Jones (2006) as presented in Chapter
2. They found that those with a greater financial need (or lower expected family
contribution) persisted at lower rates. However, their study found that persistence rates
67
were moderated by level of academic achievement. Academic achievement levels may be
correlations with expected family contribution and also be the causal factor in the lower
rate other than EFC. The implications for enrollment management of this finding suggest
that yield efforts not focus on students’ ability to pay based on the EFC as calculated by
the FAFSA.
The type of student financial aid also did not yield statistically significant results
in terms of association with retention. Students who received grant aid did not persist at
higher levels than those who did not. Likewise, students who received loan aid did not
persist at higher levels than those who did not.
There was, however, a statistically significant relationship between the total
amount of aid a student received and retention. A Kendall’s Tau yielded a statistically
significant relationship beyond the .0001 level for total aid received and retention. Those
who received less aid, in general, persisted at a lower rate than those who received larger
financial aid amounts. This finding reinforced Walke’s (2010) research which linked
increased amounts of financial aid and retention. There are several implications for this
finding. When the student’s expected family contribution is calculated based upon the
FAFSA data, a financial aid package is then awarded to the student. For students with
high EFC’s, financial packages include loan amounts which would cover the estimated
cost of the family’s contribution. This finding indicates that some families are accepting
large financial aid loans, regardless of their ability to pay. It is possible that this
reinforces Bean’s (1992) theory which suggests that providing additional support to
students enhances familial support which would result in a positive impact on student
retention. This presents an interesting perspective for future research as suggested in the
68
literature on social class and the effect on persistence. It begs the question of just how
accurate the EFC as reported on the FAFSA genuinely reflects the family’s ability, or in
some cases, willingness, to pay for college.
Because of the findings regarding total aid, several post hoc analyses were
conducted to determine if the specific type of loan or grant aid impacted retention rates.
While the specific type of loan did not yield any statistically significant findings, the Pell
grant emerged as having a positive relationship with retention. This is interesting as Pell
recipients are typically categorized as the neediest students financially. It contradicts the
initial findings of the EFC not being related to retention. Total Pell amounts for the
cohort amounted to over $1.2 million dollars. However, loan amounts, specifically
unsubsidized loan amounts, amounted to over $1.1 million dollars. It is important to note
that unsubsidized loans are available to all students, regardless of need, while Pell is only
awarded to those who qualify based on need. This finding reinforces the importance of
further research to address issues of financial aid, retention, and economic standing.
Future research should be asking if financial aid reflects ability to pay or willingness to
pay and should also investigate whether or not the FAFSA is an accurate reflection of the
family’s economic circumstance.
Limitations and Strengths
The study was limited in that it addressed one cohort at one institution because the
purpose was to better understand an issue within a specific, local context. Because of this,
the results are not considered universal and are not automatically generalizable to other
institutions. Instead, readers interested in using the results obtained at this institution in
their own work setting will need to factor in their local contexts and needs before
69
accepting the findings or adopting the recommendations based on data from this study.
Furthermore, the same study conducted at the same institution at a different point in time
may yield different results. This study was conducted during an era of financial and
economic crisis in the nation, the state, and the SUNY system. However, the use of data
drawn from students at SUNY Cobleskill to develop an understanding of the local
context is also a strength of the research. Had decisions on how to deploy scarce
resources to enhance retention been based on the typical or average patterns reported in
the existing research literature, several of the foundations for decision-making would
have been inaccurate when compared to the findings of this study on students from the
institution.
Another issue related to using the results of this research is the use of one cohort
of students for the analysis. This provided a sort of “snapshot” of relationships between
predictor and predicted variables at one point in time. To provide even more useful and
solid data for making decisions about retention efforts at SUNY Cobleskill, this and other
data should be collected on a regular basis so that a longitudinal perspective can emerge
that helps identify both current conditions and possible trends that signal potential
changes.
Recommendations
As noted above, further research should be conducted at SUNY Cobleskill to
gauge whether or not the findings are generalizable to other cohorts. In addition, a study
which also reaches across the technology sector of SUNY and includes all five campuses
could yield a richer data set and more generalizable conclusions. SUNY Cobleskill is
one of five institutions in the SUNY system that is heavily focused on preparing students
70
for positions in career fields that are technology-intensive. A study of the SUNY
technology sector, which is comprised of small, technical colleges, would add to the
literature because much of the available research was conducted in either large
community college settings or large, public, research-based institutions. Given the unique
mission of the technology colleges, the nature of the student who attends these
institutions is probably different from those who may be attending other types of higher
education institutions. An important question from the perspective of SUNY Cobleskill
is whether the findings in this study are characteristic of other “technology colleges” in
the SUNY system, or are they relatively unique to the Cobleskill campus?
To better understand how the theoretical rationale supports retention efforts,
future studies would benefit from having a qualitative component to address the rationale
and motivation behind the findings. The empirical findings highlight some issues and
point to some questions that are probably better answered using qualitative methods.
Mixed method research that includes the type of quantitative data and analysis done in
this dissertation, but also involving follow-up interviews, would also enrich these
potential findings.
As the findings suggest that total aid received is a predictor of retention, SUNY
Cobleskill might wish to target retention activities towards those who receive smaller
amounts of financial aid. Further studies into why total aid predicted retention for the fall
2010 cohort, and whether or not this finding holds true for additional cohorts, would
enhance the meaningfulness of the research as well.
Most importantly, the body of existing literature has yet to address the ability to
pay versus willingness to pay question. As the findings for this cohort suggest, it is not
71
the ability to pay based on EFC which was related to retention, but rather the total aid
package students received. Further research which looks not at the data on whether socio-
economic status predicts retention but on how the type of aid received is used to support
both the student and their families may yield new and interesting insights into the field.
Conclusion
This quantitative study examined the relationship between several factors and
retention at SUNY Cobleskill. The primary predictor variables consisted of college
choice, major field of study, expected family contribution, type of student financial aid,
and total amount of student financial aid received.
The study attempted to address retention issues at SUNY Cobleskill. Student
retention remains a topic of importance in higher education from multiple perspectives
including the fiscal health of the institution (Jamelske, 2008), recruitment of students
(Walke, 2010), and involvement in society at large (Baum, Ma & Payea, 2010;
Pennington, 2004).
The study was theory-informed, rather than theory-centric, as no one theory
encapsulates the convergence of both pre- and post-matriculation factors related to
retention. The two schools of thought from which conventional theories are derived and
which informed the research are functionalism and behaviorism. The theories considered
several of the variables utilized in this study as either inputs or outputs. For example,
college retention might be viewed as a result of the experiences of the first year or it
could be viewed as a foregone conclusion at the onset due to desire or familial support of
attendance at that particular institution. Whether the theories originate from the
sociological standpoint of functionalism or the social-psychological perspectives of
72
behaviorism, they recognize that student persistence is as complex as the variables are
vast. Cabrera et al. (1992) summarize dthe overarching themes when comparing and
contrasting the many theoretical perspectives by stating, “As to the question of what
model portrays a better representation of the college persistence process, the answer
depends on the specific criterion under consideration” (p. 158). Because of the
quantitative approach used in this study, the findings led to perceptions which may lend
support to a specific theoretical basis. However, without further research into the
influences behind the findings, they cannot directly reinforce any one theoretical
perspective.
The analysis of existing research presented in Chapter 2 often supplied
contradictory answers as to what variables, and often what combination of variables,
impact retention. Regardless of the variables, all studies concluded that further research
was merited into college retention.
Because of the type of variables used in this study, several different non-
parametric statistics were used. Most often, Chi Square was appropriate as the questions
were evaluating whether or not a relationship existed between several different nominal
variables in a single sample (Huck, 2008). Kendall’s Tau and the Cramer’s V were also
used. Kendall’s Tau was appropriate for several questions where a non-parametric test of
ordinal data was necessary. Cramer’s V is used for large sample sizes of nominal data,
and in this study it was used to test the strength of the relationship between types of aid
and retention.
In general, no statistically significant results were found when looking at retention
rates through the lens of college choice. This was true regardless of whether or not
73
college choice was categorized by school of study or department of study. This adds to
the body of research by suggesting for some institutions that college choice in and of
itself is not a good predictor of student retention and is not a variable on which to base
yield efforts for enrollment managers. As suggested by the findings of the CIRP 2011
survey (Pryor et al., 2011), other variables influence the decision to attend first choice
colleges, especially proximity to home.
While the findings indicated that EFC did not correlate with retention rates, nor
did type of aid in general for this cohort of students, a relationship did exist between total
amount of aid received and retention. The pervasive view in the literature which suggests
that the need as calculated by the expected family contribution correlates with retention
rates was not supported by this study. Instead, aid packages which supplant the EFC by
offering loans to cover what the families were expected to provide in support was highly
correlated with retention. Therefore, total aid received was the only finding that was
statistically significant for this cohort, and through a post hoc analysis, the receipt of Pell
grants was identified as a possible predictor of retention.
Further recommendations for research include addressing the idea of why the
increased amount of financial aid, regardless of financial need, had a positive correlation
with student retention rates at SUNY Cobleskill. Repeating this study for additional
cohorts at SUNY Cobleskill, and similar institutions across the technology sector, would
be a useful addition to the literature.
As issues of access, economic down turn, and diminishing state support continue
to impact current and future students in higher education, the rate at which students stay
in college and the rate at which they persist to graduation. All these issues are likely to

74
become more, not less, important in the future. As a public institution with a relatively
small student body, further research into how SUNY Cobleskill can retain its students is
warranted. This study provided a good foundation for establishing routine and regular
efforts to analyze and interpret data related to retention and those factors that are
associated with it.
75
References
Ajzen, I., & Fishbein, M. (1980). Understanding attitudes and predicting social behavior. Englewood Cliffs, NJ: Prentice-Hall.
Ajzen, I. (1985). From intentions to actions: A theory of planned behavior. In J. Kuhl & J. Beckman (Eds.), Action-control: From cognition to behavior (pp. 11–39). Heidelberg, Germany: Springer.
Arthurs, J. (2009). A study of leadership factors, retention strategies, and retention rates in associate degree nursing programs. (Doctoral dissertation). Available from Proquest Dissertations and Theses database. (Publication Number: UMI 3372018).
Astin, A.W. (1975). Preventing students from dropping out. San Francisco, CA: Jossey-
Bass. Astin, A.W. (1993). What matters most in college? San Francisco, CA: Jossey-Bass. Astin, A.W. (1999). Student involvement: A developmental theory for higher
education. Journal of College Student Development, 40(5), 518-529. Baime, D., & Mullin, C. (2010). Pell power. Community College Journal, 80(5), 38-42.
Retrieved from Academic Search Complete database. Baum, S., Ma, J., & Payea, K. (2010). Education pays 2010: The benefits of higher
education for individuals and society. Retrieved from http://trends.collegeboard.com
Bean, J.P. (1982).Student attrition, intentions, and confidence: Interaction effects in a
path model. Research in Higher Education, 17, 291-319. Braunstein, A., McGrath, M., & Pescatrice, D. (1999). Measuring the impact of income
and financial aid offers on college enrollment decisions. Research in Higher Education, 40(3), 247-259.
76
Braunstein, A., McGrath., & Pescatrice, D. (2000). Measuring the impact of financial factors on college persistence. Journal of College Student Retention, 2(3), 191-203.
Cabrera, A.F., Castaneda, M.B, Nora, A., & Hengstler, D. (1992). The convergence
between two theories of college persistence. Journal of Higher Education, 63(2), 143-164.
Crichton, N. (2001). Information point: Kendall’s tau. The Journal of Clinical Nursing
10, 715. Davis, G.B., & Parker, C.A. (1997). Writing the doctoral dissertation: A systematic
approach. NY: Barron’s.
Durkheim, E. (1951). Suicide: A study in sociology. Glencoe, Ill: Free Press.
Earl, A.W. (1989). A retrospective of the effect of financial aid on college and university enrollment during a period of steady-state and decline. Retrieved from ERIC database. (ED305863)
Elam, C., Stratton, T., & Gibson, D. (2007). Welcoming a new generation to college: The
millennial students. Journal of College Admission, (195), 20-25. Retrieved from Academic Search Complete database.
Expected Family Contribution (EFC). (n.d.) Retrieved from
http://www.fafsa.ed.gov/help/fftoc01g.htm
Fishbein, M., & Ajzen, I. (1975). Belief, attitude, intention, and behavior: An introduction to theory and research. Reading, MA: Addison-Wesley.
Fleming, K. (2010). Student persistence in associate degree nursing programs at Mississippi community colleges. (Doctoral dissertation). Available from Proquest Dissertations and Theses database. (Publication Number: UMI 3437890).
Foster, M. (2008). Improving student engagement and learning. [Grant application].
SUNY Cobleskill, NY. Gaskins, B. P. (2009). A ten-year study of the conditional effects on student success in the
first year of college (Doctoral dissertation). Available from Proquest Dissertations and Theses database. (Publication Number: AAT 3371000)
Glatthorn, A. A., & Joyner, R. L. (2005). Writing the winning thesis or dissertation: A
step-by-step guide. CA: Corwin Press.
77
Goldrick‐Rab, S., Harris, D. N., Benson, J., & Kelchen, R. (2011, July 7). Conditional cash transfers and college persistence: Evidence from a randomized need-based grant program. (Discussion Paper No. 1393-11). Retrieved from http://www.finaidstudy.org/documents/Goldrick-Rab%20Harris%20Benson%20Kelchen.pdf
Huck, S. W. (2008). Reading statistics and research. MA: Pearson Education, Inc. Hulela, K. (2007). Iowa teachers’ perceptions regarding the effectiveness of agriculture
teacher education programs in addressing teaching standards and criteria (Doctoral dissertation). Available from Proquest Dissertations and Theses database. (Publication number: UMI3289394)
Irwin, M.A. (2010). Towards understanding the negotiation and decision-making process
of withdrawal from college: A qualitative approach (Doctoral dissertation). Available from Proquest Dissertations and Theses database. (Publication number: UMI3402062)
Jamelske, E. (2008). Measuring the impact of a university first-year experience program
on student GPA and retention. Higher Education, 57(3), 373-391. doi:10.1007/s10734-008-9161-1
Kuh, G. D., Kinzie, J., Buckley, J., Bridges, B., & Hayek, J.C. (2007). Piecing together
the student success puzzle: Research, propositions, and recommendations (review). Review of Higher Education, 32(5). Retrieved from Academic Search Complete database.
Malik, T. (2011). College success: First year seminar’s effectiveness of freshmen
academic and social integration, impact on academic achievement and retention at a southern institution. (Doctoral dissertation). Available from Proquest Dissertations and Theses database. (Publication Number: UMI 3439885)
Maryanski, A., & Turner, J. H. (1992). Functionalism. In Encyclopedia of sociology (Vol.
2, pp. 730-736). New York: NY: Macmillan. Merriam-Webster. (2011). Cohort – Definition and more. Retrieved from
http://www.merriam-webster.com/dictionary/cohort?show=0&t=1298218115 Miles, R. (2009). The challenges and factors that determine female career choices in
information technology professions: An exploratory investigation. (Doctoral dissertation). Available from Proquest Dissertations and Theses database. (Publication number: UMI 3378954)
Pascarella, E.T., & Terenzini, P.T. (1979). Interaction effects in Spady’s and Tinto’s
conceptual models of college dropout. Sociology of Education, 52, 197-210. Retrieved from Academic Search Complete database.
78
Paulsen, M.B., & St. John, E.P. (2002). Social class and college costs: Examining the
financial nexus between college choice and persistence. The Journal of Higher Education, 73(2), 189-236.
Pennington, H. (2004). Fast track to college: Increasing postsecondary success for all students. Double the numbers: A jobs for the future initiative. Jobs for the Future. Retrieved from EBSCOhost.
Pierce, W.D. (1992). Behaviorism. In Encyclopedia of sociology (Vol. 1, pp. 131-140). New York: NY: Macmillan.
Pitre, P.E., Johnson, T.E., & Pitre, C.C. (2006). Understanding predisposition in college
choice: Toward an integrated model of college choice and theory of reasoned action. College and University Journal, 81(2), 35-42.
Pryor, J.H., DeAngelo, L., Palucki Blake, L., Hurtado, S., & Tran, S. (2011). The
American freshman: National norms fall 2011. Los Angeles: Higher Education Institute, UCLA.
Pryor, J.H., Hurtado, S., DeAngelo, L., Palucki Blake, L., & Tran, S. (2010). The
American freshman: National norms fall 2010. Los Angeles: Higher Education Institute, UCLA.
Retention/Completion Summary Tables. (2009). Retrieved from
http://www.act.org/research/policymakers/pdf/09retain_trends.pdf Roberts, C. M. (2004). The dissertation journey. A practical and comprehensive guide to
planning, writing, and defending your dissertation. CA: Corwin Press. Schoharie County Chamber of Commerce. (n.d.).Town of Cobleskill. Retrieved from
http://www.schohariecounty-ny.gov/CountyWebSite/towncob/index.jsp
Singell, L. D. (2001). Come and stay a while: Does financial aid effect enrollment and retention at a large public university? Retrieved from ERIC database. (ED482386)
St. John, E.P. (2000). The impact of student aid on recruitment and retention: What the research indicates. New Direction for Student Services, 89, 61-75.
State University of New York. (n.d.). The state university of New York financial fact
book. Retrieved from http://www.suny.edu/sunynews/FactBookforJune302010FY.pdf
79
Sterba-Boatwright, B. (2000). The effects of mandatory freshman learning communities: A statistical report. Assessment Update, 12(2), 4. Retrieved from Academic Search Complete database.
Stewart, S. (2010). An examination of pre-entry and academic performance factors that
predict persistence for academically underprepared students at a public research university. (Doctoral dissertation). Available from Proquest Dissertations and Theses database. (Publication Number: UMI 3403011)
Tinto, V. (1975). Dropout from higher education: A theoretical synthesis of recent
research. Review of Educational Research, 45(1), 89-125. doi: 10.3102/00346543045001089
Tinto, V. (2006). Research and practice of student retention: What next? Journal of
College Student Retention,8(1), 1-19. Walke, J.T. (2010). Choosing to succeed: An exploration of the relationship between
college choice and freshman retention (Doctoral Dissertation). Available from Proquest Dissertations and Theses database. (Publication Number: AAT3405470)
Wessel, R.D., Bell, C., McPherson, J.D., Costello, M.T., & Jones, J.A. (2006). Academic
disqualification and persistence to graduation by financial aid category and academic ability. Journal of College Student Retention 8(2), 185-198.
Wohlgemuth, D., Whalen, D., Sullivan, J., Nading, C., Shelley, M., & Wang, Y. (2006).
Financial, academic, and environmental influences on the retention and graduation of students. Journal of College Student Retention, 8(4), 457-475.
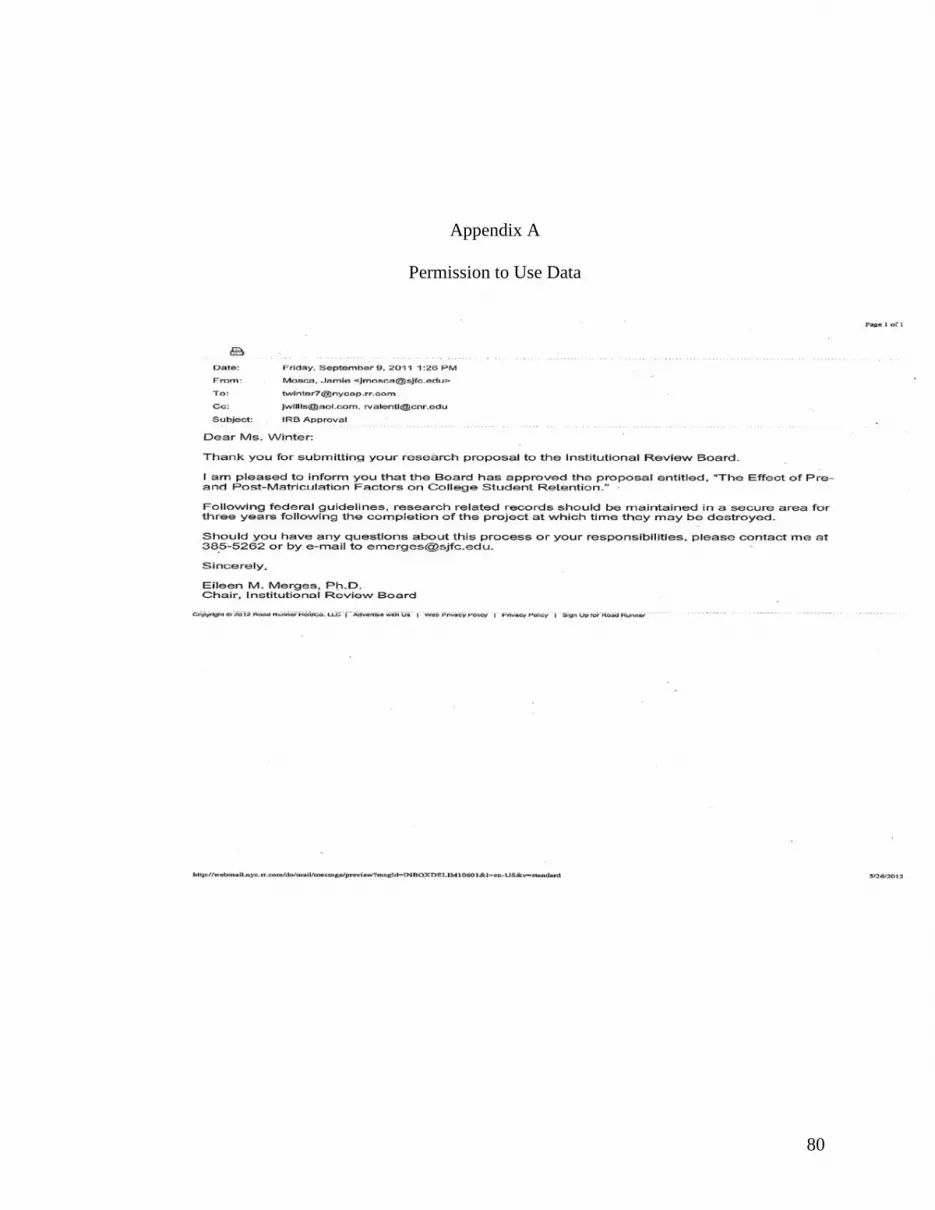
80
Appendix A
Permission to Use Data
81
Appendix B
Permission to Use Data and College Name
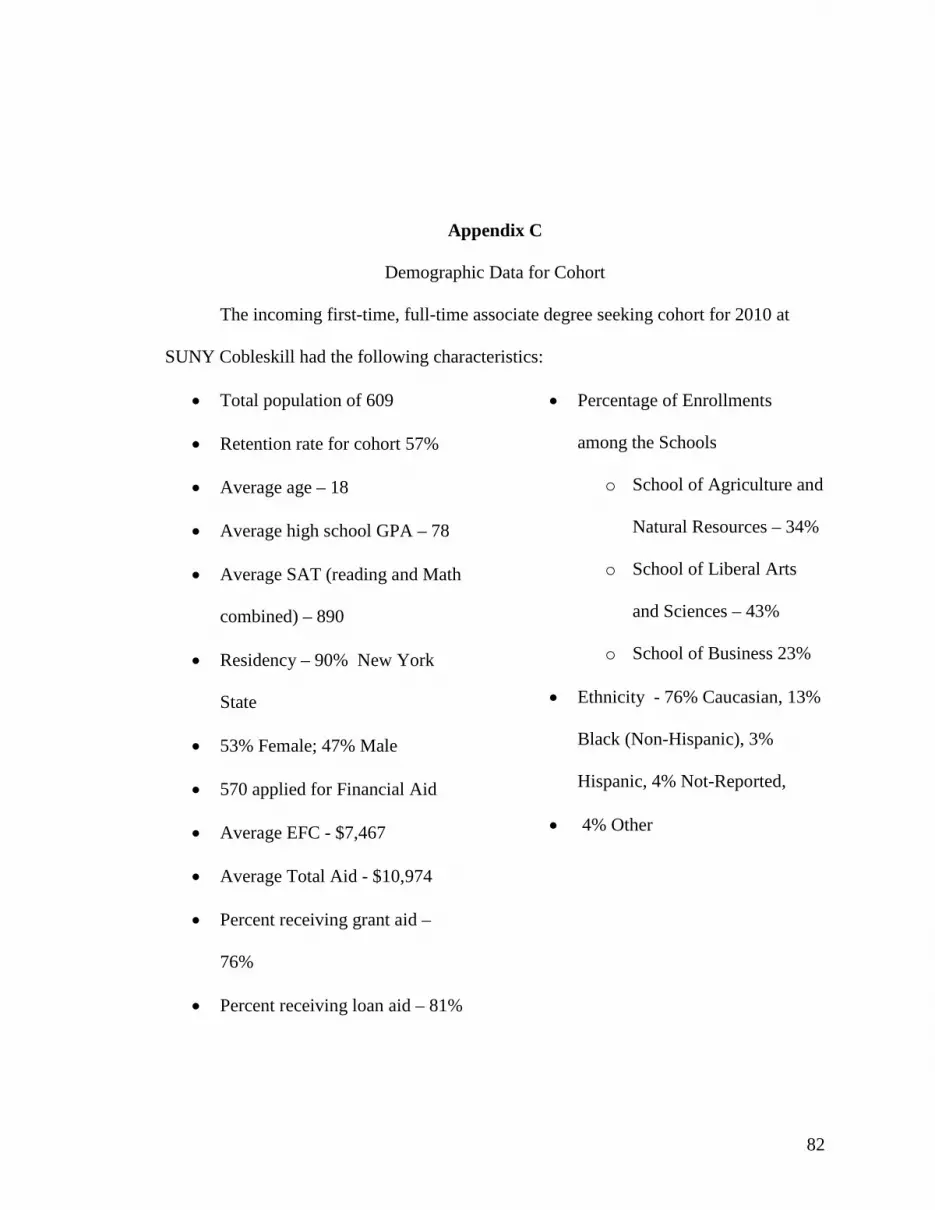
82
Appendix C
Demographic Data for Cohort
The incoming first-time, full-time associate degree seeking cohort for 2010 at
SUNY Cobleskill had the following characteristics:
• Total population of 609
• Retention rate for cohort 57%
• Average age – 18
• Average high school GPA – 78
• Average SAT (reading and Math
combined) – 890
• Residency – 90% New York
State
• 53% Female; 47% Male
• 570 applied for Financial Aid
• Average EFC - $7,467
• Average Total Aid - $10,974
• Percent receiving grant aid –
76%
• Percent receiving loan aid – 81%
• Percentage of Enrollments
among the Schools
o School of Agriculture and
Natural Resources – 34%
o School of Liberal Arts
and Sciences – 43%
o School of Business 23%
• Ethnicity - 76% Caucasian, 13%
Black (Non-Hispanic), 3%
Hispanic, 4% Not-Reported,
• 4% Other


