Embed Size (px)
Citation preview
Vol.:(0123456789)1 3
Journal of Petroleum Exploration and Production Technology https://doi.org/10.1007/s13202-021-01444-3
ORIGINAL PAPER-PRODUCTION ENGINEERING
Analysis of nonlinear effects in fluid flows through porous media
A. B. Zolotukhin1,2,3 · A. T. Gayubov1
Received: 5 August 2021 / Accepted: 23 December 2021 © The Author(s) 2021
AbstractThis article examines the nonlinear effects of fluid flow in a porous medium, governed by a new semi-analytical equation, from three aspects: equation derivation, experimental verification, and macroscale simulation modelling. The rigorous derivation of the new equation is presented with a semi-analytical approach in which the gas slippage effect and inertial forces are described. The latter effect is controlled by Fochheimer number, which is defined as a product of tortuosity and Reynolds number. The new equation successfully predicts the deviations from Darcy’s law in low-permeability media when the gas slippage effect occurs. The Klinkenberg gas slippage factor is obtained as a function of porous media’s structural parameter (porosity and intrinsic permeability) and gas property (mean free path of gas molecules). The equation validations are performed by core flow experiments for a wide range of reservoir properties, which yield good matching relationship between modelled and observed values. In addition, the proposed semi-analytical equation is used to simulate gas flow in the radial model.
Keywords Apparent permeability · Klinkenberg effect · Forchheimer’s law · Reynolds number · Forchheimer number · Tortuosity
Introduction
The continuing decline in conventional hydrocarbon resources accelerates the development of unconventional formations, such as tight sands, shales, coal beds, etc. Porous media permeability is an essential indicator in unconven-tional reservoirs and is frequently determined through labo-ratory experiments. It becomes standard to use gas instead of water as a fluid for permeability measurements because of the advantages of inert properties and low sensitivity to ambient temperature (Freeman and Bush 1983; Rodwell and Nash 1992; Tanikawa et al. 2009). Theoretically, the perme-ability value does not depend on the type of porous medium. However, numerous studies have shown that for gas flows
in porous media with low permeability such as tight sand-stones, coal-bed and shale gas, the permeability measured during the experiments (gas permeability) is greater than the intrinsic (liquid) permeability (k) and increases with decreas-ing average gas pressure
(
p)
(Heid et al. 1950; Jones 1972; Jones and Owens 1980; Faulkner and Rutter 2000; Tani-kawa et al. 2009). Fancher et al. (1933) conducted the first laboratory tests of oil-bearing rock samples to detect this phenomenon, the results of which were further reviewed by Muscat (1937). Overall, it was found that for high-permeable media, the differences between liquid and gas permeability were small. In contrast, these differences were significant for low and ultra-low (10–19–10–22 m2) permeable porous media. To distinguish it from the intrinsic permeability, the term of apparent gas permeability
(
ka)
has been introduced, which is expressed by Klinkenberg (1941) as inversely proportional to the pore pressure:
(1)ka = k
(
1 +b
p
)
* A. B. Zolotukhin [email protected]
A. T. Gayubov [email protected]
1 Department of Oil and Gas Field Development, Gubkin Russian State University of Oil and Gas (National Research University), Moscow, Russia
2 University of Stavanger, Stavanger, Norway3 Northern (Arctic) Federal University, Archangelsk, Russia
Journal of Petroleum Exploration and Production Technology
1 3
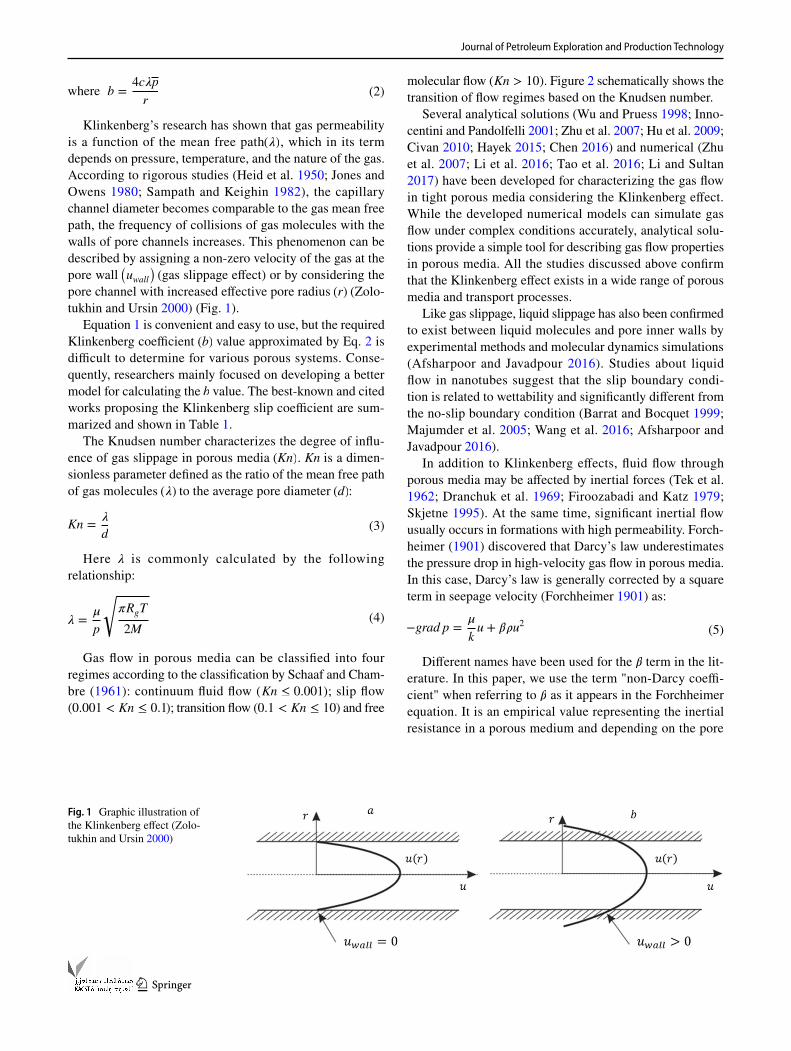
Klinkenberg’s research has shown that gas permeability is a function of the mean free path(�) , which in its term depends on pressure, temperature, and the nature of the gas. According to rigorous studies (Heid et al. 1950; Jones and Owens 1980; Sampath and Keighin 1982), the capillary channel diameter becomes comparable to the gas mean free path, the frequency of collisions of gas molecules with the walls of pore channels increases. This phenomenon can be described by assigning a non-zero velocity of the gas at the pore wall
(
uwall)
(gas slippage effect) or by considering the pore channel with increased effective pore radius (r) (Zolo-tukhin and Ursin 2000) (Fig. 1).
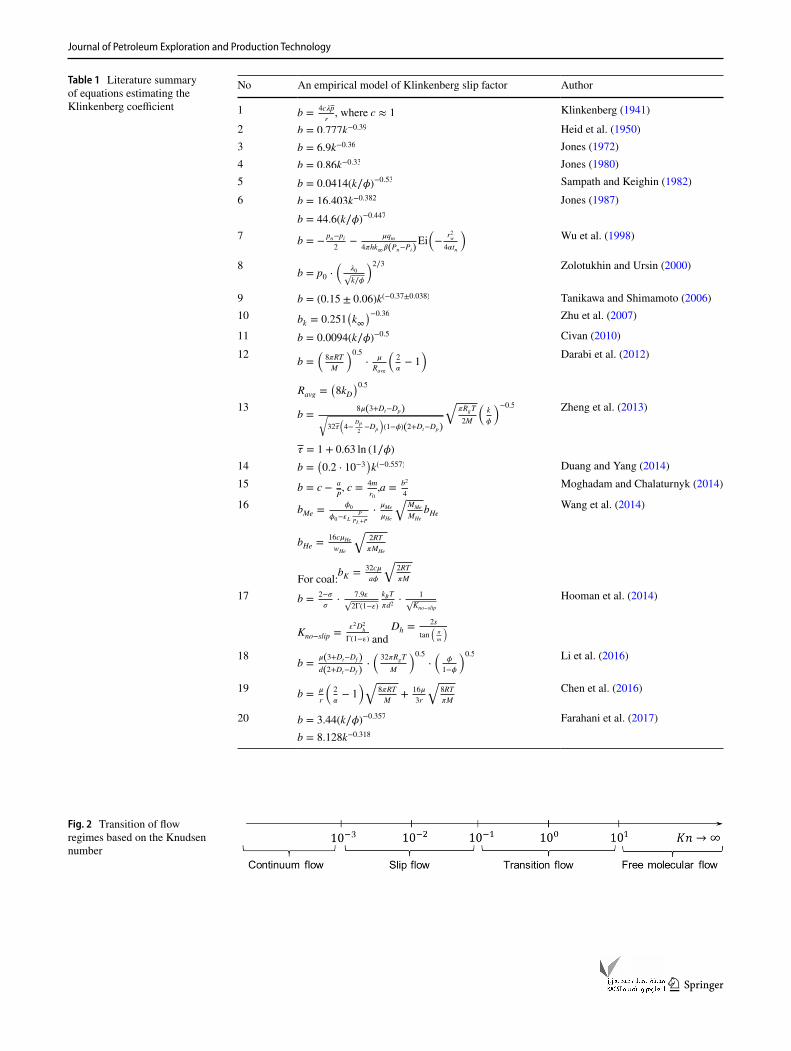
Equation 1 is convenient and easy to use, but the required Klinkenberg coefficient (b) value approximated by Eq. 2 is difficult to determine for various porous systems. Conse-quently, researchers mainly focused on developing a better model for calculating the b value. The best-known and cited works proposing the Klinkenberg slip coefficient are sum-marized and shown in Table 1.
The Knudsen number characterizes the degree of influ-ence of gas slippage in porous media (Kn) . Kn is a dimen-sionless parameter defined as the ratio of the mean free path of gas molecules (�) to the average pore diameter (d):
Here � is commonly calculated by the following relationship:
Gas flow in porous media can be classified into four regimes according to the classification by Schaaf and Cham-bre (1961): continuum fluid flow ( Kn ≤ 0.001 ); slip flow ( 0.001 < Kn ≤ 0.1 ); transition flow ( 0.1 < Kn ≤ 10 ) and free
(2)where b =4c�p
r
(3)Kn =�
d
(4)� =�
p
√
�RgT
2M
molecular flow ( Kn > 10 ). Figure 2 schematically shows the transition of flow regimes based on the Knudsen number.
Several analytical solutions (Wu and Pruess 1998; Inno-centini and Pandolfelli 2001; Zhu et al. 2007; Hu et al. 2009; Civan 2010; Hayek 2015; Chen 2016) and numerical (Zhu et al. 2007; Li et al. 2016; Tao et al. 2016; Li and Sultan 2017) have been developed for characterizing the gas flow in tight porous media considering the Klinkenberg effect. While the developed numerical models can simulate gas flow under complex conditions accurately, analytical solu-tions provide a simple tool for describing gas flow properties in porous media. All the studies discussed above confirm that the Klinkenberg effect exists in a wide range of porous media and transport processes.
Like gas slippage, liquid slippage has also been confirmed to exist between liquid molecules and pore inner walls by experimental methods and molecular dynamics simulations (Afsharpoor and Javadpour 2016). Studies about liquid flow in nanotubes suggest that the slip boundary condi-tion is related to wettability and significantly different from the no-slip boundary condition (Barrat and Bocquet 1999; Majumder et al. 2005; Wang et al. 2016; Afsharpoor and Javadpour 2016).
In addition to Klinkenberg effects, fluid flow through porous media may be affected by inertial forces (Tek et al. 1962; Dranchuk et al. 1969; Firoozabadi and Katz 1979; Skjetne 1995). At the same time, significant inertial flow usually occurs in formations with high permeability. Forch-heimer (1901) discovered that Darcy’s law underestimates the pressure drop in high-velocity gas flow in porous media. In this case, Darcy’s law is generally corrected by a square term in seepage velocity (Forchheimer 1901) as:
Different names have been used for the � term in the lit-erature. In this paper, we use the term "non-Darcy coeffi-cient" when referring to � as it appears in the Forchheimer equation. It is an empirical value representing the inertial resistance in a porous medium and depending on the pore
(5)−grad p =�
ku + ��u2
Fig. 1 Graphic illustration of the Klinkenberg effect (Zolo-tukhin and Ursin 2000)
Journal of Petroleum Exploration and Production Technology
1 3
Table 1 Literature summary of equations estimating the Klinkenberg coefficient
No An empirical model of Klinkenberg slip factor Author
1 b =4c�p
r , where c ≈ 1 Klinkenberg (1941)
2 b = 0.777k−0.39 Heid et al. (1950)3 b = 6.9k−0.36 Jones (1972)4 b = 0.86k−0.33 Jones (1980)5 b = 0.0414(k∕�)−0.53 Sampath and Keighin (1982)6 b = 16.403k−0.382 Jones (1987)
b = 44.6(k∕�)−0.447
7 b = −pn−pi
2−
�qm
4�hk∞�(Pn−Pi)Ei
(
−r2w
4�tn
)
Wu et al. (1998)
8b = p0 ⋅
�
�0√
k∕�
�2∕3 Zolotukhin and Ursin (2000)
9 b = (0.15 ± 0.06)k(−0.37±0.038) Tanikawa and Shimamoto (2006)10 bk = 0.251
(
k∞)−0.36 Zhu et al. (2007)
11 b = 0.0094(k∕�)−0.5 Civan (2010)12
b =(
8�RT
M
)0.5
⋅
�
Ravg
(
2
�− 1
) Darabi et al. (2012)
Ravg =(
8kD)0.5
13b =
8�(3+Dt−Dp)√
32�
(
4−Dp
2−Dp
)
(1−�)(2+Dt−Dp)
√
�RgT
2M
(
k
�
)−0.5 Zheng et al. (2013)
� = 1 + 0.63 ln (1∕�)
14 b =(
0.2 ⋅ 10−3)
k(−0.557) Duang and Yang (2014)15 b = c −
a
P , c = 4m
r0,a =
b2
4
Moghadam and Chalaturnyk (2014)
16 bMe =�0
�0−�LP
PL+P
⋅
�Me
�He
√
MMe
MHe
bHeWang et al. (2014)
bHe =16c�He
wHe
√
2RT
�MHe
For coal:bK =32c�
a�
√
2RT
�M
17 b =2−�
�⋅
7.9�√
2Γ(1−�)
kBT
�d2⋅
1√
Kno−slip
Hooman et al. (2014)
Kno−slip =�2D2
h
Γ(1−�) and Dh =
2s
tan
(
�
m
)
18b =
�(3+Dt−Df )d(2+Dt−Df )
⋅
(
32�RgT
M
)0.5
⋅
(
�
1−�
)0.5 Li et al. (2016)
19b =
�
r
(
2
�− 1
)√
8�RT
M+
16�
3r
√
8RT
�M
Chen et al. (2016)
20 b = 3.44(k∕�)−0.357 Farahani et al. (2017)
b = 8.128k−0.318
Fig. 2 Transition of flow regimes based on the Knudsen number
Journal of Petroleum Exploration and Production Technology
1 3
geometry and fluid properties; the determination method of which is poorly studied. Many previous studies have focused on non-Darcy coefficient determination, which was discussed in detail in our previous work (Zolotukhin and Gayubov 2021).
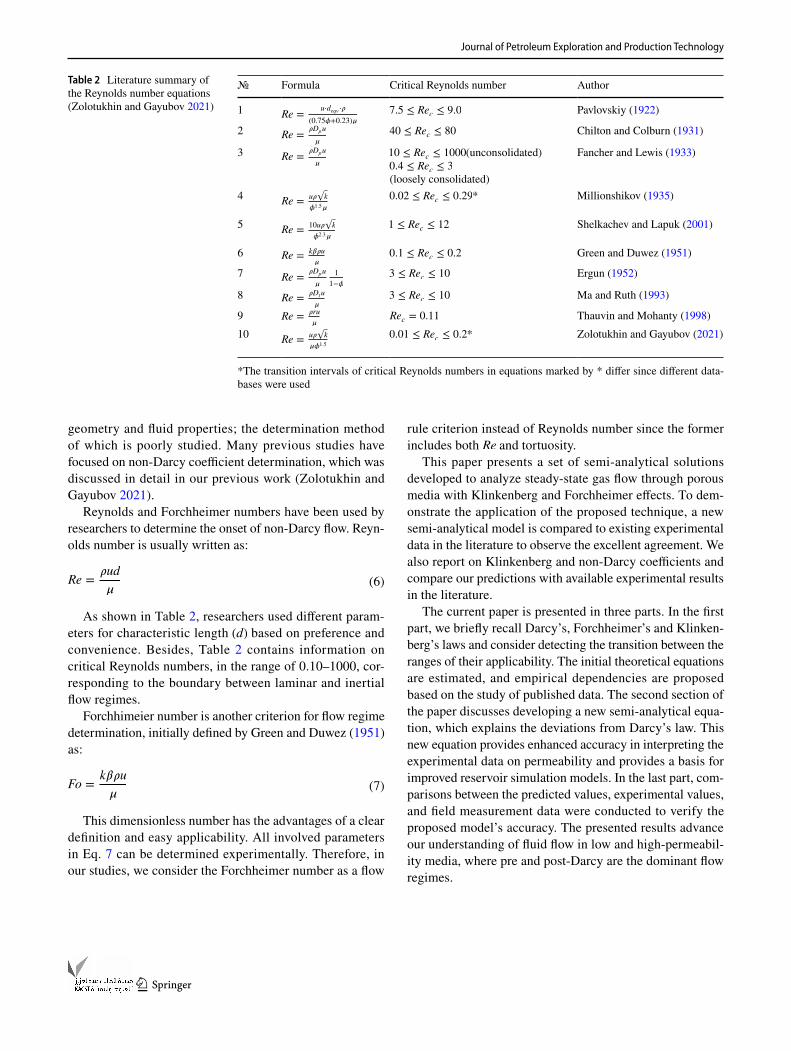
Reynolds and Forchheimer numbers have been used by researchers to determine the onset of non-Darcy flow. Reyn-olds number is usually written as:
As shown in Table 2, researchers used different param-eters for characteristic length (d) based on preference and convenience. Besides, Table 2 contains information on critical Reynolds numbers, in the range of 0.10–1000, cor-responding to the boundary between laminar and inertial flow regimes.
Forchhimeier number is another criterion for flow regime determination, initially defined by Green and Duwez (1951) as:
This dimensionless number has the advantages of a clear definition and easy applicability. All involved parameters in Eq. 7 can be determined experimentally. Therefore, in our studies, we consider the Forchheimer number as a flow
(6)Re =�ud
�
(7)Fo =k��u
�
rule criterion instead of Reynolds number since the former includes both Re and tortuosity.
This paper presents a set of semi-analytical solutions developed to analyze steady-state gas flow through porous media with Klinkenberg and Forchheimer effects. To dem-onstrate the application of the proposed technique, a new semi-analytical model is compared to existing experimental data in the literature to observe the excellent agreement. We also report on Klinkenberg and non-Darcy coefficients and compare our predictions with available experimental results in the literature.
The current paper is presented in three parts. In the first part, we briefly recall Darcy’s, Forchheimer’s and Klinken-berg’s laws and consider detecting the transition between the ranges of their applicability. The initial theoretical equations are estimated, and empirical dependencies are proposed based on the study of published data. The second section of the paper discusses developing a new semi-analytical equa-tion, which explains the deviations from Darcy’s law. This new equation provides enhanced accuracy in interpreting the experimental data on permeability and provides a basis for improved reservoir simulation models. In the last part, com-parisons between the predicted values, experimental values, and field measurement data were conducted to verify the proposed model’s accuracy. The presented results advance our understanding of fluid flow in low and high-permeabil-ity media, where pre and post-Darcy are the dominant flow regimes.
Table 2 Literature summary of the Reynolds number equations (Zolotukhin and Gayubov 2021)
*The transition intervals of critical Reynolds numbers in equations marked by * differ since different data-bases were used
№ Formula Critical Reynolds number Author
1 Re =u⋅deqv⋅�
(0.75�+0.23)�
7.5 ≤ Rec ≤ 9.0 Pavlovskiy (1922)
2 Re =�Dpu
�
40 ≤ Rec ≤ 80 Chilton and Colburn (1931)
3 Re =�Dpu
�
10 ≤ Rec ≤ 1000(unconsolidated)0.4 ≤ Rec ≤ 3
(loosely consolidated)
Fancher and Lewis (1933)
4Re =
u�√
k
�1.5�
0.02 ≤ Rec ≤ 0.29* Millionshikov (1935)
5Re =
10u�√
k
�2.3�
1 ≤ Rec ≤ 12 Shelkachev and Lapuk (2001)
6 Re =k��u
�0.1 ≤ Rec ≤ 0.2 Green and Duwez (1951)
7 Re =�Dpu
�
1
1−�
3 ≤ Rec ≤ 10 Ergun (1952)
8 Re =�Dtu
�3 ≤ Rec ≤ 10 Ma and Ruth (1993)
9 Re =�ru
�Rec = 0.11 Thauvin and Mohanty (1998)
10Re =
u�√
k
��1.5
0.01 ≤ Rec ≤ 0.2* Zolotukhin and Gayubov (2021)
Journal of Petroleum Exploration and Production Technology
1 3
Theoretical modelling
For each of linear and radial flows in porous media, first, Darcy’s law is presented. Then it is combined with pre-Darcy and post-Darcy fluxes to obtain the universal semi-analytical equation. The appropriate boundary conditions are used to solve the differential equations and obtain pressure distribution and flux as a distance function.
Linear Darcy flow
The first mention of flow measurements through a porous medium was in 1856, when Henry Darcy published his water flow studies through a sand filter (Darcy 1856). The results of the experiment were generalized into empirical law that bears his name today. The law relates the flow rate to the hydraulic gradient through a linear proportionality coeffi-cient, which Darcy called “perméabilité”. Darcy claimed that this coefficient depends on the permeability of the sand layer. In 1933, Wyckoff, Botset, Muscat, and Reed published an article entitled “The Measurement of the Permeability of Porous Medium for Homogeneous Fluids”, which outlined first time the definition of permeability and its physical con-cept in petroleum engineering (Wyckoff et al. 1933):
No theoretical justification was given for the above equa-tion and no references were made to earlier studies. In the 1950s, Hubbert provided a complete theoretical foundation to Darcy’s empirical expression, deriving it from the gen-eral Navier–Stokes equation (Hubbert 1956). For the case of compressible steady-state flow at room temperature, Eq. 8 can be written as:
Taking into account the constant mass flow rate and the perfect gas law Eq. 9 can be rewritten in the following form:
Equation 10 allows determining the mass flow rate uD,m if the inlet and outlet pressures are specified (Dirichlet bound-ary conditions). Note that the values �0 and p0 are referred to an arbitrarily selected point with index 0 (it could be referred to standard conditions or any other point).
The value of the mass flow rate uD,m enables us to deter-mine the distribution of pressure, fluid density and the volu-metric flow rate through the core sample. By integrating
(8)−uD =k
�⋅
dp
dx
(9)−k
�⋅ �(p)
dp
dx= �(p)uD
(10)k
�⋅
�0
p0
(
p21− p2
2
)
2l= uD,m
Eq. 9 from the inlet point x1 to an arbitrary point x the pressure distribution can be obtained by the following expression:
Linear post‑Darcy flow
For many years, Darcy’s law was considered the fundamen-tal equation governing the fluid flow in a porous medium. However, Darcy’s law is valid for a certain range of fluxes and some basic assumptions (laminar single-phase flow, an isothermal condition, constant fluid viscosity, and no rock-fluid interaction) for fluid flow in porous media (Hubbert 1956; Scheidegger 1960; Wu et al. 1998). Indeed, when the flow rate increases, the pressure drop is no longer pro-portional to the seepage velocity. To describe the nonlinear effect, a quadratic term was included in Eq. 8 by Dupuit (1863) and Forchheimer (1901) to generalize the flow equa-tion, i.e.:
Based on the Forchheimer equation, a plotting method was developed to determine absolute permeability and iner-tial coefficient through linear regression of experimental data. In gas wells, the coefficient � is usually determined by the analysis of multi-rate pressure test results. Unfortunately, such data measurements are expensive and not readily avail-able in many cases. Thus, it is a regular practice to use the-oretical and empirical correlations that can be derived by exploiting experimental values of the inertial coefficient �.
Using the dimensional analysis and machine learning methods, discussed in detail in our previous studies (Zolo-tukhin and Gayubov 2019, 2021), it was possible to obtain the following modified Forchheimer equation for the com-pressible linear steady-state flow:
where � is the tortuosity, a parameter that characterizes a porous medium at a mesoscale and is determined based on laboratory studies conducted on cores.
Here, B1 and � are constants equal to 9.67 ⋅ 10−5 and 0.47 , respectively. To obtain a semi-analytical expression
(11)p(x) =
√
(
p21− 2
p0
�0⋅
�
k⋅ uD,m ⋅
(
x − x1)
)
(12)−dp
dx=
�
ku + ��u2
(13)−k
�⋅ �(p)
dp
dx= �(p(x))uF + � ⋅
√
k
��1.5�2(p(x))u2
F
(14)� = B1 ⋅
(
� ⋅ l2
k
)�
Journal of Petroleum Exploration and Production Technology
1 3
for a flow rate, we provide the following expression for the non-Darcy coefficient, which is advantageous in that both hydraulic properties of the rock and the fluid properties are considered simultaneously:
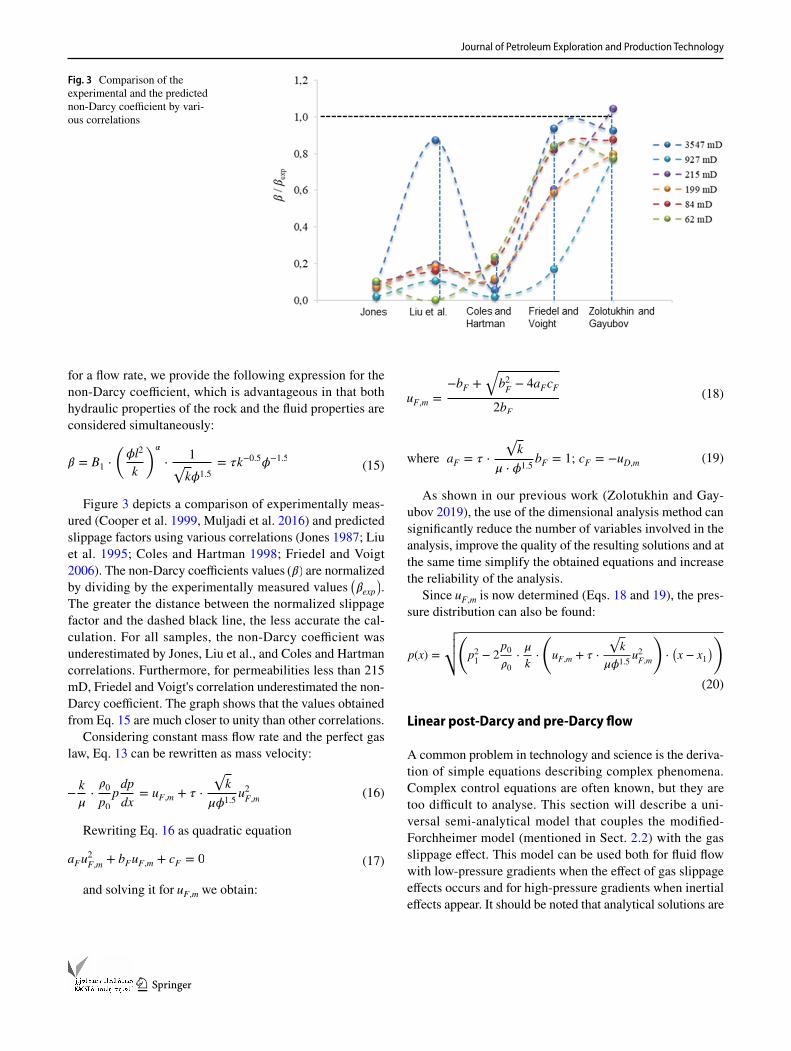
Figure 3 depicts a comparison of experimentally meas-ured (Cooper et al. 1999, Muljadi et al. 2016) and predicted slippage factors using various correlations (Jones 1987; Liu et al. 1995; Coles and Hartman 1998; Friedel and Voigt 2006). The non-Darcy coefficients values (�) are normalized by dividing by the experimentally measured values
(
�exp)
. The greater the distance between the normalized slippage factor and the dashed black line, the less accurate the cal-culation. For all samples, the non-Darcy coefficient was underestimated by Jones, Liu et al., and Coles and Hartman correlations. Furthermore, for permeabilities less than 215 mD, Friedel and Voigt's correlation underestimated the non-Darcy coefficient. The graph shows that the values obtained from Eq. 15 are much closer to unity than other correlations.
Considering constant mass flow rate and the perfect gas law, Eq. 13 can be rewritten as mass velocity:
Rewriting Eq. 16 as quadratic equation
and solving it for uF,m we obtain:
(15)� = B1 ⋅
�
�l2
k
��
⋅
1√
k�1.5
= �k−0.5�−1.5
(16)−k
�⋅
�0
p0pdp
dx= uF,m + � ⋅
√
k
��1.5u2F,m
(17)aFu2
F,m+ bFuF,m + cF = 0
As shown in our previous work (Zolotukhin and Gay-ubov 2019), the use of the dimensional analysis method can significantly reduce the number of variables involved in the analysis, improve the quality of the resulting solutions and at the same time simplify the obtained equations and increase the reliability of the analysis.
Since uF,m is now determined (Eqs. 18 and 19), the pres-sure distribution can also be found:
Linear post‑Darcy and pre‑Darcy flow
A common problem in technology and science is the deriva-tion of simple equations describing complex phenomena. Complex control equations are often known, but they are too difficult to analyse. This section will describe a uni-versal semi-analytical model that couples the modified-Forchheimer model (mentioned in Sect. 2.2) with the gas slippage effect. This model can be used both for fluid flow with low-pressure gradients when the effect of gas slippage effects occurs and for high-pressure gradients when inertial effects appear. It should be noted that analytical solutions are
(18)uF,m =−bF +
√
b2F− 4aFcF
2bF
(19)where aF = � ⋅
√
k
� ⋅ �1.5bF = 1; cF = −uD,m
(20)
p(x) =
�
�
�
�
�
p21− 2
p0
�0⋅
�
k⋅
�
uF,m + � ⋅
√
k
��1.5u2F,m
�
⋅
�
x − x1�
�
Fig. 3 Comparison of the experimental and the predicted non-Darcy coefficient by vari-ous correlations
Journal of Petroleum Exploration and Production Technology
1 3
obtained under steady-state flow conditions, and the effects of adsorption and diffusion are not considered in them.
Since gas is more compressible than solid and liquid, their permeability characteristics are different from one another. Therefore, the difference between the gas (appar-ent) and liquid permeability of most porous media can be accounted for by the Klinkenberg effect mentioned in the introduction (Sect. 1). Assuming that the apparent reservoir permeability is a function of pressure
(
ka(p))
, we can rewrite Eq. 13 in the following form:
The tortuosity of the pore channels, calculated by Eq. 14, with consideration of apparent permeability
(
ka(p))
, can be expressed in the following form:
Let us now define a formula for the parameter b . As ear-lier proposed (Zolotukhin and Ursin 2000), the equation for the Klinkenberg gas slippage factor can be written in the following form:
(21)
−ka(p)
�⋅ �(p)
dp
dx= �(p)uKF + �a
�
ka(p)�
⋅
√
ka(p)
��1.5�2(p)u2
KF
(22)
�a(
ka(p))
= B1⋅
(
�l2
ka(p)
)�
= B1⋅
(
�l2
k
)�
⋅
1(
1 +b
p
)�
= � ⋅1
(
1 +b
p
)�
(23)b = p0 ⋅
�
�0√
k∕�
�2∕3
The further estimates of the apparent permeability based on Eq. 23, made by the authors with the assistance of machine learning methods and dimension analysis give the following best-fit estimate:
Equation 24 includes a parameter that considers the type of gas when the gas slip effect occurs, which has been ignored by many researchers. Rushing et al. (2004) report the steady-state and unsteady-state permeability measure-ment results for both helium and nitrogen. The results show that although gas slippage effect is generally more pro-nounced with helium compared to the nitrogen. The sensi-tivity of the permeability values to the flowing gas type is shown in different sections of Salahshoor and Fahes (2017), demonstrating the need to capture this effect in the calcula-tions through some modification or corrections. Experimen-tally measured gas permeabilities can be misleading if the effect of gas type is not considered.
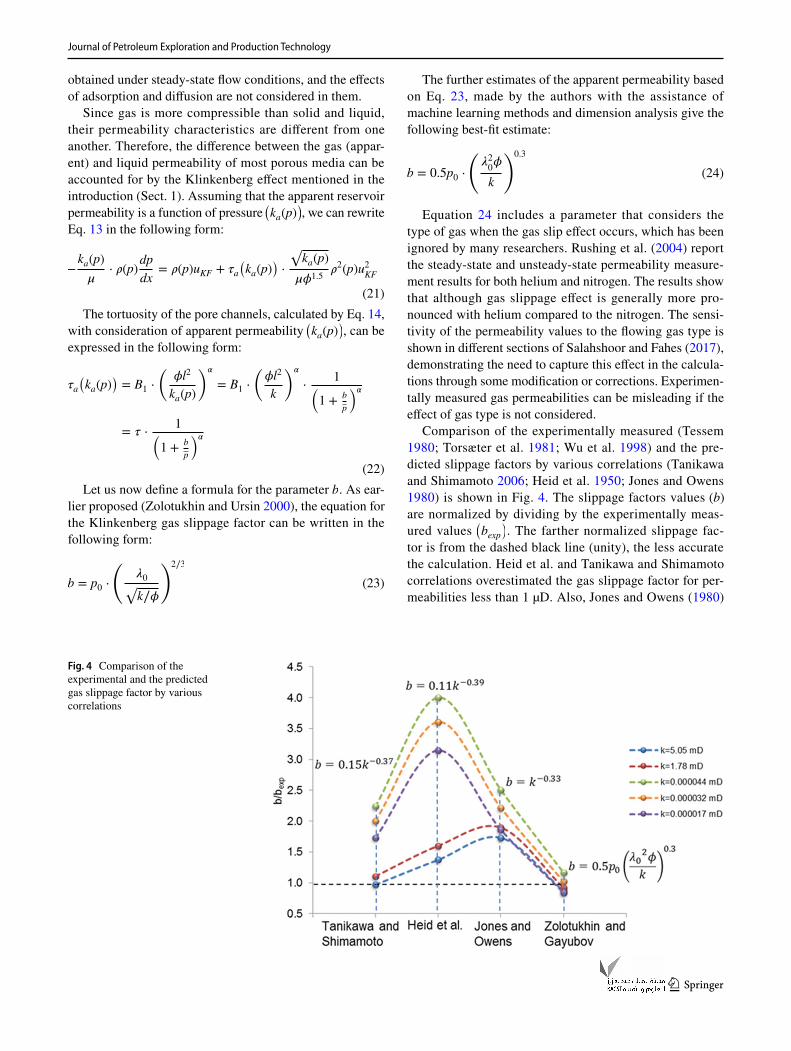
Comparison of the experimentally measured (Tessem 1980; Torsæter et al. 1981; Wu et al. 1998) and the pre-dicted slippage factors by various correlations (Tanikawa and Shimamoto 2006; Heid et al. 1950; Jones and Owens 1980) is shown in Fig. 4. The slippage factors values (b) are normalized by dividing by the experimentally meas-ured values
(
bexp)
. The farther normalized slippage fac-tor is from the dashed black line (unity), the less accurate the calculation. Heid et al. and Tanikawa and Shimamoto correlations overestimated the gas slippage factor for per-meabilities less than 1 µD. Also, Jones and Owens (1980)
(24)b = 0.5p0 ⋅
(
�20�
k
)0.3
Fig. 4 Comparison of the experimental and the predicted gas slippage factor by various correlations
Journal of Petroleum Exploration and Production Technology
1 3
correlation overestimated the gas slippage factor for the entire experimental data range. According to the graph, the values obtained using Eq. 24 (Zolotukhin and Gayubov) are much closer to unity than other correlations. However, a more extensive data set will be more helpful to investigate this relationship further.
Substituting the obtained relation (Eq. 22) into the flow equation (Eq. 21), we obtain:
Following the logic of the previous section, integration of the left-hand side of Eq. 25 yields:
Rewriting Eq. 26 as quadratic equation
and solving it for uKF,m we obtain:
The sample’s pressure distribution can be found from Eq. 26 using the following rearrangement of its terms:
Fluid flows at the macroscale
In addition to the mesoscale model discussed in Sect. 2, a macroscopic model (i.e., the reservoir scale model) for radial flow has also been developed. The problem concerns gas injection into a well in a large horizontal, uniform, and isothermal formation. A constant gas mass injection rate
(25)
−k
�⋅
�
1 +b
p
�
⋅
�0
p0⋅ p
dp
dx= uKF,m + �
√
k
��1.5⋅
�
1 +b
p
�1
2−�
⋅ u2KF,m
(26)
k
�l⋅
�0
p0⋅
��
p21− p2
2
2
�
+ b�
p1 − p2�
�
= uKF,m + �
√
k
��1.5⋅ f ⋅ u2
KF,m
(27)aKFu2
KF,m+ bKFuKF,m + cKF = 0
(28)uKF, m =−bKF +
√
b2KF
− 4aKFcKF
2aKF
(29)
where aKF = �
√
k
��1.5f ; bKF = 1; cKF
= −k
�⋅
�0
p0⋅
�
p21− p2
2
2l
�
⋅
�
1 +b
p
�
= −uD,m ⋅
�
1 +b
p
�
(30)pKF(x) =bP
2aP
(
−1 +
√
1 − 4aPcP∕b2
P
)
(31)
where aP =1
2; bP = b; cP = −
1
2p21− b ⋅ p1
+
�
uKFm + �
√
k
��1.5⋅ f ⋅ u2
KFm
�
⋅
�
k⋅
p0
�0⋅
�
x − x1�
is imposed at the well, and the initial pressure is uniform throughout the formation. Herein, we estimate the influence of the main reservoir (reservoir porosity, permeability, and tortuosity), fluid (oil and gas viscosity, and density), and technological parameters (pressure drawdown and well spac-ing) on the efficiency of field development.
Let us rewrite the equation of fluid flow (Eq. 21) in the radial geometry:
Using the obvious relation for the radial f low uKFm =
qKF,m
S=
qKF,m
2�hr and substituting it into Eq. 32, we
obtain:
Separation of the variables and integration yields:
Integration of the left-hand side term of Eq. 34 yields:
Integration of the right-hand side part of Eq. 34 results in:
Approximate integration of the second term of Eq. 36 yields:
Denoting
(32)
k
�⋅
�
1 +b
p
�
⋅
�0
p0⋅ p
dp
dr= uKF,m + �
√
k
��1.5⋅
�
1 +b
p
�1
2−�
⋅ u2KF,m
(33)k
�⋅
�
1 +b
p
�
⋅
�0
p0
⋅ pdp
dr=
qKF,m
2�hr+ �
√
k
��1.5⋅
�
1 +b
p
�1
2−�
⋅
� qKF,m
2�hr
�2
(34)
k
�⋅
�0
p0
pe
∫pw
�
1 +b
p
�
pdp =qKF,m
2�h⋅
re
∫rw
dr
r
+ � ⋅
√
k
��1.5
�qKF,m
2�h
�2
⋅
re
∫rw
�
1 +b
p
�1
2−�
dr
r2
(35)
k
�⋅
�0
p0
pe
∫pw
(
1 +b
p
)
pdp =k
�⋅
�0
p0
⋅
[(
p2e− p2
w
2
)
+ b(
pe − pw)
]
=k
�⋅
�0
p0
⋅
(
p2e− p2
w
2
)
⋅
(
1 +b
p
)
(36)
qKF,m
2�h⋅ ln
re
rw+ �
√
k
��1.5⋅
�qKF,m
2�h
�2
⋅
re
∫rw
�
1 +b
p
�1
2−�
dr
r2
(37)
re
∫rw
(
1 +b
p
)1
2−�
dr
r2≈
1
2
[
(
1 +b
pe
)1
2−�
+
(
1 +b
pw
)1
2−�]
⋅
(
1
rw−
1
re
)
Journal of Petroleum Exploration and Production Technology
1 3
we can rewrite the integral Eq. 37 as follows:
and the result of the integration of Eq. 33 in the follow-ing form:
Equation 40 is the basis for determining the fluid mass flow rate qKF,m . Rewriting it as a quadratic equation:
and solving it for qKF,m we obtain:
The pressure distribution within the drainage zone can be found from Eq. 40 using the following rearrangement of its terms. Denoting y = p(r) , we obtain:
Solution of Eq. 44 can be written as follows:
(38)f ≈1
2
[
(
1 +b
pe
)1
2−�
+
(
1 +b
pw
)1
2−�]
(39)re
∫rw
(
1 +b
p
)1
2−�
dr
r2≈ f ⋅
(
1
rw−
1
re
)
(40)
2�h
lnre
rw
⋅
k
�⋅
�0
p0⋅
�
p2e− p2
w
2
�
⋅
�
1 +b
p
�
=
qKF,m + �
√
k
��1.5⋅ f ⋅
�
1
rw−
1
re
�
⋅
1
2�h lnre
rw
⋅ q2KF,m
(41)aKF⋅qKF,m2 + bKF⋅qKF,m + cKF = 0
(42)qKF,m =−bKF +
√
b2KF
− 4aKFcKF
2aKF
(43)
where aKF = �
√
k
��1.5⋅ f ⋅
�
1
rw−
1
re
�
⋅
1
2�h lnre
rw
;
bKF = 1; cKF = −
�
1 +b
p
�
⋅ qD,m
(44)aPy2 + bPy + cP = 0
(45)p(r) =−bP +
√
b2P− 4aPcP
2aP
(46)where aP =1
2; bP = b; cP =
��
qKF,m
2�h⋅ ln
re
r+ �
√
k
��1.5⋅
�qKFm
2�h
�2
⋅ f ⋅
�
1
r−
1
re
�
�
⋅
�
k⋅
p0
�0−
1
2p2e− bpe
�
Results and discussion
In Sect. 3, the newly derived semi-analytical model for gas slippage and inertia factors for low and high permeability porous media has been derived. In order to examine the validity of such an approach, the steady gas flow in porous media will be compared with the available data in the litera-ture. Firstly, we will conduct this study at the mesoscale—a scale at which most of the experiments occur and where the principles of continuum mechanics are fully applicable. Then, the well production rates will be estimated at the mac-roscale level (102–104 m).
Experimental data
This section aims to provide an overview of the laboratory study conducted by various researchers on low permeable (Wu et al. 1998; Amao 2007) and high-permeable cores (Tessem 1980; Torsæter et al. 1981). Permeability was measured by the steady-state flow method when the dif-ferential pore pressure
(
p1 − p2)
is kept constant and out-flow from samples is monitored. The upstream side of pore pressure
(
p1)
was controlled by the gas regulator for gas permeability measurement, and fluid that flows out from the downstream of a specimen was released to atmospheric pressure
(
p0)
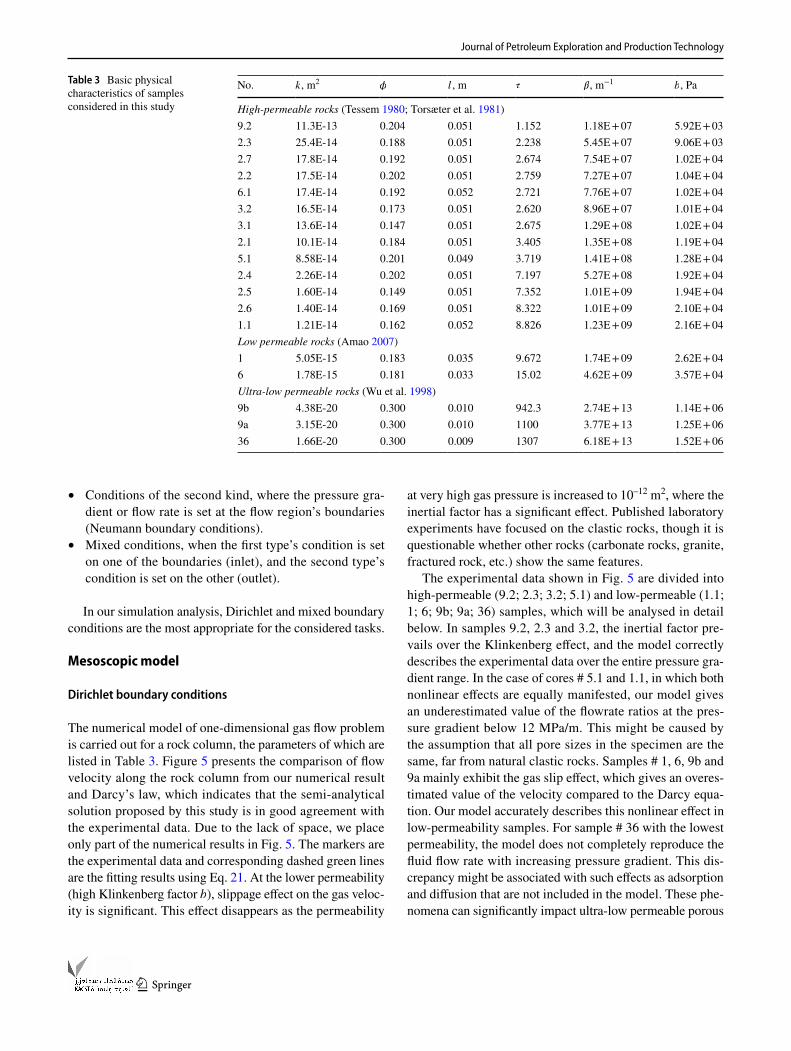
. Nitrogen (M = 28.014 g/mol) at isothermal condition was injected in all experiments with different pres-sure gradients. Core number, intrinsic permeability, porosity and length of the cores, and their derivatives are shown in Table 3. Tortuosity of pore channels (�) , non-Darcy coef-ficient (�) and slip factor (b) are calculated using Eqs. 14, 15 and 24, respectively.
In the next section, these data will be interpreted accord-ing to the traditional Darcy’s law (Eq. 9) and the new semi-analytical model (Eq. 21).
Boundary conditions
Usually, the following types of boundary conditions are used in solving differential equations:
• Conditions of the first kind, where the inlet and outlet pressure values are specified at the flow region’s bounda-ries (Dirichlet boundary conditions).
Journal of Petroleum Exploration and Production Technology
1 3
• Conditions of the second kind, where the pressure gra-dient or flow rate is set at the flow region’s boundaries (Neumann boundary conditions).
• Mixed conditions, when the first type’s condition is set on one of the boundaries (inlet), and the second type’s condition is set on the other (outlet).
In our simulation analysis, Dirichlet and mixed boundary conditions are the most appropriate for the considered tasks.
Mesoscopic model
Dirichlet boundary conditions
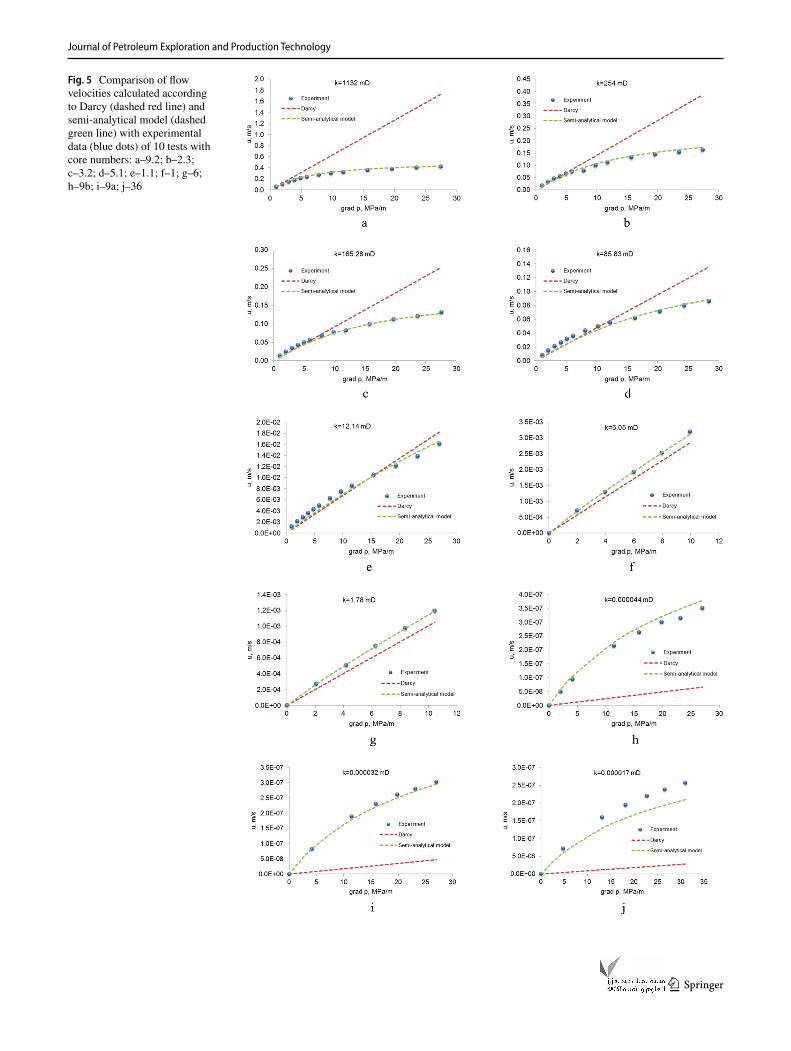
The numerical model of one-dimensional gas flow problem is carried out for a rock column, the parameters of which are listed in Table 3. Figure 5 presents the comparison of flow velocity along the rock column from our numerical result and Darcy’s law, which indicates that the semi-analytical solution proposed by this study is in good agreement with the experimental data. Due to the lack of space, we place only part of the numerical results in Fig. 5. The markers are the experimental data and corresponding dashed green lines are the fitting results using Eq. 21. At the lower permeability (high Klinkenberg factor b ), slippage effect on the gas veloc-ity is significant. This effect disappears as the permeability
at very high gas pressure is increased to 10–12 m2, where the inertial factor has a significant effect. Published laboratory experiments have focused on the clastic rocks, though it is questionable whether other rocks (carbonate rocks, granite, fractured rock, etc.) show the same features.
The experimental data shown in Fig. 5 are divided into high-permeable (9.2; 2.3; 3.2; 5.1) and low-permeable (1.1; 1; 6; 9b; 9a; 36) samples, which will be analysed in detail below. In samples 9.2, 2.3 and 3.2, the inertial factor pre-vails over the Klinkenberg effect, and the model correctly describes the experimental data over the entire pressure gra-dient range. In the case of cores # 5.1 and 1.1, in which both nonlinear effects are equally manifested, our model gives an underestimated value of the flowrate ratios at the pres-sure gradient below 12 MPa/m. This might be caused by the assumption that all pore sizes in the specimen are the same, far from natural clastic rocks. Samples # 1, 6, 9b and 9a mainly exhibit the gas slip effect, which gives an overes-timated value of the velocity compared to the Darcy equa-tion. Our model accurately describes this nonlinear effect in low-permeability samples. For sample # 36 with the lowest permeability, the model does not completely reproduce the fluid flow rate with increasing pressure gradient. This dis-crepancy might be associated with such effects as adsorption and diffusion that are not included in the model. These phe-nomena can significantly impact ultra-low permeable porous
Table 3 Basic physical characteristics of samples considered in this study
No. k , m2 � l , m � � , m−1b , Pa
High-permeable rocks (Tessem 1980; Torsæter et al. 1981)9.2 11.3E-13 0.204 0.051 1.152 1.18E + 07 5.92E + 032.3 25.4E-14 0.188 0.051 2.238 5.45E + 07 9.06E + 032.7 17.8E-14 0.192 0.051 2.674 7.54E + 07 1.02E + 042.2 17.5E-14 0.202 0.051 2.759 7.27E + 07 1.04E + 046.1 17.4E-14 0.192 0.052 2.721 7.76E + 07 1.02E + 043.2 16.5E-14 0.173 0.051 2.620 8.96E + 07 1.01E + 043.1 13.6E-14 0.147 0.051 2.675 1.29E + 08 1.02E + 042.1 10.1E-14 0.184 0.051 3.405 1.35E + 08 1.19E + 045.1 8.58E-14 0.201 0.049 3.719 1.41E + 08 1.28E + 042.4 2.26E-14 0.202 0.051 7.197 5.27E + 08 1.92E + 042.5 1.60E-14 0.149 0.051 7.352 1.01E + 09 1.94E + 042.6 1.40E-14 0.169 0.051 8.322 1.01E + 09 2.10E + 041.1 1.21E-14 0.162 0.052 8.826 1.23E + 09 2.16E + 04Low permeable rocks (Amao 2007)1 5.05E-15 0.183 0.035 9.672 1.74E + 09 2.62E + 046 1.78E-15 0.181 0.033 15.02 4.62E + 09 3.57E + 04Ultra-low permeable rocks (Wu et al. 1998)9b 4.38E-20 0.300 0.010 942.3 2.74E + 13 1.14E + 069a 3.15E-20 0.300 0.010 1100 3.77E + 13 1.25E + 0636 1.66E-20 0.300 0.009 1307 6.18E + 13 1.52E + 06
Journal of Petroleum Exploration and Production Technology
1 3
Fig. 5 Comparison of flow velocities calculated according to Darcy (dashed red line) and semi-analytical model (dashed green line) with experimental data (blue dots) of 10 tests with core numbers: a–9.2; b–2.3; c–3.2; d–5.1; e–1.1; f–1; g–6; h–9b; i–9a; j–36
Journal of Petroleum Exploration and Production Technology
1 3
media (Song et al. 2016; Zhang et al. 2017; Wang and Sheng 2017). Explaining such phenomena is not in the scope of this work. In addition, in this work, we analysed various laboratory experiments carried out by different researchers at different times and on different equipment, which could have contributed to the discrepancy between the results of the numerical model.
In the case of the cores # 9b, 9a and 36 (Wu et al. 1998) with extremely low permeabilities (Amao 2007), the gas
flow velocity is an order of magnitude higher than that cal-culated by Darcy’s law. These results imply that the differ-ence in the permeability measurement using nitrogen and liquid is more considerable for less permeable specimens (Klinkenberg effect).
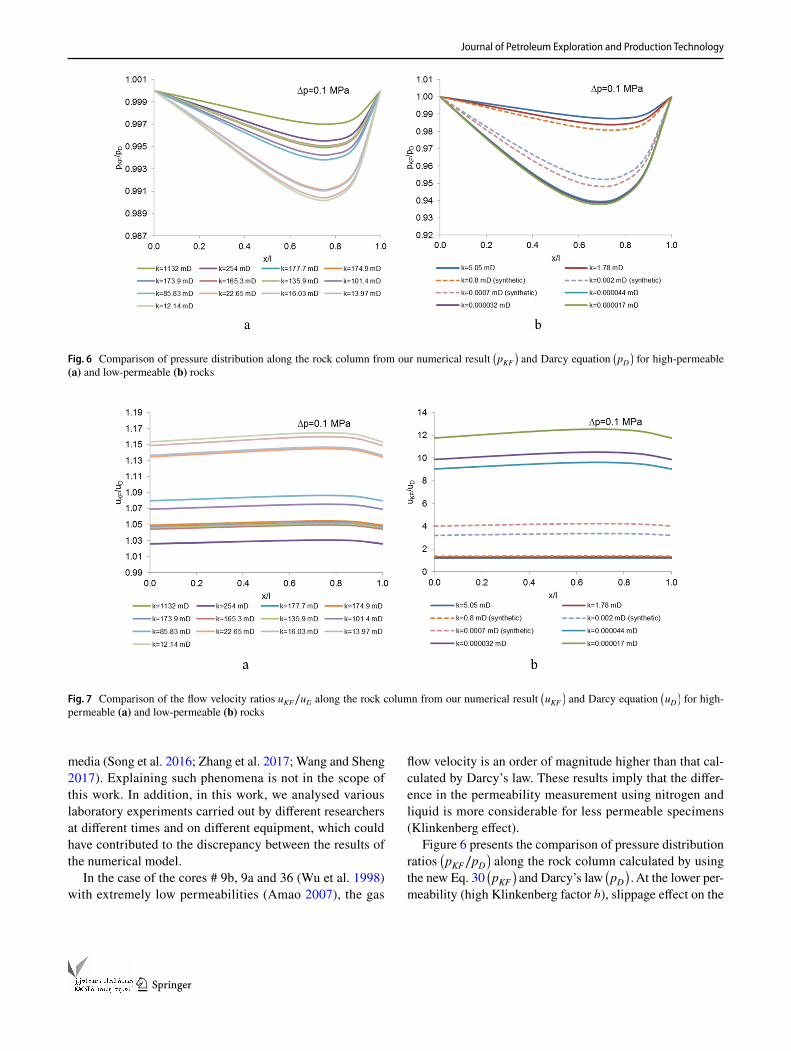
Figure 6 presents the comparison of pressure distribution ratios
(
pKF∕pD)
along the rock column calculated by using the new Eq. 30
(
pKF)
and Darcy’s law (
pD)
. At the lower per-meability (high Klinkenberg factor b ), slippage effect on the
Fig. 6 Comparison of pressure distribution along the rock column from our numerical result (
pKF
)
and Darcy equation (
pD
)
for high-permeable (a) and low-permeable (b) rocks
Fig. 7 Comparison of the flow velocity ratios uKF∕u
D along the rock column from our numerical result
(
uKF
)
and Darcy equation (
uD
)
for high-permeable (a) and low-permeable (b) rocks
Journal of Petroleum Exploration and Production Technology
1 3
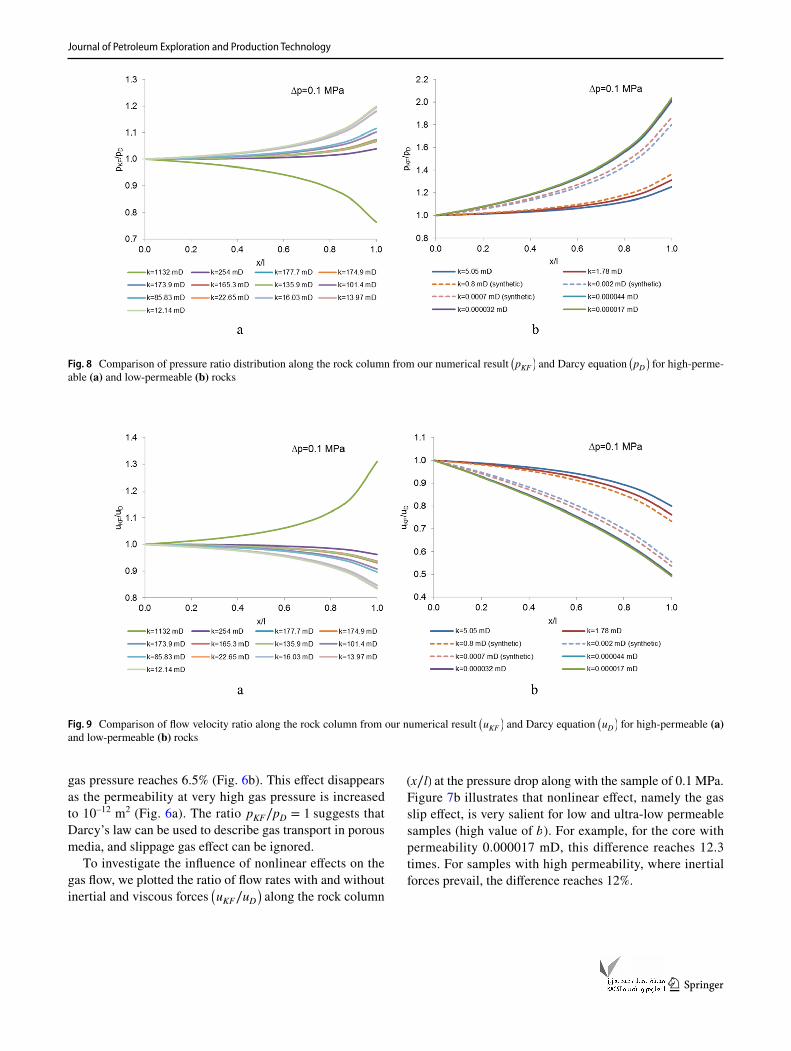
gas pressure reaches 6.5% (Fig. 6b). This effect disappears as the permeability at very high gas pressure is increased to 10–12 m2 (Fig. 6a). The ratio pKF∕pD = 1 suggests that Darcy’s law can be used to describe gas transport in porous media, and slippage gas effect can be ignored.
To investigate the influence of nonlinear effects on the gas flow, we plotted the ratio of flow rates with and without inertial and viscous forces
(
uKF∕uD)
along the rock column
(x∕l) at the pressure drop along with the sample of 0.1 MPa. Figure 7b illustrates that nonlinear effect, namely the gas slip effect, is very salient for low and ultra-low permeable samples (high value of b ). For example, for the core with permeability 0.000017 mD, this difference reaches 12.3 times. For samples with high permeability, where inertial forces prevail, the difference reaches 12%.
Fig. 8 Comparison of pressure ratio distribution along the rock column from our numerical result (
pKF
)
and Darcy equation (
pD
)
for high-perme-able (a) and low-permeable (b) rocks
Fig. 9 Comparison of flow velocity ratio along the rock column from our numerical result (
uKF
)
and Darcy equation (
uD
)
for high-permeable (a) and low-permeable (b) rocks
Journal of Petroleum Exploration and Production Technology
1 3
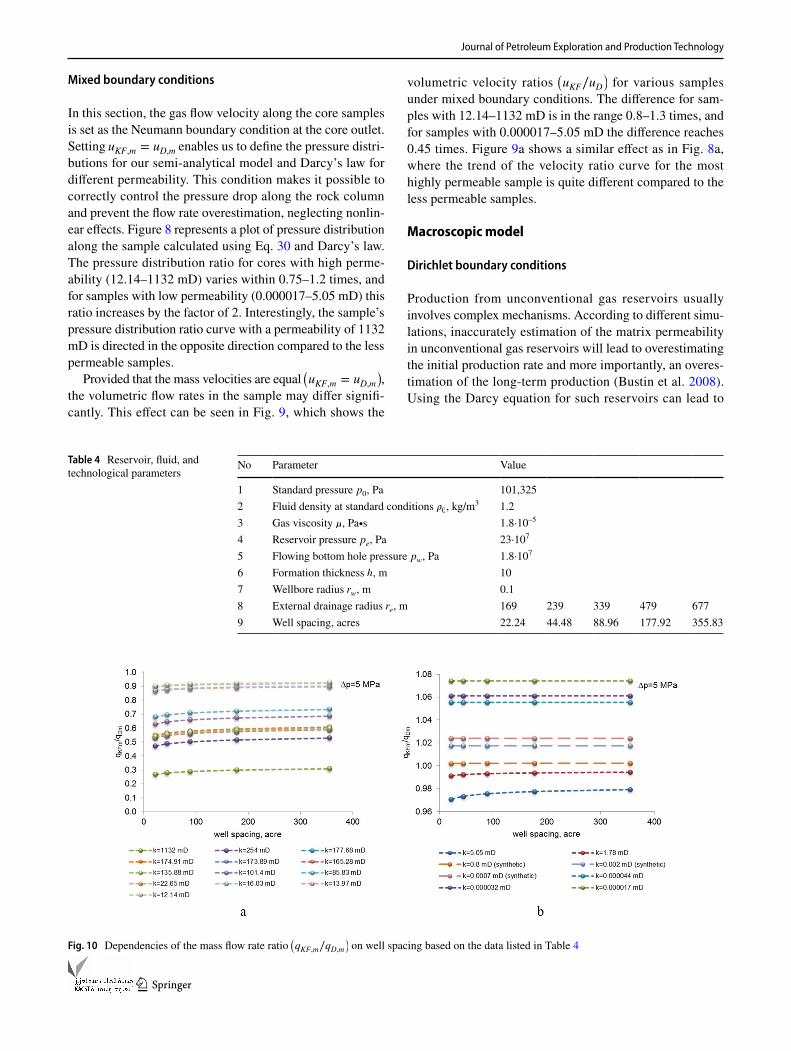
Mixed boundary conditions
In this section, the gas flow velocity along the core samples is set as the Neumann boundary condition at the core outlet. Setting uKF,m = uD,m enables us to define the pressure distri-butions for our semi-analytical model and Darcy’s law for different permeability. This condition makes it possible to correctly control the pressure drop along the rock column and prevent the flow rate overestimation, neglecting nonlin-ear effects. Figure 8 represents a plot of pressure distribution along the sample calculated using Eq. 30 and Darcy’s law. The pressure distribution ratio for cores with high perme-ability (12.14–1132 mD) varies within 0.75–1.2 times, and for samples with low permeability (0.000017–5.05 mD) this ratio increases by the factor of 2. Interestingly, the sample’s pressure distribution ratio curve with a permeability of 1132 mD is directed in the opposite direction compared to the less permeable samples.
Provided that the mass velocities are equal (
uKF,m = uD,m)
, the volumetric flow rates in the sample may differ signifi-cantly. This effect can be seen in Fig. 9, which shows the
volumetric velocity ratios (
uKF∕uD)
for various samples under mixed boundary conditions. The difference for sam-ples with 12.14–1132 mD is in the range 0.8–1.3 times, and for samples with 0.000017–5.05 mD the difference reaches 0.45 times. Figure 9a shows a similar effect as in Fig. 8a, where the trend of the velocity ratio curve for the most highly permeable sample is quite different compared to the less permeable samples.
Macroscopic model
Dirichlet boundary conditions
Production from unconventional gas reservoirs usually involves complex mechanisms. According to different simu-lations, inaccurately estimation of the matrix permeability in unconventional gas reservoirs will lead to overestimating the initial production rate and more importantly, an overes-timation of the long-term production (Bustin et al. 2008). Using the Darcy equation for such reservoirs can lead to
Table 4 Reservoir, fluid, and technological parameters
No Parameter Value
1 Standard pressure p0 , Pa 101,3252 Fluid density at standard conditions �0 , kg/m3 1.23 Gas viscosity � , Pa∙s 1.8·10–5
4 Reservoir pressure pe , Pa 23·107
5 Flowing bottom hole pressure pw , Pa 1.8·107
6 Formation thickness h , m 107 Wellbore radius rw , m 0.18 External drainage radius re , m 169 239 339 479 6779 Well spacing, acres 22.24 44.48 88.96 177.92 355.83
Fig. 10 Dependencies of the mass flow rate ratio (
qKF,m
∕qD,m
)
on well spacing based on the data listed in Table 4
Journal of Petroleum Exploration and Production Technology
1 3
an incorrect estimate in long-term production and financial planning. These overestimations can be significantly reduced by using the approaches proposed in this section.
In the above section, the gas flow model’s validation and its implementation based on theoretical solutions are given when gas flow with Klinkenberg and Forchheimer effects is considered. In this section, the coupled model that has been numerically implemented in Sect. 3 is used to simulate gas migration in the radial model. This example concerns gas injection into a well in a large vertical, uniform, and isother-mal formation, which follows Eq. 40. A constant gas mass injection rate is applied at the well, and the initial pressure is uniform throughout the formation. Herein, we estimate the influence of the main reservoir (reservoir porosity, per-meability, and tortuosity), fluid (oil and gas viscosity, and density), and technological parameters (pressure drawdown and well spacing) on the efficiency of field development. The well spacing is defined as the area of the field per production well and expressed in acres. Some of the reservoir properties (permeability, porosity, tortuosity) are taken from Table 3. The rest of the reservoir and fluid characteristics, along with technological parameters, are summarized in Table 4.
Figure 10 presents our numerical result, which compares the flow rate ratio distribution along with the sample from our semi-analytical model and Darcy equation. In the figure, the dimensionless flow rate is the ratio of the rate calculated using Eq. 42
(
qKF,m)
to the rate given by Darcy equation (
pD)
. Interestingly to note, that at the certain permeability value qKF,m∕qD,m = 1 , which indicates that both nonlinear effects are mutually compensated, and Darcy’s law can be used to describe gas transport in porous media. This phe-nomenon in a porous medium can be seen in the example of a synthetic rock sample with a permeability of 0.8 mD,
in which qKF,m∕qD,m = 1 . The ratio qKF,m∕qD,m > 1 indicates that fluid flow is dominated by slippage effect (Fig. 10b). However, the inertial effect becomes significant when the permeability at very high gas pressure increases to 10–12 m2 (Fig. 10a).
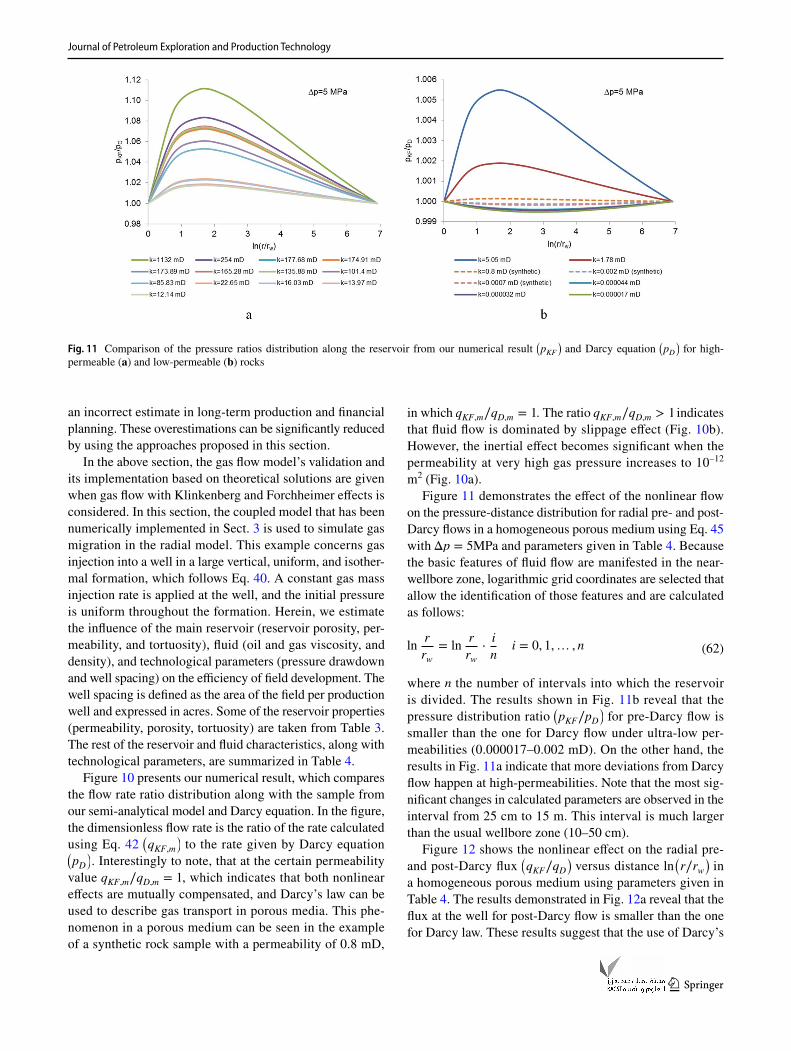
Figure 11 demonstrates the effect of the nonlinear flow on the pressure-distance distribution for radial pre- and post-Darcy flows in a homogeneous porous medium using Eq. 45 with Δp = 5MPa and parameters given in Table 4. Because the basic features of fluid flow are manifested in the near-wellbore zone, logarithmic grid coordinates are selected that allow the identification of those features and are calculated as follows:
where n the number of intervals into which the reservoir is divided. The results shown in Fig. 11b reveal that the pressure distribution ratio
(
pKF∕pD)
for pre-Darcy flow is smaller than the one for Darcy flow under ultra-low per-meabilities (0.000017–0.002 mD). On the other hand, the results in Fig. 11a indicate that more deviations from Darcy flow happen at high-permeabilities. Note that the most sig-nificant changes in calculated parameters are observed in the interval from 25 cm to 15 m. This interval is much larger than the usual wellbore zone (10–50 cm).
Figure 12 shows the nonlinear effect on the radial pre- and post-Darcy flux
(
qKF∕qD)
versus distance ln(
r∕rw)
in a homogeneous porous medium using parameters given in Table 4. The results demonstrated in Fig. 12a reveal that the flux at the well for post-Darcy flow is smaller than the one for Darcy law. These results suggest that the use of Darcy’s
(62)lnr
rw= ln
r
rw⋅
i
ni = 0, 1,… , n
Fig. 11 Comparison of the pressure ratios distribution along the reservoir from our numerical result (
pKF
)
and Darcy equation (
pD
)
for high-permeable (a) and low-permeable (b) rocks
Journal of Petroleum Exploration and Production Technology
1 3
law to predict the well production rate from a high-permea-ble formation (177.68–1132 mD) leads to significant over-estimation of the rate for the entire life of a well.
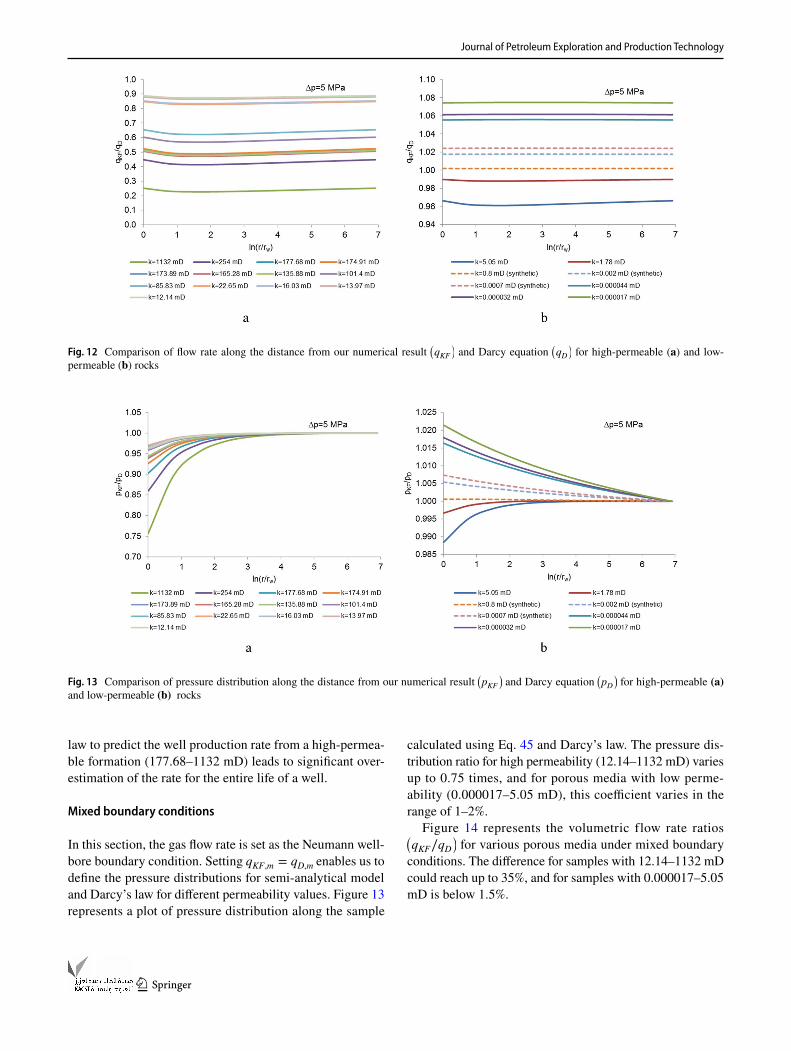
Mixed boundary conditions
In this section, the gas flow rate is set as the Neumann well-bore boundary condition. Setting qKF,m = qD,m enables us to define the pressure distributions for semi-analytical model and Darcy’s law for different permeability values. Figure 13 represents a plot of pressure distribution along the sample
calculated using Eq. 45 and Darcy’s law. The pressure dis-tribution ratio for high permeability (12.14–1132 mD) varies up to 0.75 times, and for porous media with low perme-ability (0.000017–5.05 mD), this coefficient varies in the range of 1–2%.
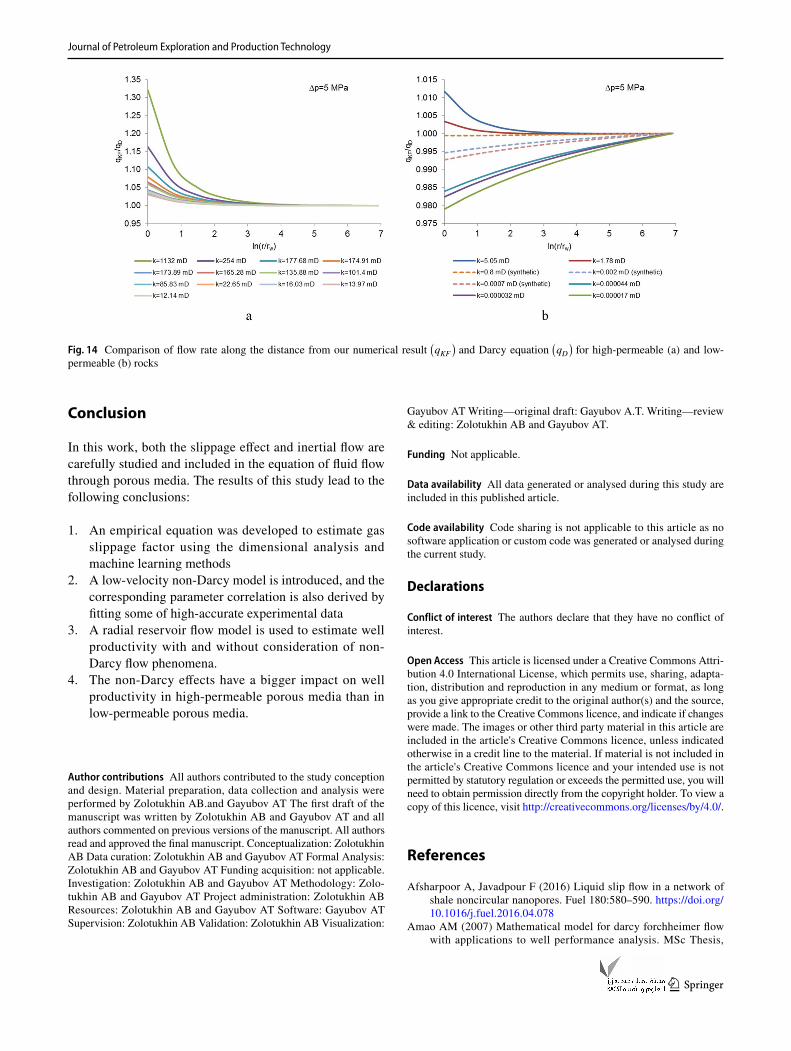
Figure 14 represents the volumetric flow rate ratios (
qKF∕qD)
for various porous media under mixed boundary conditions. The difference for samples with 12.14–1132 mD could reach up to 35%, and for samples with 0.000017–5.05 mD is below 1.5%.
Fig. 12 Comparison of flow rate along the distance from our numerical result (
qKF
)
and Darcy equation (
qD
)
for high-permeable (a) and low-permeable (b) rocks
Fig. 13 Comparison of pressure distribution along the distance from our numerical result (
pKF
)
and Darcy equation (
pD
)
for high-permeable (a) and low-permeable (b) rocks
Journal of Petroleum Exploration and Production Technology
1 3
Conclusion
In this work, both the slippage effect and inertial flow are carefully studied and included in the equation of fluid flow through porous media. The results of this study lead to the following conclusions:
1. An empirical equation was developed to estimate gas slippage factor using the dimensional analysis and machine learning methods
2. A low-velocity non-Darcy model is introduced, and the corresponding parameter correlation is also derived by fitting some of high-accurate experimental data
3. A radial reservoir flow model is used to estimate well productivity with and without consideration of non-Darcy flow phenomena.
4. The non-Darcy effects have a bigger impact on well productivity in high-permeable porous media than in low-permeable porous media.
Author contributions All authors contributed to the study conception and design. Material preparation, data collection and analysis were performed by Zolotukhin AB.and Gayubov AT The first draft of the manuscript was written by Zolotukhin AB and Gayubov AT and all authors commented on previous versions of the manuscript. All authors read and approved the final manuscript. Conceptualization: Zolotukhin AB Data curation: Zolotukhin AB and Gayubov AT Formal Analysis: Zolotukhin AB and Gayubov AT Funding acquisition: not applicable. Investigation: Zolotukhin AB and Gayubov AT Methodology: Zolo-tukhin AB and Gayubov AT Project administration: Zolotukhin AB Resources: Zolotukhin AB and Gayubov AT Software: Gayubov AT Supervision: Zolotukhin AB Validation: Zolotukhin AB Visualization:
Gayubov AT Writing—original draft: Gayubov A.T. Writing—review & editing: Zolotukhin AB and Gayubov AT.
Funding Not applicable.
Data availability All data generated or analysed during this study are included in this published article.
Code availability Code sharing is not applicable to this article as no software application or custom code was generated or analysed during the current study.
Declarations
Conflict of interest The authors declare that they have no conflict of interest.
Open Access This article is licensed under a Creative Commons Attri-bution 4.0 International License, which permits use, sharing, adapta-tion, distribution and reproduction in any medium or format, as long as you give appropriate credit to the original author(s) and the source, provide a link to the Creative Commons licence, and indicate if changes were made. The images or other third party material in this article are included in the article's Creative Commons licence, unless indicated otherwise in a credit line to the material. If material is not included in the article's Creative Commons licence and your intended use is not permitted by statutory regulation or exceeds the permitted use, you will need to obtain permission directly from the copyright holder. To view a copy of this licence, visit http:// creat iveco mmons. org/ licen ses/ by/4. 0/.
References
Afsharpoor A, Javadpour F (2016) Liquid slip flow in a network of shale noncircular nanopores. Fuel 180:580–590. https:// doi. org/ 10. 1016/j. fuel. 2016. 04. 078
Amao AM (2007) Mathematical model for darcy forchheimer flow with applications to well performance analysis. MSc Thesis,
Fig. 14 Comparison of flow rate along the distance from our numerical result (
qKF
)
and Darcy equation (
qD
)
for high-permeable (a) and low-permeable (b) rocks
Journal of Petroleum Exploration and Production Technology
1 3
Department of Petroleum Engineering, Texas Tech University, Lubbock, TX, USA
Barrat J, Bocquet L (1999) Large slip effect at a nonwetting fluid-solid interface. Phys Rev Lett 82(23):4671–4674. https:// doi. org/ 10. 1103/ PhysR evLett. 82. 4671
Bustin AMM, Bustin RM, Cui X (2008) Importance of fabric on the production of gas shales. Paper SPE 114167 Presented at the 2008 SPE Unconventional Reservoirs Conference, Keystone, Colorado, USA, 10–12 February. https:// doi. org/ 10. 2118/ 114167- MS
Chen C, Wang Z, Majeti D, Vrvilo N, Warburton T, Sarkar V, Li G (2016) Optimization of lattice Boltzmann simulation with graph-ics-processing-unit parallel computing and the application in res-ervoir characterization. SPE J 21(04):1425–1435. https:// doi. org/ 10. 2118/ 179733- PA
Chen C (2016) Multiscale imaging, modeling, and principal component analysis of gas transport in shale reservoirs. Fuel 182:761–770
Chilton TH, Colburn AP (1931) Pressure drop in packed tubes. Ind Eng Chem 23(8):913–919. https:// doi. org/ 10. 1021/ ie502 60a016
Coles ME, Hartman KJ (1998) Non-Darcy measurements in dry core and the effect of immobile liquid. In: SPE Gas Technology Sym-posium Calgary, SPE 39977. https:// doi. org/ 10. 2118/ 39977- MS
Cooper JW, Wang X, Mohanty KK (1999) Non-Darcy flow studies in anisotropic porous media. Soc Petrol Eng J 4(4):334–341. https:// doi. org/ 10. 2118/ 57755- PA
Civan F (2010) Effective correlation of apparent gas permeability in tight porous media. Transp Porous Med 82:375–384. https:// doi. org/ 10. 1007/ s11242- 009- 9432-z
Darabi H, Ettehad A, Javadpour F, Sepehrnoori K (2012) Gas flow in ultra-tight shale strata. J Fluid Mech 710:641–658. https:// doi. org/ 10. 1017/ jfm. 2012. 424Le sFont aines Publi quesd elaVi llede Dijon. Victo rDalm ont,Paris
Darcy HPG (1856) Les fontaines publiques de la ville de dijon. Victor Dalmont, Paris
Dranchuk PM, Chwyl E (1969) Transient gas flow through finite linear porous media. J Can Pet Technol 8(02):57–65. https:// doi. org/ 10. 2118/ 69- 02- 03
Duan QB, Yang XS (2014) Experimental studies on gas and water permeability of fault rocks from the rupture of the 2008 Wenchuan earthquake. China Sci China Earth Sci 57:2825–2834. https:// doi. org/ 10. 1007/ s11430- 014- 4948-7
Dupuit JÉJ (1863) Études théoriques et pratiques sur le mouvement des eaux dans les canaux découverts et à travers les terrains per-méables: avec des considérations relatives au régime des grandes eaux, au débouché à leur donner, et à la marche des alluvions dans les rivières à fond mobile. Dunod
Ergun S (1952) Fluid flow through packed columns. Chem Eng Prog 48(2):89–94
Fancher GH, Lewis JA (1933) Flow of simple fluids through porous materials. Ind Eng Chem 25(10):1139–1147. https:// doi. org/ 10. 1021/ ie502 86a020
Fancher GH, Lewis JA, Barnes KB (1933) Some physical characteris-tics of oil sands. Min Ind Expt Sta Bull 12:65–171
Farahani M, Saki M, Ghafouri A, Khaz’ali A. (2017) Laboratory measurements of slippage and inertial factors in carbonate porous media: a case study. J Petrol Sci Eng 162:666–673. https:// doi. org/ 10. 1016/j. petrol. 2017. 10. 084
Faulkner DR, Rutter EH (2000) Comparisons of water and argon per-meability in natural clay-bearing fault gouge under high pressure at 20°C. J Geophys Res 105:16415–16426. https:// doi. org/ 10. 1029/ 2000J B9001 34
Firoozabadi A, Katz DL (1979) An analysis of high-velocity gas flow through porous media. J Petrol Technol. https:// doi. org/ 10. 2118/ 6827- PA
Forchheimer P (1901) Wasserberwegung durch Boden. Z Vereines Deutscher Ing 45(50):1782–1788
Freeman DL, Bush DC (1983) Low-permeability laboratory measure-ments by nonsteady-state and conventional methods. Soc Petrol Eng J 23:928–936. https:// doi. org/ 10. 2118/ 10075- PA
Friedel T, Voigt HD (2006) Investigation of non-Darcy flow in tight-gas reservoirs with fractured wells. J Pet Sci Eng 54:112–128. https:// doi. org/ 10. 1016/j. petrol. 2006. 07. 002
Green LJ, Duwez P (1951) Fluid flow through porous metals. J Appl Mech 18:39–45
Hayek M (2015) Exact solutions for one-dimensional transient gas flow in porous media with gravity and Klinkenberg effects. Transp Porous Media 107(2):403–417
Heid JG, McMahon JJ, Nielson RF (1950) Study of the permeability of rocks to homogeneous fluids. Am Pet Inst Drill Prod Pract. 230
Hooman K, Tamayol A, Dahari M, Safaei M, Togun H, Sadri R (2014) A theoretical model to predict gas permeability for slip flow through a porous medium. Appl Therm Eng 70(1):71–76. https:// doi. org/ 10. 1016/j. applt herma leng. 2014. 04. 071
Hu G, Wang H, Fan X, Yuan Z, Hong S (2009) Mathematical model of coalbed gas flow with Klinkenberg effects in multi-physical fields and its analytic solution. Transport Porous Media 76(3):407
Hubbert MK (1956) Darcy law and the field equations for the flow of underground fluids. Trans Am Inst Mining Metal Eng 207:222–239. https:// doi. org/ 10. 2118/ 749-G
Innocentini MDM, Pandolfelli VC (2001) Permeability of porous ceramics considering the Klinkenberg and inertial effects. J Amer Ceram Soc 84:941–944. https:// doi. org/ 10. 1111/j. 1151- 2916. 2001. tb007 72.x
Jones FO, Owens WW (1980) A laboratory study of low-permeability gas sands. J Pet Tecnol 32:1631–1640. https:// doi. org/ 10. 2118/ 7551- PA
Jones SC (1972) A rapid accurate unsteady-state Klinkenberg per-meameter. Soc Petrol Eng J 12:383–397. https:// doi. org/ 10. 2118/ 3535- PA
Jones SC (1987) Using the inertial coefficient to characterize hetero-geneity in reservoir rock. SPE 16949:165–175. https:// doi. org/ 10. 2118/ 16949- MS
Klinkenberg LJ (1941) The permeability of porous media to liquids and gases. Drilling and Production Practice, American Petroleum Inst. 200–213
Li C, Xu P, Qiu S, Zhou Y (2016) The gas effective permeability of porous media with Klinkenberg effect. J Nat Gas Sci Eng 34:534–540. https:// doi. org/ 10. 1016/j. jngse. 2016. 07. 017
Li J, Sultan AS (2017) Klinkenberg slippage effect in the permeability computations of shale gas by the pore-scale simulations. J Nat Gas Sci Eng 48:197–202. https:// doi. org/ 10. 1016/J. JNGSE. 2016. 07. 041
Liu X, Civan F, Evans RD (1995) Correlation of the non-Darcy flow coefficient. J Can Pet Tech 34(10):50–54. https:// doi. org/ 10. 2118/ 95- 10- 05
Ma H, Ruth DW (1993) The microscopic analysis of high Forchheimer number flow in porous media. Transp Porous Med 13:139–160. https:// doi. org/ 10. 1007/ BF006 54407
Majumder M, Chopra N, Andrews R, Hinds B (2005) Nanoscale hydro-dynamics: enhanced flow in carbon nanotubes. Nature 44:438. https:// doi. org/ 10. 1038/ 43804 4a
Millionshikov MD (1935) Degeneration of homogeneous isotropic tur-bulence in a viscous incompressible fluid. Rep Acad Sci USSR 22(5):236–240 ((in Russian))
Moghadam A, Chalaturnyk R (2014) Expansion of the Klinkenberg’s slippage equation to low permeability porous media. Int J Coal Geol 123:2–9. https:// doi. org/ 10. 1016/j. coal. 2013. 10. 008
Muljadi BP, Blunt MJ, Raeini AQ, Bijeljic B (2016) The impact of porous media heterogeneity on non-Darcy flow behaviour from pore-scale simulation. Adv Water Resour 95:329–340
Journal of Petroleum Exploration and Production Technology
1 3
Muscat M (1937) The flow of homogeneous fluids in porous media. McGrow-Hill, New York
Pavlovsky N (1922) Theory of movement of groundwater under hydraulic engineering constructions and its main applications. Publishing House of Science and melioration institute, Petrograd (in Russian)
Rodwell WR, Nash PJ (1992) Mechanisms and modeling of gas migra-tion from deep radioactive waste repositories. United Kingdom Nirex Ltd, London, p 86
Rushing JA, Newsham KE, Lasswell PM, Cox JC, Blasingame TA (2004) Klinkenerg-corrected permeability measurements in tight gas sands: steady-state versus unsteady-state techniques. Soc Pet-rol Eng. https:// doi. org/ 10. 2118/ 89867- MS
Salahshoor S, Fahes M (2017) A study on the factors affecting the reli-ability of laboratory-measured gas permeability. SPE Abu Dhabi international petroleum exhibition & conference. Society of Petro-leum Engineers. https:// doi. org/ 10. 2118/ 188584- MS
Sampath K, Keighin CW (1982) Factors affecting gas slippage in tight sand-stones of cretaceous age in the Uinta basin. J Pet Technol 34:2715–2720. https:// doi. org/ 10. 2118/ 9872- PA
Schaaf SA, Chambre PL (1961) Flow of rarefied gases. Princeton Uni-versity Press, Princeton, NJ
Scheidegger AE (1960) The physics of flow through porous media. University of Toronto Press
Shelkachev VN, Lapuk BB (2001) Groundwater hydraulics. Moscow – Igevsk, p 736 (in Russian). ISBN 5–93972–081–1
Skjetne E (1995) High-velocity flow in porous media; analytical, numerical and experimental studies. Doctoral thesis at depart-ment of petroleum engineering and applied geophysics, faculty of applied earth sciences and metallurgy, Norwegian University of Science and Technology
Song W, Yao J, Li Y, Sun H, Zhang L, Yang Y, Zhao J, Sui H (2016) Apparent gas permeability in an organic-rich shale reservoir. Fuel 181:973–984. https:// doi. org/ 10. 1016/j. fuel. 2016. 05. 011
Tanikawa W, Shimamoto T (2006) Klinkenberg effect for gas perme-ability and its comparison to water permeability for porous sedi-mentary rocks. Hydrol Earth Syst Sci Discuss 3(4):1315–1338
Tanikawa W, Shimamoto T (2009) Comparison of Klinkenberg-cor-rected gas permeability and water permeabilityin sedimentary rocks. Int J Rock Mech and Min Sci 46:229–238. https:// doi. org/ 10. 1016/j. ijrmms. 2008. 03. 004
Tao Y, Liu D, Xu J, Peng S, Nie W (2016) Investigation of the Klinken-berg effect on gas flow in coal matrices: a numerical study. J Nat Gas Sci Eng 30:237–247. https:// doi. org/ 10. 1016/j. jngse. 2016. 02. 020
Tek MR, Coats KH, Katz DL (1962) The effect of turbulence on flow of natural gas through porous reservoirs. J Pet Technol 14:799–806. https:// doi. org/ 10. 2118/ 147- PA
Tessem R (1980) High velocity coefficient’s dependence on rock prop-erties: a laboratory study. Thesis Pet. Inst., NTH. Trondheim
Thauvin F, Mohanty KK (1998) Network modeling of non-Darcy flow through porous media. Transp Porous Med 31:19–37. https:// doi. org/ 10. 1023/A: 10065 58926 606
Torsæter O, Tessem R, Berge B (1981) High velocity coefficient’s dependence on rock properties. SINTEF report, NTH. Trondheim
Wang G, Ren T, Wang K, Zhou A (2014) Improved apparent perme-ability models of gas flow in coal with Klinkenberg effect. Fuel 128:53–61. https:// doi. org/ 10. 1016/j. fuel. 2014. 02. 066
Wang S, Javadpour F, Feng Q (2016) Molecular dynamics simula-tions of oil transport through inorganic nanopores in shale. Fuel 171:74–86. https:// doi. org/ 10. 1016/j. fuel. 2015. 12. 071
Wang XK, Sheng J (2017) Gas sorption and non-Darcy flow in shale reservoirs. Pet Sci 14:746–754. https:// doi. org/ 10. 1007/ s12182- 017- 0180-3
Wu YS, Pruess K, Persoff P (1998) Gas flow in porous media with Klinkenberg effects. Transp Porous Media 32:117–137. https:// doi. org/ 10. 1023/A: 10065 35211 684
Wyckhoff RD, Botset HG, Muskat M, Reed DW (1933) The measure-ment of the permeability of porous media for homogeneous fluids. Rev Sci Instr 4:394. https:// doi. org/ 10. 1063/1. 17491 55
Zhang Q, Su Y, Wang W, Lu M, Sheng G (2017) Apparent permeability for liquid transport in nanopores of shale reservoirs: coupling flow enhancement and near wall flow. Int J Heat Mass Transf 115:224–234. https:// doi. org/ 10. 1016/j. ijhea tmass trans fer. 2017. 08. 024
Zheng Q, Yu B, Duan Y, Fang Q (2013) A fractal model for gas slip-page factor in porous media in the slip flow regime. Chem Eng Sci 87:209–215. https:// doi. org/ 10. 1016/j. ces. 2012. 10. 019
Zhu WC, Liu J, Sheng JC, Elsworth D (2007) Analysis of coupled gas flow and deformation process with desorption and Klinkenberg effects in coal seams. Int J Rock Mech Min Sci 44(7):971–980. https:// doi. org/ 10. 1016/j. ijrmms. 2006. 11. 008
Zolotukhin AB, Gayubov AT (2019) Machine learning in reservoir per-meability prediction and modeling of fluid flow in porous media. IOP Conf Ser Mater Sci Eng 700:012023. https:// doi. org/ 10. 1088/ 1757- 899X/ 700/1/ 012023
Zolotukhin AB, Gayubov AT (2021) Semi-analytical approach to modeling forchheimer flow in porous media at meso- and macro-scales. Trans Porous Media 136:715–741. https:// doi. org/ 10. 1007/ s11242- 020- 01528-4
Zolotukhin AB, Ursin JR (2000) Fundamentals of Petroleum Reservoir Engineering. Kristiansand: 766 Høyskoleforlaget AS – Norwegian Academic Press
Publisher's Note Springer Nature remains neutral with regard to jurisdictional claims in published maps and institutional affiliations.


