Embed Size (px)
Citation preview

1
Analysis of hydrogen permeation tests considering two different modelling approaches for grain boundary trapping in iron
A. Díaz1*, I.I. Cuesta1, E. Martinez-Pañeda2,3, J.M. Alegre1
1Structural Integrity Group, Universidad de Burgos, Avda. Cantabria s/n, 09006 Burgos. SPAIN
2University of Cambridge, Department of Engineering, Trumpington Street, Cambridge CB2 1PZ, UNITED KINGDOM
3Department of Civil and Environmental Engineering, Imperial College London, LondonSW7 2AZ, UNITED KINGDOM
* Contact e-mail: [email protected]
ABSTRACT
The electrochemical permeation test is one of the most used methods for characterising hydrogen diffusion
in metals. The flux of hydrogen atoms registered in the oxidation cell might be fitted to obtain apparent
diffusivities. The magnitude of this coefficient has a decisive influence on the kinetics of fracture or fatigue
phenomena assisted by hydrogen and depends largely on hydrogen retention in microstructural traps. In
order to improve the numerical fitting of diffusion coefficients, a permeation test has been reproduced using
FEM simulations considering two approaches: a continuum 1D model in which the trap density, binding
energy and the input lattice concentrations are critical variables and a polycrystalline model where trapping
at grain boundaries is simulated explicitly including a segregation factor and a diffusion coefficient different
from that of the interior of the grain. Results show that the continuum model captures trapping delay, but it
should be modified to model the trapping influence on the steady state flux. Permeation behaviour might be
classified according to different regimes depending on deviation from Fickian diffusion. Polycrystalline
synthetic permeation shows a strong influence of segregation on output flux magnitude. This approach is
able to simulate also the short-circuit diffusion phenomenon. The comparison between different grain sizes
and grain boundary thicknesses by means of the fitted apparent diffusivity shows the relationships between
the registered flux and the characteristic parameters of traps.
KEYWORDS: Hydrogen diffusion, Permeation test, Finite Element Simulation, Grain Boundary trapping
1. INTRODUCTION
Numerous efforts have been put on the characterisation of metals and alloys behaviour in hydrogen
environments. Microstructural phenomena operating during hydrogen embrittlement failures are still not
entirely understood; however, it is accepted that damage depends on hydrogen local concentration in the
Fracture Process Zone (Hirth 1980; Gerberich et al. 1996). Therefore, hydrogen transport, i.e. hydrogen
entry, diffusion and trapping, determines the kinetics of crack initiation and propagation during the Hydrogen
Assisted Cracking process (Turnbull 1993).
brought to you by COREView metadata, citation and similar papers at core.ac.uk
provided by Apollo
Modelling hydrogen-assisted fracture requires the implementation of a coupled scheme to simultaneously
solve deformation, diffusion and damage equations (Martínez-Pañeda et al. 2018). Deformation problem
includes plasticity formulations that could be modified considering hydrogen effects, e.g. hydrogen-enhanced
localised plasticity (HELP) (Miresmaeili et al. 2010). Diffusion problem might be solved assuming different
simplifications, from the simplest fickian equations to the most complex multi-trapping models including
kinetic expressions and the influence of stress and plastic strain on hydrogen transport (Dadfarnia et al.
2011; Díaz et al. 2016a). Both deformation and hydrogen concentration fields directly influence crack
propagation within the coupled finite element scheme; different damage models have been used to simulate
hydrogen-assisted fracture (Olden et al. 2008; del Busto et al. 2017; Martínez-Pañeda et al. 2018),
especially those assuming a decohesion mechanism in which the local fracture energy is reduced by
hydrogen. Therefore, a fundamental aspect in modelling hydrogen-assisted fracture is the characterisation of
trapping parameters so the diffusion equations are physically-based and local concentrations as realistic as
possible.
Electrochemical permeation is one of the most used testing methods for characterising diffusion and trapping
phenomena in metals and alloys. This technique requires two cells separated by the tested metallic sheet. In
one cell, hydrogen is produced through a cathodic reduction while adsorption/absorption reactions take place
in the entry surface of the specimen (Devanathan et al. 1963). After permeating, hydrogen output flux is
registered in the oxidation cell. The influence of the microstructure has been extensively analysed, and it has
been demonstrated how crystal defects delay permeation (Frappart et al. 2012). Thus, permeation trough a
sample with a given number of imperfections, e.g. dislocations, grain boundaries, inclusions, etc., shows a
lower diffusivity than a free-defect ideal lattice. This phenomenon has been described as hydrogen trapping
and it is fundamental in the prediction and mitigation of hydrogen accumulation near a crack tip.
Permeation test is standardised by the standards ISO 17081:2014 and ASTM G148-97(2018); using these
procedures only apparent diffusivity and apparent concentration in the entry surfaces might be obtained but
this usually gives little information about the microstructural features of the material. Finite element
simulations considering Fick’s laws modified by trapping phenomena have been carried out by many
researchers with the aim of elucidating the effect of microstructural parameters on permeation transients
(Turnbull 2015; Raina et al. 2017; Vecchi et al. 2018a). Most of these works assume a modified mass
balance including hydrogen concentration in trapping sites and following the pioneering work of Sofronis and
McMeeking (1989). This approach, identified here as Continuum model, is revisited with the aim of
evaluating the influence of binding energy and trap density. The effect of input concentration on the entry
side is also studied within this framework. Additionally, the relationship between these three magnitudes
(binding energy, trap density and input concentration) determines whether hydrogen permeation response
deviates from the classical Fickian diffusion or not. This deviation is studied following the work of Raina et al.
(Raina et al. 2017) in which three regimes are defined for hydrogen permeation.
Even though this approach is demonstrated to be consistent in hydrogen permeation modelling, the
evaluation of grain boundary trapping is limited. Grain boundaries might be regarded as critical trapping
sites: many authors have found hydrogen segregation in grain boundaries for nickel (Oudriss et al. 2012)
and for iron (Ono and Meshii 1992). Additionally, there is a lack of consensus regarding the influence that
accelerated or “short-circuit diffusion” of hydrogen through grain boundaries might have; atomistic
simulations can give an insight of the competition between trapping and acceleration phenomena (Oudriss et
al. 2012), but this fact must be empirically elucidated. It must be taken into account that the polycrystalline
characteristics, e.g. Coincidence Site Lattice (CSL) and random boundaries distribution, misorientation
angles, segregation of impurities, etc., determine the occurrence of one or another phenomenon.
A synergistic effect between impurity segregation, e.g. manganese, silicon or sulphur, might be found in
hydrogen-related intergranular failures of steels (McMahon 2001). In these cases, fracture occurs before
macroscopic yielding, so prognosis of intergranular embrittlement is fundamental for industry.
Intergranular fracture has been observed also in nickel alloys where the influence of grain boundary
misorientation in hydrogen transport has been usually addressed (Oudriss et al. 2012). It has been
demonstrated that grain-boundary engineering, in particular the control of special and random fractions of
grain boundaries, might mitigate hydrogen embrittlement (Bechtle et al. 2009). The role of plasticity in
intergranular fractures due to hydrogen in nickel has been revisited by (Martin et al. 2012).
Hydrogen embrittlement of martensitic steels has attracted an increasing attention since they have been
proposed as materials for high pressure storage (Macadre et al. 2011) and are used in automotive industry
(Venezuela et al. 2018). However, intergranular fracture is hard to be modelled due to the competition
between fracture along prior austenite grain boundaries and fracture along lath martensite boundaries
(Nagao et al. 2012). Due to the fracture surface appearance, the latter phenomenon is usually termed as
“quasi-cleavage” despite its intergranular nature, i.e. propagation along martensite block and packet
interphases (Álvarez et al. 2019). Novak et al. (2010) proposed a complex micro-mechanism for hydrogen-
induced intergranular fracture of a 4340 high strength steel. These authors modelled fracture considering
that hydrogen promotes dislocation pile-up impinging. Hence, decohesion of carbide/matrix interface triggers
intergranular fracture.
Numerical modelling of hydrogen transport is usually focused on continuum approaches with the modified
Fick’s laws, i.e. a flux and a mass balance, as starting point – see, e.g. (Díaz et al. 2016a; Martínez-Pañeda
et al. 2016a; del Busto et al. 2017). However, the continuum framework cannot evaluate geometrical factors,
percolation phenomena or grain boundary connectivity (Hoch et al. 2015). Simulations following the work of
Sofronis and McMeeking (1989) consider that traps are isolated, i.e. that flux between traps is negligible,
which seems to be unlikely for grain boundary trapping sites. Few attempts have been made to explicitly
reproduce the grain boundary trapping effect using a polycrystalline synthetic structure still considering
continuum formulations (Hoch et al. 2015; Jothi et al. 2015). In the present work, a polycrystalline model is
considered using a synthetic structure generated with a Voronoi tessellation. Generating different
geometries, the grain size influence and the effect of grain boundary thickness are evaluated. A simplified
model is considered in which the conventional Fick’s laws govern hydrogen transport. The trapping
behaviour is not taken into account in the mass balance for each material point but in the definition of two
different materials for the grain and for the grain boundary with their corresponding diffusivity and solubility
values. Thus, two approaches are considered and compared: a continuum 1D model and a polycrystalline
model. Despite the nomenclature, both approaches are based on a continuum formulation, i.e. on a finite
element framework in which a local mass balance is solved. Nevertheless, since the polycrystal reproduces
explicitly the grain boundary diffusion barriers, permeation modelling relies on a two-scale approach.
After the model definition, the fitting procedure of the output flux in the simulated permeation test is
presented. An apparent diffusivity is thus considered as a macroscopic parameter that measures the motion
of hydrogen through the whole polycrystalline structure of 1-mm thickness. Results are then analysed and
the relationship between flux evolution, apparent diffusivity and microstructural parameters is explained.
2. CONTINUUM 1D MODEL
Mass balance is the partial differential equation (PDE) governing hydrogen transport; from the traditional
Fick’s laws, some modifications might be introduced, particularly the introduction of additional terms that take
into account trapping effects.
- Selection of variables: taking the nomenclature from Toribio and Kharin (2015) hydrogen modelling
might consider a one-level system and only one concentration (𝐶𝐶), a two-level system in which ideal
diffusion is governed by lattice hydrogen and only one type of trap is considered (𝐶𝐶𝐿𝐿 and 𝐶𝐶𝑇𝑇) or a
generalised model with multiple trap types (𝐶𝐶𝐿𝐿 and more than one kind of trap 𝐶𝐶𝑇𝑇,𝑖𝑖). Sometimes,
occupancy is the dependent variable rather than the concentration. In the one-level approach,
trapping effects can be simulated by considering modified values of diffusivity and solubility whereas
the two-level model considers explicitly hydrogen concentration in trapping sites.
𝜕𝜕𝐶𝐶𝑇𝑇𝜕𝜕𝜕𝜕
+𝜕𝜕𝐶𝐶𝐿𝐿𝜕𝜕𝜕𝜕
+ ∇ · 𝐣𝐣 = 0 (1)
- Flux expression: it is usually assumed that flux is proportional to lattice diffusivity, 𝐷𝐷𝐿𝐿, and to the
gradient of hydrogen concentration in lattice sites. However, this assumption is only verified for low
occupancy, for isolated traps or for low trap density. The accuracy of flux expression is usually
overlooked in works dealing with hydrogen transport modelling (Díaz et al. 2016a).
𝐣𝐣 = −𝐷𝐷𝐿𝐿∇𝐶𝐶𝐿𝐿 (2)
- Relationship between concentrations. If hydrogen concentration in trapping sites is included in
the mass balance as dependent variable, an additional equation relating 𝐶𝐶𝑇𝑇 (or each 𝐶𝐶𝑇𝑇,𝑖𝑖) and 𝐶𝐶𝐿𝐿
must be considered. Thermodynamic equilibrium, as proposed by Oriani (1970), is usually assumed
giving a univocal relationship that might be easily implemented in finite element (FE) codes.
However, for some conditions this equilibrium is not fulfilled, and a kinetic formulation should be
considered. In the latter case, McNabb and Foster’s equation (McNabb and Foster 1963) is
implemented to calculate hydrogen concentration in trapping sites.
In results presented in Section 5.1., two variables are implemented: 𝐶𝐶𝐿𝐿 and 𝐶𝐶𝑇𝑇, and only hydrogen flux
between lattice sites is considered. Oriani’s equilibrium is assumed so hydrogen concentration in trapping
sites at each permeation distance is calculated following expression (3):
𝐶𝐶𝑇𝑇 =𝑁𝑁𝑇𝑇
1 + 𝑁𝑁𝐿𝐿𝐶𝐶𝐿𝐿 exp �𝐸𝐸𝑏𝑏𝑅𝑅𝑅𝑅�
(3)
where 𝑁𝑁𝑇𝑇 is the trap density, 𝑁𝑁𝐿𝐿 the number of lattice sites per unit volume, 𝐸𝐸𝑏𝑏 the binding energy
characterising the considered defect, 𝑅𝑅 the ideal constant of gases and 𝑅𝑅 the temperature. Operating
expression (3) to obtain 𝜕𝜕𝐶𝐶𝑇𝑇/𝜕𝜕𝜕𝜕 and rearranging mass balance in (1), an effective diffusivity might be thus
defined as (Sofronis and McMeeking 1989):
𝐷𝐷𝑒𝑒𝑒𝑒𝑒𝑒 =𝐷𝐷𝐿𝐿
1 + 𝐶𝐶𝑇𝑇𝐶𝐶𝐿𝐿
(1 − 𝜃𝜃𝑇𝑇)(4)
Effective diffusivity is a local parameter that is defined through the mass balance modification expressed in
(1) and assuming thermodynamic equilibrium and low lattice occupancy. This magnitude must not be
confused in the present work with the apparent diffusivity 𝐷𝐷𝑎𝑎𝑎𝑎𝑎𝑎 obtained through the permeation transient
fitting even though some works swap the use of both terms. Kharin (2014) highlights the confusion around
this diffusivities and defines the term 𝐷𝐷𝑒𝑒𝑒𝑒𝑒𝑒 expressed in (4) as an “operational diffusivity” since it is a
mathematical rearrangement rather than a physical feature. Lattice diffusivity is considered as a theoretical
value from first principle calculations for bcc iron (Jiang and Carter 2004) with 𝐷𝐷𝐿𝐿,0= 0.15 mm2/s and 𝐸𝐸𝑎𝑎 =
8.49 kJ/mol (0.088 eV) considering an Arrhenius expression:
𝐷𝐷𝐿𝐿 = 𝐷𝐷𝐿𝐿,0 exp(−𝐸𝐸𝑎𝑎/𝑅𝑅𝑅𝑅) (5)
which gives a 𝐷𝐷𝐿𝐿 = 4987.5 µm2/s at room temperature. The number of lattice sites is taken from (Hirth 1980)
assuming tetrahedral occupation: 𝑁𝑁𝐿𝐿 = 5.09×1029 sites/m3. Even tough different values for 𝐷𝐷𝐿𝐿 for bcc iron
have been found and 𝑁𝑁𝐿𝐿 depends on the preferential site and the number of hydrogen atoms that a site
might allocate, the order of magnitude is always very similar. However, the trap density 𝑁𝑁𝑇𝑇 has been
experimentally found in a range from 1020 (Kumnick and Johnson 1980) to 1027 (Oudriss et al. 2012)
traps/m3. Figure 1 represents trapping densities considered in different works (Kumnick and Johnson 1980;
Sofronis et al. 2001; Juilfs 2002) dealing with hydrogen transport in bcc iron where the number of traps
depends on plastic strain because dislocations are created. Oudriss et al. (2012) found trap densities around
1025 to 1027 traps/m3 for grain boundary trapping in nickel, depending on the grain size and grain boundary
nature. In this case, 𝑁𝑁𝑇𝑇 is associated to the density of Geometrically Necessary Dislocations (GND) (Ashby
1970; Martínez-Pañeda et al. 2016b).
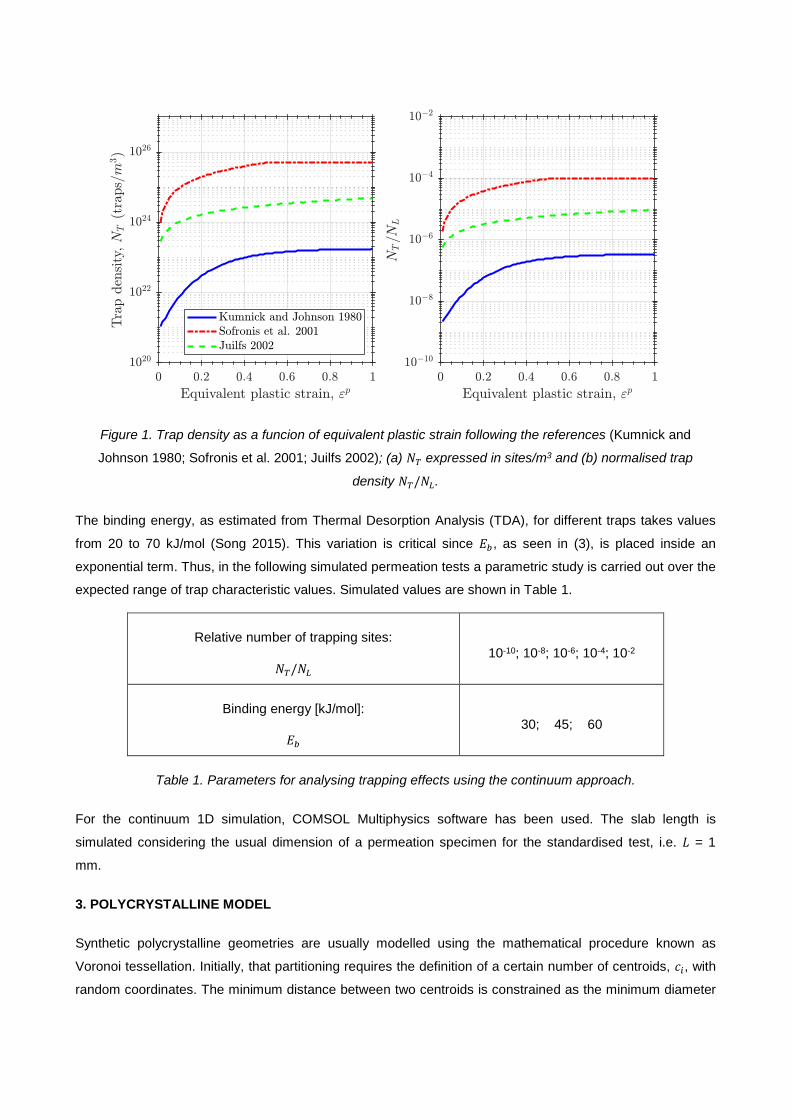
Figure 1. Trap density as a funcion of equivalent plastic strain following the references (Kumnick and
Johnson 1980; Sofronis et al. 2001; Juilfs 2002); (a) 𝑁𝑁𝑇𝑇 expressed in sites/m3 and (b) normalised trap
density 𝑁𝑁𝑇𝑇/𝑁𝑁𝐿𝐿.
The binding energy, as estimated from Thermal Desorption Analysis (TDA), for different traps takes values
from 20 to 70 kJ/mol (Song 2015). This variation is critical since 𝐸𝐸𝑏𝑏, as seen in (3), is placed inside an
exponential term. Thus, in the following simulated permeation tests a parametric study is carried out over the
expected range of trap characteristic values. Simulated values are shown in Table 1.
Relative number of trapping sites:
𝑁𝑁𝑇𝑇/𝑁𝑁𝐿𝐿 10-10; 10-8; 10-6; 10-4; 10-2
Binding energy [kJ/mol]:
𝐸𝐸𝑏𝑏 30; 45; 60
Table 1. Parameters for analysing trapping effects using the continuum approach.
For the continuum 1D simulation, COMSOL Multiphysics software has been used. The slab length is
simulated considering the usual dimension of a permeation specimen for the standardised test, i.e. 𝐿𝐿 = 1
mm.
3. POLYCRYSTALLINE MODEL
Synthetic polycrystalline geometries are usually modelled using the mathematical procedure known as
Voronoi tessellation. Initially, that partitioning requires the definition of a certain number of centroids, 𝑐𝑐𝑖𝑖, with
random coordinates. The minimum distance between two centroids is constrained as the minimum diameter

of the subsequently generated grains. From these centroids, the partition is performed imposing the following
condition: a point 𝑝𝑝𝑖𝑖 belongs to the polygon corresponding to the 𝑐𝑐𝑖𝑖 centroid only if expression (1) is verified:
‖𝑝𝑝𝑖𝑖 − 𝑐𝑐𝑖𝑖‖ < �𝑝𝑝𝑖𝑖 − 𝑐𝑐𝑗𝑗� (6)
For each 𝑗𝑗 ≠ 𝑖𝑖 . That condition implies that every point belonging to a grain is always closer to the centroid 𝑐𝑐𝑖𝑖
than to another centroid. In the present work, a python script is written for the finite element software
ABAQUS CAE which is able to set the number of Voronoi polygons in a 2D geometry and the minimum
distance between centroids. Obtained polygons are assumed to be representative enough of the real grain
shape of a polycrystalline iron.
The permeation sample is considered as a slab with 1.0-mm thickness and 0.5-mm width. The tessellated
2D geometry introduces a tortuosity influence on permeation. In the 1.0×0.5-mm2 slab, three synthetic
polycrystals with 50, 200 and 800 grains are constructed. Even though the imposed minimum distance
between each pair 𝑐𝑐𝑖𝑖 and 𝑐𝑐𝑗𝑗, represents the minimum grain diameter, average grain size is calculated after
tessellation following the Intercept procedure specified by the ASTM E112-13 Standard. Table 2 shows the
intercepted number of grains, averaged from the upper and lower lines in the models (Figure 2), which are
translated into three average grain diameters.
Theoretically, grain boundaries are 2D interfaces, so the definition of grain boundary thickness might be
regarded as physically-inconsistent. However, hydrogen trapping or segregation is demonstrated to occur in
a finite strip around the boundary plane between two grains (Hoch et al. 2015). Additionally, trapping at grain
boundaries has been attributed to the role of Geometrically Necessary Dislocations (GNDs) accumulated in
those interfaces (Oudriss et al. 2012). Impurity segregation, e.g. in sensitised steels, might also play a role in
hydrogen trapping. Considering all those phenomena, grain boundary thickness is modelled from the
nanoscopic to the microscopic range (10, 100 and 1000 nm).
Number of grains in the generated 1.0×0.5-mm2 slab 50 200 800
Number of intercepted grains in a 1.0-mm test line 7.0 19.0 36.5
Average diameter �̅�𝑑 (µm) 161.4 59.1 30.9
Table 2. Evaluated grain sizes.

Figure 2. Generated polycrystalline structures of 50, 200 and 800 grains.
As previously mentioned, two materials are defined with different diffusivities with the aim of capturing
hydrogen delay, or acceleration, in grain boundaries. Even though a crystal scale is considered, only
isotropic diffusion is studied for the sake of simplicity. It must be noted that anisotropic effects in grain
boundaries acting as diffusion barriers could have great influence. Within this numerical framework, mass
balance governs hydrogen transport in each region so two PDE must be implemented with the
corresponding parameters:
𝜕𝜕𝐶𝐶𝐿𝐿𝜕𝜕𝜕𝜕
− 𝐷𝐷𝐿𝐿∇2𝐶𝐶𝐿𝐿 = 0 (7)
𝜕𝜕𝐶𝐶𝑔𝑔𝑏𝑏𝜕𝜕𝜕𝜕
− 𝐷𝐷𝑔𝑔𝑏𝑏∇2𝐶𝐶𝑔𝑔𝑏𝑏 = 0 (8)
where 𝐶𝐶𝐿𝐿 is the hydrogen concentration within grains, 𝐷𝐷𝐿𝐿 the ideal diffusivity, 𝐶𝐶𝑔𝑔𝑏𝑏 the hydrogen concentration
in grain boundaries and 𝐷𝐷𝑔𝑔𝑏𝑏 a diffusivity determined by hydrogen jumps between trapping sites in grain
boundaries. More details about the relationship between potential energy landscapes, hydrogen jumps and
diffusivity values might be found in (Hoch 2015; Hoch et al. 2015)
The influence of grain boundary diffusivity is studied over a range for different 𝐷𝐷𝑔𝑔𝑏𝑏/𝐷𝐷𝐿𝐿 ratios, as shown in
Table 3. For relative diffusivities of 10-4 and 10-2 a delaying effect is expected whereas the positive value 102
might indicate diffusion acceleration due to grain boundary connectivity. Additionally, due to the wide range
of binding energies associated with grain boundaries, segregation effects are assessed. A segregation factor
can be defined as (Jothi et al. 2015):
𝑠𝑠𝑔𝑔𝑏𝑏 =𝐶𝐶𝑔𝑔𝑏𝑏𝐶𝐶𝐿𝐿
(9)
where the relationship between hydrogen concentration in grain boundaries 𝐶𝐶𝑔𝑔𝑏𝑏 and the concentration in the
adjacent lattice sites 𝐶𝐶𝐿𝐿 depends on the binding energy 𝐸𝐸𝑏𝑏. Thermodynamic equilibrium is assumed here so
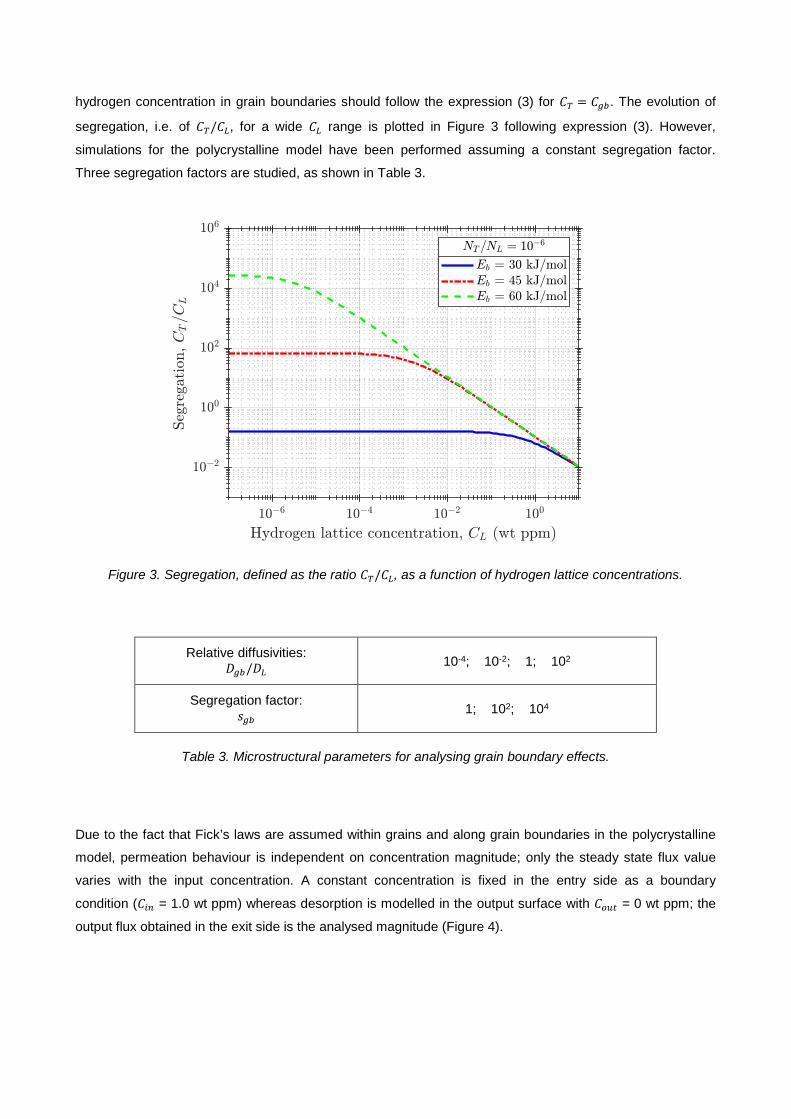
hydrogen concentration in grain boundaries should follow the expression (3) for 𝐶𝐶𝑇𝑇 = 𝐶𝐶𝑔𝑔𝑏𝑏. The evolution of
segregation, i.e. of 𝐶𝐶𝑇𝑇/𝐶𝐶𝐿𝐿, for a wide 𝐶𝐶𝐿𝐿 range is plotted in Figure 3 following expression (3). However,
simulations for the polycrystalline model have been performed assuming a constant segregation factor.
Three segregation factors are studied, as shown in Table 3.
Figure 3. Segregation, defined as the ratio 𝐶𝐶𝑇𝑇/𝐶𝐶𝐿𝐿, as a function of hydrogen lattice concentrations.
Relative diffusivities: 𝐷𝐷𝑔𝑔𝑏𝑏/𝐷𝐷𝐿𝐿
10-4; 10-2; 1; 102
Segregation factor: 𝑠𝑠𝑔𝑔𝑏𝑏 1; 102; 104
Table 3. Microstructural parameters for analysing grain boundary effects.
Due to the fact that Fick’s laws are assumed within grains and along grain boundaries in the polycrystalline
model, permeation behaviour is independent on concentration magnitude; only the steady state flux value
varies with the input concentration. A constant concentration is fixed in the entry side as a boundary
condition (𝐶𝐶𝑖𝑖𝑖𝑖 = 1.0 wt ppm) whereas desorption is modelled in the output surface with 𝐶𝐶𝑜𝑜𝑜𝑜𝑜𝑜 = 0 wt ppm; the
output flux obtained in the exit side is the analysed magnitude (Figure 4).
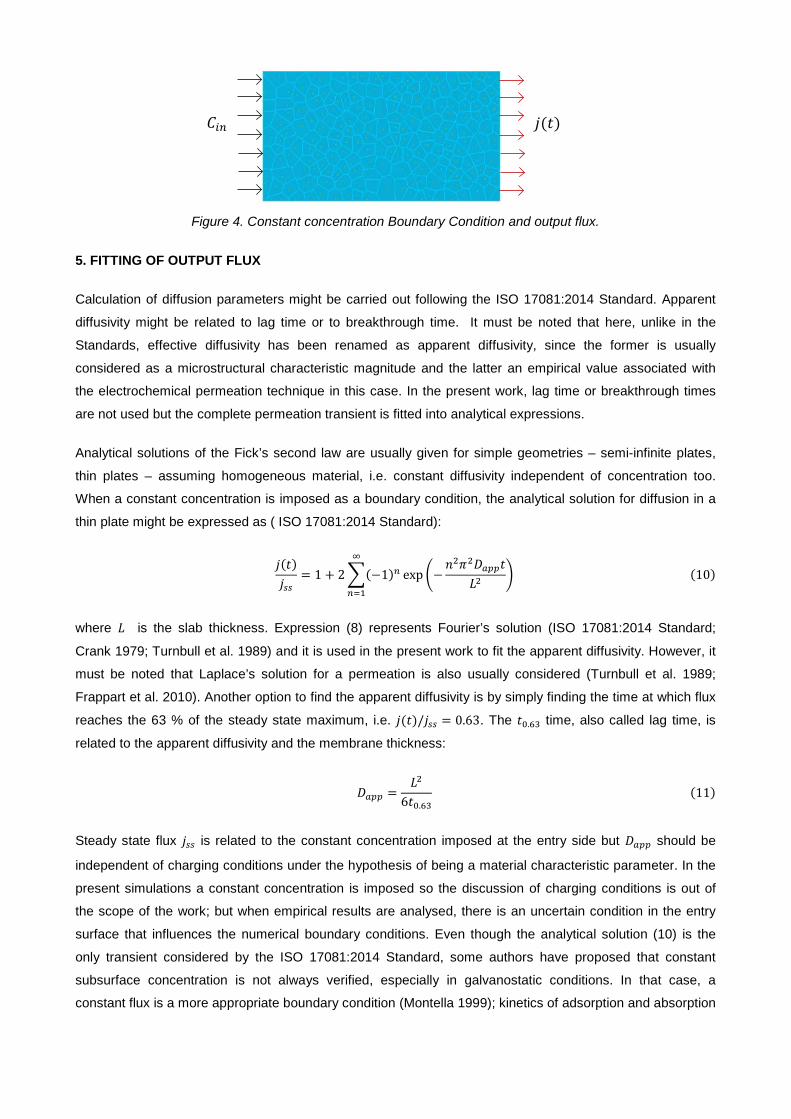
Figure 4. Constant concentration Boundary Condition and output flux.
5. FITTING OF OUTPUT FLUX
Calculation of diffusion parameters might be carried out following the ISO 17081:2014 Standard. Apparent
diffusivity might be related to lag time or to breakthrough time. It must be noted that here, unlike in the
Standards, effective diffusivity has been renamed as apparent diffusivity, since the former is usually
considered as a microstructural characteristic magnitude and the latter an empirical value associated with
the electrochemical permeation technique in this case. In the present work, lag time or breakthrough times
are not used but the complete permeation transient is fitted into analytical expressions.
Analytical solutions of the Fick’s second law are usually given for simple geometries – semi-infinite plates,
thin plates – assuming homogeneous material, i.e. constant diffusivity independent of concentration too.
When a constant concentration is imposed as a boundary condition, the analytical solution for diffusion in a
thin plate might be expressed as ( ISO 17081:2014 Standard):
𝑗𝑗(𝜕𝜕)𝑗𝑗𝑠𝑠𝑠𝑠
= 1 + 2�(−1)𝑖𝑖 exp �−𝑛𝑛2𝜋𝜋2𝐷𝐷𝑎𝑎𝑎𝑎𝑎𝑎𝜕𝜕
𝐿𝐿2�
∞
𝑖𝑖=1
(10)
where 𝐿𝐿 is the slab thickness. Expression (8) represents Fourier’s solution (ISO 17081:2014 Standard;
Crank 1979; Turnbull et al. 1989) and it is used in the present work to fit the apparent diffusivity. However, it
must be noted that Laplace’s solution for a permeation is also usually considered (Turnbull et al. 1989;
Frappart et al. 2010). Another option to find the apparent diffusivity is by simply finding the time at which flux
reaches the 63 % of the steady state maximum, i.e. 𝑗𝑗(𝜕𝜕)/𝑗𝑗𝑠𝑠𝑠𝑠 = 0.63. The 𝜕𝜕0.63 time, also called lag time, is
related to the apparent diffusivity and the membrane thickness:
𝐷𝐷𝑎𝑎𝑎𝑎𝑎𝑎 =𝐿𝐿2
6𝜕𝜕0.63(11)
Steady state flux 𝑗𝑗𝑠𝑠𝑠𝑠 is related to the constant concentration imposed at the entry side but 𝐷𝐷𝑎𝑎𝑎𝑎𝑎𝑎 should be
independent of charging conditions under the hypothesis of being a material characteristic parameter. In the
present simulations a constant concentration is imposed so the discussion of charging conditions is out of
the scope of the work; but when empirical results are analysed, there is an uncertain condition in the entry
surface that influences the numerical boundary conditions. Even though the analytical solution (10) is the
only transient considered by the ISO 17081:2014 Standard, some authors have proposed that constant
subsurface concentration is not always verified, especially in galvanostatic conditions. In that case, a
constant flux is a more appropriate boundary condition (Montella 1999); kinetics of adsorption and absorption
𝑗𝑗(𝜕𝜕) 𝐶𝐶𝑖𝑖𝑖𝑖
have been studied by some authors (Turnbull et al. 1996; Montella 1999; Turnbull 2015; Vecchi et al. 2018a,
b) but discussion on boundary conditions is usually overlooked and should be better addressed in future
research.
5. RESULTS
5.1. Continuum model
Within the two-level framework in which 𝐶𝐶𝐿𝐿 and 𝐶𝐶𝑇𝑇 are considered, the output flux in a FE permeation model
is usually found in the exit side as:
𝑗𝑗 = −𝐷𝐷𝐿𝐿𝜕𝜕𝐶𝐶𝐿𝐿𝜕𝜕𝜕𝜕
�𝑥𝑥=𝐿𝐿
(12)
And with a fixed concentration at the input side, 𝐶𝐶𝐿𝐿(𝜕𝜕 = 0) = 𝐶𝐶𝑖𝑖𝑖𝑖, the steady state flux magnitude is
independent of trapping phenomena (Raina et al. 2017):
𝑗𝑗𝑠𝑠𝑠𝑠 =𝐷𝐷𝐿𝐿𝐶𝐶𝑖𝑖𝑖𝑖𝐿𝐿
(13)
Legrand et al. (2014) placed effective diffusivity (4) inside the gradient operator so the authors conclude that
steady state flux depends on trapping parameters (Bouhattate et al. 2011). However, this rearrangement is
dubious (Kharin 2014) and here it is assumed that steady state flux does not depend on trapping parameters
when exit flux follows expression (12). From this point of view, 𝑗𝑗𝑠𝑠𝑠𝑠 should depend only on boundary
conditions on the entry surface, i.e. on adsorption/absorption phenomena. However, it must be noted that
when it is assumed that flux vector follows expression (11), fluxes from traps (𝑗𝑗𝑇𝑇𝐿𝐿), towards traps (𝑗𝑗𝐿𝐿𝑇𝑇) or
between traps (𝑗𝑗𝑇𝑇𝑇𝑇) are neglected (Díaz et al. 2016a, b). This approximation is based on the assumption of
deep potential wells or mutual remoteness of traps (Toribio and Kharin 2015). However, when modelling
grain boundary trapping, it seems unlikely that traps are actually isolated even if 𝑁𝑁𝑇𝑇 ≪ 𝑁𝑁𝐿𝐿. If the conditions
required for this assumption are not verified, the output flux at steady state would be influenced by trapping
features.
Output flux obtained through FE simulations in a 1D model is plotted versus time for each of the analysed
combinations of 𝐸𝐸𝑏𝑏 and 𝑁𝑁𝑇𝑇/𝑁𝑁𝐿𝐿. Apparent diffusivity is obtained through a non-linear least-squares fitting
algorithm in Matlab in which the expression (10) is implemented up to 𝑛𝑛 = 20. Additionally, the 𝜕𝜕0.63 time is
also calculated. Numerically, steady state is defined when the output flux increment is less than ∆𝑗𝑗/𝑗𝑗 < 10-8.
This definition is important for the transient fitting.
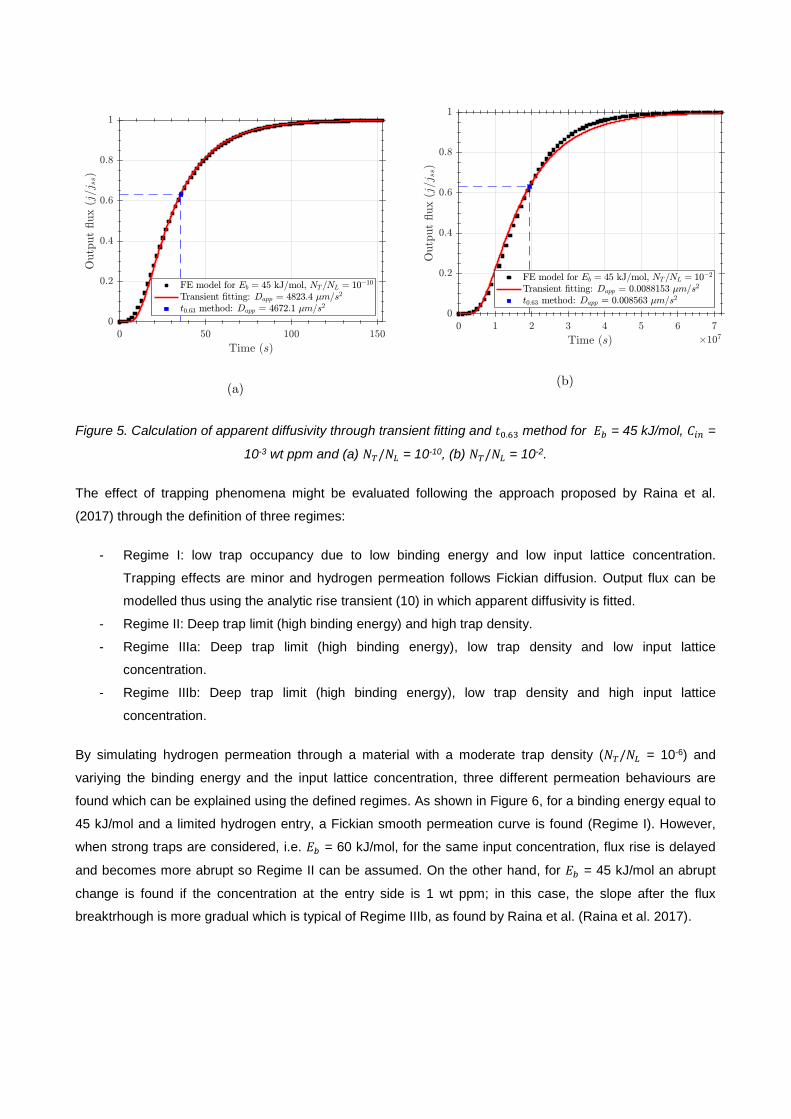
These fitting operations are shown in Figure 5 for 𝐶𝐶𝑖𝑖𝑖𝑖 = 10-3 wt ppm, 𝐸𝐸𝑏𝑏 = 45 kJ/mol and two different trap
densities. As expected, the higher trap density the lower apparent diffusivity is obtained. Even though the
regression is satisfactory for both trap densities, it can be appreciated that for 𝑁𝑁𝑇𝑇/𝑁𝑁𝐿𝐿 = 10-2, i.e. a very high
trap density, the analytic transient flux is greater than the numerical flux before 𝜕𝜕0.63 and is a little bit lower
after that instant. This behaviour is confirmed in all simulations, so it is concluded that trapping effects
produce a rise transient steeper than the flux predicted by Fick’s laws.
(a)
(b)
Figure 5. Calculation of apparent diffusivity through transient fitting and 𝜕𝜕0.63 method for 𝐸𝐸𝑏𝑏 = 45 kJ/mol, 𝐶𝐶𝑖𝑖𝑖𝑖 =
10-3 wt ppm and (a) 𝑁𝑁𝑇𝑇/𝑁𝑁𝐿𝐿 = 10-10, (b) 𝑁𝑁𝑇𝑇/𝑁𝑁𝐿𝐿 = 10-2.
The effect of trapping phenomena might be evaluated following the approach proposed by Raina et al.
(2017) through the definition of three regimes:
- Regime I: low trap occupancy due to low binding energy and low input lattice concentration.
Trapping effects are minor and hydrogen permeation follows Fickian diffusion. Output flux can be
modelled thus using the analytic rise transient (10) in which apparent diffusivity is fitted.
- Regime II: Deep trap limit (high binding energy) and high trap density.
- Regime IIIa: Deep trap limit (high binding energy), low trap density and low input lattice
concentration.
- Regime IIIb: Deep trap limit (high binding energy), low trap density and high input lattice
concentration.
By simulating hydrogen permeation through a material with a moderate trap density (𝑁𝑁𝑇𝑇/𝑁𝑁𝐿𝐿 = 10-6) and
variying the binding energy and the input lattice concentration, three different permeation behaviours are
found which can be explained using the defined regimes. As shown in Figure 6, for a binding energy equal to
45 kJ/mol and a limited hydrogen entry, a Fickian smooth permeation curve is found (Regime I). However,
when strong traps are considered, i.e. 𝐸𝐸𝑏𝑏 = 60 kJ/mol, for the same input concentration, flux rise is delayed
and becomes more abrupt so Regime II can be assumed. On the other hand, for 𝐸𝐸𝑏𝑏 = 45 kJ/mol an abrupt
change is found if the concentration at the entry side is 1 wt ppm; in this case, the slope after the flux
breaktrhough is more gradual which is typical of Regime IIIb, as found by Raina et al. (Raina et al. 2017).
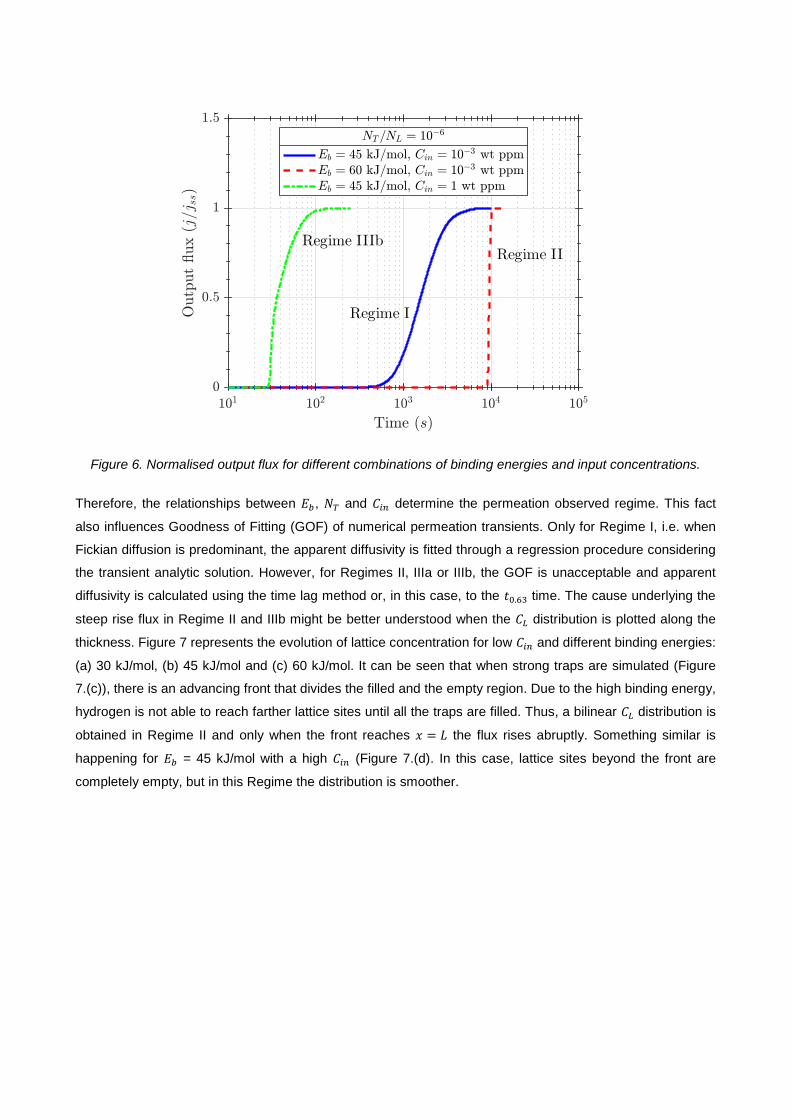
Figure 6. Normalised output flux for different combinations of binding energies and input concentrations.
Therefore, the relationships between 𝐸𝐸𝑏𝑏, 𝑁𝑁𝑇𝑇 and 𝐶𝐶𝑖𝑖𝑖𝑖 determine the permeation observed regime. This fact
also influences Goodness of Fitting (GOF) of numerical permeation transients. Only for Regime I, i.e. when
Fickian diffusion is predominant, the apparent diffusivity is fitted through a regression procedure considering
the transient analytic solution. However, for Regimes II, IIIa or IIIb, the GOF is unacceptable and apparent
diffusivity is calculated using the time lag method or, in this case, to the 𝜕𝜕0.63 time. The cause underlying the
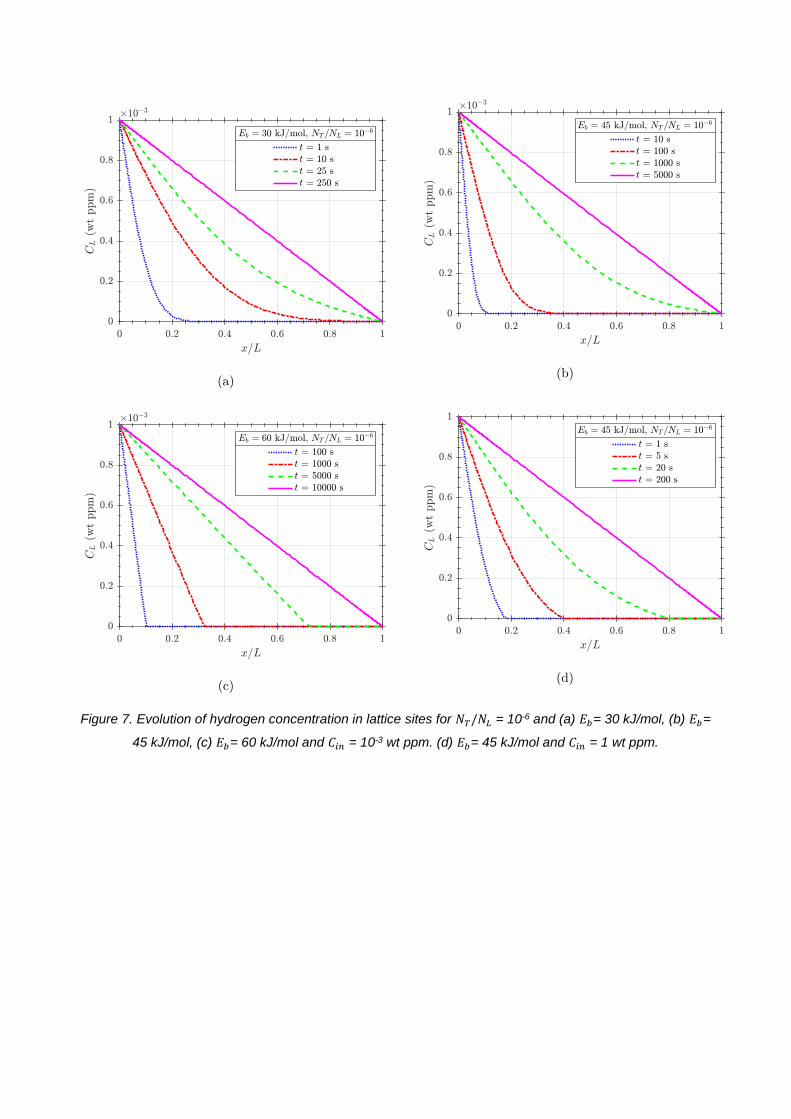
steep rise flux in Regime II and IIIb might be better understood when the 𝐶𝐶𝐿𝐿 distribution is plotted along the
thickness. Figure 7 represents the evolution of lattice concentration for low 𝐶𝐶𝑖𝑖𝑖𝑖 and different binding energies:
(a) 30 kJ/mol, (b) 45 kJ/mol and (c) 60 kJ/mol. It can be seen that when strong traps are simulated (Figure
7.(c)), there is an advancing front that divides the filled and the empty region. Due to the high binding energy,
hydrogen is not able to reach farther lattice sites until all the traps are filled. Thus, a bilinear 𝐶𝐶𝐿𝐿 distribution is
obtained in Regime II and only when the front reaches 𝜕𝜕 = 𝐿𝐿 the flux rises abruptly. Something similar is
happening for 𝐸𝐸𝑏𝑏 = 45 kJ/mol with a high 𝐶𝐶𝑖𝑖𝑖𝑖 (Figure 7.(d). In this case, lattice sites beyond the front are
completely empty, but in this Regime the distribution is smoother.
Regime IIIb
Regime I
Regime II
(a)
(c)
(b)
(d)
Figure 7. Evolution of hydrogen concentration in lattice sites for 𝑁𝑁𝑇𝑇/𝑁𝑁𝐿𝐿 = 10-6 and (a) 𝐸𝐸𝑏𝑏= 30 kJ/mol, (b) 𝐸𝐸𝑏𝑏=
45 kJ/mol, (c) 𝐸𝐸𝑏𝑏= 60 kJ/mol and 𝐶𝐶𝑖𝑖𝑖𝑖 = 10-3 wt ppm. (d) 𝐸𝐸𝑏𝑏= 45 kJ/mol and 𝐶𝐶𝑖𝑖𝑖𝑖 = 1 wt ppm.

Figure 8. Influence of binding energy and trapping density on apparent diffusivity for 𝐶𝐶𝑖𝑖𝑖𝑖 = 10-3 wt ppm.
Figure 9. Influence of binding energy and trapping density on apparent diffusivity for 𝐶𝐶𝑖𝑖𝑖𝑖 = 1 wt ppm.
FE simulations are performed in COMSOL Multiphysics software over the range of parameters shown in
Table 1. Apparent diffusivity has been fitted following Fourier’s method, i.e. expression (10), in those cases
where GOF is acceptable. However, for conditions lying on Regimes II or III the 𝐷𝐷𝑎𝑎𝑎𝑎𝑎𝑎 coefficients shown in
Figures 8 and 9 where found using the lag time expression. Figures 8 and 9 might be linked with the results
shown by Raina et al. (Raina et al. 2017) in Figures 6 and 7 where non-dimensional values are considered:

𝑁𝑁� = 𝑁𝑁𝑇𝑇/𝑁𝑁𝐿𝐿 and ∆𝐻𝐻���� = 𝐸𝐸𝑏𝑏/𝑅𝑅𝑅𝑅, and lag time is proportional to apparent diffusivity. In the present paper, an
exponential decay –since the x-axis is plotted in logarithmic scale– is found for apparent diffusivity at high
trap densities (Figures 8 and 9). The curves corresponding to different hydrogen lattice concentration in the
entry side show similar behaviour but a lower binding energy effect for 𝐶𝐶𝑖𝑖𝑖𝑖 = 1 wt ppm.
For the sake of illustration, permeation tests extracted from literature (Dietzel et al. 2006) for a low-alloy
structural steel have been analysed in order to highlight the importance of the proposed regimes, the
influence of trapping densities (𝑁𝑁𝑇𝑇) and the effect of input concentration. These authors carried out
permeation tests for different levels of deformation and calculated an apparent diffusivity using the lag time
method; however, they identified this global value with the “operational” effective diffusivity as expressed in
equation (4) and fitted the density of traps to a power law:
𝑁𝑁𝑇𝑇 = 𝑁𝑁𝑇𝑇,0 + 𝑁𝑁𝑇𝑇,1𝜀𝜀𝑎𝑎0.7 (14)
where equivalent plastic strain is expressed as a percentage, and the constants take the values: 𝑁𝑁𝑇𝑇,0=
8.8×10²² traps/m3 and 𝑁𝑁𝑇𝑇,1= 4.8×1024 traps/m3. Considering a concentration-independent effective diffusivity,
the authors fitted the binding energy as 𝐸𝐸𝑏𝑏 = 42.1 kJ/mol. Dietzel et al. (2006) assume that hydrogen
concentration in the entry side was the value obtained through the standard procedure from the steady state
flux, giving 𝐶𝐶𝐿𝐿,0 = 2.1×10²² atoms/m3 = 0.045 wt ppm. If these values of trapping density, binding energy and
input hydrogen concentration are implemented in the 1D continuum model, results in Figure 10 are obtained,
showing very poor agreement.
Figure 10. Normalised output flux for different values of equivalent plastic strain extracted from (Dietzel et al.
2006) and simulated considering 𝐶𝐶𝑖𝑖𝑖𝑖= = 2.1×10²² atoms/m3 = 0.045 wt ppm.
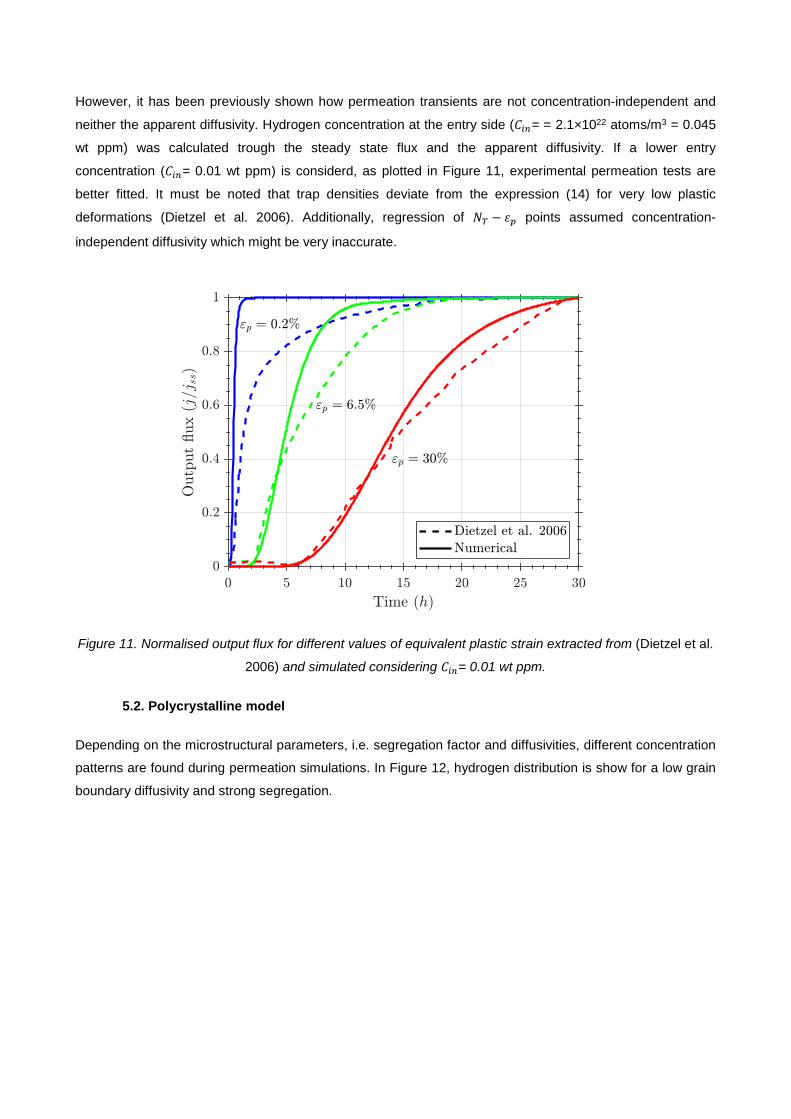
However, it has been previously shown how permeation transients are not concentration-independent and
neither the apparent diffusivity. Hydrogen concentration at the entry side (𝐶𝐶𝑖𝑖𝑖𝑖= = 2.1×10²² atoms/m3 = 0.045
wt ppm) was calculated trough the steady state flux and the apparent diffusivity. If a lower entry
concentration (𝐶𝐶𝑖𝑖𝑖𝑖= 0.01 wt ppm) is considerd, as plotted in Figure 11, experimental permeation tests are
better fitted. It must be noted that trap densities deviate from the expression (14) for very low plastic
deformations (Dietzel et al. 2006). Additionally, regression of 𝑁𝑁𝑇𝑇 − 𝜀𝜀𝑎𝑎 points assumed concentration-
independent diffusivity which might be very inaccurate.
Figure 11. Normalised output flux for different values of equivalent plastic strain extracted from (Dietzel et al.
2006) and simulated considering 𝐶𝐶𝑖𝑖𝑖𝑖= 0.01 wt ppm.
5.2. Polycrystalline model
Depending on the microstructural parameters, i.e. segregation factor and diffusivities, different concentration
patterns are found during permeation simulations. In Figure 12, hydrogen distribution is show for a low grain
boundary diffusivity and strong segregation.

Figure 12. Lattice hydrogen concentration distribution for 𝑠𝑠𝑔𝑔𝑏𝑏 = 104 and 𝐷𝐷𝑔𝑔𝑏𝑏/𝐷𝐷𝐿𝐿 = 10-4 at steady state.
Since the concentration profiles are difficult to analyse, the output flux is studied and fitted in order to find
apparent diffusivities as macroscopic indicators of trapping effects.
Hydrogen permeation trough a polycrystal shows that a low diffusivity along grain boundaries (𝐷𝐷𝑔𝑔𝑏𝑏/𝐷𝐷𝐿𝐿 ≪ 1)
promotes a delay in output flux and a lower steady state magnitude. On the other hand, when 𝐷𝐷𝑔𝑔𝑏𝑏/𝐷𝐷𝐿𝐿 ≫ 1
hydrogen exit is accelerated, and steady state flux is higher than the ideal lattice flux. Polycrystalline models
are able, in contrast to the continuum model presented in the previous section, to simulate the trapping
influence on hydrogen output flux. Figure 13 represents both situations, i.e. delay and acceleration due to a
low or a high grain boundary diffusivity, respectively. These results are obtained without segregation, so
hydrogen concentration is not enhanced in grain boundaries.
(a) (b)
Figure 13. Grain boundary diffusivity effect for 200 grains, 𝜕𝜕𝑔𝑔𝑏𝑏 = 100 nm and 𝑠𝑠𝑔𝑔𝑏𝑏 = 1.
Even if hydrogen moves fast in grain boundaries, i.e. 𝐷𝐷𝑔𝑔𝑏𝑏/𝐷𝐷𝐿𝐿 = 1, a global delay is found in the permeation
output flux when a segregation factor is considered (Figure 14). This can be explained because when
hydrogen concentrations in grain boundaries are very high, grains tend to be depleted and the diffusion from
the centre to the boundaries of a grain overweighs the macroscopic permeation.

(a) (b)
Figure 14. Segregation effect for 200 grains, 𝜕𝜕𝑔𝑔𝑏𝑏 = 100 nm and 𝐷𝐷𝑔𝑔𝑏𝑏/𝐷𝐷𝐿𝐿 = 1.
For a significant delay in grain boundary diffusion, macroscopic delay is increased, as can be seen in Figure
15, in which time is plotted in logarithmic scale. However, a contradictory result is found for the segregation
effect: strong trapping 𝑠𝑠𝑔𝑔𝑏𝑏 = 104 results in a permeation faster than for 𝑠𝑠𝑔𝑔𝑏𝑏 = 102 or for no segregation.
(a) (b)
Figure 15. Segregation effect for 200 grains, 𝜕𝜕𝑔𝑔𝑏𝑏 = 100 nm and 𝐷𝐷𝑔𝑔𝑏𝑏/𝐷𝐷𝐿𝐿 = 10-4.
In order to confirm the effect and to analyse the whole range of diffusivities and segregation factors,
apparent diffusivities are determined by fitting the output fluxes.
Finite element results are fitted to the permeation transient flux expressed in (10) with a non-linear Least
Squares algorithm. A fitting example is shown in Figure 16. A very good fitness is obtained for 𝐷𝐷𝑔𝑔𝑏𝑏/𝐷𝐷𝐿𝐿 < 1
ratios because the output flux is dominated by hydrogen desorption in grains whereas the fitting is worse for
accelerated diffusion, i.e. for 𝐷𝐷𝑔𝑔𝑏𝑏/𝐷𝐷𝐿𝐿 = 102 since hydrogen exit from grain boundaries has an important

weight in the output flux. Nevertheless, in both cases smooth curves are found that might be identified as
Regime I, i.e. Fickian diffusion, within the framework previously presented.
The obtained 𝐷𝐷𝑎𝑎𝑎𝑎𝑎𝑎 for each pair of values 𝑠𝑠𝑔𝑔𝑏𝑏 and 𝐷𝐷𝑔𝑔𝑏𝑏/𝐷𝐷𝐿𝐿 is plotted in Figure 17 for the structure with 200
grains and a grain boundary thickness of 100 nm. Apparent diffusivities are normalised using the lattice
diffusivity value of 𝐷𝐷𝐿𝐿 = 4987.5 µm2/s.
(a) (b)
Figure 14. Fitting of FE results to permeation transient (4) for 𝑠𝑠𝑔𝑔𝑏𝑏 = 104 and 𝐷𝐷𝑔𝑔𝑏𝑏/𝐷𝐷𝐿𝐿 = 10-4 (200 grains and
𝜕𝜕𝑔𝑔𝑏𝑏 = 100 nm)
As expected, for the pair of values 𝑠𝑠𝑔𝑔𝑏𝑏 = 1 and 𝐷𝐷𝑔𝑔𝑏𝑏/𝐷𝐷𝐿𝐿 = 1, the apparent diffusivity coincides with the lattice
coefficient, 𝐷𝐷𝑎𝑎𝑎𝑎𝑎𝑎/𝐷𝐷𝐿𝐿 = 1, since no trapping effect is considered. The higher the grain boundary diffusivity, the
higher the apparent diffusivity; however, this trend strongly depends on segregation. While the slope for 𝑠𝑠𝑔𝑔𝑏𝑏
= 1 is very small and increases at low ratios 𝐷𝐷𝑔𝑔𝑏𝑏/𝐷𝐷𝐿𝐿, the trend is the opposite for 𝑠𝑠𝑔𝑔𝑏𝑏 = 102 and 𝑠𝑠𝑔𝑔𝑏𝑏 = 104.
As shown in Figure 17, the result for very low diffusivities along grain boundaries (𝐷𝐷𝑔𝑔𝑏𝑏/𝐷𝐷𝐿𝐿 = 10-4) seems
contradictory: apparent diffusivity without segregation (𝑠𝑠𝑔𝑔𝑏𝑏 = 1) is higher than the value obtained for 𝑠𝑠𝑔𝑔𝑏𝑏 =
104, but lower than 𝐷𝐷𝑎𝑎𝑎𝑎𝑎𝑎 corresponding to 𝑠𝑠𝑔𝑔𝑏𝑏 = 102. This fact was attributed to the effect of segregation on
the output flux; for weak trapping, hydrogen transport is delayed but grain boundaries are not completely
filled so total output flux is not affected by hydrogen exit from grain boundaries, whereas for strong traps
diffusion is completely obstructed by grain boundaries near the entry side. Within an intermediate
segregation range, hydrogen delay is reduced but a rise in the permeation transient might be registered early
because of the enhanced hydrogen exit through grain boundaries. This phenomenon has been
experimentally found using silver decoration techniques (Koyama et al. 2017b, a).

Figure 17. Fitting results (200 grains, 𝜕𝜕𝑔𝑔𝑏𝑏 = 100 nm)
To confirm the segregation and diffusivity effects, the geometries shown in Figure 2, and whose parameters
are collected in Table 3, are also analysed. For both the 50-grain and the 800-grain polycrystals, i.e. for the
coarse-grained, (Figure 18.a.) and fine-grained (Figure 18.b) structures, respectively, a very similar
tendencies are found. Nevertheless, the 50-grain simulated slab shows a lower change in apparent diffusivity
due to grain boundary trapping. Both acceleration and delaying effects increase for the fine grain structure
because a larger amount of grain boundaries exists. This expected influence is confirmed for the 800-grain
crystal in which the 𝐷𝐷𝑎𝑎𝑎𝑎𝑎𝑎 variation over the 𝐷𝐷𝑔𝑔𝑏𝑏/𝐷𝐷𝐿𝐿 range is greater. For example, the lowest apparent
diffusivity for 800 grains corresponding to 𝑠𝑠𝑔𝑔𝑏𝑏 = 104 and 𝐷𝐷𝑔𝑔𝑏𝑏/𝐷𝐷𝐿𝐿 = 10-4 gives a value of only 𝐷𝐷𝑎𝑎𝑎𝑎𝑎𝑎 = 62.3
µm2/s.
The main limitation of this formulation is that permeation fluxes and the corresponding fitted apparent
diffusivities are independent of hydrogen concentration. However, it has been shown in the previous section
that the continuum model, which includes a physically-based mass balance modification, predicts different
regimes depending on the input concentration, i.e. for different charging conditions the obtained apparent
diffusivity might be completely different. To be more realistic, the polycrystalline model could be modified to
consider occupancies rather than total concentrations.
The 1D model can be related with grain boundary trapping and polycrystalline features when density of
defects 𝑁𝑁𝑇𝑇, and binding energy 𝐸𝐸𝑏𝑏, represent grain boundary values 𝑁𝑁𝑇𝑇,𝑔𝑔𝑏𝑏 and 𝐸𝐸𝑏𝑏,𝑔𝑔𝑏𝑏. According to some
references, (Song et al. 2013; Liu et al. 2019), trap densities associated with grain boundaries depend on
burgers vector and average grain size:
𝑁𝑁𝑇𝑇,𝑔𝑔𝑏𝑏
𝑁𝑁𝐿𝐿=𝑏𝑏�̅�𝑑
(15)
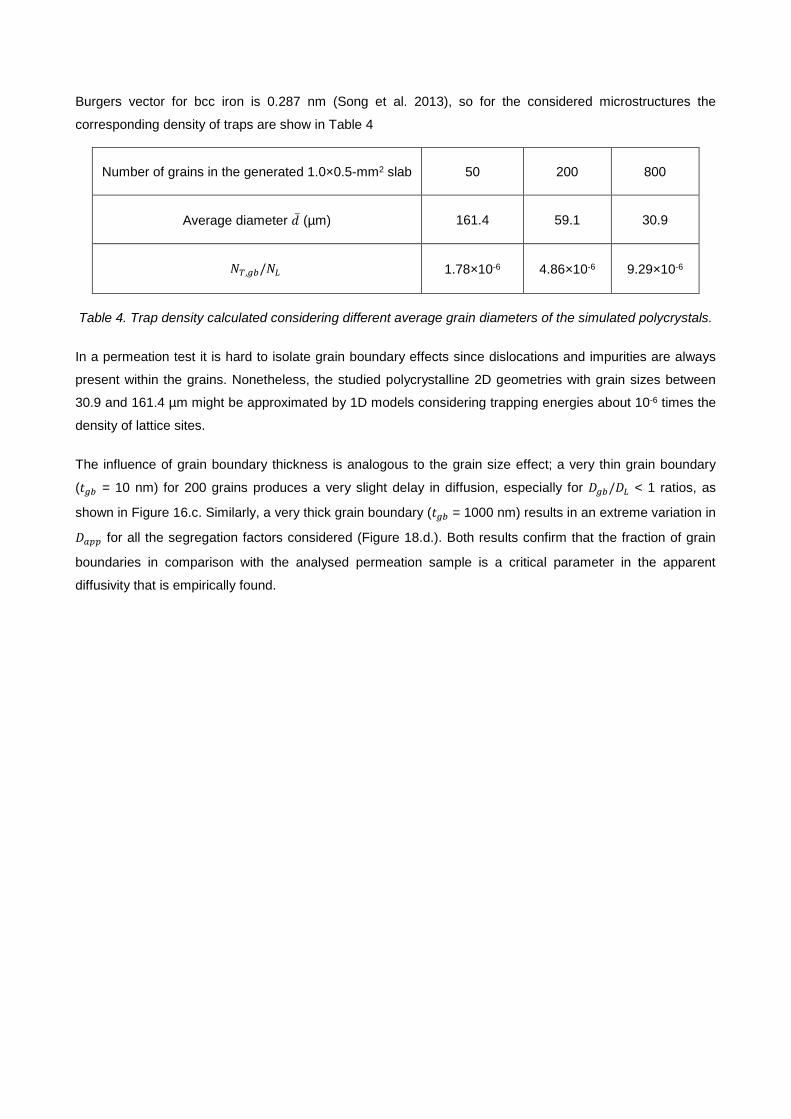
Burgers vector for bcc iron is 0.287 nm (Song et al. 2013), so for the considered microstructures the
corresponding density of traps are show in Table 4
Number of grains in the generated 1.0×0.5-mm2 slab 50 200 800
Average diameter �̅�𝑑 (µm) 161.4 59.1 30.9
𝑁𝑁𝑇𝑇,𝑔𝑔𝑏𝑏/𝑁𝑁𝐿𝐿 1.78×10⁻⁶ 4.86×10⁻⁶ 9.29×10⁻⁶
Table 4. Trap density calculated considering different average grain diameters of the simulated polycrystals.
In a permeation test it is hard to isolate grain boundary effects since dislocations and impurities are always
present within the grains. Nonetheless, the studied polycrystalline 2D geometries with grain sizes between
30.9 and 161.4 µm might be approximated by 1D models considering trapping energies about 10-6 times the
density of lattice sites.
The influence of grain boundary thickness is analogous to the grain size effect; a very thin grain boundary
(𝜕𝜕𝑔𝑔𝑏𝑏 = 10 nm) for 200 grains produces a very slight delay in diffusion, especially for 𝐷𝐷𝑔𝑔𝑏𝑏/𝐷𝐷𝐿𝐿 < 1 ratios, as
shown in Figure 16.c. Similarly, a very thick grain boundary (𝜕𝜕𝑔𝑔𝑏𝑏 = 1000 nm) results in an extreme variation in
𝐷𝐷𝑎𝑎𝑎𝑎𝑎𝑎 for all the segregation factors considered (Figure 18.d.). Both results confirm that the fraction of grain
boundaries in comparison with the analysed permeation sample is a critical parameter in the apparent
diffusivity that is empirically found.
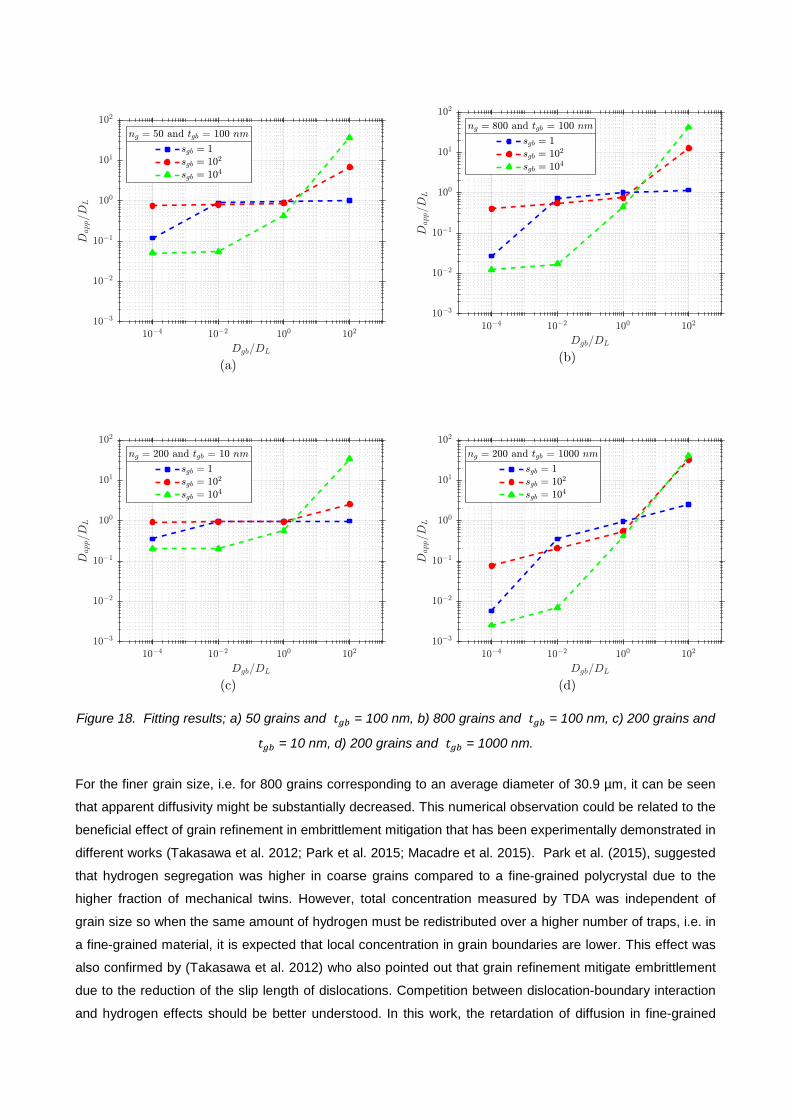
(a) (b)
(c) (d)
Figure 18. Fitting results; a) 50 grains and 𝜕𝜕𝑔𝑔𝑏𝑏 = 100 nm, b) 800 grains and 𝜕𝜕𝑔𝑔𝑏𝑏 = 100 nm, c) 200 grains and
𝜕𝜕𝑔𝑔𝑏𝑏 = 10 nm, d) 200 grains and 𝜕𝜕𝑔𝑔𝑏𝑏 = 1000 nm.
For the finer grain size, i.e. for 800 grains corresponding to an average diameter of 30.9 µm, it can be seen
that apparent diffusivity might be substantially decreased. This numerical observation could be related to the
beneficial effect of grain refinement in embrittlement mitigation that has been experimentally demonstrated in
different works (Takasawa et al. 2012; Park et al. 2015; Macadre et al. 2015). Park et al. (2015), suggested
that hydrogen segregation was higher in coarse grains compared to a fine-grained polycrystal due to the
higher fraction of mechanical twins. However, total concentration measured by TDA was independent of
grain size so when the same amount of hydrogen must be redistributed over a higher number of traps, i.e. in
a fine-grained material, it is expected that local concentration in grain boundaries are lower. This effect was
also confirmed by (Takasawa et al. 2012) who also pointed out that grain refinement mitigate embrittlement
due to the reduction of the slip length of dislocations. Competition between dislocation-boundary interaction
and hydrogen effects should be better understood. In this work, the retardation of diffusion in fine-grained
materials has been numerically demonstrated for 𝐷𝐷𝑔𝑔𝑏𝑏/𝐷𝐷𝐿𝐿 < 1; this fact might be critical in time-dependent
fractures (i.e. strain rate dependence of hydrogen embrittlement). However, as found by other authors,
(Takasawa et al. 2012; Park et al. 2015; Macadre et al. 2015), the grain refinement mitigation of
embrittlement in Slow Strain Rate tests (SSRT) is expected to happen due to the redistribution of the same
amount of hydrogen over a higher boundary surface so the local segregation and the subsequent
intergranular decohesion is reduced.
It is hard to compare experimental results with the polycrystalline model predictions for pure iron because
grain size effects on hydrogen permeation have been studied mainly for nickel alloys (Oudriss et al. 2012).
Even though many works have dealt with the influence of different processes on hydrogen permeation in
steels, e.g. heat treatment (Gesnouin et al. 2004; Lan et al. 2016) or work-hardening (Kumnick and Johnson
1980; Dietzel et al. 2006), microstructural features related to grain boundaries are not usually correlated. In
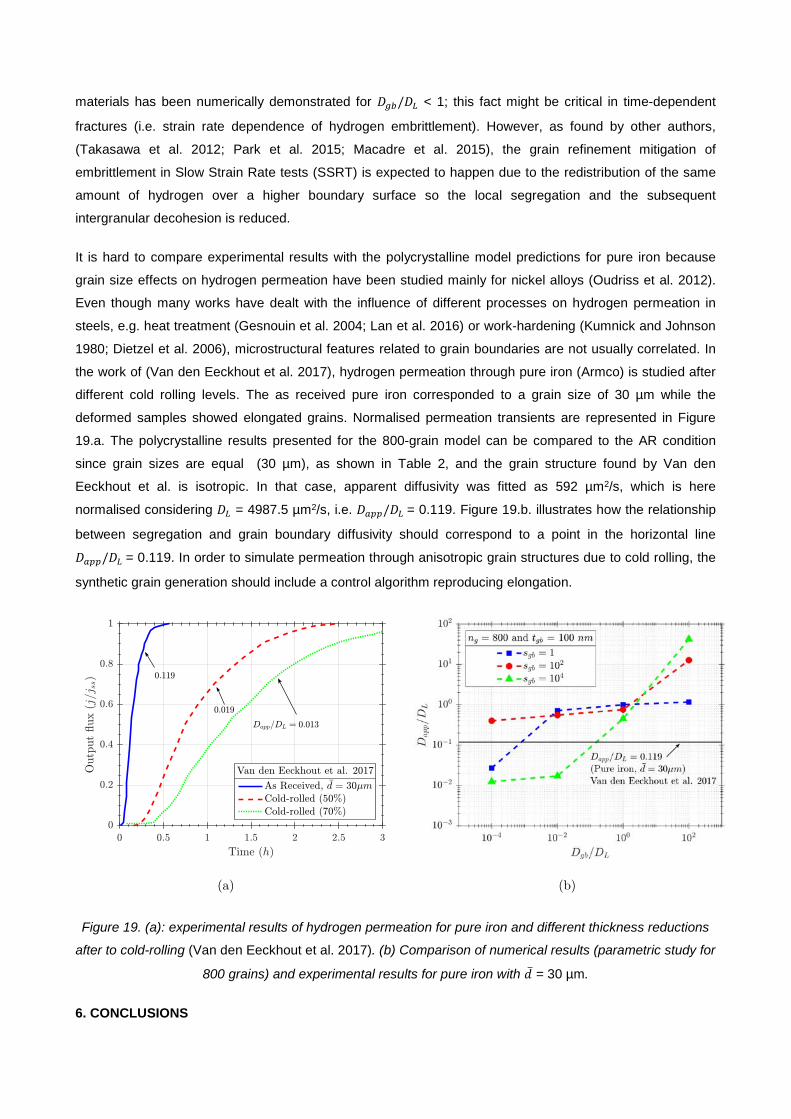
the work of (Van den Eeckhout et al. 2017), hydrogen permeation through pure iron (Armco) is studied after
different cold rolling levels. The as received pure iron corresponded to a grain size of 30 µm while the
deformed samples showed elongated grains. Normalised permeation transients are represented in Figure
19.a. The polycrystalline results presented for the 800-grain model can be compared to the AR condition
since grain sizes are equal (30 µm), as shown in Table 2, and the grain structure found by Van den
Eeckhout et al. is isotropic. In that case, apparent diffusivity was fitted as 592 µm2/s, which is here
normalised considering 𝐷𝐷𝐿𝐿 = 4987.5 µm2/s, i.e. 𝐷𝐷𝑎𝑎𝑎𝑎𝑎𝑎/𝐷𝐷𝐿𝐿 = 0.119. Figure 19.b. illustrates how the relationship
between segregation and grain boundary diffusivity should correspond to a point in the horizontal line
𝐷𝐷𝑎𝑎𝑎𝑎𝑎𝑎/𝐷𝐷𝐿𝐿 = 0.119. In order to simulate permeation through anisotropic grain structures due to cold rolling, the
synthetic grain generation should include a control algorithm reproducing elongation.
(a)
(b)
Figure 19. (a): experimental results of hydrogen permeation for pure iron and different thickness reductions
after to cold-rolling (Van den Eeckhout et al. 2017). (b) Comparison of numerical results (parametric study for
800 grains) and experimental results for pure iron with �̅�𝑑 = 30 µm.
6. CONCLUSIONS
A methodology has been established for the simulation of hydrogen permeation through two approaches: (i)
considering a 1D continuum model and (ii) generating a polycrystalline structure. The former is the most
common framework since the work of Sofronis and McMeeking (1989) and relies on the modification of the
mass balance including trapping influence. Even though it is useful for evaluating hydrogen transport, the
concept of trap density is generic and might lack of physical meaning. On the other hand, the polycrystalline
model is able to simulate a synthetic structure through a Voronoi tessellation and it is especially useful for
the evaluation of trapping at grain boundaries. Microstructural parameters that could be evaluated through
atomistic simulations are considered in a multiscale approach: lattice diffusivity, grain boundary diffusivity
and segregations. Additionally, geometric features as grain size or grain boundary thickness are analysed as
critical factors for the permeation output results. As expected, for very low grain boundary diffusivities the
output flux is delayed so the apparent diffusivity decreases. However, the evaluation of a combined
mechanism including segregation effects, i.e. a higher concentration in grain boundaries, is not
straightforward and some coupled influences are hard to differentiate. This polycrystalline model must be
related to continuum models based on a modified mass balance including density of trapping sites and
binding energies. However, some simplifications made in the present work must be addressed in the future.
For instance, the isotropy assumed here might be substituted considering a diffusivity tensor obtained
through atomistic simulations. The difference between a 2D and a 3D permeation should also be evaluated
using percolation theories and 3D finite element models. Additionally, the nature of grain boundaries, e.g.
fraction of random boundaries or misorientation angles, influences hydrogen trapping and the possibility of
short-circuit diffusion. Another possible implementation approach is based in Crystal Plasticity Finite Element
Method (CPFEM) in which dislocation density might be coupled with trapping effects in a strained specimen.
Future research will also focus on the influence of hydrogen entry processes, i.e. adsorption and absorption,
and the permeation fluxes that are obtained considering realistic boundary conditions.
ACKNOWLEDGMENTS
The authors gratefully acknowledge financial support from the project MINECO Refs: MAT2014-58738-C3-2-
R and RTI2018-096070-B-C33. E. Martínez-Pañeda acknowledges financial support from the People
Programme (Marie Curie Actions) of the European Union’s Seventh Framework Programme (FP7/2007-
2013) under REA grant agreement no. 609405 (COFUNDPostdocDTU).
REFERENCES
Álvarez G, Peral LB, Rodríguez C, et al (2019) Hydrogen embrittlement of structural steels: Effect of the
displacement rate on the fracture toughness of high-pressure hydrogen pre-charged samples. Int J
Hydrogen Energy 44:15634–15643. doi: 10.1016/J.IJHYDENE.2019.03.279
Ashby MF (1970) The deformation of plastically non-homogeneous materials. Philos Mag A J Theor Exp
Appl Phys 21:399–424. doi: 10.1080/14786437008238426
Bechtle S, Kumar M, Somerday BP, et al (2009) Grain-boundary engineering markedly reduces susceptibility
to intergranular hydrogen embrittlement in metallic materials. Acta Mater 57:4148–4157. doi:
10.1016/J.ACTAMAT.2009.05.012
Bouhattate J, Legrand E, Feaugas X (2011) Computational analysis of geometrical factors affecting
experimental data extracted from hydrogen permeation tests: I – Consequences of trapping. Int J
Hydrogen Energy 36:12644–12652. doi: 10.1016/J.IJHYDENE.2011.06.143
Crank J (1979) The mathematics of diffusion. Oxford university press
Dadfarnia M, Sofronis P, Neeraj T (2011) Hydrogen interaction with multiple traps: Can it be used to mitigate
embrittlement? Int J Hydrogen Energy 36:10141–10148. doi:
https://doi.org/10.1016/j.ijhydene.2011.05.027
del Busto S, Betegón C, Martínez-Pañeda E (2017) A cohesive zone framework for environmentally assisted
fatigue. Eng Fract Mech 185:210–226. doi: 10.1016/J.ENGFRACMECH.2017.05.021
Devanathan MA V, Stachurski Z, Beck W (1963) A technique for the evaluation of hydrogen embrittlement
characteristics of electroplating baths. J Electrochem Soc 110:886–890
Díaz A, Alegre JM, Cuesta II (2016a) Coupled hydrogen diffusion simulation using a heat transfer analogy.
Int J Mech Sci 115–116:. doi: 10.1016/j.ijmecsci.2016.07.020
Díaz A, Alegre JM, Cuesta II (2016b) A review on diffusion modelling in hydrogen related failures of metals.
Eng Fail Anal 66:. doi: 10.1016/j.engfailanal.2016.05.019
Dietzel W, Pfuff M, Juilfs GG (2006) Hydrogen permeation in plastically deformed steel membranes. Mater
Sci 42:78–84. doi: 10.1007/s11003-006-0059-8
Frappart S, Feaugas X, Creus J, et al (2012) Hydrogen solubility, diffusivity and trapping in a tempered Fe–
C–Cr martensitic steel under various mechanical stress states. Mater Sci Eng A 534:384–393. doi:
10.1016/J.MSEA.2011.11.084
Frappart S, Feaugas X, Creus J, et al (2010) Study of the hydrogen diffusion and segregation into Fe–C–Mo
martensitic HSLA steel using electrochemical permeation test. J Phys Chem Solids 71:1467–1479. doi:
10.1016/J.JPCS.2010.07.017
Gerberich WW, Marsh PG, Hoehn JW (1996) Hydrogen induced cracking mechanisms - are there critical
experiments? In: Hydrogen Effects in Materials. pp 539–551
Gesnouin C, Hazarabedian A, Bruzzoni P, et al (2004) Effect of post-weld heat treatment on the
microstructure and hydrogen permeation of 13CrNiMo steels. Corros Sci 46:1633–1647. doi:
10.1016/J.CORSCI.2003.10.006
Hirth J (1980) Effects of hydrogen on the properties of iron and steel. Metall Trans A 11:861–890. doi:
10.1007/BF02654700
Hoch BO (2015) Modelling of hydrogen diffusion in heterogeneous materials: implications of the grain
boundary connectivity
Hoch BO, Metsue A, Bouhattate J, Feaugas X (2015) Effects of grain-boundary networks on the
macroscopic diffusivity of hydrogen in polycrystalline materials. Comput Mater Sci 97:276–284
Jiang DE, Carter EA (2004) Diffusion of interstitial hydrogen into and through bcc Fe from first principles.
Phys Rev B 70:64102
Jothi S, Croft TN, Wright L, et al (2015) Multi-phase modelling of intergranular hydrogen segregation/trapping
for hydrogen embrittlement. Int J Hydrogen Energy 40:15105–15123. doi:
10.1016/J.IJHYDENE.2015.08.093
Juilfs G (2002) Das Diffusionsverhalten von Wasserstoff in einem niedriglegierten Stahl unter
Berücksichtigung des Verformungsgrades. GRIN Verlag
Kharin V (2014) Comments on “Computational analysis of geometrical factors affecting experimental data
extracted from hydrogen permeation tests: I – Consequences of trapping” [Int J Hydrogen Energy 36
(2011) 12644–12652] and “… II – Consequences of trapping and an oxide layer” [Int J Hydrogen
Energy 37 (2012) 13574–13582], “Corrigenda …” to both [Int J Hydrogen Energy 39 (2014) 2430], and
on “… III – Comparison with experimental results from the literature” [Int J Hydrogen Energy 39 (2014)
1145–1155] with “Gene. Int J Hydrogen Energy 39:19846–19850. doi:
10.1016/J.IJHYDENE.2014.09.032
Koyama M, Rohwerder M, Tasan CC, et al (2017a) Recent progress in microstructural hydrogen mapping in
steels: quantification, kinetic analysis, and multi-scale characterisation. Mater Sci Technol 33:1481–
1496. doi: 10.1080/02670836.2017.1299276
Koyama M, Yamasaki D, Nagashima T, et al (2017b) In situ observations of silver-decoration evolution under
hydrogen permeation: Effects of grain boundary misorientation on hydrogen flux in pure iron. Scr Mater
129:48–51. doi: 10.1016/J.SCRIPTAMAT.2016.10.027
Kumnick AJ, Johnson HH (1980) Deep trapping states for hydrogen in deformed iron. Acta Metall 28:33–39.
doi: http://dx.doi.org/10.1016/0001-6160(80)90038-3
Lan L, Kong X, Hu Z, et al (2016) Hydrogen permeation behavior in relation to microstructural evolution of
low carbon bainitic steel weldments. Corros Sci 112:180–193. doi: 10.1016/J.CORSCI.2016.07.025
Legrand E, Feaugas X, Bouhattate J (2014) Generalized model of desorption kinetics: Characterization of
hydrogen trapping in a homogeneous membrane. Int J Hydrogen Energy 39:8374–8384. doi:
10.1016/J.IJHYDENE.2014.03.191
Liu MA, Rivera-Díaz-del-Castillo PEJ, Barraza-Fierro JI, et al (2019) Microstructural influence on hydrogen
permeation and trapping in steels. Mater Des 167:107605. doi: 10.1016/J.MATDES.2019.107605

Macadre A, Artamonov M, Matsuoka S, Furtado J (2011) Effects of hydrogen pressure and test frequency on
fatigue crack growth properties of Ni–Cr–Mo steel candidate for a storage cylinder of a 70 MPa
hydrogen filling station. Eng Fract Mech 78:3196–3211. doi: 10.1016/J.ENGFRACMECH.2011.09.007
Macadre A, Nakada N, Tsuchiyama T, Takaki S (2015) Critical grain size to limit the hydrogen-induced
ductility drop in a metastable austenitic steel. Int J Hydrogen Energy 40:10697–10703. doi:
10.1016/J.IJHYDENE.2015.06.111
Martin ML, Somerday BP, Ritchie RO, et al (2012) Hydrogen-induced intergranular failure in nickel revisited.
Acta Mater 60:2739–2745. doi: 10.1016/J.ACTAMAT.2012.01.040
Martínez-Pañeda E, del Busto S, Niordson CF, Betegón C (2016a) Strain gradient plasticity modeling of
hydrogen diffusion to the crack tip. Int J Hydrogen Energy 41:10265–10274. doi:
https://doi.org/10.1016/j.ijhydene.2016.05.014
Martínez-Pañeda E, Golahmar A, Niordson CF (2018) A phase field formulation for hydrogen assisted
cracking. Comput Methods Appl Mech Eng 342:742–761. doi: 10.1016/J.CMA.2018.07.021
Martínez-Pañeda E, Niordson CF, Gangloff RP (2016b) Strain gradient plasticity-based modeling of
hydrogen environment assisted cracking. Acta Mater 117:321–332. doi:
10.1016/J.ACTAMAT.2016.07.022
McMahon CJ (2001) Hydrogen-induced intergranular fracture of steels. Eng Fract Mech 68:773–788. doi:
10.1016/S0013-7944(00)00124-7
McNabb A, Foster PK (1963) A new analysis of the diffusion of hydrogen in iron and ferritic steels. Trans
Metall Soc AIME 227:618–627. doi: citeulike-article-id:4956272
Miresmaeili R, Ogino M, Nakagawa T, Kanayama H (2010) A coupled elastoplastic-transient hydrogen
diffusion analysis to simulate the onset of necking in tension by using the finite element method. Int J
Hydrogen Energy 35:1506–1514. doi: http://dx.doi.org/10.1016/j.ijhydene.2009.11.024
Montella C (1999) Discussion on permeation transients in terms of insertion reaction mechanism and
kinetics. J Electroanal Chem 465:37–50. doi: 10.1016/S0022-0728(99)00051-0
Nagao A, Smith CD, Dadfarnia M, et al (2012) The role of hydrogen in hydrogen embrittlement fracture of
lath martensitic steel. Acta Mater 60:5182–5189. doi: 10.1016/J.ACTAMAT.2012.06.040
Novak P, Yuan R, Somerday BP, et al (2010) A statistical, physical-based, micro-mechanical model of
hydrogen-induced intergranular fracture in steel. J Mech Phys Solids 58:206–226. doi:
10.1016/J.JMPS.2009.10.005
Olden V, Thaulow C, Johnsen R, et al (2008) Application of hydrogen influenced cohesive laws in the
prediction of hydrogen induced stress cracking in 25%Cr duplex stainless steel. Eng Fract Mech

75:2333–2351. doi: https://doi.org/10.1016/j.engfracmech.2007.09.003
Ono K, Meshii M (1992) Hydrogen detrapping from grain boundaries and dislocations in high purity iron. Acta
Metall Mater 40:1357–1364. doi: https://doi.org/10.1016/0956-7151(92)90436-I
Oriani RA (1970) The diffusion and trapping of hydrogen in steel. Acta Metall 18:147–157. doi:
http://dx.doi.org/10.1016/0001-6160(70)90078-7
Oudriss A, Creus J, Bouhattate J, et al (2012) Grain size and grain-boundary effects on diffusion and
trapping of hydrogen in pure nickel. Acta Mater 60:6814–6828. doi:
https://doi.org/10.1016/j.actamat.2012.09.004
Park I-J, Lee S, Jeon H, Lee Y-K (2015) The advantage of grain refinement in the hydrogen embrittlement of
Fe–18Mn–0.6C twinning-induced plasticity steel. Corros Sci 93:63–69. doi:
10.1016/J.CORSCI.2015.01.012
Raina A, Deshpande VS, Fleck NA (2017) Analysis of electro-permeation of hydrogen in metallic alloys.
Philos Trans A Math Phys Eng Sci 375:20160409. doi: 10.1098/rsta.2016.0409
Sofronis P, Liang Y, Aravas N (2001) Hydrogen induced shear localization of the plastic flow in metals and
alloys. Eur J Mech - A/Solids 20:857–872. doi: http://dx.doi.org/10.1016/S0997-7538(01)01179-2
Sofronis P, McMeeking RM (1989) Numerical analysis of hydrogen transport near a blunting crack tip. J
Mech Phys Solids 37:317–350. doi: http://dx.doi.org/10.1016/0022-5096(89)90002-1
Song EJ (2015) Hydrogen desorption in steels. Grad Inst Ferr Technol 106
Song EJ, Suh D-W, Bhadeshia HKDH (2013) Theory for hydrogen desorption in ferritic steel. Comput Mater
Sci 79:36–44. doi: 10.1016/J.COMMATSCI.2013.06.008
Takasawa K, Ikeda R, Ishikawa N, Ishigaki R (2012) Effects of grain size and dislocation density on the
susceptibility to high-pressure hydrogen environment embrittlement of high-strength low-alloy steels. Int
J Hydrogen Energy 37:2669–2675. doi: 10.1016/J.IJHYDENE.2011.10.099
Toribio J, Kharin V (2015) A generalised model of hydrogen diffusion in metals with multiple trap types.
Philos Mag 1–23. doi: 10.1080/14786435.2015.1079660
Turnbull A (1993) Modelling of environment assisted cracking. Corros Sci 34:921–960. doi:
http://dx.doi.org/10.1016/0010-938X(93)90072-O
Turnbull A (2015) Perspectives on hydrogen uptake, diffusion and trapping. Int J Hydrogen Energy. doi:
http://dx.doi.org/10.1016/j.ijhydene.2015.06.147
Turnbull A, Ferriss DH, Anzai H (1996) Modelling of the hydrogen distribution at a crack tip. Mater Sci Eng A
206:1–13. doi: http://dx.doi.org/10.1016/0921-5093(95)09897-6

Turnbull A, Saenz de Santa Maria M, Thomas ND (1989) The effect of H2S concentration and pH on
hydrogen permeation in AISI 410 stainless steel in 5% NaCl. Corros Sci 29:89–104. doi: 10.1016/0010-
938X(89)90082-6
Van den Eeckhout E, Laureys A, Van Ingelgem Y, Verbeken K (2017) Hydrogen permeation through
deformed and heat-treated Armco pure iron. Mater Sci Technol 33:1515–1523. doi:
10.1080/02670836.2017.1342015
Vecchi L, Simillion H, Montoya R, et al (2018a) Modelling of hydrogen permeation experiments in iron alloys:
Characterization of the accessible parameters – Part I – The entry side. Electrochim Acta 262:57–65.
doi: 10.1016/J.ELECTACTA.2017.12.172
Vecchi L, Simillion H, Montoya R, et al (2018b) Modelling of hydrogen permeation experiments in iron alloys:
Characterization of the accessible parameters – Part II – The exit side. Electrochim Acta 262:153–161.
doi: 10.1016/J.ELECTACTA.2017.12.173
Venezuela J, Blanch J, Zulkiply A, et al (2018) Further study of the hydrogen embrittlement of martensitic
advanced high-strength steel in simulated auto service conditions. Corros Sci 135:120–135. doi:
10.1016/J.CORSCI.2018.02.037
ISO 17081:2014 Method of measurement of hydrogen permeation and determination of hydrogen uptake
and transport in metals by an electrochemical technique. International Organization for Standardization,
2014, www.iso.org


