Embed Size (px)
Citation preview

Journal of Food, Agriculture & Environment, Vol.11 (3&4), July-October 2013 725
www.world-food.net Journal of Food, Agriculture & Environment Vol.11 (3&4): 725-734. 2013
WFL PublisherScience and Technology
Meri-Rastilantie 3 B, FI-00980Helsinki, Finlande-mail: [email protected]
An investigation on the contribution of pesticide and fertilizer dealers in Kocaeliprovince concerning agricultural extension activities
Ehlinaz Torun Kocaeli University, Arslanbey Vocational School, Marketing and Advertising Department, 41285 Kartepe/Kocaeli, Turkey.
e-mail: [email protected]
Received 14 July 2013, accepted 20 October 2013.
AbstractThe present study aims to determine the contributions of agricultural pesticide and fertilizer dealers in Kocaeli province concerning agriculturalextension activities. For this purpose, a 33-question questionnaire was administered to 32 actively operating pesticide dealers out of 38 in Kocaeli(including the province and the districts). The education level of the agricultural pesticide and fertilizer dealers was very high and most of them createdemployment. Also the profession of agricultural pesticide dealers was preferred more by men than women and they transferred information tofarmers about various issues apart from pesticide and fertilizer sales. The results obtained from this study will provide useful information foracademicians and politicians who will develop strategies about the issue, farmers and other stakeholders.
Key words: Agricultural pesticide and fertilizer dealer, agricultural extension, Kocaeli, questionnaire.
IntroductionGeographical position of Kocaeli: It is located at 29°22’-30°21’east longitude and 40°31’ - 41°13’ north latitude in the Çatalca-Kocaeli part of Marmara Region. It is surrounded by Sakarya tothe east and southeast, Bursa to the South, Yalova, Izmit Gulf,Marmara Sea and Istanbul to the west and the Black Sea to theNorth.
Economic and demographic structure: There are nearly 1800industrial enterprises operating in Kocaeli according to theinformation provided by the Chamber of Industry. Kocaeli hasbeen ranked first in terms of annual per capita income across thecountry for the last decade. This value is two and a half timesmore than the average value in Turkey. Kocaeli also comes secondin Turkey in terms of the general budget and contribution to taxincomes (17.41%). Kocaeli is an industrial city district, where69.9% of total provincial GDP are produced in the industry sector 1.
The place of agriculture in the sectoral structure: Kocaeli is oneof the leading provinces in Turkey in terms of industrializationrate with a production share of 14.7% despite being one of thesmallest provinces in the country regarding its area. Agricultureis done within the borders of Kocaeli province, but the economyis mainly driven by industry. The production share of Kocaeli inthe Turkish manufacturing industry has reached 13%. Since thefertile plains in the city centre were replaced with industrialenterprises and residential areas, they are no longer used as fertileagricultural lands. The sectoral distribution rates of Kocaeli isgiven in Table 1.
Land area: The total land area of Kocaeli province is 341,847hectares and the land distribution is shown in Table 2. Thedistribution of the agricultural area is indicated in Table 3.
Sectors Percentages (%) Agriculture 3 Industry 70 Other Services 27 TOTAL 100
Table 1. Sectoral distribution rates inKocaeli economy.
Source: Kocaeli Records of Provincial Directorate of Agriculture 2.
Source: Kocaeli Records of Provincial Directorate of Agriculture 2.
Land distribution Area (ha)
Agricultural land (ha) 125,528
Grassland (ha) 11,859
Forest and pasture (ha) 147,429
Non-agricultural land (ha) 57,031
TOTAL 341,847
Table 2. Total land distribution in KocaeliProvince.
Source: Kocaeli Records of Provincial Directorate of Agriculture 2.
Utilization purpose Area (ha)
Cropland 110,246
Vegetable gardens 2,892
Olive groves 251
Orchards 12,089
Ornamental plants 50
TOTAL 125,528
Table 3. Distribution of agricultural lands.
726 Journal of Food, Agriculture & Environment, Vol.11 (3&4), July-October 2013
The agricultural land covers 125,528 ha (37%) of the total areaof Kocaeli, which is 341,847 ha. This represents 37% of the surfacearea of the province. The total area of farmlands within the totalagricultural land is 110,246 ha, the orchard area is 12,089 ha, thearea for vegetable cultivation is 2,892 ha, the area reserved forolive growing is 251 ha, and it is 50 ha for ornamental plants.
Since the surface area of the world is limited and the arablelands are gradually diminishing, efforts are made to increaseproduction and improve product quality be obtained from anygiven arable land in order to feed the fast-growing worldpopulation. For this, as in the other fields of life, modern techniquesand inputs are used to increase yield and quality in the field ofagriculture. This situation is also valid for Turkey and severalworks are carried out to increase yield and quality per unit areaalong with agricultural modernization and pesticide and fertilizerutilization. At the same time, projects aiming to increaseproductivity in agricultural production are very important inproviding suitable and sufficient raw materials for the industrialsector and obtaining sufficient and quality products forexportation. Farmers began to use agricultural pesticides andfertilizers in order to produce quality and up-to- the mark products,and today agricultural pest control has reached its highest level.
In agriculture, pesticides are one of the most effective inputs toincrease production and obtain quality products. All necessarymeasures are taken in diagnosis for protection from plant diseasesand pests. Product losses are stated to occur at a rate of 45-65%unless agricultural pesticides are used 3, 4.
In our country, agricultural pesticide and fertilizer dealers supplythe plant protection products to the market and meet the demandsof the farmers. Plant protection products used for agriculturalpest control in Turkey are licensed and supplied to the market asper the “Law on Agricultural Pest Control and AgriculturalQuarantine” numbered 6968 and the principles of the “Regulationon Licensing of Plant Protection Products” issued in parallel withthis law 5.
In addition, the Regulation on the Procedures and Principles ofthe Sale of Prescribed Plant Protection Products and theEmpowerment Act numbered 5,996 and published in the OfficialGazette dated 21.04.2011 and numbered 27,912 were arranged bythe Regulation on the Amendment of the Regulation on theProcedures and Principles of the Sale of Prescribed Plant ProtectionProducts published in the Official Gazette dated 30.05.2012 andnumbered 28,308 6.
The first reason for the establishment of agricultural pesticidedealerships is to deliver and sell agricultural inputs needed byfarmers. Agricultural pesticide dealers are institutions that arefounded, organized and licensed to sell production materials,pesticides and fertilizers they buy from corporations andwholesalers. Implicit advisory services involved in farm productionin addition to the selling of agricultural inputs. However, their jobdefinition does not include providing farmers with advisoryservices. This results from the shortcomings in legal proceduresin the field of agriculture 7.
Since sufficient number of technical staff is not employed andretired agricultural engineers are not replaced with new ones inpublic institutions and organizations under the Ministry of Food,Agriculture and Livestock, the number of engineers has becomeinadequate and vacancies occur in the field. Thus, the Ministryof Food, Agriculture and Livestock does not have a very strong
organizational structure regarding extension and cannot bringengineers and producers together in the field. This situationcauses pesticide dealers to work with agricultural engineers in thefield and provide farmers with advisory services. Moreover, whensteps are taken to set up a supervisory board of the Ministry ofFood, Agriculture and Livestock in parallel with the privatizationof services and extension and the employees considered astechnical staff are taken out of the field, the need to fill this vacancyarises during this withdrawal process. Therefore, agriculturalpesticide dealers, one of the institutions working closely to farmers,began to fill up the vacancies reserved for extension agents.Agricultural pesticide dealers have provided very importantservices as an institution that is the closest to the customers frompast to the present. Today, 6275 pesticide dealers work in Turkey 8.
As the customer portfolios of pesticide dealers expanded, theybegan to provide advisory services in a sense by offering technicalservices to farmers together with the agricultural engineers theyemployed. That is to say, such a structuring (providing advisoryservices) is currently seen in the regions where agricultural inputs,pesticides and fertilizers are used more and productiontechnologies develop rapidly 7.
Obtaining, improving, exchanging and using information is veryimportant in agriculture. The efficiency of information andtechnology in agricultural activities accelerates agriculturaldevelopment and thus it has a role in enhancing living standards.Therefore, it is necessary to know how producers use informationsources to realize agricultural production 9.
Since 1991 several studies have been conducted in the GAP(the South Anatolian Project), Mediterranean, East Anatolia andCentral Anatolia Regions related to the problems regarding theapplication of plant protection methods 10-19.
Boz et al.20 carried out a study in the Aegean Region, in whichthey asked questions to the producers (farmers) in order to evaluateagricultural pest control applications in socio-economical termsin Aydin province.
Aktaş 21, in his study titled “The Place and Importance ofAgricultural Pesticide Sellers in the Process of AgriculturalExtension”, determined the working methods of the pesticidesellers in Şanlıurfa province and evaluated the opinions related tothe attitudes and behaviors of the sellers 22.
Agricultural extension is a service or a system which helps ruralpeople within the scope of an educational process in order torenew agricultural technology already in use, to increaseproduction efficiency and income, and improve living standards 23.
Budak 24 states that the agricultural sector having an importantrole in the development of the countries and the farmers who arethe main actors of the sector provide new techniques andinformation by means of agricultural extensions 25.
Information sources used by extension agents (agriculturalengineers, agricultural technicians, agricultural operators,universities, researchers etc.) include agricultural pesticide andfertilizer dealers for the farmers to follow the latest developments.Farmers benefit from information and experiences provided bydealers in order to grow quality and standardized products andthey also require advisory services from them by putting them inthe category of agricultural extension agents.
This study was conducted to reveal the existing problems aboutwhether the employees and dealers in the field of agriculturalpesticide use and plant protection products in Kocaeli province

Journal of Food, Agriculture & Environment, Vol.11 (3&4), July-October 2013 727
provided farmers with information or advisory services or not, tolearn about the contribution of the results to Kocaeli agricultureand to offer solutions for the problems by investigating the statusof pesticide dealers operating in the field of plant protection in Kocaeli.
Materials and MethodsThe main material of this study consisted of agricultural pesticideand fertilizer dealers in Kocaeli and questionnaires administeredto them 2.-29.11.2011. The target group of the study wasdetermined by using the full-counting method in a way to coverthe entire agricultural pesticide and fertilizer dealers. The numberof the dealers in Kocaeli was 38 based on the records of the PlantProtection Office under the Provincial Directorate of Agricultureand the Chambers of Artisans. However, although the traderegistries of these dealers (n = 6) are still valid, it was determinedby the visits that they closed out and did not operate anymore.The remaining 32 dealers were administered a 33-questionquestionnaire, 3 of which were open-ended, by means of face-to-face interviews. Questionnaire evaluations were carried out byusing SPSS 16.0 statistical program. The analyses includedpercentages (%) and crosstab tables and chi-square analyses.
Results and DiscussionSocio-economic factors: Socio-economic characteristics of theagricultural pesticide dealers are given in Table 4. Of the pesticidedealers ranging age 26 to 30 is at a rate of 37%. This is followed by
the 36-40 age bracket comprising 18% of the dealers. It is alsoseen that the age range of the dealers is generally 26 to 51 yearsand over (the middle-aged group). According to this distribution,age factor is considered to be important for the self-employed andthe dealers’ level of risk taking.The requirement for the dealers tohave a university degree is another factor which is considered tobe important for the high age profiles. It is stated as per the “Lawon Agricultural Pest Control and Agricultural Quarantine”numbered 6968 and the principles of the “Regulation on Licensingof Plant Protection Products” issued in parallel with this law that“an agricultural pesticide dealership shall be opened and operatedby an agricultural engineer” for the licensed sale of the plantprotection products used for agricultural pest control in Turkey.Therefore, the education level and average age of the agriculturalpesticide and fertilizer dealers increased. Of the agriculturalpesticide and fertilizer dealers 71.9% were agricultural engineersand 12.5% senior agricultural engineers with doctoral degrees.Nearly 84.4% of the agricultural pesticide and fertilizer dealershad bachelor or master degrees, 15.6% were graduates of highschool, 87.5% had employees working for them, 56.3% were soleproprietorships, 12.5% were corporations and 31.2% werecooperatives (legal entity) and the rates were 53.1% for soleproprietorships, 31.2% for cooperatives and 15.7% forcorporations when license ownership was considered. It wasdetermined once more in this study that the business andprofessional groups related to plant protection products are alsogender-based like some other professional groups. Concerningthe gender distribution of the agricultural pesticide dealers it wasproven that this profession was the one preferred mostly by men.The rate for males was 71.9% (n = 23), compared with a female rateof 28.1% (n = 9).
According to the research carried out regarding plant protectionapplications of producers in Manisa Province in 20113, itascertained that 65.07% of the agricultural pesticide dealers inManisa were agricultural engineers, 2.74% were senior agriculturalengineers, 17.81% agricultural technicians, and the graduates ofprimary, secondary and high schools (totally 10.96%) haddealership licenses. They stated that 92% of the pesticide dealersinterviewed in the field of study were university graduates, 42%of whom were agricultural engineers and senior agriculturalengineers graduated from the Plant Protection Departments ofAgricultural Faculties and 46% were graduates of the otherdepartments under the faculty of agriculture and the remainingwere technicians and graduates of the departments other thanagriculture 3.
Again, the turnover from the sales of agricultural pesticides,fertilizers, tools and equipment within a season is given in Table 4.Of the dealers 46.9% (n=15) disclosed their turnover whereas53.1% (n=17) avoided from disclosing information about theirturnover. The dealers which did not disclose their turnover statedthat they did not want to disclose information about their turnoversand stating opinions about monetary issues was not ethicalbecause 31.3% (n=10) of them were legal entities (AgriculturalCredit Cooperatives), 21.8% (n = 7) were corporations and 9.4% (n= 3) were sole proprietorships.
Analysis showed that the annual sales of agricultural pesticideand fertilizer dealers in Kocaeli were not high since the districtwas an industrial area and thus agricultural production was nothigh. Therefore, agricultural input sales were low (due to low
*Visit http://www.xe.com/ucc/ to see the currency exchange rates.
Socio-economical characteristics Numbers and Percentages
Age Number %
20-25 1 3.1
26-30 12 37.5
31-35 4 12.5
36-40 6 18.8
41-45 2 6.2
46-50 2 6.2
51- + 5 15.6
Education level
High school 5 15.6
Faculty / School 23 71.9
Master’s degree/Doctoral degree 4 12.5
Gender
Female 9 28.1
Male 23 71.9
Types of business entities
Sole proprietorship 18 56.3
Corporation 4 12.5
Cooperative 10 31.2
Total 32 100
Licensee of the business entity
Him/Herself 17 53.1
Employee 5 15.7
Legal entity (Cooperative) 10 31.2
Total sales amount of dealers during the
season 2010-2011 (Turnover)
Sale amount (TL)* Number %
Unanswered 17 53.1
1000-100,000 7 21.9
101,000-200,000 2 6.2
301,000- 400,000 1 3.1
401,000- 500,000 2 6.2
501,000- + 3 9.4
Total 32 100
Table 4. Socio-economic characteristics of agriculturalpesticide and fertilizer dealers.
728 Journal of Food, Agriculture & Environment, Vol.11 (3&4), July-October 2013
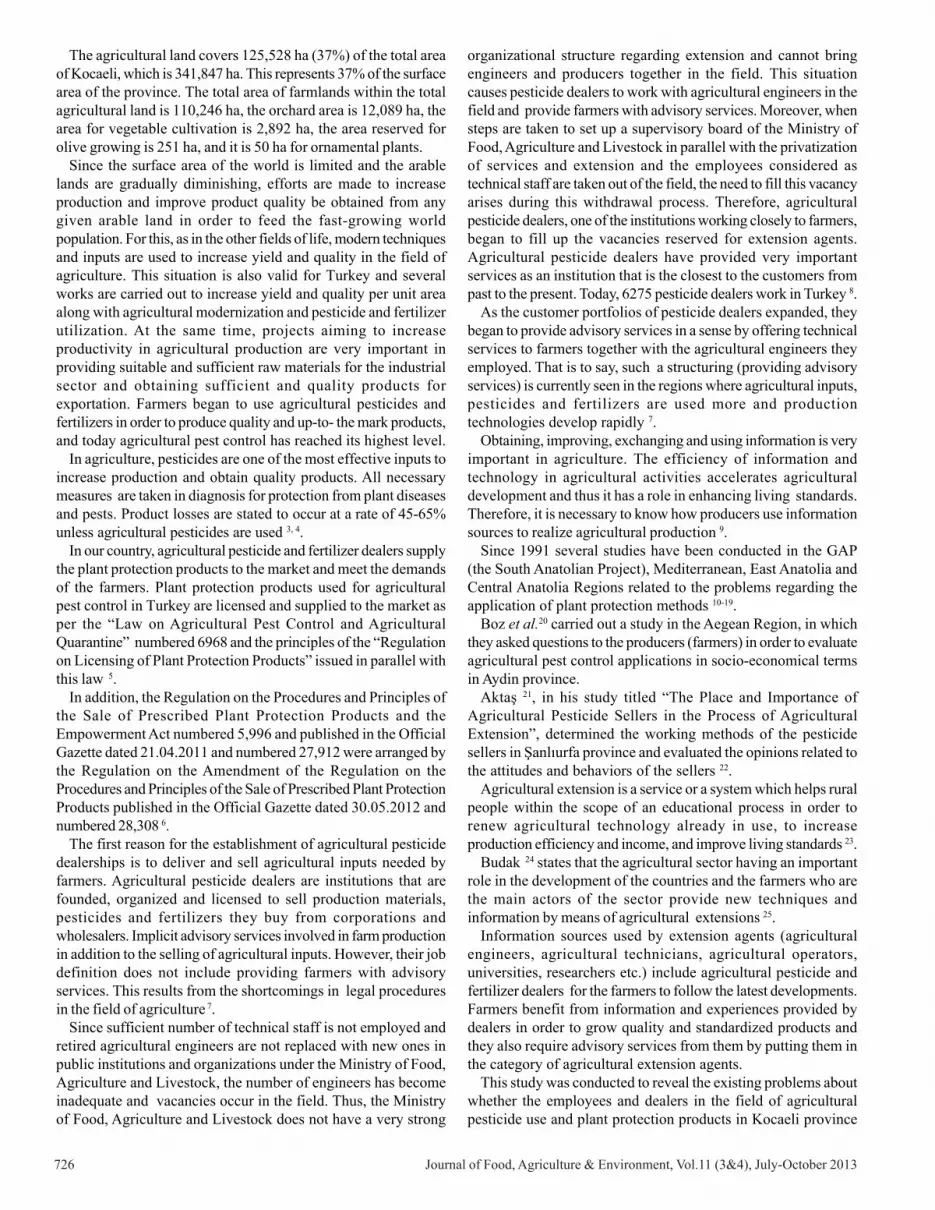
demand). The highest annual sales amount was 1000 to 100,000TL at a rate of 21.9% (n = 7 enterprises). The lowest sales amountwas 301,000 to 400,000 TL at a rate of 3.1% (n = 1 enterprise). Thatthe contribution of agriculture in Kocaeli province to economicsin the sectoral distribution is at a low level (3.1%) can be shown asa reason for low agricultural production and low sale of agriculturalpesticide.
The relationship between the type of enterprises andeducational level is given in Table 5, which indicates the highnumber of faculty and school graduates in each of three kinds ofenterprises, i.e. sole proprietorship, corporation and cooperative.This reveals that as education level increases, the spirit ofentrepreneurship increases and entrepreneurship and commercialrisk-taking also increase. Corporations were ranked first in termsof education level. The education level in all these enterpriseswas at university level. Cooperatives, ranked second, contain 90%university graduates including master and doctoral degrees and10% high school graduates.The rate of university graduates insole proprietorships was 78% and that of high school graduateswas 22%.
The relationship between the business license status and theeducation level is shown in Table 6. Rregarding the educationlevels of those having a business license, 71.9% were faculty/school graduates, 12.5% had master and doctoral degrees and15.6% were high school graduates. Education levels of theindividuals operating as an agricultural dealer were very high.
The relationship between the gender of pesticide dealers andtheir education levels is shown in Table 7. Women were not muchinvolved in the business of agricultural pesticide and fertilizerdealership, but the ones who were involved had higher educationlevels.
The relationship between the education level and employmentstatus of the dealers are indicated in Table 8. In the light of thesedata, an evaluation was made in terms of the education levels and
Education Level
High School Faculty / School
Master’s/ Doctoral Degrees
Total Gender
No % No % No % No % 1 Female 1 20 7 30.4 1 25 9 28.1 2 Male 4 80 16 69.6 3 75 23 71.9 Total 5 100 23 100 4 100 32 100
Table 7. Relationship between gender and education.
Education Level of Dealers High
School Faculty/ School
Master’s/ Doctoral Degrees
Total Staff Employment
No % No % No % No % No employee 1 20 3 13.1 0 0 4 12.5 One employee 1 20 9 39.0 1 25 11 34.3 Two employees 2 40 3 13.1 1 25 6 18.8 Three employees 1 20 2 8.7 2 50 5 15.6 Four employees 0 0.0 6 26.1 0 0 6 18.8 Total 5 100 23 100 4 100 32 100
Table 8. Relationship between employment and education level inenterprises.
*Chi-Square: 23.669; df:15; P= 0.041; P< 0.05, the hypothesis Ho is accepted. (the relationship is significant).
Education Level High
School Faculty/ School
Master’s/ Doctoral Degrees
Total Age
No % No % No % No % 20-25 0 0.0 0 0.0 1 25 1 3.1 26-30 1 20 9 39.2 2 50 12 37.5 31-35 0 0.0 4 17.4 0 0.0 4 12.5 36-40 0 0.0 6 26.1 0 0.0 6 18.7 41-45 1 20 1 4.3 0 0.0 2 6.3 46-50 0 0.0 2 8.7 0 0.0 2 6.3 51- + 3 60 1 4.3 1 25 5 15.6 Total 5 100 23 100 4 100 32 100
Table 9. Relationship between age and education.
*Chi-square : 26.670; df: 18; P = 0. 045; P < 0.05, the hypothesis Ho is accepted (the relationshipis significant).
Table 5. Relationship between education level and types ofbusiness entities.
Types of Business Entities Sole
Proprietorship Corporation Cooperative
Total Education Level
No % No % No % No % High School 4 22 0 0.0 1 10 5 15.6 Faculty/School 14 78 4 100 5 50 23 71.9 Master’s /Doctoral Degrees
0 0.0 0 0.0 4 40 4 12.5
Total 18 100 4 100 10 100 32 100
License of the business entity
Himself/
Herself Employee
Legal entity
(Cooperative)
Total Education level
No % No % No % No %
High school 4 24 0 0.0 1 10 5 15.6
Faculty / School 13 76 5 100 5 50 23 71.9
Master/Doctoral
degree 0 0.0 0 0.0 4 40 4 12.5
Total 17 100 5 100 10 100 32 100
Table 6. The relationship between obtaining a business licenseand education level.
the labor force they employed, and a significant relationship wasfound between these two components according to the chi-squareanalysis within a confidence interval of 95%. While 80% of highschool graduates had employees working for them, 86.9% offaculty/school graduates and 100% of those who completed theirmaster and doctoral degrees had at least one employee workingfor them. That is to say, as the education level of the dealersincreases, their potential to create employment also increases inparallel with their education levels.
The relationship between age and education level wasinvestigated within a confidence limit of 95% and is shown inTable 9. A significant relationship was found between age andeducation level since it is stated by law that individuals who openup dealerships have to be agricultural engineers. The high agerange among the university graduates is also a natural result. Theage group with the highest education level was found in the agerange from 26 to 30 (37.5%) and it was followed by the age rangefrom 36 to 40 (18.7%). The age range from 31 to 35 came third (12.5%). It was determined that the 51-and-over age group mostlyincluded dealers graduated from high schools (60%). Among thereasons why there became dealers with high school diplomas(Agricultural Technicians) was that those enterprises were the
Journal of Food, Agriculture & Environment, Vol.11 (3&4), July-October 2013 729
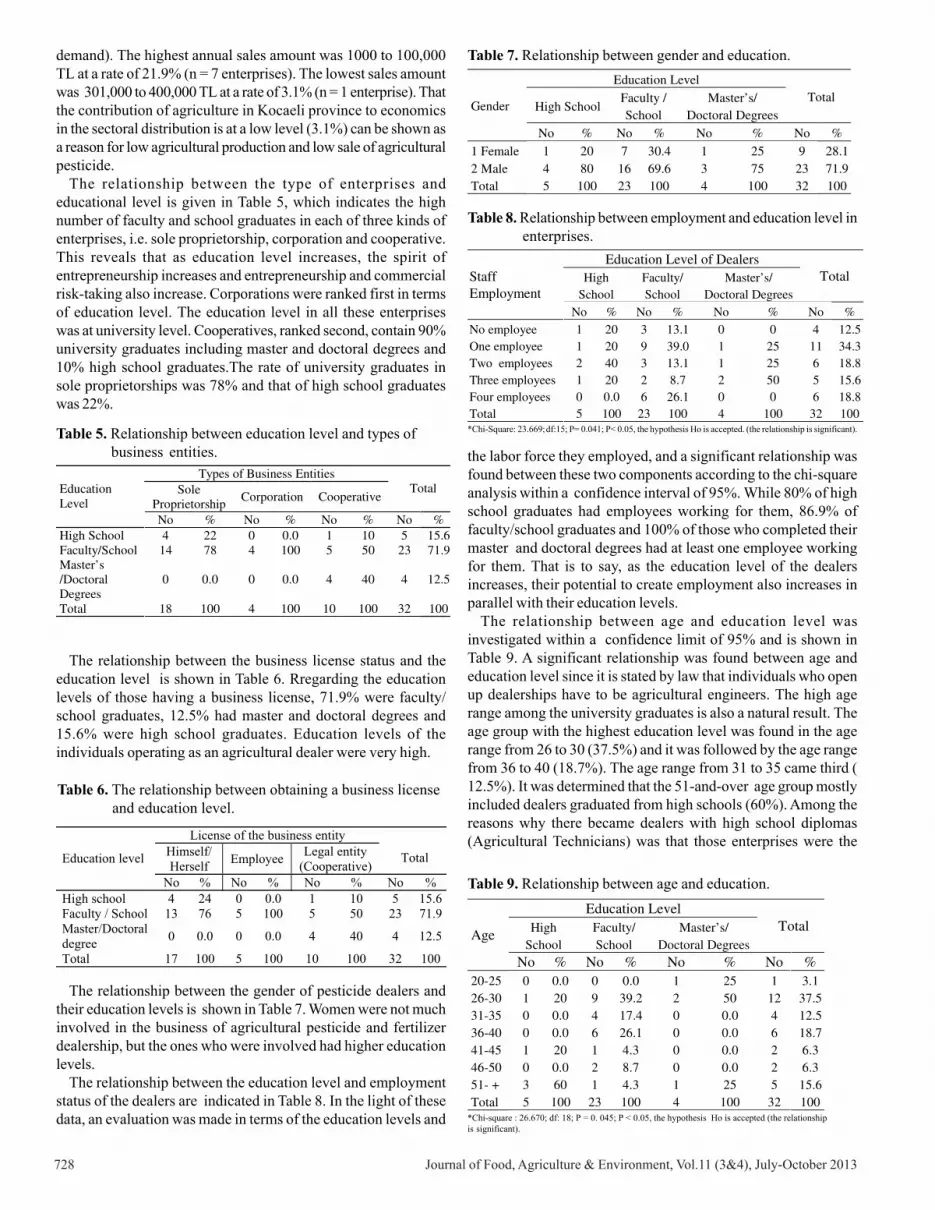
ones opened up during the period in which “the Regulation onthe Retail Sale and Wholesale of Plant Protection Products andTheir Storage” published in the Official Gazette dated 11/10/2007and numbered 26,670 before the Regulation on the Amendment ofthe Regulation on Prescribed Sales Procedures and Principles ofPlant Protection Products was published in 2012. In the study the agricultural pesticide dealers in Kocaeliprovince were asked what the most demanded pesticides andfertilizers were and the data obtained are shown in Tables 10 and11.
In Table 10, insecticide (n = 7) is the top- selling chemical andexists in all combinations; it is followed by herbicide (n = 6),fungicide (n = 5) coming in third and rodenticide (n=4) takingfourth place. However, fungicide and insecticide were the mostpreferred combination at a rate of 34.4%, and the combination ofrodenticide, herbicide, fungicide and insecticide and thecombination of herbicide, fungicide and insecticide were amongthe best-selling chemical groups at a rate of 25% and 12.5%,respectively.
When Table 11 is considered, the compost fertilizer, one of themost demanded and top-selling fertilizers, takes the first place at arate of 28.1%, compound fertilizers and nitrogen fertilizers takethe second place at a rate of 25% and compound fertilizers +nitrogen fertilizers + compost fertilizers follow them at a rate of21.9%.
The criteria the dealers consider when selling pesticides andfertilizers are given in Table 12. According to Table 12, while soilanalyses, pesticides and fertilizers prescribed by the provincialand district directorates of agriculture, dealers’experiences (n = 8)take the first place at a rate of 25%, soil analyses, farmers’ demands,dealers’ experiences, consultants’ advice, pesticides and fertilizersprescribed by the provincial and district directorates of agriculture(n = 6) come second at a rate of 18.7%, and farmers’ demands,dealers’ experiences (n = 4) take the third place at a rate of 12.5%.Due to the lack of enough agricultural activities in Kocaeli, it wasfound out that advisory services were not widespread practices
and farmers considered their own demands and dealers’experiences and pesticides and fertilizers prescribed by theprovincial and district directorate of agriculture more than theothers.
The analysis conducted between the education levels of thedealers and the criteria considered when selling pesticides andfertilizers within a confidence limit of 95% was given in Table 13.The relationship between them is significant and as the educationlevel increases, the criteria considered when selling pesticidesand fertilizers become important. It was determined that 25%carried out sales by considering the criteria including soil analysis,pesticides and fertilizers prescribed by the provincial and districtdirectorates of agriculture, dealers’ experiences, 18.7% carried outsales by considering soil analyses, farmers’ demands and dealers’experiences, consultants’ advice, pesticides and fertilizersprescribed by the provincial and district directorates of agricultureand 12.5% paid attention to the criteria including farmers’ demands,dealers’ experiences. As the education level increases, it can besaid that scientific criteria is considered more and education isimportant.
In the study, the places where the pesticides and fertilizers wereprescribed and the people who prescribed them were investigatedand are shown in Table 14. Of the prescriptions 59.4% wereprescribed by the staff of the provincial and district directoratesof agriculture, 12.5% by the authorized private agriculturalengineers directorates of agriculture and 12.5% by the the staff ofthe provincial and district directorates of agriculture and the dealerhimself, the farmer himself etc.
It was investigated whether the dealers provided advisoryservices or not and the data obtained are indicated in Table 15. Ofthe dealers 62.5% stated that they provided advisory servicesand 37.5% stated that they did not provide any advisory services.
It was investigated whether the dealers provided farmers withany information apart from pesticide and fertilizer sales and whatkind of information they provided, and the data are shown inTables 16 and 17. Of the dealers 90.6% stated that they transferredinformation to the farmers apart from pesticide and fertilizer sales;that is to say, they carried out agricultural extension activities,therefore they, in a sense, defined themselves as agriculturalextension and communication staff, namely, extension agents.
When Table 17 was considered, it was revealed that dealerstransferred their own professional knowledge and experiences at
Pesticide types Number % Herbicide 1 3.1 Insecticide 1 3.1 Rodenticide and Herbicide 1 3.1 Herbicide and Fungicide 1 3.1 Fungicide and Insecticide 11 34.4 Herbicide and Insecticide 2 6.2 Rodenticide and Insecticide 2 6.2 Herbicide, Fungicide, Insecticide 4 12.5 Rodenticide, Fungicide, Insecticide 1 3.1 Rodenticide, Herbicide, Fungicide, Insecticide 8 25.0 Total 32 100.0
Table 10. Top-selling pesticide types.
Fertilizer Types No % Compound Fertilizers 3 9.4 Nitrogen Fertilizers 2 6.2 Compost Fertilizer 9 28.1 All (Compound, Nitrogen, Compost) 7 21.9 Compound Fertilizers and nitrogen Fertilizers 8 25.0 Composite Fertilizers and compost fertilizers 3 9.4 Total 32 100.0
Table 11. Top selling fertilizer types.
Criteria No % Soil Analyses 3 9.4 Dealer’s Own Experiences 3 9.4 Farmer’s Demand, Dealer’s Own Experiences 4 12.5 Soil Analyses and Consultant’s Advice 2 6.2 Soil Analyses, Prescription of the Staff of Provincial and District Directorate of Agriculture, Dealer’s Own Experiences
8 25
Farmer’s Demand, Consultant’s Advice, Dealer’s Own Experiences
3 9.3
Soil Analyses, Farmer’s Demand and Dealer’s Own Experiences
3 9.3
Soil Analyses, Farmer’s Demand and Dealer’s Own Experiences, Consultant’s Advice, Prescription of the Staff of Provincial and District Directorate of Agriculture
6 18.7
Total 32 100
Table 12. Criteria considered when selling pesticides and fertilizers.

730 Journal of Food, Agriculture & Environment, Vol.11 (3&4), July-October 2013
Education Levels
High School
Faculty/ School
Master’s/Doctoral degrees
Total
Criteria to be Considered While Selling Pesticides and Fertilizers
No % No % No % No % Soil Analysis 1 20 2 13 0 0.0 3 9.4 Dealer’s Own Experiences 1 20 2 8.7 0 0.0 3 9.4 Farmer’s Demand, Dealer’s Own Experiences 1 20 3 4.4 0 0.0 4 12.5 Soil Analyses and Consultant’s Advice 0 0.0 1 8.7 1 25 2 6.2 Soil Analyses, Prescription of the Staff of Provincial and District Directorate of Agriculture, Dealer’s Own Experiences
0 0.0 6 8.7 2 50 8 25
Farmer’s Demand, Consultant’s Advice, Dealer’s Own Experiences
1 0.0 2 8.7 0 0.0 3 9.3
Soil Analyses, Farmer’s Demand and Dealer’s Own Experiences
0 20 3 8.7 0 0.0 3 9.3
Soil Analyses, Farmer’s Demand and Dealer’s Own Experiences, Consultant’s Advice, Prescription of the Staff of Provincial and District Directorate of Agriculture
1 20 4 13 1 25 6 18.7
Total 5 100 23 100 4 100 32 100
Table 13. Relationship between the criteria considered while selling pesticides and fertilizers andeducation level.
Chi-square: 51.027; df: 39; P = 0.044 (094); P < 0.05; the hypothesis Ho is accepted (The relationship is significant).
Providing Consulting Services No % Yes 20 62.5 No 12 37.5 Total 32 100
Table 15. Providing advisory services.
a rate of 62.4%, information about cultivation and agriculturalinput products and any kind of information farmers needed aboutagricultural activities followed it at a rate of 12.5% each.Agricultural pesticide dealers provide farmers with advisoryservices in cases when the extension agents of the provincial anddistrict directorates of agriculture and state institutions andorganizations are inadequate in number. Dealers had an importantplace among the information sources of the farmers.
The relationship between the education levels of the dealersand their providing advisory services is indicated in Table 18,which shows that 19 out of 20 dealers (95%) providing advisoryservices had bachelor, master or doctoral degrees. Therefore, itcan be said that such individuals are competent individuals withrespect to informing farmers.
Since the twenty-first century is called the information era,enterprises and farmers operating in the field of agriculture haveto follow the developments both in the country and the world andcompete with the world markets by utilizing instruments ofinformation. Therefore, do dealers have mass media whileproviding advisory services and transferring information tofarmers? If they have, the relevant data about which of thesemass media they utilized to reach farmers is given in Table 19. Itwas found out that they used slides + Internet at a rate of 21.9%,brochures and slides+ Internet at a rate of 12.5%, brochures,telephone at a rate of 12.5, radio-television at a rate of 12.5% andnewspapers, journals, farmers letters, radio-television (all) at arate of 12.4%. It can be said that both dealers and farmers use newtechnologies to communicate and get information about their
Authorized divisions No %
Unanswered 1 3.1
Provincial and district directorates of agriculture 19 59.4
My own advisory service 2 6.2
District directorates of agriculture and authorized
private agricultural engineers
4 12.5
Authorized private agricultural engineers and my
own advisory service
2 6.2
Provincial and district directorates of agriculture
and the dealer himself/herself,
Farmer himself/herself etc.
4 12.5
Total 32 100
Table 14. Distribution of divisions or people authorized toprescribe pesticides and fertilizers for the dealers.
Information Transfer to Farmers by the Dealers apart from Pesticide and Fertilizer Sales
Number %
Yes 29 90.6 No 1 3.1 Partly 2 6.2 Total 32 100.0
Table 16. Information transfer to farmers by dealers inaddition to the selling of pesticides andfertilizers.
Types of information transferred to farmers Number %
Any kind of information needed by Farmers 4 12.5
Any kind of professional information and experiences 20 62.4
Information about the solution of general problems 2 6.2
Cultivation and agricultural inputs 4 12.5
Information about irrigation and tools and equipment 2 6.2
Total 32 100
Table 17. Information transferred to farmers.
Education level
High
school
Faculty
/School
Master’s
/Doctoral degrees
Total Providing
advisory
services No % No % No % No %
Yes 1 20 16 69.6 3 75 20 62.5
No 4 80 7 30.4 1 25 12 37.5
Total 5 100 23 100 4 100 32 100
Table 18. Relationship between education level and providingadvisory services.

Journal of Food, Agriculture & Environment, Vol.11 (3&4), July-October 2013 731
agricultural activities, and they follow the latest developmentsand use them adapting to their work conditions.
The methods and equipment used by the dealers to followinnovations are shown in Table 20. Of the dealers 40.6% statedthat they used mass media, technical courses, panels, fairs, Internetetc., 37.5% used computers (Internet) and companyrepresentatives, periodicals of the ministry, 6.2% used vocationaltextbooks, staff of the provincial and district directorates ofagriculture and farmers, family members, friends and 15.6% didnot express an opinion on the issue. According to Table 20, it canbe said that dealers closely follow innovations and use the latesttechnologies.
The relationship between the advisory services provided forthe farmers by the dealers and the types of the business entitieswas analyzed by means of chi-square analysis within a confidencelimit of 95% and is shown in Table 21. The relationship betweenthese two components is significant according to the chi-squareanalysis. Of the dealers providing advisory services 50% weresole proprietorships, 45% were cooperatives and 5% werecorporations. The type of business entity was an important factorin providing advisory services and sole proprietorships carried
out more extension activities. It was followed by the dealers in thestatus of cooperatives (agricultural credit cooperative).
The effect of the type of business entity on the method ofpayment was investigated when dealers bought pesticides, andthe relationship between the two components was analyzed withina confidence limit of 95% and is given in Table 22. A significantrelationship was found between the components in the chi-squareanalysis and the type of business entity was effective in buyingand selling and payments were made convenient for the dealers.
The relationship between the sales methods the dealers use forthe sale of pesticides and fertilizers and the education level wasinvestigated, chi-square analysis was carried out within aconfidence limit of 95% and the results are given in Table 23.There was no significant relationship between the twocomponents. Of the sales 28% were realized in cash, 19% bycredit card, 13% in cash and by cheque. The result here is thatthey mostly accept cash payments. Dealers prefer to err on theside of caution in the sales not to go into an economic crisis The relationship between the ways the dealers suppliedpesticides and fertilizers and the education level is shown in Table24. There was no significant relationship between the educationlevel and input supply in the chi-square analysis conducted withina confidence limit of 95%. They choose their methods dependingon the market conditions in the free market and their rivals. Of thedealers 50% supply their agricultural inputs directly from theproducer company, but 15.6% prefer to buy them from a companythrough regional representatives.
Conclusions and SuggestionsAgricultural pesticide dealers are not consultants but they provideadvisory services since they closely cooperate with farmers’agricultural needs. It was revealed that expertise was required forthis field of business, as is in every field of business. It was alsoconsidered that it was necessary to promote advisory services inKocaeli and increase the number of enterprises which offeragricultural advisory services and are authorized to prescribeagricultural pesticides and fertilizers, and bring the number ofextension agents of the state institutions and organizations to asufficient level.
It was concluded that the age profiles of the agriculturalpesticide and fertilizer dealers in Kocaeli province generallyweighted towards those in their middle ages (26-51 and over). Asignificant relationship was found between age and educationlevel.
Today it is a must to be at least a graduate of two-yearvocational school or complete bachelor’s degree to open up anagricultural pesticide and fertilizer dealership.
When the genders of those operating as an agricultural dealerwere considered, women preferred the profession less than men.It was concluded once again that the business and professionalgroups related to plant protection products are also gender-basedlike some other professional groups.
A significant relationship was found between the educationlevels of the dealers and the labor force they employed. Higheducation level has a positive effect on staff employment. As theeducation levels of the dealers increase, their potentials to createemployment also tend to increase in parallel to their educationlevels.
Annual sales of the agricultural pesticide and fertilizer dealers
Mass media No %
Brochures, telephone 4 12.5
Farmers letters 1 3.1
Radio- television 4 12.4
Slides + Internet 7 21.9
Brochures and slides + Internet 4 12.5
Journal and slides + Internet 2 6.2
Brochures and radio- television 2 6.2
Journals and brochures 2 6.2
Newspapers and brochures 2 6.2
Newspapers, journals, brochures,
farmers letters, radio-television (all)
4 12.4
Total 32 100.0
Table 19. Mass media used for the informationtransfer by dealers as an informationsource of farmers.
Methods and equipment No %
Unanswered 5 15.6
Mass media, technical courses, panels, fairs,
Internet etc
13 40.6
Computer (Internet) and company
representatives, periodicals of the Ministry
12 37.5
Vocational textbooks, staff of the provincial
and district directorates of agriculture and
farmers, family members, friends
2 6.2
Total 32 100.0
Table 20. Methods and equipment that dealers utilize tofollow innovations.
Chi-square: 6.889; df: 3; P = 0.046; P< 0.05; the hypothesis Ho is accepted. (The relationship issignificant).
Providing advisory services
Yes No Total Type of business
entities No % No % No %
Single proprietorship 10 50 8 66.7 18 56.3
Corporation 1 5 3 25 4 12.5
Cooperative 9 45 1 8.3 10 31.2
Total 20 100 12 100 32 100
Table 21. Relationship between type of business entities and providing advisory services.

732 Journal of Food, Agriculture & Environment, Vol.11 (3&4), July-October 2013
Education Levels Sales Methods Used by Dealers When Selling Pesticides and Fertilizers High School Faculty / School
Master’s /Doctoral Degrees
Total
No % No % No % No % Cash 3 60 4 17.4 2 50 9 28 Cheque 0 0.0 1 4.3 1 0.0 2 6.2 Credit card 2 40 4 17.4 0 25 6 19 On Credit 0 0.0 1 4.3 1 25 2 6.2 Cash and Cheque 0 0.0 4 17.4 0 0.0 4 13 Cash, Cheque, credit card 0 0.0 2 8.7 0 0.0 2 6.2 Cash, Cheque, On Credit 0 0.0 2 8.7 0 0.0 2 6.2 Cash and On Credit 0 0.0 2 8.7 0 0.0 2 6.2 Cash and Credit Card 0 0.0 2 8.7 0 0.0 2 6.2 All (Cash, Cheque, On Credit and Credit card)
0 0.0 1 4.3 0 0.0 1 3.0
Total 5 100 23 100 4 100 32 100
Table 23. The relationship between methods of payment while selling pesticides and fertilizers and education level of the dealers.
Chi-square: 19.736; df: 3; P = 0.923; P > 0.05; the hypothesis Ho is rejected. (The relationship is not significant).
Education Levels High
School Faculty/ School
Master’s/Doctoral Degrees
Total
The ways dealers supply pesticides and fertilizers
No % No % No % No % Wholesale dealers 0 0.0 1 4.5 1 25 2 6.3 From the Company by means of regional representatives
1 20 3 13 1 25 5 15.6
From the Producing Company 1 20 14 60 1 25 16 50 From the Company by means of regional representatives, From the Producing Company
2 40 1 4.5 1 25 4 12.5
Wholesale dealers, From the Company by means of regional representatives
0 0.0 1 4.5 0 0.0 1 3.1
From Wholesalers, From the Company by means of regional representatives, From the Producing Company
0 0.0 1 4.5 0 0.0 1 3.1
Wholesale dealers, From the Company by means of regional representatives
0 0.0 1 4.5 0 0.0 1 3.1
Wholesale dealers, From the Producing Company
1 20 1 4.5 0 0.0 2 6.3
Total 5 100 23 100 4 100 32 100
Table 24. Relationship between the ways dealers supply pesticides and fertilizers and their education level.
Chi-square : 24.836; df: 27; P = 0. 584; P > 0.05, the hypothesis Ho is rejected (The relationship is not significant).
Chi-square: 41.961; df: 30; P = 0.032; P< 0.05; the hypothesis Ho is accepted. (The relationship is significant).
Type of business entities
Single
Proprietorship Corporation Cooperative
Total Method of payment
No % No % No % No %
Cash 2 12 1 25 6 60 9 28
Cheque 5 28 1 25 0 0.0 6 18
Credit Card 1 6.0 1 25 0 0.0 2 6.0
On Credit 1 6.0 0 0.0 4 40 5 15
Cash and Cheque 2 12 1 25 0 0.0 4 12
Cash, Cheque and Credit
Card
2 12 0 0.0 0 0.0 2 6.0
Cash, Cheque, On Credit 1 6.0 0 0.0 0 0.0 1 3.0
Cash and On Credit 1 6.0 0 0.0 0 0.0 1 3.0
Cash and Credit card 1 6.0 0 0.0 0 0.0 1 3.0
All (Cash, Cheque, On
Credit, Credit Card)
1 6.0 0 0.0 0 0.0 2 6.0
Total 18 100 4 100 10 100 32 100
Table 22. Relationship between types of business entities and method ofpayment when dealers buy pesticides and fertilizers.

Journal of Food, Agriculture & Environment, Vol.11 (3&4), July-October 2013 733
in Kocaeli were not found high and the reason for this is that thereis not much agricultural production since it is an industrial regionand the sale of agricultural inputs is low (due to the low demand).
The pesticides in highest demand in Kocaeli were found to berodenticide, herbicide, fungicide and insecticide while fertilizersin high demand included compound fertilizers, nitrogen fertilizers,compost fertilizers were determined to be demanded more andtherefore the sales of these pesticide and fertilizer types werehigh.
The criteria the dealers considered most when selling pesticidesand fertilizers were found out to be soil analysis and pesticidesand fertilizers prescribed by the provincial and district directoratesof agriculture.
A special case in Kocaeli is that since the industry is developedin the city, agricultural activities have decreased and advisoryservices are inadequate. The study corresponds to the realities ofTurkey with its results. Due to the inadequate number of provincialand district staff, that is, extension agents (agricultural engineers,agricultural technicians and agricultural operators), this gap isfilled by agricultural pesticide and fertilizer dealers.
The relationship between the education levels of the dealersand the criteria they consider when selling pesticides and fertilizerswas found significant. The dealers did not sell pesticides andfertilizers that were not prescribed and this was closely related toeducation. It can be said that as the education level increases,scientific criteria is considered more and thus education isimportant.
It was revealed that dealers provided any kind of information oradvisory services farmers needed in the field of agriculture apartfrom pesticide and fertilizer sales which is not their businessconsideration. It was found out as a result of the research thatdealers carried out agricultural extension activities and in a senseperformed their tasks as an extension agent. Agricultural pesticideand fertilizer dealers in Kocaeli, as in Turkey, as whole, comprisedan important information source for farmers.
While the twenty-first century is called information era,enterprises, dealers and farmers working in the field of agricultureshould follow the developments both in the country and abroadby using mass media and information to reach information sourcesand benefit from them. In the study conducted, most of the massmedia and information (those used by dealers; mass media,technical courses, panels, fairs, those used by farmers; Internet,slides, Internet radio, television, brochures, farmers letters,newspapers, journals etc.) were used by the dealers to inform thefarmers about the innovations related to their expertise and helpthem to follow innovations.
It is one of the known facts that it is necessary to useinnovations and new technologies in order to compete in today’sconditions. Following innovations is closely related to socio-economic and education levels. Therefore, the socio-economicand education levels of the dealers were high. Both dealers andfarmers use new technologies to communicate and get informationabout their agricultural activities and they follow the latestdevelopments and use them adapting to their work conditions.
As in all professional groups, it is also necessary for agriculturalengineers and technicians having agricultural pesticide andfertilizer dealership to closely follow innovations and developmentsin the world in terms of their field of works and in order to competein this market.
Business entity was an important factor regarding its status,and sole proprietorships showed more extension activities. Thiswas followed by the dealers in the status of a cooperative(agricultural credit cooperative). These results show that farmershold formalized enterprises in importance utilizing them as aninformational resource.
Dealers preferred to behave cautiously in the sales (cash sales)not to put their enterprise in economic jeopardy and not to losetheir competitive power in the market in today’s conditions.
In order for the enterprises to follow innovations anddevelopments required in today’s conditions for themselves andthe target groups they serve for, dealers should take necessarymeasures and behave consciously for the sustainability of theirenterprises. Their education levels should be high to do all thesethings. In our research an interaction between the education levelsof the dealers and their conduct was an expected result and realizedas a result of the analyses conducted.
AcknowledgementsI would like to express my thanks to my colleagues, Prof. Dr.Ercüment Çolak, Prof. Dr. İsmet Boz and Assistant Prof. Beşir Koç,for their support and Lecturer Banu Ergen for her help in thetranslation of this manuscript.
References¹Anonymous 2012a. Economy of Kocaeli. Records of Kocaeli Chamber
of Industry. [WWW document]. URL http://www.e-yasamrehberi.com/Turkiye/Kocaeli/kocaeli_ekonomisi.htm (AccessDate: 10.10.2012).
2Anonymous 2012. Kocaeli Records of Provincial Directorate ofAgriculture, Kocaeli, [WWW document]. URL http://www.kocaeli-tarim.gov.tr/sektörel-yapi/77(Access Date:12.10.21012).
3Karataş, E. and Alaoğlu, Ö. 2011. Plant protection applications ofproducers in Manisa Province. Ege University, Journal of Faculty ofAgriculture 48(3):183-189.
4Yıldırım, E. 2000. Agricultural Pest Control Methods and Chemicalsthat Are Used. Atatürk University, Faculty of Agriculture, 345 p.
5Regulations on the Prescribed Sale of Plant Protection Products 2012.Supply of Plant Protection Products to the Market [WWW document].URL http:/ /www.ziraattube.com makale/328/z0ra0-mucadelede, 2012.Pdf (Access Date: 17.10.2012).
6Anonymous 2012b. Regulation on the Procedures and Principles ofPrescribed Sales of Plant Protection Products. Ministry of Food,Agriculture and Livestock; Livestock;[WWW document]. URL http://www.resmigazete.gov.tr/eskiler/2012/05/20120530.htm ( Access Date:17.10.2012).
7Tuncer, V. 2012. 1st Agricultural Dealers Summit. Chamber of AgriculturalEngineers Antalya Branch Chairperson 28-30 January 2011JANUARY-MARCH 2011 ISSUE: 96 [WWW document]. URLhttp://www.zmo.org.tr/resimler/ekler/6f1147794752ff7_ek.pdf?dergi=1372011 (Access Date: 04.11.2012).
8Anonymous 2012c. Ministry of Food, Agriculture and Livestock,Records of Plant Protection Products Department [WWWdocument].URL http//www.tarim.gov.tr/(Access Date: 07.11.2012).
9Roling, N. R. 1988. Extension Science: Information Systems inAgricultural Development. Cambridge University Press, Cambridge,pp. 179-200.
10Yılmaz, M. A., Çınar, A., Çınar, Ö., Uygun, N., Şekeroğlu, E., Kornoşor,S., Biçici, M., Özgür, F., Koç, K., Uygur, N., Baloğlu, S. and Karaca,İ. 1991. Establishment of Pilot Plant Protection Clinics in GAP Region.Çukurova University, Faculty of Agriculture, Project Component No:5.4.1., Adana, 93 p.

734 Journal of Food, Agriculture & Environment, Vol.11 (3&4), July-October 2013
11Akbay, C. and Yurdakul, O. 1993. Marketing of agricultural pesticidesin Aşağı Seyhan Plain and economical analysis of agricultural pesticideutilization. Journal of Çukurova University, Faculty of Agriculture8(2):15-30.
12Yücel, A., Çıkman, E. and Yücel, M. 1995. Farmers’ look to agriculturalpest control in Harran Plain before GAP project was put into use.Plant Protection Problems and Solution Suggestions regarding GAPRegion, 27-29 April 1995, Şanlıurfa, Book of Proceedings, pp. 53-65.
13Tezcan, H. 1996. The current situation of agricultural pest controldealers in some provinces of Turkey and the considerations.Symposium on Agriculture and Environment Relationships, 13-15May 1996, Mersin, Sustainable Use of Natural Resources. Book ofProceedings, pp. 795- 800.
14Üremiş, I., Karaat, S., Gönen, O., Canihos, E., Kütük, H., Emekçi, U.,Çetin, V., Aytas, M. and Kadıoğlu, I. 1996. Evaluation of agriculturalpesticide utilization in Çukurova Region. 2nd National AgriculturalPesticides Symposium, 18-20 November 1996, Ankara, pp. 18-20.
15Zeren, O. and Kumbur, H. 1998. Researches on the marketing, utilizationtechnique and efficiency of agricultural pesticides in İçel Province.Türk-Koop Ekin Journal 2(5):62-68.
16İnan, H. 2001. A Research on the Situation of Agricultural PesticideDealers of Konya Province in Terms of Their Professional andKnowledge Levels and Agricultural Pest Control of Farmers. Masterthesis, Plant Protection Department, Institute of Natural and AppliedSciences, Selçuk University, Konya, 118 p.
17Yiğit, F. 2001. General situations of agricultural pesticide dealers inAntalya Province and investigation of the relationships with farmers.Turk-Koop Ekin Journal 5(15):90-96.
18İnan, H. and Boyraz, N. 2002. General evaluation of Konya farmers’agricultural pesticide utilization. Selçuk University, Journal of Facultyof Agriculture 16(30):88-101.
19Emeli, M. 2006. A Research on the Problems of Plant ProtectionMethods in Seyhan and Yüreğir Basins. Master thesis, Plant ProtectionDepartment, Institute of Natural and Applied Sciences, ÇukurovaUniversity, Adana, 123 p.
20Boz, Ö., Erol, T., Benlioğlu, S. and Öncüer, C. 1998. Socio-economicalassessment of agricultural pest control applications in Aydın Province.Turkish Entomology Journal 22(2):123-136.
21Aktaş, Y. 2001. The place and importance of agricultural pesticidesellers in the process of agricultural extension. GAP II. AgricultureCongress, 24-26 October, Şanlıurfa, pp. 581-592.
22Özel, R. 2004. Marketing structure of agricultural pesticide dealers inŞanlıurfa Province, problems and solution suggestions. HarranUniversity, Journal of Faculty of Agriculture 8(1):41-49.
23Taluğ, C. and Tatlıdil, H. 1993. Agricultural Extension andCommunication. Ankara University, Faculty of Agriculture,Reproduction No. 141, Ankara, 198 p.
24Budak, D. 1996. Public and private sector in the developing countries.2nd Agriculture Economics Congress of Turkey 2:423-426.
25Torun, E. and Taluğ, C. 2005. Information sources used by producerswithin the scope of tea pruning project. Journal of AgriculturalEconomics 11(1):41–49.