Embed Size (px)
Citation preview

University of Pennsylvania University of Pennsylvania
ScholarlyCommons ScholarlyCommons
Joseph Wharton Scholars Wharton Undergraduate Research
2016
The Credit Defaults of CDOs: An Investigation of Securitization in The Credit Defaults of CDOs: An Investigation of Securitization in
Offshore Financial Centers Offshore Financial Centers
Mei Sien (Sharon) Choong Kam Chong University of Pennsylvania
Follow this and additional works at: https://repository.upenn.edu/joseph_wharton_scholars
Part of the Business Commons
Recommended Citation Recommended Citation Choong Kam Chong, M. (2016). "The Credit Defaults of CDOs: An Investigation of Securitization in Offshore Financial Centers," Joseph Wharton Scholars. Available at https://repository.upenn.edu/joseph_wharton_scholars/20
This paper is posted at ScholarlyCommons. https://repository.upenn.edu/joseph_wharton_scholars/20 For more information, please contact [email protected].

The Credit Defaults of CDOs: An Investigation of Securitization in Offshore The Credit Defaults of CDOs: An Investigation of Securitization in Offshore Financial Centers Financial Centers
Abstract Abstract Collateralized debt obligations (CDOs) have been subject to much scrutiny with the financial crisis. In fact, while other U.S. asset-backed securities are typically issued domestically, a majority of CDOs are issued in offshore financial centers such as the Cayman Islands, Ireland and Jersey rather than in the United States. This paper investigates the legal, regulatory and economic implications of issuing CDOs offshore, and whether offshore issuance of CDOs had an impact on the packaging of the underlying securities and CDO credit defaults. Using a dataset of 517 CDOs, three main findings were made. First, the country of issuance significantly explains the losses in the CDO collateral. Second, lack of reporting requirements for offshore-issued CDOs played a role in CDO credit defaults. Third, there was no evidence that the fact that offshore vehicles are bankruptcy-remote played a role in credit rating inflation and in explaining the proliferation of collateral defaults offshore.
Keywords Keywords Credit defaults, CDO, Offshore
Disciplines Disciplines Business
This thesis or dissertation is available at ScholarlyCommons: https://repository.upenn.edu/joseph_wharton_scholars/20

1
The Credit Defaults of CDOs:
An Investigation of Securitization in Offshore Financial Centers
Mei Sien (Sharon) Choong Kam Chong
The Wharton School, University of Pennsylvania
Wharton Honors Research Thesis
in partial fulfillment of the requirements
for the Joseph Wharton Scholars Program
Faculty Advisor: Catherine M. Schrand
John C. Hower Professor and Professor of Accounting
The Wharton School, University of Pennsylvania
Research Discipline: Business
May 3, 2016

2
The Credit Defaults of CDOs:
An Investigation of Securitization in Offshore Financial Centers
Abstract:
Collateralized debt obligations (CDOs) have been subject to much scrutiny with the financial
crisis. In fact, while other U.S. asset-backed securities are typically issued domestically, a
majority of CDOs are issued in offshore financial centers such as the Cayman Islands, Ireland
and Jersey rather than in the United States. This paper investigates the legal, regulatory and
economic implications of issuing CDOs offshore, and whether offshore issuance of CDOs had an
impact on the packaging of the underlying securities and CDO credit defaults. Using a dataset of
517 CDOs, three main findings were made. First, the country of issuance significantly explains
the losses in the CDO collateral. Second, lack of reporting requirements for offshore-issued
CDOs played a role in CDO credit defaults. Third, there was no evidence that the fact that
offshore vehicles are bankruptcy-remote played a role in credit rating inflation and in explaining
the proliferation of collateral defaults offshore.
Keywords: Credit defaults, CDO, Offshore

3
Introduction
Despite the prominence of securitization activity in the United States, when it comes to
collateralized debt obligations (CDOs), a large majority are created offshore; with a dominant
share in the Cayman Islands. 97.9% of CDOs in a representative sample of vintage 2004-2007
CDOs were issued in offshore financial centers such as the Cayman Islands, Ireland and Jersey,
rather than in the United States. As the CDO market faced write-downs during the credit crisis
of 2007, losses in the collateral assets backing offshore-issued CDOs exceeded losses from US-
issued CDOs by $31,253,310 per tranche on average.
Could the offshore CDO issuances explain the proliferation of high investment grade, high credit
risk CDOs? In an attempt to provide some answers, this paper investigates CDO defaults in
relation to their country of issuance, and expands on the CDO arranger’s rationale behind
offshore issuance of the CDO securities. Using a hand-collected dataset of 517 CDOs of vintage
2004 to 2007 from Pershing Square Capital Management’s Open Source Model, supplemented
by data from various other sources, a quantitative analysis is conducted to investigate the
relationship between collateral defaults and the country of issuance of a CDO, providing for the
effects of other CDO characteristics.
The results suggest that the country of issuance significantly explains the credit quality of the
underlying collateral of CDO securities. Moreover, the results of regressions of collateral
defaults against capital ratios of CDO sponsoring banks suggest that lack of reporting
requirements for offshore-issued CDOs played a role in CDO credit defaults. This finding
concurs with the US government which implemented new regulations on offshore securitization
vehicles after the financial crisis. In particular, the 2010 Dodd-Frank Act changed the landscape
of offshore CDO regulation by mandating the holding of part of the credit risk of offshore

4
transactions in the balance sheets of the CDO arrangers, and making provisions for withholding
taxes on CDO transactions.
The structure of the paper is as follows. The first part of the paper provides the necessary
background on the CDO market. It describes the CDO securitization process, the typical CDO
structure, the rationale for offshore issuance of CDOs and the credit defaults in the CDO market
during the credit crisis starting 2007. The second part elaborates on the research thesis of the
paper and hypothesis development. Thirdly, the methodology of the quantitative analysis is
explained, after which results of the analysis are described, followed by a discussion of the
results. The paper ends with some conclusions, providing explanations of the limitations of the
analysis and recommendations for future research.
Background: the CDO Market
Securitization and CDOs
Securitization is a process by which one entity pools together different loans and/or receivables,
transfers the claims on the future assets’ cash flows to another entity that is created for the
purpose of holding the claims, and uses the cash flows to pay back the other entity’s investors,
with or without the assistance of other credit1 (Fabozzi and Kothari 2007). There is a wealth of
academic research regarding the securitization of assets. Asset securitization was developed in
the 1980’s as a means of credit risk transfer2 (Lucas, Goodman and Fabozzi 2007) and is
instrumental for structured finance. It is one of the main forms of financing for companies, partly
because it allows disintermediation by selling assets directly to the capital markets instead of
1 See “The CDO Structure” in this paper.
2 Basically, by selling its loans or receivables to another party, an entity can transfer its credit risk.

5
going through financial institutions (Schwarcz 2013, 131-132). Before the 2008 financial crisis,
Minton, Sanders and Strahan (2004) mentioned that financial institutions enjoyed a number of
advantages in securitizing their assets; including lower financial distress costs to reduce the cost
of debt, and the avoidance of capital requirements. In fact, securitization was widely regarded as
an efficient way of carrying out transactions for the originators of the securities (Lupica 1998,
597). Among securitization transactions, the market for mortgage-backed securities (MBS),
home equity ABS (HELOCs and HELOANs), retail ABS and collateralized debt obligations
(CDO) swelled in volume from around $400 billion in 1998 to $1.7 trillion in 2006 (Cetorelli
and Peristiani 2012, 51).
The CDO Structure
The process of securitizing assets using a CDO structure is described thus. The holder of a pool
of cash flow-generating assets3 first creates a special purpose vehicle (SPV)
4. According to
Gorton and Souleles (2007), the SPV is sometimes legally set up as a trust. Essentially a “brain-
dead” company created for the sole purpose of holding the assets, the SPV has no employees or
building at its registered location. Instead, it has a trustee which performs its administrative
functions. A CDO manager is also employed to select and sometimes manage the collateral
portfolio. Once established, the SPV buys the assets from the holder, financing them typically
by issuing CDO notes. The notes are "backed" by the assets since the noteholders are paid
interest and principal from the asset cash flows. Figure 1 illustrates the intricate relationships in a
typical CDO structure in the case of a collateralized bond obligation (CBO).
3 Including loans and receivables
4 Also known as a special purpose entity (SPE)

6
The CDO is often "packaged" from a pool of different assets of varying credit risks. An ABS
CDO is a CDO backed by ABS whose underlying assets are typically mortgage loans, home
equity loans, credit card loans or auto loans. In contrast, CBOs and collateralized loan
obligations (CLO) are backed by corporate bonds and whole loans respectively. Some CDOs are
packaged with other CDOs; these are known as CDO squared. At the opposite of cash CDOs5,
synthetic CDOs are backed by credit derivatives such as CDS that provide asset exposure6
instead of transacting the actual assets. Figure 2 shows the proportion of vintage 2004-2007
CDOs by underlying collateral. “Structured finance” includes a basket of collateral types such as
corporate bonds and loans and emerging market debt. Synthetic CDOs sponsored by financial
institutions were the most significant deal type. The synthetic CDO presented challenges in its
pricing model since the standard single-factor normal copula framework required assumptions
about its correlation with assets, and since base correlations sometimes failed to explain tranche
pricing (Finger 2004, 8-14).
To reflect the varying credit risk of the underlying assets, the CDO is “sliced and diced” under a
waterfall structure with CDO "tranches" of varying seniority. The highly rated senior tranches
are paid before the mezzanine tranches, after which the lowest equity tranches are paid (Duffie
and Garleanu 2001, 41). Accordingly, each tranche is often rated by credit rating agencies. Table
1 breaks down the credit ratings of CDO tranches between 2004 and 2007 by seniority. On
average, 73% of CDO tranches were rated A3/A- or above by Moody’s, Standard & Poor’s and
Fitch ratings. 20% of high grade tranches were rated Baa1/BBB+ or lower. An alarmingly
significant proportion of mezzanine tranches were rated with the highest Aaa/AAA rating,
5 Called cash CDOs because they are backed by cash flow-generating assets
6 Exposures include corporate credit risk and exposures to residential mortgage-backed securities, commercial
mortgage-backed securities, CDO tranches, and other structured finance securities (Gibson 2004, 1)
7
specifically 34.4%, 34.3% and 32.9% of mezzanine tranches for Moody’s, Standard & Poor’s
and Fitch ratings respectively.
The securitization process previously explained can further vary among CDOs since some
transactions securitize only part of the assets’ cash flows, use credit enhancements such as Credit
Default Swaps (CDS) or overcollateralization to ensure high credit ratings, enlist the help of
securitization service providers, or require different legal obligations depending on the CDO’s
legal structure. The SPV can also be established in the US or in an offshore financial center such
as the Cayman Islands or Jersey, which have different contextual implications for the CDO.
Rationale for Offshore Issuance of CDOs
Cetorelli and Peristiani (2012, 52) claim that 73% of private asset-backed issuance (including
credit card ABS, auto ABS, MBS, home equity loans HELOAN, home equity line of credit
HELOC, CMBS and CDO’s) was created in the US by 2008 and the remaining one-fourth was
offshore, mainly in the Cayman Islands where CDO issuance surged, especially synthetic CDOs.
Indeed, while MBS, credit card and auto ABS securitizations lean towards local US issuance,
CDOs tend to use offshore SPVs (Moser and Williams 2010, 161). If an offshore SPV is used
for US securitization, often a second US corporation will be established (usually in Delaware) to
co-issue the debt securities. Table 2 shows the volume of asset-backed issuance by country,
including auto, credit card, student loan ABS, residential and commercial MBS, HELOANs,
HELOCs and CDOs. Figure 3 illustrate the proportion of US-traded CDOs that were issued in
the US or offshore by financial institution sponsoring the CDO. Financial institutions chose to
issue CDOs in the Cayman Islands most of the time, including the German WestLB and

8
Dresdner bank, the British Royal Bank of Scotland, and the Swiss Credit Suisse. Only 2.1% of
CDOs in the sample were issued in the US.
What advantages would originators and investors gain by securitizing SPVs in offshore financial
centers? Belmontes (2004, 36) identifies four main motivations in establishing SPVs offshore.
Tax Neutrality
First, the SPVs are often incorporated in a tax-neutral jurisdiction. Essentially, tax neutrality
involves the elimination of tax leakage7 through corporate tax in the country of the SPV
incorporation and in the country of the underlying collateral portfolio, or through withholding
taxes on the SPV’s payments and receipts. In the US, securitization transactions are often
structured as trusts. Because it is more difficult for a CDO transaction to legally qualify for a
grantor trust8 as CDO collateral are often actively managed, practically all CDOs are structured
as corporations in low-tax jurisdictions (Carden and Nasser 2007, 120). An SPV will not be
subject to US federal income taxes if properly established offshore as a SPV not engaged “in US
trade or business”. This may occur by relying on Section 864’s safe harbor which states that
stock or security trading does not constitute a trade or business with the US (Carden and Nasser
2007, 122). Typically, tax-neutral jurisdictions provide some significant tax benefits. The
Cayman Islands allows CDOs to incorporate as ‘exempted companies9’ which benefit from a tax
holiday of twenty years, with a possible extension of ten additional years (Gorton and Souleles,
2010). Jersey also has an ‘exempt company’ rule, to be renewed yearly, whereby beneficiaries
7 For more information on motivations based on tax leakage, see Tavakoli, J.M. 2004, 55-57.
8 A grantor trust is one where the grantor pays income tax, while the trust is exempt for taxation purposes
9 This is possible only if the SPV does not do business in the country of incorporation, in this case the Cayman
Islands.

9
do not pay any withholding tax, capital gains or stamp duties (Belmontes 2004, 37). Unlike the
no-tax Cayman Islands and Jersey jurisdictions, Ireland is a nominal tax jurisdiction. An Ireland-
issued SPV can qualify for Section 110 which ensures that the SPV is treated in a tax-neutral
way (Arthur Cox 2012, 1-3). While profits are taxed, the cost of funding and expenditures are
usually tax-deductible. There are no stamp duties in Ireland, and exemptions are available to
Section 110 SPVs for withholding taxes and Value Added Tax. Minimal tax leakage is essential
for an efficient CDO structure, and therefore the tax advantages provided by offshore financial
centers are extremely valuable.
Bankruptcy Remoteness
Second, offshore financial centers are legally recognized and widely accepted as providers of
bankruptcy-remote vehicles. Under bankruptcy remoteness, if an SPV’s sponsor becomes
bankrupt or insolvent, the sponsor’s creditors cannot seize the SPV and its assets. This requires
the SPV to engage solely in securitization transactions, requires that the sale of the assets not be
framed as a loan to the SPV, and that the risk of SPV consolidation with the sponsor be
minimized. To satisfy such requirements, offshore financial centers allow the establishment of a
bankruptcy-remote vehicle in the form of an “orphan” SPV not owned or controlled by the
sponsor. Limited recourse and non-petition covenants are usually included to prevent any
investor from bringing the SPV to courts for bankruptcy or insolvency. In theory, bankruptcy
remoteness enables sponsors to create investment grade CDO securities based solely on the
credit quality of the collateral, irrespective of the sponsors’ financial profile. Indeed, bankruptcy
remoteness was a significant factor of consideration for credit rating agencies (Conyers Dill and
Pearman 2013, 12-13). Credit enhancements could boost the SPV’s ratings above the CDO

10
sponsor’s rating, thanks to the bankruptcy remoteness of the SPV. However, CDOs were often
repackaged with other structured ABS, and sometimes with other CDOs, making it hard to trace
back correlations to different assets, and therefore hard to judge the overall credit quality of the
CDO. Bankruptcy-remote vehicles are also off-balance sheet entities from the viewpoint of the
sponsor. Arnold (2009) discussed the role of accounting practices in the treatment of off-balance
transactions. It is in the 1980’s that US accounting standards allowed banks to move securitized
assets from their balance sheet to the books of an off-balance sheet entity. This created a way for
banks to avoid complying with accounting rules and regulatory capital standards. In fact, the
selling of collateral to the SPV enabled banks to remove loans from their books and therefore
lower their capital requirements so that more loans could be made (Barnett-Hart 2009, 7).
Professional Securitization Services
Third, experienced service providers can assist in setting up an SPV efficiently in an
environment where such incorporations are common. As David Lloyd of Bell Rock Group
explained of his working field, service providers provide expertise in establishing the SPV,
corporate services such as registered office, resident and qualified directors and compliance
services during the life of the SPV, which sometimes amounts to up to 20 years. Because of the
prevalence of securitization transactions in these financial centers, it is also easy to find law
firms and trustee services which are able to provide expertise in the securitization process.
Ease and Speed of SPV Set-Up
In the Cayman Islands, an SPV can be set up in as little as 24 hours under a charitable trust or a
STAR trust. This is significantly faster than other offshore jurisdictions (Belmontes 2004, 40).

11
Offshore financial centers also often have a supportive legal infrastructure that is familiar with
securitization transactions so actions may be easily enforced in the courts. Cayman Islands SPVs
have to register an office and maintain a register of directors, officers and shareholders, but are
not required to file financial reports or provide audited financial statements.
Irish SPVs are set up pursuant to the Companies Act, and must be structured a public limited
company if funds are to be raised from the public (Thorne and Houlihan 2002). Publicly issued
CDOs required a minimum capitalization of 38,100 as of 2002, but none for a private issue. The
CDOs are recorded with the Irish Companies Registration Office.
In Jersey, the Jersey Financial Services Commission (JFSC) must approve the identity of the
sponsor/arranger before the SPV can be set up, in accord with efforts to maintain Jersey’s
reputation as a premier finance center (Hollywood and Hunter 2015, 2-3). There is no minimum
capitalization requirement. The CDOs may be listed on a recognized stock exchange, and a
register of members, directors and registered office are required.
In contrast, US regulations on the establishment of an onshore SPV depend on the legal type of
business which the SPV is structured. For instance, business trusts and LLCs are typically
registered with the secretary of state or similar authority (Moser & Williams 2010).
Depending on investor demand, the CDO securities can be issued on a public offering or opt for
a Rule 144a private issue directed exclusively to qualified institutional buyers. The securities can
also be sold under Regulation S to investors outside the United States. Publicly issued securities
are not listed on a regulated exchange in the US, but a registration statement must be filed to the
US Securities Exchange Commission (SEC) and the SEC’s Regulation AB and related rules
relating to shelf registrations of ABS must be complied with. There are no share capital
requirements for listing securities on a US public exchange. After the financial crisis, under

12
Section 942 of the 2010 Dodd-Frank act, all issuers must now report standardized information on
the assets backing the CDO (SEC 2014). Moreover, prospectus disclosure requirements now
include the sponsor’s retained economic interest in the CDO and financial information about
parties obligated to repurchase assets.
CDO Credit Defaults
Even before the financial crisis, CDOs had captured attention when downgrades of Ford’s and
General Motors’ debt led to significant losses for CDO investors in 2005 (Longstaff and Rajan
2008). When the CDO market crashed during the credit crisis, CDOs saw over $542 billion in
write-downs in the 2007-2008 timespan (Barnett-Hart 2009, 3). Figures 4 and 5 indicate the
volume of collateral losses in billions of dollars and as a percentage of the tranche collateral and
cash value for vintage 2004-2007 CDO tranches. The CDO collateral packed by UBS and
Merrill Lynch had the greatest value of defaults at $219 billion and $233 billion respectively,
representing almost half of all collateral defaults in the 2004-2007 vintage CDO market10
. Yet
UBS and Merrill Lynch were not the worst issuers in terms of proportion of collateral defaults;
over 50% of the value of CDO tranches arranged by the Royal Bank of Scotland and Morgan
Stanley was lost in collateral defaults.
Many authors opine that the CDO market meltdown was in large part respnsible for the financial
crisis. Crotty (2009) discussed how CDOs’ credit risk transfer mechanism failed during the
financial crisis because banks issuing CDOs often retained the CDOs they created11
. Acharya
and Richardson (2009) argued that placing securitized assets in off-balance-sheet entities and
lower capital requirements on AAA-rated CDO tranches had led CDO-sponsoring banks to take
10
The total sum of defaults amounted to about $1.265 trillion in this sample 11
See Crotty 2009, 568-569 for the reasons behind the holding or ‘warehousing’ of CDOs by banks

13
advantage of significantly lower capital buffers, with banks holding about 50% of the CDO
market12
made up of AAA-rated tranches backed by subprime loans. This led to a concentration
of the risk of collateral defaults within banks, which magnified the effects of the housing crash
and contaminated the financial system. Barnett-Hart (2009) investigated CDOs in the financial
crisis and concluded that poorly constructed CDOs, irresponsible underwriting practices and
inadequate credit rating models contributed to the CDO market meltdown. On the other hand,
many others agree with Richards’ view that financial innovation such as CDOs is not a primary
explanation for the financial crisis (Richards 2013). To this day, there is no consensus about
whether CDOs have caused the collapse of the financial system in 2008, but this paper sets the
debate aside to focus on the offshore CDO market.
Research Thesis
The goal of this paper is to investigate the credit defaults of CDOs set up offshore as opposed to
defaults of CDOs set up domestically. The domination of offshore CDO issuance is curious.
Why would banks issue CDOs offshore when they can do so domestically? At first look, issuing
securities domestically may seem like a more obvious choice due to familiarity with the domestic
legal system, regulatory controls, economic and business environment, and the ability to build on
established domestic business relationships. Most asset-backed securities, including MBS, auto
and credit card ABS are in fact typically issued in the US (Moser and Williams 2010; Cetorelli
and Peristiani 2012), but the vast majority of CDOs are issued offshore. In relation to the CDO
market meltdown of 2008, a preliminary analysis of collateral defaults using data from
Bloomberg and the Open Source Model of Pershing Square Capital Management reveals that, on
average, collateral losses from offshore vintage 2004-2007 CDOs exceeded losses from US-
12
Representing $749 billion worth of CDO tranches (Acharya and Richardson 2009, 202)

14
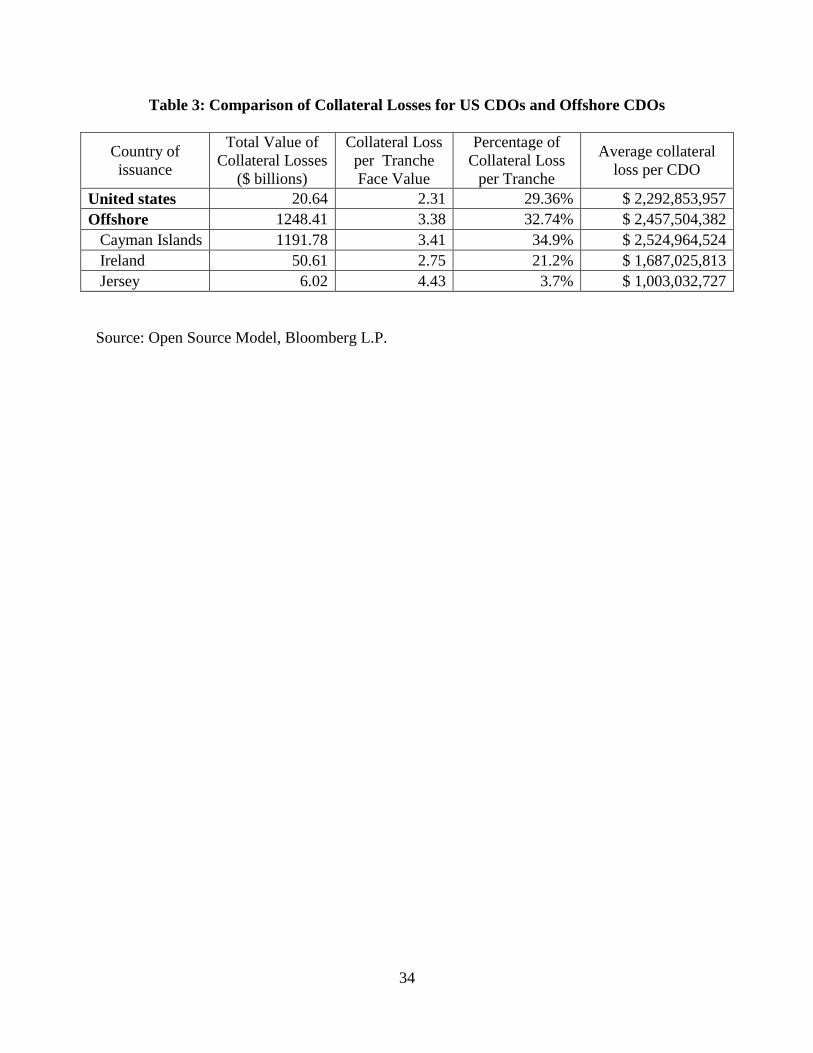
issued CDOs by $31,253,310 per tranche. Moreover, for every $1 of a tranche’s current face
value, a US-issued CDO would on average incur collateral losses of $2.31, compared with $3.41,
$2.75 and $ $4.43 losses for Cayman-, Ireland- and Jersey-issued CDOs. Were Cayman and
Jersey CDOs priced too low for their credit risk? On average, both in terms of percentage of
collateral loss per tranche and in terms of total amount of losses per CDO, Cayman CDOs
displayed the highest collateral defaults while Jersey CDOs displayed the lowest defaults. The
details are shown in Table 3. Thus, the statistics seem to suggest that CDO credit quality differed
by their country of issuance.
Opinions on offshore financial centers, popularly known as ‘tax havens’, are often controversial
because of their aggressive no-tax schemes, freedom from legal hassle in creating “empty”
companies and trusts, and freedom from accounting reporting requirements (McCann 2006).
The issues raised by critics of these centers included poor disclosure requirements, lack of
regulatory oversight and unfair tax competition leading to the creation of toxic ‘financial
innovations’, nourishing ‘fraudulent practices’ and facilitating global financial shock contagion.
After the financial crisis, several regulations were put in place to address securitization by
offshore vehicles: the Dodd-Frank Act of 2010 requires that originators of ABS retain at least 5%
of the risk of the ABS; the Foreign Account Tax Compliance Act (FATCA) requires offshore
vehicles to report to the IRS the financial accounts held by US taxpayers or foreign entities in
which the US taxpayers are majority owners; the FASB revised accounting rules on the sale of
financial assets and consolidation of certain off-balance sheet entities; the SEC has more
comprehensive registration, disclosure and reporting requirements that extend to offshore entities
with business in the US; and FATCA as part of the Hiring Incentives to Restore Employment
Act imposes a 30% withholding tax on foreign financial institutions, including CDOs (Kopp and

15
Kim 2009; Kayle, Walker and Brassel 2012, 3-5; Flock, Smith and Evans 2013). This paper
tests the notion underlying these new regulations: that there needs to be more regulatory
oversight over bankruptcy-remote entities, more transparent reporting standards and that cash
flows from offshore SPVs should be taxed. The analysis could be helpful not only for US
policymakers dealing with offshore securitization, but also for offshore financial centers as they
evolve their own regulatory controls.
Given the CDO market meltdown during the credit crisis of 2007, could the offshore CDO
issuances explain the proliferation of high investment grade, high credit risk CDOs which may
have contributed to the $524 billion of CDO write-downs by 2008? Despite the abundant
literature available on the topic of asset securitization and offshore finance, to my knowledge,
there is no empirical study investigating this question. In an attempt to provide some answers,
this paper conducts an analysis of the credit defaults of offshore-issued and US-issued CDOs
during the credit crisis. My hypotheses can be broken down into the following:
Hypothesis 1:
Legislation regarding bankruptcy remoteness in offshore financial centers led to overvaluation of
high credit risk CDOs by credit ratings agencies and relying investors, leading to a proliferation
of CDO collateral defaults in the market. Bankruptcy remoteness was an important feature for
credit rating agencies in assigning ratings to CDOs as it allowed CDOs to receive higher ratings
than the sponsors themselves, since the SPVs were delinked from the sponsor’s credit risk.
Institutional investors of the CDOs usually relied on the credit ratings in their investment
decision while the agencies were incentivized to give high ratings because their business grew
with the growth of the highly rated, high yield CDOs (Barnett-Hart 2009, 7-8).

16
Hypothesis 2:
Lack of reporting requirements in both offshore financial centers and in the books of CDO
sponsors led to misevaluation of risks by the CDO investors, creating disproportionate demand
for high credit-risk, high-yield CDOs and causing collateral defaults in offshore CDOs. In
offshore centers, reporting requirements were often non-existent or toned down in the local
accounting regulations. For the sponsors, CDOs were considered off-balance-sheet items
according to accounting standards because of their bankruptcy-remote status. Thus, their risks
were not reported in the books of the sponsors. This may have encouraged banks to create CDOs
to lower their capital requirements13
.
Hypothesis 3:
Tax advantages for offshore CDOs allowed sponsors to create high yield CDOs without any
transaction cost penalties, encouraging the proliferation of lower credit quality, high yield CDOs
for profit-seeking rather than financing purposes, and causing greater amounts of collateral
defaults on offshore CDOs. In addition to avoiding the US federal income taxes, nominal or no
taxes imposed on CDOs issued offshore meant that little or no transaction costs were levied on
CDO transactions and cash flow transfers to and from the US. This changed with a withholding
tax implemented in 2012 under FATCA as CDOs are now considered ‘financial institutions’ for
tax purposes (Walker and Brassel 2012, 3).
Hypothesis 4:
The existence of professional securitization services offshore facilitated efficient and conflict-
free CDO transactions. By providing expertise in compliance, structuring and administration of
SPVs, offshore service providers have an independent oversight role in the securitization process,
13
See the topic ‘Bankruptcy Remoteness’ of this paper

17
since they usually have no affiliation with investment managers, law firms, trustees, prime
brokers or auditors, nor do they hold investments, to avoid conflicts of interest. Unlike the other
hypotheses, this would mean that offshore CDOs would be more efficiently priced relative to
their risks than US-issued CDOs, and lower collateral defaults in offshore CDOs would be
expected.
Methodology
For the analysis, data was hand-collected from various sources and includes a sample of 517
CDOs with detailed tranche-level information on collateral defaults from the Open Source Model
dataset of Pershing Square Capital Management. This was supplemented by other CDO
characteristics data from Bloomberg and Barclays Capital Live, as well as bank CDO arranger
data from the BvD BankScope dataset of the Wharton Research Data Services (WRDS).
To test for the effects of the country of issuance on CDO performance, I perform a number of
regressions of various dependent variables representing credit defaults against variable
describing the CDO’s country of issuance and variables representing various CDO
characteristics at the tranche level. The initial regression model is the following:
Defaulti = α + β1(Country of issuance) + β2(Number of tranches) + β3(Year) + β4(Average credit
rating score) + β5(Deal type) + β6(Current face value) + β7(Coupon) + β8(Lead manager) + εi
Default is a variable describing the credit CDO performance. Tables 4 and 6 present the
regression results when using the value of the collateral losses per tranche in the CDO as Default
variable. Tables 5 and 7 present the results using as dependent variable the percentage of the

18
collateral value that has defaulted per tranche. Country of issuance, Year, Deal type and Lead
manager are categorical variables describing the country where the SPV was set up and where
CDOs were issued, the vintage year of the CDO, the type of collateral underlying the tranche,
and the CDO arranger/sponsor, respectively. Average credit rating score is a numerical average
of the credit ratings of Moody’s, Standard & Poor’s and Fitch ratings, according to the credit
ratings translation table provided on the Open Source Model dataset, with 1 being the highest
rated and 22 the lowest possible rating. Current face value is an estimate of the CDO’s face
value. Coupon describes the CDO’s coupon rate by the average 1-month, 3-month or 6-month
US LIBOR rate for the CDO’s pricing year, plus the premium added for each tranche.
Tables 4 and 5 present the results of models testing for the effects of the country of issuance of a
CDO on the CDO’s credit performance, after isolating for the effects of various CDO
characteristics described in the empirical analysis of the CDO market meltdown conducted by
Barnett-Hart (2009). As a robustness check, three estimates of collateral losses are used in three
separate regressions and the results are compared. Tables 6 and 7 show the results for models
testing for the hypotheses previously proposed to explain differences in CDO credit defaults
between offshore-issued and US-issued CDOs. Specifically, the models evaluate the country-
specific determinants of CDO performance for every country where the 2004-2007 vintage
CDOs in the sample were issued.
Results
Essentially, the results of Table 4 and 5 indicate significant statistical evidence of differences in
CDO credit defaults depending on the country of issuance of the CDOs. The F-statistic for all
regressions indicates that the model is useful in explaining variances in the dependent variable at

19
the 1% significance level. The R-squared for the three regressions in Table 4 show that the
model explains about 43-44% of the variation in the collateral default variable.
The models in Table 5 explain the variation in percentage of collateral defaults at around 44-54%.
The CDO characteristic variables corroborate several research papers on CDO defaults. First, in
all cases, a greater number of tranches, representing thinner tranches more likely to be wiped out
from single asset defaults, on average increases collateral losses by $60-70 million at the 1%
significance level, and increases the percentage of collateral losses to total collateral value of a
tranche by 2.20-2.52%. The average rating score were significant in most regressions but small,
indicating higher ratings associated with higher losses, indicating the inadequacy of credit ratings
as CDO noteholders of investment grade securities suffered greater collateral losses. Some
models also indicate a statistically significant association of year 2007 vintage CDOs with higher
default values, possibly indicating the effects of the 2007 housing crash on CDO mortgage
collateral. The complexity of the CDOs probably had an effect on collateral losses through the
mispricing of high risk CDOs; this is reflected by the statistical significance of CDO squareds
and synthetic CDOs in the models. Finally, the lead manager of the CDO seemed to matter
somewhat in explaining CDO performance, suggesting there were some idiosyncratic effects
attributed to the CDO arranger, such as the level of due diligence, on the CDO credit quality.
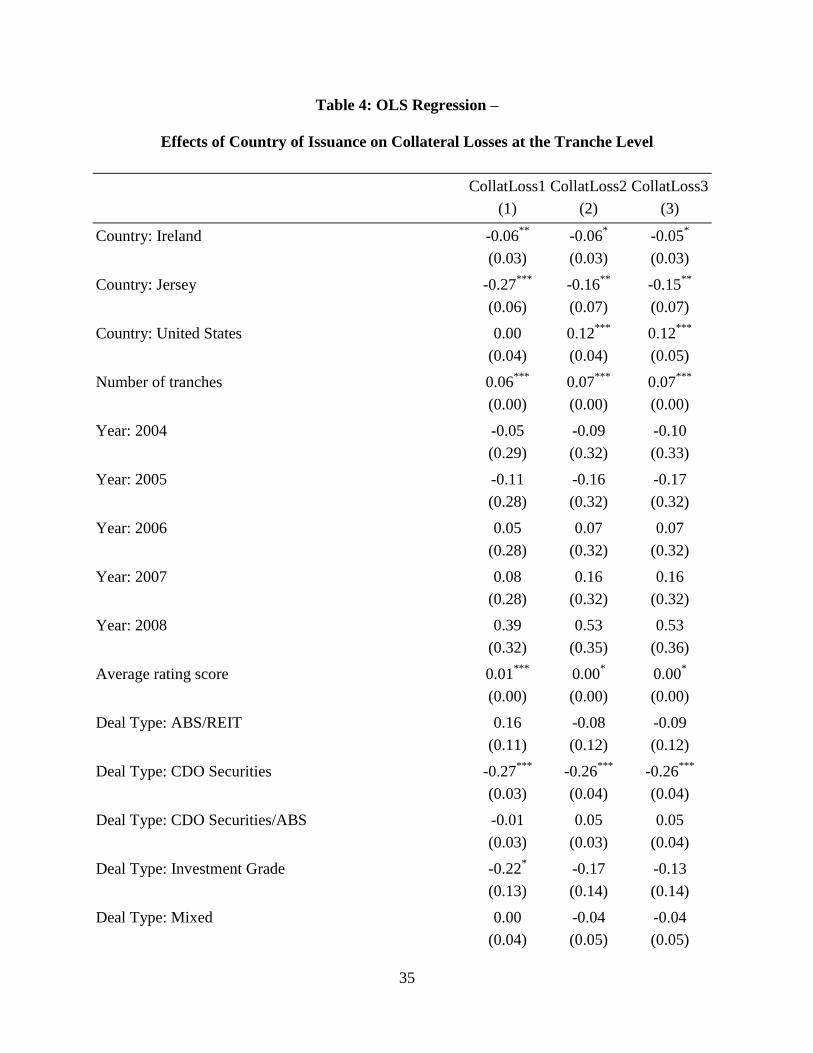
The variable of interest, Country, is statistically significant for all regressions at the 5%
significance level (see Table 8 for Wald tests), even after controlling for other effects. When
using the 2nd
and 3rd
estimations of collateral losses, US-issued CDOs on average had higher
collateral losses than Cayman-issued CDOs by $120 million. Jersey- and Ireland-issued CDOs,
on the other hand, faced $150-270 and $50-60 lower collateral losses than Cayman-issued CDOs
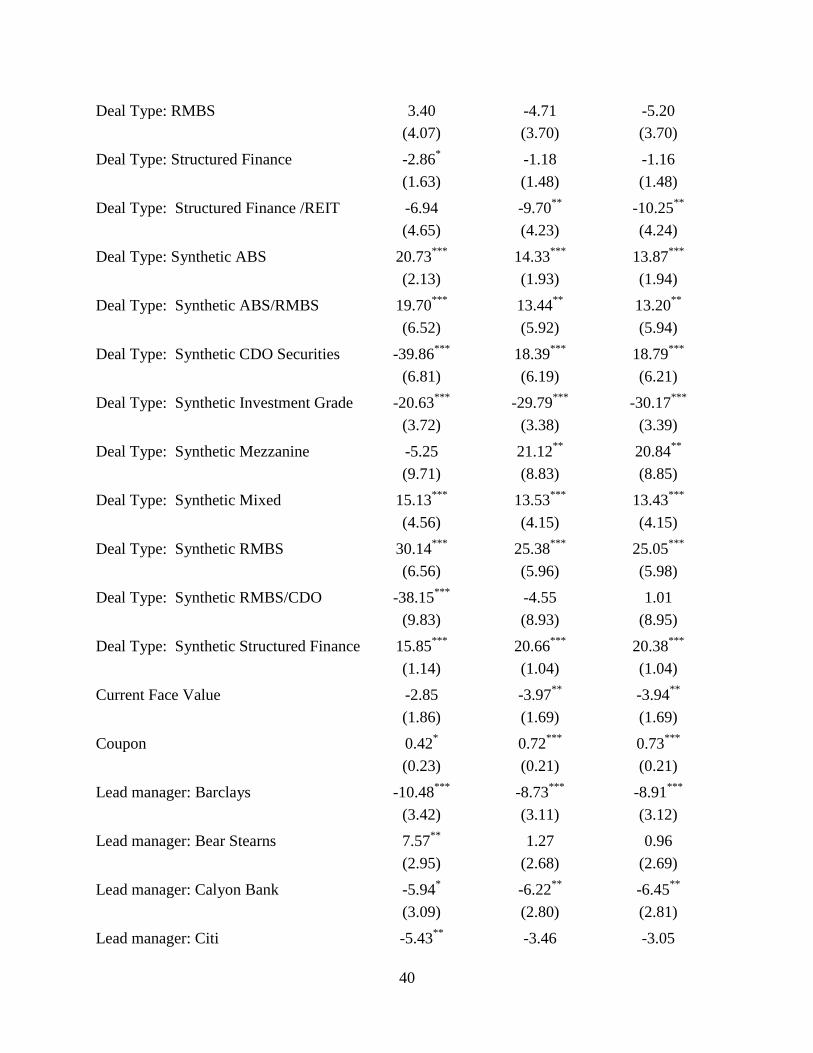
on average, respectively. From Table 5, the percentage collateral loss of US-issued, Ireland-

20
issued and Jersey-issued CDO tranches were 12.11%14
, 10.6-14.31% and 3.52-3.58% lower than
the percentage for Cayman-issued CDOs respectively, significant at the 1%.
The results of Tables 6 and 7 indicate that, controlling for CDO characteristics, there is
significant evidence that banks with lower initial Tier 1 capital ratios were associated with higher
collateral losses for Cayman-issued CDOs at 5% significance level and for Jersey-issued and
US-issued CDOs at 1% level. Similarly, banks with lower Tier 1 capital ratios were associated
with higher percentage of collateral loss per tranche for Jersey-issued, Ireland-issued and US-
issued CDOs at the 1% significance level. Moreover, evidence suggests that the coefficient for
the average rating score is zero. The one exception is the Cayman Islands, where higher credit
ratings were associated with higher collateral losses; specifically, a rating score higher by 1
increased collateral losses by $10 million. The R-squareds for the country-specific regressions
are very high at above 70% of the variance in the dependent variable explained. The only
exception is the regression for the Cayman Islands at 0.4315
.
Discussion
The analysis reveals that there are in fact differences in the credit quality of CDOs depending on
where they were issued. In general, all other CDO characteristics remaining the same, CDO
tranches from the Cayman Islands faced the greatest average percentage of losses in their
underlying collateral, followed by Ireland, US and Jersey CDOs. In terms of the magnitude of
collateral losses per CDO tranche, the 2nd
and 3rd
regressions of Table 4 show that US CDOs on
average have the highest losses, followed by Cayman, Ireland and Jersey CDOs. Thus, US
CDOs sustained the higher collateral losses, but relative to the total value of the collateral plus
14
Using the 1st estimation of collateral losses
15 After comparing the Cayman Islands model with and without Lead Manager as an independent variable, the latter
variable was added to the regression model because it increased the R-squared significantly from 0.36 to 0.43,
indicating the usefulness of this variable in explaining collateral defaults in the unique case of Cayman CDOs.

21
cash in the CDO tranche, the proportion of losses was not as bad as in the Cayman Islands and
Ireland. The collateral underlying US CDO tranches may have been greater in value than the
offshore-based collateral, leading to greater collateral losses in the US, but the proportion of
collateral losses per tranche reveals that the offshore-issued CDOs, with the exception of Jersey
CDOs, were the worse credit performers relative to their collateral portfolio than US-issued
CDOs. This would rule out Hypothesis 4 which proposed that independent offshore professional
securitization services from service providers facilitated the market for conflict-free, transparent
transactions, reducing the infestation of bad credit-quality collateral in tranches which were for
the majority rated as investment grade.
The regressions in Tables 6 and 7 test for the hypotheses 1 and 2. Hypothesis 1 suggests that
higher collateral defaults in offshore financial centers were caused by overvaluation of high
credit risk CDOs by credit ratings agencies. The latter were able to bestow CDO ratings higher
than ratings of its arranger thanks to the bankruptcy remote feature of the SPV, achieved by the
specific legal structure put in place in offshore centers. Given Hypothesis 1, one should expect
the proxy for credit ratings to be statistically significant in separate country-specific regressions
(based on the CDO country of issuance) of CDO collateral defaults. Namely, the coefficient for
the Average rating score variable would show a negative relationship with the Default variable
as a higher rating would be associated with higher collateral defaults in the ‘Overvaluation’
hypothesis. This proves not to be the case. Only the Cayman Islands regression shows an
association of the credit ratings to collateral losses. Moreover, the relationship is positive rather
than negative, indicating for instance that downgrading the ratings from AAA to AA+ (ratings
score from 1 to 2) increases collateral losses by $10 million. This suggests that credit ratings
agencies in fact did not misevaluate the Cayman CDOs’ credit risk as proposed by Hypothesis 1.

22
In Hypothesis 2, lack of reporting requirements for offshore vehicles encouraged banks with low
capital ratios to securitize their risky loans to meet capital requirements, leading to a
misevaluation of CDO risks by investors, creating disproportionate amounts of bad-quality, high
yield CDOs on the market and causing collateral defaults in offshore CDOs. If the hypothesis
were true, country-specific regressions would show that banks with low initial Tier 1 capital
ratios would arrange CDOs which would ultimately have higher collateral defaults. Tables 6 and
7 indicate that there is a negative relationship between Tier 1 capital ratio and the default
variables, corroborating Hypothesis 2. Curiously, the coefficient is positive at the 1%
significance level in the case of the Cayman Islands regression. This could just be a reflection of
the fact that by issuing CDOs in the Cayman Islands, banks increased their capital ratios. The
Tier 1 capital ratio variable is taken from 2000-2003 data on bank capital ratios. It is important
to note that, unlike the other offshore centers where the CDO issuance activity is relatively new,
the Cayman Islands have been a site for CDO securitization since 1994 (Walkers 2006). To
more accurately model the link between initial capital ratios and country-specific collateral
defaults, capital ratios from 1994 and before would be ideal for the model. However, data on
historical regulatory capital ratios for this time period are hard to find.
Conclusion
This paper investigated the effects of the characteristics of different jurisdictions where CDOs
are issued on the credit defaults of the CDOs. A thorough comparison of offshore and onshore
CDO securitization was conducted, followed by a quantitative analysis of the credit quality of
CDOs in relation to their country of issuance. Based on the results, there is evidence to suggest
that the country of issuance significantly explains the credit quality of the securities beyond other

23
CDO characteristics. Moreover, the initial capital ratio of banks is significant in explaining the
default variables in regressions, suggesting that lack of reporting requirements played a role in
CDO credit defaults. Finally, we find no evidence of overvaluation in CDO securities due to
misleading credit ratings on CDOs with low credit-quality collateral.
A number of limitations restricted the paper’s analysis. First, the data was limited in size by the
time period of the sample and by the attribution of a Committee on Uniform Security
Identification Procedures (CUSIP) number for each tranche in the data collection process. If the
sample included CDO data after the implementation of the withholding tax by FATCA
(specifically, after 2012), the tax hypothesis could have been tested in a more robust way by
comparing credit defaults before and after 2012. Moreover, CDOs are not always attributed a
CUSIP and therefore a better sample size could be obtained if another identifier was available in
our dataset. Second, the capital ratio data were not always reported in datasets, especially those
data points before the financial crisis for non-bank financial institutions such as Goldman Sachs
and Lehman Brothers as investment banks. Third, the thesis of this paper could be extended to
other subsets of CDOs such as CLOs and CBOs that were not investigated in this analysis, and
other CDO characteristics could have been explored. Several other features of CDO were used in
past research to explain CDO defaults, including the number of underlying assets in the CDO, or
the number of credit ratings downgrades before default, which this paper failed to analyze due to
lack of data availability.
This paper provides a starting groundwork on a topic which has been little investigated in
academic research, namely the question of the CDO issued offshore rather onshore and its
economic, legal and regulatory implications on the CDO’s credit risk. The analysis confirms that
the selection of the jurisdiction for CDO issuance mattered in explaining differences in collateral

24
defaults of the underlying CDO assets. However, results appear to disprove the notion that
offshore vehicles’ bankruptcy remoteness played a role in credit rating inflation and in
explaining the proliferation of collateral defaults offshore. The finding that capital ratios were
associated with the defaults of CDOs issued in a specific jurisdiction seems to suggest that the
US government is in the right direction by implementing regulations that should shed light into
the lack of reporting requirements in CDO transactions. In particular, the 2010 Dodd-Frank Act
was a significant step forward in changing offshore CDO regulation, including not only the
holding of part of the credit risk of offshore transactions in the balance sheets of the CDO
arrangers, but also provisions for withholding taxes on some offshore vehicles. It would be
interesting to look into the credit quality of offshore versus onshore-issued CDOs before and
after the full implementation of the Act in a future study.

25
References
Flock, A., D. N. Smith and M. S. Evans. 2013. Obama's HIRE Act - Explaining the Tax
Provisions. Baker Donelson. Available at: http://www.lorman.com/resources/
Acharya, V. V. and M. P. Richardson. 2009. Causes of the Financial Crisis. Critical Review, 21
(2 & 3): 195-210.
Arnold, P. J., 2009. Global financial crisis: The challenge to accounting research. Accounting,
Organizations and Society, 34 (6): 803-809.
Arthur Cox. 2012. Establishing Special Purpose Vehicles in Ireland. Arthur Cox Law Firm.
Available at: http://www.arthurcox.com.
Barnett-Hart, A. K. 2009. The Story of the CDO Market Meltdown: An Empirical Analysis.
Belmontes, M.R. 2004. Using the Cayman Islands and other offshore jurisdictions for
securitization transactions. Journal of Structured Finance, 10 (2): 36.
Carden, D. G. and Z. Nasser. 2007. US tax operating guidelines for CDO transactions. In Global
Securitization and Structured Finance: 120-127.
Cetorelli, N. and S. Peristiani. 2012. The Role of Banks in Asset Securitization. Federal Reserve
Bank of New York Economic Policy Review, 18 (2): 47-64.
Conyers Dill & Pearman. 2013. Securitization in the Cayman Islands. Available at:
conyersdill.com.
Crotty, J. 2009. Structural causes of the global financial crisis: a critical assessment of the ‘new
financial architecture’. Cambridge Journal of Economics, 33 (4): 563-580.
Duffie, D. and N. Garleanu. 2001. Risk and valuation of collateralized debt obligations.
Financial Analysts Journal, 57 (1): 41-59.
Fabozzi, F. J., and V. Kothari. 2007. Securitization: the tool of financial transformation. Yale
ICF Working Paper No. 07-07, Social Science Research Network.
Finger, C.C. 2004. Issues in the pricing of synthetic CDOs. Social Science Research Network.
Available at: http://dx.doi.org/10.2139/ssrn.643267.
Gibson, M.S. 2004. Understanding the risk of synthetic CDOs.
Gorton, G. B. & N. S. Souleles. 2007. Special purpose vehicles and securitization. In The risks of
financial institutions: 549-602. University of Chicago Press.

26
Kayle, B., A. Walker and T. Brassel. 2012. FATCA 2.0 for Funds and Securitization Vehicles.
Tax Group Client Alert: 1-5. Milbank, Tweed, Hadley & McCloy LLP.
Kopp, S.L. and S. Kim. 2009. Nonrefundable US Withholding Tax Imposed on Foreign
Investment Vehicles That Fail to Report. Journal of Taxation of Financial Products, 8 (4): 23.
Longstaff, F.A. and A. Rajan. 2008. An empirical analysis of the pricing of collateralized debt
obligations. The Journal of Finance, 63 (2): 529-563.
Lucas, D.J., L. Goodman and F.J. Fabozzi. 2007. Collateralized debt obligations and credit risk
transfer. Yale ICF Working Paper No. 0706, Social Science Research Network.
Lupica, L.R. 1998. Asset Securitization: The Unsecured Creditor's Perspective. Texas Law
Review, 76: 595-660
Minton, B., A. Sanders and P.E. Strahan. 2004. Securitization by banks and finance companies:
Efficient financial contracting or regulatory arbitrage? Working Paper Series, Ohio State
University, Charles A. Dice Center for Research in Financial Economics.
McCann, H. 2006. Offshore Finance. Cambridge University Press.
Moser, E. K. & S. J. C. Williams. 2010. Structured Finance and Securitisation 2010: Country
Q&A United States. In Structured Finance and Securitisation Handbook 2010: 159-167.
Richards, J. W. 2013. The Financial Crisis Explained: Why Complexity Wasn’t the Problem. The
American Enterprise Institute (August 14): Public Economics.
Securities Exchange Commission (SEC). 2014. SEC Adopts Asset-Backed Securities Reform
Rules. Press Release. Washington D.C: SEC.
Schwarcz, S. 2013. Securitization, Structured Finance, and Covered Bonds. The Journal of
Corporation Law, 39: 129-154.
Tavakoli, J.M. 2004. Collateralized debt obligations and structured finance: New developments
in cash and synthetic securitization. John Wiley & Sons: 249.
Thorne, M. and C. Houlihan. 2002. An introduction to securitization in Ireland. July 2002 issue.
Available at: Finance-magazine.com.
Walkers. 2006. Cayman Islands Fosters Growing CDO Market. Available at:
http://www.prnewswire.com/news-releases

27
Figure 1: The Typical CDO Structure
Source: NYU Stern: “the CDO Product”.

28
Figure 2: CDO Collateral
Sources: Open Source Model; Bloomberg L.P.
ABS 39%
ABS/REIT 0%
CDO Squared 3%
CDO Securities/ABS 2%
Investment Grade 0%
Mixed 2% RMBS
1%
Structured Finance
11%
Structured Finance/REIT
1%
ABS 7%
ABS/RMBS 1%
CDO Securities 0%
Investment Grade 2%
Mezzanine 0%
Mixed 1%
RMBS 1%
RMBS/CDO 1%
Structured Finance
28%
Synthetic 42%

29
Figure 3: Percentage of CDO Issuance
by Country of Issuance and by Lead Manager
Source: Bloomberg L.P.
Note: “Lead Manager” refers to the commercial or investment bank that has primary
responsibility for organizing the issuance. “Others” include banks such as Société Générale,
underwriters such as RSUI Group, and sponsor partnerships such as the Barclays Capital and
Merrill Lynch co-sponsorship for the LIBERTY HARBOUR CDO 2005-1.
0% 10% 20% 30% 40% 50% 60% 70% 80% 90% 100%
Bank of America
Barclays
Bear Stearns
Calyon Bank
Citi
Credit Suisse
Deutsche Bank
Dresdner Kleinwort
Fortis Bank
Goldman Sachs
ICP
JP Morgan
Lehman Brothers
Merrill Lynch
Morgan Stanley
RBC
RBS
UBS
Wachovia
WestLB
Others
Cayman Islands Ireland Jersey United States

30
Figure 4: CDO Collateral Losses by Lead Manager
in Billions of Dollars, Vintage 2004-2007
Source: Bloomberg L.P.; Open Source Model.
Bank of AmericaBarclays
Bear StearnsCalyon Bank
CitiCredit Suisse
Deutsche BankDresdner Kleinwort
Fortis BankGoldman Sachs
ICPJP Morgan
Lehman BrothersMerrill Lynch
Morgan StanleyOthers
RBCRBSUBS
Wachovia
WestLB
0 50 100 150 200
Collateral Loss ($ billion)
Lead M
anager

31
Figure 5: CDO Collateral Losses by Lead Manager
as a Percentage of Tranche Value, Vintage 2004-2007
Sources: Bloomberg L.P.; Open Source Model.
Bank of AmericaBarclays
Bear StearnsCalyon Bank
CitiCredit Suisse
Deutsche BankDresdner Kleinwort
Fortis BankGoldman Sachs
ICPJP Morgan
Lehman BrothersMerrill Lynch
Morgan StanleyOthers
RBCRBSUBS
Wachovia
WestLB
0 10 20 30 40 50
% Collateral Defaulted
Lead M
anager

32
Table 1: Credit Ratings by Tranche, CDO Vintage 2004-2007
Moody's S&P Fitch Total
Rating High
Grade
Mezz Rating High
Grade
Mezz Rating High
Grade
Mezz
Aaa 530 646 AAA 526 689 AAA 72 147 2610
Aa1 12 24 AA+ 7 11 AA+ 2 6 62
Aa2 172 280 AA 178 313 AA 19 72 1034
Aa3 36 56 AA- 32 52 AA- 9 15 200
A1 12 18 A+ 9 12 A+ 1 3 55
A2 139 254 A 146 272 A 14 59 884
A3 47 51 A- 34 56 A- 4 14 206
Baa1 7 41 BBB+ 3 38 BBB+ 1 6 96
Baa2 160 277 BBB 167 309 BBB 25 74 1012
Baa3 17 95 BBB- 12 109 BBB- 2 21 256
Ba1 30 74 BB+ 29 74 BB+ 4 12 223
Ba2 23 47 BB 16 65 BB 0 17 168
Ba3 6 9 BB- 2 4 BB- 0 0 21
B3 1 1 B 0 4 B 0 1 7
Tranches
rated
1192 1873 1161 2008 153 447 6834
Source: Open Source Model.

33
Table 2: Volume of Asset-Backed Issuance by Country, 1983-2008
Country Volume ($ billion) Share (%)
United States 7,089 73.1
Cayman Islands 1,227 12.7
Ireland 304 3.1
Netherlands 254 2.6
Great Britain 198 2.1
Italy 167 1.7
Spain 165 1.7
Luxembourg 79 0.8
Other 213 2.2
Total 9,697
Source: Cetorelli and Peristiani (2012).
34
Table 3: Comparison of Collateral Losses for US CDOs and Offshore CDOs
Country of
issuance
Total Value of
Collateral Losses
($ billions)
Collateral Loss
per Tranche
Face Value
Percentage of
Collateral Loss
per Tranche
Average collateral
loss per CDO
United states 20.64 2.31 29.36% $ 2,292,853,957
Offshore 1248.41 3.38 32.74% $ 2,457,504,382
Cayman Islands 1191.78 3.41 34.9% $ 2,524,964,524
Ireland 50.61 2.75 21.2% $ 1,687,025,813
Jersey 6.02 4.43 3.7% $ 1,003,032,727
Source: Open Source Model, Bloomberg L.P.
35
Table 4: OLS Regression –
Effects of Country of Issuance on Collateral Losses at the Tranche Level
CollatLoss1 CollatLoss2 CollatLoss3
(1) (2) (3)
Country: Ireland -0.06**
-0.06* -0.05
*
(0.03) (0.03) (0.03)
Country: Jersey -0.27***
-0.16**
-0.15**
(0.06) (0.07) (0.07)
Country: United States 0.00 0.12***
0.12***
(0.04) (0.04) (0.05)
Number of tranches 0.06***
0.07***
0.07***
(0.00) (0.00) (0.00)
Year: 2004 -0.05 -0.09 -0.10
(0.29) (0.32) (0.33)
Year: 2005 -0.11 -0.16 -0.17
(0.28) (0.32) (0.32)
Year: 2006 0.05 0.07 0.07
(0.28) (0.32) (0.32)
Year: 2007 0.08 0.16 0.16
(0.28) (0.32) (0.32)
Year: 2008 0.39 0.53 0.53
(0.32) (0.35) (0.36)
Average rating score 0.01***
0.00* 0.00
*
(0.00) (0.00) (0.00)
Deal Type: ABS/REIT 0.16 -0.08 -0.09
(0.11) (0.12) (0.12)
Deal Type: CDO Securities -0.27***
-0.26***
-0.26***
(0.03) (0.04) (0.04)
Deal Type: CDO Securities/ABS -0.01 0.05 0.05
(0.03) (0.03) (0.04)
Deal Type: Investment Grade -0.22* -0.17 -0.13
(0.13) (0.14) (0.14)
Deal Type: Mixed 0.00 -0.04 -0.04
(0.04) (0.05) (0.05)

36
Deal Type: RMBS -0.03 -0.13**
-0.14**
(0.05) (0.06) (0.06)
Deal Type: Structured Finance -0.01 0.01 0.01
(0.02) (0.02) (0.02)
Deal Type: Structured Finance /REIT -0.02 -0.08 -0.09
(0.06) (0.06) (0.06)
Deal Type: Synthetic ABS 0.31***
0.23***
0.23***
(0.03) (0.03) (0.03)
Deal Type: Synthetic ABS/RMBS 0.16**
0.13 0.13
(0.08) (0.09) (0.09)
Deal Type: Synthetic CDO Securities -0.21**
0.03 0.03
(0.08) (0.09) (0.09)
Deal Type: Synthetic Investment Grade -0.18***
-0.27***
-0.28***
(0.05) (0.05) (0.05)
Deal Type: Synthetic Mezzanine -0.07 0.11 0.10
(0.12) (0.13) (0.13)
Deal Type: Synthetic Mixed 0.27***
0.32***
0.32***
(0.06) (0.06) (0.06)
Deal Type: Synthetic RMBS 0.52***
0.46***
0.46***
(0.08) (0.09) (0.09)
Deal Type: Synthetic RMBS/CDO -0.15 0.36***
0.44***
(0.12) (0.13) (0.13)
Deal Type: Synthetic Structured Finance 0.21***
0.18***
0.18***
(0.01) (0.02) (0.02)
Current Face Value 0.16***
0.22***
0.22***
(0.02) (0.03) (0.03)
Coupon -0.00 0.00 0.00
(0.00) (0.00) (0.00)
Lead manager: Barclays 0.10**
0.17***
0.17***
(0.04) (0.05) (0.05)
Lead manager: Bear Stearns 0.05 0.00 -0.00
(0.04) (0.04) (0.04)
Lead manager: Calyon Bank 0.18***
0.23***
0.22***
(0.04) (0.04) (0.04)
Lead manager: Citi 0.06* 0.13
*** 0.13
***
(0.03) (0.03) (0.03)

37
Lead manager: Credit Suisse 0.01 -0.02 -0.02
(0.04) (0.04) (0.04)
Lead manager: Deutsche Bank 0.00 -0.03 -0.03
(0.03) (0.04) (0.04)
Lead manager: Dresdner Kleinwort -0.18**
-0.11 -0.11
(0.07) (0.08) (0.08)
Lead manager: Fortis Bank 0.07 0.11 0.11
(0.06) (0.07) (0.07)
Lead manager: Goldman Sachs -0.10***
-0.06* -0.07
*
(0.03) (0.04) (0.04)
Lead manager: ICP -0.04 -0.14* -0.15
**
(0.06) (0.07) (0.07)
Lead manager: JP Morgan -0.17***
0.05 0.05
(0.04) (0.05) (0.05)
Lead manager: Lehman Brothers 0.11***
0.08* 0.07
*
(0.04) (0.04) (0.04)
Lead manager: Merrill Lynch 0.01 0.05* 0.05
*
(0.03) (0.03) (0.03)
Lead manager: Morgan Stanley 0.01 -0.05 -0.05
(0.04) (0.04) (0.04)
Lead manager: Others 0.04 0.09* 0.09
*
(0.04) (0.05) (0.05)
Lead manager: RBC 0.05 -0.01 -0.01
(0.06) (0.07) (0.07)
Lead manager: RBS 0.06 0.00 -0.01
(0.03) (0.04) (0.04)
Lead manager: UBS 0.15***
0.12***
0.11***
(0.03) (0.03) (0.03)
Lead manager: Wachovia -0.00 -0.05 -0.05
(0.03) (0.04) (0.04)
Lead manager: WestLB 0.09 0.10 0.10
(0.07) (0.07) (0.07)
Constant -0.16 -0.14 -0.13
(0.29) (0.32) (0.32)
N 3,083 3,083 3,083
R2 0.43 0.44 0.44
Adjusted R2 0.42 0.44 0.43

38
Note: The dependent variables are three estimations of the value of collateral losses per tranche.
CDO characteristics variables are provided as control variables to isolate the effects of Country
on collateral losses. Average rating score is an average of numerical scores converted from credit
ratings of Fitch, Moody’s and Standard & Poor’s. Country refers to the country of issuance of
the CDO, i.e. the country where the SPV is established. Deal Type refers to the type of collateral
underlying the CDO. Coupon is estimated from the average 1-month, 3-month or 6-month US
LIBOR rate for the appropriate year + premium for each tranche. Collateral losses and face
values are in billions of dollars. Country, Year and Deal Type are categorical variables.
Residual Std. Error (df = 3053) 0.28 0.31 0.31
F Statistic (df = 29; 3053) 46.36***
49.40***
48.80***
Notes: ***
Significant at the 1 percent level.
**
Significant at the 5 percent level.
*Significant at the 10 percent level.

39
Table 5: OLS Regressions –
Effects of Country of Issuance on Percentage of Collateral Value Lost at the Tranche Level
%CollateralLoss1 %CollateralLoss2 %CollateralLoss3
(1) (2) (3)
Country: Ireland -3.39 -3.58* -3.52
*
(2.33) (2.12) (2.13)
Country: Jersey -14.31***
-11.04**
-10.60**
(4.84) (4.39) (4.40)
Country: United States -12.11***
1.78 2.49
(3.30) (3.00) (3.01)
Number of tranches 2.52***
2.20***
2.20***
(0.28) (0.25) (0.25)
Year: 2004 8.05 11.05 10.94
(24.02) (21.82) (21.87)
Year: 2005 13.14 15.53 15.46
(23.30) (21.17) (21.22)
Year: 2006 30.30 38.20* 38.25
*
(23.31) (21.18) (21.23)
Year: 2007 36.37 49.00**
49.27**
(23.32) (21.19) (21.24)
Year: 2008 37.54 37.27 37.30
(26.10) (23.71) (23.76)
Average rating score -0.07 -0.42***
-0.43***
(0.16) (0.14) (0.14)
Deal Type: ABS/REIT 26.24***
-2.43 -2.89
(9.05) (8.23) (8.24)
Deal Type: CDO Securities -32.34***
-10.88***
-9.23***
(2.63) (2.39) (2.39)
Deal Type: CDO Securities/ABS -9.30***
0.20 0.51
(2.58) (2.35) (2.35)
Deal Type: Investment Grade -10.42 -7.24 -5.71
(10.29) (9.35) (9.37)
Deal Type: Mixed 11.10***
12.27***
12.04***
(3.35) (3.05) (3.05)
40
Deal Type: RMBS 3.40 -4.71 -5.20
(4.07) (3.70) (3.70)
Deal Type: Structured Finance -2.86* -1.18 -1.16
(1.63) (1.48) (1.48)
Deal Type: Structured Finance /REIT -6.94 -9.70**
-10.25**
(4.65) (4.23) (4.24)
Deal Type: Synthetic ABS 20.73***
14.33***
13.87***
(2.13) (1.93) (1.94)
Deal Type: Synthetic ABS/RMBS 19.70***
13.44**
13.20**
(6.52) (5.92) (5.94)
Deal Type: Synthetic CDO Securities -39.86***
18.39***
18.79***
(6.81) (6.19) (6.21)
Deal Type: Synthetic Investment Grade -20.63***
-29.79***
-30.17***
(3.72) (3.38) (3.39)
Deal Type: Synthetic Mezzanine -5.25 21.12**
20.84**
(9.71) (8.83) (8.85)
Deal Type: Synthetic Mixed 15.13***
13.53***
13.43***
(4.56) (4.15) (4.15)
Deal Type: Synthetic RMBS 30.14***
25.38***
25.05***
(6.56) (5.96) (5.98)
Deal Type: Synthetic RMBS/CDO -38.15***
-4.55 1.01
(9.83) (8.93) (8.95)
Deal Type: Synthetic Structured Finance 15.85***
20.66***
20.38***
(1.14) (1.04) (1.04)
Current Face Value -2.85 -3.97**
-3.94**
(1.86) (1.69) (1.69)
Coupon 0.42* 0.72
*** 0.73
***
(0.23) (0.21) (0.21)
Lead manager: Barclays -10.48***
-8.73***
-8.91***
(3.42) (3.11) (3.12)
Lead manager: Bear Stearns 7.57**
1.27 0.96
(2.95) (2.68) (2.69)
Lead manager: Calyon Bank -5.94* -6.22
** -6.45
**
(3.09) (2.80) (2.81)
Lead manager: Citi -5.43**
-3.46 -3.05

41
(2.50) (2.27) (2.28)
Lead manager: Credit Suisse -1.71 -0.64 -0.93
(2.92) (2.65) (2.66)
Lead manager: Deutsche Bank 2.62 0.03 -0.24
(2.74) (2.49) (2.50)
Lead manager: Dresdner Kleinwort -22.14***
-15.17***
-14.91***
(6.10) (5.54) (5.56)
Lead manager: Fortis Bank -4.00 -2.52 -2.90
(5.32) (4.84) (4.85)
Lead manager: Goldman Sachs -19.99***
-16.74***
-16.87***
(2.65) (2.41) (2.41)
Lead manager: ICP -13.94***
-21.21***
-21.77***
(5.14) (4.67) (4.68)
Lead manager: JP Morgan -25.86***
0.90 0.95
(3.36) (3.05) (3.05)
Lead manager: Lehman Brothers -5.29* -9.96
*** -10.27
***
(3.04) (2.77) (2.77)
Lead manager: Merrill Lynch -5.06**
1.49 1.85
(2.37) (2.16) (2.16)
Lead manager: Morgan Stanley 5.38* -1.93 -2.22
(3.25) (2.95) (2.96)
Lead manager: Others -7.73**
8.56***
8.14**
(3.61) (3.28) (3.28)
Lead manager: RBC 11.35**
6.52 6.43
(5.25) (4.77) (4.78)
Lead manager: RBS 6.44**
0.99 0.56
(2.87) (2.61) (2.62)
Lead manager: UBS 0.50 -4.48**
-4.87**
(2.49) (2.26) (2.27)
Lead manager: Wachovia -15.06***
-19.31***
-19.60***
(2.88) (2.61) (2.62)
Lead manager: WestLB 0.70 2.31 2.14
(5.38) (4.88) (4.89)
Constant -11.89 -9.71 -9.18
(23.49) (21.34) (21.39)

42
N 3,079 3,079 3,079
R2 0.45 0.55 0.55
Adjusted R2 0.44 0.54 0.54
Residual Std. Error (df = 3029) 22.75 20.67 20.71
F Statistic (df = 49; 3029) 49.60***
74.86***
74.50***
Notes: ***
Significant at the 1 percent level.
**
Significant at the 5 percent level.
*Significant at the 10 percent level.
Note: The dependent variables are three estimations of the percentage of collateral value
defaulted. CDO characteristics variables are provided as control variables to isolate the effects
of Country on collateral losses. Average rating score is an average of numerical scores converted
from credit ratings of Fitch, Moody’s and Standard & Poor’s. Country refers to the country of
issuance of the CDO, i.e. the country where the SPV is established. Deal Type refers to the type
of collateral underlying the CDO. Coupon is estimated from the average 1-month, 3-month or 6-
month US LIBOR rate for the appropriate year + premium for each tranche. Country, Year and
Deal Type are categorical variables.

43
Table 6: OLS regressions –
Effects of Credit Ratings and Tier 1 Capital Ratio on Country-Specific CDO Performance
(Collateral Loss in $ billions)
Collateral Loss Collateral Loss Collateral Loss Collateral Loss
(1) (2) (3) (4)
Country Cayman Islands Jersey Ireland US
Average rating score 0.01***
0.00 0.00 -0.00
(0.00) (0.00) (0.00) (0.00)
Tier 1 capital ratio -0.02 -2.57***
-0.01 -0.23***
(0.14) (0.00) (0.01) (0.00)
Number of tranches 0.06***
-0.04***
0.07***
-0.01***
(0.00) (0.00) (0.02) (0.00)
Year: 2005 -0.06
(0.09)
Year: 2006 0.12
0.14
***
(0.09)
(0.04)
Year: 2007 0.13
0.26
*** 0.07
***
(0.09)
(0.05) (0.00)
Deal Type: ABS/REIT 0.26**
(0.11)
Deal Type: CDO
Securities -0.29
***
-0.29
***
(0.04)
(0.00)
Deal Type: CDO
Securities/ABS 0.04
-0.22
***
(0.03)
(0.00)
Deal Type:
INVESTMENT
GRADE
-0.58***
(0.12)
Deal Type: Mixed 0.09
*
(0.05)
Deal Type: RMBS -0.03

44
(0.05)
Deal Type: Structured
Finance 0.00
-0.11
***
(0.02)
(0.04)
Deal Type: Structured
finance/REIT -0.07
0.02
(0.07)
(0.07)
Deal Type: Synthetic
ABS 0.30
***
-0.22
***
(0.03)
(0.00)
Deal Type: Synthetic
ABS/RMBS 0.14
*
(0.08)
Deal Type: Synthetic
CDO Securities -0.21
**
(0.08)
Deal Type: Synthetic
Investment Grade 0.03
-0.31
***
(0.06)
(0.10)
Deal Type: Synthetic
Mezz -0.03
(0.12)
Deal Type: Synthetic
Mixed 0.30
***
(0.06)
Deal Type: Synthetic
RMBS 0.54
*** -0.21
***
(0.09) (0.00)
Deal Type: Synthetic
Structured Finance 0.21
***
0.07
(0.02)
(0.04)
Current Tranche Face
Value 0.18
*** 0.00 0.05 -0.00
***
(0.03) (0.00) (0.05) (0.00)
Coupon 0.00 0.00 -0.01 -0.00
(0.00) (0.00) (0.01) (0.00)
Constant -0.22 20.24***
-0.27 2.93***

45
(1.13) (0.00) (0.17) (0.00)
N 2,521 19 118 52
R2 0.43 1.00 0.75 1.00
Adjusted R2 0.42 1.00 0.72 1.00
Residual Std. Error 0.28 (df = 2483) 0.00 (df = 12) 0.12 (df = 104) 0.00 (df = 42)
F Statistic 49.67
*** (df =
37; 2483)
102,509,480,450,
763,399,120,208,
828.00***
(df = 6;
12)
24.00***
(df =
13; 104)
4,258,838,519,530
,944,820,464,882,
822,202.00***
(df
= 9; 42)
Notes: ***
Significant at the 1 percent level.
**
Significant at the 5 percent level.
*Significant at the 10 percent level.
Note: The dependent variable is the value of collateral losses per tranche. Regression (1) also
includes Lead Manager as an independent variable. CDO characteristics variables are provided
as control variables to isolate the effects of Average rating score and Tier 1 capital ratio on
collateral losses. Tier 1 capital ratio is an average of CDO sponsor banks’ capital ratios for the
2000-2003 period when data was available. Average rating score is an average of numerical
scores converted from credit ratings of Fitch, Moody’s and Standard & Poor’s. Deal Type refers
to the type of collateral underlying the CDO. Coupon is estimated from the average 1-month, 3-
month or 6-month US LIBOR rate for the appropriate year + premium for each tranche. Year and
Deal Type are categorical variables.

46
Table 7: OLS regressions –
Effects of Credit Ratings and Tier 1 Capital Ratio on Country-Specific CDO Performance
(Percentage of Collateral Loss per Tranche)
% Collateral Loss % Collateral Loss % Collateral Loss % Collateral Loss
(1) (2) (3) (4)
Country Cayman Islands Jersey Ireland US
Average rating
score 0.00 0.00 0.33 -0.00
(0.17) (0.00) (0.53) (0.00)
Tier 1 capital ratio 54.87***
-410.60***
-8.20***
-5.42***
(11.57) (0.00) (1.46) (0.00)
Number of tranches 2.44***
-13.54***
0.80 3.38***
(0.30) (0.00) (2.00) (0.00)
Year: 2005 3.90
(7.02)
Year: 2006 21.93
***
10.37
*
(7.02)
(5.51)
Year: 2007 26.28
***
28.46
*** 0.94
***
(7.07)
(6.95) (0.00)
Deal Type:
ABS/REIT 33.33
***
(9.05)
Deal Type: CDO
Securities -31.63
***
-27.06
***
(3.17)
(0.00)
Deal Type: CDO
Securities/ABS -5.32
*
-22.74
***
(2.79)
(0.00)
Deal Type: Mixed 23.30***
(3.64)
Deal Type: RMBS 3.51
(4.03)
Deal Type:
Structured Finance -2.08
-11.86
**
(1.82)
(4.75)

47
Deal Type:
Structured
Finance/REIT
-13.78***
35.28***
(5.23)
(8.65)
Deal Type:
Investment Grade -23.68
(14.95)
Deal Type:
Synthetic ABS 20.89
***
48.49
***
(2.44)
(0.00)
Deal Type:
Synthetic
ABS/RMBS
16.30**
(6.48)
Deal Type:
Synthetic CDO
Securities
-39.37***
(6.76)
Deal Type:
Synthetic
Investment Grade
-5.53
-4.88
(4.98)
(13.06)
Deal Type:
Synthetic Mezz 0.72
(9.68)
Deal Type:
Synthetic Mixed 17.52
***
(4.53)
Deal Type:
Synthetic RMBS 34.10
*** -44.45
***
(7.30) (0.00)
Deal Type:
Synthetic
Structured Finance
15.78***
47.57***
(1.24)
(5.49)
Deal Type:
Synthetic
RMBS/CDO
-16.32*
(8.70)

48
Current Tranche
Face Value -2.38 0.00 1.15 -0.00
***
(2.12) (0.00) (5.99) (0.00)
Coupon 0.42 0.00 -0.71 -0.00
(0.26) (0.00) (0.89) (0.00)
Constant -442.95***
3,261.49***
68.37***
54.38***
(90.46) (0.00) (21.82) (0.00)
N 2,521 19 118 52
R2 0.45 1.00 0.75 1.00
Adjusted R2 0.44 1.00 0.72 1.00
Residual Std. Error 22.48 (df = 2483) 0.00 (df = 12) 14.95 (df = 104) 0.00 (df = 42)
F Statistic 54.05
*** (df = 37;
2483)
57,217,902,157,57
7,984,912,062,488
.00***
(df = 6; 12)
23.81***
(df = 13;
104)
3,275,371,745,218,
738,641,604,286,0
08,422.00***
(df =
9; 42)
Notes: ***
Significant at the 1 percent level.
**
Significant at the 5 percent level.
*Significant at the 10 percent level.
Note: The dependent variable is the percentage of collateral value defaulted. Regression (1) also
includes Lead Manager as an independent variable. CDO characteristics variables are provided
as control variables to isolate the effects of Average rating score and Tier 1 capital ratio on
collateral losses. Tier 1 capital ratio is an average of CDO sponsor banks’ capital ratios for the
2000-2003 period when data was available. Average rating score is an average of numerical
scores converted from credit ratings of Fitch, Moody’s and Standard & Poor’s. Deal Type refers
to the type of collateral underlying the CDO. Coupon is estimated from the average 1-month, 3-
month or 6-month US LIBOR rate for the appropriate year + premium for each tranche. Year and
Deal Type are categorical variables.

49
Table 8: Wald Tests for the Overall Effect of the Country Variable on CDO Performance
Regression χ2 Degrees
of
Freedom
P(> χ2)
CollatLoss1 26.5 3 7.5e-06
CollatLoss2 9.6 3 0.023
CollatLoss3 8.6 3 0.035
%CollateralLoss1 11.1 3 0.011
%CollateralLoss2 9.4 3 0.024
%CollateralLoss3 8.7 3 0.033
Note: Regression refers to the appropriate regression for which the Wald Test was calculated.
The regressions in question are in Tables 4 and 5.


