Embed Size (px)
Citation preview
Fuel 90 (2011) 3417–3423
Contents lists available at ScienceDirect
Fuel
journal homepage: www.elsevier .com/locate / fuel
An FT-IR spectroscopic study of carbonyl functionalities in bio-oils
Caroline Lievens, Daniel Mourant, Min He, Richard Gunawan, Xiang Li, Chun-Zhu Li ⇑Fuels and Energy Technology Institute, Curtin University, GPO Box U1987, Perth, WA 6845, Australia
a r t i c l e i n f o a b s t r a c t
Article history:Received 1 April 2011Received in revised form 29 May 2011Accepted 1 June 2011Available online 14 June 2011
Keywords:Bio-oilCarbonylFT-IRPyrolysisEsterification
0016-2361/$ - see front matter � 2011 Elsevier Ltd. Adoi:10.1016/j.fuel.2011.06.001
⇑ Corresponding author. Tel.: +61 8 9266 1131.E-mail address: [email protected] (C.-Z. L
Pyrolysis bio-oil contains abundant O-containing structures. Carbonyls are particularly important notonly because they are abundant and exist in many forms (e.g. as acids, esters, ketones and aldehydes)but also because they are reactive and are a key consideration of bio-oil upgrading. This study aims toinvestigate the distribution of carbonyl groups in a variety of bio-oil samples prepared from the pyrolysisof mallee wood, bark and leaves in a fluidised-bed reactor. Some bio-oil samples also underwent ester-ification reactions with methanol in the presence of solid Amberlyst acid catalyst. The bio-oil sampleswere diluted with isopropanol prior to the acquisition of FT-IR spectra using a CaF2 liquid cell. The FT-IR spectra of bio-oils in the range of 1490–1850 cm�1 were deconvoluted with 9 Gaussian bands. Ourresults reveal that the bio-oils from the pyrolysis of wood, bark and leaves of the same mallee tree specieshad very different concentrations and types of carbonyls, which are related to the contents of hemicellu-lose, cellulose, lignin and extractives in the wood, bark and leaves. Our study also reveals that the carbon-yls in the light and heavy fractions of a bio-oil may react differently during the reactions of bio-oil withmethanol in the presence of the Amberlyst solid acid catalyst.
� 2011 Elsevier Ltd. All rights reserved.
1. Introduction
Pyrolysis followed by bio-refinery is a promising technologicalroute to convert biomass into liquid biofuels. The pyrolysis of bio-mass produces a mixture of organic compounds with a wide rangeof molar masses and O-containing functional groups [1–6]. TheseO-containing functional groups are largely responsible for the pro-found properties of bio-oil, making bio-oil distinctly different fromthe crude petroleum [1,2,4,5]. Understanding the bio-oil composi-tion, especially its O-containing functional groups, is an indispens-able aspect of the bio-refinery technology development [7].
Of the abundant O-containing functional groups in a bio-oil,carbonyl groups deserve some special attention, not only becausethey are abundant and exist in many forms (as acids, ketones, alde-hydes, etc.) but also because they are reactive even during the stor-age of bio-oil under ambient conditions [8]. Furthermore, theirreactivity, e.g. during the hydrogenation of bio-oil, depends ontheir exact form as well as their local chemical environment in abio-oil (macro) molecule [7,9].
Many analytical techniques can be used to provide some infor-mation about the carbonyl functionalities in a bio-oil [3,10–13].While the gas chromatography–mass spectrometry (GC–MS) orother forms of GC techniques can identify and quantify the exactlight molecules containing a carbonyl, these techniques do not giveany information about the carbonyls in the high molar mass
ll rights reserved.
i).
fractions of the bio-oil. Some heavy fractions of bio-oil, especiallyoligomers/polymers from the partial decomposition of celluloseand lignin during pyrolysis, would even not be amenable to analy-sis with the high performance liquid chromatography (HPLC).
Fourier transform infrared (FT-IR) spectroscopy is an ideal tech-nique to give fingerprint information about the carbonyl groups inthe entire bio-oil sample, regardless of its molar mass distribution.The carbonyl groups show a broad absorption band next to andpartially overlapping with the absorption of aromatic ring breath-ing in the 1490–1850 cm�1 range of the FT-IR spectrum of a bio-oil.This broad carbonyl band is due to a variety of carbonyl function-alities such as aldehydes, ketones, acids and esters. The spectraldeconvolution of this broad band would give a lot of detailed infor-mation, as fingerprints, about the various carbonyls in the bio-oil.Indeed, the deconvolution of FT-IR spectra of coal in this region[14] has given detailed information about the aromatic esters,acids and ketonic structures in coal. However, no such attempt ofspectral deconvolution has been made for the FT-IR spectra ofbio-oils. As the structural features of solid coal are very differentfrom those of liquid bio-oil, the spectral deconvolution methodfor coal is unlikely to be directly applicable to bio-oils.
This study aims to investigate the relative concentrations ofvarious carbonyl groups in a variety of bio-oils produced fromthe pyrolysis of mallee wood, bark and leaves in a fluidised-bedreactor as well as these bio-oils after esterification with methanol.The FT-IR spectra of these bio-oil samples were deconvoluted using9 Gaussian bands, revealing that FT-IR spectroscopy is a simple andefficient tool to examine the carbonyl functionalities of bio-oils.

60
80
100
T-IR
car
bony
l ban
d
Bark bio-oil Wood bio-oil Leaf bio-oil
3418 C. Lievens et al. / Fuel 90 (2011) 3417–3423
2. Materials and methods
2.1. Biomass and bio-oil samples
Mallee (Eucalyptus loxophleba ssp. gratiae) biomass growing inWestern Australia for controlling dryland salinity [15–17] wasused in this study. Mallee biomass samples were analysed (Table 1)to determine the contents of hemicellulose, cellulose and ligninfollowing the TAPPI test methods T-249, UM250 and T-222. Thecontent of extractives was calculated by difference, which is a col-lective term for extractives, ash, waxes, amino-acids, etc.
Bio-oils were produced from the pyrolysis of mallee wood, barkand leaves (180–425 lm particle size) at 773 K in a fluidised-bedpyrolyser [18] equipped with a condensation system consistingof a water-cooled condenser, a dry ice box, an impinger bottleand a filtering tower. The estimated particle heating rates duringpyrolysis may exceed 1000 K s�1. The bio-oil yields from the pyro-lysis of wood, bark and leaves at 773 K were 62.6, 38.3 and49.9 wt% respectively.
The bio-oil products from pyrolysis were sealed in bottles andstored in a freezer (�265 K) until being used in furtherexperiments.
2.2. Esterification of bio-oil and subsequent distillation
The catalytic esterification–acetalisation experiments were per-formed in a 130 mL Hastalloy batch autoclave reactor equippedwith a magnetic agitator and a ceramic band heater. GC-grademethanol (>99.98%) purchased from Merck was used. The com-mercially available solid acid catalyst Amberlyst-70 (Rohm & Haas)was used directly in the experiments without any pre-treatment. Adetailed description of the bio-oil esterification and the experi-mental procedure can be found elsewhere [19]. In a typical exper-iment, a mixture of methanol and raw bio-oil at a mass ratio of0.9:1 was loaded into the reactor at room temperature. Once thesolid acid catalyst was added into the reactor vessel, the reactionwas initiated, although a period of approximately 10–20 min wasrequired to reach the target reaction temperature pre-set in therange of 343–443 K.
To obtain the heavy bio-oil fraction, all bio-oils were vacuumdistilled below 313 K (2 torr) for 30 min, estimated to be equiva-lent to the distillation at 450 K at atmospheric pressure. The resid-ual fraction of bio-oil after distillation was defined as the ‘‘heavy’’fraction.
2.3. Bio-oil sample preparation and acquisition of FT-IR spectra
All FT-IR spectra presented in this paper were recorded using aPerkin-Elmer Spectrum GX FT-IR/Raman spectrometer with a spec-tral resolution of 4 cm�1 at room temperature. Each spectrum rep-resents the average of at least 6 scans. Each bio-oil sample wasanalysed for 10 times to allow for a relatively meaningful calcula-tion of standard deviation.
The raw bio-oils were initially analysed by loading the bio-oilsamples into a liquid sample cell formed by KBr windows with a
Table 1Contents of lignin, hemicellulose, cellulose and extractives in mallee wood, bark andleaves.
Wood Bark Leaf
Lignin (wt%) 24.9 14.4 25.9Hemi-cellulose (wt%) 40.7 30.9 14.8Cellulose (wt%) 22.2 19.5 14.6Extractives (wt%)a 12.2 35.2 44.7
a By difference.
0.05 mm Teflon spacer in between (i.e. the light path length wasalso 0.05 mm). However, the high content of water in the bio-oilscreated fogs on the KBr windows, resulting in non-reproducibleabsorbance. The more water-resistant CaF2 windows were thenused to record the FT-IR spectra of raw bio-oils with spacer sizesof 0.05 mm Teflon and 0.025 mm lead in between the CaF2
windows.Unfortunately, the absorbance of bio-oil samples in between
the CaF2 windows separated by the thinnest spacer available wasstill too high in the 1490–1850 cm�1 region. The bio-oil sampleshad to be diluted to record spectra that would show linear relation-ships between absorbance and bio-oil concentration. Isopropanol(IPA, LC–MS Chromasolv from Fluka) was used as the diluent andthe CaF2 cell filled with IPA was used as the reference to recordthe FT-IR spectra of IPA-diluted bio-oil samples. Fig. 1 shows goodlinear relationships between FT-IR absorbance (shown as the totalpeak area between 1490 and 1850 cm�1) and the bio-oil concen-tration with a nominal spacer thickness (also light pass length) of0.025 mm.
The dilution of bio-oil with the IPA solvent has ensured that alinearity between absorbance (and peak area) and bio-oil concen-tration was maintained for all spectral data reported here. In orderto facilitate comparison among various samples, the observed FT-IR intensity (and band area) was corrected with the followingmathematical conversion:
Intensitycorrected ¼ Intensityobserved=ð1� solvent%Þ ð1Þ
Areacorrected ¼ Areaobserved=ð1� solvent%Þ ð2Þ
so that the intensity (peak area) is expressed on the same basis ofraw bio-oil to facilitate direct comparison. Multiplying the peakarea (or intensity) by the yield of bio-oil during pyrolysis furtherconverts the spectral data so that they can be compared on thesame basis of raw substrates. In other words, the final peak inten-sity/area becomes a relative measure of the yield of each carbonylfunctionality.
The dilution of bio-oil with IPA also has additional advantages.After the dilution with IPA, very viscous samples could also be ana-lysed, which would otherwise be practically impossible to beloaded into the CaF2 cell reproducibly. As only a minute amountof bio-oil is needed to fill the CaF2 cell, any heterogeneity in abio-oil sample represents a difficulty in sampling. The dilution ofbio-oil with IPA means that a larger amount of bio-oil sample couldbe dissolved in IPA and the bio-oil IPA solution is then sampled intothe CaF2 cell. Our experiments showed that the dilution of bio-oil
0 10 20 30 400
20
40
Tota
l are
a of
F
% of oil diluted in IPA
Fig. 1. Linearity between the bio-oil concentration and the total area of FT-IRcarbonyl band.

C. Lievens et al. / Fuel 90 (2011) 3417–3423 3419
samples with IPA indeed greatly improved the reproducibility ofFT-IR data.
2.4. GC–MS analysis
The analysis of the volatile compounds in bio-oil samples wascarried out using an Agilent GC–MS (6890 series GC with 5973series MS detector) equipped with a 30 m � 0.25 mm i.d HP-Innowax capillary column (0.25 lm crosslinked polyethylene gly-col). Samples (about 3 wt%) were diluted with a mixture of chlo-roform and methanol (4:1) for injection into GC–MS. Theanalysis consisted of injecting 1 lL of sample under the follow-ing conditions: 50:1 split ratio, initial oven temperature of313 K held for 3 min, then heated with at a rate of 10 K min�1
to 533 K and held for 5 min. A solvent delay of 3.6 min was em-ployed. Masses were scanned from 15 to 500 mass units. Theidentification of the peaks in the chromatogram was based onthe comparison with standard spectra of compounds in the NISTlibrary and/or on the retention times of known species injected.Quantification was done by the manual integration of the chosensingle ion chromatogram.
3. Results and discussion
3.1. Spectral deconvolution
The FT-IR spectra of the IPA-diluted bio-oils were deconvolutedwith a curve fitting programme Galactic, Grams 32. The raw FT-IRspectra were firstly baseline-corrected using a multi-point interac-tive method provided by the PE software. After trial and error ofband positioning, 9 different Gaussian bands were chosen thatcan adequately curve-fit the spectra of all bio-oils in this study.During curve fitting, band positions were fixed whilst bandwidthswere restrained to different maximum limits. An example of spec-tral deconvolution of the FT-IR spectrum of an IPA-diluted woodbio-oil is shown in Fig. 2. The FT-IR spectra of all other bio-oilsinvestigated achieved similar success of spectral deconvolutionusing these bands and the procedures described here.
3.2. Band assignment
The assignment of the above-mentioned 9 bands is briefly sum-marised in Table 2. Some slight adjustment of peak position/width
1850 1800 1750 17000.0
0.1
0.2
0.3
0.4
0.5
Abso
rban
ce (-
)
Wavenum
Original Spectrum Total of all deconvolution bands 1767 cm-1
1740 cm-1
1713 cm-1
1696 cm-1
1654 cm-1
1606 cm-1
1565 cm-1
1517 cm-1
1501 cm-1
Fig. 2. Spectral deconvolution of the FT-IR spectrum in the region of 1850–1490 cm�1 forconcentration of bio-oil in isopropanol was 20 wt%.
had to be made when the bio-oil was diluted with methanol duemainly to the difference in molecular interaction (including hydro-gen bonding) between bio-oil–methanol and bio-oil–IPA. The bandassignment was established based on the spectra acquired in thisstudy and the spectra of pure compounds in the literature [20,21].
Band 1 (1767 cm�1) is mainly due to cyclic esters, i.e. lactones,which absorb around 1770 cm�1 [20,21].
Band 2 (1740 cm�1) is mainly due to un-conjugated alkyl alde-hydes and alkyl esters. Almost all alkyl esters, including methyl es-ters of fatty acids, absorb in the 1750–1730 cm�1 range. Formates,having a carbonyl absorption frequency around 1720 cm�1, are anexception. In vinyl and phenyl esters, two opposing effects of highelectron density of oxygen in esters and double bonds cancel eachother out, making these compounds absorb at the same frequencyas saturated esters [20,21]. However these unsaturated esters arenot commonly found in bio-oils [22–24]. It should be emphasisedthat, in terms of the intensities of alkyl aldehydes and esters inthe obtained spectra, one should keep in mind that the molarextinction coefficients of alkyl esters are twice as high as that ofthe un-conjugated alkyl aldehydes [25].
Band 3 (1713 cm�1) is mainly due to aliphatic (and fatty)acids. Saturated open chain ketones (1725–1705 cm�1) and arylaldehydes (1715–1695 cm�1) may also contribute to this band[20,21]. However, the concentrations of aliphatic ketones and aro-matic aldehydes are rather small in bio-oils compared with thatof carboxylic acids [22–24]. The carbonyl in carboxylic acids alsoabsorbs much more intensely than those in ketones and alde-hydes. Molar extinction coefficients (e) of carboxylic acids aremore than double of the values of corresponding ketones andunsaturated aldehydes [25]. Therefore, aliphatic carboxylic acidsare practically the main contributors to this band in the FT-IRspectra of bio-oils.
Band 4 (1696 cm�1) is mainly due to unsaturated aldehydes(1705–1685 cm�1) and unsaturated ketones (1690–1675 cm�1)[20,21]. However, this band should be used carefully to discusscompounds and their quantities in bio-oils, because this bandis very wide. Band 4 virtually represents unsaturated alde-hydes/ketones and curve-fitting residuals of other neighbouringbands.
Band 5 (1654 cm�1) is mainly due to hydroxy unsaturated alde-hydes/ketones. Hydroxyl group on unsaturated aldehydes/ketones
1650 1600 1550 1500
ber (cm-1)
the bio-oil from the pyrolysis of mallee wood at 773 K in a fluidised-bed reactor. The
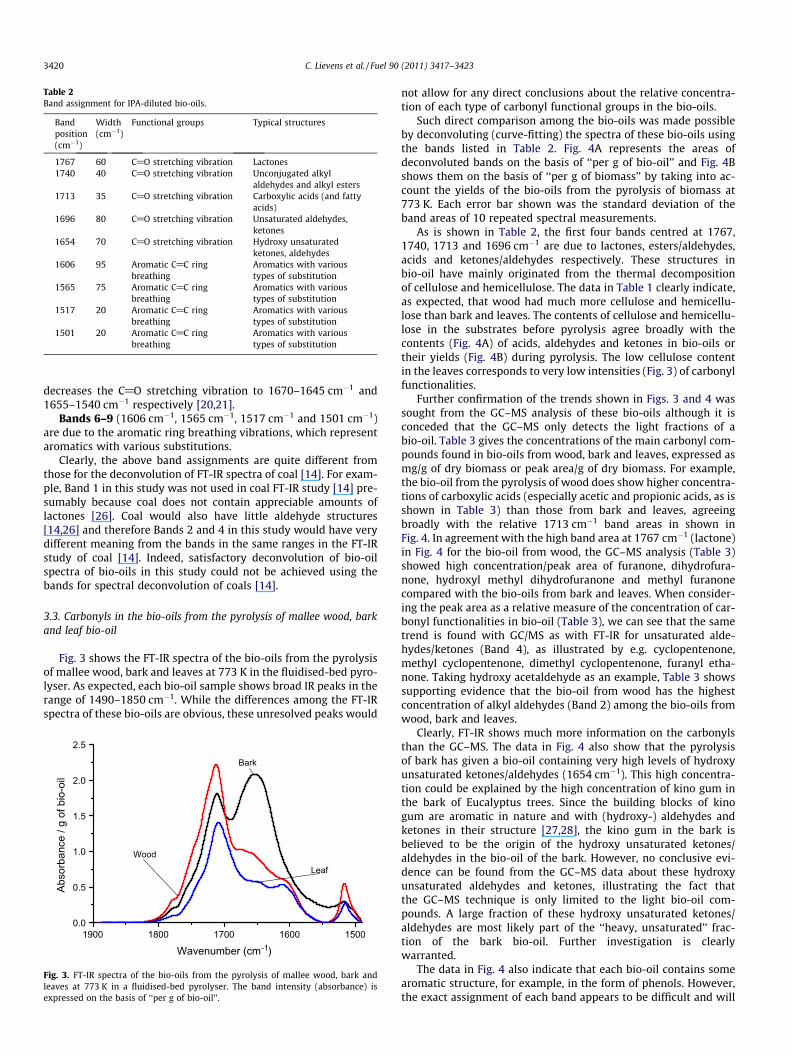
Table 2Band assignment for IPA-diluted bio-oils.
Bandposition(cm�1)
Width(cm�1)
Functional groups Typical structures
1767 60 C@O stretching vibration Lactones1740 40 C@O stretching vibration Unconjugated alkyl
aldehydes and alkyl esters1713 35 C@O stretching vibration Carboxylic acids (and fatty
acids)1696 80 C@O stretching vibration Unsaturated aldehydes,
ketones1654 70 C@O stretching vibration Hydroxy unsaturated
ketones, aldehydes1606 95 Aromatic C@C ring
breathingAromatics with varioustypes of substitution
1565 75 Aromatic C@C ringbreathing
Aromatics with varioustypes of substitution
1517 20 Aromatic C@C ringbreathing
Aromatics with varioustypes of substitution
1501 20 Aromatic C@C ringbreathing
Aromatics with varioustypes of substitution
3420 C. Lievens et al. / Fuel 90 (2011) 3417–3423
decreases the C@O stretching vibration to 1670–1645 cm�1 and1655–1540 cm�1 respectively [20,21].
Bands 6–9 (1606 cm�1, 1565 cm�1, 1517 cm�1 and 1501 cm�1)are due to the aromatic ring breathing vibrations, which representaromatics with various substitutions.
Clearly, the above band assignments are quite different fromthose for the deconvolution of FT-IR spectra of coal [14]. For exam-ple, Band 1 in this study was not used in coal FT-IR study [14] pre-sumably because coal does not contain appreciable amounts oflactones [26]. Coal would also have little aldehyde structures[14,26] and therefore Bands 2 and 4 in this study would have verydifferent meaning from the bands in the same ranges in the FT-IRstudy of coal [14]. Indeed, satisfactory deconvolution of bio-oilspectra of bio-oils in this study could not be achieved using thebands for spectral deconvolution of coals [14].
3.3. Carbonyls in the bio-oils from the pyrolysis of mallee wood, barkand leaf bio-oil
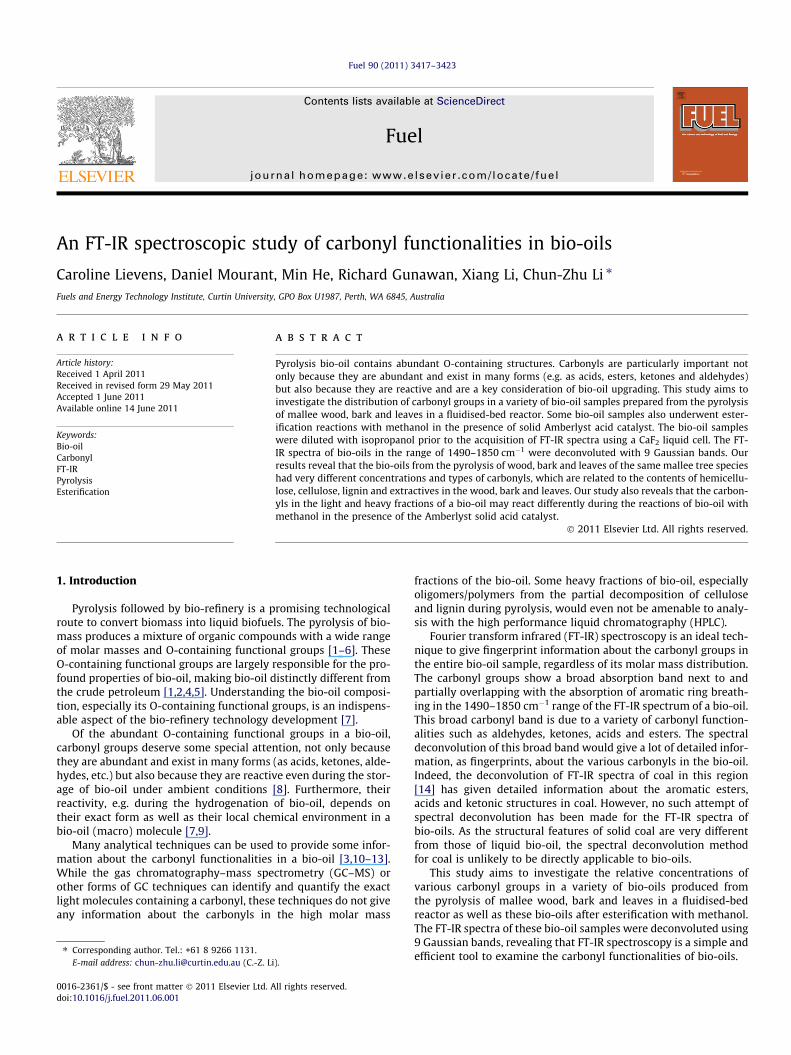
Fig. 3 shows the FT-IR spectra of the bio-oils from the pyrolysisof mallee wood, bark and leaves at 773 K in the fluidised-bed pyro-lyser. As expected, each bio-oil sample shows broad IR peaks in therange of 1490–1850 cm�1. While the differences among the FT-IRspectra of these bio-oils are obvious, these unresolved peaks would
1900 1800 1700 1600 15000.0
0.5
1.0
1.5
2.0
2.5
Leaf
Bark
Abso
rban
ce /
g of
bio
-oil
Wavenumber (cm-1)
Wood
Fig. 3. FT-IR spectra of the bio-oils from the pyrolysis of mallee wood, bark andleaves at 773 K in a fluidised-bed pyrolyser. The band intensity (absorbance) isexpressed on the basis of ‘‘per g of bio-oil’’.
not allow for any direct conclusions about the relative concentra-tion of each type of carbonyl functional groups in the bio-oils.
Such direct comparison among the bio-oils was made possibleby deconvoluting (curve-fitting) the spectra of these bio-oils usingthe bands listed in Table 2. Fig. 4A represents the areas ofdeconvoluted bands on the basis of ‘‘per g of bio-oil’’ and Fig. 4Bshows them on the basis of ‘‘per g of biomass’’ by taking into ac-count the yields of the bio-oils from the pyrolysis of biomass at773 K. Each error bar shown was the standard deviation of theband areas of 10 repeated spectral measurements.
As is shown in Table 2, the first four bands centred at 1767,1740, 1713 and 1696 cm�1 are due to lactones, esters/aldehydes,acids and ketones/aldehydes respectively. These structures inbio-oil have mainly originated from the thermal decompositionof cellulose and hemicellulose. The data in Table 1 clearly indicate,as expected, that wood had much more cellulose and hemicellu-lose than bark and leaves. The contents of cellulose and hemicellu-lose in the substrates before pyrolysis agree broadly with thecontents (Fig. 4A) of acids, aldehydes and ketones in bio-oils ortheir yields (Fig. 4B) during pyrolysis. The low cellulose contentin the leaves corresponds to very low intensities (Fig. 3) of carbonylfunctionalities.
Further confirmation of the trends shown in Figs. 3 and 4 wassought from the GC–MS analysis of these bio-oils although it isconceded that the GC–MS only detects the light fractions of abio-oil. Table 3 gives the concentrations of the main carbonyl com-pounds found in bio-oils from wood, bark and leaves, expressed asmg/g of dry biomass or peak area/g of dry biomass. For example,the bio-oil from the pyrolysis of wood does show higher concentra-tions of carboxylic acids (especially acetic and propionic acids, as isshown in Table 3) than those from bark and leaves, agreeingbroadly with the relative 1713 cm�1 band areas in shown inFig. 4. In agreement with the high band area at 1767 cm�1 (lactone)in Fig. 4 for the bio-oil from wood, the GC–MS analysis (Table 3)showed high concentration/peak area of furanone, dihydrofura-none, hydroxyl methyl dihydrofuranone and methyl furanonecompared with the bio-oils from bark and leaves. When consider-ing the peak area as a relative measure of the concentration of car-bonyl functionalities in bio-oil (Table 3), we can see that the sametrend is found with GC/MS as with FT-IR for unsaturated alde-hydes/ketones (Band 4), as illustrated by e.g. cyclopentenone,methyl cyclopentenone, dimethyl cyclopentenone, furanyl etha-none. Taking hydroxy acetaldehyde as an example, Table 3 showssupporting evidence that the bio-oil from wood has the highestconcentration of alkyl aldehydes (Band 2) among the bio-oils fromwood, bark and leaves.
Clearly, FT-IR shows much more information on the carbonylsthan the GC–MS. The data in Fig. 4 also show that the pyrolysisof bark has given a bio-oil containing very high levels of hydroxyunsaturated ketones/aldehydes (1654 cm�1). This high concentra-tion could be explained by the high concentration of kino gum inthe bark of Eucalyptus trees. Since the building blocks of kinogum are aromatic in nature and with (hydroxy-) aldehydes andketones in their structure [27,28], the kino gum in the bark isbelieved to be the origin of the hydroxy unsaturated ketones/aldehydes in the bio-oil of the bark. However, no conclusive evi-dence can be found from the GC–MS data about these hydroxyunsaturated aldehydes and ketones, illustrating the fact thatthe GC–MS technique is only limited to the light bio-oil com-pounds. A large fraction of these hydroxy unsaturated ketones/aldehydes are most likely part of the ‘‘heavy, unsaturated’’ frac-tion of the bark bio-oil. Further investigation is clearlywarranted.
The data in Fig. 4 also indicate that each bio-oil contains somearomatic structure, for example, in the form of phenols. However,the exact assignment of each band appears to be difficult and will
0
30
60
90
120
15011517156516061654169617131740
Area
/ g
of b
io-o
il
Wood Oil Bark Oil Leaf Oil
1767
(A)
0
15
30
45
Wavenumber (cm-1)
16961767
Area
/ g
of b
iom
ass
Wood biomass Bark biomass Leaf biomass
(B)
1740 1654 1606 1565 1517 15011713
Fig. 4. Band areas from the spectral deconvolution of the FT-IR spectra of the bio-oils from the pyrolysis of mallee wood, bark and leaves at 773 K in a fluidised-bed pyrolyser.The band areas are expressed on the basis of (A) ‘‘per g of bio-oil’’ and (B) ‘‘per g of biomass’’.
Table 3Concentration/peak area of main carbonyls in bio-oil identified with GC–MS.
Compounds Wood Bark Leaf
mg/g dry biomassCyclopentanone 0.19 0.16 0.35Hydroxy propanone 18.28 6.16 0.95Hydroxy acetaldehyde 45.45 2.66 0.00Acetic acid 37.50 17.73 6.49Furaldehyde 5.20 2.35 0.00Propionic acid 1.44 1.28 0.90Furanone 3.94 1.09 0.15Hydroxy methoxy benzaldehyde 0.44 0.25 0.00Hydroxy dimethoxy benzaldehyde 7.39 0.32 0.00Dimethoxy hydroxy cinnamaldehyde 1.94 0.47 0.00
Peak area/g dry biomassCyclopentenone 18,531 2616 4436Methylcyclopentenone 14,941 1520 8353Hydroxy butanone 24,417 3284 2126Furanyl ethanone 6883 770 3736Formic acid 28,439 1314 0Dimethyl cyclopentenone 3556 317 2176Methyl furaldehyde 7356 1503 0Dihydro furanone 3192 387 0Pentanoic acid 5432 618 2173Methyl butanoic acid 0 71 12,820Methyl furanone 21,558 1666 0Hydroxy cyclopentenone 6564 1412 0Butenoic acid 5256 329 0Hydroxy, methyl cyclopentenone 40,076 4019 7922Ethyl hydroxy cyclopentenone 4050 370 0Hydroxy methyl dihydrofuranone 21,350 802 04-oxo Pentanoic acid 15,824 1099 0(hydroxy–methoxyphenyl) Ethanone 15,889 400 1562(hydroxy–methoxyphenyl) Propanone 10,916 849 6511Methyl ethyl benzoic acid 0 0 31,155n-Hexadecanoic acid 0 0 9725(hydroxy dimethoxyphenyl) Ethanone 61,218 1394 1839Dihydroxy methoxyphenyl Ethanone 55,860 3349 6037Hydroxy methoxy cinnamaldehyde 10,895 93 0
C. Lievens et al. / Fuel 90 (2011) 3417–3423 3421
be a topic of further study. This difficulty is at least partly due tothe complex nature of bio-oils with aromatic structures havingmany origins. In this study, these bands representing the aromatic
rings were considered in the spectral deconvolution in order toachieve reasonable curve-fitting results for the carbonyl bands.
3.4. Changes in the carbonyl functionalities due to the esterification ofthe bio-oil
When bio-oil is esterified with methanol in the presence of anacid catalyst, a whole suit of reactions would take place. In additionto the conversion of carboxylic acids into esters, aldehydes and ke-tones would be converted into acetals. Therefore, the raw bio-oiland esterified bio-oil samples provide an ideal set of examples toverify the spectral deconvolution method presented above.
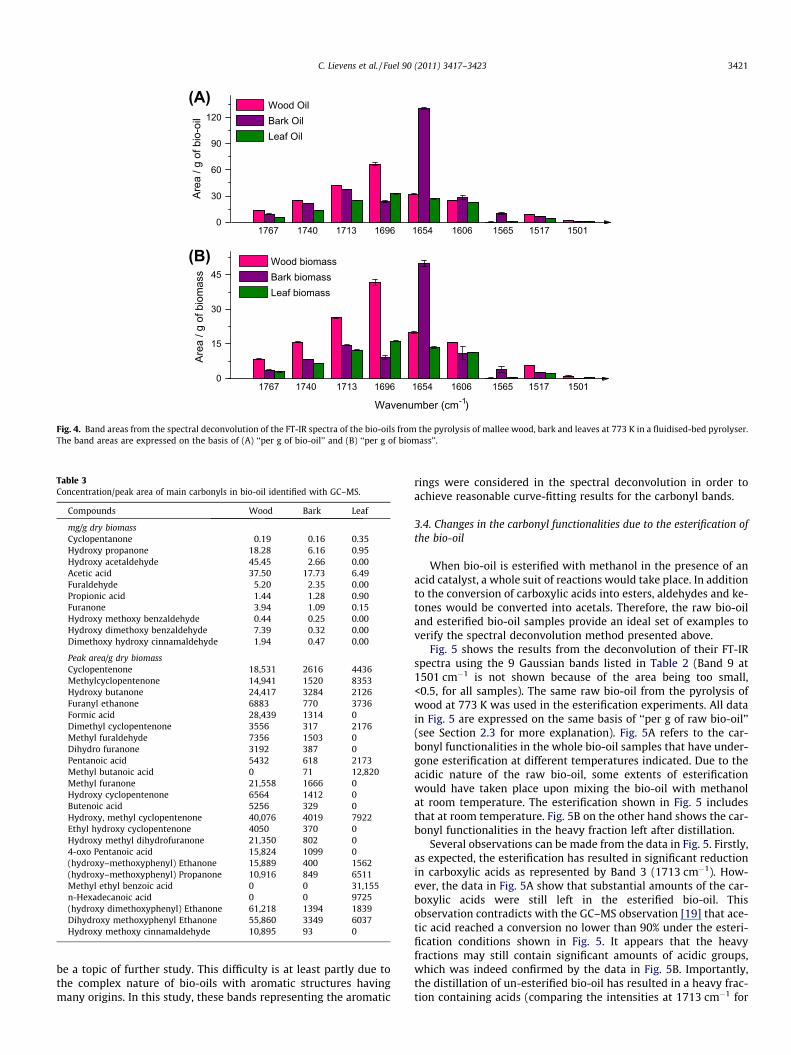
Fig. 5 shows the results from the deconvolution of their FT-IRspectra using the 9 Gaussian bands listed in Table 2 (Band 9 at1501 cm�1 is not shown because of the area being too small,<0.5, for all samples). The same raw bio-oil from the pyrolysis ofwood at 773 K was used in the esterification experiments. All datain Fig. 5 are expressed on the same basis of ‘‘per g of raw bio-oil’’(see Section 2.3 for more explanation). Fig. 5A refers to the car-bonyl functionalities in the whole bio-oil samples that have under-gone esterification at different temperatures indicated. Due to theacidic nature of the raw bio-oil, some extents of esterificationwould have taken place upon mixing the bio-oil with methanolat room temperature. The esterification shown in Fig. 5 includesthat at room temperature. Fig. 5B on the other hand shows the car-bonyl functionalities in the heavy fraction left after distillation.
Several observations can be made from the data in Fig. 5. Firstly,as expected, the esterification has resulted in significant reductionin carboxylic acids as represented by Band 3 (1713 cm�1). How-ever, the data in Fig. 5A show that substantial amounts of the car-boxylic acids were still left in the esterified bio-oil. Thisobservation contradicts with the GC–MS observation [19] that ace-tic acid reached a conversion no lower than 90% under the esteri-fication conditions shown in Fig. 5. It appears that the heavyfractions may still contain significant amounts of acidic groups,which was indeed confirmed by the data in Fig. 5B. Importantly,the distillation of un-esterified bio-oil has resulted in a heavy frac-tion containing acids (comparing the intensities at 1713 cm�1 for
0
20
40
60
Area
/ g
of b
io-o
il
Total carbonyl fractions
15171565160616541696171317401767
Area
/ g
of b
io-o
il
Wood Oil 343 K 383 K 443 K
(A)
0
20
40
60 Heavy carbonyl fractions
Wavenumber (cm-1)15171565160616541696171317401767
(B)
Fig. 5. Band areas from the spectral deconvolution of the FT-IR spectra of the wood bio-oils before and after esterification at the reaction temperatures indicated. The bandareas are expressed on the basis of ‘‘per g of bio-oil’’. The band area of 1501 cm�1 is very small and is not shown.
3422 C. Lievens et al. / Fuel 90 (2011) 3417–3423
the raw bio-oil in Fig. 5A and B). Little of these acidic groups in theheavy fraction were actually consumed during esterification(Fig. 5B). It appears that the esterification conditions were not veryeffective for the esterification of acids in the heavy components inthe bio-oil using the solid Amberlyst acid catalyst. The area of Band2 (1740 cm�1) indeed shows that esters were formed during ester-ification (Fig. 5A). Furthermore, the data in Fig. 5B indicate that thelighter esters were removed during distillation: there was little dif-ference (1740 cm�1) in the heavy fractions among the bio-oil sam-ples before and after esterification.
Further efforts were also made to seek additional evidenceabout the presence of acids after esterification, especially in theheavy fractions. The residue after distillation (i.e. the heavy frac-tion) was re-dissolved in the water–methanol mixture and thepH value of the solution was measured. For the re-dissolved heavyfraction after esterification at 363 K, the measured pH value was3.0, similar to the pH value of 2.9 for the esterified reaction mixturebefore distillation. For the re-dissolved heavy fraction after esteri-fication at 423 K, the measured pH value was 2.9, again similar tothe pH value of 2.9 for the esterified reaction mixture before distil-lation. These measurements provide clear evidence that substan-tial amounts of acidic functional groups existed in the heavyfraction of the esterified products, supporting the FT-IR data shownin Fig. 5. The main reason for the incomplete esterification of acidsin the heavy fraction is thought to be due to the lack of H+ to cata-lyse the esterification of these acids. The H+ ions are not uniformlydistributed in the solution with higher concentration near the cat-alyst surface than in the bulk solution. It is likely that insufficientconcentration of H+ ions may have reached the acids in the heavyfraction to catalyse their esterification.
Secondly, the data in Fig. 5 show a drastic reduction of ‘‘unsatu-rated’’ aldehydes and ketones (1696 cm�1) after esterification. Thisis clearly due to the acetalisation of carbonyls taking place concur-rently with esterification. Acetals do not show in this region of FT-IR spectra.
The concentrations of lactones decreased upon esterificationwith increasing temperature (1767 cm�1, Fig. 5A). When comparingFig. 5A and B, it can be concluded that the lactones present in thelight fraction were lost during the esterification process. The heavierlactones were not converted by the solid Amberlyst catalyst, as can
be seen from the concentrations of lactones before and after distilla-tion. Hydroxy unsaturated aldehydes and ketones (1654 cm�1) ofthe total and heavy carbonyl fraction increased with increasingesterification temperature. The increase in the heavy carbonyl frac-tion was more pronounced: at 343 K the 1654 cm-1 band area dou-bled, at 443 K it was tripled with respect to the original material.Combining the evolution of Bands 4 and 5, we could deduce that,apart from esterification and acetalisation, the hydration of doublebonds to form OH unsaturated aldehydes/ketones also took placeduring bio-oil esterification with the Amberlyst acid catalyst. Thelatter reaction is one of the Amberlyst’s side reactions.
4. Conclusions
This study has demonstrated that the deconvolution of FT-IRspectra of a bio-oil in the region of 1490–1850 cm�1 can give de-tailed information about various carbonyl groups in the bio-oil.When our method is applied to the bio-oils from the pyrolysis ofmallee wood, bark and leaves, our results reveal that the distribu-tions/concentrations of carbonyls in these bio-oils are very differ-ent with some carbonyls appearing to have their origins in thevarious biomass components. By applying our method to the bio-oil samples before and after esterification with methanol, our re-sults confirm that both acids and aldehydes/ketones were con-verted during esterification catalysed by the solid Amberlyst acidcatalyst. However, the carbonyl groups in the light and heavy frac-tions of a bio-oil appear to react differently during esterification.
Acknowledgements
Australian Government funding through the International Sci-ence Linkages Program and the Second Generation Biofuels Researchand Development Grant Program support this project. The study alsoreceived support from the Government of Western Australia via theCentre for Research into Energy for Sustainable Transport (CREST).The authors thank Professor Hongwei Wu for helpful discussion.
C. Lievens et al. / Fuel 90 (2011) 3417–3423 3423
References
[1] Bridgwater AV, Meier D, Radlein D. An overview of fast pyrolysis of biomass.Org Geochem 1999;30:1479–93.
[2] Czernik S, Bridgwater AV. Overview of applications of biomass fast pyrolysisoil. Energy Fuels 2004;18:590–8.
[3] Garcia-Perez M, Wang S, Shen J, Rhodes M, Lee WJ, Li C-Z. Effects oftemperature on the formation of lignin-derived oligomers during the fastpyrolysis of mallee woody biomass. Energy Fuels 2008;22:2022–32.
[4] Ba TY, Chaala A, Garcia-Perez M, Roy C. Colloidal properties of bio-oils obtainedby vacuum pyrolysis of softwood bark. Storage stability. Energy Fuels2004;18:188–201.
[5] Garcia-Perez M, Chaala A, Pakdel H, Kretschmer D, Roy C. Characterization ofbio-oils in chemical families. Biomass Bioenergy 2007;31:222–42.
[6] Oasmaa A, Kuoppala E. Solvent fractionation method with brix for rapidcharacterization of wood fast pyrolysis liquids. Energy Fuels 2008;22:4245–8.
[7] Elliott DC. Historical developments in hydroprocessing bio-oils. Energy Fuels2007;21:1792–815.
[8] Diebold JP, Czernik S. Additives to lower and stabilize the viscosity of pyrolysisoils during storage. Energy Fuels 1997;11:1081–91.
[9] Elliott DC, Hart TR, Neuenschwander GG, Rotness LJ, Zacher AH. Catalytichydroprocessing of biomass fast pyrolysis bio-oil to produce hydrocarbonproducts. Environ Prog Sustain Energy 2009;28:441–9.
[10] Tsai WT, Lee MK, Chang YM. Fast pyrolysis of rice straw, sugarcane bagasseand coconut shell in an induction-heating reactor. J Anal Appl Pyrolysis2006;76:230–7.
[11] Scholze B, Hanser C, Meier D. Characterization of the water-insoluble fractionfrom fast pyrolysis liquids (pyrolytic lignin) Part II. GPC, carbonyl groups andC-13-NMR. J Anal Appl Pyrolysis 2001;58:387–400.
[12] Ates F, Isikdag MA. Evaluation of the role of the pyrolysis temperature in strawbiomass samples and characterization of the oils by GC–MS. Energy Fuels2008;22:1936–43.
[13] Streibel T, Fendt A, Geissler R, Kaisersberger E, Denner T, Zimmermann R.Thermal analysis/mass spectrometry using soft photo-ionisation for theinvestigation of biomass and mineral oils. J Therm Anal Calorim 2009;97:615–9.
[14] Supaluknari S, Larkins FP, Redlich P, Jackson WR. An FTIR study of Australiancoals: characterization of oxygen functional groups. Fuel Process Technol1988;19:123–40.
[15] Bell SJ, Barton AFM, Stocker LJ. Agriculture for health and profit in WesternAustralia: the western oil mallee project. Ecosyst Health 2001;7:116–21.
[16] Bartle J, Olsen G, Carslake J, Cooper D. Acacia species as large-scale crops in theWestern Australian wheatbelt. Conserv Sci Western Australia J2002;4(3):96–108.
[17] Zohar Y, Di Stefano J, Bartle J. Strategy for screening eucalypts for saline lands.Agroforest Syst 2010;78:127–37.
[18] Garcia-Perez M, Wang XS, Shen J, Rhodes MJ, Tian FJ, Lee WJ, et al. Fastpyrolysis of oil mallee woody biomass: Effect of temperature on the yield andquality of pyrolysis products. Ind Eng Chem Res 2008;47:1846–54.
[19] Li X, Gunawan R, Lievens C, Wang Y, Mourant D, Wang S, et al. Simultaneouscatalytic esterification of carboxylic acids and acetalisation of aldehydes in afast pyrolysis bio-oil from mallee biomass. Fuel 2011;90:2530–7.
[20] Bellamy LJ. The infra-red spectra of complex molecules. 3rded. London: Chapman and Hall Ltd.; 1975.
[21] Mayo DW, Miller FA, Hannah RW. Course notes on the interpretation ofinfrared and Raman spectra. New Jersey: John Wiley & Sons; 2004.
[22] Diebold JP. A review of the chemical and physical mechanisms of the storagestability of fast pyrolysis bio-oils. NREL; 2000.
[23] Lievens C, Yperman J, Cornelissen T, Carleer R. Study of the potentialvalorisation of heavy metal contaminated biomass via phytoremediation byfast pyrolysis: Part II. Characterisation of the liquid and gaseous fraction as afunction of the temperature. Fuel 2008;87:1906–16.
[24] Lievens C, Carleer R, Cornelissen T, Yperman J. Fast pyrolysis of heavymetal contaminated willow: influence of the plant part. Fuel 2009;88:1417–25.
[25] Cross L, Rolfe A. Molar extinction coefficients of certain functional groupingswith special reference to compounds containing carbonyl. Trans Faraday Soc1950;47:354–7.
[26] Hayashi J-i, Li C-Z. In: Li C-Z, editor. Chapter 2 structure and properties ofvictorian brown coal in advances in the science of victorian browncoal. Elsevier; 2004. p. 1–84.
[27] Ghisalberti EL. Bioactive acylphloroglucinol derivatives from Eucalyptusspecies. Phytochemistry 1996;41:7–22.
[28] Kramer PJ, Kozlowski TT. Physiology of woody plants. New York: AcademicPress Inc.; 1979.


![l~~ft(f!]t& - Indian Liberals](https://img.dokumen.tips/doc/110x75/6326d65ecedd78c2b50d486c/lftft-indian-liberals.jpg)


