Embed Size (px)
Citation preview
Mon. Not. R. Astron. Soc. 312, 57±69 (2000)
An experimental investigation of immersed gratings
D. Lee1,2w and J. R. Allington-Smith1
1Department of Physics, University of Durham, South Road, Durham DH1 3LE2Anglo-Australian Observatory, PO Box 296, Epping, NSW 1710, Australia
Accepted 1999 September 6. Received 1999 August 2; in original form 1999 June 2
A B S T R A C T
A generic problem with spectrographs equipped with conventional diffraction gratings is
that the maximum attainable spectral resolution scales inversely with the telescope aperture
for a fixed grating dimension and angular slit width. It has long been realized that immersed
gratings, where a prism is attached to the surface of a reflection grating, offer a means to
bypass this limit. We show how, for the case of the Gemini Multiobject Spectrographs, the
maximum spectral resolution may be approximately doubled, or, equivalently, how the same
spectral resolution may be obtained with a wider slit, resulting in improved throughput when
observing extended objects.
After reviewing the theory of immersed gratings, we present experimental verification of
the theory and experimentally quantify two potential drawbacks: reduced throughput at
blaze, and ghost images. We show that these effects are small and conclude that the benefits
greatly outweigh the disadvantages.
Key words: instrumentation: spectrographs ± techniques: spectroscopic.
1 I N T R O D U C T I O N
The potential of immersed gratings to increase the maximum
attainable spectral resolution of spectrographs equipped with
conventional gratings has been explored by e.g. Dekker (1987)
and Wynne (1989, 1990a,b, 1991, 1992). The spectral resolving
power at wavelength l can be expressed as
R ;l
Dl� mlrW
xDtel
; �1�
where Dl is the width of the spectral resolution element, m is the
spectral order, r is the ruling density, x is the angular width of the
slit projected on the sky, Dtel is the diameter of the telescope
aperture and W is the length of the intersection of the collimated
beam with the plane of the grating. It can be seen that, for constant
W (a constraint imposed by the maximum attainable camera
aperture), and constant ruling density (a constraint imposed by
grating technology), the resolving power is inversely proportional
to the telescope aperture for fixed slit width. For large telescopes,
this implies a reduction in the maximum resolving power unless
the instrument is correspondingly oversized or the slit width is
reduced. Oversizing the spectrograph is impractical [for example,
each Gemini Multiobject Spectrograph (GMOS) weighs 2 tonnes
despite a modest collimated beam diameter of 100 mm]. Despite
the excellent image quality of modern telescopes, reducing the slit
width is only an option when observing point sources unless an
integral field unit or image slicer is used. We give examples of the
actual limits that this imposes in Section 2.
Immersed gratings allow this limit to be overcome. An immersed
grating is a conventional blazed reflection grating with a prism
optically coupled to the grating surface via a suitable medium. This
simple change has the potential to produce dramatic improvements
in resolving power, up to approximately a factor of 2 as shown in
Section 2.
Various ways of understanding why immersed gratings produce
this benefit have been presented by Wynne and Dekker, but the
simplest way of seeing this is to realize that the anamorphic
refraction introduced by the prism allows the length of the
illuminated grating, W, to be increased without requiring a
corresponding increase in the aperture of the camera which captures
the diffracted beam.
Although there have been many investigations of the advan-
tages of immersed gratings, very few devices have been employed
in visible-light spectrographs [however, see Dekker (1992) and
Diego et al. (1997)]. Two objections which have been cited are
that they involve an unacceptable drop in throughput and that they
produce ghost images. For these reasons, we have investigated the
properties of immersed gratings via experiments conducted on a
small laboratory prototype.
After reviewing the theory and presenting predictions for the
specific case of GMOS in Section 2.2, we present an experimental
verification of the theory in Section 3. In Section 4, we show
results of measurements of the grating efficiency, and in Section 5
we make a theoretical and experimental study of ghost images
produced by our immersed grating prototype. Our conclusions are
presented in Section 6.
q 2000 RAS
w E-mail: [email protected]
Dow
nloaded from https://academ
ic.oup.com/m
nras/article/312/1/57/985251 by guest on 26 January 2022
58 D. Lee and J. R. Allington-Smith
2 T H E O R E T I C A L BAC K G R O U N D A N D
P R E D I C T I O N S
2.1 Basic theory
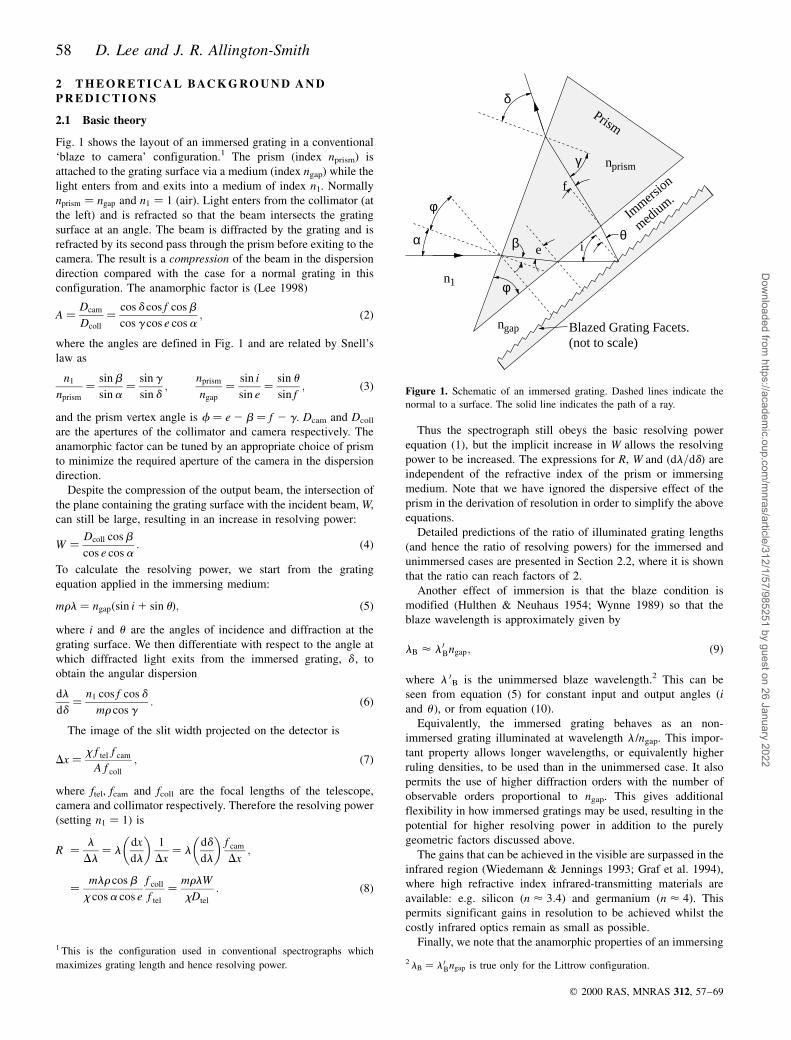
Fig. 1 shows the layout of an immersed grating in a conventional
`blaze to camera' configuration.1 The prism (index nprism) is
attached to the grating surface via a medium (index ngap) while the
light enters from and exits into a medium of index n1. Normally
nprism � ngap and n1 � 1 (air). Light enters from the collimator (at
the left) and is refracted so that the beam intersects the grating
surface at an angle. The beam is diffracted by the grating and is
refracted by its second pass through the prism before exiting to the
camera. The result is a compression of the beam in the dispersion
direction compared with the case for a normal grating in this
configuration. The anamorphic factor is (Lee 1998)
A � Dcam
Dcoll
� cos d cos f cosb
cos g cos e cosa; �2�
where the angles are defined in Fig. 1 and are related by Snell's
law as
n1
nprism
� sinb
sina� sin g
sin d;
nprism
ngap
� sin i
sin e� sin u
sin f; �3�
and the prism vertex angle is f � e 2 b � f 2 g. Dcam and Dcoll
are the apertures of the collimator and camera respectively. The
anamorphic factor can be tuned by an appropriate choice of prism
to minimize the required aperture of the camera in the dispersion
direction.
Despite the compression of the output beam, the intersection of
the plane containing the grating surface with the incident beam, W,
can still be large, resulting in an increase in resolving power:
W � Dcoll cosb
cos e cosa: �4�
To calculate the resolving power, we start from the grating
equation applied in the immersing medium:
mrl � ngap�sin i 1 sin u�; �5�where i and u are the angles of incidence and diffraction at the
grating surface. We then differentiate with respect to the angle at
which diffracted light exits from the immersed grating, d , to
obtain the angular dispersion
dl
dd� n1 cos f cos d
mr cos g: �6�
The image of the slit width projected on the detector is
Dx � x f tel f cam
A f coll
; �7�
where ftel, fcam and fcoll are the focal lengths of the telescope,
camera and collimator respectively. Therefore the resolving power
(setting n1 � 1) is
R � l
Dl� l
dx
dl
� �1
Dx� l
dd
dl
� �f cam
Dx;
� mlr cosb
x cosa cos e
f coll
f tel
� mrlW
xDtel
: �8�
Thus the spectrograph still obeys the basic resolving power
equation (1), but the implicit increase in W allows the resolving
power to be increased. The expressions for R, W and �dl=dd� are
independent of the refractive index of the prism or immersing
medium. Note that we have ignored the dispersive effect of the
prism in the derivation of resolution in order to simplify the above
equations.
Detailed predictions of the ratio of illuminated grating lengths
(and hence the ratio of resolving powers) for the immersed and
unimmersed cases are presented in Section 2.2, where it is shown
that the ratio can reach factors of 2.
Another effect of immersion is that the blaze condition is
modified (Hulthen & Neuhaus 1954; Wynne 1989) so that the
blaze wavelength is approximately given by
lB < l 0Bngap; �9�
where l 0B is the unimmersed blaze wavelength.2 This can be
seen from equation (5) for constant input and output angles (i
and u ), or from equation (10).
Equivalently, the immersed grating behaves as an non-
immersed grating illuminated at wavelength l /ngap. This impor-
tant property allows longer wavelengths, or equivalently higher
ruling densities, to be used than in the unimmersed case. It also
permits the use of higher diffraction orders with the number of
observable orders proportional to ngap. This gives additional
flexibility in how immersed gratings may be used, resulting in the
potential for higher resolving power in addition to the purely
geometric factors discussed above.
The gains that can be achieved in the visible are surpassed in the
infrared region (Wiedemann & Jennings 1993; Graf et al. 1994),
where high refractive index infrared-transmitting materials are
available: e.g. silicon �n < 3:4� and germanium �n < 4�. This
permits significant gains in resolution to be achieved whilst the
costly infrared optics remain as small as possible.
Finally, we note that the anamorphic properties of an immersing
q 2000 RAS, MNRAS 312, 57±69
1
gap
prism
Blazed Grating Facets.(not to scale)
Immersi
on
medium.
e
n
n
n
Prism
θ
f
γ
δ
α
φ
φ
iβ
Figure 1. Schematic of an immersed grating. Dashed lines indicate the
normal to a surface. The solid line indicates the path of a ray.
1 This is the configuration used in conventional spectrographs which
maximizes grating length and hence resolving power. 2lB � l 0Bngap is true only for the Littrow configuration.
Dow
nloaded from https://academ
ic.oup.com/m
nras/article/312/1/57/985251 by guest on 26 January 2022
An experimental investigation of immersed gratings 59
prism are also relevant for use with volume phase holographic
(VPH) gratings (Barden, Arns & Colburn 1998). As VPH gratings
can be produced with higher ruling densities than conventional
gratings, immersion allows access to longer wavelengths and
hence resolutions. The anamorphic properties of the prism can
also be used to reduce the beam deviation angle within the VPH,
leading to higher peak efficiency (a beam deviation of 908 has zero
efficiency in P-plane polarization).
2.2 Prediction for GMOS
To understand by how much the resolving power can be increased,
we need to make predictions for a particular grating geometry. We
take the example of the Gemini Multiobject Spectrographs
(GMOS: Allington-Smith et al. 1997; Murowinski et al. 1998)
which have a collimated beam diameter of Dcoll � 100 mm. We
have calculated the resolving power obtainable with slit width
x � 0:5 arcsec for a set of plane blazed reflection gratings
proposed at the Critical Design Review of the instruments, as
listed in Table 1 (also listed are the groove angle, j , often referred
to as the blaze angle, and the resolving power at blaze, RB, taking
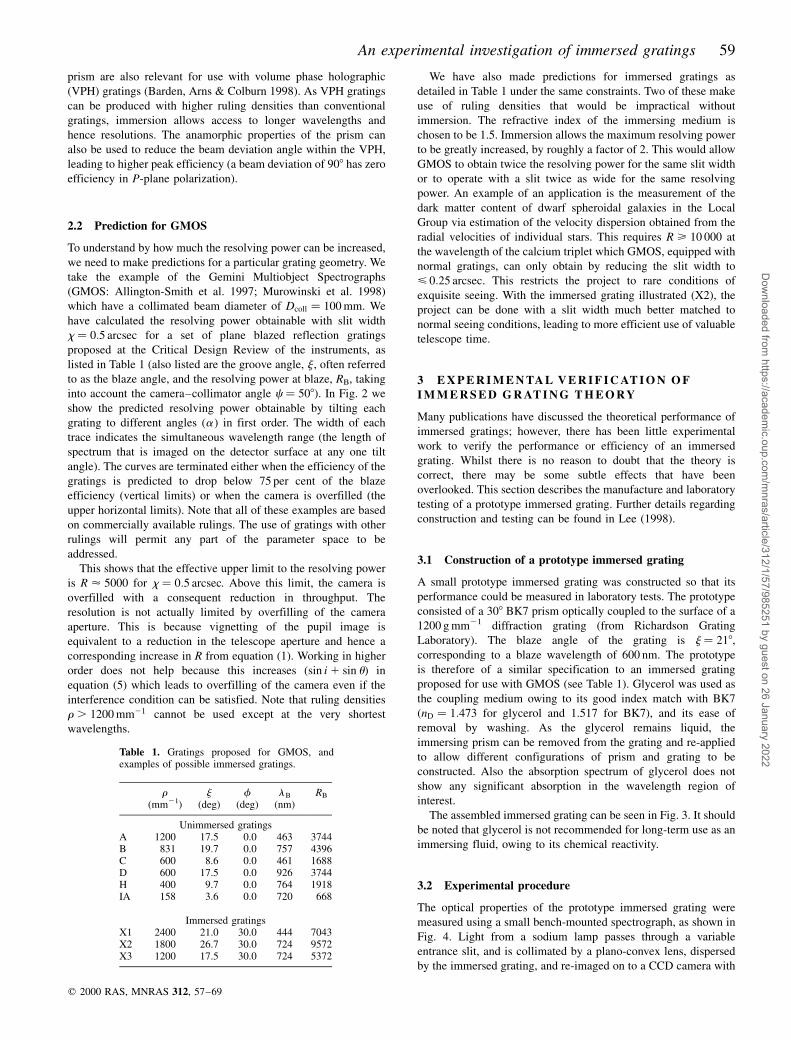
into account the camera±collimator angle c � 508). In Fig. 2 we
show the predicted resolving power obtainable by tilting each
grating to different angles (a ) in first order. The width of each
trace indicates the simultaneous wavelength range (the length of
spectrum that is imaged on the detector surface at any one tilt
angle). The curves are terminated either when the efficiency of the
gratings is predicted to drop below 75 per cent of the blaze
efficiency (vertical limits) or when the camera is overfilled (the
upper horizontal limits). Note that all of these examples are based
on commercially available rulings. The use of gratings with other
rulings will permit any part of the parameter space to be
addressed.
This shows that the effective upper limit to the resolving power
is R < 5000 for x � 0:5 arcsec. Above this limit, the camera is
overfilled with a consequent reduction in throughput. The
resolution is not actually limited by overfilling of the camera
aperture. This is because vignetting of the pupil image is
equivalent to a reduction in the telescope aperture and hence a
corresponding increase in R from equation (1). Working in higher
order does not help because this increases �sin i 1 sin u� in
equation (5) which leads to overfilling of the camera even if the
interference condition can be satisfied. Note that ruling densities
r . 1200 mm21 cannot be used except at the very shortest
wavelengths.
We have also made predictions for immersed gratings as
detailed in Table 1 under the same constraints. Two of these make
use of ruling densities that would be impractical without
immersion. The refractive index of the immersing medium is
chosen to be 1.5. Immersion allows the maximum resolving power
to be greatly increased, by roughly a factor of 2. This would allow
GMOS to obtain twice the resolving power for the same slit width
or to operate with a slit twice as wide for the same resolving
power. An example of an application is the measurement of the
dark matter content of dwarf spheroidal galaxies in the Local
Group via estimation of the velocity dispersion obtained from the
radial velocities of individual stars. This requires R > 10 000 at
the wavelength of the calcium triplet which GMOS, equipped with
normal gratings, can only obtain by reducing the slit width to
< 0:25 arcsec. This restricts the project to rare conditions of
exquisite seeing. With the immersed grating illustrated (X2), the
project can be done with a slit width much better matched to
normal seeing conditions, leading to more efficient use of valuable
telescope time.
3 E X P E R I M E N TA L V E R I F I C AT I O N O F
I M M E R S E D G R AT I N G T H E O RY
Many publications have discussed the theoretical performance of
immersed gratings; however, there has been little experimental
work to verify the performance or efficiency of an immersed
grating. Whilst there is no reason to doubt that the theory is
correct, there may be some subtle effects that have been
overlooked. This section describes the manufacture and laboratory
testing of a prototype immersed grating. Further details regarding
construction and testing can be found in Lee (1998).
3.1 Construction of a prototype immersed grating
A small prototype immersed grating was constructed so that its
performance could be measured in laboratory tests. The prototype
consisted of a 308 BK7 prism optically coupled to the surface of a
1200 g mm21 diffraction grating (from Richardson Grating
Laboratory). The blaze angle of the grating is j � 218,corresponding to a blaze wavelength of 600 nm. The prototype
is therefore of a similar specification to an immersed grating
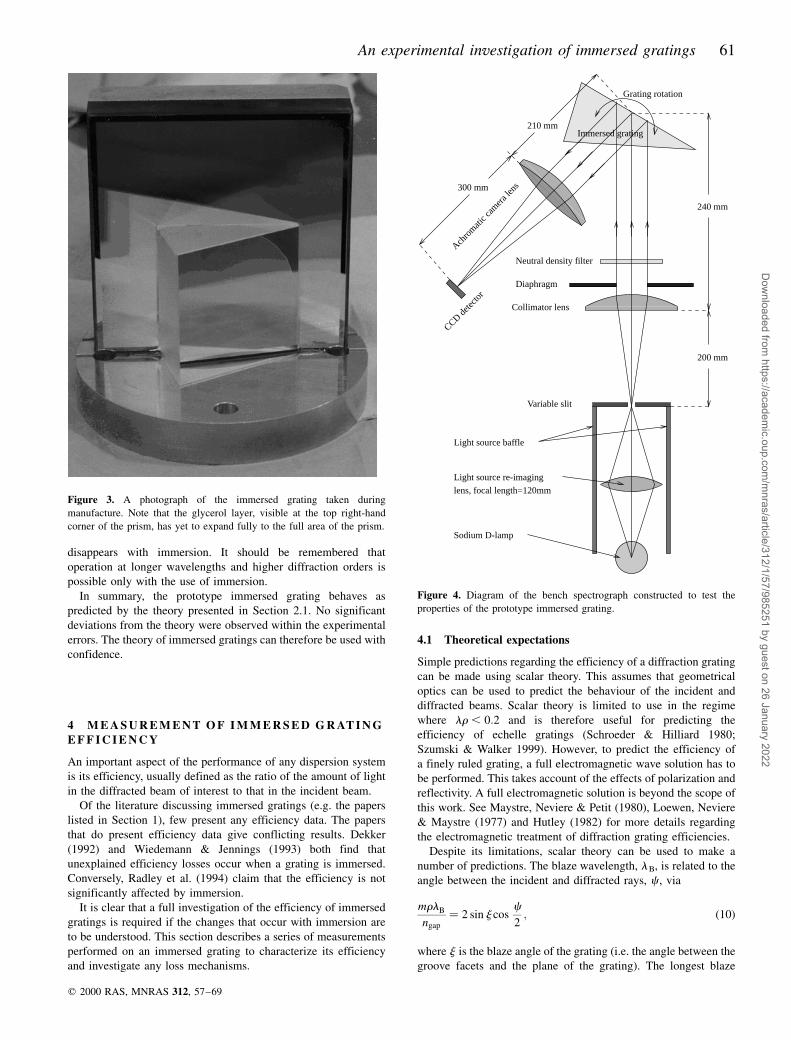
proposed for use with GMOS (see Table 1). Glycerol was used as
the coupling medium owing to its good index match with BK7
(nD � 1:473 for glycerol and 1.517 for BK7), and its ease of
removal by washing. As the glycerol remains liquid, the
immersing prism can be removed from the grating and re-applied
to allow different configurations of prism and grating to be
constructed. Also the absorption spectrum of glycerol does not
show any significant absorption in the wavelength region of
interest.
The assembled immersed grating can be seen in Fig. 3. It should
be noted that glycerol is not recommended for long-term use as an
immersing fluid, owing to its chemical reactivity.
3.2 Experimental procedure
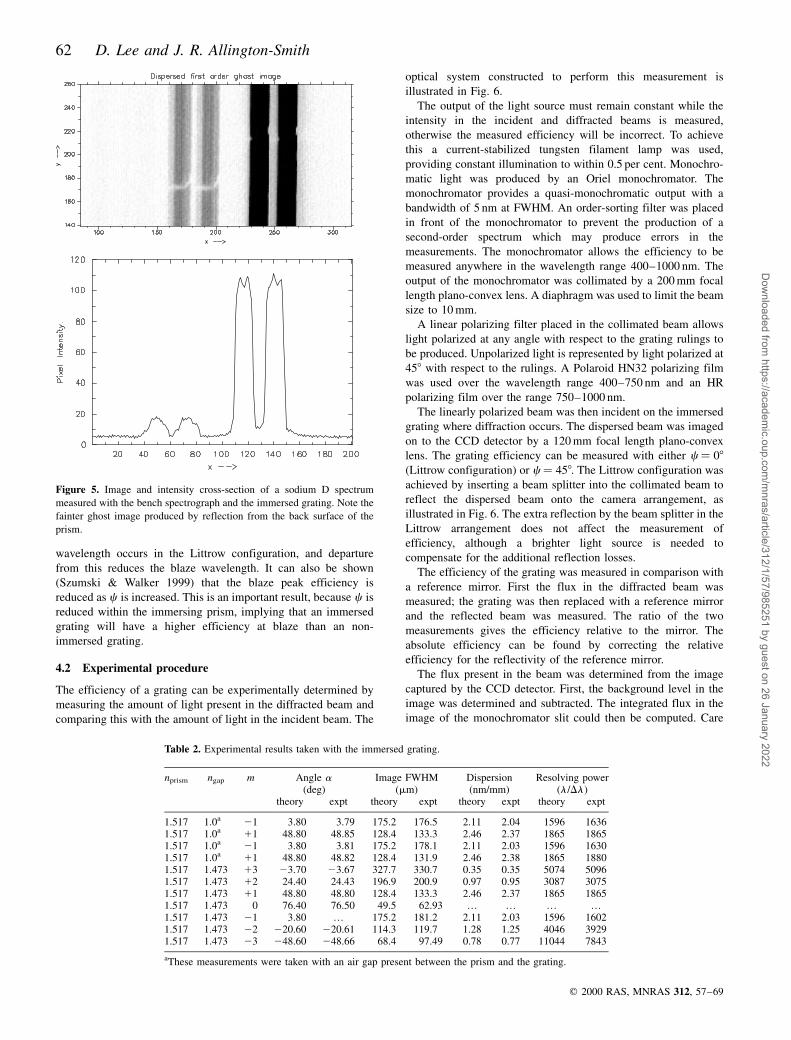
The optical properties of the prototype immersed grating were
measured using a small bench-mounted spectrograph, as shown in
Fig. 4. Light from a sodium lamp passes through a variable
entrance slit, and is collimated by a plano-convex lens, dispersed
by the immersed grating, and re-imaged on to a CCD camera with
q 2000 RAS, MNRAS 312, 57±69
Table 1. Gratings proposed for GMOS, andexamples of possible immersed gratings.
r j f lB RB
(mm21) (deg) (deg) (nm)
Unimmersed gratingsA 1200 17.5 0.0 463 3744B 831 19.7 0.0 757 4396C 600 8.6 0.0 461 1688D 600 17.5 0.0 926 3744H 400 9.7 0.0 764 1918IA 158 3.6 0.0 720 668
Immersed gratingsX1 2400 21.0 30.0 444 7043X2 1800 26.7 30.0 724 9572X3 1200 17.5 30.0 724 5372
Dow
nloaded from https://academ
ic.oup.com/m
nras/article/312/1/57/985251 by guest on 26 January 2022
60 D. Lee and J. R. Allington-Smith
an achromatic camera lens. Images are captured with a frame
grabber and PC. The beamsize is set by a diaphragm to 10 mm to
reduce aberrations.3 The grating angle is set by an encoded
rotation stage.
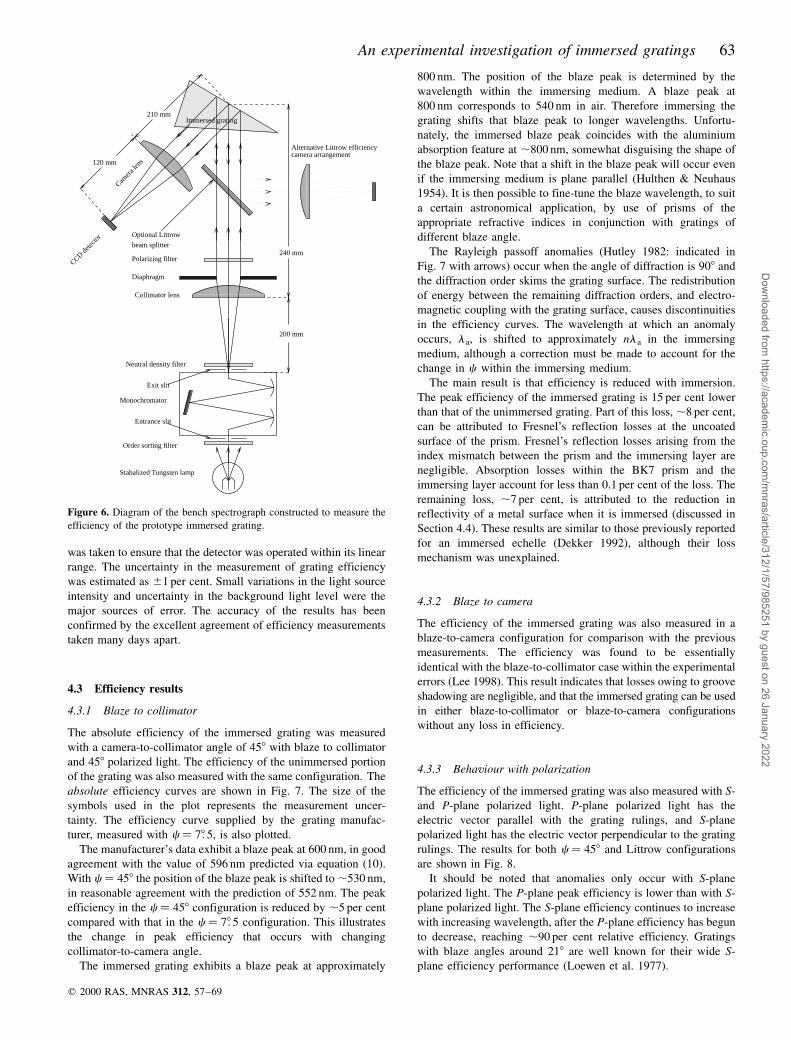
The measured sodium D lamp spectrum consists of the two
bright sodium D lines, as seen in Fig. 5. The FWHM of the
spectral lines is determined by the input slit width and the
anamorphic magnification of the spectrograph as described in
Section 2.1. The dispersion of the grating can be determined from
the separation of the two D lines on the detector. The resolution4
and dispersion can therefore be measured from the recorded
spectrum.
3.3 Results
The experimental results are summarized in Table 2 together with
predictions made using the theory described in Section 2.1. The
angle of incidence at the prism is measured from the computerized
rotating stage when the spectrum is centred on the detector. The
estimated uncertainty is ^08: 02. The small discrepancy between
theory and experiment is consistent with a collimator-to-camera
angle of 458: 06, rather than the nominal 458, otherwise the angles
are in agreement with the theory. Small angular errors such as
these have a negligible effect on the other measured quantities.
The pixel scale on the detector is 12.35mm per pixel. The spectral
line FWHM can be measured to a precision of ^0:2 pixel. In all
cases the measured value is broader than the prediction, which is
consistent with a systematic error in the width of the entrance slit
for which the true width is 103mm, rather than the nominal
100mm.
The measurement uncertainty in the dispersion is ,0.5 per cent,
determined by the accuracy to which the centroid of the spectral
lines can be determined �^0:1 pixel�. The measured dispersion is
systematically larger than the predictions by an amount which is
consistent with the dispersion of the BK7 glass prism, which gives
,4 per cent extra dispersion.5
The measured resolution is in agreement with the predicted
value once the the systematic errors are removed. Exceptions are
the cases for m � 0 and 23 which show a large difference
between the measured and predicted image FWHM which lowers
the measured resolution. This is due to aberrations introduced by
the spectrograph at the large angles of operation required.
At the test wavelength, and in first order, the immersed grating
will still operate with an air gap present between the prism and the
grating. Table 2 shows that the performance is the same with or
without the prism immersed to the grating. This indicates that, as
expected, the plane-parallel medium between the prism and the
grating does not cause any dispersive effect. The air gap does,
however, introduce an additional air±glass reflection which causes
the ghost image seen in Fig. 5 (see Section 5). This ghost
q 2000 RAS, MNRAS 312, 57±69
Figure 2. Prediction of resolving power (0.5-arcsec slit) versus wavelength obtainable with the gratings listed in Table 1 with GMOS. The curves A, B, C, D,
H, IA refer to unimmersed gratings, while X1, X2 and X3 refer to immersed gratings. The blaze conditions are marked as solid dots. The width of each trace
in the wavelength direction indicates the maximum simultaneous wavelength range available with GMOS. The curves are terminated either when the
anamorphic factor exceeds 1.5 (horizontal limits) or when the efficiency is predicted to fall below 75 per cent of the blaze value (vertical limits) based on data
supplied by the grating manufacturer. The box indicates the parameter space required for the investigation of dark matter in Local Group dwarf spheroidal
galaxies described in the text. Only with immersed gratings can the goal of R . 10 000 be obtained with a reasonable slit width.
3 Limiting the beamsize to 10 mm has no effect on the resolution of the
optical system.4The Sparrow criterion (Hutley 1982) is used to define the resolution.
5 The additional dispersion of the immersing prism is described by Wynne
(1989), and may contribute a useful gain in an astronomical immersed
grating if high-dispersion prisms are used.
Dow
nloaded from https://academ
ic.oup.com/m
nras/article/312/1/57/985251 by guest on 26 January 2022
An experimental investigation of immersed gratings 61
disappears with immersion. It should be remembered that
operation at longer wavelengths and higher diffraction orders is
possible only with the use of immersion.
In summary, the prototype immersed grating behaves as
predicted by the theory presented in Section 2.1. No significant
deviations from the theory were observed within the experimental
errors. The theory of immersed gratings can therefore be used with
confidence.
4 M E A S U R E M E N T O F I M M E R S E D G R AT I N G
E F F I C I E N C Y
An important aspect of the performance of any dispersion system
is its efficiency, usually defined as the ratio of the amount of light
in the diffracted beam of interest to that in the incident beam.
Of the literature discussing immersed gratings (e.g. the papers
listed in Section 1), few present any efficiency data. The papers
that do present efficiency data give conflicting results. Dekker
(1992) and Wiedemann & Jennings (1993) both find that
unexplained efficiency losses occur when a grating is immersed.
Conversely, Radley et al. (1994) claim that the efficiency is not
significantly affected by immersion.
It is clear that a full investigation of the efficiency of immersed
gratings is required if the changes that occur with immersion are
to be understood. This section describes a series of measurements
performed on an immersed grating to characterize its efficiency
and investigate any loss mechanisms.
4.1 Theoretical expectations
Simple predictions regarding the efficiency of a diffraction grating
can be made using scalar theory. This assumes that geometrical
optics can be used to predict the behaviour of the incident and
diffracted beams. Scalar theory is limited to use in the regime
where lr , 0:2 and is therefore useful for predicting the
efficiency of echelle gratings (Schroeder & Hilliard 1980;
Szumski & Walker 1999). However, to predict the efficiency of
a finely ruled grating, a full electromagnetic wave solution has to
be performed. This takes account of the effects of polarization and
reflectivity. A full electromagnetic solution is beyond the scope of
this work. See Maystre, Neviere & Petit (1980), Loewen, Neviere
& Maystre (1977) and Hutley (1982) for more details regarding
the electromagnetic treatment of diffraction grating efficiencies.
Despite its limitations, scalar theory can be used to make a
number of predictions. The blaze wavelength, lB, is related to the
angle between the incident and diffracted rays, c , via
mrlB
ngap
� 2 sin j cosc
2; �10�
where j is the blaze angle of the grating (i.e. the angle between the
groove facets and the plane of the grating). The longest blaze
q 2000 RAS, MNRAS 312, 57±69
Figure 3. A photograph of the immersed grating taken during
manufacture. Note that the glycerol layer, visible at the top right-hand
corner of the prism, has yet to expand fully to the full area of the prism.
300 mm
Immersed grating210 mm
240 mm
CCD det
ecto
r
Light source baffle
Light source re-imaging
lens, focal length=120mm
Sodium D-lamp
Collimator lens
200 mm
Variable slit
Achro
mat
ic ca
mer
a len
s
Neutral density filter
Diaphragm
Grating rotation
Figure 4. Diagram of the bench spectrograph constructed to test the
properties of the prototype immersed grating.
Dow
nloaded from https://academ
ic.oup.com/m
nras/article/312/1/57/985251 by guest on 26 January 2022
62 D. Lee and J. R. Allington-Smith
wavelength occurs in the Littrow configuration, and departure
from this reduces the blaze wavelength. It can also be shown
(Szumski & Walker 1999) that the blaze peak efficiency is
reduced as c is increased. This is an important result, because c is
reduced within the immersing prism, implying that an immersed
grating will have a higher efficiency at blaze than an non-
immersed grating.
4.2 Experimental procedure
The efficiency of a grating can be experimentally determined by
measuring the amount of light present in the diffracted beam and
comparing this with the amount of light in the incident beam. The
optical system constructed to perform this measurement is
illustrated in Fig. 6.
The output of the light source must remain constant while the
intensity in the incident and diffracted beams is measured,
otherwise the measured efficiency will be incorrect. To achieve
this a current-stabilized tungsten filament lamp was used,
providing constant illumination to within 0.5 per cent. Monochro-
matic light was produced by an Oriel monochromator. The
monochromator provides a quasi-monochromatic output with a
bandwidth of 5 nm at FWHM. An order-sorting filter was placed
in front of the monochromator to prevent the production of a
second-order spectrum which may produce errors in the
measurements. The monochromator allows the efficiency to be
measured anywhere in the wavelength range 400±1000 nm. The
output of the monochromator was collimated by a 200 mm focal
length plano-convex lens. A diaphragm was used to limit the beam
size to 10 mm.
A linear polarizing filter placed in the collimated beam allows
light polarized at any angle with respect to the grating rulings to
be produced. Unpolarized light is represented by light polarized at
458 with respect to the rulings. A Polaroid HN32 polarizing film
was used over the wavelength range 400±750 nm and an HR
polarizing film over the range 750±1000 nm.
The linearly polarized beam was then incident on the immersed
grating where diffraction occurs. The dispersed beam was imaged
on to the CCD detector by a 120 mm focal length plano-convex
lens. The grating efficiency can be measured with either c � 08(Littrow configuration) or c � 458. The Littrow configuration was
achieved by inserting a beam splitter into the collimated beam to
reflect the dispersed beam onto the camera arrangement, as
illustrated in Fig. 6. The extra reflection by the beam splitter in the
Littrow arrangement does not affect the measurement of
efficiency, although a brighter light source is needed to
compensate for the additional reflection losses.
The efficiency of the grating was measured in comparison with
a reference mirror. First the flux in the diffracted beam was
measured; the grating was then replaced with a reference mirror
and the reflected beam was measured. The ratio of the two
measurements gives the efficiency relative to the mirror. The
absolute efficiency can be found by correcting the relative
efficiency for the reflectivity of the reference mirror.
The flux present in the beam was determined from the image
captured by the CCD detector. First, the background level in the
image was determined and subtracted. The integrated flux in the
image of the monochromator slit could then be computed. Care
q 2000 RAS, MNRAS 312, 57±69
Figure 5. Image and intensity cross-section of a sodium D spectrum
measured with the bench spectrograph and the immersed grating. Note the
fainter ghost image produced by reflection from the back surface of the
prism.
Table 2. Experimental results taken with the immersed grating.
nprism ngap m Angle a Image FWHM Dispersion Resolving power(deg) (mm) (nm/mm) (l /Dl)
theory expt theory expt theory expt theory expt
1.517 1.0a 21 3.80 3.79 175.2 176.5 2.11 2.04 1596 16361.517 1.0a 11 48.80 48.85 128.4 133.3 2.46 2.37 1865 18651.517 1.0a 21 3.80 3.81 175.2 178.1 2.11 2.03 1596 16301.517 1.0a 11 48.80 48.82 128.4 131.9 2.46 2.38 1865 18801.517 1.473 13 23.70 23.67 327.7 330.7 0.35 0.35 5074 50961.517 1.473 12 24.40 24.43 196.9 200.9 0.97 0.95 3087 30751.517 1.473 11 48.80 48.80 128.4 133.3 2.46 2.37 1865 18651.517 1.473 0 76.40 76.50 49.5 62.93 ¼ ¼ ¼ ¼1.517 1.473 21 3.80 ¼ 175.2 181.2 2.11 2.03 1596 16021.517 1.473 22 220.60 220.61 114.3 119.7 1.28 1.25 4046 39291.517 1.473 23 248.60 248.66 68.4 97.49 0.78 0.77 11044 7843
aThese measurements were taken with an air gap present between the prism and the grating.
Dow
nloaded from https://academ
ic.oup.com/m
nras/article/312/1/57/985251 by guest on 26 January 2022
An experimental investigation of immersed gratings 63
was taken to ensure that the detector was operated within its linear
range. The uncertainty in the measurement of grating efficiency
was estimated as ^1 per cent. Small variations in the light source
intensity and uncertainty in the background light level were the
major sources of error. The accuracy of the results has been
confirmed by the excellent agreement of efficiency measurements
taken many days apart.
4.3 Efficiency results
4.3.1 Blaze to collimator
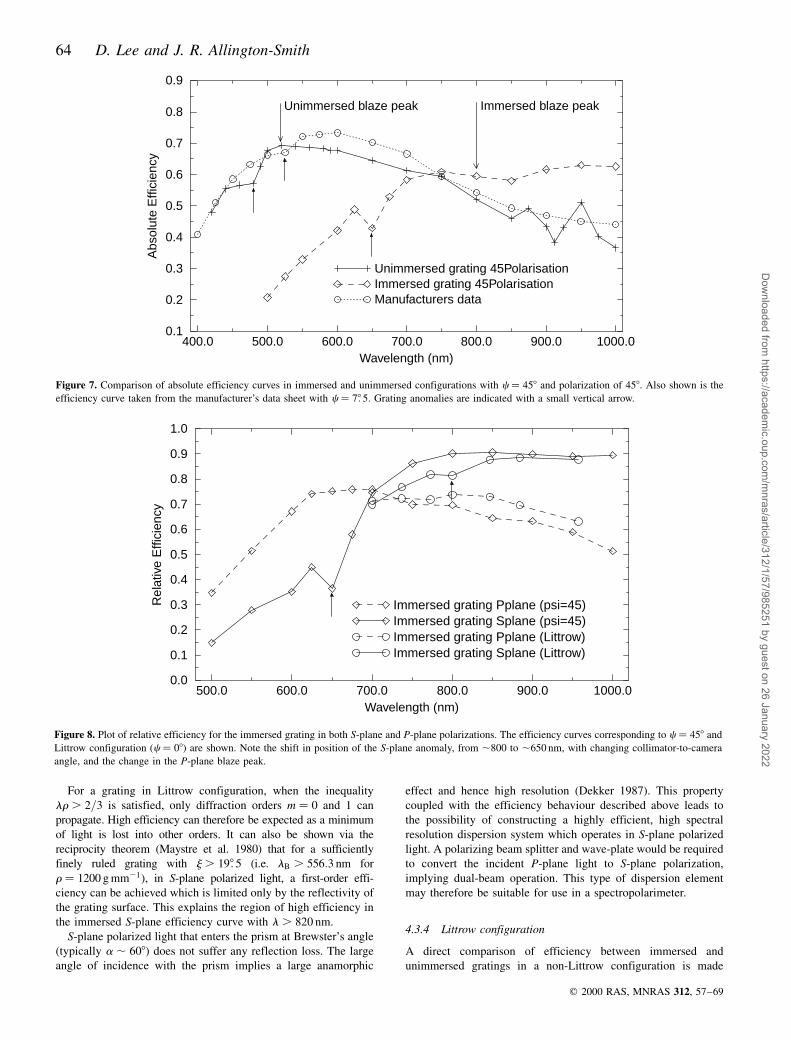
The absolute efficiency of the immersed grating was measured
with a camera-to-collimator angle of 458 with blaze to collimator
and 458 polarized light. The efficiency of the unimmersed portion
of the grating was also measured with the same configuration. The
absolute efficiency curves are shown in Fig. 7. The size of the
symbols used in the plot represents the measurement uncer-
tainty. The efficiency curve supplied by the grating manufac-
turer, measured with c � 78: 5, is also plotted.
The manufacturer's data exhibit a blaze peak at 600 nm, in good
agreement with the value of 596 nm predicted via equation (10).
With c � 458 the position of the blaze peak is shifted to ,530 nm,
in reasonable agreement with the prediction of 552 nm. The peak
efficiency in the c � 458 configuration is reduced by ,5 per cent
compared with that in the c � 78: 5 configuration. This illustrates
the change in peak efficiency that occurs with changing
collimator-to-camera angle.
The immersed grating exhibits a blaze peak at approximately
800 nm. The position of the blaze peak is determined by the
wavelength within the immersing medium. A blaze peak at
800 nm corresponds to 540 nm in air. Therefore immersing the
grating shifts that blaze peak to longer wavelengths. Unfortu-
nately, the immersed blaze peak coincides with the aluminium
absorption feature at ,800 nm, somewhat disguising the shape of
the blaze peak. Note that a shift in the blaze peak will occur even
if the immersing medium is plane parallel (Hulthen & Neuhaus
1954). It is then possible to fine-tune the blaze wavelength, to suit
a certain astronomical application, by use of prisms of the
appropriate refractive indices in conjunction with gratings of
different blaze angle.
The Rayleigh passoff anomalies (Hutley 1982: indicated in
Fig. 7 with arrows) occur when the angle of diffraction is 908 and
the diffraction order skims the grating surface. The redistribution
of energy between the remaining diffraction orders, and electro-
magnetic coupling with the grating surface, causes discontinuities
in the efficiency curves. The wavelength at which an anomaly
occurs, la, is shifted to approximately nla in the immersing
medium, although a correction must be made to account for the
change in c within the immersing medium.
The main result is that efficiency is reduced with immersion.
The peak efficiency of the immersed grating is 15 per cent lower
than that of the unimmersed grating. Part of this loss, ,8 per cent,
can be attributed to Fresnel's reflection losses at the uncoated
surface of the prism. Fresnel's reflection losses arising from the
index mismatch between the prism and the immersing layer are
negligible. Absorption losses within the BK7 prism and the
immersing layer account for less than 0.1 per cent of the loss. The
remaining loss, ,7 per cent, is attributed to the reduction in
reflectivity of a metal surface when it is immersed (discussed in
Section 4.4). These results are similar to those previously reported
for an immersed echelle (Dekker 1992), although their loss
mechanism was unexplained.
4.3.2 Blaze to camera
The efficiency of the immersed grating was also measured in a
blaze-to-camera configuration for comparison with the previous
measurements. The efficiency was found to be essentially
identical with the blaze-to-collimator case within the experimental
errors (Lee 1998). This result indicates that losses owing to groove
shadowing are negligible, and that the immersed grating can be used
in either blaze-to-collimator or blaze-to-camera configurations
without any loss in efficiency.
4.3.3 Behaviour with polarization
The efficiency of the immersed grating was also measured with S-
and P-plane polarized light. P-plane polarized light has the
electric vector parallel with the grating rulings, and S-plane
polarized light has the electric vector perpendicular to the grating
rulings. The results for both c � 458 and Littrow configurations
are shown in Fig. 8.
It should be noted that anomalies only occur with S-plane
polarized light. The P-plane peak efficiency is lower than with S-
plane polarized light. The S-plane efficiency continues to increase
with increasing wavelength, after the P-plane efficiency has begun
to decrease, reaching ,90 per cent relative efficiency. Gratings
with blaze angles around 218 are well known for their wide S-
plane efficiency performance (Loewen et al. 1977).
q 2000 RAS, MNRAS 312, 57±69
Neutral density filter
Collimator lens
Diaphragm
Polarizing filter
Order sorting filter
Stabalized Tungsten lamp
Optional Littrow
beam splitter
CCD det
ecto
r
Camer
a len
s
200 mm
120 mm
Immersed grating
Monochromator
210 mm
240 mm
Exit slit
Entrance slit
camera arrangementAlternative Littrow efficiency
Figure 6. Diagram of the bench spectrograph constructed to measure the
efficiency of the prototype immersed grating.
Dow
nloaded from https://academ
ic.oup.com/m
nras/article/312/1/57/985251 by guest on 26 January 2022
64 D. Lee and J. R. Allington-Smith
For a grating in Littrow configuration, when the inequality
lr . 2=3 is satisfied, only diffraction orders m � 0 and 1 can
propagate. High efficiency can therefore be expected as a minimum
of light is lost into other orders. It can also be shown via the
reciprocity theorem (Maystre et al. 1980) that for a sufficiently
finely ruled grating with j . 198: 5 (i.e. lB . 556:3 nm for
r � 1200 g mm21�, in S-plane polarized light, a first-order effi-
ciency can be achieved which is limited only by the reflectivity of
the grating surface. This explains the region of high efficiency in
the immersed S-plane efficiency curve with l . 820 nm.
S-plane polarized light that enters the prism at Brewster's angle
(typically a , 608) does not suffer any reflection loss. The large
angle of incidence with the prism implies a large anamorphic
effect and hence high resolution (Dekker 1987). This property
coupled with the efficiency behaviour described above leads to
the possibility of constructing a highly efficient, high spectral
resolution dispersion system which operates in S-plane polarized
light. A polarizing beam splitter and wave-plate would be required
to convert the incident P-plane light to S-plane polarization,
implying dual-beam operation. This type of dispersion element
may therefore be suitable for use in a spectropolarimeter.
4.3.4 Littrow configuration
A direct comparison of efficiency between immersed and
unimmersed gratings in a non-Littrow configuration is made
q 2000 RAS, MNRAS 312, 57±69
400.0 500.0 600.0 700.0 800.0 900.0 1000.0Wavelength (nm)
0.1
0.2
0.3
0.4
0.5
0.6
0.7
0.8
0.9
Abs
olut
e E
ffici
ency
Unimmersed grating 45PolarisationImmersed grating 45PolarisationManufacturers data
Unimmersed blaze peak Immersed blaze peak
Figure 7. Comparison of absolute efficiency curves in immersed and unimmersed configurations with c � 458 and polarization of 458. Also shown is the
efficiency curve taken from the manufacturer's data sheet with c � 78: 5. Grating anomalies are indicated with a small vertical arrow.
500.0 600.0 700.0 800.0 900.0 1000.0Wavelength (nm)
0.0
0.1
0.2
0.3
0.4
0.5
0.6
0.7
0.8
0.9
1.0
Rel
ativ
e E
ffici
ency
Immersed grating Pplane (psi=45)Immersed grating Splane (psi=45)Immersed grating Pplane (Littrow)Immersed grating Splane (Littrow)
Figure 8. Plot of relative efficiency for the immersed grating in both S-plane and P-plane polarizations. The efficiency curves corresponding to c � 458 and
Littrow configuration �c � 08� are shown. Note the shift in position of the S-plane anomaly, from ,800 to ,650 nm, with changing collimator-to-camera
angle, and the change in the P-plane blaze peak.
Dow
nloaded from https://academ
ic.oup.com/m
nras/article/312/1/57/985251 by guest on 26 January 2022
An experimental investigation of immersed gratings 65
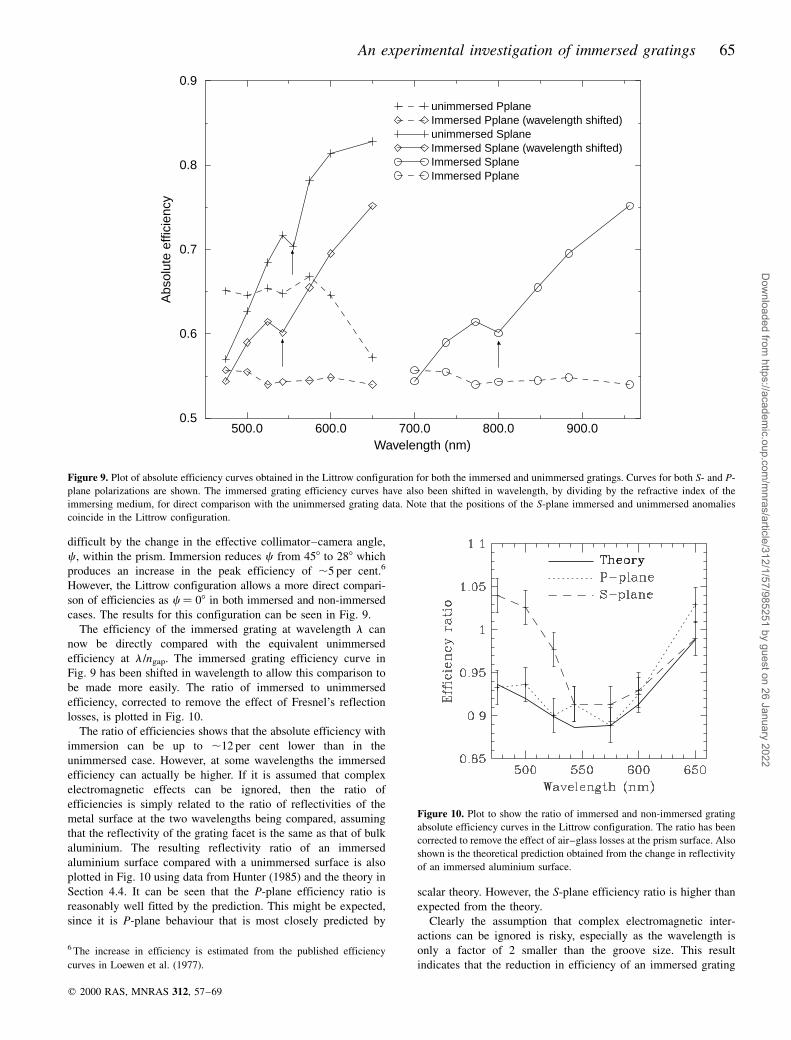
difficult by the change in the effective collimator±camera angle,
c , within the prism. Immersion reduces c from 458 to 288 which
produces an increase in the peak efficiency of ,5 per cent.6
However, the Littrow configuration allows a more direct compari-
son of efficiencies as c � 08 in both immersed and non-immersed
cases. The results for this configuration can be seen in Fig. 9.
The efficiency of the immersed grating at wavelength l can
now be directly compared with the equivalent unimmersed
efficiency at l /ngap. The immersed grating efficiency curve in
Fig. 9 has been shifted in wavelength to allow this comparison to
be made more easily. The ratio of immersed to unimmersed
efficiency, corrected to remove the effect of Fresnel's reflection
losses, is plotted in Fig. 10.
The ratio of efficiencies shows that the absolute efficiency with
immersion can be up to ,12 per cent lower than in the
unimmersed case. However, at some wavelengths the immersed
efficiency can actually be higher. If it is assumed that complex
electromagnetic effects can be ignored, then the ratio of
efficiencies is simply related to the ratio of reflectivities of the
metal surface at the two wavelengths being compared, assuming
that the reflectivity of the grating facet is the same as that of bulk
aluminium. The resulting reflectivity ratio of an immersed
aluminium surface compared with a unimmersed surface is also
plotted in Fig. 10 using data from Hunter (1985) and the theory in
Section 4.4. It can be seen that the P-plane efficiency ratio is
reasonably well fitted by the prediction. This might be expected,
since it is P-plane behaviour that is most closely predicted by
scalar theory. However, the S-plane efficiency ratio is higher than
expected from the theory.
Clearly the assumption that complex electromagnetic inter-
actions can be ignored is risky, especially as the wavelength is
only a factor of 2 smaller than the groove size. This result
indicates that the reduction in efficiency of an immersed grating
q 2000 RAS, MNRAS 312, 57±69
500.0 600.0 700.0 800.0 900.0Wavelength (nm)
0.5
0.6
0.7
0.8
0.9
Abs
olut
e ef
ficie
ncy
unimmersed PplaneImmersed Pplane (wavelength shifted)unimmersed SplaneImmersed Splane (wavelength shifted)Immersed SplaneImmersed Pplane
Figure 9. Plot of absolute efficiency curves obtained in the Littrow configuration for both the immersed and unimmersed gratings. Curves for both S- and P-
plane polarizations are shown. The immersed grating efficiency curves have also been shifted in wavelength, by dividing by the refractive index of the
immersing medium, for direct comparison with the unimmersed grating data. Note that the positions of the S-plane immersed and unimmersed anomalies
coincide in the Littrow configuration.
Figure 10. Plot to show the ratio of immersed and non-immersed grating
absolute efficiency curves in the Littrow configuration. The ratio has been
corrected to remove the effect of air±glass losses at the prism surface. Also
shown is the theoretical prediction obtained from the change in reflectivity
of an immersed aluminium surface.
6 The increase in efficiency is estimated from the published efficiency
curves in Loewen et al. (1977).
Dow
nloaded from https://academ
ic.oup.com/m
nras/article/312/1/57/985251 by guest on 26 January 2022
66 D. Lee and J. R. Allington-Smith
may be related, in P-plane polarization, to the drop in
efficiency of an immersed metal surface. The S-plane ratio
shows an improvement in efficiency for a small portion of the
blaze profile. This indicates that for certain conditions it may be
possible to achieve higher efficiencies with immersion.
The anomaly at 819 nm, or equivalently 556 nm in air, is caused
by spectral orders m � 21 and 2 being diffracted at u � 908. The
depth of this anomaly is unchanged by immersion (there is no
sharp deviation in the ratio of efficiencies), indicating that
immersion does not have a significant effect on the strength of
anomalies.
4.4 Metal±dielectric losses
The decrease in efficiency of an immersed grating is partly caused
by metal±dielectric losses. Reflection losses that occur at an air±
glass interface are well known. It is, however, less well known that
a reduction in reflectivity occurs when a metal surface is
immersed. The refractive index of a metal surface can be
represented by a complex number (Jenkins & White 1976):
nc � nR 1 inI; �11�where nR is the real refractive index and nI is the imaginary
refractive index. The real refractive index behaves as an ordinary
refractive index, determining the wave speed in the material, and
the imaginary refractive index behaves as an extinction coeffi-
cient, determining the rate of absorption in the material (Pedrotti
& Pedrotti 1993). The refractive index coefficients are frequency-
dependent and are therefore unaltered by the change in wavelength
that occurs in the immersing medium.
A derivation of the reflectivity of a metal surface, in S- and P-
plane polarizations, can be found in most introductory optics texts
(e.g. Fowles 1989). For normal incidence the following simplified
formula can be derived:
R � �ngap 2 nR�2 1 n2I
�ngap 1 nR�2 1 n2I
; �12�
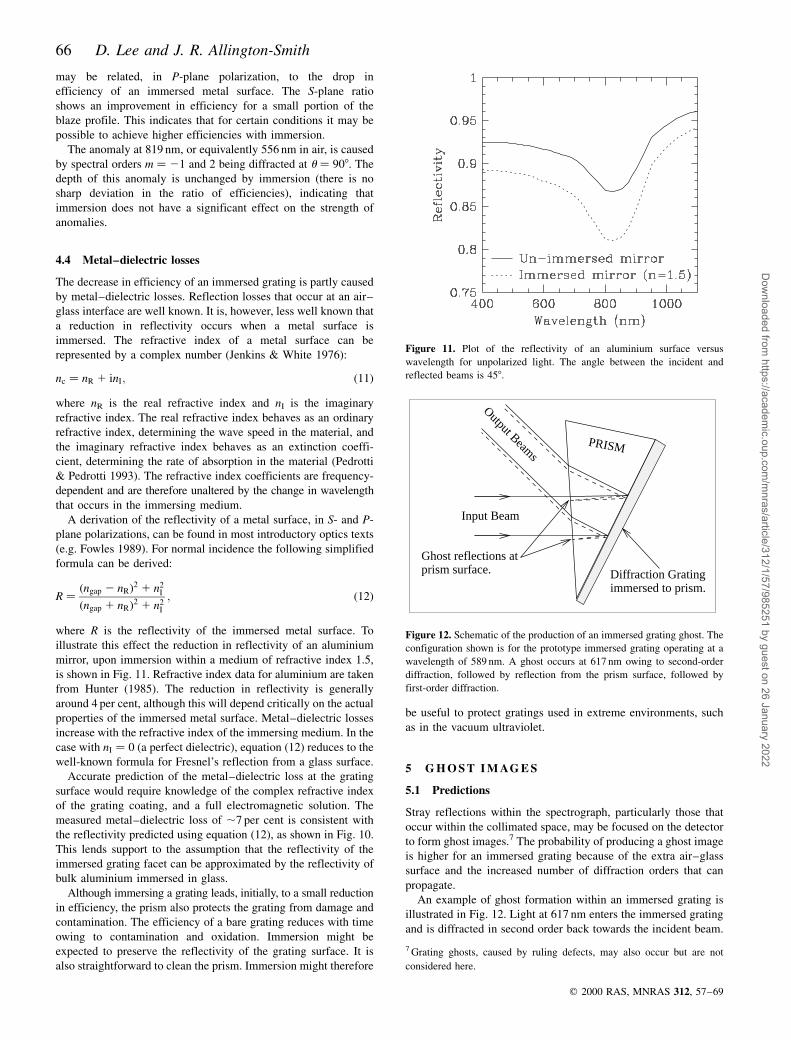
where R is the reflectivity of the immersed metal surface. To
illustrate this effect the reduction in reflectivity of an aluminium
mirror, upon immersion within a medium of refractive index 1.5,
is shown in Fig. 11. Refractive index data for aluminium are taken
from Hunter (1985). The reduction in reflectivity is generally
around 4 per cent, although this will depend critically on the actual
properties of the immersed metal surface. Metal±dielectric losses
increase with the refractive index of the immersing medium. In the
case with nI � 0 (a perfect dielectric), equation (12) reduces to the
well-known formula for Fresnel's reflection from a glass surface.
Accurate prediction of the metal±dielectric loss at the grating
surface would require knowledge of the complex refractive index
of the grating coating, and a full electromagnetic solution. The
measured metal±dielectric loss of ,7 per cent is consistent with
the reflectivity predicted using equation (12), as shown in Fig. 10.
This lends support to the assumption that the reflectivity of the
immersed grating facet can be approximated by the reflectivity of
bulk aluminium immersed in glass.
Although immersing a grating leads, initially, to a small reduction
in efficiency, the prism also protects the grating from damage and
contamination. The efficiency of a bare grating reduces with time
owing to contamination and oxidation. Immersion might be
expected to preserve the reflectivity of the grating surface. It is
also straightforward to clean the prism. Immersion might therefore
be useful to protect gratings used in extreme environments, such
as in the vacuum ultraviolet.
5 G H O S T I M AG E S
5.1 Predictions
Stray reflections within the spectrograph, particularly those that
occur within the collimated space, may be focused on the detector
to form ghost images.7 The probability of producing a ghost image
is higher for an immersed grating because of the extra air±glass
surface and the increased number of diffraction orders that can
propagate.
An example of ghost formation within an immersed grating is
illustrated in Fig. 12. Light at 617 nm enters the immersed grating
and is diffracted in second order back towards the incident beam.
q 2000 RAS, MNRAS 312, 57±69
Figure 11. Plot of the reflectivity of an aluminium surface versus
wavelength for unpolarized light. The angle between the incident and
reflected beams is 458.
Input Beam
Output Beams
PRISM
prism surface.Ghost reflections at
Diffraction Gratingimmersed to prism.
Figure 12. Schematic of the production of an immersed grating ghost. The
configuration shown is for the prototype immersed grating operating at a
wavelength of 589 nm. A ghost occurs at 617 nm owing to second-order
diffraction, followed by reflection from the prism surface, followed by
first-order diffraction.
7 Grating ghosts, caused by ruling defects, may also occur but are not
considered here.
Dow
nloaded from https://academ
ic.oup.com/m
nras/article/312/1/57/985251 by guest on 26 January 2022
An experimental investigation of immersed gratings 67
The beam is reflected by the surface of the prism and is then
diffracted in first order to produce a ghost image in the same
location as the first-order image. Ghosts can also be produced by
reflections from other reflective surfaces in the optical system
such as the entrance slit or detector surface.
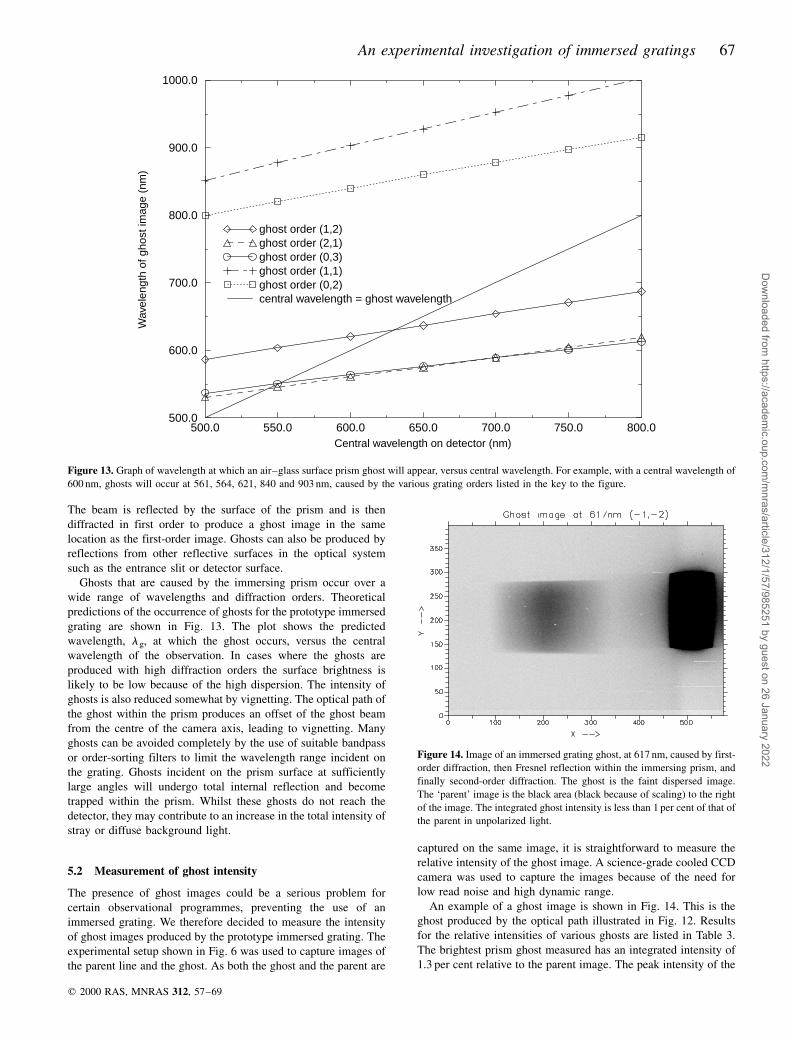
Ghosts that are caused by the immersing prism occur over a
wide range of wavelengths and diffraction orders. Theoretical
predictions of the occurrence of ghosts for the prototype immersed
grating are shown in Fig. 13. The plot shows the predicted
wavelength, lg, at which the ghost occurs, versus the central
wavelength of the observation. In cases where the ghosts are
produced with high diffraction orders the surface brightness is
likely to be low because of the high dispersion. The intensity of
ghosts is also reduced somewhat by vignetting. The optical path of
the ghost within the prism produces an offset of the ghost beam
from the centre of the camera axis, leading to vignetting. Many
ghosts can be avoided completely by the use of suitable bandpass
or order-sorting filters to limit the wavelength range incident on
the grating. Ghosts incident on the prism surface at sufficiently
large angles will undergo total internal reflection and become
trapped within the prism. Whilst these ghosts do not reach the
detector, they may contribute to an increase in the total intensity of
stray or diffuse background light.
5.2 Measurement of ghost intensity
The presence of ghost images could be a serious problem for
certain observational programmes, preventing the use of an
immersed grating. We therefore decided to measure the intensity
of ghost images produced by the prototype immersed grating. The
experimental setup shown in Fig. 6 was used to capture images of
the parent line and the ghost. As both the ghost and the parent are
captured on the same image, it is straightforward to measure the
relative intensity of the ghost image. A science-grade cooled CCD
camera was used to capture the images because of the need for
low read noise and high dynamic range.
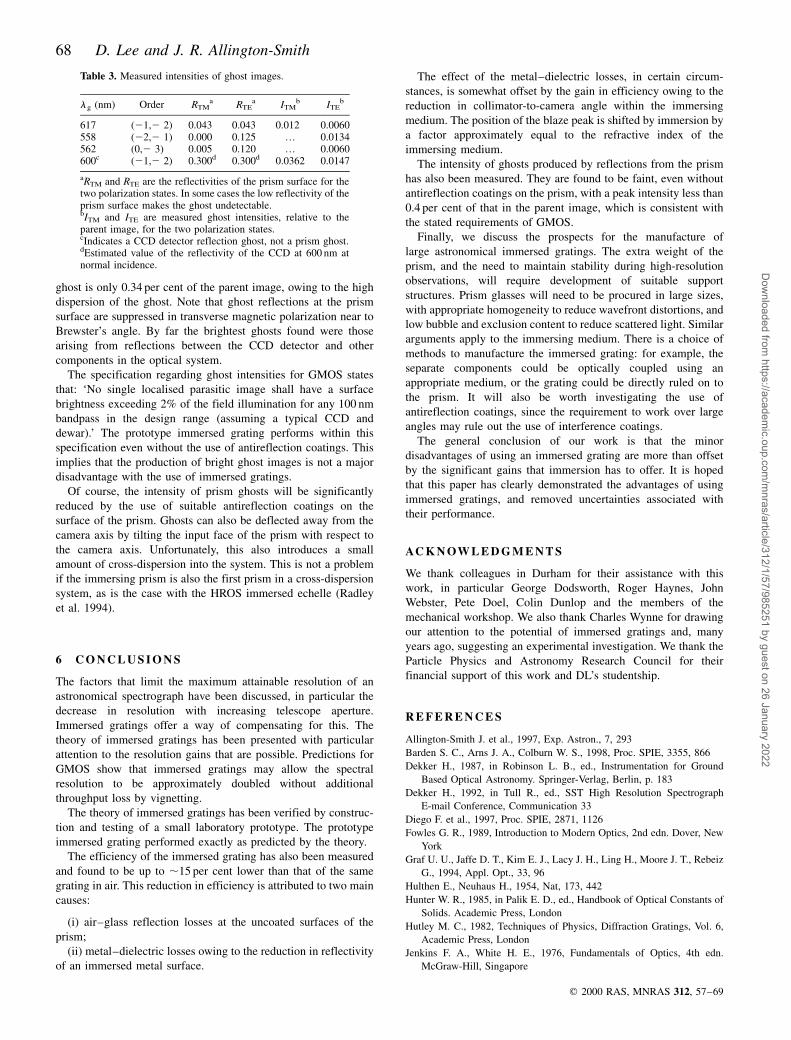
An example of a ghost image is shown in Fig. 14. This is the
ghost produced by the optical path illustrated in Fig. 12. Results
for the relative intensities of various ghosts are listed in Table 3.
The brightest prism ghost measured has an integrated intensity of
1.3 per cent relative to the parent image. The peak intensity of the
q 2000 RAS, MNRAS 312, 57±69
500.0 550.0 600.0 650.0 700.0 750.0 800.0Central wavelength on detector (nm)
500.0
600.0
700.0
800.0
900.0
1000.0
Wav
elen
gth
of g
host
imag
e (n
m)
ghost order (1,2)ghost order (2,1)ghost order (0,3)ghost order (1,1)ghost order (0,2)central wavelength = ghost wavelength
Figure 13. Graph of wavelength at which an air±glass surface prism ghost will appear, versus central wavelength. For example, with a central wavelength of
600 nm, ghosts will occur at 561, 564, 621, 840 and 903 nm, caused by the various grating orders listed in the key to the figure.
Figure 14. Image of an immersed grating ghost, at 617 nm, caused by first-
order diffraction, then Fresnel reflection within the immersing prism, and
finally second-order diffraction. The ghost is the faint dispersed image.
The `parent' image is the black area (black because of scaling) to the right
of the image. The integrated ghost intensity is less than 1 per cent of that of
the parent in unpolarized light.
Dow
nloaded from https://academ
ic.oup.com/m
nras/article/312/1/57/985251 by guest on 26 January 2022
68 D. Lee and J. R. Allington-Smith
ghost is only 0.34 per cent of the parent image, owing to the high
dispersion of the ghost. Note that ghost reflections at the prism
surface are suppressed in transverse magnetic polarization near to
Brewster's angle. By far the brightest ghosts found were those
arising from reflections between the CCD detector and other
components in the optical system.
The specification regarding ghost intensities for GMOS states
that: `No single localised parasitic image shall have a surface
brightness exceeding 2% of the field illumination for any 100 nm
bandpass in the design range (assuming a typical CCD and
dewar).' The prototype immersed grating performs within this
specification even without the use of antireflection coatings. This
implies that the production of bright ghost images is not a major
disadvantage with the use of immersed gratings.
Of course, the intensity of prism ghosts will be significantly
reduced by the use of suitable antireflection coatings on the
surface of the prism. Ghosts can also be deflected away from the
camera axis by tilting the input face of the prism with respect to
the camera axis. Unfortunately, this also introduces a small
amount of cross-dispersion into the system. This is not a problem
if the immersing prism is also the first prism in a cross-dispersion
system, as is the case with the HROS immersed echelle (Radley
et al. 1994).
6 C O N C L U S I O N S
The factors that limit the maximum attainable resolution of an
astronomical spectrograph have been discussed, in particular the
decrease in resolution with increasing telescope aperture.
Immersed gratings offer a way of compensating for this. The
theory of immersed gratings has been presented with particular
attention to the resolution gains that are possible. Predictions for
GMOS show that immersed gratings may allow the spectral
resolution to be approximately doubled without additional
throughput loss by vignetting.
The theory of immersed gratings has been verified by construc-
tion and testing of a small laboratory prototype. The prototype
immersed grating performed exactly as predicted by the theory.
The efficiency of the immersed grating has also been measured
and found to be up to ,15 per cent lower than that of the same
grating in air. This reduction in efficiency is attributed to two main
causes:
(i) air±glass reflection losses at the uncoated surfaces of the
prism;
(ii) metal±dielectric losses owing to the reduction in reflectivity
of an immersed metal surface.
The effect of the metal±dielectric losses, in certain circum-
stances, is somewhat offset by the gain in efficiency owing to the
reduction in collimator-to-camera angle within the immersing
medium. The position of the blaze peak is shifted by immersion by
a factor approximately equal to the refractive index of the
immersing medium.
The intensity of ghosts produced by reflections from the prism
has also been measured. They are found to be faint, even without
antireflection coatings on the prism, with a peak intensity less than
0.4 per cent of that in the parent image, which is consistent with
the stated requirements of GMOS.
Finally, we discuss the prospects for the manufacture of
large astronomical immersed gratings. The extra weight of the
prism, and the need to maintain stability during high-resolution
observations, will require development of suitable support
structures. Prism glasses will need to be procured in large sizes,
with appropriate homogeneity to reduce wavefront distortions, and
low bubble and exclusion content to reduce scattered light. Similar
arguments apply to the immersing medium. There is a choice of
methods to manufacture the immersed grating: for example, the
separate components could be optically coupled using an
appropriate medium, or the grating could be directly ruled on to
the prism. It will also be worth investigating the use of
antireflection coatings, since the requirement to work over large
angles may rule out the use of interference coatings.
The general conclusion of our work is that the minor
disadvantages of using an immersed grating are more than offset
by the significant gains that immersion has to offer. It is hoped
that this paper has clearly demonstrated the advantages of using
immersed gratings, and removed uncertainties associated with
their performance.
AC K N OW L E D G M E N T S
We thank colleagues in Durham for their assistance with this
work, in particular George Dodsworth, Roger Haynes, John
Webster, Pete Doel, Colin Dunlop and the members of the
mechanical workshop. We also thank Charles Wynne for drawing
our attention to the potential of immersed gratings and, many
years ago, suggesting an experimental investigation. We thank the
Particle Physics and Astronomy Research Council for their
financial support of this work and DL's studentship.
R E F E R E N C E S
Allington-Smith J. et al., 1997, Exp. Astron., 7, 293
Barden S. C., Arns J. A., Colburn W. S., 1998, Proc. SPIE, 3355, 866
Dekker H., 1987, in Robinson L. B., ed., Instrumentation for Ground
Based Optical Astronomy. Springer-Verlag, Berlin, p. 183
Dekker H., 1992, in Tull R., ed., SST High Resolution Spectrograph
E-mail Conference, Communication 33
Diego F. et al., 1997, Proc. SPIE, 2871, 1126
Fowles G. R., 1989, Introduction to Modern Optics, 2nd edn. Dover, New
York
Graf U. U., Jaffe D. T., Kim E. J., Lacy J. H., Ling H., Moore J. T., Rebeiz
G., 1994, Appl. Opt., 33, 96
Hulthen E., Neuhaus H., 1954, Nat, 173, 442
Hunter W. R., 1985, in Palik E. D., ed., Handbook of Optical Constants of
Solids. Academic Press, London
Hutley M. C., 1982, Techniques of Physics, Diffraction Gratings, Vol. 6,
Academic Press, London
Jenkins F. A., White H. E., 1976, Fundamentals of Optics, 4th edn.
McGraw-Hill, Singapore
q 2000 RAS, MNRAS 312, 57±69
Table 3. Measured intensities of ghost images.
lg (nm) Order RTMa RTE
a ITMb ITE
b
617 (21,2 2) 0.043 0.043 0.012 0.0060558 (22,2 1) 0.000 0.125 ¼ 0.0134562 (0,2 3) 0.005 0.120 ¼ 0.0060600c (21,2 2) 0.300d 0.300d 0.0362 0.0147
aRTM and RTE are the reflectivities of the prism surface for thetwo polarization states. In some cases the low reflectivity of theprism surface makes the ghost undetectable.bITM and ITE are measured ghost intensities, relative to theparent image, for the two polarization states.cIndicates a CCD detector reflection ghost, not a prism ghost.dEstimated value of the reflectivity of the CCD at 600 nm atnormal incidence. D
ownloaded from
https://academic.oup.com
/mnras/article/312/1/57/985251 by guest on 26 January 2022
An experimental investigation of immersed gratings 69
Lee D., 1998, PhD thesis, University of Durham
Loewen E. G., Neviere M., Maystre D., 1977, Appl. Opt., 16, 2711
Maystre D., Neviere M., Petit R., 1980, in Petit R., ed., Electromagnetic
Theory of Gratings. Springer-Verlag, Berlin, p. 176
Murowinski R. et al., 1998, Proc. SPIE, 3355, 188
Pedrotti F. L., Pedrotti L. S., 1993, Introduction to Optics, 2nd edn.
Prentice Hall, Englewood Cliffs, NJ
Radley A. S., Szumski R., Diego F., Walker D. D., 1994, Design Study For
An Unfolded Cryogenic Camera and Immersed Echelle For HROS,
Final Report, OSL technical report
Schroeder D. J., Hilliard R. L., 1980, Appl. Opt., 19, 2833
Szumski R., Walker D. D., 1999, MNRAS, 302, 139
Wiedemann G., Jennings D. E., 1993, Appl. Opt., 32, 1176
Wynne C. G., 1989, Opt. Commun., 73, 419
Wynne C. G., 1990a, Opt. Commun., 75, 1
Wynne C. G., 1990b, Opt. Commun., 77, 355
Wynne C. G., 1991, MNRAS, 250, 796
Wynne C. G., 1992, MNRAS, 254, 7
This paper has been typeset from a TEX/LATEX file prepared by the author.
q 2000 RAS, MNRAS 312, 57±69
Dow
nloaded from https://academ
ic.oup.com/m
nras/article/312/1/57/985251 by guest on 26 January 2022


