Embed Size (px)
Citation preview

Journal of Hydrology, 31 (1976) 359--380 © Elsevier Scientific Publishing Company, Amsterdam -- Printed in The Netherlands
AN E X A M I N A T I O N OF THE V A R I A N C E M I N I M I Z A T I O N T E N D E N C I E S OF A S U P R A G L A C I A L S T R E A M
JEFF DOZIER
Department of Geography, University of California, Santa Barbara, Calif. (U.S.A.)
(Received February 18, 1976; accepted for publication February 24, 1976)
ABSTRACT
Dozier, J., 1976. An examination of the variance minimization tendencies of a supraglacial stream. J. Hydrol., 31: 359--380.
Synthesis of landscape evolution based upon the actual processes of transfer of energy and material is difficult, because the hydraulics of erodible channels are not fully understood. Previous workers have utilized variance minimization postulates to derive certain hydraulic relations, but these have been unsatisfactory because of the lack of a mechanism for variance minimization. This study examines the validity of the variance-minimization principle through an investigation of the changes in the longitudinal distribution of the bed-shear~stress components over a two-month period in two reaches, one meandering and one straight, of a rapidly eroding supraglacial stream. During this time the coefficients of variation of bed shear stress, skin resistance, and form resistance decreased in both reaches. Except for skin resistance, the values were lower for the curved reach than for the straight. Spectral analysis of the paths of the reaches and of the stress distributions indicates that the scale of the regularities decreases with decreasing discharge. Cross-spectral analysis of the shear-stress components on different dates indicates that in the curved reach, the locations of the minimum shear stresses at the end of the summer coincide with the locations of the maximum skin resistances at the beginning of the summer.
VARIANCE MINIMIZATION IN SUPRAGLACIAL STREAM
Many geomorpho log i s t s have been intr igued by the p lanimetr ic similarities be tween streams f lowing on the surfaces o f glaciers and those f lowing on alluvium. Supraglacial s t reams o f t en meander , and the m e a n d e r g e o m e t r y is similar to t ha t o f o rd inary rivers (Leopo ld and Wolman, 1960 , pp. 7 7 3 - - 7 7 6 ; Knigh ton , 1972, p .202) . C o m p a r e d to o rd ina ry rivers, however , supraglacial s t reams adjust very rapidly, as t h e y main ta in channels on glaciers where ice- surface abla t ion exceeds 1 m per m o n t h (Ferguson, 1973b , p . 2 5 3 ; Dozier , 1974 , p. 195) . It may be, then, t ha t the channel behavior which one can observe in a supraglacial s t ream over a single field season is comparab le to tha t which would occur over a m u c h longer per iod in a normal river, and there fore supra- glacial s t reams are interest ing laborator ies where principles o f river channel ad jus tmen t can be tested. The controvers ia l " T h e o r y o f Min imum Var iance" ,

360
whereby river-channel adjustment is constrained by the minimization of the variances of one or more parameters, is so examined in this paper, to see whether the channel adjusts over time in accord with any variance-minimization principle.
THEORY OF MINIMUM VARIANCE: BACKGROUND AND PROBLEMS
The variance-minimization principle has been presented in the geomorphol- ogical literature in two forms: (1) minimization of the variance of certain variables as measured at different cross-sections along a reach of a river (Lang- bein and Leopold, 1966); (2) minimization of the sums of squares of com- binations of the exponents in the hydraulic geometry relations (Langbein, 1964, 1965; Maddock, 1969).
Both Gilbert (1880) and Mackin (1948) held that a river profile should smooth itself through time, by eroding material over sections where slope is steepest and depositing where slope is least, and thus they implicitly supported the concept o f longitudinal minimization of variance. Langbein and Leopold (1966) measured bed shear stress and the Darcy-Weisbach resistance coefficient (also called friction factor) over both straight and meandering reaches of five streams below the Wind River Range in Wyoming, and found in all cases that the sums of the squared coefficients of variation of these two factors, as measured along the channel, were less over the meandering reaches. This they interpreted as evidence that meandering represents a condit ion closer to equilibrium. They gave, however, no rational reasons, based either upon theoretical principles of erosion and deposit ion or upon experiment, for their choice of variables.
The first explicit s ta tement of the variance minimization principle was given by Langbein (1964) in his a t tempt to derive the values commonly observed for the exponents in the "hydraulic geomet ry" relationships, whereby many stream parameters (for instance, width, depth, velocity, slope, sediment load) are expressed as power functions of a single independent variable, usually dis- charge (Leopold and Maddock, 1953). By minimizing the sums of squares ("variances") of selected combinations of exponents, he was able to arrive at solutions which resemble typical values from field measurements. Maddock (1969) extended Langbein's concepts by analyzing a variety of independent and dependent variables under different constraints. He considered the principal constraint to be the joint minimization of the variances of bed shear stress and the friction factor, and by using this, he was able to develop solutions for a variety of conditions, which compared favorably with experimental data.
The papers by Langbein and Maddock have been criticized for the many ad hoc assumptions in the analyses (Kennedy et al., 1964; ASCE, 1971). Neither author presented any concise guidelines, or derivations from mechanical principles, for determining which variances are to be minimized. Instead, the factors were selected because the results gave answers close to the values of the exponents in the hydraulic geometry. The strength of such evidence is

361
questionable. Since the cont inui ty constraint requires such exponents to sum to one, it is not surprising that there is some general similarity. Moreover, considerable dispersion among the exponents exists, even along rivers where all cross-sections are in similar material (Dozier, 1973, pp. 15 and 16). Wolden- berg (1966) has shown that the allometric growth equation has a power function solution, but he overlooks the fact that the corollary is not necessarily true; that is, a power function relationship does not necessarily imply an allo- metric generating process. All this suggests that any conclusions about the theory of minimum variance which are supported only by the data of hydraulic geometry are likely to be unsatisfactory. What is needed is a more direct evaluation based upon processes of erosion and deposition. Cherkauer (1973) provided a helpful step in this direction when he found that Langbein's constraints described base-flow conditions of a pool-riffle reach of the Treia River in central Italy. But because his measurements were limited to base-flow discharge, when virtually no sediment transport took place, his analysis also lacks any consideration of a mechanism for adjustment.
The approach taken by Langbein and Leopold (1966), from measurements along the channel at approximately the same time, offers more room for exploration than the hydraulic geometry approach, as the analysis is not dependent on the power function relationship of the dependent variables to discharge, nor upon their log-normal distribution. This s tudy therefore examines the variance of selected factors over two reaches of a supraglacial stream, and asks whether any variance minimization principle can explain the change of these variances over time. Also considered is a mechanism by which variance minimization might take place.
D E F I N I T I O N OF V A R I A N C E
In this paper the square of the coefficient of variation is used as a measure of dispersion:
[CV] 2 = =1 j = l x - 2 = (1)
Such a measure allows direct comparison of the dispersion of different samples with different means, Langbein and Leopold {1966) also used this measure, although they simply called it "variance".
CHOICE OF V A R I A B L E S
Water flowing in a channel exerts a shear stress on the walls and the bed. The mean bed shear stress r0 is equal to pgRS, where p is the fluid density,

3 6 2
g the gravitational acceleration, R the hydraulic radius, and S the energy slope. The derivation can be found in many texts (for example Leopold et al., 1964, pp. 156 and 157). The bed shear stress can be thought of as the potential- energy loss per unit length per unit volume. Sometimes it is expressed instead by the "shear veloci ty" u . , which is equal to (gRS) 1/~ and has the same dimensions as velocity.
Since neither the stream's kinetic energy nor ice nor water temperature (~ 0°C) changes, this loss of potential energy is available to melt the bed. Not all of it actually is used for thermal erosion in the short section of a reach over which To is measured, apparently, as energy is also expended in turbulence and secondary circulation. Since this turbulence is dissipated as heat, it eventually will be used for thermal erosion, but at an indeterminate distance downstream. Einstein (1950) attacked this problem heuristically by assuming that the mean bed shear stress T0 is divided into a "grain" or "sk in" component To' and a " f o r m " component r0", such that:
To = To' + TO" = p g R ' S + p g R " S (2)
where R = R' + R" . Leopold et al. (1960) point out that a "spill" resistance comprises part of
the form component . As water flows around a bank projection, a raised water level is created on the upstream side and a lower one on the downstream side. At low velocities adjustments between flow depth and velocity head take place so that the energy slope remains constant, with no energy loss specifically attributable to the obstruction. As velocity approaches the speed of wave propagation this adjustment ceases to be possible; the high velocity upstream impinges on the lower velocity downstream, and this spill resistance leads to additional dissipation of energy. Apparently this occurs locally even if the river flow as a whole is subcritical.
In order to calculate R' for a smooth-wall channel, Einstein (1950, p. 10) presented an equation, adapted from Keulegan (1938) for the ratio of mean velocity in a cross-section to the skin component of shear velocity:
~/u . ' = 5.75 1°log (3.67 R 'u,'/r) (3)
where p . ' equals (gR'S) 1/2 and v is the kinematic viscosity. If ~ is known, the equation can be solved iteratively for R' .
This division of the hydraulic radius, while heuristic, has provided an excellent method for calculated bed-load sediment transport in streams, as it separates the energy lost at the bed from that lost by other means [see Graf (1971) for comprehensive summary] . Here the assumption is made that To' provides a good estimate of the energy transferred directly to the supraglacial stream bed, although eventually all of To is converted to heat. Thus the rate at which a stream erodes the underlying ice is related to To. The mass of ice eroded per unit time is To Q/G, where Q is the discharge of the stream and ~ is the latent heat of fusion of ice. Unlike ordinary sediment transport, no threshold should exist. This erosion can take place laterally as well as downward, as the common under-

363
cut banks on the outsides of bends at test (Fig. 1}. Although the average rate of erosion is related to T0, any local control that exists is due to r0', because of the downstream lag that results before the heat resulting from T0 is trans- ferred to the ice.
The mechanism envisioned for variance minimization is similar to that of Gilbert (1880, pp. 117 and 118), except that it implies that depth as well as slope may adjust. Erosion at places where the skin componen t of bed shear stress is highest, should decrease the slope there, reducing the shear stress. As slope decreases, however, depth increases, and it is possible to have uniform bed shear stress wi thout either uniform slope or depth.
Fig. 1. Channe l b e n d o n a supraglacia l s t r e a m o n Capps Glacier . Latera l e ros ion is ev iden t in t he u n d e r c u t b a n k .
D E S C R I P T I O N OF T H E F I E L D P R O G R A M
Two reaches, one meandering and one straight, o f a small supraglacial stream (discharge about 10 -2 m 3 s -1 ) on Capps Glacier, 2 km south of Chitistone Pass in the Wrangell Mountains of Alaska, were examined during the summer of

364
1969 (see Figs. 2--4). The glacier is about 3 km long and ranges in elevation from 1,500 to 2,600 m. The study area, at about 1,700 m, lay well below the transient snow line after mid~lune.
The stream, 0.3--0.5 m wide, was first observed early in June as a slush flow when the glacier was still covered by n~v~. Channel development began on a sinuous trip of ice bared by the slush flow. As there was no evidence of a remnant channel, the stream was probably of the annual type, as opposed to the perennial, in Ewing's (1972) classification. The stream incised about 0.3 m into the glacier before the snow had melted from the nearby glacier surface but never became appreciably deeper, maintaining an approximate equilibrium with the rate of downwasting of the glacier, which amounted to over 2 m in 6 weeks. Slope in the area was about 0.23.
The curved and straight reaches of stream were examined twice during the summer, on 19--20 June and 3--4 August to see if: (1) the dispersion of the bed shear stress and its skin and form components decreased over time; and (2) the dispersion was smaller for the curved reach than for the straight reach, as was demonstrated by Langbein and Leopold (1966) to be the case for five streams in the foothills of the Wind River Range.
Each reach was 18 m long; the straight reach was about 30 m upstream from the curved reach, but no tributaries entered the stream between them. At 13 cross-sections along each reach the following variables were calculated from
I
SuproglQcial Stream, 9 June 1969 li
Fig. 2. L o c a t i o n o f research area.

3 6 5
Fig. 3. Curved reach. Measurement s takes are at 1 . 5 2 - m (5- f t . ) intervals.
D
~ k
Fig. 4. Straight reach. S n o w cover is sti l l present on glacier.

366
profiles of the cross-section: cross-sectional area, wetted perimeter, and hydraulic radius• Average velocity over the entire reach was measured by timing floating matchsticks and multiplying by the correction factor 0.8 (Matthes, 1956) and mean velocities for each cross-section were calculated from continuity considerations (Dozier, 1974, p. 193).
ANALYSIS OF DATA
For each reach in each measurement period, the squares of the coefficients of variation o f total bed shear stress and it components were computed. The squares of the coefficients of variation of the Darcy-Weisbach friction factor (f = 8 g R S / u 2) were also calculated, in order to compare the results to those of Langbein and Leopold (1966), although the physical meaning of this dispersion is unclear. The results are presented in Fig. 5 and summarized in
1,000
I 0 0
=-
co
03
-g
a3
, 0 0 0 ]
J U N E I , o o o
T o l o l Bed Shear S t r e s s - - - - - - F o r m R e s i s t a n c e
. . . . . . Sk in R e s i s t a n c e '~E
Z I 0 0
u ~
° . o ~ . . . . "- . . . . . . . . ~ . . . . - " " " : . . . . . . . . " ! m
, , , , T- 4 8 12 16 D i s t a n c e A l o n g C h a n n e l , m
A U G U S T 1 ,000
!,oo _ _ z,oo | - - -
~o J ~ ~o 0'3 ° . . . . ° . . . . . . . • ° ° ° ° ° . ° ° O3
m
0 4 8 12 16 D i s t a n c e A l o n g C h a n n e l , m
CURVED REACH
J U N E
o . .O° . . . . . . . . : . . . . . . . : ' ° o_.
, , T , 8 12 16
D i s t a n c e A l o n g C h a n n e l , m
A U G U S T
. . . . . . . . • . . . . • o . ° ° . ° 0 ° _ , " ' ~ . . . . . . , . . . . ; . . . . . o * .
n • r 0 4 8 12 16
D i s t a n c e A l o n g C h a n n e l , m
S T R A I G H T R E A C H
Fig. 5. Bed-shear-stress components (total, skin, and form) in curved and straight reaches on 19/20 June and 3/4 August. The squared coefficients o f variation o f these components are tabulated in Table I.
367
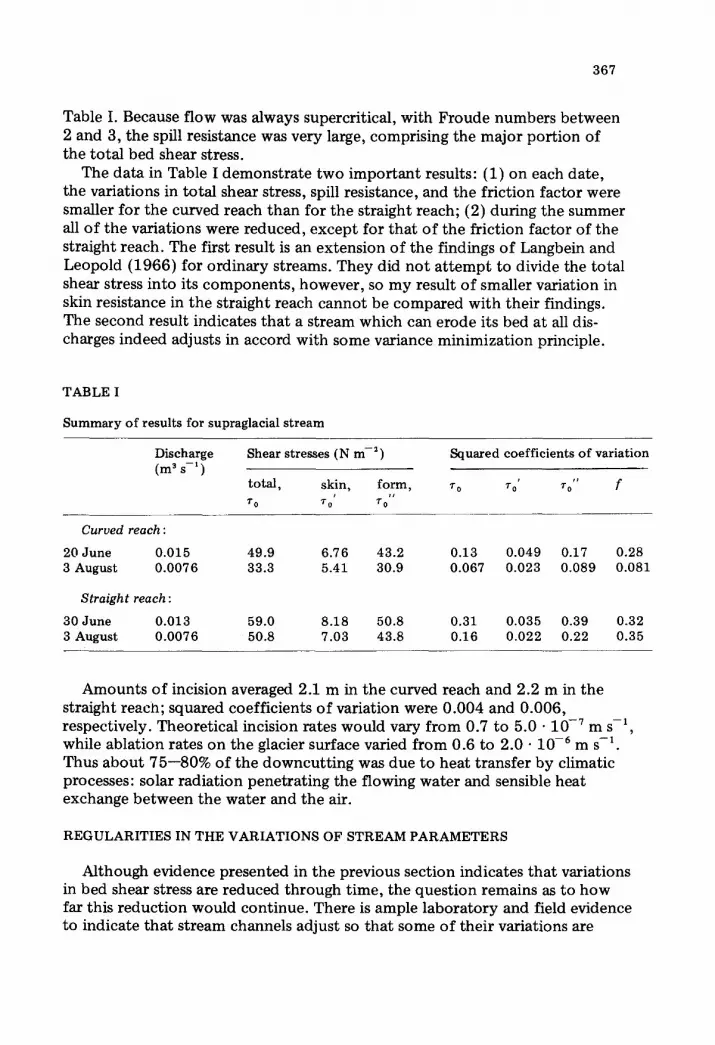
Table I. Because flow was always supercritical, with Froude numbers between 2 and 3, the spill resistance was very large, comprising the major portion of the total bed shear stress.
The data in Table I demonstrate two important results: (1) on each date, the variations in total shear stress, spill resistance, and the friction factor were smaller for the curved reach than for the straight reach; (2) during the summer all of the variations were reduced, except for that of the friction factor of the straight reach. The first result is an extension of the findings of Langbein and Leopold (1966) for ordinary streams. They did not a t tempt to divide the total shear stress into its components, however, so my result of smaller variation in skin resistance in the straight reach cannot be compared with their findings. The second result indicates tha t a stream which can erode its bed at all dis- charges indeed adjusts in accord with some variance minimization principle.
TABLE I
Summary of results for supraglacial stream
Discharge (m ~ s-')
Shear stresses (N m -2) Squared coefficients of variation
total, skin, form, T o %' %" f t i i
T O T O T O
C u r v e d reach :
20 June 0.015 49.9 6.76 43.2 0.13 0.049 0.17 0.28 3 August 0.0076 33.3 5.41 30.9 0.067 0.023 0.089 0.081
S t r a i g h t reach :
30 June 0.013 59.0 8.18 50.8 0.31 0.035 0.39 0.32 3 August 0.0076 50.8 7.03 43.8 0.16 0.022 0.22 0.35
Amounts of incision averaged 2.1 m in the curved reach and 2.2 m in the straight reach; squared coefficients of variation were 0.004 and 0.006, respectively. Theoretical incision rates would vary from 0.7 to 5.0 • 10 -~ m s - i , while ablation rates on the glacier surface varied from 0.6 to 2.0 • 10 -6 m s -1. Thus about 75--80% of the downcutt ing was due to heat transfer by climatic processes: solar radiation penetrating the flowing water and sensible heat exchange between the water and the air.
REGULARITIES IN THE VARIATIONS OF STREAM PARAMETERS
Although evidence presented in the previous section indicates that variations in bed shear stress are reduced through time, the question remains as to how far this reduction would continue. There is ample laboratory and field evidence to indicate that stream channels adjust so that some of their variations are

368
regular. Commonly cited examples of this are meanders, pool-riffle sequences, and deflections of the thalweg in straight channels. Clearly any examination of longitudinal variations in bed shear stress in a river should include analysis of any regularities that might exist.
Spectral analysis, using the Fourier transform, was carried out on the total bed shear stress and its two components for both reaches of the supraglacial stream on both dates. Because bed shear stress is measured over short sections of a reach, the original data can be considered a step funct ion (Fig. 5). Lanczos (1966, p. 37) gives equations for calculating the Fourier coefficients of a step- function directly, wi thout digitizing the data at regularly spaced intervals:
2 N a [ k ] = - -
j=l
k cos + sin [ k ( s / + l
b[k] =~--~ ~ r / s in (si+ 1 +si) sin (si+ 1 -s]
(4)
1 Ftk] = 1A(a[k l - ib[k ] ) = ~
nk
N
2i [exp(-iks/) - exp(-iksj+ 1)1,
j=l
k = 1, 2, ... (5)
where i 2 = - 1 and F[k] is the complex Fourier coefficient for harmonic k. The step-function can be approximated as closely as desired by increasing the number of coefficients. A smooth approximation results by calculating one coefficient for every two steps. In the complex version, choosing the number of coefficients to equal an integer power of 2 allows the well-known economies of the fast Fourier transform to be used in subsequent calculations. A F O R T R A N subroutine for the fast Fourier transform can be found in Robinson (1967, pp. 63 and 64). The complex Fourier coefficients were smoothed once by the "sigma" method to suppress high-frequency oscillations (Lanczos, 1961,
j=l
with :
k = 1 , 2, ...
where N is the number of steps, a[k] and b[k] are the cosine and sine coeffi- cients for harmonic k, and r, is the bed shear stress measured between distances s 1 and si+ 1 along t~e channel, expressed in radians where total reach length equals 2n. For calculation economy, Lanczos' two equations can be rewritten in complex form in one equation:

369
pp. 75 and 76). From the smoothed Fourier coefficients the power spectrum estimates P[k] for each harmonic equal the product F[k] • F[k ]*, where * denotes complex conjugation. The imaginary parts are eliminated by this multiplication. These power spectrum estimates were in turn smoothed once with the elementary binary filter (weights 1A, 1~, 1~). Since the sum of the power spectrum estimates equals the variance, each of them can be expressed as a proport ion of the total variance, and these are called the power spectral density estimates. The conventional autocorrelat ion function is calculated by taking the inverse Fourier transform of the spectral density funct ion (Jenkins and Watts, 1968, p. 218).
Graphs of the power spectra and spectral density and autocorrelat ion functions for the data of Fig. 5 comprise Fig. 6. In all cases the spectra for the form com- ponent of bed shear stress were virtually identical to those of total bed shear stress and so have been omit ted from Fig. 6 for sake of clarity. In the curved reach the spectrum of the skin componen t of shear stress peaks at higher frequency than that of total bed shear stress. Moreover, the higher frequencies account for more of the variance in August than they do in June, and this is interpreted as an effect o f the decreased discharge, whereby the spacing between regularities decreases. In the straight reach the spectra are flatter in June and are more concentrated in the lower frequencies in August, in com- parison to the curved reach. The higher frequency regularities in the curved reach, which are absent in the straight reach, correspond to a wavelength of 3--6 m, or 9--15 channel widths, as measured along the stream path. The longer of these corresponds to the average channel length of a meander, as there were three meanders in the 18-m reach.
The planimetric path of the stream was also analyzed by spectral techniques. River paths are not normally expressed in the conventional x--y coordinate system, because a univalued function will not always result. Instead, the direction angle ¢, with reference to the mean downstream direction, is expressed as a function of the distance s along the channel from some arbitrary starting point. Spectral analysis of the paths of ordinary rivers has shown that the normal geomorphological term "meander wavelength" is usually subjectively chosen and of ten meaningless, because in most rivers a number of regular wavelengths exist (Speight, 1965, 1967; Thakur and Scheidegger, 1970).
Ferguson (1973a) has summarized various theoretical models of the general form that the function ¢ = f ( s ) should take. The general class of curves for the most probable path on a plane is an elliptic integral (Von Schelling, 1964). This can be closely approximated by a "sine-generated" curve, whereby the direction angle is a sine-function of the distance along the path. Sine- generated curves correspond to the paths of individual meanders in a variety of North American rivers (Langbein and Leopold, 1966).
Where reach lengths are longer than just one meander, however, a single harmonic tr igonometric funct ion does no t adequately describe a river's path. It is necessary to use the sum of many harmonics, a Fourier series, from which the power spectrum can be calculated. The procedure is greatly simplified by

370
1 , 0 0 0
I00
e~ E
Z I0
d
g_ 01
D o I
I t \ \ , / k
::: \
\ • . . . . . . . . . . . ~
0 2 4 6 F r e q u e n c y , C y c l e s / m
5 0
4 O
c o
a 30 >
o
m 2 0
I 0
+ 1 0
3
-- 0 o
8 o
--I 0
~ * . . t o
t
~ , ~ . . . . ~.. 2 4 6
F r e q u e n c y , C y c l e s / m
oX_-., , "-~,o°°°
%~ ~" . •
.?-~ ~,- .-
0
f r
2 3
L a g , m
CURVED REACH
I ,O00
I 0 0
E z , o -
E"
I1) Q. (/)
I
o? O I
001
.~.-June Total Bed Sheer Stress
August Total BSS ~ \ x ~ - , , \
June Bed Sheor Stress, S k i n " . . ~
.. '2~.... o o o o o 0 0 % ' ,
: / -. %° , C, / " ° , ° ° , . ° ° ,2,
August B.SS, Skin "'.~':'%
"°- ';'o i i
' 2 ' ,1 6
Frequency, Cycles/m
4O
o
~0
oo~o ~ z , / : - ~ - . ~ = _ , . o o
* " . 2
+ LO-
~ 5
3 g
~ 0
S o
5
- - I 0 i
4 0
2 4 6 F r e q u e n c y , C y c l e s / m
~ .
~, \ "°° ~, \ %, ~, \ °°° • , \ ° ° °
f- i I
2 3 4
L a g , m
STRAIGHT REACH
Fig. 6. Power spectra, spectral density functions, and autocorrelation functions for total bed shear stresses and skin components in curved and straight reaches in June and August. Form components were similar to totals and have been eliminated from these graphs.

371
the use of eq. 5, for calculating the complex Fourier series of a step-function. The river path must be digitized, and the points must be spaced sufficiently closely so that the path is essentially straight between any two points. They need not, however, be equally spaced. Furthermore, the direction angles between points are calculated from an inverse trigonometric function, instead of being measured with a protractor, and the method seems far less laborious than the previous approaches (e.g., Speight, 1965, 1967; Thakur and Scheidegger, 1968). Given a set of points along the channel designated by x--y coordinates Ix1 ,Yl ], [x2,y2 ], ... [Xn,Y n ], the distance s between successive points is calculated by the Pythagorean theorem:
s i = [x j - x i + 1 )2 + (y ] _ Y ; + I )2],/2
The angle ~ of the channel between any two points can be obtained from any of the three common inverse trigonometric functions, for example:
Cj = arcsin [(Y/+I - Yj)/sj]
These are then standardized to a mean of zero, so that the ¢'s represent deviations from the mean direction. The resulting step-function can be trans- formed into a mooth curve by the use of eq. 5.
Fig. 7 presents the data, direction angle as a function of channel distance, for the curved and straight reaches on 20 June and 3 August. Fig. 8 presents the power spectra and spectral density and autocorrelation functions. In the curved reach the third harmonic (frequency 0.164 cycle m -1) accounts for most of the variance, but this is hardly surprising since the reach included three meanders. The peak at this frequency is more pronounced in August. The same frequency also accounts for most of the variance in the straight reach, even though here the deviations from the mean path are much smaller. Another interesting result is that on 3 August the sixth harmonic (frequency 0.328 cycle m -1) assumes slightly more importance in both reaches. This is interpreted as a scale effect of the decreased discharge. As flow decreases, the spacing be- tween regularities in the bed shear stresses and direction angles also decreases. The frequency changes are not striking, because of the residual effects of higher discharges, but the spectra support the viewpoint that stream channels are a result of the whole range of flow magnitudes, and not created solely by some "dominant discharge".
CROSS-SPECTRAL ANALYSIS OF PLANIMETRIC PATH AND BED-SHEAR-STRESS COMPONENTS
To explore the relationship between the direction angle o f the supraglacial stream and the longitudinal distribution of the various components of bed shear stress, and between these variables on different dates, the cross-spectra were calculated from the Fourier coefficients (see Jenkins and Watts, 1968, for methods). The cross-spectrum estimate C12[h], between series 1 and 2 at

372
or"
09 o~ c
£D
._a
cr v
c < [
;5
+ 1 . 5 0
I 0 0
5 0
0
50
I.OO
1.50
1.50 ]
LO 0
. 5 0 J
0
. 5 0
LO 0
- I . 5 0 O
CURVED REACH
June - -
August - -- --
Distance Along Channel ( M e t e r s )
STRAIGHT REACH
June
August - - - - - -
4 8 12 16
Distance Along Channel (Meters)
MAPS: CURVED REACH N
~,o ~ / ~ ~2,,9 ,52~
0 305 " ~'~%
c) 19 June ~ 18 29
4 Augus t ~ - - N
STRAIGHT REACH \ !
914
5 05 6 I0 12 19 15 24 18 2.9
0 305 12. 19
! .... o , 2 , ? , 6, Meters
Z t A b l a t i o n Stoke Arrow shows movement re la t ive to fixed stake (4~) between 19 June
and 4 August ~ Distance along channel in meters
5o5
Fig. 7. D i rec t ion angles vs. distance a long channe] in curved and straight reaches in June and August . The l o w e r part o f the f igure shows the reaches.

373
I
g
h-
i '
(,9
~o, / £
0 0 1 0
I00
8 0
g a > 6O
o
4o
2O
+ 1 0
"Z 0 .5
0
0 0
5
I 0
I
~, June-- ~ 'i A o 0 o s , - o i
O~
. . . . . O 0 1 - ~ - ' - - - - ~
2 .4 6 0 2 4 6
F r e q u e n c y , C y c l e s / m F r e q u e n c y , C y c l e s / m
I 0 0
fl
!
0 2 4 6
Frequency, Cycles/m
Lag, m
CURVED REACH
8 0
o o
°t "r"
6o
0 2 4 6
Frequency, Cycles/m + ~ 0
c
(_~
g . ,2-
0 , ~ , , _, /z
2
, - I 0 3 4 0 2
L o g , rn
S T R A I G H T
3 4
REACH
Fig. 8. Power spectra, spectral density functions, and autocorrelation functions for direction angles in curved and straight reaches in June and August.

374
harmonic k, is a complex number equal to the product F l [k] • F2[k]*. The cross-correlation function may be obtained by taking the inverse Fourier transform of the cross-spectrum and dividing by the square root of the product of the variances of the two series. The cross-spectra were smoothed once with the elementary binary filter, and from these smoothed estimates the squared coherency spectra were calculated. The squared coherency estimate R~22[k] between two series at harmonic k is analogous to a squared correlation coefficient at that frequency; it is calculated by:
Cl~[k] • C12[k]* R122 [k] = (6)
P t [k ] -P2[k]
The phase angle • 12 [k] at f requency k i t (where T is the window length) represents the average distance, in radians, between the maximum of variable 1 at that f requency and the maximum of variable 2 (or min imum if the maximum absolute value of the cross-correlation function is associated with a negative cross-correlation). It is equal to the argument of C12 [k] :
J im C12[k] 1 ~12[k1 =arc tan - - Re ~ J (7)
The phase shift ~s~2[k ] is the actual distance, in meters in this case, represented by the phase angle:
T ,I, s12[k] = ,I, 12[k] (8)
2nk
The upper and lower 95%-confidence limits associated with the phase angle ~12 [k] are given by Rayner (1971, p. 89):
t • ~2[k] _+ arcsin - - F[2 ,~-2;0 .05] (9) • \ R I ~ 2 [ k ]
where F[2 ,~-2;0 .05] refers to the F distribution with two different degrees of f reedom at the 95%~onfidence level. From the confidence limits of the phase angle, the confidence limits of the phase shift can be calculated by eq. 8.
Direction angles and bed-shear-stress components
In examining the cross,spectra between deviation angles and bed-shear-stress components , it is important to realize that the minimum values for the direction angles represent large deviations f r o m t h e mean downstream direction, and the maximum values also represent large deviations. This is not true for the bed-shear-stress components , where the minimum values represent smaller magnitude stresses: For this reason, the direction angles used in this portion of the analysis were converted to their absolute deviations from the mean.

3 7 5
Fig. 9 presents the cross-correlation functions and phase spectra between the direction angles ~b and the total bed shear stress To and skin components %'. In the curved reach the maximum values o f r0 lag 3 m downstream from the maximum deviation angles in June and 4.5 m in August. The maximum values of r0' occur 3 m upstream of the maximum deviation angles in both June and August, and the cross-correlation function is minimized at zero lag. This indicates that the minimum values of %' occur at the inflection points, while the maximum values occur slightly upstream from the bends• In the straight reach the maximum values of T0 and %' occur about 1 m downstream of the maximum deviation angles in June. In August the maximum r0 occurs about 1 m upstream of the inflection points, while To' is minimized slightly down- stream from them.
~- I 0 0
5 0 ?
g o 0
t
m 5 0 o
o
- I 0 0
J U N E : D i r e c t i o n A n g l e s w i t h
B e d S h e a r S t r e s s , T o t a l
B e d She~ S t r e s s , S k i n ~ ' ~ > ~ + 1 0 0
I ~ 50
~ ° . °o
x ~ . .~ ~ . - . . "
~ 5 0
~3
, . . . . . - - I 0 0
- 4 0 2 0 0 2 0 + 4 . 0
L a g , m
A u g u s t : D i r e c t i o n A n g l e s w i t h
B e d S h e a r S t r e s s , T o t a l
B e d Shea5 S l r e s s , S k i n . . . . . . . '
• / \ / YT • 1 . . . , _ o , '""oo , . . . . %
* o ° ° ° •
r , T , , , , , I ' - - 4 0 20 0 2 0 + 4 0
Log, m
+ 1 2 0 4- 1 2 0
8 0 8 0
E E 40 k / - . . : ' . " " #, ~ _ i ~ 40
o v , J . . . , . . . . , . . . . . . . . . . . . . ~n o #
~_~ 40 ~.%~o..'~o . . . . . . . . . . . . . ° . . . . . . . . Q~ 4 0
8 0 " , , 8 0
- 1 2 0 - t 2 0 0 2 4 6 8 0
F r e q u e n c y , C y c l e s / m
C U R V E D R E A C H
I
- .
2 4 6 8
F r e q u e n c y , C y c l e s / m
S T R A I G H T R E A C H
Fig. 9. Cross-correlation func t ions and p h a s e ~ h i f t spectra b e t w e e n d irec t ion angles and tota l bed shear stress and skin res istance in curved and straight reaches in June and August .

376
Deviation angles on different dates
Fig. 10 presents the cross-correlation function and phase spectra between the June and August values of the deviation angles for both reaches. In the curved reach the cross-correlation function peaks at zero lag, indicating no appreciable downstream meander migration, while in the straight reach the maximum deviation angles appear to have moved downstream by 0.5 m from June to August. The apparent downstream shift in Fig. 7 is primarily a result of foreshortening of the entire reach due to movement of the glacier.
+ I O0 ] S t ra igh t Reach
~ - 5 0
o ( D
g 0 .~_.
2
£ 9
I 50
o
~ D
- 0 0 4 - - , , , 7 ~
- 4O 2 0
Curved
i J i
0 2 0 + 4 ~ Lag, m
E 4 - "
13..
+ 2 0
8 0
4 0
0
4 0
8 0
- i 2 0 0 2 .4 .6
Frequency , CycLes /m
Fig. 10. Cross-correlation functions and phase-shift spectra between June and August direction angles in curved and straight reaches. The direction angles in the straight reach have shifted slightly downstream, while the curved reach has not.

377
Bed-shear-stress components on different dates
Fig. 11 presents the cross-spectral relations between the June and August values of ro and ro' in both reaches. In the curved reach the total bed shear stress ro appears to have undergone a phase reversal from June to August. Locations in which ro was maximized in June have the minimum values of r0 in August. Moreover, the phase spectrum displays intriguing variation with frequency. In the straight reach the maximum values of ro have migrated up- stream between 1.5 and 2 m during the summer.
+ 1 O0
Total Bed Shear Stress Shear S t r e s s , S k i n
c
5 0 4
o I
.z 0 .~ ~ %%%: • 2
S Cg J f %.
~ ~ 150
- O 0 , , , , - -
- 4 0 2 0 0 2 0 + 4 0
Lag, m
- - - - - - Bed
+ 1 0 0
,~ 5 0
j 2 o
I
o ¢.)
5 0
- I 0 0
\ i J ' J ~ \ /
- 4 0 2 0 0 2 0 + 4 0
L a g , m
+ 1 2 0
80
E 4 0
o
4 0 =o 13..
8 0 -
1 2 0
+ 1 2 0
80
_ 1 _ _ ' - - - - o
~ 40
8O
- - 1 2 0 I I i I
.2 4 6 2 4
F r e q u e n c y , C y c l e s / m F r e q u e n c y , Cycles/m
C U R V E D REACH S T R A I G H T REACH
6
Fig. 11. Cross-correlat ion f u n c t i o n s and phase-shif t spectra b e t w e e n June and August bed-shear-stress c o m p o n e n t s in curved and straight reaches . The to ta l bed shear stress d isplays a phase reversal.

378
In the curved reach the maximum values o f the skin component of bed shear stress r0' have migrated over 1 m upstream, while in the straight reach the minimum values for August are about 2.5 m upstream from the maximum values of June.
Fig. 12 presents the cross-spectral relations for r0' in June vs r0 in August for both reaches. The strong cross-correlation in the curved reach indicates that this variable may indeed exert strong control over the subsequent spatial distribution of energy losses in the stream. The maximum values of the August To occur about 2 m upstream of the maximum values of the June To', while the minimum values of the August r0 lie 1 m downstream of the maximum
o
+ l O 0
5 0
5 0
- - I 0 0
S t r a i g h t C u r v e d - - - - - Reach R e a c h
• , I f / ' ~
l ' ! - - 4 0 2 0 "~'0 2 0 + 4 0
Lag, m
+ 1 2 0
8 0
E 4 .0
~o 0
4 0 o_
8 0
- 1 2 o ~ L 0 2 4 6
Frequency, C y c l e s / m
Fig. 12. Cross-correlation functions and phase-shift spectra between June skin resistances and August total bed shear stresses in curved and straight reaches. The strong cross-correlation in the curved reach indicates that the skin resistance corresponds with future distributions o f energy losses.

379
values of the June r0'. The straight-reach relations are similar, but the cross- correlations are not as strong. It seems that the increased local erosion from the concentrations of the skin resistance in June create areas of low total- energy expenditure in August.
CONCLUSION
The major result presented in this paper is the field demonstrat ion of minimization through time of the squares of the coefficients of variation of bed shear stress and its skin and form components in two reaches of a supra- glacial stream. The two reaches differed in planimetric shape, one being curved and the other straight. Except for the skin resistance, variations were lower for the curved than for the straight reach, partially conforming to the results of Langbein and Leopold (1966) for five streams in the foothills of the Wind River Range, Wyoming.
Power spectra of the planimetric path, bed shear stress, and skin resistance indicate that as flow decreases, the higher frequencies account for increased proportions of the variances. This reduction in the spacing of regularities is partially obscured by residual effects in the channel from previous high flows. The cross-spectra indicate that the skin component of bed shear stress is the variable which is correlated best with future distributions of energy losses.
ACKNOWLEDGEMENTS
The field work on Capps Glacier was carried out during a summer's em- ployment with the Arctic Institute of North America's High Mountain En- vironment Project, supported by Army Research Office, Durham, Contract DAHCO4 67 C 0047. Mr. E.F. Koenig provided field assistance, and Mr. E.A. Gustafson drew the figures. The computat ions were performed on the IBM 360/75 at the University of California, Santa Barbara, under a grant from the Academic Senate Committee on Research.
REFERENCES
ASCE (American Society of Civil Engineers), Committee on Sedimentation of the Hydraulics Division, 1971. Sediment transportation mechanics: F. Hydraulic relations for alluvial streams. J. Hydraul. Div., Proc. ASCE, 97 (HY 1): 101--141.
Cherkauer, D.S., 1973. Minimization of power expenditure in a riffle-pool alluvial channel. Water Resour. Res., 9: 1613--1628.
Dozier, J., 1973. An Evaluation of the Variance Minimization Principle in River Channel Adjustment. Ph.D. Thesis, University of Michigan, Ann Arbor, Mich., 117 pp..
Dozier, J., 1974. Channel adjustments in supraglacial streams. In: V.C. Bushnell and M.G. Marcus (Editors), Icefield Ranges Research Project, Scientific Results. Am. Geograph. Soc., New York, N.Y., 4: 189--205.
Einstein, H.A., 1950. The bed-load function for sediment transportation in open channel flows. U.S. Dep. Agric., Tech. Bull., 1026, 69 pp.

380
Ewing, K.J., 1972. Supraglacial streams of the Kaskawulsh Glacier, Yukon Territory. In: V.C. Bushnell and R.H. Ragle (Editors), Icefield Ranges Research Project, Scientific Results. Am. Cbograph. Soc., New York, N.Y., 3: 153--162.
Ferguson, R.I., 1973a. Regular meander path models. Water Resour. Res., 9: 1079--1086. Ferguson, R.I., 1973b. Sinuosity of supraglacial streams. Geol. Soc. Am. Bull., 84: 251--256. Gilbert, G.K., 1880. Report on the Geology of the Henry Mountains. U.S. Government
Printing Office, Washington, 2nd ed., 170 pp. Graf, W.H., 1971. The Hydraulics of Sediment Transport. McGraw-Hill, New York, N.Y.,
513 pp. Jenkins, G.M. and Watts, D.G., 1968. Spectral Analysis and its Applications. Holden-Day,
San Francisco, Calif., 525 pp. Kennedy, J.F., Richardson, P.D. and Sutera, S.P., 1964. Discussion o f Geometry o f river
channels by W.B. Langbein. J. Hydraul. Div., Proc. ASCE, 90 (HY6): 332--341. Keulegan, G.H., 1938. Laws of turbulent flow in open channels. (U.S.) Natl. Bur. Stand.,
J. Res., 21: 707--741. Knighton, A.D., 1972. Meandering habit of supraglacial streams. Geol. Soc. Am. Bull., 83:
201--204. Lanczos, C., 1961. Linear Differential Operators. Van Nostrand, I.~ndon, 564 pp. Lanczos, C., 1966. Discourse on Fourier Series. Oliver and Boyd, Edinburgh, 255 pp. Langbein, W.B., 1964. Geometry of river channels. J. Hydraul. Div., Proc. ASCE, 90 (HY2):
301--312. Langbein, W.B., 1965. Closure to Geometry of river channels. Proc. ASCE, J. Hydraul. Div.,
91 (HY3): 297--313. Langbein, W.B. and Leopold, L.B., 1966. River meanders - - t h e o r y of minimum variance.
U.S. Geol. Surv. Prof. Pap. 422-H, 15 pp. Leopold, L.B. and Maddock, Jr., T., 1953. The hydraulic geometry of stream channels
and some physiographic implications. U.S. Geol. Surv., Prof. Pap. 252, 57 pp. Leopold, L.B. and Wolman, M.G., 1960. River meanders. Geol. Soc. Am. Bull., 71: 769--
794. Leopold, L.B., Bagnold, R.A., Wolman, M.G. and Brush, L.M., 1960. Flow resistance in
sinuous or irregular channels. U.S. Geol. Surv., Prof. Pap., 282-D: 111--134. Leopold, L.B., Wolman, M.G. and Miller, J.P., 1964. Fluvial Processes in Geomorphology.
Freeman, San Francisco, Calif., 522 pp. Mackin, J.H., 1948. Concept of the graded river. Geol. Soc. Am. Bull., 59: 463--512. Maddock, Jr., T., 1969. The behavior of straight open channels with movable beds. U.S.
Geol. Surv., Prof. Pap. 622-A, 70 pp. Matthes, G., 1956. River surveys in unmapped terri tory. Trans., ASCE 121: 739--758. Rayner, J.N., 1971. An Introduct ion to Spectral Analysis. Pion, London, 174 pp. Robinson, E.A., 1967. Multichannel Time Series Analysis with Digital Computer Programs.
Holden-Day, San Francisco, Calif., 298 pp. Speight, J.G., 1965. Meander spectra of the Angabunga River, Papua. J. Hydrol., 3: 1--15. Speight, J.G., 1967. Spectral analysis of meanders of some Australasian rivers. In: J.N.
Jennings and J.A. Mabbutt (Editors), Landform Studies from Australia and New Guinea. Aust. Natl. Univ. Press, Canberra, A.C.T., pp. 48---63.
Thakur, T.R. and Scheidegger, A.E., 1968. A test of the statistical theory of meander formation. Water Resour. Res., 4: 317--329.
Thakur, T.R. and Scheidegger, A.E., 1970. Chain model of river meanders. J. Hydrol., 12: 25--47.
Von Schelling, H., 1964. Most frequent random walks. General Electric Co., Adv. Technol. Lab., Rep. 64GL92, 60 pp.
Woldenberg, M.J., 1966. Horton's laws justified in terms of allometric growth and steady state in open systems. Geol. Soc. Am. Bull., 77 : 431--434.


