Embed Size (px)
Citation preview
Noname manuscript No.(will be inserted by the editor)
An Evaluative Baseline for Geo-Semantic Relatednessand Similarity
Andrea Ballatore · Michela Bertolotto ·David C. Wilson
Received: date / Accepted: date
Abstract In geographic information science and semantics, the computationof semantic similarity is widely recognised as key to supporting a vast numberof tasks in information integration and retrieval. By contrast, the role of geo-semantic relatedness has been largely ignored. In natural language processing,semantic relatedness is often confused with the more specific semantic simi-larity. In this article, we discuss a notion of geo-semantic relatedness basedon Lehrer’s semantic fields, and we compare it with geo-semantic similarity.We then describe and validate the Geo Relatedness and Similarity Dataset(GeReSiD), a new open dataset designed to evaluate computational measuresof geo-semantic relatedness and similarity. This dataset is larger than existingdatasets of this kind, and includes 97 geographic terms combined into 50 termpairs rated by 203 human subjects. GeReSiD is available online and can beused as an evaluation baseline to determine empirically to what degree a givencomputational model approximates geo-semantic relatedness and similarity.
Keywords geo-semantic relatedness · geo-semantic similarity · goldstandards · geo-semantics · cognitive plausibility · GeReSiD
1 Introduction
Is lake related to river? Is road related to transportation? Are mountain andhill more related than mountain and lake? While it may seem natural to an-swer yes to all of these questions, the logical and computational formalisation
Andrea Ballatore & Michela BertolottoSchool of Computer Science and InformaticsUniversity College Dublin, Belfield, Dublin 4, IrelandE-mail: {andrea.ballatore,michela.bertolotto}@ucd.ie
David C. WilsonDepartment of Software and Information SystemsUniversity of North Carolina, Charlotte, NC, USAE-mail: [email protected]
arX
iv:1
402.
3371
v1 [
cs.C
L]
14
Feb
2014
2 Andrea Ballatore et al.
of why this is the case has raised considerable interest in philosophy, psychol-ogy, linguistics and, more recently, in computer science. The human ability todetect semantic relatedness is essential to perform key operations in communi-cation, such as word-sense disambiguation (e.g. interpreting bank as financialinstitution or as the terrain alongside the bed of a river), reducing semanticambiguity and increasing efficiency in meaning-creation and sharing. The hu-man cognitive apparatus possesses a remarkable ability to detect co-occurrencepatterns that are not due to chance, but that indicate the existence of somesemantic relation between the terms.
Semantic similarity has been identified as a particular subset of this generalnotion of semantic relatedness. While semantically related terms are connectedby any kind of relation, semantically similar terms are related by synonymy,hyponymy, and hypernymy, all of which involve an is a relation. In this sense,train and bus are intuitively similar (they are both means of transport), whilstbus and road are related but not similar (i.e. they often co-occur but withdifferent roles). Semantic similarity relies on the general cognitive ability todetect similar patterns in stimuli, which attracts considerable attention incognitive science. Notably, Goldstone and Son [15] stated that “assessments ofsimilarity are fundamental to cognition because similarities in the world arerevealing. The world is an orderly enough place that similar objects and eventstend to behave similarly” (p. 13). Therefore, the vast applicability of semanticsimilarity in computer and information science should come as no surprise.
In geographic information science (GIScience), the theoretical and practicalimportance of geo-semantic similarity has been fully acknowledged, resultingin a growing body of research [2, 4, 23]. By contrast, the importance of se-mantic relatedness, which is widely studied in the non-geographic domain, hasbeen almost completely ignored, with the exception of the works by Hechtand Raubal [16] and Hecht et al. [17]. Computational measures of semanticrelatedness play a pivotal role in natural language processing, informationretrieval (IR), and word sense disambiguation, providing access to deeper se-mantic connections between words and sets of words. Despite the large numberof existing measures, their rigorous evaluation still constitutes an importantresearch challenge [12].
This article contributes to GIScience and semantics in the following ways.First, we discuss in detail the notion of geo-semantic relatedness, drawing onLehrer’s theory of semantic fields, which consist of sets of terms covering a re-stricted semantic domain. Geo-semantic relatedness is defined with respect tospecifiable geographic relations between terms, and is compared and contrastedwith the more widely studied geo-semantic similarity. Second, we have devel-oped and validated the Geo Relatedness and Similarity Dataset (GeReSiD),tackling the complex issue of the evaluation of computational measures ofgeo-semantic relatedness and similarity. In this new dataset, we have collectedpsychological judgements about 50 pairs of terms, covering 97 unique geo-graphic terms, from 203 human subjects. The human judgements in GeReSiDfocus explicitly on geo-semantic relatedness and similarity between geographicterms.

An Evaluative Baseline for Geo-Semantic Relatedness and Similarity 3
The resulting dataset provides an evaluation test bed for geo-semantic re-latedness and similarity. This is compared against the existing human-generatedgold standards used to assess computational measures of semantic relatednessand similarity, highlighting the limitations of such datasets. Such an evalua-tive baseline constitutes a valuable ground truth against which computationalmeasures can be assessed, providing empirical evidence about the cognitiveplausibility of the measures. GeReSiD can inform research in geo-semantics, in-dicating to what degree computational approaches match human judgements.More specifically the contribution of this evaluative baseline consists of thefollowing aspects:
– GeReSiD covers a sample of geographic terms larger than existing similar-ity datasets, including 97 natural and man-made unique terms, grouped in50 unique pairs. Psychological judgements of geo-semantic relatedness andsimilarity were collected separately on the 50 pairs.
– GeReSiD includes a sample of evenly distributed relatedness/similarityjudgements, ranging from near-synonymity to no relationship between theterms. Our methodology is described explicitly and precisely, in order toprovide practical guidelines to construct similar datasets.
– Unlike existing datasets, the semantic judgements on the term pairs con-tained in GeReSiD are analysed with respect to interrater agreement (IRA)and interrater reliability (IRR).
– The psychological judgements in GeReSiD can be observed as the mean ofrelatedness/similarity of the pairs, using correlation coefficients of related-ness/similarity rankings (such as Spearman’s ρ or Kendall’s τ). Alterna-tively, the data can be interpreted as categorical, using Cohen’s kappa orFisher’s exact test [7] to evaluate the computational measure.
– GeReSiD is an open dataset freely available online.1 Both raw data andthe resulting dataset are available.
The remainder of this article is organised as follows. Section 2 discusses indepth the two key notions of geo-semantic relatedness and similarity, propos-ing a synthetic definition. Section 3 summarises existing datasets for semanticrelatedness and similarity, with particular attention to those restricted to thegeographic domain. The new evaluative baseline, GeReSiD, is outlined, anal-ysed and discussed in Section 4. Conclusions and directions for future researchare indicated in Section 5.
2 Geo-semantic relatedness and similarity
This section introduces the notion of geo-semantic relatedness, comparing itand contrasting it with geo-semantic similarity. In the natural language pro-cessing literature, several terms are used inconsistently, including semanticrelatedness, relational similarity, taxonomical similarity, semantic association,
1 http://github.com/ucd-spatial/Datasets (acc. Apr 10, 2013)
4 Andrea Ballatore et al.
analogy, and attributional similarity [53]. These terms are often used inter-changeably [9]. A striking example of this tendency is the article title ‘Word-Net::Similarity: Measuring the relatedness of terms’ [39].
In natural language, terms are connected by an open set of semanticrelations. Common semantic relations are synonymy (A coincides with B),antonymy (A is the opposite of B), hyponymy (A is a B), hypernymy (B isa A), holonymy (A is whole of B), meronymy (A is part of B), causality (Acauses B), temporal contiguity (A occurs at the same time as B), and function(A is used to perform B). Khoo and Na [28] have surveyed these semantic rela-tions, whilst Morris and Hirst [36] have explored other non-classical semanticrelations. As Khoo and Na [28] remarked, semantic relations are characterisedby productivity (new relations can be easily created), uncountability (semanticrelations are an open class and cannot be counted), and predictability (theyfollow general, recurring patterns). In the geographic domain, spatial relationssuch as proximity (A is near B), and containment (A is within B) have animpact on semantics [49].
Before providing our definition of geo-semantic relatedness and similarity,it is beneficial to review the semantics of these terms in the literature. In thecontext of semantic networks, Rada et al. [40] suggested that semantic related-ness is “based on an aggregate of the interconnections between the terms” (p.18). To obtain semantic similarity, the observation must be restricted to tax-onomic is a relationships between terms. Resnik [41] followed this approach,and defined semantic similarity and relatedness as follows: “Semantic simi-larity represents a special case of semantic relatedness: for example, cars andgasoline would seem to be more closely related than, say, cars and bicycles,but the latter pair are certainly more similar” (p. 448).
More recently, Turney [53] added a further distinction between ‘attribu-tional’ and ‘relational similarity.’ Following the approach outlined by Medinet al. [32], ‘attributes’ are statements about a term that take only one pa-rameter, e.g. X is red, X is long. Therefore, attributional similarity mea-sures the correspondence between the attributes of the two terms. ‘Relations,’on the other hand, are statements that take two or more parameters, e.g.X is a Y,X is longer than Y . Hence, relational similarity is based on thecommon relations between two pairs of terms [53]. On these assumptions,synonymy is seen as a high degree of attributional similarity between twoterms, e.g. <river,stream>. Analogy, by contrast, is characterised as a highdegree of relational similarity between two pairs of terms, e.g. <boat,river>and <car,road>. The next sections discuss geo-semantic relatedness and sim-ilarity in detail.
2.1 Geo-semantic relatedness
A general notion of relatedness in the geographic context was stated in Tobler’sfirst law, which asserts that everything is related to everything else, but nearthings are more related than distant things [51]. While this law was formulated
An Evaluative Baseline for Geo-Semantic Relatedness and Similarity 5
to express intuitively the high spatial autocorrelation of many geographic phe-nomena, it has generated several responses in GIScience. For example, in thecontext of information visualisation, Montello et al. [35] have proposed thefirst law of cognitive geography, which states that “people believe closer thingsto be more similar than distant things” (p. 317). Applying the same intuitionto the domain of geo-semantics, we assert that two terms are geo-semanticallyrelated to the degree to which they refer to entities or phenomena connectedvia specifiable relations grounded in the geographic dimension.
To define a notion of geo-semantic relatedness, we rely on the notion ofsemantic field. According to Lehrer [31], a semantic field is “a set of lexemeswhich cover a certain conceptual domain and which bear certain specifiablerelation to one another” (p. 283). While a ‘domain’ is an epistemological notionreferring to a subset of human knowledge and experience (e.g. geography,politics, medicine, etc.), a semantic field is a more specific linguistic notionthat refers to a set of lexemes utilised to describe a domain. For example, asemantic field might be formed by terms train, bus, trip, fare, delay, accident,etc., which are all connected to the underlying term of transportation, andcommonly used to generate observations on the domain of mobility.
Terms appear to be semantically related to the degree to which they be-long to the same semantic field, and can indeed belong to different semanticfields. Semantic fields are neither static nor well-defined sets, but rather fuzzyconfigurations that shift over time, and across different agents and informa-tion communities. The condition of specifiability of relations emphasises thefact that random co-occurrence has no impact on semantic relatedness. If arelation is not specifiable, the co-occurrence of the two terms must be random.A term has a certain degree of centrality in a semantic field, i.e. the density ofconnectedness with other terms. For example, in the aforementioned semanticfield on transportation, car is more central than delay. Similarly, in a semanticfield on social life, car is likely to be less central than restaurant or pub.
Geo-semantic relatedness can therefore be defined as a specific sub-domainof semantic relatedness, focusing on relations grounded in the geographic di-mension, i.e. relations in which at least one of the terms has a spatial dimen-sion. Examples of geo-semantically related terms are judge, trial, and tribunal,where tribunal has a strong geographic component that grounds the otherterms geographically. A computational measure of geo-semantic relatednesshas to aggregate and quantify the intensity of such relations between twoterms, providing a useful tool for several complex tasks. For example, termsriver and flood should be more geo-semantically related than vehicle and car,which possess a less prominent geographic component. Acknowledging the factthat most terms in natural language have some degree of geographic ground,we express this approach to geo-semantic relatedness following Tobler’s firstlaw of geography:
Every term is geo-semantically related to all other terms, but terms thatco-occur with specifiable geographic relations are more related than otherterms.
6 Andrea Ballatore et al.
In other words, every term can in principle have some degree of geo-semanticrelatedness to any other term, but terms that co-occur in observations bearingspecifiable relations tend to be more geo-semantically related than those thatdo not. This formulation puts terms in relation to human spatial experiencefrom which terms arise, suggesting indistinct, gradual, and shifting boundariesbetween geo-related and unrelated terms.
In this sense, geo-semantic relatedness is intrinsically fuzzy, admitting acontinuous spectrum of relatedness rather than a binary classification (i.e. re-lated or unrelated). Highly related terms belong to the same semantic field.The same terms can belong to several overlapping semantic fields. Relatednessinvolves all semantic relations, including synonymy, antonymy, hyponymy, hy-pernymy, holonymy, meronymy, causality, temporal contiguity, function, prox-imity, and containment. This law applies both to natural language, wheregeographic terms can be highly imprecise and vague, and to scientific concep-tualisations, which generally aim at stricter semantics.
Surprisingly, in GIScience semantic relatedness has been almost completelyignored, with two notable exceptions [16, 17]. In order to explore semanticallyand spatially related entities in Wikipedia, Hecht and Raubal [16] developedExploSR, a graph-based relatedness measure. ExploSR computes a semanticrelatedness score of two articles by assigning weights to spatially-referencedarticles in the Wikipedia Article Graph. More recently, the Atlasify systemgenerates human-readable explanations of the relationship between terms tosupport exploratory search [17].
Geo-semantic relatedness can be informed by ideas developed in the areaof text mining. The latent Dirichlet allocation (LDA) adopts a probabilisticapproach to cluster highly semantically-related terms in a text corpus [8]. LDAwas extended to include a geographic dimension into the Location Aware TopicModel (LATM) [55]. LATM quantifies the geo-semantic relatedness betweenkeywords, topics, and geographic locations, adopting a fully distributional ap-proach.
2.2 Geo-semantic similarity
While geo-semantic relatedness of terms can be based on co-occurrence inobservations, geo-semantic similarity of terms can only be determined throughthe analysis of the terms’ attributes and relations. Geo-semantic similarity isa subset of geo-semantic relatedness: all similar terms are also related, butrelated terms are not necessarily similar. The relations considered for geo-semantic similarity include only synonymy, hyponymy, and hypernymy. Unlikegeo-semantic relatedness, geo-semantic similarity has been deeply explored bythe GIScience community, and is recognised as one of the key concepts ofgeo-semantics [29].
Several theories of similarity have been used to conceptualise and measuregeo-semantic similarity, including featural, transformational, geometric, andalignment models [47, 22, 23, 48]. Specific techniques have been devised for
An Evaluative Baseline for Geo-Semantic Relatedness and Similarity 7
specific knowledge-representation formalisms [20, 44]. More recently, graph-based [5] and lexical techniques [3, 4] have been investigated in the emergingarea of volunteered geographic information (VGI). These works tend to fo-cus on the conceptual level, computing the similarity of abstract geographicterms (e.g. city and river), rather than the instance level (e.g. New York andDanube).
Beyond the specificities of such approaches, we can state that terms A andB are semantically similar with respect to C, where C is a set of attributesand relations, also known as context [26]. The context C focuses on the typicalspatial organisation and appearance of the entity identified by the term (e.g.shape, size, material composition). Alternatively, the similarity of A and Bcan be measured with respect to their affordances, i.e. the possibilities that anentity offers to humans [19].
As observed in relation to geo-semantic relatedness, all terms can be geo-semantically similar to some limited extent, and geo-semantic similarity istherefore best modelled as a continuous spectrum, rather than a binary classi-fication. For example, terms restaurant and continent are similar with respectto the fact that they both refer to geographically-grounded entities. To capturethis idea at the linguistic level that is relevant to this discussion, we adopt theapproach outlined in [4]. Considering the terms used in lexical definitions ofterms, we state recursively that:
All terms are geo-semantically similar, but geographic terms describedusing the same terms are more similar than other terms.
A geo-semantic similarity measure has to quantify the similarity of two termsinto a score, enabling a number of semantic tasks in IR and information in-tegration. For example, terms restaurant and pub are very similar becausethey share similar spatial organisation and affordances. Houses and schoolsare geo-semantically similar with respect to their spatial organisation of partsand can be described as having walls, windows, doors, a roof, etc. Roads andrivers show similar affordances – they can be used for transportation.
3 Semantic relatedness and similarity gold standards
Semantic similarity and relatedness measures can be evaluated against a human-generated set of psychological judgements. This section gives an overview ofpublished similarity and relatedness gold standards, mostly from psychologyand computational linguistics. The term ‘gold standard’ is described by theOxford Dictionary of English as “a thing of superior quality which serves as apoint of reference against which other things of its type may be compared.”2 Incomputer science, the term is used to describe high-quality, human-generateddatasets, capturing human behaviour in relation to a well-defined task. Suchdatasets can then be used to assess the performance of automatic approaches,
2 http://oxforddictionaries.com/definition/gold+standard (acc. Apr 10, 2013)
8 Andrea Ballatore et al.
by quantifying the correlation between the machine and the human-generateddata.
3.1 Cognitive plausibility
In a seminal discussion on expert systems, Strube [50] argued that knowledgeengineering should strive towards increasing the cognitive adequacy of compu-tational systems, defined as their ‘degree of nearness to human cognition’ (p.165). In the context of GIScience, geo-relatedness or geo-similarity measuresneed not replicate the workings of human mind in their entirety (defined asabsolutely strong adequacy), but should aim at what Strube called relativelystrong adequacy, i.e. the ability of the system to function like a human ex-pert in a circumscribed domain. Following this approach, we adopt the notionof cognitive plausibility to assess to what degree a measure mimics humanbehaviour [27].
In order to quantify the cognitive plausibility of a computational seman-tic relatedness or similarity measure, two complementary approaches can beadopted: (1) psychological evaluations, and (2) task-based evaluations. In psy-chological evaluations, human subjects are asked to rank or rate term pairs.These rankings or ratings are then compared with computer-generated rank-ings, usually using correlation as an indicator of performance. Alternatively,human subjects can perform a task based on the assessment of relatedness orsimilarity, such as word sense disambiguation, and the cognitive plausibility ofthe measure is observed indirectly in the results of the task, using for exampleprecision and recall measures. Such human-generated datasets are used as goldstandards.
The usage of gold standards is common in natural language processingtasks, such as part-of-speech tagging, entity resolution, and word sense dis-ambiguation [46, 52, 10, 38]. Adopting this approach, a technique or a modelcan be deemed to be more or less plausible by observing its correlation withhuman-generated results. Such datasets are created by combining the resultsfrom a number of human subjects who perform a given task, either undercontrolled conditions, or through online forms. To be considered valid by aresearch community, a gold standard needs to meet certain criteria, such ascoverage, quality, precision, and inter-subject agreement. Disagreements aboutthe validity of a gold standard are quite common and, when weaknesses areuncovered, a gold standard can be demoted to a golden calf [e.g. 24].
The intrinsic high subjectivity of relatedness and similarity rankings makesthe collection and validation of gold standards complex and challenging. Al-though task-based evaluations might appear more ‘objective,’ they are equallyaffected by subjectivity: ultimately, relatedness-based or similarity-based tasksare generated, interpreted, and validated by human subjects. Acknowledg-ing the unlikelihood of total agreement, the reliability of a similarity evalu-ation should be grounded in stability over time, consistency across differentdatasets, and reproducibility of psychological results. Ideally, both evaluation
An Evaluative Baseline for Geo-Semantic Relatedness and Similarity 9
approaches should show convergent, cross-validating results: a strong correla-tion is expected between the cognitive plausibility of a measure and its per-formance in similarity-based tasks.
3.2 Comparison of relatedness and similarity gold standards
Over the past 50 years, several authors investigating semantic issues in psy-chology, linguistics, and computer science created datasets focused on semanticsimilarity and, more recently, semantic relatedness. The first similarity goldstandard was published in 1965, in a article in which Rubenstein and Goode-nough [45] collected a set of 65 word pairs ranked by their synonymy. Followinga similar line of research, Miller and Charles [33] published a similar datasetwith 30 word pairs in 1991. More recently, Finkelstein et al. [13] created theWordSimilarity-353 dataset, which contains 353 word pairs actually ranked bysemantic relatedness.3 The dataset was subsequently extended to distinguishbetween similarity and relatedness [1].4 In a study of the retrieval mechanismof memories, Nelson et al. [37] collected associative similarity ratings for 1,016word pairs.
A smaller number of geo-semantic similarity datasets have been generatedin the areas of GIScience and geographic information retrieval (GIR). In thisarea, Janowicz et al. [21] conducted a study on the cognitive plausibility oftheir Sim-DL similarity measure. However, the study was conducted in Ger-man on a very small set of terms, and for this reason it is difficult to reusein different contexts. In order to evaluate their Matching-Distance SimilarityMeasure (MDSM), Rodrıguez and Egenhofer [44] collected similarity judge-ments about geographic terms, including large natural entities (e.g. mountainand forest), and man-made features (e.g. bridge and house). Before GeReSiD,the MDSM evaluation dataset was the largest similarity gold standard forgeographic terms. For this reason, this dataset was utilised to carry out theevaluation of network-based similarity measures [5]. In contrast, geo-semanticrelatedness has been largely ignored in the geospatial domain.
The salient characteristics of these gold standards are summarised in Table1, detailing their human subjects, the terms and term pairs. For each dataset,the table shows whether they focus on semantic relatedness (rel), semanticsimilarity (sim), and exclusively on the geographic domain (geo). The existingdatasets are compared with GeReSiD, the gold standard described in Section4, and have several limitations. First, the procedure followed to construct thedatasets is usually only sketched and not described in detail. Second, the sizeof the datasets tends to be rather small.
The size of such datasets can be observed along three dimensions: num-ber of human subjects, number of terms, and number of term pairs. A cleartrade-off exists between number of human subjects and number of term pairs.
3 http://www.cs.technion.ac.il/~gabr/resources/data/wordsim353 (acc. Apr 10,2013)
4 http://alfonseca.org/eng/research/wordsim353.html (acc. Apr 10, 2013)

10 Andrea Ballatore et al.
Referen
ceS
ub
jectsT
erms
&term
pairs
rel
simgeo
Ru
ben
steinan
dG
ood
enou
gh
[45]
51
paid
colleg
eu
nd
ergra
ds:
gro
up
I(1
5su
bjects),
gro
up
II(3
6su
bjects).
48
terms
(ord
inary
En
glish
word
s);65
termp
airs,
ran
gin
gfro
mh
igh
lysy
nonym
ou
spairs
tosem
antica
llyu
nrela
tedp
airs.
√
Miller
an
dC
harles
[33]
38
un
derg
rad
uate
stud
ents.
US
En
glish
nativ
esp
eakers.
40
terms
selectedfro
mR
ub
enstein
an
dG
ood
enou
gh
[45];
32
termp
airs.
√
Fin
kelstein
etal.
[13],
Agirre
etal.
[1]
13
exp
ertsfo
rfi
rstset
(153
pairs),
16
exp
ertsfo
rseco
nd
set(2
00
pairs).
Nea
r-nativ
eE
nglish
pro
ficien
cy.
346
terms
(manu
ally
selectedn
ou
ns
an
dco
mp
ou
nd
nou
ns);
353
termp
airs.
√√
Rod
rıgu
ezan
dE
gen
hofer
[44]
72
paid
un
derg
rad
stud
ents
(two
gro
up
sof
36
peo
ple).
US
En
glish
nativ
esp
eakers.
33
geo
gra
ph
icterm
sfro
mW
ord
Net
an
dS
DT
S;
10
setsof
10
or
11
termp
airs.
√√
Nelso
net
al.
[37]
94
un
derg
rad
uate
stud
ents
reward
edw
ithaca
dem
iccred
its1,0
16
termp
airs
selectedu
nsy
stematica
llyfro
ma
cued
recall
data
base
of
2,0
00+
pairs.
√
Jan
ow
iczet
al.
[21]
28
un
paid
sub
jects(2
0-3
0yea
rsof
age).
Six
geo
gra
ph
icterm
srela
tedto
bod
iesof
water.
√√
GeReSiD
(seeS
ection
4)
203
un
paid
En
glish
nativ
esp
eakers.
97
geo
gra
ph
icterm
sfro
mO
pen
StreetM
ap
;50
termp
airs.
√√
√
Table
1S
emantic
related
ness
an
dsim
ilarity
gold
stan
dard
s
An Evaluative Baseline for Geo-Semantic Relatedness and Similarity 11
Furthermore, most datasets do not capture the distinction between semanticsimilarity and relatedness, and do not analyse the IRA and IRR. It is impor-tant to note that most authors did not have the explicit intention to constructgold standards, but rather to analyse specific aspects of semantic similarity orrelatedness. However, in some cases, these datasets have been treated as goldstandards in the subsequent literature [45, 33]. To the best of our knowledge,only WordSimilarity-353 was explicitly designed to be a generic gold standard.
Some of these gold standards have been extensively utilised to assess gen-eral term-to-term similarity measures [45, 33, 13]. In the geographic context,only the MDSM evaluation dataset is suitable to evaluate semantic similarityof geographic terms [44]. However, no existing dataset focusing on geographicterms accounts explicitly for the difference between semantic relatedness andsemantic similarity.
4 Geo Relatedness and Similarity Dataset (GeReSiD)
This section presents the Geo Relatedness and Similarity Dataset (GeReSiD),a dataset of human judgements that we have developed to provide a groundtruth for the assessment of computational relatedness and similarity mea-surements. GeReSiD captures explicitly the difference between geo-semanticrelatedness and similarity on a sample of geographic terms larger than ex-isting similarity datasets surveyed in Section 3, including both natural andman-made terms. In order to ensure its validity as a gold standard, it focuseson a sample of evenly distributed relatedness/similarity judgements, rangingfrom very high to very low. Section 4.1 describes our methodology precisely, inorder to provide guidelines on constructing datasets to ground the evaluationof measures of geo-semantic relatedness and similarity. Subsequently, Section4.2 outlines the results obtained from the online survey.
4.1 Survey design
The psychological judgements about geo-semantic relatedness and similaritywere collected via an online survey, through an interactive Web interface specif-ically designed for this purpose. Online surveys constitute a powerful researchtool, with well-known advantages and disadvantages [57]. Given the focus ofthis study on generic terms found in web maps, subjects involved in projectssuch as OpenStreetMap represent an ideal virtual community of map usersand producers to conduct a psychological evaluation. An online survey is aninexpensive and effective way to reach these online communities.
A cross-disciplinary consensus exists on the fact that semantic judgementsare affected by the context in which the terms are considered [44, 22]. Rodrıguezand Egenhofer [44] asked their subjects to rank geographic terms in the follow-ing contexts: ‘null context,’ ‘play a sport,’ ‘compare constructions,’ and ‘com-pare transportation systems.’ The subjects’ attention was therefore focused on

12 Andrea Ballatore et al.
specific aspects of the terms being analysed, rather than on the terms in anunspecified setting.
Although context affects the assessment of semantic similarity, in this sur-vey we aim at capturing the overall difference between semantic relatednessand similarity of terms, without focusing on specific aspects of the concep-tualisation. This comparison is an important research topic, frequently men-tioned but rarely addressed directly through empirical evaluation. Introducingspecific contexts into our survey would increase the complexity of the studyby introducing new biases, making the direct comparison between similar-ity and relatedness problematic. For example, adding a specific context doesnot increase the inter-subject agreement: in their evaluation, Rodrıguez andEgenhofer [44] report a considerably lower association between subjects inthe case of context-specific questions (mean Kendall’s W being .5), than witha-contextual questions (mean W = .68). Moreover, specific contexts would in-troduce specific biases, which are beyond the scope of Geo Relatedness andSimilarity Dataset (GeReSiD).
As a solution to these issues, we frame the evaluation in the general con-text of popular web maps, in which geographic terms are most frequently vi-sualised and utilised by users. This way, the subjects are induced to use theirown conceptualisation of the geographic entities. As happens with semanticjudgements, subjectivity inevitably affects the subjects’ choices. In this study,subjects are free to choose what properties they consider most relevant tothe comparison, and the mean of their ratings quantifies the perceived inter-subject similarity and relatedness of the terms. While the study of the contextis beyond the scope of this survey, it certainly represents an important direc-tion for future work.
The geographic terms included in this survey are taken from the Open-StreetMap project. In our previous work, we extracted the lexicon utilised inOpenStreetMap into a machine-readable vocabulary, the OSM Semantic Net-work [6]. To date, the OSM Semantic Network contains a total of about 4,300distinct terms, called ‘tags’ in the project’s terminology. From this large setof geographic terms, a suitable sample had to be selected. To be included, aterm had to be clearly intelligible, well defined on the OSM Semantic Network,as culturally-unspecific as possible, and present in the actual OpenStreetMapvector map. Following these criteria, we manually selected a set C of 400 terms,including a wide range of natural and man-made entities, such as ‘sea,’ ‘light-house,’ ‘landfill,’ ‘valley,’ and ‘glacier.’ Using the terms in C, we defined a setP containing all possible pairs of geographic terms 〈a, b〉 where a, b ∈ C, for atotal of 160,000 pairs. We subsequently removed from P symmetric pairs (e.g.removing 〈b, a〉 when 〈a, b〉 is defined) and identities (e.g. 〈a, a〉), resulting in76,000 valid pairs.
In order to detect issues in the survey, a pilot study was then conductedwith 12 graduate students at University College Dublin. A set Prand was con-structed by selecting 100 pairs randomly from P . Each pair was associatedwith a 5-point Likert scale, ranging from low to high relatedness/similarity.The subjects were asked to rate each pair both for semantic relatedness and

An Evaluative Baseline for Geo-Semantic Relatedness and Similarity 13
similarity, and were then interviewed informally, to obtain direct feedbackabout the survey. Several useful observations were obtained from this pilotsurvey. First, most subjects found the test too long. A smaller sample size hadto be selected, considering a trade-off between number of pairs and the com-pletion time, in order to ensure that enough subjects would complete the taskwithout losing concentration. Based on the opinion of subjects, we identified50 pairs as the maximum size of the task, with a completion time of aroundfive minutes, suitable for an unpaid online questionnaire.
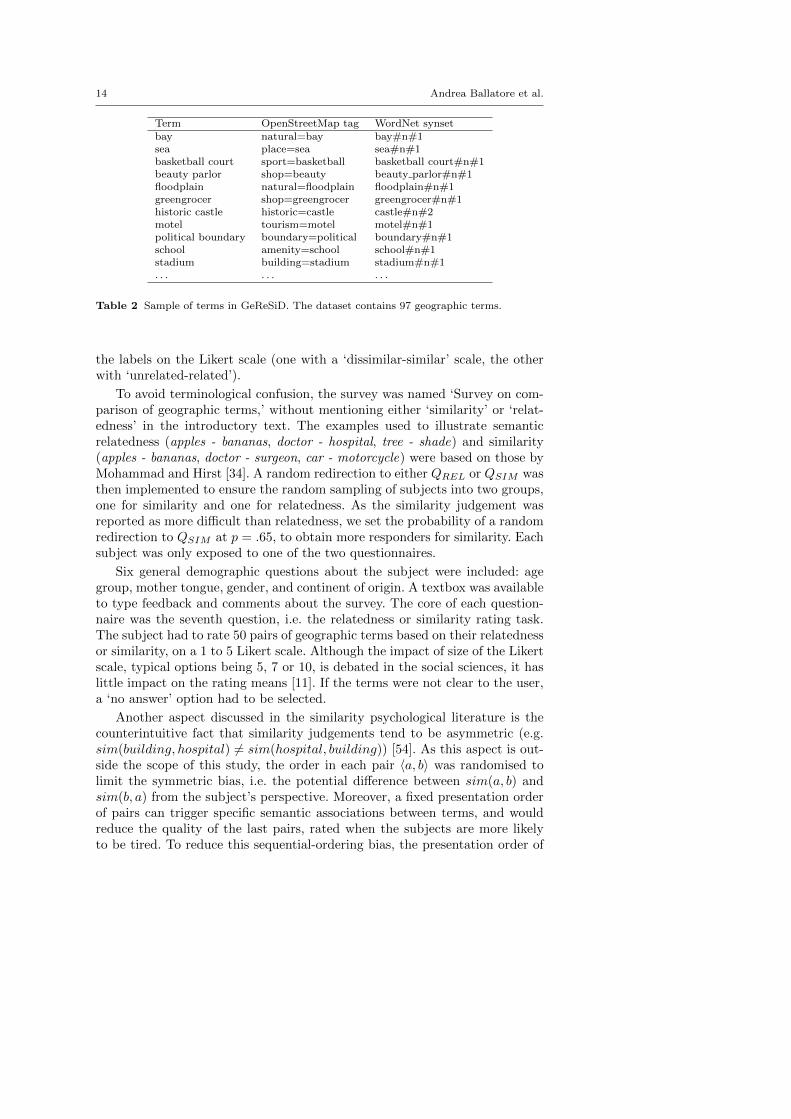
In the OpenStreetMap semantic model, tags are made of a key and a value(e.g. amenity=school). In the pilot survey, this formalism had to be explainedto the subjects, who generally found it confusing. For example, the psychologi-cal comparison between amenity=school and amenity=community centre wasinfluenced by the shared word ‘amenity,’ which is highly generic and ambigu-ous. To make the dataset independent from the peculiar OpenStreetMap tagstructure, we extracted short labels for all the 400 terms from the terms’definitions. For example, amenity=food court was labelled as ‘food court,’shop=music as ‘music shop.’ In order to increase their semantic clarity, theterms were manually mapped to the corresponding terms in WordNet (seeTable 2).
The fully random set of 100 pairs Prand used in the pilot survey obtaineda distribution heavily skewed towards low similarity and relatedness. To reacha more uniform distribution, we introduced a partial manual selection in theprocess. In order to obtain an even distribution in the resulting relatedness andsimilarity scores, we manually extracted from the pilot survey a set of 50 pairsrated by the 12 subjects as highly related/similar pairs (Phigh), and 50 middlerelatedness/similarity pairs (Pmed). It is worth noting that while the selectionof highly related/similar pairs is intuitive, middle-relatedness/similarity pairsis more challenging, and requires dealing with highly subjective conceptual-isations. This aspect is reflected in the survey results (see Section 4.2). Thefinal set of 50 pairs for the questionnaire Pq was assembled from the followingelements:
– 16 high-relatedness/similarity pairs (random sample from Phigh)– 18 middle-relatedness/similarity pairs (random sample from Pmed)– 16 low-relatedness/similarity pairs (random sample from P )
The pilot survey also showed clearly that assigning both the relatedness andthe similarity tasks to the same subject was impractical, and was deemed con-fusing by all subjects who did not possess specific expertise in linguistics. Forthis reason, we opted to assign randomly only one task to each subject, eitheron relatedness or similarity, without trying to explain to them the technicalitiesof this distinction. Instead, we relied on the subjects’ inductive understandingof the task through correct examples. Thus, in order to collect reliable judge-ments on similarity and relatedness, we defined two separate questionnaires,one on relatedness (QREL), and one on similarity (QSIM ). The two question-naires were identical, with the exception of the description of the task, and
14 Andrea Ballatore et al.
Term OpenStreetMap tag WordNet synsetbay natural=bay bay#n#1sea place=sea sea#n#1basketball court sport=basketball basketball court#n#1beauty parlor shop=beauty beauty parlor#n#1floodplain natural=floodplain floodplain#n#1greengrocer shop=greengrocer greengrocer#n#1historic castle historic=castle castle#n#2motel tourism=motel motel#n#1political boundary boundary=political boundary#n#1school amenity=school school#n#1stadium building=stadium stadium#n#1. . . . . . . . .
Table 2 Sample of terms in GeReSiD. The dataset contains 97 geographic terms.
the labels on the Likert scale (one with a ‘dissimilar-similar’ scale, the otherwith ‘unrelated-related’).
To avoid terminological confusion, the survey was named ‘Survey on com-parison of geographic terms,’ without mentioning either ‘similarity’ or ‘relat-edness’ in the introductory text. The examples used to illustrate semanticrelatedness (apples - bananas, doctor - hospital, tree - shade) and similarity(apples - bananas, doctor - surgeon, car - motorcycle) were based on those byMohammad and Hirst [34]. A random redirection to either QREL or QSIM wasthen implemented to ensure the random sampling of subjects into two groups,one for similarity and one for relatedness. As the similarity judgement wasreported as more difficult than relatedness, we set the probability of a randomredirection to QSIM at p = .65, to obtain more responders for similarity. Eachsubject was only exposed to one of the two questionnaires.
Six general demographic questions about the subject were included: agegroup, mother tongue, gender, and continent of origin. A textbox was availableto type feedback and comments about the survey. The core of each question-naire was the seventh question, i.e. the relatedness or similarity rating task.The subject had to rate 50 pairs of geographic terms based on their relatednessor similarity, on a 1 to 5 Likert scale. Although the impact of size of the Likertscale, typical options being 5, 7 or 10, is debated in the social sciences, it haslittle impact on the rating means [11]. If the terms were not clear to the user,a ‘no answer’ option had to be selected.
Another aspect discussed in the similarity psychological literature is thecounterintuitive fact that similarity judgements tend to be asymmetric (e.g.sim(building, hospital) 6= sim(hospital, building)) [54]. As this aspect is out-side the scope of this study, the order in each pair 〈a, b〉 was randomised tolimit the symmetric bias, i.e. the potential difference between sim(a, b) andsim(b, a) from the subject’s perspective. Moreover, a fixed presentation orderof pairs can trigger specific semantic associations between terms, and wouldreduce the quality of the last pairs, rated when the subjects are more likelyto be tired. To reduce this sequential-ordering bias, the presentation order of
An Evaluative Baseline for Geo-Semantic Relatedness and Similarity 15
the pairs was randomised automatically for each subject at the Web interfacelevel.
At the end of the design process, the survey dataset contained 50 pairsof geographic terms to be rated on 5-point Likert scales, including 97 Open-StreetMap terms, with three terms being repeated twice. The pairs were se-lected to ensure an even distribution between low, medium and high related-ness/similarity. The rating was to be executed in two independent question-naires, one for semantic similarity (QSIM ) and one for semantic relatedness(QREL), randomly assigned to the human subjects. In February 2012, the sur-vey was disseminated in OpenStreetMap and geographic information system(GIS)-related forums and mailing lists.
4.2 Survey results
The online questionnaires on relatedness and similarity received 305 responses,124 for relatedness and 181 for similarity. Given the nature of online surveys,particular attention has to be paid to the agreement between the human sub-jects, and the detection of unreliable and random answers. In this survey,raters expressed quantitative judgements on geo-semantic relatedness and sim-ilarity on a 5-point Likert scale. Two important statistical aspects to be dis-cussed are the interrater reliability (IRR) and the interrater agreement (IRA)[30]. IRR considers the relative similarity in ratings provided by multiple raters(i.e. the human subjects) over multiple targets (i.e. the term pairs), focusingon the order of the targets. IRA, on the other hand, captures the absolute ho-mogeneity between the ratings, looking at the specific rating chosen by raters.
Several indices have been devised to capture IRR and IRA in psychologi-cal surveys [7, 30]. Most indices range between 0 (total disagreement) and 1(perfect agreement). For example, the ratings of two raters on three targets{1, 2, 3} and {2, 3, 4} obtain a IRR = 1 and IRA = 0: the subjects agree per-fectly on the ordering of the targets, while disagreeing on all absolute ratings.LeBreton and Senter [30] recommend using several indices for IRR and IRA,to avoid the bias of any single index. We thus include the following indicesof IRA and IRR: the mean Pearson’s correlation coefficient [43]; Kendall’sW [25]; Robinson’s A [42]; Finn coefficient [14]; James, Demaree and Wolf’srWG(J) [18].
The 305 responders included both native (208) and non-native Englishspeakers (97). We observed a substantially lower inter-subject agreement whenincluding non-native speakers (rWG(J) < .5): the wider variability in these re-sults is due to the varying knowledge of English of these subjects, who mighthave associated terms to ‘false friends’ in their native language, i.e. expressionsin two different languages that look or sound similar, but differ considerablyin meaning. For example, Italian speakers may confuse the meaning of ‘fac-tory’ with ‘farm’ (‘fattoria’ in Italian). Hence, they were excluded from thedataset. Furthermore, three subjects did not complete the task, and their re-sponses were discarded. In order to detect random answers, we computed the
16 Andrea Ballatore et al.
Relatedness Similarity OverallQREL QSIM –
Responders total N 81 122 203Gender Male 72 93 165
Female 9 29 38Age 18-25 28 39 67
26-35 14 41 5536-45 12 23 3546-55 15 10 2556-65 7 9 16>65 5 - 5
Continent Africa - 3 3Asia - 1 1
Europe 58 95 153North America 11 20 31South America - - -
Oceania 12 3 15Web map Never used 6 14 20expertise Occasional user 18 33 51
Frequent user 37 39 76Expert 20 36 56
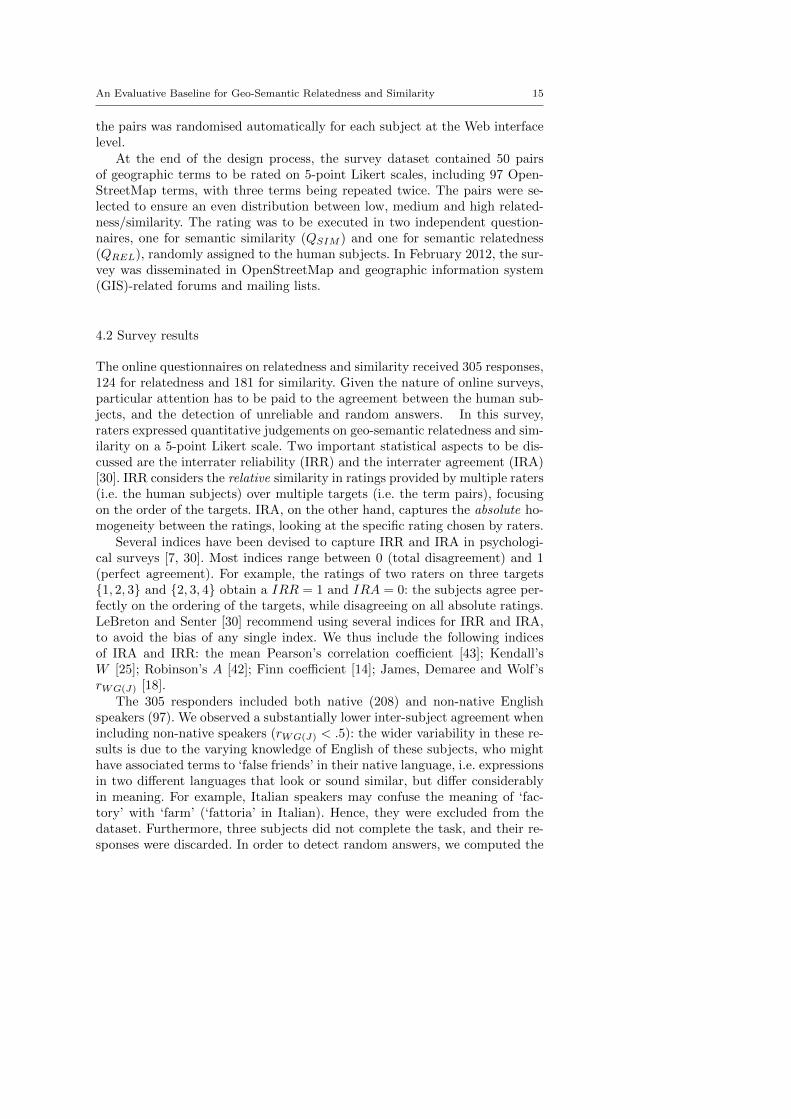
Table 3 Demographics of human subjects in GeReSiD
correlation between every individual subject and the means. This way, twosubjects in the similarity test showed no correlation at all with the mean rat-ings (Spearman’s ρ ∈ [−.05, .05]), and were removed from the dataset.
Of the resulting dataset, Table 3 summarises demographic information (agegroup, gender, continent of origin, and self-assessed map expertise). As is pos-sible to observe, the subjects tend be young, male, European, and frequentusers of web maps.5 Table 4 focuses on the indices of IRR and IRA. FollowingResnik [41], we consider upper bound on the cognitive plausibility of a com-putable measure to be the highest correlation obtained by a human rater withthe means (e.g. ρ = .92 for relatedness). The table shows these upper boundsboth for Spearman’s ρ and Kendall’s τ . All the IRR and IRA indices indicatevery similar results, falling in the range [.61, .67]. Given the highly subjectivenature of semantic conceptualisations, this correlation is satisfactory, and iscomparable with analogous psychological surveys [44].
Given the set of term pairs, and the set of human raters, we computedthe relatedness/similarity scores as the mean ratings, normalised in the inter-val [0, 1], where 0 means no relatedness/similarity, and 1 maximum related-ness/similarity. As we have stated in the survey objectives, the distribution ofsuch scores should be as even as possible, to ensure that a semantic measureperforms well across the board, and not only in a specific region of the seman-tic relatedness/similarity space. Several pairs in the dataset contain relatedbut not similar terms, and the scores confirm this difference. More specifically,<sea,island> obtained a relatedness score of .74 and a similarity of .4. Sim-
5 Although a better gender, age, and geographic balances would be desirable, we found itdifficult to obtain it in practice without drastically limiting the size of the sample.
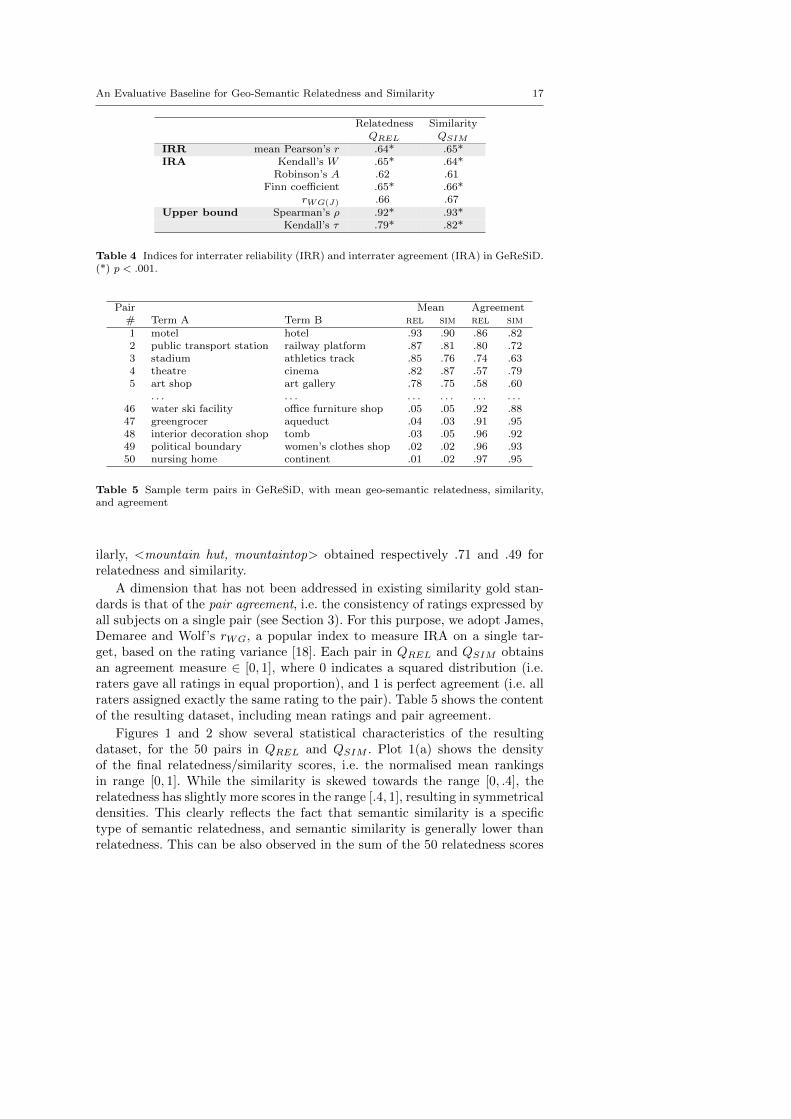
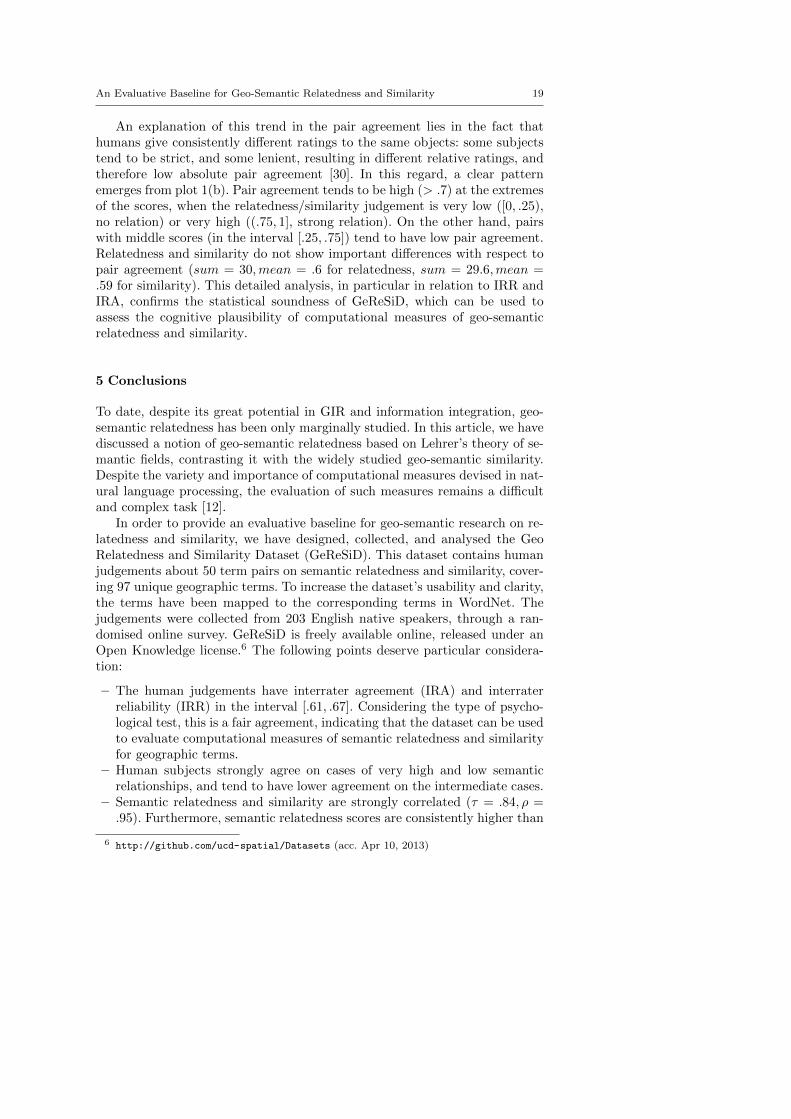
An Evaluative Baseline for Geo-Semantic Relatedness and Similarity 17
Relatedness SimilarityQREL QSIM
IRR mean Pearson’s r .64* .65*IRA Kendall’s W .65* .64*
Robinson’s A .62 .61Finn coefficient .65* .66*
rWG(J) .66 .67Upper bound Spearman’s ρ .92* .93*
Kendall’s τ .79* .82*
Table 4 Indices for interrater reliability (IRR) and interrater agreement (IRA) in GeReSiD.(*) p < .001.
Pair Mean Agreement# Term A Term B rel sim rel sim1 motel hotel .93 .90 .86 .822 public transport station railway platform .87 .81 .80 .723 stadium athletics track .85 .76 .74 .634 theatre cinema .82 .87 .57 .795 art shop art gallery .78 .75 .58 .60
. . . . . . . . . . . . . . . . . .46 water ski facility office furniture shop .05 .05 .92 .8847 greengrocer aqueduct .04 .03 .91 .9548 interior decoration shop tomb .03 .05 .96 .9249 political boundary women’s clothes shop .02 .02 .96 .9350 nursing home continent .01 .02 .97 .95
Table 5 Sample term pairs in GeReSiD, with mean geo-semantic relatedness, similarity,and agreement
ilarly, <mountain hut, mountaintop> obtained respectively .71 and .49 forrelatedness and similarity.
A dimension that has not been addressed in existing similarity gold stan-dards is that of the pair agreement, i.e. the consistency of ratings expressed byall subjects on a single pair (see Section 3). For this purpose, we adopt James,Demaree and Wolf’s rWG, a popular index to measure IRA on a single tar-get, based on the rating variance [18]. Each pair in QREL and QSIM obtainsan agreement measure ∈ [0, 1], where 0 indicates a squared distribution (i.e.raters gave all ratings in equal proportion), and 1 is perfect agreement (i.e. allraters assigned exactly the same rating to the pair). Table 5 shows the contentof the resulting dataset, including mean ratings and pair agreement.
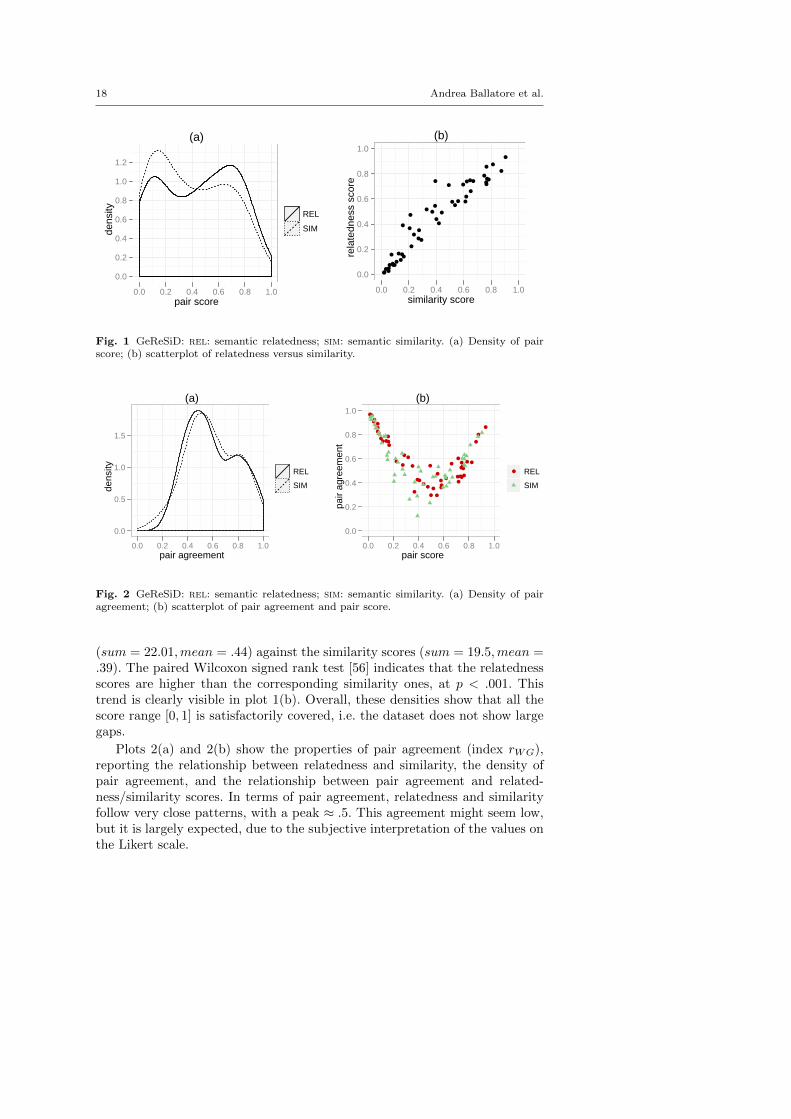
Figures 1 and 2 show several statistical characteristics of the resultingdataset, for the 50 pairs in QREL and QSIM . Plot 1(a) shows the densityof the final relatedness/similarity scores, i.e. the normalised mean rankingsin range [0, 1]. While the similarity is skewed towards the range [0, .4], therelatedness has slightly more scores in the range [.4, 1], resulting in symmetricaldensities. This clearly reflects the fact that semantic similarity is a specifictype of semantic relatedness, and semantic similarity is generally lower thanrelatedness. This can be also observed in the sum of the 50 relatedness scores
18 Andrea Ballatore et al.
(a)
pair score
dens
ity
0.0
0.2
0.4
0.6
0.8
1.0
1.2
0.0 0.2 0.4 0.6 0.8 1.0
REL
SIM
(b)
similarity score
rela
tedn
ess
scor
e
0.0
0.2
0.4
0.6
0.8
1.0
●●
●
●
●
●
●
●
●
●
●
●
●
●
●
●
●
●
●
●
●
●
●
●
●
●
●
●●
●
●
●
●
●●
●
●●
●●
●
●
●●
●
●
●
●
●●
0.0 0.2 0.4 0.6 0.8 1.0
Fig. 1 GeReSiD: rel: semantic relatedness; sim: semantic similarity. (a) Density of pairscore; (b) scatterplot of relatedness versus similarity.
(a)
pair agreement
dens
ity
0.0
0.5
1.0
1.5
0.0 0.2 0.4 0.6 0.8 1.0
REL
SIM
(b)
pair score
pair
agre
emen
t
0.0
0.2
0.4
0.6
0.8
1.0●
●
●
●
●
●
●
●
●
●
●
●
●●
●
●
●
●
●
●
●
●
●
●
●
●
● ●●
●
●
●
●
●
●●
●
●
●
● ●
●
●
●
● ●
●
●
●
●
0.0 0.2 0.4 0.6 0.8 1.0
● REL
SIM
Fig. 2 GeReSiD: rel: semantic relatedness; sim: semantic similarity. (a) Density of pairagreement; (b) scatterplot of pair agreement and pair score.
(sum = 22.01,mean = .44) against the similarity scores (sum = 19.5,mean =.39). The paired Wilcoxon signed rank test [56] indicates that the relatednessscores are higher than the corresponding similarity ones, at p < .001. Thistrend is clearly visible in plot 1(b). Overall, these densities show that all thescore range [0, 1] is satisfactorily covered, i.e. the dataset does not show largegaps.
Plots 2(a) and 2(b) show the properties of pair agreement (index rWG),reporting the relationship between relatedness and similarity, the density ofpair agreement, and the relationship between pair agreement and related-ness/similarity scores. In terms of pair agreement, relatedness and similarityfollow very close patterns, with a peak ≈ .5. This agreement might seem low,but it is largely expected, due to the subjective interpretation of the values onthe Likert scale.
An Evaluative Baseline for Geo-Semantic Relatedness and Similarity 19
An explanation of this trend in the pair agreement lies in the fact thathumans give consistently different ratings to the same objects: some subjectstend to be strict, and some lenient, resulting in different relative ratings, andtherefore low absolute pair agreement [30]. In this regard, a clear patternemerges from plot 1(b). Pair agreement tends to be high (> .7) at the extremesof the scores, when the relatedness/similarity judgement is very low ([0, .25),no relation) or very high ((.75, 1], strong relation). On the other hand, pairswith middle scores (in the interval [.25, .75]) tend to have low pair agreement.Relatedness and similarity do not show important differences with respect topair agreement (sum = 30,mean = .6 for relatedness, sum = 29.6,mean =.59 for similarity). This detailed analysis, in particular in relation to IRR andIRA, confirms the statistical soundness of GeReSiD, which can be used toassess the cognitive plausibility of computational measures of geo-semanticrelatedness and similarity.
5 Conclusions
To date, despite its great potential in GIR and information integration, geo-semantic relatedness has been only marginally studied. In this article, we havediscussed a notion of geo-semantic relatedness based on Lehrer’s theory of se-mantic fields, contrasting it with the widely studied geo-semantic similarity.Despite the variety and importance of computational measures devised in nat-ural language processing, the evaluation of such measures remains a difficultand complex task [12].
In order to provide an evaluative baseline for geo-semantic research on re-latedness and similarity, we have designed, collected, and analysed the GeoRelatedness and Similarity Dataset (GeReSiD). This dataset contains humanjudgements about 50 term pairs on semantic relatedness and similarity, cover-ing 97 unique geographic terms. To increase the dataset’s usability and clarity,the terms have been mapped to the corresponding terms in WordNet. Thejudgements were collected from 203 English native speakers, through a ran-domised online survey. GeReSiD is freely available online, released under anOpen Knowledge license.6 The following points deserve particular considera-tion:
– The human judgements have interrater agreement (IRA) and interraterreliability (IRR) in the interval [.61, .67]. Considering the type of psycho-logical test, this is a fair agreement, indicating that the dataset can be usedto evaluate computational measures of semantic relatedness and similarityfor geographic terms.
– Human subjects strongly agree on cases of very high and low semanticrelationships, and tend to have lower agreement on the intermediate cases.
– Semantic relatedness and similarity are strongly correlated (τ = .84, ρ =.95). Furthermore, semantic relatedness scores are consistently higher than
6 http://github.com/ucd-spatial/Datasets (acc. Apr 10, 2013)

20 Andrea Ballatore et al.
semantic similarity, confirming the more specific nature of semantic simi-larity.
– The contribution of GeReSiD lies both in its design and validation method-ology, as well as the dataset itself. The raw data and the resulting datasetare available for analysis and re-use under a Creative Commons license.
– GeReSiD constitutes an evaluative baseline to evaluate measures of se-mantic similarity and relatedness. Furthermore, it permits the empiricaldetermination of whether a given measure better approximates similarityor relatedness through the direct comparison of rankings or scores.
– A variety of techniques can be used to compare the rankings or scores gen-erated by a computational measure with GeReSiD, including correlationcoefficients (Spearman’s ρ and Kendall’s τ), and categorical approaches(Cohen’s kappa or Fisher’s exact test).
Although GeReSiD provides a novel resource to evaluate computational mea-sures of geo-semantic relatedness and similarity, several questions remain open.GeReSiD distinguishes between geo-semantic relatedness and similarity, butnot among different contexts. As context has been identified as a key aspect ofsemantic similarity [26], new datasets should be generated to capture explic-itly the differences in geo-similarity and relatedness judgements with respectto different contexts, such as appearance and affordances. The investigation ofwhat specific geographic aspects are used by subjects in their judgements alsoconstitutes important future work. The dataset’s IRA and IRR are comparableto similar datasets, but have a large margin of improvement.
As Ferrara and Tasso [12] point out, this evaluative approach has severallimitations. Human subjects understand intuitively semantic relatedness andsimilarity, but the translation of such judgements into a number is very sub-jective. Different information communities can express different judgementson the same term pairs. Alternative approaches to the evaluation of computa-tional measures should be investigated, aiming at cross-validating the findingsgenerated by GeReSiD. A promising route might consist of evaluating human-readable explanations of relatedness measures, and not only numeric scores orrankings [17]. Moreover, the collection of judgements was conducted throughonline surveys in an uncontrolled environment, which have well-known issues[57].
Ultimately, the cognitive plausibility is assessed using correlation indexessuch as Spearman’s ρ and Kendall’s τ , which have specific limitations. Forexample, they tend to attribute the same weight to high and low similar-ity rankings, whilst computational applications normally need more precisionon highly-related/similar pairs, which tend to be utilised in GIR and infor-mation integration. Using GeReSiD as input data, new techniques to assesscognitive plausibility can be developed, offering tools tailored to the study ofgeo-semantic relatedness and similarity. Fruitful future work, as geo-semanticsimilarity is a specific case of geo-semantic relatedness, will consist of the gen-eralisation of existing geo-similarity theories to the framework of geo-semanticrelatedness.
An Evaluative Baseline for Geo-Semantic Relatedness and Similarity 21
Acknowledgements The research presented in this article was funded by a Strategic Re-search Cluster grant (07/SRC/I1168) by Science Foundation Ireland under the NationalDevelopment Plan. The authors gratefully acknowledge this support.
References
1. Agirre, E., Alfonseca, E., Hall, K., Kravalova, J., Pasca, M., Soroa, A.(2009). A study on similarity and relatedness using distributional andWordNet-based approaches. In: Proceedings of Human Language Tech-nologies: The 2009 Annual Conference of the North American Chapterof the Association for Computational Linguistics (pp. 19–27), ACL.
2. Bakillah, M., Bedard, Y., Mostafavi, M., Brodeur, J. (2009). SIM-NET: AView-Based Semantic Similarity Model for Ad Hoc Networks of GeospatialDatabases. Transactions in GIS, 13 (5-6), 417–447.
3. Ballatore, A., Wilson, D., Bertolotto, M. (2012). The Similarity Jury:Combining expert judgements on geographic concepts. In: Castano, S.,Vassiliadis, P., Lakshmanan, L., Lee, M. (Eds) Advances in ConceptualModeling. ER 2012 Workshops (SeCoGIS), LNCS, vol. 7518, Springer,pp. 231–240.
4. Ballatore, A., Bertolotto, M., Wilson, D. (2013). Computing the Seman-tic Similarity of Geographic Terms Using Volunteered Lexical Definitions.International Journal of Geographical Information Science, 27 (10), 2099–2118.
5. Ballatore, A., Bertolotto, M., Wilson, D. (2013). Geographic KnowledgeExtraction and Semantic Similarity in OpenStreetMap. Knowledge andInformation Systems, 37 (1), 61–81.
6. Ballatore, A., Wilson, D., Bertolotto, M. (2013). A Survey of VolunteeredOpen Geo-Knowledge Bases in the Semantic Web. In: Pasi, G., Bordogna,G., Jain, L. (Eds) Quality Issues in the Management of Web Information,Intelligent Systems Reference Library, vol. 50, Springer, pp. 93–120.
7. Banerjee, M., Capozzoli, M., McSweeney, L., Sinha, D. (1999). BeyondKappa: A review of interrater agreement measures. Canadian Journal ofStatistics, 27 (1), 3–23.
8. Blei, D. M., Ng, A. Y., Jordan, M. I. (2003). Latent Dirichlet Allocation.The Journal of Machine Learning Research, 3, 993–1022.
9. Budanitsky, A., Hirst, G. (2006). Evaluating WordNet-based Measures ofLexical Semantic Relatedness. Computational Linguistics, 32 (1), 13–47.
10. Cimiano, P., Volker, J. (2005). Towards large-scale, open-domain andontology-based named entity classification. In: Recent Advances in Nat-ural Language Processing, RANLP 2005 (pp. 166–172), ACL.
11. Dawes, J. (2008). Do data characteristics change according to the numberof scale points used? International Journal of Market Research, 50 (1),61–78.
12. Ferrara, F., Tasso, C. (2013). Evaluating the Results of Methods for Com-puting Semantic Relatedness. In: Gelbukh, A. (ed.) Computational Lin-
22 Andrea Ballatore et al.
guistics and Intelligent Text Processing, LNCS, vol. 7816, Springer, pp.447–458.
13. Finkelstein, L., Gabrilovich, E., Matias, Y., Rivlin, E., Solan, Z., Wolfman,G., Ruppin, E. (2002). Placing Search in Context: The Concept Revisited.ACM Transactions on Information Systems, 20 (1), 116–131.
14. Finn, R. (1970). A Note on Estimating the Reliability of Categorical Data.Educational and Psychological Measurement, 30 (1), 71–76.
15. Goldstone, R., Son, J. (2005). Similarity. In: Holyoak, K., Morrison, R.(Eds) Cambridge Handbook of Thinking and Reasoning, New York: Cam-bridge University Press, pp. 13–36.
16. Hecht, B., Raubal, M. (2008). GeoSR: Geographically Explore SemanticRelations in World Knowledge. In: The European Information Society:Taking Geoinformation Science One Step Further, LNGC, Springer, pp.95–113.
17. Hecht, B., Carton, S. H., Quaderi, M., Schoning, J., Raubal, M., Gergle,D., Downey, D. (2012). Explanatory semantic relatedness and explicit spa-tialization for exploratory search. In: Proceedings of the 35th InternationalACM SIGIR Conference on Research and Development in Information Re-trieval (pp. 415–424), ACM.
18. James, L., Demaree, R., Wolf, G. (1984). Estimating within-group inter-rater reliability with and without response bias. Journal of applied psy-chology, 69 (1), 85–98.
19. Janowicz, K., Raubal, M. (2007). Affordance-based similarity measure-ment for entity types. In: Spatial Information Theory, LNCS, vol. 4736,Springer, pp. 133–151.
20. Janowicz, K., Keßler, C., Schwarz, M., Wilkes, M., Panov, I., Espeter,M., Baumer, B. (2007). Algorithm, implementation and application of theSIM-DL similarity server. In: GeoSpatial Semantics: Second InternationalConference, GeoS 2007 (pp. 128–145), Springer, LNCS, vol. 4853.
21. Janowicz, K., Keßler, C., Panov, I., Wilkes, M., Espeter, M., Schwarz, M.(2008). A study on the cognitive plausibility of SIM-DL similarity rankingsfor geographic feature types. In: Fabrikant, S., Wachowicz, M. (Eds) TheEuropean Information Society: Taking Geoinformation Science One StepFurther, LNGC, Springer, pp. 115–134.
22. Janowicz, K., Raubal, M., Schwering, A., Kuhn, W. (2008). Semantic Sim-ilarity Measurement and Geospatial Applications. Transactions in GIS,12 (6), 651–659.
23. Janowicz, K., Raubal, M., Kuhn, W. (2011). The semantics of similarity ingeographic information retrieval. Journal of Spatial Information Science,2 (1), 29–57.
24. Kaptchuk, T. (2001). The double-blind, randomized, placebo-controlledtrial: Gold standard or golden calf? Journal of Clinical Epidemiology,54 (6), 541–549.
25. Kendall, M., Smith, B. (1939). The problem of m rankings. The annals ofmathematical statistics, 10 (3), 275–287.
An Evaluative Baseline for Geo-Semantic Relatedness and Similarity 23
26. Keßler, C. (2007). Similarity measurement in context. In: Proceedings ofthe 6th International and Interdisciplinary Conference on Modeling andUsing Context (pp. 277–290), Springer, LNCS, vol. 4635.
27. Keßler, C. (2011). What is the difference? A cognitive dissimilarity mea-sure for information retrieval result sets. Knowledge and Information Sys-tems, 30 (2), 319–340.
28. Khoo, C., Na, J. (2006). Semantic relations in information science. AnnualReview of Information Science and Technology, 40 (1), 157–207.
29. Kuhn, W. (2013). Cognitive and linguistic ideas and geographic informa-tion semantics. In: Cognitive and Linguistic Aspects of Geographic Space,LNGC, Springer, pp. 159–174.
30. LeBreton, J., Senter, J. (2008). Answers to 20 questions about interraterreliability and interrater agreement. Organizational Research Methods,11 (4), 815–852.
31. Lehrer, A. (1985). The influence of semantic fields on semantic change. In:Fisiak, J. (ed.) Historical Word Formation, Berlin: Walter de Gruyter, pp.283–296.
32. Medin, D., Goldstone, R., Gentner, D. (1990). Similarity involving at-tributes and relations: Judgments of similarity and difference are not in-verses. Psychological Science, 1 (1), 64–69.
33. Miller, G., Charles, W. (1991). Contextual correlates of semantic similar-ity. Language and Cognitive Processes, 6 (1), 1–28.
34. Mohammad, S., Hirst, G. (2012). Distributional Measures of Semantic Dis-tance: A Survey. Computing Research Repository (CoRR), abs/1203.1858,1–39, URL http://arxiv.org/abs/1203.1858.
35. Montello, D. R., Fabrikant, S. I., Ruocco, M., Middleton, R. S. (2003).Testing the first law of cognitive geography on point-display spatializa-tions. In: Kuhn, W., Worboys, M., Timpf, S. (Eds) Spatial InformationTheory. Foundations of Geographic Information Science, LNCS, vol. 2825,Springer, pp. 316–331.
36. Morris, J., Hirst, G. (2004). Non-classical lexical semantic relations. In:Proceedings of the HLT-NAACL Workshop on Computational Lexical Se-mantics (pp. 46–51), ACL.
37. Nelson, D., Dyrdal, G., Goodmon, L. (2005). What is preexisting strength?Predicting free association probabilities, similarity ratings, and cued recallprobabilities. Psychonomic Bulletin & Review, 12 (4), 711–719.
38. Pedersen, T., Kolhatkar, V. (2009). Wordnet::senserelate::allwords: abroad coverage word sense tagger that maximizes semantic relatedness.In: Proceedings of Human Language Technologies: The 2009 Annual Con-ference of the North American Chapter of the Association for Computa-tional Linguistics, Companion Volume: Demonstration Session (pp. 17–20), ACL.
39. Pedersen, T., Patwardhan, S., Michelizzi, J. (2004). WordNet::Similarity:measuring the relatedness of concepts. In: Proceedings of Human LanguageTechnologies: The 2004 Annual Conference of the North American Chap-ter of the Association for Computational Linguistics, Companion Volume:
24 Andrea Ballatore et al.
Demonstration Session (pp. 38–41), ACL.40. Rada, R., Mili, H., Bicknell, E., Blettner, M. (1989). Development and
application of a metric on semantic nets. IEEE Transactions on Systems,Man and Cybernetics, 19 (1), 17–30.
41. Resnik, P. (1995). Using Information Content to Evaluate Semantic Simi-larity in a Taxonomy. In: Proceedings of the 14th International Joint Con-ference on Artificial Intelligence, IJCAI’95 (pp. 448–453), Morgan Kauf-mann, vol. 1.
42. Robinson, W. (1957). The statistical measurement of agreement. AmericanSociological Review, 22 (1), 17–25.
43. Rodgers, J., Nicewander, W. (1988). Thirteen ways to look at the corre-lation coefficient. American Statistician, 42 (1), 59–66.
44. Rodrıguez, M., Egenhofer, M. (2004). Comparing Geospatial EntityClasses: An Asymmetric and Context-Dependent Similarity Measure. In-ternational Journal of Geographical Information Science, 18 (3), 229–256.
45. Rubenstein, H., Goodenough, J. (1965). Contextual Correlates of Syn-onymy. Communications of the ACM, 8 (10), 627–633.
46. Schutze, H. (1998). Automatic word sense discrimination. Computationallinguistics, 24 (1), 97–123.
47. Schwering, A. (2008). Approaches to Semantic Similarity Measurement forGeo-Spatial Data: A Survey. Transactions in GIS, 12 (1), 5–29.
48. Schwering, A., Kuhn, W. (2009). A hybrid semantic similarity measurefor spatial information retrieval. Spatial Cognition & Computation, 9 (1),30–63.
49. Schwering, A., Raubal, M. (2005). Spatial relations for semantic similar-ity measurement. In: Perspectives in Conceptual Modeling (pp. 259–269),Springer, LNCS, vol. 3770.
50. Strube, G. (1992). The role of cognitive science in knowledge engineering.Contemporary knowledge engineering and cognition, 622, 159–174.
51. Tobler, W. (1970). A computer movie simulating urban growth in the De-troit region. In: Economic geography. Supplement: Proceedings. Interna-tional Geographical Union. Commission on Quantitative Methods, vol. 46,Worcester, MA: Clark University, pp. 234–240.
52. Toutanova, K., Klein, D., Manning, C., Singer, Y. (2003). Feature-richpart-of-speech tagging with a cyclic dependency network. In: Proceedingsof the 2003 Conference of the North American Chapter of the Associationfor Computational Linguistics on Human Language Technology (pp. 173–180), ACL, vol. 1.
53. Turney, P. (2006). Similarity of semantic relations. Computational Lin-guistics, 32 (3), 379–416.
54. Tversky, A. (1977). Features of similarity. Psychological review, 84 (4),327–352.
55. Wang, C., Wang, J., Xie, X., Ma, W. Y. (2007). Mining geographic knowl-edge using location aware topic model. In: Proceedings of the 4th ACMWorkshop on Geographical Information Retrieval (pp. 65–70), ACM.

An Evaluative Baseline for Geo-Semantic Relatedness and Similarity 25
56. Wilcoxon, F. (1945). Individual comparisons by ranking methods. Biomet-rics Bulletin, 1 (6), 80–83.
57. Wright, K. (2005). Researching Internet-based populations: Advan-tages and disadvantages of online survey research, online question-naire authoring software packages, and web survey services. Journal ofComputer-Mediated Communication, 10 (3), URL http://jcmc.indiana.
edu/vol10/issue3/wright.html, article 11.


![Geo Journal Visser fulltext[1]](https://img.dokumen.tips/doc/110x75/631af720d43f4e176304ae4b/geo-journal-visser-fulltext1.jpg)


