Embed Size (px)
Citation preview

““AAnn EEffffiicciieenntt TTeesstt ooff FFiissccaall SSuussttaaiinnaabbiilliittyy””
VVaassccoo JJ.. GGaabbrriieell PPaattaaaarreeee SSaannggdduuaann
NIPE WP 32/ 2010

““AAnn EEffffiicciieenntt TTeesstt ooff FFiissccaall SSuussttaaiinnaabbiilliittyy””
VVaassccoo JJ.. GGaabbrriieell PPaattaaaarreeee SSaannggdduuaann
NNIIPPEE** WWPP 3322// 22001100
URL: http://www.eeg.uminho.pt/economia/nipe
* NIPE – Núcleo de Investigação em Políticas Económicas – is supported by the Portuguese Foundation for Science and Technology through the Programa Operacional Ciência, Teconologia e Inovação (POCI 2010) of the Quadro Comunitário de Apoio III, which is financed by FEDER and Portuguese funds.
An Efficient Test of Fiscal Sustainability
Vasco J. Gabriel�
Department of Economics, University of Surrey, UK and NIPE-UM
Pataaree Sangduan
Bureau of the Budget, Thailand
January 2010
Abstract
We suggest a multivariate e¢ cient test of the �strong��scal sustainability hypo-
thesis, based on Horvath and Watson�s (1995) cointegration test when cointegration
vectors are pre-speci�ed. Using data for a set of developed and developing eco-
nomies, we show that, unlike our procedure, conventional methodologies tend to
penalize the sustainability hypothesis.
JEL Classi�cation: C32; E62; H60
�Corresponding author. Address: Department of Economics, University of Surrey, Guildford, Surrey,
GU2 7XH, UK. Email: [email protected]. Tel: + 44 1483 682769. Fax: + 44 1483 689548.
1

1 Introduction
A stable and sustainable long-term relationship between government expenditures and
revenues is a key requirement for macroeconomic stability. Given its relevance, this issue
has attracted a great deal of attention, with particular emphasis on testing empirically
whether or not a given country�s �scal stance is sustainable. There is, however, a contra-
diction between the predictions of empirical models, which point to a signi�cant degree
of unsustainability across di¤erent countries, and the relative scarcity of episodes of full-
scale defaults. Therefore, it is of great importance to reassess empirical methodologies
dealing with the analysis of �scal sustainability. In this paper, we show that once an
appropriate testing method is put to use, the paradoxical �ndings of earlier literature
virtually disappear.
Tests of �scal sustainability are commonly based on the government�s intertemporal
budget constraint (IBC) in its present value form. Given (in real terms) government
expenditures G, revenues R, public debt B and the interest rate i, the government�s one-
period budget constraint is written as
Gt + (1 + i)Bt�1 = Rt +Bt:
A similar condition holds for periods t+1; t+2; ::: with forward substitution yielding the
IBC
Bt =1Xj=0
�jk=1(1 + it+k)�1(Rt+j �Gt+j) + lim
j!1�k=1(1 + it+k)
�1Bt+j; (1)
implying that current government debt Bt must be �nanced by the present value of future
primary surpluses1. Assuming that interest rates are stationary, the above expression can
1Ruling out Ponzi games and therefore the second, asymptotic term should converge to 0.
2
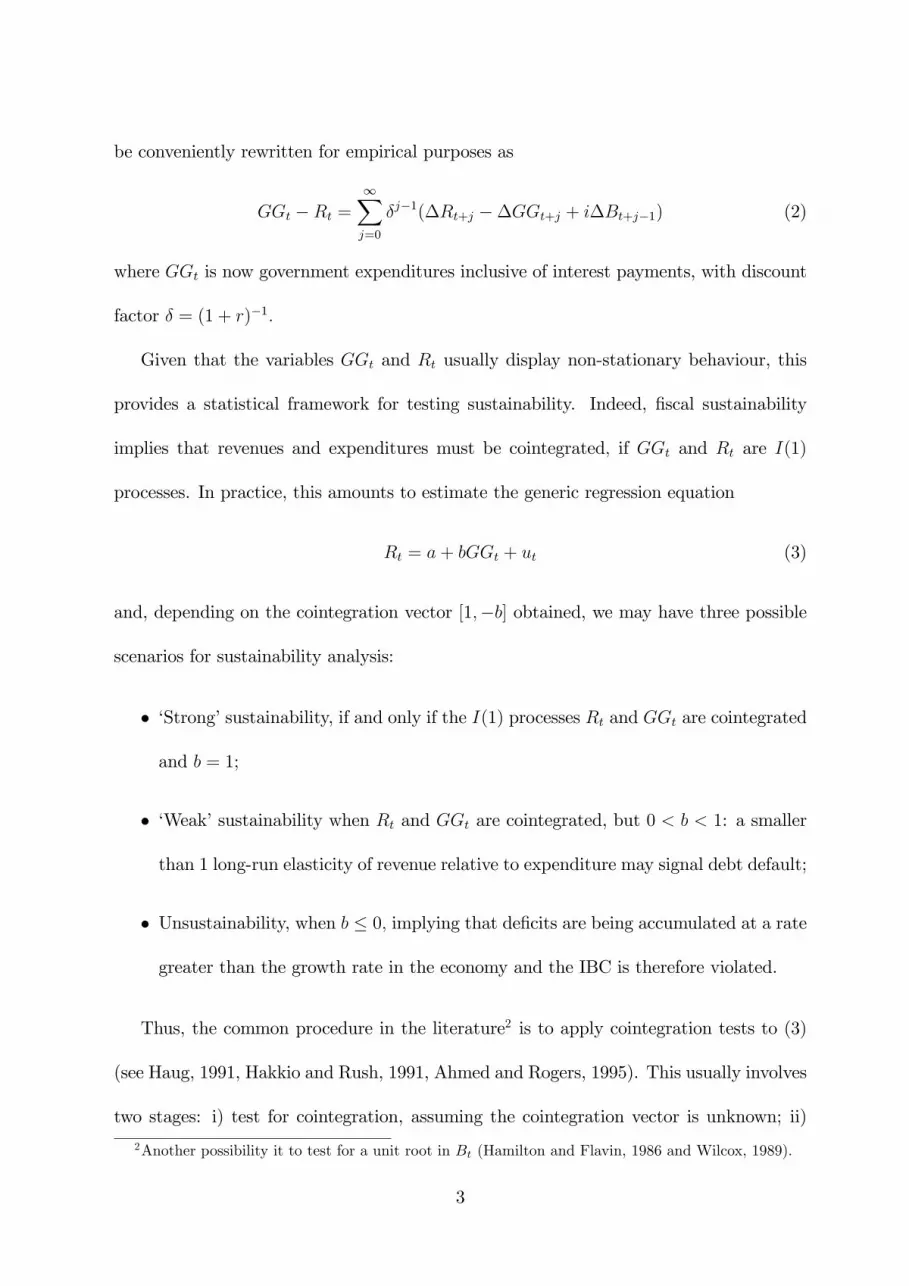
be conveniently rewritten for empirical purposes as
GGt �Rt =1Xj=0
�j�1(�Rt+j ��GGt+j + i�Bt+j�1) (2)
where GGt is now government expenditures inclusive of interest payments, with discount
factor � = (1 + r)�1:
Given that the variables GGt and Rt usually display non-stationary behaviour, this
provides a statistical framework for testing sustainability. Indeed, �scal sustainability
implies that revenues and expenditures must be cointegrated; if GGt and Rt are I(1)
processes. In practice, this amounts to estimate the generic regression equation
Rt = a+ bGGt + ut (3)
and, depending on the cointegration vector [1;�b] obtained, we may have three possible
scenarios for sustainability analysis:
� �Strong�sustainability, if and only if the I(1) processes Rt and GGt are cointegrated
and b = 1;
� �Weak�sustainability when Rt and GGt are cointegrated, but 0 < b < 1: a smaller
than 1 long-run elasticity of revenue relative to expenditure may signal debt default;
� Unsustainability, when b � 0; implying that de�cits are being accumulated at a rate
greater than the growth rate in the economy and the IBC is therefore violated.
Thus, the common procedure in the literature2 is to apply cointegration tests to (3)
(see Haug, 1991, Hakkio and Rush, 1991, Ahmed and Rogers, 1995). This usually involves
two stages: i) test for cointegration, assuming the cointegration vector is unknown; ii)
2Another possibility it to test for a unit root in Bt (Hamilton and Flavin, 1986 and Wilcox, 1989).
3

if cointegration is found, proceed with estimation, with cointegration maintained both
under the null and the alternative, with a �restricted�cointegration vector arising from
the �rst step.
However, as pointed out by Horvath and Watson (1995), in this situation the usual
tests are ine¢ cient. These authors derived a testing procedure for the case when the
cointegration vector is known, which allows for substantial gains in power when compared
to standard procedures that do not impose a cointegration vector. Its computation is
straightforward, as it is based on a Wald test of the error correction term in a Vector
Error Correction Model (VECM). Therefore, we depart from, and thus contribute to,
the literature by using the Horvath-Watson e¢ cient test of the �strong� sustainability
hypothesis, when the cointegration vector is pre-speci�ed as [1;�1]:
The theoretical restriction implied by the IBC also suggests an alternative, stricter
test of the �strong�sustainability hypothesis, obtained by testing the stationarity of the
primary surplus/de�cit PSt = Rt�GGt. However, Horvath and Watson (1995) show that
a multivariate cointegration approach can lead to e¢ ciency gains over the univariate unit
root tests if the error terms of GGt and Rt are correlated. This is likely to be the case, as
shocks a¤ecting the expenditure and the revenue sides are likely to be highly correlated.
Therefore, there seems to be a compelling case for the use of this procedure. The
caveat of this test is, naturally, that its relative power will su¤er if the variables are
cointegrated with a cointegrating vector di¤erent form the pre-speci�ed one, namely the
case of �weak�sustainability. We argue, however, that given the implications of the latter,
the �strong�hypothesis should be the benchmark case when assessing �scal sustainability.
The next section describe the Horvath-Watson testing procedure. We then analyse the
4

�scal regimes of 6 countries using conventional unit root and cointegration methodologies
and contrast these results with those obtained with the e¢ cient test of Horvath and
Watson (1995). A summary concludes.
2 Testing for cointegration when the cointegration
vector is pre-speci�ed
The setup for the derivation of the test is similar to the reduced rank procedure based on
a Gaussian VAR
Yt = dt +Xt
Xt =
pXi=1
�iXt�i + "t
where Yt and Xt are n � 1 variables, dt is a deterministic term (possibly including time
trends) and "t is normally distributed with covariance matrix �". We can rewrite the
above system in vector error-correcting form as
�Xt = �Xt�1 +
p�1Xi=1
�i�Xt�i + "t (4)
where � = �In +Pp
i=1�i.
As in Johansen (1988), a test for r = rank(�) can be developed for the hypotheses
Ho : rank(�) = r = ro
Ha : rank(�) = r = ro + ra; ra > 0:
We follow the notation of Horvath and Watson (1995), so that the alternative hypothesis
contains ra, the number of additional cointegrating vectors that are present under the
5

alternative. We can partition the ranks according to the number of (un)known cointeg-
ration vectors, that is, ro = rok + rou and ra = rak + rau , with the subscripts k and u
indicating �known�and �unknown�, respectively.
In order to derive the test statistic, we need to factor the matrix � as � = ��0, so that
� and � are n�r matrices of full column rank and the columns of � give the cointegration
vectors. As above, these matrices can be partitioned into � = (�o�a) and � = (�o�a) and,
to re�ect the knowledge of the cointegration vector, �a = (�akaau) and �a = (�ak�au);
so that the rak columns of �ak are the additional known cointegration vectors under the
alternative Ha. This implies that �Xt�1 = �o(�0oXt�1) + �a(�
0aXt�1):
In our case, given that we have a bivariate relationship, we will be testing Ho v Ha in
the case where ro = 0 (i.e., no cointegration) and ra = rak = 1; since we have a single, pre-
speci�ed cointegration vector [1;�1] implied by IBC: Thus, the model can be rewritten
as (ignoring dt for notational convenience)
�Yt = �ak(a0akYt�1) + �Zt + "t;
where � = (�1�2:::�p�1) and Zt = (�Y 0t�1�Y0t�2:::�Y
0t�p+1): Let Y = [Y1Y2:::YT ]
0, �Y =
Y � Y�1; Z = [Z1:::ZT ], " = ["1:::"T ] and MZ = [I � Z(Z 0Z)�1Z 0]: The Wald statistic for
Ho against Ha is
W = [vec(�Y 0MzY�1�ak)]0[(�0akY
0�1MzY�1�ak)
�1 �̂�1" ][vec(�Y 0MzY�1�ak)] (5)
where �̂�1" is the OLS (MLE, given the Gaussianity assumption) estimator of � (�̂" =
T�1"̂0"̂) and (�Y 0MzY�1�ak)(�0akY 0�1MzY�1�ak)
�1 is the OLS (MLE) estimator of �ak .
Horvath and Watson (1995) show that the above statistic has an asymptotic distri-
bution that depends on Wiener processes. Critical values were obtained by simulation
6
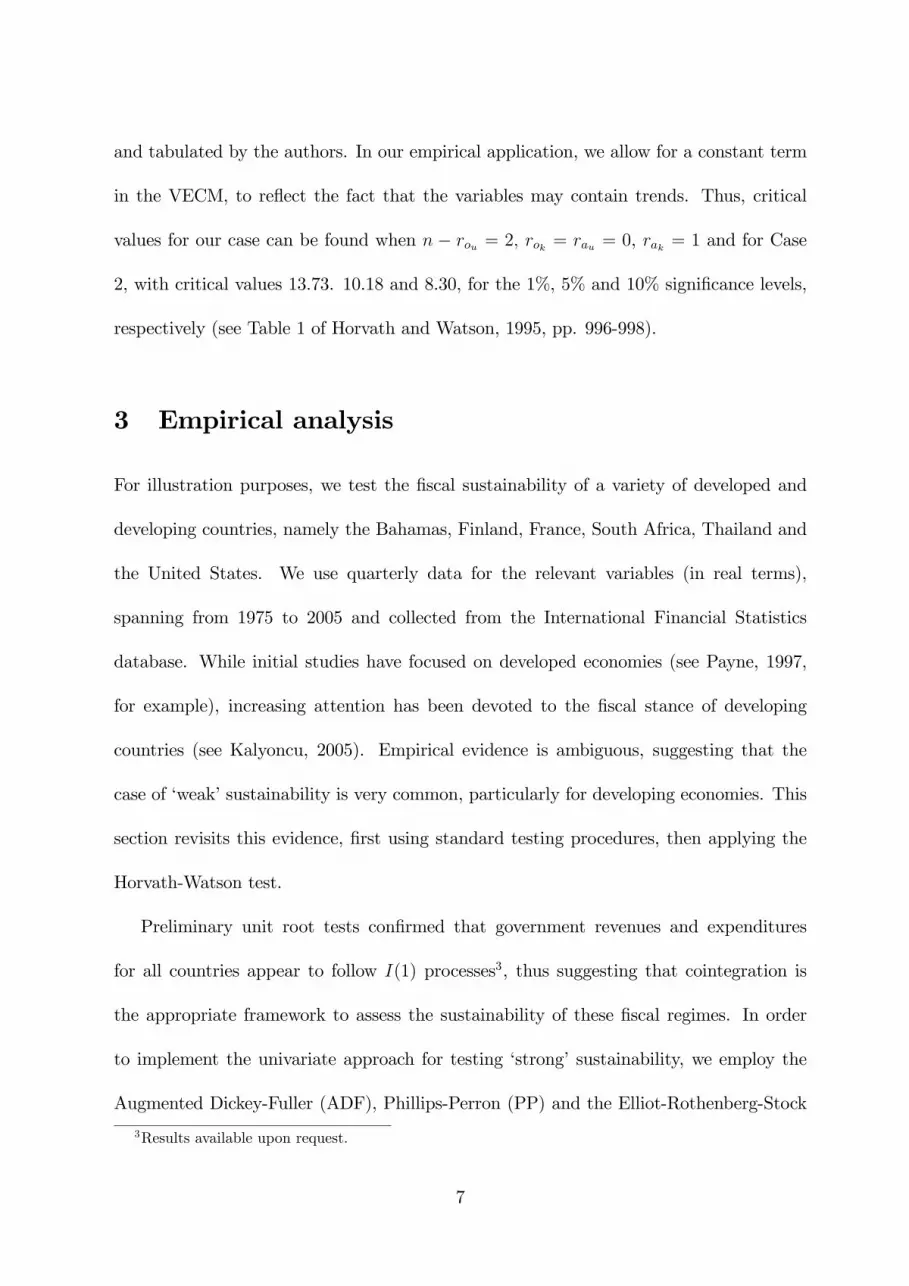
and tabulated by the authors. In our empirical application, we allow for a constant term
in the VECM, to re�ect the fact that the variables may contain trends. Thus, critical
values for our case can be found when n � rou = 2; rok = rau = 0, rak = 1 and for Case
2, with critical values 13.73. 10.18 and 8.30, for the 1%, 5% and 10% signi�cance levels,
respectively (see Table 1 of Horvath and Watson, 1995, pp. 996-998).
3 Empirical analysis
For illustration purposes, we test the �scal sustainability of a variety of developed and
developing countries, namely the Bahamas, Finland, France, South Africa, Thailand and
the United States. We use quarterly data for the relevant variables (in real terms),
spanning from 1975 to 2005 and collected from the International Financial Statistics
database. While initial studies have focused on developed economies (see Payne, 1997,
for example), increasing attention has been devoted to the �scal stance of developing
countries (see Kalyoncu, 2005). Empirical evidence is ambiguous, suggesting that the
case of �weak�sustainability is very common, particularly for developing economies. This
section revisits this evidence, �rst using standard testing procedures, then applying the
Horvath-Watson test.
Preliminary unit root tests con�rmed that government revenues and expenditures
for all countries appear to follow I(1) processes3, thus suggesting that cointegration is
the appropriate framework to assess the sustainability of these �scal regimes. In order
to implement the univariate approach for testing �strong�sustainability, we employ the
Augmented Dickey-Fuller (ADF), Phillips-Perron (PP) and the Elliot-Rothenberg-Stock
3Results available upon request.
7

(ERS) unit root tests, both on the levels and in �rst-di¤erences of the primary surplus
PSt series (with a constant term included, lag lengths and bandwidths of the Bartlett
kernel automatically selected based on the Schwarz Information Criterion). Results are
presented in Table 1.
< Insert Table 1 here >
We �nd that the series for primary surplus in the Bahamas and France display sta-
tionary and, hence, sustainable behaviour. The picture is less clear for the USA, given
that the PP test does not reject the null of a unit root. On the other hand, Finland,
South Africa and Thailand appear to be on an unsustainable path, given that all tests
fail to reject the null of non-stationarity.
However, it could be argued that this approach lacks �exibility, given that it implicitly
imposes the cointegration vector [1;�1]: Also, there may be e¢ ciency gains in resorting to
a multivariate testing framework, using the joint dynamics of expenditures and revenues.
We next explore cointegration inference involving these two variables, by estimating the
cointegration regression (3) and testing whether b = 1 or 0 < b < 1.
We employ a residual-based approach to testing cointegration, i.e., we �rst estimate
(3) and then ascertain whether the estimated equilibrium errors are stationary or not, by
means of the cointegration counterparts of the ADF and PP tests (denoted as AEG and
PO). There are no e¢ ciency losses in pursuing a single-equation route when compared to
the multi-equation method of Johansen (1988), as we are studying a bivariate relationship
with only one potential cointegration vector. Thus, for conciseness, we consider the
standard OLS estimator of b; as well as the dynamic OLS (DOLS) e¢ cient estimator
8
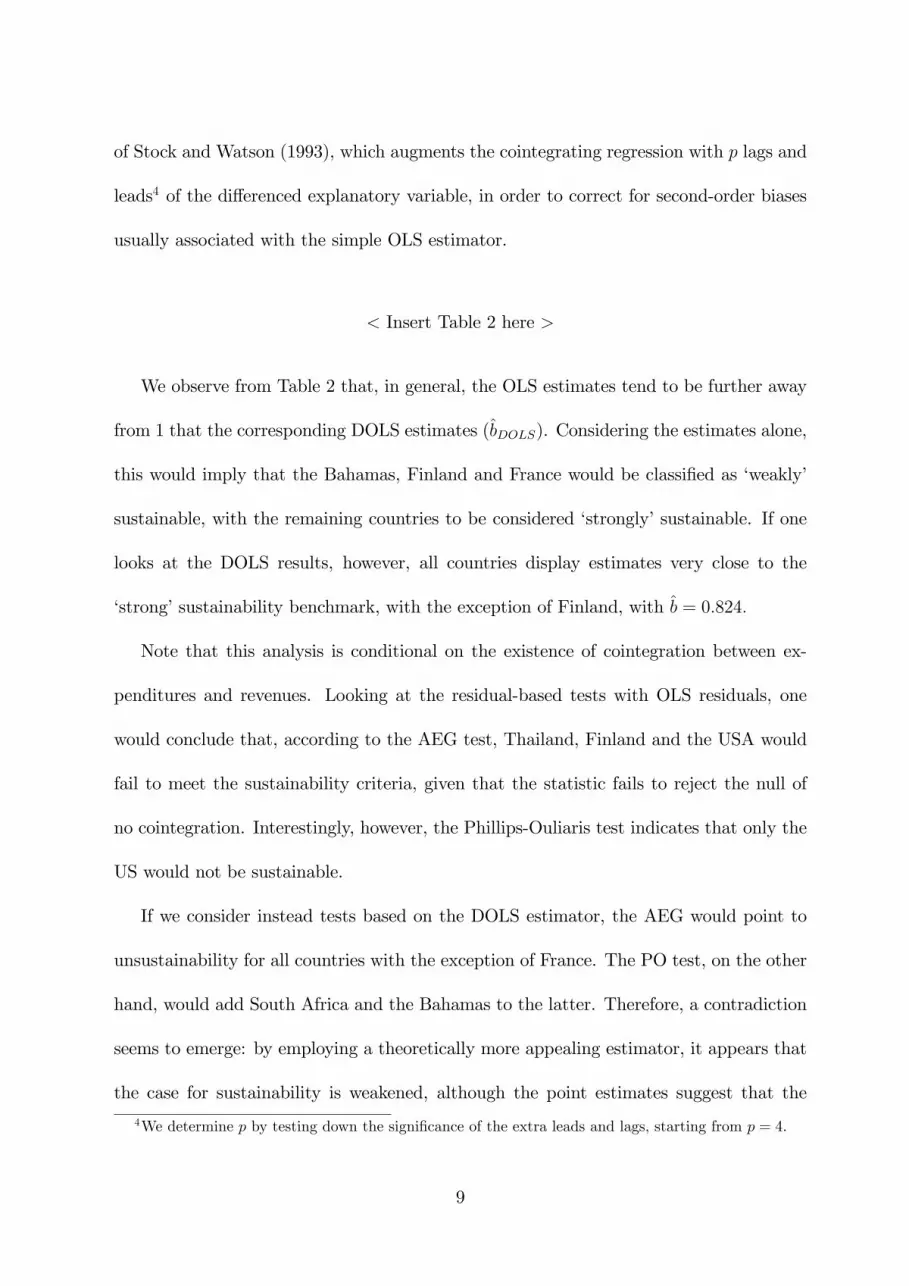
of Stock and Watson (1993), which augments the cointegrating regression with p lags and
leads4 of the di¤erenced explanatory variable, in order to correct for second-order biases
usually associated with the simple OLS estimator.
< Insert Table 2 here >
We observe from Table 2 that, in general, the OLS estimates tend to be further away
from 1 that the corresponding DOLS estimates (b̂DOLS). Considering the estimates alone,
this would imply that the Bahamas, Finland and France would be classi�ed as �weakly�
sustainable, with the remaining countries to be considered �strongly�sustainable. If one
looks at the DOLS results, however, all countries display estimates very close to the
�strong�sustainability benchmark, with the exception of Finland, with b̂ = 0:824:
Note that this analysis is conditional on the existence of cointegration between ex-
penditures and revenues. Looking at the residual-based tests with OLS residuals, one
would conclude that, according to the AEG test, Thailand, Finland and the USA would
fail to meet the sustainability criteria, given that the statistic fails to reject the null of
no cointegration. Interestingly, however, the Phillips-Ouliaris test indicates that only the
US would not be sustainable.
If we consider instead tests based on the DOLS estimator, the AEG would point to
unsustainability for all countries with the exception of France. The PO test, on the other
hand, would add South Africa and the Bahamas to the latter. Therefore, a contradiction
seems to emerge: by employing a theoretically more appealing estimator, it appears that
the case for sustainability is weakened, although the point estimates suggest that the
4We determine p by testing down the signi�cance of the extra leads and lags, starting from p = 4:
9

cointegration vector is indeed [1;�1]: We therefore employ the e¢ cient test of Horvath
and Watson (1995) to try to disentangle this issue.
We test the rank of matrix � in (4) using the Wald statistic (5) described in the
previous section. In the case at hand, the null hypothesis if H0 : r = 0, that is, no
cointegration, againstH1 : r = 1, with cointegration vector [1;�1]. This entails estimating
the VAR in vector-error correction form. We establish the number of lags to be included
using the SIC criterion.
The results of the test are displayed in the rightmost column of Table 2 (under H-
W Wald test). It is interesting to notice that the null hypothesis of no cointegration is
rejected quite comfortably, at the 1% signi�cance level, for all countries. This suggests
that these countries pursue a strongly sustainable �scal policy. It appears that the results
of conventional methodologies tend to penalize the sustainability hypothesis, even when
the estimated b is close to 1. This could be explained by the fact that the ine¢ ciency
of conventional tests may lead to loss of power of unit root and cointegration tests and,
therefore, that the null hypothesis of no cointegration is rejected less often than it should.
4 Conclusion
This paper revisited the empirical evidence on the implications of a government�s Intertem-
poral Budget Constraint, using a multivariate e¢ cient test of the �strong�sustainability
hypothesis, based on the test of Horvath and Watson (1995). This framework is more
e¢ cient than both univariate and standard cointegration tests, as it accounts for the likely
correlation between innovations to revenues and expenditures and it incorporates the ap-
propriate theoretical restriction on the cointegration vector. When the Horvath-Watson
10

test is employed, the empirical support for the �strong�sustainability hypothesis is quite
convincing, with the null of no cointegration being rejected at the 1% signi�cance level
for all countries.
References
[1] Ahmed, S. and Rogers, J. H.(1995), Government budget de�cits and trade de�cits
Are present value constraints satis�ed in long-term data?, Journal of Monetary Eco-
nomics, 36, 351-374.
[2] Hakkio, C. S. and Rush, M. (1991), Cointegration and Government Borrowing Con-
straints: Evidence for the United States, Journal of Business and Economic Statist-
ics, 9, 429-445.
[3] Hamilton J. D. and Flavin M. A. (1986), On the Limitations of Government Borrow-
ing. A framework for Testing, American Economic Review, 76, 808-819.
[4] Haug, A. A. (1991), Cointegration and Government Borrowing Constraints: Evidence
for the United States, Journal of Business and Economic Statistics, 9, 97-101.
[5] Horvath, M. T. K. and Watson, M. W. (1995), Testing For Cointegration When Some
of the Cointegrating vectors are Prespeci�ed, Econometric Theory, 11, 984-1014.
[6] Johansen, S. (1988), Statistical Analysis of Cointegration Vectors, Journal of Eco-
nomic Dynamics and Control, 12, 231-254.
[7] Kalyoncu, H. (2005), Fiscal policy sustainability: test of intertemporal borrowing
constraints, Applied Economics Letters, 12, 957-962.
11

[8] Payne, J. E. (1997), International evidence on the sustainability of budget de�cits,
Applied Economics Letters, 4, 775-779.
[9] Stock, J. H. and Watson, M. W. (1993), A Simple Estimator of Cointegrating Vectors
in Higher Order Integrated Systems, Econometrica, 61, 783-820.
[10] Wilcox D. (1989), The Sustainability of Government De�cit: Implications of the
Present-value Borrowing Constraint, Journal of Money Credit and Banking, 21 291-
306.
12

5 Appendix
13

Table 1: Unit root tests for the Primary Surplus series
Levels First-di¤erence
Countries ADF PP ERS ADF PP ERS
Bahamas �4:381�� �4:454�� 1:001�� �10:608�� �15:013�� 0:226��
Finland �1:859 �2:358 �3:657 �11:242�� �16:210�� 0:259��
France �7:846�� �8:350�� 0:465�� �9:251�� �14:647�� 0:946��
South Africa �1:133 �1:467 20:411 �5:514�� �10:104�� 2:489�
Thailand �1:713 �3:371 4:476 �12:044�� �16:147�� 0:267��
United States �3:022� �0:842 0:021�� �2:502 �15:505�� 6:654
Note: � signi�cant at 5%, �� signi�cant at 1%
Table 2: Cointegration analysis
Countries AEG PO b̂ AEGDOLS POOLS b̂OLS HW-Wald test
Bahamas �3:460� �12:575�� 0:899(0:042)
�3:324 �9:395�� 0:972(0:036)
30:516��
Finland �2:015 �3:555� 0:813(0:042)
�1:609 �2:866�� 0:824(0:046)
15:553��
France �7:671�� �8:229�� 0:825(0:067)
�4:353�� �6:956�� 1:013(0:059)
29:181��
South Africa �3:670� �7:049�� 0:929(0:035)
�2:836 �3:761� 0:975(0:031)
14:270��
Thailand �1:725 �3:378� 1:005(0:034)
�1:672 �2:519 1:008(0:033)
14:602��
United States �2:469 �2:736�� 0:969(0:026)
�2:499 �2:196 0:978(0:026)
46:194��
Note: see notes to Table 1; standard errors in brackets
14

Most Recent Working Paper NIPE WP 32/2010
GGaabbrriieell,, VVaassccoo JJ.. ee PPaattaaaarreeee SSaannggdduuaann,, ““AAnn EEffffiicciieenntt TTeesstt ooff FFiissccaall SSuussttaaiinnaabbiilliittyy””,, 22001100
NIPE WP 31/2010
BBaattiinnii,, NNiiccoolleettttaa,, VVaassccoo JJ.. GGaabbrriieell,, PPaauull LLeevviinnee ee JJoosseepphh PPeeaarrllmmaann,, ““AA FFllooaattiinngg vveerrssuuss MMaannaaggeedd EExxcchhaannggee RRaattee RReeggiimmee iinn aa DDSSGGEE MMooddeell ooff IInnddiiaa””,, 22001100
NIPE WP 30/2010
GGaabbrriieell,, VVaassccoo JJ.. ee LLuuiiss FF.. MMaarrttiinnss,, ““TThhee ccoosstt cchhaannnneell rreeccoonnssiiddeerreedd:: aa ccoommmmeenntt uussiinngg aann iiddeennttiiffiiccaattiioonn--rroobbuusstt aapppprrooaacchh””,, 22001100
NIPE WP 29/2010
GGaabbrriieell,, VVaassccoo JJ..,, PPaauull LLeevviinnee,, JJoosseepphh PPeeaarrllmmaann ee BBoo YYaanngg,, ““AAnn EEssttiimmaatteedd DDSSGGEE MMooddeell ooff tthhee IInnddiiaann EEccoonnoommyy””,, 22001100
NIPE WP 28/2010
GGaabbrriieell,, VVaassccoo JJ.. ee LLuuiiss FF.. MMaarrttiinnss,, ““CCooiinntteeggrraattiioonn TTeessttss UUnnddeerr MMuullttiippllee RReeggiimmee SShhiiffttss:: AAnn AApppplliiccaattiioonn ttoo tthhee SSttoocckk PPrriiccee--DDiivviiddeenndd RReellaattiioonnsshhiipp””,, 22001100
NIPE WP 27/2010
Nogueira, Carlos Gama e Linda Gonçalves Veiga, “ Economic determinants of citizens’ support for the European Union”, 2010
NIPE WP 26/2010
Castro, Vitor e Ricardo M. Sousa, "How Do Central Banks React to Wealth Composition and Asset Prices?", 2010
NIPE WP 25/2010
Agnello, Luca e Ricardo M. Sousa, "Fiscal Policy and Asset Prices", 2010
NIPE WP 24/2010
Castro, V., “The duration of business cycle expansions and contractions: Are there change-points in duration dependence?”, 2010
NIPE WP 23/2010
Aguiar-Conraria e Maria Joana Soares, “The Continuous Wavelet Transform: A Primer*”, 2010
NIPE WP 22/2010
Alexandre, Fernando, Pedro Bação, João Cerejeira e Miguel Portela, “Manufacturing employment and exchange rates in the Portuguese economy: the role of openness, technology and labour market rigidity”, 2010
NIPE WP 21/2010
Aguiar-Conraria, Luís, Manuel M. F. Martins e Maria Joana Soares, “The yield curve and the macro-economy across time and frequencies”, 2010
NIPE WP 20/2010
Kurt Richard Brekke, Tor Helge Holmås e Odd Rune Straume, “Margins and Market Shares: Pharmacy Incentives for Generic Substitution”, 2010
NIPE WP 19/2010
Afonso, Óscar, Pedro Neves e Maria Thopmson, “Costly Investment, Complementarities, International Technological-Knowledge Diffusion and the Skill Premium”, 2010
NIPE WP 18/2010
Mourão, Paulo e Linda G. Veiga, "Elections, Fiscal Policy and Fiscal Illusion", 2010
NIPE WP 17/2010
Conraria, Luís A., Pedro C. Magalhães, Maria Joana Soares, "Synchronism in Electoral Cycles: How United are the United States? ", 2010
NIPE WP 16/2010
Figueiredo, Adelaide, Fernanda Figueiredo, Natália Monteiro e Odd Rune Straume, "Restructuring in privatised firms: a Statis approach", 2010
NIPE WP 15/2010
Sousa, Ricardo M., “Collateralizable Wealth, Asset Returns, and Systemic Risk: International Evidence", 2010
NIPE WP 14/2010
Sousa, Ricardo M., “How do Consumption and Asset Returns React to Wealth Shocks? Evidence from the U.S. and the U.K", 2010
NIPE WP 13/2010
Monteiro, Natália., Miguel Portela e Odd Rune Straume, "Firm ownership and rent sharing", 2010
NIPE WP 12/2010
Afonso, Oscar, Sara Monteiro e Maria Thompson., "A Growth Model for the Quadruple Helix Innovation Theory ", 2010
NIPE WP 11/2010
Veiga, Linda G.," Determinants of the assignment of E.U. funds to Portuguese municipalities", 2010
NIPE WP 10/2010
Sousa, Ricardo M., "Time-Varying Expected Returns: Evidence from the U.S. and the U.K", 2010
NIPE WP 9/2010
Sousa, Ricardo M., "The consumption-wealth ratio and asset returns: The Euro Area, the UK and the US", 2010
NIPE WP 8/2010
Bastos, Paulo, e Odd Rune Straume, "Globalization, product differentiation and wage inequality", 2010
NIPE WP 7/2010
Veiga, Linda, e Francisco José Veiga, “Intergovernmental fiscal transfers as pork barrel”, 2010

NIPE WP 6/2010
Rui Nuno Baleiras, “Que mudanças na Política de Coesão para o horizonte 2020?”, 2010
NIPE WP 5/2010
Aisen, Ari, e Francisco José Veiga, “How does political instability affect economic growth?”, 2010
NIPE WP 4/2010
Sá, Carla, Diana Amado Tavares, Elsa Justino, Alberto Amaral, "Higher education (related) choices in Portugal: joint decisions on institution type and leaving home", 2010
NIPE WP 3/2010
Esteves, Rosa-Branca, “Price Discrimination with Private and Imperfect Information ”, 2010
NIPE WP 2/2010
Alexandre, Fernando, Pedro Bação, João Cerejeira e Miguel Portela, “Employment, exchange rates and labour market rigidity”, 2010
NIPE WP 1/2010
Aguiar-Conraria, Luís, Pedro C. Magalhães e Maria Joana Soares, “On Waves in War and Elections - Wavelet Analysis of Political Time-Series”, 2010


