Embed Size (px)
Citation preview
1 Slide
Project Scheduling: PERT/CPMProject Scheduling: PERT/CPM Project Scheduling with Known Activity TimesProject Scheduling with Known Activity Times Project Scheduling with Uncertain Activity Project Scheduling with Uncertain Activity TimesTimes
Considering Time-Cost Trade-OffsConsidering Time-Cost Trade-Offs
2 Slide
PERT/CPMPERT/CPM
PERTPERT• Program Evaluation and Review TechniqueProgram Evaluation and Review Technique• Developed by U.S. Navy for Polaris missile Developed by U.S. Navy for Polaris missile projectproject
• Developed to handle uncertain activity timesDeveloped to handle uncertain activity times CPMCPM
• Critical Path MethodCritical Path Method• Developed by DuPont & Remington RandDeveloped by DuPont & Remington Rand• Developed for industrial projects for which Developed for industrial projects for which activity times generally were knownactivity times generally were known
Today’s project management software packages Today’s project management software packages have combined the best features of both have combined the best features of both approaches.approaches.
3 Slide
PERT/CPMPERT/CPM
PERT and CPM have been used to plan, PERT and CPM have been used to plan, schedule, and control a wide variety of schedule, and control a wide variety of projects:projects:• R&D of new products and processesR&D of new products and processes• Construction of buildings and highwaysConstruction of buildings and highways• Maintenance of large and complex equipmentMaintenance of large and complex equipment• Design and installation of new systemsDesign and installation of new systems
4 Slide
PERT/CPMPERT/CPM
PERT/CPM is used to plan the scheduling of PERT/CPM is used to plan the scheduling of individual individual activitiesactivities that make up a project. that make up a project.
Projects may have as many as several thousand Projects may have as many as several thousand activities.activities.
A complicating factor in carrying out the A complicating factor in carrying out the activities is that some activities depend on activities is that some activities depend on the completion of other activities before the completion of other activities before they can be started.they can be started.
5 Slide
PERT/CPMPERT/CPM Project managers rely on PERT/CPM to help them Project managers rely on PERT/CPM to help them answer questions such as:answer questions such as:• What is the What is the total timetotal time to complete the project? to complete the project?• What are the What are the scheduled start and finish datesscheduled start and finish dates for each specific activity?for each specific activity?
• Which activities are Which activities are criticalcritical and must be and must be completed exactly as scheduled to keep the completed exactly as scheduled to keep the project on schedule?project on schedule?
• How long can How long can noncritical activitiesnoncritical activities be delayed be delayed before they cause an increase in the project before they cause an increase in the project completion time?completion time?
6 Slide
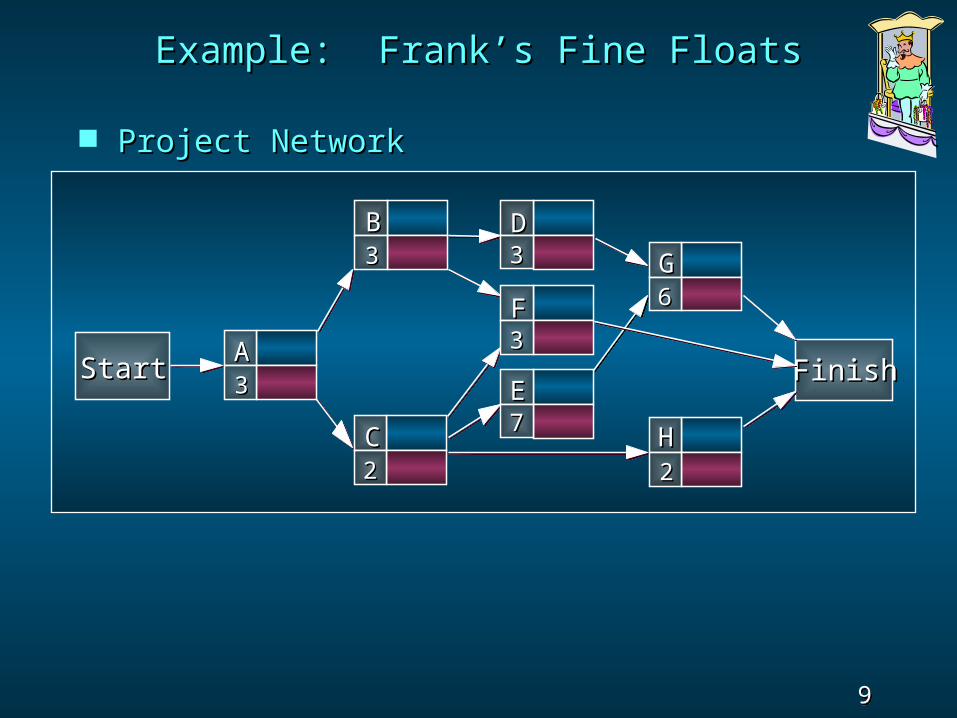
Project NetworkProject Network
A A project networkproject network can be constructed to model can be constructed to model the precedence of the activities. the precedence of the activities.
The The nodesnodes of the network represent the of the network represent the activities. activities.
The The arcsarcs of the network reflect the of the network reflect the precedence relationships of the activities. precedence relationships of the activities.
A A critical pathcritical path for the network is a path for the network is a path consisting of activities with zero slack.consisting of activities with zero slack.
7 Slide
Example: Frank’s Fine FloatsExample: Frank’s Fine Floats
Frank’s Fine Floats is in the business of Frank’s Fine Floats is in the business of buildingbuilding
elaborate parade floats. Frank ‘s crew has a newelaborate parade floats. Frank ‘s crew has a newfloat to build and want to use PERT/CPM tofloat to build and want to use PERT/CPM tohelp them manage the projecthelp them manage the project . . The table on the next slide shows theThe table on the next slide shows theactivities that comprise the project as well asactivities that comprise the project as well aseach activity’s estimated completion time (ineach activity’s estimated completion time (indays) and immediate predecessors.days) and immediate predecessors. Frank wants to know the total time toFrank wants to know the total time tocomplete the project, which activities are complete the project, which activities are critical,critical,
and the earliest and latest start and finish and the earliest and latest start and finish dates fordates for
each activity.each activity.
8 Slide
Example: Frank’s Fine FloatsExample: Frank’s Fine Floats
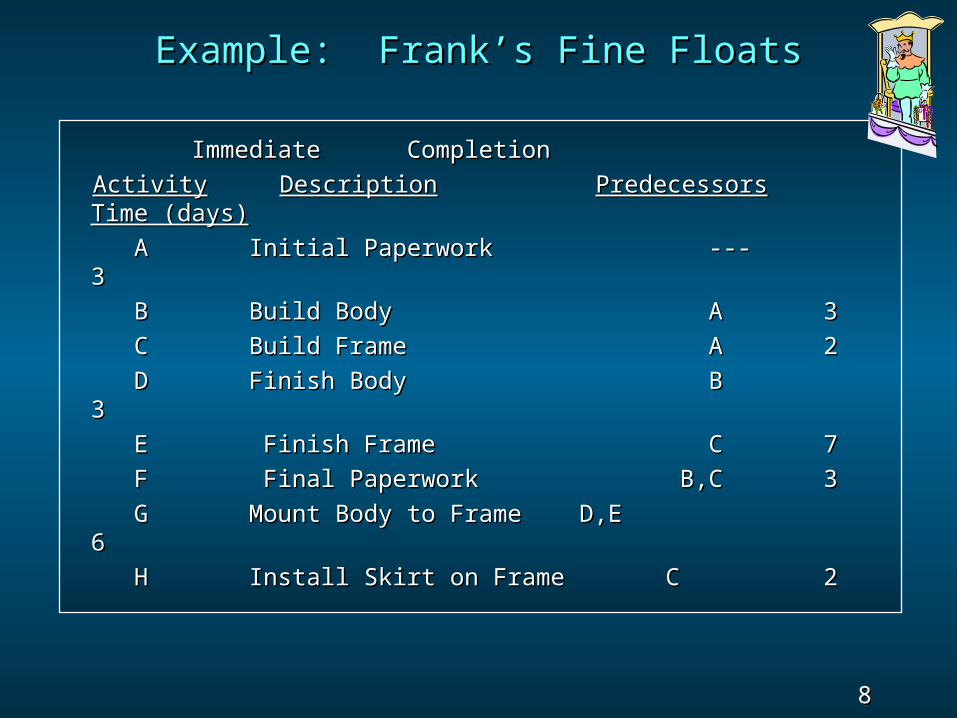
Immediate CompletionImmediate Completion ActivityActivity DescriptionDescription PredecessorsPredecessors Time (days)Time (days) A Initial Paperwork A Initial Paperwork --- --- 33 B Build Body B Build Body A A 3 3 C Build Frame C Build Frame A A 2 2 D Finish Body D Finish Body B B 33 E Finish Frame E Finish Frame C C 7 7 F Final Paperwork F Final Paperwork B,C B,C 3 3 G Mount Body to Frame D,EG Mount Body to Frame D,E 66 H Install Skirt on Frame CH Install Skirt on Frame C 2 2
9 Slide
Example: Frank’s Fine FloatsExample: Frank’s Fine Floats
Project NetworkProject Network
StartStart FinishFinish
BB33
DD33
AA33
CC22
GG66 FF
33
HH22
EE77

10 Slide
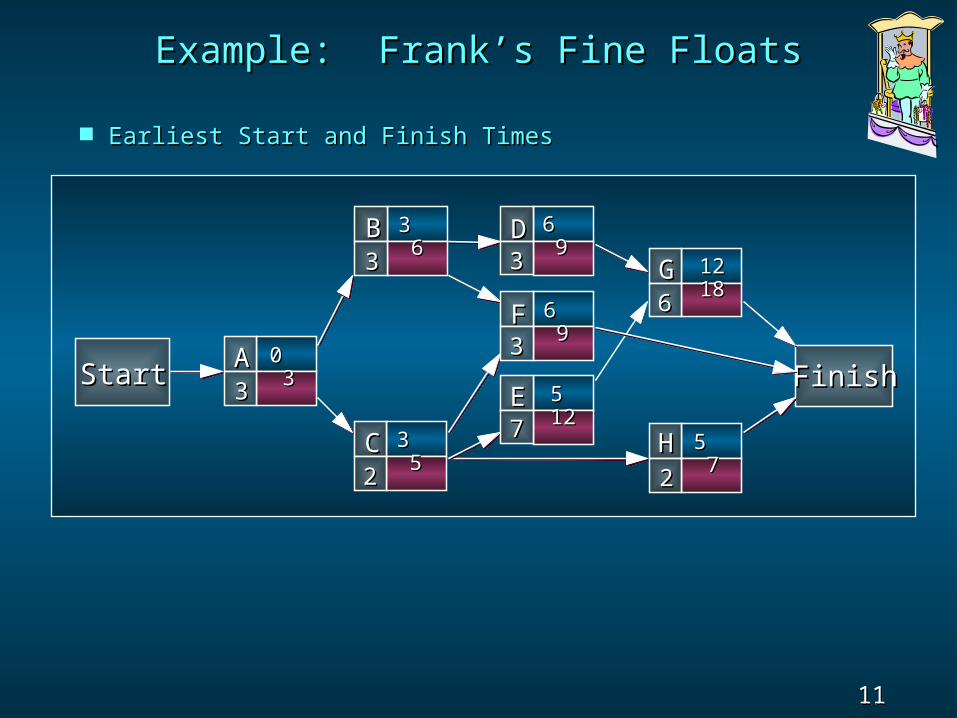
Earliest Start and Finish TimesEarliest Start and Finish Times
Step 1:Step 1: Make a forward pass through the Make a forward pass through the network as follows: For each activity network as follows: For each activity i i beginning at the Start nodebeginning at the Start node, , compute:compute:• Earliest Start TimeEarliest Start Time = the maximum of the = the maximum of the earliest finish times of all activities earliest finish times of all activities immediately preceding activity immediately preceding activity ii. (This is . (This is 0 for an activity with no predecessors.)0 for an activity with no predecessors.)
• Earliest Finish TimeEarliest Finish Time = (Earliest Start = (Earliest Start Time) + (Time to complete activity Time) + (Time to complete activity i i ).).
The project completion time is the maximum The project completion time is the maximum of the Earliest Finish Times at the Finish of the Earliest Finish Times at the Finish node.node.
11 Slide
Example: Frank’s Fine FloatsExample: Frank’s Fine Floats
Earliest Start and Finish TimesEarliest Start and Finish Times
StartStart FinishFinish
BB33
DD33
AA33
CC22
GG66 FF
33
HH22
EE77
0 0 33
3 3 66
6 6 99
3 3 55
12 12 1818
6 6 99
5 5 77
5 5 1212
12 Slide
Latest Start and Finish TimesLatest Start and Finish Times
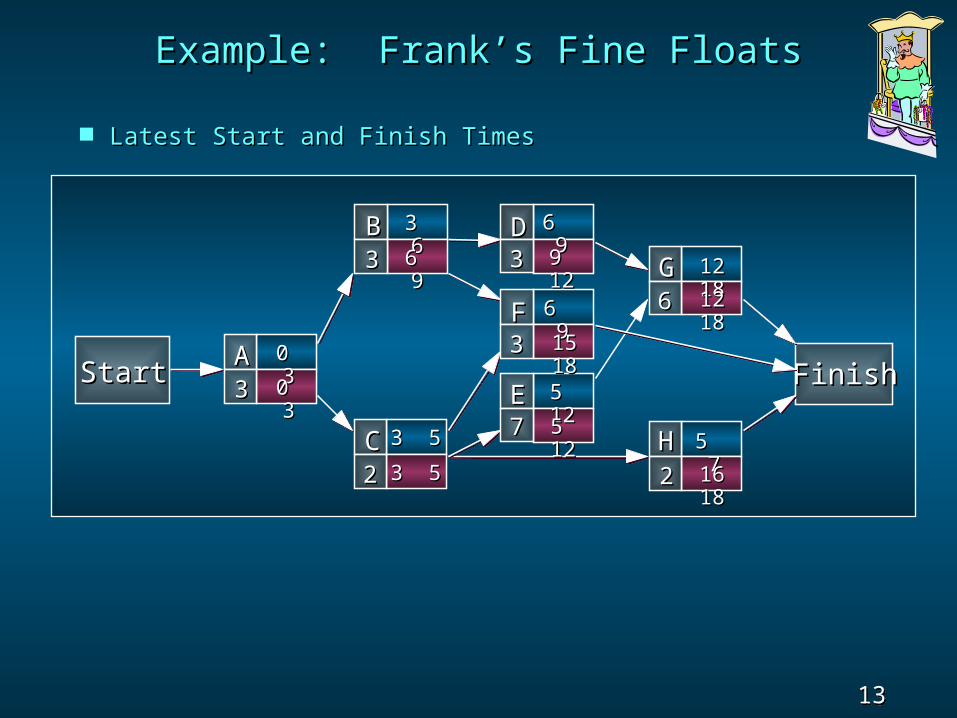
Step 2:Step 2: Make a backwards pass through the Make a backwards pass through the network as follows: Move sequentially network as follows: Move sequentially backwards from the Finish node to the Start backwards from the Finish node to the Start node. At a given node, node. At a given node, jj, consider all , consider all activities ending at nodeactivities ending at node j j. For each of these . For each of these activities, activities, ii, compute:, compute:• Latest Finish TimeLatest Finish Time = the minimum of the = the minimum of the latest start times beginning at node latest start times beginning at node jj. (For . (For node node NN, this is the project completion , this is the project completion time.)time.)
• Latest Start TimeLatest Start Time = (Latest Finish Time) - = (Latest Finish Time) - (Time to complete activity (Time to complete activity i i ).).
13 Slide
Example: Frank’s Fine FloatsExample: Frank’s Fine Floats
Latest Start and Finish TimesLatest Start and Finish Times
StartStart FinishFinish
BB33
DD33
AA33
CC22
GG66 FF
33
HH22
EE77
0 0 33
3 3 66
6 6 99
3 53 5
12 12 1818
6 6 99
5 5 77
5 5 1212
6 6 99
9 9 1212
0 0 33
3 53 5
12 12 1818
15 15 1818
16 16 1818
5 5 1212
14 Slide
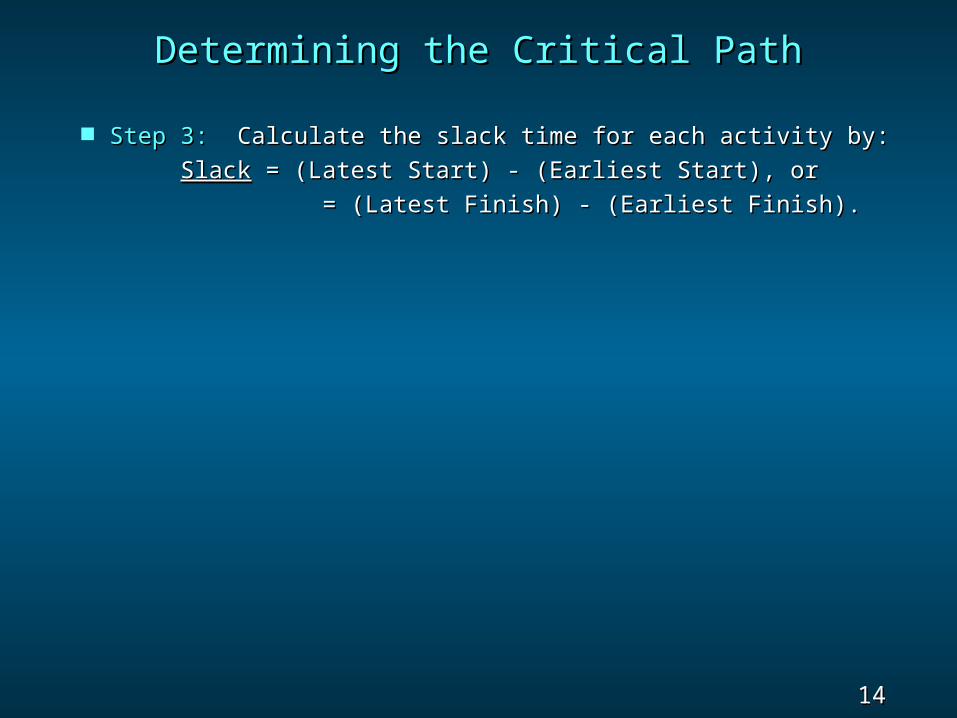
Determining the Critical PathDetermining the Critical Path
Step 3:Step 3: Calculate the slack time for each activity by: Calculate the slack time for each activity by: SlackSlack = (Latest Start) - (Earliest Start), or = (Latest Start) - (Earliest Start), or = (Latest Finish) - (Earliest Finish).= (Latest Finish) - (Earliest Finish).
15 Slide
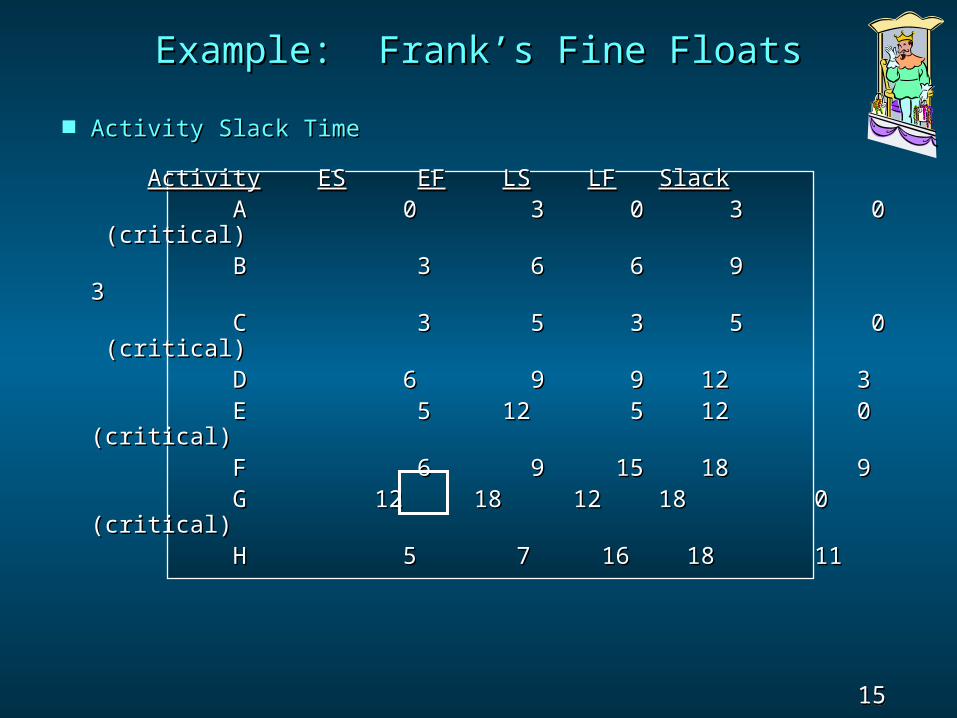
Example: Frank’s Fine FloatsExample: Frank’s Fine Floats Activity Slack TimeActivity Slack Time
ActivityActivity ESES EFEF LSLS LFLF SlackSlack A 0 3 0 3 0 A 0 3 0 3 0 (critical) (critical) B 3 6 6 9 B 3 6 6 9 33 C 3 5 3 5 0 C 3 5 3 5 0 (critical) (critical) D 6 9 9 12 3D 6 9 9 12 3 E 5 12 5 12 0 E 5 12 5 12 0 (critical)(critical) F 6 9 15 18 9F 6 9 15 18 9 G 12 18 12 18 0 G 12 18 12 18 0 (critical)(critical) H 5 7 16 18 11H 5 7 16 18 11
16 Slide
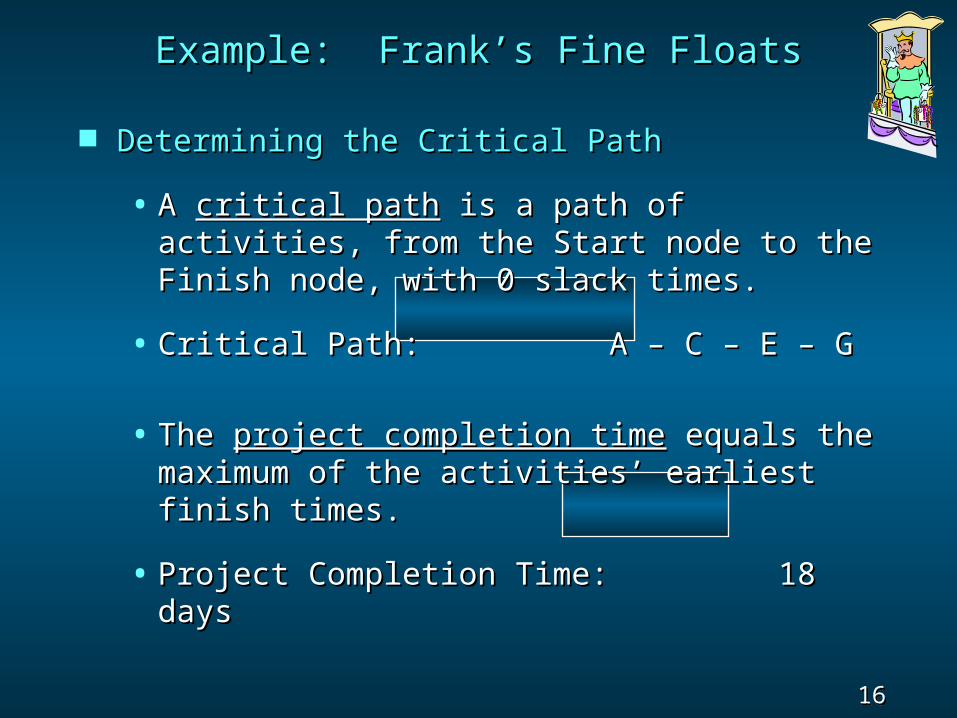
Determining the Critical PathDetermining the Critical Path
• A A critical pathcritical path is a path of is a path of activities, from the Start node to the activities, from the Start node to the Finish node, with 0 slack times.Finish node, with 0 slack times.
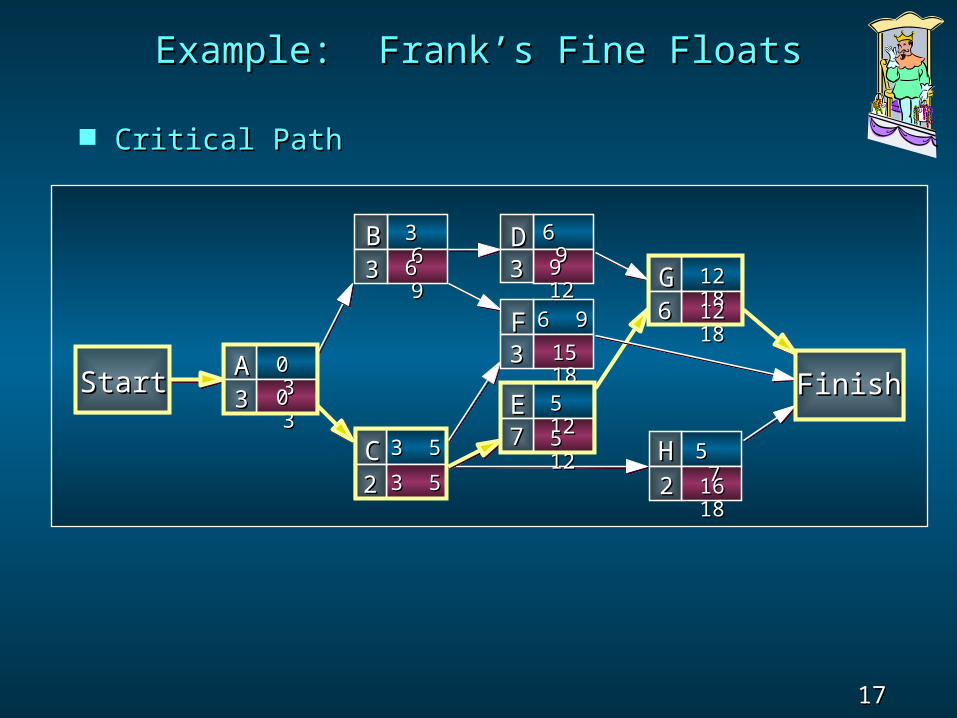
• Critical Path: A – C – E – GCritical Path: A – C – E – G
• The The project completion timeproject completion time equals the equals the maximum of the activities’ earliest maximum of the activities’ earliest finish times.finish times.
• Project Completion Time: 18 Project Completion Time: 18 daysdays
Example: Frank’s Fine FloatsExample: Frank’s Fine Floats
17 Slide
Example: Frank’s Fine FloatsExample: Frank’s Fine Floats
Critical PathCritical Path
StartStart FinishFinish
BB33
DD33
AA33
CC22
GG66 FF
33
HH22
EE77
0 0 33
3 3 66
6 6 99
3 53 5
12 12 1818
6 96 9
5 5 77
5 5 1212
6 6 99
9 9 1212
0 0 33
3 53 5
12 12 1818
15 15 1818
16 16 1818
5 5 1212
18 Slide
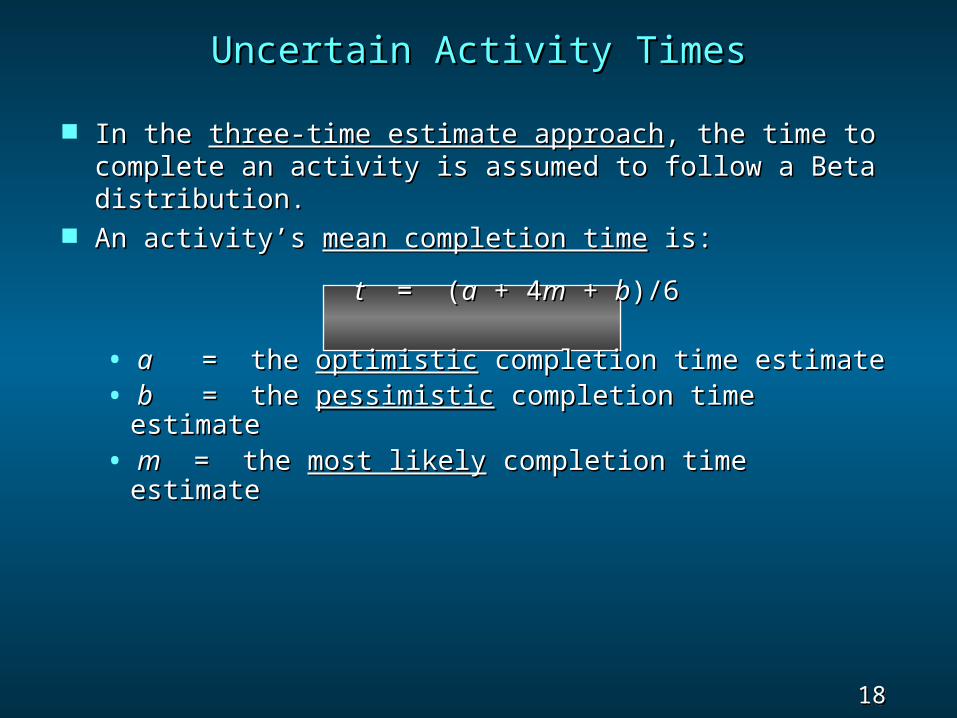
In the In the three-time estimate approachthree-time estimate approach, the time to , the time to complete an activity is assumed to follow a Beta complete an activity is assumed to follow a Beta distribution. distribution.
An activity’s An activity’s mean completion timemean completion time is: is:
tt = ( = (aa + 4 + 4mm + + bb)/6)/6
• aa = the = the optimisticoptimistic completion time estimate completion time estimate• bb = the = the pessimisticpessimistic completion time completion time estimateestimate
• mm = the = the most likelymost likely completion time completion time estimateestimate
Uncertain Activity TimesUncertain Activity Times
19 Slide
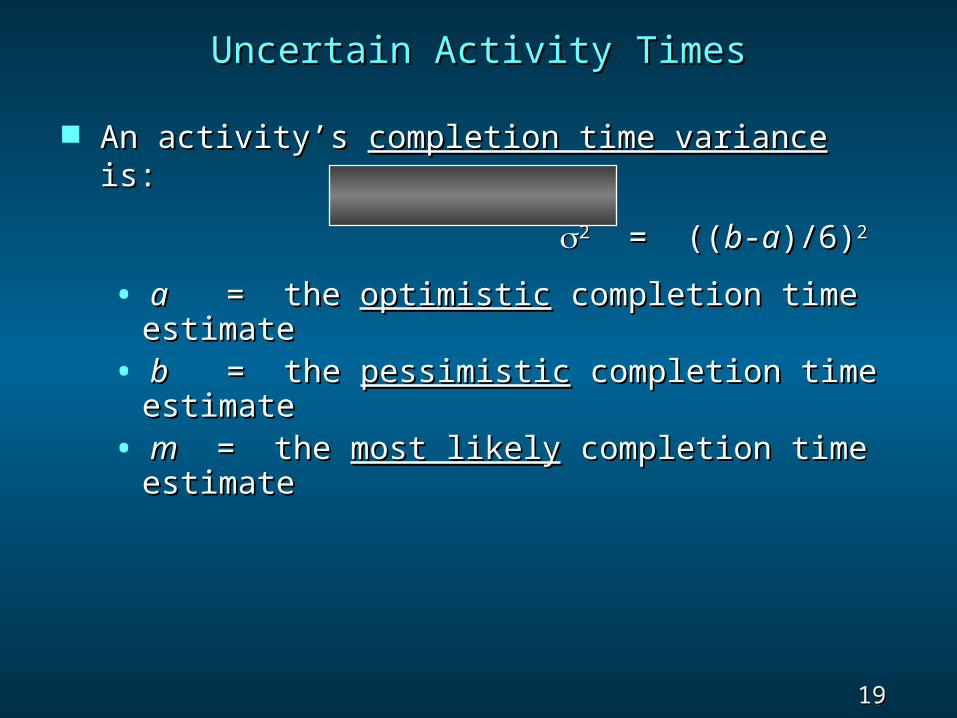
An activity’s An activity’s completion time variancecompletion time variance is:is:
22 = (( = ((bb--aa)/6))/6)22
• aa = the = the optimisticoptimistic completion time completion time estimateestimate
• bb = the = the pessimisticpessimistic completion time completion time estimateestimate
• mm = the = the most likelymost likely completion time completion time estimateestimate
Uncertain Activity TimesUncertain Activity Times
20 Slide
Uncertain Activity TimesUncertain Activity Times
In the three-time estimate approach, the In the three-time estimate approach, the critical path is determined as if the mean critical path is determined as if the mean times for the activities were fixed times. times for the activities were fixed times.
The The overall project completion timeoverall project completion time is is assumed to have a normal distribution with assumed to have a normal distribution with mean equal to the sum of the means along the mean equal to the sum of the means along the critical path and variance equal to the sum critical path and variance equal to the sum of the variances along the critical path.of the variances along the critical path.
21 Slide
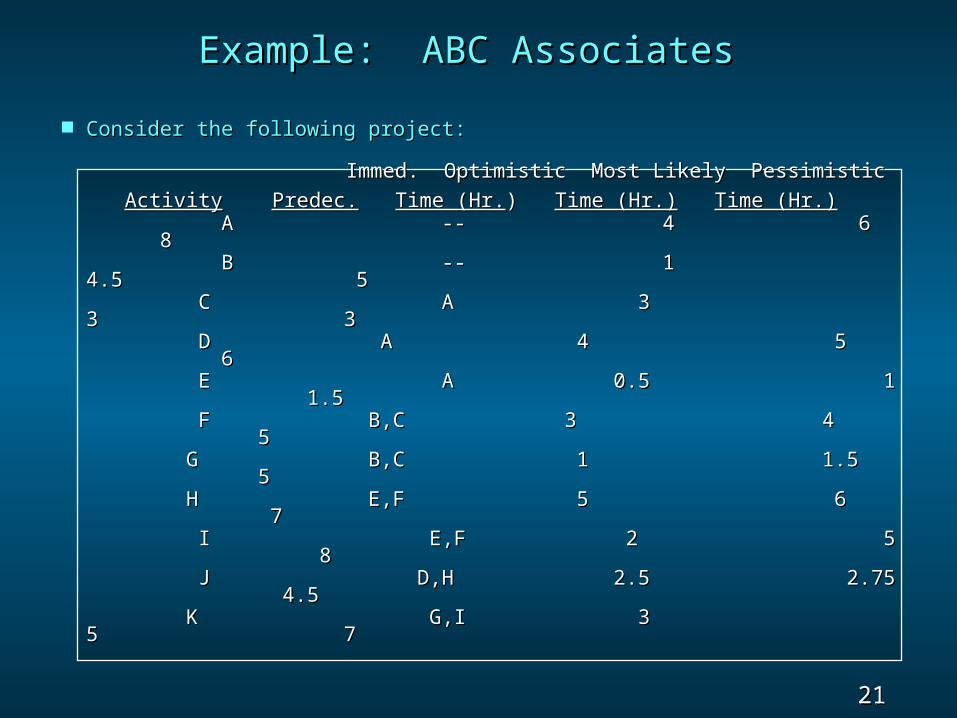
Example: ABC Associates Example: ABC Associates Consider the following project:Consider the following project:
Immed. Optimistic Most Likely PessimisticImmed. Optimistic Most Likely Pessimistic ActivityActivity Predec.Predec. Time (Hr.Time (Hr.) ) Time (Hr.)Time (Hr.) Time (Hr.)Time (Hr.) A A -- 4 -- 4 6 6 8 8
B B -- 1 -- 1 4.5 54.5 5
C C A A 3 3 3 33 3
D D A 4 5 A 4 5 6 6
E E A 0.5 1 A 0.5 1 1.5 1.5
F F B,C 3 4 B,C 3 4 5 5
G G B,C B,C 1 1.5 1 1.5 5 5
H H E,F E,F 5 6 5 6 7 7
I I E,F 2 5 E,F 2 5 8 8
J J D,H D,H 2.5 2.75 2.5 2.75 4.5 4.5
K K G,I 3 G,I 3 5 75 7
22 Slide
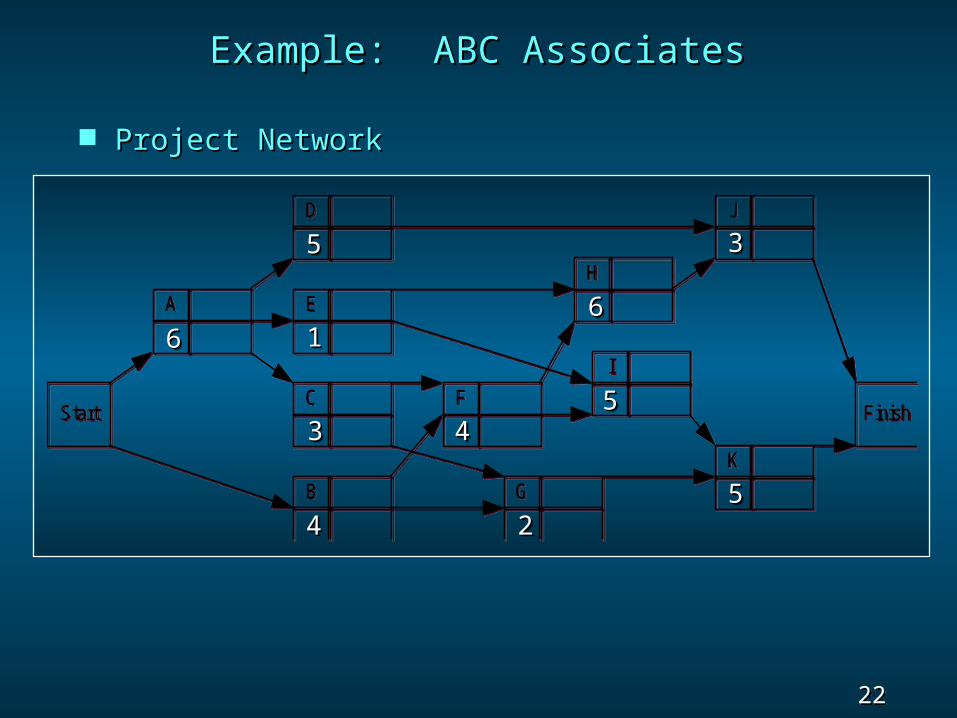
Example: ABC AssociatesExample: ABC Associates
Project NetworkProject Network
E
Start
A
H
D
F
J
I
K
Finish
B
C
G
66
44
33
55
55
22
44
1166
33
55
23 Slide
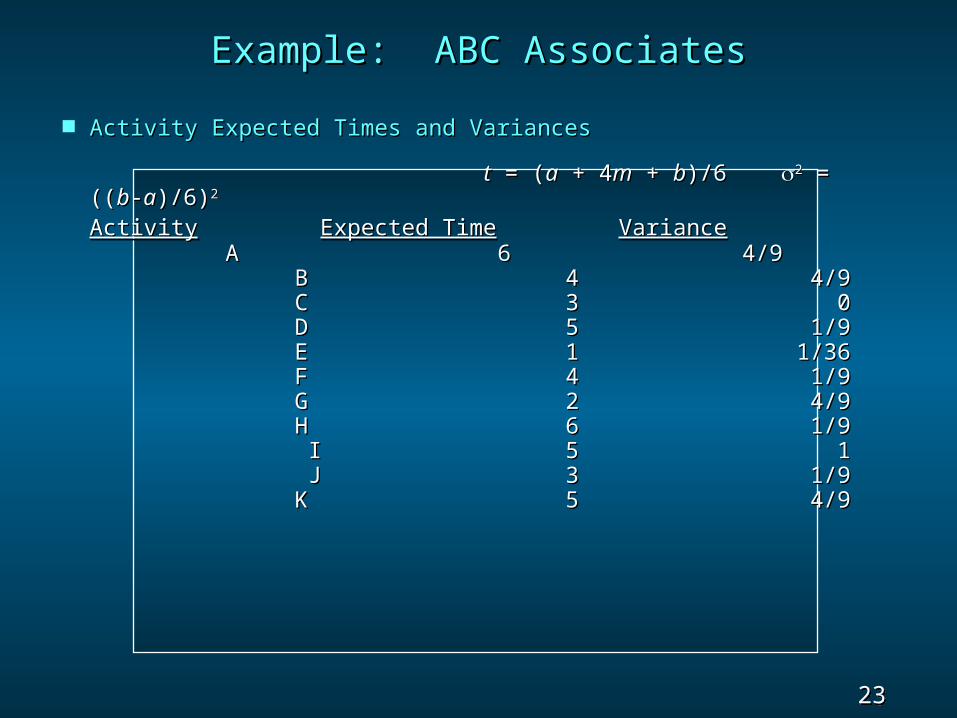
Example: ABC AssociatesExample: ABC Associates Activity Expected Times and VariancesActivity Expected Times and Variances
tt = ( = (aa + 4 + 4mm + + bb)/6 )/6 22 = = ((((bb--aa)/6))/6)22
ActivityActivity Expected TimeExpected Time VarianceVariance A A 6 6 4/9 4/9
B B 4 4 4/9 4/9 C C 3 3 0 0 D D 5 5 1/9 1/9 E E 1 1 1/36 1/36 F F 4 4 1/9 1/9 G G 2 2 4/9 4/9 H H 6 6 1/9 1/9 I I 5 5 1 1 J J 3 3 1/9 1/9 K K 5 5 4/9 4/9
24 Slide
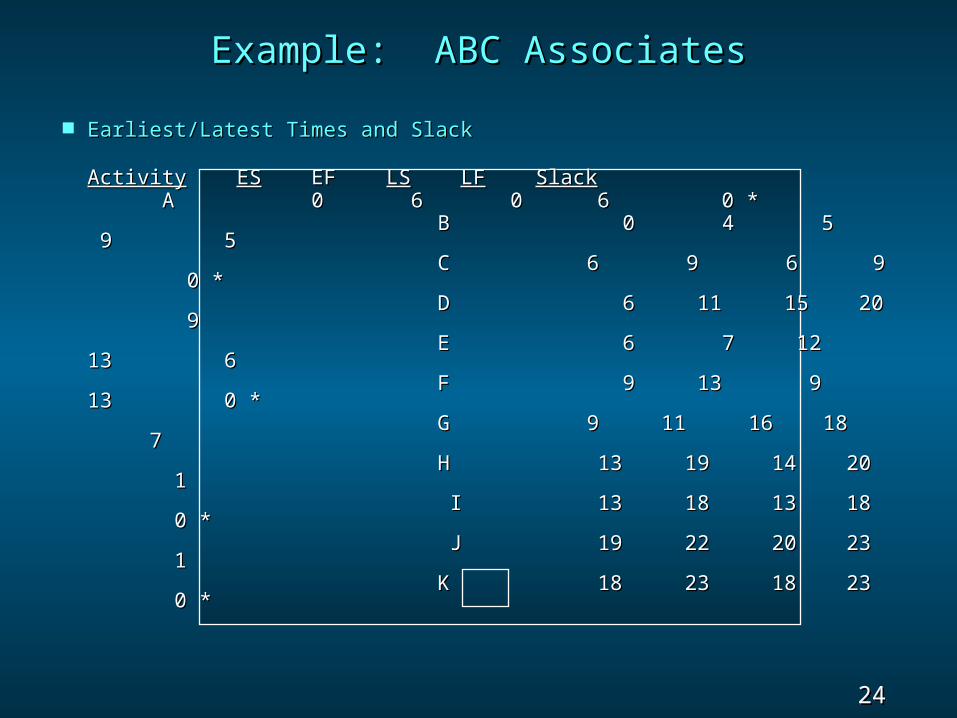
Example: ABC AssociatesExample: ABC Associates Earliest/Latest Times and SlackEarliest/Latest Times and Slack
ActivityActivity ESES EF EF LSLS LFLF SlackSlack A A 0 6 0 6 0 * 0 6 0 6 0 *
B B 0 4 5 0 4 5 9 5 9 5
C 6 9 6 9 C 6 9 6 9 0 * 0 *
D D 6 11 15 20 6 11 15 20 9 9
E E 6 7 12 6 7 12 13 613 6
F F 9 13 9 9 13 9 13 0 *13 0 *
G 9 11 16 18 G 9 11 16 18 7 7
H H 13 19 14 20 13 19 14 20 1 1
I I 13 18 13 18 13 18 13 18 0 * 0 *
J J 19 22 20 23 19 22 20 23 1 1
K K 18 23 18 23 18 23 18 23 0 * 0 *
25 Slide
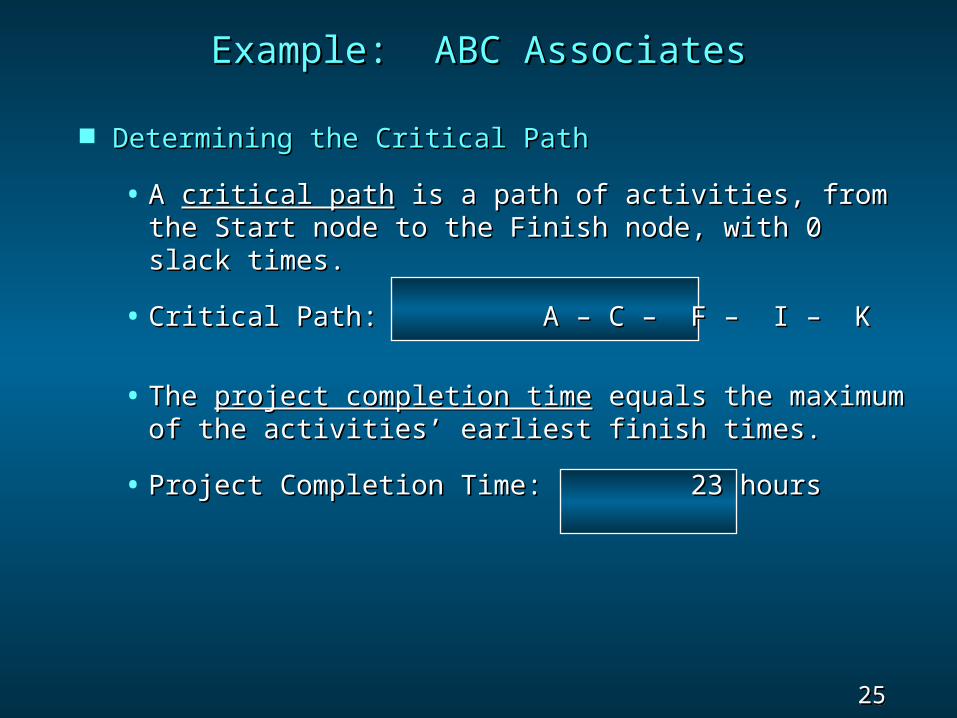
Determining the Critical PathDetermining the Critical Path
• A A critical pathcritical path is a path of activities, from is a path of activities, from the Start node to the Finish node, with 0 the Start node to the Finish node, with 0 slack times.slack times.
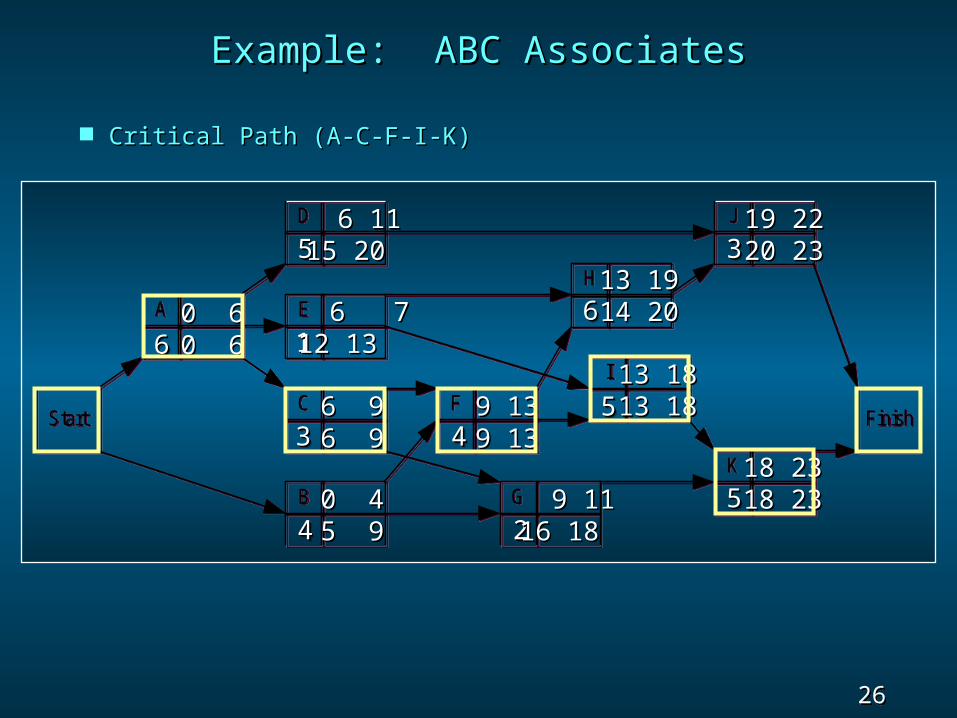
• Critical Path: A – C – F – I – KCritical Path: A – C – F – I – K
• The The project completion timeproject completion time equals the maximum equals the maximum of the activities’ earliest finish times.of the activities’ earliest finish times.
• Project Completion Time: 23 hoursProject Completion Time: 23 hours
Example: ABC AssociatesExample: ABC Associates
26 Slide
Example: ABC AssociatesExample: ABC Associates
Critical Path (A-C-F-I-K)Critical Path (A-C-F-I-K)
E
Start
A
H
D
F
J
I
K
Finish
B
C
G
66
44
33
55
55
22
44
1166
33
55
0 60 60 60 6
9 139 139 139 13
13 1813 1813 1813 18
9 119 1116 1816 18
13 1913 1914 2014 20
19 2219 2220 2320 23
18 2318 2318 2318 23
6 76 712 1312 13
6 96 96 96 9
0 40 45 95 9
6 116 1115 2015 20

27 Slide
Probability the project will be completed Probability the project will be completed within 24 hrswithin 24 hrs22 = = 22
AA + + 22CC + + 22
FF + + 22HH + + 22
KK
= 4/9 + 0 + 1/9 + 1 + 4/9 = 4/9 + 0 + 1/9 + 1 + 4/9 = 2= 2
= 1.414= 1.414
zz = (24 - 23)/ = (24 - 23)/(24-23)/1.414 = .71(24-23)/1.414 = .71 From the Standard Normal Distribution table: From the Standard Normal Distribution table:
P(z P(z << .71) = .5 + .2612 = .7612 .71) = .5 + .2612 = .7612
Example: ABC AssociatesExample: ABC Associates
28 Slide
EarthMover is a manufacturer of road EarthMover is a manufacturer of road constructionconstruction
equipment including pavers, rollers, and graders. equipment including pavers, rollers, and graders. The The
company is faced with a newcompany is faced with a newproject, introducing a newproject, introducing a newline of loaders. Managementline of loaders. Managementis concerned that the project mightis concerned that the project mighttake longer than 26 weeks totake longer than 26 weeks tocomplete without crashing somecomplete without crashing someactivities.activities.
Example: EarthMover, Inc.Example: EarthMover, Inc.
29 Slide
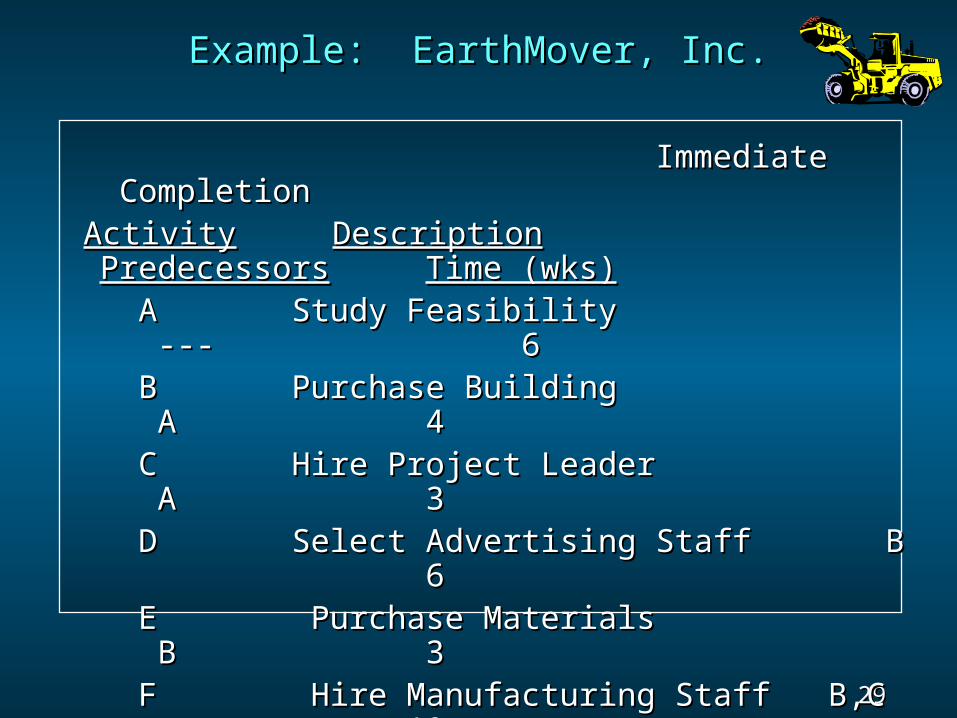
Immediate Immediate Completion Completion
ActivityActivity DescriptionDescription PredecessorsPredecessors Time (wks)Time (wks) A Study Feasibility A Study Feasibility --- --- 6 6 B Purchase Building B Purchase Building A A 4 4 C Hire Project Leader C Hire Project Leader A A 3 3 D Select Advertising StaffD Select Advertising Staff B B
6 6 E Purchase Materials E Purchase Materials B B 3 3 F Hire Manufacturing Staff B,CF Hire Manufacturing Staff B,C
10 10 G Manufacture Prototype E,FG Manufacture Prototype E,F
2 2 H Produce First 50 Units GH Produce First 50 Units G
6 6 II Advertise Product Advertise Product D,G D,G 8 8
Example: EarthMover, Inc.Example: EarthMover, Inc.
30 Slide
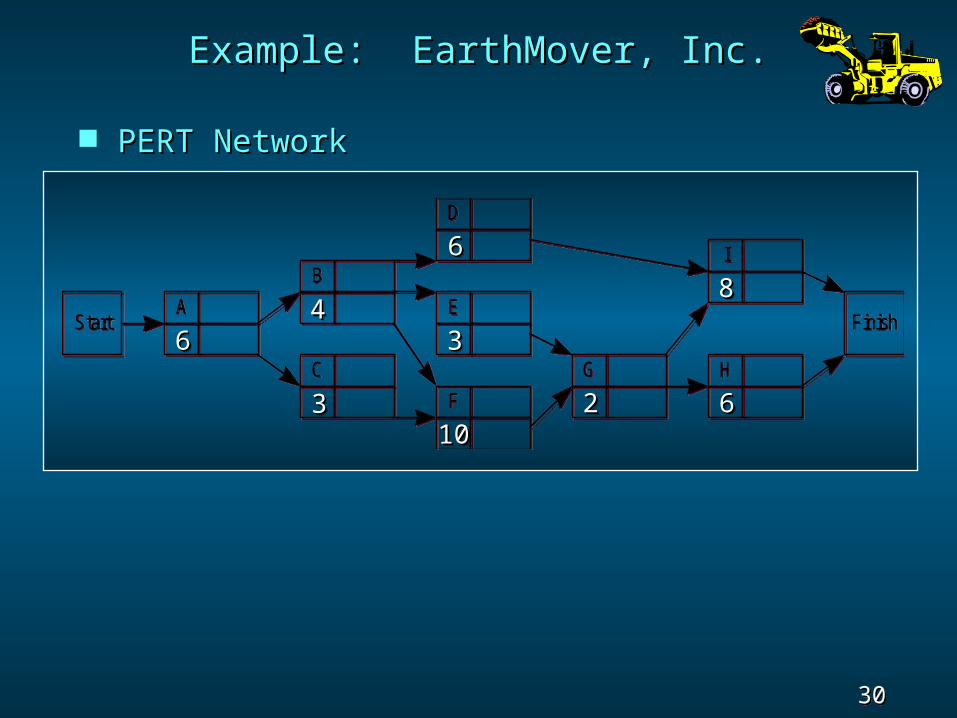
PERT NetworkPERT Network
Example: EarthMover, Inc.Example: EarthMover, Inc.
C
Start
D
E
I
A Finish
H
G
B
F
6644
331010
33
66
22 66
88
31 Slide
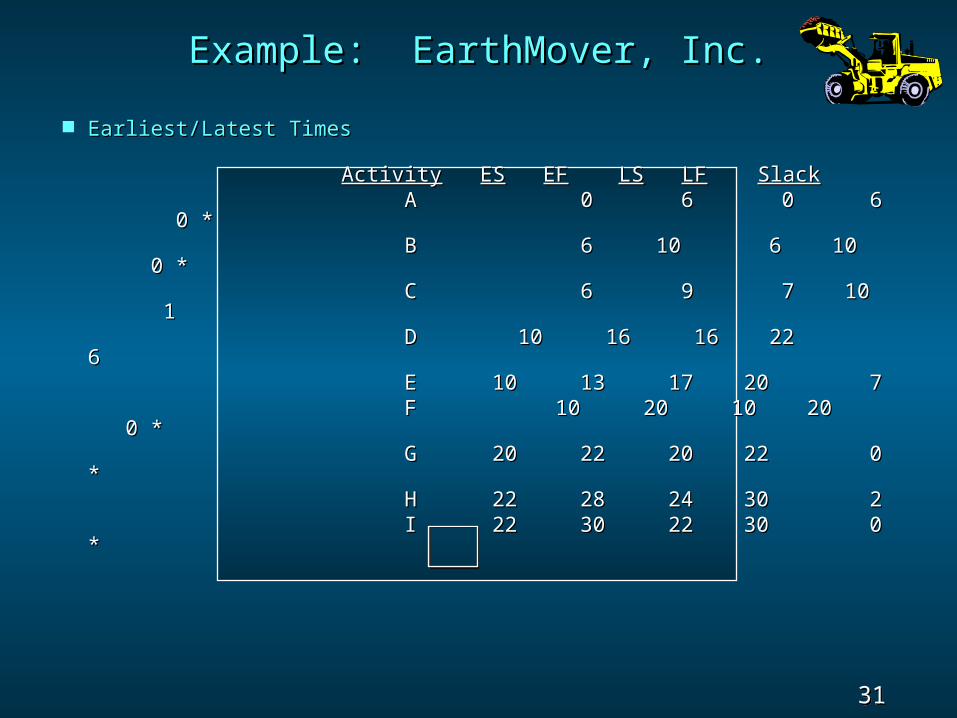
Earliest/Latest TimesEarliest/Latest Times
ActivityActivity ESES EFEF LSLS LFLF SlackSlack A A 0 6 0 6 0 6 0 6 0 * 0 *
B B 6 10 6 10 6 10 6 10 0 * 0 *
C C 6 9 7 10 6 9 7 10 1 1
D 10 16 16 22 D 10 16 16 22 66
E E 10 13 17 20 7 10 13 17 20 7 F F 10 20 10 20 10 20 10 20 0 * 0 *
G G 20 22 20 22 0 20 22 20 22 0 **
H H 22 28 24 30 2 22 28 24 30 2 I I 22 30 22 30 0 22 30 22 30 0 **
Example: EarthMover, Inc.Example: EarthMover, Inc.
32 Slide
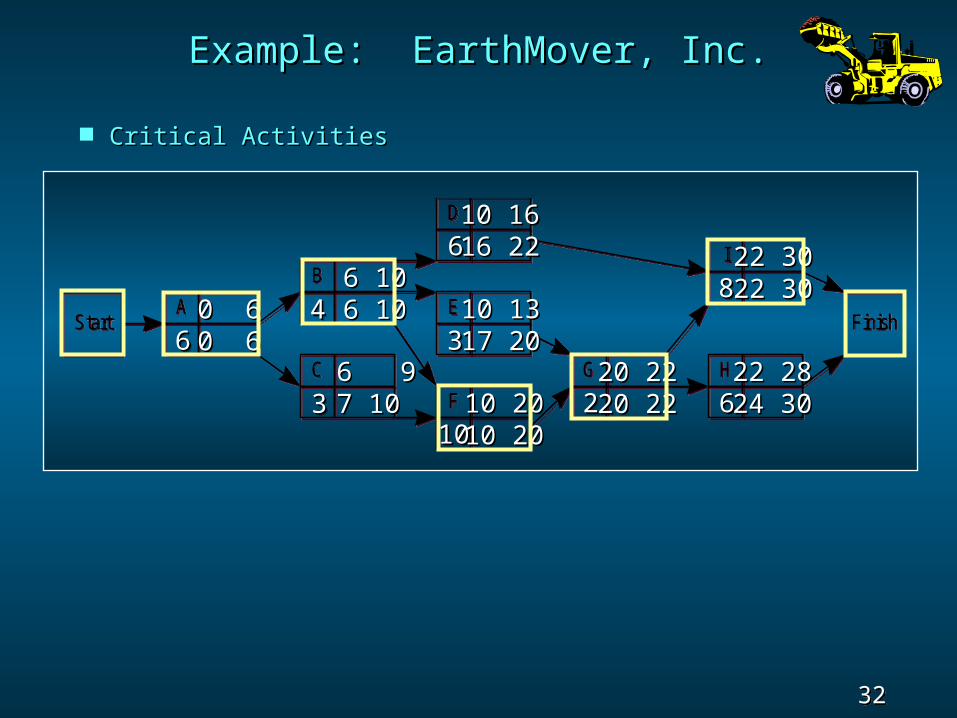
Example: EarthMover, Inc.Example: EarthMover, Inc.
Critical ActivitiesCritical Activities
C
Start
D
E
I
A Finish
H
G
B
F
6644
331010
33
66
22 66
880 60 60 60 6
10 2010 20 10 2010 20
20 2220 2220 2220 22
10 1610 1616 2216 22 22 3022 30
22 3022 30
22 2822 2824 3024 30
6 96 9 7 107 10
10 1310 1317 2017 20
6 106 10 6 106 10
33 Slide
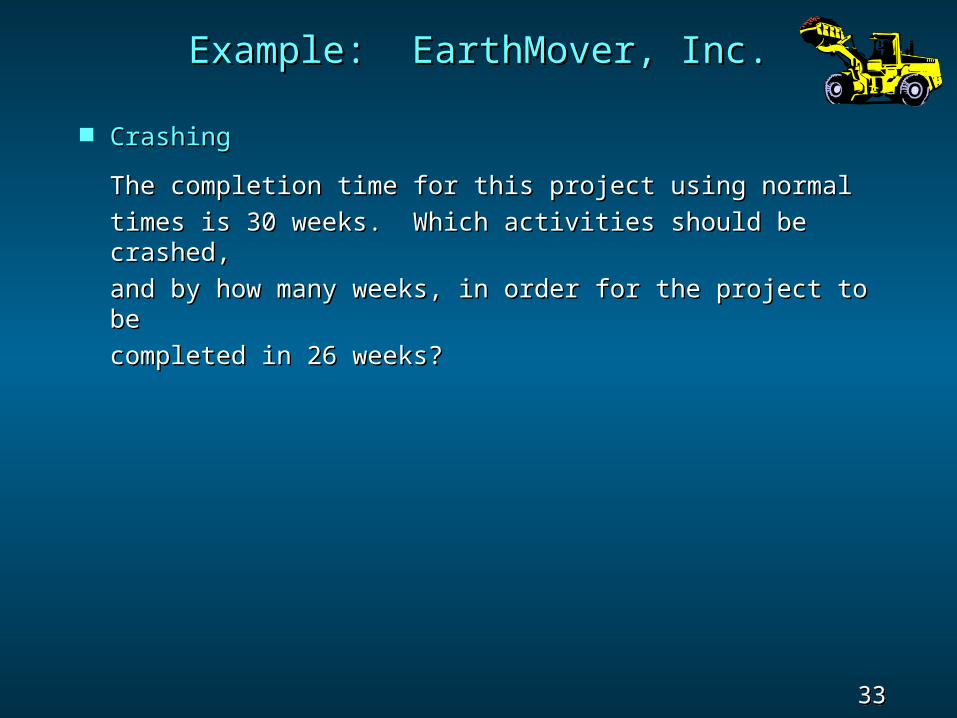
Example: EarthMover, Inc.Example: EarthMover, Inc.
CrashingCrashingThe completion time for this project using normalThe completion time for this project using normaltimes is 30 weeks. Which activities should be times is 30 weeks. Which activities should be crashed,crashed,and by how many weeks, in order for the project to and by how many weeks, in order for the project to bebecompleted in 26 weeks?completed in 26 weeks?
34 Slide
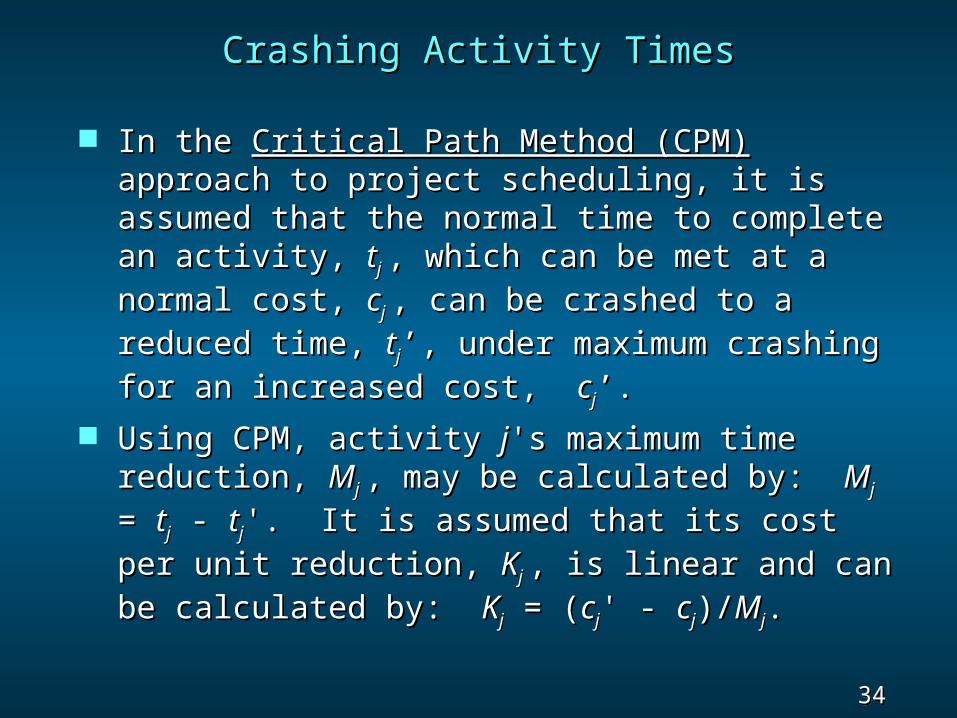
Crashing Activity TimesCrashing Activity Times
In the In the Critical Path Method (CPM)Critical Path Method (CPM) approach to project scheduling, it is approach to project scheduling, it is assumed that the normal time to complete assumed that the normal time to complete an activity, an activity, ttj j , which can be met at a , which can be met at a normal cost, normal cost, ccj j , can be crashed to a , can be crashed to a reduced time, reduced time, ttjj’, under maximum crashing ’, under maximum crashing for an increased cost, for an increased cost, ccjj’.’.
Using CPM, activity Using CPM, activity jj's maximum time 's maximum time reduction, reduction, MMj j , may be calculated by: , may be calculated by: MMj j
= = ttjj - - ttjj'. It is assumed that its cost '. It is assumed that its cost per unit reduction, per unit reduction, KKj j , is linear and can , is linear and can be calculated by: be calculated by: KKjj = ( = (ccjj' - ' - ccjj)/)/MMjj..
35 Slide
Example: EarthMover, Inc.Example: EarthMover, Inc.
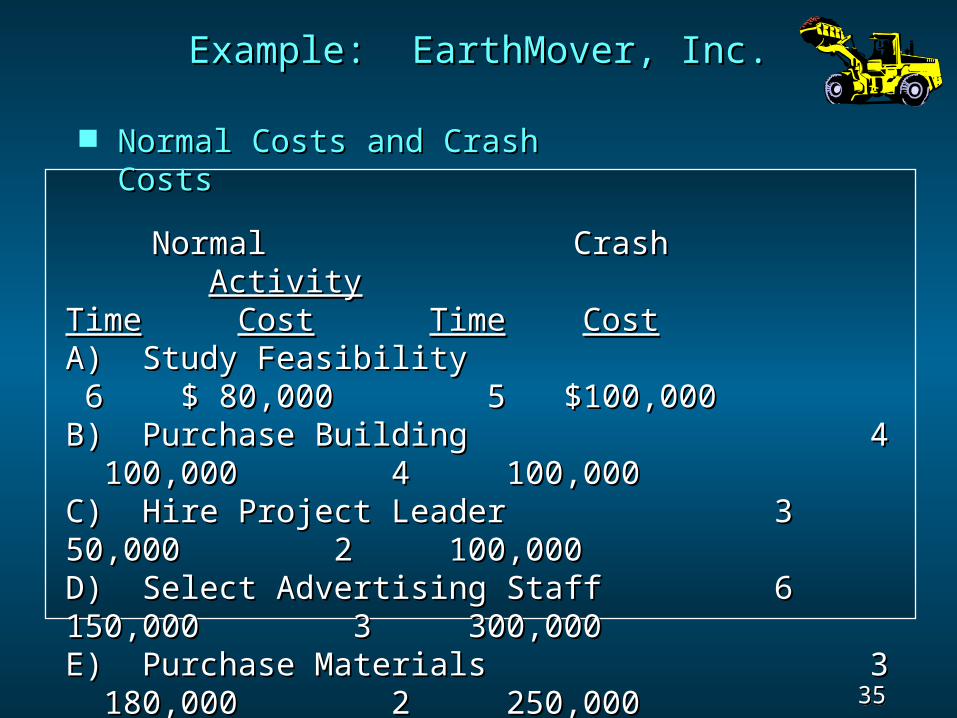
Normal CrashNormal Crash
ActivityActivity TimeTime CostCost TimeTime CostCostA) Study Feasibility A) Study Feasibility 6 $ 80,000 5 $100,000 6 $ 80,000 5 $100,000B) Purchase Building B) Purchase Building 4 4 100,000 4 100,000 100,000 4 100,000C) Hire Project Leader C) Hire Project Leader 3 3 50,000 2 100,00050,000 2 100,000D) Select Advertising Staff D) Select Advertising Staff 6 6 150,000 3 300,000150,000 3 300,000E) Purchase Materials E) Purchase Materials 3 3 180,000 2 250,000 180,000 2 250,000F) Hire Manufacturing Staff F) Hire Manufacturing Staff 10 10 300,000 7 480,000300,000 7 480,000G) Manufacture Prototype G) Manufacture Prototype 2 2 100,000 2 100,000100,000 2 100,000H) Produce First 50 Units H) Produce First 50 Units 6 6 450,000 5 800,000450,000 5 800,000 I) Advertise Product I) Advertise Product 8 8 350,000 4 650,000 350,000 4 650,000
Normal Costs and Crash Normal Costs and Crash CostsCosts

36 Slide
Min 20Min 20YYAA + 50 + 50YYCC + 50 + 50YYDD + 70 + 70YYEE + 60 + 60YYFF + 350 + 350YYHH + 75+ 75YYII s.t. s.t. YYAA << 1 1 XXAA >> 0 + (6 - 0 + (6 - YYII) ) XXGG >> XXFF + (2 - + (2 - YYGG) ) YYCC << 1 1 XXBB >> XXAA + (4 - + (4 - YYBB) ) XXHH >> XXGG + (6 - + (6 - YYHH) ) YYDD << 3 3 XXCC >> XXAA + (3 - + (3 - YYCC) ) XXII >> XXDD + (8 - + (8 - YYII) ) YYEE << 1 1 XXDD >> XXBB + (6 - + (6 - YYDD) )
XXII >> XXGG + (8 - + (8 - YYII)) YYFF << 3 3 XXEE >> XXBB + (3 - + (3 - YYEE)) XXHH << 26 26 YYHH << 1 1 XXFF >> XXBB + (10 - + (10 - YYFF) ) XXII << 26 26 YYII << 4 4 XXFF >> XXCC + (10 - + (10 - YYFF) ) XXGG >> XXEE + (2 - + (2 - YYGG) ) XXii, , YYjj >> 0 for all i 0 for all i
Example: EarthMover, Inc.Example: EarthMover, Inc.
Linear Program for Minimum-Cost CrashingLinear Program for Minimum-Cost CrashingLet: Let: XXii = earliest finish time for activity = earliest finish time for activity ii
YYii = the amount of time activity = the amount of time activity ii is crashed is crashed
37 Slide
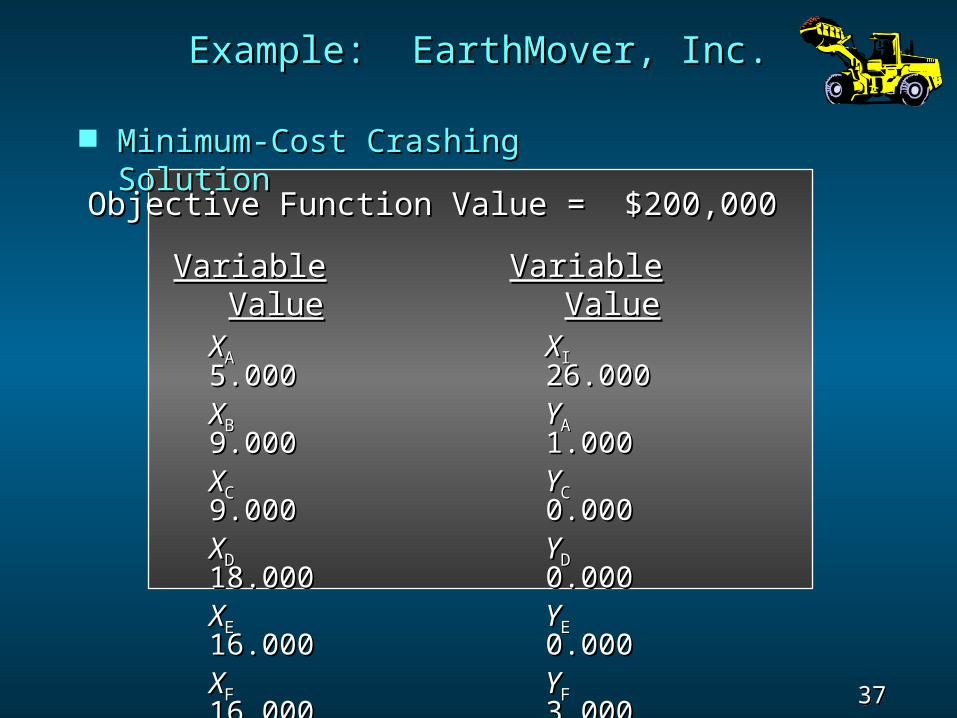
Minimum-Cost Crashing Minimum-Cost Crashing SolutionSolution
Objective Function Value = $200,000Objective Function Value = $200,000VariableVariable ValueValueXXAA 5.0005.000XXBB 9.0009.000XXCC 9.0009.000XXDD 18.00018.000XXEE 16.00016.000XXFF 16.00016.000XXGG 18.00018.000XXHH 24.00024.000
VariableVariable ValueValueXXII 26.00026.000YYAA 1.0001.000YYCC 0.0000.000YYDD 0.0000.000YYEE 0.0000.000YYFF 3.0003.000YYHH 0.0000.000YYII 0.0000.000
Example: EarthMover, Inc.Example: EarthMover, Inc.


