Embed Size (px)
Citation preview
An Analysis of Cercopithecoid Odontornetrics I . THE SCALING OF THE MAXILLARY DENTITION
SERGE GOLDSTEIN,' DAVID POST ' AND DON MELNICK ' ' Department of Anthropology, Y a k Unwrrsity, N m i Haom, Conner t icut 06520 m r l 'Department of Anthropology, Columbia L'niuersity, h'ew York, New Yurk 10027
KEY WORDS Cercopithecoids . Odontometrics I Tooth size Allometry . Diet . Dimorphism
ABSTRACT The relations between two tooth indices, post-canine area and incisor width in the upper jaw, and three variables, diet, body weight and body weight dimorphism, were examined separately for the males and females of 29 cercopithecoid species. Each species was assigned to one of three diet classes (folivore, frugivore, omnivore). Data on the other variables consisted of species means (log-transformed) obtained from published sources. The analytic tech- niques used were bivariate and multiple regression, the tooth indices being the dependent variables.
All tooth indices scaled isometrically within diet classes, and all except female incisor width scaled with positive allometry across diet classes. In both sexes, t he body weight adjusted mean incisor width of folivores was significant- ly smaller than that of either frugivores or omnivores. In the females, the body weight adjusted mean post-canine areas did not differ significantly across diet classes, while in the males the omnivores had a larger body weight adjusted mean post-canine area than either the folivores or frugivores. Female post-ca- nine area was the only tooth index for which body weight dimorphism was a significant predictor. Extrapolations of these findings to other extant and to fossil primate species are discussed.
As l a te as 1975, S. J. Gould could write: "I have encountered no quantitative da ta on the general scaling of tooth size.. . . We do not even have strong predictions for the basic in- terspecific trend of post-canine area vs. body size among species of higher mammalian taxa" (Gould, '75) . Since tha t time a number of studies have appeared which treat various aspects of t h e scaling of pr imate t ee th (Hylander, '75; Gould, '75; Swindler, '76; Leutenegger and Kelly, '771, but a comprehen- sive analysis has yet to be done. We began examining primate tooth scaling in the hope of constructing models for inferring the diet of fossil species on the basis of tooth size. An ap- proach to the development of such models is first to examine the relationship between diet and tooth size in extant primate species, and then to analogize this relationship to fossil species. In qualitative terms, for example, i t may be hypothesized that, relative to body
AM. J. PHYS. ANTHROP (1978) 49. 517-532
size, folivores would have large cheek teeth (for masticating a tough, fibrous diet, cf. Kay, '73) , while frugivores would have large in- cisors (for slicing fruit, cf. Hylander, '75). If this hypothesis can be confirmed for extant primate species, then we may infer tha t fossil primate species with relatively large cheek teeth were probably folivores, while those with relatively large incisors were probably frugivores. The risk taken in making such an inference is tha t fossil primate species in question may have had diets or dentitions unlike tha t of any extant species (or a t least different enough so as t o render the inferen- tial process invalid). This risk can be reduced, though never fully eliminated, by marshalling independent evidence on the diet of fossil spe- cies, such as may be obtained from tooth shape and overall morphology (Kay, '78).
A major difficulty encountered in applying the above-described approach is the transla-
517

518 SERGE GOLDSTEIN, DAVID
tion of qualitative concepts such as “large cheek teeth relative to body size” into quan- titative terms. This translation is generally accomplished through the concept of allome- try. To paraphrase Gould (’751, we are inter- ested in partitioning between-species dif- ferences in mean tooth size into two compo- nents; one tha t is a function of differences in mean body size, the other a function of dif- ferences in diet. The body size component can be quantitatively modeled with an allometric power function of t he form:
where K and A in this equation (and the equa- tions below) refer to empirically determined constants.
The diet component can he modeled by adding another term t o this equation, a term we designate diet effect:
1 Tooth size = K, X (body size)*’
2 Tooth size = K? X (diet effect) X (hodysizel*’
When diet is treated as a nominal variable with three classes (folivore, frugivore, om- nivore) equation 2 breaks down into three equations, as
3(a)
3 i c l
follows: Folivore tooth size = Kd X lfolivore diet effect) X
ifolivore b o d y s i d A 3 Frugivore tooth size = K, X (frugivore diet effect) X (frugivore body sizeIA‘ Omnivore tooth size = Ks X (omnivore diet effect) X (omnivore bodysizelA‘
Finally, equations forms :
1’
3’(a)
3’tb)
3’tc)
under logarithmic transformation 1 and 3 take the following linear
logkooth q ize l
log(fo1ivore tooth size) =
logtfruovore too ths ize) =
log(omnivore tooth size) =
E, + A] x logbody size)
8, + Ai x log(fo1ivore body size)
B, - A, x log(frug1vore body size)
B, + As X loglomnivore body size)
The constant and diet effect terms of equa- tions 3(a-c) have been lumped together into the B’s of equations 3’ (the B in equation 1’ is simply the log of the constant in equation 1).
Equations 1’ and 3’ can be fitted on data on mean tooth size, mean body size and diet for a set of species using either least-squares regression or major axis line fitting tech- niques. When this is done, equation 1’ pro- duces the “best” estimates of tooth size when body size alone is used as a predictor variable, while equations 3’ produce the “best” esti-
POST AND DON MELNICK
mates of tooth size when body size and diet a re used as predictor variables (the definition of “best” depending upon which l ine-fi t t ing technique is used). The question we are inter- ested in answering is: are the coefficients in equations 1’ and 3’ materially different? If so, this would imply tha t knowing the diet of a species helps in inferring the mean tooth size of tha t species, and the reverse conditions should hold; i.e., knowing tooth and body size should help in inferring diet. Our reason for approaching the problem of inferring diet on the basis of tooth and body size in this reversed fashion (i.e., by examining equations for inferring tooth size on the basis of diet and body size) is tha t in the process of comparing equations 1‘ and 3‘ we can arrive at very spe- cific conclusions regarding the relationship between tooth size and diet. For example, by comparing the As in equations 1’ and 3‘ we can arrive at conclusions regarding the rela- tionship of within to between diet class tooth scaling, while the B’s in equation 3’ give us information about the relative tooth size of each diet class. Furthermore, t he coefficients in these equations can be given a biological in- terpretation. If our index of tooth size is post- canine area. we can set as our isometric null hypothesis a value of 0.66 for the A’s in equa- tions l’ and 3‘ (cf. Gould, ’75) . Departures from this value may be indicative of well known biological scaling relationships; in par- ticular, values close to 0.75 suggest t ha t post- canine area is scaling linearly with metabolic rate.
Our aim here, then, is to discern biologically interpretable structural patterns in the rela- tionship between tooth size and diet. Once known, these patterns can he used as a basis for constructing models tha t infer the diet of fossil species on the basis of their tooth and body size.
MATERIALS
The data used in our analysis consisted of log-transformed species means of two tooth indices, body weight and body weight dimor- phism (males and females treated separately), along with a diet classification. All data used were taken from published sources. These da ta are given in table 1, along with a defini- tion of t he variables, abbreviations used in the remainder of this paper, and descriptive sta- tistics. Sources for the data in table 1 are listed in table 2. Data collection is discussed below.

CERCOPITHECOID ODONTOMETRICS 519
?ABLE 1
Lkfcaltion of mriables Vanable Abbreviation Computation
Log of incisor width, male maxilla
Log of incisor width, female maxilla
Log of post-canine area, male maxilla
log ofpost-canine area, female maxilla
Log of male weight
Log of female weight Log of body weight dimorphlsm Diet
Dnta tabulat ion Ypec1rs LMWT
Cercopithecus neglectus nictitans ascanius mona mitis cephus
Cercoccbus albigena turquatus galeritus
Macaco nemestrana mulattcl fascicularis arctoides nigra
guereza p l y k om os verus
Colobus badius
Presbytis phayrei johnii uygul a i:ristatus
Pygathrix namaeus Nasalis laruatus Cercopithecus aethiops Papio rynocephalus
anubis ursinus
Theropithecus gelada
N Mean S.D. Skewness
1.91 1.88 1.43 1.53 2.00 1.45 2.17 2.36 2.32 2.34 2.16 1.59 - -
2.35 2.35 2.30 1.33 1.90 2.44 1.86 1.91
3.02 1.50 2.97 3.28 3.02 3.02
-
26 2.17 0.55 0.39
IJWMX
LIWFX
In isummedmesio distal breadth, I ’ lo 1-1
In (summed mesio dlstal breadth. I ’ to 1’)
In (summed length X breadth, P’to M’J
In (summed length X breadth, P’to MJJ
In (male weight, in kg)
In (female weight, in kp)
LPAMX
LPAFX
L M W l LFWT LUM DT
LFWT
1.44 1.39 1.06 1.28 1.66 1.03 1.87 1.43 1.70 2.05 1.79 1.23
~
- -
1.95 1.95 2.00 1.28 1.59
1.90 1.76
2.29 1.25 2.36 2.79 2.82 2.53
-
-
25 1.78 0.50 0.39
100 X In (maleweight/frmale weight) Frugivore = Lfolivoi-e = 2,ornnivore = 3
LI’AMX LIWMX LPAFX 1,IWFX LDM UT
5.06
4.69 4.82 5.01 4.87 5.34 5.57 5.57 5.28 5.62 5.44 5.84 5.48 5.24 5.45 5.38 4.75 5.13 5.18 4.89 5.07 5.35 5.39 4.96 6.33 6.33 6.45 6.18
4.84
29 5.36 0.48 0.84
2.22 2.24 2.11 2.17 2.26 2.25 2.64 2.49 2.54 2.41 2.57 2.42 2.59 2.31 2.30 2.30 2.27 2.03 2.27 2.20 2.10 2.13 2.29 2.30 2.19 2.93 2.93 2.89 -
28 2.37 0.24 1.14
4.90 4.80 4.59 4.75 4.93 4.76 5.20 5.58 5.46 5.23 5.47 5.39 5.39 5.29 5.24 5.34 5.29 4.76 5.10 5.28 4.86 5.04 5.24 5.28 4.80 6.13 6.11 6.22 6.13
29 5.26 0.44 0.79
Kurtosis -0.66 -0.40 0.02 0.54 0.05
2.15 2.24
2.13 2.25 2.23 2.55 2.48 2.50 2.39 2.51 2.39 2.43 2.24 2.29 2.24 2.23 2.05 2.20 2.12 2.10 2.08 2.20 2.25 2.12 2.83 2.80 2.77
2.09
- 28
2.32 0.22 1.05 0.23
46.97 49.07 36.32 24.51 34.33 41.96 29.99 93.00 62.02 28.77 36.75 36.16 - -
40.55 40.55 29.84
5.41 30 99
-4.13 15.42
72.96 25.13 60.82 49.49 19.42 49.47
25 38.23 20.58 0.48 0.86
-
-
1 1 1 1 1 1 1 1 1 1 1 1 1 1 2 2 2 2 2 2 2 2 2 2 3 3 3 3 3
As indices of tooth size we chose post-canine area (summed length x breadth measures of the cheek teeth) and incisor width (summed mesio-distal breadths of the incisors). These are gross indicators of the size of the “chewing unit” and “slicing unit” in the anthropoid den- tition. The accuracy with which post-canine
area and incisor width measure the size of their respective functional units largely de- pends on the surface morphology of the teeth being measured. They are fully accurate only when the teeth are flat and, in the case of post- canine area, rectangular. Kay (’73) computed actual surface areas in his inter-specific com-

520 SERGE GOLDSTEIN, DAVID POST AND DON MELNICK
TABLE 2
Sources of data
Species Dental dimensions Body weights
Cercopithecus aethiops neglectus nictitans ascanius mona mitis cephus
Cercocebus albigena torquatus galerrtus
Macaca nemestrina mulatta fascicularis arctoides nigra
Papio cynocephalus anubis ursinus
Theropithecus gelada
Colobus badius guereza polykomos uerus
Presbytis pharer johnii
cristatus w @ l a
Pygathrix namaeus Nasalis larvatus
Sirianni, '74 Swindler, '76 Swindler, '76 Sirianni, '74 Swindler, '76 Swindler, '76 Swindler. '76
Swindler, '76 Swindler, '76 Swindler, '76 Swindler, '76 Swindler, '76 Swindler, '76 Swindler, '76 Swindler, '76 Swindler, '76 Swindler e t al., '67 Freedman, '57 Jolly, '72; Swindler, '76
Swindler, '76 Sirianni, '74 Swindler, '76 Leutenegger, '71, '76 Swindler, '76 Swindler, '76 Swindler, '76 Swindler, '76 Swindler, '76 Swindler, '76
Kay, '73; Bauchot and Stephan, '69 Kay, '73; Gautier-Hion, '75 Kay, '73; Gautier-Hion, '75 Kay, '73; Haddow, '52 Kay, '73; Bauchot and Stephan, '69 Bauchot and Stephan, '69 Malbrandt and Maclatchy, '49;
Kay, '73; Gautier-Hion, '75 Kay, '73 Gautier-Hion, '75
Gautier-Hion, '75
Kay, '73; Bauchot and Stephan, '69 Kay, '73 Kay, '73 Data not found Data not found Kay, '73 Kay, '73 Clutton-Brock and Harvey, '77 Napier and Napier, '67;
Struhsaker, '75 Struhsaker, '75 Kay, '73 Booth, '57 Bauchot and Stephan, '69 Kay, '73 (males only) Kay, '73 Kay, '73 Data not found Kay, '73
Bauchot and Stephan, '69
parison of M, morphology; however, applying this method to the entire tooth row is tech- nically difficult, and in any case such data are not presently available in the literature. We believe that post-canine area and incisor width are relatively accurate indices as long as comparisons are restricted to species whose teeth are basically similar in form and shape. To maximize this similarity we restricted our analysis to the upper dentition of cerco- pithecoid species (cf. Kay, '78). To minimize incompatibility of data due to differing mea- surement techniques, we used whenever possi- ble length and breadth data as reported by D. Swindler and his colleagues (tables 1, 2). When a choice was available, we used max- imum length and breadth measures, as these are the ones most frequently reported in the literature. Otherwise collection of data on tooth size was completely dictated by what was available in the literature.
Originally we had hoped to treat diet as a continuous variable (e.g., percent of leaves in
the diet) but such data are scanty and be- tween-species comparisons are complicated by the differing techniques of field-workers. We settled on Kay's ('73) grouping of species into frugivore and folivore classes, and added an omnivore class for a few species (baboons, C. aethiops), recognizing that this is only a very rough classification. It should be noted that our use of the term "omnivore" conforms to most general usage within the ecological lit- erature implying "versatility and flexibility in choice of foods" (Rozin, '76: p. 27) and not mixed carnivory-herbivory. It is, admittedly, a somewhat vaguely defined class to which are allocated species we felt could not be well accommodated within the more specialized folivore or frugivore categories. Papio cy- nocephalus (Post, '781, P. anubis (Harding, '73; Rose, '77) and Cercopithecus aethiops (D. Klein, personal communication; Struhsaker, '67) seemed to fall most appropriately within this generalist class. Theropithecus gelada is difficult to place within any category (cf.

52 1 CERCOPITHECOID ODONTOMETRICS
Clutton-Brock and Harvey, '77: p. 5); al- though primarily a specialized grass-eater, the high proportion of seeds and rhizomes, foods which in consistency and nutritive con- tent resemble neither leaves nor fruit, in cer- tain seasons (Dunbar, '77) suggests i t s assign- ment to this category as well. The problem of assigning species to dietary categories i s also discussed in the following paper (Post et al., '78).
We chose body weight as an index of body size. Body weight data on primates are scanty and of varying reliability. In some instances (e.g., E. patas) the weights given in Napier and Napier ('67) are based on only a few speci- mens. Further, body weight and tooth size data for a given species may not be compara- ble if obtained from geographically widely separated populations. One way to avoid these problems is to use as indices of body size cra- nial or skeletal measures from the population on which tooth measures are taken. This pro- cedure is valid, however, only if the cranial or skeletal measure in question scales linearly with body size; otherwise one must ultimately regress the cranial or skeletal measure on some general index of body size, such as body weight. We are unable to follow this procedure because i t would have severely limited our sample. Instead we used the body weights re- ported in Kay ('73), updating them wherever possible. These weights are subject to con- siderable error and should be viewed with caution.
Body weight dimorphism (computed as the logarithm of the ratio of male weight to female weight) was included in our analysis because we wanted to see i f highly dimorphic species deviated in any systematic way from the overall scaling relationship of tooth size on body size. This might be the case if se- lection for dimorphism had acted on body size but not on tooth size (i.e., males of highly di- morphic species would, under these circum- stances, have smaller teeth than expected on the basis of their weights, cf. Post e t al., '78). The inclusion of body weight dimorphism as a predictor variable in our analysis is modeled through the addition of a third linear term to the right sides of equations 3'.
METHODS
We chose the common least-squares regres- sion technique for fitting equations 1' and 3' to our data. Jolicoeur ('68) and Gould ('75) have argued tha t major axis equations should
be fitted to data sets for which all of the varia- bles have associated error terms, rather than least-squares regression equations. We dis- agree. Major axis equations make no assump- tions regarding the dependency of variables in the data set; i.e., they are invertible. Concep- tually, body weight, diet and body weight di- morphism are independent variables in our equations (e.g., body weight affects tooth size, but not vice versa). Although these indepen- dent variables are clearly measured with error, this does not necessitate abandoning the least-squares regression technique. Model IT regression specifically covers the case where the independent variables are mea- sured with error (Sokal and Rohlf, '69). Snedecor and Cochran ('67: p. 165) describe a procedure for estimating the bias in the com- putation of the regression coefficients in Model I1 regression. The estimation of this bias for our equations is discussed in the APPENDIX.
Equation 1' was fitted to our data by means of the SPSS Scattergram program (Nie et al., '75: p. 296). This procedure resulted in the computation of four simple bivariate regres- sion equations, one for each tooth index.
Equations 3' were fitted to our data by means of the SPSS Multiple Regression pro- gram, with diet treated as a dummy variable (Nie et al., '75: pp. 373-377). This procedure is equivalent to an analysis of covariance with diet as the treatment and body weight and body weight dimorphism as the covariates. For each tooth index, we began by examining the full, or saturated, model, which included the individual effects of diet, body weight and body weight dimorphism plus all possible in- teraction effects (the interaction effect of body weight and diet, for example, indicates to what extent the body weight scaling coeffi- cients differ among the three diet classes). This saturated model was compared to the additive model, which excluded all interaction effects. The SS (sum of squares) for the in- teraction effects was computed as the dif- ference between the SS for the saturated model and the SS for the additive model. For none of our tooth indices were the interaction effects significant. Therefore the more complex saturated model could be reduced to the simpler additive model without a significant loss of predictive power. The SS for each of the independent variables in the additive model (diet, body weight and body weight dimorph- ism) were computed as the difference between
522 SERGE GOLDSTEIN, DAVID POST A N D DON MELNICK
the SS for the total additive model and the SS for the additive model excluding that variable. Because of the non-orthogonality of our design (unequal numbers of species in the diet classes) the SS for the independent variables in our additive model do not necessarily add up to the SS for the total additive model.
Throughout our analysis, a species was ex- cluded from the computation of a regression equation only if data on that species were missing for the particular variables that went into the equation (“pairwise deletion” in the terminology of SPSS); hence sample sizes vary somewhat from one equation to another. A 5% significance level was used throughout. The regression coefficients for equations 3’ were taken from the model which excluded all non-significant effects; we have termed these the final regression models. We examined the residuals from the final regression models to see if the distributional assumptions of analy- sis of covariance were met by our data, and also to see if the residuals showed any sugges- tive patterns.
RESULTS
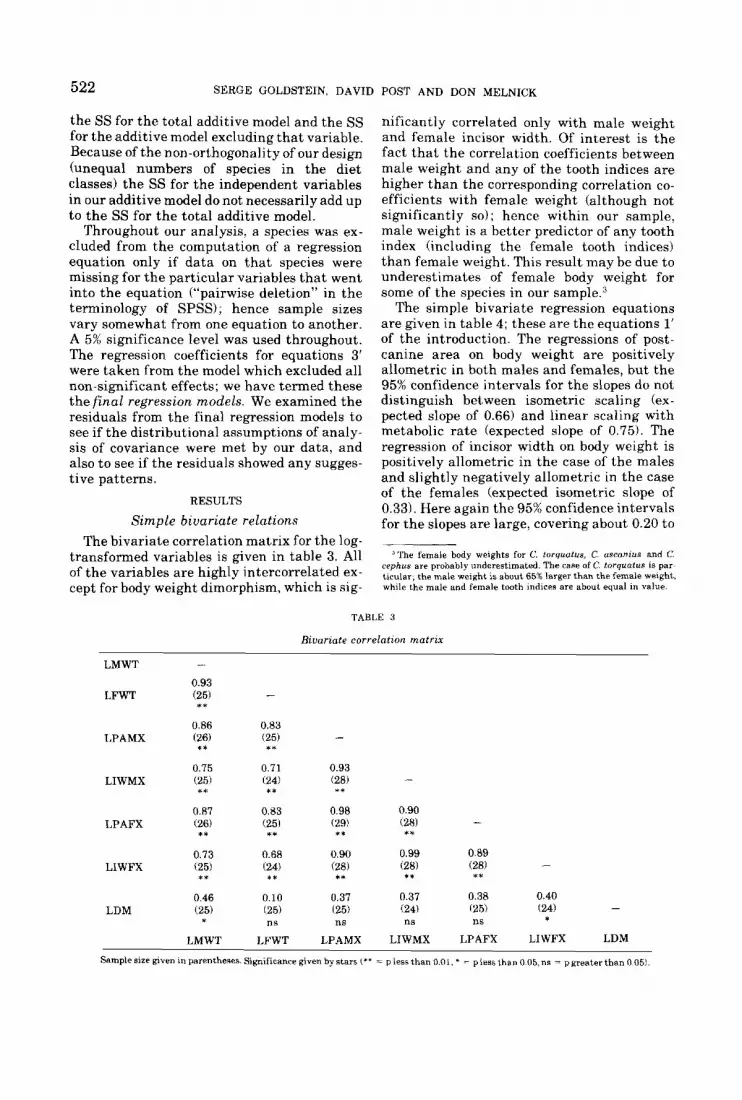
Simple biuariate relations The bivariate correlation matrix for the log-
transformed variables is given in table 3. All of the variables are highly intercorrelated ex- cept for body weight dimorphism, which is sig-
nificantly correlated only with male weight and female incisor width. Of interest is the fact that the correlation coefficients between male weight and any of the tooth indices are higher than the corresponding correlation co- efficients with female weight (although not significantly so); hence within our sample, male weight is a better predictor of any tooth index (including the female tooth indices) than female weight. This result may be due to underestimates of female body weight for some of the species in our ample.^
The simple bivariate regression equations are given in table 4; these are the equations 1‘ of the introduction. The regressions of post- canine area on body weight are positively allometric in both males and females, but the 95% confidence intervals for the slopes do not distinguish between isometric scaling (ex- pected slope of 0.66) and linear scaling with metabolic rate (expected slope of 0.75). The regression of incisor width on body weight is positively allometric in the case of the males and slightly negatively allometric in the case of the females (expected isometric slope of 0.33). Here again the 95% confidence intervals for the slopes are large, covering about 0.20 t o
The female body weights for C. torquatus, C. USCUPZUS and C. rephus are prohably underestimated. The case of C. torquutus is par^ ticular, the male weight is about 65% larger than the female weight. while the male and female tooth Indices are about equal in value.
TABLE 3
Bivariate correlation matrix
LMWT -
LFWT (25) - 0.93
** 0.86 0.83
LPAMX (26) (25) - ** **
0.75 0.71 0.93 (25) (24) (28) -
0.87 0.83 0.98 0.90
** LIWMX ** * *
(28) - ** LPAFX (26) (25) (29) * * * * **
0.73 0.68 0.90 0.99 0.89 iz8) (28) -
** LIWFX (25) (24) 128) * * ** I* ** 0.46 0.10 0.37 0.37 0.38 0.40
(24) (25) (24) - LDM (25) (25) (25) * ns ns ns ns c
LMWT LFWT LPAMX LIWMX LPAFX LIWFX LDM
Sample size given in parentheses. Significance given by stars (** = P less than 0.01, * ~ p Less than 0.05, ns = p greater than 0 051.

CERCOPITHECOID ODONTOMETRICS 523
TABLE 4
Simple biuarinte regressions
Dependent Independent S.E of vnriable vanable Slupe Intercept slope N
LPAMX LMWT 0.783 3.641 0.091 LIWMX LMWT 0.357 1.603 0.064 LPAFX LFWT 0.786 3.858 0.112 LIWFX LFWT 0.326 1.759 0.071
26 25 25 24
TABLE 5
Analysis of covariance
Anova Source
ss df F Final regression mcdel
(1) LPAMX SS (total) SS (additive model)
SS (weight) SS (diet) SS (dimorphism)
SS (residual) (2) LIWMX
SS (total) SS (additive model)
SS (weight) SS (diet) SS (dimorphism)
SS (residual) (3) LPAFX
SS (total) SS (additive model)
SS (weight) SS (diet) SS (dimorphism)
SS (residual)
(4) LIWFX
SS (total) SS (additive model)
SS (weight) SS (diet) SS (dimorphism)
SS (residual)
6.284 5.383 1.585 0.547
0.901 0.009
1.544 1.296 0.431 0.361 0.010 0.248
5.478 4.539 1.393 0.322
0.939 0.310
1.239
0.355 1.015
0.282 0.044 0.224
24 4 1 2 1
20
23 4 1 2 1
19
24 4 1 2 1
20
23 4 1 2 1
19
29.865 * * 35.171 * *
6.073 ** 0.195ns
24.840 ** 33.011 ** 13.830 ** 0.789ns
24.162 * * 29.666 ** 3.429 ns 6.611 * *
21.563 ** 30.134 ** 11.991 ** 3.758 na
Frugivore int. = 3.891 Folivore int. = 3.745 Omnivore int . = 4.212
Slope (LMWT) = 0.666 S.E. of slope = 0.092
Frugivore int. = 1.721
Omnivore int. = 1.843
Slope (LMWT) = 0.331 S.E. of slope = 0.051
Folivore Int. = 1.508
I: Without diet Overall Int. = 3.646 Slope (LFWT) = 0.757 Slope (LDM) = 0.007
S.E.ofslope (LFWTJ = 0.10
11: With Diet Frugivore int. = 3.851 Folivore int. = 3.737 Omnivore int. = 4.095 Slope (LFWTJ = 0.655
S.E. of slope (LFWTJ = 0.120 Slope (LDM) = 0.006
I: Without dimorphism Frugivore int. = 1.792 Folivore Int. = 1.524 Omnivore int. = 1.087
Slope (LFWT) = 0.357
11: Withdimorphism Frugivore int. = 1.732 Folivore int. = 1.505 Omnivore int. = 1.778 Slope (LFWT) = 0.331
S.E. of slope = 0.063
Slope (LDMJ = 0.002 S.E. of slope (LFWT) = 0.060
S~gnmficance (of F values) indicated as in table 3.

524 SERGE GOLDSTEIN, DAVID POST AND DON MELNICK
0.50. Overall there is a tendency for tooth scal- ing across the diet classes to be positively allometric within our samples, but the large 95!X confidence intervals for the slopes do not permit us to reject the isometric null hypothe- sis for the cercopithecoids as a whole.
Analysis of couariance The final regression models for the four log-
transformed tooth indices are given in table 5 , along with their analysis of variance tables. These are the equations 3' a t the beginning of the article. They are plotted on bivariate scat- tergrams of tooth index vs. body weight in figures 1 and 2; the final regression models for each tooth index are discussed separately below.
Male post-canine area Body weight dimorphism did not contribute
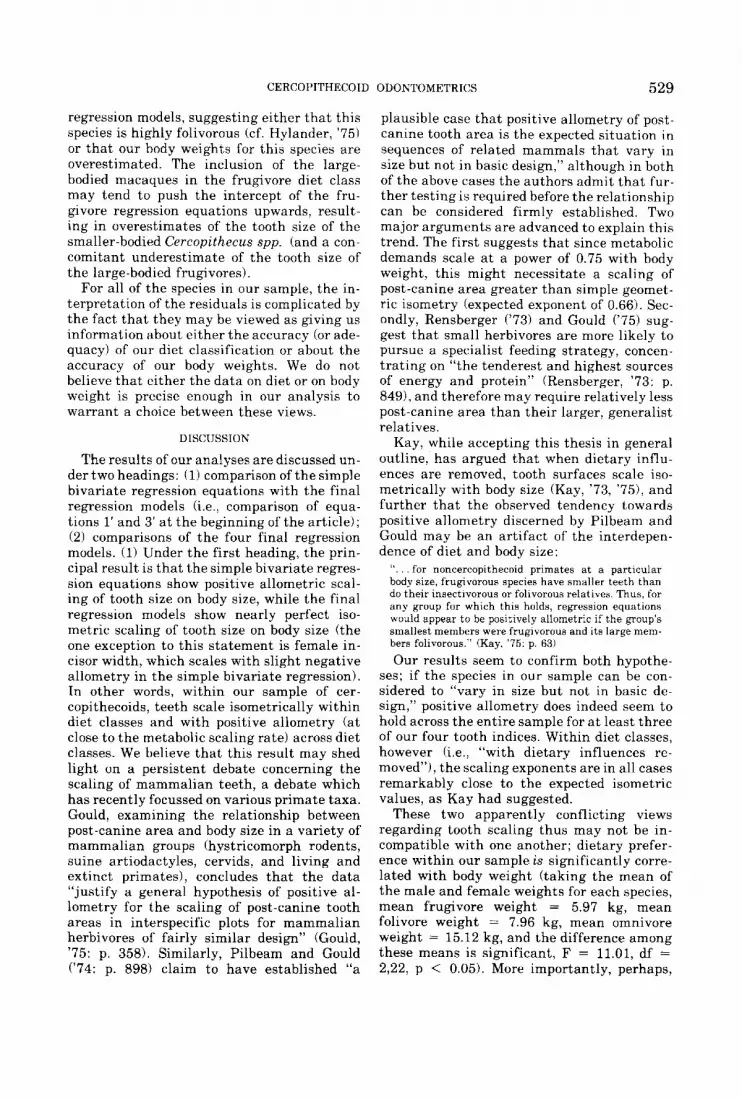
significantly to the final regression model. This model shows perfect isometric scaling of post-canine area on body weight within each of the diet classes. The standard error of the slope gives 95% confidence intervals that over- laps 0.75 (linear scaling with metabolic rate). The folivore and frugivore intercepts are not significantly different, while the omnivore in- tercept is significantly higher than both the folivore and frugivore intercepts4 Thus the omnivore males stand out as having larger body weight adjusted post-canine areas than either the frugivore or folivore males. Four out of the five omnivores in our sample are long-faced, open country baboons, and are thus homogenous and distinct from members of the other diet classes. Hence the effect that we are attributing to diet here might just as well be interpreted as a phylogenetic or gen- eral ecological effect. This problem in in- terpretation is considered further in the DISCUSSION
Female post-canine area The final regression model for female post-
canine area differs from that of the males in two ways: (1) the body weight dimorphism ef- fect is significant; (2) the diet effect is not quite significant. For comparative purposes we have given both the models with and with- out the diet effect in table 5. In figure 1 we have plotted the model with the diet e f f e ~ t . ~ Inclusion of the diet effect in the final regres- sion model brings the body weight regression coefficient close to the isometric scaling value
0.53) while its exclusion gives a value close to the metabolic rate scaling coefficient of 0.75 (95% confidence interval of 0.85 to 0.65). In the final regression model with the diet effect, the only significant difference in intercepts is between the omnivore and folivore regression lines.
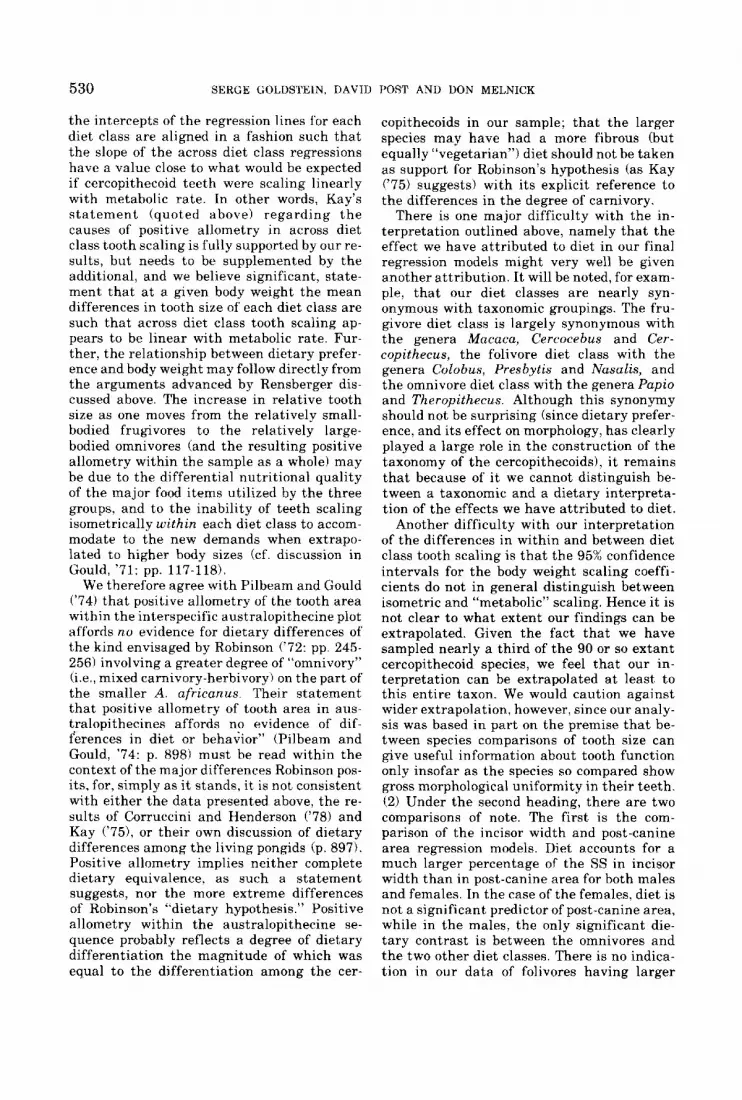
Male incisor width The final regression model for male incisor
width shows many of the same features as that for male post-canine area. The body weight dimorphism term is not significant. The body weight regression coefficient has exactly the expected isometric scaling value of 0.33 (95% confidence intervals for this coefficient cover 0.38 to 0.28). The male in- cisor width model differs from the male post- canine area model, however, in the pattern of the intercepts. The intercepts of both the omnivore and frugivore regression equations are significantly higher than the intercept of the folivore regression equation; the dif- ference between the omnivore and frugivore intercepts is not significant. Overall, diet accounts for a larger proportion of the total SS in male incisor width (23%) than in male post- canine area (9%); in this very limited sense, diet can be said to be a better predictor of in- cisor width than of post-canine area.
Female incisor width The final regression model for female in-
cisor width is almost identical to that of male incisor width, except that in the females the body weight dimorphism effect is nearly sig-
*The significance of differences in intercepts was tested using the procedure described in Snedecor and Cochran ('67: p. 423).
Three axes are requlred to accurately plot the female post-canine area model (one each for LPAFX. LFWT and LDM). Only two of lhese axes could be shown in figure 1 (LPAFX and LFWT); hody weight dimorphism was incorporated into the regression lines for LPAFX in figure I by arbitrarily assigning t o each species in our sample the overall mean of body weight dimorphism in the sample.
Fig. 1 Bivariate plot of the natural logarithm of max- illary post-canine area against natural logarithm of body weight for males (upper graph) and females (lower graph) of 29 cercopithecoid species. Species code for males is: Frugiuores. A = Cercopithecus neglectus; B = C. nic- titans; C = C. rrscanius; D = C. mona; E = C. mitis; F = C. cephus; G = Cercocebus albigena; H = C. torquatus; I = C. galeritus; J = Macaca nemestrina; K = M. mulatta; L = M. fascicularis. Foliuores. 1 = Colobus badius; 2= C. guerera; 3 = C. polykomos; 4 = C. uerus; 5 = Presbytis phuyrei; 6 = P. johnii; 7 = P. aygula; 8 = P. cristatus; 9 = Nasalis laruatus. Omnivores. a = Cercopithecus aethiops; b = Papio cynocephalus; c = P. anubis; d = P. ursinus: e = Therooithecus nelada. The mecies code for
I
females is the same except: 6 = Presbytis aygula; 7 = I! cristatus; 8 = Nasalis laruatus. of 0.66 (95% confidence intervals of 0.77 to

6.5-
LPAMX 5 5 .
4 5
6
LPAFX 5
CERCOPITHECOID ODONTOMETRICS 525
d , 'oinniwrr
9
0 I I I 1 2 0 3 0
LMWT
, ,,'omnivore
d, '
Figure 1
526 SERGE GOLDSTEIN, DAVID
nificant. We have given both the models with and without the body weight dimorphism ef- fect in table 5 , while in figure 2 we have plot- ted the final regression model without t he body weight dimorphism effect. In the final regression model with the body weight dimor- phism effect t h e body weight regression coefficient has exactly t h e expected isometric scaling value of 0.33 (95% confidence intervals of 0.39 to 0.27) while in the model without the body weight dimorphism effect this coeffi- cient has a value of 0.36 (95% confidence in- tervals of 0.42 to 0.30). In both models the pat- tern of the intercepts is the same as tha t of male incisor width; t he omnivore and fru- givore intercepts are significantly higher than the folivore intercept, and are not signif- icantly different from each other. Overall, diet accounts for a larger percentage of the SS in female incisor width (23% in the model with the body weight dimorphism effect, 46% in the model without i t) than in female post-canine area (6%). Hence, as was the case in the males,
POST AND DON MELNICK
diet can be said to be a better predictor of female incisor width than of female post-ca- nine area.
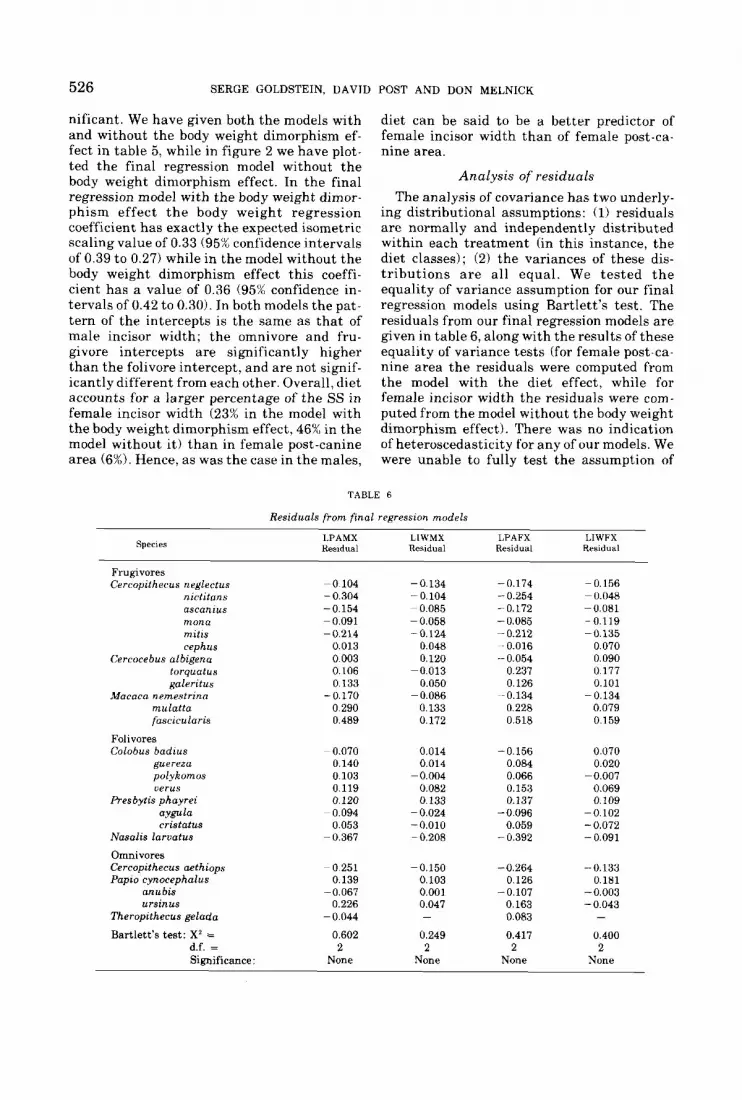
Analysis of residuals The analysis of covariance has two underly-
ing distributional assumptions: (1) residuals a re normally and independently distributed within each treatment (in this instance, the diet classes); (2) the variances of these dis- t r ibu t ions a r e all equal. We tested t h e equality of variance assumption for our final regression models using Bartlett’s test. The residuals from our final regression models are given in table 6, along with the results of these equality of variance tests (for female post-ca- nine area the residuals were computed from the model with the diet effect, while for female incisor width the residuals were com- puted from the model without the body weight dimorphism effect). There was no indication of heteroscedasticity for any of our models. We were unable to fully test the assumption of
TABLE 6
Residuals from final regression models
LPAMX LIWMX LPAFX LIWFX Residual Residual Residual Residual species
Frugivores Cercopithet*us neglectus -0 104 -0.134 -0.174 -0.156
nictitnns - 0.304 - 0.104 - 0.254 - 0.048 ascanius -0.154 - 0.085 -0.172 -0.081 mona -0.091 - 0.058 - 0.085 -0.119 mitw - 0.214 -0.124 -0.212 -0.135 cephus 0.013 0.048 ~~ 0.016 0.070
Cercocebus albigena 0.003 0.120 - 0.054 0.090 torquatus 0.106 -0.013 0.237 0.177 galeritus 0.133 0.050 0.126 0.101
Maraca nemestrinn -0.170 - 0.086 -~ 0.134 -0.134 mulatta 0.290 0.133 0.228 0.079 fascicularis 0.489 0.172 0.518 0.159
Folivores Colobus badrus
guereza polykomos uerus
Presbytis phayrei aygula eristatus
Nasalis larvatus Omnivores Cercopithecus aethiops Papto cynocephalus
anu bis ursinus
Theropithecus gelada
- 0.070 0.140 0.103 0.119 0.120
- 0.094 0.053
- 0.367
- 0 251 -
0.139 - 0.067
0.226 -0.044
0.014 0.014
-0.004 0.082 0.133
- 0.024 -0.010 - 0.208
-0.156 0.084 0.066 0.153 0.137
-0.096 0.059
- 0.392
0,070 0.020
-0,007 0.069 0.109
-0.102 - 0.072 - 0.091
-0.150 -0.264 -0.133 0.103 0.126 0.181 0.001 -0.107 -0.003 0.047 0.163 - 0.043 - 0.083 -
Bartlett’s test: X2 = 0.602 0.249 0.417 0.400 d.f. = 2 2 2 2 Significance : None None None None

CERCOPITHECOID ODONTOMETRICS 527 31
LIWMX 2
31
LIWFX 2
, , I omnivore
b C /
V
6
4 ,
) & I
2 0 30 LMWT
omnivore
b
1 - I 1
I 8 2 5 LFWT
Fig. 2 Plot of the natural logarithm of maxillary incisor width against the natural logarithm of body weight for males (upper graph) and females (lower graph) of 29 cercopithecoid species. Refer to figure 1 for species code.
528 SERGE GOLDSTEIN, DAVID
normally distributed residuals in each diet class because of the small number of om- nivores in our sample. We did, however, exam- ine the overall distribution of the residuals across the diet classes using a chi-square test for normality; for none of our models did the residuals deviate significantly from normal- i ty on this test. Hence we concluded tha t , to t he extent testable, our data satisfied the distributional assumptions of analysis of co- variance.
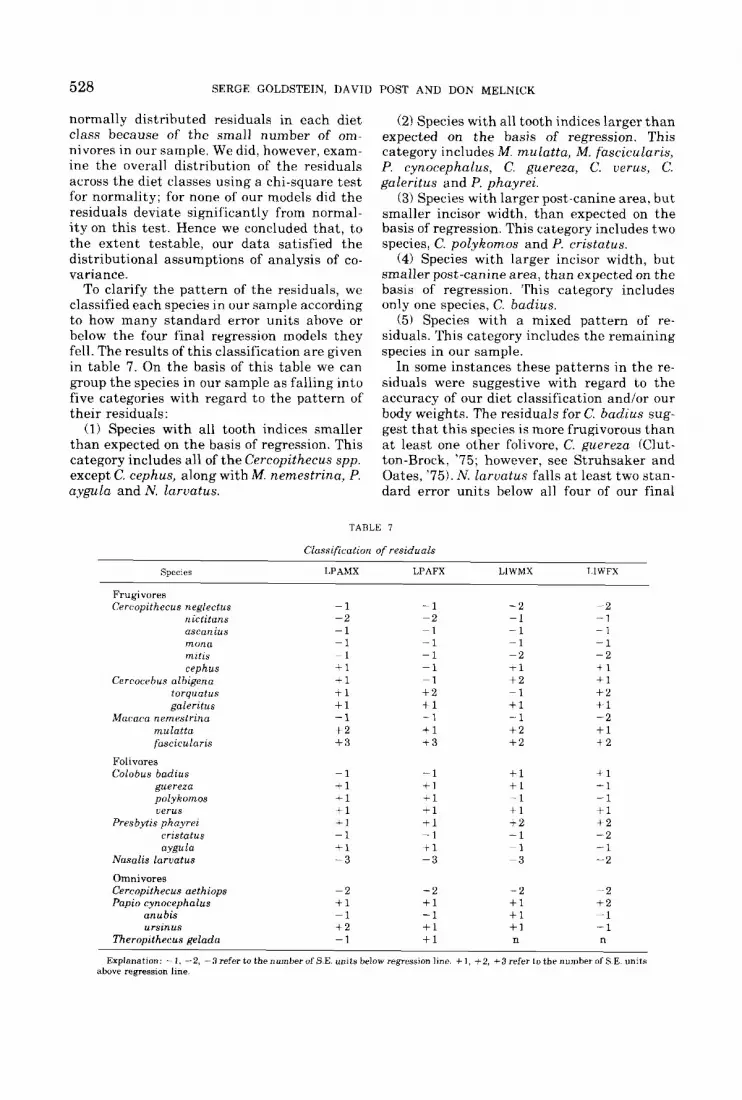
To clarify the pattern of the residuals, we classified each species in our sample according to how many standard error units above or below the four final regression models they fell. The results of this classification a re given in table 7. On the basis of this table we can group the species in our sample as falling into five categories with regard t o the pattern of their residuals:
(1) Species with all tooth indices smaller than expected on the basis of regression. This category includes all of the Cercopithecus spp. except C, cephus, along with M. nemestrina, P. a,ygula and N. laruatus.
POST AND DON MELNICK
(2) Species with all tooth indices larger than expected on t he basis of regression. This category includes M. mulatta, M. fascicularis, P. cynocephalus, C. guereza, C. uerus, C. galeritus and P. phayrei.
(3) Species with larger post-canine area, but smaller incisor width, than expected on the basis of regression. This category includes two species, C. polykomos and P. cristatus.
(4) Species with larger incisor width, but smaller post-canine area, than expected on the basis of regression. This category includes only one species, C. badius.
( 5 ) Species with a mixed pattern of re- siduals. This category includes the remaining species in our sample.
In some instances these patterns in the re- siduals were suggestive with regard to the accuracy of our diet classification and/or our body weights. The residuals for C. badzus sug- gest tha t this species is more frugivorous than at least one other folivore, C. guereza (Clut- ton-Brock, '75; however, see Struhsaker and Oates, '75). N. laruatus falls at least two stan- dard error units below all four of our final
TABLE T
Classification of residuals
S p e c m LPAMX LPAFX LlWMX T.IWFX
Frugivores Cercopithecus neglectus
riictitans ascanius mona mitw cephus
Cerrocchus albigena torquatus galeritus
Maraca nninestrina mulatta fascicularis
Folivores Colobus badius
guereza polykomos uerus
Presbytis phayrez crastatus aygula
Nasalis laruatus Omnivores Cercopithecus aethiops Papio cynocephalus
anubis ursinus
Theropithecus gelada
-1 -2 -1 -1 -1 t 1 +1 tl +1 -1 + 2 + 3
-1 +1 + l + l -1 -1 7 1 - 3
- 2 +1 -1 + 2 -1
-1 -2 ~~ 1 -1 -1 -1 -1 +2 +1 -1 +1 + 3
-1 + 1 t l + l +1 -1 + 1 -3
- 2 +1 -1 f l + l
- 2 -1 -1 -1 - 2 t 1 + 2 -1 +1 -1 + 2 + 2
fl + l -1 + 1 t 2 -1 -1 - 3
- 2 f l f l f l n
- 2 -1 - i -1 - 2 $1 +1 + 2 t l -2 +1 t 2
i l -1 -1 +1 t 2 - 2 -1 - 2
- 2 + 2 -1 -1 n
Explanation: - 1 . -2 , - n r e f e r t o t h e n u m ~ r o f S . E . units helowregression line. + I , +2. f3 re fe r to thenumhero fSE . units above regression line.
CERCOPITHECOID OUONTOMETRICS 529
regression models, suggesting either tha t this species is highly folivorous (cf. Hylander, ’751 or t ha t our body weights for this species are overestimated. The inclusion of the large- bodied macaques in the frugivore diet class may tend to push the intercept of the fru- gvore regression equations upwards, result- ing in overestimates of the tooth size of the smaller-bodied Cercopithecus spp. (and a con- comitant underestimate of t he tooth size of the large-bodied frugivores).
For all of the species in our sample, the in- terpretation of the residuals is complicated by the fact t ha t they may be viewed as giving us information about either the accuracy (or ade- quacy) of our diet classification or about the accuracy of our body weights. We do not believe tha t either the data on diet or on body weight is precise enough in our analysis to warrant a choice between these views.
DISCUSSION
The results of our analyses are discussed un- der two headings: (1) comparison of t he simple bivariate regression equations with the final regression models (i.e., comparison of equa- tions l’ and 3’ at the beginning of the article); (2) comparisons of t he four final regression models. (1) Under the first heading, the prin- cipal result is tha t the simple bivariate regres- sion equations show positive allometric scal- ing of tooth size on body size, while the final regression models show nearly perfect iso- metric scaling of tooth size on body size (the one exception to this statement is female in- cisor width, which scales with slight negative allometry in the simple bivariate regression). In other words, within our sample of cer- copithecoids, teeth scale isometrically within diet classes and with positive allometry (at close to the metabolic scaling rate) across diet classes. We believe tha t this result may shed light on a persistent debate concerning the scaling of mammalian teeth, a debate which has recently focussed on various primate taxa. Gould, examining the relationship between post-canine area and body size in a variety of mammalian groups (hystricomorph rodents, suine artiodactyles, cervids, and living and extinct primates), concludes tha t the data “justify a general hypothesis of positive al- lometry for the scaling of post-canine tooth areas in interspecific plots for mammalian herbivores of fairly similar design” (Gould, ”75: p. 358). Similarly, Pilbeam and Gould (’74: p. 898) claim to have established “a
plausible case tha t positive allometry of post- canine tooth area is the expected situation in sequences of related mammals tha t vary in size but not in basic design,” although in both of the above cases the authors admit tha t fur- ther testing is required before the relationship can be considered firmly established. Two major arguments are advanced to explain this trend. The first suggests tha t since metabolic demands scale at a power of 0.75 with body weight, this might necessitate a scaling of post-canine area greater than simple geomet- ric isometry (expected exponent of 0.66). Sec- ondly, Rensberger (’73) and Gould (’75) sug- gest tha t small herbivores a re more likely to pursue a specialist feeding strategy, concen- trating on “the tenderest and highest sources of energy and protein” (Rensberger, ’73: p. 8491, and therefore may require relatively less post-canine area than their larger, generalist relatives.
Kay, while accepting this thesis in general outline, has argued tha t when dietary influ- ences are removed, tooth surfaces scale iso- metrically with body size (Kay, ’73, ’75): and further tha t the observed tendency towards positive allometry discerned by Pilbeam and Gould may be an artifact of the interdepen- dence of diet and body size:
“. . . for noncercopithecoid primates a t a particular body size, frugivoroufi species have smaller teeth than do their insectivorous or folivorous relatives. Thus, for any group for which this holds, regression equations would appear to be positively allometric if the group’s smallest members were frugivorous and its large mem- bers folivorous.” (Kay. ‘75: p. 63) Our results seem t o confirm both hypothe-
ses; if the species in our sample can be con- sidered to “vary in size but not in basic de- sign,” positive allometry does indeed seem to hold across the entire sample for at least three of our four tooth indices. Within diet classes, however (i.e., “with dietary influences re- moved”), t he scaling exponents are in all cases remarkably close to the expected isometric values, as Kay had suggested.
These two apparently conflicting views regarding tooth scaling thus may not be in- compatible with one another; dietary prefer- ence within our sample is significantly corre- lated with body weight (taking the mean of the male and female weights for each species, mean frugivore weight = 5.97 kg, mean folivore weight = 7.96 kg, mean omnivore weight = 15.12 kg, and the difference among these means is significant, F = 11.01, df = 2,22, p < 0.05). More importantly, perhaps,
530 SERGE GOLDSTEIN, DAVID POST AND DON MELNICK
the int,ercepts of t he regression lines for each diet class are aligned in a fashion such tha t t he slope of the across diet class regressions have a value close to what would be expected if cercopithecoid teeth were scaling linearly with metabolic rate. In other words, Kay’s s t a t emen t (quoted above) regarding t h e causes of positive allometry in across diet class tooth scaling is fully supported by our re- sults, but needs to be supplemented by the additional, and we believe significant, state- ment tha t at a given body weight the mean differences in tooth size of each diet class are such tha t across diet class tooth scaling ap- pears to be linear with metabolic rate. Fur- ther, the relationship between dietary prefer- ence and body weight may follow directly from the arguments advanced by Rensberger dis- cussed above. The increase in relative tooth size as one moves from the relatively small- bodied frugivores to the relatively large- bodied omnivores (and the resulting positive allometry within the sample as a whole) may be due to the differential nutritional quality of t he major food items utilized by the three groups, and to the inability of teeth scaling isometrically within each diet class to accom- modate to the new demands when extrapo- lated to higher body sizes (cf. discussion in
We therefore agree with Pilbeam and Gould (’74) that positive allometry of the tooth area within the interspecific australopithecine plot affords no evidence for dietary differences of the kind envisaged by Robinson (‘72: pp. 245- 256) involving a greater degree of “omnivory” (i.e., mixed carnivory-herbivory) on the part of the smaller A. africanus. Their statement tha t positive allomet,ry of tooth area in aus- tralopjthecines affords no evidence of dif- ferences in diet or behaSior” (Pilbeam and Gould, ’74: p. 898) must be read within the context of the major differences Robinson pos- its, for, simply as it stands. i t is not consistent with either the data presented above, the re- sults of Corruccini and Henderson (’78) and Kay (‘75), or their own discussion of diet,ary differences among the living pongids (p. 897). Positive allometry implies neither complete dietary equivalence, as such a statement suggests, nor the more extreme differences of Robinson’s “dietary hypothesis.” Positive allometry within the australopithecine se- quence probably reflects a degree of dietary differentiation the magnitude of which was equal to the differentiation among the cer-
Gould, “71: pp. 117-118),
copithecoids in our sample; tha t t he larger species may have had a more fibrous (but equally “vegetarian”) diet should not be taken as support for Robinson‘s hypothesis (as Kay (’75) suggests) with i ts explicit reference to the differences in the degree of carnivory.
There is one major difficulty with the in- terpretation outlined above, namely tha t t he effect we have attributed to diet in our final regression models might very well be given another attribution. I t will be noted, for exam- ple, tha t our diet classes are nearly syn- onymous with taxonomic groupings. The fru- givore diet class is largely synonymous with the genera Macaca, Cercocebus and Cer- copithecus, the folivore diet class with the genera Colobus, Presbytis and Nasalis, and the omnivore diet class with the genera Papio and Theropithecus. Although this synonymy should not be surprising (since dietary prefer- ence, and its effect on morphology, has clearly played a large role in the construction of the taxonomy of t h e cercopithecoids). i t remains tha t because of it. we cannot distinguish be- tween a taxonomic and a dietary interpreta- tion of t he effects we have attributed to diet.
Another difficulty with our interpretation of the differences in within and between diet class tooth scaling is tha t the 95% confidence intervals for t he body weight scaling coeffi- cients do not in general distinguish between isometric and “metabolic” scaling. Hence i t is not clear t o what extent our findings can be extrapolated. Given the fact tha t we have sampled nearly a third of t he 90 or so extant cercopithecoid species, we feel that our in- terpretation can be extrapolated a t least to this entire taxon. We would caution against wider extrapolation, however, since our analy- sis was based in part on the premise tha t be- tween species comparisons of tooth size can give useful information about tooth function only insofar as the species so compared show gross morphological uniformity in their teeth. (2) Under the second heading, there a re two comparisons of note. The first. is the com- parison of the incisor width and post-canine area regression models. Diet accounts for a much larger percentage of the SS in incisor width than in post-canine area for both males and females. In the case of the females, diet is not a significant predictor of post-canine area, while in the males, the only significant die- tary contrast is between the omnivores and the two other diet classes. There is no indica- tion in our data of folivores having larger

CERCOPTTHECOID ODONWJMETRICS 53 1
cheek teeth, relative to body weight, than either frugivores or omnivores (as might be predicted on functional grounds). The wide in- cisors of frugivores, relative to their body sizes, is consistent with the functional hy- pothesis that frugivores require large incisors for slicing through the tough skin of certain fruits (cf. Hylander, '75). The omnivores in general appear to have larger teeth, relative to their body sizes, than either the folivores or the frugivores. With regard to the incisors, a t least, this can be interpreted within the con- text of the explanation proffered by Hylander ("75) and Kay ('731, namely that the tough gritty diet of omnivores selects for large in- cisors (and possibly also large cheek teeth).
The second comparison is between the final regression models for the males and for the females. There are some data that suggest that males and females of a t least one primate species, P. cynocephalus, differ in their die- tary preferences (Post, '781, but otherwise we can proffer no functional explanations for the differences in the male and female final regression models. There remains the possi- bility that some of these differences are due to underestimates of female body weights, and that body weight dimorphism is acting as a correction factor for the species whose female body weights are underestimated.
ACKNOWLEDGMENTS
We thank David Pilbeam, Stephen Gould, John Rhoads, William Hylander, Richard Kay and two anonymous reviewers for reading and providing valuable criticisms of an earlier draft of this paper. We also thank Joyce Sirianni for providing us with data from her dissertation and Ray Heimbuch for advice on the statistics.
LITERATURE CITED
Bauchot. R., and €1. Stephan 1969 Encephalization et niveau evolutiv chez les simiens. Mammalia, 33: 225-275.
Booth, A. H. 1957 Observations on the natural history of the olive colobus monkey. Prorolobus iwrus. Proc. Zool. Soc. Lond., 122: 297-394
Clutton-Brock, T. 1975 Feeding behavior of red colohus and black and white colobus in East Africa. Folia primat., 23: 165-207.
Clutton-Brock, T.. and P. Harvey 1977 Primate ecology and social organization. J. zool., 183: 1-39.
Corruccini, R. S., and A. M. Henderson 1978 Multivariate dental allometry in primates. Am. J. Phys. Anthrop., 48: 203-208.
Dunhar, R. I. M. 1977 Feedingecologyof gelada baboons: A preliminary report. In: Primate Ecology. T. H. Clutton- Brock, ed. Academic Press, New York.
Freedman, L. 1957 The fossil Cercopithecoidea of South Africa. Ann. Transvaal Mue., 23: 121-262.
Gautier-Hion. A. 1975 Dimorphisme sexuel et organisa- tion sociale chez lee Cercopithecines forestiers Afri- caines. Mammalia, 39: 365-374.
Gould, S. J. 1971 Geomptric similarity in allometric growth: a contribution to the problem of scaling in the evolution of size. Am. Nat., 105: 113-136. I_ 1975 On the scaling of tooth size in mammals.
Amer. Zool., 15: 351-362. Haddow, A. J. 1952 Field and laboratory studies on an
African monkey, Cercopithecus nscnnius s c h m i d t i Matsche. Pror. Zool. SOC. Lond., 129: 421 430.
Range Utilization by a Troop of Olive Baboons. Ph.D. thesis, University of California, Berkeley.
Hylander, W. L. 1975 Incisor size and diet in Anthro- poids with special reference to Cercopithecidae. Science, 189: 1095-1098.
Jolicoeur, P. 1968 Interval estimation of the slope of the major axis of a bivariate normal distribution in the case of a small sample. Biornetrics, 24: 679-682.
Jolly, C. 1972 The classification and natural history of 'Theroprthecus (Sinopithecusi (Andrews, '16) baboons of the African Plio-Pleistocene. Bull. of the Brit. Mus. (Nat. Hist.), 22(1).
Kay. R. 1973 Mastication, Molar Tooth Structure, and Diet in Primates. Ph.D. Thesis, Yale University.
1975 Allometry and early hominids (Letter). Science, 189: 63,
1978 Molar structure and diet in extant Cer- copithecidae. In: Development, Function, and Evolution of Teeth. K. Joysey, ed. Academic Press, London, in press.
Leutenegger, W. 1971 Metric variability of the postca- nine dentition in colobus monkeys. Am. J. Phys. An- throp., 35: 91.100. -__ 1976 Metric variability in the anterior dentition of African colohines. Am. J. Phys. Anthrop., 45: 45-52.
Leutenegger, W., and J. T. Kelly 1977 Relationship of sex- ual dimorphism in canine size and body size to social, be- havioral and ecological correlates in anthropoid primates. Primates, 18: 117-136.
Malbrandt, M., and A. Maclatchy 1949 Faune de L'Equateur Africaine Francais. Tome 11. Mammiferes. Paul Lechevalier, Paris.
Napier, J. R ~ and P. H. Napier 1967 A Handbook of Living Primates. Academic Press, New York.
Nie, N. H., C. H. Hull, J. G. Jenkins, K. Steinbrenner. and U €1. Bent 1975 Statistical Package for the Social Sciences. Second ed. McGraw Hill, New York.
Pilbeam, 11. R., and S. J. Gould 1974 Size and scaling in human evolution. Science, 286: 892-901.
Post, D. G. 1978 Feeding and Ranging Behavior of Yellow Baboons (Papio cynocephalusi. Ph.D. thesis, Yale University.
Post, D., S. Goldstein and 1). Melnick 1978 An analysis of Cercopithecoid odontometrics. 11. Relations between den- tal dimorphism, hody size dimorphism and diet. Am. J. Phys. Anthrop., 49: 533-544.
Rensberger, J. M. 1973 Sanctimus (Mammalia, Roden- tia) and the phyletic relationships of the large Ankareean geomyoids. J. Paleont., 47: 835-853.
Robinson. J. T. 1972 Early Hominid Posture and Locomution. University of Chicago Press, Chicago.
Rose, M. D. 1977 Positional behavior of olive baboons Pupio flubi id and its relationship to social and mainte- nance activities. Primates, 18: 59.116.
Rozin, P. The selection of fond by rats, humans, and other animals. Adv. Stud. Beh., 6: 21-76.
Sirianni, J. 1974 Dental Variahility in African Cer- copithecidae: A Morphologic, Metric and Discriminant Analysis Ph.D. thesis, University of Washington.
Harding, R. S. 0. 1973
1976

532 SERGE GOLDSTEIN, DAVID POST AND DON MELNICK
Snedecor, G. W., and W. C. C.ochran 1967 Statistical Meth- ods. Sixth ed. Iowa State University Press, Ames, Iowa.
Sokal. R. R., and F. J. Rohlf 1969 Biometry. W. H. Freeman, San Francisco.
Struhsaker. T. T. 1967 Ecology of vervet monkeys (Cer- copithecus aethiopsi in the Masai-Amboseli Game Re- serve. Ecology, 48: 891-904.
1975 The Red Colubus Monkey. University of Chicago Press, Chicago.
Struhsaker, T. T., and J. F. Oates 1975 Comparison of the
behavior and ecology of red colobus and black and white colobus monkeys in Uganda: A summary. In: Socio- ecology and Psychology of Primates. R. Tuttle, ed. Mouton, The Hague.
Swindler, D. S. 1976 The Dentition of Living Primates. Academic Press, New York.
Swindler, D. S., H. A. McCoy and P. V. Hornbeck 1967 The dentition of the baboon Papio unubisi. In: The Baboon in Medical Kesearch. Vol. TI. H. Vagtborg, ed. University of Texas Press, Austin.
APPENDIX
In Model I1 regression (i.e., when the inde- pendent variables are measured with error) the sample regression coefficients do not pro- vide an unbiased estimate of the population regression coefficients; they are biased down- wards by a factor of 1 + a, where a is com- puted as the ratio of the (measurement) error variance in the independent variable and the “true” variance in the independent variable - the “true” variance is in turn computed as the difference between the observed variance and the (measurement) error variance (Sne- decor and Cochran, ’67: pp. 164-167). Al- though we cannot compute the error variance, in the case of the body weights we can get some idea of how large the bias in the com- putation of the regression coefficients might be by assuming that our data on body weights is on average in error by 10%. The observed variance of t h e body weights (log-trans-
formed) is about 0.30 (table 1). Under log- transformation, the average error of 10% in our body weight data are transformed into additive error variance terms of about 0.01. The downward bias in our sample regression coefficients can now be estimated as follows:
0.01 0.30 - 0.01
a=--- - 0.034
Thus assuming an average error of 10% in our body weight data, we obtain about a 3.5% downward bias in our estimates of the popula- tion regression coefficients. Our body weight data are clearly only approximate, but we feel that on average these weights are off by con- siderably less than l o % , hence we see no com- pelling reason to introduce the above correc- tion factor in our sample regression coeffi- cients, or even more radically to abandon the least-squares regression line fitting technique in favor of major axis equations.


