Embed Size (px)
Citation preview
© 2010 Taylor & Francis Group, LLC
6000 Broken Sound Parkway, NW Suite 300, Boca Raton, FL 33487711 Third Avenue New York, NY 100172 Park Square, Milton Park Abingdon, Oxon OX14 4RN, UK
an informa business
www.taylorandfrancisgroup.com
K12865
“This book is the most comprehensive treatment of animal amino-acid metabolism and will be a valuable resource to all working in this area.”
—Dr. Malcolm Watford, Professor of Nutrition, Rutgers University
“Dr. Wu’s book is a highly valuable contribution to the armamentarium of knowledge in nutritional biochemistry and will be a classic textbook in the area.”
—Dr. Teresa A. Davis, Professor of Pediatrics, Baylor College of Medicine
Amino acid biochemistry and nutrition spans a broad range of fields including biochemistry, metabolism, physiology, immunology, reproduction, pathology, and cell biology. In the last half-century, there have been many conceptual and technical advancements, from analysis of amino acids by high-performance liquid chroma-tography and mass spectrometry to molecular cloning of transporters for amino acids and small peptides. Amino Acids: Biochemistry and Nutrition presents comprehensive coverage of these scientific developments, providing a useful refer-ence for students and researchers in both biomedicine and agriculture.
The text begins with the discoveries and basic concepts of amino acids, peptides, and proteins, and then moves to protein digestion and absorption of small peptides and amino acids. Additional chapters cover cell-, tissue-, and species-specific syn-thesis and catabolism of amino acids and related nitrogenous substances (includ-ing nitric oxide, creatine, and heme), as well as the use of isotopes to study amino acid metabolism in cells and the body. The book also details protein synthesis and degradation, regulation of amino acid metabolism, physiological functions of amino acids, and inborn errors of amino acid metabolism. The final chapter discusses di-etary requirements of amino acids by humans and other animals.
While emphasizing basic principles and classical concepts of amino acid biochem-istry and nutrition, the author includes recent progress in the field. This book also provides concise coverage of major historical developments of the scientific disci-pline, so that readers will appreciate the past, understand the current state of the knowledge, and explore the future of amino acid biochemistry, nutrition, and physi-ology. Each chapter contains select references to provide comprehensive reviews and original experimental data on the topics discussed.
Nutrition
Amino Acids
Am
ino
Ac
ids
Guoyao Wu
Wu
Biochemistry and Nutrition
Bio
che
mis
try a
nd
Nutritio
n

© 2010 Taylor & Francis Group, LLC
AminoAcids
Biochemistry and Nutrition


© 2010 Taylor & Francis Group, LLC
Boca Raton London New York
CRC Press is an imprint of theTaylor & Francis Group, an informa business
AminoAcids
Guoyao Wu
Biochemistry and Nutrition

CRC PressTaylor & Francis Group6000 Broken Sound Parkway NW, Suite 300Boca Raton, FL 33487-2742
© 2013 by Taylor & Francis Group, LLCCRC Press is an imprint of Taylor & Francis Group, an Informa business
No claim to original U.S. Government worksVersion Date: 20130220
International Standard Book Number-13: 978-1-4398-6190-5 (eBook - PDF)
This book contains information obtained from authentic and highly regarded sources. Reasonable efforts have been made to publish reliable data and information, but the author and publisher cannot assume responsibility for the validity of all materials or the consequences of their use. The authors and publishers have attempted to trace the copyright holders of all material reproduced in this publication and apologize to copyright holders if permission to publish in this form has not been obtained. If any copyright material has not been acknowledged please write and let us know so we may rectify in any future reprint.
Except as permitted under U.S. Copyright Law, no part of this book may be reprinted, reproduced, transmit-ted, or utilized in any form by any electronic, mechanical, or other means, now known or hereafter invented, including photocopying, microfilming, and recording, or in any information storage or retrieval system, without written permission from the publishers.
For permission to photocopy or use material electronically from this work, please access www.copyright.com (http://www.copyright.com/) or contact the Copyright Clearance Center, Inc. (CCC), 222 Rosewood Drive, Danvers, MA 01923, 978-750-8400. CCC is a not-for-profit organization that provides licenses and registration for a variety of users. For organizations that have been granted a photocopy license by the CCC, a separate system of payment has been arranged.
Trademark Notice: Product or corporate names may be trademarks or registered trademarks, and are used only for identification and explanation without intent to infringe.
Visit the Taylor & Francis Web site athttp://www.taylorandfrancis.com
and the CRC Press Web site athttp://www.crcpress.com

v
© 2010 Taylor & Francis Group, LLC
ContentsPreface....................................................................................................................xviiAcknowledgments ...................................................................................................xixAuthor .....................................................................................................................xxi
Chapter 1 Discovery and Chemistry of Amino Acids ..........................................1
Definition and Nomenclature of AA ....................................................1Definition of AA ..............................................................................1Definition of Imino Acids ................................................................3Isomers of AA .................................................................................3Protein and Nonprotein AA.............................................................5Free and Peptide (Protein)-Bound AA ............................................5
Discovery of AA ..................................................................................8l-AA and Glycine ............................................................................8β- and γ-AA with Physiological Significance ............................... 15d-AA .............................................................................................. 16
Presence of d-AA in Foods ...................................................... 16Presence of d-AA in the Animal Kingdom .............................. 17
Chemical Properties of AA ................................................................ 18Physical Appearance and Melting Points of Crystalline AA ........ 18Tastes of Crystalline AA ...............................................................20Solubility of AA in Water and Organic Solvents ..........................20Zwitterionic Form of AA............................................................... 21Stability of AA in Water and Buffered Solutions ..........................22Stability of AA in Water under High Pressure and High Temperature ...................................................................................23Stability of AA in Strong Acid and Alkaline Solutions ................23Chemical Reactions of AA ............................................................24
Chemical Reactions of the Amino Group in α-AA .................24Chemical Reactions of the Carboxyl Group in α-AA ..............26Chemical Reactions of the Side Chain in α-AA ......................27Chemical Reactions Involving Both the Amino and Carboxyl Groups of α-AA ........................................................27
Proteins ..........................................................................................30Peptides versus Proteins ................................................................30
Summary ............................................................................................ 31References .......................................................................................... 32
Chapter 2 Protein Digestion and Absorption of Peptides and Amino Acids ...... 33
Classification and Content of Protein in Diets ...................................34Classification of Protein ................................................................34

vi Contents
© 2010 Taylor & Francis Group, LLC
Content of Foodstuff Proteins of Animal and Plant Origin ..........34Definitions of Digestion and Absorption............................................ 35
Digestion ........................................................................................ 35Absorption ..................................................................................... 35Developmental Changes in Intestinal Digestion and Absorption .... 37
Protein Digestion and Absorption of Peptides and AA in Monogastric Animals ....................................................... 38
Historical Perspective of Protein Digestion and Absorption ......... 38Digestion of Dietary Protein in the Gastrointestinal Tract ........... 38Determination of Protein Digestibility ..........................................40Absorption of Free AA and Small Peptides by the Small Intestine ......................................................................................... 42
Transport of Free AA via Transmembrane Transporters ......... 42Transport of AA via the γ-Glutamyl Cycle .............................. 42Transport of Small Peptides ..................................................... 42
Net Balance of AA across the Small Intestine in Fed Animals ....46Extensive Recycling of Nitrogen in the Intestine of Animals .......48
Protein Digestion and Absorption of Peptides and AA in Ruminants ...................................................................................... 51
Nutritional Significance of Protein Digestion in Ruminants......... 51Digestion of Dietary Protein in the Gastrointestinal Tract ........... 52Absorption of Free AA and Small Peptides by the Small Intestine ......................................................................................... 55Nitrogen Recycling in Ruminants and Its Nutritional Implications ................................................................................... 55Protecting High-Quality Protein from Rumen Degradation .........56
Heating ...................................................................................... 57Chemical Treatments ................................................................ 57Polyphenolic Phytochemicals ................................................... 57Physical Encapsulation of Proteins or AA................................ 59Inhibition of AA Degradation .................................................. 59
Summary ............................................................................................ 59References ..........................................................................................60
Chapter 3 Synthesis of Amino Acids .................................................................. 63
Synthesis of AA in Tissues and Cells of Animals .............................64General Considerations .................................................................64Cell-, Tissue-, and Species-Specific Synthesis of AA ...................64
General Pathways for Synthesis of AA in Animal Cells ................... 70Overall Pathways for Synthesis of AA in Animal Cells ............... 70Historical Aspects of AA Transamination .................................... 70
Specific Pathways for Synthesis of AA in Animal Cells ................... 72Synthesis of Alanine, Glutamine, and Glutamate in Animal Cells ... 72Synthesis of Arginine, Citrulline, and Ornithine in Animal Cells ....74Synthesis of Cysteine and Taurine in Animal Cells ...................... 76
viiContents
© 2010 Taylor & Francis Group, LLC
Synthesis of Glycine and Serine in Animal Cells ......................... 76Synthesis of Methylarginines in Animal Cells ............................. 79Synthesis of Proline and Hydroxyproline in Animal Cells ........... 81Synthesis of Tyrosine in Animal Cells .......................................... 82Formation of β-Alanine in Animal Cells ...................................... 83
Pathways for Synthesis of AA in Microorganisms ............................ 83Overall Pathways for Synthesis of AA in Microorganisms .......... 83Pathways for Synthesis of NEAA in Microorganisms ..................84Pathways for Synthesis of EAA in Microorganisms .....................87
Synthesis of d-AA in Animal Cells and Bacteria .............................. 91Conversion of d-AA to l-AA in Animal Cells and Bacteria .............92Summary ............................................................................................93References ..........................................................................................94
Chapter 4 Degradation of Amino Acids .............................................................97
General Characteristics of AA Degradation in Animal Cells ...........97Overall View of AA Catabolism ...................................................97Cell- and Tissue-Specific Degradation of AA ............................. 103
Pathways for Degradation of AA in Animal Cells........................... 105Historical Perspective .................................................................. 105Catabolism of Alanine, Aspartate, Asparagine, Glutamate, and Glutamine ............................................................................. 106Catabolism of Arginine, Citrulline, and Ornithine ..................... 111Catabolism of BCAA .................................................................. 118Catabolism of Glycine and Serine ............................................... 123Catabolism of Histidine ...............................................................124Catabolism of Lysine ................................................................... 127Catabolism of Phenylalanine and Tyrosine ................................. 128Catabolism of Proline .................................................................. 128Catabolism of Sulfur-Containing AA ......................................... 131Catabolism of Threonine ............................................................. 134Catabolism of Tryptophan ........................................................... 135
Catabolism of d-AA in Animal Cells .............................................. 138Catabolism of l-AA and d-AA in Microorganisms ........................ 138Summary .......................................................................................... 142References ........................................................................................ 143
Chapter 5 Synthesis and Catabolism of Special Nitrogenous Substances from Amino Acids............................................................................ 145
Production of Dipeptides Consisting of Histidine or Its Methylated Derivatives ........................................................... 145
History of Research on Carnosine and Related Dipeptides in Animal Tissues ............................................................................ 145

viii Contents
© 2010 Taylor & Francis Group, LLC
Synthesis of Carnosine and Related Dipeptides .......................... 148Catabolism of Carnosine and Related Dipeptides ....................... 149
Synthesis and Degradation of GSH .................................................. 149History of GSH Research ............................................................ 149Concentrations of GSH in Physiological Fluids and Tissues ...... 150GSH Synthesis ............................................................................. 150Regulation of GSH Synthesis ...................................................... 152Transport and Degradation of GSH ............................................. 153
Production of Gly–Pro–Hydroxyproline .......................................... 153Abundance of Tripeptide Gly–Pro–Hydroxyproline in Milk and Plasma ................................................................................... 153Utilization of Gly–Pro–Hydroxyproline by Animals .................. 154
Synthesis and Catabolism of Polyamines ......................................... 155History of Polyamine Research ................................................... 155Polyamine Synthesis .................................................................... 156
Pathways of Polyamine Synthesis ........................................... 156Regulation of Polyamine Synthesis ........................................ 158
Polyamine Degradation ............................................................... 158Synthesis and Utilization of Creatine ............................................... 159
History of Creatine Research ...................................................... 159Creatine Synthesis through Interorgan Cooperation ................... 159Regulation of Creatine Synthesis ................................................ 161Degradation of Creatine .............................................................. 161
Synthesis and Catabolism of l-Carnitine ......................................... 161History of Carnitine Research ..................................................... 161Carnitine Synthesis through Interorgan Cooperation ................. 162Regulation of Carnitine Synthesis ............................................... 164Catabolism of Carnitine .............................................................. 165
Synthesis and Catabolism of Purine and PyrimidineNucleotides .........................................................................................165
History of Purine and Pyrimidine Research ............................... 165Purine and Pyrimidine Bases in Nucleotides .............................. 165Synthesis of Purine Nucleotides .................................................. 166Synthesis of Pyrimidine Nucleotides .......................................... 168
Regulation of Pyrimidine Nucleotide Synthesis ..................... 170Catabolism of Purines and Pyrimidines...................................... 170
Heme Synthesis and Catabolism ...................................................... 171History of Heme Research .......................................................... 171Pathways of Heme Biosynthesis .................................................. 172Regulation of Heme Biosynthesis ................................................ 174Regulation of Heme Synthesis in Hepatocytes ........................... 174
Regulation of Heme Synthesis in Erythroid Cells .................. 175Catabolism of Heme .................................................................... 176
Synthesis and Catabolism of Histamine .......................................... 177Synthesis of Histamine ................................................................ 177Catabolism of Histamine ............................................................. 178

ixContents
© 2010 Taylor & Francis Group, LLC
Synthesis and Catabolism of Catecholamines, Thyroid Hormones, and Melanin ..................................................... 178
Synthesis and Catabolism of Catecholamines ............................. 178Synthesis and Catabolism of Thyroid Hormones ........................ 180Synthesis and Catabolism of Melanin ......................................... 181
Synthesis and Catabolism of Serotonin and Melatonin ................... 184Synthesis of Serotonin and Melatonin ......................................... 184Catabolism of Serotonin and Melatonin ...................................... 185
Synthesis and Catabolism of d-Glucosamine and Glycosaminoglycans......................................................................... 185
Historical Perspectives ................................................................ 185Synthesis and Catabolism of d-Glucosamine ............................. 186
Synthesis of d-Glucosamine ................................................... 186Catabolism of Glucosamine-6-P ............................................ 186
Synthesis and Catabolism of Glycosaminoglycans ..................... 187Synthesis of Glycosaminoglycans .......................................... 187Catabolism of Glycosaminoglycans ....................................... 188
Conjugation Products for Excretion ................................................. 190Formation of Hippurate from Glycine ......................................... 190Formation of Phenylacetylglutamine from Phenylalanine and Glutamine ............................................................................. 191
Summary .......................................................................................... 191References ........................................................................................ 192
Chapter 6 Synthesis of Urea and Uric Acid ...................................................... 195
Ammonia Production and Toxicity in Animals ............................... 195Historical Observations on Ammonia Production ...................... 195Removal of Ammonia in Animals under Physiological Conditions .................................................................................... 196Ammonia Toxicity to the Central Nervous System ..................... 197
Urea Production in Mammals .......................................................... 198Historical Perspectives ................................................................ 198Hepatic Urea Cycle in Mammals ................................................ 198Calculation of Urea Production in Mammals .............................. 201Synthesis of Urea from Ammonia in Extrahepatic Cells ............203Regulation of the Urea Cycle in Mammals .................................203Energy Requirement of Ureagenesis ...........................................206Urea Recycling in Ruminants ......................................................207Excretion of Urea by the Kidney .................................................207
Uric Acid Synthesis ..........................................................................209Historical Perspectives ................................................................209Conversion of Ammonia and Bicarbonate to Purine Nucleosides ..................................................................................209Uric Acid Synthesis from Purine Nucleosides ............................ 211Regulation of Uric Acid Synthesis .............................................. 211

x Contents
© 2010 Taylor & Francis Group, LLC
Energy Requirement for Uric Acid Synthesis ............................. 212Synthesis of Uric Acid from Ammonia via Adenosine .......... 212Synthesis of Uric Acid from Ammonia via Guanosine .......... 214
Nutritional and Metabolic Implications of Uric Acid Synthesis.... 215Species-Dependent Degradation of Uric Acid ............................ 215Excretion of Uric Acid by the Kidney ......................................... 216
Comparisons between Uric Acid and Urea Synthesis ...................... 216Similarities between Urea and Uric Acid Synthesis ................... 216Differences between Urea and Uric Acid Synthesis ................... 217
Summary .......................................................................................... 217References ........................................................................................ 218
Chapter 7 Use of Isotopes for Studying Amino Acid Metabolism ................... 221
Basic Concepts about Isotopes ......................................................... 221What Are Isotopes? ..................................................................... 221Decay of Radioisotopes ............................................................... 223Isotope Formula ...........................................................................225Tracer and Tracee ........................................................................225Concepts of Specific Radioactivity and Isotope Enrichment ...... 227
SR of Radioactive Isotopes ..................................................... 227Isotope Enrichment of Stable Isotopes ...................................228
Significance of SR and IE of a Tracer ......................................... 229Calculation of Product Formation or Metabolic Flux Using Radioisotopes ............................................................... 229Calculation of Product Formation or Metabolic Flux Using Stable Isotopes ..............................................................230
Why Are Isotopes Used in Metabolic Research? ........................ 231Interpretation of Data from Isotope Experiments ............................ 232
Changes in the SR or IE of the Intracellular Labeled Precursor Pool ............................................................................. 233
Increased Dilution of the Isotope in Cells .............................. 233Decreased Dilution of the Isotope in Cells .............................234
Isotope Randomization ................................................................ 235Isotope Exchange ......................................................................... 237Isotope Recycling ........................................................................ 237Isotopic Nonsteady State ............................................................. 238
Potential Pitfalls of Isotopic Studies ................................................240Summary .......................................................................................... 243References ........................................................................................ 243
Chapter 8 Protein Synthesis ..............................................................................245
Historical Perspectives of Protein Synthesis Pathway .....................245Pathways of Protein Synthesis in the Cytoplasm andMitochondria ....................................................................................246
xiContents
© 2010 Taylor & Francis Group, LLC
Pathway of Protein Synthesis in the Cytoplasm ..........................246Gene Transcription .................................................................246Initiation of Translation ..........................................................248Peptide Elongation .................................................................. 253Termination of Peptide Chain Elongation .............................. 255Posttranslational Modifications of Newly Synthesized Proteins ...................................................................................256
Pathway of Protein Synthesis in Mitochondria ........................... 258Biochemical Characteristics and Significance of Protein Synthesis .... 259
Energy Requirement .................................................................... 259Physiological Significance of Protein Synthesis ..........................260
Physiological Functions of Proteins ........................................ 261Regulation of Protein Concentrations ..................................... 261Replacement of Cells .............................................................. 262Wound Healing ....................................................................... 263Immune Responses ................................................................. 263
Measurements of Protein Synthesis ................................................. 263Measurement of Protein Synthesis In Vitro ................................ 263
General Considerations ........................................................... 263In Vitro Preparations ...............................................................264Choosing a Labeled AA Tracer ..............................................265Measuring Rate of Protein Synthesis .....................................266
Measurement of Protein Synthesis In Vivo ................................. 267General Considerations ........................................................... 267General Terminologies Used in Measuring Protein Turnover In Vivo ..................................................................... 267Pulse Labeling of Proteins by Single Administration of a Labeled AA .............................................................................269Flooding Dose Technique ....................................................... 271Continuous Infusion of a Tracer AA ...................................... 272Leucine Oxidation Method ..................................................... 274
Summary .......................................................................................... 276References ........................................................................................ 277
Chapter 9 Intracellular Protein Degradation .................................................... 279
Historical Perspectives of Intracellular Protein Degradation .......... 279Proteases (Peptidases) for Intracellular Protein Degradation ..........280
Classification by Reaction Type .................................................. 281Exopeptidases ......................................................................... 281Endopeptidases ....................................................................... 281
Classification by Catalytic Site .................................................... 282Classification by Evolutionary Relationship ................................284
Intracellular Proteolytic Pathways ...................................................284Lysosomal Proteolytic Pathway ...................................................285Nonlysosomal Proteolytic Pathway .............................................286

xii Contents
© 2010 Taylor & Francis Group, LLC
Ca2+-Dependent Proteolytic System (Calpain System) ..........286Caspases ..................................................................................286ATP-Dependent and Ubiquitin-Independent Proteolytic System .....................................................................................286ATP-Dependent and Ubiquitin-Dependent Proteolytic System .....................................................................................287
Characteristics and Physiological Significance of Intracellular Protein Degradation ......................................................................... 291
Biological Half-Lives of Proteins ................................................ 291ATP Requirement for Intracellular Protein Degradation ............ 291Physiological Significance of Intracellular Protein Degradation ... 293
Measurements of Intracellular Protein Degradation ........................294Measurement of Intracellular Protein Degradation In Vitro .......294
General Considerations ...........................................................294Tracer and Nontracer Methods for Measuring Protein Degradation In Vitro ............................................................... 295
Measurement of Intracellular Protein Degradation In Vivo ........297General Considerations ...........................................................297Pulse Labeling of Proteins by Single Administration of a Labeled AA ............................................................................. 298Leucine Oxidation Method .....................................................299Urinary Excretion of 3-Methylhistidine .................................299
Summary ..........................................................................................300References ........................................................................................ 301
Chapter 10 Regulation of Amino Acid Metabolism ...........................................303
Basic Concepts in Metabolism .........................................................305Chemical Reactions .....................................................................305Laws of Thermodynamics as Applied to AA Metabolism ..........306
First Law of Thermodynamics ...............................................306Second Law of Thermodynamics ...........................................307Concept of Free Energy Unifies the First and Second Laws of Thermodynamics ......................................................307
Concept of Equilibrium ...............................................................308Near-Equilibrium (Reversible) and Nonequilibrium (Irreversible) Reactions ................................................................309Enzymes as Biochemical Reactions ............................................ 310
Enzymes as Biological Catalysts ............................................ 310Reversible Inhibition of Enzymes ........................................... 310Irreversible Inhibition of Enzymes ......................................... 312
Intracellular Compartmentation of Metabolic Pathways............. 312Metabolic Design Principles ....................................................... 313Regulation of AA Metabolism .................................................... 314Allosteric Regulation ................................................................... 314Reversible Phosphorylation and Dephosphorylation of Protein .... 315

xiiiContents
© 2010 Taylor & Francis Group, LLC
Concentrations of Substrates and Cofactors ................................ 317Concentrations of Activators and Inhibitors ................................ 319Signal Transduction ..................................................................... 320
Binding of an Extracellular Ligand with the Plasma Membrane ............................................................................... 321Generation of Intracellular Second Messengers ..................... 322Covalent Modifications of Target Proteins ............................. 322Termination of Signaling Cascades ........................................ 323
Changes in Cell Volume .............................................................. 323Other Forms of Regulation of Enzyme Activity ......................... 324
Effects of Nutritional and Physiological Factors on AA Metabolism ....................................................................................... 324
AA Synthesis ............................................................................... 325Arginine Synthesis ................................................................. 325Glutamine Synthesis ............................................................... 325
AA Catabolism ............................................................................ 326Arginine Catabolism .............................................................. 326Glutamine Catabolism ............................................................ 327
Intracellular Protein Turnover ..................................................... 328MTOR Cell Signaling ............................................................. 328Factors That Affect Intracellular Protein Turnover ................ 330
Blood Flow as a Regulator of AA Metabolism In Vivo .............. 332Summary .......................................................................................... 333References ........................................................................................ 337
Chapter 11 Physiological Functions of Amino Acids ......................................... 339
Roles of AA in Peptide Synthesis .................................................... 339Protein Synthesis ......................................................................... 339Synthesis of Small Peptides .........................................................344
Roles of AA for Synthesis of Nonpeptide Molecules ....................... 345Synthesis of Nonpeptide Molecules ............................................ 345Gaseous Signaling by NO, CO, and H2S ..................................... 345
Chemical Properties of AA-Derived Gases ........................... 345Functions of NO ......................................................................346Functions of CO ......................................................................348Functions of H2S ..................................................................... 350
Roles of Select AA ...................................................................... 351Arginine .................................................................................. 351Glutamine ............................................................................... 351Glycine .................................................................................... 354Proline ..................................................................................... 355
Roles of Select Nitrogenous Products of AA .............................. 356Functions of Polyamines ......................................................... 356Functions of Creatine .............................................................. 357Functions of Reduced GSH .................................................... 358

xiv Contents
© 2010 Taylor & Francis Group, LLC
Functions of Purine and Pyrimidine Nucleotides .................. 361Functions of Taurine ............................................................... 361Functions of Histamine .......................................................... 362Functions of Melanin .............................................................. 362Functions of Melatonin ........................................................... 362Functions of Carnosine and Related Dipeptides .................... 362Functions of Glucosamine ...................................................... 363AA and AA Metabolites as Natural Ligands and Activators of the Aryl Hydrocarbon Receptor........................364
Functions of d-AA .......................................................................364Functions of d-Alanine ...........................................................364Functions of d-Aspartate ........................................................ 365Functions of d-Serine ............................................................. 365
Regulatory Roles of AA in Food Intake, Nutrient Metabolism, and Gene Expression ........................................................................ 365
Regulatory Roles of AA in Food Intake ...................................... 365Regulatory Roles of AA in Nutrient Metabolism ........................ 367Regulatory Roles of AA in Gene Expression and Cell Signaling... 369
Regulatory Roles of AA in Gene Expression ......................... 369Regulatory Roles of AA in Epigenetics .................................. 372Regulatory Roles for AA in Cell Signaling ............................ 374
Roles for AA in the Immune Response ............................................ 376Immune System ........................................................................... 376Protein Malnutrition and Compromised Immunity .................... 377Unifying Mechanisms Responsible for Roles of AA in Immunity ..................................................................................... 378
Use of AA in Nutrition, Therapy, and Health .................................. 378Use of AA in Medical and Pharmaceutical Therapy .................. 378Use of AA as Dietary Supplements ............................................. 379Use of AA or Derivatives as Food Additives .............................. 381
AA as Food Additives............................................................. 381Mechanisms for AA-Induced Chemical Sensing in the Gastrointestinal Tract ............................................................. 381
Use of AA in Cosmetic and Toiletry Products ............................384Efficacy and Safety of Dietary AA Supplementation ...................... 385
Efficacy and Safety of AA Supplementation ............................... 385AA Imbalance and Antagonism .................................................. 385Arginine as an Example for the Safety of AA Supplementation ... 386
Summary .......................................................................................... 387References ........................................................................................ 388
Chapter 12 Inborn Errors of Amino Acid Metabolism ...................................... 391
Inherited Diseases Resulting from Disorders of AA Metabolism ... 395All or Most AA............................................................................ 395Basic AA...................................................................................... 396
xvContents
© 2010 Taylor & Francis Group, LLC
Branched-Chain AA .................................................................... 397Carnitine ...................................................................................... 397Creatine ....................................................................................... 398Glutamate .................................................................................... 398Glutamine .................................................................................... 399Glutathione ..................................................................................400Glycine .........................................................................................400Heme ............................................................................................ 401Histidine ......................................................................................402Phenylalanine and Tyrosine .........................................................402Proline and Hydroxyproline ........................................................404Purines .........................................................................................405Pyrimidines .................................................................................408Serine ...........................................................................................409Sulfur-Containing AA ................................................................. 410Tryptophan .................................................................................. 411Urea Cycle ................................................................................... 411Other Organic Acidurias ............................................................. 412
Treatment of Inborn Errors of AA Metabolism ............................... 413Summary .......................................................................................... 416References ........................................................................................ 416
Chapter 13 Dietary Requirements of Amino Acids ........................................... 419
Historical Perspectives of Dietary AA Requirements ..................... 421Studies Involving Laboratory Animals ....................................... 421Human Studies ............................................................................ 422Studies Involving Farm Animals .................................................424Dietary Requirements of NEAA by Humans and Other Animals ....................................................................................... 427Functional AA in Nutrition ......................................................... 428
Determination of AA Requirements ................................................ 430N Balance Studies ....................................................................... 430
Measurement of N Balance under Various Nutritional and Physiological Conditions ........................................................ 430Advantages and Limitations of N Balance Studies ................ 433
Factorial Method for Determining AA Requirements ................ 436Tracer Methods to Determine AA Requirements ....................... 437
General Considerations of the Direct and Indicator AA Oxidation Methods for Estimating AA Requirements ........... 437Direct AA Oxidation Method ................................................. 438Indicator AA Oxidation Method ............................................440Advantages and Disadvantages of Tracer Studies for Estimating Dietary AA Requirements ................................... 443
Potential Use of “-omics” Technologies to Estimate Dietary AA Requirements ........................................................................444

xvi Contents
© 2010 Taylor & Francis Group, LLC
Nutrigenomics .........................................................................444Proteomics ..............................................................................445Metabolomics..........................................................................446
Assessment of Dietary Protein Quality ............................................446Chemical Methods ....................................................................... 447
AA Analysis ...........................................................................447Chemical Score ....................................................................... 450EAA Index .............................................................................. 450Dye-Binding Techniques ........................................................ 450Mutual AA Ratios ................................................................... 450
Animal Feeding Experiments ..................................................... 451Overall Consideration ............................................................. 451Biological Value ...................................................................... 452Protein Efficiency Ratio .......................................................... 452Net Protein Ratio .................................................................... 453Net Protein Utilization ............................................................ 453Nitrogen Growth Index ........................................................... 453Relative N Utilization ............................................................. 453
Metabolic Indicators in Animals ................................................. 454Concentrations of AA in Plasma ............................................ 454Concentrations of Proteins in Plasma or Serum ..................... 454Concentrations of Urea and Ammonia in Plasma and Urine .... 454Enzyme Activities ................................................................... 455Flux of EAA in Plasma ........................................................... 455
Methods Using Microorganisms ................................................. 455Summary .......................................................................................... 456References ........................................................................................ 457

xvii
© 2010 Taylor & Francis Group, LLC
PrefaceAmino acid biochemistry and nutrition are interesting, dynamic, and challenging subjects in biological sciences. They span a wide range from chemistry, metabolism, and physiology to reproduction, immunology, pathology, and cell biology. In the nearly half-century since the last two volumes of the monograph Biochemistry of the Amino Acids were published by Alton Meister in 1965, this field has developed rap-idly. Important technical and conceptual advances include (1) the analysis of amino acids by high-performance liquid chromatography and mass spectrometry; (2) isoto-pic measurements of synthesis and degradation of proteins and amino acids in cells, tissues, and the whole body; (3) interorgan metabolism of amino acids involving key tissues and organs such as liver, skeletal muscles, small intestine, and kidneys; (4) amino acids in cell signaling and regulation of gene expression; (5) nonlysosomal protein degradation by ATP- and ubiquitin-dependent multicatalytic proteasomes; (6) molecular and cellular regulation of intracellular protein turnover and amino acid metabolism; (7) determination of true ileal digestibilities of amino acids; (8) molecu-lar cloning of transporters for amino acids and small peptides; (9) development of the ideal protein concept; and (10) elucidation of dietary requirements of functional amino acids by humans and other animals. Comprehensive and systematic coverage of these new scientific developments in a well-organized book will benefit research-ers and students in both biomedical and agricultural disciplines to improve health and the nutritional value of foods.
Amino Acids: Biochemistry and Nutrition consists of 13 chapters. The text starts with the discoveries and basic concepts of amino acids, peptides, and proteins. It then advances to protein digestion in the gastrointestinal tract and the absorption of small peptides and free amino acids in the small intestine. This chapter is followed by detailed coverage of cell- and tissue-specific synthesis and catabolism of amino acids and related nitrogenous substances (including nitric oxide, polyamines, gluta-thione, creatine, urea and uric acid) in animals. After the use of isotopes in studying nitrogen metabolism is introduced in Chapter 7, the book continues with intracel-lular protein turnover, short- and long-term regulation of amino acid metabolism, physiological functions of amino acids, and inborn errors of amino acid metabolism. Finally, the text ends with dietary requirements of amino acids by humans and other animals. While the classical concepts and principles of amino acid biochemistry and nutrition are emphasized throughout the book, every effort has been made to include the most recent progress in this ever-expanding field so that readers in various bio-logical disciplines can integrate amino acid biochemistry with nutrition, health, and disease in mammals, birds, and other animal species. At the end of each chapter, selected references are listed to provide readers with both comprehensive reviews of the chosen topics and original experimental data on which modern concepts in amino acid biochemistry and nutrition are based. Reading the scientific literature is essential for a thorough understanding of the history of the field and also provides “food” for creative thinking and for rigorous development as a productive scientist.

xviii Preface
© 2010 Taylor & Francis Group, LLC
In the Index, a list of key words, phrases, and abbreviations is provided to help read-ers quickly find information presented in all the chapters.
This book owes its origin to the lecture notes of a graduate course ANSC/NUTR 613 “Protein Metabolism” the author has taught at Texas A&M University for the past 21 years. Its conception was motivated largely by the lack of a suitable text-book for teaching such an advanced course for students majoring in animal sci-ence, biochemistry, biomedical engineering, biology, human medicine, kinesiology, veterinary medicine, nutrition, physiology, toxicology, and other related disciplines. Besides its use as a textbook, all of the chapters also provide useful references to gen-eral and specific knowledge on amino acid biochemistry and nutrition for research-ers in biomedicine and agriculture (including animal science and plant breeding).
The sciences of amino acid biochemistry and nutrition have been built on the shoulders of many giants and pioneers worldwide. Their seminal contributions to the field have made this book possible. The author must apologize to those whose published works are not cited in the text due to limited space. Sincere thanks are also extended to the author’s past and current students for their constructive comments on the “Protein Metabolism” course and for their stimulating discussions to further improve its content.

xix
© 2010 Taylor & Francis Group, LLC
AcknowledgmentsThis book was initiated at the invitation of Dr. Ira Wolinsky, a consulting editor for CRC Press, and completed with the patience and guidance of its editorial staff, Randy L. Brehm and Kari A. Budyk. The author would like to thank Sudath Dahanayaka for drawing structures and metabolic pathways of amino acids, Dr. Gregory A. Johnson for illustrating enterocytes of the small intestine, and Syed Mohamad Shajahan and his team at Techset Composition for their professional typesetting of the entire man-uscript. Sincere thanks also go to a group of accomplished scientists who critically reviewed various chapters and provided constructive suggestions for improvement: Drs. Vickie E. Baracos, Fuller W. Bazer, Brian J. Bequette, John T. Brosnan, Teresa A. Davis, Catherine J. Field, Nick E. Flynn, C. Andy Hu, Darrell A. Knabe, Errol B. Marliss, James C. Matthews, Cynthia J. Meininger, Sidney M. Morris Jr., J. Marc Rhoads, James R. Thompson, and Malcolm Watford.
The author is appreciative of important contributions of his former and current students, postdoctoral fellows, visiting scholars, and technicians to the conduct of research and valuable discussions, particularly Drs. Houssein Assaad, Douglas G. Barstow Jr., Arturo G. Borbolla, Christopher M. Dekaney, Zhaolai Dai, Sujay Datta, J. Todd Davidson, E. Lichar Dillon, Michael E.R. Dugan, Nick E. Flynn, Wenjiang Fu, Haijun Gao, Fei Ji, Wenjuan Jobgen, Xiangfen Kong, Hyuk-Jung Kwon, Arantza Lassala, Jian Lei, Hui Li, Peng Li, Xilong Li, Maria E. Mahata, Ronald D. Mateo, Jason R. McKnight, Yose Rizal, M. Carey Satterfield, Jon T. Self, Bie Tan, Carmen D. Tekwe, Junjun Wang, Xiuqi Wang, Jiawei Wei, Zhenlong Wu, Pengbin Xi, Haipeng Yang, Ying Yang, Kang Yao, and Yulong Yin as well as Professor Lixiang Chen, Sudath Dahanayaka, Mou Dasgupta, Paula K. Davis, Sean P. Flynn, Chenxing Fu, Merrick Gearing, Tony E. Haynes, Sichao Jia, Scott C. Jobgen, Ning Jiao, Ripla Kohli, Katherine A. Kelly, Gang Lin, Chuang Liu, Sabina A. Meier, Reza Rezaei, Robin R. Simon, Yuli Sun, Bin Wang, Weiwei Wang, Xiaoqiu Wang, Natalie A. Morrow, Wene Yan, Wei Ying, and Chen Zhang.
The author is grateful to his graduate advisors Professor Sheng Yang and Dr. James R. Thompson, as well as postdoctoral mentors Dr. Errol B. Marliss and Dr. John T. Brosnan for training in amino acid biochemistry and nutrition, as well as their enthu-siastic support and inspiration for a life-long pursuit of this discipline. Productive and enjoyable collaborations with colleagues at Texas A&M University (particularly Drs. Fuller W. Bazer, Robert C. Burghardt, Douglas G. Burrin, Raymond J. Carroll, Timothy A. Cudd, Teresa A. Davis, Kathrin A. Dunlap, William C. Ellis, L. Wayne Greene, Cristine L. Heaps, Laurie A. Jaeger, Gregory A. Johnson, Sung Woo Kim, Darrell A. Knabe, Joanne R. Lupton, Catherine J. McNeal, Cynthia J. Meininger, Judy M. Muller-Delp, Wilson G. Pond, M. Carey Satterfield, Joseph R. Sharkey, Stephen B. Smith, Thomas E. Spencer, Yanan Tian, Nancy D. Turner, Shannon E. Washburn, Beiyan Zhou, and Huaijun Zhou), at other U.S. institutions (particularly Drs. Matthew A. Boegehold, Gautam Chaudhuri, Susan K. Fried, David A. Geller, Bernhard Hennig, Louis J. Ignarro, Duane H. Keisler, Sidney M. Morris, Jr., Juan
xx Acknowledgments
© 2010 Taylor & Francis Group, LLC
B. Ochoa, J. Marc Rhoads, Penelope Perkins-Veazie, Nathalie L. Trottier, Kimberly A. Vonnahme, Malcolm Watford, and Feng-Qi Zhao), and in China (particularly Drs. Yongqing Hou, Zongyong Jiang, Defa Li, Ning Li, Shiyan Qiao, Haizhou Sun, Fenglai Wang, Junjun Wang, Zhenlong Wu, Weiyun Zhu, Yulong Yin, and Yongliang Zhang) are gratefully acknowledged. The author is indebted to Drs. David H. Baker, Fuller W. Bazer, H. Russell Cross, Susan K. Fried, Harris J. Granger, Bryan H. Johnson, Peter J. Reeds, and Malcolm Watford for their mentoring of career devel-opment and for their professional support.
Work in the author’s laboratory was supported, in part, by grants from Ajinomoto Inc. (Tokyo, Japan), American Heart Association, The Chinese Academy of Sciences, Gentech Inc. (Shanghai, China), Houston Livestock Show and Rodeo, International Council of Amino Acid Science (Brussels, Belgium), International Glutamate Technical Committee (Brussels, Belgium), JBS United (Sheridan, Indiana), Juvenile Diabetes Research Foundation (USA), National Institutes of Health (USA), National Natural Science Foundation of China, Pfizer Inc., Scott & White Hospital (Temple, Texas), Texas A&M AgriLife Research, Texas A&M University, the Thousand-People Talent Program at China Agricultural University, United States Department of Agriculture, U.S. National Corn Growers Association, U.S. National Watermelon Promotion Board, and U.S. Poultry & Egg Harold E. Ford Foundation.
Special thanks are extended to the author’s parents for being role models of patience, kindness, strong work ethics, integrity, and respect for others. Finally, the great assistance and support of the author’s wife (Yan Chen), son (Neil D. Wu), and daughter (Jennifer M. Wu) in preparing the entire manuscript are gratefully acknowledged.

xxi
© 2010 Taylor & Francis Group, LLC
AuthorDr. Guoyao Wu is a university distinguished professor, university faculty fellow, and Texas A&M AgriLife Research senior faculty fellow at Texas A&M University. He received a BS in animal science from the South China Agricultural University at Guangzhou, China (1978–1982), an MS in animal nutrition from China Agricultural University at Beijing, China (1982–1984), and an MSc (1984–1986) and PhD (1986–1989) in animal biochemistry from The University of Alberta at Edmonton, Canada. Dr. Wu completed his postdoctoral training in diabetes, nutrition, and bio-chemistry at McGill University Faculty of Medicine in Montreal, Canada (1989–1991) and Memorial University of Newfoundland Faculty of Medicine in St. John’s, Canada (1991). He joined the Texas A&M University faculty in October 1991. His sabbatical leave was to study human obesity at the University of Maryland School of Medicine in Baltimore, USA (2005).
Dr. Wu has taught graduate (experimental nutrition, general animal nutrition, protein metabolism, and nutritional biochemistry) and undergraduate (problems in animal science, nutrition, and biochemistry) courses at Texas A&M University for the past 21 years. He has given numerous lectures at other institutions in the United States, Canada, Mexico, Brazil, Europe, and Asia. His research focuses on the bio-chemistry, nutrition, and physiology of amino acids (AA) in animals at genetic, molecular, cellular, and whole-body levels. Research interests include (1) functions of AA in gene expression (including epigenetics) and cell signaling; (2) biochemi-cal mechanisms that regulate intracellular synthesis and catabolism of proteins and AA; (3) hormonal and nutritional regulation of homeostasis of metabolic fuels; (4) biology and pathobiology of nitric oxide and polyamines; (5) key roles of AA in preventing metabolic diseases (including diabetes, obesity, and intrauterine growth restriction) and associated cardiovascular complications; (6) essential roles of AA in survival, growth and development of embryos, fetuses, and neonates; (7) dietary requirements of AA and proteins in the life cycle; and (8) animal models (e.g., pigs, rats, and sheep) for studying human metabolic diseases. He has published 365 papers in peer-reviewed journals, including Amino Acids, American Journal of Physiology, Annual Review of Nutrition, Biochemical Journal, Biology of Reproduction, British Journal of Nutrition, Cancer Research, Clinical and Experimental Immunology, Comparative Biochemistry and Physiology, Diabetes, Diabetologia, Endocrinology, FASEB Journal, Frontiers in Bioscience, Gut, Journal of Animal Science, Journal of Biological Chemistry, Journal of Nutrition, Journal of Nutritional Biochemistry, Journal of Pediatrics, Journal of Physiology (London), Livestock Science, and Proceedings of National Academy of Science (USA), and 48 book chapters.
Dr. Wu has received numerous prestigious awards from China, Canada, and the United States, which include the China National Scholarship for Graduate Studies Abroad (1984), the University of Alberta Andrew Stewart Graduate Prize (1989), the Medical Research Council of Canada Postdoctoral Fellowship (1989), the American Heart Association Established Investigator Award (1998), the Texas

xxii Author
© 2010 Taylor & Francis Group, LLC
A&M AgriLife Faculty Fellow (2001), the Texas A&M University Faculty Fellow (2002), the Nonruminant Nutrition Research Award from American Society of Animal Science (2004), the Outstanding Young Investigator Award from National Science Foundation of China (2005), the Texas A&M Agriculture Program Vice Chancellor’s Award for Excellence in Team (2006) and Individual (2008) Research, and in Diversity (2011), the Changjiang Scholar Award from China (2008), the Texas A&M University Distinguished Research Achievement Award (2008), the Texas A&M Agrilife Research Senior Faculty Fellow Award (2008), the Chutian Scholar Award from Hubei Province of China (2008), the FASS-AFIA New Frontiers in Animal Nutrition Research Award from the Federation of Animal Science Societies and American Feed Industry Association (2009), the Dingying Scholar Award from South China Agricultural University (2009), the Thousand-People-Talent Award from China (2010), and the Samburu Collaboration Award from the International Association of Giraffe Care Professionals (2010).
Dr. Wu is a member and an elected fellow of the American Association for the Advancement of Science, as well as a member of the American Heart Association, the American Society of Animal Science, the American Society of Nutrition, and the Society for the Study of Reproduction. He has served on editorial advisory boards for the Biochemical Journal (1993–2005), the Journal of Animal Science and Biotechnology (2010−present), the Journal of Nutrition (1997–2003), and the Journal of Nutritional Biochemistry (2006−present), as well as an editor of Amino Acids (2008−present), an editor of the Journal of Amino Acids (2009−present), and a managing editor of Frontiers in Bioscience (2009−present).

1
© 2010 Taylor & Francis Group, LLC
Discovery and Chemistry of Amino Acids
There is a rich history of studies on natural amino acids (AA) (Vickery and Schmidt 1931; Brosnan 2001). This field was pioneered predominantly by European chem-ists in the nineteenth century. In the past 210 years, it has been greatly advanced by biochemists, nutritionists, medical professionals, and other life scientists world-wide. Specifically, the year 1806 witnessed the discovery of an AA, asparagine, in nature by two French chemists L.N. Vauquelin and P.J. Robiquet. Glycine was the first AA isolated from a protein (gelatin) by hydrolysis with sulfuric acid in 1820 by the French chemist H. Braconnot. The usage of the term amino acid in the English language started in 1898. More than 25 years later, in 1925, threonine was discovered, which was the last addition to the long list of 20 AA required for pro-tein biosynthesis (Table 1.1). By 1950, ~200 natural AA (AA present in animals, plants, and microorganisms) had been reported and characterized. The identifica-tion of selenocysteine in 1973 as a rare AA only in selenoproteins expanded the list of AA present in certain proteins (Stadtman 1996).
The common or trivial names of AA were derived from: (1) the history of their discoveries, (2) their characteristics, including appearance (e.g., arginine and leu-cine), taste (e.g., glycine), and chemical structure (hydroxyproline, isoleucine, lysine, methionine, proline, and threonine), (3) their sources of isolation (e.g., asparagine, citrulline, cysteine, glutamate, serine, tryptophan, tyrosine, and valine), or (4) the precursors of their chemical syntheses (e.g., alanine and phenylalanine). Because of variations in their side chains, AA have remarkably different chemical properties and physiological functions. To appreciate the historical development of AA bio-chemistry and nutrition, to understand the basis for the different physiological func-tions of AA in the body, and to help stimulate future research in this ever-growing field, this chapter highlights the discoveries, nomenclature, and chemical properties of AA that are substrates for the synthesis of proteins, polypeptides, and other bio-logically active nitrogenous molecules.
DEFINITION AND NOMENCLATURE OF AA
Definition of AA
AA are defined as organic substances that contain both amino and acid groups. The different carbon atoms of AA are named in sequence according to the Greek alpha-bet. If the amino group is linked to the α-carbon (the carbon adjacent to the primary acid group), then the AA is termed an α-AA. Likewise, if the amino group is linked
1

2 Amino Acids: Biochemistry and Nutrition
© 2010 Taylor & Francis Group, LLC
TABLE 1.1Discovery of Natural AA
AA Year Source Scientist(s)
Neutral AAl-Alanine 1888 Silk fibroin T. Weyl
β-Alanine 1911 Beef muscle W. Gulewitsch
γ-Aminobutyrate 1950 Brain E. Roberts and S. Frankel
l-Asparagine 1806 Asparagus juice L.N. Vauquelin and P.J. Robiquet
1932 Edestin M. Damodaran
l-Citrulline 1930 Watermelon juice M. Wada
l-Cysteine 1884 Cystine E. Baumann
l-Cystine 1899 Horn K.A.H. Mörner
l-Glutamine 1883 Beet juice E. Schulze and E. Bosshard
1932 Gliadin M. Damodaran, G. Jaaback, and A.C. Chibnall
Glycine 1820 Gelatin H. Braconnot
l-Hydroxyproline 1902 Gelatin E. Fischer
l-Isoleucine 1904 Sugar beet molasses F. Ehrlich
l-Leucine 1819 Cheese J.L. Proust
l-Methionine 1922 Casein J.H. Mueller
l-Phenylalanine 1881 Lupine sprouts E. Schulze and J. Barbieri
l-Proline 1901 Casein E. Fischer
l-Serine 1865 Silk gelatin E. Cramer
l-Taurine 1827 Ox bile F. Tiedermann and L. Gmelin
l-Threonine 1925 Oat protein S.B. Schryver and H.W. Buston
1925 Teozein R.A. Gortner and W.F. Hoffmann
1935 Casein W.C. Rose
l-Tryptophan 1901 Casein F.G. Hopkins and S.W. Cole
l-Tyrosine 1846 Crude casein J. von Liebig
1849 Casein hydrolysate F. Bopp
3,5-Diiodotyrosine 1896 Skeleton of coral E. Drechsel
3,5,3′-Triiodotyrosine 1953 Thyroid tissue J. Gross and R. Pitt-Rivers
Thyroxine 1915 Thyroid tissue E.C. Kendall
l-Valine 1856 Animal tissues E. von Gorup-Besanez
1879 Albumin P. Schützenberger
Basic AAl-Arginine 1886 Lupine seedling extracts E. Schulze and E. Steiger
1895 Horn protein S.G. Hedin
l-Histidine 1896 Sturine protein A. Kossel
1896 Various proteins S.G. Hedin
l-Hydroxylysine 1925 Fish gelatin S.B. Schryver, H.W. Buston, and D.H. Mukherjee
l-Lysine 1889 Casein E. Drechsel
l-Ornithine 1877 Hen urine M. Jaffé

3Discovery and Chemistry of Amino Acids
© 2010 Taylor & Francis Group, LLC
to the β-, γ-, δ-, or ε-carbon, then the AA is termed a β-, γ-, δ-, or ε-AA, respectively. Note that, glutamate has a γ-carboxyl group and lysine has an ε-amino group, as well as a-amino groups. Some AA in animals, plants, and microorganisms contain two carboxyl groups, whereas several AA contain two amino groups.
C CCOOHH2N H2NR
H
CH2N CH2CH2 CH2COOH
R
H
COOH
R
H
α-Amino acid(R = side chain)
β-Amino acid(R = side chain)
γ-Amino acid(R = side chain)
γα α αβ β
Definition of imino AciDs
Proline and hydroxyproline contain a secondary α-amino (α-imino) group and, therefore, are α-imino acids. Since proline is a substrate for protein synthesis like α-AA and hydroxyproline is the posttranslational metabolite of proline, proline and hydroxyproline are loosely referred to as α-AA in biochemistry and nutrition. Hydroxyproline occurs as both 4-hydroxyproline (the major form) and 3-hydroxy-proline (the minor form) in animals.
isomers of AA
Except for glycine (the simplest AA in nature), all protein AA have at least one asym-metric carbon and exhibit optical activity or rotatory polarization. That is, when a beam of plane-polarized light is passed through a solution of an optical isomer, the light will be rotated either to the right or to the left. Some β-AA (e.g., taurine and β-alanine) do not have an asymmetric carbon or isomers. Since each asymmetric carbon can have two possible configurations, an AA with n asymmetric carbons has 2n different possible stereoisomers and 2n−1 enantiomeric pairs (nonsuperimposable mirror images). For example, the β-carbon atom in isoleucine and threonine is also asymmetric; therefore, these two AA can possibly exist in four optical isomer forms. The absolute configuration of AA (l- or d-isomers as introduced by Emil Fischer in 1908) is arbitrarily defined with reference to glyceraldehyde (Figure 1.1). Fischer
TABLE 1.1 (continued)Discovery of Natural AA
AA Year Source Scientist(s)
Acidic AAl-Aspartic acid 1827 Marshmallow extracts A. Plisson
1868 Conglutin and legumin H. Ritthausenl-Glutamic acid 1866 Gliadin H. Ritthausen
Source: Adapted from Greenstein, J.P. and M. Winitz. Chemistry of Amino Acids. 1961. New York, and Meister, A. 1965. Biochemistry of Amino Acids. Academic Press, New York.

4 Amino Acids: Biochemistry and Nutrition
© 2010 Taylor & Francis Group, LLC
projections, which are commonly used to represent AA, are abbreviated structural forms that convey valuable stereochemical information without having to draw a three-dimensional representation of a molecule.
Almost all free α-AA and protein-bound AA (except glycine) in organisms have the absolute configuration of l-glyceraldehyde. l-AA are the predominant physi-ological isomers of AA in nature. However, d-AA also exist in animals, microor-ganisms, and plants (Friedman 1999).
The nomenclature of an AA with more than one asymmetric carbon includes an allo-form. Namely, if the β- or γ-carbon configuration in an AA is opposite to the configuration of the α-carbon, then this AA is said to have an allo-form. For exam-ple, a synthetic l-threonine whose β-carbon has a configuration opposite to that of the α-carbon is called l-allo-threonine. l-Threonine and l-allo-threonine are called diastereomers, and the relationship between the two AA is called diastereomerism.
Optical isomerism of organic molecules has traditionally been described as dextrorotatory (right, “+,” or d) or levorotatory (left, “−,” or l), depending on the direction of optical rotation. Since measurement conditions can affect the angle of optical rotation, the terms “dextrorotatory” and “levorotatory” have been aban-doned. It should be noted that the d- and l-configurations for an organic substance may not necessarily determine the rotation of plane-polarized light. For example, the naturally occurring form of fructose is the d(-) isomer (d-configuration with a levorotatory optical activity). When equal amounts of d- and l-AA (e.g., dl-methi-onine) are present, the resulting mixture has no optical activity.
The standard conditions for acid (6 N HCl at 110°C for 24 h under nitrogen gas), base (4.2 N NaOH plus 1% thiodiglycol, antioxidant, at 110°C for 20 h), or enzy-matic hydrolysis do not affect the preexisting isomer of AA in peptides. However, l- or d-AA may lose their optical activity (known as racemization) in stronger acid or alkaline solutions at high temperature (e.g., >105°C). To date, d-AA are often analyzed by high-performance liquid chromatography (HPLC) on a chiral or ligand column, or by involving precolumn derivatization with reagents that convert the enantiomers to diastereomers to improve chromatographic resolution.
L-Glyceraldehyde L-Amino acid
D-Glyceraldehyde D-Amino acid
HO C H
CH2OH
CHO
CH2N H
COOH
R
H C OH
CHO
CH2OH
CH NH2
COOH
R
FIGURE 1.1 Fisher projections for configurations of AA relative to l- and d-glyceraldehydes. The general structure of AA in the nonionized form is shown.

5Discovery and Chemistry of Amino Acids
© 2010 Taylor & Francis Group, LLC
Protein AnD nonProtein AA
There are more than 700 AA in nature, but only 20 of them (α-AA) serve as build-ing blocks of protein (Figure 1.2). Those AA that serve as substrates for polypeptide biosynthesis are called protein AA (e.g., arginine, methionine, and proline), whereas those AA that are not building blocks of polypeptides are referred to as nonprotein AA (e.g., citrulline, homocysteine, and hydroxyproline). In some publications, pro-tein and nonprotein AA are also known as standard and nonstandard AA, respec-tively. According to the International Union of Biochemistry and Molecular Biology, a three-letter abbreviation can be used to designate a protein AA, with one capital letter followed by two lower-case letters (e.g., Gln for glutamine). A one-letter abbre-viation is used to represent an AA in protein or polypeptide sequences (e.g., E, Q, and R for glutamate, glutamine, and arginine, respectively).
On the basis of the foregoing definitions, not all AA present in polypeptides are clas-sified as protein AA. This is because some of the AA residues in polypeptides are formed during posttranslational events. An example is hydroxyproline, which is generated from proline by peptidyl proline hydroxylase after a protein is synthesized. Other examples of the formation of new AA residues in polypeptides due to posttranslational modifi-cations include citrulline and asymmetric dimethylarginine from arginine; 1-methyl-histidine and 3-methylhistidine from histidine; hydroxyserine and hydroxythreonine from serine and threonine, respectively; hydroxytyrosine and nitrosylated tyrosine from tyrosine; acetylated lysine, hydroxylysine, and methylated lysine from lysine.
free AnD PePtiDe (Protein)-BounD AA
Free AA are defined as those AA that are not covalently bound in polypeptides. Peptide (protein)-bound AA are those AA that are in peptide linkage. Selenocysteine can be considered to be a special peptide-bound AA found in selenoproteins, because it is derived from serine and selenium at the translational step of protein synthesis. A free pool of selenocysteine does not exist in animals because its high reactivity with many electrophiles (e.g., H+, NO+, Zn2+, nitroalkene derivatives of fatty acids, and unsaturated carbonyls) would damage cells. Strictly speaking, proteins contain AA residues (AA without one molecule of water) but not intact AA. Complete hydrolysis of protein yields free, intact AA. Different AA have different content of nitrogen (N).
The composition of peptide-bound AA can vary greatly among different proteins, but the overall composition of AA in whole-body proteins is largely similar among different species. The available evidence shows that concentrations of individual free AA can differ markedly among cells, tissues, and species. For example, concentra-tions of free glutamine are 0.5 and 1 mM in the plasma of healthy humans and chick-ens, respectively, and are 20–25 and 1.5–15 mM in the skeletal muscle of the same species, respectively. Intramuscular concentrations of free AA are also influenced by the type of muscle fiber [e.g., 1.5 and 14 mM glutamine in chicken breast (predomi-nantly glycolytic fiber) and leg muscle (mainly oxidative fiber)], respectively. Also, concentrations of free glycine are 0.25 and 1 mM in the plasma of healthy humans and pigs, respectively. Interestingly, glycine, rather than glutamine, is the most abundant

6 Amino Acids: Biochemistry and Nutrition
© 2010 Taylor & Francis Group, LLC
Name Symbol Structural formula at neutral pH
With aliphatic side chains
Glycine Gly [G]
Alanine Ala [A]
Valine Val [V]
Leucine Leu [L]
Isoleucine
With side chains containing hydroxylic (OH) groups
Serine
Threonine Thr [T]
Tyrosine Tyr [Y]
With side chains containing sulfur atoms
Cysteine Cys [C]
Methionine Met [M]
Aspartate Asp [D]
With side chains containing acidic groups
Ile [I]
C
NH3+
NH3+
NH3+
NH3+
NH3+
NH3+
NH3+
NH3+
NH3+
NH3+
NH3+
COO–H
H
CH COO–H3C
H3C
H3C
H3C
H3C
H3C
H3C
H3C
H3C
H2C
CH COO–CH
CH CH COO–
Ser [S]
CH COO–CH
OH
CH COO–
OH
CH COO––OOC
–OOC
CH
CH2
CH2
CH2
CH2
CH2 CH2
CH2
CH2
CH COO–
CH COO–SH
CH COO–S
Glutamate CH COO–Glu [E]
See aromatic amino acids
FIGURE 1.2 Chemical structures of AA present in the proteins of animals at neutral pH. These AA also occur in microorganisms and plants. Selenocysteine is a rare, special peptide-bound AA in selenoproteins.

7Discovery and Chemistry of Amino Acids
© 2010 Taylor & Francis Group, LLC
Glutamine Gln [Q]
Arginine Arg [R]
Lysine Lys [K]
Histidine His [H]
With side chains containing basic groups
With side chains containing amide groups
Phenylalanine Phe [F]
Tyrosine
Tryptophan Trp [W]
Tyr [Y]
Selenocysteine Sec [U]
With side chains containing aromatic rings
With side chain containing seleno group
C CH COO–
O
CH COO–NH
C
N
CH COO–
H
CH COO–
CH COO–OH
CH COO–
HN NH+
CH COO–
Asn [N] C CH2
CH2
CH2
CH2 CH2
CH2
CH2
CH2
CH2
CH2
CH2
CH2 CH2
NH2
CH2
CH COO–H2N
H2N
H2C
OAsparagine
Name Symbol Structural formula at neutral pH
Proline Pro [P]
With side chain containing imino group
N COO–
H2
+
HSe CH COO–
NH3+
NH3+
NH3+
NH3+
NH3+
NH3+
NH3+
NH3+
NH3+
NH3+
NH2+
FIGURE 1.2 Continued.

8 Amino Acids: Biochemistry and Nutrition
© 2010 Taylor & Francis Group, LLC
free AA in the plasma of postnatal pigs. Furthermore, concentrations of arginine, glutamine, citrulline, and serine can be as high as 1, 25, 10, and 20 mM, respectively, in ovine allantoic fluid during gestation, whereas values for the corresponding AA in porcine allantoic fluid are 6, 2.5, 0.1, and 0.2 mM, respectively. These differences in concentrations of free AA reflect tissue and species differences in AA metabolism.
The ratio of total free AA to total peptide-bound AA in the whole body and most tissues (e.g., skeletal muscle, liver, and small intestine) is approximately 1:30 (g:g), meaning that the total free AA represent ~3% of the total AA (free plus peptide-bound) in humans and other animals. However, a ratio of some individual free AA to the same peptide-bound AA can be greater than 1:10 or lower than 0.1:100 (g:g). For example, in human skeletal muscle, the ratio of free glutamine to peptide-bound glutamine is approximately 2:10 (g:g), whereas that of free tryptophan to peptide-bound tryptophan is only 0.06:100 (g:g).
Free AA and their metabolites are widely present in animals (Figures 1.2 through 1.4). Many of them (e.g., citrulline, ornithine, β-alanine, putrescine, spermidine, and spermine) commonly occur in plants and microorganisms. Some free AA in plants [e.g., l-theanine (N-ethyl-l-glutamine in teas and citrulline in watermelon)] are ben-eficial for animal health, whereas others [e.g., β-cyanoalanine, djenkolic acid (two cysteine radicals connected by a methylene group), and mimosine (chemically simi-lar to tyrosine)] are toxic to mammals (Figure 1.5).
In most food ingredients of plant and animal origin, more than 98% of total AA are present in proteins and polypeptides, whereas only small amounts (<2% of the total AA) occur in a free form. However, some free AA represent significant amounts of the total AA in certain animal products. Notably, free glutamate and glutamine (1 and 4 mM, respectively) account for ~2.5% and 10% of the total glutamate and glu-tamine (free plus peptide-bound), respectively, in sow’s milk on day 28 of lactation. Similar results have also been reported for human milk. Also, the concentration of free taurine in human and porcine milk can be as high as 1 mM. These AA play an important role in the growth and development of the neonatal small intestine.
DISCOVERY OF AA
l-AA AnD Glycine
l-Alanine (α-aminopropionic acid) was the first AA to be obtained through chemical synthesis before its presence as a component of protein was recognized. Specifically, alanine was first synthesized from acetaldehyde, KCN, and NH4Cl by A. Strecker in 1850. In 1875, P. Schutzenberger and A. Bourgeois hydrolyzed silk proteins with barium hydroxide in an autoclave at 150–200°C and reported that the fractional crystallization of the resulting hydrolysate contained 30% alanine and 70% other AA. However, none of these products was rigidly identified. In 1888, T. Weyl iso-lated alanine from the hydrolytic cleavage products of silk fibroin as its particularly abundant constituent. The structure and configuration of alanine were established in 1901 by its conversion to lactic acid.
l-Arginine (2-amino-5-guanidinovaleric acid) was first isolated in 1886 by E. Schulze and E. Steiger from extracts of etiolated lupine seedlings as a basic substance. In 1895,

9Discovery and Chemistry of Amino Acids
© 2010 Taylor & Francis Group, LLC
β-A
lani
neγ-
Am
inob
utyr
ic a
cid
(GA
BA)
β-A
min
oiso
buty
ric a
cid
COO
–CH
COO
–
CH3
H2C H2N
H2C
H2C
H2C
H2C
H2C
H3N
+CH
2CH
2CH
2CH
2
CH2
CH2
CH2
CH2H
C
COO
–
Arg
inin
osuc
cini
c ac
id
NH
COO
–– O
OC
NH
C
CHCO
O–
HN C
OCy
stei
nesu
lfini
c ac
id
HC
COO
–
SO– 2
Citr
ullin
e
HS Cy
stea
min
e(2
-Am
inoe
than
ethi
ol)
– OO
CCH
CH2
SCH
2CH
COO
–
Cyst
ine
[3,3′-
Dith
iobi
s(2-
amin
opro
pano
ic a
cid)
]
– OO
CCH
CHCO
O–
Dia
min
opim
elic
aci
d (D
APA
)H
omoc
yste
ine
SH
Hom
oser
ine
CHCO
O–
OH
N
HO
COO
–
H2+
4-H
ydro
xypr
olin
eO
rnith
ine
(α,δ
-Dia
min
oval
eric
aci
d)
CHCO
O–
SO3–
Taur
ine
(2-A
min
o-et
hane
sulfo
nic
acid
)
C O
H Glu
tam
yl-γ
-sem
iald
ehyd
e
NG
-Mon
omet
hyl-L
-arg
inin
e(N
MM
A)
N CH3
CN
H(C
H2)
3CH
COO
–H
NCO
O–
H2
OH
+
3-H
ydro
xypr
olin
e
NH
3+N
H3+
NH
3+
CH2
CH2 CH
2CH
2CH
2CH
2
CH2
CH2
CH2
CH2
H2C
CHCO
O–
CH2
CHCO
O–
CH2
CH2
CH2
CH2
CHCO
O–
NH
3+
NH
3+N
H3+
NH
3+
NH
3+
NH
3+
NH
3+
NH
3+N
H3+N
H3+
NH
3+
NH
3+N
H3+
NH
3+
NH
2+
NH
2+
S
FIG
UR
E 1.
3 C
hem
ical
str
uctu
res
of n
onpr
otei
n A
A in
ani
mal
s at
neu
tral
pH
. T
hese
sub
stan
ces
occu
r in
phy
siol
ogic
al fl
uids
of
anim
als,
and
som
e of
th
em a
re a
lso
pres
ent i
n m
icro
orga
nism
s an
d pl
ants
. Tau
rine
is p
rese
nt o
nly
in a
nim
als
as a
fre
e A
A.

10 Amino Acids: Biochemistry and Nutrition
© 2010 Taylor & Francis Group, LLC
S.G. Hedin isolated arginine from the hydrolysate of horn protein as a silver nitrate precipitate. One year later, A. Kossel found that arginine is an abundant AA in the basic proteins from fish sperm. The structure of arginine was established through: (1) alkaline hydrolysis to yield stoichiometrically ornithine and urea in 1897 (E. Schulze and E. Winterstein), (2) arginase-catalyzed hydrolysis to yield ornithine and urea in 1904 (A. Kossel), and (3) chemical synthesis from benzoylornithine in 1910 (S.P.L. Sörensen). In 1924, A. Kossel discovered that arginine forms a highly insoluble and beautiful crystal-line compound with 2,4-dinitro-α-naphthol-7-sulfonic acid. Endogenous synthesis of arginine by mammals was deduced in the classic nutrition studies of W.C. Rose and his colleagues in 1930. The discovery of the urea cycle (ornithine cycle) by H.A. Krebs and K. Henseleit in 1932 revealed a key role for arginine in metabolic pathways.
C NH O COO– C CHN COO– CH S S CH COO––OOC
NH
C
CH COO–
N CH COO–
HO
O
N C CH COO–
OH
Canavanine β-Cyano-L-alanine Djenkolic acid
Homoarginine Mimosine Theanine
H2N
H3C
CH2CH2CH
NH3+
NH3+
NH3+ NH3
+
NH3+
NH3+
NH3+
NH2+
NH2+
CH2
CH2
CH2 CH2 CH2 CH2
NH2
CH2
CH2
CH2
CH2CH2
FIGURE 1.5 Chemical structures of nonprotein AA in certain plants at neutral pH. These substances are generally absent in animals. β-Cyano-l-alanine and homoarginine are synthe-sized and occur in microorganisms. Canavanine and homoarginine are structurally similar to arginine. Djenkolic acid is similar to cystine, mimosine to tyrosine, and theanine to glutamine.
350.00
300.00
250.00
200.00
150.00
100.00
50.00
0.00
0.00 5.00 10.00 15.00 20.00 25.00Minutes
Fluo
resc
ence
Asp G
lu
Asn
Ser
Gln
His
Gly
Cit
Arg
β-A
laT
auA
laT
yr
Trp M
etV
alPh
e
IleLe
uO
rnLy
s
�r
30.00 35.00 40.00 45.00
FIGURE 1.4 Analysis of primary AA as their o-phthaldialdehyde (OPA) derivatives. The concentration of each AA standard used for the reaction with OPA is 10 μM. The resultant products are separated by HPLC followed by detection at an excitation wavelength of 340 nm and an emission wavelength of 455 nm. (Reprinted from Meth. Enzymol., 440, Wu, G. and C.J. Meininger. Analysis of citrulline, arginine, and methylarginines using high-performance liquid chromatography, 177–189, Copyright 2008, with permission from Elsevier.)

11Discovery and Chemistry of Amino Acids
© 2010 Taylor & Francis Group, LLC
l-Asparagine (α-aminosuccinamic acid) was first isolated from asparagus juice by the French chemists L.N. Vauquelin and P.J. Robiquet in 1806. However, due to technical difficulties in the analysis of peptide-bound asparagine (i.e., the conver-sion of asparagine into aspartate under both acid and alkaline hydrolysis conditions), a key role for asparagine in nutrition was not recognized for more than a century after its initial discovery. Fortunately, based on enzymatic hydrolysis of edestin (a globular legumin protein in hempseeds) using pepsin, trypsin, and dipeptidase, the occurrence of asparagine in protein was finally reported in 1932.
l-Aspartate (α-aminosuccinic acid) was first obtained by A. Plisson in 1827 from the alkaline hydrolysis of marshmallow root-derived asparagine in the presence of boiling lead hydroxide. The composition of aspartate was proposed by A. Plisson in 1830 and was firmly established by A.F. Boutron-Charlard and T.J. Pelouze in 1833. In 1838, J. Liebig obtained aspartate by hydrolyzing asparagine with potas-sium hydroxide. The first chemical synthesis of aspartate was accomplished by V. Dessaignes in 1850 by heating the ammonium salts of malic, maleic, and fumaric acids at 160–200°C. The presence of aspartate in plant and animal proteins was first identified in 1868 and 1869, respectively. Derivatives of aspartate such as N-acetyl-l-aspartate and phosphoaspartate are present in animal tissues (including brain, liver, kidney, and muscle).
l-Citrulline (α-amino-δ-carbamidovaleric acid) was originally isolated by M. Wada from watermelon (the Latin word for Citrullus) juice as an abundant free AA in 1930. Two years later, H.A. Krebs proposed that citrulline is an intermediate of the hepatic urea cycle. H.G. Windmueller and A.E. Spaeth discovered the release of citrulline from the rat small intestine in 1975. This seminal work revolutionized the field of AA biochemistry. In 2003, G. Wu and colleagues found that ovine allan-toic fluid during early gestation (day 60) contains an extremely high concentration of citrulline (~10 mM). This AA is an effective substrate for arginine synthesis.
l-Cysteine (α-amino-β-mercaptopropionic acid) was named after cystine, which was discovered in 1810 by W.H. Wollaston as a component of a bladder calculus (“kystis” in Greek for bladder). The name “cystine” was coined by J.J. Berzelius in 1832. A.E. Baudrimont and F.J. Malaguti reported in 1837 that cystine contains sul-fur. In 1884, E. Baumann discovered that cysteine was the product of cystine reduc-tion. Subsequently, it was found in 1899 that cystine was a major constituent of horn protein. This observation raised the possibility of utilizing cysteine for polypeptide synthesis. The structures of cystine and cysteine were established by chemical syn-thesis in 1903–1904.
l-Glutamate (α-aminoglutaric acid) was first isolated by H. Ritthausen from wheat gluten (gliadin) hydrolysate in 1866. Seven years later, H. Hlasiwetz and J. Habermann obtained glutamate from casein, the first protein of animal origin shown to contain this AA. Glutamate was synthesized chemically from levulinic acid by L. Wolff in 1890. Monosodium glutamate (l-glutamic acid in the form of its monoso-dium salt) was discovered by K. Ikeda in 1907 as the substance in kombu broth (a Japanese type of seaweed) that gave the fifth basic taste he coined “umami” which is distinct from the other four tastes (bitter, salty, sour, and sweet) known at that time. Two derivatives of glutamate (N-acetylglutamate and phosphoglutamate) are present in animals primarily as free AA.

12 Amino Acids: Biochemistry and Nutrition
© 2010 Taylor & Francis Group, LLC
l-Glutamine (α-aminoglutaramic acid) was first obtained as a free AA from beet juice by E. Schulze and E. Bosshard in 1883. E. Fischer recognized in 1904 that glutamine is a major source of ammonia produced upon acid hydrolysis of proteins. After much effort to refine laboratory procedures, glutamine was eventually isolated from enzymatic hydrolysates of gliadin by M. Damodaran and coworkers in 1932. One year later, this AA was first synthesized chemically from carbobenzoxy-l-glu-tamic acid anhydride by M. Bergmann, L. Zervas, and L. Salzmann. In the 1940s through the 1960s, glutamine was not considered to be a nutrient needed in diets for animals and received little attention in classic nutrition textbooks. In 1965, E.M. Neptune discovered that small-intestinal (ileal) preparations from various animal species (guinea pigs, hamster, monkeys, rabbits, and rats) have high rates of gluta-mine oxidation. This began a new era of biochemical and nutritional research on glutamine in humans and other animals.
Glycine (aminoacetic acid) was isolated from the acid hydrolysates of gelatin by the French chemist H. Braconnot in 1820. He found that this substance was as sweet as glucose. In 1838, G.J. Mulder reported that glycine could also be obtained from gelatin and meat using alkaline hydrolysis with potassium hydroxide. In 1845, V. Dessaignes identified glycine as a component of hippuric acid. The correct com-position of glycine was determined independently in 1846 by three chemists: E.N. Horsford, A. Laurent, and G.J. Mulder. The structure of glycine was established by A. Cahours in 1857 and one year later, it was synthesized chemically from ammonia and monochloroacetic acid. Glycine accounts for one-third of all AA residues in col-lagen proteins, which represent ~30% of the total proteins in animals.
l-Histidine (α-amino-β-imidazolepropionic acid) was first isolated from acid hydrolysates of sturine protein by A. Kossel in 1896. This finding was published in the Proceedings of the Prussian Academy of Science on April 9, 1896. One month later, on May 11, 1896, the editors of Zeitschrift für Physiologische Chemie received a manuscript from S.G. Hedin who reported the isolation of histidine from various proteins using a superior method. The simultaneous discovery of histidine by two different groups is truly remarkable. The structure of histidine, which possesses an imidazole ring, was elucidated by H. Pauly in 1904 and confirmed through chemical synthesis from diaminoacetone by F.L. Pyman in 1911.
4-Hydroxy-l-proline (4-hydroxypyrrolidine-2-carboxylic acid) was originally produced from the acid hydrolysates of gelatin by E. Fischer in 1902 soon after his discovery of l-proline. A racemic mixture of 4-hydroxy-l-proline was first synthe-sized chemically from epichlorohydrin and sodium malonic ester by H. Leuchs in 1905. Subsequently, 4-hydroxy-l-proline was found to be an abundant constituent of collagen and elastin. Studies in the 1960s revealed that 4-hydroxy-l-proline is derived from the posttranslational hydroxylation of l-proline in proteins (primarily collagen) in the presence of oxygen, ascorbic acid, α-ketoglutarate, and Fe2+.
l-Isoleucine (α-amino-β-methylvaleric acid) was one of the three branched-chain AA (BCAA) abundant in both plant proteins and most animal proteins but was the last BCAA to be discovered. Specifically, it was first isolated from sugar beet molas-ses by F. Ehrlich in 1904. In the following years, this AA was obtained from a pancreatic digest of fibrin and from acid hydrolysates of wheat gluten, egg albumin, and beef muscle. F. Ehrlich reported in 1907 that isoleucine has the same chemical

13Discovery and Chemistry of Amino Acids
© 2010 Taylor & Francis Group, LLC
composition as leucine but different physicochemical properties (e.g., melting point, optical activity, and solubility). The structure of isoleucine was established through its chemical synthesis by F. Ehrlich in 1908.
l-Leucine (α-aminoisocaproic acid) was the first BCAA to be obtained from cheese by J.L. Proust in 1819. One year later, H. Braconnot isolated leucine from the acid hydrolysates of skeletal muscle and wool. The term “leucine” was coined by Braconnot to indicate the white crystalline substance that separated from the acid hydrolysate of protein on addition of alcohol. In 1839, G.J. Mulder reported that leucine could also be obtained by alkaline hydrolysis of proteins. A. Laurent and C. Gerhardt correctly determined the composition of leucine in 1848. Its structure was established through chemical synthesis from isovaleraldehyde by E. Schulze in 1891. Among the three BCAA, leucine is usually the most abundant one in both plant and animal proteins.
l-Lysine (α,ε-diaminocaproic acid) was discovered by E. Drechsel in 1889 as an alkaline substance in casein hydrolysates. In 1891, M. Siegfried, a member of the Drechsel’s laboratory, identified lysine as a component in the hydrolysates of other proteins, including conglutin, glutenfibrin, and egg albumin. In the same year, the composition of lysine was determined by E. Drechsel and the term “lysine” was coined by Ernst Fischer to indicate the release of urea from this new substance upon alkaline hydrolysis by barium hydroxide. The structure of lysine was pro-posed by A. Ellinger in 1899 and was established through chemical synthesis from γ-cyanopropylmalonic ester by E. Fischer and F. Weigert in 1902. Crystalline lysine was first prepared by two American chemists H.B. Vickery and C.S. Leavenworth in 1928.
l-Methionine (α-amino-γ-methylthiobutyric acid) was discovered by J.H. Mueller in 1922 as a substance in an acid hydrolysate of casein during his studies to define the growth factors for a hemolytic streptococcus. One year later, the composition of methionine as a sulfur-containing AA was proposed by Mueller after developing an improved method to obtain a large amount of this substance from casein. Meanwhile, he successfully isolated methionine from other sources of proteins, including egg albumin, edestin, and wool. Likewise, in 1925, S. Odake obtained methionine from yeast extracts. The structure of methionine was established through chemical synthe-sis from β-methylthiolpropaldehyde by G. Barger and F.P. Coyne in 1928.
l-Ornithine (α,δ-diaminovaleric acid) was discovered by M. Jaffé in 1877 as a hydrolysis product of ornithuric acid in the urine of hens that were fed with benzoic acid. The structure of ornithine was established through chemical synthesis from phthalimidopropylmalonic ester by E. Fischer in 1901. Subsequently, ornithine was identified by A. Kossel in 1904 as a product of arginine hydrolysis by arginase. In 1932, H. Krebs found that ornithine served as a catalyst to stimulate the conversion of ammonia into urea in liver slices and proposed the ornithine cycle involving orni-thine as an intermediate for urea synthesis in mammals.
l-Phenylalanine (α-amino-β-phenylpropionic acid) was first obtained from etio-lated lupine sprouts by E. Schulze and J. Barbieri in 1879. Two years later, these authors isolated phenylalanine from hydrolysates of plant proteins (e.g., those from lupine seedlings) and correctly determined its composition. In 1882, E. Erlenmeyer and A. Lipp reported the first chemical synthesis of phenylalanine from

14 Amino Acids: Biochemistry and Nutrition
© 2010 Taylor & Francis Group, LLC
phenylacetaldehyde, hydrocyanic acid, and ammonia. Following its synthesis by Schulze and Barbieri in 1883, the structure of phenylalanine originally isolated from lupine sprouts was finally established. This advance was highly significant in the late nineteenth century, as another aromatic AA (after tyrosine) had been discovered in nature. In 1934, the Norwegian doctor A. Følling discovered an inborn metabolic disorder called phenylketonuria that was shown in 1947 to result from the impaired catabolism of phenylalanine.
l-Proline (pyrrolidine-2-carboxylic acid) was the second AA to be obtained through chemical synthesis before its discovery as a component of protein in nature. Specifically, proline was originally synthesized chemically from α,δ-dibromopropylmalonic ester by R. Willstätter in 1900. One year later, without the knowledge of Willstätter’s published results, E. Fischer discovered proline as a component of casein’s acid hydrolysates and established its structure through chem-ical synthesis from phthalimide propylmalonic ester. Thereafter, Fischer obtained proline from a tryptic digest of casein, alkaline hydrolysates of casein, and an enzy-matic digest of gliadin in 1901, 1902, and 1911, respectively, to rule out the pos-sibility that the ring structure of the proline molecule could result from an artifact during the processes of acid hydrolysis and AA esterification. Subsequently, proline and hydroxyproline were found to constitute one-third of all AA residues in the extracellular proteins, collagens, which comprise ~30% of the body proteins.
l-Selenocysteine is the most recent addition to the list of peptide-bound AA. Among the analyzed proteins, only selenoprotein has been found to contain sele-nocysteine. Selenium was detected by the Swedish chemist J.J. Berzelius in 1818 as a by-product of sulfuric acid production and had long been considered as an industrial hazard. However, more than one century later, J. Pinsent reported in 1953 that selenite was required for the optimum activity of formic acid dehydrogenase in Escherichia coli. Selenium was identified in 1957 to be an essential nutrient for animals and was reported in 1971 to be a cofactor for glutathione (GSH) peroxidase. As early as 1973, L. Flohé suggested the presence of l-selenocysteine in selenopro-teins. In support of this notion, T.C. Stadtman and colleagues discovered seleno-cysteine in clostridial glycine reductase in 1973. Work in the 1990s has shown that selenocysteine is formed from selenium and serine at the translation step of protein synthesis.
l-Serine (α-amino-β-hydroxypropionic acid) was isolated from a hydrolysate of silk protein (named sericine) by E. Cramer in 1865. This author also correctly deter-mined the composition of serine and found it to be similar to alanine. In 1901, E. Fischer and A. Skita obtained serine from the acid hydrolysates of silk. The structure of serine was established through chemical synthesis from glycolic aldehyde and cyanohydrin by E. Fischer and E. Leuchs in 1902. Serine was identified in human sweat by E. Embden and H. Tachau in 1910 and was isolated from the extracts of green alfalfa leaves by H.B. Vickery in 1925. In 1931, F.S. Daft and R.D. Coghill reported that serine was highly unstable when heated in a strong alkaline solution. This finding paved the way to optimize AA analysis in protein. The occurrence of serine as a phosphate ester (i.e., phosphoserine) in the acid hydrolyzates of proteins (e.g., casein) was reported by F.A. Lipmann and P.A. Levene in 1932, which laid the foundation for the future discovery of protein phosphorylation in cells.

15Discovery and Chemistry of Amino Acids
© 2010 Taylor & Francis Group, LLC
l-Threonine (α-amino-β-hydroxybutyric acid) was the last protein AA to be dis-covered. It was first isolated from oat protein by S.B. Schryver and H.W. Buston and also from teozein by R.A. Gortner and W. F. Hoffmann in 1925. Ten years later, W. Rose and coworkers identified threonine as a component of the acid hydrolysates of casein. This finding made it possible to prepare purified or semipurified diets con-taining crystalline AA for nutritional research. The structure of threonine was estab-lished by chemical synthesis in 1935. The occurrence of threonine as a phosphate ester in proteins, reported for the first time in 1952, results from posttranslational protein phosphorylation.
l-Tryptophan (α-amino-β-3-indolepropionic acid) was obtained from a pancre-atic digest of casein by F.G. Hopkins and S.W. Cole in 1901. Two years later, these authors determined the composition of tryptophan and A. Ellinger reported that tryptophan was the precursor of indole in the intestine. In 1906, Hopkins prepared a tryptophan-free diet using the acid hydrolysates of casein and found that dietary tryptophan is required for animal growth. After much discussion among the contem-porary chemists, the structure of tryptophan was finally established through chemi-cal synthesis of β-indolealdehyde by A. Ellinger and C. Flamand in 1907. Note that about 50 years before the discovery of tryptophan, some of its metabolites were iden-tified in animals, including kynurenic acid in dog urine first reported by the German chemist J. von Liebig in 1853.
l-Tyrosine [α-amino-β-(p-hydroxyphenyl)propionic acid) was discovered in a crude casein preparation by J. von Liebig in 1846. One year later, he obtained the same substance from fibrin and serum albumin preparations, and named it “tyro-sine.” In 1848, W. de La Rue correctly determined the composition of tyrosine as C9Hl1NO3. This AA was isolated in 1849, for the first time, from an acid hydrolysate of casein by F. Bopp. In 1861, C. Bodeker identified that a large amount of homogen-tisic acid was formed from tyrosine in the urine of patients with alcaptonuria. The structure of tyrosine was established through chemical synthesis from p-aminophe-nylalanine by E. Erlenmeyer and A. Lipp in 1883.
l-Valine (α-aminoisovaleric acid) was the second BCAA to be discovered. It was first isolated from the extracts of animal tissues (liver, pancreas, spleen, thymus, and thyroid) by E. von Gorup-Besanez in 1856. Valine was obtained from an acid hydrolysate of albumin by P. Schützenberger in 1879, and then from a pancreatic protein hydrolysate by E. Fischer in 1901. The structure of valine was established through chemical synthesis by E. Fischer in 1906. In the same year, E. Fischer named α-aminoisovaleric acid as “valine.”
β- AnD γ-AA with PhysioloGicAl siGnificAnce
β-Alanine (β-aminopropionic acid, also known as 3-aminopropanoic acid) was first synthesized by W. Heintz in 1870, only 20 years after the chemical synthesis of α-alanine. In 1911, the Russian biochemist W. Gulewitsch discovered that β-alanine is a component of carnosine (β-alanyl-l-histidine) in beef muscle. In subsequent years, two additional β-alanine-containing peptides (anserine and balenine) were discovered in the skeletal muscle and in the brain in a species-dependent manner. β-Alanine has no asymmetric carbon and therefore has no optical activity.

16 Amino Acids: Biochemistry and Nutrition
© 2010 Taylor & Francis Group, LLC
γ-Aminobutyric acid (GABA) was first synthesized in 1883. In 1950, an analysis of brain tissue using paper chromatography revealed that free GABA is an integral component of the central nervous system. This nonprotein AA was subsequently found to be a product of glutamate decarboxylation by glutamate decarboxylase in bacteria, animals, and plants. On the basis of its chemical structure, GABA has no asymmetric carbon and therefore has no optical activity.
Taurine (2-aminoethanesulfonic acid) was the first sulfur-containing AA to be discovered in nature. Specifically, in 1827, two Austrian scientists F. Tiedermann and L. Gmelin isolated taurine from bile acids of the ox, Bos taurus. The term “taurine” was coined by H. Demarcay in 1838. In the same year, two French chem-ists J.B. Dumas and E. Pelouze determined the composition of taurine but both of them overlooked its sulfur atom, thereby incorrectly giving it the formula C2H7NO5. In 1846, another Austrian chemist, J. Redtenbacher, recognized the presence of sulfur in the taurine molecule and correctly identified its formula to be C2H7NO3S. The structure of taurine was established through chemical synthesis of ethylene dibromide, potassium thiocyanate, and ammonia by H. Kolbe in 1862. By the 1910s, taurine was known to be widely distributed in the animal kingdom and to be present in relatively high concentrations in all mammalian tissues. This AA has no asym-metric carbon and, therefore, has no isomer.
D-AA
Chemists in the nineteenth century had known that d-AA could be obtained by chemical synthesis. The presence of d-AA in nature was first recognized in 1935 when W.A. Jacobs and L.C. Craig reported the presence of d-proline in ergotinine (a tripeptide alkaloid isolated from ergot). The presence of d-AA in animal tis-sues and processed foods was demonstrated in the 1950s and 1970s, respectively. The sources of d-AA in the body are: (1) diets, (2) the posttranslational action of racemases on peptide-bound l-AA in proteins, and (3) the synthesis of d-AA from free l-AA by specific racemases. Racemization of d-AA to form l-AA may occur in both gastrointestinal microorganisms and animals [e.g., mammals, birds, freshwater and marine invertebrates (e.g., snails, crayfish, and lobster), insects, and worms]. The discovery of d-AA in natural proteins and physiological fluids marks the beginning of an important chapter in AA biochemistry.
Presence of D-AA in FoodsNatural plant proteins and animal products (e.g., milk and meat) contain some d-AA. d-Ala is the most prevalent d-AA in higher plants. Also, free d-AA represent ~2% of the total free AA in unprocessed cow’s milk, and it is likely that d-AA are derived pri-marily from microbial activity in the digestive tract. Processing food at high tempera-ture can result in the formation of both free and peptide-bound d-AA in a time-and pH-dependent manner. Rates of the racemization of different l-AA residues to their respective d-isomers in a food protein vary, but the relative rates for the same d-AA in different proteins are similar under the same conditions. In 1979, P.M. Masters and M. Friedman reported for the first time that alkali-treated food proteins contain a signifi-cant amount of d-alanine, d-aspartic acid, d-glutamate, d-leucine, d-phenylalanine,

17Discovery and Chemistry of Amino Acids
© 2010 Taylor & Francis Group, LLC
d-proline, and d-valine. For example, the ratio of each of these d-AA to the cor-responding l-AA in untreated casein, lactalbumin, soy protein, and wheat gluten is only 0.02–0.03 but increases substantially (e.g., up to 0.45 for d-aspartate:l-aspartate in soy protein) in response to alkaline treatment with 0.1 N NaOH at 65°C for 3 h. Subsequent studies have shown the presence of other d-AA (including d-asparagine, d-serine, and d-threonine) in other processed foods. Racemization of AA in proteins as well as the formation of d-peptide bonds and the crosslinked AA (e.g., lanthionine and lysinoalanine) may impair digestibility and nutritional value.
Presence of D-AA in the Animal KingdomFree and peptide-bound d-AA have been reported to be present in the animal kingdom. In mammals and birds, d-AA account for <0.02% of the total AA in the body. However, d-AA can exceed 1% of the total AA in certain marine shellfish. Interestingly, the content of d-serine, d-aspartate, d-asparagine, and d-threonine in proteins of human cataract lenses is significantly higher than that in age-matched normal lenses. To date, d-alanine, d-aspartate, and d-serine in the free form have been found in substantial amounts in mammalian tissues and are also detected in avian and invertebrate (including insects and aquatic animals) tissues as well as in physiological fluids (e.g., plasma and saliva). In addition, d-glutamate has also been reported in chicken and pigeon tissues.
d-Alanine is not synthesized in mammalian cells due to the lack of d-alanine racemase. However, insects and certain aquatic animals possess this enzyme for d-alanine formation. Because of the synthesis by gastrointestinal microorganisms and the possible intake from the plant-based rodent diet, d-alanine is present in the rat pancreas, as well as in the mouse brain and the peripheral tissues. Furthermore, a relatively large amount of d-alanine is found in the urine of mice, which is primarily bacterial, but not dietary origin. Finally, d-alanine is present in insects at relatively low concentrations but is highly abundant in certain crustaceans, mollusks, and other aquatic animals. For example, aquatic crustaceans and some bivalve mollusks contain up to 100 mM d-alanine in their tissues.
d-Aspartate was discovered in the brain of cephalopods (Octopus vulgaris) by A. D’Aniello and A. Guiditta in 1977 and was found in the brain and peripheral organs of rodents and humans by D.S. Dunlop and colleagues in 1986. In all the brain areas of rats at all stages of life, d-aspartate is exclusively restricted to neuronal population and is localized in both the cytoplasm and fiber tracks. Interestingly, free d-aspartate occurs in substantial amounts in the brain at the embryonic phase and during the first few days of postnatal life but greatly decreases in adulthood. The concentration of d-aspartate in the human frontal cortex at gestational week 14 exceeds that of l-aspar-tate (d-Asp = 0.36 μmol/g, l-Asp = 0.21 μmol/g) and then dramatically declines after birth. In adult mice, concentrations of d-aspartate are ~50 μM in the striatum, cortex, cerebellum, and olfactory bulbs and are ~200 μM in the hippocampus. In addition to nervous tissues, d-aspartate is present in endocrine glands (e.g., pancreas, pineal, adrenal, and pituitary), reproductive organs (e.g., testis, ovary, and placenta), immune system (e.g., spleen and thymus), heart, and physiological fluids (e.g., plasma and saliva) in mammals. The results of recent studies indicate that d-aspartate is also widespread in both nervous and endocrine tissues in birds and marine invertebrates.

18 Amino Acids: Biochemistry and Nutrition
© 2010 Taylor & Francis Group, LLC
d-Serine was initially identified in the mammalian brain by T. Nishikawa, A. Hashimoto, and coworkers in 1992. This AA is present in protoplasmic astrocytes and neurons of the forebrain regions where its concentrations remain relatively high throughout the postnatal life. The levels of d-serine in the rodent brain can be as much as one-third of l-serine levels. Besides the nervous tissues, d-serine is present in the peripheral tissues (e.g., blood, heart, pancreas, spleen, liver, kidneys, testes, epididymis, lungs, skeletal muscles, and retina) of mice (Nishikawa 2011). Similarly, d-serine has been detected in the plasma, brain, and urine of humans and in the brain and kidney of chickens. Besides mammals and birds, d-serine occurs in microor-ganisms, certain insects (e.g., silkworms), aquatic animals, and other invertebrates. Interestingly, in certain species of insects, d-serine accounts for <1% and 5–50% of the total serine in larvae and pupae, respectively.
d-AA occur in some peptides or proteins as a result of posttranslational race-mization (or isomerization). For example, d-aspartic acid, d-glutamic acid, and d-alanine exist in bacterial cell-wall peptidoglycans. F. Lipmann and coworkers reported in 1941 that d-AA account for 20% and 45%, respectively, of the total AA in tyrocidine and gramicidin (peptide antibiotics produced by an aerobic spore-forming organism, Bacillus brevis). In 1997, G. Kreil summarized the evidence for d-AA-containing peptides produced by animals, which include: (1) opioid pep-tides (consisting of a d-alanine or d-methionine residue) and antimicrobial peptides (containing a d-alanine residue) from the amphibian skin, (2) neuropeptides from the snail ganglia (fulicin; consisting of an asparagine residue), (3) a hyperglycemic hormone (consisting of d-phenylalanine) from crustaceans, and (4) a constituent of a protein (containing d-serine) from the venom of a funnel-web spider Agelenopsis aperta (Kreil 1997). Peptide bonds formed from a d-AA are resistant to attacks by proteases.
CHEMICAL PROPERTIES OF AA
Knowledge about the chemical properties of AA in water, physiological fluids, and organic solvents is crucial for the preparation of AA solutions for cell culture, nutri-tional support, and medical therapy (Lubec and Rosenthal 1990). Such information can also guide the practice of processing, storing, and analyzing biological samples. In addition, the chemical properties of AA can be utilized to develop new delicious and healthy foods for consumption by humans and other animals.
PhysicAl APPeArAnce AnD meltinG Points of crystAlline AA
AA crystals are generally white. All crystalline AA, except for glutamine and cys-teine, have a high melting point of more than 200°C. Glutamine and cysteine have melting points of 185°C and 178°C, respectively. At or above their melting points, AA decompose spontaneously. The hydrochlorides of l-arginine (l-arginine–HCl), l-lysine (l-lysine–HCl), and l-ornithine (l-ornithine–HCl) have melting points of 235°C, 236°C, and 231°C, respectively (Table 1.2). Interestingly, the melting points of l-arginine and l-arginine–HCl are nearly identical. The crystalline forms of AA are stable at room temperature.

19Discovery and Chemistry of Amino Acids
© 2010 Taylor & Francis Group, LLC
TABLE 1.2Molecular Weights and Chemical Properties of AA
AA MW MP (oC) Solubilitya pK1b pK2
c pK3d pI
(1) Neutrall-Alanine 89.09 297 16.5 2.35 9.87 6.11
β-Alanine 89.09 197 82.8 3.55 10.24 6.90
γ-Aminobutyrate 103.12 202 107.3 4.03 10.56 7.30
l-Asparagine 132.12 236 2.20 2.02 8.80 5.41l-Citrulline 175.19 222 15.2 2.43 9.41 5.92l-Cysteine 121.16 178 17.4 1.96e 8.18e 10.28e 5.07e
l-Cystine 240.30 261 0.011 <1.0f 8.02f 5.06f
2.10f 8.71f
l-Glutamine 146.14 185 4.81e 2.17 9.13 5.65Glycine 75.07 290 25.0 2.35 9.78 6.07l-Hydroxyproline 131.13 270 36.1 1.92 9.73 5.83l-Isoleucine 131.17 284 4.12 2.36 9.68 6.02l-Leucine 131.17 337 2.19 2.33 9.75 6.04l-Methionine 149.21 283 5.06 2.28 9.21 5.74l-Phenylalanine 165.19 284 2.96 2.20 9.31 5.76l-Proline 115.13 222 162.3 1.99 10.6 6.30l-Serine 105.09 228 41.3 2.21 9.15 5.68l-Taurine 125.15 328 10.5 1.50 8.74 5.12l-Threonine 119.12 253 9.54 2.15 9.12 5.64l-Tryptophan 204.22 282 1.14 2.38 9.39 5.89l-Tyrosine 181.19 344 0.045 2.20 9.11 10.07 5.66l-Valine 117.15 315 5.82 2.29 9.72 6.01
(2) Basicl-Arginine 174.20 238 18.6 2.17 9.04 12.48 10.76l-Histidine 155.15 277 4.19 1.80 9.33 6.04 7.69l-Lysine 146.19 224 78.2g 2.18 8.95 10.53 9.74l-Ornithine 132.16 231h 54.5h 1.94 8.65 10.76 9.71
(3) Acidicl-Aspartic acid 133.10 270 0.45 1.88 9.60 3.65 2.77l-Glutamic acid 147.13 249 0.86 2.19 9.67 4.25 3.22
Source: Adapted from Greenstein, J.P. and M. Winitz. Chemistry of Amino Acids. 1961. New York, and Meister, A. 1965. Biochemistry of Amino Acids. Academic Press, New York.
a Solubility in water (g/100 mL at 25°C unless otherwise indicated).b pK for α-COOH (SO3H for taurine) at 25°C unless otherwise indicated.c pK for α-NH3
+ at 25°C unless otherwise indicated.d pK for the ionized group in the side chain at 25°C unless otherwise indicated.e Determined at 30°C.f Determined at 35°C.g l-Lysine–H2O.h l-Ornithine–HCl.MP, melting point; MW, molecular weight.

20 Amino Acids: Biochemistry and Nutrition
© 2010 Taylor & Francis Group, LLC
tAstes of crystAlline AA
The taste of AA results from their interactions with specific receptors [guanine nucle-otide-binding protein (G protein)-coupled receptors] on the tongue (Fernstrom et al. 2012). l-Glutamate has a “meaty” taste. l-Alanine and glycine have a sweet taste, l-serine and l-threonine have a faintly sweet taste, and l-citrulline has a slightly sweet taste. l-Arginine base has a bitter and unpleasant taste by itself, but in a mix-ture with citric acid in drinking water, it is palatable. l-Isoleucine has a bitter taste, whereas l-lysine, l-aspartate and l-phenylalanine have a slightly bitter taste. l-Glu-tamine, β-alanine, and taurine are flat (lacking tastiness). l-Asparagine, l-cysteine, l-cystine, l-methionine, l-tryptophan, l-proline, l-ornithine, l-histidine, l-leucine, l-tyrosine, and l-valine have a flat-to-bitter taste. d-Glutamate is almost taste-less, whereas d-aspartate is flat. d-Alanine, d-leucine, d-serine, d- tryptophan, and d-valine are very sweet, whereas d-glutamine, d-histidine, d-isoleucine, d-methi-onine, d-phenylalanine, d-threonine, and d-tyrosine are sweet (Kawai et al. 2012). The taste of a basic AA is altered by its hydrochloride salt (San Gabriel et al. 2009).
soluBility of AA in wAter AnD orGAnic solvents
All AA are soluble in water at room temperature. Leucine, isoleucine, valine, phenyl-alanine, tryptophan, methionine, tyrosine, and cysteine are among the most hydro-phobic AA. All AA (except for cystine) are soluble in Krebs bicarbonate buffer (pH 7.4 at 25°C) at concentrations that are at least 10 times greater than those in animal plasma. The solubility of α-AA in water varies with their side chains, with proline, and cystine being the most and least soluble, respectively (Table 1.2). The solubility of β-alanine and γ-aminobutyrate in water is higher than that of lysine. Salts affect the solubility of AA in water, and such an effect depends on their structures (Table 1.3).
The solubility of AA generally increases in acidic or alkaline solutions as well at elevated temperatures. With the exception of proline and hydroxyproline, AA are
TABLE 1.3Effects of Salts on the Solubility of AA in Water
AA Salts Change in Solubility in Watera
Glycine 5 mM CaCl2 ↑ 24%
10 mM CaCl2 ↑ 40%
20 mM KCl ↓ 34%
l-Aspartic acid 5 mM NaCl ↑ 29%
10 mM NaCl ↑ 4%
5 mM KCl ↑ 29%
l-Glutamic acid 20 mM NaCl ↑ 31%
l-Leucine 20 mM NaCl ↓ 33%
20 mM KCl ↓ 34%
Source: Greenstein, J.P. and M. Winitz. Chemistry of Amino Acids. 1961. New York.a Compared with the absence of salt. ↑, increase; ↓, decrease.

21Discovery and Chemistry of Amino Acids
© 2010 Taylor & Francis Group, LLC
generally insoluble in organic solvents (e.g., absolute ethanol). Because of their pyr-role ring structures, proline and hydroxyproline are fairly soluble in absolute ethanol (~1.6 g/100 mL at 20°C).
The hydrochlorides of AA (both neutral and basic) are generally more soluble in water than the corresponding free AA. Most of the AA hydrochlorides are highly soluble in absolute ethanol. The hydrochloride salts of basic AA (e.g., arginine and lysine) are often used for their neutralization in water and in physiological solution. The sodium salts of most AA dissolve more readily in water and are more ethanol-soluble than the corresponding free AA.
Zwitterionic form of AA
Since the amino and the acidic groups have opposite electrical charges, an AA (an amphoteric electrolyte) acts as a base or an acid by accepting and supplying a hydro-gen ion, respectively. Thus, all AA form intramolecular salts both in the crystalline state and in aqueous solution. This structure, in which a molecule has both positive and negative electrical charges, is known as a dipolar ion or zwitterion (ionizable). Uncharged (nondissociated) forms of AA almost do not exit. For example, the ratio of charged dipolar (ionized α-amino and α-carboxyl groups) to uncharged forms of l-aspartic acid in aqueous solution is approximately 28,000:1 at pH 7.0. Similarly, the proportion of charged dipolar (ionized α-amino and α-carboxyl groups) to uncharged forms of l-lysine in aqueous solution is approximately 320,000:1 at pH 7.0.
H3N C
R
H
+COO–
α
The zwitterionic (ionized) form of an AA
In an aqueous solution, the carboxyl and amino groups of an AA dissociate in a pH-dependent manner, and, therefore, have their respective dissociation constants (pK). The dissociation constants for the acid-, amino-, and side-chain groups are termed pK1, pK2, and pK3, respectively. The pH of an aqueous solution at which an AA has no net electrical charge is called the isoelectric point (pI). When an AA is dissolved in pure water until the solution is saturated, the pH of this solution will approach the pI value of the AA.
H3NCHRCOO–+H2NCHRCOO–H3NCHRCOOH
+
K1
–H+
+H+
–H+
+H+
K2
H2NCHRCOOH
[H3NCHRCOO–] [H+]+
K1 = K2 =, [H2NCHRCOO–] [H+]
[H3NCHRCOO–]+
[H3NCHRCOOH]+

22 Amino Acids: Biochemistry and Nutrition
© 2010 Taylor & Francis Group, LLC
pK1 = -log K1, pK2 = -log K2
pH = pK + log ([A−]/[HA]), where A− = base and HA = acidpK = pH - log ([A−]/[HA])
The pI values of AA in the solutions are based on the dissociation constants for their acid-, amino-, and side-chain groups. For an AA without an ionizable side chain, pI = (pKa1 + pKa2)/2.
Examples: For alanine, pI = (2.35 + 9.87)/2 = 6.11; for citrulline, pI = (2.4 + 9.69)/ 2 = 6.05.
For an AA with an ionizable side chain, pI = average of the pKa values of the two most similar acid groups.
Examples: For aspartic acid, pI = (1.99 + 3.90)/2 = 2.95; for arginine, pI = (8.99 + 12.5)/2 = 10.7.
Since the pKa values of the α-carboxyl groups of α-AA are ~2.0–2.4 (Table 1.3), these groups are almost entirely in their carboxylate forms at pH > 3.5. Similarly, because the pKa values of the α-amino groups of α-AA are ~9.0–10.0, these groups are almost entirely in their ammonium ion forms at pH < 8.0. Thus, at physiological pH (e.g., pH 7.4 in plasma and fetal fluid and pH 7.0 in cytoplasm), the α-carboxylic acid and α-amino groups of α-AA are completely ionized to take the zwitterion form. In their ionized state, glutamic acid and aspartic acid are often referred to as glutamate and aspartate, respectively.
Data on the pI values of AA help one understand the mechanisms responsible for: (1) buffering functions of AA, (2) acid–base balance in physiological fluids, (3) transport of AA by cells, (4) interorgan metabolism of AA, (5) AA antagonism and imbalance, (6) protein structure and function, and (7) intracellular trafficking and location. Additionally, the knowledge of pI values is useful in designing effective methods to analyze AA and their products. For example, the different charges of free AA at a given pH are the chemical basis for their separation by ion-exchange chromatography. Likewise, the different charges of peptide-bound AA allow for the separation of proteins and polypeptides by electrophoresis.
On the basis of their net charges at neutral pH, AA are classified as neutral (net charge = 0), basic (net change ≥ +1), or acidic (net change ≤ −1). Thus, the addition of acidic or basic AA to a solution with a weak buffering capacity will substantially decrease or increase its pH, respectively. Similarly, intravenous infusion of large amounts of acidic or basic AA into animals and humans will adversely disturb the acid–base balance of the body. Interestingly, supplementing an appropriate amount of acidic (e.g., 1% glutamic acid) or basic (e.g., 1% arginine) AA to a corn- and soybean meal-based diet does not affect the pH in the lumen of the swine gastroin-testinal tract. This is likely due to the highly acidic environment of the stomach (pH 2–2.5) and bicarbonate-containing secretions in the lumen of the small intestine.
stABility of AA in wAter AnD BuffereD solutions
Except for cysteine, AA in water, buffered solutions (e.g., Krebs bicarbonate buffer), or deproteinized and neutralized biological samples are stable at −80°C for 6 months

23Discovery and Chemistry of Amino Acids
© 2010 Taylor & Francis Group, LLC
without any detectable loss. Likewise, AA are generally stable in aqueous solution at physiological pH and body temperature (e.g., 37°C in mammals), except for (1) cysteine, which undergoes rapid oxidation to cystine particularly in the presence of metal ions and the absence of reducing agents, and (2) glutamine, whose amide and carboxyl groups spontaneously and slowly interact to form the cyclic product, the ammonium salt of pyrrolidone carboxylate (pyroglutamate). This reaction occurs at a rate of <1%/day for 1 mM glutamine at 37°C.
The ratio of cystine to cysteine is approximately 10:1 in the plasma or serum of healthy subjects. Cystine is readily converted into cysteine inside the cell under physiological reducing conditions. N-Acetylcysteine (a water-soluble synthetic substance) is a stable precursor of cysteine for cultured cells and for intravenous or oral administration into humans and other animals. In chemical analysis, the thiol (–SH) group of cysteine can be protected by iodoacetic acid, whereas cystine can readily be reduced to cysteine by 2-mercaptoethanol. In contrast to cysteine, few means are available to protect glutamine from spontaneous cyclization in an aqueous solution.
stABility of AA in wAter unDer hiGh Pressure AnD hiGh temPerAture
Under high-pressure and high-temperature conditions in an autoclave, glutamine and asparagine are almost completely destroyed and cysteine is oxidized to cystine, but other AA (including cystine) are stable. However, in a dipeptide form (e.g., l-alanyl-glutamine and glycyl-glutamine as well as l-leucyl-asparagine and glycyl-asparagine), glutamine and asparagine are stable under these conditions. To prevent the loss of glutamine and asparagine under autoclaving conditions, a solution containing free glu-tamine and asparagine can be sterilized through a 0.2 μm filter before use for cell or tissue culture. Note that, under autoclaving conditions, cysteine (2%, w/v) in deoxy-genated water is stable at pH 4.9 but undergoes 8% and 17% losses at pH 7 and 8, respectively.
stABility of AA in stronG AciD AnD AlkAline solutions
Under standard conditions of acid hydrolysis (i.e., 6 M HCl, 110°C, and 24 h under N gas), changes in the following AA occur: (1) all glutamine and asparagine are converted to glutamate and aspartate, respectively, (2) tryptophan is completely destroyed, and (3) 20% of methionine undergoes oxidation to generate methionine sulfoxide. Notably, under these conditions, other AA are either highly stable (i.e., no detectable loss for alanine, arginine, cystine, glutamate, glycine, histidine, leu-cine, lysine, phenylalanine, and valine) or relatively stable (3% loss for aspartate and threonine, 5% loss for tyrosine and proline, and 10% loss for serine).
Most AA (including glutamine, asparagine, serine, cysteine, and cystine) are destroyed to a great extent by alkaline hydrolysis, particularly at high temperature. In contrast, tryptophan is stable in alkaline solution even at boiling temperature. Thus, the analysis of tryptophan in protein can be successfully accomplished by alkaline hydrolysis in the presence of 4.2 M NaOH and 1% thiodiglycol (an antioxidant) at 110°C for 20 h.
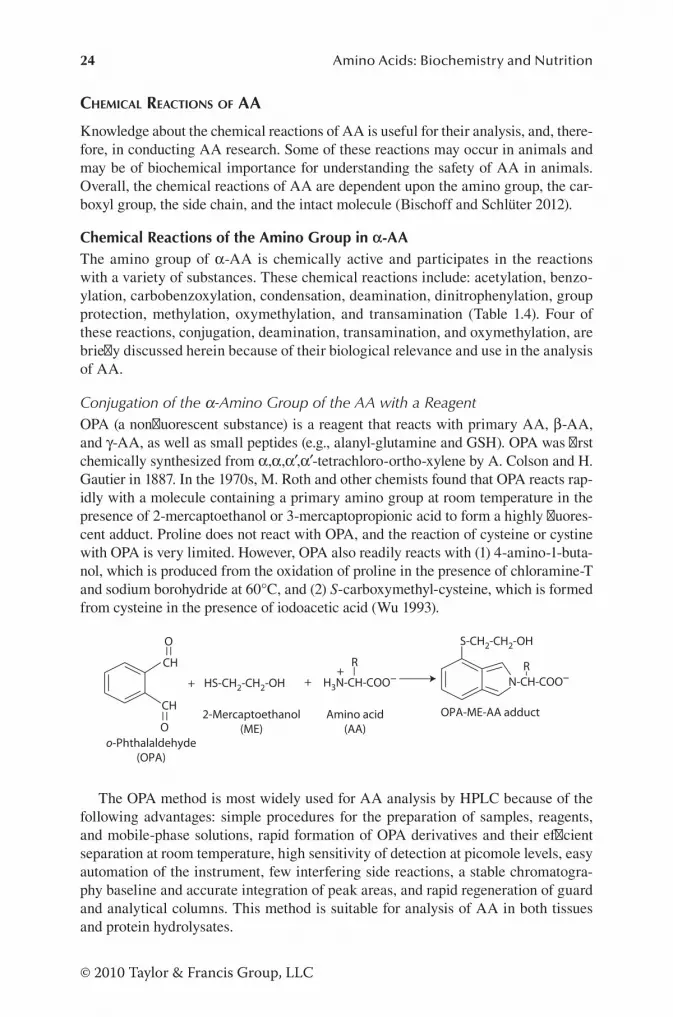
24 Amino Acids: Biochemistry and Nutrition
© 2010 Taylor & Francis Group, LLC
chemicAl reActions of AA
Knowledge about the chemical reactions of AA is useful for their analysis, and, there-fore, in conducting AA research. Some of these reactions may occur in animals and may be of biochemical importance for understanding the safety of AA in animals. Overall, the chemical reactions of AA are dependent upon the amino group, the car-boxyl group, the side chain, and the intact molecule (Bischoff and Schlüter 2012).
Chemical Reactions of the Amino Group in α-AAThe amino group of α-AA is chemically active and participates in the reactions with a variety of substances. These chemical reactions include: acetylation, benzo-ylation, carbobenzoxylation, condensation, deamination, dinitrophenylation, group protection, methylation, oxymethylation, and transamination (Table 1.4). Four of these reactions, conjugation, deamination, transamination, and oxymethylation, are briefly discussed herein because of their biological relevance and use in the analysis of AA.
Conjugation of the α-Amino Group of the AA with a ReagentOPA (a nonfluorescent substance) is a reagent that reacts with primary AA, β-AA, and γ-AA, as well as small peptides (e.g., alanyl-glutamine and GSH). OPA was first chemically synthesized from α,α,α′,α′-tetrachloro-ortho-xylene by A. Colson and H. Gautier in 1887. In the 1970s, M. Roth and other chemists found that OPA reacts rap-idly with a molecule containing a primary amino group at room temperature in the presence of 2-mercaptoethanol or 3-mercaptopropionic acid to form a highly fluores-cent adduct. Proline does not react with OPA, and the reaction of cysteine or cystine with OPA is very limited. However, OPA also readily reacts with (1) 4-amino-1-buta-nol, which is produced from the oxidation of proline in the presence of chloramine-T and sodium borohydride at 60°C, and (2) S-carboxymethyl-cysteine, which is formed from cysteine in the presence of iodoacetic acid (Wu 1993).
CH
O
CH
O
+ HS-CH2-CH2-OH H3N-CH-COO–+
R+ R
N-CH-COO–
S-CH2-CH2-OH
o-Phthalaldehyde(OPA)
2-Mercaptoethanol(ME)
Amino acid(AA)
OPA-ME-AA adduct
The OPA method is most widely used for AA analysis by HPLC because of the following advantages: simple procedures for the preparation of samples, reagents, and mobile-phase solutions, rapid formation of OPA derivatives and their efficient separation at room temperature, high sensitivity of detection at picomole levels, easy automation of the instrument, few interfering side reactions, a stable chromatogra-phy baseline and accurate integration of peak areas, and rapid regeneration of guard and analytical columns. This method is suitable for analysis of AA in both tissues and protein hydrolysates.

25Discovery and Chemistry of Amino Acids
© 2010 Taylor & Francis Group, LLC
Deamination of AARemoval of the α-amino group from an AA after treatment with nitrous acid to yield the corresponding hydroxyl acid and nitrogen gas was recognized in the early 1910s. This reaction, known as the Van Slyke assay, was first used in 1911 by D.D. Van Slyke to determine AA. The N gas is measured by volumetric or manometric methods and its production is directly proportional to the amount of the AA. Note that secondary AA (e.g., proline and hydroxyproline) do not react with nitrous acid.
H2N─CHR─COOH (AA) + HNO2 (nitrous acid) → HO─CHR─COOH + N2 + H2O
TABLE 1.4Chemical Reactions of the Amino Group in α-AA
Type of Reaction Reagent Product
Acetylation Acetic anhydride [(CH3CO)2O] or acetyl chloride (CH3COCl)
N-Acetyl AA
Benzoylation Benzoyl chloride (C6H5COCl) N-Benzoyl AA
Carbobenzoxylation Carbobenzoxy chloride (C6H5CH2OCOCl)
N-Carbobenzoxy AA
Condensation 6-Aminoquinolyl-N-hydroxy- succinimidyl carbamate (AQC; C14H11N3O4)
AQC-AA derivatives (highly stable)
4-Chloro-7-nitrobenzofurazan (NBD-Cl; C6H2ClN3O3)
NBD-AA
Dansyl chloride (C12H12ClNO2S) AA derivatives (stable)
9-Fluorenylmethyl chloroformate (FMOC; C15H11ClO2)
FMOC-AA derivative (highly stable)
o-Phthaldialdehyde [OPA; C6H4(CHO)2] + ME
OPA-AA adduct (highly fluorescent)
Phenylisothiocyanate (PITC; C7H5NS)
Phenylthiocarbamyl AA
Deamination Nitrous acid (HNO2) Ammonia + hydroxyl acid
Dinitrophenylation 1-Fluoro-2,4-dinitrobenzene (FDNB; C6H3FN2O4)
2,4-Dinitrophenyl AA (yellow product)
Group protection t-Butyloxy carbamate [t-BOC; (t-C4H9OCO)2O]
BOC-AA
Aldehyde (RCHO) Schiff base (C∙N-)
Methylation Dimethyl sulfate [(CH3)2SO4] or methyl iodide (CH3I)
N-Methyl AA + betaine
Oxymethylation Formaldehyde (HCHO) N-Hydroxymethyl AA
Transamination α-Ketoacid AA + α-ketoacid (new)
Source: Adapted from Greenstein, J.P. and M. Winitz. Chemistry of Amino Acids. 1961. New York; Meister, A. 1965. Biochemistry of Amino Acids. Academic Press, New York; and Ajinomoto®. 2003. Ajinomoto’s Amino Acid Handbook. Ajinomoto Inc., Tokyo, Japan.
Note: ME, 2-mercaptoethanol.

26 Amino Acids: Biochemistry and Nutrition
© 2010 Taylor & Francis Group, LLC
An AA can undergo deamination to yield ammonia and the corresponding α-ketoacid in the presence of reactive carbonyls (e.g., alloxan, isatin, and quinones) or α-dicarbonyls (e.g., methylglyoxal and phenylglyoxal). In biology, deamination is catalyzed by d-AA deaminase (oxidase) and l-AA deaminase (oxidase). In 1909, O. Neubauer reported the deamination of α-AA in the mammalian body. Enzyme-catalyzed deamination of AA in animal tissues was discovered by H.A. Krebs in 1935. This biochemical reaction has important functions in neurological and immunological systems.
Transamination of AANonenzymatic transamination of AA occurs in response to heating. For example, α-aminophenyl-acetic acid (C6H5CH(NH2)COOH) reacts with pyruvic acid in aque-ous solution to yield alanine, benzaldehyde (C6H5CHO), and CO2. This chemical reaction was discovered in 1934 by R.M. Herbst and L.L. Engel and is used to syn-thesize dipeptides, such as alanyl-alanine. Enzyme-catalyzed transamination of AA is widespread in animals, plants, and microorganisms and plays an essential role in the synthesis and catabolism of many AA.
Oxymethylation of AAIn oxymethylation, the α-amino group of an AA reacts with formaldehyde to form N-hydroxymethyl AA. This reaction was proposed by H. Schiff in 1899 and was developed in 1907 by S.P.L. Sörensen for AA analysis. In this method, excess form-aldehyde is added to an AA solution, followed by titration with the standard alkali to a strong red color with phenolphthalein as the indicator. It should be noted that: (1) the AA must be dissolved in a colorless solution to prevent any interference of the assay, (2) cysteine, but not cystine, reacts with formaldehyde or 1,2-naphthoqui-none-4-sodium sulfonate, and (3) many nitrogenous substances, including ammo-nia, peptides, primary amines (substances in which one hydrogen atom in ammonia is replaced by an alkyl group), nitrite, and nitrate also react with formaldehyde. Thus, this method greatly overestimates the concentrations of free AA in animal products or tissue enzymatic hydrolysates.
H2N─CHR─COOH + HCHO → HOCH2─NH─CHR─COOH
Chemical Reactions of the Carboxyl Group in α-AAThe carboxyl group of AA is involved in several chemical reactions. These reac-tions include the following: amidation, decarboxylation, esterification, and reduction (Table 1.5). An example of amidation of AA is the formation of glutamine from glu-tamate, whereas an example of decarboxylation of AA is the conversion of histidine into histamine. AA can be esterified by a base (e.g., NaOH). In addition, methyl, ethyl, and benzyl esters of many AA can be chemically prepared using 2,2-dime-thoxypropane, absolute ethanol, and p-toluenesulfonic acid plus benzyl alcohol, respectively. Esterification of an AA serves to block its α-carboxyl group. Finally, α-AA can be chemically converted into 1,2-amino alcohols. In these methods, modi-fication of unprotected or N-protected α-AA as the corresponding amino alcohol involves activation of the acid group to become an anhydride, acid fluoride, or active ester, followed by the reduction with sodium borohydride. Alternatively, an AA can

27Discovery and Chemistry of Amino Acids
© 2010 Taylor & Francis Group, LLC
be reduced to form the corresponding alcohol directly using sodium borohydride and iodine in tetrahydrofuran.
Chemical Reactions of the Side Chain in α-AAThe amino or carboxyl group of the side chain of α-AA takes part in some chemical reactions. For example, the ε-amino group of lysine and the guanidino amino group of arginine can participate in hydrogen bonding, methylation, and reactions with carbohydrates. In addition, the guanidino group of arginine, not its amino group, can react specifically with diketones. This reaction is used to determine a role for arginine residues in the stabilization of the tertiary and quaternary structures of proteins and in the allosteric and active sites of enzymes. Furthermore, the γ-amino group of asparagine can react with the reducing carbohydrates, thereby providing the key sites for N-linked glycosylation of proteins. Asparagine can also react with the reactive carbonyls at high temperature to generate acrylamide (a potential car-cinogen), which is present in baked foods.
Chemical Reactions Involving Both the Amino and Carboxyl Groups of α-AASince α-AA contain both amino and carboxyl groups that are chemically active, they participate in some unique reactions, including chelation, cyclization, racemi-zation, formation of N-carboxy anhydride, and oxidative deamination (decarboxyl-ation) (Table 1.6). These reactions yield AA chelates, azlactone, diketopiperazine, N-carboxy AA anhydride (NCA), peptide bonds, and aldehyde. The structures of some products (including the copper–AA complex) generated from these reactions are illustrated as follows:
RCH-CO RCH-C=O RCH-CO CO-NHNH O RHC CHRNH-CO N O NH-CO NH-CO
C
CH3
R CH NH2 O C=O
O=C O H2N CH R
Cu
Copper–AA chelate Hydantoin Azlactone NCA Diketopiperazine
TABLE 1.5Chemical Reactions of the Carboxyl Group in α-AA
Type of Reaction Reagent Product
Amidation Ammonia α-AA amide (H2NCHRCONH2)
Decarboxylation Base (e.g., Ba(OH)2) and heating Amine
Esterification Base (ROH) and other reagentsa AA ester (H2NCHRCOOR′)Reduction Lithium borohydride (LiBH4) or
sodium borohydride (NaBH4)Amino alcohol (H2NCHRCH2OH)
Source: Adapted from Greenstein, J.P. and M. Winitz. Chemistry of Amino Acids. 1961. New York, and Meister, A. 1965. Biochemistry of Amino Acids. Academic Press, New York.
a Other reagents include 2,2-dimethoxypropane, absolute ethanol, and p-toluenesulfonic acid plus benzyl alcohol.

28 Amino Acids: Biochemistry and Nutrition
© 2010 Taylor & Francis Group, LLC
Chelation of AA with MetalsChelates of AA with metals are used to efficiently supply an inorganic nutrient (e.g., Zn, Cu, and Fe) to animals. AA have both ionizable carboxyl and amino groups and, therefore, have the capacity to form metal complexes (Yamauchi et al. 2002). This physicochemical property of AA was discovered in 1854 when A. Gössmann first prepared the copper–leucine chelate. Subsequently, the copper complex of gly-cine in the ratio of 1:2 [(NH2CH2COO)2Cu] was made in 1904 by mixing glycine in hot aqueous solution with an excess of copper carbonate. AA-mineral chelates are widely used as supplements in animal feeds.
In the copper–glycine complex, a hydrogen in each glycine molecule is displaced by a single copper atom, and the metal forms coordinate covalent bonds with the amino groups of two glycine molecules. In contrast to the salts of the alkaline met-als with glycine, aqueous solutions of the copper–glycine complex have virtually no conductivity. It is now known that only α- and β-AA, but not γ- or δ-AA, may form stable copper complexes and that their stability depends on the dissociation constant of the complexing nitrogen atom rather than simply the nature of the side chain. In addition to copper, α- and β-AA can also form chelates with Ni2+, Zn2+, Co2+, Fe2+, Mn2+, Mg2+, and Ca2+. Examples include Zn–Met, Cu–Lys, and Mn–Gly that are now commercially available as feed additives for farm animals. For serine, threo-nine, and tyrosine, Ca2+ can form covalent bonds with all their functional groups (i.e., carboxyl, amino, and hydroxyl groups).
TABLE 1.6Chemical Reactions Involving Both the Amino and Carboxyl Groups of α-AA
Type of Reaction Reagent Product
Chelation Minerals (e.g., Cu2+) AA complex [e.g., (H2NCHRCOO)2Cu]
Cyclization Potassium cyanate (KCNO) Hydantoin (HNCHRCOCO-NH)
Various reagentsa Diketopiperazine
Esterification and Nα-dehydrogenation
Base (R-OH), ethanol, and fatty acyl chloride
Ethyl-Nα-fatty acyl-AA
NCA formation Phosgene (COCl2) NCA
Oxidative deamination (decarboxylation)
Ninhydrin, H2O2/Fe3+, or other reagentsb
Ammonia + aldehyde + CO2
Racemization Acetic anhydride Azlactone
Peptide bond formation NCA plus various reagentsc Peptide
Source: Adapted from Greenstein, J.P. and M. Winitz. Chemistry of Amino Acids. 1961. New York; Meister, A. 1965. Biochemistry of Amino Acids. Academic Press, New York; and Ajinomoto®. 2003. Ajinomoto’s Amino Acid Handbook. Ajinomoto Inc., Tokyo, Japan.
Note: NCA, N-carboxy amino acid anhydride.a Various reagents are used (e.g., N-butyloxy carbamate-phenylalanal, dichloroglyoxime, and imidazolin-
2,4-5-trione) depending on experimental methods (Dinsmore and Beshore 2002).b Other reagents include lead dioxide plus dilute sulfuric acid, sodium hypochlorite, or chloramine-T.c Various reagents are used depending on experimental methods (Fridkin and Patchornik 1974).

29Discovery and Chemistry of Amino Acids
© 2010 Taylor & Francis Group, LLC
Esterification and Nα-Dehydrogenation of α-AAAn example for esterification and Nα-dehydrogenation of an α-AA is the chemical synthesis of lauric arginate (ethyl-Nα-lauroyl-l-arginate hydrochloride) from l-argi-nine monohydrochloride, ethanol, and lauroyl chloride. This reaction is initiated by thionyl chloride (SOCl2)-catalyzed esterification of the carboxyl group of l-arginine hydrochloride with ethanol in the presence of a base (NaOH) to form ethyl arginine dihydrochloride, followed by its condensation with lauroyl chloride to finally yield lauric arginate. This substance is a novel cationic surfactant that has a potent antimi-crobial effect. Thus, lauric arginate (e.g., 200 ppm) is now used as a safe preservative in food and beverage industries. It may also be a useful feed additive to diets for animals (e.g., weanling pigs) to improve intestinal health and the efficiency of nutri-ent utilization.
Ethyl-Nα-lauroyl-L-arginate hydrochloride
CH3–(CH2)10–CO–NH–CH–(CH2)3–NH– C =NH · HCl
C=O NH2
OCH2CH3
Lauroyl Ethyl
L-Arginate·HCl
Oxidative Deamination (Decarboxylation) of AAOxidative deamination (decarboxylation) of an AA to form ammonia, CO2, and aldehyde in response to a mixture of lead dioxide and dilute sulfuric acid was first recognized by J. von Liebig in 1849. Such a reaction also occurs when AA are treated with sodium hypochlorite or chloramine-T. The formation of the aldehyde is specific to the AA under consideration, whereas ammonia and CO2 are gener-ated nonspecifically from all AA. Another well-utilized oxidative deamination (decarboxylation) of an AA is its reaction with ninhydrin to yield colored products. This chemical reaction was discovered by S. Ruhemann in 1911 and its chemis-try is very complex. First, an AA reacts with ninhydrin to form an intermediate amine, the corresponding aldehyde, carbon dioxide, and ammonia. Interestingly, the initial products vary with AA. For example, aspartate and cystine yields 2 mol of CO2, whereas proline and hydroxyproline do not generate ammonia. Second, the intermediate amine reacts with ninhydrin to yield indandione-2-N-2′-indanone enolate (Ruhemann’s purple), hydrindantin [which can be detected by ultraviolet (UV) absorption], and ammonia. Third, hydrindantin reacts with ammonia to form Ruhemann’s purple (bluish-violet color with maximum absorption at 570 nm). Additionally, ammonia reacts with ninhydrin and the reduced ninhydrin to yield the Ruhemann’s purple. Overall, only the N atom of this pigment arises from α-AA. On paper chromatography, the reaction of proline or hydroxyproline with ninhydrin gives a yellow color product (maximum absorption at 440 nm), whereas bluish-purple color is formed for other AA. In addition to AA and ammonia, pep-tides can also react with ninhydrin to yield color products. To date, ninhydrin is often used to analyze AA.
Ninhydrin + amino acid → RCHO (aldehyde) + CO2 + H2O + Ruhemann’s purple

30 Amino Acids: Biochemistry and Nutrition
© 2010 Taylor & Francis Group, LLC
Peptide SynthesisA carboxyl group of one AA and the amino group of another AA can form a peptide bond (-CONH-) with the loss of one molecule of H2O (Figure 1.6). NCA is an impor-tant activated derivative of AA for the chemical synthesis of small peptides and pro-teins (Marglin and Merrifield 1970). Liquid-phase peptide synthesis is a classical method for peptide formation and is useful for large-scale production of peptides for industrial purposes. Solid-phase peptide synthesis, pioneered by R.B. Merrifield in 1963, is now widely used to synthesize peptides and proteins in the laboratory (Hughes 2012). Unlike ribosomal protein synthesis, the chemical synthesis of peptides proceeds in a C-terminal to N-terminal manner, with the N-termini being protected by either t-butyloxy carbamate (t-BOC) or 9-fluorenylmethyl chloroformate (FMOC).
Proteins
In 1787, Antoine-François Fourcroy and colleagues recognized proteins [e.g., albumin (from egg whites and blood serum), fibrin, and wheat gluten] as a distinct class of biological molecules that can coagulate under heating or acid treatments. In 1838, the chemical composition (carbon, hydrogen, N, oxygen, phosphorus, and sulfur) of proteins (coined by J.J. Berzelius, a Swedish physician chemist) was described by G.J. Mulder (a Dutch chemist) to be remarkably similar. The word protein originated from the Greek “proteios,” meaning prime or primary. This is very appropriate, since proteins were then recognized by most scientists (e.g., Carl von Voit) to be the most fundamental component of tissues in animals and humans. In 1840, J. von Liebig correctly proposed that proteins were made up of AA. During the past century, advanced physicochemical techniques aided in the determination of protein composition and structure. It is now known that proteins are macromolecules consisting of one or more polypeptide chains that have distinct three-dimensional structures.
PePtiDes versus Proteins
A peptide consists of two or more AA residues linked by peptide bonds. An oligo-peptide (oligo, “few”) consists of 2–20 AA residues. An oligopeptide containing ~10 or less AA residues is also called a small peptide. Peptides of more than 20 AA are termed polypeptides. Proteins are high-molecular-weight polypeptides consist-ing of α-AA with typical peptide bonds between α-amino and α-carboxyl groups of
C CO
O-H3N
H
R1 R1 R2R2
C CO
O-
H
C C
H
N
O
C
H
H
C
O
O-
Peptide bond
+H3N
+H3N
+H2O+ +
FIGURE 1.6 Synthesis of a dipeptide from two AA. R1 and R2 represent the side chains of two AA. With the loss of one H2O molecule, a peptide bond (-CONH-) is formed.

31Discovery and Chemistry of Amino Acids
© 2010 Taylor & Francis Group, LLC
adjacent AA. A peptide may contain ~40 to more than 1000 AA. Some substances with nontypical peptide bonds [e.g., GSH and N-pteroyl-l-glutamate (folate)] are beneficial for nutrition and physiology, whereas others [e.g., ergovaline (present in endophyte-infected Tall fescue—a cool-season grass) and phalloidine] are toxic to animals and humans. Chemical synthesis of peptides and proteins from AA can be achieved using chemical reagents. Biological synthesis of these nitrogenous poly-mers occurs in the presence of enzymes and cofactors.
The dividing line between proteins and polypeptides is usually their molecular weight. Generally speaking, polypeptides with molecular weight greater than 8000 (i.e., ~72 AA residues) are considered as proteins. For example, growth hormone has 191 AA with a molecular weight of ~22,000. Polypeptides with a molecular weight less than 8000 are considered as peptides. Glucagon has 29 AA residues with molecular weight ~3500 and is considered as a polypeptide. However, this division between proteins and peptides on the basis of molecular weight is not absolute. For example, ubiquitin, which has 72 AA residues, has a well-defined three-dimensional structure and, therefore, is called a small protein. In addition, insulin [MW = ~5700; 51 AA residues (20 in chain A and 31 in chain B)] has 51 (20 + 31) AA residues and yet is well recognized as a protein that also exhibits a defined three-dimensional structure (Jones 2012).
SUMMARY
AA are unique organic substances widely present in nature. Their history dates back to more than 200 years ago when groups of dedicated chemists discovered AA as components of proteins and nonprotein extracts. Except glycine, all protein AA can have both l- and d-isomers. l-AA are physiological isomers in organ-isms and account for >99.98% of the total AA in the body, but some d-AA (e.g., d-aspartate and d-serine) in animals may have important functions, particularly in the neurological and immune systems. Peptide-bound AA and free AA account for ~97% and 3% of the total AA in animals, respectively. However, certain free AA are notably abundant in plasma (e.g., glutamine and glycine), skeletal muscle (e.g., glutamine, glutamate, and taurine), fetal fluids (e.g., arginine, orni-thine, glutamine, and serine), and animal products (e.g., glutamine, glutamate, proline, and BCAA in milk protein; and free glutamine, glutamate, and taurine in milk). Dynamic changes in the concentrations of free AA (particularly the arginine family of AA) in animal physiological fluids during growth and devel-opment and under pathological conditions reveal an exciting aspect of multidis-ciplinary research on AA. The diversity of AA also lies in their different side chains, which determine their different chemical properties, including solubility, stability, reactions, and taste. The reactivity of the amino and carboxyl groups of AA with select organic or inorganic reagents provides a basis for the analysis of AA (including d-AA) and peptides, which is necessary for comprehensive stud-ies of AA biochemistry and nutrition. In this book, unless indicated otherwise, “AA” refer to l-AA and the letter “l-” is not used as the prefix before the names of individual l-AA.

32 Amino Acids: Biochemistry and Nutrition
© 2010 Taylor & Francis Group, LLC
REFERENCES
Ajinomoto®. 2003. Ajinomoto’s Amino Acid Handbook. Ajinomoto’s Inc., Tokyo, Japan.Bischoff, R. and H. Schlüter. 2012. Amino acids: Chemistry, functionality and selected non-
enzymatic post-translational modifications. J. Proteomics 75:2275–2296.Brosnan, J.T. 2001. Amino acids, then and now—A reflection on Sir Hans Krebs’ contribution
to nitrogen metabolism. IUBMB Life 52:265–270.Dinsmore, C.J. and D.C. Beshore. 2002. Recent advances in the synthesis of diketopipera-
zines. Tetrahedron 58:3297–3312.Fernstrom, J.D., S.D. Munger, A. Sclafani, I.E. de Araujo, A. Roberts, and S. Molinary. 2012.
Mechanisms for sweetness. J. Nutr. 142:1134S–1141S.Fridkin, M. and A. Patchornik. 1974. Peptide synthesis. Annu. Rev. Biochem. 43:419–443.Friedman, M. 1999. Chemistry, nutrition, and microbiology of d-amino acids. J. Agric. Food
Chem. 47:3457–3479.Greenstein, J.P. and M. Winitz. 1961. Chemistry of Amino Acids. John Wiley, New York.Hughes, A.B. 2012. Amino Acids, Peptides and Proteins in Organic Chemistry. Wiley-VCH
Verlag Gmbh, Weinheim, Germany.Jones, S. 2012. Computational and structural characterization of protein associations. Adv.
Exp. Med. Biol. 747:42–54.Kawai, M., Y. Sekine-Hayakawa, A. Okiyama, and Y. Ninomiya. 2012. Gustatory sensation of
l- and d-amino acids in humans. Amino Acids 43:2349–2358.Kreil, G. 1997. d-Amino acids in animal peptides. Annu. Rev. Biochem. 66:337–345.Lubec, G. and G.A. Rosenthal (eds.). 1990. Amino Acids: Chemistry, Biology and Medicine.
ESCOM Science Publisher B.V. Leiden, The Netherlands.Marglin, A. and R.B. Merrifield. 1970. Chemical synthesis of peptides and proteins. Annu.
Rev. Biochem. 39:841–866.Meister, A. 1965. Biochemistry of Amino Acids. Academic Press, New York.Nishikawa, T. 2011. Analysis of free d-serine in mammals and its biological relevance.
J. Chromatogr. B 879:3169–3183.San Gabriel, A., E. Nakamura, H. Uneyama, and K. Torii. 2009. Taste, visceral informa-
tion and exocrine reflexes with glutamate through umami receptors. J. Med. Invest. 56 Suppl:209–217.
Stadtman, T.C. 1996. Selenocysteine. Annu. Rev. Biochem. 65:83–100.Vickery, H.B. and C.A. Schmidt. 1931. The history of the discovery of the amino acids. Chem.
Rev. 9:169–318.Wu, G. 1993. Determination of proline by reversed-phase high performance liquid chroma-
tography with automated pre-column o-phthaldialdehyde derivatization. J. Chromatogr. 641:168–175.
Wu, G. and C.J. Meininger. 2008. Analysis of citrulline, arginine, and methylarginines using high-performance liquid chromatography. Meth. Enzymol. 440:177–189.
Yamauchi, O., A. Odani, and M. Takani. 2002. Metal-amino acid chemistry. Weak interactions and related functions of side chain groups. J. Chem. Soc., Dalton Trans. 2002:3411–3421.

33
© 2010 Taylor & Francis Group, LLC
Protein Digestion and Absorption of Peptides and Amino Acids
Digestion of dietary proteins and absorption of their hydrolysis products (small peptides and free AA) are the first two steps in their utilization by humans and other animals. Except for the absorption of intact immunoglobulins (Ig) by the small intes-tine of mammalian neonates, dietary proteins have no nutritional values until they are hydrolyzed to short-chain peptides and free AA in the digestive tract. Thus, to nourish organisms, non-Ig proteins in food must be broken down into short peptides and/or individual AA in the lumen of the stomach and small intestine. The prod-ucts of protein digestion are either utilized by microorganisms in the gastrointestinal tract or absorbed into enterocytes (Figure 2.1). Inside these cells, oxidation of AA is the major source of energy to support their high metabolic rates. The extensive
2
EnterocytesApicalmembrane
Tightjunctions
AdherensjunctionsBasolateral
membrane
Lateralspace
BloodCapillaries
Basementmembrane
Microvilli
FIGURE 2.1 Anatomical relationships of the enterocytes (absorptive epithelial cells) with tight junctions in the small intestine. Each enterocyte has apical membrane and basolateral membrane. Before gut closure, macromolecules may pass the enterocyte through the tight junction. AA are absorbed into the enterocyte by AA transporters.

34 Amino Acids: Biochemistry and Nutrition
© 2010 Taylor & Francis Group, LLC
catabolism of dietary AA in the small intestine not only reduces the efficiency of the utilization of dietary proteins and AA, but also alters the pattern of AA that enter the portal circulation (Wang et al. 2009). This chapter highlights the key processes for protein digestion, absorption of the resulting small peptides and free AA, as well as the extensive recycling of N in the intestine.
CLASSIFICATION AND CONTENT OF PROTEIN IN DIETS
clAssificAtion of Protein
There are four orders of protein structure: primary structure (the sequence of AA along the polypeptide chain), secondary structure (the conformation of the poly-peptide backbone), tertiary structure (the three-dimensional arrangement of pro-tein), and quaternary structure (the spatial arrangement of polypeptide subunits). The forces stabilizing polypeptide aggregates are hydrogen and electrostatic bonds between AA residues. Proteins in diets (based on plant and animal products), such as proteins in the body, can be classified according to their overall shape (globular or fibrous), solubility in water (hydrophobic or hydrophilic), electric charge (acidic, basic, or neutral), three-dimensional structure, or function. For example, albumin and hemoglobin are globular proteins. Fibrous proteins include collagens, elastin, α-keratins (wool and hair), and β-keratins (the feathers, skin, beaks, and scales of most birds and reptiles). Collagens are rich in proline plus hydroxyproline (~1/3) and glycine (~1/3) and are particularly abundant in connective tissues of animals. Keratins are rich in cysteine; wool protein contains ~4% sulfur.
Proteins have colloidal properties and differ in their solubility in water. Like AA, proteins exhibit characteristic isoelectric points and have buffering capacities. All proteins can be denatured or changed from their natural state by heat, acids, alkalis, alcohols, urea, and salts of heavy metals. The susceptibility of foodstuff proteins to heat damage during processing is increased in the presence of carbohydrates, owing to the Maillard reaction, which involves a condensation between the carbonyl group of a reducing sugar with the free amino group of an AA residue (e.g., lysine).
content of fooDstuff Proteins of AnimAl AnD PlAnt oriGin
In 1742, the Italian chemist G.B. Beccari isolated gluten “of animal nature” from wheat flour. Sixty-four years later, the French chemist L.N. Vauquelin identified a high con-tent of a gluten-like substance in soybeans. In 1841, the German chemist J. von Liebig analyzed protein contents in foodstuffs. In the late 1880s, the French chemist P.E.M. Bertholet found that protein is the major constituent of dry matter in animal tissues.
Historically, crude protein content in animal tissues and foodstuffs was often obtained by multiplying the N content by a factor of 6.25, on the basis of the average N content (16%) in protein. Total N is usually determined using the Kjeldahl method developed in 1883. Such an approach for quantifying protein in diets or ingredi-ents can yield misleading results because some proteins contain less or more N and because some nitrogenous compounds (e.g., ammonia, urea, amides, choline, beta-ine, purines, pyrimidines, nitrite, and nitrate) are neither proteins nor AA. Crude

35Protein Digestion and Absorption of Peptides and Amino Acids
© 2010 Taylor & Francis Group, LLC
protein content can be greatly overestimated by the presence of N-rich and toxic com-pounds (e.g., melamine containing 66% N) in food. Thus, the composition of AA in diets or ingredients must be determined to ensure safety and quality of foodstuff. This goal can be easily and reliably achieved by using established analytical methods (e.g., HPLC, gas chromatography, and mass spectrometry). The content of protein in differ-ent foodstuffs varies between 7% and 90%, depending on their sources.
NH2
NH2H2N
NN
N
Melamine (66% nitrogen)
DEFINITIONS OF DIGESTION AND ABSORPTION
DiGestion
Digestion is defined as chemical disintegration of foodstuffs in the digestive tract into smaller molecules that are suitable for assimilation by the animal. The term “AA digestibility” refers to the hydrolysis of dietary protein to small peptides and free AA in the lumen of the small intestine (Figure 2.2). This process requires proteases and peptidases in the lumen of the gastrointestinal tract (Table 2.1). It is noteworthy that the concept of protein digestibility differs from that of dietary protein bioavailability, which represents the combined result of digestion, absorption, and metabolism of protein and AA. Moreover, the processes of protein digestion and its products differ markedly between nonruminant species (including humans, dogs, cats, rats, pigs, horses, and chickens), which have one stomach (glandular structure), and ruminant species (e.g., cattle, deer, goat, and sheep), which have a more complex digestive system. In ruminants, the glandular stomach (i.e., abomasum) is preceded by three organs (rumen, reticulum, and omasum) that support extensive digestion and fer-mentation of foodstuff proteins and AA by anaerobic microorganisms as well as microbial metabolism and propagation (Broderick et al. 1991).
ABsorPtion
Absorption refers to the movement of the products of digestion from the intestinal lumen into the intestinal mucosa. Subsequently, some products of protein digestion are extensively metabolized by the mucosa, whereas others are readily transferred into the vascular system for utilization by the body. The cells responsible for absorp-tion of protein digestion products (free AA and small peptides) are the enterocytes. The concept that significant amounts of dietary protein were absorbed in the form of small peptides rather than as free AA by the small intestine was initially proposed in 1959 by H. Newey and D.H. Smyth and is now widely accepted.

36 Amino Acids: Biochemistry and Nutrition
© 2010 Taylor & Francis Group, LLC
The enterocyte contains apical (lumen-facing) and basolateral (blood-facing) membranes. There is lateral space between enterocytes. Apical membranes of the enterocytes form microvilli. An advantage of these microvilli is to increase the area of absorption. Absorption of nutrients can occur through three routes. First, nutrients may pass completely through the enterocytes via transporters, entering at the apical membrane and leaving through the basolateral membrane into the lateral space (transcellular absorption). Second, nutrients may move through the tight junc-tions directly into the lateral spaces (paracellular absorption). Third, intact mac-romolecules (e.g., proteins) can be absorbed by epithelial cells of the small intestine via clatharin- or receptor-mediated transcytosis (vesicular transport from one side of a cell to the other within a membrane-bound carrier) and then exported through the lateral membrane. Examples of transcytosis are the absorption by enterocytes of proteins that resist degradation by proteases in the digestive tract, including: (1) intact proteins (e.g., IgG) via the neonatal Fc receptor-mediated ligand transport in mammalian neonates before the “gut closure” (e.g., within 48 h after birth in pigs), (2) intact bovine lactoferrins, and (3) the prion protein that causes bovine spongiform encephalopathy (mad cow disease). Intestinal absorption of intact proteins does not directly play a significant role in protein nutrition, but has important implications for health and disease.
Protein in diet
Large peptides
Small peptides(2 or 3 AA residues)
Enterocytes andluminal bacteria
Portal vein
proteases
peptidases
Stomach and SI
SI
Dipeptidases ortripeptidases
Transport
Transport(PepT1)
Free AA and possiblysmall peptides
25–97%
NEAA andother NM
Oxidation
Protein
3–75%
(Ala, Arg, Cit, Orn, Pro,Tyr, GSH, NT, and NH4
+)
Undegraded AA
Free AA
FIGURE 2.2 Digestion of dietary protein in the gastrointestinal tract of the small intestine in monogastric animals and humans. All diet-derived AA undergo various degrees of catabo-lism by luminal bacteria and some of them are oxidized by enterocytes. AA, amino acids; GSH, glutathione; NEAA, nutritionally nonessential AA; NM, nitrogenous metabolites; NT, nucleotides; PepT1, H+ gradient-driven peptide transporter 1; SI, small intestine.

37Protein Digestion and Absorption of Peptides and Amino Acids
© 2010 Taylor & Francis Group, LLC
DeveloPmentAl chAnGes in intestinAl DiGestion AnD ABsorPtion
There are developmental changes in the proteolytic digestive capacity in all animals. For example, the pig is born with relatively low activities of gastric and pancreatic proteolytic enzymes, as well as relatively low concentrations of H+ ions in the lumen of the stomach (e.g., pH 3–5 in neonatal pigs as compared with pH 2–3 in young adults), but a well-developed peptidase capacity. Nonetheless, the neonatal piglet digests sow’s milk protein well, with average AA digestibilities of 92–100%, and has
TABLE 2.1Digestive Proteases in the Stomach and the Small Intestine
Enzyme Site of Production
Recognized AA Residues in Peptide
BondspH of Optimal
Activity
(1) Proteases in the Lumen of the StomachPepsins A, B, and Ca Mucosa of stomach Aromatic and
hydrophobic AA (most efficient)
1.8–2
Renin Mucosa of stomach Weak proteolytic activity; clot milk protein
1.8–2
(2) Proteases in the Lumen of the Small IntestineTrypsinb Pancreas Arginine, lysine 8–9Chymotrypsinb Pancreas Aromatic AA and
methionine8–9
Elastaseb Pancreas Aliphatic AA 8–9Carboxypeptidase Ac Pancreas Aromatic AA 7.2Carboxypeptidase Bc Pancreas Arginine, lysine 8.0Aminopeptidased Mucosa of small intestine AA with free NH2 groups 7.4
a Aspartate proteases. They are endopeptidases with origin in chief cells in the mucosa of the stomach and are secreted as inactive forms (pepsinogens) into the gastric fluid. Hydrochloric acid (HCl) cleaves pepsinogens to generate active enzymes (pepsins). An endopeptidase cleaves the peptide bond adjacent to the recognized AA residue in the interior of the peptide chain. This results in the formation of a product with the recognized AA residue. Note that pepsin does not attack mucin.
b Serine proteases. They are endopeptidases with their origin in pancreatic acinar cells and are secreted as inactive proenzymes into the duodenal fluid. Enterokinase (now designated as enteropeptidase) was discovered by I.P. Pavlov in 1910 and is a glycoprotein released by the mucosal cells of the small intes-tine. Enterokinase converts trypsinogen to trypsin. Trypsin hydrolyzes chymotrypsinogen to form chy-motrypsin. Elastase breaks down elastin, a protein in the connective tissue.
c Zinc metalloenzymes. They are exopeptidases, which have their origin in pancreatic acinar cells and are secreted as inactive proenzymes into the duodenal fluid. A carboxypeptidase cleaves the last peptide bond adjacent to the recognized AA residue at the COOH terminus. This results in the release of a free aromatic or basic AA.
d Zinc metalloenzyme. It is an exopeptidase, which has its origin in the mucosal glands of the small intestine and is secreted as an inactive proenzyme into the duodenal fluid. An aminopeptidase (e.g., leucine aminopeptidase) cleaves the last peptide bond adjacent to the recognized AA residue (e.g., leucine) at the NH2 terminus.

38 Amino Acids: Biochemistry and Nutrition
© 2010 Taylor & Francis Group, LLC
a high capacity to absorb free AA and small peptides (Mavromichalis et al. 2001). In contrast, proteins of plant origin (e.g., corn and soy proteins) are less digested in the neonatal piglet than milk protein due to the presence of antinutritional factors, including cell walls and trypsin inhibitors. In early weaned pigs (e.g., piglets weaned 3 weeks of age), which often exhibit intestinal atrophy and inflammatory mucosa, the gastrointestinal tract has an impaired ability to digest dietary protein due to (1) reduced secretion of gastric juice and pancreatic juice, (2) reduced mass of the small intestine, and (3) stress- and starvation-induced abnormality in intestinal motility. By the age of 6–8 weeks, the pig’s digestive capacity is well developed to utilize plant protein-based diets (Knabe et al. 1989).
PROTEIN DIGESTION AND ABSORPTION OF PEPTIDES AND AA IN MONOGASTRIC ANIMALS
historicAl PersPective of Protein DiGestion AnD ABsorPtion
A series of studies with guinea pigs by Antoine Lavoisier (a French scientist) in the 1770s revealed that nutrients (including nitrogenous substances) in ingested food are utilized by the body. A British physician chemist, William Prout, reported in 1824 that this digestive process was greatly facilitated by hydrochloric acid as the major acid in gastric juice. In 1836, T. Schwann discovered pepsin in the stomach as the first digestive enzyme of animal origin to hydrolyze protein and coined the name of this enzyme from the Greek word pepsis, meaning digestion. Approximately half a century later, F. Hofmeister found in 1882 that the small intestine could cause the disappearance of a dietary protein (called “peptone” at that time). An important discovery was made in 1901 when O. Cohnheim reported that an enzyme, called “erepsin,” isolated from the intestinal mucosa could break down the peptone into AA. In 1903, Emil Fischer and his student Emil Abderhalden reported the hydrolysis of purified proteins (casein, edestin, hemoglobin, egg albumin, serum globulin, and fibrin) by pancreatic trypsin. They were puzzled by the same pattern of the libera-tion into AA: first tyrosine, followed by leucine, alanine, aspartate, and glutamate, and then the three basic AA (arginine, histidine, and lysine) but no release of phe-nylalanine and proline. Meanwhile, E. Fischer and E. Abderhalden proposed that the hydrolysis of phenylalanine and proline in a polypeptide was resistant to trypsin. These results suggested the presence of enzymes to digest the dietary protein, which was confirmed by O. Abderhalden and P. Rona who demonstrated in 1904 that mice fed either trypsin-digested casein hydrolysates or intact casein had the same rate of growth and survival. Similar findings were obtained for dogs in 1905. In the same year, Abderhalden proposed that dietary proteins (e.g., milk proteins such as casein, lactalbumin, and lactoglobulin) must be degraded in the digestive tract to a series of nonspecific building blocks (e.g., AA), which are subsequently absorbed into the systemic circulation for the synthesis of specific proteins in the body.
DiGestion of DietAry Protein in the GAstrointestinAl trAct
It is clear from the above historic account that by the end of the nineteenth century, the physiological processes for the digestion of protein in ingested foods by the higher

39Protein Digestion and Absorption of Peptides and Amino Acids
© 2010 Taylor & Francis Group, LLC
animals had largely been discovered. Specifically, it was known that: (1) dietary pro-tein is degraded in the lumen of the stomach of higher animals to form smaller and more soluble aggregates without the formation of free AA, (2) products of protein hydrolysis in the stomach and proteins that escape the gastric mucosa are broken down to produce smaller and more soluble aggregates in the lumen of the upper small intestine through the action of pancreatic secretions, and (3) hydrolysis of the smaller aggregates to generate free AA because of secretions from both the pancreas and the small-intestinal mucosa. What was unknown at that time was the generation of large amounts of di- and tripeptides from dietary protein in the lumen of the digestive tract.
In monogastric animals, the digestion of dietary protein starts in the stomach (pH ~2–3), where the protein is denatured by hydrochloric acid, followed by digestion with proteases (pepsins A, B, and C, and renin) (Yen et al. 2004). Renin, an enzyme of weak proteolytic activity, is secreted into the stomach of young mammals and causes clotting of milk protein. Renin liberates a glycopeptide from k-casein, and the remaining molecule (paracasein), along with calcium, forms a clot or curd that slows the passage of proteins in the intestinal tract. This allows additional time for the action of digestive proteolytic enzymes, thereby improving the utilization of milk proteins. The products of protein hydrolysis by pepsins, namely large peptides, enter the lumen of the small intestine to be further hydrolyzed by specific proteases (includ-ing trypsin, chymotrypsin, elastase, carboxyl peptidases, and aminopeptidases) in an alkaline medium (owing to bile salts, pancreatic juice, and duodenal secretions) (Miner-Williams et al. 2012). These enzymes generate small peptides and consider-able amounts of free AA (Figure 2.3). Oligopeptides composed of more than three AA residues are further hydrolyzed extracellularly by peptidases (located mainly on the brush border of enterocytes, and to a lesser extent, in the intestinal lumen) to
Leu Arg
Arg
Tyr COOH
Leu Tyr
COOH
COOH
Endopeptidases
Elastase Trypsin Chymotrypsin
Exopeptidases
NH2
NH2
NH2
NH2
NH2
NH2
NH2
NH2
NH2
Carboxy-peptidase A Carboxy-
peptidase B
LeuArg
Tyr
Carboxy-peptidase A Amino-
peptidase
COOH COOH
COOH
Phe
Leu Phe
Pepsin
Phe
FIGURE 2.3 Hydrolysis of specific peptide bonds by digestive proteases in the stomach and small intestine of animals including humans. Different proteases in the lumen of the gastrointestinal tract specifically cleave peptide bonds formed by basic, aromatic, aliphatic, or large neutral AA.

40 Amino Acids: Biochemistry and Nutrition
© 2010 Taylor & Francis Group, LLC
form tripeptides, dipeptides, and free AA (Figure 2.2). Note that mucosa-derived pro-lidases specifically hydrolyze the peptide bonds formed by proline or hydroxyproline.
Amounts and activities of proteases and peptidases in the gastrointestinal tract are affected by dietary factors (Boirie et al. 1997). For example, increasing dietary protein levels stimulates the synthesis and secretion of proteolytic enzymes by the pancreas and small-intestinal mucosa. In contrast, the use of raw soybeans as ingre-dients for young animals (e.g., pigs, rats, and chicks) results in growth impairment. This is because soybeans and other leguminous seeds contain protease inhibitors, which inhibit the activities of digestive proteolytic enzymes, such as trypsin and chymotrypsin. Because protease inhibitors are heat-sensitive, soybeans must be heated at an appropriate temperature before they are used to feed animals.
DeterminAtion of Protein DiGestiBility
Since the ileum is the last segment of the small intestine, the content of AA in the diet and in the lumen of the distal ileum [often expressed on the basis of dry matter (DM) content] is sometimes used to estimate the digestibility of dietary protein and its constituent AA. However, such values should only be considered as “apparent digest-ibility” (Gottlob et al. 2006). This is due to the large flow of endogenous AA into the lumen of the small intestine (g/kg of DM intake) as well as the extensive microbial metabolism of AA in the lumen of the small intestine. In animals, there is a net flow of endogenous AA into the lumen of the ileum, leading to the substantial underestima-tion (25–30%) of the true digestibility of dietary protein in the small intestine:
Apparent ileal digestibility of AA (%) = [(AA intake − AA in ileal digesta)/AA intake] × 100%
True ileal digestibility of AA (%) = [AA intake − (AA in ileal digesta − total EIAA)]/AA intake × 100%
where EIAA is the flow of endogenous AA into the lumen of the small intestine.The flow of endogenous AA into the lumen of the ileum occurs under both basal- and
diet-specific conditions. The AA in ileal digesta consists primarily of three fractions: undigested dietary AA, basal EIAA (EIAAb), and diet-specific EIAA (EIAAs). EIAAb can be measured by using: (1) a cornstarch-based nitrogen-free diet, (2) the regression method (EIAAb is obtained when the intake of dietary protein in animals fed graded levels of protein is extrapolated to 0.0), or (3) the peptide alimentation technique (ani-mals are fed a diet containing enzyme-hydrolyzed casein). If a nitrogen-free diet is used, EIAAb is usually estimated by determining AA in ideal digesta and using an indigest-ible marker (e.g., 0.3% chromium oxide, Cr2O3) in the diet (Sauer and Ozimek 1986):
EIAAb (g/kg of DM intake) = AA in ileal digesta (g/kg DM) × (marker in diet/ marker in digesta)
There are currently no procedures for directly determining EIAAs in animals. However, EIAAs may be estimated by subtracting EIAAb from the total EIAA (EIAAt).
41Protein Digestion and Absorption of Peptides and Amino Acids
© 2010 Taylor & Francis Group, LLC
In this case, EIAAt can be estimated by using the homoarginine (HA) or isotope tracer dilution technique [animals receive either a diet containing [15N]AA- labeled protein or intravenous infusion of [15N]AA (e.g., [15N]leucine)]. The HA method is based on the following principles that: (1) a small but representative proportion of lysine in the diet can be converted into HA in a guanidination reaction with methylisourea, (2) HA is neither formed nor degraded in mammalian cells or microorganisms, (3) HA is not a substrate for protein synthesis, (4) after absorption, HA does not return to the small intestine, and (5) diet-derived HA can be differentiated from endogenous AA:
True ileal digestibility of lysine (%) = [(HA in diet − HA in ileal digesta)/HA in diet] × 100%
Total EIAA for lysine (EIAATLys) is estimated as the total flow of lysine in the distal ileal digesta minus the flow of undigested dietary lysine:
EIAATLys = Total lysine in ileal digesta − [lysine in diet × (1 − True ileal digestibility of lysine (%))]
EIAAt for other AA is calculated on the basis of EIAATLys and the reported ratios of other AA to lysine in endogenous secretions (mainly proteins), which are rela-tively constant in swine:
= ×EIAA for other AA EIAA AA
Lys in edogenous proteinst TLysLiterature
Literature
For growing pigs, EIAAb values obtained with feeding a N-free diet or the regres-sion method are similar (~11 g crude protein/kg of DM intake) but 35% lower than that (17 g crude protein/kg of DM intake) obtained with the peptide alimentation tech-nique. It appears that feeding peptides or protein to animals can stimulate the flow of endogenous AA into the lumen of the ileum likely due to increases in: (1) the secretion of pancreatic juice into the lumen of the small intestine, (2) the release of proteins, peptides, and AA from enterocytes into the lumen of the small intestine, and (3) the synthesis of proteins, peptides, or AA by microorganisms in the lumen of the small intestine. On the basis of these reasons, feeding a N-free diet may be preferred over the other two methods to estimate EIAAb. Normally, EIAAb is relatively constant but EIAAs is markedly affected by the diet ingredient composition. For example, EIAAs is minimal in growing pigs fed a diet containing highly digestible protein (e.g., casein or egg protein) but can account for >50% of EIAAt in response to a diet containing a high proportion of fiber or antinutritional factors.
Recently, a concept of standardized ileal AA digestibility has been proposed to eliminate the need for the estimation of EIAAs. The values of standardized ileal AA digestibility are intermediate between apparent and true ileal AA digestibilities (Stein et al. 2007):
Standardized ileal AA digestibility (%) = [AA intake − (AA in ileal digesta − EIAAb)]/AA intake × 100

42 Amino Acids: Biochemistry and Nutrition
© 2010 Taylor & Francis Group, LLC
ABsorPtion of free AA AnD smAll PePtiDes By the smAll intestine
Transport of Free AA via Transmembrane TransportersThe jejunum is the major site for absorption of small peptides and free AA, followed by the ileum and duodenum. The major AA transporter systems and their proteins (many of which are not expressed by the intestinal epithelia) are summarized in Table 2.2. On the basis of sequence similarity, AA transporters are grouped into solute carrier (SLC) families. Eleven of them have been identified to date for animal cells. Interestingly, a lysosomal cystine transporter (cystinosin) has not been given an SLC number. Traditionally, AA transport systems have been classified according to the sub-strate preference and Na+ dependence. As a result of molecular cloning, contempo-rary classifications are usually based on the gene family and Na+ or H+ dependence (Malandro and Kilberg 1996). Note that: (1) more than one transporter can trans-port an AA, (2) systems A and IMINO can transport aminoisobutyrate (AIB) and N-methylaminoisobutyrate (MeAIB), but systems N, ASC, and neutral brush border (NBB) do not transport N-methylated substrates, (3) system N can use lithium (Li+) to substitute Na+, (4) systems A and N are sensitive to inhibition by a low extracellular pH, and (5) system ASC is relatively insensitive to low pH. In recent years, some AA transporters, including system L transporters (LAT1 and LAT2), system N transporter (SNAT3), and a bidirectional Gln transporter (SLC1A5; in epithelial cells), may serve as transceptors, which are capable of sensing and signaling AA availability to a regula-tory machinery [e.g., the mechanistic target of rapamycin (MTOR) pathway)] in cells.
Transport of AA via the γ-Glutamyl CycleIn 1973, A. Meister proposed that the γ-glutamyl cycle could function as a mecha-nism for the transport of AA across biological membranes (Figure 2.4). Note that the γ-carboxyl group of glutamate forms a peptide bond with the amino group of cysteine. This cycle has the following biochemical features: (a) The requirement of 3 mol ATP for the transport of 1 mol AA, (b) a 1:1 stoichiometry between GSH turnover and AA transport, (c) dependence of a membrane-bound enzyme, instead of a transmembrane protein channel, for AA transport, (d) no requirement of Na+ for cotransport of AA, and (e) decrease in AA transport due to an inhibition of one of the enzymes in the γ-glutamyl cycle. On a theoretical basis, this γ-glutamyl cycle does not seem to be efficient for AA transport because of the following reasons. First, the turnover of GSH has a high requirement for ATP. Note that only 1 mol of ATP is required for the uptake of 1 mol of AA by an Na+-dependent transporter. Second, γ-glutamyl transpeptidase has a poor affinity toward proline and thus the γ-glutamyl cycle plays only a minor role in proline transport by animal cells. It is now clear that the γ-glutamyl cycle is not a major mechanism for AA transport in mammalian cells (Vina et al. 1989).
Transport of Small PeptidesDipeptides or tripeptides in the lumen of the small intestine can be directly trans-ported into the enterocytes (i.e., the absorptive epithelial cells) through their apical membrane by H+ gradient-driven (Na+-independent) peptide transporter 1 (PepT1). PepT1 is encoded by the SLC15A1 gene and has broad specificity for dipeptides and tripeptides (Daniel 2004). Neither free AA nor peptides containing four or more AA

43Protein Digestion and Absorption of Peptides and Amino Acids
© 2010 Taylor & Francis Group, LLC
TABLE 2.2Transporters of AA in Animal Cells
Gene Protein Substrate(s) System
Na+-Independent SystemsSLC7A1 CAT-1 Arg, His, Lys, and Orn y+
SLC7A2 CAT-2 Arg, His, Lys, and Orn y+
SLC7A3 CAT-3 Arg, His, Lys, and Orn y+
SLC7A5 LAT1/4F2hc His, Met, Leu, Ile, Val, Phe, Tyr, and Trp
L
SLC7A6 y+LAT2/4F2hc Arg, Lys, Gln, His, Met, and Leu y+L
SLC7A7 y+LAT1/4F2hc Arg, Lys, Gln, His, Met, Leu, Ala, and Cys
y+L
SLC7A8 LAT2/4F2hc All neutral AA, except proline L
SLC7A9 b0,+AT/rBAT Arg, Lys, Orn, and Cystine b0,+
SLC7A10 asc-1/4F2hc Gly, Ala, Ser, Cys, and Thr asc
SLC7A11 xCT/4F2hc Asp, Glu, and Cystine x−c
SLC7A12 asc-2 Gly, Ala, Ser, Cys, and Thr asc
SLC16A10 TAT1 Trp, Tyr, and Phe T
SLC36A1 PAT1/LYAAT1 Pro, Gly, Ala, GABA, Me-AIB, and β-Ala
Imino (Proton AAT)
SLC36A2 PAT2/LYAAT2 Pro, Gly, Ala, GABA, Me-AIB, and β-Ala
Proton AAT
SLC43A1 LAT3 Leu, Ile, Met, Phe, and Val L
SLC43A2 LAT4 Leu, Ile, Met, Phe, and Val L
Na+-Dependent SystemsSLC1A1 EAAT3 d-Asp, l-Asp, l-Glu, Cys, and
cystineXAG
−
SLC1A2 EAAT2 d-Asp, l-Asp, l-Glu, Cys, and cystine
XAG−
SLC1A3 EAAT1 d-Asp, l-Asp, and l-Glu XAG−
SLC1A4 ASCT1 Ala, Ser, and Cys ASC
SLC1A5 ASCT2 Ala, Ser, Cys, Thr, and Gln ASC
SLC1A6 EAAT4 d-Asp, l-Asp, and l-Glu XAG−
SLC1A7 EAAT5 d-Asp, l-Asp, and l-Glu XAG−
SLC3A1 rBAT Trafficking subunits HC-HAAT
SLC3A2 4F2hc Trafficking subunits HC-HAAT
SLC6A1 GAT1 GABA BETA
SLC6A5 GLYT2 Gly and sarcosine Gly
SLC6A6 TAUT Taurine BETA (β)
SLC6A7 PROT Pro (in the central nervous system) Proline transporter
SLC6A9 GLYT1 Gly and sarcosine Gly
SLC6A11 GAT3 GABA, betaine, and taurine BETA (β)
SLC6A12 BGT1 GABA and betaine BETA (β)
continued

44 Amino Acids: Biochemistry and Nutrition
© 2010 Taylor & Francis Group, LLC
TABLE 2.2 (continued)Transporters of AA in Animal Cells
Gene Protein Substrate(s) System
SLC6A13 GAT2 GABA, betaine, Pro, and β-Ala BETA (β)
SLC6A14 ATB0,+ All neutral and cationic AA B0,+
SLC6A15 B0AT2 Pro, Leu, Val, Ile, and Met B0
SLC6A17 NTT4/B0AT3 Leu, Met, Pro, Cys, Ala, Gln, Ser, His, and Gly
B0
SLC6A18 XT2/B0AT3 Gly and Ala Gly
SLC6A19 B0AT1 All neutral AA (brush border of the intestine)
NBB (B0)
SLC6A20 IMINO Pro, OH-Pro; Cys, Ala, Leu, Met, Phe, and Gly
IMINO
SLC7A13 AGT1 Asp and Glu Asp and Glu transporter
SLC17A6 VGLUT2 Glu VGT
SLC17A7 VGLUT1 Glu VGT
SLC17A8 VGLUT3 Glu VGT
SLC25A2 ORC2 Arg, Lys, His, Orn, and Cit Orn/Cit carrier
SLC25A12 AGC1 Asp and Glu Asp/Glu carrier
SLC25A13 AGC2 Asp and Glu Asp/Glu carrier
SLC25A15 ORC1 Arg, Lys, His, Orn, and Cit Orn/Cit carrier
SLC25A18 GC2 Glu Glu carrier
SLC25A22 GC1 Glu Glu carrier
SLC32A1 VIAAT Gly and GABA VGGT
SLC36A4 PAT4 Pro and Trp Amino acid sensor
SLC38A1 SNAT1 (SAT1) Gly, Ala, Asn, Cys, Gln, His, and Met
A
SLC38A2 SNAT2 (SAT2) Gly, Pro, Ala, Ser, Cys, Gln, Asn, His, and Met
A
SLC38A3 SNAT3 (SN1) Gln, Asn, Cit, and His N
SLC38A4 SNAT4 (SAT3) Gly, Ala, Ser, Cys, Gln, Asn, and Met
A
SLC38A5 SNAT5 (SN2) Gln, Asn, Cit, His, Ser, and Ala N
Not assigned Cystinosin Cystine LCT
Not assigned Not known Phe and Met (brush border of the small intestine)
Phe
Source: Adapted from Bröer, S. and M. Palacín. 2011. Biochem. J. 436:193–211; Hyde, R., P.M. Taylor, and H.S. Hundal. 2003. Biochem. J. 373:1–18.
Note: EAAT1, excitatory amino acid transporter 1; GABA, γ-aminobutyric acid; HC-HAAT, heavy chains of heteromeric AAT; LCT, lysosomal Cys transporter; Me-AIB, 2-methylaminoisobutyric acid; NBB, neutral brush border; PAT, proton-coupled amino acid transporter; VGGT, vesicular Gly/GABA transporter; VGT, vesicular Glu transporter.

45Protein Digestion and Absorption of Peptides and Amino Acids
© 2010 Taylor & Francis Group, LLC
CHCO
H3N
CH2S
HN
HCH
2CO
O–
Cell
mem
bran
e
γ−G
luta
myl
-am
ino
aci
d
γ−G
luta
myl
cyc
lotr
ansf
eras
e
5-O
xopr
olin
eA
TPA
DP
+ Pi
Glu
tam
ic a
cid
CH2S
H
CHCO
O–
H3N Cy
stei
neGly
cine
Cyst
einy
l-gly
cine
5-O
xopr
olin
ase
ATP
AD
P +
Pi
ATP
AD
P +
Pi
Pept
idas
e
γ -G
luta
myl
-cys
tein
yl-g
lyci
ne(g
luta
thio
ne)
Am
ino
acid
(out
side
the
cell)
γ−G
luta
myl
tran
spep
tidas
e
Glu
tath
ione
syn
thet
ase
CH2
H3N
COO
–
(insi
de th
e ce
ll)γ -
Glu
tam
yl-c
yste
ine
synt
heta
se
CH
RCO
O–
NH
3
Am
ino
acid
N
HO
H2
+
+
+
+
+
+
+
CH
RCO
O–
NH
3+
CO-N
HCH
COO
–
(CH
2)2
HC CO
O–
NH
3
CH2S
H γ -G
luta
myl
-+
cyst
eine
COO
–
(CH
2)2
HC CO
O–
NH
3+
C (CH
2) 2
HC CO
O–
NH
3
ON
HCH
COO
–
R
C (CH
2) 2
HC CO
O–NH
3
ON
HCHCH
2SH CO
NH
CH2
COO
–
COO
–
FIG
UR
E 2.
4 A
pro
pose
d ro
le fo
r th
e γ-
glut
amyl
cyc
le in
the
tran
spor
t of
AA
by
anim
al c
ells
. γ-G
luta
myl
tran
spep
tida
se is
req
uire
d fo
r A
A tr
ansp
ort
acro
ss t
he c
ell m
embr
ane.
In
gene
ral,
thre
e m
olec
ules
of
AT
P w
ould
be
requ
ired
for
the
upt
ake
of o
ne m
olec
ule
of A
A. E
xper
imen
tal e
vide
nce
show
s th
at th
e γ-
glut
amyl
cyc
le p
lays
a m
inor
rol
e of
AA
tran
spor
t by
anim
al c
ells
. (A
dapt
ed f
rom
Mei
ster
, A. 1
973.
Sci
ence
180
:33–
39.)

46 Amino Acids: Biochemistry and Nutrition
© 2010 Taylor & Francis Group, LLC
residues are accepted as substrates for PepT1. Free AA in the lumen of the small intestine are taken up by enterocytes via several mechanisms: (1) simple diffusion (passive and nonsaturable), (2) Na+-independent systems (facilitated diffusion), and (3) Na+-dependent systems (active transport). Some transport proteins can use lith-ium to replace sodium, and a few of the transport proteins are H+-driven.
Compelling evidence indicates that the small intestine transports small peptides (2–3 AA residues) at a faster rate than free AA. The transport of di- and tripeptides or free AA from the lumen into the enterocytes is associated with an influx of both Na+ and water. Once inside enterocytes, the small peptides are hydrolyzed rapidly by intracellular peptidases to form free AA, which are utilized in multiple pathways. A small proportion of these peptides may exit the enterocytes via their basolateral mem-brane into the bloodstream. The available evidence supports the view that a peptide transporter is expressed in the basolateral membrane of the enterocytes for the move-ment of small peptides from inside the cell into the portal circulation. However, the identity of basolateral peptide transporters remains elusive.
Besides the small intestine, other tissues also contain transporters for small pep-tides so that di- and tripeptides in the plasma can be rapidly utilized in the body. Specifically, PepT1 is also present in the kidney and PepT2 (encoded by the SLC15A2 gene) is widely expressed in extraintestinal tissues (Gilbert et al. 2008).
The PepT1 gene was first cloned from rabbit tissues in 1994, providing the defi-nite proof for the presence of peptide transport by animal cells. Two years later, J.C. Matthews cloned and characterized the peptide transporter in sheep. To date, PepT1 has been cloned in many other animal species, including the Atlantic cod, cattle, chicken, dog, human, monkey, mouse, pig, rat, sheep, turkey, and zebrafish.
The transport of small peptides offers distinct advantages over the transport of free AA. First, some free AA are not highly unstable (e.g., glutamine and cysteine) or have low solubility (e.g., tyrosine, tryptophan, and cysteine) in the solution. These shortcomings can be overcome by the delivery of small peptides (e.g., Ala–Gln, Gly–Gln, and Glu–Cys–Gly) so as to increase the availability of the constituent AA to the body. Second, for equal molar concentrations of AA, the use of dipeptides and tripeptides can reduce the osmolarity of free AA by 50% and 67%, respectively. Third, dipeptides and tripeptides are absorbed faster and more efficiently by the intestine than free AA. This can reduce the catabolism of peptides by microorgan-isms in the lumen of the gastrointestinal tract and can improve the balance of AA supply to the portal circulation. Thus, compared with intact proteins or a mixture of free AA, the addition of small peptides or hydrolyzed proteins to diets can offer a greater nutritional value to enhance animal growth and development.
net BAlAnce of AA Across the smAll intestine in feD AnimAls
An exciting new aspect of AA metabolism and nutrition is the finding that 20–97% of dietary AA may be catabolized by the small intestine during the first pass. It had been a long-standing belief that dietary AA entered the portal vein intact. However, this concept has recently been challenged by findings from studies with young pigs that AA in the enteral diet are degraded extensively by the small intestine in the first pass (Table 2.3), with <20% of the extracted AA being utilized for intestinal mucosal

47Protein Digestion and Absorption of Peptides and Amino Acids
© 2010 Taylor & Francis Group, LLC
protein synthesis. For example, nearly all of glutamate and aspartate, 67–70% of glutamine, 30–40% of proline, and 35% of BCAA in the enteral diet are catabolized by the small intestine of neonatal, weaned, and gestating swine. There is also evi-dence for extensive extraction (%) of dietary AA by the portal-drained viscera (small intestine, large intestine, spleen, stomach, and pancreas) in healthy adult humans: glutamine, 67%; glutamate, 96%; arginine, 38%; leucine, 20–30%; lysine, 30%; and phenylalanine, 27%. The nitrogenous products of glutamate and glutamine metabo-lism in the small intestine of rats, pigs, sheep, cattle, and humans include ornithine, citrulline, arginine, proline, aspartate, and alanine. Among AA in a regular diet, glutamate exhibits the highest rate of degradation in the small intestine, followed by glutamine, aspartate, and proline. The results of recent studies indicate that entero-cytes can degrade BCAA, but the oxidation of lysine, methionine, phenylalanine, tryptophan, threonine, and histidine to CO2 is absent or negligible in enterocytes.
The digestive tract of humans and other animals is colonized by a dense and highly complex community of microorganisms composed mainly of bacteria, whose total number can exceed 1014 cells. Bacteria in the intestinal lumen also take up and degrade free AA and small peptides to generate ammonia, CO2, polyamines, nucleo-tides, proteins, and other nitrogenous substances (including nitrite, nitrate, and GSH). These metabolites, which are produced from the intestinal (combined enterocyte and microbial) AA catabolism, may enter the portal vein, the lumen of the small intestine, or synthetic/degradative pathways in enterocytes. Studies in the last decades have mainly focused on AA fermentation by diverse bacteria in the intestine. Among the AA-fermenting bacteria are strains that belong to the Clostridium clusters (including
TABLE 2.3Net Balance of AA across the Portal-Drained Viscera in Young Pigs (6–10 kg)a
EAA Percentage of Dietary Intake NEAA Percentage of Dietary Intake
Arginine 147 Alanine 154
Histidine 71 Asparagine 74
Isoleucine 66 Aspartate 5
Leucine 64 Cysteine 69
Lysine 55 Glutamate 3
Methionine 69 Glutamine −16
Phenylalanine 63 Glycine 69
Proline 59 Serine 66
Threonine 50 Tyrosine 71
Tryptophan 75
Valine 65
Source: Adapted from Stoll, B. and D.G. Burrin. 2006. J. Anim. Sci. 84:E60–E72; Wu, G. et al. 2010. In: Dynamics in Animal Nutrition (J. Doppenberg and P. van der Aar, ed). pp. 69–98. Wageningen Academic Publishers, The Netherlands.
a Values (percentage of dietary intake) are adapted from Stoll and Burrin (2006) and from Wu et al. (2010). Pigs were fed a milk protein-based diet. The negative value for glutamine results from the sub-stantial uptake of arterial blood glutamine (30%) by the small intestine.

48 Amino Acids: Biochemistry and Nutrition
© 2010 Taylor & Francis Group, LLC
Clostridium spp., Fusobacterium spp., Peptostreptococcus spp., Veillonella spp., Megasphaera elsdenii, Acidaminococcus fermentans, and Selenomonas ruminan-tium). They are the predominant AA-fermenting microbiota along the digestive tract. Phylogenetic analysis of the bacterial 16S rRNA gene sequences have shown that bacteria belonging to the Clostridium clusters, the Bacillus–Lactobacillus–Streptococcus group (including Streptococcus spp.), and Proteobacteria (including Escherichia coli and Klebsiella spp.) are abundant in the small intestines of humans and swine. Intestinal bacteria can degrade BCAA and are primarily responsible for the catabolism of lysine, methionine, phenylalanine, tryptophan, threonine, and his-tidine in the small intestine.
Intestinal metabolism of AA has profound impacts on nutrition and health. First, the catabolism of glutamine, glutamate, and aspartate provides most of ATP to main-tain gut integrity and function. Second, because elevated levels of glutamine, gluta-mate, and aspartate in the plasma exert a neurotoxic effect, their extensive catabolism by the small intestine is essential to the survival of organisms. Third, transformations of AA in the intestine play an important role in regulating the endogenous synthesis of AA (e.g., citrulline, arginine, proline, and alanine) and modulating the availability of dietary AA to extraintestinal tissues. Thus, the ratios of most AA in diets relative to lysine differ markedly from those entering the portal vein from the small-intestinal lumen or appearing in the plasma and in the body proteins. The discrepancies in the patterns of AA between diets and body proteins are particularly large for arginine, cysteine, glutamate, glutamine, glycine, histidine, methionine, proline, and serine. Therefore, the ratios of these AA to lysine in the body proteins are not accurate esti-mates of their optimal dietary requirements by rapidly growing animals or infants.
extensive recyclinG of nitroGen in the intestine of AnimAls
In monogastric animals, the diet is the major source of N in the lumen of the small intestine. N can be in the forms of AA, proteins, peptides, ammonia, urea, and other nitrogenous substances (including GSH, polyamines, purines, pyrimidines, nitrite, nitrate, uric acid, and nitrosylated products). Dietary protein that is neither digested nor absorbed in the small intestine will enter the large intestine. The endogenous sources of N in the lumen of the small intestine include saliva, gastric secretions, sloughed cells, and cell debris originating from the stomach and intestinal epithe-lium, bile, small-intestinal secretions, pancreatic secretions, mucus, microorganisms, and mesenteric arterial blood. There are also secretions of N-containing compounds from the circulation (e.g., glutamine, urea, and ammonia) into the small and upper large intestine. Flows of sloughed colonocytes and colonized microbiota into the lumen of the large intestine, although the amounts are less than those from the upper gastrointestinal parts, also represent endogenous N. Most of the endogenous N can be reabsorbed before reaching the terminal ileum and, to a much lesser extent, in the large intestine; this process is referred to as N recycling (Figure 2.5). In the lumen of the large intestine, AA and peptides undergo extensive fermentation to yield ammo-nia, new AA, methane, H2S, and short-chain fatty acids.
In growing pigs, adult humans, and formula-fed infants, endogenous N flow leaving the small intestine (determined by collecting the digesta at the terminal

49Protein Digestion and Absorption of Peptides and Amino Acids
© 2010 Taylor & Francis Group, LLC
Lum
en
Die
tEn
doge
nous
Mic
robi
alPr
otei
n
(a)
(d)
(c)
H2S
SO2
CO
2C
H4
Prot
eoly
sis
Firs
t-pa
ssm
etab
olism M
icro
bial
prot
ein
NH
3
NH
3H
CO
3–AT
P
AA
SCF
AA
Col
on
Ure
a
Ure
a
Ure
a
Urease
AA
AA Pro
P5C
Orn
ithin
e
Citr
ullin
e
NO
OC
T
Cit
(e)
Pro
Pro
Ala
Ala
Arg
inin
e
Asp
Glu
Gln
CP
AA
Circ
ulat
ion
Ente
rocy
te
Lim
ited
first
-pas
s met
abol
ism fo
r mos
t EA
A
Gln
NH
3SP
PSP
P
(b)
FIG
UR
E 2.
5 N
itro
gen
flow
s an
d re
cycl
ing
in th
e sm
all i
ntes
tine
and
col
on. (
a) S
mal
l int
esti
ne, (
b) e
nter
ocyt
es, (
c) li
ver,
and
(d)
prim
aril
y la
rge
inte
s-ti
ne. M
ost o
f th
e di
etar
y N
is a
bsor
bed
into
the
ent
eroc
yte
and
then
into
the
sys
tem
ic c
ircu
lati
on. B
oth
endo
geno
us a
nd u
ndig
este
d pr
otei
ns, a
s w
ell a
s in
test
ine-
deri
ved
AA
flow
fro
m th
e lu
men
of t
he s
mal
l int
esti
ne in
to th
e la
rge
inte
stin
e w
here
thes
e ni
trog
enou
s su
bsta
nces
und
ergo
ext
ensi
ve fe
rmen
ta-
tion
to y
ield
am
mon
ia, A
A, m
etha
ne, H
2S, a
nd s
hort
-cha
in f
atty
aci
ds. T
here
is a
ctiv
e re
cycl
ing
of N
bet
wee
n th
e in
test
ine
and
the
extr
aint
esti
nal t
is-
sues
. EA
A, n
utri
tion
ally
ess
enti
al A
A; C
P, c
arba
moy
l pho
spha
te; S
CFA
, sho
rt-c
hain
fatt
y ac
ids;
SPP
, sho
rt p
epti
des;
and
P5C
, pyr
roli
ne-5
-car
boxy
late
. (R
epro
duce
d fr
om B
erge
n, W
.G. a
nd G
. Wu.
200
9. J
. Nut
r. 1
39:8
21–8
25, w
ith
perm
issi
on f
rom
the
Am
eric
an S
ocie
ty o
f N
utri
tion
.)

50 Amino Acids: Biochemistry and Nutrition
© 2010 Taylor & Francis Group, LLC
ileum) represents 30–33% of the dietary N intake and can be substantially increased in response to dietary antinutritional factors, high levels of fiber, as well as pro-tein intake. Approximately 75% and 15% of the N endogenously secreted from the upper gastrointestinal tract are reabsorbed by the small intestine and large intestine, respectively, into mucosal epithelial cells (Table 2.4). Studies with pigs and humans indicate that 20–25% of urea synthesized in the liver enter, via the circulation, the lumen of the intestine (primarily the small intestine) where urea is hydrolyzed by microbial urease into ammonia and CO2. Interestingly, the in vivo kinetics data indicate equal returns of urea carbon and N moieties to the urea pool, suggesting the presence of a metabolically significant rate of urea resynthesis in the epithelial cells of the intestine. In support of this view, G. Wu discovered in 1995 the synthesis of urea from both extracellularly and intracellularly generated ammonia in the enterocytes of postweaning pigs (see Chapter 6). Urea resynthesis in enterocytes helps one to explain the apparent discrepancy in urea recycling between isotope dilution and mass balance studies. In enterally fed humans, N cycling or salvage from the gut back into the body AA pool is about 50% of the dietary N intake. Extensive N recycling occurs at the expense of energy.
Among the endogenous AA in the terminal ileum, the arginine family of AA (proline, glutamate plus glutamine, aspartate plus asparagine, and arginine) are most abundant, followed by (1) serine and glycine, (2) BCAA, and (3) other AA (including alanine and tyrosine). In response to the oral administration of [15N] NH4Cl, arginine is highly enriched with 15N in humans. This phenomenon can now
TABLE 2.4Sources and Absorption of Nitrogen in the Lumen of Pig Intestinea
Source Amount of N (mg/kg Body Weight)
Sources of N in the small intestine
Diet 1530
Endogenous source 500
Saliva 14
Stomach 180
Bile 50
Pancreatic secretions 56
Small-intestinal secretions 100
Microorganisms in the lumen 100
Absorption of N in the small intestine 1600
Secretions of N into the lumen of the large intestine 65
Absorption of N in the large intestine 320
Fecal N excretion 175
Source: Data are adapted from Fuller, M.F. and P.J. Reeds. 1998. Annu. Rev. Nutr. 18:385–411; Bergen, W.G. and G. Wu. 2009. J. Nutr. 139:821–825.
Note: DM intake is 5.3% of the body weight per day.a Estimated from the 30–50 kg growing pig consuming an 18% crude protein diet.

51Protein Digestion and Absorption of Peptides and Amino Acids
© 2010 Taylor & Francis Group, LLC
be explained by arginine synthesis from ammonia, bicarbonate, ornithine (derived from glutamine, glutamate, and proline), and aspartate in enterocytes. Poor 15N abundance of lysine and threonine may largely reflect the absence of catabolic path-ways for their degradation initiated by a transaminase. Ammonia fixation initially involves glutamate dehydrogenase (GDH) to generate glutamate, which reacts with another ammonia molecule to form glutamine by glutamine synthetase (GS). These two enzymes are abundant in the bacteria but have low activities in the intestinal mucosal cells. Some of the ammonia is utilized by luminal microorganisms to grow (i.e., synthesize AA and microbial protein). To varying degrees, such cells may be subsequently digested and the arising peptides and AA absorbed, catabolized, or transported with the digesta flow to the large intestine. Evidence shows that the colonic epithelium is not a source of digestive enzymes and that protein/peptide hydrolyses in the colon are a principal function of microorganisms. Most likely, deamination and decarboxylation by colonic luminal microbes will outcompete any AA or peptide transporters in colonocytes for the substrates. Therefore, microor-ganisms in the intestinal lumen likely play a role in ammonia utilization through the synthesis of AA, some of which can enter the lumen of the large intestine. Although AA can arise from N cycling and microbial synthesis in the lumen of the large intestine, the actual net impact of this process on the protein nutrition status appears to be limited in humans and other animals.
PROTEIN DIGESTION AND ABSORPTION OF PEPTIDES AND AA IN RUMINANTS
nutritionAl siGnificAnce of Protein DiGestion in ruminAnts
Before weaning, calves, lambs, and kids utilize dietary protein in the same manner as monogastric animals do. However, with the development of a functional rumen that contains different kinds of microorganisms, postweaning ruminants (e.g., cattle, sheep, and goat) are unique in digestive physiology in that they can convert low-qual-ity feeds into organic molecules required for the synthesis of AA, protein, glucose, and fatty acids (including short-chain fatty acids, conjugated linoleic acid, and odd-carbon number long-chain fatty acids). Ruminants can also effectively utilize nonpro-tein and non-AA N (e.g., urea and ammonia) for the synthesis of AA and microbial protein in the rumen when the dietary supplies of fermentable carbohydrates and minerals (e.g., sulfur and cobalt) are not limited (Figure 2.6). Thus, ruminants can convert low-quality protein and nonprotein materials into high- quality products (e.g., milk, meat, and wool) for human consumption and use without the need to com-pete with monogastric animals or humans for foods and natural resources (Chalupa 1972). This underscores the nutritional and economic significance of the digestion of plant proteins by ruminants. An understanding of these processes will aid in increas-ing the supply of all AA to the small intestine for absorption and utilization for tissue protein synthesis. Additionally, because the colon and cecum of humans also harbor large numbers of various strains of bacteria, the knowledge about N metabolism in the rumen has important implications for preventing human bowel disease (e.g., colon cancer and inflammatory disorders).

52 Amino Acids: Biochemistry and Nutrition
© 2010 Taylor & Francis Group, LLC
DiGestion of DietAry Protein in the GAstrointestinAl trAct
In ruminants fed a roughage diet, the rumen (normally pH 5.8–6.2) contains many different strains and species of bacteria, protozoa, and anaerobic fungi (Firkins et al. 1998). These microorganisms, primarily bacteria, release a variety of proteases, pep-tidases, and deaminases. The rumen bacterial proteases, which are located on the outside cell surface and are mainly cell bound, are readily available to their extracel-lular substrates. Dietary protein is hydrolyzed by microbial proteases to form small peptides and free AA (Figure 2.7). These products can be taken up by the various species of microbes to produce: (1) ammonia, microbial protein, and nitrogenous
Protein
Protein
Protein
Peptides
Amino acids
Ammonia
Protein
NPN
Ammonia
Amino acids
Nitrogenous substancesMetabolic fecal N
Amino acids
Ammonia
Urea
UreaAmmonia
Other endogeneous N
Extrahepatictissues
Abomasumsmall intestine
Rumen
Diet Saliva
Liver
Urine
NPN Urea
MetabolismLarge intestine Feces
Kidneys
FIGURE 2.6 Utilization of dietary protein and nonprotein nitrogen (NPN) by ruminants. Multiple organs participate in the conversion of dietary proteins into tissue proteins, ammo-nia, and urea. Some of the urea produced in the liver is recycled to the gastrointestinal tract where urea is hydrolyzed into ammonia by the luminal urease of bacterial origin. This ammo-nia enters the portal circulation and then the liver for ureagenesis.

53Protein Digestion and Absorption of Peptides and Amino Acids
© 2010 Taylor & Francis Group, LLC
substances on the cell wall; (2) pyruvate and short-chain fatty acids (acetate, propio-nate, and butyrate); (3) branched-chain fatty acids (isobutyrate, isovaleric acid, and 2-methylbutyric acid from valine, isoleucine, and leucine, respectively); and (4) CO2 and methane. Branched-chain fatty acids in the rumen serve as growth factors for microorganisms and as starting materials for the formation of long-chain branched fatty acids. In contrast, rumen protozoa cannot utilize ammonia, but can derive their nitrogen by engulfing bacteria and digesting them with powerful intracellu-lar proteases (optimal pH of 6.0–7.0). Rumen protein synthesis reaches a maximum level when ammonia (the sum of NH4
+ and NH3) concentrations in the rumen fluid reach 5 mM (90 mg/L). This concentration can be obtained with diets containing 13% crude protein. In the rumen, 50–80% of microbial N is derived from ammonia. Studies with 15N have revealed that bacteria can derive up to 30% of their protein from sources (e.g., peptides and AA) other than ammonia. The microbial protein content in the small intestine can be measured by assays of components associated with only microorganisms. The markers of microbial proteins include 2,6-diami-nopimelic acid (characteristic of bacteria) and aminoethylphosphonic acid (charac-teristic of protozoa). An alternative approach would be to measure the incorporation of 15N- or 35S-labeled AA into proteins in microbes.
Many enzymes (including AA transaminases, AA hydroxylases, and AA decar-boxylases) can initiate AA degradation in the rumen, ultimately leading to the pro-duction of ammonia and CO2 (Smith and Bryant 1979). However, AA deaminases, AA oxidases, and AA dehydrogenases can directly catalyze the production of ammo-nia and α-ketoacids from AA in bacteria, protozoa, and the extracellular fluid of the rumen (Figure 2.8). AA deaminases are the principal enzymes whereby the amino groups of dietary AA are lost irreversibly as ammonia in the rumen. The NADH and
Proteins
Large peptides
Small peptides
Amino acids
Carbon skeletons + Ammonia
Short-chain fatty acids
Fermentation
Proteases
Peptidases
Peptidases
DeaminasesDehydrogenases
Oxidases
Extr
acel
lula
rIn
trac
ellu
lar Bacterial proteins
Amino acids
Protozoa
Protozoal proteins
Engulfingbacteria
CH2Oand S
FIGURE 2.7 Synthesis of microbial proteins in the rumen of ruminants. Dietary proteins are hydrolyzed to form small peptides and AA. AA can be degraded to form ammonia and the corresponding α-ketoacids. Bacteria use small peptides, AA, and ammonia to synthesize new proteins. CH2O, fermentable carbohydrates; S, sulfur-containing precursors.

54 Amino Acids: Biochemistry and Nutrition
© 2010 Taylor & Francis Group, LLC
FADH2, which are produced from AA dehydrogenases and AA oxidases, respec-tively, cannot be used for ATP production in the rumen via the electron transport system due to the anaerobic environment. As noted above, the carbon skeletons of AA are utilized, in part, for the synthesis of fatty acids. It is noteworthy that some carbon skeletons of AA are also utilized for the synthesis of new AA.
The proportion of the total dietary protein that is digested in the rumen varies from 70% to 85% for most diets to 30% to 40% for less soluble proteins. The rates of protein degradation in the rumen depend on residence time in the rumen, proteolytic activity of ruminal microorganisms, the type of protein, and the level of feeding. For example, certain proteins of animal origin (e.g., feather meal, meat and bone meal, and blood meal) are much more resistant to rumen degradation than plant proteins. About 90% of the total N in the rumen content exists in an insoluble form (e.g., microbial proteins, smaller particles of undigested dietary protein, and sloughed rumen epithelial cells). N in the soluble pool (about 10% of the total rumen N) con-sists of ammonia N (~70%) and a mixture of free AA and peptides. Ammonia N is
Amino acidsNAD(P)+
NAD(P)H + H+
FAD
FADH2
H2O3
41 2
NAD(P)H + H+
Glutamate Glutamine
OAA Pyruvate
Aspartate Alanine87
11
10
5
NAG + GABA + P5C + Formyl-Glu
Asparagine
ATPAMP + PPi
9
6NH4
+ + ATP ADP + Pi
AmmoniaGlucosamine-6-P
Purine and pyrimidineα-Ketoglutaramate
Phenylacetylglutamine
NADPH +H+ + α-KG
NADP+
12
NAD(P)+ + α-KG13
GlutamineGlutamate
α-KA + Ammonia
α-KG
FIGURE 2.8 Production and utilization of ammonia by microorganisms in the rumen of ruminants. GABA, γ-aminobutyrate; Formyl-Glu, formylglutamate; α-KA, α-ketoacids; α-KG, α-ketoglutarate; NAG, N-acetylglutamate; P5C, pyrroline-5-carboxylate. The enzymes that catalyze the indicated reactions are: (1) AA dehydrogenases, (2) AA transaminases, (3) AA deaminases, (4) AA oxidases, (5) glutamate dehydrogenase, (6) glutamine synthetase, (7) glutamate–oxaloacetate transaminase (aspartate transaminase), (8) glutamate–pyruvate transaminase (alanine transaminase), (9) asparagine synthetase, (10) the synthesis of NAG, GABA, P5C, and formyl-Glu from glutamate are catalyzed by NAG synthase, glutamate decarboxylase, γ-glutamyl kinase plus glutamyl semialdehyde dehydrogenase, and complex enzymes, respectively, (11) a series of enzymes required in multiple pathways, (12) glutamate synthase (also known as NADPH-dependent glutamine:α-ketoglutarate amidotransferase, glu-tamine + 2α-ketoglutarate + NADPH + H+ → 2-glutamate + NADP+), and (13) conversion of α-ketoacids to α-ketoglutarate via various reactions. NAG, N-acetyl-glutamate; OAA, oxalo-acetate; P5C, pyrroline-5-carboxylate.

55Protein Digestion and Absorption of Peptides and Amino Acids
© 2010 Taylor & Francis Group, LLC
present in the rumen in concentrations varying between 20 and 500 mg/L, depend-ing on the diet and the time after feeding. Maximum concentrations of ammonia are usually reached about 2 h after ingestion of a protein-containing diet. AA N and peptide N are present at much lower concentrations (usually <20 mg/L) in the rumen.
The most important initial reaction for microbial assimilation of ammonia is cata-lyzed by GDH to produce glutamate, which is then utilized to synthesize glutamine, alanine, aspartate, and asparagine by GS, glutamate–pyruvate transaminase, glu-tamate–oxaloacetate transaminase, and asparagine synthetase, respectively (Figure 2.8). Glutamate is also formed from glutamine and α-ketoglutarate (α-KG) by GS. This glutamate family of AA (glutamate, glutamine, alanine, aspartate, and aspara-gine) serves as substrates for the synthesis of all other AA by microorganisms in the presence of fermentable carbohydrates and sulfur in the rumen. Sulfur is needed for the synthesis of methionine and cysteine and can be supplied as sulfate or protein. Sulfate is converted to sulfide by ruminal microorganisms. The diets for ruminants should contain N and sulfur at the ratio of 10:1.
ABsorPtion of free AA AnD smAll PePtiDes By the smAll intestine
Microbial cells (bacteria and protozoa) containing proteins, peptides, and AA, as well as undigested dietary protein, leave the reticulorumen and enter the omasum, abomasum (pH 2–3), and the small intestine. Digestion of proteins in the abomasum and small intestine of ruminants is qualitatively similar to that in the stomach and small intestine of monogastric animals (Xue et al. 2010). However, there are some quantitative differences between ruminants and nonruminants. First, the amount of metabolic N (e.g., the N supplied from pancreatic juice and bile into the duodenum, and the N from epithelial cells sloughed from the intestinal tract) in proportion to the amount of feed N is considerably greater in ruminants than in nonruminants. Second, because of high concentrations of short-chain fatty acids in the gastric fluid of the abomasum, the rate of neutralization of the digesta entering the duodenum is slower in ruminants than in monogastric animals. Third, in sharp contrast to simple-stomached animals, 50–90% of the protein entering the small intestine is of microbial origin in ruminants, with the remainder being feed protein that has escaped degradation in the rumen. Fourth, activation and peak activity of pancre-atic proteases occur in the mid-jejunum in ruminants, rather than in the duodenum in simple-stomached animals. Fifth, the pancreatic juice of ruminants contains a high activity of nucleases as a mechanism of adaptation to the high content of nucleic acid in microbial cells.
nitroGen recyclinG in ruminAnts AnD its nutritionAl imPlicAtions
The ammonia that is produced in the rumen but is not utilized for synthesis of AA or polypeptides in microorganisms is absorbed into the blood circulation and converted into urea via the hepatic urea cycle (Figure 2.5). Ammonia in the rumen fluid may also be utilized by rumen epithelial cells for biosynthetic processes (including the production of urea, glutamate, and glutamine) (Tyler 1978). Ammonia in the plasma is taken up by the liver for the synthesis of urea (containing 46.7% N) via the urea cycle.
56 Amino Acids: Biochemistry and Nutrition
© 2010 Taylor & Francis Group, LLC
Most of the urea is excreted into the urine. About 20% of the circulating urea is taken up by the intestine where it is hydrolyzed by microbial urease to form ammonia plus CO2. Ammonia, which takes up H+ to form NH4
+, can increase the pH of the rumen fluid. Some urea in blood enters the rumen through saliva. In the rumen, urea is hydrolyzed by microbial urease to form ammonia plus CO2. Such a N recycling mech-anism helps conserve ammonia for biosynthetic processes in the rumen (Reynolds and Kristensen 2008). Because of its hydrolysis to form ammonia by microbial ure-ase, urea can be used as a source of N for the diets of ruminants. Urea is well utilized by rumen microorganisms when diets contain <13% crude protein. The results of extensive research indicate that urea may account for 15–25% of crude protein in the diets for beef cattle, cows, and sheep.
Urea is a natural substance in forages and is a major form of nonprotein N in con-ventional ruminant diets. Corn silage and alfalfa may contain up to 50% and 20% of nonprotein N, respectively. The efficacy and safety of urea supplementation to the diets for cattle and sheep depend on many factors, including (1) the dosage and fre-quency, (2) percentages of dietary carbohydrates and crude protein as well as their digestibilities in the rumen, and (3) adequate supply of phosphorus, sulfur, and trace minerals. It should be borne in mind that the toxicity of ammonia and urea can occur when their concentrations in the rumen are very high. The underlying mechanisms involve: (1) a substantial increase in the rumen pH, leading to reductions in bacterial growth and synthetic activity in the rumen, (2) removal of α-KG from the Krebs cycle, thereby interfering with ATP production by cells and tissues, particularly those in the central nervous system, (3) disturbance of acid–base balance in the circulation, and (4) enhanced synthesis of glutamine, which inhibits the synthesis of nitric oxide (NO) from arginine in endothelial cells and, therefore, blood flow and oxygen supply to vital organs, particularly the brain. It is advantageous to supply urea as a liquid food supplement with higher concentrations of molasses and phosphoric acid. This is because (1) molasses serve as an energy source for microbial utilization of ammonia and protein synthesis and (2) phosphoric acid lowers the pH in the rumen fluid.
ProtectinG hiGh-QuAlity Protein from rumen DeGrADAtion
High-quality protein is required to support maximal growth, reproduction, and lac-tation performance of beef, dairy cows, sheep, and goats. However, not all dietary protein is utilized for microbial protein synthesis. Additionally, microbial protein syn-thesis requires large amounts of energy, and the efficiency of energetic transformations for protein synthesis from AA is usually less than 75%. Thus, high-quality protein or supplemental AA (e.g., arginine, lysine, and methionine) in the diet should be pro-tected from rumen degradation. Several approaches have been developed to reduce the degradation of protein in the rumen. These methods include the treatment of protein by mild heating, chemical treatment, addition of polyphenolic phytochemicals, and physi-cal encapsulation. In the small intestine, the coating lipids are readily broken down by lipase to release proteins or AA. Similarly, supplemental AA for ruminants should be protected from rumen degradation and should be generally recognized as safe (GRAS) to ensure both high efficacy and safety. Rumen-protected AA should be stable particu-larly when it is incorporated into silage- or forage-based total mixed ratios.

57Protein Digestion and Absorption of Peptides and Amino Acids
© 2010 Taylor & Francis Group, LLC
HeatingHeating is one of the earliest methods used to increase the escape of high-quality protein (e.g., casein) from the rumen. This classic work was first reported in 1954. The underlying principle is the Maillard reaction (Figure 2.9). This involves the reaction between the free amino groups of certain AA [particularly the ε-amino groups (−NH2) of lysine residues in protein and the amino groups of free arginine and lysine] and carbonyl compounds (−HC=O), usually reducing sugars (e.g., glu-cose, fructose, or ribose). The initial reaction is the formation of a Schiff’s base, followed by Amadori rearrangement of the Schiff’s base to generate an Amadori compound. The formation of the Schiff’s base is reversible. However, further heating results in the production of melanoidin polymers that give a brown color. The dark coloration of overheated hays and silages is symptomatic of the Maillard reaction. The modified lysine in the form of melanoidin polymers is nutritionally unavailable to animals. Therefore, excess heating of feed proteins poses a problem. If the heated proteins escape the breakdown by proteases in the rumen, these proteins may also escape the breakdown by proteases in the abomasum and the small intestine. The Maillard reaction, which can occur at a low rate under hyperglycemic conditions, also has important implications for human nutrition and health.
Chemical TreatmentsAn objective of chemical treatment of dietary proteins is to decrease the protein solubility and decrease the susceptibility of proteins to proteolysis in the rumen. An example of chemical treatments is the use of formaldehyde (HCHO), which has a carbonyl group. Therefore, a Maillard reaction occurs between AA and form-aldehyde. AA whose α-amino groups (and side-chain NH2 groups if any) have a high reactivity with formaldehyde include arginine, histidine, lysine, methionine, tryptophan, and tyrosine. Peptide bonds, as well as the amide groups of glutamine and asparagine, also react with formaldehyde. All these reactions lead to reduced solubility of protein and therefore to decreased protein degradation in the rumen. An advantage of formaldehyde treatment is that most of the formaldehyde–protein reactions are unstable at low pH, such as the pH in the abomasum and the upper part of the small intestine. Therefore, formaldehyde-treated proteins are susceptible to degradation by proteases in the abomasum and the small intestine. A disadvantage of this method is that formaldehyde is a potential carcinogen, which poses hazards to the personnel who use formaldehyde and risks to the safety of animal products for human consumption.
Polyphenolic PhytochemicalsNatural phytochemicals that have been used to protect protein degradation in the rumen include tannins (polyphenolic compounds). A chemical property of tannins is that they spontaneously react with proteins, primarily by hydrogen bonding, to form a water-insoluble complex. Such a tannin–protein complex is not susceptible to degradation by proteases at pH 5.5–6.5. However, at pH 2–3, proteins are dissociated from tannins and become available for degradation by proteases. Thus, the value of supplemental tannins lies in the difference in the pH among the rumen, abomasum, and small intestine. In the normal pH range in the rumen, the protein remains bound

58 Amino Acids: Biochemistry and Nutrition
© 2010 Taylor & Francis Group, LLC
H2O
Furt
her h
eatin
g
C C CH2O
HOH
OH
C C
O H
H HHO
H2C
NH
R
C C CH2O
HOH
OH
H H
C CH2
HC
OO
C C CH2O
HOH
OH
H H
C CO
H
H2C
N OH
H
R
OH
OH
2CCO
H
Am
ador
i com
poun
d(k
eto
form
)
5-H
ydro
xym
ethy
l fur
fura
l
Mel
anoi
dins
(bro
wn
colo
r)
RNH
2
RNH
2
Furf
ural
+
OCO
H
Glu
cose
Schi
� ba
seco
mpo
und
HC C C
OH
HO
H
H
O
C C CH2O
HOH
OH
H H
HC C C
OH
HO
H
H
NR
C C CH2O
HOH
OH
H H
HC C C
OH
HO
H
H
NH
R
C C CH2O
HOH
OH
H H
3-D
eoxy
gluc
oson
e
H+
Furt
her h
eatin
g
Am
ador
i com
poun
d(e
nol f
orm
)
FIG
UR
E 2.
9 T
he M
aill
ard
reac
tion
bet
wee
n A
A a
nd c
arbo
hydr
ates
. RN
H2 i
s a
free
AA
or a
pep
tide
-bou
nd A
A (e
.g.,
lysi
ne o
r arg
inin
e). T
he fo
rmat
ion
of th
e Sc
hiff
’s b
ase
is r
ever
sibl
e. H
owev
er, i
n re
spon
se to
ove
rhea
ting
, the
mod
ified
AA
in th
e fo
rm o
f m
elan
oidi
n po
lym
ers
is n
utri
tion
ally
una
vail
able
to
ani
mal
s.

59Protein Digestion and Absorption of Peptides and Amino Acids
© 2010 Taylor & Francis Group, LLC
to the tannin. However, at a lower pH in the abomasum and the upper part of the small intestine, the protein is released from its tannin complex. Thus, high-quality proteins can be effectively protected from degradation in the rumen and become available for digestion in the abomasum and small intestine. In practice, tannins may be added directly to feedstuffs for ruminants.
Physical Encapsulation of Proteins or AAThe idea for coating proteins originated from the observations in the 1970s that certain protein ingredients of animal origin are resistant to rumen degradation. The methods for physical encapsulation of proteins or AA include blood spraying and the use of a hydrogenated lipid layer. In the first technique, protein supplements are sprayed by blood, followed by heating the mixture to dryness. This procedure has been used to effectively coat the surface of proteins, which resists attack by rumen microorganisms due, in part, to the poor colonization of the protein par-ticles by rumen bacteria. In the second approach, proteins or AA are coated with hydrogenated lipids (e.g., lecithin or soy oils) to form microcapsules. Feeding an oil-coated linseed meal to young sheep has been reported to improve their N retention. Additionally, the entry of dietary protein to the abomasum is substantially increased in cattle fed rumen-protected soybeans that are prepared using the roasting and extrusion methods.
Inhibition of AA DegradationThe conversion of AA to their carbon skeletons and ammonia is catalyzed by AA deaminases. Thus, an inhibition of AA breakdown in the rumen is expected to increase the availability of dietary AA for absorption in the small intestine. In sup-port of this view, dietary supplementation with an inhibitor of AA deaminases (e.g., diphenyliodonium chloride) can enhance the flow of high-quality protein from the rumen into the abomasum and the small intestine, thereby improving growth perfor-mance in beef cattle. It should be noted that the inhibition of AA deaminases would result in a decreased availability of ammonia for the synthesis of AA by rumen microorganisms and, therefore, is not beneficial for ruminants fed a diet containing low-quality and low-content protein.
SUMMARY
Except for the absorption of milk-born intact immunoglobulins by the small intes-tine of neonates, dietary proteins have no nutritional values until they are digested to form short-chain peptides and free AA in the digestive tract. In nonruminants, the digestion starts in the stomach (pH ~2–3) where the protein is first denatured by HCl and then hydrolyzed by proteases (e.g., pepsins A, B, and C, and renin). The resulting large peptides enter the small intestine to undergo further degradation by proteases (e.g., trypsin, chymotrypsin, elastase, carboxyl peptidases, and aminopep-tidases) in an alkaline medium (owing to bile salts, pancreatic juice, and duodenal secretions). These enzymes release small peptides and considerable amounts of free AA. Oligopeptides composed of more than three AA residues are broken down by peptidases to form tripeptides, dipeptides, and free AA. The major mechanisms for

60 Amino Acids: Biochemistry and Nutrition
© 2010 Taylor & Francis Group, LLC
the intestinal absorption of AA include both Na+-dependent and Na+-independent systems. Dipeptides and tripeptides are absorbed intact into enterocytes of the small intestine through H+-gradient-driven peptide transporters (mainly PepT1). Once inside enterocytes, peptides are hydrolyzed by peptidases to form free AA. Since substantial amounts of dietary AA are catabolized by the small intestine in the first pass, only a portion of them (ranging from 3% to 74% depending on individual AA) enters the portal circulation for utilization by extraintestinal tissues. In ruminants, dietary protein is hydrolyzed by rumen microbial proteases to form small peptides and free AA, which are further degraded to form ammonia, short-chain fatty acids, and CO2. Small peptides, AA, and ammonia are utilized by microorganisms in the presence of adequate energy supply (carbohydrates) to synthesize new AA, protein, nucleic acids, and other nitrogenous substances. The most important initial reaction for microbial ammonia assimilation is catalyzed by glutamate dehydrogenase to pro-duce glutamate, which is then utilized to synthesize glutamine, alanine, aspartate, and asparagine. These AA serve as substrates for the synthesis of all other AA by microorganisms in the presence of sulfur and ATP. Rumen protozoa cannot utilize ammonia but can derive their N by engulfing bacteria and digesting them with pow-erful intracellular proteases. Ammonia that cannot be fixed by rumen microorgan-isms is absorbed into the blood for conversion into urea via the hepatic urea cycle. Rumen microbial cells (bacteria and protozoa) containing proteins and AA as well as undigested dietary proteins enter the abomasum and small intestine where the digestion of protein is similar to that in nonruminants. In both ruminants and nonru-minants, extensive recycling of N occurs in the intestine at the expense of energy to improve the efficiency of utilization of dietary AA.
REFERENCES
Bergen, W.G. and G. Wu. 2009. Intestinal nitrogen recycling and utilization in health and disease. J. Nutr. 139:821–825.
Boirie, Y., M. Dangin, P. Gachon, M.P. Vasson, J.L. Maubois, and B. Beaufrère. 1997. Slow and fast dietary proteins differently modulate postprandial protein accretion. Proc. Natl. Acad. Sci. USA 94:14930–14935.
Broderick, G.A., R.J. Wallace, and E.R. Orskov. 1991. Control of rate and extent of protein degradation. In: Physiological Aspects of Digestion and Metabolism in Ruminants (T. Tsuda, Y. Sasaki, and R. Kawashima, eds). Academic Press, New York, pp. 541–592.
Bröer, S. and M. Palacín. 2011. The role of amino acid transporters in inherited and acquired diseases. Biochem. J. 436:193–211.
Chalupa, W. 1972. Metabolic aspects of nonprotein nitrogen utilization in ruminant animal. Fed. Proc. 31:1152–1164.
Daniel, H. 2004. Molecular and integrative physiology of intestinal peptide transport. Annu. Rev. Physiol. 66:361–384.
Firkins, J.L., M.S. Allen, B.S. Oldick, and N.R. St-Pierre. 1998. Modeling ruminal digestibility of carbohydrates and microbial protein flow to the duodenum. J. Dairy Sci. 81:3350–3369.
Fuller, M.F. and P.J. Reeds. 1998. Nitrogen cycling in the gut. Annu. Rev. Nutr. 18:385–411.Gilbert, E.R., E.A. Wong, and K.E. Webb, Jr. 2008. Peptide absorption and utilization:
Implications for animal nutrition and health. J. Anim. Sci. 86:2135–2155.

61Protein Digestion and Absorption of Peptides and Amino Acids
© 2010 Taylor & Francis Group, LLC
Gottlob, R.O., J.M. DeRouchey, M.D. Tokach, R.D. Goodband, S.S. Dritz, J.L. Nelssen, C.W. Hastad, and D.A. Knabe. 2006. Amino acid and energy digestibility of protein sources for growing pigs. J. Anim. Sci. 84:1396–1402.
Hyde, R., P.M. Taylor, and H.S. Hundal. 2003. Amino acid transporters: Roles in amino acid sensing and signalling in animal cells. Biochem. J. 373:1–18.
Knabe, D.A., D.C. LaRue, E.J. Gregg, G.M. Martinez, and T.D. Tanksley, Jr. 1989. Apparent digestibility of nitrogen and amino acids in protein feedstuffs by growing pigs. J. Anim. Sci. 67:441–458.
Malandro, M.S. and M.S. Kilberg. 1996. Molecular biology of mammalian amino acid trans-porters. Annu. Rev. Biochem. 65:305–336.
Mavromichalis, I., T.M. Parr, V.M. Gabert, and D.H. Baker. 2001. True ileal digestibility of amino acids in sow’s milk for 17-day-old pigs. J. Anim. Sci. 79:707–713.
Meister, A. 1973. On the enzymology of amino acid transport. Science 180:33–39.Miner-Williams, W., A. Deglaire, R. Benamouzig, M.F. Fuller, D. Tomé, and P.J. Moughan.
2012. Endogenous proteins in terminal ileal digesta of adult subjects fed a casein-based diet. Am. J. Clin. Nutr. 96:508–515.
Newey, H. and D.H. Smyth. 1959. The intestinal absorption of some dipeptides. J. Physiol. 145:48–56.
Reynolds, C.K. and N.B. Kristensen. 2008. Nitrogen recycling through the gut and the nitro-gen economy of ruminants: An asynchronous symbiosis. J. Anim. Sci. 86(14 Suppl): E293–E305.
Sauer, W.C. and L. Ozimek. 1986. Digestibility of amino acids in swine—results and their practical applications—a review. Livest. Sci. Prod. 15:367–388.
Smith, C.J. and M.P. Bryant. 1979. Introduction to metabolic activities of intestinal bacteria. Am. J. Clin. Nutr. 32:149–157.
Stein, H.H., B. Sève, M.F. Fuller, P.J. Moughan, and C.F. deLange. 2007. Amino acid bioavail-ability and digestibility in pig feed ingredients: Terminology and application. J. Anim. Sci. 85:172–180.
Stoll, B. and D.G. Burrin. 2006. Measuring splanchnic amino acid metabolism in vivo using stable isotopic tracers. J. Anim. Sci. 84:E60–E72.
Tyler, B.M. 1978. Regulation of the assimilation of nitrogen compounds. Annu. Rev. Biochem. 47:1127–1162.
Vina, J.R., M. Palacin, I.R. Puertes, R. Hernandez, and J. Vina. 1989. Role of the γ-glutamyl cycle in the regulation of amino acid translocation. Am. J. Physiol. 257:E916–E922.
Wang, W.W., S.Y. Qiao, and D.F. Li. 2009. Amino acids and gut function. Amino Acids 37:105–110.
Wu, G., F.W. Bazer, R.C. Burghardt, G.A. Johnson, S.W. Kim, D.A. Knabe, X.L. Li, M.C. Satterfield, S.B. Smith, and T.E. Spencer. 2010. Functional amino acids in swine nutri-tion and production. In: Dynamics in Animal Nutrition (J. Doppenberg and P. van der Aar, eds). Wageningen Academic Publishers, The Netherlands, pp. 69–98.
Xue, Y., S.F. Liao, K.W. Son, S.L. Greenwood, B.W. McBride, J.A. Boling, and J.C. Matthews. 2010. Metabolic acidosis in sheep alters expression of renal and skeletal muscle amino acid enzymes and transporters. J. Anim. Sci. 88:707–717.
Yen, J.T., B.J. Kerr, R.A. Easter, and A.M. Parkhurst. 2004. Difference in rates of net portal absorption between crystalline and protein-bound lysine and threonine in growing pigs fed once daily. J. Anim. Sci. 82:1079–1090.


63
© 2010 Taylor & Francis Group, LLC
Synthesis of Amino Acids
Since O. Neubauer postulated in 1909 that phenylalanine is converted to tyrosine in animals, research on AA synthesis has spanned more than a century. The earlier work in this field involved primarily the N balance and growth of laboratory ani-mals such as dogs and rats to infer which AA is synthesized in the body. In 1912, E. Abderhalden suggested that proline is synthesized in dogs because they could maintain a positive N balance and could grow when fed a proline-free diet contain-ing other AA found in casein hydrolysates. In contrast, the dogs lost weight and died when fed tryptophan-free casein hydrolysates. On this basis, Abderhalden classified AA as either nutritionally essential (indispensable) or nonessential (dispensable). An AA that is synthesized in the body at a rate to support N balance was defined as a nutritionally nonessential AA (NEAA), and an AA that is not synthesized in the body was called essential AA (EAA).
Beginning in 1924, W.C. Rose and coworkers published a series of landmark papers on AA nutrition and metabolism in rats and humans. These studies, along with those of others (including A.E. Braunstein, F.G. Hopkins, H.A. Krebs, and D. Shemin), concluded that most animals can synthesize alanine, arginine, aspartate, cysteine, glutamate, glutamine, glycine, proline, serine, and tyrosine, but not isoleu-cine, leucine, lysine, methionine, phenylalanine, threonine, tryptophan, and valine (Rose 1957). These AA-synthetic pathways are now known to be cell-, tissue-, and species-specific. Because most of the EAA can be formed from their corresponding α-ketoacids in vivo, A. Meister indicated in 1965 that it is the carbon skeletons of EAA, not AA themselves, that cannot be synthesized in animals. Recent analysis of whole-genome sequences in a wide variety of eukaryotes reveals that deleteri-ous mutations occurred during evolution for almost all the genes that were lost in AA-synthetic pathways (Guedes et al. 2011). This may have nutritional and physi-ological significance in: (1) sparing phosphoenolpyruvate, D-erythrose-4-phosphate, and acetyl-CoA for synthesis of glucose, nucleotides, and fatty acids, respectively; (2) reducing energy expenditure; and (3) minimizing the numbers of proteins and intermediary metabolites as well as metabolic complexity. Conversely, selective con-servation of pathways for NEAA synthesis indicates that they are indispensable for the metabolic needs and survival of animals.
As indicated in Chapter 2, the lumen of the small and large intestines contains many different kinds of microbes, which form a complex ecosystem with their host animals. The interactions between intestinal epithelial cells and bacteria can profoundly influence intestinal mucosal integrity and function. Thus, the meta-bolic activities of these bacteria have potential effects on host nutrition and health. Microorganisms in the lumen of the gastrointestinal tract of animals (including humans) can synthesize all protein-AA from ammonia, sulfur, and fermentable car-bohydrates (the sources of appropriate carbon skeletons). These synthetic pathways
3

64 Amino Acids: Biochemistry and Nutrition
© 2010 Taylor & Francis Group, LLC
are quantitatively important in ruminants but they are nutritionally insignificant as a source of AA for nonruminants (Reeds 2000). The objective of this chapter is to highlight AA synthesis in animals and intestinal microbes.
SYNTHESIS OF AA IN TISSUES AND CELLS OF ANIMALS
GenerAl consiDerAtions
Rapidly growing neonates (e.g., piglets, lambs, calves, young rats, and young chicks) are useful animal models to study AA synthesis because they are very sensitive to changes in their endogenous provision of AA. For mammalian species, milk had tra-ditionally been thought to supply adequate amounts of all AA to neonates. However, the results of recent studies with lactating sows indicate that milk provides at most only 40% of arginine and proline for protein accretion in 7- to 21-day-old suckling pigs. Therefore, piglets must synthesize daily at least 60% of the arginine and proline required by the body. Additionally, based on the glycine and alanine content of sow’s milk, it meets at most 23% and 66%, respectively, of the piglet’s needs for protein synthesis (Wu et al. 2010). This indicates that the neonate must synthesize daily at least 77% of the glycine and 34% of the alanine needed by the body. Interestingly, although aspartate plus asparagine and glutamate plus glutamine represent 23% and 42%, respectively, of the total NEAA in the sow’s milk, this food provides at most only 8% and 9% of aspartate and glutamate for whole-body protein deposition in suckling piglets, respectively (Table 3.1). Similarly, a typical corn- and soybean meal-based diet cannot provide sufficient amounts of arginine, proline, aspartate, glutamate, glutamine, or glycine requirement for protein synthesis in postweaning growing pigs (Table 3.2). In contrast, more EAA are provided from milk or wean-ling diets than is needed for protein accretion in young animals (Table 3.3). Excess amounts of dietary EAA are used to synthesize NEAA in the body (Figure 3.1).
cell-, tissue-, AnD sPecies-sPecific synthesis of AA
Most mammals, including cattle, dogs, humans, pigs, rats, and sheep, can synthesize the following 11 protein-AA (alanine, arginine, aspartate, asparagine, cysteine, glu-tamate, glutamine, glycine, proline, serine, and tyrosine) and nonprotein AA (e.g., citrulline, ornithine, and taurine). All tissues in mammals can synthesize proline from arginine. Some mammals (e.g., cats, ferrets, and mink) and fish cannot syn-thesize arginine due to the lack of Δ1-pyrroline-5-carboxylate (P5C) synthase for citrulline production in the body, particularly the enterocytes of the small intestine. Preterm mammals (including humans and pigs) have a limited ability to synthesize citrulline and, therefore, arginine; the underlying mechanisms are unknown but may involve low expression of P5C synthase and N-acetylglutamate synthase in the small intestine. Avian species cannot synthesize arginine due to an absence of endogenous synthesis of citrulline from glutamine, glutamate, or proline, and have a limited ability to produce proline due to the near absence or low activity of arginase in tis-sues. Likewise, birds cannot make adequate amounts of glycine to meet the need for hepatic synthesis of uric acid.

65Synthesis of Amino Acids
© 2010 Taylor & Francis Group, LLC
While most animal species can make taurine from methionine and cysteine, cats have a limited ability to synthesize this sulfur-containing AA because of a deficiency of cysteine dioxygenase. Since taurine is absent from plants, cats must be fed a diet containing animal products or supplemental taurine. Human infants (both term and preterm) cannot synthesize adequate amounts of taurine or cysteine due to underde-velopment of key enzymes for the pathways. Thus, complete infant formulas must be fortified with these two AA.
TABLE 3.1Utilization of AA in Sow’s Milk for Protein Accretion by 14-Day-Old Pigsa
AA
AA in Sow’s Milkb (g/L)
AA Intake by Pigc (g/Day)
Dietary AA
Entering Portal Veind
(g/Day)
AA Content in Pig (mg/g Wet
Weight)
AA Accretion in Proteins (g/Day)e
Whole Body
Intestines (Small and
Large)Extraintestinal
Tissues
Alanine 1.97 1.80 1.38 8.85 2.08 0.10 1.98
Arginine 1.43 1.31 1.06 9.13 2.15 0.10 2.05
Asparagine 2.53 2.31 2.00 4.76 1.12 0.05 1.07
Aspartate 2.59 2.36 0.11 5.74 1.35 0.06 1.29
Cysteine 0.72 0.66 0.50 1.77 0.42 0.02 0.40
Glutamate 4.57 4.17 0.21 10.5 2.47 0.11 2.36
Glutamine 4.87 4.45 1.42 6.78 1.59 0.07 1.52
Glycine 1.12 1.02 0.82 15.2 3.57 0.16 3.41
Histidine 0.92 0.84 0.76 2.79 0.66 0.03 0.63
Isoleucine 2.28 2.08 1.41 4.75 1.12 0.05 1.07
Leucine 4.46 4.07 2.78 9.20 2.16 0.10 2.06
Lysine 4.08 3.73 3.09 8.11 1.91 0.09 1.82
Methionine 1.04 0.95 0.85 2.54 0.60 0.03 0.57
Phenylalanine 2.03 1.85 1.50 4.67 1.10 0.05 1.05
Proline 5.59 5.10 3.12 11.3 2.66 0.12 2.54
Pro-OH 1.04 0.95 0.86 4.96 1.17 0.05 1.12
Serine 2.35 2.15 1.72 5.97 1.40 0.06 1.34
Threonine 2.29 2.09 1.32 4.72 1.11 0.08 1.03
Tryptophan 0.66 0.60 0.52 1.47 0.35 0.02 0.33
Valine 2.54 2.32 1.51 5.71 1.34 0.06 1.28
Total AA 50.0 44.8 27.6 132 31.2 1.40 29.8
Source: Adapted from Wu, G. et al. 2010. In: Dynamics in Animal Nutrition. Wageningen Academic Publishers, The Netherlands, pp. 69–98.
Note: AA, amino acids; Pro-OH, hydroxyproline (not a substrate for proline or protein synthesis).a The molecular weights of intact AA were used for all the calculations.b Protein-bound plus free AA in sow’s whole milk obtained on days 7–21 of lactation.c Milk consumption of 913 mL/day by 14-day-old pigs (3.9 kg body weight).d Products of intestinal AA metabolism that enter the portal vein are not included.e Calculated on the basis of a body weight gain of 235 g/day.

66 Amino Acids: Biochemistry and Nutrition
© 2010 Taylor & Francis Group, LLC
TABLE 3.2Utilization of Dietary AA for Protein Accretion in 30-Day-Old Postweaning Pigsa
AA
AA in Sow’s Milkb (g/L)
AA Intake by Pigc (g/Day)
Dietary AA
Entering Portal Veind
(g/Day)
AA Content in Pig (mg/g Wet
Weight)
AA Accretion in Proteins (g/Day)e
Whole Body
Intestines (Small and
Large)Extraintestinal
Tissues
Alanine 13.0 4.57 3.50 9.24 2.68 0.12 2.56
Arginine 13.2 4.64 2.50 9.52 2.76 0.13 2.63
Asparagine 9.40 3.30 2.44 5.06 1.47 0.06 1.41
Aspartate 13.2 4.64 0.23 6.02 1.75 0.08 1.67
Cysteine 3.74 1.32 0.91 1.86 0.54 0.02 0.52
Glutamate 17.2 6.04 0.21 11.9 3.45 0.15 3.30
Glutamine 18.4 6.46 1.79 7.20 2.09 0.09 2.00
Glycine 8.81 3.10 2.21 16.5 4.79 0.21 4.58
Histidine 5.73 2.01 1.43 2.92 0.85 0.04 0.81
Isoleucine 8.91 3.13 1.79 4.97 1.44 0.06 1.38
Leucine 17.8 6.25 3.63 9.61 2.79 0.13 2.67
Lysine 14.2 4.98 3.14 8.48 2.46 0.11 2.35
Methionine 3.58 1.26 0.89 2.63 0.76 0.03 0.73
Phenylalanine 9.93 3.49 2.37 4.82 1.40 0.06 1.34
Proline 15.8 5.55 2.91 12.1 3.51 0.15 3.36
Pro-OH 0.00 0.00 0.00 5.33 1.55 0.07 1.48
Serine 7.86 2.76 2.04 6.23 1.81 0.08 1.73
Threonine 8.52 2.99 1.79 4.93 1.43 0.08 1.35
Tryptophan 2.49 0.87 0.60 1.56 0.45 0.02 0.43
Tyrosine 7.62 2.68 1.89 3.82 1.11 0.05 1.06
Valine 9.96 3.50 1.94 5.93 1.72 0.07 1.65
Total AA 209 73.6 38.2 141 40.8 1.80 39.0
Source: Adapted from Wu, G. et al. 2010. In: Dynamics in Animal Nutrition. Wageningen Academic Publishers, The Netherlands, pp. 69–98.
Note: AA, amino acids; Pro-OH, hydroxyproline.a The molecular weights of intact AA were used for all the calculations.b Corn- and soybean meal-based diet (protein-bound plus free AA) containing 21.5% crude protein. DM
content in the diet was 89.5%.c Feed intake (as fed basis) is 45.0 g/kg body weight per day by 30-day-old pigs weaned at 21 days of
age. The body weight of pigs at 30 days of age is 7.8 kg.d Products of intestinal AA metabolism that enter the portal vein are not included.e Calculated on the basis of a body weight gain of 290 g/day.

67Synthesis of Amino Acids
© 2010 Taylor & Francis Group, LLC
TABLE 3.3Patterns of AA in Diets, Entry from Diets into the Portal Vein, Plasma, and Body Tissue Proteins of Sow-Reared Pigs and Postweaning Pigsa
Patterns of AA in Diet
Patterns of Dietary AA Entering the
Portal VeinPatterns of Free AA in Plasma
Patterns of AA in Tissue Proteins of the Whole Body
AASow’s Milkb
Weaned Dietc
Milk-Fed Pigsd
Weaned Pigse
Milk-Fed Pigsd
Weaned Diete
Milk-Fed Pigsf
Weaned Pigsg
Alanine 48 92 45 112 203 194 109 109
Arginine 35 93 34 80 73 120 113 112
Asparagine 62 66 65 78 39 42 59 60
Aspartate 63 93 4 7 7 7 71 71
Cysteine 18 26 16 29 59 69 22 22
Glutamate 112 121 7 7 67 86 130 140
Glutamine 119 130 46 57 228 290 84 85
Glycine 27 62 27 70 203 236 187 195
Histidine 23 40 25 46 44 60 34 34
Isoleucine 56 63 46 57 47 55 59 59
Leucine 109 125 90 116 71 97 113 113
Lysine 100 100 100 100 100 100 100 100
Methionine 25 25 28 28 36 33 31 31
Phenylalanine 50 70 49 76 46 50 58 57
Proline 137 111 101 93 198 212 201 205
Pro-OH 25 — 28 — 35 34 61 63
Serine 58 55 56 65 78 85 74 74
Threonine 56 60 43 57 91 104 58 58
Tryptophan 16 18 17 19 25 30 18 18
Tyrosine 48 54 46 60 90 98 44 45
Valine 62 70 49 62 104 121 70 70
Note: AA, amino acids; Pro-OH, hydroxyproline.a Lysine is used as the reference value (100). The ratio of AA to lysine is expressed as percent
(g/g × 100%).b Lysine content in sow’s milk is 1.66% (g/g; DM basis).c Corn- and soybean meal-based diet containing 21.5% crude protein. Lysine content in the diet is
1.59% (g/g; DM basis).d Sow-reared 14-day-old pigs.e Thirty-day-old pigs weaned at 21 days of age to a corn- and soybean meal-based diet containing
21.5% crude protein.f Suckling 14-day-old pigs. Lysine concentration in the plasma of blood samples obtained from the
jugular vein at 1.5 h after feeding is 230 µM.g Thirty-day-old pig weaned at 21 days of age to a corn- and soybean meal-based diet containing 21.5%
crude protein. Lysine concentration in the plasma of blood samples obtained from the jugular vein at 1.5 h after feeding is 186 µM.

68 Amino Acids: Biochemistry and Nutrition
© 2010 Taylor & Francis Group, LLC
It is important to recognize that the synthesis of AA occurs in a tissue- and cell-specific manner, requires energy, and also involves interorgan and compartmental-ized metabolism of AA (Arentson et al. 2012). Some NEAA can be synthesized in certain tissues of animals, but not in others due to the lack of one or more of the required enzymes (Guedes et al. 2011). Examples are illustrated as follows:
1. Liver. This organ can synthesize many NEAA in a species-dependent man-ner. Under physiological conditions, there is no net synthesis of citrulline or arginine in the liver because (a) citrulline is immediately converted into argi-nine via argininosuccinate synthase and argininosuccinate lyase and (b) argi-nine formed via the urea cycle is rapidly hydrolyzed to urea plus ornithine by hepatic arginase. The liver cannot synthesize proline from glutamine or glutamate due to its lack of P5C synthase. However, in mammals, the liver can produce proline from arginine via arginase. The liver can synthesize aspartate, asparagine, glutamate, glutamine, cysteine, glycine, serine, and tyrosine from their respective precursor AA. BCAA have a limited role in the direct synthe-sis of AA in this organ because the hepatic activity of BCAA transaminase is negligible or absent under physiological conditions. In most species (except for cats), the liver can produce taurine from cysteine or cysteic acid.
2. Skeletal muscle, heart, brain, white adipose tissue, mammary tissue, and placenta. Alanine, aspartate, and glutamate can be synthesized from BCAA (the donors of the amino group) and glucose-derived carbon skeletons in skel-etal muscles, heart, brain, white adipose tissue, mammary tissue, and pla-centa (e.g., human, pig, rat, and sheep). These organs contain ATP-dependent
Acetyl-CoA
Pyruvate Alanine
Oxaloacetate Aspartate
NH3 NH3
BCAA
P5C Arginine
IleValMetPheTyr His
IleLeuLysPheTyr
Trp
Cys Met
CO2
D3PG
Choline
HYPGluc
NH3
TF
Proline
Tau
α-Ketoglutarate
Glycine�reonine
Serine
Glutamate Glutamine
Orn
Asparagine
Gluc
FIGURE 3.1 An overall view of metabolic transformations of nutritionally essential AA into nutritionally nonessential AA in animals. BCAA, branched-chain amino acids; D3GP, d-3-glyceraldehyde phosphate; HYP, hydroxyproline; P5C, pyrroline-5-carboxylate; Tau, taurine; TF, tetrahydrofolate.

69Synthesis of Amino Acids
© 2010 Taylor & Francis Group, LLC
glutamine synthetase (GS), which converts glutamate and ammonia into glu-tamine (Self et al. 2004). In food-deprived or starved subjects, alanine and glutamine account for ∼50% of the total AA released by the muscle. The syn-thesis of glutamine from NH3 and glutamate plays a major role in removing ammonia in skeletal muscle, heart, and brain, with glucose being the primary source of the glutamate carbons. In the brain, cell-specific synthesis of gluta-mate and glutamine is important for the regulation of neurological function. In pregnant animals, the release of glutamine from the placenta contributes to a high ratio (>2) of fetal to maternal concentrations of glutamine in the plasma. In lactating mammals, synthesis of glutamine by the mammary tis-sue contributes to a high abundance of this AA in milk. Because of its large mass (40% and 45% of the body weight in neonates and adults, respectively), skeletal muscle is the major source of both alanine and glutamine in postab-sorptive animals and humans. The brain can convert phenylalanine into tyro-sine, whereas interconversion between serine and glycine actively occurs in the lactating gland and the placenta.
3. Small intestine. The small intestine of most mammals can synthesize: (1) alanine, arginine, aspartate, asparagine, citrulline, ornithine, and proline from glutamate and glutamine; (2) glutamate from BCAA plus glucose, glutamine, and proline; and (3) tyrosine from phenylalanine. In many mammalian species, the small intestine releases alanine, arginine, citrul-line, ornithine, and proline in the postabsorptive state, indicating the net synthesis of these AA by the gut. In the fed state, the small intestine of pigs also releases a substantial amount of tyrosine into the portal circulation. Because of complex compartmentation of AA metabolism involving both the mitochondrion and cytoplasm, extracellular ornithine is poorly utilized for citrulline or arginine synthesis in enterocytes. Interconversion between serine and glycine occurs in the gut. The major responsible cells for these synthetic pathways are enterocytes. The mammalian small intestine has a limited ability to synthesize glutamine due to a low activity of GS in enterocytes and other cell types. In contrast to mammals, the avian small intestine cannot synthesize ornithine, citrulline, arginine, or proline.
4. Kidneys. The kidneys can synthesize alanine, aspartate, glutamate, glycine, and serine. Alanine transaminase activity is present in the kidneys of some species (e.g., humans, dogs, pigs, and rats) but is relatively low in the kid-neys of most of other species. Hydroxyproline is the major substrate for renal synthesis of glycine. The kidneys contain argininosuccinate synthase and argininosuccinate lyase for converting citrulline into arginine. These two enzymes are localized within the proximal convoluted tubules, which express little arginase activity. In adults, ∼60% of the net arginine synthesis occurs in the kidneys.
5. Endothelial cells, smooth muscle cells, cardiac myocytes, macrophages, and lymphocytes. The cells of the immune and circulatory systems can synthesize alanine, aspartate, and glutamate from glutamine via the glu-taminolysis pathway. These cells can also convert citrulline into arginine as a mechanism to conserve arginine at the expense of aspartate, thereby

70 Amino Acids: Biochemistry and Nutrition
© 2010 Taylor & Francis Group, LLC
sustaining NO production by NO synthase. Finally, endothelial cells, smooth muscle cells, cardiac myocytes, macrophages, and lymphocytes can transaminate BCAA with α-ketoglutarate to form glutamate, which is utilized for the production of alanine and aspartate by glutamate–pyruvate transaminase and glutamate–oxaloacetate transaminase.
GENERAL PATHWAYS FOR SYNTHESIS OF AA IN ANIMAL CELLS
overAll PAthwAys for synthesis of AA in AnimAl cells
The overall pathways for synthesis of alanine, arginine, asparagine, aspartate, cys-teine, glutamate, glutamine, glycine, proline, taurine, serine, and tyrosine in animal cells are illustrated in Figure 3.2. With the exception of arginine and taurine, path-ways for the synthesis of these AA were uniformly conserved in the animal lineage. Notably, except for arginine and cysteine, only one or a few steps are required for the synthesis of these AA. Selective conservation of a metabolic pathway during evolu-tion indicates its essentiality for the survival, growth, and reproduction of the organ-ism. Pyruvate, oxaloacetate, and α-ketoglutarate are the ultimate sources of the carbon skeletons of alanine, arginine, asparagine, aspartate, glutamate, glutamine, glycine, proline, and serine. In most cases, glutamate provides the amino group and ATP supplies the energy for AA synthesis (Brosnan 2000). Glutamine synthesis plays a central role in N metabolism. Interestingly, there is evidence that liver GS is activated in a dose-dependent manner by high concentrations of α-ketoglutarate (e.g., 5–30 mM). However, the physiological significance of such a mechanism remains unclear because the concentration of this ketoacid is well below 5 mM in hepato-cytes. Note that the accumulation of ammonia from the oxidative deamination of glutamate by glutamate dehydrogenase (GDH) is self-limiting in most cells because of the close-to-equilibrium nature of the reaction. Enzyme-catalyzed transamination of AA in the biological system, discovered by A.E. Braunstein in 1937, is crucial for AA syntheses. While AA transaminases have broad substrate specificities for AA and α-ketoacids, not all exogenous α-ketoacids can be used to form the corre-sponding AA in organisms. For example, the oral administration of α-keto-ε-amino caproic acid (the α-ketoacid of lysine, spontaneously cyclizes to Δ1-piperidine-2-carboxylate) or α-keto-β-hydroxy-butyric acid (the α-ketoacid of threonine) is not effective in producing lysine or threonine in humans or other animals, possibly because of: (1) the extensive utilization of the α-ketoacids by the bacteria in the lumen of the small intestine and (2) the absence of a true transaminase for lysine and threonine in the bacteria or animal cells.
historicAl AsPects of AA trAnsAminAtion
Because transamination plays a crucial role in AA synthesis, it is important to review the historical development of this field. Studies of AA transamination can be dated back to 1910 when F. Knoop reported that: (1) when α-keto-γ-phenylbutyric acid (or its α-hydroxy analog) was administered into dogs, some of the carbon skeleton was recovered in the urine as α-acetylamino-γ-phenylbutyric acid and (2) when

71Synthesis of Amino Acids
© 2010 Taylor & Francis Group, LLC
dl-α-amino-γ-phenylbutyric acid was administered, some of its carbon was recov-ered as α-hydroxy-γ-phenylbutyric acid in urine. These results implicated the revers-ible conversion of an α-AA to its corresponding α-ketoacid in animals. In 1930, D.M. Needham found that glutamate could be oxidized in muscle tissue extracts with-out the production of ammonia, suggesting a role for a biochemical reaction other than oxidative deamination in glutamate catabolism. In 1937, Russian biochemists
α-KG
Glutamate
BCAA
BCKA
H2O
(2)(1)
(5)
(11)
NH3 + NADH+ H+
NAD+
Glucose
Glutamine
(6)
GlutamineKGM
ATPAMP + PPi
α-KG
Pyruvate
Aspartate
OAA
AlanineAsn
(12)
NH4+
ATPADP + Pi
Arg Ornithine
ATP + NADPH + H+
ADP + NADP+
P5C
Urea
(10)
(7)
(13)(14)
NADPH + H+
NADP+(4)
(3)
ProlineOH-Pro
Serine
Thr
(20)
(9)
Glycine
THF
MHF
Choline
(19) (18)
(17) (16)
Asp
GlcN-6-P
(25)
Kynurenine
3-HydroxykynurenineTryptophan
β-Alanine
(8)
(30)
GTP
(27)
(26)
D3PG(24)
Tetrahydrobiopterin
Phe
Tyr
Dihydrobiopterin
(28)
Cystathionine
HCys
H2O
(22)
(21)
H2O
α-Ketobutyrate+ NH3
Met
O2
H2ONADPH
+ H+
NADP+
(29)
Cysteine Taurine(23)
CO2
(36)
(31)Citrulline
(15)
Glu
Glucose
Pyrimidines
(32)
CoA-SH(33)(34)
Carnosine(35)
Malonic acidsemialdehyde
Glu
α-KG(37)
Asp
Fructose-6-P
FIGURE 3.2 Synthesis of amino acids in animal tissues in a cell- and species-dependent manner. The enzymes catalyzing the indicated reactions are: (1) BCAA transaminase; (2) glutamate dehydrogenase; (3) pyrroline-5-carboxylate (P5C) synthase; (4) P5C reduc-tase; (5) aspartate transaminase; (6) alanine transaminase; (7) asparagine synthetase; (8) enzymes for tryptophan catabolism; (9) enzymes for converting glucose into α-KG; (10) glutamine:fructose-6-phosphate transaminase; (11) phosphate-activated glutaminase; (12) glutamine synthetase; (13) ornithine aminotransferase; (14) arginase; (15) ornithine carbamo-yltransferase; (16) enzymes for protein synthesis, hydroxylation of peptide-bound proline, and protein degradation; (17) enzymes for converting hydroxyproline into glycine; (18) enzymes for converting threonine into glycine; (19) enzymes for converting choline into glycine; (20) serine hydroxymethyltransferase; (21) cystathionine β-synthase; (22) cystathionine γ-lyase; (23) enzymes for converting cysteine into taurine; (24) enzymes for converting d-3-phospho-glycerate (D3PG) and glutamate into serine; (25) enzymes for methionine catabolism; (26) enzymes for GTP synthesis; (27) enzymes for tetrahydrobiopterin synthesis; (28) phenylala-nine hydroxylase; (29) dihydrobiopterin reductase; (30) enzymes of the pentose cycle; (31) proline oxidase; (32) enzymes for pyrimidine synthesis; (33) enzymes for pyrimidine catabo-lism; (34) enzymes for coenzyme A (CoA-SH) catabolism; (35) carnosinase; (36) aspartate decarboxylase; (37) β-alanine-α-KG transaminase, with malonic acid semialdehyde being produced from propionyl-CoA and malonyl-CoA semialdehyde. GlcN-6-P, glucosamine-6-phosphate; Hcys, homocysteine; KGM, α-ketoglutaramate; MTH, N5-N10-methylene tetrahy-drofolate; OH-Pro, hydroxyproline; OAA, oxaloacetate; THF, tetrahydrofolate.

72 Amino Acids: Biochemistry and Nutrition
© 2010 Taylor & Francis Group, LLC
A.E. Braunstein and M.G. Kritzmann demonstrated that: (1) exogenous glutamate and endogenous lactate were utilized in equal amounts by extracts of pigeon muscle incubated aerobically and (2) in the absence of oxygen, glutamate disappeared from the incubation medium only when pyruvate was added. However, in both situations, the disappearance of glutamate was accompanied stoichiometrically by the forma-tion of alanine. These authors proposed an enzyme-catalyzed, reversible reaction involving the transfer of an amino group between glutamate and alanine in tissues. In 1939, M.K. Karyagina confirmed the l-configuration of the AA produced in transamination. Meanwhile, extensive studies have established the biological impor-tance of AA transamination in various tissues of animals.
SPECIFIC PATHWAYS FOR SYNTHESIS OF AA IN ANIMAL CELLS
synthesis of AlAnine, GlutAmine, AnD GlutAmAte in AnimAl cells
H.A. Krebs described in 1935 the synthesis and degradation of glutamine in ani-mal tissues. He also identified GS and glutaminase to catalyze these reactions, respectively. However, the sources of the N in glutamate or glutamine were not fully understood until the seminal discovery of E.B. Marliss in 1971 that large amounts of glutamine are released by the skeletal muscle of obese humans. Using the rat model, A.L. Goldberg demonstrated in 1978 that BCAA donate an amino group to α-ketoglutarate to form glutamate, which is either amidated to produce glutamine or transaminated with pyruvate to yield alanine. The same reactions also occur in other species, including cattle, chickens, dogs, humans, pigs, and sheep. However, there is a species difference in the location of intracellular GS in that it is a cytosolic enzyme in mammalian cells (Krajewski et al. 2008) and in avian skeletal muscle, but is a mitochondrial protein in avian hepatocytes (Wu et al. 1991). In all species, the ammonia utilized by GS is primarily derived from blood, GDH (in some tis-sues), AA degradation, or the purine nucleotide cycle (particularly during exercise) (Figure 3.3), whereas glucose is the major source of α-ketoglutarate for glutamate formation (Figure 3.2). In skeletal muscle and white adipose tissue, the catabolism of the α-ketoacids of valine and isoleucine is relatively low due to a low activity of branched-chain α-ketoacid dehydrogenase, thereby limiting the contribution of these two AA to α-ketoglutarate formation (Kowalski et al. 1997). Likewise, GDH activity is quite low in the skeletal muscle and thus may not be a quantitatively sig-nificant source of ammonia. In the liver, the equilibrium of GDH favors the forma-tion of ammonia and α-ketoglutarate from glutamate.
Glutamine and alanine are two major sources of N and carbon in the interorgan metabolism of AA (Goldberg and Chang 1978). In contrast to the muscle, there is little release of glutamine by the mammalian liver in the healthy state. However, under acidotic conditions, the liver becomes a net producer of glutamine and its release by the skeletal muscle is enhanced markedly to meet the increased demand of this AA by the kidneys for ammoniagenesis, which is necessary for the regulation of acid–base balance in the body. Work involving mice with the selective knockout of muscle gluta-mine synthetase confirms an important role for this enzyme in whole-body glutamine production and extrahepatic removal of ammonia, particularly in the fasting state.

73Synthesis of Amino Acids
© 2010 Taylor & Francis Group, LLC
Since the liver releases glucose, which is taken up by the skeletal muscle to form pyruvate (the carbon skeleton of alanine), L.E. Mallette, J.H. Exton, and C.R. Park proposed in 1969 the glucose–alanine cycle between these two organs (Figure 3.4). Although there is no net contribution to glucose from the glucose–alanine cycle, this pathway fulfils the following functions: (1) carrying ammonia as alanine in a nontoxic form, (2) removing pyruvate from the skeletal muscle, which allows for
GTP GMP + PPi
Adenylosuccinatesynthetase
Aspartate
IMP AMPS AMP
Adenylate deaminase
Fumarate
NH3
Adenylosuccinase
FIGURE 3.3 The purine nucleotide cycle in animals. AMP, adenosine monophosphate; AMPS, adenosine monophosphate succinate; GTP, guanosine triphosphate; GMP, guanosine monophosphate; IMP, inosine monophosphate.
Liver
Skeletal muscle
Glucose
Alanine
NH3
Glucose
Pyruvate
Alanine
Glu
Alanine
Urea
Glucose
FIGURE 3.4 The glucose–alanine cycle. The liver releases glucose into the circulation. The skeletal muscle takes up arterial glucose for generation of pyruvate, which is used for alanine synthesis via transamination. The skeletal muscle releases alanine, which is converted into urea and glucose in the liver. There is no net synthesis of glucose by the glucose–alanine cycle, when the source of pyruvate in the muscle is glucose.

74 Amino Acids: Biochemistry and Nutrition
© 2010 Taylor & Francis Group, LLC
more ATP production from glucose because glycolysis-derived NADH can enter the mitochondria for oxidation via the electron transport system, (3) facilitating the con-version of muscle glycogen into glucose in the liver, and (4) maintaining a relatively high concentration of alanine in the liver to inhibit protein degradation (Felig 1975; Goldberg and Chang 1978). It is now known that an active glucose–alanine cycle also exists between the liver and cells of the immune system (e.g., lymphoid organs), and may play a role in defending the host against infectious disease.
synthesis of ArGinine, citrulline, AnD ornithine in AnimAl cells
Nutritional studies (N balance and growth) in 1930 by W.C. Rose indicated that rats can synthesize arginine. Subsequently, H.J. Sallach, R.E. Koeppe, and W.C. Rose reported in 1951 the conversion of l-[U-14C]glutamate into arginine and proline in rats. The 1970s–1990s witnessed groundbreaking research on arginine synthesis in mammals via the intestinal–renal axis. In their study of lipid metabolism, H.G. Windmueller and A.E. Spaeth serendipitously discovered in 1974 the uptake of arte-rial glutamine and the release of citrulline by the small intestine of the rat. After extensive investigation, these authors concluded in 1981 that the small intestine is the major source of circulating citrulline for endogenous synthesis of arginine in adult rats. This classical finding led to M.E. Jones’s elucidation in 1983 of pathways for the intestinal synthesis of citrulline from glutamine via P5C synthase. Using both in vivo and in vitro techniques, John T. Brosnan reported in 1990 that citrulline is quanti-tatively converted into arginine in the kidneys of adult rats and that this synthetic pathway is not affected by dietary levels of arginine. Emerging evidence shows that glutamine is also a major AA for the synthesis of citrulline and arginine in humans.
Studies involving neonatal pigs have greatly expanded our knowledge of the crucial role for intestinal synthesis of citrulline and arginine in animal growth. Particularly, F. Blachier and colleagues identified in 1993 that carbamoyl phosphate, formed from bicarbonate (derived from 14CO or 14C-labeled glutamine oxidation) and ammonia, is incorporated into 14C-arginine in enterocytes of neonatal pigs. Using HPLC analysis of AA, the conversion of glutamine and glutamate into orni-thine, citrulline, and arginine in both pig and rat enterocytes were firmly established by G. Wu in 1994. In search for an explanation for the nutritional paradox that 7- to 21-day-old sow-reared piglets continue to grow despite a progressive and marked decline in the intestinal production of citrulline from glutamine and glutamate, G. Wu discovered in 1997 the conversion of proline into both citrulline and arginine via proline oxidase in the enterocytes of developing pigs. Quantitatively, proline is a major AA for the intestinal synthesis of citrulline and arginine in swine (Wu et al. 2004). The nutritional significance of this proline-dependent pathway was graphi-cally illustrated by the subsequent work of R. Ball and P. Pencharz in 1999 who found that a deficiency of proline in the enteral diet resulted in arginine deficiency and death in neonatal pigs. In 2011, these authors reported that proline is a major AA for the synthesis of citrulline and arginine in human infants (Tomlinson et al. 2011).
It should be borne in mind that the entire molecule of P5C is incorporated into citrulline via ornithine aminotransferase and ornithine carbamoyltransferase in enterocytes. Thus, proline and glutamine provide their N and carbon skeletons for

75Synthesis of Amino Acids
© 2010 Taylor & Francis Group, LLC
citrulline and arginine synthesis in the small intestine, which expresses these two enzymes and P5C synthase (Hu et al. 2008). A lack of knowledge or misunderstand-ing of these basic biochemical reactions can lead researchers to make erroneous con-clusions regarding the contribution of proline or glutamine carbons to endogenous synthesis of arginine. The results of both enzymatic and metabolic studies indicate that P5C synthase, N-acetylglutamate synthase, and proline oxidase are major regu-latory enzymes in arginine synthesis in the small intestine (Figure 3.5).
PDG
-Glutamine
NH3
-Glutamate
OAT
P5CSATP-Mg2+
ADP-Mg2+
P5CS
-Glutamyl-γ-semialdehyde
Spontaneous H2O
-Glutamyl-γ-phosphate
NADPH + H+
NADP+ + Pi
Glutamate
-Ornithine
-Citrulline
CP
-Citrulline
ATP-Mg2+ + Aspartate
AMP-Mg2+ + PPi-Argininosuccinate
Fumarate
-Arginine
2 ATP-Mg2+ 2 ADP-Mg2+ + Pi
HCO3– + NH3 CPS-I
N-Acetylglutamate (NAG)
-Glutamate
Acetyl-CoA
ATP
CO2 + H2O
ADP
NH3
SRN
OAAAspartate
Glutamate-OAAtransaminase
Proline
½O2H2O
Proline oxidase
Mitochondrion
Cytoplasm
Argininosuccinatesynthase
Argininosuccinate lyase
NAGsynthase
Ornithinecarbamoyltransferase
Δ1--Pyrroline-5-carboxylate
α-Ketoglutarate
α-Ketoglutarate
FIGURE 3.5 Arginine synthesis in most mammals. There is no net synthesis of arginine by the liver under physiological conditions. The conversion of glutamine and glutamate into citrulline occurs exclusively in the mitochondria of enterocytes. Arginine is formed from citrulline in the cytoplasm of almost all cell types. In the neonatal small intestine, the near absence of arginase maximizes the output of arginine into the portal circulation. In adults, most of the intestine-derived citrulline is released into the portal circulation, bypasses the liver, and is extracted primarily by the kidneys for arginine synthesis. CPS-I, carbamoylphos-phate synthase I; OAA, oxaloacetate; OAT, ornithine aminotransferase; PDG, phosphate-acti-vated glutaminase; P5CS, pyrroline-5-carboxylate synthase (a bifunctional enzyme); SRN, a series of enzyme-catalyzed reactions, including glutamate dehydrogenase and the Krebs cycle.

76 Amino Acids: Biochemistry and Nutrition
© 2010 Taylor & Francis Group, LLC
synthesis of cysteine AnD tAurine in AnimAl cells
In studies to formulate an explanation for the large amounts of cystine in the urine from patients with cystinuria, Erwin Brand discovered in 1935 that cysteine is syn-thesized from methionine in mammals. Approximately 20 years later, taurine was identified in 1954 as a product of cysteine metabolism via the formation of cysteine-sulfinic acid in the rat liver. The pathways for synthesis of cysteine and taurine are illustrated in Figure 3.6. During the past half century, much research has focused on the species and developmental differences in cysteine and taurine synthesis. In cats, the conversion of cysteine into cysteinesulfinic acid is limited primarily due to a low activity of cysteine dioxygenase and of cysteinesulfinate decarboxylase that cata-lyzes the formation of taurine from cysteinesulfinic acid (Morris and Rogers 1992). Interestingly, compared with adult rats, adult humans also have relatively low activi-ties of both cysteine dioxygenase and cysteinesulfinate decarboxylase but are rela-tively resistant to a short-term deficiency of taurine in diets. This is likely because humans can conserve taurine by reabsorption of hepatic bile acid-derived taurine in the lumen of the small intestine to the portal vein. Note that enterally derived cysteinesulfinic acid is extensively transaminated by the small-intestinal mucosa to form β-sulfinylpyruvate, which spontaneously decomposes to pyruvate and SO2 and, therefore, cannot enter the liver for taurine synthesis. In contrast to enteral admin-istration, parenterally or intraperitoneally administered cysteinesulfinic acid is an effective precursor of taurine in animals (including cats and rats).
In addition to methionine, N-acetyl-cysteine (a chemically stable synthetic sub-stance), cysteamine, and cystamine are effective precursors of cysteine in animals including humans. N-Acetyl-cysteine is readily taken up by cells where it is con-verted to cysteine by cytosolic deacetylase. Cystamine is a linear aliphatic diamine that is composed of a disulfide linkage and is generated from the spontaneous oxida-tion of two cysteamine molecules. Cysteamine (a structural analog of cysteine) is a product of the constitutive degradation of coenzyme A in all tissues, with the liver, brain, and heart being the major sites. In animals, cysteamine can be metabolized to hypotaurine and, therefore, taurine.
synthesis of Glycine AnD serine in AnimAl cells
There is a rich history of studies on glycine and serine synthesis. Using 15N-labeled serine with 13C in the carboxyl group, D. Shemin reported in 1945 the interconver-sion between serine and glycine in rats and guinea pigs. Earlier nutritional and iso-topic studies in the 1950s led to the discovery that glycine is synthesized from both AA and non-AA substrates in mammals, including pigs, rats, and humans (Snell 1984). Specifically, these investigations showed that: (1) young animals could grow even though the diet did not contain glycine and (2) 15N-glycine was greatly diluted due to the formation of new unlabeled glycine synthesized in the body. In the mean-time, biochemical studies with rats concluded that glycine is formed from: (1) serine [which is produced from glucose and glutamate via serine hydroxymethyltransfer-ase (Figure 3.7)], (2) choline via the formation of sarcosine (Figure 3.8), and (3) threonine via the threonine dehydrogenase pathway. Subsequent investigations in

77Synthesis of Amino Acids
© 2010 Taylor & Francis Group, LLC
Hyp
otau
rine
NER T
aurin
e
SOX
H2O
NER
TSR
CSE
or NER
RSH
CBS
GC
S
GSS
GG
SH
PPG
CSE
SAM
OA
A
CD
O
CSD
CSE
CA
T
GS
Gly
NER
Pyru
vate
CSE
Cys
SR Thi
osul
fate
(S2O
32–)
GSH
GSS
G
Sulfi
te(S
O32–
)
CBS
Serin
e(+
)
β-Su
lfiny
lpyr
uvat
e
NER
Asp
NER
Sulfa
te(S
O42–
)
Pyru
vate
Cys
tein
esul
finat
e
γ-G
luta
myl
cyst
eine
Cys
NH
4+
Thi
ocys
tein
eC
ystin
eC
yste
ine
β-Μ
erca
ptop
yruv
ate
Sulfi
teCS
E
NH
3
Sulfa
te(S
O42–
)
O2
NADPH ox
idas
e
Glu H
cy
Cys
tath
ioni
ne
(+)
α-Α
Αα-
ΚΑ
Pyru
vate
Cys
teat
e
AA
T
MPS
T
Asp
(–)
H2S
H2S
H2O
O2
[O]
[O]
O2
CO
2
H2S
H2S
SO2
Mitoch
ondria (u
nknown)
FIG
UR
E 3.
6 Sy
nthe
sis
of c
yste
ine
and
taur
ine
in a
nim
al c
ells
. The
liv
er is
the
exc
lusi
ve s
ite f
or t
he c
onve
rsio
n of
met
hion
ine
into
cys
tein
e, w
hich
is
subs
eque
ntly
cat
abol
ized
to
form
tau
rine
. AA
T, a
min
o ac
id t
rans
amin
ase;
CA
T, c
yste
ine
amin
otra
nsfe
rase
; C
DO
, cys
tein
e di
oxyg
enas
e; C
SD, c
yste
-in
esul
fina
te d
ecar
boxy
lase
; C
ysSR
, cys
tein
e–th
iol
com
plex
; G
CS,
γ-g
luta
myl
cyst
eine
syn
thas
e; G
S, g
luta
thio
ne s
ynth
ase;
GSH
, red
uced
glu
tath
ione
; G
SSG
, oxi
dize
d gl
utat
hion
e; α
-KA
, α-k
etoa
cid;
α-A
A, α
-am
ino
acid
; N
ER
, non
enzy
me
cata
lyze
d re
acti
on;
OA
A, o
xalo
acet
ate;
PP
G, p
ropa
rgyl
gly-
cine
(an
irr
ever
sibl
e in
hibi
tor
of c
ysta
thio
nine
γ-l
yase
); R
SH, a
thi
ol-c
onta
inin
g co
mpo
und;
SA
M, S
-ade
nosy
lmet
hion
ine;
SO
X, s
ulfit
e ox
idas
e; T
SR,
thio
sulf
ate
redu
ctas
e.
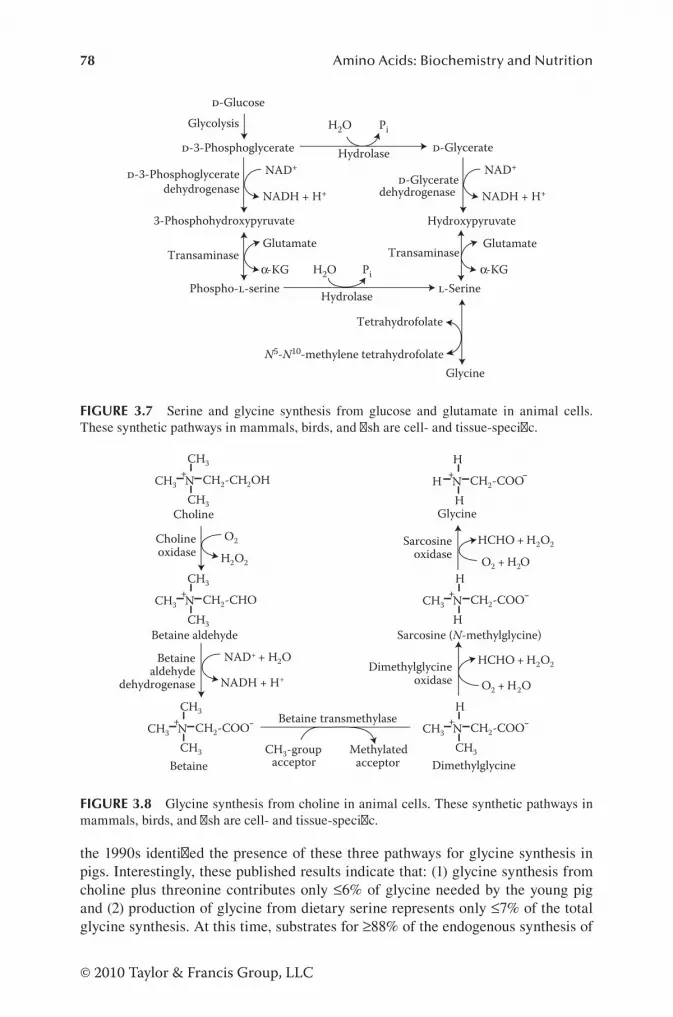
78 Amino Acids: Biochemistry and Nutrition
© 2010 Taylor & Francis Group, LLC
the 1990s identified the presence of these three pathways for glycine synthesis in pigs. Interestingly, these published results indicate that: (1) glycine synthesis from choline plus threonine contributes only ≤6% of glycine needed by the young pig and (2) production of glycine from dietary serine represents only ≤7% of the total glycine synthesis. At this time, substrates for ≥88% of the endogenous synthesis of
Transaminase
Phospho--serineα-KG
Glutamate
Hydrolase
PiH2O
-3-Phosphoglycerate
-Glucose
Glycolysis
3-Phosphohydroxypyruvate
-3-Phosphoglyceratedehydrogenase
NAD+
NADH + H+
Hydrolase -Glycerate
H2O Pi
Hydroxypyruvate
-Glyceratedehydrogenase
NAD+
NADH + H+
-Serineα-KG
GlutamateTransaminase
Glycine
Tetrahydrofolate
N5-N10-methylene tetrahydrofolate
FIGURE 3.7 Serine and glycine synthesis from glucose and glutamate in animal cells. These synthetic pathways in mammals, birds, and fish are cell- and tissue-specific.
CH3
CH3
CH3
N CH2-CH2OH
Choline
O2
H2O2
Betaine aldehyde
Betainealdehyde
dehydrogenase
Cholineoxidase
NAD+ + H2O
NADH + H+
+
Betaine DimethylglycineCH3-group
acceptorMethylated
acceptor
Betaine transmethylase
O2 + H2O
HCHO + H2O2
Sarcosine (N-methylglycine)
Dimethylglycineoxidase
Sarcosineoxidase
Glycine
O2 + H2O
HCHO + H2O2
H
HHN CH2-COO+
CH3
CH3
CH3
N CH2-CHO+H
CH3
HN CH2-COO+
H
CH3
CH3
N CH2-COO+CH3
CH3
CH3
N CH2-COO+
FIGURE 3.8 Glycine synthesis from choline in animal cells. These synthetic pathways in mammals, birds, and fish are cell- and tissue-specific.

79Synthesis of Amino Acids
© 2010 Taylor & Francis Group, LLC
glycine in milk-fed pigs are unknown. Of particular interest, J.T. Brosnan and col-leagues reported in 1985 that the rat kidney converts 4-hydroxyproline (a product of collagen degradation) into glycine via 4-hydroxyproline oxidase (Figure 3.9). In the 1980s, J.T. Brosnan and coworkers discovered that 4-hydroxy-l-proline is a precursor for the synthesis of glycine in rat kidneys via 4-hydroxyproline oxidase. This provides a novel mechanism for the conversion of proline into glycine in ani-mals. Because milk contains large amounts of 4-hydroxyproline, this pathway is expected to have nutritional significance for neonates. At present, the contribution of 4-hydroxyproline (an abundant AA in collagens) to whole-body glycine synthesis has not been quantified in any species.
synthesis of methylArGinines in AnimAl cells
Because of their roles in the regulation of NO synthesis, there has been a grow-ing interest in mammalian metabolism of methylarginines. After arginine is incorporated into proteins, arginine residues are methylated by an emerging family of protein arginine N-methyltransferases (PRMT). The posttranslational modification of protein-bound arginine results in the formation of NG-monomethyl-l-arginine (NMMA), NGNG-dimethyl-l-arginine (asymmetrical dimethylarginine; ADMA), and NGNNG-dimethyl-l-arginine (symmetrical dimethylarginine; SDMA) (Figure 3.10). All PRMT identified to date can monomethylate arginine residues in proteins. However, further dimethylation of NMMA to form ADMA and SDMA
4-Hydroxyproline
FAD
FADH2
4-Hydroxyprolineoxidase
NAD+
NADH + H+
3-Hydroxy-P5Cdehydrogenase
4-Erythro-4-hydroxy-glutamate
GluGlutamate-OAA
transaminase
4-Hydroxy-2-ketoglutarate 4-Hydroxy-2-
KG aldolase
Glyoxylate
H2O
Pyrrole-2-carboxylate
Excretion in urine
Oxalate
O2
H2O2GO
NAD+
NADH + H+
LDH
Glycolate
-Amino acid oxidase
Glycine
Ala PyrAGT
Spontaneous
NADH + H+
NAD+
GR
GLO [O]
O2 H2O2
α-KG
Δ1-Pyrroline-3-hydroxy-5-carboxylate
Δ1-Pyrroline-4-hydroxy-2-carboxylate
FIGURE 3.9 Glycine synthesis from hydroxyproline in animal cells. This synthetic path-way in mammals, birds, and fish may be cell- and tissue-specific. The kidneys may be the major site for the conversion of hydroxyproline into glycine. AGT, alanine–glyoxylate ami-notransferase; GLO, glycolate oxidase; GO, glycolate oxidase; GOT, glutamate–oxaloacetate transaminase; GR, glyoxylate reductase; KG, ketoglutarate; P5C, Δ1-pyrroline-5-hydroxy-5-carboxylate; LDH, lactate dehydrogenase; OAA, oxaloacetate; Pyr, pyruvate.

80 Amino Acids: Biochemistry and Nutrition
© 2010 Taylor & Francis Group, LLC
Arg residuein protein
~N C~
C
(CH2)3
NH
C
NH2
H
NH2+
O
NMMA residuein protein
~N C~
C
(CH2)3
NH
C
NH
H
NH2+
O
CH3
SDMA residuein protein
~N C~
C
(CH2)3
NH
C
NH
H
NH+
O
CH3
CH3
SDMA
H3N C
(CH2)3
NH
C
NH
NH+
CH3
PD
ADMA residuein protein
~N C~
C
(CH2)3
CH
C
N
H
NH2+
O
CH3
CH3
PD
ADMA
C
(CH2)3
NH
C
N
NH2+
CH3
CH3
SAM SAHC
PRMT
SAM
SAHC
SAM
SAHC
H2O
CH3CH3 N
H
L-Citrulline
H3N C
(CH2)3
NH
C
NH2
O
+
H3N+
NMMA
H3N C
(CH2)3
NH
C
NH
NH2
+
PD
+
CH3
COO–
COO–
DDAH
COO–
H2O
CH3
NH2
DDAH
PD
L-Arginine
H3N C
NH
C NH2
NH2
(CH2)3
CH3
COO–
PRMT-I
PRMT-II
COO–+
+
PS
+
H H
H
H
H H
HH
H
FIGURE 3.10 Synthesis of methylarginines from protein-bound arginine in animal cells. The liver and kidneys are two major organs for the production of methylarginines. In animals, alanine:glyoxylate aminotransferase 2 (the mitochondrial isoform of the enzyme) can transam-inate ADMA and glyoxylate to form α-keto-δ-(N,N-dimethylguanidino)valeric acid and gly-cine (Rodionov et al. 2010). Arg, l-arginine; ADMA, asymmetrical dimethylarginine; DDAH, dimethylarginine dimethylaminohydrolase; PRMT, protein arginine N-methyltransferase; PRMT-I, type-I protein arginine N-methyltransferase; PRMT-II, type-II protein arginine N-methyltransferase; NMMA, NG-monomethyl-l-arginine; PD, protein degradation; PS, pro-tein synthesis; SAM, S-adenosylmethionine; SAHC, S-adenosylhomocysteine; SDMA, sym-metrical dimethylarginine. (Reprinted from Biomed. Pharmacother. 56, Flynn, N.E. et al. The metabolic basis of arginine nutrition and pharmacotherapy. 427–438, Copyright 2002, with permission from Elsevier.)

81Synthesis of Amino Acids
© 2010 Taylor & Francis Group, LLC
is catalyzed by type-I PRMT and type-II PRMT, respectively. Most PRMT genes encode type-I PRMT, but Janus kinase binding protein-1 and an estrogen recep-tor α activator have recently been shown to be a type-II PRMT. All the arginine methylation reactions involve the modification of guanidino N atoms and require S-adenosylmethionine. When proteins are degraded by proteases and peptidases, free methylarginines (NMMA, ADMA, and SDMA) are formed. A majority of free NMMA and ADMA produced in the body is metabolized by dimethylargi-nine dimethylaminohydrolase, of which two isoforms have recently been identified. Dimethylarginine dimethylaminohydrolase is widespread in mammalian tissues and cells, including heart, brain, placenta, lung, liver, skeletal muscle, kidney, pan-creas, and endothelial cells and catalyzes the hydrolysis of the C–N bond in the methylated guanidine moiety of NMMA and ADMA to form citrulline and methyl-amines. Concentrations of free NMMA, ADMA, and SDMA in the plasma are low in healthy subjects (<1 μM), but can be elevated in patients with various cardiovas-cular and other disorders, such as obesity, diabetes, renal failure, hypercholester-olemia, atherosclerosis, schizophrenia, and multiple sclerosis, suggesting a role for dimethylarginines in these diseases.
synthesis of Proline AnD hyDroxyProline in AnimAl cells
The unique structures of proline and its related metabolites are illustrated in Figure 3.11. Nutritional and biochemical studies in the 1930s by W.C. Rose and H.A. Krebs established that mammals can synthesize proline. It is now known that proline synthesis from glutamine, glutamate, arginine, and ornithine in animals is cell-, tissue-, and species-specific. All mammals can synthesize proline from arginine via arginase (both types I and II), ornithine aminotransferase, and P5C reductase, with the mammary tissue, small intestine (postweaning animals), liver, and kidneys
N COO–
H2
+
L-Proline
N COO–
H2
HO
+
4-Hydroxy-proline
N COO–
H2
OH
+N COO–
H
+N COO–
H
+
N COO–
H
HO
+N COO–
H
HO
+N COO–
H2
+N COO–
H2
OHHO
+H3N
CHOCOO–+
3-Hydroxy-proline
Δ′-Pyrroline-5-carboxylate
Δ′-Pyrroline-2-carboxylate
Δ′-Pyrroline-3-hydroxy-
5-carboxylate
Δ′-Pyrroline-4-hydroxy-
2-carboxylate
Pyrrole-2-carboxylate
3,4-Hydroxy-proline
L-Glutamyl-semialdehyde
FIGURE 3.11 Chemical structures of proline and related substances.

82 Amino Acids: Biochemistry and Nutrition
© 2010 Taylor & Francis Group, LLC
being quantitatively the most active tissues (Phang et al. 2010). In the mammary tissue, the activity of P5C reductase is at least 50-fold greater than that of P5C dehydrogenase, thereby favoring the conversion of arginine-derived P5C into pro-line rather than into glutamate and glutamine. The active synthesis of proline from arginine contributes to a high abundance of proline in milk proteins and also helps to prevent an irreversible loss of arginine carbons. In addition, the small intestine of postweaning pigs degrades approximately 40% of dietary arginine, 97% of dietary glutamate, and 70% of dietary glutamine to generate several AA, including pro-line, as major nitrogenous products. Studies with jejunum-cannulated young pigs demonstrated the net release of proline from the small intestine of food-deprived piglets. De novo synthesis and the hydrolysis of small peptides in enterocytes and in the intestinal lumen may be the sources of this gut-derived proline. Compelling evidence shows that neonates cannot synthesize adequate amounts of proline to support maximal growth. Additionally, carnivores (e.g., cats and ferrets) lack P5C synthase in enterocytes and other cell types, and, therefore, cannot convert glu-tamine or glutamate into proline. Proline synthesis is particularly important for wound healing and remodeling of the extracellular matrix.
Both proline and hydroxyproline are major AA in the collagen proteins, which contain three chains of polypeptides (two α1 chains and one α2 chain) and are major extracellular components in connective tissues (e.g., skin, tendon, cartilage, vessels of the vascular system, and bone). The helical region of collagen comprises the repeat of Gly–X–Y, where proline can be in the X or Y position and hydroxy-proline occurs only in the Y position. The unique ring structure of proline and hydroxyproline distinguishes them from other AA in terms of rigidity, chemical stability, and biochemical reactions. The hydroxyproline residue results from post-translational hydroxylation of proline in proteins. Specifically, proline residues in the collagen proteins are hydroxylated in the endoplasmic reticulum by collagen prolyl 4-hydroxylase or prolyl 3-hydroxylase in the presence of oxygen, ascorbic acid, α-ketoglutarate, and Fe2+. The ratio of 4-hydroxyproline to 3-hydroxyproline in collagen proteins is approximately 100:1. Other prolyl 4-hydroxylases, includ-ing hypoxia-inducible transcription factor α, act on noncollagen proteins. The hydroxylation of peptide-bound proline occurs after the collagen polypeptides or other proteins are synthesized. Free 4-hydroxyproline and 3-hydroxyproline are generated from the degradation of these proteins that contain 4-hydroxylprolyl and 3-hydroxylprolyl residues, respectively.
synthesis of tyrosine in AnimAl cells
As early as 1909, O. Neubauer postulated that phenylalanine is converted into tyro-sine in animals. On the basis of their studies with the perfused rat liver, Embden and Baldes reported in 1913 the synthesis of tyrosine from phenylalanine. Subsequently, results from clinical experiments involving the oral administration of tyrosine or phenylalanine to patients with tyrosinosis led Grace Medes to conclude in 1932 that phenylalanine can be converted into tyrosine in humans. This conclusion was sup-ported by W.C. Rose who demonstrated in 1934 that young rats could grow when fed a tyrosine-free diet containing phenylalanine. Interestingly, nutritional studies

83Synthesis of Amino Acids
© 2010 Taylor & Francis Group, LLC
in the 1940s indicated that tyrosine can partially replace phenylalanine in the diets for young and adult animals, including rats and chicks. Biochemical studies in 1958 by S. Kaufman revealed that the hydroxylation of phenylalanine by phenylalanine hydroxylase requires BH4 as an essential cofactor (Kaufman 1987). Tyrosine syn-thesis takes place primarily in the liver and kidneys and, to a much lesser extent, in other tissues (e.g., adrenal medulla, the small intestine, and brain) and cell types (e.g., endothelial cells and placental cells) (Hufton et al. 1995). Of particular note, there is evidence that the human kidneys synthesize an appreciable amount of tyro-sine from phenylalanine (5.2 μmol/min) compared with that in the splanchnic bed (including the liver; 3.0 μmol/min) (Møller et al. 2000). Thus, in healthy adults, the kidneys may be the major site of tyrosine production.
formAtion of β-AlAnine in AnimAl cells
β-Alanine is formed from six sources (Griffith 1986): (1) aspartate decarboxylation (primarily in bacteria), (2) hydrolysis of coenzyme A by a combination of several enzymes (phosphomonoesterase, phosphodiesterase, CoA pyrophosphatase, and a type of peptidase), (3) degradation of carnosine by carnosinase, (4) catabolism of pyrimidines through a series of reactions (see Chapter 5), (5) transamination of malonic acid semialdehyde with glutamate (Figure 3.2), and (6) polyamine degra-dation (Chapter 5). Concentrations of β-alanine in the plasma are much higher in ruminants than in nonruminants (Kwon et al. 2003; Wu et al. 1995), suggesting an important contribution of bacteria to β-alanine synthesis in the body.
PATHWAYS FOR SYNTHESIS OF AA IN MICROORGANISMS
overAll PAthwAys for synthesis of AA in microorGAnisms
If dietary supplies of energy, carbon, N, and sulfur are adequate, all AA can be synthesized by microorganisms living in the rumen of ruminants and in the large intestine of monogastric species, including humans, rats, dogs, pigs, chickens, and horses (Metges 2000). Bacteria can adapt well to changes in extracellular provisions of nitrogenous substances to maintain their ecosystem and activities. As described in Chapter 2, ammonia, glutamate, and pyruvate are the ultimate substrates for the synthesis of all nonsulfur AA in bacteria. In the presence of serine, inorganic sul-fur can be used by these cells to produce cysteine and methionine (Campbell et al. 1997). The overall pathways for EAA synthesis by microorganisms are summarized in Figure 3.12. Microbial synthesis of AA appears to meet the maintenance needs of ruminants and their low levels of growth or production. However, results of recent studies clearly indicate that these synthetic pathways in the rumen are inadequate for maximal growth of ruminants (e.g., beef cattle and sheep) or lactation of high-producing cows (Lapierre et al. 2006). Although microorganisms in the large intes-tine of monogastric animals are able to synthesize all AA, it is unlikely that this is a quantitatively significant source of EAA or NEAA due to the limited absorption of AA by colonocytes. Nonetheless, N metabolism in the large intestine may play a role in the pathogenesis of inflammatory diseases and colon cancer.

84 Amino Acids: Biochemistry and Nutrition
© 2010 Taylor & Francis Group, LLC
PAthwAys for synthesis of neAA in microorGAnisms
Microorganisms virtually use the same pathways to synthesize alanine, aspartate, glutamate, glutamine, proline, serine, and tyrosine, as do animal cells. However, AA-synthetic pathways that are not found in animals may be present in the bacteria. For example, in E. coli, two molecules of glutamate can be formed from one molecule of glutamine plus two molecules of α-ketoglutarate by glutamine:α-ketoglutarate ami-dotransferase (also known as glutamate synthase). Furthermore, different reactions are utilized to synthesize arginine from glutamate or asparagine from aspartate in bacteria than in mammals. Specifically, P5C synthase catalyzes the formation of P5C from glu-tamate in enterocytes of most mammals, whereas two separate enzymes are respon-sible for this conversion in bacteria (Figure 3.13). Additionally, N-acetylglutamate is an allosteric activator of CPS-1 in mammalian ornithine synthesis, but is an inter-mediate in the production of ornithine from glutamate in bacteria. Also, ammonia and glutamine are substrates for asparagine synthesis in animals and microorganisms, respectively. Furthermore, hydroxyproline may be a major precursor for renal glycine synthesis in animals, but this pathway is unlikely to be significant due to the near absence of hydroxyproline in bacteria. Notably, microorganisms, but not animal cells, can form cysteine (Figure 3.14) or tyrosine from non-AA substrates. In contrast to the liver of animals, the gut microbiota cannot synthesize taurine from cysteine.
GDH and GS play essential roles in the utilization of ammonia for the microbial synthesis of glutamate and glutamine, respectively. Thus, much work has been done to understand the structures and catalytic mechanisms of these two enzymes. Most bac-teria, including Corynebacterium glutamicum, E. coli, Salmonella typhimurium, and Synechocystis PCC 6803, have the NADP+-dependent GDH isoform, which is a hexa-meric oligomer with six identical subunits (a subunit molecular weight of ~50 kDa). This type of GDH is encoded by the gdhA gene. Some bacteria (e.g., Bacteroides fragilis Bf1 and Antarctic bacterium Psychrobacter sp.) possess two distinct isoforms of GDH: NAD(P)+-dependent (encoded by gdhA) and NAD+-specific (encoded by gdhB). The NAD+-dependent GDH has either six identical subunits of ~48 kDa (e.g.,
Saccharopine DAPA Homoserine
Lysine reonine Methionine
Shikimic acid
-Erythrose-4-P PEP
N-Acetyl-glutamate
Arginine
Glutamate Acetyl-CoAAspartate
SO42–
Cys
Serine
KIV
Pyr KIC KMV
Valine Isoleucine
Glu r
Acetyl-CoA
PRPP
Histidine
Gln ATP
Glucose
CO2
Leucine
Trp Phe Tyrα-KG
α-KG
α-KG
FIGURE 3.12 An overall view of pathways for the synthesis of nutritionally essential AA in microorganisms. DAPA, diaminopimelate; α-KG, α-ketoglutarate; KIC, α-ketoisocaproate; KIV, α-ketoisovalerate; KMV, α-keto-β-methylvalerate; PEP, phosphoenolpyruvate; PRPP, 5-phosphoribosyl-α-pyrophosphate; Pyr, pyruvate.

85Synthesis of Amino Acids
© 2010 Taylor & Francis Group, LLC
1
-Glutamine
NH3
-Glutamate
6
5
2
3
-Glutamyl-γ-semialdehyde
4 H2O
ATP-Mg2+
ADP-Mg2+
-Glutamyl-γ-phosphateNADPH + H+
NADP+ + Pi
Glutamate
-Ornithine
-Citrulline
CP
7
AMP-Mg2+
+ PPi
-Argininosuccinate8
Fumarate-Arginine
2 ATP 2 ADP + Pi
Glutamine + HCO3– 10
ATPCO2 + H2O
ADP
NH3
11
Acetyl-CoACoA
N-Acetylglutamate 12
Proline
NADPH + H+
9
ATP
ADPN-Acetylglutamate-5-P
NAD(P)H + H+
NAD(P)+
N-Acetylglutamate-5-semialdehyde
Glutamate
N-Acetylornithine
Glu
Acetate
Pi
13
14
15
16
Asp +ATP-Mg2+
α-KG
α-Ketoglutarate
NADP+
Δ1--Pyrroline-5-carboxylate
FIGURE 3.13 Ornithine and arginine synthesis from glutamate and glutamine in microorganisms. The enzymes catalyzing the indicated reactions are: (1) glutaminase (two isoforms: phosphate independent, and phosphate activated); (2) γ-glutamyl kinase; (3) glutamyl-γ-phosphate dehydrogenase; (4) nonenzymatic reaction; (5) ornithine amino-transferase; (6) ornithine carbamoyltransferase; (7) argininosuccinate synthase; (8) argini-nosuccinate lyase; (9) pyrroline-5-carboxylate reductase; (10) carbamoylphosphate synthase II; (11) a series of enzyme-catalyzed reactions involving glutamate dehydrogenase, α-ketoglutarate dehydrogenase, and succinyl-CoA dehydrogenase; (12) N-acetylglutamate synthase; (13) acetylglutamate kinase; (14) N-acetyl-γ-glutamyl phosphate dehydrogenase; (15) N-acetylornithine-δ-aminotransferase; (16) acetylornithine deacetylase.
Serine
O-Acetylserine
Acetyl-CoACoA
Cysteine
S2–
Acetate
H+
3 NADPH + H+3 NADP+
Sulfite
NADPH + H+ NADP+
3′-Phospho-AMP
3′-Phosphoadenosine-5′-phosphosulfate
ATP + Sulfate
ATP
ADP
Adenosine-5′-phosphosulfate
H+ PPi
6
1
2 34
5
FIGURE 3.14 Cysteine synthesis from serine and inorganic sulfur in microorganisms. The enzymes catalyzing the indicated reactions are: 1, serine acetyltransferase; 2, O-acetylserine lyase; 3, sulfite reductase; 4, 3′-phosphoadenosine-5′-phosphosulfate reductase; 5, adenosine-5′-phosphosulfate kinase; 6, ATP sulfurylase.
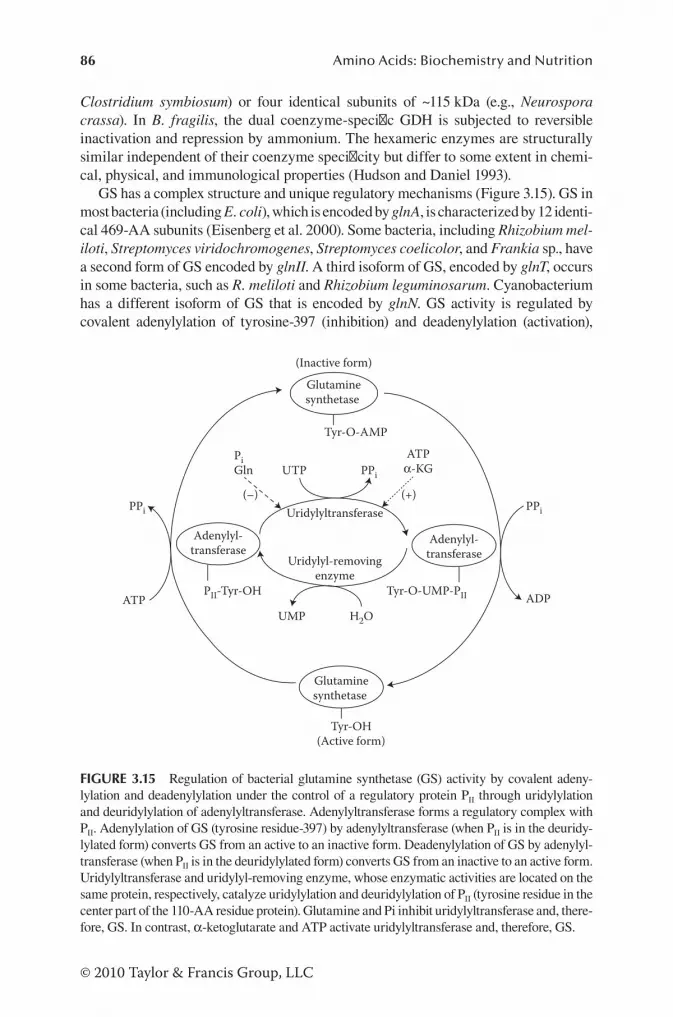
86 Amino Acids: Biochemistry and Nutrition
© 2010 Taylor & Francis Group, LLC
Clostridium symbiosum) or four identical subunits of ~115 kDa (e.g., Neurospora crassa). In B. fragilis, the dual coenzyme-specific GDH is subjected to reversible inactivation and repression by ammonium. The hexameric enzymes are structurally similar independent of their coenzyme specificity but differ to some extent in chemi-cal, physical, and immunological properties (Hudson and Daniel 1993).
GS has a complex structure and unique regulatory mechanisms (Figure 3.15). GS in most bacteria (including E. coli), which is encoded by glnA, is characterized by 12 identi-cal 469-AA subunits (Eisenberg et al. 2000). Some bacteria, including Rhizobium mel-iloti, Streptomyces viridochromogenes, Streptomyces coelicolor, and Frankia sp., have a second form of GS encoded by glnII. A third isoform of GS, encoded by glnT, occurs in some bacteria, such as R. meliloti and Rhizobium leguminosarum. Cyanobacterium has a different isoform of GS that is encoded by glnN. GS activity is regulated by covalent adenylylation of tyrosine-397 (inhibition) and deadenylylation (activation),
ATP
PPi PPi
ADP
Adenylyl-transferase
PII-Tyr-OH
Adenylyl-transferase
Tyr-O-UMP-PII
Tyr-O-AMP
Glutaminesynthetase
(Inactive form)
UTP PPi
UMP H2O
Uridylyltransferase
Uridylyl-removingenzyme
(–)
ATPα-KG
PiGln
(+)
Glutaminesynthetase
(Active form)Tyr-OH
FIGURE 3.15 Regulation of bacterial glutamine synthetase (GS) activity by covalent adeny-lylation and deadenylylation under the control of a regulatory protein PII through uridylylation and deuridylylation of adenylyltransferase. Adenylyltransferase forms a regulatory complex with PII. Adenylylation of GS (tyrosine residue-397) by adenylyltransferase (when PII is in the deuridy-lylated form) converts GS from an active to an inactive form. Deadenylylation of GS by adenylyl-transferase (when PII is in the deuridylylated form) converts GS from an inactive to an active form. Uridylyltransferase and uridylyl-removing enzyme, whose enzymatic activities are located on the same protein, respectively, catalyze uridylylation and deuridylylation of PII (tyrosine residue in the center part of the 110-AA residue protein). Glutamine and Pi inhibit uridylyltransferase and, there-fore, GS. In contrast, α-ketoglutarate and ATP activate uridylyltransferase and, therefore, GS.

87Synthesis of Amino Acids
© 2010 Taylor & Francis Group, LLC
with both enzymatic activities being catalyzed by the same protein known as adenylyl transferase. Adenylyl transferase acts in coordination with a tetrameric regulatory pro-tein PII. When a specific tyrosine residue in PII is uridylylated by UTP-dependent uri-dylyltransferase, the adenylyl transferase–PII complex catalyzes the deadenylylation of GS to generate an active form of GS. The uridylyltransferase is activated by ATP and α-ketoglutarate but is inhibited by glutamine and Pi. When the attached UMP group in PII is removed by the uridylyl-removing enzyme, the adenylyl transferase–PII complex catalyzes the adenylylation of GS to form an inactive form of GS. The adenylylation of GS is stimulated by glutamine and inhibited by α-ketoglutarate. Of particular inter-est, the uridylyltransferase and uridylyl-removing enzyme activities are possessed by the same protein, which can be classified as a bifunctional protein. In addition to the covalent regulation of GS activity, this enzyme is inhibited, via allosteric mechanisms, by end products of microbial glutamine metabolism, including histidine, carbamoyl phosphate, ADP, adenosine monophosphate (AMP), and other nucleotides.
PAthwAys for synthesis of eAA in microorGAnisms
Unlike animal cells, microorganisms are capable of producing all protein-AA. The metabolic pathways have been established for the microbial synthesis of (1) BCAA from pyruvate, α-ketobutyrate, and glutamate (Figure 3.16); (2) histidine from 5-phosphoribosyl-α-pyrophosphate and glutamine (Figure 3.17); (3) lysine,
Pyruvate
CO2
TPP
[C2 unit-TPP]
1
�reonine
NH3
2
Pyruvate
2
NAD(P)H + H+
NAD(P)+
H2O
Valine
3 3
4 4
5
6
NAD(P)H + H+
NAD(P)+
α, β-Dihydroxy-β-methylvalerate
Isoleucine
10
NAD+
Acetyl-CoA
NADH + H+
Glutamate Glutamate
α-KG
Glutamate
Leucine
66
H2O5
CoA
78
9CO2
α-Acetolactate
α-Keto-β-hydroxyisovalerate α-Isopropylmalate
α-Ketoisovalerate
α-KG
α-Ketoisocaproate
α-KG
α-Keto-β-methylvalerate
α,β-Dihydroxyisovalerate
α-Keto-β-hydroxyvalerate
α-Aceto-α-hydroxybutyrate
α-Ketobutyrate
β-Isopropylmalate
FIGURE 3.16 BCAA synthesis in microorganisms. The enzymes catalyzing the indicated reactions are: (1) pyruvate dehydrogenase complex; (2) acetolactate synthase; (3) acetolactate mutase; (4) reductase; (5) dihydroxy acid dehydratase; (6) branched-chain AA transaminase; (7) α-isopropylmalate synthase; (8) isopropylmalate isomerase; (9) isopropylmalate dehydra-tase; (10) threonine deaminase. α-KG, α-ketoglutarate; TPP, thiamine pyrophosphate.

88 Amino Acids: Biochemistry and Nutrition
© 2010 Taylor & Francis Group, LLC
methionine, and threonine from aspartate, α-ketoglutarate, and cysteine (Figure 3.18); and (4) phenylalanine, tyrosine, and tryptophan from phosphoenolpyruvate, erythrose-4-phosphate, and glutamate (or glutamine) (Figure 3.19). The common characteristics of these synthetic pathways are the requirements of multiple reactions, ATP, and glu-tamate (Umbarger 1978). In addition, NADPH and NADH play an important role in the synthesis of EAA. Interestingly, because animals can consume plants and other foods, one or more enzymes involved in EAA syntheses had been lost early in ani-mal evolution (Payne and Loomis 2006; Whitworth and Cock 2009). This adaptation mechanism may be of evolutional advantages for animals because it helps: (1) elimi-nate the energy-dependent complex pathways for EAA synthesis, thereby conserving energy, (2) reduce the size of animal genomes and the metabolic costs of maintenance and growth, (3) minimize incidences of the inborn errors of AA metabolism, (4) spare energy, and AA precursors (e.g., glutamate, glutamine, aspartate, asparagine, and ala-nine) for utilization by other pathways such as protein synthesis and glucose synthesis in animals, (5) maximize the efficiency of nutrient utilization in animals by utilizing the preformed AA in plants, and (6) establish interdependence relationships among species in the ecosystem involving animals, microorganisms, and plants.
Available evidence shows that the efficiency of EAA synthesis in microorganisms and plants is optimized by metabolic channeling, namely the intermediate of two reac-tions is directly transferred from the active site of one enzyme to another closely associ-ated enzyme (Light and Anderson 2013). The channeling can maintain a relatively high
N1-5′-Phosphoribosyl ATP
5-Phosphoribosyl-α -pyrophosphate
PPi
N1-5′-Phosphoribosyl AMP
H2O
PPi
N1-5′-Phosphoribosylformimino-5-aminoimidazole-4-
carboxamide ribonucleotide
H2O
N1-5′-Phosphoribulosylformimino-5-aminoimidazole-4-
carboxamide ribonucleotide Glutamine Glutamate
Imidazole glycerol phosphate
PurinesImidazole acetol phosphate
Glutamate
α -Ketoglutarate
L-Histidinol phosphateH2O
PPi
L-Histidinol2 NAD+
2 NADH + 2 H+Histidine
1
2
3
4
5
6
7
8
9
H2O5-Aminoimidazole-
4-carboxamideribonucleotide
ATP
FIGURE 3.17 Histidine synthesis in microorganisms. The enzymes catalyzing the indicated reactions are: (1) ATP phosphoribosyl transferase; (2) pyrophosphohydrolase; (3) phosphoribosyl-AMP cyclohydrolase; (4) phosphoribosylformimino-5-aminoimidazole carboxamide ribonucleotide isomerase; (5) glutamine amidotransferase; (6) imidazole glyc-erol phosphate dehydratase; (7) l-histidine phosphate aminotransferase; (8) histidinol phos-phate phosphatase; (9) histidinol dehydrogenase.

89Synthesis of Amino Acids
© 2010 Taylor & Francis Group, LLC
concentration of a substrate at the active site of its enzyme, prevent the loss or degrada-tion of the intermediate by other enzymes, and, therefore, increase the rate of a meta-bolic pathway. A good example is tryptophan synthase, which has a tetrasubunit (α2β2) structure and is a bifunctional enzyme (Dunn et al. 2008). The α units of tryptophan synthase catalyze the reversible conversion between indole-3-phosphate and indole plus glyceraldehyde-3-phosphate, whereas the β units of tryptophan synthase catalyze the irreversible step of the formation of tryptophan from indole and serine. Because indole is a hydrophobic substance, its immediate utilization by tryptophan synthase within the same protein can prevent a possible loss of indole from the bacterial cell by diffusing through the plasma and other membranes.
-Aspartate
ATP
ADP
Aspartyl-β-phosphate
NADPH + H+
NADP+
DihydropicolinateH2O
NADPH + H+
NADP+
Succinyl-CoA
CoAN-Succinyl-2-amino-6-keto--pimelate
Glutamate
N-Succinyl-,-α-ε-diamino-pimelate
meso-α-ε-Diamino-pimelate
LysineCO2
Phosphohomoserine
Pi
Aspartyl-β-semialdehyde Homoserine
NADPH + H+ NADP+
ADP
ATP
-Threonine
H2O
Pi
O-Succinylhomoserine
Succinyl-CoA
CoA
Cysteine
Succinate
Cystathionine
Homocysteine
NH3 Pyruvate
N 5-Methyl-THF
THF
Methionine
Acetyl-CoA + α-KG
Homocitrate
CoA
H2OHomoaconitate
CO2
Homoisocitrate
H2O
NADH + H+
NAD+
Oxaloglutarate
NADPH + H+
NADP+
,-α-ε-Diamino-pimelate
H2O
Succinate
NADPH + H+
NADP+
Saccharopine
Glutamate
NAD+ NADH + H+
25
1
2
3
4
5
6
7
8
9
1011
12
13
14
15
16
19
17
18
20
21
22
23
24
H2O
Pyr
Δ1-Piperidine-2,6-dicarboxylateα-Ketoadipate
α-Aminoadipate
α-Aminoadipate6-semialdehyde
α-KA
α-AA
α-KG
α-KG
FIGURE 3.18 Synthesis of lysine, methionine, and threonine in microorganisms. The enzymes catalyzing the indicated reactions are: (1) aspartokinase; (2) aspartyl-β-phosphate dehydrogenase; (3) dihydropicolinate synthase; (4) dihydropicolinate synthase dehydrogenase; (5) N-succinyl-2-amino-6-keto-l-pimelate synthase; (6) succinyl-diaminopimelate amino-transferase; (7) succinyl-diaminopimelate desuccinylase; (8) diaminopimelate epimerase; (9) diaminopimelate decarboxylase; (10) aspartyl-β-semialdehyde dehydrogenase; (11) homoserine kinase; (12) threonine synthase; (13) homoserine acyltransferase; (14) cystathionine γ-synthase; (15) cystathionine β-lyase; (16) homocysteine methyltransferase; (17) homocitrate synthase; (18) homocitrate dehydratase; (19) homoaconitate hydratase (lys2); (20) homoisocitrate dehydroge-nase; (21) oxaloglutarate decarboxylase; (22) aminoadipate aminotransferase; (23) aminoadi-pate reductase (lys1 and lys7); (24) saccharopine reductase; (25) saccharopine dehydrogenase. In E. coli, reactions #1 and #10 are catalyzed by the same protein (a bifunctional protein).

90 Amino Acids: Biochemistry and Nutrition
© 2010 Taylor & Francis Group, LLC
5
68
-Er
ythr
ose-
4-P
+ PE
P2-
Ket
o-3-
deox
y--
arab
inoh
eptu
loso
nate
-7-P
5-D
ehyd
ro-
quin
ate
5-D
ehyd
ro-
shik
imat
e
H2O
P i
12
34
P i
NA
D+
NA
DH
+ H
+N
AD
+ Shik
imat
eAT
P
AD
PSh
ikim
ate-
5-P
PEP
P i
3-En
olpy
ruvy
l-sh
ikim
ate-
5-P
Cho
rism
ate
P i9
13
7Pr
ephe
nate
NA
DH
+ H
+N
AD
+
CO
2
4-H
ydro
xyph
enyl
pyru
vate
Tyro
sine
OH
-
Phen
ylpy
ruva
te
CO
2
11
Phen
ylal
anin
e
NA
DP+
+ H
2ON
AD
PH+
H+
Glu
12
Glu
10O
2
Gln
Glu
Ant
hran
ilate
1917
14
15
16PR
PPPP
i
N-(
5′-P
hosp
horib
osyl
)-an
thra
nila
te
Pyr
Enol
-1-o
-car
boxy
phen
ylam
ino-
1-de
oxyr
ibul
ose
phos
phat
eIn
dole
-3-g
lyce
rol
phos
phat
eH
2O
CO
2
18In
dole
Gly
cera
ldeh
yde-
3-P
Tryp
toph
an
Serin
eH
2O
α-KG
α-KG
FIG
UR
E 3.
19
Synt
hesi
s of
phe
nyla
lani
ne, t
yros
ine,
and
tryp
toph
an in
mic
roor
gani
sms.
The
enz
ymes
cat
alyz
ing
the
indi
cate
d re
acti
ons
are:
(1) 2
-ket
o-3-
deox
y-d
-ara
bino
hept
ulos
onat
e-7-
phos
phat
e sy
ntha
se; (
2) d
ehyd
roqu
inat
e sy
ntha
se (a
n N
AD
+ -ac
tivat
ing
reac
tion
); (3
) 5-
dehy
droq
uina
te d
ehyd
rata
se;
(4)
5-de
hydr
oshi
kim
ate
redu
ctas
e; (
5) s
hiki
mat
e ki
nase
; (6
) 3-
enol
pyru
vyls
hiki
mat
e-5-
phos
phat
e sy
ntha
se;
(7)
chor
ism
ate
synt
hase
; (8
) ch
oris
mat
e-m
utas
e; (9
) pr
ephe
nate
deh
ydro
gena
se; (
10)
amin
otra
nsfe
rase
; (11
) pr
ephe
nate
deh
ydra
tase
; (12
) am
inot
rans
fera
se; (
13)
phen
ylal
anin
e hy
drox
ylas
e; (1
4)
anth
rani
late
syn
thas
e; (
15)
anth
rani
late
–pho
spho
ribo
syl
tran
sfer
ase;
(16
) N
-(5′
-pho
spho
ribo
syl)
-ant
hran
ilat
e is
omer
ase;
(17
) in
dole
-3-g
lyce
rol
phos
-ph
ate
synt
hase
; (18
) tr
ypto
phan
syn
thas
e (α
-sub
units
); (1
9) tr
ypto
phan
syn
thas
e (β
-sub
units
). α
-KG
, α-k
etog
luta
rate
; PE
P, p
hosp
hoen
olpy
ruva
te; P
RPP
, 5-
phos
phor
ibos
yl-α
-pyr
opho
spha
te.

91Synthesis of Amino Acids
© 2010 Taylor & Francis Group, LLC
SYNTHESIS OF D-AA IN ANIMAL CELLS AND BACTERIA
An AA racemase (also known as d-AA racemase) converts a free l-AA into a d-AA (Wolosker et al. 1999). Most AA racemases (including d-aspartate racemase, d-serine racemase, and d-alanine racemase) depend on pyridoxal-5′-phosphate for catalytic activity. These enzymes localize in the cytoplasm with their respective sub-strates. Only two AA racemases, d-aspartate and d-serine racemases, have been identified in mammals so far.
All animals express d-aspartate racemase, which converts free l-aspartate into d-aspartate in certain tissues (e.g., the brain). Recently, P.M. Kim and colleagues obtained and cloned the mammalian aspartate racemase in 2010. The Km value of recombinant d-aspartate racemase for l-aspartate is 3.1 mM and the Vmax value is 0.46 μmol/(mg/min) at the optimum pH of 7.5 and the optimum temperature of 37°C (Kim et al. 2010). Both d-aspartate and d-aspartate racemase are concentrated in: (1) pinealocytes of the pineal gland, (2) pituicytes of the posterior pituitary gland, (3) epinephrine-producing chromaffin cells of the medulla of the adrenal glands, and (4) elongated spermatids of the testes. In the brain, endogenously synthesized d-aspartate is important for neurological function, because the entry of d-AA from the peripheral circulation into this organ appears to be limited by the blood–brain barrier. In addition to nervous tissues, d-aspartate racemase has been reported in the kidney and in the liver of mammals, which is in keeping with the presence of d-aspartate in these organs.
In the animal kingdom, d-serine racemase converts free l-serine into d-serine. This enzyme does not use glycine as a substrate but is competitively inhibited by high levels of glycine. In 1999, H. Wolosker and coworkers isolated and cloned, for the first time, d-serine racemase in mammals. This enzyme is enriched in the rat brain where it occurs in glial cells that possess high levels of d-serine. d-Serine racemase has a striking similarity to the serine/threonine dehydratase enzyme of E. coli, rather than to classical AA racemases. Mg-ATP appears to stabilize the fold-ing of d-serine racemase. In the rat brain, the Km of serine racemase for l-serine is approximately 10 mM with a Vmax of 5 μmol/mg protein per hour. The enzyme can also convert d-serine into l-serine but with lesser affinity, as the Km value in this direction is approximately 60 mM. In addition to mammals, d-serine racemase has been detected in fungi, plants, and invertebrates.
d-Alanine racemase converts free l-alanine into d-alanine, which is a key build-ing block in the biosynthesis of the peptidoglycan layer in bacterial cell walls. This enzyme (Km for d-alanine = 8.5 mM) was discovered in Streptococcus faecalis by W.A. Wood and I.C. Gunsalus in 1951 based on the report by J.T. Holden and E.E. Snell in 1949 of the interconversion between d-alanine and l-alanine in these cells. d-Alanine racemases are ubiquitous among microorganisms and are also present in certain invertebrates, but are typically absent from mammals, birds, and fish. Bacteria (e.g., S. faecalis, Mycobacterium tuberculosis, E. coli, Listeria monocyto-genes, and Bacillus anthracis) and invertebrates (e.g., Corbicula japonica, a brack-ish-water species; and crayfish) use d-alanine to grow. Thus, d-alanine racemase is an attractive target for the development of novel antimicrobials in both medicine and livestock production.

92 Amino Acids: Biochemistry and Nutrition
© 2010 Taylor & Francis Group, LLC
CONVERSION OF D-AA TO l-AA IN ANIMAL CELLS AND BACTERIA
Animal cells lack d-AA transaminases. Therefore, d-AA do not undergo transamina-tion reactions in mammalian, avian, or other vertebrate cells. However, many animal tissues (e.g., liver, kidney, brain, and heart) contain d-AA oxidases (oxidoreductases) to oxidize d-AA to their corresponding α-ketoacids. Subsequently, l-AA transami-nases catalyze the conversion of these α-ketoacids and glutamate (or alanine) into the corresponding l-α-AA and α-ketoglutarate (or pyruvate) (Figure 3.20). Let us take the conversion of d-methionine to l-methionine in animal cells as an example:
1. d-Methionine + O2 + H2O + FAD → α-keto-γ-methylthiobutyrate + FADH2 + H2O2
2. α-Keto-γ-methylthiobutyrate + l-glutamate ↔ l-methionine + α-ketoglutarate
Like animal cells, bacteria in the lumen of the small intestine express both d-AA oxidases and l-AA transaminases and, therefore, can convert d-AA into l-AA. Notably, in contrast to animal cells, bacteria possess d-AA transaminases to produce α-ketoacids from d-AA. These α-ketoacids are transaminated by l-AA transami-nases to generate new l-α-AA. Let us use d-tryptophan as an example to illustrate a role for the transamination of a d-AA in the production of an l-α-AA in bacteria:
1. d-Tryptophan + α-ketoglutarate (or pyruvate) ↔ indole-3-pyruvate + l-glu-tamate (or l-alanine)
2. Indole-3-pyruvate + l-glutamate (or l-alanine) ↔ l-tryptophan + α-ketoglu-tarate (or pyruvate)
The conversion of dietary d-AA to l-AA in the whole body can take place both in the luminal bacteria of the small intestine and, after the absorption of d-AA into the portal vein, in animal tissues. Because the final steps for the synthesis of l-arginine, l-cysteine, l-lysine, and l-threonine do not involve AA transaminases, d-arginine,
-AA
FAD FADH2
O2 H2O2
-AA
Glu
Ala Pyr
NH3H2O
6
312
H2O5
½O2
H2O
4½O2
α-Ketoacid
α-KG
FIGURE 3.20 Conversion of d-AA into l-AA in the animal body. Luminal bacteria of the small intestine and animal tissues contribute to the conversion of d-AA to l-AA in the body. The enzymes that catalyze the indicated reactions are: (1) d-AA oxidase; (2) l-glutamate transaminase; (3) l-alanine transaminase; (4) catalase; (5) enzymes of the mitochondrial electron transport system; and (6) glutamate dehydrogenase (an NAD+-dependent enzyme). Glu, glutamate; α-KG, α-ketoglutarate; Pyr, pyruvate.

93Synthesis of Amino Acids
© 2010 Taylor & Francis Group, LLC
d-cysteine (d-cystine), d-lysine, or d-threonine are not precursors for l-AA in all the animal species studied (Figure 3.4). Thus, except for d-arginine, d-cysteine (d-cystine), d-lysine, and d-threonine, all the d-AA can be converted to their corresponding l-AA in animals, but the rates vary greatly with d-AA, dietary content of l-AA, developmen-tal stage, and species. The efficiency of utilization of some d-AA by animals is shown in Table 3.4. At present, little is known about the production of “nutritionally nonessential” l-AA from their corresponding d-AA in animals.
SUMMARY
Microorganisms in the lumen of the gastrointestinal tract can synthesize all AA from ammonia, carbohydrates, and sulfur. These synthetic pathways are quantita-tively important in ruminants (e.g., cows, cattle, sheep, and goats) but nutritionally insignificant in nonruminants (e.g., humans, dogs, pigs, and rats). The animal king-dom cannot form isoleucine, leucine, lysine, methionine, phenylalanine, threonine, tryptophan, and valine from nitrogenous precursors, carbohydrates, and sulfur. Thus, these AA must be provided in the diet to maintain the life of animals. In contrast, all animals can synthesize alanine, aspartate, cysteine, glutamate, glutamine, glycine, serine, and tyrosine, and these AA have historically not received much attention from nutritionists. However, the synthesis of arginine, citrulline, ornithine, proline, and taurine is species-specific and must be quantified to guide conceptual development and nutritional practice. Most mammals (including humans, pigs, and rats) can syn-thesize arginine, citrulline, and ornithine from glutamate, glutamine, and proline via the metabolism of enterocytes in the small intestine, but these synthetic pathways are absent from carnivores, birds, and possibly most aquatic animals. In avian species,
TABLE 3.4Efficiency of Utilization of D-AA by Animals
Percent of the Value for the l-Isomer
D-AA Chick Rat Mouse Dog Human Pig
Histidine 10 22 10 — — —
Isoleucine (2R, 3R) 0 0 0 — 0 0
Alloisoleucine (2R, 3S) 60 — — — — —
Leucine 100 50 15 — 0 —
Methionine 90 90 75 100 36 100
Phenylalanine 75 70 52 — 50 —
Threonine (2R, 3R) 0 0 0 — 0 0
Tryptophan 20 100 30 36 0 80
Tyrosine 100 100 — — 0 100
Valine 70 15 5 — — —
Source: Adapted from Baker, D.H. 1994. In: Amino Acids in Farm Animal Nutrition. CAB International, Wallingford, Oxon, UK, pp. 37–61.
Note: —, data not available.

94 Amino Acids: Biochemistry and Nutrition
© 2010 Taylor & Francis Group, LLC
proline synthesis is limited due to the absence of P5C and a low activity of arginase. Except for carnivores (e.g., cats), all animals can synthesize taurine from methio-nine or cysteine. While it had traditionally been assumed that animals could ade-quately synthesize all NEAA to support maximal growth and development, results of recent studies involving pigs and rats indicate that this assumption is likely invalid. In all animals, AA synthesis requires cofactors (e.g., NADH, NADPH, FAD, pyru-vate, oxaloacetate, and α-ketoglutarate), which should be taken into consideration in metabolically engineering pathways and in developing transgenic animals expressing AA-synthetic enzymes. As the resources of protein and l-AA have become more and more scarce and the demands for l-AA are increasing in both human consumption and livestock production worldwide, there is growing interest in the use of d-AA (e.g., d-methionine and d-tryptophan) as precursors of l-AA. Likewise, the recent discov-ery that d-AA (e.g., d-aspartate and d-serine) are synthesized from their l-isomers by racemases in animals has opened a new avenue to study the mechanisms for the regu-lation of these novel synthetic pathways and the physiological significance of d-AA.
REFERENCES
Arentson, B.W., N. Sanyal, and D.F. Becker. 2012. Substrate channeling in proline metabolism. Front. Biosci. 17:375–388.
Baker, D.H. 1994. Utilization of precursors for l-amino acids. In: Amino Acids in Farm Animal Nutrition (J.P.F. D’Mello ed.). CAB International, Wallingford, Oxon, UK, pp. 37–61.
Brosnan, J.T. 2000. Glutamate at the interface between amino acid and carbohydrate metabolism. J. Nutr. 130:988S–990S.
Campbell, C.G., E.C. Titgemeyer, and G. St-Jean. 1997. Sulfur amino acid utilization by growing steers. J. Anim. Sci. 75:230–238.
Dunn, M.F., D. Niks, H. Ngo, T.R. Barends, and I. Schlichting. 2008. Tryptophan synthase: the workings of a channeling nanomachine. Trends Biochem. Sci. 33:254–264.
Eisenberg, D., H.S. Gill, G.M. Pfluegl, and S.H. Rotstein. 2000. Structure-function relationships of glutamine synthetases. Biochim. Biophys. Acta 1477:122–145.
Felig, P. 1975. Amino acid metabolism in man. Annu. Rev. Biochem. 44:933–955.Flynn, N.E., C.J. Meininger, T.E. Haynes, and G. Wu. 2002. The metabolic basis of arginine
nutrition and pharmacotherapy. Biomed. Pharmacother. 56:427–438.Goldberg, A.L. and T.W. Chang. 1978. Regulation and significance of amino acid metabolism
in skeletal muscle. Fed. Proc. 37:2301–2307.Griffith, O.W. 1986. Beta-amino acids: Mammalian metabolism and utility as alpha-amino
acid analogues. Annu. Rev. Biochem. 55:855–878.Guedes, R.L.M., F. Prosdocimi, G.R. Fernandes, L.K. Moura, H.A.L. Ribeiro, and J.M.
Ortega. 2011. Amino acids biosynthesis and nitrogen assimilation pathways: A great genomic deletion during eukaryote evolution. BMC Genomics 12(Suppl. 4):S2; doi: 10.1186/1471-2164-12-S4-S2.
Hu, C.A., S. Khalil, S. Zhaorigetu, Z. Liu, M. Tyler, G. Wan, and D. Valle. 2008. Human Delta1-pyrroline-5-carboxylate synthase: Function and regulation. Amino Acids 35:665–672.
Hudson, R.C. and R.M. Daniel. 1993. L-glutamate dehydrogenases: distribution, properties and mechanism. Comp. Biochem. Physiol. B. 106:767–792.
Hufton, S.E., I.G. Jennings, and G.H. Cotton. 1995. Structure and function of the aromatic amino acid hydroxylase. Biochem. J. 311:353–366.
Kaufman, S. 1987. Enzymology of the phenylalanine-hydroxylating system. Enzyme 38:286–295.

95Synthesis of Amino Acids
© 2010 Taylor & Francis Group, LLC
Kim, P.M., X. Duan, A.S. Huang, C.Y. Liu, G.L. Ming, H. Song, and S.H. Snyder. 2010. Aspartate racemase, generating neuronal d-aspartate, regulates adult neurogenesis. Proc. Natl. Acad. Sci. USA 107:3175–3179.
Kowalski, T.J., G. Wu, and M. Watford. 1997. Rat adipose tissue amino acid metabolism in vivo as assessed by microdialysis and arterio-venous techniques. Am. J. Physiol. 273: E613–E622.
Krajewski, W.W., R. Collins, L. Holmberg-Schiavone, T.A. Jones, T. Karlberg, and S.L. Mowbray. 2008. Crystal structures of mammalian glutamine synthetases illustrate sub-strate-induced conformational changes and provide opportunities for drug and herbicide design. J. Mol. Biol. 375:317–328.
Kwon, H., T.E. Spencer, F.W. Bazer, and G. Wu. 2003. Developmental changes of amino acids in ovine fetal fluids. Biol. Reprod. 68:1813–1820.
Lapierre, H., D. Pacheco, R. Berthiaume, D.R. Ouellet, C.G. Schwab, P. Dubreuil, G. Holtrop, and G.E. Lobley. 2006. What is the true supply of amino acids for a dairy cow? J. Dairy Sci. 89 (Suppl 1):E1-14.
Light, S.H. and W.F. Anderson. 2013. The diversity of allosteric controls at the gateway to aromatic amino acid biosynthesis. Protein Sci. doi: 10.1002/pro.2233.
Mallette, L.E., J.H. Exton, and C.R. Park. 1969. Control of gluconeogenesis from amino acids in the perfused rat liver. J. Biol. Chem. 244:5713–5723.
Marliss, E.B., T.T. Aoki, T. Pozefsky, A.S. Most, and G.F. Cahill. 1971. Muscle and splanchnic glutamine and glutamate metabolism in postabsorptive and starved man. J. Clin. Invest. 50:814–817.
Metges, C.C. 2000. Contribution of microbial amino acids to amino acid homeostasis of the host. J. Nutr. 130:1857S–1864S.
Møller, N., S. Meek, M. Bigelow, J. Andrews and K.S. Nair. 2000. The kidney is an important site for in vivo phenylalanine-to-tyrosine conversion in adult humans: A metabolic role of the kidney. Proc. Natl. Acad. Sci. USA. 97:1242–1246.
Morris, J.H. and Q.R. Rogers. 1992. The metabolic basis for the taurine requirement of cats. Adv. Exp. Med. Biol. 315:33–44.
Payne, S.H. and W.F. Loomis. 2006. Retention and loss of amino acid biosynthetic pathways based on analysis of whole-genome sequences. Eukaryotic Cell 5:272–276.
Phang, J.M., W. Liu, and O. Zabirnyk. 2010. Proline metabolism and microenvironmental stress. Annu. Rev. Nutr. 21;30:441–463.
Reeds, P.J. 2000. Dispensable and indispensable amino acids for humans. J. Nutr. 130: 1835S–1840S.
Rodionov, R.N., D.J. Murry, S.F. Vaulman, J.W. Stevens, and S.R. Lentz. 2010. Human alanine-glyoxylate aminotransferase 2 lowers asymmetric dimethylarginine and protects from inhibition of nitric oxide production. J. Biol. Chem. 285:5385–5391.
Rose, W.C. 1957. The amino acid requirements of adult man. Nutr. Abstr. Rev. Ser. Hum. Exp. 27:631–647.
Self, J.T., T.E. Spencer, G.A. Johnson, J. Hu, F.W. Bazer, and G. Wu. 2004. Glutamine synthe-sis in the developing porcine placenta. Biol. Reprod. 70:1444–1451.
Snell, K. 1984. Enzymes of serine metabolism in normal, developing and neoplastic rat tissues. Adv. Enzyme Regul. 22:325–400.
Tomlinson, C., M. Rafii, M. Sgro, R.O. Ball, and P. Pencharz. 2011. Arginine is synthesized from proline, not glutamate, in enterally fed human preterm neonates. Pediatr. Res. 69:46–50.
Umbarger, H.E. 1978. Amino acid biosynthesis and its regulation. Annu. Rev. Biochem. 47: 533–606.
Whitworth, D.E. and P.J. Cock. 2009. Evolution of prokaryotic two-component systems: insights from comparative genomics. Amino Acids 37:459–466.

96 Amino Acids: Biochemistry and Nutrition
© 2010 Taylor & Francis Group, LLC
Wolosker, H., S. Blackshaw, and S.H. Snyder. 1999. Serine racemase: A glial enzyme syn-thesizing d-serine to regulate glutamate-N-methyl-d-aspartate neurotransmission. Proc. Natl. Acad. Sci. USA 96:13409–13414.
Wu, G., J.R. Thompson, and V.E. Baracos. 1991. Glutamine metabolism in skeletal muscle from the broiler chick (Gallus domesticus) and the laboratory rat (Rattus norvegicus). Biochem. J. 274:769–774.
Wu, G., F.W. Bazer, and W. Tuo. 1995. Developmental changes of free amino acid concentra-tions in fetal fluids of pigs. J. Nutr. 125:2859–2868.
Wu, G., D.A. Knabe, and S.W. Kim. 2004. Arginine nutrition in neonatal pigs. J. Nutr. 134:2783S–2390S.
Wu, G., F.W. Bazer, R.C. Burghardt, G.A. Johnson, S.W. Kim, D.A. Knabe et al. 2010. Functional amino acids in swine nutrition and production. In: Dynamics in Animal Nutrition (J. Doppenberg and P. van der Aar, eds). Wageningen Academic Publishers, The Netherlands, pp. 69–98.

97
© 2010 Taylor & Francis Group, LLC
Degradation of Amino Acids
Catabolism of AA occurs in animals regardless of their nutritional states, with the rates being the highest immediately after feeding (Jungas et al. 1992). Since physi-ological levels of AA are readily soluble in water (a major component of the body) and accumulation of large amounts of free AA in the body can substantially increase the osmolarity of physiological fluids, most of the AA in excess of the needs for the synthesis of protein and other biologically active substances are degraded in a cell- and tissue-specific manner. Nonetheless, in cells or tissues constantly exposed to elevated concentrations of an AA, its intracellular concentrations can be greatly increased (Yao et al. 2012). For example, elevating extracellular concentrations of glutamine from 0.5 to 15 mM greatly increases its intracellular concentrations from 6 to 36 mM in chicken skeletal muscle. This is in contrast to the common belief that regardless of their source, the AA not immediately incorporated into new protein are rapidly degraded in ani-mals. It is now known that degradation of AA fulfils important physiological functions in organisms (Van Der Schoor et al. 2002). Thus, even when there is no exogenous pro-vision of AA (e.g., fasting and consumption of a nitrogen-free diet), AA undergo oxida-tion to produce ammonia (NH3) because the constitutive enzymes are not completely inhibited. It should be borne in mind that although some cell types (e.g., enterocytes) depend on the oxidation of certain AA (glutamate, aspartate, and glutamine) as the major source of energy, the use of AA as metabolic fuels is energetically inefficient when compared with the oxidation of glucose and fatty acids. Pathways for AA degra-dation in animals and microbes will be highlighted in this chapter.
GENERAL CHARACTERISTICS OF AA DEGRADATION IN ANIMAL CELLS
overAll view of AA cAtABolism
A major difference between AA and other macronutrients (fat and carbohydrate) is that AA contain N. In nature, N in substances exists in various oxidation states: +5 (NO3
−, nitrate), +3 (NO2−, nitrite), +2 (NO), 0 (N2), −3 (NH3, urea, and the -NH2
group in AA). Except for N2, all of these forms of N are produced by animals. Thus, N actively participates in metabolic transformations in the body. The carbon skel-etons of AA have similar metabolic fate to those of glucose and fatty acids.
Owing to differences in side chains, individual AA have their own unique cat-abolic pathways. However, the catabolism of many AA shares a number of com-mon steps to generate pyruvate, oxaloacetate, α-KG, fumarate, succinyl-CoA, and acetyl-CoA (Figure 4.1). In addition to transamination, other reactions also play an
4

98 Amino Acids: Biochemistry and Nutrition
© 2010 Taylor & Francis Group, LLC
important role in initiating AA degradation (Table 4.1). Complete oxidation of many AA requires interorgan cooperation. Metabolites of AA include NH3, CO2, urea, uric acid, acetyl-CoA, short-chain fatty acids, formate, glucose, H2S, ketone bodies, NO, polyamines, and other nitrogenous substances, with each having enormous biologi-cal importance. In aqueous solution, free NH3 is at equilibrium with ammonium ion (NH4
+ ) (Wu et al. 2011; Lamarre et al. 2012). At pH 7.4 and 37°C, ~1.6% and 98.4% of NH3 exist as free NH3 and NH4
+ ion, respectively. In this book, free NH3 and NH4+
are collectively referred to as ammonia.
NH H NH
pH p NH / NH
p at 37 C
[NH ]/[NH
a
a
3 4
3 4
3
9 2
+= += °
+ +
+
�
K
K
log([ ] [ ])
.
44 0 016+ =] .
In the fed state, oxidation to CO2 and water for ATP production is a metabolic fate of the carbon skeletons of the AA not used for storage or peptide synthesis (Bender 2012). In the Krebs cycle, oxaloacetate serves as a substrate of citrate syn-thase to introduce acetyl-CoA into the cycle and there is extensive randomization of both carbons and hydrogens due to the symmetric nature of the succinate molecule
Citrate
α-Ketoglutarate
Succinyl-CoA
Krebs cycle
Oxaloacetate Fumarate
Glutamate
ArginineCitrullineGlutamineHistidineOrnithineProline
AspartatePhenylalanineTyrosine
Aspartate
Asparagine
Acetyl-CoA
Pyruvate
Acetoacetyl-CoA
LeucineLysinePhenylalanineTryptophanTyrosine
AlanineCysteineGlycineHydroxyprolineSerine�reonineTryptophan
γ-ΑminobutyrateIsoleucineMethionineValine
IsoleucineLeucine�reonineTryptophanTyrosine
FIGURE 4.1 Different metabolic pathways for catabolism of AA converge to common intermediates (α-KG, oxaloacetate, and pyruvate) that feed into the Krebs cycle in animals.

99Degradation of Amino Acids
© 2010 Taylor & Francis Group, LLC
(Figure 4.2). The major function of the Krebs cycle is to oxidize acetyl-CoA, gen-erating CO2, NADH + H+, FADH2, and GTP. Subsequently, NADH and FADH2 are oxidized via the mitochondrial electron transport system to produce ATP and water (Newsholme et al. 2011). Note that none of the intermediates of the Krebs cycle (including oxaloacetate) undergoes net oxidation to CO2 and water via the cycle. Rather, all intermediates of the Krebs cycle are regenerated through the cyclic pro-cess. Thus, complete oxidation of AA occurs only if their carbons are ultimately converted into acetyl-CoA. The conversion of oxaloacetate into pyruvate involves (1) phosphoenolpyruvate carboxykinase (PEPCK), which catalyzes the decarboxyl-ation of oxaloacetate to form phosphoenolpyruvate, and (2) pyruvate kinase, which generates pyruvate from phosphoenolpyruvate (Figure 4.3). Whether AA may be substrates for glucose synthesis critically depends on the intracellular localization of PEPCK in the liver and kidneys. PEPCK is present exclusively in the mitochondria (the livers of pigeons, chickens, and rabbits) or the cytoplasm (rats, mice, and golden
TABLE 4.1Reactions Initiating AA Catabolism in Animals
Reactions Examples
Amidotransferation Glutamine + F6P → glucosamine-6-phosphate + glutamate (1)
Cleavage Glycine + NAD+ + THF ↔ MTHF + CO2 + NH3 + NADH + H+ (2)
Condensation Methionine + Mg-ATP → S-adenosylmethionine + Mg-PPi + Pi (3)
Deaminated oxidation (FAD)
d-Amino acid + O2 + H2O → α-ketoacid + H2O2 + NH3 (4)
l-Amino acid + O2 + H2O → α-ketoacid + H2O2 + NH3 (5)
Deamidation Leucine + 1/2O2 → ketoacid → NH3 (6)
Decarboxylation (PLP) Ornithine → putrescine + CO2 (7)
Dehydration Serine → aminoacrylate + H2O (8)
Dehydrogenation Threonine + NAD+ → 2-amino-3-ketobutyrate + NADH + H+ (9)
Dioxygenation Cysteine + O2→ cysteinesulfinate (10)
Hydrolysis Arginine + H2O → ornithine + urea (11)
Glutamine + H2O → glutamate + NH3 (12)
Hydroxylation Arginine + O2+ BH4 + NADPH + H+ → NO + BH4 + citrulline + NADP+ (13)
One-carbon unit transfer Glycine + MTHF ↔ serine + THF (14)
Oxidation (FAD) Proline + 1/2O2 → pyrroline-5-carboxylate + H2O (15)
Oxidative deamination Glutamate + NAD+ ↔ α-ketoglutarate + NH3 + NADH + H+ (16)
Reduction Lysine + α-ketoglutarate + NADPH + H+ → saccharopine + NADP+ (17)
Transamination (PLP) Leucine + α-ketoglutarate ↔ α-ketoisocaproate + glutamate (18)
Note: Enzymes that catalyze the indicated reactions are: (1) glutamine:fructose-6-phosphate transami-nase; (2) glycine synthase (glycine cleavage system); (3) S-adenosylmethionine synthase; (4) d-amino acid oxidase; (5) d-amino acid oxidase; (6) deaminase; (7) ornithine decarboxylase; (8) serine dehydratase; (9) threonine dehydrogenase; (10) cysteine dioxygenase; (11) arginase; (12) glu-taminase; (13) NO synthase; (14) hydroxymethyltransferase; (15) proline oxidase; (16) glutamate dehydrogenase; (17) lysine:α-ketoglutarate reductase; and (18) BCAA transaminase; F6P, fructose-6- phosphate; MTHF, N5, N10-methylene-THF; NO, nitric oxide; THF, tetrahydrofolate. BH4, tetra-hydrobiopterin (required for hydroxylation of arginine, phenylalanine, tyrosine, and tryptophan).

100 Amino Acids: Biochemistry and Nutrition
© 2010 Taylor & Francis Group, LLC
hamsters), or both compartments (humans, cattle sheep, pigs, guinea pigs, and frogs, as well as the kidneys of chickens), depending on species and cell type. Because NADH is required for the conversion of phosphoenolpyruvate into glucose in the cytoplasm, the presence of PEPCK in this compartment allows for the generation of NADH and, therefore, glucose from AA catabolism. In contrast, the presence of PEPCK in mitochondria does not allow for generation of NADH; therefore, little
OxaloacetateMalate
COO-C H
CH2 COO-
OH
COO-C
C H
OH
OOCFumarate
COO-CH2
CH2 COO-
FAD
GTP + CoA-SH
COO-CH2
C H2
C~S-CoAO
COO-CH2
C H2
C COO-O
COO-C H2
CH
C COO-O
COO-
COO-C H2
CH
C H COO-
COO-
OHIsocitrate
α−Ketoglutarate
OxalosuccinateCO2CoA-SH
COO-C H2
C COO-
CH COO-
Succinyl-CoA
+
*
CH3 CO~S CoA*
CH2
C
CH2
OH
COO-
COO-
COO-
*
*
*
*
*
*
*
GDP + Pi
*
*
*Citrate
Cis-aconitate
COO-C
O
CH2 COO-
Acetyl-CoA
synthase*
thiokinase
dehydrogenase
Aconitase
H2O H2O
H2O
H2O
-
CO2
Mg
FADH2
Citrate
Aconitase
Isocitratedehydrogenase
Isocitratedehydrogenase
α−Ketoglutaratedehydrogenase
complex
Succinate
Succinatedehydrogenase
Succinate
Fumarase
L-Malate
2+
Mn2+
NAD+ NADH + H+
NADH + H+
Fe2+
Fe2+
NAD+
NAD+
NADH + H+
CoA-SH
FIGURE 4.2 The Krebs cycle (citric acid cycle) in animals. The carboxyl and methyl car-bons of acetyl-CoA are shown with labels designated by symbols “*” and “·,” respectively. In the first turn of the cycle, two molecules of CO2 are produced, which are derived from the oxaloacetate portion of citrate but not the acetyl-CoA that immediately enters the cycle. Because succinate is a symmetric compound and because succinate dehydrogenase does not differentiate between its two carboxyl groups, “randomization” of label occurs at this step such that all four carbons of succinate, fumarate, malate, and oxaloacetate are labeled after one turn of the cycle. The carboxyl and methyl carbons of acetyl-CoA are completely lost as CO2 after 2 and 15 turns of the cycle, respectively.

101Degradation of Amino Acids
© 2010 Taylor & Francis Group, LLC
glucose is formed from AA catabolism. This concept is supported by the finding of M. Watford and colleagues in 1981 that alanine, aspartate, glutamate, glutamine, glycine, proline, or serine (5 mM each, which is ~5−20 times physiological concen-trations in plasma) is a poor substrate for gluconeogenesis in the chicken liver which expresses PEPCK only in the mitochondria (Watford 1985). However, these AA are effective precursors for glucose production in the chicken kidneys which express PEPCK in both the cytoplasm and mitochondria.
On a molar basis, oxidation of AA to CO2 and water is less efficient for ATP production than oxidation of fat and glucose to CO2 and water (Table 4.2).
NADH + H+ OAA
GDP + CO2
NAD+
Krebs Cycle
GTP
PEP
ADP + Pi
α-KA
Pyruvate
ATP
Acetyl-CoA
α-KG
Glu
α -KG
MalateCitrate
CO2
CO2
Malate
Asp
OAA
NAD+ NADH + H+
PEP
GTP
GDP + CO2
Pyruvate
ADP ATP
NADH + H+
NAD+FADH2 + GTP + CO2
NAD+
Mitochondrion
Cytoplasm
16
1
3
4
4
6
5
6
7
9
AsnNH3
Asn
NH3
Glu
Alanine
α -KG
Alanine
Glu
α -KG
NH3
NAD+NADH + H+
Glutamate
Glutamine
α-Ketoglutaramate NH3
α -KA
α -AA
8
11
10
1314
12
15
ATP
17
1.5 ATP
H+ +NADH
2.0 ATP
½O2
H2O1818
8
α-Ketosuccinamate
α-AA
12
ADP
GDP
2
FIGURE 4.3 Conversion of oxaloacetate into pyruvate in animal cells. Complete oxidation of AA-derived oxaloacetate to CO2 occurs through its conversion into pyruvate that involves both mitochondria and the cytoplasm. Pyruvate enters the mitochondria and is decarboxylated to form acetyl-CoA. α-KG, α-ketoglutarate OAA, oxaloacetate; PEP, phosphoenolpyruvate. The enzymes that catalyze the indicated reactions are: (1) citrate synthase; (2) aconitase and iso-citrate dehydrogenase; (3) α-KG dehydrogenase, succinate dehydrogenase, and fumarase; (4) malate dehydrogenase; (5) aspartate transaminase; (6) phosphoenolpyruvate carboxykinase; (7) pyruvate kinase; (8) alanine transaminase; (9) pyruvate carboxylase; (10) asparaginase; (11) asparagine transaminase; (12) ω-amidase; (13) glutamine transaminase; (14) phosphate-acti-vated glutaminase; (15) glutamate dehydrogenase; (16) pyruvate dehydrogenase; (17) nucle-oside-diphosphate kinase; and (18) enzymes of the mitochondrial electron transport system.

102 Amino Acids: Biochemistry and Nutrition
© 2010 Taylor & Francis Group, LLC
TABLE 4.2Energetic Efficiency of Oxidation of AA, Protein, and Other Substrates in Animals
Nutrients
Combustion EnergykJ per
Net ATP Productiona
mol perEfficiency of Energy
Transfer to ATPb
%mol g mol gAlanine 1577 17.7 13 0.146 42.6Arginine 3739 21.5 23.5 0.135 32.4Asparagine 1928 14.6 11 0.083 29.5Aspartate 1601 12.0 13 0.098 41.9Citrulline 3392 19.4 21.5 0.123 32.7Cysteine 2249 18.6 10.5 0.086 24.1Glutamate 2244 15.3 20.5 0.139 47.2Glutamine 2570 17.6 18.5 0.126 37.2Glycinec 973 13.0 7 0.093 37.1Histidine 3213 20.7 16.5 0.106 26.5Isoleucine 3581 27.3 33.5 0.256 48.3Leucine 3582 27.3 32.5 0.248 46.8Lysined 3683 25.2 30 0.205 42.0Methionine 3245 23.0 15 0.101 23.8Ornithine 3030 22.9 23.5 0.177 40.0Phenylalanine 4647 28.1 32 0.194 35.5Proline 2730 23.7 23 0.200 43.5Serine 1444 13.7 10.5 0.100 37.6Threoninee 2053 17.2 19.5 0.163 49.0Tryptophan 5628 27.6 35.5 0.174 32.5Tyrosine 4429 24.4 34.5 0.191 40.2Valine 2922 25.0 26 0.222 45.9Proteinf 2486 22.6 20 0.200 41.5Glucose 2803 15.6 30 0.167 55.3Starchg 2779 17.2 30 0.185 55.7Palmitate 9791 38.2 106 0.414 55.9Fath 31676 39.3 336.5 0.417 54.8
a Based on (1) production of 2.5 mol of ATP from oxidation of 1 mol of NADH or NADPH to H2O and (2) production of 1.5 mol of ATP from oxidation of 1 mol of FADH2 to H2O. Thus, complete oxidation of 1 mol of acetyl-CoA to CO2 and H2O via the Krebs cycle and the mitochondrial electron transport system results in net production of 10 mol of ATP. Net production of ATP from AA oxidation is calculated as total ATP production minus the amounts of ATP required for AA catabolism (including the urea cycle). Conversion of 1 mol of NH3 to 0.5 mol of urea via the urea cycle consumes 2 mol of ATP.
b Calculated on the basis of 51.6 kJ/mol for one high-energy bond in ATP (mol of net ATP production/mol substrate × 51.6 kJ/mol ÷ combustion energy of kJ/mol substrate × 100%).
c When 1 mol of glycine is catabolized by the glycine cleavage system, 1 mol of ATP is produced. When 1 mol of glycine is converted into serine and then oxidized, 13 mol of ATP are produced. Because N5, N10-methylene-tetrahydrofolate, which donates one carbon unit for converting glycine to serine, is formed from tetrahydrofolate via reactions that consume 3.5 mol ATP, this amount is subtracted in the calculation of net ATP production from glycine oxidation via the serine pathway.
d Calculated on the basis of lysine catabolism via the lysine-α-ketoglutarate reductase pathway.e Calculated on the basis of threonine catabolism via the threonine dehydrogenase pathway.f Assuming that the average molecular weight of an AA residue in protein is 100. Protein oxidation: C4.3H7O1.4N1.2 → 0.6CH4N2O + 3.7CO2 + 2.3H2O.g The average molecular weight of glucose residue in starch is 162.h Tripalmitoylglycerol is used as an example.

103Degradation of Amino Acids
© 2010 Taylor & Francis Group, LLC
Calculations for ATP production from the oxidation of selective AA are provided for glutamine (Table 4.3), arginine (Table 4.4), and leucine (Table 4.5). On aver-age, oxidation of 100 g protein to CO2 and water generates a net amount of 20 mol of ATP in animals. The efficiency of energy transfer from AA to ATP ranges from 24% for methionine to 49% for threonine. However, glutamine is a preferred major fuel for rapidly dividing cells (e.g., enterocytes and tumors), cells with great division potential (e.g., lymphocytes), and certain metabolically active cells and tissues (e.g., monocytes, macrophages, and kidney). Provision of NH3 from an abundant neutral AA to rapidly remove both diet-derived and endogenously gen-erated H+ may be an important reason for extensive catabolism of glutamine by these cells and tissues in animals, including humans.
cell- AnD tissue-sPecific DeGrADAtion of AA
AA degradation is catalyzed by specific enzymes, whose distribution varies greatly in different cells, tissues, and species (Hanigan et al. 1998; Kalhan and Bier 2008). Thus, like AA synthesis, catabolism of most AA occurs in a tissue- and cell-specific man-ner. Owing to complex compartmentation for AA degradation in cells, extracellularly
TABLE 4.3ATP Production from Glutamine Oxidation in Animal Cells
Reactions ATP Production
A. Mitochondria (glutamine to malate)
1. Glutamine + H2O → glutamate + NH4+
2. Glutamate + NAD+→ NH4+ + α-KG + NADH + H+ 2.5
3. 2NH HCO4 3+ −+ + 3ATP → urea + 2ADP + 1AMP + 2Pi + PPi (equivalent to four high-energy bonds)
− 4
4. α-KG + CoA + NAD+ → succinyl-CoA + CO2 + NADH + H+ 2.5
5. Succinyl-CoA + GDP + Pi → succinate + GTP 1
6. Succinate + FAD → fumarate + FADH2 1.5
7. Fumarate + H2O → malate
B. Cytoplasm (malate to pyruvate)
8. Malate + NAD+ → oxaloacetate + NADH + H+ 2.5
9. Oxaloacetate + GTP → phosphoenolpyruvate + CO2 + GDP −1
10. Phosphoenolpyruvate + ADP → pyruvate + ATP 1
C. Mitochondria (pyruvate to CO2 and H2O)
11. Pyruvate + NAD+ → acetyl-CoA + CO2 + NADH + H+ 2.5
12. Acetyl-CoA + 2H2O + 3NAD+ + FAD + GDP + Pi 10
→ 2CO2 + 3NADH + 3H+ + FADH2 + GTP + CoA
D. Net reaction
C5H10N2O3 + 4.5O2 → CH4N2O + 4CO2 + 3H2O 18.5
Note: α-KG, α-ketoglutarate.

104 Amino Acids: Biochemistry and Nutrition
© 2010 Taylor & Francis Group, LLC
and intracellularly derived AA may have very different metabolic fates. Additionally, rates of degradation of AA are critically dependent on their extracellular concentra-tions. For reversible reactions, AA catabolism is also influenced by their equilibrium. For most AA, cooperation of multiple organs is required for their complete oxidation to CO2, urea, and water. In animals, alanine, aspartate, glutamate, arginine, and orni-thine can be degraded by all cells and tissues, but the rates of their degradation vary considerably. Except for the placenta, mammary gland, and red blood cells, all kinds of cells and tissues (including skeletal muscle and heart) can degrade glutamine via the phosphate-activated glutaminase pathway. With exception of the liver, all other organs and cells can initiate BCAA transamination and can decarboxylate the α-ketoacids of BCAA. All of the other AA can be degraded in the liver but net degradation may not always occur depending on their extracellular concentrations. For example, in studies
TABLE 4.4ATP Production from Arginine Oxidation via the Arginase Pathway in Animals
Reactions ATP Production
A. Mitochondria and cytoplasm
1. Arginine + H2O → urea + ornithine
B. Mitochondria (ornithine to malate)
2. Ornithine + α-KG → P5C + glutamate
3. Glutamate + NAD+ → NH4+ + α-KG + NADH + H+ 2.5
4. P5C + NADP+ → glutamate + NADPH + H+ 2.5
5. Glutamate + NAD+ → NH4+ + α-KG + NADH + H+ 2.5
6. α-KG + NAD+ + CoA → succinyl-CoA + CO2 + NADH + H+ 2.5
7. Succinyl-CoA + GDP + Pi → succinate + GTP + CoA 1
8. Succinate + FAD → fumarate + FADH2 1.5
9. Fumarate + H2O → malate
10. 2 NH HCO4 3+ −+ + 3ATP → urea + 2ADP + 1AMP + 2Pi + PPi
(equivalent to four high-energy bonds)− 4
C. Cytoplasm (malate to pyruvate)
11. Malate + NAD+ → oxaloacetate + NADH + H+ 2.5
12. Oxaloacetate + GTP → phosphoenolpyruvate + CO2 + GDP −1
13. Phosphoenolpyruvate + ADP → pyruvate + ATP 1
D. Mitochondria (pyruvate to CO2 and H2O)
14. Pyruvate + NAD+ + CoA → acetyl-CoA + CO2 + NADH + H+ 2.5
15. Acetyl-CoA + 2H2O + 3NAD+ + FAD + GDP + Pi 10
→ 2CO2 + 3NADH + 3H+ + FADH2 + GTP + CoA
E. Net reaction
C6H14N4O2 + 5.5O2 → 2CH4N2O + 4CO2 + 3H2O 23.5
Note: α-KG, α-ketoglutarate; P5C, pyrroline-5-carboxylate.

105Degradation of Amino Acids
© 2010 Taylor & Francis Group, LLC
with the perfused rat liver, M. Watford found no net degradation of physiological levels of glutamine (0.5−1 mM in the perfusion medium) by this organ. However, net deg-radation of glutamine occurs in the liver when its extracellular concentration exceeds 1 mM. Among extrahepatic tissues and cells, only the brain, kidneys, and small intes-tine can degrade phenylalanine to form tyrosine. Because the catabolism of some AA in the liver produces acetoacetate, which does not undergo oxidation in hepatocytes, this metabolite is oxidized to CO2 and water by extrahepatic tissues and cells. All AA transaminases and AA decarboxylases depend on vitamin B6 for their catalytic activi-ties. Vitamin B6 is also required for threonine aldolase activity.
PATHWAYS FOR DEGRADATION OF AA IN ANIMAL CELLS
historicAl PersPective
A major product of AA catabolism is NH3, which was known as a metabolite of animals (including humans) in the Middle Ages. However, how NH3 was produced
TABLE 4.5ATP Production from Leucine Oxidation in Animals
Reactions ATP Production
A. Mitochondria and cytoplasm (leucine to KIC)
1. Leucine + α-KG → KIC + glutamate
B. Mitochondria (KIC to CO2 and H2O)
2. Glutamate + NAD+ → NH4+ + α-KG + NADH + H+ 2.5
3. NH4+ + 1.5ATP → 0.5urea + 1ADP + 0.5AMP + 1Pi + 0.5PPi −2
4. KIC + CoA + NAD+ → isovaleryl-CoA + CO2 + NADH + H+ 2.5
5. Isovaleryl-CoA + FAD → β-methylcrotonyl-CoA + FADH2 1.5
6. β-Methylcrotonyl-CoA + ATP + CO2 + H2O −1
→ β-methylglutaconyl-CoA + ADP + Pi
7. β-Methylglutaconyl-CoA + H2O → HMG-CoA
8. HMG-CoA → acetyl-CoA + acetoacetate
9. Acetyl-CoA + 2O2 + 3NAD+ + FAD + GDP + Pi 10
→ 2CO2 + 4H2O + 3NADH + 3H+ + FADH2 + GTP + CoA
10. Acetoacetate+ succinyl-CoA → acetoacetyl-CoA + succinate
11. Succinate + GTP + CoA → succinyl-CoA + GDP −1
12. Acetoacetyl-CoA → 2acetyl-CoA
13. 2Acetyl-CoA + 4H2O + 6NAD+ + 2FAD + 2GDP + 2Pi 20
→ 4CO2 + 6NADH + 6H+ + 2FADH2 + 2GTP + 2CoA
C. Net reaction
C6H13NO2 + 7.5O2 → 0.5CH4N2O + 5.5CO2 + 5.5H2O 32.5
Note: KIC, α-ketoisocaproate; α-KG, α-ketoglutarate.

106 Amino Acids: Biochemistry and Nutrition
© 2010 Taylor & Francis Group, LLC
in the body was a mystery until the late 1700s and the 1800s when chemists and physicians had interest in studying the components of proteins in foodstuffs and their utilization by animals and humans. In 1794, the French chemist Antoine Lavoisier proposed that oxidation of organic substances (including protein) to CO2 and water would be a source of NH3 produced by the body. Due to the lack of analytical techniques to quantify most nitrogenous products, metabolic pathways for AA degradation were largely unknown at the end of the nineteenth century. In the early 1900s, it was discovered that AA are oxidized into α-ketoacids and NH3 by deaminases and that NH3 is subsequently converted into urea and uric acid in mammals but exclusively to uric acid in avian species. In the 1930s when stable isotopes (e.g., 15N-, 13C-, or 2H-labeled AA) became available for use in biochemi-cal research, scientists had a powerful tool to initiate studies aimed at elucidating detailed pathways for AA catabolism in organisms. Progress in this endeavor was greatly facilitated by the availability of radioactive tracers (e.g., 14C- or 3H-labeled AA) in the 1940s. Thus, by the early 1960s, pathways for AA metabolism had largely became known and were elegantly summarized by Hans A. Krebs in his chapter published in the book titled Mammalian Protein Metabolism edited by H. Munro and J.B. Allison in 1964.
cAtABolism of AlAnine, AsPArtAte, AsPArAGine, GlutAmAte, AnD GlutAmine
The pioneering work of biochemists in the early twentieth century on the interme-diary metabolism of alanine, aspartate, asparagine, and glutamate laid a founda-tion for subsequent studies of AA catabolism in animals. Specifically, L. Knopf, A.I. Ringer, and G. Lusk discovered the conversion of asparagine, glutamate, and aspartate into glucose in animals, respectively, in 1903, 1908, and 1910. Similar observations were confirmed from studies with diabetic dogs by H.D. Dakin in 1913. Meanwhile, Dakin found that alanine was also readily converted into glucose in the canine liver. A series of papers by H.A. Krebs in the 1930s greatly advanced the field of AA catabolism. Meanwhile, alanine, aspartate, and glutamate were found to par-ticipate in intracellular transamination in animal tissues. Subsequently, glutamate was recognized as an excitatory neurotransmitter in the brain in the 1960s. It was discovered in the 1970s–1990s that dietary glutamate is almost completely degraded by the small intestine of the mammals studied (including rats, humans, pigs, cattle, and sheep) in first-pass metabolism and does not enter the portal circulation in signif-icant quantities. This seminal finding substantially expanded our knowledge about the utilization of dietary glutamate by mammals and helped scientists to understand the safety of consumption of monosodium glutamate by humans and other animals as a flavor enhancer and physiological regulator of intestinal function.
Since H.G. Windmueller and A.E. Spaeth reported in 1975 that the rat small intes-tine utilizes large amounts of both dietary and arterial glutamine as a major meta-bolic fuel, there has been growing interest in the use of glutamine to improve gut function of animals and humans in the last four decades. Additionally, the findings in the 1980s that glutamine stimulates muscle protein synthesis and lymphocyte pro-liferation led to extensive laboratory and clinical research on glutamine physiology and nutrition in the 1990s and 2000s. Glutamine is now known to be an abundant

107Degradation of Amino Acids
© 2010 Taylor & Francis Group, LLC
AA in physiological fluids (e.g., plasma, milk, fetal fluid, and skeletal muscle), a major vehicle for interorgan metabolism of both carbon and N, a key regulator of gene expression, and an essential precursor for the synthesis of molecules [including nucleotides, aminosugars, and NAD(P)].
Transamination plays an important role in initiating the degradation of alanine, aspartate, and glutamate to yield pyruvate, oxaloacetate, and α-KG, respectively (Figure 4.3). Alanine transaminase (also known as glutamate-pyruvate transaminase) and aspartate transaminase (also known as glutamate oxaloacetate transaminase) are abundant in both mitochondria and the cytoplasm of most mitochondria-containing cells, particularly hepatocytes and enterocytes. Thus, the activities of these two enzymes in serum are often determined to assess hepatic injury in clinical medi-cine. In addition, glutamine transaminases L and K, which convert glutamine into α-ketoglutaramate (Figure 4.3), are ubiquitous in both mitochondria and the cytoplasm of animal tissues (including skeletal muscle, liver, and kidneys). α-Ketoglutaramate undergoes hydrolysis by ω-amidase (expressed in both mitochondria and the cyto-plasm of mitochondria-containing cells) to form α-KG and NH3. Asparagine is hydrolyzed by asparaginase (expressed in both mitochondria and the cytoplasm of certain tissues, including liver and kidneys) to form aspartate and NH3. Interestingly, although the chemical structures of asparagine and glutamine are similar, asparagine is not degraded by mammalian enterocytes, which is in sharp contrast to glutamine. This is because, unlike phosphate-activated glutaminase, asparaginase activity is vir-tually absent from the small-intestinal mucosa. Pyruvate, oxaloacetate, and α-KG are oxidized to CO2 and water, as described in Figure 4.3. As shown in Table 4.2, glutamine has a lower value of energetic efficiency than glutamate in animals (37% vs. 47%) because two additional ATPs are required for converting the glutaminase-generated NH3 into urea.
In addition to transamination, dehydrogenation of glutamate by GDH results in the production of α-KG plus NH3. Although GDH catalyzes the interconversion of glu-tamate into α-KG and NH3, the equilibrium of this reaction at physiological concen-trations of substrates and products favors NH3 production. GDH is a major enzyme that directly produces NH3 from AA catabolism in animal cells. Interestingly, this enzyme is allosterically activated by l-leucine, which has important implications for the regulation of glutamate metabolism and hormone secretion.
Decarboxylation of glutamate by glutamate decarboxylase produces GABA in tis-sues (Figure 4.4). This enzyme is particularly abundant in the brain and the pancreas of animals. In mammals, glutamate decarboxylase exists in two isoforms, which are encoded by two different genes: GAD1 (the brain) and GAD2 (the pancreas). GAD1 and GAD2 proteins have molecular weights of 67 and 65 kDa, respectively. Oxidation of GABA is further degraded to either succinate by succinate semialdehyde dehydro-genase or γ-hydroxybutyrate (Figure 4.4). In the brain, the production and catabolism of GABA occur in neurons and glial cells, respectively (Figure 4.5). These highly cell-specific events play an important role in neurotransmission.
Besides glutamine transaminases, glutamine:fructose-6-phosphate transami-nase (GFAT; a cytosolic enzyme) catalyzes the formation of glutamate from glu-tamine in all cell types, as noted in Chapter 3. GFAT is particularly abundant in red blood cells and endothelial cells. This reaction may be the major source of

108 Amino Acids: Biochemistry and Nutrition
© 2010 Taylor & Francis Group, LLC
glutamate in red blood cells that do not take up extracellular glutamate. Glutamine donates the amide group (−NH2) for the synthesis of UDP-N-acetylglucosamine, which is a precursor for the formation of all macromolecules containing amino sugars (including membrane hormone receptors, hyaluronic acid, chondroitins, heparin, and mucins). Thus, the hexosamine-synthetic pathway is essential to cell growth, development, and function as well as the structure of the extracellular matrix that contains large amounts of glycosaminoglycans.
Phosphate-activated glutaminase (a mitochondrial enzyme) is quantitatively the major enzyme for initiating glutamine degradation in nearly all of mitochondria-containing mammalian cells (Curthoys and Watford 1995). The lack of this enzyme in the placenta and mammary gland maximizes the transfer of glutamine from the mother to the fetus and from maternal blood to milk, respectively. Of particular note, the avian liver expresses only a low level of glutaminase, which minimizes gluta-mine degradation to CO2 and urea so as to maximize the availability of glutamine for uric acid synthesis. Glutaminase has two isoforms: the hepatic protein (~66.3 kDa) and the renal protein (~73.5 kDa) that are encoded by two different genes and differ in biochemical properties. Glutaminase in extrahepatic tissues and cells is the kidney type. Differences in catalytic kinetics and regulation between kidney- and liver-type glutaminases, as originally noted by H.A. Krebs in 1935, are summarized as follows.
CCH2CH2
COO–
OH
Succinate semialdehyde
Succinate semialdehydedehydrogenase
COO–
CH2CH2COO–
Succinate
CH2OHCH2CH2COO–
C OCH2CH2COO–
COO–
α-Ketoglutarate
CCH2CH2
COO–
NH+3H
COO–
L-Glutamate
γ-Hydroxybutyrate (GHB)
L-Glutamatedecarboxylase
(PLP)
H3N CH2CH2CH2 COO–
NAD+
NADH+ H+
H2O NAD+ NADH + H+
α-Ketoglutarate
Glutamate
Succinatesemialdehyde
reductase α-Ketoglutaratedecarboxylase (TPP)GABA transaminase
CO2
CO2
GHBdehydro-genase
γ-Aminobutyrate (GABA)
+
(PLP)
FIGURE 4.4 Oxidation of γ-aminobutyrate in animals. PLP, pyridoxal phosphate; TPP, thiamine pyrophosphate. PLP is a cofactor for glutamate decarboxylase and γ-aminobutyrate transaminase, whereas TPP is required by α-ketoglutarate decarboxylase for catalytic activity.

109Degradation of Amino Acids
© 2010 Taylor & Francis Group, LLC
Kidney-type glutaminase: (a) Does not require NH3 for activation(b) Has low Km for glutamine and low affinity for
phosphate(c) Subject to inhibition by low [glutamate]
Liver-type glutaminase: (a) Absolutely requires NH3 for activation(b) Has high Km for glutamine and high affinity for
phosphate(c) Not affected by low [glutamate]
The glutamine-derived glutamate is degraded as described previously. In many cells types, including cells of the immune system (e.g., lymphocytes, macrophages, and natural killer cells), oxidation of glutamate is incomplete, producing relatively large amounts of aspartate and alanine. The importance of high rates of glutamine hydrolysis to glutamate, aspartate, alanine, and NH3 in cells, which is known as glu-taminolysis (Figure 4.6), remains obscure, but may provide aspartate and ATP for the synthesis of purine and pyrimidine nucleotides. In the small intestine of most
Neuron Neuron
Glutamine
Glutamate
Glutamine Glutamine
Glutamine
Glutamate
Glutamine
Glutamate
Glutamate
GABA
GABA
GABA
Succinatesemialdehyde
Succinate
NH4+
NH4+
NH4+
Mit CO2
ATP
ADP
Cyt
PostsynapticGABA-ergic
cell
Postsynapticglutamatergic
cell
11
2
3
Glial cell
α-KG
FIGURE 4.5 Cell-specific production and catabolism of GABA in the brain. A synapse (a small gap between two cells) allows for the first cell (the presynaptic cell) to communi-cate with the second cell (the postsynaptic cell) through a chemical signal (e.g., glutamate or GABA). These neurotransmitters act on the postsynaptic cell through specialized pro-tein molecules called neurotransmitter receptors. In the brain, neurons produce and release glutamate and GABA into synapses from which these two AA are taken up by glial cells to form glutamine or succinate, respectively. Within mitochondria, succinate can be metabo-lized to α-ketoglutarate which is subsequently converted into glutamate by glutamate dehy-drogenase. The enzymes that catalyze the indicated reactions are: (1) phosphate-activated glutaminase (mitochondrial enzyme); (2) glutamine synthetase (mitochondrial enzyme); and (3) glutamate decarboxylase (a pyridoxal phosphate-dependent cytosolic enzyme). GABA, γ-aminobutyrate; Mit, mitochondrion; Cyt, cytoplasm.
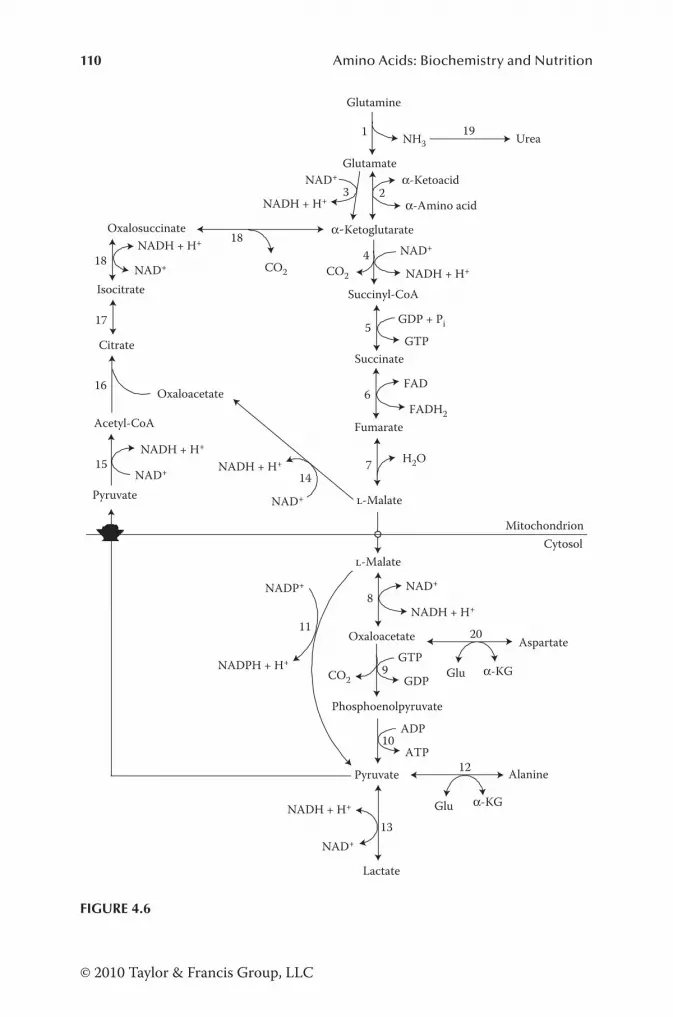
110 Amino Acids: Biochemistry and Nutrition
© 2010 Taylor & Francis Group, LLC
Glutamine
Glutamate
1
α-Ketoacid
α-Αmino acid
α-Ketoglutarate
2
NAD+
NADH + H+
Succinyl-CoA
GDP + Pi
GTPSuccinate
Fumarate
FAD
-Malate
-Malate
Oxaloacetate AspartateGTP
GDP
Phosphoenolpyruvate
Pyruvate Alanine
Lactate
NADH + H+
NAD+
8
PyruvateNAD+
NADH + H+
Acetyl-CoA
Citrate
Isocitrate
OxalosuccinateNADH + H+
NAD+
Oxaloacetate
NADH + H+
NADH + H+
NAD+
NAD+
1415
18
NADP+
NADPH + H+
11
4
NAD+
NADH + H+
Mitochondrion
6
Glu α-KG
Cytosol
Urea19
5
7
20
9
10
12
13
ADP
ATP
16
17
18
Glu α-KG
NH3
3
FADH2
H2O
CO2
CO2 CO2
FIGURE 4.6

111Degradation of Amino Acids
© 2010 Taylor & Francis Group, LLC
mammals, glutamate is used to produce ATP, alanine, ornithine, proline, citrulline, and arginine, as discussed in Chapter 3. Although glucose had long been considered to be the sole metabolic fuel for immunocytes, the work of E.A. Newsholme in the 1980s led to the recognition that glutamine is extensively degraded via glutaminoly-sis in lymphocytes and macrophages. Subsequent studies by G. Wu and colleagues concluded that glutamine contributes ~50% of ATP to these cells. It is now known that dietary glutamate, aspartate, and glutamine plus arterial glutamine provide ~80% of ATP to the small-intestinal mucosa in mammals.
Although the mammalian liver contains high glutaminase activity, oxidation of physiological levels of glutamine by the rat liver is limited. To explain this phenom-enon, D. Haussinger proposed in 1990 an intercellular glutamine−glutamate cycle between periportal and perivenous hepatocytes in the liver (Figure 4.7). Periportal and perivenous hepatocytes are located near the portal vein and hepatic vein, respec-tively, representing ~90–95% and 5–10% of total hepatocytes in the liver (Haussinger 1990). When extracellular glutamine is <1 mM, it is converted into glutamate and NH3 in periportal hepatocytes and can be resynthesized from glutamate and NH3 in perivenous hepatocytes. The intercellular glutamine−glutamate cycle consumes energy (1 mol of ATP per mol of glutamine turnover), but has important physiologi-cal significance. First, this cycle can scavenge NH3 by the high-affinity glutamine synthetase, and maintain low concentrations of NH3 in plasma. Second, this cycle can help adjust NH3 flux into either urea or glutamine according to the needs for the regulation of the acid−base balance. At normal pH, there is no release of gluta-mine by the liver. However, at pH <7.4, the hydrolysis of glutamine into glutamate and NH3 is decreased and the formation of glutamine from glutamate and NH3 is increased, thereby resulting in the release of glutamine from the liver.
cAtABolism of ArGinine, citrulline, AnD ornithine
Work on arginine catabolism dates back to 1904 when arginase was discovered by A. Kossel and H.D. Dakin to hydrolyze AA to ornithine and urea. Physiological and nutritional studies in the late 1930s–1970s identified important roles for arginine in the synthesis of creatine, NH3 detoxification, and maintenance of N balance in young mam-mals and carnivores. During the 1950s, arginine was also found to exist as phosphoar-ginine (a hydrogen atom in the quanidino group was replaced by a phosphate group) in skeletal muscle from various invertebrate animals, where phosphoarginine functions to store biological energy like phosphocreatine in vertebrate species.
FIGURE 4.6 Catabolism of glutamine in animal cells. The enzymes that catalyze the indicated reactions are: (1) phosphate-activated glutaminase; (2) glutamate transaminase; (3) glutamate dehydrogenase; (4) α-ketoglutarate dehydrogenase; (5) succinate thiokinase; (6) succinate dehydrogenase; (7) fumarase; (8) NAD+-linked malate dehydrogenase (cyto-plasm); (9) phosphoenolpyruvate carboxykinase; (10) pyruvate kinase; (11) NADP+-linked malate dehydrogenase; (12) glutamate-pyruvate transaminase; (13) lactate dehydrogenase; (14) NAD+-linked malate dehydrogenase (mitochondria); (15) pyruvate dehydrogenase; (16) citrate synthase; (17) aconitase; (18) isocitrate dehydrogenase; (19) conversion of NH3 into urea via the urea cycle (Chapter 6); (20) glutamate-oxaloacetate transaminase. Glutamine degradation to form glutamate, aspartate, and alanine is known as glutaminolysis.

112 Amino Acids: Biochemistry and Nutrition
© 2010 Taylor & Francis Group, LLC
Since the discovery of NO synthesis from l-arginine by BH4-dependent NO syn-thase (NOS) in mammalian cells in 1987 (Figure 4.9), there has been growing inter-est in arginine biochemistry, nutrition, and physiology. Arginine catabolism occurs via multiple pathways, generating NO, ornithine, urea, polyamines, proline, gluta-mate, creatine, agmatine, CO2, and water (Wu and Morris 1998). These pathways are initiated by arginases, three isoforms of the NOS, arginine decarboxylase (Figure 4.8), and arginine:glycine amidinotransferase (Figure 4.9). In mammals, the arginase pathway is quantitatively most important for arginine degradation and responsible for the oxidation of arginine to CO2 and H2O, with an energetic efficiency of ~30% (Table 4.2). Quantitatively, <1% and 2% of metabolized arginine is utilized for poly-amine synthesis and constitutive NO production, respectively, in mammalian cells. Because guanidinoacetate (a product of arginine:glycine amidinotransferase) is neu-rotoxic, it must be converted into a nontoxic substance, namely creatine, which has both metabolic and regulatory roles. There is complex compartmentation of arginine degradation at cellular, tissue, and whole-body levels.
Much of our current knowledge on molecular regulation of arginase expression has been produced by the extensive studies of S.M. Morris Jr (2009). Type-I arginase is expressed abundantly in hepatocytes and to a limited extent, in extrahepatic cells, including enterocytes of postweaning mammals, endothelial cells, mammary epithe-lial cells, macrophages, and primate red blood cells. In contrast, Type-II arginase is widely expressed at relatively low levels in virtually all mitochondria-containing extra-hepatic cells (including neuronal, renal, vascular, and muscle cells) and plays an impor-tant role in regulating the synthesis of NO, proline, and polyamines. Arginases I and II are encoded by two different genes and differ in their biochemical and immunological properties. In mammals, the arginine-derived ornithine is utilized for the synthesis of glutamate in mitochondria and of proline, glutamine, and polyamines in the cytoplasm. Concentrations of polyamines depend on the rates of their synthesis and degradation. Pathways for the catabolism of polyamines will be described in Chapter 5.
Arginase expression varies with tissue and species. One example is that arginase activity is absent from rapidly growing porcine placentae and enterocytes of suck-ling piglets. These metabolic strategies help maximize the supply of arginine from mother to fetus and from maternal milk to the systemic circulation of neonates.
Periportal hepatocytes
Mitochondria
Gln Glu + NH4+
Urea
HCO3–
GlutaminaseGlu + NH4
+ Gln
Perivenous hepatocytes
Cytoplasm
Gln synthetase
ATP ADP + Pi
FIGURE 4.7 Intercellular glutamine−glutamate cycle involving periportal and perivenous hepatocytes in the mammalian liver. NH3 that is not converted into urea in periportal hepato-cytes is utilized to synthesize glutamine in perivenous hepatocytes.

113Degradation of Amino Acids
© 2010 Taylor & Francis Group, LLC
Δ1 --
Pyrr
olin
e-5-
carb
oxyl
ate
Glu
α-K
G
OA
T
Mito
chon
dria
Cyt
osol
CO
2
Putr
esci
ne
OD
C
NA
DP+
Δ1 --
Pyrr
olin
e-5-
carb
oxyl
ate
Ure
a
-A
rgin
ine
-O
rnith
ine
Ure
a Arg
inas
e IH
2O
-O
rnith
ine
Arg
inas
e II H
2O
NO
S
Sper
mid
ine
DC
AM
MT
AD
CA
M
Sper
min
e
MT
A
SPD
S
Sper
min
e sy
ntha
se
P5C
R
NA
DPH
+ H
+
NA
DP+
Prol
ine
-C
itrul
line
NO
AS
Fum
arat
eA
SL
Asp
NA
DPH
+ H
+
-A
rgin
ine
-G
luta
mat
e
P5C
D
NA
DP+
NA
DPH
+ H
+N
AD
PH +
H+
+ A
TP
NA
DP+
+ P i
+ A
DP
P5C
S-
Citr
ullin
e
ASS
NA
GA
cety
l CoA
CoA
CP2A
DP
+ P i
2AT
P HC
O3– +
NH
3
Prol
ine
H2O ½O
2
Agm
atin
e
CO
2 Orn
GA
GA
Cre
atin
e
PO
AD
C
-G
ln
H2O
BH4
NH
4+ Glu
tam
inas
eC
PS-I
OC
T
-G
luta
mat
e PUT
Ure
a
AG
A
GM
AT
SAH
CSA
M
Cr-
P
NA
GS
CK
AD
PA
TP
Cre
atin
ine
H2OP i
SAM
CO
2
SAM
D
Gly
AG
AT
α-K
GG
DH
FIG
UR
E 4.
8

114 Amino Acids: Biochemistry and Nutrition
© 2010 Taylor & Francis Group, LLC
FIGURE 4.8 Catabolism of arginine and proline in animals. Most of the enzymes that degrade arginine and proline are cell- and tissue-specific. ADC, arginine decarboxyl-ase; AGA, agmatinase; AGAT, arginine:glycine amidinotransferase; ASL, argininosucci-nate lyase; ASS, argininosuccinate synthase; AS, argininosuccinate; Asp, aspartate; BH4, (6R)-5,6,7,8-tetrahydro-l-biopterin; CP, carbamoylphosphate; CPS-I, carbamoylphosphate synthetase-I; DCAM, decarboxylated S-adenosylmethionine; Glu, glutamate; Gln, gluta-mine; GDH, glutamate dehydrogenase; GA, guanidinoacetate; GMAT, guanidinoacetate N-methyltransferase; CK, creatine kinase; Cr-P, creatine-phosphate; α-KG, α-ketoglutarate; MTA, methylthioadenosine; NAG, N-acetylglutamate; NAGS, N-acetylglutamate synthase; NO, nitric oxide; NOS, nitric oxide synthase; OAT, ornithine aminotransferase; OCT, orni-thine carbamoyltransferase; ODC, ornithine decarboxylase; PO, proline oxidase; PUT, putrescine; P5CD, pyrroline-5-carboxylate dehydrogenase; P5CR, pyrroline-5-carboxylate reductase; P5CS, pyrroline-5-carboxylate synthase; SAM, S-adenosylmethionine; SAMD, S-adenosylmethionine decarboxylase; SAHC, S-adenosylhomocysteine; SPDS, spermidine synthase.
Guanosine triphosphate
7,8-Dihydroneopterin triphosphate Neopterin
6-Pyruvoyl-5,6,7,8-tetrahydropterin
(6R)-5,6,7,8-Tetrahydrobiopterin 4a-Peroxy-tetrahydrobiopterin
Pterin-4a-carbinolamineQuinonoid-7,8-dihydrobiopterin
Tetrahydrobiopterinradical
7,8-Dihydropterin
7,8-Dihydropterin Biopterin
Dihydroxanthopterin
Sepiapterin
7,8-Dihydrobiopterin
NADPH + H+
NADP+
NADPH + H+
NADP+
Formate
OPPPZn2+, Mg2+
2 NADPH + H+
2 NADP+
NAD+
NADH + H+
GSSG
2GSH
Try
Dopa
Phe
Tyr
Typ
ST
2e– + 2H+H2O
HPAe– + H+
NADPH + H+
Arg + O2
NADP+
Cit + NO
H2O
1
2
15 3
34
14
5 7 6 8 9 10
11
1213
e–
[O]
O2
FIGURE 4.9 Synthesis of tetrahydrobiopterin via de novo and salvage pathways in ani-mal cells. Enzymes that catalyze the indicated reactions are: (1) GTP cyclohydrolase I; (2) 6-pyruvoyl tetrahydropterin synthase; (3) sepiapterin reductase; (4) dihydrofolate reductase; (5) dihydropteridine reductase; (6) reduction by reduced glutathione; (7) oxidation by reactive oxygen and nitrogen species; (8) tyrosine hydroxylase; (9) phenylalanine hydroxylase; (10) tryptophan hydroxylase; (11) pterin-4a-carbinolamine dehydratase; (12) nonenzymic rear-rangement; (13) nonenzymatic loss of the alkyl side chain; (14) NO synthase; (15) phospha-tases. Arg, arginine; Cit, citrulline; GSH, reduced glutathione; GSSG, glutathione disulfide; HPA, 2-hydroxy-propionaldehyde (CH3CHOHCHO).

115Degradation of Amino Acids
© 2010 Taylor & Francis Group, LLC
Thus, in these cell types, proline is the major source of ornithine for polyamine syn-thesis. In contrast, a relatively high arginase activity is expressed in ovine placentae to compensate for lower concentrations of proline in ovine maternal plasma. This species difference in placental arginase expression contributes to an unusual abun-dance of arginine (e.g., 4–6 mM at day 40 of gestation) in porcine allantoic fluid but much lower concentrations of arginine (e.g., 0.82 mM at day 60 of gestation) in ovine allantoic fluid. Interestingly, citrulline is unusually abundant (e.g., 10 mM at day 60 of gestation) in ovine allantoic fluid as an effective precursor for arginine generation in the conceptus. Available evidence shows that arginase is expressed in human and rat placentae. Notably, the lactating mammary gland in all species studied (includ-ing cow, pig, rat, and sheep) expresses a high level of arginase, resulting in arginine deficiency but relatively high abundances of both proline and polyamines in milk.
There are three isoforms of the NOS: NOS1, NOS2, and NOS3 that differ greatly in biochemical properties and tissue distribution (Table 4.6). The NOS1 isoform (also known as nNOS) was first discovered in 1990 in neuronal tissues, the NOS2 isoform (also known as iNOS) was originally found in 1991 to be inducible under certain conditions in macrophages, and the NOS3 isoform (also known as eNOS) was first identified in 1991 in endothelial cells. Both NOS1 and NOS3 are Ca2+-dependent and constitutively expressed, whereas NOS2 is Ca2+-independent and expressed abun-dantly in response to immunological challenges. The NOS isoforms can be present in the plasma membrane caveolae, cytoplasm, nucleus, rough endoplasmic reticu-lum, and mitochondria, depending on isoform and cell type. The NOS isoforms are encoded by three different genes, have 51–57% homology in nucleotide sequences, and require arginine, O2, BH4, NADPH, calmodulin, FMN, and FAD for NO syn-thesis. Arginine, BH4, and heme promote and stabilize the active dimeric form of all isoforms of the NOS. Additionally, BH4 plays a redox role in NOS catalysis. Specifically, BH4 donates an electron to form a BH4 radical, which then returns to the reduced state by accepting an electron from a flavin in the reductase domain of NOS. BH4 is synthesized de novo from GTP in all cell types, with GTP cyclohydro-lase I as the first and rate-controlling enzyme (Figure 4.9). Sepiapterin (a synthetic chemical) can readily be converted into BH4 via the “salvage pathway” in all cells, and this pathway has been exploited experimentally to treat endothelial dysfunction associated with BH4 deficiency. Thus, since the initial description of a pteridine in butterflies by F.G. Hopkins in 1889, research on BH4 and its related substances (Figure 4.10) has greatly advanced AA biochemistry and nutrition.
Arginase and NOS compete for arginine. Therefore, relative changes in their enzymatic activities serve as major determinants of NO and polyamine produc-tion in many cell types, including endothelial cells, macrophages, smooth muscle cells, astrocytes, bacteria, and parasites. A marked elevation in arginase activity provides a mechanism responsible for the survival of immunologically challenged parasites and bacteria. The Km values of NOS for arginine have been reported to be 3–20 μM (≤10% of intracellular arginine concentrations) depending on isoforms (e.g., 2.9 μM for eNOS). For comparison, intracellular concentrations of arginine are usually 0.5−2 mM in extrahepatic cells exposed to 0.1−0.2 mM extracellular argi-nine, which are usually physiological concentrations in the plasma of healthy posta-bsorptive humans and animals, depending on the species. Thus, in extrahepatic cells,

116 Amino Acids: Biochemistry and Nutrition
© 2010 Taylor & Francis Group, LLC
intracellular concentrations of arginine are usually 5−10 times those in plasma or culture medium. Even in mammalian hepatocytes with an exceedingly high arginase activity, intracellular concentrations of arginine are normally 50–100 μM, depend-ing on species and extracellular concentrations of arginine. Therefore, in animal cells exposed to 0.05 mM extracellular arginine, NOS is already well saturated with its substrate arginine and the enzyme-catalyzed reaction would not be affected by an extracellular concentration of arginine greater than 0.05 mM. However, increas-ing extracellular concentrations of arginine from 0.05 to 10 mM dose dependently
TABLE 4.6Compartmentalization, Biochemical Properties, and Gene Structure of the NOS Isoforms in Animal Tissues
Tissue nNOS (NOS1) iNOS (NOS2) eNOS (NOS3)
Tissue DistributionBlood vessel Weakly expressed Weakly expressed Cytoplasm, PMC
Brain Cytoplasm, RER PM, mitochondria
Primarily cytoplasm Cytoplasm, PMC
Brown adipose Weakly expressed in cytoplasm
Cytoplasm, nucleus Cytoplasm, nucleus, PMC
Heart Mitochondria, SR Primarily cytoplasm PTC, sarcoplasm
Kidney Mitochondria Primarily cytoplasm Cytoplasm, PMC
Liver Mitochondria Primarily cytoplasm in Cytoplasm, PMC
periportal hepatocytes in hepatocytes
Placenta Weakly expressed Absent Cytoplasm, PMC
Skeletal muscle Mitochondria, sarcoplasm, SM
Sarcoplasm, SM Sarcoplasm, SR, SM caveolae
White adipose Weakly expressed in cytoplasm
Cytoplasm, plasma membrane
Cytoplasm, PMC
Chromosome, Gene Size, and Gene StructureChromosome 12 17 7
Gene size (kb) 160 37 21
Gene structure 29 exons, 28 introns 26 exons, 25 introns 26 exons, 25 introns
Protein Structure, Molecular Weight, and Enzyme KineticsProtein structure Homodimer Homodimer Homodimer
Molecular weight 160 kDa/monomer 125–130 kDa/monomer 135 kDa/monomer
Km (arginine) 3–16 μM 3–16 μM 2.9 μM
Km (BH4) 0.2–0.3 μM 1.6 μM 0.2–0.3 μM
Km (NADPH) 3–5 μM 0.2–1 μM 3.0 μM
Source: Adapted from Wu, G. and S.M. Morris, Jr. 1998. Biochem. J. 336:1–17; Alderton, W.K., C.E. Cooper, and R.G. Knowles. 2001. Biochem. J. 357:593–615.
Note: eNOS, endothelial NO synthase; iNOS, inducible NO synthase; nNOS, neuronal NO synthase; PM, postsynaptic membrane; PMC, plasma membrane caveolae; PTC, plasmalemmal and T-tubular caveo-lae; RER, rough endoplasmic reticulum; SM, sarcolemmal membrane; SR, sarcoplasmic reticulum.
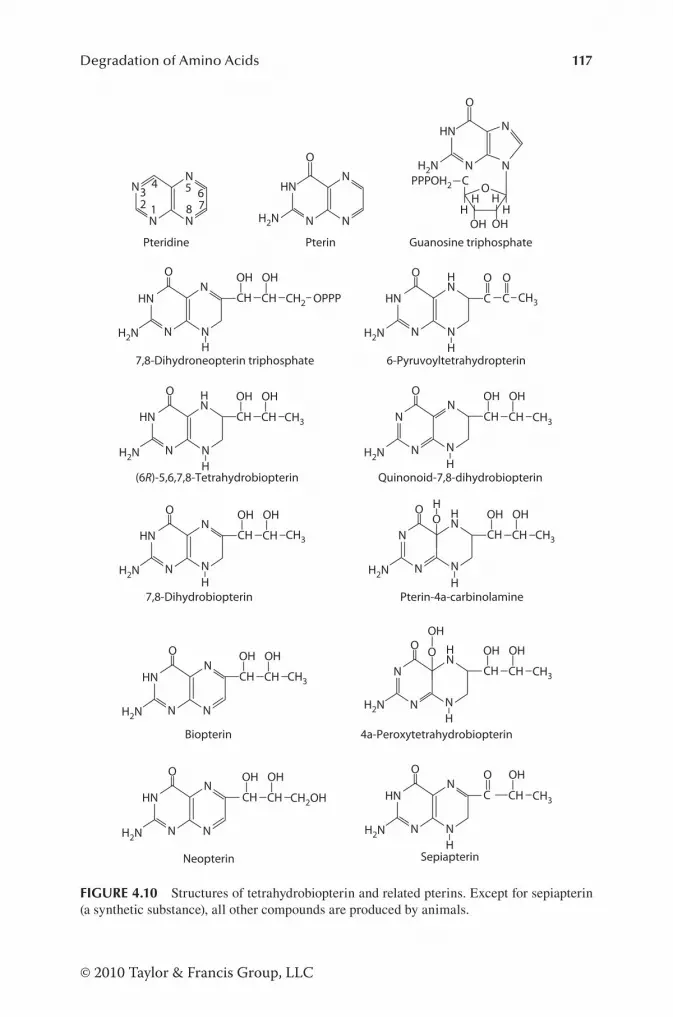
117Degradation of Amino Acids
© 2010 Taylor & Francis Group, LLC
NN
NN
Pteridine
123
4678
NN
HN
H2N
H2N
H2N
H2N H2N
H2N
H2N
H2N
H2N
H2N
N
O
Pterin
N
HNN
C C CH3
OO
6-Pyruvoyltetrahydropterin
NH
HO
N
HNN
7,8-Dihydroneopterin triphosphate
NH
CH2 OPPP
OHOH
CH CH
O
CH3 CH3
CH3
CH3CH3
CH3
CH3
N
HN
(6R)-5,6,7,8-Tetrahydrobiopterin
NH
NH OHOH
CH CH
O
N
NN
Quinonoid-7,8-dihydrobiopterin
NH
OHOH
CH CH
O
N
HNN
7,8-Dihydrobiopterin
NH
O OHOH
CH CH
N
HNN
Biopterin
N
O OHOH
CH CH
N
HNN
Neopterin
N
CH2OH
OHOH
CH CH
O
NH2N
H2N
O
N
N
OHOHGuanosine triphosphate
PPPOH2 C
HN
HHHH
O
N
HNN
Sepiapterin
N
O OHO
C CH
N
NN
4a-Peroxytetrahydrobiopterin
NH
HO
OH
OHOH
CH CH
O
N
NN
Pterin-4a-carbinolamine
NH
OHOH
CH CH
HOHO
H
5
FIGURE 4.10 Structures of tetrahydrobiopterin and related pterins. Except for sepiapterin (a synthetic substance), all other compounds are produced by animals.

118 Amino Acids: Biochemistry and Nutrition
© 2010 Taylor & Francis Group, LLC
increases NO production by endothelial cells, activated macrophages, and other cell types. This phenomenon has been termed “the arginine paradox” for NO synthesis. This paradox can now be explained satisfactorily by arginine-induced changes in the amounts of NOS or cofactors. For example, in cells (e.g., cytokine-stimulated astrocytes), arginine promotes the translation of NOS1 mRNA and increases the amount of iNOS, thereby enhancing NO synthesis. In endothelial cells, arginine has no effect on eNOS abundance but stimulates expression of GTP cyclohydrolase I for BH4 synthesis, thereby stimulating NO generation.
Arginine decarboxylase (a mitochondrial enzyme) was discovered in the rat brain in 1994 and is the most recent addition to a family of mammalian arginine-meta-bolic enzymes. This enzyme catalyzes the synthesis of agmatine from arginine in rat brain, liver, kidney, adrenal gland, macrophages, and other cell types. Agmatine was initially identified as an endogenous agonist at imidazoline receptors in the brain and was subsequently found to be an inhibitor of NOS. In cells expressing arginine decarboxylase, agmatine is decarboxylated by agmatinase (a mitochondrial enzyme) to produce putrescine, and this may be a novel path for polyamine synthesis in animal cells (Figure 4.8). There are species and perhaps developmental differ-ences in tissue distribution of arginine decarboxylase activity. For example, arginine decarboxylase or agmatinase activity is absent from porcine enterocytes. In contrast, low levels of both enzymes are expressed in the liver. Additionally, agmatinase is present constitutively in some cell types (e.g., the RAW 264.7 murine macrophage line) and its expression can be induced by hepatitis B virus, suggesting a role for this enzyme in the pathogenesis of this liver disease. Because arginase activities are much higher than those of arginine decarboxylase or agmatinase in rat tissues, changes in arginase activities will likely have a much greater impact on mammalian synthesis of NO and polyamines, compared with arginine decarboxylase. At present, almost nothing is known about the properties of mammalian arginine decarboxylase or agmatinase nor about agmatine metabolism in vivo.
Arginine-derived ornithine can be converted into putrescine, spermidine, and spermine almost in all cell types. As noted previously, ornithine can also be utilized for proline synthesis (Figure 4.8). In addition, large amounts of creatine are formed from arginine, glycine, and methionine via interorgan metabolism in animals. These pathways will be described in Chapter 5.
cAtABolism of BcAA
Early in 1906, G. Embden recognized that leucine is converted into acetoacetate and β-hydroxybutyrate in mammals. In contrast, A.I. Ringer reported in 1913 that valine is converted into glucose via succinate as an intermediate, indicating a different metabolic pathway than leucine. Subsequently, N.L. Edson found in 1935 that isoleu-cine can be metabolized to either glucose and ketone bodies in animals, depending on experimental conditions. It was long assumed without much evidence that BCAA were catabolized extensively in the liver. This assumption was questioned in 1965 by the observation that concentrations of BCAA in plasma did not change in liverless dogs for up to 22 h, suggesting that the liver is not a site for BCAA catabolism. This conclusion was subsequently supported by the finding that the liver has a very low

119Degradation of Amino Acids
© 2010 Taylor & Francis Group, LLC
activity of BCAA transaminase in the presence of physiological concentrations of BCAA. In contrast to the liver, skeletal muscle had long been considered to be a rela-tively inert protein reservoir until 1961 when P. Johnson reported for the first time that 14CO2 is produced from l-[1-14C]leucine by the rat diaphragm. Subsequent work established skeletal muscle as the major site for BCAA transamination in the body. Based on isotopic and enzymological studies, H.A. Krebs proposed in 1964 that BCAA catabolism shares the first three common steps (Figure 4.11): transamination, oxidative decarboxylation, and acyl-CoA dehydrogenation. The first two reactions are now known to be highly tissue-specific (Brosnan and Brosnan 2006).
Two isoforms of BCAA transaminase (mitochondrial and cytosolic) have been identified in animal tissues (including skeletal muscle, small intestine, adipose tis-sue, mammary gland, placenta, kidneys, heart, and brain), which use α-KG as the major acceptor of the amino group (Table 4.7). This enzyme accepts all three BCAA as substrates but has little activity with pyruvate and none with oxaloacetate. In the liver, the mitochondria have little or low activity of BCAA transaminase. The level of the cytosolic enzyme protein in the liver is also much lower than that in the skeletal muscle, kidney, heart, and small intestine. Thus, at physiological concen-trations of BCAA, their transamination in the liver is limited. Owing to the large size of skeletal muscle, this tissue is the major site for BCAA transamination in the body. In contrast, the activity of BCKA dehydrogenase (a mitochondrial enzyme), which decarboxylates BCKA (products of BCAA transamination) to form acyl-CoA, is particularly high in the liver but much lower in other tissues (including skeletal muscle, small intestine, adipose tissue, mammary gland, placenta, kidneys, heart, and brain) (Harper et al. 1984). Thus, most of the BCKA produced by extrahepatic tissues is released to circulation for uptake and catabolism by the liver. The BCKA dehydrogenase complex, which is analogous to the pyruvate dehydrogenase complex and the α-KG dehydrogenase complex, consists of BCKA decarboxylase (E1 which requires thiamine pyrophosphate as a cofactor), dihydrolipoamide acyltransferase (E2 which requires lipoate and coenzyme A as cofactors), and dihydrolipoamide dehy-drogenase (E3 which requires FAD and NAD as cofactors) (Islam et al. 2007). The BCKA dehydrogenase E1 is composed of two subunits: E1a and E1b. The oxidative decarboxylation of BCKA is regulated by both allosteric and covalent mechanisms. BCKA dehydrogenase is inhibited by phosphorylation and activated by dephosphory-lation. Allosteric inhibition of BCKA dehydrogenase kinase by BCKA [particularly by α-ketoisocaproate (KIC; the α-ketoacid of leucine)] provides a mechanism for pro-moting the catabolism of excess BCAA and conserving low concentrations of BCAA.
Besides BCKA dehydrogenase, ~5–10% of KIC is degraded by KIC dioxygen-ase in the cytosol of the liver to generate β-hydroxy-β-methylbutyrate (HMB). This enzyme was initially discovered by P.J. Sabourin and L.L. Bieber in 1981. As noted by K. Bloch in 1954, HMB is metabolized to β-hydroxy-β-methylglutaryl-CoA in hepatocytes, which is the precursor of acetyl-CoA, acetoacetate, and cholesterol.
After acryl-CoA dehydrogenation, the carbon skeletons of leucine, isoleucine, and valine are degraded by different enzymes, which are all located in the mito-chondria. Specifically, acetyl-CoA plus acetoacetate, succinyl-CoA, and acetyl-CoA plus succinyl-CoA are produced from leucine, valine, and isoleucine, respectively. Because the liver cannot utilize acetoacetate due to the lack of 3-ketoacid CoA

120 Amino Acids: Biochemistry and Nutrition
© 2010 Taylor & Francis Group, LLC
Isol
euci
neVa
line
Leuc
ine
Glu
tam
ate
α-KG
Glu
tam
ate
α-KG
α-K
G
Glu
tam
ate
α-K
eto-
β-m
ethy
lval
erat
eα-
Ket
oiso
vale
rate
α-K
etoi
soca
proa
te
β-M
ethy
lcro
tony
l-CoA
NA
D+
NA
DH
+ H
+
α-M
ethy
lbut
yryl
-CoA
Isob
utyr
yl-C
oAIs
oval
eryl
-CoA
NA
D+
NA
DH
+ H
+
NA
D+
NA
DH
+ H
+
FAD
FAD
H2
FAD
FAD
H2
FAD
FAD
H2
Tigl
yl-C
oAM
ethy
lacr
ylyl
-CoA
H2O
H2O H2O
H2O
H2O
H2O
ATP
+ C
O2
AD
P +
P iα-
Met
hyl-β
-hyd
roxy
buty
ryl-C
oAβ-
Hyd
roxy
buty
ryl-C
oAβ-
Met
hylg
luta
cony
l-CoA
NA
D+
NA
DH
+ H
+C
oAα-
Met
hyla
ceto
acet
yl-C
oAβ-
Hyd
roxy
isob
utyr
ate
β-H
ydro
xy-β
-met
hyl-
glut
aryl
-CoA
(HM
G-C
oA)
CoA
Ace
tyl-C
oA
NA
D+
NA
DH
+ H
+ A
cety
l-CoA
Prop
iony
l-CoA
Met
hylm
alon
ate
sem
iald
ehyd
eN
AD
+N
AD
H +
H+
Succ
inyl
-CoA
Ace
toac
etat
e Succ
inyl
-CoA
Succ
inat
e
Ace
toac
etyl
-CoA
CoA
β-H
ydro
xy-
β-m
ethy
lbut
yrat
e(H
MB)
O2
CO
2 ATP
+ C
oA
AM
P +
PPi
HM
B-C
oA
ATP
+ C
O2
AD
P +
P i
CoA
CoA
CoA
CO
2C
O2
CO
2
Mev
alon
ate
Cho
lest
erol
Glu
cose
CO
2
CO
2
Uri
ne
(10–
40%
)1
11
22
33
3
4 5
6
7 8 9
10
11
12 13
1416
17
18
19
20
21
22
23
24
25
25
ATP
AM
P15
CO
2C
oA
CoA PP
iS-
β-A
min
o-iso
buty
rateG
luα-
KG26
2
FIG
UR
E 4.
11

121Degradation of Amino Acids
© 2010 Taylor & Francis Group, LLC
transferase, this metabolite must be converted into β-hydroxybutyrate and the two ketone bodies are subsequently oxidized by extrahepatic tissues. The catabolism of valine also generates β-aminoisobutyrate, whose excretion in urine is increased in patients with neoplastic disease. Based on the metabolic fate of BCAA, leucine is strictly ketogenic, valine is glucogenic, and isoleucine is both ketogenic and gluco-genic. As illustrated with leucine as an example (Table 4.5), BCAA are among the AA with a relatively high value (47%) of energetic efficiency in animals.
TABLE 4.7BCAA Transaminases and BCKA Dehydrogenase in Mammalian Cells
Enzyme Molecular MassCofactor or
Prosthetic Group
BCAA transaminase
Mitochondrial 41 kDa/mononer (homodimer) Pyridoxial phosphate
Cytosolic 43 kDa/mononer (homodimer) Pyridoxial phosphate
BCKA dehydrogenase complex
BCKA decarboxylase (E1) α2β2 (1.7 × 10⁵ Da) TPP
α-Subunit 46.5 Da Mg2+
β-Subunit 37.2 Da
Dihydrolipoyl transacylase (E2) α24 (1.1 × 10⁶ Da) Lipoic acid
Subunit 46,518 Da
Dihydrolipoyl dehydrogenase (E3) 1.12 × 10⁵ Da FAD
Subunit 55 kDa
BCKD kinase 43 kDa Mg2+
BCKD phosphatase 4.6 × 10⁵ Da Mn2+
Subunit 33 kDa
Source: Adapted from Brosnan, J.T. and M.E. Brosnan 2006. J. Nutr. 136:207S–211S; Harper, A.E., R.H. Miller, and K.P. Block. 1984. Annu. Rev. Nutr. 4:409–454; Islam, M.M. et al. 2007. J. Biol. Chem. 282:11893–11903.
Note: BCKD, branched-chain ~-ketoacid dehydrogenase; TPP, thiamine pyrophosphate.
FIGURE 4.11 Catabolism of BCAA in animals via interorgan cooperation. The enzymes that catalyze the indicated reactions are: (1) BCAA transaminase; (2) branched-chain ~-keto-acid dehydrogenase; (3) acyl-CoA dehydrogenase; (4) enol-CoA hydratase; (5) ~-hydroxy-acyl-CoA dehydrogenase; (6) acetyl-coA acetyltransferase; (7) enol-CoA hydratase; (8) ~-hydroxyisobutyryl-CoA hydrolase; (9) ~-hydroxyisobutyrate dehydrogenase; (10) meth-ylmalonate semialdehyde dehydrogenase; (11) ~-methylcrotonyl-CoA carboxylase (a biotin-dependent enzyme); (12) ~-methylglutaconyl-CoA hydratase; (13) HMG-CoA lyase; (14) 3-ketoacid CoA transferase; (15) succinyl-CoA:3-ketoacid CoA transferase; (16) acetoacetyl-CoA thiolase; (17) ~-ketoisocaproate dioxygenase; (18) HMB-CoA synthase; (19) HMB-CoA carboxylase; (20) HMG-CoA reductase (an NADPH-dependent enzyme); (21) enzymes for cholesterol synthesis; (22) enzymes for conversion of propionyl-CoA into succinyl-CoA; (23) enzymes for gluconeogenesis; (24) enzymes for conversion of succinyl-CoA to acetyl-CoA; (25) enzymes of the Krebs cycle; and (26) ~-aminoisobutyrate transaminase.

122 Amino Acids: Biochemistry and Nutrition
© 2010 Taylor & Francis Group, LLC
MT
HF
+ N
AD
H +
H+
TH
F +
NA
D+
Gly
cine
Serin
e
Gly
oxyl
atePy
r
Ala
½O
2
NH
3Fo
rmat
e
½O
2C
O2
Mn
CO
2
NA
D+
NA
D+
NA
DH
+ H
+
[Am
inoa
cryl
ate]
H2O
NH
3
Gly
oxyl
ate
Oxa
late O
2H2O
2
2CO
2
2H+
+ O
2
H2O
2 Pero
xiso
me
1
2
34
5
6
7
7
89
NH
3N
AD
H +
H+
MT
HF
TH
F
Serin
eα-
KG
Glu
Hyd
roxy
pyru
vae
NA
D(P
)H +
H+
NA
D(P
)+
D-G
lyce
rate
D-3
-Pho
spho
glyc
erat
e
Mito
chon
drio
n
Pyru
vate
Phos
phat
idyl
serin
e
Phos
phat
idyl
chol
ine
Cho
line
Phos
phat
idyl
etha
nola
min
e
CO
2
Etha
nola
min
e
Serin
e
Deh
ydro
sphi
ngos
ine
Palm
itoyl
-CoA
CO
2
Dih
ydro
sphi
ngos
ine
NA
DPH
+ H
+
NA
DP+
FAD
FAD
H2
Sphi
ngos
ine
Sphi
ngos
ine-
1-P
AT
PA
DP
PiH
2O
Cyt
opla
sm
22
15
14
13
12
11 10
21
20
18
17
16
AT
PA
DP
FIG
UR
E 4.
12
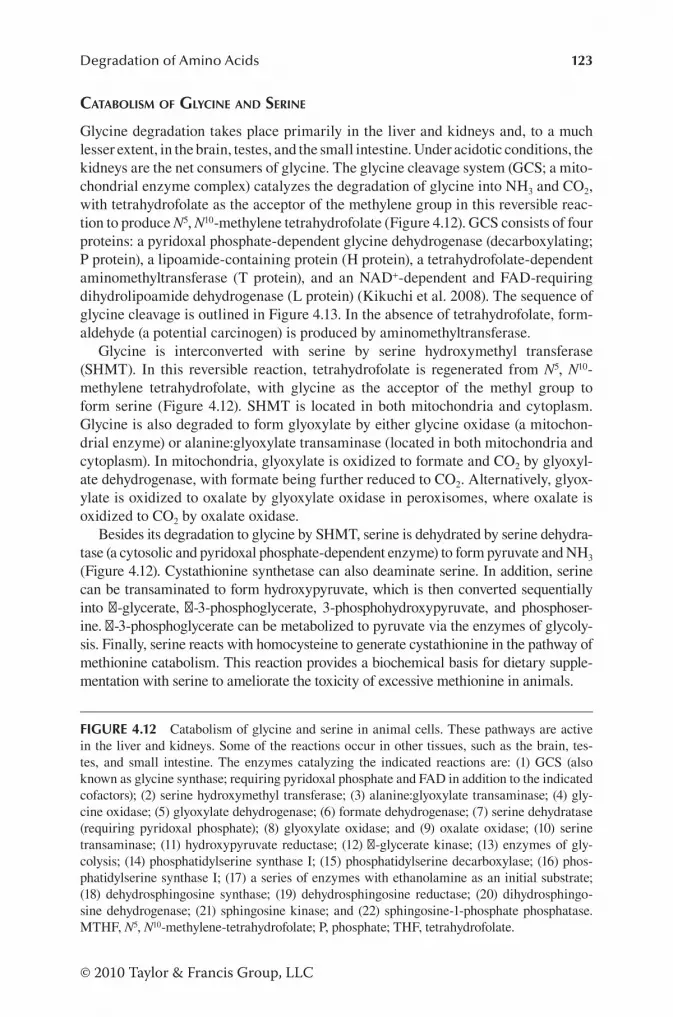
123Degradation of Amino Acids
© 2010 Taylor & Francis Group, LLC
cAtABolism of Glycine AnD serine
Glycine degradation takes place primarily in the liver and kidneys and, to a much lesser extent, in the brain, testes, and the small intestine. Under acidotic conditions, the kidneys are the net consumers of glycine. The glycine cleavage system (GCS; a mito-chondrial enzyme complex) catalyzes the degradation of glycine into NH3 and CO2, with tetrahydrofolate as the acceptor of the methylene group in this reversible reac-tion to produce N5, N10-methylene tetrahydrofolate (Figure 4.12). GCS consists of four proteins: a pyridoxal phosphate-dependent glycine dehydrogenase (decarboxylating; P protein), a lipoamide-containing protein (H protein), a tetrahydrofolate-dependent aminomethyltransferase (T protein), and an NAD+-dependent and FAD-requiring dihydrolipoamide dehydrogenase (L protein) (Kikuchi et al. 2008). The sequence of glycine cleavage is outlined in Figure 4.13. In the absence of tetrahydrofolate, form-aldehyde (a potential carcinogen) is produced by aminomethyltransferase.
Glycine is interconverted with serine by serine hydroxymethyl transferase (SHMT). In this reversible reaction, tetrahydrofolate is regenerated from N5, N10-methylene tetrahydrofolate, with glycine as the acceptor of the methyl group to form serine (Figure 4.12). SHMT is located in both mitochondria and cytoplasm. Glycine is also degraded to form glyoxylate by either glycine oxidase (a mitochon-drial enzyme) or alanine:glyoxylate transaminase (located in both mitochondria and cytoplasm). In mitochondria, glyoxylate is oxidized to formate and CO2 by glyoxyl-ate dehydrogenase, with formate being further reduced to CO2. Alternatively, glyox-ylate is oxidized to oxalate by glyoxylate oxidase in peroxisomes, where oxalate is oxidized to CO2 by oxalate oxidase.
Besides its degradation to glycine by SHMT, serine is dehydrated by serine dehydra-tase (a cytosolic and pyridoxal phosphate-dependent enzyme) to form pyruvate and NH3 (Figure 4.12). Cystathionine synthetase can also deaminate serine. In addition, serine can be transaminated to form hydroxypyruvate, which is then converted sequentially into d-glycerate, d-3-phosphoglycerate, 3-phosphohydroxypyruvate, and phosphoser-ine. d-3-phosphoglycerate can be metabolized to pyruvate via the enzymes of glycoly-sis. Finally, serine reacts with homocysteine to generate cystathionine in the pathway of methionine catabolism. This reaction provides a biochemical basis for dietary supple-mentation with serine to ameliorate the toxicity of excessive methionine in animals.
FIGURE 4.12 Catabolism of glycine and serine in animal cells. These pathways are active in the liver and kidneys. Some of the reactions occur in other tissues, such as the brain, tes-tes, and small intestine. The enzymes catalyzing the indicated reactions are: (1) GCS (also known as glycine synthase; requiring pyridoxal phosphate and FAD in addition to the indicated cofactors); (2) serine hydroxymethyl transferase; (3) alanine:glyoxylate transaminase; (4) gly-cine oxidase; (5) glyoxylate dehydrogenase; (6) formate dehydrogenase; (7) serine dehydratase (requiring pyridoxal phosphate); (8) glyoxylate oxidase; and (9) oxalate oxidase; (10) serine transaminase; (11) hydroxypyruvate reductase; (12) d-glycerate kinase; (13) enzymes of gly-colysis; (14) phosphatidylserine synthase I; (15) phosphatidylserine decarboxylase; (16) phos-phatidylserine synthase I; (17) a series of enzymes with ethanolamine as an initial substrate; (18) dehydrosphingosine synthase; (19) dehydrosphingosine reductase; (20) dihydrosphingo-sine dehydrogenase; (21) sphingosine kinase; and (22) sphingosine-1-phosphate phosphatase. MTHF, N5, N10-methylene-tetrahydrofolate; P, phosphate; THF, tetrahydrofolate.

124 Amino Acids: Biochemistry and Nutrition
© 2010 Taylor & Francis Group, LLC
cAtABolism of histiDine
Catabolism of histidine in animals is initiated by histidase, histidine decarboxyl-ase, and histidine transaminase in a cell- and tissue-specific manner (Figure 4.14). The elucidation of the histidase pathway spanned almost one century. In 1874, even before histidine was known as a component of protein, M. Jaffe reported that the urine of a dog contained urocanic acid. This finding was independently con-firmed by S. Edlbacher in the same year. Several groups of investigators between in 1898 and 1933 consistently observed that the urinary excretion of this metabo-lite by animals was substantially increased in response to oral administration of histidine. During this intervening period, H. Raistrick found in 1917 that bacteria could synthesize urocanate from histidine and suggested that microorganisms in the lumen of the intestine might be the source of urocanate produced by the intact animal. However, in 1926, P. György and H. Röthler demonstrated that mam-malian liver can cleave the imidazole ring of histidine via histidase to form NH3, glutamate, and formic acid. The authors proposed that urocanate is an interme-diate of histidine degradation in mammals. This hypothesis was supported by Y. Sera and S. Yada in 1939 when they performed a series of elegant studies to
P protein(LPL)
Glycine
CO2Decarboxylated
moiety of glycine
H protein
DihydrolipoamideHS SH
N5,N10-Methylene-tetrahydrofolate
T protein
Tetrahydrofolate+ NH3
Lipoic acid
L protein(FAD)
NAD+
NADH + H+
FIGURE 4.13 The glycine cleavage system in animal cells. This reaction starts with glycine decarboxylation by glycine dehydrogenase (P protein; a homodimer in humans, animals, and bacteria; ~200 kDa) in the presence of a lipoic acid-binding protein (a monomer; ~14 kDa; H protein). The decarboxylated moiety of glycine is deaminated by a tetrahydrofolate-dependent enzyme (aminomethyltransferase; a monomer with a molecular weight of ~40 kDa; T pro-tein), with the production of dihydrolipoamide. Dihydrolipoamide is reduced by an NAD+-dependent and FAD-requiring dihydrolipoamide dehydrogenase (L protein; a homodimeric flavoprotein; the molecular weight of each subunit = 50.2 kDa), which is the common E3 protein component of the α-ketoacid dehydrogenase complex.

125Degradation of Amino Acids
© 2010 Taylor & Francis Group, LLC
Hist
idin
e NH
3
Uro
cana
te H2O
4-Im
idaz
olon
e5-
prop
iona
te
H2O
N-F
orm
imin
oglu
tam
ate
Glu
tam
ateT
HF
N5 -
Form
imin
o-T
HF
NH
3
N5 ,
N10
-Met
heny
l-TH
F
13
54321
Hyd
anto
in-
5-pr
opio
nate
O2
1410
8
7 6
α-K
AIm
idaz
olep
yruv
ate
α-A
A
Imid
azol
elac
tate
NA
DH
+ H
+
NA
D+
CO
2H
istam
ine
Hist
amin
e di
nucl
eotid
e
DPP
N
[O]
NH
3 +
form
ate
+ 4-
keto
glut
amat
eN
ER
N-F
orm
yliso
glut
amin
e
H2O
NER
NA
D+
NA
DH
+ H
+C
O2
17 16
12
9
Imid
azol
eace
tic a
cid
PRPP
+ A
TP
Imid
azol
eace
tic a
cid
ribon
ucle
otid
eH
2O
Imid
azol
eace
tic a
cid
ribon
ucle
osid
e
H2OPi
AD
P +
PPi +
Pi
Imid
azol
e ac
etal
dehy
de15
11[O
]
[O]
Imid
azol
onea
cetic
aci
dN
AD
PH +
O2
H2O
+N
AD
P+
18
Form
imin
oasp
arta
te
NH
3
H2O
Form
ylas
part
ate
Asp
arta
te
H2O
Form
ate
2019
N-A
cety
lhist
amin
eM
ethy
lhist
amin
e
21
SAM
SAH
CA
cety
l-CoA
FIG
UR
E 4.
14

126 Amino Acids: Biochemistry and Nutrition
© 2010 Taylor & Francis Group, LLC
identify that liver fractions can convert histidine into urocanic acid and glutamate derivatives. These reactions were unequivocally established by the studies of H. Tabor in 1952 that involved specifically labeled histidine. Meanwhile, the conver-sion of histidine into urocanate was found to be irreversible because urocanic acid could not replace histidine in the diet to support the growth of young rats. Additionally, nutritional studies revealed that folate-deficient animals excreted N-formiminoglutamate in urine and had reduced the rate of histidine catabolism by the liver. Subsequent work in the mid-1950s led to the recognition that tetrahy-drofolate is required for converting N-formiminoglutamate into glutamate. This discovery was supported by the purification in 1959 of glutamate formimotrans-ferase from the porcine liver. In the past 40 years, many of the genes involved in histidine catabolism via the histidase pathway have been cloned, sequenced, and characterized.
Another pathway for histidine catabolism is pyridoxal phosphate-dependent transamination. J. Roche and coworkers discovered in 1954 that histidine under-goes transamination to form imidazolepyruvate in mussel hepatopancreas. In the 1960s, histidine aminotransferase in the liver was reported by several research groups. Two isoforms of histidine aminotransferase in the rat liver were shown in the 1970s to differ in substrate requirements, kinetics, and hormonal induction. Isoenzyme I is present only in liver and is induced by glucagon. In contrast, iso-enzyme II is expressed in the liver, kidney, heart, and skeletal muscle, has cata-lytic activity with pyruvate but not α-KG, and is not induced by glucagon. Further metabolism of imidazolepyruvate results in the production of imidazoleacetate and imidazoleacetate ribonucleoside. The occurrence of the histidine transamination pathway explains: (1) the excretion of these products in the urine of human, rats, and other animals; and (2) the results of nutritional studies that d-histidine can partially replace l-histidine in animal and human diets because the organisms can convert some d-histidine into l-histidine.
Histidine degradation can also be initiated by histidine decarboxylase to form histamine in animals (Ohtsu 2011). This pathway is quantitatively significant in cells of the immune system and will be described in Chapter 5.
FIGURE 4.14 Catabolism of histidine in animals. The enzymes that catalyze the indicated reactions are: (1) histidase (histidine ammonia lyase); (2) urocanate hydratase; (3) imidazo-lone propionase; (4) glutamate formimonotransferase; (5) N5-formimino-tetrahydrofolate cyclodeaminase; (6) 4-imidazolone 5-propionate oxidase; (7) histidine transaminase; (8) imidazolepyruvate reductase; (9) imidazolepyruvate dehydrogenase; (10) histidine decar-boxylase; (11) histaminase (diamine oxidase); (12) histamine methyltransferase; (13) acetyl-histamine synthase; (14) imidazoleacetate phosphoribosyltransferase; (15) xanthine oxidase or aldehyde dehydrogenase (in the presence of diphosphopyridine nucleotide); (16) imidaz-oleacetic acid ribonucleotide synthase; (17) acid phosphatase; (18) imidazoleacetic acid oxi-dase; (19) imidazoloneacetic acid ribonucleoside; (20) formiminoaspartate deaminase; and (21) formylaspartate deformylase. α-AA, α-amino acid (e.g., glutamate and alanine); α-KA, α-ketoacid (e.g., α-ketoglutarate and pyruvate); DPPN, diphosphopyridine nucleotide; NER, nonenzymatic reaction; SAHC, S-adenosylhomocysteine; SAM, S-adenosylmethionine; and THF, tetrahydrofolate.

127Degradation of Amino Acids
© 2010 Taylor & Francis Group, LLC
cAtABolism of lysine
Lysine is degraded to α-aminoadipate-6-semialdehyde in the liver of animals and humans through the saccharopine pathway and the pipecolic acid pathway (Figure 4.15). The brain has low activities of the initial enzymes involved in the pipecolic acid pathway. α-Aminoadipate-6-semialdehyde is subsequently converted into acetyl-CoA and acetoacetate. The saccharopine pathway is present in mitochondria and primarily responsible for lysine catabolism in animals (Benevenga and Blemings 2007). This pathway was based on the early suggestion in 1913 by A.I. Ringer and colleagues that lysine is metabolized to glutaric acid in dogs, and subsequently estab-lished by H. Borsook and coworkers in 1948. In the pipecolic acid pathway, which was originally proposed by M. Rothstein and L.L. Miller in 1953 from studies with
NADPH + H+
NADP+
Lysine
α-KG
α-KG
Saccharopine
NAD+
NADH + H+Gluα-Aminoadipate-6-
semialdehydeNAD(P)+
NAD(P)H + H+ α-Aminoadipate
Gluα-Ketoadipate
NAD+
NADH + H+
CoA
CO2
Glutaryl-CoA
FAD
FADH2Glutaconyl-CoACrotonyl-CoA
CO2
β-Hydroxybutyryl-CoA
NADH + H+
NAD+
Acetoacetyl-CoA
Acetyl-CoA
β-Hydroxy-β-methyl-glutaryl-CoA (HMG-CoA)
CoA
CoA
Acetoacetate
Acetyl-CoA
CO2
14
1
2
3
4
5
6
78
9
10
11
1214
β-Hydroxybutyrate
NADH + H+
NAD+ 13
α-Keto-ε-amino-caproic acid
O2 NH3
Δ1-Piperideine-2-carboxylic acid
SpontaneousH2O
H2O
H2O
H2O
Pipecolic acid
NADH + H+
NADP+
Δ1-Piperideine-6-carboxylic acid
O2
H2O2
H2OSpontaneous
15
16
17
FIGURE 4.15 Catabolism of lysine in animals. Lysine is degraded via the mitochondrial saccharopine pathway and the peroxisomal pipecolate pathway. The enzymes that catalyze the indicated reactions are: (1) lysine:α-ketoglutarate reductase; (2) saccharopine dehydrogenase (NAD+, glutamate-forming); (3) aminoadipate semialdehyde dehydrogenase; (4) aminoadipate aminotransferase; (5) α-ketoacid dehydrogenase; (6) glutaryl-CoA dehydrogenase; (7) gluta-conyl-CoA decarboxylase; (8) enol-CoA hydratase; (9) β-hydroxyacyl-CoA dehydrogenase; (10) thiolase; (11) HMG-CoA synthase; (12) HMG-CoA lyase; (13) β-hydroxybutyrate dehy-drogenase; (14) enzymes of the Krebs cycle; (15) lysine oxidase (a peroxisomal protein); (16) peperideine-2-carboxylic acid reductase; and (17) pipecolate oxidase (a peroxisomal protein).
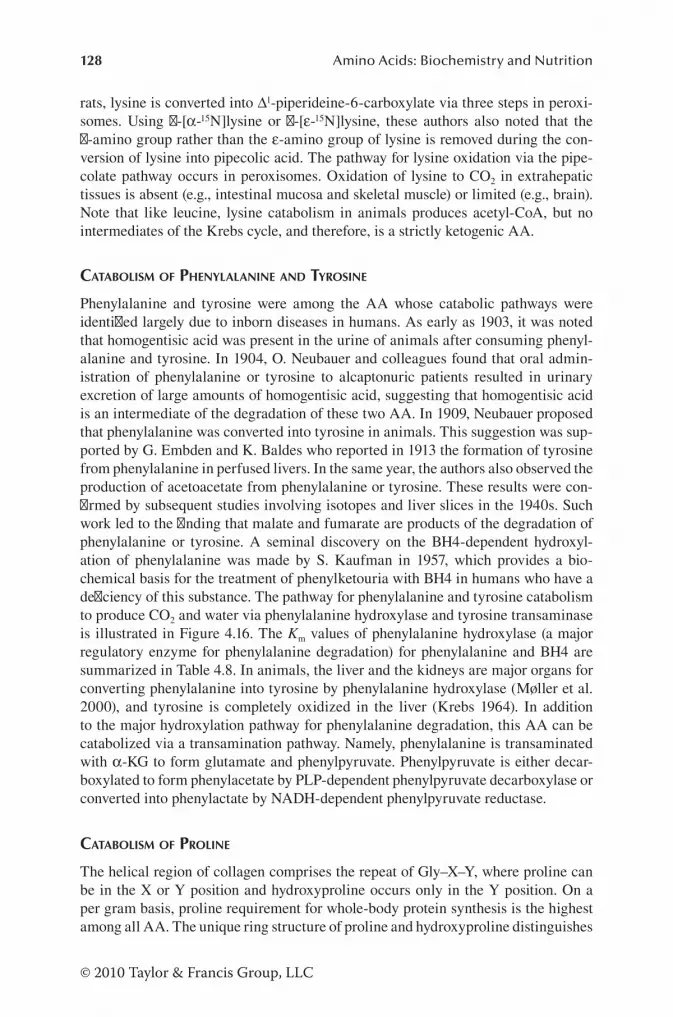
128 Amino Acids: Biochemistry and Nutrition
© 2010 Taylor & Francis Group, LLC
rats, lysine is converted into Δ1-piperideine-6-carboxylate via three steps in peroxi-somes. Using l-[α-15N]lysine or l-[ε-15N]lysine, these authors also noted that the ~-amino group rather than the ε-amino group of lysine is removed during the con-version of lysine into pipecolic acid. The pathway for lysine oxidation via the pipe-colate pathway occurs in peroxisomes. Oxidation of lysine to CO2 in extrahepatic tissues is absent (e.g., intestinal mucosa and skeletal muscle) or limited (e.g., brain). Note that like leucine, lysine catabolism in animals produces acetyl-CoA, but no intermediates of the Krebs cycle, and therefore, is a strictly ketogenic AA.
cAtABolism of PhenylAlAnine AnD tyrosine
Phenylalanine and tyrosine were among the AA whose catabolic pathways were identified largely due to inborn diseases in humans. As early as 1903, it was noted that homogentisic acid was present in the urine of animals after consuming phenyl-alanine and tyrosine. In 1904, O. Neubauer and colleagues found that oral admin-istration of phenylalanine or tyrosine to alcaptonuric patients resulted in urinary excretion of large amounts of homogentisic acid, suggesting that homogentisic acid is an intermediate of the degradation of these two AA. In 1909, Neubauer proposed that phenylalanine was converted into tyrosine in animals. This suggestion was sup-ported by G. Embden and K. Baldes who reported in 1913 the formation of tyrosine from phenylalanine in perfused livers. In the same year, the authors also observed the production of acetoacetate from phenylalanine or tyrosine. These results were con-firmed by subsequent studies involving isotopes and liver slices in the 1940s. Such work led to the finding that malate and fumarate are products of the degradation of phenylalanine or tyrosine. A seminal discovery on the BH4-dependent hydroxyl-ation of phenylalanine was made by S. Kaufman in 1957, which provides a bio-chemical basis for the treatment of phenylketouria with BH4 in humans who have a deficiency of this substance. The pathway for phenylalanine and tyrosine catabolism to produce CO2 and water via phenylalanine hydroxylase and tyrosine transaminase is illustrated in Figure 4.16. The Km values of phenylalanine hydroxylase (a major regulatory enzyme for phenylalanine degradation) for phenylalanine and BH4 are summarized in Table 4.8. In animals, the liver and the kidneys are major organs for converting phenylalanine into tyrosine by phenylalanine hydroxylase (Møller et al. 2000), and tyrosine is completely oxidized in the liver (Krebs 1964). In addition to the major hydroxylation pathway for phenylalanine degradation, this AA can be catabolized via a transamination pathway. Namely, phenylalanine is transaminated with α-KG to form glutamate and phenylpyruvate. Phenylpyruvate is either decar-boxylated to form phenylacetate by PLP-dependent phenylpyruvate decarboxylase or converted into phenylactate by NADH-dependent phenylpyruvate reductase.
cAtABolism of Proline
The helical region of collagen comprises the repeat of Gly–X–Y, where proline can be in the X or Y position and hydroxyproline occurs only in the Y position. On a per gram basis, proline requirement for whole-body protein synthesis is the highest among all AA. The unique ring structure of proline and hydroxyproline distinguishes

129Degradation of Amino Acids
© 2010 Taylor & Francis Group, LLC
them from other AA in terms of rigidity, chemical stability, and biochemical reac-tions. The discovery of proline oxidase in the 1960s created a new research area in proline biochemistry.
Early studies of proline metabolism were often conducted along with those of glutamate and arginine. In 1913, H.D. Dakin reported that proline, like glutamate, is
Tyrosine
Phenylalanine
Tetrahydrobiopterin + O2
Dihydrobiopterin + H2O
p-Hydroxyphenylpyruvate
Fumarate
Acetoacetate
1
α-KetoglutarateGlutamate
2
5
6
Ascorbate + O2
Dihydroascorbate + H2O3
Homogentisate
4-Maleylacetoacetate
CO2
O24
4-Fumarylacetoacetate
NADPH + H+
NADP+
FIGURE 4.16 Catabolism of phenylalanine and tyrosine to fumarate and acetoacetate in animals. The enzymes that catalyze the indicated reactions are: (1) phenylalanine hydroxy-lase; (2) tyrosine aminotransferase; (3) p-hydroxyphenylpyruvate dioxygenase; (4) homogen-tisate dioxygenase; (5) maleylacetoacetate isomerase; and (6) fumarylacetoacetate.
TABLE 4.8Km Values of Substrates and Cofactors for Tetrahydrobiopterin (BH4)-Dependent Enzymes in Mammalian Cells
AA Substrate BH4
Enzyme Substrate Km (μM) Km (μM)
Nitric oxide synthase l-Arginine 3–20 0.2–2
Phenylalanine hydroxylase l-Phenylalanine 200–300 15–25
Tryptophan hydroxylase-1 l-Tryptophan 23 29
Tryptophan hydroxylase-2 l-Tryptophan 40–140 20–27
Tyrosine hydroxylase l-Tyrosine 25–50 15–20
Source: Adapted from Werner, E.R., N. Blau, and B. Thöny. 2011. Biochem. J. 438:397–414.
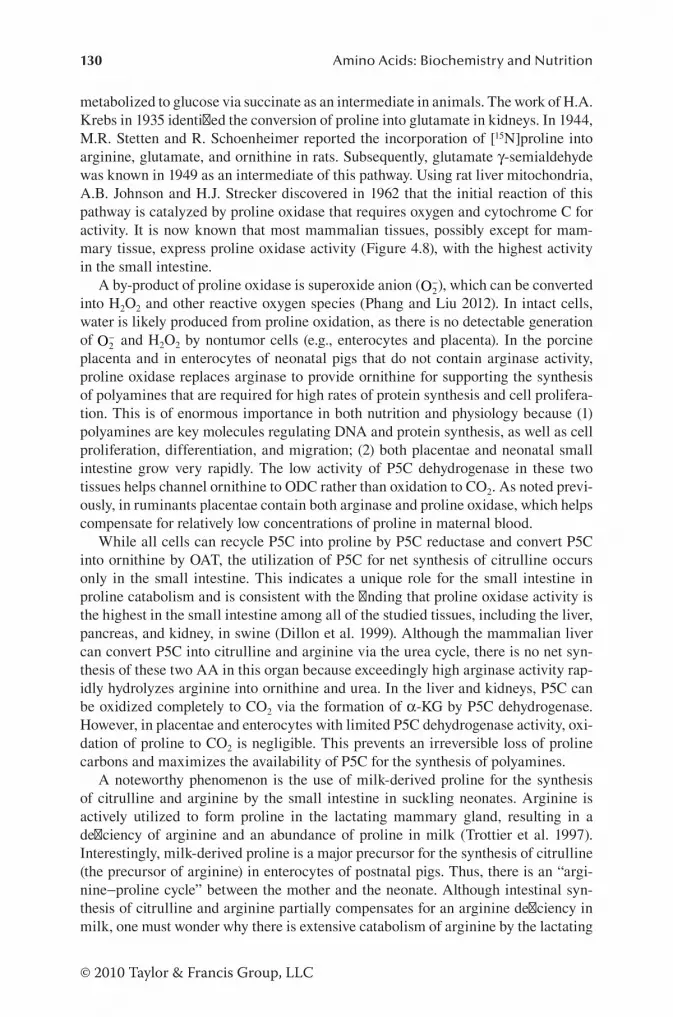
130 Amino Acids: Biochemistry and Nutrition
© 2010 Taylor & Francis Group, LLC
metabolized to glucose via succinate as an intermediate in animals. The work of H.A. Krebs in 1935 identified the conversion of proline into glutamate in kidneys. In 1944, M.R. Stetten and R. Schoenheimer reported the incorporation of [15N]proline into arginine, glutamate, and ornithine in rats. Subsequently, glutamate γ-semialdehyde was known in 1949 as an intermediate of this pathway. Using rat liver mitochondria, A.B. Johnson and H.J. Strecker discovered in 1962 that the initial reaction of this pathway is catalyzed by proline oxidase that requires oxygen and cytochrome C for activity. It is now known that most mammalian tissues, possibly except for mam-mary tissue, express proline oxidase activity (Figure 4.8), with the highest activity in the small intestine.
A by-product of proline oxidase is superoxide anion (O2−), which can be converted
into H2O2 and other reactive oxygen species (Phang and Liu 2012). In intact cells, water is likely produced from proline oxidation, as there is no detectable generation of O2
− and H2O2 by nontumor cells (e.g., enterocytes and placenta). In the porcine placenta and in enterocytes of neonatal pigs that do not contain arginase activity, proline oxidase replaces arginase to provide ornithine for supporting the synthesis of polyamines that are required for high rates of protein synthesis and cell prolifera-tion. This is of enormous importance in both nutrition and physiology because (1) polyamines are key molecules regulating DNA and protein synthesis, as well as cell proliferation, differentiation, and migration; (2) both placentae and neonatal small intestine grow very rapidly. The low activity of P5C dehydrogenase in these two tissues helps channel ornithine to ODC rather than oxidation to CO2. As noted previ-ously, in ruminants placentae contain both arginase and proline oxidase, which helps compensate for relatively low concentrations of proline in maternal blood.
While all cells can recycle P5C into proline by P5C reductase and convert P5C into ornithine by OAT, the utilization of P5C for net synthesis of citrulline occurs only in the small intestine. This indicates a unique role for the small intestine in proline catabolism and is consistent with the finding that proline oxidase activity is the highest in the small intestine among all of the studied tissues, including the liver, pancreas, and kidney, in swine (Dillon et al. 1999). Although the mammalian liver can convert P5C into citrulline and arginine via the urea cycle, there is no net syn-thesis of these two AA in this organ because exceedingly high arginase activity rap-idly hydrolyzes arginine into ornithine and urea. In the liver and kidneys, P5C can be oxidized completely to CO2 via the formation of α-KG by P5C dehydrogenase. However, in placentae and enterocytes with limited P5C dehydrogenase activity, oxi-dation of proline to CO2 is negligible. This prevents an irreversible loss of proline carbons and maximizes the availability of P5C for the synthesis of polyamines.
A noteworthy phenomenon is the use of milk-derived proline for the synthesis of citrulline and arginine by the small intestine in suckling neonates. Arginine is actively utilized to form proline in the lactating mammary gland, resulting in a deficiency of arginine and an abundance of proline in milk (Trottier et al. 1997). Interestingly, milk-derived proline is a major precursor for the synthesis of citrulline (the precursor of arginine) in enterocytes of postnatal pigs. Thus, there is an “argi-nine−proline cycle” between the mother and the neonate. Although intestinal syn-thesis of citrulline and arginine partially compensates for an arginine deficiency in milk, one must wonder why there is extensive catabolism of arginine by the lactating

131Degradation of Amino Acids
© 2010 Taylor & Francis Group, LLC
mammary gland? There are several possible answers to this intriguing question. First, the uptake of proline from maternal blood by the lactating mammary gland may be inadequate for milk protein synthesis. Thus, arginine catabolism may be necessary to provide sufficient proline for maximizing protein synthesis by the lactating mam-mary gland. Second, through the NADPH-dependent conversion of P5C into proline, arginine may regulate the cellular redox state and pentose cycle activity. The pentose cycle functions to provide NADPH and ribose-5-phosphate for a variety of metabolic processes. For example, NADPH is required for fatty acid synthesis, whereas ribose-5-phosphate is essential for purine synthesis and cell proliferation. This notion is consistent with the finding that dietary arginine supplementation to sows increases production of milk lipids and piglet growth. Third, arginine is the common substrate for both arginase and NOS, and thus arginase may play an important role in regulat-ing NO and polyamine synthesis by the lactating mammary gland. Although NO is quantitatively a minor product of arginine catabolism, it may play a crucial role in the regulation of mammary gland blood flow and thus the uptake of nutrients from blood by the lactating mammary gland. Likewise, polyamines produced by mammary tis-sue regulate lactogenesis and greatly contribute to their relatively high abundance in milk. There is little arginase activity in the small intestine of neonates and yet polyamines are essential for cell proliferation and differentiation. Thus, milk-borne polyamines is of nutritional importance for growth and development of the neona-tal intestine. Finally, because the neonate has a low capacity to synthesize proline (a nutritionally essential AA), arginine catabolism via the arginase pathway in the lactating mammary gland will ensure an adequate supply of proline to the neonate to support tissue protein synthesis and extracellular matrix formation. Thus, through the “arginine−proline cycle” between the mother and the neonate, the mother sus-tains a capacity for milk synthesis and provides both proline and polyamines to her offspring, whereas the neonate can synthesize arginine and have both exogenous and endogenous polyamines required for protein synthesis and cell growth.
cAtABolism of sulfur-contAininG AA
Nutritional studies in the 1930s revealed that the need of animals for cysteine can be met by dietary methionine and that part of the dietary requirement for methi-onine can be fulfilled by cysteine. These results indicate that cysteine is formed from methionine and, therefore, can spare methionine. In 1939, V. du Vigneaud and coworkers reported that homocysteine can also replace dietary methionine and cys-teine in rats fed a diet containing adequate amounts of choline and the vitamin B complex. These authors discovered in 1940 that methionine undergoes transmethyl-ation in animals, with its methyl group being transferred to choline and creatine. A series of papers from the du Vigneaud group in 1942 established that homocysteine and serine are converted into cysteine via cystathionine as an intermediate. In 1947, H. Borsook found that the transmethylation of methionine involves its reaction with ATP enzymatically to generate an active methionine derivative, which was shown in 1952 by G.L. Cantoni (an Italian chemist) to be SAM. It is now known that SAM is the major donor of methyl groups in animals. The transsulfuration pathway for conversion of methionine into cysteine is illustrated in Figure 4.17.

132 Amino Acids: Biochemistry and Nutrition
© 2010 Taylor & Francis Group, LLC
Interest in cysteine catabolism in the early twentieth century originated, in part, from the human inborn disease cystinuria. V. du Vigneaud and coworkers reported in 1934 that cystine (cysteine) is oxidized in animals to sulfate, thiosulfate, and sul-fite. Catabolism of cysteine occurs primarily in hepatocytes. However, many cell types (including neurons, endothelial cells, and vascular smooth muscle cells) can produce H2S (a signaling gas) from cysteine. Additionally, cysteine can be oxidized by formaldehyde to N-formylcysteine, and acetylation of cysteine residue in its con-jugates with electrophiles and physiological metabolites forms mercapturate. Finally, cysteine, along with glutamate and glycine, is used to synthesize GSH and coenzyme A in organisms.
As noted in Chapter 3, there are multiple pathways for cysteine catabolism in ani-mals to generate taurine, H2S, pyruvate, and sulfate. Sulfate is the major metabolite of the sulfur of cysteine and is quantitatively excreted in the urine. Both H2S and SO2 are exhaled by the lungs, but sulfite and sulfate are excreted by kidneys (Stipanuk 2004). In saline, H2S exists in equilibrium with HS−, with the ratio of H2S to HS− being approximately 1:2. In physiological solutions, SO2 spontaneously reacts with water to yield sulfurous acid (H2SO3) and then sulfite (SO3
2−) through dissociation of bisulfate (HSO SO H O H SO HSO H SO H3 2 2 2 3 3 3
2 2− − + − ++ ↔ ↔ + ↔ +): .N.J. Benevenga proposed in 1978 that an alternative pathway for methionine deg-
radation in animals involved transamination (Figure 4.18). This proposal was based
S-AdenosylmethionineMethionine
4
Cystathionine
Homocysteine
Serine
H2O
Mg-PPi + PiMg-ATP + H2O
Propionyl-CoA
CH3-group acceptor
Methylated acceptor
S-Adenosylhomocysteine
H2OAdenosine
8
7
1
2
3
5
α -Ketobutyrate
NH3H2O
CO2
NAD+
NADH + H+
CoASH
6
Succinyl-CoA
Tetrahydrofolate
N5-N10-methylene tetrahydrofolate
Cysteine
FIGURE 4.17 Catabolism of methionine via the transulfuration pathway in animals. The enzymes that catalyze the indicated reactions are: (1) S-adenosylmethionine synthase (methionine adenosyltransferase); (2) methylase; (3) S-adenosylhomocysteinase; (4) homo-cysteine methyltransferase (a vitamin B12-dependent enzyme); (5) cystathionine β-synthase (a pyridoxal phosphate-dependent enzyme); (6) cystathionine γ-lyase (a pyridoxal phosphate-dependent enzyme); (7) α-ketobutyrate dehydrogenase; (8) a series of enzymes [propionyl-CoA carboxylase, methylmalonyl-CoA racemase, and methylmalonyl-CoA mutase (a vitamin B12-dependent enzyme).

133Degradation of Amino Acids
© 2010 Taylor & Francis Group, LLC
on the detection of methionine transamination in homogenates of rat skeletal muscle, liver, small intestine, and other tissues. However, these studies were performed in the presence of very high concentrations of methionine (10–20 mM) and the absence of other AA. In 1989, G. Wu and J.R. Thompson found that BCAA strongly inhibit methionine transamination in rat and chick muscle homogenates. In the absence of BCAA, rates of transamination of 0.5 mM methionine are very low in intact rat skel-etal muscle but relatively high in intact chick skeletal muscle. Physiological levels
Cytoplasm Mitochondria
β-Methylthiopropionyl-CoA
β-Methylthiopropenoyl-CoA
Malonylsemialdehyde-CoA
-Methionine -Methionine
Methanethiol
Amino acidtransaminase
Amino acidtransaminase
α-Keto-γ-methylthiobutyric acid
α-Keto-γ-methylthiobutyric acid
α-KG
Glu
α-KG
Glu
CoA-SHBCKAdehydrogenase
FAD Acyl-CoAdehydrogenase
H2Oβ-Enoyl-CoA hydratase
(Crotonase)
β-Enoyl-CoA hydratase(Crotonase)
NADP+
NADPH + H+
β-Hydroxypropionyl-CoA
H2O β-Enoyl-CoA hydratase
Acryloyl-CoA
NADPH + H+
NADP+
Acryloyl-CoAreductase
Propionyl-CoA
Sulfate
Hydrogen sulfide(H2S)
Methanethiol(CH3SH)
Formaldehyde(HCHO)
Formate(HCOOH)
CO2
CO2
FADH2
FIGURE 4.18 Catabolism of methionine via the transamination pathway in animals. Under physiological conditions, this pathway does not play a significant role in degradation methio-nine in animals or humans. BCKA, branched-chain α-ketoacids; α-KG, α-ketoglutarate.

134 Amino Acids: Biochemistry and Nutrition
© 2010 Taylor & Francis Group, LLC
of BCAA essentially block methionine transamination in skeletal muscle from both rats and chicks. Thus, methionine transamination may occur in animals but it is nor-mally a minor pathway for methionine degradation (Scislowski and Pickard 1994). This conclusion is supported by findings from clinical studies with healthy humans regardless of oral administration of methionine.
It was previously thought that taurine is degraded only in microorganisms but not in animal cells. However, this view is incorrect, as there is evidence that inhibition of AA transamination markedly increases concentrations of taurine in the plasma of young pigs. It is possible that a transaminase plays a key role in taurine catabolism in tissues and cells (e.g., liver, kidneys, and brain) of animals. In this putative pathway, taurine:pyruvate transaminase initiates taurine degradation to form sulfoacetaldehyde, which is converted into acetyl-phosphate plus sulfite (SO3
2−) by sulfoacetaldehyde acet-yltransferase. Acetyl-phosphate is degraded to acetyl-CoA by phosphate acetyl-CoA transferase, whereas sulfite is oxidized to sulfate (SO4
2−) by sulfite dehydrogenase.
cAtABolism of threonine
There is a rich history of studying threonine catabolism via multiple pathways in animals (Figure 4.19). A.E. Braunshtein and G.Y. Vilenkina reported in 1949 that threonine is cleaved into glycine and acetaldehyde in animals. This reaction was confirmed by H.L. Meltzer and D.B. Sprinson in 1950. The responsible enzyme (a cytosolic protein) was named “threonine aldolase” in 1954 by D.M. Greenberg. Meanwhile, threonine dehydratase [also known as threonine hydrolyase (deam-inating)] was proposed in 1952 by H.L. Meltzer and D.B. Sprinson to hydrolyze threonine to NH3 and α-ketobutyrate in the cytoplasm of liver. This enzyme was subsequently found to be dependent on pyridoxal phosphate for catalytic activity. Based on earlier reports that threonine was catabolized to form aminoacetone, D.M. Greenberg discovered in 1964 the presence of threonine dehydrogenase in the liver mitochondria of animals. Thus, nutritional and biochemical studies led to the iden-tification of three metabolic pathways responsible for the degradation of threonine in the liver of animals (including humans), which are initiated by threonine dehy-dratase, threonine aldolase, and threonine dehydrogenase (Davis and Austic 1997). In contrast to the threonine dehydratase pathway, both the threonine aldolase and the threonine dehydrogenase pathways generate glycine. In the rat liver, threonine dehydratase and lactate dehydrogenase (or an α-ketoacid-linked NADPH dehydro-genase) may be responsible for threonine aldolase activity, but cannot explain the formation of glycine plus acetaldehyde from threonine by threonine aldolase. In ani-mals (e.g., growing pigs and rats), the threonine dehydrogenase pathway accounts for ~80% of threonine catabolism. However, in young pigs fed a milk protein-based or corn- and soybean meal-based diet, quantitatively only a small amount of threo-nine is degraded to form glycine and CO2 because threonine supply in the diet is limited and barely meets requirements for tissue protein synthesis. In humans, the relative importance of the threonine dehydratase, threonine aldolase, and threonine dehydrogenase pathways in threonine degradation remains largely unknown. P.B. Pencharz reported that 44% of threonine oxidation in human infants occurs via the threonine dehydrogenase pathway but this pathway plays only a minor role in adult

135Degradation of Amino Acids
© 2010 Taylor & Francis Group, LLC
humans. Thus, while this finding remains to be confirmed, there are possibly species differences in threonine catabolism among animals and also developmental differ-ences within the same species.
cAtABolism of tryPtoPhAn
In animals, three pathways are responsible for degrading tryptophan in a highly cell- and tissue-specific manner: the kynurenine, serotonin, and transamination pathways Le Floc’h et al. 2011). The kynurenine pathway, which involves the deamination and decarboxylation of tryptophan to form kynurenine, occurs primarily in the liver and the brain. The serotonin pathway, which depends on the hydroxylation and decarbox-ylation of tryptophan to generate serotonin (5-hydroxytryptamine), takes place mainly in the gastrointestinal tract and the brain (Figure 4.20). The catabolism of kynurenine
CH3
C
S-CoA
O
NH3
NH3+
L-Serine
Acetate thiokinaseAcetate
CO H
–OOC CH
CH
CH3
CH3
OH
+
CCH2
O
HO
H3N
CH O–
OOH
+
C
CH3
O–O
CH
C
CH3
NH3
O
NH3–OOC
+
C
C
CH3
O–O
O + H2O
MTF
TF
MTF TF
FAD + H2O FADH2
Acetaldehyde Aldehyde dehydrogenase Acetyl-CoA
NADH + H+
NAD+ CoA-SH
CO2
Pyruvate
Thre
onin
e al
dola
se (C
ytop
lasm
)
Glycine
Serinedehydratase
Threoninedehydrogenase
(Mit)
NADH + H+
NAD+
L-Threonine
Glycine cleavage system
Acetyl-CoA
COO–
CH2
Glycine
H3C C CHOO
Methylglyoxal
H3C C CH2NH3O
+
2-Amino-3-ketobutyrate
2-Amino-3-ketobutyrate CoA lyase (Mit)
Aminoacetone
Spontaneous
CO2 + NH3 α-Ketoaldehydedehydrogenase
NAD(P)+
+ H+
NAD(P)H
+
CoA-SH
CoA-SH
Pyruvate dehydrogenase
C
O
SCoA
CO2 Amine oxidase
NH3
NH4+
Thre
onin
e de
hydr
atas
e (C
ytop
lasm
)
α-Ketobutyrate
H3C
H3C
CH2 C
O
CH3
CO2 + NADH + H+CoA + NAD+
α-Ketobutyrate dehydrogenase (Mit)Propionyl-CoA
H3C CH2 C COO–
O
Serine hydroxy-methyltransferase
NH3
H2C
H2O
FIGURE 4.19 Catabolism of threonine in animals. Threonine degradation in the liver is initiated primarily by threonine dehydrogenase (a mitochondrial enzyme) and, to a much lesser extent, threonine dehydratase and threonine aldolase (cytosolic enzymes). Products of threonine catabolism includes glycine, pyruvate, and propionyl-CoA.

136 Amino Acids: Biochemistry and Nutrition
© 2010 Taylor & Francis Group, LLC
-T
rypt
opha
n
N-F
orm
ylky
nure
nine
Kyn
uren
ine
PRPP
PPi +
CO
2
Form
ate
SAM
SAH
C
NA
DP+
O2
α-K
GG
luK
TA
Kyn
uren
ate
3-H
ydro
xyky
nure
nine
α-K
GG
lu
Xan
thur
enat
eH
KT
A
Ala
3-H
ydro
xyan
thra
nila
te
KN
A
HD
O (F
e2+)
2-A
min
o-3-
carb
oxym
ucon
ate
sem
iald
ehyd
eQ
uino
linat
eN
ER
AT
P
PPi
QPR
T
Nic
otin
ate
mon
onuc
leot
ide
Des
amin
o-N
AD
+
NG
H
NA
D+
AT
P+
Gln
AM
P +
PPi
+ G
lu
NA
DS
O2
5-H
ydro
xytr
ypto
phan
BH4
BH2
TH
L
5-H
ydro
xytr
ypta
min
e(5
-HT
; ser
oton
in)
CO
2
HT
D
5-H
ydro
xyin
dole
-3-
acet
ate
O2
NH
3M
AO
5-M
etho
xyin
dole
-3-
acet
ate
SAM
SAH
ASM
T
5-M
etho
xytr
ypta
min
e
O2
NH
3MA
O
SAM
SAH
HM
T
Ant
hran
ilate
H2O
H2O
H2O H2O
H2O
H2O
Ala
KNA
NA
D(P
)H +
H+
NA
D(P
)+ +
NH
3
O2
CO
2
AN
H
2,3-
Dih
ydro
xybe
nzoa
te
2-A
min
omuc
onat
ese
mia
ldeh
yde
CO
2
PCL
NH
3
NA
DH
+ H
+
NA
D+
AM
SR
Oxa
locr
oton
ate
NA
D(P
)H +
H+
NA
D(P
)+O
CR
α-K
etoa
dipa
te
N-A
cety
lsero
toni
n
Ace
tyl-C
oA CoA
SNA
T
N-A
cety
l-5-m
etho
xyse
roto
nin
(mel
aton
in)
ASM
T
Glu
tary
l-CoA
CoA
CO
2
NA
D+
NA
DH
+ H
+
KA
D
Ace
tyl-C
oA
SR
KYN
F
TD
O
Indo
le-3
-py
ruvi
c ac
id
α-K
GG
luT
AT
Indo
le-3
-ac
etal
dehy
de
CO
2
IPD
C (M
g2+)
NA
D+
NA
DH
+ H
+
NA
DPH
+ H
+
Indo
le-3
-la
ctic
aci
dIn
dole
-3-
acet
ic a
cid
O2
AO
XIP
RID
OO
2
5HT
S F5
HT
5HK
M
Hem
e
FIG
UR
E 4.
20

137Degradation of Amino Acids
© 2010 Taylor & Francis Group, LLC
produces indoleacetic acid, niacin, pyruvate, and acetyl-CoA. Serotonin is a biogenic amine which functions as a neurotransmitter and a gastrointestinal hormone.
Quantitatively, the kynurenine pathway accounts for the degradation of more than 95% of the available peripheral tryptophan. In 1925, Z. Matsuoka and N. Yoshimatsu discovered kynurenine in the urine of rabbits fed large amounts of tryptophan. Subsequently, it was found that kynurenine is converted into kynurenic acid, a sub-stance discovered by J. von Liebig in 1853. These findings paved the way for elucida-tion of the major pathway for tryptophan degradation. Concentrations of kynurenic acid, which undergoes little catabolism in animals, are relatively high in bile and pan-creatic juice (e.g., ~1 μM in porcine bile and pancreatic juice). It is now known that the first and rate-controlling step in this pathway is catalyzed by either the ubiquitous indoleamine 2,3-dioxygenase (IDO) or tryptophan 2,3-dioxygenase (TDO) which is localized primarily in the liver. Notably, BH4 is an essential cofactor for both IDO and TDO. An exciting new development in tryptophan metabolism is that expres-sion of IDO in lymphocytes and macrophages mediates the function of the immune system and is potently induced by inflammatory cytokines (e.g., interferon-γ) and endotoxin. In contrast, TDO activity is increased by tryptophan and its analogs via an allosteric binding site, but is competitively inhibited by some common indoleamines, including tryptamine. Proinflammatory cytokines can induce IDO under stressful or disease conditions, activate the kynurenine pathway, and reduce serotonin synthesis.
Tryptophan catabolism can also be initiated by transamination to form indole-pyruvate in many animal species (including pigs and rats). Indolepyruvate can be further metabolized to indoleacetate or indolelactate, which are excreted in urine. The presence of this pathway is supported by the findings of nutritional studies that d-tryptophan can be utilized by animals to replace some or all l-tryptophan in diets
FIGURE 4.20 Catabolism of tryptophan in animals. Degradation of l-tryptophan is initiated by indoleamine-2,3-dioxygenase, tryptophan-2,3-dioxygenase, and tryptophan hydroxylase. These pathways are cell- and tissue-specific. Serotonin, melatonin, and their metabolites can form sulfate and glucuronide conjugates for excretion in urine and feces. Products of tryptophan catabolism include NAD, serotonin, melatonin, kynurenine, indoles, and acetyl-CoA. AMSR, 2-ami-nomuconate semialdehyde reductase; ANH, anthranilate hydroxylase [also known as anthra-nilate 3-monooxygenase (deaminating)]; AOC, aldehyde oxidase; ASMT, N-acetylserotonin O-methyltransferase; F5HT, formyl 5-hydroxytryptamine; HDO, 3-hydroxyanthranilate dioxy-genase; HIMT, 5-hydroxyindole-O-methyltransferase; 5HKM, 5-hydroxykynuremine; HKTA, 3-hydroxykynurenine transaminase; 5-HT, 5-hydroxytryptamine; 5HTS, 5-hydroxytryptamine sulfate; 5-HTP, 5-hydroxy-l-tryptophan; IDO, indoleamine-2,3-dioxygenase; IPDC, indole-3-pyruvate decarboxylase (a thiamine diphosphate-dependent enzyme); IPR, indole-3-pyruvate reductase; KAD, α-ketoadipate dehydrogenase; KHL, kynurenine hydroxylase; KNA, kyn-ureninase; KTA, kynurenine transaminase; KYN, kynurenine; KYNF, kynurenine formami-dase; MAO, monoamine oxidase; NADS, NAD synthase; NER, nonenzymatic reaction; NGH, NAD glycohydrolase; OCR, oxalocrotonate reductase; PCL, picolinate carboxylase; PLP, pyridoxal phosphate; PRPP, 5-phosphoribosyl-1-pyrophosphate; QPRT, quinolinate phosphori-bosyl transferase; SNAT, serotonin-N-acetyltransferase; SAM, S-adenosylmethionine; SAHC, S-adenosylhomocysteine; SR, a series of reactions for conversion of glutaryl-CoA into acetyl-CoA; TAT, tryptophan aminotransferase; TDO, tryptophan-2,3-dioxygenase; THL, tryptophan hydroxylase. The following enzymes require pyridoxal phosphate for catalytic activities: HTD, HKTA, KNA, KTA, and TAT. QPRT is inhibited by high concentrations of leucine.

138 Amino Acids: Biochemistry and Nutrition
© 2010 Taylor & Francis Group, LLC
(Chapter 3). In such a series of reactions, d-tryptophan is transaminated with an α-ketoacid (e.g., α-KG) to form indolepyruvate, which is transaminated with an α-AA (e.g., glutamate) to generate l-tryptophan.
CATABOLISM OF D-AA IN ANIMAL CELLS
Similar to l-AA, the entry of d-AA into cells is the first step in their catabolism. It appears that transporters for l-AA can transport d-AA across the plasma and other biological membranes although they preferentially transport l-AA. Compared with l-AA, the rate of d-AA transport is lower and the affinity of the l-AA transporters for d-AA is also lower in mammalian cells. In neurons, the l-Glu/l-Asp transporter, which utilizes the Na+/K+-electrochemical gradient to move excitatory AA against their concentration gradient, can transport d-Asp but not d-glutamate. Interestingly, in Drosophila, the invertebrate B0 system transporter (D. melanogaster NAT1), which normally transports a broad range of neutral AA, can equally or even pref-erentially transport the d-isomers to support intestinal and neurological functions (Miller et al. 2008). It is possible that the fly has developed a symbiotic relationship with d-AA-producing microbes.
Animal cells do not express d-AA transaminase but contain d-AA racemases (or epimerases), d-AA deaminase, and d-AA oxidase (strategically localized in per-oxisomes with peroxidase and catalase) as almost the exclusive enzymes to degrade d-AA (including d-alanine, d-aspartate, and d-serine) (Bada 1984). Racemases may convert d-AA directly to l-isomers, but this enzymatic activity is likely limited in mammals, birds, and fish. d-AA deaminase removes the amino group from d-AA to yield the corresponding α-ketoacid and NH3. d-AA oxidase (FAD-containing flavoprotein) converts d-AA into not only α-ketoacid and NH3, but also hydrogen peroxide (Chapter 3). An overall reaction catalyzed by d-AA oxidase is as follows:
D-AA O H O -Ketoacid H O NH+ → + + +2 2 2 2 4+ α
d-AA oxidase generally acts on both neutral and basic d-AA, whereas d- aspartate oxidase uses only acidic d-AA (e.g., d-aspartate, d-glutamate, and NMDA) as pre-ferred substrates in mammals (e.g., pigs, rats, and mice) and birds (e.g., chickens and pigeons). d-Aspartate oxidase is the sole enzyme which selectively degrades d-aspartate and is inactive toward d-Ser (Ohide et al. 2011). In contrast to mammals, d-AA oxidase is not expressed in the chicken brain. Rather, d-serine dehydratase (a cytosolic enzyme requiring pyridoxal-5′-phosphate as a cofactor) is responsible for the catabolism of d-serine to form pyruvate and NH3 in the brain, kidney, and liver of chickens (Kera et al. 1996). This indicates a cell- and species-specific dif-ference in d-AA oxidation. In all animals, d-AA-derived ketoacids can be oxidized to acetyl-CoA and then to CO2 plus water (Figure 4.1).
CATABOLISM OF l-AA AND D-AA IN MICROORGANISMS
Catabolism of both l-AA and d-AA by intestinal bacteria in animals can be substan-tial. This can be illustrated by utilization of all l-AA [e.g., l-arginine (Figure 4.21)]

139Degradation of Amino Acids
© 2010 Taylor & Francis Group, LLC
by intestinal microbes and of certain d-AA in the body. For example, d-lysine is poorly metabolized in animal cells but can be degraded by microorganisms. Ratner and coworkers reported in 1943 that in young rats fed a diet containing d-[15N]lysine, ~50% of the d-lysine was excreted unchanged in urine, ~20% of the total 15N-administered appeared in urinary urea and NH3, and ~20% of the total 15N-administered was found in nonlysine AA in tissue proteins. Like d-lysine, d-threonine is not utilized by animal cells but is extensively oxidized by d-AA oxidase. Much evidence shows that microorganisms contain d-AA transaminases,
Arginine
Ornithine
Urea
Glutamatesemialdehyde
Glutamate
Citrulline
NAD+
NADH + H+
Pyrroline-5-carboxylateH2O
NH3
Proline
NH3½O2
H2O
NAD+
NADH + H+
Pi
CP NH3
HCO3–
ADP ATP
N2-Succinylarginine
Succinyl-CoACoA
N2-Succinylornithine
2NH3 + CO2
N2-Succinylglutamatesemialdehyde
2α-KG
Glu
N2-Succinylglutamate
Succinate
11
5
4
13
12
10
98
7
6
3
2
1
14
Agmatineα-Ketoarginine
CO2NH3 24
23
15
NH3
17
16
N-Carbamoylputrescine
NH3 + CO2
Putrescine
Urea
19
18
4-Aminobutyraldehyde
½O2
NH3
2α-KG
Glu
25
20
4-Guanidino-butyraldehyde
CO2
4-Aminobutyrate
26
Urea
4-Guanidino-butyraldehyde
NAD+NADH + H+
NAD+
NADH + H+
21
27
2α-KG
Gluα-KG
Glu
Succinate semialdehyde
22
Succinate
NAD(P)+ NAD(P)H + H+
FIGURE 4.21 Catabolism of arginine in bacteria via multiple pathways. The enzymes that catalyze the indicated reactions are: (1) arginase; (2) ornithine aminotransferase; (3) pyrroline-5-carboxylate dehydrogenase; (4) ornithine cyclase; (5) spontaneous reaction; (6) proline dehydro-genase; (7) arginine deiminase; (8) ornithine carbamoyltransferase; (9) carbamate kinase; (10) arginine succinyltransferase; (11) succinylarginine dihydrolase; (12) succinylornithine amino-transferase; (13) succinylglutamate semialdehyde dehydrogenase; (14) succinylglutamate desuc-cinylase; (15) arginine decarboxylase; (16) agmatine deiminase; (17) N-carbamoylputrescine hydrolase; (18) agmatine ureohydrolase; (19) putrescine oxidase; (20) putrescine transaminase; (21) 4-aminobutyraldehyde dehydrogenase; (22) 4-aminobutyrate transaminase; (23) succinate semialdehyde dehydrogenase; (24) arginine oxidase; (25) α-ketoarginine decarboxylase; (26) 4-guanidinobutyraldehyde oxidoreductase; and (27) 4-guanidinobutyrase.

140 Amino Acids: Biochemistry and Nutrition
© 2010 Taylor & Francis Group, LLC
d-AA oxidases, and d-AA deaminases to degrade d-AA. Some bacteria also possess NAD+- or NADP-linked d-AA dehydrogenase (e.g., d-threonine dehydrogenase in Pseudomonas cruciviae) to initiate the catabolism of d-AA. In addition, d-serine dehydratase is expressed in bacteria as another pathway for d-serine utilization. Because the large intestine has a limited ability to absorb l-AA and d-AA into the blood circulation, these results indicate a potentially important contribution of bacte-rial metabolism to the de novo synthesis of AA in the small intestine and to the loss of dietary AA from the hindgut.
Nearly all of the pathways for AA catabolism to generate NH3, other nitrogenous metabolites, H2S, sulfate, CO2, and water in animal cells as discussed in the pre-ceding sections are present in microorganisms (Dai et al. 2011). Pathways for AA catabolism are more similar between bacteria and yeast than between the microor-ganisms and animals. Different strains of bacteria (e.g., commensal vs. pathogenic) or yeasts [e.g., Saccharomyces cerevisiae (a baker’s yeast) vs. Candida albicans (a highly infectious yeast)] may also have different metabolic patterns.
There are noteworthy differences in AA catabolism between bacteria and ani-mals. First, rates of AA degradation per protein basis are generally higher in bac-teria than in avian and mammalian cells. This is clearly illustrated by Z.L. Dai and colleagues who studied AA catabolism in bacteria from the lumen of the small intestine and jejunal enterocytes of pigs. Second, pathways for AA catabolism take place in a single bacteria but involves interorgan or intercellular coordina-tion in animals. For example, in humans, pigs, and rats, BCAA are transaminated in extrahepatic tissues and their α-ketoacids are oxidized primarily in the liver. Third, some enzyme-catalyzed reactions (e.g., the conversion of glutamate into P5C and proline oxidation) and intermediates of the pathways for AA degradation (e.g., conversion of glutamine into arginine) differ between eukaryotes (e.g., ani-mals) and prokaryotes (e.g., bacteria). Fourth, the metabolic fate of the carbons of AA and their metabolites differ between bacteria and animals. For example, AA can be fermented to methane (CH4) in anaerobic bacteria due to the lack of oxygen, but this pathway is absent from animal cells. Rather, oxidation to CO2 and H2O via the Krebs cycle and the mitochondrial electron transport system is the major pathway for the complete catabolism of AA carbons in mammals, birds, and fish (Figure 4.22). Also, indole is metabolized to indican in the liver of animals, but to anthranilic acid and salicylic acid in bacteria. Furthermore, catabolism of argi-nine is almost the exclusive source of energy for certain bacteria but plays only a minor role in ATP production in animal cells. Fifth, bacteria possess some unique enzymes for degradation of some AA [e.g., arginine deiminase (Figure 4.21), tryp-tophanase (a pyridoxal phosphate-dependent enzyme), tryptophan decarboxylase (a pyridoxal phosphate-dependent enzyme), and β-tyrosinase] and their products (e.g., urease for urea, sulfite reductase for SO3
2− , tryptamine, and nitrate reductase for nitrate), but these enzymes are absent from animal cells. In the hepatic micro-somal hydroxylating system, indole is converted into indoxyl, which is conjugated with potassium sulfate to form indican. Some bacteria (e.g., Escherichia coli and Fusobacterium nucleatum) can further degrade indole to yield sequentially isatin, formylanthranilic acid, anthranilic acid, and salicylic acid in the lumen of the small intestine:

141Degradation of Amino Acids
© 2010 Taylor & Francis Group, LLC
1. l-Tryptophan → indole + pyruvate + NH3 (tryptophanase) 2. l-Tryptophan → tryptamine + CO2 (tryptophan decarboxylase) 3. Tyrosine → phenol + pyruvate + NH3 (β-tyrosinase) 4. Urea + H2O → 2NH3 + CO2 (urease) 5. Nitrate + NADPH + H+ → nitrite + NADP+ (nitrate reductase)
Likewise, some reactions for AA catabolism (e.g., conversion of cysteine into taurine) occur in animals but are virtually absent from microorganisms (Dai et al.
NAD(P)H + H+ NAD(P)+Complex I
2e– + 2H+
FADH2
FAD2e– + 2H+ CoQComplex II
CoQH2
2e– + 2H+
Cytochrome b (Fe3+)
Cytochrome c1 (Fe2+)
Complex III
2e–
Cytochrome c oxidase
2H+ + ½O2 H2O
2e–
ADP + Pi
ATP
ATP synthase(Complex V)
Cytochrome c (Fe3+)
Complex IV
Acetyl-CoAFA
GlucAA
AAFA
Succinate
AA and FA
Fe2+ in heme a3
2e–Cytochrome c (Fe2+)
Protein
ADP + Pi
ATP
ATP synthase
ADP + Pi
ATP
ATP synthase
(Cu2+ Fe3+ in heme a Fe3+ in heme a3)
FIGURE 4.22 Oxidation of NAD(P)H and FADH2 via the mitochondrial electron transport system. This respiratory chain consists of complex I (NADH dehydrogenase) for the trans-fer of electrons from NADH to coenzyme Q (CoQ, a lipid-soluble mobile carrier); complex II (succinate dehydrogenase) for the transfer of electrons from succinate to coenzyme Q; complex III (cytochrome c reductase) for the transfer of electrons from reduced coenzyme Q to cytochrome c (a water-soluble mobile carrier); complex IV (cytochrome c oxidase) for the transfer of electrons from reduced cytochrome c to O2; and complex V (ATP synthase). Complexes I, III, and IV also act as proton pumps that contribute to generation of the proton-motive force across the inner mitochondrial membrane. In complex IV, O2 serves as the final oxidant of NADH and FADH2, where ½O2 is reduced and then reacts with 2H+ to form H2O. AA, amino acids; FA, fatty acids; Gluc, glucose.

142 Amino Acids: Biochemistry and Nutrition
© 2010 Taylor & Francis Group, LLC
2012). An example is that many prokaryotes lack spermine synthase and thus spermine, whereas all animal cells normally express this enzyme and contains this polyamine (Blachier et al. 2011). Sixth, major nitrogenous products of AA catabolism in animals are urea, uric acid, and NH3, depending on species and their living environment, but are primarily NH3 in microorganisms. Detoxification of NH3 as urea and uric acid in animals will be discussed in Chapter 6.
SUMMARY
Multiple pathways exist for the catabolism of both l-AA and d-AA to CO2, NH3, water, and SO4
2− in animals and microorganisms. These pathways are not only species-specific, but also depend on the cell type. Except for glycine whose catab-olism via the GCS takes only one step, a series of reactions spanning both the cytoplasm and mitochondria are required for degrading AA to the above metabo-lites in mammals, birds, and fish. Based on their metabolic fates, AA can be classified into three groups: ketogenic, glucogenic, and ketogenic plus glucogenic (Table 4.9). Catabolism of leucine and lysine yields only acetyl-CoA (a precur-sor of either ketone bodies or long-chain fatty acids, depending on nutritional and hormonal status) and, therefore, they are strictly ketogenic AA. However, catabolism of many AA (e.g., alanine, aspartate, glutamate, glutamine, and argi-nine) generates pyruvate and 4–5 carbon unit metabolites (e.g., oxaloacetate and α-KG) for glucose synthesis in the liver and kidneys (i.e., they are glucogenic). Catabolism of some AA can result in the formation of both acetyl-CoA and 4–5 carbon unit metabolites, and they are called ketogenic plus glucogenic AA. For all AA, the complete oxidation of their carbon skeletons to CO2 in the body requires the formation of acetyl-CoA, which then enters the Krebs cycle for oxidation to CO2, NADH, FADH2. NADPH is also generated from catabolism of certain AA. NAD(P)H and FADH2 are oxidized to water via the mitochondrial electron transport system, where ATP is synthesized from ADP plus Pi. Because of the different lengths of carbon skeletons and different numbers of N atoms, the effi-ciency of oxidation of different AA for ATP production varies greatly. Catabolism of l-AA and d-AA by bacteria in the lumen of the gastrointestinal tract and the animal host plays an important role in utilizing AA (either food- or endogenously derived) and regulating AA homeostasis in the body.
TABLE 4.9Classification of AA into Ketogenic, Glucogenic, and Ketogenic Plus Glucogenic Groups in Animal Metabolism
Group AA
Ketogenic Leucine and lysine
Glucogenic Alanine, γ-aminobutyrate, arginine, asparagine, aspartate, citrulline, cysteine, glutamate, glutamine, glycine, histidine, methionine, ornithine, proline, serine, and valine
Ketogenic plus glucogenic Isoleucine, phenylalanine, threonine, tryptophan, and tyrosine
143Degradation of Amino Acids
© 2010 Taylor & Francis Group, LLC
REFERENCES
Alderton, W.K., C.E. Cooper, and R.G. Knowles. 2001. Nitric oxide synthases: Structure, function and inhibition. Biochem. J. 357:593–615.
Bada, J.L. 1984. In vivo racemization in mammalian proteins. Methods Enzymol. 106:98–115.Bender, D.A. 2012. The metabolism of “surplus” amino acids. Br. J. Nutr. 108:S113–S121.Benevenga, N.J. and K.P. Blemings. 2007. Unique aspects of lysine nutrition and metabolism.
J. Nutr. 137:1610S–1615S.Blachier, F., A.M. Davila, R. Benamouzig, and D. Tome. 2011. Channelling of arginine in NO
and polyamine pathways in colonocytes and consequences. Front. Biosci. 16:1331–1343.Brosnan, J.T. and Brosnan, M.E. 2006. Branched-chain amino acids: Enzyme and substrate
regulation. J. Nutr. 136:207S–211S.Curthoys, N.P. and M. Watford. 1995. Regulation of glutaminase activity and glutamine
metabolism. Annu. Rev. Nutr. 15:133–159.Dai, Z.L., G. Wu, and W.Y. Zhu. 2011. Amino acid metabolism in intestinal bacteria: Links
between gut ecology and host health. Front. Biosci. 16:1768–1786.Dai, Z.L., X.L. Li, P.B. Xi, J. Zhang, G. Wu, and W.Y. Zhu. 2012. Metabolism of select amino
acids in bacteria from the pig small intestine. Amino Acids 42:1597–1608.Davis, A.J. and R.E. Austic. 1997. Dietary protein and amino acid levels alter threonine dehy-
drogenase activity in hepatic mitochondria of Gallus domesticus. J. Nutr. 127:738–744.Dillon, E.L., D.A. Knabe, and G. Wu. 1999. Lactate inhibits citrulline and arginine synthe-
sis from proline in pig enterocytes. Am. J. Physiol. Gastrointest Liver Physiol. 276: G1079–G1086.
Hanigan, M.D., J.P. Cant, D.C. Weakley, and J.L. Beckett. 1998. An evaluation of postabsorptive protein and amino acid metabolism in the lactating dairy cow. J. Dairy Sci. 81:3385–3401.
Haussinger, D. 1990. Nitrogen metabolism in liver: Structural and functional organization and physiological significance. Biochem. J. 267:281–290.
Harper, A.E., R.H. Miller, and K.P. Block. 1984. Branched-chain amino acid metabolism. Annu. Rev. Nutr. 4:409–454.
Islam, M.M., R. Wallin, R.M. Wynn, M. Conway, H. Fujii, J.A. Mobley, D.T. Chuang, and S.M. Hutson. 2007. A novel branched-chain amino acid metabolon: Protein−protein interactions in a supramolecular complex. J. Biol. Chem. 282:11893–11903.
Jungas, R.L., M.L. Halperin, and J.T. Brosnan. 1992. Quantitative analysis of amino acid oxi-dation and related gluconeogenesis in humans. Physiol. Rev. 72:419–448.
Kalhan, S.C. and D.M. Bier. 2008. Protein and amino acid metabolism in the human newborn. Annu. Rev. Nutr. 28:389–410.
Kera, Y., H. Aoyama, N. Watanabe, and R.H. Yamada. 1996. Distribution of d-aspartate oxidase and free d-glutamate and d-aspartate in chicken and pigeon tissues. Comp. Biochem. Physiol. B 115:121–126.
Kikuchi, G., Y. Motokawa, T. Yoshida, and K. Hiraga. 2008. Glycine cleavage system: Reaction mechanism, physiological significance, and hyperglycinemia. Proc. Jpn. Acad. Ser. B 84:246–263.
Krebs, H.A. 1964. The metabolic fate of amino acids. In: Mammalian Protein Metabolism, edited by H.N. Munro and J.B. Allison. Academic Press, New York. pp. 125–176.
Lamarre, S.G., G. Morrow, L. Macmillan, M.E. Brosnan, and J.T. Brosnan. 2012. Formate: An essential metabolite, a biomarker or more? Clin. Chem. Lab. Med. 14:1–8.
LeFloc’h, N., W. Otten, and E. Merlot. 2011. Tryptophan metabolism, from nutrition to poten-tial therapeutic applications. Amino Acids 41:1195–1205.
Miller, M.M., L.B. Popova, E.A. Meleshkevitch, P.V. Tran, and D.Y. Boudko. 2008. The inver-tebrate B(0) system transporter, D. melanogaster NAT1, has unique d-amino acid affin-ity and mediates gut and brain functions. Insect Biochem. Mol. Biol. 38:923–931.

144 Amino Acids: Biochemistry and Nutrition
© 2010 Taylor & Francis Group, LLC
Møller, N., S. Meek, M. Bigelow, J. Andrews, and K.S. Nair. 2000. The kidney is an important site for in vivo phenylalanine-to-tyrosine conversion in adult humans: A metabolic role of the kidney. Proc. Natl. Acad. Sci. USA 97:1242–1246.
Morris, S.M. Jr. 2009. Recent advances in arginine metabolism: Roles and regulation of the arginases. Br. J. Pharmacol. 157:922–930.
Newsholme, P., F. Abdulkader, E. Rebelato, T. Romanatto, C.H.J. Pinheiro, K.F. Vitzel, E.P. Silva et al. 2011. Amino acids and diabetes: Implications for endocrine, metabolic and immune function. Front. Biosci. 16:315–339.
Ohide, H., Y. Miyoshi, R. Maruyama, K. Hamase, and R. Konno. 2011. d-Amino acid metabo-lism in mammals: Biosynthesis, degradation and analytical aspects of the metabolic study. J. Chromatogr. B. 879:3162–3168.
Ohtsu, H. 2011. Histamine synthesis and lessons learned from histidine decarboxylase deficient mice. Adv. Exp. Med. Biol. 709:21–31.
Phang, J.M. and W. Liu. 2012. Proline metabolism and cancer. Front. Biosci. 17:1835–1845.Scislowski, P.W.D. and K. Pickard. 1994. The regulation of transaminative flux of methionine
in rat liver mitochondria. Arch. Biochem. Biophys. 314:412–416.Stipanuk, M.H. 2004. Sulfur amino acid metabolism: Pathways for production and removal of
homocysteine and cysteine. Annu. Rev. Nutr. 24:539–577.Trottier, N.L., C.F. Shipley, and R.A. Easter. 1997. Plasma amino acid uptake by the mammary
gland of the lactating sow. J. Anim. Sci. 75:1266–1278.Van Der Schoor, S.R., P.J. Reeds, B. Stoll, J.F. Henry, J.R. Rosenberger, D.G. Burrin, and J.B.
Van Goudoever. 2002. The high metabolic cost of a functional gut. Gastroenterology 123:1931–1940.
Watford, M. 1985. Gluconeogenesis in the chicken: Regulation of phosphoenolpyruvate car-boxykinase gene expression. Fed. Proc. 44:2469–2474.
Werner, E.R., N. Blau, and B. Thöny. 2011. Tetrahydrobiopterin: Biochemistry and patho-physiology. Biochem. J. 438:397–414.
Wu, G. and S.M. Morris Jr. 1998. Arginine metabolism: Nitric oxide and beyond. Biochem. J. 336:1–17.
Wu, G., F.W. Bazer, R.C. Burghardt, G.A. Johnson, S.W. Kim, D.A. Knabe, P. Li et al. 2011. Proline and hydroxyproline metabolism: Implications for animal and human nutrition. Amino Acids 40:1053–1063.
Yao, K., Y.L. Yin, X.L. Li, P.B. Xi, J.J. Wang, J. Lei, Y.Q. Hou, and G. Wu. 2012. Alpha-ketoglutarate inhibits glutamine degradation and enhances protein synthesis in intestinal porcine epithelial cells. Amino Acids 42:2491–2500.

145
© 2010 Taylor & Francis Group, LLC
Synthesis and Catabolism of Special Nitrogenous Substances from Amino Acids
Most of the metabolic products arising from AA catabolism in organisms are described in Chapter 4. However, multiple AA (two or three) or single AA also serve as substrates for synthesis of other biologically important metabolites (e.g., billirubin, carnosine and related dipeptides, carnitine, catecholamines, creatine, glucosamine, GSH, heme, histamine, polyamines, purines, and pyrimidines) in a tissue-specific manner. Structures of some of these special nitrogenous substances are illustrated in Figure 5.1. Their synthetic pathways share one or more of the following charac-teristics. First, AA are utilized to produce unique compounds without undergoing extensive oxidation. Second, histidine and its methylated derivatives are used to form major dipeptides in skeletal muscle, brain, and other tissues. Third, methionine plays a critical role in the formation of polyamines, creatine, and carnitine by providing the necessary methyl group via S-adenosylmethionine. Fourth, most of the synthetic pathways for utilizing multiple AA involve the cooperation of several organs, such as liver, kidney, and skeletal muscle, where glutamine [or its metabolites (e.g., arginine, proline, and glutamate)] and glycine are essential precursors.
As a mechanism responsible for the maintenance of their homeostasis in the body, the special nitrogenous products of AA undergo continuous catabolism, yielding unique substances with both physiological and pathological significance. Some of these metabolites are useful indicators of the nutritional status and the progression of certain genetic or metabolic diseases in humans and other animals. Conjugation with glucuronic acid or bile acid is an important pathway for removing many nitrogenous products. To expand our knowledge of AA metabolism, the pathways for synthesis and catabolism of nitrogenous products beyond those described in the preceding chapters are highlighted in this chapter.
PRODUCTION OF DIPEPTIDES CONSISTING OF HISTIDINE OR ITS METHYLATED DERIVATIVES
history of reseArch on cArnosine AnD relAteD DiPePtiDes in AnimAl tissues
Animals contain dipeptides consisting of histidine or its methylated derivatives as well as β-alanine or GABA in a species- and tissue-specific manner (Table 5.1).
5

146 Amino Acids: Biochemistry and Nutrition
© 2010 Taylor & Francis Group, LLC
Discoveries of most of these peptides date back to the early twentieth century. In 1900, the Russian biochemist W. Gulewitsch found that the total N content in minced beef muscle was greater than the sum of the total N accounted for by protein and nonpro-tein substances known to be present in skeletal muscle at that time. He demonstrated that this difference was attributed to by an abundant molecule named carnosine (meaning meat in Latin). Eleven years later, W. Gulewitsch reported that β-alanine is a constituent of carnosine. In 1918, through chemical synthesis, L. Baumann and Th. Ungwaldsen identified carnosine to be β-alanyl-l-histidine. Synthesis of the
CHH COO–
Betaine(trimethylglycine)
3,5-Diiodotyrosine
CH2 CH COO–
I
I
–O
NH3+
3-Monoiodotyrosine
-
CH2 CH2 CH2
NH3+
H2C
NH3+
Putrescine
3,5,3′,-Triiodothyronine
CH2 C COO–
I
I
O
I
NH 3+
H
Thyroxine (3,5,3′,5′-tetraiodothyronine)
CH2 C COO–
I
I
O
I
NH 3+
H
I
–O–O
H2C CH2 CH2 N CH2 CH2 CH2
NH3+
CH2
NH 3+H2
Spermidine
H2C CH2 CH2 N (CH2)4
NH 3+
N
H2
CH2 CH2 CH2
NH3+H2
Spermine
H3C N+
CH2 CH
CH3
CH3
CH2 COO–
OH
Carnitine(γ-amino-β-hydroxybutyric
acid trimethylbetaine)
Carnosine(β-alanyl-L-histidine)
CH2 CH2CH2CH2CH2 C N CH
H2C NH+
+
HN
OH3N H3N
H2C
H
COO–
Histamine(β-aminoethylimidazole)
C N
NH+
HN
O
H
Carcinine(β-alanyl-L-histamine)
OCH2
H
HOH
NH 2
OH
HH
OH H
OH
Glucosamine
O
CH2
H
HOH
NH2
OH
HH
OH H
O PO32–
Glucosamine-6-P
CH2 CH COO–
NH3+I
O
NH
N
O
O
H
Orotic acid
NH2
C CH2 CH COO–
O NH3+
Kynurenine
α-Ketoadipate(α-keto-hexanedioic acid)
N COO–
OH
Kynurenic acid
N
CH2 CH2 NH3+
HO5
4
67 1 2
3
1 25
4 3
H
N
CH2 CH2 NOH3C C CH3
OH
HMelatonin (N-acetyl-5-methoxytryptamine)
NH+HN
CH2 CH2 NH3+
5-Hydroxytryptamine (serotonin)
N
CH2 CH COO–HO
NH3+
H5-Hydroxytryptophan
–OOC CH2 CH2 CH2 C COO–
O
H2CNH+
N
CH COO–
H3C
1-Methyl-L-histidine
H2CN
CH COO–
CH3
+H3N
3-Methyl-L-histidine
+H3N
HN+
N+
CH3
CH3H3C
+ +
N
CH2 CH2
NH 3+
H
Tryptamine
–OOC
+
+
FIGURE 5.1 Chemical structures of some special metabolites of AA in animals.

147Synthesis and Catabolism of Special Nitrogenous Substances
© 2010 Taylor & Francis Group, LLC
dipeptide is catalyzed by ATP-dependent carnosine synthetase primarily found in skeletal muscle. Although both acid and base hydrolyses can decompose carnosine, intestinal proteases (e.g., pepsin or trypsin) or intestinal bacteria cannot hydrolyze this dipeptide. In 1949, an enzyme in intestinal juice, named carnosinase, was discovered to convert β-alanyl-l-histidine to β-alanine and l-histidine. A relatively high activity of carnosinase occurs in the mammalian brain, explaining the very low level of car-nosine in this tissue. In contrast, carnosinase activity in muscle is low and varies with species. This accounts for the relatively high concentration of carnosine in mamma-lian skeletal muscle, which contains high concentrations (in the millimolar range) of carnosine in a species-dependent manner (Sauerhöfer et al. 2007). Notably, carnosine concentrations in human skeletal muscle ranging from 25 to 30 mM are ~2, 10, and 40 times greater than those in the skeletal muscle of pigs, rats, and mice, respectively.
Intensive efforts were made in the 1920s to determine the carnosine content of animal tissues. In 1921, W.M. Clifford concluded that, in contrast to mammalian skeletal muscle, chicken skeletal muscle contains a substance similar to carnosine but no carnosine. In 1929, N. Tolkatschevskaya and D. Ackermann independently identified this carnosine-like compound in chicken skeletal muscle to be a dipep-tide (methyl carnosine; β-alanyl-N-methyl-l-histidine), which was named anserine after the taxonomic name for the goose. Anserine is also abundant in the retina of birds. In 1909, U. Suzuki was the first to report the presence of a carnosine-like substance in fish skeletal muscle. This substance was likely anserine. In 1957, R.W. Cargill and B. Freeburgh demonstrated that anserine was synthesized from either β-alanine plus l-1-methylhistidine by an ATP-dependent synthase or carnosine plus
TABLE 5.1Dipeptides and Tripeptides in Animalsa
Common Name Composition Storage in Major Tissue
1. DipeptidesAnserineb β-Alanyl-l-1-methylhistidine Skeletal muscle and brain (birds)
Balenine (ophidine) β-Alanyl-l-3-methylhistidine Skeletal muscle and brain
Carcinine β-Alanyl-histamine Brain and heart of vertebrates
Carnosinec β-Alanyl-l-histidine Skeletal muscle and brain
Homocarnosine γ-Aminobutyryl-l-histidine Brain
Homoanserine γ-Aminobutyryl-l-1-methylhistidine
Brain of vertebrates
2. TripeptidesGlutathione γ-Glu–Cys–Gly Cells, bile acid, pancreatic juice,
and uterine fluid
Collagen peptide Gly–Pro–hydroxyproline Milk and plasma
a Present in both mammals and birds, unless indicated otherwise.b Also known as methyl carnosine, not found in mammalian muscle or brain.c Absent in birds.

148 Amino Acids: Biochemistry and Nutrition
© 2010 Taylor & Francis Group, LLC
S-adenosylhomocysteine by carnosine-N-methyltransferase in avian skeletal muscle. Invertebrates contain little carnosine or anserine.
The 1960s witnessed the discovery of homocarnosine (γ-aminobutyryl-l-histidine) and homoanserine (γ-aminobutyryl-l-1-methylhistidine) in the mammalian brain and of balenine in skeletal muscle. In the brain, the concentrations of homocarnosine, which range from 0.05 to 0.5 mM depending on species and developmental stage, are much greater than those of carnosine. The highest concentrations of homocarnosine are found in the substantia nigra, dentate gyrus, and olfactory bulb as well as in the cerebrospinal fluid. In 1963, A. Carisano and F. Cara discovered balenine (β-alanyl-l-3-methylhistidine) in meat extracts. This compound was subsequently found to be present in the skeletal muscles of many mammals (including cat, cattle, chicken, dog, human, pig, snake, sheep, and whale). Meanwhile, a substance (acetylhistidine or neorosine), which is structurally similar to carnosine, was found in the brain, ret-ina, and lens of amphibians where these small peptides are synthesized. Acetylated derivatives of anserine, carnosine, and homocarnosine were discovered in the 1970s and 1980s in the mammalian brain and cardiac muscle. In 1985, carcinine (β-alanyl-histamine) was identified in crab muscle and in vertebrate nervous tissue and cardiac muscle. Human heart, kidneys, small intestine, and stomach contain carcinine, which can be derived from both diets and endogenous synthesis in these tissues.
synthesis of cArnosine AnD relAteD DiPePtiDes
The pathways for the cytosolic synthesis of dipeptides are illustrated in Figure 5.2. Methylated histidines (3-methylhistidine and 1-methylhistidine) are produced from the hydrolysis of proteins (e.g., myofibrillar proteins) containing 3-methylhistidine and 1-methylhistidine residues. These residues are derived from the post-transla-tional methylation of histidine residues in polypeptides by S-adenosylmethionine-dependent protein methylases. β-Alanine is formed from aspartate decarboxylation, as well as the catabolism of pyrimidines, polyamines, and coenzyme A (Chapter 3).
β-Alanine
-1-Methylhistidine ATP
ADP
-Histidine
H2O
H2O
76
5
31
Homocarnosine
GABA
ATP ADP+ Pi
H2O
-1-Methylhistidine HomoanserineATP ADP + Pi
Balenine
-3-Methylhistidine
H2O
ATP
ADP + Pi
PiAnserine Carnosine
SAMSAHC
42
Carcinine
CO2
FIGURE 5.2 Synthesis of dipeptides consisting of l-histidine or its methylated derivatives in animals. The enzymes that catalyze the indicated reactions are: (1) anserine synthetase; (2) carnosine-N-methyltransferase; (3) carnosine synthetase; (4) carnosine decarboxylase; (5) homocarnosine synthetase; (6) homoserine synthetase; and (7) balenine synthetase. Expression of these enzymes is species- and tissue-specific. GABA, γ-aminobutyrate.
149Synthesis and Catabolism of Special Nitrogenous Substances
© 2010 Taylor & Francis Group, LLC
The enzymes that catalyze the synthesis of carnosine and related dipeptides are anserine synthetase, carnosine-N-methyltransferase, carnosine synthetase, carno-sine decarboxylase, homocarnosine synthetase, homoserine synthetase, and bale-nine synthetase. All these enzymes are localized in the cytoplasm. As indicated previously, their expression is species- and tissue-specific. For example, anserine is synthesized in the skeletal muscle and brain of birds but not in mammals, whereas the opposite is true for carnosine. Additionally, in rats, the synthesis of anserine and carnosine occurs in skeletal muscle but not in liver. In humans and other animals, dietary supplementation with β-alanine can increase concentrations of β-alanine in plasma as well as concentrations of β-alanine and β-alanine-containing dipeptides (e.g., carnosine) in skeletal muscle.
cAtABolism of cArnosine AnD relAteD DiPePtiDes
Carnosinase (also known as carnosine dipeptidase) catalyzes the hydrolysis of carno-sine and dipeptides, which are structurally similar to carnosine. Two isoforms of the enzyme have been reported for animal tissues (e.g., liver and kidney), but are virtually absent from skeletal muscle. Carnosinase-1 (a cytosolic enzyme) has substrate speci-ficity for carnosine and homocarnosine, whereas carnosinase-2 (a cytosolic enzyme) can hydrolyze carnosine and related dipeptides. The resultant products of carnosinase include histidine, 3-methylhistidine, 1-methylhistidine, and β-alanine. Histidine is degraded as described in Chapter 4, whereas 3-methylhistidine and 1-methylhistidine are excreted in the urine if they are not reutilized for dipeptide synthesis in the body. Finally, β-alanine is catabolized to acetyl-CoA plus CO2 in animal tissues through a series of enzymes. These enzymes include (1) β-alanine:pyruvate transaminase, form-ing malonate semialdehyde and alanine; (2) β-alanine:α-KG transaminase, yielding malonate semialdehyde and glutamate; (3) alanine aminotransferase, GDH, malonate semialdehyde dehydrogenase, catalyzing both dehydrogenation and decarboxylation of malonate semialdehyde to form acetaldehyde; and (4) aldehyde dehydrogenase, generating acetyl-CoA. Acetyl-CoA is then oxidized to CO2 and water through the Krebs cycle and electron transport system in the mitochondria.
SYNTHESIS AND DEGRADATION OF GSH
history of Gsh reseArch
GSH was discovered by J. de Rey-Paihade in 1888 from extracts of yeast and many animal tissues (beef skeletal muscle and liver, fish skeletal muscle, lamb small intes-tine, and sheep brain) and in fresh egg white. de Rey-Paihade named this substance philothion meaning love and sulfur in Greek. In 1921, F.G. Hopkins suggested that the philothion isolated from liver, skeletal muscle, and yeast is a dipeptide consist-ing of cysteine and glutamate but these authors overlooked the presence of glycine in philothion possibly due to misinterpretation of the Van Slyke amino N data. Honoring the history of the discovery of philothion, Hopkins named the substance “glutathione.” Based on the content of nitrogen and sulfur in GSH isolated from yeast, blood, and liver, G. Hunter and B.A. Eagles indicated in 1927 that GSH is

150 Amino Acids: Biochemistry and Nutrition
© 2010 Taylor & Francis Group, LLC
not a dipeptide containing Glu–Cys but is a tripeptide consisting of Glu–Cys and an additional low-molecular-weight AA (possibly serine). Using an acid hydro-lysate of GSH, Hopkins proposed in 1929 that GSH is a tripeptide formed from cysteine, glutamate, and glycine. This proposal was supported by the independent work of E.C. Kendall and coworkers in 1929 and 1930. Based on titration of GSH in water and formaldehyde as well as the observed pK values, N.W. Pirie and K.G. Pinhey reported in 1929 that the structure of GSH is γ-Glu–Cys–Gly. The struc-ture of GSH was confirmed by C.R. Harington and T.H. Mead in 1935 through chemical synthesis from N-carbobenzoxycystine and glycine ethyl ester. One year later, another chemical synthesis of GSH was performed by V. du Vigneaud and G.L. Miller using S-benzylcysteinylglycine methyl ester and the acid chloride of N-carbobenzoxyglutamate-α-methyl ester. During the past half century, GSH has been found in all cells. Related substances reported to date include γ-Glu–Cys–Gly–spermidine in E. coli and (γ-Glu–Cys)n–Gly in plants.
concentrAtions of Gsh in PhysioloGicAl fluiDs AnD tissues
GSH is the predominant low-molecular-weight thiol in animal cells, ranging from 0.5 to 10 mM. Most of the cellular GSH (85–90%) is present in the cytosol, with the remainder in many organelles (including mitochondria, nuclear matrix, and per-oxisomes). With the exception of bile acid, which may contain up to 10 mM GSH, extracellular concentrations of GSH are relatively low (e.g., 2–20 μM in plasma). Because of the cysteine residue, GSH is readily oxidized nonenzymatically to gluta-thione disulfide (GSSG) by electrophilic substances (e.g., free radicals and reactive oxygen/nitrogen species). GSSG efflux from cells contributes to a net loss of intra-cellular GSH. Cellular GSH concentrations are reduced markedly in response to protein malnutrition, oxidative stress, and many pathological conditions. Like other sulfur-containing AA metabolites, GSH plus 2 GSSG represent total GSH in cells, a significant amount of which, up to 15%, may be bound to protein. The ratio of [GSH] to [GSSG], which is often used as an indicator of the cellular redox state, is >10 under normal physiological conditions. GSH/GSSG is the major redox couple that deter-mines the antioxidative capacity of cells, but its value can be affected by other redox couples, including NADPH/NADP+ and thioredoxinred/thioredoxinox.
Gsh synthesis
GSH is synthesized from cysteine, glutamate, and glycine sequentially by two cytosolic enzymes (γ-glutamylcysteine synthetase and GSH synthetase) (Figure 5.3). Virtually all cell types can synthesize GSH, with the liver being the major producer and exporter of this tripeptide. In the γ-glutamylcysteine synthetase reaction, the γ-carboxyl group of glutamate reacts with the amino group of cysteine to form a peptidic γ-linkage, which protects GSH from hydrolysis by intracellular peptidases. Although γ-glutamyl-cysteine can be a substrate for γ-glutamylcyclotransferase, GSH synthesis is favored in animal cells because of the much higher affinity and activity of GSH synthetase. Mammalian γ-glutamylcysteine synthetase is a heterodimer consisting of a catalyt-ically active heavy subunit (73 kDa) and a light (regulatory) subunit (31 kDa). The

151Synthesis and Catabolism of Special Nitrogenous Substances
© 2010 Taylor & Francis Group, LLC
Cysteinyl-glycine
-Cysteine
γ-Glutamyl-AA
γ-Glutamyl-cysteine5-Oxoproline
-Glutamate
1AA
NO
-Arginine GS-NO
LOOH LOH
H2O2H2O
O2– O2
2H+e–
Glutathione (GSH) (GSSG)
R
8GSH-X
X R
NADP+ NADPH + H+
Glucose R-5-PF-6-P
GlcN-6-P
ATP
ADP + Pi
α-KGBCAA
NH3
H2ONH3
BCKA
ATP
ADP + Pi
MetAA
OTC
Glycine
ATP
Ser
Cystine
NAC
ADP
Pentosecycle
α-KG
-Glutamine -Glutamine
+ Pi
14 16
7
15
171312
1110
3
2
20
19
18
621 5
4
3
22
BH4
FIGURE 5.3 Glutathione synthesis and utilization in animals. The enzymes that catalyze the indicated reactions are (1) γ-glutamyl transpeptidase; (2) γ-glutamyl cyclotransferase; (3) 5-oxoprolinase; (4) γ-glutamyl-cysteine synthetase; (5) glutathione synthetase; (6) dipep-tidase; (7) glutathione peroxidase; (8) glutathione reductase; (9) superoxide dismutase; (10) branched-chain amino acid transaminase (cytosolic and mitochondrial); (11) glutaminase; (12) glutamate dehydrogenase; (13) glutamine:fructose-6-phosphate transaminase (cytosolic); (14) nitric oxide synthase; (15) glutathione S-transferase; (16) NADPH oxidase and mito-chondrial respiratory complexes; (17) glycolysis; (18) glutathione-dependent thiol- disulfide or thioltransferase; (19) transsulfuration pathway; (20) deacylase; (21) serine hydroxymethyl-transferase; and (22) nonenzymatic reaction. AA, amino acid; BCAA, branched-chain amino acids (primarily providing an amino group for glutamate synthesis); BCKA, branched-chain α-ketoacids; BH4, tetrahydrobiopterin; GlcN-6-P, glucosamine-6-phosphate; GS–NO, glutathione–NO adduct; GSSG, glutathione disulfide; KG, α-ketoglutarate; LOO•, lipid per-oxyl radical; LOOH, lipid hydroperoxide; NAC, N-acetylcysteine; OTC, l-2-oxothiazolidine-4-carboxylate; R•, radicals; R, nonradicals; R-5-P, ribulose-5-phosphate; X, electrophilic xenobiotics.

152 Amino Acids: Biochemistry and Nutrition
© 2010 Taylor & Francis Group, LLC
heavy subunit contains all substrate-binding sites, whereas the light subunit modu-lates the affinity of the heavy subunit for substrates and inhibitors. The Km values of mammalian γ-glutamylcysteine synthetase for glutamate and cysteine are 1.7 and 0.15 mM, respectively, which are similar to intracellular concentrations of glutamate (2–4 mM) and cysteine (0.15–0.25 mM) in the rat liver. Mammalian GSH synthetase is a homodimer (52 kDa/subunit) and is an allosteric enzyme with cooperative binding for its γ-glutamyl substrate. The Km values of mammalian GSH synthetase for ATP and glycine are ~0.04 and 0.9 mM, respectively, which are lower than intracellular concen-trations of ATP (2–4 mM) and glycine (1.5–2 mM) in the liver of healthy rats. Thus, GSH synthetase is normally saturated with its substrates in animal cells.
reGulAtion of Gsh synthesis
Both biochemical and metabolic studies have established that γ-glutamylcysteine syn-thetase is the rate-controlling enzyme in the de novo synthesis of GSH (Wu et al. 2004). Among the substrates, cysteine is a major limiting AA for GSH synthesis. Cysteine is readily oxidized to cystine in oxygenated extracellular solutions. Thus, cysteine concentration in plasma is low (10–25 μM) when compared with cystine (50–150 μM). Cysteine and cystine are transported by distinct membrane carriers, and cells typically transport one more efficiently than the other. Interestingly, some cell types (e.g., hepatocytes) have little or no capacity for direct transport of extracel-lular cystine. However, GSH that effluxes from the liver can reduce cystine to cysteine on the outer cell membrane, and the resulting cysteine is taken up by hepatocytes. Other cell types (e.g., endothelial cells) can take up cystine and reduce it intracel-lularly to cysteine because cellular reducing conditions normally favor the presence of cysteine. Compelling evidence shows that increasing the provision of cysteine or its precursors (e.g., cystine, N-acetylcysteine, l-2-oxothiazolidine-4-carboxylate) via oral or intravenous administration enhances GSH synthesis and prevents GSH defi-ciency in humans and other animals under various nutritional and pathological condi-tions, including protein malnutrition, adult respiratory distress syndrome, HIV, and AIDS. Dietary methionine can replace cysteine to support GSH synthesis in vivo.
Extracellular- and intracellular-generated glutamate can be used for GSH syn-thesis. Besides its function as a substrate for γ-glutamylcysteine synthetase, gluta-mate plays a regulatory role in GSH synthesis through two mechanisms: (1) uptake of cystine and (2) prevention of GSH inhibition of γ-glutamylcysteine synthetase. Glutamate and cystine share the System Xc
– amino acid transporter. When extracel-lular glutamate concentrations are high, as in patients with advanced cancer, HIV infection, and spinal cord or brain injury as well as in cultured cells (e.g., endothelial cells), cystine uptake is competitively inhibited by glutamate, resulting in reduced GSH synthesis. GSH is a nonallosteric feedback inhibitor of γ-glutamylcysteine syn-thetase, but the binding of GSH to the enzyme is competitive with glutamate. When intracellular glutamate concentrations are unusually high, as in canine erythrocytes, GSH synthesis is enhanced and its concentration is particularly high. Interestingly, rat erythrocytes do not take up or release glutamate. Glutamine, valine, and iso-leucine are the precursors of glutamate in these cells. Also, as noted in Chapter 4, leucine donates its amino group for glutamate synthesis. Therefore, glutamine is an

153Synthesis and Catabolism of Special Nitrogenous Substances
© 2010 Taylor & Francis Group, LLC
effective precursor of glutamate for GSH synthesis in many cell types, including enterocytes, neural cells, hepatocytes, and lymphocytes. Thus, supplementing gluta-mine to total parenteral nutrition maintains tissue GSH concentrations and improves survival after reperfusion injury, ischemia, acetaminophen toxicity, chemotherapy, inflammatory stress, and bone marrow transplantation. Similarly, dietary supple-mentation with glutamate or glutamine increases GSH concentration in the small-intestinal mucosa of neonates.
Glycine may become a limiting AA for GSH synthesis under conditions such as protein malnutrition, sepsis, inflammatory stimuli, weaning, obesity, and diabetes. For example, glycine availability limits erythrocyte GSH synthesis in burn patients and in children recovering from severe malnutrition. Also, dietary glycine supple-mentation increases hepatic GSH concentration in protein-deficient rats challenged with tumor necrosis factor-α. At present, it is not known how concentrations of gly-cine are reduced in the plasma of obese animals, but the underlying mechanisms may include a reduction in glycine synthesis and an increase in glycine catabolism. A deficiency of this AA may contribute to oxidative stress in these subjects.
trAnsPort AnD DeGrADAtion of Gsh
GSH can be transported out of the cell. In plasma, most GSH originates primar-ily from the liver, but some dietary GSH can enter the portal circulation. GSH is transported out of the sinusoidal and canicular membranes of the liver via a carrier-dependent facilitative mechanism. GSH molecules exit the liver either intact or as γ-Glu–(Cys)2 due to γ-glutamyl transpeptidase activity on the outer plasma mem-brane (Figure 5.4). Because of the rapid degradation of GSH by γ-glutamyl transpep-tidase, concentrations of GSH plus GSSG in plasma are usually very low, ranging from 5 to 50 μM, depending on animal species, physiological state, and sampling sites. This is in striking contrast to intracellular concentrations of GSH ranging from 0.5 to 10 mM in animal tissues. Such an extremely high concentration gradi-ent across the plasma membrane makes the transport of extracellular GSH or GSSG into the cell thermodynamically unfavorable. However, γ-Glu–(Cys)2 and Cys–Gly, which are derived from GSH and (Cys)2, respectively, are readily taken up by extra-hepatic cells and tissues, including the kidney, brain, heart, skeletal muscle, and adi-pose tissue. In these cells, γ-Glu–(Cys)2 and Cys–Gly are utilized for GSH synthesis (Figure 5.3). Thus, the interorgan metabolism of GSH serves to transport cysteine in a nontoxic form between tissues and also helps maintain intracellular concentrations of GSH and the cellular redox state.
PRODUCTION OF GLY–PRO–HYDROXYPROLINE
ABunDAnce of triPePtiDe Gly–Pro–hyDroxyProline in milk AnD PlAsmA
Results of recent studies identify the presence of the tripeptide Gly–Pro–hydroxy-proline in physiological fluids (e.g., plasma and milk). Collagen proteins in connective tissue turn over in animals to release its repeat constituent, Gly–Pro–hydroxyproline. The rate of collagen degradation is greater in neonates than in

154 Amino Acids: Biochemistry and Nutrition
© 2010 Taylor & Francis Group, LLC
adults. Studies with young pigs (7–21-day-old) indicate that concentrations of this tripeptide in plasma range from 6 to 10 mM. Sow milk also contains relatively high concentrations of the peptide in the range 2–3 mM. Based on kilogram of body weight, larger amounts of Gly–Pro–hydroxyproline are produced from col-lagen degradation in the connective tissue (e.g., the bone, joints, and skin) of young animals compared with older ones.
utiliZAtion of Gly–Pro–hyDroxyProline By AnimAls
The utilization of Gly–Pro–hydroxyproline requires interorgan cooperation in the body. The small peptide is readily transported from the lumen of the small intestine into enterocytes via PepT-1. Some of this tripeptide is hydrolyzed by peptidases inside the enterocytes, and the remaining tripeptide enters the systemic blood circu-lation. Besides glycine and proline, which are utilized in multiple pathways (Chapter 4), hydroxyproline (a posttranslational product of proline) may be a precursor for glycine generation in the kidneys via hydroxyproline oxidase (Chapter 3). The quan-titative contribution of this pathway to endogenous glycine provision is unknown
GSH
GSSG
3 2
γ-Glu–Cys
GSH(–)
Glu
Cysteine Cys–Gly
Glycine
γ-Glu–(Cys)2
Cys–Glyγ-Glu–(Cys)2
GSH
ATP
Intracellular
Plasmamembrane
Extracellular 1
5
6
4
(Cys)2
ATP
NADPH+ H+
NADP+
7
GSH(–)
FIGURE 5.4 Transport and degradation of glutathione. Transport of glutathione occurs in most cell types. The liver is the major site for glutathione synthesis in the body. Glutathione is transported out of the hepatocyte by a specific transporter for utilization in extrahepatic tis-sues. Glutathione is the major vehicle for interorgan transport of cysteine in a nontoxic form. Enzymes that catalyze the indicated reactions are: (1) γ-glutamyl transpeptidase; (2) trans-hydrogenase; (3) glutathione disulfide reductase; (4) γ-glutamyl-cysteine synthetase; (5) glu-tathione synthetase; and (6) dipeptidase. GSH is an inhibitor of γ-Glu–(Cys)2 transport and γ-glutamyl-cysteine synthetase. Cys, cysteine; (Cys)2, cystine (Cys–Cys); GSH, reduced glu-tathione; GSSG, glutathione disulfide (oxidized glutathione).

155Synthesis and Catabolism of Special Nitrogenous Substances
© 2010 Taylor & Francis Group, LLC
but may be substantial. It is likely that the synthesis of glycine from hydroxyproline will compensate, in part, for the severe glycine deficiency in milk and also allow for efficient utilization of proline by piglets and possibly other animal species. Thus, Gly–Pro–hydroxyproline may play an important role in interorgan metabolism of glycine and proline (Figure 5.5). Much work on the physiology and nutrition of this tripeptide remains to be done.
SYNTHESIS AND CATABOLISM OF POLYAMINES
history of PolyAmine reseArch
The history of polyamines began in 1678 when A. van Leeuwenhoek used a primi-tive microscope to observe spermine as a crystalline substance in human semen after several days of standing at room temperature. Such a crystal was described in 1791 by L.N. Vauquelin as a phosphate derivative, which was identified in 1878 by P. Schreiner to be an organic base and named spermine (meaning an amine from semen) in 1888 by two German chemists, A. Ladenburg and J. Abel. Putrescine, like cadaverine, was first isolated from putrefying meat (decomposing animal mate-rial) in 1885 by Ludwig Brieger and its structure was established through chemi-cal synthesis in 1886 by A. Ladenburg. Putrescine was named because of its origin and the foul smell of putrefaction. A biological function of polyamines was first demonstrated in 1898 by A. Von Poehl who reported that high concentrations of
Proline + Glycine + AA
–Gly–Pro–Pro–AA–AA–Gly–Pro–Pro–Collagen
Gly–Pro–Pro Hydroxyproline
OH OH
Kidney
Glycine
(1)
(2) (2)
(3) (4)
OH
Pro + Orn
FIGURE 5.5 Metabolism of Gly–Pro–hydroxyproline in animals. Through protein synthesis, proline is incorporated into collagen proteins in the connective tissue (Step 1). Degradation of collagen by collagenase in animals results in the release of relatively large amounts of 4-hydroxyproline and the tripeptide Gly–Pro–hydroxyproline (Step 2). The kid-neys take up both 4-hydroxyproline and Gly–Pro–hydroxyproline from the circulation where the tripeptide is hydrolyzed into free hydroxyproline by peptidases (Steps 3 and 4). In the kidneys, as in other tissues, a dipeptide containing proline or hydroxyproline is hydrolyzed by a special dipeptidase, prolidase. Hydroxyproline is converted to glycine in the kidneys via a series of reactions involving hydroxyproline oxidase. Proline oxidase oxidizes proline to form pyrroline-5-carboxylate, which reacts with glutamate to generate ornithine by ornithine aminotransferase. AA, amino acids; Orn, ornithine; Pro, proline.

156 Amino Acids: Biochemistry and Nutrition
© 2010 Taylor & Francis Group, LLC
spermine inhibit the growth of Gram-positive bacteria. The structure of spermine was established in 1924 by O. Rosenheim through chemical synthesis. In 1927, O. Rosenheim discovered spermidine in animal tissues (including ox pancreas, liver, kidney, spleen, lung, and brain) and established its structure through chemical syn-thesis. Spermidine was named because of its association with and structural similar-ity to spermine in animal tissues.
Research on the metabolism of polyamines started in 1938 when E. Zeller dis-covered diamine oxidase as an enzyme responsible for their catabolism in animals. After R. Hämälainen reported high concentrations of polyamines in animal tissues in 1941, intensive interest arose in metabolic pathways for polyamine biosynthesis as well as in their physiological functions and pathological roles in disease. In 1958, H. Tabor reported that methionine was required to provide SAM for the synthesis of spermidine and spermine from putrescine in E. coli (discovered by H. Tabor in 1958). Meanwhile, other researchers demonstrated that physiological concentrations of polyamines stimulated the growth of many species of Gram-negative bacteria. With these findings, the 1950s and 1960s witnessed rapid expansion of polyamine research. In exploring the underlying mechanisms for the actions of polyamines, A.M. Liquori observed in 1967 their secondary structures and close association with DNA and RNA (including tRNA and ribosomal RNA) in solution. A crucial role of ornithine in putrescine synthesis in animal tissues was established in 1968 when A.E. Pegg and H.G. Williams-Ashman discovered ODC in the rat prostate gland as did D.H. Russell and S.H. Snyder for the rat liver, chick embryo, and tumors (including rat hepatomas and fibrosarcomas). At the first international congress on polyamines in 1970, there were landmark reports of polyamine accumulation in the regenerating rat liver and brain, in the chick embryo and brain, as well as in mamma-lian cells and Drosophila melanogaster during growth and development. A role for polyamines in disease was proposed in 1971 when D.H. Russell found that concen-trations of polyamines in blood and urine were markedly elevated in cancer patients. Meanwhile, similar results were observed in patients with parasitic diseases. In 1976, E.S. Canellakis and colleagues discovered the 26-kDa protein, antizyme, in rat liver and in H-35 hepatoma cells exposed to high levels of putrescine. These authors found that antizyme was a noncompetitive protein inhibitor of ODC. Antizyme acts by specifically binding to ODC, thereby inhibiting its catalytic activity. Capitalizing on these new findings, B.W. Metcalf synthesized an ornithine analog, α-difluoromethyl ornithine (DFMO), as a suicidal inhibitor of ODC in 1978. These seminal stud-ies have greatly advanced the field of polyamine biochemistry and pathophysiology. Owing to its effects on inhibiting putrescine production and depleting polyamines in pathogens, DFMO is now used effectively to treat patients suffering from the African Sleeping Sickness caused by the eukaryotic parasite Trypanosoma brucei.
PolyAmine synthesis
Pathways of Polyamine SynthesisThe metabolic pathway for polyamine synthesis is illustrated in Figure 5.6. The source of ornithine can be mitochondria, cytoplasm, or diet, depending on the cell type. As noted previously, decarboxylated SAM serves as an essential precursor for

157Synthesis and Catabolism of Special Nitrogenous Substances
© 2010 Taylor & Francis Group, LLC
the conversion of putrescine into spermidine and spermine. All the enzymes required for converting ornithine to spermine are present in the cytoplasm. Additionally, argi-nine, proline, glutamine, and glutamate are potential sources of putrescine in ani-mals, depending on the cell types and developmental stages. Although glutamine and glutamate play a role in providing ornithine via P5C production in enterocytes, most of the glutamine- and glutamate-derived ornithine is channeled into OCT for citrulline formation rather than to ODC for putrescine production. It should be borne in mind that arginine is not a precursor of ornithine in all animal cells. For example, because there is little expression of arginase in porcine placentae at all stages of gestation or in enterocytes of neonates (e.g., piglets, lambs, calves, rats, and mice), these cells cannot convert arginine into ornithine. In search of alternative precursors of ornithine, G. Wu and coworkers discovered in the 2000s that proline catabolism
½O2 H2O
Glu
α-KG
-OrnithineArgArginase II
NO + CitH2O Urea
-Proline Δ1-Pyrroline-5-carboxylateProline oxidase
NADPH+ H+
NADP+
Ornithineaminotransferase
BH4O2
-OrnithineArgArginase I
Cit + NOH2O UreaNADPH
+ H+NADP+
NOSBH4 O2
NOS
PutrescineCO2
ODC
Agmatine
ADCCO2
Putrescine
H2OUrea
Agmatinase
Spermidine
DCAM
MTASpermidinesynthase
Spermine
DCAM
MTA
S-Adenosylmethionine
CO2
SAMDMg-PPi + Pi
Mg-ATP-Methionine
SAMsynthase Spermine
synthase
Argininosuccinate
Asp ASS FumarateASL
Glutamyl-γ-semialdehydeSpontaneous
NAD(P)+
NAD(P)H + H+
P5CDehydrogenase
-Glutamate
5CO2+ NH3+ 3H2O
N1-Acetylspermine
Acetyl-CoA CoA
SAT
N1-Acetyl-SPD
Acetyl-CoA CoASAT
O2
H2O2 + 3-AcetamidopropanalPAO
O2
Antizyme
H2O2 + 3-Acetamidopropanal
(–)
PAO
N-Acetyl-β-alanine
NAD+
NADH + H+Aldehydedehydrogenase
β-Alanine
H2O
Acetate
N-Acetyl-β-alaninedeacetylase
Δ1-Pyrroline-5-carboxylate-Proline
NADPH + H+ NADP+
P5C Reductase
Mitochondrion
Cytoplasm
O2 SPD
Spermine oxidase
4.5O2
FIGURE 5.6 Synthesis and catabolism of polyamines in animal cells. Enzymes that com-pete for arginine include arginase I, arginase II, constitutive and inducible nitric oxide syn-thases (NOS), and arginine decarboxylase (ADC). Arginine is hydrolyzed to ornithine plus urea by arginase I and arginase II in many cell types. Synthesis of putrescine from orni-thine is catalyzed by ornithine decarboxylase (ODC) in all cell types. In certain tissues, arginine may be decarboxylated to form agmatine by ADC and agmatine is then converted into putrescine by agmatinase. Argininosuccinate synthase (ASS) and argininosuccinate lyase (ASL) regenerate arginine from citrulline in the presence of aspartate. Catabolism of polyamines is initiated by polyamine oxidase, spermine oxidase, and spermidine/spermine N1-acetyltransferase (SAT) to produce 3-aceaminopropanal and β-alanine in the cytoplasm. BH4, (6R)-5,6,7,8-tetrahydro-l-biopterin; DCAM, decarboxylated 5-adenosylmethionine; α-KG, α-ketoglutarate; MTA, methylthioadenosine; OAT, ornithine aminotransferase; PAO, N1-acetylpolyamine oxidase; P5C, pyrroline-5-carboxylate; SAM, S-adenosylmethionine; SAMD, S-adenosylmethionine decarboxylase; and SPD, spermidine.

158 Amino Acids: Biochemistry and Nutrition
© 2010 Taylor & Francis Group, LLC
via proline oxidase is the exclusive intracellular source of ornithine for polyamine synthesis in enterocytes of neonatal pigs and in the porcine placentae, both of which share the common feature of rapid cell growth (Wu et al. 2000).
Regulation of Polyamine SynthesisReduced availabilities of substrates (e.g., ornithine, arginine, proline, and methio-nine) and vitamin B6 can limit polyamine synthesis in mammalian cells. Evidence shows that arginase activity is a limiting factor for polyamine synthesis and cell pro-liferation in many cell types, including endothelial cells, macrophages, and smooth muscle cells. Arginase, which can be released from cells and tissues, is present in extracellular fluid (e.g., plasma, intestinal lumen, and ovine allantoic fluid) and in wounds to degrade arginine to ornithine plus urea. Indeed, under conditions of inflammation and injury (particularly liver disease), a high activity of arginase in plasma results in a severe deficiency of arginine and, therefore, impaired synthesis of polyamines by stressed cells.
ODC, a pyridoxal phosphate-dependent enzyme, plays a key role in regulating polyamine synthesis in animal cells. Active mammalian ODC is a homodimer, with each monomer containing 461 AA residues (~51 kDa). ODC has a short half-life of ~10 min, allowing for a rapid response of the cell to a variety of stimuli to regulate polyamine synthesis. The activity of ODC is increased by elevated physiological levels of cAMP and NO but inhibited by high concentrations of putrescine, spermidine, and spermine. ODC is a rate-controlling enzyme in polyamine synthesis and is subject to inhibition by antizyme, which has several isoforms 1, 2, 3, and 4. Antizyme 1 is induced after the addition of putrescine to the culture medium for tumor cells (e.g., hepatoma cells and neuroblastoma cells). Immediately following this report, antizyme 1 was found to be present in several other cell lines (e.g., IEC-6 intestinal cells and prostate cancer cells) and to be induced by spermidine and spermine, which have a greater effect than putrescine on stimulating antizyme 1 expression. It is now known that antizyme 1 is ubiquitous in animal tissues and cells. Antizyme 2 is also ubiquitous but is less abundant than antizyme 1. Antizyme 3 is present only in male germ cells in the postmeiotic stage of their differentiation to mature sperm. Antizyme 4 is structur-ally most closely related to antizyme 1 but has not been well characterized. Antizyme has a high affinity for the monomer of ODC. Upon binding ODC, antizyme inacti-vates the enzyme and also tags it for degradation by the proteasome. Antizyme also inhibits the transport of polyamines by cells via yet unknown mechanisms. Results of recent studies indicate that asparagine and glutamine, which increase ODC activity in diverse cell types, inhibit antizyme-1 expression at both mRNA and protein levels.
PolyAmine DeGrADAtion
Catabolism of polyamines occurs in both the cytoplasm and peroxisomes. In 1953, an amino oxidase, first designated as spermine oxidase, was reported to be present in ovine and bovine sera. This enzyme could oxidize both spermine and spermidine to their respective aldehydes (RCHO), NH3, and H2O2. As noted previously, diamine oxidase oxidizes putrescine, spermidine, and spermine to produce ammonia and their respective aldehydes. This catabolic pathway is physiologically relevant. In addition,

159Synthesis and Catabolism of Special Nitrogenous Substances
© 2010 Taylor & Francis Group, LLC
spermidine and spermine can be oxidized by acetyl-CoA:spermidine-N1-acetyl-transferase to N1-acetyl-spermidine and N1-acetyl-spermine, respectively (Figure 5.6). N1-acetyl-spermidine is then oxidized by N1-acetylpolyamine oxidase (PAO) to putrescine, H2O2, and 3-acetamidopropanal. Similarly, N1-acetyl-spermine is oxi-dized by PAO to spermidine, H2O2, and 3-acetamidopropanal. 3-Acetamidopropanal undergoes oxidation to generate N-acetyl-β-alanine and then β-alanine. In 2002, a new inducible flavin-containing spermine oxidase (SMO/PAOh1; a cytosolic pro-tein) was found in mammalian cells, which selectively oxidizes spermine to produce H2O2, spermidine, and the aldehyde 3-aminopropanal. In contrast to the previously reported “spermine oxidase,” SMO/PAOh1 does not use spermidine as a substrate. The recent discovery of SMO/PAOh1 adds a new enzyme-catalyzed reaction to the complexity of the polyamine catabolic pathways. Alone or in combination with PAO, SMO/PAOh1 may play a key role in regulating intracellular polyamine homeostasis under various conditions (e.g., changes in cellular signals, drug treatment, oxida-tive stress, and other environmental and/or cellular stressors). Both PAO and SMO/PAOh1 generate toxic aldehydes and H2O2 (an oxidant). Depending on concentra-tions, these products can either be antineoplastic drugs or carcinogens.
SYNTHESIS AND UTILIZATION OF CREATINE
history of creAtine reseArch
Creatine (meaning meat in Greek) was discovered by M. Chevreul in 1832 as a com-ponent of skeletal muscle. In his analysis of urine from animals and humans, J. von Liebig discovered creatinine in 1847. Both creatine and creatinine are neutral sub-stances. In 1925, G. Edgar and H.E. Shiver found that, at room temperature, creatine is in chemical equilibrium with creatinine in aqueous solution. In 1927, two British biochemists at University College, London, P. Eggleton and G. Eggleton, reported a labile form of organic phosphate phosphagen in the frog gastrocnemius muscle. Immediately thereafter, C. Fiske and Y. Subbarow at Harvard Medical School iden-tified this new compound as creatine phosphate, in which phosphate is linked to creatine via a phosphoamide bond. A few years later, D. Nachmansohn discovered an important role of phosphocreatine in energy metabolism in skeletal muscle and the nervous system. The mechanism for the production of phosphocreatine was elu-cidated in 1934 when K. Lohmann discovered creatine kinase. Multiple molecular forms of creatine kinase were first reported by A. Burger and coworkers in 1964. Since then, many isoforms of the enzyme have been cloned, sequenced, and char-acterized. Interestingly, recent studies by J.T. Brosnan and colleagues have identi-fied nutritionally significant amounts of creatine in milk (e.g., porcine, bovine, and human milk) to support neonatal growth and development.
creAtine synthesis throuGh interorGAn cooPerAtion
Creatine synthesis is a quantitatively important pathway for arginine catabolism in mammals. This pathway is initiated by arginine:glycine amidinotransferase, which transfers the guanidino group from arginine to glycine to form guanidinoacetate and
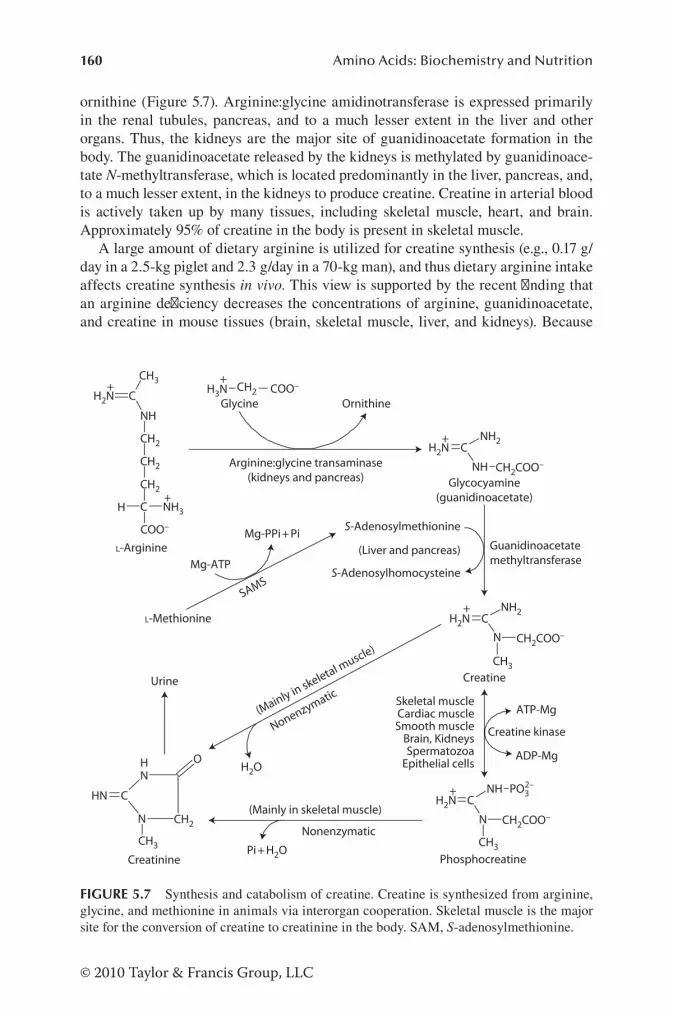
160 Amino Acids: Biochemistry and Nutrition
© 2010 Taylor & Francis Group, LLC
ornithine (Figure 5.7). Arginine:glycine amidinotransferase is expressed primarily in the renal tubules, pancreas, and to a much lesser extent in the liver and other organs. Thus, the kidneys are the major site of guanidinoacetate formation in the body. The guanidinoacetate released by the kidneys is methylated by guanidinoace-tate N-methyltransferase, which is located predominantly in the liver, pancreas, and, to a much lesser extent, in the kidneys to produce creatine. Creatine in arterial blood is actively taken up by many tissues, including skeletal muscle, heart, and brain. Approximately 95% of creatine in the body is present in skeletal muscle.
A large amount of dietary arginine is utilized for creatine synthesis (e.g., 0.17 g/day in a 2.5-kg piglet and 2.3 g/day in a 70-kg man), and thus dietary arginine intake affects creatine synthesis in vivo. This view is supported by the recent finding that an arginine deficiency decreases the concentrations of arginine, guanidinoacetate, and creatine in mouse tissues (brain, skeletal muscle, liver, and kidneys). Because
COO–
C
CH2
CH2
CH2
NH
CH2N
CH3
NH3H
++
+
CH2 COO–H3N
L-Arginine
Glycine
Arginine:glycine transaminase(kidneys and pancreas)
Ornithine
CNH2
NH CH2COO–
H2N+
Glycocyamine(guanidinoacetate)
Guanidinoacetatemethyltransferase
CNH
N CH2COO–
H2NPO3
CH3
N CH2
NH
CHN
O
CH3
(Liver and pancreas)
S-Adenosylmethionine
S-Adenosylhomocysteine
Nonenzymatic
Creatinine Phosphocreatine
Urine
2–+
CNH2
N CH2COO–
H2N
CH3Creatine
+
ATP-Mg
ADP-Mg
Creatine kinase
Skeletal muscleCardiac muscleSmooth muscle
Brain, KidneysSpermatozoa
Epithelial cells
(Mainly in skeletal muscle)
Nonenzymatic
L-Methionine
Mg-ATP
Mg-PPi + Pi
SAMS
H2O
Pi + H2O
(Mainly in skeletal muscle)
FIGURE 5.7 Synthesis and catabolism of creatine. Creatine is synthesized from arginine, glycine, and methionine in animals via interorgan cooperation. Skeletal muscle is the major site for the conversion of creatine to creatinine in the body. SAM, S-adenosylmethionine.

161Synthesis and Catabolism of Special Nitrogenous Substances
© 2010 Taylor & Francis Group, LLC
the methylation of guanidinoacetate to form creatine consumes more methyl groups than all other methylation reactions in the body combined, creatine synthesis from arginine regulates the availability of the methyl group donor for other methylation reactions, such as the synthesis of methionine from homocysteine. Thus, arginine can indirectly affect one-carbon-unit metabolism in the whole body.
reGulAtion of creAtine synthesis
Creatine synthesis is regulated primarily through changes in the expression of renal arginine:glycine amidinotransferase in both rats and humans. Dietary intake of cre-atine and circulating levels of growth hormone are major factors affecting the de novo synthesis of creatine. Activities and mRNA levels for arginine:glycine amidi-notransferase in the rat kidney are greatly reduced by hypophysectomy or by feed-ing a diet containing creatine. In contrast, the administration of growth hormone to hypophysectomized rats induces the expression of arginine:glycine amidinotransfer-ase, but this induction is largely blunted when the animals are simultaneously fed a creatine-supplemented diet. The mechanisms responsible for the effects of growth hormone or creatine on the expression of renal arginine:glycine amidinotransferase remain unknown. Neither creatine supplementation nor growth hormone influences the hepatic activity of guanidinoacetate N-methyltransferase in animals.
DeGrADAtion of creAtine
Circulating creatine is actively taken up by skeletal muscle and nerves. In these tis-sues, creatine is phosphorylated to form phosphocreatine, which, along with cre-atine, eventually undergoes nonenzymatic and dehydration to yield creatinine. Creatinine is excreted by the kidneys. Thus, creatine homeostasis primarily involves three major organs: the kidney, liver, and skeletal muscle. Urinary excretion of cre-atinine is the most widely used clinical marker of renal function in humans and other animals, and is also a useful indicator of skeletal muscle mass.
SYNTHESIS AND CATABOLISM OF l-CARNITINE
history of cArnitine reseArch
l-Carnitine (the betaine derivative of β-hydroxybutyrate) was discovered by the Russian scientist W. Gulewitsch in 1905 as a nitrogenous substance. Its structure was established by two Japanese chemists M. Tomita and Y. Sendju in 1927. The role of l-carnitine (the biologically active isomer of carnitine) as an essential growth factor for mealworm larvae was reported by G. Fraenkel and S. Friedman in 1957. I.B. Fritz discovered in 1961 that carnitine stimulates the oxidation of long-chain fatty acids in animal tissues and further demonstrated in 1965 that carnitine is an essential substrate for carnitine palmitoyltransferase-I on the outer mitochondrial membrane to convert acyl-CoA to acylcarnitine. Acylcarnitine is transported across the inner mitochondrial membrane by carnitine acylcarnitine translocase into the mitochon-drial matrix where acylcarnitine is hydrolyzed by carnitine palmitoyltransferase-II

162 Amino Acids: Biochemistry and Nutrition
© 2010 Taylor & Francis Group, LLC
to release acyl-CoA and carnitine. Thus, carnithine plays an essential role in the transport of long-chain fatty acids from the cytoplasm into the mitochondria for β-oxidation, a major mechanism for ATP production in insulin-sensitive tissues, including skeletal muscle, heart, liver, and adipose tissue. In 1973, A.G. Engel and C. Angelini reported that carnitine deficiency in human skeletal muscle results in a rare disease of lipid storage myopathy, which is prevented by dietary supplementa-tion with carnitine. It is now known that carnitine plays additional important roles in (1) protecting organisms from oxidative stress, (2) promoting substrate oxidation in brown adipose tissue, and (3) regulating energy partitioning in the body.
cArnitine synthesis throuGh interorGAn cooPerAtion
The pathway for carnitine synthesis in animals is illustrated in Figure 5.8. Although free lysine can be methylated by ε-N-l-lysine methyltransferase to form trimethyl-lysine in Neurospora orassa, this enzyme is not present in animal tissues. Rather, in animals, protein-bound lysine residues are methylated by SAM-dependent pro-tein methyltransferase to form ε-N-l-trimethyllysine residues. Partially methylated protein-bound lysines are not precursors for carnitine synthesis in animals. The degradation of proteins by proteases releases ε-N-l-trimethyllysine, which serves as a substrate for carnitine synthesis via the sequential formation of β-hydroxy-trimethyllysine, γ-butyrobetaine aldehyde (ε-N-trimethylaminobutyraldehyde), and γ-butyrobetaine. SAM (ultimately l-methionine) was known to be the donor of the three methyl groups on the N of carnitine in the 1960s, and the source of the carbon backbone (chain) of the carnitine molecule was identified to be lysine in the early 1970s. Three vitamins, ascorbate (vitamin C), niacin (the precursor of NAD+), and vitamin B6 (the precursor of pyridoxal 5′-phosphate), are required for carnitine synthesis (Figure 5.7). A healthy adult human synthesizes 1.2 μmol of carnitine/kg body weight per day. Endogenous synthesis of carnitine is important for strict vegetarians because this nutrient is present primarily in foods of animal origin.
Enzymes responsible for carnitine synthesis are expressed in a species- and tissue-specific manner (Vaz and Wanders 2002). In rats and humans, the highest activity of ε-N-l-trimethyllysine dioxygenase (a mitochondrial enzyme) occurs in the kidney, and this enzyme is also expressed in the liver, skeletal muscle, heart, and brain. ε-N-l-trimethyllysine dioxygenase is a rate-controlling enzyme in carnitine synthesis. β-Hydroxy-trimethyllysine aldolase (a pyridoxal 5′-phosphate-dependent cytosolic enzyme) is present at high activity in both the kidneys and liver in rats, but pre-dominantly in the liver in humans. There is evidence that β-hydroxy-trimethyllysine aldolase may be identical to the cytosolic isoform of serine hydromethyl transferase. In humans, cattle, and rats, γ-butyrobetaine aldehyde dehydrogenase (an NAD+-dependent cytosolic enzyme) is expressed primarily in the liver and kidney, and, to a much lesser extent, in brain, heart, and skeletal muscle. In animals, no activity of this enzyme is found in either mitochondria or microsomes. In both rats and humans, the conversion of trimethyllysine to γ-butyrobetaine takes place primarily in the kidney and, to a lesser extent, in the liver, skeletal muscle, heart, and brain. Studies with rats show that the testes and epididymis can also produce γ-butyrobetaine

163Synthesis and Catabolism of Special Nitrogenous Substances
© 2010 Taylor & Francis Group, LLC
from trimethyllysine. In rats, dogs, guinea pigs, and mice, only the liver can con-vert γ-butyrobetaine to l-carnitine via the action of γ-butyrobetaine dioxygenase (also known as γ-butyrobetaine hydroxylase; a cytosolic enzyme), and this reaction is absent from the kidneys. In humans, the activity of γ-butyrobetaine dioxygenase in the kidney is 3–16-fold and 6–32-fold greater than that in the liver and brain, respec-tively; therefore, the hydroxylation of γ-butyrobetaine to carnitine occurs primarily in the kidneys and to a lesser extent in the liver and brain. The kidneys of cats, ham-sters, rabbits, and pigs have levels of γ-butyrobetaine dioxygenase activity equal to or exceeding those in their livers; in these species, the kidney and liver are important sites for hydroxylating γ-butyrobetaine to carnitine.
ε-N-Trimethyllysine
β-Hydroxy-trimethyllysine
Glycine
γ-Butyrobetaine aldehyde
NAD+
NADH + H+
γ-Butyrobetaineα-KG + O2 + ascorbate
Succinate + CO2 + dehydroascorbateFe2+
α-KG + O2 + ascorbate
Succinate + CO2 + dehydroascorbateFe2+
-Carnitine
7
2
Protein-ε-N-trimethyllysine
Protein -Lysine + amino acids1
3 -Methionine3 SAM
3 Mg-ATP3 Mg-PPi + Pi
Amino acids
8
3
4
5
6
Humans and rats:mainly in kidney
Humans: mainly in liverRats: mainly in kidney and liver
Humans and rats: mainlyin liver and kidney
Humans: mainly in kidneyRats: only in liver
Cytoplasm
Cytoplasm
Mit
Vit B6
Niacin9
FIGURE 5.8 Synthesis of l-carnitine from lysine and methionine in animals via interor-gan cooperation. The enzymes that catalyze the indicated reactions are: (1) protein synthe-sis; (2) S-adenosylmethionine-dependent protein methyltransferase; (3) protein degradation; (4) ε-N-l-trimethyllysine dioxygenase (a mitochondrial enzyme); (5) β-hydroxy-trimethyllysine aldolase (possibly identical to the cytosolic isoform of serine hydromethyl transferase); (6) γ-butyrobetaine aldehyde dehydrogenase (also known as ε-N-trimethylaminobutyraldehyde dehydrogenase); and (7) γ-butyrobetaine dioxygenase (also known as γ-butyrobetaine hydrox-ylase). The conversion of β-hydroxy-trimethyllysine to l-carnitine occurs in the cytoplasm. Amino acids, glycine plus l-amino acids; α-KG, α-ketoglutarate; Mit, mitochondrion; SAM, S-adenosylmethionine; Vit B6, vitamin B6.

164 Amino Acids: Biochemistry and Nutrition
© 2010 Taylor & Francis Group, LLC
reGulAtion of cArnitine synthesis
Carnitine synthesis is regulated by diet, age, hormones, and disease states. First, a deficiency of dietary protein, lysine, methionine, vitamin C, niacin, or vitamin B6 impairs carnitine synthesis in animals. In adult rats, dietary supplementation with 1% carnitine decreases the hepatic activity of γ-butyrobetaine hydroxylase by ~40%, whereas dietary supplementation with 1% γ-butyrobetaine increases the enzyme activity by ~60%. In contrast, supplementation with either 1% carnitine or 1% γ-butyrobetaine does not affect the renal activity of trimethyllysine dioxygen-ase. During starvation, the carnitine content of the liver is markedly elevated pos-sibly as a result of increases in protein degradation and expression of key enzymes for carnitine synthesis. Under such a condition, enhanced synthesis of carnitine is of physiological significance as the oxidation of long-chain fatty acids promotes ketogenesis to provide ketone bodies to the brain as metabolic fuels. Similarly, intravenous administration of lipids reduces concentrations of carnitine in plasma and urinary excretion of carnitine possibly due to enhanced uptake by liver and skeletal muscle to facilitate the oxidation of long-chain fatty acids.
Second, there are developmental changes in carnitine synthesis in mammals. In rats, the hepatic activity of γ-butyrobetaine dioxygenase is low in the fetus despite rapid development during late gestation and rises to adult levels on day 8 after birth. In humans, the hepatic activity of γ-butyrobetaine dioxygenase in infants is only 12% of the value for adults but increases to the adult level at 15 years of age. Similarly, in pigs, the activity of γ-butyrobetaine dioxygenase in the kidney and liver is low at birth and increases progressively within the subsequent seven weeks of life. Third, hormones (e.g., high levels of glucagon, glucocorticoids, and thyroid hormones) that can stimulate protein degradation to supply trimethyllysine can enhance carnithine synthesis. Additionally, administration of thyroxine to rats enhances the hepatic activity of trimethyllysine dioxygenase twofold, as well as concentrations of carni-tine in both plasma and liver by nearly 100%. Sex hormones and pituitary hormones increase carnitine content in tissues likely through augmenting carnitine synthesis.
Fourth, pathological conditions greatly affect carnitine synthesis and availability in animals including humans. For example, within the first 10 days after injury, con-centrations of carnitine are reduced in plasma due to elevation of its urinary excretion but are enhanced in liver and skeletal muscle partly because of enhanced whole-body proteolysis and carnitine synthesis. Similar results have been reported for burn patients, who exhibit a reduction of circulating levels of carnitine and an increase of urinary excretion. Interestingly, concentrations of carnitine in plasma are substan-tially lower in obese mice compared with lean mice, which may contribute, in part, to reduced oxidation of fatty acids in the insulin-sensitive tissues of obese subjects. Accordingly, administration of clofibrate (a peroxisome proliferator and ligand for the nuclear receptor peroxisome proliferator-activated receptor α) to rats increases hepatic carnitine and acylcarnitine concentrations by six- and fivefold, respectively, primarily due to enhanced synthesis of carnitine in liver. There is also evidence that denerva-tion in rats causes a pronounced decline in intramuscular levels of carnitine, with the change being greater in red than in white fibers. Thus, carnitine synthesis is precisely regulated at multiple steps to meet the physiological and nutritional needs of animals.

165Synthesis and Catabolism of Special Nitrogenous Substances
© 2010 Taylor & Francis Group, LLC
cAtABolism of cArnitine
In animals, catabolism of carnitine takes place in the body and is initiated by (1) carnitine decarboxylase to form β-methylcholine and (2) carnitine dehydrogenase to yield 3-dehydrocarnitine. β-Methylcholine can be acetylated to generate acetyl-β-methylcholine, whereas 3-dehydrocarnitine can be either spontaneously converted to acetonyltrimethylammonium or deacetylated by 3-ketoacid CoA-transferase to pro-duce glycine betaine (N,N,N-trimethylglycine) for renal excretion. Carnitine is also metabolized to trimethylamine, trimethylamineoxide, butyrobetaine, crotonobeta-ine, and trimethylaminoacetone in bacteria in the lumen of the gastrointestinal tract.
SYNTHESIS AND CATABOLISM OF PURINE AND PYRIMIDINE NUCLEOTIDES
history of Purine AnD PyrimiDine reseArch
Purines and pyrimidines are N-containing heterocyclic substances. A purine consists of a pyrimidine ring fused to an imidazole ring. The history of both chemical and biochemical research on purines and pyrimidines has recorded many ground-breaking discoveries. The terms purine and pyrimidine were coined, respectively, by E. Fischer and A. Pinner in 1884. The term pyrimidine was derived from a combination of the words pyridine and amidine. The research on purines and pyrimidines dates back to 1868 when the young Swiss physician, J.F. Miescher, isolated nuclein (now known as nucleic acids) from the nuclei of white blood cells. In search of the chemical composi-tion of nuclein, A. Kossel discovered and named adenine (in 1886), cytosine (in 1894), guanine (in 1882), thymine (in 1893), and uracyl (in 1900). E. Fischer first synthesized purine from uric acid in 1899, and his work on purines brought him the 1902 Nobel Prize in chemistry. Meanwhile, A. Kossel synthesized cytosine in 1903 and won the 1910 Nobel Prize in chemistry for this work. In 1906, H. Steudel reported that nucleic acids contain two purine and two pyrimidine bases in approximately the same molar proportion. While working at the Rockefeller Institute of Medical Research in 1911, P.A. Levene found that AMP contains adenine and ribose-5-phosphate. He went on to identify the structure of deoxynucleic acids in 1929. In the same year, K. Lohmann, A.N. Drury, and A. Szent-Györgyi discovered ATP. Using pigeon liver and isotopes, J.M. Buchanan and colleagues elucidated the pathways for purine and pyrimidine syn-theses during the 1940s and 1950s, which require glutamine, aspartate, ribose-5-P, ATP, HCO3
−, and tetrahydrofolate as common substrates. In addition, glycine is needed for purine synthesis. The precursors of the carbon and nitrogen atoms in the purine and pyrimidine rings are illustrated in Figure 5.9.
Purine AnD PyrimiDine BAses in nucleotiDes
Purine (adenine and guanine) and pyrimidine (cytosine, uracil, and thymine) bases are components of nucleosides and nucleotides (phosphorylated nucleosides) in all cell types (Table 5.2). Nucleoside triphosphates are the monomer unit precur-sors of ribonuleic acid, which has two types: deoxyribonucleic acid (DNA) and ribonucleic acid (RNA). DNA, which contains the genetic information, consists of

166 Amino Acids: Biochemistry and Nutrition
© 2010 Taylor & Francis Group, LLC
four deoxynucleotides: deoxyadenylate, deoxyguanylate, deoxycytidylate, and thy-midylate (methylated deoxyuridylate). These monomeric units of DNA are held together by 3′,-5′-phosphodiester bridges to constitute a single strand. Two comple-mentary strands of DNA are paired through hydrogen bonding between adenine and thymidine as well as between guanosine and cytidine to form a double-stranded helical molecule. In contrast, RNA is a polymer of purine (adenine and guanine) and pyrimidine (cytosine and uracil) ribonucleotides linked by 3′,-5′-phosphodiester bridges as a single-strand molecule.
synthesis of Purine nucleotiDes
In animal and bacterial cells, purine nucleotides are synthesized by de novo and salvage pathways via enzyme-catalyzed reactions in the cytoplasm (Olsson 2003). The de novo pathway requires, as starting materials, glutamine, glycine, aspar-tate, ribose-5-P (a product of glucose metabolism via the pentose cycle), ATP, HCO3
−, and tetrahydrofolate (Figure 5.10). Intermediates of this pathway include
C
C
C
N
N
C
N
C
NH34
56
1
2 C
C
C
N
N
C 12
34
5
6
78
9
Aspartate
Formate
HCO3–
Glutamine amide
Formate
GlycineGlutamine
amide
HCO3–
Aspartate
Origins of purine ring atoms Origins of pyrimidine ring atoms
FIGURE 5.9 Sources of carbon and nitrogen in purine and pyrimidine rings. Glutamine, aspartate, ribose-5-phosphate, HCO3
−, and tetrahydrofolate are common substrates for the ATP-dependent synthesis of purine and pyrimidine nucleotides in animal cells. Glycine is also required for the formation of purines.
TABLE 5.2Purines, Pyrimidines, Nucleosides, Nucleotides, and Nucleic Acids
Heterocyclic Compound Base
Nucleoside (Base + Ribose
or Deoxyribose)
Nucleotide (Base + Ribose 5-Phosphate) Nucleic Acid
Purine Adenine Adenosine Adenosine monophosphate DNA and RNA
Purine Guanine Guanosine Guanosine monophosphate DNA and RNA
Pyrimidine Cytosine Cytidine Cytidine monophosphate DNA and RNA
Pyrimidine Uracil Uridine Uridine monophosphate RNA
Pyrimidine Thymine Thymidine Thymidine monophosphate DNA
Note: DNA, deoxyribonuleic acid; RNA, ribonuleic acid.

167Synthesis and Catabolism of Special Nitrogenous Substances
© 2010 Taylor & Francis Group, LLC
5-phosphoribosyl-1-pyrophosphate (PRPP), glycinamide ribosyl-5-P, formylglyc-inamidine ribosyl-5-P, and 5-aminoimidazole-4-carboxamide ribosyl-5-P. In the salvage pathway, purine bases, released from the hydrolysis of nucleic acids and nucleotides, can be salvaged and recycled into purine nucleotides. Adenine phos-phoribosyltransferase catalyzes the formation of AMP from PRPP and adenosine, whereas hypoxanthine-guanine phosphoribosyltransferase catalyzes the formation
O
OHOHH
OH
HCH2OP
H H
O H
OHOHH
O P-O-P
CH2OP
Gln O
OHOHH
OHH H
CH2OP
ATP ADP + Pi
CHO
NH
NH
H2C
CO
Ribose-5-PMg2+
CHO
NH
NH
H2C
CHN
Ribose-5-P
HC
NCH
N
H2NRibose-5-P
C
NCH
N
H2N
OH
O
Ribose-5-P
CH CH2 COO–NH3
–OOC
HCCH2COO–
COO–
C
NCH
N
H2N
NH
O
Ribose-5-P
CH
HC
COO–
Fumarate
COO–
C
C NCH
NH2N
H2N
O
Ribose-5-P
C
C NCH
N
N
H2N
C
O
O
Ribose-5-PHH
C
C
C
N
HN
HC
NCH
N
O
Ribose-5-P
O
OHOHH
OHH H
NHCH2OPC
H2C
O
NH3
THFFTHF
1
PPiβ-5-Phospho-ribosylamine Glycinamide
ribosyl-5-P
Formylglycinamideribosyl-5-P
Formylglycinamidineribosyl-5-P
5-Aminoimidazoleribosyl-5-Pcarboxylate ribosyl-5-P
Aminoimidazole
Aspartate
5-Aminoimidazole-4-succinylcarboxamide ribosyl-5-P
5-Aminoimidazole-4-carboxamide ribosyl-5-P
THFFTHF
Inosine monophosphate
H2O
Glycine
ADP + Pi
ADP + Pi
6
ATP+
ADP
Pi+
ADP + Pi
5-Formaminoimidazole-4-carboxamide ribosyl-5-P
C
C
C
N
N
HC
N
CHN
Ribose-5-P
NHCH2 CH COO––OOC
Adenylosuccinate
Asp + GTP
GDP + Pi
C
C
C
N
N
HC
NCH
N
Ribose-5-P
NH2
Fumarate
Adenosine monophosphate
C
C
C
N
HN
C
N
CHN
O
Ribose-5-P
OH
Xanthosine monophosphate
C
C
C
N
HN
C
NCH
N
O
Ribose-5-PH2N
GlnGlu
ATPAMP + PPi
Guanosine monophosphate
2 3 4
5
78
9
10 11 12
1314
15
H2O
HCO3–
Mg2+
H2O
NAD+
NADH + H+
Mg2+
C
C
C
N
N
HC
N
CHN
Ribose
NH2 Pi H2O
16
Adenosine
+ +
C
C
C
N
HN
C
NCH
N
O
RiboseH2N
Pi
16
Guanosine
H2O
ATP AMP Glu
Glu
ATP Gln
ATP
ATP
α-D-Ribose-5-P PRPP
FIGURE 5.10 The pathway for de novo synthesis of purine nucleosides from ribose-5-phosphate, glutamine, glycine, aspartate, bicarbonate, and formate in animals. The enzymes that catalyze the indicated reactions are (1) ribose phosphate pyrophosphokinase (5-phospho-ribosyl-1-pyrophosphate synthetase); (2) amidophosphoribosyl transferase (glutamine PRPP amidotransferase); (3) glycinamide ribosyl-5-P (also known as glycinamide ribotide or glyc-inamide ribonucleotide) synthetase; (4) glycinamide transformylase; (5) formylglycinamidine ribosyl-5-P synthetase; (6) 5-aminoimidazole ribosyl-5-P synthetase; (7) 5-aminoimidazole ribosyl-5-P carboxylase; (8) 5-aminoimidazole-4-succinylocarboxamide ribosyl-5-P synthe-tase; (9) adenylosuccinate lyase; (10) 5-aminoimidazole-4-carboxamide ribosyl-5-P (AICAR) transformylase; (11) inosine monophosphate cyclohydrolase; (12) adenylosuccinate synthe-tase; (13) adenylosuccinate lyase; (14) inosine monophosphate dehydrogenase; (15) guano-sine monophosphate synthase; and (16) 5′-nucleotidase. FTHF, N10-formyl-tetrahydrofolate; PRPP, 5-phosphoribosyl-1-pyrophosphate; THF, tetrahydrofolate.

168 Amino Acids: Biochemistry and Nutrition
© 2010 Taylor & Francis Group, LLC
of guanosine monophosphate (GMP) or inosine monophosphate (IMP) from PRPP and guanine or hypoxanthine. The enzymes in both the de novo and salvage path-ways are present as a macromolecular aggregate to increase the efficiency of purine nucleotide synthesis in cells.
Control of purine nucleotide synthesis occurs primarily in three steps. The first regulatory step is the production of PRPP by PRPP synthetase, which is activated by inorganic phosphate and inactivated by purine ribonucleotides. The second step of control in purine nucleotide synthesis is catalyzed by amidophosphoribosyl transferase (APRT). Specifically, APRT is under allosteric control by feedback inhibition. AMP, GMP, or IMP alone can inhibit this enzyme, while either AMP plus GMP or AMP plus IMP acts synergistically as inhibitors. The nucleotides inhibit APRT by causing the enzyme to aggregate to a larger inactive complex. PRPP can also regulate APRT activ-ity because intracellular concentrations of PRPP are normally below the Km of APRT for PRPP. Of particular note, very high concentrations of PRPP can overcome the nucleotide feedback inhibition by converting a large, inactive aggregate of APRT into a small active enzyme. The third step of control in purine nucleotide synthesis involves maintenance of an appropriate balance between intracellular concentrations of ATP and GTP. This is because (1) each of these two purine nucleotides stimulates the syn-thesis of the other by providing energy, (2) ATP and GTP are required for GMP and AMP syntheses, respectively, and (3) GMP inhibits the conversion of IMP to xanthine monophosphate, whereas AMP inhibits the conversion of IMP to adenylosuccinate.
synthesis of PyrimiDine nucleotiDes
In animal and bacterial cells, pyrimidine nucleotides are synthesized by de novo and salvage pathways. The de novo synthesis of pyrimidine nucleotides depends on the availability of glutamine, aspartate, ribose-5-P, ATP, HCO3
−, and tetrahydro-folate (Figure 5.11). In animals, this synthetic pathway spans both the cytoplasm and mitochondria, with high activities in tissues possessing rapid rates of protein synthesis such as the gastrointestinal tract, liver, spleen, testis, and thymus. In bacteria, pyrimidine nucleotides are synthesized de novo in the cytoplasm. Like purines, the sugar phosphate portion of the pyrimidine molecule is supplied by PRPP. However, in contrast to de novo purine synthesis in which a nucleotide is formed first (Figure 5.10), pyrimidines are first synthesized as free bases before their attachment to ribose-5-P and there is no branch in the pyrimidine synthesis pathway. In both animal and bacterial cells, pyrimidine bases and ribonucleosides are salvaged to nucleotides by the following reactions:
Cytosine + H2O → Uracil + NH3 (spontaneously or cytosine deaminase)Cytidine + ATP → Cytidine monophosphate + ADP (uridine/cytidine kinase)Deoxycytidine + ATP → Deoxycytidine monophosphate + ADP (deoxycyti-
dine kinase)Uracil + Ribose-1-P → Uridine + Pi (uridine phosphorylase)Uridine + ATP → Uridine monophosphate + ADP (uridine/cytidine kinase)Deoxyuridine + ATP → Deoxyuridine monophosphate + ADP (thymidine
kinase)

169Synthesis and Catabolism of Special Nitrogenous Substances
© 2010 Taylor & Francis Group, LLC
O P
CO
1CH2
CHNH
CO COO–
NH2
O–O
CH2
CHN
HN
O
O COO–H
2
Aspartate
Carbamoylphosphate
Carbamoyl aspartate
N
HN
O COO–
O
H
Dihydroorotate
PRPP
5N
HN
O COO–
R-5-P
O
Orotidinemonophosphate
N
NH
O
R-5-P
O
6
Uridine diphosphate
Uridine monophosphate
ADP
Deoxyuridine diphosphate
ATP
ADP
Uridine triphosphate
GlutamineATP
N
N
H2N
OR-5-P-P-P
Cytidine triphosphate
Deoxyuridine-5′-monophosphate
Dihydrofolate
N
HN
OdR-5-P
CH3
O
9
H2O
Pi
Orotate
H2O
Pi
NADP+
3
4
7
8NADPH + H+
11
+NH3
10
12
Thymidine monophosphate
MTHF
CO2
ATP
ATP
ADP + Pi
α-D-Ribose-5-P
ATP
AMP
Q
Cytidine diphosphate
H2OPi
14Cytidinemonophosphate
H2O
H2O
H2O
Pi15
Cytidine
Pi13
R-1-P16
Cytosine
Uridine 13
H2O
Uracil
H2O
R-1-P
17
N
HN
ODeoxy-ribose
CH3
O
Thymidine
13
H2O Pi
Thymine
17
dR-1-P
H2O
18 QH2
PPi
Pi
HCO3– + Glutamine
Mg2+
FIGURE 5.11 The pathway for de novo synthesis of pyrimidine nucleotides from glutamine, aspartate, and bicarbonate in animals. The enzymes that catalyze the indicated reactions are: (1) carbamoylphosphate synthetase-I; (2) aspartate transcarbamoylase; (3) dihydroorotase; (4) dihydroorotate dehydrogenase (a mitochondrial enzyme); (5) orotate phosphoribosyltransfer-ase; (6) orotidine monophosphate decarboxylase; (7) uridine monophosphate kinase; (8) uridine diphosphate kinase; (9) cytidine triphosphate synthetase; (10) ribonucleotide reductase (thiore-doxin is required for the activity of this enzyme); (11) nucleotide phosphatase; and (12) thymi-dylate synthetase. Note that (1) in humans and other animals, the catalytic activities of CPS-II, aspartate transcarbamylase, and dihydroorotase activities are carried out by a trifunctional pro-tein (known as CAD protein); (2) in mammals and other multicellular organisms, the catalytic activities of orotate phosphoribosyltransferase and orotidine monophosphate decarboxylase are carried out by a bifunctional enzyme known as uridine monophosphate synthase, whereas, in bacteria and yeast, they are separate proteins encoded for by two different genes; and (3) in animal cells, pyrimidine synthesis involves the cytoplasm and mitochondria, as dihydrooro-tate is transported from the cytoplasm to mitochondria for conversion into orotate by dihydro-orotate dehydrogenase (which is located in the inner mitochondrial membrane and requires quinone as an electron acceptor), followed by the transport of orotate from the mitochondria to the cytoplasm. dR-5-P, deoxyribose-5-phosphate; MTHF, N5-N10-methylenetetrahydrofolate; Q, quinone; QH2, reduced quinone; PRPP, 5-phosphoribosyl-1-pyrophosphate; R-1-P, ribose-1-phosphate; R-5-P-P-P, ribose-5-triphosphate; THF, tetrahydrofolate.

170 Amino Acids: Biochemistry and Nutrition
© 2010 Taylor & Francis Group, LLC
Thymine + Deoxyribose-1-P → Thymidine + Pi (thymine phosphorylase)Thymidine + ATP → Thymidine monophosphate + ADP (thymidine kinase)
Regulation of Pyrimidine Nucleotide SynthesisThe control of pyrimidine nucleotide synthesis is exerted primarily at the level of carbamoylphosphate synthase-II. This enzyme is inhibited by UTP (acting competi-tively with ATP) but activated by PRPP. Secondary sites of control are the inhibition of orotate monophosphate decarboxylase by uridine monophosphate and cytidine monophosphate. In bacteria, aspartate transcarbamylase is a key regulatory enzyme in pyrimidine synthesis, where carbamoyl phosphate participates in the synthesis of either pyrimidine nucleotides or arginine in the cytoplasm.
cAtABolism of Purines AnD PyrimiDines
Concentrations of purines and pyrimidines in cells depend on the rates of their syn-thesis and degradation. The catabolism of these nucleotides occurs primarily in the liver, although other cell types contain some of the enzymes in the degradation path-ways. Figure 5.12 illustrates the pathways for the conversion of AMP, IMP, xantho-sine monophosphate, and GMP by 5-nucleotidase to adenosine, inosine, xanthosine, and guanosine, respectively. Xanthosine is converted into xanthine by purine nucleo-side phosphorylase. Further catabolism of adenosine, inosine, and guanosine to uric acid and allantoin will be described in Chapter 6.
In contrast to purines, catabolism of pyrimidines in the liver produces water-soluble metabolites, including CO2, ammonia, β-alanine, and β-aminoisobutyrate (Figure 5.13). Some of the β-aminoisobutyrate is transaminated to form methyl-malonate semialdehyde, which is subsequently metabolized to succinyl-CoA. The remaining β-aminoisobutyrate is excreted in the urine. Interestingly, ~25% of human adults of Chinese or Japanese ancestry consistently excrete large amounts of β-aminoisobutyrate in the urine, indicating individual differences in pyrimidine metabolism.
NH4+H2O
N
N N
N
R-5-P
NH2
NH
HN N
N
O
O
R-5-P
5′-Nucleotidase
Adenosine Inosine
5′-Nucleotidase
N
HN N
N
R-5-P
H2N
O
Pi
H2O
GuanosineXanthosine
N
HN N
N
R-5-P
O
N
N N
N
Ribose
NH2
N
HN N
N
Ribose
O
NH
HN N
N
O
O
RiboseN
HN N
N
Ribose
H2N
O
5′-Nucleotidase 5′-NucleotidasePi
H2O
Pi
H2O
Pi
H2O
Inosine monophosphateAdenosine monophosphate Xanthosine monophosphate Guanosine monophosphate
AMPD
FIGURE 5.12 Degradation of purine nucleotides to purine nucleosides in animals. AMPD, adenosine monophosphate (AMP) deaminase; R-5-P, ribose-5-phosphate.

171Synthesis and Catabolism of Special Nitrogenous Substances
© 2010 Taylor & Francis Group, LLC
HEME SYNTHESIS AND CATABOLISM
history of heme reseArch
Heme is a highly lipophilic iron-porphyrin. The history of its discovery dates back to 1747 when the Italian physician V.A. Menghini found that blood contains iron.
NH
N
O
NH2
Cytosine
NH
HN
O
O NH3
Uracil
NADP+
NADPH + H+
NH
NH
O
OH
H
HH
CH2
COO–
CH2NH
H2N
O
β-Ureidopropionate(N-carbamoyl-β-alanine)
H2O
CO2 + NH3
O2 CH3COO–
AcetateH3N CH2 CH COO–
CH3
+
CH2
COO–
CH2NH
H2N
O
H2O
H2O
NH
HN
O
OH
H
HH
NADP+
NADPH + H+
NH
HN
O
OCH3
Thymine
1/2O2
1
2
H2O
Dihydrothymine
β-Ureidoisobutyrate
β-AlanineH3N CH2 CH2 COO–
R-β-Aminoisobutyrate
H C CH COO–
CH3OMethylmelonate
semialdehyde
α-KG
Glutamate
C CH COO–
CH3O
CoA-S
Malonyl-CoA NADH + H+
CH2 CH2 COO–CCoA-S
O Succinyl-CoA
NAD+
3
4
5
6
7
8
9
1011
Dihydrouracil
CoA
FIGURE 5.13 Degradation of pyrimidine nucleosides in animals. The enzymes that catalyze the indicated reactions are (1) cytosine deaminase; (2) uracil reductase (also known as dihydro-pyrimidine dehydrogenase); (3) dihydrouracil hydratase; (4) β-ureidopropionase; (5) thymine reductase (also known as dihydropyrimidine dehydrogenase); (6) dihydrothymine hydratase; (7) β-ureidoisobutyrate hydratase; (8) a series of enzymes, which include β-alanine:pyruvate transaminase (forming malonic semialdehyde and alanine), β-alanine:α-ketoglutarate trans-aminase (forming malonic semialdehyde and glutamate), alanine aminotransferase, glutamate dehydrogenase, malonate semialdehyde dehydrogenase (catalyzing both dehydrogenation and decarboxylation of malonate semialdehyde to form acetaldehyde), and aldehyde dehydrogenase (forming acetyl-CoA); (9) β-aminoisobutyrate:α-ketoglutarate transaminase; (10) methylmelonate semialdehyde dehydrogenase; and (11) methylmalonyl-CoA isomerase. α-KG, α-ketoglutarate.

172 Amino Acids: Biochemistry and Nutrition
© 2010 Taylor & Francis Group, LLC
Almost one century later, in 1840, F.L. Hünefeld discovered hemoglobin, which accounts for 97% of dry matter content in red blood cells. Hemoglobin was described then as a protein, but its composition was unknown. In 1841, during the course of investigating the nature of blood, H. Scherer discovered porphyrin (a red dark sub-stance) after treating dried blood with concentrated sulfuric acid followed by the sequential removal of precipitated iron and then protein through alcohol treatment. In 1844, G.J. Mulder determined the composition of this iron-free substance (named hematin) derived from blood and found that hematin can take up molecular oxygen. In 1853, L.K. Teichmann discovered hemin (also known as Teichmann’s crystals) in blood, which was later found to be the hydrochloride of heme. Following the coin-ing of the term “porphyrin” (a Greek word, meaning reddish-purple) by F. Hoppe-Seyler in 1864, J.L.W. Thudichum prepared the first porphyrin (a red porphyrin with a unique spectrum and fluorescence properties) from hemoglobin through treatment with concentrated acid in 1867. In 1871, Hoppe-Seyler crystallized hema-tin and reported its physiological property of reversibly binding molecular oxy-gen. Between 1874 and 1889, human diseases associated with abnormal porphyrin metabolism and reddish urine were described. Meanwhile, C.A. MacMunn discov-ered heme-containing pigments (now known as cytochromes) in animal tissues in 1884. The chemical composition of heme was identified by H. Bertin-Sans and J. de Moitessier in 1892.
In the early 1900s, H. Fisher began his ground-breaking research on porphyrin chemistry. By 1915, he had shown that uroporphyrins differ from coproporphyrins and hemaporphyrins. Subsequently, he synthesized porphyrins in 1925, hemin in 1929 (for which he won the 1930 Nobel Prize in chemistry), and bilirubin (which was previously found by him to be a product of hemin degradation) in 1944. Among the first biochemists to use 15N- and 14C-labeled substrates and metabolites, D. Shemin and D. Rittenberg elucidated the metabolic pathways for mammalian heme synthesis in 1945. Using x-ray crystallography, Max Perutz determined in 1959 the molecular structure of hemoglobin, which contains both four heme molecules and four globin polypeptides (two α-subunits and two β-subunits) as a tetramer. This work resulted in his winning the 1962 Nobel Prize in chemistry.
PAthwAys of heme Biosynthesis
Heme is synthesized by virtually all cell types in aerobic organisms. In humans, ~85% of heme is synthesized in immature red blood cells (erythroid cells) in the bone marrow during their development from proerythroblasts to reticulocytes, and the remaining 15% is synthesized primarily in the liver and to a much lesser extent in other organs. In both erythroid cells and hepatocytes, the metabolic pathway for heme synthesis can be divided into three phases: (1) condensation of succinyl-CoA with glycine to form δ-aminolevulinic acid (ALA) in mitochondria, (2) conversion of ALA into coproporphyrinogen III in the cytoplasm, and (3) synthesis of heme from coproporphyrinogen III in the mitochondria (Figure 5.14). Four mitochondrial enzymes involved in heme synthesis are localized within the mitochondrial inner membrane, with the active site of ferrochelatase being on the matrix side of the membrane (Layer et al. 2010). Such strategic metabolic channeling ensures a high

173Synthesis and Catabolism of Special Nitrogenous Substances
© 2010 Taylor & Francis Group, LLC
CoA-SH
+
CO2
C O CH
C
C
CH2
–OOC
H2C NCH
C
+
CH2
CH2
COO–
NH3+ H2
2H2O
Porphobilinogen (PBG)(first precursor pyrrole)
Succinyl-CoA Glycine
C COOHNH3
+
H
H
α-Amino- β-ketoadipate
δ-Aminolevulinate (ALA)
4NH3
NH
NH
NH
CH2
HN
A P
A
CH2
A
P
H2C
H2C
A
P
P
NH
NH
NH
CH2
HN
M P
M
CH2
M
P
H2C
H2C
M
P
P
4CO2
Uroporphyrinogen IIICoproporphyrinogen III
NH
NH
NH
CH2
NH
M V
M
CH2
M
V
H2C
H2C
M
P
P
Protoporphyrinogen IX
Protoporphyrin IX
3O2
3H2O2
NH
N
NH
CH
N
M V
CHCH
CH
V
M
P M
M
P
+
Heme
N
N
NCH
N
M V
CHCH
CH
V
M
P M
M
PFe
Fe2+
ALA
Coproporphyrinogen III
2CO2
Cytoplasm
Mitochondrion
O2
1
2
3
4 5
6
7
8
+ 2H+ + 2H2O
CH2 CH2 CO
C COO––OOC
NH3+
H
CH2 CH2 C
O
S CoA–OOC
NH2+
HH
CH2
CH2
O C
COO–
CH2
COO–
C
CH2
NH3+
H2
FIGURE 5.14 Synthesis of heme from glycine and succinyl-CoA in animals. The enzymes that catalyze the indicated reactions are (1) and (2) δ-aminolevulinic acid synthase (ALAS, a pyri-doxal phosphate-dependent enzyme localized in the matrix side of the inner mitochondrial mem-brane); (3) porphobilinogen synthase (a Zn-requiring enzyme; also known as ALA dehydratase); (4) uroporphyrinogen synthase (also known as porphobilinogen deaminase or hydroxymethyl-bilane synthase) and uroporphyrinogen III cosynthase; (5) uroporphyrinogen decarboxylase; (6) coproporphyrinogen oxidase; (7) protoporphyrinogen oxidase (an FAD-dependent enzyme); and (8) ferrochelatase. Note that (1) there are two forms of the ALAS, with ALAS-1 expressed in all cell types and ALAS-2 specifically in erythroid cells and fetal liver; (2) the CO2 lost in the ALAS-catalyzed reaction originates from the carboxyl group of glycine; (3) ALA exits the mitochondria to the cytoplasm, where two molecules of ALA are linked to yield the pyrrole ring compound porphobilinogen; (4) coproporphyrinogen III in the cytoplasm is transported into the mitochondria for its decarboxylation by coproporphyrinogen oxidase to form protoporphyrino-gen IX; (5) coproporphyrinogen oxidase requires molecular oxygen and is inactive under anaero-bic conditions, and this enzyme is not affected by NAD(P)+, NAD(P)H, FAD, FMN, riboflavin, or ATP; and (6) ferrochelatase inserts Fe2+ into the tetrapyrrole nucleus of protoporphyrin IX to produce heme in the presence of ascorbic acid and cysteine or reduced glutathione.

174 Amino Acids: Biochemistry and Nutrition
© 2010 Taylor & Francis Group, LLC
efficiency for this metabolic pathway. Heme synthesis does not occur in mature erythrocytes that contain neither nuclei nor mitochondria or in some other cells at the very end of their differentiation pathways.
reGulAtion of heme Biosynthesis
Heme synthesis depends not only on the amounts of the enzymes, but also on the availabilities of AA, glucose, iron, vitamin B6, and vitamin C. Thus, nutrition, including the transport of nutrients, plays a crucial role in this synthetic event in both the bone marrow and liver. Common to heme synthesis in both bone marrow and liver is that porphobilinogen synthase and ferrocheletase are inhibited by lead, which is the biochemical basis for the toxicity of the heavy metal. However, heme synthesis is regulated differently in erythroid cells than in hepatocytes at molecular levels, reflecting the different functions of heme in these two cell types (Ryter et al. 2006). In the liver, heme is the prosthetic group of many proteins involved in cellular res-piration and antioxidative reactions. In differentiating erythroid cells, the additional function of heme is to serve as a component of hemoglobin.
reGulAtion of heme synthesis in hePAtocytes
In the liver, the major control target in heme synthesis is δ-aminolevulinic acid synthase (ALAS), which has a relatively short half-life (~60 min). Heme, hemin, or metalloporphyrins suppress hepatic heme synthesis through (1) direct feedback inhibition of ALAS activity, (2) inhibition of ALAS synthesis, and (3) inhibi-tion of the transport of ALAS from its site of synthesis in the cytoplasm to its site of action in the mitochondria. The molecular mechanisms responsible for these effects of heme involve the binding of heme to cysteine–proline motifs of ALAS-1 and those of the transcriptional repressor Bach1, thereby leading to repression of expression of the genes for ALAS-1 and for the ALAS-1 transporter from the cytoplasm to mitochondria where the functionally active ALAS acts (Figure 5.14).
Fasting increases, while elevated levels of glucose suppress, the expression of ALAS-1 in hepatocytes, whereas nonheme iron (including dietary supplementation with iron) has no effect. Additionally, phospholipids (e.g., phosphatidylethanolamine and l-α-lysophosphatidylcholine) increase hepatic ALAS activity. Results of recent studies have shown that expression of the peroxisome proliferator-activated receptor coactivator-1 (PGC-1α) gene mediates the stimulating effect of fasting on expres-sion of hepatic ALAS-1. Specifically, through coactivating nuclear respiratory factor 1 (NRF-1) and Forkhead box protein O1 (FOXO1), both of which directly bind to the ALAS-1 promoter, PGC-1α enhances ALAS-1 expression. Thus, knockout of the liver-specific PGC-1α gene in mice prevents fasting-induced increase in hepatic ALAS activity. In animals, glucose reduces ALAS-1 expression in hepatocytes through increased secretion of insulin and decreased secretion of glucagon. Insulin can activate the protein kinase Akt, which then phosphorylates FOXO1. This results in impaired binding of FOXO1 to PGC-1α and its export from the nucleus, thereby inhibiting the action of PGC-1α on ALAS-1 expression.

175Synthesis and Catabolism of Special Nitrogenous Substances
© 2010 Taylor & Francis Group, LLC
Peroxisome proliferator-activated receptor-α (PPAR-α) increases the expression of ALAS-1 in hepatocytes. This effect of PPAR-α is mediated by two functional PPAR binding sites at positions −9 and −2.3 kb relative to the ALAS-1 transcrip-tion start site. Additionally, PPAR-α enhances the expression of ALA dehydratase, uroporphyrinogen III synthase, uroporphyrinogen decarboxylase, coproporphyrino-gen oxidase, and protoporphyrinogen oxidase in hepatocytes, resulting in increased synthesis of heme. Thus, PPAR-α may beneficially improve heme homeostasis in the liver. In contrast, hypoxia reduces heme synthesis in hepatocytes by decreasing the transcription of the genes for uroporphyrinogen synthase and uroporphyrinogen III cosynthase without affecting the half lives (~9–10 h) of their mRNAs. These results suggest that transcription plays an important role in regulating the expression of the heme-synthetic genes in the liver.
Regulation of Heme Synthesis in Erythroid CellsErythropoiesis drives heme synthesis in immature erythroid cells. In reticulo-cytes, the major factors limiting heme synthesis include not only ALAS-2, but also uroporphyrinogen synthase and ferrochelatase, as well as the transport of iron in plasma by transferrin and the uptake of the iron–transferrin complex by cells via receptor-mediated endocytosis. At the transcriptional level, the expres-sion of the transferrin receptor 1 and ferrochelatase genes, like many other genes, is controlled by their methylation status. For example, 5-aza-2′-deoxycytidine (5-aza-CdR, a hypomethylating agent) and its derivatives can stimulate heme syn-thesis by inducing erythroid cell differentiation and increasing the expression of transferrin receptor 1 and ferrochelatase. Recent studies have identified new regulatory E-boxes outside of CpG islands in the transferrin receptor 1 and fer-rochelatase promoters and that the methylation status of these sites are altered by 5-aza-CdR. Nuclear translocation of the transcription factor c-Myc and its sub-sequent binding to these promoter elements results in increased expression of the transferrin receptor 1 and ferrochelatase genes.
In contrast to hepatocytes, physiological levels of heme or hemin stimulate the synthesis of proteins in erythroid cells, such as globin and the enzymes involved in heme synthesis (including ALAS-2, ferrochelatase, and the receptor for the iron–transferrin complex). The global increase in protein synthesis brought about by elevated levels of heme results from an inhibition of eFI-2α kinase activity, leading to reduced phosphorylation of eFI-2α, a key factor in the initiation of polypeptide synthesis. The coordinated increases in the synthesis of both heme and globin ensure the correct ratio of these two components for assembly into hemoglobin. In explaining the different mechanisms in the control of heme syn-thesis between erythroid and nonerythroid cells, emerging evidence shows that ALAS-1 and ALAS-2 differ in their gene structure (including the DNA sequence encoding the heme regulatory motif) and transcription patterns. For example, results from studies with mouse reticulocytes indicate that more than 90% of the total ferrochelatase mRNA is present as the 2.2 kb transcript, a characteristic phenomenon not found for hepatocytes. This 2.2 kb transcript is produced due to the preferential utilization of the upstream polyadenylation signal in the erythro-cyte ferrochelatase gene.

176 Amino Acids: Biochemistry and Nutrition
© 2010 Taylor & Francis Group, LLC
cAtABolism of heme
Depending on cell type, the intracellular degradation of heme-containing proteins in the cytoplasm (e.g., NOS, hemoglobin, and myoglobin), mitochondria (e.g., cyto-chromes), peroxisome (e.g., catalase), and other organelles (e.g., nucleus) releases their heme into membrane-bound vesicles of the endolysosomal system. Red blood cells (~120 days of life span) contain ~85% of heme in the body. When these cells are aged or injured and when hemorrhage occurs, they release large amounts of heme into the circulation. Other cell types, including hepatocytes, skeletal muscle, cardiac myocytes, and macrophages, contain about 15% of the heme in the organism. Recently, a heme transporter HRG-1 was identified in the endolysosomal system to transport heme from the site of its release to the site of its degradation. While red blood cells had been known in the nineteenth century to be a source of color com-pounds, including biliverdin and bilirubin, it was only in 1968 when R. Tenhunen discovered heme oxygenase (HO) that the metabolic pathways for heme catabolism via interorgan cooperation began to be unraveled (Figure 5.15).
Cleavage of the heme methene bridge is initiated by membrane-bound HO to form equimolar amounts of CO, Fe3+, and biliverdin (a green, lipophilic, and linear tetrapyrrole). The HO system depends on NADPH-cytochrome 450 for its catalytic activity. There are three isoforms of the HO, namely HO1 (also known as heat shock protein 32), HO2, and HO3. HO1 is a highly inducible protein (e.g., induced by heme and other agents) and its activity can increase up to 100-fold when cells are treated with oxidants, endotoxins, or inflammatory cytokines. In contrast, HO2 is constitu-tively expressed and its activity is not altered by these compounds. HO1 and HO2 proteins are encoded by two different genes. In 1997, the HO3 cDNA was isolated from rat brain and its protein was purified. Recent work shows that white adipose tissue expresses HO3 and its mRNA levels are markedly increased by l-arginine. The predicted amino acid sequence of HO3 differs from that of HO1, but has ~90% identity with HO2. Many cell types (including liver, spleen, brain, heart, and mac-rophages) express HO1 and HO2. Erythroid precursor cells lack a significant level of HO1 and exhibit progressive reduction in HO2 expression during differentiation. Mature erythrocytes have little HO activity. Thus, heme released from these cells is taken up by other cell types for degradation by the various isoforms of the HO.
Biliverdin is reduced to bilirubin (a highly lipophilic antioxidant; reddish-orange color) by biliverdin reductase, which is a soluble cytosolic enzyme. In liver, some of the bilirubin is esterified with glucuronic acid (a metabolite of glu-cose) to form a more hydrophilic substance, bilirubin diglucuronide. This reaction is catalyzed by bilirubin glucuronyl transferase, whose low activity in the liver of infants (particularly preterm infants) causes the accumulation of bilirubin in the blood, skin, and the surrounding tissues of the eyes, leading to jaundice. In healthy subjects, bilirubin diglucuronide is secreted into the bile. In the lumen of the intestines, microbial enzymes convert bilirubin and bilirubin diglucuronide to urobilinogen. Most of the urobilinogen is further reduced by microbial enzymes to generate stereobilin (reddish-brown color), which is then excreted in feces. Some of the urobilinogen is taken up by the kidneys where it is oxidized to urobilin (yel-low color), which is excreted in the urine. Thus, the color of feces and urine is a

177Synthesis and Catabolism of Special Nitrogenous Substances
© 2010 Taylor & Francis Group, LLC
useful indicator of heme degradation in the body and the development of certain diseases (e.g., hepatitis, liver cancer, and colorectal cancer).
SYNTHESIS AND CATABOLISM OF HISTAMINE
synthesis of histAmine
Histamine (formerly known as β-iminazolylethylamine) was the second AA-derived amine to be isolated, following tyramine. Work on histamine began in 1907 when it
N
N
NCH
N
M V
CHHC
HC
V
M
P M
M
PFe Fe3+ + CO
1
2
3
4
5
6
8
Heme (red)
Biliverdin (green)
Urobilinogen (colorless)
Urobilin (yellow)Stercobilin (reddish–brown)
+
NH
O
M V
NH
P M
NH
M P
NH
O
M V
H HNH
O
M V
O
HH
H
HOOH
H OH
O
COO–
C
CH2
CH2
O
NH
M
O
HH
H
HOOH
H OH
O
COO–
CCH2
CH2
O
NH
M
NH
O
M V
H H
NH
O
M V
N
P M
NH
M P
NH
O
M V
Bilirubin diglucuronide(water-soluble)
NH
O
M E
HNH
P M
NH
M P
NH
O
M E
H
H H HH H H
NH
O
M E
HN
P M
NH
M P
H
NH
O
M E
H H H
NH
O
M EHH
HN
P M
NH
M P
NH
O
M EHH
H
H HH H
Bilirubin (reddish–orange)
(Kidney)Microbial enzymes
(intestine)
Microbial enzymes(intestine)
GlucuronateH2OMicrobial enzymes
(Liver)
UDP UDP-glucuronate
NADPH + H+
NADP+
8H
2H
2H
O2
72H
FIGURE 5.15 Degradation of heme via interorgan cooperation in animals. The enzymes that catalyze the indicated reactions are: (1) heme oxygenase; (2) biliverdin reductase; (3) glucuronyl bilirubin transferase (a microsomal enzyme); (4) β-glucuronidases; (5) intestinal microbial enzymes (bilirubin reductase); (6) intestinal microbial enzymes (urobilinogen oxi-dases and urobilinogen reductases); (7) intestinal microbial enzymes (urobilinogen dehydro-genase); and (8) urobilinogen dehydrogenase (kidneys).
178 Amino Acids: Biochemistry and Nutrition
© 2010 Taylor & Francis Group, LLC
was first chemically synthesized by A. Windaus and W. Vogt. In 1910, this substance was obtained for the first time by D. Ackermann from putrefactive organisms treated with histidine. In the same year, G. Barger and H. Dale, and F. Kutscher simultane-ously announced the isolation of histamine from ergot extracts. In 1936, W. Bloch and H. Pinösch reported that the administration of large amounts of histidine into guinea pigs resulted in increases in the urinary excretion of histamine and in the concentration of histamine in the lungs. One year later, E. Werle and H. Herrmann identified the presence of histidine decarboxylase (a cytosolic enzyme) in animal tissues, including the small intestine, stomach, lung, and brain. Using [14C]histidine, R.W. Schayer demonstrated the mammalian biosynthesis of histamine from histi-dine in 1952. Bacterial histidine decarboxylase was characterized by H.M. Epps in 1945. In both eukaryotic and prokaryotic cells, histidine decarboxylase requires pyridoxal phosphate for its catalytic activity. In response to allergens, the production and release of histamine by master cells are markedly increased. This enzyme is inhibited by catechin-like phytochemicals (e.g., those in water-soluble extracts from green mung beans Vigna radiata) and histidine analogs.
cAtABolism of histAmine
In the 1940s, there were extensive studies to characterize histamine catabolism in ani-mals. Histamine was found in 1949 to be converted to acetylhistamine by an acetyl-CoA-dependent enzyme. H. Tabor observed in 1951 that animals metabolize histamine to imidazoleacetaldehyde, which is further oxidized to imidazoleacetate and imidaz-oleacetic acid ribonucleoside. In 1956, methylhistamine was reported to be formed from histamine by imidazole N-methyltransferase in animals via a SAM-dependent mechanism. Interestingly, there is a species difference in the activities of this enzyme in animals (e.g., high in guinea pigs but low in rats) which is associated with their different biological responses to histamine (e.g., low sensitivity in rats) (Moya-Garcia et al. 2005). The pathways for histamine catabolism are summarized in Figure 4.14.
SYNTHESIS AND CATABOLISM OF CATECHOLAMINES, THYROID HORMONES, AND MELANIN
Tyrosine is utilized for the synthesis of epinephrine, norepinephrine, thyroid hor-mones, and melanin in animals. The initial step of these pathways is commonly catalyzed by tyrosine hydroxylase, a BH4-dependent enzyme (see Chapter 4). Note that phenylalanine is converted into tyrosine primarily in the liver and kidneys by phenylalanine hydroxylase, another enzyme that requires BH4 for catalytic activity. This enzyme is absent from many other tissues, including the heart, skeletal muscle, and small-intestinal mucosa.
synthesis AnD cAtABolism of cAtecholAmines
Catecholamines include dopamine, norepinephrine, and epinephrine. Epinephrine, also known as adrenaline, which is both a hormone and a neurotransmitter, was discovered in the adrenal gland by the Japanese chemist J. Takamine in 1900. Using

179Synthesis and Catabolism of Special Nitrogenous Substances
© 2010 Taylor & Francis Group, LLC
[2H]- or [3H]-labeled phenylalanine, S. Gurin and A.M. Delluva reported, in 1947, that epinephrine is formed from tyrosine via a series of enzyme-catalyzed reactions, with norepinephrine as an intermediate (Figure 5.16). Methylation of norepineph-rine by S-adenosylmethionine-dependent phenylethanolamine N-methyltransferase (a cytosolic enzyme) generates epinephrine. This synthetic pathway occurs in the chromaffin cells of the adrenal medulla and in some neurons of the central nervous system. Results of recent studies indicate the presence of catecholamine synthesis in human epidermis keratinocytes.
In animals, circulating catecholamines have a half-life of only a few minutes, reflecting the high rates of their uptake and catabolism by cells and tissues (Kopin 1985). Catecholamines are degraded through (1) O-methylation by Mg2+-dependent catechol-O-methyltransferases, (2) deamination by FAD-dependent monoamine oxi-dases, and (3) sulfoconjugation by phenolsulfotransferase in all animals, as well as the formation of glucuronide conjugates by UDP-glucuronosyl-transferases in some spe-cies (e.g., humans and rats) (Figure 5.17).
Catechol-O-methyltransferase, which has membrane-bound and cytoplasmic forms, is expressed in most animal tissues, including brain and liver. This enzyme introduces a methyl group from S-adenosylmethionine to a catecholamine, generat-ing a methylated derivative. Monoamine oxidase, which exists in two distinct types in the mitochondria, oxidizes catecholamine to generate the corresponding aldehyde and ammonia. Note that because epinephrine has no amino group, this catecholamine is not a substrate for monoamine oxidase. Phenolsulfotransferase, which has cyto-solic and membrane-bound isoforms, catalyzes the production of sulfate derivates of catecholamines. The activity of this enzyme is relatively higher in liver than in other tissues. Inorganic sulfate, derived from food, the catabolism of sulfur-containing
CH2
CH
C
O-
NH3
O
OH
L-Tyrosine
CH2
CH
C
O-
NH3
OH
O
OH
CH2
CH2
CH2
NH3
OHOH
(DOPA)
HC NH3
OH
OH
OH
CH
CH2
OH
OH
OH
NH2
C H3
Epinephrine
Dopamine
+ BH4+ +
+
++
[O]
Vitamin C
Norepinephrine
CO2
PLP
3,4-Dihydroxyphenylalanine
Cu2+
S-Adenosyl-methionine
S-Adenosyl-homocysteine
Phenylethanolamine N-methyltransferase
+ O2Dopamineβ-oxidase
DOPAdecarboxylase
Tyrosinehydroxylase
BH2
FIGURE 5.16 Conversion of tyrosine to catecholamines in animals. A series of enzyme- catalyzed reactions convert tyrosine to dopa, dopamine, norepineprhine, and epineph-rine, which are collectively referred to as catecholamines. Tetrahydrobiopterin (BH4) and S-adenosylmethionine are essential cofactors for catecholamine synthesis. BH2, dihydrobi-opterin; PLP, pyridoxal phosphate.

180 Amino Acids: Biochemistry and Nutrition
© 2010 Taylor & Francis Group, LLC
AA, or degradation of highly sulfated glycosaminoglycans, is activated in an ATP-dependent enzymatic reaction to form phosphoadenosinephosphosulfate, which is the sulfate donor for the sulfations catalyzed by phenolsulfotransferase. Finally, gluc-uronide formation (glucuronidation), which plays an important role in metabolizing a variety of foreign and endogenous compounds, is performed by UDP-glucuronosyl transferases (a cytosolic and membrane-bound enzyme) primarily in the liver and, to a lesser extent, in the gastrointestinal tract, kidney, skin, and possibly other tissues. This enzyme catalyzes the transfer of the glucuronic acid (glucose metabolite) com-ponent of UDP-glucuronic acid to the phenolic hydroxide of catecholamine metabo-lites. Catecholamine metabolites (including sulfate and glucuronic acid conjugates) are water-soluble and excreted in urine.
synthesis AnD cAtABolism of thyroiD hormones
Thyroid hormones, which include thyroxine (T4, the predominant form) and tri-iodothyronine (T3), are formed from tyrosine and iodine by thyroid gland follicu-lar cells in vertebrates. T4 was first isolated in pure form from extracts of porcine thyroid glands in 1914 at the Mayo Clinic by the American biochemist E. Kendall and chemically synthesized in 1926 by the British chemist C.R. Harington. Owing to the availability of chromatographic techniques and 125I-labeled compounds, T3
3-MT DHPA NMN DHPG MET
DOPA Dopamine Norepinephrine Epinephrine
3-MD
111 2
2 3
3 1
1 2
2 3
3 1
HVA VMAMHPL
α-KG
Glu
NADH + H+
NAD+
4
5
MHPA DOPAC MHPG DHMAMHPP Glucuronideconjugates
6SCSC7
7
7
7
SAM
SAHNH3
NAD+
NADH+ H+
FIGURE 5.17 Catabolism of catecholamines in animals. The enzymes that catalyze the indi-cated reactions are: (1) catechol-O-methyltransferases (Mg2+-dependent enzyme); (2) mono-amine oxidases (FAD-dependent enzyme); (3) aldehyde dehydrogenase; (4) 3-O-methyldopa transaminase (possibly tyrosine aminotransferase); (5) 3-methoxy-4-hydroxyphenylpyru-vate reductase; (6) formation of glucuronide conjugates by uridine diphosphoglucuronyl transferase; and (7) phenolsulfotransferase. DHMA, 3,4-dihydroxymandelic acid; DHPA, 3,4-dihydroxyphenylacetaldehyde; DHPG, dihydroxyphenylglycol; DOPAC, 3,4-dihydroxy-phenylacetic acid; Glu, glutamate; HVA, homovanillic acid; α-KG, α-ketoglutarate; 3-MD, 3-methoxydopa; MET, metanephrine; MHPA, 3-methoxy-4-hydroxyphenylacetaldehyde; MHPG, 3-methoxy-4-hydroxyphenylglycol; MHPL, 3-methoxy-4-hydroxyphenyllactate (vanillactate); MHPP, 3-methoxy-4-hydroxyphenylpyruvate; 3-MT, 3-methoxytyramine; NMN, normetanephrine; SAH, S-adenosylhomocysteine; SAM, S-adenosylmethionine; SC, sulfate conjugates; and VMA, vanillylmandelic acid.

181Synthesis and Catabolism of Special Nitrogenous Substances
© 2010 Taylor & Francis Group, LLC
was isolated from enzymatic hydrolysates of thyroglobulin (a glycoprotein) in 1952. Studies in the 1960s and 1970s led to the recognition that iodination of tyrosyl resi-dues in thyroglobulin (a tyrosine-rich protein) as mono- and di-iodotyrosyl residues is essential to the formation of thyroid hormones (Figure 5.18). In thyroglobulin, T4 residues are converted into T3 by a deiodinase (5′-iodinase) (Bianco and Kim 2006). Proteolysis of thyroglobulin results in the release of free T4 and T3. In animal tis-sues, free T3 can be converted into free T4 by iodization. The physiological effects of thyroid hormones are mediated by nuclear thyroid hormone receptors that have their highest affinity for T3, ultimately inducing expression of many genes related to energy metabolism and cell development in various tissues.
T4 is converted either into the more active form T3 by 5′-deiodination of its outer phenolic ring or into inactive reverse-T3 by 5-deiodination of its inner tyrosyl ring. Likewise, T3 can be metabolized to an inactive di-iodotyrosine. Deiodination of thy-roid hormones is catalyzed by hepatic phase II sulfotransferases and glucuronosyl-transferases. Outer ring deiodination is inhibited while inner ring deiodination is stimulated by sulfation of the phenolic hydroxyl group of T4. Glucuronidation of T3 and T4 by UDP-glucuronosyl transferases, generates inactive, water-soluble products that are excreted into bile (ultimately feces) and urine. Thyroid hormone degrada-tion can be enhanced by treatment with phenobarbital or other antiepileptic drugs through a nuclear receptor CAR-dependent induction of phase II enzymes of xeno-biotic metabolism. Additionally, PPARα agonists synergize with phenobarbital to induce another prototypical CAR target gene, CYP2B1, to stimulate the breakdown of thyroid hormones (McNabb 1995).
synthesis AnD cAtABolism of melAnin
In 1887, K. Mörner discovered a dark substance melanin in the urine of patients with melanotic tumors. Subsequently, J.J. Abel and W.S. Davis identified melanin in human black hair and skin in 1896. Similarly, in 1903, E. Spiegler reported melanin in the wools from black sheep and in the hair from black horses. Based on the sug-gestion in 1901 by V. Fürth that an aromatic AA is the precursor of melanin, the work of H.S. Raper in the 1920s and 1930s led to the elucidation of the synthetic pathway via DOPA as an intermediate (Figure 5.19).
The initial step of melanin synthesis from tyrosine is catalyzed by BH4-dependent tyrosinase to form DOPA. This enzyme is a type I membrane protein found in mela-nosomes, which are lysosomal-like organelles and specific for pigment cells. Note that cysteine and GSH participate in melanin synthesis. The enzymes involved in melanin synthesis occur exclusively in melanosomes. It is now known that mela-nin is ubiquitously synthesized from tyrosine in melanocytes of the skin, as well as in select cell types (e.g., retinal pigment epithelial cells and ovine placentome) of most organisms (including humans, cattle, and pigs). The most common form of melanin in animals and humans is eumelanin, which is a black or brown polymer of dihydroxyindole carboxylic acids (Borges et al. 2001). The other form of melanin is pheomelanin, which is a brownish-red or yellowish-orange and violet polymer. For example, in humans, black hair contains 99% eumelanin and 1% pheomelanin, brown and blond hair contain 95% eumelanin and 5% pheomelanin, and red hair

182 Amino Acids: Biochemistry and Nutrition
© 2010 Taylor & Francis Group, LLC
CH2
HC CO
HN
OH
CH2OH
CH2
HC CO
HN
OH
I I
CH2OH
I
I
CH2
HC CO
HN
OII I
Tyr
Tyr
Thyroglobin
Thyroperoxidase
CH2OH
I
I
CH2HO
I
I
CH2
HC CO
HN
O
I I
OH
I I
CH2
HC CO
HN
O
I IProteolysisT4
I–+ H2O2
I–+ H2O2
I– + H2O2
H2C
I–
Thyroperoxidase
CH2
CH CO
HN
OI
I I
CH2OH
I
CH2OH
I
CH2
CH CO
HN
O
I I
OH
I
CH2
CH CO
HN
O
I I
H2C
T3
Prot
eoly
sis
Iodotyrosine
Tyrosine
Deiodinase
Thyroperoxidase
Thyroperoxidase
DeiodinaseI–
FIGURE 5.18 Synthesis of tri-iodothyronine (T3) and thyroxine (T4) on thyroglobulin in the thyroid gland of animals. This synthetic process involves the following steps: (1) forma-tion of the tyrosine-rich thyroglobulin protein in the thyroid gland; (2) uptake of iodide (I−) by the thyroid gland; (3) iodination of the tyrosyl residues of thyroglobulin by thyroid peroxidase (also known as thyroperoxidase) to generate mono- and di-iodotyrosyl residues; (4) coupling of iodotyrosyl to iodothyronyl residues; (5) proteolysis of thyroglobulin to release free T3 and T4, as well as free iodotyrosines; and (6) free iodotyrosines are deiodinated to tyrosine and iodide, thereby allowing their recycling for T3 and T4 synthesis within the thyroid gland.

183Synthesis and Catabolism of Special Nitrogenous Substances
© 2010 Taylor & Francis Group, LLC
contains 67% eumelanin and 33% pheomelanin. Melanin is chemically very similar to lignin, a major constituent of wood. The type of melanin synthesized by melano-cytes is regulated by genetic and environmental factors.
As a component of the epidermis, intact melanin is gradually sloughed off the skin and hair. This is a mechanism for the elimination of melanin from the body.
COO–
NH3+
HO
COO–
NH3+
HO
HO
Tyrosine
Dopa(3,4-Dihydroxyphenylalanine)
Dopaquinone(DQ)
COO–H3N
S
COO–
NH3+
OHOH
5–S–Cysteinyl–dopa
S
COO–
COO–H3NNH3
+
OO
5-S-Cysteinyl-dopaquinone
COO–
N
S
COO–
OH
OH
COO–H3N
N
S
NH2O
O
NH–O
COO–
O
NH2
HO
HO
COO–Reducedglutathione
Glutathionyl-dopa
Mixed-typemelanins
Eumelanins(black or brown
polymers)
Melanochrome(purple polymers)
Indole-5,6-quinone(yellow)
5,6-Dihydroxyindole(DHI)
Benzothiazineintermediate
Trichochromes(yellowish-orange and
violet pigments)
NH2HO
HO
COO–
NH3+
O
O
CO2
Dopachrome
1BH2
BH4
1BH2
BH4
[O]
Quinoleimineintermediate
Leucodopachrome(cyclodopa)
O2
O2
O 2
DHICATRP2TRP1
Spontaneous
2
+
+
H3N+
+
+
+
+
+
Pheomelanins(brownish-red
polymers)
TRP2
O2
ICQA
[O], Fe3+, Cu2+
1
DQ
Dopa
2H+
H2O
tyrosinaseor peroxidases
DQ
Dopa
H2O
Glutamyl-glycine
γ-Glutamyl-transpeptidase
Cysteine
2–S–CD+ 6–S–CD
Tyrosinaseor TRP1
Tyrosinase or
peroxidases[O]
Tyrosinase orperoxidases
Tyrosinase or peroxidases
[O], Zn2+
Tyrosinase or peroxidases
OH
OH
S
NH3
2-S-Cysteinyldopa (2-S-CD)
OH
S
COO–
OH
H3N
COO–
6-S-Cysteinyldopa (6-S-CD)
+
NH3
+
NH3
+
+
–OOC
–OOC
N
HO
HO
COO–
H2
+
N
COO–
H2
O
O
Indole-5,6-quinone-2-carboxylate (ICQA)
+
5,6-Dihydroxyindole-2-carboxylate (DHICA)
NH
SS
O
N
H3N
NH3
OH
COO–
OH
+
+
–OOC
Trichochrome C
–OOC
O2
H2O2
[O] Tyrosinaseperoxidases
FIGURE 5.19 Conversion of tyrosine to the melanin polymers, eumelanins and phe-omelanins, in animals. Both eumelanins and pheomelanins are polymers. The enzymes that catalyze the indicated reactions are (1) tyrosinase; (2) tyrosine hydroxylase; and (3) TRP1, tyrosinase-related protein 1; TRP2, tyrosinase-related protein 2 (also known as dopachrome tautomerase). DHICA, 5,6-dihydroxy-indole-2-carboxylic acid.

184 Amino Acids: Biochemistry and Nutrition
© 2010 Taylor & Francis Group, LLC
At present, little is known about melanin degradation in animals. Limited evidence shows that the hair does not appear to degrade melanin. However, human kerati-nocytes have lysosomal enzymes to degrade melanin (Sitaram and Marks 2012). Macrophages in tissues (e.g., the retinal pigmented epithelium) can engulf melanin and then degrade it through the action of lysosomal hydrolases. Likewise, bacteria in the lumen of the intestinal tract can break down melanin. In mammalian cells or microorganisms, the products of melanin degradation have not been identified but may include pyrrole-2,3-dicarboxylic acid, pyrrole-2,3,5-tricarboxylic acid, 3-ami-notyrosine, and 4-amino-3-hydroxyphenylalanine.
SYNTHESIS AND CATABOLISM OF SEROTONIN AND MELATONIN
synthesis of serotonin AnD melAtonin
Tryptophan catabolism via the hydroxylation and decarboxylation pathway gener-ates serotonin, N-acetylserotonin, melatonin, anthranilic acid, and ammonia, as indi-cated in Figure 4.20. This pathway originated from the initial observation in 1935 by the Italian scientist V. Erspamer that a substance in an extract from enterochromaffin cells can make the intestine contract. Two years layer, Erspamer recognized this unknown substance to be an amine and named it “enteramine.” In 1948, M. Rapport and colleagues at the Cleveland Clinic found a vasoconstrictor molecule in serum that can affect the vascular tone and named it “serotonin.” In 1952, enteramine was shown to be identical to serotonin. J.D. Fernstrom and R.J. Wurtman reported in 1971 that concentrations of serotonin in the brain depend on the circulating levels of tryptophan. It is now known that two isoforms of tryptophan hydroxylase (TPH) catalyze serotonin synthesis from tryptophan in mammals. This enzyme critically depends on BH4 for catalytic activity (Table 4.8). TPH1 generates serotonin in the enterochromaffin cells of the intestine and in the pineal glands of the brain. TPH2 produces serotonin in the neurons of the raphe nuclei (the major site for the synthesis of this hormone in the brain) and in the myenteric plexus. Consistent with the site of its synthesis, serotonin is present predominantly in the gastrointestinal tract (80–90% of body stores) (Sanger 2008). This neurotransmitter is involved in the regula-tion of gastrointestinal secretion, motility, and sensation. There is also evidence that an increase in serotonin synthesis can be a sensitive biomarker of oxidative stress and the generation of reactive oxygen/nitrogen species.
In serotonergic neurons of the central nervous system and peripheral cells (includ-ing the retina, the gastrointestinal tract, bone marrow cells, epithelial cells, and lym-phocytes), serotonin can be transformed into melatonin, which was first discovered in the cow’s pineal gland in 1917 and isolated from urine in 1958. In this pathway, N-acetyltransferase transfers an acetyl group from acetyl-CoA to the amino group of serotonin to form N-acetylserotonin, which is the precursor for the synthesis of melatonin primarily in the pineal gland (Chapter 4). This tissue exhibits a diurnal rhythm in N-acetyltransferase activity, with low and high values in the light and dark periods, respectively. Exposure to constant light reduces N-acetyltransferase activity in the pineal gland and suppresses the circadian rhythm of this enzyme. In

185Synthesis and Catabolism of Special Nitrogenous Substances
© 2010 Taylor & Francis Group, LLC
contrast, synthesis or concentrations of melatonin in peripheral cells do not appear to be regulated by the photoperiod.
cAtABolism of serotonin AnD melAtonin
Catabolism of serotonin in animals takes place primarily in the cytoplasm of the brain, liver, and neurons of the gastrointestinal tract, and, to a lesser extent, in other tissues and cell types (including kidneys and cells of the immune system). Serotonin is degraded to 5-hydroxyindole-3-acetate and 5-methoxytryptamine by monoamine oxidase and SAM-dependent methyltransferase, respectively (Ferry et al. 2005). 5-Hydroxyindole-3-acetate and 5-methoxytryptamine are converted into 5-methoxy-indole-3-acetate by N-acetylserotonin O-methyltransferase and monoamine oxidase, respectively. Serotonin can also be metabolized in the cytoplasm to other derivatives, including formyl 5-hydroxytryptamine, 5-hydroxykynuremine, and 5-hydroxytryp-tamine sulfate (Chapter 4). Furthermore, results of recent studies indicate that sero-tonin-derived 5-hydroxyindoleacetaldehyde may be condensed with cysteine to form 5-hydroxyindole thiazoladine carboxylic acid in the mitochondria of the rodent brain and small intestine. In contrast to tryptophan, serotonin is not a substrate for indole-amine 2,3-dioxygenase.
Catabolism of melatonin involves conjugation and oxidative cleavage of its indole moiety (Squires et al. 2006). Approximately 70% of melatonin (either diet-derived or endogenously synthesized) is catabolized in animals by sulfo- and glucurono-conju-gation pathways, which are described previously. Some melatonin (~15%) is excreted in urine untransformed. About 30% of melatonin is degraded in the presence of H2O2 through oxidation by two cytosolic enzymes, myeloperoxidase and indoleamine 2,3-dioxygenase. Both enzymes have similar Km values (the micromolar range) for melatonin. In addition, the metabolism of melatonin may result in the production of an acetylated kynurenine derivative (N1-acetyl-N5-methoxykynurenamine) by kynurenine formamidase (a cytosolic enzyme) and of N-formyl-N-acetyl-5-methoxy kynurenamine by indole 2,3-dioxygenase.
SYNTHESIS AND CATABOLISM OF D-GLUCOSAMINE AND GLYCOSAMINOGLYCANS
historicAl PersPectives
d-Glucosamine was first prepared from the hydrolysis of chitin by G. Ledderhose in 1876 using concentrated hydrochloric acid. The structure of d-glucosamine was established by W. Haworth in 1939. C.E. Becker and H.G. Day reported in 1953 that d-[14C]glucose was converted into hexosamine in rats, indicating a role for glucose or its metabolite in the synthetic pathway. In the same year, L.F. Leloir and C.E. Cardini found that extracts from Neurospora crassa produced d-glucosamine-6-phosphate and l-glutamate from l-glutamine and hexose phosphate. The enzyme that catalyzed this reaction was identified in 1960 by S. Ghosh and colleagues. Thereafter, the path-way for the biosynthesis of aminosugars was elucidated in the 1960s.
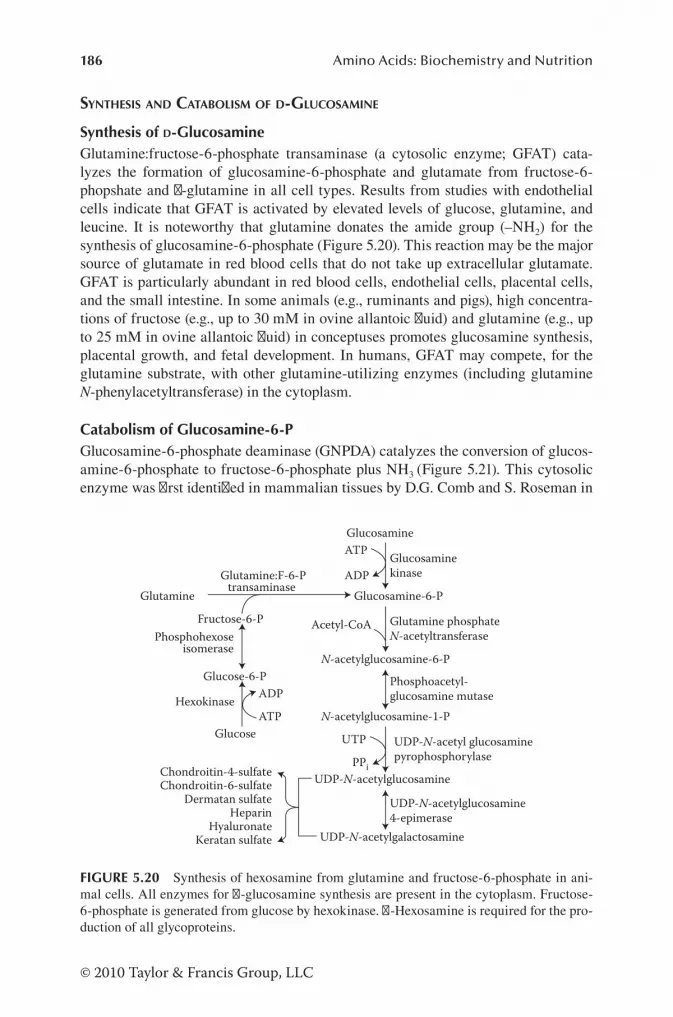
186 Amino Acids: Biochemistry and Nutrition
© 2010 Taylor & Francis Group, LLC
synthesis AnD cAtABolism of D-GlucosAmine
Synthesis of D-GlucosamineGlutamine:fructose-6-phosphate transaminase (a cytosolic enzyme; GFAT) cata-lyzes the formation of glucosamine-6-phosphate and glutamate from fructose-6-phopshate and l-glutamine in all cell types. Results from studies with endothelial cells indicate that GFAT is activated by elevated levels of glucose, glutamine, and leucine. It is noteworthy that glutamine donates the amide group (–NH2) for the synthesis of glucosamine-6-phosphate (Figure 5.20). This reaction may be the major source of glutamate in red blood cells that do not take up extracellular glutamate. GFAT is particularly abundant in red blood cells, endothelial cells, placental cells, and the small intestine. In some animals (e.g., ruminants and pigs), high concentra-tions of fructose (e.g., up to 30 mM in ovine allantoic fluid) and glutamine (e.g., up to 25 mM in ovine allantoic fluid) in conceptuses promotes glucosamine synthesis, placental growth, and fetal development. In humans, GFAT may compete, for the glutamine substrate, with other glutamine-utilizing enzymes (including glutamine N-phenylacetyltransferase) in the cytoplasm.
Catabolism of Glucosamine-6-PGlucosamine-6-phosphate deaminase (GNPDA) catalyzes the conversion of glucos-amine-6-phosphate to fructose-6-phosphate plus NH3 (Figure 5.21). This cytosolic enzyme was first identified in mammalian tissues by D.G. Comb and S. Roseman in
Glutamine Glucosamine-6-P
Glutamine:F-6-Ptransaminase
Fructose-6-P
Glucose-6-P
Phosphohexoseisomerase
GlucoseATP
ADPHexokinase
N-acetylglucosamine-6-P
Acetyl-CoA Glutamine phosphateN-acetyltransferase
N-acetylglucosamine-1-P
Phosphoacetyl-glucosamine mutase
UTP
PPi
UDP-N-acetyl glucosaminepyrophosphorylase
UDP-N-acetylglucosamine
UDP-N-acetylgalactosamine
UDP-N-acetylglucosamine4-epimerase
Chondroitin-4-sulfateChondroitin-6-sulfate
Dermatan sulfateHeparin
HyaluronateKeratan sulfate
GlucosamineATP
ADPGlucosaminekinase
FIGURE 5.20 Synthesis of hexosamine from glutamine and fructose-6-phosphate in ani-mal cells. All enzymes for d-glucosamine synthesis are present in the cytoplasm. Fructose-6-phosphate is generated from glucose by hexokinase. d-Hexosamine is required for the pro-duction of all glycoproteins.

187Synthesis and Catabolism of Special Nitrogenous Substances
© 2010 Taylor & Francis Group, LLC
1958 and was cloned by H. Wolosker and colleagues in 1998. GNPDA is selectively localized to (1) tissues with high-energy requirements, including the apical zone of transporting epithelia in the proximal convoluted tubules of the kidney and the small intestine, as well as placenta, uterus, testis, and skin; (2) neurons (but not glia) and especially to nerve terminals in the brain; and (3) motile sperm cells. Products of GNPDA enter glycolysis and N-utilizing pathways.
synthesis AnD cAtABolism of GlycosAminoGlycAns
Synthesis of GlycosaminoglycansGlycosaminoglycans are heteropolysaccharides that are composed of repeating disac-charide units that consist of either sulfated or nonsulfated monosaccharides. Their
Chondroitin sulfateproteoglycan
Hyaluronan (HA) Chondroitin sulfate (CS)
HA Fragments
1
22
CS Fragments
HA Fragments CS Fragments
3
HA Fragments CS Fragments
Small oligosaccharides Small oligosaccharides-SO4
65
44
3
GlcUA + GlcNAc7
Small oligosaccharidesSO4
2-87
GlcNAcGlcUA
Lysosome
GlcNAc-6-P
ATP ADP9 Glucosamine-6-P
H2O
Acetate
10
Fructose-6-P
H2O
NH311
Lactate + Pyvuvate
12
Extracellular
Conjugates
Xenobiotics 13
Intracellular
FIGURE 5.21 Degradation of glycosaminoglycans in animal cells. Hyaluronan (HA) and chondroitin sulfate (CS) proteoglycan are degraded in multiple cell types (e.g., keratocytes, synovial fibroblasts, endothelial cells, sinusoidal cells, placental trophoblasts, and tumors) through a series of reactions that involve extracellular and lysosomal hyaluronidases, as well as exoglycosidases. Entry of HA and CS into the cell occurs through cell-surface recep-tors, including CD44, RHAMM (receptor for HA-mediated motility), and ICAM1 (inter-cellular adhesion molecule 1). The internalized glycosaminoglycans enter the lysosome for degradation to N-acetyl-d-glucosamine (GlcNAc) and d-glucuronic acid (GlcUA), which subsequently exit the lysosom into the cytoplasm fir further catabolism. Enzymes that cata-lyze the indicated reactions are: (1) extracellular proteases; (2) extracellular hyaluronidase [HYAL (e.g., HYAL2)]; (3) cell-surface receptors; (4) endocytosis; (5) endoglycosidases (e.g., HYAL 1 and 3); (6) endoglycosidases (e.g., HYAL 1 and 4); (7) exoglycosidases; (8) aryl-sulfatase B and N-acetylgalactosamine-6-sulfatase; (9) N-acetyl-d-glucosamine kinase; (10) N-acetylglucosamine-6-phosphate deacetylase; (11) glucosamine-6-phosphate deaminase; (12) enzymes of glycolysis; (13) enzymes for glucuronidation. 6-P, 6-phosphate.

188 Amino Acids: Biochemistry and Nutrition
© 2010 Taylor & Francis Group, LLC
molecular size and the sulfation type vary with tissue and their state (e.g., part of proteoglycan or free chains). All animals synthesize glycosaminoglycans from glucosamine-6-phospahte. In this synthetic pathway, glucosamine-6-phospahte is converted into UDP-N-acetylglucosamine (Figure 5.20), which is a precursor for the formation of all macromolecules containing amino sugars (including membrane hor-mone receptors, intracellular glycoproteins, cell membrane-associated mucins in the intestinal mucosa, and extracellular matrix proteins [including hyaluronic acid, also known as hyaluronan (HA), chondroitins, and heparin]). All enzymes required for their synthesis are expressed in the cytoplasm of animal cells, including connective tissue, placenta, and gastrointestinal mucosal cells. Note that the glycosaminogly-cans synthesized by cells are exported to the extracellular matrix. Their production is essential to cell growth, development, and function, and to the structure of the extracellular matrix.
All vertebrates (e.g., mammals, birds, and fish) contain HA and chondroitin sul-fate. HA, a nonsulfated member of the glycosaminoglycan family, is a critical com-ponent of the extracellular matrix in the tissues of these animals. In HA, d-glucuronic acid and N-acetyl-d-glucosamine (also known as N-acetylglucosamine) are linked via alternating β-1,4 and β-1,3 glycosidic bonds. Chondroitin sulfate is a major com-ponent of the connective tissue matrix (e.g., skin and cartilage). This sulfated glycos-aminoglycan is composed of alternating units of N-acetyl-β-d-galactosamine(β1,3)β-d-glucuronate linked to each other by a β(1,4) linkage, and is usually attached to proteins as part of a proteoglycan.
Chitin (β-(1–4)-poly-N-acetyl-d-glucosamine) is a species-specific glycosami-noglycan. It is the major component of the cell walls of bacteria and fungi (e.g., mushrooms), as well as in the microfilarial sheath of parasitic nematodes. Chitin also constitutes the exoskeletons of crustaceans (e.g., crabs, lobsters, and shrimps), worms and insects, the lining of the digestive tracts of many insects, the radulas of mollusks, and the beaks of cephalopods (including squid and octopuses). In all of these lower organisms, chitin is synthesized from UDP-N-acetylglucosamine by chitin synthase (a cytosolic enzyme). Vertebrates do not synthesize or contain chitin.
Catabolism of GlycosaminoglycansDigestion of Dietary Glycosaminoglycans in the Gastrointestinal TractThe gastrointestinal mucosae release enzymes (e.g., exoglycosidases, endoglycosi-dases, sulfohydrolase, and hyaluronidase-like enzymes) to the lumen of the small intestine to degrade dietary glycosaminoglycans. These enzymes include heparan-ases (endoglycosidase) that cleave the heparan sulfate glycosaminoglycans from proteoglycan core proteins and degrade them to small oligosaccharides (Ahn et al. 1998). Exoglycosidases are glycoside hydrolases that cleave specific terminal mono-saccharides from glycans. Dietary glycosaminoglycans are also hydrolyzed by bac-terial enzymes in the lumen of the small intestine, including polysaccharide lyases (e.g., heparin lyase and chondroitin sulfate lyase), heparanases, chondroitinases, and chitinases in the cytoplasm. The resulting products [for example, uronic acids (l-idu-ronic acid and d-glucuronic acid) and low-molecular-weight aminosugars (d-galac-tosamine and d-glucosamine)] are either absorbed into the portal circulation or enter

189Synthesis and Catabolism of Special Nitrogenous Substances
© 2010 Taylor & Francis Group, LLC
the lumen of the large intestine. Glycosaminoglycans that escape the small intestine undergo degradation by the same bacterial enzymes.
Intracellular Degradation of Glycosaminoglycans in AnimalsAvailable evidence shows that degradation of extracellular HA and chondroitin sul-fate occurs in certain cell types, which include (1) keratocytes in the skin, (2) syno-vial fibroblasts, (3) endothelial cells, (4) sinusoidal cells in lymph nodes, liver, and spleen, (5) placental cells (including trophoblasts), and (6) tumors. The lysosome is the major site for initiating and completing the intracellular degradation of HA and chondroitin sulfate in these cell types (Gushulak et al. 2012). Chitin can be degraded by chitinases (cytosolic enzymes) in some animals (including mammals and insects).
The current model for HA degradation includes the actions of extracellular and lysosomal hyaluronidases (also known as hyaluronoglucosaminidases) as well as exo-glycosidases (Figure 5.21). According to this model, the degradation of HA begins with the cleavage of low- to high-molecular-weight HA by an extracellular hyaluroni-dase (HYAL2), which is a glycosylphosphatidylinositol-anchored, lipid raft-associated hyaluronidase. The resulting HA fragments, which include those with specific bio-logical activities (e.g., mediating inflammation, ovulation, and angiogenesis), may be internalized through interactions with a cell surface receptor into the lysosome, where other hyaluronidases (including the endoglycosidases HYAL1 and HYAL3) break down HA to form short oligosaccharides that serve as substrates for lysosomal exogly-cosidases [β-glucuronidase and β-hexosaminidase (N-acetyl-β-d-glucosaminidase)]. Results of recent studies indicate that both HYAL1 and β-hexosaminidase can degrade HA. This function of β-hexosaminidase explains the absence of accumula-tion of HA in multiple tissues in transgenic mice deficient in any hyaluronidase. The N-acetylglucosamine released from HA hydrolysis enters the cytoplasm where it is converted by N-acetylglucosamine kinase to form N-acetylglucosamine-6-phosphate (Jadin et al. 2012). The latter is deacetylated by a deacetylase to glucosamine-6-P, which is a substrate of GNPDA for further catabolism (Figure 5.21).
Catabolism of extracellular chondroitin sulfate proteoglycan in a tissue involves a cleavage of its core proteins by extracellular proteinases and the subsequent entry, through endocytosis, of the proteolytic products (chondroitin sulfate and proteins) into the target cell. The degradation of chondroitin sulfate in the lysosome requires a family of enzymes known as hyaluronidases [e.g., HYAL4 (a dedicated chon-droitinase) and HYAL1] that catalyze the hydrolysis of the large chondroitin sul-fate polymer to small oligosaccharides (e.g., hexa- and tetrasaccharides) and then eventually into chondroitin sulfate disaccharides. Because the sugars in the chon-droitin sulfate molecule are sulfated, specific enzymes (e.g., arylsulfatase B and N-acetylgalactosamine-6-sulfatase) remove the sulfate groups, resulting in regular disaccharide molecules that are further hydrolyzed into monomers.
Chitinases are hydrolytic enzymes that break down glycosidic bonds in chitin. Macrophages and epithelial cells of the lung and digestive tracts in animals (includ-ing mammals) express two functional chitinases (chitotriosidase and acidic mam-malian chitinase) in the cytoplasm to degrade chitin. These enzymes cleave chitin polymers into oligosaccharides (e.g., chitotriose) of varying sizes (endochitinase activity) and releases glucosamine monosaccharides (e.g., N-acetyl-d-glucosamine)

190 Amino Acids: Biochemistry and Nutrition
© 2010 Taylor & Francis Group, LLC
from the end of a chitin polymer (exochitinase activity). The presence of chitin-ases in such strategic sites may be the body’s first line of defense against exogenous agents including chitin-containing pathogens. Additionally, mammals and insects contain β-N-acetyl-d-hexosaminidase (a cytosolic enzyme) to degrade chitin, releas-ing N-acetyl-glucosamine.
CONJUGATION PRODUCTS FOR EXCRETION
formAtion of hiPPurAte from Glycine
A pathway for glycine utilization is the synthesis of hippurate, which shares a long history with AA metabolism. In 1829, J. von Liebig identified a difference between hippuric acid and benzoic acid, and in 1839 determined the composition of hippuric acid. The structure of hippuric acid was established by its chemical synthesis from benzoyl chloride and the zinc salt of glycine in 1873 by V. Dessaignes. In animals and humans, benzoic acid reacts with glycine to form hippurate in the mitochon-dria of hepatocytes (Figure 5.22). Hippurate is excreted in the urine. This pathway
Benzoate
C
S-CoA
O
Benzoyl-CoA
CoASH
Glycine
Mg-AMP + PPi
Mg-ATP
Hippurate
NH
CH2
COO-
O
Phenylalanine
Phenylacetate
Phenylacetyl-CoA(Human tissues)
CO2
Serine
Glutamine
CoASH
Phenylacetylglutamine
NH4+
CoASH + ATP
AMP + PPi
+ CoASH Benzoyl-CoAsynthetase
GlycineN-acyltransferase
Glutamine
transferaseN-phenylacetyl-
Acyl-CoAsynthetase
decarboxylasePyridoxal
phosphate
Glutamate
α-KG
CO2
COO- Phenylpyruvate
Phenylpyruvate
NAD+
NADH + H+
H2Oα-KG Glu
Transaminase
FIGURE 5.22 Formation of hippurate and phenylacetylglutamine in the liver mitochon-dria of animals. Hippurate is produced from glycine and benzoate in all animals (including humans), whereas phenylacetylglutamine is synthesized from phenylalanine and glutamine only in certain species (e.g., humans). Ammonia is incorporated into glycine, serine, and glutamine through AA metabolism (Chapter 3). The enzymes that catalyze the indicated reactions are: (1) benzoyl-CoA synthetase; (2) glycine N-acyltransferase; (3) phenylalanine decarboxylase; (4) phenylacetyl-CoA synthetase (acylating enzyme); and (5) glutamine N-phenylacetyltransferase.

191Synthesis and Catabolism of Special Nitrogenous Substances
© 2010 Taylor & Francis Group, LLC
is physiologically important for herbivores and omnivores that consume significant amounts of benzoic acid that naturally occurs in plants, particularly berries and fruits. Because ammonia is incorporated into glycine via GCS and serine (Figure 5.22), the formation of hippurate irreversibly removes ammonia from the circula-tion. Thus, sodium benzoate is often used to treat patients with hyperammonemia in clinical practice. In healthy humans, the urine contains only a small amount of hippurate. Interestingly, concentrations of hippurate are relatively high in the urine of healthy herbivores.
formAtion of PhenylAcetylGlutAmine from PhenylAlAnine AnD GlutAmine
Phenylacetylglutamine was originally described in 1914 by H. Thierfelder and C.P. Sherwin as a normal constituent of human urine. This substance was present in large amounts in the plasma of human subjects after oral administration of phenylacetate and in patients with renal insufficiency. A pathway for the utilization of phenylala-nine and glutamine is the synthesis of phenylacetylglutamine in a species-specific manner. In the liver and kidneys of humans, phenylalanine can be transaminated to yield phenylpyruvate, which is then decarboxylated to form phenylacetate (Figure 5.22). Phenylacetate is activated by an acylating enzyme (e.g., acyl-CoA synthetase) to become phenylacetyl-CoA, which subsequently reacts with glutamine to produce phenylacetylglutamine for excretion in urine. The enzyme that catalyzes the forma-tion of phenylacetylglutamine is glutamine N-phenylacetyltransferase. Interestingly, tissues of the cat, dog, monkey, rabbit, rat, and sheep do not appear to convert phe-nylalanine to phenylacetylglutamine. The urinary concentration of phenylacetylglu-tamine is very low in normal subjects but increases markedly in patients who have elevated levels of phenylalanine in the circulation. Because glutamine is synthesized from ammonia and α-ketoglutarate, phenylacetate (sodium salt) is often used to treat human patients with hyperammonemia (Chapter 12).
SUMMARY
In animals, AA are utilized in many synthetic pathways to produce carnitine, cat-echolamines, creatine, dipeptides, GSH, Gly–Pro–hydroxyproline, heme, hex-osamine, hippurate, imidazoles, melanin, melatonin, phenylacetylglutamine, polyamines, purines, pyrimidines, serotonin, and thyroid hormones. Physiologically significant imidazoles include anserine, acetylhistidine, carcinine, carnosine, hista-mine, homoanserine, homocarnosine, and urocanic acid, which are all derivatives of methylhistidine. Synthesis of most of these imidazoles and nonimidazoles require (1) BH4, S-adenosylmethionine, and pyridoxal phosphate; (2) glutamine, glutamate, glycine, histidine, and tyrosine; (3) interorgan metabolism of multiple AA involv-ing skeletal muscle, brain, kidney, and liver (e.g., creatine and carnitine), ubiquitous expression of enzymes in all cell types (purines and pyrimidines), or specific endo-crine glands (e.g., pineal gland and thyroid); and (4) intracellular compartmentaliza-tion involving the mitochondrion and the cytoplasm. Mammalian liver and skeletal muscle have particularly high concentrations of GSH and carnosine, respectively, whereas creatine is very abundant in both the central nervous system and skeletal

192 Amino Acids: Biochemistry and Nutrition
© 2010 Taylor & Francis Group, LLC
muscle. Hippurate, phenylacetylglutamine, as well as sulfate and glucuronide conju-gates of catecholamines, melatonin, melanin, and foreign compounds are nontoxic substances for urinary N excretion from the body. It is expected that the rich his-tory for the synthesis of the AA derivatives described in this chapter will guide future discovery of new AA metabolites, dipeptides, and tripeptides with biological importance.
REFERENCES
Ahn, M.Y., K.H. Shin, D.H. Kim, E.A. Jung, T. Toida, R.J. Linhardt, and Y.S. Kim. 1998. Characterization of a Bacteroides species from human intestine that degrades glycos-aminoglycans. Can. J. Microbiol. 44:423–429.
Bianco, A.C. and B.W. Kim. 2006. Deiodinases: Implications of the local control of thyroid hormone action. J. Clin. Invest. 116:2571–2579.
Borges, C.R., J.C. Roberts, D.G. Wilkins, and D.E. Rollins. 2001. Relationship of mela-nin degradation products to actual melanin content: Application to human hair. Anal. Biochem. 290:116–125.
Ferry, G., C. Ubeaud, P.H. Lambert, S. Bertin, F. Cogé, P. Chomarat, P. Delagrange, B. Serkiz, J.P. Bouchet, R.J. Truscott, and J.A. Boutin. 2005. Molecular evidence that melatonin is enzymatically oxidized in a different manner than tryptophan: Investigations with both indoleamine 2,3-dioxygenase and myeloperoxidase. Biochem. J. 388:205–215.
Fernstrom, J.D. and R.J. Wurtman. 1971. Brain serotonin content: Physiological dependence on plasma tryptophan levels. Science 173:149–152.
Gushulak, L., R. Hemming, D. Martin, V. Seyrantepe, A. Pshezhetsky, and B. Triggs-Raine. 2012. Hyaluronidase 1 and β-hexosaminidase have redundant functions in hyaluronan and chondroitin sulfate degradation. J. Biol. Chem. 287:16689–16697.
Layer, G., J. Reichelt, D. Jahn, and D.W. Heinz. 2010. Structure and function of enzymes in heme biosynthesis. Protein Sci. 19:1137–1161.
Jadin, L., L.H. Bookbinder, and G.I. Frost. 2012. A comprehensive model of hyaluronan turn-over in the mouse. Matrix Biol. 31:81–89.
Kopin, I.J. 1985. Catecholamine metabolism: Basic aspects and clinical significance. Pharmacol. Rev. 37:333–364.
McNabb, F.M. 1995. Thyroid hormones, their activation, degradation and effects on metabo-lism. J. Nutr. 125:1773S–1776S.
Moya-Garcia, A.A., M.A. Medina, and F. Sánchez-Jiménez. 2005. Mammalian histidine decarboxylase: From structure to function. BioEssays 27:57–63.
Olsson, R.A. 2003. Robert Berne: His place in the history of purine research. Drug Dev. Res. 58:296–301.
Reiter RJ. 1991. Pineal melatonin: Cell biology of its synthesis and of its physiological inter-actions. Endocr. Rev. 12:151–180.
Ryter, S.W., J. Alam, and A.M. Choi. 2006. Heme oxygenase-1/carbon monoxide: From basic science to therapeutic applications. Physiol. Rev. 86:583–650.
Sanger, G.J. 2008. 5-Hydroxytryptamine and the gastrointestinal tract: Where next? Trends Pharmacol. Sci. 29:465–471.
Sauerhöfer, S., G. Yuan, G.S. Braun, M. Deinzer, M. Neumaier, N. Gretz, J. Floege, W. Kriz, F. van der Woude, and M.J. Moeller. 2007. l-Carnosine, a substrate of carnosinase-1, influences glucose metabolism. Diabetes 56:2425–2432.
Sitaram, A. and M.S. Marks. 2012. Mechanisms of protein delivery to melanosomes in pig-ment cells. Physiology (Bethesda) 27:85–99.

193Synthesis and Catabolism of Special Nitrogenous Substances
© 2010 Taylor & Francis Group, LLC
Squires, L.N., J.A. Jakubowski, J.N. Stuart, S.S. Rubakhin, N.G. Hatcher, W.S. Kim, K. Chen, J.C. Shih, I. Seif, and J.V. Sweedler. 2006. Serotonin catabolism and the formation and fate of 5-hydroxyindole thiazolidine carboxylic acid. J. Biol. Chem. 281:13463–13470.
Vaz, F.M. and R.A. Wanders. 2002. Carnitine biosynthesis in mammals. Biochem. J. 361: 417–429.
Wu, G., N.E. Flynn, and D.A. Knabe. 2000. Enhanced intestinal synthesis of polyamines from proline in cortisol-treated piglets. Am. J. Physiol. 279:E395–E402.
Wu, G., Y.Z. Fang, S. Yang, J.R. Lupton, and N.D. Turner. 2004. Glutathione metabolism and its implications for health. J. Nutr. 134:489–492.


195
© 2010 Taylor & Francis Group, LLC
Synthesis of Urea and Uric Acid
During the eighteenth century, urea and uric acid were first obtained from urine and urine stones, respectively. These two metabolites have since become a focus of researchers studying protein metabolism and nutrition. During the following cen-tury, it was established that urea and uric acid are the major nitrogenous end prod-ucts of protein catabolism in mammals and birds, respectively. At the beginning of the twentieth century, ammonia and purines were known to be the precursors of urea and uric acid, respectively; however, the underlying biochemical synthetic processes had yet not been elucidated. In 1932, H.A. Krebs and K. Henseleit studied N metabolism in incubated liver slices and proposed the urea cycle (ornithine cycle) in the rat liver for the conversion of ammonia into urea. The urea cycle was the first metabolic cycle discovered in animals and the concept has led to major advances in biochemistry, medicine, nutrition, and physiology. Using the same technique for preparing liver slices, H.A. Krebs and coworkers identified the biochemical pathway for uric acid synthesis from purine via xanthine oxidase in 1936. Guided by the con-cept of cyclic metabolic pathways, Krebs used pigeon breast-muscle homogenates as a model system to study substrate metabolism and discovered the citric acid cycle in 1937 (Chapter 4). This metabolic cycle is responsible for the oxidation of acetyl-CoA produced from the catabolism of AA, glucose, and fatty acids. The landmark discovery of the citric acid cycle helps explain how proteins, carbohydrates, and lipids from ingested food are converted into CO2, water, and biological energy in the body. Notably, AA bridge the ornithine cycle with the citric acid cycle, indicating a central role for these nutrients in intermediary metabolism. This chapter highlights the biochemical pathways for synthesis of urea and uric acid in animals.
AMMONIA PRODUCTION AND TOXICITY IN ANIMALS
historicAl oBservAtions on AmmoniA ProDuction
For more than 16 centuries, it has been known that ammonia (a colorless alkaline gas with very pungent odor) is a significant substance in the urine of humans and other animals. The term ammonia was derived from Ammon, the Sun God of ancient Egypt, because the Romans found ammonium chloride deposits near Amun (Ammon in Greek), the Temple of Jupiter. During the Middle Ages, ammonia was obtained by the distillation of stale urine. Gaseous ammonia was first obtained in 1774 by J. Priestley (a British chemist) and its composition was determined in 1780 by the French scientist C.L. Berthollet. In 1893, C. van Caulaert and coworkers reported that dogs, which had a shunt placed between the portal system and the peripheral venous system
6

196 Amino Acids: Biochemistry and Nutrition
© 2010 Taylor & Francis Group, LLC
to bypass the liver, developed characteristic symptoms, including dizziness, anorexia, and death, when fed high-protein diets. Meanwhile, these investigators observed toxic effects of intravenous infusion of ammonium salts into patients with cirrhosis of the liver and suggested that high levels of ammonia in blood contributed to neurological disorders and mortality. By the end of the nineteenth century, it was known that ammo-nia is present in the blood of healthy subjects at low concentrations and that urinary ammonia is a by-product of protein and AA catabolism in humans and other animals. However, the major organs or AA precursors that contributed to urinary ammonia remained unclear. In 1909, F. Haber and C. Bosch produced ammonia from N in the air, further supporting the notion that metabolites in the body can be produced through organic synthesis, paving the way for ammonia analysis and for developments in AA research. Based on the reports of the biological deamination of AA in the early 1900s, H.A. Krebs discovered the degradation of glutamine by phosphate-activated glutamin-ase in animal tissues, including the kidney, in 1935 (Chapter 4). In a classic study, D.D. Van Slyke and colleagues reported in 1943 that glutamine degradation by the kidneys is the major source of ammonia in dog’s urine, particularly under acidotic conditions. This seminal observation was confirmed by subsequent studies in the 1950s–1980s involving humans, rats, sheep, and other species. All these findings established that ammonia is produced from AA oxidation in all animals.
removAl of AmmoniA in AnimAls unDer PhysioloGicAl conDitions
In vertebrates, glutamate dehydrogenase and glutamine synthetase play significant roles in removal of ammonia from the blood circulation and tissues (Chapters 3 and 4). Other means of clearing ammonia from the body depend on species. Specifically, ammoniotelic organisms (e.g., teleostean fishes, fish with a bony skeleton) release NH3 through their gills into the aqueous environment, uricotelic animals (e.g., birds, insects, earthworms, as well as the squamatile reptiles such as lizards and snakes) excrete ammonia as uric acid, and ureotelic species (mammals) form urea from ammo-nia and bicarbonate and release urea in their urine. By weight, NH3, urea, and uric acid contain 82.25%, 46.64%, and 33.33% N, respectively. The species differences in ammonia disposal may be related to the animal’s living environment, the solubility of the end nitrogenous products, and physiological adaptations to evolution. For example, the aqueous niche of the teleostean fish compels them to excrete water, therefore facili-tating the continuous excretion of water-soluble ammonia. Urea, which is highly water-soluble and nontoxic, is a desirable form to dispose of ammonia in mammals which periodically excrete water primarily as the major component of urine. In contrast, uric acid is relatively insoluble in water and is excreted as a concentrated salt, therefore allowing birds to conserve water and maintain a low body weight during long-distance flights. Accordingly, chelonian reptiles (e.g., turtles) excrete ammonia, uric acid, or urea, depending on whether they are primarily aquatic or on land.
The most important pathways for removal of ammonia in mammals and birds are the hepatic urea cycle and uric acid synthesis, respectively. Some individual enzymes of the urea cycle are present in various animal tissues, including macrophages, endo-thelial cells, smooth muscle cells, enterocytes, brain, and kidney. It should be noted that urea can also be produced from arginine by extrahepatic arginase in birds. Uric

197Synthesis of Urea and Uric Acid
© 2010 Taylor & Francis Group, LLC
acid is the major end product of N metabolism in avian species in which urea synthesis from ammonia does not occur because of the absence of CPS-I, NAG synthase, and OCT. Uric acid is also a product of purine nucleoside metabolism in both mammalian and avian species. Finally, at physiological concentrations, uric acid is a scavenger of oxygen free radicals and can protect cells and tissues from oxidative damage.
AmmoniA toxicity to the centrAl nervous system
As noted above, hyperammonemia results in multiple organ dysfunctions and death in humans and other animals, particularly preterm neonates. Ammonia is produced from AA catabolism in both animal cells and in microorganisms in the lumen of the gastrointestinal tract. Concentrations of ammonia in the lumen of the small intestine are high (e.g., 2 mM in pigs 2 h after feeding), without causing damage to the muco-sal cells. Similarly, intracellular concentrations of ammonia in tissues (e.g., liver and skeletal muscle) can range from 0.3 to 0.5 mM, without causing adverse effects. In contrast, elevating concentrations of ammonia in plasma from 30 to 80 μM can result in vomiting, nausea, and coma in humans (particularly neonates). Similar syndromes occur in other animals (e.g., cats, dogs, and pigs) with concentrations of ammonia in plasma >150 μM. In both mammals and birds, hyperammonemia causes severe coma and death, indicating the potential for extremely toxic effects of ammonia to the central nervous system.
It had long been thought that high levels of ammonia drain α-ketoglutarate from the Krebs cycle, thereby reducing the production of ATP by cells and reducing intra-cellular ATP concentrations. This, in turn, causes dysfunction of cells in the cen-tral nervous system. However, such an effect of ammonia on ATP depletion can potentially also occur in other cell types (e.g., enterocytes and lymphocytes), and yet they do not exhibit an accelerated rate of apoptosis when extracellular concen-trations increase from 0.05 to 0.5 mM in culture medium. Thus, in the presence of adequate buffering mechanisms, ammonia itself is not toxic to cells. Interestingly, hyperammonemia in animals including humans is often associated with elevated levels of glutamine in plasma due to enhanced synthesis of glutamine in multiple tissues (Chapter 3). Emerging evidence from animal studies shows that hyperammo-nemia does not result in coma or death when glutamine synthesis is inhibited in vivo. These results indicate that prolonged elevation of glutamine in plasma is potentially harmful to organisms. A possible mechanism is that high levels of glutamine (e.g., >2 mM) inhibit NO synthesis via NOS in endothelial cells through its catabolism to glucosamine-6-phosphate. Subsequently, this hexosamine, an analog of glucose-6-phosphate, competitively inhibits generation of NADPH (an essential cofactor for NOS) via the pentose cycle, thereby reducing blood flow and the supply of oxygen and nutrients to the brain, as well as ATP production by neuronal cells.
Effective strategies for the treatment of hyperammonemia depend on its under-lying causes. For example, in neonates and adults, ammonia toxicity induced by arginine deficiency can be successfully prevented by oral or intravenous administra-tion of arginine, citrulline, or ornithine. Oral administration of proline is also effec-tive to ameliorate neonatal death brought about by diet-induced hypoargininemia. In patients who have defects in enzymes of the hepatic urea cycle and elevated levels

198 Amino Acids: Biochemistry and Nutrition
© 2010 Taylor & Francis Group, LLC
of ammonia in the circulation, intravenous administration of sodium benzoate is often used to prevent death (Chapter 5). This method can also apply to birds and other animal species. In the case of NAG deficiency due to low mitochondrial NAG synthase-I activity, oral or intravenous administration of N-carbamoylglutamate (a metabolically stable analog of NAG) can specifically reduce high concentrations of ammonia in the blood of both humans and other mammals (e.g., pigs) by allo-steric regulators of CPS-I. In ruminants, vinegar (consisting mainly of acetic acid and water) is often used to treat ammonia toxicity because H+ from this acid rap-idly combines with free NH3 to form NH4
+ , which is then quantitatively excreted in urine. Additionally, acetic acid can help normalize blood pH, while providing energy required for the liver to convert ammonia into urea.
UREA PRODUCTION IN MAMMALS
historicAl PersPectives
The Dutch physician-chemist H. Boerhaave discovered urea in urine in 1727. Indeed, urea was the first animal metabolite to be isolated in crystalline form. In 1773, H. Rouelle (a French chemist) prepared urea from dog’s urine and in 1816, the British physician-chemist W. Prout reported the presence of urea in blood plasma. With the improved method, urea composition was first determined precisely in 1817 by Prout. By the late nineteenth century, it was known that urea is the major nitrogenous product of protein and AA catabolism in mammals. Research on urea metabolism was greatly facilitated when F. Wöhler (a German chemist) first synthesized urea from silver iso-cyanate and ammonium chloride in 1828. In search of the origin of urinary urea, A. Clementi reported in 1913 that the mammalian liver can convert ammonia and AA into urea. The pathway for urea biosynthesis had been elusive until H.A. Krebs and K. Henseleit proposed the urea (ornithine) cycle in 1932. Extensive research in the 1950s to the 1980s greatly expanded our knowledge of the metabolic control of the urea cycle by substrates, cofactors, protein turnover, allosteric regulators, and hormones.
hePAtic ureA cycle in mAmmAls
In the early 1930s, H.A. Krebs observed that either ornithine or arginine stimu-lates the conversion of ammonia to urea in rat liver slices incubated in the presence of physiological concentrations of major cations and anions (including sodium and bicarbonate). Interestingly, there was no change in the amount of ornithine in the medium or tissue. In his 1981 book titled Reminiscences and Reflections, Krebs wrote that “The interpretation of this finding was not at once obvious. It took a full month to find the correct interpretation. At first, we were skeptical about the correct-ness of the observations. Was the ornithine perhaps contaminated with arginine? The answer was no. Then it occurred to us that the effect of ornithine might be related to the presence of arginase in the liver, the enzyme which converts arginine into ornithine and urea, known since the work of Kossel and Dakin in 1904.” Based on this consideration, Krebs and Henseleit proposed the following sequential reactions:
Ornithine + NH3 + CO2 → Citrulline → Arginine → Urea + Ornithine

199Synthesis of Urea and Uric Acid
© 2010 Taylor & Francis Group, LLC
After H.A. Krebs published his paper on the urea cycle, he was congratulated on this important discovery by some biochemists but he also received severe criticisms from some scientists who could not reproduce his findings using perfused rat livers. In his reminiscence of the discovery of the ornithine cycle, Krebs wrote the follow-ing comments. “Luck, it is true, is necessary, but the more experiments are carried out, the greater is the probability of meeting with luck. The story also shows that adverse criticisms are liable to be raised on the grounds that either the observations are not confirmed or that some other observations do not fit in with the interpretation of the findings. Almost every major development in science meets with criticisms of this kind.” The basic concept of the original proposed cycle has stood the test of time in the past 80 years. The kinetics and other biochemical properties of the urea-cycle enzymes are summarized in Tables 6.1 and 6.2, respectively.
One of the most remarkable features of the urea cycle is its compartmentation (Figure 6.1). Namely, urea synthesis involves both cytoplasm and mitochondria in the liver. Note that NH3 (rather than NH4
+ ) and HCO3− (rather than CO2) are substrates for
TABLE 6.1Kinetics of Urea-Cycle Enzymes in Liver and Enterocytes
EnzymeReactant or Activator
Rat Livera Pig Liverb Pig Enterocytesb
Vmax Km (mM) Vmax Km (mM) Vmax Km (mM)
CPS-I Ammonia 21 1–2 (0.6) 18.6 1.2 6.68 1.34
HCO3− 4–5 (2) 5.77 58.6
Mg-ATP 0.5–3 (1.2) 1.69 15.2
Mg2+ 0.17–2 (<1) ND ND
NAG (free) 0.04–0.1 (0.1) 0.13 0.82
NAG (total) (0.8) 0.96 ND
OCT Ornithine 799 0.2–1.8 921 1.58 706 5.13
CP 0.02–0.4 (>0.15) 0.46 17.1
ASS Citrulline 7.4 0.04 (>0.2) 8.45 0.068 1.89 0.15
Aspartate 0.02 0.031 0.054
Mg-ATP 0.15 0.24 2.86
ASL AS 13.3 0.04–0.13 (>0.03) 17.7 0.12 3.50 0.63
Arginase-I Arginine 5143 3.5 (>0.06) 3072 3.38 7.13 7.46
NAGS Glutamate 0.22 3 0.28 3.56 4.25
Acetyl-CoA 0.7 0.84 1.02
Arginine 0.01 (0.05) 0.061 0.11
Source: Data are taken from Meijer, A.J., W.H. Lamers, and R.A. Chamuleau. 1990. Physiol. Rev. 70:701–748; Davis, P.K. and G. Wu. 1998. Comp. Biochem. Physiol. B 119:527–537.
Note: ND, not determined. Ammonia is the sum of NH4+ and NH3.
a Values in parentheses are Km values for enzymes in situ, either in permeabilized mitochondria (CPS-I), intact mitochondria (OCT), or intact hepatocytes (ASS, ASL, arginase, and NAGS). Vmax is expressed as μmol/min per g dry weight (adult rats).
b Vmax is expressed as μmol/min per g tissue protein (60-day-old growing pigs). Data are taken from Davis, P.K. and G. Wu. 1998. Comp. Biochem. Physiol. B 119:527–537.

200 Amino Acids: Biochemistry and Nutrition
© 2010 Taylor & Francis Group, LLC
CPS-I. However, NH3 is in chemical equilibrium with NH4+ , whereas HCO3
− is pro-duced from CO2 and H2O by carbonic anhydrase. Both NH3 and HCO3
− are formed from the catabolism of AA (including glutamate, glutamine, and glycine) in mito-chondria. Once ammonia is formed, it reacts with HCO3
− to generate carbamoylphos-phate. Most of the CO2 production occurs in the mitochondria, therefore providing immediate bicarbonate for urea synthesis. The source of ornithine for OCT is the diet or the cytosolic arginase. In either case, ornithine is transported by ORNT1 (mito-chondrial ornithine transporter 1) from the cytoplasm to the mitochondrial matrix in the mammalian hepatocyte. The ORNT1 is an antiporter whereby mitochondrial citrulline is exchanged for cytosolic ornithine across the inner mitochondrial mem-brane to exit into the cytoplasm. During long-term fasting, urea synthesis is reduced to: (1) conserve AA N and ultimately body protein; (2) maintain a relatively constant concentration of HCO3
− in the circulation (because the source of CO2 is limited due to decreased AA oxidation); and (3) minimize energy expenditure.
Another important feature of the urea cycle is metabolic channeling, which can be defined as the restricted flow of substrates and products in a series of enzyme-cat-alyzed reactions. Studies of the urea cycle in the 1980s involving the use of labeled substrates or intermediates led to the development of this concept in cell metabolism. Metabolic channeling facilitates the immediate transfer of intermediates between enzymes and helps maintain a relatively high concentration of substrates in cata-lytic sites. This ensures rapid and efficient formation of end products via a series of biochemical reactions. Available evidence shows that metabolic channeling in the hepatic urea cycle occurs in both the cytoplasm and mitochondria.
The overall reaction of the urea cycle:
NH HCO Aspartate H N CO NH Fumarate3 + + →3 2 2− +� � (6.1)
Aspartate can be formed from NH3 and oxaloacetate:
NH3 + α-Ketoglutarate → Glutamate (6.2)
Glutamate + Oxaloacetate → α-Ketoglutarate + Aspartate (6.3)
TABLE 6.2Subunits of Urea-Cycle Enzymes in the Mammalian Liver
EnzymeSubunit Molecular
MassStructure (Total Molecular Mass)
Cofactor or Allosteric Factor
NAG synthase 57 kDa Homotrimer (171 kDa) Arginine
CPS-I 155 kDa Homodimer (310 kDa) NAG
OCT 36 kDa Homotrimer (108 kDa) None
ASS 46,250 Da Homotetramer (185 kDa) Mg2+
ASL 51.7 kDa Homotetramer (206.8 kDa) None
Arginase-I 35 kDa Homotrimer (105 kDa) Mn2+
Source: Adapted from Jackson, M.J., A.L. Beaudet, and W.E. O’Brien. 1986. Annu. Rev. Genet. 20:431–64; Morris, S.M. Jr. 2002. Annu. Rev. Nutr. 22:87–105; Ash, D.E. 2004. J. Nutr. 134:2760S–2764S.

201Synthesis of Urea and Uric Acid
© 2010 Taylor & Francis Group, LLC
Thus, the net reaction of the urea cycle:
2 3 3 2 2NH HCO H N CO NH+ →− � �
cAlculAtion of ureA ProDuction in mAmmAls
Based on the reactions of the urea cycle, the production of urea by healthy adult mammals fed a protein-containing diet can be accurately estimated. The chemical composition, by weight, of the average protein is as follows:
N 13–19% (16%)C 51–55% (53%)
C O
NH2
NH2
H2O
Arginase
Urea
C P
O
O–O–O
O
H2N
Pi
2Mg-ADP + Pi
NAG
OCT
C NH3+
CH2
CH2
CH2
H
Mg-ATP AMP + PPi
L-Aspartate
ASS
CH
CH COO–
–OOC
L-Arginine
CPS-I
ASL
Mitochondrion
Cytoplasm
Carbamoylphosphate
C NH3+H
C
NH2
NH CH
CH2
Fumarate
Argininosuccinate
2Mg-ATP
+
+
H2C
CH2
CH2
C
COO–
COO–
COO–
COO–
COO–
COO–
NH3+H
NH
C O
NH2
L-Citrulline
HCO3– + NH3
H2C NH3+
CH2
CH2
C
COO–
NH3+H
L-Ornithine
H2C
CH2
CH2
C
COO–
NH3+H
NH
C
NH2
NH2
CH2 · NH
CH2
CH2
FIGURE 6.1 The urea cycle in mammals. The synthesis of urea from ammonia and bicar-bonate involves both the mitochondrion and the cytoplasm. Citrulline exits the mitochon-drion into the cytoplasm where it is converted into arginine, which is hydrolyzed by arginase into urea plus ornithine. Ornithine is then reused for another turnover of the cycle. ASL, argininosuccinate lyase; ASS, argininosuccinate synthase; CPS-I, carbamoylphosphate syn-thase-I; NAG, N-acetylglutamate.

202 Amino Acids: Biochemistry and Nutrition
© 2010 Taylor & Francis Group, LLC
O 20–24% (22%)H 6.5–7.3% (7%)S 0.5–2% (1.2%)P 0–1.5% (0.8%)
When an individual consumes 100 g protein per day, dietary intakes of N and carbon can be calculated as follows:
100 g protein × 16 g N/100 g protein = 16 g N16 g N/14 g N per mol N = 1.14 mol N100 g protein × 53 g C/100 g protein = 53 g C53 g C/12 g C per mol C = 4.42 mol C
Assuming that an adult man (70 kg) consumes 100 g protein/day and the true digestibility of protein is 90%, then 1.026 mol N (1.14 × 0.9 = 1.026) and 3.978 mol C (4.42 × 0.9 = 3.978) would be available for utilization by the small intestine and extra-intestinal tissues. Based on the ratio of N to C in urea (2:1), namely
2 mol of NH 1 mol of HCO 1 mol of urea3 3+ →−
the following equation is obtained:
1 026 0 5133. .mol N 0.513 mol HCO mol urea+ →−
Thus, daily production of urea by the adult would be 0.513 mol. Then, 3.465 mol C (3.978–0.513 = 3.465) would be available for the oxidation to CO2 or for the syn-thesis of glucose and lipids. Therefore, it is evident that AA oxidation in the liver is sufficient to provide bicarbonate for urea production and that the urea cycle itself does not necessarily depend on bicarbonate in the blood plasma or affect acid–base balance in the body. This notion can also be explained by the following examples of the oxidation of alanine, glutamate, and glutamine to form urea and provide addi-tional C, H, and O atoms for other metabolic pathways in mammals. Respiratory quotients (CO2/O2) differ among these AA when they are completely oxidized to CO2 and H2O in the body.
1. Alanine oxidationC3H7NO2 – 0.5(CH4N2O) → C2.5H5O1.5
Alanine UreaC2.5H5O1.5 + 3O2 → 2.5CO2 + 2.5H2O RQ = 2.5/3 = 0.833
2. Glutamate oxidationC5H9NO4 – 0.5(CH4N2O) → C4.5H7O3.5
Glutamate UreaC4.5H7O3.5 + 4.5O2 → 4.5CO2+ 3.5H2O RQ = 4.5/4.5 = 1.00
3. Glutamine oxidationC5H10N2O3 – CH4N2O → C4H6O2
Glutamine UreaC4H6O2 + 4.5O2 → 4CO2 + 3H2O RQ = 4/4.5 = 0.889

203Synthesis of Urea and Uric Acid
© 2010 Taylor & Francis Group, LLC
For growing mammals, urea production can be estimated when intake of dietary protein, the digestibility of dietary protein, and growth rate (protein deposition) are known. When enzymes of the urea cycle are functioning normally and concentra-tions of its cofactors (e.g., Mg2+ and Mn2+) are adequate and when AA composition in the diet is optimal, urinary excretion of ammonia and urea can be used to deter-mine an animal’s dietary protein and AA requirements. Likewise, concentrations of ammonia and urea in plasma and in urine (when its volume is known) may be useful indicators of whole-body AA oxidation in animals.
synthesis of ureA from AmmoniA in extrAhePAtic cells
In studying intestinal AA metabolism, G. Wu reported in 1995 that enterocytes in postweaning mammals (e.g., pigs and rats) contain all the enzymes required for the synthesis of urea from either ammonia and CO2 or glutamine. This physiologically relevant pathway was established by measuring the formation of urea in enterocytes from these nitrogenous substrates at concentrations present in the lumen of pig and rat small intestines. Results from studies with postweaning pigs indicate that, at the same concentrations of substrates, the rate of ureagenesis from extracellular ammonia or glutamine in enterocytes is ∼5% of that in hepatocytes. Thus, enterocytes are capable of producing significant amounts of urea from extracellular and intramitochondrion-derived ammonia. Urea is also formed from arginine via arginase in enterocytes of weaned mammals. Urea synthesis by enterocytes in postweaning mammals is the first line of defense against the potential toxicity of ammonia that is (1) produced by extensive intestinal degradation of dietary and blood-derived glutamine (a major fuel for enterocytes) and (2) derived from diets and luminal microorganisms. Additionally, F. Blachier and B.J. Bequette reported, respectively, that colonocytes of the rat large intestine and the epithelial cells lining the ovine rumen can synthesize urea from ammonia and bicarbonate. Although the liver is undoubtedly the major site of ure-agenesis in mammals, the hepatocyte is not the only cell type which can convert ammonia into urea. Thus, the traditional textbook view that the urea cycle occurs only in the mammalian liver needs to be revised.
reGulAtion of the ureA cycle in mAmmAls
Regulation of the urea cycle under physiological conditions is complex and is still not fully understood. The activity of the urea cycle is controlled by nutritional, physio-logical, and pathological factors. First, energy supply, dietary protein intake, as well as the availability of substrates (e.g., AA and ammonia) and cofactors (e.g., Mn2+ and Mg2+) in plasma and cells are key nutritional factors influencing ureagenesis in the mammalian liver. The expression and activities of hepatic urea-cycle enzymes are enhanced by high intake of dietary protein and AA to facilitate the removal of AA-derived ammonia from the body. In contrast, hepatic expression of urea-cycle enzymes is markedly reduced in response to low intake of dietary protein or AA as an adaptation mechanism to conserve both energy and N in mammals. Therefore, a sudden substantial increase in the consumption of dietary protein immediately after a prolonged period of severe protein malnutrition may result in hyperammonemia

204 Amino Acids: Biochemistry and Nutrition
© 2010 Taylor & Francis Group, LLC
and even death. Second, extracellular pH can modulate ureagenesis. For example, reducing extracellular pH from 7.4 to 7.1 inhibits the uptake of AA by hepatocytes and, therefore, inhibits urea production. In contrast, increasing extracellular pH from 7.4 to 7.6 stimulates urea synthesis from glutamine by enhancing the flux of glu-tamine through phosphate-activated glutaminase and, therefore, the generation of ammonia and glutamate (a precursor of NAG). Third, compelling evidence shows that CPS-I and ASS are two key regulatory enzymes in hepatic urea synthesis from ammonia (Table 6.1). In hepatocytes, Km values of the urea-cycle enzymes for their substrates and activators are similar to concentrations of the substrates and activators in mitochondria and the cytoplasm (Table 6.3). Studies in the 1970s and 1980s by A. Meijer and colleagues led to the identification of arginine as the allosteric activa-tor of NAG. This enzyme converts acetyl-CoA and glutamate into NAG, which is the allosteric activator of CPS-I. Thus, when arginine is deficient, ammonia exits the mitochondria into the cytoplasm, where it is utilized for the synthesis of purines and then orotate and uric acid (Figure 6.2). High levels of orotate and uric acid poten-tially result in fatty liver and gout, respectively. Fourth, some hormones also regulate urea synthesis. For example, growth hormone reduces the activities of CPS-I, ASS, ASL, arginase, and glutaminase in liver, thereby contributing to the conservation of AA for protein synthesis. Insulin reduces the circulating levels of AA by stimulating whole-body protein synthesis and suppressing proteolysis, thereby decreasing the availability of the AA substrates for urea synthesis. In contrast, high levels of gluco-corticoids upregulate expression of urea-cycle enzymes through a cAMP-dependent mechanism. This helps explain, in part, increased excretion of ammonia and urea under catabolic conditions.
TABLE 6.3Concentrations of Urea-Cycle Enzyme Substrates or Activators in Pig Liver and Enterocytes
Pig Liver Pig Enterocytes
Substrate Cytoplasm Mitochondria Cytoplasm Mitochondria
Ammonia 0.35 0.52 0.45 1.18
ATP 5.97 12.6 4.28 8.56
Aspartate 2.26 2.50 5.56 2.41
Citrulline 0.10 0.12 0.36 0.52
Arginine 0.13 0.14 0.84 0.75
Ornithine 0.65 0.82 0.30 0.61
AS 0.078 ND 0.042 ND
CP 1.63 0.50 2.26 0.59
NAG ND 1.08 ND 0.64
Source: Data are taken for 60-day-old pigs from Davis, P.K. and G. Wu. 1998. Comp. Biochem. Physiol. B 119:527–537.
Note: Values are expressed as mM. AS, argininosuccinate; CP, carbamoylphosphate; NAG, N-acetylglutamate; ND, not detectable. Ammonia is the sum of NH4
+ and NH3.
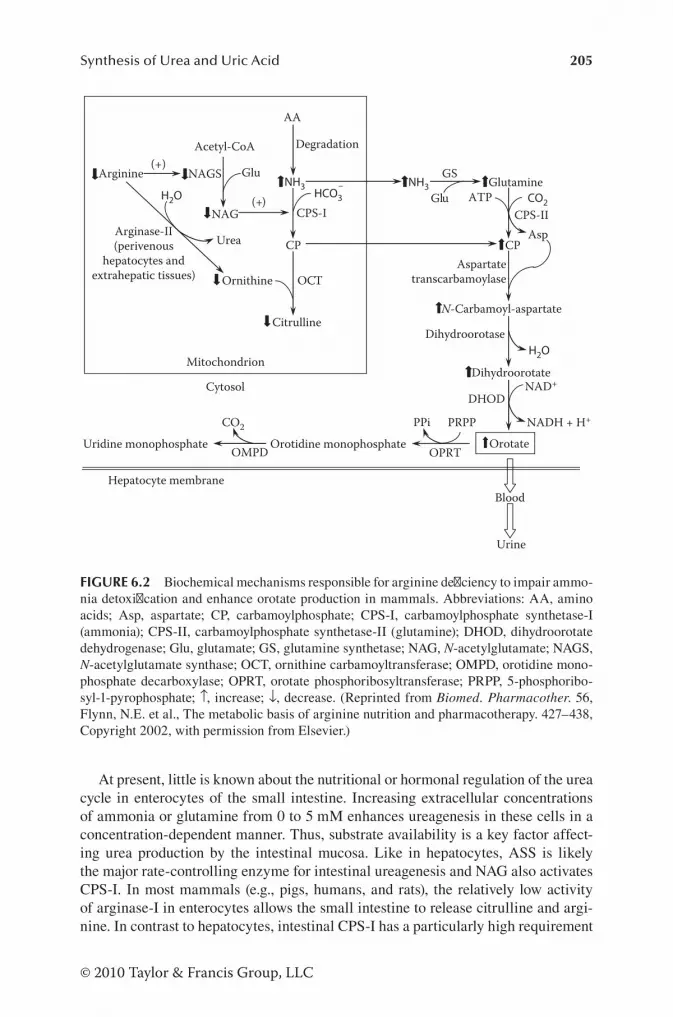
205Synthesis of Urea and Uric Acid
© 2010 Taylor & Francis Group, LLC
At present, little is known about the nutritional or hormonal regulation of the urea cycle in enterocytes of the small intestine. Increasing extracellular concentrations of ammonia or glutamine from 0 to 5 mM enhances ureagenesis in these cells in a concentration-dependent manner. Thus, substrate availability is a key factor affect-ing urea production by the intestinal mucosa. Like in hepatocytes, ASS is likely the major rate-controlling enzyme for intestinal ureagenesis and NAG also activates CPS-I. In most mammals (e.g., pigs, humans, and rats), the relatively low activity of arginase-I in enterocytes allows the small intestine to release citrulline and argi-nine. In contrast to hepatocytes, intestinal CPS-I has a particularly high requirement
Arginine
Acetyl-CoA
NAG
(+)NAGS
H2O
Urea
Ornithine
AA
CPS-I
CP
HCO3–
Degradation
OCT
Citrulline
Mitochondrion
Cytosol
NH3 Glutamine
CP
CO2
AspCPS-II
ATP
Aspartatetranscarbamoylase
N-Carbamoyl-aspartate
Dihydroorotate
H2O
NAD+
NADH + H+
Orotate
PRPPPPi
OPRTOrotidine monophosphate
CO2
Uridine monophosphateOMPD
Blood
Urine
Hepatocyte membrane
Arginase-II(perivenous
hepatocytes andextrahepatic tissues)
Glu
GS
Dihydroorotase
DHOD
(+)
GluNH3
FIGURE 6.2 Biochemical mechanisms responsible for arginine deficiency to impair ammo-nia detoxification and enhance orotate production in mammals. Abbreviations: AA, amino acids; Asp, aspartate; CP, carbamoylphosphate; CPS-I, carbamoylphosphate synthetase-I (ammonia); CPS-II, carbamoylphosphate synthetase-II (glutamine); DHOD, dihydroorotate dehydrogenase; Glu, glutamate; GS, glutamine synthetase; NAG, N-acetylglutamate; NAGS, N-acetylglutamate synthase; OCT, ornithine carbamoyltransferase; OMPD, orotidine mono-phosphate decarboxylase; OPRT, orotate phosphoribosyltransferase; PRPP, 5-phosphoribo-syl-1-pyrophosphate; ↑, increase; ↓, decrease. (Reprinted from Biomed. Pharmacother. 56, Flynn, N.E. et al., The metabolic basis of arginine nutrition and pharmacotherapy. 427–438, Copyright 2002, with permission from Elsevier.)

206 Amino Acids: Biochemistry and Nutrition
© 2010 Taylor & Francis Group, LLC
for bicarbonate, whose concentration in the lumen of the small intestine is two- to threefold greater than that in plasma (25 mM). As reported for the liver, glucocor-ticoids stimulate expression of all urea-cycle enzymes primarily at transcriptional and translational levels and, therefore, the conversion of ammonia to urea in the gut. However, in contrast to the liver, growth hormone does not regulate the activity of any urea-cycle enzymes in the small intestine. At present, mechanisms responsible for the tissue-specific effect of growth hormone are not known.
enerGy reQuirement of ureAGenesis
A relatively large proportion of dietary energy is required to maintain the urea cycle in an active state. The ATP requirements for urea synthesis are composed of two processes:
1. Formation of 1 mol of urea from 1 mol each of ammonia, aspartate, and HCO3
− : This process requires 4 mol of ATP. Note that when ATP is converted
into AMP + PPi in the reaction catalyzed by ASS, two high-energy phos-phate bonds are hydrolyzed to provide energy, which is equivalent to the use of 2 mol of ATP.
2. Incorporation of 1 mol of ammonia into 1 mol of aspartate:
NH Ketoglutarate NADH H Glutamate NAD
equivalent to 4+ + ++ − + + → +α
( 22 5 mol of ATP. )
Glutamate + Oxaloacetate ↔ α-Ketoglutarate + Aspartate
Thus, a total of 6.5 mol of ATP are required to convert 2 mol of ammonia into 1 mol of urea in the mammalian liver. This is equivalent to 3.25 mol of ATP per mol ammonia.
Depending on AA, the detoxification of protein-derived ammonia as urea con-sumes ∼10–15% of ATP produced from AA oxidation. Optimizing the quality and quantity of dietary AA requirements by mammals can reduce urea production, thereby improving the efficiency of protein and energy utilization. Compared with mammals, aquatic animals, which excrete ammonia directly into the environment (water), have a higher efficiency of utilization of dietary AA for protein synthesis.
When the rate of formation of carbamoyl phosphate from ammonia, CO2, and ATP exceeds the rate of conversion of carbamoyl phosphate plus ornithine into citrulline in mitochondria, carbamoyl phosphate exits into the cytoplasm for syn-thesis of orotic acid. This can occur when (1) OCT or arginine is deficient and (2) dietary intake of protein or ammonia concentrations in plasma is very high. Elevated production of orotic acid is associated with the development of fatty liver in experi-mental animals and also with an increased incidence of colon cancer in susceptible subjects who chronically consume high quantities of dietary protein.

207Synthesis of Urea and Uric Acid
© 2010 Taylor & Francis Group, LLC
ureA recyclinG in ruminAnts
In ruminants, urea in the circulation enters the lumen of the rumen through saliva and through uptake from arterial blood across rumen epithelium via a urea transporter. Within the rumen, urease produced by bacteria rapidly hydrolyzes urea to form ammonia and CO2. A large proportion of the urea-derived ammonia is utilized for the synthesis of free AA, small peptides, and proteins by rumen microbes (Chapter 2). These nitrogenous products of ammonia flow into the lumen of the abomasum and thence into the lumen of the small intestine for digestion and absorption. Once absorbed, free AA and small peptide-derived AA are used for protein synthesis or undergo metabolism in tissues and their N is ultimately transformed into urea in the liver. Some of this urea N is again recycled into the gastrointestinal tract via saliva and from arterial blood into the rumen, as described in Chapter 2. Collectively, these events are referred to as urea recycling.
The proportion of urea transferred from the liver to the gastrointestinal tract ranges from 10% to 80% in ruminants and is affected by species and diet. Under normal feeding conditions, the ratio of hepatic urea synthesis (g urea N) to digestible N intake from the diet (g N) is 1.15 for bulls, 1.07 for steers, 0.87 for dairy cows, 1.42 for sheep fed forage diets, 2.34 for sheep fed hay/barley diets, 1.05–1.21 for grow-ing goats, 2.83–4.86 for wapiti, 0.54–1.32 for white-tailed deer, and 0.82–1.79 for reindeer/caribou (NRC 2006). Thus, an extensive recycling of urea to the rumen for microbial synthesis of AA and proteins provides a metabolic basis for (1) reindeer/caribou to meet maintenance requirements in winter and (2) bulls, sheep, wapiti, and deer to support maintenance requirements plus weight gain as tissue protein (meat and wool) or milk protein.
The magnitude of urea recycling in ruminants is affected greatly by dietary intake of protein and N. The proportion of urea synthesized in the liver that is returned to the gastrointestinal tract are high and low, respectively, at low and high intakes of dietary N (Table 6.4). In ewe lambs fed diets containing 9.7%, 17.8%, and 25.8% crude protein, 75%, 41%, and 30% of the urea produced in the liver is reutilized each day, respectively, via urea recycling. Urea recycling in ruminants serves to spare dietary and endogenous N for protein synthesis and other metabolic functions and is particularly important for ruminants that generally consume relatively low-protein (e.g., 10% crude protein) diets.
excretion of ureA By the kiDney
Nearly all of the urea produced in the nonruminant mammal is excreted by the kidneys. In 1962, K. Diem provided the following data (g N/day) showing the com-position of N-containing compounds in the urine of healthy adult humans consum-ing 100 g protein per day (~16 g N/day).
Urea 12.8Ammonia 0.7Amino acids 0.7Creatine 0.7

208 Amino Acids: Biochemistry and Nutrition
© 2010 Taylor & Francis Group, LLC
Uric acid 0.3Hippuric acid 0.1Total 15.3
Urea elimination via the kidneys involves glomerular filtration, followed by reab-sorption in the proximal renal tubules. Until about 60 years ago, it was thought that urea in blood was filtered and reabsorbed passively into the proximal renal tubules. However, this simplistic view was challenged by B. Schmidt-Nielsen, who reported in 1952 that urea clearance in desert kangaroo rats fed a high-protein diet can exceed the filtered load. Based on her subsequent extensive studies, she proposed that urea clearance and glomerular filtration by the kidneys must be independently regulated in response to intakes of different amounts of dietary protein. In other words, renal tubules likely express specific transporters to transport urea across the plasma mem-brane. Therefore, urea transporters in the kidney play an important role in both urea N salvaging and urinary concentration.
In support of the notion of B. Schmidt-Nielsen, J.M. Sands and coworkers pro-posed, for the first time in 1987, that urea is transported by a facilitated or carrier-mediated transporter in the mammalian collecting duct. Subsequently, K.H. Beyer and R.T. Gelarden reported Na+-dependent active transport of urea by the mamma-lian kidney in 1988. Furthermore, M.A. Hediger and coworkers identified and cloned the first facilitative urea transporter (UT), now named UT-A2, in 1993. To date, evidence shows that humans and other mammals have two types of urea transport
TABLE 6.4Urea-Nitrogen Recycling in Growing Ewe Lambs (21 kg)
Crude-Protein Levels in Diet (%, DM basis)
9.7 17.8 25.8
N content in diet, g/kg DM 15.5 28.4 41.3
DM intake, g/day 575 705 630
N intake, g/day 8.9 20.3 25.9
Weight gain, g/day 40 144 122
Plasma urea, mM 1.5 7.2 9.9
Urinary excretion of N, g/day 2.4 10.0 16.5
Urinary excretion of urea, g N/day 0.7 7.0 13.4
Fecal excretion of N, g/day 5.0 5.2 4.9
N balance, g/day 1.5 5.1 4.4
Urea production in the body, g N/day 2.4 11.8 19.2
Urea recycled to the GI tract, g N/day 1.8 4.8 5.8
Percentage of urea produced in the body recycled to the GI tract, %
75 41 30
Source: Adapted from Marini, J.C. et al. 2004. J. Anim. Sci. 82:1157–1164.Note: Ewe lambs were individually fed their respective, isocaloric diets (2.75 Mcal metabolizable energy/kg
dry matter) for 25 days before measurements of urea recycling were made. DM, dry matter; GI, gas-trointestinal tract.

209Synthesis of Urea and Uric Acid
© 2010 Taylor & Francis Group, LLC
proteins, UT-A and UT-B, which are encoded by two distinct genes, SLC14A2 (UT-A) and SLC14A1 (UT-B), respectively. The UT-A proteins are important for renal handling of urea and are produced by alternative splicing of the SLC14A2 gene under the control of alternative promoters. There are six protein isoforms of UT-A (UT-A1 through UT-A6), with a distinct pattern of expression in various cell types (e.g., UT-A1 and UT-A3 are located in the inner medullary collecting duct, UT-A2 in the descending thin limb of Henle’s loops, UT-A4 in low abundance in the kidney medulla, UT-A5 in the testis, and UT-A6 in the colon). Both UT-A5 and UT-A6 are absent from the kidney. The single isoform of the UT-B protein is encoded by the SLC14A1 gene. UT-B is widely expressed in the kidney, erythrocytes, small intes-tine, large intestine, the blood–brain barrier, and the basolateral and apical regions of the descending vasa recta (capillary-sized microvessels that supply blood to the renal medulla). Another facilitated urea transporter, UT-C, has been reported to be pres-ent in the eel proximal tubule. Expression of urea transporters UT-A1 and UT-A2 in the kidneys is increased by vasopressin but is not affected by the dietary intake of protein or AA.
URIC ACID SYNTHESIS
historicAl PersPectives
Uric acid is a heterocyclic organic compound consisting of carbon, N, oxygen, and hydrogen. It was first isolated from kidney stones by K. Wilheim Scheele in 1776. One century later, W. von Kninerem reported in 1877 that AA or ammonium salts were converted into uric acid in birds, which was confirmed by I. von Schroeder in 1878. The chemical synthesis of uric acid was first achieved in 1882 by E. Hoffmann who used trichlorolactimide as the starting material. By 1890, it was known that uric acid was the major metabolite of N metabolism in birds, serpents, insects, and a great majority of invertebrate species. Thus, uric acid is produced in both mammals and in many other animal species. The structure of uric acid was established by Emil Fischer in 1902. Uric acid is a weak organic acid with a pKa of 5.75. At physiological pH values, uric acid is present primarily as monosodium urate (the chemically stable form of uric acid). Four years after the discovery of the urea cycle, H.A. Krebs and coworkers elu-cidated the biochemical pathway for uric acid synthesis from purine in the avian liver, kidney, and pancreas, with hypoxanthine as an intermediate. This metabolic pathway for uric acid synthesis was later confirmed in mammals. It is now known that degrada-tion of purines (adenosine and guanosine) to uric acid is common to all species.
conversion of AmmoniA AnD BicArBonAte to Purine nucleosiDes
Purine nucleosides (adenosine and guanosine) are the nitrogenous substrates for uric acid synthesis. As described in Chapter 5, the use of isotopes by J.M. Buchanan and coworkers in their experiments led to the discovery of purine synthesis from HCO3
− , aspartate, glutamine, glycine, and N-10-formyl-tetrahydrofolate in animals. The N atoms in these AA are ultimately derived from NH4
+ (Figure 6.3). Carbons other than those from glycine are derived from HCO3
− and formate. Formate is

210 Amino Acids: Biochemistry and Nutrition
© 2010 Taylor & Francis Group, LLC
activated to N10-formyl-tetrahydrofolate before its incorporation to purines. Thus, knowledge of AA and purine syntheses is essential to our understanding of uric acid production.
The synthesis of purines occurs in all avian and mammalian tissues and is most active in the liver of all animal species. Hepatic purine synthesis is regulated
Inosine
N
NH N
NH
O
45
NH
NH N
NH
O
O
Xanthine
NH
NH NH
NH
O
O
O
N
NH N
NH
H2N
O
6
Guanine
Guanosine
Hypoxanthine
Uric acid
O2 H2O2
O2
H2O2
NH3
CO2H2O
H2O H2O
7
Uricase
Allantoin
N
CC
NO
O
NO
H2N
H HH
H
[O]
Adenosine
N
N N
N
NH2
Ribose
NH4+ H2O
Pi
Ribose-1-P
1
2
3
Glutamine + Aspartate + Glycine + α-D-Ribose 5-P + N10-Formyl-THF +
Glutamate
NH4+
NH4+
α-KG
NAD+
OAA
α-KG Serine
OH-Pyrα-KG
ATP
ADP + Pi
THF
H+
CO2 + H2O
NADH + H+
8
9
11 12
13
10
N
NH N
N
O
RiboseN
NH N
N
O
H2N
Ribose
+
HCO2–
Formate
Pi
Ribose-1-P10
HCO3–
FIGURE 6.3 Uric acid synthesis. The enzymes that catalyze the indicated pathways are: (1) glutamate dehydrogenase; (2) glutamine synthetase; (3) glutamate-oxaloacetate transami-nase; (4) glutamate-hydroxypyruvate transaminase; (5) N10-formyl-tetrahydrofolate synthe-tase; (6) carbonic anhydrase; (7) a series of enzymes for adenosine synthesis; (8) a series of enzymes for guanosine synthesis; (9) adenosine deaminase; (10) purine nucleoside phosphor-ylase; (11) xanthine oxidase; (12) guanine deaminase (guanase); and (13) xanthine oxidase.

211Synthesis of Urea and Uric Acid
© 2010 Taylor & Francis Group, LLC
not only by the availability of substrates (ammonia and AA) and nucleotides (Chapter 5), but also by the activities of key enzymes, including adenylosuc-cinate synthetase, adenosine kinase, 5′-nucleotidase, and adenylate deaminase. Additionally, energy supply is a key factor influencing the synthesis of purines and, therefore, uric acid.
uric AciD synthesis from Purine nucleosiDes
In mammals, fish, and uricotelic species, the synthesis of uric acid from purines (adenosine and guanosine) takes place primarily in the liver and, to a lesser extent, in other tissues, including kidneys, pancreas, and the mucosa of the gastrointestinal tract. This metabolic pathway is outlined in Figure 6.3. Xanthine oxidase (a homodi-mer and a molybdenum-dependent enzyme), the last enzyme in the uric acid-syn-thetic pathway, possesses xanthine dehydrogenase activity which requires NAD+ as a cofactor to form uric acid and NADH. In humans, the catalytic activities of xanthine oxidase and xanthine dehydrogenase are carried out by the same protein encoded by the same gene XDH. In other animals, xanthine dehydrogenase (a homodimer and a molybdenum-dependent enzyme) is converted into xanthine oxidase by reversible sulfhydryl oxidation or limited proteolysis.
The liver, kidneys, pancreas, mucosa of the gastrointestinal tract, heart, skeletal muscle, and lymphoid organs of birds (e.g., chickens) and mammals (e.g., rats and pigs) can release hypoxanthine. In pigeons, whose liver has a low xanthine oxidase/xanthine dehydrogenase activity, hypoxanthine released by the liver is taken up by the kidneys for conversion into uric acid by xanthine oxidase/xanthine dehydroge-nase. Likewise, in chickens, skeletal muscle may take up hypoxanthine from the circulation and convert this purine metabolite into uric acid. Some of the enzymes involved in purine metabolism, such as adenosine deaminase and purine nucleoside phosphorylase, are particularly abundant in lymphocytes (e.g., thymocytes, lymph node lymphocytes, and splenic lymphocytes) and can degrade adenosine to hypoxan-thine. Because accumulation of adenosine is deleterious to cells (particularly lym-phocytes), a deficiency of one or both of these two enzymes can result in cytotoxicity to lymphocytes and, therefore, lymphopenia. Thus, rates of purine synthesis and degradation must be precisely controlled in organisms.
reGulAtion of uric AciD synthesis
Uric acid synthesis is regulated by a number of factors: (1) dietary intake of protein; (2) energy supply in cells; (3) concentrations of ammonia, AA, and tetrahydrofolate in plasma; (4) activities of adenosine deaminase, purine nucleoside phosphorylase, and xanthine oxidase/xanthine dehydrogenase. One-carbon-unit metabolism serves a crucial role in modulating the production of uric acid via the synthesis of purine nucleosides. In chickens, starvation reduces uric acid synthesis by the liver (Table 6.5). Tumor necrosis factor-α, interferon-γ, interleukin-1, interleukin-6, and dexa-methasone all increase expression of xanthine dehydrogenase/xanthine oxidase at both the mRNA and protein levels in renal epithelial cells, thereby stimulating urate production under inflammatory and stressful conditions.

212 Amino Acids: Biochemistry and Nutrition
© 2010 Taylor & Francis Group, LLC
enerGy reQuirement for uric AciD synthesis
The ATP requirements for uric acid synthesis are determined by three events: (1) formation of adenosine or guanosine from glutamine, aspartate, glycine, ribose-5-P, bicarbonate, and N10-formyltetrahydrofolate; (2) the incorporation of ammonia into glutamine, aspartate, and glycine; and (3) formation of N10-formyl-tetrahydrofolate from formate and tetrahydrofolate. One mole of ammonia is generated from 1 mol of adenosine by adenosine deaminase in the pathway for uric acid synthesis from adenosine. This ammonia molecule subsequently participates in another round of purine and uric acid synthesis. Thus, 4 mol of NH4
+ are incorporated into 1 mol of uric acid. As indicated by the following calculations, 46% more ATP is required to detoxify 1 mol of ammonia via uric acid synthesis than by urea synthesis.
Synthesis of Uric Acid from Ammonia via Adenosine
1. As illustrated in Chapter 5, the synthesis of 1 mol of adenosine requires 8 mol of ATP.
2. Incorporation of 5 mol of ammonia into 2 mol of glutamine, 2 mol of aspar-tate, and 1 mol of glycine requires 9.5 mol of ATP.
a. Net 2 mol of of ATP are required to incorporate 2 mol of ammonia in the formation of 2 mol of glutamine.
2NH 2 -Ketoglutarate 2NADH 2H
2Glutamate 2NAD4+ +++ α + →
+ +
TABLE 6.5Release of Uric Acid by the Liver and Skeletal Muscle in Fed and Starved Adult Chickens
Concentration in Whole Arterial
Blood (nmol/mL)
Arteriovenous Difference(nmol/mL of Whole Blood)
Liver Kidney HindquarterMetabolite Fed Starved Fed Starved Fed Starved Fed StarvedGlucose 10,360 11,670 −940 −1450 −44 −307 792 199
Uric acid 212 230 −100 −76 88 83 −72 −50
Source: Data were taken from Tinker, D.A., J.T. Brosnan, and G.R. Herzberg. 1986. Biochem. J. 240:829–836.
Note: Eight-week-old adult male White Leghorn chickens, which were either fed a regular diet or starved for 6 days, were used in the study. Rates of hepatic blood flow were 59 and 36 mL/min/kg body weight in fed and 6-day-starved chickens, respectively. Thus, based on arteriovenous difference, the release of uric acid by the liver and hindquarter (skeletal muscle) is markedly reduced in the starved than in the fed chickens. It is unlikely that de novo synthesis of uric acid occurs in skeletal muscle. However, the muscle can take up hypoxanthine from arterial blood and convert this purine metabolite to uric acid.

213Synthesis of Urea and Uric Acid
© 2010 Taylor & Francis Group, LLC
2Glutamate 2NH 2ATP 2Glutamine 2ADP+ + → +4+
In the metabolic pathway of adenosine synthesis:
2Glutamine 2H O 2Glutamate 2NH2+ → + 4+
2Glutamate 2NAD 2NH 2 -Ketoglutarate 2NADH 2H+ + α + ++ + +→ 4
Net reaction: 2Glutamate 2NH 2ATP 2Glutamine 2ADP+ + → +4+
b. 5 mol of ATP are required to convert 2 mol of ammonia and 2 mol of oxaloacetate to 2 mol of aspartate.
2NH 2 -Ketoglutarate 2NADH 2H 2Glutamate 2NAD4+ + +++ α + + →
2Glutamate + 2Oxaloacetate ↔ 2α-Ketoglutarate + 2Aspartate
c. 2.5 mol of ATP are required to convert 1 mol of ammonia and 1 mol of CO2 to 1 mol of glycine (via the glycine cleavage system or serine synthesis).
NH CO NADH H Glycine NAD
equivalent to 2 5 mol of ATP24
+ + ++ + + → +( . ))
or
NH -Ketoglutarate NADH H Glutamate NAD4+ + ++ α + + → +
Glutamate + Hydroxypyruvate ↔ α-Ketoglutarate + Serine
Serine + Tetrahydrofolate ↔ Glycine + Methylene-tetrahydrofolate
3. 2 mol of ATP required for formation of 2 mol of N10-formyl-tetrahydrofolate from 2 mol of formate and 2 mol of tetrahydrofolate.
2Formate + 2Tetrahydrofolate + 2ATP ↔ 2N10-formyl-tetrahydrofolate + 2ADP + 2Pi
4. 1 mol of ammonia is produced from adenosine by adenosine deaminase in the pathway of uric acid synthesis.
Adenosine H O Inosine NH2+ → + 4+

214 Amino Acids: Biochemistry and Nutrition
© 2010 Taylor & Francis Group, LLC
Thus, 4 mol of ammonia (the net amount) are converted into 1 mol of uric acid via adenosine as an intermediate. Overall, this pathway for uric-acid synthesis requires 19.5 mol of ATP.
Synthesis of Uric Acid from Ammonia via Guanosine
1. As illustrated in Chapter 5, the synthesis of 1 mol of guanosine requires 8.5 mol of ATP.
2. Incorporation of 5 mol of ammonia into 3 mol of glutamine, 1 mol of aspar-tate, and 1 mol of glycine requires:
a. Net 3 mol of ATP is required to incorporate 3 mol of ammonia for the formation of 3 mol of glutamine.
3NH 3 -Ketoglutarate 3NADH 3H 3Glutamate 3NAD4+ + +→ ++ α + +
3Glutamate 3NH 3ATP 3Glutamine 3ADP+ + → +4+
In the metabolic pathway of adenosine synthesis:
3Glutamine 3H O 3Glutamate 3NH2+ → + 4+
3Glutamate 3NAD 3NH 3 -Ketoglutarate 3NADH 3H+ → + α + ++ + +4
Net reaction: 3Glutamate 3NH 3ATP 3Glutamine 3ADP+ + → ++4
b. 2.5 mol of ATP are required to convert 1 mol of ammonia and 1 mol of oxaloacetate into 1 mol of aspartate.
NH -Ketoglutarate NADH H Glutamate NAD4+ + ++ α + + → +
Glutamate + Oxaloacetate ↔ α-Ketoglutarate + Aspartate
c. 2.5 mol of ATP are required to convert 1 mol of ammonia and 1 mol of CO2 to 1 mol of glycine (via the glycine cleavage system or serine synthesis).
NH CO NADH H Glycine NAD
equivalent to 2 5 mol of ATP24
+ + ++ + + → +( . )
or
NH -Ketoglutarate NADH H Glutamate NAD4+ + ++ + +α + →
Glutamate + Hydroxypyruvate ↔ α-Ketoglutarate + Serine
215Synthesis of Urea and Uric Acid
© 2010 Taylor & Francis Group, LLC
Serine + Tetrahydrofolate ↔ Glycine + Methylene-tetrahydrofolate
3. Two moles of ATP required for the formation of 2 mol of N10-formyl-tetrahydrofolate from 2 mol of formate and 2 mol of tetrahydrofolate.
2Formate + 2Tetrahydrofolate + 2ATP ↔ 2N10-formyl-tetrahydrofolate + 2ADP + 2Pi
4. One mole of ammonia is produced from guanosine-derived guanine by guanase in the pathway of uric acid synthesis. Thus, net 4 mol of ammonia are converted into 1 mol of uric acid via guanosine.
Guanine → Xanthine + NH3
Thus, 4 mol of ammonia are incorporated to 1 mol of uric acid via gua-nosine as an intermediate. Overall, this pathway for uric-acid synthesis requires 18.5 mol of ATP.
Assuming that equal amounts of ammonia are converted into uric acid through the adenosine and guanosine pathways, the entire process for uric acid synthesis from 4 mol of ammonia requires, on average, 19 mol of ATP. This is equivalent to 4.75 mol of ATP per mol of ammonia.
nutritionAl AnD metABolic imPlicAtions of uric AciD synthesis
In birds, uric acid is the major nitrogenous end product of protein catabolism and the predominant N-containing metabolite in urine. The high requirements for both glycine and glutamine by avian species to synthesize uric acid place high demands for provision of these two AA from diets and endogenous synthesis. The higher ATP requirement for uric acid synthesis in birds than in mammals may contribute to a higher body temperature in birds (e.g., 40°C in chickens and ducks) than in mam-mals (e.g., 37°C in humans and pigs). Despite the nutritional and metabolic burdens on animals, production of uric acid and its physiological concentrations (e.g., 0.2 mM in chicken plasma) can confer benefits. For example, because uric acid is relatively water-insoluble, its excretion through urine is associated with little loss of water. This certainly has physiological significance for birds, particularly when there is a need to fly for long distances during which drinking water is not available. In addi-tion, uric acid is an antioxidant, protecting cells from oxidative stress. However, it should be borne in mind that elevated levels of uric acid in tissues (including blood) are associated with various metabolic diseases, including diabetes, obesity, and car-diovascular disorders. Also, as noted previously, in mammals (e.g., humans), high levels of uric acid in blood (uriaciduria) and other tissues result in gout, urolithiasis, as well as acute and chronic nephropathy due to the deposition of urate crystals in joints and the urinary tract.
sPecies-DePenDent DeGrADAtion of uric AciD
In the liver of most mammals, except for humans and higher apes, uric acid is oxi-dized to allantoin by the copper-containing uricase (urate oxidase) in peroxisomes.

216 Amino Acids: Biochemistry and Nutrition
© 2010 Taylor & Francis Group, LLC
Allantoin-producing mammals do not express allantoinase or allantoicase and, therefore, release allantoin in urine. The conversion of uric acid to allantoin also occurs in the kidneys of amphibia. In contrast, uricase is absent from tissues of humans and other primates, and therefore they excrete uric acid in urine as the end product of purine catabolism. Likewise, uricotelic species do not express uricase and, therefore, they excrete quantitatively large amounts of uric acid in urine as the major end product of AA catabolism. In the liver and kidneys of amphibia and teleost fish, allantoin is hydrolyzed by allantoinase (a mitochondrial enzyme in amphibia but a cytosolic and peroxisomal enzyme in fish) to form allantoic acid, which is hydrolyzed by allantoicase (a peroxisomal enzyme) to urea and glyoxylic acid.
excretion of uric AciD By the kiDney
In humans, ∼70% and 30% of uric acid in the arterial circulation is excreted by the kid-ney (via urine) and intestine (via feces), respectively. In birds, because of their anatomy, uric acid is found collectively in the urine plus feces. In the kidney, urate elimination involves glomerular filtration, followed by reabsorptive and secretory processes in renal tubules. The relative importance of the reabsorption and secretion mechanisms dif-fers among species. Humans, mice, and rats predominantly reabsorb uric acid, whereas birds, pigs, rabbits, and reptiles have more active secretory mechanisms. Urate reab-sorption takes place in the proximal tubules in humans and in both proximal and distal convoluted tubules in mice. The urate transport systems in the tubules are complicated because of their bidirectional transport and species differences.
In 2002, A. Enomoto and colleagues identified the urate/anion exchanger URAT1 (a protein consisting of 12 transmembrane domains) through a search for organic anion transporter-like molecules in gene databases and expression/functional stud-ies in Xenopus oocytes. URAT1 is encoded by the SLC22A12 gene and expressed in the apical membrane of proximal tubule epithelial cells. This protein transports urate in exchange for Cl– or organic anions. Urate reabsorption by kidney epithelial cells on the apical membrane involves URAT1, as well as organic anion transport-ers 4 and 10, and intracellular urate is released through basolateral Glut9 (a glucose transporter family isoform). Expression of Glut9 is a major determinant of uric acid concentrations in plasma. In addition to URAT1, OAT1 and OAT3 can exchange intracellular urate with extracellular dicarboxylates. The urate transport systems exist in proximal tubules but they are complicated because of their bidirectional transport and species differences. An antiuricosuric agent (e.g., lactate, pyrazino-ate, and nicotinate) can serve as a substrate for the antiporter activity of URAT1 to increase urate reabsorption. In contrast, URAT1 is inhibited by classical uricosuric agents, such as benzbromarone, probenecid, and losartan.
COMPARISONS BETWEEN URIC ACID AND UREA SYNTHESIS
similArities Between ureA AnD uric AciD synthesis
The pathways of uric acid and urea syntheses share some common features. First, both pathways are catalyzed by a series of enzymes, utilize ammonia as a substrate

217Synthesis of Urea and Uric Acid
© 2010 Taylor & Francis Group, LLC
in the initial reaction, and involve mitochondrial and cytoplasmic compartments. The conversion of ammonia into glutamine in the avian liver (uric acid synthesis) and to citrulline in the mammalian liver (urea synthesis) occurs within mitochon-dria. Both glutamine and citrulline are N-rich neutral AA, which exit mitochondria into the cytoplasm for subsequent metabolism in the respective pathways for uric acid and urea syntheses. Second, HCO3
− , aspartate, and ATP are required for uric acid and urea syntheses. These three substrates can be sufficiently produced from transamination and oxidation of AA (e.g., glutamate and glutamine) in mitochon-dria. Third, inter-organ cooperation is required for ureagenesis and uricogenesis in that ammonia produced in extrahepatic tissues and cells is transported to the liver for detoxification. Importantly, the liver is the most active organ to synthesize urea and uric acid from ammonia, whereas these two pathways also occur in the small-intestinal mucosa to a lesser extent. Fourth, physiological levels of urea and uric acid have no feedback inhibitory effects on their respective synthetic pathways from ammonia. Both urea and uric acid are excreted primarily in urine via the kidneys and, to a small extent, via the feces.
Differences Between ureA AnD uric AciD synthesis
There are many differences between uric acid and urea syntheses. First, as indicated previously, uric acid synthesis requires more energy than ureagenesis. This can con-tribute to a higher heat increment and a lower energetic efficiency of AA utilization in birds compared with mammals. Second, urea and uric acid synthesis requires AA and purines, respectively, as intermediates. Thus, urea is highly water-soluble (1 g/mL water at room temperature). In contrast, uric acid is largely hydrophobic and its solubility in water at room temperature is 1 g/39,500 mL. Third, the enzymes and the regulation of their activities differ between urea and uric acid syntheses. As noted pre-viously, feedback inhibition by intermediates or products is an important mechanism for the regulation of purine and uric acid synthesis, but such a mechanism is apparently absent from the metabolic control of ureagenesis. Fourth, large amounts of glycine are required as a direct substrate for uric acid synthesis, whereas glycine participates in urea production only as a precursor of ammonia. Fifth, urea synthesis from ammonia is species-dependent and takes place only in mammals (albeit ureagenesis occurs in some species of fish). In contrast, uric acid is produced by all animal species as a major metabolite of purine catabolism. Sixth, ureagenesis is cell-specific and takes place only in periportal hepatocytes and in enterocytes, whereas virtually all cells can synthesize uric acid albeit at different rates. Finally, the products of the urea cycle and purine degradation have very different physiological functions. Physiological concentrations of uric acid have a potent antioxidative action in the body, whereas physiological con-centrations of urea do not have an antioxidative action.
SUMMARY
All mammals possess the hepatic urea cycle to convert ammonia into water-soluble nontoxic urea. This pathway requires CPS-I, OCT, ASS, ASL, and arginase, as well as ATP, bicarbonate, and NAG (synthesized from glutamate and acetyl-CoA by NAG

218 Amino Acids: Biochemistry and Nutrition
© 2010 Taylor & Francis Group, LLC
synthase). CPS-I, OCT, and NAG synthase localize in the mitochondrion to form citrulline (a neutral AA) from ammonia, bicarbonate, and ornithine, whereas ASS, ASL, and arginase are cytosolic enzymes to convert citrulline into arginine and then urea plus ornithine. Enterocytes of the small intestine in postweaning mammals also have a functional urea cycle to generate urea from extracellular and intramitochon-drially derived ammonia. This is the first line of defense against the potential toxic-ity of ammonia that is (1) produced by extensive intestinal degradation of glutamine (a major fuel for enterocytes) and (2) derived from the diet and luminal microorgan-isms. In contrast to mammals, uric acid is the major end product of AA catabolism via purine formation in avian species which virtually lack CPS-I, OCT, and arginase in their liver and enterocytes. Uric acid synthesis occurs primarily in the liver and involves the conversion of ammonia into glutamine (a neutral AA) by glutamine syn-thetase (a mitochondrial enzyme in avian hepatocytes), followed by the production of adenosine and guanosine in the cytoplasm. In both mammals and birds, ammonia detoxification requires large amounts of ATP and is essential to survival, growth, and development. Although there are major species differences in the removal of ammonia from tissues, the biochemical processes are highly compartmentalized in animals and span both the mitochondrion and the cytoplasm. Such highly orches-trated metabolic pathways function to efficiently detoxify ammonia in organisms via facilitative urea and uric transporters without disturbing the acid–base balance.
REFERENCES
Adeva, M.M., G. Souto, N. Blanco, and C. Donapetry. 2012. Ammonium metabolism in humans. Metabolism. doi.org/10.1016/j.metabol.2012.07.007.
Ash, D.E. 2004. Structure and functions of arginases. J. Nutr. 134:2760S–2764S.Beaumier, L., L. Castillo, A.M. Ajami, and V.R. Young. 1995. Urea cycle intermediate kinetics
and nitrate excretion at normal and “therapeutic” intakes of arginine in humans. Am. J. Physiol. 269:E884–E896.
Beyer, K.H. Jr and R.T. Gelarden. 1988. Active transport of urea by mammalian kidney. Proc. Natl. Acad. Sci. USA 85:4030–4031.
Caldovic, L., N. Ah Mew, D. Shi, H. Morizono, M. Yudkoff, and M. Tuchman. 2010. N-acetylglutamate synthase: Structure, function and defects. Mol. Genet. Metab. 100 (Suppl 1):S13–S19.
Cheung, C.W., N.S. Cohen, and L. Raijman. 1989. Channeling of urea cycle intermediates in situ in permeabilized hepatocytes. J. Biol. Chem. 264:4038–4044.
Cooper, A.J. 2012. The role of glutamine synthetase and glutamate dehydrogenase in cerebral ammonia homeostasis. Neurochem. Res. doi: 10.1007/s11064-012-0803-4.
Curis, E., I. Nicolis, C. Moinard, S. Osowska, N. Zerrouk, S. Bénazeth, and L. Cynober. 2005. Almost all about citrulline in mammals. Amino Acids 29:177–205.
Davis, P.K. and G. Wu. 1998. Compartmentation and kinetics of urea cycle enzymes in porcine enterocytes. Comp. Biochem. Physiol. B 119:527–537.
Eklou-Lawson, M., F. Bernard, N. Neveux, C. Chaumontet, C. Bos, A.M. Davila-Gay, D. Tomé, L. Cynober, and F. Blachier. 2009. Colonic luminal ammonia and portal blood L-glutamine and L-arginine concentrations: A possible link between colon mucosa and liver ureagenesis. Amino Acids 37:751–760.
Enns, G.M., S.A. Berry, G.T. Berry, W.J. Rhead, S.W. Brusilow, and A. Hamosh. 2007. Survival after treatment with phenylacetate and benzoate for urea-cycle disorders. N. Engl. J. Med. 356:2282–2292.

219Synthesis of Urea and Uric Acid
© 2010 Taylor & Francis Group, LLC
Flynn, N.E., C.J. Meininger, T.E. Haynes, and G. Wu. 2002. The metabolic basis of arginine nutrition and pharmacotherapy. Biomed. Pharmacother. 56:427–438.
Gerson, A.R. and C.G. Guglielmo. 2011. Flight at low ambient humidity increases protein catabolism in migratory birds. Science 333:1434–1436.
Gougeon-Reyburn, R. and E.B. Marliss. 1989. Effects of sodium bicarbonate on nitrogen metabolism and ketone bodies during very low energy protein diets in obese subjects. Metabolism 38:1222–1230.
Jackson, M.J., A.L. Beaudet, and W.E. O’Brien. 1986. Mammalian urea cycle enzymes. Annu. Rev. Genet. 20:431–464.
Kokko, J.P. and J.M. Sands. 2006. Significance of urea transport: The pioneering studies of Bodil Schmidt-Nielsen. Am. J. Physiol. 291:F1109–F1112.
Krebs, H.A. 1981. Reminiscences and Reflections. Oxford University Press, Oxford, UK.Krebs, H.A. 1982. The discovery of the ornithine cycle of urea synthesis. Trends Biochem.
Sci. 7:76–78.Lipkowitz, M.S. 2012. Regulation of uric acid excretion by the kidney. Curr. Rheumatol. Rep.
14:179–188.Mapes, J.P. and H.A. Krebs. 1978. Rate-limiting factors in urate synthesis and gluconeogen-
esis in avian liver. Biochem. J. 172:193–203.Marini, J.C., J.D. Klein, J.M. Sands, and M.E. Van Amburgh. 2004. Effect of nitrogen intake on
nitrogen recycling and urea transporter abundance in lambs. J. Anim. Sci. 82:1157–1164.Meijer, A.J., W.H. Lamers, and R.A. Chamuleau. 1990. Nitrogen metabolism and ornithine
cycle function. Physiol. Rev. 70:701–748.Morris, S.M. Jr. 2002. Regulation of enzymes of the urea cycle and arginine metabolism.
Annu. Rev. Nutr. 22:87–105.NRC (National Research Council). 2006. Nutrient Requirements of Small Ruminants, National
Academy Press, Washington, DC.Nissim, I., M. Yudkoff, and J.T. Brosnan. 1996. Regulation of [15N]urea synthesis from [5-15N]
glutamine. Role of pH, hormones, and pyruvate. J. Biol. Chem. 271:31234–31242.Oba, M., R.L. Baldwin VI, S.L. Owens, and B.J. Bequette. 2005. Metabolic fates of ammo-
nia-N in ruminal epithelial and duodenal mucosal cells isolated from growing sheep. J. Dairy Sci. 88:3963–3970.
Singer, M.A. 2003. Do mammals, birds, reptiles and fish have similar nitrogen conserving systems? Comp. Biochem. Physiol. B 134:543–558.
So, A. and B. Thorens. 2010. Uric acid transport and disease. J. Clin. Invest. 120:1791–1799.Stewart, G. 2011. The emerging physiological roles of the SLC14A family of urea transport-
ers. Br. J. Pharmacol. 164:1780–1792.Tinker, D.A., J.T. Brosnan, and G.R. Herzberg. 1986. Interorgan metabolism of amino acids,
glucose, lactate, glycerol and uric acid in the domestic fowl (Gallus domesticus). Biochem. J. 240:829–836.
Wright, P.A. 1995. Nitrogen excretion: Three end products, many physiological roles. J. Exp. Biol. 198:273–281.
Wu, G. 1995. Urea synthesis in enterocytes of developing pigs. Biochem. J. 312:717–723.

221
© 2010 Taylor & Francis Group, LLC
Use of Isotopes for Studying Amino Acid Metabolism
Physics and chemistry are two fields of study driving the development of biochemical research in the past century. This is exemplified by the use of radioactive and stable isotopes for studying the biochemistry, physiology, and nutrition of AA. The history of isotopes dates back to November 8, 1895, when x-rays (emitted by electrons outside the nucleus) were discovered by the British chemist Wilhelm Conrad Roentgen. Two-and-a-half months later, Henri Becquerel (a French physicist) discovered radioactivity on January 20, 1896 (a term coined by Marie Curie in 1899). The existence of isotopes was first suggested in 1912 by the British chemist Frederick Soddy, and the term “isotope” was coined in 1914 by the Scottish physician Margaret Todd. Recognizing that isotopes have nearly identical chemical behaviors, George de Hevesy employed radioactive tracers to investigate metabolic processes in plants in 1923. All these pio-neers were awarded the Nobel Prize in chemistry or physics for their work. During the 1940s, radioisotopes (14C and 3H) received much attention from biochemists attempt-ing to identify the precursors, intermediates, and products of metabolic pathways. Meanwhile, AA labeled with the stable isotope 15N (e.g., 15N-leucine) were employed by R. Schoenheimer to study protein turnover in humans and laboratory animals. These approaches were extensively utilized in the 1950s through the 1960s as rela-tively low-cost radioactive and stable isotopes became readily available. Publications in the current Web of Science database indicate that radioactive and stable isotopes continue to play an important role in both in vitro and in vivo studies in the life sciences. To date, the widespread use of radioactive and stable isotopes has greatly advanced research on all aspects of N-containing compounds, including AA synthesis and catabolism, as well as protein synthesis and degradation. It is necessary to have a basic knowledge about both isotopes and metabolism to design meaningful biological experiments involving the use of isotopes. This chapter, which aims at achieving such a goal, consists of two parts. Part I deals with tracer methodologies, whereas Part II focuses on the interpretation of data from isotope experiments.
BASIC CONCEPTS ABOUT ISOTOPES
whAt Are isotoPes?
Before we define “isotopes,” let us review the fundamental knowledge of the element. A chemical element is a pure substance consisting of one type of atom [e.g., carbon (C), chlorine (Cl), hydrogen (H), nitrogen (N), oxygen (O), phosphorus (P), and sulfur
7

222 Amino Acids: Biochemistry and Nutrition
© 2010 Taylor & Francis Group, LLC
(S)]. Each element contains a unique number of protons referred to as the element’s atomic number (Z), an equal number of orbital electrons (e−), and neutrons. Protons and neutrons are located in the nucleus. The atom is neutral with respect to electrical charge because protons are positively charged, while electrons are negatively charged. The mass of the electrons is negligible. Neutrons are uncharged with mass similar to the mass of protons. Neutrons are held together with protons by the nuclear force. Each element has a unique mass number (A; the sum of the number of protons plus the number of neutrons), which is approximately equal to the atomic mass of an atom.
A (mass number) = N (neutron number) + Z (proton number or atomic number)
The term “isotope” (from Greek, “the same place”) refers to one of the two or more chemical elements that contain the same number of protons (i.e., the same atomic num-ber) but different numbers of neutrons. Some isotopes commonly used in metabolic research are listed in Figure 7.1. Thus, isotopes (e.g., 2H and 3H, 13C and 14C, and 14N and 15N) have the same atomic number but different mass numbers. Normally, the mass number, but not the atomic number, is shown in a chemical formula. Because of an imbalance between the numbers of protons and neutrons in the nucleus, some isotopes are not stable and spontaneously disintegrate or decay emitting electrons, x-rays or other particles to achieve a stable nuclear composition. These isotopes are called radioactive isotopes (also known as radioisotopes or radionuclides). Examples of radioactive isotopes are 3H, 14C, 32P, 35S, 125I, and 238U (uranium). In contrast, some isotopes are stable and do not emit any particle or radiation, and they are referred to as stable isotopes. Examples of stable isotopes are 1H, 2H, 12C, 13C, 14N, 15N, 16O, and 18O.
Because some stable isotopes (e.g., 1H, 12C, 14N, 16O, 31P, and 32S) have a high abundance in nature, they are not used as tracers in metabolic studies. Similarly,
XNAZ
H121
N714
7 N815
7N6
137
O816
8 O917
8 O1018
8
P163115 P17
3215 P18
3315
S163216 S18
3416 S19
3516
I 72125
53 I73126
53 I78131
53
H011
C612
6
H231
C814
6C713
6
FIGURE 7.1 Relationship among mass number, proton number, and neutron number for isotopes. Isotopes are defined as one of the two or more chemical elements that contain the same number of protons (Z) but different numbers of neutrons (N) and, therefore, different mass numbers (A).

223Use of Isotopes for Studying Amino Acid Metabolism
© 2010 Taylor & Francis Group, LLC
radioactive isotopes with a relatively short half-life (T1/2) [e.g., 11C (T1/2 = 20.4 min), 13N (T1/2 = 9.97 min), 15O (T1/2 = 2.04 min), 30P (T1/2 = 2.50 min), and 31S (T1/2 = 2.57 s)] have limited value in biological research. In contrast, those with a low natural abun-dance and a relatively long half-life [e.g., radioactive isotopes (3H, 14C, 32P, and 35S) and stable isotopes (2H, 13C, 15N, and 18O)] are often used (Lapierre et al. 2008; Pereira et al. 2008; Gasier et al. 2009).
DecAy of rADioisotoPes
As noted above, radioisotopes undergo spontaneous decay or disintegration. The dis-integration of radioisotopes is an exponential process and the rate (disintegration per unit time) is proportional to the number of radioactive atoms present at any time. The half-life and decay constant of a given radioisotope are its unique physicochemical properties that are not affected by the environment. Table 7.1 lists the half-lives and types of disintegration of the radioisotopes commonly employed in AA metabolism and related studies. The following equations relate the number of nuclei, the number of radionuclei, the decay constant, and T1/2:
Nt = N0 × e−λt (Nt, number of nuclei at time t; N0, number of nuclei at time 0)At = A0 × e−λt (At, radioactivity at time t; A0, radioactivity at time 0)T1/2 = 0.693/λ (T1/2, half-life; λ, decay constant, which is characteristic of the
isotope)
Radioactive isotopes emit β-, α-, or γ-particles, and their decay is known as β-, α-, or γ-decay, respectively (Figure 7.2). During β-decay, a neutron (n) is converted into
TABLE 7.1Half-Lives and Types of Decay for Some Radioactive Isotopes
Radioisotope Half-Life Type of Decay
Hydrogen-3 (3H) 12.32 years β-Emission
Carbon-14 (14C) 5730 years β-Emission
Sodium-22 (22Na) 2.602 years γ-Rays
Phosphorus-32 (32P) 14.29 days β-Emission
Sulfur-35 (35S) 87.44 days β-Emission
Chromium-51 (51Cr) 27.70 days γ-Rays
Iron-59 (59Fe) 44.53 days β-Emission
Cobalt-60 (60Co) 5.271 years β-Emission
Zinc-65 (65Zn) 243.9 days γ-Raysa
Selenium-75 (75Se) 119.8 days γ-Rays
Iodine-125 (125I) 60.14 days γ-Rays
a Zinc-65 decays primarily via emission of γ-rays (97.8%) and to a much lesser extent via positron emission (2.2%).

224 Amino Acids: Biochemistry and Nutrition
© 2010 Taylor & Francis Group, LLC
a proton (p) with the release of a β-particle and an antineutrino. A β-particle is an electron derived from the conversion of a proton into a neutron in the nucleus of a radioactive element, but not from its orbital electrons. Some β-particles have rela-tively high energy (e.g., those emitted by 14C and 32P), whereas others have relatively low energy (e.g., those emitted by 3H). Thus, β-particles from each radioisotope have very different energy spectra, which provide the basis for their detection using liq-uid scintillation spectrometry. In α-decay [e.g., the decomposition of 238Uranium to yield 234Th (thorium)], the radioisotope emits an α-particle (consisting of two pro-tons and two neutrons bound together), which is identical to the nucleus of a helium atom. α-Particles are usually measured by a Geiger–Mueller counter. In γ-decay [e.g., the decay of 125I (often used to study tyrosine iodization) to form 125Te (tellu-rium)], neither the atomic number nor the mass number of the element is changed and the γ-particles emitted from the nucleus are high-energy photons, which are usually measured by a γ-counter. In some radioisotopes (e.g., zinc-65), emission of γ-rays is accompanied with other types of emission as well (e.g., positron emission).
The rate of disintegration of a radioisotope (radioactivity) is expressed in curies (Ci) in honor of Marie Curie who made seminal contributions to radiochemistry and discovered radium (a radioactive metallic element). The amount of radioactivity is measured in a liquid scintillation counter, which normally generates a readout in dis-integrations per minute (dpm). The relationships among Curies, disintegrations per minute, and disintegrations per second [dps, also known as Bequerel (Bq), 1 dps = 1 Bq] are as follows:
1 Ci = 2.22 × 10¹² dpm = 3.7 × 10¹⁰ dps
In determining the decay of radioisotopes by a liquid scintillation counter, the values measured are normally the counts of atomic disintegrations per minute
35
C814
6 N + β–+ ve14
7
S193516
+ + veCl 1817
p + β– + ve
S 163216P17
3215
+ + ve
He1 + β–+ ve32H2
31
U146238
92+�
14490234 4
2He
n + Neutrino + γ-Rays
I72
12553
+ Neutrino + γ-Rays + X-RaysTe7352
125
β-Decay : n
β–
β–
α-Decay: n + p α
γ-Decay: p
7
FIGURE 7.2 Type of radioisotope decay. Radioisotopes have unstable nuclei and decompose spontaneously by the emission of a nuclear electron (β-decay), helium nucleus (α-decay), or γ-rays (γ-decay), thereby achieving a stable nuclear composition.

225Use of Isotopes for Studying Amino Acid Metabolism
© 2010 Taylor & Francis Group, LLC
(cpm) recorded by the instrument. This value is then corrected for the counting efficiency of the instrument to provide true numbers of atomic disintegrations per minute (dpm) [namely, dpm = cpm/counting efficiency (%)]. Because efficiency in the detection of radioactive decays is always less than 100%, not all radioactive decays can be registered as counts per minute. In practice, the counting efficiency is ~90% and 40%, respectively, for 14C and 3H in a biological sample that is mixed well with a scintillation cocktail. While measuring radioactivity in some biological samples (e.g., solubilized tissue or 14CO2 collected from the oxidation of 14C-labeled AA), chemiluminescence should be avoided by appropriately setting special param-eters in the liquid scintillation counter and placing the vials (containing a mixture of a sample and liquid scintillation fluid known) overnight at room temperature before counting.
isotoPe formulA
The nomenclature of a radiolabeled or a stable isotope-labeled substance is based on the position of the label in the molecule (Figure 7.3). The numbering of car-bon atoms in AA or related metabolites is based on the conventional method used in organic chemistry. Examples are given as follows: l-[1-14C]leucine means that only carbon-1 of l-leucine is labeled with 14C. l-[U-14C]leucine means that all the carbons of l-leucine are uniformly labeled with 14C and that all the carbons have the same specific radioactivity (SR). l-[G-14C]leucine means that all the carbons of l-leucine are labeled with 14C but their SR may differ. l-[15N]leucine means that the nitrogen of l-leucine is labeled with 15N. l-[Ring-2,6-3H]phenylalanine means that the hydrogens attached to carbons 2 and 6 of l-phenylalanine are uniformly labeled with 3H. l-[Ring-3H5]phenylalanine means that, in l-phenylalanine, the hydrogens attached to the five carbons of its ring structure are labeled with 3H; l-[Ring-13C6]phenylalanine means that all the carbons of the ring structure in l-phenylalanine are labeled with 13C. Furthermore, l-[guanido-15N2]arginine means that the two nitrogen atoms in the guanido group of l-arginine are labeled with 15N.
It is possible to include two or more differently labeled isotopes in one molecule. Examples are [3-13C, 15N]β-alanine, l-[U-13C, 15N]aspartate, and [1-13C, 15N]glycine. Such a labeled substance can be added to either a medium for cell incubation or a whole-body infusion system because detection instruments can measure the amount of more than one labeled molecule at a time. Similarly, d-[5-3H]glucose and l-[U-14C]glutamine can be present simultaneously in the same biological system (e.g., cell culture or perfused organ) to quantify glycolysis and glutamine oxidation.
trAcer AnD trAcee
A radioisotope (e.g., 14C in l-[U-14C]leucine) or a stable isotope (e.g., 15N in l-[15N]leucine) is called a tracer. A tracer is used to trace the corresponding atom in an unlabeled molecule (e.g., 12C and 14N in leucine), which is called a tracee. When a specific atom in a compound is labeled (e.g., carbon-1 in l-[1-14C]leucine or l-[1-13C]leucine), it can be used to trace the fate of the specific atom in the unlabeled molecule (e.g., carbon-1 in leucine in this case). Because a liquid scintillation counter or mass

226 Amino Acids: Biochemistry and Nutrition
© 2010 Taylor & Francis Group, LLC
CH2CH
H3C
H3C
H3C
H3C
H3C
H3C
(C = 14C)
(C = 14C)
(N = 15N)
(N = 15N)
(H = 3H)
(H = 2H)
(C = 13C)
[1-14C]leucine:
[U-14C]leucine:
[15N]leucine:
[Guanido-15N2]arginine:
[Ring-2H5]phenylalanine:
[Ring-13C6]phenylalanine:
[Ring-2,6-3H]phenylalanine:
CH2 CH2 CH2 CHN
C
NH2
NH
COOH
NH2
CH2 CH COOH
NH2
CH2 CH COOH
NH2
CH2 CH COOH
NH2
H
C C
C C
C C
H
HH
H
H
C C
C C
C C
H
HH
H
H
C C
C C
C C
H
HH
H
H
CH COOH
NH2
CH2CH CH COOH
NH2
CH2CH CH COOH
NH2
FIGURE 7.3 Nomenclature for some common isotopes showing the positions of labeled atoms. Examples are provided for 13C-, 14C-, 3H-, 2H,- or 15N-labeled leucine, arginine, or phe-nylalanine. The bold letter denotes a labeled atom (either radioactive or stable). Amino acids are shown in the nonionized form.

227Use of Isotopes for Studying Amino Acid Metabolism
© 2010 Taylor & Francis Group, LLC
spectrometry instrument can detect very low levels of a radioisotope or a stable iso-tope, respectively, their use as tracers provides a highly sensitive means to study the metabolic fate of the tracee in cells and in the body.
The principle behind the use of isotopes in metabolic studies is that the tracer and its tracee normally have similar biochemical behaviors in cells and in the body (Wolfe 1993). This is likely true for many isotopes, including 32S and 35S, 31P and 32P, 16O and 18O, 14N and 15N, as well as 12C and 14C. However, an isotope effect may occur in cell metabolism due to the different masses of labeled and nonlabeled atoms. For example, tritium (3H), which has a mass three times that of hydrogen (1H), can behave differently than hydrogen. An isotope effect may affect the rate of a biochemical reaction, but still can allow for the tracing of the metabolic fate of a substance in cells and in the body.
concePts of sPecific rADioActivity AnD isotoPe enrichment
The amount of a radioisotope or a stable isotope relative to the unlabeled isotope is expressed as SR or isotope enrichment (IE), respectively. The SR of a radioactive com-pound is normally expressed as disintegrations per minute (or Ci) per unit of the amount of substance (e.g., dpm/nmol and mCi/mol). The IE of a stable isotope is defined as the relative abundance of the labeled isotope in a mixture containing both labeled and non-labeled isotopes. SR or IE at a steady state is needed to calculate product formation and metabolic flux in experiments involving the use of a radioisotope or stable isotope. The flux is defined as the quantity of a substrate or a product that passes through a pathway or enters a metabolic pool per unit time and mass. In cell incubation or culture, rela-tively high extracellular concentrations of substrates are often needed to rapidly attain an isotopic steady state. In studies using intact animals, a priming dose of the tracer plus the tracee is usually administered intravenously, followed by constant infusion of the labeled, and unlabeled substrates at lower concentrations (Boelens et al. 2005).
SR of Radioactive IsotopesThe SR of any radioactive isotope can be calculated on the basis of the amount of radioactivity and the mass of the tracee isotope (Wu 1997). In practice, this can be described by the following equation, with a 14C-labeled isotope as an example:
SR (dpm/nmol) = radioactivity (dpm)/[mass of tracee (μmol)]
= 14C (dpm)/12C-tracee (μmol)
The amount of the radioactive tracer (e.g., 14C or 3H) is negligible compared to the amount of the tracee (e.g., 12C or 1H). Thus, the mass of the tracer (e.g., 14C or 3H) can be ignored in the calculation. Let us use alanine as an example to do a calculation of the SR of a radioisotope. If 6 × 10³ dpm [1-14C]alanine is mixed with 2 μmol of [12C]alanine (unlabeled natural alanine) in a solution, the SR of [1-14C]alanine is as follows:
SR of [1-14C]alanine = 6 × 10³ dpm/2 μmol alanine
= 3 × 10³ dpm/μmol alanine

228 Amino Acids: Biochemistry and Nutrition
© 2010 Taylor & Francis Group, LLC
We can say that, in the above case, the SR of [1-14C]alanine is 3 × 10³ dpm/μmol of alanine or 3 × 10³ dpm/μmol of carbon-1 of alanine. If 6 × 10³ dpm [U-14C]alanine is mixed with 2 μmol of alanine, the SR of [U-14C]alanine is as follows:
SR of [U-14C]alanine = 6 × 10³ dpm/2 μmol alanine
= 3 × 10³ dpm/μmol alanine = 3 × 10³ dpm/3 carbons in alanine = 1 × 10³ dpm/μmol carbon of alanine
We can say that the SR of [U-14C]alanine is 3 × 10³ dpm/μmol of alanine, or 1 × 10³ dpm/μmol alanine carbon. This assumes importance when the rates of oxi-dation of AA to CO2 in cells or in the body are calculated.
Isotope Enrichment of Stable IsotopesThe addition of a stable isotope to an incubation medium or whole-body infu-sion system enriches the concentration of the isotope above that of natural abun-dance. IE [also known as molar percent enrichment or atom percent enrichment] of any stable isotope (expressed as percent) can be calculated on the basis of the mass of the stable isotope tracer and the mass of the stable isotope tracee (Castillo et al. 1993). This can be described by the following equation, with a 13C-labeled isotope as an example:
IE(%) = mass of stable isotope tracer/(mass of stable isotope tracer + mass of stable isotope tracee) × 100%
= 13C-labeled substance (μmol)/[13C-labeled substance (μmol) + unlabeled 12C-substance (μmol)] × 100%
Since the amount of a stable isotope tracer (e.g., 13C or 2H) is significant as com-pared to the tracee (e.g., unlabeled 12C- or 1H-substance), the mass of the tracer (e.g., 13C- or 2H-labeled substances) must be included in the calculation of IE. Let us use alanine again as an example to do a calculation of IE for a stable isotope. When 0.2 μmol [1-13C]alanine is mixed with 1.8 μmol of [12C]alanine (unlabeled natural alanine) in a solution, the IE of [1-13C]alanine is as follows:
IE of [1-13C]alanine = 0.2 μmol/(0.2 μmol + 1.8 μmol) × 100% = 10%
We can say that the IE of [1-13C]alanine is 10% for the C-1 of alanine. If 0.2 μmol of [U-13C]alanine is mixed with 1.8 μmol of alanine, the IE of [U-13C]alanine is as follows:
IE of [U-14C]alanine = 0.2 μmol/(0.2 μmol + 1.8 μmol) × 100%
= 10% for all alanine carbons
= 10% ÷ three carbons in alanine
= 3.33% for each carbon of alanine

229Use of Isotopes for Studying Amino Acid Metabolism
© 2010 Taylor & Francis Group, LLC
siGnificAnce of sr AnD ie of A trAcer
Accurate values for SR or IE of metabolic substrates at their site of metabolism are required for meaningful calculations of the rates of product formation and meta-bolic flux in cells, tissues, or the whole body. Intracellular SR or IE of a tracer at a steady state must be measured at steady state when the substrate SR or IE remains constant to avoid the complex problems associated with tracer experiments (see the following sections). If the intracellular SR or IE of a tracer at the location of the metabolic event cannot be measured due to practical problems (e.g., obtaining a sample from an internal organ), the SR or IE of a subrogate metabolite (e.g., [14C]isocaproate or [13C]isocaproate in the venous plasma of subjects infused with l-[1-14C]leucine or l-[1-13C]leucine, respectively) can sometimes be used to represent the SR or IE of the substrate (e.g., l-[1-14C]leucine or l-[1-13C]leucine) at the site of metabolism under study (Fukagawa et al. 1989). The principle for calculating product formation from the substrate is the same for radioactive tracers and stable isotopes. In either case, the SR or IE should be at an isotopic steady state (namely, a constant value throughout the study or the sampling period).
Calculation of Product Formation or Metabolic Flux Using RadioisotopesCalculation of Product Formation Using RadioisotopesA flooding dose of a substrate plus the tracer is normally used to achieve a steady-state SR under both in vitro and in vivo experimental conditions (Garlick et al. 1975). The SR of the labeled substrate at plateau at the site of its metabolism is required to calculate the rate of product formation from the substrate in incubated cells, per-fused organ, or the whole body. The equation is given as follows:
Product formation (nmol) = radioactivity in the product (dpm)/SR of the tracer at the plateau (dpm/nmol)
Let us use the oxidation of alanine to CO2 as an example to illustrate the calcula-tion of product formation in a radioactive tracer experiment. Hepatocytes (5 × 10⁶ cells) are incubated at 37°C for 1 h in 2 mL of Krebs bicarbonate buffer containing 1.5 mM (i.e., 1500 nmol/mL) alanine plus 300,000 dpm [1-14C]alanine. The SR of the tracer reaches a plateau very rapidly within 5 min after its addition to the incuba-tion medium. At the end of the 1 h incubation, the total 14CO2 (900 dpm) is collected in 0.2 mL of Soluene, with an efficiency of 90% for 14CO2 trapping. The background (blank or cell-free incubation) radioactivity of 14C in the solution is 50 dpm. How much CO2 is produced from alanine oxidation by the cells? In this reaction, alanine is the precursor and CO2 is the product.
The SR of [1-14C]alanine = 300,000 dpm/(1500 nmol/mL × 2 mL) = 100 dpm/nmol C–1 of alanine
Radioactivity in the product (14CO2) = (900 dpm – 50 dpm) ÷ 90% = 944 dpmProduction of CO2 = 944 dpm/100 dpm/nmol C–1 of alanine = 9.44 nmol for the total number of 5 × 10⁶ cells per hour = 9.44 nmol/(5 × 106 cells × 1 h) = 1.89 nmol/106 cells/h

230 Amino Acids: Biochemistry and Nutrition
© 2010 Taylor & Francis Group, LLC
On the basis of the above example, we can state that the oxidation of carbon-1 of alanine to CO2 in the hepatocytes is 1.9 nmol/106 cells per h. However, if the same amount of 14C was in [U-14C]alanine instead of [1-14C]alanine, the SR of [U-14C]alanine would be 33.3 dpm/nmol alanine carbon (i.e., 100 dpm/nmol ala-nine ÷ 3) and the rate of CO2 production would be 5.67 nmol/106 cells per h. [i.e., 944 dpm ÷ 33.3 dpm/nmol C of alanine ÷ (5 × 10⁶ cells × 1 h)].
Calculation of Metabolic Flux In Vivo Using RadioisotopesThe SR of the labeled substrate at plateau in the plasma, along with the rate of intrave-nous infusion of the tracer (e.g., dpm/kg body weight/min), is required to calculate the flux of the substrate or the rate of production of a metabolite in the whole body. For example, the flux of arginine in the plasma can be determined using l-[U-14C]argi-nine, and the whole-body production of CO2 can be measured using [14C]NaHCO3. In these cases, it is not necessary to know the substrate SR at the site of metabolism. An equation for calculating the metabolic flux in vivo using a radioisotope is as follows:
Q = rate of tracer infusion (dpm/min)/SR of the tracer (labeled substrate) in the plasma at plateau (dpm/nmol)
where Q is the flux (nmol/kg body weight/min).
Calculation of Product Formation or Metabolic Flux Using Stable IsotopesWhole-body production of CO2 from all substrates can be estimated using intrave-nous infusion of [13C]NaHCO3. In the plasma, [13C]NaHCO3 is dissociated to form [ ] ,13C HCO3
− which is in chemical equilibrium with 13CO2. It is practically difficult to intravenously administer this gas into animals including humans, because a constant dose of 13CO2 can readily evolve from the infusion solution and becomes irreversibly lost. Thus, [13C]NaHCO3 is often used to estimate the whole-body production of CO2 from the oxidation of all substrates (namely, the flux of CO2 into the plasma pool), as described below (Bush et al. 2002).
The rate of whole-body CO2 production (μmol/kg body weight/h) = [(IEi/IEb1) – 1] × IR
where IEi is the IE (%) of intravenously infused [13C]NaHCO3, IEb1 is the IE (%) of expired 13CO2 at plateau during the infusion of [13C]NaHCO3, and IR is the rate of [13C]NaHCO3 infusion (μmol/kg body weight/h).
To determine the rate of whole-body oxidation of an AA using a 13C-labeled tracer, the rate of whole-body CO2 production, the IE of expired 13CO2 in breath at plateau during the infusion of a 13C-labeled AA, and the IE of the 13C-labeled AA in the plasma at plateau must be measured (Darmaun et al. 1986). The intravenous admin-istration of l-[1-13C]phenylalanine in pigs can be used as an example. Of course, this will provide the information only about the oxidation of phenylalanine carbon-1.
Rate of whole-body phenylalanine oxidation (μmol/kg body weight/h) = (CO2 PR × IEb2)/IEp

231Use of Isotopes for Studying Amino Acid Metabolism
© 2010 Taylor & Francis Group, LLC
where CO2 PR is the rate of whole-body CO2 production (μmol/kg body weight/h) estimated using the intravenous infusion of [13C]NaHCO3, IEb2 is the IE (%) of expired 13CO2 at the plateau during the infusion of l-[1-13C]phenylalanine, and IEp is the IE of l-[1-13C]phenylalanine in the plasma at the plateau during the last 2 h of l-[1-13C]phenylalanine infusion. Note that in this case, two separate experiments are required: one to measure the total CO2 production and the other to measure CO2 production from the AA.
why Are isotoPes useD in metABolic reseArch?
Radioactive or stable isotopes are extensively used in research involving AA metab-olism. The choice of a tracer depends on the experimental design or the biological questions to be asked (Raguso et al. 1999; Kong et al. 2012). Isotopes offer the fol-lowing unique advantages over studies involving no tracers:
1. Tracing metabolic pathways. Radioisotopes or stable isotopes allow for the tracing of specific atoms in an AA or other substances in metabolic pathways. For example, l-[1-14C]leucine and l-[U-14C]leucine are used to determine (1) the rate of oxidative decarboxylation of leucine plus the net release of its α-ketoacid (α-ketoisocaproate) and (2) the oxidation of all leucine carbons into CO2, respectively (Wu and Thompson 1987). Additionally, data on 14CO2 production from l-[1-14C]leucine and l-[U-14C]leucine can provide the necessary basis to calculate (1) the oxidation of leucine carbons 2–6 via the Krebs cycle, (2) the net transamination of leucine, (3) the percentage of transaminated leucine released as its α-ketoacid, and (4) the percentage of decarboxylated leucine oxidized into CO2. Thus, the metabolic fate of leucine can be identified in response to nutritional, physiological, and pathological changes. In many cases, tracer experiments provide unequivocal evidence to indicate the presence or absence of a metabolic pathway in cells or tissues (e.g., the synthesis of putrescine, spermidine, and spermine from proline in enterocytes and in the placenta).
Isotopes also have other important applications in biochemical studies. For example, 32P-ATP is employed to quantify protein phosphorylation as a mechanism that may regulate AA metabolism. l-[2-15N]glutamine is useful to trace the metabolic fate of its α-amino group N, while distinguishing this N from the amide N of glutamine. In addition, the generation of 3H2O from [5-3H]glucose during glycolysis in cells (e.g., lymphocytes) or tissues (e.g., skeletal muscle) incubated in the presence or absence of 2 mM glutamine is a valid indicator of the effect of this AA on glycolysis. Furthermore, the production of 15NO from l-[guanido-15N2]arginine provides the definitive proof that one of the two identical N atoms in the guanido group of arginine serves as the physiological source of NO synthesized by mammalian cells (e.g., macrophages and endothelial cells). Similarly, l-[ring-2,6-3H]phenyl-alanine or L-[ring-2H5]phenylalanine is often used as a tracer to measure protein synthesis and degradation in vitro and in vivo.

232 Amino Acids: Biochemistry and Nutrition
© 2010 Taylor & Francis Group, LLC
2. High sensitivity of detection of tracers. Radioisotopes and stable isotopes are readily detected with very high sensitivity by liquid scintillation spec-trometry and mass spectrometry, respectively. Radiotracer methods are normally much more sensitive than methods using stable isotopes. With an appropriately managed environment, the background values are usu-ally very low (e.g., <20 dpm for 14C and 3H). These instruments offer the most sensitive analytical methods to quantify the rates of many biochemical reactions in cells and organisms. For example, when incubated in the pres-ence of 1 mM l-glutamine, 1 × 10⁶ lymphocytes produce only ~3 nmol CO2 from oxidation of this AA per hour. If 14C-glutamine was not included in cell incubation or culture medium, such a small amount of CO2 would not have been detected by a CO2 analyzer. Similarly, in in vitro experiments, the skeletal muscle from young rats incorporates approximately only 0.2 nmol of phenylalanine into protein per milligram tissue within 2 h. Such a small change in protein synthesis relative to the amount of the total protein in the tissue cannot be detected by measuring the amount of tissue protein before and after a period of 2-h incubation. However, this seemingly impossible task can easily be accomplished by the administration of a flooding dose of l-phenylalanine plus l-[ring-2,6-3H]phenylalanine into the incubation or culture medium or into the whole body to subsequently quantify the amount of peptide-bound l-[3H]phenylalanine in tissue proteins.
INTERPRETATION OF DATA FROM ISOTOPE EXPERIMENTS
In tracer experiments, a radioisotope or a stable isotope is administered to an animal, or added to a tissue or to a cell incubation medium, followed by the measurement of labeled products as well as SR (for a radioactive tracer) or IE (for a stable isotope) of the tracer at plateau in cells or a compartment of interest (Bequette et al. 2006; Xi et al. 2012). On the basis of these data, the rate of metabolism of a substrate or the rate of product formation is calculated, as detailed in the preceding sections. This means that an investigator obtains data from a black box.
Radioisotope or stable isotope in substrates —> BLACK BOX —> radioactivity or stable isotope in products.
To interpret data from tracer studies, it is very important to have adequate knowledge of the metabolic pathways in this black box and to take necessary cau-tion when interpreting the data obtained. For example, if 14CO2 is provided to plants or animals, newly formed 14C-glucose is found in both experimental organ-isms (Figure 7.4). Does this mean that glucose is synthesized from CO2 in both plants and animals? During the process of photosynthesis, there is a net synthesis of glucose from CO2 and H2O in plants, with sunlight as the source of energy. However, there are no known metabolic pathways by which a net synthesis of glu-cose from CO2 and H2O occurs in any animal species, including cattle, chickens, dogs, humans, pigs, rats, and sheep. How does 14C from 14CO2 appear in glucose produced in these animals? This question illustrates some of the problems associ-ated with the tracer experiments (Brunengraber et al. 1997), which will be dis-cussed in the following sections.

233Use of Isotopes for Studying Amino Acid Metabolism
© 2010 Taylor & Francis Group, LLC
chAnGes in the sr or ie of the intrAcellulAr lABeleD Precursor Pool
Increased Dilution of the Isotope in CellsIn a radiotracer study, the amount of radioactivity in a product is influenced by the SR of the precursor, which is affected by the dilution of the labeled precur-sor. Similarly, in an experiment involving a stable isotope, the mass of the stable isotope in a product is influenced by the IE of the precursor, which is affected by the dilution of the labeled precursor. Of particular note, many AA (including gluta-mate, glutamine, aspartate, proline, ornithine, and arginine) are metabolized to form intermediates of the Krebs cycle within the mitochondria (Chapter 3). The carbons of these AA do not pass directly through citrate. Rather, a portion of the molecule is converted into citrate and returned to α-ketoglutarate. Because of the enzyme-catalyzed reactions involving both asymmetric and symmetric carbons, the labeled carbons derived from these AA can be diluted within the Krebs cycle to a different extent. The greater the fraction of mitochondrial oxaloacetate that is recycled within the Krebs cycle, the greater the differential dilution of the substrate’s carbon atoms. This phenomenon is known as differential dilution of the isotope within the Krebs cycle, which results in underestimations of both oxidation and glucogenic capacity of AA in cells and in the whole body.
Isotope dilution may potentially lead to an underestimation of product formation if the intracellular SR of the labeled substrate at the site of its metabolism is not accu-rately determined. Let us assume that the production of 14CO2 from the oxidation of l-[U-14C]arginine in the presence of 0.5 mM l-arginine is decreased by 50% in hepa-tocytes incubated with 2 mM l-glutamate compared with the absence of l-glutamate. Does this mean that less l-arginine is oxidized in the presence of l-glutamate than in the absence of l-glutamate? The answer is not necessarily so. Why? This is because oxidation of both arginine and glutamate to form CO2 occurs via the formation to α-ketoglutarate as a common intermediate. [U-14C]α-ketoglutarate produced from l-[U-14C]arginine is diluted by unlabeled α-ketoglutarate generated from unlabeled l-glutamate. Therefore, the SR of intracellular l-[U-14C]α-ketoglutarate at the site of oxidation is lower in the presence of 5 mM l-glutamate than in its absence, lead-ing to the reduced production of 14CO2 from l-[U-14C]arginine. Note that it is 14CO2,
14CO2
Plant
Animal
[U-14C]Glucose
H2O
H2O
?
FIGURE 7.4 Appearance of 14C from 14CO2 in glucose when the tracer is administered to either plants or animals. Plants can convert CO2 and H2O into glucose through photosynthe-sis. However, this metabolic pathway is absent from animals. The appearance of 14C from 14CO2 in plasma glucose should not be taken to indicate any net synthesis of this sugar from CO2 and H2O in animals (e.g., cows, pigs, and humans).

234 Amino Acids: Biochemistry and Nutrition
© 2010 Taylor & Francis Group, LLC
but not CO2, which is analyzed by liquid scintillation spectrometry. However, our ultimate interest is the production of CO2, but not 14CO2, by cells or by the body. To determine whether the oxidation of l-arginine into CO2 in hepatocytes is suppressed by exogenous l-glutamate, the SR of [14C]α-ketoglutarate in the mitochondria of hepatocytes incubated in the presence or in the absence of the added glutamate must be determined for the accurate calculation of CO2 production.
Now, let us look at another example of isotope dilution. Liver slices are incu-bated with [1-14C]alanine plus 1 mM alanine in the presence or absence of 5 mM glucose. The addition of 5 mM glucose to the basal incubation medium results in the decreased production of 14CO2. Does this mean that glucose decreases the oxi-dation of carbon-1 of alanine? The answer is “not necessarily so.” The addition of 5 mM glucose to the medium will produce more pyruvate via glycolysis, leading to the dilution of [1-14C]alanine-derived [1-14C]pyruvate and, consequently, leading to reduced production of 14CO2 (Figure 7.5). In this case, the SR of intracellular [1-14C]pyruvate must be determined to account for isotope dilution so that the researcher could accurately calculate the rate of alanine carbon-1 oxidation.
Decreased Dilution of the Isotope in CellsWhile an increase in isotope dilution (namely a decrease in the SR or IE of the labeled precursor) frequently occurs in tracer studies, the opposite may also take place. In response to a treatment, a decrease in isotope dilution leading to a greater value of the SR or IE of the labeled precursor as compared to the control group can result, in part, from a reduction in the formation of an unlabeled intermediate from metabolic pathways (e.g., protein degradation as well as the synthesis and catabolism of AA) other than the pathway being studied. Let us use the oxidation of l-[1-14C]glutamate in the chick skeletal muscle as an example. In this case, a graduate student wanted to use l-cycloserine (an inhibitor of transaminases) to suppress glutamate oxidation by inhibiting glutamate transaminase in the skeletal muscle incubated in the presence of
H3C H3C
H3C H3C
H3CCH
NH3+
NH3+
COO– C
O
COO–
CH COO– C
O
COO–
C
O
SCoA + CO2
Glucose
Alanine(unlabeled)
[1-14 C]Alanine
Pyruvate(unlabeled)
Glycolysis
[1-14 C]pyruvate Acetyl-CoA
FIGURE 7.5 Dilution of the labeled precursor by the unlabeled substrate in the liver. Liver slices are incubated at 37°C for 2 h in Krebs bicarbonate buffer containing l-[1-14C]alanine plus 1 mM l-alanine. l-[1-14C]alanine-derived [1-14C]pyruvate is diluted by unlabeled pyru-vate produced from glucose. This results in the decreased production of 14CO2 from l-[1-14C]alanine in the presence of glucose. Under this experimental condition, the specific radioactiv-ity of intracellular [1-14C]pyruvate should be determined to calculate the rate of CO2 produc-tion from alanine. The bold letter represents 14C.

235Use of Isotopes for Studying Amino Acid Metabolism
© 2010 Taylor & Francis Group, LLC
l-[1-14C]glutamate plus 1 mM l-glutamate and physiological concentrations of other AA. However, the student observed that 14CO2 production from l-[1-14C]glutamate was actually increased in the presence of 1.5 mM l-cycloserine than in its absence. It turned out that a large amount of glutamate was produced from BCAA transami-nation in the chick skeletal muscle. Since l-cycloserine inhibited BCAA transami-nation, it decreased l-glutamate production from BCAA in the tissue. This means that, when compared with the absence of l-cycloserine, intracellular 14C-glutamate is less diluted in the presence of l-cycloserine, leading to a greater value of the SR of intracellular 14C-glutamate and, therefore, 14CO2 production from l-[1-14C]glutamate (Figure 7.6). Again, this example illustrates the fundamental importance of measur-ing the SR of the substrate at the site where it is metabolized.
isotoPe rAnDomiZAtion
In a preceding section of this chapter, we asked the question why does 14C from 14CO2 infused into animals appear in glucose? The answer to this question is “iso-tope randomization,” which refers to random distribution of a labeled isotope among chemically indistinguishable atoms in a molecule. For example, in succinate, which is a symmetric molecule, its carbon-1 and carbon-4 are identical, and so are its car-bon-2 and carbon-3. Thus, when carbon-1 and carbon-2 of succinate in the Krebs
–OOC CH2CH2CH COO–
NH3+
–OOC CH2CH2C COO–
–OOC CH2CH2C COO–
O
–OOC CH2CH2CH COO–
NH2
(–)
O
CO2
BCKA (Pyr, OAA)
(–)L-Cycloserine
BCAA (Ala, Asp)
L-Cycloserine
[1-14C]glutamate [1-14C]α-ketoglutarate
Glutamate (unlabeled)
α-Ketoglutarate
FIGURE 7.6 A reduction in the dilution of the labeled precursor due to the decreased for-mation of unlabeled intermediate in the skeletal muscle. Chick skeletal muscle is incubated at 37°C for 2 h in Krebs bicarbonate buffer containing l-[1-14C]glutamate plus 1 mM l-glu-tamate and physiological concentrations of other AA found in the plasma. The addition of 1.5 mM l-cycloserine inhibits the production of unlabeled glutamate from BCAA, thereby reducing the dilution of l-[1-14C]glutamate when compared with the absence of l-cycloserine. Consequently, the production of 14CO2 from l-[1-14C]glutamate is higher in the presence of 1.5 mM l-cycloserine than its absence. Under this experimental condition, the specific activ-ity of intracellular [1-14C]glutamate should be determined to calculate the rate of CO2 produc-tion from glutamate. The bold letter represents 14C.
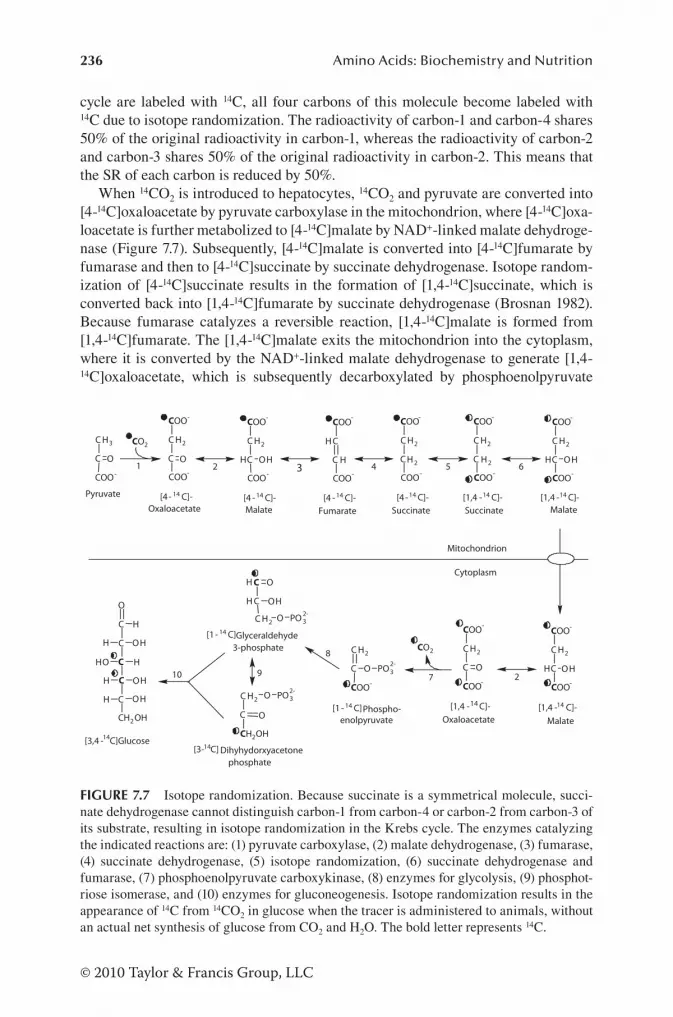
236 Amino Acids: Biochemistry and Nutrition
© 2010 Taylor & Francis Group, LLC
cycle are labeled with 14C, all four carbons of this molecule become labeled with 14C due to isotope randomization. The radioactivity of carbon-1 and carbon-4 shares 50% of the original radioactivity in carbon-1, whereas the radioactivity of carbon-2 and carbon-3 shares 50% of the original radioactivity in carbon-2. This means that the SR of each carbon is reduced by 50%.
When 14CO2 is introduced to hepatocytes, 14CO2 and pyruvate are converted into [4-14C]oxaloacetate by pyruvate carboxylase in the mitochondrion, where [4-14C]oxa-loacetate is further metabolized to [4-14C]malate by NAD+-linked malate dehydroge-nase (Figure 7.7). Subsequently, [4-14C]malate is converted into [4-14C]fumarate by fumarase and then to [4-14C]succinate by succinate dehydrogenase. Isotope random-ization of [4-14C]succinate results in the formation of [1,4-14C]succinate, which is converted back into [1,4-14C]fumarate by succinate dehydrogenase (Brosnan 1982). Because fumarase catalyzes a reversible reaction, [1,4-14C]malate is formed from [1,4-14C]fumarate. The [1,4-14C]malate exits the mitochondrion into the cytoplasm, where it is converted by the NAD+-linked malate dehydrogenase to generate [1,4-14C]oxaloacetate, which is subsequently decarboxylated by phosphoenolpyruvate
C H3
C
COO-
O
CO2C H2
C
COO-
O
COO-
C H2
CH
COO-
COO-
OH
Pyruvate
Oxaloacetate Malate
C H2
C
COO-
O PO3
CO2
Phospho-enolpyruvate
C H2
COO-
C
COO-
O
COO-
C H2
COO-
CH OH
MalateOxaloacetate
[4 - C]-14 [4 - C]-14
[1,4 - C]-14[1,4 - C]-14[1 - C]14
[3,4 - C]Glucose
1 2
7
C
C
C
C
C
CH2OH
O
OH
H
H
OH
OHH
H
OH
H
2-
Cytoplasm
Mitochondrion
14
Fumarate[4 - C]-14
3
C
C
COO-
COO-
H
H C H2
C
COO-
COO-
H 2
Succinate[4 - C]-14
4
C H2
C
COO-
COO-
H 2
Succinate[1,4 - C]-14
5
C H2
CH
COO-
COO-
OH
Malate[1,4 - C]-14
6
2
C H2
C
C OH
OHH
O PO 3
Dihyhydorxyacetonephosphate
[3 - C]14
Glyceraldehyde3-phosphate
[1 - C]14
2-
C H2 O PO3
C
CH2OH
O
2-
8
910
FIGURE 7.7 Isotope randomization. Because succinate is a symmetrical molecule, succi-nate dehydrogenase cannot distinguish carbon-1 from carbon-4 or carbon-2 from carbon-3 of its substrate, resulting in isotope randomization in the Krebs cycle. The enzymes catalyzing the indicated reactions are: (1) pyruvate carboxylase, (2) malate dehydrogenase, (3) fumarase, (4) succinate dehydrogenase, (5) isotope randomization, (6) succinate dehydrogenase and fumarase, (7) phosphoenolpyruvate carboxykinase, (8) enzymes for glycolysis, (9) phosphot-riose isomerase, and (10) enzymes for gluconeogenesis. Isotope randomization results in the appearance of 14C from 14CO2 in glucose when the tracer is administered to animals, without an actual net synthesis of glucose from CO2 and H2O. The bold letter represents 14C.
237Use of Isotopes for Studying Amino Acid Metabolism
© 2010 Taylor & Francis Group, LLC
carboxykinase to produce 14CO2 and [1-14C]phosphoenolpyruvate. Through the path-way of gluconeogenesis, two molecules of [1-14C]phosphoenolpyruvate form one molecule of [3,4-14C]glucose. In these biochemical reactions, there is a net loss of 1 mol of CO2, the same amount of CO2 that is incorporated into oxaloacetate by pyruvate carboxylase. However, isotope randomization in the Krebs cycle results in the appearance of 14C from the administered 14CO2 in glucose, without a contribution of CO2 to a net synthesis of glucose (Figure 7.7).
isotoPe exchAnGe
Interconversion of metabolites results in the transfer of a labeled isotope (either radioisotope or stable isotope) from one molecule to another in cells or in the body. This event is known as isotope exchange (Fink et al. 1988). Let us use [3,4-14C]acetoacetate as an example. When this labeled substance is introduced into skeletal muscle, [3,4-14C]β-hydroxybutyrate, [3,4-14C]acetoacetyl-CoA, and [1,2-14C]acetyl-CoA are formed. In the muscle, the oxidation of fatty acids generates unlabeled acetoacetyl-CoA and acetyl-coA. Acetyl-CoA is also produced from the catabo-lism of glucose, pyruvate, and AA. Thus, [3,4-14C]acetoacetate undergoes extensive exchange with the unlabeled products (acetyl-CoA and acetoacetyl-CoA) produced from glucose, AA, and fatty acids regardless of the presence or absence of ketogen-esis, resulting in the dilution of the labeled tracer (Figure 7.8). Unfortunately, the dilution of 14C-acetoacetate was previously used by some investigators to estimate the production of acetoacetate and β-hydroxybutyrate by the skeletal muscle. This was based on the unsubstantiated assumption that if the tissue produced acetoac-etate, the SR of 14C-acetoacetate would be reduced. However, Henry Bruengraber and his coworkers reported in 1988 that, in the dog liver with little capacity for keto-genesis, 14C-acetoacetate was also substantially diluted, indicating a problem in data interpretation when isotope exchange occurs in cells and tissues.
isotoPe recyclinG
Most substances (e.g., protein and “nutritionally nonessential” AA) in the body undergo continuous degradation and resynthesis, which is collectively referred to as turnover. As a result, the substrate and the product of a biochemical reaction can be interconverted through separate enzymes. When these compounds are labeled, isotope recycling can occur. For example, after l-[U-14C]phenylalanine is incorpo-rated into a protein, this protein will be subsequently hydrolyzed to yield l-[U-14C]phenylalanine and other AA in the cytoplasm where these AA may be reincorpo-rated into a new molecule of protein. Also, the degradation of l-[2-15N]glutamine by phosphate-activated glutaminase generates free 15NH3, some of which can serve as a substrate for l-glutamine synthesis in the same cell and different tissues in the body. Furthermore, l-[U-14C]proline is oxidized to l-[U-14C] P5C by proline oxidase in the mitochondrion, and some of the l-[U-14C]P5C exits to the cytoplasm for conversion into l-[U-14C]proline by P5C reductase. Thus, recycling of the iso-tope can be an intracellular (in the same compartment or among organelles) or intercellular process. When isotope recycling occurs, the SR or IE of the labeled

238 Amino Acids: Biochemistry and Nutrition
© 2010 Taylor & Francis Group, LLC
substrate is increased, leading to underestimations of the activities of metabolic pathways, such as protein synthesis, glutaminolysis, and proline oxidation in the above examples (Figure 7.9). One effective means of minimizing isotope recycling is to increase the extracellular concentration of the unlabeled substrate (e.g., flood-ing dose technology in vivo and in cell or tissue incubation).
isotoPic nonsteADy stAte
When a cell is exposed to a labeled AA at a constant rate (e.g., the incubation or culture of cells or a tissue, or the constant intravenous infusion of a tracer after a priming dose), its intracellular SR or IE increases until it reaches a plateau value, which is referred to as an isotopic steady state (Figure 7.10). The rate at which the SR or IE of an intracellular AA reaches the isotopic steady state depends on many factors, including the extracellular concentration of AA, the activity of AA trans-porters, the size of the metabolic pool of the tracee AA, the rates of intracellular
H3C CH CH2 CO
O–OH
C CH2 CO
O–O
H3C C CH3
O
Lactate Pyruvate
H3C CO
S-CoA
H3CH3C C CH2 C
O
S-CoAO
CO2
CO2
Fatty acid
Glucose
Aminoacids
1
2
3
4 5
6
7
8
9
10
11
12
[3,4 -14C]-β-hydroxybutyrate
[1,2-14C]acetone
[3,4-14C]-acetoacetyl-CoA
[1,2-14C]-acetyl-CoA
[3,4-14C]-acetoacetate
FIGURE 7.8 Isotope exchange. Interconversion of metabolites in cells results in isotope exchange and dilution of labeled precursors. The enzymes catalyzing the indicated reac-tions are: (1) 3-ketoacid CoA transferase or succinyl-CoA:3-ketoacid CoA transferase, (2) β-hydroxybutyrate dehydrogenase, (3) spontaneous reaction, (4) and (5) acetoacetyl-CoA thi-olase, (6) pyruvate dehydrogenase, (7) lactate dehydrogenase, (8) Krebs cycle, (9) β-oxidation, (10) glycolysis, (11) conversion of glucogenic AA into pyruvate, and (12) conversion of keto-genic AA into pyruvate. The bold letter represents 14C.

239Use of Isotopes for Studying Amino Acid Metabolism
© 2010 Taylor & Francis Group, LLC
protein turnover, as well as the rates of catabolism and/or synthesis of the AA. Ideally, intracellular SR or IE should reach the plateau value as soon as possible and be maintained for a prolonged period of time to minimize confounding issues such as isotope dilution and recycling as well as under- and over-estimated values of SR or IE, so that the rate of a biochemical reaction can be measured accurately (Stoll et al. 1999). This is because both the amount of radioactivity or stable isotope in the labeled product and the SR or IE of the labeled precursor are used to calculate product formation or metabolic flux. For example, when skeletal muscle from young chicks is incubated at 37°C in Krebs bicarbonate buffer containing 1 mM l-phe-nylalanine, l-[2,6-3H]phenylalanine, and physiological concentrations of other AA found in the plasma, the SR of intracellular l-[2,6-3H]phenylalanine reaches a pla-teau value within 15 min after initiation of the tissue incubation. Similarly, when piglet enterocytes are incubated at 37°C in Krebs bicarbonate buffer containing 2 mM l-[U-13C]glutamine and physiological concentrations of other AA found in the plasma, the IE of intracellular l-[U-13C]glutamine reaches a plateau value within 5 min after initiation of the cell incubation. Note that it is the concentration of the tracee (e.g., l-phenylalanine), not the amount of the tracer (e.g., l-[2,6-3H]phenyl-alanine) that primarily affects the time needed for the SR or IE to reach a plateau value. However, both the concentration of the tracee (e.g., l-phenylalanine) and the
[U-14C]Phe [U-14C]Phe-protein
PS
PD
[2-15N]Gln 15NH3 + Glu
PAG
GS
[U-14C]Pro [U-14C]P5C
PO
P5CR
FIGURE 7.9 Isotope recycling. A labeled isotope in a product is reincorporated into its precursor. This can result in an increase in the specific activity or isotope enrichment of the labeled precursor, leading to underestimations of product formation or metabolic flux. PAG, phosphate-activated glutaminase; PD, protein degradation; PO, proline oxidase; PS, protein synthesis; P5CR, pyrroline-5-carboxylate reductase.

240 Amino Acids: Biochemistry and Nutrition
© 2010 Taylor & Francis Group, LLC
amount of the radioactive tracer (e.g., l-[2,6-3H]phenylalanine) or the concentration of the stable isotope tracer (e.g., l-[2,6-2H]phenylalanine) determine the absolute value of SR or IE at isotopic steady state. In some experiments, an isotopic steady state may not be obtained in a certain experimental period (Figure 7.11), resulting in an inability to determine accurately the product formation. For example, when skeletal muscle from young chicks is incubated at 37°C in Krebs bicarbonate buf-fer containing 0.2 mM l-phenylalanine, l-[2,6-3H]phenylalanine, and physiological concentrations of other AA found in the plasma, the SR of intracellular l-[2,6-3H]phenylalanine does not reach a plateau value within 1 h after initiation of the tissue incubation. Thus, such an incubation condition is not appropriate for determining the rate of protein synthesis in this tissue, for example. Also, in macrophages incu-bated at 37°C in Krebs bicarbonate buffer containing [6-14C]glucose and 5 mM glucose, an isotopic steady state of [6-14C]glucose is not reached during a 1 h period of incubation, and, therefore, the rate of CO2 produced from carbon-6 of glucose cannot be accurately determined. A researcher can get around these problems by increasing extracellular concentrations of phenylalanine from 0.2 to 1 mM and by extending the time of macrophage incubation from 1 to 3 h.
POTENTIAL PITFALLS OF ISOTOPIC STUDIES
The foregoing problems associated with isotopic studies may lead to potential pitfalls if investigators do not have adequate knowledge of both tracer methodologies and metabolism of the molecules under study. These pitfalls may include incorrect data interpretation, misleading conclusions, and unwarranted suggestions, as indicated
Time after administration of tracer and tracee (min) 0 15 30 45 60 75 90 105 120
Spec
ific
radi
oact
ivity
(dpm
/nm
ol)
or is
otop
e en
richm
ent (
%)
50
25
75
100
Isotopic steady state
135 150 160
FIGURE 7.10 Isotopic steady state in cells. When a radioactive or stable isotope is admin-istered to cells or animals at a constant rate by a constant or primed constant infusion, the specific radioactivity of the radioisotope or the isotope enrichment of the stable isotope at the site of its metabolism can reach a plateau value (e.g., between 15 and 160 min after the addi-tion of a tracer and the tracee). This is known as an isotopic steady state. In tracer studies, an isotopic steady state in cells should be achieved as soon as possible. The X-axis refers to time after either the addition of a tracer plus a tracee to the incubation medium or the start of constant intravenous infusion of a tracer plus a tracee. A plateau value is set at 100 dpm/nmol for a radioisotope or 100% for a stable isotope.

241Use of Isotopes for Studying Amino Acid Metabolism
© 2010 Taylor & Francis Group, LLC
in the preceding sections. Let us use the oxidation of l-[1-14C]valine and l-[U-14C]valine in rats (Table 7.2) as an example of how to carefully and correctly interpret data from isotopic studies.
In this example, rats were fed either a low-protein diet (2.5% protein) or a high-protein diet (21.5% protein) for 16 days and then received a single administration of l-[1-14C]valine or l-[U-14C]valine via enteral feeding. The percentage of the administered l-[U-14C]valine appearing in expired 14CO2 during the subsequent 1 h was measured. The percentage of l-[U-14C]valine exhaled as 14CO2 within 1 h after administration of the radioisotope was higher in rats fed a low-protein diet than in rats fed a high-protein diet. These data appear to suggest that feeding rats with a high-protein diet reduces valine oxidation in rats. This suggestion would not be consistent with our knowledge of valine metabolism and nutrition in animals. Then, how could these results be explained satisfactorily? To address this question, let us review how CO2 is produced during valine oxidation. As illustrated in Chapter 4, the oxidative decarboxylation of valine by branched-chain α-ketoacid dehydrogenase releases carbon-1 from valine and the remaining carbons can be oxidized to CO2 via the Krebs cycle. Concentrations of valine in the plasma are lower in rats fed a low-protein diet compared with rats fed a high-protein diet. Thus, l-[U-14C]valine in the plasma and in the cells is diluted to a lesser extent in rats fed a low-protein diet, as they oxidize more l-[U-14C]valine and excrete more 14CO2. Note that dilution of 14C-labeled valine carbons occurs both at the branched-chain ketoacid (BCKA) dehydrogenase step and in the Krebs cycle primarily due to the formation of unla-beled acetyl-CoA from the oxidation of AA other than valine. Because the complete
Time after administration of tracer and tracee (min) 0 15 30 45 60 75 90 105 120
Spec
ific
radi
oact
ivity
(dpm
/nm
ol)
or is
otop
e en
richm
ent (
%)
50
25
75
100
135 150 160
FIGURE 7.11 Isotopic nonsteady state in cells. When a radioactive or stable isotope is administered to cells or animals at a constant rate by a constant or primed constant infusion and the extracellular concentration of the tracee is low, the specific radioactivity of the radio-isotope or the isotope enrichment of the stable isotope at the site of its metabolism cannot reach a plateau value within a prolonged period of time (e.g., 160 min in this example). This is known as isotopic nonsteady state. In tracer studies, isotopic nonsteady state in cells should be avoided. The X-axis refers to time after either the addition of a tracer plus a tracee to the incubation medium or the start of constant intravenous infusion of a tracer plus a tracee. A plateau value is set at 100 dpm/nmol for a radioisotope or 100% for a stable isotope.

242 Amino Acids: Biochemistry and Nutrition
© 2010 Taylor & Francis Group, LLC
oxidation of the decarboxylated carbon skeleton of l-[U-14C]valine via the Krebs cycle accounts for 80% of its 14CO2 production, isotope dilution in the mitochondria is the major reason for the observation that rats fed a low-protein diet produced lesser amounts of 14CO2 from l-[U-14C]valine than rats fed a high-protein diet. However, this should not be taken to indicate that feeding a high-protein diet reduces valine oxidation in rats.
In contrast to the experiment involving l-[U-14C]valine, consumption of the low-protein diet reduced the production of 14CO2 from l-[1-14C]valine in rats compared with the high-protein diet. Note that 14CO2 is generated from l-1-14C]valine only at the step of oxidative decarboxylation by BCKA dehydrogenase, but not via the Krebs cycle. It is likely that: (1) the dilution of l-[1-14C]valine in the plasma and in the cells of rats fed a high-protein diet occurs to a relatively lesser extent than the activation of l-[1-14C]valine oxidation for 14CO2 production, (2) compared to rats fed a low-protein diet, the high-protein diet stimulates the oxidative decarboxylation of l-[1-14C]valine to a much greater extent than that which would be offset by the dilution of l-[1-14C]valine-derived l-[1-14C]α-ketoacid in the cytoplasm and in the mitochondria. To sup-port these possible explanations, the SR of l-[1-14C]valine in major organs for valine transamination and oxidative decarboxylation should be determined in rats fed a low- and high-protein diets.
Because the same amounts of l-[1-14C]valine and l-[U-14C]valine were adminis-tered to the rats, the rate of 14CO2 production from l-[1-14C]valine should be greater than that from l-[U-14C]valine, which has only 20% of its radioactivity in the car-boxyl carbon. Thus, in rats fed a high-protein diet, the percentage of l-[1-14C]valine excreted as 14CO2 was higher than that of l-[U-14C]valine although the increase was much less than expected. In contrast, in rats fed a low-protein diet, the percentage of l-[1-14C]valine excreted as 14CO2 was lower than that of l-[U-14C]valine within 1 h
TABLE 7.2 Production of 14CO2 by Rats Fed a Low- or a High-Protein Diet for 1 h after Receiving a Single Enteral Administration of l-[1-14C]Valine or l-[U-14C]Valine
Diet Labeled AA % of 14C-Valine Excreted as 14CO2
Low protein l-[U-14C]valine 85
High protein l-[U-14C]valine 56
Low protein l-[1-14C]valine 46
High protein l-[1-14C]valine 69
Source: Data are taken from Reeds, P.J. 1974. Br. J. Nutr. 31:259–270.Note: The rats were fed a low-protein (2.5% protein) or a high-protein (21.5% protein)
diet for 16 days. Thereafter, the rats were given by tube a single dose of 5 μCi of either l-[U-14C]valine or l-[1-14C]valine per 100 g body weight. The AA were administered in casein hydrolysate supplying a total of 10 µmol valine per 100 g body weight. 14CO2 produced by the individual rats was collected for 1 h imme-diately after the administration of the isotopes.

243Use of Isotopes for Studying Amino Acid Metabolism
© 2010 Taylor & Francis Group, LLC
after administration of the radioisotopes. Such an observation is in striking contrast to the expected results and can be explained by additional data on: (1) the SR of l-[1-14C]valine and l-[U-14C]valine, as well as the SR of their α-ketoacids at isotopic steady state, and (2) 14CO2 production from the radioisotopes at various times within 1 h of their administration, in major tissues of valine catabolism.
SUMMARY
Radioisotopes and stable isotopes have been employed in biochemical research for more than a half-century. In these studies, the calculation of product formation is based on the SR of the radioisotope or the IE of the stable isotope at the site of its metabolism. The measurements of products should be made at isotopic steady state when the values of SR or IE are constant. Tracer experiments offer the advantages of high specificity and sensitivity over conventional methods. Thus, the use of isotopes can greatly facilitate studies to identify new pathways for AA synthesis and catabo-lism and to understand the mechanisms responsible for regulating AA metabolism in cells and in the body. Without isotopes, it would not be possible to perform many key biochemical or nutritional experiments (e.g., oxidation and synthesis of AA, as well as synthesis and degradation of protein) at cellular, molecular, and whole-body levels. The common problems encountered in tracer experiments include dilution, randomization, exchange, and recycling of isotopes, as well as isotopic nonsteady state in cells or in plasma. As with all biological experiments, adequate knowledge of biology and due caution should be exercised when performing tracer studies. Additionally, all necessary steps must be taken to avoid the potential pitfalls leading to incorrect conclusions.
REFERENCES
Bequette, B.J., N.E. Sunny, S.W. El-Kadi, and S.L. Owens. 2006. Application of stable iso-topes and mass isotopomer distribution analysis to the study of intermediary metabolism of nutrients. J. Anim. Sci. 84:E50–E59.
Boelens, P.G., P.A. van Leeuwen, C.H. Dejong, and N.E. Deutz. 2005. Intestinal renal metabo-lism of l-citrulline and l-arginine following enteral or parenteral infusion of l-alanyl-l-[2,15N]glutamine or l-[2,15N]glutamine in mice. Am. J. Physiol. 289:G679–G685.
Brosnan, J.T. 1982. Pathways of carbon flux in gluconeogenesis. Fed. Proc. 41:91–95.Brunengraber, H., J.K. Kelleher, and C. Des Rosiers. 1997. Applications of mass isotopomer
analysis to nutrition research. Annu. Rev. Nutr. 17:559–596.Bush, J.A., G. Wu, A. Suryawan, H.V. Nguyen, and T.A. Davis. 2002. Somatotropin-induced
amino acid conservation in pigs involves differential regulation of liver and gut urea cycle enzyme activity. J. Nutr. 132:59–67.
Castillo, L., T.E. Chapman, M. Sanchez, Y.M. Yu, J.F. Burke, A.M. Ajami, J. Vogt, and V.R. Young. 1993. Plasma arginine and citrulline kinetics in adults given adequate and arginine-free diets. Proc. Natl. Acad. Sci. USA 90:7749–7753.
Darmaun, D., D.E. Matthews, and D.M. Bier. 1986. Glutamine and glutamate kinetics in humans. Am. J. Physiol. 251:E117–E126.
Fink, G., S. Desrochers, C. Des Rosiers, M. Garneau, F. David, T. Daloze, B.R. Landau, and H. Brunengraber. 1988. Pseudo-ketogenesis in the perfused rat heart. J. Biol. Chem. 263:18036–18042.
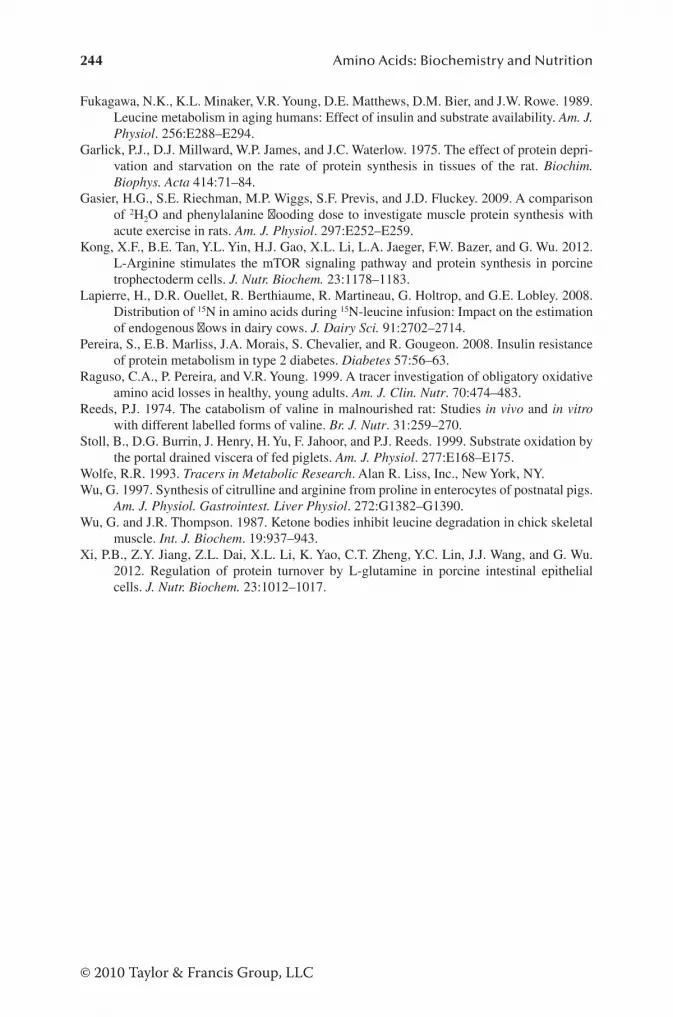
244 Amino Acids: Biochemistry and Nutrition
© 2010 Taylor & Francis Group, LLC
Fukagawa, N.K., K.L. Minaker, V.R. Young, D.E. Matthews, D.M. Bier, and J.W. Rowe. 1989. Leucine metabolism in aging humans: Effect of insulin and substrate availability. Am. J. Physiol. 256:E288–E294.
Garlick, P.J., D.J. Millward, W.P. James, and J.C. Waterlow. 1975. The effect of protein depri-vation and starvation on the rate of protein synthesis in tissues of the rat. Biochim. Biophys. Acta 414:71–84.
Gasier, H.G., S.E. Riechman, M.P. Wiggs, S.F. Previs, and J.D. Fluckey. 2009. A comparison of 2H2O and phenylalanine flooding dose to investigate muscle protein synthesis with acute exercise in rats. Am. J. Physiol. 297:E252–E259.
Kong, X.F., B.E. Tan, Y.L. Yin, H.J. Gao, X.L. Li, L.A. Jaeger, F.W. Bazer, and G. Wu. 2012. L-Arginine stimulates the mTOR signaling pathway and protein synthesis in porcine trophectoderm cells. J. Nutr. Biochem. 23:1178–1183.
Lapierre, H., D.R. Ouellet, R. Berthiaume, R. Martineau, G. Holtrop, and G.E. Lobley. 2008. Distribution of 15N in amino acids during 15N-leucine infusion: Impact on the estimation of endogenous flows in dairy cows. J. Dairy Sci. 91:2702–2714.
Pereira, S., E.B. Marliss, J.A. Morais, S. Chevalier, and R. Gougeon. 2008. Insulin resistance of protein metabolism in type 2 diabetes. Diabetes 57:56–63.
Raguso, C.A., P. Pereira, and V.R. Young. 1999. A tracer investigation of obligatory oxidative amino acid losses in healthy, young adults. Am. J. Clin. Nutr. 70:474–483.
Reeds, P.J. 1974. The catabolism of valine in malnourished rat: Studies in vivo and in vitro with different labelled forms of valine. Br. J. Nutr. 31:259–270.
Stoll, B., D.G. Burrin, J. Henry, H. Yu, F. Jahoor, and P.J. Reeds. 1999. Substrate oxidation by the portal drained viscera of fed piglets. Am. J. Physiol. 277:E168–E175.
Wolfe, R.R. 1993. Tracers in Metabolic Research. Alan R. Liss, Inc., New York, NY.Wu, G. 1997. Synthesis of citrulline and arginine from proline in enterocytes of postnatal pigs.
Am. J. Physiol. Gastrointest. Liver Physiol. 272:G1382–G1390.Wu, G. and J.R. Thompson. 1987. Ketone bodies inhibit leucine degradation in chick skeletal
muscle. Int. J. Biochem. 19:937–943.Xi, P.B., Z.Y. Jiang, Z.L. Dai, X.L. Li, K. Yao, C.T. Zheng, Y.C. Lin, J.J. Wang, and G. Wu.
2012. Regulation of protein turnover by L-glutamine in porcine intestinal epithelial cells. J. Nutr. Biochem. 23:1012–1017.

245
© 2010 Taylor & Francis Group, LLC
Protein Synthesis
AA have been known to be components of proteins since the early 1900s. In 1901, Nobel laureate A. Kossel suggested that individual AA were added to the protein molecule in varying amounts. One year later, E. Fischer (another Nobel laureate) correctly proposed that proteins result from the formation of bonds between the amino group of one AA and the carboxyl group of another in a linear structure termed peptide. In the same year, O. Loewi reported that dogs fed a diet consisting of protein-free hydrolysates of pancreatic protein could maintain positive N balance and suggested that animals must synthesize their own body proteins from the prod-ucts of breakdown of dietary protein occurring in the lumen of the small intestine. However, how peptide bonds are formed from AA in cells puzzled chemists at that time. A series of isotopic studies by R. Schoenheimer and coworkers in the 1930s showed that 15N-labeled tyrosine and leucine could be incorporated into proteins in animals. Thirty years later, the pathway of protein synthesis was discovered by sev-eral groups of scientists using both eukaryotes and bacteria. The molecular mecha-nisms for the nutritional regulation of this biochemical event began to be unfolded in the 1990s when activation of the MTOR signaling pathway by certain AA was discovered (Kimball and Jefferson 2010). In essence, protein synthesis represents a major physiological process for AA utilization in cells. In this chapter, the pathway of intracellular protein synthesis in animals will be described along with its charac-teristics, significance, and measurement.
HISTORICAL PERSPECTIVES OF PROTEIN SYNTHESIS PATHWAY
The history of studies of the metabolic pathway responsible for protein biosynthesis dates back to the late 1930s when T. Caspersson and J. Brachet found that DNA is localized almost exclusively in the nucleus of the eukaryotic cell, whereas RNA is present primarily in the cytoplasm. J. Brachet also noted that the RNA-containing par-ticles in the cytoplasm are rich in proteins and suggested that these particles are the site of protein synthesis. In 1941, both authors further observed that the amount of cyto-solic RNA–protein complexes (later named ribosomes) is positively correlated with the rate of protein synthesis. The 1950s witnessed rapid advances in the field, includ-ing: (1) K. Porter’s discovery in 1952 of the endoplasmic reticulum (an organelle that consists of an interconnected network of tubules, vesicles, and cisternae) in eukary-otic cells, with the rough endoplasmic reticulum being involved in protein synthesis; (2) G.E. Palade’s description of ribosomes consisting of RNA–protein complexes in 1953; (3) G. Gamow’s suggestion of a minimum genetic code of three nucleotides in 1954; (4) isolation by M. Grunberg-Manago and S. Ochoa of the enzyme that links RNA nucleotides to form RNA in vitro in 1955; (5) the report by A. Kornberg in 1956 that enzymes are necessary for DNA synthesis in vitro; (6) the discoveries by M.B. Hoagland and coworkers that separate enzymes catalyze the activation of different AA
8

246 Amino Acids: Biochemistry and Nutrition
© 2010 Taylor & Francis Group, LLC
for incorporation into peptides (1956), that cells contain tRNA, which combines with AA before protein synthesis (1957), and that the DNA polymerase isolated from E. coli could catalyze DNA synthesis in vitro. In 1958, A. Tissières and J.D. Watson isolated 70S ribosomes from E. coli that contain two subunits (50S and 30S), while F. Crick proposed that DNA determines the sequence of AA in a polypeptide.
The early 1960s was the beginning of functional studies identifying an essential role for RNA in protein synthesis. Specifically, S. Weiss and J. Hurtwitz indepen-dently discovered in 1960 that RNA polymerase (a nucleotidyl transferase) is respon-sible for the DNA-directed synthesis of RNA. Additionally, five landmark papers published in 1961 showed that (1) the production of a particular AA sequence by a specific RNA (by M. Nirenberg and H. Mathei), (2) the presence and function of mRNA in protein synthesis (independently reported by F. Jacob and J. Monod, and by S. Brenner, F. Jacob, and M. Meselson), (3) direct evidence that the genetic code is a triplet-deoxynucleotide unit (by F. Crick and J.D. Watson), and (4) the compelling proof that the mRNA molecule is formed on one DNA template strand (by B.D. Hall and S. Spiegelman). Two years later, H.M. Temin reported that, in certain viruses, RNA synthesizes DNA, which in turn codes for proteins. In 1964, the biochemistry of tRNA molecules was uncovered when R.W. Holley demonstrated the nucleotide sequence of the alanine–tRNA molecule in yeast and M. Nirenberg and P. Leder found that the binding of tRNA to the ribosome depends on mRNA as a template. Thus, by the mid-1960s, the pathway for protein synthesis in animal cells had been established, in which DNA is transcribed forming messenger RNA (mRNA), trans-fer RNA (tRNA), and ribosomal RNA (rRNA, a component of the ribosome), with tRNA bringing AA to the mRNA template for the formation of polypeptides.
PATHWAYS OF PROTEIN SYNTHESIS IN THE CYTOPLASM AND MITOCHONDRIA
PAthwAy of Protein synthesis in the cytoPlAsm
The process of cytosolic protein synthesis in both prokaryotic and eukaryotic organ-isms is now well understood and includes five steps: (1) gene transcription, (2) initia-tion of translation, (3) peptide elongation, (4) termination, and (5) posttranslational modifications (Kong and Lasko 2012). Steps 2–4 are collectively referred to as trans-lation (the formation of a polypeptide from AA on the mRNA template). Note that tRNA is necessary for translation because mRNA cannot directly recognize AA but can bind to a tRNA that carries a corresponding AA. In essence, the mRNA syn-thesized from DNA encodes the polypeptide with each AA designated by a specific codon (three nucleotides). The genetic codes for AA are summarized in Table 8.1. tRNAs serve as the adaptors to translate genetic information from nucleic acids into proteins with ribosomes as the factories.
Gene TranscriptionThe first step in protein synthesis is the transcription of a DNA gene to form rRNA, mRNA, and tRNA in the nucleus by RNA polymerases I, II, and III, respectively. Meanwhile, various other types of RNA (e.g., signal recognition particle RNA, small

247Protein Synthesis
© 2010 Taylor & Francis Group, LLC
nuclear RNA, and microRNA) are synthesized using the appropriate DNA (Palangat and Larson 2012). These processes are similar for eukaryotic and prokaryotic cells. Each tRNA contains a trinucleotide sequence (collectively known as an anticodon), which is complementary to a codon in mRNA for a specific AA. The mRNA has a 5′-cap (methyl-guanosyl triphosphate), which is critical for protection from RNases in the nucleus. In eukaryotic organisms, most mRNA molecules are polyadenyl-ated at the 3′ end via the covalent linkage of a polyadenylyl moiety. The poly(A) tail and its associated proteins protect mRNA from degradation by exonucleases. Polyadenylation, which occurs during and immediately after transcription of DNA, is also important for transcription termination.
Eukaryotic pre-mRNA requires extensive processing to become mature mRNA before transport through the nuclear pore to the cytoplasm (Lackner and Bähler 2008). Several steps are required for mRNA processing, which include: (1) the
TABLE 8.1Standard Genetic Codons for AA in Protein Biosynthesisa
First Position (5′ End)
Second PositionThird Position
(3′ End)U C A G
U Phe Ser Tyr Cys U
Phe Ser Tyr Cys C
Leu Ser Stop Stopc A
Leu Ser Stop Trp G
C Leu Pro His Arg U
Leu Pro His Arg C
Leu Pro Gln Arg A
Leu Pro Gln Arg G
A Ile Thr Asn Ser U
Ile Thr Asn Ser C
Ile Thr Lys Arg A
Metb Thr Lys Arg G
G Val Ala Asp Gly U
Val Ala Asp Gly C
Val Ala Glu Gly A
Val Ala Glu Gly G
Note: A, adenine; C, cytosine; G, guanine; U, uracil.a A codon on the mRNA molecule consists of three nucleotides. One AA in protein can
be coded for by more than one codon. For example, Phe is specified by UUU or UUC, and Ser by UCU, UCC, UCA, or UCG.
b AUG codes for the initiation signal and for internal Met residues.c Selenocysteine is incorporated into a selenoprotein during translation elongation and
is coded for by a combination of an internal UGA stop codon and a specific mRNA hairpin structure located further downstream, the SECIS (selenocysteine inserting sequence) element.

248 Amino Acids: Biochemistry and Nutrition
© 2010 Taylor & Francis Group, LLC
exo- and endonucleolytic removal of polynucleotide segments, (2) the modification of specific nucleosides, and (3) the addition of nucleotide sequences to the 5′ and 3′ ends. The 5′ cap, which consists of a guanine nucleotide connected to the mRNA via an unusual 5′ to 5′ triphosphate linkage, is present on the 5′ end of an mRNA. This guanosine is methylated on the 7 position by guanine-N7-methyltransferase, with S-adenosylmethionine (SAM) as the donor of a methyl group, to form a 7-methyl-guanylate cap (m7G). Further modifications in the mRNA molecule include the pos-sible methylation of the 2′ hydroxy groups of its first two ribose sugars at the 5′ end. The 5′-cap (methyl-guanosyl triphosphate) of mRNA is critical for protection from an RNase (e.g., 5′ exonuclease), recognition of mRNA by the ribosome, and the bind-ing of mRNA to the 40S ribosomal subunit. The poly(A) tail of the mRNA is gener-ated from ATP by polyadenylate polymerase. The formation of the 3′ poly(A) tail in mRNA involves cleavage of the 3′ end of the mRNA molecule and the subsequent addition of ∼250 adenine residues from ATP catalyzed by polyadenylate polymerase.
In eukaryotic cells, processed RNAs must migrate from the nucleus into the cytoplasm where protein synthesis takes place. Although the movement of mRNA within the nucleus occurs without metabolic energy, ATP is required for the mRNA–protein complex to resume its motion when it becomes stalled within high-density chromatin. The transport of mRNA out of the nucleus is mediated by nuclear pore complexes (consisting of highly conserved protein factors) that are the channels con-necting the nucleus and the cytoplasm. In prokaryotic cells, because both transcrip-tion and translation occur in the cytoplasm, no transport of RNAs across an organelle is required after their synthesis. Also, prokaryotic mRNA is essentially mature upon transcription and requires no processing (except in rare cases).
Initiation of TranslationBefore polypeptide synthesis is initiated, the 80S (eukaryotic cells; 4200 kDa) or 70S (prokaryotic cells; 2700 kDa) ribosome is formed from 60S and 40S subunits (eukaryotic cells) or 50S and 30S subunits (prokaryotic cells). The steps of this pro-cess are similar for eukaryotic and prokaryotic cells, although more initiation factors are required by eukaryotes than prokaryotes, and the sizes of the ribosomes are also different. For example, the 40S subunit in eukaryotic cells contains an 18S RNA that is homologous to the prokaryotic 16S RNA. Additionally, the 60S subunit in eukaryotic cells contains three RNAs: the 5S and 28S RNAs (which are the coun-terparts of the prokaryotic 5S and 23S molecules) and a 5.8S RNA (which is unique to eukaryotes). Initiation can be divided into four steps: (1) dissociation of the 80S (e.g., in animals) or 70S (e.g., in bacteria) ribosome into its constituent subunits, (2) formation of the 43S preinitiation complex, (3) formation of the 48S initiation com-plex, and (4) formation of the translationally active 80S or 70S ribosome as the site of protein synthesis (Figure 8.1). These steps are described below, primarily with eukaryotic cells as examples.
Dissociation of the Free 80S Ribosome into Its 40S and 60S SubunitsThe dissociation of free 80S ribosomes into their constituent 40S and 60S subunits is an essential event in translation and is controlled by initiation factors [e.g., eukary-otic initiation factors (eIF)] and elongation factors [eukaryotic elongation factors

249Protein Synthesis
© 2010 Taylor & Francis Group, LLC
GTP
eIF2·GDP
eIF2·GTP
GDP
40S Met–tRNAi
eIF4E 4EBP1
4EBP1
P
eIF4E
eIF4GeIF4E
eIF4E eIF4G
p70S6KP
.mRNA
eIF4A
eIF4G
43S
ATP
ADP + Pi
eIF1eIF3
60S
eIF5B
mTORC1
48S
Translationally active80S ribosomeProtein
AA + ATP + GTP
mTORC1
Anabolicagents
mTORC1
RPS6
p70S6K
Anabolicagents
PP
P
mTORC1
GTP
PKC
P60S eIF6
PeIF6
60S eIF6
eIF4B
mRNA
5′ 3′
eIF1A
eIF2
eIF4BeIF4A +
eIF5A
GDP + PieIF1 + eIF2 + eIF3
48SP
eIF6
eIF2B
RPS6
RPS6
eIF1B
FIGURE 8.1 The pathway of translation initiation for protein synthesis in animal cells. In the presence of various initiation factors, 40S and 60S ribosomes combine with the mRNA template to form the translationally active 80S ribosome where protein synthesis in the cyto-plasm and mitochondria takes place. eIF, eukaryotic initiation factor; 4EBP1, eIF4E-binding protein 1; mTORC1, complex 1 of mammalian or mechanistic target of rapamycin; p70S6K, ribosomal protein S6 kinase 1 (a 70-kDa protein); PKC, protein kinase C; RPS6, ribosomal protein S6; S, Svedberg unit of flotation.

250 Amino Acids: Biochemistry and Nutrition
© 2010 Taylor & Francis Group, LLC
(eEF)] (Table 8.2). Under resting or stress conditions, nearly all ribosomes in eukary-otes exist in the free 80S form. However, in response to growth stimuli or activators of protein synthesis, the free 80S ribosomes rapidly dissociate into subunits to enter the translation cycle. This process is facilitated by initiation factors and translation factors. Specifically, when two initiation factors (eIF1A and eIF3) bind to the 40S subunit of the free 80S ribosome, the dissociation of the free 80S ribosome into its 40S and 60S subunits is triggered. In contrast to bacteria where the GTP-dependent dissociation of the free 70S ribosome is catalyzed by EF-G and ribosome recycling factor, recent evidence suggests that, in eukaryotes, eEF2 (translocase-2) dissociates the 80S ribosome into its subunits in the presence of ATP but not GTP or other nucle-oside triphosphates. After the dissociation of the free 80S ribosome, several eIF (e.g., eIF1, eIF1A, eIF3, and eIF6) may prevent reassociation of the 40S and 60S subunits.
Formation of the 43S Preinitiation ComplexeIF2, a heterotrimer of α, β, and γ subunits, plays an important role in the forma-tion of the 43S preinitiation complex. In essence, eIF2 in the dephosphorylated state binds GTP to form a binary complex, which then binds to Met–tRNAi. tRNAi is a tRNA that specifically binds the universal initiation codon (AUG) on mRNA, and Met–tRNAi is formed from l-methionine (Met) and tRNAi by aminoacyl-tRNA synthetase. Like other tRNAs, the secondary structure of tRNAi is a cloverleaf. In eukaryotes, the eIF2–GTP–Met–tRNAi complex then binds to the 40S subunit to yield the 43S preinitiation complex, which is stabilized by eIF1A and eIF3. eIF1A is essential for the transfer of the initiator Met–tRNAi (as Met–tRNAi ⋅ eIF2 ⋅ GTP ter-nary complex) to the 40S ribosomal subunit in the absence of mRNA to form the 43S preinitiation complex. In prokaryotes, the initiator tRNA carries N-formylmethionine (fMet), which is modified from Met–tRNAi by methionyl-tRNA formyltransferase. This covalent modification occurs after Met–tRNAi is produced from Met and tRNAi by aminoacyl-tRNA synthetase. The initial AUG codon (encoding for Met or fMet) on mRNA signals the interaction of the ribosome with (1) the mRNA molecule and (2) the tRNA containing the anticodon.
Formation of the 48S Initiation ComplexSeveral initiation factors (particularly eIF4E and eIF3) are crucial for the formation of the 48S initiation complex. eIF4E (an RNA helicase) recognizes and binds to the 5′ cap structure of mRNA. The phosphorylation of eIF4E-binding protein 1 (4EBP1) by mTOR complex 1 releases eIF4E from the eIF4E–4EBP1 complex. This allows eIF4E to bind eIF4G to form the eIF4E–eIF4G binary complex. Because eIF4G is a scaffolding protein that interacts with other transcription factors (eIF3, eIF4A, eIF4E) and binds to the poly(A) tail, the formation of the eIF4E–eIF4G complex helps recruit eIF4A to mRNA to assemble the eIF4E–eIF4G–eIF4A–mRNA ternary complex. The complex of eIF4A, eIF4E, and eIF4G is often referred to as eIF4F.eIF4B, which contains two RNA-binding domains (one nonspecifically interacting with mRNA, whereas the second specifically binding the 18S portion of the 40S ribosomal subunit), acts as an anchor for mRNA, thereby promoting the circular-ization and activation of the bound mRNA. Note that, in vertebrates, eIF4H is an additional initiation factor with similar function to eIF4B.
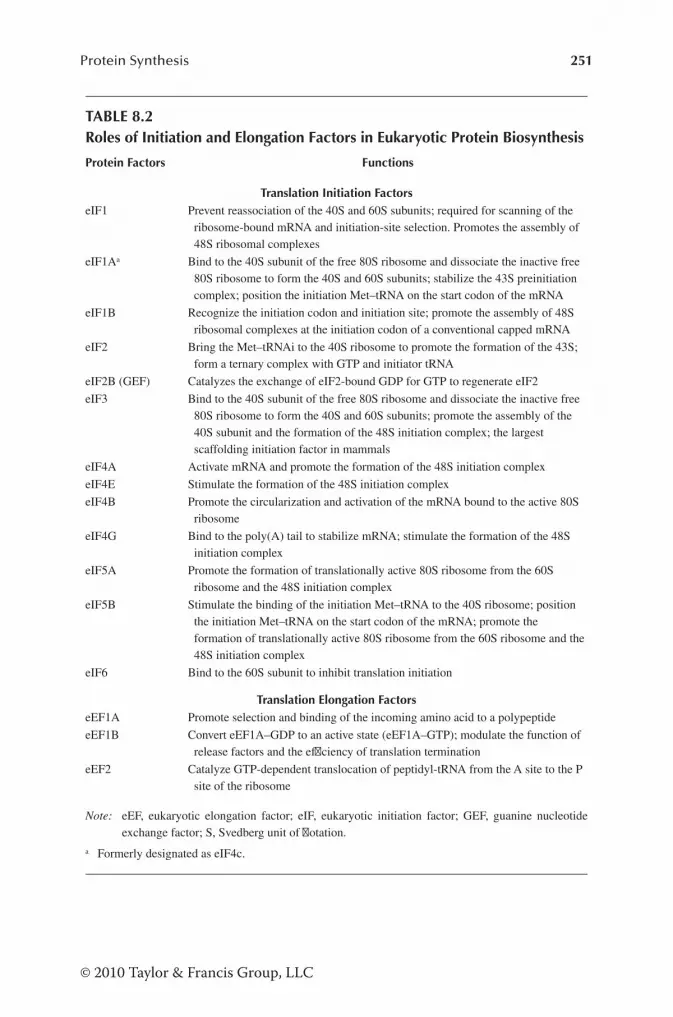
251Protein Synthesis
© 2010 Taylor & Francis Group, LLC
TABLE 8.2Roles of Initiation and Elongation Factors in Eukaryotic Protein Biosynthesis
Protein Factors Functions
Translation Initiation FactorseIF1 Prevent reassociation of the 40S and 60S subunits; required for scanning of the
ribosome-bound mRNA and initiation-site selection. Promotes the assembly of 48S ribosomal complexes
eIF1Aa Bind to the 40S subunit of the free 80S ribosome and dissociate the inactive free 80S ribosome to form the 40S and 60S subunits; stabilize the 43S preinitiation complex; position the initiation Met–tRNA on the start codon of the mRNA
eIF1B Recognize the initiation codon and initiation site; promote the assembly of 48S ribosomal complexes at the initiation codon of a conventional capped mRNA
eIF2 Bring the Met–tRNAi to the 40S ribosome to promote the formation of the 43S; form a ternary complex with GTP and initiator tRNA
eIF2B (GEF) Catalyzes the exchange of eIF2-bound GDP for GTP to regenerate eIF2
eIF3 Bind to the 40S subunit of the free 80S ribosome and dissociate the inactive free 80S ribosome to form the 40S and 60S subunits; promote the assembly of the 40S subunit and the formation of the 48S initiation complex; the largest scaffolding initiation factor in mammals
eIF4A Activate mRNA and promote the formation of the 48S initiation complex
eIF4E Stimulate the formation of the 48S initiation complex
eIF4B Promote the circularization and activation of the mRNA bound to the active 80S ribosome
eIF4G Bind to the poly(A) tail to stabilize mRNA; stimulate the formation of the 48S initiation complex
eIF5A Promote the formation of translationally active 80S ribosome from the 60S ribosome and the 48S initiation complex
eIF5B Stimulate the binding of the initiation Met–tRNA to the 40S ribosome; position the initiation Met–tRNA on the start codon of the mRNA; promote the formation of translationally active 80S ribosome from the 60S ribosome and the 48S initiation complex
eIF6 Bind to the 60S subunit to inhibit translation initiation
Translation Elongation FactorseEF1A Promote selection and binding of the incoming amino acid to a polypeptide
eEF1B Convert eEF1A–GDP to an active state (eEF1A–GTP); modulate the function of release factors and the efficiency of translation termination
eEF2 Catalyze GTP-dependent translocation of peptidyl-tRNA from the A site to the P site of the ribosome
Note: eEF, eukaryotic elongation factor; eIF, eukaryotic initiation factor; GEF, guanine nucleotide exchange factor; S, Svedberg unit of flotation.
a Formerly designated as eIF4c.

252 Amino Acids: Biochemistry and Nutrition
© 2010 Taylor & Francis Group, LLC
On the other arm of initiation, powered by ATP, eIF1A and eIF3 are recruited to the 43S preinitiation complex, which binds to the capped 5′ end of the mRNA asso-ciated with eIF4E, eIF4G, and eIF4A to form a 48S initiation complex. Here, eIF3 functions to promote the assembly of this 48S initiation complex by positioning the mRNA strand near the exit site of the 40S ribosome subunit. The newly formed 48S complex scans downstream along the 5′-untranslated region (5′-UTR) of the mRNA by moving step by step in the 3′ direction until it encounters the first AUG codon. eIF1B is necessary for the recognition of the initiation codon during the scanning process, which is catalyzed by ATP-dependent helicases. Thus, the 48S initiation complex forms at the initiation codon of a conventional capped mRNA, and this event is promoted by eIF1B. Pairing of the anticodon of Met–tRNAi with the AUG codon of the mRNA signals that the initial target for polypeptide synthe-sis has been found.
Formation of the Translationally Active 80S Initiation ComplexRibosomal protein S6 (RPS6) and eIF5 (consisting of eIF5A and eIF5B) are crucial for the formation of the translationally active 80S complex from the 60S ribosome and the 48S initiation complex (which contains the 40S ribosome). After RPS6 is phosphorylated by RPS6 kinase-1 (a 70-kDa protein; p70S6K1), whose activation is catalyzed by MTOR complex-1 (MTORC1), a phosphorylated RPS6 is recruited to the 48S initiation complex. Meanwhile, eIF5A, which contains the unusual AA hypusine, acts as a GTPase-activator protein, whereas eIF5B (a GTPase) hydrolyzes the GTP that is bound to eIF2 (the initiation factor that brings the Met–tRNAi to the 40S ribosome) in the 48S initiation complex. Hydrolysis of the GTP to GDP plus Pi is required for the assembly of the functional 80S ribosome. eIF2B (also known as guanine nucleotide exchange factor) promotes the GDP–GTP exchange to regenerate active eIF2.
The free 60S ribosome joins the 40S ribosome in the 48S initiation complex through a mechanism mediated by eIF6 (also known as p27BBP; the β4 integrin interactor p27). The x-ray structure reveals that when protein synthesis is not acti-vated, the eukaryotic 60S subunit is in complex with eIF6. The release of eIF6 from the eIF6–60S complex allows the 60S ribosome to join the 40S ribosome in the 48S initiation complex to form the translationally active 80S initiation complex. The for-mation of the functional 80S ribosome is associated with the release of eIF1, eIF2, and eIF3. It is now known that eIF6 interacts with RACK1 (a receptor for activated protein kinase C) in the cytoplasm. Upon stimulation, protein kinase C catalyzes the phosphorylation of eIF6 (an ATP-dependent reaction), leading to its release from the eIF6–60S complex and, consequently, ribosome activation.
The translationally active 80S ribosome contains three RNA binding sites, des-ignated as A, P, and E (Figure 8.2). The aminoacyl site (also known as acceptor site; A site) binds an aminoacyl-tRNA; the peptidyl site (P site) binds the nascent poly-peptide chain linked to the last aminoacyl-tRNA (namely, binding a peptidyl-tRNA, which is a tRNA bound to the peptide being synthesized); and the exit site (E site), which allows for the release of deacylated tRNA after peptide bond formation. After translation initiation is completed, the A site of the 80S ribosome is free, whereas the initiator Met–tRNAi occupies the P site (Kapp and Lorsch 2004).

253Protein Synthesis
© 2010 Taylor & Francis Group, LLC
Peptide ElongationActive translation occurs on the functional 80S ribosome complex where the ribo-some reads mRNA in the 5′ to 3′ direction. During this process, each tRNA that carries the corresponding AA moves through the 80S ribosome from the A site to the P site and then exit the ribosome via the E site. Elongation factors are crucial for addition of an AA to a polypeptide and for peptide elongation. Both eEF1A and eEF2 are remarkably conserved throughout evolution. Protein synthesis occurs at a high speed and accuracy. Eukaryotic and prokaryotic ribosomes can incorporate 6 and 18 AA per second, respectively. This rapid process of peptide elongation can be divided into four steps.
Activation of AA to Form Aminoacyl-tRNABefore an AA is added to a growing peptide, the AA must be bound to a specific tRNA to form aminoacyl-tRNA (AA-tRNA). This AA activation is catalyzed by each of ∼20 aminoacyl-tRNA synthetases, in addition to Met–tRNAi. In the reaction of aminoacylation, ATP is hydrolyzed to AMP and PPi:
AA + tRNA AA-tRNAAminoacyl-tRNA synthetase
ATP AMP + PPi
Except for selenocysteine, all AA that are the building blocks of proteins react directly with their respective tRNA. The selenocysteine tRNA [tRNA(Sec)] reacts with serine to form seryl-tRNA(Sec), which is catalyzed by seryl-tRNA ligase (also known as seryl-tRNA synthetase). The selenocysteine tRNAs contain several unique fea-tures [including a 10-base (in eukaryotes) or 8-base (in bacteria) pair acceptor stem,
E
Site
P
Site
A
Site
mRNAM7G-5′ 3′ Poly(A)
80S ribosome
||| |||n n+1
FIGURE 8.2 The 80S ribosome contains three RNA-binding sites designated as A, P, and E. In the process of peptide elongation, the peptidyl moiety from the tRNA on the P site of the 80S ribosome is transferred to the acceptor end of the existing aminoacyl-tRNA on the A site of the ribosome. The discharged tRNA rapidly dissociates from the P site and is transferred to the E site before exiting the ribosome. M7G, 7-methylguanylate cap; Poly(A), polyadenylyl tail.

254 Amino Acids: Biochemistry and Nutrition
© 2010 Taylor & Francis Group, LLC
a long variable region arm, and substitutions at several well-conserved base posi-tions] and differ substantially from canonical (conventional and well-established) tRNAs that carry regular AA. Therefore, the resulting Ser-tRNA(Sec) is not recog-nized by the normal translation factor (eEF1A in eukaryotes or EF-Tu in bacteria) during translation. Rather, the seryl residue bound to tRNA(Sec) is converted into a selenocysteine residue by selenocysteine synthase (a pyridoxalphosphate-containing enzyme), and seryl-tRNA(Sec) is recognized in a special way on mRNA.
Addition of an Incoming AA to a tRNA-Bound AA on the 80S RibosomeAddition of an incoming AA to an existing tRNA-bound AA or peptide on the P site of the 80S ribosome begins as a new aminoacyl-tRNA reads the next codon on the mRNA molecule. Overall, this process involves: (1) transfer and binding of an incoming aminoacyl-tRNA to the A site of the ribosome, (2) covalent linkage of the new tRNA-bound AA to the growing polypeptide chain (peptidyl transfer), and (3) movement of the newly formed peptidyl-tRNA, together with its bound mRNA, from the A site to the P site of the 80S ribosome (translocation). Elongation factors play an essential role in achieving the accuracy of peptide elongation.
Transfer and Binding of an Incoming Aminoacyl-tRNA to the A SiteFor the cytosolic synthesis of protein, all aminoacyl-tRNAs are formed in the cyto-plasm but they are not freely diffusible in this compartment. However, aminoacyl-tRNA synthetases are present in the vicinity of ribosomes and have a capacity to interact with the polyribosomes (assemblies of ribosomes). Additionally, these enzymes are closely associated with elongation factors and the cytoskeletal network. Interestingly, there is evidence that several components of the translation machinery (including aminoacyl-tRNA synthetases, ribosomes, mRNAs, initiation and elonga-tion factors) are colocalized in animal cells. The supramolecular organization of enzymes, proteins, and RNAs may form a metabolon to preferentially channel a newly synthesized aminoacyl-tRNA from the cytoplasm to the ribosomes.
Any aminoacyl-tRNA cannot directly enter the A site. Rather, eEF1A (or EF-Tu in bacteria) is responsible for the selection and binding of the incoming aminoacyl-tRNA to the A site of the 80S ribosome. In this process, eEF1A (formerly known as eEF1α; a G-protein) forms a complex with both the new incoming aminoacyl-tRNA and GTP, and the resulting complex then binds to the A site. The interaction of aminoacyl-tRNA with eEF1A stimulates GTP hydrolysis by eEF1A and also results in a conformational change in eEF1A. This causes eEF1A–GDP to detach from the 80S ribosome and leave the aminoacyl-tRNA attached at the A-site. Therefore, both the A site and the P site of the 80S ribosome contain their respec-tive aminoacyl-tRNAs. After the release of eEF1A–GDP and Pi, eEF1A–GDP can recycle to an active state (eEF1A–GTP) through the action of eEF1B (formerly known as eEF1β).
Unlike other protein-bound AA that are coded for directly in the genetic code, selenocysteine is incorporated into a selenoprotein during translation elongation and is encoded by a combination of an internal UGA stop codon and a specific mRNA hairpin structure located further downstream, the SECIS (selenocysteine insert-ing sequence) element. The SECIS element is defined by characteristic nucleotide

255Protein Synthesis
© 2010 Taylor & Francis Group, LLC
sequences and secondary structure base-pairing patterns, and differs between eukaryotes and prokaryotes. For example, the SECIS element is typically located in the 3′ untranslated region (3′ UTR) of the mammalian mRNA but immediately after the UGA codon within the reading frame of the prokaryotic mRNA. The specificity for the stop codon is achieved by tRNASec, whose UCA anticodon is complemen-tary to the UGA stop codon.
The Sec-tRNA(Sec) is specifically bound to a specialized translational elonga-tion factor called selenocysteine-tRNA-specific elongation factor (SelB) in a GTP-dependent manner in all three kingdoms of life [animals, plants, and unicellular organisms (e.g., bacteria)]. SelB recognizes only Sec-tRNA(Sec), but not other amino-acyl-tRNAs, and delivers Sec-tRNA(Sec) to the ribosomal A site. An eukaryotic elon-gation factor specific for selenocysteine-tRNA (eEFSec) or mammalian SelB (mSelB) has been found in recent years. The specificity of the Sec-tRNA(Sec) delivery mecha-nism is conferred by the presence, in Sec-tRNA(Sec), of an extra subunit (SBP2 for mSelB/eEFSec in eukaryotes) or an extra protein domain (SelB in bacteria), which binds to the SECIS elements in a selenoprotein mRNA.
Peptide Bond FormationPeptidyltransferase in the 60S subunit catalyzes the formation of a peptide bond between the amino group of the new aminoacyl-tRNA in the A site and the carboxyl group of the peptidyl-tRNA occupying the P site. This enzymatic activity is now known to be performed by an RNA of the ribosome (e.g., 23S RNA), and such an RNA is called a ribozyme. The ribozyme facilitates formation of the peptide bond through the following mechanisms: (1) lowering the activation entropy of the reac-tion by strategically positioning the two substrates, (2) placing water in the active site, (3) providing an electrostatic network that stabilizes intermediates of the reac-tion, and (4) coordinating proton transfer via a concerted proton shuttle mechanism involving ribose hydroxyl groups on the tRNA substrate. The nucleophilic reaction for covalent formation of the peptide bond requires no further energy because the AA on the aminoacyl-tRNA is already activated.
Translocation of the Newly Formed Peptidyl-tRNAUpon peptide bond formation, the peptidyl moiety from the tRNA on the P site of the 80S ribosome is transferred to the acceptor end of the existing aminoacyl-tRNA on the A site of the ribosome. The discharged tRNA rapidly dissociates from the P site and is transferred to the E site before exiting the ribosome. Simultaneously, eEF2 binds to the ribosome in complex with GTP. This interaction causes a change in the conformation of eEF2 and its activation. The activated eEF2 then hydrolyzes GTP to GDP plus Pi and catalyzes the translocation of the newly formed peptidyl-tRNA, together with its bound mRNA, from the A site to the P site of the 80S ribosome toward the 3′ direction. This frees the A site for another cycle of elongation.
Termination of Peptide Chain ElongationAfter multiple cycles of elongation to polymerize AA into a protein molecule, the completion of polypeptide chain elongation is recognized in the A site by the ter-minating signal known as the nonsense or terminating codon (e.g., UGA, UAG, or

256 Amino Acids: Biochemistry and Nutrition
© 2010 Taylor & Francis Group, LLC
UAA) on the mRNA. Except for the special Sec-tRNA(Sec), tRNA normally does not have an anticodon that can recognize such a termination codon. Rather, the recogni-tion of a termination codon residing in the A site of the 80S ribosome is performed by eukaryotic protein release factors (eRF) (e.g., eRF1, eRF2, and eRF3), and the stop codon induces the binding of a release factor that prompts the disassembly of the entire ribosome–mRNA complex. The functions of the release factors are modu-lated by eEF1B. eRF1 recognizes UAA and UAG, whereas eRF2 recognizes UAA and UGA. In complex with GTP, eRF3 (a GTP-binding protein) promotes the bind-ing of eRF1 and eRF2 to the ribosome. In a complex with the peptidyltransferase and GTP, the eRF catalyzes the hydrolysis of the bond between the peptide and the terminal tRNA occupying the P site. Therefore, the newly synthesized peptide and the tRNA are released from the P site. GTP hydrolysis to GDP plus Pi triggers the dissociation of the eRF from the ribosome. Thereafter, eIF2–GDP is converted into eIF2–GTP by eIF2B (the guanine nucleotide exchange factor), whereas the 80S ribo-some dissociates into the 40S and 60S subunits, which are utilized for another cycle of protein synthesis.
Posttranslational Modifications of Newly Synthesized ProteinsMost proteins have no biological activities when released from the ribosome. The polypeptides must undergo appropriate modifications in the cytoplasm and/or on the rough endoplasmic reticulum in eukaryotes (equivalent to becoming mature proteins). These posttranslational modifications include: (1) proteolytic cleavage [including removal of the initiating AA (e.g., Met or fMet) and the C- and N-terminal residues (e.g., signal peptide by signal peptidase), and limited proteolysis of propro-teins or propeptides (inactive proteins or peptides)] and (2) covalent modifications of AA residues in proteins or peptides (Table 8.3). Protein modifications have biological significance and practical implications for research design. For example, while post-translational modifications of proteins are necessary for their biological activities, oxidation of proteins may result in their damage. On the other hand, the release of modified AA (e.g., 3-methylhistidine and 4-hydroxyproline) from proteins can be used to estimate the degradation of myofibrillar proteins in skeletal muscle and con-nective tissue, respectively.
The multiple forms of lysine residues in the posttranslational modifications of proteins deserve special mentioning. For example, these lysine residues can undergo: (1) methylation to form methyl-, dimethyl-, and trimethyllysine, (2) acetylation and ubiquitination (important mechanisms for regulation of protein expression and deg-radation), (3) hydroxylation to form hydroxylysine in collagen and other types of proteins, and (4) O-glycosylation of protein-bound hydroxylysine residues in the endoplasmic reticulum and Golgi apparatus to mark certain proteins for secretion from cells. The extent to which lysine residues are modified may affect the amounts of lysine produced from acid or enzymatic hydrolysis of proteins. Additionally, because of the formation of polymerized cross-linking of proteins, transglutamin-ases play an important role in blood coagulation, skin barrier function, and wound healing, and these enzymes are called nature’s biological glues. Thus, since their initial description by D.D. Clarke in 1959, transglutaminases have received increas-ing interest from life and biomedical scientists.

257Protein Synthesis
© 2010 Taylor & Francis Group, LLC
TABLE 8.3Posttranslational Modifications of Proteins in Cells
Type of Posttranslational Modification Examples
Proteolytic cleavage Removal of the initiating AA (e.g., Met or fMet) and the C- and N-terminal residues (e.g., signal peptide by signal peptidase), and limited proteolysis of proproteins (e.g., proinsulin) or propeptides (inactive proteins or peptides)
Covalent modifications of AA residues in proteins or peptides
Formation of chemical bonding by the sharing of one or more electrons (especially pairs of electrons) between atoms
Acetylation Addition of an acetyl group, usually at the N-terminus of proteins (e.g., histone deacetylases and tubulin)
ADP-ribosylation Addition of one or more ADP-ribose moieties to proteins (e.g., histones and membrane adenylate cyclase)
Biotinylation Acylation of conserved lysine residues in proteins (e.g., avidin and acyl carrier protein) with biotin
γ-Carboxylation Addition of a carboxyl group to glutamate residues in proteins (e.g., prothrombin and blood-clotting factors)
Disulfide linkage Coupling of two thiol (–SH) groups in cysteine residues of proteins (e.g., insulin) to form –S–S– linkage
Flavin attachment Covalent attachment of FAD and FMN to proteins (e.g., NOS and mammalian succinate dehydrogenase)
Glutamylation Covalent linkage of glutamic acid residues to a γ-carboxyl group of a glutamate residue in proteins (e.g., α- and β-tubulin)
Glycosylation Enzyme-catalyzed attachment of carbohydrate to the side chain of proteins (e.g., membrane hormone receptors and lactoferrin) to form glycoproteins
Glycation (nonenzymatic glycosylation)
Covalent bonding of proteins (e.g., hemoglobin and amyloid protein) with a sugar molecule (e.g., glucose and fructose)
Glycylation Covalent linkage of one or more glycine residues to proteins (e.g., α- and β-tubulin)
Heme attachment Attachment of heme to proteins (e.g., cytochromes a and c)
Hydroxylation Introduction of a hydroxyl group to certain AA (e.g., proline and lysine) residues in proteins (e.g., collagens) to form hydroxylated AA (e.g., 4-hydroxyproline and hydroxylysine)
Methylation Addition of a methyl group to certain AA (e.g., histidine, lysine, and arginine) residues in proteins (e.g., actin, myosin, and histones) to form methylated AA (e.g., 3-methylhistine and methylated arginines); a type of alkylation
Myristoylation Covalent attachment of myristate (a 14-carbon saturated fatty acid) to N-terminal glycine residue in proteins (e.g., calcineurin B and the catalytic subunit of AMPK)
S-Nitrosylation Covalent incorporation of a NO moiety into the thiol group of cysteine in proteins (e.g., NMDA-type glutamate receptor and GSH reductase) to form S-nitrosothiol (SNO)
continued

258 Amino Acids: Biochemistry and Nutrition
© 2010 Taylor & Francis Group, LLC
PAthwAy of Protein synthesis in mitochonDriA
Most mitochondrial proteins are synthesized on ribosomes in the cytoplasm. The newly synthesized proteins for subsequent transport into the mitochondrion contain mitochondrion-targeting sequences and are taken up into this organelle by binding to its surface receptor proteins that can recognize specific mitochondrion-targeting sequences.
Research on mitochondrial protein synthesis dates back to the 19th century, when the mitochondrion was discovered. Specifically, intracellular structures of mitochon-dria in mammalian cells were observed in the 1840s. The name mitochondrion was coined in 1898 by C. Benda, referring to the Greek “mitos” (thread) and “chondros” (granule) to indicate the appearance of these structures during spermatogenesis. In
TABLE 8.3 (continued)Posttranslational Modifications of Proteins in Cells
Type of Posttranslational Modification Examples
3-Nitration Introduction of a nitro (NO2) group to a tyrosine residue in proteins (e.g., bovine serum albumin and angiotensin II) to form 3-nitrotyrosine
Oxidationa Oxidation of protein by various oxidants
Phosphorylation Addition of a covalently bound phosphate group into a serine, threonine, or tyrosine residue of proteins (e.g., BCKA dehydrogenase and MTOR) by a protein kinase
Palmitoylation Covalent attachment of a fatty acid (e.g., palmitic acid) to cysteine and other residues (e.g., serine and threonine) of proteins (e.g., eNOS and CPS-I)
Racemization Interconversion of certain AA residues in proteins (e.g., aspartate in myelin basic protein and β-amyloid protein) from l- to d-isoform
Selenoylation Cotranslational incorporation of selenium into selenoproteins (e.g., GSH peroxidase and thioredoxin reductase)
Tyrosine sulfation Addition of a sulfate group to tyrosine residues in proteins (e.g., bovine fibrinopeptide B and G-protein coupled receptors) to form tyrosine-O-sulfate
Ubiquitination Formation of the linkage between the protein substrate with ubiquitin
Transglutamination Formation, by transglutaminases, of a covalent bond between a free amine group (e.g., an ε-amino group of a peptide-bound lysine residue) in protein and a γ-carboxamide group (–CO–NH2) of a peptide-bound glutamine to create an inter- or intramolecular isopeptidyl bond that is highly resistant to proteolysis
a Oxidants include superoxide anion, hydrogen peroxide, hydroxyl radical, NO, peroxynitrite, hypo-chlorous acid, peroxy radicals, and lipid peroxide. Cysteine and methionine residues are most suscep-tible to oxidation, but tyrosine, proline, and tryptophan can also be oxidized. Oxidatively modified residues include 3-hydroxytyrosine, 3-chlorotyrosine, 3-nitrated tyrosine (Tyr-NO2), 5-hydroxypro-line, 5-hydroxytryptophan, cysteine sulfenic acid, and S-nitrated cysteine. AA residues in proteins can also be modified by carbonate anion radicals to yield protein carbonyls in organisms.
259Protein Synthesis
© 2010 Taylor & Francis Group, LLC
1972, protein synthesis within mitochondria was first reported by two independent groups (A. Tzagoloff and P. Meagher in New York, USA, and H. Weiss in Munchen, Germany). Between 1975 and 1976, physical mapping of mitochondrial DNA was performed for various species. In 1977, mitochondrially translated polypeptides were found to be coded for by mitochondrial DNA. Nucleotide sequences of mito-chondrial genes were published in 1979–1980, revealing unique features of the mito-chondrial genetic code.
It is now known that mitochondria in eukaryotes possess their own genome to synthesize a limited number of mitochondrial proteins (e.g., 8 in certain yeasts, 13 in mammals, and ∼20 in plants). These proteins are subunits of enzyme complexes located on the inner membrane that are involved in respiration and oxidative phos-phorylation. The mitochondrial genome encodes all the components required for protein synthesis, as previously described for this biochemical process in the cyto-plasm. Mitochondrial translation systems are more similar to those in prokaryotes than in eukaryotes. In addition, mitochondrial protein synthesis has some unusual features, including (1) some different codon assignments from the “universal” genetic code, (2) the use of a restricted number of tRNAs that is much less than necessary to translate all the codons of the genetic code, and (3) unusual structural features of mitochondrial ribosomes (e.g., a higher protein-to-RNA ratio).
BIOCHEMICAL CHARACTERISTICS AND SIGNIFICANCE OF PROTEIN SYNTHESIS
enerGy reQuirement
Intracellular protein synthesis requires large amounts of energy, primarily in the forms of ATP and GTP. The energy-dependent reactions include: (1) AA activation, (2) the entry of tRNA-AA into the A site on the ribosome that requires the cleavage of GTP to GDP, and (3) the translocation of the newly formed peptidyl-tRNA from the A site to the P site on the ribosome.
1. AA activation: ATP → AMP + PPi (two high-energy phosphate bonds) 2. Entry of tRNA-AA into the A site: GTP → GDP + Pi (one high-energy
phosphate bond) 3. Translocation of the newly formed peptidyl-tRNA from the A site to the P site:
GTP → GDP + Pi (one high-energy phosphate bond)
Thus, four high-energy phosphate bonds (equivalent to 4ATP → 4ADP + 4Pi) are required to incorporate one AA molecule into a growing polypeptide. This amounts to 206.4 kJ for 1 mol of AA, based on 51.6 kJ/mol for one high-energy bond in ATP. To synthesize 100 g of protein, whose AA residues are assumed to have an average molecular mass of 100 Da, the energy requirement for this event would be 206.4 kJ. The transport of some AA by cells also requires ATP. The energy released during protein biosynthesis helps explain, in part, the phenomenon of “heat increment” after an animal eats a protein meal.

260 Amino Acids: Biochemistry and Nutrition
© 2010 Taylor & Francis Group, LLC
Let us take an adult man, for example. To estimate the energy requirement for protein synthesis, assuming that a healthy adult man (70 kg) synthesizes 250 g of protein per day, then
250 g of protein → 250/100 = 2.5 mol of AA
Let us assume that 0.5 mol of ATP is needed by the cell to transport 1 mol of AA across the plasma membrane.
ATP requirement for protein synthesis:
2.5 mol of AA (4 mol of ATP/mol of AA + 0.5 mol of ATP/mol of AA) = 11.25 mol of ATP
Oxidation of 1 mol of glucose (180 g), 1 mol of AA (on average), 1 mol of palmi-tate, and 1 mol of glycerol produces 30, 20, 106, and 18.5 mol of ATP, respectively (Chapter 4). If a healthy adult consumes 300 g of starch (the molecular weight of the glucose residue is 162), 60 g of protein (the molecular weight of the AA residue is 100), and 60 g of fat (e.g., tripalmitoylglycerol whose molecular weight is 806) per day, with true digestibilities of 98%, 90%, and 96%, respectively, ∼13% of the dietary energy substrates is oxidized to support whole-body protein synthesis:
ATP produced from dietary intake of 300 g of starch = 300 g/162 g × 0.98 × 30 = 54.4 mol
ATP produced from dietary intake of 60 g of protein = 60 g/100 g × 0.90 × 20 = 10.8 mol
ATP produced from dietary intake of 60 g of fat in diet = 60 g/806 g × 0.96(3 × 10⁶ + 1 × 18.5) = 24.0 mol
(Note: 1 mol of tripalmitoylglycerol contains 3 mol of palmitate and 1 mol of glycerol.)
The percentage of ATP produced from oxidation of dietary macronutrients that is utilized for protein synthesis is ∼13% [namely, 11.25/(54.4 + 10.8 + 24.0) = 12.6%] in the healthy adult. Note that this calculation does not take, into consideration, the energy required for glucose and glycerol transport as well as intracellular fatty-acid trafficking.
PhysioloGicAl siGnificAnce of Protein synthesis
Dietary proteins must be converted into tissue proteins in order to exert their nutri-tional and physiological roles. This metabolic conversion is accomplished only by intracellular synthesis of the various types of proteins from AA. The physiological significance of protein biosynthesis can be readily appreciated because of the vital functions of proteins in animals. Protein synthesis also functions to regulate: (1) intracellular and extracellular concentrations of proteins (including enzymes), (2) replacement of cells, (3) wound healing, and (4) immune responses in organisms (Yu et al. 1996; McAllister et al. 2000; Hallemeesch et al. 2002).

261Protein Synthesis
© 2010 Taylor & Francis Group, LLC
Physiological Functions of ProteinsThere are ∼100,000 different proteins in the animal. Proteins maintain both cell structure and extracellular structure. In cardiac, skeletal, and smooth muscle, actin and myosin are the major protein constituents of the cellular machinery required for their contraction. Many proteins are enzymes catalyzing biochemical reactions, without which there would be no life. Some proteins regulate gene expression and nutrient metabolism, while protecting the body from oxidative stress and infectious diseases. In addition, as hormones secreted by endocrine glands, proteins mediate cell-to-cell communications in the body. Furthermore, proteins serve to transport and store nutrients (including water and AA) and oxygen. Finally, proteins are hydro-philic molecules. In general, 1 g of protein is associated with retention of 3 g of water in the body. Given the various physiological roles of proteins (Table 8.4), a loss of more than 50% of the protein from the body is not compatible with the survival of humans and other animals.
Regulation of Protein ConcentrationsProtein synthesis is necessary for replacing the degraded proteins and for main-taining intracellular and extracellular concentrations of proteins in all organisms. In young animals, protein synthesis plays an important role in determining tissue growth and development. Rates of protein synthesis in major tissues of 35-day-old pigs are summarized in Table 8.5. Note that proteins in the liver are almost com-pletely synthesized de novo every 24 h. In adults who do not usually accrete proteins and have lower rates of protein synthesis than the young, protein synthesis remains necessary to maintain protein homeostasis in cells. In all animals, proteins synthe-sized and exported by cells, such as hepatocytes, enterocytes, and immunocytes, regulate the concentrations of these proteins in plasma and other extracellular fluids. For extracellular proteins, the rates of their release from cells are also controlled by exocytosis. The following equation regarding intracellular protein balance applies to
TABLE 8.4Physiological Functions of Proteins in Animals
Functions Examples of Proteins Involved
Cell structure Integral and peripheral membrane proteins
Extracellular structure Collagen, elastin, and proteoglycans
Enzyme-catalyzed reactions Dehydrogenase, decarboxylase, and protein kinase
Gene expression DNA-binding proteins, histones, and repressor proteins
Hormone-mediated effects Insulin, somatotropin, and placental lactogen
Muscle contraction Actin, myosin, and tubulin
Osmotic regulation Proteins in plasma
Protection Blood-clotting factors, antibodies, and interferons
Regulation of metabolism Calmodulin, leptin, and osteopontin
Storage of nutrients and O2 Ferritin, metallothionein, and myoglobin
Transport of nutrients and O2 Albumin, hemoglobin, and plasma lipoproteins

262 Amino Acids: Biochemistry and Nutrition
© 2010 Taylor & Francis Group, LLC
all cell types. There could be a positive or negative protein balance in a given tissue or the whole body:
Intracellular protein balance = rate of protein synthesis − rate of protein degradation
Regulation of protein metabolism is the biochemical basis for increasing protein deposition in animal tissues, particularly in skeletal muscle, and for decreasing pro-tein wasting in disease conditions. Studies with young pigs by T.A. Davis and P.J. Reeds have shown that an increase in protein accretion in skeletal muscle brought about by protein feeding and AA supplementation results primarily from an increase in protein synthesis rather than a decrease in protein degradation. Changes in the rates of protein synthesis and degradation are also crucial for regulating concentra-tions of key enzymes in metabolic pathways (see Chapter 10).
Replacement of CellsProtein synthesis is required for the ongoing production of all cells, particularly rapidly proliferating cells such as (1) epithelial cells of the gastrointestinal tract, mammary glands, and skin, (2) reticulocytes, (3) immunologically challenged lymphocytes, and (4) gamete cells of the reproductive system. These cells are vital to the survival and reproduction of organisms. For example, rapid growth of epi-thelial cells in the small intestine of neonatal pigs and rats is essential as their life span is only 7–20 days depending on age. Also, when an animal is immunologi-cally challenged, T-cells and B-cells rapidly proliferate so that large amounts of lymphokines and antibodies are generated. An inability for lymphocytes to pro-liferate in response to activating signals results in impaired immune response and immunodeficiency.
TABLE 8.5Rates of Protein Synthesis in Tissues of 35-Day-Old Pigsa
TissueProtein Synthesis
(%/Day)b TissueProtein Synthesis
(%/Day)b
Colon 42 Skeletal musclec 12
Heart 31 Small intestined
Kidney 40 Proximal 60
Liver 84 Distal 59
Lung 58 Spleen 57
Pancreas 76 Stomach 58
Source: Adapted from Deng, D. et al. 2009. J. Nutr. Biochem. 20:544–552.a Measured under the fed state.b Fractional rate of protein synthesis.c Longissimus dorsi muscle.d Including both enterocytes and smooth muscle cells.

263Protein Synthesis
© 2010 Taylor & Francis Group, LLC
Wound HealingSuccessful wound healing is critical to the recovery of patients from injury and to minimize postoperative morbidity and mortality. This process involves: (1) the inflammatory phase during which cells of the immune system (e.g., macrophages) produce factors to stimulate the migration and division of cells in a wounded tis-sue; (2) the proliferative phase characterized by angiogenesis, collagen deposition, granulation tissue formation, epithelialization, and wound contraction by the action of myofibroblasts; and (3) the maturation and remodeling phase during which col-lagen is synthesized, remodeled, and realigned along tension lines. Each of these steps requires enhanced synthesis of multiple proteins from AA. Increased provi-sion of AA, particularly arginine, proline, and glycine, improves wound healing in humans and other animals.
Immune ResponsesAn ability of the host to prevent the invasion of various pathogens depends on both the innate (natural, nonspecific) and the acquired (adaptive, specific) immune sys-tems. The innate immune system consists of several integral components: (1) physical barriers (e.g., skin and endothelial cell layer in the respiratory tract and gastrointesti-nal tract); (2) mononuclear phagocytes (e.g., monocytes and macrophages), dendritic cells, polymorphonuclear granulocytes (e.g., neutrophils, eosinophils, and basophils), mast cells, natural killer cells, and platelets; (3) humoral factors, including collectins, complements, lysozymes, C-reactive proteins, and interferons; (4) antimicrobial pep-tides in the mucosa and lumen of the small intestine; and (5) neutrophil extracellular traps, comprising DNA and proteins as major structural components. The acquired immune system consists of T-lymphocytes, B-lymphocytes, and humoral factors. The bone marrow is primarily responsible for hematopoiesis and lymphopoiesis, while the thymus is required for T-cell development. The spleen, lymph nodes, and the mucosa-associated lymphoid tissues in the gastrointestinal, respiratory, reproduc-tive tracts, and other organs are secondary lymphoid tissues. Antibodies produced by B-lymphocytes are highly effective against extracellular pathogens. Both the innate and acquired immune systems require the synthesis of cytokines, antibodies, comple-ments, and other related proteins. Thus, dietary protein deficiency impairs immunity and increases risk for infectious disease.
MEASUREMENTS OF PROTEIN SYNTHESIS
meAsurement of Protein synthesis In VItro
General ConsiderationsLabeled AA tracers are used to measure protein synthesis and degradation in isolated tissues or incubated cells (Fukls et al. 1975). The advantages of in vitro methods are numerous. First, the preparation and incubation of tissues or cells are simple, making it possible to study a relatively large number of tissues or cells at one time. Second, the use of contralateral tissues (e.g., skeletal muscle) or cells (e.g., lymphocytes) can decrease experimental errors due to interanimal differences and increases the power for statistical analysis. Third, experimental conditions can easily be imposed

264 Amino Acids: Biochemistry and Nutrition
© 2010 Taylor & Francis Group, LLC
to quickly test a large number of interesting hypotheses. Fourth, in vitro methods allow studies of specific cell types, which would be no small undertaking in vivo. Fifth, isolated tissues or cells are free of interference from other tissues or interfering factors, thus allowing studies of direct effects of hormones or other substances on protein turnover in a specific tissue or a cell type. Sixth, in vitro studies are invalu-able for elucidating biochemical mechanisms of protein turnover and for gaining information fundamental to designing in vivo studies.
In vitro measurement of protein synthesis has shortcomings. First, the rate of protein synthesis in vitro is always lower than that measured in vivo. This is due, in part, to the limited diffusion of oxygen into the core of an incubated tissue (e.g., skeletal muscle), thus causing a hypoxic zone. To facilitate oxygen diffusion and substrate transport, it is desirable to use small-size tissues from young rodents, young chickens, and other small animals. The viability of in vitro preparations can be assessed by measuring: (1) the linearity of biochemical reactions, (2) intra-cellular ATP concentration, (3) oxygen consumption, and (4) the integrity of cell structures as indicated by the release of lactate dehydrogenase and exclusion of trypan blue. Second, incubated tissues (e.g., skeletal muscle) are usually in nega-tive N balance. This, however, may not be true for skeletal muscle isolated from young growing animals (e.g., 9-day-old chicks). For incubated muscle, this nega-tive N balance can be improved by mounting the tissue at normal length. Third, in vitro data may not necessarily be extrapolated to in vivo situations, due to the absence, from the incubated tissue and cells, of mechanisms responsible for main-taining homeostasis in intact animals such as the neuroendocrine and circulatory systems.
In Vitro PreparationsIn vitro preparations for measuring protein synthesis include: (1) perfused organs (e.g., liver, kidneys, heart, lung, intestine, leg muscles, and hemicorpus), (2) incubated tis-sues or organs (e.g., skeletal muscle of ~15–25 mg; quarters of young rat diaphragm), atria, and epididymal fat pads, (3) isolated cells (e.g., myocytes, neutrophils, adipo-cytes, lymphocytes, hepatocytes, macrophages, enterocytes, tumor cells, skeletal muscle cells, red blood cells, Hela cells, 3T3 cells, lung cells, L6 myoblasts, and fibro-blasts), and (4) cell-free systems. Cells or tissues are usually cultured or incubated for up to 3 h (Tischler et al. 1984). In vitro studies have played, and will continue to play, a major role in advancing our knowledge of protein synthesis. In isolated cells or tissues, the rate of protein synthesis is usually determined by measuring the rate of incorpora-tion of a labeled AA into newly synthesized protein. This measurement can yield false high values for protein synthesis due to reincorporation of labeled AA released during protein degradation into recently synthesized protein. The simplest and most effec-tive strategy to minimize this tracer reincorporation is the use of appropriately high concentrations of the tracee AA (e.g., 1 mM phenylalanine) in the incubation (extracel-lular) medium (Xi et al. 2012).
Both perfused organs and incubated tissues contain extracellular space. Therefore, the amounts of radioactivity in the extracellular space should be corrected for to determine the intracellular specific radioactivity (SR) of the labeled AA (Chapter 7). This can be done by using a labeled substance (e.g., 3H-inulin) that cannot be

265Protein Synthesis
© 2010 Taylor & Francis Group, LLC
taken up by cells of the tissue. Similar considerations are applied to studies involving stable isotopes.
Caution should also be exercised to ensure the viability of a tissue used to mea-sure protein synthesis in vitro. In general, an incubated tissue should be small and thin to permit the rapid diffusion of O2 from the medium into the tissue. Also, the incubation period should be relatively short so that the tissue remains biochemically viable. Some investigators, however, are not aware of these important cautions in their studies and have reported using 500 mg isolated skeletal muscle for incubation, for example. Likewise, some scientists incubated large pieces of skeletal muscle for 96 h. In such studies, the viability of skeletal muscle is questionable.
Choosing a Labeled AA TracerNot all AA tracers can be used to measure protein synthesis. Selection of a tracer AA depends on cell type and tissue (Adegoke et al. 2003; Long et al. 2012). However, the following criteria for choosing an appropriate tracer AA must be considered:
1. The AA tracer or its tracee is neither synthesized nor degraded by the cell or tissue of interest. This facilitates rapid achievement of an intracellu-lar isotopic steady state and the measurement of intracellular SR or iso-tope enrichment (IE) of the labeled free AA. Note that labeled AA that are metabolized in pathways other than through protein turnover can be converted into other labeled intermediates including AA or may become diluted, to a large extent, by the synthesis of nonlabeled AA (see Chapter 7).
2. The tracee AA must be transported readily across the plasma membrane and have a small metabolic pool size. This facilitates rapid achievement of intracellular isotopic steady state in the cells or tissue of interest.
3. The tracee AA has no effect on intracellular protein turnover in the cells and tissue of interest. This ensures that the presence of a relatively high concentration of the tracee AA in the incubation or culture medium will not interfere with the effects of tested substances.
4. The isotopically labeled atoms in the tracer cannot be spontaneously exchangeable with nonlabeled atoms and the labeled AA must be of high purity. This helps to prevent the loss and contamination of the tracer AA, while ensuring accurate measurement of protein synthesis.
5. The tracee AA can be analyzed by a reliable method. This ensures accurate measurement of intracellular SR or IE of the free labeled AA in the cells and tissue of interest.
6. The labeled AA should be readily available and relatively economical to help reduce the cost of the studies to allow for a number of replicates.
The tracee AA that meet the above requirements vary with cells and tissue (Wu and Thompson 1990). For example, labeled leucine, valine, or isoleucine can be used to measure protein synthesis in the liver, but not in skeletal muscle because BCAA are extensively transaminated in skeletal muscle but undergo little catabolism in the liver. In contrast, phenylalanine or tyrosine is a good choice for the measurement of protein synthesis in the skeletal muscle.

266 Amino Acids: Biochemistry and Nutrition
© 2010 Taylor & Francis Group, LLC
Measuring Rate of Protein SynthesisIn all studies, extracellular medium must contain physiological levels of AA found in plasma or in the lumen of the small intestine, depending on the experimental design. A labeled AA is added into the perfusate or incubation medium. The incorporation of the labeled AA into proteins is measured over a period of time (e.g., 2–3 h) during which protein synthesis is in steady state. At the end of the perfusion or incubation, tissue samples or cells are homogenized with an acid (e.g., 5 mL of 10% trichloroacetic acid or 1.5 M HClO4 per 100 mg of tissue; or 0.5 mL of 10% trichloroacetic acid or 1.5 M HClO4 per 5 × 10⁶ cells) to precipitate proteins and obtain the intracellular free AA pool. The precipitated proteins are solubilized overnight in 0.5 mL of Soluene or 1 M NaOH at 60°C. Labeled AA and tracee in proteins and the intracellular free AA pool are analyzed using various instruments, including high-performance liquid chromatography, liquid scintillation spectrometry, or mass spectrometry. The rate of protein synthesis is generally calculated on the basis of the intracellular SR or IE of the labeled AA in the precursor pool rather than the SR or IE of the aminoacyl-tRNA. This is because the measurement of aminoacyl-tRNA is technically challenging due to its very low concentration in cells and its very high rate of turnover. The rate of protein synthesis measured in vitro is expressed often as nmol AA incorporated into protein per milligram tissue but sometimes as %/h. Let us use a radioactive tracer as an example.
Incorporation of AA into protein = A/F* ÷ amount of tissue (mg) ÷ time
A: Amount of radioactivity in the protein (dpm) at the end of the incubation periodF*: SR of the precursor, namely the labeled free AA in the cell (dpm/nmol)t: Length of time tissue exposed to labeled AAKs: Fractional rate of protein synthesis (%/time)
Ks (%/t) = (P*/F*) ÷ time × 100%
P*: SR of labeled AA in tissue proteins (dpm/nmol)
Amount of protein synthesized per unit of time = Ks × protein mass
Example for the calculation of the rate of protein synthesis in vitro: Rat soleus muscle (25 mg) is incubated for 2 h at 37°C in the presence of 10 mU/mL insulin, 5 mM d-glucose, 1 mM l-phenylalanine plus l-[U-14C]phenylalanine, and physio-logical concentrations of other AA found in plasma. The SR of 14C-phenylalanine in the incubation medium is 310 dpm/nmol. The intracellular SR of 14C-phenylalanine is 300 dpm/nmol at 15 min of incubation and is maintained constant during the 2 h incubation period. The amounts of 14C-phenylalanine radioactivity and phenylala-nine in proteins are 3500 dpm and 2.8 μmol, respectively. Protein content in skeletal muscle is 20%. What is the rate of protein synthesis in the tissue?
Amount of 14C-Phe radioactivity in protein = 3500 dpm
F* = 300 dpm/nmol Phe

267Protein Synthesis
© 2010 Taylor & Francis Group, LLC
Incorporation of AA into protein = A/F* ÷ amount of tissue (mg) ÷ time (h) = 3500/300 ÷ 25 mg ÷ 2 h = 0.233 nmol Phe/mg tissue per h
P* = 3500 dpm/2.8 μmol Phe = 1250 dpm/μmol Phe = 1.25 dpm/nmol Phe
Ks = (P*/F*) ÷ time × 100 = 1.25/300 ÷ 2 h × 100 = 0.208%/h
Amount of protein synthesized per h = Ks × protein mass = 0.208%/h × 5 mg = 0.01 mg/h
meAsurement of Protein synthesis In VIVo
General ConsiderationsThe criteria for the selection of a tracer AA for in vivo studies are the same as for in vitro experiments, except that all AA can be degraded in animals. Many methods have been developed to measure in vivo protein synthesis in tissues of the animal, which include (1) single administration of a tracer AA, (2) flooding dose technique, and (3) constant infusion of a tracer AA (Davis and Reeds 2001). Measurement of whole-body protein synthesis based on two or more compartment models has also been validated for use in animals. The most common methods are the flooding dose technique and the constant infusion of a tracer. However, the experimental approach chosen for measuring tissue protein synthesis in vivo should be dictated by the scien-tific question being addressed (Garlick et al. 1994; Johnson et al. 2003).
In vivo methods offer distinct advantages by: (1) allowing studies of protein metabo-lism under both physiological and pathological conditions, which cannot be absolutely mimicked in vitro, (2) providing an invaluable approach to verify in vitro findings and their significance in intact animals, and (3) eliminating the need to perform invasive procedures on animals. Disadvantages of in vivo studies include the following. First, the number of animals, particularly large animals, used in each experiment is lim-ited by laboratory space and costs. Second, in vivo conditions are difficult to control and methodologies are often complicated, thus introducing many variables in data analysis. Third, biological differences between experimental animals can be large, therefore decreasing the sensitivity of the response to treatments. Fourth, it is difficult to study protein turnover in specific cell types in vivo, due to interactions between different cell types within a tissue. Fifth, interferences of the studied tissue by other tissues exist in vivo, making it very difficult to interpret experimental data.
General Terminologies Used in Measuring Protein Turnover In VivoRadioactive or stable tracers are often used for in vivo measurement of protein syn-thesis in animals (Southorn et al. 1992; Dillon et al. 2011). The common terminolo-gies for the kinetics of protein synthesis are described in this section (Figure 8.3). Because a labeled AA in protein can leave the protein pool through protein degrada-tion, terminologies for its kinetics are also introduced herein. Methods to determine in vivo protein degradation in animals will be discussed in more detail in Chapter 9.
A: The amount of radioactivity (dpm for a radioisotope) or mass (nmol for a stable isotope) of the labeled AA in the protein molecule.

268 Amino Acids: Biochemistry and Nutrition
© 2010 Taylor & Francis Group, LLC
P: The amount of a given AA in the total pool of the protein molecule (nmol). Because the AA composition of a protein is constant, P is proportional to the total amount of protein.
P*: SR (dpm/nmol) of the radioactive tracer AA (e.g., 14C-Phe) or IE (%) of the stable tracer AA in the protein molecule. P* = A/P.
F*: SR (dpm/nmol) of the radioactive tracer AA (e.g., 14C-Phe) or IE (%) of the stable tracer AA in the precursor pool (see Chapter 7 for calculation).
Ks: Fractional rate of the tracer AA entering the protein molecule as a result of protein synthesis.
Kd: Fractional rate of the tracer AA leaving the protein molecule as a result of protein degradation.
Kp: Fractional turnover rate of tracer AA in the protein molecule (i.e., frac-tional rate of protein synthesis or degradation at steady state when Ks = Kd; %/min).
KF: Rate constant (%/min) for rise of SR or IR of the tracer AA in the free precursor pool to plateau; KF depends on the tissue and the amount of the labeled AA infused into the body:
dP*/dt = (Ks × F*) − (Kd × P*)
t: the duration of protein labeling in tissue.
In a physiological steady state (Ks = Kd), dP*/dt = Kp(F* − P*).
Protein poolP* = A/P
Amino acidprecursor pool
F*
Ks Kd
FIGURE 8.3 Common terminologies for the kinetics of in vivo protein turnover measured with a tracer AA. A labeled AA is incorporated into a protein through protein synthesis, and AA is released from the protein through protein degradation. A, the amount of radioactivity (dpm for a radioisotope) or mass (nmol for a stable isotope) of the labeled AA in the protein molecule; F*, specific radioactivity or isotopic enrichment of a tracer AA in the precursor pool; Kd, fractional rate of protein degradation; Ks, fractional rate of protein synthesis; P, the amount of a given AA in the total pool of the protein molecule (nmol); P*, specific radioactiv-ity or isotopic enrichment of a tracer AA in the protein molecule.

269Protein Synthesis
© 2010 Taylor & Francis Group, LLC
This equation means that the rate of change of the SR or IE in the protein mol-ecule at any time depends on the difference between the amount of tracer AA enter-ing the protein molecule from the precursor pool (Ks × F*) and the amount of tracer AA leaving the protein molecule through protein degradation (Kd × P*).
Pulse Labeling of Proteins by Single Administration of a Labeled AAWhen a single dose of a labeled AA along with a small amount of the tracee AA is administered into an animal, the precursor−product relationship for SR or IE of the labeled AA is shown in Figure 8.4 with three distinct phases.
Phase 1: F* ≫ P*. This phase is not useful for the measurement of protein turnover.
Phase 2: F* = P* (crossover point). This phase is not useful for the measure-ment of protein turnover.
Phase 3: F* < P*. This phase, which may span several hours, can be useful for the measurement of protein turnover. Specifically, the decrease in P* (SR or IE of the tracer AA in protein) with time is related to the rate of synthesis of new protein. In this phase, F* is less than P* because the turnover rate of the labeled AA in the precursor pool is greater than that in the protein pool:
dP*/dt = −Ks × P*
Time after administration of a tracer
Spec
ific
radi
oact
ivity
(dpm
/nm
ol)
or is
otop
e en
richm
ent (
%)
F *
P *
F* >> P*
F * = P*
F *< P*
FIGURE 8.4 The precursor–product relationship in the protein pool and the precursor pool in three phases after single administration of a labeled AA into the animal. F*, specific radio-activity or isotopic enrichment of a tracer AA in the precursor pool; P*, specific radioactivity or isotopic enrichment of a tracer AA in the protein molecule. Phase 3 is useful for measur-ing protein synthesis in tissues. (Adapted from Zak, R., A.F. Martin, and R. Blough. 1979. Physiol. Rev. 59:407–447.)

270 Amino Acids: Biochemistry and Nutrition
© 2010 Taylor & Francis Group, LLC
When Ks is a constant with respect to protein, this equation is integrated to give the following mathematical formula to calculate the fractional rate of protein synthesis.
ln(P*0/P*t ) = Ks × t
P*0 is the SR or IE of the labeled AA in protein at time 0, P*t is the SR or IE of the labeled AA in protein at any given time, and t is the duration of measurement of P* after administration of a tracer. In the plot of ln(P*0/P*t) as the Y-axis against time (t), the slope is the fractional rate (Ks) of protein synthesis expressed as %/min or %/h (Figure 8.5).
An advantage of the pulse labeling technique is that it can be used to simulta-neously determine both rates of synthesis and degradation of a single protein or a group of proteins with similar turnover rates in a tissue within the same animal (Yin et al. 2010). This method, however, is not appropriate for mixed proteins with differ-ent synthesis rates because of their complex kinetics in cells. When using the pulse labeling technique, the recycling of a labeled AA into protein can be minimized if [14C]Na2CO3 is intravenously administered into a mammal to generate [guanido-14C]arginine. This is because after [guanido-14C]arginine is released from protein degra-dation, the labeled AA is rapidly hydrolyzed to form 14C-urea in the liver.
Duration (time) of measurementafter tracer administration
ln(P
* 0/P* t)
Protein A
Protein B
FIGURE 8.5 Measurement of protein synthesis using the pulse labeling method. In Phase 3 of the pulse labeling of proteins (see Figure 8.4), a decline in the SR or IE of the labeled protein with time can be used to measure the rate of tissue protein synthesis. P*0 is the SR or IE of the labeled AA in protein at time 0, P*t is the SR or IE of the labeled AA in protein at any given time, and t is a given time during the measurement of P* after administration of a tracer. The fractional rate of synthesis of protein A is greater than that of protein B.

271Protein Synthesis
© 2010 Taylor & Francis Group, LLC
Flooding Dose TechniqueThe so-called flooding dose technique involves the single administration (intrave-nously, intraperitoneally, or intramuscularly) of large amounts of both tracer (e.g., 150 μCi l-[ring-2,4-3H]phenylalanine per kg body weight) and tracee AA (e.g., 180 μmol l-phenylalanine per kg body weight) into an animal (Fiorotto et al. 2013). The goal is to “flood” the entire precursor pool (extracellular and intracellular com-ponents) to such an extent that the plasma and intracellular SR are the same. Indeed, a primary assumption of the method that the free AA precursor pool is equilibrated with the true precursor pool (i.e., aminoacyl-tRNA) in tissues (e.g., skeletal muscle, heart, and liver) has been validated for pigs and rats by T.A. Davis and coworkers. In a short period after administration of the tracer (e.g., 10 min in rats and chickens after intravenous administration; 30 min in young pigs for intravenous, intraperitoneal, or intramuscular administration), tissues are obtained from the animal for analysis. The fractional rate of protein synthesis (Ks) is calculated as described previously.
There are several practical advantages to the flooding dose technique. Theoretically, it should eliminate uncertainty regarding SR or IE because the value is the same in all compartments. Second, because the precursor pool is flooded, it should be possible to use only precursor SR or IE in plasma to quantify the true value for the intracellular precursor labeled AA. Third, it is possible to measure protein synthesis in a short period of time (10–30 min), and this is important for tissues with low rates of protein synthesis (e.g., skeletal muscle and brain), which may otherwise require 4 h or more of constant tracer infusion to achieve a steady-state level of SR or IE. Such an approach also allows for the determination of tissue protein synthesis under metabolic non-steady-state conditions such as feeding, short-term hormone infusion, during exercise, during surgery, and immediately after trauma. Finally, the flooding dose technique is very convenient and useful for measuring synthetic rates of proteins with very short half-lives, as the recycling of labeled AA into pro-teins would be minimized. Thus, this method has been extensively used to measure protein synthesis in tissues of rodents, farm animals and fish, and in human tissues (including skeletal muscle, liver, and intestinal mucosa) and cells (including lympho-cytes and tumor cells).
The flooding dose technique has potential limitations. First, the most crucial assumption is that the bolus injection of an AA (e.g., Phe) well in excess of the total body free pool of that AA will not affect the rate of protein synthesis. This technique may not be valid for certain AA (e.g., leucine, lysine, and arginine) because of their possible effects on the transport of other AA and on cellular signaling pathways. However, experimental evidence shows that single administration of a large dose of Phe does not appear to affect tissue protein synthesis during a short time period (e.g., 10–30 min) in chickens, rats, and pigs (Suryawan et al. 2011; Watford and Wu 2005). Second, an additional assumption for the flooding dose technique is that there is no delay in the incorporation of tracer from the free pool to the protein-bound pool. On the basis of the blood circulation, only a very short period of time (<15 s) is required for the transport of a labeled AA from the site of administration to the site of protein synthesis in the tissue of interest. Third, in the flooding dose method, a steady state of the precursor SR or IE is not met because the precursor SR or IE
272 Amino Acids: Biochemistry and Nutrition
© 2010 Taylor & Francis Group, LLC
declines with time, which complicates the calculation of the rate of protein synthesis. However, within the short period (e.g., 10–30 min) of protein labeling, the change in the precursor SR or IE is very modest (<5%) and does not significantly alter the rate of tissue protein synthesis. Fourth, the rate of tissue protein synthesis measured by the flooding dose technique may not represent the rate of tissue protein synthesis for a 24-h period because of diurnal changes in cell metabolism. This concern can be addressed by measuring tissue protein synthesis at various time points of the day.
Continuous Infusion of a Tracer AAThe tracer AA can be administered directly into the venous circulation with an initial bolus dosage (priming), followed by a constant rate of infusion until steady-state label-ing of the free AA pool is attained (Yu et al. 1996). A priming dose of the isotopically labeled tracer AA is administered at the start of the infusion so as to reduce the time needed to achieve isotopic steady state of the precursor AA. The rate of constant infu-sion of the tracer must be adequate to ensure the detection of labeled AA in the free and protein pools of tissues. The SR or IE of a tracer AA in the blood and in the intracellular compartments increases until an equilibrium is reached during which the precursor SR or IE remains constant (Chapter 7). This usually takes 4–6 h. The mathematical treat-ment of experimental data is simplified considerably, when the precursor SR or IE is constant. The fractional rate of protein synthesis is calculated from the ratio of protein-bound and free AA SR (or IE) for tissues (e.g., such as skeletal muscle, heart, and brain) with slow protein turnover (Figure 8.6). A slightly modified equation is used to deter-mine protein synthesis for tissues (e.g., liver and kidney) with high protein turnover rates because the rate constant (KF) for rise of SR or IR of the precursor AA in blood can be readily determined.
Prolonged constant infusion of the tracer has advantages over the pulse labeling or flooding dose techniques. First, a distinct advantage of the constant infusion method is that whole-body protein synthesis and protein degradation can be measured concur-rently with protein synthesis in specific tissues. This makes it possible to estimate the contribution of protein synthesis in different tissues to whole-body protein synthesis in animals. Second, the rate of protein synthesis can be measured from single samples of tissues because the kinetics of the free pool labeling can be calculated from the rela-tive amounts of the tracer AA in the protein-bound and precursor AA pools. Third, the SR or IE of the free labeled AA remains constant for a substantial proportion of the infusion period, and therefore the kinetics of protein labeling are relatively simple. Fourth, the cost of a labeled tracer used in the constant infusion method is lower than that employed in the single administration of a large dose of a tracer AA used in the flooding dose technique. Thus, the constant infusion technique is preferred in studies with humans and large farm animals, including cattle, sheep, and pigs. Finally, the constant infusion technique is particularly applicable to tissues (e.g., skeletal muscle) with slow turnover rates because of the prolonged length of the protein labeling period.
Using the constant infusion method to measure the rate of protein synthesis in vivo has shortcomings. First, this method is unsatisfactory in tissues and cells (e.g., the liver and intestinal epithelial cells) with rapid protein turnover rates because the SR or IE of the free labeled AA rises during the course of the infusion due to the recycling of the labeled AA from the protein pool into the free AA pool. Second, the constant

273Protein Synthesis
© 2010 Taylor & Francis Group, LLC
Time (t)
F *(t)
P* KF
KF – KS
KS
KF – KS
1 – e–KSt
1 – e–KF
×
F *(t) = F*max × (1 – e–KFt)
Isotopic steady state
dP*
dt= KS (F* – P*) (1)
(2)
(3)
R
R – 1
11 – e–KSt
1 – e–RKSt×
F*(t) = F*max × (1 – e–RKSt) (4)
(5)R – 1
F*=
P*
F*=
FIGURE 8.6 Measurement of protein synthesis using the constant infusion of a tracer. A tracer AA is infused intravenously into human subjects or other animals at a constant rate after a short administration of a priming dose of the tracer. The expressions for F* are sub-stituted in the equation dP*/dt = Ks(F* − P*), which is integrated to give mathematical for-mulae to calculate the fractional rate of protein synthesis depending on the tissue type (i.e., tissues with high or slow protein turnover rates). e, the base for natural logarithms; F*, SR (dpm/nmol) of the radioactive tracer AA or IE (%) of the stable tracer AA in the precursor pool; F*max is maximum SR (dpm/nmol) of the radioactive tracer AA or maximum IE (%) of the stable tracer AA in the precursor pool; KF, the rate constant (%/min or %/h) for the rise of SR or IE of the free tracer AA to describe an increase of tracer in the precursor pool; Ks, the fractional rate of protein synthesis (%/min or %/h); P*, SR (dpm/nmol) of the radioactive tracer AA (e.g., 14C-Phe) or IE (%) of the stable tracer AA in the protein molecule; R, ratio of protein-bound AA to free AA in tissue; t, the duration of protein labeling in tissue. Equation 1 is applicable to tissues with either a low or a high rate of protein turnover. Equations 2 and 3 are used for tissues with a high rate of protein turnover (e.g., liver and small intestine), whereas Equations 4 and 5 are suitable for tissues with a low rate of protein turnover (e.g., skeletal muscle and heart).

274 Amino Acids: Biochemistry and Nutrition
© 2010 Taylor & Francis Group, LLC
infusion technique is not suitable for use in tissues (the liver and gastrointestinal tract) from which substantial proportions of synthesized proteins are exported, as the rate of protein synthesis is underestimated. Third, in the constant infusion method, the SR or IE of the labeled AA or its ketoacid (a product of transamination of the labeled AA within the tissues) in plasma is generally used as a surrogate of the true SR or IE of the labeled AA in the intracellular precursor pool (namely the aminoacyl-tRNA). However, this is not supported by experimental evidence. For example, the IE of [1-13C]α-ketoisocaproic acid and [1-13C]leucine in plasma are higher than those of [1-13C]leucine-tRNA in skeletal muscle, whereas the intracellular IE of [1-13C]leucine in the free pool is close to, but generally greater than, that of the [1-13C]leucine-tRNA pool in the muscle. There is also evidence that SR of the true precursor (tRNA) for protein synthesis during the constant tracer infusion lies between the plasma and intracellular SR of free AA. Thus, the SR or IE of the labeled AA in the tissue-free AA pool is the most reliable predictor of the SR or IE of the aminoacyl-tRNA pool during the constant infusion of a labeled AA. Fourth, the constant infusion method requires a metabolic steady state, which may not exist under certain nutritional (e.g., feeding), physiological (e.g., during exercise), and diseased (e.g., infection) conditions. Thus, this method is not suitable for measuring acute changes in rates of tissue pro-tein synthesis in humans and other animals. Finally, the constant infusion method is not applicable to small animals (e.g., rats, mice, and neonatal pigs) because it is very stressful to physically restrain them for a prolonged period of time.
Leucine Oxidation MethodThe rate of production of an end product (e.g., 14C- or 13C-labeled CO2, 15N-urea, or 3H- or 2H-labeled H2O) of the oxidation of an appropriately administered AA (e.g., leucine) can be used to calculate the rate of whole-body protein synthesis and protein degradation in humans and other animals (Duggleby and Waterlow 2005). [1-14C]Leucine or [1-13C]leucine is often used for this purpose because of the following reasons. First, leucine cannot be synthesized in the body. The use of nonessential AA renders calculation of protein degradation difficult because both the dietary uptake and synthesis de novo have to be measured. Second, the metabolic fate of leucine is relatively simple and easy to quantify, particularly with carboxyl-labeled leucine. For example, the oxidative decarboxylation of [1-14C]leucine or [1-13C]leucine gives labeled CO2, which can be readily measured. Either [1-14C]leucine or [1-13C]leucine has an additional advantage in that its transamination product, α-ketoisocaproate, can be isolated from plasma and used to estimate intracellular SR or IE of free labeled leucine. Third, leucine is usually not a limiting AA in the diet for animals. Fourth, leucine is well distributed throughout body proteins and the free pool.
Let us consider the two-compartment model for leucine oxidation in animals (Figure 8.7). This model is based on several assumptions. First, leucine is utilized in vivo only via the oxidation pathway and protein synthesis. Second, in physi-ological and isotopic steady state, the amount of labeled leucine entering the free AA pool equals the amount of the labeled AA leaving this pool. Third, leucine kinetics are representative of whole-body protein kinetics. Fourth, intracellular SR or IE of labeled leucine is the same for leucine oxidation and for protein syn-thesis. Fifth, CO2 produced from leucine oxidation is quantitatively recovered in

275Protein Synthesis
© 2010 Taylor & Francis Group, LLC
the expired air. Using the leucine oxidation method, labeled leucine is infused intravenously into the animal at a constant rate for 4–6 h as described above. Depending on whether a radioactive or stable isotope is used, SR or IE of labeled leucine in plasma at steady state is measured to calculate the rate of leucine oxida-tion. The flux (Q) of leucine through the free AA pool is determined using intra-venous infusion of labeled leucine (Figure 8.8). The relationship between flux of leucine and the rate of protein synthesis or degradation is described as follows:
Q = I + B = E + Z
Dietary amino acid (I)
Total freeamino
acid poolWhole-bodyprotein pool
Protein synthesis (Z)
Protein degradation (B)
Oxidation (E)
I + B = E + Z = Q
Urea CO2H2O
FIGURE 8.7 Measurement of protein synthesis using the leucine oxidation method. [1-14C]Leucine or [1-13C]leucine is infused intravenously into human subjects or other animals at a constant rate after a short administration of a priming dose of the tracer. E is the rate of leu-cine oxidation, which can be measured using either [1-14C]leucine (14CO2 production) or [15N]leucine (urinary excretion of 15N-urea); I is the rate of leucine intake from the diet, which can be determined by chemical analysis; B is the rate of whole-body protein degradation; and Z is the rate of protein synthesis.
Q
i
Q = i/SA
Q
At isotopic steady statein plasma
(Constant infusion of 14C-leucine)
LeucineSA =
14C-leucine
FIGURE 8.8 Measurement of plasma leucine flux. Plasma leucine flux (Q) is measured using intravenous infusion of labeled leucine at a constant rate. The isotopic steady-state SR or IE of the labeled free AA in plasma and the rate of tracer infusion (i) into the study subject are used to calculate the plasma leucine flux, which is also taken to represent whole-body leucine flux.

276 Amino Acids: Biochemistry and Nutrition
© 2010 Taylor & Francis Group, LLC
where E is the rate of leucine oxidation, which can be measured by [1-14C]leucine (14CO2 production) or [15N]leucine (urinary excretion of 15N-urea), I is the intake of leucine from the diet, which can be determined by chemical analysis, B is the rate of whole-body protein degradation, and Z is the rate of protein synthesis.
Protein synthesis (Z) = Q − E
Protein degradation (B) = Q − I
A major advantage of the leucine oxidation method is that it can be used to simul-taneously determine both the rates of protein synthesis and protein degradation in the body. The second advantage is that this method is noninvasive and convenient for determining protein turnover in humans and large animals. Third, the model involves simple and straightforward mathematics. Fourth, the use of SR or IE of labeled α-ketoisocaproate in plasma is a good indicator of the intracellular SR or IE of labeled leucine in skeletal muscle and other tissues to determine leucine oxidation and protein synthesis. This increases the practical usefulness of the leucine oxidation technique in clinical research.
A significant disadvantage of the leucine oxidation method is that it cannot be used to determine the rate of protein synthesis in individual tissues. Additionally, there are potential problems in accurate and precise determination of recovery of labeled CO2 produced from leucine oxidation. When [15N]leucine is used to estimate urea production from its oxidation, it usually takes a long time (e.g., 9 h) to collect urine samples completely from study subjects before and after tracer administration. Other disadvantages of the technique include those discussed previously for the AA constant infusion method used to determine protein synthesis.
SUMMARY
Protein synthesis from AA on the mRNA template occurs primarily in the cyto-plasm and, to a much lesser extent, in the mitochondria. This process consists of five stages: activation of AA (catalyzed by aminoacyl-tRNA synthetase), initia-tion of polypeptide synthesis (formation of 80S ribosome from 40S and 60S sub-units), elongation of polypeptide, termination (recognized by the terminating signal on the mRNA), and posttranslational modifications of peptides (Figure 8.9). The protein synthetic pathway requires a number of eukaryotic initiation factors (e.g., eIF1, eIF2, eIF2B, eIF3, eIF4A, eIF4E, eIF4G, and eIF5), elongation factors (e.g., eEF1A, eEF1B, and eEF2), and release factors. Translation initiation also depends on the phosphorylation of several regulatory proteins, including MTOR, 4EBP1, and p70S6K1. After newly synthesized proteins are released from the ribosome, they undergo posttranslational modifications (e.g., limited cleavage, acetylation, disulfide linkage formation, methylation, phosphorylation, and/or ubiquitination) to become biologically active. Protein synthesis requires a relatively large amount of energy (∼15% of dietary energy intake) but fulfils important physiological functions, includ-ing regulating intracellular concentrations of proteins, promoting cell proliferation, and supporting cell replacement. Tracer methodologies have been developed to determine both in vitro and in vivo rates of protein synthesis in cells, tissues, and

277Protein Synthesis
© 2010 Taylor & Francis Group, LLC
the whole body. The most common in vivo methods are the flooding dose technique and the constant infusion of a tracer AA. Each of these methods has advantages and disadvantages, and should be chosen on the basis of experimental objectives.
REFERENCES
Adegoke, O.A., M.I. McBurney, S.E. Samuels, and V.E. Baracos. 2003. Modulation of intestinal protein synthesis and protease mRNA by luminal and systemic nutrients. Am. J. Physiol. 284:G1017–G1026.
Davis, T.A. and P.J. Reeds. 2001. Of flux and flooding: The advantages and problems of differ-ent isotopic methods for quantifying protein turnover in vivo: II. Methods based on the incorporation of a tracer. Curr. Opin. Clin. Nutr. Metab. Care 4:51–56.
Deng, D., Y.L. Yin, W.Y. Chu, K. Yao, T.J. Li, R.L. Huang, Z.Q. Liu, J.S. Zhang, and G. Wu. 2009. Impaired translation initiation activation and reduced protein synthesis in weaned piglets fed a low-protein diet. J. Nutr. Biochem. 20:544–552.
Dillon, E.L., S.L. Casperson, W.J. Durham, K.M. Randolph, R.J. Urban, E. Volpi, M. Ahmad, M.P. Kinsky, and M. Sheffield-Moore. 2011. Muscle protein metabolism responds
mRNA template the 80S ribosome
P-site A-siteClose association
with the P siteInitial AA AA-tRNAi
tRNAi
ATP AMP + PPi
Incoming AA AA-tRNAtRNA(new)
1
1
(i.e., Met)
tRNAi-AA-C---N-AA-tRNAO
H
Initial AA
New AA
Peptide bond formation
Binding to the A site
GTP GDP + Pi 2
Peptidyl-tRNAon the P site
Translocation of newly formed peptidyl-tRNA
from the A to the P site
3
GTP
GDP + Pi tRNAi from P site
eEF1A
eEF2 and eEF1B
Polypeptidyl-tRNA
Protein or peptide Terminating codon
on the mRNA
GTPGDP+ Pi
eRF1eRF2eRF3eEF1B
40S60StRNA
mRNA + 40S + 60SeIF 1, 2, 2B, 3, 4A, 4E, 4G, and 5
cycles ofelongation
Multiple
Post-translationalmodifications
AA-tRNAi AA-tRNA
3′5′
A-site
Peptidyl-tRNA
FIGURE 8.9 Protein synthesis from AA on the cytosolic 80S ribosome in animal cells. The 80S ribosome is formed from 40S and the 60S ribosomes as the site for the transla-tion of mRNA to produce protein. These processes require a variety of eukaryotic initiation factors (eIF), elongation factors (eEF), and release factors (eRF). Polypeptide elongation is terminated by a terminating codon on the mRNA template. The newly synthesized protein or peptide undergoes post-translational modifications to become biologically active. Enzymes that catalyze the indicated reactions are: (1) aminoacyl-tRNA synthetase, which is specific for each AA; (2) peptidyltransferase (a ribozyme; i.e., 28S rRNA in eukaryotes or 23S rRNA in bacteria), which catalyzes peptide bond formation between two aminoacylated tRNA sub-strates; and (3) peptidyltransferase, which, together with RF (RF1 in eukaryotes or RF1/RF2 in bacteria), hydrolyzes peptidyl-tRNA to release the newly synthesized peptide.

278 Amino Acids: Biochemistry and Nutrition
© 2010 Taylor & Francis Group, LLC
similarly to exogenous amino acids in healthy younger and older adults during NO-induced hyperemia. Am. J. Physiol. 301:R1408–R1417.
Duggleby, S.L. and J.C. Waterlow. 2005. The end-product method of measuring whole-body protein turnover. Br. J. Nutr. 94:141–153.
Fiorotto, M.L., H.A. Sosa Jr., and T.A. Davis. 2012. In vivo measurement of muscle protein synthesis rate using the flooding dose technique. Methods. Mol. Biol. 798:245–264.
Fukls, R.M., J.B. Li, and A.L. Goldberg. 1975. Effects of insulin, glucose, and amino acids on protein turnover in rat diaphragm. J. Biol. Chem. 250:290–298.
Garlick, P.J., M.A. McNurlan, P. Essén, and J. Wernerman. 1994. Measurement of tissue pro-tein synthesis rates in vivo: A critical analysis of contrasting methods. Am. J. Physiol. 266:E287–E297.
Hallemeesch, M.M., P.B. Soeters, and N.E. Deutz. 2002. Renal arginine and protein synthesis are increased during early endotoxemia in mice. Am. J. Physiol. 282:F316–F323.
Johnson, H.A., C.C. Calvert, and K.C. Klasing. 2003. Challenging the assumptions in estimat-ing protein fractional synthesis rate using a model of rodent protein turnover. Adv. Exp. Med. Biol. 537:221–237.
Kapp, L.D. and J.R. Lorsch. 2004. The molecular mechanics of eukaryotic translation. Annu. Rev. Biochem. 73:657–704.
Kimball, S.R. and L.S. Jefferson. 2010. Control of translation initiation through integration of signals generated by hormones, nutrients, and exercise. J. Biol. Chem. 285:29027–29032.
Kong, J. and P. Lasko. 2012. Translational control in cellular and developmental processes. Nature Rev. Genet. 13:383–394.
Lackner, D.H. and J. Bähler. 2008. Translational control of gene expression from transcripts to transcriptomes. Int. Rev. Cell Mol. Biol. 271:199–251.
McAllister, T.A., J.R. Thompson, and S.E. Samuels. 2000. Skeletal and cardiac muscle protein turnover during cold acclimation in young rats. Am. J. Physiol. 278:R705–R711.
Palangat, M. and D.R. Larson. 2012. Complexity of RNA polymerase II elongation dynamics. Biochim. Biophys. Acta 1819:667–672.
Southorn, B.G., J.M. Kelly, and B.W. McBride. 1992. Phenylalanine flooding dose proce-dure is effective in measuring intestinal and liver protein synthesis in sheep. J. Nutr. 122:2398–2407.
Suryawan, A., R.A. Orellana, M.L. Fiorotto, and T.A. Davis. 2011. Leucine acts as a nutrient signal to stimulate protein synthesis in neonatal pigs. J. Anim. Sci. 89:2004–2016.
Tischler, M.E., A.H. Ost, B. Spina, P.H. Cook, and J. Coffman. 1984. Regulation of pro-tein turnover by glucose, insulin, and amino acids in adipose tissue. Am. J. Physiol. 247:C228–C233.
Watford, M. and G. Wu. 2005. Glutamine metabolism in uricotelic species: Variation in skel-etal muscle glutamine synthetase, glutaminase, glutamine levels and rates of protein synthesis. Comp. Biochem. Physiol. B. 140:607–614.
Wu, G. and J.R. Thompson. 1990. The effect of glutamine on protein turnover in chick skeletal muscle. Biochem. J. 265:593–598.
Xi, P.B., Z.Y. Jiang, Z.L. Dai, X.L. Li, K. Yao, C.T. Zheng, Y.C. Lin, J.J. Wang, and G. Wu. 2012. Regulation of protein turnover by L-glutamine in porcine intestinal epithelial cells. J. Nutr. Biochem. 23:1012–1017.
Yin, Y.L., K. Yao, Z.J. Liu, M. Gong, Z. Ruan, D. Deng, B.E. Tan, Z.Q. Liu, and G. Wu. 2010. Supplementing L-leucine to a low-protein diet increases tissue protein synthesis in weanling pigs. Amino Acids 39:1477–1486.
Yu, Y.M., R.L. Sheridan, J.F. Burke, T.E. Chapman, R.G. Tompkins, and V.R. Young. 1996. Kinetics of plasma arginine and leucine in pediatric burn patients. Am. J. Clin. Nutr. 64:60–66.
Zak, R., A.F. Martin, and R. Blough. 1979. Assessment of protein turnover by use of radio-isotopic tracers. Physiol. Rev. 59:407–447.

279
© 2010 Taylor & Francis Group, LLC
Intracellular Protein Degradation
The seminal work of R. S to become an choenheimer and coworkers in 1938 and 1939 that involved 15N-labeled tyrosine and leucine in animals revealed, for the first time, dynamic changes of the body’s components, including protein and AA. This revolutionary finding directly challenged the long-standing view that structural pro-teins in the body were in a static state and that dietary protein was used only as a metabolic fuel by humans and other animals. The continuous synthesis and degrada-tion of protein is collectively termed “intracellular protein turnover.” This metabolic cycle occurs in all cell types as an essential physiological event. Note that intracel-lular protein turnover is not a synonym for intracellular protein degradation (also known as proteolysis) because the former is composed of both protein synthesis and protein degradation. While the pathway for protein biosynthesis was elucidated in the mid-1960s, many of the pathways for intracellular proteolysis were not well understood until the late 1980s and early 1990s when the ubiquitin−proteasome cas-cade was discovered (Ciechanover 2012). In essence, protein degradation, which is an energy-dependent process, is an endogenous source of AA for utilization in the body. In this chapter, the pathway of intracellular protein degradation in animals will be described along with its characteristics, significance, and measurement.
HISTORICAL PERSPECTIVES OF INTRACELLULAR PROTEIN DEGRADATION
Research on intracellular protein degradation has spanned over 70 years since R. Schoenheimer published in 1942 his groundbreaking book on the dynamics of whole-body protein turnover in mammals. A decade later, M.V. Simpson reported in 1953 that mammalian cells can degrade intracellular proteins and this biochemical event requires metabolic energy. In the same year, C. de Duve discovered that the lysosome is a membrane-bound organelle in cells. This organelle was found in 1955 by C. de Duve to contain cathepsins for degrading cellular proteins. The requirement of metabolic energy for protein breakdown in bacteria (E. coli) was reported by J. Mandelstam in 1958, which paved the way to future studies of energy-dependent proteolysis in animal cells. Meanwhile, ongoing work in the area of neurobiology led to the identification of Ca2+-dependent protease (calpain) for degrading intracellular proteins outside the lysosome. Specifically, calpain was extracted for the first time from rat brain by G. Guroff in 1964, and this work was extended to skeletal muscle and other tissues in the late 1960s.
The 1970s witnessed exciting developments in the field of protein degradation. Specifically, G. Goldstein discovered in 1974 ubiquitin (a 76-AA polypeptide) in
9

280 Amino Acids: Biochemistry and Nutrition
© 2010 Taylor & Francis Group, LLC
eukaryotic cells. In 1977, A.L. Goldberg found that protein degradation requires ATP in a reticulocyte preparation without lysosomes and proposed both lysosomal and nonlysosomal systems for intracellular proteolysis. Further studies revealed that the lysosome is not involved in the degradation of most intracellular proteins under basal conditions, indicating a major role for the nonlysosomal pathway for prote-olysis in cells. A seemingly unrelated study was published in 1977, which identified the linkage between ubiquitin and histone H2A as an iso-peptide bond. However, it is this work that laid the foundation for the future elucidation of how ubiquitin conjugates with a protein targeted for degradation. Thus, in 1978, A. Ciechanover and A. Hershko found that two fractions (I and II) isolated from reticulocytes were required to reconstitute ATP-dependent protein degradation in a cell-free system. The active component in Fraction I turned out to be a small, ~8.5 kDa heat-stable protein, called ATP-dependent proteolysis factor 1 (APF1), whereas a protease in Fraction II catalyzed the degradation of protein.
Much effort in the 1980s and the early 1990s to characterize the two unknown fractions from reticulocytes led to the discovery of the ATP- and ubiquitin-dependent proteasome in the 1980s (Hershko and Ciechanover 1998). Specifically, in 1980, A. Hershko demonstrated that APF1 is covalently conjugated to protein substrates and proposed that APF1 serves as a signal for a downstream protease. In the same year, APF1 was shown to be identical to ubiquitin, linking this polypeptide with intra-cellular proteolysis, whereas the “multicatalytic protease complex” (later known as the 20S core-particle subcomplex of the 26S proteasome) was identified. In 1983, A. Ciechanover and colleagues proposed a three-step ubiquitin−protein ligase cascade that is catalyzed by ubiquitin-activating enzyme (E1), ubiquitin-conjugating enzyme (E2), and ubiquitin−protein ligase (E3). Using the unique cell-cycle arrest mutant, ts85, that contains a thermolabile E1 enzyme, A. Ciechanover provided compelling evidence for a link between ubiquitination and protein degradation in 1984, as the cells failed to degrade normal short-lived proteins in response to heat inactivation. Two years later, R. Housh, G. Pratt, and M. Rechsteiner partially purified an ATP-dependent protease that specifically degrades ubiquitin conjugates, and this protease was later called the 26S proteasome. In 1987, A. Hershko correctly proposed that the 20S proteasome is part of the 26S proteasome. In 1990, A.L. Goldberg identified the proteasome (multicatalytic protease) to be a component of the 1500-kDa proteolytic complex that degrades ubiquitin-conjugated proteins. Two years later, M. Rechsteiner recognized the multiple forms of the 20S multicatalytic and the 26S ubiquitin- and ATP-dependent proteases from reticulocyte lysates, thereby completing the answers to the previous questions of the identity and functions of the two unknown fractions that were isolated in 1980 from the same type of cell-free preparations. The discovery of the proteasome was recognized with the 2004 Nobel Prize in Chemistry.
PROTEASES (PEPTIDASES) FOR INTRACELLULAR PROTEIN DEGRADATION
Protein degradation is catalyzed by proteases, with the resulting small peptides being hydrolyzed by tripeptidases and dipeptidases (Craik et al. 2011). Most proteases are hydrolases (also known as peptidases), but some (e.g., asparagine peptide lyases)

281Intracellular Protein Degradation
© 2010 Taylor & Francis Group, LLC
are not. Therefore, the terms “proteases” and “peptidases” should not be treated as synonymous. Upon the discovery of intracellular proteolysis in the 1950s, a system of nomenclature for the enzymes was developed. Proteases are classified according to (1) the reaction type, (2) the chemical nature of the catalytic site, and (3) their evo-lutionary relationship, as revealed by AA sequences and enzyme structures (Rivett 1990). The classification and naming of enzymes based on the type of reaction is the primary principle of the enzyme nomenclature of the International Union of Biochemistry and Molecular Biology. Note that the use of impure enzyme prepara-tions in experiments can lead to errors in the classification of proteases.
clAssificAtion By reAction tyPe
Proteases can be classified as exopeptidases and endopeptidases based on the type of reaction, namely hydrolysis of a peptide bond formed by AA in either the termi-nal region or within an internal region of a protein or peptide (exopeptidases and endopeptidases, respectively). Some proteases hydrolyze dipeptides (dipeptidases), whereas others remove terminal AA residues that are substituted, cyclized, or linked by isopeptide bonds (namely peptide linkages other than those of α-carboxyl to α-amino groups; e.g., ω-peptidases). When a protease exhibits marked preference for a particular AA residue, the name of this AA is used to form a qualifier (e.g., “leucine” aminopeptidase and “proline” endopeptidase). In contrast, for enzymes with very complex or broad specificity, alphabetical or numerical serial names (e.g., peptidyl-dipeptidase A, peptidyl-dipeptidase B, dipeptidyl-peptidase I, and dipepti-dyl-peptidase II) are used. Some proteases may have both exopeptidase and endo-peptidase properties, and these enzymes include cathepsins B and H.
ExopeptidasesExopeptidases cleave peptide bonds from either the carboxyl (C)- or the amino (N)-terminus of a polypeptide chain and can further be divided into aminopeptidases and carboxypeptidases. Aminopeptidases attack peptide bonds beginning from the N-terminus. Examples for aminopeptidases are leucine aminopeptidase, alanine (ala-nyl) aminopeptidases, proline (prolyl) aminopeptidase, dipeptidyl peptidases, and tri-peptidyl peptidases, and pyroglutamyl aminopeptidase. Carboxypeptidases hydrolyze peptide bonds beginning from the C-terminus. Examples for carboxypeptidases are carboxypeptidases A, B, C, D, and E, as well as peptidyl dipeptidases I and II.
EndopeptidasesEndopeptidases preferentially attack peptide bonds in the inner regions of peptide chains (also known as proteinases). The presence of free α-amino or α-carboxyl groups in peptides has a negative effect on the activity of these enzymes. Examples of endopeptidases are proteasome, cathepsin D, glutamate (glutamyl) endopeptidase, lysine (lysyl) endopeptidase, proline (prolyl) endopeptidase, serine endopeptidase, cysteine endopeptidase, and oligoendopeptidases. The oligopeptidases act on oligo-peptide or polypeptide substrates that are smaller than proteins. Note that the endo-peptidases that cleave synthetic substrates consisting of a small number of AA may not always act on the same sequences present in proteins.

282 Amino Acids: Biochemistry and Nutrition
© 2010 Taylor & Francis Group, LLC
clAssificAtion By cAtAlytic site
Owing to the difficulties in classifying and naming some proteases, an alternative system based on the catalytic site of the enzymes was invented in the 1960s. Thus, carboxypeptidases and endopeptidases are divided into seven subclasses according to catalytic mechanisms: serine, cysteine, aspartate, threonine, glutamate, asparagine, and metallo proteases (Table 9.1), although some endopeptidases (e.g., thermopsin 26 and Aspergillus proteinase A) have not yet been assigned to any of these sub-classes due to insufficient evidence. Serine- and cysteine-type peptidases have serine and cysteine residues, respectively, at their active sites. Aspartate-type peptidases have two aspartic acid residues at their active site. Threonine peptidases were first reported in 1995 when the structure of the proteasome was solved to reveal that 3 of the 14 different subunits are peptidases possessing an N-terminal threonine. The role of threonine in the active sites of the catalytic units of the proteasome helps explain how this large protease acts in cells. Glutamate peptidases (first described in 2004; carboxypeptidases) have glutamate and glutamine in the active sites. Asparagine peptide lyases (first described in 2011; also known as asparagine peptide lyases) uti-lize asparagine as a nucleophile in the active site. Unlike other proteolytic enzymes (which are hydrolases), asparagine peptide lyases are lyases and perform only self-cleavages. Metallopeptidases depend on a metal ion for their catalytic activity.
Use of protease inhibitors has provided an experimental basis for the classifica-tion of the proteolytic system (Figure 9.1). The reagent of choice to identify a ser-ine peptidase is 3,4-dichloroisocoumarin, which reacts rapidly with and irreversibly inhibits a wide range of serine peptidases. E-64 is a rapid, specific, and irreversible inhibitor of many cysteine endopeptidases (e.g., the calpain and papain families) of animal and plant origin, and yet does not usually react with low-molecular-mass thiols such as cysteine and dithiothreitol (Katunuma and Kominami 1995). However,
TABLE 9.1Classification of Proteolytic Enzymes by Catalytic Type and their Inhibitors
ClassActive Site
(AA Residues) Inhibitors (Examples)
Serine Ser, Asp, His 3,4-DCI, DFP, PMSF, leupeptin, chymostatin, antipain
Cysteine Cys, His Thiol reagents, E-64, leupeptin, chymostatin, antipain, IDA
Aspartate Asp, Asp Pepstatin A
Threonine Thr Bortezomib, N-capped dipeptidyl leucine boronic acid
Glutamate Glu, Gln PT1, and TA1
Asparagine Asn Not known
Metallo Zn, Glu, Tyr or Zn, Glu, His EDTA, 1,10-phenanthroline, and phosphoramidon
Note: 3,4-DCI, 3,4-dichloroisocoumarin (3,4-DCI); DFP, di-isopropylfluorophosphate; E-64, l-3-carboxy-trans-2,3-epoxypropyl-leucylamido(4-guanidino)butane; IDA, iodoacetate; PMSF, phenylmethylsulfonylfluoride; PT1, 20-residue peptide encoding Glu29 to Thr48 of the T. emersonii glutamic peptidase 1 propeptide; TA1 (6-residue transition state analog), Ac-Phe−Lys−Phe−AHPPA−Leu−Arg-NH2.

283Intracellular Protein Degradation
© 2010 Taylor & Francis Group, LLC
some cysteine peptidases from microorganisms (e.g., clostripain and streptopain) are poorly inhibited by E-64. Iodoacetate, iodoacetamide, and N-ethylmaleimide (1 mM) can be used as inhibitors of these enzymes, but it should be borne in mind that these reagents react rapidly with low-molecular-mass thiol activators of cysteine peptidases. Pepstatin A is a highly specific and effective inhibitor of all aspartic-type
CH2 CH
NH
C
N
CH
NH
NH
NH C
NH
CH
COOH
H
CH2CHH3C
C
NH
CHCH2
CHO
CH3O
O
O
Pepstatin A
O
OH
OH
OH
OPO
OH
NH
CHCH2CH
C
NH
CHCH2
NH HOOC
OH3C
H3C
H3C
C
CO
COOHH
HC
NH
CHCH2CH
HNOC
(CH2)4
NH
C
NH2
H3C
H3C
NH
O
E-64
H3C
NH2
CH
CH
C
N
CHCH2
CH2
CH
COOH
OH
CH3 H
OC
NH
CHCH2
C
NH
CH(CH2)3NHC
CHO
CH
CCH2HC
NH
C
H
CH3
NH
CH3
NH2
CH3
H3C
H3C
O
O
O
(CH2)3
(CH2)3
H3C
H3CCHCH
C
NH
CHNHC
CHO
NH
CHNHC
NH
CH2 CH
NH
C
COOH
C
NH
NH
H2N
NH2
O
O
O
LeupeptinBestatin
Antipain
PhosphoramidonChymostatin A
H3C
H3C
H3C
H3C
H3C
H3C
H3C
NH
CHCH2CH
HC OH
H2C
C
NH
CH
C
NH
CHCH2CH
HOHC CH2 COOH
O
O
NH
CHCH
C
NH
CHCH
H3C
H3C
H3C
H3C
C
O
C
CH CH2
O
O
FIGURE 9.1 Structures of some protease inhibitors of microbial origin. These protease inhibitors are small peptides consisting of one or more modified L-AA residues. They inhibit serine, cysteine, aspartate, and metalloproteases in both bacteria and animal cells.

284 Amino Acids: Biochemistry and Nutrition
© 2010 Taylor & Francis Group, LLC
peptidases, and yet does not usually affect other types of peptidases. Importantly, removal of pepstatin A can restore enzyme activity. Inhibitors of threonine pepti-dases, glutamate peptidases, and asparagine peptide lyases are under development. Most of metallopeptidases are zinc-containing enzymes, and zinc can react with a bidentate ligand in coordination chemistry to form a strong complex. One of these ligands is 1,10-phenanthroline, which is widely used to recognize metallopeptidases many of which are extracellular proteases. Caution should be taken in interpreting data from these kinds of studies. For example, inhibition of a metallopeptidase by a chelating agent is not necessarily due to removal of the metal ion from the active site of the enzyme. Additionally, inhibition of a peptidase by an unspecific chelating agent (e.g., EDTA) does not indicate that the enzyme is a metallopeptidase, because many peptidases of other types are activated by cations (e.g., Ca2+ in the calpains).
clAssificAtion By evolutionAry relAtionshiP
There may be as many as 700 distinct peptidases (Rawlings et al. 2012). Approximately 450 peptidases (endopeptidases and exopeptidases) from more than 1400 organisms (bacteria, archaea, archezoa, protozoa, fungi, plants, animals, and viruses) have been sequenced. The genes encoding many proteases have also been cloned. In addition, x-ray structures have revealed the sites for substrate binding, inhibitor binding, and catalysis on the enzyme molecules. These data provide useful information about the evolutionary and structural relationships among the enzymes, which can be used to provide a third approach to their classification as various families. Such extensive efforts resulted in the development of the MEROPS database (http://www.merops.co.uk), which includes a frequently updated listing of all peptidase sequences. Available evidence shows that enzymes of the same catalytic type can be unrelated (e.g., papain and caspases are unrelated cysteine peptidases; methionyl aminopepti-dase and thermolysin are unrelated metallopeptidases). However, peptidases of dif-ferent catalytic types can be evolutionarily related [e.g., the poliovirus picornain 3C is a cysteine peptidase but has a similar structure to trypsin (a serine peptidase)]. Thus, peptidases can be classified by structure and sequence similarity. As proposed by N.D. Rawling and A.J. Barrett in 1993, proteases with homologous sequences are grouped into families, and families with related structures are grouped into clans. For example, Clan PA includes serine and cysteine peptidases with a structure simi-lar to trypsin. Clan PB includes peptidases with an N-terminal serine nucleophile (e.g., the penicillin G acylase precursor) and an N-terminal cysteine nucleophile (e.g., the penicillin V acylase precursor). Clan PC includes cysteine peptidases [e.g., γ-glutamyl hydrolase and the serine peptidase (dipeptidase E)].
INTRACELLULAR PROTEOLYTIC PATHWAYS
Intracellular proteins are degraded via highly selective pathways to maintain a dynamic state of protein turnover (Goldberg 2003). Proteases are present in the cytoplasm, plasma membrane, and many organelles of the cell. Besides the cyto-plasm and the lysosome, peptidases are present in the plasma membrane, mitochon-dria, nucleus, and rough endoplasmic reticulum. Thus, since the 1970s, intracellular

285Intracellular Protein Degradation
© 2010 Taylor & Francis Group, LLC
proteolytic pathways have been classified according to the location of proteases: the lysosomal system and the nonlysosomal system. This nomenclature is still used to date to designate the ATP-dependent proteolysis in the cytoplasm.
lysosomAl Proteolytic PAthwAy
The lysosome contains many proteases that are tagged with mannose-6-phosphate for targeting into this organelle from the endoplasmic reticulum. Proteins are delivered from the cytoplasm to the lysosome via the endocytic pathway mediated by one or more of the following five mechanisms: (1) endocytosis; (2) crinophagy; (3) macroau-tophagy; (4) microautophagy; and (5) chaperone-mediated autophagy (Benbrook and Long 2012). Endocytosis refers to the engulfing of cytosolic proteins into the lyso-some through the endosome pathway. Crinophagy involves the direct fusion of the lysosome with secretory granules containing damaged proteins. Macroautophagy is a process whereby a fraction of cytosolic constituents (e.g., proteins and organelles) is enclosed and isolated by a double-membrane structure called the phagophore to form an autophagosome, which is then fused with the lysosome to become an auto-lysosome. The autophagosome may also fuse with an endosome to form an amphi-some before fusion with the lysosome. Microautophagy refers to the internalization of cytosolic proteins into the lysosome. In chaperone-mediated autophagy, a protein containing a KFERQ sequence is recognized by the cytosolic chaperone protein (heat-shock cognate 70) and cochaperones to form a complex, which is then translocated into the lysosome through its transmembrane protein Lamp-2A. Although autophagy was originally thought to be a bulk, nonselective “self-eating” degradative process, this event is now known to be also regulated through selective interaction of a polyu-biquitinated protein (e.g., p62) with microtubes-associated protein 1 light chain-3. The selective autophagy occurs constitutively and can be induced by cellular stress signals (Mizushima and Komatsu 2011).
Once cytosolic proteins are inside the lysosome, they are denatured due to the low pH and then hydrolyzed by proteases to release AA. These proteases include: (1) cathepsin B (cysteine protease) with both endopeptidase and exopeptidase (C-terminus) activities; (2) cathepsin H (cysteine protease; a glycoprotein) with both endopeptidase and exopeptidase (N-terminus) activities; (3) cathepsin L (a major lysosomal cyste-ine protease; endopeptidase); (4) cathepsin D (aspartate protease; endopeptidase); (5) cathepsin K (cysteine protease in osteoclasts and bronchial epithelium); and (6) other recently identified proteases, such as cathepsins C (myeloid cells), F (macrophages), O (widespread), V (thymic epithelium), W (CD8+ T-cells), and Z (widespread). The optimal pH for lysosomal proteases is 3–5. Thus, some weak bases [e.g., ammonia, methylamine, chloroquine, or monensin (an ionophore)] inhibit lysosomal protein degradation by increasing intralysosomal pH above 5 (Shaid et al. 2013).
The lysosomal proteolytic system participates in the intracellular degradation of (1) endocytosed proteins and (2) nonmyofibrillar proteins under conditions of nutri-tional deprivation. Studies involving the use of inhibitors of lysosomal enzymes indi-cate that, in the presence of physiological concentrations of insulin, glucose, and AA, the lysosomal proteolytic system contributes to the degradation of 30–35% and 20–25% of intracellular proteins in enterocytes and skeletal muscle, respectively.

286 Amino Acids: Biochemistry and Nutrition
© 2010 Taylor & Francis Group, LLC
The lysosomal system is not involved, to a significant extent, in the degradation of myofibrillar proteins in skeletal, cardiac, or smooth muscle.
nonlysosomAl Proteolytic PAthwAy
A variety of low- and high-molecular-mass proteases are found outside the lyso-some. Based on catalytic mechanisms, the nonlysosomal pathway for proteolysis can be divided into: (1) the Ca2+-dependent proteolytic system; (2) the caspases; (3) the ATP-dependent, ubiquitin-independent proteolytic system; and (4) the ATP- and ubiquitin-dependent proteolytic system. All of these protein degradation pathways are present in the cytoplasm and may also be expressed in certain organelles (e.g., peroxisomes, nucleus and mitochondria). The optimal pH for nonlysosomal prote-ases is 7–8. The nonlysosomal system is responsible for the degradation of: (1) nor-mal short-lived proteins; (2) abnormal, denatured, and aged proteins under basal metabolic conditions; and (3) both myofibrillar and nonmyofibrillar proteins under conditions of nutritional deprivation (Goll et al. 2008). Depending on the cell type, the nonlysosomal system can contribute to the degradation of 70–80% of intracellular proteins in the presence of physiological concentrations of insulin, glucose, and AA.
Ca2+-Dependent Proteolytic System (Calpain System)The calpain system consists of 14 different members of the Ca2+-dependent protease (cysteine proteases) plus calpastatin. Many tissues, including skeletal muscle, contain two well-characterized Ca2+-dependent proteases: μ-calpain and m-calpain. In skeletal muscle, calpains are concentrated in the I-band and Z-disk areas of the myofibril. The calpains initiate myofibrillar protein degradation by disassembling the outer layer of proteins from the myofibril and releasing them as myofilaments (Fiorotto et al. 2000). Myofilaments undergo further degradation by calpains. No specific AA sequence is rec-ognized by calpains but these enzymes prefer to hydrolyze peptide bonds consisting of leucine, valine, isoleucine, phenylalanine, and tyrosine residues. Note that the calpains partially degrade myofibrillar proteins and do not hydrolyze proteins to small peptides or AA. Available evidence shows that the calpains are not responsible for the degrada-tion of the bulk of the sarcoplasmic proteins. However, defects in a muscle-specific calpain (p94) cause the limb-girdle muscular dystrophy type 2A disease in humans.
CaspasesCells express several caspases (cysteine proteases; e.g., caspases 1, 3, and 9) which are responsible for partial (or limited) degradation of proteins during apoptosis (programmed cell death). The caspases do not require Ca2+ for activity but are activated by the events that initiate apoptosis. These enzymes do not appear to play a significant role in intracel-lular degradation of proteins (including myofibrillar proteins) in healthy animals, but are crucial for cell signaling in response to necrosis, inflammation, and oxidative stress.
ATP-Dependent and Ubiquitin-Independent Proteolytic SystemSome proteases (e.g., proteasome) in cells (e.g., skeletal muscle and reticulocytes) hydro-lyze proteins in an ATP-dependent and ubiquitin-independent manner. These enzymes are soluble alkaline proteins. Their proteolytic activity is also stimulated by UTP, CTP,

287Intracellular Protein Degradation
© 2010 Taylor & Francis Group, LLC
and GTP but to a much lesser extent than ATP. ATP is not hydrolyzed by this type of reaction, where ATP targets protein substrates to the proteases (e.g., mitochondrial proteases and 26S proteasome), activates the proteases, and destabilizes the substrate proteins, thereby facilitating the attack of the substrates by the enzymes independent of ubiquitin conjugation. This proteolysis system is responsible for the degradation of short-lived proteins, including ornithine decarboxylase. Because these proteins are key regulatory enzymes of metabolic pathways, the ATP-dependent and ubiquitin-indepen-dent proteolytic system plays an important role in cell physiology and function.
ATP-Dependent and Ubiquitin-Dependent Proteolytic SystemThe ATP- and ubiquitin (76-AA residue polypeptide)-dependent proteasome system is now considered to be the major system responsible for protein degradation within cells (Varshavsky 2012). The proteasome is ubiquitous in eukaryotes and archaea, and is present in bacteria. The proteasome subcomponents are referred to by their Svedberg sedimentation coefficient (S). The most common form of the proteasome is the 26S proteasome, which is ∼2000 kDa in molecular mass. This eukaryotic protea-some and its role on proteolysis are described below.
Structure of the 26S ProteasomeThe 26S proteasome contains one 20S proteasome (a hollow proteolytic core par-ticle; 700 kDa) and two 19S regulatory caps with one cap on each end of the core particle (Figure 9.2). The core has openings at its two ends (which allow the target protein to enter) and an enclosed cavity in which proteins are degraded.
In eukaryotic cells, the 20S core particle contains 28 different subunits grouped into two classes: α and β subunits, the molecular weights of which range from 20 to 35 kDa. There are seven different gene products for each of the α and β classes. The
20S
19S
19S
α-Subunit (α1 to α7)
α-Subunit (α1 to α7)
2β-Subunits (β1 to β7)(proteolytic activity)
ATPases (6 HPT)
ATPases (6 HPT)
8 Different PT (Lid)
8 Different PT (Lid)
3 Polypeptides
3 Polypeptides
Base
Base
FIGURE 9.2 The 26S proteasome for intracellular protein degradation in animal cells. The 26S proteasome (2000 kDa) in eukaryotes contains one 20S proteasome and two 19S regula-tory caps. The 20S proteasome is a 700-kDa hollow proteolytic core particle that contains multiple peptidase activities. One of the two 19S regulatory caps is located on each end of the core particle. The 19S regulatory complex is composed of multiple ATPase and components for binding protein substrates. HPT, homologous polypeptides; PT, polypeptides.
288 Amino Acids: Biochemistry and Nutrition
© 2010 Taylor & Francis Group, LLC
individual α or β subunits have sequence homology with each other, but they differ markedly from any other proteolytic enzyme. The 20S particle is arranged in four rings of seven subunits each, with the α subunits forming the two outer rings and the β subunits (possessing proteolytic activity, with the β1, β2, and β5 subunits contain-ing functional catalytic sites) forming the two inner rings.
The 19S regulatory particle functions to unfold polypeptides and recognize the substrates for the 20S core particle. This is important because protein molecules can-not enter the catalytic center without first being unfolded. The 19S regulatory com-plex consists of a lid and a base. The lid contains eight different polypeptides that are involved in binding polyubiquitin chains and removing them from the polypeptide that is marked to be degraded. The base contains six homologous ATPases and three polypeptides that do not have any ATPase activity. The ATPases use the energy of ATP to (1) unfold the polypeptide entering the proteasome chamber, (2) facilitate substrate binding to the 20S core particle, and (3) attach ubiquitin to the polypeptide.
Ubiquitin-Dependent Protein DegradationUbiquitin-dependent protein degradation involves several steps: (1) activation of ubiq-uitin by a multienzyme system that involves three conjugation factors and requires the hydrolysis of ATP to AMP plus PPi; (2) binding of multiple ubiquitin moieties to the protein substrate to form the conjugating enzymes−ubiquitin−protein substrate complex; (3) ATP-dependent degradation of the protein substrate by the multicata-lytic 26S proteasome to yield AA and small peptides; and (4) de-ubiquitination of the conjugating enzymes−ubiquitin complex by isopeptidase to regenerate ubiquitin and the conjugating enzymes. This proteolytic pathway is highly specific for substrates and highly conserved among eukaryotic cells (Figure 9.3).
Ubiquitination of proteins (also called ubiquitylation) is necessary before their degradation by the 26S proteasome. This involves the linkage between the pro-tein substrate with ubiquitin (a 76-AA, 8565-Da protein in all eukaryotic cells) and requires three classes of enzymes: (1) E1 enzyme, which activates the ubiquitin, (2) E2 enzyme, which binds to the ubiquitin molecule, and (3) E3 enzyme, which trans-fers the ubiquitin molecule to the target protein. Specifically, an ε-amino group of the selected protein is first attached through an isopeptide bond to the C-terminal end ubiquitin. Attachment may also occur through the N-terminal AA of the selected pro-tein, but the N-terminal amino group of many proteins (including most myofibrillar proteins) is blocked by covalent modifications, such as acetylation. This initial step of protein ubiquitination is catalyzed by the E1 enzyme (ubiquitin-activating enzyme) to produce the E1−substrate−ubiquitin complex and to activate the ubiquitin molecule. This reaction is driven by the energy released from the hydrolysis of ATP to AMP and PPi. The activated ubiquitin is transferred to the E2 enzyme, which is also known as the ubiquitin-conjugating enzyme or ubiquitin carrier protein. Subsequently, the E2−ubiquitin complex interacts with the E3 enzyme (also called ubiquitin ligase) to form the E2−E3−ubiquitin complex in which ubiquitin is attached to the E3 enzyme. The E2−E3−ubiquitin complex then conjugates with a targeted protein and, thereaf-ter, the E2 enzyme catalyzes the transfer of the ubiquitin moiety to the protein sub-strate yielding the E2−E3−ubiquitin−protein complex. It is noteworthy that ubiquitin is covalently linked to the protein substrate destined for degradation. In most cases,
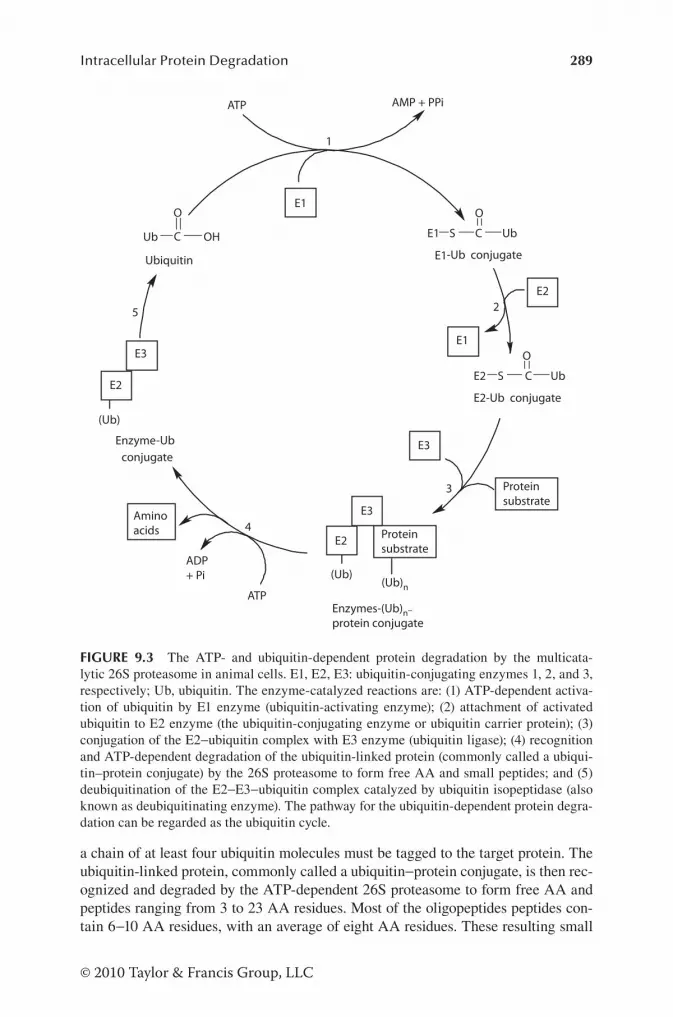
289Intracellular Protein Degradation
© 2010 Taylor & Francis Group, LLC
a chain of at least four ubiquitin molecules must be tagged to the target protein. The ubiquitin-linked protein, commonly called a ubiquitin−protein conjugate, is then rec-ognized and degraded by the ATP-dependent 26S proteasome to form free AA and peptides ranging from 3 to 23 AA residues. Most of the oligopeptides peptides con-tain 6−10 AA residues, with an average of eight AA residues. These resulting small
ATP
Proteinsubstrate
ATP AMP + PPi
Ub C OH
O
Ubiquitin
E1 S C Ub
O
S C Ub
O
-Ub conjugate
Proteinsubstrate
(Ub)n(Ub)
Aminoacids
ADP+ Pi
(Ub)
Enzyme-Ubconjugate
1
2
3
4
5
E3
E2
E1
E2
E1
E2
E3
E3
E2
-Ub conjugateE1
Enzymes-(Ub)n–
protein conjugate
E2
FIGURE 9.3 The ATP- and ubiquitin-dependent protein degradation by the multicata-lytic 26S proteasome in animal cells. E1, E2, E3: ubiquitin-conjugating enzymes 1, 2, and 3, respectively; Ub, ubiquitin. The enzyme-catalyzed reactions are: (1) ATP-dependent activa-tion of ubiquitin by E1 enzyme (ubiquitin-activating enzyme); (2) attachment of activated ubiquitin to E2 enzyme (the ubiquitin-conjugating enzyme or ubiquitin carrier protein); (3) conjugation of the E2−ubiquitin complex with E3 enzyme (ubiquitin ligase); (4) recognition and ATP-dependent degradation of the ubiquitin-linked protein (commonly called a ubiqui-tin–protein conjugate) by the 26S proteasome to form free AA and small peptides; and (5) deubiquitination of the E2−E3−ubiquitin complex catalyzed by ubiquitin isopeptidase (also known as deubiquitinating enzyme). The pathway for the ubiquitin-dependent protein degra-dation can be regarded as the ubiquitin cycle.

290 Amino Acids: Biochemistry and Nutrition
© 2010 Taylor & Francis Group, LLC
peptides are further broken down to free AA by di- and tripeptidases in the cell. After proteolysis is completed, ubiquitin, the E2 enzyme, and the E3 enzyme are released from the E2−E3−ubiquitin complex in a reaction catalyzed by ubiquitin isopeptidase (also known as deubiquitinating enzyme) that cleaves the ubiquitin−protein bonds. The resulting ubiquitin, E2 enzyme, and E3 enzyme are reused for the degradation of another protein molecule. Analogous to the role of ornithine in the urea cycle, ubiq-uitin acts as a catalyst in the pathway of the ubiquitin-dependent protein degradation. This pathway can be regarded as the intracellular ubiquitin cycle in which ubiquitin brings in the protein substrate for degradation via a series of coordinated reactions and is regenerated at the end of the proteolysis.
Although binding of ubiquitinated proteins activates the proteasome’s degrada-tive machinery, some ubiquitinated proteins bind to the 26S ribosome but escape proteolysis and are subsequently deubiquitinated and released. Thus, there are com-plex mechanisms that regulate proteasome activity. Results of recent studies indicate a key regulatory role for phosphorylation of the proteasome in protein degradation. Specifically, a phosphatase, UBLCP1, binds to the 19S subunit Rpn1. The subunit phosphorylation promotes the association of the 19S regulatory particle with the 20S proteasome to form the 26S complex, thereby stimulating proteolysis. Conversely, dephosphorylation of Rpn1 in the purified proteasome enhances its dissociation into 20S and 19S components, leading to suppressed protein breakdown. Likewise, phos-phorylation of Rpt6 (a component of the proteasome) by protein kinase A increases the proteolytic activity of the 26S proteasome under both in vitro and in vivo condi-tions. Because phosphorylation occurs primarily on the α-subunits of the 20S pro-teasome and the ATPases of the 19S proteasome, it is likely that specific kinases regulate the rate of breakdown of ubiquitinated protein substrates by the 26S protea-some in the different compartments of cells.
The ubiquitin−proteasome system functions to: (1) selectively degrade short-lived regulatory proteins (e.g., proteins involved in apoptosis or programmed cell death and proteins involved in signaling processes in the cell), abnormal proteins, and most of long-lived proteins in mammalian cells, (2) regulate cellular processes such as cell division, cell signaling, and regulation of gene activity, (3) remove misfolded and damaged proteins, and (4) in certain immune cells, cleave foreign proteins into smaller pieces called antigenic peptides presented by MHC class I molecules on the cell surface to induce an immune response. The proteasome pathway plays a major role in degrading most of long-lived myofibrillar proteins (e.g., actin, myosin, troponin, and tropomyosin) and soluble (cytoplasmic) proteins in skeletal muscle. In this tissue, specific interactions between the myofibrillar proteins protect them from ubiquitin-dependent hydrolysis by the 26S proteasome, and the key rate-controlling step of this pathway is their dissociation from the myofibril (contractile filament) that is catalyzed by other proteases (including calpains). Results from studies of isolated skeletal muscles indicate that activation of the ubiquitin−proteasome pathway is pri-marily responsible for the rapid loss of proteins from skeletal muscle under various catabolic conditions, such as cancer cachexia, denervation atrophy, fasting, injury, metabolic acidosis, and sepsis (Bonaldo and Sandri 2013). Conversely, impairment of the proteasome activity may play a key role in the pathogenesis of tumorigenesis, Huntington’s disease, Parkinson’s disease, and other neurodegenerative diseases.

291Intracellular Protein Degradation
© 2010 Taylor & Francis Group, LLC
CHARACTERISTICS AND PHYSIOLOGICAL SIGNIFICANCE OF INTRACELLULAR PROTEIN DEGRADATION
BioloGicAl hAlf-lives of Proteins
Different proteins are degraded at different rates. Thus, intracellular proteins have remarkably different half-lives that range from several minutes for short-lived pro-teins to several days for long-lived proteins (Table 9.2). In cells, abnormal proteins are more rapidly degraded than normal proteins. Evidence shows that the rates of degradation of normal proteins vary widely depending on their functions. For exam-ple, enzymes at key metabolic control points may be degraded much faster than those whose activity is largely constant under physiological conditions (Waterlow 1984). One of the most rapidly degraded proteins is ornithine decarboxylase, which has a half-life of 11 min. In contrast, structural proteins such as actin and myosin in skeletal muscle have half-life of a month or more, while hemoglobin essentially lasts for the entire life time of the erythrocyte. To ensure the proper functioning of cells, the half-lives of all proteins must be maintained through proteolysis.
The half-lives of proteins are affected by their physicochemical properties and their structures (Dice 1987). For example, short-lived proteins tend to be (1) large, acidic, and hydrophobic proteins; (2) proteins with low thermal stability; (3) proteins with attached carbohydrate or phosphate groups; (4) proteins with oxidized cyste-ine, histidine, and methionine residues; (5) proteins with deaminated glutamine and asparagine residues; or (6) proteins in the absence of stabilizing ligands.
The AA sequence may also partially determine the half-life of a protein. According to the PEST hypothesis, rapidly degrading proteins (e.g., T1/2 < 2 h) gener-ally have regions rich in proline (P), glutamate (E), serine (S), and threonine (T) resi-dues (Rogers et al. 1986). Such PEST regions rarely occur in more stable proteins. In addition, the stability of proteins is affected partially by the N-terminal AA resi-due, which is called the N-end rule (Tasaki et al. 2012). Let us use β-galactosidase (the enzyme that hydrolyzes lactose to galactose and glucose) as an example (Table 9.3). An obvious difference among these AA is the size of the side chain. It appears that the stabilizing AA have small side chains, whereas those of destabilizing AA tend to be large. It is now known that N-terminal residues of short-lived proteins are recognized by recognition components (called N-recognins), which are essential components of N-degrons (degradation signal or a specific sequence of AA in the N-terminus of protein). Known N-recognins in eukaryotes interact with small pro-teins (including ubiquitin), mediate protein ubiquitylation, and selective proteolysis by the 26S proteasome. Dysregulation of the N-end rule pathway due to mutations in the human UBR1 gene (encoding ubiquitin-protein ligase E3 component N-recognin 1) causes diseases, such as the Johanson-Blizzard syndrome (an autosomal recessive disorder) characterized by congenital exocrine pancreatic insufficiency, facial dys-morphism, multiple malformations, and often mental retardation.
AtP reQuirement for intrAcellulAr Protein DeGrADAtion
The energy requirement for peptide bond cleavage cannot be explained by thermody-namic considerations, since the hydrolysis of peptide bonds is an exergonic process.

292 Amino Acids: Biochemistry and Nutrition
© 2010 Taylor & Francis Group, LLC
However, experimental evidence shows that ATP is required for protein breakdown by (1) ATP-dependent but ubiquitin-independent proteases (two ATP molecules per peptide bond) and (2) the ATP- and ubiquitin-dependent 26S proteasome (equivalent to three ATP molecules per peptide bond) (Figure 9.3). Combining all proteolytic pathways in cells, approximately two ATP molecules are used for the cleavage of one
TABLE 9.2 Biological Half-Lives (T1/2) of Proteins in Mammalian Tissues
Proteins Tissue T1/2
Short-Lived Proteins (T1/2 < 5 h)Ornithine decarboxylase Liver 11 min
δ-Aminolevulinate synthetase
Soluble Liver 0.33 hMitochondrial Liver 1.1 hRNA polymerase I Liver 1.3 hTyrosine aminotransferase Liver 2.0 hTryptophan oxygenase Liver 2.5 hDeoxythymidine kinase Liver 2.6 hHMG-CoA reductase Liver 3.0 hSerine dehydratase Liver 4.0 hAmylase Liver 4.3 h
Proteins with Intermediate Half-Lives (5 h ≤ T1/2 < 50 h)PEP carboxykinase Liver 5.0 hAniline hydroxylase Liver 5.0 hGlucokinase Liver 12 hRNA polymerase II Liver 12 hDihydrooratase Liver 12 hGlucose-6-P dehydrogenase Liver 15 h3-PG dehydrogenase Liver 15 hEndothelial NO synthase Vasculature 20 h
Long-Lived Proteins (T1/2 > 50 h)Ornithine aminotransferase Kidney 4.0 days
Liver 0.95 daysArginase Liver 4.0 daysLactate dehydrogenase Liver 4.3 days
Kidney 6.1 daysHeart 8.2 daysSkeletal muscle 43 days
Aldolase Skeletal muscle ~20 daysMyosin Skeletal muscle ~20 daysActin Skeletal muscle ~60 days
Source: Adapted from Dice, J.F. 1987. FASEB J. 1:349–357; Goldberg, A.L. and A.C. St John. 1976. Annu. Rev. Biochem. 45:747–803; Swick, R.W. and H. Song. 1974. J. Anim. Sci. 38:1150–1157.

293Intracellular Protein Degradation
© 2010 Taylor & Francis Group, LLC
peptide bond in proteins. Based on the example of protein synthesis in healthy adult humans (Chapter 8), it can be estimated that ~6.5% of dietary energy is utilized for intracellular protein degradation in these subjects. Thus, whole-body protein turn-over alone accounts for about 20% of energy metabolism in fed adults.
PhysioloGicAl siGnificAnce of intrAcellulAr Protein DeGrADAtion
The intracellular degradation of protein has many functions. First, proteolysis is required to remove aged proteins, abnormal proteins, and denatured proteins due to changes in extracellular and intracellular environments (e.g., pollution, heat stress, as well as oxidative stress induced by free radicals and other oxidants). The presence of abnormal proteins within cells may interfere with normal cellu-lar metabolism, result in changes in cell volume and osmolarity, and cause tissue injury. Second, protein degradation serves to regulate cellular biochemical reac-tions by removing enzymes and regulatory proteins that are no longer needed. Third, protein degradation plays an important role in adaptation to nutritional deprivation (e.g., such as fasting and lack of dietary protein intake) and pathologi-cal conditions (e.g., burn, cancer, infection, inflammation, and injury) by supplying AA (e.g., alanine, glutamine, and arginine) for gluconeogenesis, ammoniagenesis, ATP production, synthesis of essential proteins, production of neurotransmit-ters, generation of gaseous signaling molecules, and immune responses. Note that
TABLE 9.3Effects of the N-Terminal Amino Acid on the Half-Life of β-Galactosidase
N-Terminal Amino Acid T1/2 of β-Galactosidase
Met >20 h
Ser >20 h
Ala >20 h
Thr >20 h
Val >20 h
Gly >20 h
Ile ~30 min
Glu ~30 min
Tyr ~10 min
Gln ~10 min
Phe ~3 min
Leu ~3 min
Asp ~3 min
Lys ~3 min
Arg ~2 min
Source: Adapted from Rogers, S., R. Wells, and M. Rechsteiner. 1986. Science 234:364–368.

294 Amino Acids: Biochemistry and Nutrition
© 2010 Taylor & Francis Group, LLC
because AA oxidation always occurs in animals even though they have been food-deprived for many days, protein degradation is necessary to provide AA under catabolic conditions associated with the irreversible loss of AA from the body. Fourth, many newly synthesized proteins must undergo partial degradation (i.e., removal of peptide fragments) to achieve their normal biological activities or be directed to their appropriate place in the cell. Fifth, proteolysis regulates the life span of normal proteins to control their concentrations, cell growth, and cell func-tions that are essential to survival.
Let us use glutamine metabolism in lymphocytes as an example to illustrate the nutritional and physiological importance of intracellular protein degradation. An adult man has 1012 lymphocytes, which, in the resting state, utilize 13 mmol glutamine/h per 1012 cells. Assuming that 10% of glutamine carbons are irreversibly lost as CO2 and its N can be efficiently salvaged, net use of glutamine by the lympho-cytes of the whole body would be 1.3 mmol/h per 1012 cells. Glutamine concentra-tion in plasma is 0.55 mM or 8.25 mmol in the total extracellular fluid (15 L). This amount of glutamine would be sufficient for utilization by lymphocytes alone for at most 6.4 h, even not considering glutamine utilization by other tissues and cell types such as the kidneys, small intestine, pancreas, spleen, and macrophages (Chapter 4). Thus, net protein degradation in response to fasting and protein malnutrition is essential to provide glutamine for the immune and other systems of the body.
MEASUREMENTS OF INTRACELLULAR PROTEIN DEGRADATION
meAsurement of intrAcellulAr Protein DeGrADAtion In VItro
General ConsiderationsIntracellular protein degradation releases free AA (Figure 9.4). The criteria for the selection of AA to measure intracellular protein degradation are the same as or similar to those used for studies of protein synthesis. The rate of protein
Protein
Aminoacids
Proteindegradation
Proteinsynthesis
Aminoacids
Release
Cell
Plasmamembrane
FIGURE 9.4 Release of AA from intracellular protein degradation in cells or tissues. When the rate of protein degradation is greater than the rate of protein synthesis, the cell or tissue releases AA into the extracellular space (e.g., blood in vivo or incubation medium in vitro). Some of the AA can be used as indicators of protein breakdown. When the reincorporation of AA into protein is inhibited, the release of AA reflects total protein degradation in cells or tissues.

295Intracellular Protein Degradation
© 2010 Taylor & Francis Group, LLC
degradation is also measured by the release of a nonmetabolizable AA from intra-cellular proteins by cells or tissues (Baracos 1988). Such a measurement is affected by the reincorporation of AA into newly synthesized proteins. In incubated cells or tissues whose pathway of protein synthesis is not inhibited, the release of an AA is an indicator of only net protein degradation, and protein synthesis should be determined simultaneously to calculate the rate of protein degradation. In contrast, when an inhibitor of protein synthesis (e.g., 0.5 mM cycloheximide) is included in the incubation medium, the release of an AA is an indicator of total protein degra-dation (or simply called protein degradation) in cells or tissues. In studies involving the release of a labeled AA from labeled proteins, inclusion of a high concentra-tion of the unlabeled AA in the incubation medium (e.g., 1 mM Phe in medium for skeletal muscle and intestinal cells) is sufficient to minimize the reincorporation of the labeled tracer AA into the protein pool. A caveat to these methods is that incubated tissues are invariably in net negative N balance, even if they are taken from animals undergoing rapid muscle growth (Wu and Thompson 1990).
Net protein degradation = Protein degradation − Protein synthesis
Protein degradation = Net protein degradation + Protein synthesis
Tracer and Nontracer Methods for Measuring Protein Degradation In VitroRelease of Labeled AA from Intracellular Labeled ProteinsLet us use the rat and the chick as the sources of skeletal muscle to study pro-tein degradation. A young rat or chick receives a bolus intraperitoneal injection of [ring-2,6-3H]Phe. Twenty-four hours later, extensor digitorum longus muscle or extensor digitorum communis muscle is isolated from the rat or the chick, respectively. The muscle is washed twice with physiological saline and then pre-incubated at 37°C for 30 min in 2 mL of oxygenated (95% O2/5% CO2) Krebs buffer containing 10 mU/mL insulin, 5 mM d-glucose, 1 mM Phe, and plasma concentrations of other AA to deplete intracellular free 3H-Phe. Thereafter, the muscle is incubated at 37°C for 2 h in 2 mL of oxygenated Krebs buffer contain-ing 10 mU/mL insulin, 5 mM d-glucose, 1 mM Phe, and plasma concentrations of other AA to determine the release of 3H-Phe into the medium. The use of high Phe concentration in the medium is to facilitate the release of 3H-Phe from the skeletal muscle and to minimize the reincorporation of intracellular 3H-Phe into proteins. Similar approaches have been applied to studies of protein degradation in intestinal or placental cells (Tan et al. 2010). The release of labeled leucine or valine from labeled proteins in the perfused rat liver is often used as an index of hepatic protein degradation.
A major advantage of the tracer technique is that protein degradation can be mea-sured at a high sensitivity in the presence of all AA and simultaneously with the assessment of intracellular protein synthesis. A disadvantage of this method is that the release of an AA from the cell into extracellular medium may be affected by other AA if they share a common transport system. This should be verified to ensure that the release of a labeled AA accurately reflects the rate of protein degradation in the studied cells or tissues (Reeds and Davis 1999).

296 Amino Acids: Biochemistry and Nutrition
© 2010 Taylor & Francis Group, LLC
Dilution of a Labeled AAThe dilution of a labeled AA is based on the principle that, in a tissue receiv-ing a tracer AA, a decrease in the SR or IE of the labeled AA in the free pool is affected by the extent to which intracellular protein is degraded (MacLennan et al. 1988). For example, a greater dilution of SR or IE of the free labeled AA indicates a higher rate of protein degradation in the cells or tissue. An example is the use of 15N-Phe to measure protein degradation in rat skeletal muscle perfused with various concentrations of glutamine. Compared with the control (0 mM glu-tamine), the presence of 2−10 mM glutamine results in less dilution of 15N-Phe in the collected perfusate, suggesting a role for glutamine to inhibit intramuscular proteolysis. Advantages of this method are high sensitivity, a lack of interference by processes of protein synthesis, and simplicity. A disadvantage of the technique is that dilution of a labeled AA may occur due to isotope exchange independent of intracellular protein degradation, as discussed in Chapter 7. For example, hydroly-sis of a small peptide to individual AA may affect the dilution of SR or IE of the labeled AA precursor.
Release of Indicator AA from Incubated TissuesDepending on individual tissues, release of an indicator AA is determined to mea-sure intracellular protein degradation in vitro. Examples are given as follows.
1. The release of Leu or Val from perfused liver. Neither leucine nor valine is degraded in the liver because of the absence or very low activity of hepatic BCAA aminotransferase. Because transamination is the first step in BCAA degradation, the absence of BCAA aminotransferase limits the catabolism of BCAA in hepatocytes.
2. The release of Tyr or Phe from incubated muscles. Neither tyrosine nor phenylalanine is degraded in skeletal muscle because of the lack of the nec-essary enzymes (tyrosine hydroxylase and phenylalanine hydroxylase). Tyr can be measured easily by a sensitive fluorescence method, but simple and accurate analysis of all AA is now made possible by advanced chemical techniques. Disadvantage of this method are that: (1) Tyr is usually absent from the incubation medium in order to adequately determine the release of a small amount of Tyr; and (2) an inhibitor of protein synthesis is usu-ally present in the medium to block protein synthesis in order to estimate total protein degradation. The absence of Tyr from the incubation medium results in decreased protein synthesis, and cycloheximide itself may inhibit protein degradation in cultured muscle cells.
3. The release of 3-methylhistidine from actin and myosin. 3-Methylhistidine is formed from protein-bound histidine as a posttranslational event and is not a substrate for protein synthesis. Because actin and myosin are present almost exclusively in smooth muscle, cardiac muscle, and skeletal muscle, the release of 3-methylhistidine can be used to estimate protein degrada-tion in these tissues. This method is highly specific for measuring actin and myosin degradation, but is beset with analytical problems as this AA

297Intracellular Protein Degradation
© 2010 Taylor & Francis Group, LLC
is difficult to be determined in a general laboratory. Additionally, 3-meth-ylhistidine can be released from the hydrolysis of dipeptides (e.g., balenine) independent of intracellular proteolysis.
While this chapter focuses on intracellular proteolysis, it is worth mentioning in passing that the release of 4-hydroxyproline from an incubated tissue is a useful indica-tor of the degradation of its extracellular collagen. 4-Hydroxyproline is a unique pro-line derivative found exclusively in collagen (extracellular protein) of skeletal muscle, skin, and other connective tissues and is not a substrate for protein synthesis. Thus, the release of 4-hydroxyproline is directly proportional to collagen breakdown. This method is highly specific for measuring collagen degradation, but is beset with analyti-cal problems, as 4-hydroxyproline is difficult to be determined in a general laboratory. Also, the release of 4-hydroxyproline may not be used to estimate collagen degradation in tissues (e.g., kidneys and small intestine) that express hydroxyproline oxidase.
meAsurement of intrAcellulAr Protein DeGrADAtion In VIVo
General ConsiderationsMeasurements of intracellular protein degradation in vivo involve a labeled AA. Stable isotope tracers are often used in humans and large farm animals, because they are ethically acceptable and safe for studies (Bier and Matthews 1982). In con-trast, radioactive tracers are good choices for studying in vivo protein degradation in rodents and farm animals because of high sensitivity, easy analysis, and low costs. In rapidly growing young animals, assessment of intracellular protein degradation can be based on fractional rates of protein synthesis and protein growth.
AA metabolism and protein turnover exhibit complex multiple kinetics. Thus, except in tissue biopsy where a small amount of tissue can be obtained after adminis-tration of a tracer, kinetic variables such as AA oxidation, protein synthesis, and pro-tein degradation cannot be directly measured because these physiological processes take place in intracellular pools, which are experimentally nonaccessible (Claydon et al. 2012). Thus, an alternative to tissue sampling is necessary for estimation of protein turnover in vivo, which is generally based on tracer kinetics data in plasma, an easily accessible pool for tracer input and sampling. From these plasma data, one has to make quantitative inferences to the nonaccessible metabolic pools of AA. Therefore, it is essential to have “a model of the system,” namely a hypothesis, to account for the metabolic fate of AA and protein in vivo.
When the rate of protein synthesis and protein growth in cells or a tissue is known, the rate of protein degradation can be calculated using the following equation:
Kd = Ks − Kg
Kd (%/day) is the fractional rate of protein degradation.Kg (%/day) is the fractional rate of protein growth, which is determined experi-
mentally based on protein accumulation in the tissue within a given period of time (e.g., 2−7 days depending on age and species):
Kg (%/day) = (Pt2− Pt1)/(Pt1) ÷ t × 100%
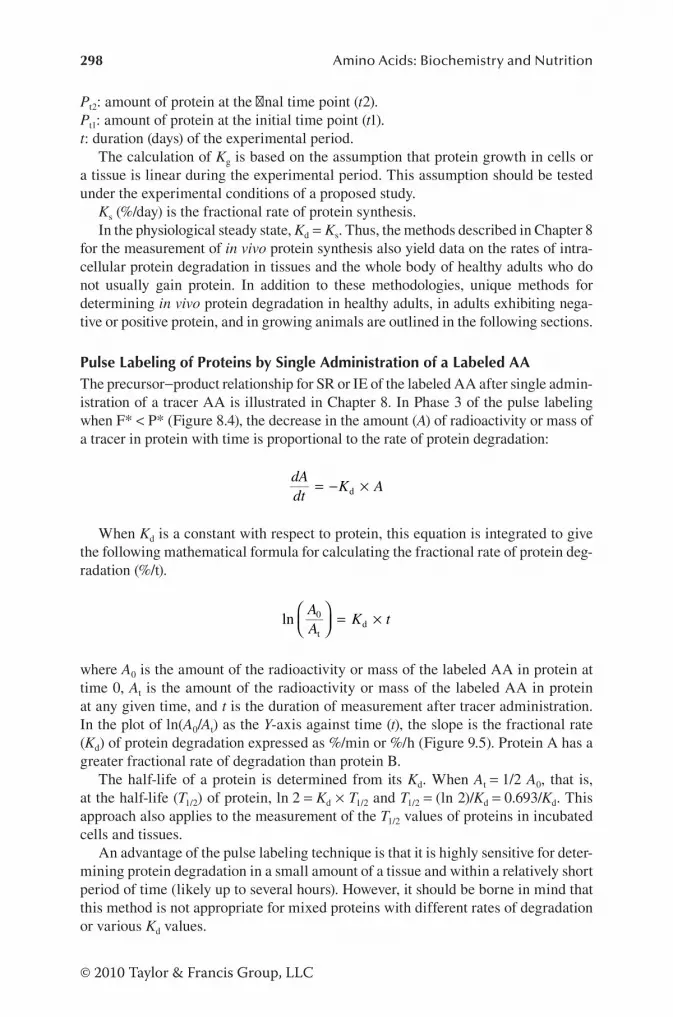
298 Amino Acids: Biochemistry and Nutrition
© 2010 Taylor & Francis Group, LLC
Pt2: amount of protein at the final time point (t2).Pt1: amount of protein at the initial time point (t1).t: duration (days) of the experimental period.
The calculation of Kg is based on the assumption that protein growth in cells or a tissue is linear during the experimental period. This assumption should be tested under the experimental conditions of a proposed study.
Ks (%/day) is the fractional rate of protein synthesis.In the physiological steady state, Kd = Ks. Thus, the methods described in Chapter 8
for the measurement of in vivo protein synthesis also yield data on the rates of intra-cellular protein degradation in tissues and the whole body of healthy adults who do not usually gain protein. In addition to these methodologies, unique methods for determining in vivo protein degradation in healthy adults, in adults exhibiting nega-tive or positive protein, and in growing animals are outlined in the following sections.
Pulse Labeling of Proteins by Single Administration of a Labeled AAThe precursor−product relationship for SR or IE of the labeled AA after single admin-istration of a tracer AA is illustrated in Chapter 8. In Phase 3 of the pulse labeling when F* < P* (Figure 8.4), the decrease in the amount (A) of radioactivity or mass of a tracer in protein with time is proportional to the rate of protein degradation:
dAdt
K A= − ×d
When Kd is a constant with respect to protein, this equation is integrated to give the following mathematical formula for calculating the fractional rate of protein deg-radation (%/t).
ln
AA
K t0
td
= ×
where A0 is the amount of the radioactivity or mass of the labeled AA in protein at time 0, At is the amount of the radioactivity or mass of the labeled AA in protein at any given time, and t is the duration of measurement after tracer administration. In the plot of ln(A0/At) as the Y-axis against time (t), the slope is the fractional rate (Kd) of protein degradation expressed as %/min or %/h (Figure 9.5). Protein A has a greater fractional rate of degradation than protein B.
The half-life of a protein is determined from its Kd. When At = 1/2 A0, that is, at the half-life (T1/2) of protein, ln 2 = Kd × T1/2 and T1/2 = (ln 2)/Kd = 0.693/Kd. This approach also applies to the measurement of the T1/2 values of proteins in incubated cells and tissues.
An advantage of the pulse labeling technique is that it is highly sensitive for deter-mining protein degradation in a small amount of a tissue and within a relatively short period of time (likely up to several hours). However, it should be borne in mind that this method is not appropriate for mixed proteins with different rates of degradation or various Kd values.

299Intracellular Protein Degradation
© 2010 Taylor & Francis Group, LLC
Leucine Oxidation MethodAs discussed in Chapter 8, production of 14C- or 13C-labeled CO2 from [1-14C]leucine or [1-13C]leucine constantly infused into humans or other animals can be determined to calculate whole-body protein turnover, including protein degrada-tion (Figure 8.7). Excretion of 3H2O or 15N-urea from intravenously infused [6-3H]leucine or [15N]leucine, respectively, can also be used to estimate leucine oxidation. In all these experiments, SR or IE of the precursor pool and products at isotopic steady state should be obtained for the calculation of in vivo whole-body protein degradation (Hankard et al. 1998).
Urinary Excretion of 3-MethylhistidinePosttranslational methylation of some histidine residues in actin and myosin proteins generates 3-methylhistidine residues. After these proteins are hydrolyzed by prote-ases, 3-methylhistidine is produced by skeletal, smooth, and cardiac muscles and is not reincorporated into proteins. Much evidence shows that 3-methylhistidine is quantitatively excreted in the urine in some species (including cats, cattle, chickens, deer, frogs, humans, rats, and rabbits), and therefore can be a useful noninvasive tech-nique for measuring protein degradation in these animals. Because skeletal muscle is the major source of urinary 3-methylhistidine, it has been used as an indicator of
Duration (time) of measurement after tracer administration
ln (A
0/A t)
Protein A
Protein B
FIGURE 9.5 Measurement of protein degradation using the pulse labeling method. In Phase 3 of the pulse labeling of protein (see Chapter 8), a decline in the amount of the radio-activity or mass of the labeled AA in protein with time can be used to measure the rate of tissue protein degradation. A0 is the amount of the radioactivity or mass of the labeled AA in protein at time 0, At is the amount of the radioactivity or mass of the labeled AA in protein at any given time, and t is the duration of measurement after tracer administration. The rate of degradation of protein A is greater thant that of protein B.

300 Amino Acids: Biochemistry and Nutrition
© 2010 Taylor & Francis Group, LLC
protein breakdown in this tissue (Young and Munro 1978). In some species (e.g., dogs, goats, mice, pigs, and sheep), 3-methylhistidine cannot be quantitatively excreted in the urine, and thus is not a useful indicator of muscle protein degradation. This is because in pigs, sheep, and goats, 3-methylhistidine reacts with β-alanine to form a dipeptide, β-alanyl-l-3-methylhistidine (balenine), which is abundant in skeletal muscle. In dogs, 3-methylhistidine undergoes decarboxylation to form 3-methylhis-tamine, and a large amount of 3-methylhistidine is excreted in the feces. In mice, 3-methylhistidine is also decarboxylated to form 3-methylhistamine, followed by oxi-dative deamination to yield 1-methylimidazole-4-acetic acid, whereas 3-methylhisti-dine can be acetylated to N-acetyl-3-methylhistidine.
The relative contribution of the skeletal muscle to 3-methylhistidine in the body may depend on many factors such as the metabolic rates of nonskeletal muscle tis-sues (e.g., small intestine, cardiac muscle, and skin). In young growing rats, the small intestine contributes significant amounts of 3-methylhistidine due to the rapid turn-over rates of intracellular proteins. Additionally, dietary intake of 3-methylhistidine from animal products (e.g., meat and bones) must be considered and corrected for when calculating the production of 3-methylhistidine from the degradation of actin and myosin. Furthermore, concentrations of the dipetides containing 3-methylhisti-dine in animal tissues should be constant during a 24-h period of urine collection. Thus, caution should be exercised when using the urinary excretion of 3-methylhis-tidine as an indicator of skeletal muscle protein breakdown in the body.
SUMMARY
Intracellular protein degradation, which is a component of intracellular protein turn-over, is catalyzed by exopeptidases and endopeptidases. Based on the catalytic sites, enzymes responsible for proteolysis are classified as serine, cysteine, aspartate, and metallo-proteases. On the basis of the location of proteases, proteolytic systems are classified as lysosomal (optimal pH 3–5) and nonlysosomal (optimal pH 7–8) sys-tems (Figure 9.6). Lysosomal proteases consist of cathepsins B, H, L, and D and are responsible mainly for degradation of long-lived intracellular proteins, endocytosed proteins, partly myofibrillar proteins, and proteins under conditions of nutrient depri-vation. Nonlysosomal proteases include calpains, the caspases, ATP-dependent but ubiquitin-independent proteases, and the ATP- and ubiquitin-dependent 26S protea-some, and is responsible for degradation of both short-lived and long-lived proteins, as well as abnormal and denatured proteins. In recent years, much attention has been paid to the structure and functions of the complex 26S proteasome, which contains one 20S core and two 19S regulatory caps. This multi-unit protease is highly con-served among eukaryotic cells and is responsible for most of protein degradation in the cells. Thus, the 26S proteasome functions as a universal degradation machine for a wide variety of protein substrates. Intracellular protein degradation requires a large amount of energy (~2 ATP molecules for hydrolysis of each peptide bond) but is essential for regulation of many cellular processes, including the cell cycle, gene expression, processing of antigens in the immune system, and responses to oxidative stress. To understand the regulatory mechanism of protein homeostasis, both tracer and nontracer methods, including pulse labeling, leucine oxidation, and release of

301Intracellular Protein Degradation
© 2010 Taylor & Francis Group, LLC
indicator AA, have been developed to determine rates of protein turnover in vitro and in vivo. Choice of the methods should be dictated by scientific questions to be asked.
REFERENCES
Baracos, V.E. 1988. Role of factors derived from activated macrophages in regulation of mus-cle protein turnover. Adv. Exp. Med. Biol. 240:225–234.
Benbrook, D.M. and A. Long. 2012. Integration of autophagy, proteasomal degradation, unfolded protein response and apoptosis. Exp. Oncol. 34:286–297.
Bier, D.M. and D.E. Matthews. 1982. Stable isotope tracer methods for in vivo investigations. Fed. Proc. 41:2679–2685.
Bonaldo, P. and M. Sandri. 2013. Cellular and molecular mechanisms of muscle atrophy. Dis. Model Mech. 6:25–39.
Ciechanover, A. 2012. Intracellular protein degradation: From a vague idea thru the lyso-some and the ubiquitin−proteasome system and onto human diseases and drug targeting. Biochim. Biophys. Acta 1824:3–13.
Claydon, A.J., M.D. Thom, J.L. Hurst, and R.J. Beynon. 2012. Protein turnover: Measurement of proteome dynamics by whole animal metabolic labelling with stable isotope labelled amino acids. Proteomics 12:1194–1206.
Craik, C.S., M.J. Page, and E.L. Madison. 2011. Proteases as therapeutics. Biochem. J. 435:1–16.Dice, J.F. 1987. Molecular determinants of protein half-lives in eukaryotic cells. FASEB J.
1:349–357.Fiorotto, M.L., T.A. Davis, and P.J. Reeds. 2000. Regulation of myofibrillar protein turnover
during maturation in normal and undernourished rat pups. Am. J. Physiol. Regul. Integr. Comp. Physiol. 278:R845–R854.
Goldberg, A.L. 2003. Protein degradation and protection against misfolded or damaged proteins. Nature 426:895–899.
Goldberg, A.L. and A.C. St John. 1976. Intracellular protein degradation in mammalian and bacterial cells. Annu. Rev. Biochem. 45:747–803.
Intracellular proteins
Amino acids
Proteases in the lysosome(e.g., Cathepsins B, C, D, F,
H, K, L, O, V, W, and Z)
Degradation of 20–30% of cellular proteins
Responsible for degradation of(1) endocytosed proteins;
(2) nonmyofibrillar proteinsunder conditions of
nutritional deprivation
(proteins enter the lysosome from the
cytosol via autophagy, endocytosis, and
crinophagy)
Optimal pH 3–5
Nonlysosomalpathway
Calpain (µ-calpain and m-calpain)Caspases (particularly important during apotosis)ATP-dependent and Ub-independent proteasesATP-dependent and Ub-dependent proteasesOther proteases in the cytosol and neutral
organelles (e.g., peroxisomes, nucleus and Mit)
Responsible for degradation of(1) normal short-lived proteins;
(2) abnormal, denatured and aged proteinsunder basal metabolic conditions;
(3) myofibrillar and nonmyofibrillar proteins under conditions of nutritional deprivation
Optimal pH 7–8
Lysosomalpathway
Degradation of 70–80% of cellular proteins
(mainly in the cytosol)
FIGURE 9.6 Degradation of intracellular proteins via the lysosomal and nonlysosomal pathways in animal cells. Mit, mitochondria; Ub, ubiquitin.

302 Amino Acids: Biochemistry and Nutrition
© 2010 Taylor & Francis Group, LLC
Goll, D.E., G. Neti, S.W. Mares, and V.F. Thompson. 2008. Myofibrillar protein turnover: The proteasome and the calpains. J. Anim. Sci. 86(Suppl 14):E19–E35.
Hankard, R.G., D. Hammond, M.W. Haymond, and D. Darmaun. 1998. Oral glutamine slows down whole body protein breakdown in Duchenne muscular dystrophy. Pediatr. Res. 43:222–226.
Hershko, A. and A. Ciechanover. 1998. The ubiquitin system. Annu. Rev. Biochem. 67:425–479.Katunuma, N. and E. Kominami. 1995. Structure, properties, mechanisms, and assays of cyste-
ine protease inhibitors: Cystatins and E-64 derivatives. Methods Enzymol. 251:382–397.MacLennan, P.A., K. Smith, B. Weryk, P.W. Watt, and M.J. Rennie. 1988. Inhibition of protein
breakdown by glutamine in perfused rat skeletal muscle. FEBS Lett. 237:133–136.Mizushima, N. and Komatsu, M. 2011. Autophagy: renovation of cells and tissues. Cell
147:728–741.Rawlings, N.D., A.J. Barrett, and A. Bateman. 2012. MEROPS: The database of proteolytic
enzymes, their substrates and inhibitors. Nucleic Acids Res. 40:D343–D350.Reeds, P.J. and T.A. Davis. 1999. Off flux and flooding: The advantages and problems of dif-
ferent isotopic methods for quantifying protein turnover in vivo: I. Methods based on the dilution of a tracer. Curr. Opin. Clin. Nutr. Metab. Care 2:23–28.
Rivett, A.J. 1990. Intracellular protein degradation. Essays Biochem. 25:39–81.Rogers, S., R. Wells, and M. Rechsteiner. 1986. Amino acid sequences common to rapidly
degraded proteins: The PEST hypothesis. Science 234:364–368.Shaid, S., C.H. Brandts, H. Serve, and I. Dikic. 2013. Ubiquitination and selective autophagy.
Cell Death Differ. 20:21–30.Swick, R.W. and H. Song. 1974. Turnover rates of various muscle proteins. J. Anim. Sci. 38:
1150–1157.Tan, B.E., Y.L. Yin, X.F. Kong, P. Li, X.L. Li, H.J. Gao, X.G. Li, R.L. Huang, and G. Wu. 2010.
l-Arginine stimulates proliferation and prevents endotoxin-induced death of intestinal cells. Amino Acids 38:1227–1235.
Tasaki, T., S.M. Sriram, K.S. Park, and Y.T. Kwon. 2012. The N-end rule pathway. Annu. Rev. Biochem. 81:261–289.
Varshavsky, A. 2012. The ubiquitin system, an immense realm. Annu. Rev. Biochem. 81:167–176.
Waterlow, J.C. 1984. Protein turnover with special reference to man. Q. J. Exp. Physiol. 69:409–438.
Wu, G. and J.R. Thompson. 1990. The effect of glutamine on protein turnover in chick skeletal muscle in vitro. Biochem. J. 265:593–598.
Young, V.R. and H.N. Munro. 1978. Nτ-Methylhistidine (3-methylhistidine) and muscle protein turnover: An overview. Fed. Proc. 37:2291–2300.

303
© 2010 Taylor & Francis Group, LLC
Regulation of Amino Acid Metabolism
A metabolic pool of free AA in organs (e.g., skeletal muscle, liver, and kidneys), tissues (e.g., blood, white adipose tissue, and skin), cells (e.g., hepatocytes, macro-phages, and lymphocytes), and intracellular organelles (e.g., cytoplasm and mito-chondria) is relatively constant in healthy subjects at a given developmental stage (Figure 10.1). This reflects the fine balance between the supply of AA (exogenous and endogenous) and their utilization. In the postabsorptive state, concentrations of AA in plasma and tissues do not fluctuate substantially so as to maintain desirable concentration gradients between the plasma and tissues or cells. As illustrated with rapidly growing pigs, concentrations of most AA in cells and tissues (except for argi-nine in the mammalian liver) are much greater than those in the plasma (Table 10.1). It is noteworthy that concentrations of free AA in the plasma and tissues vary with species, developmental stage, nutritional state, endocrine status, physical activity, time of the day, and diseased condition.
In 1932, W.B. Cannon coined the term “homeostasis,” which is defined as a rela-tively constant state of the body. In other words, homeostasis is the maintenance of the composition of the internal environment that is essential for health, which includes the balances of AA, ammonia, proteins, carbohydrates (including glucose), lipids, water, acid–base, and electrolytes in the organism. Disturbance of homeosta-sis for either a short or a prolonged period of time may result in diseases and even death. Clinical examples in human medicine are hypoargininemia, hyperammone-mia, hypercysteinemia, and endothelial dysfunction.
Because of alterations in rates of AA metabolism brought about by changes in hormonal and developmental status, circulating levels of many AA vary greatly during fetal and neonatal periods, as well as under catabolic conditions and in disease. In addition, results of recent studies indicate dynamic changes of free AA concentrations in milk, the skeletal muscle of lactating mammals, and fetal fluids during pregnancy. For example, concentrations of free glutamine in sow
10
A metabolic pool of free AA(e.g., cytoplasm, mitochondrion,
cell, tissue, plasma, or whole body)
Input ofAA
(e.g., synthesis,proteolysis, anddietary intake)
Utilization ofAA(e.g., oxidation, andsynthesis of proteinsand NPN)
FIGURE 10.1 The regulation of homeostasis of free AA by their input and utilization in a metabolic pool, which can be an organ, a tissue, a cell, and an intracellular organelle. The free pool of AA is relatively constant in healthy subjects at a given developmental stage. NPN, nonprotein nitrogenous substances.

304 Amino Acids: Biochemistry and Nutrition
© 2010 Taylor & Francis Group, LLC
milk increase from 0.1 to 4 mM between days 1 and 21 of lactation and those in ovine allantoic fluid increase from 0.1 to 25 mM between days 30 and 60 of gestation. In contrast, intramuscular concentrations of glutamine decrease by >50% in lactating sows and mares, as well as in humans and other animals with injury and sepsis, because of enhanced release of glutamine from skeletal muscle. Additionally, arginine, ornithine, and citrulline are unusually abundant in porcine
TABLE 10.1Concentrations of Free AA and Ammonia in the Plasma and Tissues of Rapidly Growing Pigs
AA Plasma Brain Liver Skeletal Musclec
Alanine 408 1386 5586 1886
Arginine 144 1103 120 1686
Asparagine 109 186 1143 164
Aspartate 13 2871 2105 161
β-Alanine 12 89 572 1043
Citrulline 154 150 95 304
Cysteinea 141 286 290 106
Glutamine 513 10,704 4814 6186
Glutamate 105 12,086 5320 2014
Glycine 996 1543 9229 3429
Histidine 57 143 1072 404
Isoleucine 120 122 404 92
Leucine 131 204 815 122
Lysine 172 214 686 286
Methionine 74 91 118 76
Ornithine 83 34 586 243
Phenylalanine 56 86 272 74
Proline 440 1386 6904 2857
Serine 131 1214 1513 286
Taurine 90 3007 14,146 12,214
Threonine 399 2086 1286 903
Tryptophan 48 34 106 47
Tyrosine 133 205 329 203
Valine 280 249 872 287
Ammoniab 53 371 496 343
Source: Data are adapted from Li, P. et al. 2008. Nitric Oxide 19:259–265; Li, P. et al. 2009. Amino Acids 37:709–716.
Note: Values are expressed in µM. Blood and other tissues were obtained from 49-day-old pigs at 2 h after feeding.
a Including cysteine + 1/2 cystine (i.e., the two cysteine moieties in cystine).b Sum of NH3 plus ammonium (NH4
+).c Gastrocnemius muscle.

305Regulation of Amino Acid Metabolism
© 2010 Taylor & Francis Group, LLC
allantoic fluid (e.g., 4–6 mM arginine on day 40 of pregnancy) and ovine allan-toic fluid (e.g., 10 mM citrulline on day 60 of pregnancy) during early to mid-gestation, compared with their plasma concentrations (e.g., 0.1–0.2 mM arginine and citrulline). Notably, these three AA plus glutamine represent ~70% of total α-AA N in allantoic and amniotic fluids. A great increase (up to 80-fold) in their concentrations in allantoic fluid occurs during the most rapid period of placental growth. Also, the concentration of serine in ovine allantoic fluid increases from 0.51 mM on day 30 of pregnancy to 16.5 mM on day 140 of pregnancy when serine contributes to 60% of total α-AA in this fetal fluid. Furthermore, total recoverable amounts of glutamine, leucine, and isoleucine in ovine uterine flush-ings increased by 20-, 3-, and 14-fold, respectively, between days 10 and 15 of pregnancy, whereas those of arginine, histidine, ornithine, and lysine increased 8-, 22-, 5-, and 28-fold, respectively, between days 10 and 16 of gestation. Such dynamic changes of AA concentrations in physiological fluids occur as a result of the complex regulation of AA metabolism in a cell-, tissue-, and species-specific manner. Thus, quantitative analysis of metabolic control in health and disease is an important area of biochemical research. The major objective of this chapter is to highlight the cellular mechanisms responsible for the regulation of AA metabo-lism (including protein turnover) in animals.
BASIC CONCEPTS IN METABOLISM
chemicAl reActions
The general principles of chemical reactions apply to enzyme-catalyzed reactions in cells and cell-free systems. In a chemical reaction that occurs with no change in the volume of the system, the reaction rate (or velocity) equals the change in concentra-tion of product per unit time. On the basis of kinetics, there are at least five chemical reaction orders, most of which are relevant to cell metabolism in animals.
Zero-order reaction: The rate of product formation is independent of the sub-strate concentration but dependent on time.
First-order reaction: The rate of product formation is directly proportional to the substrate (S) concentration: υ ∝ [S].
Second-order reaction: The rate of product formation either depends directly on the concentration of two substrates (S1 and S2) or depends on the square of the concentration of a single substrate (S): υ ∝ [S1] × [S2], or υ ∝ [S]2.
Mixed-order reaction: The rate of product formation depends on the concen-tration of a reactant raised to a fractional power due to changes in variables (e.g., pH): υ ∝ [S]1/n, n ≥ 2.
Higher-order reaction: The rate of product formation depends on the concen-tration of a reactant raised to a power greater than 2: υ ∝ [S]n, n > 2.
Many reactions of AA metabolism require energy and/or reducing equivalents, whereas others produce ATP and/or reducing equivalents. ATP is the major form of chemical energy that can be converted into all other forms of energy used by liv-ing organisms. Therefore, ATP has been described as the “energy currency” of the

306 Amino Acids: Biochemistry and Nutrition
© 2010 Taylor & Francis Group, LLC
cell. The ratio of [ATP]/([ADP] + [AMP]) is often used to describe cellular energy status. Some enzymes for AA synthesis and degradation depend on NADH/NAD+ or NADPH/NADP+ as cofactors [e.g., pyrroline-5-carboxylate + NADPH + H+ → pro-line + NADP+]. An alteration in redox state is an important mechanism that regulates the synthesis and catabolism of AA in cells. Additionally, cellular redox signaling affects gene expression and, therefore, the metabolic network.
lAws of thermoDynAmics As APPlieD to AA metABolism
Thermodynamics was originally applied to physics and engineering and the laws were formulated to describe the properties of devices such as heat engines. The first and second laws of thermodynamics also apply equally well to animals with con-stant temperature and pressure but the emphasis is somewhat different. For example, there is a less emphasis on temperature and pressure in metabolic thermodynamics. The third law of thermodynamics states that the entropy of a pure crystalline sub-stance at absolute zero temperature (0 K) is zero; this law does not apply to animal metabolism and, therefore, is not discussed in this chapter.
First Law of ThermodynamicsThe first law of thermodynamics is the law of energy conservation. Any energy that is released by the system (e.g., an animal) must be gained by its surroundings (e.g., the environment). Thus, energy can neither be created nor destroyed, it can only be con-verted from one form into another. (Remember that there is no production of energy in animals!). In other words, the change in chemical energy (internal energy) when 1 mol of substance A is converted into B is equal to the heat produced plus the work done on the reaction, or the heat consumed plus the work done by the reaction. The energy absorbed in the forward reaction is equal to the energy released in the reverse reaction. The first law of thermodynamics can be expressed mathematically as
ΔH = q + w
Here ΔH is the change in chemical energy when pressure is constant, under which conditions a change in volume can occur. These are likely to be the conditions apply-ing in metabolic reactions. ΔH is also known as the change in enthalpy of the reac-tion. q is the heat released in an exothermic reaction or consumed in an endothermic reaction. w is the work done on or by the system. ΔH is independent of the chemical pathway by which a process is carried out and depends only on the differences in chemical energy before and after the process has occurred. For example, whether glucose is oxidized either by burning in oxygen in a calorimeter or by a series of biochemical reactions including the glycolysis and Krebs cycle in the brain, ΔH is the same. This is because these processes involve the same substrates and generate the same products; namely glucose + 6O2 → 6CO2 + 6H2O.
If no work is done by the reaction, the whole of the enthalpy change appears as heat, namely when w = 0, ΔH = q. This principle is used to calculate the total energy content of an AA. Specifically, ΔH values are calculated from the heat produced when the foodstuff or a substance is combusted with excess O2 in a bomb calorimeter. Thus,
307Regulation of Amino Acid Metabolism
© 2010 Taylor & Francis Group, LLC
all the carbon is oxidized to CO2, all the hydrogen to H2O, and all N to nitrogen oxide. In combustion, AA or protein oxidation is complete with production of water, CO2, and nitrogen oxide, whereas AA oxidation is incomplete in animals with N excreted in the forms of ammonia, urea, and uric acid. Because of the differences in the end products of combustion and biological oxidation of AA, the biological values of ΔH for AA are lower than these obtained from combustion. This is important in calculat-ing the biological energy of AA and protein in food and in estimating the efficiency of metabolic transformations of AA in animals (Chapter 4).
Second Law of ThermodynamicsThe key to understanding direction and equilibrium in chemical reactions is the second law of the thermodynamics, which introduces the concept of change in the entropy (ΔS). Spontaneous reactions always proceed with an increase in total entropy (i.e., ΔS > 0). Like enthalpy, entropy’s value depends only on the state of a system and not on the route by which it arrived at that state. We can state the second law of thermodynamics as “all processes proceed in a direction that increases the total entropy.” In a formal mathematical term, entropy is the heat (q) absorbed in a thermodynamically reversible reaction (at T K) divided by the absolute temperature (T expressed as Kelvin temperature), namely ΔS = q/T.
Concept of Free Energy Unifies the First and Second Laws of ThermodynamicsAlthough the total entropy change is a sufficient criterion upon which to establish which process can and cannot occur, it is not always easy to measure the changes in entropy of both the reactants and the environment. A change in Gibbs free energy (ΔG), which was originally developed in the 1870s by the American mathematician J.W. Gibbs, defines the equilibrium condition in terms of the enthalpy and entropy of the system at constant temperature and pressure. The free energy refers to the avail-able energy that does useful work in a chemical reaction:
ΔG = ΔH – TΔS
where ΔG is the Gibbs free energy change, ΔH is the enthalpy change, ΔS is the entropy change, and T is the Kelvin temperature.
Thus, the Gibbs free energy change provides a unifying principle in thermody-namics. ΔG can be positive, negative, or zero.
If ΔG < 0, the process is spontaneous and is called exergonic.If ΔG > 0, the process is not spontaneous and is called endergonic.If ΔG = 0, the system is at equilibrium (no change in free energy and no net flux
through a reaction).ΔG = ΔGo + RT lnX or ΔG = ΔGo + 2.3 RT logXAt equilibrium, ΔG = 0, ΔGo = −2.3 RT logXΔGo: standard free energy changeX = [B]/[A] (mass action ratio at a given time for the reaction: A ↔ B. A = sub-
strate; B = product)
308 Amino Acids: Biochemistry and Nutrition
© 2010 Taylor & Francis Group, LLC
R: gas constant (1.987 cal/K mol) or 8.314 J/K mol (1 cal = 4.1842 J)T: Kelvin temperature (K) (37°C = 310 K; 25°C = 298 K; 0°C = 273 K)
Note that ΔGo′ (standard free energy change measured at pH 7.0, 25°C, pressure 1 atm, concentrations of all reactants and products at 1 M except for 55.6 M water) is often used to replace ΔGo in a biological reaction. Values of ΔGo or ΔGo′ for many reactions involving AA can be found in the biochemical literature.
The mass action ratio equals the equilibrium constant when the concentrations of product(s) and reactant(s) are at equilibrium. Based on the second law of thermo-dynamics, changes in concentrations of substrates and products can affect the net flux through an enzyme-catalyzed reaction. Let us take ornithine aminotransferase (OAT) as an example.
P5C + glutamate ↔ ornithine + α-KG
OAT favors either the formation of ornithine from P5C and glutamate or the catabolism of ornithine to generate P5C in the enterocyte, which depends on concen-trations of reactants of the reaction and the removal of its product via absorption into the portal circulation. An inborn deficiency of OAT causes: (1) hypoornithinemia (a risk factor for ammonia toxicity) in neonates who have low rates of intestinal synthe-sis of P5C by P5C synthase and of ornithine by arginase and (2) hyperornithinemia (a risk factor for retinal damage) in adults who have a relatively high rate of ornithine production from arginine by arginase in the small intestine and other tissues.
concePt of eQuiliBrium
Biochemical reactions in AA metabolism are basic physiological events in ani-mals. Some reactions are reversible, but others are irreversible. The directionality of the reactions, which is affected by pH, temperature, electrical potential, and ionic strength, as well as the concentrations of reactants and products, plays a signifi-cant role in determining the net flux through a given metabolic pathway. Thus, it is important to understand the concept of equilibrium and nonequilibrium reactions. Consider the following hypothetical enzyme-catalyzed reaction in a closed system (no exchange of matter or energy with its surroundings):
A B
V
V
f
r →←
where A and B are reactants, Vf is the rate of forward component, and Vr is the rate of reverse component.
The state in which the rates of forward and reverse reactions are equal (Vf = Vr) is referred to as an equilibrium. An animal is an example of open thermodynamic system in which there is a continuous exchange of both matter and energy with its surround-ings. In metabolic pathways, some reactions (e.g., most of AA transamination reactions) are close to equilibrium (Vf ≈ Vr), and some (e.g., AA decarboxylation) are far removed

309Regulation of Amino Acid Metabolism
© 2010 Taylor & Francis Group, LLC
from equilibrium (Vf ≫ Vr, or Vf ≪ Vr). Equilibrium constant (Keq) is defined as the ratio of concentrations of product and substrate when the reaction is at equilibrium. Under this condition, there is no net work done and no change in ΔG. Equilibrium constant depends only on the stoichiometry of the reaction, not on its mechanism.
Keq = [Beq]/[Aeq] at equilibrium; for the reaction: A ↔ BNote: mass action ratio = [B]/[A]
Keq = ([Beq] × [Deq]2)/([Aeq] × [Ceq]2) at equilibrium; for the reaction: A + 2C ↔ B + 2D
Note: mass action ratio for the above reaction = ([B] × [D]2)/([A] × [C]2)
Water and H+ participate in many biochemical reactions. The concentration of water is 55.6 M in biochemical reactions, whereas concentrations of H+ at pH 7.0 and 7.4 are 100 and 40 nM, respectively. In calculating Keq, the units of concentrations of substrate(s) and products(s) should be expressed consistently.
neAr-eQuiliBrium (reversiBle) AnD noneQuiliBrium (irreversiBle) reActions
Reactions in metabolic pathways for AA metabolism can be divided into near- equilibrium (close to equilibrium or reversible reaction in cells) and nonequilibrium (far removed from equilibrium or irreversible reaction in cells). Near-equilibrium reactions are often loosely called equilibrium reactions. A nonequilibrium reaction that is saturated with pathway substrate may be a flux-generating reaction. Let us consider the following hypothetical reaction in a metabolic pathway:
E E E
S A B P
1 2 310 01
0 01
100
90
10 1
0 1
.
.
.
. →← →← →←
In this enzyme-catalyzed pathway, the initial substrate (S) is converted into its product (A). The intermediate B is formed from A and is continuously converted into P (product). The metabolic significance of near-equilibrium reactions is: (1) allowing easy reversal of the pathway; (2) conferring relatively high rates of reac-tions; and (3) providing sensitivity for regulation of flux through a pathway. Small changes in concentrations of substrates or products can produce large changes in flux. For example, in the E2 step, if the forward reaction is increased by 10% due to an increase in [A] or the removal of the intermediate B without a change in the backward reaction, the next flux would double. Thus, removal of products or sub-strates determines both the directionality and net flux of the equilibrium reactions. For comparison, the metabolic significance of nonequilibrium reactions is: (1) pro-viding directionality in a metabolic pathway, (2) providing potential sites for the regulation of flux by biological factors (e.g., allosteric factors), and (3) maintaining concentrations of intermediates while allowing for rapid transmission of changes in flux through the pathway.

310 Amino Acids: Biochemistry and Nutrition
© 2010 Taylor & Francis Group, LLC
enZymes As BiochemicAl reActions
Enzymes as Biological CatalystsIn 1877, the German physiologist Wilhelm Kühne first coined the term “enzyme” as a substance to facilitate the fermentation of sugar to alcohol by yeast. Enzymes are biological catalysts. Most of the enzymes are protein in nature, while certain RNAs have catalytic activity. The significance of enzymes in living organisms is not just that of catalysis. The existence of enzymes not only increases the rates of metabolic processes, but also enables them to be regulated. As a result of this regulation, indi-vidual reactions and metabolic pathways can be integrated into the overall metabolic system, which functions so effectively in the whole organism that the homeostasis of AA, protein, and other nutrients can be precisely maintained in healthy animals. The properties of enzymes include substrate specificity, denaturation, pH dependence, temperature dependence, and inhibition.
Enzyme kinetics are determined extracellularly (e.g., a test tube) using either cell extracts or purified proteins in laboratory studies. The classic Michaelis–Menton equation describes a hyperbolic relationship between initial rate (i.e., catalytic activ-ity) and substrate concentration:
V
VV
KV V
KV Vi
i= + = + = × +max
max max max
[ ][ ]
;[ ]
[ ];
[ ][ ]
[SS
SS S
S
m
m
K1 1 1m
SS]
where Vmax is the maximum rate of reaction and Km is the Michaelis constant. Km is defined as the substrate concentration at which enzyme velocity is half-maximal.
A Km value allows for: (1) estimating the affinity of enzymes toward their sub-strates, with a low or high Km value indicating a high or low affinity of the enzyme toward the substrate, respectively and (2) assessing whether a particular enzyme plays a part in a metabolic pathway. When a Km value of an enzyme for its substrate is 100 times the substrate concentration in the cell, it is unlikely that this reaction would have physiological relevance. In contrast, when a Km value of an enzyme for its substrate is much lower than the intracellular concentration of the substrate (e.g., <1% of the substrate concentration in the cell), it is likely that this reaction is regu-lated by the availability of a cofactor rather than directly by the substrate. An exam-ple is NO synthesis from arginine by NO synthase in endothelial cells, where the Km value of NO synthase for arginine is only 3 μM but the concentrations of arginine are 1–2 mM depending on the concentration of arginine in the extracellular solution. It is now known that the intracellular concentration of tetrahydrobiopterin (an essen-tial cofactor for NO synthase) plays a critical role in regulating NO synthesis by NO synthase in endothelial cells.
Reversible Inhibition of EnzymesAn enzyme can be inhibited by both endogenous or exogenous inhibitors. The main classes of reversible enzyme inhibition are known as competitive, noncompetitive, and uncompetitive. These classes of enzyme inhibition can be distinguished by

311Regulation of Amino Acid Metabolism
© 2010 Taylor & Francis Group, LLC
kinetics and the sites of action of inhibitors, as well as double reciprocal plots (also known as Lineweaver plots) (Figure 10.2).
Competitive inhibition occurs at the substrate-binding (catalytic) site. An inhibi-tor is usually a substrate analog. In competitive inhibition, Km value is increased but Vmax is not altered. Increasing substrate concentration can overcome competitive inhibition. In noncompetitive inhibition, inhibitors bear no structural resemblance to the substrate and can bind reversibly either to the free enzyme or to the enzyme–substrate complex. Vmax is decreased but Km remains unaltered in noncompetitive inhibition, which is usually reversible. An increase in substrate concentration gener-ally does not relieve this type of enzyme inhibition. However, noncompetitive inhi-bition can be alleviated or reversed by reducing the concentration of the inhibitor. In uncompetitive inhibition, an inhibitor binds with the enzyme–substrate complex. Both Km and Vmax are altered in uncompetitive inhibition, which is rare for reactions with single substrates but may occur in multimeric enzymes. Uncompetitive inhibi-tion generally cannot be relieved by increasing substrate concentration but can be reversed by reducing the concentration of the inhibitor.
Competitive inhibition: This kind of enzyme inhibition is characterized by an increase in Km (example: inhibition of NOS by NG- monomethylarginine and inhibi-tion of dihydrofolatereductase by methotrexate).
E S ES
I
EI
+ →+
↓
Noncompetitive inhibition: This kind of enzyme inhibition is characterized by a decrease in Vmax (examples: inhibition of phosphofructokinase-I by ATP or citrate and inhibition of intestinal proline oxidase by l-lactate).
Competitive inhibition
1/[S]
1/VUninhibited
Uninhibited
–1/Km
1/Vmax
Noncompetitive inhibition
1/[S]
1/VUninhibited
Uninhibited
1/Vmax
–1/Km
Uncompetitive inhibition
1/Vmax
1/[S]
1/VUninhibited
Uninhibited
–1/Km
FIGURE 10.2 Double reciprocal plots (also known as Lineweaver plots) for competitive, noncompetitive, and uncompetitive inhibition of enzyme-catalyzed reactions.

312 Amino Acids: Biochemistry and Nutrition
© 2010 Taylor & Francis Group, LLC
E S ES
I
+ →+ +
↓ ↓I
EI ESI
Uncompetitive inhibition: This kind of enzyme inhibition is characterized by decreases in both Km and Vmax [examples: inhibition of acyl peptide hydrolase (an enzyme that catalyzes the removal of acetylamino acids from the N-terminus of peptides and cytoplasmic proteins) by a small peptide inhibitor such as trifluoro-acetylated tetrapeptide, and inhibition of δ-aminolevulinate dehydratase by alloxan].
E + S ES
I
ESI
→
↓
+
Irreversible Inhibition of EnzymesEnzymes can be irreversibly inhibited by substances that usually covalently modify the structures or AA residues of the enzymes. Irreversible inhibitors often contain electrophilic groups such as aldehydes, haloalkanes, alkenes, phenylsulfonates, or fluorophosphonates. These reactive groups react with the side chains of AA to form covalent adducts. An example for irreversible enzyme inhibition is the inactivation, by diisopropylfluorophosphate, of acetylcholinesterase (the enzyme hydrolyzes the neurotransmitter acetylcholine) and chymotrypsin (a protease in the lumen of the small intestine). In both enzymes, diisopropylfluorophosphate covalently modifies their active serine sites (e.g., serine-203 of acetylcholinesterase and serine-195 of chymotrypsin).
Suicide inhibition is an unusual type of irreversible inhibition in that the enzyme converts the inhibitor into a reactive form in its active site. An example is the inhi-bition of ODC by α-difluoromethylornithine (DFMO; an analog of ornithine) to reduce the synthesis of polyamines from ornithine and treat African trypanosomia-sis (sleeping sickness). ODC can catalyze the decarboxylation of DFMO, followed by the elimination of a fluorine atom, to convert DFMO into a highly reactive conju-gated imine, which then reacts with either a cysteine or a lysine residue in the active site of ODC to irreversibly inactivate the enzyme (Poulin et al. 1992).
intrAcellulAr comPArtmentAtion of metABolic PAthwAys
A metabolic pathway can be defined as a series of enzyme-catalyzed reactions in which a molecule is either degraded to simpler products or synthesized from sim-pler precursors. A pathway can be linear (such as arginine synthesis), cyclic (such

313Regulation of Amino Acid Metabolism
© 2010 Taylor & Francis Group, LLC
as the urea cycle), or spiral (fatty acid synthesis from AA-derived acetyl-CoA). In fatty acid synthesis, the same set of enzymes is used repeatedly for chain-lengthen-ing. A physiologically useful definition of a metabolic pathway would be a series of enzyme-catalyzed reactions, initiated by flux-generating steps and ending with the formation of products. This latter definition indicates that a metabolic pathway may span more than one organ. For example, the pathway for the synthesis of arginine from glutamine could be considered to be initiated in the small intestine or skeletal muscle depending on the source of glutamine (arterial or enteral diet). An excellent example of intracellular compartmentation of a metabolic pathway is the urea cycle. It involves both the mitochondrion and the cytosol. Within a compartment, enzymes are closely associated and sequentially pass intermediates along the pathway (Ovadi and Saks 2004). In the hepatic and intestinal urea cycle, the physiological signifi-cance of intracellular compartmentation of a metabolic pathway is evident in that ammonia produced in the mitochondrion is locally converted into citrulline, a non-toxic product, for export to the cytosol. Another example is arginine synthesis from glutamine in enterocytes.
metABolic DesiGn PrinciPles
Reading general biochemistry textbooks, students might be led to believe (1) that all the important principles of metabolic control are well established, (2) that metabolic pathways are sequential, isolated events, and (3) the control of a metabolic pathway resides only at a single step. It is worth pointing out that metabolism and its control are not so simplistic as the long-standing dogma of a “rate-limiting step” in a linear reaction sequence implies. John T. Brosnan (2005) states that the metabolic design principles are determined by physical and chemical constraints to minimize: (1) unwanted side reactions by maintaining very low levels of metabolic intermediates, (2) the occurrence of highly reactive chemical groups (e.g., aldehydes), (3) changes in pH, temperature, osmotic pressure, ammonia concentration, and solvent capacity, and (4) excess mass. Fortunately, animals including humans have evolved to develop mechanisms ensuring that metabolic chaos does not occur in animals. These mecha-nisms include: (1) the occurrence of highly active and specific enzymes that catalyze “desired” reactions, (2) compartmentation (e.g., metabolic channeling and reactions within organelles), (3) many rescue and repair reactions (e.g., DNA repair and defense against oxidative stress), and (4) positive and feedback regulation of enzyme-cata-lyzed reactions.
Two important concepts concerning metabolism have been advanced in the past three decades: distributive metabolic control and metabolon (supramolecular orga-nization of the enzymes in a single metabolic sequence). The theory of distributive metabolic control states that control can be distributed throughout the metabolic sequence or resides in one or more of the individual steps. For example, control points for hepatic urea synthesis could be AA or ammonia transport, CPS-I, and NAG synthase. A metabolon has been defined as a pathway that is organized in a sequential association to convert a substrate into its product (Srere 1985). Isotope-based experimental evidence for this concept has come from the initial study of the urea cycle enzymes in hepatocytes and experiments on other pathways (e.g., BCAA

314 Amino Acids: Biochemistry and Nutrition
© 2010 Taylor & Francis Group, LLC
catabolism via BCAA transaminase and BCKA dehydrogenase). The interdepen-dence of all metabolic reactions can be demonstrated by the observation that deletion of a single enzyme of a metabolic pathway results in many changes in a variety of pathways not directly related to the one being studied. An advantage of a metabolon is to facilitate the transfer of intermediates between enzymes and to maintain a high concentration of a substrate in the catalytic site of an enzyme.
reGulAtion of AA metABolism
Long-term regulation of enzyme activity (i.e., the order of days) is achieved pri-marily through changes in gene expression and protein synthesis, as well as protein degradation (Watford 2003; Wang et al. 2012). Concentrations of the enzymes with relatively short half-lives (e.g., ornithine decarboxylase and tyrosine transaminase) are more sensitive to regulation by protein synthesis and proteolysis than those with relatively long half-lives (e.g., ornithine carbamoyltransferase, glutaminase, and arginase) in rat liver. An increase in enzyme activity can be achieved by increasing the amount of enzyme protein, which is referred to as enzyme induction. Enzyme induction involves protein synthesis, namely the transcription of DNA to mRNA and the translation of mRNA to protein. Thus, the induction of most enzymes [except for some enzymes (e.g., ODC and the cytosolic δ-aminolevulinate synthetase with short half-lives of 11 min and 0.33 h, respectively)] in cells is generally a slow process. For example, the amount of arginase in the rat liver is increased slowly in response to feeding of high dietary protein. Conversely, inhibition of protein synthesis or activa-tion of protein degradation can result in a decrease in abundance of enzyme protein.
For short-term regulation of enzyme activity (i.e., the order of seconds, minutes, or hours), both in vitro and in vivo studies of AA metabolism have demonstrated the following regulatory mechanisms: (1) allosteric regulation of enzymes, (2) covalent modification of enzymes (e.g., protein phosphorylation, acetylation, methylation, and ubiquitination), (3) changes in concentrations of activators and inhibitors, (4) changes in phosphorylation potential [ATP/(ADP × Pi)] or energy status, (5) changes in con-centrations of substrates, cofactors, and products, (6) redox potential, (7) acyl-CoA potential, and (8) changes in cell volume. Alterations in hormones, nutrition (dietary intake of protein, AA, lipids, carbohydrates, energy, vitamins, and minerals), and cell volume can affect AA metabolism through one or more of these mechanisms (Lei et al. 2012; Morris 2012). Because regulation of gene expression is discussed in Chapter 11, the short-term mechanisms that regulate AA metabolism are detailed in the following sections.
Allosteric reGulAtion
Allosteric regulation, which was first described for microbial threonine deaminase and aspartate transcarbamylase in 1956, is defined as the regulation of an enzyme by an effector molecule that binds to a regulatory site on the protein other than its active site. Effectors that increase or decrease enzyme activity are referred to as allosteric activators or inhibitors, respectively. For example, NAG and arginine are allosteric activators of CPS-I and NAG synthase, respectively. Additionally, GDH is

315Regulation of Amino Acid Metabolism
© 2010 Taylor & Francis Group, LLC
allosterically controlled by ATP and ADP, in that ATP and ADP act as an inhibitor and an activator, respectively. In many of the metabolic pathways for microbial AA synthesis, products are allosteric inhibitors of certain key enzymes.
Allosteric effects can be explained by the concerted MWC model proposed by J. Monod, J. Wyman, and J.-P. Changeux in 1965 or by the sequential model described by D.E. Koshland, G. Nemethy, and D. Filmer in 1966. Both models postulate that: (1) the subunits of an enzyme can exist in one of two conformations [tensed (T) or relaxed (R)], (2) relaxed subunits bind substrate(s) more rapidly than those in the tense state, and (3) conformational changes in the enzyme alters its catalytic activity. However, the two models differ most in their assumptions about subunit interaction and the preexistence of both states. First, the MWC model postulates that the sub-units of an enzyme are all connected in such a way that a conformational change in one subunit will be conferred to all other subunits; therefore, all subunits must exist in the same conformation. Therefore, in the MWC model, the binding of an allosteric effector can result in an R or T conformational state. Second, the sequential model states that the subunits of an enzyme are not necessarily connected and may not have the same conformation. According to this model, binding of a substrate to one subunit can increase the affinity of adjacent subunits for the same substrate, thereby enhancing or decreasing enzyme activity.
reversiBle PhosPhorylAtion AnD DePhosPhorylAtion of Protein
In 1906, P.A. Levene at the Rockefeller Institute for Medical Research reported the presence of phosphate in the protein vitellin (known as phosvitin). The same author, working with Fritz Lipmann, identified in 1933 phosphoserine in casein. Twenty years later, E.P. Kennedy at the University of Chicago described in 1954 the enzy-matic phosphorylation of animal proteins (casein and mitochondrial proteins). It is now known that the activities of some enzymes are regulated by reversible phosphor-ylation (addition of the phosphoryl group of ATP) and dephosphorylation (removal of a phosphoryl group by hydrolysis) of the enzyme proteins. Protein phosphoryla-tion is catalyzed by a protein kinase (e.g., cAMP-dependent kinase), whereas pro-tein dephosphorylation is performed by a protein phosphatase (Figure 10.3). The AA residues in a protein that are phosphorylated are tyrosine, serine, threonine, and histidine. The protein kinases catalyzing phosphorylation reactions constitute one of the largest protein families known to date, including more than 100 homolo-gous enzymes in yeast and more than 550 in a human being. This multiplicity of enzymes permits the fine-tuned regulation of metabolic pathways in a tissue-, time-, and substrate-specific manner (Meijer and Dubbelhuis 2004). Most protein kinases are highly specific for their substrates (proteins), but some have activities toward a broad spectrum of proteins.
Phosphorylation and dephosphorylation are not the reverse of each other. The phosphorylation and dephosphorylation mechanism does not involve an alteration in the amount of the enzyme protein and therefore allows for rapid modification of enzyme activity. Phosphorylation of a protein results in its conformational change, leading to activation or inactivation of enzymatic activity. Phosphorylation is a highly effective means to regulate the activities of proteins. The major characteristics of
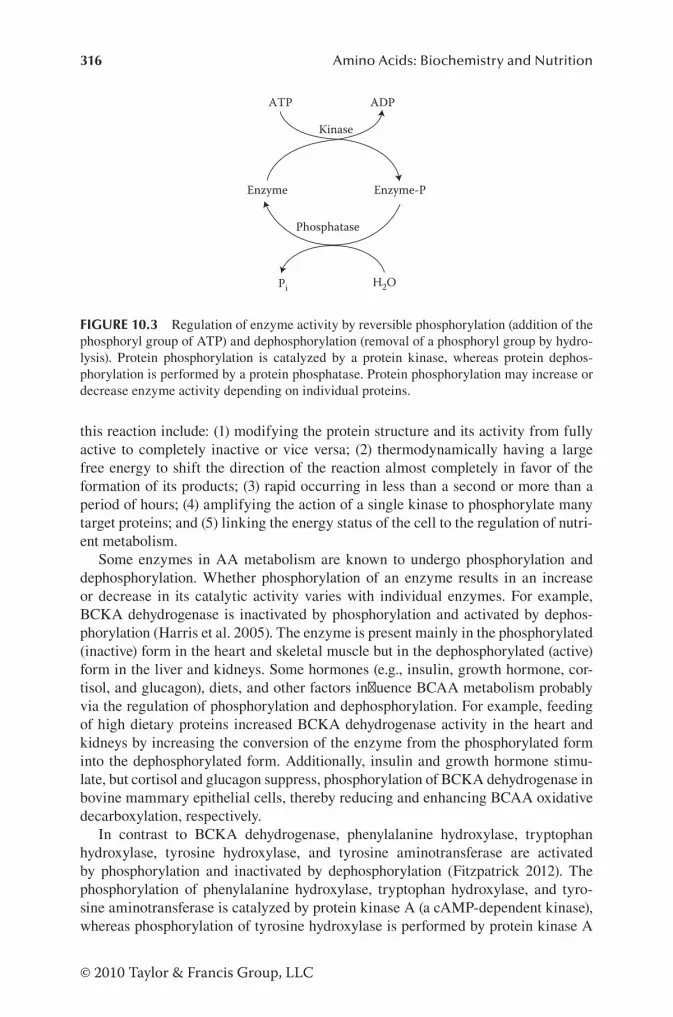
316 Amino Acids: Biochemistry and Nutrition
© 2010 Taylor & Francis Group, LLC
this reaction include: (1) modifying the protein structure and its activity from fully active to completely inactive or vice versa; (2) thermodynamically having a large free energy to shift the direction of the reaction almost completely in favor of the formation of its products; (3) rapid occurring in less than a second or more than a period of hours; (4) amplifying the action of a single kinase to phosphorylate many target proteins; and (5) linking the energy status of the cell to the regulation of nutri-ent metabolism.
Some enzymes in AA metabolism are known to undergo phosphorylation and dephosphorylation. Whether phosphorylation of an enzyme results in an increase or decrease in its catalytic activity varies with individual enzymes. For example, BCKA dehydrogenase is inactivated by phosphorylation and activated by dephos-phorylation (Harris et al. 2005). The enzyme is present mainly in the phosphorylated (inactive) form in the heart and skeletal muscle but in the dephosphorylated (active) form in the liver and kidneys. Some hormones (e.g., insulin, growth hormone, cor-tisol, and glucagon), diets, and other factors influence BCAA metabolism probably via the regulation of phosphorylation and dephosphorylation. For example, feeding of high dietary proteins increased BCKA dehydrogenase activity in the heart and kidneys by increasing the conversion of the enzyme from the phosphorylated form into the dephosphorylated form. Additionally, insulin and growth hormone stimu-late, but cortisol and glucagon suppress, phosphorylation of BCKA dehydrogenase in bovine mammary epithelial cells, thereby reducing and enhancing BCAA oxidative decarboxylation, respectively.
In contrast to BCKA dehydrogenase, phenylalanine hydroxylase, tryptophan hydroxylase, tyrosine hydroxylase, and tyrosine aminotransferase are activated by phosphorylation and inactivated by dephosphorylation (Fitzpatrick 2012). The phosphorylation of phenylalanine hydroxylase, tryptophan hydroxylase, and tyro-sine aminotransferase is catalyzed by protein kinase A (a cAMP-dependent kinase), whereas phosphorylation of tyrosine hydroxylase is performed by protein kinase A
Enzyme Enzyme-P
ATP ADP
H2OPi
Kinase
Phosphatase
FIGURE 10.3 Regulation of enzyme activity by reversible phosphorylation (addition of the phosphoryl group of ATP) and dephosphorylation (removal of a phosphoryl group by hydro-lysis). Protein phosphorylation is catalyzed by a protein kinase, whereas protein dephos-phorylation is performed by a protein phosphatase. Protein phosphorylation may increase or decrease enzyme activity depending on individual proteins.

317Regulation of Amino Acid Metabolism
© 2010 Taylor & Francis Group, LLC
and protein kinase C (a Ca2+-dependent kinase). Through changes in the activities of protein kinase A and protein kinase C, many hormones (including insulin, glucagon, glucocorticoids, and epinephrine) affect the catabolism of aromatic AA in liver and possibly other tissues (e.g., the kidney and brain).
concentrAtions of suBstrAtes AnD cofActors
Concentrations of substrates and cofactors play an important role in regulating AA metabolism (Wu and Thompson 1998; Kim et al. 2012). This can be graphically illustrated by BCAA catabolism in skeletal muscle exposed to ketone bodies (Table 10.2). Both acetoacetate and β-hydroxybutyrate inhibit the transamination of leucine and valine as well as alanine synthesis, while increasing glutamine synthesis, in the skeletal muscle of fasted chicks. The inhibitory effect of ketone bodies on BCAA transamination is prevented by the addition of pyruvate (Figure 10.4). These find-ings can be explained by the following biochemical mechanisms. First, inhibition of glycolysis by ketone bodies decreases the production of pyruvate from glucose, resulting in decreased transamination of glutamate with pyruvate to form alanine
TABLE 10.2Effects of Ketone Bodies and Pyruvate on Leucine and Valine Transamination in Skeletal Muscle from 24-h Fasted Young Chicks
Addition to Incubation Medium
Net Rate of Transamination
Alanine Release Glutamine ReleaseLeucine Valine
nmol/mg Tissue per 2 hNone 1.46 ± 0.08 0.80 ± 0.09 2.05 ± 0.09 1.98 ± 0.11
4 mM AcAc 0.66 ± 0.04a 0.38 ± 0.06a 1.26 ± 0.05a 2.41 ± 0.09a
None 1.40 ± 0.14 0.76 ± 0.07 1.97 ± 0.12 2.01 ± 0.17
4 mM DL-BHB 0.78 ± 0.06a 0.44 ± 0.04a 1.44 ± 0.05a 2.53 ± 0.16a
5 mM pyruvate 1.34 ± 0.11 0.72 ± 0.04 2.75 ± 0.10 1.78 ± 0.18
5 mM pyruvate + 4 mM AcAc
1.30 ± 0.08 0.68 ± 0.04 2.89 ± 0.17 1.86 ± 0.14
5 mM pyruvate 1.42 ± 0.10 0.80 ± 0.08 2.98 ± 0.14 1.87 ± 0.14
5 mM pyruvate + 4 mM BHB
1.36 ± 0.07 0.82 ± 0.10 2.62 ± 0.20 1.75 ± 0.15
Source: Data are taken from Wu, G. and J.R. Thompson. 1988. Biochem. J. 255:139–144.Note: Values are means ± SEM, n = 12 for BCAA transamination and n = 10 for alanine and glutamine
release by skeletal muscle. Extensor digitorum communis muscles from 24-h fasted young chicks were incubated at 37°C for 2 h in Krebs bicarbonate buffer containing 12 mM glucose and 0.3 mM NH4Cl. Alanine and glutamine release are indicators of their synthesis by the muscle.
AcAc, acetoacetate; BHB, β-hydroxybutyrate.a P < 0.01 versus the corresponding control.

318 Amino Acids: Biochemistry and Nutrition
© 2010 Taylor & Francis Group, LLC
and α-KG. Because of the reduced formation of both pyruvate and oxaloacetate from glucose, α-KG production via citrate and isocitrate is also suppressed. As a result, glutamate is channeled to the production of glutamine, whereas a decrease in α-KG availability ultimately reduces the transamination of BCAA. In the presence of added pyruvate, α-KG is generated from the transamination of glutamate as well as the metabolism of pyruvate and oxaloacetate, and, therefore, is available for BCAA transamination. Consequently, pyruvate promotes alanine synthesis, while reducing glutamine synthesis by skeletal muscle (Figure 10.4).
Ketone bodies also inhibit the oxidative decarboxylation of BCKA in extrahepatic tissues (including skeletal muscle, mammary tissue, kidneys, and the small intes-tine) in the absence or presence of pyruvate. Acetoacetate and β-hydroxybutyrate are readily oxidized to CO2 and water in these tissues, particularly under food-deprivation conditions. The oxidation of ketone bodies consumes large amounts of both CoA-SH and NAD+, thereby decreasing the availability of these cofactors for both pyruvate dehydrogenase and BCKA dehydrogenase. Elevation of pyruvate further reduces the availability of NAD+ and CoA-SH for pyruvate and BCKA decarboxylation. The ratios of NADH/NAD+ and acyl-CoA/R-COOH can also control the activities of these enzymes and the oxidation of pyruvate and BCKA. Thus, competition for the cofactors of enzymes is a major mechanism responsible for the effect of ketone bodies on inhibiting BCAA catabolism in skeletal muscle (Figure 10.5).
-Glutamate
α-Ketoglutarate
-Glutamine-Glucose
NH+4
Pyruvate
-Alanine
1
Oxaloacetate
Acetyl-CoA
Ketone bodies(–)
2
BCKA
BCAA
3
4
5
6
FIGURE 10.4 Mechanisms whereby ketone bodies reduce the transamination of branched-chain amino acids (BCAA) and alanine synthesis, while increasing glutamine synthesis in skeletal muscle. Note that ketone bodies inhibit the production of pyruvate from glucose via glycolysis, thereby suppressing the transamination of glutamate with pyruvate to form ala-nine and α-ketoglutarate. Glutamate is then channeled to glutamine synthesis. Reduced avail-ability of α-ketoglutarate ultimately impairs BCAA transamination. Provision of exogenous pyruvate prevents the inhibitory effects of ketone bodies on BCAA transamination and ala-nine synthesis. Enzymes that catalyze the indicated reactions are (1) enzymes of the glycoly-sis pathway, (2) glutamate–pyruvate transaminase, (3) BCAA transaminase, (4) glutamine synthetase, (5) pyruvate carboxylase (Mg2+- and ATP-dependent), and (6) some enzymes of the Krebs cycle (citrate synthase, aconitase, and isocitrate dehydrogenase).
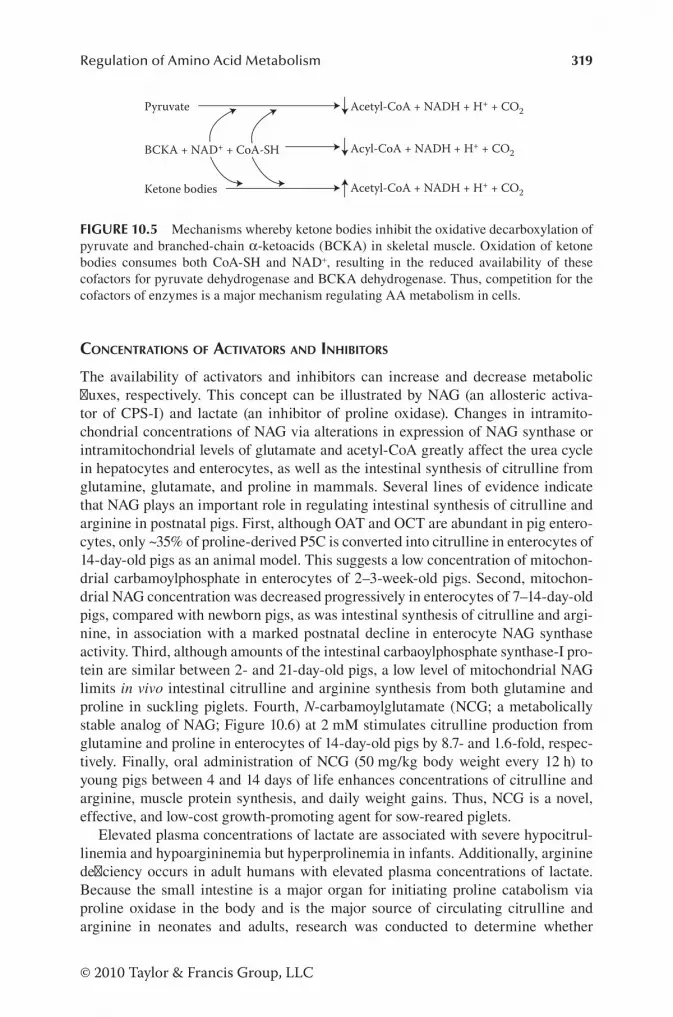
319Regulation of Amino Acid Metabolism
© 2010 Taylor & Francis Group, LLC
concentrAtions of ActivAtors AnD inhiBitors
The availability of activators and inhibitors can increase and decrease metabolic fluxes, respectively. This concept can be illustrated by NAG (an allosteric activa-tor of CPS-I) and lactate (an inhibitor of proline oxidase). Changes in intramito-chondrial concentrations of NAG via alterations in expression of NAG synthase or intramitochondrial levels of glutamate and acetyl-CoA greatly affect the urea cycle in hepatocytes and enterocytes, as well as the intestinal synthesis of citrulline from glutamine, glutamate, and proline in mammals. Several lines of evidence indicate that NAG plays an important role in regulating intestinal synthesis of citrulline and arginine in postnatal pigs. First, although OAT and OCT are abundant in pig entero-cytes, only ~35% of proline-derived P5C is converted into citrulline in enterocytes of 14-day-old pigs as an animal model. This suggests a low concentration of mitochon-drial carbamoylphosphate in enterocytes of 2–3-week-old pigs. Second, mitochon-drial NAG concentration was decreased progressively in enterocytes of 7–14-day-old pigs, compared with newborn pigs, as was intestinal synthesis of citrulline and argi-nine, in association with a marked postnatal decline in enterocyte NAG synthase activity. Third, although amounts of the intestinal carbaoylphosphate synthase-I pro-tein are similar between 2- and 21-day-old pigs, a low level of mitochondrial NAG limits in vivo intestinal citrulline and arginine synthesis from both glutamine and proline in suckling piglets. Fourth, N-carbamoylglutamate (NCG; a metabolically stable analog of NAG; Figure 10.6) at 2 mM stimulates citrulline production from glutamine and proline in enterocytes of 14-day-old pigs by 8.7- and 1.6-fold, respec-tively. Finally, oral administration of NCG (50 mg/kg body weight every 12 h) to young pigs between 4 and 14 days of life enhances concentrations of citrulline and arginine, muscle protein synthesis, and daily weight gains. Thus, NCG is a novel, effective, and low-cost growth-promoting agent for sow-reared piglets.
Elevated plasma concentrations of lactate are associated with severe hypocitrul-linemia and hypoargininemia but hyperprolinemia in infants. Additionally, arginine deficiency occurs in adult humans with elevated plasma concentrations of lactate. Because the small intestine is a major organ for initiating proline catabolism via proline oxidase in the body and is the major source of circulating citrulline and arginine in neonates and adults, research was conducted to determine whether
Pyruvate
BCKA + NAD+ + CoA-SH
Ketone bodies
Acetyl-CoA + NADH + H+ + CO2
Acyl-CoA + NADH + H+ + CO2
Acetyl-CoA + NADH + H+ + CO2
FIGURE 10.5 Mechanisms whereby ketone bodies inhibit the oxidative decarboxylation of pyruvate and branched-chain α-ketoacids (BCKA) in skeletal muscle. Oxidation of ketone bodies consumes both CoA-SH and NAD+, resulting in the reduced availability of these cofactors for pyruvate dehydrogenase and BCKA dehydrogenase. Thus, competition for the cofactors of enzymes is a major mechanism regulating AA metabolism in cells.

320 Amino Acids: Biochemistry and Nutrition
© 2010 Taylor & Francis Group, LLC
lactate is an inhibitor of intestinal synthesis of citrulline and arginine from proline. Kinetics analysis revealed noncompetitive inhibition of intestinal proline oxidase by lactate (decreased maximal velocity and unaltered Michaelis constant). Lactate did not affect either activities of other enzymes for arginine synthesis from proline or proline uptake by enterocytes but decreased the synthesis of ornithine, citrul-line, and arginine from proline in a concentration-dependent manner. These results demonstrate that lactate inhibits the synthesis of citrulline and arginine from proline via an inhibition of proline oxidase in enterocytes and provide a biochemical basis for explaining hyperprolinemia, hypocitrullinemia, and hypoargininemia in infants with hyperlactacidemia.
siGnAl trAnsDuction
Signal transduction is defined as a chain of biochemical reactions in cells brought about by their responses to extracellular chemicals (including nutrients, hormones, drugs, toxins, or phytochemicals) (Figure 10.7). For example, hormones (e.g., gluca-gon) in blood are chemical signals that control cell metabolism (e.g., stimulation of glycine oxidation in the mitochondria of hepatocytes), and monosodium glutamate in food confers good taste through its interaction with specialized sensory cells. Approximately half of the 25 largest protein families encoded by the human genome play important roles in signal transduction, indicating its widespread and diverse information-processing circuits in the body. Signal-transduction cascades (also known as a molecular circuit) mediate the sensing and processing of both physiologi-cal and nonphysiological substances by cells to detect, amplify, and integrate exter-nal signals to generate responses in the membrane, cytoplasm, mitochondrion, and other intracellular organelles. The biochemical responses include changes in nutri-ent transport, enzyme activity, gene expression, ion-channel activity, or metabolism. Defects in signal transduction can cause: (1) impairments in growth, development, and homeostasis; (2) increased susceptibility to infectious diseases; and (3) obesity, diabetes, cardiovascular disorders, DNA mutation, cancer, and other diseases.
Signal transduction generally includes four processes: (1) interaction of an extracellular chemical (also known as a ligand or the primary messenger) with the
NAG
COOH
NHC
CH2
CH2
C O
OH
H CH3C
O
NCG
COOH
NHC
CH2
CH2
C O
OH
H NH2C
O
FIGURE 10.6 Chemical structures of N-acetylglutamate (NAG) and N-carbamoylglutamate (NCG) in the nonionized form. NCG is a metabolically stable analog of NAG and an effective activator of carbamoylphosphate synthase-I in hepatocytes and enterocytes.

321Regulation of Amino Acid Metabolism
© 2010 Taylor & Francis Group, LLC
plasma membrane, (2) generation of intracellular second messengers, (3) covalent modifications of target proteins, and (4) termination of signaling cascades. Note that signal transduction cascades in response to an extracellular ligand may share the common reactions among different species, tissues, and cell types. However, the physiological responses to hormones, nutrients, and environmental stimuli may be cell-specific due to the absence of one or more of the above steps and, therefore, do not generally occur in all cell types. For example, cAMP increases the synthesis of tyrosine aminotransferase in the liver and kidneys but not the small intestine or skeletal muscle.
Binding of an Extracellular Ligand with the Plasma MembraneBecause large molecules (e.g., glucagon and insulin) cannot enter the cytoplasm of the cell, they can bind to specific membrane-associated receptor proteins that initi-ate signal transduction (Jois et al. 1989). Some small-molecular-weight hormones (e.g., epinephrine and norepinephrine) also bind to their target receptors (e.g., the β-adrenergic receptor) on the plasma membrane, which in turn activates G pro-teins (guanine nucleotide-binding proteins). The activated G protein stimulates membrane-bound adenylyl cyclase. Receptors for extracellular ligands are intrinsic
Extracellular signals(e.g., hormones, nutrients and drugs, and toxins)
Reception
Membrane-boundreceptors
Cytoplasm
Second messengers(e.g., cAMP, cGPM,Ca2+, PI3, and DAG)
Binding to specific DNA REL(e.g., estrogen or glucocorticoid
responsive elements)
Protein kinases Gene transcription
Transduction
Amplification
Protein synthesis
GenomicNongenomic
Physiological responses
FIGURE 10.7 Signal transduction in cells. The extracellular signal is transduced to the cell via four sequential events. They are interaction of an extracellular chemical (also known as a ligand or the primary messenger) with the plasma membrane, generation of intracellular second messengers, covalent modifications of target proteins, and termination of signaling cascades. The last step, which is not illustrated in this figure, requires the removal of second messengers and reversing protein modification (e.g., switching off protein kinases). DAG, diacylglycerol; PI3, phosphoinositide 3; REL, responsive elements.

322 Amino Acids: Biochemistry and Nutrition
© 2010 Taylor & Francis Group, LLC
membrane proteins that have both extracellular and intracellular domains. A binding site on the extracellular domain can specifically recognize its ligand. The interac-tion between the ligand and the receptor alters the conformational (e.g., tertiary or quaternary) structures of the extracellular and intracellular domains of the receptor. These structural changes of the receptor proteins trigger subsequent generation of intracellular signaling molecules (also known as second messengers).
Many hydrophobic substances (e.g., estrogens, cortisol, and other steroid hor-mones) can enter the cytoplasm of the cell by diffusing through the plasma mem-brane. Once inside the cell, these molecules can bind to proteins (e.g., glucocorticoid receptors) that interact directly with DNA. The activated receptor is translocated from the cytoplasm to the nucleus through the nucleopore. Inside the nucleus, the receptor complex binds to specific DNA responsive elements (e.g., glucocorticoid responsive elements) to activate gene transcription. Results of recent studies have shown that estrogens, cortisol, and other steroid hormones can exert some of their rapid physi-ological effects through nongenomic mechanisms (e.g., Ca2+ influx, phospholipase C activity, and production of cAMP, as well as mitogen-activated protein kinase, phos-phoinositide 3-kinase, and AMP-activated protein kinase signaling cascades) that do not involve gene transcription.
Generation of Intracellular Second MessengersIntracellular second messengers are usually small molecules that act to relay infor-mation from the ligand–receptor (either membrane-bound or cytosolic) complex. These second messengers include cAMP, cGMP, Ca2+, inositol-1,4,5-trisphosphate, and diacylglycerol, depending on the first messengers, and may have the following functions: (a) influencing gene expression and other processes, (b) amplifying the physiological responses by affecting a number of key protein kinases and the activi-ties of many enzymes, therefore leading to the generation of many second messen-gers within the cell, (c) affecting multiple signaling pathways to create cross-talks that can finely tune the regulation of cell metabolism and activity.
Covalent Modifications of Target ProteinsThe covalent attachment of a molecule to a protein can modify its enzymatic or physiological activity. Most modifications are reversible, but some are not readily reversible. An example is the irreversible attachment of a lipid group to Ras and Src (a protein tyrosine kinase) that are localized to the cytoplasmic face of the plasma membrane. Phosphorylation and dephosphorylation, which are noted in the previ-ous section, are the most common but not the only means of covalent modification in proteins. The activities of many enzymes, membrane channels, and other tar-get proteins are regulated by phosphorylation virtually in every metabolic process. Other types of covalent modifications include acetylation, methylation, and ubiqui-tination. For example, histones can be rapidly acetylated and deacetylated in vivo to affect gene transcription. However, the acetyltransferase and deacetylase enzymes are themselves regulated by phosphorylation. Also, as noted in Chapter 11, meth-ylation of DNA and protein is a well-known mechanism of epigenetic regulation in cells. Finally, the attachment of ubiquitin to a protein targets the degradation of the protein by the proteasome (Chapter 9).

323Regulation of Amino Acid Metabolism
© 2010 Taylor & Francis Group, LLC
Termination of Signaling CascadesAfter a signaling process has been initiated and the extracellular information from ligands has been transduced into cells, the signaling cascade must be terminated. Mechanisms for the termination of a signaling process include dephosphorylation, deacetylation, demethylation, deubiquitination of proteins, GTP hydrolysis (in G pro-tein signaling), as well as the degradation of cAMP and cGMP. The corresponding enzymes include protein phosphatases, deacetylases, demethylases, deubiquitinases, GTPase, phosphodiesterases 4, 7, and 8, as well as phosphodiesterases 5, 6, and 9. Switching off protein kinases can prevent the effects of primary ligands on specific cells. If a signaling process is not terminated, cells can lose their responsiveness to new signals. Also, signaling processes that are not terminated properly may lead to uncontrolled cell growth and development of cancer.
chAnGes in cell volume
All cells express water channels or transporters (aquaporins) and water can rap-idly enter most of the cells through the plasma membrane. Cell volume (primarily determined by intracellular water content) can change in response to alterations in extracellular osmolarity that are affected by nutritional, physiological, and patho-logical conditions. For example, upon ingestion of a meal and fluids, nutrients (including water) are transported into the cell, leading to cell swelling. Conversely, loss of cellular water in dehydration leads to cell shrinkage. The maintenance of adequate cell volume is a major prerequisite for cell survival, growth, and develop-ment. A change in cell volume has recently been proposed as a mediator of cellu-lar metabolism in hepatocytes (Hoffmann et al. 2009). For example, cell swelling induced by hypotonicity or AA stimulates glycogen synthesis, lipogenesis, gly-colysis, and glutaminolysis, but inhibits proteolysis, glycogen breakdown, and urea synthesis, in isolated rat liver preparations. On the other hand, cell shrinkage increases protein degradation and decreases protein synthesis in the perfused rat liver, regardless of whether cell volume is modulated by extracellular osmolarity, AA, or hormones. Furthermore, cell swelling in hypo-osmotic medium decreases, whereas cell shrinkage in hyperosmotic medium increases, the rates of release of glutamine and alanine from incubated rat skeletal muscle.
An exciting new development in the metabolism of AA in cells of the immune system is a role for cell volume in regulating their utilization of both glucose and glutamine. Specifically, decreasing extracellular osmolarity from 336 to 286 mOsmol by decreasing medium NaCl from 119 to 94 mM increases cell volume and the rates of glutamine metabolism and glycolysis in lymphocytes and macrophages (Wu and Flynn 1995). Conversely, increasing extracellular osmolarity from 286 to 386 mOsmol by the addition of 50 and 100 mM n-marmitol progressively decreases cell volume and the rates of glutamine and glucose degradation in both cell types. The findings that glutamine and glucose metabolism in lymphocytes and macrophages are regulated by cell volume changes may have physiological and immunological implications. For example, the cell volume of both lymphocytes and macrophage increases in response to mitogenic stimulation and immunological activation, probably due to alterations in transmembrane transport systems. Although the phosphorylation of protein kinase C

324 Amino Acids: Biochemistry and Nutrition
© 2010 Taylor & Francis Group, LLC
has been proposed as a signaling mechanism for the increased cellular metabolism in activated lymphocytes and macrophages, the increased cell volume per se may be partially responsible for the increased glutamine and glucose metabolism in these cells in response to mitogenic stimulation. It is also known that the phagocytosis of particles such as starch, latex beads, and microorganisms by macrophages results in increased glycolysis. However, the mechanisms involved have not yet been elucidated. Note that both phagocytosis and pinocytosis increase the cell volume of macrophages, due to increased accumulation of particles or solutes inside the cells and the associ-ated increase in the influx of water, possibly through activation of aquaporins. The increased cell volume induced by phagocytosis may account, in part, for the increased cellular metabolism previously reported for macrophages. As the change in cell vol-ume is an early event in the activation of lymphocytes and macrophages, this may be a mechanism in regulating the function of these cells. Because glutamine and glucose are two major metabolic fuels in lymphocytes and macrophages, a change in cell vol-ume may affect the provision of energy and protein turnover, thereby regulating the function of immunocytes.
other forms of reGulAtion of enZyme Activity
Activities of some enzymes (e.g., hormone-sensitive lipase and glucokinase) are also regulated by intracellular movement to and from the sites of their substrates (e.g., lipid droplets for hormone-sensitive lipase) or between different compartments (e.g., between the nucleus and cytoplasm for glucokinase). Interestingly, palmitoylation inhibits hepatic CPS-I activity, whereas both palmitoylation and myristoylation acti-vate eNOS in endothelial cells. In addition, polymerization of acetyl-CoA carbox-ylase plays a role in affecting its catalytic activity and, therefore, the conversion of AA into fatty acids in the liver, skeletal muscle, adipose tissue, and other tissues. Furthermore, binding of a molecule to the active site of an enzyme can modulate its catalytic activity. For example, NO binds to the heme moiety of guanylate cyclase (a heme enzyme) and the iron–sulfur center of aconitase (a nonheme iron enzyme) to rapidly activate and inhibit their enzymatic activity, respectively. Physiological lev-els of NO bind to the heme moiety of guanylate cyclase (a heme enzyme) to rapidly activate its enzymatic activity. In contrast, the activity of aconitase (a nonheme iron enzyme) is inhibited in response to the binding of high concentrations of NO to its iron–sulfur center.
EFFECTS OF NUTRITIONAL AND PHYSIOLOGICAL FACTORS ON AA METABOLISM
AA synthesis and catabolism depend on concentrations of substrates and cell signal-ing cascades. Therefore, dietary factors and hormones have profound effects on AA metabolism in a cell-, tissue-, and species-specific manner. In general, endogenous synthesis of NEAA is largely independent of its dietary intake or plasma concentra-tions within physiological ranges. However, AA catabolism is stimulated by dietary AA and protein intakes as well as by elevated extracellular concentrations of AA.

325Regulation of Amino Acid Metabolism
© 2010 Taylor & Francis Group, LLC
Let us use arginine and glutamine as examples because the metabolism of these two AA in animals has been well characterized and has received much attention in the past three decades. Thus, these examples illustrate some principles of the regulation of AA metabolism.
AA synthesis
Arginine SynthesisBoth enzymological and metabolic data indicate that P5C synthase, proline oxidase, and NAG synthase catalyze key steps in arginine synthesis from glutamine and pro-line. In enterocytes, the synthesis of citrulline and arginine is not subject to feedback inhibition by physiological levels of arginine. For example, intestinal expression of P5C synthase and proline oxidase is not affected by increasing dietary intake of argi-nine within a physiological range (e.g., from 0.5% to 2% arginine in swine and rat diets). Similarly, augmenting the concentration of arginine in arterial plasma from 0.2 to 0.5 mM does not influence the conversion of arterial citrulline into arginine in the kidneys. However, the synthesis of citrulline and arginine from glutamine, glutamate, and proline in enterocytes increases with increasing: (1) their extracellular concentrations from 0.5 to 5 mM, (2) the circulating levels of cortisol within a physi-ological range (e.g., from 21 to 83 μg/L) by stimulating the expression of P5C syn-thase, proline oxidase, and NAG synthase, and (3) intramitochondrial concentrations of NAG and ammonia. Likewise, in healthy animals, renal synthesis of arginine from citrulline increases stoichiometrically with extracellular citrulline, when intracellular aspartate is not a limiting factor. In contrast, elevating extracellular concentrations of lactate from 0.5 to 10 mM dose dependently inhibit intestinal synthesis of citrulline from proline by inhibiting proline oxidase activity, thereby limiting the availability of citrulline for arginine production by the kidneys. Thus, intensive exercise may con-tribute to lowered levels of arginine in plasma, which can be ameliorated by dietary intake of arginine precursors (e.g., citrulline, glutamine, and proline).
Glutamine SynthesisBCAA transaminase and GS are two key regulatory enzymes in glutamine syn-thesis, which is subject to feedback inhibition by glutamine. In muscle cells, gluta-mine synthesis is strongly inhibited by high levels of extracellular glutamine beyond 2 mM primarily because of reduced expression of the GS protein due to destabi-lization of its mRNA. However, increasing extracellular concentrations of BCAA, glutamate, and ammonia within physiological ranges increases glutamine synthesis by skeletal muscle, lactating mammary tissue, white adipose tissue, heart, brain, and lungs. Thus, human studies have demonstrated that dietary intake of BCAA is effec-tive in promoting glutamine production by skeletal muscle and other tissues both in the fed state and under catabolic conditions. Similar results have been obtained from experiments involving young pigs and lactating sows. This led to the practical use of dietary BCAA supplementation to improve lactation and muscle function in swine.
Increasing concentrations of insulin and glucocorticoids within physiological ranges inhibit and increase glutamine synthesis in skeletal muscle, respectively,

326 Amino Acids: Biochemistry and Nutrition
© 2010 Taylor & Francis Group, LLC
by suppressing and stimulating BCAA transamination. Thus, in response to stress factors, such as lactation and elevated environmental temperatures, skeletal muscle mobilizes protein-bound BCAA to synthesize and release glutamine for utilization by other cell types and tissues, including lymphocytes, macrophages, hepatocytes, mammary epithelial cells, small intestine, and kidneys. Likewise, there are marked changes in circulating levels of hormones during lactation. For example, in cows, lactation is associated with elevated concentrations of stress hormones (cortisol and glucagon), but lowered concentrations of anabolic hormones (insulin and growth hormone), in the plasma. Increases in extracellular concentrations of the stress hor-mones and the anabolic hormones promote and inhibit glutamine synthesis in mam-mary epithelial cells, respectively. These metabolic changes in glutamine synthesis are consistent with the decreased abundance of BCAA transaminase in the presence of the anabolic hormones but increased levels of this enzyme in the presence of the stress hormones to regulate glutamate and glutamine synthesis. Such coordinated alterations in hormones facilitate milk production by lactating mammals to feed the neonates.
AA cAtABolism
Arginine CatabolismArginine metabolism is regulated by multiple factors that include transport by the cell membrane, nutrients (e.g., lysine, BCAA, manganese, n-3 fatty acids), hor-mones (e.g., glucocorticoids, growth hormone, and leptin), cytokines, endotoxins, and endogenously generated substances (e.g., creatine, ornithine, P5C, and methy-larginines). Lysine competes with arginine for entry into cells and also inhibits arginase activity. Therefore, an arginine:lysine ratio in the diet is a critical factor influencing arginine utilization in the body. Under normal feeding conditions, the total amount of arginine in diets for farm animals and rodents should not be 150% greater than that of lysine (namely, arginine:lysine ratio <3.0). However, experi-mental evidence shows that humans can tolerate a greater arginine:lysine ratio in the enteral diet.
Glucocorticoids play a major role in upregulating arginine catabolism via the arginase pathway in many cell types, particularly hepatocytes, enterocytes, and mac-rophages. In contrast, these hormones inhibit NO generation by suppressing NOS expression and BH4 synthesis. During weaning, the glucocorticoid surge induces expression of intestinal arginase, resulting in enhanced hydrolysis of arginine for polyamine and proline syntheses. Interestingly, a high level of circulating cortisol in the fetus during late gestation and in the newborn does not induce arginase expres-sion in their small intestines. Thus, intestinal arginase expression is unresponsive to cortisol during the fetal and early neonatal periods, but the underlying mechanisms are unknown.
Cytokines (e.g., interleukin 4 and interferon-γ), other inflammatory stimuli (e.g., lipopolysaccharide), and cAMP can greatly stimulate expression of arginase I, argi-nase II, and ornithine decarboxylase in many cell types. Inflammatory cytokines and endotoxins also strongly induce expression of NOS2 and GTP cyclohydrolase I (which catalyzes the first step in de novo BH4 synthesis) in almost all cell types. Therefore,

327Regulation of Amino Acid Metabolism
© 2010 Taylor & Francis Group, LLC
these substances upregulate arginine degradation for the synthesis of urea, ornithine, proline, polyamines, and NO in a cell-specific manner, and concentrations of arginine in plasma are reduced markedly in response to infection or inflammation.
NG-Monomethy-l-arginine (NMMA) and asymmetric dimethylarginine (ADMA) are competitive inhibitors of all NOS isoforms (Ki = 1.0–1.6 μM). However, concen-trations of NMMA and ADMA are relatively low in the plasma of healthy sub-jects (0.5–1 μM) compared with those of arginine (100–250 μM) depending on the nutritional state and developmental stages. There are reports that 1 μM NMMA or ADMA do not affect NO synthesis in endothelial cells cultured in the presence of 0.2 mM l-arginine. Although much higher concentrations of NMMA and ADMA (e.g., 5–10 μM), which can occur in patients with obesity, diabetes, cardiovascular disease, and renal dysfunction, can inhibit NO synthesis by these cells, the physi-ological significance of endogenous methylarginines in the regulation of NO produc-tion by endothelial cells remains to be defined.
Glutamine CatabolismTwo distinct isoforms of the phosphate-activated glutaminase (the liver and kidney types) catalyze the first and key regulatory step of glutamine catabolism in animals. In all cell types studied, increasing extracellular concentrations of glutamine from 0.5 to 5 mM increases the hydrolysis of glutamine to glutamate and ammonia in a dose-dependent manner, ensuring that glutamine will not inhibit NO-dependent blood circulation under physiological conditions. In the kidneys, further degrada-tion of glutamate relieves its potential inhibitory effect of the glutaminase, thereby allowing the complete catabolism of glutamine to form two molecules of ammonia and five molecules of CO2. In the small intestine and liver of many species, includ-ing dogs, humans, pigs, and rats, glutamine degradation is stimulated by elevated levels of glucocorticoids and glucagon within physiological ranges to enhance intes-tinal synthesis of citrulline and hepatic production of glucose. Thus, glutamine uti-lization is augmented in diabetic subjects, resulting in increased requirements for dietary AA.
Acid–base balance strongly affects glutamine utilization in a cell-specific man-ner to maximize its supply to the kidneys. In response to metabolic acidosis, the following coordinated changes in interorgan glutamine metabolism occur. First, uptake of arterial glutamine by the small intestine and lymphocytes (which amount to ~1.5 kg in the adult human) is markedly inhibited by elevated extracellular levels of H+ to spare glutamine for the kidneys. Second, oxidation of glutamine in the liver is reduced by a low pH and this organ releases glutamine into the circulation. Third, the renal activity of phosphate-activated glutaminase, as well as the uptake and catabolism of glutamine by the kidneys of acidotic animals is greatly enhanced to generate NH3 for removing excess H+ as NH4
+. Interestingly, a similar pattern of glutamine catabolism occurs in pregnant mothers with the fetal alcohol syndrome, resulting in reduced transfer of glutamine from mother to fetus and, therefore, reduced concentration of glutamine in the fetal circulation. Importantly, this new knowledge led to the development of glutamine supplementation as a novel strategy to ameliorate acid–base imbalance and intrauterine growth retardation in alcoholic gestating mothers.

328 Amino Acids: Biochemistry and Nutrition
© 2010 Taylor & Francis Group, LLC
intrAcellulAr Protein turnover
MTOR Cell SignalingMTOR is a major component of a cell signaling pathway that provides a mecha-nism for regulation of protein synthesis and cytoskeleton remodeling, as well as intracellular protein degradation via autophagy (Figure 10.8). MTOR is a highly conserved serine/threonine protein kinase, also known as FK506 binding protein 12-rapamycin-associated protein 1. The MTOR system consists of MTOR complex 1 (MTORC1) and MTOR complex 2 (MTORC2), which are structurally and function-ally distinct in cells.
Insulin receptor substrate-1/2
Phosphoinositide-dependent kinase-1
Protein kinase B/AKT
TSC-1/2 PLD
MitogensPhospholipids
AMPK
[AMP][ATP]
AAor glucose
4E-BP1 p70S6K1
Rapamycin
Phosphatidic acid
Plasmamembrane
Insulin
mRNA translation
Insulin receptor
Rapt
or
Rag A/B FKBP12
Rag C/D
Rag C/D
Rag A/B
Rheb
LKB1
GβL
MTORMTORC1
Lysosome
Ulk
1
DAP1
Autophagy Protein
AA
Protein
AA
Ribosome biogenesis
Amino acids
AA
GEF
Phosphoinositide-3 kinase
PIP2
PIP3
PTEN
mVps34
PRAS40Rheb
MAP4K3mVps34
MTORMTORC2
Rictor GβL
Sin1
Protein kinase B/AKT Cytoskeletal reorganizationGlucose and lipid metabolism
P
P P
P
P
(+)
(+)
(+)
Glucose
Glucose
FIGURE 10.8

329Regulation of Amino Acid Metabolism
© 2010 Taylor & Francis Group, LLC
MTORC1MTORC1 is composed of the following: MTOR, raptor (regulatory associated protein of TOR), mLST8 [MTOR-associated protein, LST8 homolog; also known as G pro-tein beta subunit-like (GβL)], and PRAS40 (the proline-rich Akt substrate of 40 kDa; a raptor-interacting protein that binds MTOR). PRAS40 is dissociated from MTOR under conditions (e.g., sufficient AA) that activate MTOR signaling. Conservely, PRAS40 binds the MTOR kinase domain under conditions (e.g., nutrient deprivation) that inhibit MTOR signaling. MTORC1 has long been known to be inhibited by rapa-mycin, a microbial product that was discovered more than 40 years ago.
In response to certain AA (e.g., arginine, glutamine, leucine, and proline), MTOR1 is activated when its Ser2448 residue is phosphorylated by an upstream kinase. The underlying mechanisms are complex and remain largely unknown. Some lines of evidence suggest that AA exert their effects by stimulating (1) GTPases (Rag A/B and Rag C/D), which then bind raptor; (2) MAP4K3 (a conserved Ser/Thr kinase), which binds Rag A/B and Rag C/D; and (3) mVps34 (mammalian vacuolar protein sorting mutant 34), which activates Rheb (Ras homolog enriched in brain (a Ras family GTPase). Activated MTOR phosphorylates two downstream target proteins: ribosomal protein S6 kinase-1 (S6K1) and 4E-BP1 (eIF4E-binding protein-1, a trans-lational repressor protein) (Dennis et al. 2011). An increase in S6K1 phosphoryla-tion results in hyperphosphorylation of ribosomal protein S6 and thus facilitates the
FIGURE 10.8 The MTOR1 signaling in regulation of intracellular protein turnover. The MTOR integrates nutrient and other cellular signals to increase protein synthesis and inhibit protein degradation via autophagy. MTORC1 is composed of four components: MTOR (a highly conserved serine/threonine protein kinase), raptor (regulatory associated protein of TOR), mLST8 (MTOR-associated protein, LST8 homolog), and PRAS40 (a raptor-inter-acting protein that binds to MTORC1). MTORC1 can be activated by certain AA through protein phosphorylation. Specifically, AA may bind to the Rag complex (Rag A/B and Rag C/D), triggering an exchange between GDP with GTP in the Rag A/B protein and MTOR phosphorylation. Activated MTOR phosphorylates eIF4E-binding protein-1 (4E-BP1) and ribosomal protein S6 kinase-1 (p70S6K1), thereby stimulating mRNA translation for protein synthesis. MTOR is inhibited by TSC-1/2 (tuberous sclerosis complex-1/2) whose activity is enhanced by AMPK (AMP-activated protein kinase) but suppressed by protein kinase B (also known as AKT). Phosphorylation of AKT in response to insulin and other growth factors relieves an inhibitory effect of TSC-1/2 on MTOR. Additionally, certain nutrients (e.g., gluta-mine, arginine, leucine, and glucose) and phosphatidic acid stimulate MTOR phosphorylation and thus increase its activity. Oxidation of AA, glucose, and fatty acids reduces the cellular ratio of AMP:ATP, therefore suppressing AMPK activity via liver kinase B1 (LKB1; also known as serine/threonine kinase 11). Activated MTOR also inhibits lysosomal proteolysis via autophagy by phosphorylating death-associated protein 1 (DAP1) and Ulk1; GEF, gua-nine nucleotide exchange factor; MAP4K3, a conserved Ser/Thr kinase; mVps34, mamma-lian vacuolar protein sorting mutant 34; PIP2, phosphatidylinositol-4,5-bisphosphate; PIP3, phosphatidylinositol-3,4,5-triphosphate; PLD, phospholipase D; PRAS40, proline-rich Akt substrate of 40 kDa; PTEN, phosphatase and tensin homolog; Rheb, Ras homolog enriched in brain (a Ras family GTPase); rictor, rapamycin-insensitive companion of TOR; SIN1, stress-activated MAP kinase interacting protein 1; Ulk1, Unc-51-like kinase 1. Open circle, GDP; solid circle, GTP. The + sign denotes activation by AA.

330 Amino Acids: Biochemistry and Nutrition
© 2010 Taylor & Francis Group, LLC
translation of mRNAs for protein synthesis (see Chapter 8). In a nonphosphorylated state, 4E-BP1 binds eIF4E (an initiation factor) with high affinity and, thus, eIF4E cannot bind eIF4G (an initiation factor) to form the translationally active eIF4F–eIF4G complex. Conversely, phosphorylation of 4E-BP1 reduces its binding affinity for eIF4E, relieving translational repression of 4E-BP1 on the binding of eIF4E to eIF4G and generating the translationally active eIF4F–eIF4G complex. Activation of MTORC1 also inhibits autophagy and, therefore, the lysosome protein degrada-tion in cells (e.g., enterocytes). Insulin, certain AA (e.g., arginine, glutamine, leu-cine, and proline), and α-ketoglutarate are known to stimulate the phosphorylation of MTORC1 in a cell-specific manner, thereby regulating intracellular protein turnover.
MTORC2MTORC2 contains MTOR, rictor (rapamycin-insensitive companion of TOR), mLST8, and SIN1 (stress-activated MAP kinase interacting protein 1). Although MTORC2 was previously thought to be insensitive to rapamycin, emerging find-ings from both in vitro and in vivo studies indicate that chronic exposure of cells to rapamycin also inhibits MTORC2. Like MTORC1, MTORC2 is activated when it is phosphorylated by a protein kinase. Results of recent studies indicate that MTORC2 phosphorylates protein kinase B/Akt and may function to regulate cell proliferation, differentiation, migration, and cytoskeletal reorganization (Kim and Guan 2011). There is growing interest in MTORC2 in the regulation of nutrient metabolism. Specifically, studies involving liver-specific rictor knockout mice revealed a criti-cal role for hepatic MTORC2 in glucose and lipid metabolism via insulin-induced Akt signaling. These mice lacked Akt Ser473 phosphorylation and exhibited reductions in hepatic glucokinase and sterol regulatory element binding protein 1c (SREBP1c) activities, resulting in enhanced gluconeogenesis, hyperglycemia, and hyperinsulinemia but impaired glycolysis, reduced lipogenesis, and hypolipidemia. Expression of constitutively active Akt2 in MTORC2-deficient hepatocytes restored both glycolysis and lipogenesis, whereas overexpression of glucokinase normal-ized glycolysis but not lipogenesis. Thus, hepatic MTORC2 activates glycolysis and lipogenesis through Akt, glucokinase, and SREBP1c signaling. In support of this view, emerging evidence shows that MTORC2 is required for insulin-mediated suppression of hepatic gluconeogenesis. Therefore, chronic administration of rapa-mycin impairs glucose tolerance and insulin action in the whole body. In some mammalian cells (e.g., Hela, HEK293, and MCF7), a mixed group of AA (EAA + NEAA) can activate MTORC2 through the phosphoinositide-3 kinase and Akt pathway (Tato et al. 2011).
Factors That Affect Intracellular Protein TurnoverA better understanding of the factors affecting intracellular protein turnover is essential to increase protein deposition in animals and to reduce negative N bal-ance in organisms under catabolic conditions. Much of our current knowledge about the regulation of AA metabolism, including intracellular protein turnover, has been generated from studies involving various cytokines released by cells of the immune system (Figure 10.9). The following general conclusions can be made regarding the effects of diverse factors on protein synthesis and degradation in animal tissues and

331Regulation of Amino Acid Metabolism
© 2010 Taylor & Francis Group, LLC
the whole body. First, increasing dietary intake of AA or extracellular concentra-tions of AA stimulates protein synthesis and inhibits intracellular protein degrada-tion in tissues (including the small intestine, liver, heart, kidney, and skeletal muscle). Second, energy substrates (e.g., glucose, saturated fatty acids, and ketone bodies) have little effect on protein synthesis, while inhibiting protein degradation in diverse tissues (including skeletal muscle, heart, and liver). Third, anabolic hormones (e.g., insulin and growth hormone) primarily promote protein synthesis, whereas catabolic hormones (glucocorticoids), metabolic acidosis, and inflammatory cytokines acti-vate proteolysis. Fourth, by stimulating protein synthesis and inhibiting protein deg-radation, feeding adequate amounts of high-quality protein is the most attractive way to promote protein deposition in the whole body. Fifth, both the fractional rate of protein synthesis and the fractional rate of protein degradation decrease with aging. In elderly subjects who exhibit a gradual loss of body protein, the fractional rate of protein synthesis is slower than the fractional rate of protein degradation in various
αβT
CD8
�oCD4
NK
IFNγ �1
�2
IL-4, IL-13 IL-10
Mast
ESP
DCIL-12
B BActivation
AgPC
IL-4
IL-5
BDivision
AbPCDifferentiation
IL-1,IL-6, NO
O–2, H2O2, .OH
MHC Class II
IL-4
IL-4IL-5IL-6IL-10IL-13
Defensin
Seprocidins
Lysozyme
HydrolaseMyeloperoxidase
NTP
NETs
MC
IL-8TNFα MΦ
IL-2 TNFαIFNγ(–)
(–)
(+)
IL-12
IFNγPMA LPS
IFNγ
IL-1
GM-CSFM-CSF
TNFα
Abs
IL-1
Histamine
NOSCF
AgsAgs
NO
HistaminasePeroxidase
Arylsulfatase
PerforinGranzyme IL-10
EC
Humoral immunity
Cytotoxicity to target cells
FIGURE 10.9 Cytokines and other regulatory molecules released by cells of the immune system that regulate AA metabolism, including intracellular protein turnover in animals. Abbreviations: αβT, αβ T cell; Abs, antibodies; Ags, antigens; AbPC, antibody-producing cells; AgPC, antigen-presenting cells; B, B lymphocytes; CD8, cytotoxic T cells carrying CD8 marker; DC, dendritic cell; EC, endothelial cells; ESP, eosinophil; GM-CSF, granulocyte/macrophage colony-stimulating factor; IFN, interferon; IL, interleukin; LPS, lipopolysaccha-ride; MΦ, macrophage; M-CSF, macrophage colony-stimulating factor; Mast, mast cells; MC, monocyte; NETs, neutrophil excellular traps; NK, natural killer cells; NO, nitric oxide; NTP, neutrophil; PMA, phorbol myristate acetate; SCF, stem cell factor; Th0 CD4, T cells carrying CD4 marker; Th1, T helper cell 1; Th2, T helper cell 2; TNFα, tumor necrosis factor α. Note that macrophages are classified as inflammatory (M1) and anti-inflammatory (M2) and that the balance between M1 and M2 cells affects the immune response. (Reproduced from Li, P. et al. 2007. Br. J. Nutr. 98:237–252. With permission.)

332 Amino Acids: Biochemistry and Nutrition
© 2010 Taylor & Francis Group, LLC
tissues, resulting in a gradual loss of body proteins. Thus, improving protein balance is fundamental to increase resistance to cellular stress, improve muscle strength, and extend the life span of individuals.
Our current knowledge about regulation of protein metabolism has been built, to a great extent, on studies involving skeletal muscle, mainly because of two reasons. First, the muscle represents 40–45% of the body weight in healthy animals and is the largest reservoir of both free and peptide-bound AA in animals. Second, a dramatic loss of intramuscular proteins occurs in response to numerous catabolic conditions, such as starvation, low intake of dietary protein, infection, diabetes, denervation, hyperthyroidism, and heat stress; therefore, effective means to reverse the negative protein balance are highly desirable. Collective evidence from extensive studies worldwide has shown that many factors can affect protein turnover in skeletal muscle (Goldberg and St John 1976; Southorn et al. 1990; Sugden and Fuller 1991; Strack et al. 1996; Frost and Lang 2008; Rose and Richter 2009). These factors include: (1) dietary intakes of protein, energy, AA, and other nutrients (Table 10.3); (2) hor-mones, hormone-like factors, and other physiological factors (Table 10.4); and (3) stress and pathological factors (Table 10.5). Note that most of these published studies involved a mixed group of proteins in skeletal muscle, which contains three types of proteins: (1) sarcoplasmic (cytoslic), (2) myofibrillar, and (3) stroma. Sarcoplasmic proteins represent 30–35% of total protein in the muscle by weight. Myofibrillar proteins, which constitute the myofibrillar (contractile) structure in skeletal muscle, accounts for 55–60% of total protein in the muscle by weight. The major myofibril-lar proteins are actin and myosin, but more than 15 other proteins are associated with the myofibrillar structure. Therefore, care should be taken to interpret effects of nutritional, physiological, pathological, and environmental factors on the synthesis and degradation of specific proteins in skeletal muscle.
BlooD flow As A reGulAtor of AA metABolism In VIVo
In intact animals, AA metabolism is controlled at both cellular and systematic lev-els, including inter-organ cooperation. For example, intestinal absorption of AA and their transport among tissues are dependent on adequate rates of blood flow. Furthermore, metabolic products (e.g., ammonia and CO2) are carried through blood circulation from peripheral tissues to specific target organs (e.g., liver and lungs) for disposal. Thus, regulation of blood flow is not only vital to life but is also an important mechanism for the modulation of metabolism of AA and other nutri-ents. For example, utero-placental blood flow is a major determinant of AA transfer from mother to fetus and, therefore, fetal survival and growth in mammals (Figure 10.10). Compelling evidence shows that physiological levels of NO stimulate blood flow, thereby increasing the supply of AA, fatty acids, glucose, and oxygen to tis-sues for protein synthesis and mitochondrial oxidation of energy substrates in vivo. Additionally, increased uptake of AA (e.g., arginine and ornithine) by insulin-sen-sitive tissues can promote the synthesis of polyamines (putrescine, spermidine, and spermine), which can enhance DNA synthesis, angiogenesis, mitochondrial biogen-esis, and oxidative capacity. Thus, although either nanomolar or micromolar con-centrations of NO inhibit oxygen consumption by isolated mitochondria in vitro,

333Regulation of Amino Acid Metabolism
© 2010 Taylor & Francis Group, LLC
physiological levels of NO enhance whole-body energy expenditure in obese sub-jects and the loss of excessive white adipose tissue from the body.
SUMMARY
Metabolism of AA involves both near-equilibrium and nonequilibrium reactions, which are under the control of the first and second laws of thermodynamics (namely,
TABLE 10.3Nutritional Factors That Affect Protein Turnover in Skeletal Muscle
Factors Protein Synthesis Protein Degradation Net Effect
Frequency of FeedingIntermittent feeding Increase No effect Anabolic
Dietary Protein and Energy IntakeHigh energy intake Increase Decrease Anabolic
Low energy intake Decrease Increase Catabolic
High protein intake
High quality Increase Decrease Anabolic
Low quality Increase Increase Catabolic
Low protein intake Decrease No effect Catabolic
Fasting
Short-term Decrease Increase Catabolic
Long-term Decrease Decrease Preserve N
AA and Their MetabolitesArginine Increase Decrease Anabolic
Citrulline Increase Decrease Anabolic
Glutamine Increase Decrease Anabolic
Leucine Increase Decrease Anabolic
Proline Increase No effect Anabolic
Mixture of EAA Increase Decrease Anabolic
α-Ketoglutarate Increase Decrease Anabolic
α-Ketoisocaproate No effect Decrease Anabolic
Other Nutritional FactorsCalcium No effect Increase Catabolic
Glucose No effect Decrease Anabolic
Saturated fatty acids No effect Decrease Anabolic
n-3 fatty acids Increase No effect Anabolic
n-6 fatty acids No effect Increase Catabolic
Ketone bodies
Fed state Decrease No effect Catabolic
Fasted state Decrease Decrease Preserve N
Magnesium No effect Decrease Catabolic

334 Amino Acids: Biochemistry and Nutrition
© 2010 Taylor & Francis Group, LLC
energy conservation and the notion that an inherent direction occurs in a chemical reaction). Either type of reaction offers distinct biochemical advantages. Precise regulation of metabolic pathways is essential to the survival, growth, and develop-ment of organisms. Of particular interest, knowledge about the complex mechanisms responsible for metabolic control helps us gain a more complete understanding of AA synthesis, catabolism, and utilization under both physiological and pathologi-cal conditions. The intracellular concentrations and localization of enzymes, their covalent and noncovalent modifications, as well as intracellular concentrations of
TABLE 10.4Hormones, Hormone-Like Factors, and Other Physiological Factors That Affect Protein Turnover in Skeletal Muscle
Factors Protein SynthesisProteins
Degradation Net Effect
HormonesEstradiol Increase Decrease Anabolic
Glucocorticoids
Fed state, low dose Decrease No effect Catabolic
Fed state, high dose Decrease Increase Catabolic
Fasted state Decrease Increase Catabolic
Growth hormone Increase No effect Anabolic
Insulin Increase Decrease Anabolic
Testosterone Increase Decrease Anabolic
Triiodothyronine
Physiological dose Increase Increase No change
High dose Increase Increase Catabolic
Hormone-Like FactorsIGF-I and IGF-II Increase Decrease Anabolic
β-Agonistsa Increase No effect Anabolic
Synthetic steroidsb Increase No effect Anabolic
Prostaglandin E2 No effect Increase Catabolic
Prostaglandin F2α Increase No effect Anabolic
Physiological FactorsAgingc Decrease Decrease Catabolic
Cell volume expansion Increase Decrease Anabolic
Exercise Increase Increase Anabolic
Muscle contraction Increase Increase Anabolic
Note: IGF, insulin-like growth factor.a Including cimaterol, clenbuterol, isoproterenol, and ractopamine.b Including zeranol, trenbolone acetate, and oestradiol-17β.c Compared with neonates. Elderly subjects exhibit a lower rate of fractional protein synthesis and a
higher rate of fractional protein degradation in skeletal muscle, compared with young adults.

335Regulation of Amino Acid Metabolism
© 2010 Taylor & Francis Group, LLC
cofactors, activators, and inhibitors affect the activities of enzymes in cells. Changes in these variables may take seconds, minutes, hours, or days, depending on individual proteins, cell type, developmental stage, and animal species. While much of useful knowledge about enzyme kinetics is based on in vitro experiments, what is demon-strated in test tubes does not always take place in intact cells and, even if occurring, may not affect metabolic flux in vivo that is also regulated by rates of blood flow to affect the uptake of AA and other nutrients as well as the removal of their metabolites. Additionally, it should be borne in mind that in vivo concentrations of macromol-ecules in cells are exceedingly high and there are protein–protein interactions, but such characteristics may be absent from cell lysates or purified enzymes. Therefore, caution should be exercised in extrapolating studies involving in vitro preparations to the whole animal. Finally, regulation of AA metabolism via intracellular protein synthesis and degradation is also controlled by the MTOR cell signaling. AA are important nutrient signals to activate MTORC1 and MTORC2, thereby increasing protein synthesis, inhibiting proteolysis, and enhancing cytoskeletal reorganization. Thus, MTOR is an attractive target for the regulation of AA metabolism (including intracellular protein turnover) in animal cells. A better understanding of the complex
TABLE 10.5Stress and Pathological Factors That Affect Protein Turnover in Skeletal Muscle
Factors Protein Synthesis Protein Degradation Net Effect
Stress FactorsAcidosis Decrease Increase Catabolic
Cold stress Decrease Increase Catabolic
Free radicals/oxidants Decrease Increase Catabolic
Heat stress Decrease Increase Catabolic
LymphokinesInterleukin 1 No effect Increase Catabolic
Interleukin 6 No effect Increase Catabolic
TNF-α No effect Increase Catabolic
Pathological FactorsBurn Decrease Increase Catabolic
Cancer Decrease Increase Catabolic
Denervation No effect Increase Catabolic
Diabetes Decrease Increase Catabolic
Fever Decrease Increase Catabolic
Inflammation Decrease Increase Catabolic
Injury Decrease Increase Catabolic
High NO levels Decrease Increase Catabolic
Obesity Decrease Increase Catabolic
Note: NO, nitric oxide; TNF-α, tumor necrosis factor-α.

336 Amino Acids: Biochemistry and Nutrition
© 2010 Taylor & Francis Group, LLC
Ute
rine
arte
ry
Ute
rine
vein
AA
, Glu
c, O
2
Um
bilic
al v
ein
Um
bilic
al a
rter
y
AA
Glu
cG
ln
Plac
enta BC
AA
CitO
rn
PAPr
o
Arg
AA
Fruc
Ute
rine
mic
ro-
vasc
ula-
ture
CO
2 +
NH
4+C
O2
+ N
H4+
CO
2 +
NH
4+
Fetu
s
Glu
Gln CitSk
elet
al
mus
cle
Smal
lin
test
ine
Orn
Arg
Pro
BCA
A
Asp
Asn
AA
Gly
Ser
Ala
Tyr
AA
Prot
ein
AT
PC
O2
CO
2
Ute
rus
Glc
N6P
Gln
PA
GSH
PA GSH
GSH
Met
Met
Bloo
d flo
w
Bloo
d flo
wBl
ood
flow
Bloo
d flo
w
Bloo
d flo
wBl
ood
flow
Prot
ein
Prot
ein +
NH
4+
NH
4+
O2
FIG
UR
E 10
.10
Pro
visi
on o
f A
A f
rom
mot
her
to f
etus
via
NO
-dep
ende
nt u
tero
-pla
cent
al b
lood
flow
in
the
gest
atin
g m
amm
al. U
teri
ne a
rter
y in
the
m
othe
r de
live
rs o
xyge
n, A
A, a
nd o
ther
nut
rien
ts f
rom
mat
erna
l art
eria
l blo
od to
the
ute
rus
and,
thr
ough
the
ute
rine
mic
rova
scul
atur
e, to
the
pla
cent
a.
Subs
eque
ntly
, um
bili
cal v
ein
supp
lies
thes
e su
bsta
nces
fro
m th
e pl
acen
ta to
the
fetu
s. U
ptak
e of
a n
utri
ent b
y th
e ut
erus
or t
he fe
tus
is d
eter
min
ed o
n th
e ba
sis
of t
he F
ick
prin
cipl
e: U
ptak
e =
blo
od fl
ow r
ate
× (A
~ V
), w
here
(A
~ V
) re
pres
ents
the
dif
fere
nce
in a
rter
iove
nous
con
cent
rati
on o
f th
e nu
trie
nt
acro
ss th
e ut
erus
or
the
fetu
s. F
ruc,
fru
ctos
e; G
luc,
glu
cose
; Glc
N6P
, glu
cosa
min
e-6-
phos
phat
e; O
rn, o
rnit
hine
.

337Regulation of Amino Acid Metabolism
© 2010 Taylor & Francis Group, LLC
mechanisms responsible for the regulation of AA metabolism will not only greatly advance the field but will also have important implications for the development of new means to improve animal growth, health, and reproduction.
REFERENCES
Brosnan, J.T. 2005. Metabolic design principles: Chemical and physical determinants of cell chemistry. Adv. Enzyme Regul. 45:27–36.
Dennis, M.D., J.I. Baum, S.R. Kimball, and L.S. Jefferson. 2011. Mechanisms involved in the coordinate regulation of mTORC1 by insulin and amino acids. J. Biol. Chem. 286:8287–8296.
Fitzpatrick, P.F. 2012. Allosteric regulation of phenylalanine hydroxylase. Arch. Biochem. Biophys. 519:194–201.
Frost, R.A. and C.H. Lang. 2008. Regulation of muscle growth by pathogen-associated mol-ecules. J. Anim. Sci. 86(Suppl 14):E84–E93.
Goldberg, A.L. and A.C. St John. 1976. Intracellular protein degradation in mammalian and bacterial cells: Part 2. Annu. Rev. Biochem. 45:747–803.
Harris, R.A., M. Joshi, N.H. Jeoung, and M. Obayashi. 2005. Overview of the molecular and biochemical basis of branched-chain amino acid catabolism. J. Nutr. 135(Suppl 6): 1527S–1530S.
Hoffmann, E.K., I.H. Lambert, and S.F. Pedersen. 2009. Physiology of cell volume regulation in vertebrates. Physiol. Rev. 89:193–277.
Jois, M., B. Hall, K. Fewer, and J.T. Brosnan. 1989. Regulation of hepatic glycine catabolism by glucagon. J. Biol. Chem. 264:3347–3351.
Kim, J. and K.L. Guan. 2011. Amino acid signaling in TOR activation. Annu. Rev. Biochem. 80:1001–1032.
Kim, J.Y., G.W. Song, G. Wu, and F.W. Bazer. 2012. Functional roles of fructose. Proc. Natl. Acad. Sci. USA 109:E1619–E1628.
Lei, J., D.Y. Feng, Y.L. Zhang, S. Dahanayaka, X.L. Li, K. Yao, J.J. Wang, Z.L. Wu, Z.L. Dai, and G. Wu. 2012. Hormonal regulation of leucine catabolism in mammary epithelial cells. Amino Acids. doi: 10.1007/s00726-012-1332-9.
Li, P., Y.L. Yin, D.F. Li, S.W. Kim, and G. Wu. 2007. Amino acids and immune function. Br. J. Nutr. 98:237–252.
Li, P., S.W. Kim, X.L. Li, S. Datta, W.G. Pond, and G. Wu. 2008. Dietary supplementation with cholesterol and docosahexaenoic acid increases the activity of the arginine-nitric oxide pathway in tissues of young pigs. Nitric Oxide 19:259–265.
Li, P., S.W. Kim, X.L. Li, S. Datta, W.G. Pond, and G. Wu. 2009. Dietary supplementation with cholesterol and docosahexaenoic acid affects concentrations of amino acids in tis-sues of young pigs. Amino Acids 37:709–716.
Meijer, A.J. and P.F. Dubbelhuis. 2004. Amino acid signalling and the integration of metabo-lism. Biochem. Biophys. Res. Commun. 313:397–403.
Morris, S.M. Jr. 2012. Arginases and arginine deficiency syndromes. Curr. Opin. Clin. Nutr. Metab. Care 15:64–70.
Ovadi, J. and V. Saks. 2004. On the origin of intracellular compartmentation and organized metabolic systems. Mol. Cell. Biochem. 256:5–12.
Poulin, R., L. Lu, B. Ackermann, P. Bey, and A.E. Pegg. 1992. Mechanism of the irrevers-ible inactivation of mouse ornithine decarboxylase by α-difluoromethylornithine: Characterization of sequences at the inhibitor and coenzyme binding sites. J. Biol. Chem. 267:150–158.
Rose, A.J. and E.A. Richter. 2009. Regulatory mechanisms of skeletal muscle protein turnover during exercise. J. Appl. Physiol. 106:1702–1711.

338 Amino Acids: Biochemistry and Nutrition
© 2010 Taylor & Francis Group, LLC
Southorn, B.G., R.M. Palmer, and P.J. Garlick. 1990. Acute effects of corticosterone on tissue protein synthesis and insulin-sensitivity in rats in vivo. Biochem. J. 272:187–191.
Srere, P.A. 1985. The metabolon. Trends Biochem. Sci. 10:109–110.Strack, P.R., L. Waxman, and J.M. Fagan. 1996. Activation of the multi-catalytic endopepti-
dase by oxidants. Effects on enzyme structure. Biochemistry 35:7142–7249.Sugden, P.H. and S.J.Fuller. 1991. Regulation of protein turnover in skeletal and cardiac mus-
cle. Biochem. J. 273:21–37.Tato, I., R. Bartrons, F. Ventura, and J.L. Rosa. 2011. Amino acids activate mammalian tar-
get of rapamycin complex 2 (mTORC2) via PI3K/Akt signaling. J. Biol. Chem. 286: 6128–6142.
Wang, J.J., Z.L. Wu, D.F. Li, N. Li, S.V. Dindot, M.C. Satterfield, F.W. Bazer, and G. Wu. 2012. Nutrition, epigenetics, and metabolic syndrome. Antioxid. Redox Signal. 17:282–301.
Watford, M. 2003. The urea cycle. Biochem. Mol. Biol. Edu. 31:289–297.Wu, G. and N.E. Flynn. 1995. Regulation of glutamine and glucose metabolism by cell volume
in lymphocytes and macrophages. Biochim. Biophys. Acta 1243:343–350.Wu, G. and J.R. Thompson. 1988. The effect of ketone bodies on alanine and glutamine
metabolism in isolated skeletal muscle from the fasted chick. Biochem. J. 255:139–144.

339
© 2010 Taylor & Francis Group, LLC
Physiological Functions of Amino Acids
AA serve as not only the building blocks of proteins, but also signaling molecules in cell physiology. Furthermore, AA are regulators of food intake, gene expression, the protein phosphorylation cascade, and cell-to-cell communication. Additionally, AA are key precursors for synthesis of hormones and low-molecular-weight nitrog-enous substances, with each having enormous biological importance (Table 11.1). Physiological concentrations of AA metabolites [e.g., CO, creatine, catecholamines (such as dopamine, epinephrine, and norepinephrine), GSH, NO, polyamines, sero-tonin, taurine, D-AA, and thyroid hormones] are required for cellular functions (Kharitonov et al. 2005; Fernstrom 2012; Friedman and Levin 2012; Lei et al. 2012). However, elevated levels of other products (e.g., ammonia, GABA, homocysteine, and dimethylarginines) are pathogenic factors for neurological disorders, oxidative stress, and cardiovascular disease. Thus, an optimal balance among AA in the diet and cir-culation is crucial for whole-body homeostasis. There is growing recognition that AA regulate key metabolic pathways that are necessary for maintenance, growth, devel-opment, reproduction, lactation, and immunity. These AA include arginine, cysteine, glutamate, glutamine, glycine, leucine, proline, and tryptophan. Dietary supplemen-tation with one or a mixture of these AA is beneficial for: (1) improving embryonic, fetal, and postnatal survival; (2) enhancing antioxidative capacity and immunity; (3) ameliorating health problems at various stages of the life cycle (e.g., fetal growth restriction, neonatal morbidity and mortality, weaning-associated intestinal dysfunc-tion and wasting syndrome, obesity, diabetes, cardiovascular disease, the metabolic syndrome, and infertility); and (4) optimizing efficiency of metabolic transformations to enhance muscle growth, milk production, and athletic performance, while prevent-ing excess fat deposition and reducing adiposity. The physiological functions of AA are highlighted along with their use for dietary supplementation and therapy in this chapter and are also epitomized by inborn errors of metabolism, which will be dis-cussed in Chapter 12.
ROLES OF AA IN PEPTIDE SYNTHESIS
Protein synthesis
The primary utilization of AA in animals is to serve as building blocks for proteins, which are essential components of the body and are required for cell growth, devel-opment, and function. The protein synthetic pathway is illustrated in Chapter 8. Note that not all mature proteins contain each of the 20 protein AA. For example, mature bovine, human, and porcine insulin lack both tryptophan and methionine.
11

340 Amino Acids: Biochemistry and Nutrition
© 2010 Taylor & Francis Group, LLC
TABLE 11.1Major Metabolites and Functions of Amino Acids in Nutrition and Metabolism
Amino AcidMetabolites or Direct Action Major Functions
Amino acids Proteins Structural components of the body; cell growth, development, and function; colloidal properties
Peptides Hormones, antibiotics, metabolic regulation, and antioxidants
Ammonia Substrate for carbamoylphosphate synthetase II and glutamate dehydrogenase; bridging amino acid and glucose metabolism; regulation of acid–base balance
Alanine Directly Inhibition of pyruvate kinase and hepatic autophagy; gluconeogenesis; transamination; glucose–alanine cycle; interorgan metabolism and transport of both carbon and N
β-Alanine Directly A component of coenzyme A and pantothenic acid
Dipeptides Carnosine (β-alanyl-l-histidine), carcinine (β-alanyl-histamine), anserine (β-alanyl-1-methyl-l-histidine), and balenine (β-alanyl-3-methyl-histidine) with antioxidative effect; improvement of skeletal muscle function and exercise performance; osmolytes
Arginine Directly Activation of MTOR and AMPK signaling pathways; antioxidant; regulation of hormone secretion; allosteric activation of N-acetylglutamate synthase; ammonia detoxification; regulation of gene expression; immune function; activation of tetrahydrobiopterin synthesis; N reservoir; methylation of proteins; deimination (formation of citrulline) of proteinsa
Nitric oxide Signaling molecule; regulator of food intake, nutrient metabolism, vascular tone, hemodynamics, angiogenesis, spermatogenesis, embryogenesis, fertility, immune function, hormone secretion, wound healing, neurotransmission, tumor growth, mitochondrial biogenesis, energy metabolism, and cell function
Agmatine Inhibition of NOS, ornithine decarboxylase, and monoamine oxidase; ligand for α2-adrenergic and imidazoline receptors
Ornithine Ammonia detoxification; synthesis of proline, glutamate, and polyamines; mitochondrial integrity; wound healing; precursor for synthesis of putrescine
Methylarginines Competitive inhibition of NOS
Asparagine Directly Cell metabolism and physiology; regulation of gene expression and immune function; ammonia detoxification; function of the nervous system
Acrylamideb Oxidant; cytotoxicity; gene mutation; low food quality
Aspartate Directly Purine, pyrimidine, asparagine, and arginine synthesis; transamination; urea cycle; activation of NMDA receptors; synthesis of inositol and β-alanine

341Physiological Functions of Amino Acids
© 2010 Taylor & Francis Group, LLC
TABLE 11.1 (continued)Major Metabolites and Functions of Amino Acids in Nutrition and Metabolism
Amino AcidMetabolites or Direct Action Major Functions
d-Aspartate Activation of NMDA receptors in brain
Citrulline Directly Antioxidant; arginine synthesis; osmoregulation; ammonia detoxification; N reservoir in the conceptus
Cysteine Directly Disulfide linkage in protein; transport of sulfur
Taurine Antioxidant; regulation of cellular redox state; osmolyte
H2S A signaling molecule; regulation of cell metabolism; killing of pathogens; vasodilation; neurological function
Glutamate Directly Glutamine, citrulline, and arginine syntheses; bridging the urea cycle with the Krebs cycle; transamination; ammonia assimilation; flavor enhancer; activation of NMDA receptors; N-acetylglutamate synthesis; metabolic fuel
γ-Aminobutyrate Inhibitory or excitatory neurotransmitter, depending on age, type of receptor, and the region of brain; regulation of neuronal excitability throughout the nervous system; modulation of muscle tone; inhibition of T-cell response and inflammation
Glutamine Directly Regulation of protein turnover through cellular MTOR signaling; regulation of cell volume, gene expression, and immune function; a major fuel for rapidly proliferating cells; inhibition of apoptosis; synthesis of purine, pyrimidine, ornithine, citrulline, arginine, proline, and asparagine; N reservoir; synthesis of NAD(P)
Glu and Asp Excitatory neurotransmitters; components of the malate shuttle; cell metabolism; ammonia detoxification; major fuels for enterocytes; alanine synthesis
Glucosamine-6-P Synthesis of aminosugars and glycoproteins; inhibition of NO synthesis; antiinflammation; angiogenesis; cell growth and development; inhibition of the pentose cycle
Ammonia Renal regulation of acid–base balance; synthesis of glutamate and carbamoyl-phosphate
Glycine Directly Inhibition of calcium influx through activation of a glycine-gated channel in the cell membrane; purine and serine syntheses; synthesis of porphyrins and heme; inhibitory neurotransmitter in the central nervous system; coagonist with glutamate for NMDA receptors; antioxidant; antiinflammation; one-carbon-unit metabolism; conjugation with bile acids
Heme Hemoproteins (e.g., hemoglobin, myoglobin, catalase, and cytochrome c); production of carbon monoxide (a signaling molecule); storage of iron in the body
Bilirubin Natural ligand of aryl hydrocarbon receptor in the cytoplasm
Histidine Directly Protein methylation; hemoglobin structure and function; antioxidative dipeptides; one-carbon-unit metabolism
continued

342 Amino Acids: Biochemistry and Nutrition
© 2010 Taylor & Francis Group, LLC
TABLE 11.1 (continued)Major Metabolites and Functions of Amino Acids in Nutrition and Metabolism
Amino AcidMetabolites or Direct Action Major Functions
Histamine Allergic reaction; vasodilator; activation of central acetylcholine secretion; stimulation of secretions by the gastrointestinal tract
Imidazoleacetate Analgesic and narcotic actions
Urocanate Modulation of the immune response in skin; protecting the skin against ultraviolet radiation
Isoleucine Directly Synthesis of glutamine and alanine; balance among BCAA
Leucine Directly Regulation of protein turnover through cellular MTOR signaling and gene expression; activator of glutamate dehydrogenase; BCAA balance; flavor enhancer
Gln and Ala Many metabolic functions
HMB Regulation of immune responses
Lysine Directly Regulation of nitric oxide synthesis; antiviral activity (treatment of herpes simplex); protein methylation (e.g., trimethyllysine in calmodulin), acetylation, ubiquitination, and O-linked glycosylation
Hydroxylysine Structure and function of collagen
Methionine Homocysteine Oxidant; independent risk factor for cardiovascular disease; inhibition of nitric oxide synthesis
Betaine Methylation of homocysteine to methionine; one-carbon unit metabolism
Cysteine Cellular metabolism and nutrition
SAM Methylation of proteins and DNA; creatine, epinephrine and polyamine synthesis; regulation of gene expression; one-carbon-unit metabolism
Taurine Antioxidant; osmoregulation; organ development; vascular, muscular, cardiac, and retinal functions; antiinflammation; conjugation with bile acids
Phospholipids Synthesis of lecithin and phosphatidylcholine cell signaling
Phenylalanine Directly Activation of tetrahydrobiopterin (a cofactor for NOS) synthesis; synthesis of tyrosine and phenylacetylglutamine; neurological development and function
Proline Directly Collagen structure and function; neurological function; osmoprotectant; activation of MTOR; a sensor of cellular energy status; an antioxidant; a regulator of the differentiation of cells (including embryonic stem cells)
H2O2 Killing pathogens; intestinal integrity; a signaling molecule; an oxidant required for innate immunity
P5C Cellular redox state; DNA synthesis; lymphocyte proliferation; ornithine, citrulline, arginine, and polyamine syntheses; gene expression; stress response
Hydroxyproline Structure and function of collagen; glycine synthesis

343Physiological Functions of Amino Acids
© 2010 Taylor & Francis Group, LLC
TABLE 11.1 (continued)Major Metabolites and Functions of Amino Acids in Nutrition and Metabolism
Amino AcidMetabolites or Direct Action Major Functions
Serine Directly One-carbon-unit metabolism; synthesis of cysteine, purine, pyrimidine, ceramide, and phosphatidylserine; synthesis of tryptophan in bacteria; gluconeogenesis (particularly in ruminants); protein phosphorylation
Glycine Many metabolic and regulatory functions
d-Serinec Activation of NMDA receptors in brain
Theanine Directly An amino acid (glutamine analog) in tea leaves; antioxidant; increasing concentrations of γ-aminobutyrate, dopamine, and serotonin in brain; neuroprotective effect
Threonine Directly Synthesis of the mucin protein that is required for maintaining intestinal integrity and function; immune function; protein phosphorylation and O-linked glycosylation; glycine synthesis
Tryptophan Serotonin Neurotransmitter; inhibiting production of inflammatory cytokines and superoxide; regulation of food intake
N-Acetylserotonin Inhibitor of tetrahydrobiopterin synthesis; antioxidant; inhibition of the production of inflammatory cytokines and superoxide
Melatonin Antioxidant; inhibition of the production of inflammatory cytokines and superoxide; circadian rhythms
Anthranilic acid Inhibiting production of proinflammatory T-helper-1 cytokines; preventing autoimmune neuroinflammation; enhancing immune function
Niacin A component of NAD and NADP, coenzymes for many oxidoreductases; posttranslational modifications of proteins, including poly(ADP-ribose) polymerases
Indolesd Natural ligands of aryl hydrocarbon receptor in the cytoplasm; regulation of immune responses
Tyrosine Directly Protein phosphorylation, nitrosation, and sulfation
Dopamine Neurotransmitter; regulation of immune response
EPN and NEPN Neurotransmitters; cell metabolism
Melanin Antioxidant; inhibition of the production of inflammatory cytokines and superoxide; immunity; energy homeostasis; sexual activity; stress response; pigmentation of skin and hair
T3 and T4 Regulation of energy and protein metabolism, as well as growth and development
Valine Directly Synthesis of glutamine and alanine; balance among BCAA
Arg and Met Polyamines Gene expression; DNA and protein synthesis; ion channel function; apoptosis; signal transduction; antioxidants; cell function; cell proliferation and differentiation
Arg, Met, and Gly
Creatine Antioxidant; antiviral; antitumor; energy metabolism in heart, skeletal muscle and brain; neurological and muscular development and function
continued

344 Amino Acids: Biochemistry and Nutrition
© 2010 Taylor & Francis Group, LLC
synthesis of smAll PePtiDes
As noted in Chapter 5, many small peptides with enormous physiological impor-tance are synthesized from AA. These peptides include (1) antibiotics produced by bacteria and the intestinal mucosa, (2) GSH (a tripeptide), (3) dipeptides (car-nosine, carcinine, anserine, and balenine), and (4) physiologically important small peptides consisting of 9 or 10 AA residues. In some but not all of these peptides, two cysteine residues form a disulfide linkage (–S–S–). A synthetic dipeptide widely used in the food industry is aspartame (Asp–Phe–O–CH3), which has ∼200 times greater sweetness than sucrose. Examples of small peptides are given here:
Angiotensin II (10 AA): Asp–Arg–Val–Tyr–Ile–His–Pro–Phe–His–Leu (NH2)Bradykinin (9 AA): Arg–Pro–Pro–Gly–Phe–Ser–Pro–Phe–Arg (NH2)Oxytocin (9 AA): Cys–Tyr–Ile–Gln–Asn–Cys–Pro–Leu–Gly (NH2)Arginine vasopressin Cys–Tyr–Phe–Gln–Asn–Cys–Pro–Arg–Gly (NH2)(9 AA):
TABLE 11.1 (continued)Major Metabolites and Functions of Amino Acids in Nutrition and Metabolism
Amino AcidMetabolites or Direct Action Major Functions
Cys, Glu, and Gly
Glutathione Free radical scavenger; antioxidant; cell metabolism (e.g., formation of leukotrienes, mercapturate, glutathionylspermidine, glutathione–nitric oxide adduct and glutathionyl proteins); signal transduction; gene expression; apoptosis; cellular redox; immune response
Gln, Asp, and Gly
Nucleic acids Coding for genetic information; gene expression; cell cycle and function; protein and uric acid syntheses; lymphocyte proliferation; facilitation of wound healing
Uric acid Antioxidant; the major end product of amino acid oxidation in avian species
Lys and Met Carnitine Transport of long-chain fatty acids into mitochondria for oxidation; storage of energy as acetylcarnitine; antioxidant
Ser and Met Choline A component of acetylcholine (a neurotransmitter) and phosphatidylcholine (a structural lipid in the membrane); precursor for the synthesis of betaine (a methyl donor in the one-carbon-unit metabolism), sarcosine, and glycine
Note: Unless indicated, the amino acids mentioned herein are l-amino acids. BCAA, branched-chain amino acids; SAM, S-adenosylmethionine; EPN, epinephrine; HMB, β-hydroxy-β-methylbutyrate; MTOR, mechanistic target of rapamycin; NEPN, norepinephrine; NOS, nitric oxide synthase; T3, triiodothyronine; T4, thyroxine.
a Including myelin basic protein, filaggrin, and histone proteins.b Formed when asparagine reacts with reducing sugars or reactive carbonyls at high temperature.c Synthesized from l-serine by serine racemase.d Including indole acetic acid, kynurenine, and tryptamine.

345Physiological Functions of Amino Acids
© 2010 Taylor & Francis Group, LLC
Kallidin (10 AA): Lys–Arg–Pro–Pro–Gly–Phe–Ser–Pro–Phe–Arg (NH2)Lysine vasopressin (9 AA): Cys–Tyr–Phe–Gln–Asn–Cys–Pro–Lys–Gly (NH2)
ROLES OF AA FOR SYNTHESIS OF NONPEPTIDE MOLECULES
synthesis of nonPePtiDe molecules
AA are substrates for synthesis of nonpeptide hormones (e.g., epinephrine, norepi-nephrine, and thyroxine), low-molecular-weight nitrogenous substances (e.g., ammo-nia, carnitine, creatine, dopamine, NO, nucleotides, polyamines, and thyroxine), and other molecules (e.g., CO and H2S). Each of these AA metabolites has enormous biological importance (Bieber 1988; Smriga and Torii 2003; Li et al. 2009; Wu 2009; Faure et al. 2012). For example, AA plays a major role in gaseous signaling (see the section below). Physiological concentrations of AA metabolites are essen-tial to whole-body homeostasis, reproduction, growth, development, and immunity. However, excessive amounts of some metabolites (e.g., ammonia, homocysteine, and asymmetric dimethylarginine) are pathogenic factors for neurological disorders, oxi-dative stress, and cardiovascular disease. There has been growing recognition that metabolites of AA at physiological concentrations are cell signaling molecules that affect gene expression, the protein phosphorylation cascade, neurotransmission, nutri-tion, and metabolic pathways in humans and other animals (Table 11.2).
GAseous siGnAlinG By no, co, AnD h2s
Chemical Properties of AA-Derived GasesNO, CO, and H2S are lipophilic, colorless molecules that easily penetrate biological membranes, and exert their effects independent of membrane receptors. NO and CO
TABLE 11.2Important Roles for AA and Their Metabolites in Nutrition and MetabolismFood intake, as well as nutrient absorption and metabolism (e.g., nutrient transport, protein turnover, fat synthesis and oxidation, glucose synthesis and oxidation, amino acid synthesis and oxidation, urea and uric synthesis for ammonia detoxification, and efficiency of food utilization)
Cellular signaling via MTOR, cAMP, and cGMP pathways, as well as the generation of NO, CO, and H2S
Hormone synthesis and secretion (e.g., insulin, glucagon, growth hormone, prolactin, placental lactogen, and epinephrine)
Regulation of endothelial cell function, blood flow, and lymph circulation
Immune function and health (e.g., T-cell proliferation and B-cell maturation, antibody production by B-cells, killing of pathogens, obesity, diabetes, and metabolic syndrome)
Reproduction and lactation (e.g., spermatogenesis, male fertility, ovulation, ovarian steroidogenesis, embryonic implantation and survival, placental angiogenesis and growth, fetal growth and development, and lactogenesis)
Acid–base balance, neurotransmission, extracellular and intracellular osmolarity, antioxidative defense, and whole-body homeostasis
Postnatal survival, growth, and development, as well as tissue regeneration and remodeling

346 Amino Acids: Biochemistry and Nutrition
© 2010 Taylor & Francis Group, LLC
are odorless, but H2S and SO2 each have a characteristic strong, pungent odor (e.g., the smell of rotten eggs for H2S). NO is a highly reactive free radical, whereas CO, H2S, and SO2 are strong reducing agents (Bouillaud and Blachier 2011). None of these gases are stable in physiological solutions. Particularly, NO is rapidly oxidized to nitrite (NO2
−) and nitrate (NO3−) as stable products in the body. NO has an exceed-
ingly short half-life (<5 s) in cells and tissues. CO is oxidized to CO2, which, along with H2O, is in chemical equilibrium with H+ plus HCO3
−. The half-life of CO in the blood circulation has been reported to be 22–120 and 40–75 min, respectively, for humans and pigs. In saline, H2S exists in equilibrium with HS−, with the ratio of H2S to HS− being approximately 1:2. In physiological solutions, SO2 spontaneously reacts with water to yield sulfurous acid (H2SO3) and then sulfite (SO3
2−) through dissocia-tion of bisulfate (HSO3
−):
SO2 + H2O ↔ H2SO3 ↔ HSO3− + H+ ↔ SO3
2− + 2H+
Oxidation of H2S also occurs in mitochondria. The half-lives of H2S in rat blood and mammalian plasma has been reported to be 2.5 min and <30 min, respectively.
As gases, NO, CO, H2S, and SO2 are exhaled by lungs. The remaining amounts are oxidized in the body, as noted previously. The end products of their oxidation in cells and tissues, which include nitrite, nitrate, HCO3
−, sulfite, and sulfate, are excreted from the body primarily by kidneys (via the urine) and, to a lesser extent, by the large intestine (via the feces).
Functions of NONO is a signaling molecule in animals (Figure 11.1). Physiological concentrations of NO enhance: (1) angiogenesis, (2) cell signal transduction, (3) embryogenesis, (4) expression of genes related to tissue growth and development, oxidation of energy substrates, and antioxidative responses, (5) mitochondrial biogenesis and respira-tion, (6) secretion of hormones (e.g., insulin, GH, prolactin, and placental lactogen), (7) immune responses, (8) intestinal motility and mucosal integrity, (9) neurotrans-mission, (10) transport and metabolism of nutrients, (11) ovulation in females, (12) spermatogenesis in males, (13) thermogenesis and control of body temperature, (14) vasodilation and cardiovascular function, and (15) wound healing.
Among the first identified functions of NO are its role as the major endothelium-derived relaxing factor, a mediator of the immune response, a neurotransmitter, a cytotoxic free radical, and a widespread signaling molecule. Thus, NO partici-pates in virtually every cellular and organ function in the body (Kots et al. 2011). In blood vessels, NO released by endothelial cells activates guanylyl cyclase in adjacent smooth muscle cells, thereby elevating cellular cGMP concentrations and causing smooth muscle relaxation. As such, physiological concentrations of NO produced by the endothelial isoform of eNOS are essential for regulating vascular tone and hemodynamics. In addition, NO stimulates angiogenesis (the formation of new blood vessels from preexisting ones), which plays an important role in physi-ological events (e.g., wound healing, vascular remodeling, ovulation, and placental growth) and in pathological conditions (e.g., tumor growth, myocardial infarction, and diabetic retinopathy). Furthermore, NO inhibits leukocyte adhesion, platelet

347Physiological Functions of Amino Acids
© 2010 Taylor & Francis Group, LLC
aggregation, superoxide generation, the expression of vascular cell adhesion mol-ecules and monocyte chemotactic peptides, proliferation of smooth muscle cells, and the release of endothelin-1 (a vasoconstrictor). Thus, NO is a vasodilator, anti-atherogenic, antiproliferative, and antithrombotic factor in the cardiovascular sys-tem (Li et al. 2009).
Physiological concentrations of NO also regulate the transport and metabolism of nutrients, including glucose, fatty acids, and AA in animals. As a signaling mol-ecule, increasing the availability of NO in the physiological range stimulates glucose and fatty-acid uptake, as well as glucose and fatty acid oxidation in skeletal muscle, heart, liver, and adipose tissue, inhibit the synthesis of glucose, glycogen, and fat in target tissues (e.g., liver and adipose) and enhance lipolysis in white adipocytes. Thus, a chronic inhibition of NO synthesis causes hyperlipidemia and fat accretion in rats, whereas dietary arginine supplementation (e.g., 1.25% arginine–HCl in drink-ing water for 10 weeks) reduces fat mass in diabetic fatty rats. The underlying mech-anisms may involve multiple cGMP-dependent pathways. First, NO stimulates the
{ {
Antiapoptosis
Glutathione
Antiinflammation Cytoprotection
ATP
H2SGTP
NOCOSO2
cGMP
Relaxationof bloodvessels
NMDAreceptorsCa2+ influx
to cells(particularlyin the CNS)
Calmodulin
SynapticCa2+ waves
in astrocytes
KATP channels
Proteinkinase A
cAMP
Cellmetabolism
Inhibitionof VSMC
proliferation
Oxygentransport and
storage
Killing of pathogensProtein
kinase G
Mitochondrialbiogenesis and
respiration
Oxidation ofenergy substrates
Ameliorationof metabolic
syndrome
Activation ofcalmodulin-
dependent proteins
sGC
Blood flow andcardiovascular
function
HemodynamicsMembrane hyper-
polarization
Long-termpotentiation ofhippocampus
Relaxationof bloodvessels
(+) (+) ACNon-sGC
hemeprotein
FIGURE 11.1 Gaseous signaling in cells via cGMP- and cAMP-dependent and - independent pathways in animal cells. Physiological levels of both NO and CO activate guanylate (guany-lyl) cyclase to generate cGMP, which stimulates cGMP-dependent protein kinase. H2S acti-vates adenylate cyclase activity to yield cAMP, which stimulates cAMP-dependent protein kinase. NO, CO, and H2S enhance glutathione synthesis to protect cells from oxidative stress. AC, adenylate cyclase; CNS, central nervous system; sGC, soluble guanylate cyclase.
348 Amino Acids: Biochemistry and Nutrition
© 2010 Taylor & Francis Group, LLC
phosphorylation of AMP-activated protein kinase, resulting in: (1) decreased levels of malonyl-CoA via inhibition of acetyl-CoA carboxylase and activation of malonyl-CoA decarboxylase and (2) decreased expression of genes related to lipogenesis and gluconeogenesis (glycerol-3-phosphate acyltransferase, sterol regulatory element binding protein-1c, and phosphoenolpyruvate carboxykinase). Second, NO increases the phosphorylation of hormone-sensitive lipase and perilipins, leading to the trans-location of the lipase to the surface of neutral lipid droplets and hence the stimulation of lipolysis. Third, NO activates the expression of peroxisome proliferator-activated receptor γ (PPARγ) coactivator-1α, thereby enhancing mitochondrial biogenesis, oxidative phosphorylation, and development of brown adipose tissue. Fourth, NO increases blood flow to insulin-sensitive tissues, promoting the uptake of energy sub-strates and the removal of their oxidation products via the circulation. Modulation of the arginine–NO pathway through dietary supplementation with l-arginine or l-citrulline may aid in the prevention and treatment of metabolic syndrome in obese humans and companion animals, and in reducing unfavorable fat mass in animals of agricultural importance (Wu 2009).
As a free radical species, NO has two facets in its biology. As an oxidant, high or pathological concentrations of NO inhibit nearly all enzyme-catalyzed reactions through protein oxidation. Proteins inactivated by NO include (1) heme-containing proteins, including cytochromes (e.g., cytochromes b, c, c1, and aa3) in the mito-chondrial respiratory chain, (2) enzymes containing nonheme iron (also known as iron–sulfur proteins), including aconitase of the Krebs cycle, as well as NADH dehy-drogenase, succinate dehydrogenase, and coenzyme Q reductase of the mitochondrial electron transport system, and (3) proteins that undergo S-nitrosothiol modification, including creatine kinase, insulin-receptor substrate-1, and protein kinase B. NO also reacts with H2O2 to form ONOO–, another potent oxidant. Elevated levels of NO and peroxynitrite readily oxidize biomolecules (e.g., proteins, amino acids, lipids, and DNA), which leads to cell injury and death. This cytotoxic effect of NO is respon-sible for killing pathogens by activated macrophages and other phagocytes in the immune system, but is deleterious to mammalian cells and mediates the pathogen-esis of many diseases, including the autoimmune destruction of pancreatic β-cells in type-I diabetes mellitus, arthritis, glomerulonephritis, and neurological disorders. In addition, when excess NO is produced by all NOS isoforms under septic and inflam-matory conditions, life-threatening hypotension occurs in animals.
Functions of COUnlike NO, CO is not an oxidant and, therefore, does not directly cause oxidative damage to AA or macromolecules. However, like NO, CO reversibly binds heme-containing proteins, including oxyhemoglobin, myoglobin, and cytochrome c oxi-dase, and soluble guanylyl cyclase. CO, a product of heme oxygenase (HO), binds the enzyme’s physiological substrate (heme), and this reaction may be a mechanism for regulating CO bioavailability. Because physiological concentrations of CO acti-vate the conversion of GTP to cGMP, which triggers cGMP-dependent kinases and the phosphorylation of target proteins, this gas can elicit a series of physiological responses (e.g., relaxation of vascular smooth muscle cells, vasodilation, and mito-chondrial biogenesis) (Figure 11.1).

349Physiological Functions of Amino Acids
© 2010 Taylor & Francis Group, LLC
CO is a neural messenger that differs markedly from classical neurotransmitters (e.g., glutamate, acetylcholine, and noradrenaline) in biosynthesis, chemical nature, cel-lular localization, and mechanisms of action. In neurons, CO, either alone or in combi-nation with NO, enhances the synthesis of cGMP from GTP. CO acts downstream from the NMDA receptor as a retrograde messenger at synapses and stimulates long-term potentiation (a type of synaptic plasticity used as a mechanism of learning) in the hip-pocampus. Endogenous CO may also play an important role in memory processing.
Physiological concentrations of CO have potent cytoprotective effects, particu-larly on neurons. Overexpression of the HO1 gene protects dopaminergic neurons against neurotoxicity induced by 1-methyl-4-phenylpyridinium. In contrast, HO1 knockout mice exhibit a profound lesion in the brain following the administration of NMDA into the striatum. Moreover, overexpression of HO2 protects olfactory receptor neurons from glutathione depletion-induced apoptosis. The neuroprotective action of CO is a new addition to the long list of the functions of glycine and heme in animals.
CO can also modulate the function of the immune system. For example, high concentrations of CO above physiological ranges inhibit microbial growth and kill pathogenic organisms, but also induce apoptosis and tissue injury via the NF-κB cell signaling pathway. This notion is further substantiated by the following lines of evidence. First, CO is a key modulator of NO-mediated antiapoptotic and anti-inflammatory functions in hepatocytes and macrophages, as these effects are absent in mice lacking HO1 or receiving HO1 inhibitors. Similar results were obtained for human enterocytes treated with enterohemorrhagic Escherichia coli. Second, CO derived from HO1 prevents reactive oxygen species-induced translocation of Toll-like receptors (TLR) 2, 4, 5, and 9 to lipid rafts in macrophages, thereby inhibiting TLR signaling and conferring potent antiinflammatory effects. Third, CO reduces NO synthesis by iNOS in hepatocytes and intestinal cells, decreases the circulating levels of proinflammatory cytokines (e.g., interleukins 1β and 6, and tumor necrosis factor-α), and increases production of antiinflammatory cytokines (e.g., interleukin 10) via the p38 mitogen-activated protein kinase pathway. Also, inhaled CO confers antiinflammatory effects against ventilator-induced lung injury.
Like NO, CO can regulate the metabolism of energy substrates in mitochondria. At high doses above physiological ranges, CO inhibits cytochrome c oxidase, there-fore reducing substrate oxidation and ATP production. Addition of a CO donor to the incubation medium results in a dose-dependent increase in the oxidation of glucose and oleic acid in both adipose tissue and skeletal muscle of rats. Thus, upregulation of CO synthesis, within physiological ranges, may reduce adiposity. In support of this notion, oral administration of arginine via drinking water increases NOS1 and HO3 expression in adipose tissue of both Zucker diabetic fatty rats and diet-induced obese rats, while reducing fat gain and improving whole-body insulin sensitivity in both animal models. Similarly, partly through regulation of nutrient metabolism via cGMP signaling, dietary supplementation with arginine reduces fat mass and enhances antioxidative capacity primarily through changes in gene expression in growing-finishing pigs. Furthermore, arginine supplementation (e.g., adding 1% argi-nine to the basal diet between days 14 and 28 or between days 30 and 114 of gesta-tion) increases embryonic/fetal survival and growth in gilts. Weekly intraperitoneal

350 Amino Acids: Biochemistry and Nutrition
© 2010 Taylor & Francis Group, LLC
administration of an HO1 inducer (cobalt protoporphyrin, 3 mg/kg body weight) to obese diabetic mice for 6 weeks reduces visceral and subcutaneous fat, concentra-tions of proinflammatory cytokines (e.g., interleukins 6 and 1β, and TNF-α) and glu-cose in plasma. In addition, arginine supplementation improves whole-body insulin sensitivity as well as the profiles of fatty acids and glucose in plasma. These findings indicate that CO may ameliorate adverse effects of obesity and metabolic syndrome in humans and other animals.
Functions of H2SH2S is another gas that has recently been recognized to play an important role in the cardiovascular system through a number of mechanisms (Figure 11.1). First, there may be cross-talk between various gaseous signaling pathways. Particularly, physiological levels of H2S modulate the arginine–NO pathway in endothelial cells of the aorta and induce vascular dilation. For example, H2S improves survival after cardiac arrest and cardiopulmonary resuscitation via an eNOS-dependent mecha-nism in mice. Second, increasing physiological concentrations of H2S can increase cGMP availability in the vasculature, which in turn triggers cGMP-dependent kinases and the phosphorylation of target proteins that elicit a series of physi-ological responses (e.g., relaxation of vascular smooth muscle cells, vasodilation, and mitochondrial biogenesis). Third, H2S has a Ca2+-dependent effect on vaso-dilation via cGPM- independent mechanisms that may involve: (1) direct stimula-tion of ATP-sensitive K+ channels and membrane hyperpolarization, (2) a decrease in production of oxidants, and (3) Ca2+/calmodulin signaling in vascular smooth muscle cells. Fourth, physiological levels of H2S inhibit myocardial injury induced by oxidants (e.g., homocysteine), thereby maintaining the circulatory system in the normal state.
H2S is a novel mediator of neurological functions. The H2S released from astro-cytes or glia surrounding synapses facilitates induction of hippocampal long-term potentiation via activation of NMDA receptors. This gas also increases Ca2+ con-centrations in glial cells and induces Ca2+ waves in astrocytes to mediate glial signal transduction. Furthermore, H2S has an antiinflammatory effect by augmenting GSH availability in neurons. This conclusion is based on evidence that: (1) H2S increases γ-glutamylcysteine synthase activity either by direct activation of the enzyme or through a posttranscriptional mechanism (e.g., enhancement of mRNA translation and/or inhibition of protein degradation), (2) H2S enhances concentrations of cAMP that activate protein kinase A, leading to NMDA phosphorylation and the opening of Ca2+ channels, and (3) H2S stimulates ATP-sensitive K+ channels in neuronal cells, causing the efflux of K+ and membrane hyperpolarization.
Finally, H2S can regulate cell metabolism. For example, H2S is an inhibitor of cytochrome c in the mitochondrial electron transport system. Thus, nontoxic levels of H2S also decrease cellular oxidative metabolism, attenuate production of reactive oxygen species, and possibly increase longevity of animals. H2S may be an oxygen sensor, thereby modulating the response of cells to hypoxia. In the lumen of the large intestine where the concentrations of total and free H2S are in millimolar and micromolar ranges, physiological levels of H2S regulate the metabolism of short-chain fatty acids (including butyrate), glucose, and glutamine, while modulating the

351Physiological Functions of Amino Acids
© 2010 Taylor & Francis Group, LLC
proliferation of colonocytes and possibly tumorigenesis and progression of colon cancer. Therapeutic applications of H2S in clinical medicine are being actively investigated.
roles of select AA
ArginineArginine has crucial roles in nutrition and metabolism. First, as a major building block for protein, arginine represents 14% of total N in body protein. In addition, there are multiple pathways for arginine catabolism to generate ornithine, poly-amines, proline, glutamate, agmatine, creatine, and NO (Chapters 4 and 5). Each of these substances has enormous biological importance (see other sections of this chapter). Thus, arginine requirements by the fetus, young animals, and adults are particularly high. Second, arginine is required for maintaining hepatic urea synthe-sis in an active state. Third, arginine stimulates the secretion of growth hormone and insulin and also activates the cellular MTOR signaling in mammals, thereby playing an important role in regulating protein synthesis and degradation (Chapter 10). Fourth, arginine increases the proliferation and migration of enterocytes by activating MTOR and focal adhesion kinase, respectively. Fifth, arginine inhibits the expression of prooxidative and lipogenic genes, while increasing the expression of genes (e.g., PPARγ coactivator-1α and AMPK kinase, and glutathione synthase) related to mitochondrial biogenesis, development of brown adipose tissue, antioxida-tive responses, and oxidation of energy substrates (e.g., fatty acids and glucose) in a cell-specific manner. Compelling evidence shows that dietary supplementation with arginine is beneficial in improving cardiovascular function, immunity, neurological function, wound healing, fertility in both males and females, nutrient absorption, mitochondrial biogenesis, and insulin sensitivity, while reducing hyperglycemia, dyslipidemia, obesity, high blood pressure, atherosclerosis, infections, embryonic and fetal deaths, and diarrhea (Table 11.3). The actions of arginine on the vascula-ture are mediated by both NO-dependent and NO-independent mechanisms (Table 11.4). The favorable effect of l-arginine in treating many common health problems is unique among AA and offers great promise for improved health and well-being in humans and other animals.
GlutaminePhysiological functions of glutamine include its roles in: (1) modulating secretion of hormones (e.g., increased release of insulin and growth hormone but reduced pro-duction of glucocorticoids), (2) participating in multiple metabolic pathways (e.g., nucleotide and arginine syntheses), and (3) regulating gene expression and signal transduction in cells. Through its oxidation pathway, glutamine is a major energy substrate for rapidly dividing cells, including enterocytes and immunologically challenged lymphocytes, and other cell types (e.g., kidneys during food depriva-tion, reticulocytes, and activated macrophages), providing ATP for intracellular protein turnover, nutrient transport through the plasma membrane, cell growth and migration, as well as the maintenance of integrity of cells. The formation of ammo-nia from glutamine is vital for renal regulation of acid–base balance in animals,

352 Amino Acids: Biochemistry and Nutrition
© 2010 Taylor & Francis Group, LLC
TABLE 11.3Roles of Arginine in Growth, Health, and Disease
Roles of Arginine Effect Mediators
Cardiovascular disorders
Coronary and peripheral arterial diseases ↓ NO
Heart failure, stroke, and ischemia/reperfusion injury ↓ NO
Sickle cell anemia and vasculopathy ↓ NO
Endothelial dysfunction in patients with CVRF
Aging and hyperhomocysteinemia ↓ NO
Diabetes, hypertension, and smoking ↓ NO
Hypercholesterolemia and high-fat feeding ↓ NO
Hormone secretion
Growth hormone, glucagon, insulin, and prolactin ↑ NO and ornithine
Placental lactogen and progesterone ↑ NO and ornithine
Immune function
B-cell maturation and antibody production ↑ NO, PA, and PS
Killing pathogens (bacteria, fungi, parasites, and virus) ↑ NO
T-cell proliferation and cytokine production ↑ NO, PA, and PS
Metabolism
BAT growth and energy substrate oxidation ↑ cGMP, PA, cAMP, and NO
Cell signaling (AMPK, MTOR, and cGMP) ↑ NO and Arg
Lactogenesis and neonatal growth and development ↑ Arg, NO, MTOR, PA, and proline
Mitochondrial biogenesis and function ↑ cGMP, PA, and NO
Protein synthesis and muscle growth ↑ MTOR and PA
Ammonia detoxification via the urea cycle ↓ Arg, NAG, and ornithine
Obesity, insulin resistance, and dyslipidemia ↓ AMPK, Arg, and NO
Orotic aciduria and gout ↓ NAG and ornithine
Production of ROS and oxidative stress ↓ Arg, creatine, PA, and NO
Protein degradation and apoptosis ↓ MTOR, NO, and autophagy
Reproduction
Embryo implantation, survival, and growth ↑ NO, PA, PS, and MTOR
Fetal survival, growth, and health ↑ NO, PA, PS, and MTOR
Ovulation, ovarian steroidogenesis, and oocyte quality ↑ NO and PA
Placental angiogenesis, growth, and function ↑ NO, PA, PS, and MTOR
Spermatogenesis, sperm quality, and male fertility ↑ NO, PA, and PS
Uterine contractility and preterm labor ↓ NO
Erectile dysfunction ↓ NO
Preeclampsia in human pregnancy and animal models ↓ NO
Skeletal muscle and brain function ↑ Creatine, NO, and PS
Tissue injury and repair
Cystic fibrosis and lung injury ↓ NO, PA, and proline
Gastrointestinal, liver, and vessel injury ↓ NO, PA, and proline
Necrotizing enterocolitis in infants ↓ NO, PS, PD, and PA

353Physiological Functions of Amino Acids
© 2010 Taylor & Francis Group, LLC
particularly under acidotic conditions. Glutamine is also a precursor for the syn-thesis of purine and pyrimidine nucleotides (Chapter 5) that are essential for the proliferation of cells, including embryonic cells, trophoblasts, intraepithelial lym-phocytes, and mucosal cells. Importantly, glutamine is a major AA for the endog-enous synthesis of citrulline and arginine in most mammals, including pigs, cattle, and sheep, via the intestinal–renal axis. This synthetic pathway compensates for: (1) a deficiency of arginine (an EAA for young mammals) in milk during the suckling period and (2) the extensive catabolism of dietary arginine by the small intestine of
TABLE 11.3 (continued)Roles of Arginine in Growth, Health, and Disease
Roles of Arginine Effect Mediators
Renal disease with systemic hypertension ↓ NO
Severe malaria, ulcers, and mitochondrial myopathy ↓ NO
Tissue integrity, wound healing, and angiogenesis ↑ NO, PA, proline, and PS
Tumor growth
Tumorigenesis at early stages ↓ NO
Tumorigenesis at late stages ↑ PA, proline, ornithine, and PS
Note: The symbols “↑”and “↓” denote enhancement and inhibition (or prevention), respectively. AMPK, AMP-activated protein kinase; BAT, brown adipose tissue; CVRF, cardiovascular risk factors; MTOR, mechanistic target of rapamycin (protein kinase); NAG, N-acetylglutamate; NO, nitric oxide; PA, polyamines; PS, protein synthesis; ROS, reactive oxygen species.
TABLE 11.4NO-Dependent and NO-Independent Actions of l-Arginine on the Vasculature
NO-Dependent Vascular Actions NO-Independent Vascular Actions
↑ GC and smooth muscle cell relaxation ↑ EC membrane polarization and transport activity
↑ EC proliferation and angiogenesis ↑ Extracellular and intracellular pH
↓ Endothelin-1 release by EC ↑ Release of insulin, GH, glucagon, and prolactin
↓ Leukocyte adhesion to blood vessel wall ↑ Synthesis of ornithine, creatine, Pro, and PA
↓ Platelet aggregation within blood vessel ↑ Plasmin generation and fibrinogenolysis
↓ Superoxide production by EC ↓ Leukocyte adhesion to non-EC matrix
↓ Expression of cell adhesion molecules ↓ FA profile, oxygenation, and viscosity of blood
↓ Expression of monocyte chemotactic peptides ↓ Angiotensin-converting enzyme activity
↓ Proliferation of vascular smooth muscle cells ↓ Release of O2− and H2O2 and lipid peroxidation
↓ EC mitochondrial injury and apoptosis ↓ Formation of TXB2, fibrin, and platelet-fibrin
EC, endothelial cell; FA, fatty acid; GC, guanylyl cyclase; GH, growth hormone; PA, polyamines; Pro, proline; TXB2, thromboxane B2. The symbols ↑ and ↓ denote increase and decrease, respectively.

354 Amino Acids: Biochemistry and Nutrition
© 2010 Taylor & Francis Group, LLC
postweaning animals. In addition, glutamine is converted into alanine in entero-cytes through the glutaminolysis pathway, which compensates for a relatively low concentration of alanine in milk for suckling neonates, including calves, human infants, lambs, and piglets. Furthermore, glutamine is required for the formation of N-acetylglucosamine-6-phosphate, a common substrate for the synthesis of glyco-proteins that are particularly abundant in mucosal cells and plasma membranes. As a precursor of glutamate, glutamine plays a role in the synthesis of glutathione, the most abundant low-molecular-weight antioxidant in cells.
Besides its roles as a major substrate for multiple metabolic pathways, glutamine has a plethora of key regulatory functions in animals. For example, glutamine modulates the expression of genes that beneficially regulate nutrient metabolism and cell survival, including ODC, heat-shock proteins, and NOS in multiple cell types. Heat-shock proteins are crucial for protecting cells from death, whereas NOS catalyzes arginine oxygenation to form NO, a signaling molecule that regu-lates many cellular functions. In activated macrophages, expression of inducible NOS is critical for the killing of pathogens (e.g., bacteria, fungi, virus, and para-sites) by macrophages and this depends on the availability of glutamine. Notably, ODC is a key enzyme for converting ornithine into polyamines, which stimulate DNA and protein synthesis. In addition, glutamine increases intestinal expression of genes that are necessary for cell growth and removal of oxidants, while reducing the expression of genes that promote oxidative stress and immune activation. The transcription of a gene to mRNA may be regulated by glutamine through one or more of the following mechanisms: (1) alteration of specificity of RNA polymerase for promoters, (2) binding of repressors to noncoding DNA sequences that are near or overlap the promoter region, and (3) changes in the availability of transcription factors (e.g., upregulation and downregulation of coactivators and corepressors) (Brasse-Lagnel et al. 2010).
Cell signaling pathways are also regulated by glutamine. For example, in the presence of physiological concentrations of glucose, glutamine activates MTOR in diverse cell types, including skeletal muscle, the small intestine, and placental cells through the phosphorylation of this well-conserved protein kinase, thereby stimulating protein synthesis and inhibiting intracellular proteolysis (Chapter 10). There is also evidence that glutamine affects the activities of AMPK, extracellular signal-related kinase, Jun kinase, and mitogen-activated protein kinase (MAPK), thereby initiating a cascade of protein phosphorylation and a series of physiologi-cal responses. At present, it is not known whether glutamine directly or indirectly phosphorylates MTOR and other protein kinases. Furthermore, glutamine modu-lates the production of NO and CO in diverse cell types (e.g., macrophages and endothelial cells), which are important gaseous signaling molecules in the body. Exquisite integration of these glutamine-dependent regulatory networks affects cell proliferation, migration, differentiation, metabolism, homeostasis, survival, and function.
GlycineGlycine has crucial roles in nutrition and metabolism. First, glycine represents 11.5% of total AA (20% of AA N) in body proteins. Protein synthesis accounts for 80% of

355Physiological Functions of Amino Acids
© 2010 Taylor & Francis Group, LLC
whole-body glycine needs by neonates, such as calves, human infants, lambs, and piglets. Of note, there are multiple pathways for glycine utilization to generate glu-tathione, creatine, purines (RNA and DNA), heme (hemoglobins), and serine, all of which have crucial physiological functions (see other sections of this chapter). For example, heme-containing proteins are crucial for oxygen transport and mitochon-drial biogenesis. Second, glycine, like taurine, is a major AA for the conjugation of bile acids in animals, which play a key role in the digestion and absorption of lipids and lipid-soluble vitamins. Third, through glycine-gated chloride channels in leukocytes and macrophages, glycine modulates intracellular Ca2+ levels, thereby regulating the production of cytokines and superoxide, as well as immune function. Fourth, glycine is a neurotransmitter in the central nervous system, thereby regulat-ing locomotion, food intake, and whole-body homeostasis.
ProlineProline is a unique AA both chemically and biochemically (Bringaud et al. 2012). On a per gram basis, the requirement of proline for whole-body protein synthesis is the highest among all AA. Growing evidence shows that proline is a key regulator of multiple biochemical and physiological processes in cells. For example, proline is a major nitrogenous substrate for the synthesis of polyamines in the neonatal small intestine and in the placentae of mammals. This discovery is significant because both tissues are characterized by high rates of protein synthesis and cell prolifera-tion. Pathways exist for the synthesis of polyamines from proline via proline oxidase and ornithine decarboxylase. Additionally, proline and its metabolite (P5C) are now known to regulate gene expression and cellular signaling pathways that are crucial to health and disease. Interestingly, proline can scavenge free radicals and this anti-oxidant property of proline may explain why its concentrations increase markedly in response to cellular oxidative stress. Furthermore, results of recent findings suggest that proline may play a role in regulating the MTOR activation pathway, which inte-grates signals from nutrients (glucose and AA), cellular energy status, growth fac-tors, and various stress factors to affect cell growth and function. Therefore, proline acts in concert with arginine, glutamine, and leucine to enhance protein synthesis in cells and tissues.
Proline is an EAA for poultry because P5C is not synthesized de novo. This AA is a CEAA for young mammals (including piglets) and patients with burns because of inadequate endogenous synthesis via the arginase and P5C synthase pathways relative to needs. Additionally, endogenous synthesis of proline from glutamate can-not meet the requirements for proline by many species of fish. Therefore, proline is now considered as an EAA or CEAA for fish in both early life and adult stages. The essential requirement for proline as a nutrient for poultry, young mammals, and wounded subjects is supported by several lines of experimental evidence. First, supplementing 0.0%, 0.2%, 0.4%, and 0.8% proline to a chemically purified diet containing 1% arginine and 10% glutamate dose dependently increased daily weight gains (from 11.88 to 13.38 g/day) of young chickens without affecting their feed intake (an average of 114 g/chick). Second, supplementing 0%, 0.35%, 0.7%, 1.05%, 1.4%, and 2.1% proline to a proline-free chemically defined diet containing 0.48% arginine and 2% glutamate dose dependently improved daily weight gains (from 342
356 Amino Acids: Biochemistry and Nutrition
© 2010 Taylor & Francis Group, LLC
to 411 g/day) and feed efficiency (gram feed/gram gain; from 1.66 to 1.35) of young pigs, while reducing concentrations of urea in plasma by one-half. Notably, increas-ing the dietary content of proline from 0.0% and 2.1% enhanced daily N retention from 1.27 to 1.53 g/(kg body weight)0.75. Similarly, supplementing 1% proline to a corn- and soybean meal-based diet enhanced villus height, small-intestinal weight, and growth performance in weanling pigs. Third, dietary proline is necessary for promoting tissue repair and N balance in humans and other animals with wounds and burns. These findings have important implications for proline as an essential nutrient in mammals.
roles of select nitroGenous ProDucts of AA
Physiological functions of nitrogenous AA metabolites are summarized in Table 11.1. The physiological roles of NO have been highlighted previously. In the follow-ing sections, functions of the following nitrogenous metabolites are summarized. These substances include polyamines, GSH, nucleotides, taurine, histamine, mela-nin, melatonin, carnosine, and glucosamine.
Functions of PolyaminesMuch is known about the biochemical properties of polyamines and their roles in health and disease. At physiological pH, putrescine, spermidine, and spermine have 2, 3, and 4 positive charges, respectively. These alkaline molecules can greatly affect the intracellular milieu. As polycationic substances, polyamines participate in many cellular processes through binding to RNA, DNA, nucleotide triphosphate, proteins, and other negatively charged molecules. In animals, physiological concen-trations of polyamines enhance: (1) angiogenesis, (2) DNA and protein synthesis, (3) embryogenesis, (4) expression of genes related to metabolism and growth of cells and tissues (e.g., brain, liver, skeletal muscle, brown adipose tissue, and lymphoid organs), (5) production of antibodies and immune responses, (6) intestinal matura-tion, (7) ion channel function, (8) proliferation and differentiation of cells, (9) apop-tosis, N-methyl-d-aspartate (NMDA) receptor activity, and cell signal transduction, (10) spermatogenesis, (11) wound healing, and (12) secretion of hormones. However, excessive amounts of polyamines are toxic to cells.
Polyamines participate in the posttranslational modifications of some proteins in cells. Of particular interest, J.E. Folk and colleagues discovered in 1980 that spermidine is required for the modification of eIF5A by deoxyhypusine synthase [also known as spermidine:eIF5A-lysine 4-aminobutyltransferase (propane-1,3-diamine-forming) or eIF5A-precursor-lysine:spermidine 4-aminobutyltransfer-ase (propane-1,3-diamine-forming)] to form a hypusine residue. Specifically, the enzyme catalyzes the transfer of a moiety (a 4-aminobutyl group) of spermidine to the active site lysine residue of eIF5A to yield (eIF5A-precursor)-deoxyhypusine, which is essential for the activity of eIF5A and, therefore, DNA synthesis. The overall reaction is as follows:
[eIF5A-precursor]-lysine + spermidine → [eIF5A-precursor]-deoxyhypusine + propane-1,3-diamine

357Physiological Functions of Amino Acids
© 2010 Taylor & Francis Group, LLC
Polyamines are also physiological substrates for transglutaminases that catalyze the incorporation of low-molecular-weight amines into the γ-glutamine sites of pro-teins (Folk et al. 1980). This reaction affects the biological activity of those proteins. For example, the polyaminated phospholipase A2 has a specific activity approxi-mately threefold higher than that of control phospholipase A2. In addition, poly-amines regulate the activities of transglutaminases in the gastrointestinal mucosa and in other cell types (e.g., colonocytes, lymphocytes, placental cells, and tumors).
When cells are stimulated with growth factors, one of the first crucial events is the induction of polyamine synthesis, which precedes increases in DNA repli-cation and protein synthesis. An increase in the expression of genes involved in polyamine synthesis (e.g., arginase I or II and ODC) promotes the proliferation of cells (e.g., endothelial cells, enterocytes, and vascular smooth muscle cells), but depletion of cellular polyamines by inhibition of these genes arrests cell division (Agostinelli et al. 2010). Finally, polyamines are necessary for normal growth, development, and maturation of embryos, fetal, and postnatal tissues (including the small intestine, lungs, and heart), as well as wound healing, the production of antibodies by B-lymphocytes, lactation in mammals, and hormone secretion.
Functions of CreatineCreatine kinase (also known as creatine phosphokinase) converts creatine and ATP to phosphocreatine (a high-energy compound; also known as creatine phosphate) and ADP. This enzyme is expressed at high levels in most of the cells and tissues that have high energy requirements, including brain, kidneys, retinal photoreceptor cells, spermatozoa, testis, uterus, placenta, sensory hair cells of the inner ear, as well as skeletal, cardiac, and smooth muscles. The phosphocreatine/creatine kinase system is characterized by cell- and tissue-specific isoforms of creatine kinase, which are differentially localized in the cytoplasm and mitochondria to fulfill the need for met-abolic channeling and efficient provision of energy. For example, skeletal muscle and brain express both cytosolic and mitochondrial creatine kinases to utilize ATP gen-erated via glycolysis and the mitochondrial electron transport systems, respectively. Therefore, distinct isoforms of creatine kinase are associated with sites of ATP pro-duction in vertebrates. Creatine kinase may “buffer” the cellular phosphorylation potential and regulate the activity of intracellular ATPases. Interestingly, the liver does not contain creatine kinase or phosphocreatine. Low levels of hepatic creatine kinase activity previously reported by some researchers might have resulted from the presence of adenylate kinase in the enzyme assay.
The ability of cells to generate phosphocreatine from excessive ATP at the resting state and the utilization of phosphocreatine for rapid regeneration of ATP in response to high demands for energy provide a mechanism for maintaining ATP homeostasis. Thus, creatine plays an important role in energy metabolism, particularly in the ner-vous, muscular, and reproductive systems (Brosnan and Brosnan 2007). Therefore, defects in creatine synthesis result in neurological and muscular dysfunction and possibly reproductive failure. Additionally, there is increasing evidence that creatine has antioxidative functions, reduces inflammatory responses, and improves glucose tolerance in humans. Finally, creatine may regulate the expression of transcription factors and other proteins in diverse cell types.

358 Amino Acids: Biochemistry and Nutrition
© 2010 Taylor & Francis Group, LLC
Functions of Reduced GSHGSH participates in many cellular reactions. First, GSH effectively scavenges free radicals and other reactive oxygen species (e.g., hydroxyl radical, lipid peroxyl rad-ical, peroxynitrite, and H2O2) directly, and indirectly through enzymatic reactions. In such reactions, GSH is oxidized to form GSSG, which is then reduced to GSH by the NADPH-dependent glutathione reductase. In addition, glutathione peroxi-dase (a selenium-containing enzyme) catalyzes the GSH-dependent reduction of H2O2 and other peroxides. Second, GSH reacts with various electrophiles, physi-ological metabolites (e.g., estrogen, melanins, prostaglandins, and leukotrienes), and xenobiotics (e.g., bromobenzene and acetaminophen) to form mercapturates (Figure 11.2). These reactions are initiated by glutathione-S-transferase (a family of Phase II detoxification enzymes). Third, GSH conjugates with NO to form an S-nitroso-glutathione adduct, which is cleaved by the thioredoxin system to release GSH and NO. Recent evidence suggests that the targeting of endogenous NO is mediated by intracellular GSH. Additionally, both NO and GSH are necessary for the hepatic action of insulin-sensitizing agents, indicating their critical role in regulating lipid, glucose, and AA utilization. Fourth, GSH serves as a substrate for formaldehyde dehydrogenase, which converts formaldehyde and GSH to S-formyl-glutathione. S-Formyl-glutathione is hydrolyzed by S-formyl-glutathione hydro-lase to formate, and this reaction regenerates GSH (Figure 11.3). The removal of
Gly
Cys
Gly
Cys R
Glutathione
GlutathioneS-transferase
Gly
Cys R
GluGlycyl-cysteine
Glutathione
γ−Glutamyltranspeptidase
COOH
CH
NH2
CH2SR
Cysteine conjugate
COOH
CH
HN
CH2SR
C CH3
O
Gly
Cysteinyl-glycinedipeptidase
Mercapurate
N-Acetyltransferase
Deacetylase
conjugate
Rconjugate
Acetyl-CoA
γ−Glu γ−Glu
FIGURE 11.2 Role of glutathione in mercapturate formation in animals. R, various electro-philes, physiological metabolites (e.g., estrogen, prostaglandins, leukotrienes, and melanins), and foreign compounds or xenobiotics (e.g., bromobenzene and acetaminophen) that can con-jugate with glutathione.
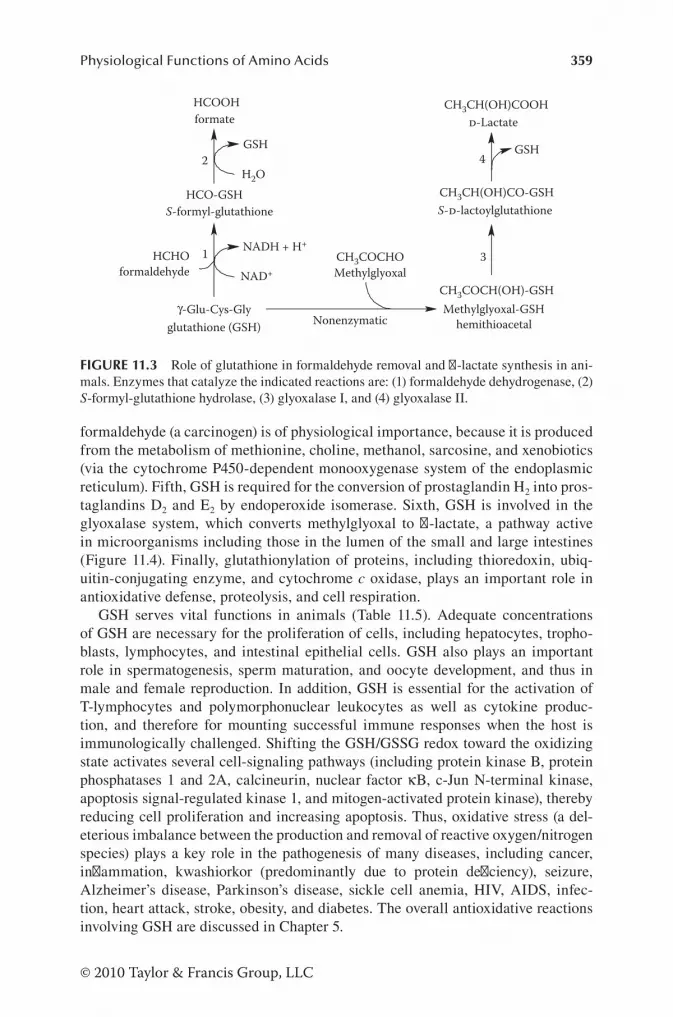
359Physiological Functions of Amino Acids
© 2010 Taylor & Francis Group, LLC
formaldehyde (a carcinogen) is of physiological importance, because it is produced from the metabolism of methionine, choline, methanol, sarcosine, and xenobiotics (via the cytochrome P450-dependent monooxygenase system of the endoplasmic reticulum). Fifth, GSH is required for the conversion of prostaglandin H2 into pros-taglandins D2 and E2 by endoperoxide isomerase. Sixth, GSH is involved in the glyoxalase system, which converts methylglyoxal to d-lactate, a pathway active in microorganisms including those in the lumen of the small and large intestines (Figure 11.4). Finally, glutathionylation of proteins, including thioredoxin, ubiq-uitin-conjugating enzyme, and cytochrome c oxidase, plays an important role in antioxidative defense, proteolysis, and cell respiration.
GSH serves vital functions in animals (Table 11.5). Adequate concentrations of GSH are necessary for the proliferation of cells, including hepatocytes, tropho-blasts, lymphocytes, and intestinal epithelial cells. GSH also plays an important role in spermatogenesis, sperm maturation, and oocyte development, and thus in male and female reproduction. In addition, GSH is essential for the activation of T-lymphocytes and polymorphonuclear leukocytes as well as cytokine produc-tion, and therefore for mounting successful immune responses when the host is immunologically challenged. Shifting the GSH/GSSG redox toward the oxidizing state activates several cell-signaling pathways (including protein kinase B, protein phosphatases 1 and 2A, calcineurin, nuclear factor κB, c-Jun N-terminal kinase, apoptosis signal-regulated kinase 1, and mitogen-activated protein kinase), thereby reducing cell proliferation and increasing apoptosis. Thus, oxidative stress (a del-eterious imbalance between the production and removal of reactive oxygen/nitrogen species) plays a key role in the pathogenesis of many diseases, including cancer, inflammation, kwashiorkor (predominantly due to protein deficiency), seizure, Alzheimer’s disease, Parkinson’s disease, sickle cell anemia, HIV, AIDS, infec-tion, heart attack, stroke, obesity, and diabetes. The overall antioxidative reactions involving GSH are discussed in Chapter 5.
formateHCOOH
S-formyl-glutathioneHCO-GSH
GSH
H2O
NADH + H+
NAD+formaldehyde
glutathione (GSH)
HCHO
γ-Glu-Cys-Gly
Methylglyoxal
Nonenzymatic
CH3COCHO
GSH
-LactateCH3CH(OH)COOH
2
1 3
4
CH3COCH(OH)-GSH
S--lactoylglutathioneCH3CH(OH)CO-GSH
Methylglyoxal-GSHhemithioacetal
FIGURE 11.3 Role of glutathione in formaldehyde removal and d-lactate synthesis in ani-mals. Enzymes that catalyze the indicated reactions are: (1) formaldehyde dehydrogenase, (2) S-formyl-glutathione hydrolase, (3) glyoxalase I, and (4) glyoxalase II.

360 Amino Acids: Biochemistry and Nutrition
© 2010 Taylor & Francis Group, LLC
TABLE 11.5Roles of Glutathione in Animal Metabolism and PhysiologyAntioxidant defense
Scavenging of free radicals and other reactive species
Removal of hydrogen and lipid peroxides
Prevention of the oxidation of biomolecules
Maintenance of thiol homeostasis
Metabolism
Synthesis of leukotrienes and prostaglandins
Conversion of formaldehyde to formate
Production of d-lactate from methylglyoxal
Formation of mercapturates from electrophiles
Formation of glutathione–NO adduct
Storage and transport of cysteine
Regulation
Intracellular redox status
Signal transduction and gaseous signaling
Gene expression
DNA and protein synthesis and proteolysis
Cell proliferation and apoptosis
Cytokine production and immune response
Protein glutathionylation
Function and integrity of membranes and mitochondria
NADPH + H+
NADP+
GR
TrxRred
Trxox Prxred H2O2 or ROOH
H2O or ROH
GSSG
GSH-PX
2GSH
ROHor H2O
Prxox
ProteinSHSH
Protein SS
TrxR
2GSH
GSSG
Grxox
Grxred
H2O, LOH, or protein
H2O2, LOOH, or protein
SH
SHS
S
Protein-SH + GSSG Protein-S-SG + GSH
DHA
ASA
Vit Ered
Vit Eox
ROOHor H2O2
LOOH
LOO–
FIGURE 11.4 Role of glutathione in thiol and free radical homeostasis. ASA, ascorbic acid; DHA, dehydroascorbic acid; Grx, glutaredoxin; GR, glutathione reductase; GSH, reduced glutathione; GSH-Px, glutathione peroxidase; GSSG, oxidized glutathione; LH, lipid; LOO, lipid peroxyl radical; LOOH, lipid hydroperoxide; ox, oxidized form; Prx, peroxiredoxin; red, reduced form; ROH, alkyl alcohol; ROOH, alkyl hydroperoxide; Trx, thioredoxin; TrxR, thioredoxin reductase.

361Physiological Functions of Amino Acids
© 2010 Taylor & Francis Group, LLC
Functions of Purine and Pyrimidine NucleotidesPurines and pyrimidines have versatile functions in cells. First, DNA stores genetic information as the gene and its structure represents the chemical basis of hered-ity in organisms, including animals, plants, bacteria, and yeasts. This discovery by James Watson and Francis Crick in 1953 is one of the major scientific achievements of the twentieth century. DNA directs the synthesis of RNA (including mRNA, tRNA, rRNA, sRNA, miRNA, and siRNA) and, therefore, protein synthesis in cells (Chapter 8). Second, ATP and other nucleoside triphosphates (i.e., GTP and CTP) drive endergonic reactions in synthetic and catabolic pathways. These reac-tions also generate the phosphorylated metabolites (e.g., glucose-6-phosphate and fructose-6-phosphate) that normally cannot escape the cell because of their nega-tive charges in the phosphate group. As high-energy intermediates, UDP-glucose and UDP-galactose participate in the synthesis of complex carbohydrates, and CDP-acylglycerol in the formation of lipid derivatives. Third, nucleotides are components of FAD, FMN, NAD, NADP, CoA, and SAM, which participate in many reactions, including oxidation, dehydrogenation, and methylation. Fourth, nucleotides have regulatory roles in physiology and metabolism. For example, cGMP and cAMP are second messengers in hormone-mediated or gaseous (e.g., NO, CO, and H2S) signaling. In addition, ATP and ADP can regulate the activities of enzymes (e.g., α-ketoacid dehydrogenase complex) and mitochondrial oxidative phosphorylation. Furthermore, since Robert Berne and Eckehard Gerlach independently reported in 1963 that adenosine (a product of ATP degradation) causes hypoxic coronary vaso-dilation, much has been learned about the metabolism and physiology (e.g., anti-inflammatory and neuroprotection) of this purine nucleoside and its transmembrane receptors (e.g., A1, A2A, A2B, and A3) in cells.
Functions of TaurineTaurine is a highly abundant free β-AA in the bile, vertebrate retina (e.g., 50 mM in the rat), milk, skeletal muscle, heart, brain, and many of other tissues. Thus, taurine is present in high concentration in the animal kingdom (including insects and arthropods). This is also true for certain marine algae (e.g., Rhodophyceae), but taurine is generally absent from other algae (e.g., Chlorophyceae) that live mainly in freshwater as well as from the bacterial and plant kingdoms. Until the early 1970s, taurine was thought to be a biochemically inert molecule. However, a critical role for taurine in nutrition was suggested in 1975 with the discovery that retinal degeneration occurs in taurine-deficient cats. In the same year, it was found that consumption of infant formula without taurine could result in cardiac and reti-nal dysfunction in preterm neonates. Importantly, these problems can be reversed by adding taurine to infant formula. Available evidence shows that taurine acts by serving as: (1) a major antioxidant in the body, (2) a regulator of intracellular osmolarity and retinal photoreceptor activity, (3) a key component of the nerve conduction network, and (4) a modulator of the digestion and absorption of dietary fats and lipid-soluble vitamins. Thus, this AA exerts beneficial effects on cardio-vascular, digestive, endocrine, immune, muscular, neurological, reproductive, and visual systems.

362 Amino Acids: Biochemistry and Nutrition
© 2010 Taylor & Francis Group, LLC
Functions of HistamineThere is a rich history of studies of histamine functions in animals. Specifically, the original work on the physiological function of histamine dates back to 1910 when two British physiologists, G. Barger and H.H. Dale, reported that histamine pro-duces tonic contraction of the uterus. Such an effect of histamine was independently confirmed by F. Kutscher in the same year. Many actions of histamine (including vasodilation and induction of hypotension) on multiple organs were revealed by H.H. Dale and P.P. Laidlaw in 1910. By 1932, it had been established that histamine causes allergic reactions. D. Bovet was credited for chemically synthesizing the first antihis-tamine drug in 1937. A large amount of histamine produced by master cells causes allergy by serving as the endogenous ligand of histamine receptors H1–H4 (a class of G-protein-coupled receptors). In addition, histamine plays a role in regulating acetylcholine secretion by the central nervous system and in the functions of the gastrointestinal tract (e.g., stimulation of gastric acid secretion).
Functions of MelaninPigmentation by melanin (a metabolite of tyrosine) has important biological, cos-metic, and social significance. Eumelanin and pheomelanin are two known forms of melanin in the body. There are two types of eumelanin: black and brown color. Eumelanin occurs in tissues (e.g., skin and feathers) and hair. Another common bio-logical melanin is pheomelanin, which is a polymer of benzothiazine units. There are two types of pheomelanin: red and yellow color. Pheomelanin is largely responsible for red hair. Dark-skinned animals and people have more melanin than light-skinned individuals. By acting as a sunscreen, melanin protects the skin from ultraviolet light. Increased production of melanin can result in freckles in the skin. Results of recent studies indicate that melanin can influence physiological and behavioral func-tions, including stress response, energy homeostasis, anti-inflammation, immunity, sexual activity, aggressiveness, and resistance to oxidative injury.
Functions of MelatoninMelatonin is a hormone and its circulating levels vary in a daily cycle, thereby regu-lating the circadian rhythms and sleep–wake pattern of animals, including birds, humans, and sheep. At physiological levels, melatonin serves as an antioxidant, pro-tecting nuclear and mitochondrial DNA as well as cell membranes, proteins, and lipids from oxidative injury. Melatonin regulates neurological function (e.g., mem-ory and mood), aging, and immunity in animals (including humans). This hormone also affects the mating behavior and reproductive function in seasonal breeders. Melatonin exerts its beneficial effects on animals through (1) antioxidative reactions, (2) changes in nutrient metabolism (e.g., an increase in fatty acid and glucose oxida-tion in skeletal muscle but a decrease in hepatic lipogenesis), and (3) the activation of melatonin receptors (G-protein-coupled receptors) on the plasma membrane to trigger the transmission of cell signaling.
Functions of Carnosine and Related DipeptidesDipeptides containing histidine or its derivatives are potent quenchers of reactive oxygen, N, and carbonyl species. Much work has been done on carnosine. Emerging

363Physiological Functions of Amino Acids
© 2010 Taylor & Francis Group, LLC
evidence also shows that carnosine acts on histamine H1 or H3 receptors and on the hypothalamic suprachiasmatic nucleus, a master regulator of the circadian clock in animals. Additionally, through activating the signaling cascades involving mito-gen-activated protein kinase and cGMP-dependent protein kinase while inhibiting proapoptotic signaling, carnosine affects the activities of both sympathetic and para-sympathetic nerves innervating the adrenal glands, brown adipose tissue, kidneys, liver, pancreas, stomach, and white adipose tissue. This results in beneficial changes in appetite, digestion, absorption, blood pressure, glucose metabolism, lipolysis, and thermogenesis. Containing a histidine moiety, carnosine and carnosine-like dipeptides also play a role in pH buffering, which is of physiological importance in contracting skeletal muscle. Thus, based on the report of J. Bergstrom in 1974 that human skeletal muscle contain relatively high concentrations of carnosine, anserine, and balenine, studies in the 1980s demonstrated a positive relationship between intra-muscular β-alanine concentration and exercise performance in adults. An increase in intramuscular concentrations of these dipeptides brought about by either in vivo synthesis or dietary supplementation may help remove the hydrogen ions generated from enhanced glycolysis in response to intensive exercise. Furthermore, carnosine plays a role in scavenging oxidants, preventing protein glycation, chelating copper, and ameliorating telomere shortening. Finally, concentrations of carnosine, carno-sine-like dipeptides, and their acetylated metabolites in skeletal muscle may not only influence the flavor and taste of meat, but also help identify its species of origin.
Functions of GlucosamineElevated levels of glucosamine inhibit constitutive NO synthesis in: (1) endothe-lial cells by reducing pentose cycle activity and, therefore, the intracellular levels of NADPH, and (2) inducible NO synthesis in immunologically activated macrophages and other cell types by suppressing the expression of the iNOS protein. Thus, glu-cosamine may exhibit either beneficial or detrimental effects on animals, depend-ing on physiological or pathophysiological conditions. For example, as an inhibitor of endothelial cell synthesis of NO, superoxide anion, and peroxynitrite (ONOO−), glutamine exerts cardioprotective, neuroprotective, and antiinflammatory effects during ischemia–reperfusion injury. Accordingly, glucosamine can alleviate or pre-vent endothelial cell activation and endothelial cell oxidative damage brought about by endotoxin and inflammatory factors (e.g., tumor necrosis factor-α and NF-κB). Furthermore, oral administration of glucosamine can ameliorate: (1) cartilage degeneration in osteoarthritis, (2) collagen degeneration in chondrocytes, and (3) atherosclerosis aggravated by chronic arthritis. Thus, glucosamine is widely used as a dietary supplement to treat osteoarthritis in humans and other animals.
On the other hand, glucosamine mediates insulin resistance in diabetes and may also have important implications in diabetes- associated cardiovascular complications and the metabolic syndrome. The activity of GFAT is enhanced in both endothelial cells and skeletal muscle of diabetic animals. In addition, plasma concentrations of glucose and glutamine, as well as tissue concentrations of fructose-6-phosphate, are elevated in diabetic subjects with poor metabolic control. Thus, increases in both GFAT activity and its substrate concentrations are expected to enhance the synthe-sis of glucosamine in endothelial cells and skeletal muscle under hyperglycemic

364 Amino Acids: Biochemistry and Nutrition
© 2010 Taylor & Francis Group, LLC
conditions. This may explain decreased endothelial NO synthesis and impaired endothelium-dependent relaxation in diabetes. For this reason, dietary supplementa-tion with glucosamine is not recommended for (1) diabetic patients, (2) subjects with impaired NO synthesis by endothelial cells, or (3) individuals with physiological acti-vation of NO-dependent angiogenesis in tissues (e.g., gestating mammals with rapidly growing placentae, females with ovulating ovaries, and pregnant or lactating mothers with high rates of cell proliferation in the mammary gland). Inhibition of GFAT may improve cardiovascular function in subjects with obesity and diabetes.
AA and AA Metabolites as Natural Ligands and Activators of the Aryl Hydrocarbon ReceptorTryptophan and its metabolites (e.g., indole acetic acid, kynurenine, and tryptamine), as well as bilirubin (a metabolite of heme), are natural ligands and activators of the aryl hydrocarbon receptor (AhR; also known as dioxin receptor), which is a cytosolic ligand-activated transcription factor in many cell types and tissues (e.g., enterocytes, hepatocytes, lymphoid cells, lungs, and brain). AhR is normally present in a dormant state in association with a complex consisting of HSP90, XAP2 (hepatitis B virus X-associated protein), and p23. Upon ligand binding, AhR undergoes a conforma-tional change, leading to the exposure of a nuclear localization signal. Thereafter, the ligand-activated AhR translocates into the nucleus, dissociates from the com-plex, and forms a heterodimer with the closely related Arnt protein in the nucleus. This, in turn, enhances the expression of target genes including cytochrome P450s, which are a superfamily of hemoproteins that catalyze the monooxygenation of vari-ous endogenous and exogenous substrates before their excretion in urine and feces. In addition, AhR plays a role in regulating antiinflammatory pathways and numer-ous other physiological processes, such as cell metabolism and differentiation. For example, activation of AhR is beneficially associated with the downregulation of NF-κB expression and antiinflammatory responses in the small-intestinal mucosa, lungs, and brain. This may be an important mechanism for tryptophan and other AA to modulate intestinal function and gut-associated chronic diseases.
functions of D-AA
Functions of D-AlanineThe physiological functions of d-alanine in animals are largely unknown. Experimental evidence from rodent studies suggests that d-alanine is an agonist of the glycine site on the NMDA subtype glutamate receptor, thereby possibly affect-ing memory function and synaptic plasticity. In support of this suggestion, there are reports that: (1) inadequate activity of this receptor is associated with schizophre-nia (a neurological disorder) in humans, (2) oral administration of d-alanine can improve cognitive ability of patients with this disease, and (3) reduced production of d-alanine by microflora is linked to antibiotic-induced psychosis. In addition, the concentration of d-alanine in the brain and pancreas of rats has been shown to be related to diurnal and nocturnal (circadian) behaviors, but the underlying mecha-nisms remain elusive. Besides its neurological effects, d-alanine may affect cell metabolism. For example, through the production of H2O2, d-alanine may regulate

365Physiological Functions of Amino Acids
© 2010 Taylor & Francis Group, LLC
cellular redox signaling at low concentrations but induce cytotoxic oxidative stress at high concentrations as reported in tumors. Interestingly, in aquatic crustaceans and some bivalve mollusks, a large amount of free d-alanine is usually accumu-lated under high-salinity stress to possibly serve as a major regulator of intracellular osmotic regulation (Abe et al. 2005).
Functions of D-Aspartated-Aspartate is the precursor for the important neurotransmitter agonist, NMDA (D’Aniello 2007). d-Aspartate binds and activates NMDA receptors to affect long-term potentiation and spatial memory. Moreover, administration of d-aspartate to old mice is able to rescue the physiological age-related decay of hippocampal long-term potentiation. In mice, an increase in concentrations of d-aspartate completely suppresses long-term depression at corticostriatal synapses and attenuate the pre-pulse inhibition deficits produced by the psychotomimetic drugs (amphetamine and MK-801). Thus, depletion of d-aspartate racemase in newborn neurons causes severe defects in the dendritic development of the adult mouse hippocampus. Similarly, a reduction in d-aspartate results in a phenotype resembling a deficiency of d-aspar-tate racemase, indicating an important role for this enzyme in adult neurogenesis. In addition to its action on the neurological system, d-aspartate has been correlated with the functional maturation of endocrine glands during the postnatal period, as well as with the synthesis and release of different hormones in rodents. These hor-mones include gonadotropin-releasing hormone, growth hormone, prolactin, proges-terone, oxytocin, luteinizing hormone, and testosterone. Moreover, administration of d-aspartate to adult men and women has been reported to increase circulating levels of reproductive hormones.
Functions of D-Serined-Serine is an endogenous ligand for the glycine site of the NMDA receptor and functions as a novel neurotransmitter (Billard 2012). Selective degradation of d-serine with d-AA oxidase attenuates NMDA receptor-mediated neurotransmis-sion. Conversely, the inhibitory effects of this enzyme are fully reversed by exog-enous d-serine. Thus, in the nervous system, d-serine appears to be a more selective agonist of the NMDA receptor than glycine, the AA that exhibits biphasic effects, namely acting both as an inhibitory transmitter at strychnine-sensitive glycine recep-tors and as an excitatory transmitter at the NMDA receptor. There is evidence that a reduced activity of d-serine racemase in the brain is associated with the development of schizophrenia, Alzheimer’s disease, and age-related memory loss. Therefore, d-serine has been proposed to be a novel pharmacologic agent to treat these diseases.
REGULATORY ROLES OF AA IN FOOD INTAKE, NUTRIENT METABOLISM, AND GENE EXPRESSION
reGulAtory roles of AA in fooD intAke
Food intake by animals is affected by the taste, quantity, and quality of dietary pro-tein, and by dietary AA. Specifically, food consumption by animals is depressed in

366 Amino Acids: Biochemistry and Nutrition
© 2010 Taylor & Francis Group, LLC
response to: (1) a severe deficiency of dietary protein or an individual AA (particu-larly an EAA or CEAA); (2) a distortion of the dietary pattern of AA when protein intake is either high or low; and (3) a substantial increase in dietary protein or AA content. Under all of these conditions, changes in feeding behavior are associated with substantial alterations in concentrations of many AA (especially those that are the precursors for the synthesis of neurotransmitters) in the lumen of the stomach and small intestine, as well as the plasma and the brain. Interestingly, high dietary protein contributes to satiety to a greater extent than an isocaloric amount of fats or carbohydrate, further supporting a crucial role for AA in the control of food con-sumption. Thus, the amount and balance of supplemental AA can either stimulate or suppress food intake, depending on individual AA, composition of AA and other nutrients in the basal diet, as well as endocrine status and developmental stage. For example, supplemental arginine and glycine (1% and 2% in the diet, respectively) moderately stimulate, but supplemental glutamine and leucine (2% and 4% in the diet, respectively) substantially depress, food intake by young pigs fed a typical corn- and soybean meal-based diet. The underlying mechanisms are complex and involve hormonal, neuronal, and metabolic signals generated from the digestive system [including the stomach, small intestine, pancreas (insulin, amylin, and glucagon), liver, and large intestine], central nervous system, and other organs [e.g., white adi-pose tissue (leptin)]. In support of this view, much evidence shows that ingested pro-tein can evoke satiation by inducing both gastrointestinal distention and the release of peptides from enteroendocrine cells.
At the stomach level, a variety of neurotransmitters, neuromodulators (e.g., gluta-mate, acetylcholine, NO, calcitonin-gene-related peptide, and substance P), and other peptides [including ghrelin and bombesin-related peptides (e.g., gastrin-releasing peptide and neuromedin B produced by gastric myenteric neurons)] are utilized to control gastric emptying. These substances also act to relay signals from the mecha-noreceptors on the gastric wall to the brain by vagal and spinal sensory nerves. In the small intestine, cholecystokinin (produced by I cells in duodenal and jejunal muco-sae) and products of its endoproteolytic cleavage, as well as glucagon-like peptide-1, oxyntomodulin and peptide YY (produced by L cells in the distal small intestine and colon), serve as primary satiation signals to inhibit food intake. In contrast, ghrelin stimulates food intake by animals, and physiological levels of glutamate increase gastric emptying and intestinal motility.
At the brain level, both the direct blood pathway and the indirect neuromediated (mainly vagus-mediated) pathway contribute to the effects of dietary AA on food intake. Dietary intake of protein and AA affect concentrations of AA, peptides, hormones, glucose, and fatty acids that act on different sites in the brain (the area postrema and the anterior piriform cortex for AA and the arceus nucleus for hor-mones such as insulin, leptin). Interestingly, the area postrema localized near the nucleus of the solitary tract) receives information directly from the blood, whereas an AA chemosensor system occurs in the anterior piriform cortex of the brain. AA imbalances result in: (1) altered concentrations of EAA or limiting AA in specific sites of the brain, such as the anterior prepyriform cortex, anterior cingulated cor-tex, locus ceruleus, and nucleus of solitary tract; (2) impaired synthesis and reduced concentrations of neurotransmitters (e.g., NO, glutamate, glycine, serotonin, and

367Physiological Functions of Amino Acids
© 2010 Taylor & Francis Group, LLC
norepinephrine) in the prepyriform region; and (3) activation of the general AA control nonderepressing-2 (GCN2) enzyme system in the highly excitable anterior piriform cortex of the brain, which increases phosphorylation of eukaryotic initia-tion factor (eIF2α) to block general protein synthesis. The neuro-mediated pathway transfers preabsorptive and visceral information to the forebrain through the vagal nerve that innervates the stomach, the duodenum, and the liver (components of the oro-sensory zone) to control neural circuits. For example, the lateral hypothalamus secretes peptides (orexin, melanin-concentrating hormone, and neuropeptide Y) to increase food intake, as reported for the effect of ghrelin. In contrast, satiation factors (e.g., leptin) desensitize the brain to hunger signals and inhibit the release of neuropeptide Y, thereby suppressing food intake. These mechanisms aid in our understanding of how dietary protein or AA affects the food intake, preference, and adaptation of animals.
reGulAtory roles of AA in nutrient metABolism
Many lines of evidence identify AA as regulators of nutrient metabolism. First, arginine is an allosteric activator of NAG synthase, a mitochondrial enzyme that converts glutamate and acetyl-CoA into NAG (an allosteric activator of CPS-I). Thus, arginine and glutamate maintain the hepatic urea cycle in an active state for ammonia detoxification. Second, alanine inhibits pyruvate kinase, thereby regulating gluconeogenesis and glycolysis to ensure net glucose production by hepatocytes during periods of food deprivation. Third, glutamate and aspartate mediate the transfer of reducing equivalents across the mitochondrial membrane and thus regulate glycolysis and cellular redox state. Fourth, arginine and phenyl-alanine increase GTP cyclohydrolase-I expression and activity, thereby increas-ing the availability of tetrahydrobiopterin for NO synthesis and the hydroxylation of aromatic AA. The arginine–NO pathway can also be modulated by a number of other AA, including taurine, lysine, glutamate, homocysteine, and asymmet-ric dimethylarginine, to exert their physiological and pathological effects. For example, NO synthesis by endothelial cells is stimulated by physiological levels of arginine, citrulline, and taurine but inhibited by elevated levels of lysine, gluta-mine, homocysteine, and asymmetric dimethylarginine. Fifth, arginine increases the expression of key proteins and enzymes (e.g., AMPK and PGC-1α) respon-sible for mitochondrial biogenesis in brown adipose tissue and substrate oxidation in insulin-sensitive tissues (e.g., skeletal muscle, liver, and white adipose tissue), thereby reducing excess fat mass in obese animals (Figure 11.5). Likewise, gluta-mine regulates ion and nutrient transport as well as oxidative defense, signal trans-duction, and protein turnover (e.g., stimulation of protein synthesis and inhibition of protein degradation in enterocytes), therefore preventing intestinal atrophy and enhancing growth in animals (e.g., weanling pigs) with intestinal damage and dys-function. In addition, as noted above, H2S and CO, which are products of cyste-ine and heme degradation, respectively, may also play signaling roles in nutrient metabolism (e.g., stimulation of glucose and fatty acid oxidation). Sixth, metabo-lism of AA (glycine, histidine, methionine, and serine), along with vitamins (B6, B12, and folate), actively participate in one-carbon-unit metabolism and play a

368 Amino Acids: Biochemistry and Nutrition
© 2010 Taylor & Francis Group, LLC
key role in provision of methyl donors for DNA and protein methylation (Figure 11.6), thereby regulating gene expression and the biological activity of proteins. Seventh, leucine allosterically activates GDH. In the pancreas, this effect of leu-cine results in enhanced secretion of insulin from β-cells via a series of biological responses. Specifically, a leucine-induced increase in GDH activity stimulates glu-tamate oxidation, leading to an elevated ratio of intracellular [ATP]/[ADP]. This, in turn, inhibits the plasma membrane-bound ATP-gated K+ channel, resulting in membrane depolarization, influx of extracellular Ca2+, and activation of exocyto-sis of insulin granules from pancreatic β-cells. Finally, the complex interorgan metabolism of AA among liver, skeletal muscle, intestine, and immune cells maxi-mizes glutamine availability for renal ammoniagenesis under acidotic conditions, while producing arginine, proline, and glutathione in response to physiological and nutritional needs (Figure 11.7).
NO
GTP cGMPGC
GMPPDE5
Viagra
(+) (-)
PKG
ACC-P(inactive)
ACC(active)
AMPK-P(active)
AMPK(inactive)
Acetyl-CoA
Fattyacid
HSLPEP
HSL-PPEP-P
PKA
cAMP
TAG Fattyacid
GPAT
G3P
SREBP1C
(+)
(+)
(-)
(+)
Glucose
(-)
(+)
(+)(+)
(-) Glycerol
Glucose
(+)
CO2 + H2O
Malonyl-CoA
AMP
(+)
Acetyl-CoA
(-)
Mitochondrialbiogenesis, UCP-1,
and BATdevelopment
(+)
(+)
PDE3B
Insulinβ-Cellsin pancreas
Proteinsynthesis
AA
AA
MTOR-P(+)
(+)
ATPAC
(+)
PI3K PKB
AA
Pyruvate
LPL
AA
ArginineO2
CitNOSBH4
CO
Heme
HO
(+)
(+)Ornithine
Arginase
Polyamines
PGC-1α
MTOR
(+)(+)
mtTFANRF-1NRF-2PPAR α
(+)
ODC
(+)
(+) (+)
(+)(+)
(+)
FIGURE 11.5 A proposed mechanism for l-arginine to enhance substrate oxidation and reduce adiposity via the cGMP and AMPK signaling pathways in obese animals. Abbreviations: AA, amino acids; AC, adenylyl cyclase; ACC, acetyl-CoA carboxylase; AMPK, AMP-activated protein kinase; BH4, tetrahydrobiopterin; Cit, citrulline; GC, guanylyl cyclase; G3P, glycerol-3-phosphate; GPAT, glycerol-3-phosphate acyltransferase; HO, heme oxygen-ase; HSL, hormone-sensitive lipase; LPL, lipoprotein lipase; MTOR, mammalian target of rapamycin; mtTFA, mitochondrial transcription factor A; NO, nitric oxide; NOS, nitric oxide synthase; NRF, nuclear respiration factor; ODC, ornithine decarboxylase; PDE5, phosphodi-esterase 5; PDE3B, phosphodiesterase 3B; PEP, perilipins; PGC-1α, peroxisome proliferator-activated receptor γ (PPAR-γ) coactivator 1α; PKA, cAMP-dependent protein kinase A; PKG, cGMP-dependent protein kinase G; PPARα, peroxisome proliferator-activated receptor α; SREBP-1c, sterol regulatory element binding protein-1c; TAG, triacylglycerols.

369Physiological Functions of Amino Acids
© 2010 Taylor & Francis Group, LLC
reGulAtory roles of AA in Gene exPression AnD cell siGnAlinG
Regulatory Roles of AA in Gene ExpressionRegulation of gene expression by AA can occur at any step in the highly specific pro-cesses that involve the transfer of information encoded in a gene into its product (RNA and/or protein) (Figure 11.8). These biochemical events are transcription, transla-tion, and posttranslational modifications. In both eukaryotic and noneukaryotic cells,
NADPH + H+
NADP+
1
ADP + Pi
2
Folate
H4-folate
Dihydrofolate
N5, N10-methylene H4-folate
Ser GlyVit B6
4 N5-methyl H4-folate
NADH + H+ NAD+
5
HomocysteineMethionine Vitamin B12
6
dUMP
dTMP13
DNA synthesisNADPH + H+
NADP+1
N10-formyl H4-folate N5, N10-methenyl H4-folateH2O
Purinesynthesis
N5-formimino H4-folate
NADPH + H+
NADP+
2
N5-formyl H4-folate(folinic acid)
NH4+
92
N-Formiminoglutamate
H4-folate
-Glutamate14 9
H2O10
-Histidine 12
NADP+
NADPH + H++ CO2
ATP + Formate
3
SAMSAH 8 7
ATP
ADP + Pi11
DNA
Oxidativestress
15
BetaineDimethylglycine Choline
GuanidinoacetateDNAProtein
CreatinaeCH3-DNACH3-protein
16
17
19Glycine 18
20
FIGURE 11.6 One-carbon unit metabolism for provision of methyl donors in cells. Folate, histidine, methionine, and serine participate in the transfer of one-carbon units for the syn-thesis of purines and DNA as well as methylation reactions in animals. The enzymes that catalyze the indicated reactions are: (1) folate reductase, (2) N5, N10-methylene H4-folate dehydrogenase (a trifunctional enzyme possessing N10-formyl H4-folate synthetase, N5, N10-methylene H4-folate dehydrogenase, and N5, N10-methenyl H4-folate cyclohydrolase activities), (3) N10-formyl H4-folate dehydrogenase, (4) serine hydroxymethyl transferase, (5) N5, N10-methylene H4-folate reductase, (6) methionine synthase, (7) S-adenosylmethionine synthase, (8) S-adenosylmethionine as a major methyl group donor in methyltransferase reactions, (9) formiminotransferase-cyclodeaminase (a bifunctional enzyme possessing glutamate formim-inotransferase and formimidoyl H4-folate cyclodeaminase activities), (10) serine hydroxy-methyl transferase, N5, N10-methenyl H4-folate cyclohydrolase, and spontaneous reaction at pH 4 to 7.0, (11) N5, N10-methenyl H4-folate synthetase, (12) a sequential series of enzymes: histidase, urocanase, and imidazolone propionate hydrolase, (13) thymidylate synthase, (14) formyltransferase, (15) an oxidant for cells, (16) betaine:homocysteine methyltransferase, (17) choline dehydrogenase, (18) enzymes for glycine synthesis (dimethylglycine oxidase and sarcosine oxidase), (19) S-adenosylhomocysteine hydrolase, and (20) enzymes for DNA synthesis. Abbreviations: dTMP, deoxythymidine 5′-monophosphate; dUMP, deoxyuridine 5′-monophosphate; Gly, glycine; H4-folate, tetrahydrofolate; SAH, S-adenosylhomocysteine; SAM, S-adenosylmethionine; Ser, serine; Vit, vitamin.

370 Amino Acids: Biochemistry and Nutrition
© 2010 Taylor & Francis Group, LLC
BCAA
GlutamineGlutamateProline
Diet
ArginineSkeletal muscle
Glutamine
Small intestineArginine
Arginine
60% 40% OrnithineProlineUrea
Arginine
ArginineUrea
Liver
100%
90–93%
7–10%
Kidney
AA
Citrulline
Citrulline
Ornithine
Ornithine
Urea
Alanine AA
CysGluGly
GSH
GSH
Alanine
Glucose
Citrulline
Alanine
Glutamine
Citrulline
Arginine
Asp
NH3
BCKA
BCKA
Glucose
Glucose
CO2
Arginine
GSH
Glutamine ATPGlucose
NADPH+ H+
NADP+
Arginine
Citrulline
NO
O2Asp
Glutamate
ATP
Cells of the immune systemEndothelial cells and other cells types
Ornithine
PolyaminiesArginine
AA
Proteins
AlbuminAA
AA
Cytokines Cytokines(+)(+)
O–2
FIGURE 11.7 Interorgan metabolism of branched-chain AA, glutamine, and arginine and its role in immune function. Skeletal muscle takes up BCAA from the arterial blood, synthe-sizes both alanine and glutamine from BCAA and α-ketoglutarate, and releases these two amino acids into the circulation. The small intestine utilizes glutamine to synthesize citrul-line, which is converted into arginine in kidneys, cells of the immune system, and other cell types. The liver is the primary organ for the synthesis of glutathione from glutamate, glycine, and cysteine and of glucose from alanine for use by extrahepatic cells (including immu-nocytes) and tissues. Abbreviations: Asp, aspartate; BCAA, branched-chain amino acids; BCKA, branched-chain α-ketoacids; GSH, glutathione.

371Physiological Functions of Amino Acids
© 2010 Taylor & Francis Group, LLC
transcription is controlled by transcription factors, which are proteins that bind to spe-cific DNA sequences. Transcription factors either act alone or in combination with other proteins, by promoting (as activators) or inhibiting (as repressors) the recruitment of RNA polymerases to specific genes. Actinomycin D, which is an anticancer agent pro-duced by Streptomyces antibioticus, blocks gene transcription by inhibiting both DNA and RNA polymerases. In bacteria, gene expression is often suppressed by the accumu-lation of products. For example, an increase in glucose concentration can suppress the expression of genes that encode for enzymes hydrolyzing lactose and galactose in E. coli. Such a regulatory mechanism also exists in mammalian cells for some enzymes (e.g., inhibition of argininosuccinate lyase expression by arginine in hepatocytes).
Translation (both mRNA stability and efficiency of polypeptide formation) is also a step for the control of protein synthesis. Results of cell culture studies indicate that deficiency of an AA results in increased availability of uncharged tRNA that binds and activates the general control nonderepressible protein 2 (GCN2) kinase. This kinase phosphorylates eIF-2α, leading to a decrease in global protein synthe-sis. However, under conditions of nutrient deprivation, some mRNA may undergo enhanced translation via mechanisms involving GCN4 and activating transcription factor 4. In contrast, the excess of an AA may down- or upregulate the expression of genes depending on its side chains and target proteins. For example, glutamine
Chromatin structure
DNA
mRNA
Protein
Biologically active protein
Transcription factor assemblyPolymerase activityRNA polymerase initiationPolyadenylationmRNA splicing, export, and stability
Limited and targeted proteolytic cleavageAddition of functional groupsCovalent modifications of AA residuesFormation of 3-dimensional structure
Synthesis DegradationAA
AA
AA
AA
Transcription
Translation
Posttranslationalmodifications
Ribosome number and activityAminoacyl-tRNA synthesisInitiation factors and MTOR signalingElongation factors and release factors
DNA methylation
microRNA
Methylation and acetylation ofhistone proteins
NonhistoneDNA-binding
chromosomal proteinsEpigenetics
AA
AA
FIGURE 11.8 Possible mechanisms responsible for AA regulation of gene expression in cells. AA may regulate gene expression in animal cells at transcriptional, translational, and posttranslational levels.

372 Amino Acids: Biochemistry and Nutrition
© 2010 Taylor & Francis Group, LLC
stimulates ASS gene expression in Caco-2 cells at the transcriptional level but reduces GS protein levels in mouse C2C12 skeletal muscle cells probably at the posttransla-tional level. Moreover, either an excess or a deficiency of arginine modulates global gene expression in mammalian cells, whereas methionine deficiency stimulates osteopontin expression in hepatocytes through hypomethylation of DNA and pro-tein. Consistent with these in vitro studies, microarray analyses indicate that dietary supplementation with glutamine or arginine increases the expression of antioxidative genes and reduces the expression of proinflammatory genes in the small intestine and adipose tissue. Additionally, dietary intake of methionine may affect the expres-sion of the fetal genome, fetal growth and survival, and pregnancy outcomes.
Regulatory Roles of AA in EpigeneticsEffects of AA on gene expression may also be mediated by epigenetics, which is affected by the availability of SAM. Epigenetics can be defined as stable and heritable alterations of gene expression through covalent modifications of DNA and core his-tones without changes in the DNA sequence. Four mechanisms that are responsible for mediating epigenetic effects are: (1) chromatin modifications, (2) DNA methylation (occurring at the 5′-position of cytosine residues within CpG dinucleotides throughout the mammalian genome), (3) histone modifications (acetylation, methylation, phos-phorylation, ubiquitination, and sumoylation), and (4) RNA-based mechanisms such as small noncoding RNAs or inhibitory RNAs. The enzymes involved in these reac-tions include: (1) specific DNA methyltransferases (DNMT1, DNMT3a, and DNMT3b) (Figure 11.9), (2) protein methyltransferases (e.g., histone methyltransferases) for
2. Histone acetylation
1. DNA methylation
Deoxycytidine-DNA 5-Methylcytidine-DNA
DNAdemethylase
DNA methyltransferase
SAM SAH
Histone Acetyl-histoneAcetyl-CoA CoA-SH
Histone acetyltransferase
Histonedeacetylase
Histonedemethylase
Histone CH3-histoneDNA methyltransferase
SAM SAH
3. Histone methylation
4. Histone phosphorylation 5. Histone ubiquitination
Histone Ub-histoneATP-Ub ADP + Pi
Histone ubiquitinase
Histonedeubiquitinase
Histone Phospho-histoneATP ADP
Histone phosphorylase
Histonedephosphorylase Pi Ub
–CH3Acetyl group
–CH3
FIGURE 11.9 Biochemical reactions involving DNA methylation and histone modifica-tions. These reactions are localized in specific compartments of the cell. Abbreviations: SAH, S-adenosylhomocysteine; SAM, S-adenosylmethionine; Ub, ubiquitin.

373Physiological Functions of Amino Acids
© 2010 Taylor & Francis Group, LLC
regulation of gene expression (Figure 11.10), (3) DNA demethylases, (4) histone acety-lase (lysine acetyltransferase), (5) GCN5-related N-acetyltransferase (a superfamily of acetyltransferase), and (6) histone deacetyltransferase.
Epigenetic regulation of gene expression is also mediated by small-interfering RNAs or small noncoding RNAs that act through their respective pathways to induce SAM-dependent DNA methylation or histone modifications to silence or enhance gene expression. In mammals, the small noncoding RNAs include Piwi RNA and microRNA (miRNA). The biogenesis of mature (functional) miRNA containing ~22 nucleotides from its miRNA gene involves both the nucleus and the cytoplasm in mammalian cells (Figure 11.11). Piwi RNA is restricted to the germ line (e.g., testes in males and oocytes in females) and regulates gene expression possibly through sequence-specific targeting of heterochromatin formation factors to the mobile ele-ments in the genome and the degradation of mobile element transcripts. In contrast, miRNAs are widespread in cells and tissues to regulate gene expression at the post-transcriptional level. Since the discovery of lin-4 as the first miRNA in 1993, ~1000 human miRNAs have been identified, annotated, and catalogued. Emerging evi-dence shows a key role for AA in regulating miRNA expression in animal cells. For example, supplementing arginine to the diet of pregnant swine increases the expres-sion of miRNA-15b/16 and miRNA-221/222 and endothelial NO synthesis in the
H2A H2B H3 H4
H2A H2BDimer
H3 H4Dimer
2[H2A H2B]Tetramer
2[H3 H4]Tetramer
2[H2A H2B]2[H3 H4]
Nucleosomes
DNA
Nucleosomes-H1
H1
Activationof gene
transcription
Repressionof gene
transcription
H2BK5, H3K4, H3K9, H3K14
H3K27,H3K79
H4K20,H4R3
Dimethylation: H3K79
Trimethylation: H3K4, H3K79
Acetylation:
H2A, H2B, H3K9, H3K14
H3K18, H3K27, H4K8, H4K16
Monoubiquitination: H2B
Phosphorylation:
H1, H2A, H2B, H3, H4
Monomethylation:
H4K20, H4K59
Dimethylation: H3K9, H3K27
Trimethylation:
H2BK5, H3K9, H3K27, H3K79
Acetylation: H4K12
Lack of H3 and H4 acetylation
Monoubiquitination: H2A
Lack of phosphorylation of
H1, H2A, H2B, H3, H4
Sumoylation: H4
DNA hypermethylation
Monomethylation:
FIGURE 11.10 Roles of histone modifications in the regulation of gene transcription. Methylation of histones, acetylation, or ubiquitination can either activate or repress gene expression, depending on specific histone proteins and the sites of modifications. In a variety of cell types, histone methylation is generally associated with transcriptional repression, but methylation of some lysine (e.g., lysine 4 of histone 3) and arginine residues (e.g., those on H3 and H4) of histones can result in transcriptional activation. In general, phosphorylation of histones promotes transcription, DNA repair, and apoptosis. Abbreviations: H, histone; K, lysine residue; R, arginine residue.

374 Amino Acids: Biochemistry and Nutrition
© 2010 Taylor & Francis Group, LLC
porcine umbilical vein. Additionally, dietary supplementation with EAA enhances the abundances of miRNA-499, miRNA-208b, and miRNA-23a as well as protein synthesis in human skeletal muscle.
Regulatory Roles for AA in Cell SignalingSome AA (e.g., arginine, glutamate, glutamine, and proline) are activators of many cell signaling pathways. These pathways involve MTOR, cAMP-dependent kinases, cGMP-dependent kinases, G-protein coupled receptors, AMPK, and MAPK (Suryawan and Davis 2011). These are complex networks of metabolic regulation,
miRNA gene
Nucleus
Cytoplasm
Primary miRNA (Pri-miRNA; ~80 nt)
RNA polymerase II
Drosha (Type-III RNase) and DGCR8
Precursor miRNA (Pre-miRNA; ~70 nt)
Exportin-5
Precursor miRNA (pre-miRNA; ~70 nt)
miRNA: miRNA* Duplex (~22 nt)
Dicer (Type-III ribonuclease) and TRBP
Mature miRNA(Single-stranded; ~22 nt)
miRNA*(Passenger miRNA)
Degradation miRNARISC
RISC
Target mRNA-3′-UTR miRNA RISC
Target mRNA
Induction of targetmRNA deadenylation
Inhibition oftranslation initiation
Inhibition of translation elongation
Inhibition of protein synthesis(usual effects)
Exoribonuclease
FIGURE 11.11 Biogenesis of microRNA and its role in the regulation of gene expression. The biogenesis of mature (functional) miRNA from its miRNA gene involves both the nucleus and the cytoplasm in mammalian cells. A single-stranded mature (functional) miRNA with ∼22 nucleotides (nt) binds the 3′-untranslated region of the target mRNA. This usually results in decreased protein synthesis through induction of mRNA deadenylation, reduction of trans-lation initiation, and inhibition of translation elongation. DGCR8, associated protein DGCR8 of Drosha (also known as Pasha); TRBP (transacting RNA-binding protein); miRNA*, pas-senger strand miRNA for degradation; RISC, RNA-induced silencing complex (RISC) con-taining several components, including Argonaute proteins, PW182 protein, and fragile X mental retardation protein.

375Physiological Functions of Amino Acids
© 2010 Taylor & Francis Group, LLC
but they are all regulated by protein phosphorylation and protein dephosphorylation mechanisms. These pathways also involve the activation of various proteins in the cytoplasm and the nucleus (Dar and Shokat 2011).
AMPK is a heterotrimeric enzyme consisting of three subunits: a catalytic α sub-unit as well as regulatory β and γ units. AMPK acts as a sensor for cellular energy and is activated by an increased [AMP]/[ATP] ratio. Activation of AMPK occurs via phosphorylation by an established upstream AMPK kinase, LKB1. The overall effect of AMPK activation is to switch off the ATP-consuming pathways such as lipogenesis, gluconeogenesis, glycogenesis, and protein synthesis, while switching on the ATP-producing pathways such as glycolysis as well as fatty acid and glucose oxidation.
Members of the MAPK family include extracellular signal-regulated kinases (ERK 1 and 2), c-Jun NH(2)-terminal kinase (JNK), p38 MAPK, and ERK5 (Figure 11.12). ERK activate a number of transcription factors and protein kinases. This results in the transmission of signals from many extracellular agents (including glutamine) to intracellular organelles, thereby regulating cellular processes, includ-ing (1) gene expression, (2) cell proliferation, differentiation, and migration, (3) mito-sis and cell survival, and (4) cell-cycle progression. Jun was originally identified in 1994 as a kinase that binds and phosphorylates c-Jun on Ser-63 and Ser-73 within its transcriptional activation domain, whereas p38 MAPK was first isolated in 1993 as a 38-kDa protein that underwent rapid tyrosine phosphorylation in response to endo-toxin stimulation. Both JNK and p38 MAPK are responsive to stress stimuli, such as cytokines, inflammatory signals, protein synthesis inhibitors, heat shock, and osmotic shock to contribute to apoptosis and inflammatory responses. In response to extracellular signals (e.g., growth factors), ERK5 translocates to the nucleus, where this kinase regulates gene expression by phosphorylating and activating a number of transcription factors. Activation of the ERK5 signaling pathway has been implicated in physiological functions (e.g., cell survival, proliferation, and differentiation) and pathological processes (e.g., carcinogenesis, cardiac hypertrophy, and atherosclero-sis). While both ERK1/2 and ERK 5 respond to extracellular growth factors, results of recent studies indicate that ERK5 has a key role in cardiovascular development, neural differentiation, and myocyte fusion.
G-protein (also known as guanine nucleotide-binding protein)-coupled recep-tors (GPCR) are seven-transmembrane domain receptors that can sense extracel-lular AA (e.g., glutamate) and other molecules (e.g., pheromones, hormones, and neurotransmitters) and activate the cAMP signal pathway and the phosphatidylino-sitol signal pathway inside the cell. Specifically, the binding of the GPCR to a ligand changes the conformational structure of the GPCR, allowing for its cata-lytic role as a guanine nucleotide exchange factor. The GPCR then activates an associated G-protein by exchanging its bound GDP for a GTP. The G-protein’s α subunit, together with the bound GTP, then dissociates from the β and γ subunits to either activate signaling proteins (e.g., adenylyl cyclase, phospholipases C and A2, and calcium channel) or directly act on the target proteins. Experimental evidence shows that the GPCR participates in (1) the sense of smell, taste, visual signals, and cell density, (2) neurotransmission and neurological function, and (3) immunity, mood, and behavior.

376 Amino Acids: Biochemistry and Nutrition
© 2010 Taylor & Francis Group, LLC
ROLES FOR AA IN THE IMMUNE RESPONSE
immune system
Because leukocytes are important targets for the physiological functions of AA, this section provides a brief review of the pertinent literature related to the defense against infectious diseases. The immune system protects the host from various pathogens and consists of the innate (natural, nonspecific) and the acquired (adap-tive, specific) systems. These two systems are highly interrelated through cytokines and signaling molecules. The innate immune system can rapidly respond to invading microbes, but its major disadvantages include nonspecificity and a lack of memory
Raf
MEK1/2
ERK1/2
MEKK1
MKK4/7
JNK1/2/3
Ask1MLK
MKK3/6
p38 MAPK(α, β, γ, δ)
MEKK2/3
MEK3
ERK5(BMK1)
Growthfactors
Stress stimuli
Ras
Growthfactors
TCF/Elk-1c-MycCREBMSK1S6K1c-Fos
Elk-1ATF-2c-Jun
p53Ub ligase
NFATSTAT3
Elk-1CHOPATF-2CREBMEF2c
c-MycMEF-2S6K1c-Fos
Cellgrowth
Apoptosisinflammation
Vascularand neural
development
(MAPK)
(MAPKK)
(MAPKKK)
Plasma
membrane
Cytosol
Nucleus
FIGURE 11.12 Cell signaling pathways induced by mitogen-activated protein kinases (MAPK). Four members of the MAPK family are extracellular signal-regulated kinases (ERK 1 and 2), c-Jun NH(2)-terminal kinase (JNK), p38 MAPK, and ERK5. AP-1, activat-ing protein-1; ASK1, apoptosis signal-regulating kinase-1; ATF, activating transcription factor; CHOP, CCAAT/enhancer binding-protein homologous protein; CREB, cAMP response ele-ment binding protein; Elk-1, E 26-like transcription factor; ERK5 (also known as BMK1, ERK/big MAP kinase 1); MEF2C, myocyte-specific enhancer factor 2C; MEK, MAPK/ERK kinase; MEKK, MEK kinase; MLK, mixed lineage kinase; MSK1, stress- activated protein kinase-1; NFAT, nuclear factor of activated T-cells; Raf, rapidly accelerated fibrosarcoma protein (a pro-tein kinase); Ras, rat sarcoma protein (a small GTPase); S6K1, ribosomal S6 kinase-1; STAT3, signal transducer and activator of transcription 3 (an acute response factor); TCF, ternary complex factor; and Ub, ubiquitin. (Adapted from Gui, T. et al. 2012. J. Signal Transduction. doi:10.1155/2012/289243; Rhoads, J.M. and G. Wu. 2009. Amino Acids 37:111–122.)

377Physiological Functions of Amino Acids
© 2010 Taylor & Francis Group, LLC
effect. When infection cannot be fully cleared by the innate immune system over a short period, the adaptive immune system is activated to destroy infectious agents. In the acquired immune system, each lymphocyte carries surface receptors for a single antigen, therefore conferring highly specific immune responses. This immune system becomes effective over days after initial stimulation and possesses immuno-logical memory. B-lymphocytes are unique in their ability to produce and release specific antibodies in humoral immunity. The antibodies can neutralize pathogenic microorganisms (including viruses) or toxins by: (1) binding to them, (2) activat-ing complement proteins in plasma for the destruction of bacteria by phagocytes, (3) immobilizing bacteria, and (4) opsonizing various pathogens. When pathogens escape humoral immunity, they are targeted by the cell-mediated immunity that involves the production of cytokines (e.g., interferon-γ) and other cytotoxic proteins by T-lymphocytes (Shewchuk et al. 1997; Li et al. 2007).
The innate and acquired immune systems are regulated by a highly interactive network of chemical communications, which includes the synthesis of the antigen-presenting machinery, immunoglobulins, and cytokines (Chapter 10). Both immune systems are highly dependent on adequate availability of AA for the synthesis of these proteins and polypeptides, as well as other molecules of enormous biologi-cal importance. These substances include NO, superoxide, hydrogen peroxide, histamine, GSH, and anthranilic acid (Table 11.1). Individual AA effect immune responses either directly or indirectly through their metabolites. While the immune system is vital to health, it can be dysfunctional under certain conditions, resulting in the development of autoimmune and hypersensitivity diseases, such as insulin-dependent diabetes mellitus, rheumatoid arthritis, and asthma.
AA influence several or all aspects of the immune system. Thus, there are mul-tiple, complex methods for assessing immune function in individuals, depending on experimental conditions, the availability of analytical facilities, and the investiga-tor’s interest. The classic functional measurements in vivo include: (1) the delayed-type hypersensitivity response measured by skin testing, (2) serum antibody titers or humoral immunity in response to primary or secondary (booster) immunization, (3) blood levels of different lymphocyte subsets as well as serum concentrations of cytokines and other immune mediators, (4) weights of lymphoid organs, and (5) morbidity and recovery from infectious disease. The in vitro assays of immune func-tion examine: (1) the metabolism of immunocytes, (2) lymphocyte blastogenesis (cell proliferation) in response to mitogens, (3) cell morphology and apoptosis, (4) the phagocytosis of particles by monocytes and macrophages, and (5) the production of antibodies, cytokines, and low-molecular-weight cytotoxic substances.
Protein mAlnutrition AnD comPromiseD immunity
Malnutrition (particularly dietary deficiency of protein) and infection are major obstacles to survival, health, growth, and reproduction of animals and humans world-wide. This global concern has led to the development of nutritional immunology as a new scientific discipline that integrates nutrition and immunology research meth-odologies to define a role for nutrients in the metabolism and function of cells of the immune system at molecular, cellular, tissue, and whole-body levels. Recent studies

378 Amino Acids: Biochemistry and Nutrition
© 2010 Taylor & Francis Group, LLC
indicate that dietary protein deficiency compromises both the innate and adaptive immune systems in animals and humans. This remains a significant nutritional prob-lem in developing countries and also occurs in subpopulations (e.g., the elderly or the hospitalized patients) of developed nations. Although dietary supplementation with high-quality protein may be effective in improving protein nutritional status in mal-nourished subjects, this is not feasible for patients who cannot tolerate enteral feed-ing. Consequently, defining the roles of individual AA in immune responses can aid in developing effective strategies to improve health and prevent infectious diseases.
unifyinG mechAnisms resPonsiBle for roles of AA in immunity
Protein malnutrition, starvation, and many pathological conditions associated with compromised immunity (e.g., sepsis, cancer, and AIDS) result in reduced concentra-tions of most AA in plasma. There is growing interest in the role of AA in the immune function of mammals, birds, fish, and other species. Findings from recent studies sup-port an important role for AA in immune responses as they regulate: (1) the activation of T-lymphocytes, B-lymphocytes, natural killer cells, and macrophages; (2) cellular redox state, gene expression, and lymphocyte proliferation; and (3) the production of antibodies, cytokines, and other cytotoxic substances (including NO and superoxide). Increasing evidence shows that dietary supplementation of specific AA to animals with malnutrition and infectious disease enhances the immune status, thereby reducing mor-bidity and mortality. Arginine, BCAA, glutamine, glutamate, glycine, histidine, methi-onine, tryptophan, and cysteine precursors are the best prototypes. However, because of a negative impact of imbalance and antagonism among AA on nutrient intake and utilization, care should be exercised in developing effective strategies of enteral or parenteral provision for maximum health benefits. Such measures should be based on knowledge about the biochemistry and physiology of AA, their roles in immune responses, nutritional and pathological states of individuals, and expected treatment outcomes. Recent advances in leukocyte AA metabolism are critical for the develop-ment of effective means to prevent and treat immunodeficiency diseases. AA hold great promise in improving health and preventing infectious diseases in animals and humans.
USE OF AA IN NUTRITION, THERAPY, AND HEALTH
Because of their important physiological functions, AA are utilized for many pur-poses worldwide, including: (1) medical and pharmaceutical therapy, (2) dietary sup-plements, (3) food additives and flavors, (4) manufacturing of cosmetic and toiletry products, and (5) cell culture. These applications, with emphasis on humans and farm animals, are highlighted in the following sections.
use of AA in meDicAl AnD PhArmAceuticAl therAPy
On the basis of his observation that dogs fed for 6 days a synthetic AA diet contain-ing glucose, fructose, glycerol, and fatty acids could maintain a positive nitrogen balance, O. Abderhalden first predicted in 1912 the possibility of parenteral nutri-tion consisting of a mixture of AA and other essential nutrients for humans and other animals. This prediction came true in 1956 when crystalline AA were first

379Physiological Functions of Amino Acids
© 2010 Taylor & Francis Group, LLC
included as components of a total parenteral nutrition (TPN) solution for intrave-nous administration to patients. Since then, both EAA and NEAA have been used increasingly in the nutritional support of patients who cannot eat, tolerate enteral feeding, or adequately synthesize AA. These patients may have gastrointestinal dis-eases, coma, surgical operations, feeding difficulties, underdeveloped organs, and/or inborn errors of metabolism (e.g., defects of urea-cycle enzymes). For example, arginine has been frequently used to treat hypoargininemia-induced hyperammo-nemia in preterm infants since the early 1970s. Also, glutamine is often included in TPN solution to manage patients with small-intestinal atrophy and damage. In addi-tion, intravenous administration of BCAA, BCKA, arginine, or glutamine is effec-tive in improving N balance in catabolic patients. Furthermore, intravenous infusion of arginine can ameliorate fetal growth retardation and pulmonary hypertension in humans and other animals. Thus, when oral ingestion is not possible or viable, TPN is now widely used in human clinical medicine and has also received much attention from practicing veterinarians. Finally, TPN solutions or enteral diets supplemented with arginine, BCAA, glutamine, and N-acetylcysteine can be beneficial for (1) enhancing T-cell function, antibody production, and immune cell-mediated wound healing, (2) reducing susceptibility to infectious diseases and inflammation, and (3) shortening ventilator days, the time for intensive-care-unit care, and hospital stay.
Elemental diets containing crystalline AA were developed as space foods for the American NASA Apollo Project in the 1960s. In the past 50 years, enteral feed-ing of an AA mixture has become part of nutritional therapy for patients with food allergy, inflammatory disease, Crohn’s disease, and metabolic syndrome. Examples for medical and pharmaceutical therapy involving AA and their derivatives include oral administration of N-acetylcysteine, arginine, BCAA, glutamine, and tryptophan to ameliorate liver damage induced by drugs, necrotizing enterocolitis in infants, hepatic encephalopathy, short bowel syndrome, and sleeping disorders, respectively. BCAA are also beneficial for ameliorating hypoalbuminemia and emaciation in patients with uncomplicated hepatic cirrhosis. Moreover, alanine, glycine, lysine, tryptophan, and DOPA are used to treat muscular degeneration, eczema, herpes sim-plex, depression, and Parkinson’s disease, respectively.
In the pharmaceutical industry, AA are used to synthesize water-soluble regulators of biochemical pathways. For example, cysteine, glutamate, glutamine, and ornithine are the precursors of N-acetylcysteine, N-carbamoylglutamate, N-acetylglutamine, and α-KG-ornithine, respectively. Additionally, AA are raw materials for chemical synthesis of peptides or peptide-like substances. Examples are l-alanyl-l-glutamine, glycyl-l-glutamine, d-glutamyl-d-glutamate, l-ornithine-l-aspartate, angiotensin-converting-enzyme inhibitors, angiotensin II receptor antagonists, HIV protease inhibitors, antiviral agents (e.g., Valaciclovir), antidiabetic agents (e.g., Nateglinide), antibiotics (e.g., ampicillin), polyarginines, and vitamins (e.g., folic acid and panto-thenic acid from glutamate and β-alanine, respectively).
use of AA As DietAry suPPlements
A dietary supplement is a substance taken by mouth to provide a nutrient that ani-mals including humans may not obtain adequately from their regular diet relative to

380 Amino Acids: Biochemistry and Nutrition
© 2010 Taylor & Francis Group, LLC
their optimal growth, development, and health. In the United States, many AA and related substances are available in food stores for human consumption. They include β-alanine, arginine, carnosine, citrulline, glutamate, glutamine, glycine, leucine, lysine, and tryptophan. Individuals use AA supplements for different purposes, includ-ing maintenance of skeletal muscle, lean-tissue gain, white-fat loss, overall well-being, optimization of fetal and postnatal growth, good taste, control of mood and behav-ior, muscle strength, exercise endurance, and sports performance. In some developing countries, where consumption of high-quality proteins is limited, dietary supplementa-tion with limiting AA (e.g., lysine, methionine, tryptophan, and arginine) may be effec-tive in: (1) increasing the growth of children and preventing short statue, (2) delaying the onset and process of aging, and (3) reducing infectious and chronic diseases, while improving the general health in both the young and the elderly. This can also apply to a subset of the population with limited resources in developed nations. Globally, deficiencies of AA frequently occur in subjects of specific age groups and can be pre-vented by dietary supplementation. For example, results of recent studies indicate that 70% of homebound elderly subjects in the United States are deficient in at least one EAA (Dasgupta et al. 2005). There is evidence that, compared with the placebo group, dietary supplementation with a mixture of AA (arginine, histidine, isoleucine, leucine, lysine, methionine, phenylalanine, threonine, and valine) can enhance lean body mass, muscle strength, and physical function in elderly subjects. Also, formula-fed infants are deficient in taurine and will greatly benefit from its supplementation. Furthermore, because cow’s milk is deficient in arginine, dried milk preparations can be enriched with this AA to achieve a good balance of all AA in the diet.
In the past 60 years, animal production has greatly benefited from dietary supplemen-tation with some AA. Farm animals (e.g., chickens, pigs, cows, and sheep) are usually fed plant-based diets that generally contain low levels of lysine, methionine, threonine, and tryptophan. Deficiencies of these AA limit the maximum growth and production performance of these animals, while impairing their immunity. To partially correct this problem, dl-methionine was first used in the late 1950s as a supplement in feeds for broiler chickens. In the 1960s, l-lysine–HCl became commercially available for piglet diets. The 1980s witnessed the beginning of the use of l-threonine and l-tryptophan as supplements for swine and poultry feeds to enhance growth, improve immune function, and reduce glucocorticoid-induced stress. In the 1990s and 2000s, there was interest in the use of isoleucine and valine to improve milk production by lactating sows, but inconsistent results were reported in the literature, likely due to different experimental conditions. In the past, rumen-protected lysine came into use for ruminants (e.g., cows and beef cattle) to increase milk production of lactating cows and growth performance of postweaning calves. While traditional research logically focused on dietary supple-mentation with EAA, recent advances in the physiological roles of NEAA have resulted in their use in swine production. For example, in 2005, a mixture of glutamate and glu-tamine was first produced for feeding postweaning pigs and chickens in some countries (including Brazil and Mexico) to prevent intestinal atrophy and improve feed efficiency. However, the U.S. Food and Drug Administration does not currently allow the use of these two AA as supplements for animal feeds due to historic reasons. These reasons include: (1) the absence of data on glutamine content in feedstuffs due to analytical problems; (2) the complete lack of glutamine research in livestock production, and (3)

381Physiological Functions of Amino Acids
© 2010 Taylor & Francis Group, LLC
the failure to describe glutamine as a component of proteins in classic animal nutrition textbooks. Finally, based on discoveries driven by basic research, arginine (Progenos•) was first marketed in 2006 to enhance embryonic survival and litter size in gilts and sows. Arginine can also be used to promote lean tissue growth, reduce whole-body white fat, and enhance immunity in livestock and avian species. Advantages of dietary AA supplementation include: (1) balancing AA composition in diet, (2) reducing total protein content in diet without compromising maximal growth or production perfor-mance, (3) minimizing the impact of animal production on environmental pollution, (4) improving health status and reducing infectious diseases and the associated costs of treatment, (5) enhancing feed efficiency and economic returns, and (6) mitigating the global shortage of protein resources.
use of AA or DerivAtives As fooD ADDitives
AA as Food AdditivesFood or feed additives are substances added to food or feed to preserve or create flavor, enhance its taste and appearance, and/or improve its nutritional value. As noted in Chapter 1, individual AA alone, or in combination, have different chemical properties and, therefore, are used as food additives to generate different flavors. Thus, seasonings can be made of one or more AA, hydrolyzed vegetable protein, hydrolyzed animal protein, or small peptides. Examples are: (1) addition of AA (e.g., glutamate) to processed foods (e.g., frozen meals, hamburger, instant noodles, sausage, snack cakes, and soup base), (2) heat-induced browning of products con-taining added AA and carbohydrate, (3) use of sulfur-containing AA (e.g., cysteine, cystine, and methionine) to produce the flavor of livestock meats and increase the extensibility of bread dough, (4) a mixture of AA and other ingredients used for creating the flavor of crab, shrimp, and fish-cake products, (5) use of l-alanine and l-aspartic acid to improve the flavor of soft drinks, and (6) the discovery of the use of l-phenylalanine for the synthesis of aspartame (a methyl ester of l-aspartic acid and l-phenylalanine dipeptide; a highly effective artificial sweetener) by researchers at the G.D. Searle & Company of the United States in 1965.
A popular food additive made from an AA is monosodium glutamate. It has been used for more than 100 years as a seasoning to impart the savory taste quality gener-ally described as “umami,” which is one of the five basic tastes. Guanosine mono-phosphate and inosine monophosphate amplify the taste intensity of glutamate. A combination of these two nucleotides plus glutamate and other components in some foods (e.g., mushroom extracts) are responsible for the good taste of their soups.
Mechanisms for AA-Induced Chemical Sensing in the Gastrointestinal TractTaste Cells on the Tongue and the Gastrointestinal TractHumans receive tastes through sensory organs (called taste buds) on the tongue, other regions of the mouth, and gastrointestinal tract. According to their morphol-ogy, taste cells are classified into four types: type I (dark), type II (light), intermedi-ate (type III), and type IV (San Gabriel and Uneyama 2012).
Type I cells have voltage-gated outward currents but lack voltage-gated inward currents. These cells are glial-like (e.g., transmitter clearance and functional

382 Amino Acids: Biochemistry and Nutrition
© 2010 Taylor & Francis Group, LLC
isolation of other taste cell types) and express the glutamate–aspartate transporter and the ecto-ATPase, nucleoside triphosphate diphosphohydrolase-2, and oxytocin receptors. Thus, type I taste cells are generally thought to have a support function in the taste bud, similar to astrocytes in the nervous system. In addition, these cells may also function in salt taste transduction.
Type II cells, also known as “receptor” cells, have voltage-gated Na+ and K+ currents, as well as the receptors and transduction machinery for bitter, sweet, and umami taste stimuli. The specification of these cells appears to be controlled by a homeodomain protein known as Skn-1a. Type 2 taste cells express the taste-specific G-protein (gustducin) on the plasma membrane and the selective cation channel known as transient receptor potential melastatin 5 (TRPM5). These cells contain taste receptor type 1, member 1 (Tas1R1), taste receptor type 1, member 2 (Tas1R2), taste receptor type 1, member 3 (Tas1R3), and taste receptor type 2 (Tas2R), as well as metabotropic glutamate receptors (mGluRs), including taste-mGluR4, truncated-mGluR1, and mGluR2/3. mGluR4, Tas1R1, and Tas1R3 sense umami taste, Tas1R2 and Tas1R3 sense sweet taste, and Tas2R senses bitter taste. These taste receptors are all cell-specific G-protein-coupled receptors, which activate the gustducin upon its binding to a ligand (tastant).
Type III cells form conventional synapses with the gustatory neurons innervat-ing the taste buds and, therefore, are also known as “synaptic cells.” These cells have voltage-gated Na+, K+, and Ca2+ currents and express specific channels to sense acids. The nonselective cation channel PKD2L1 is expressed exclusively in type III cells, where it serves as the sour taste receptor. Type III taste cells may use sero-tonin and norepinephrine as neurotransmitters. Thus, these cells make prominent synapses with afferent nerve fibers and sense the sour taste.
Type IV taste cells have a rounded shape and their plasma membrane is located at the basal portion of the taste buds. These cells (also known as basal cells) are rapidly dividing progenitor cells (stem cells) that differentiate into the other types of taste cells. Thus, type IV taste cells replace aged and damaged taste cells (type I–III) dur-ing the rapid cell turnover in taste buds. Full physiological functions of type IV taste cells remain to be elucidated.
Sodium salt transduction is mediated by amiloride-sensitive epithelial sodium channels (ENaC). Specifically, Na+ salt transduction involves the passage of Na+ into the receptor cell through passive, amiloride-blockable ion channels on the api-cal membrane of the receptor cell. The ENaC present in taste cells comprises three homologous subunits (a, b, and g) and is functionally similar to that in other Na+-transporting epithelia. Additionally, Na+ and probably other cations (e.g., K+) can pass through the tight junctions between cells in the taste bud to interact with baso-lateral ion channels. The apical ion channel is gated by acids, which allows the entry of cations. Changes in intracellular concentrations of these ions result in the depolar-ization of the taste receptor cell and the release of neurotransmitters at the synapses with the sensory nerve fibers.
In addition to the four types of taste cells and ENaC, the gastrointestinal tract pos-sesses multiple cell types that can sense luminal nutrients, including the enteroendo-crine L and K cells as well as brush cells (also called tuft cells or caveolated cells) and enterocytes. The enteroendocrine L and K cells can sense sweeteners and secrete

383Physiological Functions of Amino Acids
© 2010 Taylor & Francis Group, LLC
hormones (e.g., glucagon-like peptide-1 by L-cells and glucose-dependent insulinotro-pic polypeptide). Brush cells express gustducin and TRPM5, and, therefore, may likely be chemosensory cells in the gastrointestinal tract. These cells express phospholipase C-γ2 rather than the C-β2 isoform and may also sense bitter taste.
AA Sensing in the TongueThe taste sensations of foods, dietary supplements, and other orally administered substances originate at the tongue epithelium. Different AA have different taste qualities: bitter, sour, sweet, and umami (see Chapter 1). The most studied AA in chemical sensing by the tongue is glutamate. While species differences exist in the expression of taste receptors, results of recent studies indicate that the human tongue has specific receptors for l-glutamate and can detect the umami taste independent of their location on the tongue. These glutamate receptors are: (1) Tas1R1 and Tas1R3 and (2) mGluRs, including taste-mGluR4, truncated-mGluR1, and mGluR2/3.
As noted above, Tas1R1, Tas1R3, and mGluRs are G-protein-coupled receptors with similar signaling molecules, including G-proteins βγ, phospholipase C-β2, phosphoinositide 3 (PI3)-kinase, and calcium (Figure 11.13). Specifically, in type II taste cells, receptor binding initiates a transduction cascade leading to: (1) activation
Taste stimuli (e.g., bitter, sweet, and umami)
G protein-coupled receptors on the plasma membrane(e.g., Tas1R1, Tas1R3, and mGluRs)
Gustducin (G protein)
Phospholipase C-β2
Phospholipids Inositol-1,4,5-trisphosphate (IP3)
IP3 receptor type 3 inendoplasmic reticulum
Activation of Ca2+ channelson plasma membrane
Intracellular [Ca2+]
Activation of TRPM5 on plasma membrane(monovalent-selective cation channels)
Na+ influx and depolarization of plasma membrane
Transmitter (ATP) Taste cell
Activation of sensory gustatory nerves
Electrical impulses to brain
Taste cell NO and hormones
Serotonin Enteroendocrine cells
Vagal nerve endings Forebrain
Ca2+ influx
Tongue Gastrointestinal tract
Tastecells
FIGURE 11.13 Taste signaling mechanisms in the digestive tract of humans and other ani-mals. Extracellular taste stimuli induce a series of chemosensing cascade reactions that are common in both the tongue and the gastrointestinal tract. NO, nitric oxide; TRPM5, tran-sient receptor potential melastatin 5 (selective cation channel); Tas1R1, taste receptor type 1, member 1; Tas1R2, taste receptor type 1, member 2; Tas1R3, taste receptor type 1, member 3; Tas2R, taste receptor type 2 (Tas2R).
384 Amino Acids: Biochemistry and Nutrition
© 2010 Taylor & Francis Group, LLC
of phospholipase C-β2, (2) an inositol trisphosphate (IP3)-mediated increase in intra-cellular Ca2+ concentrations due to the release of Ca2+ from intracellular stores and the activation of voltage-gated basolateral calcium channels, (3) Ca2+-dependent acti-vation of the monovalent-selective cation channel TRPM5, (4) Na+-induced depolar-ization of the plasma membrane, (5) the release of ATP as a synaptic transmitter, and (6) activation of sensory neurons on the tongue. These neurons then send electrical impulses to the cerebellum to interpret and identify taste quality. Thus, taste nerves play an afferent role in AA sensing (namely, receiving information and then sending it to the brain for processing and interpretation).
In addition to Tas1R1, Tas1R3, and mGluRs, taste cells on the tongue also express NMDA receptors and non-NMDA ionotropic glutamate receptors (iGluRs). These NMDA and non-NMDA iGluRs on the basal membrane (but not the taste pore) can directly detect glutamate released by the nerve endings as a neurotransmitter, lead-ing to activation of the two types of glutamate receptors and subsequent NO cell signaling. Thus, NMDA receptors and non-NMDA iGluR in taste cells may be indi-rectly involved in the perception of umami taste.
AA Sensing in the Gastrointestinal TractAA sensing in the gastrointestinal tract and the tongue shares common steps in signal transduction between ligand binding and the depolarization of the plasma membrane of taste cells (Figure 11.13). However, chemosensing in the gastrointestinal tract (e.g., the gastric mucosa, duodenum, and ileum) involves enhanced release of NO and pos-sibly gut hormones from taste cells. Subsequently, these molecules stimulate enteroen-docrine cells to synthesize and release serotonin. Taste cells may also directly generate and release serotonin to amplify taste signal transduction. Serotonin acts on vagal nerves, which transmit electrical impulses to the forebrain, including the cortex, hypo-thalamus, and limbic areas.
Evidence from a limited number of studies shows that nutrient sensing in the gas-trointestinal tract may also involve chemosensing mechanisms other than the taste receptor pathways. This alternative route of nutrient sensing is known as the postinges-tive effect, which can modulate flavor preference, food intake, and mood. For example, the absence of Tas1R3, TRPM5, or PI3 receptor type 3 did not completely abolish the detection of sweet or umami substances by the mouse intestine. Furthermore, trans-genic mice lacking taste receptor-mediated signaling components (e.g., gut Tas1R3) still exhibit the postingestive effect. Results from intraduodenal infusion studies indi-cate that nutrient sensing independent of the taste receptor-mediated taste signal trans-duction originates in the upper part of the small intestine. The possible underlying mechanisms include the composition of food (e.g., content of protein, AA, carbohy-drate, fatty acids), production of metabolites in the intestinal lumen and mucosa (Table 11.1), stimulation of vagal nerve activity, changes in intestinal secretion of hormones and other factors, as well as NMDA- and iGluRs-dependent cell signaling.
use of AA in cosmetic AnD toiletry ProDucts
AA have a high water-holding capacity and, thus, are used as moisturizing factors in cosmetics (particularly creams and emulsions) to retain water in the skin. Typical

385Physiological Functions of Amino Acids
© 2010 Taylor & Francis Group, LLC
cosmetics contain ~40% AA and ~12% pyrrolidone carboxylic acid (formed from the cyclodehydration of glutamic acid). Generally speaking, serine is the most abun-dant AA in the mixture of moisturizing factors, followed (in the descending order of decrease) by (1) citrulline; (2) alanine, glycine, aspartic acid, and threonine; (3) leucine, ornithine, and tyrosine; (4) lysine; (5) valine, arginine, and histidine; (6) phenylalanine; (7) glutamic acid; and (8) proline. Some cosmetic products may con-tain 10% or more arginine as a surfactant neutralizer. Furthermore, current cleansing products contain glutamic acid, glycine, alanine, or β-alanine that are condensed with fatty acids via acylation. Additionally, lysine condensed with fatty acids is widely used to prepare lubricating cosmetic powders. Finally, some hair conditioner products contain glutamic acid, glycine, or arginine to obtain different pH values in solutions. Notably, these AA-based “environmentally friendly” materials have low irritation to the skin and are biodegradable surfactants.
EFFICACY AND SAFETY OF DIETARY AA SUPPLEMENTATION
efficAcy AnD sAfety of AA suPPlementAtion
Crystalline AA in the diet are directly available for absorption by the small intestine. Therefore, they are absorbed into enterocytes and appear in the portal vein more rapidly than peptide-bound AA released from protein digestion. This may result in a transient imbalance among AA in the systemic circulation, the extent of which likely depends on both the quality and quantity of dietary protein. Such a phenom-enon raises a question about the bioequivalence of supplemental AA relative to AA in dietary proteins and peptides. However, experimental evidence from studies with humans, pigs, chickens, and rats consistently indicates that crystalline AA have high nutritional values when they are added to a diet deficient in those AA. Extensive research has also shown that supplementing appropriate amounts of an AA (usually 0.2–2.5% of the diet on a dry matter basis depending on AA, age, and species) is generally safe for animals. For example, supplementing up to 1% arginine, 1% glu-tamine, 2% glycine, 2% proline, or 4% glutamate in diets (on an as-fed basis) is safe for lactating sows and postweaning pigs.
AA imBAlAnce AnD AntAGonism
Results of recent studies indicate the absence of a systematic pattern of adverse effects of oral AA administration in adult humans, which precludes the selection of “no observed adverse effect level” or “lowest observed adverse effect level” as the usual approach to identify a tolerable upper level of intake for AA. Thus, investiga-tors have developed a newer method for risk assessment, named the observed safe level or the highest observed intake (Wong et al. 2011), which is defined by FAO/WHO as the highest intake level with sufficient evidence of safety.
Excessive amounts of one or more AA relative to other AA in TPN solution or enteral feeding can result in severe adverse effects, including reduced food intake, abnormal behavior, and impaired growth, owing to AA imbalances (disproportion-ate amounts of AA; a term first used by S.W. Hier in 1944) or antagonism (mutually

386 Amino Acids: Biochemistry and Nutrition
© 2010 Taylor & Francis Group, LLC
adverse and opposing actions of AA; a term first used by W.L. Brickson in 1948). AA imbalances may occur among AA regardless of their chemical structure and can be prevented by addition of one or more of the limiting AA to the diet. In contrast, AA antagonism commonly occurs among chemically or structurally related AA (e.g., lysine–arginine–ornithine, leucine–isoleucine–valine, and threonine–trypto-phan) and can be overcome by the addition of a chemically or structurally similar AA. AA imbalance or antagonism may result from (1) impairment of intestinal AA absorption and transport by extraintestinal cells, (2) disturbance of AA metabo-lism and homeostasis, (3) reduced generation of signaling molecules (e.g., GABA, NO, CO, and H2S), and (4) excess production of toxic substances (e.g., ammonia and homocysteine). Thus, like all other nutrients (e.g., glucose, fatty acids, miner-als, and vitamins), excessive amounts of supplemental AA or their metabolites (via intravenous or enteral administration) can be toxic to organisms and this must be avoided in dietary formulation and clinical therapy. Safety levels for AA supple-mentation can be established by well-controlled studies with humans and other ani-mals. There may be species differences in AA imbalance or antagonism such that different kinds of animals tolerate different ratios of dietary AA. Likewise, within the same species, nutritional and physiological factors [e.g., dietary intakes of nutri-ents (such as total amounts of protein, energy, and vitamins), developmental stage, and endocrine status] may also affect AA imbalance and antagonism.
ArGinine As An exAmPle for the sAfety of AA suPPlementAtion
Let us use l-arginine as an example for the safety of AA supplementation. l-Argi-nine is stable under sterilization conditions (e.g., high temperature and high pressure) and is not toxic to cells (Tsubuku et al. 2004). Thus, its administration at an appro-priate dose, chemical form, and means is safe for animals including humans. For example, neonatal pigs, growing-finishing pigs, pregnant pigs, and adult rats tolerate large amounts of chronic supplemental l-arginine–HCl (at least 0.62, 0.32, 0.21, and 2.14 g arginine/kg body weight per day, respectively) administered via enteral diets without any adverse effects. Additionally, long-term intravenous infusion of l-arginine–HCl to ewes at 81 mg/kg body weight per day between days 60 and 147 (term) of gestation is safe for both mother and fetus. On the basis of the finding that the intake of dry matter by adult humans is ~10% of that by adult rats, an adult human can likely tolerate an enteral supplemental dose of l-arginine of at least 0.21–0.57 g/kg body weight/day (or 15–40 g/day for a 70-kg subject).
In support of the data from animal studies, intravenous l-arginine infusion (up to 0.5 g l-arginine–HCl/kg body weight for infants or 30 g l-arginine–HCl for an adult over 30–60 min) or oral administration of l-arginine (9 g l-arginine–HCl/day for an adult) generally has no adverse effects on humans. In a double-blind, placebo-controlled trial with 16 healthy adult males, oral administration of 20 g l-arginine/day for 4 weeks did not result in any adverse effect as determined using standard clinical chemistry indices. Likewise, healthy adults could tolerate oral administra-tion of 40 g l-arginine/day for 1 week (duration of the study). Similarly, results from other trials indicated no side effects of oral administration of 21 and 42 g arginine/day to patients with hypercholesterolemia and cystic fibrosis for 4 and 6 weeks,

387Physiological Functions of Amino Acids
© 2010 Taylor & Francis Group, LLC
respectively. It is important that arginine be taken in divided doses on each day of administration to (1) prevent gastrointestinal tract disorders due to abrupt production of large amounts of NO; (2) increase the availability of circulating arginine over a longer period of time; and (3) avoid a potential imbalance among AA.
However, higher oral doses of l-arginine–HCl (>9 g/day) are occasionally associ-ated with nausea, gastrointestinal discomfort, and diarrhea for some subjects, which may result from a rapid and excess production of NO by the gastrointestinal tract and from impaired intestinal absorption of other dietary basic AA (lysine and histidine). Also, supplementing 4% or more arginine to diets for animals can cause skin lesions, reduction of food intake, and growth depression. A solution to this potential problem may be the alternative use of l-citrulline, a precursor for arginine synthesis. As a neutral AA, l-citrulline does not compete with basic AA for transport by cells, its conversion to arginine consumes 1 mol of ammonia in the form of aspartate, and its administration does not require equimolar HCl. Thus, enteral or parenteral l-citrul-line may be particularly useful for patients with elevated ammonia concentrations, impaired l-arginine transport, enhanced intestinal l-arginine catabolism, or a high activity of constitutively expressed arginase. Finally, because excessive production of NO is destructive to cells, it would not be advisable to administer l-arginine to animals or patients with severe infections, active inflammatory or autoimmune disorders, active malignancy (e.g., late stages of tumorigenesis), or pathological angiogenesis.
SUMMARY
By serving as substrates for the synthesis of both polypeptides and other nitrogenous substances that have enormous physiological significance, AA have both nutritional and regulatory roles in animals. Cell signaling, protein modifications, antioxida-tive defense, chemical sensing, and epigenetic regulation of transcription are five emerging roles for AA and their metabolites in organisms. These nutrients are essen-tial to the functions of all cell types and, therefore, whole-body homeostasis, sur-vival, growth, and development. AA play important roles in preventing metabolic and infectious diseases, and in treating certain disorders in digestive, neurological, muscular, reproductive, and cardiovascular systems. Increasing evidence suggests important roles for d-alanine, d-aspartate, and d-serine in neuroendocrine function as well as for d-alanine in intracellular osmotic regulation in certain aquatic animals. Along with l-glutamate and glycine, the d-AA modulates the activity of the NMDA receptor, which plays critical roles in synaptic plasticity, memory storage, excito-toxicity, neuronal development, and behavior. When diets cannot provide adequate amounts of certain AA (e.g., arginine, glutamine, glutamate, glycine, proline, and tryptophan), their supplementation can beneficially prevent AA deficiency, enhance food intake, protect cells from oxidative stress, optimize immune response, improve health, modulate behavior, and alter body composition (e.g., an increase in skeletal muscle and a decrease in white adipose tissue). When using AA in dietary supple-mentation and medical therapy, their chemical properties, balance, and antagonism must be taken into consideration to maximize the desired nutritional and physiologi-cal effects and prevent any undesirable outcomes.

388 Amino Acids: Biochemistry and Nutrition
© 2010 Taylor & Francis Group, LLC
REFERENCES
Abe, H., N. Yoshikawa, M.G. Sarower, and S. Okada. 2005. Physiological function and metab-olism of free d-alanine in aquatic animals. Biol. Pharm. Bull. 28:1571–1577.
Agostinelli, E., M.P. Marques, R. Calheiros, F.P. Gil, G. Tempera, N. Viceconte, V. Battaglia, S. Grancara, and A. Toninello. 2010. Polyamines: Fundamental characters in chemistry and biology. Amino Acids 38:393–403.
Bieber, L.L. 1988. Carnitine. Annu. Rev. Biochem. 57:261–283.Billard, J.-M. 2012. d-Amino acids in brain neurotransmission and synaptic plasticity. Amino
Acids 43:1851–1860.Bouillaud, F. and F. Blachier. 2011. Mitochondria and sulfide: A very old story of poisoning,
feeding, and signaling? Antioxid. Redox. Signal 15:379–391.Brasse-Lagnel, C.G., A.M. Lavoinne, and A.S. Husson. 2010. Amino acid regulation of mam-
malian gene expression in the intestine. Biochimie 92:729–735.Bringaud, F., M.P. Barrett, and D. Zilberstein. 2012. Multiple roles of proline transport and
metabolism in trypanosomatids. Front. Biosci. 17:349–374.Brosnan, J.T. and M.E. Brosnan. 2007. Creatine: Endogenous metabolite, dietary, and thera-
peutic supplement. Annu. Rev. Nutr. 27:241–261.D’Aniello, A. 2007. d-Aspartic acid: An endogenous amino acid with an important neuroen-
docrine role. Brain Res. Rev. 53:215–234.Dar, A.C. and K.M. Shokat. 2011. The evolution of protein kinase inhibitors from antagonists
to agonists of cellular signaling. Annu. Rev. Biochem. 80:769–795.Dasgupta, M., J.R. Sharkey, and G. Wu. 2005. Inadequate intakes of indispensable amino
acids among homebound older adults. J. Nutr. Elderly 24:85–99.Faure, C., A. Raynaud-Simon, A. Ferry, V. Daugé, L. Cynober, C. Aussel, and C. Moinard.
2012. Leucine and citrulline modulate muscle function in malnourished aged rats. Amino Acids 42:1425–1433.
Fernstrom, J.D. 2012. Large neutral amino acids: Dietary effects on brain neurochemistry and function. Amino Acids. doi: 10.1007/s00726-012-1330-y.
Folk, J.E., M.H. Park, S.I. Chung, J. Schrode, E.P. Lester, and H.L. Cooper. 1980. Polyamines as physiological substrates for transglutaminases. J. Biol. Chem. 255:3695–3700.
Friedman, M. and C.E. Levin. 2012. Nutritional and medicinal aspects of d-amino acids. Amino Acids 42:1553–1582.
Gui, T., Y. Sun, A. Shimokado, and Y. Muragaki. 2012. The roles of mitogen-activated pro-tein kinase pathways in TGF-β-induced epithelial mesenchymal transition. J. Signal Transduction. doi:10.1155/2012/289243.
Kharitonov, S.A., G. Lubec, B. Lubec, M. Hjelm, and P.J. Barnes. 1995. l-Arginine increases exhaled nitric oxide in normal human subjects. Clin. Sci. (Lond.) 88:135–139.
Kots, A.Y., K. Bian, and F. Murad. 2011. Nitric oxide and cyclic GMP signaling pathway as a focus for drug development. Curr. Med. Chem. 18:3299–3305.
Lei, J., D.Y. Feng, Y.L. Zhang, F.Q. Zhao, Z.L. Wu, A. San Gabriel, Y. Fujishima, H. Uneyama, and G. Wu. 2012. Nutritional and regulatory role of branched-chain amino acids in lac-tation. Front. Biosci. 17:2725–2739.
Li, P., Y.L. Yin, D.F. Li, S.W. Kim, and G. Wu. 2007. Amino acids and immune function. Br. J. Nutr. 98:237–252.
Li, X.L., F.W. Bazer, H. Gao, W. Jobgen, G.A. Johnson, P. Li, J.R. McKnight, M.C. Satterfield, T.E. Spencer, and G. Wu. 2009. Amino acids and gaseous signaling. Amino Acids 37:65–78.
Rhoads, J.M. and G. Wu. 2009. Glutamine, arginine, and leucine signaling in the intestine. Amino Acids 37:111–122.
San Gabriel, A. and H. Uneyama. 2012. Amino acid sensing in the gastrointestinal tract. Amino Acids. doi: 10.1007/s00726-012-1371-2.

389Physiological Functions of Amino Acids
© 2010 Taylor & Francis Group, LLC
Shewchuk, L.D., V.E. Baracos, and C.J. Field. 1997. Dietary l-glutamine supplementation reduces the growth of the Morris Hepatoma 7777 in exercise-trained and sedentary rats. J. Nutr. 127:158–166.
Smriga, M. and K. Torii.2003. l-Lysine acts like a partial serotonin receptor 4 antagonist and inhibits serotonin-mediated intestinal pathologies and anxiety in rats. Proc. Natl. Acad. Sci. USA 100:15370–15375.
Suryawan, A. and T.A. Davis. 2011. Regulation of protein synthesis by amino acids in muscle of neonates. Front. Biosci. 16:1445–1460.
Tsubuku, S., K. Hatayama, K. Mawatari, M. Smriga, and T. Kimura. 2004. Thirteen-week oral toxicity study of l-arginine in rats. Int. J. Toxicol. 23:101–105.
Wong, A.W., B.A. Magnuson, K. Nakagawa, and R.G. Bursey. 2011. Oral subchronic and genotoxicity studies conducted with the amino acid, l-glutamine. Food Chem. Toxicol. 49:2096–2102.
Wu, G. 2009. Amino acids: Metabolism, functions, and nutrition. Amino Acids 37:1–17.


391
© 2010 Taylor & Francis Group, LLC
Inborn Errors of Amino Acid Metabolism
The term “inborn errors of metabolism” was coined in 1908 by the British physi-cian Archibald Garrod who reported the first case of inherited disorders of cystine metabolism in humans. Since then, more than 75 disorders of inborn metabolism of AA have been reported for humans. Many of these diseases are autosomal recessive disorders as two copies of the recessive, defective gene (one from each parent) occur on autosomal chromosomes. Clinical diagnosis often includes analyses of metabo-lites in the plasma, urine, and cerebrospinal fluid. Concentrations of AA metabo-lites in these fluids depend on a pleura of factors, including: (1) digestion of dietary protein, (2) intestinal absorption of AA into the portal circulation, (3) uptake of AA from the plasma by extraintestinal tissues, (4) cell-specific synthesis and catabolism of AA, (5) intracellular protein turnover (synthesis and degradation), (6) reabsorption of luminal AA by the renal proximal tubules into the blood, and (7) excretion of AA by the kidneys. Thus, changes in AA concentrations in physiological fluids reflect complex biochemical processes and should be interpreted carefully.
Because of their physicochemical properties, excessive AA in the circulation are removed from the body through excretion in the urine. All diseases are associated with alterations in the metabolism of one or more AA. However, a severe deficiency of an enzyme (an actual deficit or abnormal form of the protein) in the pathways for AA synthesis or degradation has long been recognized to result in characteristic elevations or reductions in AA and their metabolites in the plasma and urine. It is noteworthy that the changes in either a group of related AA or all AA in physiologi-cal fluids can be brought about by renal dysfunction. In the kidneys, each nephron filters the arterial blood entering this organ. The filtrate flows along the length of the nephron, where its epithelial cells normally reabsorb AA into the blood through the actions of multiple transporters. For example, three transporters encoded by three different genes are responsible for the reabsorption of imino acids and glycine in the kidney proximal tubule: a common transporter for both imino acids and glycine and a specific transporter each for glycine and imino acids. Excessive accumulation of AA and their metabolites in the kidney can cause its injury, electrolyte imbalance, acid–base imbalance, hypertension, ammonia toxicity, and even death.
Knowledge about the inborn errors of AA metabolism has led to the rapid development of “molecular medicine” during the past half-century. Many of these diseases are inherited in an autosomal recessive manner, meaning that the defec-tive gene responsible for the disorder is located on an autosome and two copies of the defective gene (one inherited from each parent) are required for the expres-sion of an inborn error of metabolism. Diseases resulting from the inborn errors of AA metabolism in humans are summarized in Table 12.1 and are discussed in
12

392 Amino Acids: Biochemistry and Nutrition
© 2010 Taylor & Francis Group, LLC
TABLE 12.1Inborn Errors of AA Metabolism
AA or Related SubstanceName of Disease or
Disorder Cause
1. All AAAll AA Fanconi syndrome Defect in renal reabsorption of AA
All AA Galactosemia Deficiency of G1PUT
All AA Wilson’s disease Defect in hepatic copper-binding P-type ATPase
2. Basic AAArginine, lysine, and ornithine Lysinuric protein intolerance Defect in the transport of basic AA
Ornithine Gyrate Deficiency of ornithine aminotransferase
3. Branched-Chain AAIsoleucine, leucine, and valine Maple syrup urine Deficiency of BCKA dehydrogenase
Leucine Isovaleric acidemia Deficiency of isovaleric acid CoA dehydrogenase
Isoleucine Methylbutyric acidemia Deficiency of 2-methylbutyryl-CoA dehydrogenase
4. CarnitineCarnitine Carnitine deficiency Defect in carnitine transport
Trimethyllysine (TML) Carnitine deficiency Deficiency of TML dioxygenase
5. CreatineArginine and glycine Creatine deficiency Deficiency of AGAT
Guanidinoacetate Creatine deficiency Deficiency of guanidinoacetate methyltransferase
Creatine Creatine deficiency Defect in creatine transporter
6. GlutamateGABA Neurological dysfunction Deficiency of GABA transaminase
Glutamate Hypoargininemia Deficiency of P5C synthase
Glutamate HI/HA syndrome Superactivity of GDH
7. GlutamineGlutamine (Gln) Glutamine deficiency Deficiency of Gln synthetase
Glutamine Hyperglutaminemia Deficiency of glutaminase
8. GlutathioneGlutathione Glutathione deficiency Deficiency of γ-glutamyl-cysteine
synthetase
Glutathione (GSH) Glutathione deficiency Deficiency of GSH synthetase
5-Oxoproline 5-Oxoprolinuria Deficiency of 5-oxoprolinase
9. GlycineDimethylglycine Glycine synthesis defect Deficiency of dimethylglycine
dehydrogenase

393Inborn Errors of Amino Acid Metabolism
© 2010 Taylor & Francis Group, LLC
TABLE 12.1 (continued)Inborn Errors of AA Metabolism
AA or Related SubstanceName of Disease or
Disorder Cause
Glycine Glycinuria Defect in renal reabsorption of glycine
Glycine Ketotic hyperglycinemia Possibly due to organic acidurias
Glycine Nonketotic hyperglycinemia Deficiency of the glycine cleavage system
Glycine Sarcosinemia Deficiency of sarcosine dehydrogenase
10. HemeBilirubin Jaundice Deficiency of UGT1A1 or G6PDH
Heme Protoporphyria Defect in heme synthesis
11. HistidineHistidine Cerebromacular
degenerationDefect in renal reabsorption of imidazoles
Histidine Histidinemia Deficiency of histidinase
Histidine (His) Mastocytosis Deficiency of His decarboxylase
Histidine Urocanic aciduria Deficiency of urocanase
12. Phenylalanine and TyrosinePhenylalanine (Phe) Phenylketonuria, type-1 Deficiency of Phe hydroxylase
Phenylalanine Phenylketonuria, type-2 Deficiency of tetrahydrobiopterin
Tyrosine Albinism Deficiency of tyrosinase
Tyrosine Alkaptouria (black urine disease)
Deficiency of homogentisate oxidase
Tyrosine Hypertyrosinemia Deficiency of tyrosine transaminase
Tyrosine Pheochromocytoma Excessive catabolism of tyrosine to form catecholamines
Tyrosine Tyrosinosis Deficiency of p-hydroxyphenylpyruvate oxidase
13. Proline and HydroxyprolineHydroxyproline Hyperhydroxyprolinemia Deficiency of hydroxyproline
oxidase
Proline, hydroxy-proline, and glycine
Iminoglycinuria Defect in the proton-coupled AA transporter gene
Proline Disorder of proline and hydroxyproline dipeptides
Deficiency of prolidase
Proline (Pro) Type-I hyperprolinemia Deficiency of Pro dehydrogenase
Proline Type-II hyperprolinemia Deficiency of P5C dehydrogenase
14. PurinesPurine Gout Superactivity of PRPS and
deficiency of HGPRT
continued

394 Amino Acids: Biochemistry and Nutrition
© 2010 Taylor & Francis Group, LLC
TABLE 12.1 (continued)Inborn Errors of AA Metabolism
AA or Related SubstanceName of Disease or
Disorder Cause
Purine Immunodeficiency Deficiency of adenosine deaminase
Purine Immunodeficiency Deficiency of purine nucleoside phosphorylase
Purine Kidney stone and failure Deficiency of APRT
Purine Lesch–Nyhan syndrome Almost complete deficiency of HGPRT
Purine Muscle weakness Myoadenylate deaminase deficiency
Purine Xanthinuria Deficiency of xanthine oxidase
Purine ADSL deficiency Deficiency of ADSL
15. PyrimidinesPyrimidine β-Aminoisobutyric aciduria Deficiency of AIB:glutamate
transaminase
Pyrimidine Familial pyrimidinemia Deficiency of dihydropyrimidine dehydrogenase
Pyrimidine Hyper-β-alaninemia Deficiency of β-alanine:α-ketoglutarate transaminase
Pyrimidine Orotic aciduria Deficiency of uridine monophosphate synthase or the urea cycle
16. SerineSerine Hypophosphatasia Deficiency of alkaline phosphatase
Serine Hyposerinemia Deficiency of phosphoglycerate dehydrogenase
17. Sulfur-Containing AACystine Cystinuria Defect in renal transport of cystine
Cystine Cystinosis Defect in cystine transport across lysosomal membrane
Methionine Homocyst(e)inuria Deficiency of cystathionine synthetase
Methionine Cystathioninuria Deficiency of cystathionase
Methionine Hypermethioninemia Deficiency of methionine adenosyltransferase
18. TryptophanTryptophan Carcinoid Excessive tryptophan catabolism
Tryptophan Hartnup Defect in transport of tryptophan and other neutral AA
19. The Urea CycleAmmonia Hyperammonemia Deficiency of carbamoyl phosphate
synthetase I
Arginine Hyperargininemia Deficiency of type-1 arginase

395Inborn Errors of Amino Acid Metabolism
© 2010 Taylor & Francis Group, LLC
the following sections. Some of these disorders also occur in animals but they are less studied.
INHERITED DISEASES RESULTING FROM DISORDERS OF AA METABOLISM
All or most AA
Fanconi syndrome results from a general defect in the transport of all AA, bicar-bonate, glucose, phosphate, and uric acid by the proximal renal tubules. These sub-stances cannot be reabsorbed from the lumen of the renal tubules into the blood, leading to their elevated excretion in the urine. Inhibition of the endocytotic process
TABLE 12.1 (continued)Inborn Errors of AA Metabolism
AA or Related SubstanceName of Disease or
Disorder Cause
Argininosuccinate Argininosuccinic aciduria Deficiency of argininosuccinate lyase
Citrulline Hypercitrullinemia Deficiency of argininosuccinate synthase
Glutamate Hyperammonemia Deficiency of NAG synthase
Ornithine Hyperornithinemia Deficiency of ornithine carbamoyltransferase
Ornithine HHH syndrome Mutations in mitochondrial ornithine transporter 1
20. Other Organic AciduriasGlycine and hydroxy-proline Hyperoxaluria Defect in oxidation of glycine and
hydroxyproline
Isoleucine, methionine, threonine, valine
Propionic acidemia Deficiency of propionyl-CoA carboxylase
Isoleucine, methionine, threonine, valine
Methylmalonic acidemia Deficiency of methylmalonyl-CoA mutase
Lysine and tryptophan Ketoadipic acidemia Deficiency of 2-ketoadipate dehydrogenase
Lysine and tryptophan Glutaric acidemia Deficiency of glutaryl-CoA dehydrogenase
Note: ADSL, adenylosuccinate lyase; AGAT, arginine:glycine amidotransferase; AIB, β-aminoisobutyrate; APRT, adenine phosphoribosyltransferase; BCKA, branched-chain α-ketoacid; G1PUT, galactose-1-phosphate uridyltransferase; G6PDH, glucose-6-phosphate dehydrogenase; HHH, hyperornithin-emia, hyperammonemia and homocitrullinemia; HI/HA syndrome, hyperinsulinism and hyperammonemia; HGPRT, hypoxanthine-guanine phosphoribosyltransferase; P5C, pyrroline-5-carboxylate; NAG, N-acetylglutamate; PRPS, phosphoribosylpyrophosphate synthetase; UGT1A1, diphosphoglucuronate glucuronosyltransferase 1A1.

396 Amino Acids: Biochemistry and Nutrition
© 2010 Taylor & Francis Group, LLC
mediated by the megalin membrane glycoprotein may primarily be responsible for the Fanconi syndrome. Subjects with this disease exhibit acidosis, aminoaciduria, cystinosis, dehydration, glycosuria, growth failure, hyperchloremia, hyperuricos-uria, hypokalemia, liver enlargement, osteomalacia, and proteinuria (Bröer and Palacín 2011).
Galactosemia results from a deficiency of galactose-1-phosphate uridyltrans-ferase, which converts galactose-1-phosphate and uridine triphosphate into uridine diphosphate galactose. The patients have elevated levels of (1) galactose and galacti-tol (a product of galactose degradation by aldose reductase) in the plasma and urine and (2) AA in the urine (generalized aminoaciduria), but reduced concentrations of glucose in the plasma. Infants with galactosemia exhibit lethargy, vomiting, diar-rhea, failure of growth, and jaundice. The progression of this disease leads to ataxia, cataract, enlargement and cirrhosis of the liver, convulsions, premature ovarian fail-ure, and mental retardation.
Wilson’s disease (also known as hepatolenticular degeneration) results from a defect of a hepatic type of copper-binding P-type ATPase, which is responsible for directing the efflux of copper from the liver. Thus, copper is not excreted from the liver into the bile or into the blood circulation, resulting in (1) accumulation of cop-per in the liver, brain, kidney, red blood cells, and urine, and (2) a decrease in serum Cu2+ and serum ceruloplasmin. Interestingly, affected subjects exhibit increased uri-nary excretion of all AA (generalized aminoaciduria) possibly due to the impaired reabsorption of AA from the lumen of the proximal renal tubules into the blood, without increased concentrations of AA in the blood. Relatively large amounts of peptides are also excreted in the urine of individuals with Wilson’s disease likely because of their impaired renal transport. These patients suffer from liver damage, neurological dysfunction, skeletal musculature abnormality, and personality change. The patients also have a green or a golden pigment ring around the corner of their eyes, due to the deposition of copper in the cell membrane.
BAsic AA
Lysinuric protein intolerance is an exceedingly rare condition that results from the defects in the absorption of basic AA (arginine, lysine, and ornithine) from the lumen of the small intestine and in the reabsorption of these AA from the lumen of the renal proximal tubules into the blood (Chapter 2). Thus, concentrations of arginine, lysine, and ornithine are reduced in the plasma but are elevated in the urine (due to increased excretion from the kidneys). The affected individuals also have elevated levels of glutamine, glycine, and orotic acid in the plasma and urine primarily due to increased synthesis (Chapter 3). The patients experience hypoar-gininemia, growth retardation, hyperammonemia, vomiting, convulsions, coma, as well as skeletal, immunological, pulmonary, renal, and cardiovascular abnor-malities. The deficiency of arginine and ornithine impairs the function of the urea cycle and leads to hyperammonemia after the consumption of a protein-rich meal.
Hyperornithinemia is caused by the deficiency of OAT. The affected subjects have elevated levels of ornithine in the plasma (up to 1.4 mM) and urine (up to 10 mM). Concentrations of glutamate, glutamine, lysine, creatine, and creatinine

397Inborn Errors of Amino Acid Metabolism
© 2010 Taylor & Francis Group, LLC
in the plasma are moderately reduced. Patients with hyperornithinemia experience two distinct disorders: (1) gyrate atrophy of the choroid and retina (progressive cho-rioretinal degeneration as an autosomal recessive trait) and (2) hyperornithinemia–hyperammonemia–homocitrullinemia syndrome. Mental retardation also occurs in these subjects.
BrAncheD-chAin AA
Maple syrup urine disease (also known as branched-chain ketoaciuria) occurs in subjects with a severe deficiency of BCKA dehydrogenase, which decarboxylates BCAA-derived BCKA into acyl-CoA (Chapter 4). This disease is characterized by (1) excretion of urine that possesses an unpleasant but sweet odor similar to that of maple syrup, (2) elevated levels of all three branched-chain AA (leucine, isoleucine, and valine) in the plasma, urine, and spinal fluid, and (3) relatively large amounts of BCKA. Patients with maple syrup urine disease suffer from pathological changes in the central nervous system, convulsions, mental retardation, respiratory distress, and feeding difficulties.
Isovaleric acidemia (also known as isovaleric aciduria) results from a deficiency of isovaleric acid CoA dehydrogenase. This enzyme catalyzes the conversion of isovale-ric acid CoA into β-methylcrotonyl-CoA in the metabolic pathway of leucine catab-olism. The affected individuals have elevated levels of: (1) isovalerate in the plasma and urine, (2) isovalerylcarnitine in the plasma, and (3) isovalerylglycine in the urine. Isovalerylcarnitine and isovalerylglycine are formed from the conjugation of isovalerate with carnitine and glycine, respectively. A characteristic feature of isovaleric acidemia is a distinctive odor of sweaty feet due to the accumulation of isovalerate in physio-logical fluids and in tissues. Infants with the acute neonatal form exhibit poor feeding, severe episodes of vomiting, and profound ketoacidosis, progressing to coma and death. These patients may experience dehydration, hypocalcemia, hepatomegaly and hyper/hypoglycemia, depressed bone marrow function, thrombocytopenia, and pancreatitis.
Methylbutyric acidemia is an autosomal recessive disorder specific to isoleucine catabolism because of a deficiency of 2-methylbutyryl-CoA dehydrogenase. This enzyme catalyzes the conversion of 2-methylbutyryl-CoA into tiglyl-CoA (Chapter 4). The affected infant typically has increased concentrations of 2-methylbutyrate, 2-methylbutyrylglycine, and 2-methylbutyrylcarnitine in their physiologic fluids (including plasma and urine). The symptoms include poor feeding, lethargy, hypo-glycemia, hypothermia, dehydration, and apnea.
cArnitine
Primary carnitine deficiency results from a deficiency of a carnitine transporter due to a mutation of the SLC22A5 gene. The metabolic problems can be triggered by periods of fasting or by illnesses such as viral infections. In this disorder, cells cannot take up carnitine from the circulation, resulting in a severe deficiency in the transfer of long-chain fatty acids from the cytoplasm to the mitochondria for β-oxidation. Clinical symptoms of this disorder may include severe brain dysfunction (encephalop-athy), a weakened and enlarged heart (cardiomyopathy), confusion, vomiting, muscle

398 Amino Acids: Biochemistry and Nutrition
© 2010 Taylor & Francis Group, LLC
weakness, and hypoglycemia (due to impaired gluconeogenesis). Some subjects may be asymptomatic. However, all affected individuals are at risk for heart failure, liver abnormality, skeletal muscle dysfunction, and possibly sudden death.
Trimethyllysine (TML) dioxygenase deficiency was recently identified as an X-linked disorder in humans. This mitochondrial enzyme, which is encoded by the TMLHE gene, catalyzes the conversion of TML to hydroxy-TML in the first step of carnitine biosynthesis. The affected subject has increased concentrations of TML and decreased concentrations of hydroxy-TML and γ-butyrobetaine in the plasma, urine, and brain. Interestingly, TMLHE deficiency is associated with autism.
creAtine
Arginine:glycine amidinotransferase (AGAT) deficiency is the third inborn error of creatine metabolism to be reported in humans. This enzyme catalyzes the first step of creatine synthesis, resulting in the formation of guanidinoacetate and ornithine from arginine and glycine (Chapter 5). The affected individuals have reduced con-centrations of guanidinoacetate and creatine in tissues, as well as reduced excretion of guanidinoacetate. The patients develop mental retardation and muscular abnor-malities (including weakness and structural myopathy). Oral administration with creatine can reverse the adverse effects of AGAT deficiency.
Guanidinoacetate methyltransferase deficiency (the first inborn error of creatine metabolism to be discovered) is an autosomal recessive disorder. This enzyme cata-lyzes the formation of creatine from guanidinoacetate and S-adenosylmethionine (Chapter 5). Guanidinoacetate is a product of arginine catabolism by AGAT. The affected individuals have excessive amounts of guanidinoacetate in body fluids but low concentrations of creatine or creatinine in tissues (including the brain as indi-cated by proton magnetic resonance). The patients exhibit impaired muscular and neurological developments, as well as neurological symptoms, including muscular hypotonia and weakness, epilepsy, and austic behavior.
The X-linked creatine transporter deficiency, which results from a mutation in the SLC6A8 gene, was the second inborn error of creatine metabolism to be discovered in humans. In this disorder, cells cannot take up creatine from the circulation, result-ing in a severe deficiency of creatine in energy metabolism in the central nervous system and muscle (Chapter 11). The affected patients exhibit X-linked mental retar-dation, expressive speech and language delay, epilepsy, developmental delay, and autistic behavior. Dietary supplementation with creatine cannot reverse the adverse effects of the creatine transporter deficiency (Braissant et al. 2011).
GlutAmAte
GABA transaminase deficiency impairs the catabolism of GABA (a product of glu-tamate decarboxylation) to form succinic semialdehyde. This disorder is character-ized by increased levels of free GABA (up to 5 μM), homocarnosine [a dipeptide of GABA and histidine (up to 25 μM)], β-alanine, and growth hormone (up to 40 ng/mL) in the plasma, as well as increased excretion of GABA in the urine. The affected

399Inborn Errors of Amino Acid Metabolism
© 2010 Taylor & Francis Group, LLC
patients experience severe psychomotor retardation, leukodystrophy, hypotonia, hyperreflexia, and growth acceleration.
Hyperinsulinism (HI) and HA syndrome results from dominantly expressed, gain-of-function mutations of GDH, which catalyzes the interconversion of glutamate into α-ketoglutarate and ammonia in the mitochondrion. This enzyme occurs widely in the brain, kidneys, liver, and pancreatic β-cells. Patients with the HI/HA syndrome have elevated levels of insulin (due to its enhanced secretion from pancreatic β-cells) and ammonia (due to GDH activation), hypoglycemia (due to hyperinsulinemia), an increased frequency of generalized seizures even in the absence of hypoglycemia, and spinocerebellar degeneration. The HI/HA syndrome can be treated with diazoxide, a KATP channel agonist to normalize concentrations of glucose and insulin in the plasma.
P5C synthase deficiency occurs in humans. This condition results in the impaired conversion of glutamate into P5C, which is the carbon backbone and a N source for the intestinal synthesis of ornithine, citrulline, and arginine (Chapter 3). Infants with this disease have low concentrations of ornithine, citrulline, and arginine but elevated levels of ammonia and glutamine in their plasma. The clinical features in the first few weeks after birth include hypotonia, dysmorphic signs, pes planus (flat feet), and clonic seizures. The progression of the disease leads to neurodegeneration, peripheral neuropathy, joint laxity, skin hyperelasticity, bilateral subcapsular cata-racts, convulsions, mental retardation, and poor growth.
GlutAmine
GS deficiency results from a mutation of the GS gene. This enzyme converts ammo-nia and glutamate into glutamine (Chapter 3). Fetuses with severe GS deficiency have intrauterine growth retardation (Häberle et al. 2006). Despite enteral or total parenteral nutrition feeding, newborn infants with a near absence of free glutamine in the serum (only 2 μM) compared with a normal value of 500–600 μM, urine (nondetectable), and CSF (only 11 μM) exhibit HA, cerebral abnormalities, and very severe neurological problems (no spontaneous movements, no responsiveness, no primitive reflexes, marked axial hypotonia, and convulsions). These patients die from multiple organ failure in the first month after birth. In a less severe case of GS deficiency, with serum glutamine concentration being 126 μM at day 16 after birth and <100 μM (~<20% of the normal value) at 3 years of age, the affected infants have HA, frequent seizures and convulsions, chronic encephalopathy, severe neu-rological disease, psychomotor retardation, and severe retardation of growth and development, but can survive up to at least 3 years of age. Thus, depending on the severity of hypoglutaminemia, GS deficiency is not always a lethal disorder early in life. The findings from this inborn error of metabolism indicate that: (1) endogenous synthesis of glutamine by the fetus and the neonate plays an essential role in main-taining their glutamine homeostasis, and (2) intake of dietary glutamine by gestating mothers or by neonates is insufficient for their optimal growth, development, health, and survival.
Phosphate-activated glutaminase deficiency occurs in patients with hereditary protein intolerance. This enzyme plays a major role in hydrolyzing glutamine into glutamate and ammonia (Chapter 4). The affected individuals have reduced numbers
400 Amino Acids: Biochemistry and Nutrition
© 2010 Taylor & Francis Group, LLC
of leucocytes and granulocytes and also exhibit brain atrophy, intellectual impair-ment, progressive cortical atrophy, and marked skeletal fragility. The patients have poor tolerance to foods containing a high level of protein, likely because of a low rate of glutamine utilization.
GlutAthione
γ-Glutamyl-cysteine synthetase deficiency is another defect in GSH biosynthesis. This enzyme catalyzes the formation of γ-glutamyl-cysteine from glutamate and cys-teine (Chapter 5). The affected individuals may have only 5% of reduced glutathi-one in cells, including erythrocytes, leading to a reduced capacity for antioxidative defense and a short life span for red blood cells. Thus, the patients suffer from spi-nocerebellar degeneration and hereditary hemolytic anemia, while having increased risk for infectious disease.
GSH synthetase deficiency is characterized by reduced concentrations of GSH in cells. This enzyme catalyzes the condensation of γ-glutamylcysteine and glycine to form glutathione (Chapter 5). Subjects with GSH synthetase deficiency have unex-plained jaundice at birth and markedly elevated excretion of 5-oxoproline in the urine. The affected individuals exhibit oxidative stress, progressive neurologic dis-orders, hemolytic anemia, and metabolic acidosis.
5-Oxoprolinuria (possibly an autosomal recessive disorder) results from a defi-ciency of 5-oxoprolinase. This enzyme converts 5-oxoproline into glutamate in the pathway of GSH synthesis (Chapter 5). The patients experience recurrent episodes of vomiting, enterocolitis, diarrhea, urolithiasis, and abdominal pain. Despite normal glomerular and tubular function tests, the affected subjects have elevated levels of 5-oxoproline in the plasma and massive excretion in the urine.
Glycine
Dimethylglycine dehydrogenase (DMGDH) deficiency results from a mutation of the DMGDH gene and has recently been reported for one patient. This mitochondrial enzyme catalyzes the demethylation of dimethylglycine to form sarcosine in the pathway of glycine synthesis from choline (Chapter 3). The affected subject (diag-nosed at 38 years of age) has elevated levels of dimethylglycine in the urine and serum, which are 20- and 100-fold higher than the normal values, respectively. The patient has chronic muscle weakness and fatigue and a fish-like body odor, but oth-erwise has no central nervous system symptoms. The intensity of the odor increases with physiological stress (e.g., illness).
Glycine encephalopathy (also known as nonketotic hyperglycinemia or NKHG) is an autosomal recessive disorder. This disease results primarily from a deficiency of the glycine cleavage system, which converts glycine into ammonia and CO2 in the mitochondria (Chapter 4). Thus, the affected subjects have elevated levels of glycine in the plasma (up to 1.8 mM), CSF (up to 0.28 mM), tissues (particularly the brain), and urine. There are several forms of glycine encephalopathy, with varying severity of neurological dysfunction. NKHG is coined to distinguish it from “ketotic hypergly-cinemia” in glycinemia, propionic acidemia, and other inherited metabolic disorders.

401Inborn Errors of Amino Acid Metabolism
© 2010 Taylor & Francis Group, LLC
Glycinemia is characterized by ketotic hyperglycinemia. The possible cause of this disorder is enzymatic inhibition of the catabolism of glycine and related AA by toxic metabolites generated in organic acidurias. The clinical symptoms include ketosis, dehydration, lethargy, vomiting, neutropenia, hypo-γ-globulinemia, and mental retardation. Affected infants have elevated levels of ketone bodies, glycine (up to 1.5 mM), and other AA (e.g., serine, alanine, isoleucine, and valine) in the plasma, as well as increased urinary excretion of ketone bodies and glycine.
Glycinuria is a sex-linked disease that has been reported for females. This disease results from a defect in the renal reabsorption of glycine into blood, leading to exces-sive excretion of glycine in the urine. Most of the patients experience nephrolithiasis. Subjects with glycinuria have a normal concentration of glycine in the plasma but excrete 0.5–1 g of glycine in the urine daily.
Sarcosinemia (also known as hypersarcosinemia) results from a deficiency of sar-cosine dehydrogenase, a mitochondrial enzyme that catalyzes the demethylation of sarcosine to form glycine (Chapter 3). The affected subjects have elevated levels of sarcosine in the plasma (up to 0.76 mM) and have increased urinary excretion (up to 8 mmol/day). The patients may experience low appetite, vomiting, growth retarda-tion, hypertension, hypoactivity, cardiomyopathy, irritability, muscle tremors, and mental retardation.
heme
Gilbert’s syndrome or Crigler–Najjar syndrome is a rare disorder caused by the abnormal metabolism of bilirubin, resulting in an inherited form of nonhemolytic jaundice. Specifically, jaundice results from hyperbilirubinemia due to a defi-ciency of uridine diphosphoglucuronateglucuronosyl-transferase 1A1 (UGT1A1) or glucose-6-phosphate dehydrogenase (G6PDH). UGT1A1 catalyzes the degradation of bilirubin derived from heme, which is released from the breakdown of hemo-globin due to the lysis of red blood cells (Chapter 5). Therefore, a deficiency of this enzyme results in the accumulation of bilirubin in the plasma (>18 mg/L). There are two UGT1A1-deficiency syndromes depending on either partial or a complete absence of the enzyme: Gilbert’s syndrome (mild phenotype, type-2) and Crigler–Najjar syndrome (intermediate phenotype, type-2, and severe phenotype, type-1). G6PDH catalyzes the conversion of NADP+ into NADPH in the pentose phosphate pathway of glucose metabolism. Limited production of NADPH reduces the anti-oxidative capacity of the body and increases the vulnerability of red blood cells to oxidative stress. This may shorten the life span of these cells, causing them to release more hemoglobin for the production of heme and bilirubin. Patients with hyperbili-rubinemia exhibit a yellowish color in the skin, eyes, and mucus membranes.
Protoporphyria (an autosomal dominant trait) results from a deficiency of ferro-chelatase (also known as heme synthase), which catalyzes the chelation of porphyrin with Fe2+ to form heme (synthesized from glycine and succinate) (Chapter 5). The affected subjects have elevated levels of protoporphyrin in the plasma, tissues, and urine. The patients may experience very painful acute photosensitivity, skin lesions, hepatobiliary disease, and liver failure. Prolonged exposure to the sun can lead to edema and blistering in the skin.

402 Amino Acids: Biochemistry and Nutrition
© 2010 Taylor & Francis Group, LLC
histiDine
Histidinemia results from a deficiency of histidase (the enzyme that converts histi-dine into urocanate and NH4
+), leading to elevated levels of histidine in the plasma (as much as 15 times the normal value), as well as increased urinary excretion of histidine, imidazolepyruvate, imidazolelactate, and imidazoleacetate (Chapter 4). Subjects with histidinemia have little urocanic acid in the skin or sweat. This disease is associated with mental retardation and speech defects.
Mastocytosis is caused by excessive production of histamine by histidine decar-boxylate in mast cells (Chapter 5). The affected subjects have an excessive number of apparently normal mast cells in the skin and, occasionally, in other tissues and in organs (including the bone marrow, gastrointestinal tract, liver and spleen, central nervous system, heart, or blood). Patients with this disorder have elevated urinary excretion of histamine and its metabolite (1-methylimidazole-4-acetate). The symp-toms of mastocytosis include a severe urticarial skin rash (commonly referred to as hives), edema, enlargement of the liver and spleen, erythema, diarrhea, and tachy-cardia. Drug therapy (histamine H1 and H2 blockers and the avoidance of triggering factors) focuses on stabilizing mast cell membranes, reducing the severity of the attacks, and blocking the action of inflammatory mediators.
Tay–Sachs disease. Cerebromacular degeneration occurs because of a defect in the renal reabsorption of imidazole compounds into the blood. This disease is inherited as a dominant trait. The patients have increased urinary excretion of anserine, carnosine, histidine, and methylhistidines. Subjects with cerebromacu-lar degeneration suffer from blindness, deafness, paralysis, and disorders of the central nervous system. Notably, a cherry red spot is seen in the macula on eye examination.
Urocanic aciduria (an autosomal recessive disorder) results from a deficiency of urocanase (also known as urocanate hydratase). In the liver, urocanase converts urocanic acid (a product of histidine catabolism by histidinase) into 4-imidazolone-5-propionic acid and subsequently into glutamate. This disorder is characterized by elevated levels of urocanic acid in both the plasma and urine. The clinical symptoms, which are generally benign and various, include intermittent ataxia, psychomotor dysfunction, aggressive behavior, and mental retardation.
PhenylAlAnine AnD tyrosine
Albinism is caused by a deficiency of tyrosinase (tyrosine hydroxylase) in melano-cytes. This enzyme oxidizes tyrosine into dopa (an intermediate in melanin bio-synthesis) by a BH4-dependent mechanism (Chapter 5). The defect in melanin production results in reduced or no pigment in the skin, hair, and eyes. Albinism is associated with a number of vision defects, such as poor development of retinal pigment epithelium, photophobia, nystagmus (irregular rapid movement of the eyes back and forth, or in circular motion), optic nerve hypoplasia (underdevelopment of the optic nerve), and astigmatism (blurred vision due to the inability of the optics of the eye to focus a point object into a sharp focused image on the retina). A lack of skin pigmentation increases the risk for sunburn and skin cancers.

403Inborn Errors of Amino Acid Metabolism
© 2010 Taylor & Francis Group, LLC
Alkaptonuria is caused by a deficiency of homogentisic acid oxidase, which oxidizes homogentisate into maleylacetoacetate in the metabolic pathway of phenylalanine and tyrosine catabolism. This disease is characterized by increased urinary excretion of homogentisate (up to 0.5 g/day). Urine from the patients becomes black on standing due to the oxidation of homogentisate by atmospheric oxygen. Subjects with alkaptonuria suffer from ochronosis, which is named after the characteristic pigmentation (ochre color) of the connective tissue seen on microscopic examination. Although alkapton-urics generally do not exhibit clinically adverse symptoms early in life, they subse-quently develop a darkening of the tendons and cartilages due to pigment deposition.
Hypertyrosinemia results from a deficiency of cytosolic tyrosine transaminase (oculocutaneous tyrosinemia), 4-hydroxyphenylpyruvate dioxygenase, or fumaryl-acetoacetate hydrolase (Chapter 4). This disease is characterized by elevated levels of tyrosine in the plasma (up to 3 mM) and elevated excretion in the urine (up to 2 g/day). The patients experience painful corneal erosions with photophobia, liver fail-ure, cirrhosis, skin lesions, kidney disturbances, peripheral neuropathy, and mental retardation. The treatment varies with the type of hypertyrosinemia and, in all cases, patients can benefit from a diet containing a low level of tyrosine and phenylalanine.
Hypothyroidism is a thyroid dysfunction caused by a deficiency of dehalogenase activity or a defect in the utilization of iodide in the thyroid gland (Chapter 5). The subjects lacking dehalogenase have elevated levels of monoiodotyrosine and diiodo-tyrosine in the plasma and urine after the administration of iodine. In contrast, the individuals who cannot utilize inorganic iodide fail to iodinate tyrosyl compounds in the metabolic pathway of thyroid hormone synthesis. In any case, the patients have low concentrations of triiodothyronine and thyroxine in their plasma, leading to compensatory thyroid hyperplasia followed by the degeneration of the thyroid gland and the replacement with fibrous tissue. Some of the affected subjects may experience congenital nerve deafness. Note that, in most cases, hypothyroidism is secondary (e.g., to surgery, radiation therapy, iodine deficiency, or an autoimmune disease called Hashimoto’s thyroiditis), rather than to a primary mutation, although a congenital form has been recognized.
Phenylketonuria (PKU) was the first inborn error of metabolism shown to affect the neurological function of humans (Figure 12.1). This disease results from the impaired conversion of phenylalanine into tyrosine because of a deficiency of either phenylalanine hydroxylase (autosomal recessive trait) or its essential cofactor, BH4 (Chapter 4). BH4 deficiency is caused by mutations of one of the genes encoding enzymes for the biosynthesis (GTP cyclohydrolase I or 6-pyruvoyl-tetrahydropterin synthase) or regeneration (pterin-4a-carbinolamine dehydratase or dihydropteridine reductase) (Werner et al. 2011). The patients have increased concentrations of phe-nylalanine but decreased concentrations of serotonin in the plasma. These individ-uals exhibit increased urinary excretion of phenylalanine, phenylpyruvate (due to phenylalanine degradation via an alternative transamination pathway), phenylace-tate, phenylacetylglutamine, α-hydroxyphenylpyruvate, and related compounds, but decreased urinary excretion of serotonin and 5-hydroxyindoleacetate (Centerwall and Centerwall 2000). Patients with phenylketonuria have abnormal muscle tone, dysfunctional tendon reflexes, eczema, convulsions, mental retardation, seizures, and brain damage. The mainstay of treatment for PKU is either a low-phenylalanine

404 Amino Acids: Biochemistry and Nutrition
© 2010 Taylor & Francis Group, LLC
diet (Figure 12.1) or oral administration of BH4, depending on the molecular basis of the disease.
Pheochromocytoma is a tumor of the adrenal medulla or ganglia of the sympa-thetic nervous system that produces excessive amounts of epinephrine and norepi-nephrine from tyrosine. One or more enzymes of the pathway for catecholamine synthesis are highly expressed or activated in the affected cells. This disease is characterized by increased excretion of epinephrine, norepinephrine, metanephrine, normetanephrine, and 3-methoxy-4-hydroxymandelic acid in the urine. Patients with pheochromocytoma have skin sensation, frank pain, hypertension, anxiety, dia-phoresis, headaches, weight loss, and elevated concentrations of free fatty acids and glucose (due to increases in lipolysis, glycogenolysis, and gluconeogenesis).
Tyrosinosis results from a deficiency of p-hydroxyphenylpyruvate hydroxylase (oxidase). This enzyme oxidizes p-hydroxyphenylpyruvate into homogentisate and depends on ascorbate and Cu2+ for its catalytic activity. This condition is character-ized by an elevated level of tyrosine in the plasma (up to five times the normal value), as well as an increased urinary excretion of tyrosine, acetyl-tyrosine, p-hydroxy-phenylpyruvate, hydroxyphenylacetate, and p-hydroxyphenylacetate. The patients exhibit cirrhosis, severe hypophosphatemic rickets, and renal tubular defects. A diet containing reduced phenylalanine and tyrosine can help improve the health status.
Proline AnD hyDroxyProline
Hyperhydroxyprolinemia results from a deficiency of hydroxyproline oxidase, which oxidizes hydroxyproline into Δ1-pyrroline-3-hydroxy-5-carboxylate. This condition leads to mental retardation. The affected individuals have high concentrations of hydroxyproline in the plasma (up to 0.5 mM) and urine (up to 270 mg/day), but they
FIGURE 12.1 Two siblings carrying a mutated phenylalanine hydroxylase gene. The untreated 11-year-old boy (on the left) has phenylketonuria and is severely retarded. However, his 2-year-old sister (on the right), who was diagnosed with phenylketonuria in early infancy and promptly treated with dietary therapy, has normal development. (Reproduced from Siegried, A.C. and W.R. Centerwall. Pediatrics 105:89–103. Copyright 2000, with permis-sion by the American Academy of Pediatrics.)

405Inborn Errors of Amino Acid Metabolism
© 2010 Taylor & Francis Group, LLC
have normal levels of other AA (including proline) in both physiological fluids. No abnormality is found for collagen metabolism in subjects with hydroxyprolinemia. Ingestion of a hydroxyproline-free diet or dietary supplementation with proline does not affect concentrations of hydroxyproline in the plasma or urine. It is likely that dietary hydroxyproline has different metabolic patterns than endogenously gener-ated hydroxyproline due to substrate channeling in cells and the body.
Hyperprolinemia occurs due to a deficiency of either proline oxidase (also known as PRODH, the enzyme that oxidizes proline into P5C, type I) or P5C dehy-drogenase (the enzyme that converts P5C into glutamate, type II). The patients have high concentrations of proline in the plasma (0.5–2.6 mM in type I and 0.5–3.7 mM in type II) and excrete large amounts of free and peptide-bound proline (up to 3 g/day), hydroxyproline, and glycine (up to 0.7 g/day) when concentrations of proline in the plasma exceed 0.8 mM. The high levels of proline (up to 42 mM), hydroxyproline (up to 3 mM), and glycine (up to 20 mM) in the urine are likely caused by increased glomerular filtration and impaired renal reabsorption because proline, hydroxyproline, and glycine share the same transport system (Chapter 2). The affected subjects have convulsions, mental retardation, and renal disease. The results of recent genetic and clinical studies also indicate a close association between a deficiency of PRODH and schizophrenia in humans (Willis et al. 2008).
Iminoglycinuria is an autosomal recessive abnormality of the renal transport and reabsorption of imino acids (proline and hydroxyproline) and glycine. This disorder is characterized by increased excretion of these three AA in the urine. A defect in the proton-coupled AA transporter gene SLC36A2 (PAT2) is the major factor respon-sible for iminoglycinuria. The symptoms in affected patients include hypertension, glycosuria, nephrolithiasis, mental retardation, atypical gyrate atrophy, deafness, and blindness.
Prolidase (imidodipeptidase) deficiency is an autosomal recessive disorder associ-ated with imidodipeptiduria (Figure 12.2). Molecular analysis of prolidase deficiency cases identified 13 different mutations in the prolidase gene (PEPD): six missense and four exon skipping mutations, two AA deletions, and a large genomic deletion. Since prolidase (a cytosolic enzyme) hydrolyzes dipeptides containing a C-terminal proline or hydroxyproline (Chapter 5), a deficiency of this enzyme results in the urinary excre-tion of excessive dipeptides (up to 15 mmol/day) that include glycyl–proline, gluta-myl–proline, and hydroxyproline dipeptides. The affected patients have skin ulcers (particularly on their hands and feet) (Figure 12.2), mild-to-severe mental retardation, impaired wound healing, and increased susceptibility to infections.
Purines
Adenine phosphoribosyltransferase (APRT) deficiency is an autosomal recessive disorder. APRT catalyzes the synthesis of adenosine monophosphate (AMP) from adenine and 5-phosphoribosyl-1-pyrophosphate. Patients with APRT deficiency have an impaired ability to break down dietary or endogenous adenine, which is sub-sequently oxidized by xanthine dehydrogenase via the 8-hydroxy intermediate to 2,8-dihydroxyadenine. This results in excessive production and urinary excretion of 2,8-dihydroxyadenine. Since 2,8-dihydroxyadenine is poorly soluble in urine, its
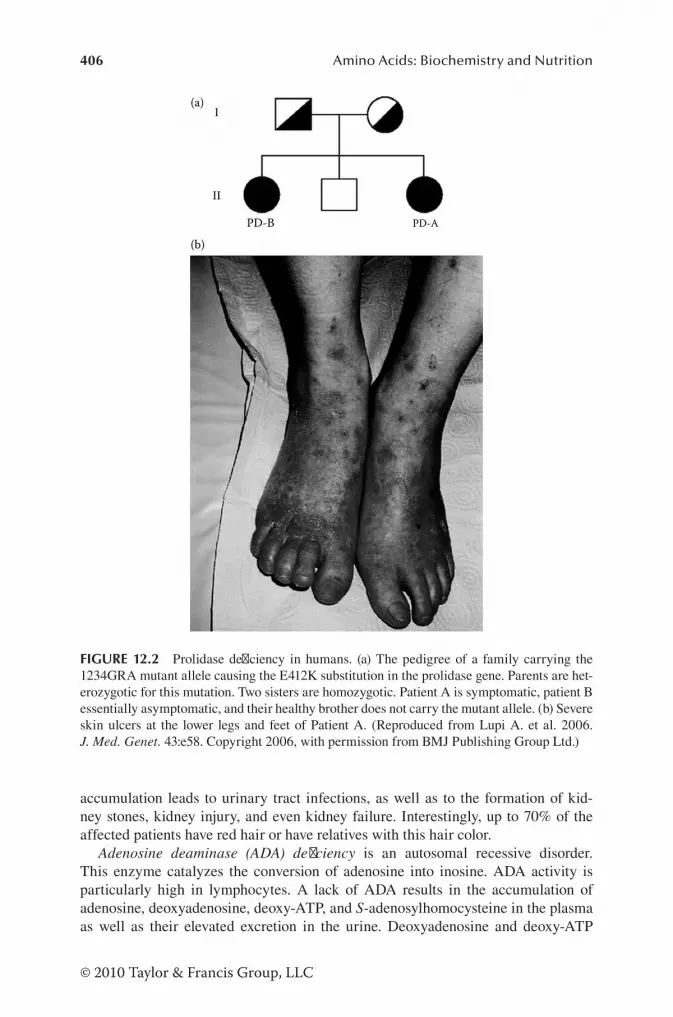
406 Amino Acids: Biochemistry and Nutrition
© 2010 Taylor & Francis Group, LLC
accumulation leads to urinary tract infections, as well as to the formation of kid-ney stones, kidney injury, and even kidney failure. Interestingly, up to 70% of the affected patients have red hair or have relatives with this hair color.
Adenosine deaminase (ADA) deficiency is an autosomal recessive disorder. This enzyme catalyzes the conversion of adenosine into inosine. ADA activity is particularly high in lymphocytes. A lack of ADA results in the accumulation of adenosine, deoxyadenosine, deoxy-ATP, and S-adenosylhomocysteine in the plasma as well as their elevated excretion in the urine. Deoxyadenosine and deoxy-ATP
FIGURE 12.2 Prolidase deficiency in humans. (a) The pedigree of a family carrying the 1234GRA mutant allele causing the E412K substitution in the prolidase gene. Parents are het-erozygotic for this mutation. Two sisters are homozygotic. Patient A is symptomatic, patient B essentially asymptomatic, and their healthy brother does not carry the mutant allele. (b) Severe skin ulcers at the lower legs and feet of Patient A. (Reproduced from Lupi A. et al. 2006. J. Med. Genet. 43:e58. Copyright 2006, with permission from BMJ Publishing Group Ltd.)

407Inborn Errors of Amino Acid Metabolism
© 2010 Taylor & Francis Group, LLC
inhibit ribonucleotide reductase and thus DNA synthesis, thereby leading to reduced proliferation and development of cells, particularly immature T and B lymphocytes and natural killer cells. Additionally, S-adenosylhomocysteine is cytotoxic to these immunocytes. Therefore, the affected subjects have a small, underdeveloped thy-mus, lymphopenia, immunodeficiency, and increased risk for infectious disease.
Adenylosuccinate lyase (ADSL, also known as adenylosuccinase) deficiency is an autosomal recessive disorder. This enzyme catalyzes several reactions in the de novo purine biosynthetic pathway (Chapter 5). In the first reaction, succinylamino-imidazolecarboxamide is converted into 5-aminoimidazole-4-carboxamide ribotide and fumarate. 5-Aminoimidazole-4-carboxamide ribotide proceeds through three more reactions to become adenylosuccinate (also called succinyladenosine mono-phosphate). ADSL cleaves adenylosuccinate into AMP and fumarate. Thus, this enzyme plays an important role in purine synthesis and also regulates metabolic processes by controlling the levels of AMP and fumarate in cells. ADSL deficiency is characterized by the appearance of succinylaminoimidazolecarboxamide and suc-cinyladenosine in the plasma, CSF, and urine. The affected individuals may have a range of symptoms that involve psychomotor retardation, epileptic seizures, and autistic features.
Gout is a single-joint arthritis usually involving a toe, less often an ankle, or a knee. This disorder is caused by the deposition of monosodium urate crystals within the joints after chronic hyperuricemia. At a physiological pH of 7.4, 98% of uric acid (the end product of purine catabolism) in the plasma is in the ionized form of urate, which is largely present as monosodium urate with a low solubility limit of about 380 μM. When urate concentrations exceed 380 μmol/L, the risk of monosodium urate crystal formation and precipitation increases. The abnor-mal activity of two enzymes results in uric acid overproduction: superactivity of phosphoribosylpyrophosphate synthetase and deficiency of hypoxanthine–guanine phosphoribosyltransferase (HGPRT). Phosphoribosylpyrophosphate synthetase converts ribose-5-phosphate and ATP into phosphoribosyl pyrophosphate. HGPRT catalyzes the reaction of hypoxanthine and guanine with 5-phosphoribosyl-1-pyro-phosphate to form inosine monophosphate and guanosine monophosphate, respec-tively, thereby playing a role in the generation of purine nucleotides through the purine salvage pathway (Chapter 5). A deficiency of HGPRT results in increased oxidation of hypoxanthine and guanine into uric acid. The symptoms of gout include a red, tender, hot, and swollen joints, as well as neurological dysfunction (e.g., dystonia, mild-to-moderate mental retardation, and self-mutilation), and uric acid nephrolithiasis.
Lesch–Nyhan syndrome is an X-linked recessive disease caused by almost a com-plete deficiency of HGPRT due to mutations in the HPRT gene, which are usually carried by the mother and passed on to her son. As noted previously, the HGPRT deficiency causes a buildup of uric acid in all body fluids, resulting in hyperuricemia and hyperuricosuria, as well as severe gout and kidney problems. The neurological symptoms include poor muscle control and mental retardation, which usually appear during the first year of life. Beginning in the second year of life, the affected patients often exhibit self-mutilating behaviors, characterized by lip and finger biting. These patients generally have severe mental and physical problems throughout life.

408 Amino Acids: Biochemistry and Nutrition
© 2010 Taylor & Francis Group, LLC
Myoadenylate deaminase deficiency (also known as type-1 AMP deaminase defi-ciency) is an autosomal recessive disorder of purine metabolism in skeletal muscle. AMP deaminase converts AMP into inosine monophosphate and ammonia (Chapter 5). This enzyme plays an important role in the purine nucleoside cycle with physi-ological significance. The affected subjects experience early fatigue, as well as pain, cramping, and weakness of skeletal muscle during exercise.
Purine nucleoside phosphorylase (PNP) deficiency is an autosomal recessive disorder. This enzyme catalyzes the conversion of inosine (a product of adenos-ine) and guanosine into hypoxanthine (Chapter 5). PNP activity is particularly high in lymphocytes. A lack of PNP results in the accumulation of inosine, guanosine, and deoxy-GTP in the plasma as well as elevated excretion in the urine. Deoxy-GTP inhibits ribonucleotide reductase and thus DNA synthesis, thereby leading to reduced proliferation of cells, particularly immature T lymphocytes. Additionally, inosine, guanosine, and deoxy-GTP are cytotoxic to T lymphocytes. Therefore, the affected subjects have a small, underdeveloped thymus, reduced number of T lym-phocytes, immunodeficiency, and increased risk for infectious diseases. The patients may also have neurological dysfunction (e.g., mental retardation) and are prone to the development of autoimmune disorders, including Lupus-erythematosis, hemolytic anemia, and idopathic thrombocytopenic purpura.
Xanthinuria (an autosomal recessive trait) results from a deficiency of xanthine oxidase (also known as xanthine dehydrogenase or xanthine oxidoreductase). This enzyme catalyzes the oxidation of hypoxanthine into xanthine and then into uric acid, the last two steps in the catabolism of purines (Chapter 6). The deficiency of xanthine oxidase, coupled with the continuous formation of xanthine from gua-nine by guanase, results in the accumulation of xanthine (a substance with low water solubility) in the plasma and urine. Hypoxanthine does not accumulate to an appreciable degree because this purine is recycled through a salvage pathway by HGPRT. Patients with xanthinuria experience arthropathy, myopathy, urinary tract infections, crystal nephropathy, urolithiasis, and renal failure.
PyrimiDines
β-Aminoisobutyric aciduria is characterized by high urinary excretion of β-aminoisobutyrate (up to 250 mg/day compared to a normal value of <10 mg/day for healthy subjects). This disorder is likely due to a defect in β-aminoisobutyrate–glu-tamate transaminase in the pathway for thymine (a pyrimidine) catabolism (Chapter 5). There is a large variation in the urinary excretion of β-aminoisobutyrate among individuals. So far, no clinical symptoms have been described for β-aminoisobutyric aciduria. However, high levels of β-aminoisobutyrate occur in the urine of fasted individuals and in patients with cancer, tuberculosis, liver disease, and lead poison-ing (in each case likely due to increased degradation of pyrimidine).
Familial pyrimidinemia results from a deficiency of dihydropyrimidine dehydro-genase (DPD), which is an autosomal recessive disorder. This enzyme (also known as uracil reductase or thymine reductase) catalyzes the reduction of uracil and thy-mine into dihydrouracil and dihydrothymine, respectively (the first step in pyrimi-dine catabolism; Chapter 5). Thus, a deficiency of DPD results in the accumulation

409Inborn Errors of Amino Acid Metabolism
© 2010 Taylor & Francis Group, LLC
of uracil and thymine in the plasma and urine but impaired synthesis of β-alanine and R-β-aminoisobutyrate. The clinical symptoms include convulsions, seizures, psychomotor retardation, hypertonicity, microcephaly, autism, and growth retarda-tion. The affected subjects may be vulnerable to lethal toxicities after exposure to some pyrimidine-related chemotherapy drugs such as 5-fluorouracil.
Hyper-β-alaninemia results from a deficiency of β-alanine:α-ketoglutarate transaminase (Chapter 5) and inhibition of renal reabsorption of β-AA (including β-alanine, β-aminoisobutyrate, and taurine). β-Alanine:α-ketoglutarate transaminase is responsible for the degradation of β-alanine (a product of pyrimidine catabolism) and, to some extent, GABA. Thus, affected individuals exhibit elevated levels of β-AA and GABA in the plasma, CSF, and urine, as well as elevated concentrations of carnosine in skeletal muscle and urine. The clinical symptoms include neonatal respi-ratory distress, seizures, drowsiness, convulsions, mental retardation, and, if uncor-rected, death (Jurecka 2009).
Orotic aciduria (an autosomal recessive disorder) results from a deficiency of uri-dine monophosphate (UMP) synthase or defects in the urea-cycle enzymes (Chapter 6). UMP synthase is a bifunctional enzyme catalyzing the last two steps of the de novo pyrimidine biosynthesis and contains the activities of orotate phosphoribosyl-transferase and orotidine-5′-monophosphate decarboxylase (Chapter 5). A deficiency of this enzyme will lead to the accumulation of orotic acid in the plasma and urine. Orotic aciduria can also arise secondary to a blockage of the urea cycle (particularly in OCT deficiency) because ammonia is channeled to the synthesis of glutamine and then orotic acid. Patients with orotic aciduria exhibit anemia, abnormal changes in the bone marrow, leukopenia, and retarded growth.
serine
Hypophosphatasia is caused by a reduced activity of alkaline phosphatase. This enzyme catalyzes the catabolism of phosphoaminoethanol (a metabolite of serine and phosphocholine; Chapter 4). Thus, deficiency of alkaline phosphatase results in elevated levels of phosphoaminoethanol in the plasma and urine. The patients suffer from the onset of poor feeding and inadequate weight gain, clinical manifestations of rickets, bone lesions, central nervous system disease, and anemia.
Phosphoglycerate dehydrogenase deficiency is a severe but potentially treatable inborn error of metabolism in humans. This enzyme catalyzes the conversion of 3-phosphoglycerate into phosphohydroxypyruvate in the pathway of serine bio-synthesis (Chapter 3). The affected subjects have markedly low concentrations of serine and, to a lesser extent, glycine, in the plasma and CSF. The affected individu-als develop congenital microcephaly, profound psychomotor retardation, hyperto-nia, epilepsy, dysmyelination in the brain, growth retardation, and hypogonadism. Congenital bilateral cataracts may also occur in individuals with phosphoglycerate dehydrogenase deficiency. Dietary supplementation can ameliorate the symptoms of this disease. The findings from this inborn error of metabolism indicate that: (1) endogenous synthesis of serine plays an essential role in maintaining serine homeo-stasis in neonates and (2) intake of dietary serine from milk or the current milk formula is insufficient for optimal growth, development, and health.

410 Amino Acids: Biochemistry and Nutrition
© 2010 Taylor & Francis Group, LLC
sulfur-contAininG AA
Cystathioninuria is caused by a severe deficiency of cystathionase, which hydro-lyzes cystathionine into cysteine and NH4
+ (Chapter 4). This is an autosomal recessive metabolic disorder. Subjects with cystathioninuria have high concentrations of cysta-thionine in the plasma (up to 20 μM) and large amounts are excreted in the urine (up to 1 g/day). The patients also suffer from mental retardation. Note that a deficiency of vitamin B6 also results in cystathioninuria.
Cystinosis is an autosomal recessive disorder due to a defect in the carrier-mediated transport of cystine across the lysosomal membrane in tissues and cells, including the kidneys and polymorphonuclear leukocytes. As a result, cystine is accumulated within the lysosomes at concentrations that are 10–100 times the normal values. Infants are normal at birth but develop renal abnormalities between 6 and 12 months of age. The clinical symptoms include dehydration, acidosis, vomiting, electrolyte imbalance, hypophosphatemic rickets, hypothyroidism, growth retardation, photo-phobia, renal glomerular damage, and retinal damage.
Cystinuria, which was the first aminoaciduria to be reported, is an autosomal recessive defect in the reabsorptive transport of cystine and dibasic AA (arginine, lysine, and ornithine) from the luminal fluid of the renal proximal tubule and in the absorption of these AA from the lumen of the small intestine (Chapter 2). This disease is characterized by abnormally high urinary excretion of cystine, arginine, lysine, and ornithine (Finkelstein 2006). In Newfoundland dogs exhibiting cystin-uria in association with a nonsense mutation, R198X, in the SLC7A9 gene encoding for the rBAT transporter, urinary excretion of cystine and lysine (but not arginine and ornithine) is high (Henthorn et al. 2000). The major clinical syndrome is renal calculi. Penicillamine, a degradation product of penicillin, is used to treat patients with cystinuria, because penicillamine reacts with cystine to form a mixed disulfide, penicillamine cysteine.
Homocyst(e)inuria is caused by a deficiency of cystathionine β-synthase, which converts homocysteine and serine into cystathionine (Chapter 4). Subjects with this disease have high concentrations of homocyst(e)ine in the plasma (up to 50 μM) and urine (up to 100 mg/day), as well as high levels of methionine in the plasma. Patients with homocyst(e)-inuria suffer from convulsions, mental retardation, cardiovascular disease, fatty liver, mottled red skin, lens dislocation, and fine sparse hair. In this disease, cysteine becomes a nutritionally essential AA. Note that a severe deficiency of dietary folate and vitamin B6 also results in homocyst(e)inuria.
Hypermethioninemia. M. Furujo and colleagues recently reported a hyper-methioninemia case in a female patient. The subject has a severe deficiency of methionine adenosyltransferase (MAT, also known as SAM synthetase) I/III and elevated concentrations of methionine in the plasma (10–15 times the nor-mal value). This was found to result from two compound heterozygous missense mutations (R292C and R356L) in the gene encoding the human MAT1A protein. Hypermethioninemia and mental retardation persisted until the age of 4 years and 8 months, when dietary supplementation with SAM (a metabolite produced from methionine by MAT) was initiated [400–800 mg SAM-disulfate tosylate (tosylate disulfate salt of SAM) twice daily] (Furujo et al. 2012). This treatment improved
411Inborn Errors of Amino Acid Metabolism
© 2010 Taylor & Francis Group, LLC
the neurological development of the affected patient, although the concentration of methionine in the plasma remained substantially elevated.
tryPtoPhAn
Carcinoid (tumors derived from the enterochromaffin or argentaffin cells) results from excessive formation of 5-hydroxytryptophan from tryptophan and the enhanced decarboxylation of 5-hydroxytryptophan to yield serotonin. Subjects with this dis-ease have elevated levels of serotonin and increased urinary excretion of serotonin and 5-hydroxyindoleacetate. The patients experience chronic diarrhea, heart disease, flushes, pellagra-like symptoms, respiratory distress, and weight loss.
Hartnup disease occurs in subjects with defects in intestinal transport and renal reabsorption of neutral AA, particularly tryptophan. The patients have increased uri-nary excretion of indole compounds, histidine, and many neutral AA (except for gly-cine, proline, and hydroxyproline), including alanine, asparagine, glutamine, BCAA, phenylalanine, tyrptophan, and tyrosine. Subjects with this disease suffer from a pellagra-like rash (likely due to niacin deficiency), aberrations of the central nervous system, psychiatric disturbances, and mental retardation.
ureA cycle
N-acetylglutamate (NAG) synthase deficiency is an autosomal recessive disorder. This mitochondrial enzyme catalyzes the conversion of glutamate and acetyl-CoA into NAG, which is an allosteric activator of carbamoylphosphate synthase-I (CPS-I) (a urea-cycle enzyme; Chapter 6). Thus, a deficiency of NAG synthase results in elevated levels of alanine, glutamine, and ammonia in the plasma, spinal fluid, and urine but reduced concentrations of citrulline, arginine, and urea in these physiologi-cal fluids. Subjects with NAG synthase deficiency may experience growth retarda-tion, lethargy, vomiting, mental retardation, deep coma, and even death.
Argininosuccinic aciduria results from the deficiency of argininosuccinate lyase, which converts argininosuccinate into arginine and fumarate. This disease is associ-ated with elevated concentrations of argininosuccinate in the plasma (up to 0.3 mM) and the excretion of relatively large amounts of argininosuccinate (up to 10 g/day) in the urine. The patients develop mental retardation, epilepsy, ataxia, and hepato-megaly within the first few years of life and may also exhibit hair defect (i.e., coarse brittle hair that breaks easily).
CPS-I deficiency is an autosomal recessive disorder. This mitochondrial enzyme converts NH3 and HCO3
− into carbamoylphosphate, which then condenses with ornithine to form citrulline (Chapter 6). Thus, a deficiency of CPS-I impairs the urea cycle for ammonia detoxification in the liver and citrulline/arginine synthesis from glutamine in the small intestine, resulting in elevated levels of glutamine and ammonia in the plasma, spinal fluid, and urine but reduced concentrations of citrul-line, arginine, and urea in these physiological fluids. Infants with CPS-I deficiency may experience growth retardation, developmental delay, lethargy, vomiting, mental retardation, deep coma, and even death. In some affected individuals, symptoms of CPS-I deficiency may be less severe and may not manifest until later in life.

412 Amino Acids: Biochemistry and Nutrition
© 2010 Taylor & Francis Group, LLC
Hyperargininemia results from a deficiency of cytosolic arginase, which hydro-lyzes arginine into urea plus ornithine (the last step of the urea cycle). Thus, the affected subjects exhibit elevated levels of arginine and ammonia in the plasma, spinal fluid, and urine, but reduced concentrations of proline, urea, and ornithine in these fluids. The patients suffer from stiffness (especially in the legs) caused by abnormal tensing of skeletal muscle, reduced growth, developmental delay, seizures, mental retardation, tremor, and ataxia (difficulty with balance and coordination) (Endo et al. 2004). In response to high protein intake, a rapid increase in ammonia leads to episodes of irritability, nausea, and vomiting.
Hypercitrullinemia (also known as citrullinuria) occurs due to a deficiency of argininosuccinate synthase, which catalyzes the formation of argininosuccinate from citrulline and aspartate (Chapter 6). The concentrations of citrulline are greatly elevated in the plasma (up to 2 mM) and CSF (up to 0.35 mM), as well as increased excretion in the urine (up to 0.5–2 g/day). The patients exhibit high circulating levels of ammonia (up to 170 μM), convulsion, alkalotic coma, and severe mental retardation.
Hyperornithinemia (also known as OCT deficiency) is an X-linked recessive disease and the most common defect in the urea cycle. This enzyme catalyzes the formation of citrulline from ornithine and carbamoylphosphate in the mitochondria (Chapter 6). Thus, subjects with OCT deficiency have elevated levels of ornithine, ammonia, orotic acid, glutamate, and glutamine in the plasma, spinal fluid, and urine but reduced concentrations of citrulline, arginine, and urea in these physiologi-cal fluids. The affected individuals develop severe episodes of nausea and vomiting, growth retardation, neurological dysfunction, seizures, mood swing, liver damage, skin lesions, and brittle hair.
Hyperornithinemia–hyperammonemia–homocitrullinuria (HHH) syndrome is an autosomal recessive disorder caused by mutations in the SLC25A15 gene that encodes ORNT1 [mitochondrial ornithine transporter 1 (Chapter 6)]. This disease is diagnosed by persistent hyperornithinemia, episodic or postprandial hyperammone-mia, and urinary excretion of homocitrulline. In the cases of neonatal onset (∼12% of affected individuals), patients exhibit, on day 1 or 2 after birth, hyperammonemia-related problems, such as poor feeding, vomiting, lethargy, low temperature, and rapid breathing. When the disease occurs in infancy, childhood, and adults (∼88% of affected individuals), clinical manifestations include neurocognitive deficits, acute encephalopathy secondary to hyperammonemia, and liver dysfunction.
other orGAnic AciDuriAs
Glutaric acidemia occurs because glutaryl-CoA cannot be converted into crotonyl-CoA due to a deficiency of glutaryl-CoA dehydrogenase. Glutaryl-CoA then under-goes hydrolysis to form glutaric acid. Thus, this disorder is associated with elevated levels of glutaric acid, glutaryl-CoA, 3-hydroxyglutaric acid, and glutaconic acid in the plasma and urine. The affected individuals may have difficulty in moving and may experience spasms, jerking, rigidity, or decreased muscle tone. Some individu-als with glutaric acidemia have developed bleeding in the brain or eyes. Strict dietary control may help limit the progression to neurological damage.

413Inborn Errors of Amino Acid Metabolism
© 2010 Taylor & Francis Group, LLC
Hyperoxaluria occurs because of the impaired oxidation of glycine- and hydroxy-proline-derived glyoxylate into CO2. Glyoxylate is then channeled to the formation of oxalate and glycolate. Hyperoxaluria is characterized by excessive urinary excretion of both oxalate and glycolate, as well as progressive deposition of calcium oxalate in the kidneys and other tissues. Individuals with hyperoxaluria have genitourinary tract disease and calculi. This disease may result in early death.
α-Ketoadipic acidemia occurs because α-ketoadipate (an intermediate in the catabolism of lysine, hydroxylysine, and tryptophan) cannot be converted into glutaryl-CoA due to deficiency of the α-ketoadipate dehydrogenase com-plex (Chapter 4). This disorder is characterized by the accumulation of α-keto, α-amino, and 2-hydroxy derivatives of adipic acid in the plasma (e.g., up to 45 μM α-aminoadipate) and their excessive excretion in the urine (e.g., up to 1.2 μmol α-aminoadipate, 3 mmol α-ketoadipate, and 1 mmol α-hydroxyadipate/mg creati-nine). The clinical symptoms are various and may include hypertonia, psychomotor abnormality, delayed development, seizures, and mental retardation.
Methylmalonic acidemia is caused by a deficiency of methylmalonyl-CoA mutase, which converts methylmalonyl-CoA (a product of the propionyl-CoA carboxylation) into succinyl-CoA. Propionyl-CoA is generated from the catabolism of some AA (including isoleucine, methionine, threonine, and valine). Adenosylcobalamin, a metabolite of vitamin B12, is a cofactor for methylmalonyl-CoA mutase. Subjects with methylmalonyl-CoA mutase deficiency have elevated levels of methylmalonic acid in the plasma and urine. The patients experience neurological, cardiac, skeletal muscle dysfunction, as well as episodic attacks of severe vomiting and acidosis, sei-zures, coma, and possibly death.
Propionic acidemia is caused by a deficiency of propionyl-CoA carboxylase, which converts propionyl-CoA [a product of the catabolism of some AA (including isoleucine, methionine, threonine, and valine)] into d-methylmalonyl-CoA in a biotin-dependent mechanism. Thus, this disease is associated with a marked elevations of glycine in the plasma and urine, as well as increased urinary excretion of propionate (Scholl-Bürgi et al. 2012). The initial symptoms of propionic acidemia include poor feeding, vomiting, loss of appetite, weak muscle tone, and fatigue; many of these symptoms are related to metabolic acidosis. Children with this disease may experience intellectual disability or delayed development. As the disease progresses, the affected subjects may have more serious medical problems, including heart abnormalities, seizures, coma, and possibly death.
TREATMENT OF INBORN ERRORS OF AA METABOLISM
Besides clinical management of symptoms and complications, the traditional treat-ment for the inborn errors of AA metabolism varies with the affected enzymes (Table 12.2). Management of diets is the mainstay for the treatment of many inborn errors of AA metabolism (Singh et al. 2005). It should be borne in mind that such a daily therapy is a life-long process. Other means include: (1) restriction of specific AA in the diet, (2) reduction of endogenous substrates of a defected enzyme, (3) dietary supplementation with a deficient product, (4) dietary replacement with the immediate precursor of a deficient AA, (5) stimulation of residual enzyme activity,

414 Amino Acids: Biochemistry and Nutrition
© 2010 Taylor & Francis Group, LLC
(6) administration of intermediary metabolites, compounds, or drugs that facilitate or retard the specific metabolic pathway, and (7) removal of ammonia from the systemic circulation. These approaches are designed for daily management of the affected patients to reduce ammonia production, remove toxic molecules (including ammonia) from tissues, and provide the deficient AA.
Let us provide examples to illustrate the mechanism-based development of drugs to treat disorders resulting from inborn errors of AA metabolism. First, allopurinol (a structural isomer of hypoxanthine) is an inhibitor of xanthine oxidase, the enzyme that is responsible for the successive oxidation of hypoxanthine and xanthine to
TABLE 12.2Traditional Means to Treat Inborn Errors of AA Metabolism in Humans
Therapy Example
Reduction of dietary protein and provision of high-quality protein
Mainstay of treatment for PKU and many other disorders of AA metabolism (maple syrup urine disease, homocystinurea, tyrosinemia, and defects of urea-cycle enzymes)
Restriction of specific AA in diets
Lysine and tryptophan in type-I acidurea due to the deficiency of glutaryl-CoA dehydrogenase; isoleucine, valine, methionine, and threonine in propionic or methylmalonic aciduria due to propionyl-CoA carboxylase or methylmalonyl-CoA carboxylase deficiency; phenylalanine and tyrosine in PKU; arginine in OCT deficiency
Reduction of endogenous substrates of a defected enzyme
Use of 2-(2-nitro-4-trifluoromethylbenzoyl)-1,3-cyclohexanedione, an inhibitor of 4-hydroxyphenylpyruvate dioxygenase, to decrease the production of fumarylacetoacetate in patients with the deficiency of fumarylacetoacetase, a downstream enzyme in the pathway of tyrosine catabolism
Dietary supplementation with a deficient product of AA synthesis or catabolism
Oral or intravenous administration of arginine to patients with P5C synthase deficiency; use of creatine for individuals with guanidinoacetate methyltransferase deficiency; use of BH4 for patients with the defect of the GTP cyclohydrolase I gene
Dietary replacement with the immediate precursor of a deficient AA
Use of citrulline to replace arginine in patients who lack arginine transporters; use of serine for patients with a defect in glycine synthesis
Stimulation of residual enzyme activity
Use of pyridoxine (vitamin B6) to treat homocystinuria due to cystathionine β-synthase deficiency
Administration of intermediary metabolites, compounds, or drugs that facilitate or retard specific metabolic pathways
Use of ornithine or arginine to stimulate the hepatic urea cycle in infants with ornithine aminotransferase deficiency; use of NCG for individuals who do not express NAG synthase; inhibition of glutamine synthesis in urea cycle defects
Removal of ammonia from the systemic circulation
Dialysis (e.g., hemodialysis, hemofiltration, or peritoneal dialysis) to remove excessive amounts of ammonia and other toxic molecules; use of sodium benzoate, phenylacetate, or sodium phenylbutyrate to remove ammonia from the circulation in subjects with urea cycle defects

415Inborn Errors of Amino Acid Metabolism
© 2010 Taylor & Francis Group, LLC
produce uric acid (Chapter 6). Thus, this drug is used to treat hyperuricemia and its complications, including chronic gout and Lesch–Nyhan syndrome. Second, sodium phenylbutyrate (trade name Buphenyl) is the primary medication to treat urea-cycle disorders. Phenylbutyrate is metabolized by β-oxidation to produce phenylacetate, which then conjugates with glutamine (an ammonia sink) to form phenylacetylgluta-mine for elimination via the urine (Chapter 6). Third, BH4, an essential cofactor of AA hydroxylases, has been used to treat PKU due to a deficiency of GTP cyclohydro-lase I. Because of its chemical instability, BH4 is often mixed with vitamin C either as a powder or in an deoxygenated solution before oral or intravenous administration to affected patients.
With advanced biomedical research in the past 20 years, therapeutic means for the inborn errors of AA metabolism now include new molecular biology and stem-cell techniques (Table 12.3). A significant advance in this area is enzyme replace-ment through gene transfer or organ transplantation (e.g., transplants of liver, bone marrow, kidneys, or their combinations), which may be a promising permanent solution for the affected individuals (Batshaw et al. 1999). All these modern meth-ods for treating the inborn errors of AA metabolism require interdisciplinary team work spanning clinical medicine, biochemistry, and cell biology (Malm et al. 2004).
TABLE 12.3Gene- and Transplantation-Based Means to Treat Inborn Errors of AA Metabolism in Humans and Animal Models
Therapy Example
Gene transfer T-lymphocyte-directed transfer of the ADA gene in humans and mice; hepatocyte-directed recombinant adenoviral gene delivery of the methylmalonyl-CoA mutase gene to mice with a severe form of methylmalonic acidemia (a deletion of exon 3 of the gene); hepatocyte-directed recombinant adenoviral gene delivery of the OCT gene to sparse fur mice; hepatocyte-directed recombinant adenoviral gene delivery of the ASS gene in mice and bovine models
Stem-cell transplantation
Correction for the deficiency of α-l-iduronidase in humans, a lysosomal enzyme that degrades the complex macromolecular glycosaminoglycans of heparan and dermatan sulfate; transplantation of human amnion epithelial stem cells to the liver of transgenic mice with BCKA dehydrogenase deficiency; treatment of PKU in mice with phenylalanine hydroxylase deficiency using hematopoietic stem cells
Bone marrow transplantation
Treatment for patients with aspartylglucosaminuria due to a deficiency of aspartylglucosaminidase; treatment of PKY in mice with phenylalanine hydroxylase deficiency using bone marrow
Liver or hepatocyte transplantation
Treatment for patients with OCT deficiency using liver and hepatocytes from healthy subjects; transplant of liver to patients and mice with PKU; transplant of liver to patients with maple syrup urine disease; transplant of liver to patients with ASS deficiency; kidney transplant to patients with methylmalonic acidemia
Combination of two or more organs
Treatment of methylmalonic aciduria in humans using both liver and kidneys from normal subjects; treatment of tyrosinemia in humans using both liver and kidneys from normal subjects

416 Amino Acids: Biochemistry and Nutrition
© 2010 Taylor & Francis Group, LLC
Of particular note, the choice of a vehicle for carrying the gene of interest is vital to the safety and success of gene transfer in humans (Wynn 2011; Sauer et al. 2012).
SUMMARY
In the past 50 years, extensive research has determined the biochemical and genetic bases of abnormal AA metabolism in humans and other animals. Many of these inherited diseases are autosomal recessive disorders as two copies (one from each parent) of the same recessive, abnormal gene are present on the autosomal chromo-somes of affected individuals. The availability of metabolic screening tests has led to the accurate diagnosis of the diseases. Depending on the affected enzymes in meta-bolic pathways, inborn errors of AA metabolism can result in: (1) little or no endog-enous synthesis of AA (e.g., arginine in infants without P5C synthase and tyrosine in patients lacking phenylalanine hydroxylase) and their deficiencies, (2) complete or impaired blockage of degradation of AA (e.g., BCAA in patients with BCKA dehy-drogenase deficiency and phenylalanine in PKU) and substantial increases in their circulating levels, (3) the lack of or impaired production of biologically active mol-ecules (e.g., NO and serotonin in subjects with GTP cyclohydrolase I deficiency), (4) HA (e.g., a deficiency of an enzyme in the urea cycle), or (5) disturbance of protein, lipid, and carbohydrate metabolism. Consequently, multiorgan dysfunction occurs, which severely compromises whole-body homeostasis, causes abnormal development of organs (including the brain) and mental retardation, and even results in death. Thus, the treatment of disorders varies with their causes, but in most cases, the affected sub-jects receive administration of sodium phenylbutyrate to remove excessive ammonia from the circulation, and are advised to adopt lifelong reduction of dietary protein intake. Advances in gene therapy, stem-cell biology, and organ transplantation have led to the development of new, long-term treatments for inherited disorders of AA metabolism. Appropriate animal models for the study of inborn errors of AA metabo-lism (e.g., sparse fur mice with OCT deficiency) are needed to understand the under-lying mechanisms and to develop effective therapies.
REFERENCES
Batshaw, M.L., M.B. Robinson, X. Ye, C. Pabin, Y. Daikhin, B.K. Burton, J.M. Wilson, and M. Yudkoff. 1999. Correction of ureagenesis after gene transfer in an animal model and after liver transplantation in humans with ornithine transcarbamylase deficiency. Pediatr. Res. 46:588–593.
Braissant, O., H. Henry, E. Béard, and J. Uldry. 2011. Creatine deficiency syndromes and the importance of creatine synthesis in the brain. Amino Acids 40:1315–1324.
Bröer, S. and M. Palacín. 2011. The role of amino acid transporters in inherited and acquired diseases. Biochem. J. 436:193–211.
Centerwall, S.A. and W.R. Centerwall. 2000. The discovery of phenylketonuria: The story of a young couple, two retarded children, and a scientist. Pediatrics 105:89–103.
Endo, F., T. Matsuura, K. Yanagita, and I. Matsuda. 2004. Clinical manifestations of inborn errors of the urea cycle and related metabolic disorders during childhood. J. Nutr. 134: 1605S–1609S.
Finkelstein, J.D. 2006. Inborn errors of sulfur-containing amino acid metabolism. J. Nutr. 136: 1750S–1754S.

417Inborn Errors of Amino Acid Metabolism
© 2010 Taylor & Francis Group, LLC
Furujo, M., M. Kinoshita, M. Nagao, and T. Kubo. 2012. S-adenosylmethionine treatment in methionine adenosyltransferase deficiency, a case report. Mol. Genet. Metab. 105: 516–518.
Häberle, J., B. Görg, A. Toutain, F. Rutsch, J.F. Benoist, A. Gelot, A.L. Suc, H.G. Koch, F. Schliess, and D. Häussinger. 2006. Inborn error of amino acid synthesis: Human glutamine synthetase deficiency. J. Inherit. Metab. Dis. 29:352–358.
Henthorn, P.S., J. Liu, T. Gidalevich, J. Fang, M.L. Casal, D.F. Patterson, and U. Giger. 2000. Canine cystinuria: Polymorphism in the canine SLC3A1 gene and identification of a nonsense mutation in cystinuric Newfoundland dogs. Hum. Genet. 107:295–303.
Jurecka, A. 2009. Inborn errors of purine and pyrimidine metabolism. J. Inher. Metab. Dis. 32:247–263.
Lupi, A., A. Rossi, E. Campari, F. Pecora, A.M. Lund, N.H. Elcioglu, M. Gultepe, M. Di Rocco, G. Cetta, and A. Forlino. Molecular characterisation of six patients with pro-lidase deficiency: Identification of the first small duplication in the prolidase gene and of a mutation generating symptomatic and asymptomatic outcomes within the same family. J. Med. Genet. 43:e58.
Malm, G., J.E. Månsson, J. Winiarski, M. Mosskin, and O. Ringdén. 2004. Five-year follow-up of two siblings with aspartyl glucosaminuria undergoing allogeneic stem-cell transplantation from unrelated donors. Transplantation 78:415–419.
Sauer, A.V., H. Morbach, I. Brigida, Y.S. Ng, A. Aiuti, and E. Meffre. 2012. Defective B cell tolerance in adenosine deaminase deficiency is corrected by gene therapy. J. Clin. Invest. 122:2141–2152.
Scholl-Bürgi, S., J.O. Sass, J. Zschocke, and D. Karall. 2012. Amino acid metabolism in patients with propionic acidaemia. J. Inherit. Metab. Dis. 35:65–70.
Singh, R.H., W.J. Rhead, W. Smith, B. Lee, K.L. Sniderman, and M. Summar. 2005. Nutritional management of urea cycle disorders. Crit. Care Clin. 21:S27–S35.
Werner, E.R., N. Blau, and B. Thöny. 2011. Tetrahydrobiopterin: Biochemistry and patho-physiology. Biochem. J. 438:397–414.
Willis, A., H.U. Bender, G. Steel, and D. Valle. 2008. PRODH variants and risk for schizophre-nia. Amino Acids 35:673–679.
Wynn, R. 2011. Stem cell transplantation in inherited metabolic disorders. Hematol. Am. Soc. Hematol. Educ. Program 2011:285–291.


419
© 2010 Taylor & Francis Group, LLC
Dietary Requirements of Amino Acids
Adequate provision of dietary AA is essential to the health, growth, development, and survival of organisms. This is graphically illustrated by the metabolic disor-ders, kwashiorkor (coined by the Jamaican pediatrician C. Williams in 1935; primar-ily resulting from a severe deficiency of dietary protein), and marasmus (“wasting away” in Greek; a term first used by Soranio in 1656; primarily caused by severe deficiencies of both protein and energy in the diet). Kwashiorkor is a common nutritional problem in both children and adults in underdeveloped nations and also occurs in subpopulations (e.g., hospitalized trauma and cancer patients) in developed countries. Less severe forms of AA or protein deficiency are frequently observed in elderly subjects (e.g., the home-bound elderly) in the industrialized world, thereby compromising their nutritional status, increasing their susceptibility to both meta-bolic and infectious diseases, and reducing their longevity.
AA derived from dietary proteins are the building blocks of tissue proteins (Table 13.1) and participate in vital metabolic processes in the body (Chapter 11). Thus, knowledge about AA biochemistry and functions provides the necessary founda-tion for determining dietary requirements of AA by humans and other animals. Requirements of dietary AA can be classified as qualitative and quantitative (Fuller and Garlick 1994). Qualitative requirements are related to the question of “what are required for maintenance, optimum performance (e.g., growth, lactation, repro-duction, and sports competition), and optimum health (e.g., prevention of chronic metabolic disorders, resistance to infectious disease, and recovery from illness)?” Quantitative requirements refer to the question of “how much is required for mainte-nance, optimum growth, and optimum health?”
Feeding experiments have traditionally been employed to determine both quali-tative and quantitative requirements of dietary AA by animals. Minimal require-ments of AA can also be estimated using the so-called factorial analysis, that is, measurements of the loss of N by animals fed a protein-free diet via urine, feces, gas, and other routes (maintenance) + AA deposited in animals + AA excreted as animal products (e.g., milk, egg, wool, and fetus). In the past three decades, studies involving radioactive and stable AA tracers have been used along with the N balance technique to determine dietary requirements of EAA by humans and farm animals (Millward 1997; Reeds 2000; Wang et al. 2009). To date, advanced research methods include metabolomics, proteomics, and genomics. While much effort has long been directed at EAA nutrition, little is known about dietary requirements of NEAA by mammals, birds, and fishes.
In practice, a useful concept in protein nutrition is “limiting AA,” which is defined as an AA that is in the shortest supply from the diet relative to its requirements by an
13

420 Amino Acids: Biochemistry and Nutrition
© 2010 Taylor & Francis Group, LLC
TABLE 13.1Composition of AA in the Bodies of Animals
Pige
AA Rata Humanb Cattleb Sheepc Chickd
IntactAA
AAf
Residues
mg AA/g Protein
Ala 66.0 72 76 66.5 66.3 65.7 61.6
Arg 68.2 77 75 68.0 68.5 67.7 71.4
Asn 36.5 — — 35.8 36.5 36.0 36.5
Asp 43.4 — — 43.7 43.1 42.8 43.6
Asp + Asn 79.9 90 87 79.5 79.6 78.8 80.1
Cys 14.5 — — 14.6 15.0 13.2 13.2
Gln 51.0 — — 50.9 50.5 51.2 52.8
Glu 83.8 — — 83.2 82.9 84.6 87.0
Glu + Gln 135 130 138 134 133 136 140
Gly 114 118 121 113 115 117 105
His 21.0 26 27 21.2 21.1 20.8 21.6
Ile 35.7 35 30 36.0 35.9 35.3 35.9
Leu 69.0 75 74 69.4 69.2 68.3 69.3
Lys 61.8 72 69 61.0 61.5 60.3 62.2
Met 19.2 20 18 19.0 18.9 18.7 19.3
Phe 34.1 41 39 34.6 34.8 34.3 35.9
Pro 85.7 84 87 85.5 85.3 86.1 85.3
OH-Pro 34.6 — — 34.8 34.8 37.9 38.5
Pro + OH-Pro 120 — — 120 120 124 124
Ser 44.8 44 47 45.2 45.0 44.3 43.1
Thr 36.0 41 43 36.8 36.3 35.1 35.0
Trp 12.0 11.4 11.6 11.1 11.9
Tyr 26.8 29 27 27.0 26.6 27.2 28.6
Val 42.0 47 42 42.6 41.8 42.2 42.0
Source: Adapted from Wu, G. et al. 2012. Amino Acids. doi: 10.1007/s00726-012-1444-2.Note: Unless indicated otherwise, calculations were based on the molecular weights of intact AA.a Adult rats (60-day-old).b Data for human fetuses (days 160–280 of gestation) and cattle (12-week-old) were obtained
from Davis et al. (1993). It was not reported whether calculations were based on the molecular weights of intact AA or AA residues.
c Adult sheep (12-month-old).d Chickens (10-day-old).e Pigs (30-day-old).f Calculations were based on the molecular weights of AA residues (molecular weights of intact
AA – 18).

421Dietary Requirements of Amino Acids
© 2010 Taylor & Francis Group, LLC
animal for maintenance, growth and health. Limiting AA are usually EAA. The first AA is often an EAA that is present in the diet in the least amount, as compared to the animal’s daily requirement. For example, lysine and methionine are often the first limiting AA for swine and chickens fed typical corn- and soybean meal-based diets, and for ruminants fed corn- and forage-based diets. Results from nutritional studies indicate that, in conventional swine diets, the second, third, and fourth limiting AA are usually methionine, tryptophan, and threonine, respectively. The major objec-tives of this chapter are to highlight the classic and modern methods for determining dietary AA requirements and for assessing the quality of dietary proteins in nutrition.
HISTORICAL PERSPECTIVES OF DIETARY AA REQUIREMENTS
stuDies involvinG lABorAtory AnimAls
In 1816, F. Magendie reported that dogs fed an N-free diet died in a short period of time and that the death could be prevented by feeding a diet containing proteins. These results indicate that animals depend on preformed protein in their diets for survival. The question of “what” and “how much” AA should be supplied in ani-mal diets puzzled pioneers in the field. To quantify dietary intake of protein, J.B. Boussingault analyzed the N content of foodstuffs in 1836. This work showed that dietary N content differed markedly between foodstuffs of animal and plant origin, and among plant proteins. In 1872, H. Ritthausen speculated that various proportions of AA among animal and plant proteins might be the cause of the differences in their nutritive value. Forty years later, this idea was supported by O. Abderhalden, who further proposed that the proportions of specific AA in dietary protein were more important than their absolute amounts.
Research on qualitative requirements of individual AA by animals began in 1904 when O. Abderhalden and P. Rona reported that mice fed either trypsin-digested casein hydrolysates or intact casein had the same rate of growth and survival, but the animals suffered from severe malnutrition, sickness, and even death when fed neutralized acid hydrolysates of casein. One year later, these two authors found that dogs exhibited a positive N balance when fed trypsin-digested casein but a negative N balance almost immediately occurred after consuming neutralized acid hydroly-sates of casein. Similar results were obtained from rat studies by V. Henriques and C. Hansen in the same year. The reason for these intriguing observations was not known until 1906 when E.G. Willcock and F.G. Hopkins discovered that tryptophan, which is completely destroyed by acid hydrolysis, is essential for the growth and survival of rats. Based on N balance in dogs fed a tryptophan- or a proline-free basal diet that was supplemented either with or without the missing AA, E. Abderhalden proposed in 1912 that AA could be classified as nutritionally essential (indispens-able) or nonessential (dispensable). EAA, not NEAA, must be provided in diets to support protein accretion in growing animals and N balance in adults. After this first convincing evidence for nutritional essentiality of a dietary AA for animals was presented, the importance of lysine in nutrition was demonstrated by T.B. Osborne and L.B. Mendel in 1914 when they noted that young rats did not grow when fed a gliadin-based diet that was severely deficient in lysine. However, when small, graded

422 Amino Acids: Biochemistry and Nutrition
© 2010 Taylor & Francis Group, LLC
amounts of lysine were added to the basal diet, the young rats exhibited growth in a dose-dependent manner. In their original 1914 publication, T.B. Osborne and L.B. Mendel defined EAA as those AA that “cannot be manufactured de novo in the animal organism” and NEAA as those AA that can be formed adequately from other AA de novo in the body. In 1916, H. Ackroyd and F.G. Hopkins reported that histidine is also an EAA for rats. Encouraged by these groundbreaking discover-ies, many experiments were conducted between 1916 and 1926 to identify dietary requirements of other EAA, but were all unsuccessful and in most instances were discontinued because the animals rejected the food. Unfortunately, low food intake was not interpreted to indicate a dietary deficiency of an AA but rather was believed to be caused by the bad taste of the ration. Thus, by 1930, only three AA (Trp, Lys, and His) had been unequivocally shown to be EAA for rats.
In 1931, R.W. Jackson and R.J. Block reported that methionine or cystine was a dietary essential AA for the growth of rats fed a diet containing gelatin and a low level of whole milk powder. It was not until 1935 when W.C. Rose isolated threo-nine from casein that it became possible to prepare nutritionally complete crystal-line AA-based diets for animals. Using rats fed various mixtures of AA, W.C. Rose discovered, between 1937 and 1948, that the lack of isoleucine, methionine, phe-nylalanine, threonine, or valine in the diet resulted in a loss of body weight (BW), diminished appetite, and eventual death. Of particular interest, this biochemist noted that animals grew at a low rate when arginine was missing from the diet but at a much higher rate when the diet contained adequate arginine. Recognizing a nutri-tional role for certain AA that can be synthesized in the body but whose synthesis is insufficient for maximal growth, W.C. Rose and coworkers defined in 1946 an EAA as “one which cannot be synthesized by the animal organism out of materials ordi-narily available to the cells at a speed commensurate with the demands for normal growth.” According to this definition, EAA vary with both species and developmen-tal stage, physiological status, and pathological conditions for a given species. For example, arginine, which is synthesized at a rate inadequate to support maximal growth of young mammals, can be considered as an EAA. Therefore, by 1950, nine EAA and one “nutritionally semi-essential” AA (i.e., arginine) had been identified for rats. Note that the major criterion used to assess whether an AA is nutritionally essential or nonessential was N balance or growth rates of animals (Rose 1968). These simple methods, although imperfect, have played an important role in studies of AA metabolism and nutrition. The discovery of EAA is a great example testifying that creative ideas are a key element in advancing nutritional sciences.
humAn stuDies
Based on the amounts of protein consumed by a group of German workmen doing moderate physical work, J. von Liebig estimated in 1840 that the average adult would require dietary intake of 120 g protein/day. Extrapolating results from canine studies without considering a human equivalent dose, Liebig’s student C. von Voit suggested dietary intake of 118 g protein/day for the average adult in 1881. Influenced by the German school of nutritionists, the American scientist W.O. Atwater (a former student of Voit) recommended dietary intake of 125 g protein/day for the average adult in 1902,

423Dietary Requirements of Amino Acids
© 2010 Taylor & Francis Group, LLC
as he found that US workmen generally worked harder, ate more, and were wealthier than the Germans. However, in 1904, R.H. Chittenden (professor of physiological chemistry at Yale University) challenged these high values of protein intake because they were not derived from human metabolic needs and were not consistent with his own observations. In his experiments, Chittenden noted that: (1) 15 adults remained healthy and in N balance for 6 months on daily diets containing 61–62 g protein; and (2) seven college student athletes consuming 64 g protein/day maintained their levels of athletic performance and well-being. Despite this advance in protein nutrition, little was known then about dietary requirements of individual AA by humans.
Guided by results from his and others’ animal studies, W.C. Rose under-took extensive research on dietary requirements of EAA by human subjects at University of Illinois between 1942 and 1955. This timely work arose partly from the urgent need to understand dietary AA requirements by soldiers who were fight-ing in World War II when food protein resources were scarce. To successfully complete his experiments, Rose cleverly designed the basal diet to contain N-free food ingredients, including cornstarch, sucrose, protein-free butterfat, corn oil, inorganic salts, and a vitamin mixture. The subjects consumed, for 8 days, an AA mixture lacking a tested AA, and N balance was the criterion for adequacy or inadequacy of the rations. In 1950, he identified methionine and valine as EAA for young adults. One year later, Rose reported that threonine, but not histidine, was an EAA for adult humans. Specifically, the absence of dietary histidine had no effect on N balance during a week-long experimental period. This finding was previously taken to suggest that histidine could be synthesized by humans. However, despite much effort by many biochemists worldwide, no pathway could be identified for histidine synthesis in animal cells. This discrepancy highlights a major weakness of N balance as the sole criterion to classify AA as EAA or NEAA. Nonetheless, luck favored Rose in his subsequent studies during which he correctly identified isoleucine, leucine, lysine, phenylalanine, and tryptophan as EAA for humans. In all of these landmark experiments, the removal of isoleucine, leucine, lysine, methionine, phenylalanine, threonine, tryptophan, or valine from the diet resulted in a strongly negative N balance, low appetite, extreme fatigue, and nervous irri-tability. Conversely, these symptoms disappeared promptly after addition of the missing AA to the ratio. In contrast, Rose found that healthy young men fed a diet lacking one of the following AA could maintain N balance: alanine, arginine, aspartate, cysteine, glutamate, glycine, proline, serine, and tyrosine. Note that he did not mention asparagine or glutamine in his work, possibly because he did not have the necessary methods for their analysis. In 1957, Rose defined an NEAA as “an amino acid which can be produced in sufficient quantities to meet fully the requirement of animals.” In the past five decades, isotopic tracer studies have been undertaken by several groups of scientists in Canada, the United Kingdom, and the United States (including R.O. Ball, E.B. Marliss, P.B. Pencharz, P.J. Reeds, J.C. Waterlow, and V.R. Young) to determine quantitative requirements of dietary EAA by infants, children, and adults. Consistent with postnatal changes in the fractional rates of tissue protein synthesis, dietary EAA requirements (expressed as mg/kg BW) by humans generally decrease with increasing age between birth and adulthood.

424 Amino Acids: Biochemistry and Nutrition
© 2010 Taylor & Francis Group, LLC
stuDies involvinG fArm AnimAls
Farm animals grow faster than humans and, therefore, are useful biological mod-els for sensitively detecting their responses to EAA and defining their requirements for these nutrients. Thus, along with the advent of AA nutrition in rats and humans between the 1930s and the 1950s, there was much interest in studying dietary EAA requirements by poultry, swine, and cattle during this period. Specifically, in 1938, A.A. Klose, E.L.R. Stokstad, and H.J. Almquist reported that arginine is an EAA for chickens. Subsequently, a series of elegant studies by E.T. Mertz and colleagues indi-cated the nutritional essentiality of tryptophan (1948), lysine (1949), threonine (1950), and methionine (1951), as well as arginine, leucine, phenylalanine, and valine (1952) in young pigs. Meanwhile, L.A. Maynard and coworkers demonstrated in 1951 that isoleucine is another EAA in swine. The Maynard group also used purified diets to determine AA requirements by young ruminants in 1948. This seminal work was fol-lowed by extensive studies of AA requirements by lactating cows, growing beef, and growing sheep in the 1950s to 1980s. To bypass the microbial actions of the rumen in ruminants, these investigations involved direct infusion of individual AA, casein, or other proteins into the abomasum and generated unique concepts and terminologies in ruminant protein nutrition, which included: (1) rumen-degradable protein (protein that can be hydrolyzed in the rumen), (2) rumen-undegradable protein (protein that can-not be hydrolyzed in the rumen), (3) microbial protein (protein synthesized by rumen bacteria), (4) metabolizable protein (true protein that is digested in the abomasum and the small intestine), and (5) nonprotein N. Although rumen bacteria can synthesize all AA from ammonia, sulfur, and carbohydrate, the microbial source of protein and AA is inadequate for supporting maximal growth of postweaning ruminants or maximum milk production by lactating cows when the animals are fed roughage diets.
Beginning in the late 1950s, H.H. Mitchell and H.M. Scott at University of Illinois developed the ideal protein concept (optimal proportions and amounts of EAA) for chicken diets. Early attempts were based on the EAA composition of eggs and casein but were largely unsuccessful because of the excess of many EAA. In 1960, H.M. Scott’s group simulated the profile of EAA in the fat-free chick carcass to design a revised pattern of dietary EAA for improving the chick growth performance. An improvement was indeed achieved using this approach but remained unsatisfactory due to the lack of NEAA in the diet. Subsequently, a mixture of several AA (cystine, glycine, proline, and glutamate), which are synthesized by birds and had previously been thought to be NEAA in chicken nutrition, was used in dietary formulations to yield better results on growth performance. This extensive research during the 1960s and the 1970s culminated in several versions of the “chick AA requirement stan-dard” for the first three weeks post-hatching. Reference values were given in the Dean and Scott Standard (1965), the Huston and Scott Reference Standard (1968), and the modified Sasse and Baker Reference Standard (1973). The common features shared by these different recommended standards of dietary AA requirements by chickens are that the diets included: (1) all protein EAA that are not synthesized by chickens; (2) several AA (cystine, glutamate, glycine, proline, and tyrosine) that are synthe-sized by animals to various extent; and (3) no data on alanine, aspartate, asparagine, glutamine, or serine. Because the content of proline plus hydroxyproline in the body
425Dietary Requirements of Amino Acids
© 2010 Taylor & Francis Group, LLC
of chickens was not known at that time, the relatively small amount of proline in the recommended ideal protein was only arbitrarily set and was thought to limit their responses to dietary EAA and their maximal growth. Thus, the lysine:proline ratio ranged from 4.75:1.00 in the Huston and Scott Reference Standard (1968) to 2.28:1.00 in the modified Sasse and Baker Reference Standard (1973). In contrast, very large amounts of glutamate (e.g., 13 times the lysine value in the modified Sasse and Baker Reference Standard) were used to presumably provide the entire need for “nonspecific AA N” (Baker 2009). However, key questions regarding whether glutamate fulfilled this role and whether excess glutamate might interfere with the transport, metabolism, and utilization of other AA in chickens were not addressed by the Illinois investigators.
In 1980, the British nutritionist D.J.A. Cole suggested that swine diets could be formulated to contain ideal ratios of EAA (with lysine as the reference AA) based on their concentrations in the pig carcass (almost exclusively tissue proteins). This idea was adopted first by the British Agricultural Research Council (ARC) in 1981 and then by the U.S. National Research Council (NRC) in 1988. Unfortunately, histidine, arginine, and all NEAA were not included in the ARC’s concept of “ideal protein.” Also, its conceptual foundation based solely on the EAA composition of the body was flawed, because the pattern of AA in the diet does not necessarily reflect the composition of AA in the body (Chapter 2). This mismatch arises from the fact that (1) individual AA in the diet undergo extensive catabolism and transformations at different rates in the small intestine; (2) the pattern of AA concentrations in the cir-culation differs markedly from the AA composition in the diet; (3) individual AA in the plasma have different metabolic fates in different animal tissues; and (4) the pat-tern of AA in tissue proteins differs greatly from that in the diet (Chapter 3). These major shortcomings limit the usefulness of the early versions of the “ideal protein” in formulating swine diets for maximal growth performance.
Dietary AA are required by animals primarily for maintenance (including the synthesis of nonprotein metabolites) and protein accretion (Kim et al. 2005). However, the ARC’s ideal protein concept did not take into consideration the relative contribution of maintenance to the total AA needs of the pig. This was due, in part, to technical challenges to accurately determine maintenance requirements of AA, because their components include: (1) protein synthesis, (2) obligatory use of AA as precursors for essential metabolites (including conventional neurotransmitters, NO, CO, and H2S), (3) obligatory oxidation of AA (as major energy substrates for specific tissues, as the sole source of ammonia to link glucose and N metabolism, and as a source of CO2 for acid–base balance and carboxylation reactions), (4) losses of AA from gastrointestinal epithelia and blood via intestinal secretions, (5) losses of AA from integument (hair and skin) and epidermal structures, and (6) urinary excre-tion of unmodified AA. In attempts to improve the original ideal protein concept, between 1989 and 1990, T.C. Wang and M.F. Fuller used gilts in the weight range of 25–50 kg to estimate an ideal AA pattern that included both maintenance and tissue protein accretion. However, these two authors still did not consider arginine, histi-dine, or all the so-called NEAA in the ideal protein although they used glutamate at 826% of the lysine value to provide nonspecific AA N. Like the chicken studies in the 1960s and 1970s, there were also concerns over the assumptions for inclusion of this high level of glutamate in the swine diet that lack all other NEAA.

426 Amino Acids: Biochemistry and Nutrition
© 2010 Taylor & Francis Group, LLC
Having recognized the need to modify the ideal protein concept for formulating swine diets, D.H. Baker took great efforts, between 1990 and 2000, to evaluate dietary requirements of EAA by 10–20 kg swine. In their original study, D.H. Baker and his student T.K. Chung (1992) added arginine (42% of lysine), glycine (100% of lysine), histidine (32% of lysine), and proline (33% of lysine) to the basal diet containing 1.2% true digestible lysine and using glutamate at 878% of the lysine value to provide non-specific AA N. However, other NEAA (including alanine, aspartate, asparagine, cys-teine, glutamine, serine, and tyrosine) were not considered in the revised version of the ideal protein and the rationale for the use of arginine, glycine, histidine, and proline at different proportions to lysine was not explained (Baker 2000). Furthermore, it was unknown (1) whether glutamate is an effective precursor for the synthesis of all other AA (including aspartate, glutamine, and serine) in specific tissues (e.g., the small intes-tine, spleen, and lymph nodes) and the whole body, or (2) whether the high content of glutamate in the diet may affect the transport, metabolism, and utilization of other AA in the diet. Disappointingly, after the 10th edition of the NRC Swine Nutrient Requirements was published in 1998 which did not recognize the needs of pigs for dietary proline or glycine, D.H. Baker omitted glycine and proline from the last version of his “ideal protein” for swine diet formulations in 2000. In the past decade, success-ful attempts to refine the patterns of some AA in diets for lactating, suckling, weanling, finishing, and gestating pigs by addition of arginine and glutamine have been made by G. Wu and colleagues (e.g., Wu et al. 2010, 2011). The outcomes are increases in neo-natal and postweaning growth, lactation performance, and litter size in pigs.
Based on an extensive review of the literature in 2009, G. Wu defined EAA as either those AA whose carbon skeletons cannot be synthesized or those that are insufficiently synthesized de novo by animals relative to their needs for maintenance, growth, development, and health and which must be provided in the diet to meet requirements. According to this definition, glutamine has been recently classified as an EAA for intestinal–mucosal integrity, function, and health in piglets within 2 weeks after weaning. Similarly, arginine is now considered to be an EAA for the maximum growth of neonatal pigs and for female reproduction. Furthermore, tyro-sine, which is derived from phenylalanine hydroxylation but whose carbon skeleton cannot be synthesized de novo, should be classified as an EAA. In humans and other animals with a deficiency of BH4 or phenylalanine hydroxylase, diets must contain tyrosine to prevent negative N balance and metabolic disorders. Likewise, cysteine, which is synthesized from methionine, should be considered as an EAA, because the carbon skeleton of cysteine or methionine cannot be made de novo in animal cells. In birds, the carbon skeleton (P5C) of proline and arginine cannot be synthesized de novo and the rate of glycine synthesis is normally lower than the rate of glycine utilization, and, therefore, these three AA are classified as EAA.
Also in 2009, G. Wu defined NEAA as those AA which can be synthesized de novo in adequate amounts by animals to meet requirements for maintenance, growth, development, and health and, therefore, need not be provided in the diet. According to this definition, classification of AA as NEAA will depend on species, developmental stage, physiological status, environmental cues, and disease (Table 13.2). Disappointingly, to date, there is no compelling experimental evidence for sufficient synthesis of NEAA by animals under these conditions. Simply grouping,

427Dietary Requirements of Amino Acids
© 2010 Taylor & Francis Group, LLC
as NEAA, of all AA that are synthesized de novo in animal cells without full consid-eration of these factors has both conceptual and practical limitations. The list of AA in the NEAA category must be revised as new experimental data become available.
DietAry reQuirements of neAA By humAns AnD other AnimAls
A key element of the historical classification of NEAA is that all NEAA were tac-tically assumed to be adequately synthesized in the animal to meet the needs for tissue protein synthesis. However, as recognized by V.R. Young in 1994 and P.J. Reeds in 2000, no such evidence was ever obtained from all the previous studies involving humans and other animals. Humans and all other animals do have dietary requirements for NEAA for optimal health and growth. In agreement with W.C. Rose’s 1946 definition of NEAA and EAA for rats, H.H. Mitchell stated in 1962 that “an amino acid may be a dietary essential nutrient even if an animal is capable of synthesizing it.” In the past decades, no studies have been performed systematically to provide quantitative data on dietary requirements of NEAA by humans, livestock
TABLE 13.2Classification of AA as EAA, NEAA, and CEAA in Animalsa
Mammalsb Poultry Fish
EAA NEAA CEAAc EAA NEAA CEAAc EAA NEAA CEAAc
Arg Ala Gln Arg Ala Gln Arg Ala Gln
Cys Asn Glu Cys Asn Glu Cys Asn Glu
His Asp Gly Gly Asp Tau His Asp Gly
Ile Ser Pro His Ser Ile Ser Tau
Leu Tau Ile Leu
Lys Leu Lys
Met Lys Met
Phe Met Phe
Thr Phe Pro
Trp Pro Thr
Tyr Thr Trp
Val Trp Tyr
Tyr Val
Val
Note: CEAA, conditionally essential AA; EAA, nutritionally essential AA; NEAA, nutritionally nonessential AA; Tau, taurine.
a Classification of AA as EAA, NEAA, or CEAA depends on species, developmental stage, physi-ological status, environmental factors, and disease.
b Preweaning ruminants have qualitatively similar requirements for dietary AA to those for nonru-minants. In postweaning ruminants, the microbial source of protein and AA is inadequate for supporting their maximal growth or milk production when the animals are fed roughage diets.
c For neonates (including human infants and piglets), adults under stress conditions (e.g., heat stress, burns, and infection), and breeding stocks (both males and females). Tau is an EAA for cats.

428 Amino Acids: Biochemistry and Nutrition
© 2010 Taylor & Francis Group, LLC
species, birds, or aquatic animals. Official publications related to AA requirements by higher organisms (e.g., the Institute of Medicine-recommended dietary allowance for humans in 2005 and the NRC-recommended AA requirements for swine in 2012) do not contain data on dietary requirements of any NEAA. Some of the explana-tions offered by the authors are not supported by our current understanding of AA metabolism and nutrition. For example, the Institute of Medicine stated in 2005 that dietary arginine was not required by healthy adults because arginine is synthesized via the hepatic urea cycle. However, there is no net synthesis of arginine in the mam-malian liver via the hepatic urea cycle (Chapter 3). In addition, NRC (2012) indicated that typically, swine has sufficient capacity for synthesis of all those AA that are not classified as EAA. However, ample evidence from recent studies is inconsistent with this notion. Furthermore, synthesis of NEAA in animals critically depends on the availability of EAA that are usually provided from protein in expensive ingredients (Chapter 4), and sufficient capacity does not necessarily translate into sufficient syn-thesis of NEAA in pigs fed an ordinary diet to minimize production costs and excre-tion of nitrogenous metabolites. This demonstrates the importance of ensuring that recommendations for dietary AA requirements be based on up-to-date knowledge of new developments in the field of AA metabolism.
The fact that some AA can be synthesized in the body at the expense of consider-able amounts of energy speaks highly for their physiological importance. Therefore, pathways for their de novo syntheses have evolved or have been highly conserved in the body. Likewise, all NEAA undergo metabolic transformations and have crucial physiological functions (see Chapter 11). For example, the unusually high concen-tration (~1 mM) of glycine in the plasma of postnatal pigs has an important role in stimulating rapid growth, and the abundance of arginine (up to 6 mM) in porcine allantoic fluid during early gestation promotes placental growth and fetal develop-ment. Thus, there is compelling evidence that an inadequate supply of an NEAA in the diet may cause a severe metabolic disorder in animals. For example, administra-tion of a glutamine-free TPN solution to post-surgical patients results in both reduced intestinal mass and a loss of skeletal muscle protein. Based on this meaningful find-ing, glutamine was classified in 1990 as a conditionally essential AA (CEAA), which is defined as an AA that normally can be synthesized in adequate amounts by ani-mals but which must be provided in the diet to meet optimal needs under certain con-ditions wherein rates of utilization are greater than rates of synthesis. Furthermore, results of recent studies indicate that (1) diets must contain sufficient amounts of arginine and glutamine to support optimal fetal, neonatal, and postweaning growth in swine; (2) dietary supplementation with proline enhances growth performance of early-weaned pigs and young rats; and (3) whole-body protein synthesis in burn patients is enhanced by dietary supplementation with arginine, proline, and glycine. Based on the definitions of EAA, NEAA and CEAA, a revised classification of AA in the nutrition of mammals, fish, and birds is summarized in Table 13.2.
functionAl AA in nutrition
The preceding discussion leads to the conclusion that whether an AA is an EAA, NEAA, or CEAA is purely a matter of definition. Unfortunately, its conceptual

429Dietary Requirements of Amino Acids
© 2010 Taylor & Francis Group, LLC
limitation has hindered the development and practice of protein nutrition in humans and other animals. For example, traditionally, there was a lack of interest in conduct-ing experiments to determine whether or not organisms can sufficiently synthesize all the AA that are not classified as EAA. Also, information on the composition of AA in foodstuffs and the animal body was incomplete in previously published stud-ies, resulting in inadequate knowledge about AA nutrition. Furthermore, the original classification of AA as EAA, NEAA, or CEAA was based on N balance or animal growth but failed to consider regulatory roles for AA in nutrition and metabolism. Therefore, historically, the dietary AA requirement for protein balance was the pri-mary focus of protein nutrition research. Since the 1990s, such shortcomings have become evident when results of recent studies indicate that: (1) dietary glutamine is necessary for intestinal mucosal immunity; (2) dietary arginine is required for maximum embryonic survival, as well as for prevention and treatment of obesity and other metabolic syndromes; (3) dietary glycine modulates an animal’s responses to inflammatory cytokines, thereby reducing mortality and morbidity in sepsis; and (4) dietary glutamate ameliorates intestinal atrophy in early-weaned pigs fed a corn- and soybean meal-based diet and prevents intestinal dysfunction in rats receiving repeti-tive intra-gastric tube feeding of a protein-rich liquid diet.
As a nonprotein EAA or CEAA, taurine deserves special attention from nutri-tionists. Compared with other animal species (e.g., cattle, chickens, pigs, rats, and sheep), humans have a low ability to synthesize taurine at any stage during develop-ment. Thus, infants and children cannot produce a sufficient amount of taurine to meet physiological needs and, therefore, must depend on a dietary source of tau-rine for optimal health, growth, and development. Depending on dietary protein intake, nutritional status, concentrations of hormones in blood, and hepatic activity, a healthy adult synthesizes 50–125 mg taurine/day and excretes taurine primarily via urine (95%) and, to a much lesser extent, bile (5%). Under stress or diseased con-ditions (e.g., heat stress, infection, obesity, diabetes, and cancer), taurine synthesis in the body may be impaired due to the suboptimal function of the liver and the reduced availability of its precursors. Notably, vegans generally have lower concentrations of taurine in the plasma and red blood cells than do their nonvegan counterparts, likely due to its insufficient synthesis (Laidlaw et al. 1988). Additionally, there is evidence that children and adults fed taurine-free parenteral nutrition are deficient in taurine and greatly benefit from supplementation with taurine. Taken together, these results suggest inadequate production of taurine by humans. However, dietary requirements of taurine have not been established for nonfeline animals, including humans, pigs, and ruminants. Based on urinary excretion of taurine (72 mg/day) by healthy adult humans, taurine requirement may be at least 75 mg/day.
Some of the traditionally classified NEAA (e.g., arginine, glutamine, glutamate, glycine, and proline) play important roles in regulating gene expression, cell sig-naling, antioxidative responses, and immunity. Additionally, glutamate, glutamine, and aspartate are major metabolic fuels for enterocytes and they, along with gly-cine, d-aspartate and d-serine, also regulate neurological development and func-tion. Furthermore, compelling evidence shows that: (1) leucine activates MTOR to stimulate protein synthesis and inhibit proteolysis; (2) tryptophan modulates neuro-logical and immunological functions through serving as a ligand for AhR receptors

430 Amino Acids: Biochemistry and Nutrition
© 2010 Taylor & Francis Group, LLC
and as a precursor for the synthesis of numerous metabolites (including serotonin and melatonin); (3) SAM (a metabolite of methionine) participates in protein and DNA methylation, and, therefore genetic and epigenetic regulation of cell growth and development; and (4) glutamine is essential for ATP production, synthesis of nucleotides, expression of antioxidative genes, and redox signaling in enterocytes.
Therefore, based on a growing body of published literature in the past 20 years, G. Wu proposed in 2010 the concept of functional AA, which are defined as those AA that participate in and regulate key metabolic pathways to improve health, survival, growth, development, lactation, and reproduction of the animal. Metabolic pathways include: (1) AA synthesis and catabolism, (2) generation of physiologically important low-molecular-weight peptides and nitrogenous substances, (3) intracellular protein turnover, (4) urea cycle and uric acid synthesis, (5) lipid and glucose metabolism, and (6) antioxidative reactions. Functional AA can be EAA (e.g., Arg, Cys, Leu, Met, and Trp), NEAA (e.g., Asp and Gly for swine), or CEAA (e.g., Gln, Glu, Pro, and taurine). Important roles of these AA in physiology are not necessarily reflected by their rela-tive or absolute concentrations in plasma and cells, as tryptophan is among the least abundant AA in both free and peptide-bound pools. The concept of functional AA takes into consideration the animal’s metabolic needs for dietary AA beyond tissue protein synthesis and unifies EAA, NEAA, and CEAA in nutrition (Wu et al. 2012).
DETERMINATION OF AA REQUIREMENTS
Many methods have been developed to determine dietary requirements of EAA and protein by humans and other animals (Elango et al. 2012). Each method has its own strengths and weaknesses. The selection of a method will vary with species, devel-opmental age, and the availability of facilities. Dietary requirements are affected by: (1) dietary factors (e.g., AA content and pattern, energy intake, presence or absence of other substances, and food processing); (2) physiological characteristics of ani-mals (e.g., age, sex, genetic backgrounds, circadian clock, hormones, pregnancy, and lactation); (3) pathological states (e.g., infection, trauma, neoplasia, diabetes, obesity, cardiovascular disease, and fetal growth restriction); and (4) environmental factors (e.g., temperatures, toxic agents, air pollution, physical activity, dietary habits, sani-tation, and personal hygiene). These factors should be taken into consideration in estimating an animal’s requirements for dietary AA.
n BAlAnce stuDies
Measurement of N Balance under Various Nutritional and Physiological ConditionsThe N atom is neither degraded nor synthesized in animals. In tissues or the whole body, N is present almost exclusively in proteins and AA. Thus, when there is no N accumulation in the body, N intake from the diet (N input) should be equal to N excre-tion by the animal in the various forms, including urea, ammonia, nitrite, nitrate, and AA in urine; NO gas; and fecal nitrogenous substances (N output). N balance can be determined for the whole body or a specific tissue and is the classic approach for measuring dietary requirements of proteins (Table 13.3) and AA (Table 13.4) by

431Dietary Requirements of Amino Acids
© 2010 Taylor & Francis Group, LLC
human subjects of all ages. This method is also applicable to both laboratory and farm animals. Complete 24-h urine and fecal collections should be made. A glass urine container should contain a final concentration of 1% (v/v) H2SO4 to preserve ammonia and inhibit bacterial activity. Fecal samples should be immediately stored at −20°C and freeze-dried. Care should be taken to avoid evaporation of ammonia and urea hydrolysis. The loss of N via skin, sweat, and other routes, which is sizable (e.g., 8 mg N/kg BW/day in human adults), should also be determined.
Whole-body N balance = Dietary N intake − (Urinary N + Fecal N + Other routes)
Growth in young animals results from protein deposition, namely a positive N bal-ance (N intake > N excretion). It is often assumed that protein contains 16% N. Thus, to convert N into protein, a factor of 6.25 is used. It should be pointed out that this is based on average molecular weight of AA residues found in protein. For protein with higher C:N ratios, the value of 16% should not be used to calculate the N content. To maintain a positive N balance, animals must be provided with AA in diets and AA from endogenous sources in appropriate ratios, because a deficiency of one AA can limit protein synthesis while increasing overall AA oxidation. The usefulness of growth and N balance studies have been instrumental in estimating dietary require-ments of AA and proteins by farm animals. Recommended values for growing and gestating swine of different BWs are summarized in Tables 13.5 and 13.6, respectively.
Diseased states are usually associated with a negative N balance, namely N intake <N excretion. This is because of increased AA oxidation and decreased intake of dietary AA. In patients with AIDS, burns, cancer, diabetes, injury, metabolic aci-dosis, or sepsis, a negative N balance usually occurs primarily due to net protein
TABLE 13.3Dietary Protein Requirements by Humans of All Age Groups
Dietary Requirement (mg/kg Body Weight Per Day)
FAO/WHO/UNUb
Group Age (Years) IOMa 1985 2007
Infants 0.3–0.5 1.52 1.75 1.31
0.75–1.0 1.50 1.57 1.14
Children 1–3 1.10 1.18 1.02
4–8 0.95 1.05 0.92
Adolescents 9–13 0.95 0.99 0.90
14–18 (boys) 0.85 0.97 0.87
14–18 (girls) 0.85 0.94 0.85
Adults ≥19 0.80 0.75 0.83
a Recommended dietary allowance (RDA) published by the Institute of Medicine (IOM, 2005).b FAO/WHO/UNU (World Health Organization/Food and Agriculture Organization/United Nations
University, 1985 and 2007).

432 Amino Acids: Biochemistry and Nutrition
© 2010 Taylor & Francis Group, LLC
degradation in skeletal muscle. Thus, treatment strategies for these patients should include stimulation of tissue protein synthesis, inhibition of intracellular protein deg-radation, and suppression of whole-body AA oxidation (Hoffer and Bistrian 2012).
Let us use, as an example, the loss of body protein in obese patients fed a low-calorie weight-reducing diet. These subjects have metabolic acidosis because the mobilization of fat from white adipose tissue produces large amounts of free fatty acids which are oxidized to form ketone bodies (acidic substances). The kidneys utilize glutamine (whose N is derived from branched-chain AA and thus protein primarily in skeletal muscle) to generate ammonia to convert H+ into NH4
+. Thus, ketoacidosis drives the loss of muscle protein and, therefore, an N imbalance in the whole body. By correcting for ketoacidosis and sparing renal ammoniagenesis from glutamine, ultimately AA and muscle protein, oral administration of NaHCO3 has been used successfully to decrease the loss of body protein in these obese patients who are fed a low-calorie diet (Table 13.7).
The N balance across the placenta of a gestating mother illustrates unique pat-terns of N and AA utilization by the fetus. Studies of AA uptake by the ovine fetus, calculated on the basis of umbilical venous–arterial differences, indicate that most AA, except lysine and histidine, are taken up by the fetus in 20–30% excess above
TABLE 13.4Dietary Requirements of EAA by Healthy Human Adults
Estimates from N Balance Experimentsa
MIT Valuesa (Tracer Studies)
(2000)IOMb (2005)
FAO/WHO/UNUc (2007)EAA Mend Womene
mg/kg BW/DayHis — — — 14 10
Ile 10 9.17 23 19 20
Leu 15.7 12.1 40 42 39
Lys 11.4 9.07 30 38 30
Met 2.36 3.23 — — —
Met + Cys 15.7 11.7 13 19 15
Phe 4.29 4.30 — — —
Phe + Tyr 15.7 — 39 33 25
Thr 7.14 6.25 15 20 15
Trp 3.57 2.80 6 5 4
Val 11.4 10.4 20 24 26
Source: Adapted from Young, V.R. and S. Borgonha. 2000. J. Nutr. 130:1841S–1849S.a MIT, Massachusetts Institute of Technology.b Recommended dietary allowance (RDA) published by the Institute of Medicine (IOM, 2005).c FAO/WHO/UNU (World Health Organization/Food and Agriculture Organization/United Nations
University, 2007).d Body weight = 70 kg.e Body weight = 60 kg.

433Dietary Requirements of Amino Acids
© 2010 Taylor & Francis Group, LLC
the amounts required for protein deposition. In pregnant sheep, uterine uptake of glutamine is the greatest among all the measured AA to support the needs of the growing fetus. Similar studies have shown the net synthesis of urea from AA N by the fetus. In gestating swine, accretion of N and AA (particularly glutamine and arginine) by fetal pigs increases more rapidly with gestation than non-N dry matter. AA N represents 83–88% of total N, and arginine is the most abundant N carrier in fetal pigs at all gestational ages. Such an abundance of arginine N in the fetus often goes unrecognized, but it reflects the important role for arginine in fetal nutrition, metabolism, survival, and growth.
Advantages and Limitations of N Balance StudiesN balance measurement is a simple and relatively inexpensive approach to esti-mate the quantitative and qualitative requirements of individual AA and proteins by humans and other animals. However, this method has the following inherent limitations: (1) failure to account for all the losses of N from the body (e.g., 0.5 g N/day or ~7.1% of daily N intake in the healthy adult human consuming ~7.0 g N/day; and in young pigs, 6.7% of dietary alanine N could not be recovered in the
TABLE 13.5 Dietary Requirements of EAA by Growing Swine at Different Body Weights
Body Weight of Growing Swine (kg)
Variable 5–7 7–11 11–25 25–50 50–75 75–10 100–135
ME content of diet (kcal/kg) 3400 3400 3350 3300 3300 3300 3300
ME intake (kcal/day) 904 1592 3033 4959 6989 8265 9196
Feed intake + wastage (g/day) 280 493 953 1582 2229 2636 2933
Content of total N in diet (%) 3.63 3.29 3.02 2.51 2.20 1.94 1.67
Content of total AA in diet (%)
Arginine 0.75 0.68 0.62 0.50 0.44 0.38 0.32
Histidine 0.58 0.53 0.48 0.39 0.34 0.30 0.25
Isoleucine 0.88 0.79 0.73 0.59 0.52 0.45 0.39
Leucine 1.71 1.54 1.41 1.13 0.98 0.85 0.71
Lysine 1.70 1.53 1.40 1.12 0.97 0.84 0.71 Methionine 0.49 0.44 0.40 0.32 0.28 0.25 0.21
Methionine + cysteine 0.96 0.87 0.79 0.65 0.57 0.50 0.43
Phenylalanine 1.01 0.91 0.83 0.68 0.59 0.51 0.43
Phenylalanine + tyrosine 1.60 1.44 1.32 1.08 0.94 0.82 0.70
Threonine 1.05 0.95 0.87 0.72 0.64 0.56 0.49
Tryptophan 0.28 0.25 0.23 0.19 0.17 0.15 0.13
Valine 1.10 1.00 0.91 0.75 0.65 0.57 0.49
Source: Adapted from National Research Council for swine fed typical corn- and soybean meal-based diets. Dry matter content in the diet is 90% (as-fed basis). 2012. Nutrient Requirements of Swine. National Academy Press, Washington, DC.
Note: ME, metabolizable energy.

434 Amino Acids: Biochemistry and Nutrition
© 2010 Taylor & Francis Group, LLC
urine and feces), resulting in underestimation of AA requirements; (2) high vari-ability in daily N balance, as small changes in N deposition may not be detected; (3) failure to detect functional changes in cells and organs or to fully evaluate dietary requirements of AA; (4) not being sufficiently sensitive to dietary intake of certain AA particularly within a short experimental period; (5) an inability to provide information about the cellular processes of intermediary metabolism of AA or protein; (6) difficulty in interpreting the experimental data either when dietary protein intake is high or when dietary protein intake is low, because enzyme systems adapt and AA oxidation can be altered; (7) N balance being strongly influenced by dietary energy intake, environmental conditions, and changes in endocrine status; (8) requirement of a relatively long period of adapta-tion to an experimental diet (e.g., 5–7 days for rats and pigs, and 7–10 days for adult humans); (9) possible inconsistency between animal growth and N balance,
TABLE 13.6Dietary Requirements of EAA by Gestating Swine at Different Parities
Variable Gestating Sows
Parity 1 2 3 4
BW at Breeding (kg) 140 165 185 205
Litter size 12.5 13.5 13.5 13.5
Days of Gestation <90 >90 <90 >90 <90 >90 <90 >90
ME content of diet (kcal/kg) 3300 3300 3300 3300 3300 3300 3300 3300
ME intake (kcal/day) 6678 7932 6928 8182 6928 8182 6897 8151
Feed intake + wastage (g/day) 2130 2530 2210 2610 2210 2610 2200 2600
Content of total N in diet (%) 1.62 2.15 1.42 1.95 1.26 1.77 1.14 1.62
Content of total AA in diet (%)
Arginine 0.32 0.42 0.27 0.37 0.23 0.32 0.20 0.29
Histidine 0.22 0.27 0.19 0.23 0.16 0.20 0.14 0.18
Isoleucine 0.36 0.43 0.31 0.38 0.27 0.33 0.24 0.29
Leucine 0.55 0.75 0.47 0.66 0.41 0.59 0.36 0.53
Lysine 0.61 0.80 0.52 0.71 0.45 0.62 0.39 0.55 Methionine 0.18 0.23 0.15 0.20 0.13 0.18 0.11 0.16
Methionine + cysteine 0.41 0.54 0.36 0.48 0.32 0.44 0.29 0.40
Phenylalanine 0.34 0.44 0.29 0.40 0.25 0.35 0.23 0.31
Phenylalanine + tyrosine 0.61 0.79 0.53 0.70 0.46 0.62 0.41 0.56
Threonine 0.46 0.58 0.41 0.53 0.37 0.48 0.34 0.44
Tryptophan 0.11 0.15 0.10 0.14 0.09 0.13 0.08 0.12
Valine 0.45 0.58 0.39 0.52 0.34 0.46 0.31 0.42
Source: Adapted from National Research Council for swine fed typical corn- and soybean meal-based diets. Dry matter content in the diet is 90% (as-fed basis). 2012. Nutrient Requirements of Swine. National Academy Press, Washington, DC.
Note: BW, body weight; ME, metabolizable energy. The recommended arginine:lysine ratios in diets for swine at various stages of growth and development may be underestimated.
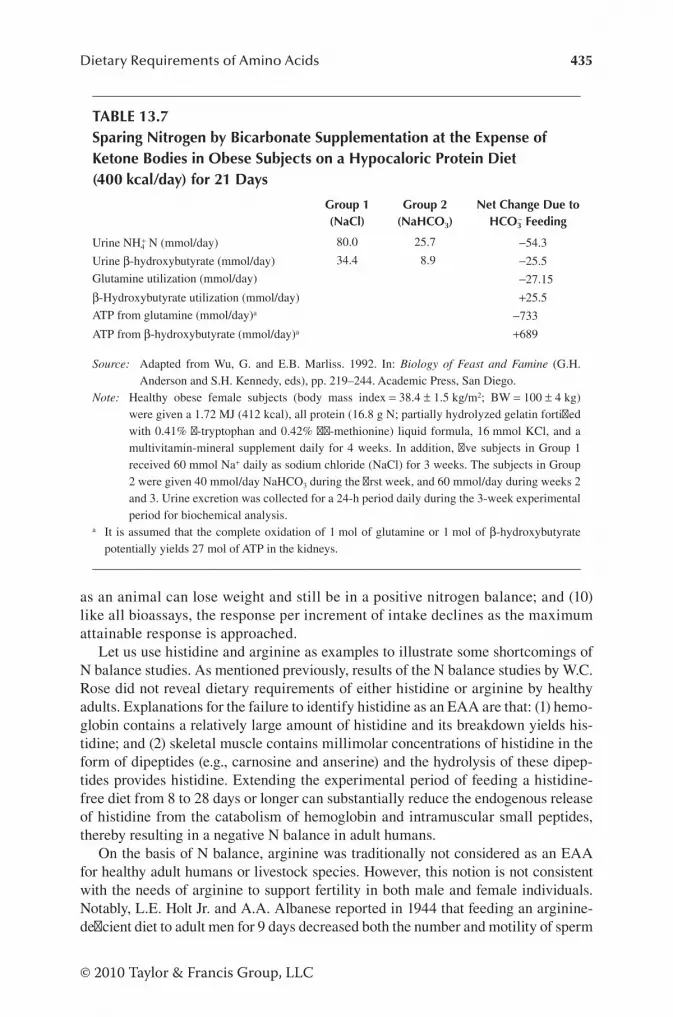
435Dietary Requirements of Amino Acids
© 2010 Taylor & Francis Group, LLC
as an animal can lose weight and still be in a positive nitrogen balance; and (10) like all bioassays, the response per increment of intake declines as the maximum attainable response is approached.
Let us use histidine and arginine as examples to illustrate some shortcomings of N balance studies. As mentioned previously, results of the N balance studies by W.C. Rose did not reveal dietary requirements of either histidine or arginine by healthy adults. Explanations for the failure to identify histidine as an EAA are that: (1) hemo-globin contains a relatively large amount of histidine and its breakdown yields his-tidine; and (2) skeletal muscle contains millimolar concentrations of histidine in the form of dipeptides (e.g., carnosine and anserine) and the hydrolysis of these dipep-tides provides histidine. Extending the experimental period of feeding a histidine-free diet from 8 to 28 days or longer can substantially reduce the endogenous release of histidine from the catabolism of hemoglobin and intramuscular small peptides, thereby resulting in a negative N balance in adult humans.
On the basis of N balance, arginine was traditionally not considered as an EAA for healthy adult humans or livestock species. However, this notion is not consistent with the needs of arginine to support fertility in both male and female individuals. Notably, L.E. Holt Jr. and A.A. Albanese reported in 1944 that feeding an arginine-deficient diet to adult men for 9 days decreased both the number and motility of sperm
TABLE 13.7 Sparing Nitrogen by Bicarbonate Supplementation at the Expense of Ketone Bodies in Obese Subjects on a Hypocaloric Protein Diet (400 kcal/day) for 21 Days
Group 1 (NaCl)
Group 2 (NaHCO3)
Net Change Due to HCO3
− Feeding
Urine NH4+ N (mmol/day) 80.0 25.7 −54.3
Urine β-hydroxybutyrate (mmol/day) 34.4 8.9 −25.5
Glutamine utilization (mmol/day) −27.15
β-Hydroxybutyrate utilization (mmol/day) +25.5
ATP from glutamine (mmol/day)a −733
ATP from β-hydroxybutyrate (mmol/day)a +689
Source: Adapted from Wu, G. and E.B. Marliss. 1992. In: Biology of Feast and Famine (G.H. Anderson and S.H. Kennedy, eds), pp. 219–244. Academic Press, San Diego.
Note: Healthy obese female subjects (body mass index = 38.4 ± 1.5 kg/m2; BW = 100 ± 4 kg) were given a 1.72 MJ (412 kcal), all protein (16.8 g N; partially hydrolyzed gelatin fortified with 0.41% l-tryptophan and 0.42% dl-methionine) liquid formula, 16 mmol KCl, and a multivitamin-mineral supplement daily for 4 weeks. In addition, five subjects in Group 1 received 60 mmol Na+ daily as sodium chloride (NaCl) for 3 weeks. The subjects in Group 2 were given 40 mmol/day NaHCO3 during the first week, and 60 mmol/day during weeks 2 and 3. Urine excretion was collected for a 24-h period daily during the 3-week experimental period for biochemical analysis.
a It is assumed that the complete oxidation of 1 mol of glutamine or 1 mol of β-hydroxybutyrate potentially yields 27 mol of ATP in the kidneys.

436 Amino Acids: Biochemistry and Nutrition
© 2010 Taylor & Francis Group, LLC
cells by 90% despite N balance at equilibrium. This striking observation underlines a critical role for arginine in spermatogenesis. In addition, feeding an arginine-free diet to pregnant rats has been reported to increase fetal resorption, intrauterine growth retardation, and perinatal mortality, while decreasing the number of live fetuses. Such adverse effects can be prevented by adding arginine to the basal diet. These findings argue strongly that functional needs beyond tissue protein synthesis and N balance should be important criteria for the classification of AA as EAA, NEAA, or CEAA. Thus, whether arginine is an EAA or NEAA for adults is only a matter of definition. Physiological functions of an AA must be fully considered in assessing its dietary requirements by animals. However, despite its shortcomings, the N balance study remains an invaluable procedure for determining dietary requirements of AA and protein for animals, until a new method is firmly established.
fActoriAl methoD for DetermininG AA reQuirements
Dietary requirements for EAA, NEAA, and CEAA by the whole body or a tissue of interest (e.g., the small intestine) can be estimated on the basis of factorial analysis, namely the sum of fecal and urinary N in response to a protein-free diet (maintenance), AA deposited in the body, and AA excreted as animal products (e.g., milk, egg, wool, and fetus growth). For certain AA, the factorial method can also be based on the sum of the needs for the AA for metabolic pathways and obligatory losses of the AA via secretions from the body. The obligatory losses of AA occur when the animal is fed an essentially N-free diet that meets energy requirements, including hair, sweat, nasal secretions, menstrual losses (women), and seminal fluid (males). The factorial method can be used only when data on AA oxidation in the whole body or a tissue of interest are available. Note that true digestibility of protein-bound glutamine must be taken into consideration in recommending its dietary requirement for animals.
Dietary requirement of AA = (MNSI + MNEIT + LSob − ESIT − ESEIT)/RE
where
MNSI and MNEIT are the metabolic needs for the AA by the small intestine and extraintestinal tissues, respectively;
LSob is the obligatory loss of AA by secretions from the body;ESIT is the endogenous synthesis of AA in the small-intestinal tissues;ESEIT is the endogenous synthesis of AA in extraintestinal tissues; andRE is the true digestibility of protein-bound AA (release of dietary protein-
bound AA into the lumen of the small intestine).
For AA that are not synthesized by animals, the factorial method can be simpli-fied because ESEIT = 0.
Let us use, as an example, glutamine requirement by the whole body of young swine (Table 13.8). The metabolic needs of glutamine by a tissue include (1) oxi-dation as a metabolic fuel; (2) protein synthesis; (3) generation of biologically active substances, and (4) formation of tissue- or sex-specific products (e.g., mucins, embryo or fetus, and milk). In young pigs, major glutamine-utilizing

437Dietary Requirements of Amino Acids
© 2010 Taylor & Francis Group, LLC
tissues are the small intestine, skeletal muscle, lymphoid organs, vascular endo-thelia, kidneys, and nonsmall-intestine portal-drained viscera (including stom-ach, spleen, and pancreas). The physiological requirement for glutamine in the whole body and endogenous synthesis of glutamine are ≥1949 and 1149 mg/kg BW/day, respectively (Table 13.2), whereas glutamine synthesis in the small intes-tine is negligible. The obligatory losses of glutamine via hair, sweat, and nasal secretions from piglets are negligible. Thus, assuming that the digestibility of glu-tamine in dietary protein is 90%, glutamine provision from the diet is ≥889 mg/kg BW/day. Calculated values of dietary AA requirements should be verified by feeding trials, N-balance experiments, or studies of functional outcome (e.g., fer-tility, health, lactation, growth, athletic performance, or survival).
trAcer methoDs to Determine AA reQuirements
General Considerations of the Direct and Indicator AA Oxidation Methods for Estimating AA RequirementsThe rate of oxidation of an AA depends on its concentration in the free pools (e.g., plasma and intracellular fluids), the nutritional status, and the physiological needs of the animal. When in excess, most AA (possibly except for glutamine) cannot be stored in the body. Thus, an excessive amount of an AA will be disposed off primarily via oxidation and urea synthesis in mammals (or uric acid synthesis in avian species). An increase in the oxidation of an AA is usually an indicator of its excessive avail-ability in the body, provided that there are no significant changes in the concentra-tions of regulatory hormones or metabolites. In other words, if the supply of an AA exceeds its needs by the animal, this AA is oxidized to CO2, water, ammonia, and
TABLE 13.8Glutamine Requirement by Young Pigsa
Tissue Glutamine Needs (mg/kg BW/day)
1. Physiological needs ≥1949
Small intestine 965
Skeletal muscle 310
Lymphoid organs 212
Vascular endothelia 163
Kidneys 151
Nonsmall intestine PDV tissuesb 148
2. Endogenous synthesis 1149
3. Provision from dietc ≥889
[(1949 − 1149)/0.9]
a The pig weighs 7.92 kg and gains 293 g BW/day.b Including stomach, spleen, and pancreas.c Assuming the digestibility of glutamine in dietary protein is 90%.Note: PDV = portal-drained viscera.

438 Amino Acids: Biochemistry and Nutrition
© 2010 Taylor & Francis Group, LLC
urea. It should be borne in mind that an increase in the availability of an AA in the circulation does not necessarily indicate that its supply exceeds its needs by the ani-mal. For example, a decrease in the rate of protein synthesis due to a deficiency of one essential AA in a diet may result in an increase in the availability of other AA in plasma for catabolism. Thus, the oxidation of an indicator AA can be used to estimate the requirement of dietary amino acids and protein by humans and other animals.
In defining dietary requirement of an AA or protein by animals, it is important to consider the following general factors: (1) a requirement for the N of “nonessential AA” from which other nitrogenous compounds can be synthesized; (2) a specific pat-tern of EAA, CEAA, and NEAA within the protein supply to allow for the optimal utilization of dietary AA or protein for maintenance and production (e.g., growth and reproduction); (3) a supply of protein to replace basal losses due to AA oxidation; and (4) an appropriate balance of protein and energy within the diet, because exces-sive amounts of AA can be oxidized for ATP provision when the dietary supply of energy is inadequate. Furthermore, when using a tracer in the AA oxidation meth-ods, one should be aware that the rate of production of 14CO2 (or 13CO2) from a 14C- or 13C-labeled AA in vivo depends on the free pool size of the tracee AA (Chapter 7), the distribution of the enzymes involved in AA oxidation, and the activities of the enzymes in specific cell types and tissues (Chapter 11).
Now, let us consider the following situations relevant to the discussion of AA oxidation in the body. First, regardless of AA balance in the diet, when the dietary intake of AA or protein is increased, the oxidation of AA is also increased, because excessive AA (probably except for glutamine) must be oxi-dized to CO2, water, and urea. Second, when the dietary intake of AA or protein is at the optimal amount for protein synthesis, the oxidation of AA is at a mini-mum level. Third, when the dietary intake of AA or protein is below the animal’s requirements, the oxidation of AA is reduced to spare AA for protein synthesis. This is partly because the enzymes involved in protein synthesis (e.g., tRNA-AA synthases) have much lower Km values for AA substrates than the enzymes that degrade AA. This means that AA are preferentially channeled to the pathway of protein synthesis rather than AA catabolism. Therefore, only a small fraction of dietary AA are available for oxidation in animals fed an AA-balanced diet. Fourth, in a protein-adequate diet, an excess of a specific AA (usually an EAA) would result in an increase in its oxidation, but not necessarily the oxidation of other AA. In contrast, when an EAA is deficient in a diet, the oxidation of other AA is increased progressively with increasing dietary intake of AA or protein. This is because the short supply of this AA limits the utilization of other AA for protein synthesis and all the excess AA are degraded in a tissue-specific manner. The interrelationships between AA oxidation and dietary intake of AA or protein with or without a deficiency of one EAA are illustrated in Figure 13.1.
Direct AA Oxidation MethodPrinciple of the Direct AA Oxidation MethodWhen dietary intake of a test AA is below its physiological requirement by the animal, the rate of its oxidation is relatively low. In contrast, when dietary intake of a test AA is above its physiological requirement by the animal, the rate of its

439Dietary Requirements of Amino Acids
© 2010 Taylor & Francis Group, LLC
oxidation is increased. At optimal requirement, the rate of oxidation of a test AA is maintained at an optimal level and varies little within a narrow range of AA content in the diet (Figure 13.2). The word “direct” is used before “AA oxida-tion” because the oxidation of a test AA (e.g., lysine) is determined to estimate its dietary requirement (i.e., dietary lysine requirement).
Example of the Direct AA Oxidation MethodIn the early 1980s, V.R. Young and his colleagues introduced the direct AA oxi-dation technique to determine dietary requirements of AA by humans. Let us use lysine oxidation as an example to illustrate how this method can be used to estimate dietary lysine requirement by healthy adults. The subjects consumed a diet providing adequate energy, 0.8 g protein/kg BW/day, and a total amount of lysine at 5–100 mg/kg BW/day, and received continuous intravenous infusions of l-[l-13C]lysine. Measurement of expired 13CO2 for 60 min was made during the isotopic steady state of l-[l-13C]lysine in the plasma. Results indicated that the oxidation of lysine was low at low dietary lysine intake, remained in a relatively constant rate at lysine intake of 25–35 mg/kg BW/day, and then markedly increased at lysine intake above 35 mg/kg BW/day (Figure 13.2). Based on these data, dietary lysine requirement was estimated to be between 25 and 35 mg/kg BW/day. The precise dietary requirement of lysine could not be provided unless other variables could be available, including N balance, lysine balance, and concentrations of proteins and metabolites in plasma. The direct AA oxidation method has been satisfactorily applied to determine dietary require-ments of EAA (e.g., phenylalanine) by farm animals (e.g., young pigs).
Dietary intake of AA or protein
Prod
uctio
n of
CO
2 fro
mA
A o
xida
tion
Diet is deficient inone EAA
Diet is balanced incomposition of amino acids
FIGURE 13.1 The interrelationships between AA oxidation and dietary intake of AA in animals. In an animal fed a protein-adequate diet, an excess of a specific AA results in an increase in its oxidation but not necessarily the oxidation of other AA. In contrast, when an essential AA is deficient in a diet, the oxidation of other AA is increased progressively with increasing dietary intake of AA or protein.

440 Amino Acids: Biochemistry and Nutrition
© 2010 Taylor & Francis Group, LLC
Indicator AA Oxidation MethodPrinciple for Use of Indicator AA Oxidation in Estimating AA RequirementsThe indicator AA oxidation method (also known as the indirect AA oxidation method) is based on the hypothesis that the partition of any EAA between oxidation and protein synthesis is sensitive to the level of the most limiting AA in the diet. When an EAA, CEAA, or an NEAA is limiting for protein synthesis, all other AA will become in excess and, therefore, must be oxidized. This means that increasing the dietary level of the limiting AA in graded amounts will increase the utilization of all dietary AA for protein synthesis, resulting in a decrease in their oxidation until the requirement point is reached. Once the requirement point is reached, further increments of the test AA in the diet may not have any effect on the utilization of other AA for oxidation or protein synthesis unless the test AA is capable of regulat-ing these pathways. This method can also be used to estimate the requirement of dietary protein by humans and other animals. The word “indicator” is used before “AA oxidation” because the oxidation of a different AA (e.g., phenylalanine) than the test AA (e.g., proline) is determined to estimate the dietary requirement of the test
Dietary lysine intake(mg/kg body weight per day)
Prod
uctio
n of
13C
O2
from
[1-13
C]ly
sine
oxid
atio
n( μ
mol
/kg
body
wei
ght p
er 6
0 m
in)
Requirement ofdietary lysine
0 5 25 35 50 60
10
5
15
20
FIGURE 13.2 Oxidation of lysine to estimate dietary lysine requirement by adult humans (direct AA oxidation method). Healthy adult subjects consumed a diet providing adequate energy, 0.8 g protein/kg BW/day, and a total amount of lysine at 5–60 mg/kg BW/day. At the end of each dietary period, while subjects were in the fed state, the subjects received an intravenous bolus (priming dose) of l-[l-13C]lysine (5.1 μmol/kg BW) and then 3-h intrave-nous infusions of l-[l-13C]lysine at a constant rate of ~0.060 μmol/kg BW/min. Measurement of expired 13CO2 for 60 min was made during the isotopic steady state of l-[l-13C]lysine in plasma to calculate the rate of CO2 production from the oxidation of carbon-1 of lysine. The rate of oxidation of lysine was low at low dietary lysine intake, remained in a steady state at lysine intake of 25–35 mg/kg BW/day, and markedly increased at a lysine intake above 35 mg/kg BW/day. These results indicate that dietary lysine requirement by healthy adults may be between 25 and 35 mg/kg BW/day. (Adapted from Meredith, C.N. et al. 1986. Am. J. Clin. Nutr. 43:787–794.)

441Dietary Requirements of Amino Acids
© 2010 Taylor & Francis Group, LLC
AA. In essence, the indicator AA oxidation method for estimating AA requirements involves the oxidation of an indicator AA in response to the feeding of graded levels of a test AA. The oxidation of the indicator AA will decrease as intakes of the test AA are increased until the animal’s requirement of the test AA is met. At require-ment and above requirement, there is no further decrease in the oxidation of the indicator AA. The inflection (break point) in the oxidation curve has been suggested to represent the physiological requirement for the test AA.
Example of the Indicator AA Oxidation MethodThe indicator AA oxidation method originated from a 1983 study by K.I. Kim, I. McMillan, and H.S. Bayley regarding dietary requirements of lysine and histidine in neonatal pigs, whose protein synthesis is very sensitive to a deficiency of dietary EAA. This technique was further refined by R.O. Ball and H.S. Bayley in the mid-1980s to estimate dietary requirements of proline, arginine, and protein in piglets. The indicator AA oxidation method has now been successfully applied to human research. Let us use the determination of dietary proline requirement as an example to illustrate this technique. In R.O. Ball’s studies, 2.5-kg young pigs were fed meals containing 20% crude protein, total content of 1.31–1.57% proline, and 10 μCi l-[1-14C]phenylalanine. Expired 14CO2 was measured for 1 h after feeding. Production of 14CO2 from l-[1-14C]phenylalanine by the piglets decreased markedly as dietary proline content increased from 1.31% to 1.44% and was then leveled off when dietary proline content increased from 1.44% to 1.57% (Figure 13.3). The breaking point for phenylalanine oxidation was 1.39% proline in the diet. When the experiment was
Dietary proline content (g/kg)
Prod
uctio
n of
14C
O2
from
[1-14
C]p
heny
lala
nine
oxi
datio
n(d
pm/k
g bo
dy w
eigh
t per
min
)
Requirement of dietary proline
13 14 15 16
1000
500
750
250
FIGURE 13.3 Oxidation of phenylalanine to estimate dietary proline requirement by neo-natal pigs (indicator AA oxidation method). Young pigs (2.5 kg BW) were fed two meals, which contained 20% crude protein, total content of 1.31%, 1.35%, 1.38%, 1.44%, or 1.57% proline, and 10 μCi l-[1-14C]phenylalanine, at 4 h and 2 h before a 60-min collection of expired 14CO2. Production of 14CO2 from l-[1-14C]phenylalanine by the pigs decreased mark-edly as dietary proline content increased from 1.31% to 1.44% and then leveled off when dietary proline content increased from 1.44% to 1.57%. The breaking point for phenylala-nine oxidation was 1.39% proline in the diet. Therefore, the dietary requirement of proline (expressed as g/100 food) by the neonatal pig is ~1.40%. (Adapted from Ball, R.O., J.L. Atkinson, and H.S. Bayley. 1986. Br. J. Nutr. 55:659–668.)

442 Amino Acids: Biochemistry and Nutrition
© 2010 Taylor & Francis Group, LLC
repeated with piglets fed a diet containing 260 g of crude protein and total content of 1.22–1.82% proline, the breaking point for phenylalanine oxidation was at 1.42% proline in the diet. Based on these two experiments, dietary requirement of proline (expressed as g/100 g food) by the neonatal pig is ~1.40%.
The indicator AA oxidation method can also be used to estimate dietary require-ment of protein. For example, 2.5-kg young pigs were fed meals containing 12%, 16%, 20%, 24%, 28%, or 32% crude protein, total content of 0.88% phenylalanine and 0.85% tyrosine, and 10 μCi l-[1-14C]phenylalanine. The basal diet contained 29.6% skim milk, providing 10% crude protein. Various amounts of a mixture of NEAA (alanine, aspartic acid, asparagine, glutamate, glutamine, glycine, and pro-line) were added to the basal diet to provide 12%, 16%, 20%, 24%, 28%, and 32% crude protein. Expired 14CO2 was measured for 1 h after feeding. Production of 14CO2 from l-[1-14C]phenylalanine by the pigs decreased markedly as dietary pro-tein content increased from 12% to 24% and was then leveled off when dietary protein content increased from 24% to 32% diet (Figure 13.4). The breaking point for phenylalanine oxidation was 24% crude protein in the diet. When the experi-ment was repeated with piglets fed a diet containing 11.18% mixture of NEAA and various amounts of skim milk to provide 16%, 20%, 24%, 26%, and 28% crude protein, the breaking point for phenylalanine oxidation was at 25.8% crude protein in the diet. The higher estimate of dietary protein requirement in young piglets
Dietary protein content (g/kg)
Requirement ofdietary protein
120 180 240 300
2000
1000
1500
500
Prod
uctio
n of
14C
O2
from
[1-14
C]p
heny
lala
nine
oxi
datio
n(d
pm/k
g bo
dy w
eigh
t per
min
)
FIGURE 13.4 Oxidation of phenylalanine to estimate dietary protein requirement by neo-natal pigs (indicator AA oxidation method). Young pigs (2.5 kg BW) were fed two meals, which contained 12%, 16%, 20%, 24%, 28%, or 32% crude protein, total content of 0.88% phenylalanine and 0.85% tyrosine, and 10 μCi l-[1-14C]phenylalanine, at 4 and 2 h before a 60-min collection of expired 14CO2. The basal diet contained 29.6% skim milk providing 10% crude protein. Various amounts of a mixture of NEAA (alanine, aspartic acid, asparagine, glutamate, glutamine, glycine, and proline) were added to the basal diet to provide 12%, 16%, 20%, 24%, 28%, and 32% crude protein. Production of 14CO2 from l-[1-14C]phenylalanine by the pigs decreased markedly as dietary protein content increased from 12% to 24% and was then leveled off when dietary protein content increased from 24% to 32%. The breaking point for phenylalanine oxidation was 24% crude protein in the diet. Therefore, the dietary require-ment of crude protein (expressed as g/100 g diet) by the neonatal pig is ~25%. (Adapted from Ball, R. and H.S. Bayley. 1986. Br. J. Nutr. 55:651–658.)

443Dietary Requirements of Amino Acids
© 2010 Taylor & Francis Group, LLC
fed the 16–28% crude protein diet may reflect the increasing proportions of AA from intact protein and a lower efficiency for utilization of free crystalline AA than intact protein. On average, the dietary requirement of crude protein (expressed as g/100 g food) by the neonatal pig is ~25%, which is similar to the values of dietary crude protein levels ranging from 24% to 25% based on growth studies of piglets fed milk-based diets.
Advantages and Disadvantages of Tracer Studies for Estimating Dietary AA RequirementsThe common advantages of both the direct and the indicator AA oxidation methods over the N balance technique are that: (1) dietary requirements of AA can be esti-mated within a short period of time after a period of several days for adaptation to experimental diets, without a need of a long, expensive stay (e.g., 1 week or longer) in a metabolic facility prior to each measurement; and (2) more sensitive techniques than the N balance method are provided to evaluate changes in whole-body AA catabolism in response to different intakes of dietary AA or protein. In addition, the direct AA oxidation method can directly determine the rate of oxidation of the dietary AA of interest, making it possible to evaluate both the pattern of change in the oxidation rate and the whole-body balance of the AA. Of note, the direct AA oxidation method does not result in substantial alterations in the pool size of AA other than the test AA, potentially limiting the conceptual and technical problems associated with the metabolic compartmentation of the test AA and with estimates of the turnover of the indicator AA. Compared with the direct AA oxidation method, the indicator AA oxidation technique offers several unique advantages. First, the test AA and the tracer are separate. Therefore, there is no problem of giving various nutritionally significant quantities of the stable isotope tracer, because it is different from the test AA. Second, the indicator AA oxidation method is practically simpler and can be performed without a need of a long stay (e.g., 1 week or longer) in a metabolic facility prior to each measurement. Third, the breakpoint is an operational indicator of the adequacy of dietary intake of the test AA. Therefore, there is no source of error that varies systematically with the intake of the test AA. This helps eliminate the need for high precision and tedious measurement of CO2 recovery for individual subjects. Fourth, one indicator AA (e.g., [1-14C]- or [1-13]-phenylala-nine) can be used in theory to estimate the dietary requirements of all other AA by humans and other animals.
The common disadvantages of the direct and indicator AA oxidation methods are that: (1) they can be used only in the fed state because food deprivation greatly affects the oxidation of all AA in the body; (2) dietary intakes of both protein and energy critically influence the oxidation of the indicator AA, the test AA, and other AA in a cell- and tissue-specific manner; (3) a breaking point in the oxidation of the labeled AA may not be easily identified in adults who have a relatively low rate of whole-body protein synthesis and in subjects who may not be sensitive to changes in the test AA (e.g., threonine, methionine, and tryptophan) in diets within a short period of time because of the complex metabolic pathways for AA; (4) the production of labeled CO2 from a 14C- or 13C-labeled AA may be influenced by the dilution of the precur-sor labeled AA and its intracellular SR or IE at the site of oxidation and, therefore,

444 Amino Acids: Biochemistry and Nutrition
© 2010 Taylor & Francis Group, LLC
may not reflect the true oxidation of the labeled AA in specific cells and tissues; and (5) measurement of the oxidation of labeled AA within a short period of time may not reflect diurnal changes in the catabolism of the indicator AA, test AA, or other AA for a 24-h period. In addition, the direct AA oxidation method has the following potential limitations. First, this technique can be used only if the carboxyl group of the test AA (e.g., lysine, phenylalanine, and BCAA) is quantitatively released as CO2 to the body bicarbonate pool when the test AA is oxidized. This poses a problem with AA (e.g., arginine, glutamine, threonine, and tryptophan) with complex meta-bolic pathways. However, such a shortcoming can be eliminated by the indicator AA oxidation method. Second, appropriately labeled AA may not always be available for use in determining their oxidation using the direct AA oxidation method. Third, in stable isotope studies, the indicator AA oxidation method requires experiments at low intakes of the test, unlabeled AA relative to the infused labeled AA, possibly leading to errors in the estimation of AA oxidation based on the production of labeled CO2.
Recent studies have shown that the N balance-based estimates of dietary AA requirements by humans are considerably lower than the values obtained by the AA oxidation methods (Kurpad and Thomas 2011). The differences can be up to two- to threefold for many EAA (Table 13.2). These discrepancies may result from both methodological and physiological factors. The original N balance experiments may overestimate N retention, therefore, underestimating dietary AA requirements. On the other hand, the use of tracers in metabolic research has significant potential prob-lems associated with label dilution, isotope exchange, determination of intracellular-specific activities of immediate precursors, and isotopic steady states (Chapter 7). New knowledge about AA biochemistry and nutrition, as well as improved method-ologies for studying whole-body AA metabolism, will be necessary to resolve the current disputes on dietary requirement of AA by humans and other animals.
PotentiAl use of “-omics” technoloGies to estimAte DietAry AA reQuirements
The traditional approaches to study dietary AA requirements have played a historically important role in advancing the field of protein and AA nutrition and remain irre-placeable today. However, these methods have limitations. With completion of human and other mammalian genome projects, revolutionary technologies in life sciences characterized by high throughput, high efficiency, and rapid computation have been developed. These advanced tools, such as genomics, proteomics, and metabolomics, are now available to determine optimal requirements of AA for individual subjects, because these nutrients can affect both the expression levels and biological activities of DNA, RNA, protein, and low-molecular-weight metabolites (Lin et al. 2011). In other words, changes in cell- and tissue-specific expression of genes, as well as in concentra-tions of proteins and metabolites in the plasma, urine, and tissues may serve as useful biomarkers for adequacy or inadequacy of dietary requirements of AA and proteins.
NutrigenomicsDifferent individuals respond differently to the same diet, as indicated by differ-ences in susceptibility to disease, as well as the efficiency of nutrient absorption and

445Dietary Requirements of Amino Acids
© 2010 Taylor & Francis Group, LLC
utilization for the synthesis of body constituents (including AA and proteins). Genetic variability is most likely to be largely responsible for the diversity of biological out-comes. Among genomic variety, single-nucleotide polymorphisms (SNPs) are con-sidered to be the major genetic source of phenotypic variability that differentiates individuals within a given species. At the same time, other types of genetic vari-ability (e.g., insertions or deletions of nucleotides and variability in copy number of repeated sequences) also make some contributions to phenotypic changes. To address this important issue, a term “nutrigenetics” has been coined, which can be defined as the relationship between diet and genotype as well as its impact on health and disease. A large body of evidence shows that mRNA levels in cells and tissues are affected by dietary adequacy or inadequacy of AA (including arginine, glutamine, lysine, and tryptophan). Identifying key SNPs that may influence the nutritional response and health of an individual has been a primary driving force in the development of most nutrigenetic approaches to date. High-throughput genotyping methods for large-scale association studies include TaqMan SNP Genotyping Assay®, single-base extension-based assays, mass spectrometry-based methods (e.g., the Sequenom MassARRAY genotyping system), the Invader assay, Pyrosequencing, and gene chip methods (e.g., the new Affymetrix 500 K SNPChip Array). Gene copy number variants, which may be an important source of changes in gene expression responsible for much of the variability in an organism’s response to diets, have been recognized. Thus, future studies will be conducted beyond the consideration of only variability between SNPs and will also take into account the other types of genetic variability. Genome-wide copy number detection using microarray technologies is one of the recent research topics on large-scale variations in genomes. Affymetrix GeneChip and Copy Number Analyzer for Affymetrix GeneChip v2.0 allow not only for accurate and high-reso-lution copy number estimations, but also for analyses of allelic imbalances, thereby providing a powerful platform to explore the complexities of genomes.
ProteomicsProteins are the final products of gene expression and have important structural and regulatory functions in cells and body fluids. Thus, proteomic technology has emerged as a revolutionary discovery tool to study how dietary AA can alter the proteomes of organisms. Using proteomics, researchers can simultaneously display and deter-mine thousands of proteins in a study sample and identify their changes in response to physiological, pathological, and nutritional alterations. Currently, the most commonly used proteomics technologies are based on either the specific digestion of proteins by a protease (usually trypsin) or the direct analysis of intact proteins. The protein hydrolysis method, also known as the bottom-up approach, involves two-dimensional polyacrylamide gel electrophoresis and multidimensional protein identification. In contrast, the analysis of intact proteins requires their chromatographic separation and identification by mass spectrometry (MS) (e.g., surface-enhanced laser desorption ion-ization). Recently, several quantitative proteomic techniques, such as 2D DIGE (dif-ference gel electrophoresis), ICAT (isotope-coded affinity tag), iTRAQ (isobaric tags for relative and absolute quantification), and proteolytic O-18-labeling strategies, have been developed. Finally, a promising approach for proteomics is protein microarray technology, which can be used to detect changes in the expression and posttranslational

446 Amino Acids: Biochemistry and Nutrition
© 2010 Taylor & Francis Group, LLC
modifications of hundreds or even thousands of proteins in a parallel way. Identification of different phosphoproteins and their phosphorylation sites can be accomplished by combining proteomics with radioactive labeling, phospho-specific staining, immu-noprecipitation, or immunoblotting, as well as metal-affinity chromatography. This approach provides informational insights into the proteomes and their signaling path-ways affected by the availability of dietary nutrients, including AA and protein.
MetabolomicsGene expression or protein concentration may indicate the potential for physiological or metabolic changes in cells, tissues, and organs, but may not represent real end-points of the complex regulatory processes in organisms. Nutrimetabolomics, defined as the analysis of effects of diet on the metabolome (a complete set of small-molecule metabolites in a biological sample), is at its infancy in nutrition research. However, this technology has already provided novel and important insights into understand-ing the metabolic responses of humans or other animals to dietary interventions. Currently, the widely used methods for metabolomics studies involve proton nuclear magnetic resonance (NMR) technology and MS. Liquid chromatography–MS, which is complementary to NMR, offers superb sensitivity, but is limited by the essentially nonquantitative nature of the method and the requirement for internal standardization.
Let us use the piglet as an animal model to illustrate how metabolomics can be used to assess dietary adequacy of arginine. Using 1H-NMR spectroscopy, Q. He and colleagues recently determined changes in serum metabolome in growing pigs brought about by different levels of dietary arginine. Principal component analy-sis indicated that serum concentrations of low-density lipoprotein, very-low-density lipoprotein, and urea were lower, but concentrations of creatinine, tricarboxylic acid cycle metabolites, ornithine, lysine, and tyrosine were greater in arginine-adequate than in control pigs. Additionally, serum concentrations of nitrogenous and lipid signaling molecules (glycerophosphorylcholine and myoinositol) and intestinal bac-terial metabolites (ethanol, methylamine, dimethylamine, acetate, and propionate) were all affected by dietary arginine supplementation.
ASSESSMENT OF DIETARY PROTEIN QUALITY
While crystalline AA can be used to prepare purified diets for consumption by humans and other animals, it is intact proteins that are the major sources of EAA, NEAA, and CEAA in regular and low-cost diets. Thus, it is important that dietary protein quality be assessed so that the organisms will receive balanced and adequate provision of all AA. The quality of any dietary protein depends on the following fac-tors: (1) the amounts and profile of its AA, particularly EAA and functional AA; and (2) the digestibility and availability of its AA to the animal relative to requirements for all AA. It should be borne in mind that a protein with balanced composition of all EAA may not be a high-quality protein for animals, if it cannot be hydrolyzed by proteases in the gastrointestinal tract. Thus, although the analysis of the AA con-tent in foodstuffs is necessary to predict which EAA is deficient or excessive in the diet, this chemical method should not be used as the sole means of evaluating the nutritive quality of food proteins. Therefore, biological studies to determine protein

447Dietary Requirements of Amino Acids
© 2010 Taylor & Francis Group, LLC
digestibility in vivo and the animal’s growth performance must be carried out concur-rently with the determination of dietary AA composition (Bender 1982). Fortunately, most common foodstuffs have been analyzed for their AA and protein content, as well as their digestibilities in various animal species. However, both chemical analyses and biological experiments are needed to eliminate fake raw materials as sources of dietary protein. Taken together, the quality and adequacy of dietary protein depends on its capability to provide all AA in appropriate amounts and proportions.
chemicAl methoDs
AA AnalysisDietary proteins must be hydrolyzed to individual AA before AA analysis. This is usually done by acid hydrolysis (Chapter 1). Unfortunately, this process results in: (1) the complete destruction of tryptophan, (2) the losses of methionine (20%), serine (10%), proline (6%), tyrosine (5%), aspartate (3%) and threonine (3%), and (3) the con-version of glutamine and asparagine to glutamate and aspartate, respectively (Chapter 1). Thus, correction for recovery rates of AA from protein hydrolysis should be made. Base hydrolysis of feedstuff is performed for the analysis of tryptophan (Chapter 1). Theoretically, feed protein can be hydrolyzed with known proteases; however, this turns out to be practically difficult. Alternatively, feed can be incubated with fluids obtained from the stomach and small intestine of post-absorptive animals to mimic the in vivo digestion process. Although this latter process is promising, whether pro-teins can be completely hydrolyzed to free AA may pose a serious problem. Separate acid and base hydrolysis of the same foodstuff provides a solution to this problem.
Free AA can be measured by HPLC, gas chromatography, or enzymic methods. HPLC is by far the most powerful technique for AA analysis. Values from AA analy-sis can tell us which AA in dietary proteins might be deficient, adequate, or exces-sive, but give little information on their availability to the animal. A good quality protein contains a high percentage of all EAA as indicated in Table 13.9 for some feedstuffs for animal diets. Note that glutamate, glutamine, asparagine, aspartate, proline, and branched-chain AA represent most of the AA content in both plant and animal proteins. Certain plant (e.g., peanut meal and cottonseed meal) and ani-mal (e.g., fish meal and gelatin) products provide high levels of arginine. However, feedstuffs of plant origin usually contain lower percentages of lysine, tryptophan, threonine, methionine, and cysteine than feedstuffs of animal origin. Unlike other animal products, the isoleucine content is relatively low in red blood cells or blood meal (only 22% of leucine). Overall, foodstuffs of animal origin (except for gelatin) are excellent sources of all AA for livestock, avian, and aquatic species.
Animal products (e.g., meats and eggs) are abundant sources of EAA, NEAA, and CEAA in human diets. These foods also contain relatively large amounts of taurine. In contrast, taurine is virtually absent from plants. There are reports that concentrations of taurine in beef, pork, lamb, and chicken meats range from 300 to 1000, 400 to 1200, 350 to 1200, and 300 to 4000 mg/kg wet weight, respectively. These values correspond to 3.4–11.4, 4.5–13.5, 4.0–13.5, and 3.4–45 mM taurine in beef, pork, lamb, and chicken meats, respectively. A 3-ounce (84 g) beef steak would provide 55 mg taurine, which may meet ~70% of daily taurine requirement

448 Amino Acids: Biochemistry and Nutrition
© 2010 Taylor & Francis Group, LLC
TAB
LE 1
3.9
Com
posi
tion
of A
A in
Foo
d In
gred
ient
s
AA
Bloo
d M
eal
Cas
ein
Coo
kie
Mea
lC
orn
Gra
inC
SMFe
athe
r M
eal
Fish
Mea
lG
elat
inM
BM
Pean
ut
Mea
lPB
MSB
MSB
M
(P)
SGH
G
rain
Gen
eral
Nut
rien
ts (
% o
f Foo
dstu
ff, A
s-Fe
d B
asis
)D
M91
.891
.790
.889
.090
.095
.191
.888
.996
.191
.896
.589
.096
.489
.1
CP
89.6
88.0
12.3
9.3
40.3
82.1
63.4
100.
152
.043
.964
.343
.651
.810
.1
TP
88.0
86.2
10.5
8.2
32.3
81.0
63.7
97.4
50.7
35.1
60.4
38.2
41.6
8.8
EA
41.9
37.2
3.3
3.0
10.7
24.9
24.9
14.4
15.4
10.7
18.4
14.5
15.5
3.2
NA
46.1
49.0
7.2
5.2
21.6
56.1
38.8
83.0
35.3
24.3
42.0
23.7
26.1
5.6
Indi
vidu
al A
A (
% o
f Foo
dstu
ff, A
s-Fe
d B
asis
)A
la7.
822.
770.
520.
711.
424.
185.
079.
014.
781.
864.
911.
952.
080.
96
Arg
4.91
3.40
0.58
0.38
4.32
5.74
4.85
7.68
3.67
5.68
4.63
3.18
3.12
0.41
Asn
4.67
2.56
0.40
0.35
1.57
1.67
2.92
1.42
2.21
1.80
2.73
2.10
2.41
0.31
Asp
6.20
3.88
0.45
0.43
1.94
2.92
4.34
2.86
3.08
2.52
4.10
3.14
3.40
0.36
Cys
1.92
0.43
0.18
0.20
0.70
4.16
0.67
0.05
0.49
0.65
1.05
0.70
0.69
0.19
Gln
4.32
11.2
1.44
1.02
3.60
2.86
3.94
3.03
2.81
2.66
3.54
3.80
4.11
0.85
Glu
6.38
9.38
1.92
0.64
4.59
4.81
6.01
5.26
4.05
4.18
4.89
4.17
4.53
1.18
Gly
3.86
1.86
0.78
0.40
2.12
8.95
6.58
33.6
8.67
3.17
9.42
2.30
2.72
0.39

449Dietary Requirements of Amino Acids
© 2010 Taylor & Francis Group, LLC
His
5.57
2.78
0.22
0.23
1.08
0.88
1.51
0.74
1.19
0.95
1.30
1.13
1.15
0.23
Hyp
0.20
0.14
0.00
0.00
0.05
4.95
1.86
12.8
2.88
0.07
3.31
0.09
0.07
0.00
Ile
2.54
4.91
0.51
0.34
1.19
3.79
3.26
1.17
1.92
1.41
2.32
2.03
2.10
0.38
Leu
11.4
8.82
0.88
1.13
2.26
6.75
5.24
2.61
3.56
2.48
4.21
3.44
3.70
1.21
Lys
8.25
7.49
0.41
0.25
1.66
2.16
5.29
3.75
3.13
1.37
3.44
2.80
2.87
0.21
Met
1.16
2.64
0.19
0.21
0.66
0.75
2.02
1.03
1.10
0.47
1.39
0.60
0.64
0.20
Phe
5.83
4.87
0.50
0.46
2.02
3.95
2.76
1.67
1.85
1.93
2.36
2.21
2.44
0.51
Pro
6.29
10.8
0.98
1.06
1.89
11.7
4.25
20.6
5.86
2.29
6.72
2.40
3.18
0.96
Ser
4.49
5.08
0.56
0.45
1.72
8.80
2.80
3.44
2.08
2.03
2.67
2.12
2.35
0.46
Trp
1.30
1.19
0.15
0.07
0.44
0.79
0.70
0.22
0.39
0.38
0.49
0.62
0.63
0.10
Thr
3.95
4.10
0.42
0.31
1.25
3.97
4.11
3.45
2.42
1.67
2.85
1.76
2.03
0.32
Tyr
2.86
5.06
0.55
0.43
1.10
2.04
2.36
0.93
1.45
1.39
1.84
1.66
1.72
0.45
Val
8.21
6.03
0.53
0.44
1.69
5.76
3.80
1.96
2.23
1.69
2.89
2.09
2.25
0.50
Sour
ce:
Ada
pted
fro
m L
i, X
.L. e
t al.
2011
. Am
ino
Aci
ds 4
0:11
59–1
168.
Not
e:
Mol
ecul
ar w
eigh
ts o
f int
act A
A w
ere
used
to c
alcu
late
the
cont
ent o
f pep
tide-
boun
d A
A in
feed
ingr
edie
nts.
CP,
cru
de p
rote
in (N
% ×
6.2
5); C
SM, c
otto
nsee
d m
eal;
DM
, dry
mat
ter;
EA
, tot
al a
mou
nts
of e
ssen
tial A
A; M
BM
, mea
t and
bon
e m
eal;
NA
, tot
al a
mou
nts
of n
ones
sent
ial A
A; (
P), (
proc
esse
d), P
BM
, pou
ltry
by-p
rodu
ct m
eal;
SBM
, soy
bean
mea
l; SG
H, s
orgh
um; T
P, tr
ue p
rote
in, w
hich
was
cal
cula
ted
on th
e ba
sis
of m
olec
ular
wei
ghts
of A
A r
esid
ues
in p
rote
in.
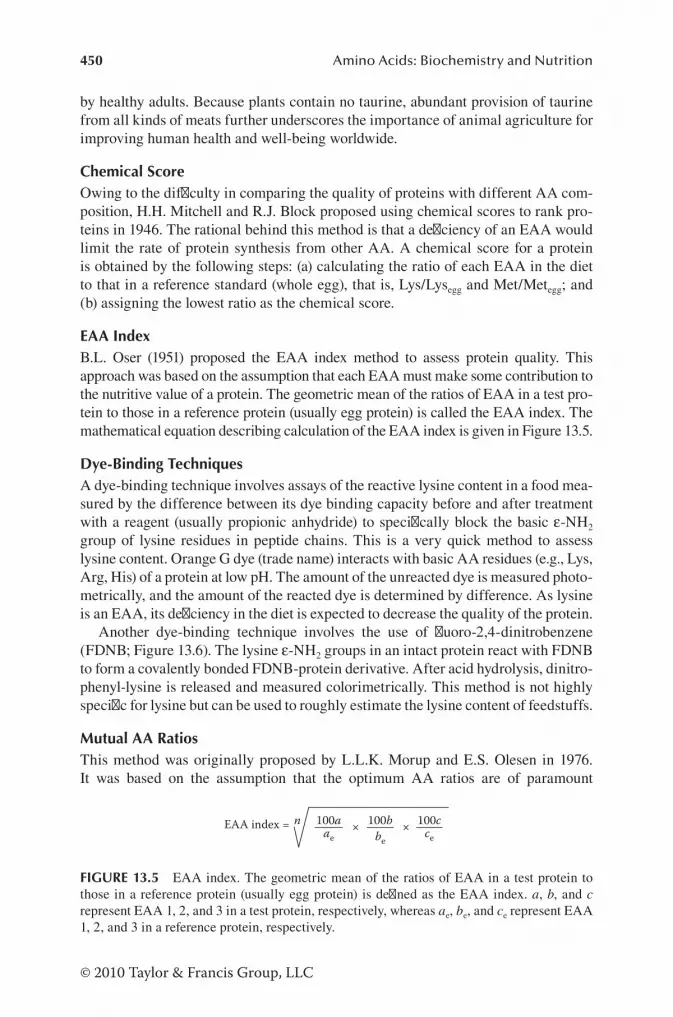
450 Amino Acids: Biochemistry and Nutrition
© 2010 Taylor & Francis Group, LLC
by healthy adults. Because plants contain no taurine, abundant provision of taurine from all kinds of meats further underscores the importance of animal agriculture for improving human health and well-being worldwide.
Chemical ScoreOwing to the difficulty in comparing the quality of proteins with different AA com-position, H.H. Mitchell and R.J. Block proposed using chemical scores to rank pro-teins in 1946. The rational behind this method is that a deficiency of an EAA would limit the rate of protein synthesis from other AA. A chemical score for a protein is obtained by the following steps: (a) calculating the ratio of each EAA in the diet to that in a reference standard (whole egg), that is, Lys/Lysegg and Met/Metegg; and (b) assigning the lowest ratio as the chemical score.
EAA IndexB.L. Oser (1951) proposed the EAA index method to assess protein quality. This approach was based on the assumption that each EAA must make some contribution to the nutritive value of a protein. The geometric mean of the ratios of EAA in a test pro-tein to those in a reference protein (usually egg protein) is called the EAA index. The mathematical equation describing calculation of the EAA index is given in Figure 13.5.
Dye-Binding TechniquesA dye-binding technique involves assays of the reactive lysine content in a food mea-sured by the difference between its dye binding capacity before and after treatment with a reagent (usually propionic anhydride) to specifically block the basic ε-NH2 group of lysine residues in peptide chains. This is a very quick method to assess lysine content. Orange G dye (trade name) interacts with basic AA residues (e.g., Lys, Arg, His) of a protein at low pH. The amount of the unreacted dye is measured photo-metrically, and the amount of the reacted dye is determined by difference. As lysine is an EAA, its deficiency in the diet is expected to decrease the quality of the protein.
Another dye-binding technique involves the use of fluoro-2,4-dinitrobenzene (FDNB; Figure 13.6). The lysine ε-NH2 groups in an intact protein react with FDNB to form a covalently bonded FDNB-protein derivative. After acid hydrolysis, dinitro-phenyl-lysine is released and measured colorimetrically. This method is not highly specific for lysine but can be used to roughly estimate the lysine content of feedstuffs.
Mutual AA RatiosThis method was originally proposed by L.L.K. Morup and E.S. Olesen in 1976. It was based on the assumption that the optimum AA ratios are of paramount
EAA index = n 100aae
100bbe
100cce
× ×
FIGURE 13.5 EAA index. The geometric mean of the ratios of EAA in a test protein to those in a reference protein (usually egg protein) is defined as the EAA index. a, b, and c represent EAA 1, 2, and 3 in a test protein, respectively, whereas ae, be, and ce represent EAA 1, 2, and 3 in a reference protein, respectively.
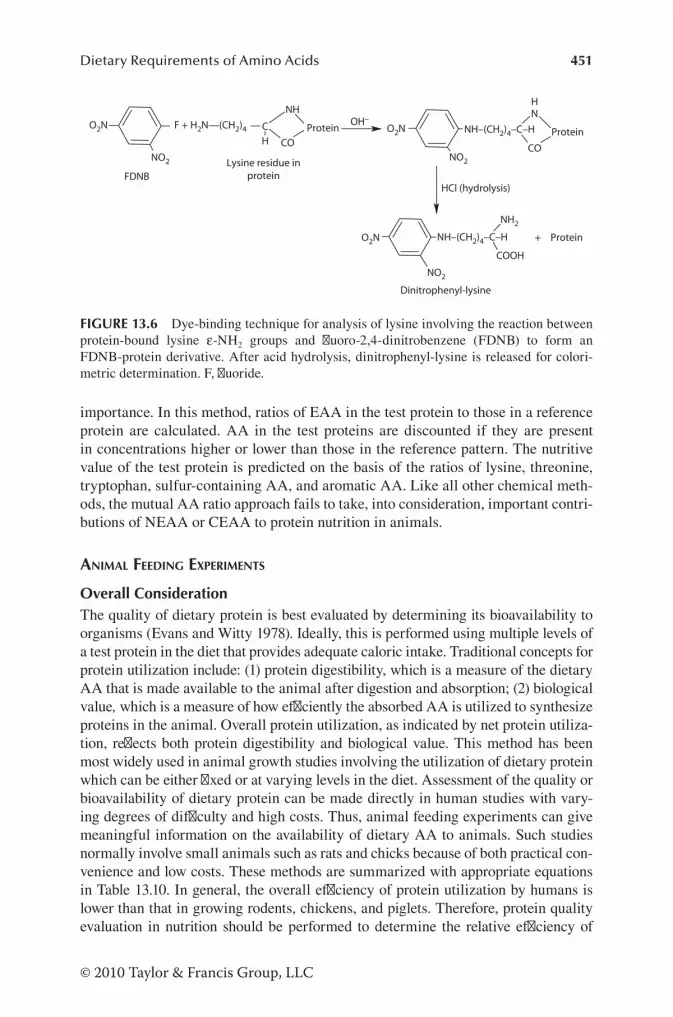
451Dietary Requirements of Amino Acids
© 2010 Taylor & Francis Group, LLC
importance. In this method, ratios of EAA in the test protein to those in a reference protein are calculated. AA in the test proteins are discounted if they are present in concentrations higher or lower than those in the reference pattern. The nutritive value of the test protein is predicted on the basis of the ratios of lysine, threonine, tryptophan, sulfur-containing AA, and aromatic AA. Like all other chemical meth-ods, the mutual AA ratio approach fails to take, into consideration, important contri-butions of NEAA or CEAA to protein nutrition in animals.
AnimAl feeDinG exPeriments
Overall ConsiderationThe quality of dietary protein is best evaluated by determining its bioavailability to organisms (Evans and Witty 1978). Ideally, this is performed using multiple levels of a test protein in the diet that provides adequate caloric intake. Traditional concepts for protein utilization include: (1) protein digestibility, which is a measure of the dietary AA that is made available to the animal after digestion and absorption; (2) biological value, which is a measure of how efficiently the absorbed AA is utilized to synthesize proteins in the animal. Overall protein utilization, as indicated by net protein utiliza-tion, reflects both protein digestibility and biological value. This method has been most widely used in animal growth studies involving the utilization of dietary protein which can be either fixed or at varying levels in the diet. Assessment of the quality or bioavailability of dietary protein can be made directly in human studies with vary-ing degrees of difficulty and high costs. Thus, animal feeding experiments can give meaningful information on the availability of dietary AA to animals. Such studies normally involve small animals such as rats and chicks because of both practical con-venience and low costs. These methods are summarized with appropriate equations in Table 13.10. In general, the overall efficiency of protein utilization by humans is lower than that in growing rodents, chickens, and piglets. Therefore, protein quality evaluation in nutrition should be performed to determine the relative efficiency of
F + H2N—(CH2)4O2N
NO2
Protein
Dinitrophenyl-lysine
NH
COProteinC
H
+
FDNBHCl (hydrolysis)
NH2
COOH
NO2
NO2
O2N
O2N
NH
CO
ProteinNH–(CH2)4–C–H
NH–(CH2)4–C–H
Lysine residue inprotein
OH–
FIGURE 13.6 Dye-binding technique for analysis of lysine involving the reaction between protein-bound lysine ε-NH2 groups and fluoro-2,4-dinitrobenzene (FDNB) to form an FDNB-protein derivative. After acid hydrolysis, dinitrophenyl-lysine is released for colori-metric determination. F, fluoride.

452 Amino Acids: Biochemistry and Nutrition
© 2010 Taylor & Francis Group, LLC
utilization of different protein sources and the absolute values. This further under-scores the importance of using laboratory animals to assess dietary protein quality.
Biological ValueThe “biological value” of a dietary protein was originally defined by K. Thomas in 1909 as the fraction of absorbed N retained in the body for maintenance and growth of the animal. This method, modified by H.H. Mitchell in 1924, is a widely used procedure for the determination of dietary protein quality. A protein-free diet is used to measure metabolic fecal N and endogenous urinary N. This is because there is excretion of N in the feces and urine in animals even though there is no dietary intake of AA or protein. The biological value method is basically an N balance technique. Major criticisms of this method are that the metabolic fecal N and the endogenous urinary N in animals fed a protein-free diet may not reflect their values under normal feeding conditions. This is partly because animals fed protein-free diets have mechanisms to spare N and, therefore, the endogenous uri-nary N may be underestimated.
Protein Efficiency RatioIn 1919, T.B. Osborne, L.B. Mendel, and E.L. Ferry introduced protein efficiency ratio as a measure of the nutritive value of dietary protein for rats. This ratio is defined by the gain in BW per gram of dietary protein or N consumed. A standard-ized procedure for measuring protein efficiency ratio was adopted first in Canada (1959) and then in the United States (1960). Subsequently, every new technique for assessing protein quality has been compared with the protein efficiency ratio method, which is the most widely used procedure for determining dietary protein quality and is the official method in the United States. The protein efficiency ratio assay requires that the protein source of interest is fed at a level of 10% protein in the diet. An advantage of the protein efficiency ratio is that there is no need to do an
TABLE 13.10Evaluation of Dietary Protein Quality for Animals
Method Equation
Biological value = [NI − (FN − MFN) − (UN − EUN)]/[NI − (FN − MFN)] × 100
Protein efficiency ratio = weight gain/total protein intake
Net protein ratio = [weight gain (test diet) + weight loss (N-free diet)]/total protein intake (test diet)
Relative N utilization = [weight gain (test diet) + 0.l (initial + final weight)]/total N intake
Net protein utilization = [NI − (FN − MFN) − (UN − EUN)]/NI × 100
Nitrogen growth index = slope of the regression of weight gain (Y-axis) on N intake (X-axis)
Note: EUN, endogenous urinary N; FN, fecal N; FN – MFN, amount of N from the diet that is excreted in the feces; MFN, metabolic fecal N; NI, dietary N intake; NI − (FN − MFN) − (UN − EUN), amount of dietary N retained by a test animal; NI − (FN − MFN), amount of dietary N that is absorbed by a test animal; UN – EUN, amount of N from the diet that is excreted in the urine.

453Dietary Requirements of Amino Acids
© 2010 Taylor & Francis Group, LLC
N balance experiment and only weight gains of a test animal are measured. A major criticism of this method is that weight gain depends on the amounts of food intake and may not necessarily be influenced by the quality of dietary protein. For example, an animal fed a diet containing a high percentage of fat but a low-quality protein may gain a substantial amount of weight mainly in the form of fat.
Net Protein RatioThe net protein ratio method was proposed by A.E. Bender and B.H. Doell in 1957 to evaluate dietary protein quality. This technique is similar to the protein efficiency ratio, except that the consideration of maintenance requirement by the animal is included. Thus, weight gain, weight loss (on protein-free diet), and protein intake by the test animal are usually determined. In addition, the original net protein ratio method requires that the protein source of interest is fed at a level of 10% protein in the diet. This technique also assumes that the weight gain is directly proportional to high-quality dietary protein. This assumption may be misleading and invalid under some circumstances, as discussed previously.
Net Protein UtilizationThe net protein utilization method was originally developed by A.E. Bender and D.S. Miller in 1953 to accurately estimate N retention by animals. This bioassay is similar to the biological value technique, except that dietary N absorbed by a test animal is used in the net protein utilization method to replace total N intake in the biological value measurement. Calculation of values for net protein utilization is based on dietary N retained and total N intake by the test animal. Thus, this method is equivalent to biological value × digestibility of dietary N. Therefore, factors that affect the functions of the gastrointestinal tract will influence net protein utilization by animals independent of dietary protein quality.
Nitrogen Growth IndexThe relationship between dietary N intake and BW gain in rats is usually curvilin-ear, but can be considered essentially linear at the lower part of the curve. Thus, based on the finding that N retention is almost linear at points slightly above and below protein maintenance requirement, J.B. Allison and H.W. Anderson proposed the N growth index technique (also called the slope ratio method) in 1945. The slope of the regression of weight gain (Y-axis) on dietary N intake (X-axis) is used to compare protein quality. An advantage of this method is that the slope of the line is affected by the utilization of dietary protein for weight gain in animals and is not independent of dietary N intake. However, a major criticism of the technique is that N gain can occur in animals fed lysine-deficient proteins.
Relative N UtilizationThe relative N utilization method for assessing dietary protein quality was proposed by J.M. McLaughlan and M.O. Keith in 1975. This method includes a factor for the protein utilized for maintenance and the value is expressed as a percent of that for the reference protein (lactalbumin). The authors assumed that 10% of the mean of the initial plus final BWs of an animal fed a protein-free diet reflects the maintenance

454 Amino Acids: Biochemistry and Nutrition
© 2010 Taylor & Francis Group, LLC
requirement. In this assay, no additional animals are required on a protein-free diet. However, dietary N intake and weight gain of the test animal must be determined. A major weakness of this technique is that the components of weight gain in animals are not known and, therefore, may not be a valid indicator of dietary protein quality.
metABolic inDicAtors in AnimAls
Concentrations of AA in PlasmaConcentrations of AA in plasma reflect their provision from the diet, rates of their synthesis and utilization, and rates of intracellular protein turnover, and, therefore, are of important value in assessing dietary protein quality. However, the data should be interpreted with caution. For example, an increase in plasma concentrations of some AA (e.g., leucine and glycine) may be an indicator of an inadequate intake of dietary protein resulting in increased degradation of intracellular proteins, rather than an excessive intake of dietary protein that is abundant in these AA. On the other hand, intake of excessive protein from the diet actually causes a decrease in concentrations of some plasma AA (e.g., threonine). This phenomenon has been referred to as “dietary protein paradox.” Nonetheless, reduced concentrations of arginine, proline, and glutamine in the plasma of neonatal pigs are sensitive and useful indicators of their low intake from the diet.
Concentrations of Proteins in Plasma or SerumProtein deficiency usually results in decreased synthesis of proteins, including those exported by the liver. In clinical medicine, concentrations of some proteins (e.g., albumin, the most abundant protein) in plasma or serum are often measured as a noninvasive indicator of dietary protein quality (Harper and Yoshimura 1993). For example, during the period of recovery from protein malnutrition, patients fed a milk protein-based diet exhibit a faster rise in serum albumin concentrations than those fed an isonitrogenous, vegetable protein-based diet. However, because the composition of AA in albumin is not representative of other proteins in the body, the concentration of albumin in serum or plasma alone may not reflect over-all dietary protein quality. In addition, the concentration of albumin in plasma or serum depends on the clearance of the protein from the circulation. Furthermore, hypoalbuminemia can be caused by some acute and chronic medical conditions such as nephrotic syndrome, hepatic cirrhosis, and inflammatory responses, inde-pendent of dietary protein quality. Nonetheless, low levels of serum albumin correlate with an increased risk of morbidity and mortality in humans and other animals, and, therefore, are a useful prognostic indicator.
Concentrations of Urea and Ammonia in Plasma and UrineAs end products of AA oxidation, urea and ammonia concentrations in plasma and urine may be useful indicators of dietary protein quality. This notion gains support from studies involving rats and young pigs. However, it should be recognized that concentrations of urea and ammonia in plasma and urine may be influenced not only by the amount and quality of dietary protein consumed, but also by the activity of the hepatic urea cycle. Feeding large amounts of low-quality protein to animals is often

455Dietary Requirements of Amino Acids
© 2010 Taylor & Francis Group, LLC
associated with increased levels of urea and ammonia in the circulation because oxida-tion of excess dietary AA in the body is enhanced substantially due to their imbalance. Conversely, animals fed a high-quality protein diet exhibit relatively low concentra-tions of both urea and ammonia in plasma and urine but elevated levels of glutamine in the plasma. However, metabolic acidosis is often associated with increased urinary excretion of NH4
+ independent of dietary protein quality. Furthermore, a deficiency of manganese (a cofactor of arginase) can also result in a decrease in the concentration of urea in plasma and urine, as well as an increase in the concentration of glutamine in plasma due to the increased synthesis of glutamine from ammonia and glutamate, but these changes may not necessarily be caused by a low-quality dietary protein. Thus, like concentrations of AA, caution should be exercised in interpreting concentrations of urea and ammonia in the plasma and urine.
Enzyme ActivitiesThe enzymes which have been used as indicators of dietary protein quality include xanthine oxidase, catalase, arginase, aspartate transaminase, and glutamate transami-nase in the plasma, liver, and/or other tissues. This is based on the assumptions that: (1) increased expression of certain enzymes is required to degrade excessive AA in the body and (2) protein malnutrition compromises the integrity of cells (particularly hepa-tocytes), therefore, releasing enzymes to the circulation. These methods have potential to be good indicators of protein quality, especially when samples are obtained from blood for analyses, but more work is required to establish their validity in practice. In this regard, it is noteworthy that cofactors are required for the catalytic activity of many enzymes. For example, hepatic arginase activity is decreased either when an animal is fed a diet with high-quality protein or when the diet is deficient in manganese.
Flux of EAA in PlasmaMeasuring the flux of EAA in plasma may be a potentially noninvasive method for assessing dietary protein quality. The assumption of this method is that the EAA flux in plasma reflects their availability in the diet provided that the digestive and absorp-tive functions of the gastrointestinal tract are intact. However, determination of the flux of only one EAA will not reflect the balance of all AA in the diet and simultane-ous measurements of the fluxes of many EAA (e.g., leucine and phenylalanine) are time-consuming, labor- and resource-intensive, and expensive. In addition, the flux of an EAA in the plasma is also influenced by their release from intracellular degradation in tissues particularly skeletal muscle. Thus, the flux of EAA in plasma with respect to dietary protein quality should be carefully interpreted. Nonetheless, the use of this method, coupled with the direct measurement of protein synthesis in specific tissues or the whole body, will be a powerful approach to assess dietary protein quality.
methoDs usinG microorGAnisms
The principle of these methods is that good-quality protein would better support the growth of microorganisms which have similar patterns of AA requirements to those of animals. Sample proteins are hydrolyzed by proteases or acid/base and the AA hydrolysates are included in the culture medium. Microorganisms used for

456 Amino Acids: Biochemistry and Nutrition
© 2010 Taylor & Francis Group, LLC
assessing dietary protein quality include the following: (1) Tetrahymena pyriformis (protozoa); (2) Streptococcus fecalis (bacteria); (3) Streptococcus zymogenes (bac-teria); (4) Leuconostoc mesenteroides (bacteria); (5) Escherichia coli; and (6) meal worm (an insect). The advantages of these microbial methods are that only small amounts of sample proteins are required for an experiment and that many differ-ent feedstuffs can be tested easily and quickly at one time. The technique can be useful for evaluating dietary protein for ruminants. However, the microorganisms-based methods cannot directly provide data on AA composition in dietary proteins. Additionally, microbes differ substantially from nonruminants in protein digestion and AA metabolism. Therefore, the microbial methods are of limited value for feed-stuffs fed to monogastric animals.
SUMMARY
Relative proportions and amounts of dietary AA have a profound impact on the food intake, growth, and health of animals. Thus, much work has been done in the past 60 years to determine dietary requirements of AA and proteins by humans and other animals. N balance studies and growth trials have traditionally been used to help accomplish this goal. Minimal requirements for dietary AA or protein can also be estimated by factorial analysis, namely the sum of fecal and urinary N in response to a protein-free diet (maintenance), AA deposited in the body, and AA excreted as ani-mal products. Based on protein accretion in growing animals and N balance in adults, AA have been traditionally classified as EAA, NEAA, or CEAA. EAA are defined herein as either those AA whose carbon skeletons cannot be synthesized de novo in animal cells or those that normally are insufficiently synthesized de novo by the ani-mal relative to its needs for maintenance, growth, development, and health and which must be provided in the diet to meet requirements. NEAA are those AA which can be synthesized de novo in adequate amounts by the animal to meet requirements for maintenance, growth, development, and health and, therefore, need not be provided in the diet. CEAA are those AA that normally can be synthesized in adequate amounts by the animal but which must be provided in the diet to meet optimal needs under certain conditions wherein rates of utilization are greater than rates of synthesis.
To date, there is no compelling evidence for sufficient synthesis of all the AA that are not classified as EAA in any higher organism. Clearly, the terms EAA, NEAA, and CEAA are only definitions. The list of AA in the EAA, NEAA, or CEAA category must be revised as new experimental data become available. Dietary requirements of AA should be based on the metabolic needs of all AA for maintenance, tissue protein synthesis, generation of physiologically important nonprotein metabolites, and their regulatory functions. This notion has led to the recent development of the concept of functional AA in nutrition, and this concept unifies EAA, NEAA, and CEAA. Dietary AA requirements likely vary with nutritional, physiological, pathological, and environmental factors. Because N balance studies underestimate N output and are not sufficiently sensitive to fully evaluate dietary requirements for AA, other advanced techniques (e.g., tracer and -omics methods) hold great promise to more accurately estimate dietary requirements of AA (including NEAA) by individuals. Specifically,

457Dietary Requirements of Amino Acids
© 2010 Taylor & Francis Group, LLC
direct and indicator (indirect) AA oxidation techniques involving radioisotopes or sta-ble isotopes have been developed to determine dietary requirements of EAA and pro-tein by humans and farm animals. Factorial analysis can yield useful data on minimal requirements for dietary AA (particularly NEAA) by the organisms, and this approach may be particularly attractive for assessing dietary requirements for NEAA.
In nutritional practice, ideal dietary protein should be evaluated by reliable meth-ods (including both chemical analysis and animal feeding experiments) and for-mulated to meet an animal’s optimal needs for all AA in appropriate amounts and proportions. This is crucial for improving reproduction, health, growth, and devel-opment of humans and other animals, while enhancing food efficiency, preventing excessive accretion of white adipose tissue in the body, and reducing the excretion of fecal and urinary nitrogenous wastes.
REFERENCES
ARC (Agricultural Research Council). 1981. The Nutrient Requirements of Pigs: Technical Review. Commonwealth Agricultural Bureaux, Slough, UK.
Baker, D.H. 2000. Recent advances in use of the ideal protein concept for swine feed formula-tion. Asian-Aust. J. Anim. Sci. 13:294–301.
Baker, D.H. 2009. Advances in protein-amino acid nutrition of poultry. Amino Acids 37:29–41.Ball, R. and H.S. Bayley. 1986. Influence of dietary protein concentration on the oxidation of
phenylalanine by the young pig. Br. J. Nutr. 55:651–658.Ball, R.O., J.L. Atkinson, and H.S. Bayley. 1986. Proline as an essential amino acid for the
young pig. Br. J. Nutr. 55:659–668.Bender, A.E. 1982. Evaluation of protein quality: Methodological considerations. Proc. Nutr.
Soc. 41:267–276.Chung, T.K. and D.H. Baker. 1992. Ideal amino acid pattern for 10-kilogram pigs. J. Anim.
Sci. 70:3102–3111.Davis, T.A., M.L. Fiorotto, and P.J. Reeds. 1993. Amino acid compositions of body and milk
protein change during the suckling period in rats. J. Nutr. 123:947–956.Elango, R., R.O. Ball, and P.B. Pencharz. 2012. Recent advances in determining protein and
amino acid requirements in humans. Br. J. Nutr. 108 (Suppl 2):S22–S30.Evans E. and R. Witty. 1978. An assessment of methods used to determine protein quality.
World Rev. Nutr. Diet. 32:1–26.FAO/WHO/UNU Technical Report Series 935. 2007. Protein and Amino Acid Requirements
in Human Nutrition. WHO Press, Geneva, Switzerland.Fuller, M.F. and P.J. Garlick. 1994. Human amino acid requirements: Can the controversy be
resolved? Annu. Rev. Nutr. 14:217–241.Harper, A.E. and N.N. Yoshimura. 1993. Protein quality, amino acid balance, utilization, and
evaluation of diets containing amino acids as therapeutic agents. Nutrition 9:460–469.Hoffer, L.J. and B.R. Bistrian. 2012. Appropriate protein provision in critical illness: A sys-
tematic and narrative review. Am. J. Clin. Nutr. 96:591–600.Institute of Medicine (IOM). 2005. Dietary Reference Intakes for Energy, Carbohydrates,
Fiber, Fat, Fatty Acids, Cholesterol, Proteins, and Amino Acids. The National Academies Press, Washington, DC.
Kim, S.W., G. Wu, and D.H. Baker. 2005. Ideal protein and amino acid requirements by gestat-ing and lactating sows. Pig News Inform. 26:89N–99N.
Kurpad, A.V. and T. Thomas. 2011. Methods to assess amino acid requirements in humans. Curr. Opin. Clin. Nutr. Metab. Care 14:434–439.

458 Amino Acids: Biochemistry and Nutrition
© 2010 Taylor & Francis Group, LLC
Laidlaw, S.A., T.D. Shultz, J.T. Cecchino, and J.D. Kopple. 1988. Plasma and urine taurine levels in vegans. Am. J. Clin. Nutr. 47:660–663.
Li, X.L., R. Rezaei, P. Li, and G. Wu. 2011. Composition of amino acids in feed ingredients for animal diets. Amino Acids 40:1159–1168.
Lin, G., C. Liu, T.J. Wang, G. Wu, S.Y. Qiao, D.F. Li, and J.J. Wang. 2011. Biomarkers for opti-mal requirements of amino acids by animals and humans. Front. Biosci. S3:1298–1307.
Meredith, C.N., Z.M. Wen, D.M. Bier, D.E. Matthews, and V.R. Young. 1986. Lysine kinetics at graded lysine intakes in young men. Am. J. Clin. Nutr. 43:787–794.
Millward, D.J. 1997. Human amino acid requirements. J. Nutr. 127:1842–1846.NRC (National Research Council). 2012. Nutrient Requirements of Swine. National Academy
Press, Washington, DC.Reeds, P.J. 2000. Dispensable and indispensable amino acids for humans. J. Nutr. 130:
1835S–1840S.Rose, W.C. 1968. The sequence of events leading to the establishment of the amino acid needs
of man. Am. J. Public Health 58:2020–2027.Wang, J.J., G. Wu, H.J. Zhou, and F.L. Wang. 2009. Emerging technologies for amino acid
nutrition research in the post-genome era. Amino Acids 37:177–186.Wu, G. 2010. Functional amino acids in growth, reproduction and health. Adv. Nutr. 1:31–37.Wu, G., F.W. Bazer, R.C. Burghardt, G.A. Johnson, S.W. Kim, X.L. Li, M.C. Satterfield, and
T.E. Spencer. 2010. Impacts of amino acid nutrition on pregnancy outcome in pigs: Mechanisms and implications for swine production. J. Anim. Sci. 88: E195–E204.
Wu, G., F.W. Bazer, G.A. Johnson, D.A. Knabe, R.C. Burghardt, T.E. Spencer, X.L. Li, and J.J. Wang. 2011. Important roles for l-glutamine in swine nutrition and production. J. Anim. Sci. 89:2017–2030.
Wu, G., Z.L. Wu, Z.L. Dai, Y. Yang, W.W. Wang, C. Liu, B. Wang, J.J. Wang, and Y.L. Yin. 2012. Dietary requirements of “nutritionally nonessential amino acids” by animals and humans. Amino Acids. doi: 10.1007/s00726-012-1444-2.
Young, V.R. and S. Borgonha. 2000. Nitrogen and amino acid requirements: the Massachusetts Institute of Technology amino acid requirement pattern. J. Nutr. 130:1841S–1849S.

© 2010 Taylor & Francis Group, LLC
6000 Broken Sound Parkway, NW Suite 300, Boca Raton, FL 33487711 Third Avenue New York, NY 100172 Park Square, Milton Park Abingdon, Oxon OX14 4RN, UK
an informa business
www.taylorandfrancisgroup.com
K12865
“This book is the most comprehensive treatment of animal amino-acid metabolism and will be a valuable resource to all working in this area.”
—Dr. Malcolm Watford, Professor of Nutrition, Rutgers University
“Dr. Wu’s book is a highly valuable contribution to the armamentarium of knowledge in nutritional biochemistry and will be a classic textbook in the area.”
—Dr. Teresa A. Davis, Professor of Pediatrics, Baylor College of Medicine
Amino acid biochemistry and nutrition spans a broad range of fields including biochemistry, metabolism, physiology, immunology, reproduction, pathology, and cell biology. In the last half-century, there have been many conceptual and technical advancements, from analysis of amino acids by high-performance liquid chroma-tography and mass spectrometry to molecular cloning of transporters for amino acids and small peptides. Amino Acids: Biochemistry and Nutrition presents comprehensive coverage of these scientific developments, providing a useful refer-ence for students and researchers in both biomedicine and agriculture.
The text begins with the discoveries and basic concepts of amino acids, peptides, and proteins, and then moves to protein digestion and absorption of small peptides and amino acids. Additional chapters cover cell-, tissue-, and species-specific syn-thesis and catabolism of amino acids and related nitrogenous substances (includ-ing nitric oxide, creatine, and heme), as well as the use of isotopes to study amino acid metabolism in cells and the body. The book also details protein synthesis and degradation, regulation of amino acid metabolism, physiological functions of amino acids, and inborn errors of amino acid metabolism. The final chapter discusses di-etary requirements of amino acids by humans and other animals.
While emphasizing basic principles and classical concepts of amino acid biochem-istry and nutrition, the author includes recent progress in the field. This book also provides concise coverage of major historical developments of the scientific disci-pline, so that readers will appreciate the past, understand the current state of the knowledge, and explore the future of amino acid biochemistry, nutrition, and physi-ology. Each chapter contains select references to provide comprehensive reviews and original experimental data on the topics discussed.
Nutrition
Amino Acids
Am
ino
Ac
ids
Guoyao Wu
Wu
Biochemistry and Nutrition
Bio
che
mis
try a
nd
Nutritio
n