Embed Size (px)
Citation preview
Soil Biology and Biochemistry 163 (2021) 108450
Available online 1 October 20210038-0717/© 2021 The Authors. Published by Elsevier Ltd. This is an open access article under the CC BY license (http://creativecommons.org/licenses/by/4.0/).
Plant community legacy effects on nutrient cycling, fungal decomposer communities and decomposition in a temperate grassland
Renske Jongen a,1,7,*, S. Emilia Hannula a,6,7, Jonathan R. De Long a,2,7, Robin Heinen a,b,3, Martine Huberty a,b,4, Katja Steinauer a,5, T. Martijn Bezemer a,b
a Department of Terrestrial Ecology, Netherlands Institute of Ecology, P.O. Box 50, 6700 AB Wageningen, The Netherlands b Institute of Biology, Above-belowground interactions group, Leiden University, P.O. Box 9505, 2300 RA Leiden, The Netherlands
A R T I C L E I N F O
Keywords: Grassland Soil legacy effects Decomposition Soil nutrient cycling Soil fungi
A B S T R A C T
Soil legacies mediated by plant species-specific microbial communities are major drivers of plant community dynamics. Most soil legacy studies focus on the role of pathogens and mutualists in driving these processes, while much less is known about plant litter-mediated changes to the soil microbial community. Here, we used an existing plant-soil feedback field experiment in which plant communities with different growth strategies (i.e., fast versus slow) and different proportions of functional groups (i.e., grasses versus forbs) were allowed to condition the soil over contrasting temporal scales (i.e., one versus two years) in a natural grassland. In the feedback phase, we removed the existent plant community, and replaced it with a standardized response plant community. We then tested the legacy effects of these different soil conditioning treatments on decomposition processes, nutrient cycling and soil decomposer community composition. Soil legacy effects on decomposition and the soil decomposer community composition were most evident right after the start of the feedback phase, but disappeared soon after the new community established. The soil conditioning time and years since distur-bance affected most of the soil functions consistently, while no strong effects of plant functional group and plant growth strategy were found. We conclude that after disturbance, it is recovery time, not soil legacy effects, that is the most important factor driving soil functions.
1. Introduction
Plants and the soil are intimately linked. Plant growth can be greatly influenced by soil microbes (Bardgett and van der Putten, 2014) and the soil microbiome is in turn shaped by plants growing in that soil (Phil-ippot et al., 2013). This interaction between plants and soil microbes, can leave a lasting signature in the soil, commonly referred to as soil legacy (Kostenko et al., 2012). These changes to the soil microbiome influence the growth of other plants growing later in that same soil, and
this can be a driver of plant community dynamics and succession (Hei-nen et al., 2020b). Most of the research on soil legacies considers plant-mediated changes to the abiotic properties of the soil, as well as to belowground pathogens and mutualists, as the primary factors influ-encing plants growing later in the same soil (Ehrenfeld et al., 2005; Heinen et al., 2020b; Kos et al., 2015; van der Putten et al., 2016). Less is known about plant litter-mediated effects on the soil decomposer com-munity (but see Freschet et al., 2013; Zhang et al., 2016). Litter decomposition is, however, an essential aspect of soil legacies, as
* Corresponding author. E-mail addresses: [email protected], [email protected] (R. Jongen).
1 Current address: School of Life and Environmental Sciences, Coastal and Marine Ecosystems, The University of Sydney, Sydney, NSW 2006, Australia. 2 Current address: Louis Bolk Institute, Kosterijland 3–5, 3981 AJ Bunnik, The Netherlands. 3 Current address: Technische Universitat München, Wissenschaftszentrum Weihenstephan für Ernahrung, Landnutzung und Umwelt, Lehrstuhl für Terrestrische
Okologie, Freising, Germany. 4 Current address: Ministry of Agriculture, Viticulture and Rural Development, Administration of Technical Agricultural Services, Agri-environment Department,
Research and Innovation, BP. 1904, L - 1019 Luxembourg, Luxembourg. 5 Current address: Institute of Plant Sciences, University of Bern, Altenbergrain 21, 3013 Bern, Switzerland. 6 Current address: Department of Environmental Biology, Institute of Environmental Sciences, Leiden University, Einsteinweg 2, 2333 CC Leiden, The Netherlands. 7 These authors contributed equally to this work.
Contents lists available at ScienceDirect
Soil Biology and Biochemistry
journal homepage: www.elsevier.com/locate/soilbio
https://doi.org/10.1016/j.soilbio.2021.108450 Received 10 August 2021; Received in revised form 28 September 2021; Accepted 30 September 2021
Soil Biology and Biochemistry 163 (2021) 108450
2
decomposition affects nutrient availability and thereby future plant performance (Ke et al., 2015; De Long et al., 2019; Veen et al., 2018; Zhang et al., 2016). Despite these findings, our understanding of how plant communities and their traits influence soil functions such as decomposition, nutrient cycling and soil decomposer communities in natural grasslands is limited.
Plant communities greatly differ in the quality and quantity of the litter and rhizodeposits they return to the soil (Broeckling et al., 2008; Cornwell et al., 2008). These distinct plant residues are a food source for decomposers, and as they accumulate over time, shape the soil decom-poser community (De Deyn and van der Putten, 2005; Lunghini et al., 2013; McGuire and Treseder, 2010). Further, the quality of plant litter is determined by its chemical characteristics, which is closely linked to the functional traits of a plant (Cornwell et al., 2008; Quested et al., 2007). Plant functional traits can be grouped by using the plant economic spectrum, which classifies plants based on the growth strategies that they have developed to handle abiotic and biotic environmental con-ditions (Díaz et al., 2016; Reich, 2014; Wright et al., 2004). Specifically, the more acquisitive traits of fast-growing plants, such as longer, finer roots and leaves with larger surface area, allow them to rapidly acquire resources, while slow-growing plants demonstrate the opposite pattern in order to survive in resource-limited environments (Funk et al., 2017; Reich, 2014). In addition, fast-growing plants produce high quality litter that is poorly defended and thus highly labile (Reich, 2014), and this promotes rapid decomposition and nutrient mineralization (Bardgett, 2017). Slow-growing plants, on the other hand, typically produce litter rich in structural and chemical defence compounds (Reich, 2014). This promotes the growth of slow-growing soil organisms such as mycelial fungi (Bardgett, 2017). As a result, the soil microbial community shifts in such a way that the decomposition rate is expected to be slower and in parallel, the rate of nutrient cycling slows down (Reich, 2014).
Similar to plants with the same growth strategies, plants from the same functional group, such as grass species and forb species, exert unique effects on soil processes and properties (McLaren and Turking-ton, 2010; Tilman et al., 1997). For example, grasses generally have dense, fibrous roots, which allow them to recover quickly after being grazed (McNaughton, 1983), while forbs generally invest more in aboveground tissue and create longer, less dense tap root systems. Furthermore, grasses leave a soil legacy which positively affects other functional groups, probably due to changes in the soil biotic community and resulting nutrient shifts (Cortois et al., 2016; Heinen et al., 2020a, 2020b), while forb litter decomposition generally creates a more dele-terious effect on future plant growth (Xiong and Nilsson, 1999), likely due to higher concentrations of allelopathic chemicals in forb litter (Bonanomi et al., 2006). In addition, forbs tend to produce more labile litter compared to grasses (Cornelissen, 1996; Xiong and Nilsson, 1999), meaning that soils conditioned by higher densities of forbs will be better primed to accelerate decomposition and have different fungal decom-poser communities (Francioli et al., 2020).
In natural grassland ecosystems, plants grow in multispecies com-munities and are subjected to constant changes in abiotic conditions. Yet, most of the evidence for plant trait effects on decomposition comes from short, single-species experiments under controlled greenhouse conditions. Testing these concepts in the field over a longer period with multiple species interacting with each other, is needed to properly un-derstand soil legacy effects and verify experiments performed under controlled conditions (Bezemer et al., 2006; Ehrenfeld et al., 2005; Veen et al., 2019). We used an existing plant-soil feedback field experiment comprised of plant communities with different growth strategies (i.e., fast versus slow) and different proportions of functional groups (grasses versus forbs) that were allowed to condition the soil over contrasting temporal scales (i.e., one versus two years) (De Long et al., 2019; Heinen et al., 2020b; Steinauer et al., 2020). We have earlier shown that having more grasses in the community in the conditioning phase leads to more forbs in the feedback community and vice versa, and that this is mainly driven by fungal pathogens (Heinen et al., 2020b). However, we do not
know whether soil functions are affected by the legacy of plants. The design of this experiment allowed us to simultaneously test for the ef-fects of plant growth strategy, plant functional group composition, and temporal effects on decomposer microbes, decomposition and nutrient cycling.
During the feedback phase of the experiment, we tested the following hypotheses: 1) Plant communities comprised of fast-growing plants will leave soil legacies in saprotrophic microbial communities that increase decomposition and nutrient cycling rates, while the opposite will be true for slow-growing communities. 2) Plant communities dominated by forbs will leave soil legacies that lead to faster decomposition and nutrient cycling rates compared to those comprised mostly of grasses. 3) Temporal conditioning by plant communities for longer time periods will strengthen the effects of growth strategy and functional group composition, with subplots conditioned for two years showing stronger effects than those that were conditioned for one; and 4) As the feedback phase progresses, soil legacy effects of temporal conditioning, commu-nity growth rate and functional group composition on nutrient cycling and decomposition will become weaker.
2. Material and methods
2.1. Study site
In 2015 the field experiment was set up in a restored grassland site (abandoned from agricultural use in 1996), “De Mossel” (Natuurmo-numenten, Ede, The Netherlands, 52◦ 04′ N, 5◦ 45′ E). Soils are holt-podzol, sandy loam (94% sand, 4% silt, 2% clay, ~5% organic matter, 5.2 pH, 2.5 mg kg− 1 N, 4.0 mg kg− 1 P, 16.5 mg kg− 1 K) (Jeffery et al., 2017). Average daily temperatures in the area are 16.7 ◦C in summer months and 1.7 ◦C in winter months. Average monthly precipitation ranges from 48 to 76 mm (www.climate-data.org).
2.2. Phase 1: conditioning phase
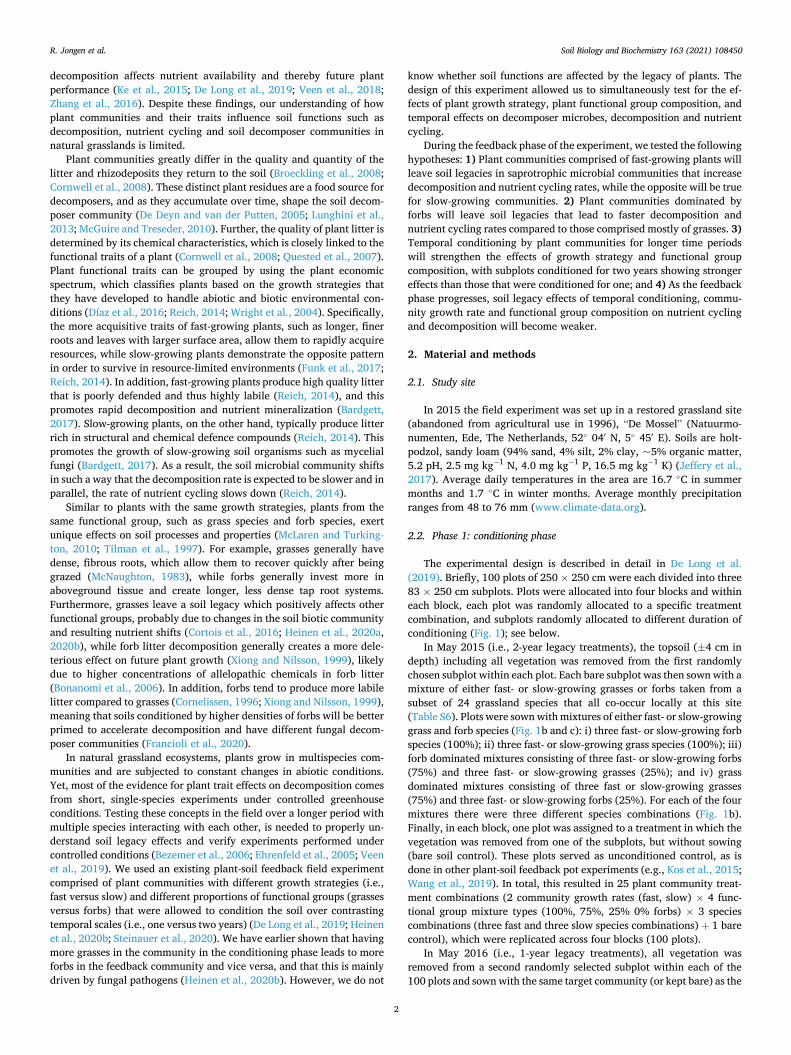
The experimental design is described in detail in De Long et al. (2019). Briefly, 100 plots of 250 × 250 cm were each divided into three 83 × 250 cm subplots. Plots were allocated into four blocks and within each block, each plot was randomly allocated to a specific treatment combination, and subplots randomly allocated to different duration of conditioning (Fig. 1); see below.
In May 2015 (i.e., 2-year legacy treatments), the topsoil (±4 cm in depth) including all vegetation was removed from the first randomly chosen subplot within each plot. Each bare subplot was then sown with a mixture of either fast- or slow-growing grasses or forbs taken from a subset of 24 grassland species that all co-occur locally at this site (Table S6). Plots were sown with mixtures of either fast- or slow-growing grass and forb species (Fig. 1b and c): i) three fast- or slow-growing forb species (100%); ii) three fast- or slow-growing grass species (100%); iii) forb dominated mixtures consisting of three fast- or slow-growing forbs (75%) and three fast- or slow-growing grasses (25%); and iv) grass dominated mixtures consisting of three fast or slow-growing grasses (75%) and three fast- or slow-growing forbs (25%). For each of the four mixtures there were three different species combinations (Fig. 1b). Finally, in each block, one plot was assigned to a treatment in which the vegetation was removed from one of the subplots, but without sowing (bare soil control). These plots served as unconditioned control, as is done in other plant-soil feedback pot experiments (e.g., Kos et al., 2015; Wang et al., 2019). In total, this resulted in 25 plant community treat-ment combinations (2 community growth rates (fast, slow) × 4 func-tional group mixture types (100%, 75%, 25% 0% forbs) × 3 species combinations (three fast and three slow species combinations) + 1 bare control), which were replicated across four blocks (100 plots).
In May 2016 (i.e., 1-year legacy treatments), all vegetation was removed from a second randomly selected subplot within each of the 100 plots and sown with the same target community (or kept bare) as the
R. Jongen et al.
Soil Biology and Biochemistry 163 (2021) 108450
3
corresponding subplot from May 2015 as described above. Within each of the 100 plots, the vegetation of the remaining third
subplot was left intact throughout the conditioning phase to act as a local control. This was done so that each local control plant community and its soil properties could be compared to the spatially-linked target plant communities and their effects on the soil. Cumulatively, this resulted in a total of 300 experimental subplots.
2.3. Phase 2: feedback phase
On 12–16 June 2017, the vegetation was removed from all three subplots within each plot using a sod-cutting machine, cut to a depth of
c. 3 cm (IB300, IBEA, Tradate, Italy). On June 20, 2017, each subplot was sown with 33 grassland species that occur at the site (Table S6), including the 24 species that were used in the conditioning phase.
2.4. Decomposition: The Teabag Index
In order to assess how the soil conditioning treatments may have affected decomposition processes in the feedback phase, green (EAN 8710908903595) and rooibos (EAN 8722700188438) Lipton teabags were used in line with The Teabag Index as described in Keuskamp et al. (2013). All teabags were oven-dried at 40 ◦C for 48 h, dry weights were recorded and each teabag was given a unique labelling code and placed
Fig. 1. Schematic showing a timeline of the main methods used in the field and the different treatments of the field-based plant–soil feedbacks exper-iment. (A) Temporal conditioning: local plant communities were removed in 2015 and 2016, respectively, from two randomly assigned separate subplots within each plot and sown with new conditioning communities. The vegetation in one subplot within each plot was left intact to act as a local control community. AG =aboveground. (B) Community growth rate: three different fast-growing communities (i.e., F1, F2, F3) and three different slow-growing communities (i.e., S1,S2, S3) were sown into each of the cleared subplots. (C) Functional group proportions: 12 fast- and 12 slow-growing plant communities that consisted of different com-binations of grasses versus forbs (i.e., 100% grasses; 100% forbs; 25% grasses, 75% forbs; 25% forbs, 75% grasses) were sown. In addition to the different plant communities, one plot had its vegetation removed and was maintained as bare soil beginning in 2015 and 2016. All treatments were replicated across four blocks. Abbreviations of the different species used to create the fast-and slow-growing communities: Ac = Agrostis capillaris, Ae = Arrhenatherum elatius, Am = Achillea millefolium, Ao = Anthoxanthum odoratum, Ap = Alopecurus pratensis, Bm = Briza media, Cc = Crepis capillaris, Cv = Clinopodium vulgare, Df = Deschampsia flexuosa, Dg = Dactylis glomerata, Eh = Epilobium hirsutum, Fo = Festuca ovina, Gem = Geranium molle, Gm = Galium mollugo, Gs = Gnaphalium sylvaticum, Hl = Holcus lanatus, Lp = Lolium perenne, Ma = Myosotis arvensis, Pl = Plantago lanceolata, Pp = Phleum pratense, Ra = Rumex acetosella, Tf = Trisetum flavescens, Tm = Tripleurospermum maritimum, To = Taraxacum officinale. Figure adapted from De Long et al. (2019).
R. Jongen et al.
Soil Biology and Biochemistry 163 (2021) 108450
4
into the field on 26 July 2017 and 19 July 2018. The bottom of each teabag was placed approximately 8 cm beneath the soil surface, with the top of each teabag ending up approximately 5 cm beneath the soil sur-face. Two teabags of each type were alternatingly placed in either the top or bottom third of each subplot, resulting in a total of four teabags per subplot. After 90 and 91 days in the field, respectively, on 25 October 2017 and 18 October 2018, teabags were taken out of the soil, brought back to the lab and dried at 40 ◦C for 48 h. Each teabag was carefully cleaned, cut open and the dried tea was picked clean of all large roots before dry weights were recorded. The mass of the tea remaining was used to determine the mass loss and the values of the two duplicates were averaged to provide a single data point per subplot prior to anal-ysis. For the plots where only one tea bag was found or one of the tea bags was damaged, the value of the remaining tea bag was used. The litter stabilization factor (S) and decomposition rate (K) were calculated using formulas and data presented in Keuskamp et al. (2013). Briefly, the decomposition rate (K) is based on the mass lost from the tea bags during their time in the soil. The stabilization factor (S) stands for the transformation of some components of the tea bags from fast-decomposing molecules into slow-decomposing molecules under the influence of environmental factors. These components are then said to be stabilized (Keuskamp et al., 2013).
2.5. Soil sampling
In order to link the patterns observed in decomposition of the tea bags with nutrient cycling, soils were sampled twice; one time roughly two months after the establishment of the responding plant community in September 2017 and a second time in August 2018 in order to assess whether the plant community legacy effects on the soil nutrients could be linked to the nutrients taken up by the resin capsules (see below) and if the soil saprotrophic microbial community could be linked to decomposition and nutrient cycling.
Nine soil cores were taken from each experimental subplot (1.3 cm diameter, 10 cm depth), then bulked and homogenized. Sub-samples for molecular analysis were taken immediately after homogenization (within 4h of sampling) and stored frozen (− 80 ◦C) until DNA extraction.
Soil samples for analysis of nutrient content were dried at 40 ◦C and sieved through a 2 mm sieve.
2.6. Nutrient availability: resin capsules
To assess if plant-available N and P concentrations in the soil was related to soil legacies that remained as the responding plant community developed, a resin capsule (PST1 capsule, Unibest Bozeman, Bozeman, MT, USA) containing approximately 1 g of mixed bed ionic resins was placed in each subplot approximately 5 cm below the soil surface (Gundale et al., 2014) on 7 July 2017 and 19 July 2018. After 110 and 91 days in the field, respectively, resin capsules were then collected from the field on 25 October 2017 and 2 November 2018, and stored at 4 ◦C until ions were extracted with three extractions of 10 mL 1 M KCl which were then pooled into one sample. Extracts were frozen at − 18 ◦C until analysed for NH4–N, NO3–N and PO4–P on a QuAAtro Auto-analyser (Seal Analytical, Mequon, WI, USA).
2.7. Nutrient availability: soil chemistry and soil organic matter
Approximately 3 g of dried soil was mixed with 30 mL of 0.01 M CaCl2. The mixture was shaken for 2 h at 250 rpm, then centrifuged for 5 m at 1693 g. Next, 15 mL of the supernatant was filtered through a Whatman Puradisc Aqua 30 syringe filter with cellulose acetate mem-brane. Subsequently, 12.87 mL of the filtrate and 130 μL HNO3 were mixed in a clean 15 mL tube. The sample was mixed using a vortex and analysed for soil extractable Fe, Zn, P, S, K and Mg by inductively coupled plasma - optical emission spectrometer (ICP-OES, Thermo
Scientific iCAP 6500 Duo Instrument with axial and radial view and CID detector microwave digestion system). The remaining part of the filtrate was transferred to a 15 mL tube to measure soil NO2+NO3–N and NH4–N on a QuAAtro Autoanalyzer (Seal Analytical, Mequon, Wisconsin, USA).
Soil organic matter content was estimated by the loss-on-ignition (LOI) method (Heiri et al., 2001). Approximately 5 g of soil was oven dried at 105 ◦C, weighed, heated at 550 ◦C and weighed again. Soil organic matter was calculated as the percentage weight loss between the oven dried and heated samples.
2.8. Soil microbial community
DNA was extracted from 0.75 g of soil using the Powersoil DNA isolation kit (Qiagen, Hilden, Germany) according to the manufacturers’ protocol. The fungal DNA was amplified using primers ITS3mix and ITS4ngs (Tedersoo et al., 2014) under conditions presented in Heinen et al. (2020). Purified amplicons were tagged using Nextera XT DNA library preparation kit sets A, B, and C (Illumina, San Diego, CA, USA), and equimolarly pooled. Fungi were sequenced in two separate libraries (300 samples from 2017 and 300 samples from 2018) using Illumina MiSeq PE250 at McGill University and Genome Quebec Innovation Center. Extraction negatives and mock communities were sequenced along the samples.
Fungal sequences were analysed using the and PIPITS pipeline (Gweon et al., 2015). The taxonomy was assigned using the rdp classifier against the UNITE fungal ITS database (Nilsson et al., 2019). Finally, the OTU table was parsed against the FunGuild (v1.1) database (Nguyen et al., 2016) to assign putative life strategies to taxonomically defined OTUs and this was further curated using in-house databases (Hannula et al., 2017). Here we especially focused on the guild ‘saprotrophs’ and their assignment to trait level was performed manually. All singletons and all reads from other than fungal origin (i.e. plant material and protists) were removed from the datasets. To account for large differ-ences in read numbers, all samples with less than 1000 reads or more than 60 000 reads were removed. We further divided the known sap-rotrophic fungi (making up around 40% of the total fungal community) into fungal functional trait-groups and analysed these groups.
2.9. Plant biomass
Aboveground plant biomass was measured in the plots during the conditioning phase in June 2017 and during the feedback phase in September 2017 and August 2018. Aboveground biomass was harvested by randomly selecting two 25 × 25 cm squares in the middle of each plot. The biomass was clipped just above the surface of the soil, put in paper bags to be dried at 40 ◦C for at least 72 h and weighed. We explored whether aboveground plant community biomass before and during the period of decomposition affected the decomposition rate or stabilization factor in both 2017 and 2018.
2.10. Statistical analyses
We analysed the data using general linear mixed models. First, we analysed the temporal legacy effect of the different plant communities (i. e., local control, 1-year, 2-year legacies) as a fixed factor. Plot identity (i. e., each unique plot that occurred only once in the experiment, which simultaneously accounts for the block and plot effects) was included as a random factor. We did not include the fixed factors community growth rate and percentage cover of forbs in this model because the local control plots did not receive these treatments.
Second, we analysed the temporal legacy effects of the different sown plant communities (i.e., 1-year, 2-year legacies), community growth rate (i.e., fast versus slow) and the percentage cover of forbs (i.e., 0%, 25%, 75%, 100%) as fixed factors. Plot identity (i.e., each unique plot that had been divided into three subplots) and plant community identity (i.e., fast: F1, F2, F3 and slow: S1, S2, S3) were included as random factors.
R. Jongen et al.
Soil Biology and Biochemistry 163 (2021) 108450
5
To explore how differences in decomposition and nutrient cycling varied between the two seasons, year (i.e., 2017, 2018) was added as a fixed factor in each of the above models. The models were corrected for using time as a covariate in an auto-regressive moving average corre-lation structure (Pinheiro and Bates, 2006). Whenever significant effects were found, post-hoc tests were performed using the lsmeans package in R (Lenth, 2016) with Tukey HSD adjustment, which accounts for mul-tiple comparisons. All data were transformed as necessary to meet the model assumptions. All analyses were performed in R (R Core Team, 2015) with the package nlme (Bates et al., 2015).
From the molecular data, we selected fungi that were allocated to the guild ‘saprotroph’. The relative abundance of saprotrophs from total fungi was then calculated per sample and fungal richness was evaluated using the phyloseq package in R (McMurdie and Holmes, 2013). The relative abundance and richness data were analysed using the package nlme. Data were arcsin square root transformed to meet requirements for normality of the data. The effects of the plant community legacies on the community structure of saprotrophic fungi was estimated using PERMANOVA with Bray-Curtis distance in vegan after normalising the data using total sum scaling (TSS) and removal of rare species (present in less than 5 samples with relative abundance of less than 0.01%). Further,
the saprotrophs were divided into finer groups (genus level) that were analysed with the package nlme after arcsin square root transformation. Finally, the fungal data was correlated with decomposition and nutrient parameters using Pearson correlation coefficients and significance was corrected for false discovery rates (FDR) using the corr.plot function in R.
2.11. Data availability
Sequences are available in ENA under accession number PRJEB31856 and PRJEB47911. Data on teabag decomposition, resin capsules, soil chemistry and plant biomass was made available in Dryad under accession 10.5061/dryad.h18931zmt.
3. Results
3.1. Decomposition
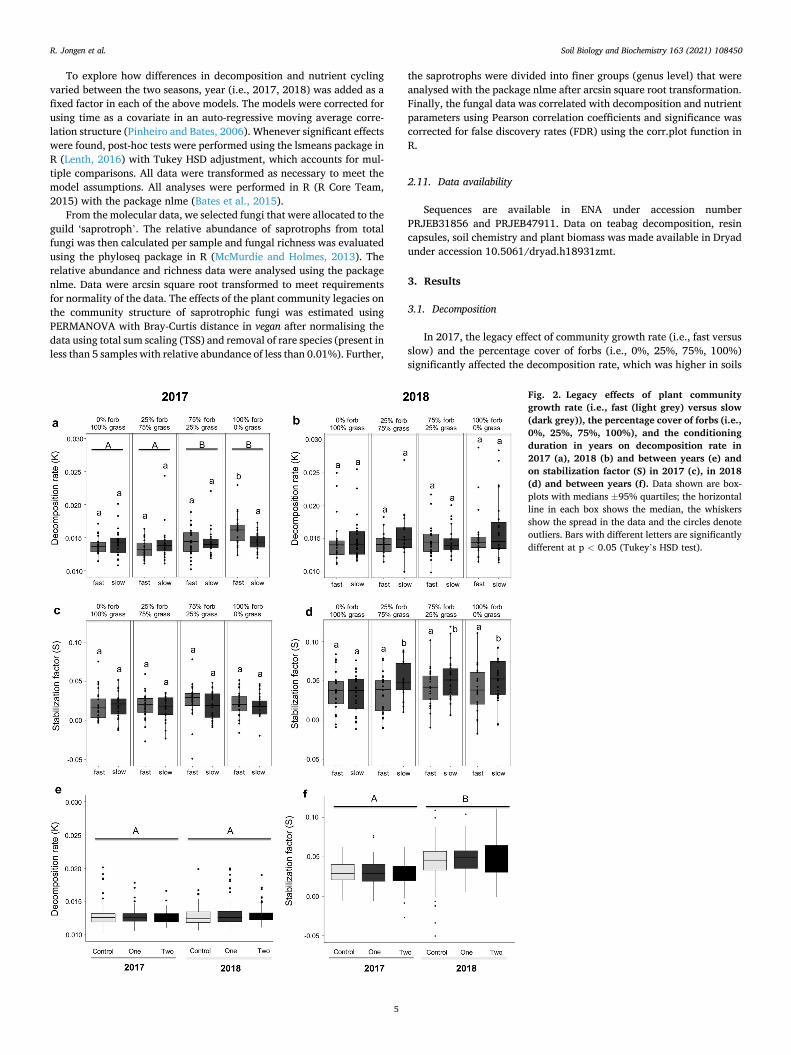
In 2017, the legacy effect of community growth rate (i.e., fast versus slow) and the percentage cover of forbs (i.e., 0%, 25%, 75%, 100%) significantly affected the decomposition rate, which was higher in soils
Fig. 2. Legacy effects of plant community growth rate (i.e., fast (light grey) versus slow (dark grey)), the percentage cover of forbs (i.e., 0%, 25%, 75%, 100%), and the conditioning duration in years on decomposition rate in 2017 (a), 2018 (b) and between years (e) and on stabilization factor (S) in 2017 (c), in 2018 (d) and between years (f). Data shown are box-plots with medians ±95% quartiles; the horizontal line in each box shows the median, the whiskers show the spread in the data and the circles denote outliers. Bars with different letters are significantly different at p < 0.05 (Tukey’s HSD test).
R. Jongen et al.
Soil Biology and Biochemistry 163 (2021) 108450
6
that were conditioned by forbs (F3,88 = 5.07, p = 0.003; Fig. 2a). Spe-cifically, decomposition rate was highest in subplots that had a soil legacy of 100% forb cover in fast communities, and a similar trend was observed in plots of 75% fast growing forbs (significant community growth rate × percentage cover of forbs interaction, F3,88 = 4.16, p =0.008; Fig. 2a). Neither the legacy effect of community growth rate nor percentage cover of forbs affected the stabilization factor (S) in 2017 (Fig. 2c).
In 2018, the community growth rate (i.e., fast versus slow) did not affect the decomposition rate, (F3,88 = 2.13, p = 0.140, Fig. 2b), but the stabilization factor was higher in plots conditioned by slow than in those conditioned by fast communities irrespective of time of conditioning and plant functional group (F1,88 = 4.84, p = 0.030; Fig. 2d).
The decomposition rate was slightly but not significantly affected by year (F1,421 = 3.74, p = 0.054; Fig. 2e), but the stabilization rate was significantly higher in 2018 than in 2017 (F1,421 = 121.66, p < 0.001, Fig. 2f). In neither one of the years, did temporal soil legacies (i.e., local control, 1-year, 2-year) affect the decomposition rate nor the stabiliza-tion factor (Fig. 2e and f).
We further examined if aboveground plant community biomass before and during the period of decomposition affected the decompo-sition rate or stabilization factor, but found no relationship between plant biomass and the decomposition rate or the stabilization factor (Figure S1).
3.2. Fungal community and decomposition
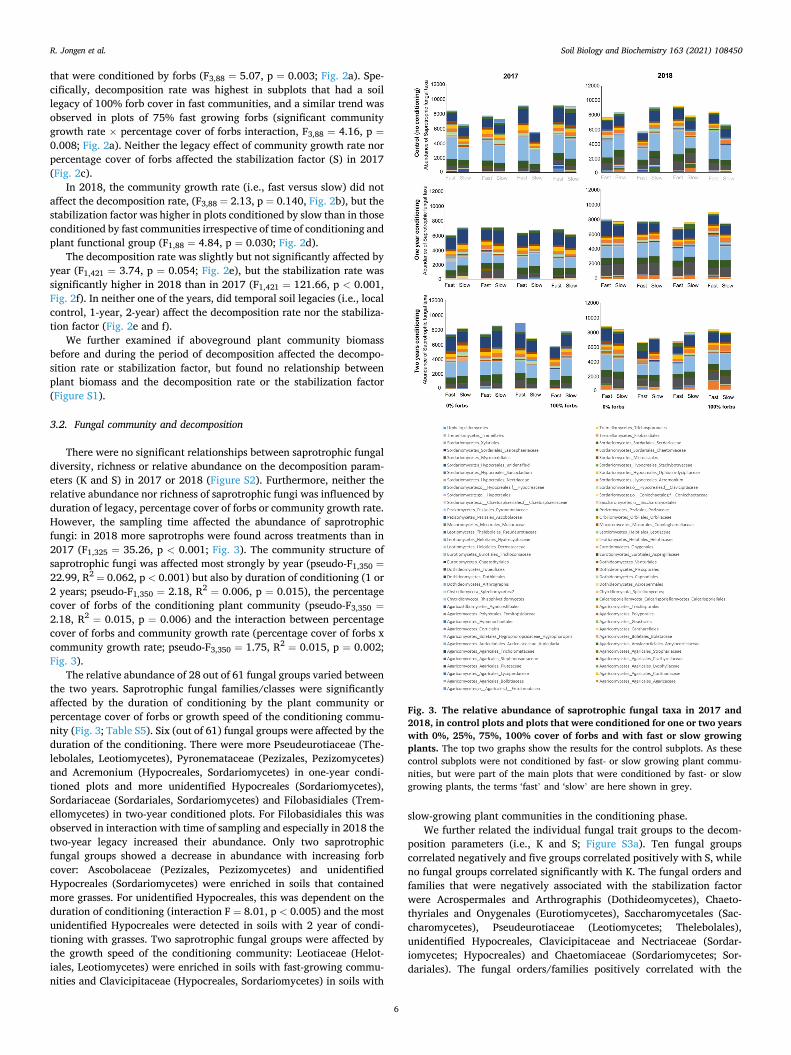
There were no significant relationships between saprotrophic fungal diversity, richness or relative abundance on the decomposition param-eters (K and S) in 2017 or 2018 (Figure S2). Furthermore, neither the relative abundance nor richness of saprotrophic fungi was influenced by duration of legacy, percentage cover of forbs or community growth rate. However, the sampling time affected the abundance of saprotrophic fungi: in 2018 more saprotrophs were found across treatments than in 2017 (F1,325 = 35.26, p < 0.001; Fig. 3). The community structure of saprotrophic fungi was affected most strongly by year (pseudo-F1,350 =
22.99, R2 = 0.062, p < 0.001) but also by duration of conditioning (1 or 2 years; pseudo-F1,350 = 2.18, R2 = 0.006, p = 0.015), the percentage cover of forbs of the conditioning plant community (pseudo-F3,350 =
2.18, R2 = 0.015, p = 0.006) and the interaction between percentage cover of forbs and community growth rate (percentage cover of forbs x community growth rate; pseudo-F3,350 = 1.75, R2 = 0.015, p = 0.002; Fig. 3).
The relative abundance of 28 out of 61 fungal groups varied between the two years. Saprotrophic fungal families/classes were significantly affected by the duration of conditioning by the plant community or percentage cover of forbs or growth speed of the conditioning commu-nity (Fig. 3; Table S5). Six (out of 61) fungal groups were affected by the duration of the conditioning. There were more Pseudeurotiaceae (The-lebolales, Leotiomycetes), Pyronemataceae (Pezizales, Pezizomycetes) and Acremonium (Hypocreales, Sordariomycetes) in one-year condi-tioned plots and more unidentified Hypocreales (Sordariomycetes), Sordariaceae (Sordariales, Sordariomycetes) and Filobasidiales (Trem-ellomycetes) in two-year conditioned plots. For Filobasidiales this was observed in interaction with time of sampling and especially in 2018 the two-year legacy increased their abundance. Only two saprotrophic fungal groups showed a decrease in abundance with increasing forb cover: Ascobolaceae (Pezizales, Pezizomycetes) and unidentified Hypocreales (Sordariomycetes) were enriched in soils that contained more grasses. For unidentified Hypocreales, this was dependent on the duration of conditioning (interaction F = 8.01, p < 0.005) and the most unidentified Hypocreales were detected in soils with 2 year of condi-tioning with grasses. Two saprotrophic fungal groups were affected by the growth speed of the conditioning community: Leotiaceae (Helot-iales, Leotiomycetes) were enriched in soils with fast-growing commu-nities and Clavicipitaceae (Hypocreales, Sordariomycetes) in soils with
slow-growing plant communities in the conditioning phase. We further related the individual fungal trait groups to the decom-
position parameters (i.e., K and S; Figure S3a). Ten fungal groups correlated negatively and five groups correlated positively with S, while no fungal groups correlated significantly with K. The fungal orders and families that were negatively associated with the stabilization factor were Acrospermales and Arthrographis (Dothideomycetes), Chaeto-thyriales and Onygenales (Eurotiomycetes), Saccharomycetales (Sac-charomycetes), Pseudeurotiaceae (Leotiomycetes; Thelebolales), unidentified Hypocreales, Clavicipitaceae and Nectriaceae (Sordar-iomycetes; Hypocreales) and Chaetomiaceae (Sordariomycetes; Sor-dariales). The fungal orders/families positively correlated with the
Fig. 3. The relative abundance of saprotrophic fungal taxa in 2017 and 2018, in control plots and plots that were conditioned for one or two years with 0%, 25%, 75%, 100% cover of forbs and with fast or slow growing plants. The top two graphs show the results for the control subplots. As these control subplots were not conditioned by fast- or slow growing plant commu-nities, but were part of the main plots that were conditioned by fast- or slow growing plants, the terms ‘fast’ and ‘slow’ are here shown in grey.
R. Jongen et al.
Soil Biology and Biochemistry 163 (2021) 108450
7
stabilization factor (S) were Pleosporales (Dothideomycetes), Orbilia-ceae (Orbiliomycetes; Orbiliales), Filobasidiales and Tremellales (Tremellomycetes), and Mucoraceae (Mucoromycetes; Mucorales). Furthermore, many fungal classes were correlated with each other (Figure S3a).
3.3. Nutrient availability: resin capsules
In both 2017 and 2018, temporal legacies (i.e., local control, 1-year, 2-year) significantly altered nutrient availability (Figure S4). In 2017, NH4 concentrations were highest in control subplots, followed by 1-year and 2-year legacies, respectively (p < 0.001, Figure S4; Table S1), while for NO3–NO2 and PO4 concentrations were highest in control subplots followed by 2-year and 1-year legacies, respectively (NO3–NO2: p <0.001, p = 0.027, Figure S4, Tables S1 and S2; PO4: p < 0.001, p =0.002, Figure S4, Tables S1 and S2). In 2018, NH4 concentrations were not affected by temporal soil legacies, but NO3–NO2 concentrations were higher in subplots with a control legacy compared to subplots with 1- year and 2-year legacies (p < 0.001, Figure S4; Table S1). PO4 concen-trations were highest in control subplots followed by 2-year and 1-year legacies, respectively (p < 0.001, p = 0.004, Figure S4). Between years, NH4 concentrations were 950% higher in 2017 than 2018, while NO3–NO2 and PO4 concentrations were 107% and 209% higher in 2018 than 2017, respectively (p < 0.001, Figure S4; Table S3).
In 2017, the legacy of the percentage cover of forbs of the condi-tioning community (i.e., 0%, 25%, 75%, 100%) significantly affected NO3–NO2 concentrations (p = 0.048), but post-hoc tests revealed no significant differences between treatments (Figure S5; Table S2). Con-centrations of PO4 were higher in subplots with legacies of 2-year slow growing communities compared to 1-year slow-growing communities, but no differences were detected between legacies of 1-year and 2-year fast communities (significant legacy × speed interaction, p = 0.031, Figure S5; Table S2). Finally, across both years, PO4 concentrations were higher in both fast and slow 2-year temporal legacy communities than in 1-year temporal legacy slow communities, but there were no differences between fast and slow 2-year temporal legacy communities and 1-year temporal legacy fast communities (significant temporal legacy × com-munity growth rate interaction, p = 0.044, Figure S5; Table S3).
Correlation analyses of fungal groups and available nutrient data showed that no saprotrophic fungal group correlated with NO3–NO2 and that only few groups were positively correlated with the content and cycling of PO4 (Figure S3b). Only the Hypocreales families Acremonium and Sarcocladium and unidentified Hypocreales positively correlated with NH4 collected in resin capsules. Five groups were negatively correlated. These groups were partially the same ones that were posi-tively correlated with the stabilization factor (S), namely Dothidealeas (Dothideomycetes), Orbiliaceae (Orbiliomycetes; Orbiliales), Filobasi-diales and Tremellales (Tremellomycetes), and Mucoraceae (Mucor-omycetes; Mucorales). For PO4 cycling only 7 significant correlations were detected and these were all negative (Figure S3b).
3.4. Nutrient availability: soil chemistry and soil organic matter
Temporal legacies (i.e., local control, 1-year, 2-year) significantly altered soil chemistry and soil organic matter content (Figures S6-S8; Table S4). In both 2017 and 2018, NH4, Fe, P, S, K concentrations were higher in control subplots, compared to 1-year and 2-year legacies (Figures S6, S7; Table S4). In 2017, NO3–NO2 and Zn concentrations were not affected by temporal soil legacies. Soil organic matter content was higher in control subplots, compared to 1-year and 2-year legacies (Figure S8; Table S4), while Mg concentrations were highest in control subplots, followed by 2-year and 1-year legacies, respectively (Figure S6; Table S4). In 2018, Zn concentrations were not affected by temporal soil legacies. NO3–NO2 and Mg concentrations and soil organic matter content were highest in control subplots, followed by 2-year and 1-year legacies, respectively (Figure S7, S8; Table S4). Both soil
chemistry, as well as the soil organic matter content were not signifi-cantly affected by the percentage cover of forbs or the community growth rate. Only in 2017, there was a significant interaction between the community growth rate and the percentage cover of forbs on K concentration, but post-hoc tests revealed no significant differences (F3,88 = 2.794, p = 0.045). Between years, NO3–NO2 concentrations were 235% higher in 2018 than in 2017 (F2,760 = 926.9, p < 0.001), but we did not find the same results for the other elements measured. Soil organic matter content did not differ between years for the feedback phase, but was higher before than during the feedback phase (F2,760 =
48.6, p < 0.001).
3.5. Plant biomass
As for the other variables measured, temporal legacies (i.e., local control, 1-year, 2-year) significantly affected aboveground biomass (Figure S9, Table S7). In June 2017, at the end of the conditioning phase, aboveground biomass was highest in control subplots, followed by 2- year and 1-year legacies, respectively (Figure S9, Table S7). Further-more, aboveground biomass was lower in forb-dominated than grass- dominated plant communities (F3,88 = 13.3, p = <0.001; Figure S10, Table S8). In the feedback phase, aboveground biomass was higher in control subplots than in to 1-year and 2-year legacies in both September 2017 and September 2018 (Figure S9, Table S7). In September 2018, there was an interaction between temporal legacy and speed of com-munity growth rate on the aboveground biomass (F1,88 = 5.0, p = 0.03), but post-hoc tests revealed no significant differences between treatments (Figure S10, Table S8). Between years, aboveground biomass was on average 144% higher in September 2018 than in September 2017 (F2,760 = 126.3, p < 0.001).
4. Discussion
We tested whether soil conditioning by plants with different func-tional traits affects soil saprotrophic microbes and soil functions such as decomposition rate and nutrient cycling. We show that, three months after the start of the feedback phase, the decomposition rate was higher in plots that had a 100% forb cover, but only when these plots were previously sown with fast-growing plants. This is in line with previous work that shows decomposition is accelerated in soils conditioned by forbs compared to grasses (Bardgett, 2017; Chen et al., 2017; Francioli et al., 2020) and that fast-growing plant communities leave a soil legacy that promotes rapid decomposition (Bardgett, 2017; Reich, 2014).
We observed strong legacy effects of forb cover and community growth speed on decomposition rates immediately after the start of the feedback phase. However, 15 months after the start of the feedback phase, these effects disappeared. We have previously shown that during the conditioning phase the functionally dissimilar plant communities (fast vs slow and grasses vs forbs) shaped the soil microbial community and soil processes (Steinauer et al., 2020), and that three months after the start of the feedback phase we found that the effect of the condi-tioning vegetation on the bacterial community had already disappeared, while the fungal legacy was longer-lasting (Heinen et al., 2020b). In the current study we show that while the saprotrophic fungal community is influenced by the soil legacy in the first months after the responding plant community was sown, there is no detectible legacy of the previous plant community on the soil saprotrophic community 15 months later. This is in line with findings that show that after introduction of new plants, the soil fungal community slowly (within months) changes depending on the identity of the current plants (Dini-Andreote et al., 2015; Hannula et al., 2019). In our present study, each plot, with soil legacies from different conditioning plant communities, was sown with a standardized plant community in the feedback phase. This standard-ized response plant community may explain why after the conditioning plant community was removed, the soil legacy was diluted over time as the new plants re-conditioned the soil. To what extent the soil microbial
R. Jongen et al.
Soil Biology and Biochemistry 163 (2021) 108450
8
community is influenced by both the past and current vegetation, and how this changes over time, requires further studies with a more frequent sampling regime.
Although we did not detect an effect of the previous plant commu-nity on the total saprotrophic fungal community after 15 months, there was a legacy effect that generated relationships between certain sapro-trophic fungal genera and decomposition rates in the soils. For example, the growth speed of the conditioning plant community had a lasting effect on both Leotiaceae, which were enriched as a legacy of fast- growing communities, and Clavicipitaceae, a group known for many plant endophytic and animal parasitic fungi, which were enriched in the legacy of slow growing communities. Plants can benefit from an asso-ciation with Clavicipitaceae by gaining protection against herbivores and pathogens (Clay, 1990). These fungal endophytes have been also shown to slow down decomposition of not only the host plants’ litter, but also the litter derived from a different, endophyte-free plant species, possibly through an indirect change of the soil micro-environment (Omacini et al., 2004). Our results showed that the stabilization rate in 2018, 15 months after the start of the feedback phase, was higher in slow-growing communities. High values of the stabilization factor indicate an inhibition of decomposition (Keuskamp et al., 2013), which could thus be related to the enrichment of Clavicipitaceae in the slow-growing communities. In addition, there was a legacy effect of plant community composition (forbs vs grasses) on several fungal groups probably due to priority effects and fungi specialised to decom-pose certain litter types (Veen et al., 2019).
The stabilization rate is calculated from the green tea mass loss, while the decomposition rate is calculated from the rooibos tea mass loss (Keuskamp et al., 2013). Interestingly, no fungal group was related to the decomposition rate (K), while the stabilization factor (S) was affected by several fungal groups. Specifically, ascomycote saprotrophs such as Pleosporales and Orbiliomycetes, basidiomycete yeasts (Filo-basidiales and Tremellales) and Mucorales were positively correlated with stabilization of the litter. These decomposers are fast-growing and very common in grassland ecosystems and usually both use easily available carbon from root exudates but can also break down cellulose (Hannula et al., 2020). The lack of any correlation between fungal trait groups and the decomposition rate might be explained by the tea type characteristics. Rooibos tea consists of recalcitrant, woody material, while green tea more closely resembles the litter characteristics of the local plant community. It is therefore possible that the fungal commu-nity in the soil was more specialized (i.e., produces the necessary en-zymes) to decompose green tea compared to rooibos tea. Since the decomposition rate is calculated from the rooibos tea mass loss, this might explain the lack of any relation between the decomposition rate, nutrient cycling and aboveground biomass. In the case of the rooibos litter (i.e., the more recalcitrant litter), using teabags instead of locally collected litter may have uncoupled the microbial community and litter decomposition. It has indeed recently been found that each tea type harbours a unique microbial community (Pioli et al., 2020), confirming a high specialization of saprotrophic fungi in substrate use (Prescott and Grayston, 2013; van der Wal et al., 2013).
In contrast with our expectations and previous studies (Díaz et al., 2016; Reich, 2014), we found no major differences between plots conditioned by fast-vs slow-growing communities and forb-vs grass dominated plots in terms of nutrient cycling or plant productivity. This could be partially explained by results from the conditioning phase, where we also did not find significant differences in nutrient cycling and plant productivity between fast- and slow-growing plant communities (Steinauer et al., 2020). The fast-growing plant communities likely did not leave a legacy that promoted rapid nutrient cycling in the condi-tioning phase. It is possible that the difference in growth speed between the fast- and slow-growing plants was not big enough, and hence we did not find a legacy of plant community growth speed. Interestingly, at the end of the conditioning phase we did find a lower aboveground pro-ductivity and a lower NO2–NO3 concentration in plots conditioned by
forbs, but this did not have any effect on the biomass of the plants in the feedback phase. We speculate that this might be explained by the physical disturbance as a result of the removal of the conditioning community. This may have caused dead soil organisms to breakdown, thereby releasing more plant-available nutrients into the soil (Choi et al., 2017), which negated any legacy effects.
Temporal soil legacies affected most of the parameters measured. In general, nutrient availability, soil organic matter and plant biomass were highest in control plots compared to the 1-year and 2-year legacy plots. This could be explained by the disturbance of the top soil removal. The factor that seems to be consistently affecting all parameters measured in our system, is the time since disturbance of setting up the feedback phase. In 2018, two years after the start of the feedback phase, we found more saprotrophs across treatments, plants produced more aboveground biomass and soils contained higher NO3–NO2 and PO4 concentrations than in 2017. The removal of the top soil inevitably leads to disturbance and may confound abiotic and biotic interactions (De Long et al., 2019). Soil disturbances can have large effects on soil communities and it may take a long time for the soil community to recover (Geisen et al., 2019; Resch et al., 2019). In addition, we do not rule out that potential legacy effects may have been reduced or elimi-nated by the partial removal of nutrients and microorganisms. However, in our study soils were 1) conditioned for a much longer period of time than similar studies that did find strong effects on the responding plant community (Kardol et al., 2013; Kulmatiski and Kardol, 2008; Lekberg et al., 2018) and 2) sods were shaken vigorously to ensure that as much soil as possible fell back into the plots. Ultimately, the cons of the disturbance caused by the top soil removal are outweighed by the pros of this design, which allows us to study plant community effects under more realistic, natural conditions compared to more artificial methods, such as the chemical removal of plants or growing plants in the green-house (De Long et al., 2019). We did indeed find an effect of the con-ditioning plant community on the responding community and on plant pathogenic fungi (see (Heinen et al., 2020b), and it is possible that the effects on saprotrophic fungi and soil functions fade away faster and are more difficult to detect under field conditions.
In summary, the results of this study show that the period of soil conditioning time and the time since the disturbance due to the setting up of the feedback phase affects most of the soil functions consistently. Plants with different functional traits (fast- vs slow-growing, grasses vs forbs) create distinct soil communities (Heinen et al., 2020b; Steinauer et al., 2020), however the legacy effects on decomposition and the soil fungal community disappear soon after a new plant community estab-lishes. In addition, the disturbance due to initiating the feedback phase does not negatively affect the legacy effect on the responding plant community (Heinen et al., 2020b), but here we found no legacy effect of the number of conditioning years on decomposition and the decomposer community. Hence, the method we selected to remove the previous plant community is possibly too invasive to study the legacy effects of conditioning time on these soil processes. Growing the conditioning plant community for a longer period of time generally results in stronger effects as more plant residues accumulate in the soil, shaping more distinct soil microbial communities (Eisenhauer et al., 2012).
Our results highlight that although soil legacy effects on soil nutrient cycling, decomposition and saprotroph communities exist, these effects are rather short-lived, and that it is time after disturbance, not soil legacy effects that impact on soil functions. This means that even though legacy effects of current plant communities on future plant communities can be observed relatively quickly (Heinen et al., 2020b), this does not mean that soil functionality, an important component of a healthy ecosystem, is affected in parallel. This has important implications for nature management practices, and pulls focus on the need for long-term, routinely collected assessments of soil properties and processes. Thor-ough knowledge of soil functionality is key to correctly evaluate the success of restoration efforts and critical to restore the functioning of degraded terrestrial ecosystems.
R. Jongen et al.
Soil Biology and Biochemistry 163 (2021) 108450
9
Declaration of competing interest
The authors declare that they have no known competing financial interests or personal relationships that could have appeared to influence the work reported in this paper.
Acknowledgements
We would like to thank Anna Kielak, Judith Smit, Feng Zhu, Martijn van der Sluijs, Simon Vandenbrande, Roeland Cortois, Tess van de Voorde, Eke Hengeveld, Thibault Costaz, Minggang Wang and various undergraduate students for assistance in the field and/or lab. This study was funded by a VICI grant from The Netherlands Organisation for Scientific Research to Martijn Bezemer (NWO VICI grant 865.14.006). This is NIOO-KNAW publication number 7294.
Appendix A. Supplementary data
Supplementary data to this article can be found online at https://doi. org/10.1016/j.soilbio.2021.108450.
References
Bardgett, R.D., 2017. Plant trait-based approaches for interrogating belowground function. Biology and Environment: Proceedings of the Royal Irish Academy 117B, 1–13. https://doi.org/10.3318/bioe.2017.03.
Bardgett, R.D., van der Putten, W.H., 2014. Belowground biodiversity and ecosystem functioning. Nature 515, 505–511. https://doi.org/10.1038/nature13855.
Bates, D., Machler, M., Bolker, B., Walker, S., 2015. Fitting linear mixed-effects models using lme4. Journal of Statistical Software 67, 1–48. https://doi.org/10.18637/jss. v067.i01.
Bezemer, T.M., Lawson, C.S., Hedlund, K., Edwards, A.R., Brook, A.J., Igual, J.M., Mortimer, S.R., van der Putten, W.H., 2006. Plant species and functional group effects on abiotic and microbial soil properties and plant–soil feedback responses in two grasslands. Journal of Ecology 94, 893–904. https://doi.org/10.1111/j.1365- 2745.2006.01158.x.
Bonanomi, G., Sicurezza, M.G., Caporaso, S., Esposito, A., Mazzoleni, S., 2006. Phytotoxicity dynamics of decaying plant materials. New Phytologist 169, 571–578. https://doi.org/10.1111/j.1469-8137.2005.01611.x.
Broeckling, C.D., Broz, A.K., Bergelson, J., Manter, D.K., Vivanco, J.M., 2008. Root exudates regulate soil fungal community composition and diversity. Applied and Environmental Microbiology 74, 738–744. https://doi.org/10.1128/AEM.02188-07.
Chen, H., Mommer, L., Ruijven, J. van, Kroon, H. de, Fischer, C., Gessler, A., Hildebrandt, A., Scherer-Lorenzen, M., Wirth, C., Weigelt, A., 2017. Plant species richness negatively affects root decomposition in grasslands. Journal of Ecology 105, 209–218. https://doi.org/10.1111/1365-2745.12650.
Choi, S., Song, H., Tripathi, B.M., Kerfahi, D., Kim, H., Adams, J.M., 2017. Effect of experimental soil disturbance and recovery on structure and function of soil community: a metagenomic and metagenetic approach. Scientific Reports 7, 2260. https://doi.org/10.1038/s41598-017-02262-6.
Clay, K., 1990. Fungal endophytes of grasses. Annual Review of Ecology and Systematics 21, 275–297.
Cornelissen, J.H.C., 1996. An experimental comparison of leaf decomposition rates in a wide range of temperate plant species and types. Journal of Ecology 84, 573–582. https://doi.org/10.2307/2261479.
Cornwell, W.K., Cornelissen, J.H.C., Amatangelo, K., Dorrepaal, E., Eviner, V.T., Godoy, O., Hobbie, S.E., Hoorens, B., Kurokawa, H., Perez-Harguindeguy, N., Quested, H.M., Santiago, L.S., Wardle, D.A., Wright, I.J., Aerts, R., Allison, S.D., Bodegom, P.V., Brovkin, V., Chatain, A., Callaghan, T.V., Díaz, S., Garnier, E., Gurvich, D.E., Kazakou, E., Klein, J.A., Read, J., Reich, P.B., Soudzilovskaia, N.A., Vaieretti, M.V., Westoby, M., 2008. Plant species traits are the predominant control on litter decomposition rates within biomes worldwide. Ecology Letters 11, 1065–1071. https://doi.org/10.1111/j.1461-0248.2008.01219.x.
Cortois, R., Schroder-Georgi, T., Weigelt, A., van der Putten, W.H., De Deyn, G.B., 2016. Plant–soil feedbacks: role of plant functional group and plant traits. Journal of Ecology 104, 1608–1617. https://doi.org/10.1111/1365-2745.12643.
De Deyn, G.B., van der Putten, W.H., 2005. Linking aboveground and belowground diversity. Trends in Ecology & Evolution 20, 625–633. https://doi.org/10.1016/j. tree.2005.08.009.
De Long, J.R., Heinen, R., Steinauer, K., Hannula, S.E., Huberty, M., Jongen, R., Vandenbrande, S., Wang, M., Zhu, F., Bezemer, T.M., 2019. Taking plant–soil feedbacks to the field in a temperate grassland. Basic and Applied Ecology 40, 30–42. https://doi.org/10.1016/j.baae.2019.08.001.
Díaz, S., Kattge, J., Cornelissen, J.H.C., Wright, I.J., Lavorel, S., Dray, S., Reu, B., Kleyer, M., Wirth, C., Prentice, I.C., Garnier, E., Bonisch, G., Westoby, M., Poorter, H., Reich, P.B., Moles, A.T., Dickie, J., Gillison, A.N., Zanne, A.E., Chave, J., Wright, S.J., Sheremet’ev, S.N., Jactel, H., Baraloto, C., Cerabolini, B., Pierce, S., Shipley, B., Kirkup, D., Casanoves, F., Joswig, J.S., Günther, A., Falczuk, V.,
Rüger, N., Mahecha, M.D., Gorne, L.D., 2016. The global spectrum of plant form and function. Nature 529, 167–171. https://doi.org/10.1038/nature16489.
Dini-Andreote, F., Stegen, J.C., Elsas, J.D. van, Salles, J.F., 2015. Disentangling mechanisms that mediate the balance between stochastic and deterministic processes in microbial succession. Proceedings of the National Academy of Sciences 112, E1326–E1332. https://doi.org/10.1073/pnas.1414261112.
Ehrenfeld, J.G., Ravit, B., Elgersma, K., 2005. Feedback in the plant-soil system. Annual Review of Environment and Resources 30, 75–115. https://doi.org/10.1146/ annurev.energy.30.050504.144212.
Eisenhauer, N., Reich, P.B., Scheu, S., 2012. Increasing plant diversity effects on productivity with time due to delayed soil biota effects on plants. Basic and Applied Ecology 13, 571–578. https://doi.org/10.1016/j.baae.2012.09.002.
Francioli, D., van Rijssel, S.Q., van Ruijven, J., Termorshuizen, A.J., Cotton, T.E.A., Dumbrell, A.J., Raaijmakers, J.M., Weigelt, A., Mommer, L., 2020. Plant functional group drives the community structure of saprophytic fungi in a grassland biodiversity experiment. Plant and Soil. https://doi.org/10.1007/s11104-020- 04454-y.
Freschet, G.T., Cornwell, W.K., Wardle, D.A., Elumeeva, T.G., Liu, W., Jackson, B.G., Onipchenko, V.G., Soudzilovskaia, N.A., Tao, J., Cornelissen, J.H.C., 2013. Linking litter decomposition of above- and below-ground organs to plant–soil feedbacks worldwide. Journal of Ecology 101, 943–952. https://doi.org/10.1111/1365- 2745.12092.
Funk, J.L., Larson, J.E., Ames, G.M., Butterfield, B.J., Cavender-Bares, J., Firn, J., Laughlin, D.C., Sutton-Grier, A.E., Williams, L., Wright, J., 2017. Revisiting the Holy Grail: using plant functional traits to understand ecological processes. Biological Reviews 92, 1156–1173. https://doi.org/10.1111/brv.12275.
Geisen, S., Briones, M.J.I., Gan, H., Behan-Pelletier, V.M., Friman, V.-P., de Groot, G.A., Hannula, S.E., Lindo, Z., Philippot, L., Tiunov, A.V., Wall, D.H., 2019. A methodological framework to embrace soil biodiversity. Soil Biology and Biochemistry 136, 107536. https://doi.org/10.1016/j.soilbio.2019.107536.
Gundale, M.J., From, F., Bach, L.H., Nordin, A., 2014. Anthropogenic nitrogen deposition in boreal forests has a minor impact on the global carbon cycle. Global Change Biology 20, 276–286. https://doi.org/10.1111/gcb.12422.
Gweon, H.S., Oliver, A., Taylor, J., Booth, T., Gibbs, M., Read, D.S., Griffiths, R.I., Schonrogge, K., 2015. PIPITS: an automated pipeline for analyses of fungal internal transcribed spacer sequences from the Illumina sequencing platform. Methods Ecol. Evol. 6, 973–980. https://doi.org/10.1111/2041-210X.12399.
Hannula, S.E., Kielak, A.M., Steinauer, K., Huberty, M., Jongen, R., De Long, J.R., Heinen, R., Bezemer, T.M., 2019. Time after time: temporal variation in the effects of grass and forb species on soil bacterial and fungal communities. mBio 10. https:// doi.org/10.1128/mBio.02635-19 e02635-19,/mbio/10/6/mBio.02635-19.atom.
Hannula, S.E., Morrien, E., de Hollander, M., van der Putten, W.H., van Veen, J.A., de Boer, W., 2017. Shifts in rhizosphere fungal community during secondary succession following abandonment from agriculture. The ISME Journal 11, 2294–2304. https:// doi.org/10.1038/ismej.2017.90.
Hannula, S.E., Morrien, E., van der Putten, W.H., de Boer, W., 2020. Rhizosphere fungi actively assimilating plant-derived carbon in a grassland soil. Fungal Ecol 48, 100988. https://doi.org/10.1016/j.funeco.2020.100988.
Heinen, R., Biere, A., Bezemer, T.M., 2020a. Plant traits shape soil legacy effects on individual plant–insect interactions. Oikos 129, 261–273. https://doi.org/10.1111/ oik.06812.
Heinen, R., Hannula, S.E., Long, J.R.D., Huberty, M., Jongen, R., Kielak, A., Steinauer, K., Zhu, F., Bezemer, T.M., 2020b. Plant community composition steers grassland vegetation via soil legacy effects. Ecology Letters 23, 973–982. https://doi.org/ 10.1111/ele.13497.
Heiri, O., Lotter, A.F., Lemcke, G., 2001. Loss on ignition as a method for estimating organic and carbonate content in sediments: reproducibility and comparability of results. Journal of Paleolimnology 25, 101–110. https://doi.org/10.1023/A: 1008119611481.
Jeffery, S., Memelink, I., Hodgson, E., Jones, S., van de Voorde, T.F.J., Martijn Bezemer, T., Mommer, L., van Groenigen, J.W., 2017. Initial biochar effects on plant productivity derive from N fertilization. Plant and Soil 415, 435–448. https://doi. org/10.1007/s11104-016-3171-z.
Kardol, P., De Deyn, G.B., Laliberte, E., Mariotte, P., Hawkes, C.V., 2013. Biotic plant–soil feedbacks across temporal scales. Journal of Ecology 101, 309–315. https://doi.org/10.1111/1365-2745.12046.
Ke, P.-J., Miki, T., Ding, T.-S., 2015. The soil microbial community predicts the importance of plant traits in plant–soil feedback. New Phytologist 206, 329–341. https://doi.org/10.1111/nph.13215.
Keuskamp, J.A., Dingemans, B.J.J., Lehtinen, T., Sarneel, J.M., Hefting, M.M., 2013. Tea Bag Index: a novel approach to collect uniform decomposition data across ecosystems. Methods Ecol. Evol. 4, 1070–1075. https://doi.org/10.1111/2041- 210X.12097.
Kos, M., Tuijl, M.A.B., de Roo, J., Mulder, P.P.J., Bezemer, T.M., 2015. Species-specific plant–soil feedback effects on above-ground plant–insect interactions. Journal of Ecology 103, 904–914. https://doi.org/10.1111/1365-2745.12402.
Kostenko, O., van de Voorde, T.F.J., Mulder, P.P.J., van der Putten, W.H., Martijn Bezemer, T., 2012. Legacy effects of aboveground-belowground interactions. Ecology Letters 15, 813–821. https://doi.org/10.1111/j.1461-0248.2012.01801.x.
Kulmatiski, A., Kardol, P., 2008. Getting plant—soil feedbacks out of the greenhouse: experimental and conceptual approaches. In: Lüttge, U., Beyschlag, W., Murata, J. (Eds.), Progress in Botany, Progress in Botany. Springer, Berlin, Heidelberg, pp. 449–472. https://doi.org/10.1007/978-3-540-72954-9_18.
Lekberg, Y., Bever, J.D., Bunn, R.A., Callaway, R.M., Hart, M.M., Kivlin, S.N., Klironomos, J., Larkin, B.G., Maron, J.L., Reinhart, K.O., Remke, M., van der Putten, W.H., 2018. Relative importance of competition and plant–soil feedback,
R. Jongen et al.
Soil Biology and Biochemistry 163 (2021) 108450
10
their synergy, context dependency and implications for coexistence. Ecology Letters 21, 1268–1281. https://doi.org/10.1111/ele.13093.
Lenth, R.V., 2016. Least-squares means: the R package lsmeans. Journal of Statistical Software 69, 1–33. https://doi.org/10.18637/jss.v069.i01.
Lunghini, D., Granito, V.M., Lonardo, D.P.D., Maggi, O., Persiani, A.M., 2013. Fungal diversity of saprotrophic litter fungi in a Mediterranean maquis environment. Mycologia 105, 1499–1515. https://doi.org/10.3852/13-103.
McGuire, K.L., Treseder, K.K., 2010. Microbial communities and their relevance for ecosystem models: decomposition as a case study. Soil Biology and Biochemistry 42, 529–535. https://doi.org/10.1016/j.soilbio.2009.11.016.
McLaren, J.R., Turkington, R., 2010. Ecosystem properties determined by plant functional group identity. Journal of Ecology 98, 459–469. https://doi.org/ 10.1111/j.1365-2745.2009.01630.x.
McMurdie, P.J., Holmes, S., 2013. Phyloseq: an R package for reproducible interactive analysis and graphics of microbiome census data. PLoS One 8, e61217. https://doi. org/10.1371/journal.pone.0061217.
McNaughton, S.J., 1983. Compensatory plant growth as a response to herbivory. Oikos 40, 329–336. https://doi.org/10.2307/3544305.
Nguyen, N.H., Song, Z., Bates, S.T., Branco, S., Tedersoo, L., Menke, J., Schilling, J.S., Kennedy, P.G., 2016. FUNGuild: an open annotation tool for parsing fungal community datasets by ecological guild. Fungal Ecol 20, 241–248. https://doi.org/ 10.1016/j.funeco.2015.06.006.
Nilsson, R.H., Larsson, K.-H., Taylor, A.F.S., Bengtsson-Palme, J., Jeppesen, T.S., Schigel, D., Kennedy, P., Picard, K., Glockner, F.O., Tedersoo, L., Saar, I., Koljalg, U., Abarenkov, K., 2019. The UNITE database for molecular identification of fungi: handling dark taxa and parallel taxonomic classifications. Nucleic Acids Research 47, D259–D264. https://doi.org/10.1093/nar/gky1022.
Omacini, M., Chaneton, E.J., Ghersa, C.M., Otero, P., 2004. Do foliar endophytes affect grass litter decomposition? A microcosm approach using Lolium multiflorum. Oikos 104, 581–590.
Philippot, L., Raaijmakers, J.M., Lemanceau, P., van der Putten, W.H., 2013. Going back to the roots: the microbial ecology of the rhizosphere. Nature Reviews Microbiology 11, 789–799. https://doi.org/10.1038/nrmicro3109.
Pinheiro, J., Bates, D., 2006. Mixed-Effects Models in S and S-PLUS. Springer Science & Business Media.
Pioli, S., Sarneel, J., Thomas, H.J.D., Domene, X., Andres, P., Hefting, M., Reitz, T., Laudon, H., Sanden, T., Piscova, V., Aurela, M., Brusetti, L., 2020. Linking plant litter microbial diversity to microhabitat conditions, environmental gradients and litter mass loss: insights from a European study using standard litter bags. Soil Biology and Biochemistry 144, 107778. https://doi.org/10.1016/j.soilbio.2020.107778.
Prescott, C.E., Grayston, S.J., 2013. Tree species influence on microbial communities in litter and soil: current knowledge and research needs. For. Ecol. Manag., Influence of tree species on forest soils: New evidence from field studies 309, 19–27. https://doi. org/10.1016/j.foreco.2013.02.034.
Quested, H., Eriksson, O., Fortunel, C., Garnier, E., 2007. Plant traits relate to whole- community litter quality and decomposition following land use change. Functional Ecology 21, 1016–1026.
Reich, P.B., 2014. The world-wide ‘fast–slow’ plant economics spectrum: a traits manifesto. Journal of Ecology 102, 275–301. https://doi.org/10.1111/1365- 2745.12211.
Resch, M.C., Schütz, M., Graf, U., Wagenaar, R., Putten van der, W.H., Risch, A.C., 2019. Does topsoil removal in grassland restoration benefit both soil nematode and plant communities? Journal of Applied Ecology 56, 1782–1793. https://doi.org/10.1111/ 1365-2664.13400.
Steinauer, K., Heinen, R., Hannula, S.E., Long, J.R.D., Huberty, M., Jongen, R., Wang, M., Bezemer, T.M., 2020. Above-belowground linkages of functionally dissimilar plant communities and soil properties in a grassland experiment. Ecosphere 11, e03246. https://doi.org/10.1002/ecs2.3246.
Tedersoo, L., Bahram, M., Polme, S., Koljalg, U., Yorou, N.S., Wijesundera, R., Ruiz, L.V., Vasco-Palacios, A.M., Thu, P.Q., Suija, A., Smith, M.E., Sharp, C., Saluveer, E., Saitta, A., Rosas, M., Riit, T., Ratkowsky, D., Pritsch, K., Poldmaa, K., Piepenbring, M., Phosri, C., Peterson, M., Parts, K., Partel, K., Otsing, E., Nouhra, E., Njouonkou, A.L., Nilsson, R.H., Morgado, L.N., Mayor, J., May, T.W., Majuakim, L., Lodge, D.J., Lee, S.S., Larsson, K.-H., Kohout, P., Hosaka, K., Hiiesalu, I., Henkel, T. W., Harend, H., Guo, L., Greslebin, A., Grelet, G., Geml, J., Gates, G., Dunstan, W., Dunk, C., Drenkhan, R., Dearnaley, J., Kesel, A.D., Dang, T., Chen, X., Buegger, F., Brearley, F.Q., Bonito, G., Anslan, S., Abell, S., Abarenkov, K., 2014. Global diversity and geography of soil fungi. Science 346. https://doi.org/10.1126/science.1256688.
Tilman, D., Knops, J., Wedin, D., Reich, P., Ritchie, M., Siemann, E., 1997. The influence of functional diversity and composition on ecosystem processes. Science 277, 1300–1302. https://doi.org/10.1126/science.277.5330.1300.
van der Putten, W.H., Bradford, M.A., Pernilla Brinkman, E., Voorde, T.F.J., Veen, G.F., 2016. Where, when and how plant–soil feedback matters in a changing world. Functional Ecology 30, 1109–1121. https://doi.org/10.1111/1365-2435.12657.
van der Wal, A., Geydan, T.D., Kuyper, T.W., de Boer, W., 2013. A thready affair: linking fungal diversity and community dynamics to terrestrial decomposition processes. FEMS Microbiology Reviews 37, 477–494. https://doi.org/10.1111/1574- 6976.12001.
Veen, G.F., Fry, E.L., ten Hooven, F.C., Kardol, P., Morrien, E., De Long, J.R., 2019. The role of plant litter in driving plant-soil feedbacks. Front. Environ. Sci. 7 https://doi. org/10.3389/fenvs.2019.00168.
Veen, G.F., Keiser, A.D., van der Putten, W.H., Wardle, D.A., 2018. Variation in home- field advantage and ability in leaf litter decomposition across successional gradients. Functional Ecology 32, 1563–1574. https://doi.org/10.1111/1365-2435.13107.
Wang, M., Ruan, W., Kostenko, O., Carvalho, S., Hannula, S.E., Mulder, P.P.J., Bu, F., van der Putten, W.H., Bezemer, T.M., 2019. Removal of soil biota alters soil feedback effects on plant growth and defense chemistry. New Phytologist 221, 1478–1491. https://doi.org/10.1111/nph.15485.
Wright, I.J., Reich, P.B., Westoby, M., Ackerly, D.D., Baruch, Z., Bongers, F., Cavender- Bares, J., Chapin, T., Cornelissen, J.H.C., Diemer, M., Flexas, J., Garnier, E., Groom, P.K., Gulias, J., Hikosaka, K., Lamont, B.B., Lee, T., Lee, W., Lusk, C., Midgley, J.J., Navas, M.-L., Niinemets, Ü., Oleksyn, J., Osada, N., Poorter, H., Poot, P., Prior, L., Pyankov, V.I., Roumet, C., Thomas, S.C., Tjoelker, M.G., Veneklaas, E.J., Villar, R., 2004. The worldwide leaf economics spectrum. Nature 428, 821–827. https://doi.org/10.1038/nature02403.
Xiong, S., Nilsson, C., 1999. The effects of plant litter on vegetation: a meta-analysis. Journal of Ecology 87, 984–994.
Zhang, N., van der Putten, W.H., Veen, G.F., 2016. Effects of root decomposition on plant–soil feedback of early- and mid-successional plant species. New Phytologist 212, 220–231. https://doi.org/10.1111/nph.14007.
R. Jongen et al.
![[Book Chapter] Biochemistry and Cell Biology of Calcium Channels and Signaling Involved in Plant Growth and Environmental Responses](https://img.dokumen.tips/doc/110x75/6350c6308624f8c9710eacad/book-chapter-biochemistry-and-cell-biology-of-calcium-channels-and-signaling-involved.jpg)