Embed Size (px)
Citation preview
PNNL-20166 EMSP-RPT-002
Prepared for the U.S. Department of Energy under Contract DE-AC05-76RL01830
Alternative Sodium Recovery Technology—High Hydroxide Leaching: FY10 Status Report LA Mahoney BM Rapko D Neiner RL Russell RA Peterson PP Schonewill February 2011
DISCLAIMER This report was prepared as an account of work sponsored by an agency of the United States Government. Neither the United States Government nor any agency thereof, nor Battelle Memorial Institute, nor any of their employees, makes any warranty, express or implied, or assumes any legal liability or responsibility for the accuracy, completeness, or usefulness of any information, apparatus, product, or process disclosed, or represents that its use would not infringe privately owned rights. Reference herein to any specific commercial product, process, or service by trade name, trademark, manufacturer, or otherwise does not necessarily constitute or imply its endorsement, recommendation, or favoring by the United States Government or any agency thereof, or Battelle Memorial Institute. The views and opinions of authors expressed herein do not necessarily state or reflect those of the United States Government or any agency thereof. PACIFIC NORTHWEST NATIONAL LABORATORY operated by BATTELLE for the UNITED STATES DEPARTMENT OF ENERGY under Contract DE-ACO5-76RL01830
Printed in the United States of America
Available to DOE and DOE contractors from the Office of Scientific and Technical Information,
P.O. Box 62, Oak Ridge, TN 37831-0062; ph: (865) 576-8401 fax: (865) 576 5728
email: [email protected]
Available to the public from the National Technical Information Service, U.S. Department of Commerce, 5285 Port Royal Rd., Springfield, VA 22161
ph: (800) 553-6847 fax: (703) 605-6900
email: [email protected] online ordering: http://www.ntis.gov/ordering.htm
PNNL-20166 EMSP-RPT-002
Alternative Sodium Recovery Technology—High Hydroxide Leaching FY10 Status Report LA Mahoney BM Rapko D Neiner RL Russell RA Peterson PP Schonewill February 2011 Prepared for the U.S. Department of Energy under Contract DE-AC05-76RL01830 Pacific Northwest National Laboratory Richland, Washington 99352

iii
Summary
Boehmite leaching tests were carried out at NaOH concentrations of 10 M and 12 M, temperatures of 85°C and 60°C, and a range of initial aluminate concentrations. These data, and data obtained during earlier 100°C tests using 1 M and 5 M NaOH, were used to establish the dependence of the boehmite dissolution rate on hydroxide concentration, temperature, and initial aluminate concentration. A semi-empirical kinetic model for boehmite leaching was fitted to the data and used to calculate the NaOH additions required for leaching at hydroxide concentrations between 5 M and 12 M. The optimal NaOH concentration for boehmite leaching at 85°C was estimated, based on minimizing the amount of Na that had to be added in NaOH to produce a given boehmite conversion.
It was found that the sodium is used most efficiently (i.e., the mass of sodium/mass of aluminum in the waste is minimized) at NaOH concentrations of 7 to 9 M, depending on the initial distribution of the aluminum-containing compounds. The simulations indicated that the amount of sodium could potentially be reduced to one-third of that needed for the 5-M case. Furthermore, significant reductions in leaching time (per batch) were also demonstrated to be attainable at higher NaOH concentrations, typically greater than 10 M.
The semi-empirical kinetic model that minimized the prediction error was found to be
0,*,
,471.1,
481.0
0,*,
0,,3/21
373
1/115
11100618.01LAl
LAlLOH
LAl
LAlb
TR
molkJ
b C
CC
C
Cfef
dt
d (S.1)
LbsbLAlLAl VnfCC 0,0,,, (S.2)
LbsbLOHLOH VnfCC 0,0,,, (S.3)
where fb = fraction of boehmite that has been dissolved by time t (hr) R = ideal gas constant (J/mol K) T = absolute temperature (K) COH,L,0 = concentration of free hydroxide (M) at time = 0 hr COH,L = concentration of free hydroxide (M) at time t (hr) CAl,L,0 = concentration of dissolved Al (M) at time = 0 hr CAl*,L,0 = concentration of dissolved Al (M) at saturation for boehmite (a function of
temperature and total hydroxide concentration; calculated from formulas in Panias et al. (2001)
CAl,L = concentration of dissolved Al (M) at time t (hr) Lbs Vn 0,
= moles of undissolved boehmite at time = 0 hr divided by liquid volume (L).
The fitted values of the pre-exponential constant, 0.00618/hr/(M OH)1.471, the activation energy, 115 kJ/mol, and the exponent of the free hydroxide concentration, 1.471, were sharply defined, statistically speaking. Relatively small percentage changes in these parameters, ± 17% for the rate constant, ± 11% for the activation energy, and ± 5% for the hydroxide exponent, caused the sum of squares of the model prediction errors to double. The exponents of the boehmite conversion and initial
iv
aluminate saturation terms were not defined nearly as well: the error doubled only for percentage changes of 40% to 100% in these parameters. There was some indication that the boehmite exponent was higher than 2/3, corresponding to a boehmite particle surface whose fractal dimension was between 2 and 3, but the model fit has too little sensitivity to this exponent to make a strong statement about it.
In general, the model gave good predictions of reaction rate and conversion over the range of 85°C to 100°C, 5 M NaOH to 12 M NaOH, and at a 0%, 40, or 70% initial aluminate saturation. At lower temperatures or hydroxide concentrations and at higher initial aluminate saturation, the model underpredicted conversion more often than it overpredicted.
v
Acronyms
AES atomic emission spectroscopy
DIW deionized water
EM Department of Energy Office of Environmental Management
FWHM full width half maximum
HDI “How do I…?” (PNNL’s standards-based management system)
HHL high hydroxide leaching
ICDD International Centre for Diffraction Data
ICP inductively coupled plasma
MDI multiple document interface
MSE Mixed Solvent Electrolyte (database)
MTB Matrix Testing Boehmite
NQA Nuclear Quality Assurance
PDF powder diffraction file (when the acronym is used in the context of XRD)
PMP polymethylpentene
PNNL Pacific Northwest National Laboratory
PQAP Project Quality Assurance Plan
QA quality assurance
SSR sum of the squares of the residual error
WTP Hanford Tank Waste Treatment and Immobilization Plant
UDS undissolved solids
XRD X-ray diffraction


vii
Acknowledgments
The authors would like to thank Andrew Felmy (PNNL) for providing Figure 1.1 and for his review of the final document, Gregg Lumetta (PNNL) for his technical review of the document, and Wayne Cosby (PNNL) for his technical editing of the document.

ix
Contents
Summary ...................................................................................................................................................... iii
Acronyms ...................................................................................................................................................... v
Acknowledgments ....................................................................................................................................... vii
1.0 Introduction ....................................................................................................................................... 1.1
1.1 Background .............................................................................................................................. 1.2
2.0 Quality Assurance ............................................................................................................................. 2.1
3.0 Test Description ................................................................................................................................ 3.1
4.0 Data Analysis .................................................................................................................................... 4.1
4.1 XRD Analysis .......................................................................................................................... 4.1
4.1.1 Sample Preparation for XRD and Diffraction Experimental Setup ............................. 4.1
4.1.2 X-Ray Powder Diffraction Data Analysis ................................................................... 4.1
4.1.3 XRD Result Summary ................................................................................................. 4.1
4.2 Model Development ................................................................................................................ 4.2
4.3 Technical Issues ....................................................................................................................... 4.4
4.3.1 Consistency of Earlier Hanford Data ........................................................................... 4.4
4.3.2 Range of Correlation for Aluminum Solubility ........................................................... 4.6
4.4 Kinetic Model Fitting .............................................................................................................. 4.9
4.4.1 Data Preparation ........................................................................................................... 4.9
4.4.2 Boehmite Leach Factors ............................................................................................ 4.10
4.4.3 Kinetic Model ............................................................................................................ 4.11
4.4.4 Discussion of Results ................................................................................................. 4.34
4.4.5 Previous PNNL Work ................................................................................................ 4.36
5.0 Optimum Sodium Use in Caustic Leaching of Aluminum ............................................................... 5.1
6.0 Conclusions ....................................................................................................................................... 6.1
7.0 References ......................................................................................................................................... 7.1
Appendix A: HHL Test Conditions and Leach Factors ............................................................................ A.1
Appendix B: X-Ray Raw Data and the Corresponding PDF Cards for Analyzed Samples .....................B.1
Appendix C: XRD Full Refinement of the Data ........................................................................................C.1
Appendix D: FWHM Profile Fits.............................................................................................................. D.1
x
Figures
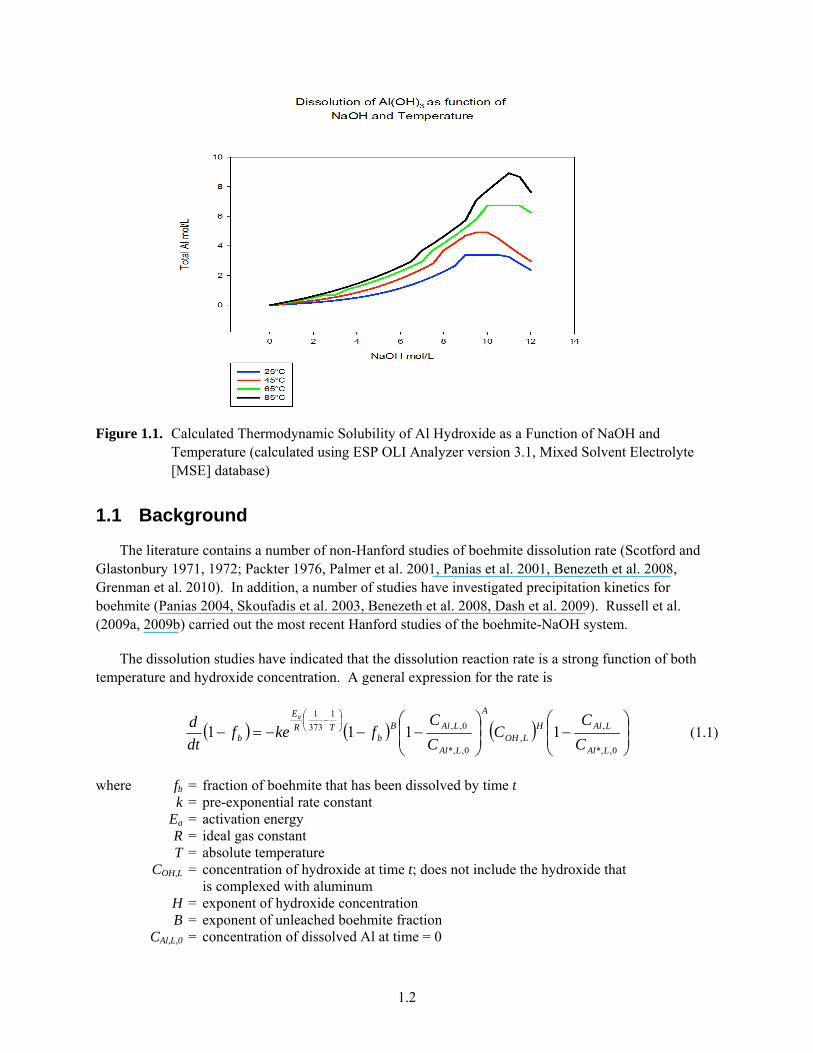
1.1. Calculated Thermodynamic Solubility of Al Hydroxide as a Function of NaOH and Temperature ..................................................................................................................................... 1.2
4.1. Comparison of all the XRD Data for HHL-1, 15–20, 25, and 29 Samples ..................................... 4.2
4.2. Solubility at 95°C of Boehmite and Sodium Aluminates ................................................................ 4.7
4.3. Expected and Measured Na/Mo Concentration Ratios in the High-Caustic Leach Tests ............... 4.9
4.4. Effects of Parametric Variation on Error of B = 2/3 Best-Fit Model ............................................. 4.16
4.5. Predicted and Measured Al Concentrations for the Nominal 5-M NaOH Tests in the High-Caustic HHL Series .............................................................................................................. 4.18
4.6. Predicted and Measured Al Concentrations for the Nominal 10-M NaOH Tests in the High-Caustic HHL Series .............................................................................................................. 4.19
4.7. Predicted and Measured Al Concentrations for the Nominal 12-M NaOH Tests in the High-Caustic HHL Series .............................................................................................................. 4.20
4.8. Prediction/Measurement Crossplot for the Nominal 1-M NaOH Test at 100°C, MTB Series...... 4.21
4.9. Prediction/Measurement Crossplot for the First Set of Nominal 5-M NaOH Tests at 100°C ....... 4.22
4.10. Prediction/Measurement Crossplot for the Second Set of Nominal 5-M NaOH Tests at 100°C ............................................................................................................................................. 4.23
4.11. Prediction/Measurement Crossplot for the Nominal 5-M NaOH Tests at 100°C, MTB Series .... 4.24
4.12. Prediction/Measurement Crossplot for the Nominal 5-M NaOH Tests at 85°C in the HHL Series .................................................................................................................................... 4.25
4.13. Prediction/Measurement Crossplot for the Nominal 5-M NaOH Tests at 85°C ........................... 4.26
4.14. Prediction/Measurement Crossplot for the Nominal 10-M NaOH Tests at 85°C in the HHL Series .................................................................................................................................... 4.27
4.15. Prediction/Measurement Crossplot for the Nominal 12-M NaOH Tests at 85°C in the HHL Series .................................................................................................................................... 4.28
4.16. Prediction/Measurement Crossplot for the Nominal 1-M NaOH Test at 60°C, MTB Series ....... 4.29
4.17. Prediction/Measurement Crossplot for the Nominal 5-M NaOH Test at 60°C, MTB Series ....... 4.30
4.18. Prediction/Measurement Crossplot for the Nominal 10-M NaOH Tests at 60°C in the HHL Series .................................................................................................................................... 4.31
4.19. Prediction/Measurement Crossplot for the Nominal 12-M NaOH Tests at 60°C in the HHL Series .................................................................................................................................... 4.32
4.20. Prediction/Measurement Crossplot for the Nominal 12-M NaOH Tests at 25°C in the HHL Series .................................................................................................................................... 4.33
4.21. Prediction/Measurement Crossplot, Closeup on the Nominal 12-M NaOH Test With Zero Initial Aluminate at 25°C in the High-Caustic Test Series ............................................................ 4.34
4.22. Ratio of Initial Kinetic Rates Calculated at a NaOH Concentration of 5 M and 85°C ................. 4.37
5.1. General Schematic of the Leaching Scenario Used in Performing Simulations to Evaluate Sodium Utility at Different OH Molarities ...................................................................................... 5.2
5.2. Comparison of the Model Presented in Russell and Peterson (2010) with the Kinetic Model Given in Section 4 at 85°C, a Boehmite Weight Fraction of 0.50, and a Target Conversion of 40% ............................................................................................................................................. 5.3
xi
5.3. Effect of Varying the Initial Weight Fraction (wb) of Boehmite on the Aluminum/Sodium Weight Ratio at 85°C....................................................................................................................... 5.4
5.4. Effect of Varying the Initial Weight Fraction of Boehmite on the Duration of the Leach Required to Reach the Target Conversion of 40% at 85°C ............................................................. 5.5
5.5. Effect of Varying the Target Conversion on the Aluminum/Sodium Weight Ratio at a Fixed Initial Boehmite Weight Fraction of 0.75 at 85°C ........................................................................... 5.6
5.6. Effect of Varying the Target Conversion on the Duration of the Leach at a Fixed Initial Boehmite Weight Fraction of 0.75 at 85°C ...................................................................................................... 5.7
Tables
3.1. Target Parameters for High-Caustic Boehmite Dissolution Tests ................................................... 3.2
3.2. Washed Dried Solids Weights from the High-Caustic Leaching Tests ........................................... 3.3
3.3. Al Results for Filtrate from the High-Caustic Leaching Tests ........................................................ 3.4
3.4. Na Results for Filtrate from the High-Caustic Leaching Tests ....................................................... 3.5
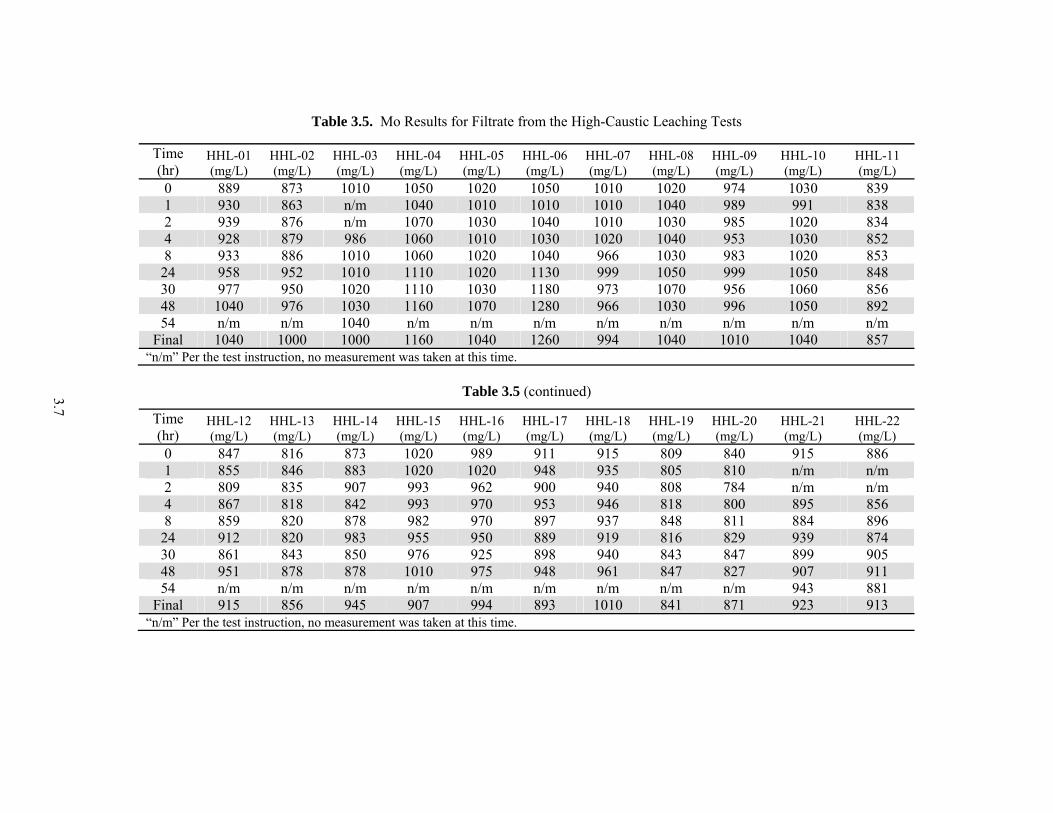
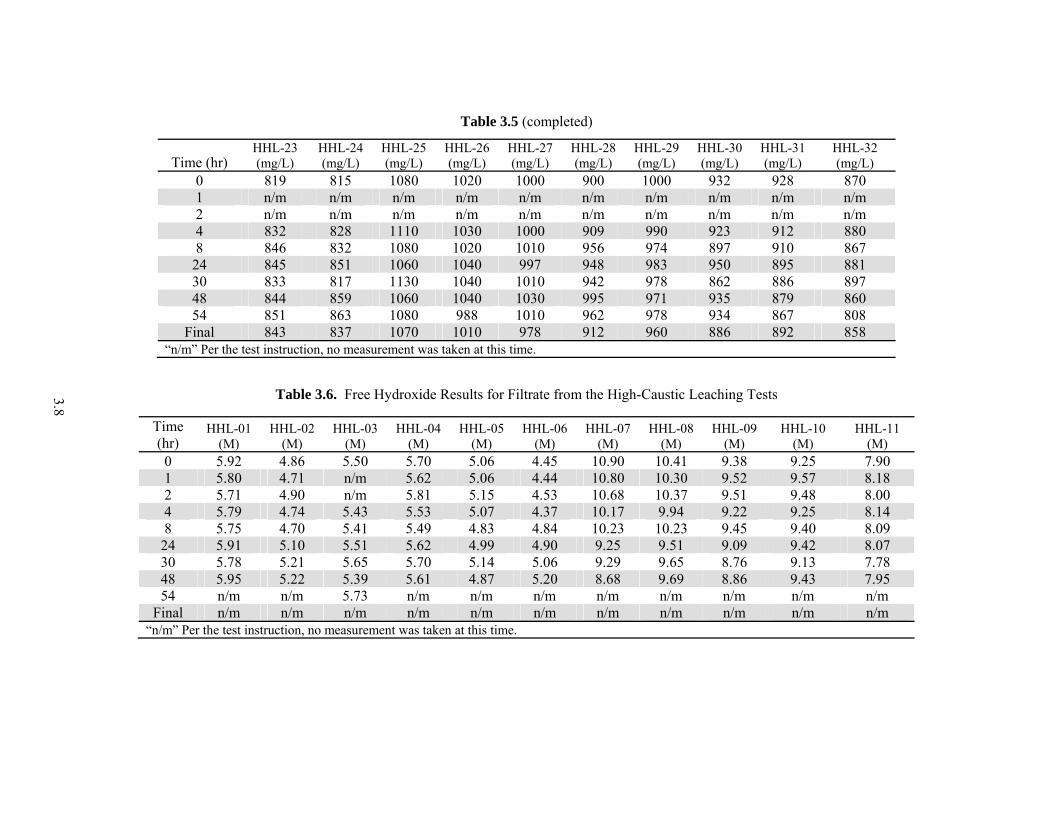
3.5. Mo Results for Filtrate from the High-Caustic Leaching Tests ...................................................... 3.7
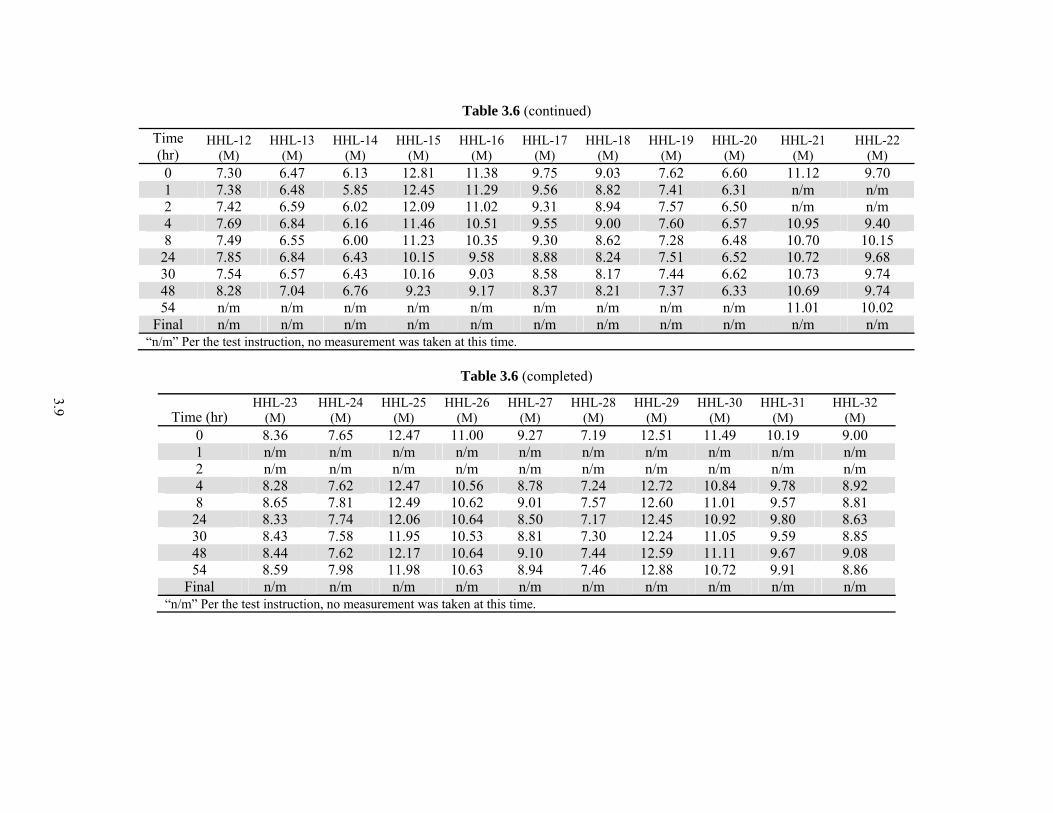
3.6. Free Hydroxide Results for Filtrate from the High-Caustic Leaching Tests ................................... 3.8
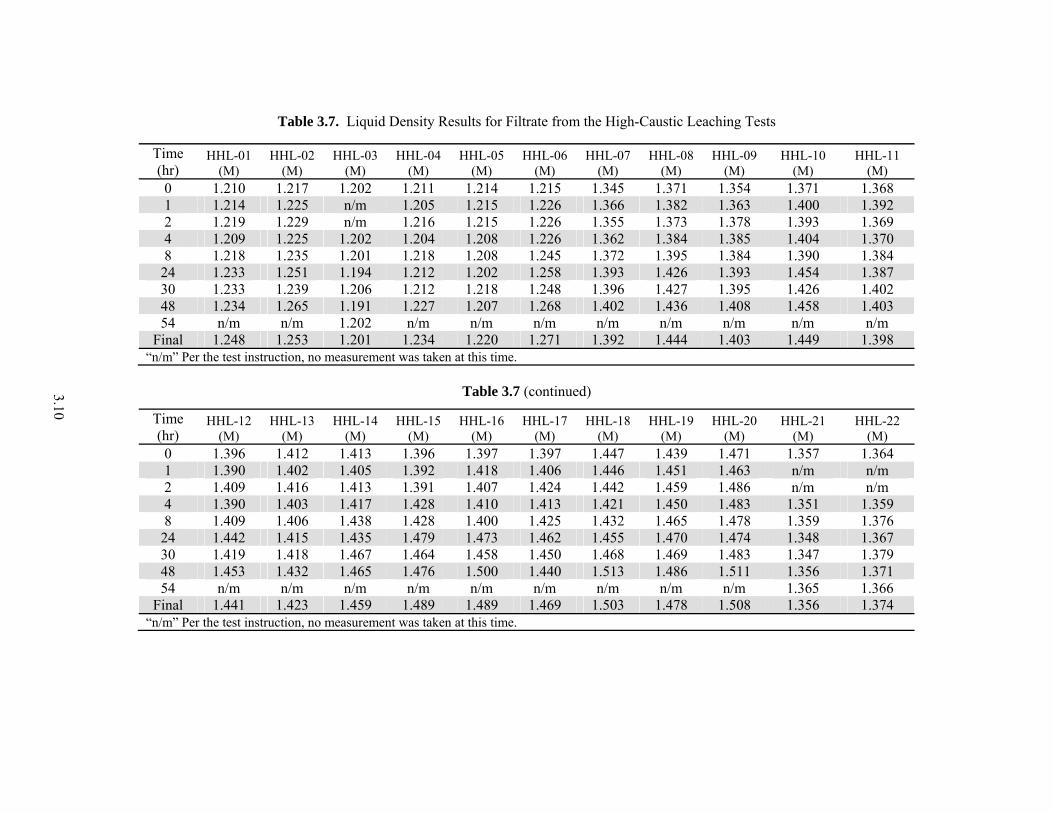
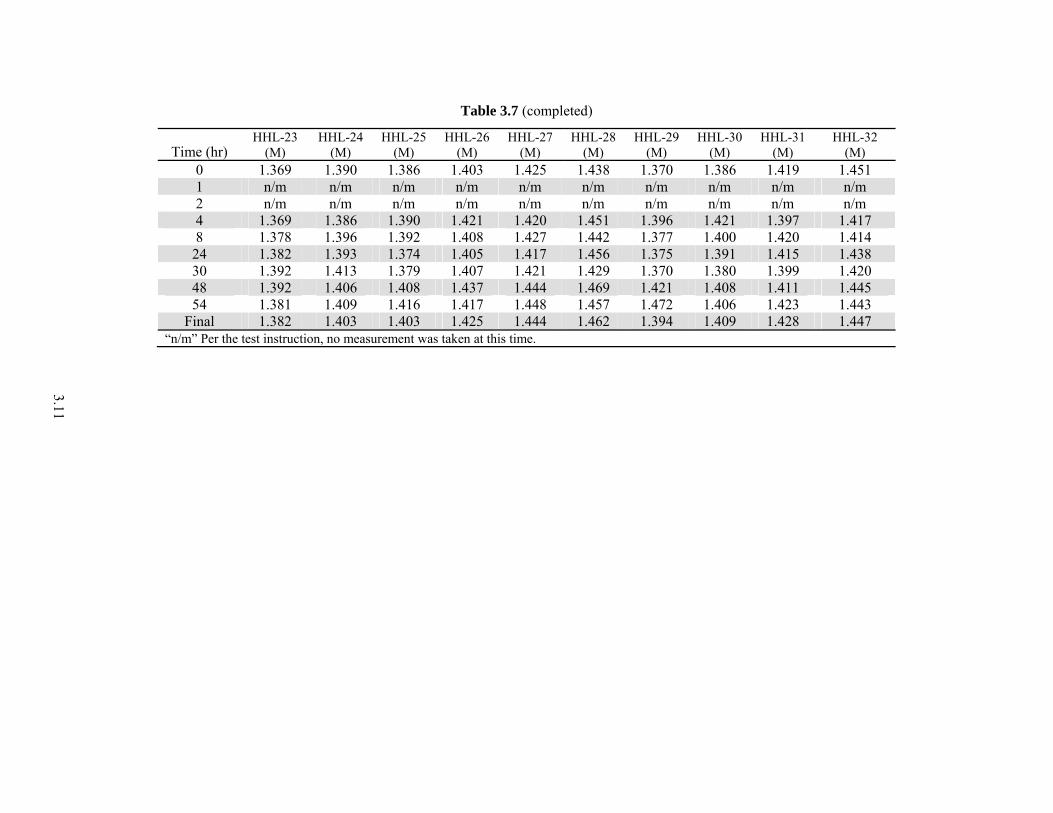
3.7. Liquid Density Results for Filtrate from the High-Caustic Leaching Tests .................................. 3.10
4.1. Undissolved Gibbsite in Previous Leaching Tests .......................................................................... 4.6
4.2. XRD Refinement Summary for the Final Solids ............................................................................. 4.8
4.3. Kinetic Model Fit for B = 2/3, H = 1, and A = 1; k and Ea Adjustable ........................................... 4.12
4.4. Kinetic Model Fit for B = 1, H = 1, and A = 1, k and Ea Adjustable ............................................. 4.12
4.5. Kinetic Model Fit for B = 2/3, A = 1, and H, k, and Ea Adjustable ................................................ 4.13
4.6. Kinetic Model Fit for B = 2/3, H = 1, and A, k, and Ea Adjustable ................................................ 4.13
4.7. Kinetic Model Fit for B = 2/3 and H, A, k, and Ea Adjustable ....................................................... 4.14
4.8. Kinetic Model Fit for B = 1 and H, A, k, and Ea Adjustable .......................................................... 4.14
4.9. Kinetic Model Fit for B, H, A, k, and Ea Adjustable ...................................................................... 4.14

1.1
1.0 Introduction
Waste vitrification is the central technology to be used in the tank waste remediation effort at the Hanford Site in southeastern Washington State. Aluminum, like sodium and several other materials in the waste, reduces the efficiency of vitrification by decreasing the mass of waste that can be incorporated into a given mass of glass. Aluminum has been found in several mineralogical phases in the wastes in Hanford tanks. These phases, in decreasing order of importance, include gibbsite and other aluminum hydroxides, boehmite, aluminosilicates, diaspore, dawsonite, and aluminum phosphate compounds. Boehmite, specifically, has been found in several tanks that have a history of high temperature.
Caustic leaching at temperatures in the vicinity of 80°C to 100°C has been proposed as the method for dissolving boehmite in the Hanford Tank Waste Treatment and Immobilization Plant (WTP) and thereby decreasing the concentration of aluminum in the solids that are to be vitrified. High concentrations of hydroxide are required to dissolve boehmite in a practicable amount of time and keep it in solution after the waste/caustic slurry is cooled to ambient temperature.
There have been numerous studies of boehmite dissolution and of the parameters that affect it, including temperature, hydroxide concentration, and aluminate concentration. In general, these tests have been carried out at hydroxide concentrations of 8 M and less. Higher hydroxide concentrations are now being considered for use in the leaching process. Consider the Al solubility versus hydroxide profile as shown in Figure 1.1. Note the increasing steepness in the Al solubility as the hydroxide concentration increases. Should the kinetic behavior of boehmite dissolution parallel the solubility curve behavior, it is hoped that less total sodium (added as sodium hydroxide) will be required to dissolve a given amount of boehmite in a given amount of time if higher concentrations of NaOH reagent are used. Another possible advantage of a higher hydroxide concentration would be the capability to leach at lower temperatures.
This report presents the results of boehmite leaching tests that were carried out at targeted NaOH concentrations of 10 M and 12 M. These data, and data obtained during earlier tests at 1 M and 5 M NaOH, are used to establish the dependence of the boehmite leach rate on hydroxide concentration. The effects of temperature and aluminate concentrations are also re-examined. A semi-empirical kinetic model for boehmite leaching is established and used to calculate the NaOH additions required for leaching at different hydroxide concentrations.
Section 1.1 discusses the technical background of the present test series. Section 2 describes the quality assurance (QA) requirements for testing, Section 3 gives a description of the test, and Section 4 contains the data analysis approach and results. The relationship between the caustic concentration and the sodium balance is discussed in Section 5.
1.2
Figure 1.1. Calculated Thermodynamic Solubility of Al Hydroxide as a Function of NaOH and Temperature (calculated using ESP OLI Analyzer version 3.1, Mixed Solvent Electrolyte [MSE] database)
1.1 Background
The literature contains a number of non-Hanford studies of boehmite dissolution rate (Scotford and Glastonbury 1971, 1972; Packter 1976, Palmer et al. 2001, Panias et al. 2001, Benezeth et al. 2008, Grenman et al. 2010). In addition, a number of studies have investigated precipitation kinetics for boehmite (Panias 2004, Skoufadis et al. 2003, Benezeth et al. 2008, Dash et al. 2009). Russell et al. (2009a, 2009b) carried out the most recent Hanford studies of the boehmite-NaOH system.
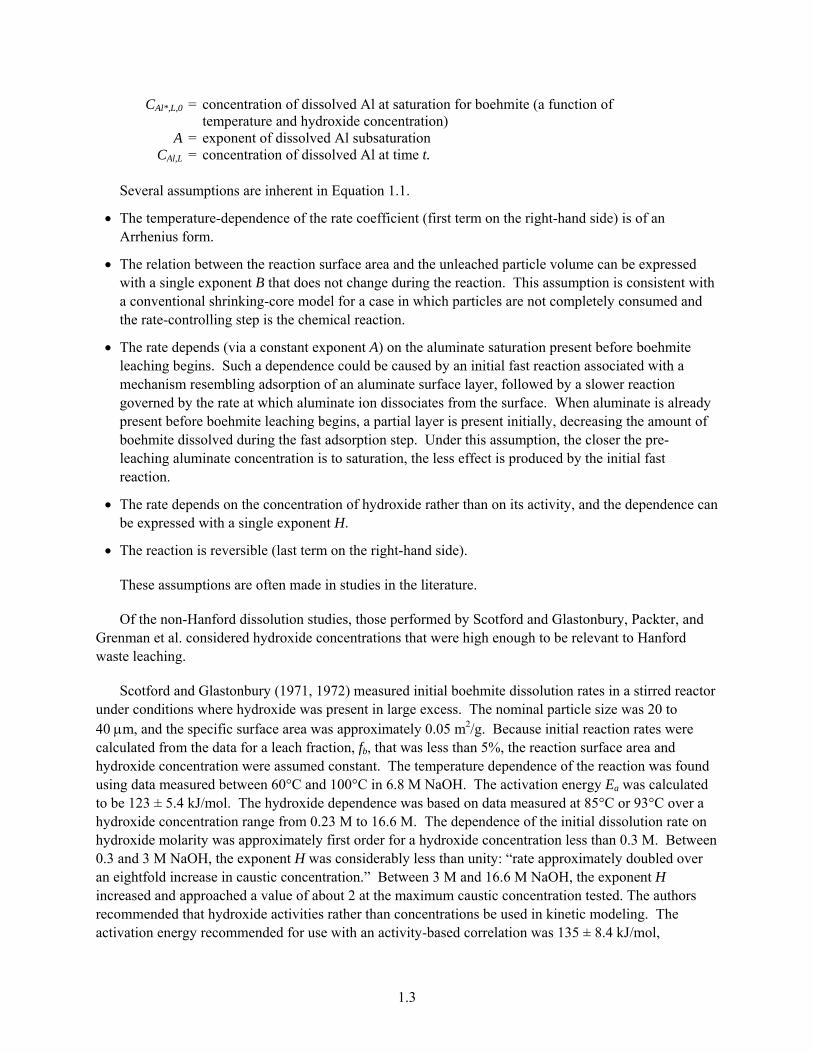
The dissolution studies have indicated that the dissolution reaction rate is a strong function of both temperature and hydroxide concentration. A general expression for the rate is
0,*,
,,
0,*,
0,,1
373
1
1111LAl
LAlHLOH
A
LAl
LAlBb
TR
E
b C
CC
C
Cfkef
dt
d a
(1.1)
where fb = fraction of boehmite that has been dissolved by time t k = pre-exponential rate constant Ea = activation energy R = ideal gas constant T = absolute temperature COH,L = concentration of hydroxide at time t; does not include the hydroxide that
is complexed with aluminum H = exponent of hydroxide concentration B = exponent of unleached boehmite fraction CAl,L,0 = concentration of dissolved Al at time = 0
1.3
CAl*,L,0 = concentration of dissolved Al at saturation for boehmite (a function of temperature and hydroxide concentration)
A = exponent of dissolved Al subsaturation CAl,L = concentration of dissolved Al at time t.
Several assumptions are inherent in Equation 1.1.
The temperature-dependence of the rate coefficient (first term on the right-hand side) is of an Arrhenius form.
The relation between the reaction surface area and the unleached particle volume can be expressed with a single exponent B that does not change during the reaction. This assumption is consistent with a conventional shrinking-core model for a case in which particles are not completely consumed and the rate-controlling step is the chemical reaction.
The rate depends (via a constant exponent A) on the aluminate saturation present before boehmite leaching begins. Such a dependence could be caused by an initial fast reaction associated with a mechanism resembling adsorption of an aluminate surface layer, followed by a slower reaction governed by the rate at which aluminate ion dissociates from the surface. When aluminate is already present before boehmite leaching begins, a partial layer is present initially, decreasing the amount of boehmite dissolved during the fast adsorption step. Under this assumption, the closer the pre-leaching aluminate concentration is to saturation, the less effect is produced by the initial fast reaction.
The rate depends on the concentration of hydroxide rather than on its activity, and the dependence can be expressed with a single exponent H.
The reaction is reversible (last term on the right-hand side).
These assumptions are often made in studies in the literature.
Of the non-Hanford dissolution studies, those performed by Scotford and Glastonbury, Packter, and Grenman et al. considered hydroxide concentrations that were high enough to be relevant to Hanford waste leaching.
Scotford and Glastonbury (1971, 1972) measured initial boehmite dissolution rates in a stirred reactor under conditions where hydroxide was present in large excess. The nominal particle size was 20 to 40 m, and the specific surface area was approximately 0.05 m2/g. Because initial reaction rates were calculated from the data for a leach fraction, fb, that was less than 5%, the reaction surface area and hydroxide concentration were assumed constant. The temperature dependence of the reaction was found using data measured between 60°C and 100°C in 6.8 M NaOH. The activation energy Ea was calculated to be 123 ± 5.4 kJ/mol. The hydroxide dependence was based on data measured at 85°C or 93°C over a hydroxide concentration range from 0.23 M to 16.6 M. The dependence of the initial dissolution rate on hydroxide molarity was approximately first order for a hydroxide concentration less than 0.3 M. Between 0.3 and 3 M NaOH, the exponent H was considerably less than unity: “rate approximately doubled over an eightfold increase in caustic concentration.” Between 3 M and 16.6 M NaOH, the exponent H increased and approached a value of about 2 at the maximum caustic concentration tested. The authors recommended that hydroxide activities rather than concentrations be used in kinetic modeling. The activation energy recommended for use with an activity-based correlation was 135 ± 8.4 kJ/mol,
1.4
accounting for the temperature dependence of activity coefficients. A half-order (exponent = 0.5) dependence on hydroxide activity was found to apply over the entire range of hydroxide concentration that was studied.
Packter (1976) conducted boehmite dissolution experiments using boehmite that was produced by hydrolysis of aluminum isopropoxide and then recrystallized. The particles were cylindrical and had lengths of 0.07 to 0.1 m. Hydroxide concentrations between 1 and 8 M and temperatures between 35°C and 65°C were tested. The reaction flask was shaken at 240 min-1. Hydroxide was present in large excess. The dissolved Al concentration data were fitted to a kinetic equation in which the dissolution rate was proportional to (1 - fb)
4/3, implying dependence on the square of the particle surface area. An activation energy for boehmite dissolution between 115 and 125 kJ/mole was found. The reaction rates increased linearly with the mean ionic activity of the hydroxide solutions.
Grenman et al. (2010) tested boehmite dissolution in a temperature range between 60°C and 85°C and a hydroxide concentration range between 2 M and 6 M. The boehmite was obtained from Nabaltec GmbH. The particle d50 was 1.3 m, giving a specific surface area of 5 m2/g. The reaction flask was shaken at 160 min-1. Samples were taken in such a way as to allow the surface area of the residual boehmite to be measured at several points during each test. The authors modeled the initial rates (fb < 5%) by directly incorporating the measured particle area values, rather than by including a term that represented the specific area using the shrinking-core assumption. They found that the activation energy was 99.1 kJ/mol, and the initial rate depended on the 0.5 power of the hydroxide molar concentration.
None of the non-Hanford studies evaluated the impact of any presence of aluminate ion beyond that produced by boehmite leaching. Hanford waste often contains gibbsite and boehmite together, so caustic leaching of boehmite in waste will occur in the presence of pre-existing aluminate ion produced by the relatively rapid dissolution of gibbsite.
The most recent Hanford studies of boehmite dissolution (Russell et al. 2009a, 2009b) focused on hydroxide concentrations between 1 M and 5 M NaOH and temperatures between 60°C and 100°C, with the 5 M NaOH/100°C condition receiving the most attention. The initial aluminate concentration (before boehmite leaching) was also varied. It was generated by dissolving gibbsite in the caustic, before adding any boehmite, and ranged from 0% to more than 100% of the saturation concentration calculated from the correlations of Panias et al. (2001). The boehmite was obtained from Nabaltec GmbH. It contained no amorphous material and had an average crystal size of 8 m (d50 by volume)and a specific surface area of 10 m2/g. Hydroxide was not present in large excess. If all the boehmite had been allowed to dissolve, the aluminate concentration would have been between 60% and 100% of the saturated concentration.
A reaction-controlled, shrinking-core model was fitted to dissolution data that extended out to relatively high conversion fractions (fb usually exceeding 20%). The model fixed B at 2/3 (assuming smooth spherical particles and a unimolecular surface reaction) and H at 1.0 (assuming that the rate dependence on molar concentration is the same as the overall stoichiometry of the reaction). The values of A = 1.0 and Ea = 120 kJ/mol were determined by fitting the model to the data.
2.1
2.0 Quality Assurance
In accordance with the Project Quality Assurance Plan (PQAP) for the Environmental Management (EM)-31 Support Project, dated 04.19.2010, this work was designated as Quality Level 3 (QL3). This designation is based on the fact that the work involved initial proof-of-concept testing. As such, the work was performed in accordance with best laboratory practices (Nuclear Quality Assurance [NQA]-1, Subpart 4.2 – based) as indicated in work flows and subject areas of the Pacific Northwest National Laboratory (PNNL) “How do I…?” (HDI) standards-based management system.

3.1
3.0 Test Description
The tests performed for the present study were intended to obtain boehmite dissolution data at high caustic concentrations and temperatures less than 100°C. Tests were conducted at several temperatures, hydroxide concentrations, and initial aluminate concentrations with the aluminate being supplied by dissolving gibbsite before beginning the boehmite leaching. All of these tests were performed under test instruction TI-57154-01, Rev. 0. This section of the report describes the test matrix, the apparatus, and the test procedure and provides the concentrations and liquid densities that were measured.
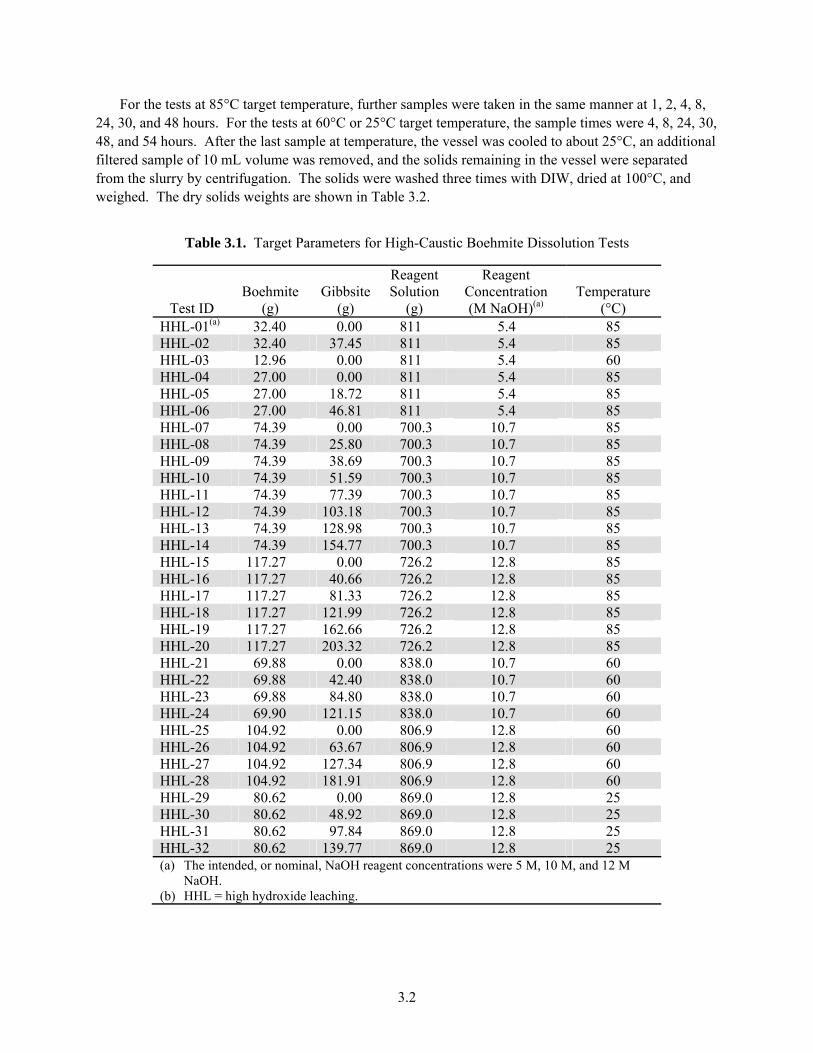
Table 3.1 shows the targeted test matrix. The first 6 tests were designed to repeat tests performed in earlier studies and confirm that behavior was consistent. Tests 7 through 20 support developing a boehmite dissolution rate equation incorporating the impact of aluminate ion and hydroxide concentration. Tests 21 through 28 were designed to determine the effect of temperature on the boehmite dissolution, and tests 29 through 32 were designed to determine whether room-temperature reaction rates were substantial when 12 M NaOH (nominal) was present.
The same type of boehmite was used in the present tests that had been used by Russell et al. (2009a, 2009b). The boehmite was APYRAL AOH20, supplied by Nabaltec GmbH. X-ray diffraction (XRD) analysis and comparison to a boehmite standard confirmed that the boehmite contained no apparent amorphous material or crystalline contamination. The particle size was determined with an S3000 Microtrac Analyzer with deionized water (DIW) carrier fluid. The boehmite had a crystal size of 8 m (50th percentile by volume) and a specific surface area of 10 m2/g (measured by nitrogen adsorption from a helium carrier gas). Testing had established that the kinetic behavior of AOH20 was similar to that of the boehmite in Hanford waste (Russell 2009a).
The reaction vessel was a 1-liter, wide-mouth jar with straight sides and internal baffles, all made of polymethylpentene (PMP). A stainless steel impeller was used to stir the vessel contents. A heating jacket was wrapped around the vessel to maintain the test mixture at a constant temperature throughout the test. The temperature was measured with a calibrated thermocouple and controlled with a calibrated temperature controller. The boehmite was added to the reaction vessel through the sample port while stirring. More description of the apparatus can be found in Russell et al. (2009b).
The tests were performed by placing the required amounts of NaOH and gibbsite in the test vessel,(a) attaching the lid, and heating to leaching temperature while stirring at 120 RPM. When the vessel reached 85°C and all of the gibbsite was completely dissolved as confirmed by visual inspection, the temperature was adjusted to the target leach temperature, and the vessel was allowed to operate overnight, still stirring at the leach temperature. In the morning, complete dissolution of the gibbsite was verified, and the temperature was confirmed to be within ± 0.5°C of the target. One 5-mL sample and one 2-mL sample were removed while stirring continued, using a 10-mL syringe passed through a sample port. Samples were filtered immediately through a 0.45-μm syringe filter. Boehmite was then added to the vessel and the time recorded (t = 0).
(a) A small amount of a stock solution of 50 g/L Na2MoO4 was also added at this point. The Mo was to be used as
a liquid tracer in case Na (the usual tracer) precipitated as sodium aluminate at high NaOH concentration. The volume of molybdate solution added was 14.2 mL in Tests 1 through 6, 10.9 mL in Tests 7 through 20, 13.0 mL in Tests 21 through 24, 12.0 mL in Tests 25 through 28, and 13.0 mL in Tests 29 through 32.
3.2
For the tests at 85°C target temperature, further samples were taken in the same manner at 1, 2, 4, 8, 24, 30, and 48 hours. For the tests at 60°C or 25°C target temperature, the sample times were 4, 8, 24, 30, 48, and 54 hours. After the last sample at temperature, the vessel was cooled to about 25°C, an additional filtered sample of 10 mL volume was removed, and the solids remaining in the vessel were separated from the slurry by centrifugation. The solids were washed three times with DIW, dried at 100°C, and weighed. The dry solids weights are shown in Table 3.2.
Table 3.1. Target Parameters for High-Caustic Boehmite Dissolution Tests
Test ID Boehmite
(g) Gibbsite
(g)
Reagent Solution
(g)
Reagent Concentration (M NaOH)(a)
Temperature (°C)
HHL-01(a) 32.40 0.00 811 5.4 85 HHL-02 32.40 37.45 811 5.4 85 HHL-03 12.96 0.00 811 5.4 60 HHL-04 27.00 0.00 811 5.4 85 HHL-05 27.00 18.72 811 5.4 85 HHL-06 27.00 46.81 811 5.4 85 HHL-07 74.39 0.00 700.3 10.7 85 HHL-08 74.39 25.80 700.3 10.7 85 HHL-09 74.39 38.69 700.3 10.7 85 HHL-10 74.39 51.59 700.3 10.7 85 HHL-11 74.39 77.39 700.3 10.7 85 HHL-12 74.39 103.18 700.3 10.7 85 HHL-13 74.39 128.98 700.3 10.7 85 HHL-14 74.39 154.77 700.3 10.7 85 HHL-15 117.27 0.00 726.2 12.8 85 HHL-16 117.27 40.66 726.2 12.8 85 HHL-17 117.27 81.33 726.2 12.8 85 HHL-18 117.27 121.99 726.2 12.8 85 HHL-19 117.27 162.66 726.2 12.8 85 HHL-20 117.27 203.32 726.2 12.8 85 HHL-21 69.88 0.00 838.0 10.7 60 HHL-22 69.88 42.40 838.0 10.7 60 HHL-23 69.88 84.80 838.0 10.7 60 HHL-24 69.90 121.15 838.0 10.7 60 HHL-25 104.92 0.00 806.9 12.8 60 HHL-26 104.92 63.67 806.9 12.8 60 HHL-27 104.92 127.34 806.9 12.8 60 HHL-28 104.92 181.91 806.9 12.8 60 HHL-29 80.62 0.00 869.0 12.8 25 HHL-30 80.62 48.92 869.0 12.8 25 HHL-31 80.62 97.84 869.0 12.8 25 HHL-32 80.62 139.77 869.0 12.8 25 (a) The intended, or nominal, NaOH reagent concentrations were 5 M, 10 M, and 12 M
NaOH. (b) HHL = high hydroxide leaching.
3.3
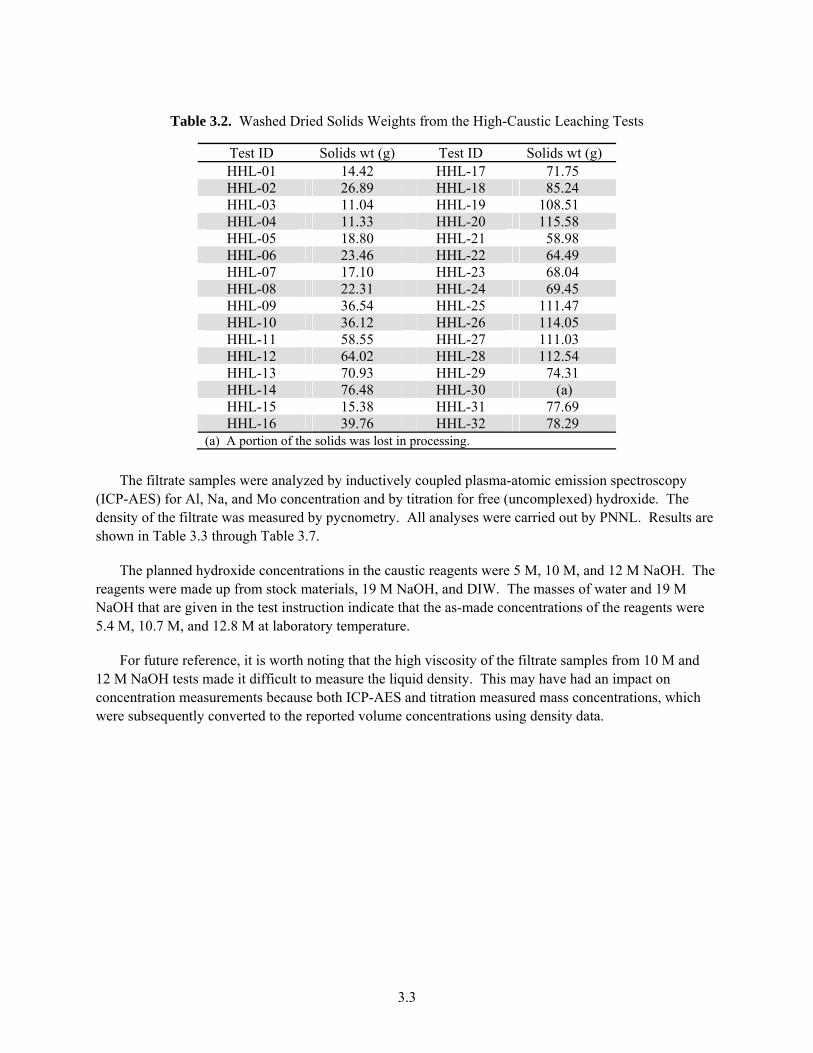
Table 3.2. Washed Dried Solids Weights from the High-Caustic Leaching Tests
Test ID Solids wt (g) Test ID Solids wt (g) HHL-01 14.42 HHL-17 71.75 HHL-02 26.89 HHL-18 85.24 HHL-03 11.04 HHL-19 108.51 HHL-04 11.33 HHL-20 115.58 HHL-05 18.80 HHL-21 58.98 HHL-06 23.46 HHL-22 64.49 HHL-07 17.10 HHL-23 68.04 HHL-08 22.31 HHL-24 69.45 HHL-09 36.54 HHL-25 111.47 HHL-10 36.12 HHL-26 114.05 HHL-11 58.55 HHL-27 111.03 HHL-12 64.02 HHL-28 112.54 HHL-13 70.93 HHL-29 74.31 HHL-14 76.48 HHL-30 (a) HHL-15 15.38 HHL-31 77.69 HHL-16 39.76 HHL-32 78.29
(a) A portion of the solids was lost in processing.
The filtrate samples were analyzed by inductively coupled plasma-atomic emission spectroscopy (ICP-AES) for Al, Na, and Mo concentration and by titration for free (uncomplexed) hydroxide. The density of the filtrate was measured by pycnometry. All analyses were carried out by PNNL. Results are shown in Table 3.3 through Table 3.7.
The planned hydroxide concentrations in the caustic reagents were 5 M, 10 M, and 12 M NaOH. The reagents were made up from stock materials, 19 M NaOH, and DIW. The masses of water and 19 M NaOH that are given in the test instruction indicate that the as-made concentrations of the reagents were 5.4 M, 10.7 M, and 12.8 M at laboratory temperature.
For future reference, it is worth noting that the high viscosity of the filtrate samples from 10 M and 12 M NaOH tests made it difficult to measure the liquid density. This may have had an impact on concentration measurements because both ICP-AES and titration measured mass concentrations, which were subsequently converted to the reported volume concentrations using density data.
3.4
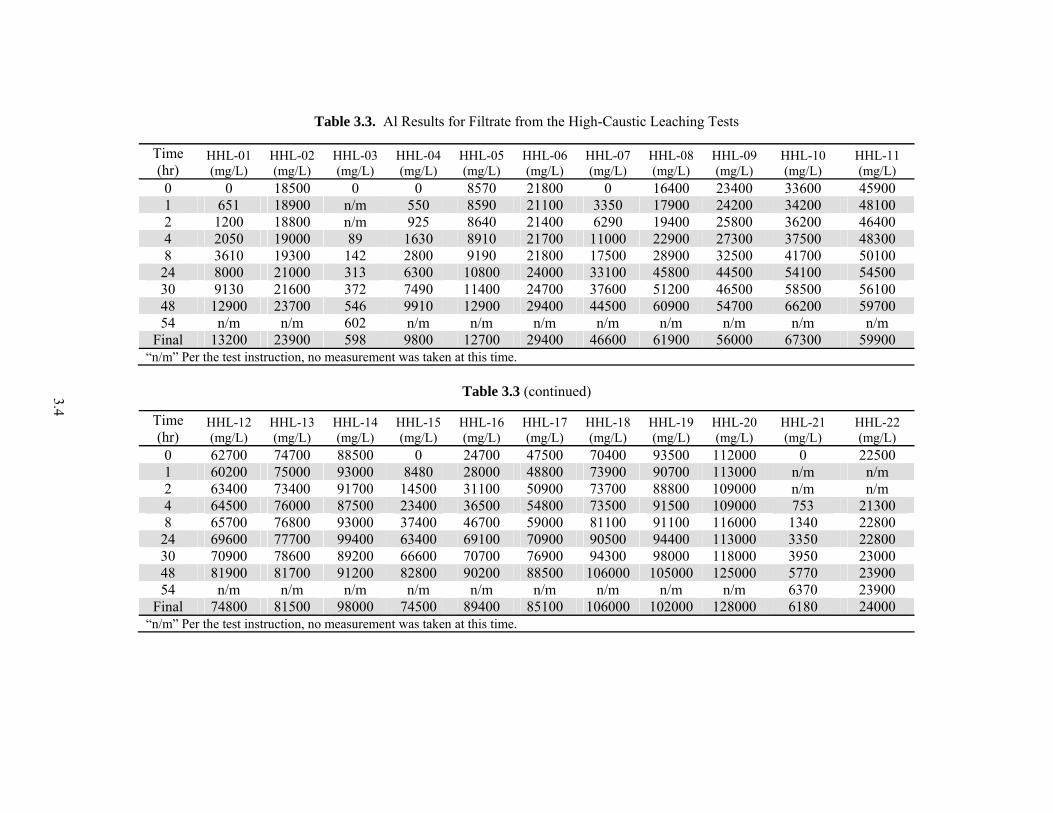
Table 3.3. Al Results for Filtrate from the High-Caustic Leaching Tests
Time (hr)
HHL-01 (mg/L)
HHL-02 (mg/L)
HHL-03 (mg/L)
HHL-04 (mg/L)
HHL-05 (mg/L)
HHL-06 (mg/L)
HHL-07 (mg/L)
HHL-08 (mg/L)
HHL-09 (mg/L)
HHL-10 (mg/L)
HHL-11 (mg/L)
0 0 18500 0 0 8570 21800 0 16400 23400 33600 45900 1 651 18900 n/m 550 8590 21100 3350 17900 24200 34200 48100 2 1200 18800 n/m 925 8640 21400 6290 19400 25800 36200 46400 4 2050 19000 89 1630 8910 21700 11000 22900 27300 37500 48300 8 3610 19300 142 2800 9190 21800 17500 28900 32500 41700 50100
24 8000 21000 313 6300 10800 24000 33100 45800 44500 54100 54500 30 9130 21600 372 7490 11400 24700 37600 51200 46500 58500 56100 48 12900 23700 546 9910 12900 29400 44500 60900 54700 66200 59700 54 n/m n/m 602 n/m n/m n/m n/m n/m n/m n/m n/m
Final 13200 23900 598 9800 12700 29400 46600 61900 56000 67300 59900 “n/m” Per the test instruction, no measurement was taken at this time.
Table 3.3 (continued)
Time (hr)
HHL-12 (mg/L)
HHL-13 (mg/L)
HHL-14 (mg/L)
HHL-15 (mg/L)
HHL-16 (mg/L)
HHL-17 (mg/L)
HHL-18 (mg/L)
HHL-19 (mg/L)
HHL-20 (mg/L)
HHL-21 (mg/L)
HHL-22 (mg/L)
0 62700 74700 88500 0 24700 47500 70400 93500 112000 0 22500 1 60200 75000 93000 8480 28000 48800 73900 90700 113000 n/m n/m 2 63400 73400 91700 14500 31100 50900 73700 88800 109000 n/m n/m 4 64500 76000 87500 23400 36500 54800 73500 91500 109000 753 21300 8 65700 76800 93000 37400 46700 59000 81100 91100 116000 1340 22800
24 69600 77700 99400 63400 69100 70900 90500 94400 113000 3350 22800 30 70900 78600 89200 66600 70700 76900 94300 98000 118000 3950 23000 48 81900 81700 91200 82800 90200 88500 106000 105000 125000 5770 23900 54 n/m n/m n/m n/m n/m n/m n/m n/m n/m 6370 23900
Final 74800 81500 98000 74500 89400 85100 106000 102000 128000 6180 24000 “n/m” Per the test instruction, no measurement was taken at this time.
3.5
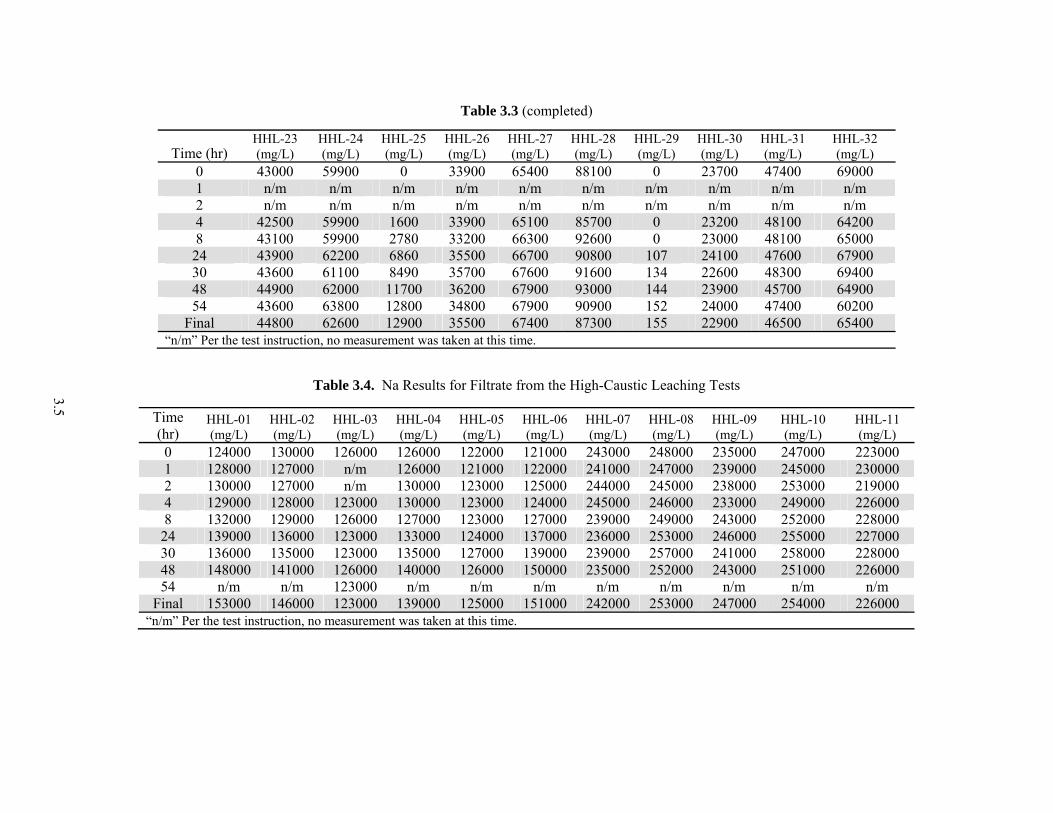
Table 3.3 (completed)
Time (hr) HHL-23 (mg/L)
HHL-24 (mg/L)
HHL-25 (mg/L)
HHL-26 (mg/L)
HHL-27 (mg/L)
HHL-28 (mg/L)
HHL-29 (mg/L)
HHL-30 (mg/L)
HHL-31 (mg/L)
HHL-32 (mg/L)
0 43000 59900 0 33900 65400 88100 0 23700 47400 69000 1 n/m n/m n/m n/m n/m n/m n/m n/m n/m n/m 2 n/m n/m n/m n/m n/m n/m n/m n/m n/m n/m 4 42500 59900 1600 33900 65100 85700 0 23200 48100 64200 8 43100 59900 2780 33200 66300 92600 0 23000 48100 65000
24 43900 62200 6860 35500 66700 90800 107 24100 47600 67900 30 43600 61100 8490 35700 67600 91600 134 22600 48300 69400 48 44900 62000 11700 36200 67900 93000 144 23900 45700 64900 54 43600 63800 12800 34800 67900 90900 152 24000 47400 60200
Final 44800 62600 12900 35500 67400 87300 155 22900 46500 65400 “n/m” Per the test instruction, no measurement was taken at this time.
Table 3.4. Na Results for Filtrate from the High-Caustic Leaching Tests
Time (hr)
HHL-01 (mg/L)
HHL-02 (mg/L)
HHL-03 (mg/L)
HHL-04 (mg/L)
HHL-05 (mg/L)
HHL-06 (mg/L)
HHL-07 (mg/L)
HHL-08 (mg/L)
HHL-09 (mg/L)
HHL-10 (mg/L)
HHL-11 (mg/L)
0 124000 130000 126000 126000 122000 121000 243000 248000 235000 247000 223000 1 128000 127000 n/m 126000 121000 122000 241000 247000 239000 245000 230000 2 130000 127000 n/m 130000 123000 125000 244000 245000 238000 253000 219000 4 129000 128000 123000 130000 123000 124000 245000 246000 233000 249000 226000 8 132000 129000 126000 127000 123000 127000 239000 249000 243000 252000 228000
24 139000 136000 123000 133000 124000 137000 236000 253000 246000 255000 227000 30 136000 135000 123000 135000 127000 139000 239000 257000 241000 258000 228000 48 148000 141000 126000 140000 126000 150000 235000 252000 243000 251000 226000 54 n/m n/m 123000 n/m n/m n/m n/m n/m n/m n/m n/m
Final 153000 146000 123000 139000 125000 151000 242000 253000 247000 254000 226000 “n/m” Per the test instruction, no measurement was taken at this time.
3.6
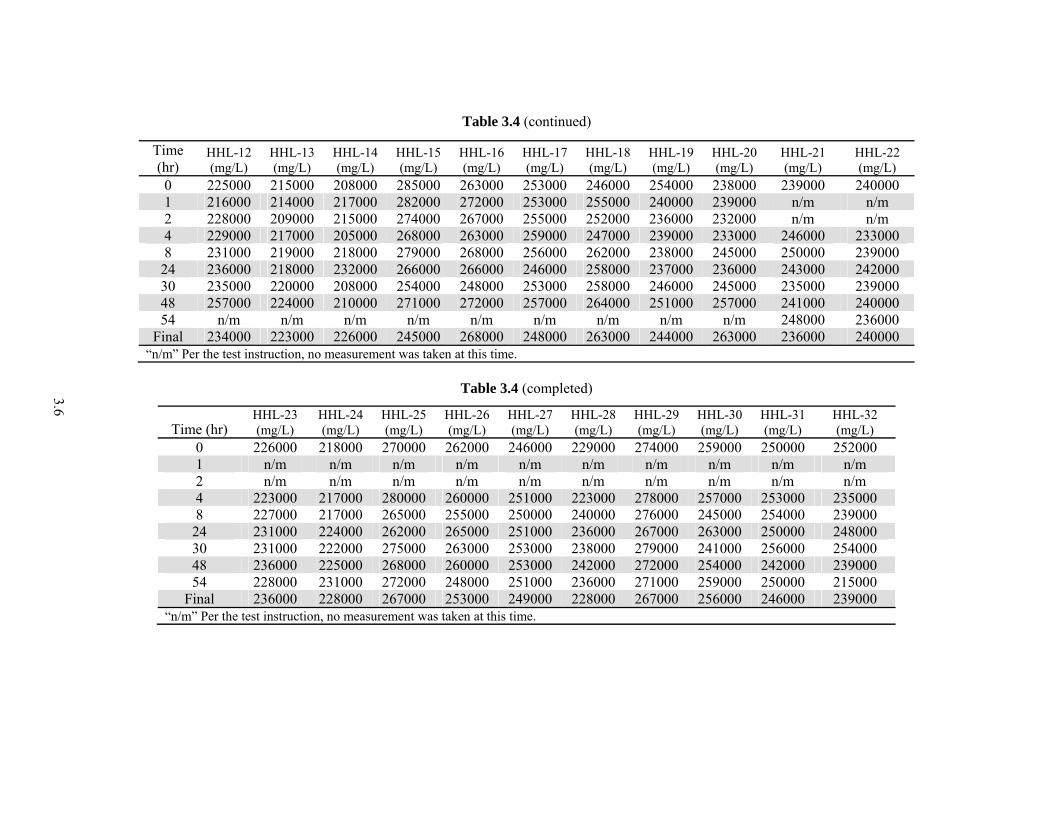
Table 3.4 (continued)
Time (hr)
HHL-12 (mg/L)
HHL-13 (mg/L)
HHL-14 (mg/L)
HHL-15 (mg/L)
HHL-16 (mg/L)
HHL-17 (mg/L)
HHL-18 (mg/L)
HHL-19 (mg/L)
HHL-20 (mg/L)
HHL-21 (mg/L)
HHL-22 (mg/L)
0 225000 215000 208000 285000 263000 253000 246000 254000 238000 239000 240000 1 216000 214000 217000 282000 272000 253000 255000 240000 239000 n/m n/m 2 228000 209000 215000 274000 267000 255000 252000 236000 232000 n/m n/m 4 229000 217000 205000 268000 263000 259000 247000 239000 233000 246000 233000 8 231000 219000 218000 279000 268000 256000 262000 238000 245000 250000 239000
24 236000 218000 232000 266000 266000 246000 258000 237000 236000 243000 242000 30 235000 220000 208000 254000 248000 253000 258000 246000 245000 235000 239000 48 257000 224000 210000 271000 272000 257000 264000 251000 257000 241000 240000 54 n/m n/m n/m n/m n/m n/m n/m n/m n/m 248000 236000
Final 234000 223000 226000 245000 268000 248000 263000 244000 263000 236000 240000 “n/m” Per the test instruction, no measurement was taken at this time.
Table 3.4 (completed)
Time (hr) HHL-23 (mg/L)
HHL-24 (mg/L)
HHL-25 (mg/L)
HHL-26 (mg/L)
HHL-27 (mg/L)
HHL-28 (mg/L)
HHL-29 (mg/L)
HHL-30 (mg/L)
HHL-31 (mg/L)
HHL-32 (mg/L)
0 226000 218000 270000 262000 246000 229000 274000 259000 250000 252000 1 n/m n/m n/m n/m n/m n/m n/m n/m n/m n/m 2 n/m n/m n/m n/m n/m n/m n/m n/m n/m n/m 4 223000 217000 280000 260000 251000 223000 278000 257000 253000 235000 8 227000 217000 265000 255000 250000 240000 276000 245000 254000 239000
24 231000 224000 262000 265000 251000 236000 267000 263000 250000 248000 30 231000 222000 275000 263000 253000 238000 279000 241000 256000 254000 48 236000 225000 268000 260000 253000 242000 272000 254000 242000 239000 54 228000 231000 272000 248000 251000 236000 271000 259000 250000 215000
Final 236000 228000 267000 253000 249000 228000 267000 256000 246000 239000 “n/m” Per the test instruction, no measurement was taken at this time.
3.7
Table 3.5. Mo Results for Filtrate from the High-Caustic Leaching Tests
Time (hr)
HHL-01 (mg/L)
HHL-02 (mg/L)
HHL-03 (mg/L)
HHL-04 (mg/L)
HHL-05 (mg/L)
HHL-06 (mg/L)
HHL-07 (mg/L)
HHL-08 (mg/L)
HHL-09 (mg/L)
HHL-10 (mg/L)
HHL-11 (mg/L)
0 889 873 1010 1050 1020 1050 1010 1020 974 1030 839 1 930 863 n/m 1040 1010 1010 1010 1040 989 991 838 2 939 876 n/m 1070 1030 1040 1010 1030 985 1020 834 4 928 879 986 1060 1010 1030 1020 1040 953 1030 852 8 933 886 1010 1060 1020 1040 966 1030 983 1020 853
24 958 952 1010 1110 1020 1130 999 1050 999 1050 848 30 977 950 1020 1110 1030 1180 973 1070 956 1060 856 48 1040 976 1030 1160 1070 1280 966 1030 996 1050 892 54 n/m n/m 1040 n/m n/m n/m n/m n/m n/m n/m n/m
Final 1040 1000 1000 1160 1040 1260 994 1040 1010 1040 857 “n/m” Per the test instruction, no measurement was taken at this time.
Table 3.5 (continued)
Time (hr)
HHL-12 (mg/L)
HHL-13 (mg/L)
HHL-14 (mg/L)
HHL-15 (mg/L)
HHL-16 (mg/L)
HHL-17 (mg/L)
HHL-18 (mg/L)
HHL-19 (mg/L)
HHL-20 (mg/L)
HHL-21 (mg/L)
HHL-22 (mg/L)
0 847 816 873 1020 989 911 915 809 840 915 886 1 855 846 883 1020 1020 948 935 805 810 n/m n/m 2 809 835 907 993 962 900 940 808 784 n/m n/m 4 867 818 842 993 970 953 946 818 800 895 856 8 859 820 878 982 970 897 937 848 811 884 896
24 912 820 983 955 950 889 919 816 829 939 874 30 861 843 850 976 925 898 940 843 847 899 905 48 951 878 878 1010 975 948 961 847 827 907 911 54 n/m n/m n/m n/m n/m n/m n/m n/m n/m 943 881
Final 915 856 945 907 994 893 1010 841 871 923 913 “n/m” Per the test instruction, no measurement was taken at this time.
3.8
Table 3.5 (completed)
Time (hr) HHL-23 (mg/L)
HHL-24 (mg/L)
HHL-25 (mg/L)
HHL-26 (mg/L)
HHL-27 (mg/L)
HHL-28 (mg/L)
HHL-29 (mg/L)
HHL-30 (mg/L)
HHL-31 (mg/L)
HHL-32 (mg/L)
0 819 815 1080 1020 1000 900 1000 932 928 870 1 n/m n/m n/m n/m n/m n/m n/m n/m n/m n/m 2 n/m n/m n/m n/m n/m n/m n/m n/m n/m n/m 4 832 828 1110 1030 1000 909 990 923 912 880 8 846 832 1080 1020 1010 956 974 897 910 867
24 845 851 1060 1040 997 948 983 950 895 881 30 833 817 1130 1040 1010 942 978 862 886 897 48 844 859 1060 1040 1030 995 971 935 879 860 54 851 863 1080 988 1010 962 978 934 867 808
Final 843 837 1070 1010 978 912 960 886 892 858 “n/m” Per the test instruction, no measurement was taken at this time.
Table 3.6. Free Hydroxide Results for Filtrate from the High-Caustic Leaching Tests
Time (hr)
HHL-01 (M)
HHL-02 (M)
HHL-03 (M)
HHL-04 (M)
HHL-05 (M)
HHL-06 (M)
HHL-07 (M)
HHL-08 (M)
HHL-09 (M)
HHL-10 (M)
HHL-11 (M)
0 5.92 4.86 5.50 5.70 5.06 4.45 10.90 10.41 9.38 9.25 7.90 1 5.80 4.71 n/m 5.62 5.06 4.44 10.80 10.30 9.52 9.57 8.18 2 5.71 4.90 n/m 5.81 5.15 4.53 10.68 10.37 9.51 9.48 8.00 4 5.79 4.74 5.43 5.53 5.07 4.37 10.17 9.94 9.22 9.25 8.14 8 5.75 4.70 5.41 5.49 4.83 4.84 10.23 10.23 9.45 9.40 8.09
24 5.91 5.10 5.51 5.62 4.99 4.90 9.25 9.51 9.09 9.42 8.07 30 5.78 5.21 5.65 5.70 5.14 5.06 9.29 9.65 8.76 9.13 7.78 48 5.95 5.22 5.39 5.61 4.87 5.20 8.68 9.69 8.86 9.43 7.95 54 n/m n/m 5.73 n/m n/m n/m n/m n/m n/m n/m n/m
Final n/m n/m n/m n/m n/m n/m n/m n/m n/m n/m n/m “n/m” Per the test instruction, no measurement was taken at this time.
3.9
Table 3.6 (continued)
Time (hr)
HHL-12 (M)
HHL-13 (M)
HHL-14 (M)
HHL-15 (M)
HHL-16 (M)
HHL-17 (M)
HHL-18 (M)
HHL-19 (M)
HHL-20 (M)
HHL-21 (M)
HHL-22 (M)
0 7.30 6.47 6.13 12.81 11.38 9.75 9.03 7.62 6.60 11.12 9.70 1 7.38 6.48 5.85 12.45 11.29 9.56 8.82 7.41 6.31 n/m n/m 2 7.42 6.59 6.02 12.09 11.02 9.31 8.94 7.57 6.50 n/m n/m 4 7.69 6.84 6.16 11.46 10.51 9.55 9.00 7.60 6.57 10.95 9.40 8 7.49 6.55 6.00 11.23 10.35 9.30 8.62 7.28 6.48 10.70 10.15
24 7.85 6.84 6.43 10.15 9.58 8.88 8.24 7.51 6.52 10.72 9.68 30 7.54 6.57 6.43 10.16 9.03 8.58 8.17 7.44 6.62 10.73 9.74 48 8.28 7.04 6.76 9.23 9.17 8.37 8.21 7.37 6.33 10.69 9.74 54 n/m n/m n/m n/m n/m n/m n/m n/m n/m 11.01 10.02
Final n/m n/m n/m n/m n/m n/m n/m n/m n/m n/m n/m “n/m” Per the test instruction, no measurement was taken at this time.
Table 3.6 (completed)
Time (hr) HHL-23
(M) HHL-24
(M) HHL-25
(M) HHL-26
(M) HHL-27
(M) HHL-28
(M) HHL-29
(M) HHL-30
(M) HHL-31
(M) HHL-32
(M) 0 8.36 7.65 12.47 11.00 9.27 7.19 12.51 11.49 10.19 9.00 1 n/m n/m n/m n/m n/m n/m n/m n/m n/m n/m 2 n/m n/m n/m n/m n/m n/m n/m n/m n/m n/m 4 8.28 7.62 12.47 10.56 8.78 7.24 12.72 10.84 9.78 8.92 8 8.65 7.81 12.49 10.62 9.01 7.57 12.60 11.01 9.57 8.81
24 8.33 7.74 12.06 10.64 8.50 7.17 12.45 10.92 9.80 8.63 30 8.43 7.58 11.95 10.53 8.81 7.30 12.24 11.05 9.59 8.85 48 8.44 7.62 12.17 10.64 9.10 7.44 12.59 11.11 9.67 9.08 54 8.59 7.98 11.98 10.63 8.94 7.46 12.88 10.72 9.91 8.86
Final n/m n/m n/m n/m n/m n/m n/m n/m n/m n/m “n/m” Per the test instruction, no measurement was taken at this time.
3.10
Table 3.7. Liquid Density Results for Filtrate from the High-Caustic Leaching Tests
Time (hr)
HHL-01 (M)
HHL-02 (M)
HHL-03 (M)
HHL-04 (M)
HHL-05 (M)
HHL-06 (M)
HHL-07 (M)
HHL-08 (M)
HHL-09 (M)
HHL-10 (M)
HHL-11 (M)
0 1.210 1.217 1.202 1.211 1.214 1.215 1.345 1.371 1.354 1.371 1.368 1 1.214 1.225 n/m 1.205 1.215 1.226 1.366 1.382 1.363 1.400 1.392 2 1.219 1.229 n/m 1.216 1.215 1.226 1.355 1.373 1.378 1.393 1.369 4 1.209 1.225 1.202 1.204 1.208 1.226 1.362 1.384 1.385 1.404 1.370 8 1.218 1.235 1.201 1.218 1.208 1.245 1.372 1.395 1.384 1.390 1.384
24 1.233 1.251 1.194 1.212 1.202 1.258 1.393 1.426 1.393 1.454 1.387 30 1.233 1.239 1.206 1.212 1.218 1.248 1.396 1.427 1.395 1.426 1.402 48 1.234 1.265 1.191 1.227 1.207 1.268 1.402 1.436 1.408 1.458 1.403 54 n/m n/m 1.202 n/m n/m n/m n/m n/m n/m n/m n/m
Final 1.248 1.253 1.201 1.234 1.220 1.271 1.392 1.444 1.403 1.449 1.398 “n/m” Per the test instruction, no measurement was taken at this time.
Table 3.7 (continued)
Time (hr)
HHL-12 (M)
HHL-13 (M)
HHL-14 (M)
HHL-15 (M)
HHL-16 (M)
HHL-17 (M)
HHL-18 (M)
HHL-19 (M)
HHL-20 (M)
HHL-21 (M)
HHL-22 (M)
0 1.396 1.412 1.413 1.396 1.397 1.397 1.447 1.439 1.471 1.357 1.364 1 1.390 1.402 1.405 1.392 1.418 1.406 1.446 1.451 1.463 n/m n/m 2 1.409 1.416 1.413 1.391 1.407 1.424 1.442 1.459 1.486 n/m n/m 4 1.390 1.403 1.417 1.428 1.410 1.413 1.421 1.450 1.483 1.351 1.359 8 1.409 1.406 1.438 1.428 1.400 1.425 1.432 1.465 1.478 1.359 1.376
24 1.442 1.415 1.435 1.479 1.473 1.462 1.455 1.470 1.474 1.348 1.367 30 1.419 1.418 1.467 1.464 1.458 1.450 1.468 1.469 1.483 1.347 1.379 48 1.453 1.432 1.465 1.476 1.500 1.440 1.513 1.486 1.511 1.356 1.371 54 n/m n/m n/m n/m n/m n/m n/m n/m n/m 1.365 1.366
Final 1.441 1.423 1.459 1.489 1.489 1.469 1.503 1.478 1.508 1.356 1.374 “n/m” Per the test instruction, no measurement was taken at this time.
3.11
Table 3.7 (completed)
Time (hr) HHL-23
(M) HHL-24
(M) HHL-25
(M) HHL-26
(M) HHL-27
(M) HHL-28
(M) HHL-29
(M) HHL-30
(M) HHL-31
(M) HHL-32
(M) 0 1.369 1.390 1.386 1.403 1.425 1.438 1.370 1.386 1.419 1.451 1 n/m n/m n/m n/m n/m n/m n/m n/m n/m n/m 2 n/m n/m n/m n/m n/m n/m n/m n/m n/m n/m 4 1.369 1.386 1.390 1.421 1.420 1.451 1.396 1.421 1.397 1.417 8 1.378 1.396 1.392 1.408 1.427 1.442 1.377 1.400 1.420 1.414
24 1.382 1.393 1.374 1.405 1.417 1.456 1.375 1.391 1.415 1.438 30 1.392 1.413 1.379 1.407 1.421 1.429 1.370 1.380 1.399 1.420 48 1.392 1.406 1.408 1.437 1.444 1.469 1.421 1.408 1.411 1.445 54 1.381 1.409 1.416 1.417 1.448 1.457 1.472 1.406 1.423 1.443
Final 1.382 1.403 1.403 1.425 1.444 1.462 1.394 1.409 1.428 1.447 “n/m” Per the test instruction, no measurement was taken at this time.

4.1
4.0 Data Analysis
4.1 XRD Analysis
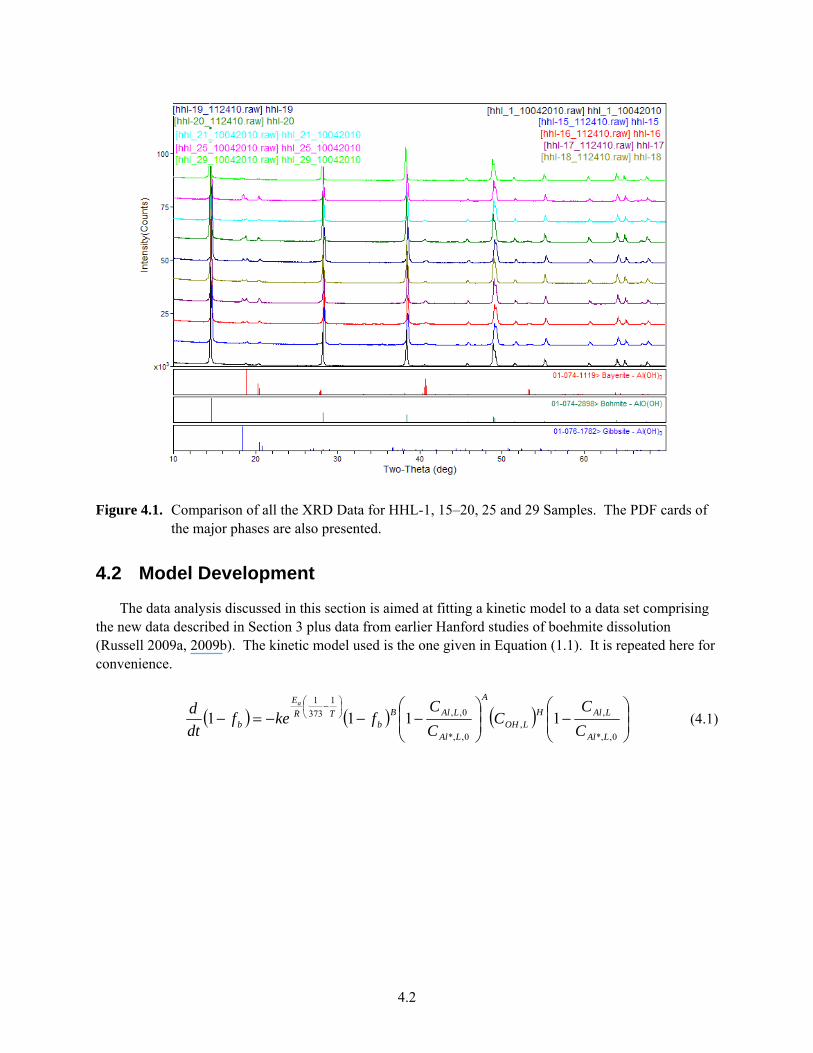
Selected samples were examined by XRD analysis to verify their initial identities before caustic leaching and determining the solid’s identities after caustic leaching. Details are given below. The raw XRD data (Appendix B) as well as refinement summaries (Appendix C) and full width height matches to the Al peak (Appendix D), the latter of which allows calculation of the relative % of Al species, are shown below.
4.1.1 Sample Preparation for XRD and Diffraction Experimental Setup
XRD analyses were performed on a Bruker Advance X-ray Diffractometer (Cu K radiation ( = 1.5418 Å). Data were collected in a step scan mode between 10 and 70° 2 with a step size of 0.01486° and a time/step of 0.3 seconds (total collection time per scan of 21 minutes). The X-ray tube operating conditions were 40 kV and 40 mA. A multistrip Lynxeye detector was used, and this allowed for fast data collection. The samples were analyzed as received.
4.1.2 X-Ray Powder Diffraction Data Analysis
Phase identification was performed using the Search/Match option in Jade multiple document interface (MDI) and the International Centre for Diffraction Data (ICDD) 2009 database. The search included the following elements: Al, O, H, C, and Na.
4.1.3 XRD Result Summary
The raw XRD patterns are shown in Figure 4.1 for all of the samples analyzed. Except sample C333, which is Al(OH)3, gibbsite, the others are AlO(OH) boehmite. Figures in Appendix C show each XRD pattern individually with the corresponding PDF cards. Although samples AOH and HHL-1 to HHL-29 are mainly boehmite, there is a small amount of bayerite present as indicated by the small peaks present in these samples at 18 and 20° 2 theta. This can be seen from Figure 4.1. The greatest amount of bayerite (more than 10%) based on the XRD intensities and the full refinement of the XRD data (Figure 4.1) is in samples HHL-25, HHL-19, HHL-16 and HHL-17.
4.2
Figure 4.1. Comparison of all the XRD Data for HHL-1, 15–20, 25 and 29 Samples. The PDF cards of the major phases are also presented.
4.2 Model Development
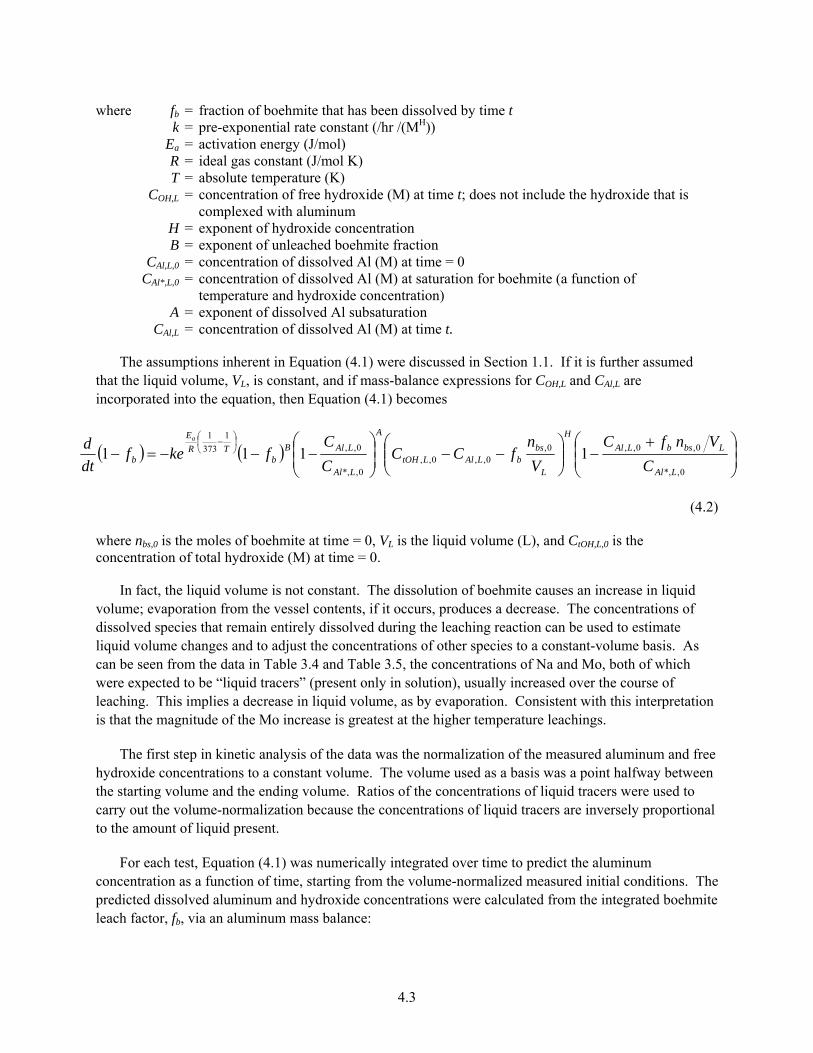
The data analysis discussed in this section is aimed at fitting a kinetic model to a data set comprising the new data described in Section 3 plus data from earlier Hanford studies of boehmite dissolution (Russell 2009a, 2009b). The kinetic model used is the one given in Equation (1.1). It is repeated here for convenience.
0,*,
,,
0,*,
0,,1
373
1
1111LAl
LAlHLOH
A
LAl
LAlBb
TR
E
b C
CC
C
Cfkef
dt
d a
(4.1)
4.3
where fb = fraction of boehmite that has been dissolved by time t k = pre-exponential rate constant (/hr /(MH)) Ea = activation energy (J/mol) R = ideal gas constant (J/mol K) T = absolute temperature (K) COH,L = concentration of free hydroxide (M) at time t; does not include the hydroxide that is
complexed with aluminum H = exponent of hydroxide concentration B = exponent of unleached boehmite fraction CAl,L,0 = concentration of dissolved Al (M) at time = 0 CAl*,L,0 = concentration of dissolved Al (M) at saturation for boehmite (a function of
temperature and hydroxide concentration) A = exponent of dissolved Al subsaturation CAl,L = concentration of dissolved Al (M) at time t.
The assumptions inherent in Equation (4.1) were discussed in Section 1.1. If it is further assumed that the liquid volume, VL, is constant, and if mass-balance expressions for COH,L and CAl,L are incorporated into the equation, then Equation (4.1) becomes
0,*,
0,0,,0,0,,0,,
0,*,
0,,1
373
1
1111LAl
LbsbLAl
H
L
bsbLAlLtOH
A
LAl
LAlBb
TR
E
b C
VnfC
V
nfCC
C
Cfkef
dt
d a
(4.2)
where nbs,0 is the moles of boehmite at time = 0, VL is the liquid volume (L), and CtOH,L,0 is the concentration of total hydroxide (M) at time = 0.
In fact, the liquid volume is not constant. The dissolution of boehmite causes an increase in liquid volume; evaporation from the vessel contents, if it occurs, produces a decrease. The concentrations of dissolved species that remain entirely dissolved during the leaching reaction can be used to estimate liquid volume changes and to adjust the concentrations of other species to a constant-volume basis. As can be seen from the data in Table 3.4 and Table 3.5, the concentrations of Na and Mo, both of which were expected to be “liquid tracers” (present only in solution), usually increased over the course of leaching. This implies a decrease in liquid volume, as by evaporation. Consistent with this interpretation is that the magnitude of the Mo increase is greatest at the higher temperature leachings.
The first step in kinetic analysis of the data was the normalization of the measured aluminum and free hydroxide concentrations to a constant volume. The volume used as a basis was a point halfway between the starting volume and the ending volume. Ratios of the concentrations of liquid tracers were used to carry out the volume-normalization because the concentrations of liquid tracers are inversely proportional to the amount of liquid present.
For each test, Equation (4.1) was numerically integrated over time to predict the aluminum concentration as a function of time, starting from the volume-normalized measured initial conditions. The predicted dissolved aluminum and hydroxide concentrations were calculated from the integrated boehmite leach factor, fb, via an aluminum mass balance:
4.4
LbsbLAlLAl VnfCC 0,0,,, (4.3a)
LbsbLOHLOH VnfCC 0,0,,, (4.3b)
The dissolved aluminum concentration was calculated at each modeled time step and compared to the volume-normalized measured dissolved aluminum concentrations. The saturated aluminum concentration CAl,L,0 was calculated from the temperature and the total hydroxide concentration (free plus complexed), using the correlations in Panias et al. (2001).
The adjustable parameters in the equation were solved by numerically determining the best fit between predicted and measured (normalized) concentrations of dissolved aluminum. The potential fitting parameters are k, Ea, B, H, and A, though not all of those were treated as fitting parameters (i.e., some were fixed at physically plausible values). The best fit criterion used was to minimize the sum of squares of the differences between predicted and measured aluminum concentrations. The summation included all the measurement points in the runs.
In addition, the final boehmite leach factors were calculated directly from dissolved aluminum and tracer concentration data. These leach factors were found directly from measurements and were independent of the kinetic model. The equation for the boehmite leach factor, based on a liquid-phase tracer such as Na or Mo, is
Lbs
LAlLAlk
k
b Vn
CCC
C
f0,
0,,,0,
(4.4)
where Ck,0 is the concentration of liquid tracer k (M) in the liquid phase at time = 0, and Ck is the concentration of liquid tracer k (M) in the liquid phase at time t.
Section 4.3 discusses technical issues that were considered during the data analysis, and Section 4.4 describes the model fitting procedure and gives the final model.
4.3 Technical Issues
4.3.1 Consistency of Earlier Hanford Data
Since the data from earlier boehmite dissolution tests (Russell 2009a, 2009b) were to be combined with the data from the present high-caustic test series, the earlier tests were reviewed to check their consistency with the present tests. In general, the test procedures and the sets of measurements taken were consistent, but two aspects required closer examination:
1. The earlier tests did not include measurements of free hydroxide concentration and liquid density. In addition, the aluminum and sodium concentrations were provided in mass concentration form (Russell 2009b) in one of the test sets; density was required to convert these into volumetric concentration units for model fitting.
2. The earlier tests did not impose an overnight wait for the gibbsite (used to supply the initial aluminate concentration) to be completely dissolved before beginning boehmite leaching.
4.5
The following procedure was used to generate free hydroxide and density “data” for use in unit conversions and other modeling functions:
1. Determine the NaOH concentration in the reagent used in each test. The initial Na concentrations in tests where no gibbsite was added (initial Al saturation = 0%) were used to determine the initial NaOH concentration. In tests B-AL1 through B-AL20 (Russell 2009b), the average Na concentration at time 0 for the five zero-gibbsite tests in the series was 89,200 mg/kg liquid. This corresponds to 4.53 M NaOH, calculated from standard NaOH solution data provided by CRC (1975). Using the same approach, it was found that the caustic reagent in tests B-AL1a through B-AL10a was 4.92 M NaOH, and the caustic reagents in the 1-M and 5-M NaOH tests in the Matrix Testing Boehmite (MTB) series (Russell 2009a) were 0.953 M and 4.77 M NaOH, respectively.
2. Make initial guesses (to be refined in a later step) of the mass of boehmite dissolved and the mass of water evaporated at each measurement time. Use these, and the known values for masses of reagents, to calculate the mass of liquid present at each measurement time.
3. Use the NaOH/NaAl(OH)4 solution density correlation from Panias et al. (2001) to estimate the liquid density, based on the reagent NaOH and the masses of dissolved gibbsite and boehmite. Calculate the liquid volume at each measurement time.
4. Calculate the free hydroxide concentration by subtracting the moles of dissolved Al (from gibbsite and boehmite) from the moles of hydroxide in the reagent and dividing the difference (moles of free hydroxide) by the liquid volume.
5. Calculate the Na and Al concentrations at each time step and find the differences between these calculated concentrations and the measured concentrations.
6. Use the Excel™ SOLVER module to find the values of dissolved boehmite mass and evaporated water that give minimum values of the sum of squares of the differences from step (5).
The procedure provided calculated liquid densities and calculated free hydroxide concentrations at all measurement times. These, and the measured aluminum and sodium concentrations, were used in the subsequent kinetic modeling data analysis.
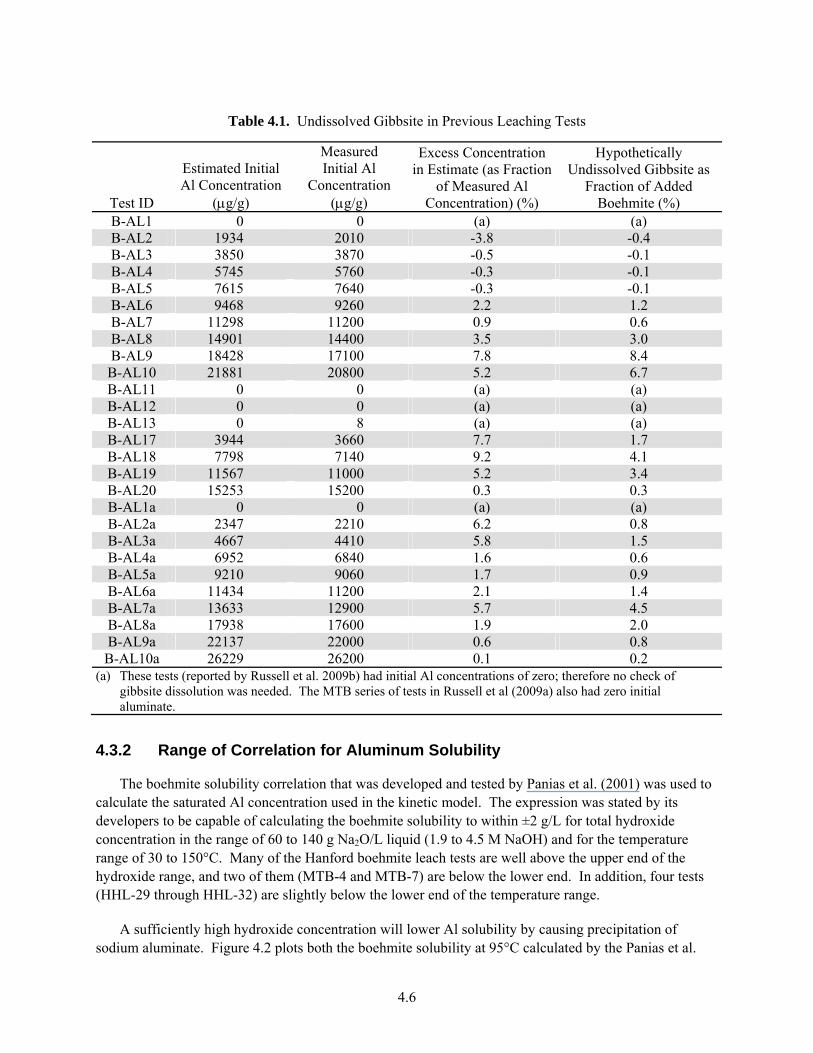
The procedure also gave estimates of the initial dissolved aluminum concentrations, assuming that all gibbsite was dissolved at time t = 0 and that no boehmite dissolution or water evaporation had occurred. These estimated Al concentrations for complete gibbsite dissolution were compared to the measured initial Al concentrations, as shown in Table 4.1. The estimated Al concentrations usually exceeded the actual Al concentrations by a small percentage (fourth column of Table 4.1), suggesting that a small amount of the gibbsite could still have been dissolving while the boehmite was being leached. The hypothetically undissolved portion of the gibbsite was a small fraction of the Al present in the boehmite to be leached (fifth column of Table 4.1).
4.6
Table 4.1. Undissolved Gibbsite in Previous Leaching Tests
Test ID
Estimated Initial Al Concentration
(g/g)
Measured Initial Al
Concentration (g/g)
Excess Concentration in Estimate (as Fraction
of Measured Al Concentration) (%)
Hypothetically Undissolved Gibbsite as
Fraction of Added Boehmite (%)
B-AL1 0 0 (a) (a) B-AL2 1934 2010 -3.8 -0.4 B-AL3 3850 3870 -0.5 -0.1 B-AL4 5745 5760 -0.3 -0.1 B-AL5 7615 7640 -0.3 -0.1 B-AL6 9468 9260 2.2 1.2 B-AL7 11298 11200 0.9 0.6 B-AL8 14901 14400 3.5 3.0 B-AL9 18428 17100 7.8 8.4
B-AL10 21881 20800 5.2 6.7 B-AL11 0 0 (a) (a) B-AL12 0 0 (a) (a) B-AL13 0 8 (a) (a) B-AL17 3944 3660 7.7 1.7 B-AL18 7798 7140 9.2 4.1 B-AL19 11567 11000 5.2 3.4 B-AL20 15253 15200 0.3 0.3 B-AL1a 0 0 (a) (a) B-AL2a 2347 2210 6.2 0.8 B-AL3a 4667 4410 5.8 1.5 B-AL4a 6952 6840 1.6 0.6 B-AL5a 9210 9060 1.7 0.9 B-AL6a 11434 11200 2.1 1.4 B-AL7a 13633 12900 5.7 4.5 B-AL8a 17938 17600 1.9 2.0 B-AL9a 22137 22000 0.6 0.8 B-AL10a 26229 26200 0.1 0.2
(a) These tests (reported by Russell et al. 2009b) had initial Al concentrations of zero; therefore no check of gibbsite dissolution was needed. The MTB series of tests in Russell et al (2009a) also had zero initial aluminate.
4.3.2 Range of Correlation for Aluminum Solubility
The boehmite solubility correlation that was developed and tested by Panias et al. (2001) was used to calculate the saturated Al concentration used in the kinetic model. The expression was stated by its developers to be capable of calculating the boehmite solubility to within ±2 g/L for total hydroxide concentration in the range of 60 to 140 g Na2O/L liquid (1.9 to 4.5 M NaOH) and for the temperature range of 30 to 150°C. Many of the Hanford boehmite leach tests are well above the upper end of the hydroxide range, and two of them (MTB-4 and MTB-7) are below the lower end. In addition, four tests (HHL-29 through HHL-32) are slightly below the lower end of the temperature range.
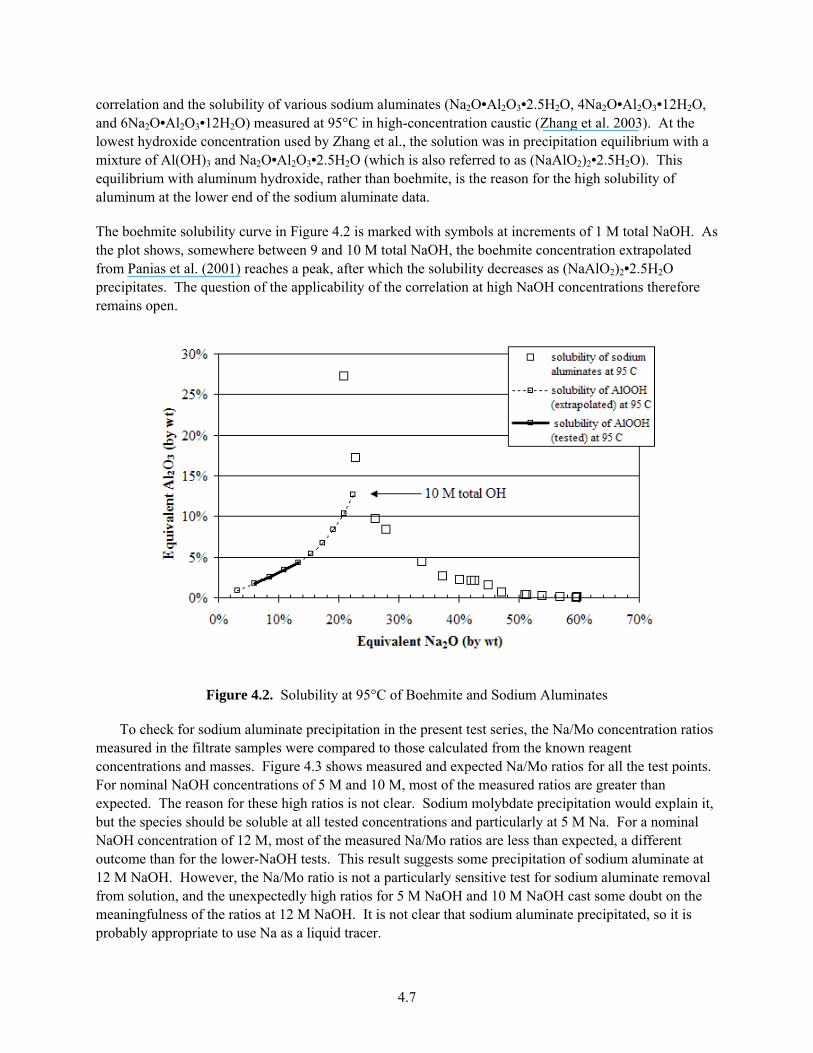
A sufficiently high hydroxide concentration will lower Al solubility by causing precipitation of sodium aluminate. Figure 4.2 plots both the boehmite solubility at 95°C calculated by the Panias et al.
4.7
correlation and the solubility of various sodium aluminates (Na2O•Al2O3•2.5H2O, 4Na2O•Al2O3•12H2O, and 6Na2O•Al2O3•12H2O) measured at 95°C in high-concentration caustic (Zhang et al. 2003). At the lowest hydroxide concentration used by Zhang et al., the solution was in precipitation equilibrium with a mixture of Al(OH)3 and Na2O•Al2O3•2.5H2O (which is also referred to as (NaAlO2)2•2.5H2O). This equilibrium with aluminum hydroxide, rather than boehmite, is the reason for the high solubility of aluminum at the lower end of the sodium aluminate data.
The boehmite solubility curve in Figure 4.2 is marked with symbols at increments of 1 M total NaOH. As the plot shows, somewhere between 9 and 10 M total NaOH, the boehmite concentration extrapolated from Panias et al. (2001) reaches a peak, after which the solubility decreases as (NaAlO2)2•2.5H2O precipitates. The question of the applicability of the correlation at high NaOH concentrations therefore remains open.
Figure 4.2. Solubility at 95°C of Boehmite and Sodium Aluminates
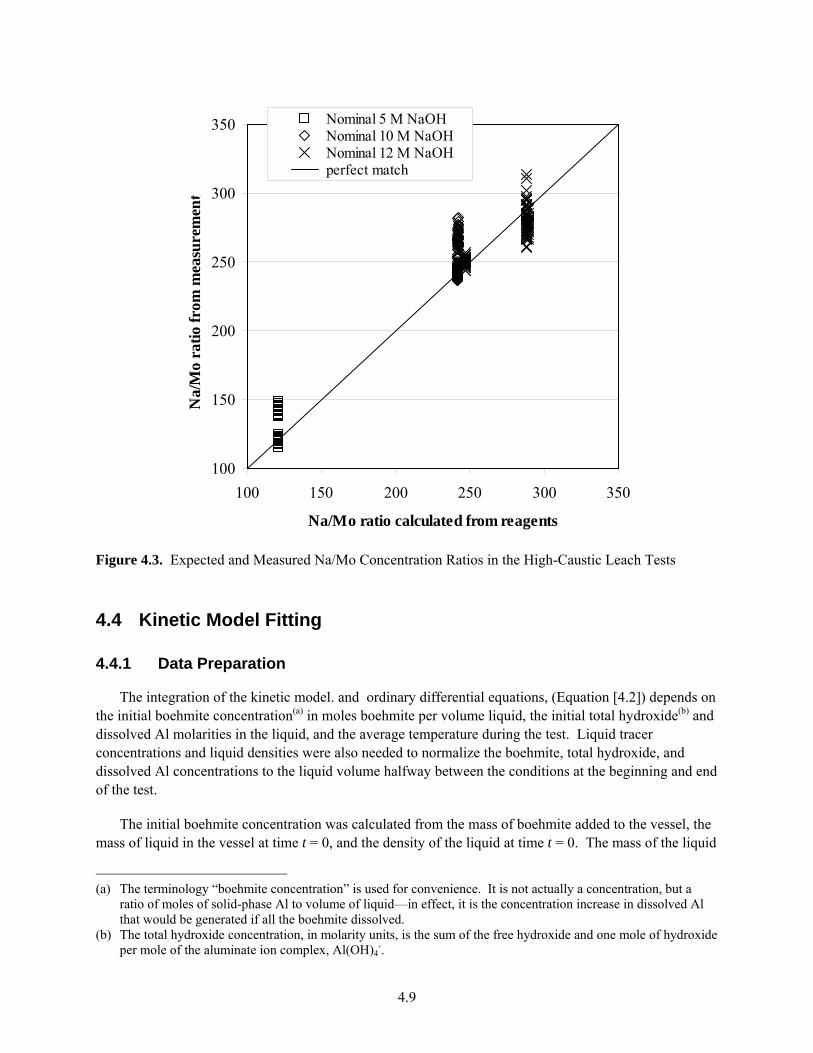
To check for sodium aluminate precipitation in the present test series, the Na/Mo concentration ratios measured in the filtrate samples were compared to those calculated from the known reagent concentrations and masses. Figure 4.3 shows measured and expected Na/Mo ratios for all the test points. For nominal NaOH concentrations of 5 M and 10 M, most of the measured ratios are greater than expected. The reason for these high ratios is not clear. Sodium molybdate precipitation would explain it, but the species should be soluble at all tested concentrations and particularly at 5 M Na. For a nominal NaOH concentration of 12 M, most of the measured Na/Mo ratios are less than expected, a different outcome than for the lower-NaOH tests. This result suggests some precipitation of sodium aluminate at 12 M NaOH. However, the Na/Mo ratio is not a particularly sensitive test for sodium aluminate removal from solution, and the unexpectedly high ratios for 5 M NaOH and 10 M NaOH cast some doubt on the meaningfulness of the ratios at 12 M NaOH. It is not clear that sodium aluminate precipitated, so it is probably appropriate to use Na as a liquid tracer.
4.8
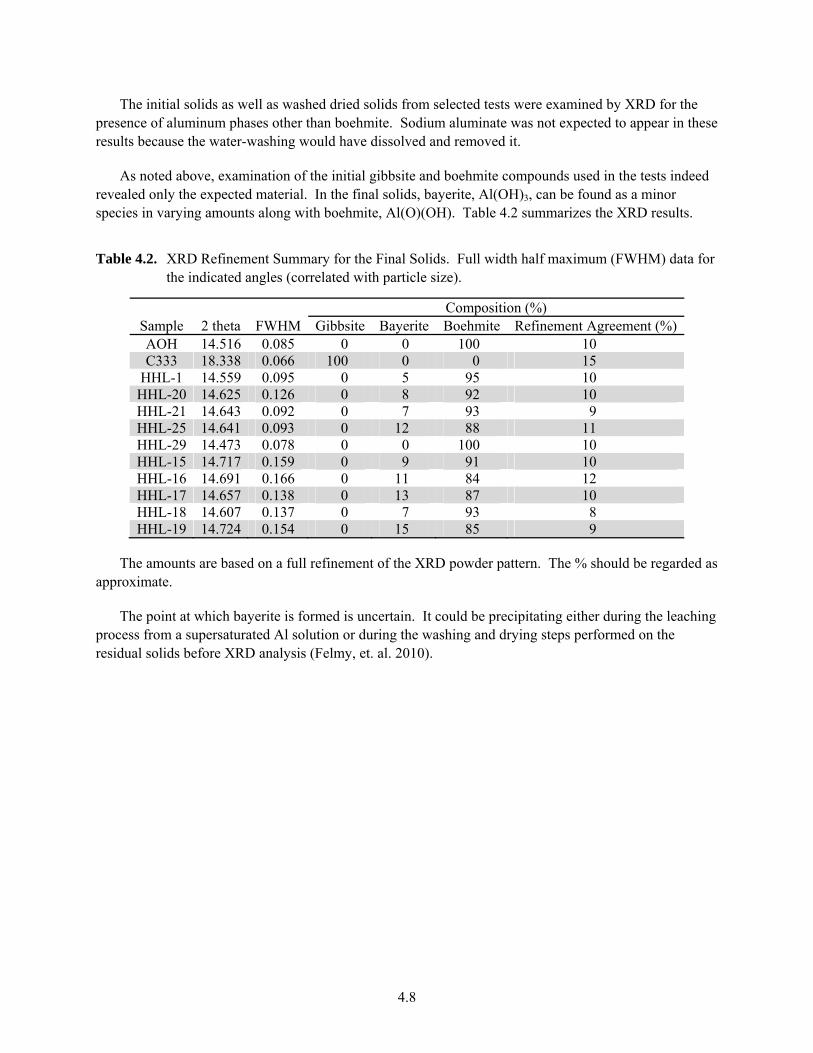
The initial solids as well as washed dried solids from selected tests were examined by XRD for the presence of aluminum phases other than boehmite. Sodium aluminate was not expected to appear in these results because the water-washing would have dissolved and removed it.
As noted above, examination of the initial gibbsite and boehmite compounds used in the tests indeed revealed only the expected material. In the final solids, bayerite, Al(OH)3, can be found as a minor species in varying amounts along with boehmite, Al(O)(OH). Table 4.2 summarizes the XRD results.
Table 4.2. XRD Refinement Summary for the Final Solids. Full width half maximum (FWHM) data for the indicated angles (correlated with particle size).
Sample 2 theta FWHM Composition (%)
Gibbsite Bayerite Boehmite Refinement Agreement (%)AOH 14.516 0.085 0 0 100 10 C333 18.338 0.066 100 0 0 15
HHL-1 14.559 0.095 0 5 95 10 HHL-20 14.625 0.126 0 8 92 10 HHL-21 14.643 0.092 0 7 93 9 HHL-25 14.641 0.093 0 12 88 11 HHL-29 14.473 0.078 0 0 100 10 HHL-15 14.717 0.159 0 9 91 10 HHL-16 14.691 0.166 0 11 84 12 HHL-17 14.657 0.138 0 13 87 10 HHL-18 14.607 0.137 0 7 93 8 HHL-19 14.724 0.154 0 15 85 9
The amounts are based on a full refinement of the XRD powder pattern. The % should be regarded as approximate.
The point at which bayerite is formed is uncertain. It could be precipitating either during the leaching process from a supersaturated Al solution or during the washing and drying steps performed on the residual solids before XRD analysis (Felmy, et. al. 2010).
4.9
100
150
200
250
300
350
100 150 200 250 300 350
Na/Mo ratio calculated from reagents
Na/
Mo
rati
o fr
om m
easu
rem
ent..
..
Nominal 5 M NaOH Nominal 10 M NaOH Nominal 12 M NaOH perfect match
Figure 4.3. Expected and Measured Na/Mo Concentration Ratios in the High-Caustic Leach Tests
4.4 Kinetic Model Fitting
4.4.1 Data Preparation
The integration of the kinetic model. and ordinary differential equations, (Equation [4.2]) depends on the initial boehmite concentration(a) in moles boehmite per volume liquid, the initial total hydroxide(b) and dissolved Al molarities in the liquid, and the average temperature during the test. Liquid tracer concentrations and liquid densities were also needed to normalize the boehmite, total hydroxide, and dissolved Al concentrations to the liquid volume halfway between the conditions at the beginning and end of the test.
The initial boehmite concentration was calculated from the mass of boehmite added to the vessel, the mass of liquid in the vessel at time t = 0, and the density of the liquid at time t = 0. The mass of the liquid
(a) The terminology “boehmite concentration” is used for convenience. It is not actually a concentration, but a
ratio of moles of solid-phase Al to volume of liquid—in effect, it is the concentration increase in dissolved Al that would be generated if all the boehmite dissolved.
(b) The total hydroxide concentration, in molarity units, is the sum of the free hydroxide and one mole of hydroxide per mole of the aluminate ion complex, Al(OH)4
-.
4.10
was the sum of the masses of NaOH reagent, gibbsite (if present), and molybdate stock solution (if present). The initial boehmite concentration was normalized to the halfway-point volume condition, using a volume correction factor that was the average of the factors calculated from the Na and Mo concentrations.
The normalized initial total hydroxide molar concentration (CtOH,L,i) was calculated as the arithmetic average of all the normalized total hydroxide concentrations during the test. The averaging was intended to smooth out noise in the measurements; it was based on the fact that so long as liquid volume is constant and hydroxide reacts only with Al, the total hydroxide (which is the sum of aluminate and free hydroxide molarities) should be constant during the test. The total hydroxide molar concentration at each measurement time was calculated using data for free hydroxide and dissolved Al. It was then normalized to the halfway-point dilution condition to provide the set of data that were averaged to give the normalized initial condition for the kinetic model. The standard deviation of normalized total hydroxide concentrations was 4% or less of the average for each data set in the HHL tests.
The dissolved Al concentration at time 0 was converted to molarity and then normalized to the halfway-point dilution condition to provide the dissolved Al initial condition (CAl,L,0) for the kinetic model. The subsequent dissolved Al concentrations (CAl,L) were similarly converted and normalized to provide the data set to which the model predictions are compared. All the volume-normalization factors were the averages of factors calculated from Na and Mo concentrations. Because it was not certain whether sodium aluminate had precipitated during testing (see Section 4.3.2), Na and Mo were both treated as liquid tracers.
The complete kinetic equation includes an Arrhenius term to account for temperature, as shown in Equation (4.2). The temperature varies slightly throughout the test and is not an initial condition. The temperature used in modeling was the arithmetic average of the temperatures measured at all sample times during leaching.
The saturated aluminum concentration 0,*,LAlC was calculated from the normalized initial total
hydroxide concentration and the average temperature, using the correlations given by Panias et al. (2001).
4.4.2 Boehmite Leach Factors
The final boehmite leach factors were calculated using Equation (4.4). Since the leach factors were not the main focus of the HHL tests, they are not discussed in detail in this report. The leach factors are tabulated in Table A.1 and Table A.2 in Appendix A together with the conditions that produced them.
As a rough cross-check, the leach factors calculated from Equation (4.4) were compared to a pseudo-leach-factor calculated as one minus the ratio of the final washed dried solid mass to the initial boehmite mass. In general, the match was close, with the greatest discrepancies being seen in tests where little leaching occurred because of low temperatures or high initial aluminate saturation.
Note that the factor calculated from the solid masses approximates the leach factor, but does not account for the mass of solids removed in samples. The mass-based factor is expected to overestimate the leach factor by attributing the solids removed as samples to leaching alone. However, if the washing of the final solids precipitated aluminum hydroxide from the Al dissolved in the interstitial liquid, the final
4.11
solid mass would be greater than the true mass of leached solids, causing the mass-based factor to underestimate the leach factor. This may explain some of the negative values for the mass-based factor that appear in Table A.1.
4.4.3 Kinetic Model
The potential fitting parameters in Equation 4.2 are k, Ea, B, H, and A. Mechanistically, these represent the intrinsic rate constant (including the initial specific area) and the dependence of rate of reaction on temperature, specific area, free hydroxide concentration, and initial aluminate concentration. In past studies (Russell et al. 2009a, 2009b), the reaction dependences have been considered to be Ea = 120 kJ/mole (consistent with some values reported in the literature), B = 2/3 (shrinking core model for a smooth spherical particle), H = 1 (from the reaction stoichiometry), and A = 1 (assumes the fraction of reaction sites initially occupied by aluminate ions equals the fraction of saturation in the liquid).
The entire database consisted of 64 runs, 32 runs from the high-caustic test series and 32 runs made in previous tests (Russell 2009a, 2009b). Many of these runs were considered unsuitable for use in fitting the model because low temperatures or high initial aluminate saturation caused the leached increment of aluminum concentration to be in the “noise” of measurement. These low-leach runs could weight the parameters in a way that did not represent leaching under processing conditions.
The database that was used to fit the kinetic model was a subset that contained 39 runs and 299 data points. The subset was selected from runs with reasonably measurable leaching. It included 1) runs at 80 to 100°C where the initial aluminate saturation was 70% or less; 2) the runs at 60°C with nominal 10 M and 12 M NaOH and 0% initial saturation; and 3) runs at 60°C and 100°C with nominal 1 M NaOH and 0% initial saturation. The runs that were used in kinetic model fitting are marked with a star in Tables A.3 and A.4, which are tabulations of the measured test parameters (not the targets, as in Table 3.1).
The ranges of the independent variables in the fitting database were
CtOH,L,0: 1 M to 13 M; most values tend to cluster near 5 M, 10 M, and 12 M
T: 60°C to 100°C; most values are 85°C or 100°C
0,*,0,, / LAlLAl CC : 0% to 70%.
Model fitting was carried out by minimizing the sum of the squares of the residual errors (SSRs), where the SSR is the predicted aluminate concentration minus the measured concentration at the same time. The summation included all 299 points in the database. Note that the 299-point set did not include initial concentrations because the initial predicted concentration for each run was defined as equal to the measurement (after normalization). The SOLVER module of Excel™ was used to perform the minimization.(a)
The sum of the squares of the differences between the measured aluminate concentrations and the mean of the measurements for each run was also calculated. For the same 39 runs described above, there
(a) The standard SOLVER settings were used: tangent method for making estimates, forward derivatives, Newton
search routine, and a convergence criterion of 0.0001.
4.12
were 260 points where differences were calculated, because initial concentrations were included. The sum of the squares of the differences was 33.324.
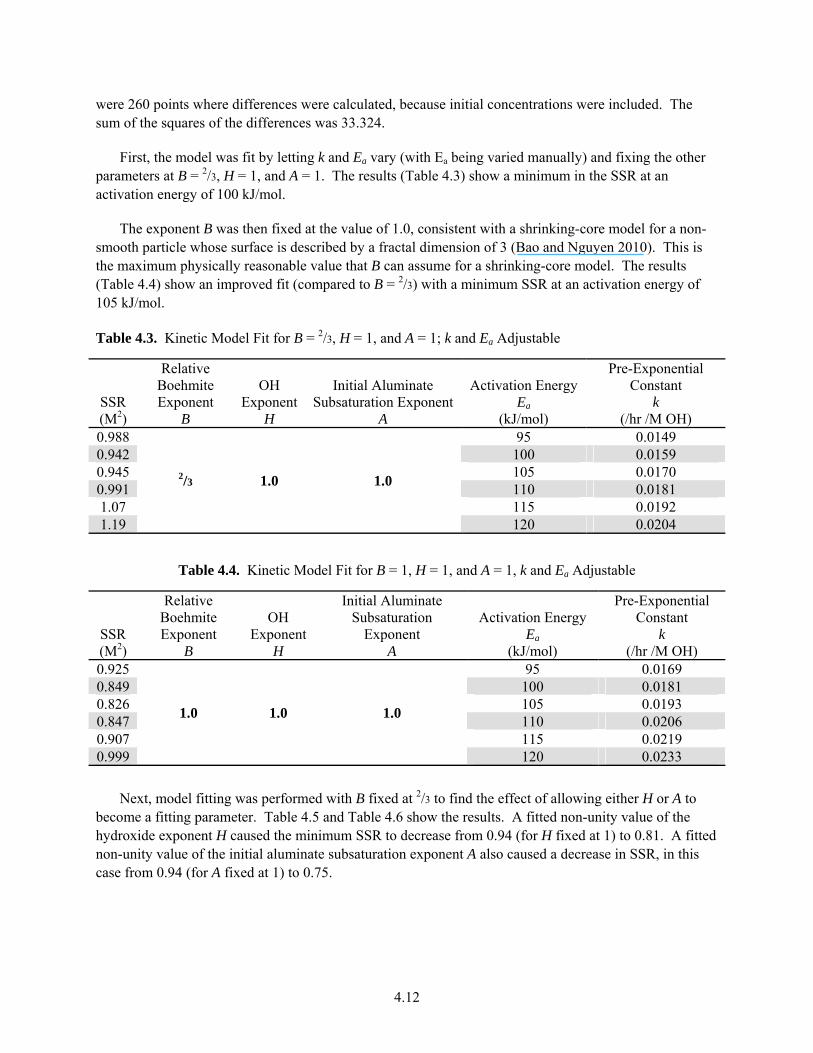
First, the model was fit by letting k and Ea vary (with Ea being varied manually) and fixing the other parameters at B = 2/3, H = 1, and A = 1. The results (Table 4.3) show a minimum in the SSR at an activation energy of 100 kJ/mol.
The exponent B was then fixed at the value of 1.0, consistent with a shrinking-core model for a non-smooth particle whose surface is described by a fractal dimension of 3 (Bao and Nguyen 2010). This is the maximum physically reasonable value that B can assume for a shrinking-core model. The results (Table 4.4) show an improved fit (compared to B = 2/3) with a minimum SSR at an activation energy of 105 kJ/mol.
Table 4.3. Kinetic Model Fit for B = 2/3, H = 1, and A = 1; k and Ea Adjustable
SSR (M2)
Relative Boehmite Exponent
B
OH Exponent
H
Initial Aluminate Subsaturation Exponent
A
Activation Energy Ea
(kJ/mol)
Pre-Exponential Constant
k (/hr /M OH)
0.988
2/3 1.0 1.0
95 0.0149 0.942 100 0.0159 0.945 105 0.0170 0.991 110 0.0181 1.07 115 0.0192 1.19 120 0.0204
Table 4.4. Kinetic Model Fit for B = 1, H = 1, and A = 1, k and Ea Adjustable
SSR (M2)
Relative Boehmite Exponent
B
OH Exponent
H
Initial Aluminate Subsaturation
Exponent A
Activation Energy Ea
(kJ/mol)
Pre-Exponential Constant
k (/hr /M OH)
0.925
1.0 1.0 1.0
95 0.0169 0.849 100 0.0181 0.826 105 0.0193 0.847 110 0.0206 0.907 115 0.0219 0.999 120 0.0233
Next, model fitting was performed with B fixed at 2/3 to find the effect of allowing either H or A to become a fitting parameter. Table 4.5 and Table 4.6 show the results. A fitted non-unity value of the hydroxide exponent H caused the minimum SSR to decrease from 0.94 (for H fixed at 1) to 0.81. A fitted non-unity value of the initial aluminate subsaturation exponent A also caused a decrease in SSR, in this case from 0.94 (for A fixed at 1) to 0.75.
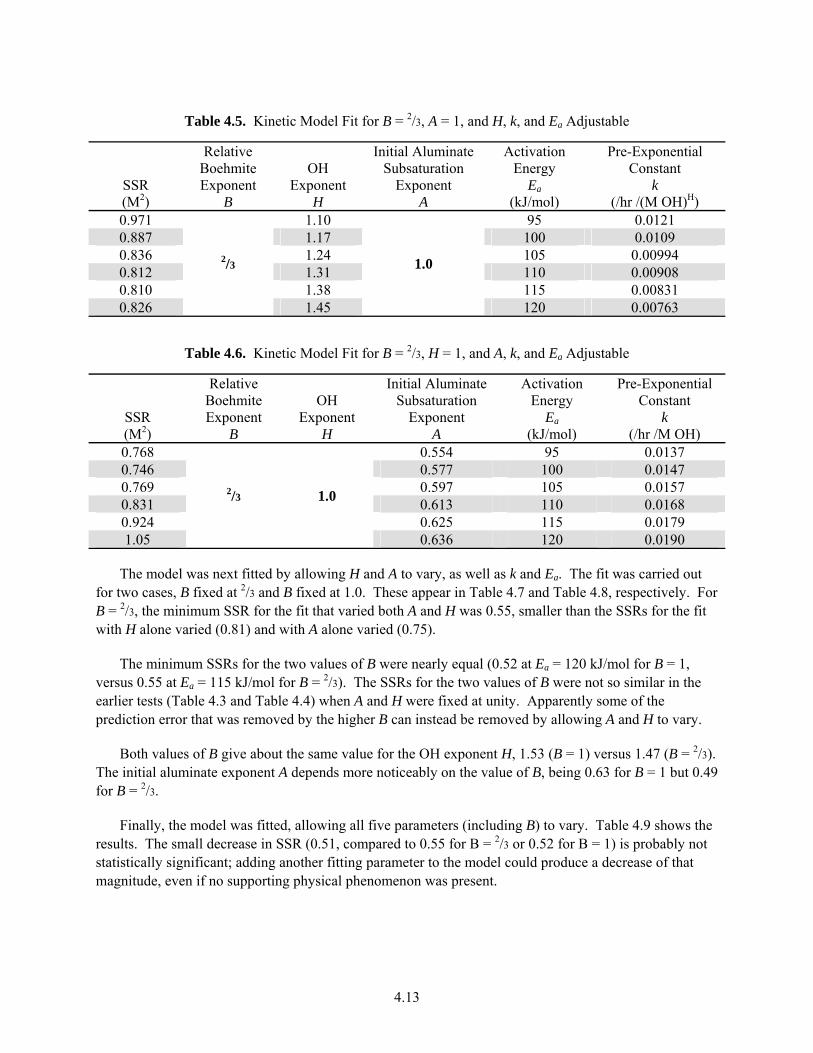
4.13
Table 4.5. Kinetic Model Fit for B = 2/3, A = 1, and H, k, and Ea Adjustable
SSR (M2)
Relative Boehmite Exponent
B
OH Exponent
H
Initial Aluminate Subsaturation
Exponent A
Activation Energy
Ea (kJ/mol)
Pre-Exponential Constant
k (/hr /(M OH)H)
0.971
2/3
1.10
1.0
95 0.0121 0.887 1.17 100 0.0109 0.836 1.24 105 0.00994 0.812 1.31 110 0.00908 0.810 1.38 115 0.00831 0.826 1.45 120 0.00763
Table 4.6. Kinetic Model Fit for B = 2/3, H = 1, and A, k, and Ea Adjustable
SSR (M2)
Relative Boehmite Exponent
B
OH Exponent
H
Initial Aluminate Subsaturation
Exponent A
Activation Energy
Ea (kJ/mol)
Pre-Exponential Constant
k (/hr /M OH)
0.768
2/3 1.0
0.554 95 0.0137 0.746 0.577 100 0.0147 0.769 0.597 105 0.0157 0.831 0.613 110 0.0168 0.924 0.625 115 0.0179 1.05 0.636 120 0.0190
The model was next fitted by allowing H and A to vary, as well as k and Ea. The fit was carried out for two cases, B fixed at 2/3 and B fixed at 1.0. These appear in Table 4.7 and Table 4.8, respectively. For B = 2/3, the minimum SSR for the fit that varied both A and H was 0.55, smaller than the SSRs for the fit with H alone varied (0.81) and with A alone varied (0.75).
The minimum SSRs for the two values of B were nearly equal (0.52 at Ea = 120 kJ/mol for B = 1, versus 0.55 at Ea = 115 kJ/mol for B = 2/3). The SSRs for the two values of B were not so similar in the earlier tests (Table 4.3 and Table 4.4) when A and H were fixed at unity. Apparently some of the prediction error that was removed by the higher B can instead be removed by allowing A and H to vary.
Both values of B give about the same value for the OH exponent H, 1.53 (B = 1) versus 1.47 (B = 2/3). The initial aluminate exponent A depends more noticeably on the value of B, being 0.63 for B = 1 but 0.49 for B = 2/3.
Finally, the model was fitted, allowing all five parameters (including B) to vary. Table 4.9 shows the results. The small decrease in SSR (0.51, compared to 0.55 for B = 2/3 or 0.52 for B = 1) is probably not statistically significant; adding another fitting parameter to the model could produce a decrease of that magnitude, even if no supporting physical phenomenon was present.
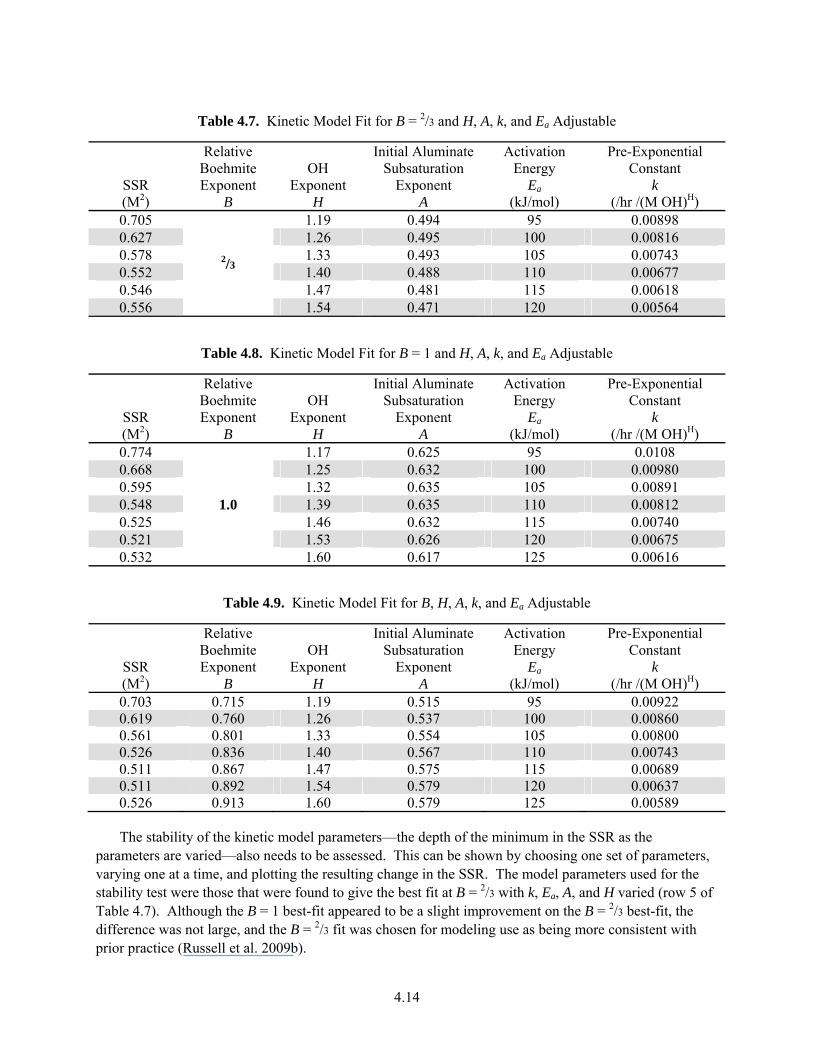
4.14
Table 4.7. Kinetic Model Fit for B = 2/3 and H, A, k, and Ea Adjustable
SSR (M2)
Relative Boehmite Exponent
B
OH Exponent
H
Initial Aluminate Subsaturation
Exponent A
Activation Energy
Ea (kJ/mol)
Pre-Exponential Constant
k (/hr /(M OH)H)
0.705
2/3
1.19 0.494 95 0.00898 0.627 1.26 0.495 100 0.00816 0.578 1.33 0.493 105 0.00743 0.552 1.40 0.488 110 0.00677 0.546 1.47 0.481 115 0.00618 0.556 1.54 0.471 120 0.00564
Table 4.8. Kinetic Model Fit for B = 1 and H, A, k, and Ea Adjustable
SSR (M2)
Relative Boehmite Exponent
B
OH Exponent
H
Initial Aluminate Subsaturation
Exponent A
Activation Energy
Ea (kJ/mol)
Pre-Exponential Constant
k (/hr /(M OH)H)
0.774
1.0
1.17 0.625 95 0.0108 0.668 1.25 0.632 100 0.00980 0.595 1.32 0.635 105 0.00891 0.548 1.39 0.635 110 0.00812 0.525 1.46 0.632 115 0.00740 0.521 1.53 0.626 120 0.00675 0.532 1.60 0.617 125 0.00616
Table 4.9. Kinetic Model Fit for B, H, A, k, and Ea Adjustable
SSR (M2)
Relative Boehmite Exponent
B
OH Exponent
H
Initial Aluminate Subsaturation
Exponent A
Activation Energy
Ea (kJ/mol)
Pre-Exponential Constant
k (/hr /(M OH)H)
0.703 0.715 1.19 0.515 95 0.00922 0.619 0.760 1.26 0.537 100 0.00860 0.561 0.801 1.33 0.554 105 0.00800 0.526 0.836 1.40 0.567 110 0.00743 0.511 0.867 1.47 0.575 115 0.00689 0.511 0.892 1.54 0.579 120 0.00637 0.526 0.913 1.60 0.579 125 0.00589
The stability of the kinetic model parameters—the depth of the minimum in the SSR as the parameters are varied—also needs to be assessed. This can be shown by choosing one set of parameters, varying one at a time, and plotting the resulting change in the SSR. The model parameters used for the stability test were those that were found to give the best fit at B = 2/3 with k, Ea, A, and H varied (row 5 of Table 4.7). Although the B = 1 best-fit appeared to be a slight improvement on the B = 2/3 best-fit, the difference was not large, and the B = 2/3 fit was chosen for modeling use as being more consistent with prior practice (Russell et al. 2009b).
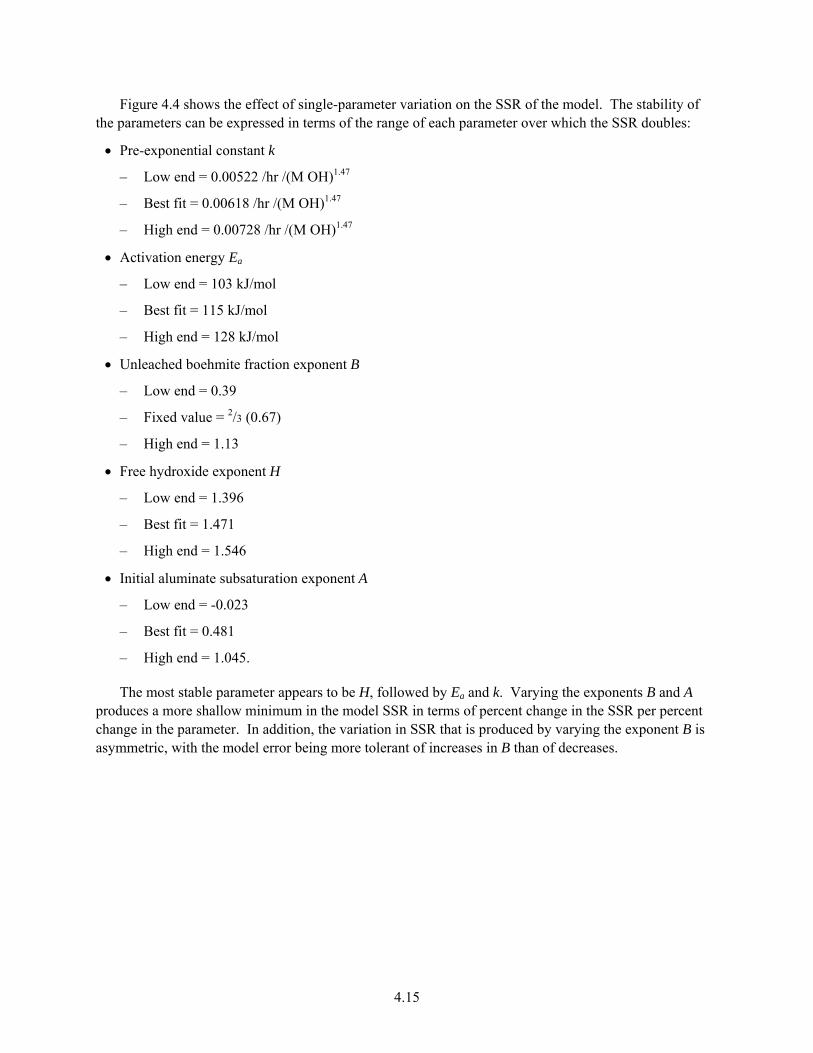
4.15
Figure 4.4 shows the effect of single-parameter variation on the SSR of the model. The stability of the parameters can be expressed in terms of the range of each parameter over which the SSR doubles:
Pre-exponential constant k
– Low end = 0.00522 /hr /(M OH)1.47
– Best fit = 0.00618 /hr /(M OH)1.47
– High end = 0.00728 /hr /(M OH)1.47
Activation energy Ea
– Low end = 103 kJ/mol
– Best fit = 115 kJ/mol
– High end = 128 kJ/mol
Unleached boehmite fraction exponent B
– Low end = 0.39
– Fixed value = 2/3 (0.67)
– High end = 1.13
Free hydroxide exponent H
– Low end = 1.396
– Best fit = 1.471
– High end = 1.546
Initial aluminate subsaturation exponent A
– Low end = -0.023
– Best fit = 0.481
– High end = 1.045.
The most stable parameter appears to be H, followed by Ea and k. Varying the exponents B and A produces a more shallow minimum in the model SSR in terms of percent change in the SSR per percent change in the parameter. In addition, the variation in SSR that is produced by varying the exponent B is asymmetric, with the model error being more tolerant of increases in B than of decreases.
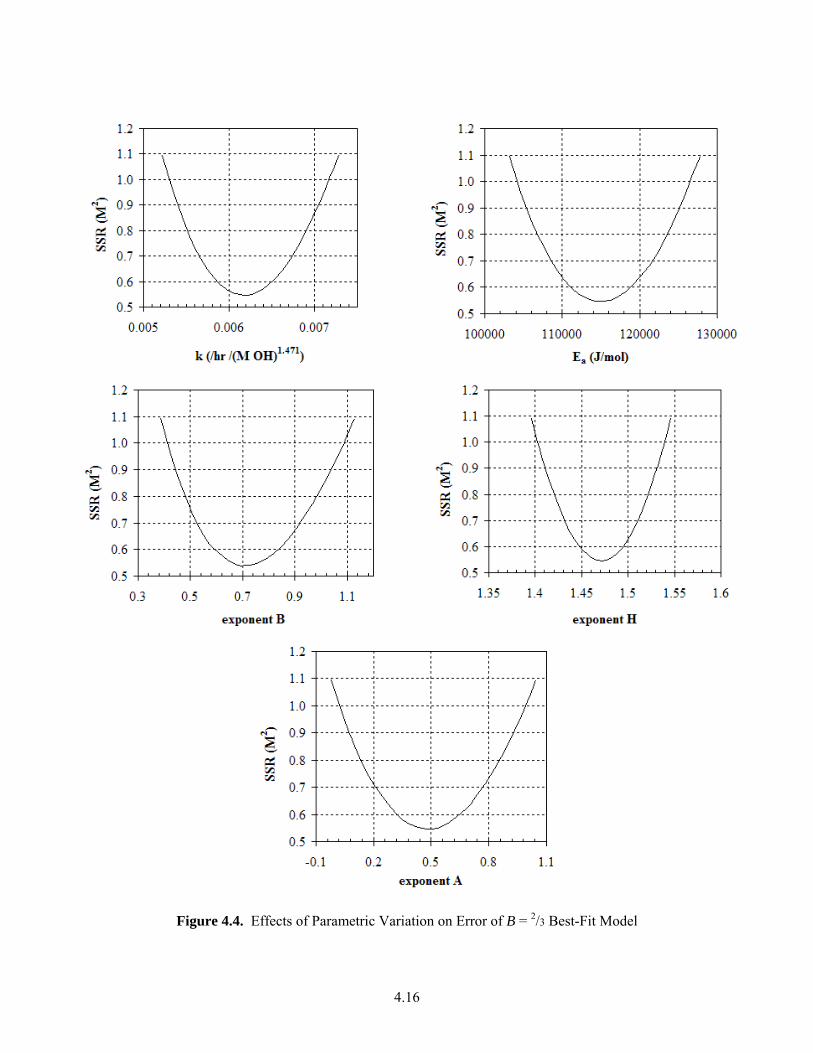
4.16
Figure 4.4. Effects of Parametric Variation on Error of B = 2/3 Best-Fit Model
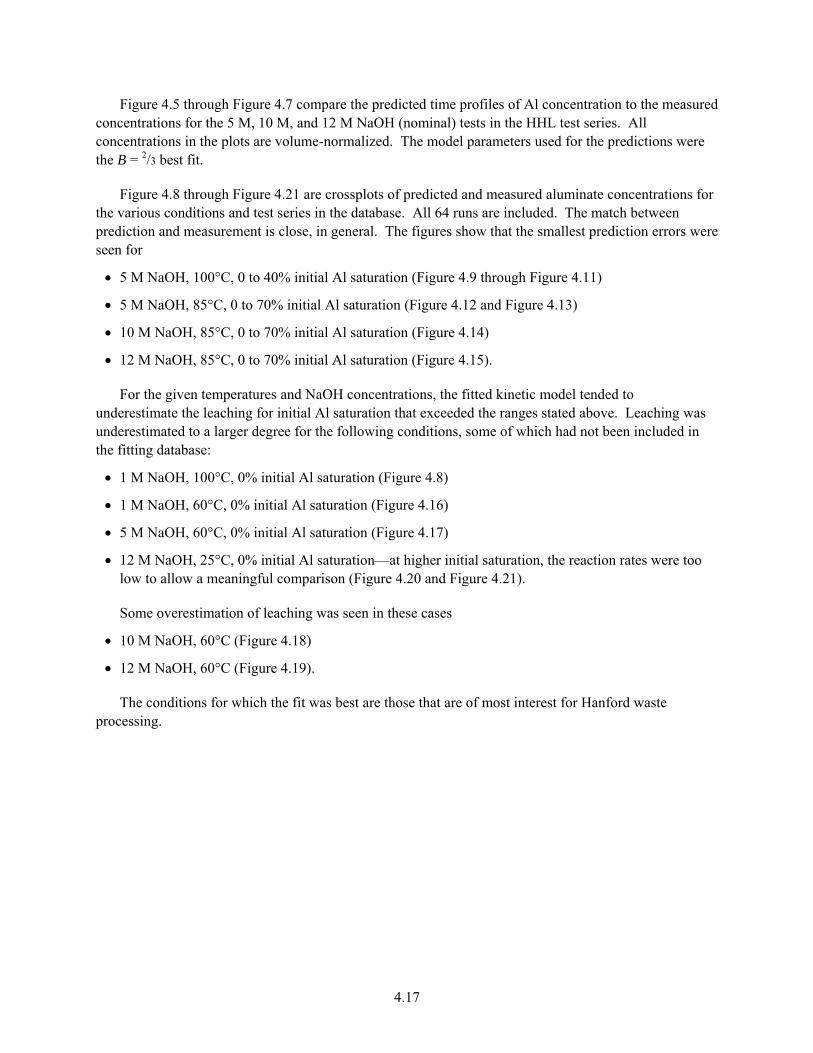
4.17
Figure 4.5 through Figure 4.7 compare the predicted time profiles of Al concentration to the measured concentrations for the 5 M, 10 M, and 12 M NaOH (nominal) tests in the HHL test series. All concentrations in the plots are volume-normalized. The model parameters used for the predictions were the B = 2/3 best fit.
Figure 4.8 through Figure 4.21 are crossplots of predicted and measured aluminate concentrations for the various conditions and test series in the database. All 64 runs are included. The match between prediction and measurement is close, in general. The figures show that the smallest prediction errors were seen for
5 M NaOH, 100°C, 0 to 40% initial Al saturation (Figure 4.9 through Figure 4.11)
5 M NaOH, 85°C, 0 to 70% initial Al saturation (Figure 4.12 and Figure 4.13)
10 M NaOH, 85°C, 0 to 70% initial Al saturation (Figure 4.14)
12 M NaOH, 85°C, 0 to 70% initial Al saturation (Figure 4.15).
For the given temperatures and NaOH concentrations, the fitted kinetic model tended to underestimate the leaching for initial Al saturation that exceeded the ranges stated above. Leaching was underestimated to a larger degree for the following conditions, some of which had not been included in the fitting database:
1 M NaOH, 100°C, 0% initial Al saturation (Figure 4.8)
1 M NaOH, 60°C, 0% initial Al saturation (Figure 4.16)
5 M NaOH, 60°C, 0% initial Al saturation (Figure 4.17)
12 M NaOH, 25°C, 0% initial Al saturation—at higher initial saturation, the reaction rates were too low to allow a meaningful comparison (Figure 4.20 and Figure 4.21).
Some overestimation of leaching was seen in these cases
10 M NaOH, 60°C (Figure 4.18)
12 M NaOH, 60°C (Figure 4.19).
The conditions for which the fit was best are those that are of most interest for Hanford waste processing.
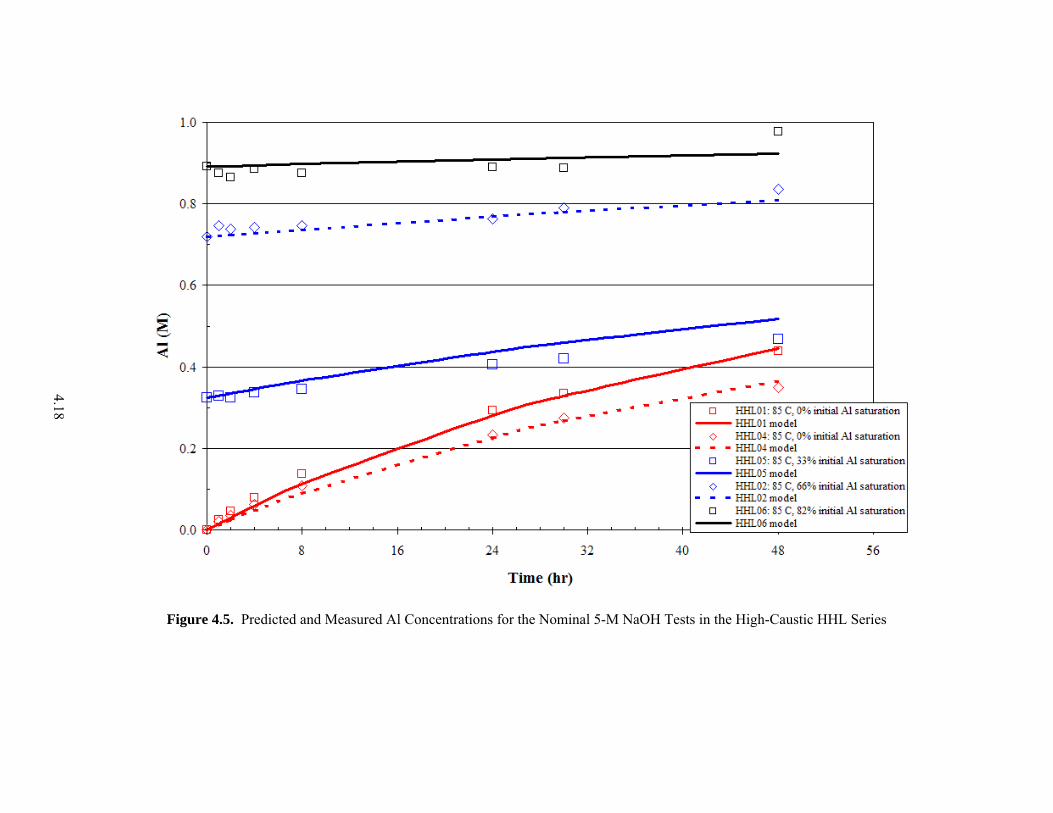
4.18
Figure 4.5. Predicted and Measured Al Concentrations for the Nominal 5-M NaOH Tests in the High-Caustic HHL Series
4.19
Figure 4.6. Predicted and Measured Al Concentrations for the Nominal 10-M NaOH Tests in the High-Caustic HHL Series
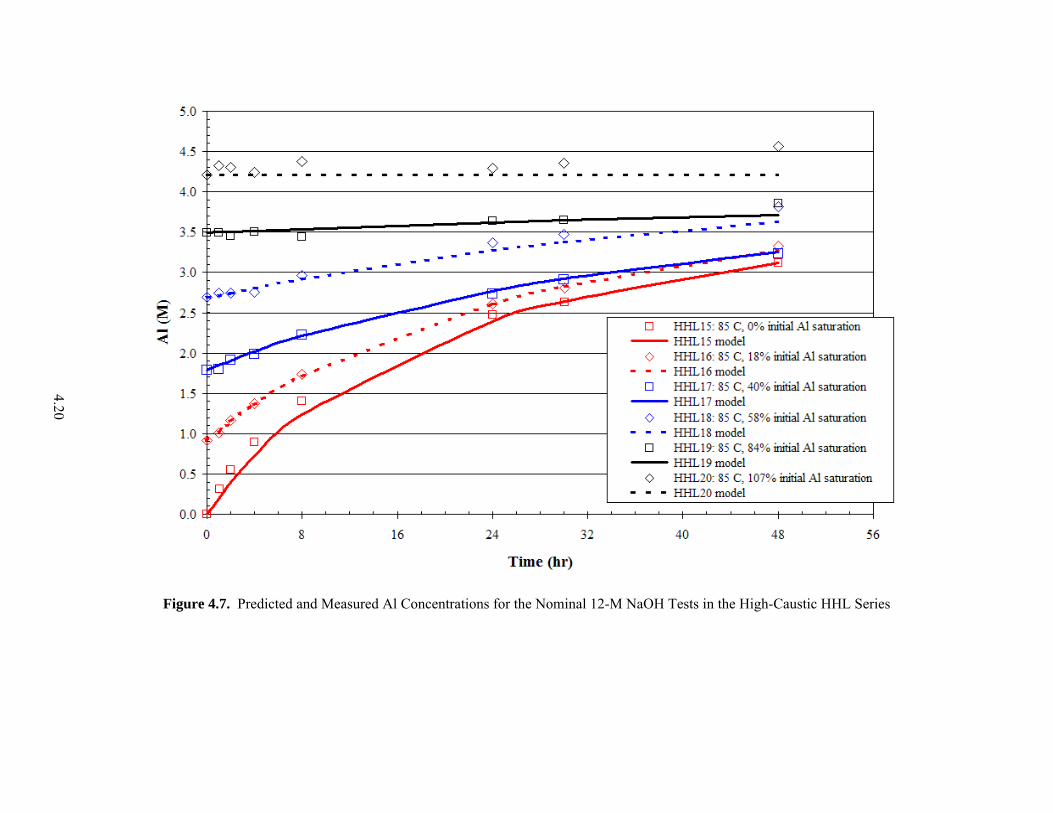
4.20
Figure 4.7. Predicted and Measured Al Concentrations for the Nominal 12-M NaOH Tests in the High-Caustic HHL Series
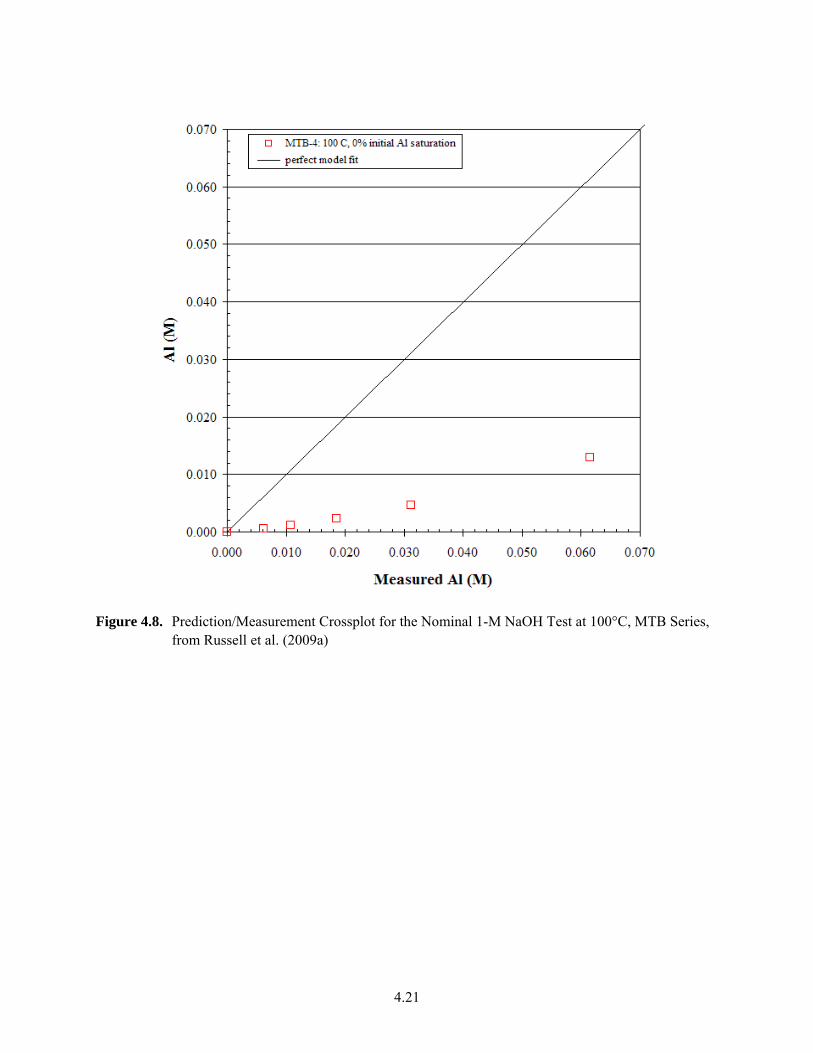
4.21
Figure 4.8. Prediction/Measurement Crossplot for the Nominal 1-M NaOH Test at 100°C, MTB Series, from Russell et al. (2009a)
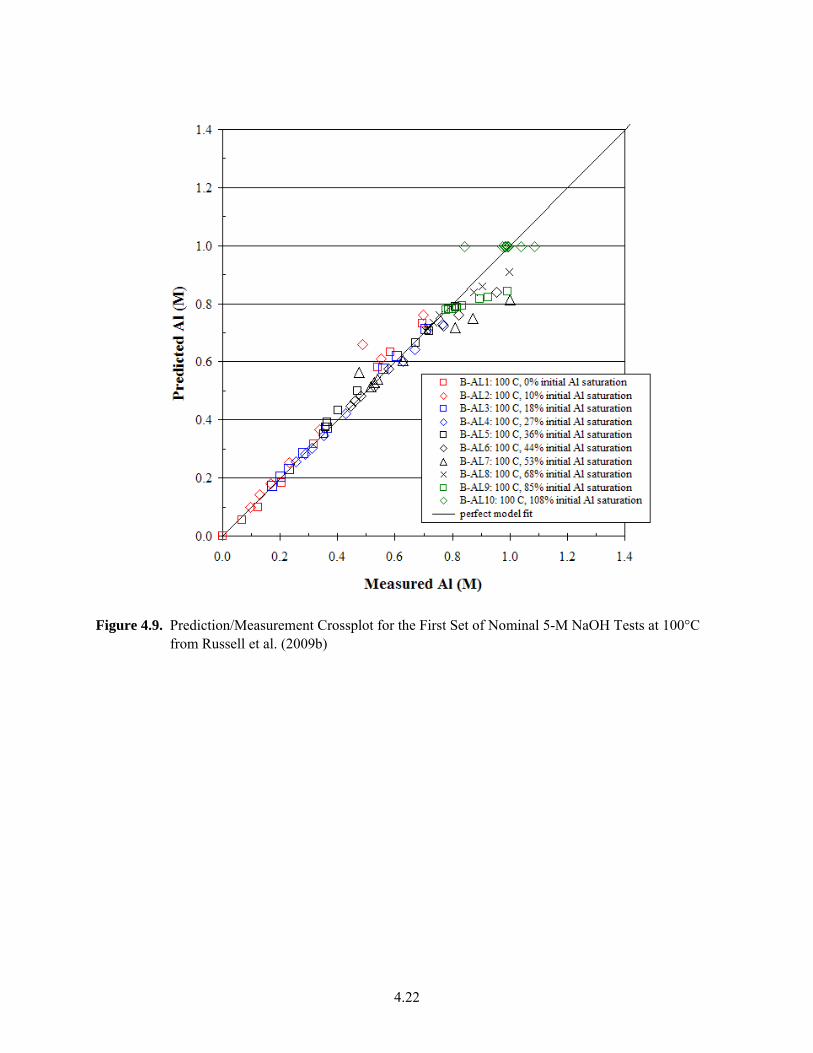
4.22
Figure 4.9. Prediction/Measurement Crossplot for the First Set of Nominal 5-M NaOH Tests at 100°C from Russell et al. (2009b)
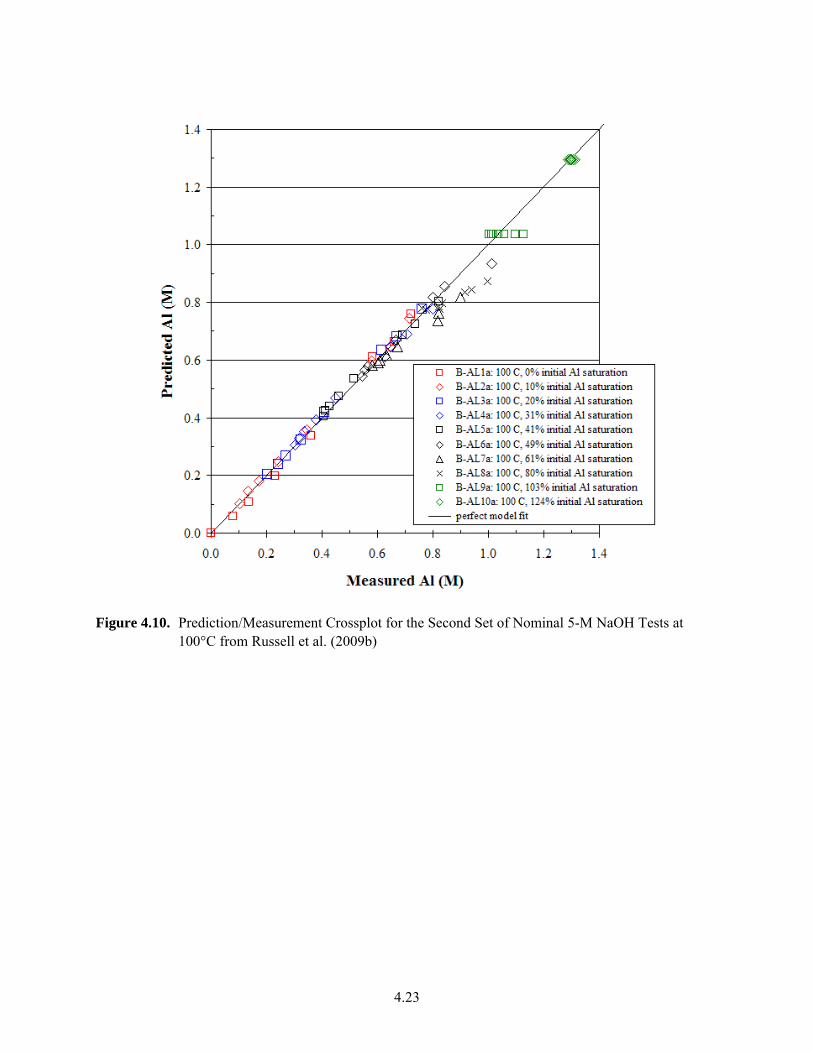
4.23
Figure 4.10. Prediction/Measurement Crossplot for the Second Set of Nominal 5-M NaOH Tests at 100°C from Russell et al. (2009b)
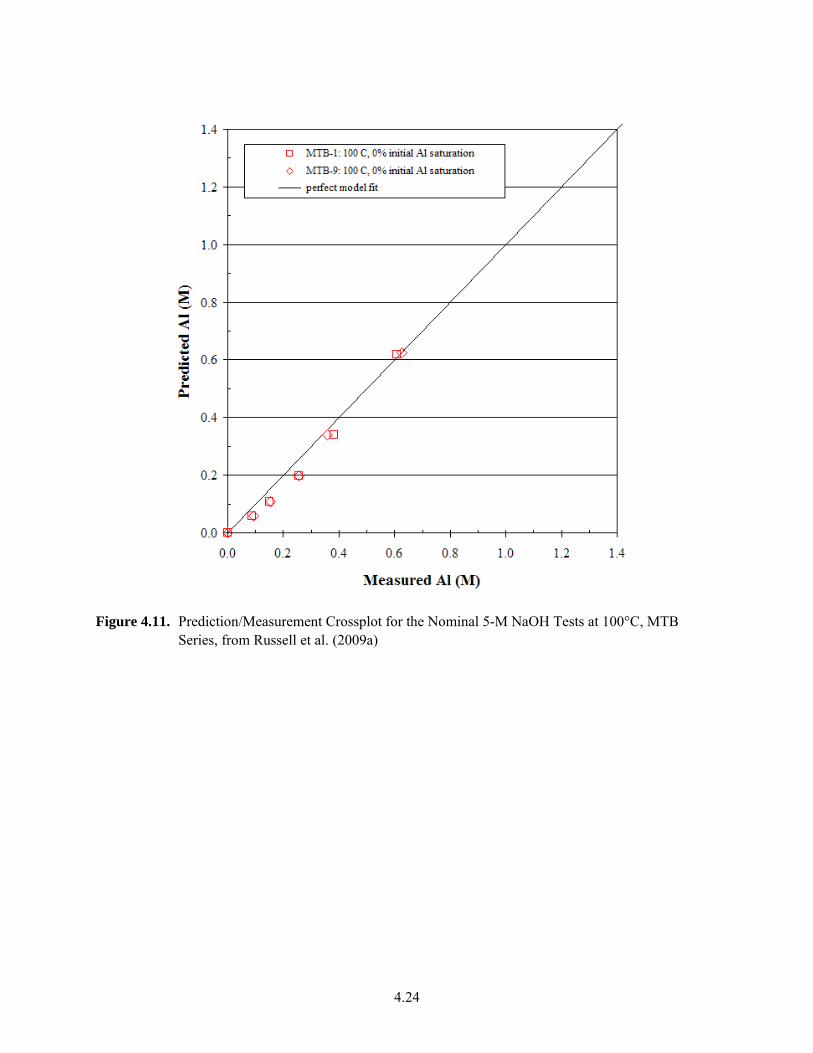
4.24
Figure 4.11. Prediction/Measurement Crossplot for the Nominal 5-M NaOH Tests at 100°C, MTB Series, from Russell et al. (2009a)
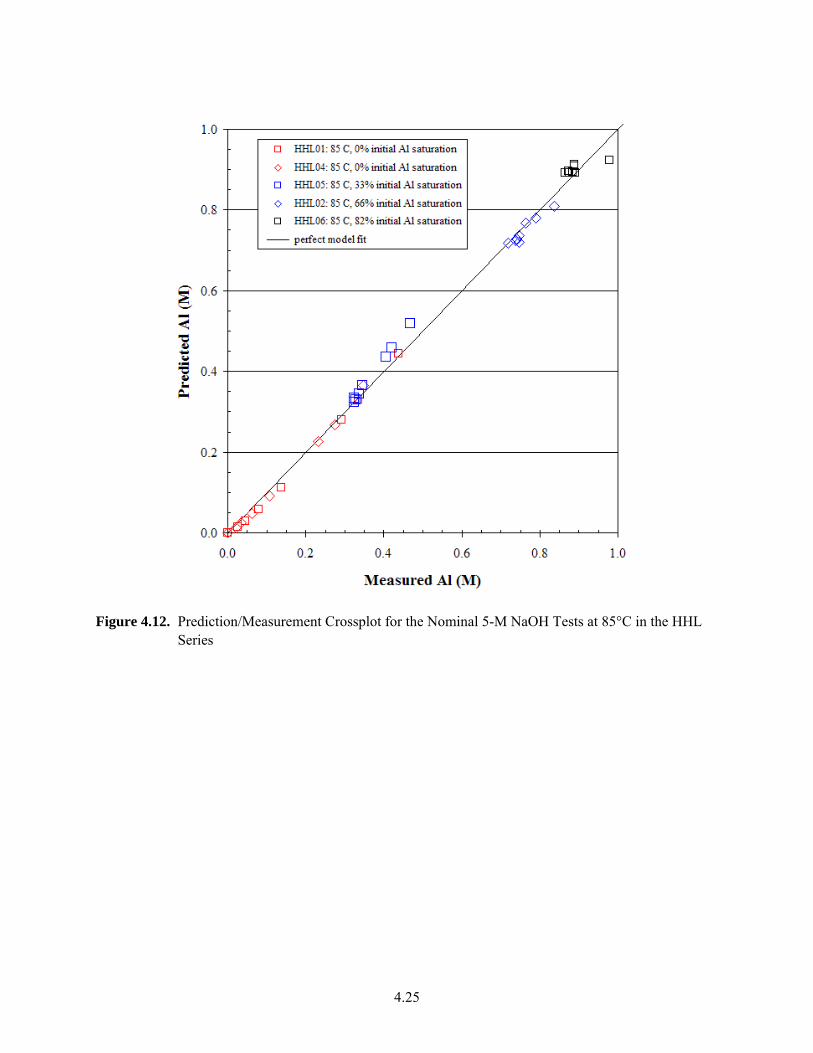
4.25
Figure 4.12. Prediction/Measurement Crossplot for the Nominal 5-M NaOH Tests at 85°C in the HHL Series
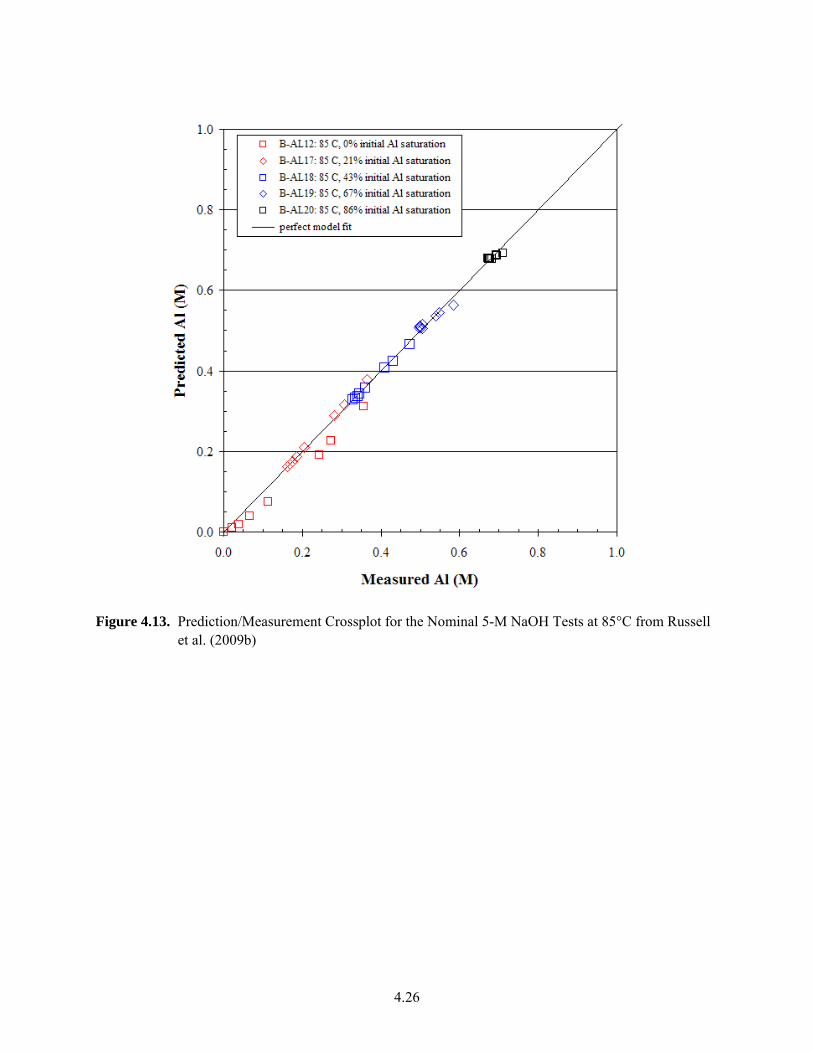
4.26
Figure 4.13. Prediction/Measurement Crossplot for the Nominal 5-M NaOH Tests at 85°C from Russell et al. (2009b)
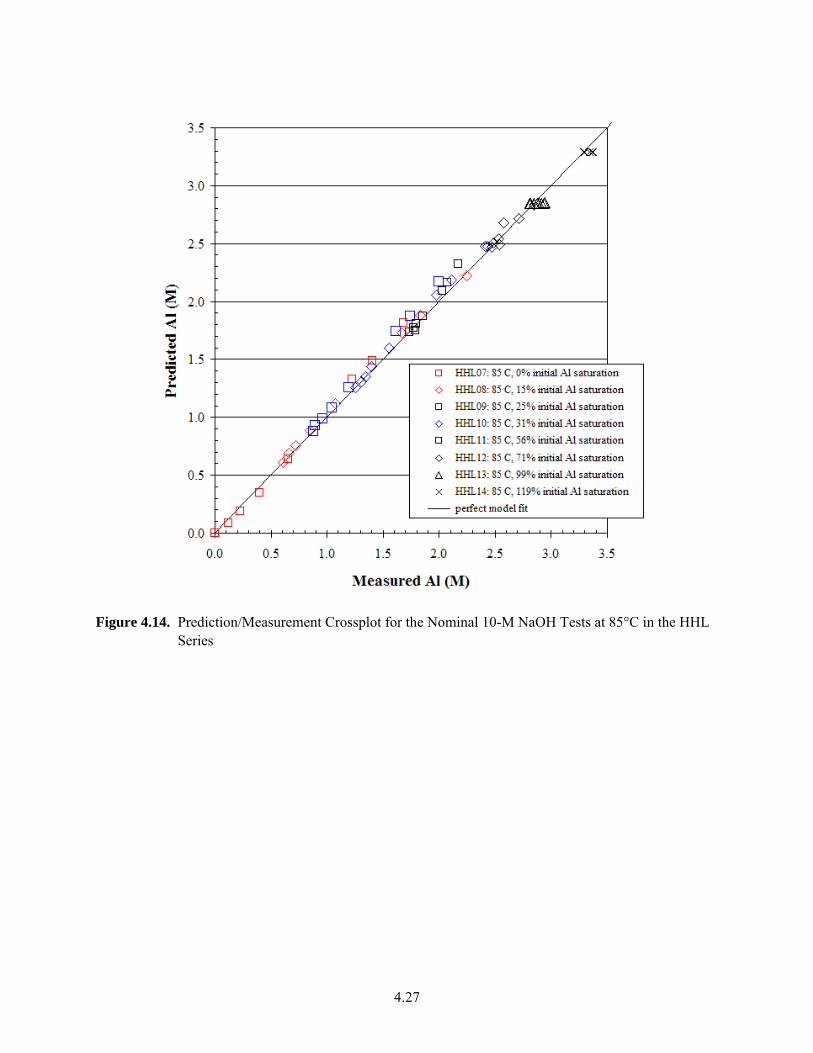
4.27
Figure 4.14. Prediction/Measurement Crossplot for the Nominal 10-M NaOH Tests at 85°C in the HHL Series
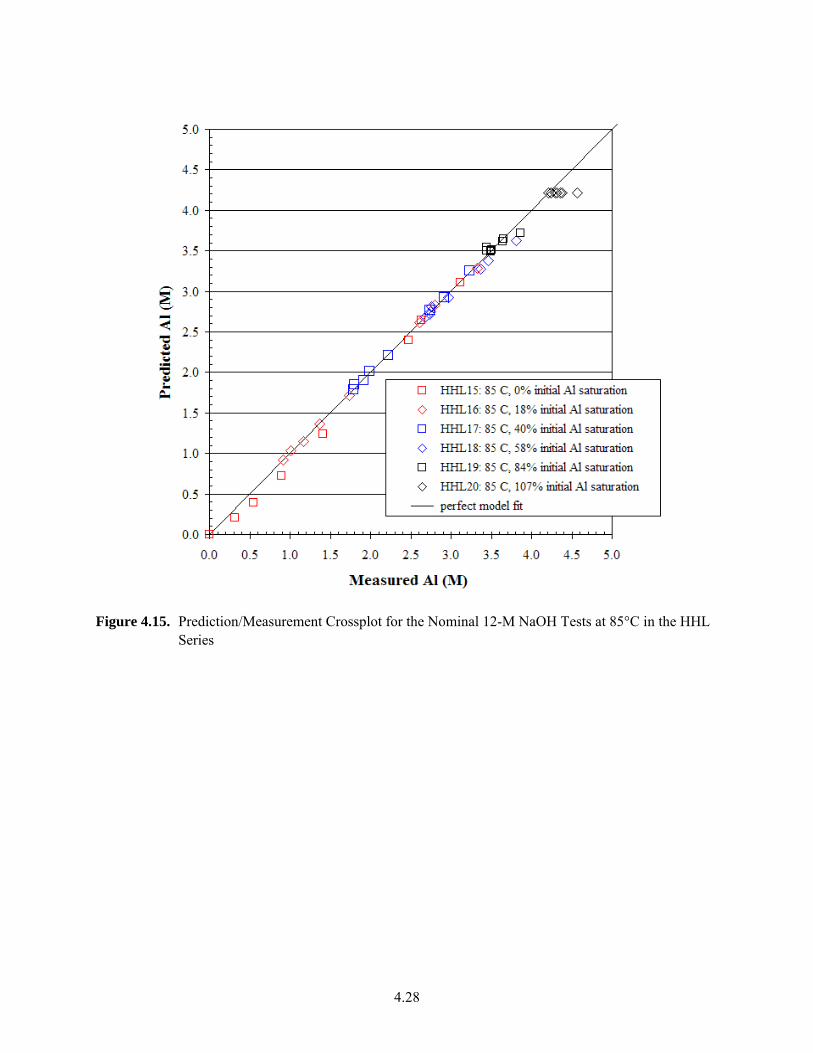
4.28
Figure 4.15. Prediction/Measurement Crossplot for the Nominal 12-M NaOH Tests at 85°C in the HHL Series
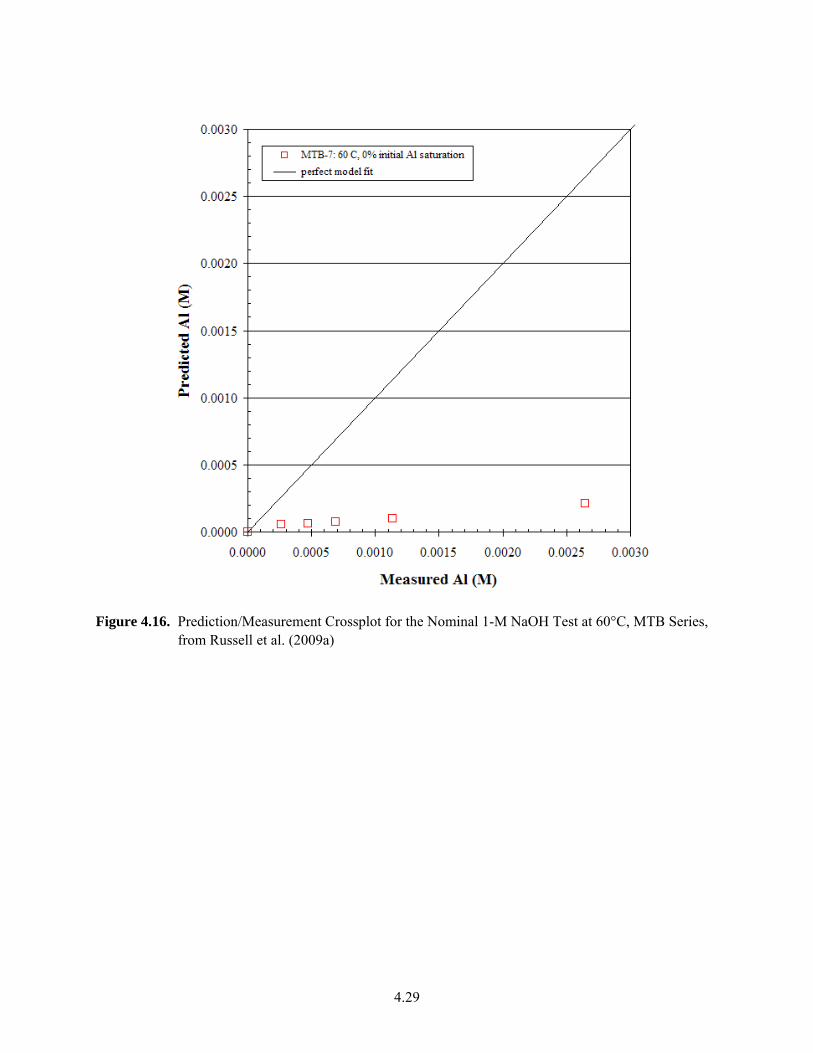
4.29
Figure 4.16. Prediction/Measurement Crossplot for the Nominal 1-M NaOH Test at 60°C, MTB Series, from Russell et al. (2009a)
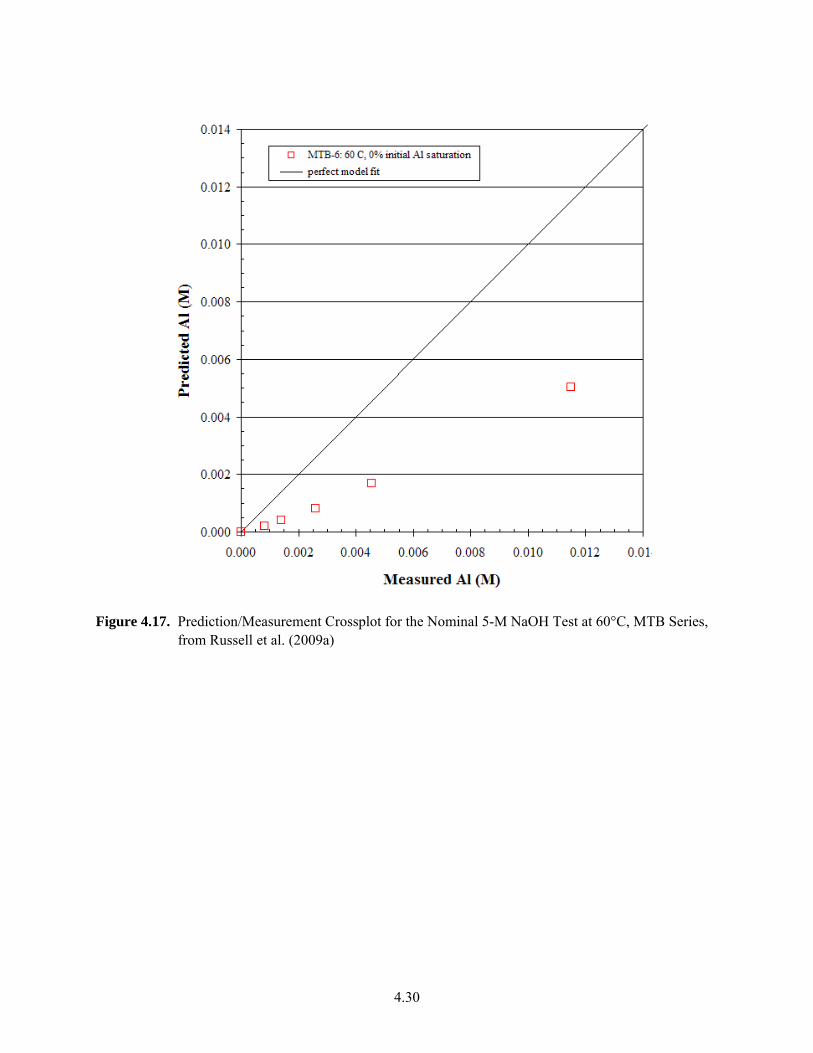
4.30
Figure 4.17. Prediction/Measurement Crossplot for the Nominal 5-M NaOH Test at 60°C, MTB Series, from Russell et al. (2009a)
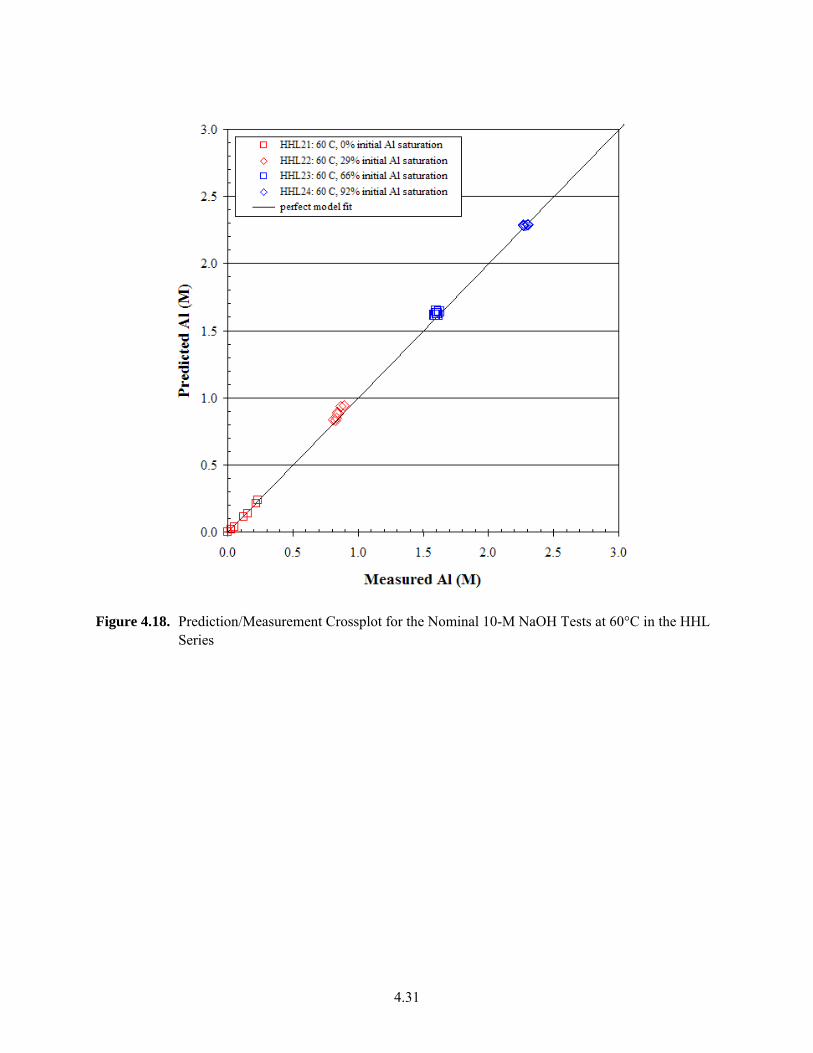
4.31
Figure 4.18. Prediction/Measurement Crossplot for the Nominal 10-M NaOH Tests at 60°C in the HHL Series
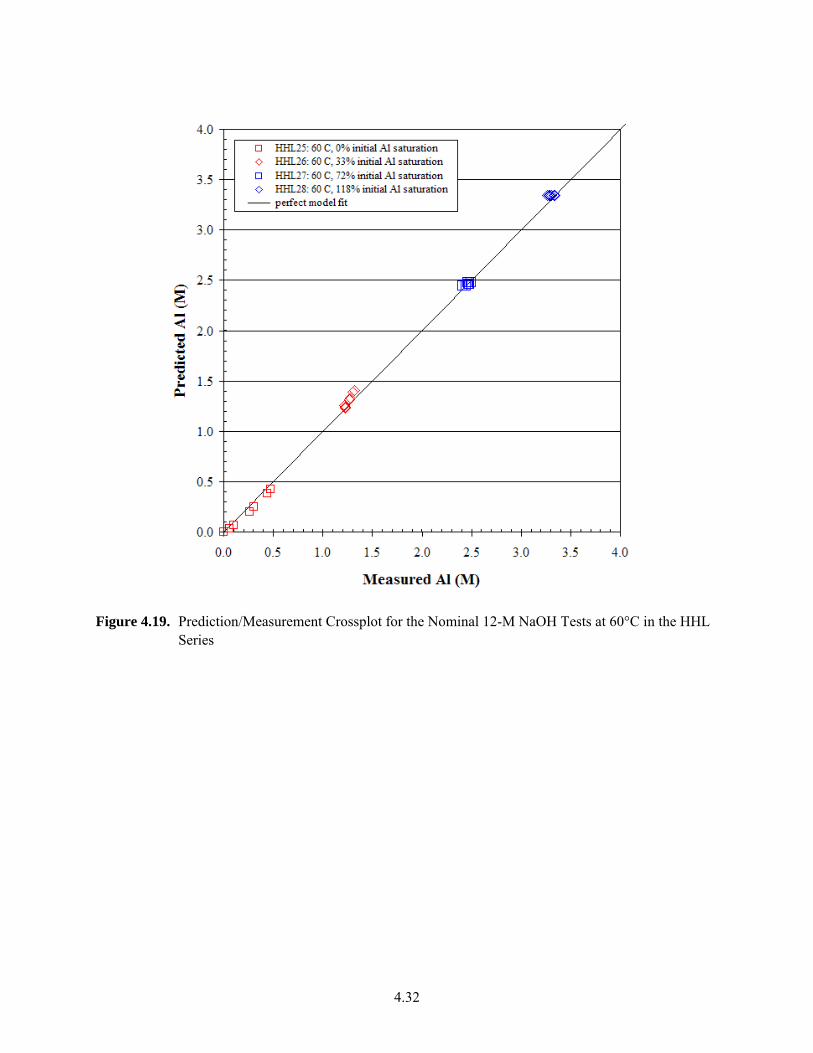
4.32
Figure 4.19. Prediction/Measurement Crossplot for the Nominal 12-M NaOH Tests at 60°C in the HHL Series
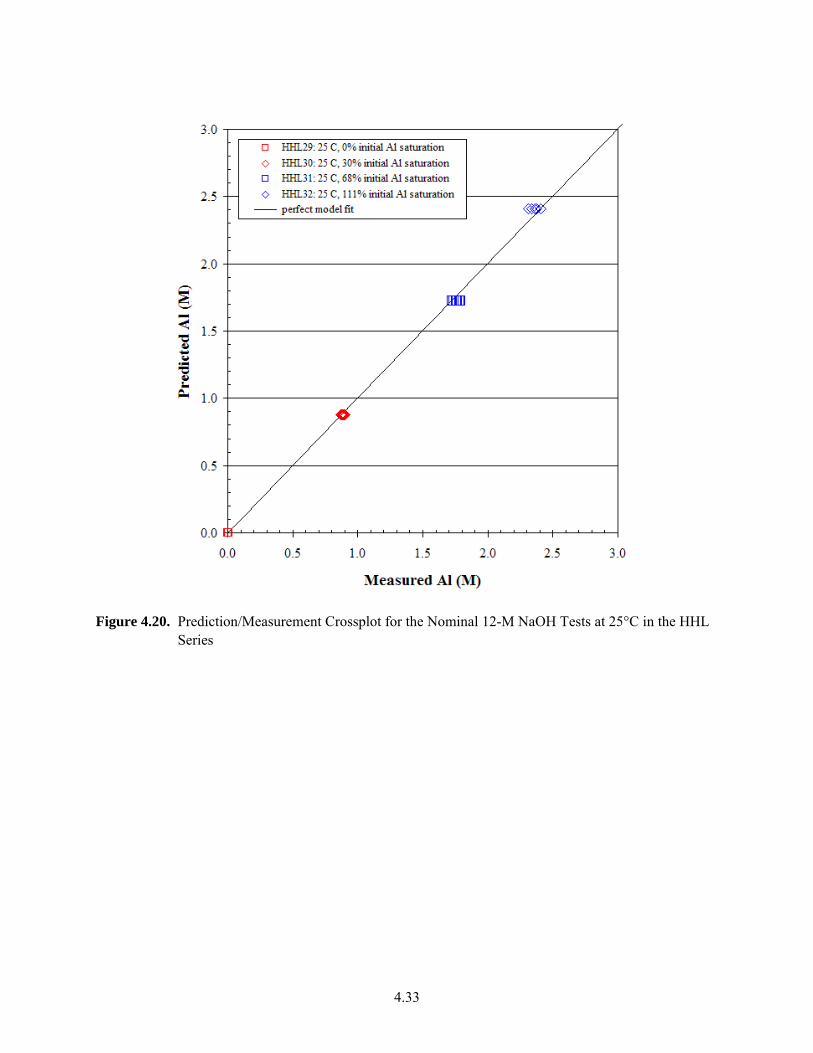
4.33
Figure 4.20. Prediction/Measurement Crossplot for the Nominal 12-M NaOH Tests at 25°C in the HHL Series
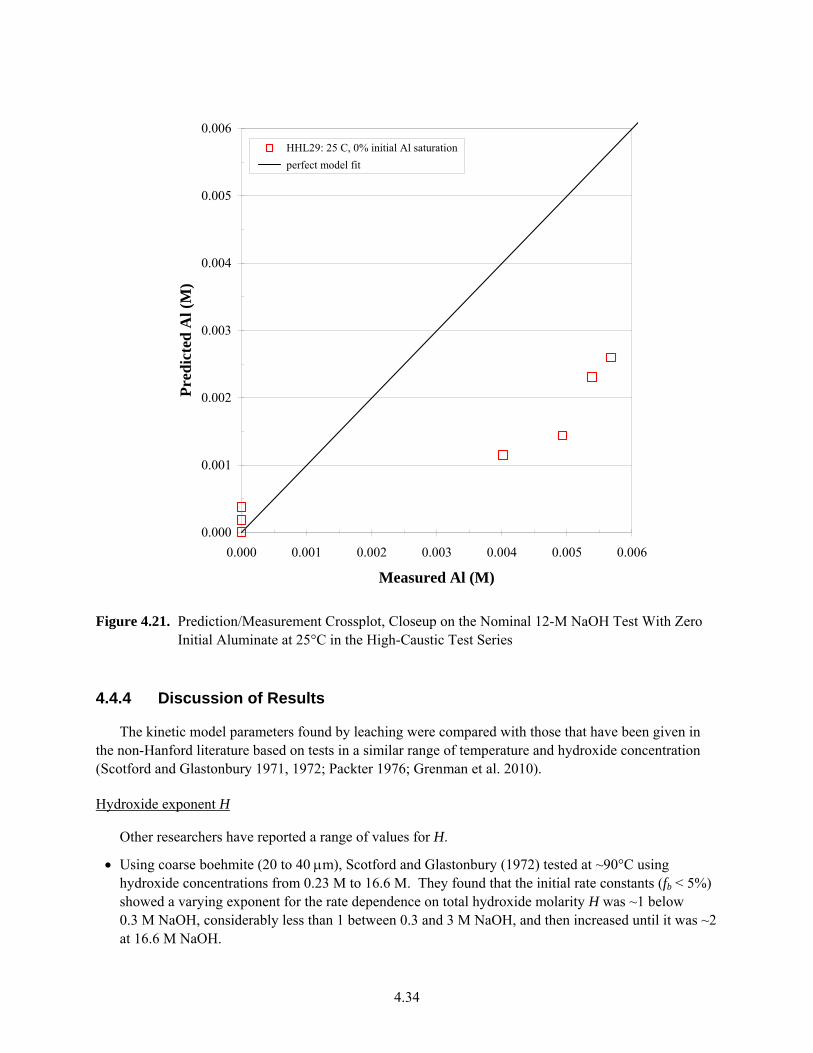
4.34
0.000
0.001
0.002
0.003
0.004
0.005
0.006
0.000 0.001 0.002 0.003 0.004 0.005 0.006
Measured Al (M)
Pre
dic
ted
Al (
M).
....
HHL29: 25 C, 0% initial Al saturation
perfect model fit
Figure 4.21. Prediction/Measurement Crossplot, Closeup on the Nominal 12-M NaOH Test With Zero Initial Aluminate at 25°C in the High-Caustic Test Series
4.4.4 Discussion of Results
The kinetic model parameters found by leaching were compared with those that have been given in the non-Hanford literature based on tests in a similar range of temperature and hydroxide concentration (Scotford and Glastonbury 1971, 1972; Packter 1976; Grenman et al. 2010). Hydroxide exponent H
Other researchers have reported a range of values for H.
Using coarse boehmite (20 to 40 m), Scotford and Glastonbury (1972) tested at ~90°C using hydroxide concentrations from 0.23 M to 16.6 M. They found that the initial rate constants (fb < 5%) showed a varying exponent for the rate dependence on total hydroxide molarity H was ~1 below 0.3 M NaOH, considerably less than 1 between 0.3 and 3 M NaOH, and then increased until it was ~2 at 16.6 M NaOH.
4.35
Using very fine boehmite (< 0.1 m), Packter (1976) ran tests between 35°C and 65°C using hydroxide concentrations from 1 M to 8 M NaOH. He found that the rate constants showed a linear dependence on the mean ionic activity (a±) of the hydroxide solutions. His data indicate this is equivalent to a hydroxide molarity exponent greater than 1. His rate constants were not initial rate constants, but were fitted to data that extended out to fb > 0.25. It is not clear whether Packter accounted for consumption of hydroxide by the reaction or instead used total hydroxide as the independent variable.
Using fine boehmite (d50 = 1.3 m), Grenman et al. (2010) tested between 60°C and 85°C and between 2 M and 6 M NaOH. They found that the initial rate constants (fb < 5%) depended on the 0.5 power of the hydroxide molarity.
The hydroxide exponent determined by the present study was ~1.5 for tests in which 50% of the boehmite volume was < 8 m and where most of the total hydroxide concentrations were near 5 M, 10 M, or 12 M, and most of the temperatures were 85°C or 100°C. This result was stable in terms of its effect on model error.
It is not immediately evident that the H values found in the literature are consistent with each other or with the present study. The cited studies used boehmite particles of different sizes, different temperature ranges, different extents of reaction, and different assumptions for the model parameters other than hydroxide concentration. Packter (1976) was the only researcher who fitted to data at a high leach fraction. This study also has the exponent (when put in terms of dependence on hydroxide molarity) that is closest to the H found by the present study. Plotting the rate constants that Packter reports for 50°C against the hydroxide molarities gives H ~ 1.5. However, Packter’s model depended on a fixed value of B = 4/3, which is higher than the data in the present study can justify. Activation Energy Ea:
The literature reports activation energies for boehmite dissolution that range from 99.1 kJ/mol (Grenman et al. 2010) to ~125 kJ/mol (Scotford and Glastonbury 1971, Packter 1976). The present study obtained a value of 115 kJ/mol (to the nearest 5 kJ/mol), which is consistent with the other findings. Unleached Boehmite Fraction Exponent B
The exponent B reflects the effect on leach rate of the decrease in surface area that is caused by dissolution. Values of B in the range of 2/3 to 1.0 are appropriate for describing cases where a unimolecular chemical reaction at the surface controls the dissolution rate.(a) For smooth spherical particles, B is 2/3; for fractal surfaces, the upper limit of B is 1.0, which is reached at a fractal dimension of 3 (Bao and Nguyen 2010).
Two of the studies in the literature (Scotford and Glastonbury 1971, 1972) used only data for initial rates (from fb = 2% to fb = 5%), a region where dfb/dt was linear. They refer to particle breakup, but do not discuss a dependence of rate on the change in specific area. As already noted, Packter (1976) used
(a) If the surface reaction was bimolecular, with H2O and OH- adsorbed on adjacent sites, the reaction rate would
depend on the square of the number of sites. The reaction rate could be assumed to depend on the square of the specific area, so the exponent B would be between 4/3 (for a smooth particle surface) and 2.0 (for a surface with fractal dimension of 3).
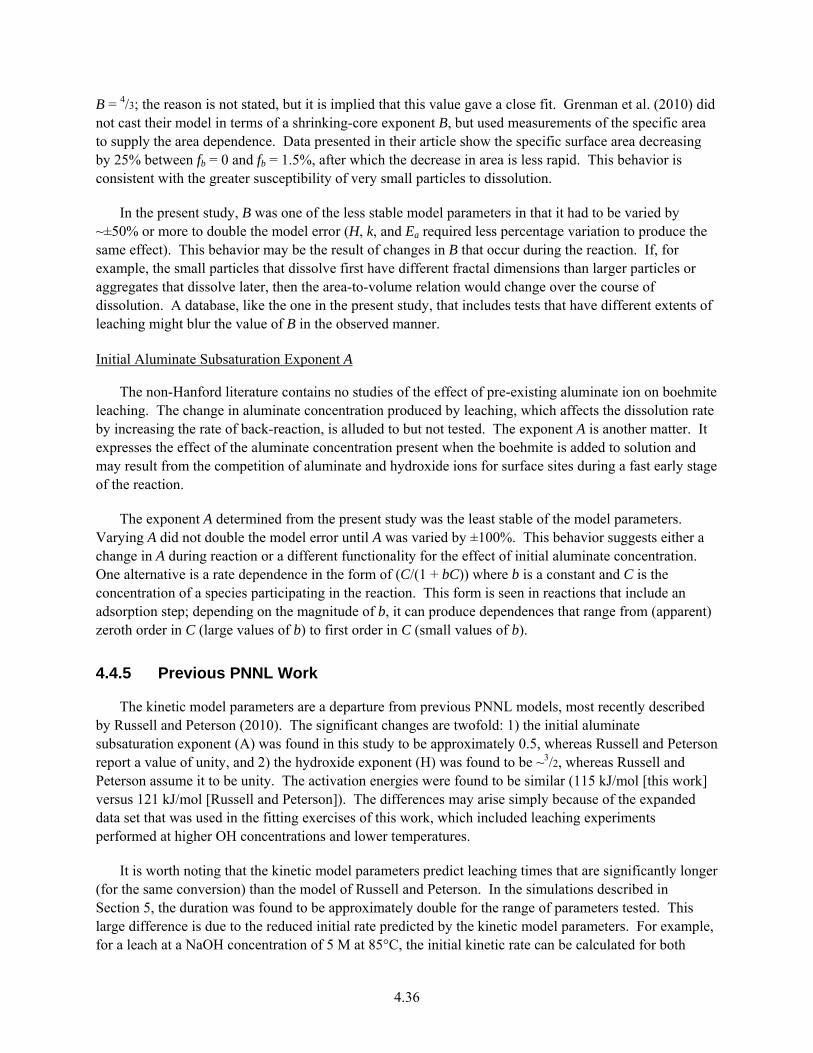
4.36
B = 4/3; the reason is not stated, but it is implied that this value gave a close fit. Grenman et al. (2010) did not cast their model in terms of a shrinking-core exponent B, but used measurements of the specific area to supply the area dependence. Data presented in their article show the specific surface area decreasing by 25% between fb = 0 and fb = 1.5%, after which the decrease in area is less rapid. This behavior is consistent with the greater susceptibility of very small particles to dissolution.
In the present study, B was one of the less stable model parameters in that it had to be varied by ~±50% or more to double the model error (H, k, and Ea required less percentage variation to produce the same effect). This behavior may be the result of changes in B that occur during the reaction. If, for example, the small particles that dissolve first have different fractal dimensions than larger particles or aggregates that dissolve later, then the area-to-volume relation would change over the course of dissolution. A database, like the one in the present study, that includes tests that have different extents of leaching might blur the value of B in the observed manner. Initial Aluminate Subsaturation Exponent A
The non-Hanford literature contains no studies of the effect of pre-existing aluminate ion on boehmite leaching. The change in aluminate concentration produced by leaching, which affects the dissolution rate by increasing the rate of back-reaction, is alluded to but not tested. The exponent A is another matter. It expresses the effect of the aluminate concentration present when the boehmite is added to solution and may result from the competition of aluminate and hydroxide ions for surface sites during a fast early stage of the reaction.
The exponent A determined from the present study was the least stable of the model parameters. Varying A did not double the model error until A was varied by ±100%. This behavior suggests either a change in A during reaction or a different functionality for the effect of initial aluminate concentration. One alternative is a rate dependence in the form of (C/(1 + bC)) where b is a constant and C is the concentration of a species participating in the reaction. This form is seen in reactions that include an adsorption step; depending on the magnitude of b, it can produce dependences that range from (apparent) zeroth order in C (large values of b) to first order in C (small values of b).
4.4.5 Previous PNNL Work
The kinetic model parameters are a departure from previous PNNL models, most recently described by Russell and Peterson (2010). The significant changes are twofold: 1) the initial aluminate subsaturation exponent (A) was found in this study to be approximately 0.5, whereas Russell and Peterson report a value of unity, and 2) the hydroxide exponent (H) was found to be ~3/2, whereas Russell and Peterson assume it to be unity. The activation energies were found to be similar (115 kJ/mol [this work] versus 121 kJ/mol [Russell and Peterson]). The differences may arise simply because of the expanded data set that was used in the fitting exercises of this work, which included leaching experiments performed at higher OH concentrations and lower temperatures.
It is worth noting that the kinetic model parameters predict leaching times that are significantly longer (for the same conversion) than the model of Russell and Peterson. In the simulations described in Section 5, the duration was found to be approximately double for the range of parameters tested. This large difference is due to the reduced initial rate predicted by the kinetic model parameters. For example, for a leach at a NaOH concentration of 5 M at 85°C, the initial kinetic rate can be calculated for both
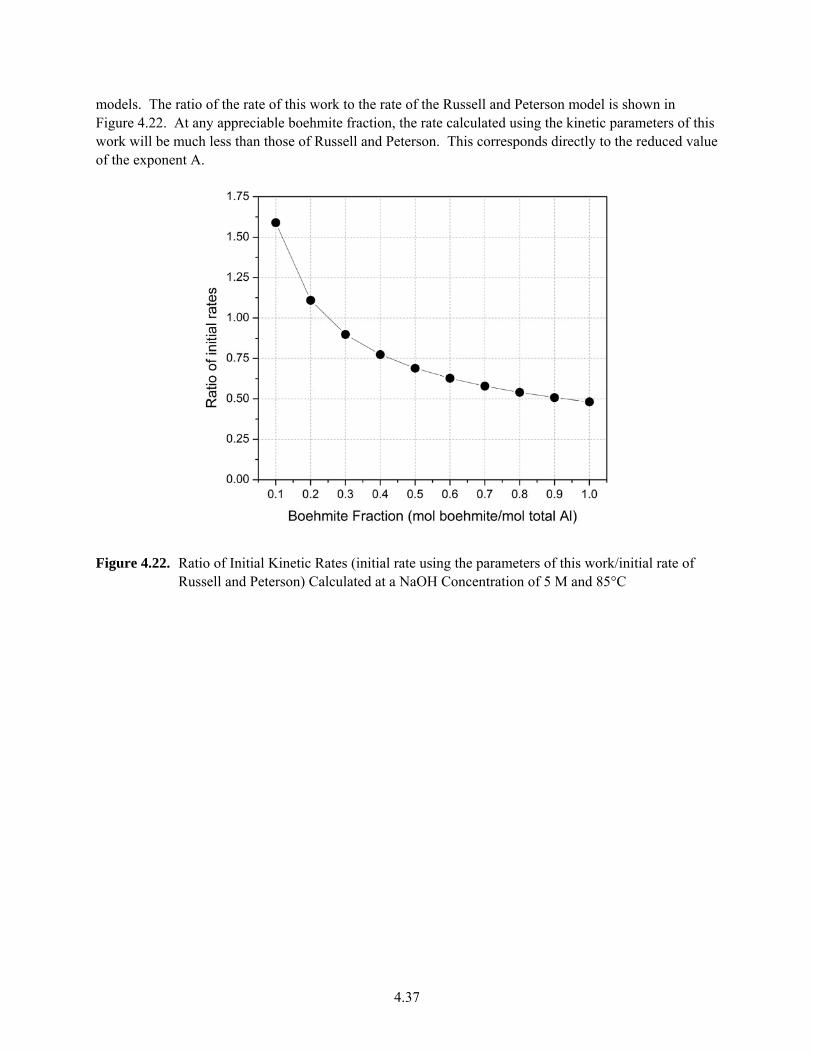
4.37
models. The ratio of the rate of this work to the rate of the Russell and Peterson model is shown in Figure 4.22. At any appreciable boehmite fraction, the rate calculated using the kinetic parameters of this work will be much less than those of Russell and Peterson. This corresponds directly to the reduced value of the exponent A.
Figure 4.22. Ratio of Initial Kinetic Rates (initial rate using the parameters of this work/initial rate of Russell and Peterson) Calculated at a NaOH Concentration of 5 M and 85°C

5.1
5.0 Optimum Sodium Use in Caustic Leaching of Aluminum
As mentioned previously, caustic leaching performed at higher sodium hydroxide concentrations (> 8 M) is being considered as an alternative to the baseline WTP flowsheet in which the leaching occurs at 85°C with 5 M NaOH. Elevated sodium hydroxide concentrations result in sodium being present in greater amounts in the waste streams. Larger amounts of sodium are undesirable in the WTP because the vitrification of radioactive waste (which occurs downstream of leaching operations) is limited by the sodium content: more total sodium will result in an increased low-activity waste glass mass. Thus, there is a balance between more complete boehmite leaching (which reduces the amount of high-level waste glass) and the amount of sodium required to achieve it.
A leaching scenario was developed to assess the implications of using higher sodium hydroxide concentrations at 85C. Besides aluminum compounds, the leaching scenario did not consider the potential impacts of other constituents that could be present in concentrated NaOH, e.g., precipitated sodium salts. The scenario assumes a fixed volume Vmax in a hypothetical leach vessel. This volume is divided into three portions (see Figure 5.1 for a graphical representation):
1. Water—accumulates as the leach progresses because of condensation from steam heating, finally reaching a volume of fcVmax at the end of the leach. The fraction of the volume that is condensate (fc) was estimated based on Pretreatment Engineering Platform (PEP) testing(a) performed at the same temperature (see Kurath et al. 2009).
2. Sodium hydroxide—the amount of sodium hydroxide required to reach the target hydroxide concentration (COH) being assessed. The amount was specified by setting the concentration of NaOH to the nominal value at the start of the leach. Note that the free OH concentration will be less because any gibbsite present at the start will be dissolved. The OH concentration will decay over the leach as it consumes boehmite and is diluted by the condensate.
3. Waste—the remaining volume not taken up by condensate and sodium hydroxide is left for waste. Together, the sodium hydroxide and waste have a batch volume, Vbatch.
The waste is constrained to be composed of undissolved solids (UDS) between 5 wt% and 20 wt% in accordance with the properties of the waste processed by the WTP. The UDS is used to estimate a density assuming a linear relationship between slurry density and UDS consistent with densities observed during PEP testing. The mass of insoluble solids can be calculated with this information. Of the insoluble solids, 80% is assumed to be aluminum-containing compounds. These compounds are assumed to be gibbsite and boehmite only, with all the gibbsite dissolved by the start of the leach.
The simulation proceeds once three variables are specified:
Hydroxide concentration (COH)
Weight fraction of aluminum compounds that is boehmite (wb)
Target conversion of boehmite (xb).
(a) The PEP was a pilot version (1/4.5 scale) of the WTP pretreatment facility. All the important processing
equipment was prototypic of the WTP. Integrated testing was conducted by PNNL staff.
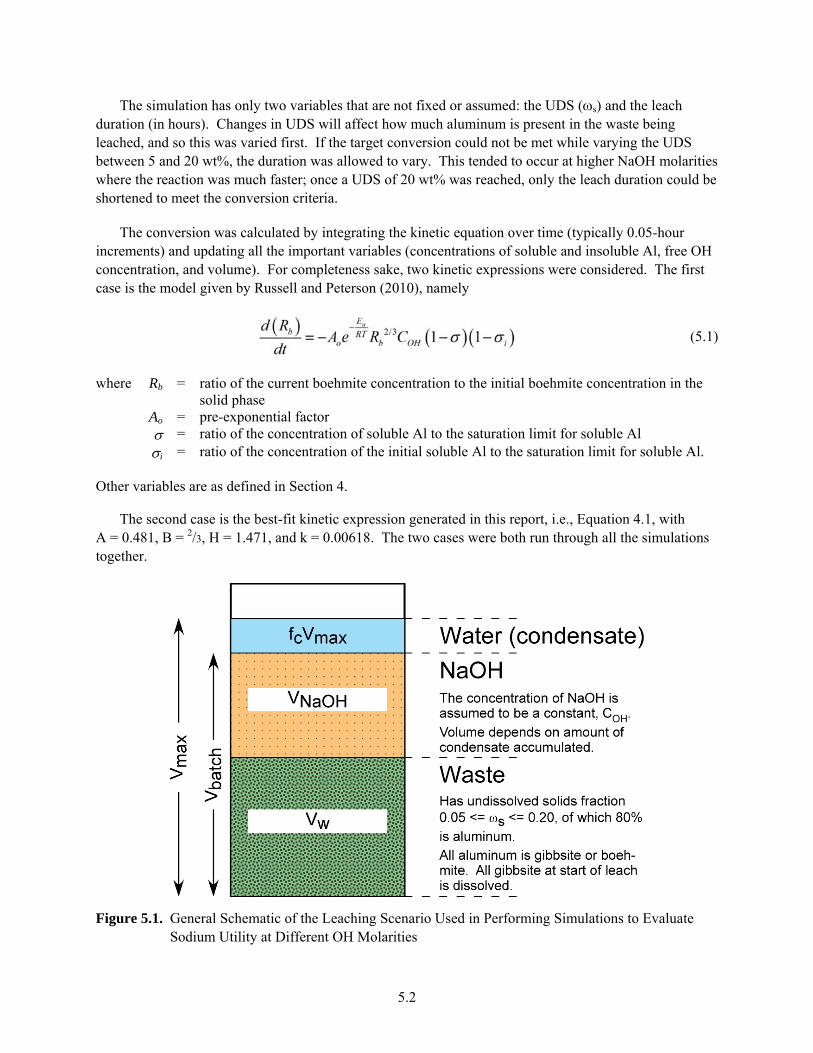
5.2
The simulation has only two variables that are not fixed or assumed: the UDS (s) and the leach duration (in hours). Changes in UDS will affect how much aluminum is present in the waste being leached, and so this was varied first. If the target conversion could not be met while varying the UDS between 5 and 20 wt%, the duration was allowed to vary. This tended to occur at higher NaOH molarities where the reaction was much faster; once a UDS of 20 wt% was reached, only the leach duration could be shortened to meet the conversion criteria.
The conversion was calculated by integrating the kinetic equation over time (typically 0.05-hour increments) and updating all the important variables (concentrations of soluble and insoluble Al, free OH concentration, and volume). For completeness sake, two kinetic expressions were considered. The first case is the model given by Russell and Peterson (2010), namely
(5.1)
where Rb = ratio of the current boehmite concentration to the initial boehmite concentration in the
solid phase Ao = pre-exponential factor = ratio of the concentration of soluble Al to the saturation limit for soluble Al i = ratio of the concentration of the initial soluble Al to the saturation limit for soluble Al. Other variables are as defined in Section 4.
The second case is the best-fit kinetic expression generated in this report, i.e., Equation 4.1, with A = 0.481, B = 2/3, H = 1.471, and k = 0.00618. The two cases were both run through all the simulations together.
Figure 5.1. General Schematic of the Leaching Scenario Used in Performing Simulations to Evaluate Sodium Utility at Different OH Molarities
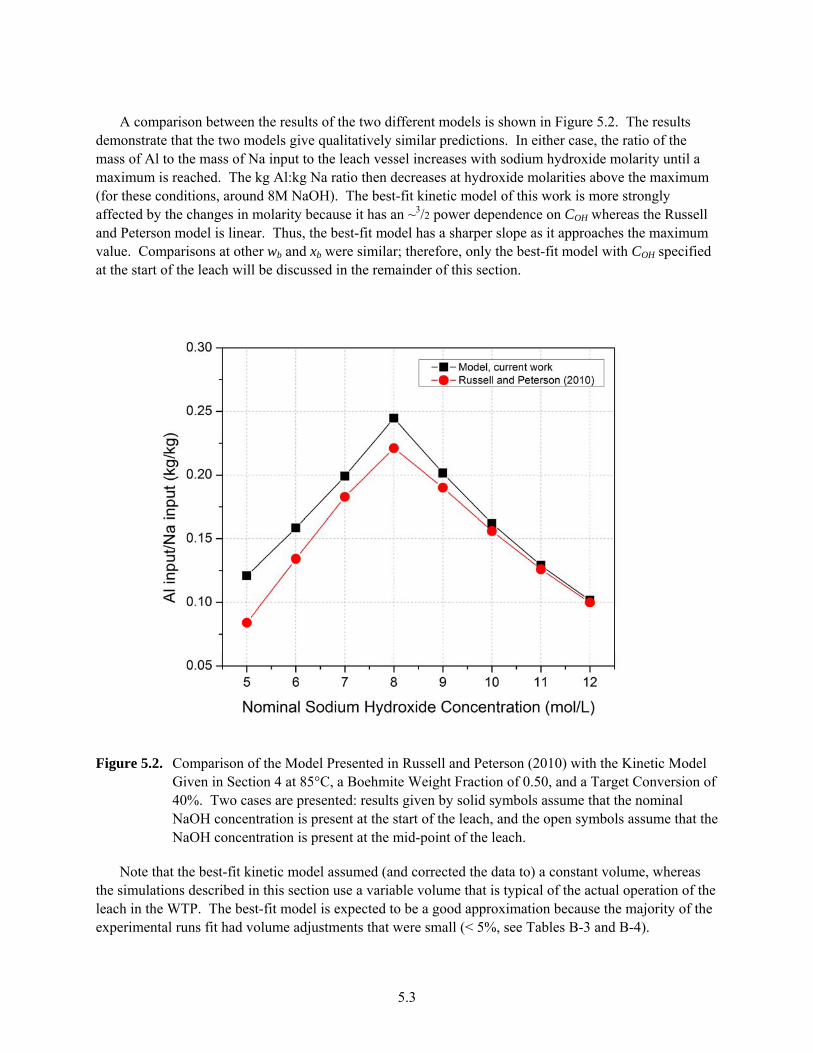
5.3
A comparison between the results of the two different models is shown in Figure 5.2. The results demonstrate that the two models give qualitatively similar predictions. In either case, the ratio of the mass of Al to the mass of Na input to the leach vessel increases with sodium hydroxide molarity until a maximum is reached. The kg Al:kg Na ratio then decreases at hydroxide molarities above the maximum (for these conditions, around 8M NaOH). The best-fit kinetic model of this work is more strongly affected by the changes in molarity because it has an ~3/2 power dependence on COH whereas the Russell and Peterson model is linear. Thus, the best-fit model has a sharper slope as it approaches the maximum value. Comparisons at other wb and xb were similar; therefore, only the best-fit model with COH specified at the start of the leach will be discussed in the remainder of this section.
Figure 5.2. Comparison of the Model Presented in Russell and Peterson (2010) with the Kinetic Model Given in Section 4 at 85°C, a Boehmite Weight Fraction of 0.50, and a Target Conversion of 40%. Two cases are presented: results given by solid symbols assume that the nominal NaOH concentration is present at the start of the leach, and the open symbols assume that the NaOH concentration is present at the mid-point of the leach.
Note that the best-fit kinetic model assumed (and corrected the data to) a constant volume, whereas the simulations described in this section use a variable volume that is typical of the actual operation of the leach in the WTP. The best-fit model is expected to be a good approximation because the majority of the experimental runs fit had volume adjustments that were small (< 5%, see Tables B-3 and B-4).
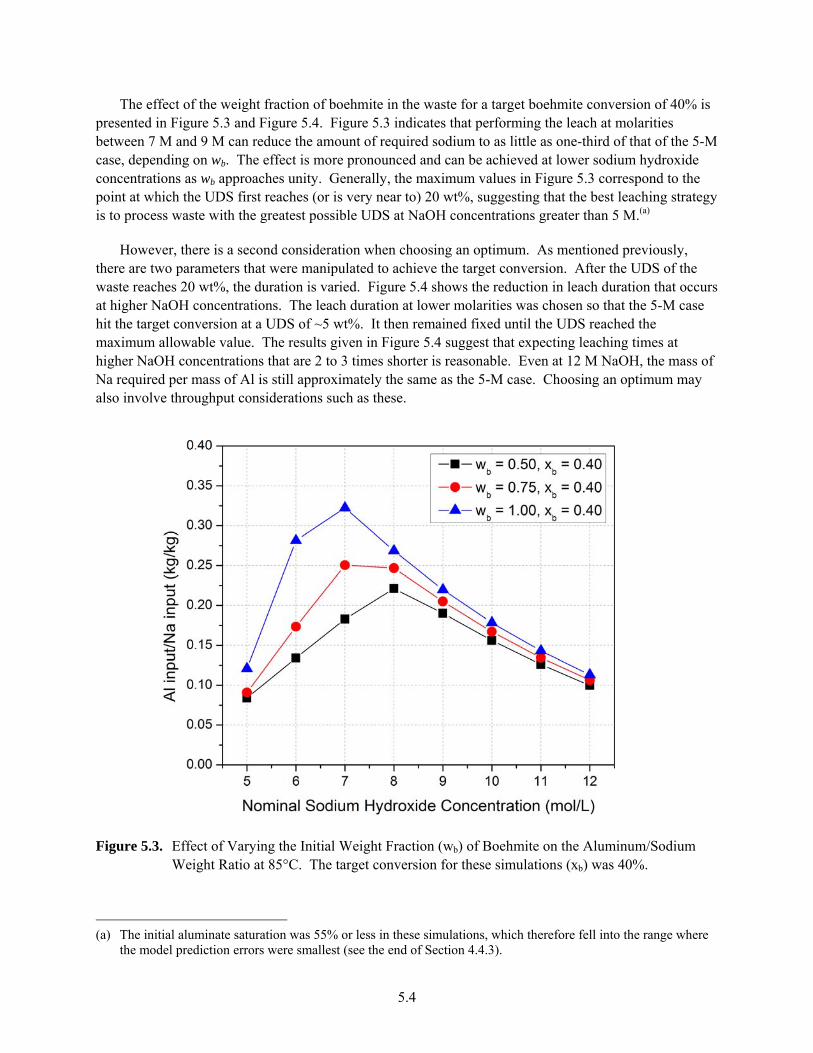
5.4
The effect of the weight fraction of boehmite in the waste for a target boehmite conversion of 40% is presented in Figure 5.3 and Figure 5.4. Figure 5.3 indicates that performing the leach at molarities between 7 M and 9 M can reduce the amount of required sodium to as little as one-third of that of the 5-M case, depending on wb. The effect is more pronounced and can be achieved at lower sodium hydroxide concentrations as wb approaches unity. Generally, the maximum values in Figure 5.3 correspond to the point at which the UDS first reaches (or is very near to) 20 wt%, suggesting that the best leaching strategy is to process waste with the greatest possible UDS at NaOH concentrations greater than 5 M.(a)
However, there is a second consideration when choosing an optimum. As mentioned previously, there are two parameters that were manipulated to achieve the target conversion. After the UDS of the waste reaches 20 wt%, the duration is varied. Figure 5.4 shows the reduction in leach duration that occurs at higher NaOH concentrations. The leach duration at lower molarities was chosen so that the 5-M case hit the target conversion at a UDS of ~5 wt%. It then remained fixed until the UDS reached the maximum allowable value. The results given in Figure 5.4 suggest that expecting leaching times at higher NaOH concentrations that are 2 to 3 times shorter is reasonable. Even at 12 M NaOH, the mass of Na required per mass of Al is still approximately the same as the 5-M case. Choosing an optimum may also involve throughput considerations such as these.
Figure 5.3. Effect of Varying the Initial Weight Fraction (wb) of Boehmite on the Aluminum/Sodium Weight Ratio at 85°C. The target conversion for these simulations (xb) was 40%.
(a) The initial aluminate saturation was 55% or less in these simulations, which therefore fell into the range where
the model prediction errors were smallest (see the end of Section 4.4.3).
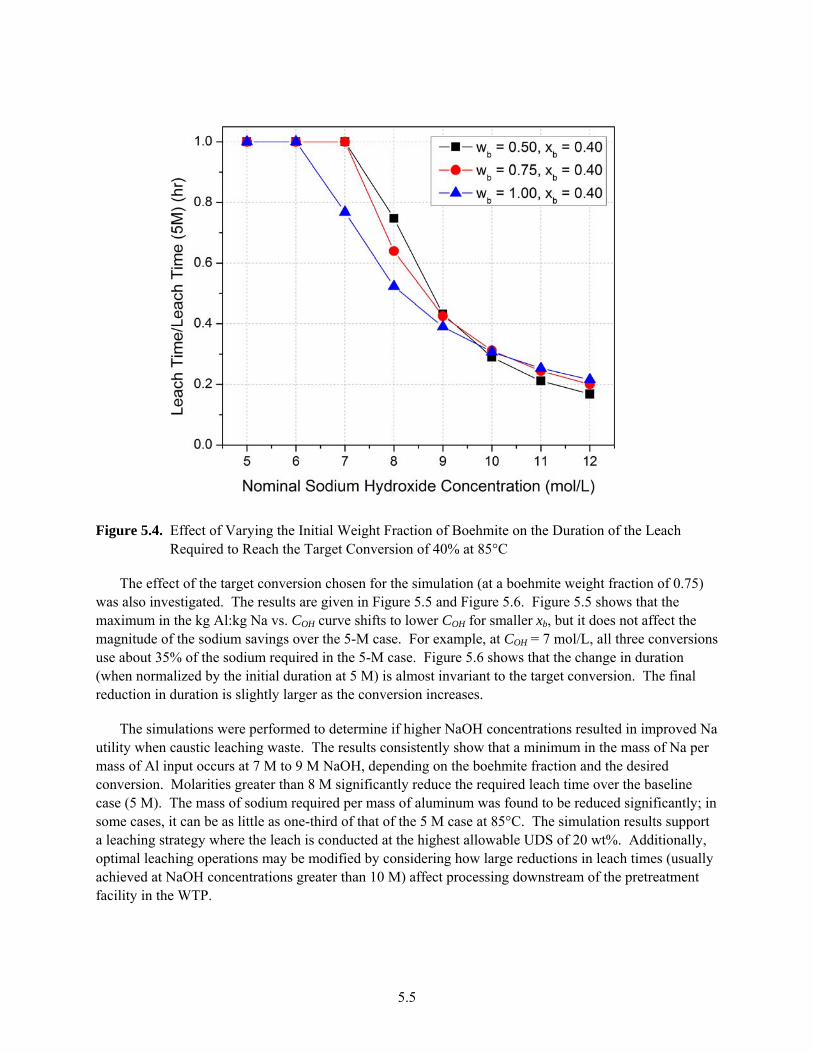
5.5
Figure 5.4. Effect of Varying the Initial Weight Fraction of Boehmite on the Duration of the Leach Required to Reach the Target Conversion of 40% at 85°C
The effect of the target conversion chosen for the simulation (at a boehmite weight fraction of 0.75) was also investigated. The results are given in Figure 5.5 and Figure 5.6. Figure 5.5 shows that the maximum in the kg Al:kg Na vs. COH curve shifts to lower COH for smaller xb, but it does not affect the magnitude of the sodium savings over the 5-M case. For example, at COH = 7 mol/L, all three conversions use about 35% of the sodium required in the 5-M case. Figure 5.6 shows that the change in duration (when normalized by the initial duration at 5 M) is almost invariant to the target conversion. The final reduction in duration is slightly larger as the conversion increases.
The simulations were performed to determine if higher NaOH concentrations resulted in improved Na utility when caustic leaching waste. The results consistently show that a minimum in the mass of Na per mass of Al input occurs at 7 M to 9 M NaOH, depending on the boehmite fraction and the desired conversion. Molarities greater than 8 M significantly reduce the required leach time over the baseline case (5 M). The mass of sodium required per mass of aluminum was found to be reduced significantly; in some cases, it can be as little as one-third of that of the 5 M case at 85°C. The simulation results support a leaching strategy where the leach is conducted at the highest allowable UDS of 20 wt%. Additionally, optimal leaching operations may be modified by considering how large reductions in leach times (usually achieved at NaOH concentrations greater than 10 M) affect processing downstream of the pretreatment facility in the WTP.
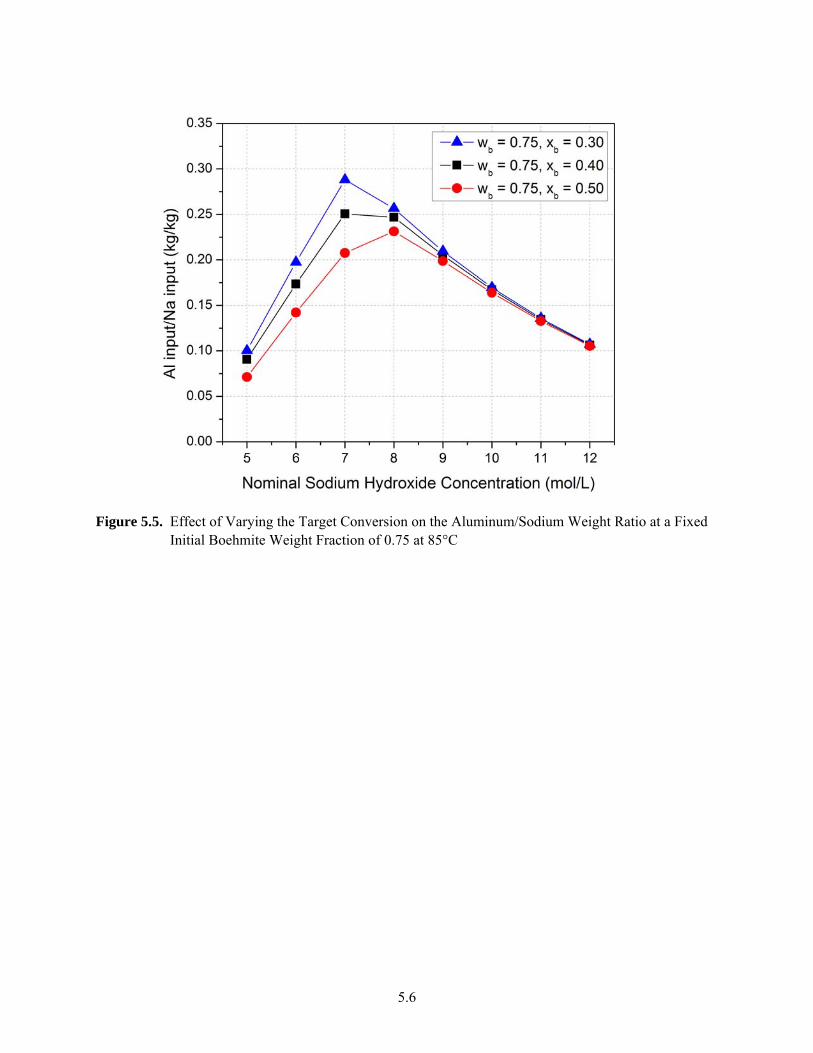
5.6
Figure 5.5. Effect of Varying the Target Conversion on the Aluminum/Sodium Weight Ratio at a Fixed Initial Boehmite Weight Fraction of 0.75 at 85°C
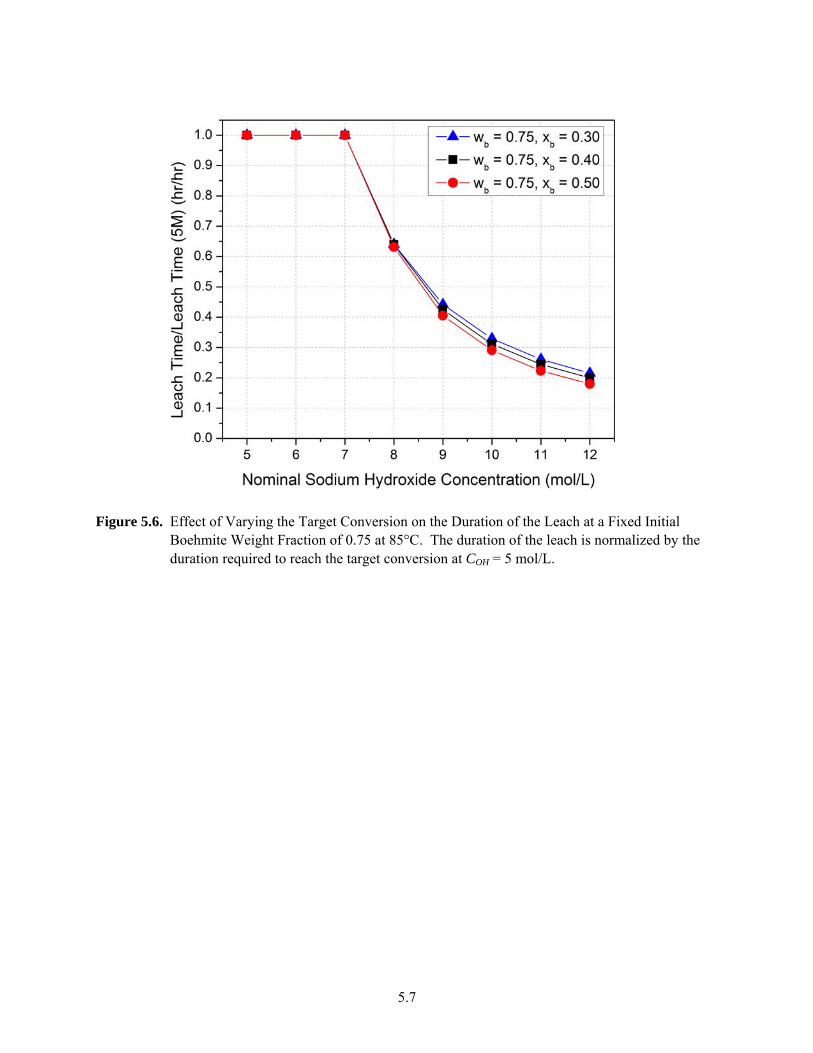
5.7
Figure 5.6. Effect of Varying the Target Conversion on the Duration of the Leach at a Fixed Initial Boehmite Weight Fraction of 0.75 at 85°C. The duration of the leach is normalized by the duration required to reach the target conversion at COH = 5 mol/L.

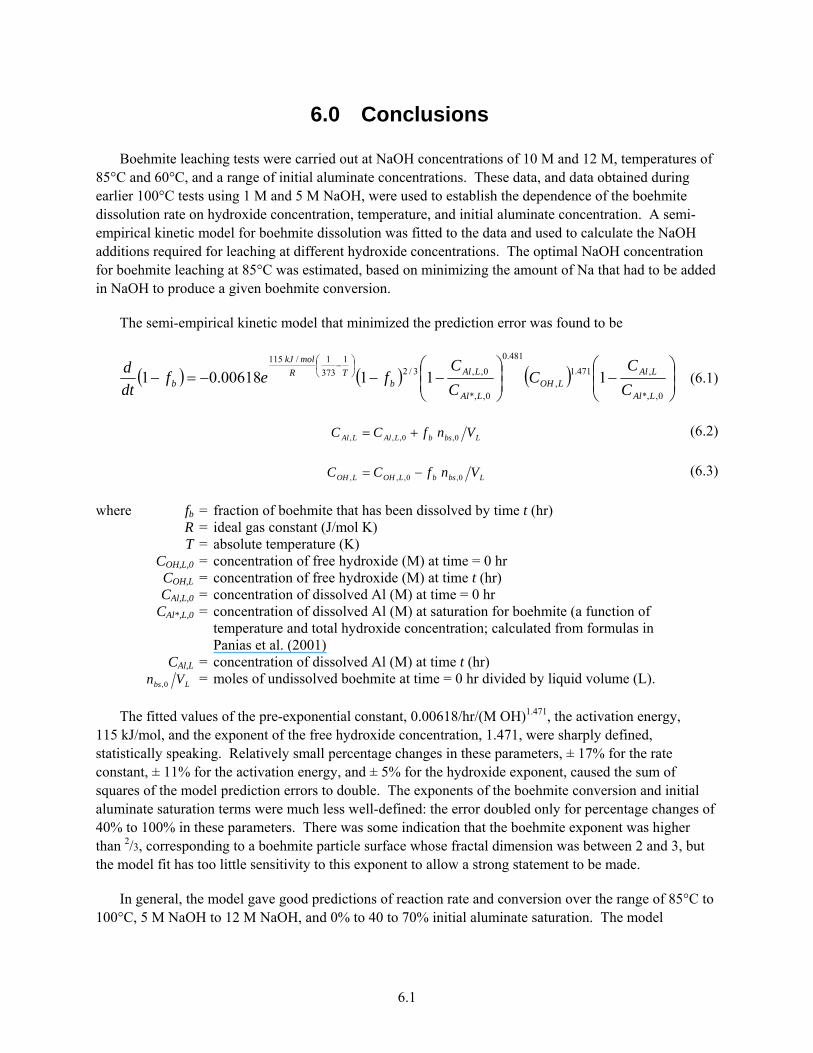
6.1
6.0 Conclusions
Boehmite leaching tests were carried out at NaOH concentrations of 10 M and 12 M, temperatures of 85°C and 60°C, and a range of initial aluminate concentrations. These data, and data obtained during earlier 100°C tests using 1 M and 5 M NaOH, were used to establish the dependence of the boehmite dissolution rate on hydroxide concentration, temperature, and initial aluminate concentration. A semi-empirical kinetic model for boehmite dissolution was fitted to the data and used to calculate the NaOH additions required for leaching at different hydroxide concentrations. The optimal NaOH concentration for boehmite leaching at 85°C was estimated, based on minimizing the amount of Na that had to be added in NaOH to produce a given boehmite conversion.
The semi-empirical kinetic model that minimized the prediction error was found to be
0,*,
,471.1,
481.0
0,*,
0,,3/21
373
1/115
11100618.01LAl
LAlLOH
LAl
LAlb
TR
molkJ
b C
CC
C
Cfef
dt
d (6.1)
LbsbLAlLAl VnfCC 0,0,,, (6.2)
LbsbLOHLOH VnfCC 0,0,,, (6.3)
where fb = fraction of boehmite that has been dissolved by time t (hr) R = ideal gas constant (J/mol K) T = absolute temperature (K) COH,L,0 = concentration of free hydroxide (M) at time = 0 hr COH,L = concentration of free hydroxide (M) at time t (hr) CAl,L,0 = concentration of dissolved Al (M) at time = 0 hr CAl*,L,0 = concentration of dissolved Al (M) at saturation for boehmite (a function of
temperature and total hydroxide concentration; calculated from formulas in Panias et al. (2001)
CAl,L = concentration of dissolved Al (M) at time t (hr) Lbs Vn 0,
= moles of undissolved boehmite at time = 0 hr divided by liquid volume (L).
The fitted values of the pre-exponential constant, 0.00618/hr/(M OH)1.471, the activation energy, 115 kJ/mol, and the exponent of the free hydroxide concentration, 1.471, were sharply defined, statistically speaking. Relatively small percentage changes in these parameters, ± 17% for the rate constant, ± 11% for the activation energy, and ± 5% for the hydroxide exponent, caused the sum of squares of the model prediction errors to double. The exponents of the boehmite conversion and initial aluminate saturation terms were much less well-defined: the error doubled only for percentage changes of 40% to 100% in these parameters. There was some indication that the boehmite exponent was higher than 2/3, corresponding to a boehmite particle surface whose fractal dimension was between 2 and 3, but the model fit has too little sensitivity to this exponent to allow a strong statement to be made.
In general, the model gave good predictions of reaction rate and conversion over the range of 85°C to 100°C, 5 M NaOH to 12 M NaOH, and 0% to 40 to 70% initial aluminate saturation. The model
6.2
underpredicted conversion more often than it overpredicted at lower temperatures or hydroxide concentrations and at higher initial aluminate saturation.
The kinetic model was used to simulate a series of constrained caustic leaching scenarios at 85°C to assess the mass of sodium required per mass of aluminum when leaching at NaOH concentrations greater than 5 M. It was found that the sodium is used most efficiently (i.e., the mass of sodium/mass of aluminum in the waste is minimized) at NaOH concentrations of 7 to 9 M, depending on the initial distribution of the aluminum-containing compounds. The simulations indicated that the amount of sodium could potentially be reduced to as little as one-third of that in the 5-M case. Furthermore, significant reductions in leaching time (per batch) were also demonstrated to be attainable at higher NaOH concentrations, typically greater than 10 M.
It should be noted that the work above deals only with a system that, at least initially, contains only soluble sodium aluminate and solid crystalline boehmite. There are many other Na phases that could potentially form solids, including fluoride, nitrate, carbonate, and phosphate salts. The study above does not consider the impact of these other constituents. In future work, this concern will be addressed by examining high hydroxide Al dissolution first with the more complex simulant used previously with PEP studies at PNNL (Kurath et al. 2009) and then with actual Hanford tank sludge.
7.1
7.0 References
Bao L and AV Nguyen. 2010. “Developing a physically consistent model for gibbsite leaching kinetics.” Hydrometallurgy 104:86–98.
Benezeth P, DA Palmer, and DJ Wesolowski. 2008. “Dissolution/precipitation kinetics of boehmite and gibbsite: Application of a pH-relaxation technique to study near-equilibrium rates.” Geochimica et Cosmochimica Acta 72:2429–2453.
CRC. 1975. Handbook of Chemistry and Physics. 56th Edition, RC Weast editor. CRC Press, Cleveland, Ohio.
Dash B, BC Tripathy, IN Bhattacharya, SC Das, CR Mishra, and BK Mishra. 2009. “Precipitation of boehmite in sodium aluminate liquor.” Hydrometallurgy 95:297–301.
Felmy AR, O Qufoku, B Arey, and KD Boomer. 2010. “Chemical Species in the Vapor Phase of Hanford Double-Shell Tanks: Potential Impacts on Waste Tank Corrosion Processess.” PNNL-19767, Pacific Northwest National Laboratory, Richland, WA 99352.
Grenman H, T Salmi, DY Murzin, and J Addai-Mensah. 2010. “Dissolution of boehmite in sodium hydroxide at ambient pressure: Kinetics and modeling.” Hydrometallurgy 102:22–30.
Kurath DE, BD Hanson, MJ Minette, DL Baldwin, BM Rapko, LA Mahoney, PP Schonewill, RC Daniel, PW Eslinger, JL Huckaby, JM Billing, PS Sundar, GB Josephson, JJ Toth, ST Yokuda, EBK Baer, SM Barnes, EC Golovich, SD Rassat, CF Brown, JGH Geeting, GJ Sevigny, AJ Casella, JR Bontha, RL Aaberg, PM Aker, CE Guzman-Leong, ML Kimura, SK Sundaram, RP Pires, BE Wells, and OP Bredt. 2009. Pretreatment Engineering Platform Phase 1 Final Test Report . PNNL-18894; WTP-RPT-197 Rev 0, Pacific Northwest National Laboratory, Richland, Washington.
Packter A. 1976. “The Effect of Concentration on the Rates of Dissolution of Gibbsite and Boehmite.” Colloid and Polymer Sci. 254:1024–1029.
Palmer DA, P Benezeth, and DJ Wesolowski. 2001. “Aqueous high-temperature solubility studies. I. The solubility of boehmite as functions of ionic strength (to 5 molal, NaCl), temperature (100 –290°C), and pH as determined by in situ measurements.” Geochimica et Cosmochimica Acta 65:2081–2095.
Panias D. 2004. “Role of boehmite/solution interface in boehmite precipitation from supersaturated sodium aluminate solutions.” Hydrometallurgy 74:203–212.
Panias D, P Asimidis, and I Paspaliaris. 2001. “Solubility of Boehmite in Concentrated Sodium Hydroxide Solutions: Model Development and Assessment.” Hydrometallurgy 59:15–29.
Russell RL and RA Peterson. 2010. "Boehmite Dissolution Model Based on Simulant Data." Industrial and Engineering Chemistry Research 49(10):4542-4545.
Russell RL, Smith HD, Peterson RA, Rinehart DE, Aker PM, and Buck EC. 2009a. Development and Characterization of Boehmite Component Simulant. WTP-RPT-184 Rev. 0, Pacific Northwest National Laboratory, Richland, Washington.
7.2
Russell RL, Peterson RA, Rinehart DE, Buchmiller WC. 2009b. PEP Support: Laboratory Scale Leaching and Permeate Stability Tests. WTP-RPT-200 Rev. 1, Pacific Northwest national Laboratory, Richland, Washington.
Scotford RF and JR Glastonbury. 1971. “Effect of Temperature on the Rates of Dissolution of Gibbsite and Boehmite.” Can. J. Chem. Engng. 49:611–616.
Scotford RF and JR Glastonbury. 1972. “The Effect of Concentration on the Rates of Dissolution of Gibbsite and Boehmite.” Can. J. Chem. Engng. 50:754–758.
Skoufadis C, D Panias, and I Paspaliaris. 2003. “Kinetics of boehmite precipitation from supersaturated sodium aluminate solutions.” Hydrometallurgy 68:57–68.
Zhang Y, Y Li, and Y Zhang. 2003. “Phase Diagram for the System Na2O-Al2O3-H2O at High Alkali Concentration.” J. Chem. Eng. Data 48:617–620.
Appendix A
HHL Test Conditions and Leach Factors

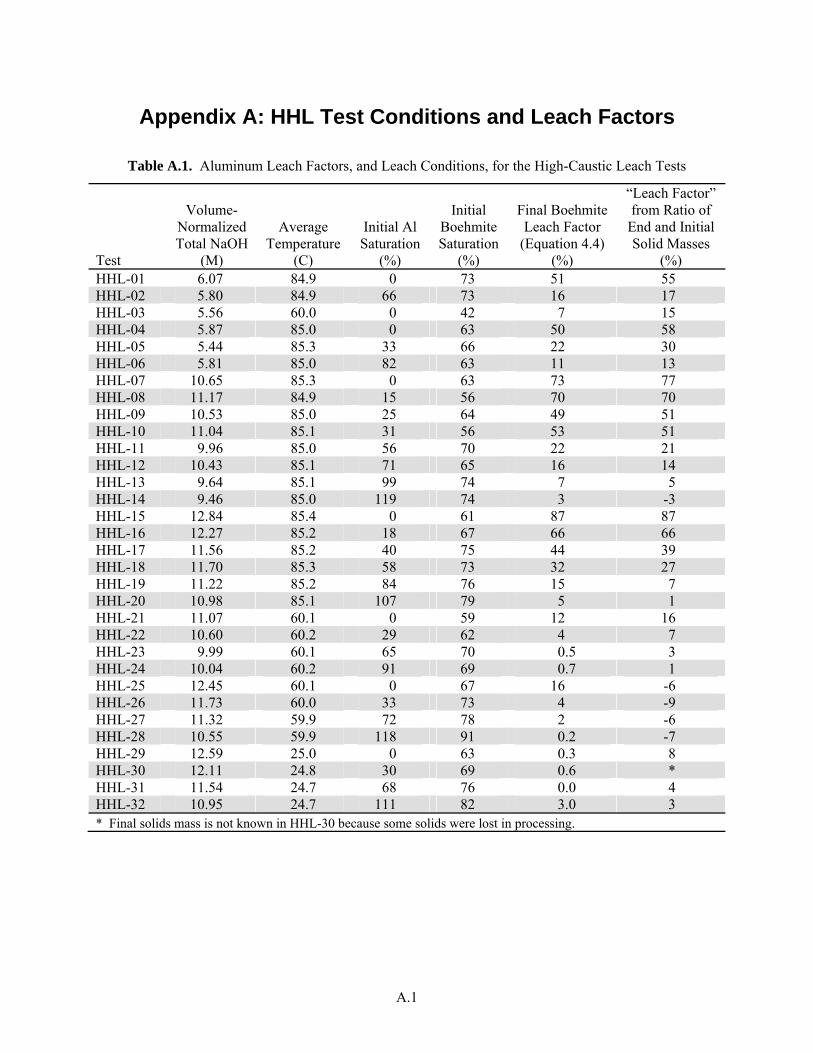
A.1
Appendix A: HHL Test Conditions and Leach Factors
Table A.1. Aluminum Leach Factors, and Leach Conditions, for the High-Caustic Leach Tests
Test
Volume-Normalized Total NaOH
(M)
Average Temperature
(C)
Initial Al Saturation
(%)
Initial Boehmite Saturation
(%)
Final Boehmite Leach Factor
(Equation 4.4) (%)
“Leach Factor” from Ratio of
End and Initial Solid Masses
(%) HHL-01 6.07 84.9 0 73 51 55 HHL-02 5.80 84.9 66 73 16 17 HHL-03 5.56 60.0 0 42 7 15 HHL-04 5.87 85.0 0 63 50 58 HHL-05 5.44 85.3 33 66 22 30 HHL-06 5.81 85.0 82 63 11 13 HHL-07 10.65 85.3 0 63 73 77 HHL-08 11.17 84.9 15 56 70 70 HHL-09 10.53 85.0 25 64 49 51 HHL-10 11.04 85.1 31 56 53 51 HHL-11 9.96 85.0 56 70 22 21 HHL-12 10.43 85.1 71 65 16 14 HHL-13 9.64 85.1 99 74 7 5 HHL-14 9.46 85.0 119 74 3 -3 HHL-15 12.84 85.4 0 61 87 87 HHL-16 12.27 85.2 18 67 66 66 HHL-17 11.56 85.2 40 75 44 39 HHL-18 11.70 85.3 58 73 32 27 HHL-19 11.22 85.2 84 76 15 7 HHL-20 10.98 85.1 107 79 5 1 HHL-21 11.07 60.1 0 59 12 16 HHL-22 10.60 60.2 29 62 4 7 HHL-23 9.99 60.1 65 70 0.5 3 HHL-24 10.04 60.2 91 69 0.7 1 HHL-25 12.45 60.1 0 67 16 -6 HHL-26 11.73 60.0 33 73 4 -9 HHL-27 11.32 59.9 72 78 2 -6 HHL-28 10.55 59.9 118 91 0.2 -7 HHL-29 12.59 25.0 0 63 0.3 8 HHL-30 12.11 24.8 30 69 0.6 * HHL-31 11.54 24.7 68 76 0.0 4 HHL-32 10.95 24.7 111 82 3.0 3 * Final solids mass is not known in HHL-30 because some solids were lost in processing.
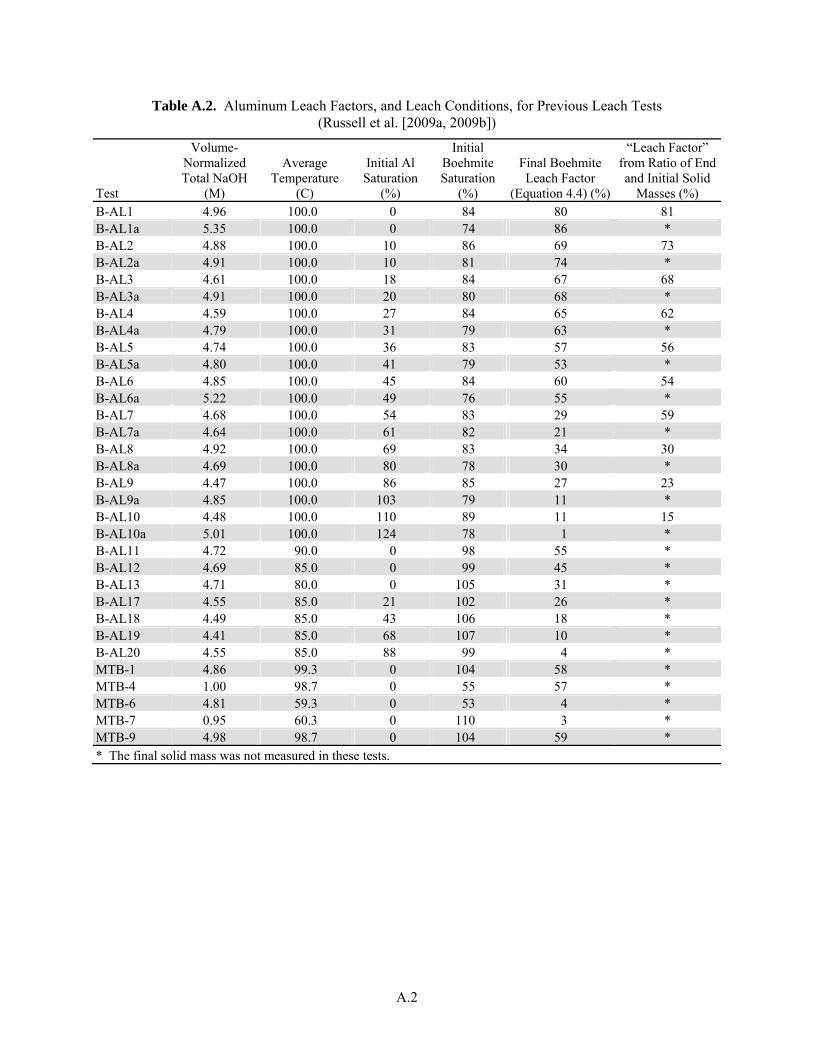
A.2
Table A.2. Aluminum Leach Factors, and Leach Conditions, for Previous Leach Tests (Russell et al. [2009a, 2009b])
Test
Volume-Normalized Total NaOH
(M)
Average Temperature
(C)
Initial Al Saturation
(%)
Initial Boehmite Saturation
(%)
Final Boehmite Leach Factor
(Equation 4.4) (%)
“Leach Factor” from Ratio of End and Initial Solid
Masses (%) B-AL1 4.96 100.0 0 84 80 81 B-AL1a 5.35 100.0 0 74 86 * B-AL2 4.88 100.0 10 86 69 73 B-AL2a 4.91 100.0 10 81 74 * B-AL3 4.61 100.0 18 84 67 68 B-AL3a 4.91 100.0 20 80 68 * B-AL4 4.59 100.0 27 84 65 62 B-AL4a 4.79 100.0 31 79 63 * B-AL5 4.74 100.0 36 83 57 56 B-AL5a 4.80 100.0 41 79 53 * B-AL6 4.85 100.0 45 84 60 54 B-AL6a 5.22 100.0 49 76 55 * B-AL7 4.68 100.0 54 83 29 59 B-AL7a 4.64 100.0 61 82 21 * B-AL8 4.92 100.0 69 83 34 30 B-AL8a 4.69 100.0 80 78 30 * B-AL9 4.47 100.0 86 85 27 23 B-AL9a 4.85 100.0 103 79 11 * B-AL10 4.48 100.0 110 89 11 15 B-AL10a 5.01 100.0 124 78 1 * B-AL11 4.72 90.0 0 98 55 * B-AL12 4.69 85.0 0 99 45 * B-AL13 4.71 80.0 0 105 31 * B-AL17 4.55 85.0 21 102 26 * B-AL18 4.49 85.0 43 106 18 * B-AL19 4.41 85.0 68 107 10 * B-AL20 4.55 85.0 88 99 4 * MTB-1 4.86 99.3 0 104 58 * MTB-4 1.00 98.7 0 55 57 * MTB-6 4.81 59.3 0 53 4 * MTB-7 0.95 60.3 0 110 3 * MTB-9 4.98 98.7 0 104 59 * * The final solid mass was not measured in these tests.
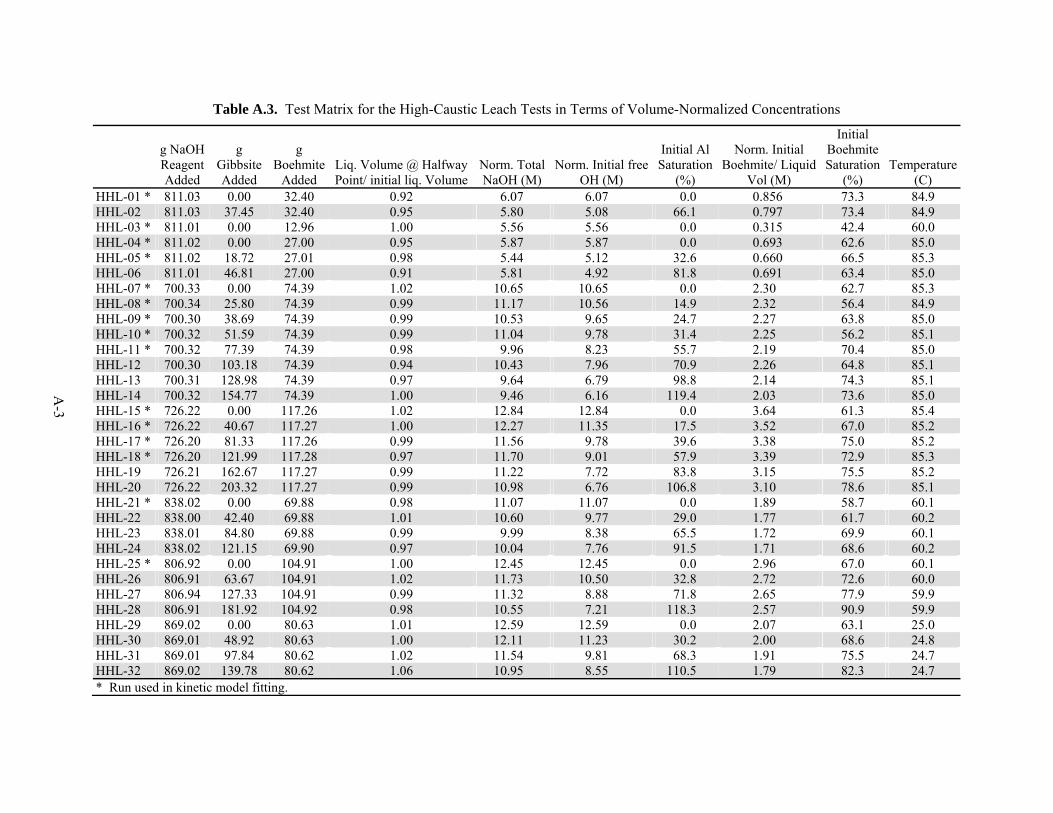
A
-3
Table A.3. Test Matrix for the High-Caustic Leach Tests in Terms of Volume-Normalized Concentrations
g NaOH Reagent Added
g Gibbsite Added
g Boehmite
Added Liq. Volume @ Halfway Point/ initial liq. Volume
Norm. Total NaOH (M)
Norm. Initial free OH (M)
Initial Al Saturation
(%)
Norm. Initial Boehmite/ Liquid
Vol (M)
Initial Boehmite Saturation
(%) Temperature
(C) HHL-01 * 811.03 0.00 32.40 0.92 6.07 6.07 0.0 0.856 73.3 84.9 HHL-02 811.03 37.45 32.40 0.95 5.80 5.08 66.1 0.797 73.4 84.9 HHL-03 * 811.01 0.00 12.96 1.00 5.56 5.56 0.0 0.315 42.4 60.0 HHL-04 * 811.02 0.00 27.00 0.95 5.87 5.87 0.0 0.693 62.6 85.0 HHL-05 * 811.02 18.72 27.01 0.98 5.44 5.12 32.6 0.660 66.5 85.3 HHL-06 811.01 46.81 27.00 0.91 5.81 4.92 81.8 0.691 63.4 85.0 HHL-07 * 700.33 0.00 74.39 1.02 10.65 10.65 0.0 2.30 62.7 85.3 HHL-08 * 700.34 25.80 74.39 0.99 11.17 10.56 14.9 2.32 56.4 84.9 HHL-09 * 700.30 38.69 74.39 0.99 10.53 9.65 24.7 2.27 63.8 85.0 HHL-10 * 700.32 51.59 74.39 0.99 11.04 9.78 31.4 2.25 56.2 85.1 HHL-11 * 700.32 77.39 74.39 0.98 9.96 8.23 55.7 2.19 70.4 85.0 HHL-12 700.30 103.18 74.39 0.94 10.43 7.96 70.9 2.26 64.8 85.1 HHL-13 700.31 128.98 74.39 0.97 9.64 6.79 98.8 2.14 74.3 85.1 HHL-14 700.32 154.77 74.39 1.00 9.46 6.16 119.4 2.03 73.6 85.0 HHL-15 * 726.22 0.00 117.26 1.02 12.84 12.84 0.0 3.64 61.3 85.4 HHL-16 * 726.22 40.67 117.27 1.00 12.27 11.35 17.5 3.52 67.0 85.2 HHL-17 * 726.20 81.33 117.26 0.99 11.56 9.78 39.6 3.38 75.0 85.2 HHL-18 * 726.20 121.99 117.28 0.97 11.70 9.01 57.9 3.39 72.9 85.3 HHL-19 726.21 162.67 117.27 0.99 11.22 7.72 83.8 3.15 75.5 85.2 HHL-20 726.22 203.32 117.27 0.99 10.98 6.76 106.8 3.10 78.6 85.1 HHL-21 * 838.02 0.00 69.88 0.98 11.07 11.07 0.0 1.89 58.7 60.1 HHL-22 838.00 42.40 69.88 1.01 10.60 9.77 29.0 1.77 61.7 60.2 HHL-23 838.01 84.80 69.88 0.99 9.99 8.38 65.5 1.72 69.9 60.1 HHL-24 838.02 121.15 69.90 0.97 10.04 7.76 91.5 1.71 68.6 60.2 HHL-25 * 806.92 0.00 104.91 1.00 12.45 12.45 0.0 2.96 67.0 60.1 HHL-26 806.91 63.67 104.91 1.02 11.73 10.50 32.8 2.72 72.6 60.0 HHL-27 806.94 127.33 104.91 0.99 11.32 8.88 71.8 2.65 77.9 59.9 HHL-28 806.91 181.92 104.92 0.98 10.55 7.21 118.3 2.57 90.9 59.9 HHL-29 869.02 0.00 80.63 1.01 12.59 12.59 0.0 2.07 63.1 25.0 HHL-30 869.01 48.92 80.63 1.00 12.11 11.23 30.2 2.00 68.6 24.8 HHL-31 869.01 97.84 80.62 1.02 11.54 9.81 68.3 1.91 75.5 24.7 HHL-32 869.02 139.78 80.62 1.06 10.95 8.55 110.5 1.79 82.3 24.7 * Run used in kinetic model fitting.
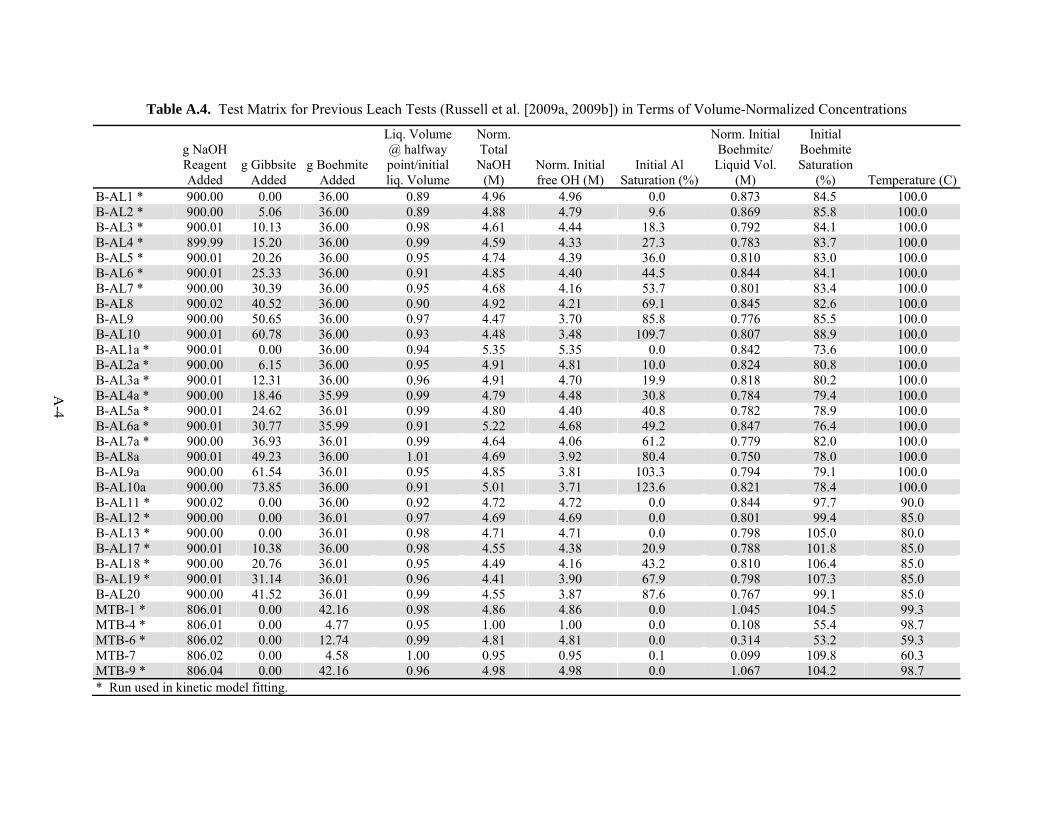
A
-4
Table A.4. Test Matrix for Previous Leach Tests (Russell et al. [2009a, 2009b]) in Terms of Volume-Normalized Concentrations
g NaOH Reagent Added
g Gibbsite Added
g Boehmite Added
Liq. Volume @ halfway point/initial liq. Volume
Norm. Total
NaOH (M)
Norm. Initial free OH (M)
Initial Al Saturation (%)
Norm. Initial Boehmite/
Liquid Vol. (M)
Initial Boehmite Saturation
(%) Temperature (C)B-AL1 * 900.00 0.00 36.00 0.89 4.96 4.96 0.0 0.873 84.5 100.0 B-AL2 * 900.00 5.06 36.00 0.89 4.88 4.79 9.6 0.869 85.8 100.0 B-AL3 * 900.01 10.13 36.00 0.98 4.61 4.44 18.3 0.792 84.1 100.0 B-AL4 * 899.99 15.20 36.00 0.99 4.59 4.33 27.3 0.783 83.7 100.0 B-AL5 * 900.01 20.26 36.00 0.95 4.74 4.39 36.0 0.810 83.0 100.0 B-AL6 * 900.01 25.33 36.00 0.91 4.85 4.40 44.5 0.844 84.1 100.0 B-AL7 * 900.00 30.39 36.00 0.95 4.68 4.16 53.7 0.801 83.4 100.0 B-AL8 900.02 40.52 36.00 0.90 4.92 4.21 69.1 0.845 82.6 100.0 B-AL9 900.00 50.65 36.00 0.97 4.47 3.70 85.8 0.776 85.5 100.0 B-AL10 900.01 60.78 36.00 0.93 4.48 3.48 109.7 0.807 88.9 100.0 B-AL1a * 900.01 0.00 36.00 0.94 5.35 5.35 0.0 0.842 73.6 100.0 B-AL2a * 900.00 6.15 36.00 0.95 4.91 4.81 10.0 0.824 80.8 100.0 B-AL3a * 900.01 12.31 36.00 0.96 4.91 4.70 19.9 0.818 80.2 100.0 B-AL4a * 900.00 18.46 35.99 0.99 4.79 4.48 30.8 0.784 79.4 100.0 B-AL5a * 900.01 24.62 36.01 0.99 4.80 4.40 40.8 0.782 78.9 100.0 B-AL6a * 900.01 30.77 35.99 0.91 5.22 4.68 49.2 0.847 76.4 100.0 B-AL7a * 900.00 36.93 36.01 0.99 4.64 4.06 61.2 0.779 82.0 100.0 B-AL8a 900.01 49.23 36.00 1.01 4.69 3.92 80.4 0.750 78.0 100.0 B-AL9a 900.00 61.54 36.01 0.95 4.85 3.81 103.3 0.794 79.1 100.0 B-AL10a 900.00 73.85 36.00 0.91 5.01 3.71 123.6 0.821 78.4 100.0 B-AL11 * 900.02 0.00 36.00 0.92 4.72 4.72 0.0 0.844 97.7 90.0 B-AL12 * 900.00 0.00 36.01 0.97 4.69 4.69 0.0 0.801 99.4 85.0 B-AL13 * 900.00 0.00 36.01 0.98 4.71 4.71 0.0 0.798 105.0 80.0 B-AL17 * 900.01 10.38 36.00 0.98 4.55 4.38 20.9 0.788 101.8 85.0 B-AL18 * 900.00 20.76 36.01 0.95 4.49 4.16 43.2 0.810 106.4 85.0 B-AL19 * 900.01 31.14 36.01 0.96 4.41 3.90 67.9 0.798 107.3 85.0 B-AL20 900.00 41.52 36.01 0.99 4.55 3.87 87.6 0.767 99.1 85.0 MTB-1 * 806.01 0.00 42.16 0.98 4.86 4.86 0.0 1.045 104.5 99.3 MTB-4 * 806.01 0.00 4.77 0.95 1.00 1.00 0.0 0.108 55.4 98.7 MTB-6 * 806.02 0.00 12.74 0.99 4.81 4.81 0.0 0.314 53.2 59.3 MTB-7 806.02 0.00 4.58 1.00 0.95 0.95 0.1 0.099 109.8 60.3 MTB-9 * 806.04 0.00 42.16 0.96 4.98 4.98 0.0 1.067 104.2 98.7 * Run used in kinetic model fitting.
Appendix B
X-Ray Raw Data and the Corresponding PDF Cards for Analyzed Samples

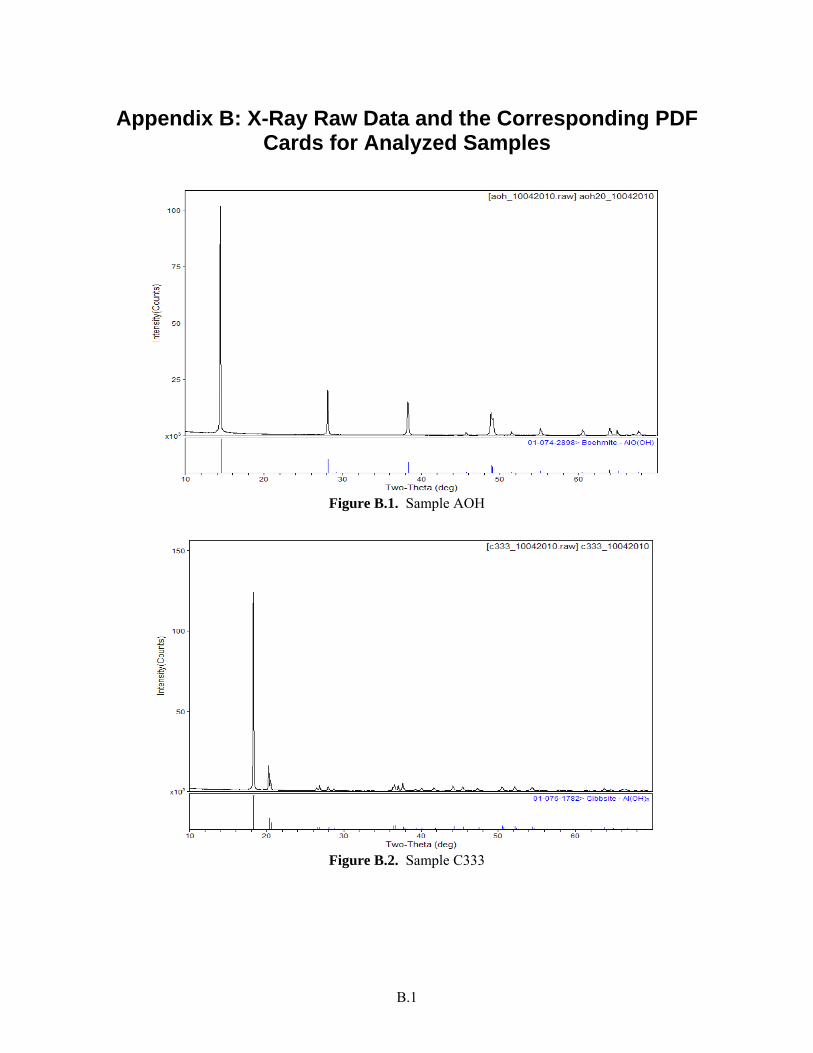
B.1
Appendix B: X-Ray Raw Data and the Corresponding PDF Cards for Analyzed Samples
Figure B.1. Sample AOH
Figure B.2. Sample C333
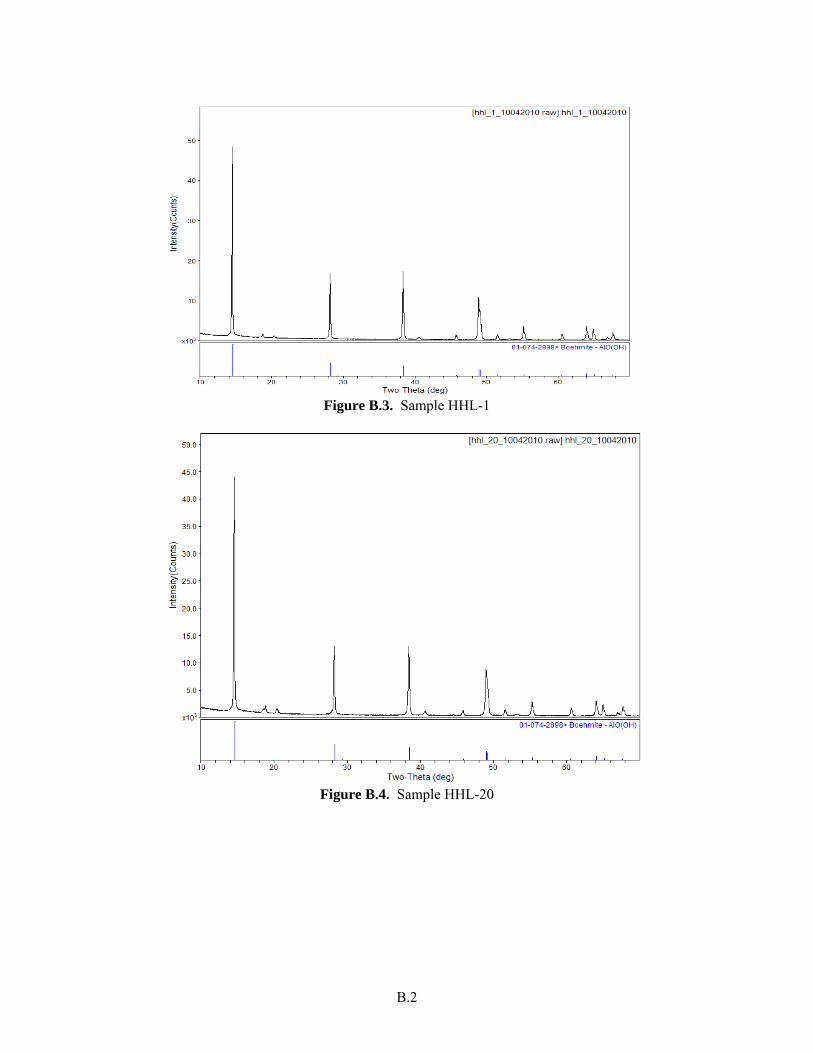
B.2
Figure B.3. Sample HHL-1
Figure B.4. Sample HHL-20
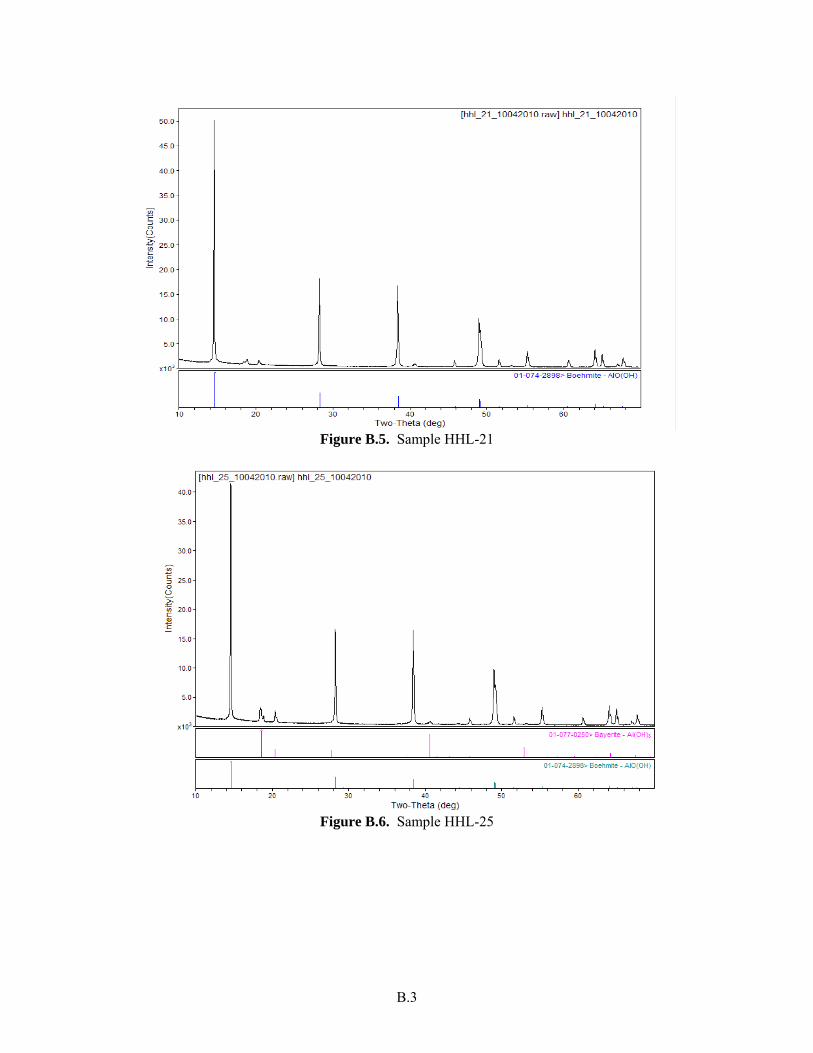
B.3
Figure B.5. Sample HHL-21
Figure B.6. Sample HHL-25
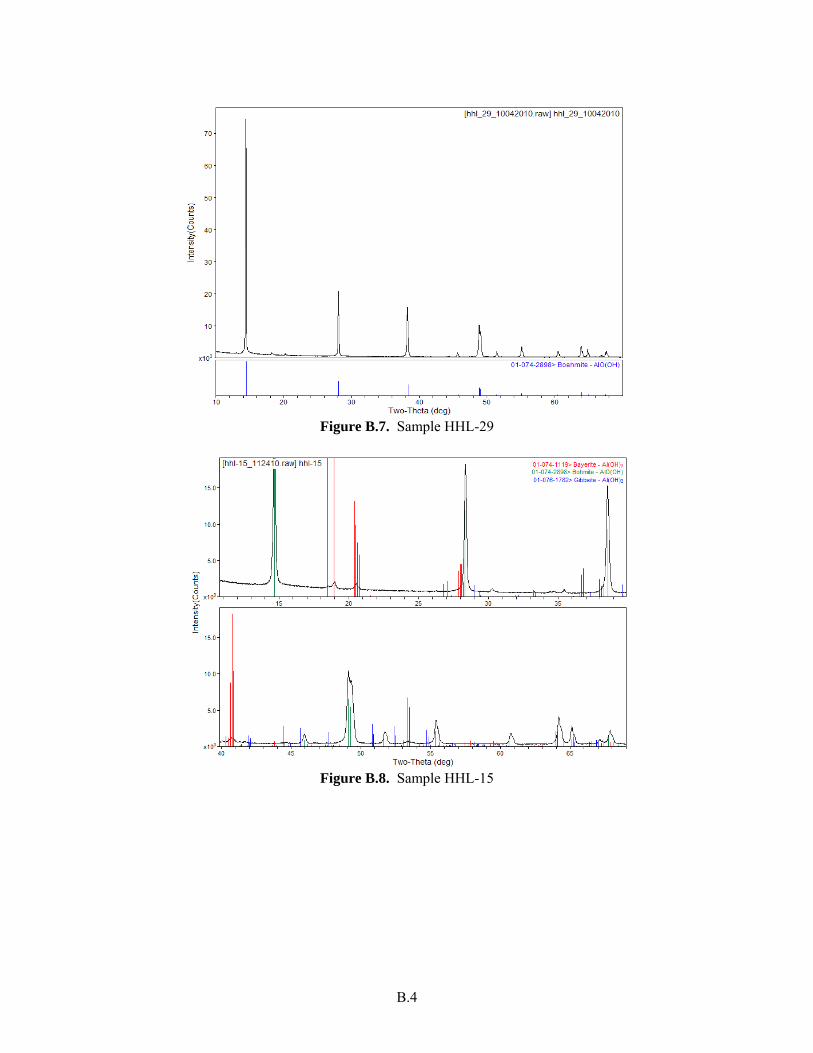
B.4
Figure B.7. Sample HHL-29
Figure B.8. Sample HHL-15
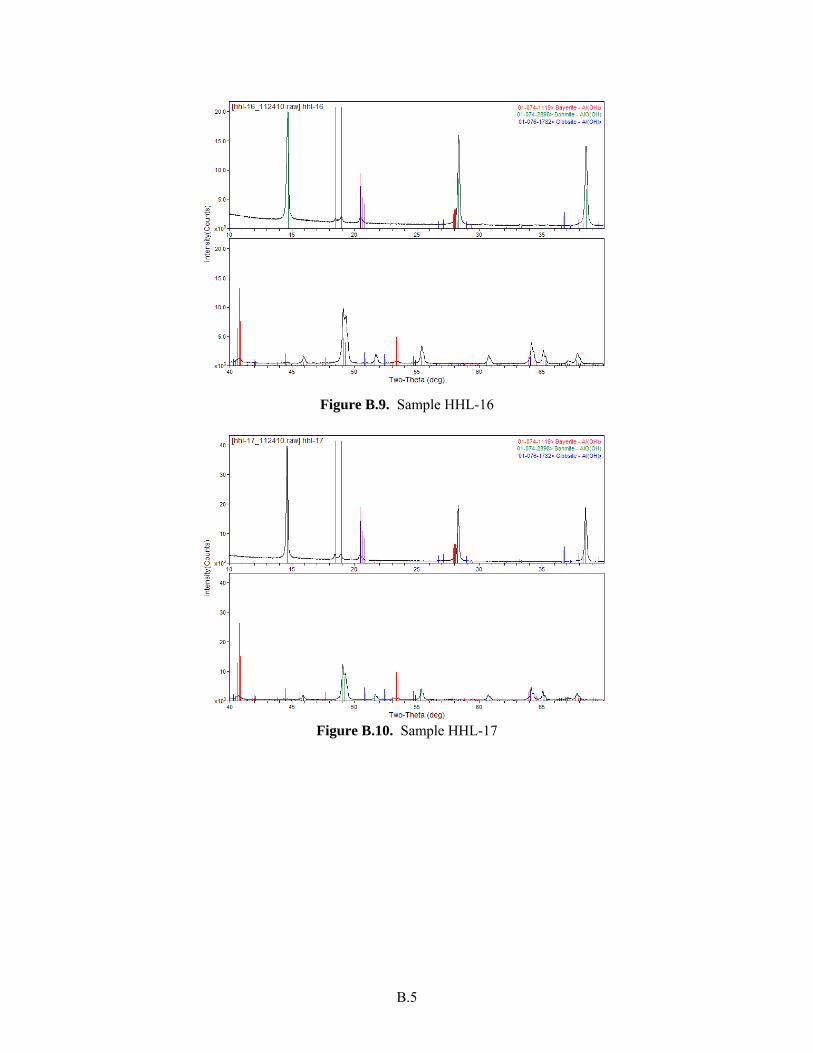
B.5
Figure B.9. Sample HHL-16
Figure B.10. Sample HHL-17
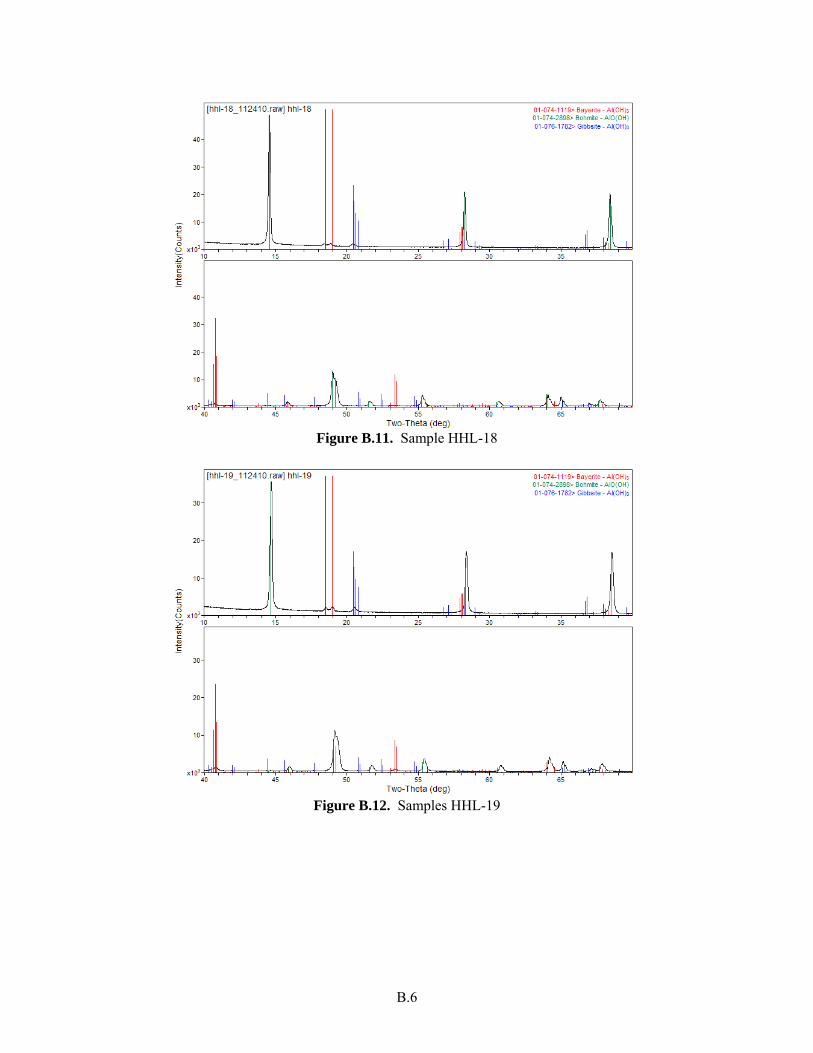
B.6
Figure B.11. Sample HHL-18
Figure B.12. Samples HHL-19

Appendix C
XRD Full Refinement of the Data

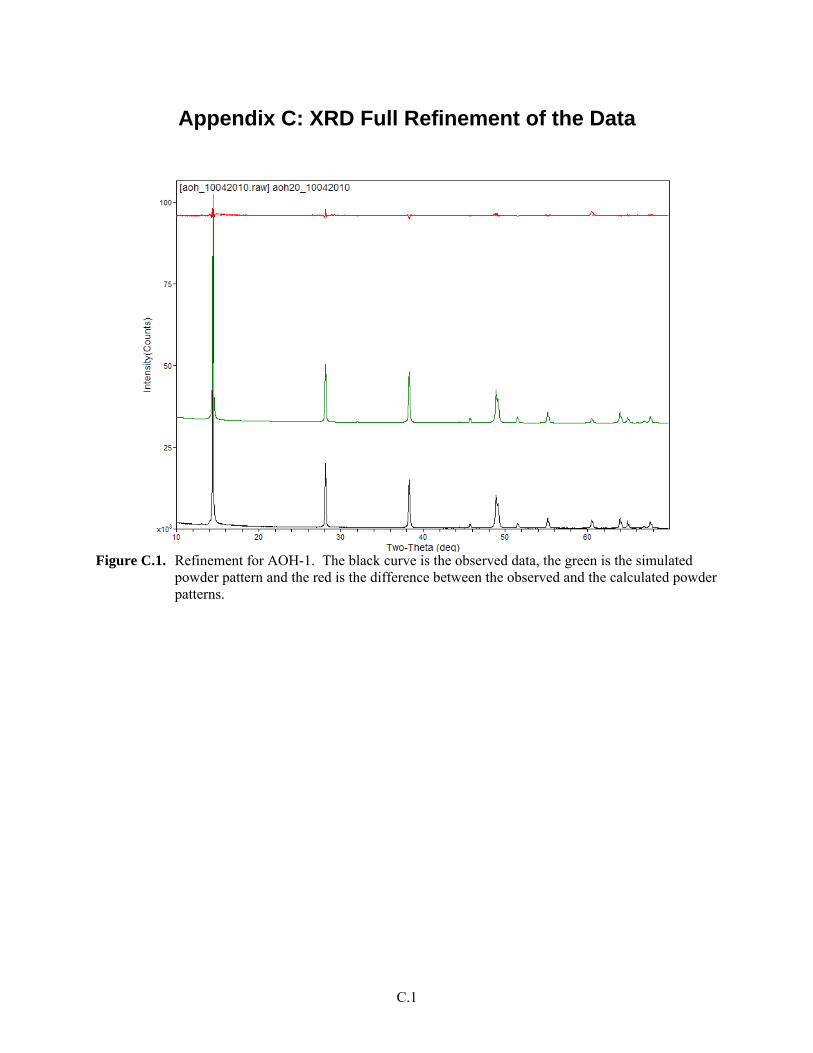
C.1
Appendix C: XRD Full Refinement of the Data
Figure C.1. Refinement for AOH-1. The black curve is the observed data, the green is the simulated
powder pattern and the red is the difference between the observed and the calculated powder patterns.
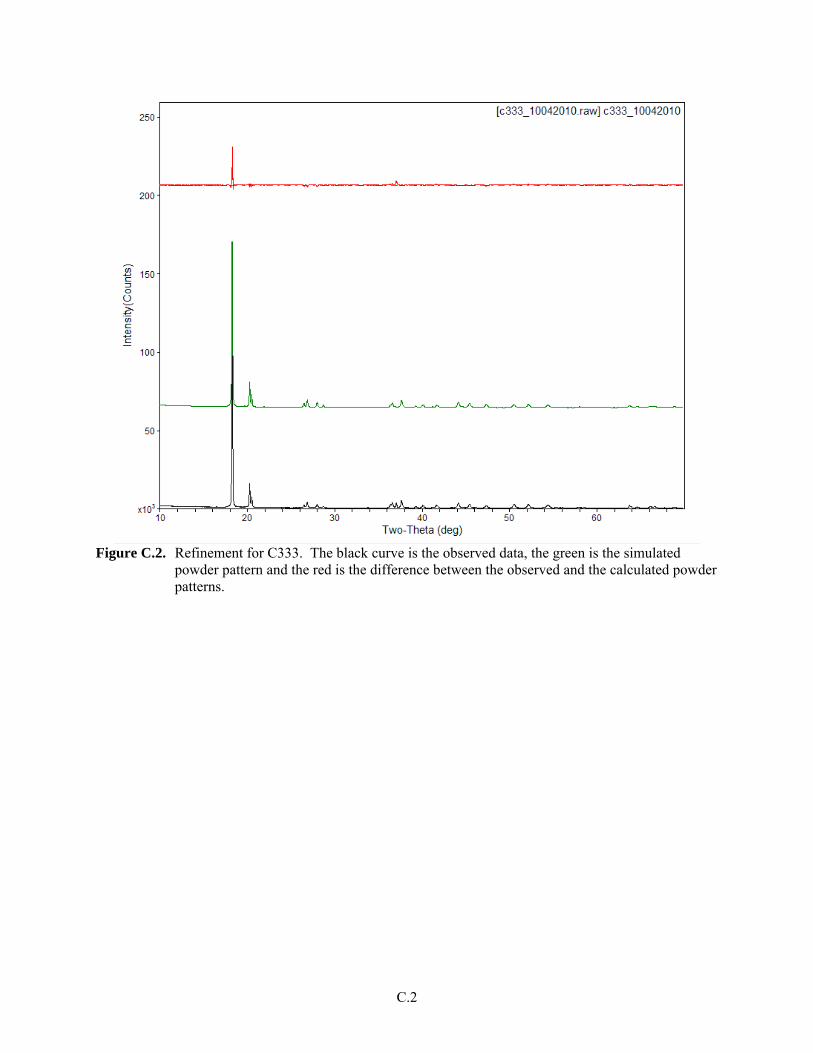
C.2
Figure C.2. Refinement for C333. The black curve is the observed data, the green is the simulated
powder pattern and the red is the difference between the observed and the calculated powder patterns.
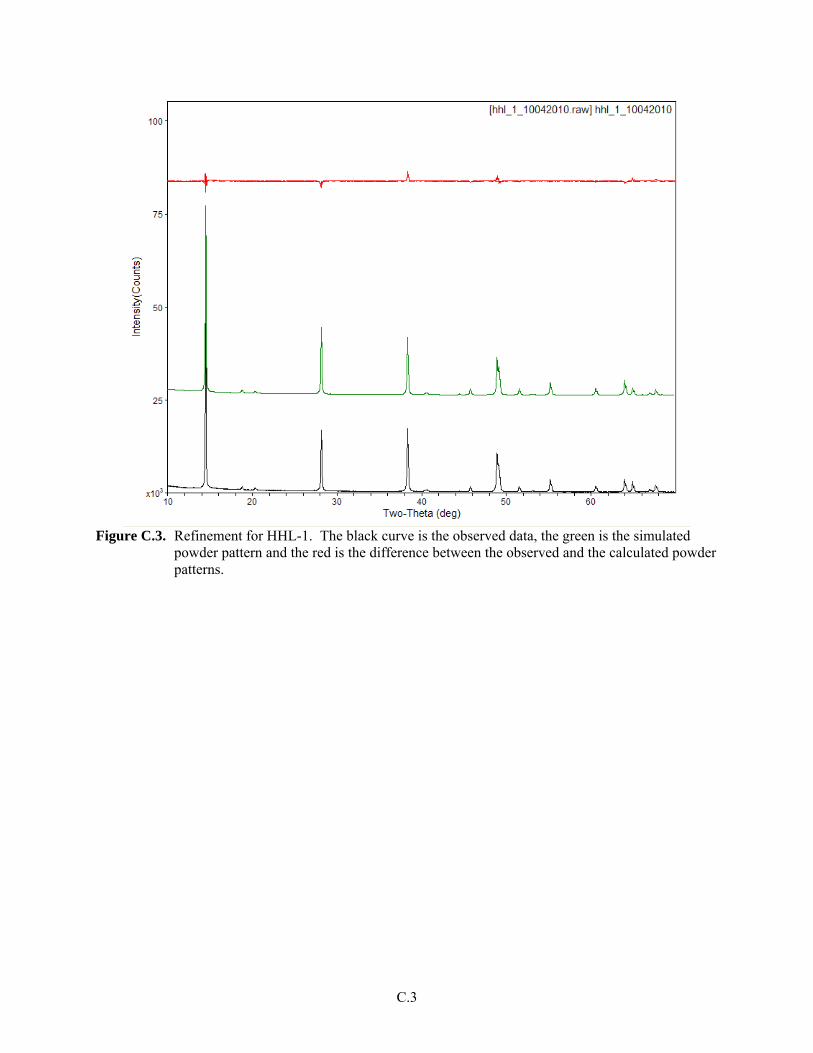
C.3
Figure C.3. Refinement for HHL-1. The black curve is the observed data, the green is the simulated
powder pattern and the red is the difference between the observed and the calculated powder patterns.
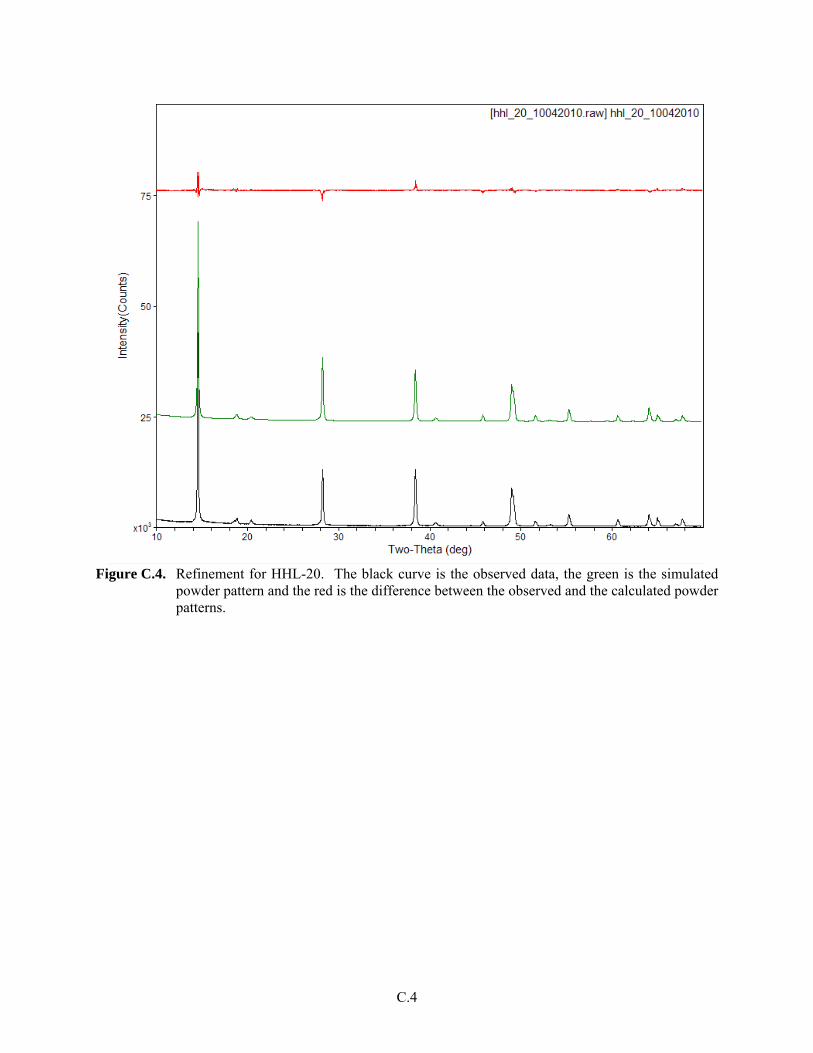
C.4
Figure C.4. Refinement for HHL-20. The black curve is the observed data, the green is the simulated
powder pattern and the red is the difference between the observed and the calculated powder patterns.
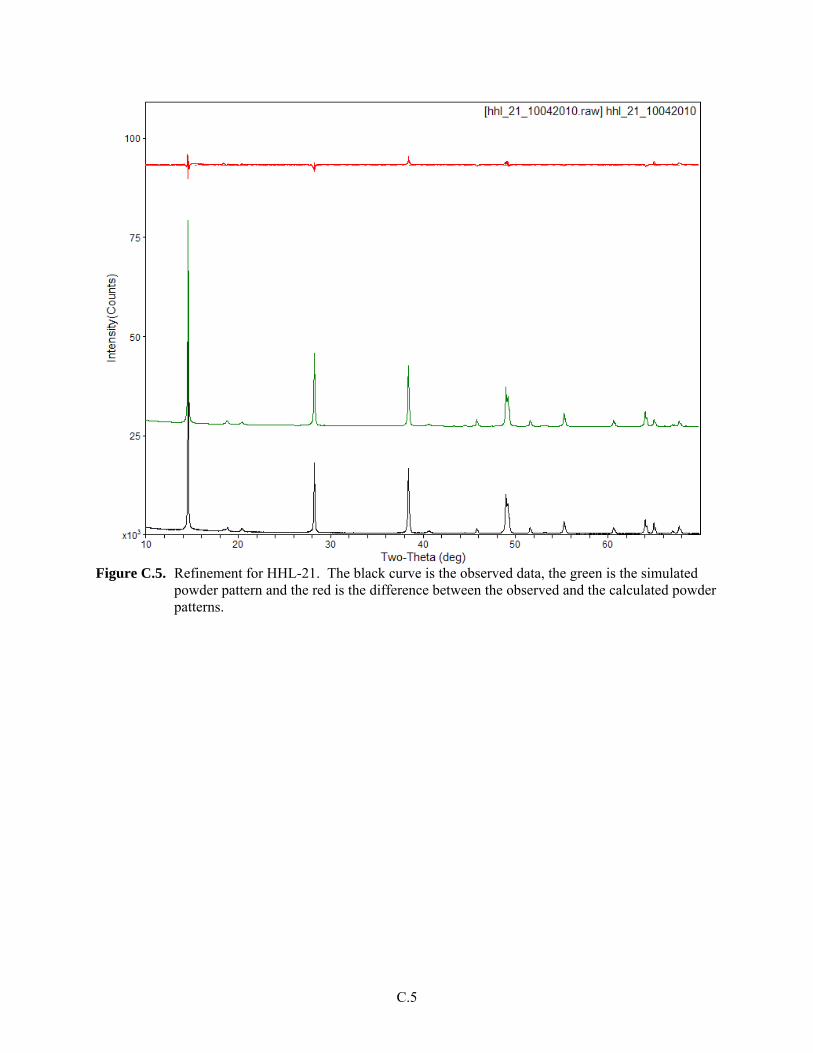
C.5
Figure C.5. Refinement for HHL-21. The black curve is the observed data, the green is the simulated
powder pattern and the red is the difference between the observed and the calculated powder patterns.

C.6
Figure C.6. Refinement for HHL-25. The black curve is the observed data, the green is the simulated
powder pattern and the red is the difference between the observed and the calculated powder patterns.
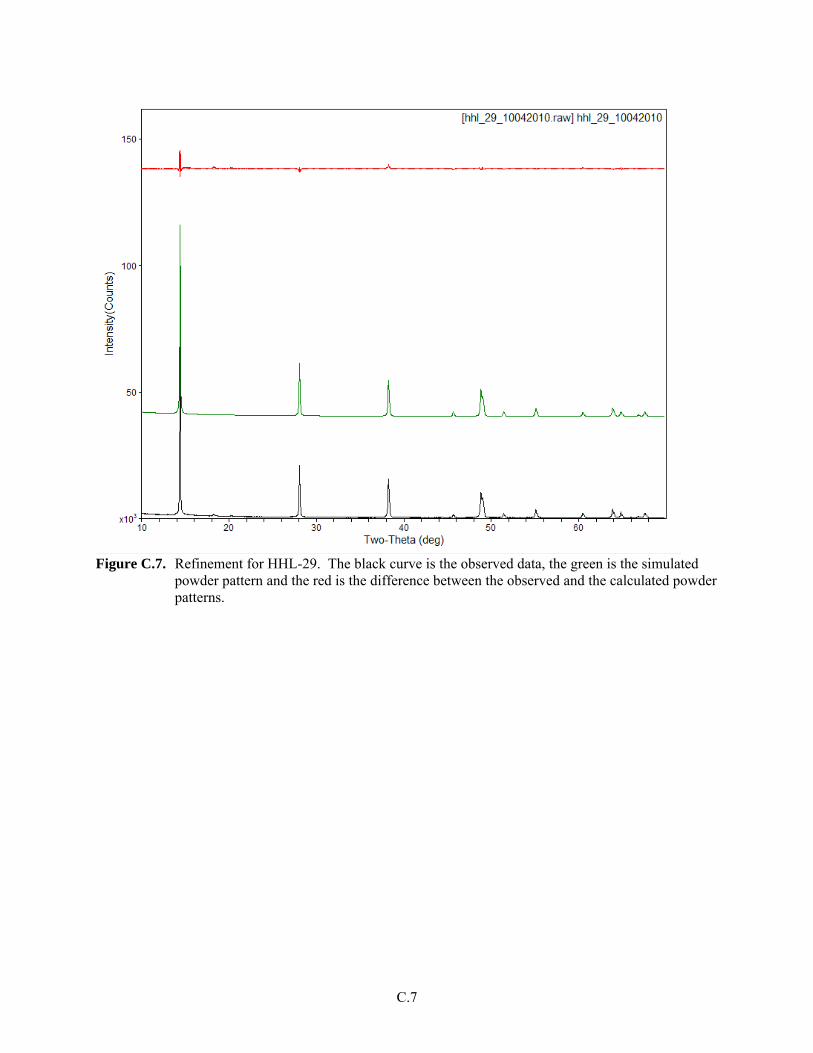
C.7
Figure C.7. Refinement for HHL-29. The black curve is the observed data, the green is the simulated
powder pattern and the red is the difference between the observed and the calculated powder patterns.
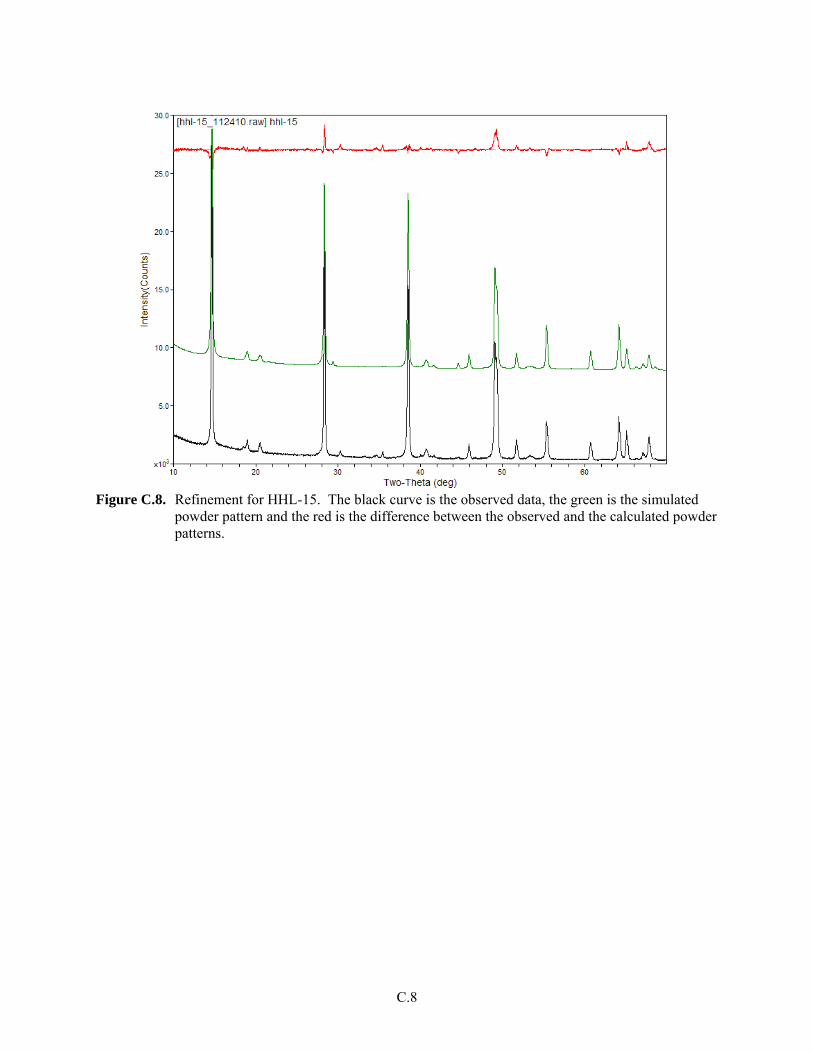
C.8
Figure C.8. Refinement for HHL-15. The black curve is the observed data, the green is the simulated
powder pattern and the red is the difference between the observed and the calculated powder patterns.
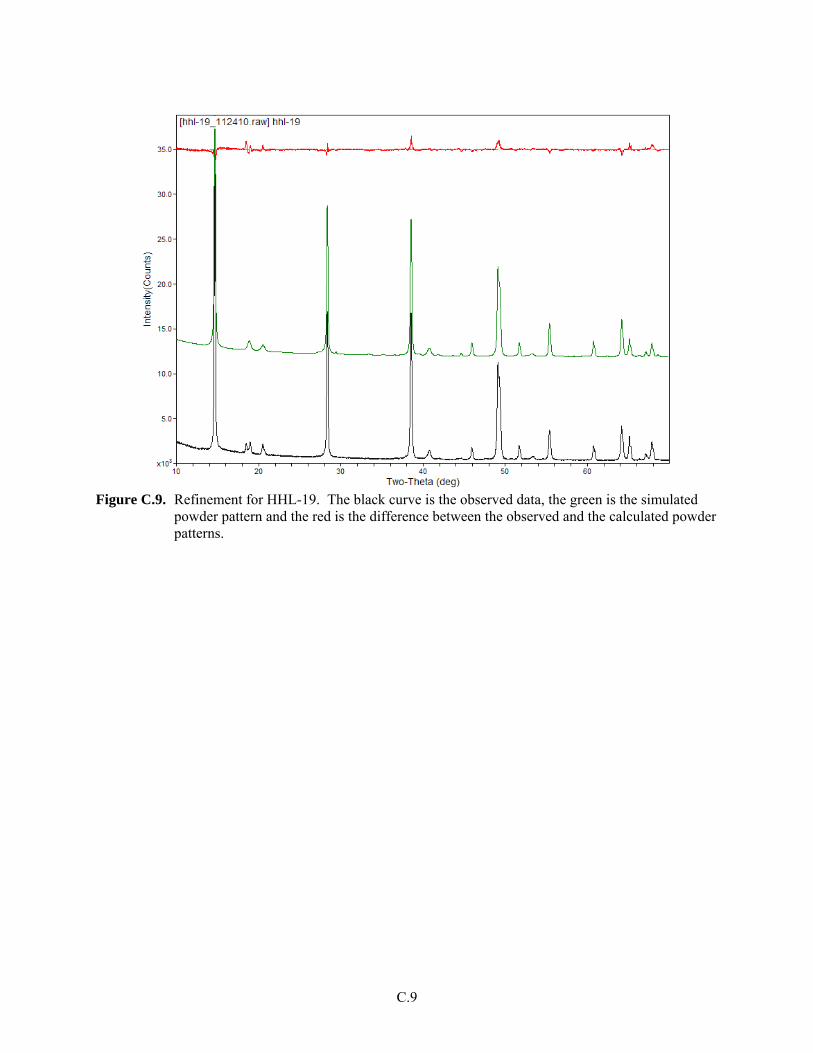
C.9
Figure C.9. Refinement for HHL-19. The black curve is the observed data, the green is the simulated
powder pattern and the red is the difference between the observed and the calculated powder patterns.
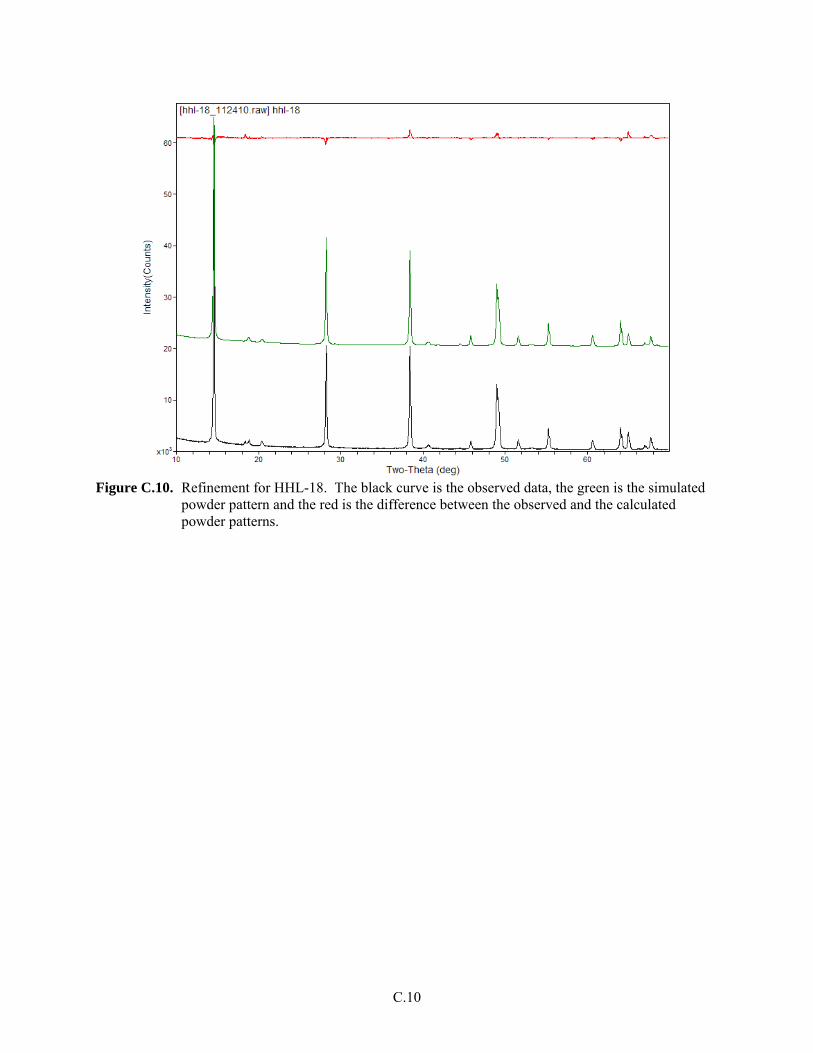
C.10
Figure C.10. Refinement for HHL-18. The black curve is the observed data, the green is the simulated
powder pattern and the red is the difference between the observed and the calculated powder patterns.
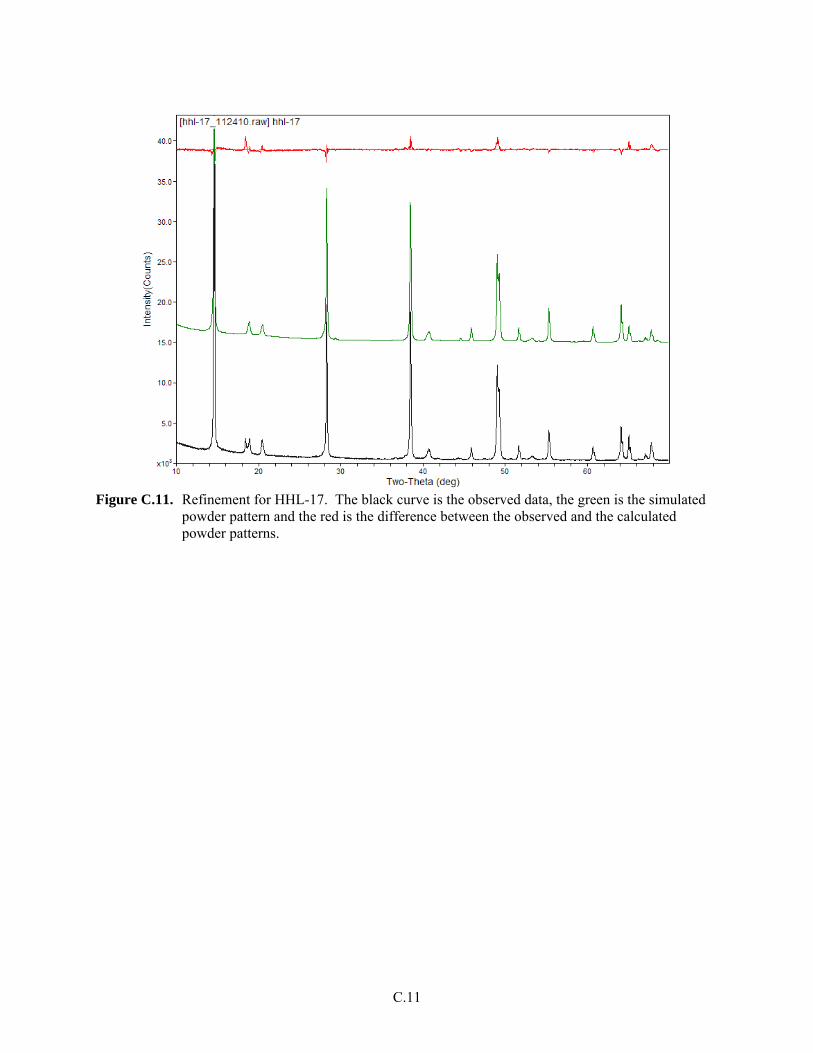
C.11
Figure C.11. Refinement for HHL-17. The black curve is the observed data, the green is the simulated
powder pattern and the red is the difference between the observed and the calculated powder patterns.
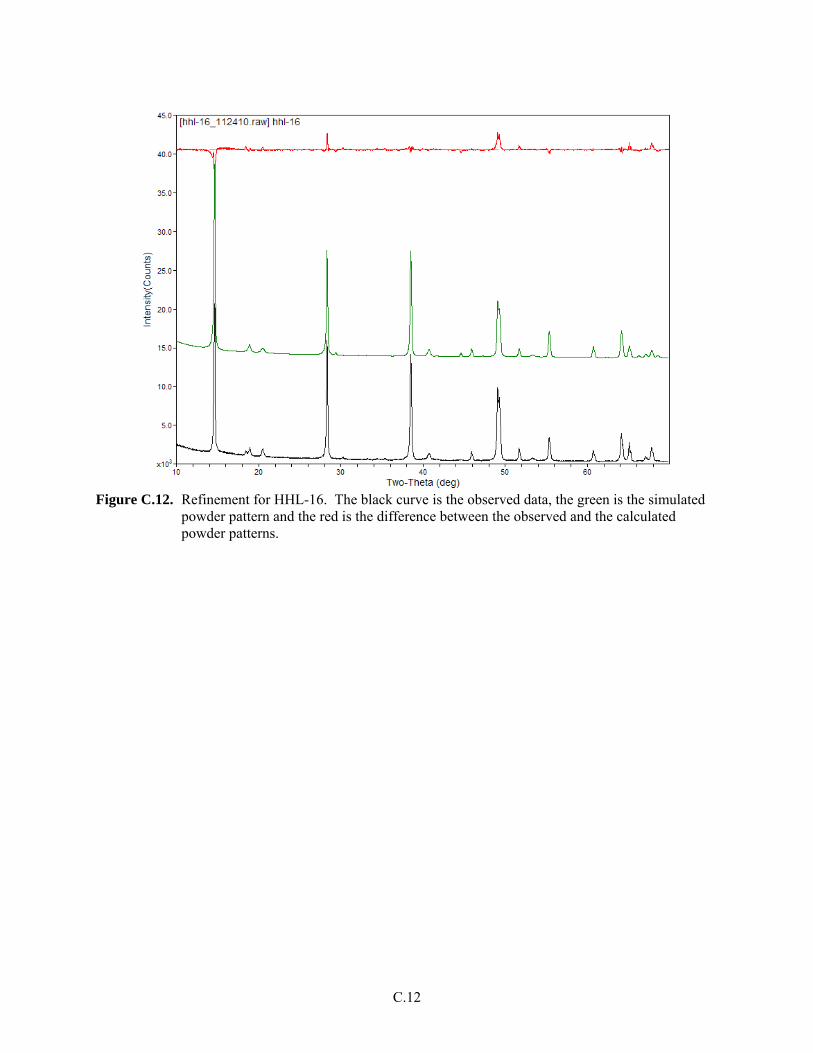
C.12
Figure C.12. Refinement for HHL-16. The black curve is the observed data, the green is the simulated
powder pattern and the red is the difference between the observed and the calculated powder patterns.

Appendix D
FWHM Profile Fits

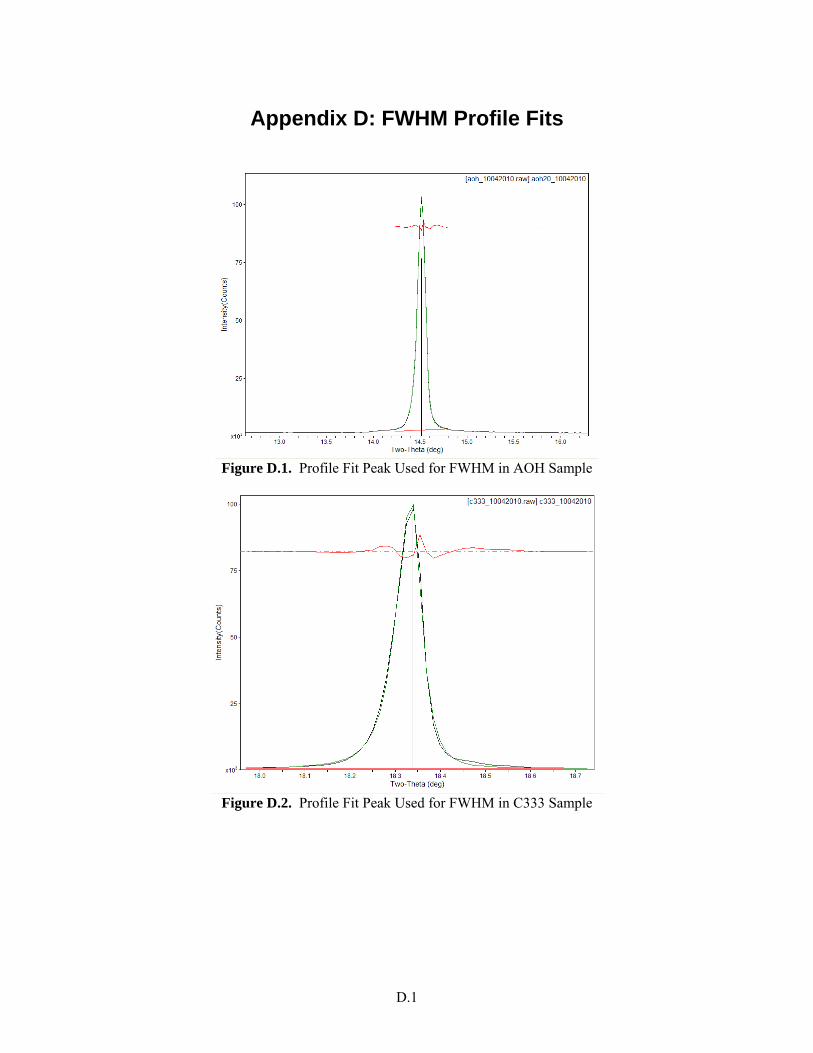
D.1
Appendix D: FWHM Profile Fits
Figure D.1. Profile Fit Peak Used for FWHM in AOH Sample
Figure D.2. Profile Fit Peak Used for FWHM in C333 Sample
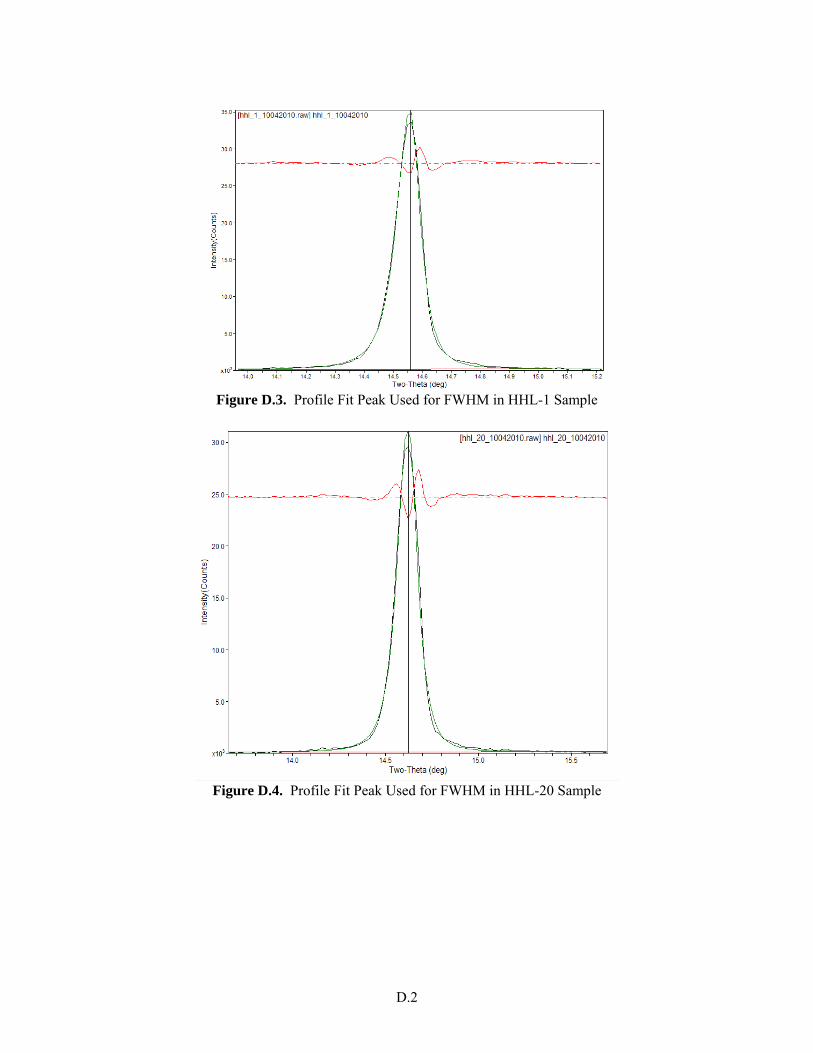
D.2
Figure D.3. Profile Fit Peak Used for FWHM in HHL-1 Sample
Figure D.4. Profile Fit Peak Used for FWHM in HHL-20 Sample
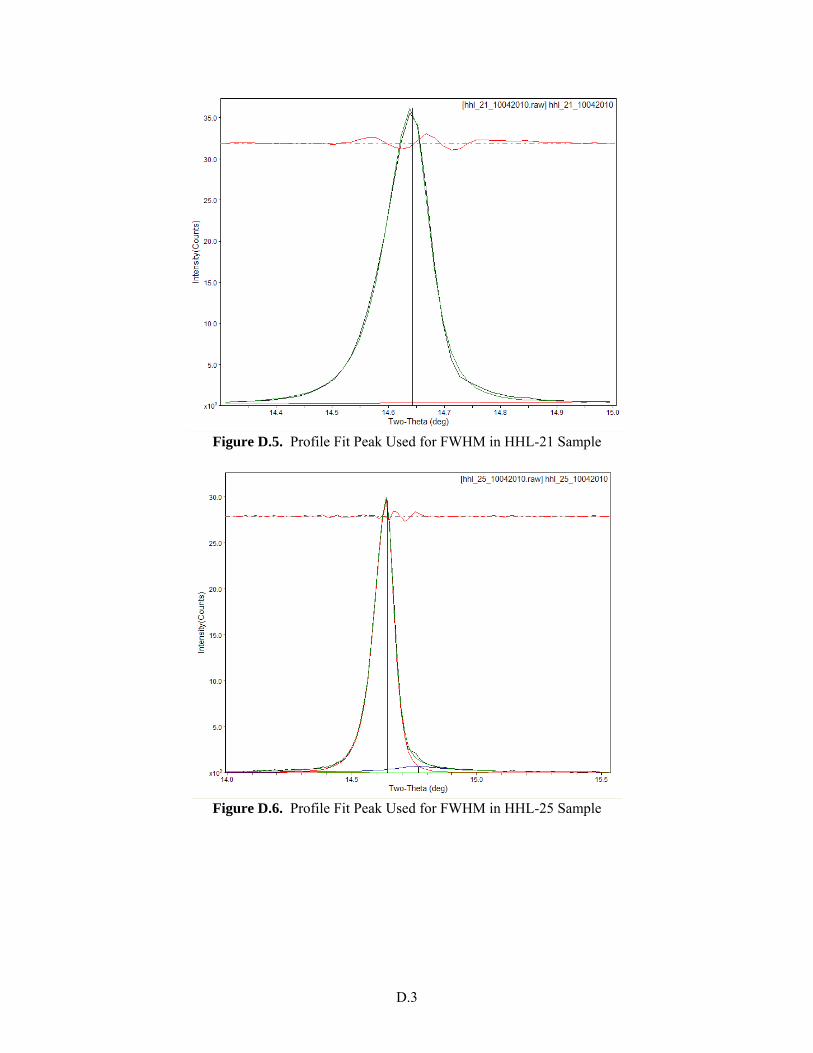
D.3
Figure D.5. Profile Fit Peak Used for FWHM in HHL-21 Sample
Figure D.6. Profile Fit Peak Used for FWHM in HHL-25 Sample
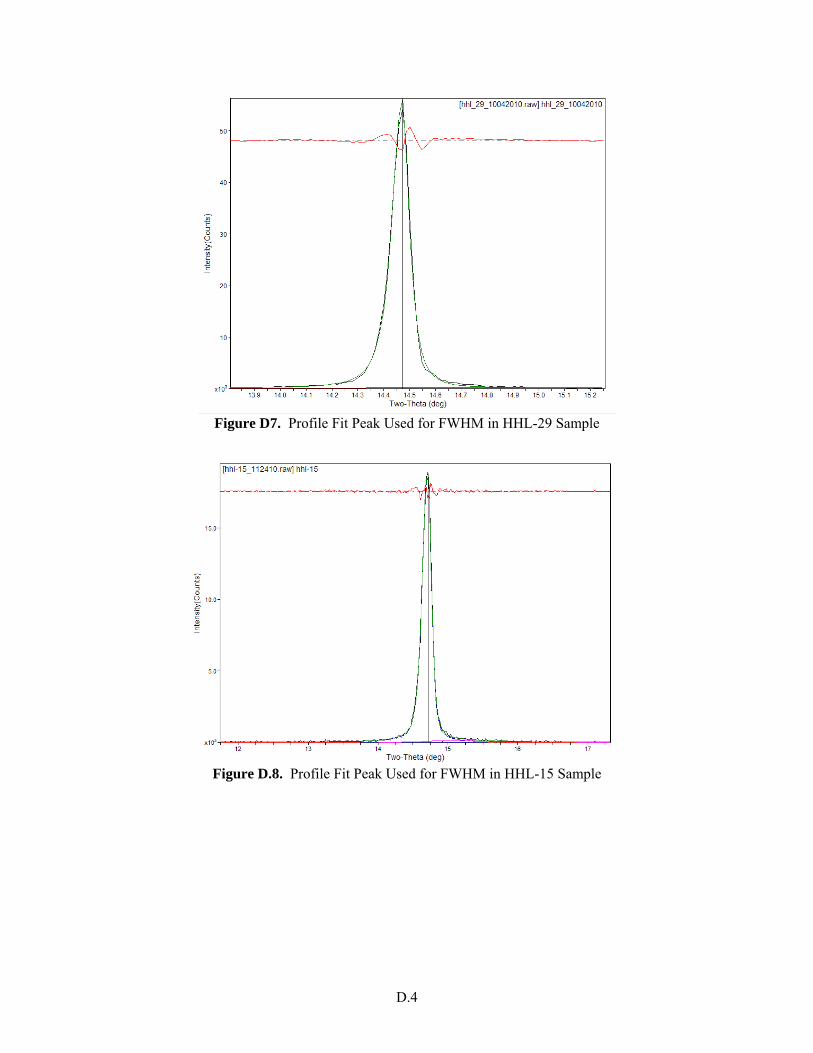
D.4
Figure D7. Profile Fit Peak Used for FWHM in HHL-29 Sample
Figure D.8. Profile Fit Peak Used for FWHM in HHL-15 Sample
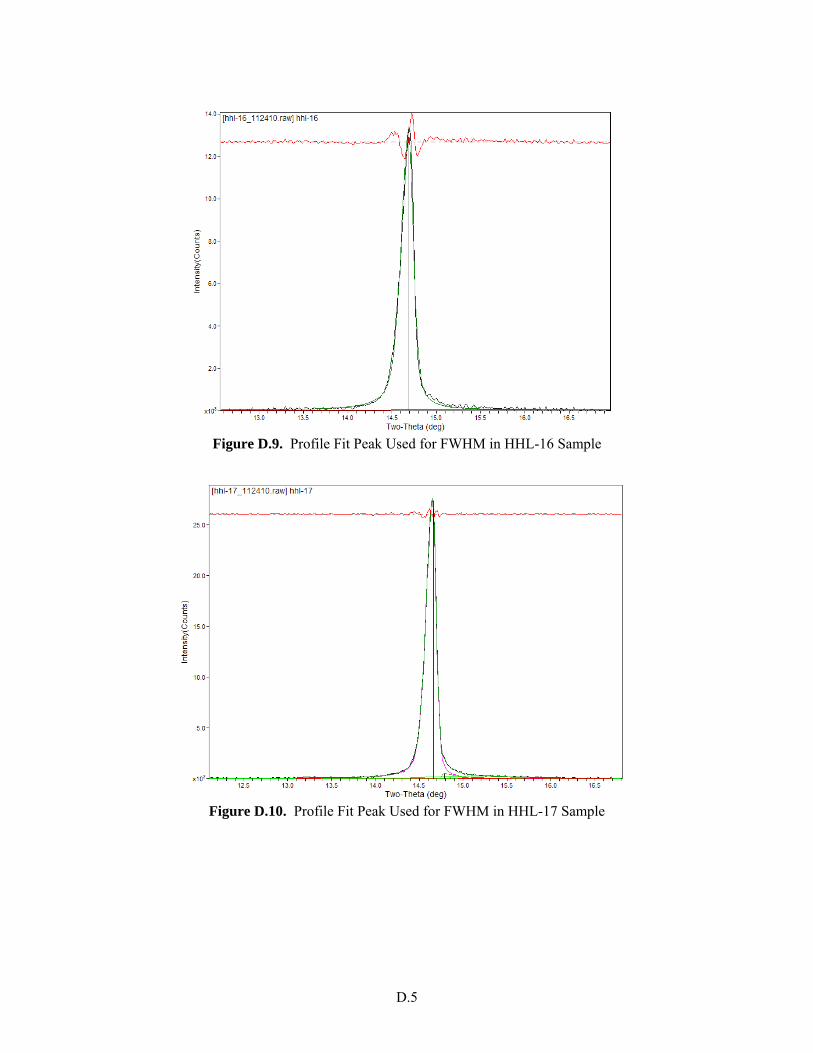
D.5
Figure D.9. Profile Fit Peak Used for FWHM in HHL-16 Sample
Figure D.10. Profile Fit Peak Used for FWHM in HHL-17 Sample
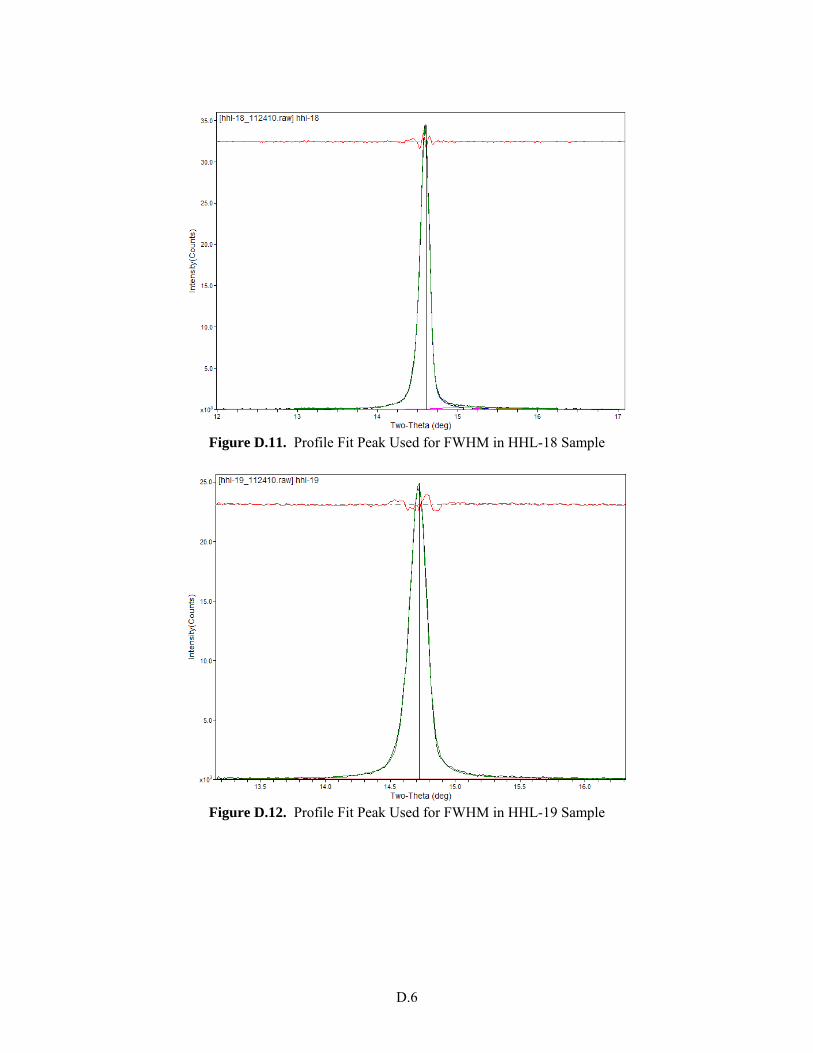
D.6
Figure D.11. Profile Fit Peak Used for FWHM in HHL-18 Sample
Figure D.12. Profile Fit Peak Used for FWHM in HHL-19 Sample
PNNL-20166 EMSP-RPT-002
Distr. 1
Distribution(a) No. of Copies OFFSITE
No. of Copies ONSITE
3 U.S. Department of Energy, EM Hoyt Johnson Nicholas Machara Steve Schneider
3 U.S. Department of Energy, ORP
Tom Fletcher Billie Mauss Stephen Pfaff
1 Savannah River National Laboratory
Bill Wilmarth
6 Pacific Northwest National Laboratory *Mahoney, L.A. K7-15 *Rapko, B.M. (3) P7-25 *Russell, R.L. K6-24 *Schonewill, P.P. P7-25 Lumetta, G.J. Neiner, D. Peterson, R.A.
(a) Recipients marked with an asterisk will receive hardcopies of the report—the others will receive an electronic
distribution.