Embed Size (px)
Citation preview

This article appeared in a journal published by Elsevier. The attachedcopy is furnished to the author for internal non-commercial researchand education use, including for instruction at the authors institution
and sharing with colleagues.
Other uses, including reproduction and distribution, or selling orlicensing copies, or posting to personal, institutional or third party
websites are prohibited.
In most cases authors are permitted to post their version of thearticle (e.g. in Word or Tex form) to their personal website orinstitutional repository. Authors requiring further information
regarding Elsevier’s archiving and manuscript policies areencouraged to visit:
http://www.elsevier.com/authorsrights
Author's personal copy
Alterations in the hepatic transcriptional landscape after RNAimediated ApoB silencing in cynomolgus monkeys
M. Sabry Hamza a, *, 1, Chanchal Kumar a, 1, Ser Mien Chia a, Vidhya Anandalakshmi a,Nicole Boo a, Walter Strapps b, Michael Robinson b, Michelle Caguyong b, Steven Bartz b,Marija Tadin-Strapps b, 2, Alain van Gool a, Shian-Jiun Shih a, **
a Translational Medicine Research Centre, Merck Sharp and Dohme, Singaporeb RNAi Therapeutics, Merck Research Labs, USA
a r t i c l e i n f o
Article history:Received 29 December 2014Received in revised form9 June 2015Accepted 18 July 2015Available online 29 July 2015
Keywords:siRNARNAiAPOBCynomolgus monkeysNHPNon-human primatesCholesterol
a b s t r a c t
The greater genomic conservation between humans and non-human primates (NHP) enables targetvalidation studies for developing of therapeutic strategies for human diseases. Together with predictingactivity and potential adverse clinical signs, the inclusion of NHP testing bequeaths to efficacy models fordose titration and pharmacodynamic effects. We have used lipid nanoparticle encapsulated siRNA tosilence ApoB in the liver and assessed the phenotypic effects on serum lipids with various levels ofhepatic ApoB mRNA knockdown in healthy lean cynomolgus monkeys. ApoB siRNA dosed animalsdemonstrated significant reductions of hepatic ApoB mRNA and serum APOB protein, with a substantiallowering of plasma lipid levels without obvious signs of toxicity. Microarray based assessment of ApoBsiRNA mediated effects revealed a number of differentially expressed genes which mapped onto bio-logical pathways and processes related to lipid and cholesterol metabolism. Furthermore, we identifiedpotential targets and cellular effects that could be studied for therapeutic benchmarking of APOBmediated effects. The network of ApoB regulated genes should be of significance for the understandingand development of novel hypercholesterolemia therapies.
© 2015 Published by Elsevier Ireland Ltd.
1. Introduction
Atherosclerosis is a chronic disease and one of the major causesof hospitalization and mortality in the developed world. Theoriesbehind the initiation of the atherosclerotic process include thedamage to arterial vessel walls by the retention and oxidation oflow-density lipoprotein (LDL) molecules to induce inflammation[1]. One of the major risk factors for atherosclerosis is hyper-lipidaemia which correlates with high levels of low density
lipoprotein (LDL) [2,3]. Likewise, increase in Apolipoprotein B(APOB) levels has been correlated with atherosclerosis [4e6],which in-turn plays a key role in assembly and secretion of very-low-density lipoprotein (vLDL) and LDL. In fact, several studieshave proposed that plasma levels of APOB may be better predictorsof atherosclerosis as it relates to the total number of atherogenicparticles that enter the arterial wall [7e10].
APOB, which is predominately expressed in the liver and smallintestines, consists of two isoforms; the B-48 version is synthesizedin enterocytes and the B-100 in the liver. As APOB is associatedwiththe assembly and transport of lipids it becomes problematic totarget using conventional therapies. However, innovative meth-odologies using antisense oligonucleotides (ASO) have progressedas viable alternatives to conventional approaches [11,12]. Anexample of which is Mipomersen, a second generation ASO, whichtargets ApoB in the liver reducing total plasma and LDL cholesterol[13,14]. RNA interference (RNAi) has also been successfully used inpreclinical models to target ApoB in the liver and produce signifi-cant lowering of circulating plasma cholesterol levels [6] [15].When siRNAs are delivered systematically by intravenous injection,
Abbreviations: siRNA, short interfering RNA; RNAi, RNA interference; APOB,apolipoprotein B.* Corresponding author. 8 Biomedical Grove, Neuros Building, #04-01, Trans-
lational Medicine Research Center, Singapore 138665, Singapore.** Corresponding author. 8 Biomedical Grove, Neuros Building, #04-01, Trans-lational Medicine Research Center, Singapore 138665, Singapore.
E-mail addresses: [email protected] (M.S. Hamza), [email protected] (S.-J. Shih).
1 Equal co-first authors.2 Current address: Genetics and Genetics and Pharmacogenomics, Merck
Research Labs, Boston, MA, USA.
Contents lists available at ScienceDirect
Atherosclerosis
journal homepage: www.elsevier .com/locate/atherosclerosis
http://dx.doi.org/10.1016/j.atherosclerosis.2015.07.0320021-9150/© 2015 Published by Elsevier Ireland Ltd.
Atherosclerosis 242 (2015) 383e395
Author's personal copy
the bio distribution of chemically synthesized siRNAs encapsulatedwith lipid nanoparticles (LNPs) has been shown to prominentlytarget the liver, with spleen and kidney accruing lower levels ofLNPs [16].
Small interfering RNA (siRNA) and antisense oligonucleotides(ASO) could have impact in the treatment of ailments linked totranscript and protein overexpression in diseased individuals. This“gain-of-function” could arise due to environmental or geneticfactors, and perturbation of genes or pathways involved using oli-gonucleotides could be a viable treatment strategy. Althoughbeyond the scope of this manuscript, the use of ApoB siRNAtreatment may be beneficial for patients showing gain-of-functionmutations in ApoB. It has been shown that mutations in the ApoBgene are known to cause a form inherited hypercholesterolemiacalled familial defective apolipoprotein B-100 (FDB). Statin treat-ment, which inhibits HMG-CoA reductase, might not be beneficialin patients carrying gain-of-function mutations in ApoB. In thesepatients, directly targeting ApoB might alleviate the symptoms ofFDB.
There are many technical challenges to using siRNA or ASO; thestability associated with in-vivo nuclease activity, delivery to thetarget tissues, potency, toxicity, durability and the off-target effectsdue to the nature of oligonucleotides. Some of these difficultiescould be overcome using chemical modifications to these oligo-nucleotides to improve potency and reduce off-target effects. Asboth platforms silence or reduce gene expression, numerousstudies have been conducted to compare the two [17,18]. siRNAshave been demonstrated in-vitro to be more potent and have beendemonstrated to have subnanomolar IC50 values in in vitro studies[19], while ASOs are less expensive to manufacture and havebroader bio distribution. Additional research needs to be conductedto state the clear advantages of using one platform over the other.
Our manuscript does not compare the two technologies, butrelies on the siRNA platform for targeting ApoB in the liver andassessing the effects on plasma LDL-c and total cholesterol incynomolgus monkeys. As the current approaches for developmentof anti-ApoB therapies for cholesterol lowering have been mired bythe increase in hepatic triglycerides and hepatic steatosis[10,20e22], the focus of our work was on better understandinggene expression changes following ApoB knockdownwith intent topotentially identify other gene targets that may still show benefitson lowering circulating lipids while having less side-effects. Thesestudies provide a pragmatic approach to develop potential newtherapies for hypercholesterolemia.
We hope that our gene expression studies conducted in NHPscould be utilized as a resource to define hepatic transcriptionalchanges that occur after reducing ApoB transcript levels. Thisresource could help decipher pathways that aremodulated by ApoBand thereby, the consequences of silencing ApoB levels in the liver.
2. Materials and methods
2.1. Ethical approvals
All studies were approved by the Institutional Animal Care andUse Committee (IACUC) of Maccine Pte Ltd and Merck ResearchLabs prior to commencement of the experimental phase.
2.2. Formulation of the siRNA LNPs and dosing
Selection of the siRNA ApoB sequence and lipid formulationwere based on previous well characterized studies for efficacy[6,15]. Test substances and vehicle were removed from refrigeratedstorage conditions and allowed to reach room temperature forapproximately 30 min prior to filling the syringe. Syringes were
transported at ambient temperature to animal area and dosedwithin 30 min after syringe filling. Animals were restrained for theentire dosing procedure and the test substance was administeredby intravenous (bolus) injection over approximately 2e5 min (max3 mL per minute) via a peripheral vein followed by a 1 mL salineflush. Dose volumes for animals receiving the test articles wereadjusted according to the animal's recently recorded body weight.Before starting IV dosing, it was ensured that the IV catheter wasplaced correctly into the peripheral vein. Animals were precondi-tioned to sit in restraint chairs for 3e4 days prior to dosing. Thecore siRNA target sequences for APOB and non-targeting siRNAsequence are listed below;
50-GGAATCTTATATTTGATCC-30- APOB50-CTAGCTGGACACGTCGATA-3’-non-targetingsiRNA synthesis, characterization and encapsulation were per-formed as previously described [6,15,23].
Three independent studies (study-01, 02 and 03) were per-formed using two types of lipid formulation. Study 01 and 02, theLNP was formulated in BMA (butyl methacrylate), and animalswere dosed at 2.5 mpk. Studies 01 and 02 were considered as twoseparate studies as they were conducted at different times withdifferent preparations of the lipid and siRNA LNP formulations. Instudy-03, animals were dosed using KC2 2,2-dilinoleyl-4-(2-dimethylaminoethyl)-[1,3]-dioxolane (DLin-KC2-DMA) lipidformulation at 1.5 mpk. KC2 is an ionizable cationic lipid 100 foldmore potent than a similar lipid composition, consisting of theionizable cationic lipid dilinoleoyl-DMA (DLinDMA) [24]. The for-mulations used in the study were different versions of cationiclipids that were being developed and assessed at Merck for hepa-tocyte delivery. BMA formulation proceeded KC2 which is why it isless potent and the dose levels needed to achieve comparable de-gree of silencing are higher than with KC2 which is a newer opti-mized version of the lipid. Our lipid optimization efforts have beenrecently published [16,25]. BMA and the KC2 lipid formulationswere selected based on previous internal in-vivo studies in rhesusand cynomolgus monkeys. The dosages were based on titrationstudies for both efficacy to reduce transcript levels as well as safetyand durability.
2.3. Animal origin, acclimatization and pre-study assessment
Male Cynomolgus monkeys (Macaca fascicularis); approxi-mately 2e4 years old and 2e4 kg in weight were housed in Mac-cine's facility in Bintan, Indonesia. The animals were antibodynegative for Simian Immunodeficiency Virus (SIV), Simian T-cellLeukemia Virus (STLV), Simian Retroviruses Type D (SRV) butmixedviral status for Herpes Simian B Virus (Macacine herpesvirus 1). Allanimals were tested to be Tuberculosis-free. The animals wereallowed to acclimatize to the indoor animal room facility for aminimum period of 14 days prior to the commencement of thestudy. To facilitate dosing procedure and sampling, animals un-derwent chair training for 3e4 days prior to dosing. The pre-studyassessment of the animal's health status included clinical chemistryand hematology evaluation of blood samples as well as assessmentby a veterinarian.
2.4. Animal handling and diet
Animals were fed a diet of monkey chow (Perfect Companion,Thailand) offered twice daily. Animals were also offered acontrolled amount of fruit once a day. Tap water was offered adlibitum and was periodically analysed for impurities and contami-nants. The criteria for acceptable levels of contaminants in stock
M.S. Hamza et al. / Atherosclerosis 242 (2015) 383e395384

Author's personal copy
diet and water supply were within the analytical specificationsestablished by the diet manufacturer and local regulations,respectively. Animals were deprived of food overnight for a mini-mum of 14 h and amaximum of 15 h prior to liver biopsy collection,dosing and blood collection. The animals were subjected to astaggered fasting regimen prior to liver biopsy collection and/orblood collection in order to achieve the same period of fasting. Asvariation in animal handling may be relevant to study outcomes, allanimals were handled consistently during the study. Clinical ob-servations and any unusual events or reactions, if any, wererecorded during handling of the animals. The animals were pro-vided with cage toys for environmental enrichment to ensureadequate welfare and psychological well-being.
2.5. Plasma lipid and clinical chemistry analysis
Animals were allocated to groups using stratification based onbody weight, safety biomarkers, such as liver enzymes, and targetplasma levels obtained prior to study start.
Blood samples for hematology, coagulation, clinical chemistryinvestigations and plasma samples were collected via alert bleedfrom each animal from the femoral and/or any peripheral vein.Approximately 2.0 mL of blood was transferred into Lithium-Heparin tubes (Becton Dickinson) and centrifuged. The resultantplasma was shipped to Singapore and assayed the next day for onRoche Cobas c501 clinical analyzer, using Roche regents, for theirlipid profile (total cholesterol, LDL-cholesterol, HDL-cholesterol,triglyceride, APOA1, APOB), liver enzymes (ALT, AST, GTT), andblood proteins. The ApoB assay (Tina-quant Apolipoprotein B,version 2,Roche Cobas C system)we used in these studiesmeasuredtotal ApoB levels (ApoB48 and ApoB100) [26]. It is recognized thatApoB48 levels are very low in animals subjected to overnightfasting [27]. Hence we assumed the majority of measured ApoBrepresents ApoB100 from LDL. Our existing data could not be usedto calculate the ratio of ApoB48 to ApoB100. Hematology sampleswere analyzed immediately after collection on site on for completeblood cell counts, including platelets. The effect of target knock-down on serum lipids (TC, HDL, LDL and triglycerides) was deter-mined both on absolute changes in levels and on % changes relativeto pre-dose averages.
2.6. Liver biopsy procedure
Animals were sedated with 0.1 ml/kg of a 100 mg/ml ketaminesolution IM, then intubated and maintained anaesthetized on iso-flurane. Intraoperative monitoring included heart rate, oxygensaturation, end-tidal carbon dioxide, eye reflexes, jaw tone, bodytemperature (water circulated heating pad will be used to keepanimals warm), and response to surgical stimulation. A single doseof meloxicam 0.2 mg/kg IM/SQ was given prior to surgery. Theanimal's right flank was clipped and prepared by scrubbing withalternating povidone iodine scrub and alcohol three times and thearea was coated with povidone iodine solution before draping. Asterile drape was placed over the flank. A sub-cutaneous incisionline block using 50e50 % of bupivicaine and lidocaine was per-formed along the flank or midline placement line. Percutaneousliver samples were collected whilst the animals are under ketamineanaesthesia. Liver tissue were collected twice using a Quick CoreDisposable Biopsy 20G needle, pre-wetted with sterile saline so-lution prior to biopsy sampling, yielding two samples that wereplaced in separate RNAlater Tissue Protect tubes. If insufficientamount of tissue was obtained in one of the two isolations, a thirdneedle biopsy isolation was performed and the additional tissuewas added to the tube of this particular isolation. Post biopsysample collection, the tubes were stored at 2e8 �C until RNA
extraction. Topical antibiotics were applied on the incision site.Meloxicam 0.2 mg/kg IM was administered after ketamine seda-tion, but before surgery, and once daily during the 48 h post-surgical period. Each animal was monitored and allowed torecover in a recovery box post-surgery before being returned to itshome cage. Post-surgical monitoring included monitoring for vitalsigns approximately every 15 min until the animal fully recoveredfrom anesthesia. Post recovery, the animals were checked twicedaily for 3 days and at least daily, thereafter. The observationincluded the animal's general behavior, appetite, locomotion andincision sites. The animals were observed for signs of abdominalpain like hunched posture. The animals were also regularlyobserved for signs of abdominal distension, blood in feces and anyother clinical signs.
2.7. Clinical observations
Clinical observations were performed at least twice daily foreach animal. The onset, intensity and duration of any signsobserved were recorded. Evaluation of test substance administra-tion site for signs of erythema, swelling, etc. was included in clinicalobservations. Following test substance administration and/orscheduled sedations, the animals were observed closely for aminimum of 1 h. All clinical observations for the animals wereevaluated by the attending veterinarian for signs of stress anddeclining animal condition. Appropriate medical treatment wasgiven in accordance with the directions of the Study Director andSponsor Local Study Monitor.
2.8. Real-time polymerase chain reaction (PCR) analysis ofcynomolgus liver biopsies
Total ribonucleic acid (RNA) was isolated from liver biopsiesusing the TRIzol® method (Invitrogen, Carlsbad, CA) and reversetranscribed into complimentary deoxyribonucleic acid (cDNA) us-ing random hexamers. We used TaqMan® probe sets (AppliedBiosystems, Carlsbad, CA) to analyse mRNAs levels. Taqman: Thelevel of mRNA reduction was determined using RT-PCR (Taqman)and compared to non-targeting siRNA treated groups. Taqman wasperformed using the APOB specific primer-probe set MmuA-POBMGB1and GAPDH specific primer-probe set. The GAPDH spe-cific primer-probe set: Rh02621745_g1 was used to normalize thedata. GAPDH was selected as the housekeeping gene based on ourprevious in-vivo studies using both rhesus and cynomolgus mon-keys. This was based on reproducibility and robustness of theGAPDH transcript levels after comparing to a panel of otherhousekeeping genes.
All QPCR assays were performed using two technical repeats foreach sample. The mean of each technical repeat was then subse-quently used for the analysis.
The mean Ct values obtained after each QPCR run were used tocalculate the DDCt and % expression values for each target geneusing the following formulas.
1. DCt ¼ CtTARGET � CtGAPDH2. DDCt ¼ DCtTREATMENT SAMPLE � DCtnon�targeting CONTROL
Custom Taqman Reagent Sequences:
Primer/probe set MmuAPOBMGB1
Forward-primer CCGCTTCTTTGGTGAAGGTACTReverse-primer GGCCTGCTTTGGAGGTGATProbe AAGGTGGGTCTCGCATTDetector Fam
M.S. Hamza et al. / Atherosclerosis 242 (2015) 383e395 385

Author's personal copy
3. 2�DDCt ¼ 2 to the power of � DDCt ðCalculated from step 2Þ4. % expression ¼ 2�DDCt � 100%
2.9. Affymetrix gene expression profiling and data analysis
The same aliquot of RNA that was used to perform Taqman RT-PCR was hybridized to Affymetrix Rhesus Macaque Genome Arrays.Each RNA sample was performed in triplicate according to Affy-metrix recommended protocols. 100 ng of total RNA was used forthe 3’ IVT Express assay.
The raw CEL files were analysed and normalized by RobustMulti-array Average (RMA) algorithm within R statistical package[28,29]. The raw intensity values were background corrected, log2transformed and quantile normalized. For each study, the foldchange of differential expression was calculated at the probe levelbased on fold change;
FC ¼ mean½APOB replicates�=mean½non� targeting replicates�.The significance p-values of fold change were calculated by ‘t-test’and the p-values were corrected for multiple testing by “Benjaminiand Hochberg false discovery rate [30]”.
2.10. Customized probe level annotation for Rhesus Affymetrixplatform (GeneChip rhesus macaque genome array)
Currently, limited genome level annotations and mapping tofunctional databases (such as Gene Ontology, KEGG) are availablefor Cynomolgus/Rhesus genes, which would have implications ondownstream functional analysis. Therefore, for the “AffymetrixRhesus Macaque Genome Array” we created custom mapping ofRhesus probe to Human orthologs (RefSeq IDs) using BLAST algo-rithm. Briefly, for each probe the target sequence were BLASTed (atthe nucleotide level) against the human RefSeq RNA database(build 37.3) and the tabular output was parsed to find highestranking Rhesus_Affy_Probe_ID - > Human_RefSeq_ID mapping foreach probe. Further annotational mapping of the Human RefSeq_IDwas performed by searching them in BioMart [31] to get corre-sponding ‘HGNC_Symbol’, ‘Gene_Description’, ‘Associated_Gene_-Name’. Lastly, a combined probe annotation file was created usingthese fields: ‘Rhesus Affy Probe_ID’, ‘Human_RefSeq_ID’,‘HGNC_Symbol’, ‘Gene_Description’ and ‘Associated_Gene_Name’.
2.11. Probe to gene level summarization and core set of ApoB KDaffected genes
For each study (01, 02, 03), differential expressed probes wereselected based on FDR� 0.05. These differentially expressed probe-level fold change (FC) values were aggregated based on ‘HGNCSymbol’ to arrive at gene-level fold change values by retaining theFC of the probe with the highest fold change depending on thedirectionality of expression (highþ ve for up-regulation or leastevefor down-regulation). These significantly expressed gene list (bothup and down regulated) were overlapped across three studies(Fig. 3) to arrive at a core set of ApoB siRNA mediated differentiallymodulated genes (1036 genes). These core set genes were subse-quently used for all downstream functional analysis.
2.12. Gene ontology enrichment analysis
The core gene list of 1036 gene IDs were analysed for over-represented Gene Ontology (GO) sub-categories separately forbiological process (BP), cellular component (CC), and molecularfunction (MF). The overrepresentation analysis was performed by‘Hypergeometric test’ using GOstats package [32] in R statisticalenvironment [29]. The enrichment p-values were corrected for
multiple testing by “Benjamini and Hochberg false discovery rate”.The categories which were significant at FDR �0.05 were retainedfor functional interpretation.
2.13. Pathway enrichment analysis & module visualization
The core set of 1036 genes were further analysed for represen-tative pathways/modules using a custom built tool, which com-bines annotation from various pathway databases and interactionsources. The over-representation analysis was performed with‘H. test’ and pathways with p-value � 0.05 were reported asenriched. Furthermore, literature curated interactions weresourced for these 1036 genes, which resulted in a high-confidencegene network with 4641 edges connecting 631 nodes. The con-stituent nodes of the GeneGO enriched pathways were selected andconnected by edges to create a sub network of 165 nodes and 534edges. The network modules were colour coded based on theirpathway names.
3. Results and discussion
3.1. Lipid profiles, blood glucose and safety biomarkers after ApoBsiRNA dosing
Three independent studies (study-01, 02 and 03) were per-formed using two different lipid formulations. Study 01 and 02, theLNP was formulated in BMA, and animals were dosed at 2.5 mpk. Instudy-03, animals were dosed using KC2 lipid formulation at1.5 mpk.
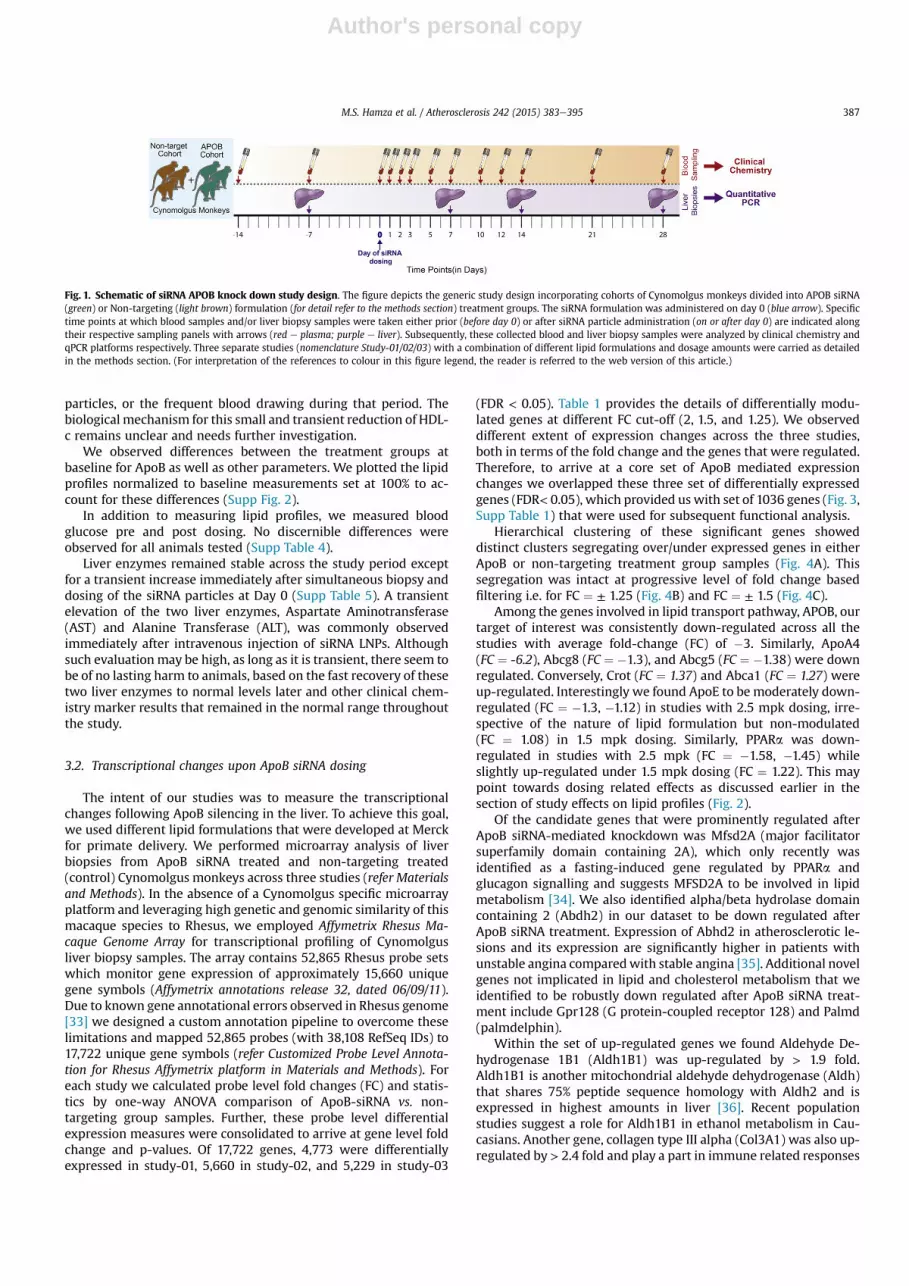
In each study, animals per treatment group (non-targeting orApoB siRNA treated) were selected based on predose plasma APOBprotein and cholesterol levels, and randomized accordingly. Liverbiopsies were harvested 7 days prior to dosing to establish baselinehepatic ApoB transcript levels. To establish clinical chemistry pa-rameters, blood was sampled 14 and 7 days prior to dosing. Asdepicted in Fig. 1, liver biopsies were performed 7 and 14 days postdosing, while blood was sampled regularly to quantitate changes inplasma lipids and protein levels in addition to measuring toxi-cology parameters. We determined from study-01 and 02 thattaking liver biopsies did not adversely affect the animal's health,and based on this factor, for study-03, we decided to take anadditional biopsy at day 28 for study-03. As shown in Fig. 2A, he-patic ApoB transcript levels were reduced as much as 70e80% inthe ApoB siRNA treated groups in study-01 and 02. Study-03 alsodemonstrated a reduction of hepatic ApoB transcript levels (~60%knockdown). The reduction of hepatic ApoB transcript levelscorrelated well with plasma APOB protein levels. The efficacy ofApoB transcript knockdown and APOB protein levels were sus-tained 28 days post-dosing for study-01 and -02, while study-03,which exhibited a reduced level of ApoB transcript knockdownwas less efficacious after 12 days post-dosing. In addition to thedecrease in plasma APOB protein levels, levels of LDL-C and totalcholesterol were reduced significantly after ApoB siRNA adminis-tration in all three studies (Fig. 2B). Plasma triglyceride levels didnot alter upon ApoB siRNA dosing. The HDL-c results in Study-01showed a statistically significant difference between these twogroups, but the difference were observed before dosing, indicatinga bias in HDL-c levels between these two groups. ApoA1 levels wereconsistent with HDL-c levels for all data points, supporting thevalidity of the HDL-c results. The animals were randomized basedon their LDL-c levels and the slight statistical difference for HDL-clevels may be coincidental. When examining the overall trend ofHDL-c results across three studies, only a slight decrease withindays post dosing was consistent. This may be caused by the trueinfluence of ApoB knockdown expression, injection of siRNA
M.S. Hamza et al. / Atherosclerosis 242 (2015) 383e395386
Author's personal copy
particles, or the frequent blood drawing during that period. Thebiological mechanism for this small and transient reduction of HDL-c remains unclear and needs further investigation.
We observed differences between the treatment groups atbaseline for ApoB as well as other parameters. We plotted the lipidprofiles normalized to baseline measurements set at 100% to ac-count for these differences (Supp Fig. 2).
In addition to measuring lipid profiles, we measured bloodglucose pre and post dosing. No discernible differences wereobserved for all animals tested (Supp Table 4).
Liver enzymes remained stable across the study period exceptfor a transient increase immediately after simultaneous biopsy anddosing of the siRNA particles at Day 0 (Supp Table 5). A transientelevation of the two liver enzymes, Aspartate Aminotransferase(AST) and Alanine Transferase (ALT), was commonly observedimmediately after intravenous injection of siRNA LNPs. Althoughsuch evaluationmay be high, as long as it is transient, there seem tobe of no lasting harm to animals, based on the fast recovery of thesetwo liver enzymes to normal levels later and other clinical chem-istry marker results that remained in the normal range throughoutthe study.
3.2. Transcriptional changes upon ApoB siRNA dosing
The intent of our studies was to measure the transcriptionalchanges following ApoB silencing in the liver. To achieve this goal,we used different lipid formulations that were developed at Merckfor primate delivery. We performed microarray analysis of liverbiopsies from ApoB siRNA treated and non-targeting treated(control) Cynomolgus monkeys across three studies (refer Materialsand Methods). In the absence of a Cynomolgus specific microarrayplatform and leveraging high genetic and genomic similarity of thismacaque species to Rhesus, we employed Affymetrix Rhesus Ma-caque Genome Array for transcriptional profiling of Cynomolgusliver biopsy samples. The array contains 52,865 Rhesus probe setswhich monitor gene expression of approximately 15,660 uniquegene symbols (Affymetrix annotations release 32, dated 06/09/11).Due to known gene annotational errors observed in Rhesus genome[33] we designed a custom annotation pipeline to overcome theselimitations and mapped 52,865 probes (with 38,108 RefSeq IDs) to17,722 unique gene symbols (refer Customized Probe Level Annota-tion for Rhesus Affymetrix platform in Materials and Methods). Foreach study we calculated probe level fold changes (FC) and statis-tics by one-way ANOVA comparison of ApoB-siRNA vs. non-targeting group samples. Further, these probe level differentialexpression measures were consolidated to arrive at gene level foldchange and p-values. Of 17,722 genes, 4,773 were differentiallyexpressed in study-01, 5,660 in study-02, and 5,229 in study-03
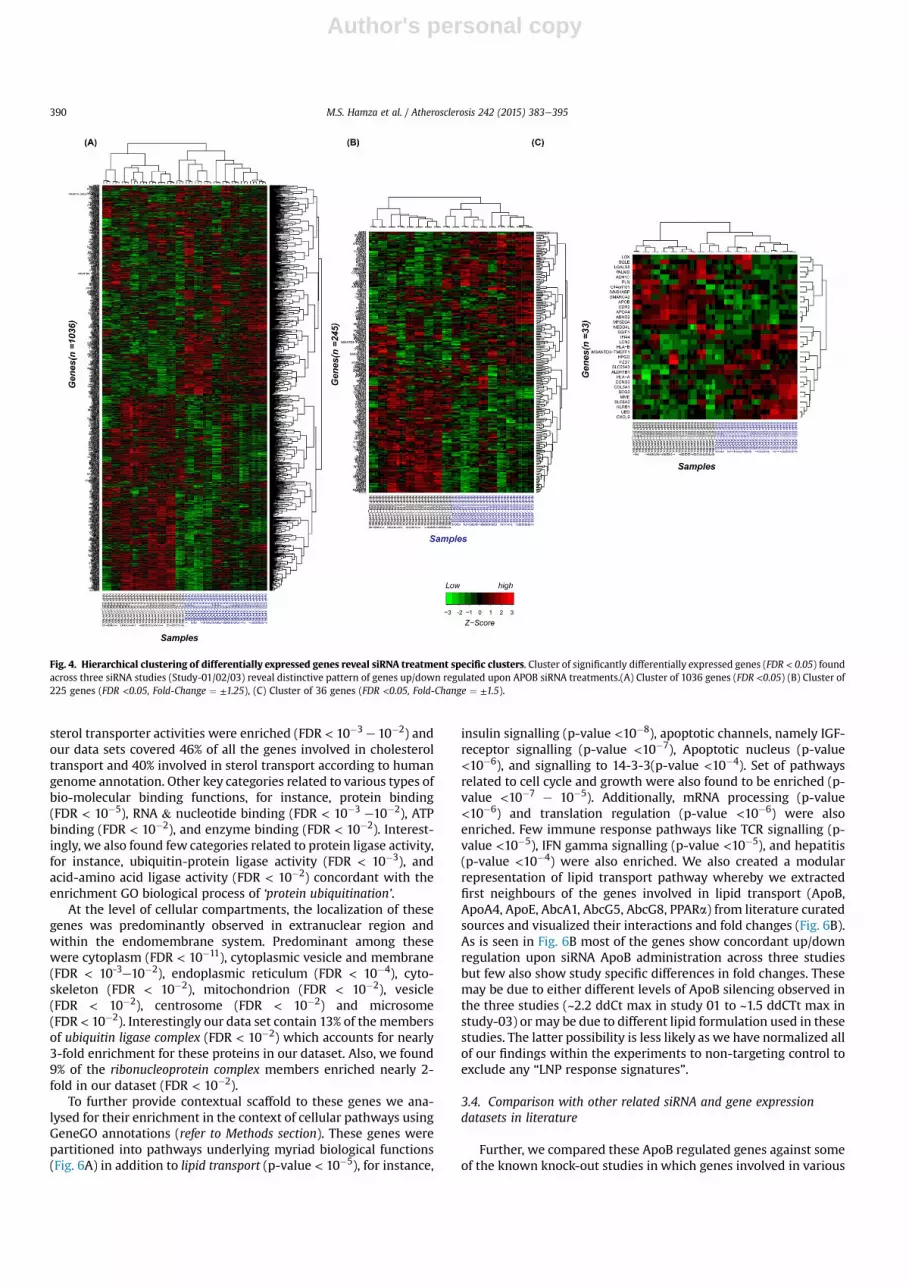
(FDR < 0.05). Table 1 provides the details of differentially modu-lated genes at different FC cut-off (2, 1.5, and 1.25). We observeddifferent extent of expression changes across the three studies,both in terms of the fold change and the genes that were regulated.Therefore, to arrive at a core set of ApoB mediated expressionchanges we overlapped these three set of differentially expressedgenes (FDR< 0.05), which provided us with set of 1036 genes (Fig. 3,Supp Table 1) that were used for subsequent functional analysis.
Hierarchical clustering of these significant genes showeddistinct clusters segregating over/under expressed genes in eitherApoB or non-targeting treatment group samples (Fig. 4A). Thissegregation was intact at progressive level of fold change basedfiltering i.e. for FC ¼ ± 1.25 (Fig. 4B) and FC ¼ ± 1.5 (Fig. 4C).
Among the genes involved in lipid transport pathway, APOB, ourtarget of interest was consistently down-regulated across all thestudies with average fold-change (FC) of �3. Similarly, ApoA4(FC ¼ -6.2), Abcg8 (FC ¼ �1.3), and Abcg5 (FC ¼ �1.38) were downregulated. Conversely, Crot (FC ¼ 1.37) and Abca1 (FC ¼ 1.27) wereup-regulated. Interestingly we found ApoE to be moderately down-regulated (FC ¼ �1.3, �1.12) in studies with 2.5 mpk dosing, irre-spective of the nature of lipid formulation but non-modulated(FC ¼ 1.08) in 1.5 mpk dosing. Similarly, PPARa was down-regulated in studies with 2.5 mpk (FC ¼ �1.58, �1.45) whileslightly up-regulated under 1.5 mpk dosing (FC ¼ 1.22). This maypoint towards dosing related effects as discussed earlier in thesection of study effects on lipid profiles (Fig. 2).
Of the candidate genes that were prominently regulated afterApoB siRNA-mediated knockdown was Mfsd2A (major facilitatorsuperfamily domain containing 2A), which only recently wasidentified as a fasting-induced gene regulated by PPARa andglucagon signalling and suggests MFSD2A to be involved in lipidmetabolism [34]. We also identified alpha/beta hydrolase domaincontaining 2 (Abdh2) in our dataset to be down regulated afterApoB siRNA treatment. Expression of Abhd2 in atherosclerotic le-sions and its expression are significantly higher in patients withunstable angina comparedwith stable angina [35]. Additional novelgenes not implicated in lipid and cholesterol metabolism that weidentified to be robustly down regulated after ApoB siRNA treat-ment include Gpr128 (G protein-coupled receptor 128) and Palmd(palmdelphin).
Within the set of up-regulated genes we found Aldehyde De-hydrogenase 1B1 (Aldh1B1) was up-regulated by > 1.9 fold.Aldh1B1 is another mitochondrial aldehyde dehydrogenase (Aldh)that shares 75% peptide sequence homology with Aldh2 and isexpressed in highest amounts in liver [36]. Recent populationstudies suggest a role for Aldh1B1 in ethanol metabolism in Cau-casians. Another gene, collagen type III alpha (Col3A1) was also up-regulated by > 2.4 fold and play a part in immune related responses
Fig. 1. Schematic of siRNA APOB knock down study design. The figure depicts the generic study design incorporating cohorts of Cynomolgus monkeys divided into APOB siRNA(green) or Non-targeting (light brown) formulation (for detail refer to the methods section) treatment groups. The siRNA formulation was administered on day 0 (blue arrow). Specifictime points at which blood samples and/or liver biopsy samples were taken either prior (before day 0) or after siRNA particle administration (on or after day 0) are indicated alongtheir respective sampling panels with arrows (red e plasma; purple e liver). Subsequently, these collected blood and liver biopsy samples were analyzed by clinical chemistry andqPCR platforms respectively. Three separate studies (nomenclature Study-01/02/03) with a combination of different lipid formulations and dosage amounts were carried as detailedin the methods section. (For interpretation of the references to colour in this figure legend, the reader is referred to the web version of this article.)
M.S. Hamza et al. / Atherosclerosis 242 (2015) 383e395 387

Author's personal copy
Fig. 2. Temporal changes in APOB at transcript and lipid levels in response to siRNA ApoB knock down. (A) The average/mean ± SD knock down level of ApoB transcript beforeand after siRNA ApoB or non-targeting treatments (at day 0, red arrow) are shown across Study-01, Study-02 and Study-03. Statistically significant knock down (p-val <0.05, one-sided t-test) of ApoB transcript levels in the ApoB siRNA treated cohorts in comparison to the non-targeting cohort (Fig. 1) are annotated/marked (with purple *). (B) The average/mean ± SD changes in the plasma lipid levels for APOB, LDL-C, CHOL, HDL-C, APOA, TRIGL respectively, are shown from top to down across three studies (left to right). Statisticallysignificant (p-val <0.05, one-sided t-test) changes in lipid levels at certain time points after ApoB siRNA treatment (day 0) are annotated/marked (with purple *). (For interpretation ofthe references to colour in this figure legend, the reader is referred to the web version of this article.)
M.S. Hamza et al. / Atherosclerosis 242 (2015) 383e395388

Author's personal copy
within liver. COL3A1 is increased in viral (HBV and hepatitis C virus)or alcohol related-liver diseases including chronic liver diseases,liver fibrosis, liver cirrhosis (CIR), and HCC [37]. Additionally wefound Cxcl9 to be > 2-fold up-regulated. CXCL9 exerts anti-fibroticeffects in liver of mice and human [38] and its systematic appli-cation could be novel therapeutic approach for chronic liver dis-eases associated with increased neoangiogenesis [39]. Amongst theHuman leukocyte antigen [6] genes, Hla-A and Hla-B were also up-regulated in the range of 2e10 folds. Hla genotype has beenestablished as an important predictor of susceptibility to drug-induced liver injury [40], and are typically used as genomicmarkers for predisposition towards drug sensitivity [41]. Hla-B*5701 genotype is a major determinant of drug-induced liverinjury due to flucloxacillin [42].Also, Hla-A is typically profiled forliver transplantation rejection [43]. We found Ubd (also calledFat10) e a potential preneoplastic marker and a protein overexpressed in hepatocellular carcinomas to be up-regulated > 2 foldacross all our studies [44].
Lcn2, an important regulator of cellular homeostasis in severalorgans (heart, lung, and kidney), which was recently shown tocorrelate with liver damage and resulting inflammatory responses[45], was up-regulated >2 fold in all our studies. Ccnd2, known tointeract with and be involved in the phosphorylation of the tumor-
suppressor protein Rb [46] was up-regulated >1.5 fold. Interest-ingly, one common polymorphism of Ccnd2 in the 5'-untranslatedregion (rs1049606) and (CCND-ht1 [TeCeTeAeT]) has been shownto be significantly associated with HBV clearance [47]. Conversely,among the geneswhichwere down-regulatedwe found the alcoholdehydrogenase 1C (Adh1C) gene to be down-regulated by�1.7 fold.Adh1C subunit is an important member of the alcohol dehydro-genase family, which plays a major role in the catabolism ofethanol. Adh1C polymorphism allele may lower the risk of AD andalcohol abuse as well as alcohol-related cirrhosis in pooled pop-ulations, with the strongest and most consistent effects in Asians[48]. The Anhydrolase domain containing 2 (AbhD2) gene wasdown-regulated by �2.71 fold. Recently a study demonstrated thatAbhD2 (and EreG) are essential for HBV propagation and providesstrong evidence that these proteins could be used as potentialtargets for anti-HBV drugs [49]. Nedd4L was found to be down-regulated by �1.8 fold and its expression is restricted to theheart, brain, liver, kidney, and to a lesser extent to the lung [50].Interestingly, various cancer cell cultures expressed abundantNedd4L [51]; thus, Nedd4L might have an oncogenic property.Major Facilitator Superfamily Domain-Containing Protein 2a(Mfsd2A) is expressed in many tissues and is highly induced in liverand brown adipose tissue (BAT) during fasting [52]. MFSD2A hasroles in body growth, motor function, and lipid metabolism. In ourdataset we found Mfsd2A to be down-regulated by �3.17 fold.Interestingly, MFSD2A is regulated by both PPARa and glucagonsignalling in the liver [34]] and we found PPARa to be moderatelydown-regulated by approximately �1.5 fold in two of our studies.
Liver is the primary site of drug metabolism and Cytochromep450 family proteins play a key role in this process [53]. Among the5 Cyp450 genes differentially expressed in our core set Cyp7B1 wasconcomitantly down (FC ¼ �1.45) and Cyp4A11 concomitantly up-regulated (1.37). Rest of the genes (Cyp51A1, Cyp11B1, andCyp4F22) showed discordant changes across the three studies. Thismay hint towards activation or repression of specific CYP genes as aresult of either dose or formulation level differences across thesestudies (see Materials and Methods).
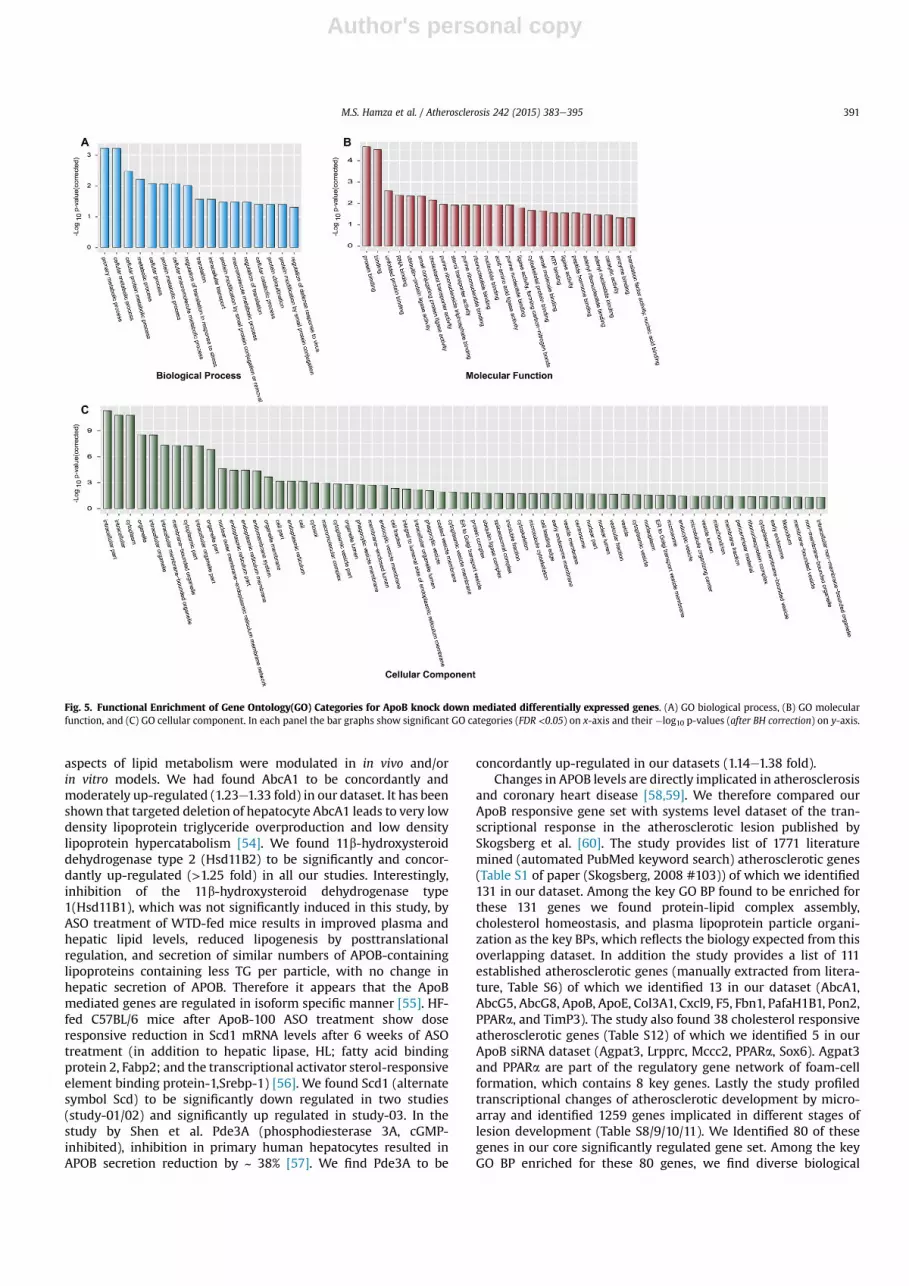
3.3. ApoB siRNA dosing mediated effects cover a gamut of cellularprocesses, function and pathways
In order to extract systems level and higher-order biologicalthemes upon ApoB siRNA treatment we applied Gene Ontology(GO) and GeneGO pathway enrichment analysis on the set ofsignificantly differentiated genes (1036 genes obtained atFDR<0.05). Fig. 5 shows the results of enrichment analysis for GOBiological Process, Molecular function and Cellular componentscategories (see Methods for details, Supp Table 2). At the level ofbiological process (panel A) these significant genes belong tovarious metabolic processes to primary, cellular or protein meta-bolism (FDR < 10�4e10�2), translation (FDR< 10�2) and regulationof translation (FDR < 10�3 e 10�2). Interestingly categories relatedto protein ubiquitination (FDR < 10�2) and regulation of defenceresponse to virus (FDR < 10�2) were also enriched.
At the level of molecular functions, as expected cholesterol and
Study-01
Study-02Study-03
1927 22791284
1724
952 1061
1036
Fig. 3. Core set of APOB knock down regulated genes. Differential expressionanalysis of genes modulated in liver tissue upon ApoB siRNA administration w.r.t. Non-targeting controls was performed for each of the three siRNA studies (details in themethods section). Significantly regulated genes (FDR <0.05, two-sided t-test) profiled bymicroarray analysis from Study-01 (n ¼ 4773), Study-02 (n ¼ 5660), Study-03(n ¼ 5119) were compared to arrive at a core set of 1036 genes.
Table 1List of number of differentially expressed (DE) genes (up regulated and down regulated) in each ApoB siRNA knock down study. The number of DE genes at three fold change(FC) cutoffs of 2, 1.5 and 1.25 are also indicated. All the numbers are indicated at FDR <0.05.
Studyname
Total no. of differentially expressedgenes
Differentially expressed genes at FC±2
Differentially expressed genes at FC±1.5
Differentially expressed genes at FC ±1.25
Study-01 4773 98 502 1948Study-02 5660 118 638 2272Study-03 5229 148 609 2201
M.S. Hamza et al. / Atherosclerosis 242 (2015) 383e395 389
Author's personal copy
sterol transporter activities were enriched (FDR < 10�3 e 10�2) andour data sets covered 46% of all the genes involved in cholesteroltransport and 40% involved in sterol transport according to humangenome annotation. Other key categories related to various types ofbio-molecular binding functions, for instance, protein binding(FDR < 10�5), RNA & nucleotide binding (FDR < 10�3 e10�2), ATPbinding (FDR < 10�2), and enzyme binding (FDR < 10�2). Interest-ingly, we also found few categories related to protein ligase activity,for instance, ubiquitin-protein ligase activity (FDR < 10�3), andacid-amino acid ligase activity (FDR < 10�2) concordant with theenrichment GO biological process of ‘protein ubiquitination’.
At the level of cellular compartments, the localization of thesegenes was predominantly observed in extranuclear region andwithin the endomembrane system. Predominant among thesewere cytoplasm (FDR < 10�11), cytoplasmic vesicle and membrane(FDR < 10-3e10�2), endoplasmic reticulum (FDR < 10�4), cyto-skeleton (FDR < 10�2), mitochondrion (FDR < 10�2), vesicle(FDR < 10�2), centrosome (FDR < 10�2) and microsome(FDR < 10�2). Interestingly our data set contain 13% of the membersof ubiquitin ligase complex (FDR < 10�2) which accounts for nearly3-fold enrichment for these proteins in our dataset. Also, we found9% of the ribonucleoprotein complex members enriched nearly 2-fold in our dataset (FDR < 10�2).
To further provide contextual scaffold to these genes we ana-lysed for their enrichment in the context of cellular pathways usingGeneGO annotations (refer to Methods section). These genes werepartitioned into pathways underlying myriad biological functions(Fig. 6A) in addition to lipid transport (p-value < 10�5), for instance,
insulin signalling (p-value <10�8), apoptotic channels, namely IGF-receptor signalling (p-value <10�7), Apoptotic nucleus (p-value<10�6), and signalling to 14-3-3(p-value <10�4). Set of pathwaysrelated to cell cycle and growth were also found to be enriched (p-value <10�7 e 10�5). Additionally, mRNA processing (p-value<10�6) and translation regulation (p-value <10�6) were alsoenriched. Few immune response pathways like TCR signalling (p-value <10�5), IFN gamma signalling (p-value <10�5), and hepatitis(p-value <10�4) were also enriched. We also created a modularrepresentation of lipid transport pathway whereby we extractedfirst neighbours of the genes involved in lipid transport (ApoB,ApoA4, ApoE, AbcA1, AbcG5, AbcG8, PPARa) from literature curatedsources and visualized their interactions and fold changes (Fig. 6B).As is seen in Fig. 6B most of the genes show concordant up/downregulation upon siRNA ApoB administration across three studiesbut few also show study specific differences in fold changes. Thesemay be due to either different levels of ApoB silencing observed inthe three studies (~2.2 ddCt max in study 01 to ~1.5 ddCTt max instudy-03) or may be due to different lipid formulation used in thesestudies. The latter possibility is less likely as we have normalized allof our findings within the experiments to non-targeting control toexclude any “LNP response signatures”.
3.4. Comparison with other related siRNA and gene expressiondatasets in literature
Further, we compared these ApoB regulated genes against someof the known knock-out studies in which genes involved in various
Fig. 4. Hierarchical clustering of differentially expressed genes reveal siRNA treatment specific clusters. Cluster of significantly differentially expressed genes (FDR < 0.05) foundacross three siRNA studies (Study-01/02/03) reveal distinctive pattern of genes up/down regulated upon APOB siRNA treatments.(A) Cluster of 1036 genes (FDR <0.05) (B) Cluster of225 genes (FDR <0.05, Fold-Change ¼ ±1.25), (C) Cluster of 36 genes (FDR <0.05, Fold-Change ¼ ±1.5).
M.S. Hamza et al. / Atherosclerosis 242 (2015) 383e395390
Author's personal copy
aspects of lipid metabolism were modulated in in vivo and/orin vitro models. We had found AbcA1 to be concordantly andmoderately up-regulated (1.23e1.33 fold) in our dataset. It has beenshown that targeted deletion of hepatocyte AbcA1 leads to very lowdensity lipoprotein triglyceride overproduction and low densitylipoprotein hypercatabolism [54]. We found 11b-hydroxysteroiddehydrogenase type 2 (Hsd11B2) to be significantly and concor-dantly up-regulated (>1.25 fold) in all our studies. Interestingly,inhibition of the 11b-hydroxysteroid dehydrogenase type1(Hsd11B1), which was not significantly induced in this study, byASO treatment of WTD-fed mice results in improved plasma andhepatic lipid levels, reduced lipogenesis by posttranslationalregulation, and secretion of similar numbers of APOB-containinglipoproteins containing less TG per particle, with no change inhepatic secretion of APOB. Therefore it appears that the ApoBmediated genes are regulated in isoform specific manner [55]. HF-fed C57BL/6 mice after ApoB-100 ASO treatment show doseresponsive reduction in Scd1 mRNA levels after 6 weeks of ASOtreatment (in addition to hepatic lipase, HL; fatty acid bindingprotein 2, Fabp2; and the transcriptional activator sterol-responsiveelement binding protein-1,Srebp-1) [56]. We found Scd1 (alternatesymbol Scd) to be significantly down regulated in two studies(study-01/02) and significantly up regulated in study-03. In thestudy by Shen et al. Pde3A (phosphodiesterase 3A, cGMP-inhibited), inhibition in primary human hepatocytes resulted inAPOB secretion reduction by ~ 38% [57]. We find Pde3A to be
concordantly up-regulated in our datasets (1.14e1.38 fold).Changes in APOB levels are directly implicated in atherosclerosis
and coronary heart disease [58,59]. We therefore compared ourApoB responsive gene set with systems level dataset of the tran-scriptional response in the atherosclerotic lesion published bySkogsberg et al. [60]. The study provides list of 1771 literaturemined (automated PubMed keyword search) atherosclerotic genes(Table S1 of paper (Skogsberg, 2008 #103)) of which we identified131 in our dataset. Among the key GO BP found to be enriched forthese 131 genes we found protein-lipid complex assembly,cholesterol homeostasis, and plasma lipoprotein particle organi-zation as the key BPs, which reflects the biology expected from thisoverlapping dataset. In addition the study provides a list of 111established atherosclerotic genes (manually extracted from litera-ture, Table S6) of which we identified 13 in our dataset (AbcA1,AbcG5, AbcG8, ApoB, ApoE, Col3A1, Cxcl9, F5, Fbn1, PafaH1B1, Pon2,PPARa, and TimP3). The study also found 38 cholesterol responsiveatherosclerotic genes (Table S12) of which we identified 5 in ourApoB siRNA dataset (Agpat3, Lrpprc, Mccc2, PPARa, Sox6). Agpat3and PPARa are part of the regulatory gene network of foam-cellformation, which contains 8 key genes. Lastly the study profiledtranscriptional changes of atherosclerotic development by micro-array and identified 1259 genes implicated in different stages oflesion development (Table S8/9/10/11). We Identified 80 of thesegenes in our core significantly regulated gene set. Among the keyGO BP enriched for these 80 genes, we find diverse biological
Fig. 5. Functional Enrichment of Gene Ontology(GO) Categories for ApoB knock down mediated differentially expressed genes. (A) GO biological process, (B) GO molecularfunction, and (C) GO cellular component. In each panel the bar graphs show significant GO categories (FDR <0.05) on x-axis and their �log10 p-values (after BH correction) on y-axis.
M.S. Hamza et al. / Atherosclerosis 242 (2015) 383e395 391

Author's personal copy
processes being affected for instance (i) cell morphogenesisinvolved in differentiation [61], insulin receptor signalling pathway,(iii) negative regulation of macrophage derived foam cell differ-entiation, and (iv) protein-lipid complex assembly, amongst others.
Our in-vivo studies detail changes in the hepatic transcriptionallandscape after siRNAmediated knockdown of ApoB. In this in-vivosetting, unidentified modulators affected by ApoB silencing haveemerged. Interestingly, “negative regulation of macrophage derivedfoam cell differentiation” is enriched as a biological process afterApoB silencing. Recent evidence suggests a dynamic cross-talkbetween the liver and arteries. Plasminogen, produced by theliver increases the expression of CD36 in macrophages. C-reactiveprotein, another liver product, increases proinflammatory effectsand has been proposed to have antiatherogenic properties[58,62,63]. Hence our data may perhaps suggest that down regu-lation of hepatic ApoB expression may have consequence beyondlowering lipid levels by having antiatherogenic significance as well.
3.5. Transcription factors
Energy metabolism and lipid homeostasis are complex andtightly orchestrated cellular processes regulated by key cellularentities, including an array of transcription factors (TFs). Cellularaberrations in TF activity and functions are implicated in metabolicdisorders, for instance obesity, type 1 and 2 diabetes, and athero-sclerosis. Therefore, we mined our siRNA ApoB gene expressiondatasets for known transcription factors. Briefly, we searched for allgenes which were annotated with Gene Ontology category GO:0003700 (sequence-specific DNA binding transcription factor ac-tivity). In total we found 46 common TFs in our data set of coresignificantly regulated genes (Supp Table 3). Literature survey ofthese genes revealed that 27 of them had established roles in eitherregulating lipid or cholesterol levels or were associated with dia-betes or atherosclerosis. Interestingly, the forkhead family of tran-scription factors which were consistently down regulated upon
ApoB knockdown have been implicated or associated withatherosclerosis, hyperlipidaemia and hypoglycaemia [64,65].Additionally, deregulation of Fox family of genes has been associ-ated with congenital disorders of which we identified FoxN3 geneas being associated with carotid intima-media thickness [66]. Ourdata likewise identified E2F3, Ikzf1, Lef1, Mll, and Nr1I2 as TFsinvolved in lipid metabolism and cholesterol uptake, whichconcomitantly were up regulated upon ApoB siRNA treatment,suggesting that APOB levels modulates the expression of these TFsdirectly involved in lipid metabolism.
Peroxisome proliferator-activated receptors (PPARs) play indis-pensable roles in development as well as carbohydrate, lipid andprotein metabolism. We find PPARa, which has been shown to in-creases the expression of lipoprotein lipase and hence hydrolysefatty acids from triglycerides [67,68] to be down regulated uponApoB siRNA treatment. We also find TFs in our dataset associatedwith Type 1 and Type 2 diabetes. The YY1 TF has been shown to beinvolved in promoting hepatic gluconeogenesis [69], while Sox6attenuates glucose-stimulated insulin secretion [70]. Tcf7L2 hasbeen shown to be significantly associated with the risk of devel-oping type 2 diabetes [71], while Taf5 has been marginally associ-ated with type-1 diabetes [72].
By extension our dataset identifies some novel transcriptionfactors that could be candidates for further investigationwithin thecontext of metabolism, which is beyond the scope of this study. Ofthe transcription factors that have not been implicated or associ-ated with lipid or cholesterol synthesis pathways were thosebelonging to the zinc finger family of transcription factors, whichwere consistently down regulated in our dataset.
4. Conclusion
APOB on LDL particles acts as ligands for LDL receptors to delivercholesterol to a number of cells throughout the body. Although themechanism of action of APOB is not fully understood, there is
Fig. 6. Pathway Enrichment for ApoB knock down mediated differentially expressed genes (A) The bar graph show significant GeneGO pathways (FDR <0.05) on x-axis andtheir �log10 p-values (after BH correction) on y-axis. (B) A network representation of 6 genes (ApoB, ApoA4, AbcG5, AbcG8, AbcA1, PparAlpha) participating in ‘Lipid Transport’pathway (shown in bold) and their first-degree interactors as per literature curation are shown. The juxtaposed boxes represent genes color coded with the fold-change values acrossStudy 01 to 03. (For interpretation of the references to colour in this figure legend, the reader is referred to the web version of this article.)
M.S. Hamza et al. / Atherosclerosis 242 (2015) 383e395392
Author's personal copy
considerable evidence correlating APOB levels with atherosclerosis[4e6]. In this study, we correlated ApoB transcript level changes tolipid level measurements of APOB, LDL-C, HDL-C, CHOL, APOA, andTRIG, to recapitulate known cellular effects upon ApoB knockdown.We show that siRNA-mediated reduction of hepatic ApoB transcriptlevels achieves lowering of LDL-C in cynomolgus monkeys. Spe-cifically, a single infusion of ApoB siRNA resulted in a highly sig-nificant (>80% knockdown) and durable (>21 days post-dosing)knockdown of ApoB transcript and protein levels respectively. Thereduction of LDL-C was observed to correlate significantly with thelevels of ApoB transcript and protein.
We observed in study 01 that there was also a statistical sig-nificant reduction in HDL-c and apoA-I. The difference in HDL-c forStudy 1 had started from Day �7 and Day 0 of dosing, likely due tothe bias from animal randomization based on their LDL-c levels.Both the Non-targeting control and ApoB siRNA groups in Study 2and 3 shared a similar trend of HDL-c and ApoA1. However, eachgroup in these two studies started at different levels of HDL-c andApoA1, for example the ApoB siRNA group in Study 2 had lowerHDL-c and ApoA1 than the control group.Whenwe normalized thedata against each animal's pre-dosing levels, as shown in SuppFigure S1, Study 2 and 3 shared similar relative changes betweenthe groups. For these cynomolgus monkeys their normal HDL-clevels are about 50 mg/dL, and any small changes might result instatistically significant but practically insignificant difference.Across all three studies, the consistent trend of HDL-c was a smalldecrease from Day 1 to Day 7 post injection, likely because of theimpact of ApoB reduction, injection of siRNA particles, or frequentblood drawing during that period. The true underling biologicalmechanism for this small transient reduction of HDL-c as well asApoA1 (this is expected since ApoA1 is themain lipoprotein of HDL-c) remains unclear and requires further investigation. Since thereductionwas small and transient and occurred in Study 2 and 3 forboth LowHex and ApoB siRNA groups, the investigation for thecause was not critical and beyond the scope of these studies.
We did not test the cholesterol efflux activity of the HDL nor thesize distribution of LDL on samples from these studies. These werejust short-term knock-down experiments, thus difficult tocomment on the anti-atherogenicity of knocking-down ApoB.
AST and ALT, in addition to other markers for liver toxicityindicated normal physiological levels after dosing, demon-strating safety as well as efficacy in our studies. We did notmeasure the TG/cholesterol accumulation in the livers of theseanimals using biochemical evaluation of liver biopsy or evaluatesteatosis by clinical imaging methods in these studies. Theseanimals were on a normal diet with low fat content. The animalson this study were on a normal diet and only went throughtransient ApoB knockdown and hence were unlikely to havesignificant changes in their TG/cholesterol levels or fat accu-mulation in their liver.
The amount of RNA that we obtained fromneedle biopsies of theliver was extremely limited for us to validate our gene expressionprofiling studies with qPCR. Our first criteria was to measure ApoBtranscript expression (which we performed four technical repli-cates for each biopsy sample). The RNA that was remaining was justsufficient to perform our affymetrix gene expression profilingstudies. The rationale why we only obtained two biopsies per timepoint for each animal was firstly, the welfare of the animal andsecondly, the awareness that taking too many biopsies would affectserum and safety biomarkers which would confound our inter-pretation of the data. Biologically, the concordance of the differ-entially expressed genes after siRNA administration was analysedusing liver biopsies from 3 different animals per group (total of 9animals per treatment group for the study). This gives us confi-dence that the list of differentially expressed genes represents the
true nature of the transcript levels seen after siRNA administration.Thus we are confident that our analysis provides a list of potentialgenes affecting lipid and cholesterol synthesis.
The overall picture that emerges is that ApoB knockdown inCynomolgus liver leads to differential expression of various geneswhich cover a gamut of biological processes and molecularfunctions in addition to canonical pathways of lipid and choles-terol metabolism. Interestingly, translation, and regulation oftranslation, protein ubiquitination and cell cycle and growth werefew of the prominent modulated biological processes. We per-formed extensive literature comparisons between our dataset andcomparable studies done in in-vitro primary human hepatocytes,mouse and monkey models. It was critical to accomplish this as itwould establish both concordant and divergent genes and path-ways affected. Profiling of liver samples following siRNA admin-istration has been previously reported in mouse models [15]. Inagreement with the mouse data we find changes in cholesterolsynthesis pathway. As most of siRNA studies have been performedin mouse models, it was necessary to compare our dataset, asthere are key differences between mouse and non-human pri-mates. Our section on “comparison with other related siRNA andgene expression datasets in literature” attests to this. As pre-dicted, we found previously unidentified genes and pathwaysaffected in our in-vivo studies. Effects on translation, regulation oftranslation, protein ubiquitination and cell cycle and growth havenot been previously reported. This finding could be due todifferent preclinical species used (mouse vs. NHP). Cholesterolester transport protein (CETP) is absent in the mouse, a keyenzyme in transport of cholesterol esters from HDL to LDL [73]. Inaddition, mice have high levels of HDL-c and low levels of LDL-cplasma distribution, contrary to those of humans and NHPs. Arecent study by Yin et al. [74]. profiled the plasma lipids of 24commonly used animal models, and found, not surprisingly, non-human primate models closely matching human lipid profiles,while the majority of mouse models did not. In addition, genomewide binding studies using PPARalpha, a master regulator of he-patic lipid metabolism was found to regulate a divergent set ofgenes between mouse and human [75].
We feel that our gene expression datasets derived from our non-human primate model better represents the most relevant modelfor target validation and preclinical research. Further work needs tobe carried out to support our finding. Critical validations experi-ments by qPCR needs to performed to confirm our gene expressionchanges after ApoB silencing. We were unable to perform thesevalidation studies due to limited biopsy sampling. In addition, tofurther corroborate our findings, additional experiments need to beconducted using different siRNA sequences with equal knockdownefficacy to demonstrate concordance of gene expression changes,and as an added measure, perform theses in-vivo experimentsusing ASO to demonstrate concordance with siRNA ApoBknockdown.
As a proof of concept we successfully employed the AffymetrixRhesus platform for gene expression profiling of liver samples fromCynomolgus monkeys, a close relative to Rhesus monkeys. Ourgene expression profiling studies and analysis underwrites to ourunderstanding of genes and pathways affected, and our work pre-sents a comprehensive map linking these physiological changeswith in-depth bioinformatics analysis on hepatic transcriptionalchanges after siRNA-mediated ApoB knockdown.
Data generated therein provides a unique proof-of-concept inleveraging this technology for potential hypercholesterolemiatherapeutics in a non-human primate (NHP) model and provides aframework for the understanding and development of novel hy-percholesterolemia therapies with potential translational value forhuman applications.
M.S. Hamza et al. / Atherosclerosis 242 (2015) 383e395 393
Author's personal copy
5. Study limitations
The non-human primate model represents the most relevantmodel to study targets with potential therapeutic benefits tohumans. To gain therapeutic insights and functional consequencesof targeting ApoB to treat dyslipidaemia, we utilized the cyn-omolgus monkey model to study hepatic transcriptional changesthat occur after ApoB silencing. Analysis of these transcriptionalchanges suggests a number of pathways affected, some of whichare divergent from previous studies performed in mice. Mostsignificantly, this manuscript provides us with a resource to furthercharacterize the beneficial and detrimental effects of targetingApoB to treat dyslipidaemia. A number of limitations to our studyneed to be addressed before a decision of using ApoB as a thera-peutic could be assured.
Although we used different lipid formulations in our in-vivostudies, the siRNA sequence that targets ApoB was the same.Retrospectively, we should have tested a number of siRNA se-quences in our study. Having said that, we demonstrate that thesiRNA sequence we used showed a robust knockdown of ApoB bothin the transcript and protein level. Some of the other shortcomingsof our study were the inability to validate the transcript profiles byqPCR, which, as we explained previously was due to limiting ma-terial harvested from liver biopsies. Our resource is still valuable, aswe performed a number of in vivo studies and overlapped thetranscript profiles to arrive at a set of genes modulated after ApoBknockdown.
As this study was performed using only one dose of siRNA, wedid not measure liver steatosis. For a more comprehensive view ofthe transcriptional changes after ApoB administration, long termdosing regiments should be considered for further study. We didobserved small but statistical significant differences for HDLc levels,which could be a detrimental effect of knocking down ApoB levels.The animals used in our study were randomized based on theirLDLc levels. Future work should also consider HDLc levels whenperforming the randomization prior to dosing. Although we seerobust reduction of LDLc and cholesterol levels after ApoB siRNAdosing, triglyceride levels remained unchanged. This is an unex-pected result. Future experiments should be performed to sub-stantiate our findings. Long term dosing should offer evidence towhether triglyceride levels change upon ApoB siRNA dosing.
Author contributions
MSH, CK, MC, SB, MR, MTS, WS, AvG and SJS designed, moni-tored and coordinated the study with Maccine Pte Ltd. MSH and CKanalysed the data and wrote the paper. MSH, SMC, VA and NBcarried out the experiments and analysed the data.
Gene expression and hybridization array data will be beendeposited onto the NCBI data repository
(http://www.ncbi.nlm.nih.gov/geo/):GEO accession number:
Conflict of interest
All authors are employees or previous employees of Merck.
Acknowledgements
We thank Maccine Pte Ltd (Singapore) for the care and use ofcynomolgus monkeys in this study. We would like to thank MerckOligo Synthesis team for providing siRNA oligos and Dipali Ruhelaand Sirna Formulation team for generating LNP formulations usedin these experiments. We are grateful to Marian Gindy forreviewing the manuscript and providing helpful comments about
lipid nanoparticle composition and generation. Funding for thisstudy was provided by Merck internal resources. All authors arecurrent or previous employees of Merck Research Laboratories andMerck, Sharpe and Dohme.
Appendix A. Supplementary data
Supplementary data related to this article can be found at http://dx.doi.org/10.1016/j.atherosclerosis.2015.07.032.
References
[1] R. Ross, Atherosclerosisean inflammatory disease, N. Engl. J. Med. 340 (2)(1999) 115e126.
[2] V.S. Narain, et al., Clinical correlation of multiple biomarkers for risk assess-ment in patients with acute coronary syndrome, Indian Heart J. 60 (6) (2008)536e542.
[3] K. Wouters, et al., Understanding hyperlipidemia and atherosclerosis: lessonsfrom genetically modified apoe and ldlr mice, Clin. Chem. Lab. Med. 43 (5)(2005) 470e479.
[4] C.P. Cannon, et al., Intensive versus moderate lipid lowering with statins afteracute coronary syndromes, N. Engl. J. Med. 350 (15) (2004) 1495e1504.
[5] P.M. Ridker, et al., C-reactive protein levels and outcomes after statin therapy,N. Engl. J. Med. 352 (1) (2005) 20e28.
[6] T.S. Zimmermann, et al., RNAi-mediated gene silencing in non-human pri-mates, Nature 441 (7089) (2006) 111e114.
[7] A.C. St-Pierre, et al., Apolipoprotein-B, low-density lipoprotein cholesterol,and the long-term risk of coronary heart disease in men, Am. J. Cardiol. 97 (7)(2006) 997e1001.
[8] P.J. Talmud, et al., Nonfasting apolipoprotein B and triglyceride levels as auseful predictor of coronary heart disease risk in middle-aged UK men,Arterioscler. Thromb. Vasc. Biol. 22 (11) (2002) 1918e1923.
[9] B. Lamarche, et al., Apolipoprotein A-I and B levels and the risk of ischemicheart disease during a five-year follow-up of men in the quebec cardiovas-cular study, Circulation 94 (3) (1996) 273e278.
[10] M. Benn, Apolipoprotein B levels, APOB alleles, and risk of ischemic cardio-vascular disease in the general population, a review, Atherosclerosis 206 (1)(2009) 17e30.
[11] R.M. Crooke, Antisense oligonucleotides as therapeutics for hyperlipidaemias,Expert Opin. Biol. Ther. 5 (7) (2005) 907e917.
[12] M.E. Visser, et al., Antisense oligonucleotides for the treatment of dyslipi-daemia, Eur. Heart J. 33 (12) (2012) 1451e1458.
[13] D.A. Bell, et al., Mipomersen and other therapies for the treatment of severefamilial hypercholesterolemia, Vasc. Health Risk Manag. 8 (2012) 651e659.
[14] D.A. Bell, A.J. Hooper, J.R. Burnett, Mipomersen, an antisense apolipoprotein Bsynthesis inhibitor, Expert Opin. Investig. Drugs 20 (2) (2011) 265e272.
[15] M. Tadin-Strapps, et al., siRNA-induced liver ApoB knockdown lowers serumLDL-cholesterol in a mouse model with human-like serum lipids, J. Lipid Res.52 (6) (2011) 1084e1097.
[16] B. Shi, et al., Biodistribution of small interfering RNA at the organ and cellularlevels after lipid nanoparticle-mediated delivery, J. Histochem. Cytochem. 59(8) (2011) 727e740.
[17] J.E. Summerton, Morpholino, siRNA, and S-DNA compared: impact of struc-ture and mechanism of action on off-target effects and sequence specificity,Curr. Top. Med. Chem. 7 (7) (2007) 651e660.
[18] A. Grunweller, et al., Comparison of different antisense strategies inmammalian cells using locked nucleic acids, 2'-O-methyl RNA, phosphor-othioates and small interfering RNA, Nucleic Acids Res. 31 (12) (2003)3185e3193.
[19] Z. Chen, et al., Proof-of-concept studies for siRNA-mediated gene silencing forcoagulation factors in rat and rabbit, Mol. Ther. Nucleic Acids 4 (2015) e224.
[20] K.R. Feingold, Does inhibition of apolipoprotein B synthesis produce foie gras?J. Lipid Res. 51 (5) (2010) 877e878.
[21] B. Ason, et al., ApoB siRNA-induced liver steatosis is resistant to clearance bythe loss of fatty acid transport protein 5 (fatp5), Lipids 46 (11) (2011)991e1003.
[22] S. Tep, et al., Rescue of Mtp siRNA-induced hepatic steatosis by DGAT2 siRNAsilencing, J. Lipid Res. 53 (5) (2012) 859e867.
[23] R. Mihaila, et al., Lipid nanoparticle purification by spin centrifugation-dialysis(SCD): a facile and high-throughput approach for small scale preparation ofsiRNA-lipid complexes, Int. J. Pharm. 420 (1) (2011) 118e121.
[24] S.C. Semple, et al., Rational design of cationic lipids for siRNA delivery, Nat.Biotechnol. 28 (2) (2010) 172e176.
[25] B. Shi, M. Abrams, Technologies for investigating the physiological barriers toefficient lipid nanoparticle-siRNA delivery, J. Histochem. Cytochem. 61 (6)(2013) 407e420.
[26] D.E. Kelsey, et al., Laboratory validation of a low density lipoproteinapolipoprotein-B assay, Clin. Biochem. 47 (16e17) (2014) 211e215.
[27] K. Nakajima, et al., Apolipoprotein B-48: a unique marker of chylomicronmetabolism, Adv. Clin. Chem. 64 (2014) 117e177.
[28] R.A. Irizarry, et al., Exploration, normalization, and summaries of high density
M.S. Hamza et al. / Atherosclerosis 242 (2015) 383e395394

Author's personal copy
oligonucleotide array probe level data, Biostatistics 4 (2) (2003) 249e264.[29] Team, R.C., R: A Language and Environment for Statistical Computing,
R Foundation for Statistical Computing, 2012. Vienna, Austria.[30] Y. Benjamini, Y. Hochberg, Controlling the false discovery rate: a practical and
powerful approach to multiple testing, J. R. Stat. Soc. Ser. B Methodol. 57 (1)(1995) 289e300.
[31] S. Haider, et al., BioMart central portaleunified access to biological data,Nucleic Acids Res. 37 (Web Server issue) (2009). W23-7.
[32] S. Falcon, R. Gentleman, Using GOstats to test gene lists for GO term associ-ation, Bioinformatics 23 (2) (2007) 257e258.
[33] X. Zhang, J. Goodsell, R.B. Norgren Jr., Limitations of the rhesus macaque draftgenome assembly and annotation, BMC Genom. 13 (2012) 206.
[34] J.H. Berger, M.J. Charron, D.L. Silver, Major facilitator superfamily domain-containing protein 2a (MFSD2A) has roles in body growth, motor function,and lipid metabolism, PLoS One 7 (11) (2012) e50629.
[35] K. Miyata, et al., Elevated mature macrophage expression of human ABHD2gene in vulnerable plaque, Biochem. Biophys. Res. Commun. 365 (2) (2008)207e213.
[36] D. Stagos, et al., Aldehyde dehydrogenase 1B1: molecular cloning and char-acterization of a novel mitochondrial acetaldehyde-metabolizing enzyme,Drug Metab. Dispos. 38 (10) (2010) 1679e1687.
[37] S.K. Lee, et al., Genetic association between functional haplotype of collagentype III alpha 1 and chronic hepatitis B and cirrhosis in Koreans, Tissue An-tigens 72 (6) (2008) 539e548.
[38] H.E. Wasmuth, et al., Antifibrotic effects of CXCL9 and its receptor CXCR3 inlivers of mice and humans, Gastroenterology 137 (1) (2009), 309e19, 319 e1-3.
[39] H. Sahin, et al., Chemokine Cxcl9 attenuates liver fibrosis-associated angio-genesis in mice, Hepatology 55 (5) (2012) 1610e1619.
[40] A.K. Daly, Using genome-wide association studies to identify genes importantin serious adverse drug reactions, Annu. Rev. Pharmacol. Toxicol. 52 (2012)21e35.
[41] M. Pirmohamed, Genetics and the potential for predictive tests in adversedrug reactions, Chem. Immunol. Allergy 97 (2012) 18e31.
[42] A.K. Daly, et al., HLA-B*5701 genotype is a major determinant of drug-inducedliver injury due to flucloxacillin, Nat. Genet. 41 (7) (2009) 816e819.
[43] A. Alfirevic, et al., In silico analysis of HLA associations with drug-induced liverinjury: use of a HLA-genotyped DNA archive from healthy volunteers,Genome Med. 4 (6) (2012) 51.
[44] J. Oliva, et al., Fat10 is an epigenetic marker for liver preneoplasia in a drug-primed mouse model of tumorigenesis, Exp. Mol. Pathol. 84 (2) (2008)102e112.
[45] E. Borkham-Kamphorst, F. Drews, R. Weiskirchen, Induction of lipocalin-2expression in acute and chronic experimental liver injury moderated bypro-inflammatory cytokines interleukin-1beta through nuclear factor-kappaBactivation, Liver Int. 31 (5) (2011) 656e665.
[46] E. Susaki, K. Nakayama, K.I. Nakayama, Cyclin D2 translocates p27 out of thenucleus and promotes its degradation at the G0-G1 transition, Mol. Cell Biol.27 (13) (2007) 4626e4640.
[47] T.J. Park, et al., CCND2 polymorphisms associated with clearance of HBVinfection, J. Hum. Genet. 55 (7) (2010) 416e420.
[48] D. Li, H. Zhao, J. Gelernter, Further clarification of the contribution of theADH1C gene to vulnerability of alcoholism and selected liver diseases, Hum.Genet. 131 (8) (2012) 1361e1374.
[49] X.R. Ding, et al., Whole genome expression profiling of hepatitis B virus-transfected cell line reveals the potential targets of anti-HBV drugs, Phar-macogenomics J. 8 (1) (2008) 61e70.
[50] E. Kamynina, et al., A novel mouse Nedd4 protein suppresses the activity ofthe epithelial Naþ channel, Faseb J. 15 (1) (2001) 204e214.
[51] C. Chen, L.E. Matesic, The Nedd4-like family of E3 ubiquitin ligases and cancer,Cancer Metastasis Rev. 26 (3e4) (2007) 587e604.
[52] M. Angers, et al., Mfsd2a encodes a novel major facilitator superfamilydomain-containing protein highly induced in brown adipose tissue duringfasting and adaptive thermogenesis, Biochem. J. 416 (3) (2008) 347e355.
[53] A.E. Aitken, T.A. Richardson, E.T. Morgan, Regulation of drug-metabolizingenzymes and transporters in inflammation, Annu. Rev. Pharmacol. Toxicol.46 (2006) 123e149.
[54] S. Chung, et al., Targeted deletion of hepatocyte ABCA1 leads to very lowdensity lipoprotein triglyceride overproduction and low density lipoproteinhypercatabolism, J. Biol. Chem. 285 (16) (2010) 12197e12209.
[55] G. Li, et al., Effects of antisense-mediated inhibition of 11beta-hydroxysteroiddehydrogenase type 1 on hepatic lipid metabolism, J. Lipid Res. 52 (5) (2011)971e981.
[56] R.M. Crooke, et al., An apolipoprotein B antisense oligonucleotide lowers LDLcholesterol in hyperlipidemic mice without causing hepatic steatosis, J. LipidRes. 46 (5) (2005) 872e884.
[57] X. Shen, et al., Identification of genes affecting apolipoprotein B secretionfollowing siRNA-mediated gene knockdown in primary human hepatocytes,Atherosclerosis 222 (1) (2012) 154e157.
[58] R. Carmena, P. Duriez, J.C. Fruchart, Atherogenic lipoprotein particles inatherosclerosis, Circulation 109 (23 Suppl. 1) (2004). III2-7.
[59] M.F. Linton, et al., Transgenic mice expressing high plasma concentrations ofhuman apolipoprotein B100 and lipoprotein(a), J. Clin. Invest 92 (6) (1993)3029e3037.
[60] J. Skogsberg, et al., Transcriptional profiling uncovers a network ofcholesterol-responsive atherosclerosis target genes, PLoS Genet. 4 (3) (2008)e1000036.
[61] K. Watanabe, et al., In vivo siRNA delivery with dendritic poly(L-lysine) for thetreatment of hypercholesterolemia, Mol. Biosyst. 5 (11) (2009) 1306e1310.
[62] R. Das, et al., Macrophage gene expression and foam cell formation areregulated by plasminogen, Circulation 127 (11) (2013), 1209e18, e1-16.
[63] H. Iwata, M. Aikawa, Liver-artery interactions via the plasminogen-CD36 axisin macrophage foam cell formation: new evidence for the role of remoteorgan crosstalk in atherosclerosis, Circulation 127 (11) (2013) 1173e1176.
[64] K. Tsuchiya, et al., FoxOs integrate pleiotropic actions of insulin in vascularendothelium to protect mice from atherosclerosis, Cell Metab. 15 (3) (2012)372e381.
[65] M. Katoh, M. Katoh, Human FOX gene family (review), Int. J. Oncol. 25 (5)(2004) 1495e1500.
[66] L. Wang, et al., Fine mapping study reveals novel candidate genes for carotidintima-media thickness in Dominican Republican families, Circ. CardiovascGenet. 5 (2) (2012) 234e241.
[67] R.S. Rosenson, et al., Modulating peroxisome proliferator-activated receptorsfor therapeutic benefit? biology, clinical experience, and future prospects, Am.Heart J. 164 (5) (2012) 672e680.
[68] M. van Bilsen, F.A. van Nieuwenhoven, PPARs as therapeutic targets in car-diovascular disease, Expert Opin. Ther. Targets 14 (10) (2010) 1029e1045.
[69] Y. Lu, et al., Yin Yang 1 promotes hepatic gluconeogenesis through upregu-lation of glucocorticoid receptor, Diabetes 62 (4) (2013 Apr) 1064e1073.
[70] H. Iguchi, et al., SOX6 attenuates glucose-stimulated insulin secretion byrepressing PDX1 transcriptional activity and is down-regulated in hyper-insulinemic obese mice, J. Biol. Chem. 280 (45) (2005) 37669e37680.
[71] S. Peng, et al., TCF7L2 gene polymorphisms and type 2 diabetes risk: acomprehensive and updated meta-analysis involving 121 174 subjects,Mutagenesis 28 (1) (2013) 25e37.
[72] J.D. Cooper, et al., The candidate genes TAF5L, TCF7, PDCD1, IL6 and ICAM1cannot be excluded from having effects in type 1 diabetes, BMC Med. Genet. 8(2007) 71.
[73] K. Tsutsumi, A. Hagi, Y. Inoue, The relationship between plasma high densitylipoprotein cholesterol levels and cholesteryl ester transfer protein activity insix species of healthy experimental animals, Biol. Pharm. Bull. 24 (5) (2001)579e581.
[74] W. Yin, et al., Plasma lipid profiling across species for the identification ofoptimal animal models of human dyslipidemia, J. Lipid Res. 53 (1) (2012)51e65.
[75] M. Rakhshandehroo, et al., Comparative analysis of gene regulation by thetranscription factor PPARalpha between mouse and human, PLoS One 4 (8)(2009) e6796.
M.S. Hamza et al. / Atherosclerosis 242 (2015) 383e395 395


