Embed Size (px)
Citation preview


J 8 MAY1959
DISTRICT MONOG RAPH
MONGHYR

ALL-INDIA
RURAL CREDIT SURVEY
DISTRICT MONOGRAPH
MONGHYR
BOMBAY -1959

Price: Rs 6·50
Copies of the publication may be obtained from the Administrative Officer, Department of Research & Statistics, Reserve Bank of India, Post Box No. 1036, Bombay-I. Cheques should be drawn in
favour of the Reserve Bank of India.

FOREWORD
The All-India Rural Credit Survey was conducted in 1951-2 by the Committee of Direction appointed by the Reserve Bank of India. The investigation extended over nearly 1,30,000 families resident in 600 villages and the various types of credit agencies in 75 selected districts spread all over the country. The data collected covered all important aspects of the working of the sys!em of rural credit in the 75 districts. The detailed study of the material in all its aspects has been completed and the Report of the Committee has been published in three volumes, namely, Volume I, the Survey Report, containing diEcussions on the results of the Survey, Volume II, the General Report, containing the recommendations of the Committee and Volume III, the Technical Report, containing a description of the technique of the Survey and the various statistical statements prepared from the data. In order to obtain integrated pictures of the working of the rural credit machinery under different local types of economies and to provide a basis for preparation of the AllIndia Report, preliminary monographs were prepared on each of the 75 selected districts. A few of these are being selected for revision and publication.
2. Each district monograph can broadly be divided into three parts. The first part describes the main features of the agricultural economy of the district 88 well as of the villages selected for investigation and provides the necessary background for the study of rural credit. The second part is mainly devoted to an analysis of the 'demand' aspect of rural credit. The third part gives a detailed description and assessment of the working of the rural credit organization. Although the treatment of subject-matter is generally on the lines of the All-India Report, the monographs attempt to focus attention on special problems in the districts, besides presenting a review ofthe detailed economic and credit pattern ofthe district. The monographs may, therefore, provide some assistance in formulation and adaptation of agricultural credit policy with reference to different types of economic conditions and in devising measures for dealing with problems of special importance to particular agricultural tracts.
3. The data presented in each district monograph are based on field investigation in eight villages selected by adopting the stratified random sampling method. All the families in each of these villages were covered by a general schedule and this was supplemented by an intensive enquiry confined to a small sub-sample of fifteen cultivating families in each of the selected villages, making a total of 120 cultivating families for the district. The district data presented in the monographs mean, for all purposes for which the data were collected, thedjl,ta for the villages in the sample. It is, of course, not the raw data for all the eight villages but the data for the eight villages weighted in a particular way. Districts in India are usually rather large
v

FOREWORD
in area and are populous. In most of them physical and crop conditions differ materially from one part to another. The number of villages in the sample was not large and a further limitation was imposed by one-half of the sample being confined to villages with co-operative credit societies. The result has often been that all parts of the district have not necessarily been adequately represented in the sample and the total picture presented by the weighted village data for the district may not accord with the average picture for the whole district. It may thus happen that the picture presented for the district by the village data does not correspond, in particular cases, to the general conception of conditions in the district or to the average figures. The fact remains, however, that they represent conditions in at least some parts of the district. Since the main objective was to study conditions not necessarily of whole areas identified with administrative units or districts bearing particular names, but with samples of varying conditions throughout the country, the different district pictures presented have full validity and considerable value for the study of different conditions in agricultural credit.
4. The monograph on Monghyr was prepared by Shri M. L. Ghosh with the assistance of Shri D. K. Bhatia in the Division of Rural Economics in co-ordination with the Division of Statistics. The responsibility for the views expressed is that of the author and not of the Reserve Bank of India.
Reserve Bank of India, Central Office, BOMBAY.
December 8, 1958.
B. K. MADAN, Principal Adviser
to the Reserve Bank of India.

CONTENTS
CHAPTER 1. General features 1.1 General
1.2 Physical features
1 . 3 Climate and rainfall
1.4 Land utilization and crop pattern ..
1 . 5 Irrigation
1.6 Demographic features
1 . 7 Industries
1 .8 Transport
1.9 Land tenure system. 1.10 Rural Credit Survey: Methods and coverage
CHAPTER 2. Selected villages and the size of the farm business 2 . 1 Selected villages
2. 1. 1 Bari Balia .. 2. 1.2 Chakmansingh ... 2.1.3 Maniappa .. 2.1.4 Mubarakchak 2.1 .5 Bangama 2. 1 .6 Dira Harwa 2. 1. 7 Luxmipur .. 2 . 1 . 8 Pahasara
2. 2 Variations in the size of farm business
2 . 3 Gross produce and cash receipts
2.4 Composition of assets
CHAPTER 3. Indebtedness
3.1 Extent of indebtedness
3.1.1 Proportion of indebted families 3.1.2 Debt per family 3.1 .3 Debt per indebted family 3. 1 .4 Concentration of debt
3.2 Incidence of debt 3.3 Growth of debt
3.4 Nature and composition of debt 3.4.1 Duration of debt
Vll
Page
1 1 2 3
3 4
6
7
7
8 9
11 11 13
. 13
13 13 14 14 14
15
15
19 ·20
22 22
22 23 24 25 26
·28 28 28

CONTENTS
Page 3.4.2 Debt according to purpose 29 3.4.3 Security offered for outstanding debt 30 3.4.4 Outstanding debt-Principal and interest 30
3.5 Dues 32
CHAPTER 4. Borrowings.. 33 4.1 Extent of borrowing 33
4 . 1 . 1 The proportion of borrowing families 33 4. 1.2 Average borrowings per family and per borrowing
family. 35 4 . 1 . 3 The share of the different classes of cultivators
in the total borrowings 4.2 Size of borrowings .. 4.3 Purpose of borrowing 4.4 Borrowings and interest rate
4.5 Nature of borrowings 4.6 Grain loans .. 4 . 7 Credit requirements
4.7.1 Purpose for which credit was required 4.7.2 Difficulties in obtaining credit 4.7.3 Credit required at various interest rates 4.7.4 Period for which credit was required 4 . 7 . 5 Security
38 39 41 42 43
45 45 45 46 46 46 46
CHAPTER 5. Repayments 48 5.1 Proportion of repaying families 49 5.2 Proportion of repaying to borrowing families 50 5 . 3 Proportion of repaying to indebted families 50 5.4 Repayments per family 51 5.5 Repayments per repaying family.. 52 5.6 Repayments in relation to borrowings and outstanding
debt plus repayments 53 5.7 Source of finance for repayments
CHAPTER 6. Family expenditure 6.1 Recorded items of family expenditure 6 . 2 Expenditure on construction and repairs of residential
55
57
57
houses and other buildings 59
6.3 Purchase of durable consumer goods 60 6.4 Expenditure on death ceremonies 61 6.5 Expenditure on marriage and other ceremonies 62
viii

CONTENTS
Page 6.6 Medical expenses, educational expenses and litigation
charges 63 6.7 Sources of finance for recorded items of family
expenditure .. 6.8 Family expenditure and borrowings
CHAPTER 7. Capital expenditure 7. 1 Financial investment expenditure
64
66
68 68
7.2 Capital expenditure in non-farm business 70 7.3 Capital expenditure in agriculture 70
7.3. 1 Purchase of land .. 70 7.3.2 Purchase of livestock 75
7.4: Capital expenditure in agriculture: Items other than land and livestock .. 79 7.4:.1 Reclamation of land 80 7.4: . 2 Bunding and other land improvements . . 81 7.4: . 3 Digging and repair of wells 81 7.4: . 4: Development of other irrigation resources 82 7.4:.5 Laying of new orchards and plantations 83 7.4:.6 Purchase of implements, machinery and
transport equipment 83 7.4:.7 Construction of farm houses, cattle sheds, etc. .. 84 7.4.8 Other (miscellaneous) capital expenditure in
agriculture .. 85 7 . 5 Sale of assets . 86 7.6 Investment and disinvestment 87
CHAPTER 8. Current farm operations .. 92 8.1 Current farm expenditure .. 92 8.2 Cash farm receipts .. 96 8.3 Seasonality of farm business operations 97 8.4: Source of finance for current cash farm expenditure 99 8.5 Distribution of cultivators classified according to grOBS
produce groups, major crops, etc. 101 8.5.1 Gross produce 102 8.5.2 Cash crop 102 8.5.3 Major crop .. 103 8.5.4: Rent paid to landlord or share to co-sharer 103
8.6 Inter-village variations 103
CHAPTER 9. Credit agencies 9. 1 Borrowings and credit agencies 9.2 Borrowings for various purposes
IX
105 105
107

CONTENTS
9.3 Outstanding debt and credit agencies 9.4 Outstanding debt classified according to various
Page 109
purposes 109
CHAPTER 10. Government finance 112 10.1 Legal structure 112
10.1.1 The Land Improvement Loans Act, 1883, and the Agriculturists' Loans Act, 1884 112
10.1. 2 The Bihar Waste Lands (Reclamation, Cultivation and Improvement) Act, 1946 114
10.1.3 The Bihar and Orissa Natural Calamities Loans Act, 1934 115
10.1.4 Minor Irrigation Schemes 115 10.2 Government as the credit agency.. 115 10.3 Loan operations 116
CIIA1'TER 11. Co-operative finance 120 11.1 Co-operative structure 120 11.2 Primary agricultural credit societies 120
11.2.1 Society No.1 122 11.2.2 Society No.2 122
11.3 Central co-operative banks 124 11 . 4 Credit Agricole 126 11.5 Co-operative development and cane marketing union 126
CHAPTER 12. Private credit agencies 128 12 . 1 Legal structure 128 12.2 Typesofdata 129 12.3 Relatives 12.4 Landlords
130 131
12.5 ProfeBBional moneylenders .. 133 12.6 Practices and loan operations of the moneylenders 134
12.6. 1 Practices of the moneylenders 134 12.6.2 Loan operations of the moneylenders 136
12.7 Traders and commission agents 137 12.8 Commercial banks .. 138 12.9 Financial superstructure of private credit agencies 138
CIIA1'TER 13. Concluding remarks 139 13.1 The economy of the district 139 13.2 Expenditure and source of finance 139 13.3 Net balance of capital transactions 140 13.4 Supply of credit 140
x

LIST OF TABLES Table No. 1.1 Area, population, villages and towns in Monghyr
1.2 Land utilization in Monghyr district during 1951-2
Page 1
3
1.3 Crop pattern in Monghyr during 1951-2 4 1.4 Area irrigated in Monghyr during 1951-2 classified according to source
of irrigation .. 5
1 . 5 Irrigated area under principal crops 5
1.6 Population according to. livelihood classes 6
2.1 Important features of the selected villages 12
2. 2 Average size of cultivated holdings: Inter-group variations 15
2.3 Proportion of cultivated area held by different groups of cultivators to total cultivated area. . 16
2.4 Variation in the size of cultivated holdings of four classes of cultivators 17
2.5 Ownership of plough cattle among different classes of cultivators 18
2.6 Cultivated holdings and area sown 19 2.7 Size of the cultivated holdings and area sown according to gross produce
groupB 20
2.8 Gross produce and cash receipts
2.9 Value of owned assets
3.1 Proportion of indebted families
3.2 Debt per family
3.3 Debt per indebted family ..
3.4 Debt of cultivators and non-cultivators in relation to the total debt of all families
3.5 Size and incidence of debt ..
3.·6 Incidence of debt
3.7 Debt and net borrowings during the year
·3.8 Outstanding debt according to duration ..
3.9 Outstanding debt classified according to purpose
3.10 Outstanding debt classified according to security
3 . 11 Principal and interest outstanding
3.12 Outstanding debt according to rate of interest
3.13 Outstanding dues
xi
20
21
22
23
24
25
26
27
28
29
29
30
31
31
32

LIST OF TABLES
Table No. Page 4.1 Proportion of borrowing families 34
4.2 Proportion of borrowing families among four classes of cultivators 34
4 . 3 Borrowings of rural families 35
4.4 Borrowings of non-cultivating families 36
4.5 Borrowings of cultivating families 36
4.6 Borrowings am0!lg four classes of cultivating families 37
4.7 Borrowings per borrowing family among four classes of cultivators 38
4.8 Borrowings among cultivating and non-cultivating families in relation to the total borrowings of all families 38
4.9 Borrowings and expenditure on major items 39
4.10 Capital expenditure on farm, expenditure on specified items of family expenditure and borrowings of all families 40
4.11 Loans borrowed and fully repaid during the year 1951-2 by the selected cultivators classified according to the month of borrowing and repayment 40
4.12 Borrowings as a source of finance as compared to declared purposes of borrowings 41
4.13 Borrowings according to various purposes: Group-wise 42
4.14 Borrowings of selected cultivators classified according to rate of interest 43
4.15 Cash loans borrowed and fully repaid during the year April 1951-March 1952: Amount classified according to duration of loans among the upper and lower strata cultivators 43
4.16 Borrowings of selected cultivators classified according to security 44
.4.17 Borrowings of selected cultivators classified according to purpose-duration 44
4. 18 Credit requirements for development purposes 45
4.19 Credit requirements of the selected cultivators at various rates of interest 46
5.1 Proportion of repaying families 49
5.2 Proportion of repaying to borrowing families
5.3 Proportion of repaying to indebted families
5.4 Repayments per family
50
51
51
5.5 Repayments per repaying family 52
5.6 Repayments as percentage of borrowings and outstanding debt plus repayments .. 54
xii

LIST OF TABLES
Table No. Page 5.7 Repayments as percentage of borrowings and outstanding debt plus
repayments among four classes of cultivating families .. 54
5.8 Repayments classified according to principal and interest 55
5.9 Source of finance for repayments .. 56
6.1 Total family expenditure 57
6.2 Expenditure on specified items of family expenditure 58
6 . 3 Expenditure on construction and repairs of residential houses and other buildings 59
6.4 Frequency distribution of cultivating families according to the size of expenditure on construction and repairs of residential houses and other buildings 60
6.5 Expenditure on purchase of durable consumer goods
6.6 Expenditure on death ceremonies ..
61
62
6.7 Expenditure on marriage and other ceremonies .. 62
6.8 Medical expenses, educational expenses and litigation charges m selected villages 63
6.9 Medical expenses, educational expenses and litigation charges. . 64
6 .10 So~ce of finance for expenditure on various items of family expendi-ture: All families 64
6. 11 Source of finance for expenditure on various items of family expendi-ture among upper and lower strata cultivators .. 65
6.12 Family expenditure and borrowings: All families 66
7.1 Financial investment expenditure in selected villages: All families 68
7.2 Financial investment expenditure 69
7.3 Purchase of land by cultivators 71
7.4 Purchase of land 72
7.5 Proportion of families reporting purchase and sale of land 73
7.6 Proportion of families reporting purchase and sale of land among four classes of cultivators 73
7 . 7 Sale of land .. 74
7. 8 Net purchase and sale of land 74
7 .9 Proportion of families reporting purchase of livestock 75
7.10 Purchase of livestock 76
7.11 Sale of livestock among cultivators, non-cultivators and all families 77
7. 12 Sale of livestock among four classes of cultivators 78
7.13 Net purchase and sale of livestock 79
XlII

LIST OF TABLES
Table No. 7.14 Other capital expenditure in agriculture by cultivators ..
7.15 Reclamation of land
7.16 Bunding and other land improvements
7.17 Digging and repair of wells
7.18 Development of other irrigation resources
7.19 Laying of new orchards and plantations
7.20 Purchase of implements, machinery and transport equipment
7.21 Construction of farm houses, cattle sheds, etc. ..
7.22 Other (miscellaneous) capital expenditure in agriculture
7 . 23 Sale of assets
7.24 Investment-disinvestment: All cultivators
7.25 Investment-disinvestment in selected villages: Four classes of culti-
Page 80
80
81
82
82
83
84
85
85
86
88
vators 89
7.26 Investment-disinvestment among cultivators, ·non-cultivators and allfumilies 00
7 . 27 Frequency distribution of selected cultivators classified according to net investment-disinvestment and value of gross produce 91
8.1 Current Farm' Expenditure-Details 93
8.2 Other current cash farm expenditure 94
8.3 Disposals in kind 96
8.4 .Cash receipts from specified sources 97
8.5 Seasonality of farm business operations 98
8.6 Borrowings and current cash farm expenditure 100
8.7 Source of finance for current cash farm expenditure 101
8.8 Composition of cultivators according to grOBB produce, cash crop, major crop and rent to landlord, etc. 102
8.9 Current cash farm expenditure and disposals in kind in the selected villages: All cultivators 103
9. 1 Borrowings classified according to credit agency
9.2 Relative importance of credit agencies--Cultivators
9.3 Purpose-wise analysis of borrowings of selected cultivators from
106
107
different credit agencies 108
9.4 Outstanding debt classified according to credit agency no 9.5 Purpose-wise analysis of outstanding debt of selected cultivators from
various credit agencies III
10.1 Government finance for agricultural purposes during 1950-1 115
XIV

LIST OF TABLES
Table No. Page 10.2 Role of Government as a credit agency 116
10.3 Case-studies of loans: Loans disbursed for various purposes 117
10.4 Case-studies of loans: Number and amount of loans classified accord-ing to security 117
10.5 Case-studies of loans: Loans disbursed by Government according to purpose-duration 118
10.6 Case-studies of loans: Loans classified according to the time-lag between the date of application and the date of disbursement " 118
11.1 Membership, working capital and share capital of the various types of co-operative institutions as on June 30, 1951 121
11.2 Primary agricultural credit societies: Loans advanced during 1950-1 classified according to size .. 122
11.3 Primary agricultural credit societies: Loans advanced during 1950-1 classified according to purpose 123
11.4 Primary agricultural credit societies: Loans advanced during -1950-1 classified accor~ing to period 123
11.5 Membership and working capital of central co-operative banks and one central co-operative union as on June 30, 1951 124
11.6 Loans advanced during the year and loans due at the end of the year 1950-1 125
12.1 Borrowings from relatives .. 130
12.2 Borrowings from relatives classified according to purpose-duration 131
12.3 Borrowings from landlords . . 131
12.4 Borrowings from landlords classified according to purpose-duration 132
12.5 Borrowings from professional moneylenders 133
12.6 Borrowings from professional moneylenders classified according to purpose-duration 134
12.7 Borrowings from professional moneylenders classified according to rate of interest 134
12.8 Moneylenders classified according to the maximum amount advanced to an agriculturist against a sound security 136
12.9 Case-studies of loans given by village moneylenders: Loans classified according to size, 136
12.10 Case-studies of loans given by village moneylenders: Loans classified according to purpose 137
12.11 Value of crops and fodder sold by selected cultivators to different agenCies 137
xv

The following symbols have been used in the tables :
-to represent' nil' or a negligible figure .
. . to indicate that the figure is not available.

..
.. ..
OI&lnct Heodquort.-, ® Sutl-dl~ls,onol Boundanes
Sub-divISIonal Headquorters 0 ROllways
Hoeds
Rl\lers
Selected Vi!lOCjeS • Selected MO"'elln~ Cenl,es • Centrol eo-operative Bonks iii
MONGHYR DISTRICT
• N G
.. II
+ .. .. ..
..
..

CHAPTER I
GENERAL FEATURES
1.1 GENERAL
District Monghyr, the most westerly district of the Bhagalpur Division, is situated between 24°22' and 25°49' north latitude and between 85°36' and 86°51' east longitude. It extends over an area of 3,943 square miles. It is bounded, on the north by Saharsa and Darbhanga, on the east by Bhagalpur, on the south by Santal Parganas and Hazaribagh, and on the west by Gaya and Patna.
For administrative purposes the district is divided into four subdivisions, namely, Monghyr Sadar, Jamui, Begusarai and Khagaria. Monghyr Sadar and Jamui subdivisions are situated to the south of the river Ganga while the other two subdivisions are situated to the north of the river Ganga. The area and population of the four subdivisions in the district are given in Table 1.1..
TABLE I.I-AREA, POPULATION, VILLAGES AND TOWNS IN MONGHYR
Area in POPULATION Number Number
Subdivision square of of miles Rural Urban Total villages towns
1 2 3 4 5 6
Monghyr Sadar .............. 1,168 747,039 190,165 937,204 1,079 7 Jamui. .....•...........•... 1,303 511,019 22,060 533,079 900 2 Begusare.i ......•..•.....•.. 715 749,100 44,842 793,942 692 3 Khagaria .............•..... 757 574,852 10,050 584,902 402 1
District ................... 3,943 2,582,010 267,117 2,849,127 3,073 13
(Source: Dis!ric! Cenaus Handbook, 1951, Monghyr)
According to 1951 census, there were 3,073 villages and 13 towns in the district. Three towns, namely, Barhee, Jhajha and Kharagpur have grown into townships during the years 1941 to 1951. The two important towns in the district are Jamalpur and Monghyr on account of the location of the Eastern Railway Workshop at Jamalpur and a cigarette manufacturing factory of the Imperial Tobacco Company of India at Monghyr. The population of the district in 1951 was 2,849,127. The increase in population over the decade (1941-1951) was 11·1 per cent as compared to the increase of 12·1 per cent during the previous decade. The growth of the population has been continuous since 1901 except for a slight fall in the decade ending 1921. Of the total population, 2,582,010 or about 91 per cent comprised rural persons. The density of population was 723 persons per square mile for the district as against 572 persons per square mile for the State as a whole.
I

2 MONGHYR
Both Begusarai and Khagaria subdivisions are fertile and densely populated. Begusarai subdivision has a density of 1,110 persons per square mile which is almost twice the density of subdivisions in South Monghyr. The areas which lie to the extreme south of Jamui subdivision are sparsely populated.
1.2 PHYSICAL FEATURES
The Ganga which flows right through the district from west to east divides it into two portions of unequal sizes. . The northern and the smaller portion comprises fertile alluvial plain devoid of hills or natural eminences, while the southern and the larger portion is composed of hills and valleys covered with forests.
About three-fourths of Begusarai subdivision lies between the channels of the Ganga and Burh Gandak rivers; the latter flows in the district from north-west to south-east. This portion of Begusarai consists of the older alluvial deposits of these two rivers, well raised above their beds and relatively free from inundation. The country to the west of the Burh Gandak river is a continuation of the cultivated plains of Tirhut which grows rich rabi and bhadoi crops, whereas northern portion of Begusarai and almost whole of Gogri thana, which covers the eastern half of North Monghyr, is a low-lying tract singularly liable to destructive floods during rainy season. In the dry season it is a wide prairie covered with grass which provides pasture for cattle. To the north of the Begusarai subdivision there is a large but shallow lake known as 'Kabar Tal' C9vering an area of about seven square miles, a portion of which is always under water and uncultivable, but the remainder dries up at the time of sowing paddy.
To the south of the Ganga, there is a quasi-diara tract along the bank of the river Ganga, which gr6ws rich rabi crops. Diara lands are found in the bed of the river and are constantly being added to or diluviated by floods. While between the river and the railway loop line, from Jamalpur to Lakhisarai, there are excellent rice fields, which yield exceptional crops in seasons free from floods. To the northwest from Lakhisarai to Barhee, there is a wide level plain in which few hills rise abruptly; a part of this tract consists of the flood area of the Harhohar river. To the south of the railway line, there are three distinct areas. Firstly to the extreme east is the valley of the Man, which is irrigated from the Kharagpur reservoir and is mainly under rice. Secondly in the centre are the Kharagpur Hills, a mass of rock and jungle with occasional patches of cultivation in the valleys. Thirdly in the west, the tract extending from the Kharagpur Hills as far as the western boundary, which comprises the Sikandra thana and the southern portion of the Sheikhpura. thana, is a wide flat plain with a slight fall from south to north. It is mainly cultivated with winter rice, but ram crops, especially, poppy are also grown to a considerable extent. The soil is dry and the rice crop is apt to fail from insufficient rainfall. To the south of Kharagpur Hills, there is a stretch of undulating country, extending to the borders of Chakai and Hazaribagh which is encircled by hills and still largely covered with jungle. The greater portion of this undulating country cannot be irrigated and beds of streamlets are terraced to grow rice, while

GENERAL FEATURES 3
in the extreme southern portion are found hard stony sides of hillocks and harder mounds of Kankar and the flat or hummocky laterites of Chakai. The soils are merely scratched with plough and a small crop of kuuhi, lrodo, til, mustard and arhar is taken.
Soils met within the different parts of the district consist of sandy, diara, loamy clayey and usar soils. Various kinds of clay soils are found ranging from light coloured to jet black, brick red and sticky clays.
1.3 CLIMATE AND RAINFALL
The climate of Monghyr is on the whole healthy but it differs somewhat in North and South Monghyr. The northern portion is a low-lying alluvial tract, damp and often water-logged in parts, while the southern portion is higher, is hilly in many places and is altogether drier. March, April and May are the healthiest months in the year. The relatively unhealthy season starts with the advent of the rains in June. The normal rainfall of the district is 48 '15", of which 43 '18" or about 89 per cent falls during the months June to October. The mean monthly highest temperature occurs in May and the mean lowest in January.
I." LAND UTILIZATION AND CROP PATTERN
Table 1.2 gives the data on land utilization in Monghyr during 1951-2.
TABLE I.2-LAND UTILIZATION IN MONGHYR DISTRICT DURING 1951·2
CI&88ification of area
Total geographical area according to : Surveyor General of India .••.•••.•.••••••••••••• Village papers .•..••••••••.••••••••••••••••.••••
Forests ....................•.•••.•...••........• Not available for cultivation •..•••..•.•••.•..•.•... Other uncultivated land excluding fallow lands ....••• Current and other fallows ..•...•.•••.•••••••.••••. Net area 8OWll •••••••••••••••••••••••••••••••••••
Area 80WD more than once .....•.•....•.••••.••.•.. Total cropped area ...••••.••.....•.•.•.••••..•.••.
(Acres)
25,43,936 25,16,480 2,07,576 4,24,677
95,596 2,97,754
14,90,877 1,53,119
16,43,996
(Source: Indian AgricuUural StaliBtica, 1951.2)
Percentage to the total geographical area
100·0 8·2
16·9 J·8
11·8 69·2 6·1
It is observed that about three-fifths of the geographical area was sown, of which hardly about six per cent of the total geographical area was sown more than once. Area under other uncultivated lands and under fallows constituted about 4 per cent and 12 per cent of the total geographical area, respectively. Area not available for cultivation and area under forests was about 17 per cent and 8 per cent. respectively, of the total geographical area.
Table 1.3 gives the area under principal crops during 1951-2 in Monghyr.
It would be observed that rice is, by far, the most important crop, especially aghani or winter rice, which is grown mainly in Gogri thana of North Monghyr, in

MONGHYR
Kharagpur pargana to the east, in the wide plain stretching from Jamui to Sheikhpura on the west and on the alluvial land in the Sheikhpura thana of South Monghyr . . Bhadoi or autumn rice is cultivated mostly in the south of the district, ordinarily on high and somewhat poor lands. In 1951-2, about 449 thousand acres or about 27 per cent of the total cropped area was under rice, of which only about 18 thousand acres was under bhadoi rice and the remaining under winter rice.
TABLE I.J-CROP PATTERN IN MONGHYR DURING 1951-2
Crop
Rice .•.••....•.•...•••.•••.•.•..•••...••.•••.•.. Maize ..... _ .....•....•••.•.•.••.......•..••..... Wheat ...............••.••....•..........••...... Gram .•••..•.•..•...•.••...•.....•••••••.•••••.• Barley ......................................... . Tur or Arhar .......••••••••••...•.•....••••...•. Other pulses ......••••.••••..•..•.........•....•. Other food crops .........•............. ; •.••..... Sugarcane ...........••...............•••.•••.•.. Condiments and spices ...••••....••.••.•..•.•••••. Fruits and vegetables .••.•.••••.••...•..•.•.••..•• Oilseeds ...............••.•...•...............•.. Other non·food crops ....•..••....••.....••.•••....
Total ......................................... .
Area under the crop
(Acres)
4,49,171 2,26,192 1,42,758 2,60,104
43,924 89,952
2,13,848 95,096 13,652 19,437 56,456 25,820
7,586
16,43,996
(Source: Indian Agricultural Statistics, 1951.2)
Percentage of the area under this crop to the total cropped
area
27·3 13·8 8·7
15·8 2·7 5·5
13·0 5·8 0·8 1·2 3·4 1·6 0·5
100·0
Gram is a crop of considerable importance in South Monghyr, especially in the belt of land bordering the Ganga between the river and the Kharagpur and Lakhisarai Hills. It is grown to a lesser extent in North Monghyr. In 1951-2, about 260 thousand acres or about 16 per cent of the total cropped area was occupied by gram.
Maize is no less an important crop in the district. It is regularly sown in diara areas on the chance of the floods coming sufficiently late to allow of the crop being reaped, and also in low-lying land liable to floods from the Ganga, the Gandak and other rivers. In 1951-2, it occupied about 226 thousand acres or about 14 per cent of the total cropped area.
Wheat is cultivated largely in North Monghyr, particularly in Begusarai thana, on lands on which the annual inundation of the Ganga leaves a rich deposit of silt. In 1951-2, about 143 thousand acres or about 9 per cent of the total cropped area was under wheat.
1.5 IRRIGATION
In 1951-2, the total gross irrigated area in the district was 2,44,002 acres, which comprised about 15 per cent of the total area. sown. The details of area irrigated by different sources are given in Table 1.4.

GENERAL FEATURES
TABLE 1.4--AREA IRRIGATED IN MONGHYR DURING 1951-1 CLASSIFIED ACCORDING TO SOURCE OF IRRIGATION
Source
Government e&nals .........•............•..••••.. Private canals ..............•..•.......••.•.••••• Tanks ....•.•••..•.•..•••.•••......•.•••.•.•••.• Wells ............•....•.••..•....••...•.•....... Other sources .........•••••.•....•...•••.••.•..•.
Total ......................................... .
Area irrigated (Acl'88)
6,983 5,469
48,137 183,413
m,OOl
Percentage of the area. irrigated by this source to the tota.l
irrigated area
2·9 2·2
19·'1 '15·2
100·0
(Source: Indian Agricultural Statistiu, 1950·1)
Artificial irrigation is not practised on any sizeable scale in North Monghyr, where there is frequent submerging of land under flood and rain water. Irrigation is also not resorted to in the low-lying rice tracts. A small area is irrigated in certain parts by means of tanks, but more by small channels and by lifting water from rivers, lakes, etc. In Gogri thana the latter furnishes the main source of irrigation for rice. No irrigation is being done by Government canals. The private canals irrigate hardly about 3 per cent of the total irrigated area whereas sources other than canals, wells and tanks irrigate about three-fourths of the total irrigated area.
TABLE I.S-IRRIGATED AREA UNDER PRINCIPAL CROPS
Proportion of Proportion of the area irri· area. m-
Area under Area irrigated gated under gated to the
Crop this crop this crop to the tota.l area total area under this irrigated crop
(Acres) (Acres) (Per cent) (Per cent) 1 2 3 4
Rice .••......•••••••.•..••...... 4,49,171 2,04,202 83·'1 45·5 Ma.ize •••..••..•.•.••.••.•.•.•..• 2,26,192 179 0·1 0·8 Wheat ....•••.......•...•.....•• 1,42,758 7,9Il 3·2 5·5 Gram ....••...........•••.•....• 2,60,104 - - -Barley ...............•••..•....• 43,924 5,886 2·4 13·4 Tur or Arhar .......•..•.•......• 89,952 - - - -Other pulses ...•....•.••••••...• 2,13,848 3,334 1·4 1·6 Other food crops ...•..•.•..•.•..• 95,096 19,374 '1·9 20·4 Sugarcane ........•...•••..••.••• 13,652 2,768 1·1 20·3 Condiments and spices .......•.•.• 19,437 - - -Fruits a.nd Vegetables ....•••.•.••. 56,456 - - -Oilseeds ......................... 25,820 - - -Other non·food crops ....•.••••.•. 7,586 348 0·1 4·6
TotaL .. ....................... \ 16,41,996 1, .... ,001 100·0 14·'
(Source: Indian Agricultural Statistiu, 1960·1)
In the west and north-west of South Monghyr, irrigation is practised far more freely and is of three main kinds, viz., from pynes, ahars and wells. Pynes are

6 MONGHYR
artificial channels leading oft' from a river or stream or from an ahar. Ahars are occasionally mere reservoirs for pynes, but generally the water stored in them is brought straight to the fields by means of small channels which are generally not to be dignified with the name of pyne. Pynes are much in evidence in the west of Sheikhpura thana, where they issue principally from the Sakri river. Ahars are found in large number in Sikandra thana. There is also a system of distributaries leading oft' from a reservoir at Kharagpur fed by the river Man. From Table 1.5, it would appear that major portion of the irrigation was utilized for growing rice.
1.6 DEMOGRAPHIC FEATURES
Table 1.6 gives population in Monghyr according to livelihood classes.
TABLE 1.6-POPULATION ACCORDING TO LIVELIHOOD CLASSES
RURAL URBAN TOTAL
Principal livelihood clal!8eS Number Percentage Number Percentage Number Per-centage
1 2 3 4 5 6
Agricultural classes 1. Cultivators of land wholly
or mainly owned and their dependants ...... 1,156,810 44·8 44,996 16·8 1,100,805 42·1
2. Cultivators of land wholly or mainly unowned and their dependants ....•• 339,000 13·1 12,962 4·9 351,961 12·4
3. Cultivating labourers and their dependants ...... 736,471 28·5 46,260 16·9 780,731 Z7·4
4. Non.cultivating owners of land, agricultural rent receivers and their dependants ..•...•..•• 16,186 0·6 2,236 0·8 17,411 0·6
Non-agricultural classes 6. Production other than
cultivation •.•.•••••• 85,174 3·3 21,371 8·0 106,545 3·7 6. Commerce ..••••••.•••• 89,383 3·4 37,754 14·1 117,117 4·$ 7. Transport ......•....... 11,811 0·4 17,484 6·5 19,195 1·0 8. Other services and miscell·
aneous sourres ......•• 160,175 5·8 86,056 31·8 135,130 8·3
Total ..•.•..•.•..•..•..•• 1,581,010 100·0 167,117 100·0 2,849,117 100·0
(Source: Dislriel Gensus Handbook, 1951, Monghyr)
About four-fifths of the total population was engaged in agriculture. About 42 per cent of the total population were cultivators· of land wholly or mainly owned and their dependants, while about 27 per cent were cultivating labourers and their dependants. Cultivators· of land wholly or mainly unowned and their dependants coru.tituted only 12 per cent of the total population. Among the non-agricultural occupations, commerce was important.
• The term used in this section is the same as that used in the Dill"'" GeM..., HIJru!.bo,I&, 1951, M01Ifhyr.

GE~ERAL FEATUREI'! 7
1.7 INDUSTRIES
According to the census of small scale industries, 1951 @ , there were 1,516 non-textile establishments and 2,889 textile establishments which included 2 cotton ginning, cleaning and pressing establishments and 5 silk spinning and weaving handlooms. The textile establishments were mostly concentrated in all the· thanas of Jamui subdivision, Gogri thana of Khagaria subdivision, Bachwara thana of Begusarai subdivision and in Monghyr town. The Eastern Railway Workshop at Jamalpur and cigarette manufacturing factory at Monghyr are the biggest units of industrial establishments. The railway workshop which is one of the largest manufacturing workshops in India has been established for the construction and repairs of rolling stock and plant connected with the railway.
The cigarette factory at Monghyr was originally built in 1908 and rebuilt after 1934 earthquake. This factory is a part of the organization of the Imperial Tobacco Company of India.
Khagaria is one of the important centres manufacturing ice used in packing of fish which is exported to .Assam and Bengal. The availability of large quantity of fish in the rivers around Khagaria has led to the establishment of ice plants.
The other industries which may be mentioned are stone quarries (at Jamalptir and Sheikhpura), slate manufacturing (at Bariarpur), tiles manufacturing (at Jhajha). Sindoor factory (at Lakhisarai) and gun factory (at Monghyr). There is also Bihar Chemical Industries at Monghyr manufacturing allopathic drugs.
1.8 TRANSPORT
There are six main railway lines in the district, three of which pass through South Monghyr and the other three through North Monghyr. The first railway line is that of Eastern Railway which enters the district at Simultala in the south and after connecting Jhajha, Gidhaur, Jamui, Kuil and Lakhisarai leaves the north-west of the district at Barhee. This line runs from Chittaranjan to Patna. The second railway line is the loop line which enters the district from east and after connecting Bariarpur, Jamalpur and Abhaipur joins the Eastern Railway main line at Kuil. The third railway line starts from Gaya on grand chord of Eastern Railway, enters the district at Sheikhpura and joins the main line at Lakhisarai. The fourth railway line which is a branch of North-Eastern Railway starts from Samastipur in Darbhanga and enters the district from north-west at Bachwara and connects Teghra, Barauni, Begusarai and Sahibpur Kamal. The fifth railway line also starts from Samastipur and after connecting Bakhri, Khagaria, Mansi and Mahesh Khunt runs through Naugachia in Bhagalpur. The sixth railway line also starts from Mansi and after connecting Koparia and Simri Bakhtiyarpur enters Saharsa.
The Ganga which flows through the district from west to east for over 70 miles is navigable at all seasons of the year for river steamers and large country boats.
@ Data obtained from Census Handbook.

MONGHYB
A considerable river borne trade is carried on by steamers carrying goods and pa88engers to a number of places between Calcutta and Patna. There is a regular steamer service between (1) Monghyr town and Monghyr Ghat and (2) Mokameh Ghat and Simaria Ghat. The Little Gandak is navigable all the year round for large country boats. The Tiljuga river is also navigable for country boats.
The most important road in the district is Patna-Monghyr-Bhagalpur road. This road starts from Patna and after traversing Mokameh, Lakhisarai, Surajgarh, Monghyr and Bariarpur terminates at Bhagalpur. From Bariarpur another road takes off which terminates at Jamui after connecting Kharagpur and Luxmipur. From Sikandra two roads run, one which is connected with Lakhisarai for Patna and another which runs upto Pakribarwan in Gaya. From Jamui two roads run, one connecting Nawadah in Gaya and the other connecting Jhajha and Simultala. In North Monghyr, the most important road is the one which runs parallel to NorthEastern Railway line. It starts from Samastipur in Darbhanga and connects Teghra, Begusarai and Monghyr Ghat. Another road starts from Rusera in Darbhanga and connects Bhakhri, Khagaria, Mansi and Gogri.
1.9 LAND TENURE SYSTEM
Prior to abolition of Zamindari, there were four kinds of estates, viz., (1) permanently settled revenue paying estates, (2) permanently settled revenue free estates, (3) temporarily settled estates, and (4) Government estates. In the case of estates which were permanently or temporarily settled, the rents were generally realized by Zamindars who subsequently paid the revenue assessed on such estates to Government. The relations between Zamindars and cultivators were being governed by the Bihar Tenancy Act, 1885, as amended from time to time. The State Government in pursuance of its policy to eliminate all intermediaries between the tiller of the soil and the State enacted the Bihar Land Reforms Act, 1950. The actual implementation of the Act started in 1952 and by January 1956 all the intermediaries between the cultivators and the State were eliminated.
The tenants in the district are (1) occupancy raiyats, (2) non-occupancy raiyats and (3) "under-raiyats.
An occupancy raiyat cannot be ejected from his land so long as he uses it in a manner which does not materially impair the value of land or render it unfit for the purpose of tenancy. His right in the land is transferable and heritable. His rent can be paid either in cash or in kind.
A non-occupancy raiyat has no right of occupancy in the land held by him. He is liable to be ejected from the land on the ground (1) that he has failed to pay any arrears of rent, or (2) that he has used the land in a manner as to render it unfit for the purpose of tenancy, or he has broken a convention on which, under the terms of the contract between him and the landlord, he is liable to be ejected, or (3) that his term of registered lease has expired. The interest of non-occupancy raiyat is neither transferable nor heritable.

GENERAL FEATURES 9
Under-raiyat is a tenant holding immediately or mediately under raiyat. If the under-raiyat has held any land in a village continuously for twelve years, he is deemed to have acquired the right of occupancy in it.
1.10 RURAL CREDIT SURVEY: METHODS AND COVERAGE
In the All India Rural Credit Survey, 1951-2 the working of rural credit system was studied in relation to two aspects, viz., the demand for credit from rural families and the supply of credit by credit agencies, both institutional and private; these two aspects are hereafter referred tQ as the 'demand' and 'supply' aspects of the Survey, respectively.
In connection with the' demand' aspect of the Survey, a sample of eight villages, viz., (1) Bari Balia, (2) Chakmansingh, (3) Maniappa, (4) Mubarakchak, (5) Bangama, (6) Dira Harwa, (7) Luxmipur and (8) Pahasara in the district was selected for investigation. As one of the main objects of the Survey was to study the working of co-operative credit in rural areas, it was considered desirable to investigate foui" villages in which the primary co-operative credit societies existed and the four villages where such societies did not exist. The first four of the above mentioned villages were with societies. Field investigations on the' demand' aspect were conducted in two rounds. The first round commenced in the first week of December 1951 and was completed in March 1952. The second round commenced in April 1952 and was over by the end of June 1952. For 'demand' aspect of the Survey, seven schedules and five questionnaires were used. During the first round all the families in the selected villages were investigated by means of General Schedule; in this, information relating tip the size of the holdings, expenditure on important items which are likely to have been occasions of borrowings, borrowings during the year with details regarding purpose and credit agency, repayments during the year, outstanding debt according to credit agency and outstanding dues was collected. Borrowings and repayments related to the period of twelve months preceding the month of investigation, while the outstanding debt was as on the date of interview. The information on the size of the cultivated holdings available in the General Schedule was used to classify all families in the villages into two groups, namely, cultivators and non-cultivators. Those> families who cultivated any land, owned or leased, excluding small garden plots, were classified as cultivators. Cultivators in each of the selected villages were arranged in descending order of magnitude of the size of their cultivated holdings. This list of the cultivators in each village was divided into ten strata or deciles, with roughly equal number of cultivators in each decile. From each of the first five deciles two cultivators were selected at random and from each of the last five deciles, one cultivator was selected at random. This sample of fifteen cultivating families was further intensively surveyed by means of the remaining schedules and questionnaires, which sought information on assets, current farm expenditure and receipts, borrowings and debt according to purpose, security, interest rate, type of mortgage, marketing practices, savings pattern and opinions regarding effects of legislation, availability of Government and other institutional finance, etc. In the intensive enquiry where detailed information was proposed to be collected regarding farm

10 MONGHYR
operations and loan transactions of the cultivating families, the information for the six months from April to September 1951, was collected during the first round of 'Visits and that for the six months from October 1951 to March 1952 was colleeted during the second round of visits.
In connection with the 'supply' aspect of the Survey, a few important centres comprising district headquarters, subdivisional headquarters and marketing centres were selected for study. In addition to the four co-operative societies situated in the four villages on demand side, four other co-operative societies situated in different villages were studied. The investigations on the supply side covered the study of eight co-operative societies and central co-operative banks at the district headquarters and at the selected centres. The investigations connected with private credit agencies covered traders, moneylenders and indigenous bankers operating in the selected villages and a sample of units of each of these agencies at each of the selected centres. In 'supply' side also seven schedules and five questionnaires were used, which mainly sought information on agricultural finance from Government and the co-operatives, method of operation and practices of primary co-operative credit societies, traders, moneylenders, indigenous bankers, commercial banks, etc.
For the purpose of analysis the data of General Schedule are presented for groups of deciles. The first three, the middle four and the last three deciles were grouped separately and the cultivators in these groups of deciles are referred to as the 'large', the 'medium' and the 'small' cultivators, respectively. In addition, the results of the first decile are presented separately and the cultivators in this decile are referred to as the' big' cultivators. Data collected in the intensive enquiry are presented separately for first five deciles and last five deciles, which are referred to as the 'upper' and the 'lower' strata cultivators, respectively.

CHAPTER 2
SELECTED VILLAGES AND THE SIZE OF THE FARM BUSINESS
In this chapter, it is proposed to describe the principal features of the agricultural economy of the selected villages and also to discuss the size of the farm business of the cultivators selected for investigation. The discussion on the main features of the agricultural economy of the selected villages is based largely upon the impressions of the visits of the field staff and on the data collected in the Survey. The discussion on farm business operations is based entirely on the Survey data.
2.1 SELECTED VILLAGES Eight villages spread over three of the four subdivisions of the district were selected
for the Survey. Of these eight villages, four villages, namely, Bari Balia, Chakmansingh, Maniappa and Mubarakchak were each having a multi-purpose co-operative society, while other villages did not have any co-operative society at the time of the Survey. Before we proceed to discuss the agricultural economy of the villages, it is proposed to describe briefly the agricultural economy of the parts in which the selected villages are located. As has already been referred to in Chapter 1, the district can broadly be divided into two parts, one part constituting the areas lying to the north of the Ganga, and the other part constituting the areas lying to the south of the Ganga. Of these two parts, North Monghyr is densely populated and has density much above the average density of South Monghyr ; of all subdivisions in Monghyr, Beguaarai subdivision has the highest density. Better irrigation facilities are available in North Monghyr than in South Monghyr. The soil in North Monghyr is comparatively fertile. Farm operations in North Monghyr are mainly conducted in bhadoi and rabi seasons. In bhadoi season, Maize, aroor, and millets are grown, while in the rabi Beason, wheat, gram, barley, rape and mustard, pulses and chillies are grown. Sugarcane is also grown in northern part of the district. In South Monghyr maize, millets and paddy are generally grown in the rainy season. In short, the agricultural economy of North Monghyr is comparatively better developed than the economy of South Monghyr.
The eight villages selected were, Bari Balia, Chakmansingh, Maniappa, Mubarakchak, Bangama, Dira Harwa, Luxmipur and Pahasara. . Of these eight villages, three villages, namely, Bari Balia, Maniappa and Pahasara are situated in Beguaarai subdivision of North Monghyr and the agricultural economy of these villages was well developed. The proximity of village Mubarakchakto Basudeopur where Peninsular Tobacco Factory is situated, has considerably influenced the occupational pattern in the village. The population in the selected villages, according to 1951 census, ranged from 84 in Chakmansingh to 4,388 in Bari Balia. Some relevant data regarding the selected villages are given in Table 2.1.

12 MONGHYR
TABLE 2.1-IMPORTANT FEATURES OF THE SELECTED VILLAGES
I MAJOR LIVELIHOOD
AGRICULTURAL
Cultiva.- Cultiva.- Non-cul-
tors of tors of tiva.ting Number Number Ia.nd la.nd
Cultiva.- owners Popula.- of of wholly wholly
ting Ia.b- of land, Village Subdivision tion occupied literate or a.gricul-or mainly ourers tura.1 houses persons mainly and un- rent owned owned their receivers and and depen- a.nd their their dants their depen- depen- depen-dants dants dants
I 2 3 4 5 6 7 ---Ba.ri Ba.lia. _____ • _ Begusa.rai .••• 4,388 594 414 398 435 1,766 124 Chakmansingh .•• Monghyr
Sadar ..•.•• 84 14· - 84 - - -Maniappa ...•••• Begusarai .... 2,521 471 237 737 9 1,396 -Mubarakchak .••• Monghyr
Sadar .••••• 769 142 60 146 - Il5 -Ba.ngama. ..•.•.•• Monghyr
Sadar ..••.• 1,009 224 84 548 III 325 -Dira Harwa. ...•.• Ja.mui ••..••. 704 / 97 12 616 6 82 -Luxmipur .•.•.•• Monghyr
Sadar •.•••• 1,1l6 192 106 469 75 236 -Pa.hasa.ra. .••••••• Begusa.rai •••• 3,102 946 571 1,387 291 1,186 8
CLASSES
NON -AGRICULTURAL
Village I Subdivision Production Other services
and other than Commerce Transport miscellaneous cultivation sources
8 9 10 II
Bari Ba.lia .•.•.•• Begusa.rai. . .. 302 418 350 595 Chakma.nsingh ..• Monghyr
Sadar ...... - - - -Maniappa. ...•.•• Begusarai ..•. 38 123 - 218 Mubarakchak ..•• Monghyr
Sadar •••••. 342 14 15 137 Ba.nga.ma •••••••• Monghyr
15 Sadar •••••• 10 - -Dira Ha.rwa. ...•.. Jamui •.•••.• - - - -Luxmipur .•••..• Mongh:vr
Sadar ...••• 220 45 - 71 Pa.hasa.ra ••...••• Begusara.i .••• 14 III - 105
(Source: Diatricl Ce1l81Ul Harulbooli:, 1951, Monghgr)

SELECTED VILLAGES AND THE SIZE OF THE FARM BUSINESS 13
2.1.1 Bari Balla
The village Bari Balia is situated in the alluvial strip of land of Begusarai thana. The village had, in 1951, a population of 4,388 persons, of which about 9 per cent were literate.
According to 1951 census, the 'cultivators of land wholly or mainly owned and their dependants formed only 9 per cent of the total population. The village was predominantly populated by cultivating labourers and their dependants and the persons engaged in non-agricultural professions. The former constituted about 40 per cent while the latter constituted about 38 per cent of the total population. The average size of the cultivated holdings per cultivating family according to the Survey data was 4·7 acres.
The village is being flooded every year by the river Ganga during rainy season. The rich deposits of silt left by the river has made the land extremely fertile. The village grows mainly, maize, arhar and millets in bhadoi season and wheat, gram, barley, rape and mustard, pulses and chillies during ram season. The marketing centre nearest to this village is Begusarai, which is connected with the village by a kachcha road.
2.1.2 Chakmansingh
The village Chakmansingh is situated near Eastern Railway Workshop at Jamalpur. The village had, in 1951, a population of only 84 persons of whom none was literate. All the persons of this village constituted only cultivators of land wholly or mainly owned and their dependants. However, according to the Survey data the proportion of cultivating families was about 28 per cent. This village according to 1951 census was the smallest in area and had the lowest population of all the eight villages selected for the Survey. The average size ofthe cultivated holdings per cultivating family according to the Survey data was one acre.
2.1.] Maniappa
The village Maniappa is situated at a distance of about one and a half miles from Begusarai. The village had, in 1951, a population of 2,521 persons of whom only 237 were literate. The number of persons engaged in agriculture was 2,142, of whom 1,396 or about 55 per cent of the total population were cultivating labourers. About 15 per cent of the population was engaged in non-agricultural professions. The average size ofthe cultivated holdings per cultivating family according to the Survey data was 5·0 acres.
2.1.4 Mubarakchak
The village Mubarakchak, is situated in Monghyr thana. The village had, in 1951, a population of 769 persons. The persons engaged in agriculture were 261, of whom 146 or about 19 per cent of the total population were cultivators ofland wholly or mainly owned and their dependants and the remaining about 15 per cent of the total population were cultivating labourers and their dependants. About 66 per cent of the population was engaged in non-agricultural professions. The average

14 MONGHYR
size of the cultivated holdings per cultivating family according to the Survey data was 7·1 acres.
In spite of the fact that the river Ganga flows at a distance of one mile from it, the village does not have any natural irrigation facilities. This is due to the location of the village on land much higher than the level of the river. The only source of irrigation is wells. The village grows mainly maize and vegetables. The marketing centre nearest to this village is Monghyr town. In this village Muslims formed the bulk of the population who followed poultry farming as subsidiary occupation. The manufacture of gUT as a small scale industry was also found.
2.1.5 Bangama
The village Bangama, is situated in Kharagpur thana. The village had, in 1951, a population of 1,009 persollB, of whom only 84 were literate. The village had a predominance of persollB who were cultivators of land wholly or mainly owned and their dependants and cultivating labourers and their dependants. The former class of cultivators accounted for 54 per cent of the total population while the latter accounted for 32 per cent of the total population. The average size of the cultivated holdings per cultivating family according to the Survey data was 4·9 acres.
2.1.6 Dira Harwa
The village Dira Harwa is situated in Sikandra thana. The village had in 1951, a population of 704 persons, of whom only 12 persons were literate. The village is mainly inhabited by the cultivators of land wholly or mainly owned and their dependants, and cultivating labourers and their dependants. The former cOllBtituted about 88 per cent and the latter 12 per cent of the total population. The average size of the cultivated holdings per cultivating family according to the Survey data was 5·8 acres.
The village is located in the interior and was not served by adequate communication system. Mahadeo Simaria which is situated on the J amui-Sikandra metalled road is connected with this village by an earth road extending upto 10 miles and the produce of the village can be transported by bus or trucks only from this point.
2.1.7 Luxmipur
The village Luxmipur is situated in Barhee Police Station. The village had in 1951, a population of 1,116 persons, of whom only 9 per cent were literate. The village was inhabited mainly by cultivators of land wholly or mainly owned and their dependants, cultivating labourers and their dependants, and persollB engaged in production other than cultivation; their proportion to the total population was 42 per cent, 21 per cent and 20 per cent, respectively. The average size of the cultivated holdings per cultivating family according to the Survey data was 7·8 acres. The nearest marketing centre for Luxmipur is Barhee which is connected with it by a pucca road.

SELECTED VILLAGES AND THE SIZE OF THE FARM BUSINESS 15
2.1.8 Pahasara
The village Pahasara is situated in Bakhri Police Station. The village had in 1951, a population of 3,102 persons, of whom 571 or 18 per cent were literate. The main inhabitants of the village were cultivators of land wholly or mainly owned and their dependants, and cultivating labourers and their dependants, who accounted for about 45 and 38 per cent of the total population, respectively. The average size of the cultivated holdings per cultivating family according to the Survey data was 10·5 acres.
The village is situated on the alluvial strip of land to the north of the Ganga. The southern portion of the village is washed away by river Burh Gandak which is the only and perennial source of irrigation for the area. The village grows mainly maize,. arhar and millets in the _ bhadoi season and wheat, gram, barley, rape and mustard, pulses and chillies during raU season.
The foregoing discussion about the selected villages is mainly based upon census data which might differ slightly from the Survey data on account of partly the timelag between the census and our enumeration and partly on account of the slightly different definition adopted by us for cultivators.
2.2 VARIATIONS IN THE SIZE OF FARM BUSINESS Table 2.2 gives the average size of the cultivated holdings in the different groups
of cultivating families in each of the selected villages.
TABLE 2.2-AVERAGE SIZE OF CULTIVATED HOLDINGS: INTER-GROUP
Village
Bari Balis. ...•
Cho.kmansingh
M aniappa ....
Mubarakchak
Bangama_ . _ .•
Diro. Ha.rwa ..
uxmipur ...• L
P ahasara .• _ .•
District ....•
Period during which the
General Schedule was filled in
I
15 Jan. 1952 to 22 Feb. 1952
4 Dec_ 1951 to 18 Dec. 1951 9 Feb. 1952 to
II Mar. 1952 18 Dec. 1951 to 2 Jan. 1952
27 Mar. 1952 to 31 Mar. 1952 12 Mar. 1952 to 18 Mar. 1952 28 Feb. 1952 to 14 Mar. 1952 4 Jan. 1952 to
13 Feb_ 1952 .. Dec. 1951 to
31 Mar. 1952
VARIATIONS [General Schedule data]
Number AVERAGE SIZE OP CULTIVATED HOLD-
Number Propor- INGS PER FAMlLY (IN ACRES): TYPE OF of rural of culti- tion of CULTIVATORS families vating culti-
families vating enu- All merated enu- families Big Large Medium Small culti-merated
vators
2 3 4 -5- -6- -7- -S- -9----- ----
72S 262 36·0 25·1 12·5 2-2 0·3 "·7
lOS 30 27·8 3·0 2·3 O·S 0·1 1·0
501 289 67·7 26·7 13·3 2·1 0·5 5·0
153 37 24·2 41·8 18·3 2·5 0·9 7·1
105 58 66·2 15·5 9·7 4·0 1·3 .. ·9
135 80 69·3 24·1 13·7 3·6 0·9 5·8
176 68 38·6 20·6 14·6 6·7 2·3 7·8
684 408 69-6 57·7 27·3 4·6 1·3 10·5
30·1 16· .. ..·5 I· .. 7·2

16 MONGHYR
For the district as a whole, the average size of cultivated holdings per cultivating family worked out to 7·2 acres. The average size of the cultivated holdings per cultivating family was lowest at 1·0 acre in Chakmansingh; the relatively high size of the cultivated holdings in Pahasara and Mubarakchak was on account of few big cultivators, mainly Bhumihar Brahmins whose holdings were large. The average size of the cultivated holdings per family of big cultivators was 30·1 acres which was 21 times the average size of the cultivated holdings of small cultivators, about 7 times that of medium cultivators and about twice the holdings of large cultivators.
Table 2.3 shows the pattern of distribution of the cultivated holdings among the four classes of cultivating families in the selected villages.
TABLE 2.l-PROPORTION OF CULTIVATED AREA HELD BY DIFFERENT GROUPS OF CULTIVATORS TO TOTAL CULTIVATED AREA
[ General Schedule data. In per cent]
Big Large Medium Small Village cultivators cultivators cultivators cultivators
1 2 3 4
Bari Balia ............... 55·0 79·8 18·0 2·2 Chakmansingh ........... 29·0 67·8 29·0 3·2 Maniappe. ............... 53·8 80·0 16·9 3·1 Mubarakchak ............ 63·7 83·6 12·2 4·2 Bangama ................ 32·5 61·2 30·4 8·4 Dira Harwa .............. 41·5 70·6 24·7 4·7 Luxmipur ..•............ 27·2 57·7 33·0 9·3 Pahasara ................ 55·3 78·7 17·6 3·7
District ................ 42·8 69·8 24·4 S·8
For the district as a whole, the big cultivators held 42· 8 per cent, large cultivators 69·8 per cent, medium cultivators 24· 4 per cent and small cultivators 5·8 per cent of the total cultivated area. The low proportion of the cultivated area held to the total cultivated area among small cultivators may be studied in context with the dominance of big land owners.
The proportion of the cultivated area held by big cultivators to the total cultivated area varied between 27· 2 per cent and 32· 5 per cent in Luxmipur, Chakmansingh and Bangama, while it varied from 53·8 per cent to 63·7 per cent in Maniappa, Bari Balia, Pahasara and Mubarakchak. The proportion of the cultivated area held by large cultivators was lowest at 57· 7 per cent in Luxmipur and highest at 83· 6 per cent in Mubarakchak. The proportion of the cultivated area held by medium and small cultivators was highest at 33· 0 per cent and 9·3 per cent, respectively, in Luxmipur.
A discussion of the range of variation in the size of cultivated holdings of the four classes of cultivating families would throw further light on the uneven distribution of cultivated holdings of cultivators in the villages. Table 2.4 shows the range of variation in the size of holdings.

SELECTED VILLAGES AND THE SIZE OF THE FARM BUSINESS 17
TABLE 2.4-VARIATION IN THE SIZE OF CULTIVATED HOLDINGS OF FOUR CLASSES OF CULTIVATORS
[ General Schedule data. Area in acres]
BIG LARGE MEDIUM SMALL All CULTIVATORS OULTIVATORS CULTIV ATOM OULTIV ATOM cultivators
Village Maxi- Mini- Maxi- Mini- Maxi- Mini- Maxi- Mini- Maxi- Mini-mum mum mum mum mum mum mum mum mum mum
--1- 2 3 4 5 6 7 -8--9- ----w--- --------BariBalia ....•• 300 8 300 4 4 1 1 - 100 -Chakmansingh .• 3 3 3 2 1 - - - 1 -Ma.niappa ....•• 77 12 77 4 4 1 1 - 77 -Muba.rakcha.k .•• 82 11 82 5 5 1 1 1 82 I Bangama ••..... 24 11 24 5 5 3 3 - 24 -Dira. Ha.rwa ••••. 35 15 35 6 6 2 2 - 15 -Luxmipur .••..• 26 16 26 10 10 4 4 - 26 -Paha.sa.m ......• 300 22 300 8 8 2 2 - 100 -
The maximum size of the cultivated holdings of big cultivators was 300 acres in Bari Balia and Pahasara, while in most of the villages, minimum size of cultivated holdings of big cultivators varied between 11 acres and 16 acres. The maximum size of the cultivated holdings of large cultivators did not exceed 82 acres in six villages, while the minimum size of the cultivated holdings of large cultivators was below 10 acres in all the villages. The reasons for the large variations between the maximum and minimum cultivated holdings among big and large cultivators were the existence of a few Bhumihar Brahmin families who owned large tracts of land. However, as we descend from higher groups to lower groups of cultivators, the disparity between the maximum and minimum size of cultivated holdings narrows down considerably.
Table 2.5 shows the proportion of families owning plough cattle and the average number of plough cattle owned per reporting family in the different groups of cultivating families in ~ach of the selected villages.
For the district as a whole, about 73·2 per cent of the cultivating families owned plough cattle, the average number of owned plough cattle per reporting cultivating family being 1·9.
About 97 per cent of the big cultivators were reported to be owning plough cattl~. In four villages, all the big cultivators were reported to be owning plough cattle. The average number of plough cattle oWned per reporting big cultivating family was 3·6. The pattern of ownership of plough cattle amongst large cultivators was not much different from that among big cultivators.
Among large cultivators, the average number of plough cattle owned per reporting family was 2·7. Among medium and small cultivators, the proportion of the families reporting ownership of plough cattle was 84·5 per cent and 35·1 per cent, respectively; the proportion was significantly low in the case of medium cultivators in Chakmansingh and in the case of small cultivators in Bari Balia. The average
I

18 MONGHYR
number of plough cattle owned per reporting family among medium and small cultivators was 1·5 and 1·2, respectively.
TABLE 1.5-0WNERSHIP OF PLOUGH CATTLE AMONG DIFFERENT CLASSES OF CULTIVATORS [ General Schedule data]
BIG LARGE MEDIUM SMALL ALL CULTIVATORS CULTIVATORS CULTIVATORS OULTIVATORS CULTIVATORS
Pro· Pro· Pro· Pro· Pro· por· por· por· por· por· tion Plough tion Plough tion Plough tion Plough tion Plough of cattle of cattle of cattle of cattle of cattle
Village {amil'- owned famil· owned famil· owned Camil. owned famil· owned ies per ies per ies per ies per ies per
owning report· owning report· owning report· owning report· owning report. plough ing plough ing plough ing plough ing plough ing cattle family cattle family cattle family cattle family cattle family (Per (Per (Per (Per (Per cent) cent) cent) cent) cent) -1- -2- -3--4--5- -6- -7---S -9-10 --
Bari Balia ..... 81·5 2·9 79·7 2·1 43·7 1·3 2·5 1·0 42·0 1·7 Chakmansingh . 66·7 1·5 66·7 1·3 16·7 1·5 22·2 1·0 33,3 1·3 Maniappa ....• 100·0 3·0 82·8 2·1 38·3 1·1 9·2 1·0 42·9 1·7 Mu barakchak .• 50·0 3·0 58·3 2·4 46·2 2·0 16·7 1·5 40·5 2·1 Bangama •..... 100·0 3·7 100·0 2·9 95·5 1·6 38·9 1·3 79·3 2·0 DiraHarwa .••• 100·0 3·0 95·8 2·4 78·1 1·7 33·3 1·3 70·0 1·9 Luxmipur .•••• 100·0 3·9 100·0 3·0 100·0 1·5 61·9 1·2 88·2 2·0 Paha.sa.ra. ....•. 95·1 3·9 96·7 2·6 74·2 1·2 17·2 1·2 64·0 1·8
District ...... 97·Z 3·' 96·8 1·7 84·5 1·5 35·J 1·1 73·Z I·'
The area of cultivated holdings per pair of owned plough cattle worked out to 10·1 acres for the district, while in Pahasara the area of cultivated holdings per pair of plough cattle was relatively large.
The size of the cultivated holdings of the cultivators selected in the intensive enquiry may be studied in relation to the area sown. The selected cultivators, as has been mentioned before, were divided broadly into two classes, namely, upper strata cultivators and lower strata cultivators. Table 2.6 shows the average size of cultivated holdings and area sown per family among upper stratllo and lower strata cultivators in each of the selected villages.
The average size of cultivated holdings per family in the case of all cultivators worked out to 8· 9 acres as compared to 7·2 acres according to General Schedule data (vide Table 2.2). The average size of cultivated holdings per family in the case of upper strata cultivators was highest at 33 acres in Pahasara ; in other villages barring Chakmansingh, the average size of cultivated holdings per family varied from 7·3 acres in Bangama to 13·4 acres in Mubarakchak. In the case of lower strata cultivators, the average size of the cultivated holdings per family was highest at 3·8 acres in Luxmipur ; in other villages it ranged from 0·2 acre in Chakmansingh to 2· 4 acres in Bangama. The area sown per family worked out to 15 acres in the case of the upper strata and 2· 9 acres in the case of the lower strata cultivators.

SELECTED VILLAGES AND THE SIZE OF THE FARM BUSINESS 19
TABLE 2.~CULTIVATED HOLDINGS AND AREA SOWN [ Intensive enquiry data.. Area in acres per family]
Ul'PEB STRATA LOWER STRATA ALL CULTIVATOBS
Village Average Average Average size of Average size of Average size of Average
cultivated area sown cultivated area sown cultivated area sown holdings holdings holdings
1 2 3 4 5 6
Bari Ba.1ia ..............•.. 8·7 10·1 0·6 0·8 4·7 5·5 Chakmansingh ..••......•.. 2·0 2·5 0·2 0·5 1·1 1·5 Maniappa ....••........•.. 11·7 10·0 0·8 1·1 6·3 5·5 Mubarakchak .•...•........ 13·4 17·4 1·2 2·4 7·3 9·9 Bangama .•...•.•..•....... 7·3 7·7 2·4 2·9 4·9 5·3 Dira Harwa ..••....•....... 10·1 11·4 1·8 1·8 5·9 6·6 Luxmipur •••......•.•..... 12·0 15·5 3·8 4·2 7·9 9·9 Pahasara .. ; .........•..... 33·0 26·3 2·2 2·8 17·6 14·5
District .................. 15·4 15·0 2·5 2·' 8·' '·0
For the district as a whole, the average area sown per family is more than the average size of the cultivated holdings per family indicating that the cultivated holdings were being sown more than once. Of all the villages, the average area sown per family was less than the cultivated holdings per family in Maniappa and Pahasara in the case of upper strata cultivators. This is on account of the fact that some of the big cultivators cultivated sugarcane.
2.:1 GROSS PRODUCE AND CASH RECEIPTS
In most cases, the measurement of the size of operation of farm. business is given by the value of gross produce of farm. The value of gross produce represents the value of all farm produce, whether sold or retained for consumption or seed. The information relating to gross produce and cash receipts from sale of crops and fodder and other sources was obtained in respect of selected cultivating families through intensive enquiry. It is necessary to mention at the outset that the value of gross produce in respect of different families was arrived at by multiplying the quantity of different commodities produced during the two agricultural seasons of the year by the price per unit declared by the responding cultivating family.
Table 2.7 shows the proportion of families classified according to various sizes of gross produce.
It is observed that the value of gross produce for about 46 per cent of the selected cultivating families was less than Rs 400 per family and for about 21 per cent of the selected cultivating families, it was between Rs 400 and Rs 800. . Another 27 per cent of the families had gross produce between Rs 800 and Rs 2,000. Only 2·5 per cent of the families reported gross produce of the value of Rs 5,000 and above; the average value of gross produce per family in their case was Rs 17,319.

20 lIiIONGHYB
TABLE 2.7-SIZE OF THE CULTIVATED HOLDINGS AND AREA SOWN ACCORDING TO GROSS PRODUCE GROUPS
[Intensive enquiry data]
Average value Size of culti· Proportion of of gross vated hold. Area sown
Gross produce group families produce ings per per family
per family family
(Per cent) (Rs) (Acres) (Acres) 1 2 3 4
Less than Rs 200 ..••.•••••••••••. 17·8 106 1·7 1·8 Rs 2oo-Rs 400 .•..•••••••.••• 27·7 296 3·1 3·3 Rs 4OO-Rs 600 •..•.•••••••••• 8·7 457 5·4 5·6 Rs 600- Rs 800 •••..•••.•••••• 12·5 711 5·4 6·2 Rs 800 - Rs 1,000 .•••••••••••••• 11·1 861 8·3 9·9 Rs 1,000 - Rs 2,000 •••••••••••.••• 15·8 1,467 12·0 14·9 Rs 2,000 - Rs 3,000 .•••.•••..•.••• 2·6 2,064 12·3 13·9 Rs 3,000 - Rs 4,000 .•...•••••••••. 1·3 3,478 22·3 29·3 Rs 4,000 - Rs 5,000 ••••••...•.•• _. - 4,350 25·0 20·0 Rs 5,000 and above ••••••••••••••• 2·5 17,319 128·4 90·5
Table 2.8 shows the concentration of gross produce and cash receipts from sale of crops and fodder and other sources in the different groups of cu1tivating families.
TABLE 2.B-GROSS PRODUCE AND CASH RECEIPTS [Intensive enquiry data. Amount in rupees per family]
Value of CASH BEOE~ FROM
Strata gross produce Sale of crops Other
and fodder sources
1 2 3
Upper strata ••••.•....•.••..•.... 1,828·4 485·7 507·8 (83·9) (99·9) (62,1)
Lower strata •••...•......••...••. 351·9 0·3 310·4 (16,1) (0·1) (37·9)
All cultlvaton . ................ 1,090·2 24]·0 409·1 (100·0) (100·0) (100·0)
Total
4
99]'5 (76,.2)
310·7 (.23")
652·1 (100·0)
(Figures within brackets denote percentages of the value reported by the group to the value reported by all cultivators.)
The share of the upper strata cultivators in the value of grOBS produce was 84 per cent and in cash receipts from sale of crops and fodder was almost cent per cent.
2.4 COMPOSITION OF ASSETS
Information relating to the value of owned assets was obtained in respect of selected cu1tivating families only. The types of owned assets included were land, buildings, livestock, implements and machinery and financial assets which comprised shares of co-operative societies, banks, etc. Postal Savings, National Savings Certificates etc., deposits in co-operative societies, banks etc., and outstanding dues.

SELECTED VILLAGES AND THE SIZE OF THE FARM BUSINESS 21
Table 2.9 shows the various types of assets owned by the upper strata and lower strata cultivators.
TABLE 2.9-VALUE OF OWNED ASSETS [ Intensive enquiry data. Amount in rupees per family]
Out- Shares Deposits Postal Imple- st.a.nding in co- in co- B&vings,
Build- Live- ments dues opera.- opera- National
Strata Land ings stock and (receiv- tive tive S&vings Total
machi- able societies, societies, Carli-nery from banks, banks, fioates,
othel'll) etc. eto. etc.
1 2 --3- --4,- 5 6 7 8 9 ---Upper
stra.ta •..•• 12,704·0 2,976·0 855·2 210·0 255·5 - 3·6 - 17,004·] (U'7) (17,.5) (.5·0) (1·3) (1,.5) H H H (100·0)
Lower stra.ta ••••• 2,326·0 515·8 264·8 0·4, - - 3·4, - ],110·4
(74·8) (16·6) (8-.5) H H (-) (0,1) H (100·0)
All cultI-vators .... 7,515'0 1,745·9 560·0 105·2 127·8 - ]·5 - 10,057·4
(74,7) (17·4) (5·6) (1·0) (1·3) H H H (100·0)
(Figures within brackets denote percentages to total)
The items of a88ets reveal that the total assets per family of the upper strata cultivators were about five times the total assets per family of the lower strata cultivators, the total assets of the upper strata cultivators being Rs 17,004 per family, while that of the lower strata cultivators being Rs 3,110 per family. About 92 per cent of the total a88ets of the upper strata cultivators and 91 per cent of the total assets of the lower strata cultivators comprised owned land and owned buildings.

CHAPTER J
INDEBTEDNESS
In thiB chapter the extent of indebtedness,. Bize, incidence, growth and other aspectB of debt of the rural families are discussed on the basiB of the data collected in the General Schedule and in the intensive enquiry. Outstanding debt here means debt incurred in cash. The debt, as reported in the General Schedule, refers to the outBtanding debt &B on the date on which the family was interviewed, i.e., any time between December 1951 and March 1952 and in the intensive enquiry to the pOBition a.B at the end of March 1952. Loan tranaa.ctions in kind were covered in the intensive enquiry, but these have been treated separately. No account of them is taken in any of the BtatiBtiCB relating to debt, borrowings and repaymentB in monetary values, particularly becaUBe it W&B difficult to incorporate the data relating to debt in kind in the data relating to money debtB. Further in Bome villages, the data collected referred to the position as in December 1951 and January 1952 while in others it referred to the position as in February and March 1952. For the diBtrict as a whole, the figures repreBent in a broad way the average conditions prevailing during the period covered by the investigation.
3.1 EXTENT OF INDEBTEDNESS
3.1.1 Proportion of Indebted families
Table 3.1 shows the proportion of indebted families among rural families, noncultivating families and different claBBes of cultivating families.
Village
Bari Balla •..•.•. Chakmansingh ..• Maniappa ...•... Mubarakchak •... Bangama ....•... Dira Harwa •..•.• Luxmipur .•. _ ... Pahasara ..•.••..
District ........
TABLE 3.I-PROPORTION OF INDEBTED FAMILIES [ General Schedule data.. In per cent]
Big Large Medium Small All Non-cultivatol'll cultivatol'll cultivatol'll cultivatol'll cultivatol'll cultivatol'll
I 2 3 4 6 6
48·1 54·4 62·1 60·0 59·2 57·7 66·7 88·9 91·7 100·0 93·3 71·8 72·4 69·0 85·3 90·8 82·0 91·0
- 16·7 69·2 50·0 45·9 58·6 100·0 83·3 81·8 88·9 84·5 89·4 62'5 79·2 87·5 91·7 86·3 89·1 57·1 61·9 69·2 76·2 69·1 55·6 51·2 68·2 84·0 86·9 80·1 45·3
68·5 73·9 81·6 86·3 80·6 68·9
All families
7
58·2 "",8 85·8 55·6 86·7 87·4 60·8 66·1
75·1
Nearly three-fourths of the rural familieB were indebted. The proportion of indebted famili~, however, showed considerable variations from village to village

INDEBTEDNESS 23
and from group to group. The proportion of indebted families ranged between 85·8 per cent and 87·4 per cent in Maniappa, Bangama and Duo. Harwa, between 66· 1 per cent and 77·8 per cent in Pahasara and Chakmansingb, and between 55·6 per cent and 60·8 per cent in Mubarakchak, Bari Balia and Luxmipur. Among non-cultivating families the proportion of indebted families was lower at 68·9 per cent but in Maniappa, Bangama and Dua Harwa, the proportion was relatively high owing to a larger number of landless labourers having incurred debt for meeting family expenditure. It may also be mentioned that the disparity in proportion of the non-cultivating and cultivating indebted families was significant in Paha.sa.ra and Mubarakchak which was mainly due to the large proportion of landless agricultural labourers and non-agricultural persons in these villages.
About four-fifths of the cultivating families were indebted. In five out of the eight villages, the proportion of indebted cultivating families was above 80 per cent and in the remaining villages the proportion ranged between 45·9 per cent and 69·1 per cent. An analysis of the four classes of indebted cultivating families shows that the proportion of indebted families increases 88 we move from the big cultivators to the small cultivators. Among the big cultivators, all the families were indebted in Bangama while in Mubarakchak not even one family was indebted. In majority of the villages the proportion of indebted families among large cultivators varied from 61· 9 per cent to 88·9 per cent. The proportion of indebted families among the medium and small cultivators was 81· 6 per cent and 86·3 per cent, respectively. In five villages, namely, Cbakmansingh, Maniappa, Bangama, Dira Harwa and Pahasara, the proportions of indebted families among both medium and small cultivators were above 80 per cent.
3.1.1 Debt per family
Table 3.2 shows the average debt per family among rural families, non-cultivating families, cultivating families and four cl88ses of cultivating families.
Village
Bari Balia ......• Chakmansingh •.. Maniappa ....... Mubarakchak ..•• Bangama ••...... Dira Harwa •..•... Lultmipur ....... Pah&a&ra ........
District ........
TABLE 3.1-DEBT PER FAMILY [General Schedule data. Amount in rupees]
Big Large Medium Small All cultivators cultivators cultivators cultivators cultivators
1 2 3 4 5
1,083 515 141 112 245 243 462 287 430 382
1,472 985 432 221 535 - 190 544 126 294
1,750 896 345 186 467 186 128 129 87 116 650 610 593 234 488
1,722 1,156 411 224 579
1,096 700 347 179 404
Non· All cultivators families
6 7
112 160 205 254 238 409 141 178 126 314 55 91
137 272 119 394
115 167
The average debt per rural family worked out to Rs 267 for the district. An examination of the data. shows that if very high debt had not been recorded among

24 )lONGHYB
big and large cultivators in Bari Balia, Maniappa, Bangama, Luxmipur and Pahasara, the average debt per family would have worked out much lower. The high debt per family among big and large cultivators in these villages is accounted for by the fact that Bhumihar Brahmins who constitute the rich land owning class in the district incurred most of the debt.
With the exception of Maniappa, Chakmansingh and Dira Harwa the average debt per non-cultivating family in other villages approximates to the district average of Rs 115 perfamily.
The average debt per cultivating family worked out to Rs 404 per family. The average debt per family among big cultivators ranged between Rs 1,000 to Rs 2,000 in four villages, namely, Bari Balia, Maniappa, Bangama and Pahasara, while no family among big cultivators reported any debt in Mubarakchak. Among medium. cultivators, the debt per family ranged between Rs 129 and Rs 593. In the case of small cultivators, the highest debt worked out at Rs 430 in village Chakmansingh while in most of the other villages it ranged between Rs 112 and Rs 234.
:1.1.3 Debt per Indebted family
Table 3.3 shows the average debt per indebted family among rural families, non-cultivating families, cultivating families and four classes of cultivating families in the selected villages.
TABLE 3.J-DEBT PER INDEBTED FAMILY [ General Schedule data. Amount in rupees per family]
Big Large Medium Small All Non· All Village cultivators cultivators cultivators cultivators cultivators cultivators families
1 2 3 4 5 6 7
Bari Balla ••..••. 2,249 946 227 186 414 195 275 Chakmansingh ..• 365 520 313 430 410 285 327 Maniappa •••••••. 2,033 1,428 507 243 652 262 477 Mubarakchak •••• - 1,140 786 252 639 240 320 Bangama .•...••. 1,750 1,075 422 209 552 140 362 Dira Harwa ...•.. 298 161 148 95 134 62 104 Luxmipur .•..... 1,138 985 857 308 705 246 448 Pahasara ........ 3,362 1,693 489 257 723 262 596
District .••...•. 1,5" 948 425 208 501 166 1S6
The average debt per indebted family for the district as a whole worked out to Rs 356. In six out of eight villages it varied from Rs 300 to Rs 600 per family. In Dira Harwa the average was lowest at Rs 104. In all villages the average debt per indebted non-cultivating family was lower than that of cultivating families.
The average debt per indebted cultivating family was around Rs 500. It, however, varied from Rs 600 to Rs 725 in Maniappa, Mubarakchak, Luxmipur and Pahasara and from Rs 400 to Rs 600 in villages, namely, Bari Balia, Chakmansingh and Bangama. Dira Harwa had the lowest debt of Rs 134 per indebted cultivating

INDEBTEDNESS 25
family. This is due to the comparative backwardness of the agricultural economy of the village, where people resort to a little cash borrowing and do so only on speciaJ occasions. The debt per indebted family in the big cultivators' group was very high. The majority of the villages fell in the class interval of Rs 1,100 to Rs 3,362. Perhaps their superior position in the share of cultivated holding and gross produce enabled them to contract high debt. Among the large cultivators' group, the debt for indebted family varied between Rs 900 and Rs 1,700 in six villages. In the remaining villages, namely, Dira Harwa and Chakmal'lJlingh it was Rs 161 and Rs 520 per indebted family, respectively. The average debt of an indebted medium cultivating family was highest at Rs 857 in Luxmipur and the next in order was Mubarakchak. In four other villages it ranged between Rs 300 and Rs 510 and in the remaining two villages, namely, Dira Harwa and Bari Balia it was Rs 148 and Rs 227 per indebted family, respectively. In the case of small cultivators, the highest debt per indebted family was Rs 430 in Chakmansingh and lowest at Rs 95 in Dira Harwa. In the other six villages it ranged between Rs 186 and Rs 308.
3.1.4 Concentration of debt
Table 3.4 shows the debt of cultivators and non-cultivators in relation to total debt of rural families.
TABLE 3.4-DEBT OF CULTIVATORS AND NON-CULTIVATORS IN RELATION TO THE TOTAL DEBT OF ALL FAMILIES
[General Schedule data. In per cent]
DEBT OWED BY THE DEBT OWED BY THE CLASS AS OROUP AS PERCENT·
PERCENTAGE OF THE TOTAL DEBT AGE OF THE TOTAL OWED BY CULTIVATORS DEBT OWED BY ALL
Village .. &MalES
Big Large Medium Small All Non· cultivatol'll cultivatol'll cultivatol'll cultivatol'll cultivatol'll cultivatol'll
1 2 3 4 Ii 6
Bari Balia .................. 45·6 63·4 22·'1 13·9 55·0 45·0 Chakmansingh .............. 6·4 36·3 JO'O 33·'1 41·8 58·2 Maniappa ....••.......•.••• 2'1,6 55·4 32·2 12·4 '15·4 24·6 Mubarakchak ....•.....•...• - 21·0 65·1 13·9 39·9 60·1 Bangama .•....•.......•.... 38·8 59·5 28·1 12·4 82·1 11·9 Dira Harwa ••••...•....•.... 16·1 33·0 44·6 22·4 15·3 24·'1 Luxmipur .••..........•.... 13·'1 38·6 46·5 14'9 69·2 30·8 Pahasara .............. · .... 29·9 60·1 28·3 11·6 8'1,8 12·2
District ..••............... n'B 53·0 JJ·5 13·5 79·7 ZO·3
Nearly 80 per cent of the totaJ debt of rural families was accounted for by cultivating families, and the remaining 20 per cent by non-cultivating families. Village-wise analysis, however, shoWB that the proportion of debt among cultivators in Mubarakchak was much lower than that for the district, because two-thirds of the population in this village constituted non-cultivators.

26 MONGHYB
Of the total debt of the cultivating families, big cultivators accounted for 27·8 per cent, large cultivators 53·0 per cent, medium cultivators 33·5 per cent and small cultivators 13·5 per cent.
3.1 INCIDENCE OF DEBT
The incidence of the debt incurred by cultivating families can best be me&8ured by relating outstanding debt to the size of cultivated holding or to the size of their farm business or to their assets. Table 3.5 shows the average debt per family and the average debt per acre of cultivated holdings among different classes of cultivators.
TABLE 3.5-SIZE AND INCIDENCE OF DEBT
[ General Schedule data]
Proportion Average Average debt per of indebted debt per
Group families family indebted family
(Per cent) (Re) (Re) 1 2 3
Big cultivators ..•••.•.••....••••• 68·S 1,096 1,699
Large cultivators ...•.•••••••••••• 73·9 700 948 Medium cultivators ......•••••.••• 81·6 347 426 Small cultivators •.•.....•...••.•• 86·3 179 208
All oultivators ••••••....••..•••.• 80·6 404 SOl Non·cultivators .•••......•.•••••. 68·9 116 166
All families .................... '15·J 267 356
Average debt per acre of
cultivated holding
(Re) 4
36
43 77
131
56 .. ..
The debt per acre of cultivated holding tends to increase consistently with the decline in the size of the cultivated holdings indicating that the burden of debt was heavier in the case of lower classes of cultivators than among big and large cultivators. If this is taken together with the fact that the outstanding dues (vide Table 3.13) as reported are more highly concentrated in the group of large cultivators than elsewhere, it is obvious that for the large cultivators' group as a whole the burden of debt per acre is, in general, much lower than that in other cultivators' groups. The burden of the debt per acre among small cultivators' group is about three times the debt per acre in the large cultivators' group. This may partly be the result of one important factor, namely, that some of the cultivators in this group, especially those in the last decile, may generally be persons, who in the main, are cultivating labourers and non-agriculturists. The outstanding debt of these persons may, therefore, have been contracted in relation not to agricultural lands or farm business but to other economic activities which they might be carrying on. To the extent this is so, the comparison of the per acre debt of small cultivators with that of other cultivators may prove misleading.

INDEBTEDNESS 27
Table 3.6 shows the outstanding debt of the selected cultivating families in relation to gross produce, owned land and owned assets.
TABLE l.t.-INCIDENCE OF DEBT [Intensive enquiry data. Amount in rupees]
AVEJLA.GE DEBT
Per Rs 100 Strata Per Rs 100 of total
Per family of value of value of owned land owned
assets
1 2 3
Upper strata ................. 361 2·8 2·1 Lower strata .••.•...........• 220 9'0 7·1
All cultivators .........•.... 290 3·' 2·'
Per Rs 100 Per RsI00 of gross of cash produce receipts
4 0
19·7 36·3 62'0 70·8
26·' 44·5
These data also bring out that the burden of debt in relation to the owned &Ssets and owned land is much greater on the cultivators with small sized holdings. But it has already been noted that many cultivators with small sized holdings were cultivating labourers and/or were engaged in non-agricultural activities which introduce an element of non-comparability even in the measure of debt burden. Apart from the difficulties arising out of the variations in the size of land holdings, there is also the problem relating to the ownership status or the variations in the interests of the cultivators in the land cultivated by them. In case there is a significant difference in the quality of the holding rights &S between different strata, the mere holding of land for cultivation purposes would not necessarily be indicative of similar capacity to require or bear debt. More particularly, if the upper strata cultivators held exclusively or to a much greater degree superior rights in land and the lower strata cultivators inferior rights, then neither the cultivated holdings nor the total value of the gross produce of cultivated holdings (a part of which may have to be handed over to landlord in lieu of rent in the case of Batai cultivators) may indicate the same propensity for expenditure on farm business or the same capacity to bear the burden of debt. Further, we collected data regarding the value of owned land and owned assets which could be used for getting a broad idea regarding the extent of debt in relation to the owned assets and owned land; these data have been given in Table 3.6 which indicates that according to assets, the debt burden on the lower strata was about four times the burden on the upper strata.
Among cultivators the debt formed 2·9 per cent of the total assets. For families in the lower strata this ratio was higher at 7·1 per cent. The relation of debt to the value of owned land has sometimes greater significance than its relation to the value of total assets. Since owned land formed about 75 per cent of the total value of &Ssets in each group there has not been much variation in the ratio of debt to the value of owned land.

28 MONGHYB
3.3 . GROWTH OF DEBT
The growth of debt can be measured by relating net borrowings to debt at the beginning of the year. The information relating to outstanding debt at the end of the year and borrowings and repayments during the year was collected. The debt at the beginning of the year was arrived at by deducting the net borrowings from the debt outstanding at the end of the year.
Table 3.7 shows the growth of the debt among ruTal families, non-cultivating families and four classes of cultivating families.
TABLE 3.7-DEBT AND NET BORROWINGS DURING THE YEAR [General Schedule data]
Debt at Borrowings Repayments Net borrow· Percentage the end during the during the inge during increa.ee
Group of the year year year the year in debt
(R8) (R8) (R8) (R8) 1 2 3 4 5
Big cultivators ............... 1,096 721 49 672 158·7
Large cultivators ... __ . _ • _ •.•. 700 416 32 384 121·6 Medium cultivators •....•...•. 347 201 9 192 123-9 SmaU cultivators ••...•.••..•. 179 81 8 73 69-0
All cultivators ••.•• _ .•••..•• _ 404 230 16 214 113·6 Non· cultivators ••.• _ ...•...•. 115 59 2 57 98·4
All families .•.............. 267 149 9 140 110·3
The increase in debt during the year was more than 100 per cent in most of the cases. This indicates that outstanding debt at the beginning of the year was low and current borrowings less repayments were relatively high. The relatively small increase in debt in the case of small cultivators and non-cultivators means that their current borrowings were comparatively low. Since their outstanding debt at the beginning of the year was relatively high, the borrowings formed a smaller proportion of the debt. We shall see in the subsequent chapter that a high level of borrowings in most cases were necessitated by scarcity conditions in the district. It must, however, be mentioned that in the case of big and large cultivators a high level of borrowings was due to other causes, such as, high level of expenditure for construction of houses, expenditure on ceremonies, etc.
3.4 NATURE AND COMPOSITION OF DEBT
In this section we discuss the data collected in intensive enquiry on outstanding debt according to duration, purpose and period, 88 also the outstanding interest as at the end of the second round of the Survey.
3.4.1 Duration of debt
Table 3.8 gives the classification of the debt according to period for which it was outstanding.

INDEBTEDNESS 29
TABLE l.8-0UTSTANDING DEBT ACCORDING TO DURATION [Intensive enquiry data. Amount in rupees per family]
DEBT REPORTED FOR THIS
AMOU1lT OF DEBT OUTSTANDING Dl1BATION AS PEBCENTAGII OF TOTAL DEBT
Period All All Upper Lower cultl· Upper Lower cultl· strata strata vaton strata strata vaton
1 --2--3 4 6 6
1 year or less •••••.•••.••••. 67·6 88·3 77·' 18·7 40·2 26·8 1-2 years .•••....•..•.•..••. 177·6 54·8 116·2 49·2 24·9 40·0 2-3 years ••••...••...••...•• 81·7 75·4 78·6 22·6 34·3 2'1·1 3-4 years •••.....•.......... 12·8 0·5 6·6 3·6 0·2 2·3 4-5 years •••.....•....•.•••. 17·6 0·6 '·1 4·9 0·3 3·1 li-l0 years .••...••..••.••... 0·2 0·1 0·1 0·1 - -Above 10 years .............. - - - - - -Period not specified •••..••... 3·5 0·2 1·8 1·0 0·1 0·'
Total ..................... 360·8 21'·' 290·4 100·0 100·0 100·0
In majority of the cases, the duration of the outstanding debt did not exceed three years. About two-thirds of the debt was oubltanding for a duration of less than two years. The proportion of the debt for a duration of less than three years to the total debt outstanding was about 91 per cent in upper strata and 99 per cent in lower strata. The largest proportion of the debt in upper strata was outstanding for a duration of one to two years, while in lower strata it was for a duration of one year or less.
3.4.2 Debt according to purpose
Table 3.9 shows the debt of the selected cultivating families classified according to various purposes.
1.
2.
3.
4. 6. 6.
TABLE ].9-0UTSTANDING DEBT CLASSIFIED ACCORDING TO PURPOSE [Intensive enquiry data. Amount in rupees per family]
AMOUNT OF OUTSTANDING DEBT REPORTED FOR TIlIS
DEBT PURPOSB A8 PBBCBNTAOB
OF TIlB TOTAL DEBT
Purpose Upper Lower All Upper Lower All cultl· cultl. strata strata vaton strata strata vaton
1 2 3 4 Ii 6
Capital expenditure on farm ................... 76·3 68·9 72·6 21·1 31·3 25·0 Current expenditure on farm ..........•........ 2·5 1·2 1·8 0·7 0·5 0·' Non·farm business expen· diture .•................ 0·2 - 0·1 0·1 - -Family expenditure ••.••. 220·9 115·3 168·2 61·2 52·4 5'1·' Other expenditure .••...• 33·0 0·2 16·6 9·1 0·1 5·' More than one purpose and unspecified purposes 27·9 34·3 31-1 7·1 15·6 10·'
Total ..............•....•. ]60·8 21'·' 290·4 100·0 100·0 100·0

30 MONGHYB
Analysis of the loaQ8 according to purpose reveals that a greater proportion of the outstanding debt was contracted for family expenditure. Among the cultivators, about three-fifths of the debt contracted was for the purpose of family expenditure, whereas only one-fourth of the debt contracted was for capital expenditure on farm.
3.4.3 Security offered for outstanding debt
Seclll"ities for outstanding debt were classified into eleven categories, namely, personal, bullion and ornaments, immovable property, movable property, shares, Government security, insurance policy, commodities, guarantee by third party, other securities and security not specified. The data relating to outstanding debt according to security are given in Table 3.10.
TABLE 3.16-0UTSTANDING DEBT CLASSIFIED ACCORDING TO SECURITY [Intensive enquiry data.- Amonnt in rupees]
AMOUliT 011' OUTSTANDING DEBT OUTSTANDING ON THIS
DEBT SECURITY AS PERCENTAGIII
011' TOTAL DEBT
Type of security All All Upper Lower culti- Upper Lower cultl-stra.ta. strata. vaton strata. strata. vaton
1 2 3 4 6 6
1. Persona.l security .•...• 262·0 206·2 22'·1 69·8 93·8 78·' 2. Bullion and ornaments .• ..:. - - - - -3. Immovable property ... 60·3 13'7 ]7 .• 16·1 6·2 12·7 4. Movable property ...... - - - - - -6. Sha.res ................ - - - - - -6. Government security ... - - - - - -7. . Insura.nce policy ....... - - - ., - -8. Commodities .......... - - - - - -9. Gua.rantee by third
party ................. - - - - - -10. Other securities ........ - - - - - -ll. Security not specified ••• 48·5 - 14·3 13·4 - 8·4
Total .•................ 360·8 II'·' 190·4 100·0 100·0 100·0
Among the upper strata cultivators, nearly 70 per cent of the outstanding loans were on personal security and 17 per cent on the security of immovable property, while in the case of the lower strata cultivators about 94 per cent of the outstanding loans were on personal security and the balance on the security of immovable property.
3.4.4 Outstanding debt-Principal and Interest
Table 3.11 shows the debt owed by the selected cultivating families classified according to principal and interest.
Of the total outstanding debt of Rs 290 per cultivating family, Rs 53 was outstanding in the form of interest aDd the remaining represented principal. Both in the upper and lower strata cultivators the outstanding interest was about onefifth of the total outstanding debt.

INDEBTEDNESS 31
TABLE ].II-PRINCIPAL AND INTEREST OUTSTANDING [Intensive enquiry data. Amount in rupees per family]
UPPER STRATA LOWER STRATA ALL OULTIVATOBS
Prin- Interest Total Prin- Interest Total Prin- Interest Total cipal cipal cipal
--1- --2- --3- 4 5 --6- --7- --8- --9---------------- ---
Debt outstand-ing for one year or less .• 63·7. 3·7 67·5 75·3 13·0 88·] 69·5 8·3 77·'
Debt outstand-ing for more than one year 231·1 62·2 29]·] 105·3 26·3 1]1,6 168·2 44·3 212·5
Total debt outstanding 294·8 65·' 360·8 180·6 ]9.] 21',' 237·7 52·6 290·4
We also collected data relating to interest rates at which the out8tanding debt was contracted. The relevant data are presented in Table 3.12.
TABLE ].12-0UTSTANDING DEBT ACCORDING TO RATE OF INTEREST [ Intensive enquiry data. Amount in rupees per family]
AMOUNT OF OUTSTANDING DEBT OONTRACTED AT TEUB
DEBT RATE OF INTEEEST AS
PERCENTAGE OF TOTAL DEBT
Rate of interest per annum Upper Lower All Upper Lower All
strata strata cultivators strata strata cultI-vators
1 2 3 4 5 6
Nil ........... ..........•.. 21·5 3·4 12·5 6·0 l·S 4·J £Us than 3! per un! • •.•..•.. - - - - - -31- 7 per un! ••.•••••••.•. 24·8 9·4 17·0 6·9 4·3 5·9 7 - 10 per un! ............. 70·3 - ]5·2 19·5 - 12·1
10 -12!perun! . ............ 48·6 24·5 ]6·5 13·5 11·1 12·6 121-18 per un! . •...•......• - 1l·2 5·6 - S'l 1·9 18 -2S per cen! .....••.•••.• 1I5·6 126·4 121·0 32·0 S7·S 41·7. 2S -3S per un! .. ........... 0·2 - 0·1 0·1 - -3S -50 per un! ....•...••..• 1I·9 44·7 28·4 3·3 20·3 9·' SO per un! and above ......... - - - - - -U 1t8pecified. • •••••••• : ••.••• 67·9 0·3 ]4·1 18·8 0·1 11·7
Total ...•.••••.. -.........• 360·8 21'·' 290·4 100·0 100·0 100·0
About 42 per cent of the total outstanding debt of the cultivating families was contracted at interest rates varying from 18 to 25 per cent per annum, while about one-fourth of the debt was contracted at rates varying from 7 to 121 per cent per annum. It may be noted that about three-fourths of the outstanding debt in the case of lower strata cultivators was contracted at interest rates varying from 18 to 25 per cent and 35 to 50 per cent per annum, while about one-third of the debt among upper strata cultivators was contracted at these rates of interest.

32 MONGHYR
3.5 DUES
Both in the Gtlneral Schedule and in the intensive enquiry, the data on amounts due from others to the selected families were collected. However, no account of such reported dues was taken while compiling the figures for average debt per family. The proportion of the families reporting dues was small compared to the proportion of indebted families. Among the cultivating families, dues may be repOlted by those who are cultivator-cum-moneylenders and/or those who give small loans to fellow cultivators or relatives. The data relating to the outstanding dues are given in Table 3.13.
TABLE l.Il-OUTSTANDING DUES [General Schedule data]
Group
Big cultivators ••••••.•.............••.•••.•......
Large cultivators ................................ . Medium cultivators ••••••.••...•..•..•.•••••••.••. Small cultivators •..•.............•..••.•••••.••••
All cultivators ••••••.•.••.•••.••..•...•......••.. Non·oultivators .•••...•..••••.......•...•........
All famill .. ................................... .
Proportion of families reporting outstanding
dues
(Per cent)
30'2
25·0 5'3 3·4
10·1 1'5
6·4
Average amount due per reporting
family
(Ra)
3,458
1,722 351 137
1,304 385
1,1"
Dues were reported by all groups of cultivators but the big and large cultivators reported sizeable amounts. The dues reported by large cultivators were about 13 times the dues reported by small cultivators and about one and a half times the dues reported by all cultivators. Although the proportion of families reporting dues among non-cultivators was negligible, yet the average amount due per non-cultivating reporting family was higher than. that reported by small and medium cultivators. The reason being that one or two families having larger income from business or other profession advanced loans to rural families.
From the foregoing analysis of outstanding debt, the following features stand out prominently. The average outstanding debt per family is not very high. The average would have worked out ~uch lower but for the heavy borrowings by some big cultivators in the northern villages. Much of the outstanding debt was accounted for by the heavy current borrowings by the rural families who were forced to borrow on account of the scarcity conditions which prevailed prior to the year of the Survey.
In majority of the cases the debt was not outstanding for more than 3 years. The burden of debt, as measured by the relation of debt to cultivated holdings, was very high in the case of families in the lower strata.

CHAPTER 4
BORROWINGS
The information relating to the amount borrowed by the rural families during the year of the Survey and the purpose for which loans were taken was obtained through the General Schedule as well as through the intensive enquiry. It may be made clear that the discussion has been confined to the loan transactions in cash only, while loan transactions in kind have been considered separately in section 4.6 ofthis chapter. -
The enquiry was confined to those transactions which might be presumed specially to lead to borrowings or repayments. The broad categories of the transactions were (1) the need of capital expenditure in agriculture including the purchase of land an~ purchase of livestock, (2) capital expenditure in non-farm business, (3) capital expenditure in relation to such assets as residential houses and other nonfarm buildings, (4) expenditure in relation to durable consumer goods such as household utensils, furniture, clothing, shoes, b(dding, etc., and (5) special occasions for large expenditures su.ch as death, marriage, medical care, litigation, education, etc. In addition to this, information was directly sought relating to the total borrowings during the twelve-month period preceding the month during which the enquiry was conducted in the case of General Schedule; in the case of the intensive enquiry the borrowings during April 1951 to March 1952 were covered. Total borrowings for all purposes were ~xhaustively enumerated and the purpose of each loan and the complete classification of purposes of all borrowings were derived from the information collected.
4.1 EXTENT OF BORROWING
4.1.1 The proportion of borrowln, families
The proportion of borrowing families in a village may tend to vary in a manner different from the amount borrowed per borrowing family. The percentage of borrowers will depend very largely on the economy of the tract in relation to both farm business and family living. A large number of families would resort to borrowings if the flow of income is concentrated in a particular season of the year and the expenditure has to be incurred continuously. Families may be forced to borrow for making capital expenditure on farm or for other large occasional expenditure. The proportion of borrowers on these accounts would depend on the size of such expenses as determined by social conventions, investment opportunities and the frequency of the incidence of occasions or of investment needs. Apart from these factors, failures of agricultural crops, involuntary capital losses, such as destruction of capital equipment, damage to land, loss of plough cattle caused by floods or other natural calamities may lead a large proportion of families to borrow.
I

34 MONGHYR
Table 4.1 shows the villages arranged in the descending order of magnitude of t,he proportion of borrowing familil's among cultivators, non-cultivators and rural families.
TABLE 4.I-PROPORTION OF BORROWING FAMILIES [ Genero.l Sch«:dule do.ta. In per cent]
CULTIVATORS NON -CULTIVATORS ALL FAMILIES
Village Proportion Villo.ge Proportion Villo.ge Proportion
Cho.kmansingh •••..• 80·0 Mo.niappa ........• 12·2 Cho.kmo.nsingh .•... 72-2 Po.ho.so.ro. ........•.. 68-1 Cho.kmo.nsingh ..... 69-2 Mo.niappo. ...•..... 68,-5 Mo.nio.ppo. ••••••...• 65-7 Dim. Ho.rwo. ..•.•.. 69·1 Dim. Ho.rwo. ..•••.. 63·7 Bango.mo. •• _ ........ 65·5 Bangama ... _ ..•..• 59·6 Bangama •. _ . _ ..... 62·9 Dira Ho.rwo. ..•••.. · 60·0 Mubo.rakcho.k ...... 50·0 Po.ho.saro. .......... 54·2 Luxmipur .•...•...• 58·8 Luxmipur ......... 41·7 Luxmipur ..•...... 48·3 Bo.ri Bo.lia ...•••.... 42·4 Bo.ri Balia ..•...... 39·3 Mubarakcho.k ••.... 47·7 Mubo.ro.kcho.k •.....• 40·6 Paho.so.ro. •...•..... 33·7 Bo.ri Balio.. _ ...•... 40-4
District .......... . 63·4 District ......... . 50·5 District ......... . 57·3
The proportion of borrowing rural famiJies for the district as a whole worked out to 57· 3 per cent. In Chakmansingh the proportion of borrowing families was the highest. In Pahasara, Bangama, Dira Harwa and Maniappa 50 to 70 per cent of the rural families resorted to borrowings. In Luxmipur, Mubarakchak and Bari Balia a comparatively smaller proportion of families borro~ed during the year.
. The proportion of borrowing cultivating families was 63·4 per cent. In Chakmansingh the proportion of borrowing cultivating families was high because of the relatively low farm income. In the case of non-cultivating families, the proportion for the district worked out to 50·5 per cent, but the proportion of borrowing families among non-cultivators in Maniappa, Mubarakchak and Dira Harwa was larger than that of cultivating families. Table 4.2 sets out the percentage of borrowing famiJies among four classes of cultivators in_each village ..
TABLE 4.2-PROPORTION OF BORROWING FAMILIES AMONG -FOUR CLASSES OF CULTIVATORS
[ Genero.l Schedule do.ta. In per cent]
BIG CULTIVATORS LARGE CULTIVATORS MEDIUM CULTIVATORS SMALL CULTIVATORS
Villo.ge Pro- Villo.ge Pro- Villo.ge Pro- Villo.ge Pro-
portion portion portion portion
Bo.ngo.mo. ••••.• 83·3 Bo.ngo.mo. ••.. 72·2 Cho.kmo.n- 75·0 Cho.kmo.n. 100·0 singh singh
Mo.nio.ppa ..••• 58·6 Chakmo.n. 66·7 Po.haso.ro. •... 73-6 Mo.nio.ppo.-... 75·9 singh
Luxmipur ....• 57·1 Po.ho.so.ro. ... _ 56·1 Mo.nio.ppo. ••• 68·7 Diro. Ho.rwo. •• 75·0 Diro. Ho.rwo. •••• 50·0 Diro. Harwo..-: 54·2 Bango.ma .•.. 63·6 Po.ho.so.ro. .... 73-0 Po.ho.so.ro. .....• 46-3 Luxmipur .•. 52·4 Mubo.rakcho.k 61·5 Luxmipur ••. 61·9 Bo.ri Bo.lio. ....• 33·3 Mo.nio.ppo. ... 51·7 Luxmipur .•. 61-3 Bango.mo. •.•. 61·1 Cho.kmo.nsingh • 33-3 Bari Balia .. _ 46·8 Dira Harwa •• 53·1 Mubo.ro.kcho.k 41·7 Muho.ro.kcho.k .• - Mubo.ro.kcho.k 16·7 Bo.ri Bo.lio. •.. 44·7 Bari Balio. •. _ 35-0
District ..... . 59·3 District ... _ 58·4 District ... . 63-6 District ... . 68·1

BORROWINGS 35
The proportion of borrowing families shows a rise as we move from the large cultivators to small cultivators. The proportion of borrowing families was 58·4: per cent among large cultivators, 63·6 per cent among medium cultivators and 68·1 per cent among small cultivators.
A very high proportion of big and large cultivators in Bangama borrowed for meeting family expenditure. In Mubarakchak, however, no big cultivator reported borrowing. The proportion of borrowing families among large cultivators was slightly lower than that among other classes of cultivators. Among medium cultivators, the proportion of borrowing families was over 70 per cent in Pahasara and Chakmansingh and ranged between 60 and 70 pel' cent in Luxmipur, Mubarakchak, Bangama and Maniappa. All small cultivators in Chakmansingh borrowed during the year. In Pabasara, Dira Harwa and Maniappa nearly 70 to 75 per cent of small cultivators reported borrowings during the year. In Luxmipur and Bangama, the proportion of borrowing families was around 61 per cent. In other villages the proportion was below 45 per cent.
4.1.2 Average borrowings per family and per borrowing family
Table 4.3 shows the villages arranged in the descending order of the average borrowings per family and borrowings per borrowing family.
TABLE 4.3-BORROWINGS OF RURAL FAMILIES [ General Schedule data. Amount in rupees]
Village
Paha.sara ..................... . Maniappa .................... . Luxmipur .................... . Chakmansingh ................ . Bangama ..................... . Mubarakchak ................. . Bari Balia .................... . Dira Harw& .................. .
District ..................... .
Average per
family
209 184 183 173 152 143 58 56
149
Village
Pahasara .................... . Luxmipur ................... . Mubarakchak ................ . Maniappa ................... . Bangama .................... . Chakmansingh ............... . Bari Balia ................... . Dira Harwa •..•..............
District .................... .
Average per borrowing
family
385 378 300 269 242 238 143 87
261
The average borrowings per family and per borrowing family worked out to Rs 149 and Rs 261, respectively. In Bari Balia and Dira Harwa, the amounts borrowed per family and per borrowing family were much below their respective district averages. The low borrowings in Dira Harwa were on account of the low level of expenditure in the village on account of its being relatively undeveloped.
Table 4.4 shows the villages arranged in the descending order of the average amount borrowed per non-cultivating family as well as per borrowing non-cultivating family.

36 MONGHYR
TABLE 4.04-BORROWINGS OF NON-CULTIVATING FAMILIES [ General Schedule data. Amount in rupees]
Village
Chakmansingh •••.............. Mubarakchak ..............•. , . Luxmipur .................•... Maniappa .•.••.....•........•. Bangama .•..............•..... Pahasara ....•.......•......... Bari Balia .................... . Dira Harwa ..•.•............•.
District ...................... 1
Average per
family
146 108
79 75 57 50 38 33
59
Average per Village borrowing
family
Mubarakchak. . . . . . . . . . . . . . . . . 216 Chakmansingh. . . . . . . . . . . . . . . . 211 Luxmipur. •...........•...... 190 Pahasara. •. ...... .... .... .... 149 Maniappa. . . • . . . . . . . . . . . . . . . . 105 Bari Balia. . . . . . . . . . . . . . . . . . . . 97 Bangama..................... 96 Dira Harwa. . . . . . . . . . . . . . . . . . 48
District. . . . . . . . . . . . . . . . . . . . . 117
In majority of the villages amount borrowed per non-cultivating family did not exceed Rs 100. It exceeded Rs 100 in Chakmansingh and Mubarakchak. The average borrowings per borrowing family were above Rs 175 but below Rs 225 in Luxmipur, Chakmansingh and Mubarakchak. In other villages these were below Rs 150. The high level of borrowings per family and per borrowing family in Chakmansingh and Mubarakchak may be studied in context of the relatively high necessity for borrowings by people in these villages due to urban influence.
Table 4.5 shows the villages arranged in the descending order of the average amount borrowed per cultivating family and the average amount borrowed per borrowing cultivating family.
TABLE 4.5-BORROWINGS OF CULTIVATING FAMILIES [General Schedule data. Amount in rupees]
Village
Luxmipur ..•.................. Pahasara ..................... . Maniappa ....•....•.........•. Mubarakchak .•................ Chakmansingh •................ Bangama ...........•.......... Bari Balia. .................... . Dira Harwa .•••...............
District ..................... .
Average per
family
347 317 264 252 239 229
92 71
230
Average per Village borrowing
family
Mubarakchak. . . . . . . . . . . . . . . . . 623 Luxmipur. • . . . . . . . . . . . . . . . . . . 589 Pahasara. . . . . . . . • . . . . . . . . • . . . 465 Maniappa. . . . . . . . . . . . . . . . . . . . 402 Bangama..................... 349 Chakmansingh. . . . . . . . . . . . . . . . 299 Bari Balia... .. . . .. .. ... ... .. .. 218 Dira Harwa.................. 119
District. . . . . . . . . . . . . . . . . . . . . 363
It may be noticed that the average amount borrowed per family and per borrowing family is consistently high in five villages, namely, Luxmipur, PahasaraMubarakchak, Maniappa and Bangama. The relatively high borrowings in these villages may be studied in context of the greater neceBBities for farm operations. In these villages the size of farm business as measured by the value of gross produce and the size of cultivated holdings was also high.

BORROWINGS 37
Table 4.6 shows the vil1ages arranged in the descending order of the average amount borrowed per family among different classes of cultivators.
TABLE ... 6--BORROWINGS AMONG FOUR CLASSES OF CULTIVATING FAMILIES [ General Schedule data]
BIG CULTIVATORS LARGE CULTIVATORS lIIEDIUlII CUL'lIV ATORS SMALL CULTIVATORS
Am- Am- Am- Am-Village ount Village ount Village ount Village ount
(Ra) (Ra) (Ra) (Ra)
Pahasara ...... 1,277 Pahasara ....• 662 Luxmipnr_ ... 495 Chakman- 249 aingh
Maniappa .••. _ 1,170 Maniappa ..•• 594 Mubarakchak. 433 Pahasara ..... 119 Bangama ...... 1,115 Bangama ..... 536 Pahasara ..... 204 Mu barakchak . 109 Luxmipur. _ ... 350 Luxmipur .... 406 Chakmansingh 189 Luxmipur .... 104 Bari Balia ..... 185 Chakmansingh 297 Maniappa .... 141 Maniappa .... 98 Dira Harwa .... 73 Mubarakchak. 200 Bangama ..... 126 Dira Harwa ..• 57 Chakmansingh . 27 Bari Balia .... 175 Dira Harwa .•. 84 Bangama .•... 48 Mubarakcbak .. - Dira Harwa ... 69 Bari Balm .... 75 Bari Balia ...• 33
District ...... 721 District ..... ... 16 Distric;t •.... 201 District ..... 81
The borrowings per family decline sharply as we move from big cultivatoTB to small cultivators. The average borrowings per family among big cultivators ranged between Rs 1,100 and Rs 1,300 in Bangama, Maniappa and Pahasara, mainly on account of heavy borrowings by a few Bhumihar Brahmin cultivating families. In Bari Balia and Luxmipur it was Rs185 and Rs 350 per family. In other villages it was below Rs 75. Among large cultivators, the average borrowings per family ranged between Rs 400 and Rs 670 in Luxmipur, Bangama, Maniappa and Pahasara. In Bari Balia, Mubarakchak, and Chakmansingh it ranged between Rs 175 and Rs 300. In the case of medium cultivators, the highest average borrowings per family were at Rs 495 in Luxmipur and lowest at Rs 75 in Bari Balia_ The average borrowings of small cultivators were highest at Rs 249 in Chakmansingh and lowest at Rs 33 in Bari Balia.
Table 4.7 shows the villages arranged in the descending order of the borrowings per borrowing family among four classes of cultivating families.
The borrowings per borrowing family were Rs 1,217 among big cultivators, Rs 713 among large cultivators, Rs 316 among medium cultivators and Rs 119 among small cultivators. The borrowings per borrowing family in the case of big and large cultivating families were significantly high in Pahasara, Maniappa and Bangama which were due to heavy borrowings by a few big Bhumihar Brahmins. In majority of the villages the average borrowings per borrowing family among medium cultivators ranged between Rs 158 and Rs 277, the highest borrowings per family being Rs 804 in Luxmipur. The average borrowings per borrowing family amongst small cultivators ranged between Rs 76 in Dira Harwa and Rs 262 in Mubarakchak.

38 MONGHYR
TABLE 4.7;.....BORROWINGS PER BORROWING FAMILY AMONG FOUR CLASSES OF CULTIVATORS
[General Schedule data]
BIG CULTIVATORS LABOE CULTIVATORS MEDIUM CULTIVATORS SMALL CULTIVATORS
Am· Am· Am· Am· Village ount Village ount Village ount Village ount
(Ra) (Ra) ~ (Ra)
Pahasara ...... 2,756 Mubarakchak 1,200 Luxmipur .•.. 804 Mubarakchak 262 Maniappa ...•. 1,995 Pahasara ..... 1,180 Mubarakchak 704 Chakmansingh 249 Bangama ...... 1,338 Maniappa .•.. '1,149 Pahasara ..... 277 Luxmipur .•.. 168 Luxmipur ..... 613 Luxmipur .•.. 775 Chakmanaingh 252 Paha.'\&ra .... r 163 Bari Balia ..... 554 Bangama ..... .742 Maniappa .... 205 Maniappa ..•. 130 Dira Harwa .... 145 Chakrnansingh 445 Bangama ..... 199 Bari Balia .... 95 Chakman.ingh 80 Bari Balia .... 373 Bari Balia .... 169 Bangama ..... 78 Mubarakchak .. - Dira Harwa •.. 127 Dira Harwa ... 158 Dira Harwa .•• 76
District ...... 1.2171 DistrIct ..... 713 District ..... 316 District ..... 119
4.1.3 The share of the different classes of cultivators In the total borrowings
Table 4.8 shows the borrowings of cultivators and non-cultivators in relation to the total borrowings of rural families.
TABLE 4.8-BORROWINGS AMONG CULTIVATING AND NON-CULTIVATING FAMILIES IN RELATION TO THE TOTAL BORROWINGS OF ALL FAMILIES
[General Schedule data. In per cent J BORROWINGS OF THIS
BORROWINGS OF THIS CLASS AS GROUP AS PERCENTAGE
PERCENTAGE OF THE TOTAL OF THE TOTAL BORROW·
BORROWINGS OF CULTIVATORS INGS OF ALL FAMILIES
Village Big Large Medium Small All Non·
culti· culti· culti· culti· culti· culti· vators vators vators vators vators vators
I 2 3 4 5 6
Bari Balia ................. 20·6 51·0 32·0 11·0 51·6 42·4 Chakmanaingh ............. 1·1 31·2 31·6 31·2 38·6 61·4 Maniappa ....•............ 44·4 61·6 21·2 11·2 82·1 11·3 Mubarakchak .............. - 25·1 60·3 14·0 42·1 .51·3 Bangarna .................. 50·4 12·6 20·9 6'5 83·2 16·8 Dira Harwa ...•........... 10·2 29·0 41·0 24·0 15·8 24·2 Luxmipur ................. 10·4 36·2 54·6 9·2 13·4 26·6 Pahasara .................. 40·6 63·1 25·1 11·2 90·3 9·1
District .................. 32·1 55·2 34·1 10·7 81·3 18·7
Of the total borrowings in the district, 81·3 per cent was accounted for by cultivating families and 18·7 per cent by n~n-cultivating families. In Chakmansingh and Mubarakchak, non-cultivating families, however, accounted for a greater proportion of the borrowings. In Bari Balia also, the share of the non-cultivating families in the total borrowings was relatively high at 42·4 per cent. In the remaining five villages their respective shares were either a little over or under 25 per cent.

BORROWINGS 39
Considering the relative share of each of the different classes of cultivators in the total borrowings of the cultivating families, it is observed that big cultivators accounted for 32·1 per cent, large cultivators 55·2 per cent, medium cultivators 34·1 per cent and small cultivators 10·7 per cent. However, in Maniappa, Bangama and Pahasara, big cultivators accounted for 40 to 50 per cent of the total borrowings. The large cultivators accounted for 72·6 per cent of the total borrowings in Bangama, 63·1 per cent in Pahasara and 67·6 per cent in Maniappa. The medium cultivators accounted for 60·3 per cent in Mubarakchak and 54·6 per cent in Luxmipur. This heavy concentration of borrowings in one or two groups lends support to the findings that heavy borrowings by a few families in those villages made the average borrowing per family diverge considerably from the district average.
4.2 SIZE OF BORROWINGS
The size of expenditure on different items, namely, capital expenditure onfarm, non-farm business expenditure and family expenditure may have some bearing on the volume of borrowings during the year. Table 4.9 gives data on total borrowings and expenditure on major items.
TABLE 4.9-BORROWINGS AND EXPENDITURE ON MAJOR ITEMS [ General Schedule data. Amount in rupees per family]
Total Capital Capital Total borrow- expenditure expenditure Family expend 1-Group Inls in in non·farm expenditure ture agriculture business
1 2 3 4 5
Big cultivators .............. 721 758 2 1,677 i.417
Large cultivators ............ 416 406 1 903 1,110 Medium cultivators .......... 201 88 - 297 185 Small cultivators ............ 81 26 - 161 187
All cultivators .............. llO 166 - 441 607 Non·cultivatol"l! ............• 59 1 2 142 145
All families ..............• 149 88 I 100 lI9
There is a broad correspondence between the level of expenditure and the size of borrowings. As the average capital expenditure on farm and family expenditure tends to decrease from big cultivators to small cultivators, the average borrowings per family also tend to decrease pari passu.
A comparison of the size of borrowings with the average expenditure for capital investment in agriculture and on specified items of family expenditure in each of the villages has been made and the data are presented in Table 4.10 on page 40.
The data reveal that there is a broad correspondence between large expenditure on the one hand and heavy borrowings on the other hand, particularly in Pahasara, Maniappa and Luxmipur.

MONGHYB
TABLE ".IO-CAPITAL EXPENDITURE ON FARM, EXPENDITURE ON SPECIFIED ITEMS OF FAMILY EXPENDITURE AND BORROWINGS OF ALL FAMILIES
[General Schedule data. Amount in rupees per family]
Village
Capital expenditure
on farm
Expenditure on specified
itemR of family expenditure
Borrowings
Bari Balm ...........•......•......•....•....•. Chakmansingh ..•.•............................ Maniappa ....•.•.•.•..•.......•......••....... Mubarakchak .••.••..•.....•...•••...•.•...•... Bangama ......•.•.••••.................. , .... Dira Harwa ••••......•........••............... Luxmipur .•...................•............•.• Pabasara ..................................... .
District ...................................... .
27 32 60 70 69 15
131 144
88
2
271 282 404 528 216 144 331 498
]00
3
68 173 184 143 162 56
183 209
149
With the data collected in the intensive enquiry, we may see whether borrowings and repayments show any seasonality. Table 4.11 shows the months in which loans were borrowed, as also the months in which these were fully repaid.
TABLE ".II-LOANS BORROWED AND FULLY REPAID DURING THE YEAR 1951-1 BY THE SELECTED CULTIVATORS CLASSIFIED ACCORDING TO THE MONTH OF
St .. ta April
BORROWING AND REPAYMENT [Intell8lve enquiry data. Amount In rupee. per family 1
1'51
Sep-Aug. Octo· Nove- Dece· May June July ust tem- ber mber mber ber
-1- -2- -3- --,- -6- -8- -7- -8- -g-
Month of borrowln.
"52
Total am-ount:
Jan· F'~C bor-uary row. uary
and fully
10 rapald
-11- 12 -1-3-
upper.t .. ta·········I 17 .O 1 0'11 - [ Lowerst .. ta......... 9·7 14'6 0·2
All cultlvaton...... IJ·J 7·J 0·1 g,sl :-1 : 1 ~::~ I 4·' - 20·4
1·4 124'313O·g 1 7·3 - -
4·J 12·2 15·5
-I 3'81 9J" - - 65·7
- I·' 7',' Month of repayment
Upper otrata .......•• -
=1
-
=1 =1
- 2'~ 1 - 9·7 18·' 18·0 I 4g·, 1 9J·' Lower. tra la .•.•..•.. - - - 9·7 0·3 9·7 9'7 38·3 65·7
All cultivator •....•. - - - 1·2 4·' S·g (J·O 12·' 42·' 79·'
Most of the borrowings of the families in the upper strata were during the period from October 1951 to January 1952. In the case of families in the lower strata more than 50 per cent of the amount was borrowed during the period from April to J wy 1951, i.e., when the preparations for sowing of bhadoi and aghani crops are undertaken. The repayments of these loans were concentrated in the period from December 1951 to March 1952. Though there is marked seasonality in the case of repayments, borrowings do not appear to have been influenced to that extent by seasonal factors.

BORROWINGS 41
".3 PURPOSE OF BORROWING
The data relating to purpose of borrowing were obtained separately through blocks 3 and 5 of the General Schedule. In block 3, questions were asked relating to total expenditure incurred during the year on certain specified items together with their source of finance including borrowings. In block 5, the information relating to borrowings contracted during the twelvemonth period preceding the month during which the enquiry was conducted and the purpose for which each of the loans was borrowed was obtained. In the former block, an exhaustive classification of purposes of borrowing was not provided while in the latter, information regarding borrowing for all purposes for which they were contI'acted was obtained. It will, therefore, be possible for us to compare the manner in which the funds borrowed were actually utilized with the declared purposes of borrowing. Table 4.12 compares the borrowed amounts utilized during the year of the Survey for various purposes with the amounts declared to have been borrowed during the year of the Survey for these purposes.
TABLE ".Il-BORROWINGS AS A SOURCE OF FINANCE AS COMPARED TO DECLARED PURPOSES OF BORROWINGS
[General Schedule data. Amount in rupees per family]
Item
Capital expenditure in agriculture ............•...... Capital expenditure in non·farm busineBS ............ . Current expenditure on farm .................•...... Family expenditure ............................... . Other expenditure ................................ .
Borrowings BS a source of finance
27
.. 100
Declared purposes of borrowing
27
1Q5 17
There appears to be a general correspondence between the two sets of data except in regard to minor difference in the family expenditure and other expenditure. The difference in the case of family and other expenditure was due to the difference in the coverage of the two sets of data. In one block only specified items of family expenditure were taken into account while in the other block respondents were required to declare all purposes of borrowing.
Table 4.13 gives the data relating to purposes for which different groups of cultivators borrowed during the year.
Considering the total average borrowings of rural families, it is observed that the borrowings for family expenditure accounted for 70·4 per cent of the total borrowings and capital expenditure and other purposes accounted for 18·3 per cent and 11·3 per cent, respectively, In the case of cultivating families about two-thirds of the borrowings were for family expenditure while in the case of non-cultivating families entire borrowings were for family expenditure. Class-wise analysis of the cultivating families reveals that about four-fifths of borrowings of small cultivators and about two-thirds of borrowings of large cultivators were for family expenditure, while a

42 MONGHYR
little more than one-sixth of borrowings of small cultivators and about one-fourth of borrowings of large cultiva~ors were for capital expenditure on farm. Borrowings for other purposes formed 23· 7 per cent in the case of medium cultivators because a few families in this group reported large expenditure on account of litigation.
TABLE 4.IJ..-BORROWINGS ACCORDING TO VARIOUS PURPOSES: GROUP·WISE [ General Schedule data. Amount in rupees per family]
BORROWINGS FOR
Total Capital Current Non-farm I borrow· Family Group ings expendi- expendi- business Other ture on ture on expen- expen· purposes
farm farm diture diture
1 2 3 4 5 6 ---Big cultivators .....•........ nl 171 - - 496 55
(100·0) (23'7) (-) (-) (68' 7) (7·6)
Large cultivators ............ 416 104 - - 270 42 (100·0) (25,1) (-) (-) (64' 7) (10,2)
Medium cultivators .......... 201 39 - - 114 48 (100·0) (19·6) (-) (-) (56'7) (23' 7)
Small cultivators ............ 81 14 - - 66 1 (100·0) (17,4) (-) (-) (81·6) (l'P)
All cultivators .............. 230 52 - - 147 32 (100·0) (22'4) (-) (-) (63·8) (13'8)
Non-cultivators ............. 59 - - - 59 -(100·0) (-) (-) (-) (100'0) (-I
All families ............... 149 27 - - 105 17 (100·0) (18·3) (-) (-) ('10·4) (11·3)
(Figures within brackets denote percentages to total)
4.4 BORROWINGS AND INTEREST RATE
Table 4.14 shows the borrowings of selected cultivators classified according to the rate of interest.
A large proportion of the loans in the district were contracted at very high rates of interest. Only loans borrowed from institutional sources were charged lower rates of interest. Nearly 9 per cent of the borrowings of the upper strata cultivators and a bout 2 per cent of the borrowings of the lower strata cultivators did not bear any interest. Amounts borrowed at rates of interest mnging between 3t per cent and 7 per cent formed about 15 per cent of the total amounts borrowed in the case of upper strata cultivators and about 4 per cent in the case of lower strata cultivators. These loans were borrowed from various institutional agencies which charge a uniform interest rate of 6t per cent per annum. Borrowings contracted at interest rates ranging between 18 per cent and 25 per cent formed about 38 per cent of the total borrowings in the case of upper strata cultivators and about 60 per cent in the case of lower strata cultivators. Loans bearing interest of 35 to 50 per cent formed about 23 per cent of the total borrowings of the cultivating families.

BORROWINGS
TABLE 4.14-BORROWINGS OF SELECTED CULTIVATORS CLASSIFIED ACCORDING TO RATE OF INTEREST
[Intensive enquiry data. Amount in rupees per family]
Rate of interest Lower All
43
Upper per annum strata strata cultivators
Nil ..................................... 13·9 3·3 8·' (8·8) (2·3) (5·8)
Leu than 3! per' cent .. .................... - - -H H H
31- 7 per cent . •••...•••..••••..•..•.•. 24·0 5·1 14·5 (15'2) (3·6) (9,7)
7 -10 per cent • ..••.••..•••..••.•••.••• 2·4 - 1·2 (1'5) H (0·8)
10 -121 per cent . .•••..•................. 6·5 14·6 10·5 (4'1) (10,4) (7·0)
12.-18 per cent • •••••..•.•.•••..•..•.••. - - -H (-) H
18 -25 per cent •• •••..••••••.........•.. 60·3 85·1 n·7 (38,2) (60·3) (48·7)
25 -35 per cent . .•••••...•••••••..••.••• 0·2 - 0·1 (0'1) H (0·1)
35 ~O per cent • •••••...•.....•.•••..... 36·8 33·0 ]4., (23·3) (23'4) (23·4)
50 per cent and above • ..••...•..•....•.•••• - - -H H H
Unapecifip.d . ....••.....•••.•..•..••••.... 13·6 - '·8 (8·6) (-) (4·6)
Total .................................. 157·7 141·0 1<49·' (100·0) (100· 0) (100·0)
(Figures within brackets denote percentages to tot.al)
4.5 NATURE OF BORROWINGS
In the preceding chapter we discussed duration for which debt was outstanding; in this section we shall dwell on the duration of loans which were borrowed and fully repaid during the year. Table 4.15 gives the data on cash loans borrowed and fully repaid classified according to duration.
TABLE 4.15-CASH LOANS BORROWED AND FULLY REPAID DURING THE YEAR APRIL 1951-MARCH 1952: AMOUNT CLASSIFIED ACCORDING TO DURATION OF
LOANS AMONG THE UPPER AND LOWER STRATA CULTIVATORS [Intensive enquiry data. Amount In rupees per family]
Total DURATION
am· I ount borr- Twe·
Strata owed One Two Three Four Five Sill Seven Eight Nine Ten Eleven Ive and mOD- mon- maD- man ... mon- man· mon- man .. mon- mono maD-fully th ths ths ths ths ths tho ths ths tho ths mon· re- ths
paid
-1- -2- -3- -4- -6- -6- -7- -8- ---- -- ----9 10 11 12 13
Upperstrata ........... 'J" 3·6 66·2 12·8 0·4 4·9 2'4 - - 14·5 0·1 - -Lower strata .......... 6S'7 - - - 26·7 14·6 0·2 - - 9'7 14·5 - -All cultl".to" ...... 7f., I·' 27·6 6·4 IJ·S ,., I·J - - 12·1 7·J - -

MONGHYR
In the case of upper strata cultivators, a greater proportion of loans was of a very short duration lasting upto 6 months. Only in a few cases the duration of the loans was upto 9 months. In the case of lower strata cultivators, most of the loans were for periods of 4 to 6 months.
Table 4.16 shows the borrowings of selected cultivators classified according to security.
TABLE ".I6-BORROWINGS OF SELECTED CULTIVATORS CLASSIFIED ACCORDING TO SECURITY
[Intensive enquiry data. Amount In rupees per fAmily 1
SECURITY
Total am·
Per· Bul· Immov· Hov· Govem· Ona· Seeu· ount lion Insur· Com· rantee other rlty Strata borr- sonal and able able Shares ment ance modi· by seen· not owed seen- orna.- pro· pro· seen- policy ties third rltles speel· rlty ments perty perty rlty party tied
-1- -2- -S- -,- -6- -6- -7- -S- -,,-10 -1-1- ----r2
Upper strata ••••• 157·7 190·1 - 13'S - - - - - - - lS'7 (100·0) (82,5) (-) (8,8) H (-) H (-) H H (-) (8,1)
Lower strata .•... 141·0 106·. - 12'7 - - - - - - - 22·0 (JOO·O) (15'6) (-) (9'0) H (-) (-) (-) H H (-) (15'6)
~II cultl_to .... 14',] .. 1·2 - Il·] - - - - - - - 17·1 (JOO,O) (7P'l) (-) (8·P) H (-) (-) (-) (-) (-) (-) (1I'P)
(Figures within brackets denote percentages to total)
For the cultivators as a whole, about 79 per cent of the borrowings were against personal security and only about 9 per cent were against the security of immovable property given under simple mortgage.
Table 4.17 shows the borrowings of selected cultivators classified according to purpose·duration.
TABLE ".17-BORROWINGS OF SELECTED CULTIVATORS CLASSIFIED ACCORD. ING TO P.URPOSE.DURATION
[Intensive enq uiry data. Amount in rupees per family]
AGlUCl:'LTl'RAL NON·AGRICUL· CONSUMPTION
PURPOSES TURAL PURPOSES Repay. ment Other
Strata of old puryoses Short· Long. Short· Long. Short· Long. debts term term term term term term
1 2 3 4 5 6 7 --8-------
Upper strata •.......... 15·3 45·3 - - 51·2 25·0 - 20·9 (9· 7) (28,7) (-) (-) (32'5) (15'8) (-) (13.3)
Lower strata .••........ - 53·4 - - 27·9 11·9 - 47·8 (-) (37·9) (-) (-) (19'8) (8,4) (-) (33.9)
All cultivators ..•.... 7·7 .. , ... - - 3'·' 18· .. - ]4 ...
(5· 1) (33·1) (-) (-) (26·S) (12·3) (-) (23·0)
(Figures within brackets denote percentages to total)

BORROWINGS 45
We have mentioned earlier that families in both the strata borrowed mainly for agricultural and consumption purposes. Loans for long-term agricultural purposes formed 2B· 7 per cent of the total amount borrowed in the case of upper strata cultivators and 37·9 per cent in the case of lower strata cultivators, while loans for short-term agricultural purposes constituted only 9·7 per cent of the total amount borrowed in the case of upper strata cultivators. The lower strata cultivators did not report borrowings for short-term agricultural purposes.
4.6 GRAIN LOANS
The practice of granting loans in kind does not appear to be widely prevalent in the district. Only 2·4 per cent of the families in the upper strata cultivators and 4· B per cent in the lower strata cultivators reported transactions in grain loan8. The number of loan transactions per reporting family in both the strata was only 1·0. The quantity borrowed per reporting family in the upper strata was BO' B seers which was twice that in the lower Rtrata. The commodities borrowed were rice in the lower strata and pulses in the upper strata. All these grain loans were for purpose of consumption only. None of the loans was reported outstanding.
4.7 CREDIT REQUIREMENTS
4.7.1 Purpose for which credit was required
Through a demand questionnaire, an attempt was made to obtain information relating to the credit requirements of the cultivators for various development purposes. The replies to the questionnaire have been tabulated and the relevant data are presented in Table 4.1B.
1. 2. 3.
4. O.
TABLE 4.I~CREDIT REQUIREMENTS FOR DEVELOPMENT PURPOSES [Intensive enquiry data. Amount in rupees per family]
UPPER STRATA LOW.ER STRATA
Item
Expenditure Credit needs Expenditure Credit needs
Purchase of land •..................... 67 128 1 155 Increasing holding by tenancy· •........ 26 20 Cultivation of costly but more remunera-
tive crops· ......................... 3 -Purchase of livestock .................. 81 68 47 78 Other capital expenditure on agriculture. 120 70 25 47 5·1 Purchase of implements and machi-
6 nery .•........................ .. -5·2 Bunding, land improvement and
land reclamation ............... .. 1 .. -5·3 Digging of wells ................. .. 63 . . 47 5'4 Other irrigation resources •...•..•. .. - .. -
• Information on actual expendiiure on these items was not obtained.
It is evident that cultivators would prefer to utilize loans, if available, for three main purposes, namely, purchase of land, purchase of livestock and digging of wells. The average expenditure per family for purchase of land in the lower strata cultivators

46 MONGHYR
was negligible owing to their inability to provide the necessary funds out of their own resources. But they were keen to increase the size of their holdings and it was for this purpose they needed credit. The credit requirement for this purpose does not appear to be large. The next important purposes are purchase of livestock and digging of wells. The families in the upper strata also expressed a more or less similar preference.
4.7.2 Difficulties In obtaining credit
When questioned whether they experienced any difficulty in obtaining credit, 34 families in the upper strata and 15 families in the lower strata stated that they did experience difficulty in obtaining credit while only one family in the upper strata stated that no difficulty was experienced in obtaining credit. The remaining 70 families did not answer the question.
4.7.] Credit required at various Interest rates
Table 4.19 shows the rates of interest at which the cultivators would like to take loans, if available.
TABLE 4.I9-CREDIT REQUIREMENTS OF THE SELECTED CULTIVATORS AT VARIOUS RATES OF INTEREST
[Intensive enquiry data]
Number of NUMBER 01' CULTIVATORS WHO REQUIRED
Number cultivators LOANS AT
of who did
Strata cultivators not reply investi· or gave 3 per cent 3-4 per 4-5 per Above 5 gated irrelevant or lU8 cent cent per cent
reply
1 2 3 4 6 6
Upper strata ..•....•....•... 80 64 10 - 4 12 Lower strata .••....••....... 40 28 6 - 1 6
Table 4.19 shows that only 26 families in the upper strata and 12 families in the lower strata replied to the Demand Questionnaire 5. Fourteen responding families in the upper strata and seven responding families in the lower strata expressed their desire to have loans at interest rates not exceeding 5 per cent. However, the majority of the families both in upper and lower strata cultivators desired loans at interest rate of 3 per cent or less.
4.1.4 Period for which credit was required
In regard to the period for which they would like to have loans, most of the respondents preferred medimn-term loans covering a period of 2 to 5 years. Only 1 family in the upper strata cultivators and 2 families in the lower strata cultivators stated that they would like to have loans for a period of 1 to 2 years.
4.7.5 Security
As regards security, most of the cultivators were prepared to contract loans on the security of immovable property owned by them. Only 2 lower strata cultivators expressed desire to borrow on personal security.

BORROWINGS 47
In conclusion it may be observed that about 63 per cent of the cultivating families in the district who reported borrowings during the year of the Survey accounted for about 81 per cent ofthe total borrowings. The remaining 19 per cent of the borrowings were accounted for by non-cultivating families and landless agricultural labourers. The average borrowings of the cultivators were Rs 230, while average expenditure on major items was Rs 607, of which Rs 441 was spent on specified items of family expenditure. The borrowings of big and Jarge cultivators were much higher and were, mainly, resorted to by a few Bhumihar Brahamin families in some villages. The borrowings of the cultivators were mainly meant for family expenditure. The large cultivators borrowed Rs 270 and small cultivators Rs 66 for family expenditure. The borrowings for family expenditure of the large cultivators and small cultivators were about two-thirds and four-fifths of their total borrowings, respectively. The borrowings of cultivators for capital expenditure on farm were about 22 per cent. Tbe large cultivators made considerable borrowings for capital expenditure on farm.

CHAPTER 5
REPAYMENTS
Repayments are made normally by people who borrow during the year or have past debt. Therefore, the repayments are to be studied in relation to borrowings during the year and debt outstanding at the beginning of the year. As the collection of data in regard to debt was confined to the debt at the end of the year, a relation needs to be established between three types of credit transactions, viz., borrowings during the year, repayments during the year and the debt outstanding at the end of the year. The proportion of families reporting repayments, the proportion of families reporting repayments to the number of borrowing families and the proportion of families reporting repayments to the number of indebted families are the three measures which could be used for studying the extent of repayments. The magnitude of repayments can be measured in terms of average repayments per family, average repayments per repaying family, repayments as proportion of borrowings during the year, and repayments as proportion of debt plus repayments. The amount of the outstanding debt at the beginning of the year plus borrowings during the year represents the amount in relation to which repayments might have been made; this total is equal to the outstanding debt at the end of the year plus repayments made during the year.
Repayments in any period of time are dependent generally on the borrower's ability to repay and on the terms and conditions of the loans. In case the loans have been taken for ~edium-term or long-term purposes, the repayments will be only in small instalments spread over a number of years. If, however, the loans are borrowed for current business operations, repayments will usually take place in large instalments soon after the harvesting of crops. Further, the repayments are also related to the agencies from which the money has been borrowed. The repaymepts may be regular and systematic in cases where the loans have been borrowed from institutional agencies like Government, co-operative institutions, etc., whereas in the case of borrowings from private agencies the repayments may not be so systematic and regular. In few cases, repayments might be made out of forced or voluntary sale of assets.
An important factor which is relevant to the data under consideration is that a major part of the debt is of comparatively recent origin. This fact may be studied in relation to the comparatively low level of outstanding debt at the beginning of the year and the period for which the debt has remained outstanding, the data for which are given in Chapter 3. The comparatively recent origin of the existing debt would mean that the repayments requirements of all medium-term and long-term loans

REPAYMENTS 49
included in it would be a small proportion of the total outstanding debt on this ac:lcount.
The discU88ion above emphasizes caution in interpreting the data relating to repayments, and it is difficult to judge repayment performance during the year in the light of the data relating to that year alone. The extent to which the year is abnormal is a necessary factor in determining the adequacy or otherwise of repayment performance during the year. The normal course of contraction of debt and its liquidation may be interrupted by extraordinary times in which the debt burden as a whole increases because of decline in receipts due to unfavourable weather conditions or due to sudden fall in prices; and borrowing becomes a factor by which the requirements of production and consumption, as normally established, are maintained as far as possible, in spite of the fall in income. Or; as pointed above, a continuous increase in the level of debt with comparatively low repayments may indicate the beginning of a period of progressive capital development.
5.1 PROPORTION OF REPAYING FAMILIES
It has been noticed in the preceding chapter that the proportion of borrowing families differed from village to village. The proportion of repaying families also varied over a wide range. In Table 5.1 we give the data in respect of the proportion of repaying families among cultivators, non-cultivators and rural families and among four classes of cultivating families.
Viliage
Bari Balia ....... Chakmansingh ... Maniappa ....... Mubarakchak .•.. Bangama ........ Dira Harwa ..••.. Luxmipur ..•.... PahaRllra ........
DI.trlct ........
TABLE s.I-PROPORTION OF REPAYING FAMILIES [ General Schedule data. In per cent]
Big Large Medium Small All Non. cultivat~rs cultivators cultivators cultivators cultivators cultivators
I 2 3 4 5 6
- 1·3 5·8 10·0 5·7 3·0 33·3 44·4 41·7 44·4 43·3 19·2 41·4 32·2 45·2 33·3 37·7 38·7
- 8·3 30·8 - 13·5 6·9 50·0 44·4 18·2 5·6 22·4 31·9
- - - - - 3·6 - 9·5 - - 2·9 -
9·8 11·4 8·6 5·7 8·6 1·8
JS·' J6·' '·6 3·5 ,.J '·0
All famille.
7
4·0 25·' 38·J 8·5
26·' J·5 J.J 5·'
,.J
The overall proportion of repaying families did not show any significant variations among cultivators and non-cultivators. The proportion centred round 9 per cent for cultivators as well as for non-cultivators. Considering the village-wise proportions, the proportion of repaying families among rural families was relatively very high in three villages, namely, Maniappa (38·1 per cent), Bangama (26·7 per cent) and Chakmansingh (25·9 per cent). Similar trend was also noticed in the case of non-cultivating families. There was no repaying family among cultivators in Dira Harwa and among non-cultivators in Luxmipur. In the remaining villages

50 MONGBYR
except Maniappa and Bangama, the proportion of repaying families was higher amo~g cultivators than among non-cultivators. However, the disparity between proportions of non-cultivating and cultivating repaying families was narrower in Maniappa than in Bangama. In Chakmansingh, Maniappa, Bangama and Pahasara all the four classes of cultivating families reported repayments. In Mubarakchak, Dira Harwa and Luxmipur small cultivators did not report any repayments.
5.1 PROPORTION OF REPAYING TO BORROWING FAMILIES
Table 5.2 gives the proportion of repaying families to borrowing families among cultivators, non-cultivators and rural families and among four classes of cultivating families.
TABLE S.l-PROPORTION OF REPAYING TO BORROWING FAMILIES [General Schedule data. In per cent 1
Big Large Medium Small All Non. All Village cultivators cultivators cultivators cultivators cultivators cultivators families
1 2 3 4 5 6 7
Bari Ba1ia ....... - 2·7 13·0 28·6 13·5 7·7 9·9 Chakmansingh .•. 100·0 66·7 55·6 44·4 54·2 27·8 35·9 Maniappa ....... 70·6 62·2 65·8 43·9 57·4 53·6 55·7 Mubarakchak .... - 50·0 50·0 - 33·3 13·8 17·8 Bangama ........ 60·0 61·5 28·6 9·1 34·2 53·6 4Z·4 Dira Harwa ...... - - - - - 5·3 Z·J Luxmipur ....... - 18·2 - - 5·0 - Z·4 Pahasara ........ 21·1 20·3 11·7 7·9 12·6 5·4 10·8
District ........ Z6·6 Z8·6 12·0 5·1 14·4 17·9 15·9
In majority of the villages, the proportion of repaying families to borrowing families was generally higher among cultivators than among non-cultivators. The proportion both among cultivators and non-cultivators stood higher in Maniappa, Chakmansingh and Bangama than in the remaining villages.
S.l PROPORTION OF REPAYING TO INDEBTED FAMILIES
In the preceding section repaying families were considered in relation to borrowing families. Some of the families who repaid during the year might not have borrowed during the year. Repayments should; therefore, be related to the total indebted position also. Table 5.3 on page 51 shows the proportion of repaying families to indebted families among cultivators, non-cultivators and rural families and among four classes of cultivating families.
The proportion of repaying families to indebted families was fairly high both among cultivators and non-cultivators in Chakmansingh, Maniappa and Bangama. Nevertheless the proportion among rural families was significantly lower in Dira Harwa and Luxmipur, which was mainly on account of the smaller number of families reporting repayments.

REPAYMENTS 51
TABLE 5.J-PROPORTION OF REPAYING TO INDEBTED FAMILIES [General Schedule data.. In per oent]
Big Large Medium Small All Non- All Village cultivators cultivators cultivatol'!! cultivators cultivators cui ti vators families
1 2 3 4 5 6 7
Bari Balia .....•. - 2·3 9·4 16·7 9·7 5·2 6·B Chakmansingh ... 50·0 50·0 45·5 44·4 46·4 26·8 33·3 Maniappa ....... 57·1 46·7 53·1 36·7 46·0 42·5 44·4 Mubarakchak .... - 50·0 44·4 - 29·4 11·8 J5·3 Bangama ........ 50·0 53·3 22·2 6·3 26·5 35·7 30'B Dira Harwa .•••.. - - - - - 4·1 J·7 Luxmipur ....... - 15·4 - - 4·3 - J., Paho.sa.ra ........ 19·0 16·7 10·2 6·6 10·7 4·0 B·B
District ........ lJ·O ZZ·6 '·3 4·J 11·3 J3·J JJ.J
The proportion of repaying families to indebted families among big cultivators varied from 50· 0 per cent to 57 ·1 per cent in Chakmansingh, Bangama and Maniappa, whereas the corresponding proportion in Pahasara was only 19·0 per cent. In the remaining villages, big cultivators did not report any repayments. The highest proportion was 53· 3 per cent among large cultivators in Bangama, 53·1 per cent among medium cultivators in Maniappa and 44·4 per cent among small cultivators in Chakmansingh.
5.4 REPAYMENTS PER FAMILY
Hitherto, the proportion ofrepaying families, the proportion ofrepaying families to the borrowing families, and the proportion of repaying families to the indebted families, were discussed without considering the extent of the average repayments made by the families in the different villages investigated. Table 5.4 gives the data on average repayments per family among Gultivators, non-cultivators and rural families and among four classes of cultivating families in each of the selected villages.
Village
Bari Balia ....... Chakmansingh ... Maniappa ....... Mu barakchak .... Bangama ........ Dira Harwa ..••.. Luxmipur ....... Paho.sa.ra ........
District ........
TABLE 5.4-REPAYMENTS PER FAMILY [ General Schedule data.. Amount in rupees]
Big Large Medium Small All cultivators cultivators cultivators cultivators cultivators
1 2 3 4 5
- 1 10 2 5 23 60 60 67 62
469 188 47 30 84 - 12 133 - 51
83 46 14 22 27 - - - - -- 17 - - 5
89 55 17 7 25
49 32 9 • 16
Non- All cultivators families
6 7
1 2 42 47 24 59 11 21 4 17 1 -- 2 2 16
2 9

52 MONGHYR
In Dira Harwa and Luxmipur, practically no repayments were reported, while in other villages the average repayments per family were below Rs 100 among cultivators, non-cultivators and rural families. In almost all the villages repayments per family worked out to be higher among cultivators than among non-cultivators. The average repayments per family among cultivators were highest at Rs 84 in Maniappa and among non-cultivators at Rs 42 in Chakmansingh. For rural families, the average repayments per family were reported to be highest at Rs 59 in Maniappa, whereas the repayments for the district as a whole were only Rs 9.
Among big cultivators, the highest average repayments per family were Rs 469 in Maniappa and lowest at Rs 23 in Chakmansingh. Among large cultivators also the highest average repayments were at Rs 188 in Maniappa and lowest average repayments were at Re 1 in Bari Balia. In the case of medium cultivators, the average repayments per family ranged between Rs 10 in Bari Balia and Rs 133 in Mubarakchak, and in the case of small cultivators, it ranged between Rs 2 in Bari Balia and Rs 67 in Chakmansingh.
5.5 REPAYMENTS PER REPAYING FAMILY
The average repayments per family may not give a true picture of the size of the repayments in as much as the families who did not either borrow during the year or had debt at the beginning of the year would not report any repayments, and this would result in reducing the size of repayments. Hence, the average repayments per repaying family need be studied.
Table 5.5 gives the data on average repayments per repaying family among cultivators, non-cultivators and rural families and among four classes of cultivating families.
Village
Bari Balia ....... Chakmansingh ..• Maniappa ....•.. Mubarakchak .... Bangama .•...... Din Harwa •.•... Luxmipur .••.... Pahasara ........
Dlltrlct ....... .
TABLE 5.S-REPAYMENTS PER REPAYING FAMILY [ General Schedule data. Amount in rupeell)
Big Large Medium Small All Non· cultivatora cultivators cultivatora cultivatora cultivatora cultivatora
1 2 3 4 5 6
- 70 173 24 87 26 70 135 144 150 143 216
1,133 584 104 90 223 62 - 150 433 - 376 159
167 104 78 400 118 14 - - - - - 20 - 175 - - 175 -
913 487 193 119 296 94
313 190 121 232 173 26
All families
7
57 181 154 242 63 20
175 271
104
It is observed from Table 5;5 that among cultivators, the repayments per repaying family varied from Rs 87 in Bari Balia to Rs 376 in Mubarakchak; Dira Harwa was an exception where no cultivating family reported repayments. The repayments per repaying family among cultivators were below Rs 100 in Bari Balia,

REPAYMENTS 53
between Rs 100 and Rs 200 in Bangama, Chakmansingh and Luxmipur, between Rs 200 and Rs 300 in Maniappa and Pahasara, and above Rs 300 in Mubarakchak. Excluding Dira Harwa where no cultivator reported repayments and Luxmipur where no non-cultivator reported repayments, in other villages except Chakmansingh the repayments per repaying family stood generally higher among cultivators than among non-cultivators. For the district as a whole, the repayments per repaying family were Rs 173 among cultivators and Rs 26 among non-cultivators.
Analysing the figures for repayments per repaying family of different classes of cultivators, it is noticed that the repayments among big cultivators were significantly large at Rs1,133 in Maniappa and at Rs 913 in Pahasara. These were lowest at Rs 70 in Chakmansingh. Among large cultivators, the repayments per repaying family were below Rs 100 in Bari Balia, between Rs 100 and Rs 200 in Bangama, Chakmansingh, Mubarakchak and Luxmipur and significantly large at Rs 584 and Rs 487 in Maniappa and Pahasara, respectively. Among medium cultivators, the repayments per repaying family were below Rs 100 in three villages including the two villages where the repayments were reported to be nil and varied between Rs 100 and Rs 200 in four villages except in Mubarakchak where repayments were highest at Rs 433. Among small cultivators, the highest repayments per repaying family were at Rs 400 in Bangama and lowest at Rs 24 in Bari Balia. No repayments were reported by small cultivators in Mubarakchak, Dira Harwa and Luxmipur.
5.6 REPAYMENTS IN RELATION TO BORROWINGS AND OUTSTANDING DEBT PLUS REPAYMENTS
We may consider the extent of repayments that have taken place in relation to borrowings during the year and outstanding debt at the beginning of the year. The amount of outstanding debt at the beginning of the year plus borrowings during the year represents the total amount in relation to which repayments might have been made. This total is equal to outstanding debt at the end of year plus repayments during the year. Table 5.6 on page 54 shows the repayments as percentage of borrowings and outstanding debt plus repayments among cultivators, noncultivators and rural families in each of the selected villages.
For the district as a whole, the proportion of repayments to borrowings worked out to 6·8 per cent among cultivators, 3·9 per cent among non-cultivators and 6·3 per cent among rural families. The proportion of repayments to borrowings in the case ofrural families was significant in Maniappa, Chakmansingh and Mubarakchak. This proportion was slightly higher among non-cultivators than among cultivators in Maniappa and Chakmansingh.
The proportion of repayments to outstanding debt plus repayments was 3·8 per cent among cultivators, 2·0 per cent among non-cultivators and 3·4 per cent among rural families. The proportion of repayments to outstanding debt plus repayments was also significant in Chakmansingh, Maniappa and Mubarakchak. The proportion in the case of cultivators was higher than in the case of non-cultivators in all villages except Chakmansingh, where most of the non-cultivating families had receipts from employment in railway workshop at Jamalpur.

MONGHYR
TABLE 5.6-REPAYMENTS AS PERCENTAGE OF BORROWINGS AND OUTSTAND· ING DEBT PLUS REPAYMENTS
[ General Schedule data]
PROPORTION or REPAYMENTS PROPORTION or REPAYMENTS TO BORROWINGS TO OUTSTANDING DEBT PUIS
REPAYMENTS (Per cent) (Per ct'nt)
Village
Culti· Non·culti· All Culti· Non·culti· All vators vators families vators vatol'l! families
I 2 3 4 5 6
Bari Balie. .................• 5·4 2·0 J., 2·0 0·7 1·4 Chakman8ingh ............ : . 25·9 28·4 27·4 14·0 16·9 15·7 Maniappa .................. 31·9 32·0 Jl·' 13·6 9·2 12·6 Mubarakchak .•............. 20·1 10·1 14·4 14·8 7·2 10·4 Bangama ................... 11·6 7·8 11·0 5·4 3·4 5·0 Dira Harwa ..••............. - 2·2 0·5 - 1·3 O·J Luxmipur .................• 1·5 - 1·1 1·0 - 0·7 Pahasara ................... 8·0 3·4 7·6 4·2 1·4 J.p
District ................... 6·' J.p 6·J J., 2·0 J·4
Table 5.7 gives the data on repayments as percentage of borrowings and outstanding debt plus repayments relating to four classes of cultivating families.
TABLE 5.7-REPAYMENTS AS PERCENTAGE OF BORROWINGS AND OUTSTANDING DEBT PLUS REPAYMENTS AMONG FOUR CLASSES OF CULTIVATING
FAMILIES [General Schedule data ]
REPAYMENTS AS PERCENTAGE
Group Borrowings
Big cultivators............................................ 6·8
Large cultivators.................................. ......... 7·6 Medium cultivators........................................ 4·6 Small cultivators.... •••••••..............................• 10·0
All cultivators. . . . . . • . . . . . . . . . . . . . . . . . . . . . . . . . . . . . . . . . . . . . 6·8 Non·cultivators. • • . . . . . . . . • . . . . . . . . . . . . . . . . . . . . . . . . . . . . . . . 3·9
All families............................................. 6·J
OF Outstanding debt plus
repayments
4·3
4·3 2·6 4·3
3·8 2·0
J·4
From a comparison of proportions of repayments to borrowings with that of outstanding debt plus repayments, it is observed that the repayment performance in the district as a whole was significantly low and strikingly lower among noncultivators. This may be on account of the fact that the borrowings during the year were not mainly resorted to for productive purposes like current and capital expenditure on farm. A large proportion of the borrowings were made for family expeuditure (vide Chapter 4, Table 4.13).

REPAYMENTS
The foregoing discussion is based upon the data collected in the General Schedule where the data on repayments were not collected separately for the loans outstanding and the borrowings during the year. However, in the intensive enquiry the data on repayments were collected for the loans outstanding as well as for the borrowings during the year. Table 5.8 gives the relevant data.
TABLE S.B-REPAYMENTS CLASSIFIED ACCORDING TO PRINCIPAL AND INTEREST
[Intensive enquiry data]
Propor. AMOUNT RBPAID PEB FA.MD.Y Amount Number tion of borrowed of loans lo&ns and fully towards outstand- which reo repaid
Strata ing per payments Total Principal Interest during the cultiv&t- year
ing family were per f&mily made
(Per cent.) (Rs) (Rs) (Rs) (RR) I 2 3 4 5 6
Upper strata 93·9 I. Loans outstanding for one
year or less ............. 0·6 - - - -2. Lo&ns outst&nding for
more than one year ....... 0·5 0·4 0·2 0·2 -Lower strata 65,.7 I. Loans outstanding for
one year or less .......... 0·7 - - - -2. Lo&ns outstanding for
more th&n one year ...... 0·6 0·4 - - -All cultlvaton 79·8 I. Loans outstanding for
one year orleM .......... 0-7 - - - -2. Loans out.~tanding for
more th&n one year .....• 0-5 0·4 0·1 0·1 -
It is observed that practically no repayments were made towards the outstanding loans, whereas Rs 79·8 were borrowed and fully repaid (including principal and interest) during the year by all cultivators, the upper and lower strata cultivators having borrowed and fully repaid Rs 93·9 and Rs 65·7 per family, respectively.
S.7 SOURCE OF FINANCE FOR REPAYMENTS
An important aspect of repayments is the means whereby these were financed. If a significant part of the relatively small repayments are made by recourse to borrowings or sale of assets, the position indicated thereby would be greatly different from that indicated by repayments made through, say, current income. If a high proportion of amount repaid is financed out of borrowings, then this may well indicate a tendency towards refinancing of debt and consequently may imply that the burden of debt is quite heavy. Therefore, the data. collected in the General Schedule on source of finance of certain items of expenditure including repayments were classified into four ma.jor categories, viz., current income, past savings, sale of assets and borrowings.

56 MONGHYR
Details relating to the source of finance for repayments collected through the General Schedule as also in the intensive enquiry are given in Table 5.9.
TABLE.5.9-S0URCE OF FINANCE FOR REPAYMENTS [ Amount in rupees per family]
SOURCE OF FINANCE FOR REPAYMENTS
Type of data Current Past Sale of Borrow- Other income savings assets ings sources
1 2 3 4 Ii
General Schedule All families __ ............... 9·3 - 0·1 0·1 -
(98,7) (-) (0·7) (0·6) (-) Intensive enquiry Upper strata ................ 4·2 - - - 2·7
(61·0) (-) (-) (-) (39·0) Lower Rtrata .•.............. 3·1 - - - -
(100·0) (-) (-) (-) (-) All cultivators .•............ 3·7 - - - 1·4
(73·3) (-) (-) H (26,7)
(Figures within brackets represent percentages to the total)
Total
II
9·4 (100·0)
6·9 (100·0)
3·1 (100·0)
5·0 (100·0)
According to the General Schedule data, practically all the repayments of rural families were financed from current income. No part of repayments was financed from past savings. Only a negligible proportion of repayments was financed from liquidation of assets and borrowings_ The figures obtained for cultivators in the intensive enquiry also showed a more or less similar trend for the source of finance for repayments. All the repayments made by lower strata cultivators and about three-fifths of repayments made by upper strata cultivators were financed from current income. For about two-fifths of repayments made by upper strata cultivators no particular source of finance was mentioned.
In conclusion, it may be remarked that the repayments per rural family during the year were only Rs 9 as against Rs 149 which were borrowed during the year and Rs 276 which represented outstanding debt plus repayments. The overall repayments in Monghyr district were significantly low among rural families and strikingly lower among non-cultivators. This is, perhaps, on account of the fact that the borrowings during the year were not mainly made for productive purposes in agricwture, but a large proportion of the borrowings were made for family expenditure_ The intensive enquiry data on outstanding debt also showed that about 58 per cent of the debt of the cultivators was outstanding for family expenditure. However, the little repayments made during the year were mostly financed from current income; past savings, sale of assets and borrowings as sources of finance for repayments were insignificant.

CHAPTER 6
FAMILY EXPENDITURE
In this chapter we shall discuss some specific items of family expenditure of the rural families. A study of family expenditure of the rural families assumes significance in view of the fact that a significant proportion of borrowings of the rural families more often than not takes place for meeting family expenditure, and any study of the operation of the rural credit system which fails to take notice of the important items of family expenditure and how these items of expenditure are financed would be incomplete. The data relating to family expenditure were collected through the General Schedule as also through the intensive enquiry. No attempt was made to collect data relating to expenditure on current consumption account such as expenditure on food, as the enquiry was not so much intended to study the family budget in detail as to study rural credit and its system. It was also expected that a large proportion of the borrowings would take place for expenditure on durable consumer goods or on special occasions of family expenditure such as death, marriage and other ceremonies, sickness, and litigation. The information, therefore, was collected relating to certain specified items of family expenditure.
The specified items on which information was obtained were (1) expenditure on construction and repairs of residential houses and other buildings, (2) expenditure on purchase of household utensils, furniture, etc., (3) expenditure on purchase of clothing, shoes, bedding, etc., (4) expenditure on death ceremonies, (5) expenditure on marriage and other ceremonies, (6) medical expenses, (7) educational expenses, and (8) litigation charges.
6.1 RECORDED ITEMS OF FAMILY EXPENDITURE
Table 6.1 shows the total expenditure per family on the above items, among cultivating, non-cultivating and rural families in each of the selected villages.
TABLE 6.I-TOTAL FAMILY EXPENDITURE [General Schedule data. Amount in rupees per family]
Village
Bari Balia ....•.......................... ChakmanBingh .......................... . Maniappa .............................. . Mubarakchak ........................... . Bangama ............................... . Dira Harwa ••.•.......................... Luxmipur ..•............................ Pahll!lBra ............................... .
District ............................... .
Cultivators
408 354 614
1,235 300 168 571 746
441
Non·cultivatol'll
2
194 254 118 303 113 110 180 133
142
All families
3
271 282 404 528 216 144 III 498
lOO

58 MONGHYR
The total family expenditure per rural family ranged from Rs 144 in Dira Harwa to Rs 528 in Mubarakchak. In the case of non-cultivating families, the total family expenditure per family varied between Rs 110 in Dira Harwa and Rs 303 in Mubarakchak. In the case of cultivating families, the highest total family expenditure at Rs 1,235 was recorded in Mubarakchak and lowest at Rs 168 in Dira Harwa. The conspicuously high family expenditure among cultivators in Mubarakchak was mainly due to the village being comparatively prosperous and its proximity with Monghyr town. The other reasons were that villagers had relatively larger cultivated holdings, and were engaged in such agricultural operations as growing of vegetables. They were also occupied in subsidiary industries like poultry farming, guT making, etc.
We may now consider overall figures of (1) the level of average expenditure among different groups of cultivating and among non-cultivating families on various items, and (2) the relative proportions of the expenditure on each of the items incurred by these families. Table 6.2 gives the relevant data.
TABLE 6.2-EXPENDITURE ON SPECIFIED ITEMS OF FAMILY EXPENDITURE [ General Schedule data. Amount in rupee9 per family]
Const· ruction
and Pur- Pur-repairs chaRe of ('haole of Marri- Educa- Total of resi- hOURe- clothing, Dea.th age and Medical tional Litiga- family dential hold cere- other expen- tion Group houses utensils, shoes, monies cere- ses expen- charges expen-
and furni- bedding, monies ses diture
other ture, etc. etc.
build-ings
1 2 3 4 5 6 7 8 9 --- ---Big 433 40 222 58 477 140 207 99 1,677
cultivators ... (25·8) (2,4) (13·3) (3·5) (28,4) (8·3) (12,4) (5·9) (100·0)
Large 191 22 159 43 260 74 94 61 90l cultivators ••. (21,1) (2,4) (17·6) (4·8) (28,7) (8,2) (10·5) (6,7) (100·0)
Medium 33 8 80 26 67 26 8 49 297 cultiva.tors ... (11·0) (2,7) (27·0) (8,7) (22,7) (8·9) (2·6) (16,4) (100·0)
Sma.ll 24 6 60 8 44 14 3 1 161 cultiva.tors •.• (15,1) (3·8) (37·3) (5·0) (27·3) (8,7) (2,0) (0·8) (100·0)
All 79 12 98 26 119 37 33 38 441 cultiva.tors ••• (17·8) (2'7) (22,2) (5·8) (27·0) (8,4) (7'5) (8·6) (100·0)
Non- 21 7 46 11 40 15 2 1 142 cultivators ••• (]4·8) (4·9) (32·5) (7,4) (28,2) (10·3) (1,2) (0· 7) (100·0)
All 51 10 7l 19 81 26 18 21 lOO families .... (17,1) (3·2) (24·5) (6·2) (27·3) (B'B) (6·0) (6·9) (100·0)
(Figures within brackets denote percentages to total family expenditure)
The data reveal that, among the rural families, the expenditure on purchase of clothing, shoes, bedding, etc., and on marriage and other ceremonies were most important. Expenditure on marriage and other ceremonies accounted for a relatively larger proportion of the total family expenditure among big and large cultivators,

FAMILY EXPENDITURE 59
whereas in the case of medium and small cultivators and non-cultivators, expenditure on purchase of clothing, shoes, bedding, etc., was more important. Expenditure on construction and repairs of residential houses and other buildings was significantly large in the case of big and large cultivators. The level of expenditure on purchase of household utensils, furniture, etc., was higher in the case of big and large cultivators than in the case of medium and small cultivators, but its proportion to the total family expenditure was more or less the same in the case of the different classes of cultivating families. This is true in the case of medical expenses also. The expenditure on account of education is significantly large only among the big and large cultivating families.
The average expenditure per family on each of the recorded items of family expenditure indicated a consistent trend among four classes of cultiV1l.tors, the expenditure being high among big cultivators and low among small cultivators.
6.2 EXPENDITURE ON CONSTRUCTION AND REPAIRS OF RESIDENTIAL HOUSES AND OTHER BUILDINGS
The expenditure on construction and repairs of residential houses and other buildings may be said to reflect the levels of standards of living and/or physical necessity on account of damage to houses caused by floods and other natural calamities. Large-scale repairs may' also be undertaken after the rainy season. Table 6.3 shows the proportion of families reporting this expenditure, average expenditure per family and per reporting family, among cultivators, non-cultivators and rural families.
TABLE 6.l-EXPENDITURE ON CONSTRUCTION AND REPAIRS OF RESIDENTIAL HOUSES AND OTHER BUILDINGS
[ General Schedule data]
PROPORTION OF FAMILIE!\ EXPENDITURE PEB EXPENDITURE PER BEPORTING EXPENDITUBE FAM[LY BEPORTINO FAMn.V
(Per cent) (Rs) (RA) Village Cult i- Non- All Culti- Non- All Culti· Non- All
vators culti- families vators culti- families vators culti· families vators vators '\"at-ors --1---2- --3- --4- --5- --8- 7 8 9 --- --- ---
Bari Balia ..... 27·5 19·5 22·4 43 18 27 157 92 121 Chakman~ingh 53·3 43·6 46·J 68 58 59 124 128 126 Maniappa ....• 45·0 40·6 4J·I 81 13 52 180 31 121 Mubarakchak .. 51·4 44·0 45·8 524 40 157 1.020 92 )44 Bangama ...... 87·9 72·3 81·0 102 13 62 118 18 76 Dira Harwa .... 17·5 12·7 15·6 6 5 6 33 43 36 Luxmipur ..... 88·2 85·2 86·4 64 30 43 72 35 50 Pahasar& ...... 78·7 83·7 80·1 134 30 92 171 36 114
District ...... 65·J 64·8 65·1 79 21 51 120 31 79
All the villages in the district can perhaps conveniently be put into three broad groups on the basis of the variations in the proportion of families reporting this expenditure. In the first group fall two villages, namely, Bari Balis and Dira Harwa where 15 to 25 per cent of the rural families reported expenditure on construction and repairs of residential houses and other buildings. In the second group fall three

60 l'tIONGHYR
villages, namely, Chakmansingh, Maniappa and Mubarakchak where nearly 40 to 50 per cent of the rural families reported this expenditure. The third group consists of Bangama, Luxmipur and Pahasara where a very high proportion (above 80 per cent) of families incurred this expenditure. Except Mubarakchak, Pahasara and Bangama, in other villages the average expenditure per cultivating family on this item was less than Rs 100. The high level of expenditure in Mubarakchak is explained by the fact that a big cultivating family reported very heavy expenditure on this item.
Table 6.4 gives the frequency distribution of cultivating families according to the size of expenditure on construction and repairs of residential houses and other buildings.
TABLE 6.4-FREQUENCY DISTRIBUTION OF CULTIVATING FAMILIES ACCORDING TO THE SIZE OF EXPENDITURE ON CONSTRUCTION AND REPAIRS OF RESIDENTIAL HOUSES AND OTHER
BUILDINGS [General Schedule data]
Size of expenditure
Nil .................................................•.... Below Rs 100 ............................................• Rs 100 - Rs 200 .•...................................... Rs 200 - Rs 300 ....................................... . Rs 300 - Rs 400 ....................................... . Rs 400 - Rs 600 ....................................... . Rs 500 - Rs 600 .......................................• Rs 600 - Rs 700 ....................................... . R8 700 - Rs 800 ....................................... . R8 800 - Rs 900 ....................................... . R8 900 - Rs 1,000 ..•..................................... Rs 1,000 and above ......................... : ............. .
Total .................................................. .
Number of families
549 513
76 26 13 8
12 4 4
1 26
1,232
Proportion of familie~
(Per cent.)
44·6 41·6 6·2 2·1 1·1 0·6 1·0 0·3 0·3
0·1 2·1
100·0
Out of 1,232 cultivating families investigated, 549 or 44·6 per cent did not report any expenditure on this item, while 513 or 41· 6 per cent of the cultivating families reported expenditure below Rs 100. Expenditure ranging from Rs 100 to Rs 400 on this item was reported by 115 or 9·4 per cent of cultivating families. Twenty-six families or 2·1 per cent of the cultivating families reported expenditure of Rs 1,000 or above.
6.1 PURCHASE OF DURABLE CONSUMER GOODS
In the General Schedule, the data were collected separately for purchase of household utensils, furniture, etc., and for the purchase of clothing, shoes, bedding, etc. The expenditure on these items have been grouped under one broad heading, 'purchase of durable consumer goods'. The expenditure on purchase of durable consumer goods may be regarded as representative of the level of general consumption account. In some ways, it maybe regarded as a truer index of varying standards of current consumption from village to village and from group to group than any

FAMILY EXPENDITURE 61
other type of expenditure. Table 6.5 shows the expenditure on purchase of durable consumer goods in each of the selected villages.
TABLE 6.S-EXPENDITURE ON PURCHASE OF DURABLE CONSUMER GOODS [ General Schedule data. Amount in rupees per family]
CULTIVATORS NON -CULTIV ATORS ALL FAMILIES
Proportion of Proportion of Proportion of expenditure expenditure expenditure on this item on this item on this item
Average to the total Average to the total Average to the total expenditure expenditure expenditure Village expendi- on specified expendi- on specified expendi- on specified ture items of ture items of ture items of
family family family expenditure expenditure expenditure (Per cent) (Per cent) (Per cent)
1 2 3 4 5 6
Bari BEilia ............ 151 37·0 69 35·4 98 36·3 Chakmansingh .•...... 86 24·3 63 24·7 69 24·6 Maniappa ............ 102 16·7 34 28·8 73 18·2 Mubarakchak ......... 205 16·6 90 29·7 118 22·3 Bangarna ............. 84 28·0 43 38·4 66 30·4 Dira Harwa ........... 76 45·2 50 45·2 65 45·2 Luxmipur ............ 131 22·9 61 34·1 88 26·6 Pahasara ............. 152 20·4 53 39·6 112 22·5
District ............. 110 24·9 53 37·4 83 27·7
For the district as a whole, the average expenditure per family on purchase of durable consumer goods was Rs 110 for cultivators, Rs 63 for non-cultivators and Rs 83 for rural families. One-fourth of the family expenditure of cultivating families and a little more than one-third of the family expenditure of non-cultivating families was incurred on this item. The average expenditure per rural family was highest in Mubarakchak and lowest in Dira Harwa, whereas the proportion of expenditure on this item to the total family expenditure was significantly low in the former village and significantly high in the latter village, which may indicate that the families in Mubarakchak are expending more on other items like medical expenses, educational expenses, litigation charges, etc., than the families in Dira Harwa on account of the former village being comparatively well developed.
6.4 EXPENDITURE ON DEATH CEREMONIES
Table 6.6 on page 62 shows the proportion of families reporting this expenditure, average expenditure per family and per reporting family among cultivating, noncultivating and rural families.
About one-seventh of rural families reported expenditure on death ceremonies. The proportions of cultivating, non-cultivating and rural families reporting expenditure on death ceremonies were below 20 per cent in all villages except Bangama where the proportion was 20·7 per cent among cultivating families, 23·4 per cent among non-cultivating families and 21·9 per cent among rural families.

62
Village
Bari Balia ..... Chakmansingh Maniappa ..... Mubarakchak .. Bangama ...... Dim Harwa .... Luxmipur ..... Pah&Bara ......
District ..... .
MONGHYR
TABLE 6.6-EXPENDITURE ON DEATH CEREMONIES r General Schedule data]
PROPORTION OF FAMILIES EXPENDITURE PER EXPENDITURE PER REPORTING EXPENDITURE FAMILY REPORTING FAMILY
(Per cent) (Rs) (R")
Culti· Non. All Culti· Non· All Culti· Non· All
vators culti· families vators culti· families vators culti· families vators vators \'atol'l' --1- --2- --3- --4- --5- 6 7 --8- --9------- --- --- ------ --- --- ---
9·2 5·2 6·6 15 5 9 166 99 132 13·3 16·7 15·7 10 11 II 76 65 68 11·4 8·0 10·0 42 7 27 366 92 272 8·1 12·9 11·8 7 II 10 82 83 83
20·7 23·4 21·9 22 12 17 105 51 80 12·5 3·6 8·9 9 1 6 71 40 66 17·6 12·0 14·2 52 20 33 296 168 230 11·0 8·7 10·1 29 4 19 264 43 187
15·0 12·1 13·7 26 II 19 171 88 135
The expenditure on death ceremonies is likely to be determined, to a large extent, by social conventions and patterns of behaviour than by any other considerations. It, therefore, shows considerable variations from village to village. The expenditure per reporting cultivating family was lowest at Rs 71 in Dira Harwa and highest at Rs 366 in Maniappa. In the case of non-cultivating families, the expenditure per reporting family was below Rs 100 in all the villages except Luxmipur where it was Rs 168.
6.5 EXPENDITURE ON MARRIAGE AND OTHER CEREMONIES
Table 6.7 gives the proportion of families reporting this expenditure, the average expenditure per family and per reporting family among cultivating, non-cultivating and rural families.
TABLE 6.7-EXPENDITURE ON MARRIAGE AND OTHER CEREMONIES [ General Schedule data]
PROPORTION OF FAMILIES EXPENDITURE PER EXPENDITURE PER REPORTING EXPENDITURE FAMILY REPORTING FAMILY
(Per cent) (Rs) (R.) VillagE! Culti· Non· All Culti· Non· All Culti· Non· All
vators culti· families va.tors culti· families vators culti· families vators vators '\'attlrs 1 2 3 4 5 6 7 8 --9-
------Bari Balia ..... 99·6 93·3 95·6 130 66 89 131 70 93 Chakma.nsingh 100.·0 91·0 93·5 51 64 61 51 71 65 Maniappa ..... 82·7 84·9 83·6 264 40 169 319 47 202 Mubarakchak .. 97·3 94·8 95·4 286 61 115 294 64 121 Bangama. ...... 94·8 95·7 95·2 42 38 40 44 39 42 Dim Harwa .... 100·0 100·0 100·0 75 50 65 75 50 65 Luxmipur ..... 97·1 87·0 90·9 125 41 13 129 47 81 Paha.sara. ...... 95·3 83·3 90·5 225 27 145 236 33 161
District ..... . 96·7 91·2 94·1 119 40 82 123 44 87
In all the villages, not less than four-fifths of the families reported expenditure on marriage and other ceremonies. However, the expenditure per family in any

FAMILY EXPENDITURE 63
village did not exceed Rs 286 among cultivators, Rs 66 among non-cultivators and Rs 169 among rural families. The high proportion of the families reporting this expenditure may be viewed in context of the celebration of popular festivals like Durga Puja and Holi.
6.6 MEDICAL EXPENSES. EDUCATIONAL EXPENSES AND LITIGATION CHARGES
Table 6.8 gives the data on medical expenses, educational expenses and litigation charges among cultivating, non-cultivating and rural families in the selected villages.
TABLE 6.8-MEDICAL EXPENSES. EDUCATIONAL EXPENSES AND LITIGATION CHARGES I N SELECTED VILLAGES
[General Schedule data ]
CULTIVATORS NON-CULTIVATORS ALL FAMILIES
Proportion of Proportion of Proportion of Average expenditure Average expenditure Average expenditure
Village expendi- on this item expendi- on this item expendi- on this item ture per to the total ture per to the total ture per to the total family family family family family family
expenditure expenditure expenditure
(Ra) (Per cent) (Rs) (Per cent) (R8) (Per cp.nt) 1 2 3 4 5 6
Bari Balia. _ ......... 68 16·7 36 18·9 48 17·7 Chakmansingh ....... 141 39·8 60 23·8 83 29·4 Maniappa ........... 126 20·4 24 20·4 83 20·4 Mubarakchak ........ 213 17·3 101 33·2 128 24·2 Bangama ............ 51 17·0 7 6·0 31 14·4 Dira Harwa .......... 2 1·4 3 2·4 2 1·7 Luxmipur ........... 199 34·9 28 15·5 94 21/·4 Pahasara ...... ; ..... 205 27·5 19 14·4 130 26·1
District ............ 108 :44·5 18 12·2 65 21·7
The level of expenditure on account of medical expenses, educational expenses and litigation charges was significantly lower in Dira Harwa and Bangama, which was mainly due to underdeveloped agricultural economy of these villages-- and social backwardness of the villages. Table 6.9 on page 64 gives the proportion of families reporting expenditure on these items and expenditure per family and per reporting family among cultivating, non-cultivating and rural families and among four classes of cultivating families.
About 41 per cent of the cultivating families and 33 per cent of the non-cultivating families reported medical expenses; the average expenses per family worked out to Rs 37 in the case of cultivators and Rs 15 in the case of non-cultivators. The proportion of families reporting educational expenses was 2·6 per cent among noncultivators and 15 per cent in the case of cultivators, the average expenditure per family in each of the groups being Rs 2 and Rs 33, respectively. In regard to litigation charges, 7·9 per cent of cultivating families reported this expenditure, the average expenditure per family for this group being Rs 38.

64 MONGHYR
TABLE 6.9-MEDICAL EXPENSES. EDUCATIONAL EXPENSES AND LITIGATION CHARGES
[General Schedule data]
MEDICAL EXPENSES EDUCATIONAL EXPENSES LrTIGATIOK CHARGES
Propor- Propor- Propor-tion of Expen- Expen- tion of Expen- Expen- tion of Expen- Expen-
Group families diture diture families diture diture families diture diture reporting per reporting per reporting per
expen- per reporting expen- per reporting expen- per reporting diture family family diture family family diture family family (Per (Per (Per cent) (Rs) (Rs) cent) (Rs) (Rs) cent) (Rs) (Ra)
--1- 2 3 --4- --5- --6---7- --S- 9 --- --- ------ --- ---
Big cultivat{)rB. 60·0 140 232 34·8 207 596 29·1 99 341
Large culti-vatOI'R ....... 48·1 74 153 28·8 94 328 16·4 61 370
Medium culti-vators ...... 41·9 26 63 11·7 8 66 6·8 49 712
Small culti-vators ...... 32·9 14 42 6·1 3 52 0·6 1 217
All cultivator". 41·1 37 90 15·2 33 216 'l·9 38 477 Non-cultivat{)rB. 32·7 15 45 2·6 2 66 0·5 I 160
All families .. 37·1 26 71 9·2 18 197 4·4 21 466 I
6.7 SOURCES OF FINANCE FOR RECORDED ITEMS OF FAMILY EXPENDITURE
Table 6.10 shows the family expenditure incurred on various items classified according to source of finance.
TABLE 6.IG-SOURCE OF FINANCE FOR EXPENDITURE ON VARIOUS ITEMS OF FAMILY EXPENDITURE: ALL FAMILIES
rGeneral Schedule data. Amount in rupees per family]
SOURCE OF FINANCE
Item Current Past Sale of Borrow- Total income savings assets ings I 2 3 4 5
1. Construction and repairs of residen-tial houses and other buildings .•.... 38·0 - - 13·4 51·4
(73,9) (-) (-) (26,1) (100·0) 2. Purchase of household utensils,
furniture, etc ...................... 9·2 - - 0·4 9·5 (96,2) (-) (-) (3·8) (100·0)
3. Purchase of clothing, shoes, bed-ding, etc .......................... 58·1 - - 15·4 7].5
(79,1) (-) (-) (20·9) (100·0) 4. Death ceremonies .................. 7·3 - - II·3 18·6
(39·3) (-) (-) (60,7) (100·0) 5. Marriage and other eeremonies ....... 50·S - -- 30·9 81·7
(62,2) (-) (-') (37·8) (100·0) 6. Medical expenses ............ _ ..... 14·9 - - II·I) 26·5
(.56·4) (-) (-) (43·6) (100·0) 7. Educational expenses ............... 17·8 - - 0·3 18·1
(98·3) (-) (-) (1.7) (100·0) 8. Litigation charges .......•.•........ 3·8 - - 16·S 20·5
(18·3) (-) (-) (81,7) (100·0)
(Figures within brackets denote percentages to total expenditure on the item)

FAMILY EXPENDITURE 65
Except in the case of death ceremonies and litigation charges, a large proportion of the expenditure on different items was financed from current income. Litigation charges and expenditure on death ceremonies were financed from borrowings to the extent of about 82 per cent and 61 per cent, respectively, whereas expenditure financed from borrowings on marriage and other ceremonies and medical expenses constituted about 38 per cent and 44 per cent, respectively. No item of expenditure was financed from past savings or liquidation of assets or from other sources.
The discussion of the foregoing data on source of finance relates to rural families on the basis of the data collected through the General Schedule. However, the data on source of finance was also obtained from intensive enquiry and are given separately .for upper and lower strata cultivators in Table 6.11.
TABLE 6.II-S0URCE OF FINANCE FOR EXPENDITURE ON VARIOUS ITEMS OF FAMILY EXPENDITURE AMONG UPPER AND LOWER STRATA CULTIVATORS
[Intensive enquiry data. Amount in rupees per family)
SOURCE OF FINANCE
TOTAL EXPENDITURE CURRENT SAT.E OJ'
BOBROWINGS INCOME
PAST SAVINGS ASSETS
Item
Upper Lower Upper Lower Upper Lower Upper Lower Upper Lower strata. strata strata strata strata strata strata strata strata strata
-1- -2- -3- -4--5- -6- -7- -8- -9-10 ------- ----- ----------I. Construction
and repairs of residential houses and other build-ings •........ 173·7 42·9 155·5 19·6 - - - - 18·2 23·3
(100·0) (100·0) (89·5) (45·8) (-) (-) (-) (-) (10·5) (54'2) 2. Purchase of
durable COD-
sumer goods. 170·2 89·7 126·0 47·7 - - - - 44·2 42·0 (100·0) (100·0) (74,0) (53,2) (-) (-) (-) (-) (26·0) (46·8)
3. Expenditure on death, marriage and other cere-monies ...•.. 126·8 93·1 96·0 32·0 - - - - 30·8 61·1
(100·0) (100·0) (75,7) (34,4) 4. Medical ex-
(-) (-) (-) (-) (24·3) (65·6)
penses, educa-tional expen-ses and litiga-tion charges .. 224·4 23·9 195·7 8·1 - - - - 28·8 15·8
(100·0) (100·0) (87,2) (33·9) (-) (-) (-) (-) (12·8) (66,1)
Total .......... 695·1 249·6 573·1 107·5 - - - - 122·0 142·2 (100·0) (100·0) (82·4) (43·0) (-) (-) (-) (-) (17·6) (57·0)
(Figures within brackets denote percentages to total expenditure on the item)
The data presented in Table 6.11 prominently bring out that the current income as a source of finance was more important among upper strata cultivators, whereas

66 MONGHYR
borrowings were important among lower strata cultivators. The current income a.s a source of finance among upper strata cultivators accounted for almost twice that among the lower strata cultivators; while borrowings a.s a source of finance among upper strata cultivators constituted about one-third of the borrowings among the lower strata cultivators.
6 •• FAMILY EXPENDITURE AND BORROWINGS
It ha.s been observed in Chapter 4 that the data in regard to the purposes of borrowings were obtained through questions regarding the purposes of particular loans contracted during the year and also through questions regarding sources of finance of particular items of expenditure incurred during the year. The expenditure and source of finance data did not cover all items of family expenditure. However, while collecting the data on purpose of borrowings, a residual item 'other' family expenditure was included. Table 6.12 gives the data on borrowings for family expenditure derived from the data relating to purpose of borrowings together with the data on borrowings derived from source of finance of expenditure on recorded items of family expenditure.
1.
2.
3.
4. 5.
6. 7. 8. 9.
TABLE 6.Il-FAMILY EXPENDITURE AND BORROWINGS: ALL FAMILIES [General Schedule data]
BORROWINGS FOR DIFFERENT PURPOSES
SOURCE OF FINANCE
Proportion of I Proportion of
Amount borrowings for Avel'&ge expenditure Item borrowed this purpose to expenditure per financed out of
per fa.mily the total borrow· family financed borrowings to the ings for family out of borrowings total expendi.
expenditure ture on this item
(Rs) (Per cent) (Rs) (Per cent) 1 2 3 4
Construction and re- I pairs of residential houses and other build-ings. __ .. _. _ ..... ____ 20·4 16·8 13·4 26·1 Purchase of household utensils. furniture, etc. 0·4 0·3 0·4 3·8 Purchase of clothing, Bhoes, bedding, etc. 12·5 10·2 15·4 20·9 Death ceremonies ..... 11·2 9·1 11·3 60-1 Marriage and other ceremonies ........ __ . 31·1 25·5 30·9 31·8 Medical expenses .••... 12·7 10·4 11·5 43·6 Educational expenses • 0·3 0·3 0·3 1·'1 Litigation charges •.• _ . 16·8 13·8 16-8 81·'1 Other family expendi-ture • .............. 16·6 13·6
Total. ...... _ ....... ___ Ill·' JOO·O 100-0 33·3
• Not listed for expenditure itemR.
It may be noted from the data on borrowings that borrowings for meeting expenditure on marriage and other ceremonies were highest at Rs 31 per family and

FAMILY EXPENDITURE 67
accounted for 25·5 per cent of the total borrowings for family expenditure. Next in importance were borrowings for meeting expenditure on construction and repairs of residential houses and other buildings which constituted about one-sixth of the total borrowings for family expenditure. The amount borrowed for meeting litigation charges and' other family expenditure' was about Rs 17 each per family and borrowings for each of these items accounted for about one-seventh of the total borrowings for family expenditure.
In conclusion, it may be worthwhile to observe that the bulk of the family expenditure was financed from current income supplemented by borrowings. Other sources of finance, viz., past savings, sale of assets, etc., were not reported to have played any role in meeting the family expenditure. Among the recorded items of family expenditure, the expenditure on marriage and other ceremonies, and durable consumer goods were quite significant; the expenditure on construction and repairs of residential houses and other buildings also constituted a sizeable portion of the total family expenditure.

CHAPTER 7
CAPITAL EXPENDITURE
The information in respect of capital expenditure was collected through the General Schedule and the intensive enquiry. The data have been claBBified for detailed analysis under three main heads, namely, (1) financial investment expenditure, (2) capital expenditure in non-farm business and (3) capital expenditure in agriculture. We did not collect information in respect of individual items falling under capital expenditure in non-farm business but only obtained the total expenditure. Capital expenditure other than that on financial investment and non-farm business has been termed as 'capital investment in agriculture'.
7.1 FINANCIAL INVESTMENT EXPENDITURE
The financial investment expenditure items, in respect of which data were collected in the General Schedule, were (1) purchase of shares of co-operative societies, banks, etc., (2) additions to deposits in co-operative societies, postal savings and other banks, etc., and (3) purchase of National Savings Certificates, Treasury Bonds, etc. Additions to financial assets such as loans made to others, addition to cash balances held by the family, etc., were not enquired into.
Table 7.1 shows the overall picture of financial investment of rural families in the selected villages.
TABLE 7.I-FINANCIAL INVESTMENT EXPENDITURE IN SELECTED VILLAGES: ALL FAMILIES
[ General schedule data]
Village
Proportion of Expenditure families report- Expenditure ing this per family per reporting
expenditure family
(Per cent) (&s) (&s)
Bari Balia .............•.•••..•.......... 0·8 1 62 Chakmansingh .......................... . 43'0 23 53 Maniappa .............................. . 1·6 19 Mubarakchak ........................... . 37·9 17 45 Bangama ............................... . Dira Harwa ....................•......... Luxmipur .............................. . Paha.sara ............................... . 0·9 1 108
District ............................... . 0·9 6]
Of the eight villages, expenditure on financial investment was not reported by rural and cultivating families in three villages and by non-cultivating families in five villages. The level of expenditure among cultivating, non-cultivating and

CAPITAL EXPENDITURE 69
rural families was significantly high in Chakmansingh and Mubarakchak. The higher level of financial investment expenditure in these villages may be s~udied in context of the fact that each of these villages had a co-operative society and each was near to Jamalpur and Monghyr towns, respectively.
Table 7.2 gives the data on financial investment expenditure incurred by cultivating, non-cultivating and rural families and also by four classes of cultivating families.
TABLE 7.2-FINANCIAL INVESTMENT EXPENDITURE [General Schedule data.]
PURCHASE OF SHARES IN ADDITIONS TO DEPOSITS IN
CO·OPERATIVE SOCIETIES, BANKS, CO·OPERATIVE SOCIETIES, POSTAL ETC. SAVINGS AND OTHER BANKS, ETC. .
Proportion Proportion of families Expendi. Expendi. of families Expendi. Expendi·
Group reporting ture per ture per reporting ture per ture per
expendi. family reporting expendi· family reporting
ture family ture family
(per cent) (Ra) (Rs) (Per cent) (Ra) (Ra) I 2 3 4 5 6
Big cultivators ..•........... 0-6 - 12 0-6 3 23
Large cultivators _ . _ . ___ . ___ . 0-6 - 20 O-S I 161 Medium cultivators __ . _ ... __ . 0-3 - 17 O-S - 47 Small cultivators _____ ...... _ 0-3 - 15 0-3 - 61
All cultivators _____ .. __ . __ .. 0-4 - 18 0-6 1 96 Non-cultivators _____ .. _____ . 0-3 - 12 0-7 - 52
All families __ .. _ .. _ ... __ .. 0-4 - 16 0-7 - 74
A negligible proportion of families in all groups reported financial investment expenditure; the proportion being hardly one per cent. The expenditure per reporting family on purchase of shares of co-operative societies, banks, etc., was highest at Rs 20 among large cultivators and lowest at Rs 12 each among big cultivators and non-cultivators. The expenditure per reporting family on additions to deposits in co-operative societies, postal savings, other banks, etc., was also highest at Rs 161 among large cultivators and lowest at Rs 23 among big cultivators. The expenditure on purchase of National Savings Certificates, Treasury Bonds, etc., was reported only by one medium cultivating family; the expenditure per medium cultivating family was negligible, while per reporting family it was Rs 10. Expenditure on all these items was financed from current income.
Cultivators in the selected villages did not have financial investment even on a modest scale. The replies to the demand questionnaire may throw some light as to why financial investment by the cultivating families was so small. In reply to the question why they did not hold deposits in postal savings bank, or purchase National Savings Certificates, insurance policies, etc., 47 families from the upper strata and 28 families from the lower strata cultivators replied that they did not have margin for savings. A small number of cultivators said that because of

70 MONGHYR
non-availability of local facility and low rate of interest they were not investing in these types of assets.
7.2 CAPITAL EXPENDITURE IN NON-FARM BUSINESS
Non-farm business embraces a large variety of economic activities from trading and proceBBing to artisan and cottage industry. Since in none of the villages there were cottage industries or big traders, no significant investment in non-farm business expenditure was reported. As in the case of financial investment expenditure, the interpretation of the data. in respect of expenditure on non-farm business also has to be carefully made owing to relatively smaller proportion of the families reporting expenditure from few villages.
The village-wise analysis of the data on capital expenditure in non-farm business, as revealed by the Survey data, showed that in only two villages, namely, Mubarakchak and Pahasara, cultivating families reported this type of expenditure. In Mubarakchak, the proportion of the cultivating families reporting expenditure was 8·1 per cent and the expenditure per reporting family was Rs 233, while in Pahasara the corresponding figures were 0·2 per cent and Rs 180. In Maniappa, Dim Harwa and Pahasa.ra, practically insignificant proportion of rural families reported expenditure.
From the analysis of the data for four classes of cultivating families, it was noticed that negligible proportion of the families reported expenditure in non-farm busineBB j
the highest proportion being 0·6 per cent among big cultivators. The expenditure per reporting rural family was Rs 437. The expenditure per reporting family was highest at Rs 500 among non-cultivators and lowest at Rs 196 among large cultivators. The medium and small cultivators did not report any expenditure in nonfarm business. The entire expenditure on this item was financed from current mcome.
7.3 CAPITAL EXPENDITURE IN AGRICULTURE
Capital investment in agriculture consisted of nine specific items and one miscellaneous residual item 'other capital investment in agriculture'. The nine specifio items were (1) purchase of land, (2) purchase of livestock, (3) reclamation of land, (4) bunding and other land improvements, (5) digging and repair of wells, (6) development of other irrigation resources, (7) laying of new orchards and plantations, (8) purchase of implements, machinery and transport equipment, and (9) construction of farm houses, cattle sheds, etc. Since data relating to purchase of land and purchase of livestock have several characteristics which distinguish them from data on other items, they require separate treatment and analysis. We, therefore, consider below in separate sections data relating to purchase of land and purchase of livestock.
7.3.1 Purchase of land
Table 7.3 on page 71 gives data on proportion of families and average expenditure incurred by cultivating families in each of the selected villages.
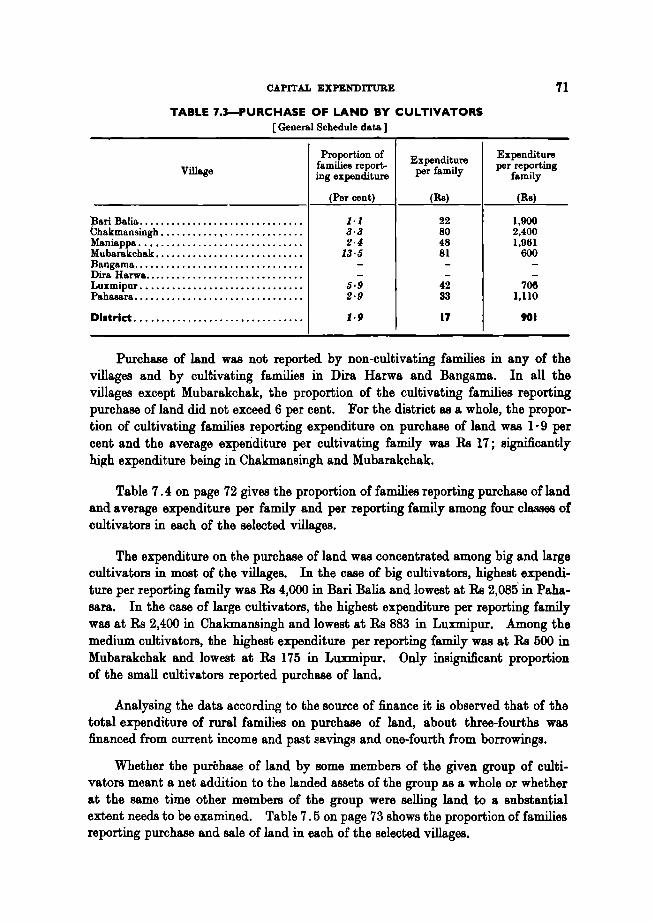
CAPITAL EXPENDITURE
TABLE 7.J-PURCHASE OF LAND BY CULTIVATORS [ General Schedule data ]
Village
:Sari Balia .......................•....... bhakmansingh .....•..... , .............. . Maniappa ..••........................... Mubarakchak •.................•......... Bangama ..••............................ Dira Harwa. ......................•......• Luxmipur .•.......•.•..••...•........... Pa.ha.sa.ra ............................... .
DI.trlct ............................... .
Proportion of families report-ing expenditure
(Per cent)
1·1 3·3 2·4
13·6
6·9 2·9
J.,
Expenditure per family
(Rs)
22 80 48 81
42 33
17
71
Expenditure per reporting
family
(R8)
1,900 2,400 1,961
600
706 1,110
901
Purchase of land was not reported by non-cultivating families in any of the villages and by cultivating families in Dira Harwa and Bangama. In all the villages except Mubarakchak, the proportion of the cultivating families reporting purchase of land did not exceed 6 per cent. For the district as a whole, the proportion of cultivating families reporting expenditure on purchase of land was 1· 9 per cent and the average expenditure per cultivating family was Rs 17; significantly hip:h expenditure being in Chakmansingh and Mubarakchak.
Table 7.4 on page 72 gives the proportion of families reporting purchase of land and average expenditure per family and per reporting family among four classes of cultivators in each of the selected villages.
The expenditure on the purchase of land was concentrated among big and large cultivators in most of the villages. In the case of big cultivators, highest expenditure per reporting family was Rs 4,000 in Bari Balia and lowest at Rs 2,085' in Pahasara. In the case of large cultivators, the highest expenditure per reporting family was at Rs 2,400 in Chakmansingh and lowest at Rs 883 in Luxmipur. Among the medium cultivators, the highest expenditure per reporting family was at Rs 500 in Mubarakchak and lowest at Rs 175 in Luxmipur. Only insignificant proportion of the small cultivators reported purchase of land.
Analysing the data according to the source of finance it is observed that of the total expenditure of rural families on purchase of land, about three-fourths was financed from current income and past savings and one-fourth from borrowings.
Whether the purChase of land by some members of the given group of cultivators meant a net addition to the landed aBBets of the group as a whole or whether at the same time other members of the group were selling land to a substantial extent needs to be examined. Table 7.5 on page 73 shows the proportion of families reporting purchase and sale of land in each of the selected villages.

72 MONGHYR
TABLE 7.4--PURCHASE OF LAND
[ General Schedule data ]
BIG OULTIVATORS LABGE CULTIVATORS
Propor- Propor-tion of Expendi- Expendi- tion of Expendi- Expendi-
Villa.ge families ture per families ture per reporting ture per reporting reporting ture per reporting expendi- family family expendi- family family
ture ture (Per cent) (Rs) (Rs) (Per cent) (Rs) (Rs)
1 2 3 4 I) 6
Bari Balia •..............•.. 3·7 148 4,000 3·8 72 1,900 Chakmansingh .............. - - - 11·1 267 2,400 Maniappa .................. 17·2 397 2,300 6·9 155 2,250 Mubarakohak ............... - .- - 8·3 83 1,000 Bangama ................•.. - - - - - -Dira Harwa ................. - - - - - -Luxmipur •.•............•.. - - - 14·3 126 883 Pahasara ................... 12·2 2M 2,085 5·7 94 1,644
District .................. . 3·3 71 2,169 4·3 51 1,171
MEDIUM CULTIVATORS 811U.LL CULTIVATORS
Propor- Propor-tion of Expendi- Expendi- tion of Expendi- Expendi-
Village families ture per families ture per reporting ture per reporting reporting ture per
rera;:rting expendi- family family expendi- family amily
ture ture (Per cent) (Rs) (Rs) (Per cent) (Rs) (Rs)
7 8 9 10 11 12
·Bari Balia .................. - - - - - -Chakmansingh .............. - - - - - -lianiappa .............•.... 0·9 2 228 - - -Mubarakchak .•........•...• 30·8 154 500 - - -Bangama .•............•.... - - - - - -Dira Harwa ••............•.. - - - - - -Luxmipur •••............•.. 3·8 7 175 - - -Pahasara ................•.. 2·5 10 405 0·8 2 200
District .................. . l·S .. 296 0·1 - 355
Transactions in land were reported mostly by cultivators. A negligible proportion of non-cultivators reported sale of land. In three villages, namely, Bari Balia, Mubarakchak and Pahasara the proportion of rural families reporting sale of land exceeded that reporting purchase of land. The largest proportion of families reporting both sale and purchase of land was from Mubarakchak.
We may now study the proportion of families reporting sale and purchase of land among different classes of cultivating families.

CAPITAL EXPENDITURE 73
TABLE 7.S-PROPORTION OF FAMILIES REPORTING PURCHASE AND SALE OF LAND
[General Schedule data. In per cent]
CULTIVATORS NON·CULTIVATORS ALL FAMILIES
Village Purchase S9.le Purchase S9.le Purchase Sale of land ofl9.nd of land of land ofland ofl9.nd
1 2 3 4, 5 6
Bari Balia. ..................• 1·1 1·9 - 0·6 0·4 1·1 Ch9.km9.nsingh ... ~ .........• 3·3 - - - 0·9 -Maniappa .................• 2·4 1·7 - - 1·4 1·0 Mubarakchak ............... 13·5 18·9 - - 3·3 4·6 Bangam9. ..................• - 1·7 - 2·1 - 1·9 Dir9. Harw9. ................• - - - - - -Luxmipur .................• 5·9 1·5 - - 2·3 0·6 Pahasara ..................• 2·9 2·9 - 0·4 1·8 1·9
District ..................• 1·9 1·6 - 0·6 1·0 1·1
For the big cultivators in the district as a whole, the proportion of families reporting purchases was almost twice of those reporting sales; the proportion of those reporting purchases was about six times those reporting sales among large cultivators. The proportion of those reporting purchases and sales was almost equal among medium cultivators, whereas among small cultivators, the proportion of those reporting sales was higher than those reporting purchases. Among big cultivators, sales were reported in Maniappa, Mubarakchak .and Pahasara, while purchases were reported in Bari Balia, Maniappa and Pahasara. Both in Maniappa and Pahasara, the proportion of families purchasing land exceeded that of families selling land. In the case of large cultivators, purchases were reported from six out of eight villages and sales were reported in four villages. In Mubarakchak, proportion of families selling land was larger than that of families purchasing land among large cultivators. In the case of medium cultivators, a large number of families in Mubarakchak reported both purchases and sales of land, while in the case of small cultivators most of the families in all villages reported sale of land, though their proportion was not above 6 per cent.
TABLE 7.6-PROPORTION OF FAMILIES REPORTING PURCHASE AND SALE OF LAND AMONG FOUR CLASSES OF CULTIVATORS
[ General Schedule data. In per cent)
BIG LAROE MEDIUM SMALL CULTIVATORS CULTIV ATORS CULTIVATORS CULTIVATORS
Village Purchase Sale Purch9.se S9.le Purchase S9.le Purchase Sale of land of land ofland of land ofland of land of land ofland
1 2 3 4, 5 6 7 8 ---Bari Balia ............• 3·7 - 3·8 3·8 - 1·0 - 1·3 Chakmansingh ......... - - 11·1 - - - - -Maniappa .•........... 17·2 13·8 6·9 4·6 0·9 - - 1·1 Mubarakchak ...... " .. - 25·0 8·3 25·0 30·8 30·8 - -Bangama .............. - - - - - - - 5·6 Dira Harwa ............ - - - - - - - -Luxmipur ••........... - - 14·3 - 3·8 - - 4·8 Pahasara .............. 12·2 4·9 5·7 2·4 2·5 3·7 0·8 2·5
District .............. 3·3 1·5 4·3 0·7 1·5 1·.2 0·1 ! 3·1

74 MONGBYR
Table 7.7 shows the average amount of receipts per reporting family from sale of land among cultivators, non-cultivators and rural families and among four classes of cultivating families.
TABLE 7.7;-SALE OF LAND [General Schedule data. Amount in rupees per reporting family]
Big Large Medium Small All Non. All Village cultivators cultivators cultivators cultivators cultivators cultivators famllles
1 2 3 4 5 6 7
Bari Balia .......• - 860 200 300 616 517 579 Chakmansingh ••.• - - - - - - -Maniappa ....•..• 2,838 2,838 - 400 2,350 - 1,350 Mubarakchak .•... 12,000 4.333 833 - 2,333 - 1,333 Bangama .......•. - - - 200 200 300 150 Dira Harwa ..••... - - - - - - -Luxmipur •••.•... - - - 450 450 - 450 Pahasara ......... 3.250 2.767 383 700 1.058 300 1,000
District ......... 3,810 3,148 409 374 775 301 661
The sales transactions were mostly accounted for by the' big and large cultivators. The average receipts per reporting family were highest at Rs 12,000 in the case of big cultivators in Mubarakchak.
The heavy sale of land in Mubarakchak by the big cultivators may be studied in context with the passing of the Bihar Land Reforms Act, 1950. In the case of small cultivators few families from five villages reported sale of land, the average receipts per reporting family being lowest at Rs 200 in Bangama and highest at Rs 700 in Pahasara.
The net result of purchase and sale transactions of land may be seen from Table 7.S.
Group
Big cultivators •.•
Large cultivators. Medium cultiva-
tors ........... Small cultivators.
All cultivators .... Non-cultivators ..
TABLE 7.B-NET PURCHASE AND SALE OF LAND [General Schedule data]
EXPENDITURE ON RECEIPTS FROM SALE
Expendi. PURCHASE OF LAND Receipts OF LA.ND BY THE
ture on BY THE GROUP AS from sale GROUP A.S PER·
purchase PERCENTAGE OF of land CENTAGE OF THE
of land EXPENDITURE BY per RECEIPTS BY
per family Cultiva· All family Cultiva· All
(Rs) tors families (R8) tors families
1 2 3 4 5 6
72 42·5 42·5 57 46·5 41·4
51 89·2 89·2 24 5'1·3 51·0
4 10·0 10·0 5 14·9 13·2 - 0·8 0·8 11 27·8 24·8
17 100·0 100·0 13 100·0 89·0 - - 2 11·0
All families .•• _ - 9 100·0 7 100·0
Net pur· chase (+) orsale(-)
of land per family
(Rs) 7
+16
+27
--11
+ 5 -2
+1

CAPITAL EXPENDITURE 75
It is evident that big and large cultivators reported net purchases while small and non-cultivators reported net sales. Among medium cultivators the net purchase and net sale of land balanced each other.
7.3.2 Purchase of livestock
Another important item included under capital expenditure in agriculture was the purchase· of livestock. Livestock included plough and milch cattle, goats, sheep and all other farm animals. The purchase of livestock may be done to add to assets or to replace dead, incapacitated or sick cattle. Secondly, it may reBect the practice, prevalent in some villages, of the purchasing of plough cattle just before the commencement of the agricultural season and of selling them after the completion of BOwing season. This may be due to several reasons such as the non-availability or high cost of fodder, the lack of grazing areas, the desire to purchase better cattle for the next season or the necessity to find finance immediately for certain purposes for which the sale of cattle offers a convenient source. The data obtained through the Survey in respect of purchase and sale of livestock consist only of the value of livestock purchased and sold and in the case of purchase, the source of finance for the purchase. There are no means of finding out directly from these data the nature of the transaction and of separating the different elements such as maintenance and replacement, seasonal purchase and sale and net addition to assets.
Table 7.9 shows the proportion of families reporting purchase of livestock among cultivating, non-cultivating and rural families and among four classes of cultivating families.
TABLE 7.9-PROPORTION OF FAMILIES REPORTING PURCHASE OF LIVESTOCK [ General Schedule data. In per cent]
Big Large Medium Small All Non· All Village cultivators cultivators cultivators cultivators cultivators cultivators families
1 2 3 " 5 6 7
Bad Balia ........ 25·9 16·5 4·9 1·3 7·3 - 2·6 Chakmansingh .... 33·3 22·2 - 22·2 13·3 3·8 6·5 Maniappa ......... 44·8 29·9 8·7 3·4 13·5 1·4 8·4 Mubarakchak ..... - 25·0 46·2 8·3 27·0 1·7 '1·8 Bangama ......... 33·3 44·4 31·8 11·1 29·3 2·1 1'1· 1 Dire. Harwa ....... 25·0 20·8 6·3 8·3 11·3 - 6·'1 Luxmipur .•...... 57·J 42·9 30·8 9·5 27·9 1·9 11·9 Pahasara ......... 41·5 26·0 ]4·7 1·6 ]4,2 0·4 8·6
District ......... 3'1·0 32·3 19·3 '1·4 19·'1 1·2 10·9
For the district as a whole, 19· 7 per cent of the cultivating families and 1· 2 per cent of non-cultivating families reported purchase of livestock. This proportion, however, varied widely from village to village. The proportion of the cultivating families reporting purchase of livestock was highest at 29· 3 per cent in Bangama and lowest at 7· 3 per cent in Bari Balia. The proportion was relatively significant in Mubarakchak, Luxmipur and Bangama. The proportion of non-cultivating

76 MONGHYB
families reporting purchase of livestock was much lower than the proportion of cultivating families.
Analysis of the proportions of families reporting purchase of livestock among different classes of cultivators shows that the proportion of big cultivators pUrchasing livestock was highest at 57·1 per cent in Luxmipur and lowest at 25·0 per cent in Dira Harwa. The highest proportion among large cultivators was 44:·4 per cent in Bangama and lowest at 16·5 per cent in Bari Balia. Among the ~edium cultivators, the highest proportion was 46·2 per cent in Mubarakchak and lowest at 4·9 per cent in Bari Balia, while among the small cultivators the highest and the lowest proportions were reported in Chakmansingh (22·2 per cent) and Bari Balia (1·3 per cent), respectively.
Table 7.10 shows the average expenditure per family and per reportirig family on purchase of livestock among cultivating, non-cultivating and rural families and among four classes of cultivating families.
Group
Big cultivators .......
Large cultivators ..... Medium cultivators ... Small cultivators .....
All cultivators ...•... Non-cultivators •..•..
All famlll ..........
Big cultivators •......
Large cultivators ..... Mediuin cultivators ... Small cultivators •....
All cultivators ....... Non-cultivators ......
All families ........
TABLE 7.IO-PURCHASE OF LIVESTOCK [ General Schedule data.. Amount in rupees]
Bari Chak Mani- Muba- Ban- Dira Balia man-
singh appa. rakchak gama Harwa
I 2 3 --4- 5 6
Average expenditure per family 86 102 200 88 26
50 48 106 33 124 23 5 12 144 55 4 I 17 4 18 12 10
17 20 38 67 63 12 4 I I I
6 8 n 17 35 7
Average expenditure per reporting family 330 305 446 - 263 105
302 215 354 130 279 112 110 - 135 312 174 70 40 78 100 215 106 125
238 146 279 248 216 105 - 108 83 43 50 -
238 130 265 213 206 105
Luxmi- Paha- Dis-pur sara trict
--7---8---0-
283 202 137
159 112 99 44 29 31 6 3 8
68 46 45 3 I I
21 21 24
495 I 486 369
372 429 305 143 196 161 62 205 107
243 325 227 158 200 .. 4
235 32] m
The average expenditure per rural family was Rs 24 for the district as a whole. It was Rs 137 per family among big cultivators, Rs 99 per family among large cultivators, Rs 31 per family among medium cultivators and Rs 8 per family among small cultivators. The average expenditure per family was highest at Rs 283 among big cultivators in Luxmipur and lowest at Re 1 among small cultivators in Bari Balia.

CAPITAL EXPENDITURE 77
The average expenditure on purchase of livestock per reporting family among big cultivators varied from Rs 105 in Dim Harwa to Rs 495 in Luxmipur. Among large cultivators; it ranged between Rs 112 in Dira Harwa and Rs 429 in Pahasara, and among medium cultivators, it varied from Rs 70 in Dira Harwa to Rs 312 in Mubarakchak. Among the small cultivators, it varied between Rs 40 in Bari Balia and Rs 215 in Mubarakchak.
As regards the source of finance for purchase of livestock, 46 per cent of the expenditure incurred by rural families was financed from current income and 54 per cent from borrowings.
Table 7.11 gives the data on receipts from sale of livestock among cultivating, non-cultivating and rural families.
TABLE 7.II-SALE OF LIVESTOCK AMONG CULTIVATORS, NON-CULTIVATORS AND ALL FAMILIES [ General Schedule data ]
CULTIVATORS NON·CULTIVATORS ALL FAMILIES
Propor. Re . ts Propor. IRe . ts Propor· Receipts tion of Receipts f celP I tion of Receipts If celP I tion of Receipts from sale families from sale rofn:-. sa. e families from sale rofn:-. sa e families from sale . fr 0 Ive- of live-
reportmg 0 lve- stock reporting of live- 0 t IV~- reporting of live· stoc.k Village sale of stock sale of stock s oc sale of stock live- pe~ re~~ing live- per per live- per per
stock family fi il stock family reporting stock family reporting (Per am y (Per family (Per family
cent) (Rs) (Rs) cent) (Rs) (Rs) cent) (Rs) (Rs) --1- --2- --3- --4- --5- 6 7 8 9 --- ------
Bari Bali&. ..... 6·1 7 125 4·6 3 59 4·9 4 86 Chakmansingh . 6·1 7 100 9·0 13 149 8·3 11 138 Maniappa ..... 11·4 18 155 3·8 3 78 8·2 11 140 Mubarakchak .. 16·2 15 93 1·1 1 75 6·2 5 89 Bangama ..•... 16·6 18 117 2·1 2 100 9·6 11 115 Dira Harwa .... 11·3 4 32 12·1 3 24 11·9 3 29 Luxmipur •.... 6·9 10 178 - - - 2·3 4 178 Paha.sa.ra ...... 9·6 16 172 0·4 1 150 6·8 10 171
District ...... 10·' 12 112 J·4 2 43 '1·4 7 97
About 7 per cent of the rural families reported sale of livestock. The villages in which relatively higher proportion of rural families reported sale of livestock were Bangama and Dira Harwa. The proportion of non-cultivating families reporting sale of livestock was about 3 per cent. In Dira Harwa, the proportion among noncultivators was highest at about 13 per cent. The receipts per family from the sale of livestock among non-cultivators did not exceed Rs 3 in any of the villages except Chakmansingh.
Among cultivators, the proportion of families reporting sale of livestock was p.bout 11 per cent for the district. The villages in which a relatively high proportion of families reported sales were Mubarakchak, Bangama, Maniappa and Dira Harwa. The receipts from sale of livestock were highest at Rs 18 per cultivating family in Maniappa and Bangama.

78 HONGHYB
Table 7.12 shows the data on receipts from sale of livestock among four classes of cultivating families.
TABLE 7.Il-SALE OF LIVESTOCK AMONG FOUR CLASSES OF CULTIVATORS [General Schedule data]
BIG CULTIVATORS LARGE CULTIVATORS
Propor- Receipts Receipts Propor- Receipts Receipts from from tion of from sale of tion of from sale of families sale of
livestock families sale of livestock Village reporting livestock reporting livestock sale of per per sale of per per
reporting reporting livestock family family livestock family family (Per cent) (Rs) (Rs) (Per cent) (Rs) (Rs)
I 2 3 4 5 6
Bari Balia .................• 14·8 32 218 7·6 13 167 Chakmansingh .............. - - - - - -Maniappa .................. 10·3 27 263 11-.5 21 187 Mubarakchak ............... - - - 25·0 18 70 Bangama ................... 33·3 30 90 16·7 19 117 Dira Harwa ................. - - - 1·2 I 20 Luxmipur .................• 28·6 33 115 14·3 23 160 Paha.sa.ra ..................• 9·8 17 175 13·0 26 196
District ................... 16·3 19 114 11·7 17 141
MEDIUM CULTIVATORS SMALL CULTIVATORS
Propor- Receipts Heceipts Propor- Receipts Receipts from from tion of from '
sale of tion of from sale of families sale of livestock families sale of livestock Village reporting livestock reporting livestock sale of per per sale of per per
livestock family reporting livestock family reporting family family
(Per cent) (Rs) (Rs) (Per cent) (Rs) (Rs) 7 8 9 10 II 12
Bari Balla •................• 1·9 4 205 8·8 6 67 Chakmansingh .............. 8·3 3 40 11·1 18 160 Maniappa .••. _ ... ' .........• 12·2 17 141 10·3 15 142 Mubarakchak ..............• 23·1 27 117 - - -Bangama ..................• 22·7 30 134 5·6 2 30 Dira Harwa ...•............• 15·6 7 44 12·5 2 17 Luxmipur .................• 3·8 9 230 - - -Pahasara ..................• 9·2 16 170 6·6 8 126
District ................... 13·4 16 117 6·8 4 51
The proportion of families reporting sale of livestock was about 16 per cent among big cultivators, 12 per cent among large cultivators, 13 per cent among medium cultivators and 7 per cent among small cultivators.
Among the big cultivators, the receipts per reporting family from sale of livestock varied from Rs 90 in Bangama to Rs 263 in Maniappa; among the large cultivators the receipts varied between Rs 20 in Dira Harwa and Rs 196 in Pahasara. The highest receipts among the medium and small cultivators were in Luxmipur and Chakmansingh, respectively, while the lowest receipts among the respective groups of cultivators were in Chakmansingh and Dira Harwa.

CAPITAL EXPENDITURE 79
The net result of purchase and sale transactions of livestock is given in Table 7.13.
TABLE 7.Il-NET PURCHASE AND SALE OF LIVESTOCK [ General Schedule data]
Expendi. EXPENDITURE ON RECEIPTS FROM
PURCHASE OF LIVE Receipts 8ALE OF LIVE· ture on STOCK BY THE from sale STOCK BY THE
purchase GROUP AS PERCENT· of live· GROUP AS PD· of live· AGE OF THE stock CENTAGE OF
Group stock EXPENDITURE BY RECEIPTS BY per per family family Culti· All Culti· All
(Rs) vators families (Rs) vators families
1 2 3 4 5 6
Big cultivators ........•. 136·5 31·3 30·5 18·5 15·5 14·0
Large cultivators ........ 98·5 67·3 65·5 16·6 41·4 37·4 Medium cultivators ...... 31·2 27·3 26·5 15·6 50·0 45·2 Small cultivators ........ 8·0 5·4 5·3 3·5 8·6 7·7
All cultivators .......... 44·7 100·0 97·3 12·2 100·0 90·3 Non.cultivators ......... 1·4 2·7 1·5 9·7
All families ........... 24·2 100·0 7·1 100·0
Net pur· chase (+)
or sale (-) of
livestock per
family
(Rs) 7
+118·0
+ 81·9 + 15·6 + 4·5
+ 32·5 - 0·1
+ 17·1
In all groups of cultivating families, the value of purchases per family exceeded the value of sales of livestock per family. However, in the case of non-cultivating families, the value of sales per family was in excess of value of purchases per family by a small amount. About two-thirds of the expenditure on purchase of livestock by rural families was accounted for by large cultivators, about one-fourth by medium cultivators and about one-twelfth by both small cultivators and non-cultivators. About four-fifths of the receipts from sales of livestock by rural families were accounted for by both large and medium cultivators. The small cultivators and non-cultivators accounted for relatively much lower receipts from sales.
About 46 per cent of the expenditure on purchase of livestock by rural families was financed from current income and past savings, while the remaining about 54 per cent of the expenditure was financed from borrowings.
7.4 CAPITAL EXPENDITURE IN AGRICULTURE: ITEMS OTHER THAN LAND AND LIVESTOCK
We have 80 far discussed the capital expenditure on purchase of land and purchase of livestock. The other types of capital expenditure in agriculture incurred in relation to land, farm equipments and fixed assets of farm were broadly classified as (1) reclamation of land, (2) bunding and other land improvements, (3) digging and repair of wells, (4) development of other irrigation resources, (5) laying of new orchards and plantations, (6) purchase of .implements, machinery and transport equipment, and (7) construction of farm houses, cattle sheds, etc. Provision was also made for recording expenditure on any item of capital expenditure other than those mentioned above under a residual heading called 'other capital investments

80 MONGHYR
in agriculture'. To avoid confusion, this item is being termed 'miscellaneous capital expenditure in agriculture' in subsequent discussion. In view of the fact that 'other' capital expenditure in agriculture is meant chiefly for farming business, its incidence per acre of cultivated holdings may have greater significance than the incidence per family.
Table 7.14 gives the data on the proportion of the cultivating families reporting 'other' capital expenditure in agriculture and the average expenditure per family.
TABLE7.14-0THER CAPITAL EXPENDITURE IN AGRICULTURE BY CULTIVATORS [ General Schedule data ]
Proportion of families Average expenditure reporting this expendi- per family on this
Item ture item
1. Reclamation of land .....•...............•..... 2. Bunding and other land improvements ••........ 3. Digging and repair of wells .•..•............... 4; Development of other irrigation resources ........ . 5. Laying of new orchards and plantations ......... . 6. Purchase of implements. machinery and transport
equipment .•.........•....................... 7. Construction offarm houses. cattle sheds. etc .•.... 8. Miscellaneous capital expenditure in agriculture .•
7.4.1 Reclamation of land
(Per cent)
3·6 7·2 1·4 1·6 1·5
32·5 23·3 23·0
(Ra)
7·5 10·2 19·2 2·4 0·7
4·6 9·5
50·0
Table 7.15 shows the proportion of families reporting expenditure on reclamation of land and the average expenditure per family and per reporting family.
TABLE 7.lS-RECLAMATION OF LAND [General Schedule data]
Proportion of expenditure
Proportion Expenditure by each
of families Expenditure per group to
Group reporting per family reporting the total
expenditure family expenditure on this item by
cultivators (Per cent) (Ra) (Ra) (Per cent)
1 2 3 4
Big cultivators .............. 5·6 46 829 63·1
Large cultivators ...........• 9·4 24 253 97·5 Medium cultivators .........• 1·9 1 25 2·5 Small cultivators ...........• - - - -All cultivators .............. 3·6 8 206 100·0 Non-cultivators •••.........• - - -All families ••............• I·' 4 206
Expenditure per acre of cultivated holdings
(Rs) 5
1·5
1·r; 0·1 -
1·0

CAPITAL EXPENDITURE 81
About 4 per cent of the cultivating families reported this expenditure. Nearly 6 per cent of the big cultivators and 9 per cent of the large cultivators spent on an average Rs 46 and Rs 24 per family, respectively, the large cultivators accounting for about 98 per cent of the expenditure incurred by cultivators. The expenditure per acre of cultivated holdings of cultivators worked out to Re 1. About 70 per cent of the expenditure incurred by rural families was financed from current income and past savings and 30 per cent from borrowings.
7.4.2 Bunding and other land improvements
Table 7.16 shows the proportion of families reporting expenditure on bunding and other land improvements and the average expenditure per family and per report. ing family.
TABLE 7.I6-BUNDING AND OTHER LAND IMPROVEMENTS [General Schedule data]
Proportion of expenditure
by each Proportion Expenditure group to of families Expenditure per the total
Group reporting per family reporting expenditure expenditure family on this
item by cultivators
(Per cent) (Ral (Ra) (Per cent) I 2 3 4
Big cultivators ............... 21·3 83 387 82·5
Large cultivators ............. 14·8 32 213 94·1 Medium cultivators ........... 6·0 I 22 5·0 Small cultivators ............. 1·1 - 26 0·9
All cultivators .•••........... 7·2 10 143 100·0 Non·cultivators .•............ - - 58
All families ................ J·B 6 14] I
Expenditure per acre of cultivated holdings
(Rs) 5
2·7
1·9 0·3 0·2
1·4
The villages in the northern tract of the district are liable to inundation during the rainy season. Therefore, bunding of land is almost every year a compulsory item of expenditure. The big and large cultivators incurred relatively high expenditure on bunding and other land improvements, the average expenditure in their case being Rs 83 and Rs 32, respectively. About 21 per cent of the big cultivators and about 15 per cent of the large cultivators reported this expenditure and accounted for about 83 per cent and 94 per cent of the expenditure incurred by all cultivators, respectively. Nearly 92 per cent of the expenditure incurred by rural families was financed from current income and past savings and the balance from borrowings.
7.4.] Digging and repair of wells
Table 7.17 on page 82 shows the proportion of families reporting expenditure on digging and repair of wells and the average expenditure per family and per reporting family on this item.

MONGHYR
TABLE 7.17-DIGGING AND REPAIR OF WELLS [General Schedule data]
iProportion Of expenditure
Proportion Expenditure by each
of families Expenditure per group to the total
Group reporting per family reporting expenditure expenditure family on this item by
cultivators (Per cent) (Rs) (Rs) (Per cent)
1 2 3 4
Big cultivators .............. 9·1 166 1,831 88·8
Large cultivators ............ 4·3 63 1,439 99·7 Medium cultivators .........• 0·1 - 125 0·3 Small cultivators •.•........• 0·1 - 20 -
All cultivators .••••........• 1·4 19 1,403 100·0 Non-cultivators .••.........• - - -All families ............... 0·7 10 1,<40J
Expenditure per acre of cultivated holdings
(Rs) I)
5·6
3·8 --
2·7
A very low proportion of families mainly comprising big and large cultivators reported expenditure on digging and repair of wells. The large cultivators accounted for 99·7 per cent of the expenditure incurred by cultivators and the average expenditure in their case was Rs 63 per family. Fifty-two per cent of the expenditure inourred by rural families was financed from current income and past savings and the balance from borrowings.
7.4.4 Development of other Irrl,atlon resources The position in regard to expenditure on development of other irrigation re-
80urces would be clear from Table 7.lB.
TABLE 7.II-DEVELOPMENT OF OTHER IRRIGATION RESOURCES [General Schedule data]
Proportion of expenditure
Proportion Expenditure by each Expenditure of families Expenditure per group to per acre of the total
Group reporting per family reporting expenditure oultivated
expenditure family on this holdings
item by cultivators
(Per cent) (Rs) (Rs) (Per cent) (Ra) 1 2 3 4 5
Big cultivators .............. 10·4 21 200 90·3 0·7
Large cultivators ............ 4·4 7 168 95·9 0·1) Medium cultivators .........• 0·6 - 39 4·1 0·1 Small cultivators •..........• - - - - -All cultivators •••••......... 1·6 2 l~ 100·0 0·8 Non-cultivators ••••......•.• - - -All families .. ............. 0·' I 146

CAPITAL EXPENDITURE 83
The level of expenditure in the case of development of other irrigation resources was strikingly lower than in the case of digging and repair of wells. A very low proportion of families, mainly comprising big and large cultivators, reported expenditure on development of other irrigation resources. The large cultivators accounted for about 96 per cent of the expenditure incurred by all cultivators. About 97 per cent of the expenditure incurred by rural families on this item was financed from current income and past savings and about 3 per cent from borrowings.
7.4.5 Laying of new orchards and plantations
Table 7.19 shows the proportion of families reporting expenditure on laying of new orchards and plantations and the average expenditure per family and per reporting family on this item.
TABLE 7.19-LAYING OF NEW ORCHARDS AND PLANTATIONS [ General Schedule data]
Proportion of expenditure
Proportion Expenditure by each Expenditure of families Expenditure per group to per acre of the total
Group reporting per family reporting expenditure cultivated
expenditure family on this holdings
item by cultivators
(Per cent) (Ra) (Ra) (Per cent) (Rs) 1 --2--- 3 4 5 -----
Big cultivators •.............. 6·9 4 60 64·6 0·1
Large cultivators ............. 4·6 2 42 87·6 0·1 Medium cultivators ..•........ 0·4 - 54 12·6 0·1 Small cultivators ............. - - - - -All cultivators •.............. 1·6 1 43 100·0 0·1 Non·cultivators .•............ - - -All families ................ 0·' - 43
In view of the fact that the climate of the district is not suitable for growing of citrus fruit and mango, orchards are also rare in Monghyr. Very few families from big and large cultivators' groups reported expenditure on the laying of new orchards and plantations. Nearly 89 per cent of the expenditure incurred. by rural families on this item was financed from current income and past savings and the remaining from borrowings.
7.4.6 Purchase of implements. machinery and transport equipment
Table 7.20 on page 84 shows the proportion of families reporting expenditure on purchase of implements, machinery and transport equipment and the average expenditure per family and per reporting family on this item.

MONGHYB
TABLE 7.1t-PURCHASE OF IMPLEMENTS, MACHINERY AND TRANSPORT EQUIPMENT
[ General Schedule data ]
Proportion of expenditure
Proportion Expenditure by each Expenditure of families Expenditure per
group to per acre of the total Group
reporting per family reporting expenditure cultivated expenditure family on this holdings
item by cultivators
(Per cent) (Rs) (Rs) (Per cent) (Ra) 1 2 3 4 5
Big cultivators ............... 52·6 16 31 35·'1 0·5
Large cultivators ...........•. 46·2 10 21 63·3 0·6 Medium cultivators •.......... 36·'1 4 10 31·4 0·8 Small cultivators •............ 13·3 1 6 5·3 0·6
All cultivators •.............. 32·5 5 14 100·0 0·6 Non-cultivators •.•........... - - -All families ................ 17·1 1 14
The level of expenditure on purchase of implements, machinery and transport equipment was not high, even though a fairly large proportion of the cultivating families reported this expenditure. The large cultivators and medium cultivators accounted for about 63 per cent and 31 per cent of the expenditure incurred by all cultivators, respectively.
About 94 per cent of the expenditure incurred by rural families on this item was financed from current income and past savings, the balance was financed from borrowings, sale of assets and other sources.
7.4.7 Construction of farm houses, cattle sheds, etc.
Table 7.21 on page 85 shows the proportion of families reporting expenditure on construction of farm houses, cattle sheds, etc., and the average expenditure per family and per reporting family on this item.
About 37 per cent of the large cultivators, 25 per cent of the medium cultivators and 7 per cent of the small cultivators reported expenditure on this item, the average expenditure per family in these groups being Rs 22, Rs 6 and Re 1, respectively. The large cultivators accounted for 70·4 per cent, the medium cultivators 25·7 per cent and the small cultivators 3· 9 per cent of the expenditure incurred on this item by all cultivators. The average expenditure per acre of cultivated holdings worked out to Rs 1· 3 for all cultivators.
About 82 per cent of the expenditure incurred on this item by rural families was financed from current income and past savings and the balance was financed from borrowings.

CAPITAL EXPENDITURE 86
TABLE 7.21-CONSTRUCTION OF FARM HOUSES, CATTLE SHEDS, ETC.
[ General Schedule data. ]
Proportion of expenditure
Proportion Expenditure by each Expenditure of families Expenditure per group to per acre of the total
Group reporting per family reporting expenditure cultivated
expenditure family on this holdings
item by oultivators
(Per cent) (Ra) (Ra) (Per cent) (Ra) 1 2 3 4 5
Big cultivators •.............• 42·8 41 96 44·2 1·4
Large cultivators ............. 37·2 22 59 70·4 1·3 Medium cultivators .........•. 24·8 6 25 25·7 1·4 Small cultivators .•........••• 7·3 1 17 3·9 0·9
All cultivators ...•........... 23·3 10 41 100·0 1·3 N on·cultivators ...•.......... - - -
All families ................ Jl·3 5 41
7.4.8 Other (miscellaneous) capital expenditure In agriculture
Table 7.22 shows the proportion of families reporting other (miscellaneous) capital expenditure in agriculture and the average expenditure per family and per reporting family on this item.
TABLE 7.ll-0THER (MISCELLANEOUS) CAPITAL EXPENDITURE IN AGRICULTURE
[ General Schedule data.]
Proportion of expenditure
Proportion Expenditure by each Expenditure of families Expenditure per group to per acre of the total
Group reporting per family reporting expenditure cultivated
expenditure family on this holdings
item by cultivators
(Per cent) (Rs) (Rs) (Per cent) (Rs) 1 2 3 4 5
Big cultivators ............... 24·1 172 715 35·3 5·7
Large cultivators ...........•. 22·8 97 428 59·6 5·9 Medium cultivators ........... 24·5 40 163 31·3 8-9 Small cultivators. _ .. _ . _ ...... 21·4 15 70 9-1 ll-O
All cultivators .••.•......•.•. 23-0 50 217 100-0 7-0 Non-cultivators •••.. _ ......•• - - -All families ................ Jl.J 16 217

86 MONGHYR
Practically equal proportions of the different classes of the cultivating families reported other (miscellaneous) capital expenditure in agriculture. However, the expenditure both per family and per reporting family was quite large among big and large cultivators. Large and medium cultivators accounted for nearly 60 per cent and 31 per cent, respectively, of the expenditure of all cultivators.
About 84 per cent of the expenditure incurred by rural families' under this head was financed from current income and past savings and the balance from borrowings.
7.5 SALE OF ASSETS
In the preceding sections we disCUBBed the level of expenditure which led to the acquisition of additional assets or added to the value of the existing assets in the form of land and livestock. In the succeeding section we shall be discU88ing the economic position of the rural families by studying their investments and disinvestments. Before proceeding with the detailed analysis of investments and disinvestments, it will be useful to study the extent ofteceipts from sale of different types of assets, data relating to which are available in respect of only six major categories, namely, land, livestock, implements and machinery, houses and buildings, bullion and ornaments, and financial and other assets. The relevant data are given m Table 7.23.
TABLE 7.2l-SALE OF ASSETS [General Schedule data. Amount in rupees per family]
Sale of Sale of Sale of imple. Sale of bullion financial Total Sale of Sale of ments houses and and Group land livestock and and other machi· buildings orna·
ments assets nery
1 2 3 4 6 6 7
Big cultivators ..•.....•. 88 67 19 - 11 1 -
Large cultivators ...•.... 45 24 17 - 4 1 -Medium cultivators ....•. 24 5 16 - - 3 -Small cultivators •....... 20 11 4 - - 5 -
All cultivators •••••.•..• 19 13 12 - 1 3 -Non·cultivators .•.....•. 7 2 2 - - 4 -All families ........... 19 7 7 - I 3 -
The data reveal that none of the families had receipts from sale of implements and machinery, and financial and other asSets, whereas the receipts from sale of land predominated except in the case of medium cultivators in whose case the receipts from sale of livestock were relatively high. The receipts from sale of houses and buildings were reported by the big and large cultivators only, the average receipts per family being Rs 11 and Rs 4, respectively. All classes of rural families reported receipts from sale of bullion and ornaments, but the receipts were highest at Rs 5 per family among small cultivators.

CAPITAL EXPENDITURE 87
7.6 INVESTMENT AND DISINVESTMENT
In this section an attempt has been made to ascertain the extent of surplus or deficit, if any, in the economy of the rural families in the district. The data relating to outstanding debt, borrowings and repayments can hardly reveal fully the extent of deficit or surplus in the economy. Borrowings may take place for a variety of purposes. An increase in the outstanding debt or a low level of repayments may 'not indicate a deterioration in the economy. In fact, in the initial stages of economio development, a low level of repayments may be indicative of a large and rapid longterm investment.
A surplus in the family economy may take the form of acquisition of capital assets, physical or financial or of direct lendings to others or of net repayments of debt, besides an augmentation in kind or cash balance of the family. A deficit in the economy may be reflected either in an increase in liabilities through net borrowings or in the liquidation of assets, in addition to depletion of kind or cash resources held. Therefore, one way to determine surplus or deficit in the economy is to compare the net assets position at the beginning and at the end of the period. A decrease in net assets would indicate deterioration, while an increase in net assets an improvement in the position. While we collected fairly detailed information regarding borrowings, repayments, and capital investments in farm and non-farm business, we did not cover certain items, namely, (1) cash in hand, (2) bullion and ornaments, (3) stocks of commodities, and (4) lendings by rural families to others. The main reason for not collecting any data on these items was the fear of arousing suspicion in the minds of the respondents. On account of the operation of the moneylending legislation, it was also considered not advisable to solicit information from each person about his moneylending operations.
An alternative way of arriving at a calculation of deficits in the economy would be through a full enumeration of all transactions during the period. Apart from the obvious difficulties of such enumeration in respect of a small and partially monetized business as that of the Indian cultivator, an important feature of Indian rural economy further complicates such a task. The common feature is that the business and the domestic economy of the cultivator are so mixed up that it may not be possible to obtain any clear idea of deficits or surpluses unless full details of family living are collected. Such a detailed enquiry was not considered practicable in the Survey with limited objectives.
In view of the above limitations, we adopted a method of calculating deficits or surpluses by taking items of capital expenditure in farm and non-farm business, financial investment and repayments of old debts on credit or investment side and those relating to borrowings and sale of assets on debit or disinvestment side. The chief assumption in this method is that all significant changes, deficits or surpluses would be reflected in the changes in capital assets and investments and in borrowings and debts. This approach has, however, certain limitations. Firstly, certain transactions leading to acquisition of assets, as sums lent and bullion and ornaments

88 MONGHYR
purchased have been omitted. Secondly, changes in the stocks and inventories were not taken into account. There is also an &88umption regarding the investment effect of certain expenditure. For the major part, it is believed, that most of these assumptions do not vitiate our conclusions to a material extent. The stocks and inventories po~itions of most of the cultivators do not change in a material way. Table 7.24 gives the data on investment and disinvestment for cultivators in selected Villages.
TABLE 7.24-1 NVESTMENT-DISINVESTMENT : ALL CULTIVATORS [General Schedule data. Amount in rupees per family]
INVESTMENT DISINVESTMENT
Net invest·
Capi- Non- Finan- ment tal ex- farm cial Bor- Sale (+) or
Village pendi- busi- invest- Repay- dis-Total row- of Total ture in ness ment ments ings assets invest-agri- expen. expen- ment
culture diture diture (-)
-1- -2- -3- -4- -6- --6- -7- -8--9-------- ------
Bari Balia ....•.• 71 - - 6 76 92 30 122 - 46 Chakmansingh .•• 106 - 42 62 210 239 32 271 - 61 Maniappa •.•.... 103 - 1 84 187 264 63 327 -140 Mubarakchak ...• 285 19 16 61 369 252 466 719 -300 Bangama ....•... 125 - - 27 151 229 23 252 -101 Dira Harwa .•••.• 26 - - - 25 71 II 82 - 57 Luxmipur •..•. _ • 333 - - 5 339 347 20 367 - 28 Pahaosara .......• 241 - 2 26 268 317 62 368 -100
District ........ 166 - 1 16 182 no 29 259 -77
Cons· truction
and repairs of resi-dential houses
and other build. ings
---w---43 66 81
624 102
6 64
134
79
Among the items constituting investment, capital expenditure in agriculture W8.8 most important. The capital expenditure in agriculture per cultivating family worked out to Rs166 for the district, the highest being at Rs 333 in Luxmipur and the lowest at Rs 25 in Dira Harwa. Except in Dira Harwa and Bari Balia, the capital expenditure in agriculture W8.8 above Rs 100 in all other villages. Another important item of investment was repayments which were reported to be highest at Rs 84 in Maniappa. In Dira Harwa no repayments were reported. Non-farm business expenditure and financial investment expenditure items did not contribute much to the investments in all the villages except in Mubarakchak and Chakmansingh, which fact may be studied in relation to proximity of towns like Monghyr and Jamalpur, respectively.
Of the two items of disinvestment of cultivating families, borrowings were more important, the average borrowings and sale of &88ets of the cultivating families for the district being Rs 230 and Rs 29, respectively. Borrowings of cultivating families were reported to be highest at Rs 347 in Luxmipur and lowest at Rs 71 in Dira Harwa. Except in Bari Balia and Dira Harwa, borrowings in the remaining villages were Rs 229 or above. Borrowings were mainly resorted to for consumption purposes.

CAPITAL EXPENDITURE 89
Except in Mubarakchak where sale of assets was preponderantly high at Rs 466, in other villages it did not exceed Rs 63. Heavy sale of assets in Mubarakchak was accounted for by a few big cultivators in the village. In other villages, sale of assets mainly consisted of livestock and ornaments.
In balancing investment and disinvestment, it appears that in all the villages there was net disinvestment which ranged from Rs 28 per cultivating family in Luxmipur to Rs 35~ per cultivating family in Mubarakchak.
H we take credit for the heavy expenditure on construction and repairs of residential houses and other buildings, the net disinvestment position changes into investment position in Chakmansingh, Mubarakchak, Bangama, Luxmipur and Pahasara.
An analysis of net investment and disinvestment of four classes of cultivating families in the selected villages would reveal as to which cultivating class contributed significantly towards disinvestment. The relevant data are given in Table 7 .25.
TABLE 7.25-INVESTMENT-DISINVESTMENT IN SELECTED VILLAGES: FOUR CLASSES OF CULTIVATORS
[General Schedule data. Amount in rupees per family]
BIG LARGE MEDIUM SMALL
CULTIVATORS CULTIVATORS CULTIVATORS CULTIVATORS
Con- Con- Con- Con-
Net struc- Net struc- Net struc- Net struc-
invest- tion and invest- tion and invest- tion and invest- tion and
ment repairs of ment repairs of ment repairs of ment repairs of
Village (+)or residen- (+)or residen-(+) or
residen- (+) or residen-
tial tial tial tial dis- houses dis- houses dis- houses dis- houses invest- and invest- and invest- and invest- and ment other ment other ment other ment other (-) build- (-) build- (-) build- (-) build-
ings ings ings ings --1- --2- --3- --4- 5 6 7 8 --- ---
Bari Bali" .............• + 194 276 - 22 114 -64 12 - 47 13 Chakmansingh ••••.•..•• + 147 10 +132 41 -102 77 -202 77 Maniappa •••.•......... - 441 354 -261 166 - 83 20 - 93 77 Mubarakchak ••......... -2,148 3,300 -763 1,114 -221 129 - 76 361 Bangama .••..•......... - 459 686 -206 266 -74 31 - 29 24 Dira Harwa .•••......... - 27 26 - 16 12 - 92 3 - 53 4 Luxmipur •••........... + 443 163 +286 128 -251 48 - 67 19 PahlUl&ra ............... + 220 762 - 49 333 -134 54 -115 42
District ..•............ + 4 4]] - 11 191 -117 ]] - 67 14
It is observed that big and large cultivators showed net disinvestment in four and six villages, respectively, while both medium and small cultivators showed net disinvestment in all the villages. However, if expenditure on construction of residential houses and other buildings is considered on investment side, the big and large cultivators each showed net disinvestment in two villages, namely, Maniappa and Dira Harwa, net disinvestment in the latter village being practically insignificant for both groups of cultivators; the medium cultivators still showed net

90 MONGHYR
disinvestment in all the villages and small cultivators in seven villages. The net disinvestment position in Bari Balia, Chakmansingh, Dua Harwa, Luxmipur and Pahasara was mainly on account of the medium and small cultivators, while in the remaining villages, it was considerably influenced by big and large cultivators.
Table 7.26 shows investment and disinvestment in respect of cultivators, noncultivators and rural families and four classes of cultivating families.
TABLE 7.26-INVESTMENT-DISINVESTMENT AMONG CULTIVATORS, NON-CULTIVATORS AND ALL FAMILIES [General Schedule data. Amount in rupees per family]
INVESTMENT DISINVESTMENT Cons·
Net truction
invest. and Capi. repairs
Capi. tal ex· Finan· ment of resi· tal ex· pendi. cial Bar· Sale
(+) or dential Group pendi· ture in invest· Repay- Total of Total dis· houses row" invest· ture in non· ment ments ings and
agri- farm a.ssets ment expen- other oulture busi· diture (-) build·
ness ings
-1- -2--3- -4- -5--6--7--8- -0- -10------ ----------------
Big cultivators ... 758 2 4 49 813 721 88 809 + 4 433
Large cultivators. 406 1 1 32 04-40 416 45 461 - 21 101 Medium cultiva-
tors ..........• 88 - - 0 98 201 24 225 -127 33 Small cultivators. 26 - - 8 34 81 20 101 - 67 "24
All cultivators .... 166 - 1 16 182 230 29 259 - 77 70 Non·cultivators .. 1 2 - 2 6 59 7 66 - 60 21
All families ... 88 I I 9 99 '49 19 168 -69 51
The data reveal that there was a net disinvestment of Rs 69 among rural families, the net disinvestment was highest at Rs 127 in the case of medium cultivators and lowest at Rs 21 in the case of large cultivators. Big cultivators only showed a small net investment of Rs 4 which was mainly on account of relatively high capital expenditure in agriculture. Even if the expenditure on construction of residential houses and other buildings is taken on investment side, no change from disinvestment to investment position is noticed among medium and small cultivators.
Table 7.27 gives the frequency distribution of selected cultivators according to net investment and disinvestment, and value of gross produce groups.
It is observed that 41 families reported investment, 64 families disinvestment and 14 families neither investment nor disinvestment and in case of one family investment and disinvestment balanced each other. In the upper strata cultivators, the investment was shown mostly by those families who fell in the gross produce group of Rs 1,000 and Rs 3,000, and disinvestment mostly by those who fell in the

CAPITAL EXPENDITURE 91
gross produce group of Rs 200 and Rs 400, and Rs 600 and Rs 1,000. Five upper strata cultivators belonging to the gross produce group of Rs 600 and Rs 1,000 reported neither investment nor disinvestment.
TABLE 7.27-FREQUENCY DISTRIBUTION OF SELECTED CULTIVATORS CLASSIFIED ACCORDING TO NET INVESTMENT-DISINVESTMENT AND
VALUE OF GROSS PRODUCE [Intensive enquiry data ]
. NUMBER OF FAMILIES ACCORDING TO VALUE OF GROSS
PRODUCE WHICH SHOW NET INVESTlIIENT (+) AND NET DISINVESTMENT (-)
Strata Less than Rs 200- Rs 400- Rs 600- Rs 1,000- Rs 3,000 Rs 200 Rs 400 Rs 600 Rs 1,000 Rs 3,000 and above
1 2 3 4 0 6 ---Upper strata .........•....... -1 -12 -0 -13 -10 -3
+3 +4 +4 +4 +12 +4 o·
Lower strata .....•••....•.••• -6 - 8 -2 -4 - -+5 +4 - + 1 - -
o· 4· l@
·Reported neither invest mont nor disinvestment. @ Investment and disinvestment balanced each other.
In the case of lower strata cultivators, the investment was shown mostly by those families who had gross produce of value of less than Rs 200 and disinvestment mostly by those families who fell in the gross produce group of Rs 200 and Rs 400. Nine lower strata cultivators falling in the gross produce group of less than Rs 400 reported neither investment nor disinvestment. Only in the case of one lower strata cultivating family investment and disinvestment balanced each other.
It may be useful to review here our observations on capital expenditure. Insignificant proportion of rural families reported financial investment expenditure, capital expenditure in non-farm business and expenditure on purchase of land, while a relatively high proportion, about one-ninth of the rural families reported expenditure on purchase of livestock. Among the different iteInB of other capital expenditure in agriculture, expenditure on (1) purchase of implements, machinery and transport equipment, and (2) construction of farm houses, cattle sheds, etc., was reported by about one-sixth and one-eighth of the rural families, respectively. The rural families showed deficits in the economy as a result of heavier borrowings in comparison with capital expenditure in agriculture. The deficits were particularly high among medium and small cultivators. Overall deficits among cultivating, non-cultivating and rural families in the district lllIiy be studied in relation to the relatively heavy borrowings which these families resorted to on account of the scarcity conditions prevailing prior to the year of the Survey.

CHAPTER 8
CURRENT FARM OPERATIONS
In thiB chapter we diBCUB8 the data collected through intenBive enquiry in regard to the expenditure incurred by the selected cultivating families on various items connected with the operation of current farm bUBineBB and the receiptB therefrom. The data were collected only for the selected cultivating families Beparately for the two Bix-month periods, namely, April to September 1951 and October 1951 to March 1952. However, from the point of view of analYBis, the data for the full year April 1951 to March 1952 are diBcUBBed and the information for Bix-month period iB uBed only for Btudy of Beasonality of farm receiptB and expenses.
In Chapter 1, it has been obBerved that rice, gram, maize, wheat and Bugarcane were important cropB in the diBtrict. The total area under foodgrainB including pulseB constituted 92·6 per cent of the total area BOwn.
1.1 CURRENT FARM EXPENDITURE
The 'total farm expenseB' noted by us inclu~ed (1) value of seed and manure, both owned and purchased, (2) cash wages paid and value of paymentB made in kind to caBual, annual and permanent farm BervantB, village artiBans and others, (3) value of fodder and other cattle feed purchased, paymentB made for grazing facilities and rent paid for pastures, (4) rent in cash or kind paid to landlords and share in kind paid to co-sharerB, (5) cost of maintenance and repairs of implements and machinery, (6) hire chargeB for implements and bullocks, (7) marketing charges including tranBport, (8) land revenue and other ceBBes, etc. No attempt was made to evaluate the family labour employed and hence 'total farm expenses' do not include the Bame. Similarly, no charges for services of owned draught cattle were added nor was any ad hoc allowance made on that account. The cost of owned fodder conBumed on farm haB alBo not been taken into account under total farm expenBes; only paymentB made in cash have been included, kind payments as well &8 the value of owned Beed, manure, etc., have been excluded.
As the purpose of our Btudy was not directed either to farm COstB or farm management, the collection of data regarding farm expenditure was not done in as great a detail as would be required in studies which have thoBe objects primarily in view. However, the data are of intereBt not only for general study of the farm economy but also in relation to the volume of expenditure and the Bize of the potential credit requirement.
Table 8.1 showB the current farm expenditure both in cash and kind for the upper strata and lower Btrata cultivatorlJ separately.

I.
2.
CURRENT FARM OPERATIONS
TABLE 8.I-CURRENT FARM EXPENDITURE-DETAILS
[Intensive enquiry data.]
93
tJPPER STRATA LOWER STRATA ALL CtJl.TIVATOBS
Propor. Propor-Average tion of Average tion of
Item expen- total ex pen- total diture current diture current
per farm per farm family expen- family expen-
diture diture
(Rs) (Per cent) (Rs) (Per cent) 1 2 3 4
Cash expenditure on: 1·1 Seed ...•.......... 28·1 2·2 29·3 11·3 1·2 Manure ............ 16·1 1·3 0·3 0·1 1·3 Fodder .•.........• 122·5 9·6 30·4 11·8 1·4 Wages ............. 58·0 4·5 20·9 8·1 1·5 Other cash expen-
diture@. _ ........ 294·5 23·0 75·2 29·1
Total current cash farm expenditure@ _ . 519·2 46·6 156·2 60·5
Expenditure In kind on:
2·1 Seed __ .......... _. 193·2 15·1 15·2 5·9 2·2 Manure ........... _ 27·3 2·1 7·0 2·1 .2·3 Disposals in kind ..• 296·4 23·2 78·0 30·2 2·4 Wages in kind other
than at harvest time'U •.•........• 241·7 18·9 2·0 0·8
Total current farm kind expenditure'U ... 758·5 59·4 102·1 39·5
Total current farm expenditure .••••.... 1,277·7 100·0 258·3 100·0
@ Includes cash expenditure on purchase of grain for payment of wages. 'U Excludes cash expenditure on purchase of grain for payment of wages.
Propor-Average tion of expen- total diture current
per farm family expen-
ditllnl
(Rs) (Per cent) 5 6
28·7 3·1 8·2 1·1
76·5 10·0 39·5 5·1
184·9 24·1
337·7 44·'
104·2 13·6 17·1 2·2
187·2 24·4
121·9 15·9
430·3 56·'
768·0 100·0
For the district as a whole, the current farm. expenditure per cultivating family worked out to Rs 768 of which 44 per cent was incurred in cash and the remaining 56 per cent in kind.
Among the upper strata cultivators, current farm expenditure per family worked out to Rs 1,278 of which Rs 519 or 40·6 per cent was incurred in cash, while the remaining amount of about Rs 759 or 59·4 per cent was incurred in kind. Of the various items of expenditure in cash, 'other cash expenditure' and purchase of fodder amounted to Rs 294·5 and Rs 122·5 per family constituting 23·0 per cent and 9·6 per cent, respectively, of the total current farm expenditure. Cash expenditure on account of purchase of seed, manure and payment of wages accounted for 2·2 per cent, 1·3 per cent and 4·5 per cent, respectively, of the total expenditure.

94 MONGHYR
In the case of lower strata cultivators, the total current farm expenditure per family worked out to Rs 258·3 of which three-fifths was expended in cash and twofifths in kind. The proportion of the total cash farm expenditure to the total current farm expenditure was higher at 60·5 per cent among lower strata cultivators than among upper strata cultivators. This was due to the fact that the families belonging to the lower strata cultivators had to purchase seed and fodder from the open market whereas families in the upper strata cultivators could depend on their own stock of grains.
It is also observed that 'other cash expenditure' amounted to Rs 294·5 per family in the upper strata cultivators and Rs 75·2 per family in the lower strata cultivators accounting for 23·0 per cent and 29·1 per cent, respectively, of the total current farm expenditure. The item' other cash expenditure' comprises expenditure on thirteen specified items such as land rent, land revenue and other agricultural charges, salaries to annual or permanent farm servants, etc. Table 8·2 shows the expenditure on thirteen specified items of 'other cash expenditure' among the upper strata and lower strata cultivators.
, TABLE I.2-0THER CURRENT CASH FARM EXPENDITURE
[ Intensive enquiry data_ Amount in rupees per family]
I All cultivators UPPER STRATA LOWER STRATA
Item
(Rs) (Per cent) (Rs) (Per cent) (Rs) (Per cent) I 2 3 4 0 6
1. Cash contributions to tenants, co-sharers and partners •. __ .. - _ .. _ .. - no·o 37-5 22-7 30-1 66-6 36·0
2. Purchase of materials for farming· . • . . ...... 2-3 0-8 0-7 0-9 1-5 0-8
3. Maintenance and repairs of implements and machinery ... _. _ .. _. 8-0 2-9 2·6 3·5 5·5 3-0
4. Hire of implements and bullocks .•. ___ ... _ .. 6-6 2-2 3-4 4-5 5-0 2·7
5. Transport charges for marketing .•.•••.. _. 0·2 0-1 0-5 0·7 0-] 0-2
6. Sale commissions •••... - - - - - -7. Storage and other
marketing costs. _ .... 2-3 0·8 - - 1-1 0-6 8. Salaries paid to annual
or permanent farm 5-3 7·1 servants .. _. _ ... _. _. 15-5 - - 4-2
9. Cash rent paid to land-lord_. _ .. - - _ .... - - _. 37·1 12·6 6·6 8·8 21-' 11·8
10. Land revenue and other agricultural charges .• 13-0 4·4 0-7 0-9 6-' 3-7
11. Interest paid on loans._ 22-1 7·5 0·2 0-3 11-2 6-1 12. Purchase of agricultural
commodities for pay-ment of wages in kind. 41·1 13·9 24-1 32·0 ]2-6 17-6
13. Other cash farm • expenses_ •......•... 35-4 12-0 13-8 18-3 24-6 13·3
Total expendIture ....... 294-5 100-0 75-2 100-0 184-' 100·0
• Otber than seed, manure and fodder.

CURRENT FARM OPERATIONS 95
Both in the upper strata and lower strata cultivators, four items, namely, (1) cash contributions to tenants, co-sharers and partners, (2) purchase of agricultural commodities for payment of wages in kind, (3) other cash farm expenses and (4) cash rent paid to landlord were important. These items together accounted for 76·0 per cent and 89·2 per cent of the total 'other current cash farm expenditure' in the case of upper strata. and lower strata. cultivators, respectively.
In the case of upper strata cultivators, the average expenditure per family on account of cash contributions to tenants, co-sharers and partners amounted to Rs 110·5 representing 37·5 per cent ofthe total 'other current cash farm expenditure.' Purchase of agricultural commodities for payment of wages in kind, cash rent paid to landlord and other cash farm expenses together worked out to Rs 113·6 accounting for 38·5 per cent of the total' other current cash farm expenditure.' The expenditure on account of salaries paid to annual or permanent farm servants was also important among upper strata cultivators.
In the case of lower strata cultivators, the average expenditure per family on purchase of agricultural commodities for payment of wages in kind was Rs 24·1 accounting for 32·0 per cent of the total 'other current cash farm expenditure,' while cash contributions to tenants, co-sharers and partners amounted to Rs 22·7 representing 30·1 per cent of the total 'other current cash farm expenditure'.
It could be observed from Table 8.1 that among the different items of expenditure in kind, wages, expenditure on seed and disposals in kind were important. The proportions of expenditure in kind on seed and wages to the total current farm expenditure were much lower among lower strata. cultivators than among upper strata. cultivators, because the lower strata cultivators could not draw much on their stock for seed. and also employed family labour. The proportion of disposals in kind to the total current farm expenditure was 23· 2 per cent and 30· 2 per cent among upper strata and lower strata cultivators, respectively. The higher proportion of disposals in kind among lower strata. cultivators ma.y be on account of the batai system, which fact is also reflected in the higher proportion of rent share to landlord or co-sharer.
The item 'disposals in kind' comprised (1) rent share to landlord or co-sharer, (2) wages to labour for harvesting, etc., (3) remuneration to artisans and services and (4) other payments at harvest time. Table 8·3 shows the value of disposals in kind under each of the four heads among the upper strata and the lower strate. cultivators.
The two important items which constituted the disposals in kind among both upper strata. and lower strata. cultivators were (1) rent share to landlord or co-sharer and (2) wages to labour for harvesting, etc. The former accounted for 36·1 per cent and 49·6 per cent of the total disposals in kind among upper strata. and lower stra~ cultivators, respectively, whereas the latter accounted for 40·8 per cent and 31·0 per cent among upper strata. and lower strata. cultivators, respectively.

96
Item
1. Rent share to landlord or co-sharer ________ ....
2_ Wages to labour for harvesting. etc __ ... __ .
3_ Remuneration to artisans and services. _ ... _ .• _
4_ Other payments at har-vest time_. ___ . _ .....
Total dIsposals In klnd .. _
MONGHYR
TABLE 8.l-DISPOSALS IN KIND [Intensive enquiry data]
UPPER STRATA LOWER STRATA
Amount Propor- Amount Propor-per tion to per tion to
family total family total
(Rs) (Per cent) (Rs) (Per cent) 1 2 3 4
107·1 36·1 38-7 49-6
120·9 40·8 24·2 31-0
25·6 8·6 3·2 4·1
42·8 U·t) 11·9 15·3
196·4 100·0 78·0 100·0
8.1 CASH FARM RECEIPTS
All cultivaton
'Amount Propor-per tlon to
family total
(Rs) (Percent) 5 6
11·8 38,'
12·6 38·8
I .. · .. 7·7
17·] 14·'
187·1 100·0
In this section, we propose to consider the size of the cash receipts and the relative importance of the various sources of cash receipts. The cash receipts can be divided into two main groups, viz., (1) cash proceeds of sale of crops and fodder and (2) other cash receipts. The latter group included cash receipts from (1) sale of milk and milk products, (2) sale of poultry and poultry products, (3) sale of seed and plants, (4) sale of manure, (5) cash wages, (6) remittances, (7) carting, (8) cash rent, (9) interest received, and (10) other sources. Cash receipts did not include earnings from any subsidiary occupations other than those specifically mentioned above, in which the cultivators might have been engaged. Table 8·4 shows the amount of receipts from various sources and the relative importance of each of them.
In the case of upper strata cultivators, the total cash receipts per family amounted to Rs 993·6 or Rs 66' 2 per acre of sown area. Nearly 49 per cent of the cash receipts was accounted for by receipts from sale of crops and fodder. Another important source of cash receipts was cash wages which amounted to Rs 145·7 per family and accounted for about 15 per cent of the total cash receipts_ Remittances and receipts on account of interest on loans amounted to Rs 107·7 and Rs 114· 3 per family, respectively. These two items together accounted for about one-fourth of the total cash receipts. The receipts from sale of milk and milk products were very low at Rs 28 -6 per family accounting for about 3 per cent of the total cash receipts.
In the case of lower strata cultivators, the cash receipts from sale of crops and fodder were negligible_ This reHected the subsistence economy of small farms. As there was a failure of crops during the year preceding the Survey, perhaps in few cases the produce of the Survey year might have been utilized to replenish stocks. The proportion of cash wages earned by the lower strata cultivators accounted for about four-fifths of the total cash receipts. Receipts from sale of milk and milk

CURRENT FARM OPERATIONS 97
TABLE 8.~ASH RECEIPTS FROM SPECIFIED SOURCES [Intensive enquiry data]
Item
Total cash receipts ..•..•.
I. Sale of crops' and fodder •.
2. Sale of milk and milk products ••..........•
3. Sale of poultry and poultry products •.•..•
4. Sale of seed and plants ... 6. Sale of manure •••..•..• 6. Cash wages ..••...•••..• 7. Remittances •••.••....• 8. Carting ............•..• 9. Cash rent .............•
10. Interest .••••.........• II. Other sources •.•......•
Total current cash farm
UPPER STRATA. LOWER STRATA.
Amount per
family
Propor. Propor. tion to Amount tion to total per total cash family cash
receipts receipts __ ~(Rs~) __ I~(P_e_r~ce_n_t~)I_~(~Rs.)~_I~(~Pe~r~ce~n~t~)
1 2 3 4
99]·6 (66·1)·
485·7 (32·4)·
28·6
74·2 0·7
146·7 107·7 36·6 0·1
114·3
JOO·O
48·9
2·9
1·4 0·1
14·1 10·8 3·1
11·5
]10·7 (107·1)·
0·3 (0,1)·
40·6
7·0
261·1 11·9
JOO'O
0·1
13·0
2·3
80·8 3·8
All cultiYaton
Amount P~opo:. per tlon t
family total cash receipts
(R.) (Per cent) 5 6
651·1 (71·5)·
1·4]·0 (17·0)·
]4·6
40·7 0·4
198·4 59·7 18·1
57·1
JOO·O
37·3
,·3
,.J O·J
30·4 ,.J l·B
B·B
expenses. . . ........ ..... 519·1 5J·3@ 156·1 50·3@ ]]7·7 5J·B@
• Denotes the average per acre of sown area. @ Denotes the percentage of current cash farm expenses to total cash receipts.
products accounted for 13 per cent of the total cash receipts. The data clearly indicate that the lower strata cultivators in whose case the gross produce was about one-fifth of the gross produce among upper strata cultivators (vide Table 8.5) derive about 94 per cent of their cash receipts from wages and by sale of milk and milk products.
8,] SEASONALITY OF FARM BUSINESS OPERATIONS
An important aspect relating to the data on farm. business collected by us is that of the extent to which there was marked seasonality either in expenditure on farm. business or in receipts of the cash income by th~ cultivating families. The expenses of which we took special account in the intensive enquiry were only current farm. business expenses; other expenses such as those of family expenditure on consumption were not noted. The important issue in a consideration of seasonality is, therefore, the extent to which farm. business expenditure is seasonal, i.e., has to be incurred more during particular periods in a year rather than during others, and the extent to which cash receipts are s68.8onal, i.e., the extent to which they accrue more during one part or period of the year than in another. The seasonality of expenditure and of these receipts may establish a certain pattern of borrowings and repayments, also to the extent that the cultivators have to borrow for their normal expenditure in various seasons.

98 -MONGHYR
Seasonality of cash farm expenses is a function of the agricultural seasons and the types of crops grown by the cultivator. Whereas the seasonality of cash receipts is a function of maturity of crops and its availability for sale. In case the crops or combination of crops are grown during all the agricultural seasons, including the crops like vegetables which mature during short periods, farm expenses and farm receipts may be distributed evenly during the year; whereas if one crop, say, sugarcane is grown, as in some of the villages of North Monghyr, the farm expenses and the farm receipts may not be distributed evenly. Farm expenses may be concentrated in one part of the year while the farm receipts in another part of the year.
Other cash receipts such as those from sale of milk and milk produ.cts and wages, except to the extent they are derived from seasonal agriculturalla.bour are not equa.lly seasonal. It may, therefore, be expected that the total cash receipts, for example, of the lower strata cultivators who derive their income mainly from wages and sale of milk and milk products would not exhibit seasonality 80 marked as would be expected from the cash receipts of upper strata cultivators whose cash receipts comprised largely sale of crops and fodder. Table 8.5 shows the cash farm expenditure and cash farm receipts of the upper strata and lower strata cultivators during the two six-month periods covered by the Survey.
TABLE 8.S-SEASONALITY OF FARM BUSINESS OPERATIONS [Intensive enquiry data. Amount in rupees per family]
UPPER STRATA LOWER 8TRATA ALL CULTIV ATOB8
April- Octo· April April- Octo· April April- Octo· April Item ber ber ber Sept.
1961- 1951- Sept. 1951- 1951- Sept· 1951- 1951-ember March March ember March March ember March March 1951 1952 1952 1961 1952 1952 1951 1952 1962
-1- 2 3 4 6 -6--7- -8--9-- -----------
Value of gross pro-duce ...•............ 468·1 1,]60·3 1,828·4 70·1 181·8 351·9 269·1 111·0 1,090·1
Current cash farm expenditure ....... 361·7 157·5 519·1 131·3 14·9 156·1 146·5 91·1 337·7
Cash farm receipts from:
.1. Sale of crops and fodder •........... 49·6 436·2 486·7 0·1 0·2 0·3 24·8 218·2 243·0
·2. Sale of milk and milk products .•... 8·1 20·6 28·6 32·7 7·8 40·5 20·4 14·2 34·6
3. Sale of poultry and poUltry products •.. - - - - - - - - -
4. Sale of seed and plants ............ 35·5 38·7 74·2 - 7·0 7·0 17·8 22·9 40·7
5. Sale of manure ..... 0·7 - 0·7 - - - 0·4 - 0·4 6. Cash wages .••••... 82·9 62·8 145·7 135·9 115·2 251·1 109·4 89·0 198·4 7. Remittances •••••.. 33·1 74·6 107·7 11·1 0·7 11·9 22·1 37·6 59·7 8. Carting ........... 27·1 9·4 36·5 - - - 13·5 4·7 18·2 9. Cash rent ......... - 0·1 0·1 - - - - - -
10. Interest ...•...•... 37·9 76·4 114·3 - - - 18·9 38·2 57·1 11. Other sources ••.•.. - - - - - - - - -
Total ............... 174·9 718·7 993·6 179·8 130·' 310·7 n7·3 414·8 651·1

CURRENT FARM OPERATIONS 99
It would be observed that a greater proportion of current cash farm expenditure was concentrated in the period, April to September, while cash farm receipts from 88.1e of crops and fodder were concentrated mostly in the period, October 1951 to March 1952. In the case of the upper strata cultivators, average current cash farm expenditure per family was Rs 361· 7 in the first half of the period and Rs 157·5 per family in the second half of the period; the expenditure in the latter period being less than even half the expenditure incurred during the former period. In the case of families in lower strata, the current cash farm expenditure per family worked out to Rs 131·3 in the first half of the period and in the second half of the period it was Rs 24·9 which is nearly one-fifth of that in the first half of the period.
Similarly, a marked seasonality is noticeable in the flow of cash receipts from 88.1e of crops and fodder. In the case of upper strata cultivators, the receipts from 88.1e of crops and fodder were Rs 49·5 in the first half of the period and the receipts increased nearly to nine times in the second half of the period. The receipts from 88.1e of crops and fodder among the lower strata cultivators were negligible in both the periods. Among other cash receipts, the receipts on account of interest in the case of upper strata cultivators were larger in the second half of the period than in the first half of the period. The receipts among lower strata cultivators did not show any marked seasonality, as a larger proportion of the receipts comprised cash wages.
The seasonality in expenditure as observed during April to September 1951 would have a definite bearing upon the borrowings, especially for current farm expenditure. Table 8.6 gives the data on borrowings as a source of finance for current cash farm expenditure among upper strata and lower strata cultivators during the two six-month periods.
The data indicate that the borrowings as a source of finance were important during April to September 1951. During this period, the proportion of total current cash farm expenditure financed from borrowings was 13·1 per cent for cultivators. The proportion was higher among lowe~ strata cultivators than among upper strata cultivators indicating that the borrowings as a source of finance for current cash farm expenditure were more important for the lower strata cultivators during April to September 1951 than for the upper strata cultivators .
•. 4 SOURCE OF FINANCE FOR CURRENT CASH FARM EXPENDITURE
Table 8.7 shows the different sources of finance for the various items of current cash farm expenditure among the upper and lower strata cultivators.
It may be observed that in the case of upper strata cultivators about 91 per cent of the total current cash farm expenditure was financed from current income, while about 8 per cent was financed from borrowings. Whereas in the case of lower strata cultivators about 79 per cent of the total current cash farm expenditure was financed from current income and about 15 per cent of the expenditure was financed from borrowings. Both the upper strata and lower strata cultivators did not resort

100 MONGHYR
TABLE 8.6-BORROWINGS AND CURRENT CASH FARM EXPENDITURE [Intensive enquiry data. Amount in rupees per family]
UPPED. S1:II.A.T .... _ LOWER STRATA
April to October 1951 to April to September 1951 March 1952 September 1951
Propor- Propor- Propor-tion of tion of tion of expen- expen- expen-diture Average diture Average diture Average
financed expen- financed expen- financed expen-Item from diture from diture from diture
borrow- financed borrow- financed borrow- financed ings to from ings to from ings to from
the total borrow- the total borrow- the total borrow-expen- ings expen- ings expen- ings diture diture diture on this on this on this
item item item (Per cent) (Per cent) (Per cent)
1 2 3 4 5 6
Purcha.se of seed •...•.. __ ... 1·8 2-2 - - 14-3 4-2 Purcha.se of ma.nure ...••••.. - - - - - -Purchase of fodder. _ .••. _ ... 5·8 4·9 0·3 0-1 10·0 2·4 Cash wages ................. 12·0 5·5 0·8 0·1 24·5 0·1 Other cash expenditure ••.•.• 15-0 28-1 - - 21·6 12·3
Total current cash farm I expenditure ............. 11·3 .·7 O·J 0·2 J8·4 24·1
LOWED. STRATA ALL CULTIVATORS
October 1951 to April to October 1951 to March 1952 September 1951 March 1952
Propor- Propor- Propor-tion of tion of tion of expen- expen- expen-diture Average diture Average diture Average
financed expen- financed expen- financed ex pen-Item from diture from diture from diture
borrow- financed borrow- financed borrow- financed-ings to from ings to from ings to from
the total borrow- the total borrow- the total borrow-expen- ings expen- ings expen- ings diture diture diture on this on this on this
item item item (Per cent) (Per cent) (per cent)
7 8 9 10 11 12
Purcha.se of seed .•• _ .......• - - 11·1 3·2 - -Purcha.se of manure ....••... - - - - - -Purchase of fodder. _ •.•....• - - 6·6 3·6 - -Cash wages ..... _ .....•....• - - 15-9 5·3 - -Other cash expenditure .••••• - - 16-6 20·2 - -Total current cash farm
expenditure ............. - - J3.J 32-4 - -

CURRENT FARM OPERATIONS 101
to past savings and sale of assets for financing their current cash farm expenditure. About nine-tenths and seven-tenths of 'other cash expenditure' in the case of upper strata and lower strata cultivators, respectively, were financed from current income.
TABLE 8.7-50URCE OF FINANCE FOR CURRENT CASH FARM EXPENDITURE [ Intensive enquiry data. Amount in rupees per family]
CURRENT INCOME BORROWINGS
Item Upper Lower All cultl- Upper Lower strata strata vators strata strata
I 2 3 4 5
Purchase of seed •••••••.... 25·8 25·1 25·" 2·2 4·2 (91·8) (85,7) (88·8) (7·8) (14·3)
Purchase of manure ....•..• 16·1 0·3 8·2 - -(100·0) (100·0) (100·0) (- ) (- )
Purchase of fodder •••••....• 117·6 27·9 11·8 4·9 2·4 (96·0) (92·1) (95·2) (4·0) (7·9)
Cash wages ................ 52·4 15·8 ]4·1 5·6 5·1 (90·3) (75·6) (86·3) (9,7) (24·4)
Other cash expenditure •.••.. 262·5 53·5 158·0 28·1 12·3 (89·1) (71·1) (85·5) (9·5) (16·3)
Total current cash farm expenditure ...........• "7"·] 122·7 298·5 .co·8 2"·1
(91·3) (78·5) (88·4) (7·9) (15·4)
OTHER SOURCES Total
Item Upper Lower All cultl- Upper Lower strata strata vators strata strata
7 8 9 10 II
Purchase of seed ........... 0·1 - - lB· I 29·] (0,4) ( -) (- ) (100·0) (100·0)
Purchase of manure .•••.•.. - - - - 16·1 0·] (-) (- ) (- ) (100·0) (100·0)
Purchase of fodder ......... - - - 122·5 ]0·4 (-) (-) (- ) (100·0) (100·0)
Cash wages ••.............. - - - 58·0 20·' (-) (- ) (- ) (100·0) (100·0)
Other cash expenditure •..... 4·0 9·5 6·7 2'''·5 75·2 (1,4) (12·6) (3·6) (100· 0) (100·0)
Total current cash farm expenditure ............ ". I '·5 6·7 519·2 156·2
(0·8) (6,1) (2·0) (100·0) (100·0)
(Figures within brackets denote percentages to total expenditure on the item.) Note: Past savings and sale of assets as sources of finance were not reported.
All cultl-vators
6
]·2 (11·l)
-(-) ]·7
(4·8) $."
(13·7) 20·2
(10·9)
]2·" (9·6)
All cultl-vators
12
lB·7 (100·0)
8·2 (100·0)
76·5 (100·0)
]'·5 (100·0)
l&.c·' (100·0)
]]7·7 (100·0)
8.5 DISTRIBUTION OF CULTIVATORS CLASSIFIED ACCORDING TO GROSS PRODUCE GROUPS, MAJOR CROPS, ETC.
In this section, we discuss the distribution of the selected cultivators, the data. in respect of whom were classified into six different categories, viz., (1) upper and lower

102 MONGHYR
strata cultivators, (2) value of gr088 produce of farm, (3) proportion of value of gro88 produce of cash crops to value of total gross produce, (4) major crops, (5) rent paid to landlord or share to co-sharer as percentage of value of total gross produce, (6) owning land or not. The classification of cultivators owning land or not is not important in the district, as all the selected cultivators were owners of land. The classification according to upper strata and lower strata cultivators has already been discUBBed in the preceding chapters, and we now propose to discU88 briefly the remaining cl888ifications. The relevant data are given in Table 8.8.
TABLE 8.8-COMPOSITIO N OF CULTIVATORS ACCORDI NG TO GROSS PRODUCE, CASH CROP, MAJOR CROP AND RENT TO LANDLORD, ETC.
[ Intensive enquiry data ]
GROSS PRODUCE GROUP
Value of grou produce of farm
Nil .•.......................•..• Less than Ra 200 ................ . Rs 200 - Rs 400 .•••••.....••.••. Rs 400 - Rs 600 ....••.••••.••..• Rs 600 - Rs 800 •..•....••..••..• Rs 800 - Rsl,OOO .............. . Rs 1,000 - Rs 2,000 .........•..... Rs 2,000 - Rs 3,000 .............. . Rs 3,000 - Ra 4,000 ...........•... Rs 4,000 - Rs 5,000 .............. . Ra 5,000 and above •..............
MAJOR CROP GROUP
Proportion of families (Per cent)
17·8 27·7 8·7
12·5 11·1 15·8 2·6 1·3
2·5
Proportion Major crop of families
(Per cent)
Rice..................... .•. .••. 42·7 Wheat. ........... ... ........... 9·9 Millets .••..................•...• Gram........................... 14·6 Other pulses •..... '. • . . . . . • . . . . . . . 3·8 Groundnut .•...................• Other oilseeds .................. .. Sugarcane. • . . . . . • . . . . . . . . • . . . . . . 2·4 Cotton or jute ................... . Tobacco ........................ . Other crops ............ ,......... 26,6
8.5.1 Gross produce
CASH CROP GROUP
Proportion of value of gross produce of cash crops to value of
total gross produce
Nil ..........................•.. LeBB than 10 per cent • ••••.•••..••. 10 - 20 per cent • •••.•.•.•••..•.•. 20 - 30 per cent ..••.............. 30 - 40 per cent • •••.•.••....•.... 40 - 50 per cent • •.•....•....•...• 50 - 60 per cent . •••..••.•...•.•.. 60 - 70 per cent • •••...•.•......•. 70 - 80 per cent • •••..•........••. 80 - 90 per cent • •••.•..•.•.••••.. 90 per cent a7Ul above •••. •••••••••.
Proportion of families (Per cent)
62·6 13·6 9·7 7·5 2·4 1·4 0·2 2·5
0·1
RENT TO LANDLORD GROUP
Rent paid to landlord, or share to co·sharer as percentage of value of
total gross produce
Nil ............................ . LUll than 5 per cent . ............. .
5 -10 percent ••••••...•.•.••••• 10 - 20 per cent • .•••..••••••••••. 20 - 30 per cent • ................. 30 - 40 per cent • ••••..•.........• 40 - 50 per cent ................. . 50 - 60 per cent • ••............•. , 60 - 70 per cent • •••..•.••...••.•• 70 - 80 per cent • .••......•.•... , • 80 per cent a7Ul above • • , .......•...
Proportion of families (Per cent)
34·9 32·5 3'9 5·2 9·8 9·8 3·9
According to gr088 produce cla88ification, about 46 per cent of the cultivating families reported gross produce below Rs 400, while about 21 per cent of the families reported gr088 produce between Rs 400 and Rs 800 and about one-tenth of the cultivQ.ting families reported gross produce between Rs 800 and Rs 1,000.
8.5.1 Cash crop Classification of the cash crop shows that little more than three-fifths of the
cultivators did not report any cash crop, while about three-tenths of the cu1tivating

CURRENT FARM OPERATIONS 103
families reported less than 30 per cent of the value of the gross produce of cash crops to the total value of the gross produce.
'.5.3 Major crop
The classification of cultivators according to major crop grown shows that about 43 per cent of the families reported rice, about 10 per cent reported wheat and about 15 per cent reported gram 8.8 their major crop.
'.5." Rent paid to landlord or share to co-sharer
According to the cla.ssification of the proportion of the rent paid to landlord or share to co-sharer to the total value of the gross produce, it is noticed that about 35 per cent of the families did not pay any rent to landlord or share to co-sharer, while about one-third of the families paid rent at less than 5 per cent of the total value of gross produce. About one-fourth of the families reported payment of rent varying between 10 and 40 per cent of the total value of gross produce. None of the families paid 50 per cent or more rent of the total value of gross produce.
'.6 INTER.VILLAGE VARIATIONS
Table 8.9 gives the village-wise data regarding the disposals in kind and current ca.sh farm expenditure.
'.9-CURRENT CASH FARM EXPENDITURE AND DISPOSALS IN KIND IN THE SELECTED VILLAGES: ALL CULTIVATORS
[Intensive enquiry data. Amount in rupees per family]
DISPOSALS IN lUND
Total current Rent Remune- Other cash share to Wages to ration to payments Total Village farm landlord labour for artisans at disposals expendl. or co- harvest- and harvest In kind ture sharer ing, etc. services time
1 2 3 4 5 6
Bari Balia .................. n"·1 250·0 37·8 3·6 11·7 303·0 Chakmansingh .•.........•.. 85·6 8·8 7·5 2·3 5·1 13·7 Maniappa ..•. : ............. 252·6 26·0 50·6 7·3 17·3 101·2 Mubarakchak ............... .. 13·0 - 38·8 10·3 7·9 57·0 Bangama ..................• m·5 178·3 39·1 5·9 22·8 246·1 Dira Harwa •..............• 164· .. 10·8 15·0 1·2 9·2 36·2 Luxmipur .................. 481·7 - 92·7 21·7 30·3 144·6 Pahasa.ra ................... .. ,4·0 102·7 148·4 29·9 49·2 330·2
District ..•................ 337·7 n·8 n·6 I .. · .. 27·3 187·2
For the district as a whole, the total disposals in kind and the total current cash farm expenditure worked out to Rs 187·2 and Rs 337'7, respectively. Of the total disposals of Rs187·2 per family, the rent share to landlord or co-sharet;.and wages to labour for harvesting accounted for about Rs 73 each per family.
Total disposals in kind per family were highest at Rs 330·2 in Pahasara and the village next in importance was Bari Balia. The level of disposals in kind was

104 MONGHYR
comparatively low in Chakmansingh, Dira Harwa and Mubarakchak. The disposals in kind in Pahasara and Bari Balia were high on account of cultivators reporting high rent share to landlord or co-sharer in Bari Balia and wages to labour for harvesting in Pahasara. The comparatively low level of disposals in kind in Chakmansingh, Dira Harwa and Mubarakchak may be seen from the fact that in Chakmansingh and Mubarakchak most of the cultivators were also engaged in non-agricultural professions, while the overall agricultural economy of Dira Harwa was relatively undeveloped.
Current cash farm expenditure per family was highest at Rs 494·0 in Pahasara and lowest at Rs 85·6 in Chakmansingh. The expenditure per family was above Rs 400 in three villages, namely, Pahasara (Rs 494·0), Luxmipur (Rs 481·7) and Mubarakchak (Rs 413 ·0). Comparatively high current cash farm expenditure in these villases was mainly on account of the upper strata cultivators who reported high expenditure.
Perhaps an important point which needs to be mentioned at the conclusion of this chapter is that the overall economy of Monghyr is one of subsistence level and the data are to be viewed and interpreted in the context of this background. The degree of monetization which we have defined broadly for our purpose as the proportion of cash expenditure to the total farm expenses is less characterized among upper strata cultivators than among lower strata cultivators. Another point which may also be worthwhile to mention is that the major source of cash receipts among upper strata cultivators W88 sale of crops and fodder while among lower strata cultivators it was cash wages, as in their case the receipts from sale of crops and fodder were negligible.

CHAPTER 9
CREDIT AGENCIES
In this chapter, an assessment of the role of various agencies supplying credit in rural areas to the cultivators and non-cultivators both on the basis of the data collected in the General Schedule and intensive inquiry is attempted, while in the succeeding chapters, the relative importance and the operations of the three major credit agencies, viz., Government, co-operatives and private agencies have been discussed. Information regarding the type of agency from which loans were taken during the year or to which loans were outstanding at the end of the year was collected for all rural families in the General Schedule and for the sample of cultivating families in the intensive enquiry. Information was also collected from each type of credit agency regarding its transactions and methods of operations.
The agencies which supply credit have been classified into nine classes, viz., (1) Government, (2) co-operatives, (3) relatives, (4) landlords, (5) agriculturist moneylenders, (6) professional moneylenders, (7) traders and commission agents, (8) commercial banks, and (9) others.
All borrowings from Government through various Departments and under various schemes were considered together in one class. Borrowings from different types of co-operative institutions, primary and central, credit and non-credit, were all treated as borrowings from co-operatives. All interest-free loans given to borrowers by their relatives were treated separately; interest-bearing loans borrowed from relatives were put in the appropriate class of private agency to which the relatives belonged such as the agriculturist moneylender, the professional moneylender, etc. Loans from landlords were classified separately and covered those loans which were given by landlords to their own tenants. An agriculturist moneylender was defined as one whose major profession was agriculture and whose moneylending business was of comparatively minor importance. The category of professional moneylenders was defined to include those who earned a substantial part of their income from moneylending and could not be classified as agriculturist moneylender. Borrowings from persons who were, in the main, traders and commission agents, were put in a separate class referred to hereafter as traders. Borrowings from all banks, scheduled and non-scheduled, including the then Imperial Bank of India, were classified as borrowings from commercial banks. In a separate class, namely, 'others' were included borrowings from agencies other than those mentioned above.
9.1 BORROWINGS AND CREDIT AGENCIES Table 9. 1 gives the data on borrowings of cultivating, non-cultivating and
rural families and also of four classes of cultivating families from various credit agencies.

106 MONGIIYB
TABLE 9.I-BORROWINGS CLASSIFIED ACCORDING TO CREDIT AGENCY [General Schedule data. Amount in rupees per romily]
Big Large Medium Small All Non- All culti- culti- culti- culti- culti- culti- fam iii e. Credit agency vators vators vators vators vators vators
1 2 3 4 5 6 7
(}overnment ••.......... 26 19 10 2 10 1 6 (3·6) (4·6) (5·1) (2·2) (4·5) (1·1) (J·9)
Co-operatives .••••...... - 1 - - - - -(0·1) (0·2) (0·1) (-) (0·1) (-) (0·1)
Relatives •.............. 95 39 8 6 17 4 II (13·1) (9·3) (4·2) (6·9) (7·3) (6·1) (7·1)
Landlords- _ • _ •......... 19 30 19 11 20 17 19 (2·6) (7·3) (9·7) (13·5) (8·8) (28·6) (1.2·4)
Agriculturist money-lenders •.............. - - - - - - -
(-) (-) (-) (-) (-) (-) (-) Professional money-
lenders ............... 582 327 163 62 182 38 114 (80·8) (78·6) (80·9) (76·2) (79·1) (63·5) (76·.2)
Traders and commission agents .. _ .•.......... - - - - - - -
(-) (-) (-) (-) (-) (-) (-) Commercial banks ....... - - - - - - -
(-) (-) (-) (-) (-) (-) (-) Others ..•.•............ - - - 1 1 - -
(-) (-) (-) - (1·2) (0·2) (0·7) (O·J)
Total ................. nl 416 201 81 no 59 149 (100·0) (100·0) (100·0) (100·0) (100·0) (100·0) (100·0)
- To tenants only. (FIgures wlthm brackets denote percentages to tota!.)
The average amount borrowed during the year was Rs 149 per family in the case of rural families, Rs 59 per family in the case of non-cultivators and Rs 230 per family in the case of cultivators. Of the average amount of Rs 230 borrowed by a cultivating family, Rs 182 or 79 per cent were from profe88ional moneylenders, and Rs 37 or 16 per cent from relatives and landlords. The borrowings from cooperatives were negligible and the borrowings from Government, though little, were relatively high. In the distribution of even this small volume of borrowings from Government among four classes of cultivators, a larger proportion went to big, large and medium. cultivators. The amounts borrowed per family from Government by small cultivators were one-thirteenth, one-tenth and one-fifth of those borrowed by big cultivators, large cultivators and medium cultivators, respectively.
Table 9.2 gives the data regarding borrowings from and debt owed to various credit agencies by the cultivators.
The data reveal that 49·3 per cent of the cultivating families borrowed from profeBSional moneylenders and borrowings from this agency constituted about 79 per cent of their total borrowings. The other important credit agencies were landlords, relatives and Government. Landlords and relatives together accounted for about 16 per cent of the total borrowings.

CREDIT AGENCIES 107
TABLE 9.2-RELATIVE IMPORTANCE OF CREDIT AGENCIES-CULTIVATORS [ General Schedule data 1
BOBROWINGS DICBT
Proportion Proportion Proportion of borrow- of debt of families ings from Average
owed to Average Credit agency reporting this agency this agency
borrowings to the total borrowing!! to the total debt per
from this borrowings per family debt owed family
agency from all to all agencies agencies
(Rs) (Per cent) (Per cent} (Rs) (Per cent) 1 2 3 4 5
Government .•. _ ...........•. 6-9 4-S 10 S-l 21 Co-operatives .. _ .. _ .........• 0-1 0-1 - O-S· 2· Commercial banks_ ••.•• _ .•.•• - - -Relatives ............ _ . __ ..•. 6·3 7-3 17 4·9 20 Landlords .. _____________ • _ •. 7-0 8-8 20 14·0 57 Agriculturist moneylenders ..••. - - - - -Professional moneylenders ...•• 49-3 79-1 182 7S-4 304 Traders and commission
agents ••...•....... _ ....•. - - - - "-
Others •••.......•.... _. _ ..•• 2-1 0-2 1 0·1 -Total ...... _ ............... 63-4 100-0 130 100-0 .....
• Including commercial banks.
Similarly about three-fourths of the debt of the cultivators was owed to professional moneylenders, while only one-seventh of their total debt was owed to landlords.
9.2 BORROWINGS FOR VARIOUS PURPOSES
The discu88ion ahove is based upon the borrowings during the year and debt at the end of the year. However, institutional credit agencies like Government and co-operatives give loans only for certain specified purposes; the role of different agencies in different types of loans may, therefore, differ widely. The data available in this connection relate to the reported purposes of borrowings. Thes~ data were classified according to each credit agency only for the selected cultivating families covered in the intensive enquiry. The loans borrowed by these families during the period covered by intensive enquiry and outstanding at the time of the second round of visits were classified into eight broad categories with reference to the purpose of borrowing. These categories included short-term and long-term under each of the three PurPoses, namely, agricultural, non-agricultural and consumption purposes. In this context, long-term agricultural purposes included medium-term agricultural purposes also. As is obvious that any classification of this type is subject to many limitations and that not all the reported loans under a purpose could necessarily fit in one category. However, in the classification adopted by us, (1) short-term agricultural purposes included purchase of seed, manure and fodder, payment of wages, rent, land revenue, cess and other charges, maintenance of irrigation resources, repairs and maintenance of implements, etc., (2) long-term agricultural purposes included purchase and reclamation of land, bunding and other land

108 MONGHYR
improvements, digging and repair of wells, development of other irrigation resources, laying of new orchards and plantations, purchase of livestock, implements, machinery and transport equipment, construction of farm houses, barns, cattle sheds, etc., (3) non-agricultural short-term purposes included non-farm business expenditure on current account, (4) non-agricultural long-term purposes included non-farm business expenditure on capital account, (5) short-term consumption purposes included purchase of household utensils, furniture, etc., medical expenses, educational expenses, purchase of clothing, shoes, bedding, etc., (6) long-term consumption purposes included construction and repairs of residential houses and other buildings, death, marriage and other ceremonies and litigation charges, and the two more classifications were repayments of old debts and 'other' purposes. Table 9.3 shows the borrowings of the selected cultivators from different credit agencies classified according to various purposes.
TABLE 9.J-PURPOSE·WISE ANALYSIS OF BORROWINGS OF SELECTED CULTIVATORS FROM DIFFERENT CREDIT AGENCIES
[ Intensive enquiry data. Amount in rupees per family]
I NON-AGRI-AGRICULTURAL
CULTURAL CONSl"MPTION
Repay-Total PUBPOSES PUBPOSES
borrow· PURPOSES ment
Credit agenoy of old Ings Short- Long- Short- Long- Short- Long- debts term term term term term term
--1--2- -3--4--5--6- -7--8----------- --
Government .•... , ..... 11·9 - - - - 9·3 - -(100·0) (-) (-) (-) (-) (78,2) (-) (-)
Co-operatives .......... - - - - - - - -(-) (-) (-) (-) (-) (-) (-) (-)
Relat.iVe8 .•. _ ... _ ...... 7·" 0·1 - - - 6·0 1·2 -(100·0) (0·7) (-) (-) (-) (80·1) (16·8) (-)
Landlords- •• ___ .. _ . _ .. 62·9 0·1 40·3 - - 10·8 7·3 -(100·0) (0,1) (64·1) (-) (-) (17,2) (11·6) (-)
Agriculturist money-lende", .• __ . _ .. _ ..... '·5 - - - - 1·1 1·0 -
(100·0) (-) (-) (-) (-) (11·6) (10-3) (-) Profe88ional money-
lenders .............. 48·1 7·3 4·6 - - 10·7 8·fI -(100·0) (15,1) (9·5) (-) (-) (22·3) (18·3) (-)
Traders and oommission agents ..... _ ........ - - - - - - - -
(-) (-) (-) (-) (-) (-) (-) (-) Commeroial banks •• _ .. _ - - - - - - - -
(-) (-) (-) (-) (-) (-) (-) (-) Others ••.... _ ......... 9·5 0·3 4·5 - - 1-6 0·1 -
(100·0) (2,6) (47,2) (-) (-) (16·9) (1·0) (-)
Total .•••... _ .......• 149· .. 7·7 49·4 - - 39·6 18· .. -(100·0) (5,1) (33·0) (-) (-) (26·5) (12,4) (-)
(Figures within brackets denote percentages to total borrowings from the specified agency.)
- To tenants only.
Other pur-poses
-9---2·6
(21·8) -
(-) 0·2
(2,4) 4-4
(7·0)
7-4 (18,1)
16·7 (34·8)
-(-) -
(-) 3·1
(32·3)
]4 ... (23·0)
It is observed that of the lIttle borrowings Which were from Government, about 78 per cent constituted borrowings for short-term consumption purposes and

CREDIT AGENCIES 109
the remaining for 'other' purposes. The high proportion of borrowings from Government which was reported to be for consumption perposes needs to be interpreted in the light of the scarcity conditions prevailing in the district.
An overwhelming proportion of the borrowings from relatives were for consumption purposes, of which about 80 per cent were accounted for by short-term consumption purposes, while about 17 per cent were accounted for by long-term consumption purposes. Sixty-four per cent of the borrowings from landlords were for long-term agricultural purposes and the remaining for consumption and other purposes. In the case of borrowings from profeBBional moneylenders, about 15 per cent were for short-term agricultural purposes and about 10 per cent for long-term agricultural purposes.
From the foregoing discuBBion it may be said that significant proportion of the borrowings from landlords and professional moneylenders were for agricultural purposes, while the borrowings from other agencies were for consumption purposes. About 82 per cent of the borrowings for long-term agricultural purposes were from landlords and about 9 per cent from professional moneylenders, while about 95 per cent of the borrowings for short-term agricultural purposes were from professional moneylenders and the remaining from relatives, landlords and 'other' agencies. Of the borrowings for short-term consumption purposes, about 27 per cent were each from landlords and professional moneylenders, about 24 per cent from Government and about 15 per cent from relatives. In the case of long-term consumption loans, the major portion of the borrowings were from professional moneylenders and landlords, the former accounting for about 48 per cent and the latter about 40 per cent.
9.J OUTSTANDING DEBT AND CREDIT AGENCIES
Table 9.4 gives the data on debt of cultivating, non-cultivating and rural families and offour classes of cultivating families owed to various credit agencies.
From the data, it is observed that the pattern of debt owed to different credit agencies does not substantially differ from that noticed in the case of borrowings. The only marked difference is that the volume of debt at the end of the year owed to Government, co-operatives and landlords is slightly higher than that in the case of the borrowings during the year.
9.4 OUTSTANDING DEBT CLASSIFIED ACCORDING TO VARIOUS PURPOSES
Table 9.5 shows the outstanding debt of the selected cultivators classified according to various purposes.
It is noticed that about 67 per cent of the debt owed to Government was for short-term consumption purposes, while only about 14 per cent was for long-term agricultural purposes and the remaining 19 per cent was for 'other' purposes. No debt was owed to co-operatives. Of the amount owed to other credit agencies, about 26 per cent was for agricultural purposes (preponderantly for long-term

110 MONGHYB
purposes) and about 61 per cent was for consumption purposes. Practically all the amounts outstanding for short-term and long-term agricultural purposes, long-term non-agricultural purposes, long-term consumption purposes and 'other' purposes were owed to credit agencies other than Government and co-operatives, while about 9 and 7 per cent of the amounts outstanding for short-term consumption purposes and 'other' purposes, respectively, were owed to Government.
TABLE 9.4--0UTSTANDING DEBT CLASSIFIED ACCORDING TO CREDIT AGENCY
[ General Schedule data. Amount in rupees per family]
Big Large Medium Small All Non· All culti· culti· culti· culti- culti- culti· fami-
Credit agency vators vators vators vators vators vators lies
I 2 3 4 5 --6- --7------- ------ ---
Government •••..•..•........... 41 38 21 3 21 1 II (3·8) (5·5) (6·0) (1·5) (5,1) (0·9) (4·J)
Co-operatives and commercial banks@ ..•.....•....•...••.. 2 I 5 - 2 - I
(0·2) (0,2) (1·3) H (0·5) H (0·4) Relatives .••••••................ 96 40 13 8 20 6 13
(8'7) (5,7) (3·8) (4'3) (4·9) (4'7) (4·8) Landlords ••.....•.•.••....•••.. 91 96 42 37 67 37 47
(8·3) (13·5) (12·0) (20·9) (14·0) (32·3) (17·8) Agriculturist. moneylenders ...••.. - - - - - - -
(-) H H H H (0·1) (-) Professional moneylenders •...•... 865 626 266 130 304 70 I'" (79·0) (75·1) (76·8) (72,7) (75·4) (61·3) (72·5) Traders and commission agents •.. - - - - - - -
(-) (-) H (0,1) H (-) H Others ••••..•.................. - - - 1 - 1 1
H (-) (0,1) (0·5) (0,1) (0·7) (0,2)
Total ......................... 1,096 700 347 17' 404 115 267 (100·0) (100·0) (100·0) (100·0) (100·0) (100·0) (100·0)
{Figures within brackets denote percentages to total.) @ Data on debt owed to co· operatives and commercial banks are not available separately.
In conclusion, it may be noted that the co.:operatives contributed a negligible proportion towards the borrowings during the year and to the debt outstanding at the end of the year, which may be studied in relation to the weak co-operative structure in the district. The role of Government was a little better than that of the co-operatives. Only about 7 per cent of the cultivating families reported borrowings from Government, while on the other hand, the proportion of the cultivating families borrowing from the professional moneylenders was 49 per cent. The borrowings of the cultivating families from Government barely constituted about 5 per cent of their total borrowings. About four-fifths of the borrowings from Government were for short-term consumption purposes, which needs to be interpreted in the light of the scarcity conditions prevailing in the district.

CREDIT AGENCIES 111
TABLt 9.5-PURPOSE-WISE ANALYSIS OF OUTSTANDING DEBT OF SELECTED CULTIVATORS FROM VARIOUS CREDIT AGENCIES
[Intensive enquiry data. Amount in rupees per family]
PROPORTION OF DEBT OWED TO THIS AGENCY TO THB
Total debt TOTAL DEBT OWED TO ALL AGENCIES FOR THB
Purpose-Duration outstanding SPBCIFIBD PUBPOSB
(Per centl Government Co-operatives Others
1 2 lJ 4
Agricultural purposes Short-term _ .•• _____ ..... __ 1·8 - - 100·0 Long-term ••• _ .......••...• n·s 2·8 - 91·2
Non-agricultural purposes Short-term ..••.........•.. - - - -Long-term ••..... _ •..•...•. 0·1 - - 100·0
Consumption purposes Short-term ...•.... ___ . _ .•• 101·8 9-4 - 90·6 Long-term ••.. _ .... __ ....... 76·2 - - 100-0
Repayment of old debts - - - -Other purposes ........•• 37·9 1·2 - 92·8
Total ..•............•.... 290· .. 4·' - 'S·l
PROPOBTION OF DBBT INCURBBD FOR THIS PURPOSE TO THB TOTAL
DBBT OWBD TO VARIOUS DBBT INCUBBBD FOB ALL PUR-AGBNCIBS POBBS nOM THB SPECIFIBD
Purpose-Duration AGBNCY
(Per cent) Govern- Co-opera- Othel'B Govern- Co-opera- Others ment tives ment tives
5 6 7 8 9 10
Agricultural purposes Short-term .•••. __ ........... - - 1·8 - - 0·1 Long-term .•................. 2·0 - 70·5 14·Z - 25·6
Non-agricultural purposes Short-term •..•.. _ . __ ... _ ..•. - - - - - -Long-term .•• __ ... ____ •... _ •. - - 0-1 - - -Consumption purposes Short-term _ .•• __ ..........•. 9·6 - 92·2 66·8 - 33·4 Long-term .••....... _ ... _ ... _ - - 76·2 - - 21·6
Repayment of old debts - - - - - -Other purposes .. _. _ .. __ ... 2·7 - 35·2 19-0 - 12-1
Total .................. _ ... I .. · .. - 276·0 100·0 - 100·0

CHAPTER 10
GOVERNMENT FINANCE
In this chapter, we propose to discuss brieHy the legal structure under which Government grant loans and give subsidies under the various Acts and schemes and also the data relating to Government finance collected during the Survey.
10.1 LEGAL STRUCTURE
Government provide finance in the shape of loans and subsidies under the following Acts and schemes:
(1) The Land Improvement Loans Act, 1883, and The Agriculturists' Loans Act, 1884,
(2) The Bihar Waste Lands (Reclamation, Cultivation and Improvement) Act, 1946,
(3) The Bihar and Orissa Natural Calamities Loans Act, 1934, and
(4) Minor Irrigation Schemes.
The main provisions of each of the Acts and schemes are set out below:
10.1.1 The Land Improvement Loan. Act, 1881, and The Alrlculturl.ts' Loan. Act, 1884
Under the Land Improvement Loans Act, 1883 loans are granted for effecting any improvement in land which adds to its letting value. The improvements included are:
(i) th& conskuetion of wells, tanks and other works for the stQrage ... supply. or distribution of water for the purposes of agriculture, or for the use of men and cattle employed in agriculture;
(ii) the preparation of land for irrigation;
(iii) the drainage, reclamation from rivers or other waters, or protection from Hoods or from erosion or other damage by water, of land used for agricultural purposes or waste land which is cultivable;
(iv) the reclamation, clearance, enclosure or permanent improvement of land for agricultural purposes ;
(v) the renewal or reconstruction of any of the foregoing works, or alterations therein or additions thereto ; and
(vi) such other works as the Government may, from time to time, declare to be improvements for the purpose of the Act".

GOVERNMENT FINANCE 113
The Agriculturists' Loans Act enables Government to give loans for relief of distress, purchase of seed or cattle or any other purpose not specified in the Land Improvement Loans Act but connected with agricultural objects.
Under the Land Improvement Loans Act, the Collector is competent to sanction loans upto Rs 2,000. The loans exceeding Rs 2,000 but upto Rs 5,000 require the sanction of the Commissioner, while loans above Rs 5,000 require the sanction of Government. In respect of the Agriculturists' Loans Act, the Subdivisional Officer can grant loans upto Rs 250 and the loans above it but upto Rs 700 are granted by the Collector. The loans above Rs 700 require the sanction of the Commissioner.
On receipt of an application for loans under any of the two Acts, the Collector or Subdivisional Officer first ensures that the application has been made or recorded in the prescribed form. If the grant of loan appears prima facie to be desirable, the Collector or Subdivisional Officer makes an enquiry or causes an enquiry to be made by an officer not below the rank of Kanungo, or by a reliable non-official agent, for the purpose of ascertaining several particulars such as the area of the land owned or occupied by the applicant, status of the applicant, that is, whether proprietor, tenure holder, etc., nature and value of immovable property offered as security, the pre-existing encumbrances on the property, names, status and means of sureties, suitable date for the repayment of first instalment with reference to the circumstances under which the loans are applied for, proposed instalments and period of repayment and the date on which the loan should be received by the applicant. In the case of a loan under the Land Improvement Loans Act, the estimated utility and the value of the work proposed to be undertaken, probable cost of the work, and the probable date on which the work will begin to yield profit are also required to be reported by the official conducting the enquiry. Particular care is also taken to ascertain what encumbrances there are on the land to be improved, and in case8 in which doubts arise, a notice is issued by the Collector or Subdivisional Officer, calling upon any person objecting to the loan, to appear before him at a time or place to be fixed in the notice and to submit his objections. Such notices are published by being fixed in a prominent place in the village in which the land to be improved is situated. Mter considering such evidences as the Gbjecting parties may produce, the Collector or Subdivisionsl Officer may admit the objections or overrule them.
Mter completion of the enquiry and the disposal of the objections, if any, the Subdivisional Officer sends the application to the Collector with his opinion as to whether the loan is to be sanctioned or not. In considering the application for a loan, the Collector is to decide (1) whether the need for the loan is established, (2) whether the security offered is sufficient, (3) what amount should be advanced, (4) the number of instalments and (5) what period is to be allowed before repayment commences~ The rules require the Collector to satisfy himself that the advance made to the cultivator is sufficient to cover so much of the total outlay required for the construction of the work as the borrower is unable to provide out of his own resources.
I

114: KONGIIYR
In the case of loans given under the Land Improvement Loans Act, where the amount of the loan does not exceed three-fourths of the value of the applicant's transferable interest in the land after carrying out the improvement no collateral security is required. Where this condition is not satisfied, further security consisting of transferable interests in other lands belonging to the applicant or to other persons willing to become his sureties or of personal security, is demanded. Lands which are not transferable without the landlord's consent are not ordinarily to be accepted as security. Where a body of five or more co-villagers bind themselves jointly and severally for the repayment of the loan, their personal I;!6curity will generally be sufficient, provided the loan does not exceed five times the annual rent of the land held by members of the group.
In the case of loans given under the Agriculturists' Loans Act, the loan may be given against the guarantee of a third party POBBessing transferable interest in the immovable property, provided the applicant does not himself have the transferable interest in immovable property; otherwise the transferable interest in immovable property of value sufficient to secure the loan is mortgaged.
The loans under the Land Improvement Loans Act are generally repayable in instalments within a period not exceeding 20 years, while the loans under the Agriculturists' Loans Act are repayable within one or two years. The dates for repayment of loans under both the Acts are fixed by the Collector with due regard to the dates of harvest of principal crops, and under the Land Improvement Loans Act the time when the profit begins to accrue. The ordinary rate of interest on both the types of loans is 61 per cent per annum.
Bya Government notification dated May 22, 1951, Monghyr was declared as one of the districts affected with distress. Special statutory rules for the grant of loans became applicable. The scale of finance under special rules of the Agriculturists' Loans Act was fixed as Rs 20 per acre for first 5 acres and Rs 15 per additional acre if the land was upto 10 acres. In case the land exceeded 15 acres, the rate was Rs 20 per acre for first 5 acres, Rs 15 per acre for next 10 acres and Rs 10 per acre for the remaining lands.
10.1.2 The Bihar Waste Lands (Reclamation, Cultivation and Improvement) Act, 1946
Under the Land Improvement Loans Act, 1883, the loans were generally given when the cultivator approached Government, whereas under the Bihar Waste Lands (Reclamation, Cultivation and Improvement) Act, Government empowered themselves to take possession of the waste or unproductive lands by notification and to arrange for their reclamation, cultivation and improvement in the prescribed manner at the cost of Government. Government after keeping the possession of the lands for a period not exceeding 10 years may direct the landlord or tenant by general or special order to take back the delivery of the land. The expenditure incurred by Government on the reclamation, cultivation and improvement under this Act may be recovered from the landlord or the tenant with interest rate not exceeding 3 per cent per annum.

GOVERNMENT FINANCE 115
10.1.3 The Bihar and Orissa Natural Calamities Loans Act, 1934
This Act enabled the Government to grant loans to owners of buildings which were damaged or destroyed by earthquakes or other natural calamities for purposes of construction or repairs of buildings.
10.1.4 Minor Irrigation Schemes The Minor Irrigation Drive was initiated in April 1948 by the Revenue Depart
ment in order to repair and extend the existing minor irrigation works, which had fallen into disrepair due to negligence of the landlords, and for the construction of new ones, wherever required.
The Collector or the Deputy Commissioner is responsible to Government for the execution of the projects under Minor Irrigation Drive in the district. The Collector can sanction schemes costing upto Rs 5,000 ; schemes costing more than Rs 5,000 but not exceeding Rs 10,000, require the sanction of the Divisional CommiBBioner; and schemes costing more than Rs 10,000 have to be sanctioned by Government. In the selection of the sites for the projects, the Collector is assisted by the District Irrigation Committee constituted under Bihar Private Irrigation Works Act, 1922. The Collector is the ex-o.f.JWio Chairman of the Committee. During 1950-1, Rs 12·0 lakhs were expended on these schemes.
10.2 GOVERNMENT AS THE CREDIT AGENCY In this section, the data collected by the field staff regarding the loans advanced
by Government for agricultural purposes are discussed. Table 10.1 shows the number and amount of loans sanctioned by Government during 1950-1 for agricultural purposes.
TABLE 10.I-GOVERNMENT FINANCE FOR AGRICULTURAL PURPOSES DURING 1950-1
[Amount in thou8&llds of rupees ]
APPLICATIONS APPLICATIONS PURPOSE roB WHICH BECEIVED 8Al'ICTIONED AMOUNT WAS BAl'ICTIONED.
Well District data digging Land
Num· Amount Num. Amount Amount Purchase and im· her applied her applied sane· of seed other prove·
tioned irriga. ment tion
I 2 3 4 5 6 7 8 ---Loans under the Land
Improvement Loans Act, 1883, or similar Acts in force ....••.• 312 250·9 59 70·9 49·2 .- - 49·2
Loans under the Agri. culturists' Loans Act, 1884, or simiIa.r Acts in force ..•......... 6,926 3,965·6 6,763 2,273'8 1,819'4 1,819·4· - -
Loans under the Grow More Food campaign - - - - - - - -
Cash subsidies under the Grow More Food camp&~ •••..•••.•. .. . . .. . . 355·2 - 355·2 -
• Includes the amount sanctIOned for purchase of draught ammals.

116 MONGHYB
Under the Land Improvement Loans Act, 1883, out of 312 applications received 69 or 18·9 per cent were sanctioned. The amount applied for was Rs 250·9 thousands of which Rs 49·2 thousands were sanctioned. Under the Agriculturists' Loans Act, the applications received were 6,926 of which 83· 2 per cent were sanctioned. The amount applied for was Rs 3,965'5 thousands and that sanctioned was Rs 1,819'4 thousands or about 46 per cent of the total amount applied.
The data on borrowings from and debt owed to Government was also collected through General Schedule in respect of cultivating, non-cultivating and rural families and four classes of cultivating families. The relevant data are given in Table 10.2.
TABLE 10.l-ROLE OF GOVERNMENT AS A CREDIT AGENCY [General Schedule data]
BORROWINGS DEBT
Propor. Borrow. Propor-tion of Borrow- ings from tion of
Group families ings per this families Debt per
borrowing agency &8 indebted from reporting percent- indebted family
Govern- family age of to Gov-
ment total bor- ernment
(Per cent) (&s) rowings (Per cent) (&s) 1 2 3 4 5
Big cuitivatol1l .............. 12·2 211 3·6 14·0 295
Large cuitivatol1l ............ 1·5 257 4·6 14·8 259 Medium cultivatol1l ...•.....• 9·4 109 5·1 13·8 150 Small cuitivatol1l •........... 3·3 54 2·2 3·0 91
All cuitivatol1l .••••......... 6·9 149 4·5 10·8 191 Non-cuitivatol1l •.•••........ 0·6 111 1·1 0·1 149
All families ••............. 3·9 147 3·9 '·0 188
Debt . owed to
this agency &I
percent-age of
the total debt owed
6
3·8
5·5 6·0 1·5
5·1 0·9
4·3
The proportion of the cultivating families borrowing from Government was 6·9 per cent and the average borrowings per reporting cultivating family were Rs149. Very few non-cultivators reported borrowings from Government. Even though the proportion of the borrowing families was relatively high among medium cultivators, the borrowings per reporting family were only Rs 109 among medium cultivators as against Rs 257 among large cultivators. The proportion of borrowings of medium cultivators from Government to their total borrowings was highest at 5·1 per cent.
The pattern of debt owed to Government was also similar to that of borrowings among various classes of cultivating families.
10.3 LOAN OPERATIONS
One hundred and thirty-four applications for loans from Government including 26 rejected applications were selected at random at the four subdivisional

GOVERNMENT FINANCE 117
headquarters for study. The discussion, in this section, on some aspects of Government loans is based upon the study of these applications.
TABLE 10.1-CASE·STUDIES OF LOANS: LOANS DISBURSED FOR VARIOUS PURPOSES
[Supply Schedule data]
Number of Percentage Amount Percentage loans disbUl'86d Purpose disbUl'86d to total to total
(Ra) 1 2 3 4
Purchase of livestock ..................... 48 44·4 17,970 44·9 Bunding and other land improvements ..•... 10 9·3 5,020 12·6 Purchase of seed .•••••••...••••.••......• 8 7·4 2,900 7·3 Other purposes and more than one purpose • 42 38·9 14,1l5 36·3
Tptal ..............................•... 108 100·0 40,005 100·0
• Loans were not disbursed for purchase of manure, digging and repair of wells, reclamation of land and purchase of implements, machinery and transport equipment.
It is observed that loans for purchase of livestock and other purposes accounted for about 83 per cent of the loans disbursed; the amount disbursed for these purposes was about Rs 32 thousands or four-fifths of the total amount disbursed. About 9 per cent of the loans constituting about 13 per cent of the amount disbursed was for bunding and other land improvements purposes. Table 10.4 sets out the data on loans classified according to security.
TABLE 10.4-CASE·STUDIES OF LOANS: NUMBER AND AMOUNT OF LOANS CLASSIFIED ACCORDING TO SECURITY
[ Supply Schedule data]
Number of Percentage Amount Percentage loans Security disbursed to total disbursed to total
(Ra) 1 2 3 4
Personal or no security .................... 19 17·6 6,600 16·6 Immovable property ...................... 89 82·4 33,405 83·6
Total .................................. lOa. 100·0 40,005 100·0
Loans secured against immovable property accounted for about 82 per cent of the number of loans disbursed and about 84 per cent of the total amount disbursed. Table 10.5 shows the data on loans classified according to purpose-duration.
A large proportion of the amount disbursed for purchase of seed and livestock was for the duration of three to five years, while for other purposes and more than one purpose the duration of one to three years was predominant.

118 MONGHYR
TABLE IO.5-CASE-STUDIES OF LOANS: LOANS DISBURSED BY GOVERNMENT ACCORDING TO PURPOSE-DURATION
[ Supply Schedule data. ]
AMOUNT DISBURSED FOR THE DURATION AS PERCENTAGE OF THE TOTAL AMOUNT
Number Average DISBURSED
of loans size of Purpose disburaed loans
disbursed One to Three to Above Duration three five five not years years years specified
(Rs) 1 2 3 4 5 6
PurchB88 of livestock ~ ••••..• 48 374 46·1 53·9 - -Bunding and other land -
improvements ••••.••••..•• 10 502 - - 100·0 PurchB88 of seed ..•.••...•.• 8 363 31·0 69·0 - -Other purposes and more
than one purpose •.•••••••• 42 336 '/1·8 17·7 10·5 -
A study of time-lag between the date of application and the date of disbursement ofthe loans was also made. Table 10.6 shoWs the relevant data.
TABLE IO.6-CASE-STUDIES OF LOANS: LOANS CLASSIFIED ACCORDI NG TO THE TIME-LAG BETWEEN THE DATE OF APPLICATION AND THE DATE
OF DISBURSEMENT [ Supply Schedule data.]
Dis· burse·
Upto One to Tbree Five to Above Time· ment in
three to five eight eight lag not more one speci. than month months months months months fied one insta.l· ment
1 2 3 4 5 --6- --7-
Number of loans disburaed ••••••. 48 32 12 4 2 - 10 (44,4) (29·6) (11,1) (3,7) (1·9) (-) (9·3)
Amount disbursed (Rs) •••••••••• 18,200 10,745 3,580 1,500 480 - 5,500 (45·5) (26·9) (8·9) (3,7) (1,2) (-) (13·S)
(Figures within brackets denote percentages to total.).
About 44 per cent of the loans constituting about 46 per cent of the amount were disbursed within one month from the date of application. This is perhaps on . account of the directives from Government for expeditious disposals of loan applications as a result of the distress conditions prevailing in the district. The loans for another 30 per cent of the applications were disbursed within the period ranging from one to three months. All the loans studied were disbursed outside the place of residence of the applicants.
A study of 26 rejected applications revealed that 11 applications were rejected due to non-approval of purposes of loans and 8 applications were rejected due to delay or irregularities in applying for loan. In one case it was rejected on account

GOVERNMENT FINANOE 119
of old dues to Government and in another case due to failure on the part of the borrower to plead for the loan. Three applications were rejected on account of official delay in scrutiny of the applications and the remaining two applications were rejected on grounds other than these.
One point which appea1'8 important from the standpoint of the Survey data is that only 3· 9 per cent of the rural families borrowed from Government. The borrowings of the rural families from Government also constituted 3· 9 per cent of their total borrowings. Judged against the background of distress conditions prevailing in the district and Government directives for liberalization of finance in rural areas by applying special rules, the quantum of finance appea1'8 to fall much short of the requirements.

CHAPTER 11
CO-OPERATIVE FINANCE
11.1 CO-OPERATIVE STRUCTURE
Like other districts of Bihar, in Monghyr the constitution and working of the co-operative societies are governed by the Bihar and Orissa Co-operative Societies Act, 1935, and the ruleS made thereunder. In 1938, Government of Bihar appointed the Co-operative Rehabilitation Committee which submitted its Report in 1941. Subsequently, a scheme for the rehabilitation of the co-operative movement in Bihar was formulated. The basic unit in the credit structure is the primary co-operative credit society with unlimited or limited liability or the primary multipurpose co-operative society with limited liability at the village level. In accordance with the scheme for rehabilitation, primary societies were reorganized. Relief was provided to members in respect of the then outstanding loans. Other measures such as removal of' non-creditworthy' members from the co-operatives and providing for the loanee members to repay the outstanding loans over long period not exceeding twenty years, and even by adjusting the outstanding loans against the paid-up share capital were also resorted to.
Attempts were also made to reorganize the central co-operative banks. Credit Agricole Scheme, details regarding which are discussed in a subsequent section, was initiated in 1945. In accordance with this scheme, the State Co-operative Bank established what were called credit agricole depots which took up the work of distribution of fertilizers and seeds, even on a credit basis within the district. The financing of primary credit societies and multi-purpose societies was, however, being done by three central co-operative banks and one central co-operative union situated at district and important subdivisional headquarters. There was no land mortgage bank in the district.
The position of the co-operatives in the district as on June 30, 1951 is given in Table 11.1.
11.2 PRIMARY AGRICULTURAL CREDIT SOCIETIES
A primary credit or multi-purpose society generally operates in one or group of contiguous villages. The society cannot be registered unless it consists of at least ten persons of above eighteen years of age, residing in the area of its operation. Its main function is to develop the spirit of self help and co-operation amongst its members and to arrange for the funds to be lent out to its members for productive purposes. The society is also required to arrange for marketing of produce of its members and to encourage banking habits among them. At the time of the Survey, the societies in the district were mainly engaged in the distribution of controlled

CO-OPERATIVE FINANCE 121
commodities like cloth, sugar, kerosene oil, etc. The supreme authority is vested in the general body. but the day-to-day work of the society is entrusted to the managing committee composed of not less than five elected members. Every member is entitled to one vote irrespective of the number of shares held by him. The maximum borrowing power of the society and the normal credit limit of the members is fixed annually at the general body meeting.
TABLE II.I-MEMBERSHIP. WORKING CAPITAL AND SHARE CAPITAL OF THE VARIOUS TYPES OF CO·OPERATIVE INSTITUTIONS AS ON JUNE 30, 1951
Number of Number of Working Paid-up co-operative
Type of society institutions membel'lJ capital share capital
(Ra) (Ra) I 2 3 4
I. Central Co-operative Banks and Central Co-operative Union _ . _ . 4 480 1,93,840 37,259
2. Co-operative Development and Cane Marketing Union, Ltd ..... 1 II 983 42
3. Agricultural Credit Co-operative Societies, Unlimited. _ .. __ . __ . _ 172 2,357 65,072 24,024
4. Multi-purpose Co-operative Societies, Ltd •..••.. _ ... ___ ... 271 15,898 3,58,015 1.52,823
6. Cane Growel'lJ' Co-operative Societies •.. __ ..•.•......... _ '. 139 3,848 63,830 17,146
6. Non-Agricultural Co-operative Societies _ .................... 6 585· 1,35,225· 94,944·
7. Primary Co-operative Stores .•.. 14 3,557·· 1,45,442·· 90,424·· 8. Teachers' Co-operative Stores ••• 2 1,819 16,633 15,680 9. Weavers' Co-operative Societies II 1,322·· 90,251t 30,082t
10. Oilmen's Co-operative Societies I IS IS 16 II. Fishermen's Co-operative Socie·
ties ..•................•. _ ... 2 48tt 291tt 291tt 12. Industrial Vishwakarma. Co-
operative Society ••••....•.... 1 .. .. . . (Source: Report on the Working oj Co-operatwe SOCleele8 111 BIhar Jor Co-operative Year, 1950-1) • Relating to four societies. •• Relating to nine societies or stores. t Relating to ten societies. tt Relating to one society.
Applications for loans are made in the prescribed form. the amount to be sanctioned is decided by the managing committee. The borrower is required to present one or two sureties depending upon the amount of loan applied. Loans are repayable in instalments within twelve months. H the borrower fails to repay interest or any instalment of principal on the due date. the committee may grant an extension of time under exceptional circumstances or may levy penal interest on arrears at rates authorized by the general body.
In the district eight credit and multi-purpose societies were surveyed. All these societies were of limited liability type. Four societies were situated in the villages where the Survey relating to demand side was conducted and the remaining four were randomly selected from the list of the co-operative societies supplied by Government. Of the eight societies only two multi-purpose societies were engaged in credit activities; the remaining societies were either dormant or engaged in noncredit activities; a dormant society being defined as one which had not issued any

122 MONGHYR
loans in 1949--50 and 1950-1 nor reported any other activity at the time of the Survey.
11.2.1 Society No. I
It was originally registered as a co-operative credit society in 1919 with 12 members. Its membership as on June 30, 1951 was 39. Its total owned funds amounted to Rs 742 of which Rs 539 constituted paid-up share capital, Rs 191 reserve funds and Rs 12 other funds. The society did not have any deposits from members or non-members, but had borrowed Rs 2,265 from the Central Co-operative Bank, Begusarai. It advanced Rs 2,265 to individuals during the year. Repayments by individuals during the year were Rs 14 only. The value of its total aBBets was Rs 140, of which shares of co-operative institutions accounted for Rs 8 and Rs 132 constituted other assets. The maximum borrowing power of the society was fixed at Rs 5,000.
11.2.2. Society No.2
The society was registered in 1949. It had 62 members as on June 30, 1951. Its total owned funds amounted to Rs 1,274, of which Rs 610 were accounted for by paid-up share capital, Rs 278 by reserve fund and Rs 386 by other funds. Loans advanced during the year to individuals were Rs 3,000 which remained outstanding at the end of the year as no repayments were made during the year. At the time of the Survey, the maximum borrowing power of the society was not fixed.
In all fifteen loans were advanced by these two societies. Table 11.2 shows the size of these loans.
TABLE 1I.l-PRIMARY AGRICULTURAL CREDIT SOCIETIES: LOANS ADVANCED DURING 1950-1- CLASSIFIED ACCORDING TO SIZE
[Supply Schedule data]
Number Amount of loans of loans
advanced in advanced in Number the range Amount the range
Size of loan of loans specified as of loans specified as
advanced percentage of advanced percentage of total number total amount
of loans of loans advanced advanced
(Re) 1 2 3 4
Less than R8 100 ................. 5 33·3 147 3·5 Rs 100 - Rs 200 .........•.•.•.••. 1 6·7 100 2·4 Rs 200 - Rs 300 .................. 4 26·6 800 19·3 Rs300-Rs400 ............... < .. 3 20·0 900 21·7 Rs 400 - Re 500 .................. - - - -Re 500 - Rs 1,000 ................ 1 6·7 700 16·9 Re 1,000 and above •....•....••••. 1 6·7 1,500 36·2
Total .......................... 15 100·0 4,147 100·0
- Or the latest year for which the information was available.

CO-OPERATIVE FINANCE 123
It is observed that about one-third of the loans advanced were of amounts below Rs 100, these loans constituted 3·5 per cent of the total amount advanced. Another one-third of the loans were of amounts between Rs 100 and Rs 300, which accounted for 21· 7 per cent of the total amount advanced. Two loans each of Rs 700 and Rs 1,500 were given which involved 63·1 per cent of the total amount advanced.
Table 11.3 classifies the loans advanced by these societies according to purpose.
TABLE ".J-PRIMARY AGRICULTURAL CREDIT SOCIETIES: LOANS ADVANCED DURING 1950-1- CLASSIFIED ACCORDING TO PURPOSE
[Supply Sohedule data]
Amount of IO&DJJ advanced for tho
Number of Amount. of purpose as Purpose 1O&DJJ advanced 1O&DJJ advanced percentagll of
total amount of iO&DJJ advanced
(&8) 1 2 3
Purcha.se of livestock ..•.•.•.•••.••••..••. 11 4,048 97·6 Current farm eJ:penditure ..•••.•••••••..•• 4 99 2·4
Total .................................. 15 4,147 100·0
• Or the latest year for which the information was available.
In the scheme of rehabilitation of co-operative societies adopted by Government of Bihar, it was laid down that co-operative societies should give only crop loans and loans for purchase of bullocks. In accordance with this policy the societies advanced loans generally for these purposes.
An analysis of· the loans according to the rate of interest and the type of security accepted showed that all these loans were advanced at interest rates varying between 6i per cent and 7tl per cent on the security of immovable property. Table 11.4 classifies the loans advanced according to period.
TABLE II.ot-PRIMARY AGRICULTURAL CREDIT SOCIETIES: LOANS ADVANCED DURING 1950-1 CLASSIFIED ACCORDING TO PERIOD
[Supply Schedule data ]
Amount of loans advanced for this
Number of Amount of period as Period loans advanced 1O&DJJ advanced percentage of
total amount of loana advanced
(&8) 1 2 3
One year or leaa ....••..••••.•..••••..•... 4 99 2·4 One to three years ••.•..•..........•.••.•. 11 4.048 97·8
Total ...............•.................. 15 4,147 I 100·0

124 MONGHYR
The overwhelming majority of the loans were for period of one to three years. The predominance of medium term loans is presumably due to large number of loans for purchase of bullocks.
11.3 CENTRAL CO-OPERATIVE BANKS
There were three central co-operative banks in the district, namely, Jamui Centra.l Co-operative Bank, Haveli Kharagpur Central Co-operative Bank and Begusarai Central Co-operative Bank, and one Monghyr Central Co-operative Union. Generally a central co-operative bank or union operates over at least a subdivision. Membership of all the central banks and central co-operative union in the district consisted of individuals and co-operative societies. At the annual general meeting, which is a supreme body of the bank, individual share holders attend it in person while each affiliated society is represented by a delegate elected by the committee of management of the society. The management of a central co-operative bank vests in a Board of Directors consisting of elected and nominated members.
The main objects of the central co-operative bank are to develop and finance co-operative societies in its jurisdiction and to control its affiliated societies by careful and regular inspection. The central co-operative bank maintains outdoor staff designated as supervisors for supervision of the affiliated societies. Broadly the functions of the supervisors are (1) to scrutinize the applications for loans made by the primary societies, (2) to arrange for disbursement of the loans sanctioned by the central banks, and (3) to effect recovery of the loans from borrowers. In addition to the central bank's supervisors, Government employees of the Co-operative Department, namely, inspectors and auditors also help in the disbursement and recovery of the loans.
Data on membership and working capital of the central co-operative banks and one central co-operative union in the district are given in Table 11.5.
TABLE II.S-MEMBERSHIP AND WORKING CAPITAL OF CENTRAL CO-OPERATIVE BANKS AND ONE CENTRAL CO-OPERATIVE UNION AS ON JUNE 30, 1951
[Amount in thousands of rupees]
NUMBER OF MEMBERS WORKING CAPITAL
Name of the institution Paid-up Loans Indivi- Banks and from co-duals societies
share Deposit.s operative Total capital banks
1 2 3 4 5 6
1. Jamlli Central Co-opera. tive Bank ••. _ .. _ : _____ .. 26 146 12-2 33-9 - 46-1
2_ Begusarai Central Co-operative Bank _______ . __ 26 116 6-9 40-6 20-8 68-3
3. Haveli Kharagpur Central Co-operative Bank. ______ 5 76 2-9 9-8 33-4 46-1
4. Monghyr Central Co-operative Union _ . ___ . _ .• 4 81 15·3 18·0 - 33-3
(Source: Report em the Working oj Co-operative Bocietie8 in B,/iar for the Co-operatwe Y ear, 1950-1)

CO-OPERATIVE FINANCE 125
Jamui Central Co-operative Bank had the largest number of members, the number of individual and society members being 26 and 146, respectively; whereas the total number of members was smallest in Haveli Kharagpur Central Co-operative Bank, the number of individuals and society members in this bank being 5 and 76, respectively.
None of the banks had reserve funds except the amount of Rs 4 only in the case of Begusarai Central Co-operative Bank. Owned funds in the case of all the banks constituted only paid-up share capital. . The paid-up share capital was highest at Rs 15·3 thousands in the case of Monghyr Central Co-operative Union and lowest at Rs 2·9 thousands in· the case of Haveli Kharagpur Central Co-operative Bank. The paid-up share capital of Jamui Central Co-operative Bank and Begusarai Central Co-operative Bank was Rs 12·2 thousands and Rs 6·9 thousands, respectively.
The total working capital was highest at Rs 68·3 thousands in the case of Begusarai Central Co-operative Bank and lowest at Rs 33·3 thousands in the case of Monghyr Central Co-operative Union. The working capital in the case of both these institutions comprised largely deposits which were relatively high in the case of Begusarai Central Co-operative Bank. The total working capital was Rs 46·1 thousands each in the case of Jamui Central Co-operative Bank and Haveli Kharagpur Central Co-operative Bank. In the case of the former bank, the working capital comprised paid-up share capital and deposits while in the case of the latter bank, about 72 per cent of working capital comprised loans from co-operative banks.
Table 11.6 gives the data on the loans advanced during the year by and loans due at the end of the year to the banks and a union.
TABLE 1I.6-LOANS ADVANCED DURING THE YEAR AND LOANS DUE AT THE . END OF THE YEAR 1950-1
[Amount in thousands of rupees]
AllOUNT A.DV A.NCED Of the DURING THE
Loans loans Of the YEAR TO Loans due at interest
repaid due at the end Interest
receiv-the end receive Name of the bank during of the of the able able,
Indivi· Banks the year year, amount and year amount overdue duals societies overdue
1 2 3 4 I) 6 7
1. Jamui Central Co· operative Bank .......
2. Begusarai Central Co· - 0·9 0·3 10·4 - 4·0 -
operative Bank ....... - 36·8 14·3 36·2 6·5 2·7 1,9 3. Haveli Kharagpur
Central Co·operative Bank •............... - - 0·9 16·2 1·1 1·8 0·9
4. Monghyr Central Co· operative Union .•.••. - - - - - - -
(Source: Report on the Working oj the Co.operative Societiu in Bihar J~r the Co· operative Yea,., 1950-1)

126 MONGHYR
Though individuals were members of the banks, none of the banks advanced loans to individuals during the year. Both Haveli Kharagpur Central Co-operative Bank and Monghyr Central Co-operative Union did not advance any loans during the year, while loans advanced by Begusarai Central Co-operative Bank were relatively very high and were of the order of -Rs 36· 8 thousands. In the case of Begusarai Central Co-operative Bank, loans due at the end of the year and the amount overdue were highest at Rs 36·2 thousands and Rs 6·5 thousands, respectively. Interest receivable was not reported in the case of Monghyr Central Cooperative Union, while in the case of Jamui, Begusarai and Haveli Kharagpur Central Co-operative Banks, it was Rs 4·0 thousands, Rs 2·7 thousands and Rs 1· 8 thousands, respectively. The relatively high interest receivable together with no overdues and low repayments during the year in the case of Jamui Central Cooperative Bank is presumably indicative of the fact that the medium-term loans were more popular in the Jamui subdivision.
11.4 CREDIT AGRICOLE
The scheme of rehabilitation of central co-operative banks concentrated mainly on the recoveries of loans and stopped all credit transactions between the years 1941 and 1945. In 1945, the State Co-operative Bank introduced Credit Agricole Scheme. According to this scheme, the apex bank etarted Credit Agrioole depots for sale of seeds, manures, implements, etc. The depots also made advances to credit-worthy agriculturists irrespective of whether or not they were members of the co-operative societies. The central co-operative bank was its agent for making loans, but both the central co-operative bank and Credit Agricole depots sold to the cultivators.
The rate of interest stipulated on loans in kind advanced by Credit Agricole depots was 8i per cent in the case of agriculturists who were not members of cooperative societies, and if the advances were made through an intermediary multip\ll'pose co-operative society to its members, the interest ~~te was 61 per cent. In the absence of sufficient demand for loans in kind, these depots made it a practice to make available fertilizers, seeds and implements to agriculturists against cash payment.
11.5 CO·OPERATIVE DEVELOPMENT AND CANE MARKETING UNION
There was one Co-operative Development and Cane Marketing Union in the district. Generally, the Cane Growers' Co-operative Societies are affiliated to the Union. The Union arranged for the disposal and transportation of sugarcane of its members to sugar mill in accordance with the Bihar Sugar Factories Control Act, 1937. The Union also acted as agent of members for purchase of seeds, manures, implements, and advanced loans to members in cash or kind. The amount of advance to any member did not exceed 40 per cent of the estimated value of his crop. The management of the union vested in a Committee of Management consisting of the Subdivisional Officer and five to nine other members elected at the annual general meeting from amongst the delegates of the affiliated societies. The Union stopped functioning since 1954-5.

CO-OPERATIVE FINANCE 127
During the co-operative year 1951-2, the working capital and share capital of the central financing agencies increased from Rs 193·8 thousands and Rs 37·3 thousands as at the end of the year 1950--1 to Rs 271· 8 thousands and Rs 42·4: thousands, respectively, as at the end of the year 1951-2. The increase in membership of the central financing agencies was 95. The increase in the number of agricultural credit societies and multi-purpose societies during the year was 48, whereas their membership increased by 4,313t. The working capital and share capital of these primary societies showed an increase from Rs 423·1 thousands and Rs 176·8 thousands as on June 30, 1951 to Rs 458·1t thousands and Rs 219'9t thousands, respectively, as on June 30, 1952.
t Data reIa.tiDg to 26 mUlti-purpose co-operative societies for the year 1951-2 are not available.

CHAPTER 12
PRIVATE CREDIT AGENCIES
It has been observed in Chapter 9 that private credit agencies accounted for a major portion of the borrowings of rural families. In this chapter, it is proposed to describe briefly the more important aspects of the legal framework within which the private credit agencies function, and the working and operations of the private credit agencies.
12.1 LEGAL STRUCTURE
Like other districts of Bihar, in Monghyr too, the activities of the private credit agencies excluding commercial banks, in so far as they relate to the extension of credit to agriculturists, are governed by the Bihar Moneylenders Act, 1938 as amended in 1939 and the Bihar Moneylenders (Regulation of Transactions) Act, 1939. All loans, whether in cash or kind, except those granted by the Government or co-operative societies come under these Acts. Any person intending to carryon the business of moneylending shall make an application to District Sub-Registrar, in the prescribed form, for registration. The application would be accompanied by a fee not exceeding Rs 25. The moneylender shall be granted a registration certificate which would be valid for five years from the date on which it was granted, unless otherwise cancelled. If in respect of any loan by a registered moneylender, the court is of the opinion that the moneylender has been guilty of fraud or contravention of any provision of the Act or is otherwise unfit to carryon the business of moneylending, the court shall bring it to the notice of the Collector. The Collector, after instituting a proper enquiry may cancel the registration for a period not exceeding five years.
The registered moneylender is required to maintain the books of accounts showing for each debtor, the date and amount of the loan and the rate of interest charged on the loans, the date and the amount of the payments received and the terms agreed upon with the debtor. The moneylender is also required to give receipts for the payments made by the debtor, to deliver to the debtor a copy of the entries in his books within 15 days of advancing the loans, to deliver to the debtor, at least once in every year, a statement of accounts showing the principal and interest outstanding, and a receipt for every article pawned with its general description.
, Failure on the part of the moneylender to maintain proper accounts or to deliver to the debtor proper receipts or statements of account may entail punishment with imprisonment which may extend to one year or with fine not exceeding Rs 500 or with both. Deductions of salami, batta, gadiana, out of the principal at the time of advancing the loan are prohibited by the Act.
The payment of the compound interest on loans advanced after the commencem6D.t of the Bihar Moneylenders (Regulation of Transactions) Act, 1939 is void.

PRIVATE CREDIT AGENCIES 129
The court cannot pass a decree in any suit in respect of a loan advanced by the moneylender for interest at rates exceeding 9 per cent simple per annum for secured loans and 12 per cent simple per annum for unsecured loans. The maximum amount of interest which can be decreed cannot exceed the amount of the loans advanced. The court can reopen a transaction, take an account between the parties and relieve the debtors of all liabilities in respect of any interest in excess of 9 per cent simple per annum for secured loans and 12 per cent simple per annum for unsecured loans or set aside either wholly or in part or revise any agreement in respect of any loan. In exercising these powers the court shall not reopen any agreement purporting to close previous dealings and to create a new obligation which has been entered into by the parties or any person from whom they claim at a date more than 12 years before the institution of such suit.
If the equity of redemption of a mortgagor is transferred by sale otherwise than in execution of a decree, and, if out of the consideration money for the transfer, any amount due under the mortgage in respect of interest for any period preceding the date of transfer is left in deposit with the transferee for payment to the mortgagee, the portion which is in excess of 9 per cent. simple per annum shall not be taken account of for purpose of reopening. When a decree is passed relating to a mortgage by which a loan is secured, the court may arrange for the payment of the decreed amount in instalments. The court is also empowered to estimate the value of judgement debtor's property and of that portion of such property, the sale proceeds of which it considers will be sufficient to satisfy the decree. No property will be sold at a price lower than the price specified in the sale proclamation. If the highest amount of bid for the property included in the sale proclamation is less than the price specified in the sale proclamation, the court may sell the property for such highest amount, provided the decree holder agrees in writing to forego the difference.
The Act, however, stipulates that a moneylender who is not licensed cannot have a recourse to a court of law for the recovery of his dues.
11.1 TYPES OF DATA
There is no generally accepted classification of private agencies in the field of rural credit. Apart from institutions like banks, all the creditors are individuals and private firms, and most of them operate a mixed business. While collecting information regarding the loan transactions of the families investigated on the demand aspect of the Survey, we attempted initially to distinguish moneylending proper from credit operations connected chiefly with other activities such as trading.
The data collected through General Schedule and intensive enquiry on demand aspect of the Survey, were supplemented by the data collected through questionnaires on the supply aspect of the Survey; the data available through questionnaires related to certa.in classes of private credit agencies. Through Supply Questionnaire SQ 2, an attempt was made to obtain information regarding credit operations of all traders in agricultural commodities in the selected villages and some selected traders in the selected marketing centres and the district headquarters, viz., Begusarai,
I

130 MONGHYR
Jamui, Barhee, Khagaria and Monghyr Sadar. Through Supply Questionnaire SQ 3 all the moneylenders in the selected villages and some selected moneylenders in the selected marketing centres and at the district headquarters were approached for information regarding the mode of operation of their business. A sample of loans given by moneylenders was also studied wherever the necessary details were made available. However, the classification of agriculturist and professional moneylenders, as made for demand side data could not be maintained and, therefore, the moneylenders were classified as urban and rural. Supply Questionnaire SQ 4 was meant for indigenous bankers who, however, were not reported in Monghyr. Supply Questionnaire SQ 5 addressed to all the commercial banks was used for obtaining information regarding advances of commercial banks for agricultural purposes.
12.3 RELATIVES
It has already been observed in Chapter 9 that relatives supplied about 7 per cent of the total borrowings of cultivators. Table 12.1 gives the data on borrowings from relatives by cultivating, non-cultivating and rural families and four classes of cultivating families.
TABLE 12.I-BORROWINGS FROM RELATIVES [ General Schedule data]
Average borrow· Proportion of ings from this
families borrow· agency per
Group ing from this family borrow·
agency ing from this agency
(Per cent) (Rs) 1 2
Big cultivators .•••.•••••••••..•.••••...•• 2·8 3,413
Large cultivators .•••....••.••••••••.•.... 3·5 1,095 Medium cultivators •.••••••••••••.••...••. 8·1 105 Small cultivators .•.•.••••••••••..•••..••. 6·8 82
All cultivators ..•••..•••••.••••.••••.••••• 6·3 267 Non-cultivators .•.•.•.•.•••• _ •••••.••.••• 7-7 47
All families ............................ 7-0 152
Borrowings from relatives as percentage
of total borrowings
3
13·1
9·3 4·2 6·9
7·3 6·1
7-J
Borrowings from relatives per borrowing family worked out to Rs 152 in the case of rural families, Rs 267 in the case of cultivators and Rs 47 in the case of non-cultivators; the average borrowings per borrowing family were significantly high among big and large cultivators and significantly low among small and medium cultivators. The proportion of families borrowing from relatives did not exceed about 8 per cent in any group of cultivators, the lowest proportion being about 3 per cent both among big and large cultivators. The data indicate that few big cultivators reported heavy borrowings from relatives. The proportion of borrowings from relatives to the total borrowings in the case of big and large cultivators was about 13 per cent and 9 per cent, respectively. Table 12 _ 2 gives the data on borrowings from relatives classified according to purpose-duration.

PRIVATE CREDIT AGENCIES 131
TABLE Il.l-BORROWINGS FROM RELATIVES CLASSIFIED ACCORDING TO PURPOSE-DURATION
[Intensive enquiry data] . Proportion of Proportion of
borrowings borrowings Average for this purpose from this agency
borrowings to the total to the total Purpose-Duration per family borrowings borrowings
from this agency from all agencies for this purpose
(Ra) (Per cent) (Per cent) 1 2 3
Agricultural purposes Short-term ___ ...........•.....•......••. 0·1 0·1 0·1 Long-term ..... _ ..•.........•............ - - -Non-agricultural purposes - - -
Conlumptlon purposes Short-term. _ . _ ............•..... _ .....• _ 6·0 80·1 15·1 Long-term •... _ . _ ....... _ ........ _ ......• _ 1·2 16·8 6·8
Repayment of old debts ................ - - -Other purposes .... _ ......... _ ...... _ .. 0·2 2·4 0·5
Total .•................................ 7·4 100·0 $·0
About 97 per cent of the borrowings from the relatives was for consumption purposes, of which about 80 per cent was for short-term consumption purposes.
11.4 LANDLORDS It has been observed in Chapter 2 that Bhumihar Brahmin landlords occupied
a superior position in most of the villages surveyed. A study of the borrowings from the landlords would give further information about their status. Table 12.3 gives the data relating to borrowings from landlords by cultivating, non-cultivating and rural families and by four classes of cultivating families.
TABLE Il.l-BORROWINGS FROM LANDLORDS [ General Schedule data]
Average Proportion of borrowings
families from this agency
Group borrowing per family
from this agency borrowing from this agency
(Per cent) (Rs) 1 2
Big cultivators .....•.•. _ ................. 2·8 680
Large cultivators ......................... 5·5 548 Medium cultivators ........•.............. 5·6 345 Small cultivators ...........•............. 10·4 105
All cultivators. _. __ ... : _ •..... : .......... 7·0 287 Non-cultivators •..•...........•.......... 13·5 125
All families .................. : .......... 10·1 114
Borrowings from landlords &8
percen tage of total borrowings
3
2·6
7·3 9·1
13·5
8·8 28·6
11·4

132 MONGHYR
About 10 per cent ofthe rural families borrowed from the landlords, the average amoWlt borrowed being Rs 184 per borrowing family. The proportion of noncultivating families borrowing from landlords was highest at 13·5 per cent, the average amount borrowed per non-cultivating borrowing family being Rs 125. The proportion of small cultivators borrowing from landlords was also significant at about 10 per cent. A relatively high proportion of non-cultivators and small cultivators borrowing from landlords is perhaps indicative of the fact that landless agricultural labourers and small cultivators who cultivated the lands on a sharecropping basis often had to meet their credit requirements from their landlords. The proportion of borrowings from landlords to total borrowings was comparatively high at about 29 per cent and 14 per cent in the case of non-cultivators and small cultivators, respectively. Table 12.4 gives the data on borrowings from landlords classified according to purpose-duration.
TABLE Il.4-BORROWINGS FROM LANDLORDS CLASSIFIED ACCORDING TO PURPOSE-DURATION [Intensive enquiry data]
Proportion of Proportion of borrowings
Average borrowings from this agency borrowings for this purpose to the total to the total
Purpose-Duration per family borrowings borrowings from all agencies
from this agency for this purpose
(Rs) (Per cent) (Per cent) 1 2 3
Agricultural purposes Short-term ..... _. _____ . __________ . ____ .. 0·1 0-1 1·0 Long-term ... _ .. ___ . ____ . ______ ......... _ 40·3 64·1 81·7
Non-agricultural purposes ... _ .. ___ ._ .. - - -Consumption purposes Short-term ...• _ ... _. _. _ ... _ ............ _ 10·8 17·2 27·4 Long-term ............ _ .. _ .. _ ............ 7·3 11·6 39·5
Repayment of old debts ..... _ ........... - - -
Other purposes .... _ ......... _ ... _ ..... 4·4 7·0 12·8
Total .... _ .............. _ .. _ ........... 61·' 100·0 42·1
About 64 per cent of the borrowings of cultivators from landlords were for longterm agricultural purposes while about 29 per cent of borrowings from landlords were for consumption purposes.
Borrowings from landlords carried high rates of interest. About 64 per cent of the borrowings from landlords were at interest rates ranging from 18 per cent to 25 per cent while about 19 per cent of the borrowings from landlords carried interest rates varying from 35 per cent to 50 per cent. Only 13 per cent of the borrowings from landlords carried interest rates between 10 per cent and 12, per cent.

PRIVATE CREDIT AGENCIES 133
About nine-tenths of the debt owed to landlords was on personal security and the remaining debt was on the security of immovable property.
12.5 PROFESSIONAL MONEYLENDERS
It has been observed in an earlier Chapter that major portion of the borrowings of rural families were from professional moneylenders; the borrowings from agriculturist moneylenders were not reported. Table 12.5 gives· the relevant data on borrowings from professional moneylenders.
TABLE 12.S-BORROWINGS FROM PROFESSIONAL MONEYLENDERS [ General Schedule data]
Average Proportion of borrowings Borrowings from
families from this agency professional borrowing per family moneylenders &8
Group from this agency borrowing percentage of from this agency total borrowings
(Per cent) (Rs) 1 2 3
Big cultivators •.......................... 46·1 1,262 80·8
Large cultivators ......................... 48·6 673 78·6 Medium cultivators ....................... 49·4 329 80·9 Small cultivators ......................... 49·9 124 76·2
All cultivators ..•........................ 49·3 370 79·1 Non·cultivators ••.•...................... 39·5 95 63·5
All families ............................ 4~4·7 255 76·Z
Borrowings from professional moneylenders per borrowing family worked out to Rs 255 for rural families, Rs 370 for cultivators and Rs 95 for non-cultivators; the average borrowings per borrowing family were relatively high in the case of big and large cultivators. The proportion of families borrowing from professional moneylenders was not less than about 46 per cent in any group of cultivators. Also, the proportion of borrowings from professional moneylenders to total borrowings was not less than 76 per cent in the case of any group of cultivators. Table 12.6 shows the purposes of borrowings by selected cultivators from professional
, moneylenders.
Apart from meeting a large proportion of credit requirements for consumption purposes the professional moneylenders provided 95 per cent of the borrowings for short-term agricultural purposes and 9·3 per cent for long-term agricultural purposes. Analysis of the debt owed to professional moneylenders shows that 64·1 per cent of the amount outstanding was against personal security while only 13· 3 per cent was secured against immovable property. No security was specified for 22·6 per cent of the total debt owed to them. Table 12.7 classifies the borrowings of selected cultivators from professional moneylenders according to the rate of interest.

134 MONGHYR
TABLE 11.6-BORROWINGS FROM PROFESSIONAL MONEYLENDERS CLASSIFIED ACCORDING TO PURPOSE-DURATION
[Intensive enquiry data]
Proportion of Proportion of
borrowings borrowings Average from this agency
borrowings for this purpose to the total to the total
Purpose-Duration per family borrowings borrowings
from this agency from all agencies for this purpose
(Rs) (Per cent) (Per cent) 1 2 3
Agricultural purposes Short-term ............................ _ . 7·3 15·1 95·0 Long-term ••......................•..•... 4·6 9·5 9·3
Non-agrlcultural purposes ............. - - -
Consumption purposes Short-term .............................. 10·7 22·3 27·1 Long-term ............... :-......•......•. 8·8 18·3 47·9
Repayment of old debts ................ - - -
Other purposes ................ _ ....... 16·7 34·8 48·6
Total ..•........................... ; ... 48·1 100·0 32·2
TABLE 11.1-BORROWINGS FROM PROFESSIONAL MONEYLENDERS CLASSIFIED ACCORDING TO RATE OF INTEREST
[Intensive enquiry data]
Rate of interest
Nil. ............... ..................................... . 3} - 7 per cent ••••.•••••••.•••••••••.•••.••. _ ...••••..•.
10 - 121 per cent ••• •••••••••••••.••••••••••.•••••.•.•••••• 18 - 25 per cent • .•• _ ••••••••••••••••••••.••.••.••.•.• _ ••• 25 - 35 per cent .••••••••••••••••••••••••••.•••.••••..•••• 35 -50· peT cent •••.•..••• •.. _ •••••••••.••••••••••••••••.•• Unapecijied . .••..••••..••••• _ .••• _ ••••• _ ..••••••••••.•.••.
Total .....•.....•.. _ ..•..•..••....•...••.•..•........•..
Amount per family
(Ra)
0·1 2·4 2·2
23·5 0·1
17·2 2·6
48·1
Percentage to total
0·2 5·1 4·6
48·8 0·2
35·8 5·3
100·0
It is observed that nearly half of the borrowings from professional moneylenders were at interest rates varying from 18 per cent to 25 per cent, while little more than one-third of the borrowings were at interest rates ranging between 35 per cent and 50 per cent.
12.6 PRACTICES AND LOAN OPERATIONS OF THE MONEYLENDERS
11.6.1 Practices of the moneylenders
The WscUBBion in this section is based upon the replies given by the moneylenders to the Supply Questionnaire SQ 3. In all, 11 village and 44 urban moneylenders replied to the questionnaire.

PRIVATE CREDIT AGENCIES 135
Apart from the business of moneylending they were engaged in other professions. Out of 11 village moneylenders, 10 moneylenders answered the question regarding their occupations other than moneylending. All the village moneylenders had cultivation as their additional occupation. Four village moneylenders were shopkeepers, one was a trader in agricultural commodities andone was a general merchant. Of the 44 urban moneylenders, 40 were cultivators, 14 were shopkeepers, 3 were traders in agricultural commodities, 7 were general merchants, 4 were brokers and commission agents and 6 were goldsmiths. It may be noted that the same moneylender by virtue of his having more than one occupation may have been included under more than one occupational category.
Of the 11 village moneylenders who replied to the question on the period for which they were engaged in moneylending business, 10 replied that they were doing this business since more than 25 years, while one replied to be practising moneylending for more than 10 years but less than 25 years.
In reply to the questions about the practices of advancing loans, all the moneylenders replied that they did not advance loans against the standing crops and loans against harvested crops and produce. None of them stipulated for the possession of erops or handling of produce for marketing. Of the 55 moneylenders, only 4 replied that they advanced grain loans.
When questioned whether they enquired about the purpose for which the loans were required and whether they supervised the actual utilization of the loans, aU th& village moneylenders and 39 of the 44 urban moneylenders replied that they enquired the purpose for which the loans were required. However, all the village and urban moneylenders replied that they did not supervise the actual utilization of the loans.
In regard to the question of stipulation of definite period for repayment of loans. all the village moneylenders and 28 of the 43 urban moneylenders allBwering the question replied that they stipulated a definite period for repayment of 10allB. The period of repayment was generally stipulated, but in the case of 10 of the 11 village moneylenders and 21 of the 28 urban moneylenders, 25 per cent or less of their loans were repaid after the expiry ·of the stipulated period.
Six of the 11 village moneylenders and 14 of the 25 urban moneylenders answering the relevant question said that 10 per cent or less of the amount lent to agriculturists was considered by them as doubtful, while the remaining 5 village moneylenders and 11 urban moneylenders stated that 10 per cent to 25 per cent of the amount lent to agriculturists was considered by them as doubtful. The moneylenders reported that for recovery of the loans, they had to institute legal proceedings against their clients, but the proportion of 10allB which involved litigation was 10 per cent or less in the case of 7 village and 28 urban moneylenders out of 11 village and 40 urban moneylenders answering the question, whereas in the case of the remaining moneylenders, the proportion of loans involving litigation was 10 per cent to 25 per cent. A majority of the village and urban moneylenders answering the

136 MONGHYR
relevant question said that 10 per cent to 25 per cent of their loans given to agriculturists involved forfeiture of the security.
Table 12.8 sets out the replies of the village and urban moneylenders regarding the volume of advances to an agriculturist against sound security.
TABLE 11.8-MONEYLENDERS CLASSIFIED ACCORDING TO THE MAXIMUM AMOUNT ADVANCED TO AN AGRICULTURIST AGAINST A
SOUND SECURITY [Supply Questionnaire]
VILLAGE MONEYLENDERS URBAN MONEYLENDERS
Proportion to Proportion to Size of loan Number total Number total
(Per cent) (Per cent) ----
Rs 500 or less ...................... - - 1 2·3 Rs 500-Ra 1,000 ................... - - 7 15·9 R8 1,000 - Rs 2,000 ................... 1 9·1 9 20·5 R8 2,000 - R8 5,000 ................... 4 36·4 17 38·6 R8 5,000 - Rs 10,000 .................. 6 54·5 2 4·5 More than Rs 10,000 .. ; ............... - - 8 18·2
Total ..••.....................•.... II 100·0 44 100·0
An overwhelming majority of the village and urban moneylenders were prepared to advance loans of sizes varying from Rs 1,000 to Rs 10,000 to an agriculturist against a sound security, which may presumably indicate that the resources of the moneylenders were enough to accommodate a large number of clientele.
11.6.1 Loan operations of the moneylenders The discussion in this section is based on the data obtained through case-studies
of 28 loans advanced by the village moneylenders who responded to Supply Questionnaire SQ 3. Table 12.9 gives the relevant data.
TABLE 11.9-CASE-STUDIES OF LOANS GIVEN BY VILLAGE MONEYLENDERS: LOANS CLASSIFIED ACCORDING TO SIZE
[Supply Schedule data.]
Size of loan
R8 50 or less ....••••.•.....•.•....•.•... R8 50 - R8 100 ...•...•.••..•......•.••.. R8 100 - Rs 200 .........•.•........•..... Rs 200 - Rs 300 ..•...••...•.•..•••..•.•.. R8 300 - R8 500 .....•.........•.•••...... Rs 500 - Rs 750 ....•......•...•........•. R8 750 - Rs 1,000 ..•.•.......••.••...••..• Above Rs 1,000 ..........•.•••.••.•.. .' •
Total. ................................. .
Number of loans
3 I 6 6 7 2 1 2
18
Total amount in this
size
(Ra)
150 100
1,150 1,660 3,150 1,200
800 19,200
17,410
Amount in this size &8 percentage of the
total amount disbursed
0·5 0·4 4·2 6·1
11·5 4·4 2·9
70·0
100·0
Of the 28 loans studied, 19 loans involving 21·8 per cent of the total amount disbursed were of the sizes varying from Rs 100 to Rs 500, whereas two loans of above

PRIVATE CREDIT AGENCIES 137
Re 1,000 constituted 70·0 per cent of the total amount disbursed. Table 12.10 shows the data about the loans classified according to purpose.
TABLE 12.IO-CASE-STUDIES OF LOANS GIVEN BY VILLAGE MONEYLENDERS: LOANS CLASSIFIED ACCORDING TO PURPOSE
r Supply Schedule db.ta]
Total amount
Number of disbursed Purpose loans for this
purpose (Rs)
Capital expenditure on farm .•.•....•••.... 3 1,700 Current farm expenditure .......•••........ - -Non·farm busine88 expenditure .•.•.••••••.• 4 730 Family expenditure ...•.•.••.•......•.••.• 21 24,980
Total. .....•.••.••.•.•.•••.•.•••..•..... 28 21,410
Amount disbursed for this purpose &8 per· centa~e of the total amount disbursed
for all purposes
6·2 -
2·7 91·1
100·0
About 91 per cent of the amount disbursed was for family expenditure. The amount advanced for capital expenditure on farm was about 6 per cent.
Ten loans constituting about 8 per cent of the amount disbursed were given on personal security. Six loans constituting about 78 per cent of the amount disbursed were given on the security of immovable property. In the tase ofthe remaining loans, security was not specified.
12.1 TRADERS AND COMMISSION AGENTS
The selected cultivators did not report any borrowings from the traders and commi88ion agents. The data on value of crops and fodder sold to different agencies indicate that co-operative marketing was undeveloped and the traders and commission agents were the main purchasing agencies. The relevant data are given in Table 12.11.
TABLE lUI-VALUE OF CROPS AND FODDER SOLD BY SELECTED CULTIVATORS TO DIFFERENT AGENCIES
[Intensive enquiry data. Amount in rupees per family]
VALUE OF CROPS AND FODDER Value of SOLD TO crops and
fodder Value of Bold to total
Value of traders produce
Other total and sold as
Strata Traders agencies produce commi88ion percent· and Co·opera. agents as age of
commission Factories tives (including sold percent. value of Govern· agents ment) age of groM
value of produce total pro· duce sold
1 2 3 4 5 6 7
Upper strata ...... 257 212 - 16 486 63·0 26·6 Lower strata ...... - - - - - 76·6· 0·1
All cultivators .. 129 106 - 8 241 53·0. 22·3
• Percentage 18 high due to very low value of total produce sold.

138 MONGHYB
Only upper strata cultivators reported sale of crops and fodder and 53· 0 per cent of its value was sold to traders and commi88ion agents. In regard to the question of the place of delivery in respect of all the 15 sale transactions entered into with traders and commission agents by upper strata cultivators the commodity was delivered in the village itself. In 17 out of 19 sale transactions entered into with traders and commi88ion agents by upper strata cultivators the price was settled at the time of delivery, while in the remaining 2 sale transactions entered into with traders and commission agents by upper strata cultivators, the price was settled before delivery.
12.8 COMMERCIAL BANKS
Ten offices of the commercial banks in~luding four offices of the then Imperial Bank of India were reported to be operating in the district during 1951-2, out of which only four offices completed the questionriaire regarding their advances for agricultural purposes against various types of securities. However, none of the four responding commercial banks reported such advances.
12.9 FINANCIAL SUPERSTRUCTURE OF PRIVATE CREDIT AGENCIES
With a view to studying the superstructure of private credit agencies, in the questionnaire addressed to the moneylenders, among others, the following two questions were included. '.Are you able to meet the heavy demands completely from your own resources, i.e., without resorting to borrowings? If not, what are the sources through which you can obtain funds?' The sources listed were (i) commercial banks, (ii) indigenous bankers, (iii) other moneylenders, (iv) by drawing hundies and (v) other 80urCes. In the questionnaire addressed to traders, some additional sources of credit, viz., manufacturing and processing concerns and wholesalers and export firms were also listed.
None of the 9 village moneylenders and 1 of the 40 urban moneylenders answering the relevant question reported to be accepting deposits. In the case of one urban moneylender, the deposits constituted about 21 per cent to 30 per cent of total resources both owned and borrowed. When questioned about borrowings for 8upplementing their resources, none of the village moneylenders replied resorting to borrowings, while 10 of the 44 urban moneylenders reported resorting to borrowings. Of the 10 urban moneylenders who reported borrowings, 5 borrowed from commercial banks, 4 borrowed from other moneylenders and 1 borrowed from indigenous bankers. In the case of half the number of urban moneylenders who reported borrowings, 10 per cent or less of their business resources comprised borrowings, while for the remaining half of the number of urban moneylenders, borrowings constituted 10 to 25 per cent of their total business resources.
Of the 66 responding traders, 55 reported borrowings, 37 reported borrowings from commercial banks, 21 reported borrowings from moneylenders, 4 reported borrowings from indigenous bankers and 1 reported borrowings by drawing hundie8. None of the traders reported borrowings from manufacturing and proce88ing ooncerns and wholesalers and export firms.

CHAPTER I]
CONCLUDING REMARKS
13.1 THE ECONOMY OF THE DISTRICT
The rural economy of Monghyr shows two different types. North Monghyr is fertile and densely populated while South Monghyr is thinly populated with its large areas under forests and mountains. The climate of the district is on the whole healthy. In 1951, the density of the population of the district was 723 persons per square mile. About 83 per cent of the population in the district was engaged in agriculture. '- The average size of the cultivated holdings, according to the General Schedule data, worked out to 7·2 acres per cultivating family. Land was very inequitably distributed, with the result that the average cultivated holdings varied in sizes, between 30· I acres per family in the case of big cultivators and I· 4 acres per family in the case of small cultivators. About four-fifths of the cultivating families were indebted, the average debt per cultivating family amounting to Rs 404. About 63 per cent of the cultivating families reported borrowings during the year, the average borrowings per cultivating family being Rs 230. Only 9 per cent of the cultivating families reported repayments during the year, the average repayments per cultivating family being Rs 16.
13.1 EXPENDITURE AND SOURCE OF FINANCE
In analysing the demand and supply of credit, we took into consideration the pattern of cultivators' expenditure with special reference to the source of finance from which it was met. The main heads of expenditure related to (I) capital expenditure, (2) current farm expenditure and (3) family expenditure. Capital expenditure included financial investment expenditure, capital expenditure in non-farm busineBB and capital expenditure in agriculture including expenditure on purchase of land and livestock. Very few families reported expenditure on financial investment items an!l expenditure in non-farm business. Only about 2 per cent of the cultivating families reported expenditure on purchase of land while about onefifth of the cultivating families reported expenditure on purchase of livestock. The average expenditure per cultivating family on purchase of livestock was Rs 45. Among other items of capital expenditure in agriculture, the expenditure on purchase of implements, machinery and transport equipment and on construction of farm houses, cattle sheds, etc., were reported by fairly large proportion of cultivators, even though the expenditure on these items was not high. The data on source of finance which were available for rural families revealed that a large part of the 'other capital expenditure' in agriculture was financed from current income and past sa.vings. The proportion of expenditure financed from current income and past sa.vings was above 90 per cent in the case of development _of other irrigation

140 MONGHYR
resources, purchase of implements, machinery and transport equipment and bunding and other land improvements; only in the case of digging and repair of wells the borrowings as a source of finance were relatively important.
The current farm expenditure per cultivating family worked out to Rs 768 of which 44 per cent was incurred in cash and the remaining 56 per cent in kind. The current farm expenditure worked out to Rs 1,278 per family in the case of upper strata cultivators and Rs 258 per family in the case of lower strata cultivators. The proportion of the current cash farm expenditure financed from current income was about 91 per cent in the case of upper strata cultivators and about 79 per cent in the case of lower strata cultivators. Both the upper strata and lower strata cultivators did not resort to past savings and sale of assets for financing their current cash farm expenditure.
Among the recorded items of family expenditure, the expenditure on marriage and other ceremonies and durable consumer goods was significant; the expenditure on construction and repairs of residential houses and other buildings also constituted sizeable portion of the total family expenditure. The bulk of the family expenditure was financed from current income supplemented by borrowings. Other sources of finance, viz., past savings, sale of assets, etc., were not reported to have played any role in the family expenditure.
11.1 NET BALANCE OF CAPITAL TRANSACTIONS
The balancing of transactions relating to investment in farm and non-farm busineBB, financial investment expenditure and liquidation of debt on one hand and of those relating to borowings and sale of assets on the other hand disclosed a deficit for agricultural economy during the year covered by the Survey. The deficit worked out to Rs 77 per family in the case of cultivators, Rs 60 per family in the case of noncultivators and Rs 69 in the case of rural families. A small surplus was observed in the case of big cultivators, whereas there was relatively heavy deficit in the case of medium cultivators. However, if the expendit':ll"e on construction and repairs of residential houses and other buildings is taken on investment side, the position appears to be much better in the case of big and large cultivators.
11.4 SUPPLY OF CREDIT
As observed earlier, the proportion of borrowings from debt owed to co-operatives to the total borrowings and total debt was negligible. This was mainly because of inadequately developed co-operative movement in the district. The role of Government was a little better than that of the co-operatives. About 7 per cent of the cultivating families reported borrowings from Government. The average borrowings per cultivating family from Government were Rs 10 constituting about 6 per cent of the total borrowings of the cultivators. Viewing from the point that Government liberalised the rules for provision of finance on account of distreBS conditions in the district, the quantum of borrowings from Government as revealed by the Survey data appears to be quite low. The proportion of cultivating families

CONCLUDING REMARKS 141
borrowing from professional moneylenders was 49 per cent, the average borrowings per cultivating family from professional moneylenders were Rs 182 which constituted about 79 per cent of the total borrowings of the cultivators. The predominant position of private credit agencies itself indicates the magnitude of the problem faced by co-operatives, if they are to meet a sizeable proportion of credit needs of cultivators.
Printed by Pyarelal Bab, at the Times of India Pl'e88, Bombay, India, and published by V. M. Jakhade for the Reserve Bank of India, Bombay.

RESERVE BANK OF INDIA PUBLICATIONS
Publications relating to All-India Rural Credit Survey (1951-2)
Price Rs"nP
Report on the All-India Rural Credit Survey Volume I (Part 1). . 9·00
Report on the All-India Rural Credit Survey Volume I (Part 2).. 7·00
Report on the All-India Rural Credit Survey Volume I (Summary) 2·00
Report on the All-India Rural Credit Survey Volume II .. 5·00
Report on the All-India Rural Credit Survey Volume II (Summary) 0·50
Report on the All-India Rural Credit Survey Volume II (Abridged Edition) 2·00
Report on the All-India Rural Credit Survey Volume III 10·00
District Monograph-West Khandesh 4·50
District Monograph-Osmanabad 4·50
District Monograph-Sorath 6·50
District Monograph-Deoria 6·50
District Monograph-Quilon 6·50
District Monograph-Barmer 6·00
District Monograph-Burdwan 6·50
Distric~ Monograph-Jullundur 6·50
Available from the Administrative Officer, Department of Research and Statistics, Reserve Bank of India, Post Box No. 1036; Bombay 1.
Cheques to be drawn on Bombay in favour of "Reserve Bank of India"
Prices quoted are exclusive of Registration or V.P.P. charges.
Payments to be made in advance or required publications may be ordered by V.P.P.