Embed Size (px)
Citation preview
Alcohol Cue Reactivity Task Development
Carmen Pulido, Ph.D.a, Sandra A. Brown, Ph.D.a,b, Kevin Cummins, M.S.a, Martin P. Paulus,M.D.a,b, and Susan F. Tapert, Ph.D.a,ba University of California San Diegob VA San Diego Healthcare System
AbstractBackground—The physiological and cognitive reactions provoked by alcohol cues, as comparedto non-alcohol cues, can predict future drinking. Alcohol cue reactivity tasks have been developed;however, most were created for use with alcohol use disordered individuals and utilize limited oronly partially standardized stimuli. This project systematically created an alcohol cue reactivity taskfor studies with non-drinkers, using well-characterized stimuli.
Objectives—We comprehensively standardized 60 alcohol and 60 non-alcohol beverage picturesusing ratings from young non-drinkers (N=82) on affective and perceptual features.
Results—A statistical matching approach yielded 26 matched alcohol - non-alcohol picture pairsmatched on valence, arousal, image complexity, brightness, and hue. The task was piloted and furtherrefined to 22 picture pairs. An 8-minute, 32-second event-related task was created using a randomstimulus function for optimized condition timing and systematic presentation of the images.
Conclusions—The long-term objectives of this project are to utilize this task with non-drinkingyouth to investigate how reactivity to alcohol stimuli may predict alcohol use initiation and escalation,to help identify the role of exposure to alcohol stimuli on the subsequent development of alcohol-related problems.
KeywordsAlcohol cue reactivity; Task development; Standardization; Affective ratings; Adolescence; Collegestudents
1. IntroductionSubjective alcohol craving and responses to alcohol-specific cues (e.g., pictures of alcoholicbeverages) have been shown to produce different physiological and cognitive interferenceresponses in contrast with exposure to non-alcohol cues (e.g., delayed reaction times onattentional tasks) (Bruce & Jones, 2004). Specifically, prior investigations have shown thatalcoholics report higher subjective reactions (e.g., craving) to alcohol stimuli (e.g., pictures)when compared to non-alcoholic stimuli (Drobes, 2002) and social drinkers (George et al.,2001). Similarly, adults (Monti et al., 1987) and adolescents (Thomas & Deas, 2005; Thomas,Drobes, & Deas, 2005) with alcohol dependence have demonstrated differential physiological
Corresponding author: Carmen Pulido, Ph.D., University of California San Diego, Department of Psychiatry, 3350 La Jolla Village Drive(151B), San Diego, CA 92161, (858) 642-1480, (858) 642-6340 fax, [email protected]'s Disclaimer: This is a PDF file of an unedited manuscript that has been accepted for publication. As a service to our customerswe are providing this early version of the manuscript. The manuscript will undergo copyediting, typesetting, and review of the resultingproof before it is published in its final citable form. Please note that during the production process errors may be discovered which couldaffect the content, and all legal disclaimers that apply to the journal pertain.
NIH Public AccessAuthor ManuscriptAddict Behav. Author manuscript; available in PMC 2011 February 1.
Published in final edited form as:Addict Behav. 2010 February ; 35(2): 84–90. doi:10.1016/j.addbeh.2009.09.006.
NIH
-PA Author Manuscript
NIH
-PA Author Manuscript
NIH
-PA Author Manuscript

responses, such as increased salivation, to the sight and smell of alcoholic beverages ascompared to non-alcoholic beverages. This population has also evidenced cognitiveinterference (e.g., delayed reaction times) when presented with alcohol cues (e.g., alcoholicbeverages or alcohol-related words) (Bauer & Cox, 1998; Sayette et al., 1994). Social drinkersalso show delayed reaction times (Bruce & Jones, 2004) or alcohol bias (Townshend & Duka,2001) when presented with alcohol stimuli, which often correlated with the level of alcoholinvolvement. Cue reactivity paradigms have been used for tailoring alcohol interventions(Drummond & Glautier, 1994; Rohsenow et al., 2001), evaluating the efficacy of alcoholtreatment programs (Hutchison et al., 2006; Schneider et al., 2001), and examining degree ofreactivity in relation to duration of abstinence (Monti et al., 1993).
In brief, from the concentration of studies with alcohol using individuals, alcohol cue reactivityappears to develop through personal alcohol use. Only a few studies have examined alcoholcue reactivity among individuals at risk for alcohol use disorders (AUD) (Tapert et al.,2003). In the present study, an alcohol cue reactivity task was developed using stimuli ratingsof non-drinkers, who have previously been shown to have different subjective affectiveresponses to alcohol beverage images as compared to drinkers (Pulido, Mok, Brown, & Tapert,2009). This alcohol cue reactivity task was developed for future use with non-drinkers at riskfor AUD, to help determine whether attentional bias is developed only through personal alcoholuse experiences, or if it can also be learned through modeling, and whether cue reactivity canpredict subsequent drinking behavior. Ultimately, these findings can help in the developmentof effective AUD prevention programming.
1.2 Alcohol Cue Reactivity Studies and LimitationsPrior to assessing alcohol cue reactivity, a task for such purpose needs to be developed. Stimulistandardization and implementation into a task is time consuming, and several research groupshave substantially advanced our understanding of stimulus characteristics important toconsider when creating an alcohol cue reactivity task (Braus et al., 2001; Grusser, Heinz, &Flor, 2000; Grusser et al., 2004; Wrase et al., 2002; Wrase et al., 2007).
First, stimulus affective and perceptual characteristics are important to consider. Fortunately,some investigators have highlighted the importance of stimulus standardization and reportedefforts to standardize task materials prior to task creation (e.g., Grusser et al., 2000; Wrase etal., 2002). However, standardization procedures have typically explored only one dimensionsuch as valence (e.g., Bauer & Cox, 1998) or the visual complexity of the stimuli (e.g., Bruce& Jones, 2004). A task simultaneously considering multiple task-relevant stimulus parametersis yet to be developed. Second, the standardization of a limited quantity of stimuli (e.g., Grusseret al., 2000) restricts its utility for creating an alcohol cue reactivity task since stimuli repetitioncan reduce statistical power or even confound results (Schwartz et al., 2003). For instance, amodest quantity of items has been managed in some studies by supplementing the task withstimuli standardized with divergent procedures (e.g., George et al., 2001; Hermann et al.,2006; Myrick et al., 2004). Third, in cases where alcohol visual stimuli standardization hasbeen undertaken with small (Grusser et al., 2000; Lang, 1999) and large (Stritzke, Breiner,Curtin, & Lang, 2004; Wrase et al., 2002) item pools, participants' alcohol use characteristicsare often unknown, despite this being an important correlate of alcohol stimulus ratings (Pulido,Mok et al., 2009). Finally, although various tasks are currently available to assess alcohol cuereactivity among AUD individuals, no task has been developed to specifically examine alcoholcue reactivity among non-drinking individuals at risk for AUD.
This study utilized a database of affective (i.e., valence and arousal) and perceptual (i.e.,familiarity and image complexity) ratings from 82 non-drinking individuals and objectivebrightness and color measures to statistically match 120 alcohol and non-alcohol beveragepictures for an alcohol cue reactivity task. The task developed here will improve upon existing
Pulido et al. Page 2
Addict Behav. Author manuscript; available in PMC 2011 February 1.
NIH
-PA Author Manuscript
NIH
-PA Author Manuscript
NIH
-PA Author Manuscript

alcohol cue reactivity paradigms in that it was developed by means of a novel and stringentprocedure, simultaneously taking into consideration multiple recommended task developmentprocedures. These included using a large item pool, collecting ratings from non-drinkers andcovering relevant parameters, using an objective matching approach, optimizing task designfor fMRI, including an active control condition, and conducting a pilot study. The carefulcreation of the task will allow for more accurate neural assessment of alcohol cue reactivityand comparison of results across samples.
2. MethodsThis study had two objectives: a) to statistically match a set of alcohol and non alcohol picturepairs on affective and perceptual features, and b) to systematically present these cues with atime course conducive to evaluating behavioral reactions as well as blood oxygen leveldependent response during functional magnetic resonance imaging studies.
2.1 Methods for Stimuli MatchingThe first objective was to generate a set of alcohol and non-alcohol beverage pictures thatwould be recognizable to non-drinkers, then to match alcohol to non-alcohol pictures onvalence, arousal, and perceptual complexity ratings, and on objective measures of brightnesslevel and net color. These aims were accomplished by (1) collecting ratings on familiarity,valence, arousal, and complexity ratings for 120 alcohol and non-alcohol beverage picturesfrom a sample of 245 adolescents and young adults, including 82 non-drinkers; and (2)obtaining objective measurement of pictures' brightness and color using the GNU ImageManipulation Program (GIMP; Berkeley, CA), a photo editing software program. Testconstruction theory was used to ensure the proper development of the task.
2.1.1 Participants—Participants (N=82) were ages 13 to 23 (M = 18.1, SD=2.2), 52%female, 41% Caucasian, 10% with paternal AUD (all denied maternal AUD), and reportedlyminimal depressive symptomatology (BDI-II score M=5.9, SD=7.1). Participants ages 18 andolder (n=67) were college students recruited from local universities (Pulido, Mok et al.,2009). Participants under age 18 (n=15) were recruited from local middle schools through anongoing adolescent brain imaging study (Pulido, Anderson, Armstead, Brown, & Tapert,2009; Spadoni, Norman, Schweinsburg, & Tapert, 2008). The inclusionary criterion for thepresent study was having had 10 or less lifetime alcohol drinking experiences, as determinedby the Customary Drinking and Drug Use Record (see below, Brown et al., 1998); thosereporting drinking more were excluded. An alcohol drinking experience was defined as a 24-hour period when one or more standardized alcoholic beverages (i.e., 12oz. beer, 8 oz. maltliquor, 4 oz. wine, or 1.25 oz. of hard liquor) were consumed. This criterion was based on thefuture objective of using this task with non-drinkers, and our previous findings of differencesin affective responses to alcohol pictures between individuals above and below this threshold(Pulido, Mok et al., 2009).
2.1.2. Measures2.1.2.1. General Interview (Brown, Vik, & Creamer, 1989): A general interview wasadministered to gather demographic information.
2.1.2.2. Customary Drinking and Substance Use Record (Brown et al., 1998): Anabbreviated form of the CDDR gathered frequency, quantity, and recency of personal alcoholand other drug use.
2.1.2.3. The Short Michigan Alcoholism Screening Test versions M and F (Sher &Descutner, 1986): The Short Michigan Alcoholism Screening Test versions M and F (Sher &
Pulido et al. Page 3
Addict Behav. Author manuscript; available in PMC 2011 February 1.
NIH
-PA Author Manuscript
NIH
-PA Author Manuscript
NIH
-PA Author Manuscript

Descutner, 1986), which are adapted forms of the SMAST, were administered to participantsto report on their Mothers (SMAST-M) and Fathers (SMAST-F) history of AUD. The SMAST-M and SMAST-F have shown good reliability and validity (Crews & Sher, 1992).
2.1.2.4. The Beck Depression Inventory-Second Edition (Beck, Steer, & Brown, 1996) andBeck Depression Inventory (Beck, 1978): The Beck Depression Inventory-Second Edition(Beck, Steer, & Brown, 1996) and Beck Depression Inventory (Beck, 1978) were used to assesscollege student's and adolescents' current level of depression (respectively).
2.1.2.5. The Beverage Pictures: The Beverage Pictures stimuli consisted of 120 color pictures:60 of alcoholic beverages and 60 of non-alcoholic beverages. Pictures were obtained frompopular magazine advertisements, amateur photographs, the Normative Appetitive PictureSystem (Stritzke et al., 2004), the International Affective Picture System ([CSEA-NIMH],1999), and the internet, then scanned at a similar resolution and image size. The pictures weredisplayed via an E-Prime (Pittsburgh, PA) program for systematic presentation (see samplepicture in Figure 1). Each subject rated 60 pictures instead of all 120 to minimize fatigue. Thus,four picture presentation programs were created with 30 alcohol and 30 non-alcohol picturesin each. Within each program, pictures were randomized to control for order effects.
2.1.2.6. The Self-Assessment Manikin (SAM): The Self-Assessment Manikin (SAM) picturerating system (Lang, 1999) includes two nine-point scales for rating valence (i.e., pleasure/displeasure) and arousal (i.e., excitement/calm) perceived while viewing each picture.
2.1.2.7. The Perceptual Ratings Booklet: The Perceptual Ratings Booklet was used to ratefamiliarity with the beverage depicted and each picture's complexity according to guidelinesin Snodgrass and Vanderwart (1980). Familiarity was measured with a five-point scale with 1(“very unfamiliar,” i.e., the participant was uncertain as to what kind of beverage was depicted)to 5 (“very familiar,” i.e., the participant recognized the beverage and knew what type ofbeverage it was). Visual complexity (e.g., “How detailed is the picture? If you had to describethe picture in detail or draw it, how simple or complicated would it be?”) was measured witha five-point scale, with 1 for “very simple” to 5 for “very complex.”
2.1.3. Procedures—College participants were tested in groups of 1 to 5 individuals, and 13to 17 year olds were tested individually to ensure attention to the task. There were four partsto the study. First, informed consent was obtained (for minors, informed consent was obtainedfrom the parent and assent from the adolescent) in accordance with University of CaliforniaSan Diego and San Diego State University Human Research Protections Program guidelines,and questionnaires covering demographic information, alcohol and drug use history, and moodwere administered.
Second, participants completed valence and arousal ratings of the alcohol and non-alcoholbeverage pictures. Detailed instructions and practice trials were provided, then each subjectrated 60 pictures, using the Self-Assessment Manikin booklets (Lang, 1999). Stimuli werepresented via E-Prime running on a laptop computer, and each trial included three components:1) the preparation slide presented for 3 seconds (“Please be ready for the next slide”); 2) astimulus picture presented for 6 seconds, and participants were asked to attend to it during itsentire presentation; and 3) a rating slide presented for 11 seconds asking participants to ratehow the picture made them feel while viewing it.
Third, subjects rated perceptual features (i.e., familiarity and complexity) of the pictures. Forthis, the same pictures presented for affective ratings were shown again but in randomizedorder. Each trial included three components: 1) the preparation slide presented for 3 seconds(“Please be ready for the next slide”); 2) a stimulus picture presented for 2.5 seconds with
Pulido et al. Page 4
Addict Behav. Author manuscript; available in PMC 2011 February 1.
NIH
-PA Author Manuscript
NIH
-PA Author Manuscript
NIH
-PA Author Manuscript

participants asked to attend to it during its entire presentation; and 3) a rating slide presentedfor 9 seconds asking participants to rate the picture in terms of their personal familiarity withthe beverage and the picture's level of visual complexity.
Fourth, subjects responded to questionnaires regarding their family history of alcohol use,followed by the debriefing of the study. Completing these procedures took approximately 2hours for each participant.
2.1.4. Statistical Procedures for Stimulus Matching—First, a visual inspection of the120 beverage pictures revealed that 8 were not fit for matching consideration because of poorimage quality. Next, pictures were screened for familiarity ratings (scale: 1 “not familiar” to5 “very familiar”). Mean familiarity ratings were higher for non-alcoholic beverage pictures(i.e., range from 2.5 to 4.8; M = 4.2, SD = 0.5) than for alcohol pictures (i.e., range 1.7 to 4.0;M = 2.8, SD = 0.6) on average, among these non-drinking participants. Alcohol pictures withmean familiarity ratings equal or below 2.3 (below “neutral”) were excluded from furtheranalysis (approximately 10% of the picture pool). In summary, 17 alcohol and 6 non-alcoholpictures were eliminated from further analysis based on image quality, or low familiarity ratingin this population.
Next, alcohol and non-alcohol pictures' valence, arousal, and complexity absolute differencescores were computed for each subject. An absolute difference score reflects the differencebetween two stimuli in a parameter of interest. For this, participants' booklets with ratings datawere coded and double checked for accuracy, entered into Microsoft Excel 4.0 and checkedfor entry accuracy, and exported into SPSS 14.0. All data were examined for outliers, normalityof distribution, and homoscedasticity. Then, within each subject and within one parameter (e.g.,valence) an absolute difference score was calculated by subtracting a valence rating to eachalcohol picture from the subject's valence rating to each non-alcohol picture (i.e., each alcoholpicture rating was contrasted against all available non-alcohol picture ratings within a subject).The same procedure was completed for arousal and complexity ratings for each participant.Mean absolute distances were computed for each picture pair on these 3 dimensions. For this,within one parameter, the distance score for one picture pair was averaged across all subjects.Mood scores (i.e., BDI-II and BDI totals) were not significant predictors of valence, arousal,or complexity ratings for alcohol and non-alcohol beverage pictures.
To consider the brightness and color constituents of each image in the matching procedure,GIMP photo editing software was used to objectively measure these parameters for eachpicture. Four values were ascertained for each picture to characterize the overall brightness, aswell as red, blue, and green content. Absolute difference scores were calculated for each alcoholpicture in contrast to every available non-alcohol picture for the matching procedure.
To consider all the above-mentioned parameters during picture matching, values werestandardized (i.e., ranging from 0 to 8), and composite summary scores were computed foreach possible picture pair, with larger scores indicating a poorer match. As valence wasconsidered to be more important for matching (Drobes, 2002; Wrase et al., 2002) thancomplexity (Braus et al., 2001; Wrase et al., 2007), brightness (Levin et al., 1998), or color(Braus et al., 2001; Wrase et al., 2007) based on reported attempts to control these parametersin the alcohol cue reactivity literature, it was assigned greater weight. The following formulawas used to compute the composite summary score:
Score = (valence*2)+(arousal*1)+(complaxity*1)+(brightness*0.5)+(red*0.167)+(green*0.167)+(blue*0.167)
Pulido et al. Page 5
Addict Behav. Author manuscript; available in PMC 2011 February 1.
NIH
-PA Author Manuscript
NIH
-PA Author Manuscript
NIH
-PA Author Manuscript

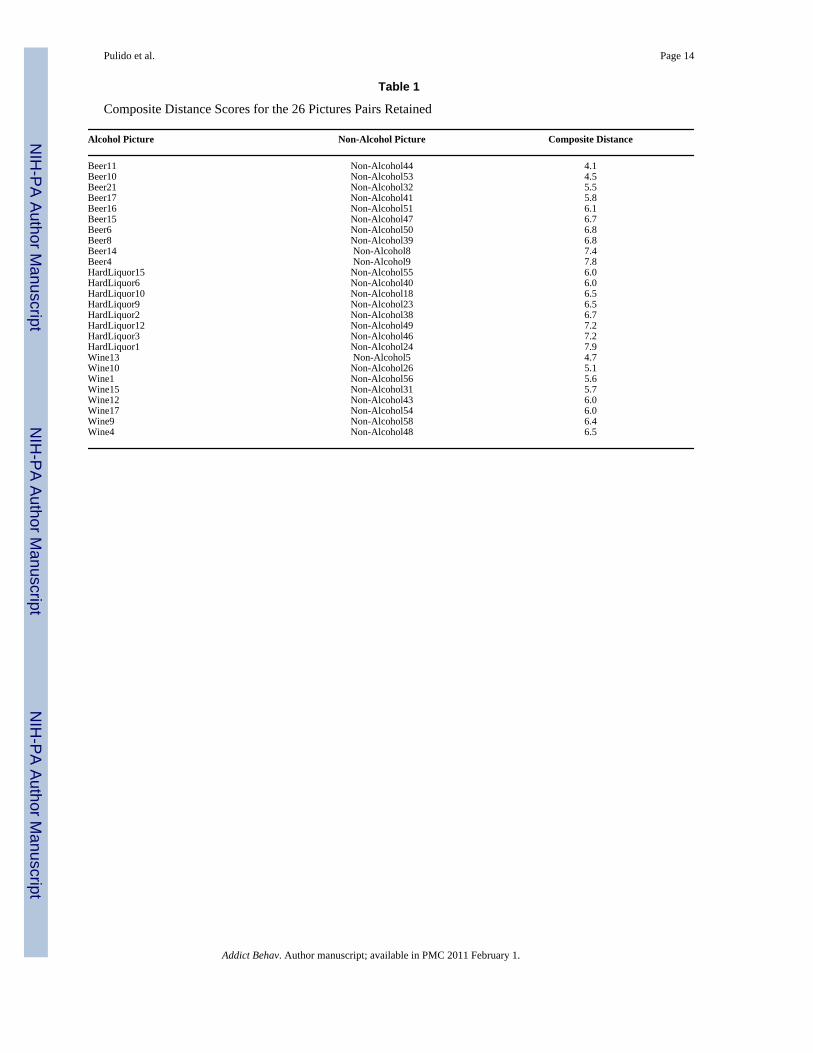
Thus, for each picture-picture difference, a single value was computed (range was 4.1 to 21.1across all possible alcohol – non-alcohol picture pairs). Matching was accomplished byselecting the minimum possible composite distance score for each alcohol picture to find itsbest non-alcohol picture match. Twenty-six picture pairs were thus determined; with compositedifference scores ranging from 4.1 to 7.9 (see Table 1).
2.2. Methods for Stimuli Presentation for Future Task AdministrationIn addition to the two primary conditions (i.e., alcohol and non-alcohol) of this cue reactivitytask, an active control condition consisting of degraded images of the alcohol and non-alcoholstimuli was created (for an example see Figure 1) using an Image Shuffle program (San Diego,CA) to facilitate controlling for responses to perceptual features (e.g., color) during futureneuroimaging data analysis.
The task design was optimized using the Analysis of Functional NeuroImages (AFNI) RSFgenprogram (Cox, 1996), which generates random stimulus functions to inform optimal durationand timing of each trial to maximize the number of trials of interest (Liu, 2004; Liu & Frank,2004). The stimulus function calculates the number of presentations required given the numberof stimulus types, number of stimuli per type, and task duration, and timing considershemodynamic response temporal characteristics so that this task can be used in functionalmagnetic resonance imaging studies (Cohen, 1997).
The pairs of alcohol – non-alcohol pictures were programmed into E-Prime for systematicpresentation. A practice version of the task and task instructions were developed for standardadministration, asking participants to press a key in response to whether they like (left arrow),feel neutral (down arrow), or dislike (right arrow) the beverage picture.
3. ResultsIn summary, 120 beverage pictures were subjected to a statistical matching process, involvingexclusion on the basis of visual inspection and ratings of familiarity in a sample of 82 non-drinking youth. This yielded 26 alcohol and 26 non-alcohol beverage pictures that wereoptimally matched in terms of affective and perceptual ratings as well as objective indices ofbrightness and hue content. Ratings and other image parameters averaged across the 26 alcoholand 26 non-alcohol pictures are shown in Table 2. In this sample of non-drinkers, the non-alcohol pictures tended to be rated more favorably (i.e., positive valence) while, on average,the alcohol pictures were rated as neutral. Arousal, complexity, brightness, and color contentindices were not statistically different between the two picture types.
The 26 picture pairs and respective active control condition were administered to a newadolescent sample (N=21) for further evaluation of behavioral responses. Based on responsesof these adolescents to the 26 picture pairs, poor matching and item recognition was observedfor some stimuli, resulting in the removal of 4 of the 26 picture pairs. Parameter ratings andobjective indices of brightness and hue content for the 22 alcohol and non-alcohol picture pairs,according to this non-drinking sample (N=82), remained significant for valence and nonsignificant for arousal, complexity, brightness and color.
Mood, age, gender, ethnicity, and paternal AUD were explored as predictors for the 22 picturespairs' valence, arousal, and complexity ratings. Participant's mood, age, ethnicity, and paternalAUD were not significant predictors of picture ratings. However, gender was significant atpredicting non-alcohol pictures valence (Females M = 3.7, SD = 1.2, Males M = 4.2, SD = 0.7;t(65) = -2.2, p = 0.03) and alcohol pictures complexity ratings (Females M =3.6, SD = 0.6, MalesM = 3.1, SD = 0.7; t(80) = 2.9, p< 0.01). Specifically, females, when compared to males, rated
Pulido et al. Page 6
Addict Behav. Author manuscript; available in PMC 2011 February 1.
NIH
-PA Author Manuscript
NIH
-PA Author Manuscript
NIH
-PA Author Manuscript

non-alcohol pictures as being more pleasant and alcohol pictures as being more perceptuallycomplex.
RSFgen was used again to generate a random stimulus function for the 22 alcohol and non-alcohol picture pairs and active control conditions (see Figure 2); they were then programmedinto E-Prime. A final task was created as an event related task with 4 conditions (i.e., alcohol,non alcohol, and alcohol and non alcohol active controls) each with 22 stimuli. The task beginswith a 12-second fixation (rest) period. The alcohol and non alcohol stimuli are each presented4 times (i.e., 88 trials per condition) while the active control stimuli are presented once (i.e.,22 trials per condition) to result in 220 trials. Each trial is presented for 750 ms (Heinz et al.,2007) with a 1250 ms inter-stimulus interval (i.e., blank screen), and 15 intermittent fixationperiods (i.e., screen with a centered cross-hair) of 2, 4, or 6 seconds (i.e., for a total of 60seconds of fixation throughout the task). During future functional magnetic resonance imagingdata analysis, the fixation and active control conditions provide the opportunity to contrastactivation to alcohol and non-alcohol pictures to a rest (i.e., fixation) and visual (i.e., activecontrol) baselines. The alcohol cue reactivity task is 8 minutes and 32 seconds in duration.Task instructions are to press a key within 2000 ms of stimuli presentation in response towhether participants Like (left button), feel Neutral (down button), or Dislike (right button)seeing the beverage picture. Ratings and reaction times are logged for statistical analysis. Apractice task with non-beverage pictures was created for establishing task demands outside thescanner.
4. DiscussionThis novel matching procedure provided a more objective and rigorous method (i.e., objectivecomparison of multiple parameters), as compared to previous alcohol cue reactivity tasks, tocontrast stimuli (i.e., alcohol and non-alcohol) on relevant affective and perceptualcharacteristics for task inclusion. This in turn, will eliminate potential confounds of futurealcohol cue reactivity studies by minimizing the extent to which the stimuli of interest (i.e.,alcohol) varies from the control (i.e., non alcohol and active control) conditions.
Studies with alcohol dependent individuals have shown that behavioral, physiological, andneural reactivity to alcohol stimuli influences subjective craving and drinking behavior. Asmost extant alcohol cue reactivity tasks were not rigorously constructed, we created an event-related neuroimaging task starting with a set of 120 (i.e., 60 alcohol and 60 non-alcohol)beverage pictures. Pictures were screened for visual quality and familiarity ratings of non-drinkers. Then, a novel approach objectively matched alcohol and non-alcohol pictures onvalence, arousal, and complexity ratings of non-drinking young people, as well as objectivemeasures of brightness and color (i.e., red, green, and blue). In addition, an active controlcondition was created to further manage pictures' perceptual characteristics, during futureneuroimaging data analysis. Task presentation sequence and timing were optimized using arandom stimulus function approach, which provided as many trials as possible in a reasonableperiod of time. Matched stimuli were programmed into a widely used presentation softwareprogram for systematic delivery, and a practice task was created. This alcohol cue reactivitytask improves upon existing tasks in that it was developed by means of a novel and stringentprocedure, since for the first time various recommended cue reactivity task developmentmeasures were simultaneously taken into consideration for the careful creation of the task.
Some may argue that matching these stimuli on affective characteristics could potentiallyremove the very alcohol reactivity we are interested in. However, by matching alcohol to non-alcohol stimuli on affective ratings and presenting it as a neuroimaging cue reactivity task, anydifferential response (i.e., neuronal activation) subjects may show between conditions (i.e.,alcohol vs. non alcohol) can more precisely be attributable to the alcohol-specific content of
Pulido et al. Page 7
Addict Behav. Author manuscript; available in PMC 2011 February 1.
NIH
-PA Author Manuscript
NIH
-PA Author Manuscript
NIH
-PA Author Manuscript

the cue as compared to the affective significance of the stimuli. Thus, this task can be used toinvestigate alcohol cue reactivity above and beyond reactivity to affectively charged stimuli.
The task here developed will help determine if alcohol cue reactivity is inherent amongindividuals at risk for developing AUD. In addition, the task could potentially be used as anindicator of risk for heavy alcohol involvement and alcohol related problems, and to determinedifferences in alcohol cue reactivity as a function of risk and protective factors (e.g., OPRM1genotype variants,Anton et al., 2008; Myrick et al., 2008).
4.1. LimitationsThe task was developed based on ratings of non-drinking college students and adolescents; assuch, its use may be limited to non-drinkers. The inclusion of a college sample, rather thanonly adolescents, may be a limitation. A non-drinking adolescent sample may have been abetter fit for this study's purposes. However, when comparing young adolescents and collegestudents' pictures ratings, only one of four ratings significantly differed. In addition, theinclusion of a college sample broadened the utility of this task for use with youth, includinglate adolescent college freshman.
The alcohol and non alcohol stimuli included in the task were matched on multiple variables;still, significant differences in the subjective valence ratings of alcohol images were found,which may be a characteristic of the population included (i.e., non-drinkers) and a limitationof this task. Specifically, females rated non-alcohol pictures as being more pleasant and alcoholpictures as being more perceptually complex when compared to males. Previous alcohol cuereactivity picture standardization studies have not reported recruiting non-drinkers and nogender differences in picture ratings have been reported among controls, thus there is noprecedent to these findings (Grusser et al., 2000; Wrase et al., 2002).
Stimuli updates will be needed to keep current with alcohol advertisement trends in comingyears. The stimuli here are limited to pictures, although moving images or olfactory cues mayfurther enhance cue-related responses. However, for studies of non-drinkers, it is unclear ifolfactory or gustatory stimuli could enhance reactivity to alcohol cues given this population'slimited personal use experiences. Alcohol cue reactivity among non-drinking youth isconceptualized as resulting from a variety of factors, including parental and peer modeling andthe media (e.g., magazine advertisements, billboards), which supports the adequacy of pictorialstimuli for the initial investigation of alcohol cue reactivity among non drinkers.
4.2 Clinical ImplicationsCue reactivity research with non-drinking youth could be used to ascertain which populationsmight be at particularly high risk for AUD. This information could be valuable for determiningwho might be at greater need for preventive services. In addition, determination of heightenedrisk for AUD on the basis of alcohol cue reactivity would point to potential interventionstargeting the extinction of the cue response.
AcknowledgmentsThis research was supported by the National Institute on Alcohol Abuse and Alcoholism grant R01 AA013419 (PI:Susan Tapert) as well as a minority supplement to this grant R01 AA013419-02S1 (Pulido); the Alcohol Research inthe Science/Practitioner Model fellowship T32 AA013525 (PI: Edward Riley); a Ruth L. Kirschstein NRSA fellowshipF31 AA016423 (PI: Carmen Pulido), and a National Institute of Mental Health postdoctoral fellowship T32 MH018399(PI: Eric Turner). Special thanks to all the undergraduate research assistants who have participated in this project:Alex Mok, Jennifer Escalante, Lain Lain Tan, Alina Anuccavech, Yoojin Kim, Sonia Lentz, and Shadi Sedijhzadeh.Thanks to Andria Norman for her feedback in making the task adolescent-friendly.
Pulido et al. Page 8
Addict Behav. Author manuscript; available in PMC 2011 February 1.
NIH
-PA Author Manuscript
NIH
-PA Author Manuscript
NIH
-PA Author Manuscript

References[CSEA-NIMH], CftSoEaA. International affective pictures system: Digitized photographs. Gainesville,
FL: The Center for Research in Psychophysiology, University of Florida; 1999.Anton RF, Oroszi G, O'Malley S, Couper D, Swift R, Pettinati H, et al. An evaluation of mu-opioid
receptor (OPRM1) as a predictor of naltrexone response in the treatment of alcohol dependence: resultsfrom the Combined Pharmacotherapies and Behavioral Interventions for Alcohol Dependence(COMBINE) study. Archives of General Psychiatry 2008;65(2):135–144. [PubMed: 18250251]
Bauer D, Cox WM. Alcohol-related words are distracting to both alcohol abusers and non-abusers in theStroop colour-naming task. Addiction 1998;93(10):1539–1542. [PubMed: 9926558]
Beck, AT. Beck Depression Inventory (BDI). San Antonio, TX: The Psychological Corporation; 1978.Beck, AT.; Steer, RA.; Brown, GK. Manual for the Beck Depression Inventory-2. San Antonio, TX: The
Psychological Corporation; 1996.Braus DF, Wrase J, Grusser S, Hermann D, Ruf M, Flor H, et al. Alcohol-associated stimuli activate the
ventral striatum in abstinent alcoholics. Journal of Neural Transmission 2001;108(7):887–894.[PubMed: 11515754]
Brown SA, Myers MG, Lippke L, Tapert SF, Stewart DG, Vik PW. Psychometric evaluation of theCustomary Drinking and Drug Use Record (CDDR): a measure of adolescent alcohol and druginvolvement. Journal of Studies on Alcohol 1998;59(4):427–438. [PubMed: 9647425]
Brown SA, Vik PW, Creamer VA. Characteristics of relapse following adolescent substance abusetreatment. Addictive Behaviors 1989;14(3):291–300. [PubMed: 2787585]
Bruce G, Jones BT. A pictorial Stroop paradigm reveals an alcohol attentional bias in heavier comparedto lighter social drinkers. Journal of Psychopharmacology 2004;18(4):527–533. [PubMed: 15582919]
Cohen MS. Parametric analysis of fMRI data using linear systems methods. Neuroimage 1997;6(2):93–103. [PubMed: 9299383]
Cox RW. AFNI: software for analysis and visualization of functional magnetic resonance neuroimages.Computers and Biomedical Research, an International Journal 1996;29(3):162–173.
Crews TM, Sher KJ. Using adapted short MASTs for assessing parental alcoholism: reliability andvalidity. Alcoholism, Clinical and Experimental Research 1992;16(3):576–584.
Drobes DJ. Cue reactivity in alcohol and tobacco dependence. Alcoholism, Clinical and ExperimentalResearch 2002;26(12):1928–1929.
Drummond DC, Glautier S. A controlled trial of cue exposure treatment in alcohol dependence. Journalof Consulting and Clinical Psychology 1994;62(4):809–817. [PubMed: 7962885]
George MS, Anton RF, Bloomer C, Teneback C, Drobes DJ, Lorberbaum JP, et al. Activation of prefrontalcortex and anterior thalamus in alcoholic subjects on exposure to alcohol-specific cues. Archives ofGeneral Psychiatry 2001;58(4):345–352. [PubMed: 11296095]
Grusser SM, Heinz A, Flor H. Standardized stimuli to assess drug craving and drug memory in addicts.Journal of Neural Transmission 2000;107(6):715–720. [PubMed: 10943911]
Grusser SM, Wrase J, Klein S, Hermann D, Smolka MN, Ruf M, et al. Cue-induced activation of thestriatum and medial prefrontal cortex is associated with subsequent relapse in abstinent alcoholics.Psychopharmacology (Berl) 2004;175(3):296–302. [PubMed: 15127179]
Heinz A, Wrase J, Kahnt T, Beck A, Bromand Z, Grusser SM, et al. Brain activation elicited by affectivelypositive stimuli is associated with a lower risk of relapse in detoxified alcoholic subjects. Alcoholism:Clinical & Experimental Research 2007;31(7):1138–1147.
Hermann D, Smolka MN, Wrase J, Klein S, Nikitopoulos J, Georgi A, et al. Blockade of cue-inducedbrain activation of abstinent alcoholics by a single administration of amisulpride as measured withfMRI. Alcoholism: Clinical & Experimental Research 2006;30(8):1349–1354.
Hutchison KE, Ray L, Sandman E, Rutter MC, Peters A, Davidson D, et al. The effect of olanzapine oncraving and alcohol consumption. Neuropsychopharmacology 2006;31(6):1310–1317. [PubMed:16237394]
Lang PJ, Bradley MM, Cuthbert BN. International affective picture system (IAPS): Instruction manualand affective ratings. Technical Report A-4. 1999
Pulido et al. Page 9
Addict Behav. Author manuscript; available in PMC 2011 February 1.
NIH
-PA Author Manuscript
NIH
-PA Author Manuscript
NIH
-PA Author Manuscript

Levin JM, Ross MH, Mendelson JH, Kaufman MJ, Lange N, Maas LC, et al. Reduction in BOLD fMRIresponse to primary visual stimulation following alcohol ingestion. Psychiatry Research 1998;82(3):135–146. [PubMed: 9754438]
Liu TT. Efficiency, power, and entropy in event-related fMRI with multiple trial types. Part II: design ofexperiments. NeuroImage 2004;21(1):401–413. [PubMed: 14741677]
Liu TT, Frank LR. Efficiency, power, and entropy in event-related FMRI with multiple trial types. PartI: theory. NeuroImage 2004;21(1):387–400. [PubMed: 14741676]
Monti PM, Binkoff JA, Abrams DB, Zwick WR, Nirenberg TD, Liepman MR. Reactivity of alcoholicsand nonalcoholics to drinking cues. Journal of Abnormal Psychology 1987;96(2):122–126. [PubMed:3584660]
Monti PM, Rohsenow DJ, Rubonis AV, Niaura RS, Sirota AD, Colby SM, et al. Alcohol cue reactivity:effects of detoxification and extended exposure. Journal of Studies on Alcohol 1993;54(2):235–245.[PubMed: 8384678]
Myrick H, Anton RF, Li X, Henderson S, Drobes D, Voronin K, et al. Differential brain activity inalcoholics and social drinkers to alcohol cues: relationship to craving. Neuropsychopharmacology2004;29(2):393–402. [PubMed: 14679386]
Myrick H, Anton RF, Li X, Henderson S, Randall PK, Voronin K. Effect of naltrexone and ondansetronon alcohol cue-induced activation of the ventral striatum in alcohol-dependent people. Archives ofGeneral Psychiatry 2008;65(4):466–475. [PubMed: 18391135]
Pulido C, Anderson KG, Armstead AG, Brown SA, Tapert SF. Family history of alcohol-use disordersand spatial working memory: effects on adolescent alcohol expectancies. Journal of Studies onAlcohol and Drugs 2009;70(1):87–91. [PubMed: 19118396]
Pulido C, Mok A, Brown SA, Tapert SF. Heavy drinking relates to positive valence ratings of alcoholcues. Addiction Biology 2009;14(1):65–72. [PubMed: 18855802]
Rohsenow DJ, Monti PM, Rubonis AV, Gulliver SB, Colby SM, Binkoff JA, et al. Cue exposure withcoping skills training and communication skills training for alcohol dependence: 6- and 12-monthoutcomes. Addiction 2001;96(8):1161–1174. [PubMed: 11487422]
Sayette MA, Monti PM, Rohsenow DJ, Gulliver SB, Colby SM, Sirota AD, et al. The effects of cueexposure on reaction time in male alcoholics. Journal of Studies on Alcohol 1994;55(5):629–633.[PubMed: 7990473]
Schneider F, Habel U, Wagner M, Franke P, Salloum JB, Shah NJ, et al. Subcortical correlates of cravingin recently abstinent alcoholic patients. The American Journal of Psychiatry 2001;158(7):1075–1083.[PubMed: 11431229]
Schwartz CE, Wright CI, Shin LM, Kagan J, Whalen PJ, McMullin KG, et al. Differential amygdalarresponse to novel versus newly familiar neutral faces: a functional MRI probe developed for studyinginhibited temperament. Biological Psychiatry 2003;53(10):854–862. [PubMed: 12742672]
Sher KJ, Descutner C. Reports of paternal alcoholism: reliability across siblings. Addictive Behaviors1986;11(1):25–30. [PubMed: 3716913]
Snodgrass JG, Vanderwart M. A standardized set of 260 pictures: norms for name agreement, imageagreement, familiarity, and visual complexity. Journal of Experimental Psychology. HumanPerception and Performance 1980;6(2):174–215.
Spadoni AD, Norman AL, Schweinsburg AD, Tapert SF. Effects of family history of alcohol use disorderson spatial working memory BOLD response in adolescents. Alcoholism, Clinical and ExperimentalResearch 2008;32(7):1135–1145.
Stritzke WG, Breiner MJ, Curtin JJ, Lang AR. Assessment of substance cue reactivity: advances inreliability, specificity, and validity. Psychology of Addictive Behaviors 2004;18(2):148–159.[PubMed: 15238057]
Tapert SF, Cheung EH, Brown GG, Frank LR, Paulus MP, Schweinsburg AD, et al. Neural response toalcohol stimuli in adolescents with alcohol use disorder. Archives of General Psychiatry 2003;60(7):727–735. [PubMed: 12860777]
Thomas SE, Deas D. The A-OCDS predicts both craving and alcohol cue reactivity in adolescentalcoholics. Addictive Behaviors 2005;30(9):1638–1648. [PubMed: 16140462]
Thomas SE, Drobes DJ, Deas D. Alcohol cue reactivity in alcohol-dependent adolescents. Journal ofStudies on Alcohol 2005;66(3):354–360. [PubMed: 16047524]
Pulido et al. Page 10
Addict Behav. Author manuscript; available in PMC 2011 February 1.
NIH
-PA Author Manuscript
NIH
-PA Author Manuscript
NIH
-PA Author Manuscript

Townshend JM, Duka T. Attentional bias associated with alcohol cues: differences between heavy andoccasional social drinkers. Psychopharmacology (Berl) 2001;157(1):67–74. [PubMed: 11512045]
Wrase J, Grusser SM, Klein S, Diener C, Hermann D, Flor H, et al. Development of alcohol-associatedcues and cue-induced brain activation in alcoholics. European Psychiatry 2002;17(5):287–291.[PubMed: 12381499]
Wrase J, Schlagenhauf F, Kienast T, Wustenberg T, Bermpohl F, Kahnt T, et al. Dysfunction of rewardprocessing correlates with alcohol craving in detoxified alcoholics. Neuroimage 2007;35(2):787–794. [PubMed: 17291784]
Pulido et al. Page 11
Addict Behav. Author manuscript; available in PMC 2011 February 1.
NIH
-PA Author Manuscript
NIH
-PA Author Manuscript
NIH
-PA Author Manuscript

Figure 1.Sample Shuffled Picture and Matched Picture Pair (Non-Alcohol44 and Beer11).
Pulido et al. Page 12
Addict Behav. Author manuscript; available in PMC 2011 February 1.
NIH
-PA Author Manuscript
NIH
-PA Author Manuscript
NIH
-PA Author Manuscript

Figure 2.Portion of Alcohol Cue Reactivity Task reference function generated by AFNI RSFgen. Taskis 8 minutes, 32 seconds in duration, with 2-second trials. The x–axis represents the first 101seconds of the task; the y-axis represents the task conditions (alcohol and non-alcohol activecontrol conditions were collapsed into one category). The horizontal lines of the blue graphrepresent the condition and its duration during the time course of the task.
Pulido et al. Page 13
Addict Behav. Author manuscript; available in PMC 2011 February 1.
NIH
-PA Author Manuscript
NIH
-PA Author Manuscript
NIH
-PA Author Manuscript
NIH
-PA Author Manuscript
NIH
-PA Author Manuscript
NIH
-PA Author Manuscript
Pulido et al. Page 14
Table 1
Composite Distance Scores for the 26 Pictures Pairs Retained
Alcohol Picture Non-Alcohol Picture Composite Distance
Beer11 Non-Alcohol44 4.1Beer10 Non-Alcohol53 4.5Beer21 Non-Alcohol32 5.5Beer17 Non-Alcohol41 5.8Beer16 Non-Alcohol51 6.1Beer15 Non-Alcohol47 6.7Beer6 Non-Alcohol50 6.8Beer8 Non-Alcohol39 6.8Beer14 Non-Alcohol8 7.4Beer4 Non-Alcohol9 7.8HardLiquor15 Non-Alcohol55 6.0HardLiquor6 Non-Alcohol40 6.0HardLiquor10 Non-Alcohol18 6.5HardLiquor9 Non-Alcohol23 6.5HardLiquor2 Non-Alcohol38 6.7HardLiquor12 Non-Alcohol49 7.2HardLiquor3 Non-Alcohol46 7.2HardLiquor1 Non-Alcohol24 7.9Wine13 Non-Alcohol5 4.7Wine10 Non-Alcohol26 5.1Wine1 Non-Alcohol56 5.6Wine15 Non-Alcohol31 5.7Wine12 Non-Alcohol43 6.0Wine17 Non-Alcohol54 6.0Wine9 Non-Alcohol58 6.4Wine4 Non-Alcohol48 6.5
Addict Behav. Author manuscript; available in PMC 2011 February 1.

NIH
-PA Author Manuscript
NIH
-PA Author Manuscript
NIH
-PA Author Manuscript
Pulido et al. Page 15
Table 2
Mean Parameter Ratings by Picture Type for the 26 Picture Pairs (N=82)
AlcoholM (SD)
Non AlcoholM (SD)
Valence a* 5.0 (1.2) 3.9 (0.9)Arousal a 5.2 (1.4) 4.9 (1.1)Complexity 3.2 (0.6) 3.2 (0.7)Brightness 140.6 (51.5) 135.5 (47.6)Red 134.7 (49.4) 124.4 (47.0)Green 100.8 (50.5) 110.0 (49.0)Blue 88.7 (56.1) 106.0 (52.7)
aFor valence and arousal, a rating of 5 represents neutral while smaller ratings indicate more pleasantness and arousal while viewing the picture (range 1
to 9)
*p ≤ .001
Addict Behav. Author manuscript; available in PMC 2011 February 1.


![[2022] IELTS Speaking Part-2 Cue Cards PDF](https://img.dokumen.tips/doc/110x75/63236a51117b4414ec0c501b/2022-ielts-speaking-part-2-cue-cards-pdf.jpg)


