Embed Size (px)
Citation preview

Please read
Knowledge Services has become aware of potential faults in some of our older scanneddocuments. We are putting this disclaimer on the front of every document in the batchconcerned. We are making them available, as they do remain substantially usable.
The following document may contain errors. It was scanned when the software was at aprevious version and quality checking was unable to pick up some of the problems that arenow apparent.
Most of the errors will be cosmetic - variation in fonts and fuzziness. From time to time theOCR capability has proved faulty and word substitution has occurred.
We are sorry that this version of the report may be poorer than we would wish. If there aresignificant errors or you have doubts about what you are reading due to poor quality, pleasecontact Knowledge Services as below and we will try to remedy the problem. Ensure that yourrequest identifies that the current pdf version is unsatisfactory.
AGARD-AG-300 VOl.9
Distribution and Availability on Back Cover
ADVISORY GROUP FOR AEROSPACE RESEARCH & DEVELOPMENT 7 RUE ANCELLE 92200 NEUILLY SUR SEINE FRANCE
l3
0
(3 4
a
2
AGARDograph No.300
AGARD Flight Test Techniques Series Volume 9 on Aircraft Exterior Noise Measurement and Analysis Techniques (Le Bruit a 1'Extbrieur des Abronefs: Techniques de Mesure et d'Analyse)

AGARDograph 300 Flight Test Techniques Series - Volume 9
Aircraft Exterior Noise Measurement and Analysis Techniques (Le Bruit B l'Ext6rieur des ALronefs: Techniques de Mesure et d'Analyse)
by Dr H.Heller Head, Technical Acoustics Division German Aerospace Research Establishment (D.L.R.) Postfach 3261 D-3300 Braunschweig Germany
The Mission of AGARD
According to its Charter, the mission of AGAKD is to bring together the leading personalities of the NATO nations in the fields of science and technology relating to aerospace for the following purposes:
-Recommending effective ways for the member nations 1'3 use their research and development capabilities for the common benefit of the NATO community;
- Providing scicntific and technical advice and assistance to the Military Committee in the field of aerospace research and development (with particular regard to its military application);
- Continuously stimulating advances in the aerospace sciences relevant to strengthening the common defence posture;
-Improving the co-operation among member nations in aerospace research and development;
- Exchange of scientific and technical information;
- Pfoviding assistance to member nations for the purpose of increasing their scientific and technical potential;
- Rendering scientific and technical assistance, as requested, to other NATO bodies and to member nations in connection with research and development problems in the aerospace field.
The highest authority within AGARD is the National Delegates Board consisting of officially appointed senior representatives from each member nation. The mission of AGARD is carried out through the Panels which are composed of experts appointed by thc National Delegates, the Consultant and Exchange Programme and the Aerospace Applications Studies Programme. The results of AGARD work are reported to the member nations arid the NATO Authorities through the AGARD series of publications of which this is one.
Participation in AGARD activities is by invitation only and is normally limited to citizens of the NATO nations.
The content of this publication has been reproduced directly from material supplied by AGARD or the authors
Published April 1991
CopyrightOAGARD 1991 All Rights Reserved
ISBN 92-835-0,512-X -
Printed by Speciulised Printiq Services Limited 4U Chigwell Lune, Loughtot!, Essex IGIU 3TZ
Preface
Since its founding in 1952, the Advisory Group for Aerospace Research and Development has published, through the Flight Mechanics Panel, a number of standard texts in the field of flight testing. The original Flight Test Manual was published in the years 1954 to 1956. The Manual was divided into four volumes:
1 Performance 2 Stability and Control 3 Instrumentation Catalog, and 4 Instrumentation Systems.
As a result of developments in the field of flight test instrumentation, the Flight Test Instrumentation Group of the Flight Mechanics Panel was established in 1968 to update Volumes 3 and 4 of the Flight Test Manual by the publication of the Flight Test Instrumentation Series, AGARDograph 160. In its published volumes AGARDograph 160 has covered recent developments in flight test instrumentation.
In 1978, the Flight Mechanics Panel decided that further specialist monographs should be published covering aspects of Volume 1 and 2 of the original Flight Test Manual, including the flight testing of aircraft systems. In March 1981, the Flight Test Techniques Group was established to carry out this task. The monographs of this Series (with the exception of AG 237 which was separately numbered) are being published as individually numbered volumes of AGARDograph 300.
At the end of each volume of both AGARDograph 160 and AGARDograph 300 two general Annexes are printed. Annex 1 provides a list of volumes published in the Flight Test Instrumentation Series and in the Flight Test Techniques Series. Annex 2 contains a list of handbooks that are available on a variety of flight test subjects, not necessarily related to the contents of the volume concerned.
The present Volume (Vol.9 of AGARDograph 300) describes testing and analysis techniques to measure aircraft noise primarily for purposes of noise certification as specified by the ‘International Civil Aviation Organization’, ICAO. The relevant aircraft noise certification ‘Standards’ and ‘Recommended Practices’ are presented in detail for subsonic jet aeroplanes, for heavy and light propeller-driven aeroplanes and for helicopters. The practical execution of conducting noise certification tests is treated in depth. The characteristics and requirements of the acoustic and non-acoustic instrumentation for data acquisition and data processing are discussed, as are the procedures to determine the special noise measures ‘Effective Perceived Noise Level‘ (EPNL) and ‘Maximum Overall A-weighted Noise Level’ (LpA,mrx) that are required for the noise certification of different types of aircraft.
The AGARDograph also contains an extensive - although selective - discussion of test and analysis techniques for more detailed aircraft noise studies by means of either flight-experiments or full-scale and model-scale wind tunnel experiments.
... ,,.
Preface
Dcpuis sa creation en 1952, le Panel dc la Micanique du vol, sous I'igide du Groupc Consultatif pour la Recherchc et Ics Realisations Airospatiales a publii, un certain nombrc de textes qiii font autorite dans le domainc des essais en v01. Le Manuel des Essais en Vol a 616 publie pour la premiire fois dans les annee; 1954-1956. II comportait quatre volumes a savoir:
1 Performances 2 Stabiliti et Contr6le 3 4 Systemes de mesure.
Cataloguc des appareils de mcsurc, ct
Lesnovationsdansledomainedesappareilsdemesurepour lesesssisenvo1,ontconduit B]-ecreer,en 1968,legroupede travail sur les appareils de mesure pour les cssais en vol pour permettre la remise a jour des volumes 3 et 4. Les travaux du groupe ont debouch6 sur I'edition d'une serie dc publications sur les appareils de mesure pour les essais en vol, I'AGARDographie 160. Lcs differents volumes de I'AGARDographie 160 publies jusqu'a ce jour couvrent les derniers diveloppements dans le domaine.
En 1978, le Panel de la Micanique du vola signale I'intirit de monsgraphies suppl&mentaires sur certains aspects des volumes 1 ct 2 du Manuel initial et notamment les essais en vol des systimes wioniques. Ainsi, au mois de mars 1981, le groupe de travail sur les techniques des essais cn vol a i t 6 recree pour mener B bien cettc tiche. Les monographies dans cette sirie (a I'exception de la AG 237 qui fait partie d'une serie distincte) sont publiees sous Forme des volumes individuels de I'AGAKDographie 300.
A la fin de chacun des volumes de I'AGAKDographie 160 et de I'AGARDographie 300 figurent deux annexes ginirales. Uannexe 1 fournit la liste des volumes publies dans la sirie "Appareils de mesure pour Ies essais en vol" et dans le serie "Techniques des essais en vol". I>'anncxe 2 donne la liste dcs m a n d s disponiblcs sur les mimes thimes dans le domainc des essais en vol, qui ne sont pas forcement en rapport avec le contenu du volume en question.
Ce volume 9 de I'AGAKDographie 300 dicrit les techniques d'essiii et d'analyse mises en oeuvre pour le calcul du bruit ginere par les aeroncfs, principalement aux fins de la certification acour,tique, conformement aux indications de I'Organisation de I'Aviation Civile Internationale (OACI). Les normcs et les pratiques recommandees appropriies dans IC domaine de la certification acoustique des aeronefs sont presentees dans le detail, pour ce qui concerne los avions B reaction subsoniques, les avions B turbopropulseur lourds et Egers et les hilicoptires. Les aspects pratiques de la realisation des essais en vue de I'homologation acoustique sont trait& de Facon approfondic. Les caracteristiques et les spiicifications des appareils de mesure acoustiques pour la saisie et le traitement des donnees sont examinis, ainsi que les procedures adoptees pour les calculs specifiques du "niveau effectif de bruit percu" (EPNL) et du "nivcau maximal global de bruit ponder6 A" (L,,,,,,,x,J qui sont demandis pour la certification acoustique de diffirents types daiionefs.
Cette AGARDographie presente Pgalement une synthese a la fois approfondie, judicieuse et tres detaillee des techniques d'essais et d'analyse propres B des itudes de bruit faisant appel B des essais en voI ou en soufflerie soit a vraie grandeur, soit a ichelle reduite.

Acknowledgement to
Working Group 11 Members
In the preparation of the present volume the members of the Flight Test Techniques Group listed helow took an active part. AGARD has been most fortunate in finding three competent people willing to contribute their knowledge and time in the preparation of this and other volumes.
La liste des membres du groupe de travail sur les techniques des essais en vol ant participi activement a la redaction de ce volume figure ci-dessous. UAGARD peut itre fier que ces personnes compitentes aient hien voulu accepter de partager lcurs connaissances et aient consacri le temps necessaire a Yelaboration de ce et autres documents.
Adolph, C.E. OSD/US Appleford, J.K. Bever, G. NASA/US Bogue, R.K. NASA/US Boischot, M. C E V E R Bothe, H. DLR/GE
Delle Chlale, S. DASRSAT Langdon, G. A&AEE/UK Nippress, K. A&AEE/UK Payze, T. MSB/TU Pool, A. (Consultant) NE Russell, R.A. NATC/US
A & A E E /U K
Campos, L.M.B. IW/PO
Tresset, J. van der Velde. R.L. fF1.L.)
CEV/FR NLR/NE
\ I
Zundel. Y CEV/FR
R.R.HILDEBRAND, AFFTC Member, Flight Mechanics Panel Chairman, Flight Test Techniques Group
Foreword
I t was Dr Helmut Bothe of DLR, longstanding member of Working, Group 11 of the AGARD Flight Mechanics Panel, who first suggested to me to write an AGARDograph on ‘Aircraft Noise Measurement Analysis Techniques’, Being overjoyed, and quite honoured, I readily agreed to his and AGARDs proposal. Had I known what I‘d been in for, I probably would not have agreed quitc so enthusiastically. And yet, i t has been an expcricnce which 1 would not want to miss. and for this reason, among others, I am quite thankful to him in particular, and to AGARD’s Flight Mechanics Panel in general.
In the course of time, I experienced much help in one way or another by many individuals. Foremost, I’d like to thank Mr Anthony Pool, my first editor, who steered me along the right track and who undertook the admirable task of going through thc (initial) version of the AGARDograph word by word. My second editor, Professor Braga da Costa Campos, too provided many helpful suggestions. Mr Michael Foster of AGARD gave me much encouragement along the way.
There have been numerous other people from whom I experienced help and with whom I had fruitful discussions. Among these were
in Canada: Alan Masscy of Transport Canada and Robert Westley of the National Research Council;
in Denmark Per Bruel and KEKittelsen of Briiel & Kjael.;
in thc Nctherlands: Dick Cornelisse, Jeff Voogt, Nico van Oosten and Sohan Sarin of Fokker Aircraft Co.;
in the United Kingdom: Michael Smith of Rolls-Royce;
in the United States: Edward Rickley of the DOT Transportation Systems Center; Bruce Metzger, Bernard Magliozzi and Donald Hanson of United Technologies’ Hamilton Standard Division; Robert Schlinker of United Technologies Research Center; Ronald Schlegel and Raj Shenoy of SikcNrsky Aircraft; Harry Siernfeld of Boeing Vertol; Stephen Newman of the FAA Ofice of Environment and Energy; Joe Kirk and Elisabeth Plunkett of Boeing Commercial Airplane Co.; Frederic Schmitz, Donald Boxwell and Yung Yu of US Army Aeromechanics Laboratory, Ames Research Center; William Galloway of BBN Laboratories; Charles Cox of Bell Helicopter; Wiliam Snyder and William Warmbrodt of NASA Ames Research Center; Henning von Gierke of the US Air Force Aerospace Medical Research Laboratory; Paul Pao, Jim Yu and David Chestnut of NASA Langley RI:search Center; Leonard Shaw of United States Air Force Wright Research R&D Center.
Geographically somewhat closer, I’d also like to thank my colleagues in the DLR, most notably Helmut Dahlen, Werner Dobrzynski (much of his original artwork appears in this AGARDograph), Michael Kallergis, Klaus-Jiirgen Schultz and Wolf Splettstoesser, all of whose research material I freely used.
Finally, my thanks go to my trustcd secretary, Miss Kerstin Ehlers, who assisted me perfectly - especially in the final phase of completing the AGARDograph.
Hanno Heller Braunschweig December 1990
Contents
P r e f a c e
P r L f a c e
Acknovledgement
Foreword
L i s t of F i g u r e s
Terms and A b b r e v i a t i o n s
Symbols
1. INTRODUCTION
1.1 Scope of AGARDograph
1.2 Content of AGARDograph
1.3 Disclamour
2. NOISE CERTIFICATION OF AIRCRAFT
2.1 Introduction
2.2 ICAO ANNEX 16
2.3 Structure a n d Content of ANNEX 16 (1988 Edition)
2.4 Noise Certification of Subsonic Jet Aeroplanes and Heavy Propeller-driven Aeroplanes (Annex 16: Chapters 3 and 5 and Appendix 2)
2.4.1 Applicability
2.4.2 Reference Noise Measurement Points and Flight Procedures
( a ) Take-off ( b ) Approach
2.4.3 Noise Evaluation Measure and Noise Limits
2.4.4 Reference and Permissible Test Atmospheric Conditions
2.4.5 Flight Path Tracking
2.4.6 Acoustic Data Acquisition
2.4.7 Data Adjustment
( a ) Correction for Noise Received on the Ground (Delta 1 and
( b ) Source Noise Correction - Jet Engine Noise (Delta 3 term) ( c ) Source Noise Correction - Propeller Noise (Delta 3 term) ( d ) Validity of Test Results
Delta 2 terms)
( e ) Trade-offs
2.5 Noise Certification of Light Propeller-driven Aeroplanes: Established Procedure (ANNEX 16: Chapter 6 a n d Appendix 3)
2.5.1 Applicability
2.5.2 Reference Noise Measurement Paint and Flight Procedure
2.5.3 Noise Evaluation Measure and Noise Limits
2.5.4 Reference and Permissible Test Atmospheric Conditions
2.5.5 Determination of Aircraft Height
2.5.6 Acoustic Data Acquisition
page
iii
iv
V
v i
x i i
x v i i
xx
3
3
1
7
12
12
12
15
17
18
18
19
24
24
24
25
25
26
26
"ii
2.5.7 Data Adjustment
( a ) Correction f o r Noise Received rsn the Ground ( b ) Source Noise Correction ( c ) Validity of Test Results ( d ) Performance Correction
2.6 Noise Certification of Light Propeller-driven Aeroplanes: New Procedure (ANNEX 16: Chapter 10 and Appendix 6)
27
2.6.1
2.6.2
2.6.3
2.6.4
2.6.5
2.6.6
2.6.7
2.6.8
Applicability
Reference Noise Measurement Point and Flight Procedure
Noise Evaluation Measure and Noise Limits
Reference and Permissible Test Atmospheric Conditions
Flight Path Tracking
Acoustic Data Acquisition
Data Adjustment
( a ) Correction for Noise Received on the Ground (Delta. M and
( b ) Source Noise Correction (Delta 2 and Delta 3 terms) ( c ) Validity of Test Results
Delta 1 terms)
Fall-back Provision
2.7 Noise Certification of Helicopters (ANNEX 16: Chapter 8 and Appendix 4)
2.7.1
2.7.2
2.7.3
2.7.4
2.7.5
2.7.6
2.7.7
Applicability
Reference Noise Measurement Paints and Flight Procedures
( a ) Take-off i b i Level Flyover ( c ) Approach
Noise Evaluation Measure and Noise Limits
Reference and Permissible Test operational and Atmospheric Conditions
Flight Path Tracking
Acoustic Data Acquisition
Noise Data Adjustment
( a ) Source-to-ground-path Correction (Delta 1 and Delta 2 terms) ( b ) Source Correction (Delta 3 term) (c) Test Result Validity ( d ) Trade-offs
3. CERTIFICATION FLIGHT NOISE TESTING AND ANALYZiIS TECHNIQUES
3.1 Introduction
3.2 Acoustic Test Equipment
3.2.1 Data Acquisition
( a ) Condenser Microphones: Types and Characteristics ( b ) Wind Screens ( c ) Dehumidifier ( d ) Preamplifier ( e ) Power Supply ( f ) Prepolarized Condenser Microphones ( i n Combination with
( 9 ) Extension Rod ( h ) Extension Cables ( i ) Electric Power Generator
Precision Sound Level Meters)
3.2.2 Data Recording
30
30
30
31
31
32
32
33
34
35
35
37
37
38
38
39
40
40
41
41
46
( a ) Signal Conditioning (Amplification, Spectral Shaping)
( b ) Analog Tape Recorders (Direct 'Mode, Frequency-modulated
( c ) Digital Tape Recorders, Video-Recorders, Pulse Code Modulation 'FM' Mode)
Technique
3.2.3 Data Monitoring and Instrumentation Considerations
( a ) Clipping ( b ) Dynamic Range considerations ( c ) Filter Phasing ( d ) Graphic Level Recording
3.2.4 Calibration
( a ) Frequency Response ( b ) Acoustic Sensitivity ( c ) Insert Voltage Frequency Calibration ( d ) Measuring Instrument Detector/lndicator Characteristics
3.2.5 Data Analysis
( a ) Precision Sound Level Meters ( b ) Integrating Precision Sound Level Meters ( c ) Measuring Amplifier ( d ) Digital Filtering Real Time Frequency Analyser (1/3-octave
Band Analysis) ( e ) FFT Narrow-Band Real Time Spectrum Analyser (Narrow-band ana lys i s ) ( f ) FFT Spectrum and Waveform Analysers ( 9 ) Plotters
3.2.6 Equipment Selection
3.3 Other Test Equipment
3.3.1 Aircraft Tracking Instrumentation
( a ) Optical Tracking / Ground-based Systems - Single Camera - Several Cameras - Kinetheodolites - Laser Tracking Equipment
- Forward/downward looking Camera
- Radar t racking using Transponders - Microwave Airplane Positioning System (MAPS)
( b ) Optical Tracking / On-board Systems
( c ) Radio and Tracking Radar
( d ) Tracking System Considerations
3.3.2 Meteorological Instrumentation
( a ) Ground based Equipment - Test Site Meteorological Station - Sodar - Airport Tower
- Sounding Balloon - Tethered padio-sonde - Meteorological Airplane
3.3.3 Time Synchronization Equipment
3 . 3 . 4 On-board Aircraft Instrumentation
( b ) Airborne Equipment
( a ) Propeller or Rotor Rotational Speed ( b ) Air Speed and "Wind Vector" ( c ) Ambient Temperature and Relative Humidity
3.4 Test-Site Selection and Set-up
3.4.1 Cri ter ia for Site Selection
3.4.2 Test Set-up
( a ) Surveying ( b ) Equipment Set-up - Setting up Acoustic Instrumentation / Central Acoustic
50
53
51
62
62
62
71
75
76
79
79
80
Control Van - Setting up Time Synchronization - Establishing Radio-Communication - Setting up Tracking Equipment - Setting up Meteorological Equipment - Setting up a n Approach Guidance System - The Control Van
ix
3.5 Test Execution
3.5.1 Acoustic Data Acquisition
( a ) Tape Selection ( b ) In-the-field System Calibration ( c ) Ground-crew Briefing ( d ) Noise Recording
3.5.2 Flight-operational Considerations
( a ) Pilot Briefing ( b ) Co-Pilot/Observer Briefing ( c ) Weight Watching
3.5.3 Meteorological Data Aquisition
3.5 .4 Aircraft Tracking
3.6 Data Analysis
3.6 .1 Data Analysis - Determination of th,? Certification maximum A-weighted Flyover Noise Level
( a ) Chapter 6 Test ( b ) Chapter 10 Test
3.6.2 Data Analysis - Determination of the Certification 'Effective Perceived Noise Level'
4. TEST ASPECTS AND ANALYSIS TECHNIQUES IN FLIGHT AND WIND TUNNEL NOISE RESEARCH
4.1 Flight Testing VS. Wind Tunnel Testing
4.2 Flight and Ground Noise Testing of Subsonic Jet Aeroplanes
4.2.1 "Noise/Power/Distance"-Curves
4.2.2 Static to Flight Projection
fa) Eneine Inflow i b j Installation Effects ( c ) Data Analysis ( d ) Separation of Engine and Airfr.me Contributions ( e ) Jet Noise/Core Noise ( f ) Remarks of Caution
4.3 Flight Noise Testing of Propeller-Aeroplanes
4.3 .1 Quasi-stationary Tests by means of .Aircraft-mounted Microphones
( a ) Types and Arrangements of In-flight Microphones ( b ) Propeller Noise Measurements
- Nearfield Studies on Counter-rotating Propellers - Separation of Propeller and Engine-exhaust Contributions based on
- Determination of Real-time Eilade-pitch Setting Pressure Time Histories
4.3.2 Fly-by Testing
4 .3 .3 Flyover Measurements
88
88 I
91
93
93
94
94
98
105
106
107
110
111
114
115
120
121
(a) Narrow-band Analysis of Transient Flyover Noise Signal - Analysis Considerations - Separation of the Propeller and Engine Contributi.on based on Frequency
Spectra ( b ) Microphone Ground Reflection E:ffects
- High-frequency Broad-band Voise Correction - Low-frequency Tonal Correction
4.4 Flight Noise Testing of Helicopters 127
4 .4 .1 Quasistationary Tests by means of Helicopter-mounted Microphones 128
4 .4 .2 Inflight Noise Measuring Technique by means of a Companion 129 Measuring Aircraft
x

4.5 Jet Noise Testing i n Wind Tunnels
4.5.1 Test Set-up
( a ) Model Jet ( b ) Mirror Microphone
4.5.2 Data Acquisition and Shear Layer Effect Calibration
4.5.3 Test Results
4.6 Propeller Noise Testing i n Wind Tunnels
4.6.1 Experimental Set-up
( a ) Test-stand Specifics ( b ) Data Reduction Technique
4.6.2 Experimental Results - Temperature Effect
4.6.3 Experimental Results - Propeller Rotation-plane Attitude Effect
4.7 Rotor Noise Testing i n Wind Tunnels
4.7.1 Isolated Main Rotor Noise Tests
4.7.2 Main-/Tail-Rotor Interaction Noise Tests
5. CONCLUDING REMARKS
APPENDICES
Appendix A: Calculation of the ‘Effective Perceived Noise Level’
A . l Perceived Noise Level A.2 Tone Correction A.3 Duration Correction A . 4 Final EPNL-value
Appendix B: Acoustical Change Evaluation and Precision of Flyover Noise Measurements
B . l Gaussian Data Distribution and Homogeneity of Variance 8 .2 Non-Gaussian Data Distribution and Inhomogeneity of Variance
Appendix C: Noise Certification Comparison according to Aircraft Types and Categories
131
131
132
132
133
134
136
131
138
138
141
144
145
145
145 146 147 148
151
151 152
156
Appendix D: Atmospheric Attenuation Coefficients
Appendix E: Establishment of the Validity of Test Results
Glossary of Terms
B i b l i o g r a p h y
161
163
166
168
Annex 1
Annex 2
172
174
Fig. 2.1
Fig. 2.2
Fig. 2.3
Fig. 2.4
Fig. 2.5
Fig. 2.6
Fig. 2.7
Fig. 2.8a
Fig. 2.8b
Fig. 2.9
Fig. 2.10
Fig. 2 .11
Fig. 2.12
Fig. 2.13
Fig. 2.14
Fig. 2.15
Fig. 2.16
Fig. 2.17
Fig. 2.18a
Fig. 2.18b
Fig. 2.19
Fig. 2.20
Fig. 2.21
Fig. 2.22
Fig. 2.23
Fig. 2.24
Fig. 3.1
List of Figures
Aircraft noise measurement scenario
Contours of 'Equal Loudness'
A-weighting and C-weighting curves (Frequency response cha.racteristics of SLMs)
Original schedule for the introduction of a i rcraf t noise certification by the ICAO-'Committee of Aircraft Noise' ( C A N ) and i t s successor organization, the 1 ICAO-Committee on Aviation Environmental Protection ' (CAEP)
Reference noise measurement points and r,?ference fl ight procedure for heavy propeller- driven aeroplanes and subsonic jet- aircraft: ( a ) Approach noise measurement point and take-off measurement point ( l a t e ra l and f lyover) ; ( b ) Power cut-back option during take-off
Equivalent procedure to determine sidelint? noise levels with two microphones only ( ra the r than with a la tera l a r r a y of s evwa l microphones)
Equivalent procedure for approach intercrpt and take-off intercept to avoid actual touch-down or s t a r t from brake-release point
EPNL-limit as function of the maximum certificated take-off mass far "heavy" propeller driven aeroplanes over 5700 kg take-off mass af ter A N N E X 16, Chapter 5
EPNL-limit as function of the maximum certificated take-off mass for subsonic jet- aircraft and "heavy" propeller driven aeroplanes over 9000 kg take-off m a s s af ter A N N E X 16, Chapter 3
Area of permitted combination of Relative Humidity ( R H ) and a i r Temperature (T) for noise certification testing of "heavy" propeller-driven aeroplanes above 5700 kg take-off mass and subsonic jet a i rcraf t a f t e r A N N E X 16, Chapter 3
Boundary conditions for noise certification testing of heavy propeller driven aeroplanes and subsonic jet a i rcracf t ; top: microphone height above ground and reflection f ree vertical cone; bottom: grazing incidence diaphragm condition
Determination of reference distance 'aeroplane/noise-measurement-point' from measured distance ( fo r source-to-ground correction) for cases ' f lyover ' a.nd 'approach '
Noise directivity of source components for a turbofan/jet-engi.ne
Schematic of noiselthrust or noise/fan-spe,sd relationship for source-noise correction of subsonic jet- aircraft
Trade-off possibili t ies for excess noise levels in the noise certification of propeller-driven aeroplanes over 5700 kg take-off mass and a l l subsonic jet a i rc ra f t
A N N E X 16, Chapter 6 noise limits
Area of permitted combinations of relative humidity and a i r temperature for noise certification testing of ("light") propeller--driven aeroplanes not exceeding 5700 kg take-off mass af ter A N N E X 16, Chapter 6
Flight corridor test requirements for noise certification of "1i.ght" propeller driven aeroplanes not exceeding 5700 kg take-off mass
"Performance correctian"-philosophy for "light" propeller-driven aeroplanes not exceeding 5700 kg take-off mass
Flight path related geometry for "performance correction"
A N N E X 16, Chapter 10 noise certification procedure
A N N E X 16, Chapter 10 noise limits
Area of permitted combinations of re la t ive humidity and a i r lemperature for noise certification testing of "light" propeller-d::iven aeroplanes not exceeding 9000 kg take-off mass after A N N E X 16, Chapter 10
Inverted microphone arrangement
Noise certification test procedure for helicopters: top - take-off; center - level flyover; bottom - landing approach
A N N E X 16 Chapter 8 noise limits per CAN/C; and CAN/7 for test procedures 'take-off', ' level f lyover ' , and ' landing approach '
Basic measurement-equipment needed in the field for noise certification testing
Fig. 3.2
Fig. 3.3
Fig. 3.4
Fig. 3.5
Fig. 3.6
Fig. 3.7
Fig. 3.8
Fig. 3.9
Fig. 3.10
Fig. 3.11
Fig. 3.12
Fig. 3.13
Fig. 3.14
Fig. 3.15
Fig. 3.16
Fig. 3.17
Fig. 3.18
Fig. 3.19
Fig. 3.20
Fig. 3.21
Fig. 3.22
Fig. 3.23
Fig. 3.24
Fig. 3.25
Fig. 3.26
Fig. 3.21
Fig. 3.28
Fig. 3.29
Fig. 3.30
Fig. 3.31
Fig. 3.32
Fig. 3.33
Fig. 3.34
Fig. 3.35
Fig. 3.36
Fig. 3.37
Block diagram of noise measuring system for acoustic cal ibrat ion, da ta acquisition and reduction (reproduced from 111 )
Pressure increase on microphone diaphragm as function of frequency for different sound incidence angles
Front panel of battery-driven 2-channel power supply (B&K type 2804)
14-channel t ape recorder (Racal Storehorse)
4-channel tape recorder (B&K type 7005)
7-channel tape recorder (Racal Store DS 71
%channel tape recorder (Nagra type IV-SJ)
Digital recorder (Teac RD-101-TI
Video recorder (Sany U-matic)
24-digital-channel/4-analog-channel recorder (Sony type PCM-3324)
Typical pressure time history t races for periodidimpulsive and stochastic/broadband noise
Dual-channel graphic level recorder (B&K type 2309)
Response to a 20 m s tone burst at various detector time constants ' impulse' , ' f a s t ' , 'slow'
Response of rectifier to tone burst of varying duration
Several types of Sound Level Meters (B&Kl
Measuring amplifier (B&K type 2610)
Real time analyser (B&K type 2133)
FFT narrowband rea l time spectrum analyser (B&K type 2033))
Waveform analyser (Hewlett Packard Model 3562A)
XY-plotter (B&K type 2308)
Example of flight height and la te ra l deviation photographic check pertaining to "valid" and "invalid" test f l ight
Principle of height/lateral/longitudinal deviation and overground speed determination by means of 2 vertically orientated cameras
Photo overhead positioning ("POP") system
ASCANIA Kinetheodolite 61 E
Measurement geometry in f l ight t racking by means of 2 Kinetheodolites (from Ref. 7)
DLR Laser transmitter/receiver
Retra-reflector attached to underside of a i rc ra f t
Radar t racking transmitting/receiving antenna ( D L R )
Transponder layout for Microwave Airplane Positioning System (from Ref. 13)
Launching of tethered radio sonde for meteorological sounding (used by NASA Langley at Wallops Flight Center1
Schematic of monitoring atmospheric parameters above test s i te by means of a probing a i rc ra f t (from Ref. 11)
Camera-recorded cockpit instrumentation panel indications at time instant when ground based camera t r igger pulse w a s released
Resonant reed tachometer (FRAHMI
Dornier-developed "Flight Log": an airborne t rue f l ight speed and a i rc ra f t angle of attack/sideslip indicator
Internat l s t ructure and housing for airborne temperature or humidity sensor ( ROSEMOUNT)
Humidity sensor elements (VAISALA))
Fig. 3.38
Fig. 3.39
Fig. 3.40
Fig. 3.41a
Fig. 3.41b
Fig. 3 . 4 1 ~
Fig. 3.42
Fig. 3.43
Fig. 3.44
Fig. 3.45
Fig. 3.46
Fig. 3.47
Fig. 3.48
Fig. 3.49
Fig. 3.50
Fig. 3.51
Fig. 3.52
Fig. 3.53
Fig. 3.54
Fig. 3.55
Fig. 3.56
Fig. 3.57
Fig. 3.58
Fig. 4 . l a
Fig. 4.lb
Fig. 4.lc
Fig. 4.2
Fig. 4.3
Fig. 4.4
Fig. 4.5a
Fig. 4.5b
Fig. 4.6
Fig. 4.7
Fig. 4.8
1-inch-diameter condensor microphone embedded in concrete runway surface
Airfield in the UK with 3 runways used iis f l ight noise measurement test s i te
Typical test set-up and cabling map for a i rc ra f t noise test
Microphone with wind-ball on 1.2 m high s tand
Inverted microphone configuration (left : ear ly version; r ight : specified version)
Microphone a r r a y on 10 m high poles
Precision Approach Path Indicator "PAPI" (BARREL LIGHTING CO)
Possible fl ight path deviations of betweer, 8.0" and 10.0" with double PAPI-system set a t angle 9" +/- 0.5"
Recording time sequence
Typical "flight-log" as generated by observer/co-pilot
Typical note-pad page from meteorological ground station
Flyover A-weighted noise level time histories for propeller-driven aeroplanes of different take-off mass and engine powers a t a fl ight height of 300 m
Time history of typical daytime ambient &weighted noise level ("background noise")
Mach number (or temperature, respectivel:,) correction through "in the field-method" by means of repeated fl ights a t different prcpeller RPMs (af ter Ref. 21)
Typical helicopter flyover A-weighted n o i x level time histories at microphone locations 'sideline por t ' , 'centerline center ' and 'sideline s ta rbord ' for certification procedures ' take-off ' , ' level flyover ' and ' landing iipproach'
Typical helicopter A-weighted noise level time histories a t microphone location 'centerline center' for 6 nominally identical ( ' take-off') flyovers
Spectral corrections ( in dB) of the d a t a recording/reduction system
Typical flyover 1/3-actave band spectrum
Typical PNLT-time history for take-off flyover (each of these 51 data-points corresponds to just one evaluated 1/3-octave band spfctrum, as shown in Fig. 3.53)
KTH-determined helicopter take-off fl ight ILrajectory in the ground-plane and the height-plane in relation to the reference profiles
Summary of exemplatory measurement resu: t s for a helicopter take-off procedure
Noise sensitivity curves for three medium weight helicopters
Determination of noise sensitivity curve through dedicated fl ight tes ts for purposes of source noise correction
German Dutch Wind Tunnel ( D N W ) in the open test section configuration
ONERA CEPRA-I9 acoustic wind tunnel, a lacil i ty of CEPr (Centre d 'Essais des Propulseurs)
Boeing Large Scale Anechoic Test Chamber
Schematic of generalized noise da ta base acquisition for use i n the noise certification of the " flight datum aircraf t" and then fc,r "derived version ai rcraf t"
Spherical intake flow straightener
De-Dopplerization of high-speed/low-altitude flyover jet- aircraft noise s ignature (from Ref. 24)
Microphone a r r a y on Cessna propeller air(:raft
Microphone nose-boom on Fairy Gannet a i rcraf t
Airborne test set-up to compare several micraphone/nose-cone arrangements for self-noise generation on a gl ider plane
Comparison of normalized self-noise spectra of ogive-nose-cone equipped condenser-microphones of different diameters
Frequency split t ing in the noise from a H.milton Standard Gannet counter rotating propeller operating at slightly different RPMs (from Ref . 31)
Fig. 4 .9 Counter-rotating propeller circumferental directivity at blade passage frequency and higher harmonics (from Ref. 31)
Test a i rc ra f t Cessna T207 with microphones for propeller near field noise s tudies
Procedure to extract the "clean" propeller noise s ignature from a signature containing both propeller and engine exhaust contributions (from Ref. 32)
Flyby testing: Formation flight of test-propeller-aeroplane ( r e a r ) and measuring gl ider aeroplane (front)
Propeller noise pressure time histories as observed at angles ' fo rward ' , ' in-plane' and ' rearward ' during flyby with propeller Mhel = 0.79 (from Ref. 33)
Change of propeller rotational frequency due to the Doppler-effect during level flyover as observed on the ground (from Ref. 34)
Dependence of sample time 'Delta t ' and ana lys i s bandwidth 'Delta f ' on the frequency band range
Flyover noise narrowband spectra with propeller and engine contributions (from Ref. 34)
A-weighted flyover noise time histories for 'propel ler ' , ' eng ine ' , 'sum of bo th ' , and ' total measured including other sources' (from Ref. 34)
( a ) Schematic represention of ground reflection interference problem ; ( b ) Appearance of the direct (D) and the ground reflected ( R ) s ignal on a microphone
positioned some distance above the ground
Normalized representation of interference function referenced to freefield condition (from Ref. 40)
( a ) Example of coincidence of ground reflection-caused amplification and attenuation pattern and propeller harmonic frequencies from flyover measurements; ( b ) Example of off-set amplification/attenuatian pattern with respect to harmonic spectrum from flyover measurements (from Ref. 40)
Ground reflection interference function for different microphone heights above ground (from Ref. 40)
Fig. 4.10
Fig. 4.11
Fig. 4.12
Fig. 4.13
Fig. 4.14
Fig. 4.15
Fig. 4.16
Fig. 4.17
Fig. 4.18
Fig. 4.19
Fig. 4.20
Fig. 4.21
Fig. 4.22
Fig. 4.23
Fig. 4.24
Fig. 4.25
Fig. 4.26
Fig. 4.27
Fig. 4.28
Fig. 4.29
Fig. 4.30
Fig. 4.31
Fig. 4.32
Fig. 4.33
Fig. 4.34
Fig. 4.35
Fig. 4.36
Helicopter-mounted swivelling microphones for nearfield noise s tudies (Bell-Helicopter/Textron test)
Main rotor pressure time history measured through helicopter nacelle mounted microphones (from Ref. 42)
Formation f l ight measuring technique for helicopter in-flight noise research (US-Army)
Microphone on companion aeroplane sensing both main rotor blade-/vortex-interaction and tail- rotor acoustic s ignal
Suppression of t a i l rotor contributions by trigger- locking onto main rotor s ignal
Comparison of two unaveraged and one (64-times) averaged sound pressure time histories for time span of one rotor revolution
Acoustic mirror microphone for model jet noise source localization s tudies in the DNW (from Ref. 46)
Downstream shif t of loudspeaker generated tone source location i n a hot model jet (from Ref. 46)
Jet noise source location at 16 kHz far a 6 cm diam. hot jet of 530 m/s speed (from Ref. 46)
Downstream shif t of jet noise sources (from Ref. 46)
Propeller noise test set-up in the German Dutch Wind Tunnel
Front view of inflow microphone arrangement in the DNW
Bang-test resul ts for inflow microphone reflection check af ter exploding charge
comparison of ( a ) unaveraged and ( b ) averaged propeller noise time history with ensuing narrowband spectra
A-weighted overall rotational noise levels vs. helical blade t ip Mach number as measured i n the plane of rotation and referenced to a source/receiver distance of one propeller diameter (from Ref. 51)
Effect of inflow angle of at tack into a propeller plane (from Ref. 52) Fig. 4.37
Fig. 4.38 Normalized A-weighted overall rotational noise levels v s . hel ical blade t i p Mach number for different propeller plane at t i tude angles
Fig. 4.39 Model main rotor test s tand with ground-.pylon support (US-Army/DLR tes t )
Fig. 4.40 Comparison of upstream inplane prer;sure--time histories for one blade-passage from wind tunnel model tests and full-scale f l ight tests (from Ref. 54 and 55).
Fig. 4.41 BVI-impulsive noise pressure waveform ccmparison for model and full-scale a t ( a ) low and ( b ) high advance-ratios
Fig. 4.42a 40% model-scale helicopter main rotor tes: set-up in the DNW
Fig. 4.42b Same main rotor system as in previous figure equipped with compatible t a i l rotor
Fig. 4.43 Blade vortex interaction contour plots under main rotor system as shown in Fig. 4.42a (from Ref. 60)
Fig. 4.44 Acoustic pressure time histories under main-rotor/tail-rotor
Fig. 4.45 Extraction of tail-rotor noise contribution only f r o m a main-rotor/tail-rotor model experiment
Figures in the Appendices
Fig. A- l
Fig. A-2
Fig. A-3
Fig. A-4
Fig. A-5
Fig. B-1
Fig. B-2
Fig. 8-3
Fig. 6-4
Fig. B-5
Fig. E-1
Fig. E-2
Flow chart to determine flyover noise EPblL-values
Contours of Perceived Noisiness
Flow chart : tone correction for EPNL computation
Definition of time duration within PNLT time history plots
Idealized PNLT flyover time histories
Maximum permissible s tandard deviation s and resulting s tandard error of the mean s as function of the number of flyovers For a 90% confidence limit not exceeding +?-1.5 dB.
Typical propeller a i rc ra f t flyover noise ltivels with ( a ) very small and ( b ) very la rge s tandard deviation and respective minimuin required mean level. differences for s ignif i- cance Delta0.05
Areas of significant level differences Delt%0.05 for error probability of 5% as function of s tandard deviation sx vs. number of flyovers Nf
Precision da ta 'Repeatability r ' and 'Reproducibility R ' for 8 propeller-driven aero- planes ( A to H )
Confidence limits based on 'Repeatability r ' from replicated tests and 'Reproducibility R ' for 8 propeller-driven aeroplanes ( A to H )
Example of a s tat is t ical frequency distrib.ition of EPNL values in 1 dB classes
Maximum permissible s tandard deviation s K as function of the number of flyovers ("sample size") for a 90% confidence limit not exceeding +/- 1.5 dB

Terms and Abbreviations AC
ACA
A/D
AIR
ANNEX 16
APU
ARINC
BMV
BNC
BPF
BVI
CAA
CAEP
CAEP/1
CAN
CAN/1
CAN/2
CAS
CRP
D
D/A
DC
DLR
DNW
DOT
DR
EDVE
EPNL
FAA
FFT
FM
GA
GMT
HTM
HPDA
HPNOR
HS
IAS
ICAO
Alternating Current
Airworthiness Certificate Application
Analog to Digital
Aerospace Information Report
International Standards and Recommended Practices "Environmental Protection", ANNEX 16 to the Convention on International Civil Aviation
Auxiliary Power Unit
(Multiplexer Unit) by Aeronautical Radio Inc
German Ministry of Transportation
Designation for type of shielded coaxial cable
Blade passage Frequency
Blade/Vortex Interaction
(Bri t ish) Civil Aviation Authority
Committee on Aviation Environmental Protection (Body of ICAO)
Firs t Meeting of CAEP ( in 1986)
Committee of Aircraft Noise (Body of ICAO)
Firs t Meeting of CAN
Second Meeting of C A N , e tc
Calibrated Airspeed
Counter-rotating Propeller
10-dB-down time (durat ion correction factor)
Digital to Analog
Direct Current
Deutsche Forschungsanstalt f u r Luft- und Raumfahrt
Deutsch-NiederlPndischer Windkanal (German Dutch Wind Tunnel)
(US) Department of Transportation
Direct Recording
Designation of Braunschweig Airport
Effective Perceived Noise Level (a l so sometimes called L E p N ) , in uni ts of EPNdB
US-Federal Aviation Authority
Fast Fourier Transform
Frequency modulated
General Aviation
Greenwich Mean Time
Helical Propeller Blade-tip Mach-number (a l so sometimes called M h e l )
Heavy Propeller-driven Aeroplanes - refers to propeller-driven aeroplanes over 5700 kg o r 9000 kg , respectively, maximum certificated take-off m a s s
Highest Power in the Normal Operating Range
High Speed (used in the context of rotor impulsive noise)
Indicated Airspeed
International Civil Aviation Organization
INS
I R I G
I SA
ISLM
KTH
L E D
LPDA
L~~~
P A E L
Madv MAPS
Mhel
MCP
MCTVW
MCTOM
MNOP
MPNVR
NASA
NGTE
NLR
NPD
VASPL
OBP
PAPI
PCM
PDA
PNL
PNLT
PNLTM
POP
PSLM
PTB
PTH
R/C
RH
RMS
RPM
RTA
SAE
Inertial Navigation System
Inter Range Instrumentation Group ( type of recording bandwidth)
International Standard Atmosphere
Integrating Sound Level Meter
Kinetheodolite
Light Emitting Diode
Light Propeller-driven Aeroplanes - refers to propeller-driven aeroplanes not exceeding 5700 kg or 9000 kg , respe':tively, in maximum certificated take-off mass
Effective Perceived Noise Level (a lso sometimes called EPNL), in uni ts of EPNdB
1-second equivalent energy noise level ( a l so called Sound Exposure Level, SEL and previously often termed L A X ) , in units of dB
Advancing (rotor blade t i p ) Mach number
Microwave Airplane Positioning System
Helical Propeller Blade-tip Mach-number (a lso sometimes called HTM)
Maximum Continous (Engine) Power
Maximum Certificated Take-off Weight
Maximum Certificated Take-off Mass
Maximum Normal Operating Power
Maximum (Engine) Power in the Normal Operating Range
(US) National Air and Space Adminisration
(British) National Gas Turbine Establishment
(Dutch) Nationaal Lucht- en Ruimtevaartlaboratorium
Noise/Pawer/Distance
Overall Sound Pressure Level
On-board Processor
Precision Approach Path Indicator
Pulse Code Modulated
Propeller-driven Aeroplane
Perceived Noise Level, in uni ts of PNdB
Tone-corrected Perceived Noise Level, in units of TPNdB
Maximum Value of the Tone-corrected Perceived Noise Level. (occuring dur ing a flyover) in units of TPNdB
Photo Overhead Positioning (System)
Precision Sound Level Meter
Physikalisch-Technische Bundesanstalt
Pressure Time History (a lso referred to as 'Wave Form')
Rate of Climb
Relative Humidity
Root Mean Square
Rotational Speed per Minute
Real Time Analyser
Society of Automotive Engineering
SARP
SEL
S/N
SLM
SLNS
SSD
STOL
STR
T
TAS
TISG
TNT
TOM
TOP
TOW
UHF
UTC
VHF
WG
WHL
Standard and Recommended Practice ( i n the lCAO ANNEX 16 document)
Sound Exposure Level
Signal to Noise (Ratio)
Sound Level Meter
Side l ine noise level
Start/stop Detector
Short Take-off and Landing Aircraft
Strouhal Number (dimensionless frequency)
Ambient A i r Temperature
True Airspeed
Technical Issues Sub Group (Body of ICAO)
Tragfliigel Neuer Technologie
Take-off Mass
Take-off Power
Take-off Weight
Ultrahigh Frequency (Range)
Universal Time Code
Very High Frequency (Range)
Working Group within CAN or CAEP
Westland Helicopter Ltd. Company
a
c
P C
C(t) or C(k)
d
D
D
D
f
FN h
H
i
k
K
L
L P
PA
L p ~ ~
PAS L
M
Mhel " n ( k )
n ( i ; k )
N
N
N(k)
P
P
QK
QrKr r
r
R
s
$2
S
' f ; a
t l
t 2
Symbols speed of sound ( m / s )
speed of sound ( m / s )
power coefficient
tone correction factor IdB)
distance ( m )
propeller diameter ( m )
duration correction factor ( 2 "10-dB-down time") (dB)
distance to c lear 15 m high obstacls a f t e r brake-release a t take-off
degree of freedom, N - 1
net thrust (N)
microphone height above ground ( m :
height above ground (usual ly of a i rc ra f t ) ( m )
hand number of spectrum
denotation of flyover number
proportionality constant
sound pressure level ( d e )
A-weighted sound pressure level (dEl)
sound exposure level (dB)
A-weighted sound pressure level memured with detector time constant 'slow' (dB)
Mach-number = V/c
helical propeller blade t ip Mach-number
Perceived Noisiness ( m y )
largest value of Perceived Noisiness ( n o r )
band(i)-related Perceived Noisiness of the kth flyover (noy)
sample size (e.g. total number of flyovers)
rotational speed (s-')
total Perceived Noisiness of kth f l y w e r ( m y )
sound pressure level ( N / m ' )
engine power (W)
measurement distance ( m )
reference distance (m)
distance ( m )
Repeatability
Reproducibility
s tandard deviation of a sample
variance of a sample
dimension
test quantity in s ta t is t ica l evaluations af ter 'Student
time instant when PNLT f i r s t exceed; (PNLTM-10) ( s )
time instant af ter which PLNT remains less than (PNLTiM-10) ( s )
T
T
T
P U
V
'b
VH
'NE
vs
' 0 0
v2
V Y
- X
Greek let ters
a
a
P AP A e
A
P
iJ
P a a *
0,'
UT'
0:
T
f4
W
+
ambient air temperature ("C or K)
time constant ( for EPNL-computation 10 s; for LAE-computation 1 s)
tone burst repetition rate ( s )
confidence l i m i t (dB)
f l ight speed or tunnel flow speed ( m / s )
propeller blade t i p rotational speed (m/s)
airspeed in level f l ight using torque at minimum instal led, maximum continuous engine power ( 4 s )
never exceed speed ( m / s )
s ta l l ing speed of a i rc ra f t ( m / s )
speed for best climb (m/s )
f l ight speed or wind tunnel flow speed ( m / s )
safe take-off speed ( m / s )
mean of a sample
p e r unit length atmospheric sound attenuation (dB/lOOm)
error probability
blade pitch angle (degrees)
local blade incidence angle (degrees)
"Delta" e correction term
angle between f l ight path and sound emission direction ("emission angle" (degrees)
wave length ( m )
advance ra t io
mean of the total population
air density (kg/m')
s tandard deviation of the total population
variance of the total population
within test var iance
between test var iance
reproducibility var iance
detector time constant ( s )
propeller rotational plane inclination (degrees)
angula r velocity (s-l)
azimuthal angle (degrees)

AIRCRAFT EXTERIOR NOISE MEASUREMENT AND ANALYSIS TECHNIQUES
Hanno Heller
German Aerospace Research Establishment (DLR) Braunschweig Research Center Federal Republic of Germany
Summary
This AGARDograph describes testing and ana lys i s techniques to measure aircraf t noise primarily for
purposes of noise certification as specified by the ' Internat ional Civil Aviation Organization' , ICAO. The relevant a i rc ra f t noise certification 'Standards ' and 'Recommended Practices' (as defined in ICAO "ANNEX 16") a r e presented in detai l for subsonic jet aeroplanes, for heavy and l ight pro- peller-driven aeroplanes and for helicopters. The pract ical execution of conducting noise certifi- cation tests i s treated in depth. The character is t ics and requirements of the acoustic and non-
acoustic instrumentation for d a t a acquisition and da ta processing a r e discussed, as a r e the pro- cedures to determine the special noise measures 'Effective Perceived Noise Level' (EPNL) and 'Maxi- mum Overall A-weighted Noise Level' (LpA,max ) tha t a r e required for the noise certification of dif-
ferent types of a i rc ra f t .
This AGARDograph a l so contains a n extensive - although selective - discussion of test and ana lys i s techniques for more detailed a i rc ra f t noise s tudies by means of ei ther flight-experiments or
full-scale and model-scale wind tunnel experiments.
Appendices to th i s AGARDograph provide supplementary information on certain aspects of noise certi-
fication, such as the calculation of the Effective Perceived Noise Level, a discussion of an "acou- st ical change"-evaluation and the at ta inable precision of flyover noise measurements, a comparative representation of noise certification specifications according to types and categories of a i rc ra f t , tables concerning the atmospheric sound attenuation and a discussion on the val idi ty of a i rc ra f t noise da t a , as obtained through very few flyover measurements. Definitions of several notions re-
lated to noise testing and ana lys i s a r e also provided.
1. INTRODUCTION
1.1 Scope of AGARDograph
This AGARDograph on a i rc ra f t noise measurement and ana lys i s techniques is primarily intended to assis t the flight test engineer in h i s effort to prepare, conduct and evaluate a test program for the determination of the noise radiated by flight vehicles in compliance with established noise certifica- tion procedures.
Aircraft noise certification h a s but one objective: to determine an aircraft-specific noise certifi- cation level to be assessed against a given noise limit. For t h i s purpose the a i rc ra f t to be tested flies over one or several microphones, positioned directly under the flight path or to the side of the f l ight t rack. Depending on the type o r category of the a i rc ra f t , it must execute a number of level flyovers at a specified height o r t ake offs o r landing approaches (or all of these) at precise-
2
ly defined operational conditions. The flyover noise 'IS measured and corrected for any deviations
from the reference f l ight path or reference operation;il and atmospheric conditions tha t may have occurred during the test. For each of these flight procedures, the corrected flyover noise levels a r e
then averaged over a l l valid test-flyovers, to yield tt e final "certification level".
Although the ICAO-specifications within any p a r t i c u h r test procedure require only f o u r ( s ix at most) "valid" flyovers, seemingly a rather minor effort, certification testing is in real i ty a very
involved, laborious and time-consuming undertaking. Surveying and preparation of the test s i te , equipment selection, check, set-up and cal ibrat ion, pretest. familiarization i l ights for the benefit of the pilots and the measurement crew, detailed weather observation in addition to the sometimes
extremely complex acoustic and non-acoustic da ta acquisition in the f ield, as well as the subse- quent da ta analysis require a very good overall Understanding of the ent i re procedure by the responsible test engineer. It i s for th i s reason that th i s AGARDograph treats all relevant subjects
in rather great - and hopefully sufficient - detail to provide the test engineer with enough guid- ance to plan and conduct a well thought-mt noise certification test.
The scope of th i s AGARDograph goes, however, beyond the certification aspects. If a n a i rc ra f t does not pass a noise test , i t i s important to understand why th i s "failure" occurs. In such a case it is often helpful to identify and isolate those part icular sources tha t a r e responsible for the "excess"
noise. Dedicated flight noise tests a r e indicated that will sometimes also provide information on changes in the aircraf t configuration or in the propulsion system which can reduce the acoustic radiation. Such tests are usually more comprehensive and cover a much broader range of parametric
variat ions than would be necessary for certification purposes.
Comprehensive flight noise tests a r e , however, inherently expensive. There sometimes a r e other -
less involved - test techniques to obtain the required information, such as "equivalent testing pro- cedures" (s t i l l using real a i r c r a f t ) or.scale-model tests - at times even ful.1-scale - in appropriate
wind tunnels. Tunnel testing - in the au thor ' s opinion - plays a n important role in fur thering the understanding of the aeroacoustics of individual aircraft- related noise generators (propellers, rotors, j e t s ) . Such in-depth testing will not only provide da ta for improving certification proce- dures and making them more efficient and accurate, but will - in the end -- perhaps even a l low the
establishment of more stringent noise limits that a r e based on technical progress ra ther than wish- iul thinking. Discussing i n detail the advantages and disadvantages of flight and wind tunnel experiments using selected examples that a r e not specifically undertaken in the context of noise certification testing and analysis i s therefore also considered a n important objective of t h i s
AGARDagraph.
1.2 Content of AG.4RDograph
This AGARDograph deals with f l ight vehicles only, specifically with fixed-wing subsonic a i rc ra f t and helicopters. It i s restricted to exterior noise as rkdiated individually from these types of a i r-
craf t . The measurement of interior noise in the aircraf t and the vast a rea of noise contouring
around airports a r e outside the scope of this AGARDograph. The subject i s treated in three major
sections:
o Noise Certification of Aircraft - Legislative Aspects: ICAO-ANNEX 16;
o Noise Certification Flight Testing and Analysis Techniques;
o Flight and Wind Tunnel Noise Testing for Research and/or Development Purposes.
The f i rs t Section discusses the legal aspects and a number of technical and procedural aspects in
the noise certification of subsonic jet aeroplanes, heavy propeller-driven a.eroplanes, l ight propel- ler-driven aeroplanes and helicopters, as specified by the International Civil Aviation Organization.
3
The second Section t rea t s - in greater depth - test and ana lys i s techniques for the noise certifica- tion of these types of a i r c r a f t . Star t ing with acoustic and non-acoustic (meteorological and flight- tracking) instrumentation, t h i s section continues with a discussion of test preparat ion, equipment
selection and laboratory pre-checks, including aspects of the optimum test-site selection, equipment deployment, field-communication, test-execution, d a t a acquisition and on-line d a t a reduction, to conclude with off- line ( laboratory) d a t a analysis and interpretation.
The third Section deals with special f l ight experiments employing subsonic jet-aeroplanes, propeller-
a i rc ra f t and helicopters and with corresponding je t , propeller and rotor experiments in wind-tun- nels. This section i l lus t ra tes how flight and wind-tunnel tests can help to investigate f l ight noise problems tha t go beyond the scope of a s tandard noise certification test .
Appendices to t h i s AGARDograph discuss (A) the calculation of the 'Effective Perceived Noise Level ' , ( S f the s tat is t ical ly correct evaluation of "acoustical changes" on a i rc ra f t and the precision of fly-
over noise measurements and (C) commonalities and differences in the noise certification of a i rc ra f t according to type and category. Additional Appendices provide ( D ) atmospheric attenuation coeffici- ents as function of humidity and temperature which a r e necessary to compute the attenuation of sound as it propagates through the atmosphere, and deal with (E) the establishment of the val idi ty
of flyover noise test results.
Specials sections at the end of t h i s AGARDograph explain acoustical terms and symbols used.
1.3 Disclamour
Names of manufacturers and of technical equipment a r e given only for purposes of i l lustrat ion and
as typical examples. Naming equipment suppliers and special items is not intended as an endorse- ment for certain products. Equipment of comparable qual i ty is avai lable from other manufacturers.
2. NOISE CERTIFICATION OF AIRCRAFT
2.1 Introduction
The noise generated by a n a i rc ra f t undergoes significant changes as i t propagates towards a n ob- server on the ground. In general terms, the "art" of measuring aircraft noise lies in properly
accounting for the effects of all non-noise-source-related disturbances i n order to determine the "true" source noise level (i .e. the noise as emitted by the a i r c r a f t ) . Only on the ba s i s of the accurately determined t rue source noise (whereby the degree of accuracy required may well v a r y ) w i l l it be possible - for example - to make noise-comparisons between a i rc ra f t .
In noise certification i t is, however, the noise as received by a n observer s tanding on the ground
and listening to a n a i rc ra f t in flyover (i .e. the immitted noise) tha t is of primary interest. In t h i s case the source directivity and the distance aircraft/observer at the time when the acoustic s ignal is emitted must be accounted for. The noise from a n a i rc ra f t is not necessarily loudest when the a i rc ra f t is directly overhead; a i rc ra f t noise frequently reaches a maximum when the a i rc ra f t is approaching or receeding. Moreover, atmospheric and spherical spreading losses account for the
attenuation of sound as it propagates away from the a i rc ra f t ; hence distance h a s a significant effect on the noise level as observed on the ground.
There a r e numerous additional influences tha t may have affected the noise before it reaches the observer 's e a r (or the microphone): wind may have blown the noise towards or away from the
observer, nearby reflecting surfaces, such as buildings or trees, or - quite importantly - the
4
ground the observer s tands on, may increase o r reduce the noise. Atmospheric turbulence of dif-
ferent scale refracts and scatters the sound waves, as may temperature-gradients along the sound propagation path. Atmospheric hymidity may absorb some sound frequencies more than others , thus changing the spectral characteristics of the sound. All these parameters a r e aircraft- independent; they must be evaluated and understood in their quanritative effects to eliminate their influence.
In addition, ever present background noise mingles with the a i rc ra f t noise, a t times even obscuring
it and making its detection (and measurement) difficult. Wind may also affect the path of the air- craf t itself, especially if the aircraf t is light in wei,:ht. In tha t case the instantaneous distance of the aircraf t to the observer changes sometimes in a rather e r ra t ic manner.
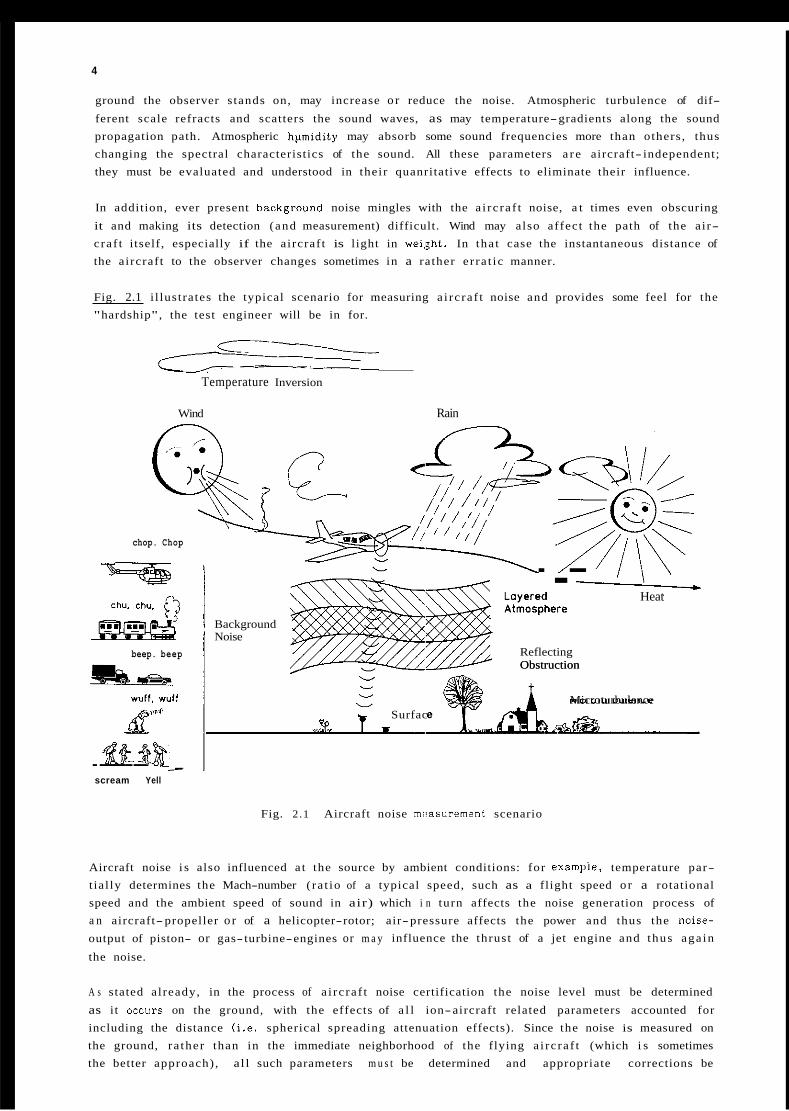
Fig. 2.1 i l lustrates the typical scenario for measuring a i rc ra f t noise and provides some feel for the "hardship", the test engineer will be in for.
Temperature Inversion
Wind Rain
chop. Chop
chu. Chu. [? 32!!as
!!&!!&
beep. beep
wuff. wuff
Heat
Obstruction
-.- ' \ '
Background Noise
Reflecting Obstruction
v v v v Microturbulence
f , Surfac Ye
----- scream Yell
Fig. 2 .1 Aircraft noise mt?asurement scenario
Aircraft noise i s also influenced a t the source by ambient conditions: for exampie, temperature par- t ial ly determines the Mach-number ( ra t io of a typical speed, such as a flight speed o r a rotational speed and the ambient speed of sound in air) which i n turn affects the noise generation process of a n aircraft-propeller o r of a helicopter-rotor; air-pressure affects the power and thus the naise- output of piston- or gas-turbine-engines or m a y influence the thrust of a jet engine and thus aga in
the noise.
A s stated already, in the process of a i rc ra f t noise certification the noise level must be determined
as it O C C U ~ S on the ground, with the effects of a l l ion-aircraft related parameters accounted for including the distance ( i . e . spherical spreading attenuation effects). Since the noise is measured on the ground, ra ther than in the immediate neighborhood of the flying a i rc ra f t (which i s sometimes the better approach) , all such parameters m u s t be determined and appropriate corrections be
5
applied in order to obtain a characterizing noise level of the a i r c r a f t . How th i s is done, is largely the subject of t h i s AGARDograph.
For t h i s purpose the immitted acoustic s ignal from the a i rc ra f t flying overhead must be measured over a sufficiently extended flyover time and over a wide frequency range using one or several microphones tha t a r e positioned along or orthogonal to the a i r c r a f t ' s f l ight pa th , depending on the
type or category of the a i rc ra f t . Normally, the sound-signals a r e recorded for l a te r laboratory ana- lysis . During the actual measurement the a i rc ra f t must follow a precisely specified flight-path. A t the same time the important a i rc ra f t flight and operational parameters a r e monitored and meteorolo- gical information is gathered at the test s i te and along the sound propagation pa th .
The t ransient and unsteady sound signal w i l l usually be processed in one of two ways. For l ight
propeller-driven a i rc ra f t , for example, only the 'maximum A-weighted noise level, LpA,max ' during flyover is of interest. Determination of the LpA,max requires next to no analyt ical effort. In prin- ciple it can be obtained directly from a visual read-out on a (precision) sound level meter, e i ther on-line in the field or off-line i n the laboratory from the recorded da ta . Only minor corrections a r e
necessary to a r r i ve at the actual certification noise level. Heavy propeller-driven aeroplanes, sub- sonic jet a i rc ra f t and helicopters, on the other hand, a r e acoustically evaluated in terms of the 'Effective Perceived Noise Level, EPNL'. Determination of the EPNL necessitates a computer and is a f a i r l y complex analyt ical procedure. Computation of the EPNL will be explained in detai l in
Appendix A to t h i s AGARDograph and the reader is encouraged to refer to th i s Appendix whenever the subject of noise measures is encountered. An example of a n EPNL determination w i l l a lso be provided in Section 3.6.2 of t h i s AGARDograph. A very brief explanation of the two noise measures L and EPNL is given in the following:
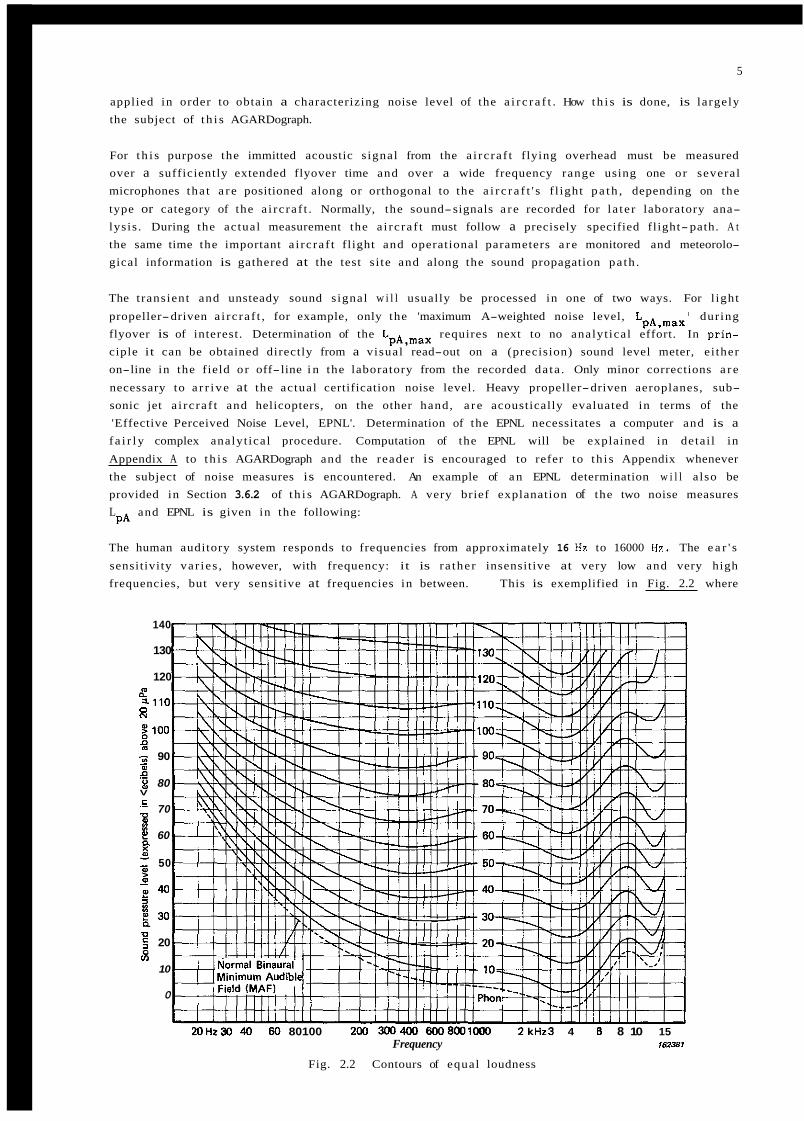
The human auditory system responds to frequencies from approximately 16 Hz to 16000 Hz. The e a r ' s
sensitivity var ies , however, with frequency: it is ra ther insensitive at very low and very high frequencies, but very sensitive at frequencies in between. This is exemplified in Fig. 2.2 where
PA
140
130
120 2 a i i o
Q
0 N
$100
2 80
90 - 0
V c '- 70 -2
60 b E = 50 !2 m - 2 4 0 ti 930
: 20 8 m
10
0
20Hzr) 40 60 80100 200 300400 6008a)l(XIo 2kHz3 4 E 8 10 15 Frequency 162381
Fig. 2.2 Contours of equal loudness
6
contours of 'equal loudness for pure tones a r e shown. For example, a 1000 Hz tone of 50 dB appears as loud as a 20 Hz tone of 95 dB or a s a 8000 Hz tone of 57 dB. The ea r i s most sensitive between
3000 and 4000 Hz.
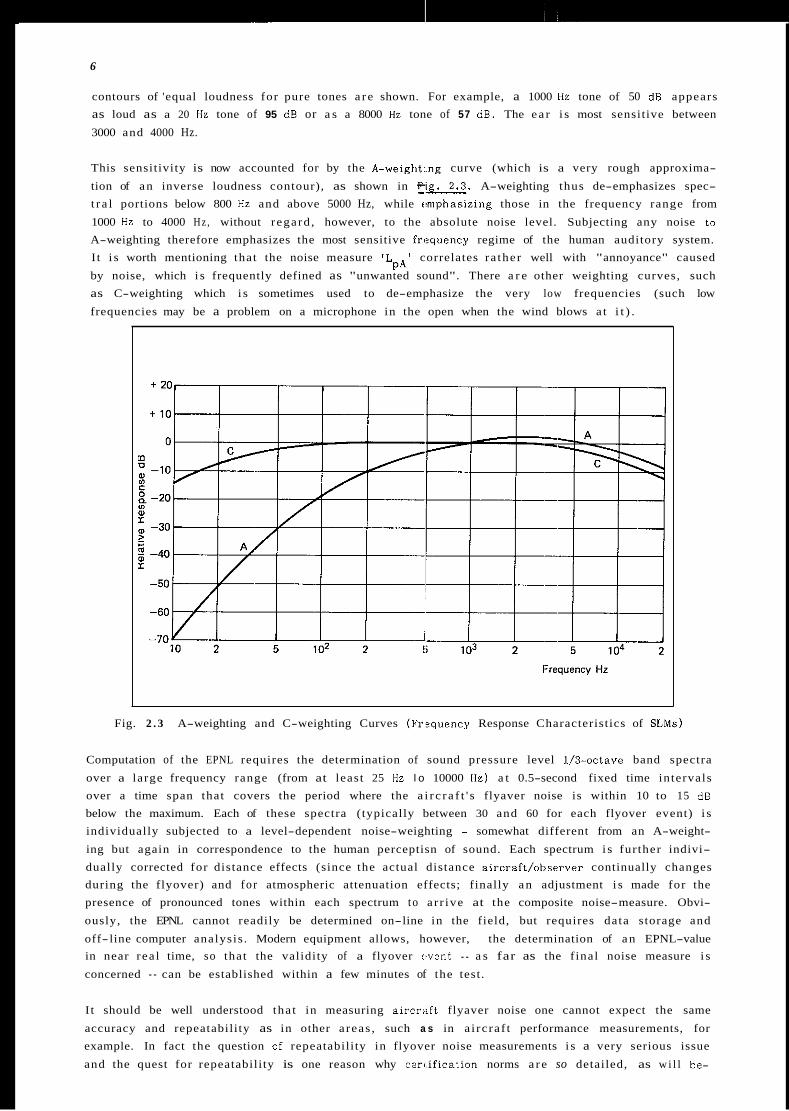
This sensitivity is now accounted for by the A-weight:.ng curve (which is a very rough approxima-
tion of a n inverse loudness contour), as shown in - F e . A-weighting thus de-emphasizes spec- t r a l portions below 800 Hz and above 5000 Hz, while mphas iz ing those in the frequency range from
1000 Hz to 4000 Hz , without regard , however, to the absolute noise level. Subjecting any noise to A-weighting therefore emphasizes the most sensitive frtsquency regime of the human auditory system. I t i s worth mentioning that the noise measure ' L ' correlates ra ther well with "annoyance" caused
by noise, which i s frequently defined as "unwanted sound". There a r e other weighting curves, such as C-weighting which i s sometimes used to de-emphasize the very low frequencies (such low
frequencies may be a problem on a microphone in the open when the wind blows a t i t ) .
PA
Fig. 2 . 3 A-weighting and C-weighting Curves (Frsquency Response Characteristics of SLMs)
Computation of the EPNL requires the determination of sound pressure level 1/3-octave band spectra
over a large frequency range (from at least 25 Hz l o 10000 Hz) a t 0.5-second fixed time intervals over a time span that covers the period where the a i r c r a f t ' s flyaver noise is within 10 to 15 dB below the maximum. Each of these spectra (typically between 30 and 60 for each flyover event) i s individually subjected to a level-dependent noise-weighting - somewhat different from an A-weight-
ing but again in correspondence to the human perceptisn of sound. Each spectrum i s fur ther indivi- dually corrected for distance effects (since the actual distance aircraft/observer continually changes during the flyover) and for atmospheric attenuation effects; finally a n adjustment i s made for the presence of pronounced tones within each spectrum to a r r ive at the composite noise-measure. Obvi-
ously, the EPNL cannot readily be determined on-line in the field, but requires data storage and
off- line computer analysis . Modern equipment allows, however, the determination of a n EPNL-value in near rea l time, so that the validity of a flyover w e n t - a s far as the f inal noise measure i s
concerned - can be established within a few minutes of the test.
I t should be well understood tha t in measuring aircrzift flyaver noise one cannot expect the same
accuracy and repeatability as in other a reas , such a s in a i rc ra f t performance measurements, for example. In fact the question of repeatability in flyover noise measurements i s a very serious issue
and the quest for repeatability is one reason why cenif icat ion norms a r e so detailed, as w i l l be-

7
come quite c lear in the following sections of th i s Chapter. For pract ical reasons, the number of flyover noise measurements is limited, cer tainly to a n extent tha t l a rge number s tat is t ics cannot be
applied. A s s ta ted before, 4 to 6 va l id test f l igh ts is all tha t is required for any par t icu la r noise certification procedure. Appendix B to th i s AGARDograph is therefore devoted to the problem of sta- t is t ical accuracy and repeatabi l i ty in measuring a i rc ra f t noise with small sample size.
2.2 ICAO ANNEX 16
The f l igh t test and ana lys i s procedures for aircraft noise-certification have been developed by the
' Internat ional Civil Aviation Organization' (ICAO) within the las t two decades. For th i s purpose,
ICAO had instituted a special body, the 'Committee of Aircraft Noise' (CAN), which h a s been re- sponsible for developing, reviewing and improving the noise certification procedures for all types of
a i rc ra f t . In the course of time, there have been I major CAN-meetings (CAN/ l to CAN/7) every two to three years . In 1983, CAN h a s been renamed 'Committee on Aviation Environmental Protection' (CAEP) to reflect its broader scope, which now covers all kinds of a i rc ra f t emissions (including en-
gine exhaust gases ) . The first (and most recent) meeting of CAEP ("CAEP/l") occurred i n 1986, and t h i s AGARDograph essentially reflects the s ta te of noise certification as of t h i s date , taking however
a l l amendments since tha t time into account.
Noise-certification "Standards" a n d "Eecommended Practices" (so-called 'SARPs' ) for subsonic jet-air-
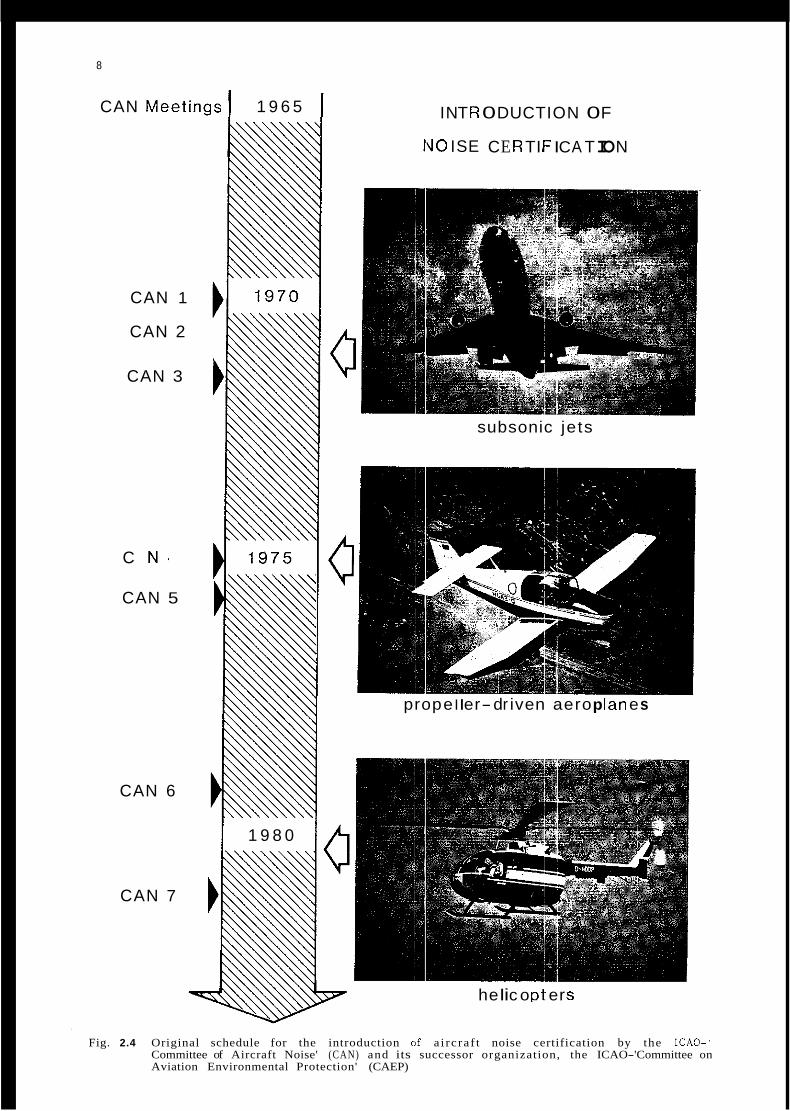
craf t and heavy propeller-driven aeroplanes were first issued more than 15 years ago. Correspond- ing SARPs for l ight propeller-driven aeroplanes were introduced in 1975, and for helicopters in 1981 (Fig. 2.4). Approximately 150 a i r fa r ing s ta tes presently contract to ICAO. Here, the term "contract" implies tha t such s ta tes in the i r national noise legislation adhere to ICAO SARPs. No s ta te is farced to accept o r adopt these ent i rely, but any deviation i n the application by a national authority
must officially be brought to the attention of ICAO. I t is worth noting tha t a t present only 10 to 15 of the ICAO member s tates a r e represented i n , o r directly contribute to the work of, CAEP. The ICAO-document, which contains all specifications for controlling a i rc ra f t noise emission and immis- sion, is entitled "International Standards and Recommended Practices - Environmental Protection;
ANNEX 16 to the Convention on International Civil Aviation / Volume 1 'Aircraft Noise' 111. I t s first edition dates from 1981, i t s second edition appeared i n 1988. This document is commonly referred to as "ANNEX 16".
2.3 Structure and Content of ANNEX 16 (1988 Edition)
There have been several editions of ANNEX 16. The most recent (1988) edition contains, within Vol- ume I , five Par t s (with Roman numerals); here Part I1 , in par t icu la r , deals with a i rc ra f t noise
Certification along 10 Chapters, each devoted to a par t icu la r type and/or weight-category of air- craf t . Furthermore, the ANNEX edition contains s ix Appendices (with Arabic numerals) and four Attachments (with sequential cap i ta l l e t te rs ) . This s t ructure is shown in on Page 10. Of special in-
terest in the context of t h i s AGARDograph a r e Chapters 3, 6 , 8 , and 10 of Part 11, Appendices 2,
3, 4 and 6, and Attachments A and D, i.e. those dealing with subsonic jet-aeroplanes, heavy and l ight propeller-driven aeroplanes and helicopters. Understanding the content and s tructure of ANNEX 16 i s helpful , since in the "jargon of the experts" terms such as "Chapter-3 a i rc ra f t" o r a "Chapter-10 v s a "Chapter-6 procedure" a r e frequently used.
In ANNEX 16, a CHAPTER defines the noise evaluation measure to be used for the type or category
of a i rc ra f t (e.g. a 'maximum A-weighted Noise Level' o r a n 'Effective Perceived Noise Level ' , etc. ), i t specifies the measurement locations, the noise limits and certain procedural aspects , such as the required engine-power setting or flight-speed for the certification test. An APPENDIX defines the test environment (e .g. the permissible atmospheric conditions), cer tain requirements about the
data-acquisition equipment and , where necessary, computation procedures for calculating the noise measure. I t also contains the requirements for reporting to the authorities. An ATTACHMENT, f inal-
8
CAN Meetings1 1 9 6 5 I
CAN 1
CAN 2
CAN 3
C
CAN 5
CAN 6
CAN 7
IN T R 0 DUCT ION 0 F
1\10 IS E C E R TI I- I C A T IO N
c subsonic jets
prop e I I er-d r ive n aero p Ian e s mi I 1 9 8 0 I
he I i c o pi: e r s
Fig. 2.4 Original schedule for the introduction of a i rc ra f t noise certification by the ICAO-' Committee of Aircraft Noise' (CAN) and its successor organization, the ICAO-'Committee on Aviation Environmental Protection' (CAEP)
9
l y , provides additional guidance material for the application of the rules and regulations of Chap-
ters and Appendices. I t may contain simplified mathematical formulations or detai ls of recommended
al ternate ("equivalent") procedures.
ICAO h a s generated a special Technical Manual 121 explaining in greater detai l the use of the various procedures in the noise certification of a i rc ra f t than is possible in the ANNEX 16 document.
This Manual must be considered as a very helpful supplement to the ANNEX 16 document per se. As
stated in the introduction to th i s Manual, 'its a i m is to promote uniformity in the implementation of the technical procedures of ANNEX 16, Volume 1, and to provide guidance such t ha t all certificating
authorities can apply the same degree of stringency and the same cr i ter ia for acceptance in approving applications for the use of "equivalent procedures"'. A s w i l l be recalled, "equivalent
procedures" do not follow exactly the procedures as delineated in ANNEX 16, but provide the same quality da ta and/or information required for purposes of noise certification; they a r e usually "more practical" o r less involved than the very ANNEX 16 procedures. However, any , equivalent procedure must he approved by the certificating authority pr ior to its application i n noise certification.
For purposes of noise certification, propeller-driven aeroplanes have originally been divided, some-
what a rb i t ra r i ly , into those with a maximum certificated take-off mass of more than 5700 kg , and those not exceeding 5700 kg. This m a s s l i m i t has recently been raised to 9000 kg. Those below th i s mass-limit (usual ly referred to as ' l ight propeller-driven aeroplanes' o r simply LPDA) include the
vast majority of General Aviation aeroplanes with one o r two engines; those over t h i s l i m i t (usual ly referred to as 'heavy propeller-driven aeroplanes' o r simply HPDA) represent the commercial and/or
commuter and heavy transport-category a i rc ra f t with 2 , 3 or 4 engines and with a m a s s of up to several hundred- thousand kilograms.
Light propeller a i rc ra f t typically operate from smaller airf ie lds , whereas the heavy ones use the same a i rpor t s as commercial jet-airliners. I t w a s argued, therefore, tha t the latter should be
subjected to the same noise regulations as turbo-jet aeroplanes. Until about 5 years ago, the heavy propeller-driven aeroplanes were deal t with in a separate A N N E X Chapter (Chapter 5). whereas the
subsonic jet-aeroplanes were covered in Chapter 2 and in Chapter 3 . The la t te r distinction relates to the date at which the application for the certificate of airworthiness for the prototype was accepted: A s shown on the following page, Chapter 2 appl ies if the application w a s f i led "before 6
October 1977", Chapter 3 if t h i s date w a s "on o r a f te r 6 October 1977". This is in effect a distinc- tion between old and new a i rc ra f t . Since the C h a p t e r 4 aeroplanes w i l l be phased out in the Nineties, there is no grea t need to discuss Chapter 2 i n detai l .
All new subsonic jet-aeroplanes w i l l have to comply with Chapter 3 regulations (which a r e more stringent than the Chapter 2 regulations). For the heavy propeller-driven aeroplanes ICAO h a s in- serted a n applicability clause into Chapter 3 . Those aeroplanes for which the prototype application
h a s been received on or af ter 17 November 1988 would have to comply with the provisions of Chap- t e r 3. Already in the pas t , Chapters 3 and 5 utilized one common Appendix, i.e. Appendix 2; the dismissal of Chapter 5 should fur ther consolidate the noise certification of these two types of a i rc ra f t .
Subsonic jet aeroplanes and heavy propeller-driven aeroplanes w i l l therefore be discussed jointly in one Section referring to Chapter 3 and - where pertinent - to Chapter 5, not however to Chapter 2; differences between Chapters 3 and 5 w i l l be pointed out.
The noise certification procedure for l ight propeller-driven aeroplanes is covered in ANNEX 16/ Chapter 6 and Appendix 3. A s s tated, CAEPf1 raised the mass-distinction between l ight and heavy propeller-driven aeroplanes to 9000 kg. Chapter 6 now includes aeroplanes up to tha t mass-value. Recently, ICAO introduced a n altogether new noise certification procedure for l ight propeller-driven
aeroplanes. The new procedure defines a n entirely different test-methodology. The relevant A N N E X Sections a r e termed Chapter 10 and Appendix 6. Although the new noise certification procedure became effective as of 17 November 1988, there is a fall-back provision: aeroplanes which a r e un-
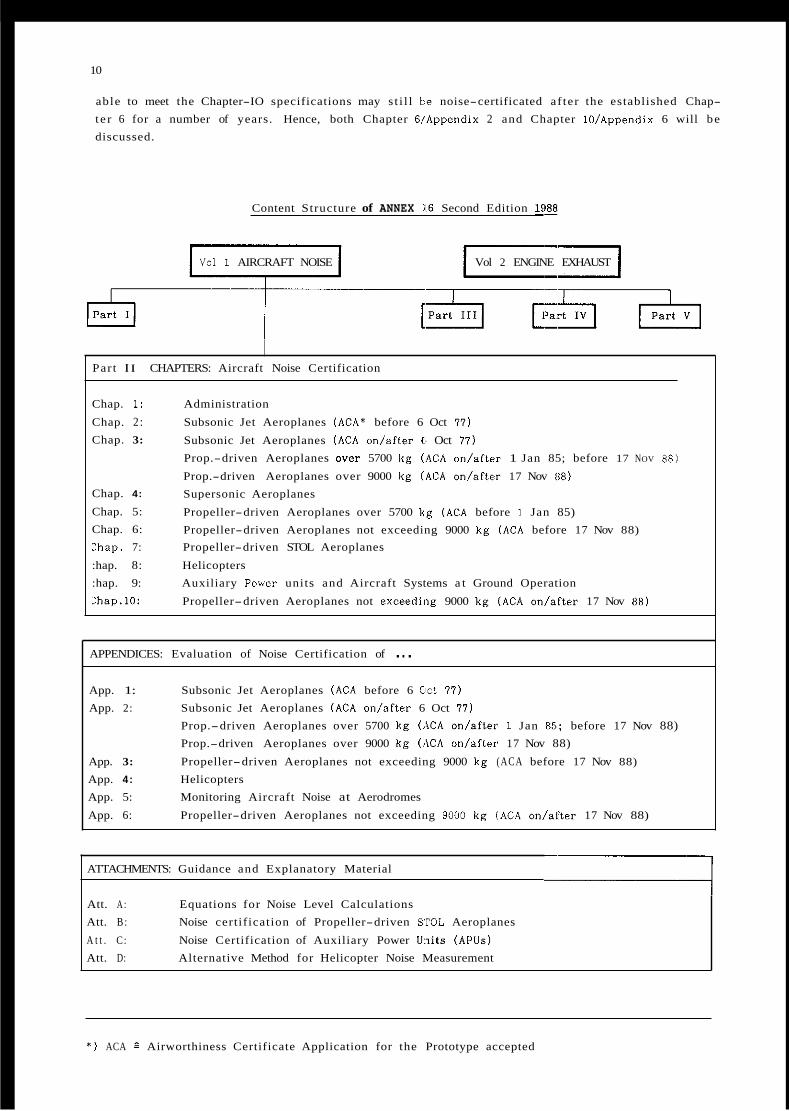
10
able to meet the Chapter-IO specifications may s t i l l b e noise-certificated af ter the established Chap- te r 6 for a number of years. Hence, both Chapter WAppendix 2 and Chapter 10/Appendix 6 will be discussed.
Content Structure of ANNEX IL6 Second Edition 19%
Val 1 AIRCRAFT NOISE Vol 2 ENGINE EXHAUST
Part I I CHAPTERS: Aircraft Noise Certification
Chap. 1:
Chap. 2 : Chap. 3:
Chap. 4:
Chap. 5: Chap. 6: :hap. 7:
:hap. 8: :hap. 9: Zhap.10:
Administration
Subsonic Jet Aeroplanes (ACA* before 6 Oct 77)
Subsonic Jet Aeroplanes (ACA on/after E t Oct 77)
Prop.-driven Aeroplanes over 5700 kg (ACA o d a f t e r 1 Jan 85; before 17 NOV 88)
Prop.-driven Aeroplanes over 9000 kg (ACA on/after 17 Nov 88)
Supersonic Aeroplanes
Propeller-driven Aeroplanes over 5700 kg (ACA before 1 Jan 85) Propeller-driven Aeroplanes not exceeding 9000 kg ( A C A before 17 Nov 88) Propeller-driven STOL Aeroplanes
Helicopters Auxiliary Power units and Aircraft Systems a t Ground Operation
Propeller-driven Aeroplanes not exceedhg 9000 kg (ACA on/after 17 Nov 88)
APPENDICES: Evaluation of Noise Certification of . . . App. 1: Subsonic Jet Aeroplanes (ACA before 6 Cict 77)
App. 2: Subsonic Jet Aeroplanes (ACA on/after 6 Oct 77)
Prop.-driven Aeroplanes over 5700 kg ( A C A d a f t e r 1 Jan 85; before 17 Nov 88) Prop.-driven Aeroplanes over 9000 kg (ACA on/after 17 Nov 88)
App. 3: Propeller-driven Aeroplanes not exceeding 9000 kg (ACA before 17 Nov 88)
App. 4: Helicopters App. 5: Monitoring Aircraft Noise at Aerodromes
App. 6: Propeller-driven Aeroplanes not exceeding 9000 kg (ACA on/aCter 17 Nov 88)
ATTACHMENTS: Guidance and Explanatory Material
Att. A : Equations for Noise Level Calculations Att. B : Noise certification of Propeller-driven S r O L Aeroplanes
A t t . C: Noise Certification of Auxiliary Power U:?its (APUs) Att. D: Alternative Method for Helicopter Noise Measurement
* ) ACA e Airworthiness Certificate Application for the Prototype accepted
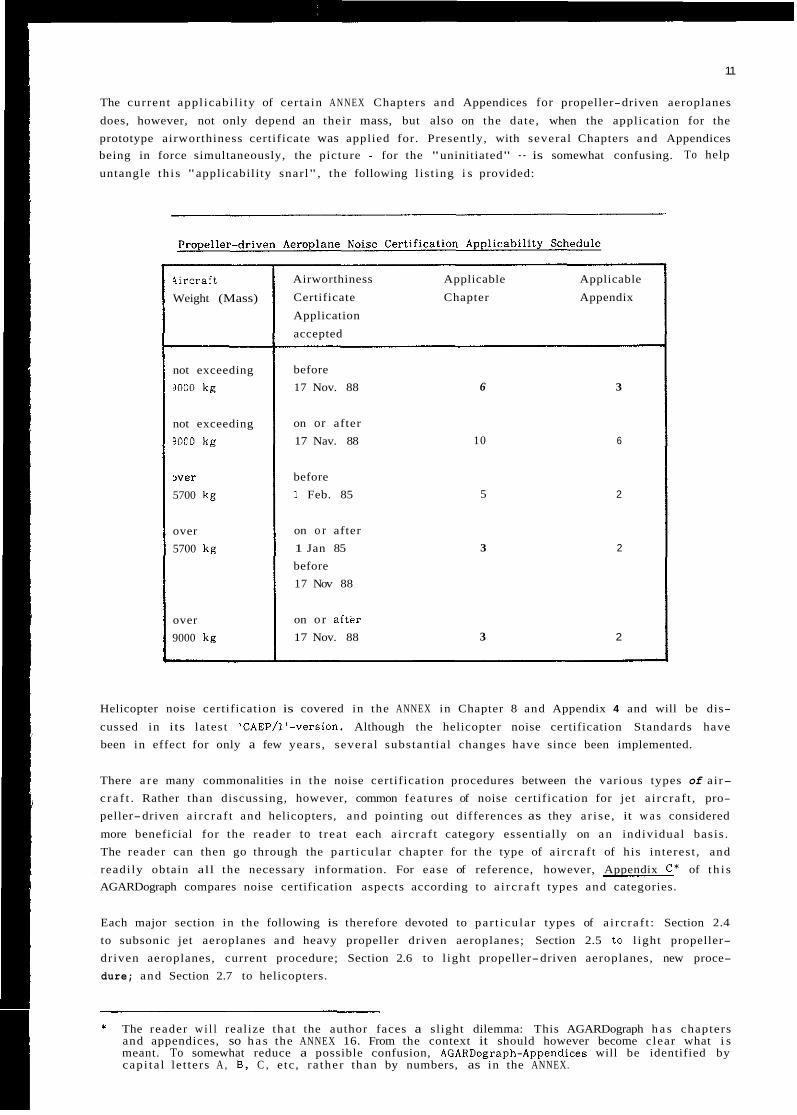
11
The current appl icabi l i ty of cer tain A N N E X Chapters and Appendices for propeller-driven aeroplanes
does, however, not only depend an their mass, but also on the date , when the application for the prototype airworthiness certificate was applied for. Presently, with several Chapters and Appendices being in force simultaneously, the picture - for the "uninitiated" - is somewhat confusing. To help
untangle th i s "applicability snarl" , the following l is t ing i s provided:
4ircraft Weight (Mass)
not exceeding 3000 kg
not exceeding 3000 k g
m e r 5700 kg
over 5700 kg
over 9000 kg
Airworthiness Applicable Applicable
Certificate Chapter Appendix
Application
accepted
before 17 Nov. 88 6 3
on or after 17 Nav. 88 10 6
before 1 Feb. 85 5 2
on o r after 1 Jan 85 before 17 Nov 88
3 2
on o r a f t k r
17 Nov. 88 3 2
Helicopter noise certification is covered in the ANNEX in Chapter 8 and Appendix 4 and will be dis-
cussed in its latest 'CAEP/l'-version. Although the helicopter noise certification Standards have been in effect for only a few years , several substant ial changes have since been implemented.
There a r e many commonalities in the noise certification procedures between the various types of air- c ra f t . Rather than discussing, however, common features of noise certification for jet a i rc ra f t , pro- peller-driven a i rc ra f t and helicopters, and pointing out differences as they a r i se , it w a s considered
more beneficial for the reader to t rea t each a i rc ra f t category essentially on a n individual basis . The reader can then go through the par t icu la r chapter for the type of a i rc ra f t of his interest , and readi ly obtain all the necessary information. For ease of reference, however, Appendix C* of t h i s AGARDograph compares noise certification aspects according to a i rc ra f t types and categories.
Each major section in the following is therefore devoted to par t icu la r types of a i rc ra f t : Section 2.4 to subsonic jet aeroplanes and heavy propeller dr iven aeroplanes; Section 2.5 to l ight propeller- driven aeroplanes, current procedure; Section 2.6 to l ight propeller-driven aeroplanes, new proce- dure; and Section 2.7 to helicopters.
* The reader w i l l realize tha t the author faces a slight dilemma: This AGARDograph h a s chapters and appendices, so h a s the ANNEX 16. From the context it should however become clear what i s meant. To somewhat reduce a possible confusion, AGARDograph-Appendices will be identified by cap i ta l le t ters A , 8 , C , e tc , ra ther than by numbers, as in the ANNEX.
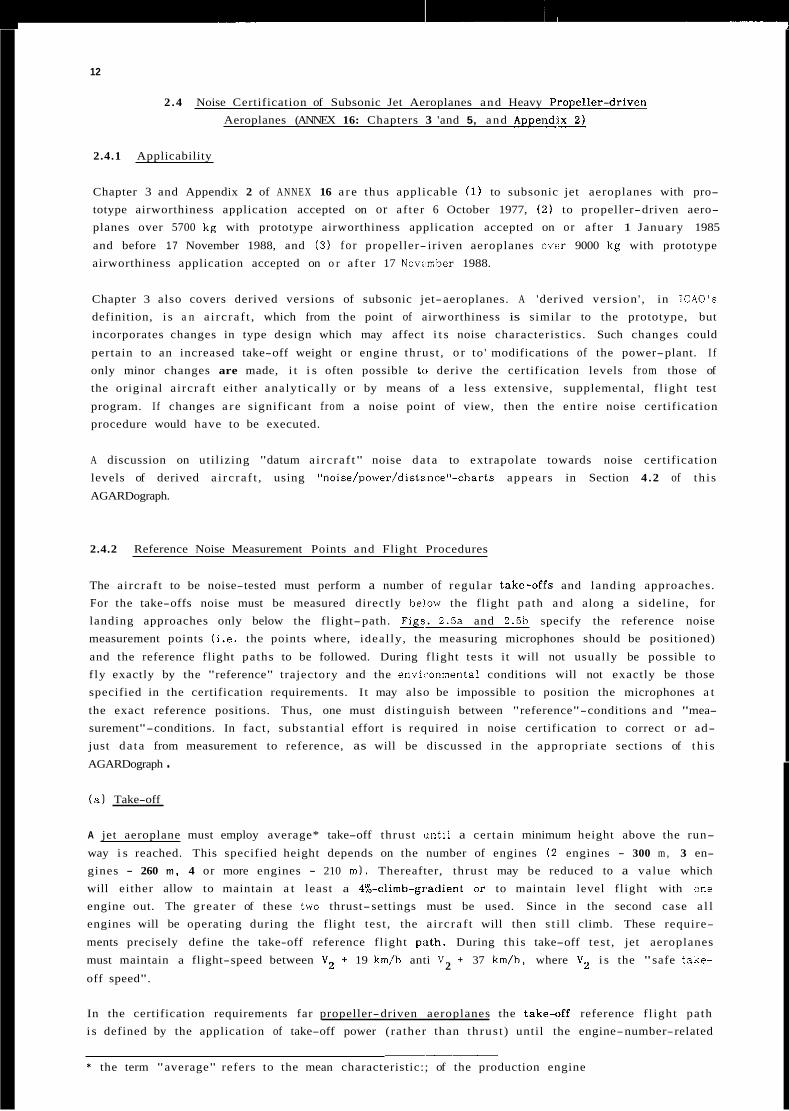
12
2 .4 Noise Certification of Subsonic Jet Aeroplanes and Heavy Propeller-driven Aeroplanes (ANNEX 16: Chapters 3 'and 5, and A p p e i g i a
2.4.1 Applicability
Chapter 3 and Appendix 2 of ANNEX 16 a re thus applicable (1) to subsonic jet aeroplanes with pro- totype airworthiness application accepted on or af ter 6 October 1977, ( 2 ) to propeller-driven aero- planes over 5700 kg with prototype airworthiness application accepted on or af ter 1 January 1985
and before 17 November 1988, and ( 3 ) fo r propeller- iriven aeroplanes wt?r 9000 kg with prototype airworthiness application accepted on o r af ter 17 Novwnber 1988.
Chapter 3 also covers derived versions of subsonic jet-aeroplanes. A 'derived version ' , in ICAO's definition, i s a n a i rc ra f t , which from the point of airworthiness is similar to the prototype, but incorporates changes in type design which may affect i t s noise characteristics. Such changes could
pertain to an increased take-off weight or engine thrust , o r to ' modifications of the power-plant. I f only minor changes are made, i t i s often possible to derive the certification levels from those of the original a ircraf t either analyt ical ly or by means of a less extensive, supplemental, f l ight test
program. If changes a r e significant from a noise point of view, then the ent i re noise certification procedure would have to be executed.
A discussion on utilizing "datum a i rc ra f t" noise da ta to extrapolate towards noise certification levels of derived a i rc ra f t , using "noise/power/distance"-charts appears in Section 4 .2 of th i s
AGARDograph.
2.4.2 Reference Noise Measurement Points and Flight Procedures
The aircraf t to be noise-tested must perform a number of regular take-oEb and landing approaches. For the take-offs noise must be measured directly bel.ow the flight path and along a sideline, for landing approaches only below the flight-path. m. 2.5a and 2.5b specify the reference noise measurement points ( i .e . the points where, ideal ly, the measuring microphones should be positioned)
and the reference flight paths to be followed. During flight tests it will not usually be possible to f ly exactly by the "reference" trajectory and the enviironmental conditions will not exactly be those specified in the certification requirements. I t may also be impossible to position the microphones a t
the exact reference positions. Thus, one must distinguish between "reference"-conditions and "mea- surement"-conditions. In fact , substant ial effort i s required in noise certification to correct o r ad- just da ta from measurement to reference, as will be discussed in the appropriate sections of t h i s
AGARDograph . ( a ) Take-off
A jet aeroplane must employ average* take-off thrust iintii a certain minimum height above the run-
way i s reached. This specified height depends on the number of engines ( 2 engines - 300 m , 3 en- gines - 260 m, 4 or more engines - 210 m ) . Thereafter, thrust may be reduced to a value which will either allow to maintain a t least a 4%-ciimb-g~adient or to maintain level flight with one engine out. The greater of these two thrust-settings must be used. Since in the second case a l l engines will be operating during the flight test , the a i rc ra f t will then s t i l l climb. These require-
ments precisely define the take-off reference flight path. During this take-off test , jet aeroplanes must maintain a flight-speed between V2 + 19 km/h anti V + 37 km/h, where V2 i s the "safe take-
off speed". 2
In the certification requirements far propeller-driven aeroplanes the take-off reference f l ight path i s defined by the application of take-off power (rather than thrus t ) until the engine-number-related
~-~ * the term "average" refers to the mean characteristic:; of the production engine
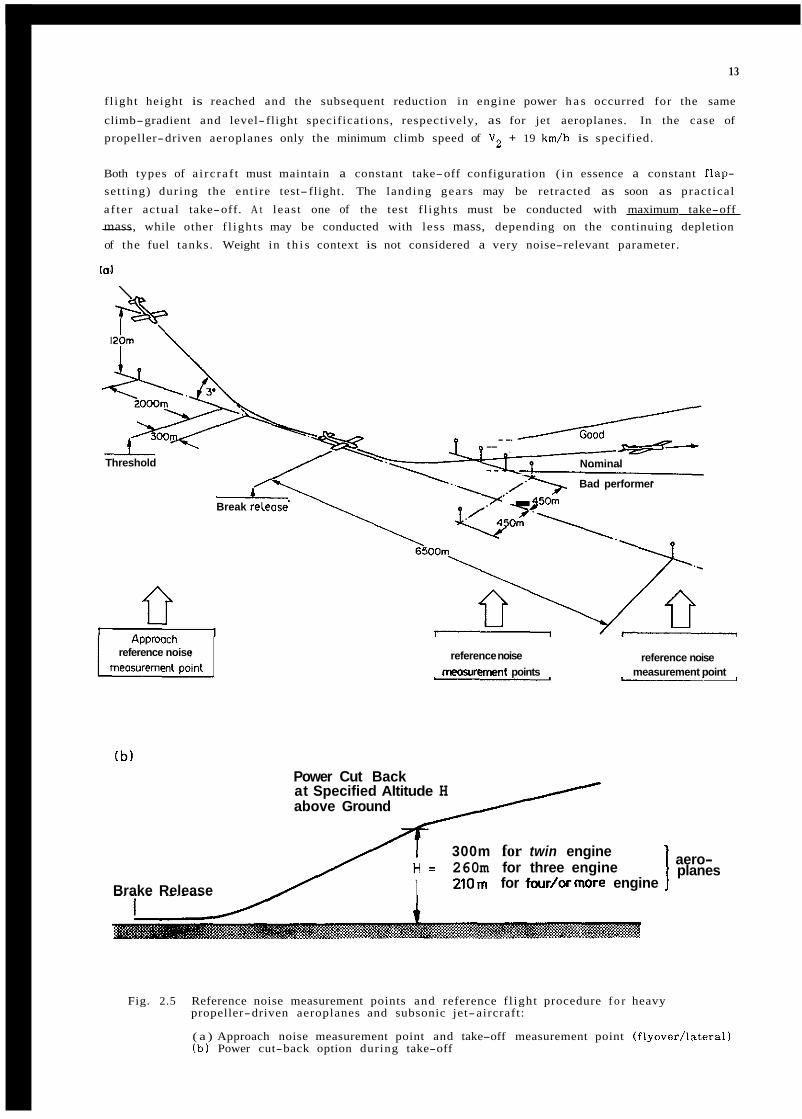
13
f l ight height is reached and the subsequent reduction in engine power h a s occurred for the same
climb-gradient and level-flight specifications, respectively, as for jet aeroplanes. In the case of propeller-driven aeroplanes only the minimum climb speed of V2 + 19 km/h is specified.
Both types of a i rc ra f t must maintain a constant take-off configuration ( i n essence a constant flap- set t ing) during the ent i re test- flight. The landing gears may be retracted as soon as pract ical
a f te r actual take-off. A t least one of the test f l ights must be conducted with maximum take-off ~ mass, while other f l igh ts may be conducted with less mass, depending on the continuing depletion
of the fuel tanks. Weight in t h i s context is not considered a very noise-relevant parameter.
la)
Threshold
- Break
reference noise
__- - Nominal ,\ Bad performer
1 .. . 450m
reference noise reference noise meosurement points measurement point
Power Cut Back at Specified Altitude H above Ground
aero- planes I 300m for twin engine
21Om for four/ormore engine = 260m for three engine
Brake Release
Fig. 2.5 Reference noise measurement points and reference f l ight procedure f o r heavy propeller-driven aeroplanes and subsonic jet-aircraft:
( a ) Approach noise measurement point and take-off measurement point ( f lyaver/ la teral) ( b ) Power cut-back option during take-off
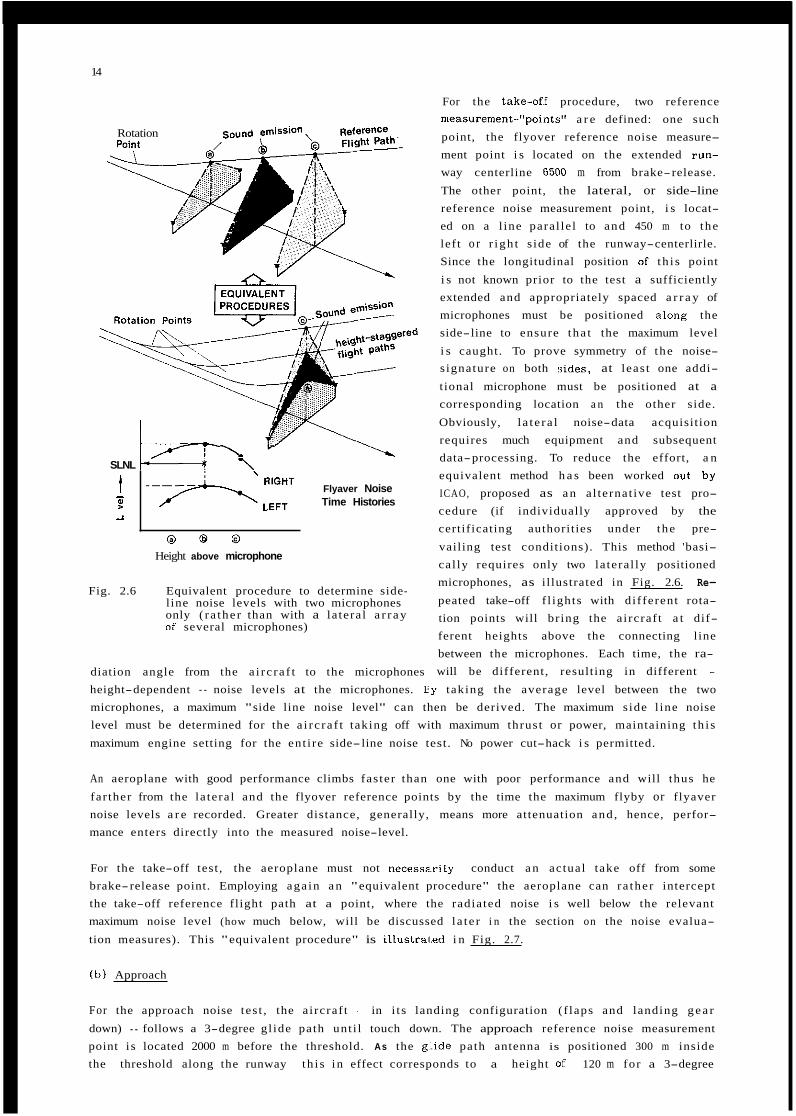
14
Rotation
SLNL
t - : -1
i \ . " 4
Flyaver Noise --& :zy Time Histories
8 @ Q Height above microphone
Fig. 2.6 Equivalent procedure to determine side- l ine noise levels with two microphones only ( ra the r than with a la tera l a r r a y of several microphones)
diation angle from the a i rc ra f t to the microphones
For the take-of.f procedure, two reference measurement-"point!i" a r e defined: one such point, the flyover reference noise measure- ment point i s located on the extended r w - way centerline 6500 m from brake-release.
The other point, the lateral, or side-line reference noise measurement point, i s locat- ed on a l ine paral le l to and 450 m to the left o r r igh t s ide of the runway-centerlirle. Since the longitudinal position of th i s point
i s not known prior to the test a sufficiently extended and appropriately spaced a r r a y of microphones must be positioned along the side-line to ensure tha t the maximum level
i s caught. To prove symmetry of the noise- signature on both !;ides, at leas t one addi-
tional microphone must be positioned at a corresponding location a n the other side.
Obviously, l a t e ra l noise-data acquisition requires much equipment and subsequent data-processing. To reduce the effort, a n equivalent method h a s been worked out by ICAO, proposed as a n al ternat ive test pro- cedure (if individually approved by the certificating authorities under the pre-
vailing test conditions). This method 'basi- cal ly requires only two la teral ly positioned microphones, as il lustrated in Fig. 2.6. Re- peated take-off f l ights with dif ferent rota- tion points will br ing the a i rcraf t a t dif- ferent heights above the connecting line between the microphones. Each time, the ra- will be different, resulting in different -
height-dependent - noise levels at the microphones. Ey taking the average level between the two microphones, a maximum "side line noise level" can then be derived. The maximum side l ine noise level must be determined for the a i rc ra f t taking off with maximum thrust or power, maintaining th i s
maximum engine setting for the ent i re side-line noise test. No power cut-hack i s permitted.
An aeroplane with good performance climbs fas ter than one with poor performance and will thus he
far ther from the la tera l and the flyover reference points by the time the maximum flyby or flyaver noise levels a r e recorded. Greater distance, generally, means more attenuation and , hence, perfor- mance enters directly into the measured noise-level.
For the take-off test , the aeroplane must not necess2.t-ily conduct a n actual take off from some brake-release point. Employing aga in a n "equivalent procedure" the aeroplane can ra ther intercept the take-off reference fl ight path at a point, where the radiated noise i s well below the relevant maximum noise level (how much below, will be discussed l a t e r i n the section on the noise evalua-
tion measures). This "equivalent procedure" is i l l u s t r a k d i n Fig. 2.7.
( b ) Approach
For the approach noise tes t , the a i rcraf t - in i t s landing configuration ( f laps and landing g e a r
down) - follows a 3-degree gl ide path unt i l touch down. The approach reference noise measurement point i s located 2000 m before the threshold. As the g:.ide path antenna is positioned 300 m inside the threshold along the runway th i s in effect corresponds to a height of 120 m for a 3-degree
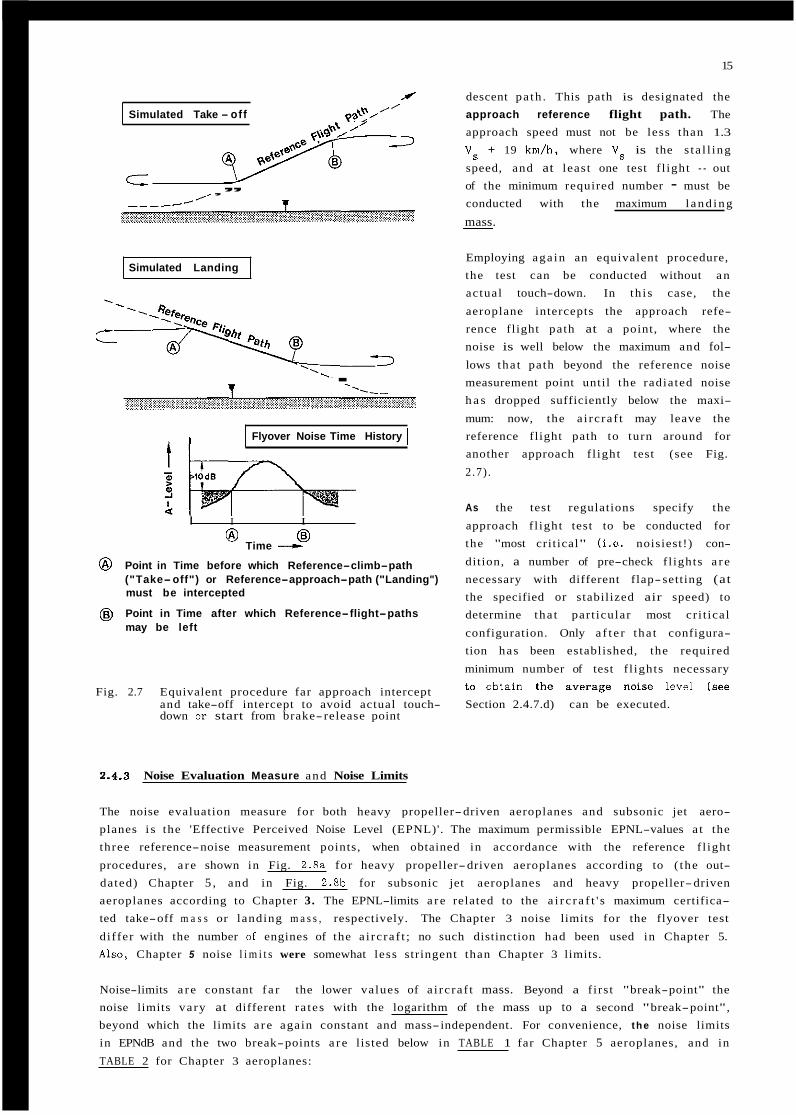
15
M descent pa th . This path is designated the Simulated Take - off pakv// approach reference flight path. The
approach speed must not be less than 1.3
Vs + 19 km/h, where Vs is the s ta l l ing
speed, and at least one test f l ight - out , , of the minimum required number - must be
/
+,9% /' ? & - J ,
c conducted with the maximum l a n d i n g
mass. -
Simulated Landing
.
Flyover Noise Time History I I 1
I I I
Time ---t @ @
@ Point in Time before which Reference-climb-path ("Take-off") or Reference-approach-path ("Landing") must be intercepted
Point in Time after which Reference-flight-paths may be left
@
Employing aga in an equivalent procedure, the test can be conducted without a n actual touch-down. In th i s case, the
aeroplane intercepts the approach refe- rence flight path at a point, where the noise is well below the maximum and fol- lows tha t path beyond the reference noise measurement point until the radiated noise h a s dropped sufficiently below the maxi-
mum: now, the a i rc ra f t may leave the reference flight path to turn around for another approach f l ight test (see Fig.
2 .7) .
As the test regulations specify the
approach f l ight test to be conducted for the "most critical" (i.e. noisiest!) con-
dition, a number of pre-check f l ights a r e necessary with different flap-setting (at the specified or stabilized air speed) to determine tha t par t icular most cr i t ical
configuration. Only a f t e r tha t configura- tion has been established, the required
minimum number of test f l ights necessary
Fig. 2.7 Equivalent procedure far approach intercept to Obtain the average noise level (see and take-off intercept to avoid actual touch- Section 2.4.7.d) can be executed. down or start from brake- release point
2.4.3 Noise Evaluation Measure and Noise Limits
The noise evaluation measure for both heavy propeller-driven aeroplanes and subsonic jet aero- planes i s the 'Effective Perceived Noise Level (EPNL)'. The maximum permissible EPNL-values a t the three reference-noise measurement points, when obtained in accordance with the reference f l ight
procedures, a r e shown in Fig. 2.8a for heavy propeller-driven aeroplanes according to ( the out- dated) Chapter 5 , and in Fig. 2.8b for subsonic jet aeroplanes and heavy propeller-driven aeroplanes according to Chapter 3. The EPNL-limits a r e related to the a i r c r a f t ' s maximum certifica- ted take-off m a s s or landing m a s s , respectively. The Chapter 3 noise limits for the flyover test
differ with the number of engines of the a i rc ra f t ; no such distinction had been used in Chapter 5. Also, Chapter 5 noise l i m i t s were somewhat less stringent than Chapter 3 limits.
Noise-limits a r e constant f a r the lower values of a i rc ra f t mass. Beyond a f i rs t "break-point" the noise limits vary at different ra tes with the logarithm of the mass up to a second "break-point", beyond which the limits a r e again constant and mass-independent. For convenience, the noise limits in EPNdB and the two break-points a r e listed below in TABLE 1 far Chapter 5 aeroplanes, and in
TABLE 2 for Chapter 3 aeroplanes:
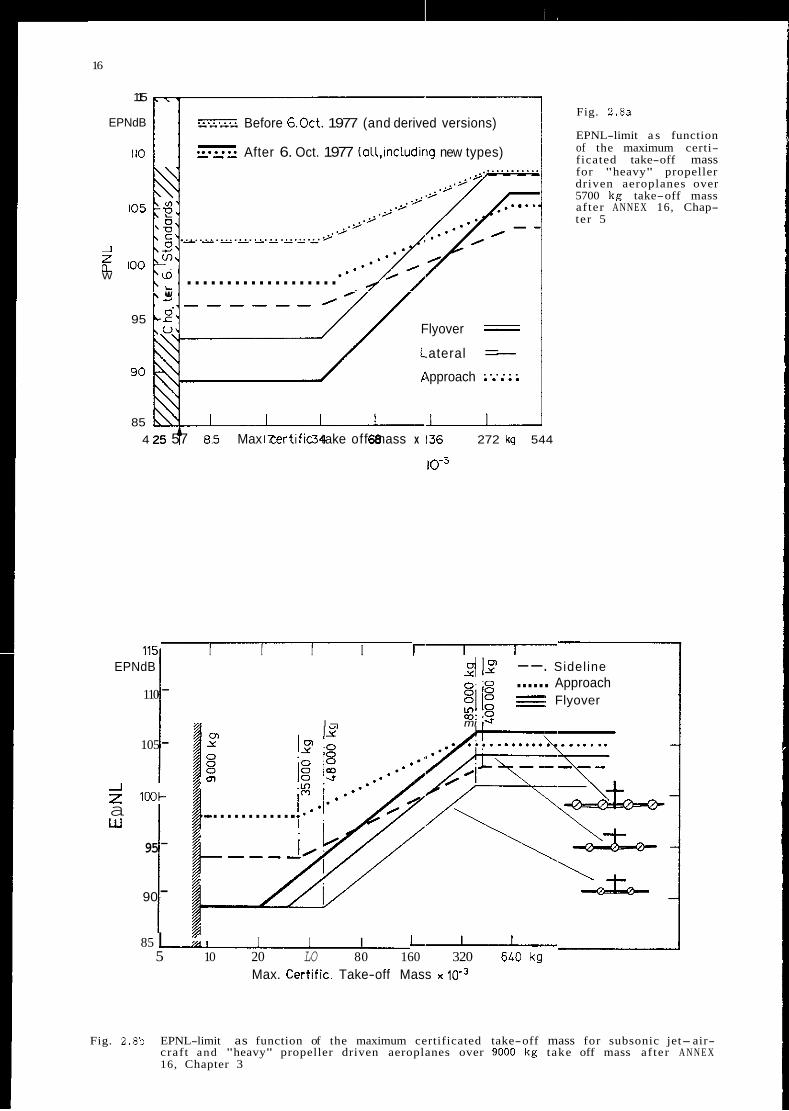
16
115
EPNdB
I10
= ........ Before 6.0ct. 1977 (and derived versions)
:== After 6. Oct. 1977 (all,including new types) -
105 :g , 0.
'U \ ~ ' . ~ . . - . ~ . ~ . ~ . ~ . ~ . ~ . ~ . . ~ ' >z: _I z
& I00 W 'co ...................
'L
'4
,V I Flyover = ,\\
W
95 G.Z.
Fig. 2.8a
EPNL-limit a s function of the maximum certi- ficated take-off mass for "heavy" propeller driven aeroplanes over 5700 kg take-off mass af ter ANNEX 16, Chap- ter 5
Lateral =--- Approach i'.';;:
85 I 4 m 5 25 57 Max certific take off 68 mass x 136 272 kg 544
1151 I I I I I-- EPNdB
110 -
105 -
2 1w- a Lu
95 -
90 -
1; lm ............. f-----
I -
4 /? --. Sidel ine ...... Approach =: Flyover
gj %..E -. mi #*
I 85 I I I I I--
5 10 20 LO 80 160 320 6LO kg Max. Certific. Take-off Mass x lom3
Fig. 2.8b EPNL-limit as function of the maximum certificated take-off mass for subsonic jet- air- craf t and "heavy" propeller driven aeroplanes over 9000 kg take off mass af ter A N N E X 16, Chapter 3
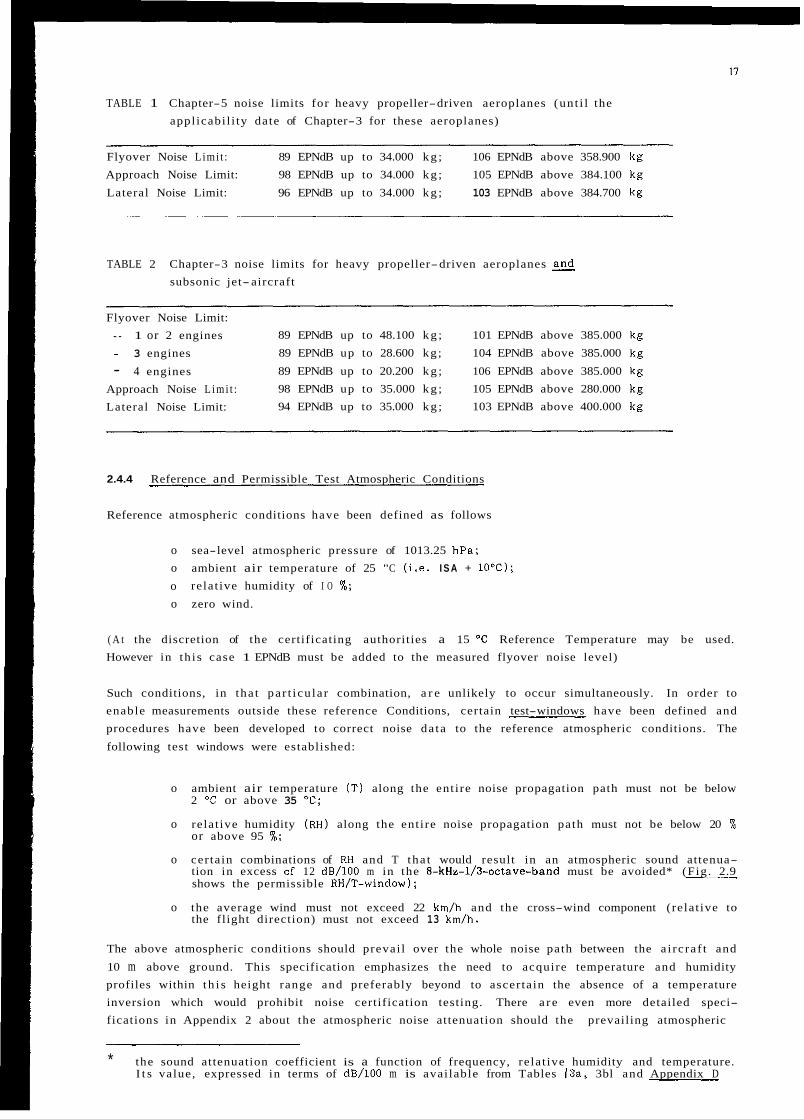
TABLE 1 Chapter-5 noise limits for heavy propeller-driven aeroplanes (un t i l the appl icabi l i ty date of Chapter-3 for these aeroplanes)
Flyover Noise Limi t : 89 EPNdB up to 34.000 kg ; 106 EPNdB above 358.900 kg Approach Noise Limit: 98 EPNdB up to 34.000 kg ; 105 EPNdB above 384.100 kg
Lateral Noise Limit: 96 EPNdB up to 34.000 kg ; 103 EPNdB above 384.700 kg
TABLE 2 Chapter-3 noise limits for heavy propeller-driven aeroplanes subsonic jet- aircraft
Flyover Noise Limit: - 1 or 2 engines 89 EPNdB up to 48.100 kg ; 101 EPNdB above 385.000 kg
- 3 engines 89 EPNdB up to 28.600 kg ; 104 EPNdB above 385.000 kg
- 4 engines 89 EPNdB up to 20.200 kg ; 106 EPNdB above 385.000 kg
Approach Noise L i m i t : 98 EPNdB up to 35.000 kg ; 105 EPNdB above 280.000 kg
Lateral Noise Limit: 94 EPNdB up to 35.000 kg ; 103 EPNdB above 400.000 kg
2.4.4 Reference and Permissible Test Atmospheric Conditions
Reference atmospheric conditions have been defined as follows
o sea-level atmospheric pressure of 1013.25 hPa; o ambient air temperature of 25 "C ( i . e . I S A + 10'C);
o o zero wind.
relat ive humidity of I O %;
( A t the discretion of the certificating authorities a 15 O C Reference Temperature may be used. However in th i s case 1 EPNdB must be added to the measured flyover noise level)
Such conditions, in tha t par t icu la r combination, a r e unlikely to occur simultaneously. In order to enable measurements outside these reference Conditions, certain test-windows have been defined and procedures have been developed to correct noise da ta to the reference atmospheric conditions. The
following test windows were established:
o ambient air temperature ( T ) along the ent i re noise propagation path must not be below 2 "C or above 35 T;
o relat ive humidity ( R H ) along the ent i re noise propagation path must not be below 20 % or above 95 %;
o certain combinations of RH and T tha t would result in an atmospheric sound attenua- tion in excess of 12 dB/lOO m in the 8-kHz-1/3-octave-band must be avoided* (Fig. 2.9 shows the permissible RH/T-window);
o the average wind must not exceed 22 km/h and the cross-wind component (relat ive to the flight direction) must not exceed 13 km/h.
The above atmospheric conditions should prevai l over the whole noise path between the a i rc ra f t and
10 m above ground. This specification emphasizes the need to acquire temperature and humidity profiles within t h i s height range and preferably beyond to ascertain the absence of a temperature inversion which would prohibit noise certification testing. There a r e even more detailed speci- fications in Appendix 2 about the atmospheric noise attenuation should the prevailing atmospheric
* the sound attenuation coefficient is a function of frequency, relat ive humidity and temperature. I t s value, expressed in terms of dB/100 m is avai lable from Tables 13a, 3bl and Appendix D
18
conditions make i t necessary to calculate the absorption in "layered al t i tude sections". Whether such a "layered calculation" i s actually required depends on the change of the attenuation coefficient in the 3.2 kHz third-octave band: if th i s coefficient var ies by more than 0.5 dB per 100
m anywhere along the noise propagation path between a i rc ra f t and 10 m ahove ground, the layering must be taken into account; th i s i s done by adding the effective 'attenuation per l ayer ' to a r r i v e
a t the composite attenuation for the whole noise path.
The wind speed da ta - measured 10 m above ground - must be averaged over 30 second periods; during th is period short-duration gusts of up to 28 kn/h a r e permissible. Furthermore - and s ta ted
rather vaguely - no "anomalous" wind conditions should exist tha t could significantly affect the recorded noise level a t any of the measurement paints.
100
%
80
I [r
>; 60
0
= LO
I .-
5 m > 0 m
._ c - [r 20
0 0 2 10 20 30 35 o c LO
Ambient Temperature. T
Fig. 2.9 Area of permitted combination of Relative Humidity ( R H ) and air Temperature (T) for noise certification testing of "heavy" propeller driven aeroplanes above 5700 kg take-off mass and subsonic jet a i rc ra f t a f t e r A N N E X 16, Chapter 3
2.4.5 Flight-Path Tracking
Since the measured acoustic d a t a must be corrected to reference conditions, precise information on
the actual fl ight path is also necessary. The f l ight path will in a l l likelihood dif fer from the refe- rence fl ight path, both in height and la tera l displacement. Thus accurate t racking i s required, preferably by some aircraft- independent means, such as radar- , laser-. o r other photographic methods. Tracking methods and equipment are discussed in Section 3.3.1~ of th i s AGARDograph. To
relate the noise s ignature to the aeroplane position, precise time synchronization between the air-
craf t trajectory and the noise measurements must also be established.
2.4.6 Acoustic Data Acquisition
The microphones must be 1.2 m above the ground surface, a height tha t is notorious for inducing
grave measuring errors on account of the superpos i t ix of the directly incident and the ground- reflected acoustic wave: associated problems a r e discussed in detail in Section 4 . 3 . 3 . The micra- phone should be of the pressure type. Data acquisition instrumentation in general , and microphone types in par t icular a r e discussed i n Section 3.2 of th i s AGARDograph.
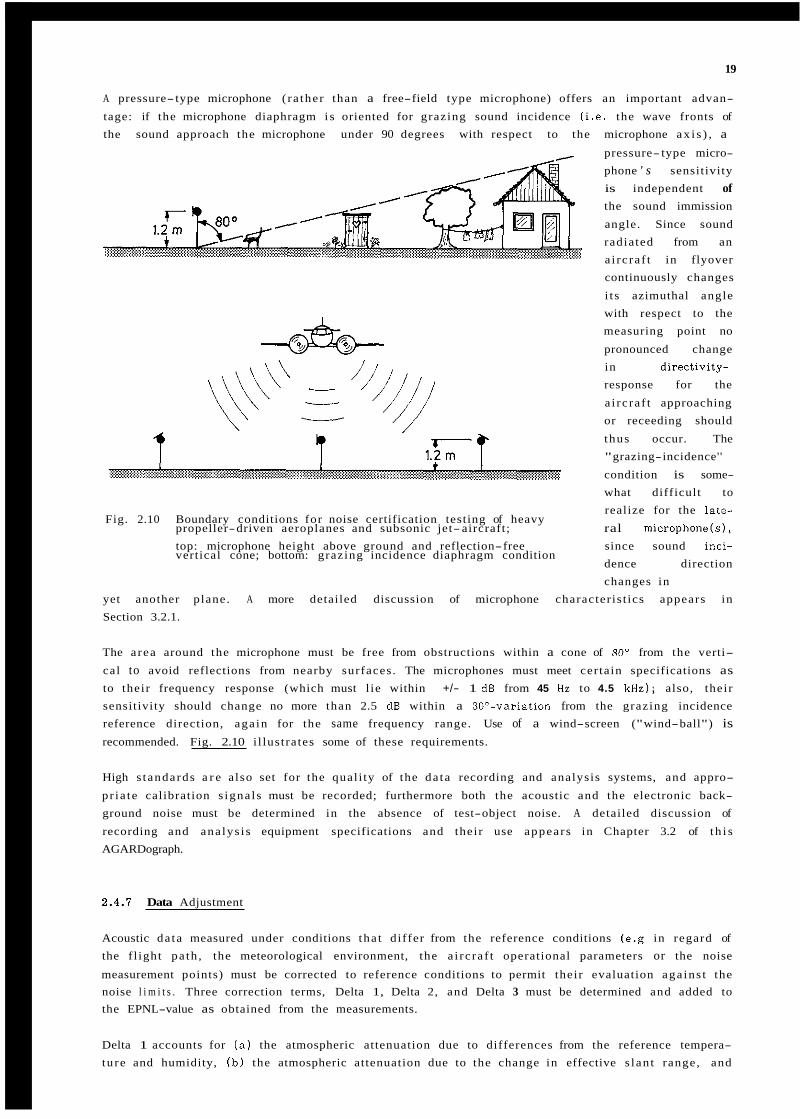
19
A pressure- type microphone ( ra ther than a free-field type microphone) offers an important advan-
tage: if the microphone diaphragm i s oriented for grazing sound incidence ( i . e . the wave fronts of the sound approach the microphone under 90 degrees with respect to the microphone ax i s ) , a
pressure- type micro- phone ' s sensitivity is independent of the sound immission
angle. Since sound radiated from an a i rc ra f t in flyover continuously changes
i t s azimuthal angle with respect to the measuring point no
pronounced change in directivity- response for the
a i rc ra f t approaching or receeding should
thus occur. The "grazing-incidence''
condition is some- what difficult to realize for the late-
propeller-driven aeroplanes and subsonic jet- aircraft; ral microphone(s), top: microphone height above ground and reflection-free since sound inci- vertical cone; bottom: grazing incidence diaphragm condition
dence direction changes in
Fig. 2.10 Boundary conditions for noise certification testing of heavy
yet another plane. A more detailed discussion of microphone character is t ics appears in Section 3.2.1.
The a rea around the microphone must be free from obstructions within a cone of 80' from the verti-
cal to avoid reflections from nearby surfaces. The microphones must meet cer tain specifications as to their frequency response (which must l ie within +/- 1 dB from 45 Hz to 4.5 kHz); also, their sensitivity should change no more than 2.5 dB within a 30O-variation from the grazing incidence reference direction, aga in for the same frequency range. Use of a wind-screen ("wind-ball") is recommended. Fig. 2.10 i l lustrates some of these requirements.
High s tandards a r e also set for the qual i ty of the da ta recording and analysis systems, and appro-
pr ia te calibration s igna ls must be recorded; furthermore both the acoustic and the electronic back- ground noise must be determined in the absence of test-object noise. A detailed discussion of
recording and ana lys i s equipment specifications and their use appears in Chapter 3.2 of t h i s AGARDograph.
2.4.1 Data Adjustment
Acoustic da ta measured under conditions tha t differ from the reference conditions (e.g in regard of the f l ight pa th , the meteorological environment, the a i rc ra f t operational parameters or the noise
measurement points) must be corrected to reference conditions to permit their evaluation aga ins t the noise l i m i t s . Three correction terms, Delta 1, Delta 2, and Delta 3 must be determined and added to the EPNL-value as obtained from the measurements.
Delta 1 accounts for (a ) the atmospheric attenuation due to differences from the reference tempera- ture and humidity, ( b ) the atmospheric attenuation due to the change in effective s lan t range, and
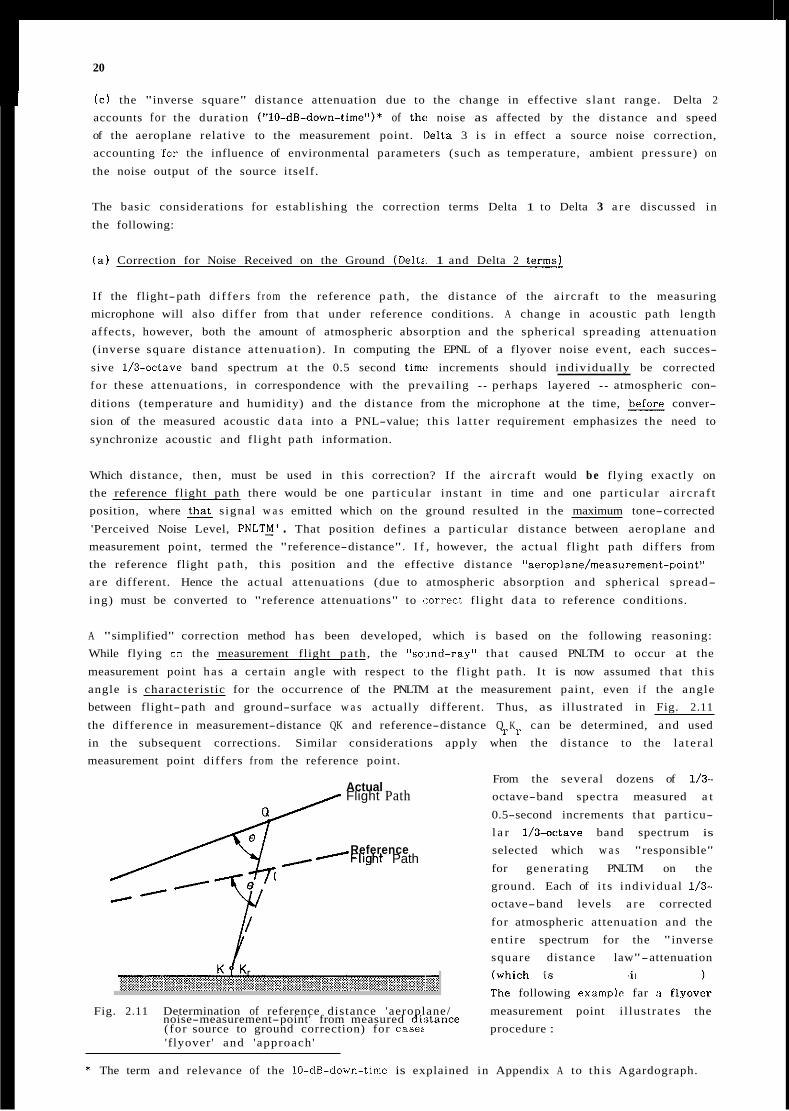
20
( c ) the "inverse square" distance attenuation due to the change in effective s lan t range. Delta 2
accounts for the duration ("10-dB-down-time")* of the noise as affected by the distance and speed of the aeroplane relative to the measurement point. ]Delta 3 i s in effect a source noise correction, accounting Tar the influence of environmental parameters (such as temperature, ambient pressure) on
the noise output of the source itself.
The basic considerations for establishing the correction terms Delta 1 to Delta 3 a re discussed in
the following:
( a ) Correction for Noise Received on the Ground (Dele. 1 and Delta 2 termsi
If the flight-path d i f fe rs f rom the reference pa th , the distance of the aircraf t to the measuring microphone will also differ from that under reference conditions. A change in acoustic path length affects, however, both the amount of atmospheric absorption and the spherical spreading attenuation (inverse square distance at tenuat ion) . In computing the EPNL of a flyover noise event, each succes-
sive 1/3-octave band spectrum a t the 0.5 second timt? increments should individual ly be corrected f o r these attenuations, in correspondence with the prevailing - perhaps layered - atmospheric con-
ditions (temperature and humidity) and the distance from the microphone at the time, befare conver- sion of the measured acoustic da ta into a PNL-value; th i s l a t te r requirement emphasizes the need to
synchronize acoustic and f l ight path information.
Which distance, then, must be used in th i s correction? If the a i rc ra f t would be flying exactly on the reference flight path there would be one part icular instant in time and one part icular a i rc ra f t position, where that signal w a s emitted which on the ground resulted in the maximum tone-corrected
'Perceived Noise Level, PNLThJ' . That position defines a part icular distance between aeroplane and measurement point, termed the "reference-distance". I f , however, the actual flight path differs from the reference flight pa th , this position and the effective distance "aeroplane/measurement-point" a re different. Hence the actual attenuations (due to atmospheric absorption and spherical spread-
ing) must be converted to "reference attenuations" to (correct flight da ta to reference conditions.
A "simplified" correction method has been developed, which i s based on the following reasoning: While flying on the measurement flight pa th , the "soJnd-ray" that caused PNLTM to occur at the
measurement point has a certain angle with respect to the f l ight path. I t is now assumed that th i s angle i s characteristic for the occurrence of the PNLTM at the measurement paint, even i f the angle between flight-path and ground-surface w a s actually different. Thus, as illustrated in Fig. 2.11
the difference in measurement-distance QK and reference-distance Q K can be determined, and used in the subsequent corrections. Similar considerations apply when the distance to the la te ra l measurement point differs from the reference point.
r r
From the several dozens of 1/3- Flight Path octave-band spectra measured a t
0.5-second increments that particu- l a r 1/3-actave band spectrum is
Reference selected which w a s "responsible"
for generating PNLTM on the ground. Each of i t s individual 1/3-
octave-band levels a r e corrected
Actual
I -Flight Path
for atmospheric attenuation and the ent i re spectrum for the "inverse square distance law"-attenuation , w h i c h i s frequsncy-riidepe,Idt.ll1). The following examplr far :i flyovcr
Fig. 2.11 Determination of reference distance 'aeroplane/ measurement point i l lustrates the noise-measurement-point' from measured di:;tance (for source to ground correction) for case: procedure : ' f lyover' and 'approach '
* The term and relevance of the 10-dB-down-time is explained in Appendix A to th i s Agardograph.
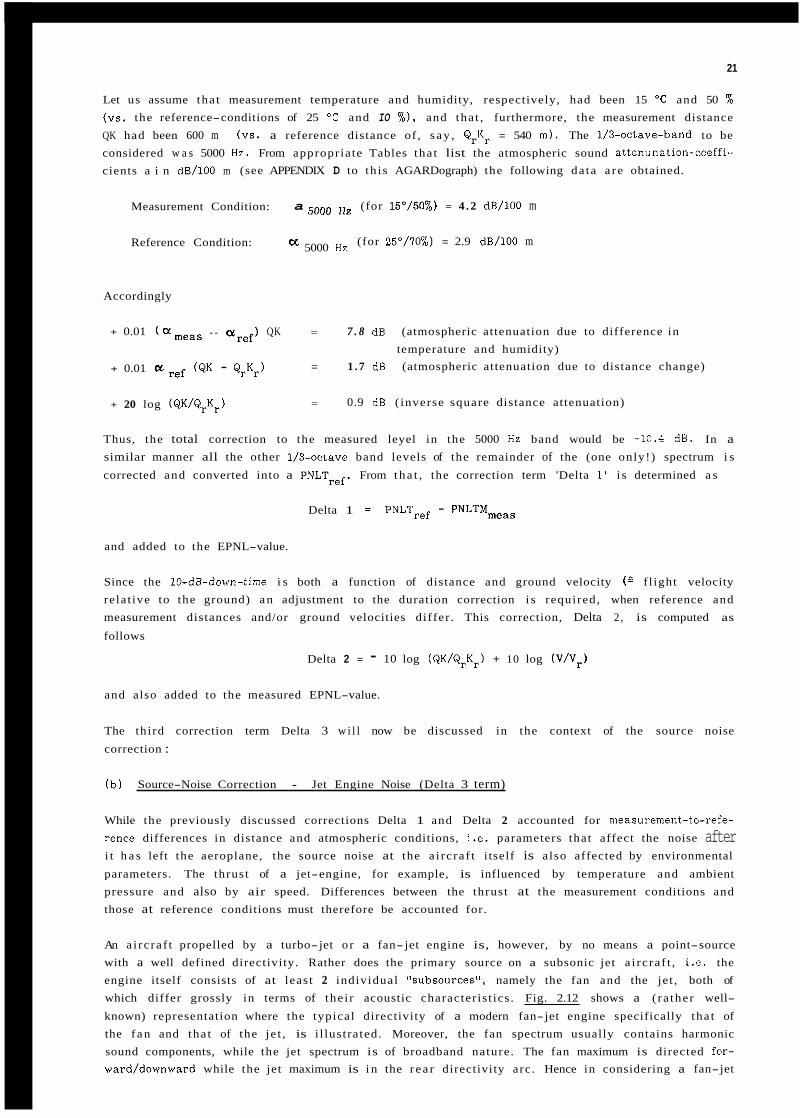
21
Let us assume tha t measurement temperature and humidity, respectively, had been 15 T and 50 % (VS. the reference-conditions of 25 "C and IO %), and tha t , furthermore, the measurement distance QK had been 600 m (VS. a reference distance of , s ay , QrKr = 540 m ) . The 1/3-octave-band to be considered w a s 5000 Hz. From appropriate Tables tha t list the atmospheric sound attenunation-coeffi- cients a i n dB/100 m (see APPENDIX D to th i s AGARDograph) the following da ta a r e obtained.
Measurement Condition: a 5ooo Hz (for 15O/50%) = 4 . 2 dB/100 m
(for 25"/70%) = 2.9 dB/100 m CC 5000 Hz Reference Condition:
Accordingly
+ 0.01 ( U m e a s - aref) QK = 7 . 8 dB (atmospheric attenuation due to difference in
+ 0.01 a ref (QK - QrK,)
+ 20 log (QK/Q,K,)
temperature and humidity) = 1 . 7 dB (atmospheric attenuation due to distance change)
= 0.9 dB ( inverse square distance attenuation)
Thus, the total correction to the measured leyel in the 5000 Hz band would be +10.4 dB. In a similar manner all the other 1/3-octave band levels of the remainder of the (one only!) spectrum i s
corrected and converted into a PNLTref. From tha t , the correction term 'Delta 1' i s determined a s
Delta 1 = PNLTref - PNLTMmeas
and added to the EPNL-value.
Since the 10-dB-down-time i s both a function of distance and ground velocity ( & f l ight velocity relat ive to the ground) a n adjustment to the duration correction i s required, when reference and measurement distances and/or ground velocities differ . This correction, Delta 2 , is computed as
follows
Delta 2 = - 10 log (QK/QrKr) + 10 log ( V / V r )
and also added to the measured EPNL-value.
The third correction term Delta 3 w i l l now be discussed in the context of the source noise
correction :
( b ) Source-Noise Correction - Jet Engine Noise (Delta 3 term)
While the previously discussed corrections Delta 1 and Delta 2 accounted for measurement-to-refe- rence differences in distance and atmospheric conditions, i.e. parameters that affect the noise after i t h a s left the aeroplane, the source noise at the a i rc ra f t i tself is also affected by environmental
parameters. The thrust of a jet-engine, for example, is influenced by temperature and ambient pressure and also by air speed. Differences between the thrust at the measurement conditions and those at reference conditions must therefore be accounted for.
An a i rc ra f t propelled by a turbo-jet o r a fan- jet engine is, however, by no means a point-source with a well defined directivity. Rather does the primary source on a subsonic jet a i rc ra f t , i.e. the engine itself consists of at least 2 individual "subsources", namely the fan and the jet , both of which differ grossly in terms of the i r acoustic character is t ics . Fig. 2.12 shows a ( ra ther well-
known) representation where the typical directivity of a modern fan-jet engine specifically tha t of the f an and tha t of the je t , is i l lustrated. Moreover, the fan spectrum usually contains harmonic sound components, while the jet spectrum is of broadband nature. The fan maximum is directed for- ward/downward while the jet maximum is i n the r ea r directivity arc . Hence in considering a fan-jet
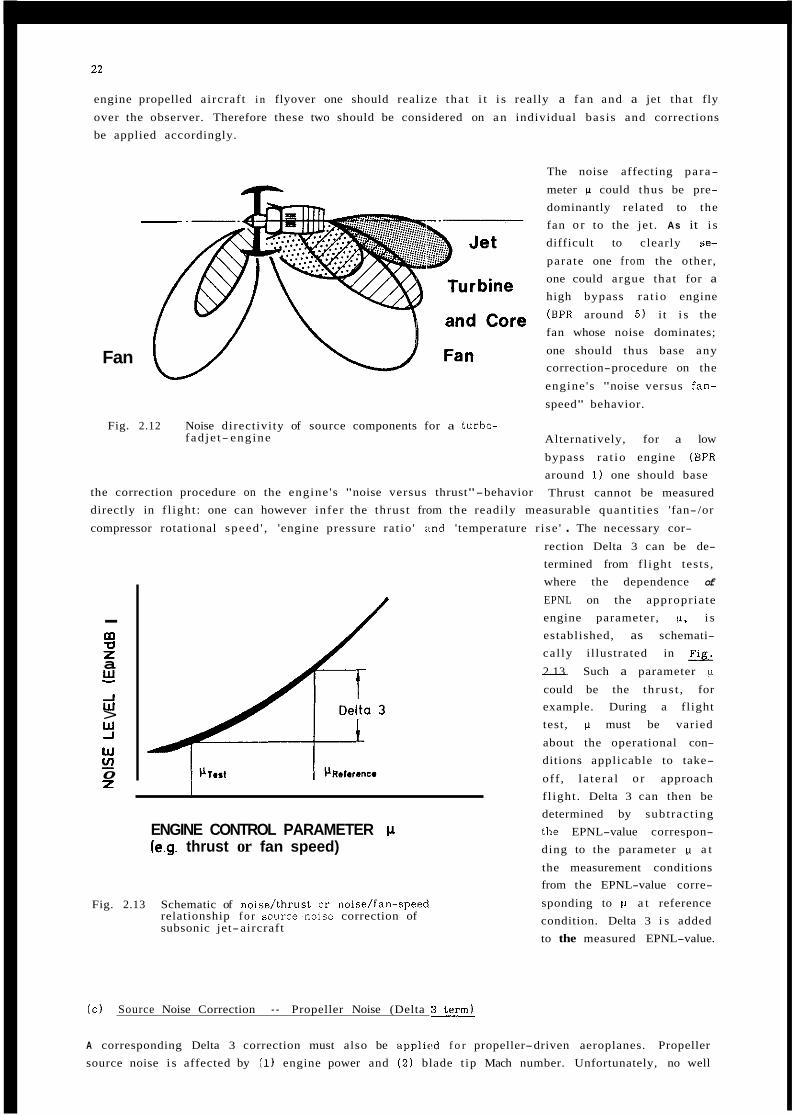
L'
engine propelled aircraf t i n flyover one should realize tha t i t i s really a f an and a jet that fly
over the observer. Therefore these two should be considered on a n individual basis and corrections be applied accordingly.
-.
Fan
Fig. 2.12 Noise directivity of source components for a turbo- fad je t- engine
the correction procedure on the engine 's "noise versus thrust"-behavior
The noise affecting para-
meter w could thus be pre- dominantly related to the fan o r to the jet . As it i s difficult to clearly $e-
parate one f rom the other, one could argue that for a high bypass ra t io engine
(BPR around 5) it i s the fan whose noise dominates;
one should thus base any correction-procedure on the
engine 's "noise versus fan-
speed" behavior.
Alternatively, for a low
bypass ra t io engine (BPR around 1 ) one should base Thrust cannot be measured
directly in f l ight : one can however infer the thrust from the readily measurable quant i t ies 'fan-/or
compressor rotational speed ' , 'engine pressure rat io ' ;md 'temperature r i se ' . The necessary cor-
rection Delta 3 can be de-
- m
a U z w -J w >
-
Y w 0 z v,
ENGINE CONTROL PARAMETER c1 1e.g. thrust or fan speed)
Fig. 2.13 Schematic of noise/thrust o r noise/fan-speed relationship fo r sourcenoise correction of subsonic jet-aircraft
( c ) Source Noise Correction - Propeller Noise (Delta
termined from fl ight tests , where the dependence of
EPNL on the appropriate engine parameter, v, i s established, as schemati- cal ly illustrated in Q
- 2.13. Such a parameter p
could be the th rus t , for example. During a flight test, p must be varied
about the operational con- ditions applicable to take-
off , l a te ra l o r approach f l ight . Delta 3 can then be determined by subtract ing the EPNL-value correspon- ding to the parameter w a t
the measurement conditions from the EPNL-value corre-
sponding to p a t reference condition. Delta 3 i s added to the measured EPNL-value.
A corresponding Delta 3 correction must also be app1ie.d f o r propeller-driven aeroplanes. Propeller source noise i s affected by (1) engine power and ( 2 ) blade t ip Mach number. Unfortunately, no well
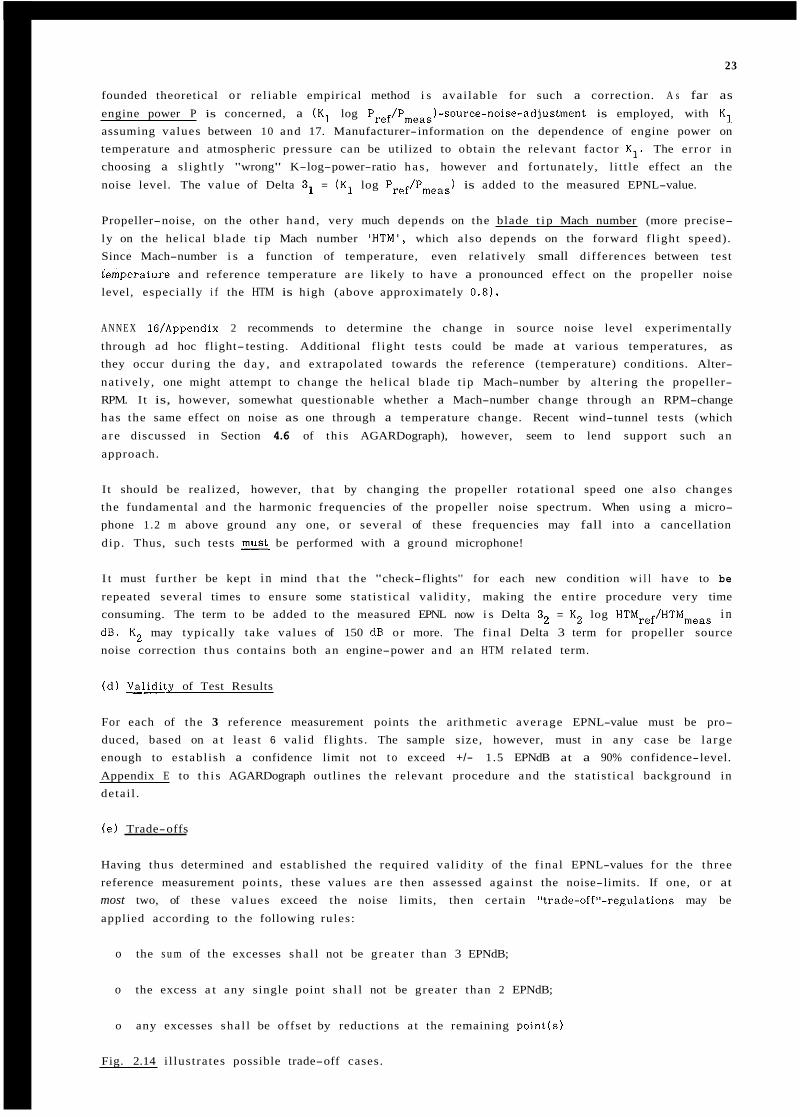
23
founded theoretical o r rel iable empirical method i s avai lable for such a correction. A s far as engine power P is concerned, a (K1 log Pref/Pmeas)-source-noise-adjustment is employed, with K1 assuming values between 10 and 17. Manufacturer-information on the dependence of engine power on temperature and atmospheric pressure can be utilized to obtain the relevant factor K1. The error in choosing a s l ight ly "wrong" K-log-power-ratio ha s , however and fortunately, l i t t le effect an the
noise level. The value of Delta 3] = (K1 log Pref/Pmeas) is added to the measured EPNL-value.
Propeller-noise, on the other hand , very much depends on the blade t i p Mach number (more precise-
ly on the helical blade t i p Mach number ' H T M ' , which also depends on the forward f l ight speed). Since Mach-number i s a function of temperature, even relatively small differences between test
t'emperature and reference temperature a r e likely to have a pronounced effect on the propeller noise level, especially i f the HTM is high (above approximately 0.8).
A N N E X 16/Appendix 2 recommends to determine the change in source noise level experimentally
through ad hoc flight- testing. Additional f l ight tests could be made at various temperatures, as they occur during the day , and extrapolated towards the reference (temperature) conditions. Alter-
nat ively, one might attempt to change the helical blade t ip Mach-number by al ter ing the propeller- RPM. I t is, however, somewhat questionable whether a Mach-number change through a n RPM-change has the same effect on noise as one through a temperature change. Recent wind-tunnel tests (which
a r e discussed in Section 4.6 of th i s AGARDograph), however, seem to lend support such a n
approach.
I t should be realized, however, tha t by changing the propeller rotational speed one also changes the fundamental and the harmonic frequencies of the propeller noise spectrum. When using a micro- phone 1.2 m above ground any one, o r several of these frequencies may fall into a cancellation
dip. Thus, such tests must be performed with a ground microphone!
I t must fur ther be kept i n mind tha t the "check-flights'' for each new condition w i l l have to be
repeated several times to ensure some stat is t ical val idi ty, making the ent i re procedure very time consuming. The term to be added to the measured EPNL now i s Delta 32 = K 2 log HTMref/HTMmeas i n dB. K2 may typically take values of 150 dB or more. The f ina l Delta 3 term for propeller source noise correction thus contains both a n engine-power and a n HTM related term.
( d ) s l t y of Test Results
For each of the 3 reference measurement points the arithmetic average EPNL-value must be pro- duced, based on a t least 6 val id f l ights . The sample size, however, must in any case be la rge enough to establ ish a confidence limit not t o exceed +/- 1.5 EPNdB at a 90% confidence-level.
Appendix E to t h i s AGARDograph outlines the relevant procedure and the s tat is t ical background in detai l .
( e ) Trade-offs
Having thus determined and established the required val idi ty of the f inal EPNL-values for the three reference measurement points, these values a r e then assessed against the noise-limits. If one, o r at most two, of these values exceed the noise limits, then certain "trade-off"-regulations may be
applied according to the following rules:
o the s u m of the excesses sha l l not be grea te r than 3 EPNdB;
o the excess a t any single point sha l l not be greater than 2 EPNdB;
o any excesses sha l l be offset by reductions a t the remaining point(s)
Fig. 2.14 i l lustrates possible trade-off cases.
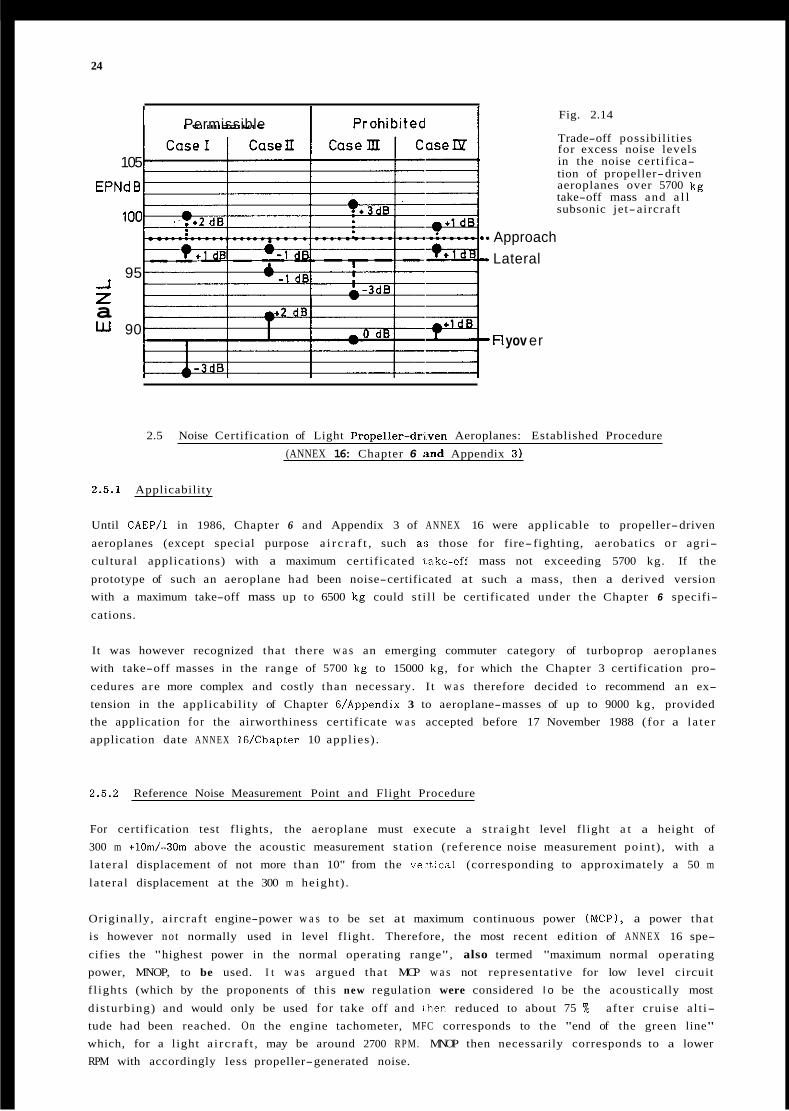
24
Fig. 2.14
Trade-off possibilities for excess noise levels in the noise certifica- tion of propeller-driven aeroplanes over 5700 kg take-off mass and a l l subsonic jet-aircraft
Permissible
105
EPNd B
100 Approach Lateral
95 -1 z a IJJ 90
FI yov er
2.5 Noise Certification of Light Propeller-drwen Aeroplanes: Established Procedure
(ANNEX 16: Chapter 6 :and Appendix 3)
2.5.1 Applicability
Until C A E P / 1 in 1986, Chapter 6 and Appendix 3 of ANNEX 16 were applicable to propeller-driven
aeroplanes (except special purpose a i r c r a f t , such ai; those for fire-fighting, aerobatics o r agri- cultural applications) with a maximum certificated itake-off mass not exceeding 5700 kg. If the
prototype of such an aeroplane had been noise-certificated at such a mass, then a derived version with a maximum take-off mass up to 6500 kg could s t i l l be certificated under the Chapter 6 specifi-
cations.
It was however recognized that there w a s an emerging commuter category of turboprop aeroplanes with take-off masses in the range of 5700 kg to 15000 kg, for which the Chapter 3 certification pro-
cedures a re more complex and costly than necessary. I t w a s therefore decided to recommend a n ex- tension in the applicability of Chapter 6/Appendix 3 to aeroplane-masses of up to 9000 kg , provided the application for the airworthiness certificate w a s accepted before 17 November 1988 (for a la te r application date A N N E X 1UChapter 10 appl ies) .
2.5.2 Reference Noise Measurement Point and Flight Procedure
For certification test flights, the aeroplane must execute a s t ra igh t level flight a t a height of 300 m +10m/-30m above the acoustic measurement station (reference noise measurement point) , with a la teral displacement of not more than 10" from the v c t i c a l (corresponding to approximately a 50 m
la teral displacement at the 300 m height) .
Originally, a ircraf t engine-power w a s to be set at maximum continuous power (MCP), a power that is however not normally used in level flight. Therefore, the most recent edition of A N N E X 16 spe-
cifies the "highest power in the normal operating range", also termed "maximum normal operating power, MNOP, to be used. I t w a s argued that MCP w a s not representative for low level circuit f l ights (which by the proponents of this new regulation were considered l o be the acoustically most
dis turbing) and would only be used for take off and lhen reduced to about 75 Yo after cruise al t i- tude had been reached. On the engine tachometer, MFC corresponds to the "end of the green line" which, for a light a i rc ra f t , may be around 2700 RPM. MNOP then necessarily corresponds to a lower RPM with accordingly less propeller-generated noise.
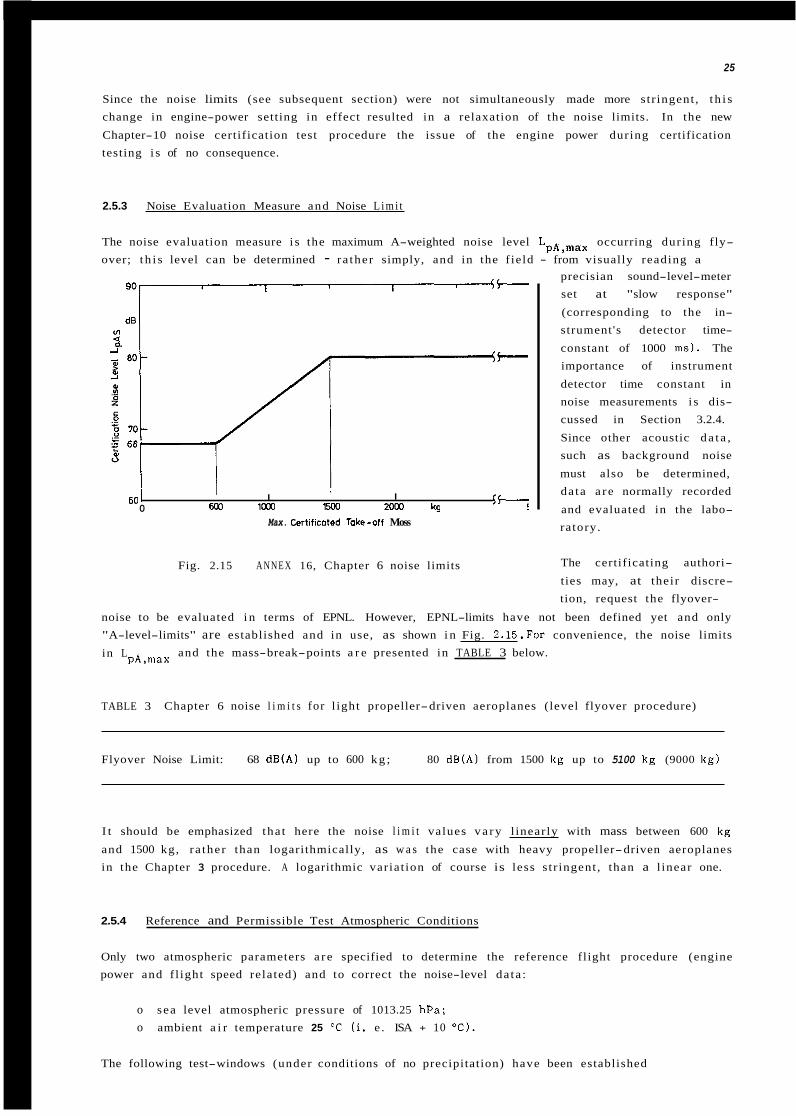
25
Since the noise limits (see subsequent section) were not simultaneously made more s tr ingent , t h i s change in engine-power setting in effect resulted in a relaxation of the noise limits. In the new
Chapter-10 noise certification test procedure the issue of the engine power during certification testing i s of no consequence.
2.5.3 Noise Evaluation Measure and Noise L imi t
The noise evaluation measure i s the maximum A-weighted noise level LpA,max occurring during fly- over; t h i s level can be determined - ra ther simply, and in the f ield - from visually reading a
d0 gO1-
I
Max. Cerlificmtted rake-off Moss
I I 603 lWl 15w Z M a kg -7 60 I
0
Fig. 2.15 A N N E X 16, Chapter 6 noise limits
precisian sound-level-meter set at "slow response"
(corresponding to the in- strument's detector time-
constant of 1000 m s ) . The importance of instrument
detector time constant in noise measurements i s dis- cussed in Section 3.2.4.
Since other acoustic da t a , such as background noise
must also be determined, da ta a r e normally recorded
and evaluated in the labo- ratory.
The certificating authori-
ties may, at their discre- tion, request the flyover-
noise to be evaluated i n terms of EPNL. However, EPNL-limits have not been defined yet and only "A-level-limits" are established and in use, as shown i n Fig. 2.15.For convenience, the noise limits
in L and the mass-break-points a r e presented in TABLE 3 below. pA,max
TABLE 3 Chapter 6 noise l i m i t s for l ight propeller-driven aeroplanes (level flyover procedure)
Flyover Noise Limit: 68 dB(A) up to 600 kg ; 80 dB(A) from 1500 kg up to 5100 kg (9000 kg)
I t should be emphasized tha t here the noise l i m i t values v a r y l inearly with mass between 600 kg
and 1500 kg, ra ther than logarithmically, as w a s the case with heavy propeller-driven aeroplanes in the Chapter 3 procedure. A logarithmic variat ion of course is less s t r ingent , than a l inear one.
2.5.4 Reference and Permissible Test Atmospheric Conditions
Only two atmospheric parameters a r e specified to determine the reference flight procedure (engine power and f l ight speed related) and to correct the noise-level da ta :
o sea level atmospheric pressure of 1013.25 hPa; o ambient a i r temperature 25 'C ( i . e . ISA + 10 "C).
The following test-windows (under conditions of no precipitation) have been established
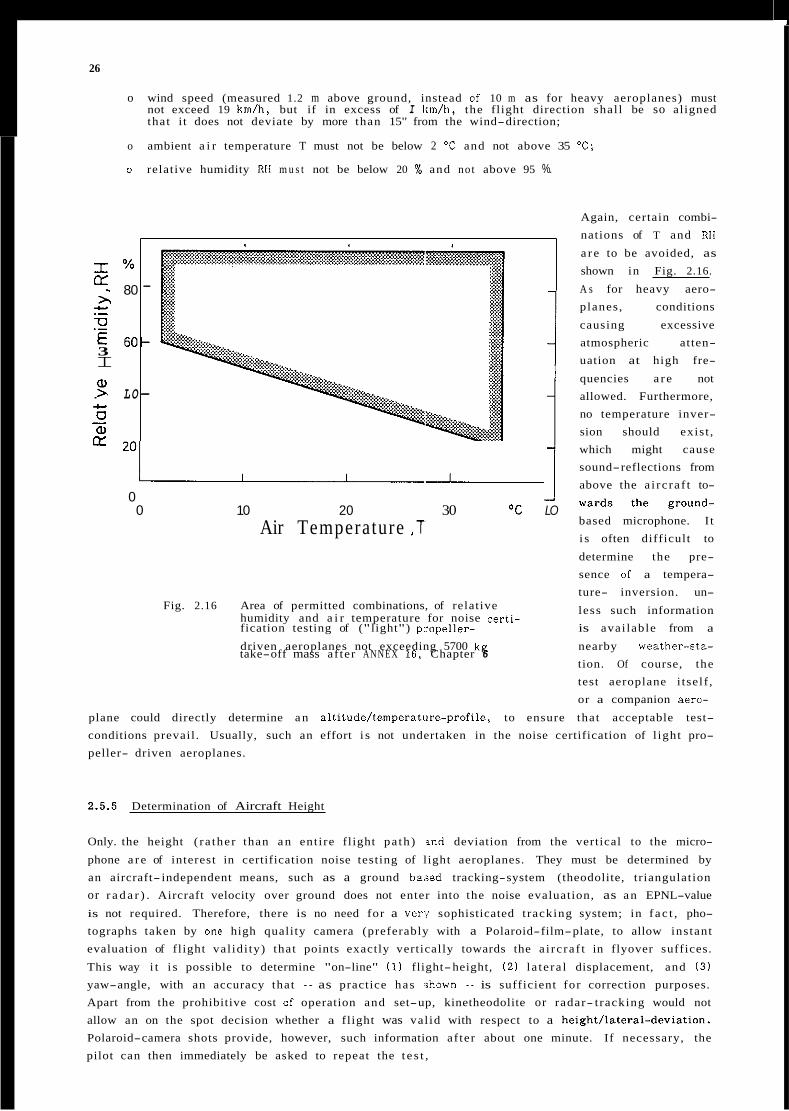
26
o wind speed (measured 1.2 m above ground, instead of 10 m as for heavy aeroplanes) must not exceed 19 km/h, but if in excess of I Irm/h, the flight direction shal l be so aligned that it does not deviate by more than 15" from the wind-direction;
o ambient a i r temperature T must not be below 2 "C and not above 35 OC;
o relative humidity RH m u s t not be below 20 % and not above 95 %.
I %
F 80 x c. .- 0 E 60- 3 I
.- : LO- c. U a, - rz 20-
-
Again, certain combi- nations of T and RH
a re to be avoided, as shown in Fig. 2.16.
A s for heavy aero- planes, conditions
causing excessive atmospheric atten- uation at high fre-
quencies a r e not allowed. Furthermore, no temperature inver- sion should exist , which might cause sound-reflections from LL above the a i rc ra f t to-
based microphone. I t i s often difficult to
determine the pre- sence of a tempera- ture- inversion. un-
0 0 10 20 30 O C LO
Air Temperature ,T
less such information humidity and a i r temperature for noise certi- fication testing of ("light") p.copeller- is avai lable from a
driven aeroplanes not exceeding 5700 kg nearby weather-sta- take-off mass af ter ANNEX 16, Chapter 6
tion. Of course, the
Fig. 2.16 Area of permitted combinations, of relative
test aeroplane i tself , or a companion aera-
plane could directly determine a n altitude/temperatiire-profile, to ensure that acceptable test- conditions prevail. Usually, such an effort i s not undertaken in the noise certification of l ight pro- peller- driven aeroplanes.
2.5.5 Determination of Aircraft Height
Only. the height ( ra ther than a n ent ire flight pa th) m d deviation from the vertical to the micro-
phone a r e of interest in certification noise testing of light aeroplanes. They must be determined by an aircraft- independent means, such as a ground ba,;ed tracking-system (theodolite, triangulation or r a d a r ) . Aircraft velocity over ground does not enter into the noise evaluation, as a n EPNL-value
is not required. Therefore, there is no need for a ver.y sophisticated t racking system; in f ac t , pho- tographs taken by one high quality camera (preferably with a Polaroid-film-plate, to allow instant evaluation of flight val idi ty) that points exactly vertically towards the a i rc ra f t in flyover suffices.
This way i t i s possible to determine "on-line" (1) flight-height, (2) l a te ra l displacement, and (3) yaw-angle, with an accuracy that - as practice has >shown - is sufficient for correction purposes. Apart from the prohibitive cost of operation and set-up, kinetheodolite or radar- tracking would not allow an on the spot decision whether a flight was val id with respect to a height/lateral-deviation. Polaroid-camera shots provide, however, such information af ter about one minute. If necessary, the pilot can then immediately be asked to repeat the t e s t ,
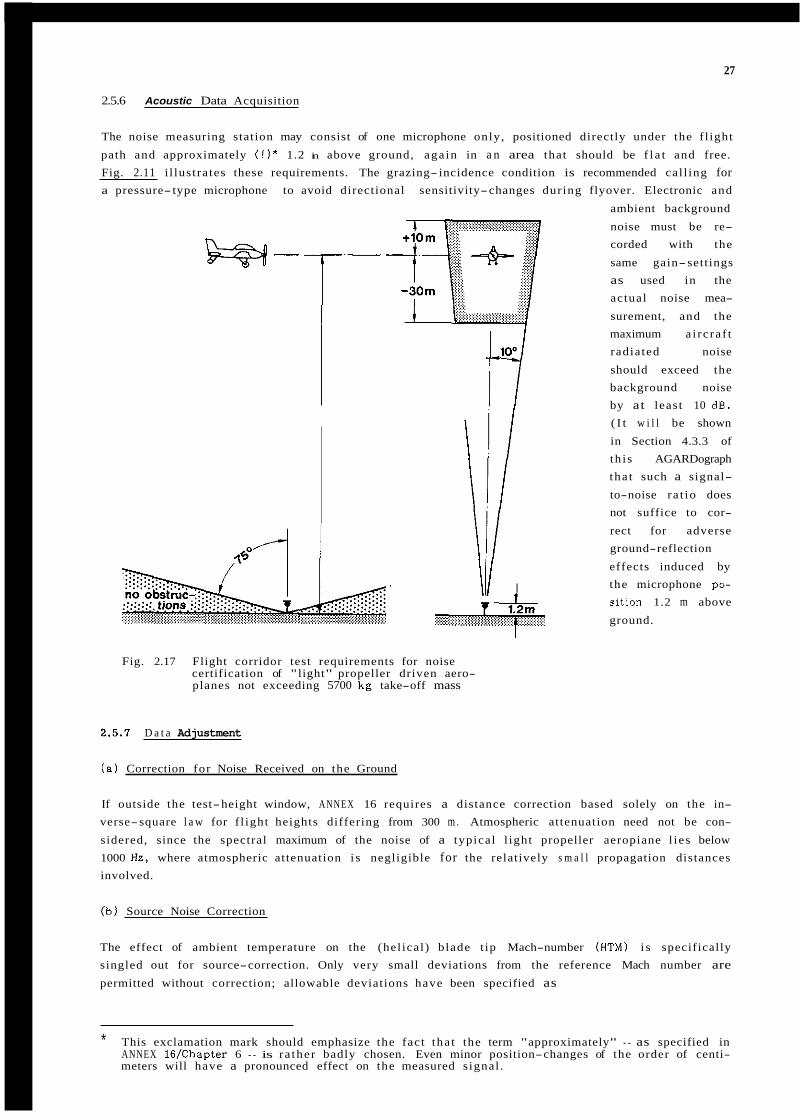
27
2.5.6 Acoustic Data Acquisition
The noise measuring station may consist of one microphone only, positioned directly under the f l ight
path and approximately ( ! ) * 1.2 in above ground, aga in in a n area that should be f l a t and free. Fig. 2.11 i l lustrates these requirements. The grazing- incidence condition is recommended cal l ing for a pressure- type microphone to avoid directional sensitivity-changes during flyover. Electronic and
ambient background
m- r- noise must be re- corded with the
same gain- settings as used in the actual noise mea-
surement, and the maximum a i rc ra f t radiated noise
should exceed the background noise by at least 10 dB. ( I t w i l l be shown
in Section 4.3.3 of th i s AGARDograph tha t such a signal-
to-noise ra t io does not suffice to cor-
rect for adverse ground-reflection
effects induced by the microphone po- I sition 1.2 m above
ground.
Fig. 2.17 Flight corridor test requirements for noise certification of "light" propeller driven aero- planes not exceeding 5700 kg take-off mass
2.5.7 D a t a Adjustment
( a ) Correction for Noise Received on the Ground
If outside the test-height window, ANNEX 16 requires a distance correction based solely on the in- verse-square l a w for f l ight heights differing from 300 m . Atmospheric attenuation need not be con-
sidered, since the spectral maximum of the noise of a typical l ight propeller aeropiane l ies below 1000 Hz, where atmospheric attenuation i s negligible for the relatively s m a l l propagation distances involved.
(b) Source Noise Correction
The effect of ambient temperature on the (hel ical) blade t ip Mach-number (HTM) i s specifically singled out for source-correction. Only very small deviations from the reference Mach number are permitted without correction; allowable deviations have been specified as
~~~~
* This exclamation mark should emphasize the fact tha t the term "approximately" - as specified in ANNEX 16/Chapter 6 - is ra ther badly chosen. Even minor position-changes of the order of centi- meters will have a pronounced effect on the measured s ignal .
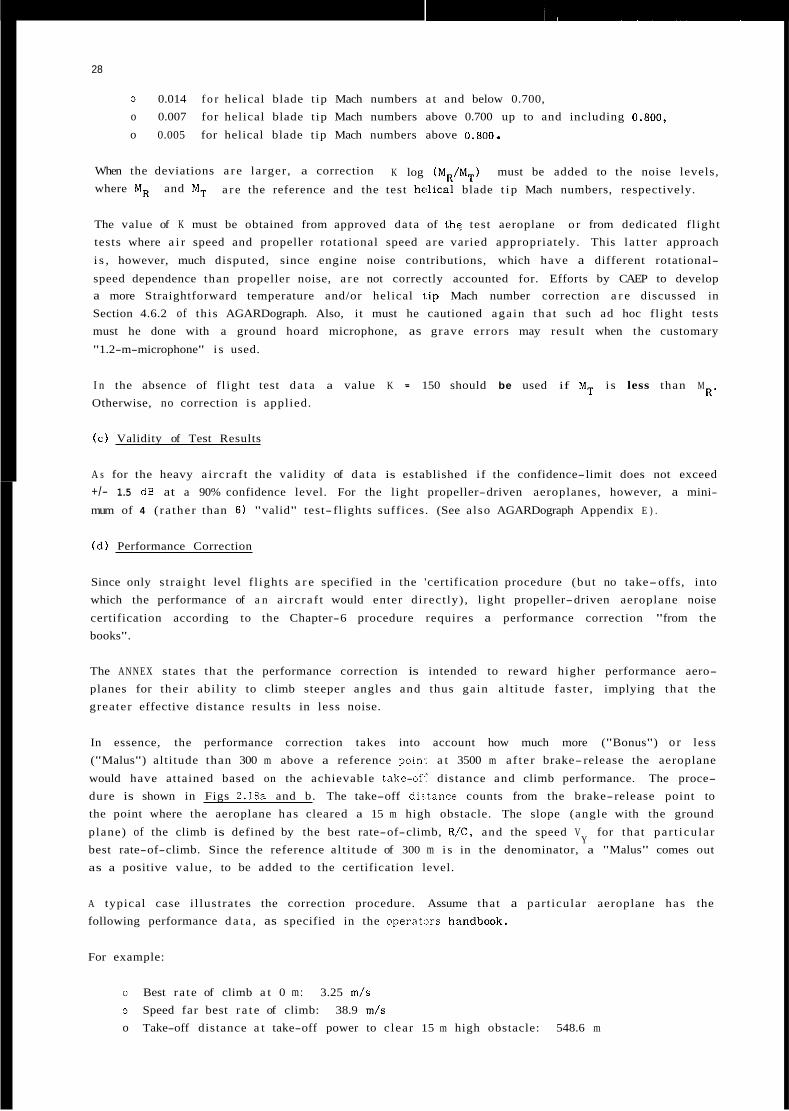
28
0 0.014 f o r helical blade t ip Mach numbers a t and below 0.700, o 0.007 for helical blade t ip Mach numbers above 0.700 up to and including 0.800,
o 0.005 for helical blade t ip Mach numbers above 0,800.
When the deviations a r e larger , a correction where M R and M T
The value of K must be obtained from approved data of thq test aeroplane o r from dedicated f l ight tests where a i r speed and propeller rotational speed a re varied appropriately. This la t te r approach
i s , however, much disputed, since engine noise contributions, which have a different rotational-
speed dependence than propeller noise, a r e not correctly accounted for. Efforts by CAEP to develop a more Straightforward temperature and/or helical (Lip Mach number correction a r e discussed in Section 4.6.2 of this AGARDograph. Also, it must he cautioned aga in tha t such ad hoc flight tests must he done with a ground hoard microphone, as grave errors may result when the customary
"1.2-m-microphone" i s used.
K log ( M R / M T ) must be added to the noise levels, a r e the reference and the test h d i c a l blade t i p Mach numbers, respectively.
R ' I n the absence of f l ight test da ta a value K = 150 should be used if M T i s less than M
Otherwise, no correction i s applied.
( c ) Validity of Test Results
A s for the heavy a i rc ra f t the validity of da ta is established i f the confidence-limit does not exceed +/- 1.5 dB at a 90% confidence level. For the light propeller-driven aeroplanes, however, a mini-
mum of 4 ( ra ther than 6 ) "valid" test- flights suffices. (See also AGARDograph Appendix E ) .
( d ) Performance Correction
Since only s traight level f l ights a r e specified in the 'certification procedure (but no take-offs, into which the performance of a n a i rc ra f t would enter direct ly) , l ight propeller-driven aeroplane noise
certification according to the Chapter-6 procedure requires a performance correction "from the books".
The ANNEX states that the performance correction is intended to reward higher performance aero- planes for their abi l i ty to climb steeper angles and thus gain al t i tude faster , implying tha t the greater effective distance results in less noise.
In essence, the performance correction takes into account how much more ("Bonus") or less ("Malus") altitude than 300 m above a reference poin: a t 3500 m a f te r brake-release the aeroplane
would have attained based on the achievable take-ofl distance and climb performance. The proce- dure is shown in Figs 2.18a and b. The take-off dir,tance counts from the brake-release point to the point where the aeroplane has cleared a 15 m high obstacle. The slope (angle with the ground
plane) of the climb is defined by the best rate-of-climb, R/C, and the speed V for that par t icu la r best rate-of-climb. Since the reference al t i tude of 300 m i s in the denominator, a "Malus" comes out as a positive value, to be added to the certification level.
Y
A typical case i l lustrates the correction procedure. Assume that a part icular aeroplane has the following performance d a t a , as specified in the operatcxs handbook.
For example:
o Best ra te of climb a t 0 m : 3.25 m / s o Speed far best r a t e of climb: 38.9 m / s
o Take-off distance a t take-off power to clear 15 m high obstacle: 548.6 m
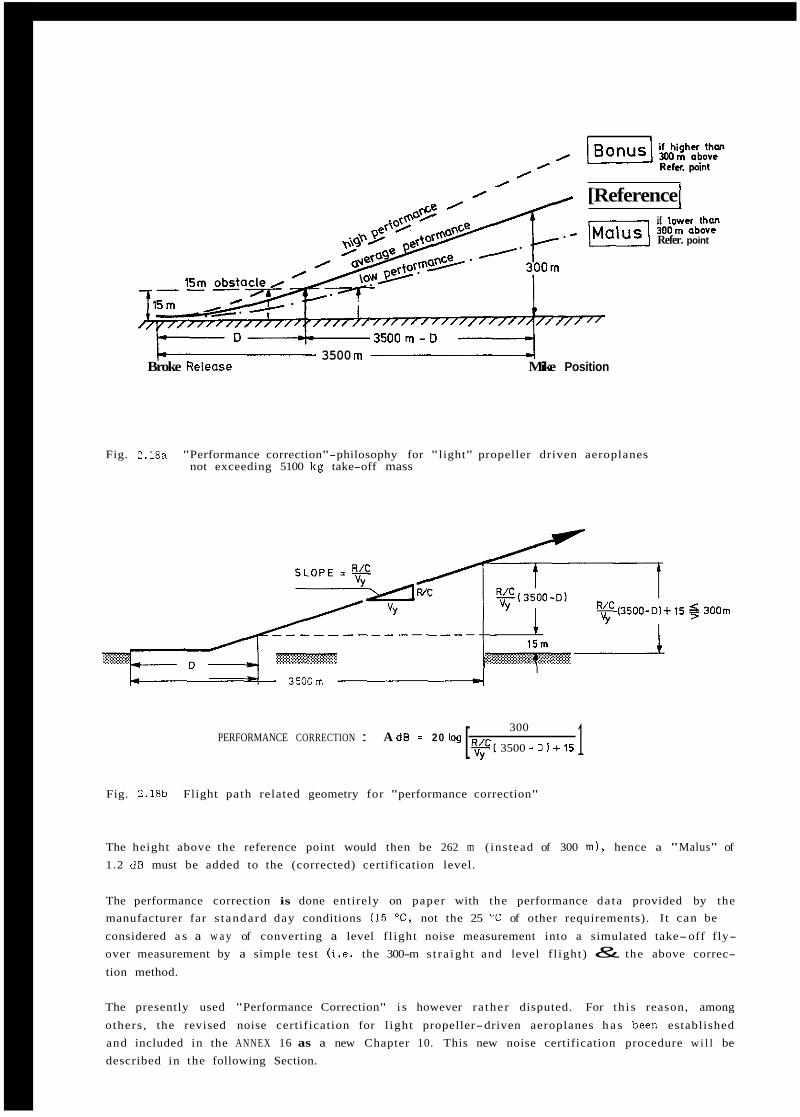
/ 0
0 /
[Reference [ if lowu than
Refer. point
3500 m Broke Reieose Mike Position
Fig. 2.18a "Performance correction"-philosophy for "light" propeller driven aeroplanes not exceeding 5100 kg take-off mass
I % 4 3500m 2 1 300 [ !$( 3500 - D 1 + I 5
PERFORMANCE CORRECTION : A dB = 20 log
Fig. 2.18b Flight path related geometry for "performance correction"
The height above the reference point would then be 262 m ( instead of 300 m ) , hence a "Malus" of 1.2 dB must be added to the (corrected) certification level.
The performance correction is done entirely on paper with the performance da ta provided by the manufacturer far s tandard day conditions (15 T, not the 25 "C of other requirements). I t can be
considered a s a w a y of converting a level f l ight noise measurement into a simulated take-off fly- over measurement by a simple test ( i . e . the 300-m s t ra igh t and level f l ight) & the above correc-
tion method.
The presently used "Performance Correction" i s however ra ther disputed. For th i s reason, among
others , the revised noise certification for l ight propeller-driven aeroplanes h a s been established and included in the ANNEX 16 as a new Chapter 10. This new noise certification procedure w i l l be described in the following Section.
30
2.6 Noise Certification of Light Propeller-driven Aeroplanes:* Procedure (ANNEX 16: Chapter 10 and Appendix 6 )
Experience over the past several years in the application of the Chapter-G/Appendix-3 noise-certifi- cation procedure for propeller-driven aeroplanes not exceeding 5700 kg had raised serious doubts on
the validity of the ensuing certification noise level a:; a t rue measure of people's annoyance. Com- munities close to airports seem more i rr i ta ted by the frequent take-offs and ini t ia l climbs of the ( l igh t ) propeller a i rc ra f t , than by flyovers a t mediun o r high altitudes. I t seemed logical, there-
fore, to piopose a noise certification scheme that includes an actual t akeof f test procedure. The task a t hand w a s to develop new noise certification procedures without adding undue complexity to those presently in use.
A take-off test for the l ight a i rc ra f t would provide a t least two distinct advantages: The test would
better reflect what many regard as the most annoying par t of the f l ight ( the ini t ia l climb) and i t would inherently account fo r the a i r c r a f t ' s performance, as a "poor climber" would pass over the microphone a t a lower height and thus cause higher noise levels, and vice versa.
Questions to be addressed were the engine power to be employed (whether a one o r a two-segment take-off should to be selected), the noise measure (whether again the maximum A-weighted level w a s to be used, or perhaps a time duration corrected !.-level, such as the "Sound Exposure Level,
LpAE", or even a time duration and tone corrected :.evel, such as the "Effective Perceived Noise Level, EPNL"). Furthermore the minimum number of r e w i r e d test f l ights w a s to be determined ( f o u r o r s ix, for example), a s well a s the atmospheric and flight operational reference and measurements conditions and the appropriate correction procedures from test to reference.
Many field evaluation tests have been conducted i n thf? process of developing the new scheme. A s a result of these efforts, the following new noise certification procedure for l ight propeller-driven aeroplanes has been developed by CAEP and has been made a Standard i n the A N N E X 16 as a new
Chapter 10.
2.6.1 Applicability
The Standard applies to a l l propeller-driven aeroplanes and their derived versions (other than aerobatic, fire- fighting and agricul tural) with a maximum certificated take-off mass not exceeding
9000 kg, for which the prototype airworthiness application w a s accepted on or af ter 17 November 1988.
2.6.2 Reference Noise Measurement Point and Flitzht Pi-
The test a ircraf t - at maximum take-off mass - must c<,nduct a minimum of 6 take-affs with take-off power until i t has cleared a point 15 m above the runway ( f i r s t phase) . I t may then retract the
undercarriage and adjust the flap-settings to i t s normal climb configuration and continue i t s f l ight with maximum continuous engine power (unless airworthiness-related 1imita.tions apply) to achieve i t s then best rate-of-climb speed V +/- 9 km/h (second phase) . This procedure defines the
reference flight path. Y
The climb configuration and speed must be maintained until well beyond the reference noise measurement point which is located 2500 m from the tsrake-release point on the runway centerline. This point must be overflown within a la teral deviation of no more than +/-10" from the vertical and within +/-ZO% of the reference height (Fig. 2 .19) . This seemingly large margin in the allowed
deviation from reference height reflects the fact that height deviations can be easily corrected on the basis of the inverse square distance l a w for an L -value. pA,max
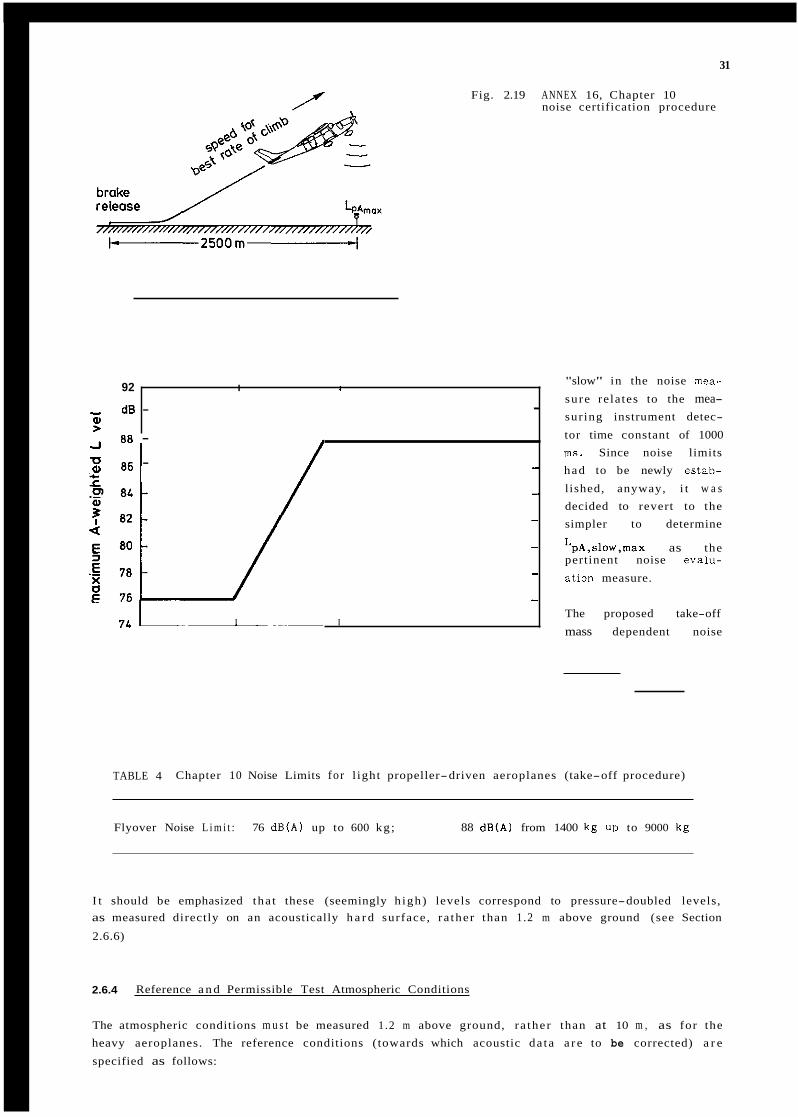
31
Fig. 2.19 ANNEX 16, Chapter 10 noise certification procedure
92 I I
- dB - - al > -I
-0
00 - - - a, 86
- - - - -
I I 7 4
"slow" in the noise mea-
sure relates to the mea- suring instrument detec-
tor time constant of 1000 m s . Since noise limits had to be newly estab-
lished, anyway, i t w a s decided to revert to the simpler to determine
LpA,slow,max as the pertinent noise evalu-
ation measure.
The proposed take-off
mass dependent noise
TABLE 4 Chapter 10 Noise Limits fo r l ight propeller-driven aeroplanes (take-off procedure)
Flyover Noise L i m i t : 76 dB(A) up to 600 kg ; 88 dB(A) from 1400 kg UD to 9000 kg
I t should be emphasized tha t these (seemingly h igh) levels correspond to pressure-doubled levels, as measured directly on an acoustically h a r d surface, ra ther than 1.2 m above ground (see Section
2.6.6)
2.6.4 Reference a n d Permissible Test Atmospheric Conditions
The atmospheric conditions m u s t be measured 1.2 m above ground, ra ther than at 10 m , as for the heavy aeroplanes. The reference conditions (towards which acoustic da ta a r e to be corrected) a r e
specified as follows:
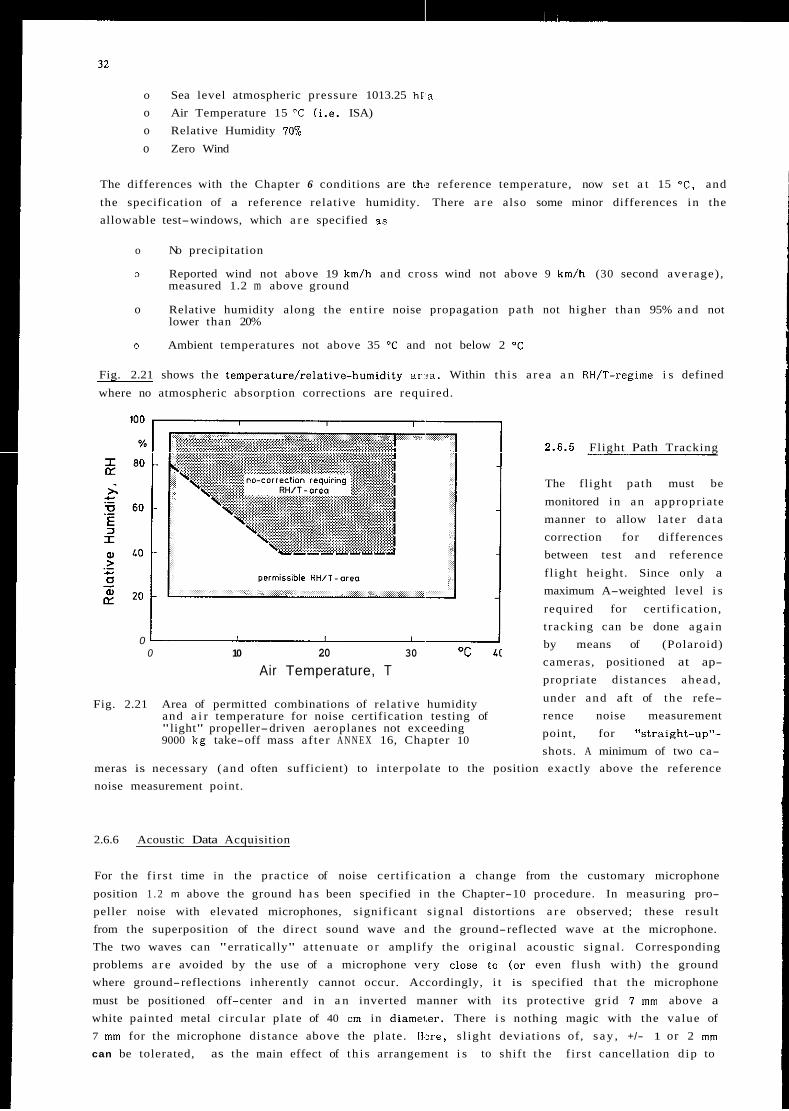
o Sea level atmospheric pressure 1013.25 hPa o Air Temperature 15 "C (i.e. ISA) o Relative Humidity 70%
o Zero Wind
The differences with the Chapter 6 conditions are th': reference temperature, now set a t 15 O C , and
the specification of a reference relative humidity. There a r e also some minor differences in the allowable test-windows, which a r e specified a s
o No precipitation
o Reported wind not above 19 km/h and cross wind not above 9 km/h (30 second average) , measured 1.2 m above ground
o Relative humidity along the ent i re noise propagation path not higher than 95% and not lower than 20%
o Ambient temperatures not above 35 T and not below 2 T
Fig. 2.21 shows the temperature/relative-humidity an?a . Within th i s a rea a n RH/T-regime i s defined
where no atmospheric absorption corrections are required.
0 0 10 20 30 O C
Air Temperature, T
Fig. 2.21 Area of permitted combinations of relative humidity and a i r temperature for noise certification testing of "light" propeller-driven aeroplanes not exceeding 9000 kg take-off mass af ter A N N E X 16, Chapter 10
2.6.5 Flight Path Tracking
The fl ight path must be
monitored in a n appropriate manner to allow la te r d a t a correction for differences between test and reference
fl ight height. Since only a maximum A-weighted level i s
required for certification, t racking can be done aga in by means of (Polaroid) cameras, positioned at ap- propriate distances ahead ,
under and aft of the refe- rence noise measurement point, for "straight-up"- shots. A minimum of two ca-
meras is necessary (and often sufficient) to interpolate to the position exactly above the reference noise measurement point.
2.6.6 Acoustic Data Acquisition
For the f i rs t time in the practice of noise certification a change from the customary microphone
position 1 . 2 m above the ground h a s been specified in the Chapter-10 procedure. In measuring pro- peller noise with elevated microphones, significant s ignal distortions a r e observed; these result from the superposition of the direct sound wave and the ground-reflected wave at the microphone. The two waves can "erratically" at tenuate o r amplify the or iginal acoustic s ignal . Corresponding problems a r e avoided by the use of a microphone very close to (or even flush with) the ground where ground-reflections inherently cannot occur. Accordingly, i t is specified tha t the microphone
must be positioned off-center and in a n inverted manner with i t s protective gr id I mm above a white painted metal c i rcular plate of 40 cm in diamel.er. There i s nothing magic with the value of 7 mm for the microphone distance above the plate. H,:re, s l ight deviations of, s a y , +/- 1 or 2 mm can be tolerated, as the main effect of th i s arrangement i s to shift the f i rs t cancellation d ip to
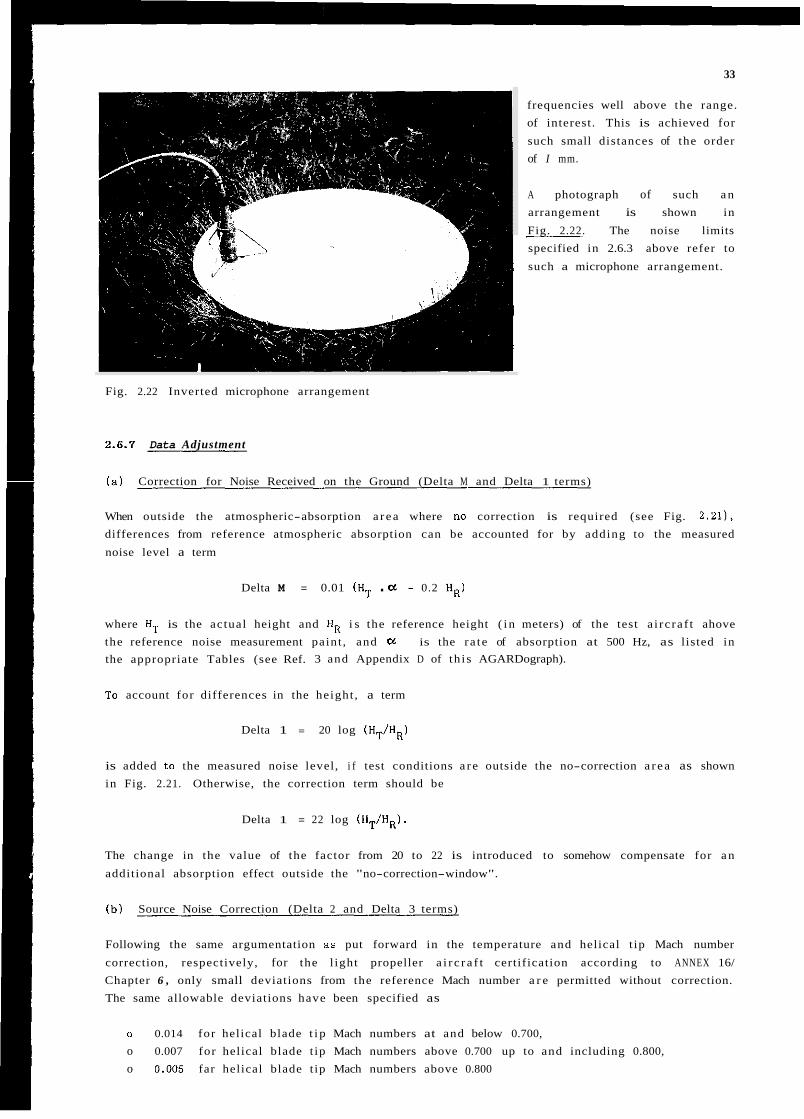
33
frequencies well above the range. of interest. This is achieved for
such small distances of the order of I mm.
Fig. 2.22 Inverted microphone arrangement
A photograph of such a n arrangement is shown in
Fig. 2.22. The noise limits specified in 2.6.3 above refer to
such a microphone arrangement.
2.6.7 Data Adjustment
( a ) Correction for Noise Received on the Ground (Delta M and Delta 1 terms)
When outside the atmospheric-absorption a r ea where no correction is required (see Fig. 2 .21 ) ,
differences from reference atmospheric absorption can be accounted for by adding to the measured
noise level a term
Delta M = 0.01 ( H T . U - 0.2 H R )
where HT is the actual height and HR i s the reference height ( i n meters) of the test a i rc ra f t ahove the reference noise measurement paint , and CY is the ra te of absorption at 500 Hz, as listed in the appropriate Tables (see Ref. 3 and Appendix D of th i s AGARDograph).
To account for differences in the height , a term
Delta 1 = 20 log (HT/HR)
is added to the measured noise level, i f test conditions a r e outside the no-correction a r ea as shown in Fig. 2.21. Otherwise, the correction term should be
Delta 1 = 22 log ( H T / H R ) .
The change in the value of the factor from 20 to 22 is introduced to somehow compensate for a n
additional absorption effect outside the "no-correction-window".
( b ) Source Noise Correction (Delta 2 and Delta 3 terms)
Following the same argumentation as put forward in the temperature and helical t ip Mach number
correction, respectively, for the l ight propeller a i r c r a f t certification according to ANNEX 16/ Chapter 6 , only small deviations from the reference Mach number a r e permitted without correction. The same allowable deviations have been specified as
o 0.014 for helical blade t i p Mach numbers at and below 0.700,
o 0.007 for helical blade t ip Mach numbers above 0.700 up to and including 0.800, o 0.005 far helical blade t ip Mach numbers above 0.800
Delta 2 = K2 log ( M R / M T )
The value of K2 must be obtained from approved d a t a of the test aeroplane, or from dedicated fl ight tests as described in Section 2.5.7 above.
I n the absence of fl ight test d a t a a value K 2 = 150 should be used if hlT is less than MR.
Otherwise, no correction i s applied.
The effect of ambient pressure or temperature on engine power P must be accounted for by adding another term to the measured noise level
Delta 3 = K3 log (PR/PT)
Again, the value of K3 shal l be determined from approved test d a t a of the test aeroplane. absence of such date , a value K3 = 17 can be used.
In the
( c ) Validity of Test Results
The final noise certification level is the average of a'. least 6 "valid" flyover noise levels. appro- priately corrected as per section ( a ) and ( b ) above. The s ta t is t ical 90% confidence limit, based on
these s ix ( o r if necessary, more) samples must again not exceed '+/- 1.5 dB. (See also AGARDagraph Appendix E ) .
2.6.8 Fall-back Provision
For a few years af ter the introduction of th is new Chapter lO/Appendix 6 Standard ' a fall-back
provision is foreseen in order to avoid undue hardship on a i rc ra f t manufacturers and operators. Aeroplanes which fail to comply with the Standards 0:: Cha,pter 10 would be allowed to go through a noise certification test according to Chapter WAppendix 3.
2.7 Noise Certification of Helicopters (ANNEX 16: Chapter 8 and Appendix 4)
Serious efforts to develop 'Standards and Recommended Practices ' for the noise certification of he- licopters began a t the fifth meeting of the ICAO Committee of Aircraft Noise in 1976 (CAN/5). Ini- t i a l ly , in a n attempt to encompass the entire range (of operational manoeuvres of a helicopter, a
very elaborate test-scheme was proposed, where four fl ight conditions were to be evaluated. Fi rs t ,
the helicopter w a s to hover a t a distance of 200 m f ron a n a r r a y of microphones a t several heights above the ground a t 8 different nose directions. Second, landing-approaches were to be conducted a t f l ight path angles of 3", 6 " , and 9". Third, hari::ontal flyavers a t 2 heights and a t 3 flight-
speeds, and fourth, simulated t a k e o f f s a t the best Irate-of-climb speed were to be executed. All
flyovers had to occur above a la teral ly extended acout,tic measurement a r r a y .
Preliminary testing along these l ines showed tha t such a procedure was unnecessarily complex. I t
w a s found, for example, tha t in hovering the helicopter had to be constantly stabilized. This caused large dispersions i n the noise-emission. Also, since the distance in the approach and the take-off fl ight procedure between the vehicle and the microphone was comparatively small, s l ight deviations from a reference flight-path caused large var ia t ions i n the noise-level.
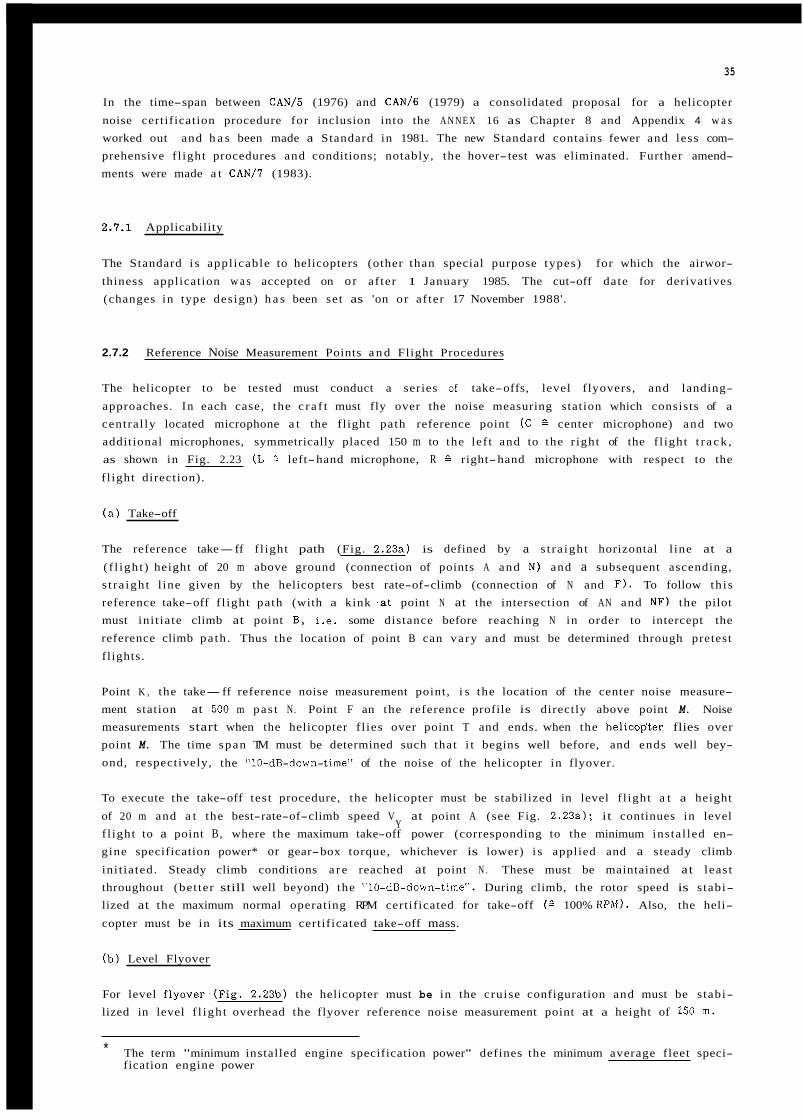
35
In the time-span between CAN/S (1976) and CAN/6 (1979) a consolidated proposal for a helicopter
noise certification procedure for inclusion into the A N N E X 16 as Chapter 8 and Appendix 4 w a s worked out and h a s been made a Standard in 1981. The new Standard contains fewer and less com- prehensive f l ight procedures and conditions; notably, the hover-test was eliminated. Further amend- ments were made a t CAN/7 (1983).
2.7.1 Applicability
The Standard i s appl icable to helicopters (other than special purpose types) for which the airwor-
thiness application w a s accepted on o r af ter 1 January 1985. The cut-off date for derivatives (changes in type design) h a s been set as 'on or af ter 17 November 1988'.
2.7.2 Reference Noise Measurement Points a n d Flight Procedures
The helicopter to be tested must conduct a series of take-offs, level flyovers, and landing-
approaches. I n each case, the c r a f t must fly over the noise measuring station which consists of a
central ly located microphone a t the flight path reference point (C 2 center microphone) and two additional microphones, symmetrically placed 150 m to the lef t and to the r ight of the f l ight t r a ck , as shown in Fig. 2.23 (L 2 left-hand microphone, R right-hand microphone with respect to the
f l ight direction).
( a ) Take-off
The reference take-ff f l ight path (Fig. 2.23a) is defined by a s t ra igh t horizontal l ine at a ( f l igh t ) height of 20 m above ground (connection of points A and N ) and a subsequent ascending, s t ra igh t l ine given by the helicopters best rate-of-climb (connection of N and F ) . To follow th i s reference take-off f l ight path (with a kink .at point N at the intersection of AN and NF) the pilot must ini t ia te climb at point 8, i.e. some distance before reaching N in order to intercept the reference climb pa th . Thus the location of point B can vary and must be determined through pretest flights.
Point K , the take-ff reference noise measurement point, i s the location of the center noise measure- ment station at 500 m pas t N. Point F an the reference profile is directly above point M. Noise measurements start when the helicopter f l ies over point T and ends. when the helicoflter flies over point M. The time span TM must be determined such that i t begins well before, and ends well bey- ond, respectively, the "IO-dB-down-time" of the noise of the helicopter in flyover.
To execute the take-off test procedure, the helicopter must be stabilized in level f l ight a t a height
of 20 m and a t the best-rate-of-climb speed V at point A (see Fig. 2.23a); it continues in level f l ight to a point B, where the maximum take-off power (corresponding to the minimum instal led en- gine specification power* or gear-box torque, whichever is lower) i s applied and a steady climb
ini t ia ted. Steady climb conditions a r e reached at point N . These must be maintained at least throughout (bet ter still well beyond) the "10-dB-dawn-time". During climb, the rotor speed is stabi- lized at the maximum normal operating RPM certificated for take-off (2 100% R P M ) . Also, the heli-
copter must be in its maximum certificated take-off mass.
Y
( b ) Level Flyover
For level f lyover ' (F ig . 2.2313) the helicopter must be in the cruise configuration and must be s tabi- lized in level f l igh t overhead the flyover reference noise measurement point at a height of 150 m.
~ ~
* The term "minimum installed engine specification power" defines the minimum average fleet speci- fication engine power
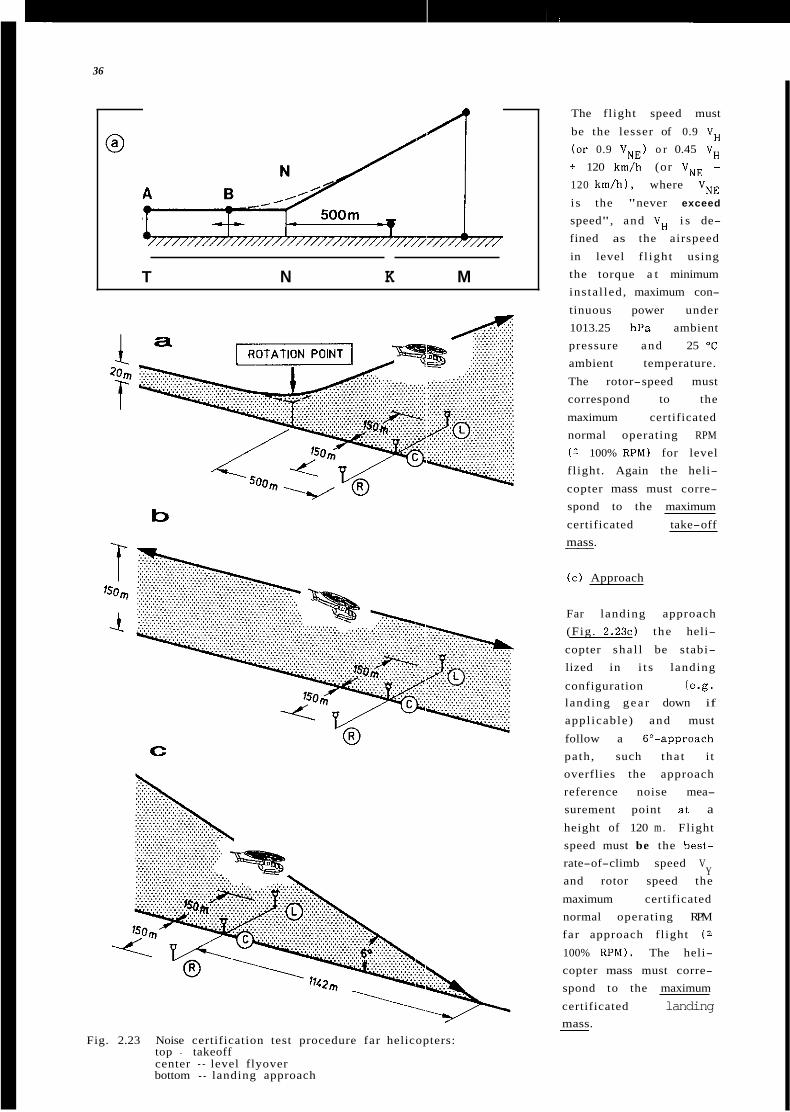
36
A [-+g T N K M
b
Fig. 2.23 Noise certification test procedure far helicopters: top - takeoff center - level flyover bottom - landing approach
The fl ight speed must
be the lesser of 0.9 VH
( o r 0.9 V N E ) o r 0.45 V H
+ 120 km/h (or V N E +
120 km/h), where V N E
i s the "never exceed
speed", and VH i s de- fined as the airspeed
in level f l ight using the torque a t minimum insta l led, maximum con-
tinuous power under 1013.25 hPa ambient pressure and 25 " C
ambient temperature.
The rotor-speed must correspond to the
maximum certificated normal operating RPM
( G 100% RPM) for level fl ight. Again the heli-
copter mass must corre-
spond to the maximum
certificated take-off mass.
~
( c ) Approach
Far landing approach (Fig. 2 . 2 3 ~ ) the heli-
copter sha l l be stabi- lized in i t s landing
configuration (e .g . landing g e a r down if
appl icable) and must
follow a 6"-approach path, such tha t i t overflies the approach reference noise mea- surement point a t a height of 120 m . Flight speed must be the best- rate-of-climb speed V
Y and rotor speed the
maximum certificated normal operating RPM far approach flight ( 2
100% RPM). The heli- copter mass must corre-
spond to the maximum
certificated landing mass.
~

37
3.1.3 Noise Evaluation Measure and Noise L i m i t s
In i t i a l ly , the "maximum A-weighted flyover noise level, LpAmax ( ( , w a s considered a n appropriate
noise evaluation measure, since the helicopter frequently operates in a r ea s , where community noise is also measured in dB(A). However, since other a i r c r a f t , such as the heavy propeller-driven aero-
plane and subsonic jet-aircraft a r e noise-certificated in terms of EPNL, homogeneity with these w a s
considered more important to allow a direct comparison, and the EPNL w a s selected as the noise
evaluation measure.
To derive appropriate noise limits, a l l avai lable da ta at the time (prior to C A N I 7 ) on current heli-
copters' were utilized. In drawing the noise-limit l ine, allowances had been made for foreseeable technical advances and measurement uncertainties. Fig. 2.24 shows the noise limits in terms of mass-dependent EPNL-values for the three flight-procedures take-off, flyover, and approach, as agreed a t CAN/6 (1981) and a s revised and presently in force since C A N / I (1983).
For convenience, the mass-dependent noise limits in EPNdB for the three test procedures and the respective break-points a r e listed in TABLE 5 below (note that a logarithmic mass-scale is used, as with the subsonic jet and heavy propeller-driven aeroplanes):
TABLE 5 Chapter 8 Noise Limits for Helicopters a f te r CAN/7
Take-off Noise Limit: 89 EPNdB up to 788 kg; 109 EPNdB above 80.000 kg
Overflight Noise Limit: 88 EPNdB up to 788 kg; 108 EPNdB above 80.000 kg
Approach Noise Limit: 90 EPNdB up to 788 kg; 110 EPNdB above 80.000 kg
2.7.4 Reference and Permissible Test Operational and Atmospheric Conditions
The following reference conditions for helicopter noise certification testing have been established
o sea-level atmospheric pressure of 1013.25 hPa ;
o ambient air temperature of 25 "C ( i .e . ISA + 10°C); o relat ive humidity of 70 %; o zero wind.
Certification noise measurements may however he conducted within the same atmospheric windows as appl icable to subsonic jet aeroplanes o r heavy propeller-driven aeroplane test ing, i .e. under the
following conditions:
o no precipitation
o ambient a i r temperature ( T ) measured 10 m above ground must not be below 2 "C o r above 35 "C;
o relat ive humidity ( R H ) along the ent i re noise propagation path must not be below 20 yo o r above 95 %;
o certain combinations of RH and T tha t would result in a n atmospheric sound attenua- tion in excess of 12 dB/100 m in the 8-kHz-1/3-octave-band must be avoided (see Fig. 2 .9) ;
o the average wind must not exceed 19 km/h and the cross-wind component (relat ive to the f l igh t direction) must not exceed 9 km/h. If a head or tailwind affects the over- ground speed, th i s fact must be accounted for in the EPNL-computation process. Spe- cif ical ly, i f in the level flight test procedure, the difference between airspeed and ground speed exceeds 7 km/h, then f l ights should be made in equal numbers with and against the wind direction.
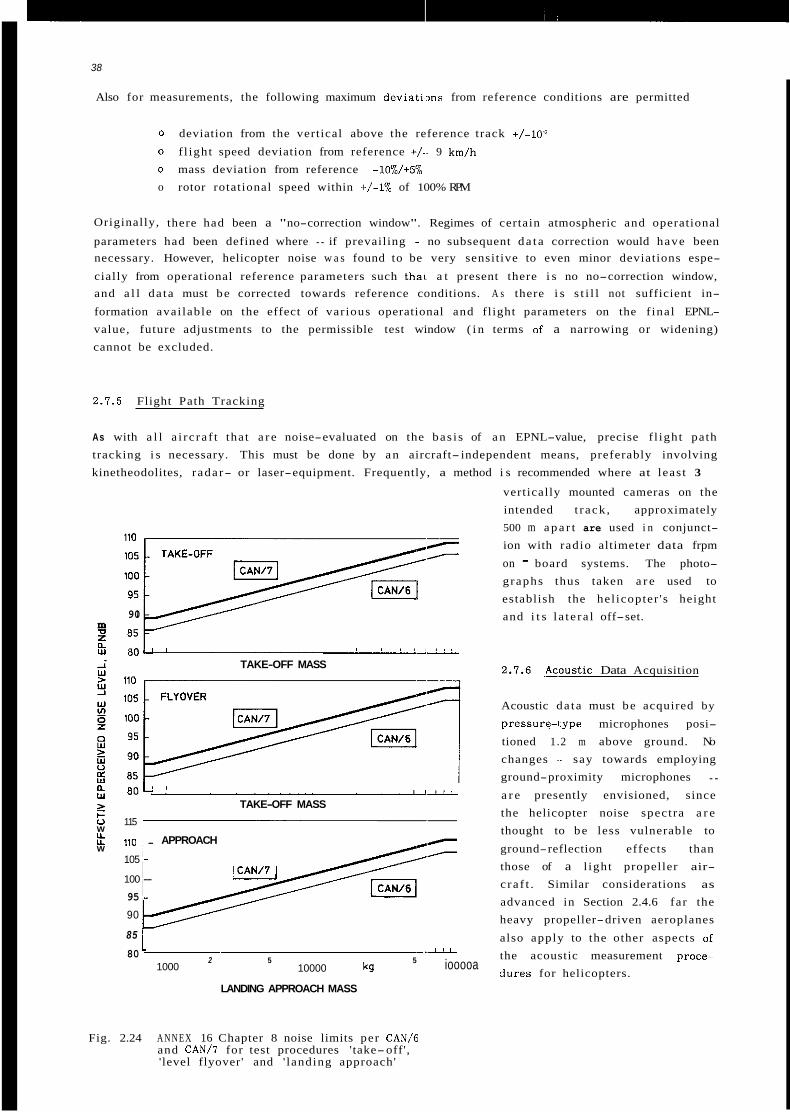
38
Also for measurements, the following maximum deviat i ,ms from reference conditions are permitted
0 deviation from the vertical above the reference track +/-lo"
0 f l ight speed deviation from reference t/-- 9 km/h 0 mass deviation from reference -10%/+5%
0 rotor rotational speed within +/-1% of 100% RPM
Originally, there had been a "no-correction window". Regimes of certain atmospheric and operational
parameters had been defined where - if prevailing - no subsequent d a t a correction would have been necessary. However, helicopter noise w a s found to be very sensitive to even minor deviations espe-
cially from operational reference parameters such thal, a t present there i s no no-correction window, and a l l da ta must be corrected towards reference conditions. A s there i s s t i l l not sufficient in-
formation avai lable on the effect of var ious operational and fl ight parameters on the f inal EPNL- value, future adjustments to the permissible test window ( i n terms of a narrowing or widening) cannot be excluded.
2.7.5 Flight Path Tracking
As with a l l a i rc ra f t that a r e noise-evaluated on the bas i s of a n EPNL-value, precise f l ight path tracking i s necessary. This must be done by a n aircraft- independent means, preferably involving kinetheodolites, radar- or laser-equipment. Frequently, a method i s recommended where at leas t 3
90 m
n
i TAKE-OFF MASS w 801' '
n
2 c U 115 W
W
TAKE-OFF MASS w 80'' '
110 . APPROACH
105 - 100 - 95 - 90
85
80 iooooa 5
10000 kg 2 5
'
1000
LANDING APPROACH MASS
Fig. 2.24 A N N E X 16 Chapter 8 noise limits per CAN/6 and CAN/7 for test procedures 'take-off', ' level flyover' and ' landing approach'
vertically mounted cameras on the intended t rack , approximately 500 m a p a r t are used i n conjunct- ion with radio altimeter data frpm
on - board systems. The photo- graphs thus taken a r e used to establish the hel icopter ' s height and i t s l a t e ra l off-set.
2.1.6 ,&owtic Data Acquisition
Acoustic da ta must be acquired by
pressure-Lype microphones posi- tioned 1.2 m above ground. No changes -- say towards employing ground-proximity microphones -
a r e presently envisioned, since the helicopter noise spectra a r e thought to be less vulnerable to
ground-reflection effects than those of a l ight propeller air-
c ra f t . Similar considerations as
advanced in Section 2.4.6 far the heavy propeller-driven aeroplanes
also apply to the other aspects of the acoustic measurement prace- dures for helicopters.
39
2.7.1 Noise Data Adjustment
A s stated a l ready , a l l da ta must be adjysted towards reference conditions, involving aga in a source-to-ground path correction (Delta 1 and Delta 2 ) and a source correction (Delta 3 ) .
( a ) Source-to-ground-path Correction (Delta 1 and Delta 2 terms)
The difference in atmospheric attenuation as a result of differences between reference and test f l ight pa th , a s well as in atmospheric conditions must be accounted for in the evaluation of the
measured da t a . The procedure corresponds to the one discussed in Section 2.4.1, relat ing to a Delta 1 adjustment of the measured EPNL-value. However the total allowed adjustment for the Delta 1 term
sha l l not exceed 4 EPNdB.
Deviations in the test flight speed and height from reference enter the calculation of the EPNL by virtue of a change in effective ground speed and the ensuing change in sound exposure duration
which requires a Delta 2 adjustment of the measured EPNL-value, again corresponding to the one discussed in Section 2.4.1. However, the total allowed adjustment fo r the Delta 2 term sha l l not
exceed 2 EPNdB.
( b ) Source Correction (Delta 3 term)
For a level f l ight condition helicopter source noise i s distinctly determined by the main rotor advancing blade t ip Mach-number and thus very sensitive to even slight changes in RPM and f l ight speed. Corrections must be made on the bas i s of a "noise sensitivity evaluation". A noise sensiti-
vity curve relates the Perceived Noise Level (PNL) to the advancing blade t ip Mach number, com- puted from t rue a i r speed, outside temperature and rotor speed. By varying one or several of these primordial parameters and measuring the ensuing PNL-values during flyover one can derive a noise sensitivity curve which can then be used for the source noise adjustment towards reference con- ditions i n terms of the required Delta 3 term. An example of such a procedure is discussed in Section 3.6.2, a n appropriate i l lustrat ion appears la te r i n th i s AGARDograph as Fig. 3.58.
( c ) Test Result Validity
Each test-flight produces one EPN-level at each of the three microphones. ANNEX 16 requires tha t these 3 EPNL-values a r e arithmetically averaged to a r r ive a t E certification EPN-level. Also, a minimum of 6 test f l ights ( for each procedure) i s to be conducted and the ensuing EPNL- values m u s t be fur ther averaged to determine ( i n a s tat is t ical sense) the mean and the s tandard deviation of the mean, to establish a 90% confidence-limit not to exceed i/- 1.5 EPNdB. (See also
AGARDograph Appendix E ) .
( d ) Trade-offs
Trade-offs are allowed, i f noise limits a t one o r two measuring points a r e exceeded. However, the s u m of the excesses shal l not be greater than 4 EPNdB, any individual excess at a measurement point sha l l not be greater than 3 EPNdB, and any excess sha l l be offset by a corresponding reduc- tion at the other point(s) . I t will be noted tha t these trade-off allowances a re more lenient than
those applicable to heavy propeller aeroplanes and subsonic jet a i r c r a f t .
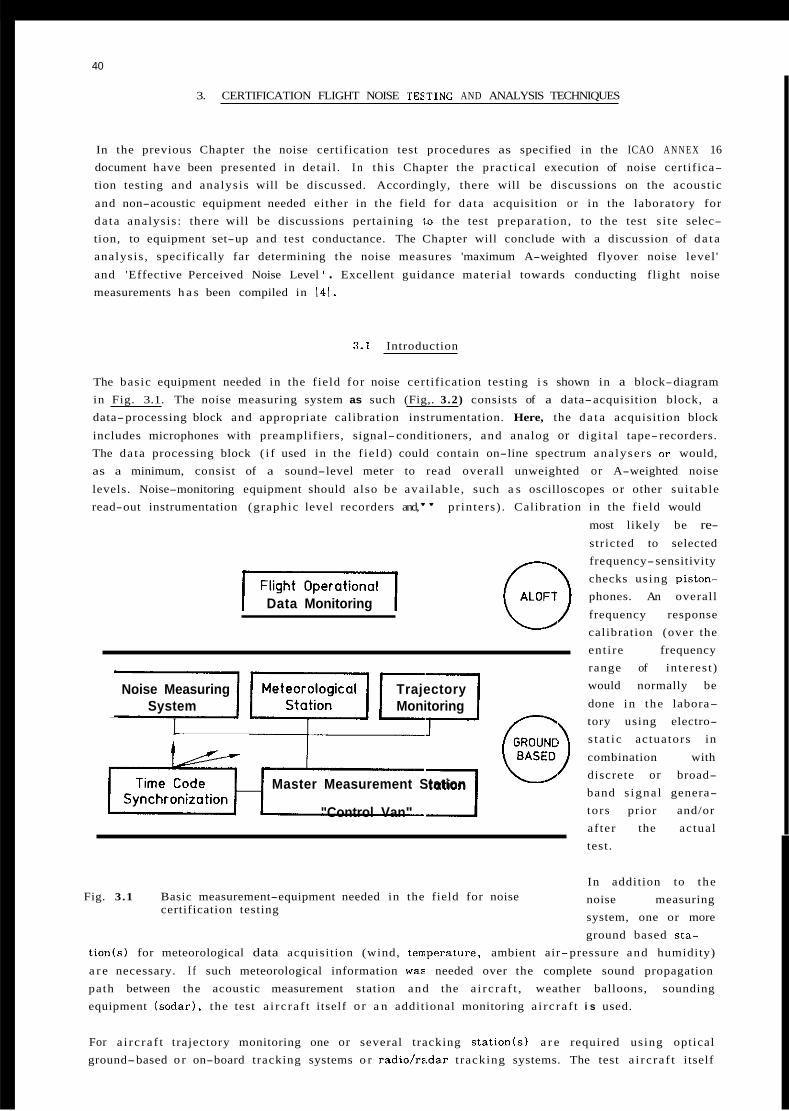
40
3. CERTIFICATION FLIGHT NOISE TEE,TING AND ANALYSIS TECHNIQUES
In the previous Chapter the noise certification test procedures as specified in the ICAO A N N E X 16 document have been presented in detail . I n th is Chapter the pract ical execution of noise certifica- tion testing and analysis will be discussed. Accordingly, there will be discussions on the acoustic
and non-acoustic equipment needed either in the field for da ta acquisition or in the laboratory for da ta analysis : there will be discussions pertaining i.0 the test preparat ion, to the test s i te selec- tion, to equipment set-up and test conductance. The Chapter will conclude with a discussion of d a t a analysis , specifically far determining the noise measures 'maximum A-weighted flyover noise level '
and 'Effective Perceived Noise Level ' . Excellent guidance material towards conducting fl ight noise measurements h a s been compiled in 141.
3.1 Introduction
The basic equipment needed in the field for noise certification testing i s shown in a block-diagram in Fig. 3.1. The noise measuring system as such (Fig,. 3.2) consists of a data-acquisition block, a data-processing block and appropriate calibration instrumentation. Here, the d a t a acquisition block
includes microphones with preamplifiers, signal-conditioners, and analog or digi ta l tape-recorders. The da ta processing block ( i f used in the f ie ld) could contain on-line spectrum ana lysers o r would, as a minimum, consist of a sound-level meter to read overall unweighted or A-weighted noise
levels. Noise-monitoring equipment should also be avai lable , such a s oscilloscopes or other sui table read-out instrumentation (graphic level recorders and," printers) . Calibration in the field would
Data Monitoring
Noise Measuring Trajectory System Monitoring
I
Master Measurement Station
"Control Van" 7 Fig. 3.1 Basic measurement-equipment needed in the field for noise
certification testing
most likely be re- stricted to selected frequency-sensitivity checks using piston- phones. An overall
frequency response calibration (over the ent i re frequency range of in teres t ) would normally be
done in the labora- tory using electro- s ta t i c actuators in
combination with discrete or broad- band s igna l genera- tors prior and/or af ter the actual test .
In addition to the noise measuring system, one or more ground based sta-
t ion(s) for meteorological data acquisition (wind, terrperature, ambient air-pressure and humidity)
a r e necessary. I f such meteorological information waz needed over the complete sound propagation path between the acoustic measurement station and the a i rc ra f t , weather balloons, sounding equipment ( sodar ) , the test a i rc ra f t itself o r a n additional monitoring a i rc ra f t i s used.
For a i rc ra f t trajectory monitoring one or several tracking station($) a r e required using optical ground-based o r on-board tracking systems o r radio/rrtdar t racking systems. The test a i rc ra f t itself
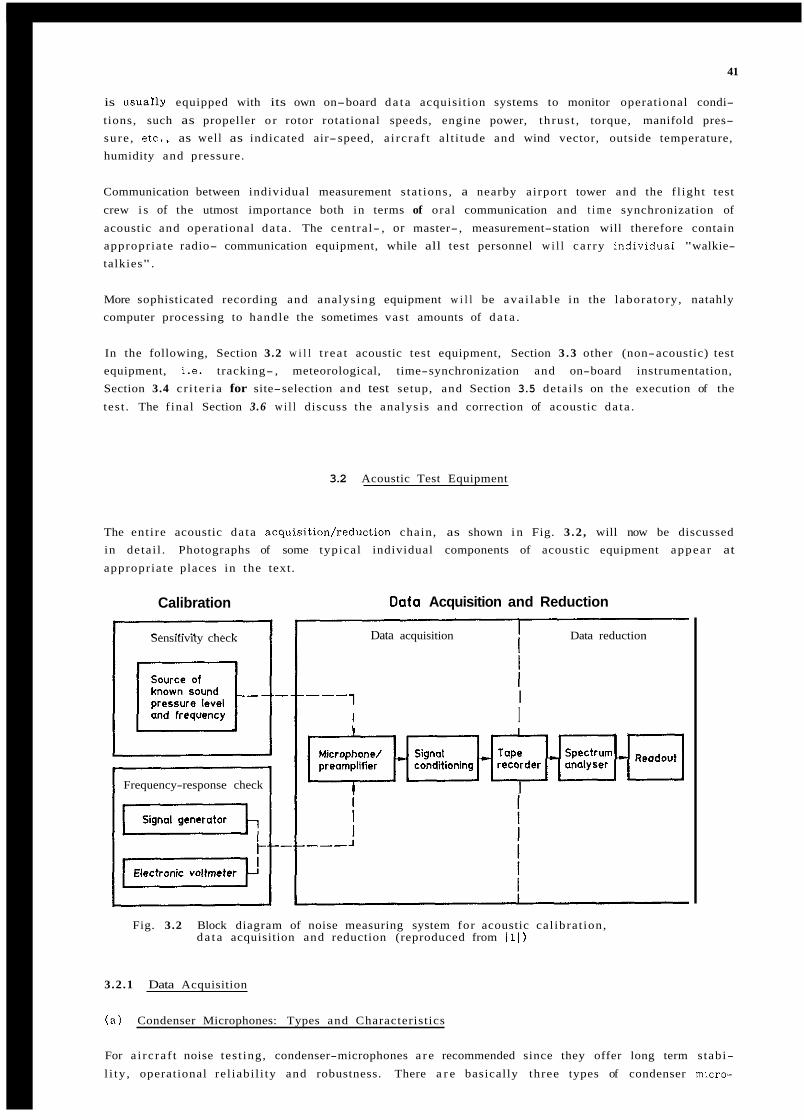
41
is usuarly equipped with its own on-board d a t a acquisition systems to monitor operational condi-
tions, such as propeller o r rotor rotational speeds, engine power, th rus t , torque, manifold pres- sure , e tc . , as wel l as indicated air-speed, a i rc ra f t a l t i tude and wind vector, outside temperature, humidity and pressure.
Communication between individual measurement s tat ions, a nearby airport tower and the f l ight test
crew i s of the utmost importance both in terms of oral communication and t i m e synchronization of
acoustic and operational da ta . The central- , or master-, measurement-station will therefore contain appropriate radio- communication equipment, while all test personnel w i l l ca r ry individuai "walkie- talkies" .
More sophisticated recording and analysing equipment w i l l be ava i lab le in the laboratory, natahly computer processing to handle the sometimes vast amounts of da t a .
In the following, Section 3.2 w i l l t rea t acoustic test equipment, Section 3 . 3 other (non-acoustic) test equipment, i .e. tracking- , meteorological, time-synchronization and on-board instrumentation, Section 3.4 cr i te r ia for site-selection and test setup, and Section 3.5 detai ls on the execution of the
test . The f inal Section 3.6 w i l l discuss the analysis and correction of acoustic da ta .
3.2 Acoustic Test Equipment
The ent ire acoustic da ta acquisition/reduction chain, as shown i n Fig. 3 .2 , will now be discussed in detai l . Photographs of some typical individual components of acoustic equipment appear at appropriate places in the text.
Calibration
Sensitivity check
Frequency-response check
Oaf0 Acquisition and Reduction
Data acquisition Data reduction
I I I
I
Fig. 3.2 Block diagram of noise measuring system for acoustic cal ibrat ion, d a t a acquisition and reduction (reproduced from Ill )
3.2.1 Data Acquisition
( a ) Condenser Microphones: Types and Characteristics
For a i rc ra f t noise test ing, condenser-microphones a r e recommended since they offer long term stabi-
l i ty , operational rel iabi l i ty and robustness. There a r e basically three types of condenser micro-
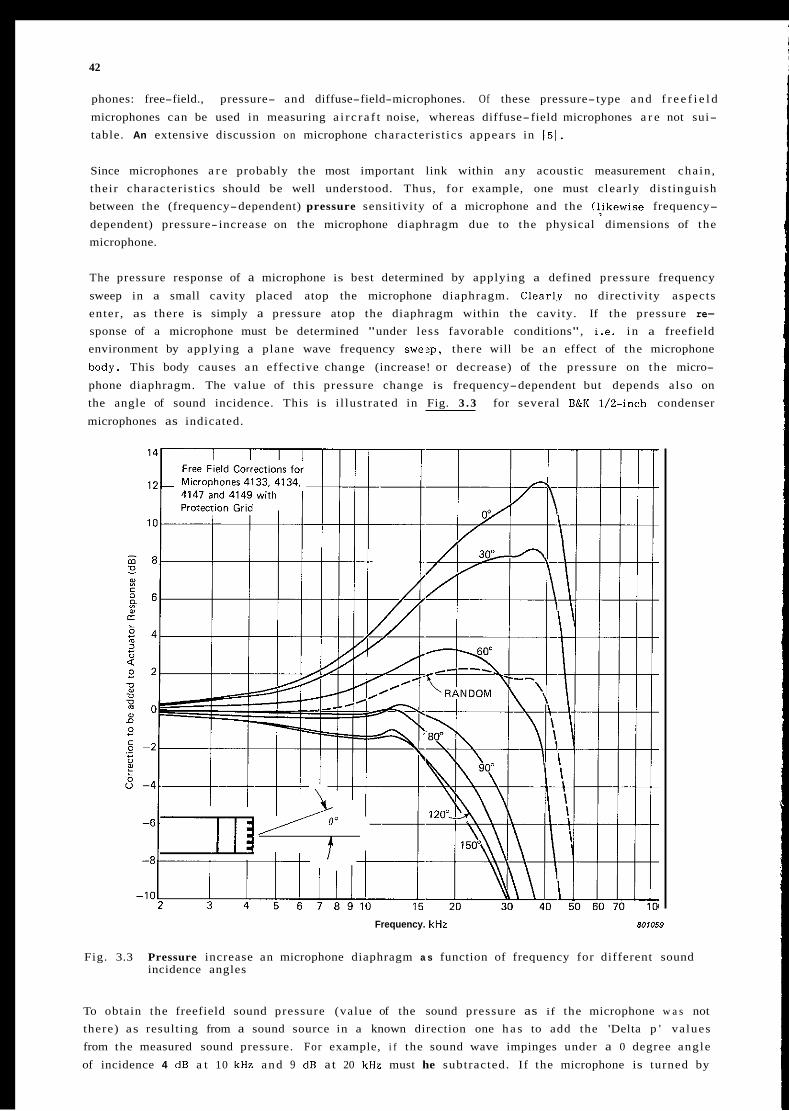
42
phones: free-field., pressure- and diffuse-field-microphones. Of these pressure-type and f r e e f i e l d
microphones can be used in measuring a i r c r a f t noise, whereas diffuse-field microphones a r e not sui- table. An extensive discussion on microphone characteris t ics appears in 151.
Since microphones a r e probably the most important link within any acoustic measurement cha in , their characteris t ics should be well understood. Thus, for example, one must clearly dist inguish between the (frequency-dependent) pressure sensitivity of a microphone and the (1,ikewise frequency-
dependent) pressure- increase on the microphone diaphragm due to the physical dimensions of the microphone.
The pressure response of a microphone is best determined by applying a defined pressure frequency
sweep in a small cavity placed atop the microphone diaphragm. C1earl.y no directivity aspects enter , as there is simply a pressure atop the diaphragm within the cavity. If the pressure re-
sponse of a microphone must be determined "under less favorable conditions", i .e. i n a freefield environment by applying a plane wave frequency swe?p, there will be a n effect of the microphone
body. This body causes a n effective change (increase! or decrease) of the pressure on the micro-
phone diaphragm. The value of this pressure change is frequency-dependent but depends also on the angle of sound incidence. This is i l lustrated in Fig. 3 . 3 for several B&K 1/2-inch condenser
microphones as indicated.
Frequency. kHz 801059
Fig. 3.3 Pressure increase an microphone diaphragm a s function of frequency for different sound incidence angles
To obtain the freefield sound pressure (value of the sound pressure as if the microphone w a s not there) as resulting from a sound source in a known direction one h a s to add the 'Delta p ' va lues from the measured sound pressure. For example, i f the sound wave impinges under a 0 degree angle
of incidence 4 dB a t 10 kHz and 9 dB a t 20 kHz must he subtracted. If the microphone is turned by
43
go", such tha t the sound from tha t source now impinges at "gracing incidence" i.e. under a 90 degree angle of incidence, one would have to subtract 0 dB at 10 kHz and add 1 dB at 20 kHz. If
the sound comes from the r ea r i .e . with an incidence angle of 180 degrees then one must subtract 0 dB at 10 kHz and add 3 dB at 20 kHz.
One might now appreciate why ICAO recommends the use of such a "pressure response" microphone to be adjusted for a grazing incidence angle with respect tb the incoming sound wave: for such a 90
degree angle of incidence the pressure change due to the physical presence of the microphone i s f a i r l y small (only 1 dB too high at 10 kHz). Pointing such a microphone towards the source ( i .e .
under an angle of incidence of 0 degrees) would cause much higher and undesirable pressure in- creases. Of course, in measuring the noise from a i rc ra f t in flyover the dominant sound intensity is
in a frequency range much below 10 kHz anyway, and the s m a l l deviation in pressure response at and above 10 kHz i s of l i t t le consequence.
For a "freefield microphones" (such as the B&K type 4133 l/2-inch condenser microphone) the fre- quency response towards a sound wave impinging under 0 degrees has been adjusted by the manu-
facturer such tha t there the pressure increase is electronically compensated for; hence i t s frequency response is f lat 'up to 20 kHz. Of course, such a microphone would have to be continuously pointed
towards the sound source, a n inconvenient undertaking for a n a i rc ra f t in flyover. Hence, again, the pressure response type microphone under a grazing incidence arrangement is to be preferred!
Thus, a microphone is named af ter its frequency response flatness: a pressure microphone h a s a f lat response for pressure excitation ("under a l i t t l e cavity") while a freefield microphone is flat for sound impingement at 0" incidence up to its highest usable frequency.
Another important aspect in selecting microphones relates to the desired frequency range. and
dynamic response. Condenser microphones a r e offered in different diameters, such as 1/10 inch, 1/8 inch, 1/4 inch, 1/2 inch and 1 inch. The small diameter microphones usually have a frequency range tha t extends to very high frequencies ( up to 150 kHz), i.e. well into the ultrasonic range. They a r e , however, much less sensi t ive than the l a rge r diameter microphones and generate higher internal noise.
For flyover noise measurements, the audio-frequency range is of primary interest. A microphone's
frequency range must therefore normally not extend much above 10 o r 12 kHz. Thus, the larger dia- meter microphones, i.e. l inch and 1/2 inch a r e mostly used. These microphones have a la rge dynamic range, typically from 10 dB to 145 dB ( r e po = Z X ~ O - ~ N/m') for the 1 inch microphone and from 25 to 160 dB for the 1/2 inch microphone. Due to i t s smaller physical size, the I/Z-inch-diam.
condenser microphone is preferred in measuring a i rc ra f t noise.
1/4-inch and 1/8-inch-diam microphones a r e mostly employed in laboratory or wind tunnel model noise s tudies , where the frequency range of interest often extends into the ultrasonic regime. I t i s
however not only the actual frequency range that is of importance in th i s context (a i rc ra f t noise h a s l i t t le energy in the ultrasonic range) , but ra ther the extremely fast pressure rise-times tha t a r e character is t ic for impulsive type sounds. Such impulsive noise typically occurs during helicop- ter blade-slap o r from high-speed propellers. Microphones with a n insufficient upper frequency range would tend to clip such a n impulsive "needle-type" signal . Those with a wide frequency
range extending into the ultrasonic regime a r e therefore sometimes used when a i rc ra f t noise contains impulsive components.
( b ) Wind Screens
Microphones in the field must be equipped with windscreens to reduce wind induced noise. Such
wind screens, sometimes also called "wind-balls'' of 6 to 9 cm in diameter typically provide a 10 dB noise reduction f o r wind-induced noise for wind speeds within the acceptable range for certification test ing.
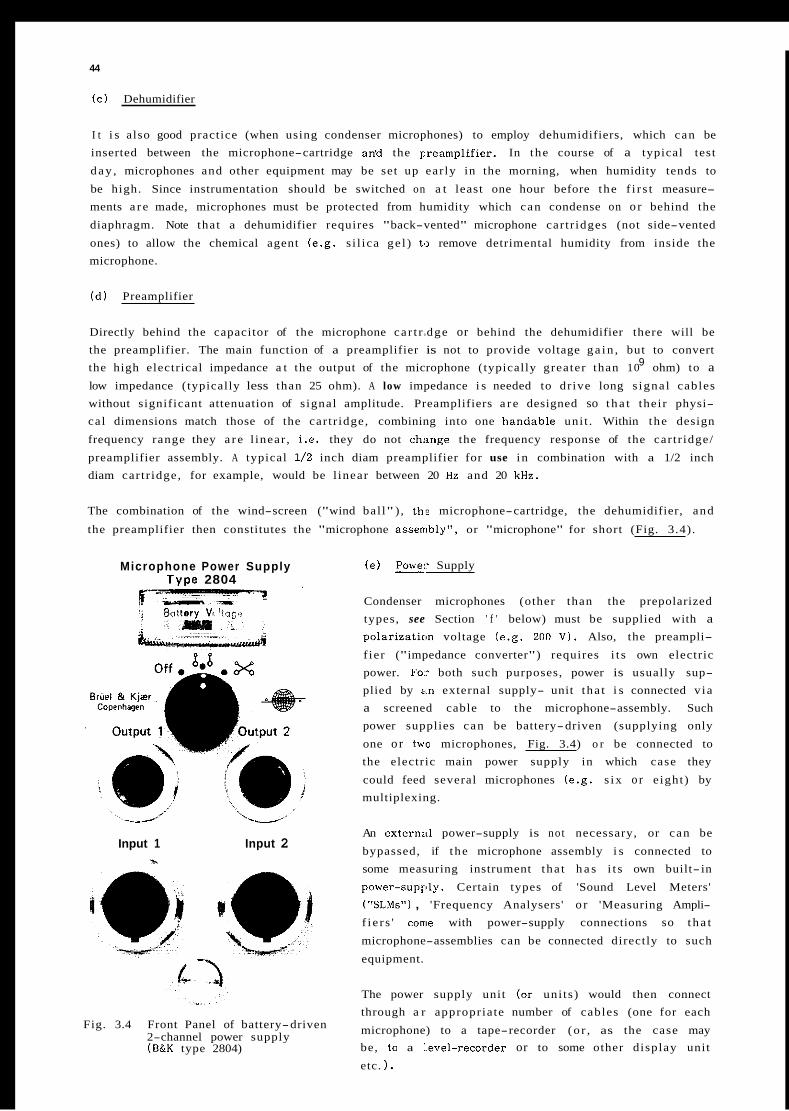
44
(c) Dehumidifier
I t i s also good practice (when using condenser microphones) to employ dehumidifiers, which can be inserted between the microphone-cartridge an'd the Freamplifier. In the course of a typical test
d a y , microphones and other equipment may be set up ear ly in the morning, when humidity tends to
be high. Since instrumentation should be switched on a t least one hour before the f i r s t measure- ments a r e made, microphones must be protected from humidity which can condense on o r behind the
diaphragm. Note that a dehumidifier requires "back-vented" microphone car t r idges (not side-vented
ones) to allow the chemical agent (e.g. s i l ica ge l ) t', remove detrimental humidity from inside the microphone.
( d ) Preamplifier
Directly behind the capacitor of the microphone ca r t r idge or behind the dehumidifier there will be the preamplifier. The main function of a preamplifier is not to provide voltage g a i n , but to convert the high electrical impedance a t the output of the microphone (typically greater than 10 ohm) to a low impedance (typically less than 25 ohm). A low impedance i s needed to dr ive long s igna l cables without significant attenuation of s ignal amplitude. Preamplifiers a r e designed so t h a t their physi- cal dimensions match those of the car t r idge, combining into one handable uni t . Within the design
frequency range they a r e l inear , i.e. they do not change the frequency response of the car t r idge/
preamplifier assembly. A typical 1/2 inch diam preamplifier for use i n combination with a 1/2 inch diam car t r idge, for example, would be l inear between 20 Hz and 20 kHz.
9
The combination of the wind-screen ("wind bal l" ) , ths microphone-cartridge, the dehumidifier, and
the preamplifier then constitutes the "microphone assenibly", or "microphone" for short (Fig. 3.4).
Microphone Power Supply T Y D e 2804
Input 1 Input 2 m
c
/ -\
Fig. 3.4 Front Panel of battery-driven 2-channel power supply (B&K type 2804)
( e ) W r Supply
Condenser microphones (other than the prepolarized types, see Section ' f ' below) must be supplied with a po la r iza t im voltage (e.g. 200 V I . Also, the preampli-
f ier ("impedance converter") requires i t s own electric power. Fo: both such purposes, power is usually sup- plied by i ,n external supply- unit tha t i s connected v ia a screened cable to the microphone-assembly. Such power supplies can be battery-driven (supplying only
one o r two microphones, Fig. 3.4) o r be connected to the electric main power supply in which case they
could feed several microphones (e.g. s ix o r e ight) by multiplexing.
An e x t e r n d power-supply is not necessary, or can be
bypassed, if the microphone assembly i s connected to some measuring instrument tha t h a s i t s own built- in
power-supg8ly. Certain types of 'Sound Level Meters' ("SLMs") , 'Frequency Analysers' o r 'Measuring Ampli- f i e r s ' conic with power-supply connections so t h a t
microphone-assemblies can be connected directly to such
equipment.
The power supply unit (or uni ts) would then connect through a r appropriate number of cables (one for each
microphone) to a tape-recorder (o r , as the case may be, to a :.evel-recorder or to some other display unit
etc. 1.
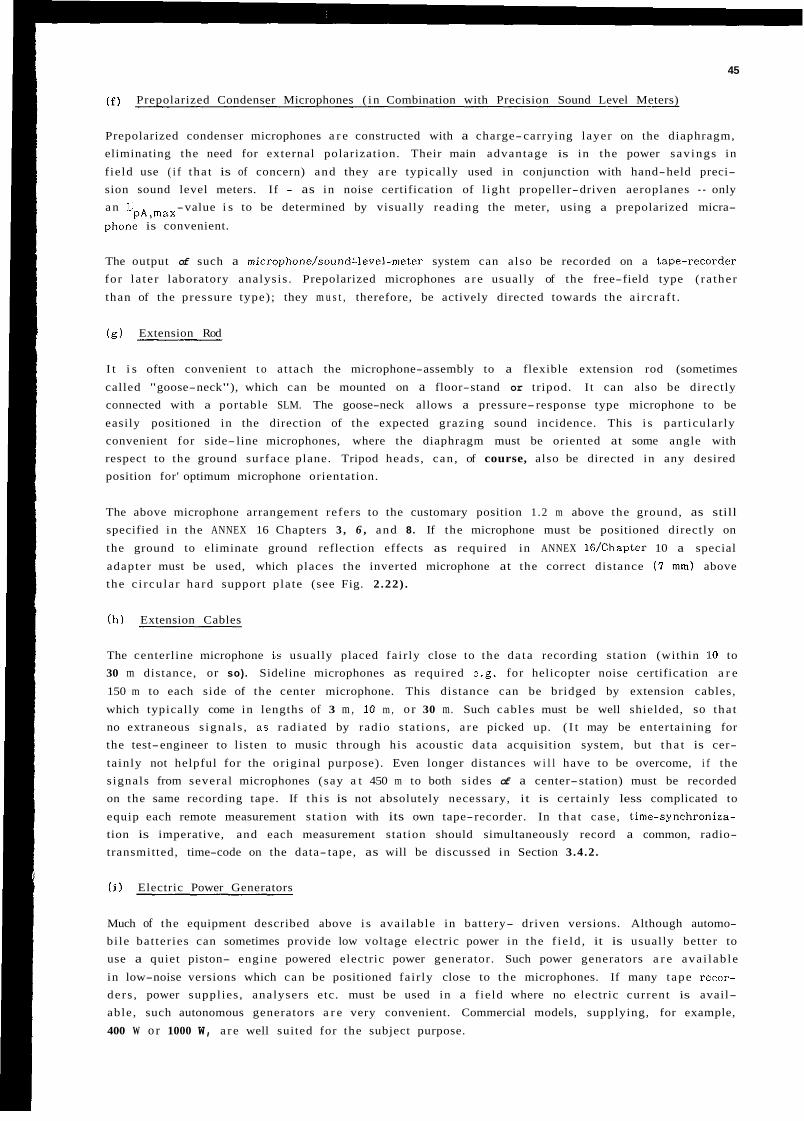
45
( f ) Prepolarized Condenser Microphones ( i n Combination with Precision Sound Level Meters)
Prepolarized condenser microphones a r e constructed with a charge-carrying layer on the diaphragm, eliminating the need for external polarization. Their main advantage is in the power sav ings in
f ield use ( i f tha t is of concern) and they a r e typically used in conjunction with hand-held preci- sion sound level meters. If - as in noise certification of l ight propeller-driven aeroplanes - only a n L -value i s to be determined by visually reading the meter, using a prepolarized micra-
phone is convenient. pA,max
The output of such a microphone/soundilevel-meter system can also be recorded on a tape-recarder for l a te r laboratory analysis . Prepolarized microphones a r e usually of the free-field type ( ra ther
than of the pressure type); they m u s t , therefore, be actively directed towards the a i rc ra f t .
(g) Extension Rod
I t i s often convenient t o a t tach the microphone-assembly to a flexible extension rod (sometimes
called "goose-neck"), which can be mounted on a floor-stand or tripod. I t can also be directly connected with a portable SLM. The goose-neck allows a pressure-response type microphone to be
easily positioned in the direction of the expected grazing sound incidence. This i s par t icular ly convenient for side- line microphones, where the diaphragm must be oriented at some angle with respect to the ground surface plane. Tripod heads, can , of course, also be directed in any desired position for' optimum microphone orientation.
The above microphone arrangement refers to the customary position 1 .2 m above the ground, as still specified in the ANNEX 16 Chapters 3 , 6 , and 8. If the microphone must be positioned directly on
the ground to eliminate ground reflection effects as required in ANNEX 16/Chapter 10 a special
adapter must be used, which places the inverted microphone at the correct distance (I mm) above the c i rcu la r hard support plate (see Fig. 2.22) .
( h ) Extension Cables
The centerline microphone i.s usually placed fair ly close to the da ta recording station (within 10 to 30 m distance, or so). Sideline microphones as required e.g. for helicopter noise certification a r e
150 m to each side of the center microphone. This distance can be bridged by extension cables,
which typically come in lengths of 3 m , 10 m , o r 30 m. Such cables must be well shielded, so tha t no extraneous s igna ls , as radiated by radio s tat ions, a r e picked up. ( I t may be entertaining for the test-engineer to listen to music through his acoustic da ta acquisition system, but t ha t is cer-
tainly not helpful for the or iginal purpose). Even longer distances w i l l have to be overcome, i f the s ignals from several microphones (say a t 450 m to both s ides of a center-station) must be recorded on the same recording tape. If t h i s is not absolutely necessary, it is certainly less complicated to
equip each remote measurement s tat ion with its own tape-recorder. In tha t case, time-synchroniza- tion is imperative, and each measurement station should simultaneously record a common, radio- transmitted, time-code on the data- tape, as will be discussed in Section 3.4.2.
( i ) Electric Power Generators
Much of the equipment described above i s avai lable in battery- driven versions. Although automo- bile bat ter ies can sometimes provide low voltage electric power in the f ie ld , it is usually better to use a quiet piston- engine powered electric power generator. Such power generators a r e ava i lab le
in low-noise versions which can be positioned fair ly close to the microphones. If many tape recar- ders , power supplies , analysers etc. must be used in a f ield where no electric current is avail- able, such autonomous generators a r e very convenient. Commercial models, supplying, for example,
400 W or 1000 W, a re well suited for the subject purpose.
46
3.2.2 Data Recording
! ( a ) Signal Conditioning (Amplification, Spectral S h a p a )
The s ignal , as it comes from the microphone via the preamplifier requires some conditioning prior
to recording. I t will have to be amplified and - i f necessary - spectrally shaped before it can be recorded on a recorder of limited dynamic range. The microphone s ignal is usually of the order of milliVolts (sometimes only microvolts) and must be amplified to the voltage required for the tape recorder (usual ly of the order of 1 Volt RMS). The s ignal conditioning depends on the or iginal sig-
na l strength and on the special characteristics of the acoustic s ignal (e .g. if It h a s predominantly low frequencies or predominantly high frequencies, o r if the dynamic range i s beyond the capabi l i- t ies of the recorder).
For example, the noise s ignature of a helicopter under blade s lap conditions with substant ial im- pulsive noise components may have a total dynamic range of 90 dE. A typical analog recorder, however, would not be capable of recording such a la rge dynamic range. In such a case one can
spectrally shape the s ignal by de-emphasizing (at tenuat ing) the low frequency-part with respect to the high-frequency par t , thus reducing the dynamic range of the ent i re s ignal before recording on
one channel. This. technique will also be discussed in Section 3.2.3.
Amplifiers with typical ga ins from 1 to 1000 in conju:nction with a band-pass f i l ter (e .g. var iab le
high-pasdow-pass capabil i t ies) could be used for such purposes. A commercially avai lable dua l channel filter for instance features a high-pass f i l ter with a variable low frequency cut-off 0.1 Hz
to 10 kHz. Such filtering can also be useful in field measurements where wind-induced noise of pre- dominantly low frequency could cause a n overloading of the tape- recorder's dynamic range.
( b ) Analog Tape Recorders (Direct Mode, Frequency-modulated ' F M ' Mode)
In the a rea of aircraf t noise research analog tape recorders a r e s t i l l most widely used, although
digi tal recorders (and moderately prized video-recorders) may eventually replace analog recorders on account of their substant ial advantages with respect to dynamic range, l ineari ty , track-to- track
phase match and long recording duration.
There a r e two basic' types of recording modes for analog tape recorders: direct recording ( D R ) and ( F M R ) . High quality tape-recorders accept p1.ug-in uni ts which allow
a l l or a number of channels to be converted from on6 into the other. In the DR-mode, the analog
s ignal is directly recorded on tape , while in the FM r(?cording mode the s ignal is modulated upon a carrier- frequency; amplitude variat ions then result in carrier-frequency modulations.
DR and FMR differ i n their relationships of tape-speed, achievable frequency range, dynamic
response and signal-to-noise rat io. In the DR-mode only AC-signals can be recorded down to a lowest frequency which is a function of tape-speed. A typical analog tape recorder, in the "inter- mediate band" mode, might have a DR-bandwidth of 30C' Hz - 600 kHz at the high tape speed of 120 in/s and one of 50 Hz - 2.3 kHz at the low tape speed of 15/32 i d s .
When operated in the FM-mode, tape-recorders can record from DC, i.e. from 0 Hz up to a highest frequency which again depends on the tape-speed. A typical t ape recorder - such as the RACAL
Starehorse 14 channel tape recorder (Fig. 3.5) in the intermediate band. mode - can record from 0 Hz to 40 kHz a t 120 in/s and from 0 Hz to 156 Hz a t 15/32 i d s . The benefits of FM recording l ie
in the good low-frequency phase linearity and the excellent amplitude s tabi l i ty . FM-recording i s therefore particularly useful, when acoustic wave-forms ("acoustic pressure time-histories") must be preserved ra ther than the spectral information.
For flyover noise measurements, where the typical frequency range of interest l i es between 50 Hz and 12.5 kHz one could use either the DR-mode at the la i r ly low tape speed of 3 3/4 in/s (with a n
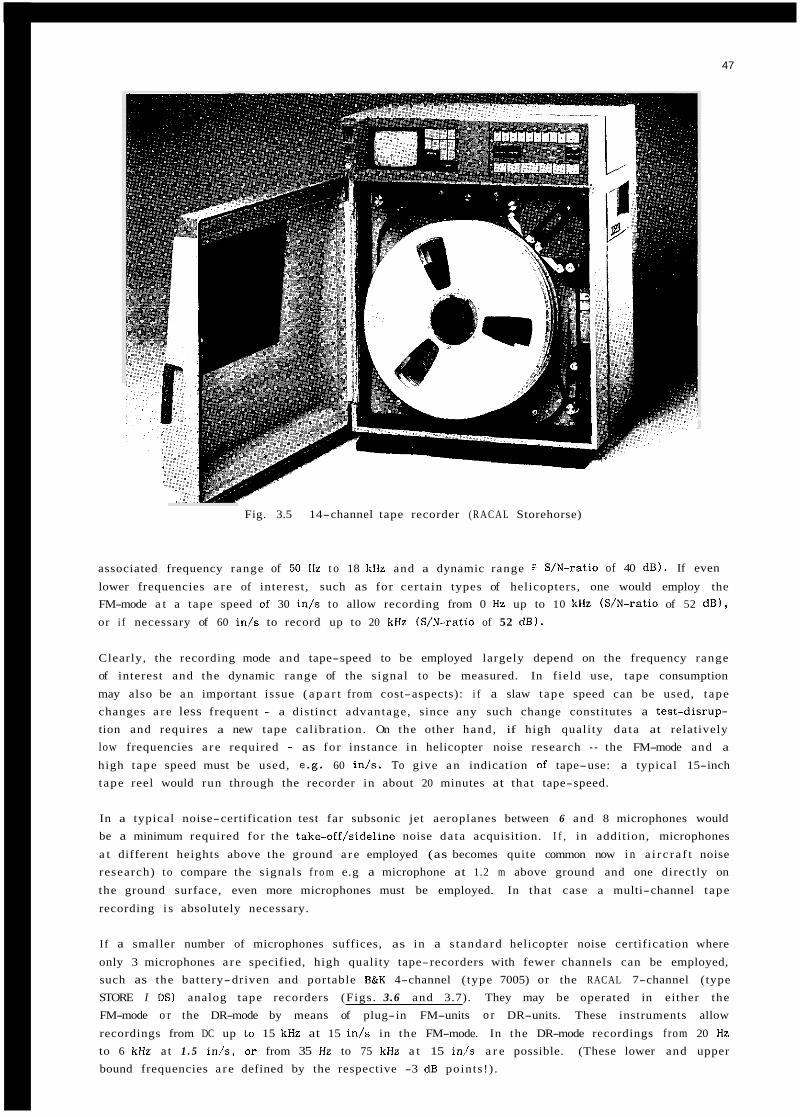
47
Fig. 3.5 14-channel tape recorder ( R A C A L Storehorse)
associated frequency range of SO Hz t o 18 kHz and a dynamic range
lower frequencies a r e of interest, such as for cer tain types of helicopters, one would employ the FM-mode a t a tape speed of 30 in /$ to allow recording from 0 Hz up to 10 kHz (S/N-ratio of 52 dB),
or i f necessary of 60 in/s to record up to 20 kHz (S/N-ratio of 52 dB).
S/N-ratio of 40 dB). If even
Clearly, the recording mode and tape-speed to be employed largely depend on the frequency range of interest and the dynamic range of the s ignal to be measured. In f ield use, tape consumption
may also be a n important issue ( a p a r t from cost-aspects): i f a slaw tape speed can be used, t ape changes a r e less frequent - a distinct advantage, since any such change constitutes a test-disrup- tion and requires a new tape cal ibrat ion. On the other hand , if high quality da ta at relatively low frequencies a r e required - as for instance in helicopter noise research - the FM-mode and a
high tape speed must be used, e .g. 60 i d s . To give a n indication of tape-use: a typical 15-inch tape reel would run through the recorder in about 20 minutes at that tape-speed.
In a typical noise-certification test far subsonic jet aeroplanes between 6 and 8 microphones would be a minimum required for the take-off/sideline noise da ta acquisition. I f , in addition, microphones
a t different heights above the ground a r e employed (as becomes quite common now i n a i r c r a f t noise research) to compare the s ignals f r o m e.g a microphone at 1.2 m above ground and one directly on
the ground surface, even more microphones must be employed. In that case a multi-channel t ape
recording i s absolutely necessary.
If a smaller number of microphones suffices, as in a s tandard helicopter noise certification where
only 3 microphones a r e specified, high quality tape-recorders with fewer channels can be employed, such as the battery-driven and portable B&K 4-channel ( type 7005) or the RACAL 7-channel (type STORE I DS) analog tape recorders (Figs. 3.6 and 3.7). They may be operated in either the FM-mode o r the DR-mode by means of plug-in FM-units o r DR-units. These instruments allow
recordings from DC up to 15 kHz at 15 in/s in the FM-mode. In the DR-mode recordings f rom 20 Hz to 6 kHz a t 1 . 5 i d s , or from 35 Hz to 75 kHz a t 15 in/s a r e possible. (These lower and upper bound frequencies a r e defined by the respective -3 dB points!) .
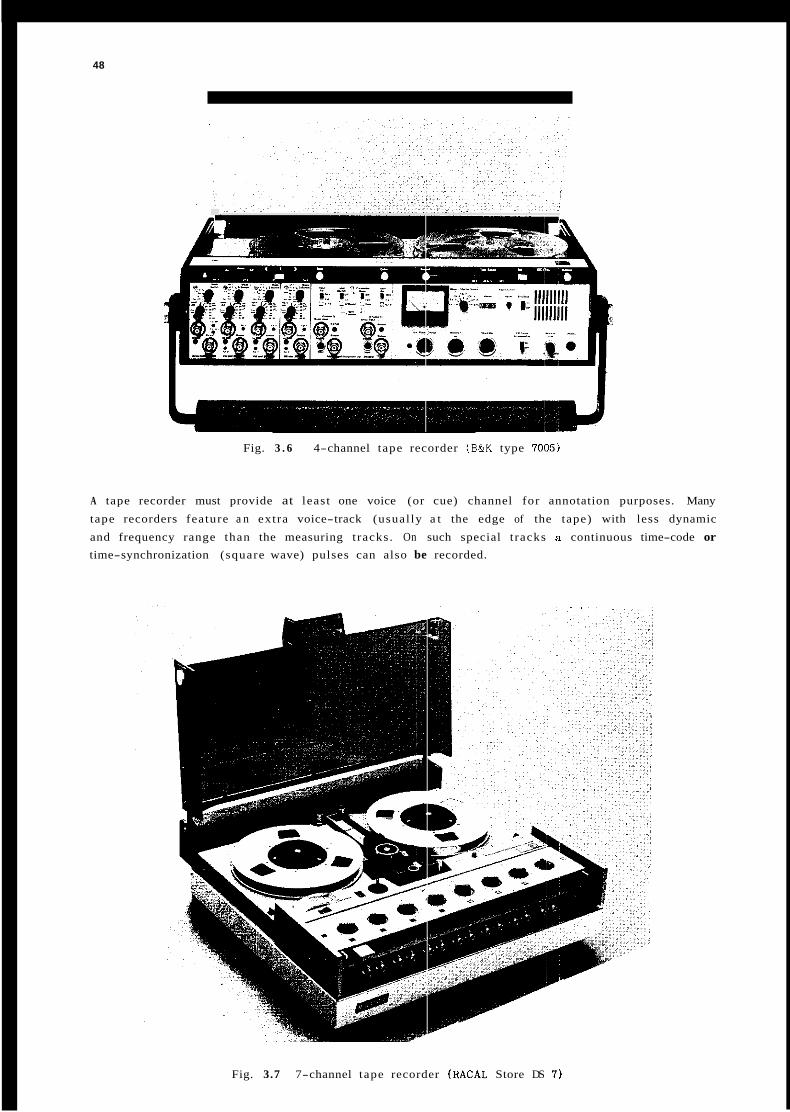
48
Fig. 3 . 6 4-channel tape recorder (B&K type '70051
A tape recorder must provide at least one voice (or cue) channel for annotation purposes. Many
tape recorders feature a n extra voice-track (usual ly a t the edge of the tape) with less dynamic
and frequency range than the measuring t racks. On such special t racks a continuous time-code or time-synchronization (square wave) pulses can also be recorded.
Fig. 3.7 7-channel tape recorder (RACAL Store DS 7)
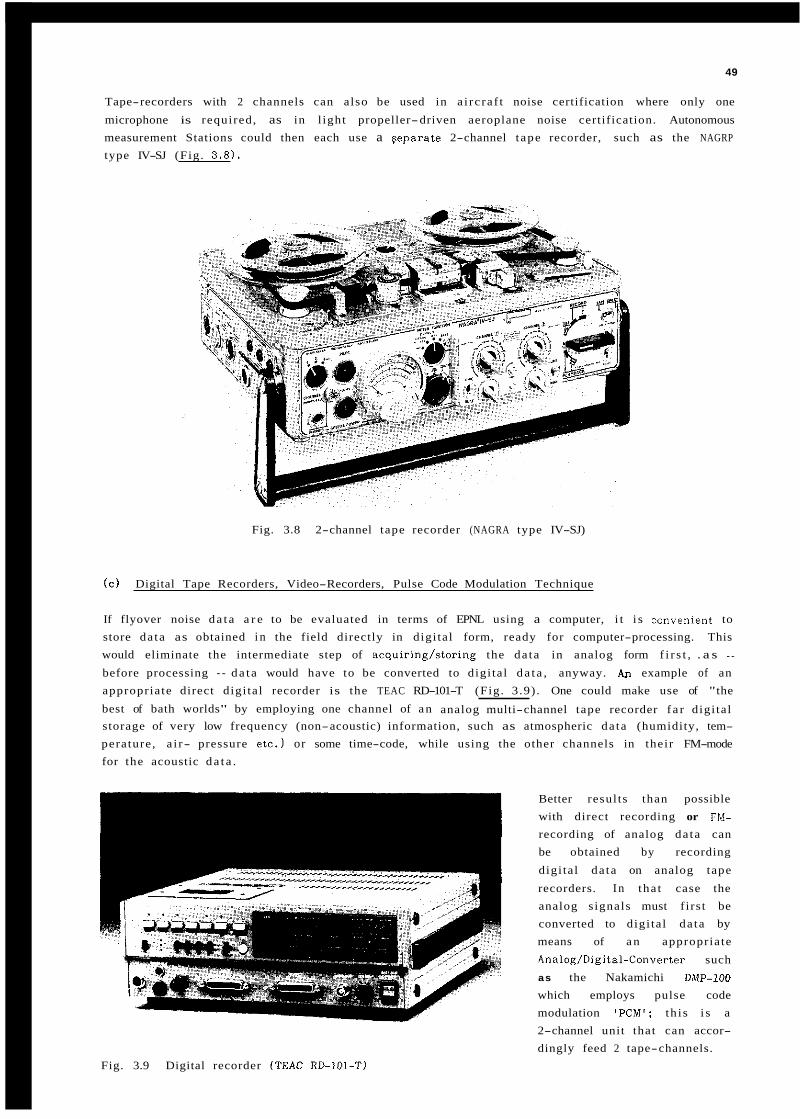
49
Tape-recorders with 2 channels can also be used in a i rc ra f t noise certification where only one
microphone is required, as in l ight propeller-driven aeroplane noise certification. Autonomous measurement Stations could then each use a Beparate 2-channel t ape recorder, such as the NAGRP
type IV-SJ (Fig. 3 .8) .
Fig. 3.8 2-channel tape recorder (NAGRA type IV-SJ)
( c ) Digital Tape Recorders, Video-Recorders, Pulse Code Modulation Technique
If flyover noise d a t a a r e to be evaluated in terms of EPNL using a computer, i t i s convenient to store da ta as obtained i n the field directly in digi tal form, ready for computer-processing. This would eliminate the intermediate step of acquiring/storing the da ta in analog form f i r s t , . a s -
before processing - d a t a would have to be converted to digi tal da t a , anyway. AI1 example of an appropriate direct digi tal recorder is the TEAC RD-101-T (Fig. 3 .9) . One could make use of "the
best of bath worlds" by employing one channel of a n analog multi-channel tape recorder f a r digi tal storage of very low frequency (non-acoustic) information, such as atmospheric da ta (humidity, tem- perature, a i r- pressure etc.) or some time-code, while using the other channels in their FM-mode for the acoustic da t a .
Better resul ts than possible with direct recording or FM-
recording of analog da ta can be obtained by recording
digi tal da ta on analog tape
recorders. I n tha t case the analog s ignals must f i rs t be converted to digi tal da ta by means of a n appropriate
Analog/Digital-Converter such as the Nakamichi DMP-100
which employs pulse code modulation 'PCM'; th i s i s a 2-channel unit that can accor- dingly feed 2 tape-channels.
Fig. 3.9 Digital recorder (TEAC RD-101-T)
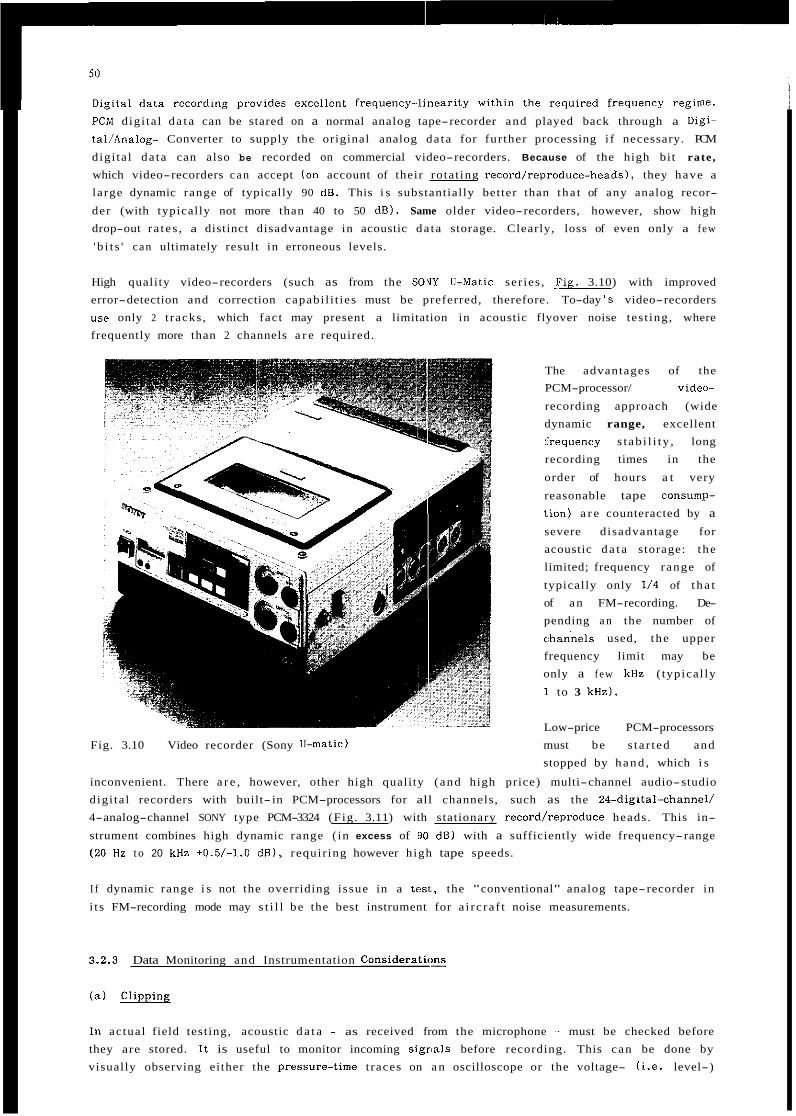
PCM digi ta l d a t a can be stared on a normal analog tape-recorder and played back through a Digi- tal/Analog- Converter to supply the original analog da ta for fur ther processing i f necessary. PCM
digi ta l da ta can also be recorded on commercial video-recorders. Because of the high bit rate,
which video-recorders c a n accept (on account of their rotat ing record/reproduce-heads), they have a
large dynamic range of typically 90 dB. This i s substantially better than tha t of any analog recor-
der (with typically not more than 40 to 50 dB1. Same older video-recorders, however, show high drop-out r a tes , a distinct disadvantage in acoustic da ta storage. Clearly, loss of even only a few
' b i t s ' can ultimately result in erroneous levels.
High quality video-recorders (such as from the SOVY U-Matic ser ies , x i g . 3.10) with improved error-detection and correction capabi l i t ies must be preferred, therefore. To-day ' s video-recorders use only 2 t racks , which fact may present a limitation in acoustic flyover noise tes t ing, where frequently more than 2 channels a r e required.
The advantages of the PCM-processor/ video-
recording approach (wide dynamic range, excellent lfrequency s t ab i l i ty , long recording times in the
order of hours a t very
reasonable tape consump- t.ion) a r e counteracted by a severe disadvantage for acoustic d a t a storage: the limited; frequency range of
typically only 114 of t h a t of a n FM-recording. De- pending a n the number of chan'nels used, the upper frequency limit may be only a few kHz ( typical ly
1 to 3 kHz).
Low-price PCM-processors Fig. 3.10 Video recorder (Sony U-matic) must be s ta r t ed and
inconvenient. There a r e , however, other high quality (and high price) multi-channel audio-studio digi ta l recorders with built- in PCM-processors for all channels, such as the 24-digital-channel/ 4-analog-channel SONY type PCM-3324 (Fig. 3.11) with stationary record/reproduce heads. This in-
strument combines high dynamic range ( in excess of 90 dB1 with a sufficiently wide frequency-range (20 Hz to 20 kHz +0.5/-1.0 dB), requir ing however high tape speeds.
stopped by h a n d , which i s
I f dynamic range i s not the overriding issue in a tesl., the "conventional" analog tape-recorder in
i t s FM-recording mode may s t i l l be the best instrument for a i rc ra f t noise measurements.
3.2.3 Data Monitoring and Instrumentation Cons idera l icz
In actual field testing, acoustic d a t a - as received from the microphone - must be checked before they are stored. I t is useful to monitor incoming sigrtals before recording. This can be done by visually observing either the pressure-time t races on a n oscilloscope or the voltage- (i .e. level-)
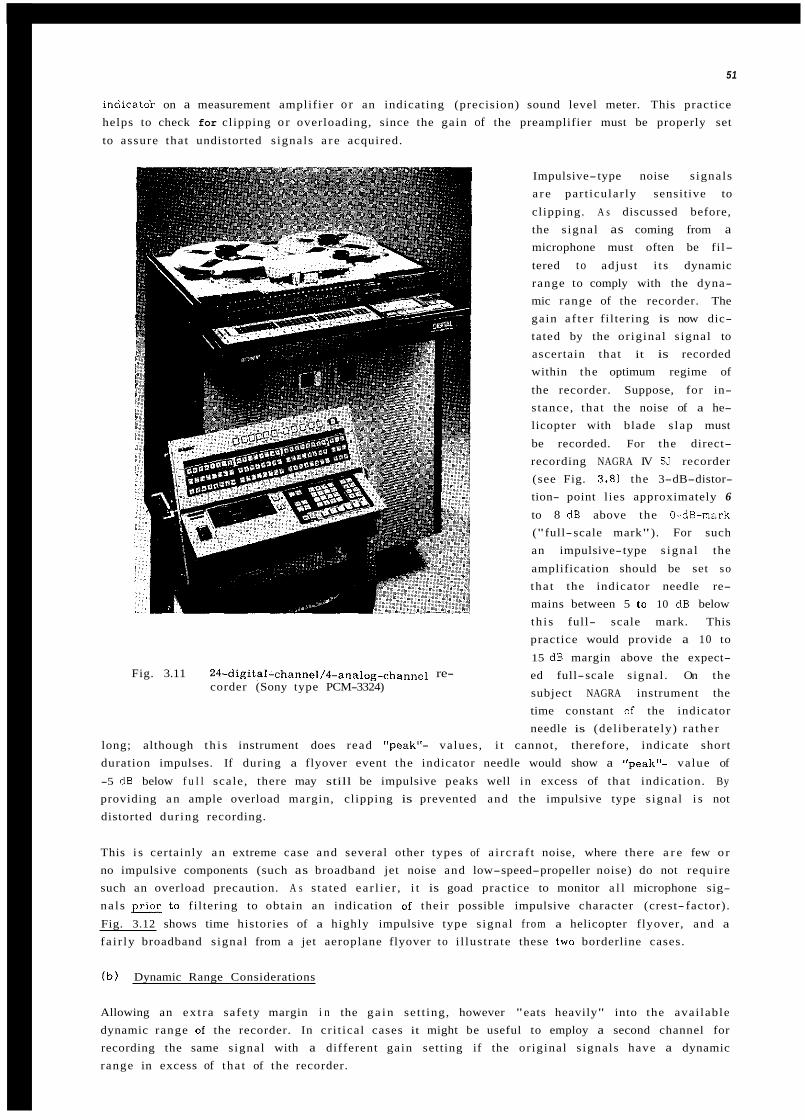
51
indicatdr on a measurement amplifier o r an indicating (precision) sound level meter. This practice helps to check for clipping o r overloading, since the gain of the preamplifier must be properly set
to assure that undistorted s ignals a r e acquired.
Fig. 3.11 24-digital-channel/4-analog-channel re- corder (Sony type PCM-3324)
Impulsive-type noise s ignals a r e part icular ly sensitive to
clipping. A s discussed before, the s ignal as coming from a microphone must often be fil-
tered to adjust i t s dynamic range to comply with the dyna- mic range of the recorder. The gain a f te r filtering is now dic- tated by the or iginal s ignal to ascertain that it is recorded within the optimum regime of
the recorder. Suppose, for in- stance, that the noise of a he- licopter with blade s lap must
be recorded. For the direct- recording NAGRA IV SJ recorder (see Fig. 3.8) the 3-dB-distor- tion- point lies approximately 6 to 8 dB above the 0-dB-mark ("full-scale mark"). For such an impulsive-type s igna l the
amplification should be set so
tha t the indicator needle re- mains between 5 to 10 dB below th i s full- scale mark. This practice would provide a 10 to
15 dB margin above the expect- ed full-scale s ignal . On the subject NAGRA instrument the time constant of the indicator needle is (del iberately) ra ther
long; although t h i s instrument does read "peak"- values, i t cannot, therefore, indicate short duration impulses. If during a flyover event the indicator needle would show a "peak"- value of
-5 dB below f u l l scale , there may still be impulsive peaks well in excess of that indication. By
providing a n ample overload margin, clipping is prevented and the impulsive type s ignal i s not distorted during recording.
This i s certainly a n extreme case and several other types of a i rc ra f t noise, where there a r e few o r
no impulsive components (such as broadband jet noise and low-speed-propeller noise) do not require such an overload precaution. A s s ta ted ear l ie r , i t is goad practice to monitor a l l microphone sig- na ls prior to filtering to obtain an indication of their possible impulsive character (crest- factor).
Fig. 3.12 shows time histories of a highly impulsive type s ignal f rom a helicopter flyover, and a
fa i r ly broadband signal from a jet aeroplane flyover to i l lustrate these two borderline cases.
( b ) Dynamic Range Considerations
Allowing an ex t ra safety margin i n the g a i n set t ing, however "eats heavily" into the avai lable dynamic range of the recorder. In cr i t ical cases it might be useful to employ a second channel for recording the same signal with a different gain setting if the or iginal s ignals have a dynamic range in excess of tha t of the recorder.
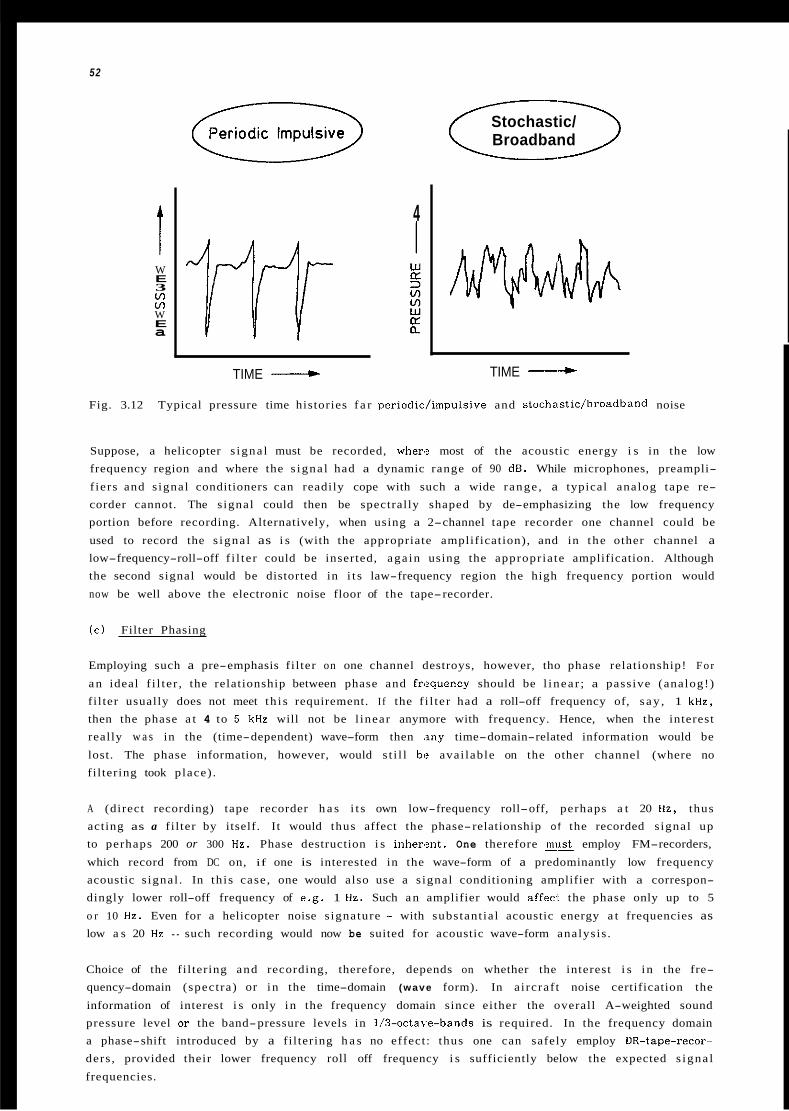
52
t W E 3 v) v) W E a
Periodic Impulsive c 3 4
Stochastic/ Broadband
TIME TIME ----)
Fig. 3.12 Typical pressure time histories f a r periodic/impulsive and stochast idbroadband noise
Suppose, a helicopter s igna l must be recorded, wher. most of the acoustic energy i s in the low frequency region and where the s igna l had a dynamic range of 90 dB. While microphones, preampli-
f iers and s ignal conditioners can readily cope with such a wide range , a typical analog tape re- corder cannot. The s ignal could then be spectrally shaped by de-emphasizing the low frequency portion before recording. Alternatively, when using a 2-channel tape recorder one channel could be
used to record the s igna l as i s (with the appropriate amplification), and in the other channel a low-frequency-roll-off f i l ter could be inserted, aga in using the appropriate amplification. Although the second signal would be distorted in i t s law-frequency region the high frequency portion would
now be well above the electronic noise floor of the tape-recorder.
( c ) Filter Phasing
Employing such a pre-emphasis f i l ter on one channel destroys, however, tho phase relationship! For
a n ideal f i l te r , the relationship between phase and fr,?quency should be l inea r ; a passive (analog!) f i l ter usually does not meet th i s requirement. If the f i l ter had a roll-off frequency of, s a y , 1 k H z , then the phase a t 4 to 5 kHz will not be l inear anymore with frequency. Hence, when the interest really w a s in the (time-dependent) wave-form then ,any time-domain-related information would be
lost. The phase information, however, would s t i l l bf? avai lable on the other channel (where no fi l tering took place) .
A (direct recording) tape recorder h a s i t s own low-frequency roll-off, perhaps a t 20 H z , thus acting as a fi l ter by itself. It would thus affect the phase-relationship o f the recorded s ignal up to perhaps 200 or 300 Hz. Phase destruction i s inheixnt. One therefore employ FM-recorders,
which record from DC on, if one is interested in the wave-form of a predominantly low frequency acoustic s ignal . In th is case , one would also use a s ignal conditioning amplifier with a correspon- dingly lower roll-off frequency of e.g. 1 Hz. Such a n amplifier would affecr the phase only up to 5
o r 10 Hz. Even for a helicopter noise s ignature - with substant ia l acoustic energy a t frequencies as low a s 20 Hz - such recording would now be suited for acoustic wave-form analysis .
Choice of the fi l tering and recording, therefore, depends on whether the interest i s in the fre- quency-domain (spectra) or in the time-domain (wave form). In a i rcraf t noise certification the
information of interest i s only in the frequency domain since either the overall A-weighted sound pressure level or the band-pressure levels in 1/3-octave-bands is required. In the frequency domain a phase-shift introduced by a fil tering h a s no effect: thus one can safely employ DR-tape-recor- ders , provided their lower frequency roll off frequency i s sufficiently below the expected s igna l
frequencies.
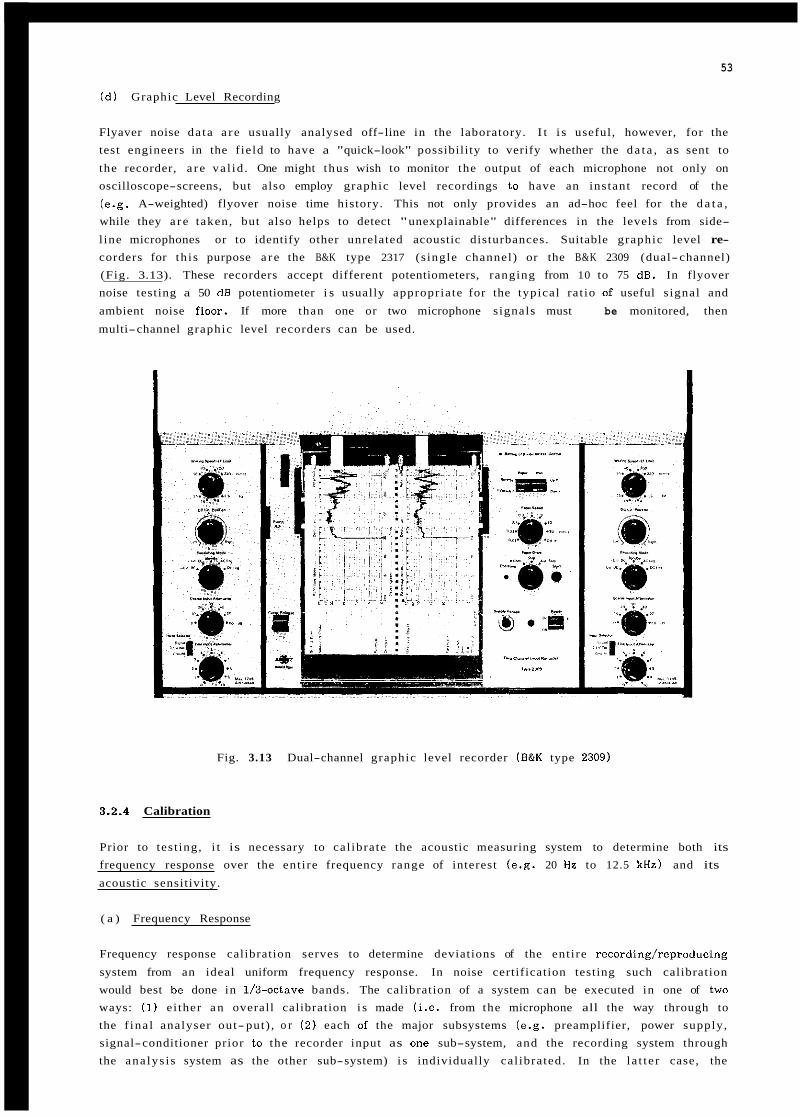
53
( d ) Graphic Level Recording
Flyaver noise da ta a r e usually analysed off-line in the laboratory. I t i s useful, however, for the test engineers in the f ield to have a "quick-look" possibility to verify whether the da t a , as sent to
the recorder, a r e va l id . One might thus wish to monitor the output of each microphone not only on oscilloscope-screens, but also employ graphic level recordings to have an instant record of the (e.g. A-weighted) flyover noise time history. This not only provides an ad-hoc feel for the d a t a , while they a r e taken, but also helps to detect "unexplainable" differences in the levels from side-
l ine microphones or to identify other unrelated acoustic disturbances. Suitable graphic level re- corders for th i s purpose a r e the B&K type 2317 (s ingle channel) or the B&K 2309 (dual-channel) (Fig. 3.13). These recorders accept different potentiometers, ranging from 10 to 75 dB. In flyover noise testing a 50 dB potentiometer i s usually appropriate for the typical rat io of useful s ignal and
ambient noise floor. If more than one or two microphone s ignals must
multi-channel graphic level recorders can be used.
be monitored, then
Fig. 3.13 Dual-channel graphic level recorder (B&K type 2309)
3.2.4 Calibration
Prior to test ing, i t is necessary to cal ibrate the acoustic measuring system to determine both its frequency response over the ent i re frequency range of interest (e .g. 20 Hz to 12.5 kHz) and its
acoustic sensitivity.
( a ) Frequency Response
Frequency response calibration serves to determine deviations of the ent i re recording/reproducing
system from an ideal uniform frequency response. In noise certification testing such calibration would best be done in l b o c t a v e bands. The calibration of a system can be executed in one of two ways: (1) ei ther a n overall calibration i s made (i.e. from the microphone all the way through to the f ina l analyser out- put) , o r (2 ) each of the major subsystems (e.g. preamplifier, power supply, signal-conditioner prior to the recorder input as one sub-system, and the recording system through the ana lys i s system as the other sub-system) i s individually cal ibrated. In the la t te r case, the
54
Calibration s ignals a r e inserted at the input of each sub-system and the output is obtained at the las t component of the sub-system. The electrical response of the ent i re system i s then the arithmetic sum of the individual responses from each Sub-system.
Before determining the system response, the pressure response of any microphone can be obtained by means of an electrostatic actuator , employing for example a reciprocity ca.libration appara tus (e.g. B&K type 4143) in conjunction with an adapter (B&K type UA 0023). When applying an appropriate sine-signal to the actuator , the resulting electrical f ie ld w i l l move the microphone diaphragm in a
way similar to an acoustic s ignal , providing the frequency response of the microphone i tself . Fre-
quently, however, the manufacturer's calibration sheet on microphone sensitivity is accepted, since only mechanical damage of the diaphragm or some gross mishandling could a l te r i t s frequency re- sponse.
The system-response i s obtained by feeding a n electrical s ignal from a sine/random-noise generator to the microphone-preamplifier from which the microphone cartr idge has been removed. The s ignal i s
then swept through the frequency range of interest . In noise certification testing a broad-band signal ( ra ther than a discrete-frequency s igna l ) sweep i s employed; a n appropriate broadband
signal would be 1/3-octave filtered random noise, since in measuring a i rc ra f t noise i t is the 1/3-octave band spectra that a r e of interest. Instead of white noise (noise of uniform spectral den-
sity : absolute constant bandwidth), pink-noise (white noise fed through a -3 dB/octave f i l t e r ) is sometimes preferred for cal ibrat ing a n acoustic mea;jurement system, since i t provides a uniform level for a 1/3-octave (E relative constant bandwidth) representation.
The output at the f ina l component of the system ( o r sub-system) then constitutes the frequency- dependent deviation f r o m the original input, i.e. the system's frequency response to any given in-
put s ignal . This information is then used to correct t'ie sound-pressure band levels.
( b ) Acoustic Sensitivity
While the above calibration serves to determine the l ineari ty of the frequency response, the abso- lute sensitivity is best determined by means of an acoustic cal ibrator generating a known sound pressure. An appropriate acoustic cal ibrator is the pistonphone. Pistonphones (being l ight in weight, portable and battery-driven) a r e held on top of the microphone-cartridge, where they gene-
ra te a n extremely s table , reproducible and constant sound pressure level of e.g. 124 dB at 250 Hz. There are other types of pistonphones that operate at 1000 Hz or a t other preset frequencies and
adjustable levels. I t suffices to check the acoustic sensitivity at one frequency only, as the frequency response i s already known from the calibration procedure described above under ( a ) .
( c ) Insert Voltage Frequency Calibration
In field testing, where a substant ial number of microphones i s used that a r e often located at la rge
distances from the central measuring s tat ion, it i s amivisable to use the insert voltage calibration technique. This i s a convenient method for remotely field-checking the electrical sensitivity of a complete sound measurement system, including preamplifiers and cables. The method does, however, not account fo r the mechanical parameters which determine the acoustic properties of the microphone cartr idge itself.
A special preamplifier such as the B&K type 2645 far a 1/2 inch diam microphone cartr idge i s
then inserted between the microphone cartr idge and the power supply; the power-supply i s connected to the preamplifier input socket of a measuring ampltfier or a frequency analyser of a type that
can supply an insert voltage (e .g. the B&K measuring; amplifier type 2636). I t i s also possible to use a n external sine-generator with variable frequency and voltage aulput. The ent ire frequency and level calibration of the measuring system ("downstream" of the microphone cartr idge) can then
be done remotely, eliminating the need to perform individual pistonphone cal ibrat ions on each microphone.
55
( d ) Measuring-Instrument Detectorllndicator Characteristics
The calibration-procedures discussed so far apply t o continuous s ignals . Aircraft flyover noise i s ,
however, inherently t ransient in nature and sometimes highly impulsive. In these cases the detec- torlindicator character is t ics of the metering instrument must be well understood in order to correct- ly interprete the s ignal observed.
Sound level meters (SLMs) are usual ly equipped with several preset response character is t ics , e.g. termed ' impulse ' , ' fast ' , and 's low' . These designations refer to the speed with which the indi- cator-needle on the metering instrument ( the "scale") approaches a maximum value. The cr i t ical
parameter i s the 'time-constant' of the 'exponential* averaging circui t ' in the instrument; these time constant - in "precision SLMs" - a re 35 m s , 125 m s , and 1000 m s far the detector responses ' impulse ' , ' f a s t ' , and 's low' , respectively.
If a ( tona l ) sound burst is applied to an SLM, the needle will s t a r t deflecting. But before i t h a s
reached the deflection that would correspond to the maximum signal level, the burst h a s ended and the needle will fall back again. The speed at which t h i s happens is a function of the duration of the tone-burst ti and of the detector time constant T . The number of deciBels Delta L by which the needle "fails" to reach the maximum can be calculated from
Delta L = 10 log ((1 - exp(- t i / t ) )
For example, i f a tone burst of 200 m s duration i s applied to the SLM set a t the detector-response
' fas t ' , the needle would come up to 1 dB of the maximum level ; i f the detector-response w a s set at ' s l o w ' , it would miss the maximum by 7.4 dB.
Aircraft do not emit single tone-bursts, but "sequences of tone-bursts" (repetitive sound events of short durat ion) which for a helicopter under a blade-slap condition would t ranslate into a periodic emission of impulses of identical wave-forms. A four-blade helicopter with a main-rotor speed of 400
RPM will, for example, emit 20 impulses per second, each perhaps only 10 m s long. The sound level meter will then show a n average needle-indication, several deciBels below the maximum sound level during the pulses.
The amount Delta L, by which the needle misses the maximum sound level is again a function of
the detector-response time constant and the burst duration (or some character is t ic time duration of the individual impulse-signal), but now also of the repetition r a t e of the bursts T , given by
10 log (((1 - exp ( - t i l T ) ) / ( ( I - exp (-T/ T ) ) ) Delta L =
These dependences a r e i l lustrated in Figs. 3.14 and 3.15.
I t is therefore necessary to specify the detector-response character is t ics of the sound level meter that is used to measure a i rc ra f t flyover noise levels. ANNEX 16 specifies a "slow" setting of SLMs (or equivalent measuring amplifiers) in all cases. This i s not wrong, even for impulsive type
sounds, as long as it i s understood tha t the levels obtained depend strongly on the part icular time constant selected; na tura l ly , a 'slaw'- reading produces lower levels than if a 'fast ' or an ' impulse'- reading w a s taken. But i f one agrees an one par t icu la r set t ing, then all a i rc ra f t of a cer tain type a r e treated equal ly.
This las t statement is not entirely t rue , since impulsive type sound signatures a r e also characte- rized by their crest-factor. The crest-factor is the ra t io of the peak sound level to the root- mean-square value of a wave during a given period of time. A very steep needle-type wave-farm
* exponential averaging refers to the fac t that averaging occurs continuously, i.e. is up-dated a l l the time. In contrast , l inear averaging refers. to averaging during a preset time interval
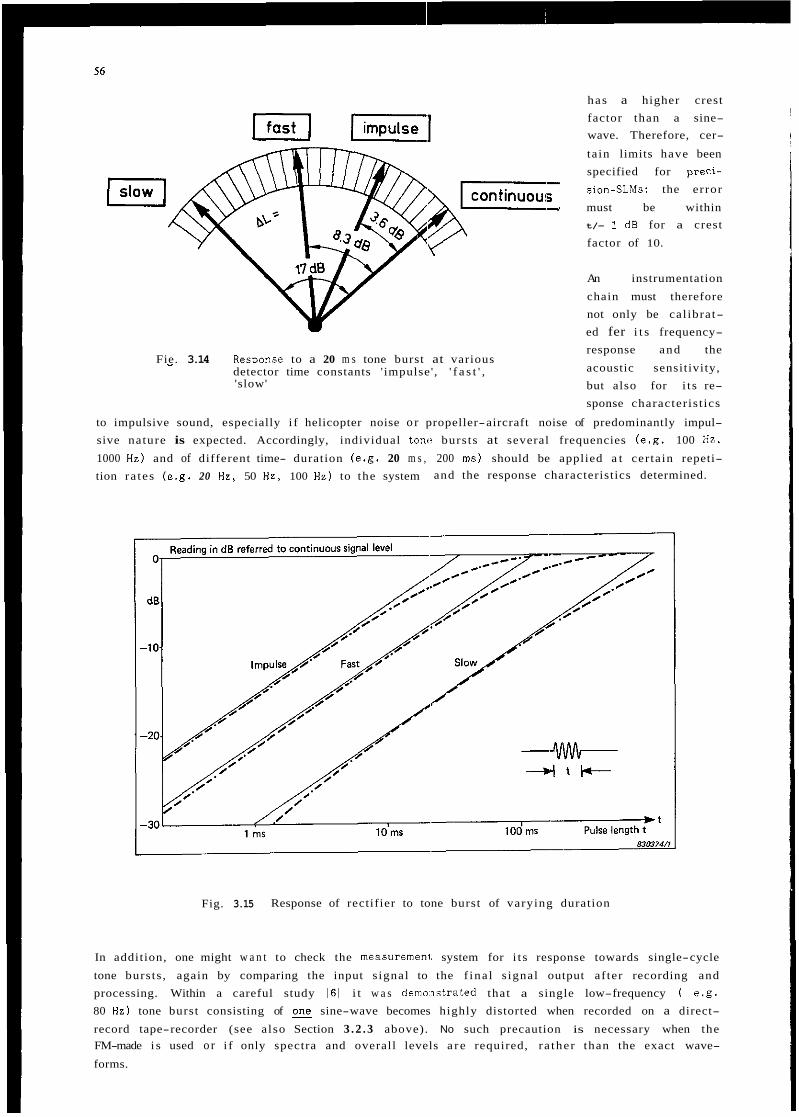
Fie. 3.14 ResDonse to a 20 m s tone burst at various - detector time constants ' impulse' , ' f a s t ' , 'slow'
has a higher crest factor than a sine- wave. Therefore, cer-
tain limits have been specified for pre.ci- sion-SLMs: the error
must be within t/- 1 dB for a crest
factor of 10.
An instrumentation
chain must therefore not only be cal ibrat- ed fer i t s frequency- response and the
acoustic sensitivity, but also for i t s re- sponse character is t ics
to impulsive sound, especially i f helicopter noise o r propeller-aircraft noise of predominantly impul- sive nature is expected. Accordingly, individual tone bursts at several frequencies (e .g. 100 H z , 1000 Hz) and of different time- duration (e.g. 20 m s , 200 m s ) should be applied a t cer tain repeti- tion ra tes (e.g. 20 Hz, 50 H z , 100 Hz) to the system and the response characteristics determined.
Fig. 3.15 Response of rectifier to tone burst of varying duration
In addition, one might w a n t to check the measuremenl system for i t s response towards single-cycle
tone bursts , again by comparing the input s ignal to the f ina l s ignal output af ter recording and processing. Within a careful study 161 i t w a s demo7strated that a single low-frequency ( e .g . 80 Hz) tone burst consisting of E sine-wave becomes highly distorted when recorded on a direct-
record tape-recorder (see also Section 3 . 2 . 3 above). No such precaution is necessary when the FM-made i s used o r i f only spectra and overall levels a r e required, ra ther than the exact wave-
forms.
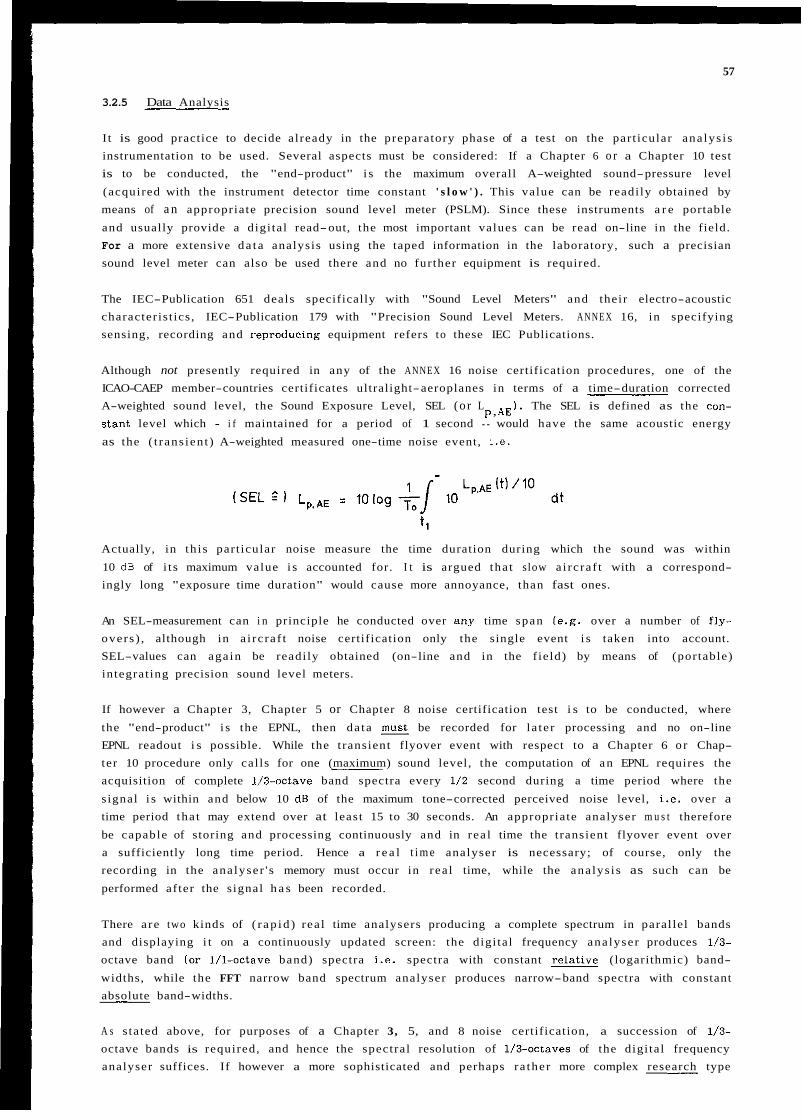
57
3.2.5 Data Analysis
I t is good practice to decide already in the preparatory phase of a test on the part icular ana lys i s instrumentation to be used. Several aspects must be considered: If a Chapter 6 o r a Chapter 10 test is to be conducted, the "end-product" i s the maximum overall A-weighted sound-pressure level
(acquired with the instrument detector time constant ' s l o w ' ) . This value can be readi ly obtained by means of a n appropriate precision sound level meter (PSLM). Since these instruments a r e portable
and usually provide a digi tal read-out, the most important values can be read on-line in the field. For a more extensive d a t a analysis using the taped information in the laboratory, such a precisian sound level meter can also be used there and no further equipment is required.
The IEC-Publication 651 deals specifically with "Sound Level Meters" and their electro-acoustic character is t ics , IEC-Publication 179 with "Precision Sound Level Meters. A N N E X 16, in specifying sensing, recording and reproducing equipment refers to these IEC Publications.
Although not presently required in any of the ANNEX 16 noise certification procedures, one of the ICAO-CAEP member-countries certificates ultralight-aeroplanes in terms of a time-duration corrected A-weighted sound level, the Sound Exposure Level, SEL (or L ) . The SEL is defined as the con- s tan t level which - i f maintained for a period of 1 second - would have the same acoustic energy
as the ( t rans ien t ) A-weighted measured one-time noise event, i.e.
P , A E
Actually, in th i s part icular noise measure the time duration during which the sound was within
10 dB of i t s maximum value i s accounted for. I t is argued tha t slow a i rc ra f t with a correspond- ingly long "exposure time duration" would cause more annoyance, than fast ones.
An SEL-measurement can i n principle he conducted over any time span 1e.g. over a number of fly- overs ) , although in a i rc ra f t noise certification only the single event i s taken into account. SEL-values can aga in be readi ly obtained (on-line and in the f ield) by means of (portable) integrat ing precision sound level meters.
If however a Chapter 3, Chapter 5 or Chapter 8 noise certification test i s to be conducted, where
the "end-product" i s the EPNL, then da ta must be recorded for la te r processing and no on-line EPNL readout i s possible. While the t ransient flyover event with respect to a Chapter 6 o r Chap- ter 10 procedure only cal ls for one (maximum) sound level, the computation of a n EPNL requires the acquisition of complete 1/3-octave band spectra every 1/2 second during a time period where the
s ignal i s within and below 10 dB of the maximum tone-corrected perceived noise level, i.e. over a time period tha t may extend over at least 15 to 30 seconds. An appropriate analyser m u s t therefore
be capable of storing and processing continuously and in rea l time the t ransient flyover event over a sufficiently long time period. Hence a r e a l t i m e analyser is necessary; of course, only the recording in the ana lyser ' s memory must occur in rea l time, while the ana lys i s as such can be
performed af ter the s ignal h a s been recorded.
There a re two kinds of ( r ap id ) rea l time analysers producing a complete spectrum in paral lel bands and displaying i t on a continuously updated screen: the digi tal frequency ana lyser produces 1/3- octave band (or l/l-octave band) spectra i .e . spectra with constant (logarithmic) band-
widths, while the FFT narrow band spectrum analyser produces narrow-band spectra with constant absolute band-widths.
A s s ta ted above, for purposes of a Chapter 3, 5, and 8 noise certification, a succession of 1/3- octave bands is required, and hence the spectral resolution of 1/3-octaves of the digi tal frequency analyser suffices. If however a more sophisticated and perhaps ra ther more complex research type
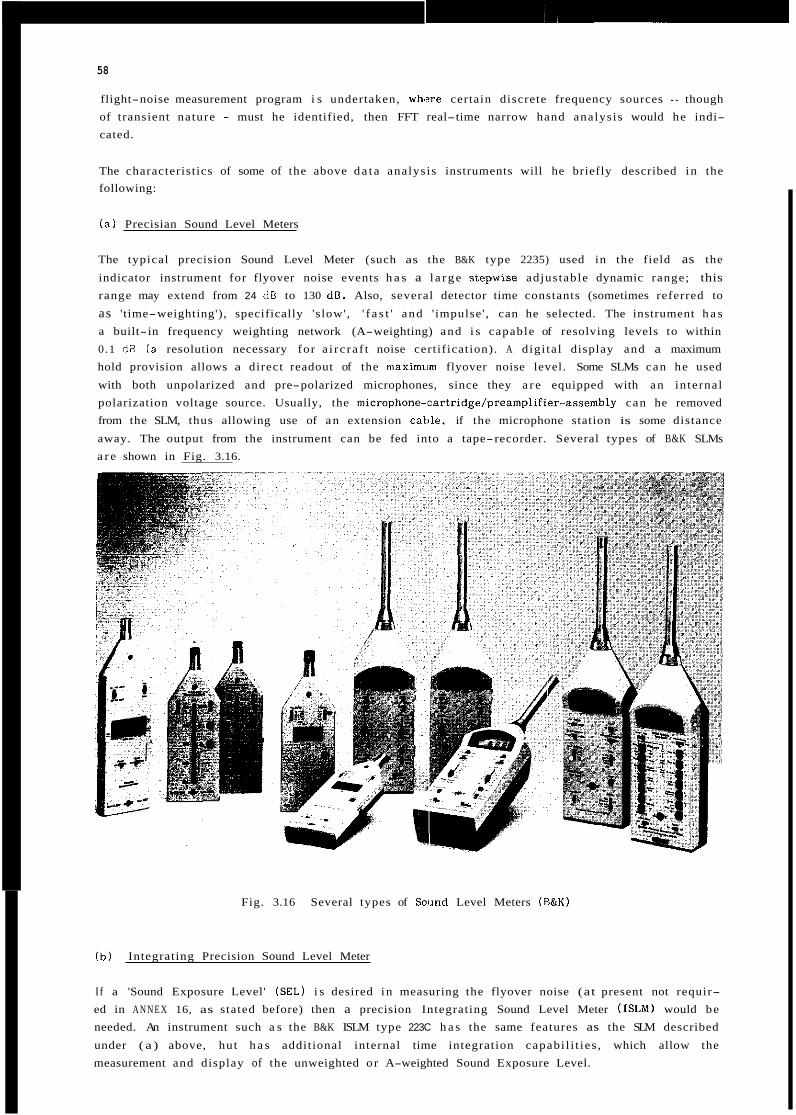
58
flight-noise measurement program i s undertaken, whfsre certain discrete frequency sources - though of transient nature - must he identified, then FFT real-time narrow hand analysis would he indi- cated.
The characteristics of some of the above d a t a analysis instruments will he briefly described in the following:
( a ) Precisian Sound Level Meters
The typical precision Sound Level Meter (such as the B&K type 2235) used in the field as the
indicator instrument for flyover noise events h a s a l a r g e stepwise adjustable dynamic range; this range may extend from 24 dB to 130 dB. Also, several detector time constants (sometimes referred to
as 'time-weighting'), specifically 'slow', ' f a s t ' and ' impulse' , can he selected. The instrument h a s a built-in frequency weighting network (A-weighting) and i s capable of resolving levels to within 0.1 dB ( a resolution necessary for a i rc ra f t noise certification). A d igi ta l display and a maximum hold provision allows a direct readout of the maximrim flyover noise level. Some SLMs can he used
with both unpolarized and pre-polarized microphones, since they a r e equipped with a n internal polarization voltage source. Usually, the microphone-cartridgdpreamplifier-assembly can he removed from the SLM, thus allowing use of a n extension cahle, if the microphone station is some distance
away. The output from the instrument can be fed into a tape-recorder. Several types of B&K SLMs a r e shown in Fig. 3.16.
Fig. 3.16 Several types of Soiind Level Meters ( B & K )
(b ) Integrating Precision Sound Level Meter
If a 'Sound Exposure Level' (SEL) i s desired in measuring the flyover noise (at present not requir- ed in A N N E X 16, as stated before) then a precision Integrating Sound Level Meter (ISLM) would be needed. An instrument such a s the B&K ISLM type 223C h a s the same features as the SLM described
under ( a ) above, hut h a s additional internal time integration capabi l i t ies , which allow the measurement and display of the unweighted or A-weighted Sound Exposure Level.
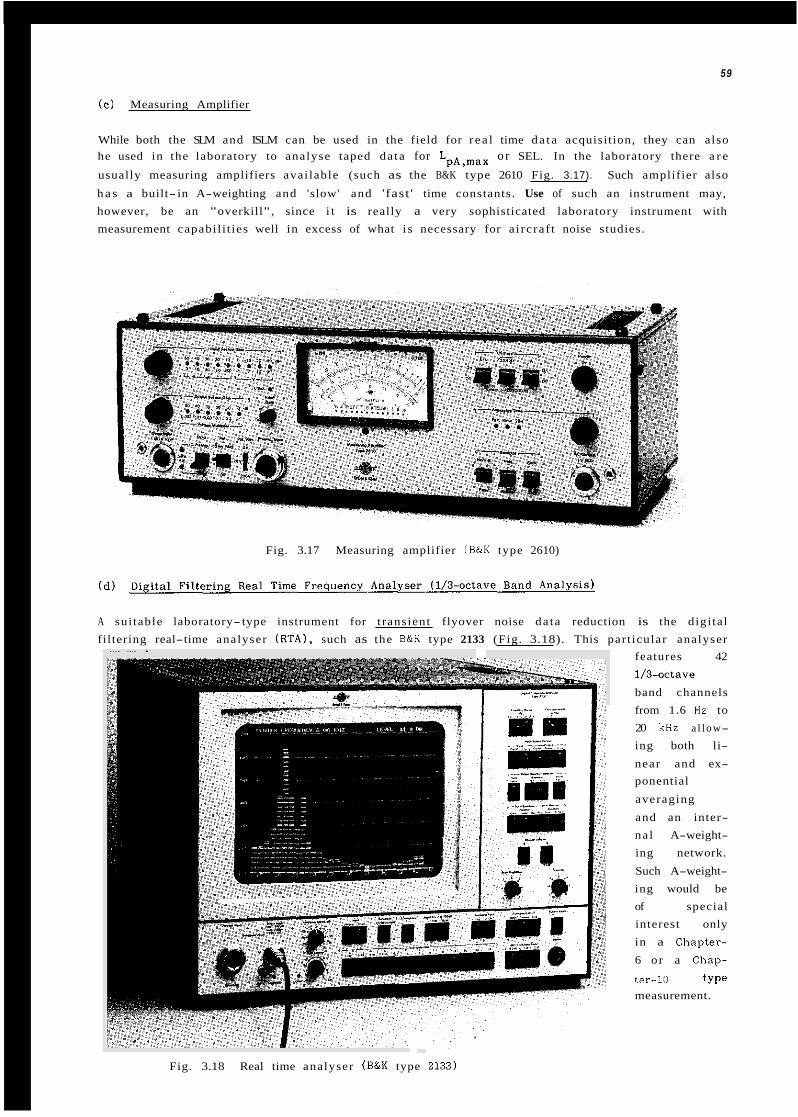
59
( c ) Measuring Amplifier
While both the SLM and ISLM can be used in the field for r e a l time d a t a acquisition, they can also he used in the laboratory to analyse taped da ta for LpA,max o r SEL. In the laboratory there a r e
usually measuring amplifiers avai lable (such as the B&K type 2610 Fig. 3.17). Such amplifier also
h a s a built- in A-weighting and 'slow' and 'fast ' time constants. Use of such an instrument may, however, be an "overkill", since i t is really a very sophisticated laboratory instrument with measurement capabi l i t ies well in excess of what i s necessary for a i rc ra f t noise studies.
Fig. 3.17 Measuring amplifier (B&K type 2610)
( d ) (
A sui table laboratory- type instrument for t ransient flyover noise da ta reduction is the digi tal fil tering real-time analyser (RTA) , such as the B&K type 2133 (Fig. 3.18). This part icular analyser
.. .. . features 42 1/3-actave
band channels from 1.6 Hz to 20 kHz a l l ow-
ing both li-
near and ex- ponential
averaging
and an inter- na l A-weight- ing network.
Such A-weight- ing would be of special interest only in a Chapter-
6 or a Chap-
ter-10 type measurement.
Fig. 3.18 Real time analyser (B&K type 2133)
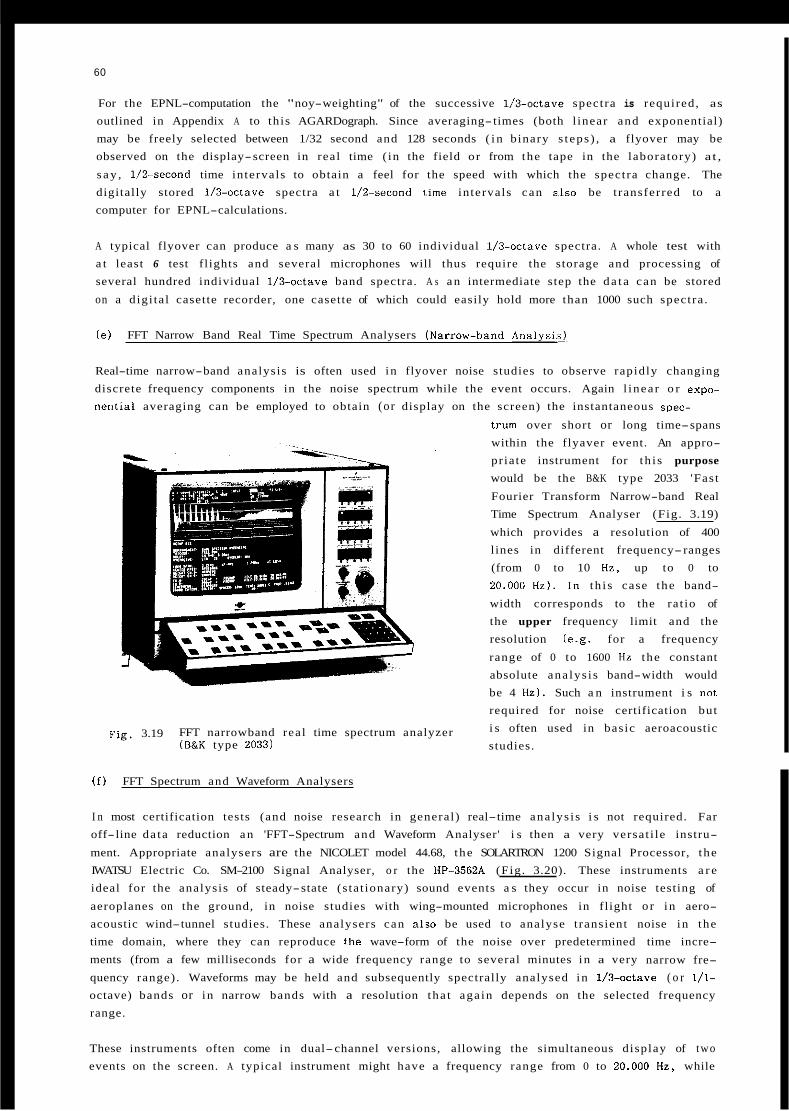
60
For the EPNL-computation the "noy-weighting" of the successive 1/3-octave spectra is required, as
outlined in Appendix A to th is AGARDograph. Since averaging-times (both l inear and exponential) may be freely selected between 1/32 second and 128 seconds ( i n binary s t eps ) , a flyover may be observed on the display-screen in real time ( in the field or from the tape in the laboratory) at ,
s a y , 1/2-second time intervals to obtain a feel for the speed with which the spectra change. The digitally stored l h o c t a v e spectra a t l/Z-second 1.ime intervals can a.lso be t ransferred to a computer for EPNL-calculations.
A typical flyover can produce a s many as 30 to 60 individual 1/3-octave spectra. A whole test with a t least 6 test fl ights and several microphones will thus require the storage and processing of several hundred individual 1/3-octave band spectra. A s a n intermediate step the d a t a can be stored
on a digi ta l casette recorder, one casette of which could easily hold more than 1000 such spectra .
( e ) FFT Narrow Band Real Time Spectrum Analysers (Narrowband AnalysisL
Real-time narrow-band analysis is often used in flyover noise studies to observe rapidly changing discrete frequency components in the noise spectrum while the event occurs. Again l inear o r erpo- nential averaging can be employed to obtain (or display on the screen) the instantaneous spec-
~ i g . 3.19 FFT narrowband real time spectrum analyzer (B&K type 2033)
( f ) FFT Spectrum and Waveform Analysers
trum over short or long time-spans within the flyaver event. An appro- pria te instrument for th i s purpose
would be the B&K type 2033 'Fast
Fourier Transform Narrow-band Real Time Spectrum Analyser (Fig . 3.19)
which provides a resolution of 400 lines in different frequency-ranges (from 0 to 10 Hz, up to 0 to 20.000 HE). In th i s case the band-
width corresponds to the ra t io of the upper frequency limit and the resolution (e.g. for a frequency
range of 0 to 1600 Hz the constant absolute ana lys i s band-width would be 4 Hz). Such a n instrument i s not required for noise certification but i s often used in basic aeroacoustic studies.
I n most certification tests (and noise research in general) real-time ana lys i s i s not required. Far off-line da ta reduction a n 'FFT-Spectrum and Waveform Analyser' i s then a very versat i le instru-
ment. Appropriate analysers are the NICOLET model 44.68, the SOLARTRON 1200 Signal Processor, the IWATSU Electric Co. SM-2100 Signal Analyser, o r the HP-3562A (Fig. 3.20). These instruments a r e ideal for the analysis of steady-state (s ta t ionary) sound events a s they occur in noise testing of
aeroplanes on the ground, in noise studies with wing-mounted microphones in fl ight o r in aero- acoustic wind-tunnel studies. These analysers can also be used to analyse t ransient noise in the time domain, where they can reproduce t.he wave-form of the noise over predetermined time incre- ments (from a few milliseconds for a wide frequency range to several minutes in a very narrow fre- quency range) . Waveforms may be held and subsequently spectrally analysed in 1/3-octave ( o r 1/1-
octave) bands or in narrow bands with a resolution tha t aga in depends on the selected frequency range.
These instruments often come in dual-channel versions, allowing the simultaneous display of two events on the screen. A typical instrument might have a frequency range from 0 to 20.000 Hz, while
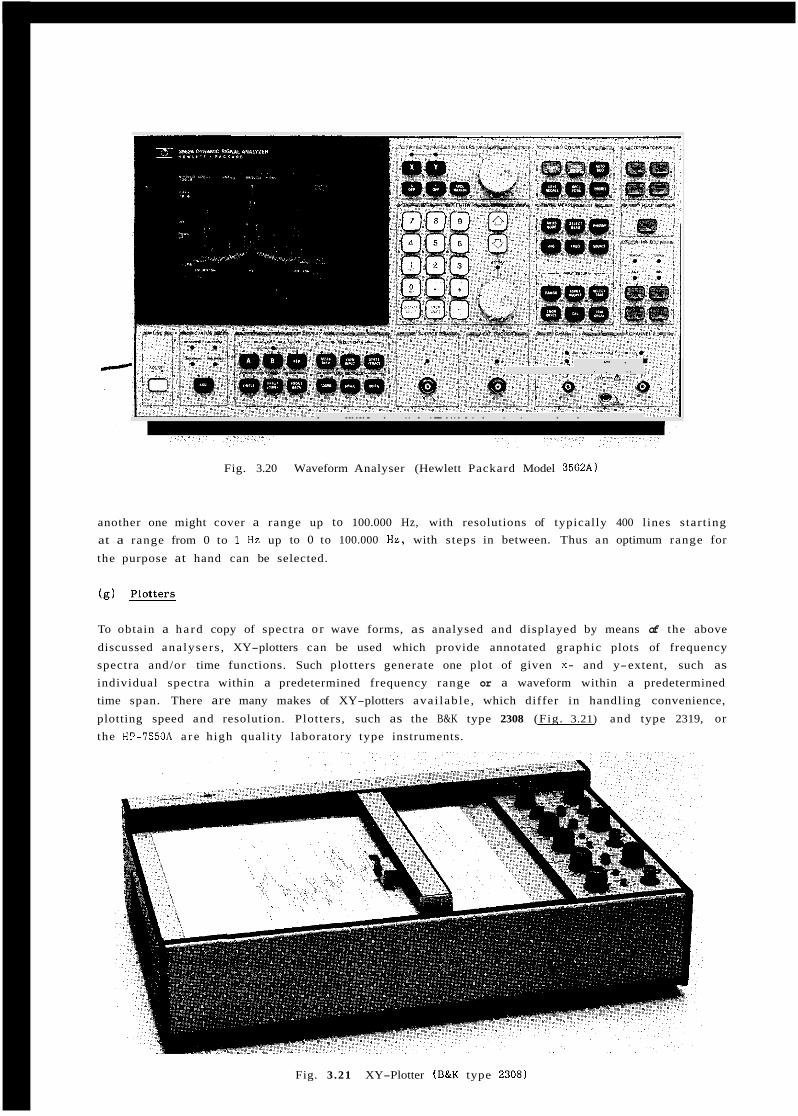
.- . . . , ..
. . . . . . . . . . . . . ... . . . . . . . . . . .
Fig. 3.20 Waveform Analyser (Hewlett Packard Model 3562A)
another one might cover a range up to 100.000 Hz, with resolutions of typically 400 lines s tar t ing at a range from 0 to 1 Hz up to 0 to 100.000 Hz, with s teps in between. Thus a n optimum range for
the purpose at hand can be selected.
(9) Plotters
To obtain a h a r d copy of spectra o r wave forms, as analysed and displayed by means of the above
discussed ana lysers , XY-plotters can be used which provide annotated graphic plots of frequency spectra and/or time functions. Such plotters generate one plot of given x - and y-extent, such as individual spectra within a predetermined frequency range or a waveform within a predetermined time span. There are many makes of XY-plotters ava i lab le , which differ in handling convenience,
plotting speed and resolution. Plotters, such as the B&K type 2308 (Fig. 3.21) and type 2319, or the HP-7550A a r e high quality laboratory type instruments.
Fig. 3.21 XY-Plotter (B&K type 2308)
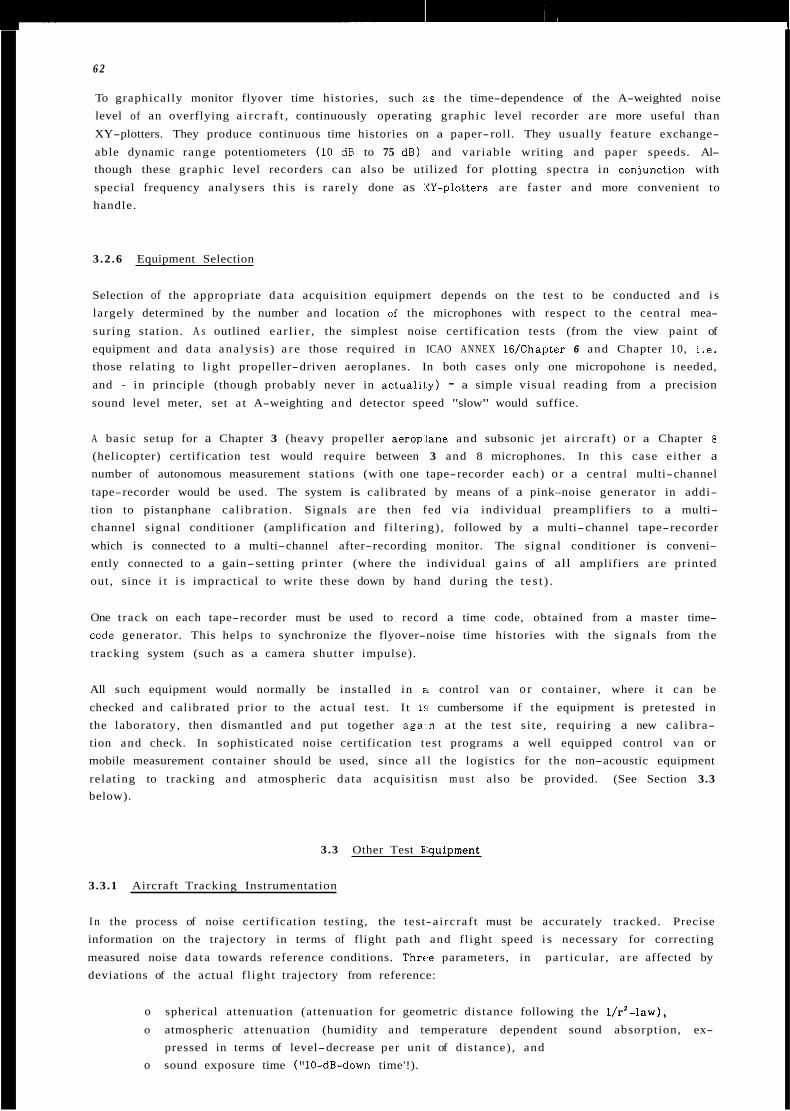
6 2
To graphically monitor flyover time histories, such iis the time-dependence of the A-weighted noise level of an overflying a i r c r a f t , continuously operating graphic level recorder a r e more useful than
XY-plotters. They produce continuous time histories on a paper-roll. They usually feature exchange-
able dynamic range potentiometers (10 dB to 75 dB) and variable writing and paper speeds. Al- though these graphic level recorders can also be utilized for plotting spectra in conjunction with
special frequency analysers th i s i s rarely done as XY-plotters a r e faster and more convenient to handle.
3.2 .6 Equipment Selection
Selection of the appropriate da ta acquisition equipmert depends on the test to be conducted and i s largely determined by the number and location of the microphones with respect to the central mea-
suring station. A s outlined ear l ie r , the simplest noise certification tests (from the view paint of equipment and da ta ana lys i s ) a r e those required in ICAO ANNEX 16/Chapter 6 and Chapter 10, i.e. those relating to l ight propeller-driven aeroplanes. In both cases only one micropohone i s needed,
and - in principle (though probably never in actua1il.y) - a simple visual reading from a precision
sound level meter, set a t A-weighting and detector speed "slow" would suffice.
A basic setup for a Chapter 3 (heavy propeller aerop:lane and subsonic jet a i rc ra f t ) o r a Chapter 8
(helicopter) certification test would require between 3 and 8 microphones. In th i s case ei ther a number of autonomous measurement stations (with one tape-recorder each) o r a central multi-channel
tape-recorder would be used. The system is calibrated by means of a pink--noise generator in addi- tion to pistanphane cal ibrat ion. Signals a r e then fed via individual preamplifiers to a multi- channel signal conditioner (amplification and f i l ter ing) , followed by a multi-channel tape-recorder
which is connected to a multi-channel after-recording monitor. The s ignal conditioner is conveni- ently connected to a gain-setting printer (where the individual ga ins of all amplifiers a r e printed out, since i t i s impractical to write these down by hand during the t e s t ) .
One t rack on each tape-recorder must be used to record a time code, obtained from a master time- code generator. This helps to synchronize the flyover-noise time histories with the s ignals from the
tracking system (such as a camera shutter impulse).
All such equipment would normally be installed in a control van o r container, where it can be
checked and calibrated prior to the actual test. I t i s cumbersome if the equipment is pretested in the laboratory, then dismantled and put together aga:.n at the test s i te , requiring a new cal ibra- tion and check. In sophisticated noise certification test programs a well equipped control van or mobile measurement container should be used, since a l l the logistics for the non-acoustic equipment
relating to tracking and atmospheric data acquisitisn m u s t also be provided. (See Section 3.3 below).
3.3 Other Test E:quipment
3.3.1 Aircraft Tracking Instrumentation
I n the process of noise certification testing, the test-aircraf t must be accurately tracked. Precise information on the trajectory in terms of flight path and flight speed i s necessary for correcting
measured noise da ta towards reference conditions. Three parameters, in part icular , a r e affected by deviations of the actual f l ight trajectory from reference:
o spherical attenuation (attenuation for geometric distance following the l / r 2 - l a w ) ,
o atmospheric attenuation (humidity and temperature dependent sound absorption, ex- pressed in terms of level-decrease per unit of dis tance) , and
o sound exposure time ("10-dB-down time'!).
63
Continuously t racking a n a i rc ra f t i s not necessary for a Chapter-6 or a Chapter-10 noise certifica- tion test. Here only the height above the microphone is of interest. In that case, determination of one point in the trajectory - preferably directly overhead the measuring microphone - suffices. But
even for the relatively simple Chapter-6 test procedures i t would still be more desirable to ascer- tain that the a i rc ra f t follows a level-flight pa th , not unintentionally climbing or descending. Deter- mination of a t least 2 points of the trajectory, e.g. one ar two seconds before and af ter the micro- phone w a s overflown would be useful to obtain a n indication of the actual flight path.
For a l l other noise certification procedures, where both centerline and sideline acoustic da ta must be measured and - more importantly still - where the noise level must be established in terms of a n EPNL (i .e. Chapters 3, 5 , and 8) t racking should he continuous - or at least a la rge number of
positions in the trajectory must be measured.
Trajectory measurements a re usually made with ground based equipment. Sometimes onboard systems (such as inert ia l platforms or a i rc ra f t mounted cameras) a r e better suited for the purpose. As f a r as ground based equipment i s concerned some test ranges tiear a irports have, sometimes extensive,
permanently installed equipment. Most trajectory measurements a r e however made with mobile equip- ment since noise certification measurements a r e often executed at or near ra ther ill-equipped
landing s t r ips . Employment of mobile and ground based equipment generally requires good advance planning, especially, if time synchronization with anboard equipment and with several ground acou-
s t ic da ta s tat ions i s to be maintained.
Depending on the par t icu la r flight- test procedure and on the degree of accuracy required, one may
select one of the following t racking methods:
Optical Tracking/Ground based Systems: o s ingle camera
o several cameras o kinetheodolite
o laser
%tical Tracking/On-board Systems: o forward/side-looking camera
R a d i o h a d a r Tracking:
o r a d a r o microwave a i rp lane positioning system (MAPS) o radio altimeter
o Mini Ranger
An excellent survey on flight t racking methods is provided in 17, 81.
The advantages and disadvantages of these various height-measuring and f l ight trajectory t racking methods w i l l be discussed in the following.
( a ) Optical Tracking / Ground-based Systems
Single camera
Aircraft height and la te ra l deviation from the vertical can be determined with only one camera. The
optical ax is of the camera must then be very accurately adjusted in the vertical. This is achieved by means of a n inclinometer, l a id directly on the camera-lens r i m o r by some appropriate bubble- level. Preferably the camera should be equipped with a Polaroid back-plate to allow immediate picture development in the field within a time span of about one minute.
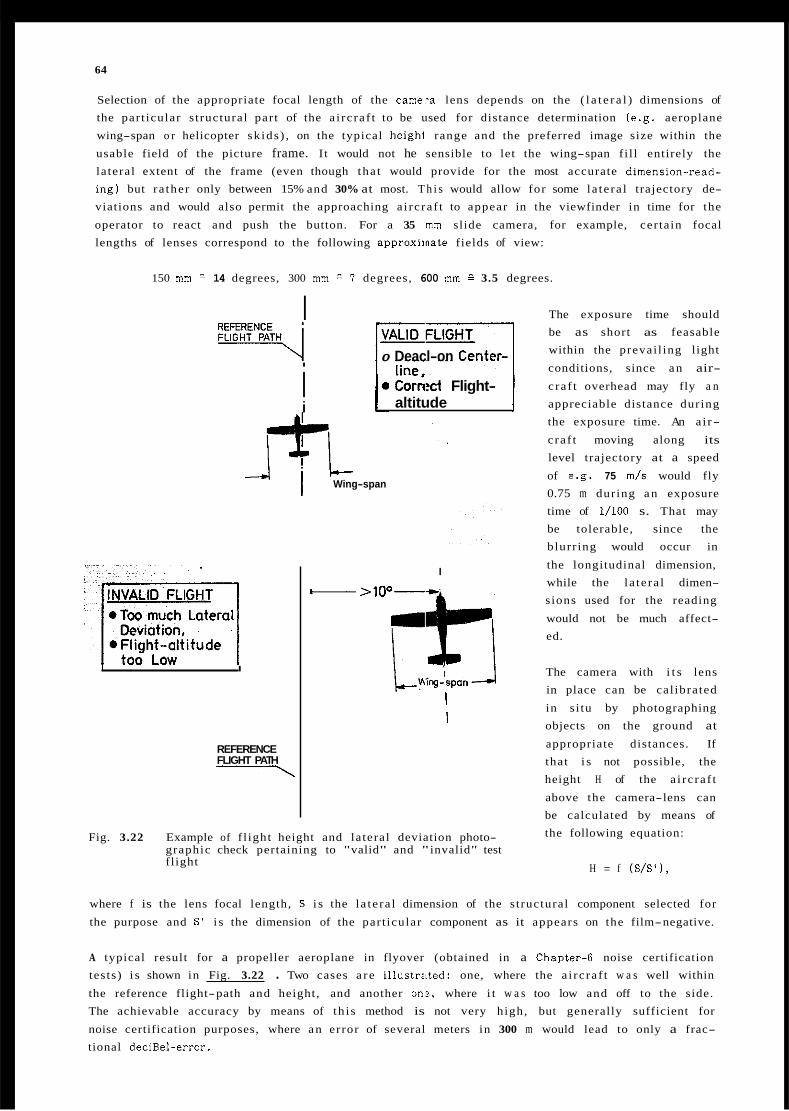
64
Selection of the appropriate focal length of the came.?a lens depends on the ( l a t e r a l ) dimensions of the part icular s t ructural par t of the a i rc ra f t to be used for distance determination (e.g. aeroplane wing-span o r helicopter sk ids ) , on the typical heighl range and the preferred image size within the
usable field of the picture frame. I t would not he sensible to let the wing-span f i l l entirely the lateral extent of the frame (even though tha t would provide for the most accurate dimension-read- ing) but ra ther only between 15% and 30% at most. T h i s would allow for some la te ra l trajectory de- viations and would also permit the approaching a i rc ra f t to appear in the viewfinder in time for the
operator to react and push the button. For a 35 mm slide camera, for example, cer tain focal lengths of lenses correspond to the following approximate fields of view:
150 mm 14 degrees, 300 mm I degrees, 600 mm 3.5 degrees.
I
i i
The exposure time should be as short as feasable within the prevai l ing light
conditions, since a n air- 0 Deacl-on Center-
( 0 Co& Flight- I craf t overhead may fly a n altitude appreciable distance during
I I
REFERENCE FLIGHT PATH -
* L Wing-span i
I
->loo-
I I
Fig. 3.22 Example of f l ight height and lateral deviation photo- graphic check pertaining to "valid" and "invalid" test flight
the exposure time. An a i r-
craf t moving along its level trajectory at a speed
of e.g. 75 m / s would fly 0.75 m during a n exposure time of 1/100 s. That may be tolerable, since the blurr ing would occur in
the longitudinal dimension, while the la te ra l dimen- sions used for the reading
would not be much affect- ed.
The camera with i t s lens in place can be cal ibrated
in s i tu by photographing objects on the ground at appropriate distances. If that i s not possible, the height H of the a i rc ra f t
above the camera-lens can be calculated by means of the following equation:
H = f ( S / S ' ) ,
where f is the lens focal length, S i s the la te ra l dimension of the s t ructural component selected for
the purpose and S' i s the dimension of the part icular component as it appears on the film-negative.
A typical result for a propeller aeroplane in flyover (obtained in a C h a p t e r 4 noise certification tests) i s shown in Fig. 3.22 . Two cases a r e il1ustr:rted: one, where the a i rc ra f t w a s well within
the reference flight-path and height, and another on:, where i t w a s too low and off to the side. The achievable accuracy by means of th i s method is not very high, but generally sufficient for
noise certification purposes, where a n error of several meters in 300 m would lead to only a frac- tional deciBel-error.
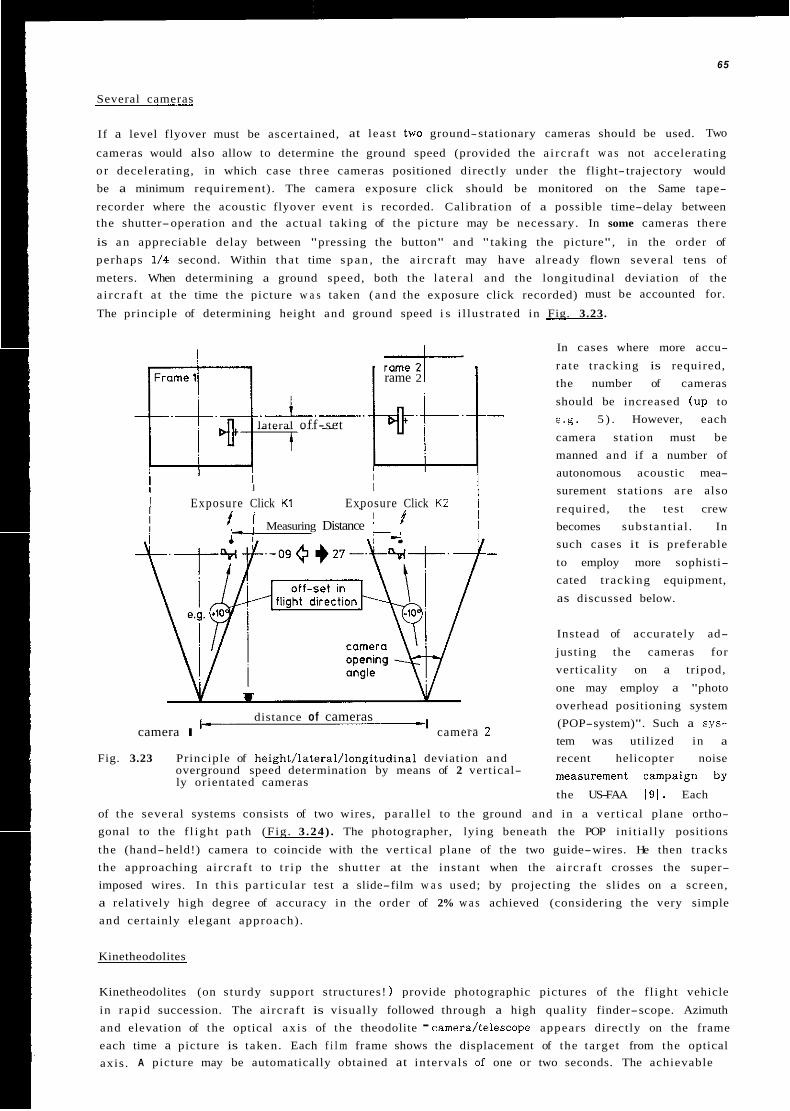
65
Several cameras
If a level flyover must be ascertained, at least two ground-stationary cameras should be used. Two
cameras would also allow to determine the ground speed (provided the a i rc ra f t w a s not accelerating o r decelerating, in which case three cameras positioned directly under the flight- trajectory would be a minimum requirement). The camera exposure click should be monitored on the Same tape-
recorder where the acoustic flyover event i s recorded. Calibration of a possible time-delay between the shutter-operation and the actual taking of the picture may be necessary. In some cameras there
is a n appreciable delay between "pressing the button" and "taking the picture", in the order of perhaps 1/4 second. Within tha t time span , the a i rc ra f t may have already flown several tens of
meters. When determining a ground speed, both the la te ra l and the longitudinal deviation of the a i rc ra f t a t the time the picture w a s taken ( a n d the exposure click recorded) must be accounted for.
The principle of determining height and ground speed i s i l lustrated in Fig. 3.23.
lateral off-set
I I I
I rame 2
! Exposure Click K1 Exposure Click K2 ' 1 t '+ / Measuring Distance I cl
In cases where more accu-
ra te t racking is required, the number of cameras
should be increased (up to e .g. 5 ) . However, each
camera station must be manned and if a number of autonomous acoustic mea- surement stations a r e also
required, the test crew becomes substant ial . In such cases it is preferable
to employ more sophisti- cated t racking equipment,
as discussed below.
-
-
Instead of accurately ad-
justing the cameras for verticality on a tripod,
one may employ a "photo overhead positioning system (POP-system)". Such a sys- distance of cameras
camera I ' camera L I
tem was utilized in a Fig. 3.23 Principle of height/lateral/longitudinal deviation and recent helicopter noise
overground speed determination by means of 2 vertical- measurement campaign by ly orientated cameras
the US-FAA 191. Each
of the several systems consists of two wires, paral lel to the ground and in a vert ical plane ortho- gonal to the f l igh t path (Fig. 3 .24) . The photographer, lying beneath the POP ini t ia l ly positions
the (hand-held!) camera to coincide with the vert ical plane of the two guide-wires. He then t racks the approaching a i rc ra f t to t r i p the shut ter at the instant when the a i rc ra f t crosses the super- imposed wires. In t h i s par t icu la r test a slide-film w a s used; by projecting the slides on a screen, a relatively high degree of accuracy in the order of 2% w a s achieved (considering the very simple and certainly elegant approach) .
Kinetheodolites
Kinetheodolites (on s turdy support structures! ) provide photographic pictures of the f l ight vehicle
in rap id succession. The aircraf t is visually followed through a high quality finder-scope. Azimuth and elevation of the optical ax is of the theodolite - camera/telescope appears directly on the frame each time a picture is taken. Each f i l m frame shows the displacement of the target from the optical axis . A picture may be automatically obtained at intervals of one or two seconds. The achievable
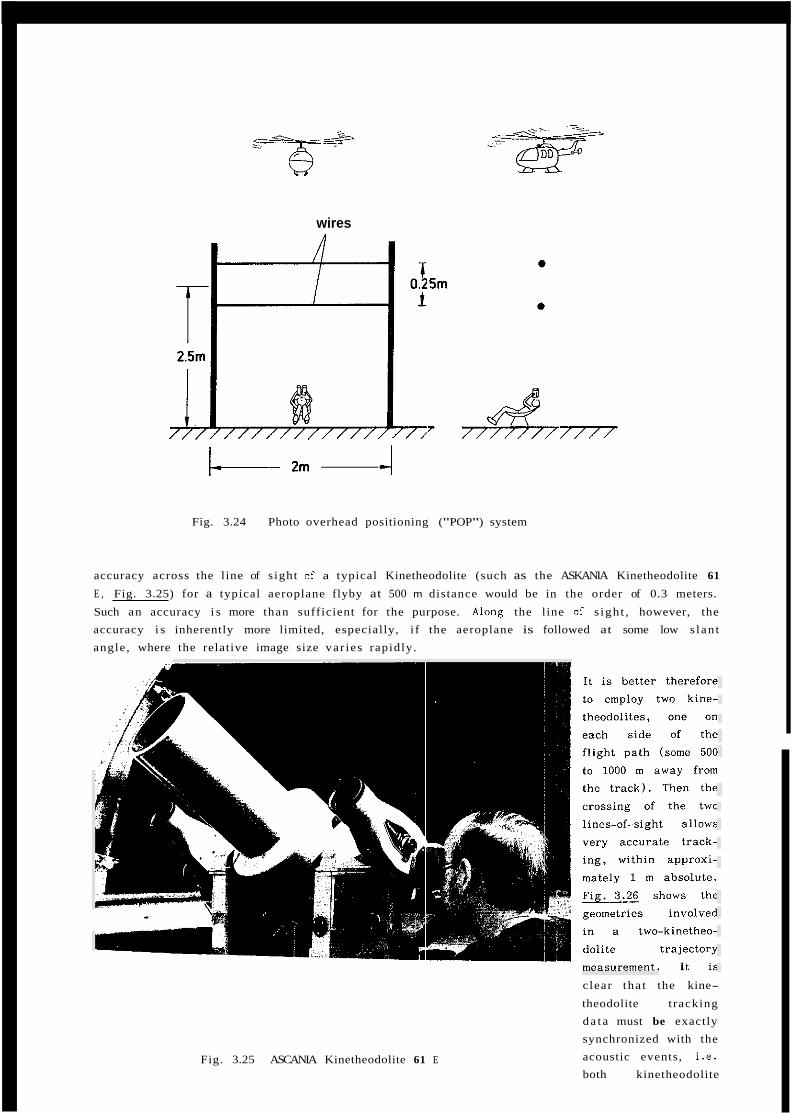
wires
I 2m 4 434 77777777777
Fig. 3.24 Photo overhead positioning ("POP") system
accuracy across the line of s ight of a typical Kinetheodolite (such as the ASKANIA Kinetheodolite 61
E , Fig. 3.25) for a typical aeroplane flyby at 500 m distance would be in the order of 0.3 meters.
Such an accuracy i s more than sufficient for the purpose. Along the line of s igh t , however, the accuracy i s inherently more limited, especially, i f the aeroplane is followed at some low s lan t angle, where the relative image size var ies rapidly.
Fig. 3.25 ASCANIA Kinetheodolite 61 E
clear tha t the kine-
theodolite t racking da t a must be exactly synchronized with the acoustic events, i .e. both kinetheodolite
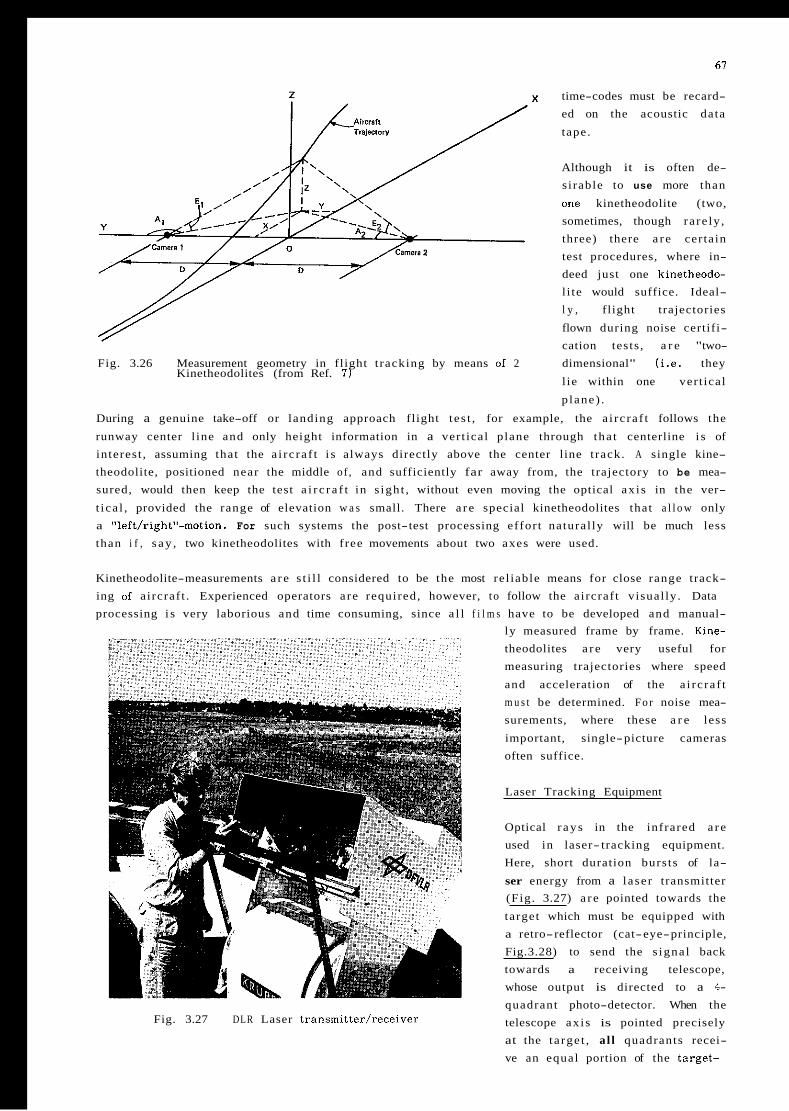
61
time-codes must be recard- ed on the acoustic data
tape.
Although it is often de- sirable to use more than
one kinetheodolite (two, sometimes, though ra re ly , three) there a r e cer tain test procedures, where in- deed just one kinetheodo- l i te would suffice. Ideal- l y , flight trajectories
flown during noise certifi- cation tests , a r e "two-
Fig. 3.26 Measurement geometry in flight t racking by means of 2 dimensional" ( i . e . they
l ie within one vert ical Kinetheodolites (from Ref. 7 )
plane) .
During a genuine take-off or landing approach flight t es t , for example, the a i rc ra f t follows the
runway center l ine and only height information in a vert ical plane through tha t centerline i s of interest , assuming that the a i rc ra f t i s always directly above the center line t rack. A single kine- theodolite, positioned near the middle of , and sufficiently far away from, the trajectory to be mea- sured, would then keep the test a i r c r a f t in s igh t , without even moving the optical ax is in the ver-
t ica l , provided the range of elevation w a s small. There a r e special kinetheodolites that a l l o w only a "left/right"-motion. For such systems the post-test processing effort natural ly will be much less than i f , s ay , two kinetheodolites with free movements about two axes were used.
Kinetheodolite-measurements a r e s t i l l considered to be the most rel iable means for close range track- ing of aircraf t . Experienced operators a re required, however, to follow the aircraf t visual ly. Data processing i s very laborious and time consuming, since a l l f i l m s have to be developed and manual-
ly measured frame by frame. Kine- theodolites a r e very useful for measuring trajectories where speed
and acceleration of the a i rc ra f t m u s t be determined. For noise mea- surements, where these a r e less
important, single-picture cameras often suffice.
Fig. 3.27 DLR Laser transmitter/receiver
Laser Tracking Equipment
Optical r ay s in the infrared a r e used in laser- tracking equipment. Here, short duration bursts of la-
ser energy from a laser transmitter (Fig. 3.27) a r e pointed towards the
target which must be equipped with a retro-reflector (cat-eye-principle, Fig.3.28) to send the s igna l back towards a receiving telescope, whose output is directed to a 4- quadrant photo-detector. When the telescope ax is is pointed precisely at the ta rge t , al l quadrants recei- ve an equal portion of the target-
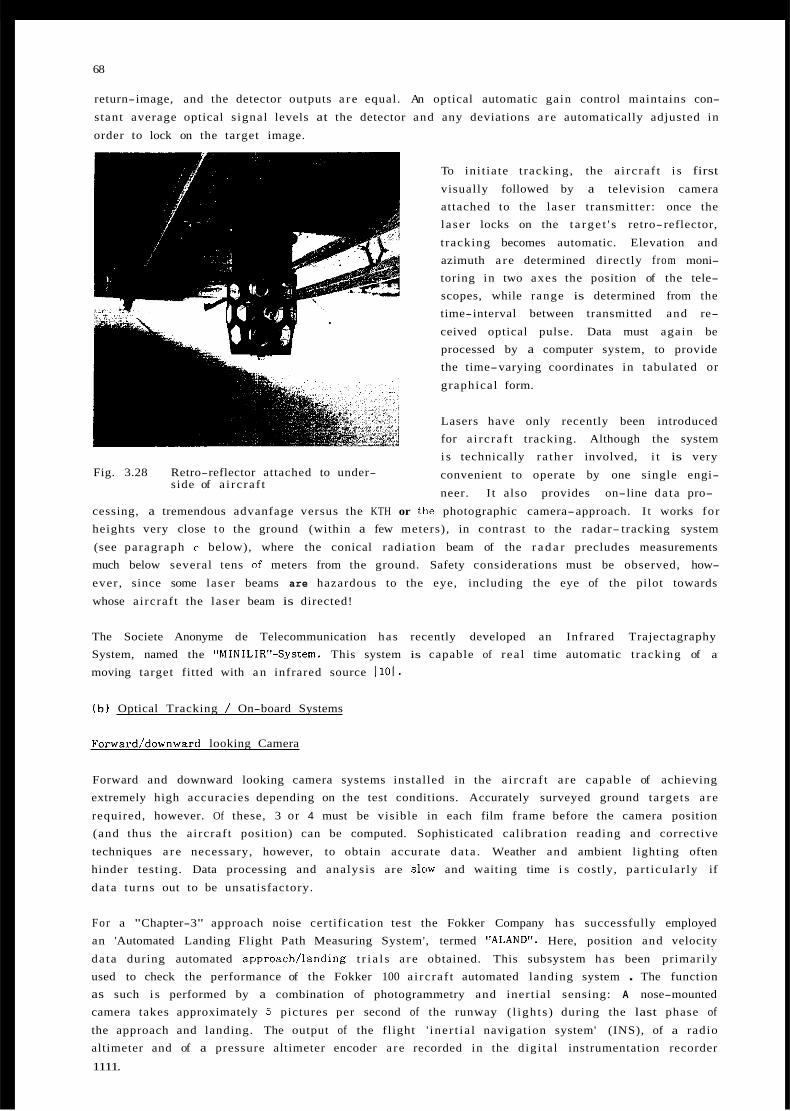
68
return-image, and the detector outputs a r e equal. An optical automatic gain control maintains con-
stant average optical s ignal levels at the detector and any deviations a r e automatically adjusted in
order to lock on the target image.
Fig. 3.28 Retro-reflector attached to under- side of a i rc ra f t
To ini t ia te t racking, the a i rc ra f t i s first
visually followed by a television camera attached to the laser transmitter: once the laser locks on the t a rge t ' s retro-reflector,
t racking becomes automatic. Elevation and azimuth a r e determined directly from moni- toring in two axes the position of the tele- scopes, while range is determined from the time-interval between transmitted and re-
ceived optical pulse. Data must again be processed by a computer system, to provide the time-varying coordinates in tabulated or graphical form.
Lasers have only recently been introduced for a i rc ra f t tracking. Although the system i s technically ra ther involved, i t is very
convenient to operate by one single engi-
neer. I t also provides on-line da ta pro-
cessing, a tremendous advanfage versus the KTH or the photographic camera-approach. I t works for heights very close t o the ground (within a few meters), in contrast to the radar- tracking system
(see paragraph c below), where the conical radiation beam of the r a d a r precludes measurements much below several tens of meters from the ground. Safety considerations must be observed, how-
ever , since some laser beams are hazardous to the eye, including the eye of the pilot towards
whose aircraf t the laser beam is directed!
The Societe Anonyme de Telecommunication has recently developed an Infrared Trajectagraphy System, named the "M1NILIR"-System. This system is capable of rea l time automatic t racking of a
moving target fitted with a n infrared source 1101.
( b ) Optical Tracking / On-board Systems
Forward/downward looking Camera
Forward and downward looking camera systems installed in the a i rc ra f t a re capable of achieving extremely high accuracies depending on the test conditions. Accurately surveyed ground targets a r e
required, however. Of these, 3 or 4 must be visible in each film frame before the camera position (and thus the aircraf t position) can be computed. Sophisticated calibration reading and corrective
techniques a r e necessary, however, to obtain accurate da ta . Weather and ambient lighting often hinder testing. Data processing and analysis are slow and waiting time i s costly, par t icular ly if
da ta turns out to be unsatisfactory.
For a "Chapter-3" approach noise certification test the Fokker Company has successfully employed an 'Automated Landing Flight Path Measuring System', termed "ALAND". Here, position and velocity
da ta during automated approach/landing t r i a l s a r e obtained. This subsystem has been primarily used to check the performance of the Fokker 100 a i rc ra f t automated landing system . The function as such i s performed by a combination of photogrammetry and inert ia l sensing: A nose-mounted camera takes approximately 5 pictures per second of the runway ( l igh ts ) during the last phase of the approach and landing. The output of the flight ' iner t ia l navigation system' (INS), of a radio altimeter and of a pressure altimeter encoder a re recorded in the digi tal instrumentation recorder
1111.
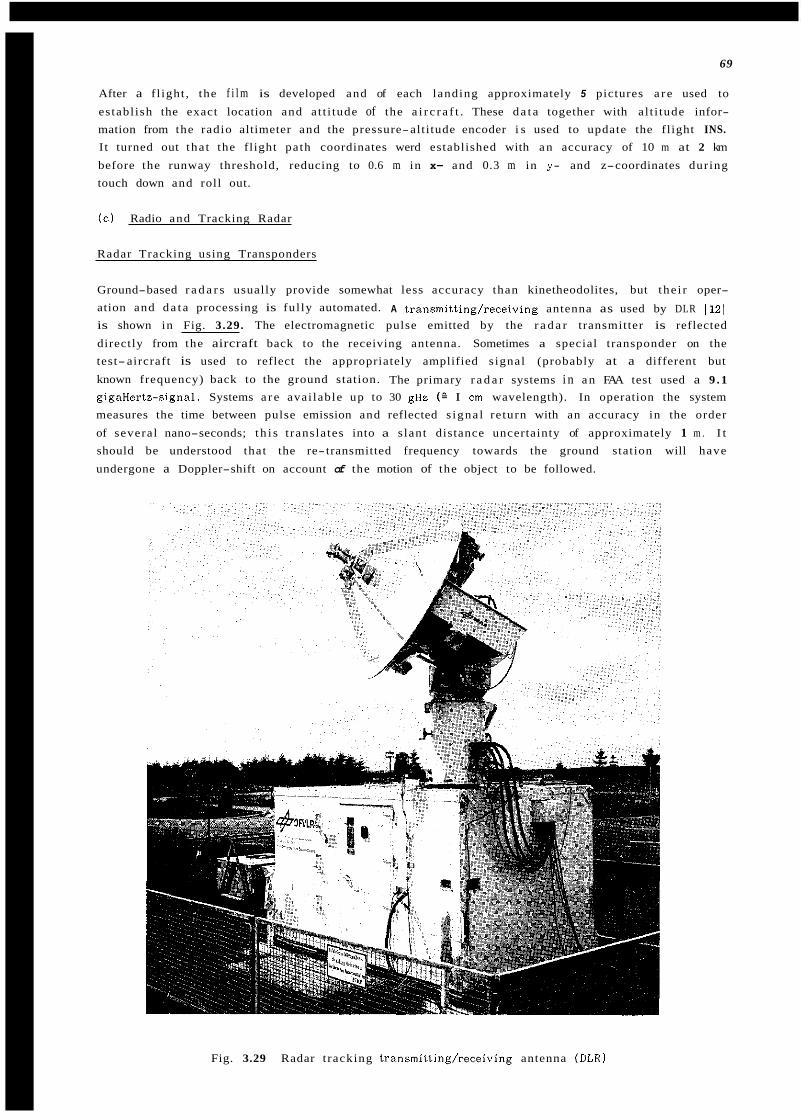
69
After a f l ight , the f i l m is developed and of each landing approximately 5 pictures a r e used to
establ ish the exact location and at t i tude of the a i r c r a f t . These d a t a together with al t i tude infor- mation from the radio altimeter and the pressure-altitude encoder i s used to update the flight INS. I t turned out tha t the flight path coordinates werd established with a n accuracy of 10 m at 2 km
before the runway threshold, reducing to 0.6 m in x- and 0.3 m in y- and z-coordinates during touch down and roll out.
( c ) Radio and Tracking Radar
Radar Tracking using Transponders
Ground-based r a d a r s usually provide somewhat less accuracy than kinetheodolites, but the i r oper- ation and d a t a processing is ful ly automated. A transmitting/receiving antenna as used by DLR 1121 is shown in Fig. 3.29. The electromagnetic pulse emitted by the r a d a r transmitter is reflected
directly from the aircraft back to the receiving antenna. Sometimes a special transponder on the test- aircraft is used to reflect the appropriately amplified s ignal (probably at a different but
known frequency) back to the ground station. The primary r a d a r systems i n a n FAA test used a 9 . 1 gigaHertz-signal. Systems a r e avai lable up to 30 gHz (; I cm wavelength). In operation the system measures the time between pulse emission and reflected s igna l return with an accuracy in the order
of several nano-seconds; t h i s t ranslates into a slant distance uncertainty of approximately 1 m . I t should be understood that the re-transmitted frequency towards the ground station will have
undergone a Doppler-shift on account of the motion of the object to be followed.
Fig. 3.29 Radar t racking transmitting/receiving antenna ( D L R )
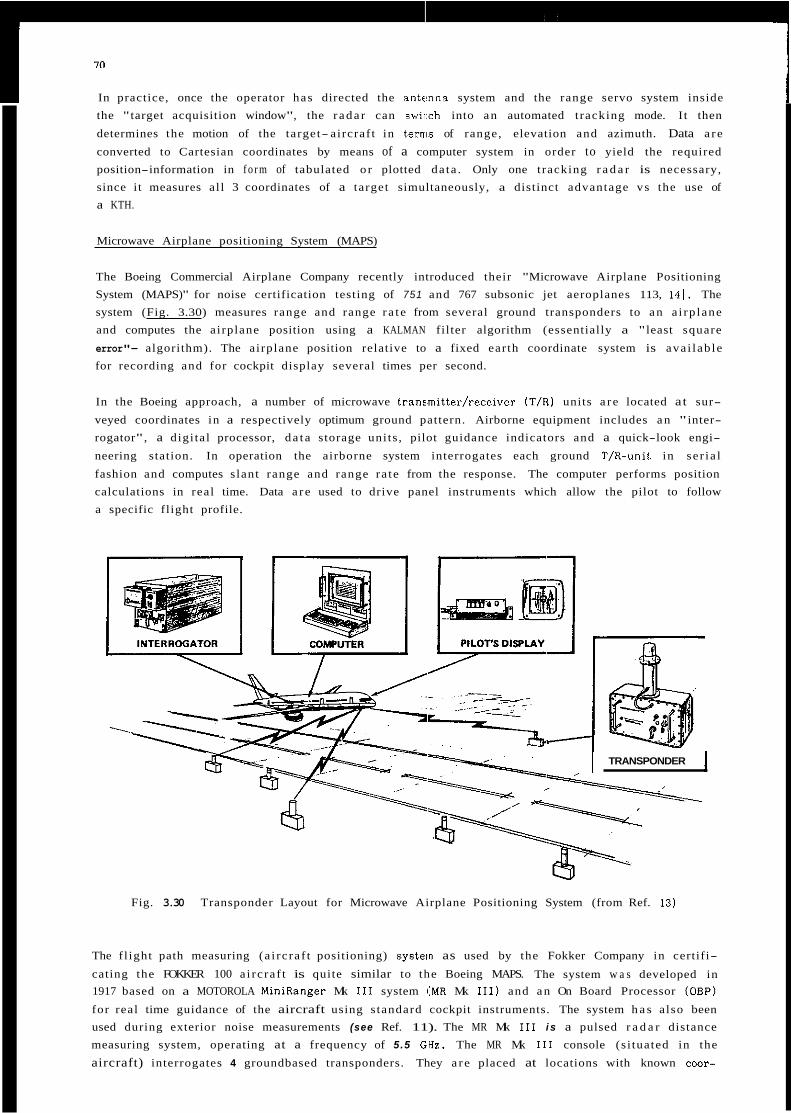
In practice, once the operator has directed the a n t m n a system and the range servo system inside the "target acquisition window", the r a d a r can swii:ch into a n automated t racking mode. I t then
determines the motion of the target- aircraf t in ternis of range, elevation and azimuth. Data a r e
converted to Cartesian coordinates by means of a computer system in order to yield the required position-information in f o r m of tabulated o r plotted da ta . Only one t racking r a d a r is necessary, since it measures al l 3 coordinates of a target simultaneously, a distinct advantage vs the use of a KTH.
Microwave Airplane positioning System (MAPS)
The Boeing Commercial Airplane Company recently introduced their "Microwave Airplane Positioning System (MAPS)" for noise certification testing of 751 and 767 subsonic jet aeroplanes 113, 141. The system (Fig. 3.30) measures range and range r a t e from several ground transponders to a n a i rp lane and computes the airplane position using a KALMAN filter algorithm (essentially a "least square
error"- algorithm). The airplane position relative to a fixed ear th coordinate system is ava i lab le for recording and for cockpit display several times per second.
In the Boeing approach, a number of microwave tranrmitter/receiver (T/R) units a r e located at sur-
veyed coordinates in a respectively optimum ground pattern. Airborne equipment includes a n "inter- rogator", a digi tal processor, d a t a storage uni ts , pilot guidance indicators and a quick-look engi-
neering station. In operation the airborne system interrogates each ground T/R-unit in se r ia l
fashion and computes s lant range and range ra te from the response. The computer performs position calculations in real time. Data a r e used to drive panel instruments which allow the pilot to follow a specific flight profile.
TRANSPONDER I
Fig. 3.30 Transponder Layout for Microwave Airplane Positioning System (from Ref. 13)
The f l ight path measuring (a i rc ra f t positioning) system as used by the Fokker Company in certifi-
cating the FOKKER 100 a i rc ra f t is quite similar to the Boeing MAPS. The system w a s developed in 1917 based on a MOTOROLA MiniRanger Mk I11 system I:MR Mk 111) and a n On Board Processor (OBP)
for real time guidance of the aircraft using s tandard cockpit instruments. The system h a s also been used during exterior noise measurements (see Ref. 11). The MR Mk 111 i s a pulsed r a d a r distance measuring system, operating at a frequency of 5.5 GHz. The MR Mk I11 console (s i tuated in the
aircraft) interrogates 4 groundbased transponders. They a r e placed at locations with known c w r -
71
dinates . To envisage the movements of the a i rc ra f t (pitch and rol l ) two transponders a r e located
longitudinal and the other two la te ra l on opposite sides of the runway. The f l ight path l ies within a quadrangle defined by the transponders. For calculat ing the position of the a i rc ra f t one lateral ly
and one longitudinally located transponder i s used. In th i s way the position error is made as small a s possible.
The a i rc ra f t speed and height are determined by measuring a i rc ra f t s ta t ic pressure, impact pressure and total air temperature. The onboard processor controls system-timing, performs d a t a
acquisition and cal ibrat ion, calculation, da ta conversion and da ta output. Calibration da ta i s put into the processors non-volatile memory before a measurement session. A special ARINC transmitter dr ives the localizer- and glide-slope-bars through a dummy NAV receiver, using s ignals generated by the OBP. Thus the pilot is provided with guidance information which enables him to fly a predefined f l ight path.
Comparison with the more t radi t ional KTH procedure shows these two systems' accuracies as better
than 2 meters, provided they operate within their design envelopes. This precludes measurement of a i rc ra f t a l t i tudes less than approximately 50 m , essentially eliminating take off and landing
approach measurements. In tha t caee other means of al t i tude determination a r e necessary such as radio altimeters o r pressure altimeters which have their own limitations.
( d ) Tracking System Considerations
For purposes of noise certification ( i n contrast to airworthiness type certification test ing) t racking requirements ca l l for a n accuracy of not much more than 1%, since e r rors of that magnitude would still only result in fractional deciBel-errors. Hence, the inherent measuring accuracy of (albei t well maintained and operated) kinetheodolites, l aser or r a d a r t racking equipment in the order of 0 .1 to
0.3 m at measuring distances is about one order of magnitude too good, leaving some comfortable margin towards less than ideal operation,
I f test cost and avai labi l i ty of sophisticated t racking equipment at the test s i t e i s of concern, one or several vertically orientated cameras will suffice for most noise certification tests. However the cost of in-the-field operation and set-up (one man per camera) and of the subsequent laborious
data-processing must be weighed against the other aspects of using more sophisticated and automated t racking methods, such as kinetheodolites, l asers o r r ada r . Laser t racking i s probably the most accurate and versat i le t racking method presently ava i lab le ; unfortunately, it is also quite
expensive.
3.3.2 Meteorological Instrumentation
Precise information on the prevailing atmospheric conditions at and near the test s i te , at and near
the test- aircraf t , and in the air space between the test-aircraft and the measurement station ( i . e . along the sound-propagation path from the source t o the receiver) i s important for correcting mea- sured acoustic da ta to reference conditions. The most important parameters a r e temperature and humidity, and wind-speed and -direction; ambient pressure is usually of less importance.
As had been s tated ear l ie r , ambient temperature a t the test a ircraf t affects a l l speed-related para- meters because i t changes the sound speed; i t follows that the same flight speed and rotational
speed (of propellers and helicopter-rororsl corresponds to a different local )Mach-number. The combi- nation of temperature and humidity along the sound transmission path affects the atmospheric ab- sorption (at tenuat ion) . Also, a temperature gradient between a i rc ra f t and microphone m a y bend a sound-ray, making source identification and path- length definition difficult.
Winds aloft , along the sound transmission path and at the ground test-site, affect the f l ight trajec- tory of the test- aircraf t , the propagation-path of the radiated sound from the test-aircraft to the
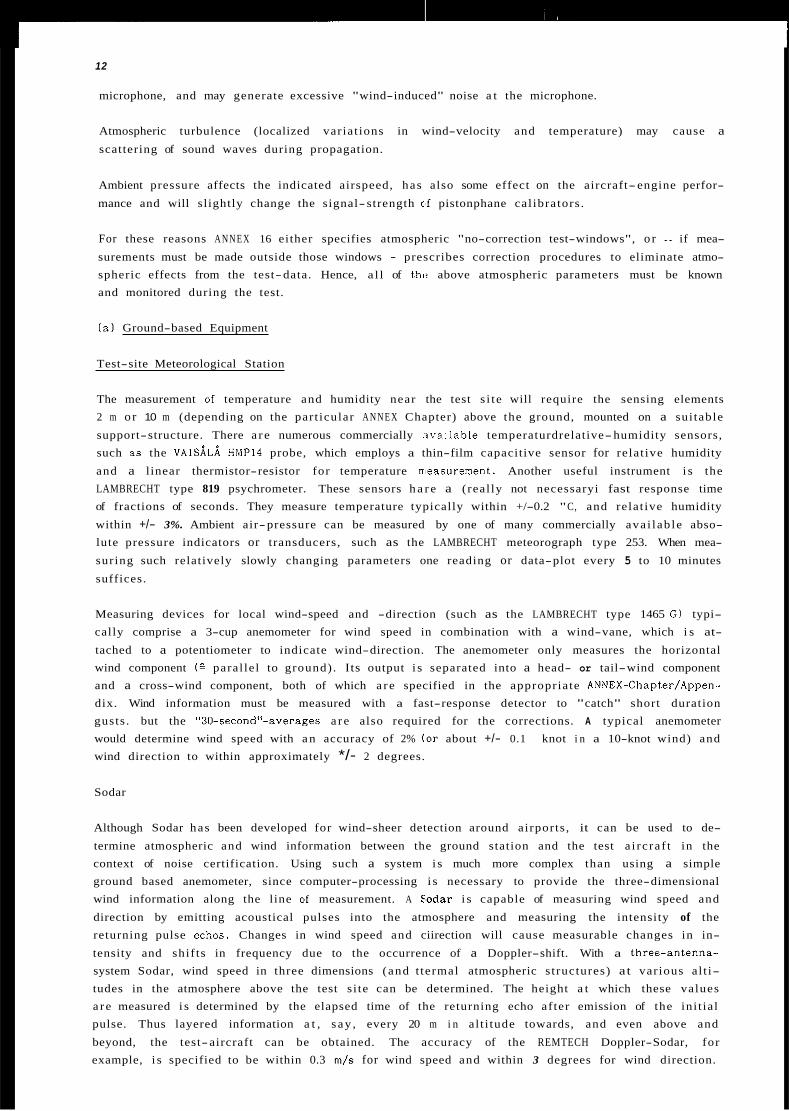
12
microphone, and may generate excessive "wind-induced" noise a t the microphone.
Atmospheric turbulence (localized variat ions in wind-velocity and temperature) may cause a scattering of sound waves during propagation.
Ambient pressure affects the indicated airspeed, has also some effect on the aircraft- engine perfor-
mance and will slightly change the signal- strength c,f pistonphane cal ibrators .
For these reasons A N N E X 16 either specifies atmospheric "no-correction test-windows", o r - if mea-
surements must be made outside those windows - prescribes correction procedures to eliminate atmo- spheric effects from the test-data. Hence, a l l of thc above atmospheric parameters must be known and monitored during the test.
( a ) Ground-based Equipment
Test-site Meteorological Station
The measurement of temperature and humidity near the test s i t e will require the sensing elements 2 m o r 10 m (depending on the part icular A N N E X Chapter) above the ground, mounted on a sui table
support-structure. There a r e numerous commercially :available temperaturdrelative-humidity sensors, such as the VAISALA HMP14 probe, which employs a thin-film capacitive sensor for relat ive humidity
and a linear thermistor-resistor for temperature nleasurement. Another useful instrument i s the LAMBRECHT type 819 psychrometer. These sensors h a r e a (real ly not necessaryi fast response time of fractions of seconds. They measure temperature typically within +/-0.2 "C, and relat ive humidity
within +/- 3%. Ambient air-pressure can be measured by one of many commercially ava i lab le abso- lute pressure indicators or transducers, such as the LAMBRECHT meteorograph type 253. When mea-
suring such relatively slowly changing parameters one reading or data-plot every 5 to 10 minutes
suffices.
Measuring devices for local wind-speed and -direction (such as the LAMBRECHT type 1465 G ) typi- cally comprise a 3-cup anemometer for wind speed in combination with a wind-vane, which i s at-
tached to a potentiometer to indicate wind-direction. The anemometer only measures the horizontal wind component ( G paral lel to ground). Its output i s separated into a head- or tail-wind component and a cross-wind component, both of which a r e specified in the appropriate ANNEX-Chapter/Appen- dix. Wind information must be measured with a fast-response detector to "catch" short duration gusts . but the "30-second"-averages a r e also required for the corrections. A typical anemometer would determine wind speed with a n accuracy of 2% (or about +/- 0.1 knot i n a 10-knot wind) and wind direction to within approximately */- 2 degrees.
Sodar
Although Sodar has been developed for wind-sheer detection around airports , it can be used to de-
termine atmospheric and wind information between the ground station and the test a i rc ra f t in the context of noise certification. Using such a system i s much more complex than using a simple ground based anemometer, since computer-processing i s necessary to provide the three-dimensional wind information along the line of measurement. A E,odar i s capable of measuring wind speed and
direction by emitting acoustical pulses into the atmosphere and measuring the intensity of the returning pulse echos. Changes in wind speed and ciirection will cause measurable changes in in-
tensity and shif ts in frequency due to the occurrence of a Doppler-shift. With a three-antenna- system Sodar, wind speed in three dimensions (and t termal atmospheric s t ructures) at various al t i- tudes in the atmosphere above the test s i te can be determined. The height a t which these values a r e measured i s determined by the elapsed time of the returning echo af ter emission of the ini t ia l pulse. Thus layered information a t , s ay , every 20 m i n a l t i tude towards, and even above and
beyond, the test-aircraft can be obtained. The accuracy of the REMTECH Doppler-Sodar, for example, i s specified to be within 0.3 m / s for wind speed and within 3 degrees for wind direction.
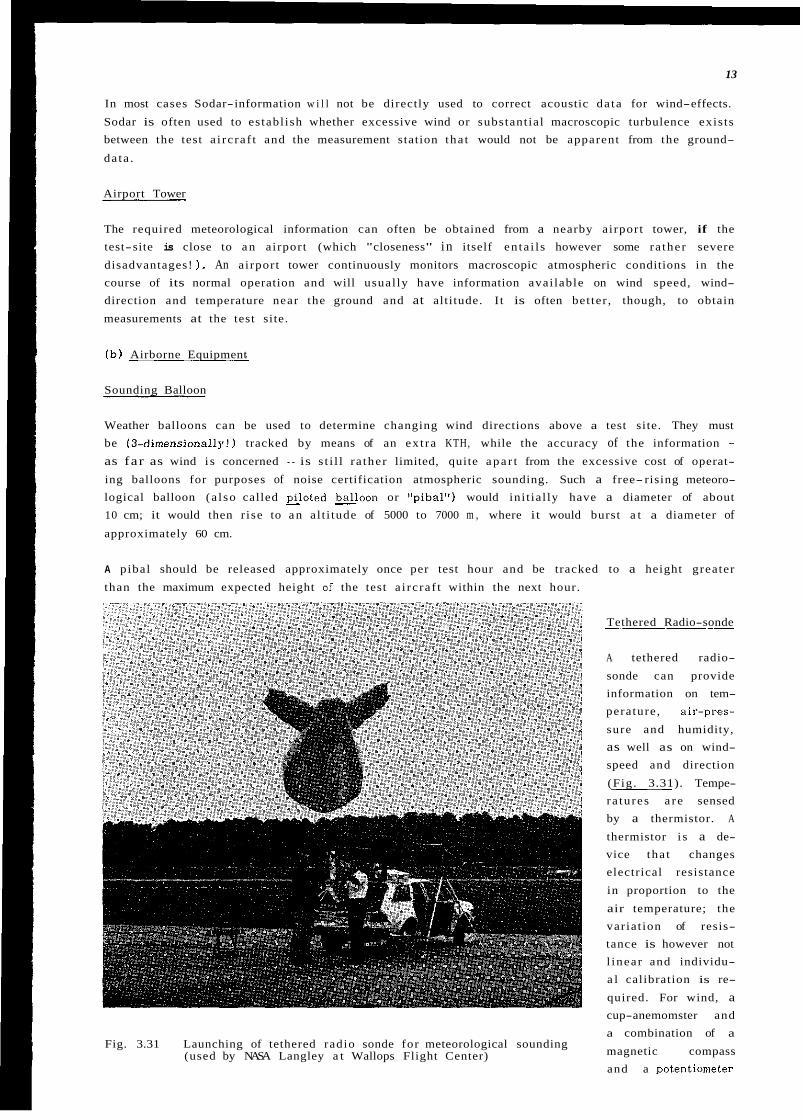
13
In most cases Sodar-information w i l l not be directly used to correct acoustic da ta for wind-effects.
Sodar is often used to establ ish whether excessive wind or substant ial macroscopic turbulence exists between the test a i rc ra f t and the measurement station tha t would not be apparent from the ground-
da ta .
Airport Tower
The required meteorological information can often be obtained from a nearby airport tower, if the test-site is close to a n airport (which "closeness" in itself en ta i l s however some ra ther severe
disadvantages! 1. An airport tower continuously monitors macroscopic atmospheric conditions in the course of its normal operation and will usual ly have information avai lable on wind speed, wind- direction and temperature near the ground and at altitude. I t is often bet ter , though, to obtain
measurements at the test site.
( b ) Airborne Equipment
Sounding Balloon
Weather balloons can be used to determine changing wind directions above a test site. They must be (3-dimensionally!) tracked by means of an ex t ra KTH, while the accuracy of the information - as far as wind i s concerned - is s t i l l r a ther limited, quite apa r t from the excessive cost of operat-
ing balloons for purposes of noise certification atmospheric sounding. Such a free- rising meteoro- logical balloon (a l so called filoted =loon or "pibal") would ini t ia l ly have a diameter of about 10 cm; it would then r ise to a n al t i tude of 5000 to 7000 m , where it would burst a t a diameter of approximately 60 cm.
A pibal should be released approximately once per test hour and be tracked to a height greater
than the maximum expected height of the test a i rc ra f t within the next hour.
Tethered Radio-sonde
A tethered radio-
sonde can provide information on tem- perature, air-pres-
sure and humidity, as well as on wind- speed and direction
(Fig. 3.31). Tempe- ra tures a r e sensed by a thermistor. A
thermistor i s a de- vice tha t changes electrical resistance
in proportion to the
air temperature; the variat ion of resis- tance is however not l inear and individu- a l calibration is re-
quired. For wind, a cup-anemomster and a combination of a
magnetic compass and a potentiometer
Fig. 3.31 Launching of tethered radio sonde for meteorological sounding (used by NASA Langley a t Wallops Flight Center)
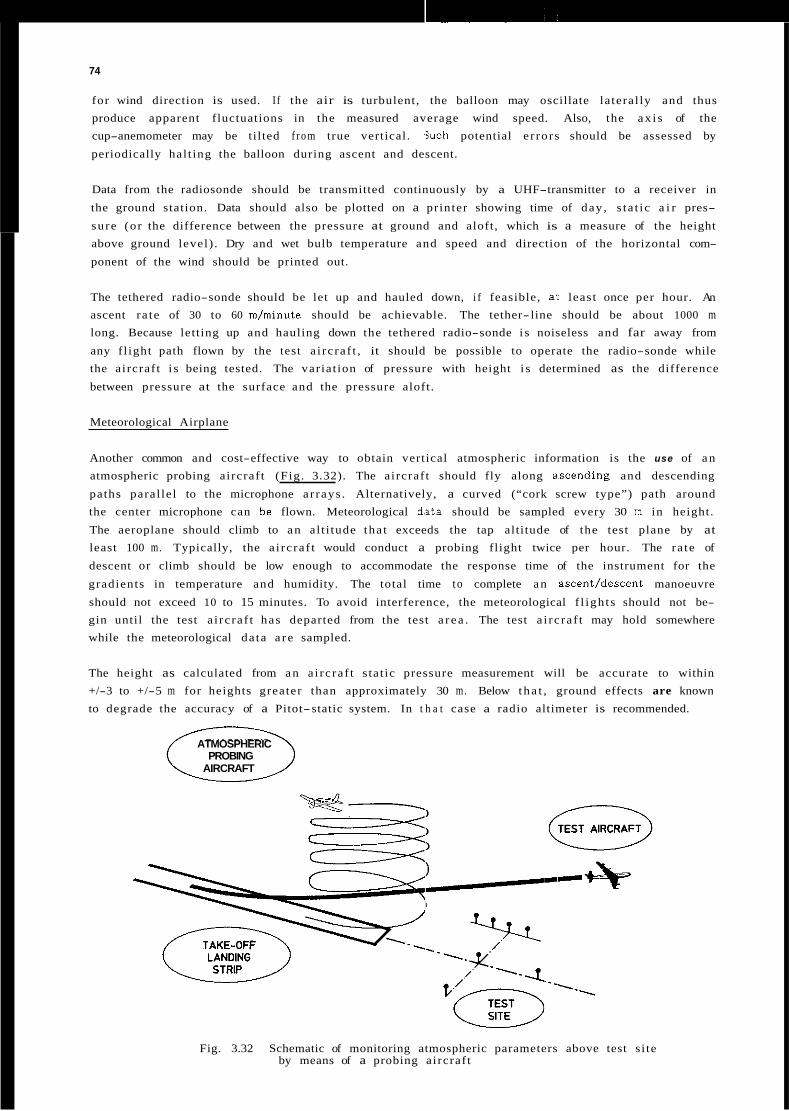
L 74
for wind direction is used. If the air is turbulent, the balloon may oscillate la teral ly and thus produce apparent fluctuations in the measured average wind speed. Also, the ax i s of the cup-anemometer may be tilted f r o m true vertical. :Such potential e r rors should be assessed by
periodically hal t ing the balloon during ascent and descent.
Data from the radiosonde should be transmitted continuously by a UHF-transmitter to a receiver in
the ground station. Data should also be plotted on a printer showing time of day , s ta t ic a i r pres-
sure (or the difference between the pressure at ground and aloft, which is a measure of the height above ground level) . Dry and wet bulb temperature and speed and direction of the horizontal com-
ponent of the wind should be printed out.
The tethered radio-sonde should be let up and hauled down, i f feasible, at least once per hour. An ascent ra te of 30 to 60 m/minute should be achievable. The tether-line should be about 1000 m long. Because letting up and hauling down the tethered radio-sonde i s noiseless and far away from
any f l ight path flown by the test a i rc ra f t , it should be possible to operate the radio-sonde while the aircraf t i s being tested. The variat ion of pressure with height i s determined as the difference
between pressure at the surface and the pressure aloft.
Meteorological Airplane
Another common and cost-effective way to obtain vertical atmospheric information is the use of a n atmospheric probing aircraf t (Fig. 3.32). The aircraf t should fly along a.scending and descending
paths paral lel to the microphone a r rays . Alternatively, a curved (“cork screw type”) path around the center microphone can be flown. Meteorological data should be sampled every 30 m in height.
The aeroplane should climb to a n al t i tude tha t exceeds the tap altitude of the test plane by at least 100 m. Typically, the a i rc ra f t would conduct a probing flight twice per hour. The ra te of
descent or climb should be low enough to accommodate the response time of the instrument for the
gradients in temperature and humidity. The total time to complete a n ascent/descent manoeuvre
should not exceed 10 to 15 minutes. To avoid interference, the meteorological f l igh ts should not be- gin until the test a i rc ra f t has departed from the test a r ea . The test a i rc ra f t may hold somewhere while the meteorological da ta a r e sampled.
The height as calculated from a n a i rc ra f t s tat ic pressure measurement will be accurate to within +/-3 to +/-5 m for heights greater than approximately 30 m. Below tha t , ground effects are known to degrade the accuracy of a Pitot-static system. In t h a t case a radio altimeter is recommended.
ATMOSPHERIC PROBING
AIRCRAFT
Fig. 3.32 Schematic of monitoring atmospheric parameters above test s i te by means of a probing aircraf t
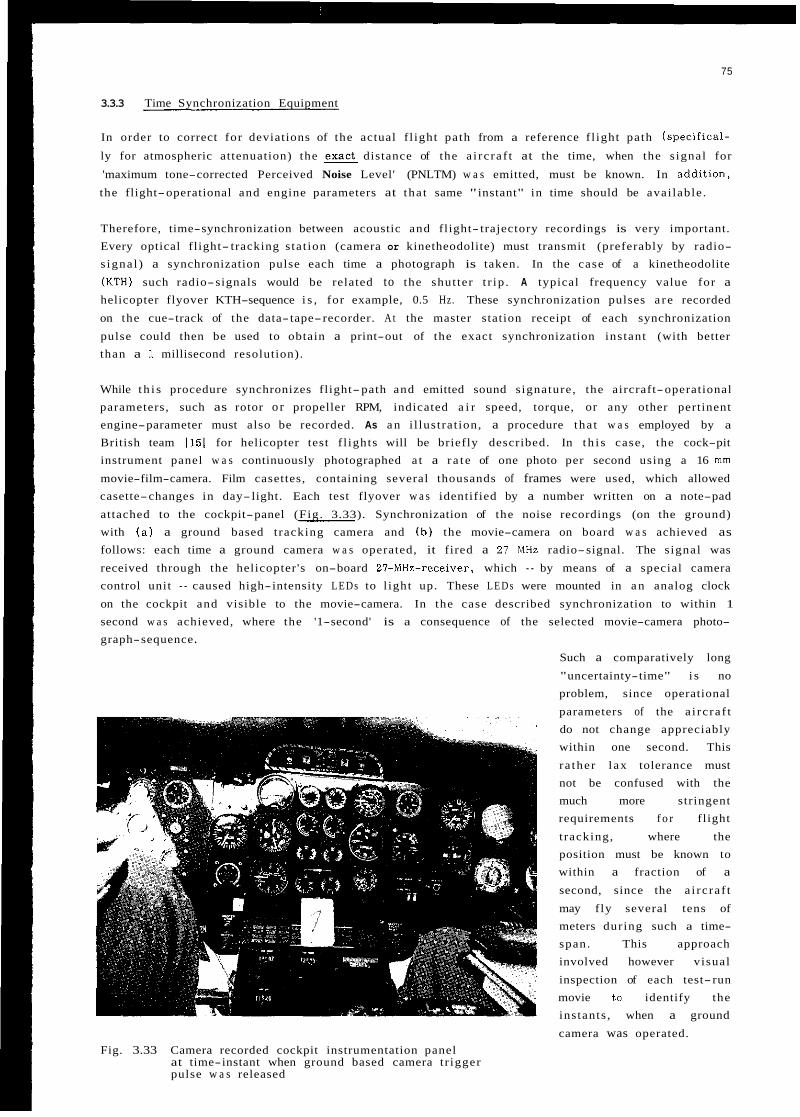
75
3.3.3 Time Synchronization Equipment
In order to correct for deviations of the actual f l ight path from a reference f l ight path (speciflcal-
ly for atmospheric attenuation) the distance of the a i rc ra f t at the time, when the s ignal for
'maximum tone-corrected Perceived Noise Level' (PNLTM) w a s emitted, must be known. In additlon,
the flight-operational and engine parameters at tha t same "instant" in time should be avai lable .
Therefore, time-synchronization between acoustic and flight- trajectory recordings is very important. Every optical flight- tracking s tat ion (camera or kinetheodolite) must transmit (preferably by radio- s igna l ) a synchronization pulse each time a photograph is taken. In the case of a kinetheodolite
(KTH) such radio-signals would be related to the shut ter t r ip . A typical frequency value for a helicopter flyover KTH-sequence i s , for example, 0.5 Hz. These synchronization pulses a r e recorded
on the cue-track of the data-tape-recorder. A t the master station receipt of each synchronization
pulse could then be used to obtain a print-out of the exact synchronization instant (with better than a 1 millisecond resolution).
While t h i s procedure synchronizes flight-path and emitted sound signature, the aircraft-operational parameters, such as rotor o r propeller RPM, indicated a i r speed, torque, or any other pertinent engine-parameter must also be recorded. As a n i l lustrat ion, a procedure tha t w a s employed by a
British team 1151 for helicopter test f l ights will be briefly described. In t h i s case, the cock-pit instrument panel w a s continuously photographed a t a r a t e of one photo per second using a 16 mm movie-film-camera. Film casettes, containing several thousands of frames were used, which allowed casette-changes in day- light. Each test flyover w a s identified by a number written on a note-pad
attached to the cockpit-panel (Fig. 3.33). Synchronization of the noise recordings (on the ground) with ( a ) a ground based t racking camera and ( b ) the movie-camera on board w a s achieved as follows: each time a ground camera w a s operated, it fired a 2 1 MHz radio-signal. The s ignal was
received through the helicopter 's on-board 21-MHz-receiver, which - by means of a special camera control unit - caused high-intensity LEDs to l ight up. These L E D s were mounted in a n analog clock
on the cockpit and visible to the movie-camera. In the case described synchronization to within 1
second w a s achieved, where the '1-second' is a consequence of the selected movie-camera photo- graph-sequence.
Such a comparatively long
"uncertainty-time" i s no problem, since operational
parameters of the a i rc ra f t do not change appreciably within one second. This
ra ther l ax tolerance must not be confused with the much more stringent requirements f o r flight
t racking, where the position must be known to within a fraction of a second, since the a i rc ra f t
may f ly several tens of meters during such a time- span. This approach involved however visual
inspection of each test- run movie to identify the instants , when a ground
camera was operated. Fig. 3.33 Camera recorded cockpit instrumentation panel
at time-instant when ground based camera t r igger pulse w a s released
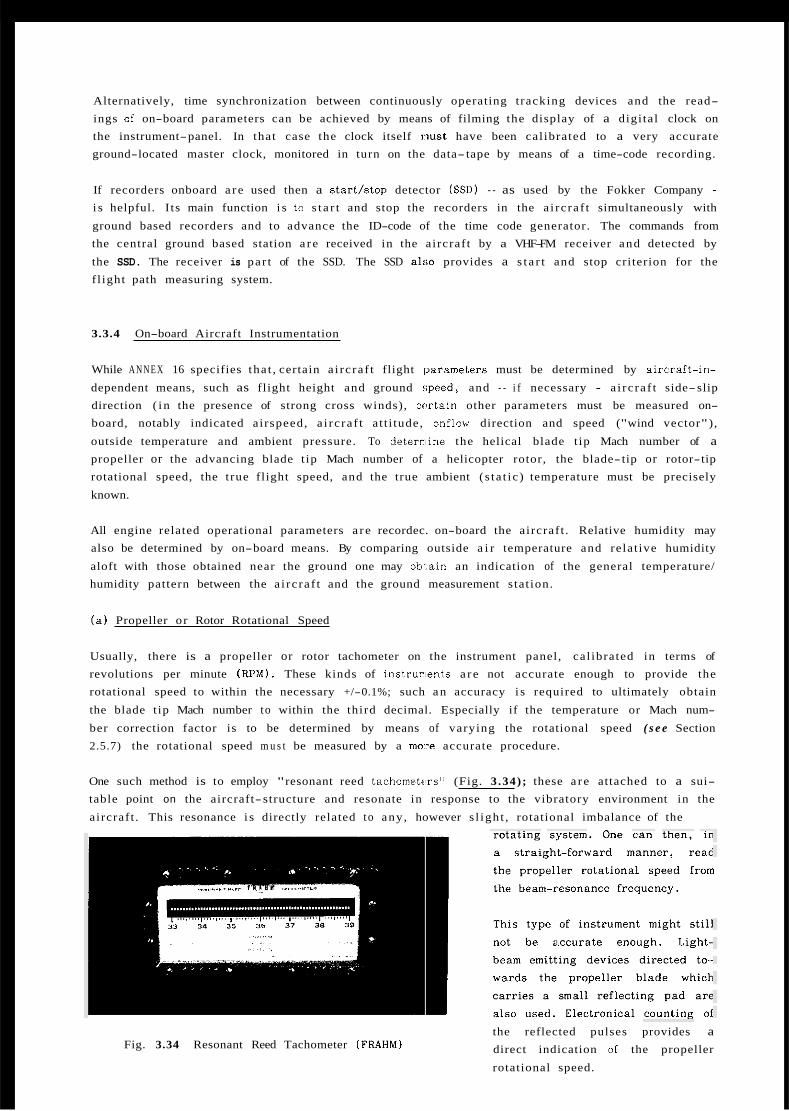
Alternatively, time synchronization between continuously operating t racking devices and the read- ings of on-board parameters can be achieved by means of filming the display of a digi tal clock on the instrument-panel. In that case the clock itself r u s t have been cal ibrated to a very accurate ground-located master clock, monitored in turn on the data- tape by means of a time-code recording.
If recorders onboard a r e used then a start/stop detector (SSD) - as used by the Fokker Company - i s helpful. I ts main function i s to s t a r t and stop the recorders in the a i rc ra f t simultaneously with
ground based recorders and to advance the ID-code of the time code generator. The commands from the central ground based station a r e received in the aircraf t by a VHF-FM receiver and detected by
the SSD. The receiver is par t of the SSD. The SSD also provides a s t a r t and stop criterion for the f l ight path measuring system.
3.3.4 On-board Aircraft Instrumentation
While A N N E X 16 specifies tha t , certain a i rc ra f t flight )parameters must be determined by aircraft-in-
dependent means, such as flight height and ground speed, and - i f necessary - a i rc ra f t side-slip direction ( i n the presence of strong cross winds), certain other parameters must be measured on- board, notably indicated airspeed, a i rc ra f t a t t i tude, onflow direction and speed ("wind vector"),
outside temperature and ambient pressure. To deterniine the helical blade t ip Mach number of a propeller or the advancing blade t ip Mach number of a helicopter rotor, the blade-tip or rotor-tip rotational speed, the t rue flight speed, and the true ambient ( s ta t ic ) temperature must be precisely
known.
All engine related operational parameters a r e recordec. on-board the aircraf t . Relative humidity may also be determined by on-board means. By comparing outside a i r temperature and relat ive humidity
aloft with those obtained near the ground one may ob.:ain an indication of the general temperature/ humidity pattern between the a i rc ra f t and the ground measurement s tat ion.
( a ) Propeller o r Rotor Rotational Speed
Usually, there is a propeller or rotor tachometer on the instrument panel, cal ibrated in terms of revolutions per minute (RPX). These kinds of instruments a r e not accurate enough to provide the rotational speed to within the necessary +/-0.1%; such a n accuracy i s required to ultimately obtain
the blade t ip Mach number to within the third decimal. Especially if the temperature or Mach num-
ber correction factor is to be determined by means of varying the rotational speed ( s e e Section 2.5.7) the rotational speed m u s t be measured by a mare accurate procedure.
One such method is to employ "resonant reed tachometr,rs" (Fig. 3.34) ; these a r e attached to a sui- table point on the aircraft- structure and resonate in response to the vibratory environment in the
aircraf t . This resonance i s directly related to any , however s l igh t , rotational imbalance of the
Fig. 3.34 Resonant Reed Tachometer ( F R A H M ) the reflected pulses provides a direct indication of the propeller
rotational speed.

77
A third possibility i s to monitor the acoustic s ignature inside the cockpit. The rotation of the pro- peller or the rotor expresses itself through a n acoustic line-spectrum consisting of a blade-rotation fundamental and a number of harmonics. Selecting any part icular ly strong harmonic within t h i s
line-spectrum will yield the rotational speed with a very high degree of accuracy.
In a helicopter, the main and the tail rotor a r e mechanically coupled with a known gear rat io;
any par t icu la r and sui tably strong tonal component in the cabin interior narrow-band acoustic spectrum may then be taken to derive rotational speeds. Since the frame of reference i s the air- craft, no speed-related Doppler frequency shift occurs. Further information on engine-rotational
speed measurement may be found in 1161.
(b) Air Speed and "Wind Vector"
The f l ight speed of the a i rc ra f t i s normally obtained on the bas i s of a Pitot-static read-out on the
cockpit instrument panel . Speed is ini t ia l ly ava i lab le in terms of the "indicated airspeed ( IAS)".
The value of the IAS, however, still contains instrument e r rors and e r rors resulting from the in-
stallation of the sensor close to a i rc ra f t s t ruc tura l components; the la t te r ones a r e termed "position errors" . The ac tua l amount of these e r rors is ava i lab le from the aircraft-specific flight manual. IAS i s a lso affected, among other things, by a i r c r a f t weight and the par t icu la r configuration as flown, notably by the wing-flap angles. These effects may quantitatively be determined from information in
the flight manual. Accounting for these e r rors will now provide the "calibrated airspeed (CAS)". The CAS must fur ther be converted into the " true airspeed (TAS)" by considering deviations f rom ISA sea-level atmospheric conditions of ambient pressure ( f l igh t height dependent) and temperature
utilizing appropriate tables. Since flight Mach-numbers in noise certification procedures never real ly exceed a value of approximately 0.35 any compressibility effects on the pitot/static-reading
can be neglected.
Most modern a i rc ra f t a r e equipped with a n on-board air-data-computer which provides TAS directly
from IAS-information.
Both a i rc ra f t a t t i tude and wind vector a r e of interest in the context of noise certification. Since aircraft- specific noise generators, most notably propellers and rotors, exhibit a pronounced direc- t iv i ty , i t can be important to know their flight-attitude with respect to a geodetic coordinate
system. Furthermore, the noise genera-
tion process as such of propellers and rotors is also affected by the air an- flow direction and velocity ( i . e . by the "wind vector"). Aircraft a t t i tude
can be determined by an on-board gyro or inert ia l navigation system. The wind vector can be derived from
information on a i rc ra f t angle-of-attack ("alpha" ), a i rc ra f t angle-of-side-slip
("beta") and TAS. In the practice of
noise certification one can assume that a f l igh t condition involving a relat ive side s l ip does not really occur. There-
fore, the wind vector can be readily
Fig. 3.35 Dornier-developed "Flight Log": a n airborne t rue flight speed and a i rc ra f t angle-of-attack/side-slip indicator
derived from speed and angle-of-attack information only. More direct ly, trua airspeed and wind vector, respective- l y , can be determined with the (DORNI ER-developed) "Flight-Log"
(Fig. 3 . 3 5 ) . I t uses a l ight and fast-
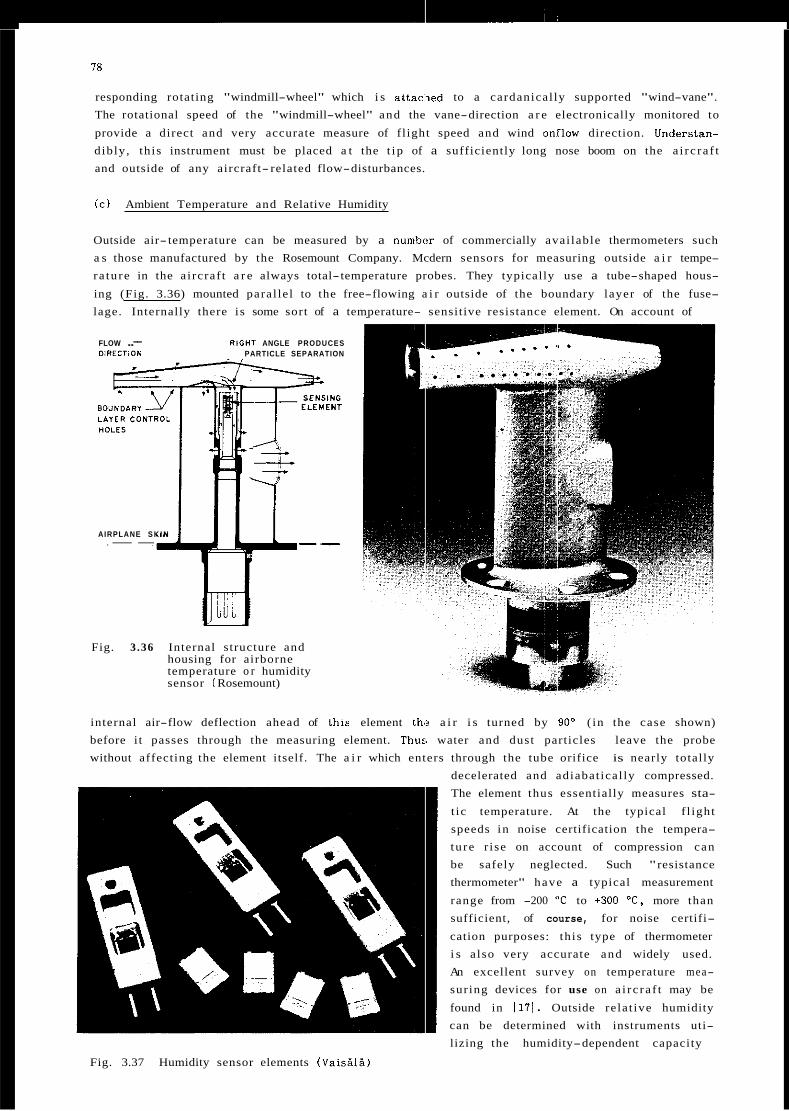
78
responding rotating "windmill-wheel" which i s attac'Ted to a cardanical ly supported "wind-vane". The rotational speed of the "windmill-wheel" and the vane-direction a r e electronically monitored to
provide a direct and very accurate measure of fl ight speed and wind onflow direction. Understan- dibly, th is instrument must be placed a t the t ip of a sufficiently long nose boom on the a i rc ra f t and outside of any aircraft- related flow-disturbances.
( c ) Ambient Temperature and Relative Humidity
Outside air- temperature can be measured by a numb(?r of commercially avai lable thermometers such a s those manufactured by the Rosemount Company. Mcdern sensors for measuring outside a i r tempe- ra tu re in the a i rcraf t a r e always total-temperature probes. They typically use a tube-shaped hous-
ing (Fig. 3.36) mounted paral le l to the free-flowing a i r outside of the boundary layer of the fuse- lage. Internally there i s some sort of a temperature- sensitive resistance element. On account of
FLOW ..-- R l G H T ANGLE PRODUCES DIRECTION PARTICLE SEPARATION
AIRPLANE S K I N .--
Fig. 3.36 Internal structure and housing for airborne temperature o r humidity sensor ( Rosemount)
internal air-flow deflection ahead of this element th,? a i r i s turned by 90' ( in the case shown) before i t passes through the measuring element. Thus; water and dust particles leave the probe without affecting the element itself. The a i r which enters through the tube orifice is nearly totally
decelerated and adiabat ical ly compressed. The element thus essentially measures sta-
t ic temperature. At the typical f l ight speeds in noise certification the tempera- ture r ise on account of compression can be safely neglected. Such "resistance thermometer" have a typical measurement
range from -200 "C to +300 'C, more than sufficient, of course, for noise certifi-
cation purposes: th is type of thermometer i s a lso very accurate and widely used. An excellent survey on temperature mea- suring devices for use on a i rc ra f t may be
found in 1171. Outside re la t ive humidity can be determined with instruments uti- lizing the humidity-dependent capacity
Fig. 3.37 Humidity sensor elements ( V a i s i l s )
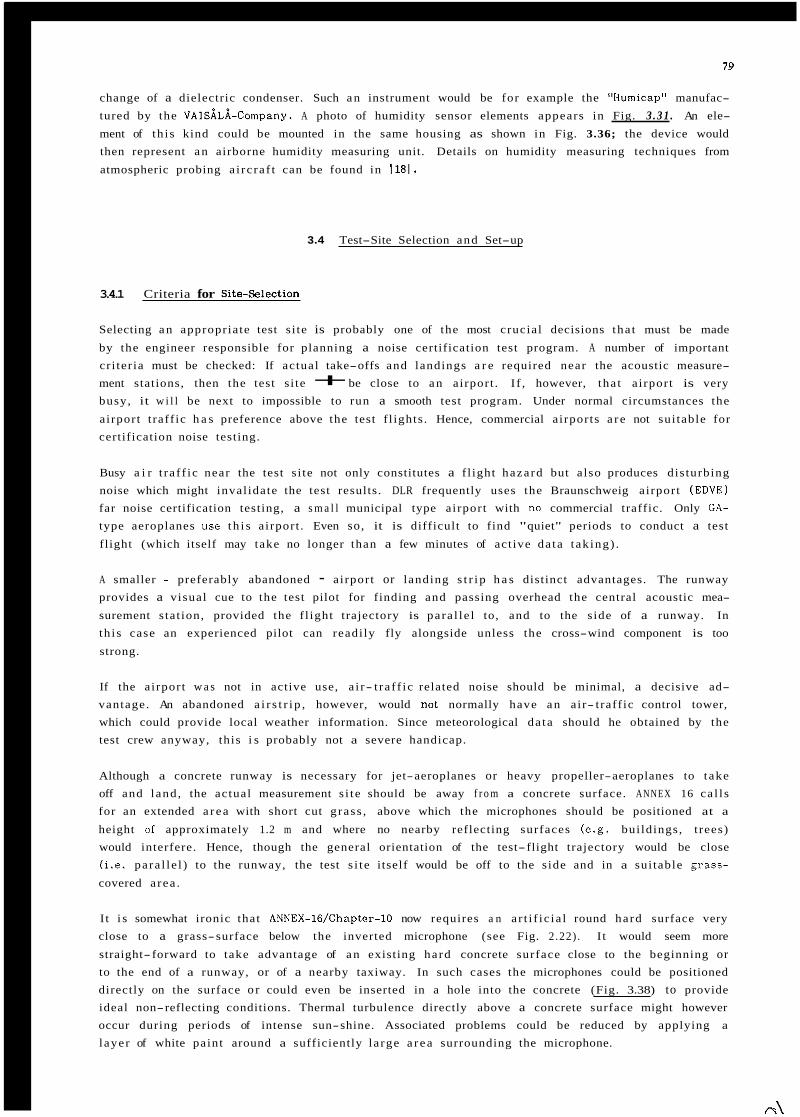
79
change of a dielectric condenser. Such a n instrument would be for example the "Humicap" manufac- tured by the VAISALA-Company. A photo of humidity sensor elements appears in Fig. 3 .31 . An ele-
ment of th i s kind could be mounted in the same housing as shown in Fig. 3.36; the device would then represent a n airborne humidity measuring unit. Details on humidity measuring techniques from
atmospheric probing a i rc ra f t can be found in 1181.
3.4 Test-Site Selection and Set-up
3.4.1 Criteria for SiteSelection
Selecting a n appropriate test s i te is probably one of the most crucial decisions tha t must be made
by the engineer responsible for planning a noise certification test program. A number of important cr i ter ia must be checked: If actual take-offs and landings a r e required near the acoustic measure- ment stations, then the test s i te + be close to a n airport . I f , however, tha t a irport is very busy, it w i l l be next to impossible to run a smooth test program. Under normal circumstances the
airport t raff ic h a s preference above the test f l ights . Hence, commercial a irports a r e not sui table for certification noise testing.
Busy a i r t ra f f ic near the test s i te not only constitutes a f l ight hazard but also produces dis turbing noise which might inval idate the test results. DLR frequently uses the Braunschweig airport (EDVE) far noise certification testing, a s m a l l municipal type airport with no commercial traffic. Only GA-
type aeroplanes use t h i s airport . Even so, it is difficult to find "quiet" periods to conduct a test
flight (which itself may take no longer than a few minutes of act ive da ta tak ing) .
A smaller - preferably abandoned - airport or landing s t r i p h a s distinct advantages. The runway provides a visual cue to the test pilot for finding and passing overhead the central acoustic mea-
surement s tat ion, provided the f l ight trajectory is para l le l to, and to the s ide of a runway. In th i s case an experienced pilot can readi ly fly alongside unless the cross-wind component is too
strong.
If the airport w a s not in active use, a i r- t ra f f ic related noise should be minimal, a decisive ad- vantage. An abandoned a i r s t r i p , however, would not normally have a n air- traff ic control tower, which could provide local weather information. Since meteorological da ta should he obtained by the test crew anyway, this i s probably not a severe handicap.
Although a concrete runway is necessary for jet-aeroplanes or heavy propeller-aeroplanes to take off and land , the actual measurement s i te should be away f r o m a concrete surface. ANNEX 16 ca l l s for an extended a r ea with short cut g rass , above which the microphones should be positioned at a
height of approximately 1.2 m and where no nearby reflecting surfaces (e .g . bui ldings, t rees) would interfere. Hence, though the general orientation of the test- flight trajectory would be close (i .e. para l le l ) to the runway, the test s i t e itself would be off to the s ide and in a sui table grass-
covered a rea .
I t i s somewhat ironic that ANNEX-lG/Chapter-lO now requires a n a r t i f ic ia l round hard surface very close to a grass- surface below the inverted microphone (see Fig. 2 .22) . I t would seem more
straight- forward to take advantage of a n existing hard concrete surface close to the beginning or to the end of a runway, or of a nearby taxiway. In such cases the microphones could be positioned directly on the surface o r could even be inserted in a hole into the concrete (Fig. 3.38) to provide ideal non-reflecting conditions. Thermal turbulence directly above a concrete surface might however occur during periods of intense sun-shine. Associated problems could be reduced by applying a
layer of white paint around a sufficiently la rge a r ea surrounding the microphone.
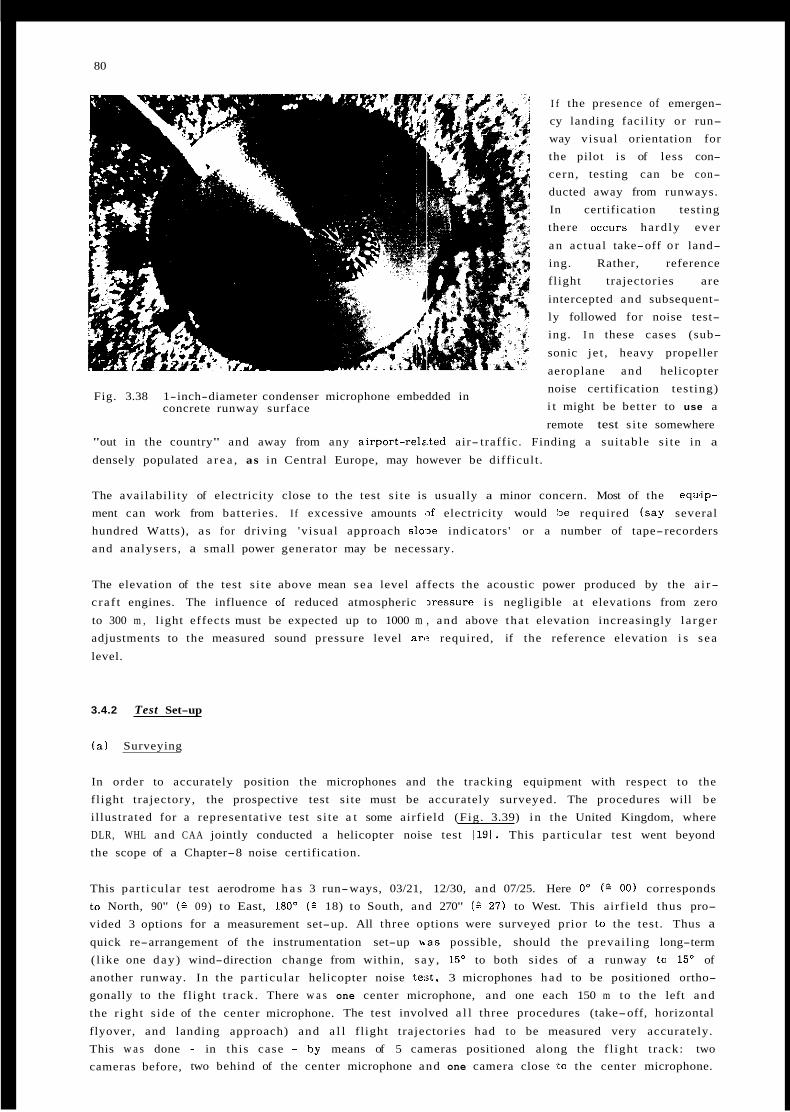
80
Fig. 3.38 1-inch-diameter condenser microphone embedded in concrete runway surface
I f the presence of emergen- cy landing facil i ty or run- way visual orientation for the pilot i s of less con- cern, testing can be con-
ducted away from runways. In certification testing there occurs hard ly ever
a n actual take-off o r land- ing. Rather, reference fl ight trajectories are
intercepted and subsequent- ly followed for noise test- ing. I n these cases (sub-
sonic je t , heavy propeller
aeroplane and helicopter noise certification tes t ing) i t might be better to use a
remote test s i te somewhere "out in the country" and away from any airport-relE.ted air- traffic. Finding a sui table s i te in a
densely populated a r e a , as in Central Europe, may however be difficult .
The availabili ty of electricity close to the test s i te is usually a minor concern. Most of the equ,ip- ment can work from batteries. If excessive amounts ,>f electricity would lbe required ( say several hundred Watts), as for driving 'v isual approach s l o x indicators ' or a number of tape-recorders and analysers , a small power generator may be necessary.
The elevation of the test s i te above mean sea level affects the acoustic power produced by the a i r- c ra f t engines. The influence of reduced atmospheric 3ressut-e i s negligible a t elevations from zero
to 300 m , l ight effects must be expected up to 1000 m , and above tha t elevation increasingly l a rger adjustments to the measured sound pressure level arc? required, if the reference elevation i s sea
level.
3.4.2 Test Set-up
( a ) Surveying
In order to accurately position the microphones and the tracking equipment with respect to the fl ight trajectory, the prospective test si te must be accurately surveyed. The procedures will be i l lustrated for a representative test s i te a t some airfield (Fig . 3.39) in the United Kingdom, where DLR, WHL and CAA jointly conducted a helicopter noise test 1191. This par t icular test went beyond the scope of a Chapter-8 noise certification.
This par t icular test aerodrome h a s 3 run-ways, 03/21, 12/30, and 07/25. Here 0' (g 00) corresponds to North, 90" ( G 09) to East, 180' ( 2 18) to South, and 270" ( G 27) to West. This airfield thus pro- vided 3 options for a measurement set-up. All three options were surveyed prior to the test . Thus a quick re-arrangement of the instrumentation set-up bas possible, should the prevai l ing long-term ( l ike one d a y ) wind-direction change from within, s a y , 1 5 O to both sides of a runway to 15' of another runway. In the par t icular helicopter noise k j t , 3 microphones had to be positioned ortho- gonally to the fl ight t r ack . There w a s one center microphone, and one each 150 m to the left and the r ight s ide of the center microphone. The test involved a l l three procedures (take-off, horizontal
flyover, and landing approach) and a l l f l ight trajectories had to be measured very accurately. This w a s done - in th is case - by means of 5 cameras positioned along the f l ight t rack: two cameras before, two behind of the center microphone and one camera close to the center microphone.
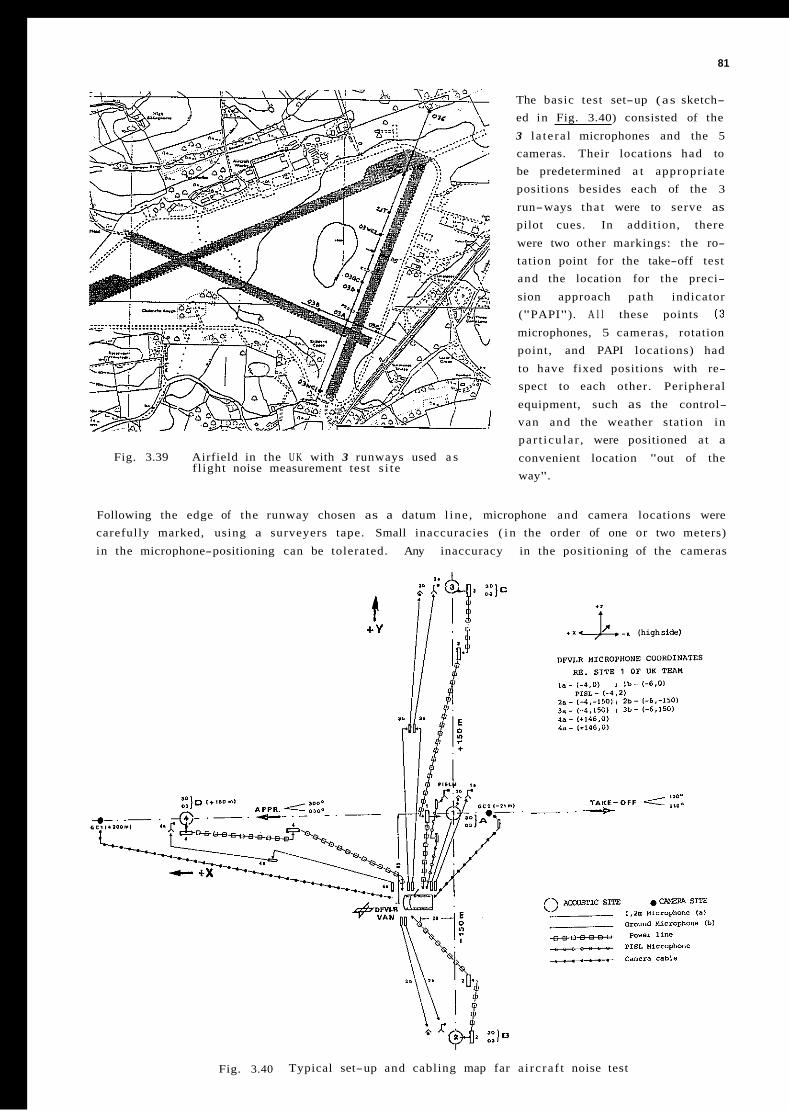
81
The basic test set-up (as sketch- ed in Fig. 3.40) consisted of the
3 l a te ra l microphones and the 5 cameras. Their locations had to be predetermined a t appropriate positions besides each of the 3
run-ways tha t were to serve as pilot cues. In addition, there
were two other markings: the ro- tation point for the take-off test and the location for the preci-
sion approach path indicator ("PAPI"). A l l these points (3 microphones, 5 cameras, rotation point, and PAPI locations) had
to have fixed positions with re- spect to each other. Peripheral
equipment, such as the control- van and the weather station in par t icu la r , were positioned a t a
convenient location "out of the way".
Fig. 3.39 Airfield in the U K with 3 runways used a s f l ight noise measurement test s i t e
Following the edge of the runway chosen as a datum l ine , microphone and camera locations were carefully marked, using a surveyers tape. Small inaccuracies ( i n the order of one or two meters)
in the microphone-positioning can be tolerated. Any inaccuracy in the positioning of the cameras
. x . .I (high side1
TA.KE-OFF ~. -P
Fig. 3.40 Typical set-up and cabling map far a i rc ra f t noise test
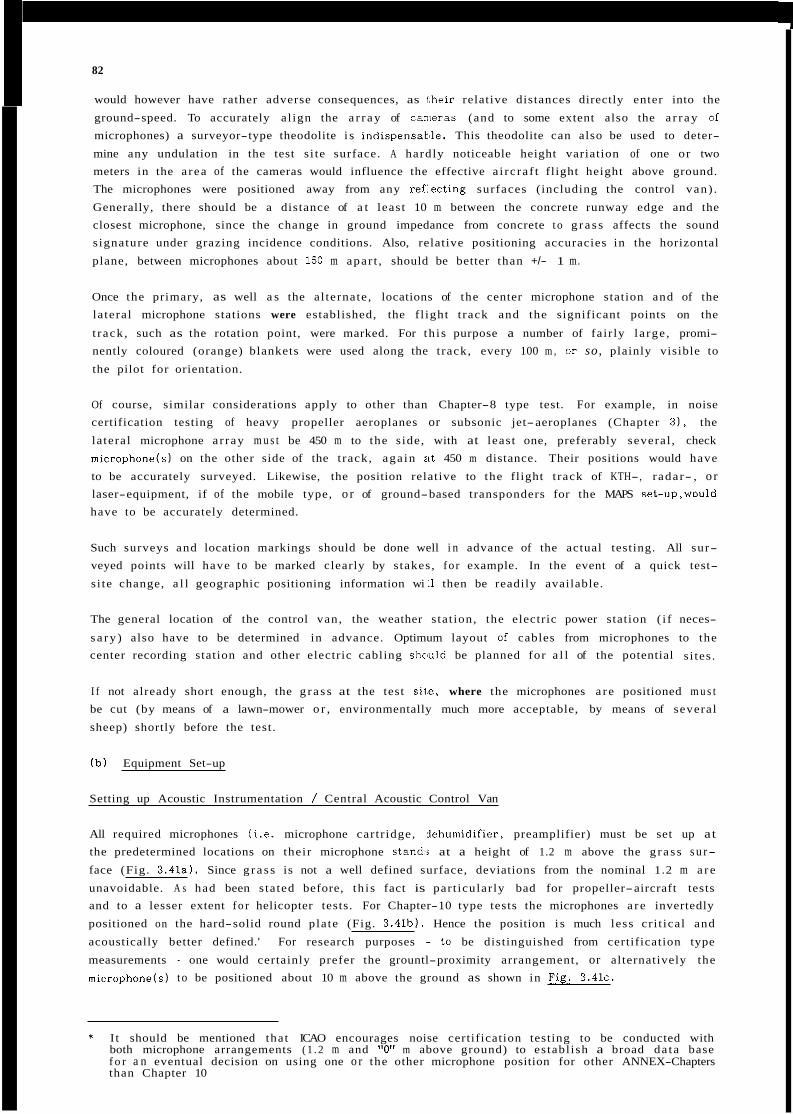
82
would however have rather adverse consequences, as their relative distances directly enter into the
ground-speed. To accurately al ign the a r r a y of canieras (and to some extent also the a r r a y of microphones) a surveyor-type theodolite i s indispensatmle. This theodolite can also be used to deter-
mine any undulation in the test s i te surface. A hardly noticeable height variation of one or two meters in the a rea of the cameras would influence the effective a i rc ra f t flight height above ground. The microphones were positioned away from any ref:ecting surfaces (including the control van) .
Generally, there should be a distance of a t least 10 m between the concrete runway edge and the closest microphone, since the change in ground impedance from concrete to g r a s s affects the sound signature under grazing incidence conditions. Also, relative positioning accuracies in the horizontal
plane, between microphones about 150 m apar t , should be better than +/- 1 m.
Once the primary, as well a s the al ternate , locations of the center microphone station and of the lateral microphone stations were established, the f l ight t rack and the significant points on the
t rack , such as the rotation point, were marked. For th i s purpose a number of fair ly la rge , promi- nently coloured (orange) blankets were used along the t rack, every 100 m , or so, plainly visible to
the pilot for orientation.
Of course, similar considerations apply to other than Chapter-8 type test. For example, in noise certification testing of heavy propeller aeroplanes or subsonic jet-aeroplanes (Chapter 3), the
lateral microphone a r ray m u s t be 450 m to the s ide, with at least one, preferably several , check microphane(s) on the other side of the t rack, aga in iit 450 m distance. Their positions would have
to be accurately surveyed. Likewise, the position relative to the flight t rack of KTH-, radar- , o r laser-equipment, if of the mobile type, o r of ground-based transponders for the MAPS set-up,would have to be accurately determined.
Such surveys and location markings should be done well i n advance of the actual testing. All sur- veyed points will have to be marked clearly by s takes, fo r example. In the event of a quick test-
si te change, a l l geographic positioning information wi L1 then be readily available.
The general location of the control van, the weather s tat ion, the electric power station ( i f neces-
sa ry ) also have to be determined in advance. Optimum layout of cables from microphones to the center recording station and other electric cabling shc,uld be planned for a l l of the potential s i tes .
I f not already short enough, the g r a s s at the test sil,e, where the microphones a r e positioned m u s t be cut (by means of a lawn-mower o r , environmentally much more acceptable, by means of several
sheep) shortly before the test.
( b ) Equipment Set-up
Setting up Acoustic Instrumentation / Central Acoustic Control Van
All required microphones ( i .e . microphone cartr idge, 3ehumidifier, preamplifier) must be set up at the predetermined locations on their microphone stand:< at a height of 1.2 m above the g r a s s s u r- face (Fig. 3.41a). Since g r a s s is not a well defined surface, deviations from the nominal 1.2 m a r e
unavoidable. A s had been s tated before, th i s fact is part icular ly bad for propeller-aircraft tests and to a lesser extent f o r helicopter tests. For Chapter-10 type tests the microphones a r e invertedly
positioned on the hard-solid round plate (Fig. 3.41b). Hence the position i s much less cr i t ical and
acoustically better defined.' For research purposes - to be distinguished from certification type
measurements - one would certainly prefer the grountl-proximity arrangement, or alternatively the micraphone(s) to be positioned about 10 m above the ground as shown in Fi.g. 3 . 4 1 ~ .
* I t should be mentioned that ICAO encourages noise certification testing to be conducted with both microphone arrangements (1 .2 m and "0" m above ground) to establ ish a broad da ta base f o r a n eventual decision on using one o r the other microphone position for other ANNEX-Chapters than Chapter 10
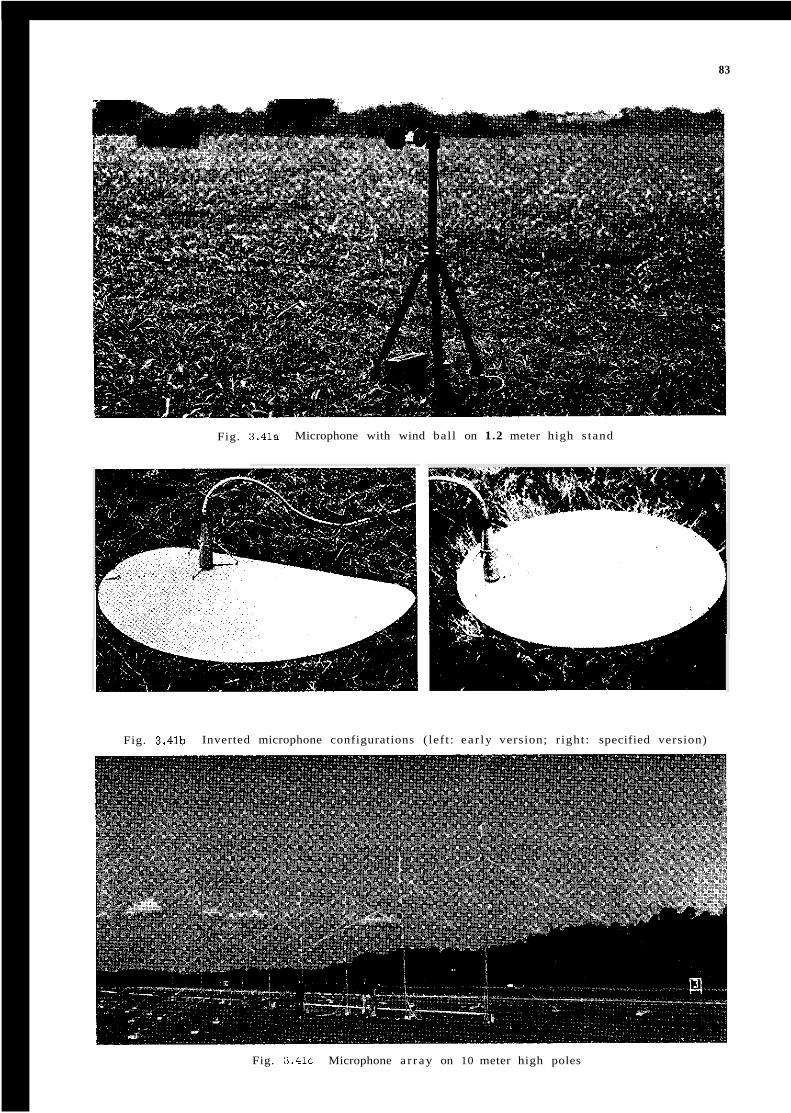
83
Fig. 3.41a Microphone with wind bal l on 1.2 meter high s tand
Fig. 3.41b Inverted microphone configurations ( lef t : ea r ly version; r ight : specified version)
Fig. 3 . 4 1 ~ Microphone a r r a y on 10 meter high poles
84
The (pressure-response type) microphones on their s t .mds should be orientated for a grazing inci- dence direction. The microphones must be covered by a polyurethan foam wind-ball ( to be tempa-
ra r i ly removed for pistonphone-calibration). The micrcmphones a r e then connected by extension cables ( 3 m to 10 m long each) to their power-supplies (if hon-prepolarized condenser-microphones a r e used) and switched on to allow for a sufficient "warn-up" time.
The power supplies themselves should have a protective housing, to provide some shielding aga ins t sunshine and unexpected drizzle ( i n which case the microphones could also be temporarily covered
with a plast ic bag for protection). Thereafter, the s ignal cables ( up to 500 m long, usually of the BNC-type) a r e rolled out to provide the connection between the power supplies and the s ignal condi-
tioning instrumentation.
Depending on the microphone sensitivity, the type of a i rc ra f t and its expected closest 'approach to the microphone, the wideband RMS signal voltage from the preamplifier might range from 100 LIV to
1 V ; this 80 dB range must be adjusted prior to recording, such that the maximum voltage (accoun- ting for crest factors and the impulsivity of the expected s ignal , see Section 3.2.3) i s close to the preferred value. Such adjustment can be achieved by using a precision sound level meter (PSLM),
being a low-noise, wide-band signal conditioner with low distortion.
Maximizing the electric signal-to-noise rat io requires ,continuity of the electrical shielding from the preamplifier all the way to the input of the PSLM. A ? radio s ignals can be picked up, the shield
should be grounded a t the tape-recorder end of the s ignal cable by a n insulated wire, so tha t con- tact with the metal s t ructure of the control van (which houses the tape-recorder and the PSLMs) is
avoided.
Each microphane/power-supply da ta channel is connected to i t s own PSLM, which in turn i s connect- ed to the multi-track tape-recorder input. A s s ta ted above, PSLMs and the tape-recorder should be
located inside the central control van or container for operation by the acoustic test engineer. T-connectors are used to connect peripheral instrumeritation, such as one o r several graphic level recorders ( to monitor flyover A-weighted pressure-level time his tor ies) . Oscilloscopes, preferably one
for each channel a r e very useful for monitoring each .nicrophone output, as each microphone receiv-
es i t s own transient s ignal , not necessarily identical to those of other microphones (especially of
side line microphones).
Precision sound level meters and research-type tape recorders a r e equipped with overload indicators to allow adjustment of levels on the s ignal conditioning instrument. If an A-weighted s ignal is to
be recorded directly, then the input-attenuator w i l l be adjusted for maximum wide-band, unweighted s ignal s t rength, and the output-attenuator for maximum wide-band weighted s ignal s t rength. This i s not normally done, unless a Chapter-6 o r Chapter-IO type measurement i s carr ied au t , o r i f dynamic range compression i s important. In a l l other cases, and especially when an EPNL-value must be determined, the unweighted wide-band signal is recorded.
At each acoustic measurement station a pistonphone, preferably one that is capable of generating several discrete-frequency tones (e .g. 250 Hz, 500 Hz, 1000 Hz), should be avai lable . In addition i t
i s advisable to employ a pink-noise generator to check the ent i re frequency response in the field. If distances between individual acoustic measurement ritations a r e not too la rge , "hand-carrying'' a cal ibrator (discrete, or wide-band) to the various stations eliminates whatever s l ight differences
might exist between individual calibration equipment.
If relatively few microphone stations (e.g. 3 ) a re used each da ta channel can be equipped with i t s own PSLM. If many microphones a r e used (e .g. 6 or more) the use of individual PSLMs would be a ra ther expensive undertaking and use of a multi-channel s ignal conditioner would be a better
approach.
85
If many channels a r e to be recorded and monitored, i t i s impractical to write down all gain-
set t ings for each channel manually. especially if gain settings have to be changed frequently f o r successive f l ights at different heights. In that case, a gain- setting printer should be connected to the s ignal conditioner.
In addition, a head-set monitor should be connected to the PSLM output o r to a n appropriate output connector on the tape recorder. This i s h6lpful for the test engineer to acoustically monitor in- coming signals "by ear" , since - i f inside the control van - he would not normally have visual o r acoustic contact with the approaching test a i rc ra f t . Also, the voice-microphone for annotation on the cue-track of the tape recorder would have to be activated with a switch to a l l ow the al ternate re-
cording of a voice annotation and the time-code-generator s ignal on tha t same t rack .
If only E multi- track tape recorder i s used, synchronization between the acoustic measurement s ta t ion(s ) is no problem. I f , however, several autonomous acoustic measurement stations a r e used,
each station constitutes an entity in itself tha t must be set up individual ly. Typically, the PSLM.
the (2- or 4-track) tape-recorder, and the graphic level recorder w i l l be placed on some field-lab table with a protective shading-umbrella some distance (10 m to 15 m ) away from the microphone/
power-supply assembly to ensure the 15' or 80' non-reflecting cone around the microphone vert ical . The only difference then i s tha t time synchronization between tape-recorders must be establ ished, as
w i l l be discussed in the following sections.
Setting up Time Synchronization
Time synchronization must be established between the various acoustic measurement s tat ions, the a i rc ra f t t racking s tat ions, the meteorological s tat ions and the a i rc ra f t cockpit and - i f applicable -
the air t r a f f i c control tower. Although Universal Time (UTC) or Greenwich Mean Time (GMT) a r e continuously broadcasted by radio-stations in America and in Europe, these s ignals a r e influenced by electromagnetic disturbances with ensuing variat ions in signal-to-noise rat io. There a r e , how- ever , geostationary satel l i te systems from which s ignals from a ground station a r e relayed back to ground. In the United States these a r e continually synchronized with the National Bureau of Stan-
dards time. The equivalent in Europe i s synchronization with the time s tandard of the German 'Physikalisch-Technische Bundesanstalt ' .
This time signal can be encoded for recording on a tape- track using a n appropriate format, such as the IRIG ("Inter-Range Instrumentation Group") time code. The "IRIG Time Code B" i s most wide- l y used for a i rc ra f t time synchronization. I t uses a 1000-Hz car r ie r frequency with a 1-second time frame containing 100 tone-bursts to provide a resolution of 1 m s . The rad io receiver in the control-
van can pick up the s ignal and convert it to a n amplitude-modulated 1000-Hz-wave. The master tape-recorder, the autonomous tape-recorder s tat ions and the t racking s tat ions must each have their own time-code generator. A portable time-code generator - synchronized with the master time code
generator in the control van - can then be carr ied to each measurement station for in i t i a l , and also for subsequent repeated synchronization among all the time-code generators used. A time code reader w i l l be required for da ta processing la te r .
Establishing Radio-Communication
The following radio-communication l inks with one, two or three specially licensed receive/transmit
VHF channel frequencies ( i n the 50 MHz to 300 MHz range) should be ava i lab le for transmission
o from the control-van to the test a i rc ra f t and to the metearologial a i rc ra f t and vice versa; o from the control-van to the acoustic, the t racking and the meteorological s tat ions and vice
versa:
o for the ground personnel amongst themselves; o from the control-van to the air- traffic control tower and vice versa.
86
The following receive-only l inks would be required, in order to monitor (on existing frequency
bands)
o communication between test aircraft and tower, o communication of a i r t raff ic control;
o communication of ground traff ic control.
Hence, appropriate special radio-communication equipirent i s to be set up in the control van, in the
test and meteorological a ircraf t and at the various outbound stations.
Setting up Tracking Equipment
Special requirements a r e to be observed in setting up any mobile t racking equipment. Independently of which system is used (e .g. kinetheodolite, l aser , o r t racking r a d a r ) its position with respect to
the geo-stationary coordinate system must be carefully determined. Also, careful leveling and deter- mination of systematic errors i s paramount, since deviations of the order of fractions of a degree will result in gross tracking errors . Such errors might result from boresight ax is collimation
e r rors , range b ias , and leveling misalignment. All these should eventually be taken into account in
the evaluation process.
If permanently installed systems a r e avai lable , say near airports , the important coordinates a r e
already precisely known. If mobile or portable systelrs a r e used, coordinates can be freely select- ed; to faci l i ta te the trajectory da ta analysis in case of a take-off or landing flight procedure, i t
would then be advantageous to select the coordinate system ( in which da ta a r e presented) to coin- cide with the runway center l ine, and a l ine vertical to the runway center line.
Modern trajectory measurement systems such as kinetheodolites and t racking r a d a r a r e usually
equipped with time synchronization. I f , for example, several kinetheodolites a r e used in a certifi- cation test i t i s advantageous to synchronize both by triggering them a t regular intervals utilizing
the same time base. The t r igger pulse could then also actuate a film-frame counter in each kine- theodolite, such that each frame number would now a1:ro be a measure of time.
Since precise time synchronization i s of the utmost importance far t racking, the time-instances of
shutter-operation (if still-picture cameras a r e used) must be relayed to the master tape recorder by means of s ignal cables o r by radio. Likewise, kinetheodolite time signals for each of the film-
frames m u s t be transmitted. If continuous t racking by laser or r a d a r equipment i s used, the time- code s ignal is recorded and plotted in real time wi1.h the flight- trajectory coordinates. Laser or r a d a r equipment will usually be several hundred mr?ters away from the ground track and will
therefore not constitute a reflecting surface to be concerned about.
Setting up Meteorological Equipment
For ease of handling, a 10 m high weather mast - usually consisting of several telescopic sections to be cranked up towards ful l length - i s often mounted an a t ra i le r . Telescopic configurations pro- vide good mechanical s tabi l i ty; otherwise stabilizing wires will be necessary. The weather m a s t
should be positioned close to the measuring microphsnes (but not too ciose because of possible reflections) and some distance away (100 to 200 m ) from the (heat-producing) control-van. The
meteorological measuring instruments should operate continuously from the s t a r t of the day , so that any gross changes in atmospheric conditions duririg the actual testing w i l l be immediately
apparent.
Weather stations close to the ground a r e somewhat easier to handle. ANNEX 16 requires tha t for Chapter-6 and Chapter-10 type measurements atmosph<:ric information be gathered at 1 .2 or 2 m
above ground.
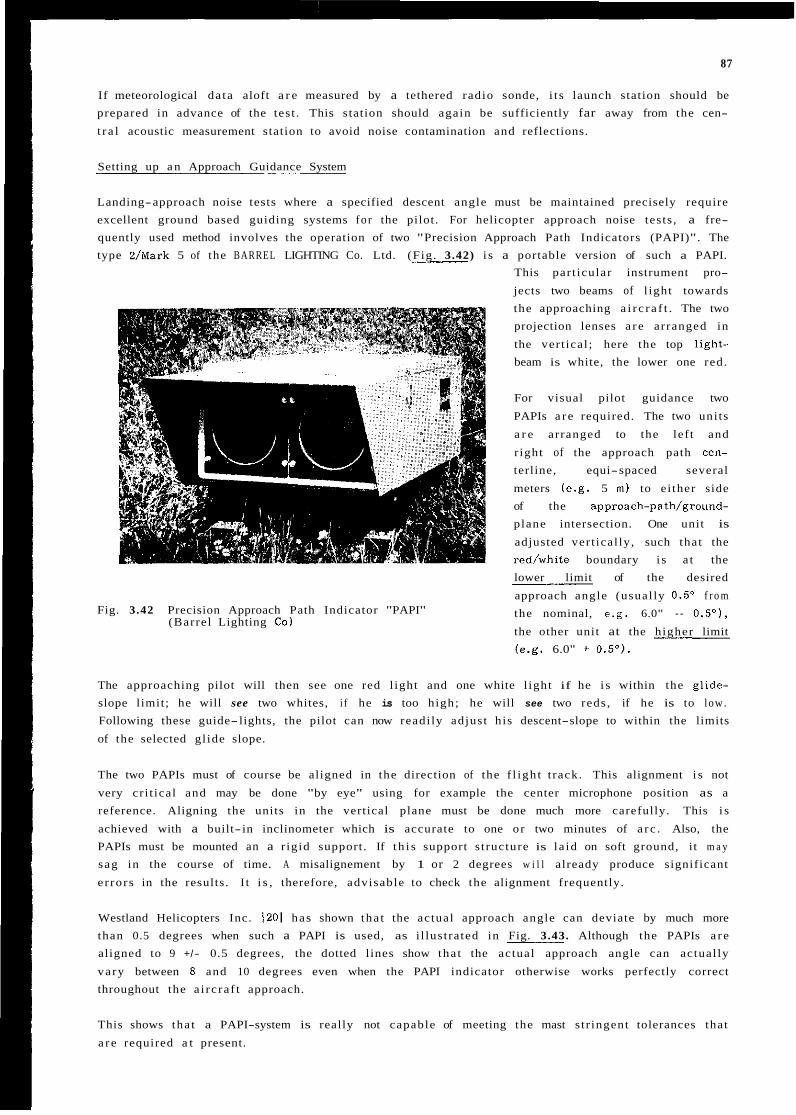
87
If meteorological da ta aloft a r e measured by a tethered radio sonde, i t s launch station should be prepared in advance of the test . This station should again be sufficiently far away from the cen-
t r a l acoustic measurement station to avoid noise contamination and reflections.
Setting up a n Approach Guidance System
Landing-approach noise tests where a specified descent angle must be maintained precisely require excellent ground based guiding systems fo r the pilot. For helicopter approach noise tests , a fre- quently used method involves the operation of two "Precision Approach Path Indicators (PAPI)". The type 2/Mark 5 of the BARREL LIGHTING Co. Ltd. (Fig. 3.42) i s a portable version of such a PAPI.
This part icular instrument pro-
jects two beams of l ight towards the approaching a i r c r a f t . The two projection lenses a r e arranged in
the vert ical ; here the top light- beam is white, the lower one red.
Fig. 3.42 Precision Approach Path Indicator "PAPI" (Barrel Lighting Co)
For visual pilot guidance two
PAPIs a r e required. The two uni ts
a r e arranged to the lef t and
r ight of the approach path cen- terline, equi-spaced several
meters (e .g . 5 m ) to ei ther side of the approach-path/ground- plane intersection. One unit is
adjusted vert ical ly, such that the red/white boundary i s a t the lower limit of the desired
approach angle (usual ly 0.5' f r o m the nominal, e.g. 6.0" - 0.5"),
the other unit at the higher limit (e.g. 6.0" + 0.5O).
The approaching pilot will then see one red l ight and one white l ight if he i s within the glide- slope limit; he will see two whites, i f he is too high; he will see two reds, if he is to low. Following these guide- lights, the pilot can now readi ly adjust his descent-slope to within the limits
of the selected gl ide slope.
The two PAPIs must of course be aligned in the direction of the f l igh t t rack. This alignment i s not
very cr i t ical and may be done "by eye" using for example the center microphone position as a reference. Aligning the units in the vertical plane must be done much more carefully. This i s
achieved with a built- in inclinometer which is accurate to one or two minutes of a r c . Also, the PAPIs must be mounted an a r igid support. If t h i s support s t ructure is la id on soft ground, it m a y
sag in the course of time. A misalignement by 1 or 2 degrees w i l l already produce significant
e r rors in the results. I t i s , therefore, advisable to check the alignment frequently.
Westland Helicopters Inc. I201 has shown tha t the actual approach angle can deviate by much more than 0.5 degrees when such a PAPI is used, as i l lustrated in Fig. 3.43. Although the PAPIs a r e aligned to 9 +/- 0.5 degrees, the dotted lines show tha t the actual approach angle can actual ly
vary between 8 and 10 degrees even when the PAPI indicator otherwise works perfectly correct throughout the a i rc ra f t approach.
This shows tha t a PAPI-system is really not capable of meeting the mast s t r ingent tolerances that
a r e required a t present.
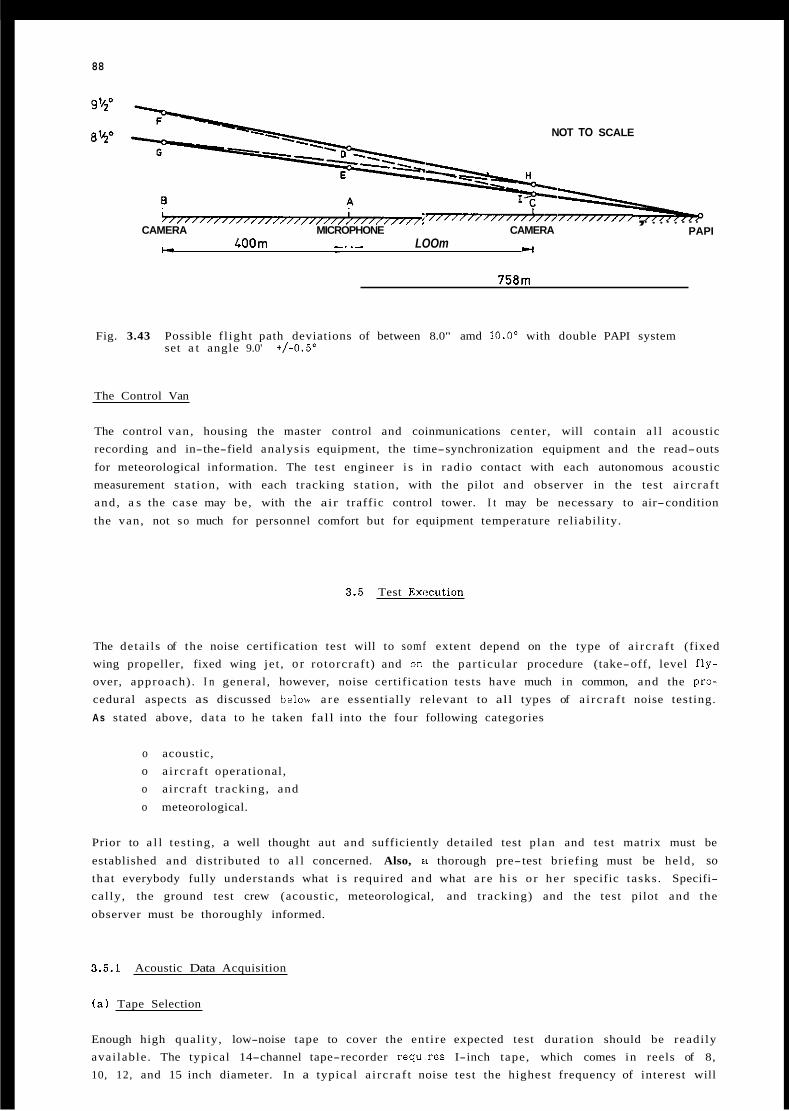
88
NOT TO SCALE
~,/,,,//,/////////////,///////,//,/~ ,-//////////// , . , , . , . . . PAPI CAMERA MICROPHONE CAMERA
c LOOm - - LOOm - Y
Fig. 3.43 Possible f l ight path deviations of between 8.0" amd 10.OQ with double PAPI system set a t angle 9.0' +/-0.5'
The Control Van
The control van , housing the master control and coinmunications center, will contain a l l acoustic recording and in-the-field analysis equipment, the time-synchronization equipment and the read-outs
for meteorological information. The test engineer i s in radio contact with each autonomous acoustic measurement s tat ion, with each tracking s tat ion, with the pilot and observer in the test a i rc ra f t and , a s the case may be, with the air traffic control tower. I t may be necessary to air-condition
the van, not so much for personnel comfort but for equipment temperature reliability.
3.5 Test Exccution
The detai ls of the noise certification test will to somf extent depend on the type of a i rc ra f t (fixed wing propeller, fixed wing jet , o r rotorcraf t) and on the part icular procedure (take-off, level fly- over, approach) . I n general, however, noise certification tests have much in common, and the pra- cedural aspects as discussed below a r e essentially relevant to all types of a i rc ra f t noise testing.
As stated above, da ta to he taken fall into the four following categories
o acoustic, o a i rc ra f t operational, o a ircraf t t racking, and
o meteorological.
Prior to a l l test ing, a well thought aut and sufficiently detailed test plan and test matrix must be
established and distributed to a l l concerned. Also, a thorough pre-test briefing must be held, so that everybody fully understands what i s required and what a r e h i s o r her specific tasks. Specifi- cal ly, the ground test crew (acoustic, meteorological, and t racking) and the test pilot and the
observer must be thoroughly informed.
3.5.1 Acoustic Data Acquisition
( a ) Tape Selection
Enough high qual i ty , low-noise tape to cover the ent i re expected test duration should be readi ly avai lable . The typical 14-channel tape-recorder requ:.res I-inch tape, which comes in reels of 8,
10, 12, and 15 inch diameter. In a typical a i rc ra f t noise test the highest frequency of interest will
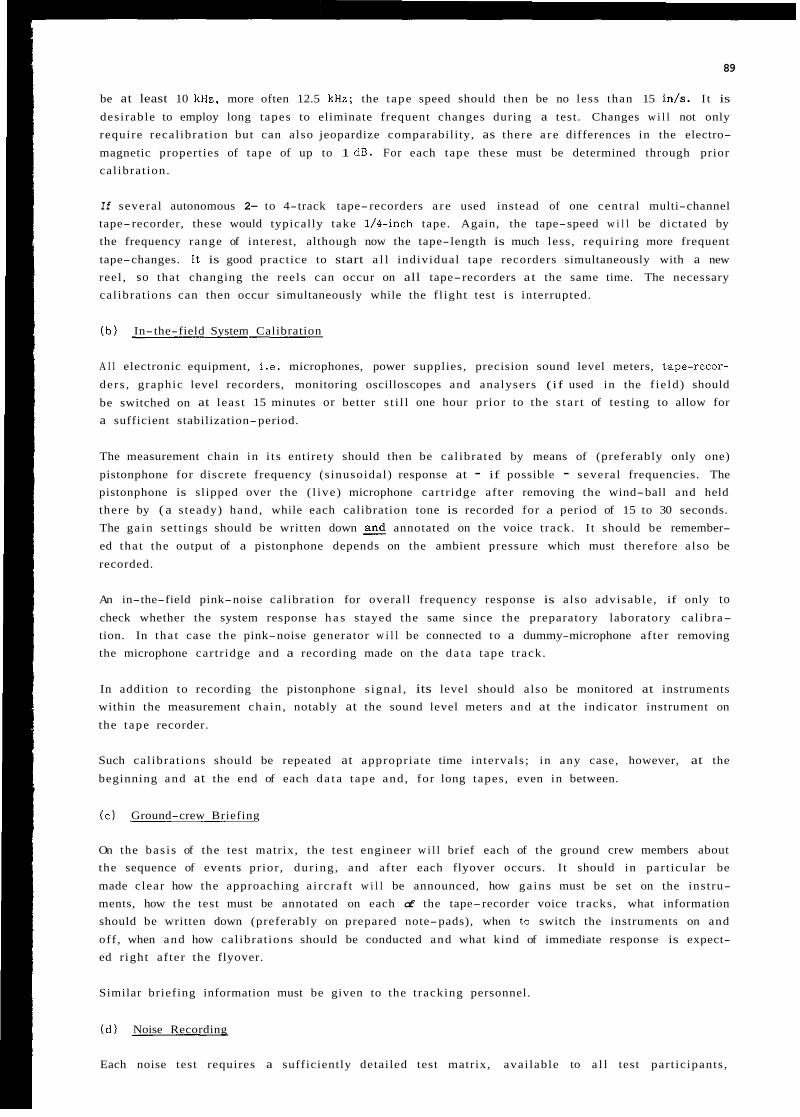
89
be at least 10 kHz, more often 12.5 kHz; the tape speed should then be no less than 15 i d s . I t is
desirable to employ long tapes to eliminate frequent changes during a test. Changes w i l l not only require recal ibrat ion but can also jeopardize comparability, as there a r e differences in the electro-
magnetic properties of t ape of up to 1 dB. For each tape these must be determined through prior cal ibrat ion.
If several autonomous 2- to 4-track tape-recorders a r e used instead of one central multi-channel tape-recorder, these would typically take 1/4-inch tape. Again, the tape-speed w i l l be dictated by the frequency range of interest, although now the tape-length is much less , requir ing more frequent
tape-changes. I t is good practice to start a l l individual tape recorders simultaneously with a new reel , so that changing the reels can occur on all tape-recorders at the same time. The necessary cal ibrat ions can then occur simultaneously while the f l ight test i s interrupted.
( b ) In-the-field System Calibration
A l l electronic equipment, i.e. microphones, power supplies, precision sound level meters, tape-recor-
ders , graphic level recorders, monitoring oscilloscopes and analysers (if used in the f ie ld) should
be switched on at least 15 minutes or better s t i l l one hour pr ior to the s t a r t of testing to allow for
a sufficient stabilization-period.
The measurement chain in i t s entirety should then be cal ibrated by means of (preferably only one)
pistonphone for discrete frequency (s inusoidal) response at - if possible - several frequencies. The pistonphone is slipped over the ( l ive) microphone car tr idge af ter removing the wind-ball and held there by ( a s teady) hand, while each calibration tone is recorded for a period of 15 to 30 seconds. The ga in set t ings should be written down and annotated on the voice t rack. I t should be remember-
ed tha t the output of a pistonphone depends on the ambient pressure which must therefore also be
recorded.
An in-the-field pink-noise calibration for overall frequency response is also advisable , if only to check whether the system response h a s stayed the same since the preparatory laboratory cal ibra- tion. In tha t case the pink-noise generator w i l l be connected to a dummy-microphone af ter removing the microphone car tr idge and a recording made on the d a t a tape t rack.
In addition to recording the pistonphone s igna l , its level should also be monitored at instruments within the measurement cha in , notably at the sound level meters and at the indicator instrument on
the tape recorder.
Such cal ibrat ions should be repeated at appropriate time intervals ; in any case, however, at the
beginning and at the end of each d a t a tape and , for long tapes, even in between.
( c ) Ground-crew Briefing
On the bas i s of the test matrix, the test engineer w i l l brief each of the ground crew members about the sequence of events pr ior , dur ing , and af ter each flyover occurs. I t should in part icular be
made clear how the approaching a i rc ra f t w i l l be announced, how ga ins must be set on the instru- ments, how the test must be annotated on each of the tape-recorder voice t racks, what information should be written down (preferably on prepared note-pads), when to switch the instruments on and
off , when and how cal ibrat ions should be conducted and what kind of immediate response is expect- ed r ight af ter the flyover.
Similar briefing information must be given to the t racking personnel.
( d ) Noise Recording
Each noise test requires a sufficiently detailed test matrix, avai lable to a l l test par t ic ipants ,
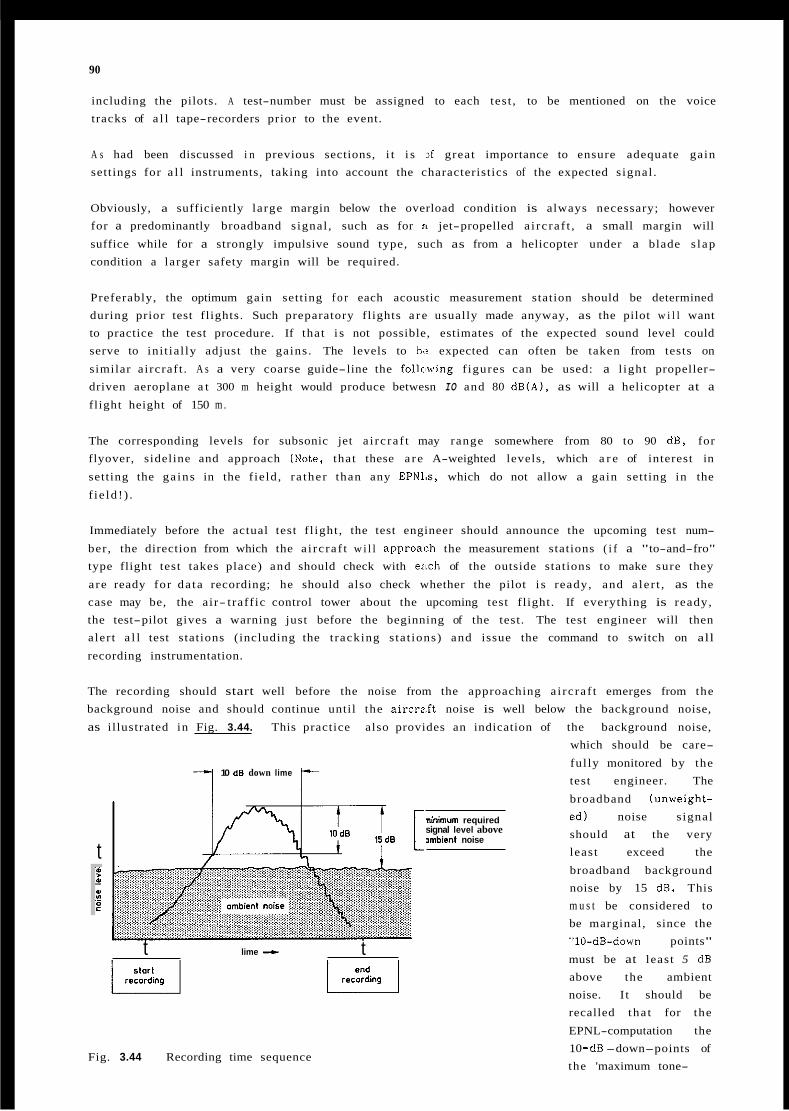
90
including the pilots. A test-number must be assigned to each test , to be mentioned on the voice tracks of a l l tape-recorders prior to the event.
A s had been discussed i n previous sections, i t i s 3f great importance to ensure adequate gain settings for a l l instruments, taking into account the characteristics of the expected s ignal .
Obviously, a sufficiently large margin below the overload condition is always necessary; however for a predominantly broadband signal , such as for a jet-propelled a i rc ra f t , a small margin will
suffice while for a strongly impulsive sound type, such as from a helicopter under a blade s lap condition a larger safety margin will be required.
Preferably, the optimum gain setting f o r each acoustic measurement station should be determined during prior test flights. Such preparatory flights a r e usually made anyway, as the pilot w i l l want to practice the test procedure. If that i s not possible, estimates of the expected sound level could serve to ini t ia l ly adjust the gains. The levels to be expected can often be taken from tests on
similar aircraf t . A s a very coarse guide-line the follcmwing f igures can be used: a l ight propeller- driven aeroplane a t 300 m height would produce betwesn IO and 80 dB(A), as will a helicopter at a flight height of 150 m .
The corresponding levels for subsonic jet a i rc ra f t may range somewhere from 80 to 90 dB, for flyover, sideline and approach (Note, that these a r e A-weighted levels, which a r e of interest in
setting the ga ins in the f ield, ra ther than any EPNLs, which do not allow a gain setting in the
f ie ld! ) .
Immediately before the actual test f l ight , the test engineer should announce the upcoming test num-
ber , the direction from which the a i rc ra f t w i l l approa<:h the measurement stations ( i f a "to-and-fro" type flight test takes place) and should check with each of the outside stations to make sure they
a re ready for da ta recording; he should also check whether the pilot i s ready, and a le r t , as the case may be, the air- traff ic control tower about the upcoming test flight. If everything is ready, the test-pilot gives a warning just before the beginning of the test. The test engineer will then aler t a l l test stations (including the t racking s tat ions) and issue the command to switch on all
recording instrumentation.
The recording should start well before the noise from the approaching a i rc ra f t emerges from the background noise and should continue until the a i rc rz f t noise is well below the background noise,
as illustrated in Fig. 3.44. This practice also provides an indication of the background noise, which should be care-
ful ly monitored by the
t
10 dB down lime
minimum required signal level above ombient noise
t lime + t
Fig. 3.44 Recording time sequence
test engineer. The
broadband (unweight- ed) noise s ignal should at the very least exceed the
broadband background noise by 15 dB. This m u s t be considered to be marginal, since the "10-dB-down points"
must be at least 5 dB above the ambient noise. I t should be recalled tha t for the
EPNL-computation the 10 -dB -down- points of the 'maximum tone-
91
corre'cted Perceived Noise Level ' , PNLTM, a r e required for data-processing (see Appendix A to th i s AGARDograph). If the difference between ( the readily ava i lab le ) maximum A-weighted s igna l level and A-weighted background noise becomes less than 15 dB during the tes t , then the test engineer
must decide whether to continue or to terminate testing. Prior to recording the flyover noise the engineers a t each of the autonomous acoustic measuring-stations should annotate on the i r tape recorders the upcoming test number, the time, the f l ight direction (e.g. East-West, o r f l ight
direction 27, or approaching f rom such and such a land mark) and all gain settings on the sound level meters (or whatever s ignal conditioning instrument is used). Redundancy of information is certainly good practice! After the test aeroplane h a s overflown the measurement stations, each of the outside test engineers must report to the control van that the a i rc ra f t flyover noise has
submerged into the background noise and w a i t far the command to switch off. The test engineer then inquires at each outside station about the acceptability of the d a t a and the occurrence of any problems. He would fur ther ask the test pilot on board, if engine and other f l ight operational parameters have been within specifications. If t racking information is readi ly ava i lab le , e.g. when a Polaroid picture o r a real-time laser t racking a r e used, h e ' c a n then proclaim the f l ight a "valid
one", and - unless a sufficient number of val id f l igh ts have already been flown - ca l l for the next test flight. The test a i r c r a f t would then ei ther prepare for a n approach of the measurement station from the other direction ( i f it w a s a level flyover) or intercept whatever climbing or descending
flight path w a s specified in the test .
3.5.2 Flight-operational Considerations
( a ) Pilot Briefing
The test pilot must know the required set t ings of engine parameters and the f l ight trajectory to be followed. The following should be considered as a typical pilot briefing pertaining - in t h i s case - to a C h a p t e r 4 helicopter noise certification test. Here the pilot is informed about the detai ls of
the take-off procedure, the level flyover procedure, and the landing approach procedure (for refe- rence see Section 2 . 1 ) . H i s (wri t ten) instructions w i l l include the following information:
o Take-off procedure:
- approach the rotation point at a n al t i tude of 20 m (66 f t ) ; - maintain a s tab le airspeed of V i/- 3 knots throughout the ent i re f l ight ; - maintain a s tab le rotor speed a t maximum (top of green a r c ) normal operating RPM;
- begin climb-out with take-off power at the designated marker, maintaining the prescribed
Y
stabilized airspe-ed and rotor-RPM; - continue the stabilized climbout unt i l informed by the test engineer tha t the test is over.
o Level Flyover:
- pass over the center-line microphone at a height of 500 f t ; - stabi l ize airspeed at 90% VH; - stabi l ize rotor speed at maximum normal operating RPM (top of green a r c ) ;
- maintain these conditions from 500 m before to 500 m af ter flying over the center measurement station.
o Landing Approach:
- maintain a steady approach angle of 6"+/-0.5' as indicated by the PAPI-system; - stabi l ize airspeed a t V ;
- stabi l ize rotor speed a t maximum normal operating RPM (top of the green a r c ) ; - commence approach at 750 f t above ground level and continue until reaching 100 f t above
Y
ground level.
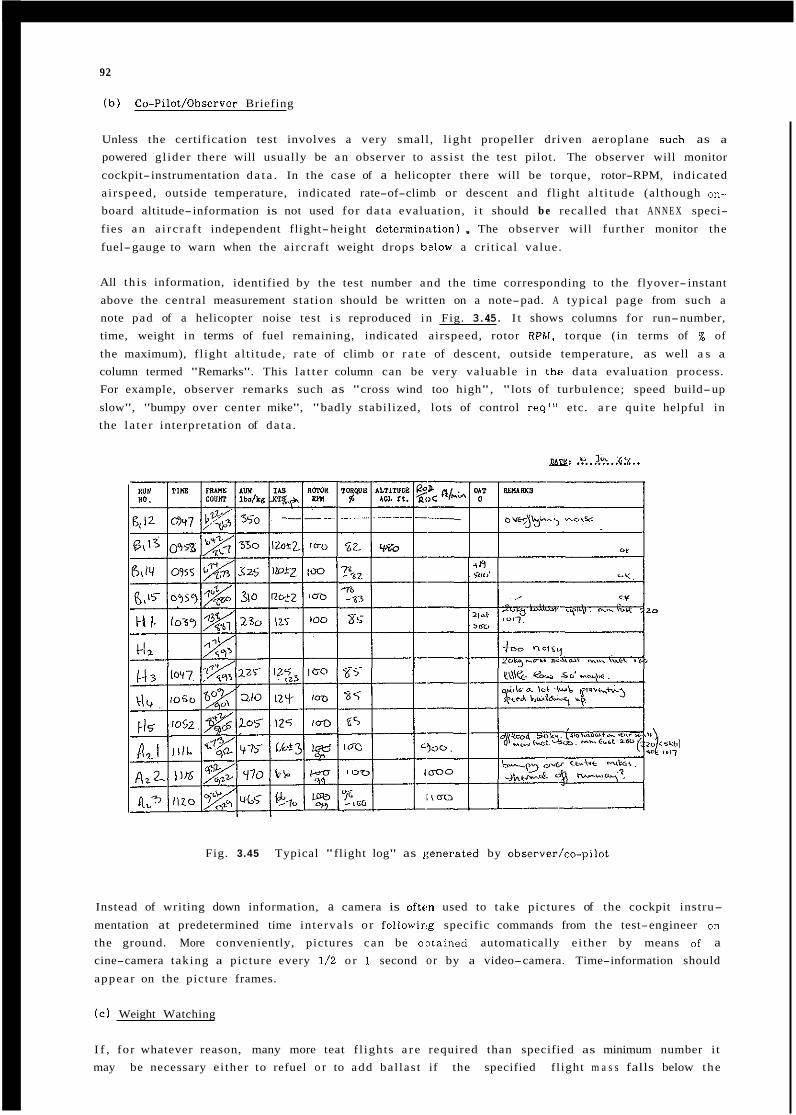
92
( b ) Co-Pilot/Observer Briefing
Unless the certification test involves a very small, l ight propeller driven aeroplane such as a
powered gl ider there will usually be a n observer to ass is t the test pilot. The observer will monitor
cockpit-instrumentation d a t a . In the case of a helicopter there will be torque, rotor-RPM, indicated airspeed, outside temperature, indicated rate-of-climb or descent and fl ight a l t i tude (although on- board altitude-information is not used for da ta evaluation, i t should be recalled tha t A N N E X speci-
fies a n a i rc ra f t independent flight-height determinsition) , The observer will fur ther monitor the
fuel-gauge to warn when the a i rcraf t weight drops bdow a crit ical value.
All th i s information, identified by the test number and the time corresponding to the flyover- instant above the central measurement station should be written on a note-pad. A typical page from such a note pad of a helicopter noise test i s reproduced in Fig. 3.45. I t shows columns for run-number, time, weight in terms of fuel remaining, indicated airspeed, rotor RPhI, torque (in terms of % of
the maximum), fl ight a l t i tude, r a te of climb o r r a t e of descent, outside temperature, as well a s a
column termed "Remarks". This l a t t e r column can be very valuable in the da ta evaluation process. For example, observer remarks such as "cross wind too high", "lots of turbulence; speed build-up
slow", "bumpy over center mike", "badly stabilized, lots of control req'" etc. a r e qui te helpful in the l a t e r interpretation of da ta .
Fig. 3.45 Typical "flight log" as t:enerated by observer/co-pilot
Instead of writing down information, a camera is o f tm used to take pictures of the cockpit instru-
mentation at predetermined time intervals o r fol1awir:g specific commands from the test-engineer on the ground. More conveniently, pictures can be oJtained automatically e i ther by means of a cine-camera taking a picture every 1/2 or 1 second or by a video-camera. Time-information should
appear on the picture frames.
( c ) Weight Watching
I f , for whatever reason, many more teat f l ights a r e required than specified as minimum number i t may be necessary e i ther to refuel o r to add bal las t if the specified fl ight m a s s falls below the
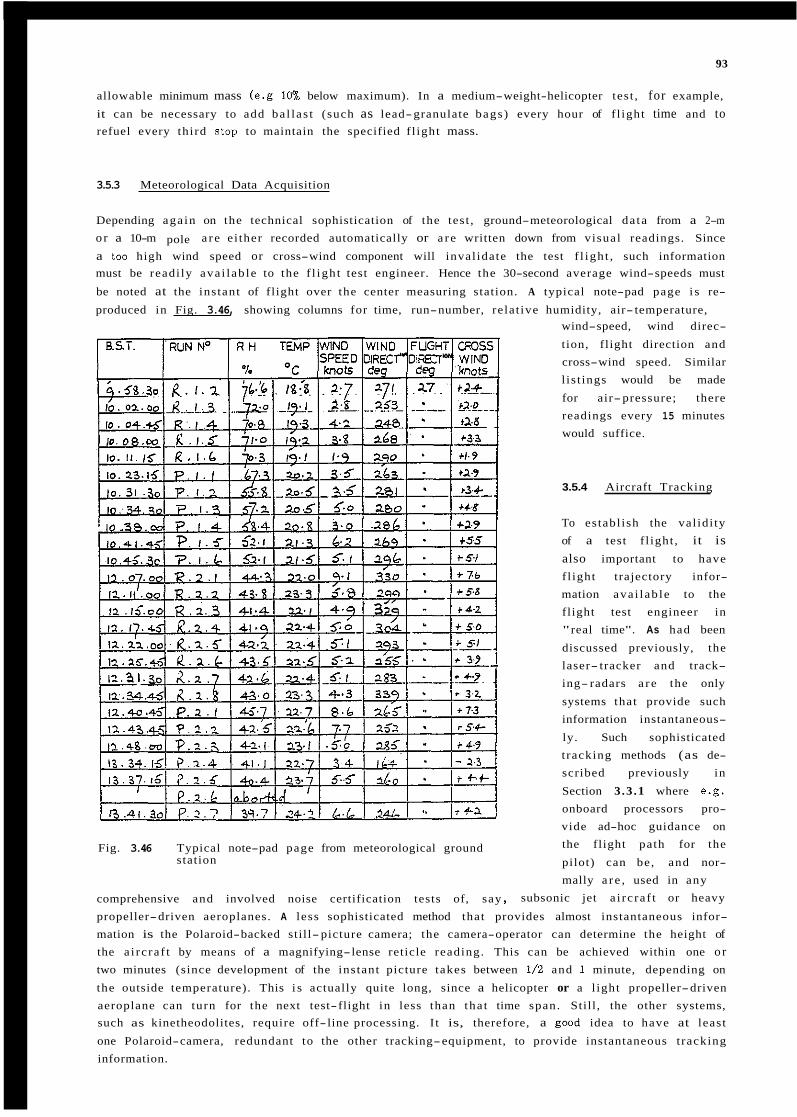
93
allowable minimum mass (e.g 10% below maximum). In a medium-weight-helicopter test , for example,
it can be necessary to add ba l las t (such as lead-granulate bags) every hour of f l ight time and to refuel every third stop to maintain the specified f l ight mass.
3.5.3 Meteorological Data Acquisition
Depending aga in on the technical sophistication of the test , ground-meteorological da ta from a 2-m o r a 10-m a re ei ther recorded automatically or a r e written down from visual readings. Since
a too high wind speed or cross-wind component will inval idate the test f l igh t , such information must be readi ly ava i lab le to the f l igh t test engineer. Hence the 30-second average wind-speeds must
be noted at the instant of flight over the center measuring station. A typical note-pad page i s re-
produced in Fig. 3.46, showing columns for time, run-number, relat ive humidity, air- temperature,
pole
Fig. 3.46 Typical note-pad page from meteorological ground station
comprehensive and involved noise certification tests of, say I
wind-speed, wind direc-
tion, flight direction and cross-wind speed. Similar l is t ings would be made
for air-pressure; there readings every 15 minutes would suffice.
3.5.4 Aircraft Tracking
To establ ish the val idi ty of a test f l ight , it is also important to have f l ight trajectory infor- mation ava i lab le to the flight test engineer in "real time". As had been
discussed previously, the laser- tracker and track- ing- radars a r e the only
systems that provide such information instantaneous-
ly. Such sophisticated t racking methods (as de- scribed previously in
Section 3.3 .1 where e.g. onboard processors pro- vide ad-hoc guidance on the flight path for the
pilot) can be, and nor- mally a r e , used in any
subsonic jet a i rc ra f t or heavy
propeller-driven aeroplanes. A less sophisticated method that provides almost instantaneous infor- mation is the Polaroid-backed still- picture camera; the camera-operator can determine the height of the a i rc ra f t by means of a magnifying-lense reticle reading. This can be achieved within one o r two minutes (since development of the instant picture takes between 1/2 and 1 minute, depending on
the outside temperature). This i s actually quite long, since a helicopter or a l ight propeller-driven aeroplane can turn for the next test-flight in less than tha t time span. Still , the other systems, such as kinetheodolites, require off- line processing. I t is, therefore, a good idea to have at least
one Polaroid-camera, redundant to the other tracking-equipment, to provide instantaneous t racking information.
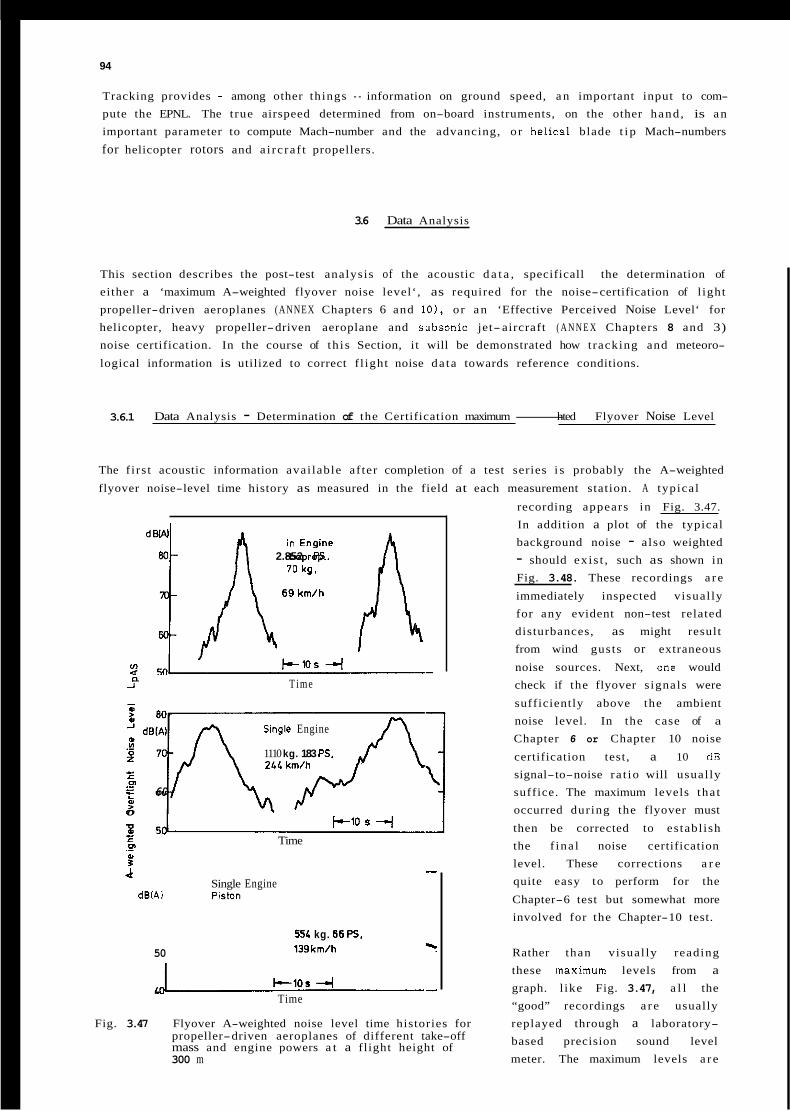
94
Tracking provides - among other things - information on ground speed, a n important input to com- pute the EPNL. The t rue airspeed determined from on-board instruments, on the other hand , is a n important parameter to compute Mach-number and the advancing, o r he:lical blade t i p Mach-numbers
for helicopter rotors and a i rc ra f t propellers.
3.6 Data Analysis
This section describes the post-test analysis of the acoustic d a t a , specificall the determination of either a ‘maximum A-weighted flyover noise level‘, as required for the noise-certification of l ight propeller-driven aeroplanes (ANNEX Chapters 6 and IO), or a n ‘Effective Perceived Noise Level‘ for helicopter, heavy propeller-driven aeroplane and sJbsonic jet- aircraft ( A N N E X Chapters 8 and 3) noise certification. In the course of th i s Section, it will be demonstrated how tracking and meteoro-
logical information is utilized to correct f l ight noise da ta towards reference conditions.
3.6.1 Data Analysis - Determination of the Certification maximum-hted Flyover Noise Level
The f i rs t acoustic information avai lable af ter completion of a test series i s probably the A-weighted
flyover noise-level time history as measured in the field at each measurement station. A typical ‘1 2.852 PS. i”: Time a
-I
-
Single Engine
1110 kg. 183 PS. 2LL km/h
CD e 60
0
I-10 s --I Time
CD .- f -
Single Engine dBlAI Piston
5% kg. 66PS. 139km/h ? 50
- +lOS --I Time
Fig. 3.47 Flyover A-weighted noise level time histories for propeller-driven aeroplanes of different take-off mass and engine powers a t a flight height of 300 m
recording appears in Fig. 3.47.
In addition a plot of the typical background noise - also weighted - should ex is t , such as shown in Fig. 3.48. These recordings a r e
immediately inspected visual ly for any evident non-test related disturbances, as might result from wind gusts or extraneous
noise sources. Next, one would check if the flyover s ignals were
sufficiently above the ambient noise level. In the case of a
Chapter 6 or Chapter 10 noise
certification test, a 10 dB signal-to-noise ra t io will usual ly suffice. The maximum levels tha t occurred during the flyover must
then be corrected to establ ish the f ina l noise certification level. These corrections a r e quite easy to perform for the
Chapter-6 test but somewhat more involved for the Chapter-10 test.
Rather than visual ly reading these inaximum levels from a graph. l ike Fig. 3.47, a l l the “good” recordings a r e usually replayed through a laboratory- based precision sound level meter. The maximum levels a r e

95
then read from a peak-hold digi- tal instrument, or , if such a n instrument is not avai lable , from
A-weighted a n analog indicator instrument.
Noise 50 These measured maximum levels and the associated a i r c r a f t ope-
rat ional and meteorological in- formation for a minimum of 4
60 dB
LpAS
LO 30 seconds
TIME I I (Chapter 6) or 6 (Chapter 10)
val id f l ights a r e then used in a n assessment of the confidence- l i m i t s as specified in the ANNEX Fig. 3.48 Time history of typical daytime ambient
A-weighted noise level ("background noise") 16.
( a ) Chapter 6 Test (See Section 2.5 of t h i s AGARDograph)
Flyover LpA,max,slow-~alues must be corrected for deviations of the test helical blade t i p Mach-
number from the i r reference values which a r e due to deviations from the reference temperature. No height correction is required i f the test a i rc ra f t w a s within +10m/-30m of the reference height; also, atmospheric absorption need not be accounted for, since the test must be conducted within the temperature/relative humidity window shown in Fig. 2.16.
The following example of a Chapter 6 Test is to i l lus t ra te the procedures. Let u s assume tha t the
test environment and a i rc ra f t operational character is t ics were
Propeller diameter = 2.0 m Reference propeller RPM Reference f l ight speed Reference temperature = 25 'C Reference f l ight height = 300 m
= 2100 min- l = 200 km/h
From this , one computes a reference helical blade t i p Mach number of 0.832.
TABLE 6 below lists (hypothetical) measured noise levels, test- flight operational parameters, and test environmental conditions. The operational and environmental parameters deviate from reference. They a r e , however, all within the allowable test windows. Recall t ha t the temperature window w a s 2 OC to 35 "C, and the height window w a s 270 m to 310 m.
TABLE 6 Example of Data-Sheet for a Chapter-6 Noise Certification Test (Tref = 25 OC, Mref = 0.832)
Test L PA voo RPM TT HT M~ M ~ - M ~ " LpA,corr
Nbr dB km/h l/min O C m dB dB
1 78.2 210 2690 33 305 0.820 0.012
2 75.4 195 2650 25 275 0.817 0.015
3 77.9 205 2710 27 290 0.833 -0.001
4 77.2 200 2700 31 295 0.824 0.008
0.9 79.1 1.2 76.6 0.0 77.9 0.6 77.8
? 78.1 1.6
S X U 1.35
P
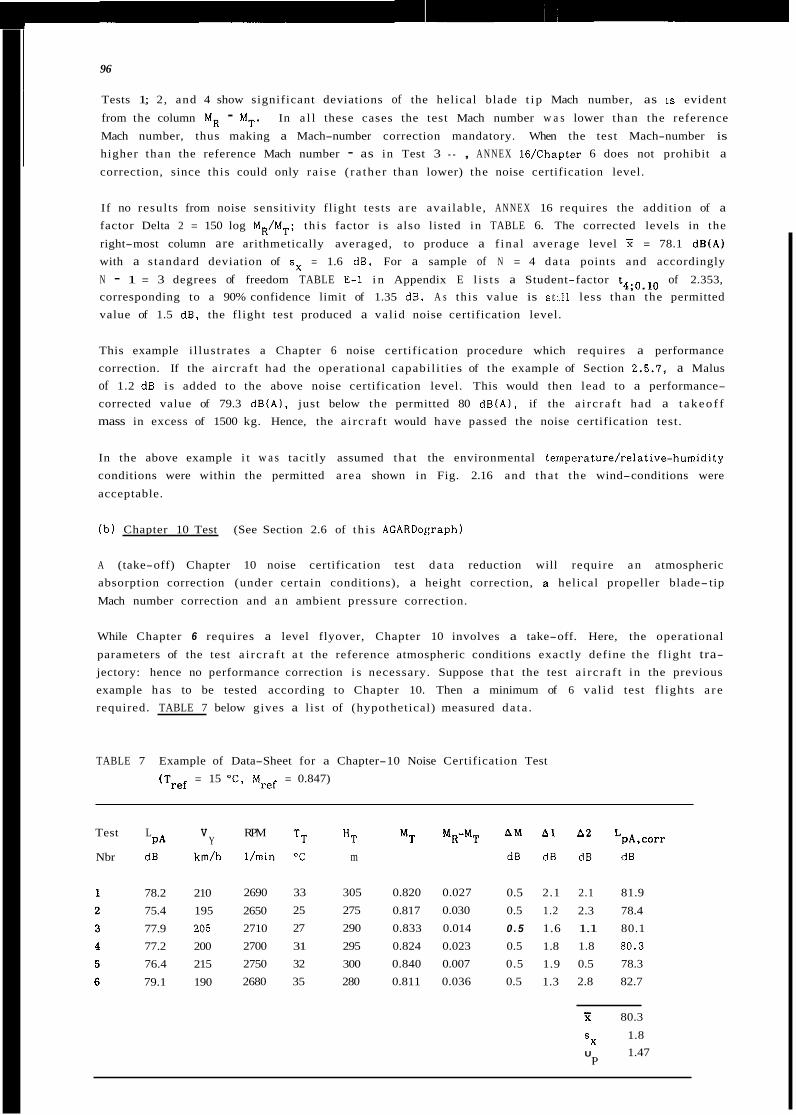
96
Tests 1; 2, and 4 show significant deviations of the helical blade t i p Mach number, as 1s evident
from the column M R - MT. In a l l these cases the test Mach number w a s lower than the reference
Mach number, thus making a Mach-number correction mandatory. When the test Mach-number is higher than the reference Mach number - as in Test 3 - , A N N E X 16/Chapter 6 does not prohibit a correction, since this could only ra i se ( ra ther than lower) the noise certification level.
I If no resul ts from noise sensitivity flight tests a r e avai lable , A N N E X 16 requires the addition of a factor Delta 2 = 150 log MR/MT; th i s factor i s also listed in TABLE 6. The corrected levels in the
right-most column are arithmetically averaged, to produce a f ina l average level Si = 78.1 dB(A) with a s tandard deviation of sx = 1.6 dB. For a sample of N = 4 da ta points and accordingly
N - 1 = 3 degrees of freedom TABLE E-1 i n Appendix E l i s t s a Student-factor t4;0.10 of 2.353, corresponding to a 90% confidence limit of 1.35 dB. A s this value is sti.11 less than the permitted value of 1.5 dB, the flight test produced a val id noise certification level.
This example i l lustrates a Chapter 6 noise certification procedure which requires a performance correction. If the a i rc ra f t had the operational capabi l i t ies of the example of Section 2.5.7, a Malus of 1.2 dB i s added to the above noise certification level. This would then lead to a performance- corrected value of 79.3 dB(A), just below the permitted 80 dB(A), if the a i rc ra f t had a t a k e o f f mass in excess of 1500 kg. Hence, the a i rc ra f t would have passed the noise certification test.
In the above example i t w a s tacitly assumed tha t the environmental temperature/relative-humidity conditions were within the permitted a rea shown in Fig. 2.16 and tha t the wind-conditions were
acceptable.
( b ) Chapter 10 Test (See Section 2.6 of th i s AGARDo[:raph)
A (take-off) Chapter 10 noise certification test da ta reduction will require a n atmospheric absorption correction (under certain conditions), a height correction, a helical propeller blade- tip
Mach number correction and a n ambient pressure correction.
While Chapter 6 requires a level flyover, Chapter 10 involves a take-off. Here, the operational
parameters of the test a i rc ra f t a t the reference atmospheric conditions exactly define the f l ight tra- jectory: hence no performance correction i s necessary. Suppose tha t the test a i rc ra f t in the previous example has to be tested according to Chapter 10. Then a minimum of 6 val id test f l ights a r e required. TABLE 7 below gives a l is t of (hypothetical) measured da ta .
TABLE 7 Example of Data-Sheet for a Chapter-10 Noise Certification Test = 15 "C, Mref = 0.847) (Tref
Test
Nbr
V PA Y
L
dB km/h
78.2 210 75.4 195 77.9 205 77.2 200 76.4 215
79.1 190
RPM
Umin
2690
2650 2710 2700 2750 2680
'T "T M~ M ~ - M ~ '' LpA,corr
O C m dB dB dB dB
33 305 0.820 0.027 0.5 2.1 2.1 81.9 25 275 0.817 0.030 0.5 1.2 2.3 78.4 27 290 0.833 0.014 0 . 5 1.6 1.1 80.1 31 295 0.824 0.023 0.5 1.8 1.8 80.3 32 300 0.840 0.007 0.5 1.9 0.5 78.3 35 280 0.811 0.036 0.5 1.3 2.8 82.7
Y 80.3
1.8 1.47
S X
P U
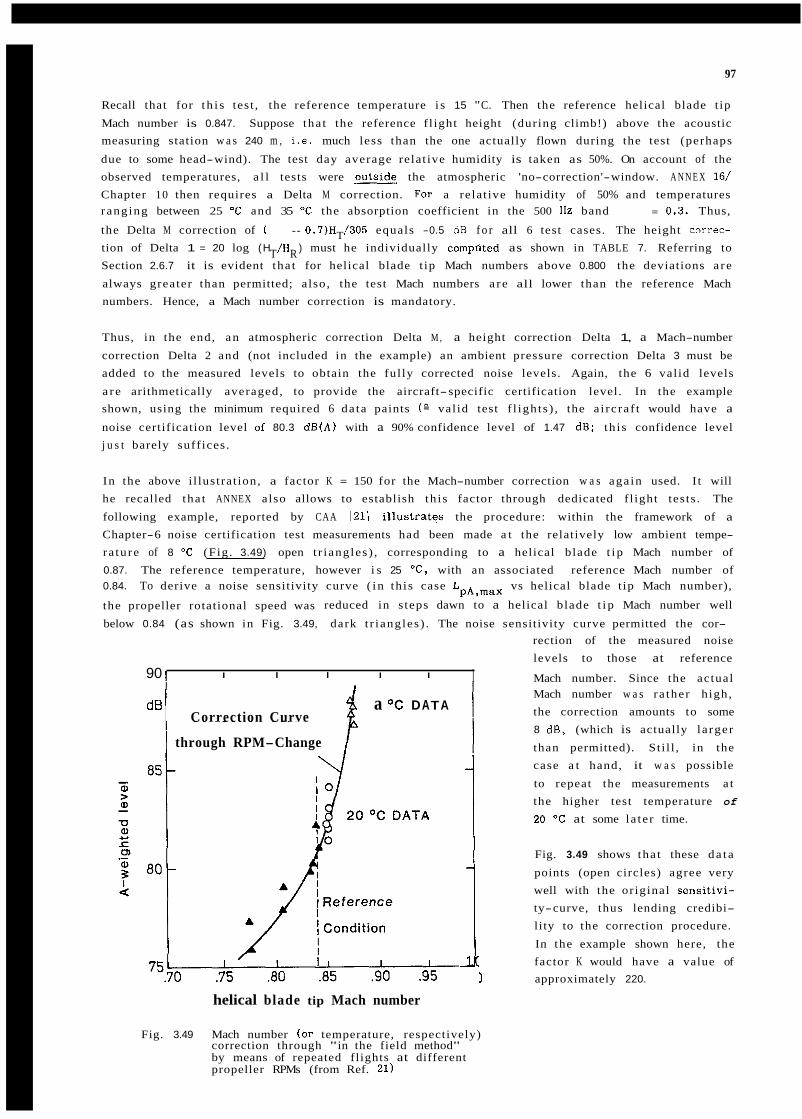
97
Recall that for t h i s test , the reference temperature i s 15 "C. Then the reference helical blade t ip
Mach number is 0.847. Suppose tha t the reference f l ight height (during climb!) above the acoustic measuring station w a s 240 m , i . e . much less than the one actually flown during the test (perhaps
due to some head-wind). The test day average relat ive humidity is taken as 50%. On account of the observed temperatures, a l l tests were outside the atmospheric 'no-correction'-window. A N N E X 161
Chapter 10 then requires a Delta M correction. For a relat ive humidity of 50% and temperatures ranging between 25 "C and 35 "C the absorption coefficient in the 500 Hz band = 0.3. Thus,
the Delta M correction of ( - 0.7)H /305 equals -0.5 dB f o r all 6 test cases. The height correc- tion of Delta 1 = 20 log (H /H ) must he individually compUted as shown in TABLE 7. Referring to Section 2.6.7 it is evident tha t for helical blade t ip Mach numbers above 0.800 the deviations a r e
always greater than permitted; a lso, the test Mach numbers a r e all lower than the reference Mach numbers. Hence, a Mach number correction is mandatory.
T
T R
Thus, in the end, a n atmospheric correction Delta M , a height correction Delta 1, a Mach-number
correction Delta 2 and (not included in the example) an ambient pressure correction Delta 3 must be added to the measured levels to obtain the ful ly corrected noise levels. Again, the 6 val id levels
a r e arithmetically averaged, to provide the aircraft-specific certification level. In the example shown, using the minimum required 6 da ta paints ( " val id test f l igh ts ) , the a i rc ra f t would have a noise certification level of 80.3 dB(A) with a 90% confidence level of 1.47 dB; th i s confidence level j u s t barely suff ices .
In the above i l lustrat ion, a factor K = 150 for the Mach-number correction w a s aga in used. I t will he recalled tha t ANNEX also allows to establish th i s factor through dedicated f l ight tests . The
following example, reported by CAA 1211 i l lustratps the procedure: within the framework of a
Chapter-6 noise certification test measurements had been made a t the relatively low ambient tempe- ra ture of 8 "C (Fig. 3.49) open t r iangles ) , corresponding to a helical blade t i p Mach number of 0.87. The reference temperature, however i s 25 'C, with an associated reference Mach number of 0.84. To derive a noise sensitivity curve ( i n th i s case LpA,max vs helical blade t ip Mach number),
the propeller rotational speed was reduced in s teps dawn to a helical blade t i p Mach number well
below 0.84 (as shown in Fig. 3.49, dark t r iangles ) . The noise sensitivity curve permitted the cor- rection of the measured noise levels to those at reference
I I I I I I Mach number. Since the actual 90 I
dB a o c DATA Correction Curve
I through RPM-Change /
helical blade tip Mach number
Fig. 3.49 Mach number (or temperature, respectively) correction through "in the field method" by means of repeated flights at different propeller RPMs (from Ref. 21)
1 1. (
Mach number w a s ra ther high, the correction amounts to some 8 dB, (which is actually la rger
than permitted). St i l l , in the case a t hand, it w a s possible
to repeat the measurements a t the higher test temperature of
20 O C at some la te r time.
Fig. 3.49 shows tha t these d a t a
points (open circles) agree very well with the or iginal sensitivi- ty-curve, thus lending credibi- lity to the correction procedure.
In the example shown here, the factor K would have a value of
1 approximately 220.
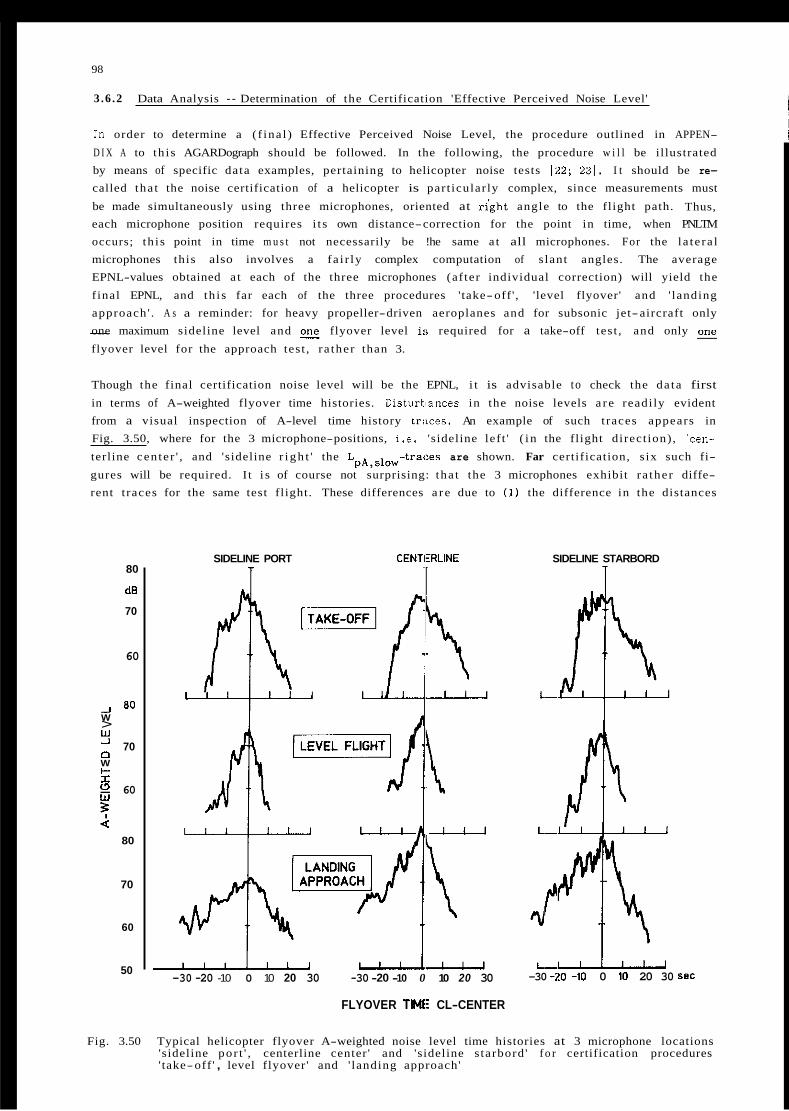
98
3 .6 .2 Data Analysis - Determination of the Certification 'Effective Perceived Noise Level'
in order to determine a ( f ina l ) Effective Perceived Noise Level, the procedure outlined in APPEN-
D I X A to th i s AGARDograph should be followed. In the following, the procedure w i l l be illustrated by means of specific data examples, pertaining to helicopter noise tests 122; 231. I t should be re-
called tha t the noise certification of a helicopter is part icular ly complex, since measurements must
be made simultaneously using three microphones, oriented at k g h t angle to the flight path. Thus, each microphone position requires i t s own distance-correction for the point in time, when PNLTM occurs; th i s point in time m u s t not necessarily be !he same a t all microphones. For the la te ra l microphones this also involves a fa i r ly complex computation of s lant angles. The average EPNL-values obtained a t each of the three microphones (af ter individual correction) will yield the
f inal EPNL, and th i s far each of the three procedures ' take-off ' , 'level flyover' and ' landing approach ' . A s a reminder: for heavy propeller-driven aeroplanes and for subsonic jet-aircraft only - one maximum sideline level and E flyover level i:; required for a take-off test , and only
flyover level for the approach test , ra ther than 3.
Though the final certification noise level will be the EPNL, i t is advisable to check the da ta first in terms of A-weighted flyover time histories. DisturtNances in the noise levels a r e readi ly evident from a visual inspection of A-level time history traces. An example of such t races appears in Fig. 3.50, where for the 3 microphone-positions, i.e. 'sideline lef t ' ( i n the flight direct ion) , 'cen-
terline cen te r ' , and 'sideline r i gh t ' the LpA,slow-traces are shown. Far certification, s ix such fi-
gures will be required. I t i s of course not surprising: tha t the 3 microphones exhibit ra ther diffe- rent t races for the same test flight. These differences a r e due to (1) the difference in the distances
80
dB
70
60
_I 80 W > !!! 70 W t- I
n
60
3 k
80
70
60
50
SIDELINE PORT CENTIERLINE
T
-30 -20 -10 0 10 20 30 -30 -20 -10 0 10 20 30
FLYOVER TIME CL-CENTER
SIDELINE STARBORD
1
h L - U
-30 -20 -10 0 10 20 30 sec
Fig. 3.50 Typical helicopter flyover A-weighted noise level time histories at 3 microphone locations 'sideline por t ' , centerline center ' and 'sideline s tarbord ' f o r certification procedures ' take-off ' , level flyover' and ' landing approach'
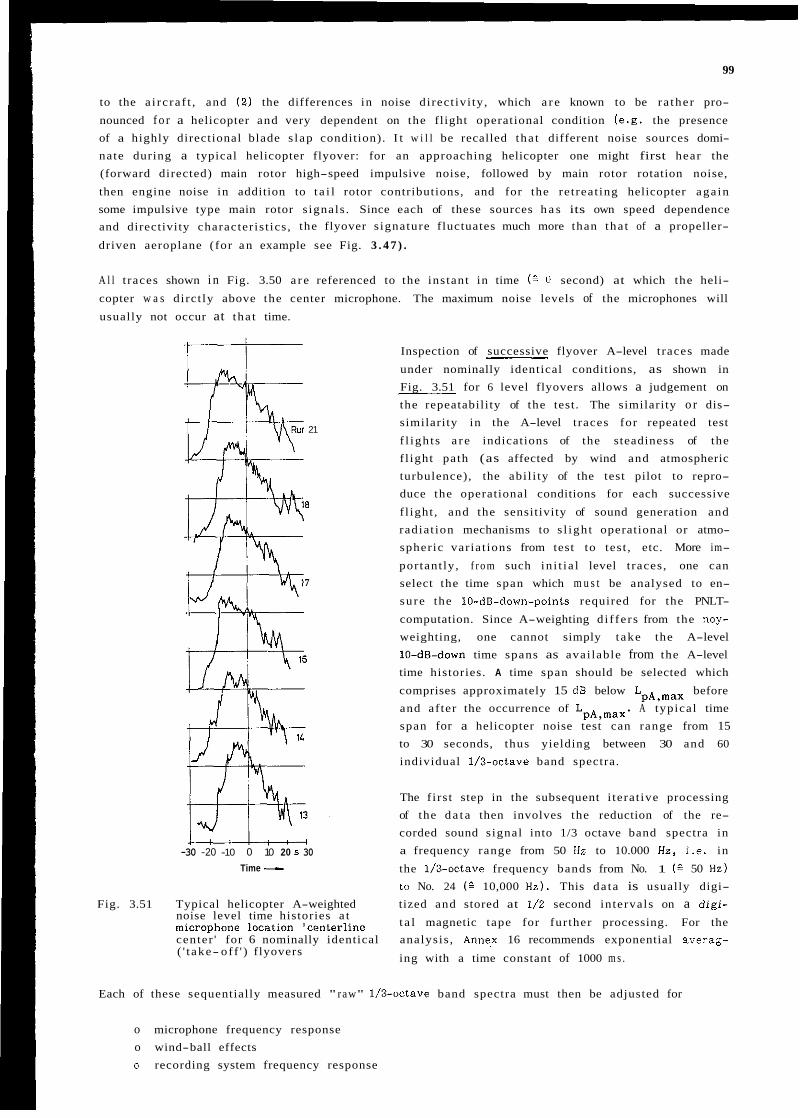
99
to the a i rc ra f t , and (2) the differences in noise direct ivi ty, which a r e known to be ra ther pro-
nounced f o r a helicopter and very dependent on the flight operational condition (e.g. the presence of a highly directional blade s lap condition). I t w i l l be recalled tha t different noise sources domi- nate during a typical helicopter flyover: for an approaching helicopter one might first hear the (forward directed) main rotor high-speed impulsive noise, followed by main rotor rotation noise,
then engine noise in addition to t a i l rotor contributions, and for the retreat ing helicopter aga in some impulsive type main rotor s ignals . Since each of these sources h a s its own speed dependence and directivity character is t ics , the flyover s ignature fluctuates much more than tha t of a propeller-
driven aeroplane (for a n example see Fig. 3 . 4 7 ) .
A l l t races shown i n Fig. 3.50 a r e referenced to the instant in time ( G 0 second) at which the heli-
copter w a s dirct ly above the center microphone. The maximum noise levels of the microphones will
usually not occur at tha t time.
21
8
7
-30 -20 -10 0 10 20 5 30 Time -
Inspection of successive flyover A-level t races made
under nominally identical conditions, as shown in Fig. 3.51 for 6 level flyovers allows a judgement on the repeatability of the test. The similarity o r dis- similarity in the A-level t races for repeated test
f l igh ts a r e indications of the steadiness of the f l ight path (as affected by wind and atmospheric turbulence), the abi l i ty of the test pilot to repro- duce the operational conditions for each successive
f l ight , and the sensitivity of sound generation and radiat ion mechanisms to s l igh t operational or atmo- spheric variat ions from test to test , etc. More im- portant ly, f r o m such in i t i a l level t races, one can select the time span which m u s t be analysed to en- sure the 10-d8-down-points required for the PNLT-
computation. Since A-weighting d i f fe rs from the noy- weighting, one cannot simply take the A-level lO-d5-down time spans as avai lable from the A-level time histories. A time span should be selected which
comprises approximately 15 d 5 below LpA,max before and af ter the occurrence of LpA,max. A typical time span for a helicopter noise test can range from 15 to 30 seconds, thus yielding between 30 and 60
individual 1/3-octave band spectra.
The f i rs t step in the subsequent i terat ive processing of the d a t a then involves the reduction of the re- corded sound signal into 1/3 octave band spectra in a frequency range from 50 Hz to 10.000 HE, i.e. in
the 1/3-octave frequency bands from No. 1 ( 2 50 Hz) to No. 24 ( 2 10,000 Hz). This da ta is usually digi-
Fig. 3.51 Typical helicopter A-weighted tized and stored at I/2 second intervals on a digi- noise level time histories a t location ,centerline t a l magnetic tape for fur ther processing. For the center ' for 6 nominally identical analysis , Anne,x 16 recommends exponential averag- ( ' t ake- off ' ) flyovers ing with a time constant of 1000 m s .
Each of these sequentially measured " raw" 1/3-octave band spectra must then be adjusted for
o microphone frequency response o wind-ball effects o recording system frequency response
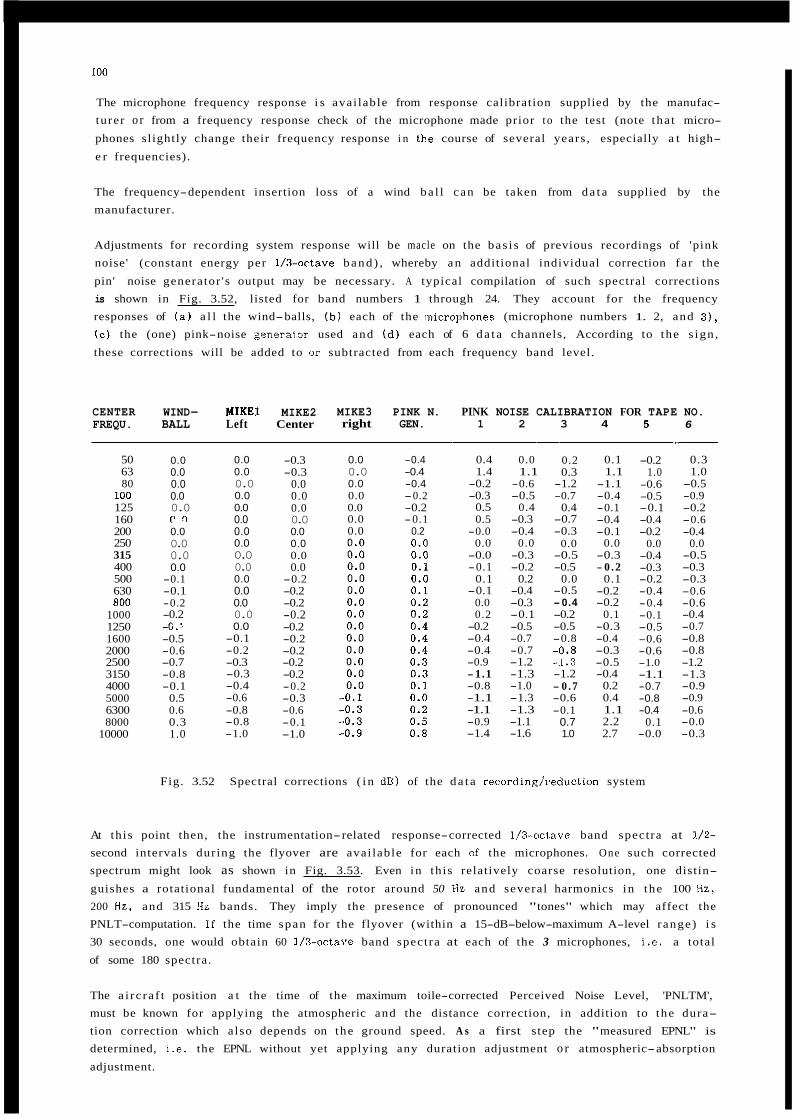
100
The microphone frequency response i s avai lable from response calibration supplied by the manufac- turer o r from a frequency response check of the microphone made prior to the test (note tha t micro-
phones slightly change their frequency response i n the course of several years , especially a t high-
e r frequencies).
The frequency-dependent insertion loss of a wind ba l l can be taken from d a t a supplied by the manufacturer.
Adjustments for recording system response will be macle on the bas i s of previous recordings of 'pink noise' (constant energy per 1/3-actave b a n d ) , whereby a n additional individual correction fa r the
pin' noise generator 's output may be necessary. A typical compilation of such spectral corrections is shown in Fig. 3.52, listed for band numbers 1 through 24. They account for the frequency responses of ( a ) a l l the wind-balls, ( b ) each of the inicrophones (microphone numbers 1. 2, and 3 ) , (c) the (one) pink-noise generat.or used and ( d ) each of 6 d a t a channels, According to the s ign ,
these corrections will be added to or subtracted from each frequency band level.
CENTER WIND- MIKE1 MIKE2 MIKE3 PINK N. FREQU. BALL Left Center right GEN.
50 63 80
100 125 160 200 250 315 400 500 630 800
1000 1250 1600 2000 2500 3150 4000 5000 6300 8000
10000
0.0 0.0 0.0 0.0 0.0
0.0 0.0 0.0 0.0
-0.1 -0.1 -0.2 -0.2 4. -0.5 -0.6 -0.7 -0.8 -0.1
0.5 0.6 0.3 1.0
r q
0.0 0.0 0.0 0.0 0.0 0.0 0.0 0.0 0.0 0.0 0.0 0.0 0.0 0.0 0.0
-0.1 -0.2 -0.3 -0.3 -0.4 -0.6 -0.8 -0.8 -1.0
-0.3 -0.3
0.0 0.0 0.0 0.0 0.0 0.0 0.0 0.0
-0.2 -0.2 -0.2 -0.2 -0.2 -0.2 -0.2 -0.2 -0.2 -0.2 -0.3 -0.6 -0.1 -1.0
0.0 -0.4 0.0 -0.4 0.0 -0.4 0.0 -0.2 0.0 -0.2 0.0 -0.1 0.0 0.2
PINK NOISE CALIBRATION FOR TAPE NO. 1 2 3 4
-
0.4 0.0 1.4 1.1
-0.2 -0.6 -0.3 -0.5
0.5 0.4 0.5 -0.3
-0.0 -0.4 0.0 0.0
-0.0 -0.3 -0.1 -0.2
0.1 0.2 -0.1 -0.4
0.0 -0.3 0.2 -0.1
-0.2 -0.5 -0.4 -0.7 -0.4 -0.7 -0.9 -1.2 -1.1 -1.3 -0.8 -1.0 -1.1 -1.3 -1.1 -1.3 -0.9 -1.1 -1.4 -1.6
0.2 0.3
-1.2 -0.7
0.4 -0.7 -0.3
0.0 -0.5 -0.5
0.0 -0.5
-0.2 -0.5 -0.8
4 . 3 -1.2 - 0 .7 -0.6 -0.1
0.7 1.0
-0.4
-0.8
0.1 1.1
-1.1 -0.4 -0.1 -0.4 -0.1
0.0 -0.3 - 0 .2
0.1 -0.2 -0.2
0.1 -0.3 -0.4 -0.3 -0.5 -0.4
0.2 0.4 1.1 2.2 2.7
5 -
-0.2 1.0
-0.6 -0.5 -0.1 -0.4 -0.2
0.0 -0.4 -0.3 -0.2 -0.4 -0.4 -0.1 -0.5 -0.6 -0.6 -1.0 -1.1 -0.7 -0.8 -0.4
0.1 -0.0
6 __
0.3 1.0
-0.5 -0.9 -0.2 -0.6 -0.4
0.0 -0.5 -0.3 -0.3 -0.6 -0.6 -0.4 -0.7 -0.8 -0.8 -1.2 -1.3 -0.9 -0.9 -0.6 -0.0 -0.3
Fig. 3.52 Spectral corrections ( i n dB) of the d a t a recording/reduction system
At th is point then, the instrumentation-related response-corrected 1/3-oct.ave band spectra at 1/2- second intervals during the flyover are avai lable for each of the microphones. One such corrected spectrum might look as shown in Fig. 3.53. Even in th is relatively coarse resolution, one distin-
guishes a rotational fundamental of the rotor around 50 Hz and several harmonics in the 100 Hz, 200 Hz, and 315 Hz bands. They imply the presence of pronounced "tones" which may affect the PNLT-computation. I f the time span for the flyover (within a 15-dB-below-maximum A-level range) i s 30 seconds, one would obtain 60 ]&octave band spectra at each of the 3 microphones, i.e. a total
of some 180 spectra.
The a i rc ra f t position a t the time of the maximum toile-corrected Perceived Noise Level, 'PNLTM', must be known for applying the atmospheric and the distance correction, in addition to the dura- tion correction which also depends on the ground speed. A s a first step the "measured EPNL" is
determined, i.e. the EPNL without yet applying any duration adjustment o r atmospheric-absorption
adjustment.
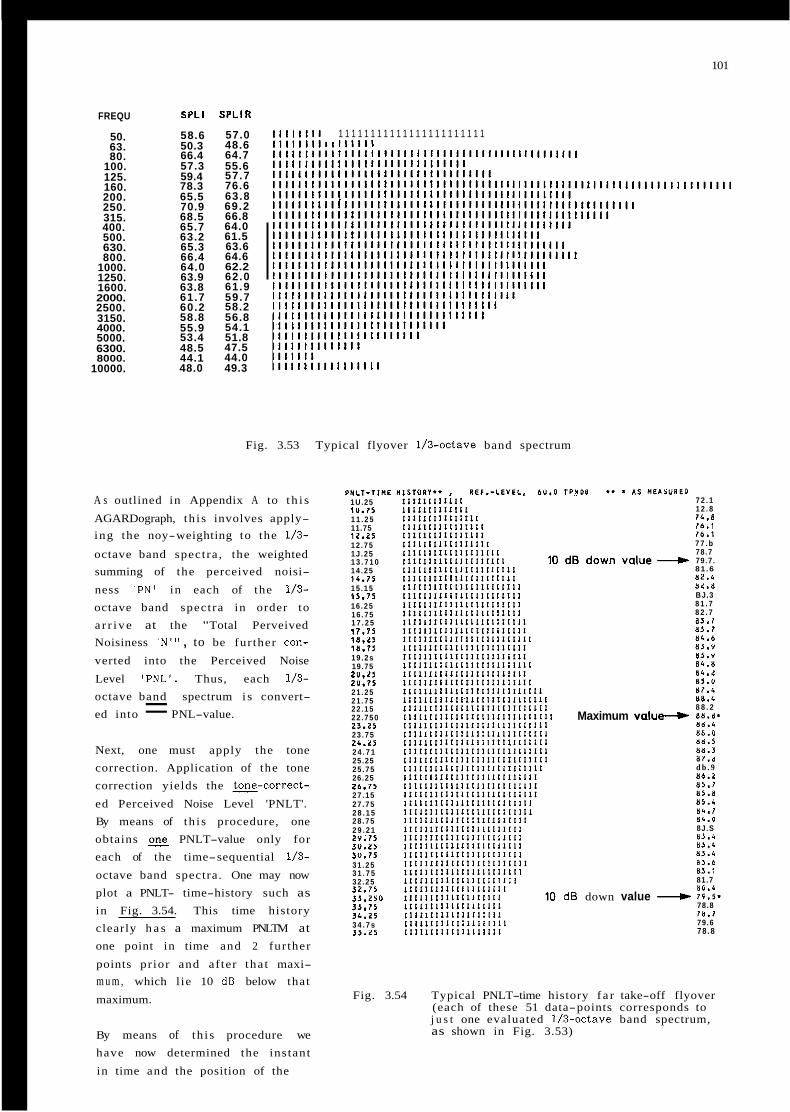
101
FREQU
50. 63. 80.
100. 125. 160. 200. 250. 315. 400. 500. 630. 800.
1000. 1250. 1600. 2000. 2500. 3150. 4000. 5000. 6300. 8000.
10000.
SPLl
58.6 50.3 66.4 57.3 59.4 78.3 65.5 70.9 68.5 65.7 63.2 65.3 66.4 64.0 63.9 63.8 61.7 60.2 58.8 55.9 53.4 48.5 44.1 48.0
SPLlR
57.0 48.6 64.7 55.6 57.7 76.6 63.8 69.2 66.8 64.0 61.5 63.6 64.6 62.2 62.0 61.9 59.7 58.2 56.8 54.1 51.8 47.5 44.0 49.3
1 1 1 1 1 1 1 1 1 1 1 1 1 1 1 1 1 1 1 1 1 1 1 I , , , , ,
Fig. 3.53 Typical flyover 1/3-octave band spectrum
A s outlined in Appendix A to t h i s
AGARDograph, th i s involves apply- ing the noy-weighting to the 1/3-
octave band spectra , the weighted summing of the perceived noisi-
ness 'PN' in each of the 1/3- octave band spectra in order to a r r i ve at the "Total Perveived Noisiness 'N"' , to be fur ther con-
verted into the Perceived Noise
Level 'PNL'. Thus, each 1/3- octave band spectrum i s convert- ed into = PNL-value.
Next, one must apply the tone correction. Application of the tone correction yields the =-correct-
ed Perceived Noise Level 'PNLT'. By means of th i s procedure, one obtains PNLT-value only for each of the time-sequential 1/3-
octave band spectra. One may now plot a PNLT- time-history such as in Fig. 3.54. This time history clearly h a s a maximum PNLTM at one point in time and 2 fur ther
points pr ior and af ter tha t maxi- m u m , which l ie 10 dB below that
maximum.
By means of th i s procedure we have now determined the instant
in time and the position of the
P H L ? - T I N E 1U.25 l Y . 7 5 1 1 . 2 5 11.75 l2.2S 1 2 . 7 5 1 J . 2 5 1 3 . 7 1 0 1 4 . 2 5 1 6 . 7 5 1 5 . 1 5 1 5 . 7 1 1 6 . 2 5 1 6 . 7 5 1 7 . 2 5 1 1 - 7 5 1 8 . 2 5 i n . 7 5 1 9 . 2 s 19.75 2U.15 2U.75 2 1 . 2 5 2 1 . 7 5 2 2 . 1 5 2 2 . 7 5 0 2 3 . 2 1 2 3 . 7 5 2G.15 2 4 . 7 1 25.25 2 5 . 7 5 26.25 2h.75 2 7 . 1 5 2 7 . 7 5 2 8 . 1 5 2 8 . 7 5 2 9 . 2 1 2 Y . 7 5 3U.15 3 U . 7 5 3 1 . 2 5 3 1 . 7 5 3 2 . 2 5 3 2 . 7 1 3 3 . 2 5 U 3 J . 7 ) 3 L . 2 5 3 4 . 7 s J5.LS
Maximum v a l u e 4
dB down value +
7 2 . 1 1 2 . 8 7 6 . 8 1 b . l 1 6 . 1 7 7 . b 78.7 79.7 . 81 .6
8 L . 8 BJ.3 8 1 . 7 8 2 . 7
8 3 . 7 8L.6 8J.Y 83."
8 6 . 1 85." MI.'
8 8 . 2 8 8 . d . 88.' 85.U 86.5
37.6 d b . 9 B b . 2
n 2 . b
8 s . r
86.8
n8.L
8 8 . 3
n s . ? 8 1 . 8 ((5.6
n i . 0 8 6 . 7
8J.S 8 5 . 6 8J. ' b3.' a s . 6 8 1 . 1
n o . & 81.7
I9.S. 78.8 l 8 . l 79.6 78 .8
Fig. 3.54 Typical PNLT-time history f a r take-off flyover (each of these 51 data-points corresponds to j u s t one evaluated 1/3-octave band spectrum, as shown in Fig. 3.53)
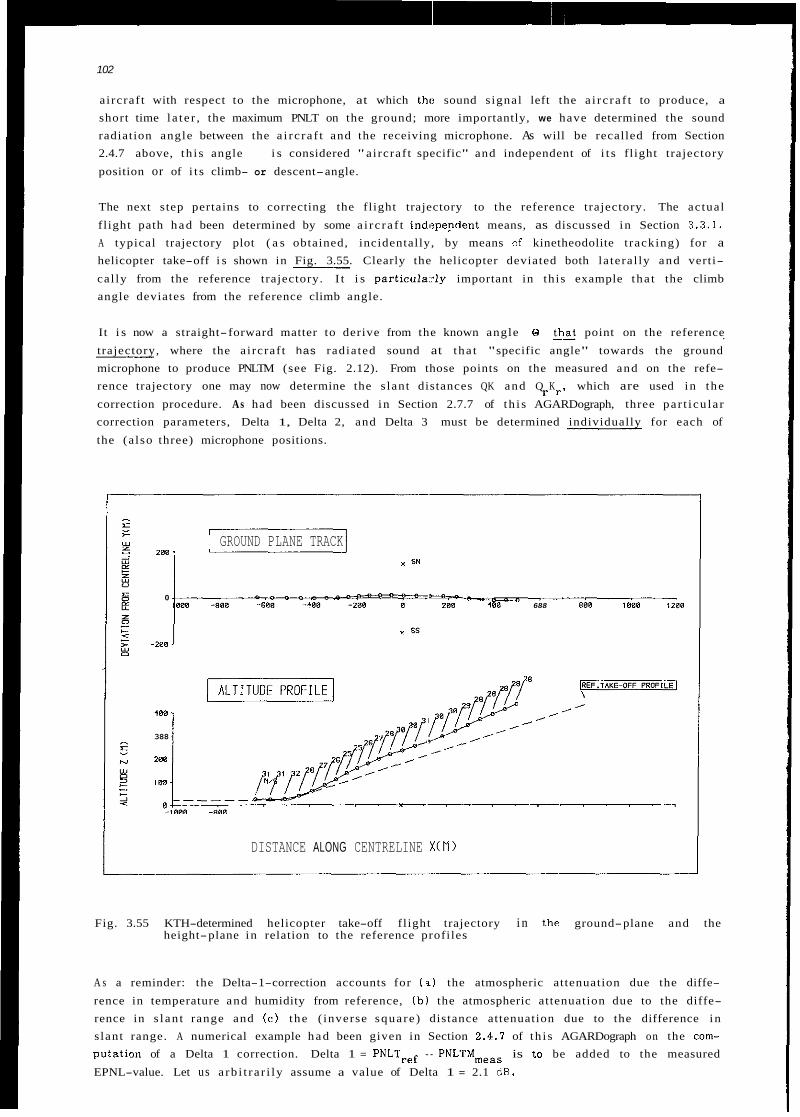
102
aircraf t with respect to the microphone, at which the sound s ignal left the a i rc ra f t to produce, a
short time l a t e r , the maximum PNLT on the ground; more importantly, we have determined the sound radiation angle between the a i rc ra f t and the receiving microphone. As will be recalled from Section 2.4.7 above, th i s angle i s considered " aircraf t specific" and independent of i t s fl ight trajectory
position or of i t s climb- or descent-angle.
The next step pertains to correcting the fl ight trajectory to the reference trajectory. The actual
fl ight path had been determined by some a i rc ra f t indi?pepdent means, as discussed in Section 3.3.1. A typical trajectory plot ( a s obtained, incidentally, by means of kinetheodolite t racking) for a helicopter take-off i s shown in Fig. 3.55. Clearly the helicopter deviated both la teral ly and verti-
cal ly from the reference trajectory. I t i s particu1a::ly important in th is example tha t the climb angle deviates from the reference climb angle.
It i s now a straight-forward matter to derive from the known angle e qhat point on the reference
trajectory, where the a i rcraf t has radiated sound at tha t "specific angle" towards the ground microphone to produce PNLTM (see Fig. 2.12). From those points on the measured and on the refe- rence trajectory one may now determine the s lant distances QK and Q K which are used in the
correction procedure. As had been discussed in Section 2.7.7 of th i s AGARDograph, three par t i cu la r correction parameters, Delta 1, Delta 2, and Delta 3 must be determined individually for each of
the (a lso three) microphone positions.
I' r '
GROUND PLANE TRACK 200
x SN
0 ta,- - 288 -%- 688 888 l0B0 l l 8 B
I08
388
280
100
DISTANCE ALONG CENTRELINE X ( 1 )
Fig. 3.55 KTH-determined helicopter take-off fl ight trajectory i n 1.he ground-plane and the height-plane in relation to the reference profiles
A s a reminder: the Delta-1-correction accounts for ( x ) the atmospheric attenuation due the diffe-
rence in temperature and humidity from reference, ( b ) the atmospheric attenuation due to the diffe- rence in s l an t range and ( c ) the ( inverse square ) distance attenuation due to the difference in s lant range. A numerical example had been given in Section 2.4.7 of th i s AGARDograph on the com- putatian of a Delta 1 correction. Delta 1 = PNLTpef - PNLTMmeas is to be added to the measured
EPNL-value. Let us a rb i t ra r i ly assume a value of Delta 1 = 2.1 dB.
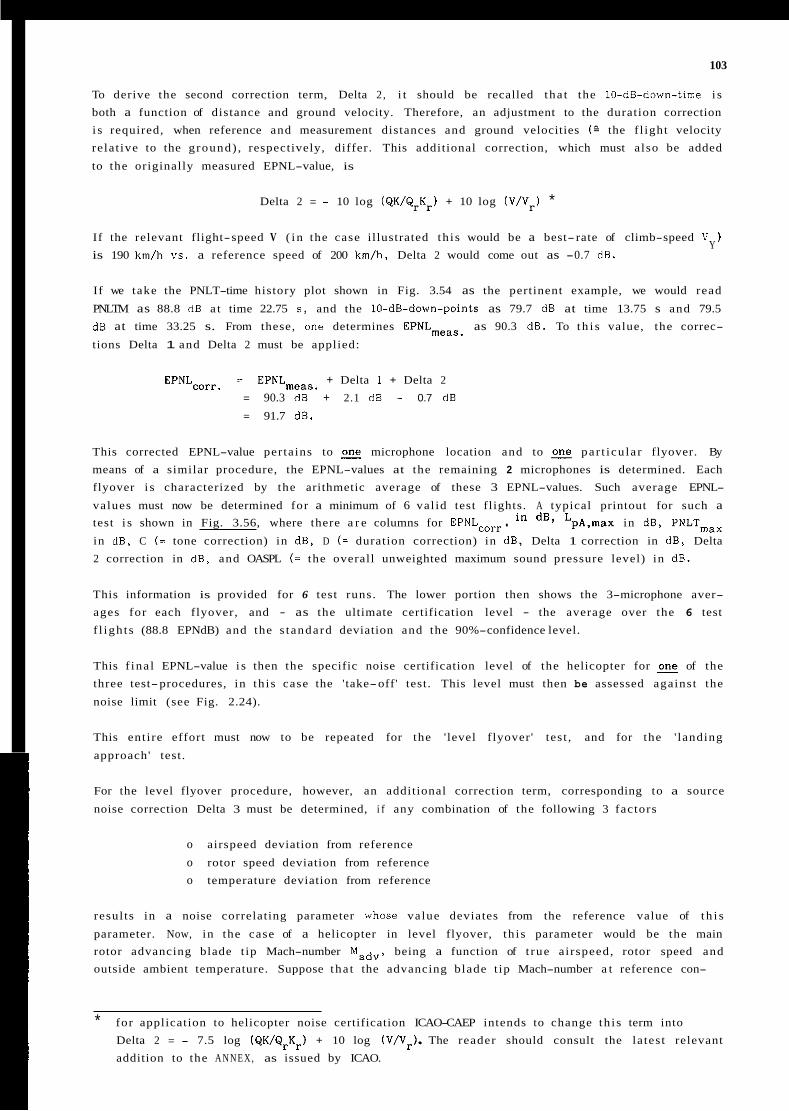
103
To derive the second correction term, Delta 2 , i t should be recalled tha t the 10-dB-down-time i s both a function of distance and ground velocity. Therefore, an adjustment to the duration correction i s required, when reference and measurement distances and ground velocities ( G the f l ight velocity relat ive to the ground) , respectively, differ. This additional correction, which must also be added
to the originally measured EPNL-value, is
Delta 2 = - 10 log (QK/QrKr) + 10 log (V/Vr) *
If the relevant flight-speed V ( i n the case illustrated th i s would be a best- rate of climb-speed V )
is 190 km/h VS. a reference speed of 200 km/h, Delta 2 would come out as -0.7 dB. Y
If we take the PNLT-time history plot shown in Fig. 3.54 as the pertinent example, we would read
PNLTM as 88.8 dB a t time 22.75 s , and the 10-dB-down-points as 79.7 dB at time 13.75 s and 79.5 dB at time 33.25 s. From these, one determines EPNLmeas. as 90.3 dB. To t h i s value, the correc-
tions Delta 1 and Delta 2 must be applied:
+ Delta 1 + Delta 2 EPNLcorr. = EPNLmeas. = 90.3 dB + 2.1 dB - 0.7 dB
= 91.7 dB.
This corrected EPNL-value pertains to E microphone location and to E par t icu la r flyover. By means of a similar procedure, the EPNL-values at the remaining 2 microphones is determined. Each flyover i s characterized by the arithmetic average of these 3 EPNL-values. Such average EPNL-
values must now be determined for a minimum of 6 val id test flights. A typical printout for such a test i s shown in Fig. 3.56, where there a r e columns for EPNLcorr . in dB, LpA,max in dB, PNLTmax
in dB, C (= tone correction) in dB, D (= duration correction) in dB, Delta 1 correction in dB, Delta 2 correction in dB, and OASPL (= the overall unweighted maximum sound pressure level) in dB.
This information is provided for 6 test runs. The lower portion then shows the 3-microphone aver- ages for each flyover, and - as the ultimate certification level - the average over the 6 test f l igh ts (88.8 EPNdB) and the s tandard deviation and the 90%-confidence level.
This f ina l EPNL-value i s then the specific noise certification level of the helicopter for E of the three test-procedures, in th i s case the 'take-off' test. This level must then be assessed against the
noise limit (see Fig. 2.24).
This ent i re effort must now to be repeated for the ' level flyover' test , and for the ' landing
approach' test.
For the level flyover procedure, however, an additional correction term, corresponding to a source
noise correction Delta 3 must be determined, i f any combination of the following 3 factors
o airspeed deviation from reference
o rotor speed deviation from reference o temperature deviation from reference
resul ts in a noise correlating parameter whose value deviates from the reference value of t h i s
parameter. Now, in the case of a helicopter in level flyover, th i s parameter would be the main rotor advancing blade t ip Mach-number M a d v , being a function of t rue airspeed, rotor speed and outside ambient temperature. Suppose tha t the advancing blade t ip Mach-number a t reference con-
* for application to helicopter noise certification ICAO-CAEP intends to change th i s term into Delta 2 = - 7.5 log (QK/Q,K,) + 10 log addition to the A N N E X , as issued by ICAO.
( V / V r ) . The reader should consult the latest relevant
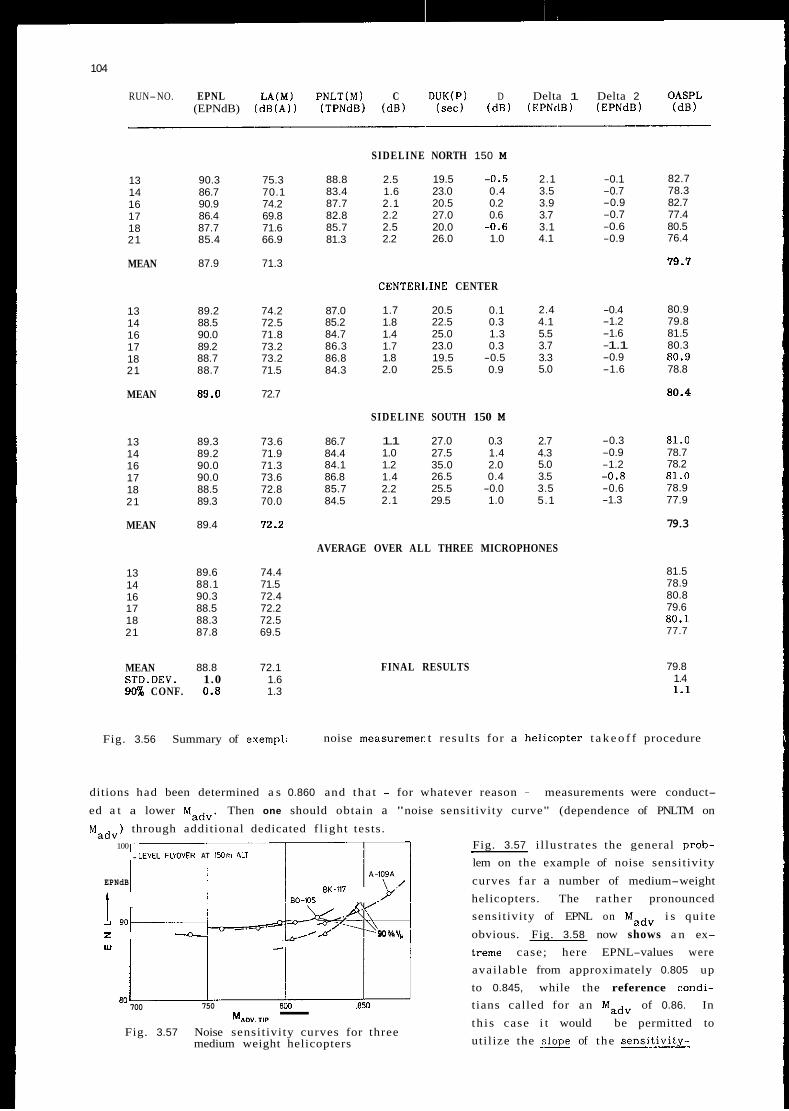
104
RUN-NO. EPNL LA(M) PNLT(M) C DUK(P) D Delta 1 Delta 2 OASPL (EPNdB) (dB(A)) (TPNdB) (dB) (sec) ( d e ) (EPNdB) (EPNdB) (dB)
13 14 16 17 18 21
MEAN
13 14 16 17 18 21
MEAN
13 14 16 17 18 21
MEAN
13 14 16 17 18 21
90.3 75.3 86.7 70.1 90.9 74.2 86.4 69.8 87.7 71.6 85.4 66.9
87.9 71.3
89.2 74.2 88.5 72.5 90.0 71.8 89.2 73.2 88.7 73.2 88.7 71.5
89.0 72.7
89.3 73.6 89.2 71.9 90.0 71.3 90.0 73.6 88.5 72.8 89.3 70.0
89.4 72.2
89.6 74.4 88.1 71.5 90.3 72.4 88.5 72.2 88.3 72.5 87.8 69.5
MEAN 88.8 72.1 STD.DEV. 1.0 1.6 9G% CONF. 0.8 1.3
Fig. 3.56 Summary of exempl;
88.8 83.4 87.7 82.8 85.7 81.3
87.0 85.2 84.7 86.3 86.8 84.3
86.7 84.4 84.1 86.8 85.7 84.5
SIDELINE NORTH 150 M
2.5 19.5 -0.5 1.6 23.0 0.4 2.1 20.5 0.2 2.2 27.0 0.6 2.5 20.0 -0.6 2.2 26.0 1.0
CENTERLINE CENTER
1.7 20.5 0.1 1.8 22.5 0.3 1.4 25.0 1.3 1.7 23.0 0.3 1.8 19.5 -0.5 2.0 25.5 0.9
SIDELINE SOUTH 150 M
1.1 27.0 0.3 1.0 27.5 1.4 1.2 35.0 2.0 1.4 26.5 0.4 2.2 25.5 -0.0 2.1 29.5 1.0
2.1 3.5 3.9 3.7 3.1 4.1
2.4 4.1 5.5 3.7 3.3 5.0
2.7 4.3 5.0 3.5 3.5 5.1
-0.1 -0.7 -0.9 -0.7 -0.6 -0.9
-0.4 -1.2 -1.6 -1.1 -0.9 -1.6
-0.3 -0.9 -1.2 -0.8 -0.6 -1.3
AVERAGE OVER ALL THREE MICROPHONES
FINAL RESULTS
82.7 78.3 82.7 77.4 80.5 76.4
19.1
80.9 79.8 81.5 80.3 80.9 78.8
80.4
81.0 78.7 78.2 81.0 78.9 77.9
79.3
81.5 78.9 80.8 79.6 80.1 77.7
79.8 1.4 1.1
noise measuremer t resul ts for a helLcopter t a k e o f f procedure
ditions had been determined a s 0.860 and tha t - for whatever reason - measurements were conduct-
ed a t a lower M a d v . Then one should obtain a "noise sensitivity curve" (dependence of PNLTM on
M a d v ) through additional dedicated f l ight tests. 100 Fig. 3.57 i l lus t ra tes the general prob-
lem on the example of noise sensitivity
curves f a r a number of medium-weight helicopters. The ra ther pronounced
. 2' __ sensitivity of EPNL on Madv i s qui te
treme case; here EPNL-values were avai lable from approximately 0.805 up to 0.845, while the reference candi-
750 8W ,850 t ians called for a n Madv of 0.86. In M,,".,,, - th i s case i t would be permitted to
. LEVEL FLYOYER AT 150m A l l
A-lO9A
.b.' EPNdB BK-117
BO-x15 - - *\& 90 % V, obvious. Fig. 3.58 now shows a n ex- _I 9 0 ~
w - z HA/.
BO 700
Fig. 3.57 Noise sensitivity curves for three medium weight helicopters uti l ize the ,slope of the sensitivity-
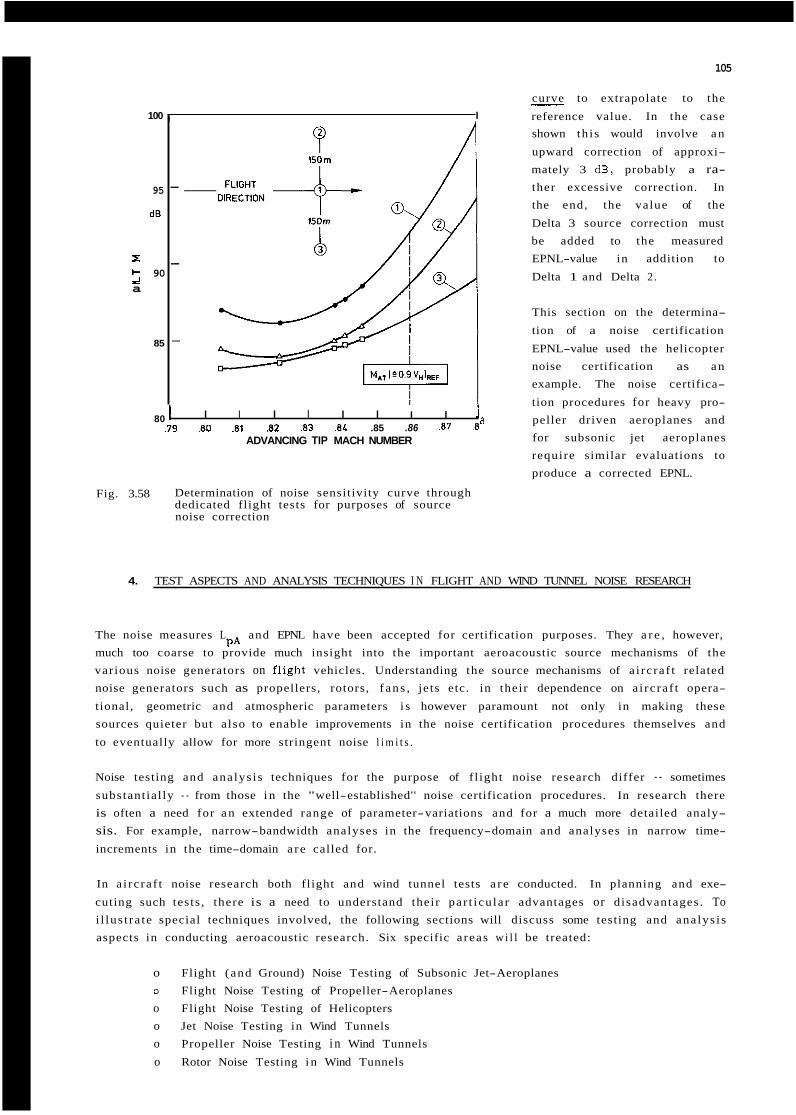
105
curve to extrapolate to the
reference value. In the case shown th i s would involve a n
upward correction of approxi- mately 3 dB, probably a ra- ther excessive correction. In the end, the value of the
Delta 3 source correction must be added to the measured EPNL-value in addition to Delta 1 and Delta 2 .
-
95
dB
P
z 5 90 a
85
100 , I
-
-
-
A
80 I I I I I I I I I 1 79 .80 .81 .82 .83 .8L .85 .86 3 7 .8
ADVANCING TIP MACH NUMBER
This section on the determina-
tion of a noise certification
EPNL-value used the helicopter noise certification as a n example. The noise certifica-
tion procedures for heavy pro- , R peller driven aeroplanes and
for subsonic jet aeroplanes require similar evaluations to produce a corrected EPNL.
Fig. 3.58 Determination of noise sensitivity curve through dedicated flight tests for purposes of source noise correction
4. TEST ASPECTS AND ANALYSIS TECHNIQUES I N FLIGHT AND WIND TUNNEL NOISE RESEARCH
The noise measures L and EPNL have been accepted for certification purposes. They a r e , however, much too coarse to provide much insight into the important aeroacoustic source mechanisms of the various noise generators on fIight vehicles. Understanding the source mechanisms of a i rc ra f t related noise generators such as propellers, rotors, f an s , je ts etc. in their dependence on a i rc ra f t opera-
tional, geometric and atmospheric parameters i s however paramount not only in making these sources quieter but a lso to enable improvements in the noise certification procedures themselves and
to eventually allow for more stringent noise l i m i t s .
PA
Noise testing and ana lys i s techniques for the purpose of f l ight noise research differ - sometimes
substant ial ly - from those i n the "well-established'' noise certification procedures. In research there is often a need for a n extended range of parameter-variations and for a much more detailed analy- sis. For example, narrow-bandwidth analyses in the frequency-domain and analyses in narrow time-
increments in the time-domain a r e called for.
In a i rc ra f t noise research both flight and wind tunnel tests a r e conducted. In planning and exe-
cuting such tests , there is a need to understand their par t icu la r advantages or disadvantages. To i l lus t ra te special techniques involved, the following sections will discuss some testing and ana lys i s aspects in conducting aeroacoustic research. Six specific a reas w i l l be treated:
o Flight (and Ground) Noise Testing of Subsonic Jet-Aeroplanes o Flight Noise Testing of Propeller-Aeroplanes o Flight Noise Testing of Helicopters o Jet Noise Testing in Wind Tunnels o Propeller Noise Testing i n Wind Tunnels
o Rotor Noise Testing i n Wind Tunnels
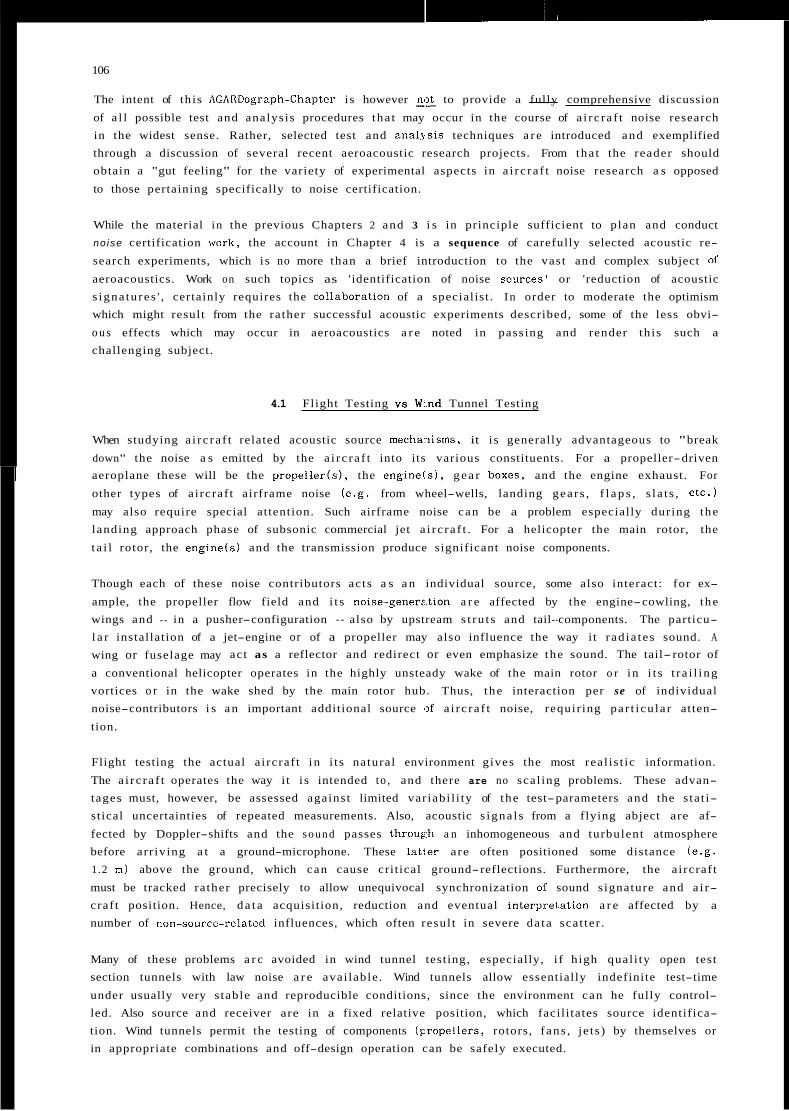
L,
106
The intent of th is AGARDograph-Chapter i s however ~ , t to provide a __ fully comprehensive discussion
of a l l possible test and analysis procedures tha t may occur in the course of a i rc ra f t noise research in the widest sense. Rather, selected test and analgsis techniques a r e introduced and exemplified through a discussion of several recent aeroacoustic research projects. From tha t the reader should obtain a "gut feeling" for the variety of experimental aspects in a i rc ra f t noise research a s opposed
to those pertaining specifically to noise certification.
While the material in the previous Chapters 2 and 3 i s in principle sufficient to plan and conduct noise certification work, the account in Chapter 4 is a sequence of carefully selected acoustic re-
search experiments, which i s no more than a brief introduction to the vast and complex subject of
aeroacoustics. Work on such topics as 'identification of noise sources' or 'reduction of acoustic s igna tures ' , certainly requires the collaboration of a specialist . I n order to moderate the optimism which might result from the rather successful acoustic experiments described, some of the less obvi-
o u s effects which may occur in aeroacoustics a r e noted in passing and render th is such a
challenging subject.
4.1 Flight Testing vs W:.nd Tunnel Testing
When studying a i rc ra f t related acoustic source mecha?isms, it i s generally advantageous to "break
down" the noise a s emitted by the a i rc ra f t into its various constituents. For a propeller-driven aeroplane these will be the propeller(s1, the eng ine l s ) , g e a r boxes, and the engine exhaust. For
other types of a i rcraf t airframe noise (e.g. from wheel-wells, landing gears , f l a p s , s l a t s , e t c . )
may also require special attention. Such airframe noise can be a problem especially during the landing approach phase of subsonic commercial jet a i r c ra f t . For a helicopter the main rotor, the
t a i l rotor, the engine(s) and the transmission produce significant noise components.
Though each of these noise contributors acts a s a n individual source, some also interact: for ex-
ample, the propeller flow field and i t s noise-generi.tion a r e affected by the engine-cowling, the wings and - in a pusher-configuration - also by upstream s t ru t s and tail--components. The particu- l a r installation of a jet-engine or of a propeller may also influence the way i t r ad ia tes sound. A
wing or fuselage may act as a reflector and redirect or even emphasize the sound. The tail- rotor of
a conventional helicopter operates in the highly unsteady wake of the main rotor o r in i t s t r a i l ing vortices o r in the wake shed by the main rotor hub. Thus, the interaction per se of individual noise-contributors i s a n important additional source ,If a i rc ra f t noise, requir ing par t i cu la r atten-
tion.
Flight testing the actual a i rcraf t in i t s natural environment gives the most real is t ic information.
The a i rc ra f t operates the way i t i s intended to , and there are no scal ing problems. These advan- tages must, however, be assessed against limited var iabi l i ty of the test-parameters and the s ta t i- stical uncertainties of repeated measurements. Also, acoustic s igna l s from a flying abject are af-
fected by Doppler-shifts and the sound passes throug;h a n inhomogeneous and turbulent atmosphere before arr iving a t a ground-microphone. These la t ier are often positioned some distance (e .g . 1.2 m ) above the ground, which can cause crit ical ground-reflections. Furthermore, the a i rcraf t
must be tracked rather precisely to allow unequivocal synchronization of sound s ignature and a i r- craf t position. Hence, d a t a acquisition, reduction and eventual interpre1,ation a r e affected by a
number of "on-source-related influences, which often resul t in severe da ta scat ter .
Many of these problems a r c avoided in wind tunnel testing, especially, i f high qual i ty open test section tunnels with law noise a r e avai lable . Wind tunnels allow essentially indefinite test-time
under usually very s table and reproducible conditions, since the environment can he fully control- led. Also source and receiver are in a fixed relative position, which facili tates source identifica- tion. Wind tunnels permit the testing of components (Fropellers, rotors, f ans , je ts ) by themselves or
in appropriate combinations and off-design operation can be safely executed.
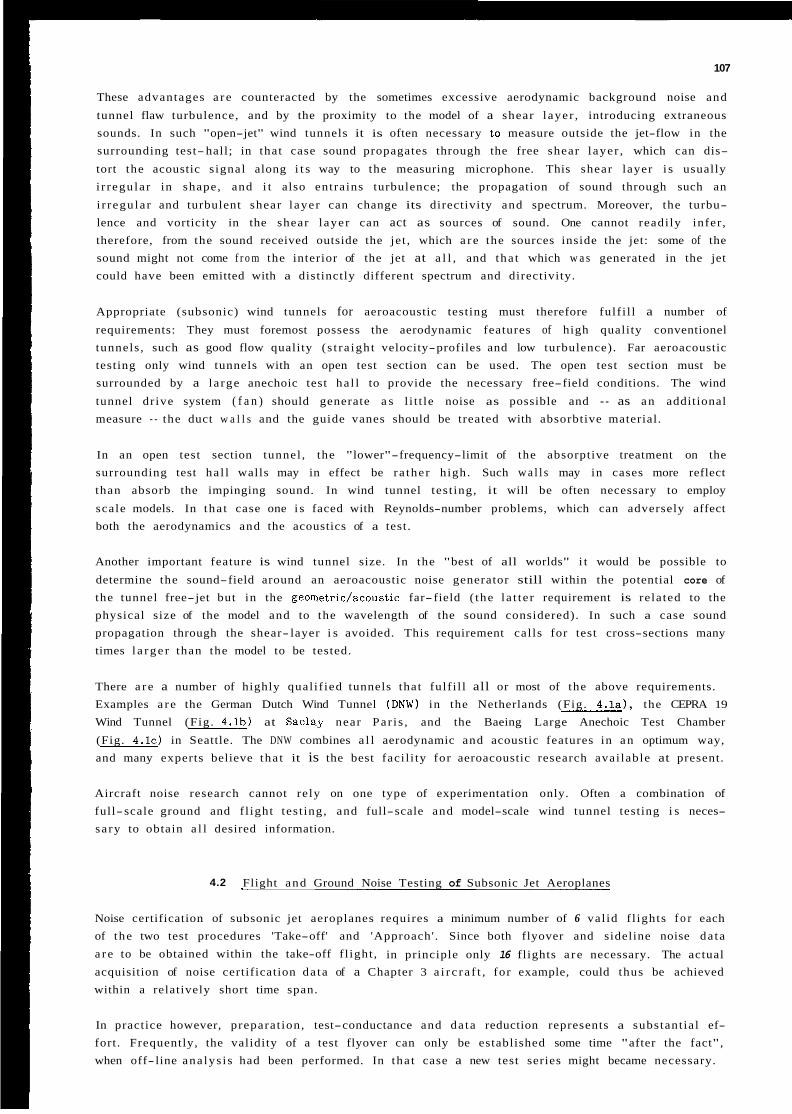
107
These advantages a r e counteracted by the sometimes excessive aerodynamic background noise and
tunnel flaw turbulence, and by the proximity to the model of a shear layer , introducing extraneous sounds. In such "open-jet" wind tunnels it is often necessary to measure outside the jet-flow in the surrounding test-hall; in that case sound propagates through the free shear layer , which can dis-
tort the acoustic s ignal along i t s way to the measuring microphone. This shear layer i s usually i r regula r in shape, and i t also entrains turbulence; the propagation of sound through such an
i r regula r and turbulent shear l ayer can change its directivity and spectrum. Moreover, the turbu- lence and vorticity in the shear l ayer can act as sources of sound. One cannot readi ly infer , therefore, from the sound received outside the jet , which a r e the sources inside the jet: some of the sound might not come f r o m the interior of the jet at a l l , and tha t which w a s generated in the jet could have been emitted with a distinctly different spectrum and directivity.
Appropriate (subsonic) wind tunnels for aeroacoustic testing must therefore fulf i l l a number of
requirements: They must foremost possess the aerodynamic features of high quality conventionel tunnels , such as good flow quality ( s t ra igh t velocity-profiles and low turbulence). Far aeroacoustic testing only wind tunnels with an open test section can be used. The open test section must be surrounded by a la rge anechoic test ha l l to provide the necessary free-field conditions. The wind
tunnel dr ive system ( f a n ) should generate a s l i t t le noise as possible and - as a n additional measure - the duct w a l l s and the guide vanes should be treated with absorbtive material.
In an open test section tunnel , the "lower"-frequency-limit of the absorptive treatment on the surrounding test ha l l walls may in effect be ra ther high. Such w a l l s may in cases more reflect than absorb the impinging sound. In wind tunnel test ing, it will be often necessary to employ
scale models. In tha t case one i s faced with Reynolds-number problems, which can adversely affect both the aerodynamics and the acoustics of a test.
Another important feature is wind tunnel size. In the "best of all worlds" i t would be possible to
determine the sound-field around an aeroacoustic noise generator still within the potential core of the tunnel free-jet but in the geometric/acoustic far-field ( the la t te r requirement is related to the physical size of the model and to the wavelength of the sound considered). In such a case sound propagation through the shear- layer i s avoided. This requirement cal ls for test cross-sections many times l a rge r than the model to be tested.
There a r e a number of highly qual i f ied tunnels that fulf i l l all or most of the above requirements. Examples a r e the German Dutch Wind Tunnel ( D N W ) in the Netherlands (Fig. 4 . l a ) , the CEPRA 19
Wind Tunnel (Fig. 4 . lb ) at Saclay near Par i s , and the Baeing Large Anechoic Test Chamber
(Fig. 4 . 1 ~ ) in Seattle. The DNW combines a l l aerodynamic and acoustic features in a n optimum way, and many experts believe tha t it is the best faci l i ty for aeroacoustic research avai lable at present.
Aircraft noise research cannot rely on one type of experimentation only. Often a combination of full- scale ground and f l ight test ing, and full-scale and model-scale wind tunnel testing i s neces- sary to obtain a l l desired information.
4.2 Flight and Ground Noise Testing of Subsonic Jet Aeroplanes
Noise certification of subsonic jet aeroplanes requires a minimum number of 6 val id f l ights f o r each of the two test procedures 'Take-off' and 'Approach'. Since both flyover and sideline noise da ta a r e to be obtained within the take-off f l ight , in principle only 16 flights a r e necessary. The actual acquisition of noise certification da ta of a Chapter 3 a i r c r a f t , for example, could thus be achieved within a relatively short time span.
In practice however, preparat ion, test-conductance and da ta reduction represents a substant ial ef- fort. Frequently, the validity of a test flyover can only be established some time "after the fact", when off- line ana lys i s had been performed. In tha t case a new test series might became necessary.
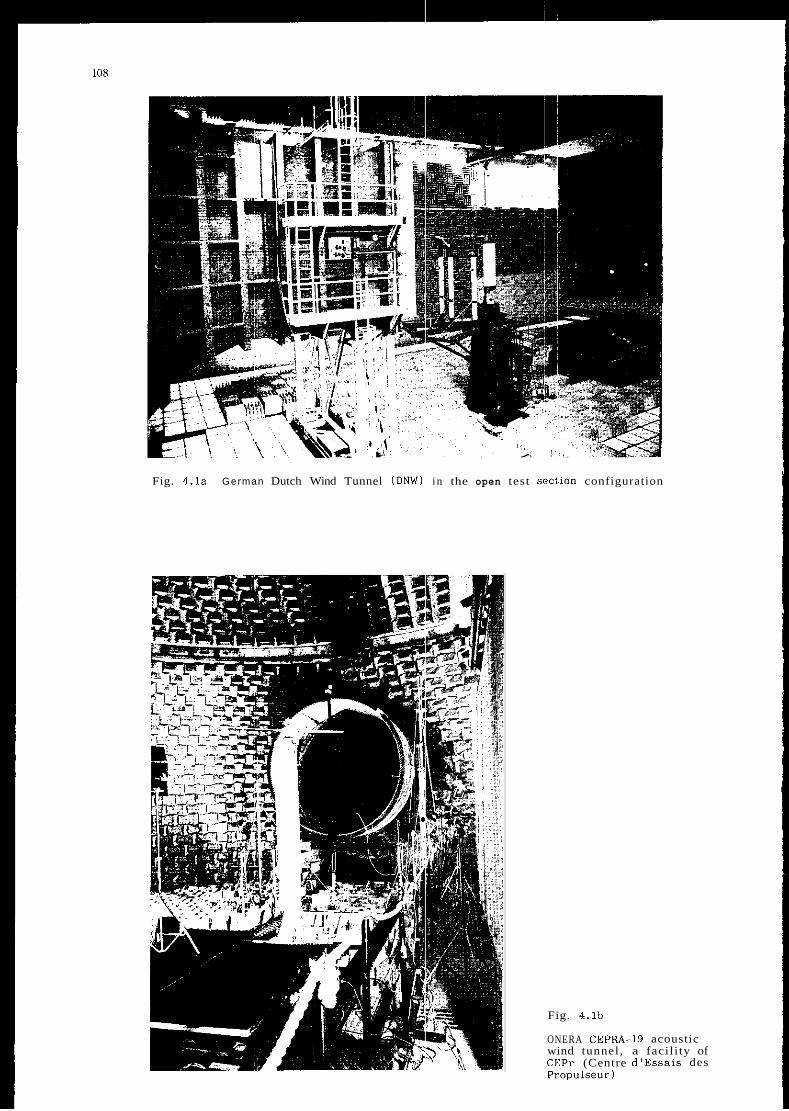
Fig. 4 . l a German Dutch Wind Tunnel ( D N W ) i n the open test sect.ion configuration
Fig. 4.lb
ONERA CEPRA~ wind tunnel, CEPr (Centre Propulseur)
~ 1 9 acoustic a facil i ty of d 'Essa i s des
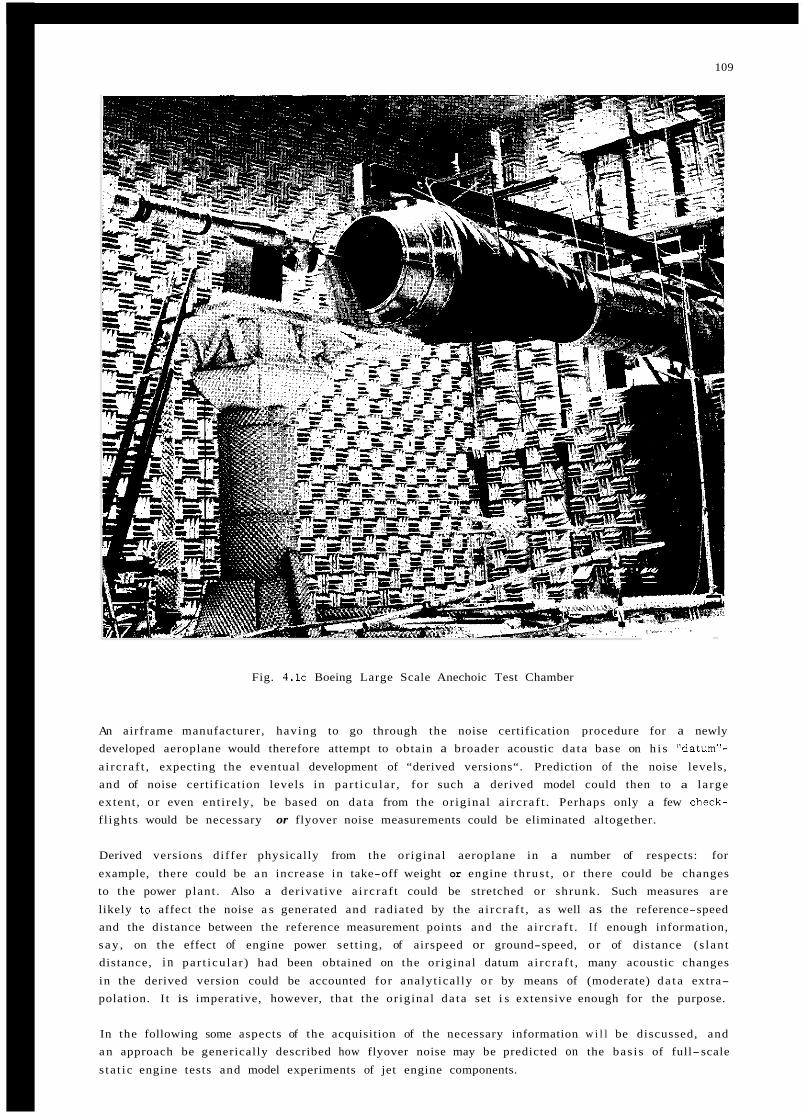
109
Fig. 4.1~ Boeing Large Scale Anechoic Test Chamber
An airframe manufacturer, having to go through the noise certification procedure for a newly developed aeroplane would therefore attempt to obtain a broader acoustic da ta base on h i s “datum’!-
a i rc ra f t , expecting the eventual development of “derived versions“. Prediction of the noise levels, and of noise certification levels in par t icu la r , for such a derived model could then to a la rge extent , o r even ent irely, be based on da ta from the original a i rc ra f t . Perhaps only a few check- f l ights would be necessary or flyover noise measurements could be eliminated altogether.
Derived versions differ physically from the or iginal aeroplane in a number of respects: for
example, there could be a n increase in take-off weight or engine th rus t , o r there could be changes to the power plant . Also a derivat ive a i rc ra f t could be stretched or shrunk. Such measures a r e
likely to affect the noise a s generated and radiated by the a i rc ra f t , a s well as the reference-speed and the distance between the reference measurement points and the a i rc ra f t . I f enough information, s ay , on the effect of engine power set t ing, of airspeed or ground-speed, o r of distance ( s lan t distance, i n par t icu la r ) had been obtained on the or iginal datum a i rc ra f t , many acoustic changes
in the derived version could be accounted for analyt ical ly or by means of (moderate) d a t a extra- polation. I t is imperative, however, that the or iginal da ta set i s extensive enough for the purpose.
In the following some aspects of the acquisition of the necessary information w i l l be discussed, and a n approach be generically described how flyover noise may be predicted on the bas i s of full-scale
s ta t ic engine tests and model experiments of jet engine components.
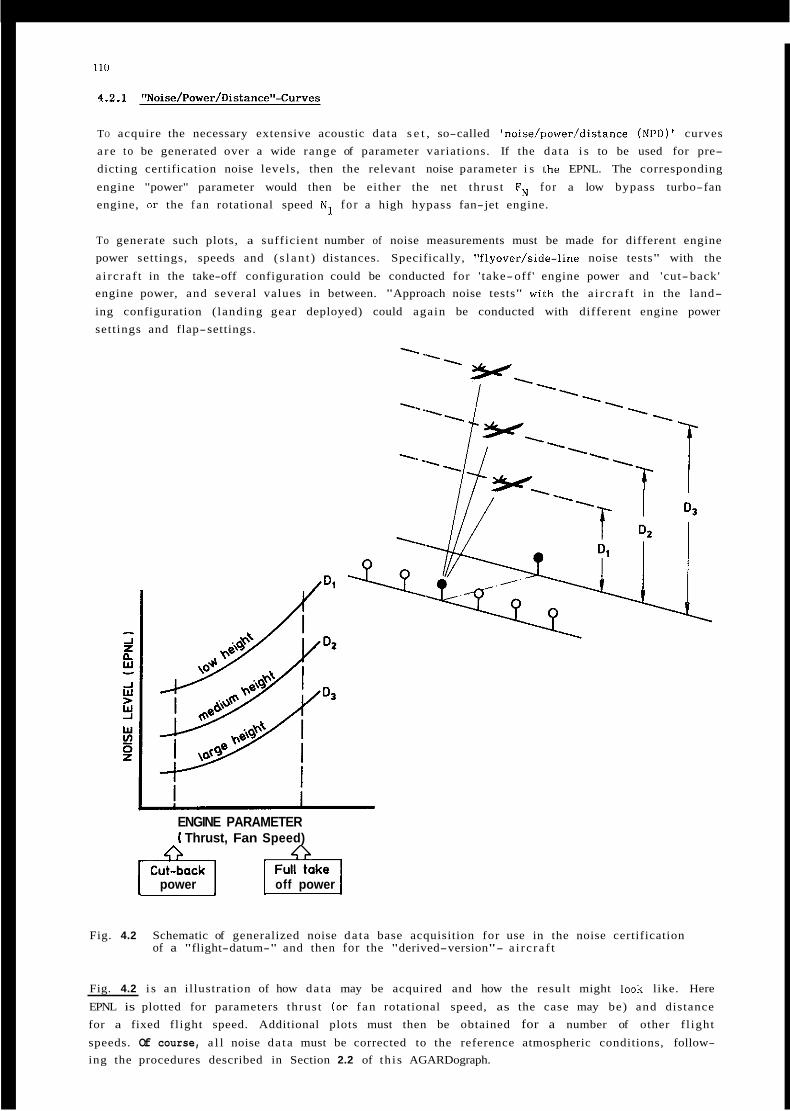
110
4.2.1 "Noise/Pawer/Distance"-Curves
TO acquire the necessary extensive acoustic data s e t , so-called 'noise/power/distance (NPD) curves a r e to be generated over a wide range of parameter variations. If the da ta i s to be used for pre- dicting certification noise levels, then the relevant noise parameter i s the EPNL. The corresponding
engine "power" parameter would then be either the net thrust FN fo r a low bypass turbo-fan engine, or the f a n rotational speed N1 f o r a high hypass fan-jet engine.
To generate such plots, a sufficient number of noise measurements must be made for different engine power settings, speeds and ( s l an t ) distances. Specifically, "flyover/side-line noise tests" with the
a i rc ra f t in the take-off configuration could be conducted for ' take-off ' engine power and 'cut-back' engine power, and several values in between. "Approach noise tests" wi1.h the a i rc ra f t in the land-
ing configuration ( landing gear deployed) could again be conducted with different engine power settings and flap-settings.
ENGINE PARAMETER I Thrust, Fan Speed)
I power I I off power I
Fig. 4.2 Schematic of generalized noise da ta base acquisition for use in the noise certification of a "flight-datum-" and then for the "derived-version"- a i rc ra f t
Fig. 4.2 i s an illustration of how da ta may be acquired and how the result might look like. Here
EPNL is plotted for parameters thrust (or fan rotational speed, as the case may be) and distance for a fixed flight speed. Additional plots must then be obtained for a number of other f l ight
speeds. Of course, a l l noise da ta must be corrected to the reference atmospheric conditions, follow- ing the procedures described in Section 2.2 of th i s AGARDograph.
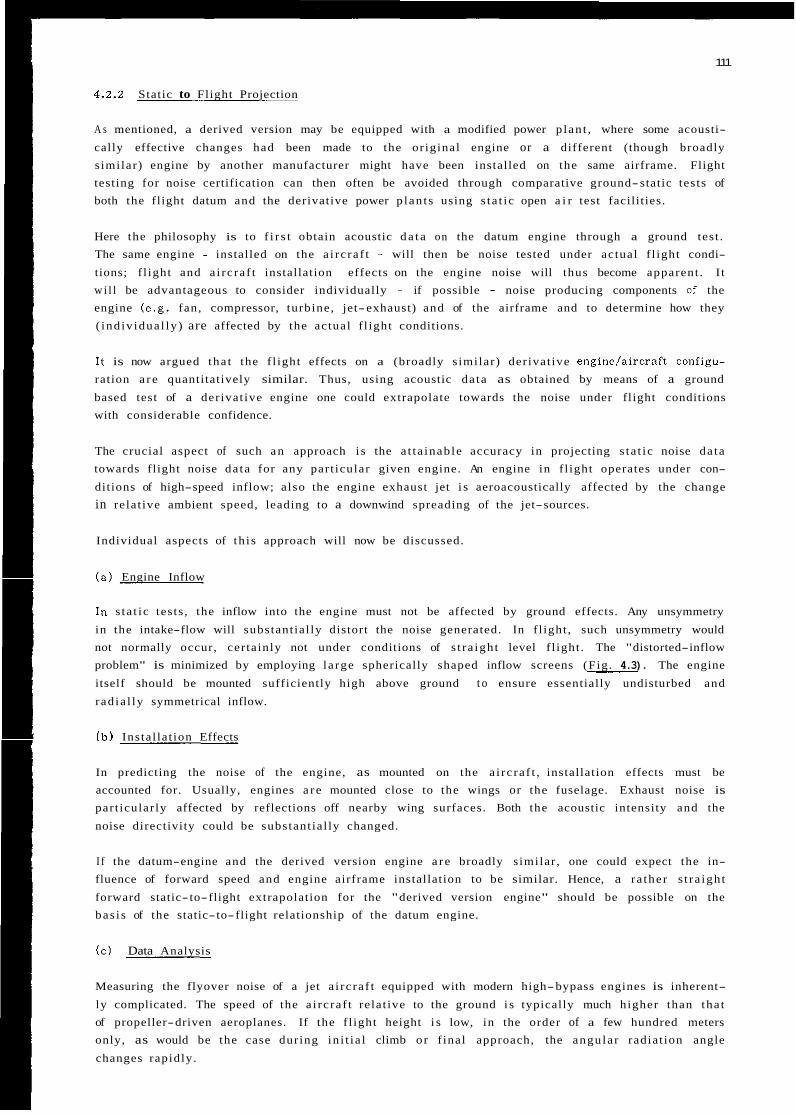
111
4.2.2 Static to Flight Projection
A s mentioned, a derived version may be equipped with a modified power p lan t , where some acousti-
cally effective changes had been made to the or iginal engine or a different (though broadly s imilar) engine by another manufacturer might have been installed on the same airframe. Flight testing for noise certification can then often be avoided through comparative ground-static tests of both the flight datum and the derivative power p lan ts using s ta t ic open a i r test facilities.
Here the philosophy is to f i r s t obtain acoustic d a t a on the datum engine through a ground test . The same engine - installed on the a i rc ra f t - will then be noise tested under actual f l ight condi-
tions; f l ight and a i rc ra f t installation effects on the engine noise will thus become apparent . I t w i l l be advantageous to consider individually - if possible - noise producing components of the engine (e .g. fan, compressor, turbine, jet-exhaust) and of the airframe and to determine how they ( ind iv idua l ly) are affected by the actual f l ight conditions.
It is now argued tha t the f l ight effects on a (broadly s imilar) der ivat ive engine/aircraf t canfigu- ration a r e quantitatively similar. Thus, using acoustic da ta as obtained by means of a ground
based test of a derivat ive engine one could extrapolate towards the noise under flight conditions with considerable confidence.
The crucial aspect of such a n approach i s the a t ta inab le accuracy in projecting s ta t ic noise da ta towards flight noise da ta for any part icular given engine. An engine in f l ight operates under con-
ditions of high-speed inflow; also the engine exhaust jet i s aeroacoustically affected by the change in relat ive ambient speed, leading to a downwind spreading of the jet-sources.
Individual aspects of th i s approach will now be discussed.
( a ) Engine Inflow
In s ta t ic tests , the inflow into the engine must not be affected by ground effects. Any unsymmetry
in the intake-flow will substant ial ly distort the noise generated. In f l ight , such unsymmetry would not normally occur, cer tainly not under conditions of s t ra igh t level f l ight . The "distorted-inflow problem" is minimized by employing la rge spherically shaped inflow screens (Fig. 4.3). The engine
itself should be mounted sufficiently high above ground t o ensure essentially undisturbed and
rad ia l ly symmetrical inflow.
( b ) Instal la t ion Effects
In predicting the noise of the engine, as mounted on the a i rc ra f t , installation effects must be accounted for. Usually, engines a r e mounted close to the wings or the fuselage. Exhaust noise is part icular ly affected by reflections off nearby wing surfaces. Both the acoustic intensity and the
noise directivity could be substant ial ly changed.
I f the datum-engine and the derived version engine a r e broadly s imilar , one could expect the in- fluence of forward speed and engine airframe installation to be similar. Hence, a ra ther s t ra igh t
forward static- to-flight extrapolation for the "derived version engine" should be possible on the bas i s of the static- to-flight relationship of the datum engine.
( c ) Data Analysis
Measuring the flyover noise of a jet a i rc ra f t equipped with modern high-bypass engines is inherent-
ly complicated. The speed of the a i rc ra f t relat ive to the ground i s typically much higher than tha t of propeller-driven aeroplanes. If the f l ight height i s low, in the order of a few hundred meters only, as would be the case during in i t i a l climb or f inal approach, the angula r radiat ion angle
changes rapidly.
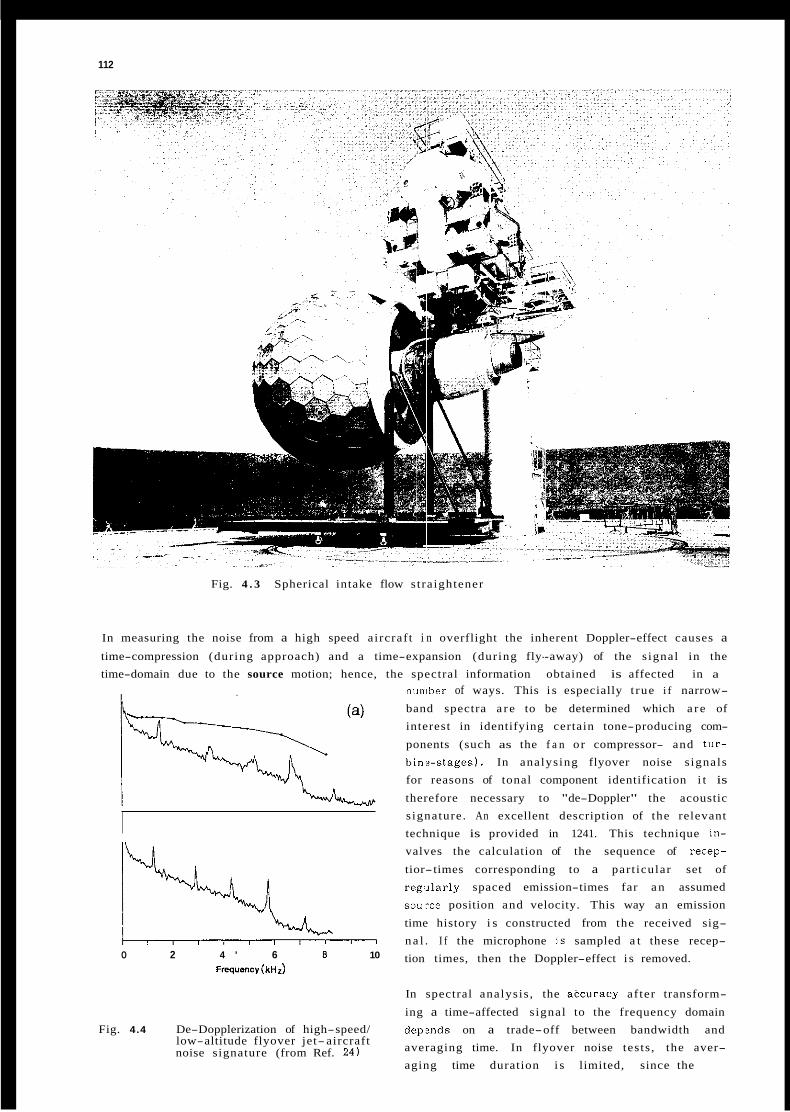
112
Fig. 4 . 3 Spherical intake flow straightener
In measuring the noise from a high speed aircraf t i n overflight the inherent Doppler-effect causes a time-compression (during approach) and a time-expansion (during fly--away) of the s ignal in the time-domain due to the source motion; hence, the spectral information obtained is affected in a
0 2 4 ' 6 8 10 Frequency(kHz)
Fig. 4.4 De-Dopplerization of high-speed/ low-altitude flyover jet- aircraft noise signature (from Ref. 24)
number of ways. This i s especially t rue i f narrow-
band spectra a r e to be determined which a r e of interest in identifying certain tone-producing com-
ponents (such as the f a n o r compressor- and t u r - bin,a-stages). In analysing flyover noise s ignals for reasons of tonal component identification i t is
therefore necessary to "de-Doppler" the acoustic s ignature. An excellent description of the relevant technique is provided in 1241. This technique in- valves the calculation of the sequence of recep-
tior-times corresponding to a part icular set of reg i la r ly spaced emission-times far a n assumed sou.:ce position and velocity. This way an emission
time history i s constructed from the received sig- na l . I f the microphone i.s sampled a t these recep- tion times, then the Doppler-effect i s removed.
In spectral analysis , the abcuracy af ter transform-
ing a time-affected s ignal to the frequency domain depsnds on a trade-off between bandwidth and averaging time. In flyover noise tests , the aver- aging time duration i s limited, since the
113
emission angle changes rapidly. By using, however, a number of microphones spaced longitudinally under the f l ight pa th , one can effectively increase the averaging time without losing angula r resolution. Fig. 4.4 (reproduced from Ref. 24) i l lustrates the dramatic improvement in frequency resolution af ter de-Dopplerization. While in the or iginal (Doppler-affected) s ignal the tones - although being clearly discernible - appear broadened and blurred, de-Dopplerization now moves these tones to the correct frequency (where they can be related to known engine-associated rotatio-
na l speeds) while a t the same time making them appear much sharper and unblurred.
( d ) Separation of Engine and Airframe Contributions
The noise s ignature of a jet-powered aeroplane contains contributions f rom the engines and the air- frame. The engine noise itself combines fan, core (combustion and turbine) , and jet contributions. Airframe noise, which tends to dominate at lower engine powers, such a s during approach, is caus-
ed by the external airstream over s t ruc tura l components ( f laps , landing gears , wheel wells, s t ru t s ,
s t r ingers , e t c . ) . The assessment of the contribution from airframe noise should always be a n inte- g ra l par t of any flyover noise s tudy. This may by obtained by conducting flyovers with engines at f l ight idle. The radiated noise would then essentially represent the a i r c r a f t ' s airframe noise.
Airframe noise increases approximately with the 5th power of a representative speed ( 2 flight speed) . One could thus obtain a n order of magnitude estimate of the airframe noise at higher engine-powers and flight-speeds, respectively, where airframe noise could not any more be deter- mined direct ly.
( e ) Jet Noise/Core Noise
If the effect of flight on jet noise were just a t ranslat ion a t uniform velocity, then a n overall
Doppler shif t and refraction of sound a t the jet/atmosphere interface would be the only result. The reality i s more complex, because even if one w a s only to compare a n a i rc ra f t in steady flight with a s ta t ic ground noise r i g , the flow in the jet is non-uniform and unsteady. Thus the Doppler sh i f t s
depend on location and time within the je t , i .e. , on the flow structure.
Sound propagation in a jet is affected by vortices, turbulence, shear layers , shock waves, and any other properties in the flow pat tern. A Doppler shift varying in space and time i s equivalent to a change in direction of propagation and frequency, i . e . , all these flow effects change the directivity
and spectrum of sound. Also, even if there w a s ini t ia l ly a coherent sound beam, with all waves in phase, propagation through the nan-uniform or unsteady jet f low causes phase leads and lags, and hence distinct wave components can interfere.
There a r e successful examples of calculating flight effects on noise, but they involve a careful study of physical phenomena and sophisticated mathematical analysis . Simple formulas allowing the
prediction of in- flight noise f rom stat ic noise tests have given at best correct t rends, because of the difficulty in taking into account a l l the effects mentioned above.
Prediction of the engine noise from s ta t ic da ta should individually cover the fan, the core and the
engine exhaust je t . In case of a modern high bypass engine, the engine exhaust itself consists of the hot core jet and the surrounding annula r cold bypass jet . The (full- scale) flyover noise from the core and f r o m the exhaust jet may, however, be predicted on the bas i s of model tests . Such a n
approach i s described in 1251. Here, a 1/20-scaled coaxial hot/cold jet experimental set-up corre- sponding to a Rolls-Royce RB 211 engine was placed in the la rge NGTE anechoic chamber. The co-
annular nozzle w a s positioned within a circular flow nozzle of l a rger diameter, providing the for-
ward f l igh t simulation air stream. Measurements were taken with microphones placed at the correct- ly scaled farf ield position for l a te r comparison with the flyover distance. By means of th i s set-up
the "uninstalled-engine" jet-noise could be determined. To account for the fact tha t the a i rc ra f t engine i s mounted under the wing, a n appropriately scaled wing w a s placed next to the model co-
axial jet set-up. Core noise w a s determined on a s ta t ic full-scale engine set-up, where by means of
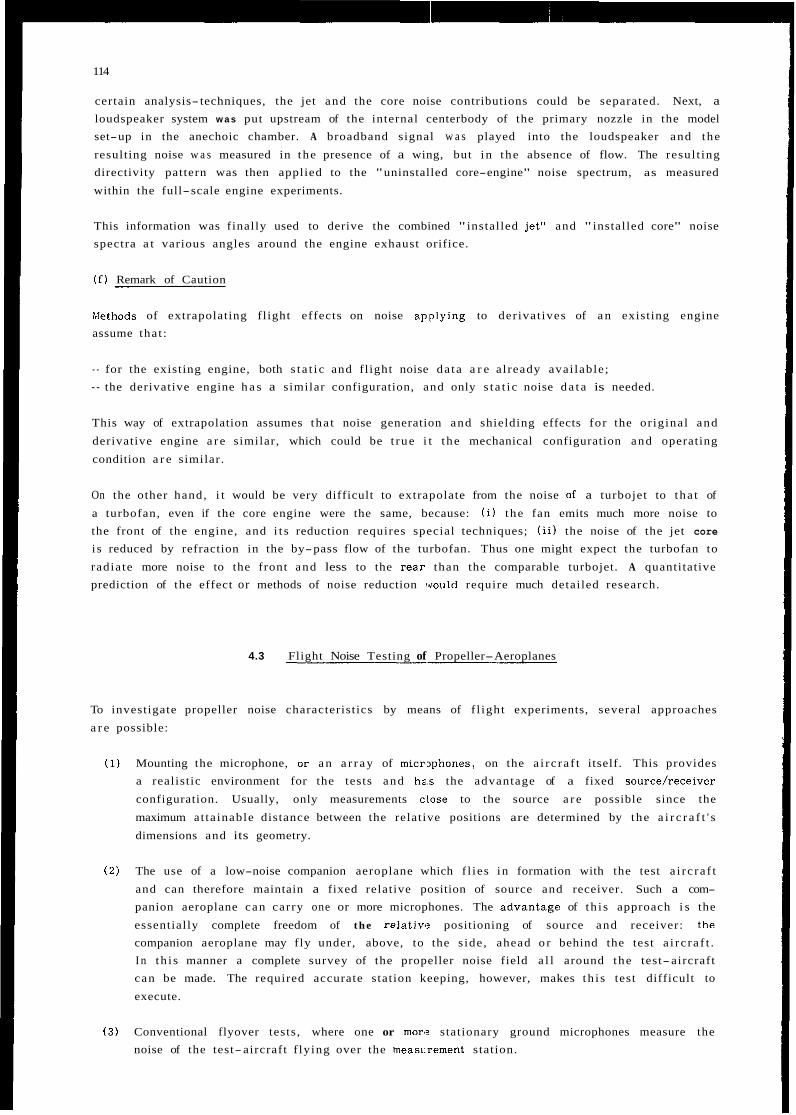
114
certain analysis- techniques, the jet and the core noise contributions could be separated. Next, a loudspeaker system w a s put upstream of the internal centerbody of the primary nozzle in the model set-up in the anechoic chamber. A broadband signal w a s played into the loudspeaker and the
resulting noise w a s measured in the presence of a wing, but in the absence of flow. The resul t ing directivity pattern was then applied to the "uninstalled core-engine" noise spectrum, as measured
within the full-scale engine experiments.
This information was finally used to derive the combined " installed jet" and " installed core" noise spectra a t various angles around the engine exhaust orifice.
( f ) Remark of Caution
Xethods of extrapolating fl ight effects on noise a,pplying to der ivat ives of a n existing engine assume that :
- for the existing engine, both s t a t i c and flight noise da ta a r e already avai lable; - the derivative engine h a s a similar configuration, and only s t a t i c noise d a t a is needed.
This way of extrapolation assumes tha t noise generation and shielding effects for the or iginal and
derivative engine a r e similar, which could be t rue i t the mechanical configuration and operating
condition a r e similar.
On the other hand, i t would be very difficult to extrapolate from the noise of a turbojet to tha t of
a turbofan, even if the core engine were the same, because: ( i ) the fan emits much more noise to the front of the engine, and i t s reduction requires special techniques; ( i i ) the noise of the jet core
i s reduced by refraction in the by-pass flow of the turbofan. Thus one might expect the turbofan to
radiate more noise to the front and less to the rea.r than the comparable turbojet. A quantitative prediction of the effect or methods of noise reduction !would require much detailed research.
4.3 Flight Noise Testing of Propeller-Aeroplanes
To investigate propeller noise characteristics by means of f l ight experiments, several approaches
a r e possible:
(1) Mounting the microphone, o r a n a r r a y of micmphones, on the a i rc ra f t itself. This provides a realistic environment for the tests and ha.s the advantage of a fixed source/receiver
configuration. Usually, only measurements close to the source a r e possible since the
maximum at ta inable distance between the relative positions are determined by the a i r c r a f t ' s
dimensions and its geometry.
( 2 ) The use of a low-noise companion aeroplane which f l ies in formation with the test a i rc ra f t
and can therefore maintain a fixed relative position of source and receiver. Such a com- panion aeroplane can carry one or more microphones. The advanta.ge of th i s approach i s the
essentially complete freedom of the reiativ,? positioning of source and receiver: t.he companion aeroplane may fly under, above, to the s ide , ahead o r behind the test a i r c ra f t . I n th i s manner a complete survey of the propeller noise field a l l around the test- aircraft can be made. The required accurate station keeping, however, makes th i s test difficult to
execute.
( 3 ) Conventional flyover tests, where one or mor'? stationary ground microphones measure the noise of the test- aircraft f lying over the measLrement station.
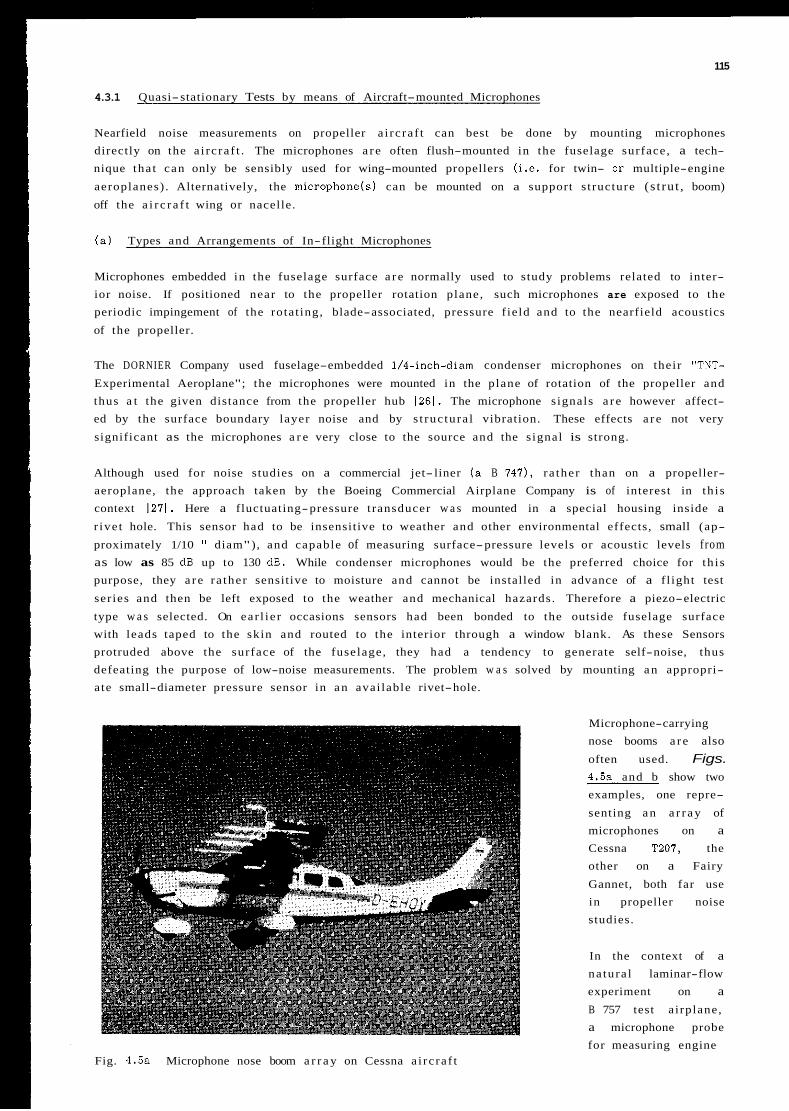
115
4.3.1 Quasi-stationary Tests by means of Aircraft-mounted Microphones
Nearfield noise measurements on propeller a i rc ra f t can best be done by mounting microphones directly on the a i rc ra f t . The microphones a r e often flush-mounted in the fuselage surface, a tech- nique tha t can only be sensibly used for wing-mounted propellers ( i .e . for twin- or multiple-engine
aeroplanes) . Alternatively, the microphone(s) can be mounted on a support s t ructure (s t rut , boom)
off the a i r c r a f t wing or nacelle.
( a ) Types and Arrangements of In-flight Microphones
Microphones embedded in the fuselage surface a r e normally used to study problems related to inter- ior noise. If positioned near to the propeller rotation plane, such microphones are exposed to the periodic impingement of the rotat ing, blade-associated, pressure f ield and to the nearfield acoustics
of the propeller.
The DORNIER Company used fuselage-embedded 1/4-inch-diam condenser microphones on their "TNT-
Experimental Aeroplane"; the microphones were mounted in the plane of rotation of the propeller and thus a t the given distance from the propeller hub 1261. The microphone s ignals a r e however affect- ed by the surface boundary layer noise and by s t ruc tura l vibration. These effects a r e not very
significant as the microphones a r e very close to the source and the s ignal is strong.
Although used for noise studies on a commercial jet- liner ( a B 747), ra ther than on a propeller- aeroplane, the approach taken by the Boeing Commercial Airplane Company is of interest in th i s context 1271. Here a fluctuating-pressure t ransducer w a s mounted in a special housing inside a r ive t hole. This sensor had to be insensitive to weather and other environmental effects, small (ap-
proximately 1/10 diam"), and capable of measuring surface-pressure levels or acoustic levels from as low as 85 dB up to 130 dB. While condenser microphones would be the preferred choice for th i s purpose, they a r e ra ther sensitive to moisture and cannot be installed in advance of a f l ight test
ser ies and then be left exposed to the weather and mechanical hazards. Therefore a piezo-electric
type w a s selected. On ear l ie r occasions sensors had been bonded to the outside fuselage surface with leads taped to the skin and routed to the interior through a window blank. As these Sensors protruded above the surface of the fuselage, they had a tendency to generate self-noise, thus defeating the purpose of low-noise measurements. The problem w a s solved by mounting a n appropri- ate small-diameter pressure sensor in a n avai lable rivet-hole.
Microphone-carrying nose booms a r e also often used. Figs. 4.5a and b show two examples, one repre-
senting a n a r r a y of microphones on a Cessna T207, the other on a Fairy
Gannet, both far use in propeller noise studies.
In the context of a na tura l laminar-flow experiment on a B 757 test a i rplane, a microphone probe for measuring engine
Fig. 4.5a Microphone nose boom a r r a y on Cessna a i rc ra f t
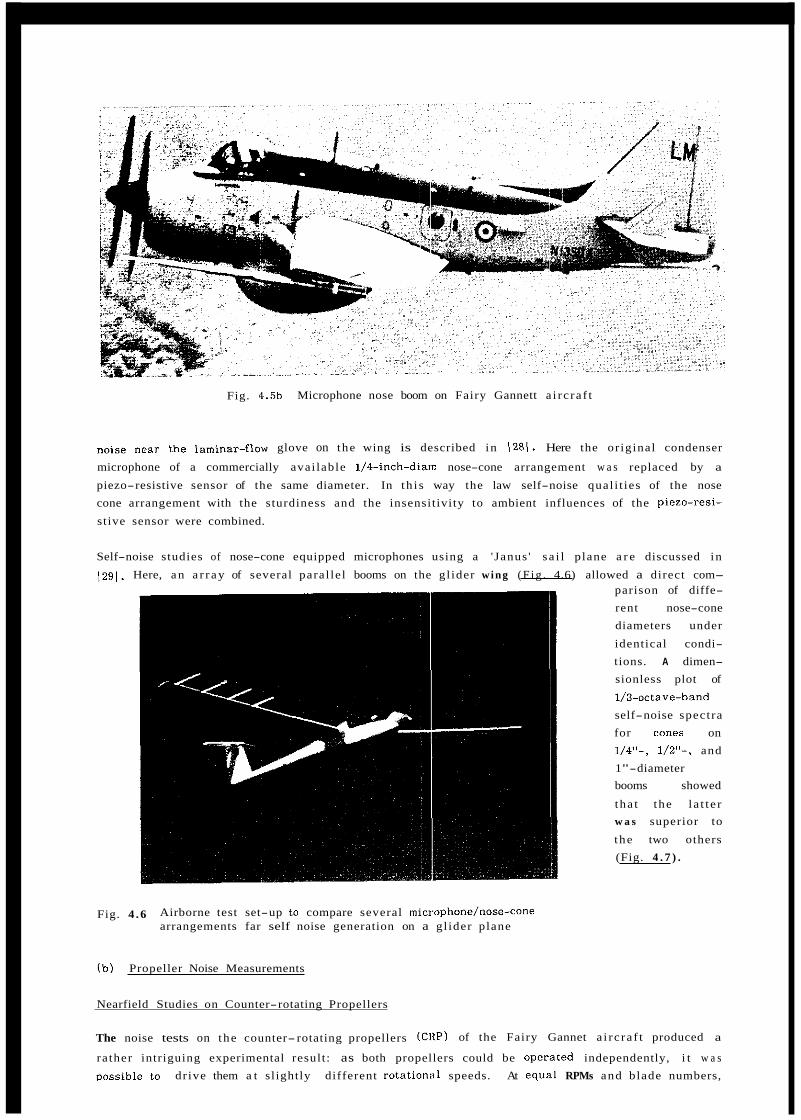
Fig. 4.5b Microphone nose boom on Fairy Gannett a i rc ra f t
noise near' the laminar-flow glove on the wing is described in \ 2 8 / . Here the or iginal condenser
microphone of a commercially avai lable 1/4-inch-diam nose-cone arrangement w a s replaced by a
piezo-resistive sensor of the same diameter. In th i s way the law self-noise qual i t ies of the nose cone arrangement with the sturdiness and the insensitivity to ambient influences of the piezo-resi-
st ive sensor were combined.
Self-noise studies of nose-cone equipped microphones using a ' Janus ' s a i l plane a r e discussed in
1291. Here, a n a r r a y of several paral le l booms on the gl ider wing ( F i g . 4.6) allowed a direct com- parison of diffe- rent nose-cone diameters under
identical condi- tions. A dimen- sionless plot of
1/3-octave-band self-noise spectra for cones on 1/4"-, 1/2"-, and 1"-diameter booms showed
tha t the l a t t e r w a s superior to
the two others (Fig. 4 . 7 ) .
Fig. 4 .6 Airborne test set-up to compare several microphone/nose-cone arrangements far self noise generation on a gl ider plane
(b ) Propeller Noise Measurements
Nearfield Studies on Counter-rotating Propellers
The noise tests on the counter- rotating propellers (CRP) of the Fairy Gannet a i rc ra f t produced a
rather intriguing experimental result: as both propellers could be operated independently, i t w a s oossible to dr ive them a t slightly different rotationnl speeds. At equa.1 RPMs and blade numbers,

117
:: 70
0 3 -. 3
0 rl
m 60
0
I * 50
a LC
1IL"
V2"
_..". - ..
... ......... . . ...... ... .... .... .... .... .\.. -- 1" /F-\ .....
/
I
\ \ \ \
Fig. 4.1
Comparison of norma- lized self-noise spectra of ogive-nose-cone equipped condenser microphones of different diameters
30 0.5 1 2 5 10 20 50 100 200 500
L STR G f - u
both the steady and the unsteady source effects would produce noise components at the blade passing frequency of one rotor and its harmonics, and no new frequencies a r e introduced by the
second propeller.
N
L'
m i E-%--
. .
Fig. 4 .8 Frequency spl i t t ing in the noise from a Hamilton Standard Gannet counter rotating propeller operating at slightly different RPMs (from Ref. 31)
Each propeller pro- duces, however, i t s own set of funda-
mental and har- monic frequencies due to the steady sources (thickness and hlade-load- i n g ) , which can be readi ly identified
on account of the slight difference in RPM (Fig. 4.8).
The obvious peak
in between, now, is due to unsteady aerodynamic inter-
action. These re- su l t s a r e theoreti-
explained cal ly and physically de- scribed in 130 and
311. The method provides a powerful diagnostic tool in CRP-noise research.
Another interesting test result of th i s experiment is shown in Fig. 4.9, providing the azimuthal
variat ion for the f i r s t four harmonics of the blade-passing frequency (BPF). This information w a s
obtained by very slowly incrementing the mesh-point around the propeller circumference and recard- ing harmonic sound pressure variat ions as function of time. Thus the pattern w a s moved pas t the
"stationary" microphone boom. (This resul t i l lustrates the importance of considering different
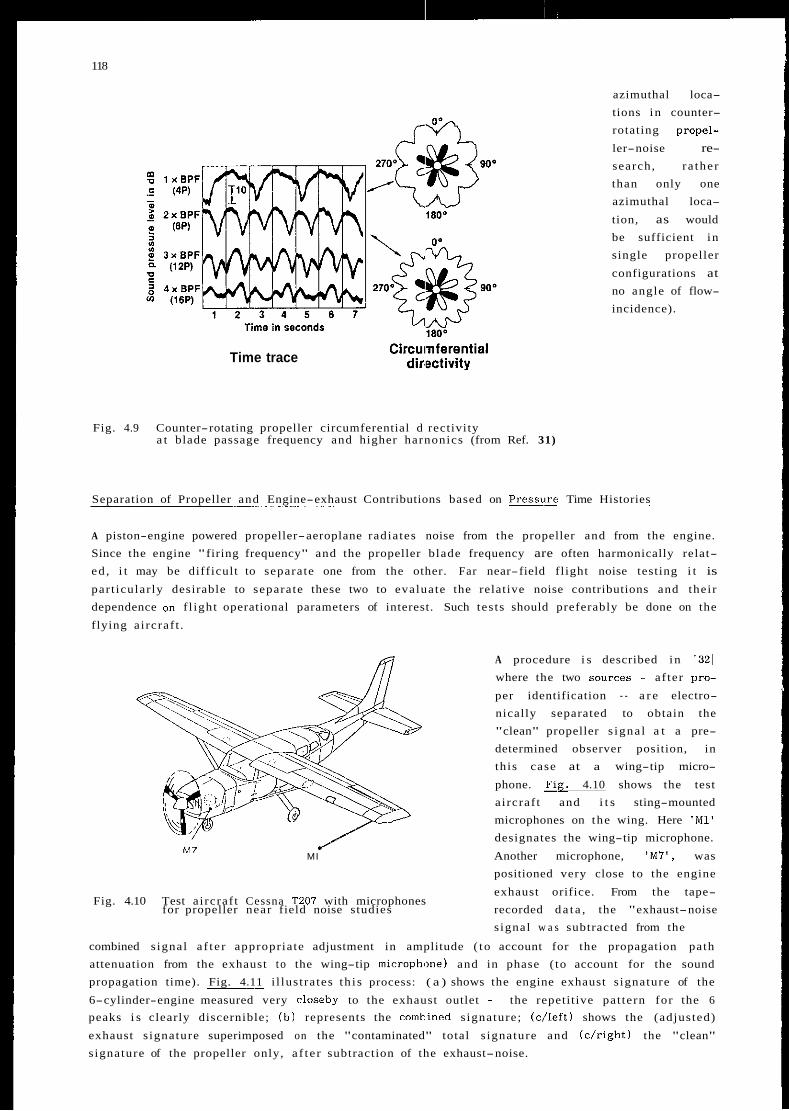
118
azimuthal loca- tions in counter- rotating prapel-
ler-noise re- search, ra ther than only one azimuthal loca-
tion, as would be sufficient in single propeller
configurations at no angle of flow- incidence).
Time trace Circuimferential dimctivity
Fig. 4.9 Counter-rotating propeller circumferential d rectivity a t blade passage frequency and higher harnonics (from Ref. 31)
Separation of Propeller and Engine-exhaust Contributions based on PressuLe Time Histories
A piston-engine powered propeller-aeroplane radiates noise from the propeller and from the engine. Since the engine "firing frequency" and the propeller blade frequency are often harmonically relat- ed , i t may be difficult to separate one from the other. Far near-field fl ight noise testing i t is
par t icular ly desirable to separate these two to evaluate the relative noise contributions and their dependence on f l ight operational parameters of interest. Such tes ts should preferably be done on the
flying a i rcraf t .
A procedure i s described in I321
where the two sources - af ter pra-
per identification - a r e electro- nically separated to obtain the "clean" propeller s igna l a t a pre- determined observer position, in th is case at a wing-tip micro-
phone. F i g . 4.10 shows the test a i rcraf t and i t s sting-mounted microphones on the wing. Here ' M l ' designates the wing-tip microphone.
MI Another microphone, 'M7', was positioned very close to the engine
exhaust orifice. From the tape- for propeller near field noise studies recorded d a t a , the "exhaust-noise
Fig. 4.10 Test a i rcraf t Cessna T201 with microphones
s ignal w a s subtracted from the
combined s ignal a f t e r appropriate adjustment in amplitude ( to account for the propagation path attenuation from the exhaust to the wing-tip microphcme) and in phase ( to account for the sound propagation time). Fig. 4.11 i l lus t ra tes th i s process: ( a ) shows the engine exhaust s ignature of the
6-cylinder-engine measured very closeby to the exhaust outlet - the repetit ive pat tern for the 6 peaks i s clearly discernible; (b) represents the comtined s ignature; ( d e f t ) shows the (adjusted)
exhaust s ignature superimposed on the "contaminated" total s ignature and (c/right) the "clean" signature of the propeller only, a f t e r subtraction of the exhaust-noise.
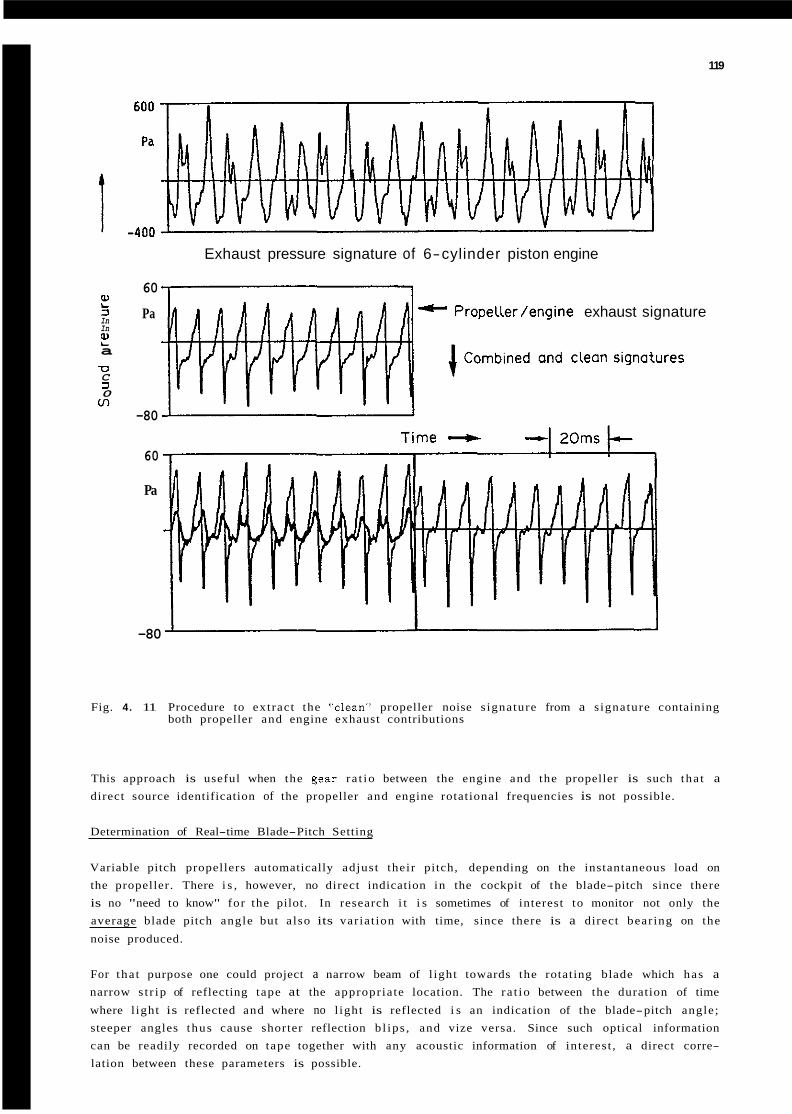
119
Exhaust pressure signature of 6-cylinder piston engine
60
2 Pa
a
- Propeller/engine exhaust signature Y
Y In In
n C 3 0 v,
-80
60
Pa
-80
Fig. 4. 11 Procedure to extract the "clean" propeller noise s ignature from a signature containing both propeller and engine exhaust contributions
This approach is useful when the $ear ra t io between the engine and the propeller is such tha t a direct source identification of the propeller and engine rotational frequencies is not possible.
Determination of Real-time Blade-Pitch Setting
Variable pitch propellers automatically adjust their pitch, depending on the instantaneous load on the propeller. There i s , however, no direct indication in the cockpit of the blade-pitch since there is no "need to know" for the pilot. In research i t i s sometimes of interest to monitor not only the average blade pitch angle but also its variat ion with time, since there is a direct bearing on the
noise produced.
For tha t purpose one could project a narrow beam of l ight towards the rotating blade which has a narrow s t r ip of reflecting tape at the appropriate location. The ra t io between the duration of time
where l ight is reflected and where no l ight is reflected i s an indication of the blade-pitch angle; steeper angles thus cause shorter reflection b l ips , and vize versa. Since such optical information can be readily recorded on tape together with any acoustic information of interest , a direct corre- lation between these parameters is possible.
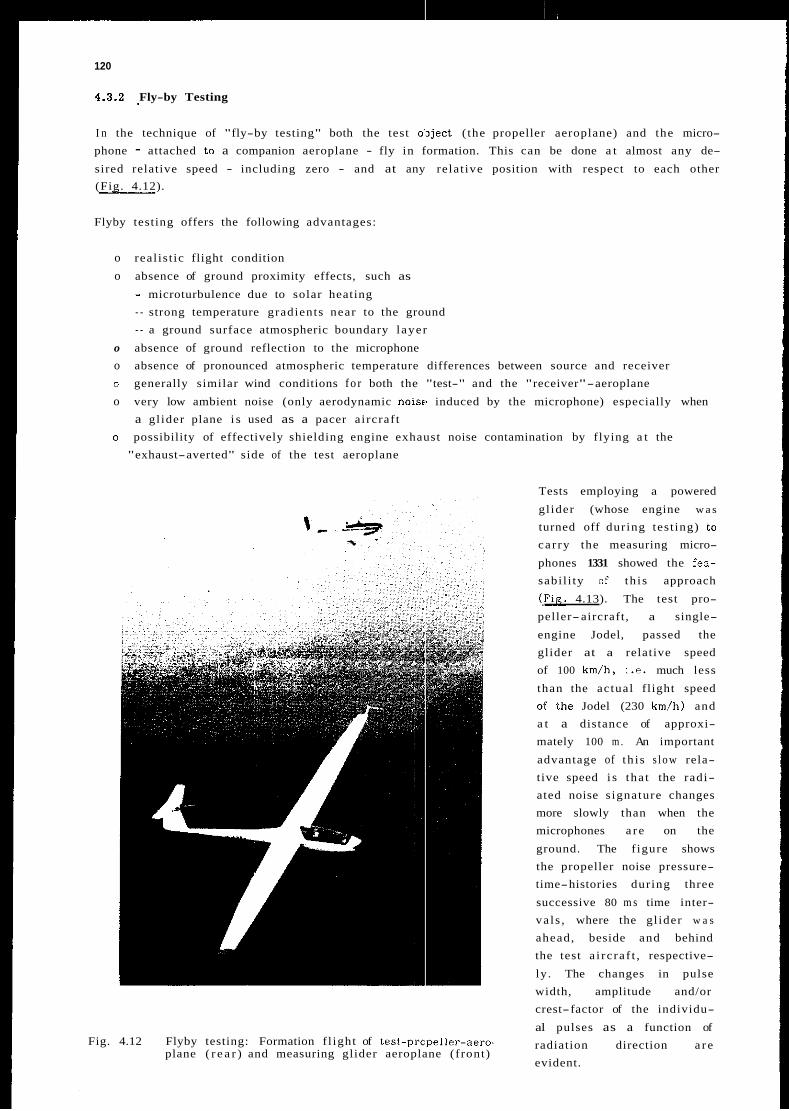
120
4.3.2 Fly-by Testing
I n the technique of "fly-by testing" both the test oJject ( the propeller aeroplane) and the micro- phone - attached to a companion aeroplane - fly in formation. This can be done a t almost any de-
sired relative speed - including zero - and at any relat ive position with respect to each other (Fig. 4.12).
Flyby testing offers the following advantages:
o real is t ic flight condition
o absence of ground proximity effects, such as
- microturbulence due to solar heating - strong temperature gradients near to the ground - a ground surface atmospheric boundary layer
o absence of ground reflection to the microphone o absence of pronounced atmospheric temperature differences between source and receiver o generally similar wind conditions fo r both the "test-" and the "receiver"-aeroplane
o very low ambient noise (only aerodynamic noisri induced by the microphone) especially when a gl ider plane i s used as a pacer aircraf t
o possibility of effectively shielding engine exhaust noise contamination by flying a t the "exhaust-averted" side of the test aeroplane
Fig. 4.12 Flyby testing: Formation f l ight of test-prcpeller-aera- plane ( r e a r ) and measuring glider aeroplane (front)
Tests employing a powered
gl ider (whose engine w a s
turned off during test ing) to car ry the measuring micro-
phones 1331 showed the fea- sabi l i ty of th i s approach
(Fig. 4.13). The test pro- peller- aircraft, a single-
engine Jodel, passed the glider at a relative speed of 100 km/h, i.e. much less
than the actual flight speed of the Jodel (230 km/h) and a t a distance of approxi- mately 100 m . An important
advantage of th i s s l ow rela- tive speed i s tha t the radi- ated noise s ignature changes more slowly than when the microphones a r e on the
ground. The f igure shows the propeller noise pressure- time-histories during three
successive 80 m s time inter- va ls , where the gl ider w a s
ahead, beside and behind the test a i rc ra f t , respective-
ly. The changes in pulse width, amplitude and/or crest-factor of the individu-
al pulses as a function of radiation direction a r e evident.
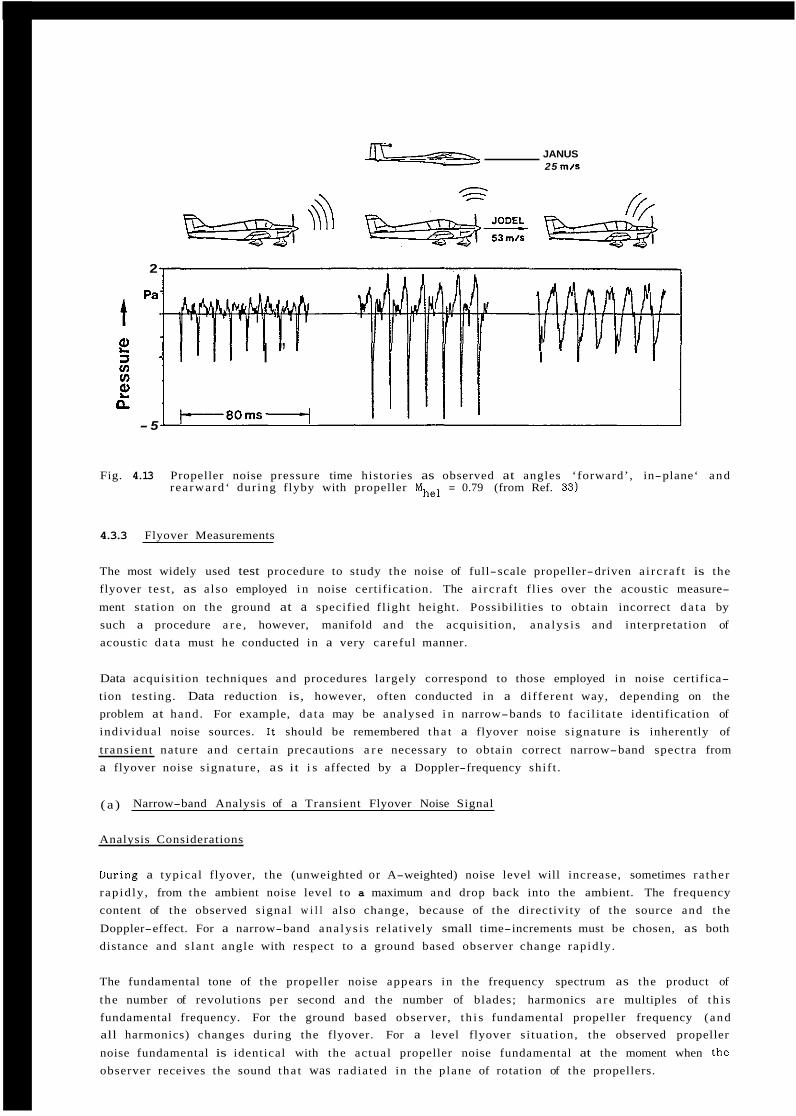
JANUS 25 m/s
2
t Pa
- 1 ’ 1 1 ’ I ” I I 2
2
z v) v)
R + 8 8 0 m s l
- 5
Fig. 4.13 Propeller noise pressure time histories as observed at angles ‘forward’, in-plane‘ and rearward‘ during flyby with propeller Mhel = 0.79 (from Ref. 33)
4.3.3 Flyover Measurements
The most widely used test procedure to study the noise of full-scale propeller-driven a i rc ra f t is the flyover tes t , as also employed i n noise certification. The a i rc ra f t f l ies over the acoustic measure-
ment station on the ground at a specified f l ight height. Possibilit ies to obtain incorrect d a t a by such a procedure a r e , however, manifold and the acquisition, ana lys i s and interpretation of acoustic d a t a must he conducted in a very careful manner.
Data acquisition techniques and procedures largely correspond to those employed in noise certifica- tion testing. Data reduction is, however, often conducted in a different way, depending on the problem at hand. For example, da ta may be analysed i n narrow-bands to faci l i ta te identification of individual noise sources. I t should be remembered t ha t a flyover noise s ignature is inherently of
t ransient nature and certain precautions a r e necessary to obtain correct narrow-band spectra from a flyover noise s ignature, as it i s affected by a Doppler-frequency shif t .
( a ) Narrow-band Analysis of a Transient Flyover Noise Signal
Analysis Considerations
Uuring a typical flyover, the (unweighted or A-weighted) noise level will increase, sometimes ra ther rap id ly , from the ambient noise level to a maximum and drop back into the ambient. The frequency content of the observed s ignal w i l l also change, because of the directivity of the source and the
Doppler-effect. For a narrow-band ana lys i s relatively small time-increments must be chosen, as both distance and s lan t angle with respect to a ground based observer change rapidly.
The fundamental tone of the propeller noise appears in the frequency spectrum as the product of
the number of revolutions per second and the number of blades; harmonics a r e multiples of t h i s fundamental frequency. For the ground based observer, t h i s fundamental propeller frequency (and all harmonics) changes during the flyover. For a level flyover s i tuat ion, the observed propeller
noise fundamental is identical with the actual propeller noise fundamental at the moment when the observer receives the sound tha t was radiated in the plane of rotation of the propellers.
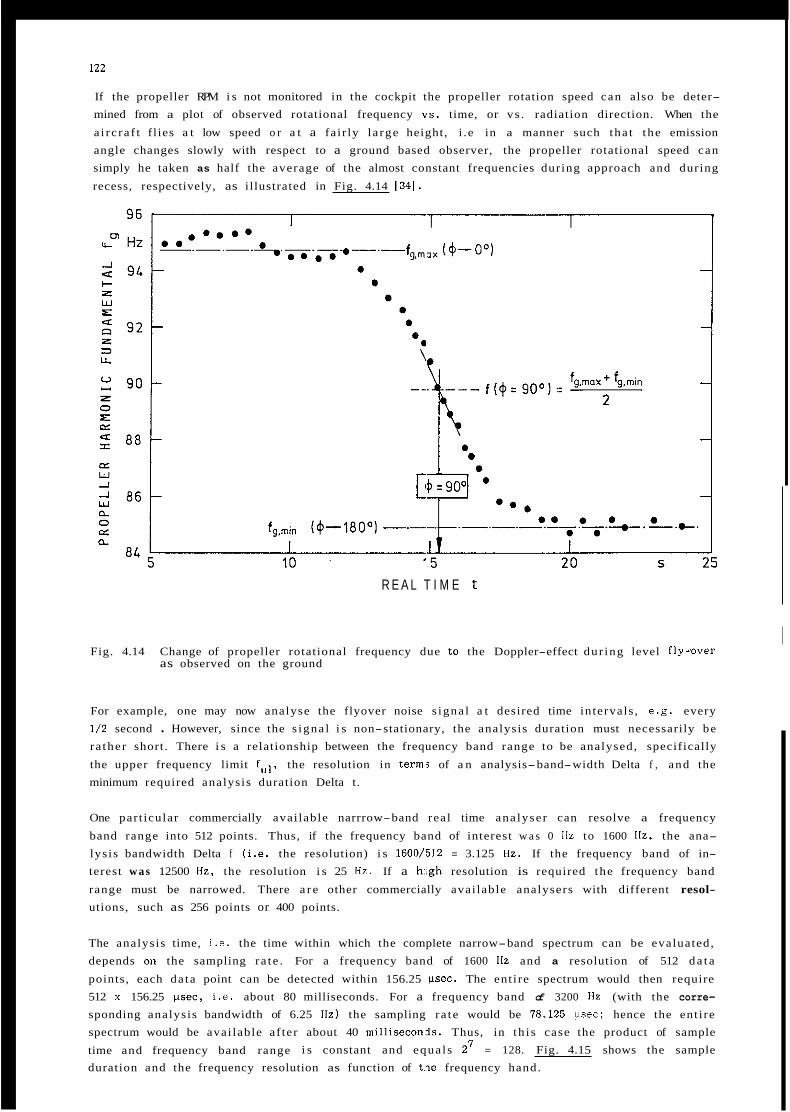
I??
If the propeller RPM i s not monitored in the cockpit the propeller rotation speed can also be deter- mined from a plot of observed rotational frequency YS. time, or vs . radiation direction. When the
a i rc ra f t f l ies a t low speed o r a t a fa i r ly l a rge height, i .e in a manner such tha t the emission angle changes slowly with respect to a ground based observer, the propeller rotational speed can simply he taken as half the average of the almost constant frequencies during approach and during
recess, respectively, as il lustrated in Fig. 4.14 1341.
R E A L T I M E t
Fig. 4.14 Change of propeller rotational frequency due to the Doppler-effect dur ing level fly-,over as observed on the ground
For example, one may now analyse the flyover noise s igna l a t desired time intervals , e.g. every 1/2 second . However, since the s igna l i s non-stationary, the analysis duration must necessarily be ra ther short. There i s a relationship between the frequency band range to be analysed, specifically
the upper frequency limit f u l , the resolution in term,: of a n analysis-band-width Delta f , and the minimum required analysis duration Delta t.
One par t icular commercially avai lable narrrow-band real time ana lyser can resolve a frequency
band range into 512 points. Thus, if the frequency band of interest w a s 0 Hz to 1600 H z , the ana- lysis bandwidth Delta f ( i .e. the resolution) i s 1600/512 = 3.125 Hz. If the frequency band of in- terest w a s 12500 Hz, the resolution i s 25 Hz. If a htgh resolution is required the frequency band
range must be narrowed. There a r e other commercially avai lable analysers with different resol- utions, such as 256 points or 400 points.
The analysis time, i .e. the time within which the complete narrow-band spectrum can be evaluated, depends on the sampling ra te . For a frequency band of 1600 Hz and a resolution of 512 d a t a
points, each da ta point can be detected within 156.25 usec. The ent i re spectrum would then require 512 x 156.25 usec, i .e. about 80 milliseconds. For a frequency band of 3200 Hz (with the corre- sponding analysis bandwidth of 6.25 Hz) the sampling ra te would be 78,125 usec; hence the ent i re spectrum would be avai lable af ter about 40 milliseconjs. Thus, in th i s case the product of sample
time and frequency band range Fig. 4.15 shows the sample duration and the frequency resolution as function of t x frequency hand.
i s constant and equa ls Z7 = 128.
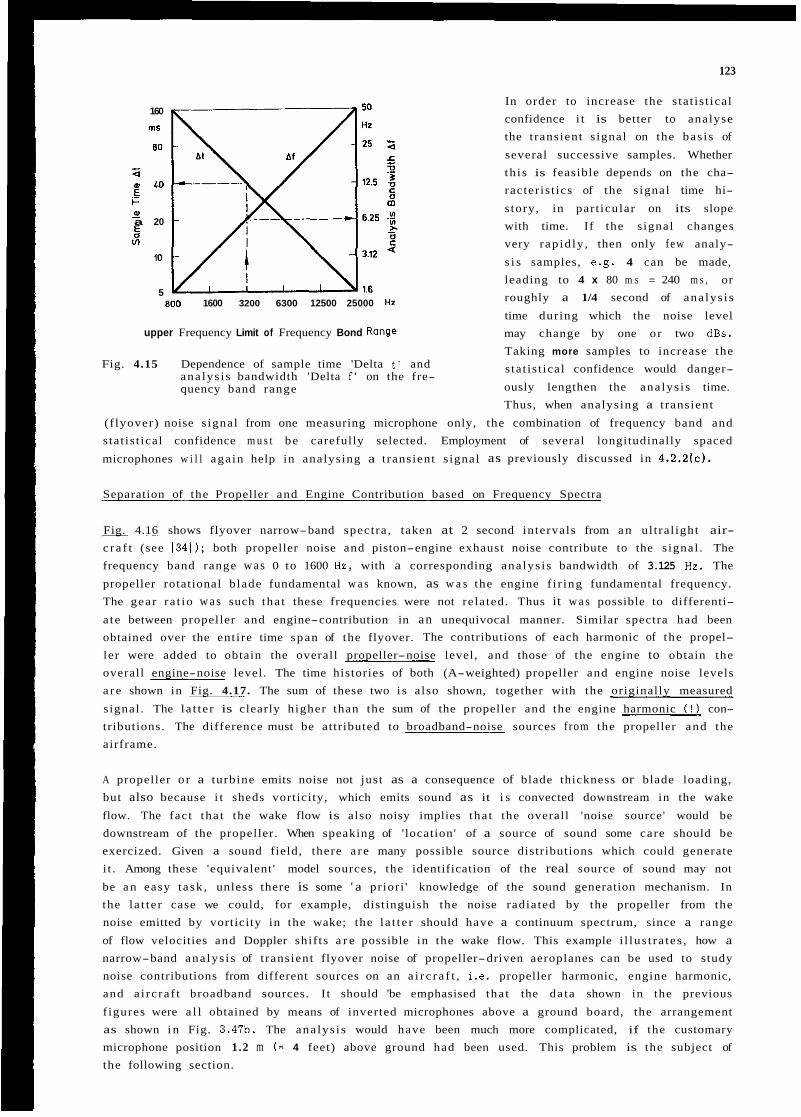
123
In order to increase the s tat is t ical confidence i t is better to analyse the t ransient s ignal on the bas i s of
several successive samples. Whether th i s is feasible depends on the cha- racter is t ics of the s ignal time hi-
story, in part icular on its slope with time. If the s ignal changes very rap id ly , then only few analy-
s i s samples, e.g. 4 can be made, leading to 4 x 80 m s = 240 m s , or roughly a 1/4 second of ana lys i s
time during which the noise level may change by one or two dBs. Taking more samples to increase the s tat is t ical confidence would danger-
ously lengthen the ana lys i s time. Thus, when analysing a t ransient
160
m5
80
z
F
a 20
LO E
5 0 - VI
10
5 800 1600 3200 6300 12500 25000 HZ
upper Frequency Limit of Frequency Bond Range
Fig. 4.15 Dependence of sample time 'Delta t ' and ana lys i s bandwidth 'Delta f ' on the fre- quency band range
(f lyover) noise s ignal from one measuring microphone only, the combination of frequency band and stat is t ical confidence m u s t be carefully selected. Employment of several longitudinally spaced
microphones w i l l aga in help in analysing a transient s ignal as previously discussed in 4.2.2tc).
Separation of the Propeller and Engine Contribution based on Frequency Spectra
Fig. 4.16 shows flyover narrow-band spectra , taken at 2 second intervals from a n ul t ral ight air- c r a f t (see 1341); both propeller noise and piston-engine exhaust noise contribute to the s ignal . The frequency band range w a s 0 to 1600 Hz, with a corresponding ana lys i s bandwidth of 3.125 Hz. The
propeller rotational blade fundamental w a s known, as w a s the engine f i r ing fundamental frequency. The gear ra t io w a s such tha t these frequencies were not related. Thus it w a s possible to differenti-
a te between propeller and engine-contribution in an unequivocal manner. Similar spectra had been obtained over the ent i re time span of the flyover. The contributions of each harmonic of the propel-
ler were added to obtain the overall propeller-noise level, and those of the engine to obtain the overall engine-noise level. The time histories of both (A-weighted) propeller and engine noise levels a r e shown in Fig. 4.17. The sum of these two i s a lso shown, together with the originally measured
s ignal . The la t te r is clearly higher than the sum of the propeller and the engine harmonic ( ! ) con- tributions. The difference must be attributed to broadband-noise sources f rom the propeller and the airframe.
A propeller o r a turbine emits noise not jus t as a consequence of blade thickness or blade loading, but also because i t sheds vorticity, which emits sound as it i s convected downstream in the wake
flow. The fact tha t the wake flow is also noisy implies tha t the overall 'noise source' would be downstream of the propeller. When speaking of ' location' of a source of sound some care should be exercized. Given a sound field, there a r e many possible source distributions which could generate i t . Among these 'equivalent ' model sources, the identification of the real source of sound may not
be a n easy task , unless there is some ' a prior i ' knowledge of the sound generation mechanism. In the la t te r case we could, for example, distinguish the noise radiated by the propeller from the noise emitted by vorticity in the wake; the la t te r should have a continuum spectrum, since a range
of flow velocities and Doppler shif ts a r e possible in the wake flow. This example i l lus t ra tes , how a narrow-band ana lys i s of t ransient flyover noise of propeller-driven aeroplanes can be used to study noise contributions from different sources on an a i r c r a f t , i.e. propeller harmonic, engine harmonic, and a i rc ra f t broadband sources. I t should 'be emphasised tha t the da ta shown in the previous
f igures were a l l obtained by means of inverted microphones above a ground board, the arrangement as shown i n Fig. 3.47b. The ana lys i s would have been much more complicated, if the customary microphone position 1.2 m (= 4 feet) above ground had been used. This problem is the subject of the following section.
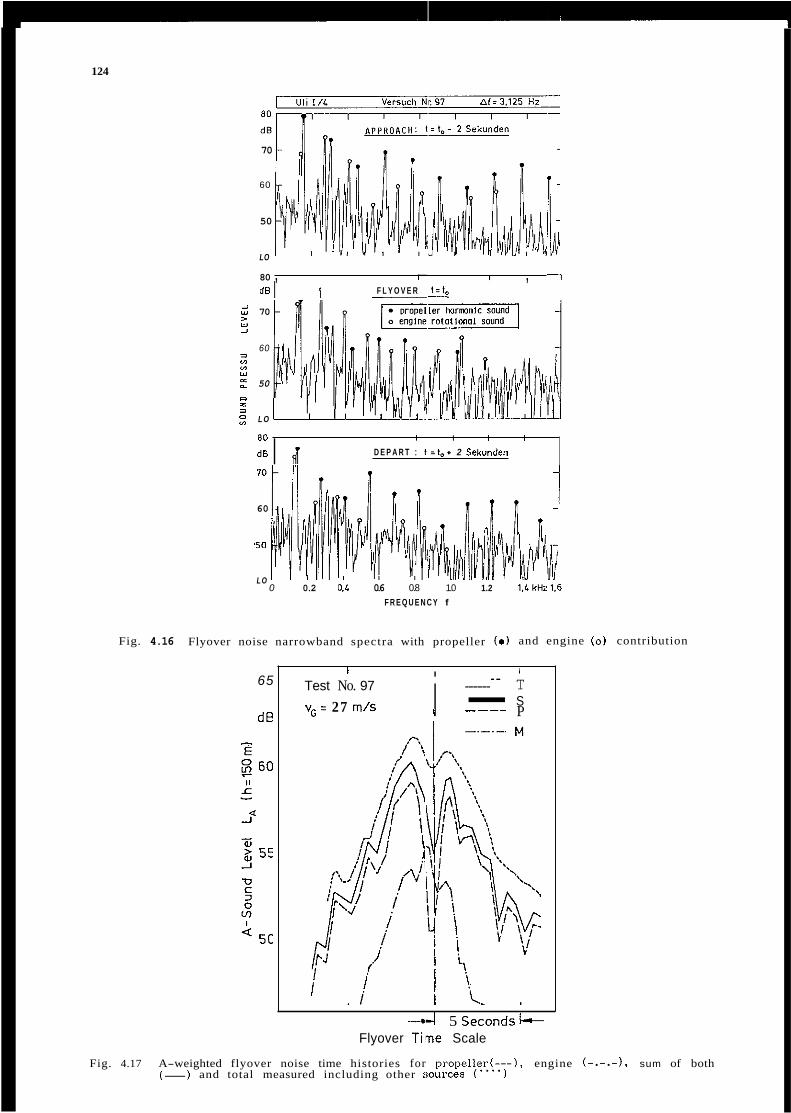
124
70
60
50
LO
80 , r I , -1 dB F L Y O V E R "1.
i
> Y i
Y 70
60 x Vl Vl Y
2 50
:: L O
n r =
a0 I I I I
D E P A R T : I = I . + 2 Sekunden dB I d
60
'50
L O 0 0.2 0.L 0.6 0.8 1.0 1.2 1.LkHi1.6
F R E Q U E N C Y f
Fig. 4.16 Flyover noise narrowband spectra with propeller ( a ) and engine ( 0 ) contribution
65 I I
T S
______-- Test No. 97
vG = 27 m/s i - I ---- P
-- 5 S e c o n d s 6 Flyover Time Scale
Fig. 4.17 A-weighted flyover noise time histories for propeller(---), engine (-.-.-), sum of both (-) and total measured including other !iourceS ( " " )
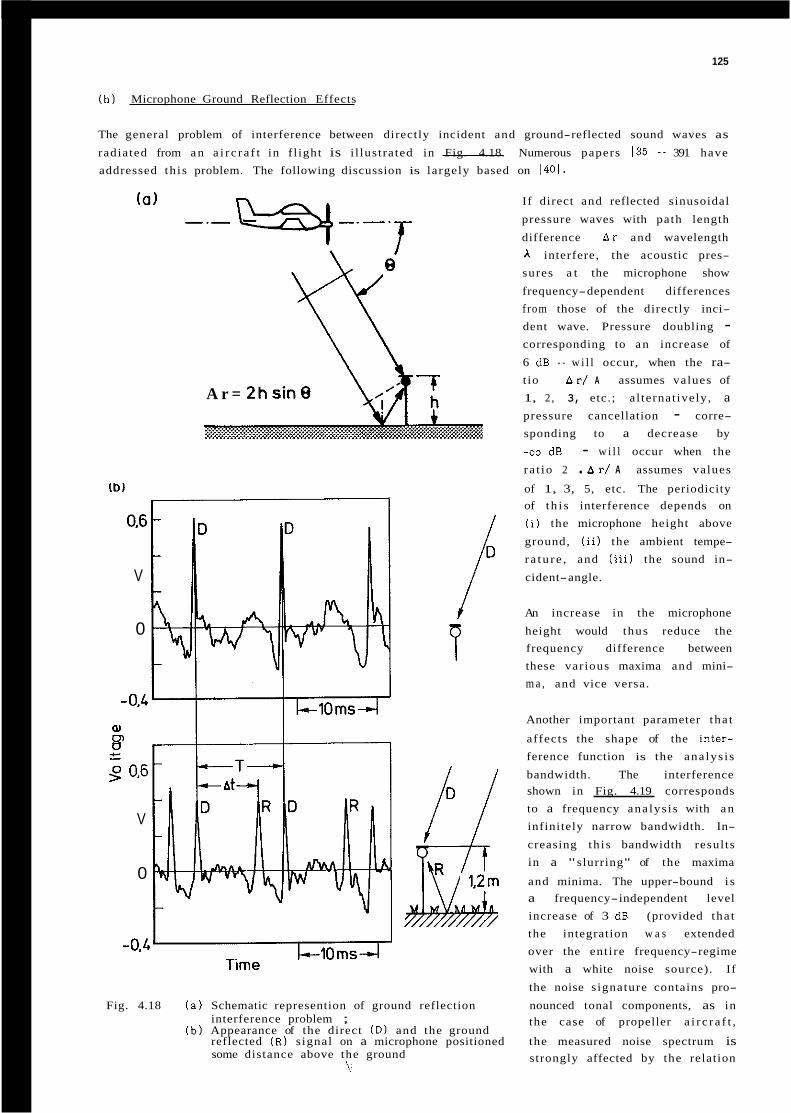
125
( b ) Microphone Ground Reflection Effects
The general problem of interference between directly incident and ground-reflected sound waves as radiated from a n a i r c r a f t in f l ight is i l lustrated in Fig. 4.18. Numerous papers 135 - 391 have addressed th i s problem. The following discussion is largely based on 1401.
(a) If direct and reflected sinusoidal
pressure waves with path length
difference A r and wavelength h interfere, the acoustic pres- sures a t the microphone show
frequency-dependent differences f rom those of the directly inci- dent wave. Pressure doubling - corresponding to a n increase of
6 dB - w i l l occur, when the ra- t io A r / A assumes values of 1, 2, 3, etc.; a l ternat ively, a A r = 2hsin8 pressure cancellation - corre- sponding to a decrease by
-00 dB - w i l l occur when the
ra t io 2 . A r / A assumes values
m) of 1, 3, 5, etc. The periodicity of t h i s interference depends on ( i ) the microphone height above
ground, ( i i) the ambient tempe- ra tu r e , and (iii) the sound in-
cident-angle.
An increase in the microphone
frequency difference between these various maxima and mini- m a , and vice versa.
height would thus reduce the
0.6
V
i? 0
-0.4 Another important parameter tha t
0) 0 affects the shape of the inter- 0 c ference function is the ana lys i s
3 0.6 bandwidth. The interference shown in Fig. 4.19 corresponds to a frequency ana lys i s with a n infinitely narrow bandwidth. In-
creasing th i s bandwidth resul ts in a "slurring" of the maxima
1,2m and minima. The upper-bound i s a frequency-independent level increase of 3 dB (provided tha t the integration w a s extended over the ent i re frequency-regime with a white noise source). If
the noise s ignature contains pro-
Fig. 4.18 ( a ) Schematic represention of ground reflection nounced tonal components, as in interference problem ; the case of propeller a i r c r a f t ,
reflected (R) signal on a microphone positioned the measured noise spectrum is some distance above the ground strongly affected by the relation
V
0
-0.L
( b ) Appearance of the direct (D) and the ground
\,:
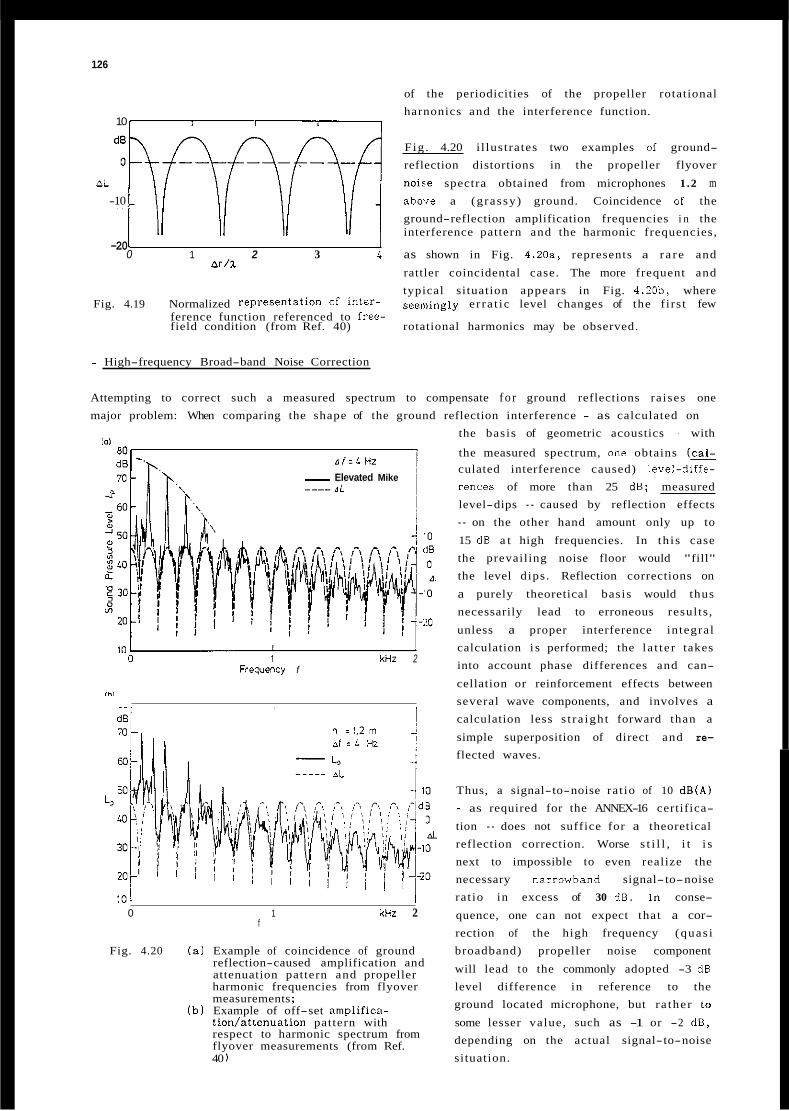
126
of the periodicities of the propeller rotational harnonics and the interference function.
10
Fig . 4.20 i l lustrates two examples of ground- reflection distortions in the propeller flyover
AL noi5,e spectra obtained from microphones 1.2 m -10 aboie a (grassy) ground. Coincidence of the
ground-reflection amplification frequencies i n the I ll II \I \I 1 interference pattern and the harmonic frequencies,
0 1 2 3 L as shown in Fig. 4.20a, represents a r a r e and
rattler coincidental case. The more frequent and typical situation appears in Fig. 4.20b, where
Fig. 4.19 Normalized representation Of inter- seemingly e r ra t ic level changes of the f i rs t few ference function referenced to free- field condition (from Ref. 40) rotational harmonics may be observed.
-20 nr/x
- High-frequency Broad-band Noise Correction
Attempting to correct such a measured spectrum to compensate f o r ground reflections raises one major problem: When comparing the shape of the ground reflection interference - as calculated on
- Elevated Mike
0 1 kHZ 2 Frequeocy f
,h/
101 I 0 1 kHz 2
f
Fig. 4.20 ( a ) Example of coincidence of ground reflection-caused amplification and attenuation pattern and propeller harmonic frequencies from flyover measurements ;
( b ) Example of off-set amplifica- tion/attenuation pattern with respect to harmonic spectrum from flyover measurements (from Ref. 40 )
the basis of geometric acoustics - with
the measured spectrum, one obtains (+
culated interference caused) level-diffe- rences of more than 25 dB; measured level-dips - caused by reflection effects - on the other hand amount only up to
15 dB a t high frequencies. In th i s case the prevailing noise floor would "fill"
the level dips. Reflection corrections on
a purely theoretical basis would thus necessarily lead to erroneous resul ts ,
unless a proper interference integral calculation i s performed; the la t te r takes into account phase differences and can-
cellation or reinforcement effects between several wave components, and involves a calculation less s t ra igh t forward than a
simple superposition of direct and re-
flected waves.
Thus, a signal-to-noise rat io of 10 dB(A) - as required for the ANNEX-16 certifica-
tion - does not suffice for a theoretical reflection correction. Worse s t i l l , i t i s next to impossible to even realize the necessary na.rrowband signal-to-noise rat io in excess of 30 dB. In conse-
quence, one can not expect that a cor- rection of the high frequency (quas i broadband) propeller noise component
will lead to the commonly adopted -3 dB level difference in reference to the ground located microphone, but ra ther to
some lesser value, such as -1 or -2 d B , depending on the actual signal-to-noise situation.
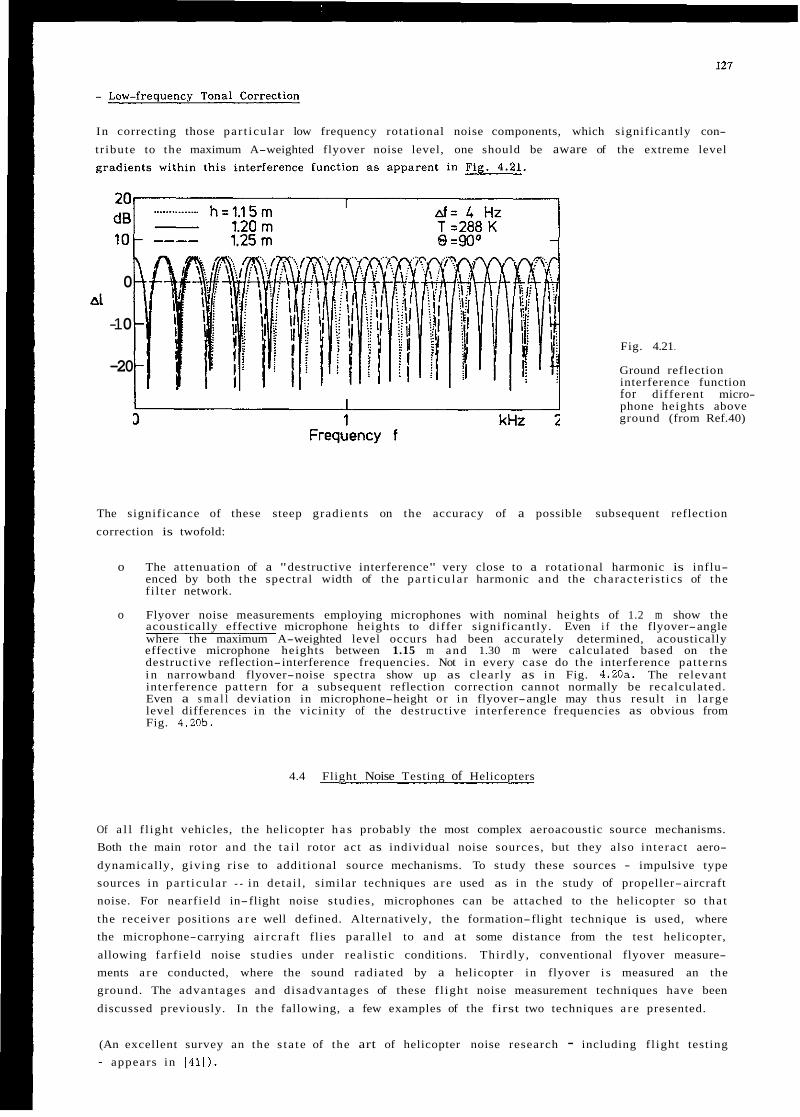
In correcting those par t icu la r low frequency rotational noise components, which significantly con-
tr ibute to the maximum A-weighted flyover noise level, one should be aware of the extreme level
0
-1 0
-20 Fig. 4.21
Ground reflection interference function for different micro- phone heights above ground (from Ref.40)
The significance of these steep gradients on the accuracy of a possible subsequent reflection
correction is twofold:
o The attenuation of a "destructive interference" very close to a rotational harmonic is influ- enced by both the spectral width of the par t icu la r harmonic and the character is t ics of the f i l ter network.
o Flyover noise measurements employing microphones with nominal heights of 1.2 m show the acoustically effective microphone heights to differ significantly. Even i f the flyover-angle where the maximum A-weighted level occurs had been accurately determined, acoustically effective microphone heights between 1.15 m and 1.30 m were calculated based on the destructive reflection-interference frequencies. Not in every case do the interference pat terns i n narrowband flyover-noise spectra show up as clear ly as in Fig. 4.20a. The relevant interference pat tern for a subsequent reflection correction cannot normally be recalculated. Even a s m a l l deviation in microphone-height or in flyover-angle may thus result in l a rge level differences in the vicinity of the destructive interference frequencies as obvious from Fig. 4.20b.
4.4 Flight Noise Testing of Helicopters
Of a l l f l ight vehicles, the helicopter h a s probably the most complex aeroacoustic source mechanisms. Both the main rotor and the t a i l rotor act as individual noise sources, but they also interact aero-
dynamically, giving r ise to additional source mechanisms. To study these sources - impulsive type sources in par t icu la r - in detai l , similar techniques a r e used as in the study of propeller-aircraft noise. For nearfield in-flight noise s tudies , microphones can be attached to the helicopter so tha t
the receiver positions a r e well defined. Alternatively, the formation-flight technique is used, where the microphone-carrying a i rc ra f t flies paral lel to and at some distance from the test helicopter,
allowing farf ield noise s tudies under real is t ic conditions. Thirdly, conventional flyover measure- ments a r e conducted, where the sound radiated by a helicopter in flyover i s measured an the ground. The advantages and disadvantages of these f l ight noise measurement techniques have been
discussed previously. In the fallowing, a few examples of the first two techniques a r e presented.
(An excellent survey an the s ta te of the art of helicopter noise research - including f l ight testing - appears in 1411).
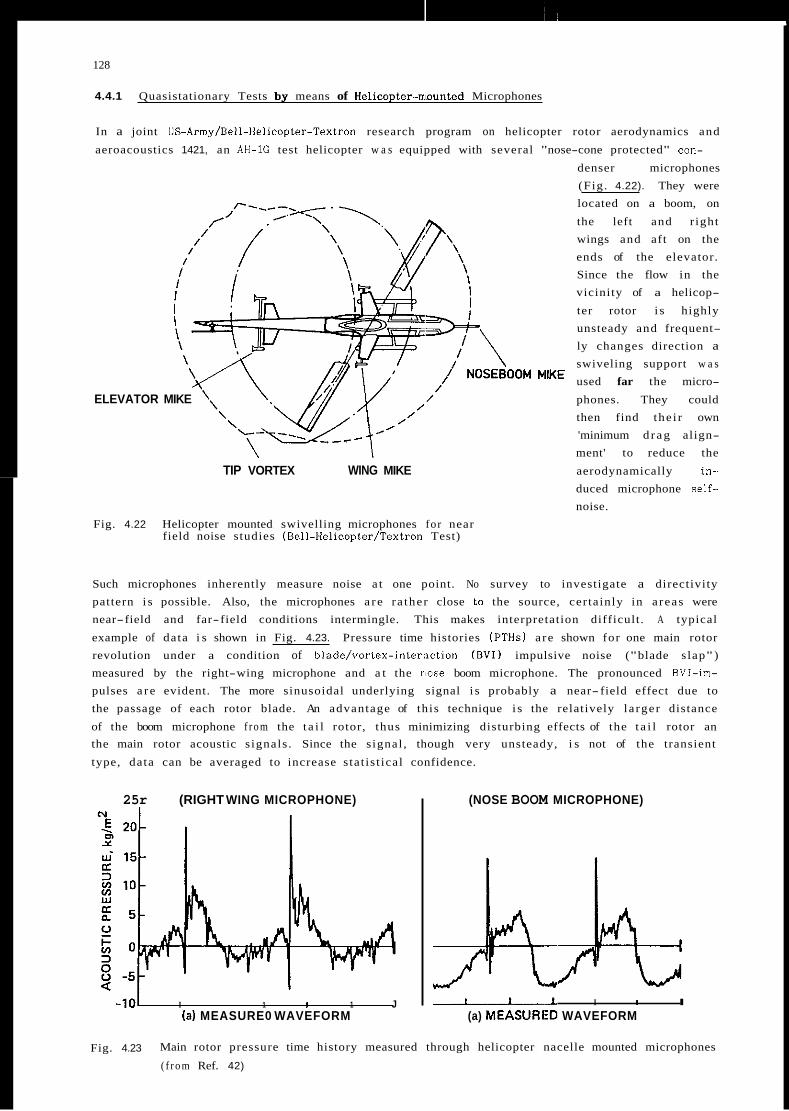
128
4.4.1 Quasistationary Tests by means of Helicopter-ntounted Microphones
In a joint US-Army/Bell-Helicopter-Textron research program on helicopter rotor aerodynamics and
aeroacoustics 1421, an AH-1G test helicopter w a s equipped with several "nose-cone protected" con-
denser microphones (Fig. 4.22). They were located on a boom, on
the left and r ight wings and aft on the ends of the elevator. Since the flow in the vicinity of a helicop-
ter rotor i s highly unsteady and frequent- ly changes direction a swiveling support w a s
'OM ''IKE used far the micro-
ELEVATOR MIKE phones. They could then find the i r own 'minimum d r a g align- ment' to reduce the
TIP VORTEX WING MIKE aerodynamically in- duced microphone self- noise.
Fig. 4.22 Helicopter mounted swivelling microphones for near field noise studies (Bell-Helicopter/Textron Test)
Such microphones inherently measure noise a t one point. No survey to investigate a directivity pattern i s possible. Also, the microphones a r e ra ther close to the source, cer tainly in a reas were near-field and far-field conditions intermingle. This makes interpretation difficult. A typical
example of data i s shown in Fig. 4.23. Pressure time histories (PTHs) a re shown for one main rotor revolution under a condition of blade/vortex-intenction (BVI) impulsive noise ("blade s lap" ) measured by the right-wing microphone and a t the rlose boom microphone. The pronounced BVI-im- pulses a r e evident. The more sinusoidal underlying signal i s probably a near-field effect due to the passage of each rotor blade. An advantage of this technique i s the relatively la rger distance
of the boom microphone f r o m the t a i l rotor, thus minimizing disturbing effects of the t a i l rotor an the main rotor acoustic s ignals . Since the s ignal , though very unsteady, i s not of the transient
type, data can be averaged to increase s tat is t ical confidence.
25r (RIGHT WING MICROPHONE)
-101 I 1 I 1 J (a) MEASURE0 WAVEFORM
(NOSE BOOM MICROPHONE)
-1 I I I
(a) MEASURliD WAVEFORM
Fig. 4.23 Main rotor pressure time history measured through helicopter nacelle mounted microphones
( f r o m Ref. 42)
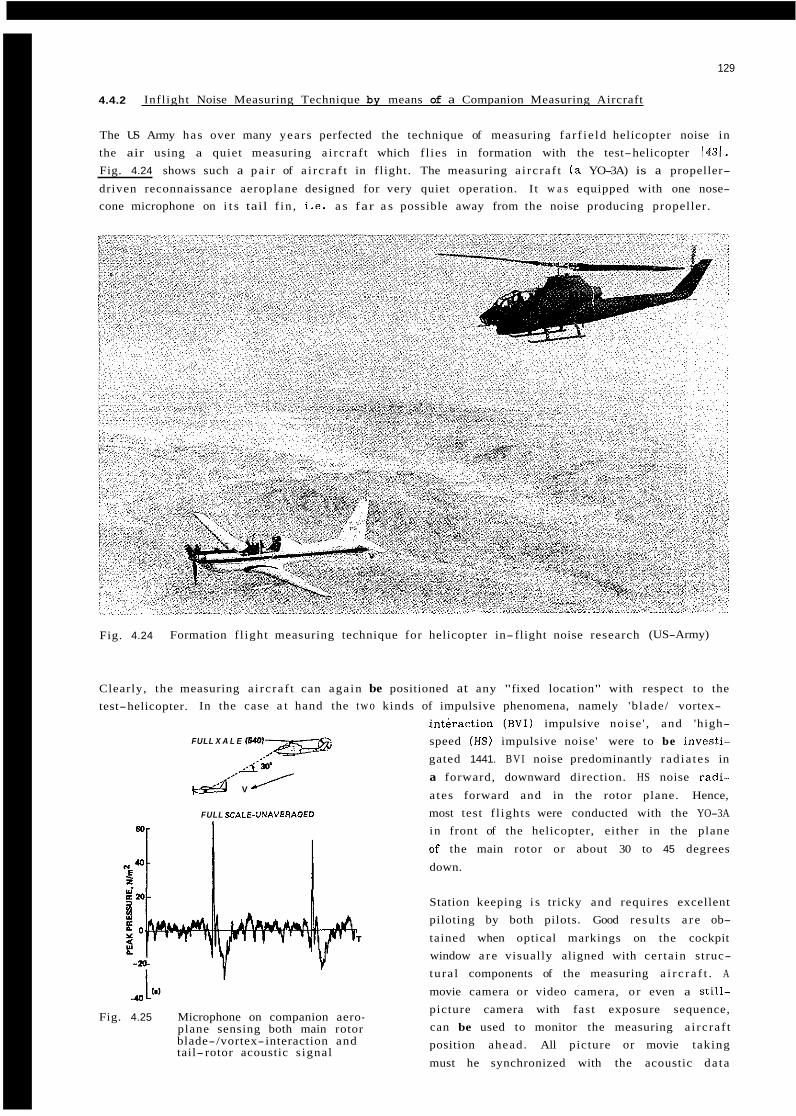
129
4.4.2 Inflight Noise Measuring Technique by means of a Companion Measuring Aircraft
The US Army has over many years perfected the technique of measuring fa r f ie ld helicopter noise in the air using a quiet measuring a i rc ra f t which f l ies in formation with the test-helicopter 1431.
Fig. 4.24 shows such a pa i r of a i rc ra f t in flight. The measuring a i rc ra f t ( a YO-3A) is a propeller-
driven reconnaissance aeroplane designed for very quiet operation. I t w a s equipped with one nose- cone microphone on i t s tail f in , i . e . a s far a s possible away from the noise producing propeller.
Fig. 4.24 Formation f l ight measuring technique for helicopter in-flight noise research (US-Army)
Clearly, the measuring a i rc ra f t can aga in be positioned at any "fixed location" with respect to the test-helicopter. In the case a t hand the two kinds of impulsive phenomena, namely 'blade/ vortex-
int i ract ion ( B V I ) impulsive noise ' , and 'high- speed (HS) impulsive noise' were to be investi- gated 1441. BVI noise predominantly rad ia tes in
a forward, downward direction. HS noise radi-
a tes forward and in the rotor plane. Hence,
FULL X A L E l S u ) I &
,_,' A ' W
V
FULL XALE-VNAVERAQED
I
Fig. 4.25 Microphone on companion aero- plane sensing both main rotor blade-/vortex-interaction and tail- rotor acoustic s ignal
most test f l ights were conducted with the YO-3A
in front of the helicopter, either in the plane
of the main rotor or about 30 to 45 degrees
down.
Station keeping i s tricky and requires excellent piloting by both pilots. Good resul ts a r e ob- tained when optical markings on the cockpit window a r e visually aligned with cer tain struc- tura l components of the measuring a i r c r a f t . A
movie camera or video camera, o r even a still- picture camera with fast exposure sequence, can be used to monitor the measuring a i rc ra f t position ahead. All picture or movie taking
must he synchronized with the acoustic da ta
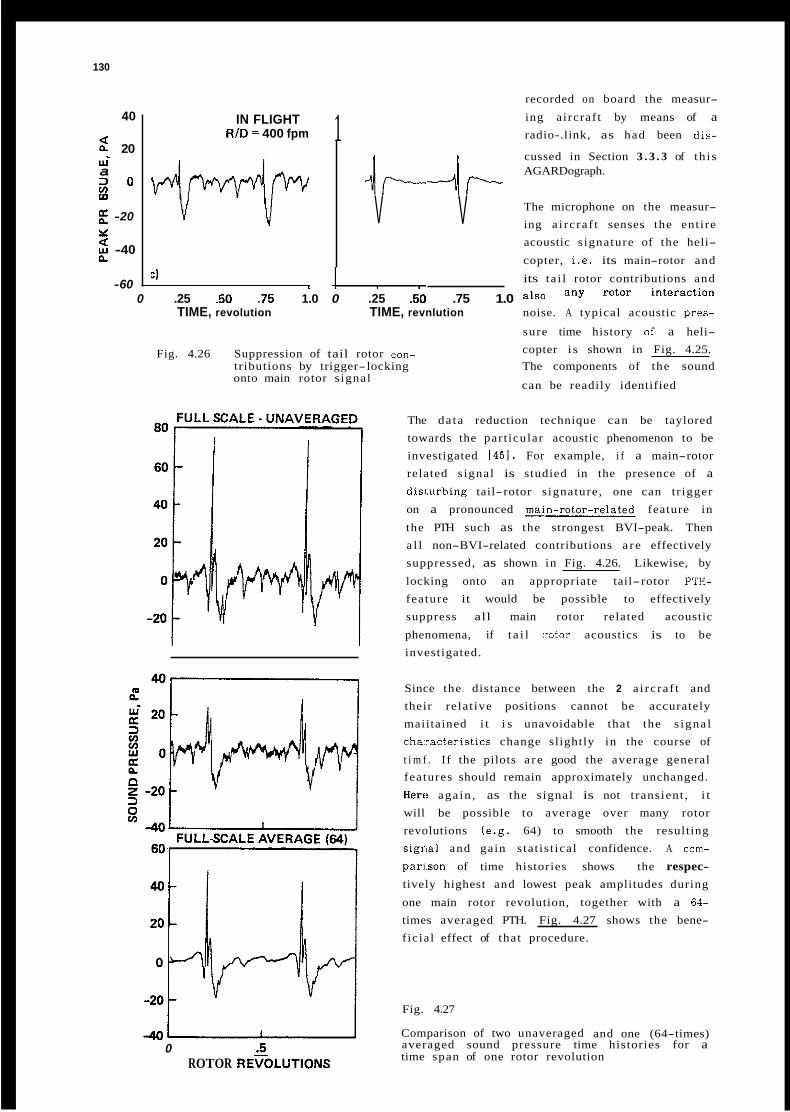
130
recorded on board the measur-
ing aircraf t by means of a radio-.link, as had been dis-
4 I cussed in Section 3 . 3 . 3 of th i s
40
2 20 w' a
i o w
-20 Y
$ -40 n.
-60
1 IN FLIGHT RID = 400 fpm
AGARDograph. 4--4,- V The microphone on the measur-
ing a i rc ra f t senses the ent i re V acoustic s ignature of the heli-
copter, i .e . its main-rotor and
its ta i l rotor contributions and any rotor interaction
TIME, revolution TIME, revnlution noise. A typical acoustic pres-
sure time history of a heli- copter i s shown in Fig. 4.25.
tributions by trigger-locking The components of the sound onto main rotor s ignal
C)
0 .25 5 0 .75 1.0 0 .25 .50 .75 1.0
Fig. 4.26 Suppression of tail rotor can-
can be readily identified
The da ta reduction technique can be taylored towards the part icular acoustic phenomenon to be investigated 1451. For example, i f a main-rotor related s ignal is studied in the presence of a dis1:urbing tail-rotor s ignature, one can t r igger on a pronounced z n - r o t o r - r e l a t e d feature in
the PTH such as the strongest BVI-peak. Then a l l non-BVI-related contributions a r e effectively suppressed, as shown in Fig. 4.26. Likewise, by
locking onto an appropriate tail- rotor PTH- feature it would be possible to effectively suppress all main rotor related acoustic
phenomena, if t a i l itotor acoustics is to be investigated.
Since the distance between the 2 a i rc ra f t and their relat ive positions cannot be accurately maiitained i t i s unavoidable that the s igna l cha::acteristics change slightly in the course of
t i m f . If the pilots a r e good the average general features should remain approximately unchanged.
Here aga in , as the s ignal is not t ransient , i t will be possible to average over many rotor revolutions (e.g. 64) to smooth the resulting sigr,al and gain s tat is t ical confidence. A com-
p a r k o n of time histories shows the respec- tively highest and lowest peak amplitudes during
one main rotor revolution, together with a 64- times averaged PTH. Fig. 4.27 shows the bene- ficial effect of that procedure.
0 .5 ROTOR REVOLUTIONS
Fig. 4.27
Comparison of two unaveraged and one (64-times) averaged sound pressure time histories for a time span of one rotor revolution
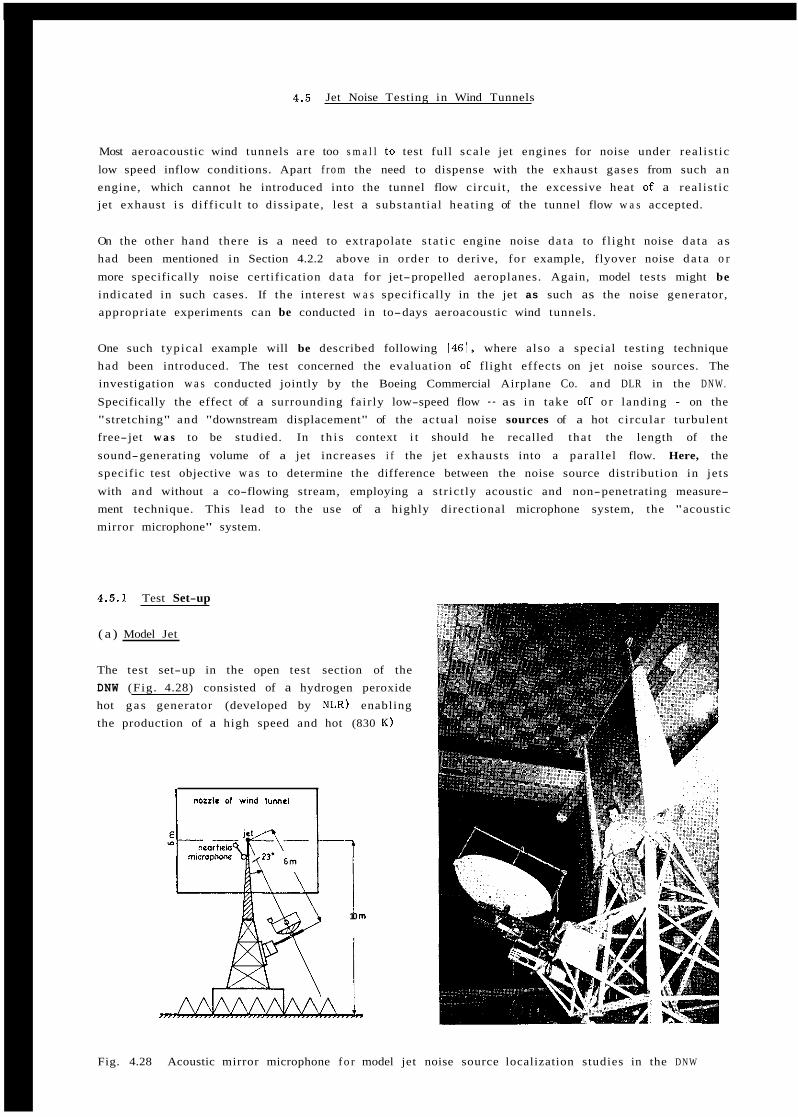
4.5 Jet Noise Testing in Wind Tunnels
Most aeroacoustic wind tunnels a r e too s m a l l to test full scale jet engines for noise under real is t ic
low speed inflow conditions. Apart f r o m the need to dispense with the exhaust gases from such a n engine, which cannot he introduced into the tunnel flow circui t , the excessive heat of a real is t ic jet exhaust i s diff icul t to dissipate , lest a substant ial heat ing of the tunnel flow w a s accepted.
On the other hand there is a need to extrapolate s ta t ic engine noise da ta to f l ight noise da ta as
had been mentioned in Section 4.2.2 above in order to derive, for example, flyover noise d a t a o r more specifically noise certification da ta for jet-propelled aeroplanes. Again, model tests might be
indicated in such cases. If the interest w a s specifically in the jet as such as the noise generator, appropriate experiments can be conducted in to-days aeroacoustic wind tunnels.
One such typical example will be described following 1461, where also a special testing technique had been introduced. The test concerned the evaluation of flight effects on jet noise sources. The investigation w a s conducted jointly by the Boeing Commercial Airplane Co. and DLR in the D N W .
Specifically the effect of a surrounding fair ly low-speed flow - as in take off o r landing - on the "stretching" and "downstream displacement" of the actual noise sources of a hot circular turbulent free-jet w a s to be studied. In t h i s context i t should he recalled tha t the length of the
sound-generating volume of a jet increases i f the jet exhausts into a paral lel flow. Here, the specific test objective w a s to determine the difference between the noise source distribution in jets
with and without a co-flowing stream, employing a s t r ic t ly acoustic and non-penetrating measure- ment technique. This lead to the use of a highly directional microphone system, the "acoustic mirror microphone" system.
4.5.1 Test Set-up
( a ) Model Jet
The test set-up in the open test section of the DNW (Fig. 4.28) consisted of a hydrogen peroxide hot g a s generator (developed by NLR) enabling the production of a high speed and hot (830 K )
\ 10 m
Fig. 4.28 Acoustic mirror microphone f o r model jet noise source localization studies in the DNW
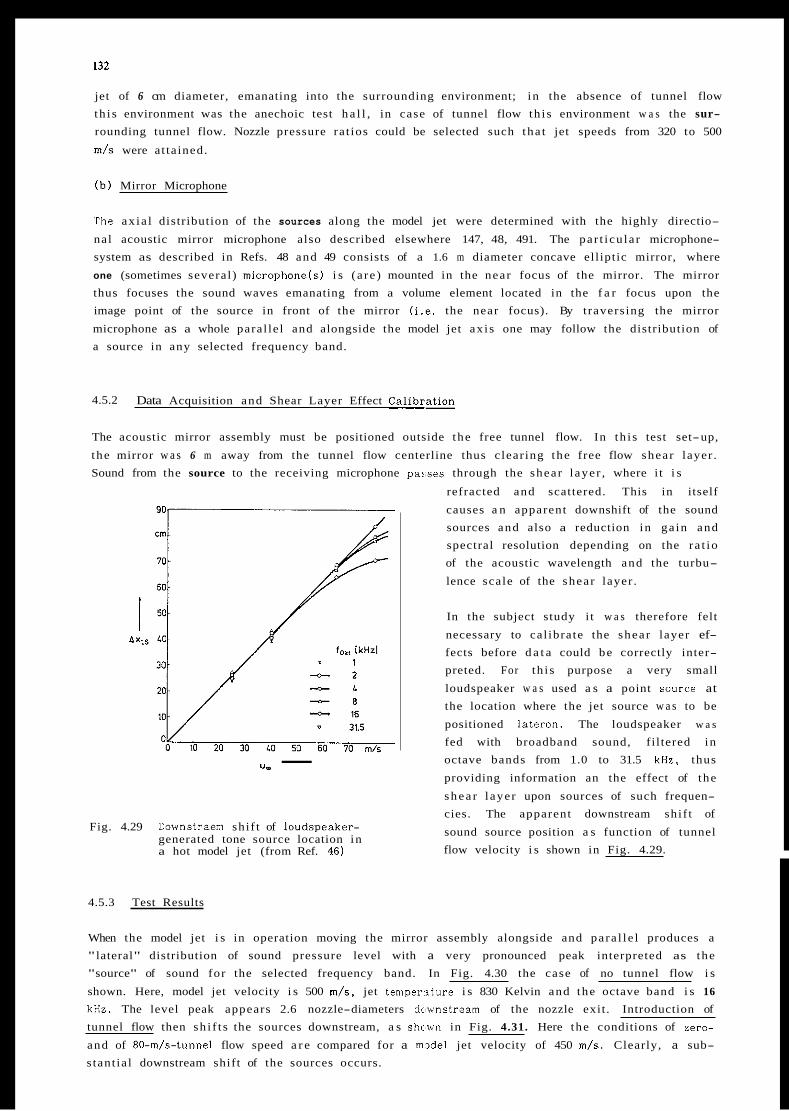
132
jet of 6 cm diameter, emanating into the surrounding environment; in the absence of tunnel flow th i s environment was the anechoic test h a l l , in case of tunnel flow th i s environment w a s the sur- rounding tunnel flow. Nozzle pressure ra t ios could be selected such tha t jet speeds from 320 to 500
m/s were a t ta ined.
( b ) Mirror Microphone
The ax ia l distribution of the sources along the model jet were determined with the highly directio-
nal acoustic mirror microphone also described elsewhere 147, 48, 491. The par t i cu la r microphone- system as described in Refs. 48 and 49 consists of a 1.6 m diameter concave ell iptic mirror, where
one (sometimes several) microphone(s) i s ( a re ) mounted in the near focus of the mirror. The mirror thus focuses the sound waves emanating from a volume element located in the f a r focus upon the image point of the source in front of the mirror (i .e. the near focus). By t raversing the mirror
microphone as a whole paral le l and alongside the model jet ax i s one may follow the distribution of a source in any selected frequency band.
4.5.2 Data Acquisition and Shear Layer Effect Calibration
The acoustic mirror assembly must be positioned outside the free tunnel flow. In th i s test set-up,
the mirror w a s 6 m away from the tunnel flow centerline thus clear ing the free flow shear layer . Sound from the source to the receiving microphone par,ses through the shear l ayer , where i t i s
refracted and scattered. This in itself
causes a n apparent downshift of the sound sources and also a reduction in ga in and spectral resolution depending on the ra t io of the acoustic wavelength and the turbu-
lence scale of the shear layer .
"., -
Fig. 4.29 Downstraem shif t of loudspeaker- generated tone source location in a hot model jet (from Ref. 46)
In the subject study i t w a s therefore felt
necessary to cal ibrate the shear layer ef- fects before d a t a could be correctly inter- preted. For th i s purpose a very small
loudspeaker w a s used a s a point source at the location where the jet source w a s to be
positioned lateron. The loudspeaker w a s
fed with broadband sound, fi l tered in octave bands from 1.0 to 31.5 kHz, thus
providing information an the effect of the
s h e a r l ayer upon sources of such frequen- cies. The apparent downstream shif t of
sound source position a s function of tunnel flow velocity i s shown in Fig. 4.29.
4.5.3 Test Results
When the model jet i s in operation moving the mirror assembly alongside and para l l e l produces a "lateral" distribution of sound pressure level with a very pronounced peak interpreted as the "source" of sound for the selected frequency band. In Fig. 4.30 the case of no tunnel flow i s
shown. Here, model jet velocity i s 500 m/s, jet t empenture i s 830 Kelvin and the octave band i s 16
kHz. The level peak appears 2.6 nozzle-diameters dwnst ream of the nozzle exit . Introduction of tunnel flow then sh i f t s the sources downstream, a s shc'wn in Fig. 4.31. Here the conditions of zero-
and of 80-m/s-tunnel flow speed a r e compared for a m d e l jet velocity of 450 m/s . Clearly, a sub- stant ia l downstream shift of the sources occurs.
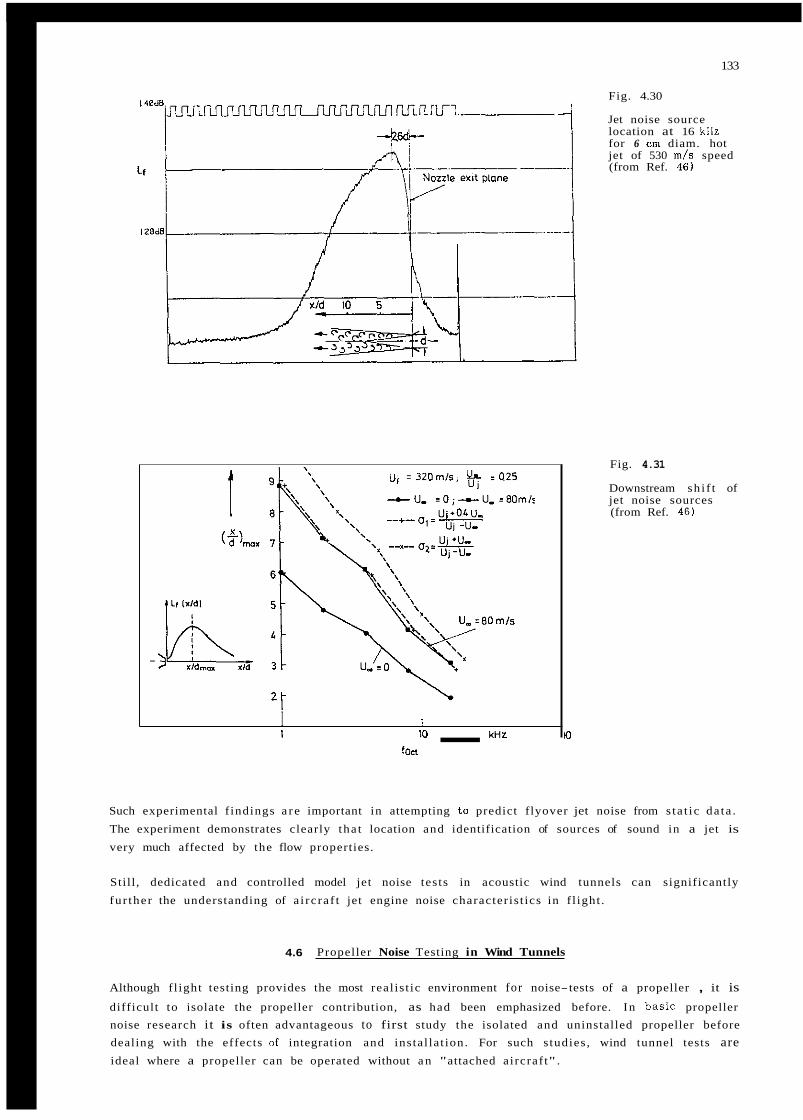
133
u, = 320m/s, & ~ 0 . 2 5
2 -
I I 1 10 kHZ
fon -
Fig. 4.30
Jet noise source location at 16 kHz for 6 cm diam. hot jet of 530 m / s speed (from Ref. 4 6 )
Fig. 4.31
Downstream sh i f t of jet noise sources (from Ref. 46)
H I
Such experimental f indings a r e important in attempting to predict flyover jet noise from s ta t ic da ta .
The experiment demonstrates clearly tha t location and identification of sources of sound in a jet is
very much affected by the flow properties.
Still , dedicated and controlled model jet noise tests in acoustic wind tunnels can significantly
fur ther the understanding of a i rc ra f t jet engine noise character is t ics in f l ight .
4.6 Propeller Noise Testing in Wind Tunnels
Although f l ight testing provides the most real is t ic environment for noise-tests of a propeller , it is difficult to isolate the propeller contribution, as had been emphasized before. In basic propeller noise research it is often advantageous to first study the isolated and uninstalled propeller before dealing with the effects of integration and instal la t ion. For such s tudies , wind tunnel tests are ideal where a propeller can be operated without a n "attached aircraf t" .
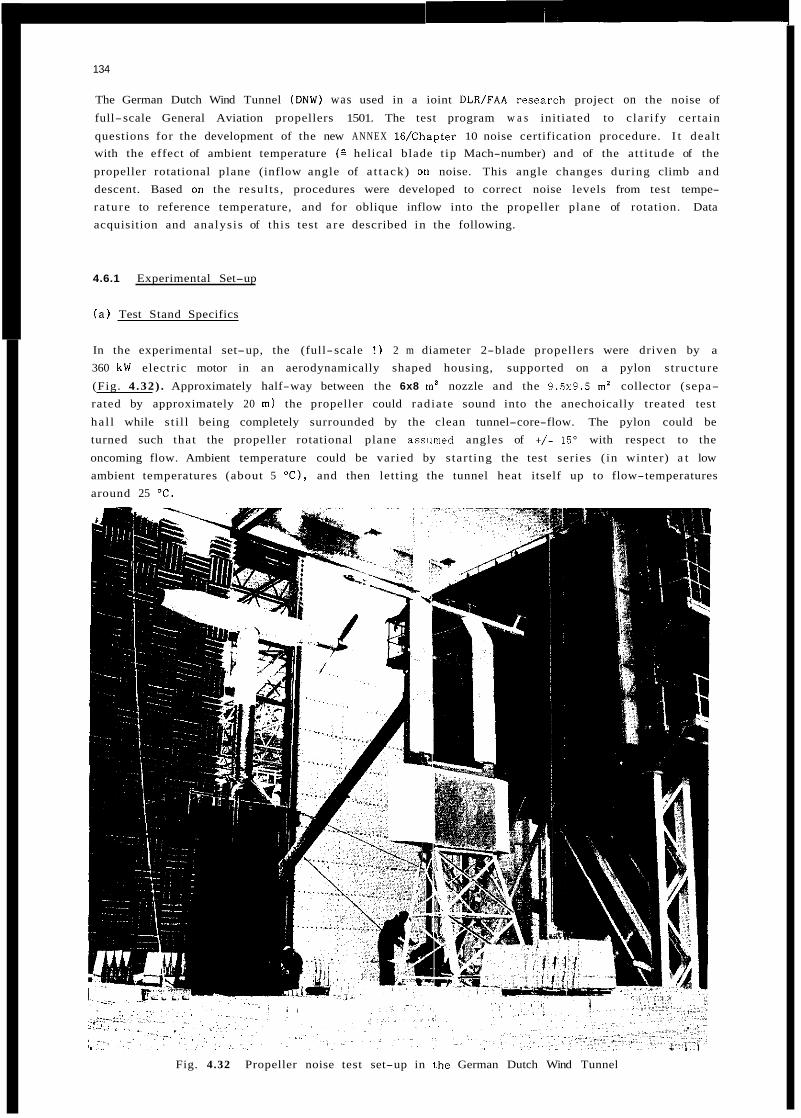
L,
134
The German Dutch Wind Tunnel ( D N W ) was used in a ioint DLR/FAA resea.rch project on the noise of
full-scale General Aviation propellers 1501. The test program w a s initiated to clar i fy cer tain
questions for the development of the new ANNEX 16/Chapter 10 noise certification procedure. I t deal t with the effect of ambient temperature (2 helical blade t ip Mach-number) and of the at t i tude of the
propeller rotational plane (inflow angle of a t tack) on noise. This angle changes during climb and descent. Based on the resul ts , procedures were developed to correct noise levels from test tempe- ra ture to reference temperature, and for oblique inflow into the propeller plane of rotation. Data acquisition and analysis of this test a r e described in the following.
4.6.1 Experimental Set-up
( a ) Test Stand Specifics
In the experimental set-up, the (full-scale ! ) 2 m diameter 2-blade propellers were driven by a
360 kW electric motor in an aerodynamically shaped housing, supported on a pylon s tructure
(Fig. 4.32) . Approximately half-way between the 6x8 i n z nozzle and the 9.5x9.5 m' collector (sepa- rated by approximately 20 m ) the propeller could radiate sound into the anechoically treated test
ha l l while s t i l l being completely surrounded by the clean tunnel-core-flow. The pylon could be turned such that the propeller rotational plane assumed angles of i/- 15' with respect to the
oncoming flow. Ambient temperature could be varied by s tar t ing the test series ( in winter) a t low ambient temperatures (about 5 " C ) , and then letting the tunnel heat itself up to flow-temperatures around 25 O C .
Fig. 4.32 Propeller noise test set-up in I.he German Dutch Wind Tunnel
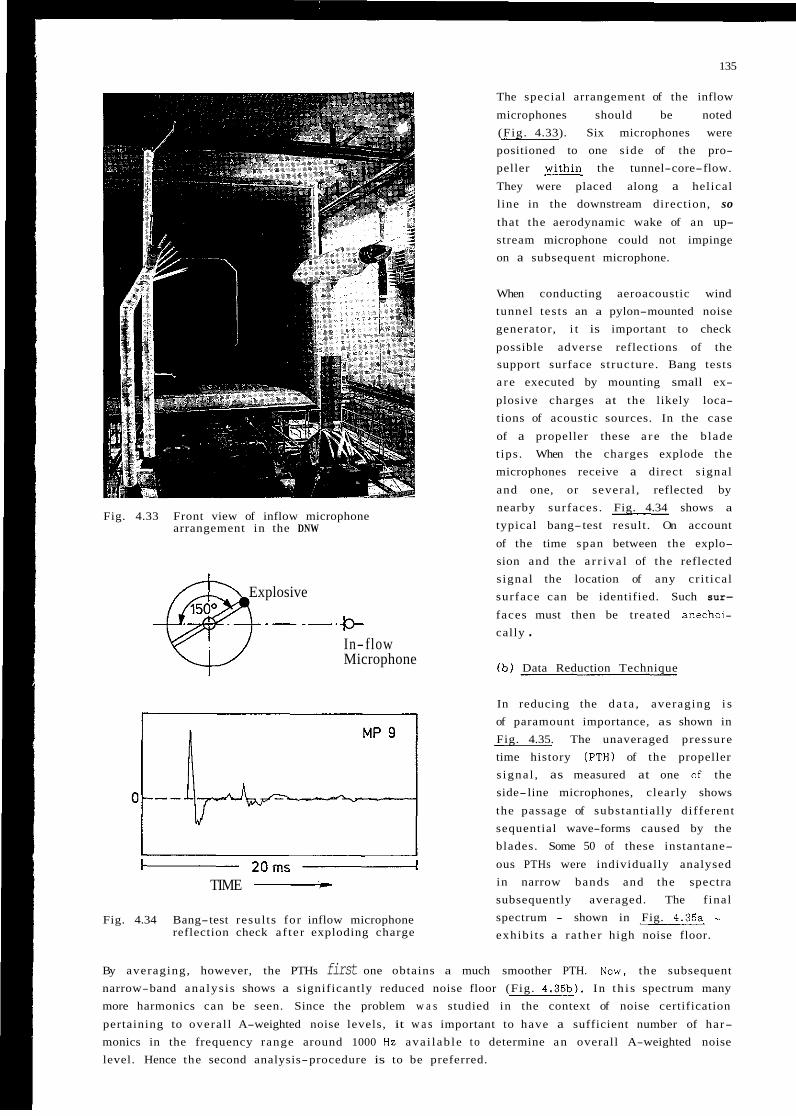
135
The special arrangement of the inflow
microphones should be noted (Fig. 4.33). Six microphones were positioned to one s ide of the pro- peller within the tunnel-core-flow.
They were placed along a helical line in the downstream direction, so that the aerodynamic wake of an up- stream microphone could not impinge on a subsequent microphone.
When conducting aeroacoustic wind tunnel tests an a pylon-mounted noise generator, i t is important to check
possible adverse reflections of the support surface s tructure. Bang tests a r e executed by mounting small ex-
plosive charges at the likely loca- tions of acoustic sources. In the case
of a propeller these a r e the blade t ips . When the charges explode the microphones receive a direct s ignal
and one, or several , reflected by nearby surfaces. Fig. 4.34 shows a
typical bang-test result. On account
of the time span between the explo- sion and the a r r i va l of the reflected s ignal the location of any cr i t ical surface can be identified. Such sur-
faces must then be treated anechoi- cally .
Fig. 4.33 Front view of inflow microphone arrangement in the DNW
Explosive
.----.+
In-flow Microphone
2 0 m s TIME -
Fig. 4.34 Bang-test resul ts for inflow microphone reflection check a f te r exploding charge
( b ) Data Reduction Technique
In reducing the da t a , averaging i s of paramount importance, as shown in Fig. 4.35. The unaveraged pressure time history (PTH) of the propeller s igna l , as measured at one of the side-line microphones, clearly shows
the passage of substant ial ly different sequential wave-forms caused by the blades. Some 50 of these instantane-
ous PTHs were individually analysed in narrow bands and the spectra subsequently averaged. The f inal spectrum - shown in Fig. 4.35a - exhibi ts a ra ther high noise floor.
By averaging, however, the PTHs first one obtains a much smoother PTH. Now, the subsequent narrow-band ana lys i s shows a significantly reduced noise floor (Fig. 4.35133. In t h i s spectrum many more harmonics can be seen. Since the problem w a s studied in the context of noise certification
pertaining to overal l A-weighted noise levels, it w a s important to have a sufficient number of har- monics in the frequency range around 1000 Hz ava i lab le to determine a n overall A-weighted noise level. Hence the second analysis-procedure is to be preferred.
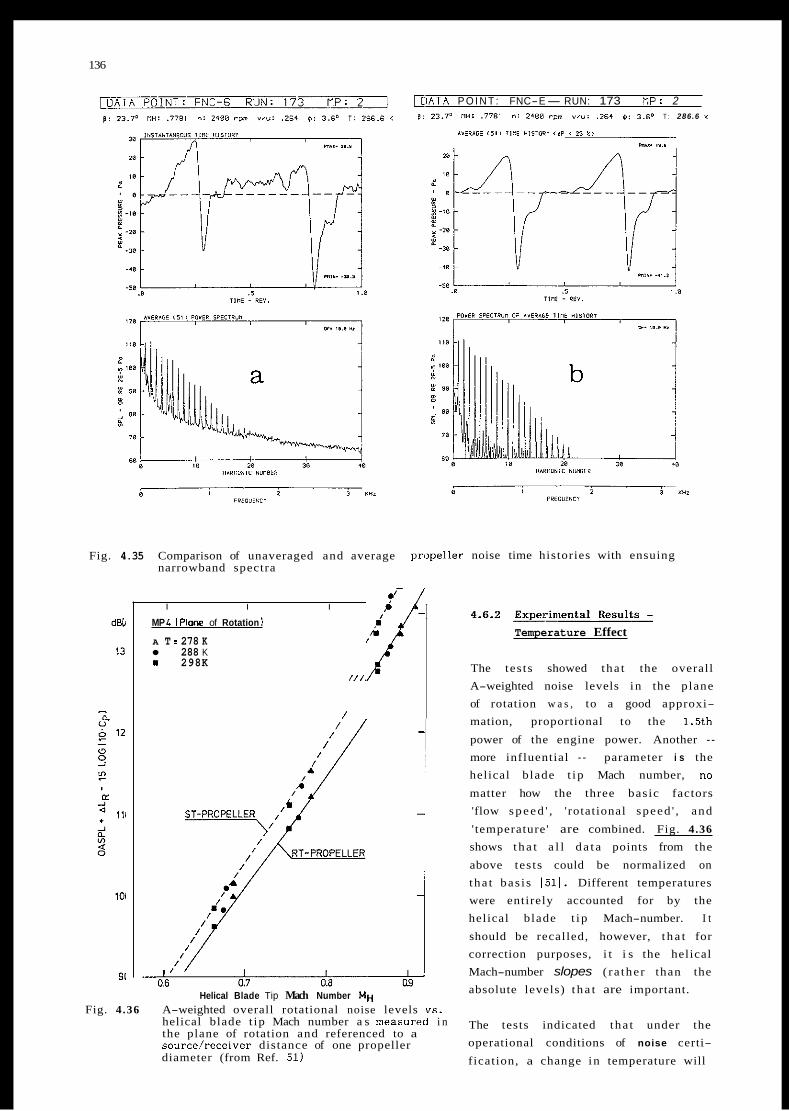
136
Fig. 4.35 Comparison of unaveraged and average narrowband spectra
D I A T A P O I N T : FNC-E-RUN: 173 RP: 2 1 8 : 23.7' I IH: ,7781 n: 230s ~ p m "8": .26t $: 3.6' T : 286.6 Y
*"5P*GF ( 5 1 > il'E HISTYXI < d P < 25 I >
'
pmpeller noise time histories with ensuing
I I
MP L I Plane of Rotation 1 A T = 278 K
288 K s 298K
$1' I I
/ / / I / /
Helical Blade Tip Mach Number M H Fig. 4.36 A-weighted overall rotational noise levels vs.
helical blade t ip Mach number a s measured i n the plane of rotation and referenced to a source/receiver distance of one propeller diameter (from Ref. 51)
4.6.2 Expelriniental Result? Temperature Effect
The tes ts showed tha t the overall A-weighted noise levels in the plane of rotation w a s , to a good approxi- mation, proportional to the 1.5th
power of the engine power. Another - more influential - parameter i s the helical blade t ip Mach number, no
matter how the three basic factors 'flow s p e e d ' , ' rotational speed ' , and
' temperature' are combined. Fig. 4.36
shows t h a t a l l d a t a points from the
above tes ts could be normalized on tha t bas i s 1511. Different temperatures were entirely accounted for by the helical blade t ip Mach-number. I t
should be recalled, however, t h a t for correction purposes, i t i s the helical Mach-number slopes ( ra ther than the absolute levels) t h a t are important.
The tests indicated tha t under the operational conditions of noise certi-
fication, a change in temperature will
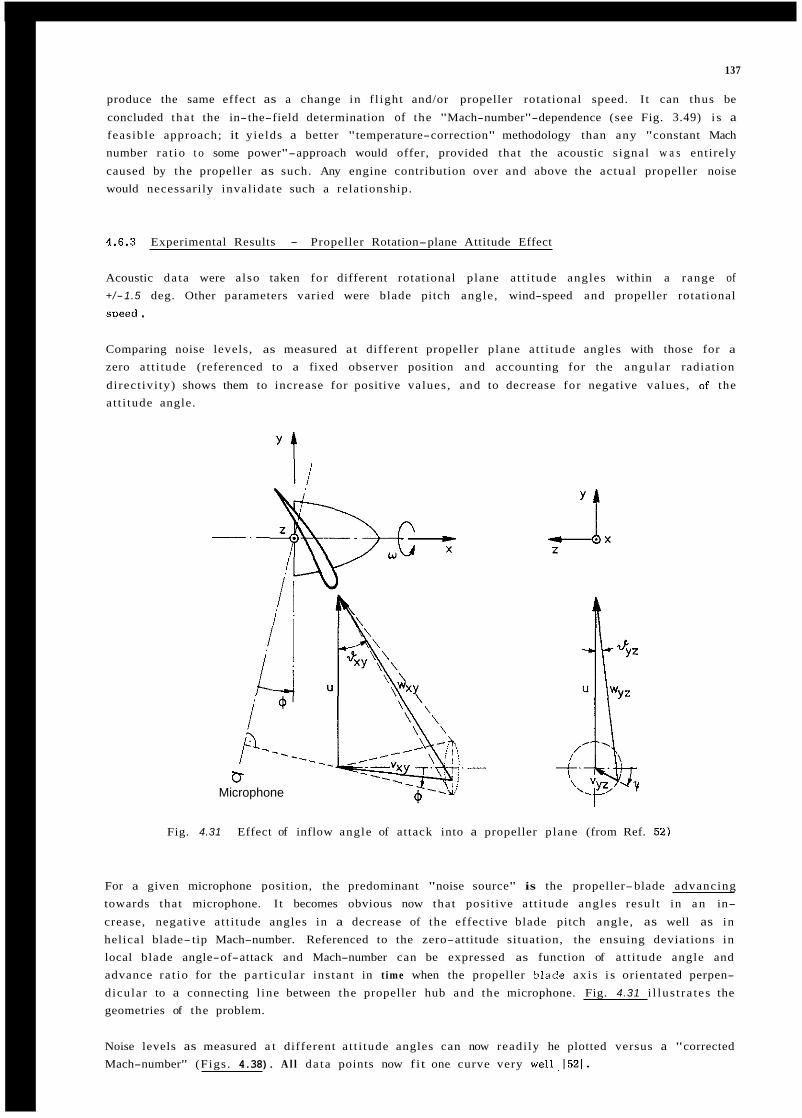
137
produce the same effect as a change in f l ight and/or propeller rotational speed. I t can thus be
concluded tha t the in-the-field determination of the "Mach-number"-dependence (see Fig. 3.49) i s a feasible approach; it yields a better "temperature-correction" methodology than any "constant Mach number ra t io t o some power"-approach would offer, provided that the acoustic s ignal w a s entirely
caused by the propeller as such. Any engine contribution over and above the actual propeller noise would necessarily inval idate such a relationship.
4.6.3 Experimental Results - Propeller Rotation-plane Attitude Effect
Acoustic da ta were also taken for different rotational plane at t i tude angles within a range of +/-1.5 deg. Other parameters varied were blade pitch angle, wind-speed and propeller rotational
sDeed .
Comparing noise levels, as measured at different propeller plane at t i tude angles with those for a
zero at t i tude (referenced to a fixed observer position and accounting for the angula r radiation
direct ivi ty) shows them to increase for positive values, and to decrease for negative values, of the at t i tude angle.
' t
0 Microphone
Fig. 4.31 Effect of inflow angle of attack into a propeller plane (from Ref. 52)
For a given microphone position, the predominant "noise source" is the propeller-blade advancing towards that microphone. I t becomes obvious now that positive at t i tude angles resul t in a n in-
crease, negative at t i tude angles in a decrease of the effective blade pitch angle, as well as in helical blade- tip Mach-number. Referenced to the zero-attitude situation, the ensuing deviations in local blade angle-of-attack and Mach-number can be expressed as function of at t i tude angle and advance ra t io for the par t icu la r instant in t ime when the propeller blade ax is i s orientated perpen- dicular to a connecting l ine between the propeller hub and the microphone. Fig. 4.31 i l lus t ra tes the geometries of the problem.
Noise levels as measured a t different a t t i tude angles can now readi ly he plotted versus a "corrected Mach-number" (Figs. 4.38). A l l data points now fit one curve very we11,1521.
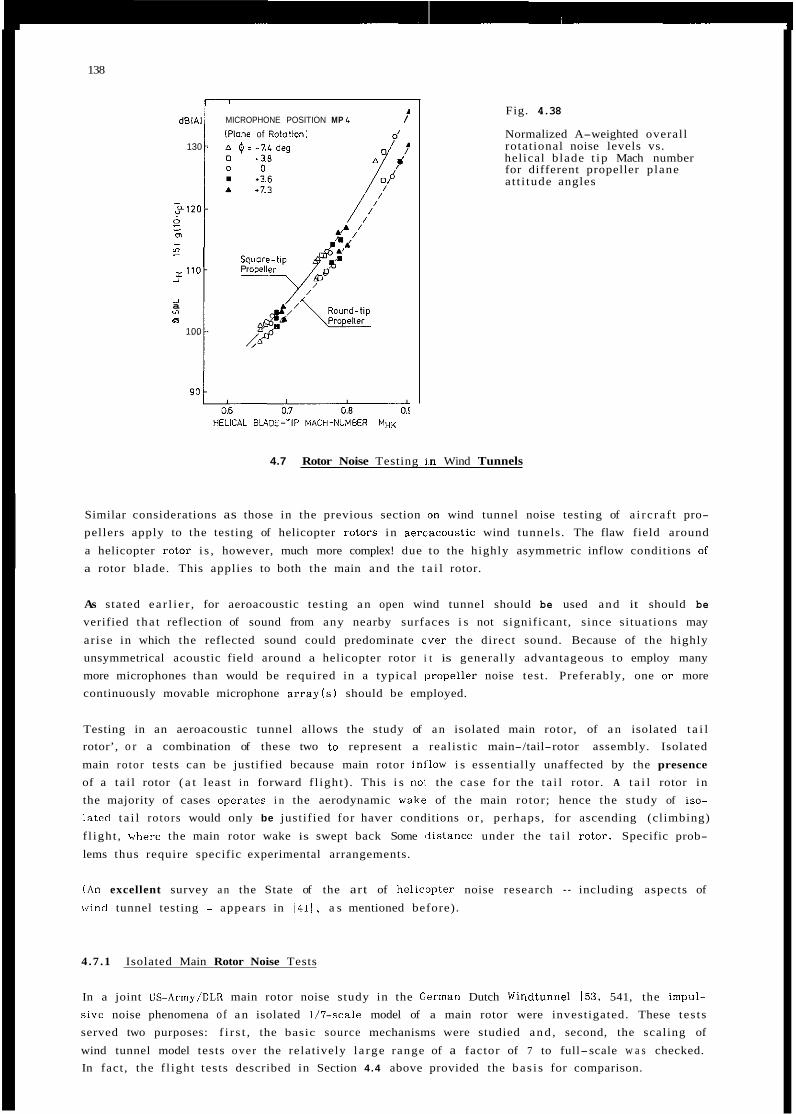
138
dWA1
130 -
- g 1 2 0 - 9
2 ,110-
I
m -
2
_I a “7 Q 0
100 -
MICROPHONE POSITION MP L i IPione of Rotation1 0‘
4.7 Rotor Noise Testing i.n Wind Tunnels
Fig. 4.38
Normalized A-weighted overall rotational noise levels vs. helical blade t ip Mach number for different propeller plane a t t i tude angles
Similar considerations as those in the previous section on wind tunnel noise testing of a i rc ra f t pro- pellers apply to the testing of helicopter TOtOTS in aercacoustic wind tunnels. The flaw field around
a helicopter rotor i s , however, much more complex! due to the highly asymmetric inflow conditions of a rotor blade. This applies to both the main and the t a i l rotor.
As stated ea r l i e r , for aeroacoustic testing a n open wind tunnel should be used and it should be verified tha t reflection of sound from any nearby surfaces i s not significant, since situations may
ar ise in which the reflected sound could predominate cver the direct sound. Because of the highly unsymmetrical acoustic field around a helicopter rotor i t is generally advantageous to employ many more microphones than would be required in a typical )propeller noise test . Preferably, one o r more continuously movable microphone a r r a y ( s ) should be employed.
Testing in an aeroacoustic tunnel allows the study of an isolated main rotor, of a n isolated t a i l rotor’, o r a combination of these two to represent a realistic main-/tail-rotor assembly. Isolated
main rotor tests can be justified because main rotor inl’low i s essentially unaffected by the presence
of a ta i l rotor ( a t least i n forward f l ight) . This i s noi the case for the t a i l rotor. A t a i l rotor in the majority of cases operates i n the aerodynamic wake of the main rotor; hence the study of iso- latcd t a i l rotors would only be justified for haver conditions or , perhaps, for ascending (climbing)
f l ight , wherc the main rotor wake is swept back Some #distance under the t a i l rotor. Specific prob-
lems thus require specific experimental arrangements.
(An excellent survey an the State of the art of helicapter noise research - including aspects of
w ~ n d tunnel testing - appears in 1411, a s mentioned before).
4 .7 .1 Isolated Main Rotor Noise Tests
In a joint CS-Army/DLR main rotor noise study in the German Dutch Windtunnel 153, 541, the impul- s ivc noise phenomena of a n isolated l/’l-scale model of a main rotor were investigated. These tes ts served two purposes: f i r s t , the basic source mechanisms were studied a n d , second, the scaling of
wind tunnel model tests over the relatively l a rge range of a factor of 7 to full-scale w a s checked. In fact , the f l ight tests described in Section 4.4 above provided the bas i s for comparison.
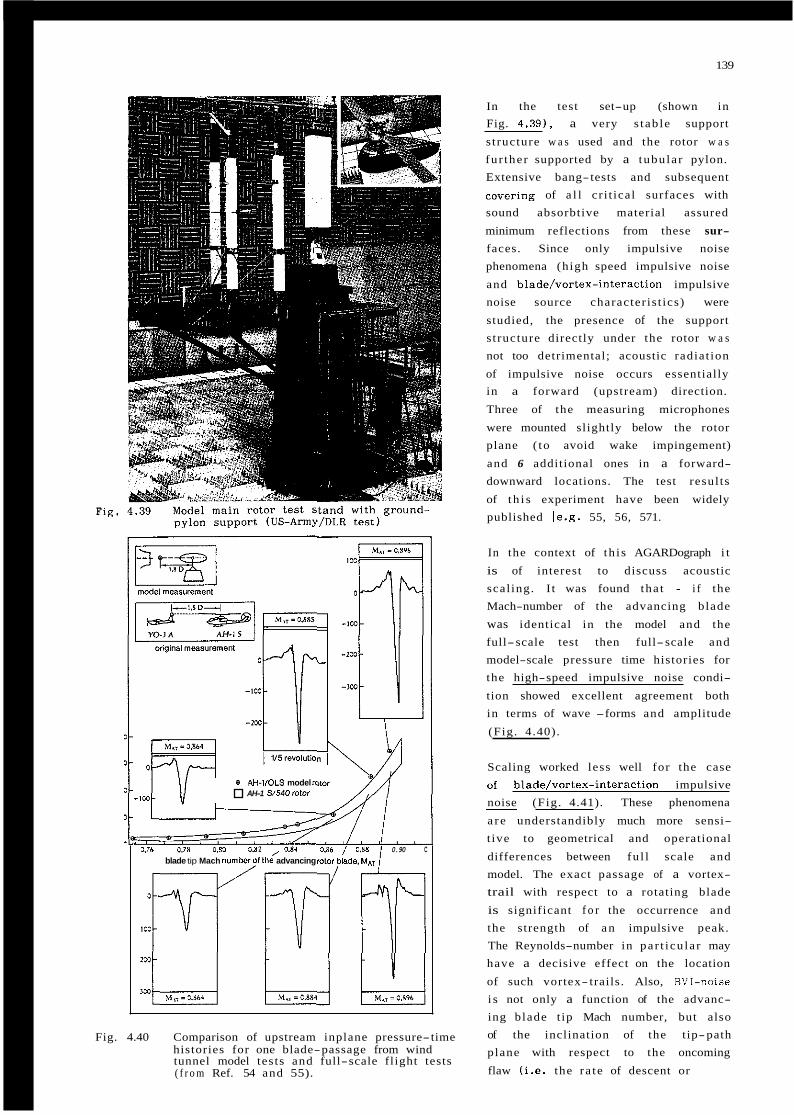
139
F ' ig .
e AH-IIOLS model iolor AH-1 SI540 mlor
0.76 0.78 0.83 3.112,0.84 3 . 8 6 / C . S 8 0.90 C blade tip Mach number_oflhe advancing mtOr;lade, MAT 1
Fig. 4.40 Comparison of upstream inplane pressure-time histories for one blade-passage from wind tunnel model tests and full-scale flight tests ( f r o m Ref. 54 and 55).
In the test set-up (shown in Fig. 4.39), a very s tab le support
s t ructure w a s used and the rotor w a s
fu r ther supported by a tubula r pylon. Extensive bang-tests and subsequent covering of a l l cr i t ical surfaces with sound absorbtive material assured
minimum reflections from these sur- faces. Since only impulsive noise phenomena (high speed impulsive noise
and blade/vortex-interaction impulsive noise source character is t ics) were
studied, the presence of the support s t ructure directly under the rotor w a s not too detrimental; acoustic radiat ion
of impulsive noise occurs essentially in a forward (upstream) direction.
Three of the measuring microphones
were mounted slightly below the rotor plane ( to avoid wake impingement)
and 6 additional ones in a forward- downward locations. The test resul ts
of t h i s experiment have been widely published 1e.g. 55, 56, 571.
In the context of th i s AGARDograph i t
is of interest to discuss acoustic scal ing. I t was found tha t - i f the Mach-number of the advancing blade
was identical in the model and the full-scale test then full-scale and model-scale pressure time histories for the high-speed impulsive noise condi-
tion showed excellent agreement both in terms of wave -forms and amplitude
(Fig. 4.40).
Scaling worked less well for the case of blade/vortex-interaction impulsive noise (Fig. 4.41). These phenomena
a r e understandibly much more sensi- t ive to geometrical and operational
differences between fu l l scale and model. The exact passage of a vortex- trail with respect to a rotating blade
is significant f o r the occurrence and the strength of a n impulsive peak. The Reynolds-number in par t icu la r may have a decisive effect on the location
of such vortex- trails. Also, BVI-noise i s not only a function of the advanc- ing blade t ip Mach number, but also of the inclination of the tip-path plane with respect to the oncoming
flaw (i.e. the ra te of descent or
-
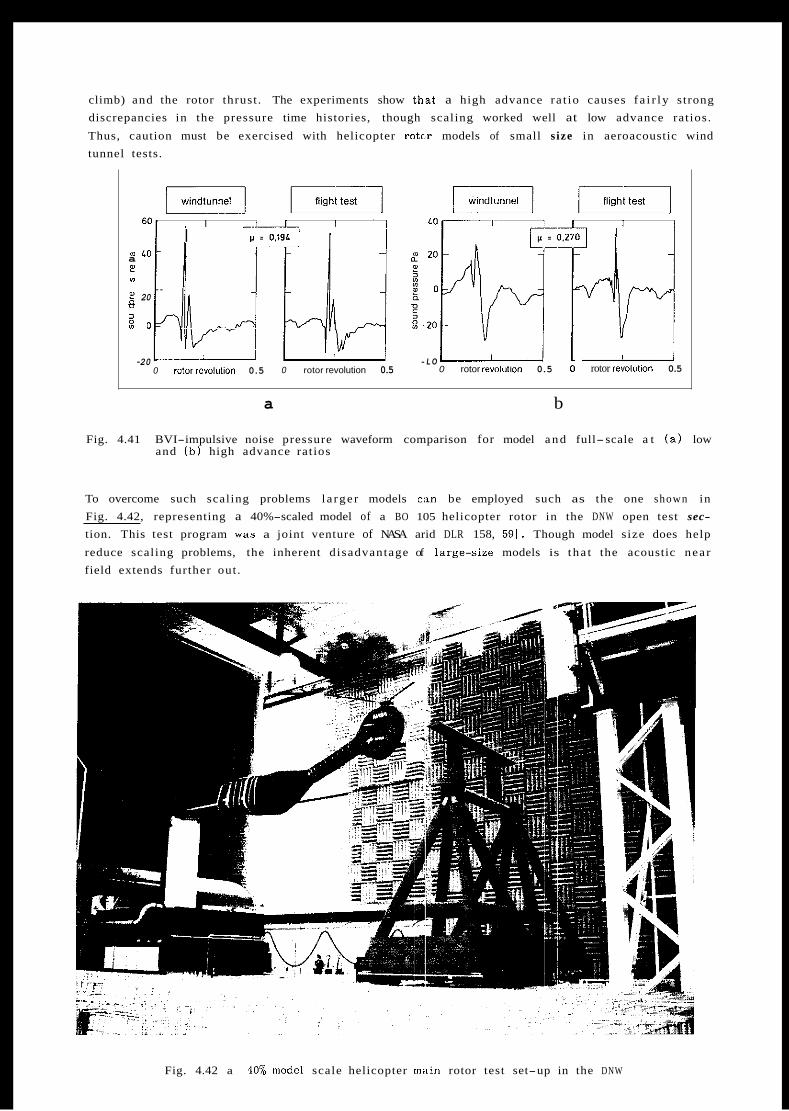
climb) and the rotor thrust . The experiments show tha t a high advance ra t io causes f a i r l y strong discrepancies in the pressure time histories, though scaling worked well at low advance rat ios.
Thus, caution must be exercised with helicopter r o t w models of small size in aeroacoustic wind tunnel tests.
I u = m LO - a
y1
g 20
5: o n
- D 3
-20 I
0 rotoirevol~t ion 0.5
0.1% 1.1 0 rotor revolution 0.5
- L O 0 rotor revoi~t lon 0.5
d rotor revolution 0.5
a b
Fig. 4.41 BVI-impulsive noise pressure waveform comparison for model a n d full-scale a t ( a ) low and ( b ) high advance ratios
To overcome such scaling problems l a rge r models can be employed such as the one shown in Fig. 4.42, representing a 40%-scaled model of a BO 105 helicopter rotor in the DNW open test sec-
tion. This test program w a s a joint venture of NASA arid DLR 158, 591. Though model size does help
reduce scaling problems, the inherent disadvantage of large-size models is tha t the acoustic near field extends further out .
Fig. 4.42 a 40%-madel scale helicopter main rotor test set-up in the DNW
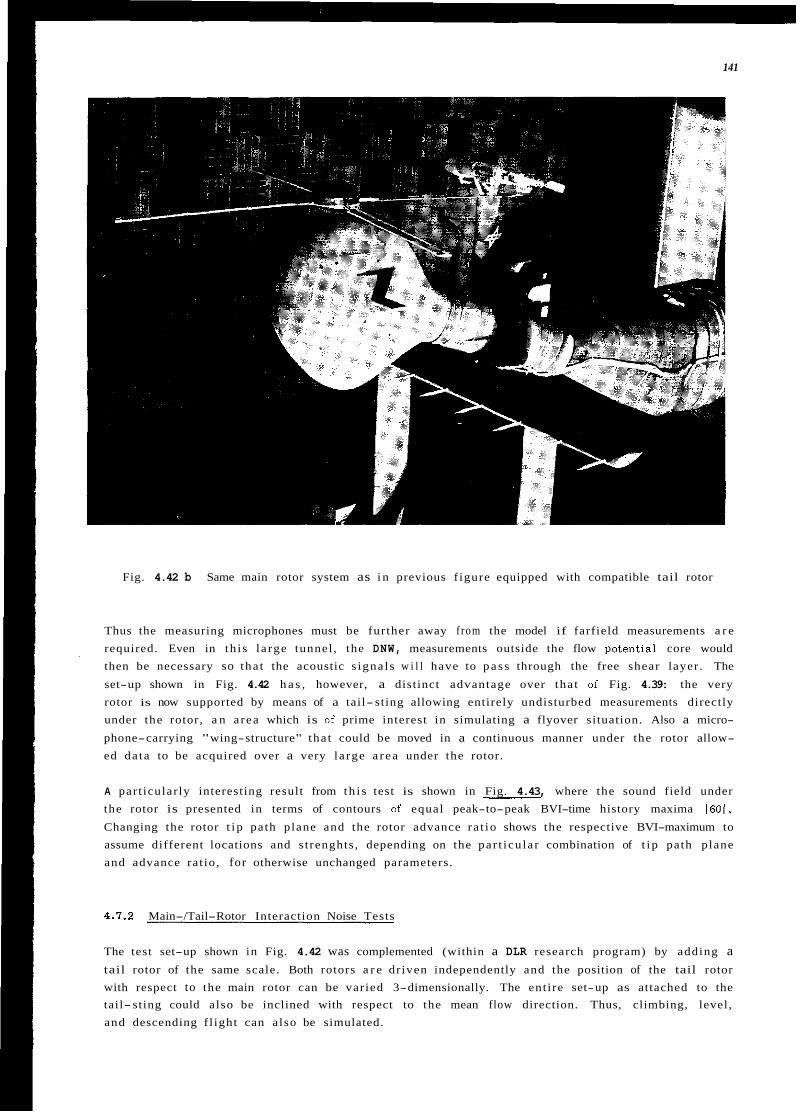
141
Fig. 4.42 b Same main rotor system as i n previous f igure equipped with compatible tail rotor
Thus the measuring microphones must be fur ther away f rom the model if farfield measurements a r e required. Even in th i s l a rge tunnel , the DNW, measurements outside the flow potential core would then be necessary so tha t the acoustic s igna ls w i l l have to p a s s through the free shear layer . The
set-up shown in Fig. 4.42 h a s , however, a distinct advantage over tha t of Fig. 4.39: the very rotor is now supported by means of a tail- sting allowing entirely undisturbed measurements directly under the rotor, a n a rea which is of prime interest in simulating a flyover situation. Also a micro-
phone-carrying "wing-structure" tha t could be moved in a continuous manner under the rotor allow- ed da ta to be acquired over a very la rge a r ea under the rotor.
A part icular ly interesting result from th i s test is shown in Fig. 4.43, where the sound field under the rotor is presented in terms of contours of equal peak-to-peak BVI-time history maxima 1601.
Changing the rotor t i p path plane and the rotor advance ra t io shows the respective BVI-maximum to assume different locations and s trenghts , depending on the par t icu la r combination of t i p path plane and advance rat io, for otherwise unchanged parameters.
4.1.2 Main-/Tail-Rotor Interaction Noise Tests
The test set-up shown in Fig. 4.42 was complemented (within a DLR research program) by adding a tail rotor of the same scale. Both rotors a r e dr iven independently and the position of the tail rotor with respect to the main rotor can be varied 3-dimensionally. The ent ire set-up as attached to the tail- sting could also be inclined with respect to the mean flow direction. Thus, climbing, level, and descending f l ight can also be simulated.
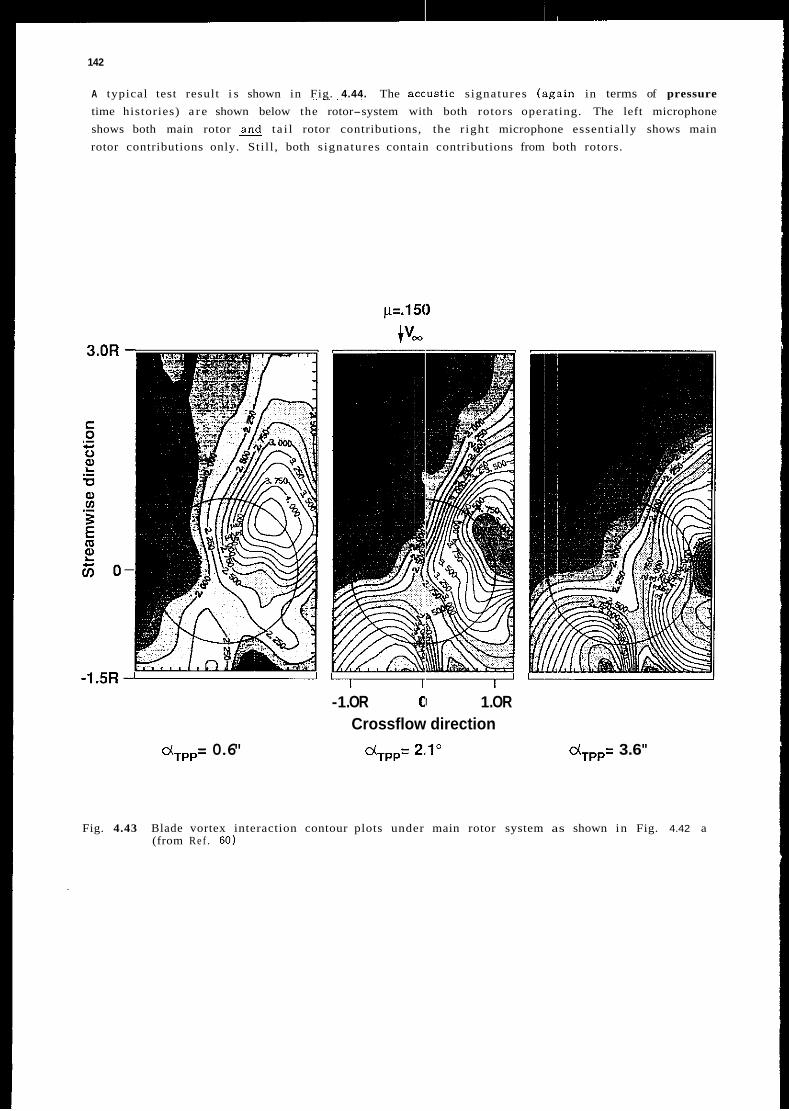
142
A typical test result i s shown in Fig. 4.44. The acc'ustic s ignatures (:igain in terms of pressure time histories) a r e shown below the rotor-system with both rotors operating. The left microphone shows both main rotor t a i l rotor contributions, the r ight microphone essentially shows main rotor contributions only. Sti l l , both s ignatures contain contributions from both rotors.
-1 .OR CI 1 .OR Crossflow direction
dTPP= 0.6" dTPP= 2.,1" dTPP= 3.6"
Fig. 4.43 Blade vortex interaction contour plots under main rotor system as shown in Fig. 4.42 a (from Ref . 60)
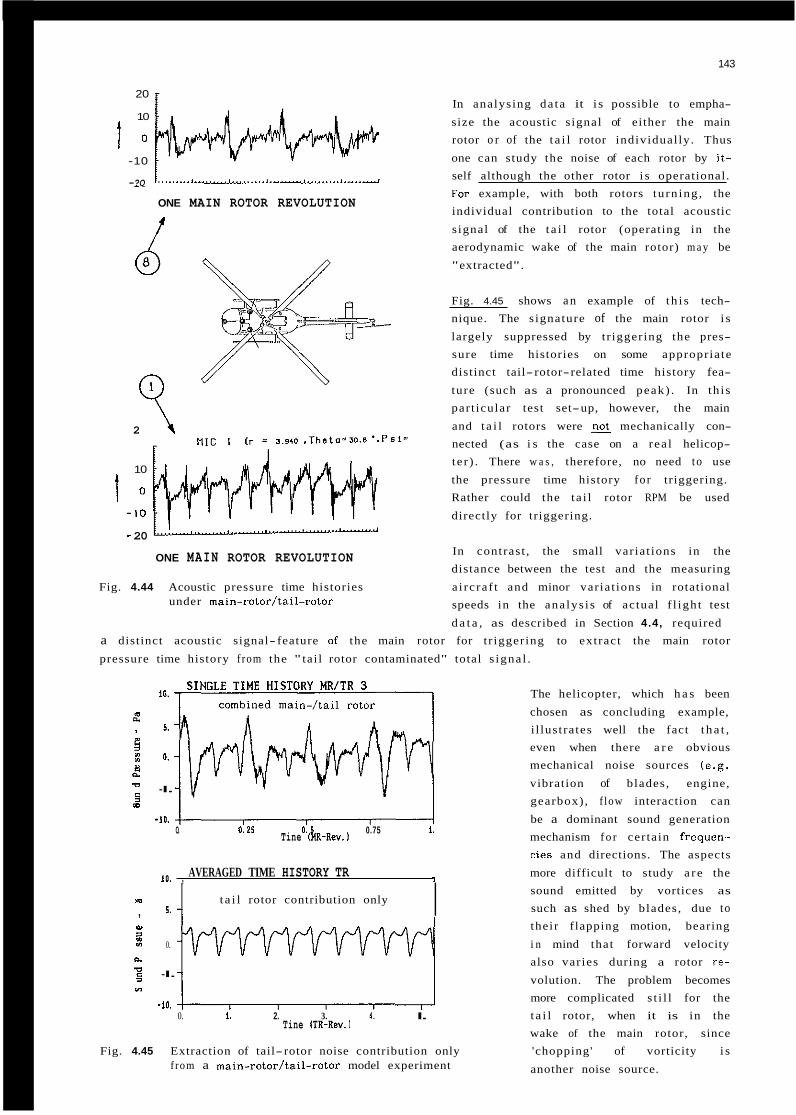
143
20
10 In analysing da ta it i s possible to empha-
size the acoustic s ignal of either the main rotor o r of the t a i l rotor individual ly. Thus
one can study the noise of each rotor by it- self although the other rotor i s operational.
t o -10
-?O -~
ONE MAIN ROTOR REVOLUTION For example, with both rotors tu rn ing , the individual contribution to the total acoustic
s ignal of the t a i l rotor (operating in the aerodynamic wake of the main rotor) m a y be
"extracted".
Fig. 4.45 shows an example of t h i s tech- nique. The s ignature of the main rotor i s
largely suppressed by t r iggering the pres- sure time histories on some appropriate distinct tail- rotor-related time history fea-
ture (such as a pronounced peak) . In th i s part icular test set-up, however, the main
and t a i l rotors were @ mechanically con- nected (as i s the case on a rea l helicop- te r ) . There w a s , therefore, no need to use
the pressure time history fo r triggering. Rather could the ta i l rotor RPM be used
directly for triggering.
20 7 10
t o - I O
- 20 In contrast , the small var iat ions in the distance between the test and the measuring
Fig. 4.44 Acoustic pressure time histories a i rc ra f t and minor variat ions in rotational speeds in the ana lys i s of actual f l igh t test
d a t a , as described in Section 4.4, required
ONE MAIN ROTOR REVOLUTION
under main-rotor/tail-rotor
a distinct acoustic signal- feature of the main rotor for t r iggering to extract the main rotor
pressure time history f rom the " tai l rotor contaminated" total s igna l .
10. The helicopter, which h a s been
chosen as concluding example, E I 5. i l lustrates well the fact t ha t , 3 even when there a r e obvious 4 0. (Y mechanical noise sources (e.g. 2
vibration of blades, engine, - -I.
C A 2 gearbox), f low interaction can
-10. be a dominant sound generation Tine (HR-Rev. ) mechanism f o r cer tain frequen-
cies and directions. The aspects
AVERAGED TIME HISTORY TR more difficult to study a r e the
a
0. 0.25 0. 5 0.75 i.
IO. , 1
n. m t a i l rotor contribution only , 5. I sound emitted by vortices as
such as shed by blades, due to e a2 their flapping motion, bearing
0. i n mind that forward velocity also varies during a rotor re-
volution. The problem becomes more complicated s t i l l for the
0. 1. 2. 3. 4. I. t a i l rotor, when it is in the wake of the main rotor, since
Fig. 4.45 Extraction of tail- rotor noise contribution only 'chopping' of vorticity i s
2
n.
-E -I. = u?
-10.
Tine (TR-Rev. 1
f rom a main-rotor/tail-rotor model experiment another noise source.
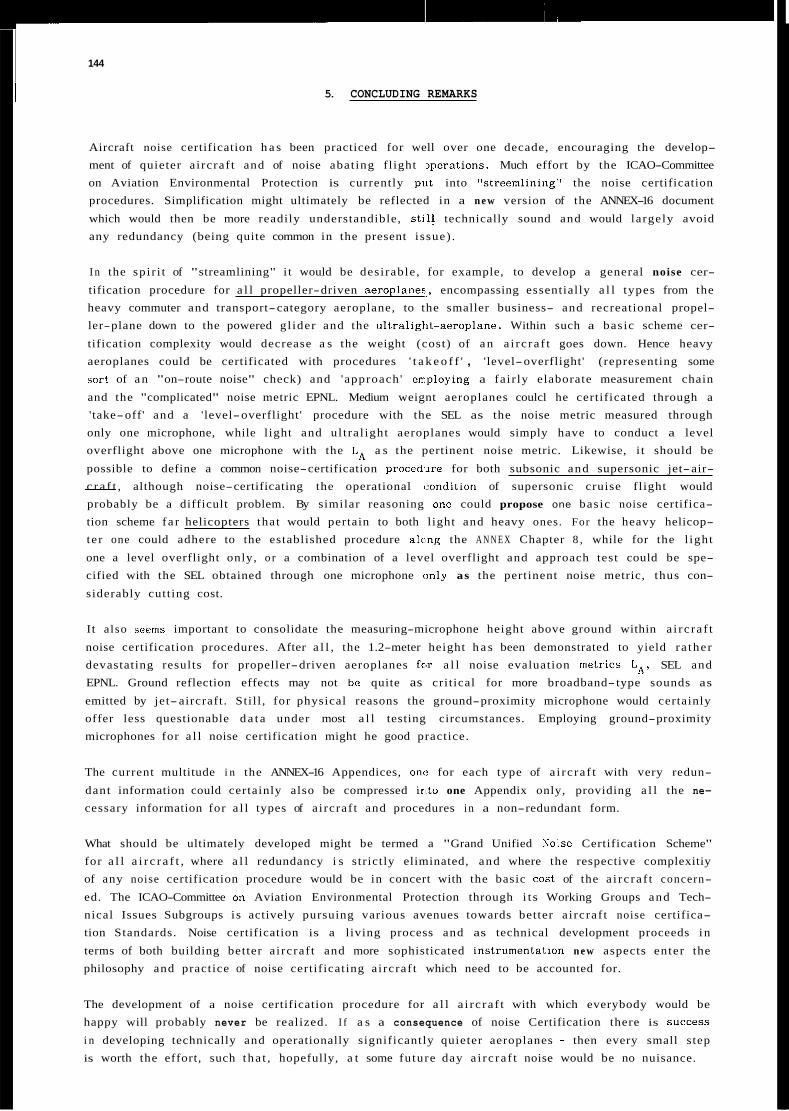
144
I 5. CONCLUDING REMARKS
Aircraft noise certification h a s been practiced for well over one decade, encouraging the develop- ment of quieter a i rcraf t and of noise abat ing fl ight Iperatians. Much effort by the ICAO-Committee on Aviation Environmental Protection is currently put into "streemlining" the noise certification procedures. Simplification might ultimately be reflected in a n e w version of the ANNEX-16 document
which would then be more readily understandible, stil! technically sound and would largely avoid any redundancy (being quite common in the present issue) .
I n the spir i t of "streamlining" i t would be desirable , for example, to develop a general noise cer-
tification procedure for a l l propeller-driven aeroplaner:, encompassing essentially a l l types from the heavy commuter and transport-category aeroplane, to the smaller business- and recreational propel- ler-plane down to the powered gl ider and the ul t ra l igt r t~aeroplane. Within such a basic scheme cer-
tification complexity would decrease a s the weight (cost) of a n a i rc ra f t goes down. Hence heavy aeroplanes could be certificated with procedures ' t a k e o f f ' , ' level-overflight' (representing some sort of a n "on-route noise" check) and 'approach ' errploying a fa i r ly elaborate measurement chain
and the "complicated" noise metric EPNL. Medium weignt aeroplanes coulcl he certificated through a 'take-off' and a 'level-overflight' procedure with the SEL as the noise metric measured through only one microphone, while l ight and ul t ra l ight aeroplanes would simply have to conduct a level overflight above one microphone with the LA a s the pertinent noise metric. i t should be
possible to define a common noise-certification procedire for both subsonic and supersonic jet-air- ~ c r a f t , although noise-certificating the operational ,condition of supersonic cruise fl ight would probably be a difficult problem. By similar reasoning one could propose one basic noise certifica- tion scheme fa r helicopters that would pertain to both l ight and heavy ones. For the heavy helicop- ter one could adhere to the established procedure a h n g the A N N E X Chapter 8 , while for the l ight
one a level overflight only, o r a combination of a level overflight and approach test could be spe- cified with the SEL obtained through one microphone only as the pertinent noise metric, thus con-
siderably cutting cost.
Likewise,
It a lso seems important to consolidate the measuring-microphone height above ground within a i rc ra f t
noise certification procedures. After a l l , the 1.2-meter height h a s been demonstrated to yield ra ther devastating results for propeller-driven aeroplanes fcsr a l l noise evaluation metric5 L A , SEL and EPNL. Ground reflection effects may not be quite as crit ical for more broadband-type sounds as
emitted by jet- aircraft . Sti l l , for physical reasons the ground-proximity microphone would certainly offer less questionable d a t a under most a l l testing circumstances. Employing ground-proximity microphones for a l l noise certification might he good practice.
The current multitude i n the ANNEX-16 Appendices, one for each type of a i rc ra f t with very redun-
dant information could certainly also be compressed irtto one Appendix only, providing a l l the ne- cessary information for a l l types of a i rcraf t and procedures in a non-redundant form.
What should be ultimately developed might be termed a "Grand Unified Uaise Certification Scheme" for a l l a i r c r a f t , where a l l redundancy i s strictly eliminated, and where the respective complexitiy of any noise certification procedure would be in concert with the basic cost of the a i rc ra f t concern-
ed. The ICAO-Committee on Aviation Environmental Protection through i t s Working Groups and Tech- nical Issues Subgroups i s actively pursuing various avenues towards better a i rcraf t noise certifica- tion Standards. Noise certification is a living process and as technical development proceeds in
terms of both building better a i rcraf t and more sophisticated instrumentalion n e w aspects enter the philosophy and practice of noise certificating a i rcraf t which need to be accounted for.
The development of a noise certification procedure for a l l a i rc ra f t with which everybody would be happy will probably never be realized. I f a s a consequence of noise Certification there is success
i n developing technically and operationally significantly quieter aeroplanes - then every small step is worth the effort, such tha t , hopefully, a t some future day a i rc ra f t noise would be no nuisance.
APPENDIX A: CALCULATION OF THE 'EFFECTIVE PERCEIVED NOISE LEVEL'
The flyover noise s ignature of a n a i rc ra f t var ies with time, both in intensity and spectral content.
To account for the human subjective response to such a noise event, a n appropriate single-number descriptor, the 'Effective Perceived Noise Level (EPNL)' , h a s been developed.
To determine the EPNL of a flyaver noise event, the da ta a r e processed to yield a succession of 1/3
octave band (1/3-o.b.) spectra in 0.5-second-increments during the time period of the ent i re flyover (Flow Chart , Fig. A- 1). The important acoustic information to be processed i s contained in a time span of 20 to 50 s during which the a i rc ra f t noise exceeds the ambient noise by at least 10 dB.
Accordingly, 40 to 100 individual 1/3-o.b.-spectra are to be obtained. I t should be kept in mind tha t within one ha l f second a n a i rc ra f t flies a distance of several tens of meters, substant ial ly changing the character is t ics of the noise s ignature as received on the ground.
A.l Perceived Noise Level
Each 1/3-o..b. spectrum consists of 24 individual 1/3-octave-bands. Here band 1 h a s a center fre- quency of 50 Hz, band 2 of 63 Hz, band 3 of 80 Hz etc. up to band 24 with a center frequency of 10,000 Hz)*. Each of these band- levels i s weighted by 'Contours of Perceived Noisiness', accounting
for the pronounced sensitivity in the frequency range from 2000 to 5000 H z , and the lesser - albeit
absolute level-dependent - sensitivity at lower and higher frequencies within the audible range. Fig, A-2 shows the 'Perceived Noisiness Contours' of which each i s designated with a noy-number.
These contours a r e then overlaid individually upon each of the (20 to 50) 1/3-o.b.-spectra to obtain
24 weighted band-levels, now termed 'Noy-values' . These Noy-values a r e called 'Perceived Noisi- ness'- values, or PN-values for short. Final ly, all PN-values a r e added up, however s t i l l with some fur ther 'weighting' such that the highest PN-value (not necessarily the highest band-level!) corints 85% and the sum of a l l others, including the highest , counts only 15%, i . e .
( A l )
24 N(k) = 0.85 n ( k ) + 0.15 n ( i , k )
i=l
where N(k) is the 'Total Perceived Noisiness', n ( k ) i s the largest of the 24 PN-values of n ( i , k ) .
Here i is the band-number (1 ,2 ,3 , ... 24) within the spectrum and k denotes the part icular spec-
trum of the flyover.
The 'Total Perceived Noisiness' is then converted back into a 'Perceived Noise Level, PNL' by
( A 2 ) PNL(k) = 40 + 33.2 log N(k)
Having thus obtained one, and one only, PNL-value f o r each spectrum, one may now already go ahead and plot a flyover-history of PNL vs time, unless the or iginal spectra contained pronounced discrete-frequency, tonal components. In th i s case each spectrum must f i r s t be corrected for ' spectral i r regular i t i es ' to obtain the 'tone corrected Perceived Noise Level, PNLT', by means of a tone correction,
* The agreed upon sequence of 1/3-octave band center frequencies is : ... 100 Hz, 125 Hz, 160 H z , 200 Hz, 250 Hz, 315 Hz, 400 H z , 500 H z , 630 H z , 800 H z , 1000 Hz, 1250 Hz ..., etc
146
A.2 Tone C o r e
Tone correction is a rather elaborate process and sha l l be explained using the Flow Chart shown in
P Fig. A-3. First, a listing i s made, individually for each spectrum, of the sound-pressure levels L
i n each successive band, with the exception of the twti lowest bands, 50 Hz and 63 Hz (Column A).
The l is t ing thus s t a r t s with band 3 ( i .e . 80 Hz).
Let u s consider the f i r s t six bands 3 to 8, corresponding to frequencies 80, 100, 125, 160, 200 and 250 Hz. The difference in sound pressure level from one band to the next (positive o r negative) is
listed in Column B. These differences a re termed 's lopes ' . Column C then l is ts the absolute changes in slopes. Now, if any value in Column C i s greater than 5, then back in Column B the value one half notch down will be encircled, i.e. in the exampla the values -7 and +4, since both 8 and 11
a r e larger than 5 in Column C .
Next, one of two cr i ter ia are applied:
(1) if in Column B the encircled va.lue i s positive and greater than the value directly above i t , then in Column A the value one half notch down will be encircled; in our example +4 is both positive and greater than -7, therefore 80 i s encircled.
(2) i f in Column B the encircled va.lue i s zero o r mgat ive , and the previous value i s positive,
then in Column A the value one half notch up i s ,encircled. In o u r example -7 i s negative and the previous value +1 is positive; therefore 83 is encircled.
Next the sound pressure levels in Column A a re adjusted as follows: Each encircled L -value is replaced by the arithmetic average of the preceeding and the following L -values. Thus, 83 becomes replaced by 1(82+76)/21 = 79, and 80 by 1(76-80)/21 .= 78. The adjusted l is t ing appears in Column
A .. ad1
P P
Thereafter, new level-differences a r e computed and lis.:ed in Column D, whereby the level-difference between a n imaginary band No.2 and band No.3 is se t , by convention, equal to tha t between bands
3 and 4, in o u r example +2. 'Average slopes' a r e now computed by taking, respectively, three suc- cessive slopes and calculating the arithmetic average, i.e.
(A31 average slope = 1/3 (slope 1 + slope 2 + slope 3 )
and listed in Column E .
The final adjusted levels ( to be listed in Column F) are obtained as follows: Band 3 remains un- changed as in Column A . Band 4 level is taken a s the s u m of the Band 3 level and the average
slope, as listed in Column E , i .e . 80+1/3 = 80 1/3. Correspondingly, Band 5 level is taken as Band 4 level plus the next average slope, i.e. 80 1/3 - 1 1/3 = 79, etc.
In the end the level differences between the original :,ound pressure level (Column A) and the final adjusted level (Column F) a re listed in Column G , but only those which a re greater than zero. The
numerical values in Column G are then converted into the tone-correction factors, C ( k ) , as follows:
I f the 1/3-0.b. under consideration has a center frecuency of (and including) 500 Hz up to 5000 Hz, the Column G values a r e divided by 3 to obtain C ( k ) ; if however the center frequency is below 500 Hz and above 5000 Hz , values a re divided by 6 to obtain C(k) . Only the largest of the tone
correction factors is ultimately added to the 'Perceive,i Noise Level ' , such tha t the 'Tone-corrected
Perceived Noise Level, PNLT,' becomes
(A4) PNLT(k) = PNL(k) + C(k)
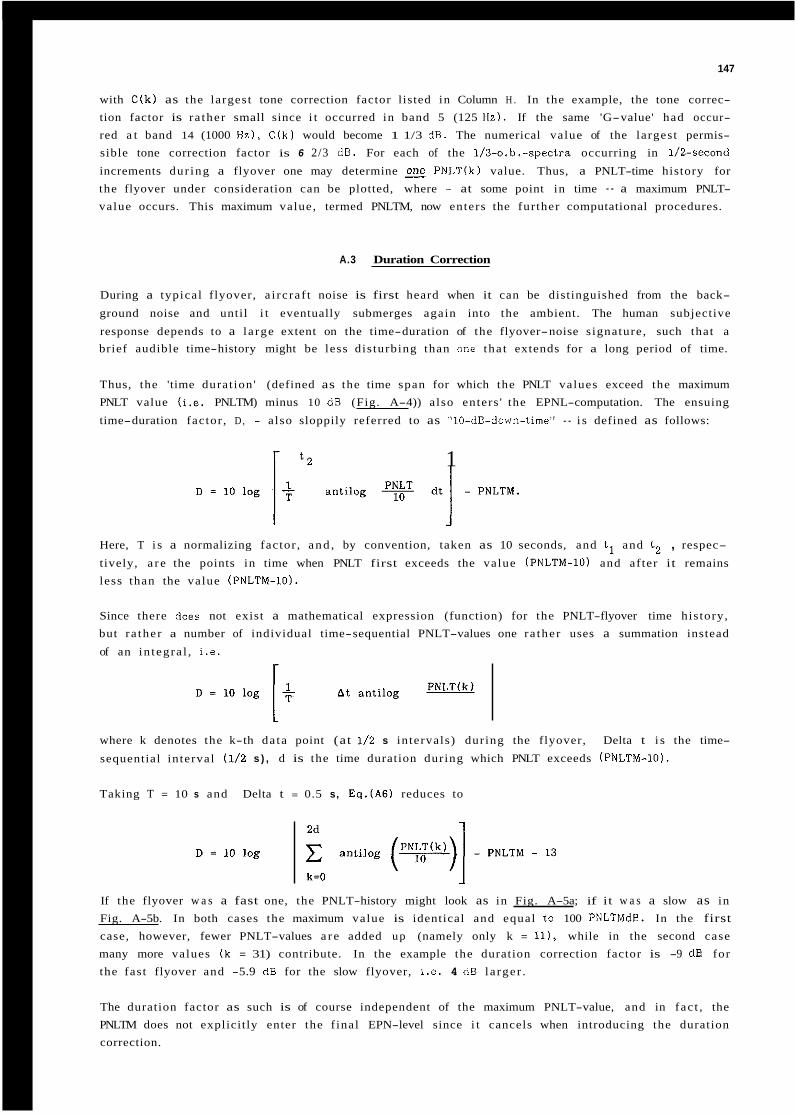
147
with C(k) as the largest tone correction factor listed in Column H . In the example, the tone correc- tion factor is ra ther small since i t occurred in band 5 (125 Hz). If the same 'G-value' had occur- red a t band 14 (1000 H z ) , C (k ) would become 1 1/3 dB. The numerical value of the largest permis- sible tone correction factor is 6 2/3 dB. For each of the 1/3-o.b.-spectra occurring in 1/2-second
increments dur ing a flyover one may determine E PNLT(k) value. Thus, a PNLT-time history for the flyover under consideration can be plotted, where - at some point in time - a maximum PNLT- value occurs. This maximum value, termed PNLTM, now enters the fur ther computational procedures.
A.3 Duration Correction
During a typical flyover, a i rc ra f t noise is first heard when it can be distinguished from the back-
ground noise and until i t eventually submerges again into the ambient. The human subjective
response depends to a la rge extent on the time-duration of the flyover-noise s ignature, such that a brief audible time-history might be less dis turbing than one tha t extends for a long period of time.
Thus, the 'time durat ion ' (defined as the time span for which the PNLT values exceed the maximum PNLT value (i .e. PNLTM) minus 10 dB (Fig. A-4)) also enters ' the EPNL-computation. The ensuing
time-duration factor , D , - also sloppily referred to as "10-dB-down-time" - i s defined as follows:
1
Here, T i s a normalizing factor , and , by convention, taken as 10 seconds, and t l and t2 , respec-
tively, a r e the points in time when PNLT first exceeds the value (PNLTM-10) and af ter it remains less than the value (PNLTM-10).
Since there does not exist a mathematical expression (function) for the PNLT-flyover time his tory, but ra ther a number of individual time-sequential PNLT-values one ra ther uses a summation instead
of an in tegra l , i.e.
where k denotes the k-th da ta point (at 1/2 s intervals) during the flyover, Delta t i s the time-
sequential interval (1/2 s ) , d is the time duration during which PNLT exceeds (PNLTM-10).
Taking T = 10 s and Delta t = 0.5 s, Eq.(AG) reduces to
If the flyover w a s a fast one, the PNLT-history might look as in Fig. A-5a; if it w a s a slow as in Fig. A-5b. In both cases the maximum value is identical and equal to 100 PNLTMdB. In the first case, however, fewer PNLT-values a r e added up (namely only k = l l ) , while in the second case many more values (k = 31) contribute. In the example the duration correction factor is -9 dB for the fast flyover and -5.9 dB for the slow flyover, i .e. 4 dB la rger .
The duration factor as such is of course independent of the maximum PNLT-value, and in fac t , the PNLTM does not explicitly enter the f inal EPN-level since i t cancels when introducing the duration correction.
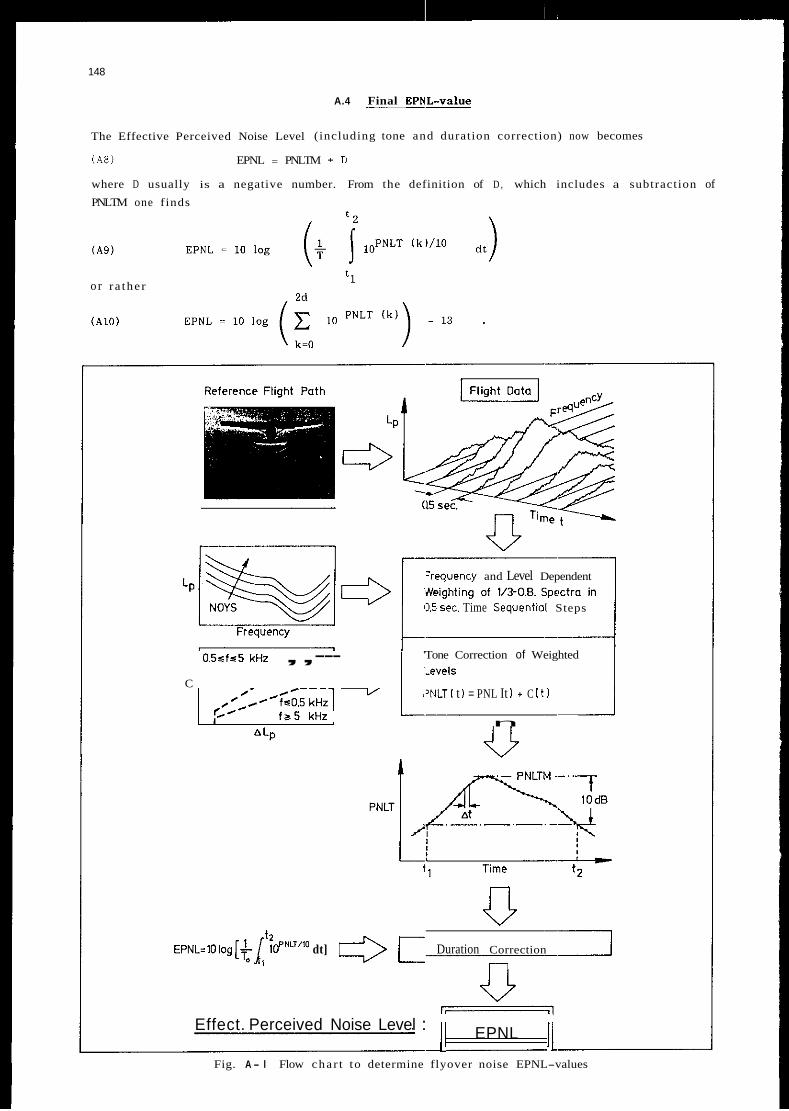
148
A.4 Final EPN-
The Effective Perceived Noise Level (including tone and duration correction) now becomes
( A 8 ) EPNL = PNLTM + D
where D usually is a negative number. From the definition of D , which includes a subtraction of PNLTM one finds
o r r a the r 2d
=requency and Level Dependent
'1.5 sec. Time Sequential Steps
0.5sfs5 kHz ,,--- 'Tone Correction of Weighted
C I'NLT [ t I = PNL It 1 + C I t 1
n f r 5 kHz
n v
n E P N L = I O I ~ ~ [ + / t2 ioPNLT/'~ dt] 6 E Duration Correction
tl
Effect. Perceived Noise Level : I / EPNL ]I Fig. A - l Flow char t to determine flyover noise EPNL-values
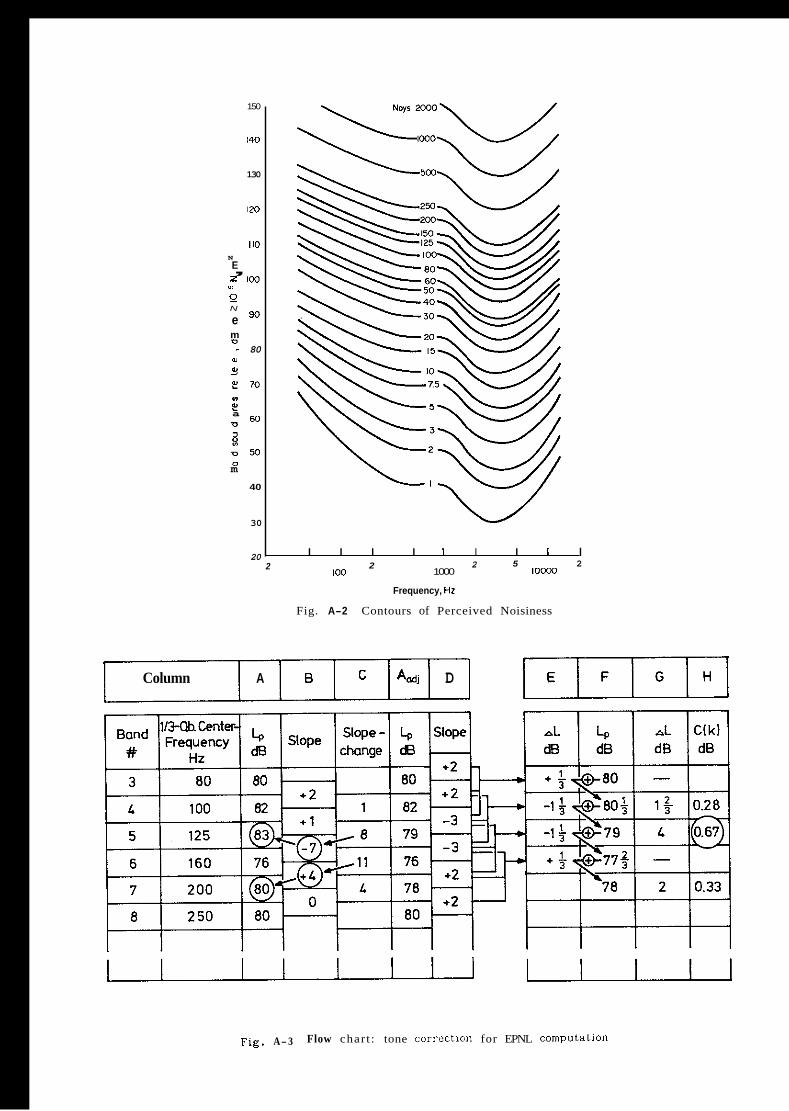
150
140
130
I20
I10 N
, E z 1x3 Q N
e
YI
90
m D
~ 80 u a, >
: 70
2 “I Y)
a u EQ
3 - 5 0 0 m
40
30
I I I I I I I I I 20 5 2
1oooo 2 1000
Frequency, HZ
Fig. A-2 Contours of Perceived Noisiness
2 100
2
Column A B c A,, D
, u Fig. A-3 Flow chart : tone carrectlon for EPNL computatlon

t ( I ) t ( 2 ) Flyover time t, sec
Fig. A-4 Definition of time duration w i t h i n PNLT time history plots
TIME
t
PNLT
toot-
Fast Overf I i g ht li - c
Slow Overf I ig h t
TIME
Fig . A- 5 Idealized PNLT flyover time histories
151
APPENDIX B: ACOUSTICAL CHANGE EVALUATION AND PRECISION OF FLYOVER NOISE MEASUREMENTS
If a n a i rc ra f t does not pass a noise certification test, "acoustical changes" (employing, e .g. a less noisy propeller o r an improved muffler) a r e necessary to lower i t s noise emission. The question a r i ses , whether the acoustic test procedure, as prescribed for certification, is a sui table method for the purpose and whether the a t ta inab le " stat is t ical precision" suffices to evaluate the Success of any such acoustical change. There is often a tendency to take measured noise levels at their "face-
value", neglecting the measurement uncertainty tha t is inherent in the s tat is t ical nature of noise d a t a obtained from a n a i rc ra f t in flight. The following discussion is largely based on I61 and 621.
To ascertain the val idi ty of noise measurements, certification regulations require tha t the arithmetic
mean of at least 4 (or 6) flyaver noise levels sha l l he produced. I n any case, however, the "final" sample size must be la rge enough to establish a 90% confidence l i m i t not exceeding +/- 1.5 dB (See
AGARDograph-Appendix E ) ; hence i t might be necessary to obtain test da ta through more than 4 (or 6) flyovers. I t is obvious tha t the da ta scat ter may become quite l a rge as long as the s tandard
error of the mean of noise levels sx does not exceed a n asymptotical value of 0.9 dB with increas- ing number of flyovers (Fig. B-1) . Practice h a s shown, tha t da t a , which comply with t h i s require- ment, a r e not difficult to obtain for propeller-driven a i rc ra f t . I f in the process of comparing two o r more a i rc ra f t with two or more empirical mean noise levels (with their individual var iances) ,
however, then th i s validation procedure does not suffice!
8.1 Gaussian Data-Distribution and Homogeneity of Variance
To assess significant changes ( i n terms of mean level differences) i t is imperative to take the sta- t is t ical nature of the da ta into account. Within the ANNEX regulations the noise level d a t a a r e
treated as if they formed a normal (Gaussian) distribution in the "dB-space". If this w a s indeed t rue and i f , in addition, both variances s2 of the respective samples were of the same magnitude, then t- statistics for two means could be readi ly applied to test for s ignif icant differences Delta0.05,
corresponding to a n error probability of CY = 0.05. ( I t i s customary to use a Delta0,05 for "signifi-
cance-testing") .
X
The following is to i l lus t ra te the procedure. Fig. 8-2 shows two examples of flight noise da ta obtained under real is t ic test conditions. In both cases a i rc ra f t were tested before and a f te r some
acoustical change had been implemented (such as the replacement of a "noisy" with a "quiet" pro- pel ler) . 'Aircraft A ' w a s tested 4 times in one configuration, then 4 times in the other configura- tion, providing, respectively, 2 times 4 levels, with 2 resulting mean-levels. I t turned out tha t the
variat ions in level from one test flyover to the next within a test ser ies of 4 were quite small; moreover, the difference of the 2 mean levels w a s also quite small, namely 0.5 dB.
Some other 'Aircraft B ' w a s a lso tested 4 times in one configuration and then 4 times in another configuration, aga in providing 2 times 4 levels with 2 mean levels. Here i t turned o u t tha t the
level var iat ions from one test f l ight to the next within one test series of 4 were quite l a rge ; more- over the difference in the mean levels w a s also quite l a rge , namely 2.0 dB.
In the case of 'Aircraft A ' one might be tempted to say : "Ah well, the difference in the mean levels for the a i rc ra f t before and af ter the change i s kind of s m a l l , i s n ' t it. Surely, changing the propeller has not gotten us anywhere!". - Enter 'Aircraft B ' : Here one might say : "Gee, look at the difference a f te r we changed the propeller. I t s a good solid 2.0 dB. Surely, th i s time the change has brought about quite some improvement!"
Such "intuitive" statements a r e however not only dangerous, they can be outrightly wrong! One must consider the s tat is t ics of the d a t a and determine the minimum necessary level-difference for signi- ficance. A level difference of 0.5 dB can be s tat is t ical ly significant, another of 2.0 dB can be s tat is t ical ly insignif icant . __
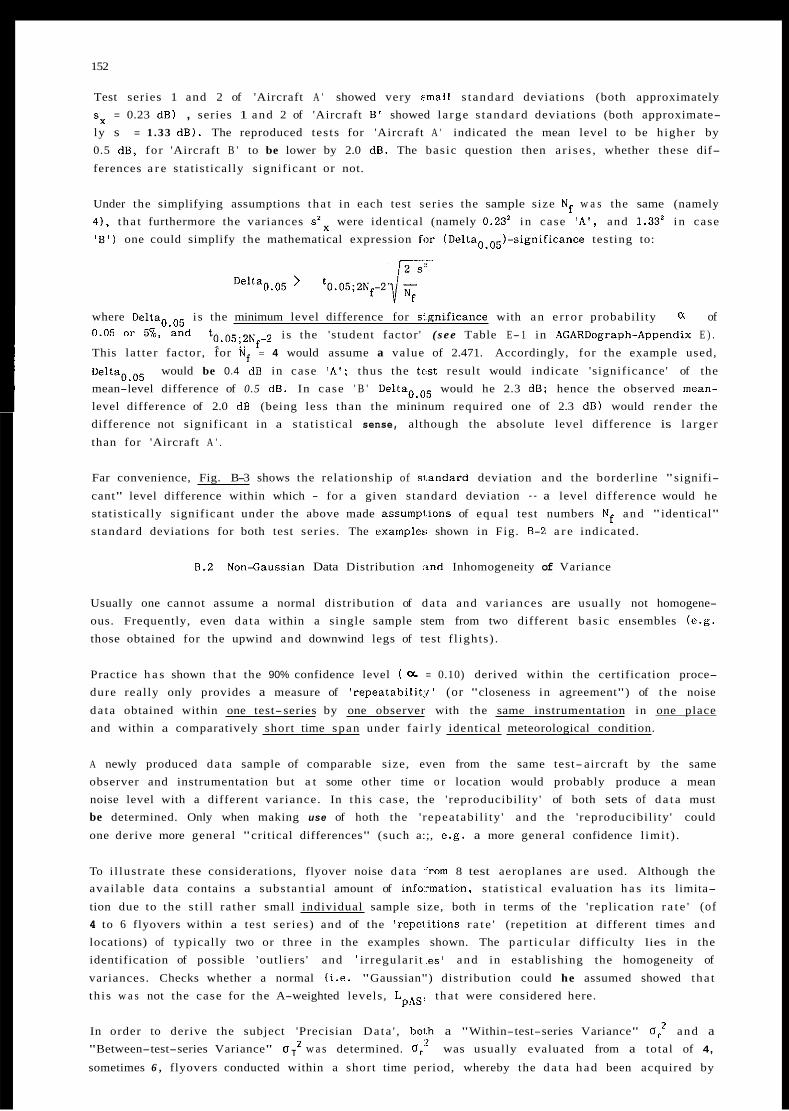
152
Test series 1 and 2 of 'Aircraft A ' showed very small s tandard deviations (both approximately sx = 0.23 dB) , series 1 and 2 of 'Aircraft B ' showed la rge s tandard deviations (both approximate- ly s = 1 .33 dB). The reproduced tes ts for 'Aircraft A ' indicated the mean level to be higher by 0.5 dB, for 'Aircraft B ' to be lower by 2.0 dB. The basic question then a r i ses , whether these dif-
ferences a r e statistically significant or not.
Under the simplifying assumptions tha t in each test series the sample size Nf w a s the same (namely 4 ) , tha t furthermore the variances s z x were identical (namely 0.23' in case ! A ! , and 1.33' in case ' 6 , ) one could simplify the mathematical expression for (Delta0,05)-significance testing to:
- 2 s:!
De1ta0.05 > '0.O5;2Nf-2&
where DeltaO,Oj i s the minimum level difference for s:gnificance with a n e r ro r probability of 0.05 or 570, and t0,0j;2Nf-2 i s the 'student factor ' ( see Table E- 1 in AGARDograph-Appendix E ) . This la t ter factor, for Nf = 4 would assume a value of 2.471. Accordingly, for the example used,
DeltaO,Oj would be 0.4 dB in case 'A ' ; thus the teist result would indicate 'significance' of the mean-level difference of 0.5 dB. In case ' B ' DeltaO,Oj would he 2.3 dB; hence the observed mean- level difference of 2.0 dB (being less than the mininum required one of 2.3 dB) would render the difference not significant in a s ta t is t ical sense, although the absolute level difference is la rger
than for 'Aircraft A ' .
a
Far convenience, Fig. B-3 shows the relationship of s1,andard deviation and the borderline "signifi-
cant" level difference within which - for a given s tandard deviation - a level difference would he statistically significant under the above made assumpl.ions of equal test numbers Nf and "identical" standard deviations for both test series. The example2; shown in Fig. B-2 a r e indicated.
8.2 Nonxauss ian Data Distribution :md Inhomogeneity of Variance
Usually one cannot assume a normal distribution of da ta and variances are usually not homogene- ous. Frequently, even da ta within a single sample stem from two different basic ensembles (e.g. those obtained for the upwind and downwind legs of test f l ights) .
Practice h a s shown tha t the 90% confidence level ( a = 0.10) derived within the certification proce- dure really only provides a measure of 'repeatabilit:!' (or "closeness in agreement") of the noise
da ta obtained within one test-series by one observer with the same instrumentation in one place and within a comparatively short time span under f a i r ly identical meteorological condition.
A newly produced da ta sample of comparable size, even from the same test- aircraft by the same observer and instrumentation but a t some other time o r location would probably produce a mean noise level with a different var iance. In th i s case , the 'reproducibili ty ' of both sets of d a t a must be determined. Only when making use of hoth the ' repeatabi l i ty ' and the 'reproducibili ty ' could
one derive more general "critical differences" (such a:;, e.g. a more general confidence l imi t ) .
To i l lus t ra te these considerations, flyover noise d a t a .:=om 8 test aeroplanes a r e used. Although the avai lable da ta contains a substant ia l amount of in famat ion , s ta t is t ical evaluation h a s i t s limita-
tion due to the s t i l l ra ther small individual sample size, both in terms of the 'replication r a t e ' (of 4 to 6 flyovers within a test ser ies) and of the 'repelitions r a t e ' (repetition at different times and locations) of typically two or three in the examples shown. The par t i cu la r difficulty lies in the identification of possible 'outliers ' and ' i r regular i t :es' and in establishing the homogeneity of
variances. Checks whether a normal ( i .e . "Gaussian") distribution could he assumed showed tha t th is w a s not the case for the A-weighted levels, LpAS. t ha t were considered here.
In order to derive the subject 'Precisian Data ' , both a "Within-test-series Variance" U: and a "Between-test-series Variance" U T z w a s determined. Ur' was usually evaluated from a total of 4,
sometimes 6 , flyovers conducted within a short time period, whereby the d a t a had been acquired by
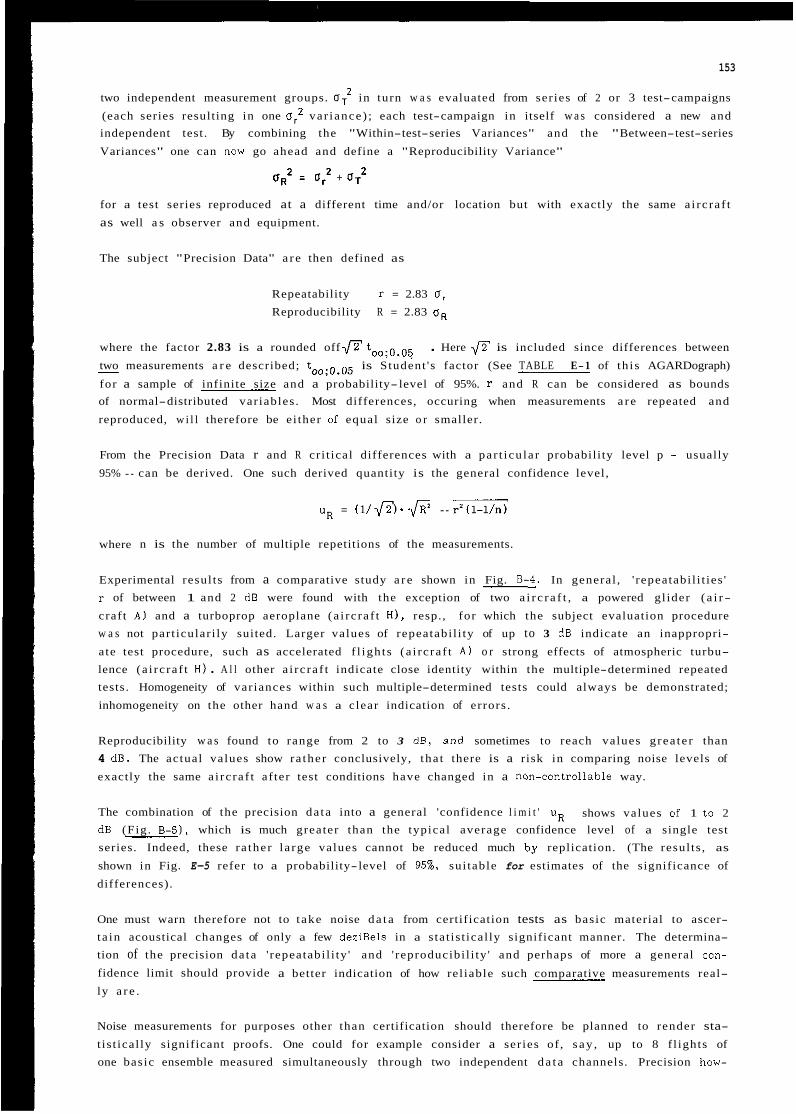
153
two independent measurement groups. 6; in turn w a s evaluated from series of 2 or 3 test-campaigns
(each series resulting in one a: var iance) ; each test-campaign in itself w a s considered a new and independent test. By combining the "Within-test-series Variances" and the "Between-test-series
Variances" one can now go ahead and define a "Reproducibility Variance"
2 a: = a: + aT
for a test series reproduced at a different time and/or location but with exactly the same a i rc ra f t
as well a s observer and equipment.
The subject "Precision Data" a r e then defined as
Repeatability r = 2.83 a, Reproducibility R = 2.83 rfR
where the factor 2.83 is a rounded off &? too;o.oa . Here fl is included since differences between
two measurements a r e described; too;0.05 is Student 's factor (See TABLE E-1 of th i s AGARDograph)
for a sample of infinite size and a probability- level of 95%. r and R can be considered as bounds of normal-distributed variables . Most differences, occuring when measurements a r e repeated and
reproduced, w i l l therefore be ei ther of equal size o r smaller.
-
From the Precision Data r and R cr i t ical differences with a par t icu la r probability level p - usually
95% - can be derived. One such derived quantity is the general confidence level,
U R = (I/+'). J R ~ - rz ( i - i /n f
where n is the number of multiple repetitions of the measurements.
Experimental resul ts from a comparative study a r e shown in Fig. 8-4. In general , ' repeatabi l i t ies ' r of between 1 and 2 dB were found with the exception of two a i r c r a f t , a powered gl ider ( a i r-
craf t A ) and a turboprop aeroplane (a i rc ra f t HI, resp., for which the subject evaluation procedure w a s not part icular i ly suited. Larger values of repeatabi l i ty of up to 3 dE indicate an inappropri-
ate test procedure, such as accelerated f l igh ts (a i rc ra f t A ) o r strong effects of atmospheric turbu- lence (a i rc ra f t H) . A l l other a i rc ra f t indicate close identity within the multiple-determined repeated tests. Homogeneity of var iances within such multiple-determined tests could always be demonstrated;
inhomogeneity on the other hand w a s a clear indication of errors .
Reproducibility w a s found to range from 2 to 3 d B , nnd sometimes to reach values grea te r than 4 dB. The actual values show ra ther conclusively, tha t there is a risk in comparing noise levels of
exactly the same a i rc ra f t af ter test conditions have changed in a nw-controllable way.
The combination of the precision da ta into a general 'confidence l i m i t ' u R shows values of 1 to 2 dB (Fig. B-5), which is much greater than the typical average confidence level of a single test series. Indeed, these ra ther l a rge values cannot be reduced much hy replication. (The resul ts , as
shown in Fig. E-5 refer to a probability-level of 95%, sui table for estimates of the significance of
differences).
One must warn therefore not to t ake noise d a t a from certification tests as basic material to ascer- ta in acoustical changes of only a few deziBels in a s tat is t ical ly significant manner. The determina- tion of the precision da ta ' repeatabi l i ty ' and ' reproducibi l i ty ' and perhaps of more a general can-
fidence limit should provide a better indication of how rel iable such comparative measurements real- ly a r e .
Noise measurements for purposes other than certification should therefore be planned to render sta- t is t ical ly significant proofs. One could for example consider a ser ies of , s ay , up to 8 f l ights of one basic ensemble measured simultaneously through two independent d a t a channels. Precision how-
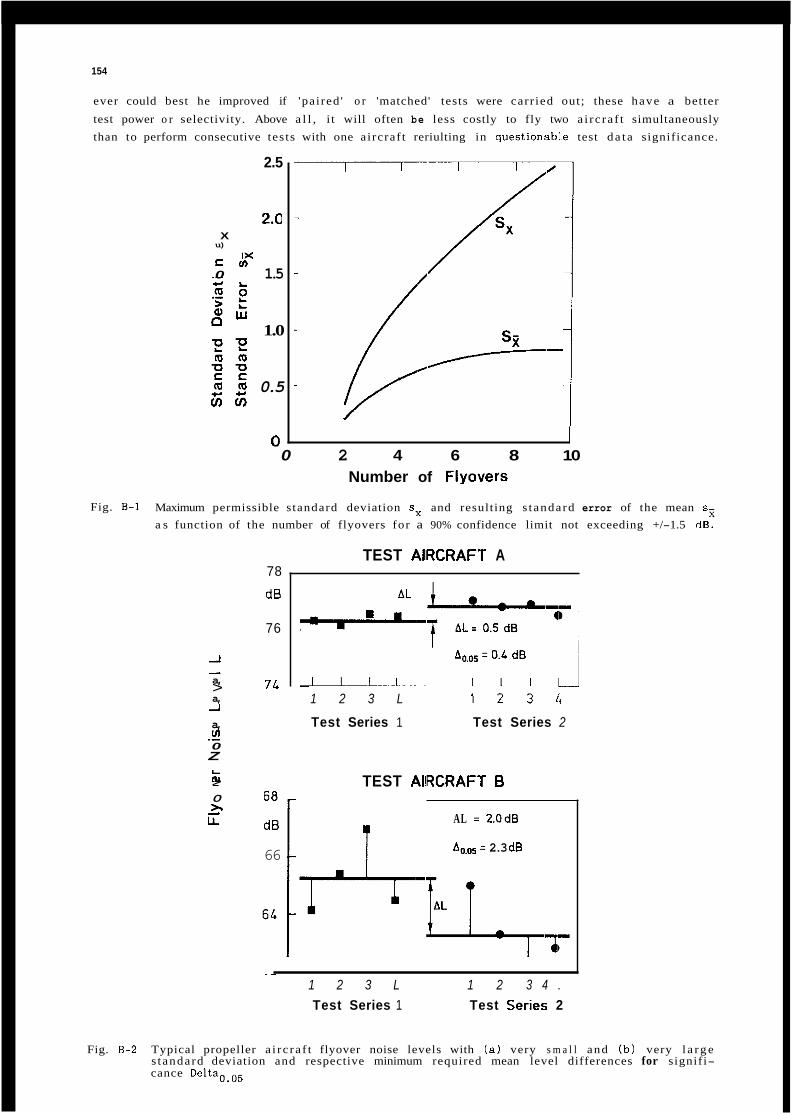
154
ever could best he improved if 'pai red ' o r 'matched' tests were carr ied out; these have a better
test power o r selectivity. Above a l l , i t will often be less costly to fly two a i rc ra f t simultaneously than to perform consecutive tes ts with one a i rcraf t reriulting in questionab1.e test d a t a significance.
2.5
2.0 X u)
c u ) 1%
.- 0 1.5
.E 2 Z & cI 1.0 ? ?
m ,m 0.5 z m
n
L L
m m -0 '0 c c
- 0 2 4 6 8 10
Number of Flyovers
Fig. 6-1 Maximum permissible s tandard deviation sx and resulting s tandard error of the mean s,
a s function of the number of flyovers for a 90% confidence limit not exceeding +/-1.5 dB.
78
dB
76
-1
a, > a, -1
a, v) 0 Z
- 74
.-
L m
TEST AIIRCRAFT A
Aa.05 = 0.L dB
1 2 3 L 1 2 3 1 ,
Test Series 1 Test Series 2
> - TEST AIIRCRAFT 6
r 0 z1 1; AL = 2.0dB
66 Ao,os = 2.3 dB
._ 1 2 3 L 1 2 3 4 . Test Series 1 Test Series; 2
Fig. 8-2 Typical propeller a i rc ra f t flyover noise levels with ( a ) very s m a l l and ( b ) very l a r g e s tandard deviation and respective minimum required mean level differences for signifi- cance Delta0.05
3.0
dB
2.5 In
2 a u 2.0
z n - 1.5
al
C
al 'c 'c .-
al > al -I
C
u c C m
Ln
4-
0 1.0 .-
.- 0.5
0
155
Fig. 8-3
Areas of significant level differences Delta0,05 for error probability of 5% as function of s tandard devia- tion sx vs. number of fly- overs Nf
Fig. B-5
Confidence l i m i t s based on 1.5 dB 2.0 'Repeatability r ' f r o m re-
plicated tests and 'Repro- ducibility R' for 8 propel- ler-driven aeroplanes
( A to H)
0 0.5 1.0
Standard Deviation s,
A B C D E F G H
Aircraft Model
Fig. 8-4 Precision da ta 'Repeatability r ' and 'Reproducibility R ' for 8 pro- peller-driven aeroplanes ( A to H)
R e p e a t a b i l i t y r R e p r o d u c i b i l i t y R
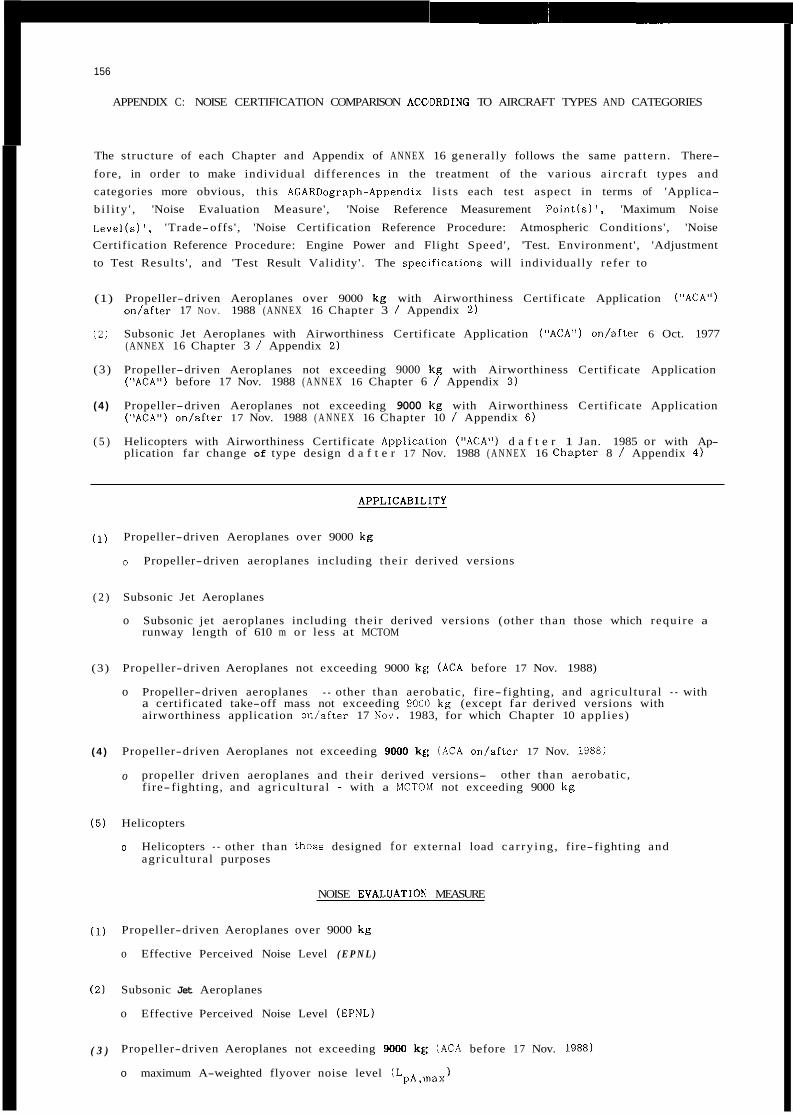
156
APPENDIX C: NOISE CERTIFICATION COMPARISON ACC'DRDING TO AIRCRAFT TYPES AND CATEGORIES
I The structure of each Chapter and Appendix of ANNEX 16 generally follows the same pat tern. There-
fore, in order to make individual differences in the treatment of the various a i rc ra f t types and categories more obvious, this AGARDograph-Appendix l i s t s each test aspect in terms of 'Applica- bi l i ty ' , 'Noise Evaluation Measure', 'Noise Reference Measurement ?oint(s) I , 'Maximum Noise
Level(s) I , 'Trade-offs ' , 'Noise Certification Reference Procedure: Atmospheric Conditions', 'Noise Certification Reference Procedure: Engine Power and Flight Speed', 'Test. Environment', 'Adjustment to Test Results ' , and 'Test Result Validity' . The specLfications will individually refer to
(1) Propeller-driven Aeroplanes over 9000 k g with Airworthiness Certificate Application ("ACA") on/after 17 NOV. 1988 (ANNEX 16 Chapter 3 / Appendix 2)
( 2 ) Subsonic Jet Aeroplanes with Airworthiness Certificate Application ("ACA") on la f te r 6 Oct. 1977 (ANNEX 16 Chapter 3 1 Appendix 2)
(3) Propeller-driven Aeroplanes not exceeding 9000 kg with Airworthiness Certificate Application ("ACA") before 17 Nov. 1988 ( A N N E X 16 Chapter 6 1 Appendix 3 )
( 4 ) Propeller-driven Aeroplanes not exceeding 9000 kg with Airworthiness Certificate Application ("ACA") on/after 17 Nov. 1988 ( A N N E X 16 Chapter 10 1 Appendix 6)
( 5 ) Helicopters with Airworthiness Certificate Applical,ion ("ACA") d a f t e r 1 Jan. 1985 or with Ap- plication far change of type design d a f t e r 17 Nov. 1988 ( A N N E X 16 Cha.pter 8 1 Appendix 4)
APPLICABILITY
(1) Propeller-driven Aeroplanes over 9000 k g
o Propeller-driven aeroplanes including their derived versions
( 2 ) Subsonic Jet Aeroplanes
o Subsonic jet aeroplanes including their derived versions (other than those which require a runway length of 610 m or less at MCTOM
(3) Propeller-driven Aeroplanes not exceeding 9000 kg (ACA before 17 Nov. 1988)
o Propeller-driven aeroplanes - other than aerobatic, fire- fighting, and agricul tural - with a certificated take-off mass not exceeding 9001) kg (except far derived versions with airworthiness application on/after 17 NOV. 1983, for which Chapter 10 appl ies)
( 4 ) Propeller-driven Aeroplanes not exceeding 9000 kg (ACA "/after 17 Nov. 1988)
o propeller driven aeroplanes and their derived versions- fire- fighting, and agricul tural - with a MCTON not exceeding 9000 kg
other than aerobatic,
(5 ) Helicopters
o Helicopters - other than thoae designed for external load car ry ing , fire-fighting and agricul tural purposes
NOISE EVALUATIOh MEASURE
(1) Propeller-driven Aeroplanes over 9000 kg
o Effective Perceived Noise Level ( E P N L )
( 2 ) Subsonic Jet Aeroplanes
o Effective Perceived Noise Level (EPNL)
( 3 ) Propeller-driven Aeroplanes not exceeding 9000 kg (ACA before 17 Nov. 1988)
o maximum A-weighted flyover noise level ( L ) pA,max
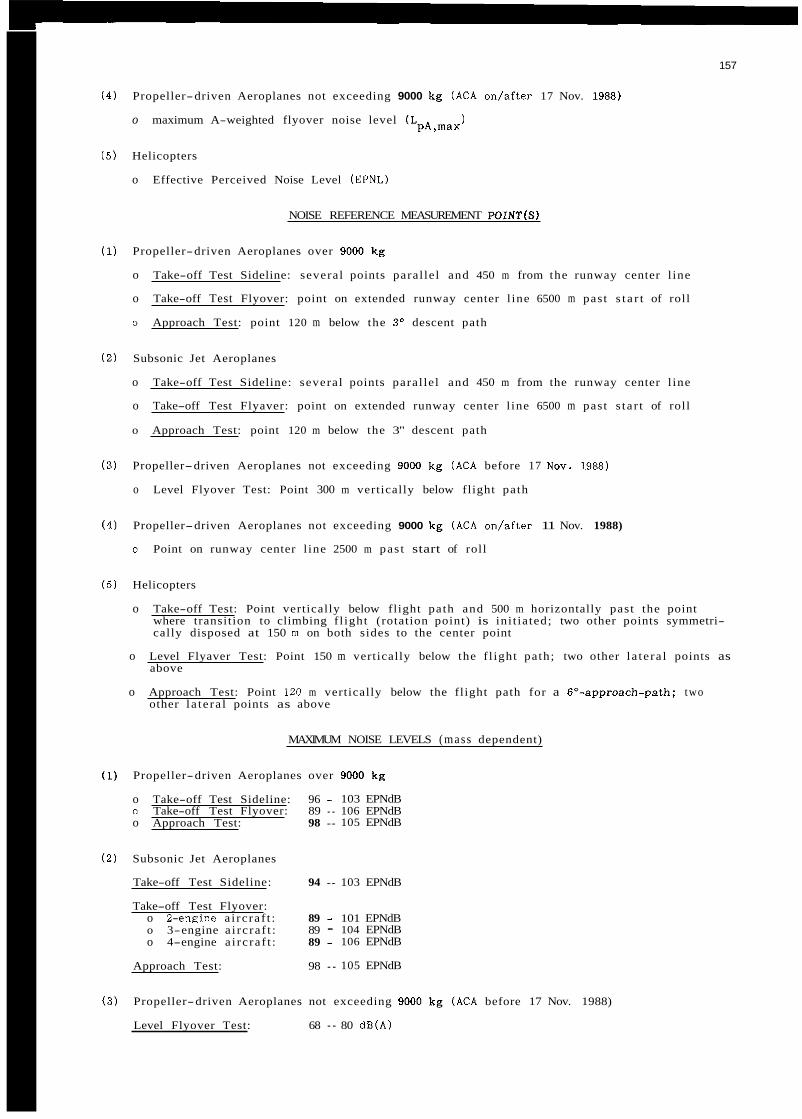
157
(4) Propeller-driven Aeroplanes not exceeding 9000 k g (ACA on/after 17 Nov. 1988)
o maximum A-weighted flyover noise level (LpA,max )
( 5 ) Helicopters
o Effective Perceived Noise Level (EPNL)
NOISE REFERENCE MEASUREMENT POINT(S)
( 1) Propeller-driven Aeroplanes over 9000 kg
o Take-off Test Sideline: several points paral lel and 450 m from the runway center l ine
o Take-off Test Flyover: point on extended runway center l ine 6500 m past s t a r t of roll
o Approach Test: point 120 m below the 3 O descent path
( 2 ) Subsonic Jet Aeroplanes
o Take-off Test Sideline: several points paral lel and 450 m from the runway center l ine
o Take-off Test Flyaver: point on extended runway center l ine 6500 m past s ta r t of roll
o Approach Test: point 120 m below the 3" descent path
( 3 ) Propeller-driven Aeroplanes not exceeding 9000 k g (ACA before 17 No". 1988)
o Level Flyover Test: Point 300 m vertically below flight path
(4) Propeller-driven Aeroplanes not exceeding 9000 k g (ACA on/after 11 Nov. 1988)
D Point on runway center l ine 2500 m pas t start of roll
( 5 ) Helicopters
o Take-off Test: Point vertically below flight path and 500 m horizontally past the point where transition to climbing f l ight (rotation point) is ini t ia ted; two other points symmetri- cally disposed at 150 m on both sides to the center point
o Level Flyaver Test: Point 150 m vertically below the f l ight path; two other la te ra l points as above
o Approach Test: Point 120 m vertically below the flight path for a 6--approach-path; two other la te ra l points as above
MAXIMUM NOISE LEVELS (mass dependent)
( 1) Propeller-driven Aeroplanes over 9000 k g
o Take-off Test Sideline: 96 - 103 EPNdB D Take-off Test Flyover: 89 - 106 EPNdB o Approach Test: 98 - 105 EPNdB
( 2 ) Subsonic Jet Aeroplanes
Take-off Test Sideline: 94 - 103 EPNdB
Take-off Test Flyover: o %engine a i rc ra f t : 89 - 101 EPNdB o 3-engine a i rc ra f t : 89 - 104 EPNdB o 4-engine a i rc ra f t : 89 - 106 EPNdB
Approach Test: 98 - 105 EPNdB
(3) Propeller-driven Aeroplanes not exceeding 9000 k g (ACA before 17 Nov. 1988)
Level Flyover Test: 68 - 80 dB(A)
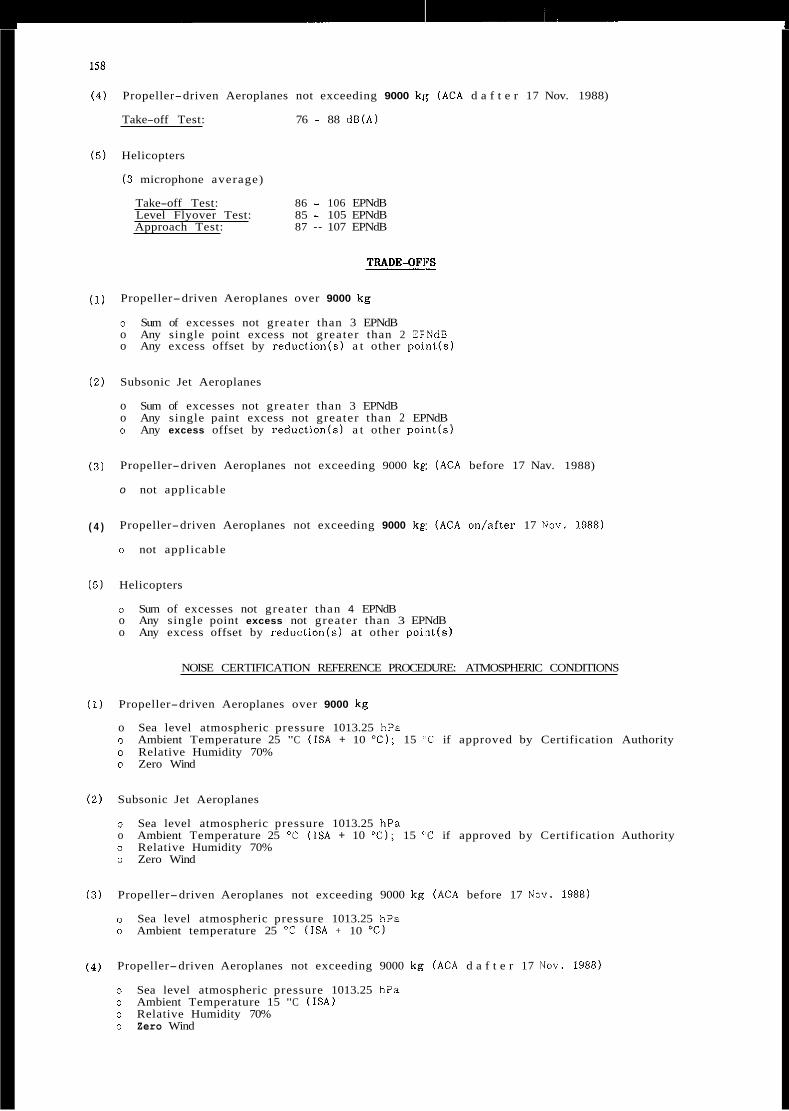
158
(4) Propeller-driven Aeroplanes not exceeding 9000 k,; (ACA d a f t e r 17 Nov. 1988)
Take-off Test: 76 - 88 dB(A)
(5) Helicopters
( 3 microphone average)
Take-off Test: 86 - 106 EPNdB Level Flyover Test: 85 - 105 EPNdB Approach Test: 87 - 107 EPNdB
TMDECIF13
(1) Propeller-driven Aeroplanes over 9000 k g
o Sum of excesses not greater than 3 EPNdB o Any single point excess not greater than 2 EFNdB o Any excess offset by reduct ian(s) a t other point(s)
( 2 ) Subsonic Jet Aeroplanes
o Sum of excesses not greater than 3 EPNdB o Any single paint excess not greater than 2 EPNdB o Any excess offset by reduction(s) a t other po in t ( s )
( 3 ) Propeller-driven Aeroplanes not exceeding 9000 kg (ACA before 17 Nav. 1988)
o not applicable
( 4 ) Propeller-driven Aeroplanes not exceeding 9000 kg: (ACA on/after 17 NOV. 1988)
o not applicable
( 5 ) Helicopters
o Sum of excesses not greater than 4 EPNdB o Any single point excess not greater than 3 EPNdB o Any excess offset by reduction(s) at other p o i i t ( s )
NOISE CERTIFICATION REFERENCE PROCEDURE: ATMOSPHERIC CONDITIONS
(1) Propeller-driven Aeroplanes over 9000 kg
o Sea level atmospheric pressure 1013.25 hPa o Ambient Temperature 25 "C (ISA + 10 ' C ) ; 15 "C if approved by Certification Authority o Relative Humidity 70% D Zero Wind
( 2 ) Subsonic Jet Aeroplanes
o Sea level atmospheric pressure 1013.25 hPa o Ambient Temperature 25 "C ( I S A + 10 "C); 15 "C if approved by Certification Authority o Relative Humidity 70% o Zero Wind
( 3 ) Propeller-driven Aeroplanes not exceeding 9000 kg (ACA before 17 No". 1988)
o Sea level atmospheric pressure 1013.25 hPa o Ambient temperature 25 "C (ISA + 10 "C)
(4) Propeller-driven Aeroplanes not exceeding 9000 kg (ACA d a f t e r 17 Nav. 1988)
o Sea level atmospheric pressure 1013.25 hPa o Ambient Temperature 15 "C (ISA) o Relative Humidity 70% o Zero Wind
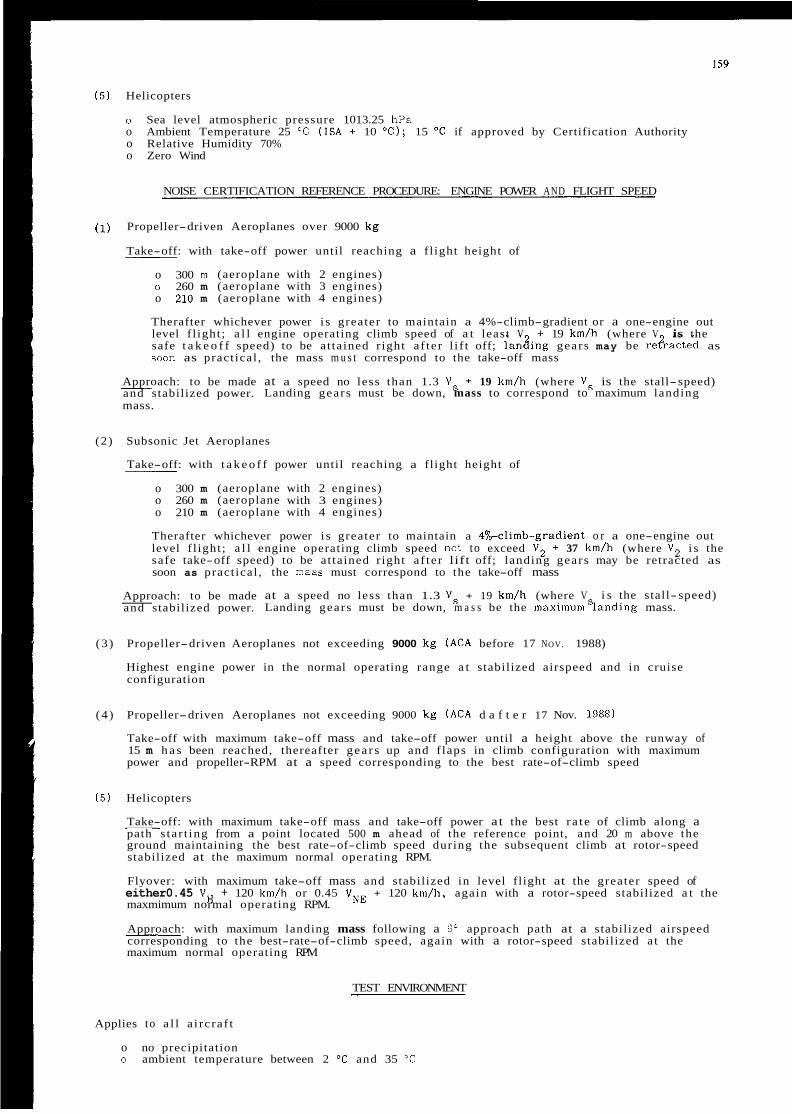
( 5 ) Helicopters
o Sea level atmospheric pressure 1013.25 hPa o Ambient Temperature 25 'C (ISA + 10 "C); 15 T if approved by Certification Authority o Relative Humidity 70% o Zero Wind
NOISE CERTIFICATION REFERENCE PROCEDURE: ENGINE POWER AND FLIGHT SPEED
(1) Propeller-driven Aeroplanes over 9000 k g
Take-off: with take-off power until reaching a f l ight height of
o 300 m (aeroplane with 2 engines) o 260 m (aeroplane with 3 engines) o 210 m (aeroplane with 4 engines)
Therafter whichever power i s greater to maintain a 4%-climb-gradient or a one-engine out level f l ight ; a l l engine operating climb speed of a t least V + 19 km/h (where V is the safe t a k e o f f speed) to be at ta ined r ight a f te r l i f t off; l a d i n g gears may be ret?racted as soon as pract ical , the mass m u s t correspond to the take-off mass
Approach: to be made at a speed no less than 1.3 Vs + 19 km/h (where Vs is the stall-speed) and stabilized power. Landing gears must be down, mass to correspond to maximum landing mass.
(2) Subsonic Jet Aeroplanes
Take-off: with t a k e o f f power until reaching a flight height of
o 300 m (aeroplane with 2 engines) o 260 m (aeroplane with 3 engines) o 210 m (aeroplane with 4 engines)
Therafter whichever power i s greater to maintain a 4%-climb-gradient o r a one-engine out level f l ight ; a l l engine operating climb speed not to exceed V2 + 37 km/h (where V2 i s the safe take-off speed) to be at ta ined r ight a f te r lift off; landing gears may be retracted as soon as pract ical , the mass must correspond to the take-off mass
Approach: to be made at a speed no less than 1.3 Vs + 19 km/h (where V and stabilized power. Landing gears must be down, m a s s be the maximum9anding mass.
i s the stall- speed)
(3 ) Propeller-driven Aeroplanes not exceeding 9000 k g ( A C A before 17 NOV. 1988)
Highest engine power in the normal operating range a t stabilized airspeed and in cruise configuration
(4 ) Propeller-driven Aeroplanes not exceeding 9000 kg (ACA d a f t e r 17 Nov. 1988)
Take-off with maximum take-off mass and take-off power until a height above the runway of 15 m h a s been reached, thereafter g e a r s up and f laps in climb configuration with maximum power and propeller-RPM at a speed corresponding to the best rate-of-climb speed
(5 ) Helicopters
Take-off: with maximum take-off mass and take-off power at the best r a t e of climb along a path s ta r t ing from a point located 500 m ahead of the reference point, and 20 m above the ground maintaining the best rate-of-climb speed during the subsequent climb at rotor-speed stabilized at the maximum normal operating RPM.
Flyover: with maximum take-off mass and stabilized in level flight at the greater speed of either0.45 VH + 120 km/h or 0.45 V N E + 120 km/h, again with a rotor-speed stabilized a t the maxmimum normal operating RPM.
Approach: with maximum landing mass following a 6' approach path at a stabilized airspeed corresponding to the best-rate-of-climb speed, again with a rotor-speed stabilized a t the maximum normal operating RPM
TEST ENVIRONMENT
Applies to a l l a i rc ra f t
o no precipitation o ambient temperature between 2 OC and 35 "C
160
o relative humidity between 20% and 95% o certain combination of the two are to be avoided, where high frequencies are much absorbed o 30 second average wind speed not to exceed I!> km/h and c ro s swind not higher than 9 km/h
measured 10 m above ground for ( l ) , ( 2 ) and (5) , and 1.2 m above ground for ( 3 ) and (4 )
ADJUSTMENTS TO TIBT RESULTS
Note: Differences between test and reference conditions result in differences of the following:
o aeroplane fl ight path and velocity re la t ive to the measurement point o amount of sound attenuation in the a i r o source noise, i .e. the generating mechanisms of propeller- , rotor- and engine-noise.
Depending on the par t icular a i rc ra f t type, i t s operation and propulsion system different degrees of adjustments a r e necessary; within certain test environmental windows, no corrections are necessary.
I f the noise evaluation measure i s the EPNL, then i t s computation requires the above listed adjust- ments; less complex adjustments a r e required for determining L This i s reflected in the relevant A N N E X 16 Appendix Sections on Data Adjustments.
Propeller-driven Aeroplanes over 9000 kg
Corrections a r e required for
o attenuation of the noise along i t s path by means of the inverse-square l a w and atmo-
o duration of the noise as affected by distance and speed of the aeroplane relative to the
o source noise emitted by the engine or the propellers a s affected by relevant parameters
spheric attenuation
measuring point
Subsonic Jet Aeroplanes
Corrections a r e required for
o attenuation of the noise along i t s path by means of the inverse-square law and atmo-
o duration of the noise as affected by distance and speed of the aeroplane re la t ive to the
o source noise emitted by the engine or the propellers as affected by relevant parameters
spheric attenuation
measuring point
Propeller-driven Aeroplanes not exceeding 9000 kl; (ACA before 17 NOV. 1988)
Corrections are required for
o engine power, o helical blade t ip Mach number (for a difference of more than 0 . 0 0 3 ) , and o fl ight height
Propeller-driven Aeroplanes not exceeding 9000 kg ( A C A on/after 17 NO". 1988)
Corrections a r e required for
o atmospheric attenuation, o noise path length, o helical blade t ip Mach number, and o engine power
Helicopters
Similar corrections as under ( I ) , ( 2 ) . and ( 4 ) are required for the helicopter; however, t h e determination of a helicopter 's noise sensitivity ldependence of EPNL. upon flight speed or Mach-number of the advancing blade) is needed lo correct for tedreference-differences in advancing blade t ip Mach number and flight speed. The inverse-square-law does not correctly adjust for differences in the f l ight height on account of the 3 la teral ly positioned measuring microphones!
TEST RESULT Vl-
For a l l noise certification testing the general requirenient h a s been set to ascertain a l a r g e enough test sample (number of valid test f l ights) to establish s ta t is t ical ly a 90% confidence limit not exceeding +/- 1.5 dB (See also Appendix E of th is AGARDograph)
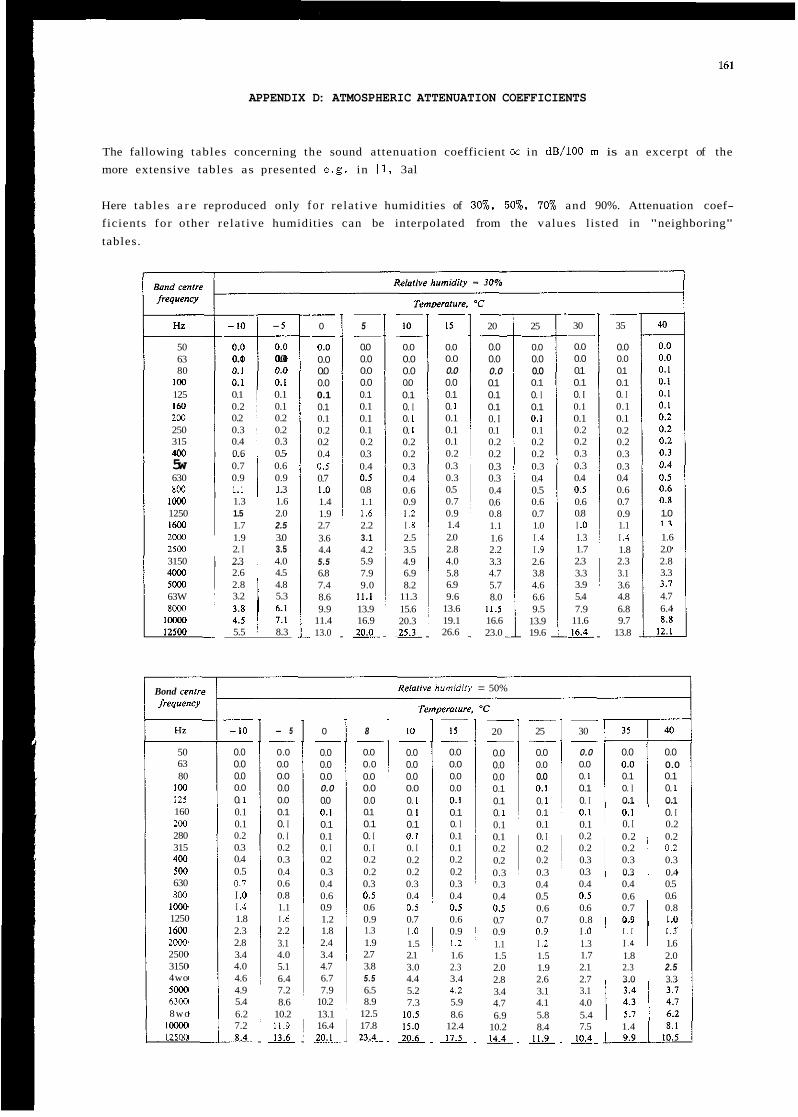
APPENDIX D: ATMOSPHERIC ATTENUATION COEFFICIENTS
The fallowing tables concerning the sound attenuation coefficient OC in dB/100 m is a n excerpt of the more extensive tables as presented e.g. in 11, 3al
Here tables a r e reproduced only f o r relat ive humidities of 30%, SO%, 10% and 90%. Attenuation coef- ficients for other relat ive humidities can be interpolated from the values listed in "neighboring"
tables.
HZ
50 63 80
IM) 125 IM) 2 w 250 315 400 5w 630 800
I C " 1250 IMX) 2wo 25w 3150 m 5 w o 63W 8wo
lw00 125w
Bond renrre /WUe"CY
HZ
50 63 80
100 125 160 200 280 315 4w 500 630 8W 1wo 1250 16W 2wo 2500 3150 4wo 5wo 63M) 8wo
IWW 125w
-$i 0. I 0.0 0. I
0.1 0.1 0.2 0.1 0.2 0.2 0.3 0.2 0.4 0.3 0.6 0.5 0.7 0.6 0.9 1 0.9 1.1 1.3 1.3 1.6 1.5 2.0 1.7 2.5 1.9 3.0 2. I 3.5 2.3 4.0 2.6 4.5 2.8 4.8 3.2 5.3 1 :I I ;:; 5.5 8.3
- 0
0.0 0.0 0.0 0.0 0.1 0.1 0.1 0.2 0.2 0.4 0.5 0.7 1.0 1.4 1.9 2.7 3.6 4.4 5.5 6.8 7.4 8.6 9.9
11.4 13.0
-
- 5
0.0 0.0 0.0 0.0 0.1 0.1 0.1 0.1 0.2 0.3 0.4 0.5
1.1 1.6 2.2 3.1 4.2 5.9 7.9 9.0
11.1 13.9 16.9
-
0.8
20.0
- 10
0.0 0.0 0.0 0.0 0.1 0. I 0. I 0. I 0.2 0.2 0.3 0.4 0.6 0.9 1.2 I .8 2.5 3.5 4.9 6.9 8.2
11.3 15.6 20.3
-
25.3
- I5
0.0 0.0 0.0 0.0 0.1 0. I 0.1 0.1 0.1 0.2 0.3 0.3 0.5 0.7 0.9 1.4 2.0 2.8 4.0 5.8 6.9 9.6
13.6 19.1 26.6
-
- 20
0.0 0.0 0.0 0.1 0.1 0.1 0. I 0.1 0.2 0.2 0.3 0.3 0.4 0.6 0.8 1.1 1.6 2.2 3.3 4.7 5.7 8.0
11.5 16.6 23.0
- 25
0.0 0.0 0.0 0.1 0. I 0.1 0.1 0.1 0.2 0.2 0.3 0.4 0.5 0.6 0.7 1.0 I .4 I .9 2.6 3.8 4.6 6.6 9.5
13.9 19.6
__ - 30
0.0 0.0 0.1 0.1 0. I 0.1 0.1 0.2 0.2 0.3 0.3 0.4 0.5 0.6 0.8 I .o 1.3 1.7 2.3 3.3 3.9 5.4 7.9
11.6
-
16.4
- 35
0.0 0.0 0.1 0.1 0. I 0.1 0.1 0.2 0.2 0.3 0.3 0.4 0.6 0.7 0.9 1.1 I .4 1.8 2.3 3.1 3.6 4.8 6.8 9.7
13.8
-
0.5
1.0
1.6 2.0 2.8 3.3
4.7 6.4
ReIolive humidily = 50%
- -IO
0.0 0.0 0.0 0.0 0. I 0.1 0.1 0.2 0.3 0.4 0.5 0.7 I .o I .4 1.8 2.3 2.8 3.4 4.0 4.6 4.9 5.4 6.2 7.2 8.4
-
- - 5
0.0 0.0 0.0 0.0 0.0 0.1 0. I 0. I 0.2 0.3 0.4 0.6 0.8 1.1 I .6 2.2 3.1 4.0 5.1 6.4 7.2 8.6
10.2 11.9
-
13.6
- 0
0.0 0.0 0.0 0.0 0.0 0.1 0.1 0.1 0. I 0.2 0.3 0.4 0.6 0.9 1.2 1.8 2.4 3.4 4.7 6.7 7.9
10.2 13.1 16.4
-
20.1
- 8
0.0 0.0 0.0 0.0 0.0 0.1 0.1 0. I 0. I 0.2 0.2 0.3 0.5 0.6 0.9 1.3 1.9 2.7 3.8 5.5 6.5 8.9
12.5 17.8 23.4
- - IO
0.0 0.0 0.0 0.0 0. I 0. I 0.1 0.1 0. I 0.2 0.2 0.3 0.4 0.5 0.7 I .o 1.5 2.1 3.0 4.4 5.2 7.3
10.5 15.0 20.6
-
- I5
0.0 0.0 0.0 0.0 0.1 0.1 0. I 0.1 0.1 0.2 0.2 0.3 0.4 0.5 0.6 0.9 1 .2 1.6 2.3 3.4 4.2 5.9 8.6
12.4 L7.5
- - 20
0.0 0.0 0.0 0.1 0.1 0. I 0.1 0.1 0.2 0.2 0.3 0.3 0.4 0.5 0.7 0.9 1.1 1.5 2.0 2.8 3.4 4.7 6.9
10.2
-
14.4
__ 25
0.0 0.0 0.0 0.1 0. I 0.1 0.1 0. I 0.2 0.2 0.3 0.4 0.5 0.6 0.7 0.9 I .2 1.5 1.9 2.6 3.1 4.1 5.8 8.4 11.9
- -
30
0.0 0.0 0. I 0.1 0. I 0.1 0.1 0.2 0.2 0.3 0.3 0.4 0.5 0.6 0.8 I .o 1.3 1.7 2.1 2.7 3.1 4.0 5.4 7.5
-
10.4
0.0 0.0
0.1 0.1 0.0 I 0.0
0. I 0. I 0.1 I 0.1 0.1 0. I 0. I 0.2 0.2 0.2 0.2 0.2 0.3 0.3 0.3 0.4 0.4 0.5 0.6 1 0.6 0.7 0.8 0.9 I .0 1.1 1.3 I .4 1.6 1.8 2.0 2.3 2.5 3.0 3.3
1.4
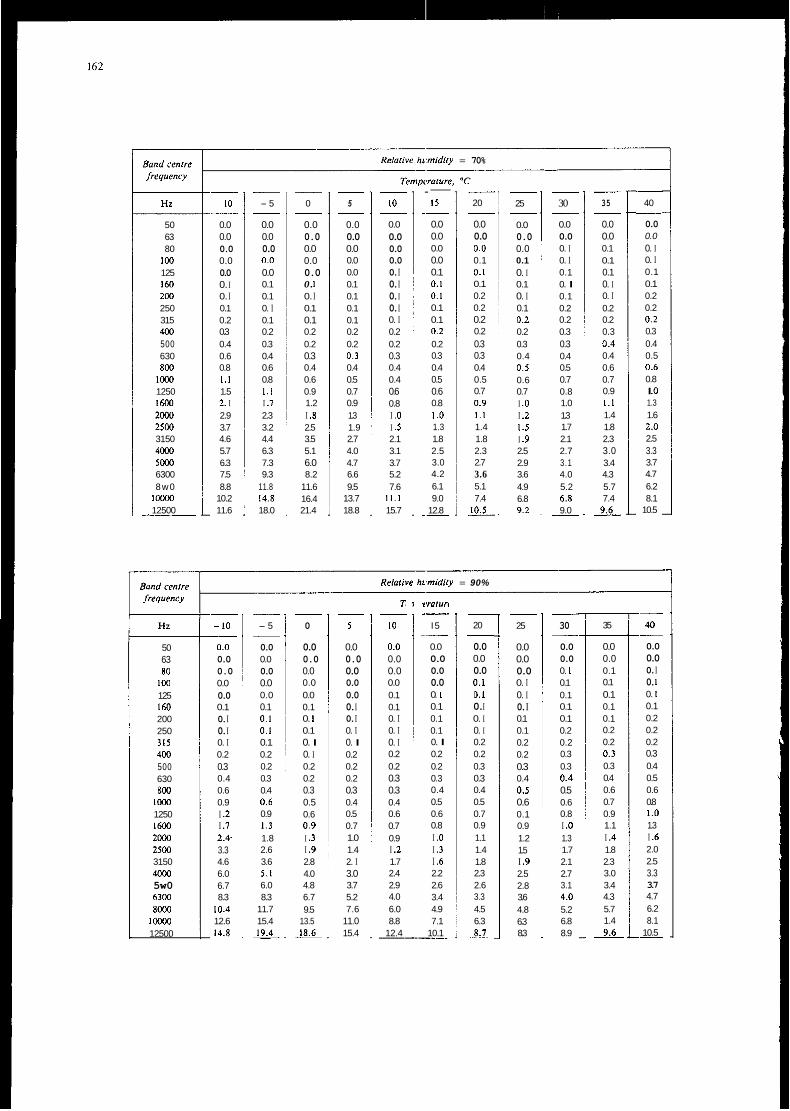
Relorive hvmidiIy = 70% -
- 40
0.0 0.0 0. I 0. I 0.1 0.1 0.2 0.2 0.2 0.3 0.4 0.5 0.6 0.8 I .O 1.3 1.6 2.0 2.5 3.3 3.7 4.7 6.2 8.1
10.5
-
- - 10
0.0 0.0 0.0 0.0 0.0 0. I 0. I 0.1 0.2 0.3 0.4 0.6 0.8 1 . 1 1.5 2. I 2.9 3.7 4.6 5.7 6.3 7.5 8.8
10.2 11.6
__ - - 5
0.0 0.0 0.0 0.0 0.0 0.1 0.1 0. I 0.1 0.2 0.3 0.4 0.6 0.8 1.1 I .7 2.3 3.2 4.4 6.3 7.3 9.3
11.8 14.8 18.0
-
- 0
0.0 0.0 0.0 0.0 0.0 0. I 0. I 0.1 0.1 0.2 0.2 0.3 0.4 0.6 0.9 1.2 I .8 2.5 3.5 5.1 6.0 8.2
11.6 16.4 21.4
-
__ 5
0.0 0.0 0.0 0.0 0.0 0.1 0.1 0.1 0.1 0.2 0.2 0.3 0.4 0.5 0.7 0.9 1.3 1.9 2.7 4.0 4.7 6.6 9.5
13.7 18.8
-
- IO
0.0 0.0 0.0 0.0 0. I 0. I 0. I 0. I 0. I 0.2 0.2 0.3 0.4 0.4 0.6 0.8 I .o I .5 2.1 3.1 3.7 5.2 7.6
11.1 15.7
-
.- I 5
0.0 0.0 0.0 0.0 0.1 0. I 0.1 0.1 0.1 0.2 0.2 0.3 0.4 0.5 0.6 0.8 I .O 1.3 1.8 2.5 3.0 4.2 6.1 9.0
12.8
.-
.-
- 20
0.0 0.0 0.0 0.1 0.1 0.1 0.2 0.2 0.2 0.2 0.3 0.3 0.4 0.5 0.7 0.9 1.1 1.4 1.8 2.3 2.7 3.6 5.1 7.4
-
10.5
__ 25
0.0 0.0 0.0 0.1 0. I 0.1 0. I 0.1 0.2 0.2 0.3 0.4 0.5 0.6 0.7 I .o I .2 1.5 I .9 2.5 2.9 3.6 4.9 6.8 9.2
-
__ 30
0.0 0.0 0. I 0. I 0.1 0. I 0.1 0.2 0.2 0.3 0.3 0.4 0.5 0.7 0.8 1.0 1.3 1.7 2.1 2.7 3.1 4.0 5.2 6.8 9.0
__
__
- 35
0.0 0.0 0.1 0.1 0.1 0. I 0. I 0.2 0.2 0.3 0.4 0.4 0.6 0.7 0.9 1 .1 1.4 1.8 2.3 3.0 3.4 4.3 5.7 7.4
-
9.6
H Z
50 63 80
100 125 160 200 250 315 4w 500 630 800
1wO 1250 IMM 2wO 2500 3150 4ixa 5wO 6300 8w0
IWW 12500 ___
Relorive htmidily = 90%
,W-Gl",,
I 5
0.0 0.0 0.0 0.0 0. I 0.1 0.1 0.1 0. I 0.2 0.2 0.3 0.4 0.5 0.6 0.8 I .o I .3 I .6 2.2 2.6 3.4 4.9 7.1
10.1
__ .-
.-
- 20
0.0 0.0 0.0 0.1 0.1 0. I 0. I 0. I 0.2 0.2 0.3 0.3 0.4 0.5 0.7 0.9 1.1 1.4 1.8 2.3 2.6 3.3 4.5 6.3
-
8.7
- 40
0.0 0.0 0. I 0. I 0. I 0.1 0.2 0.2 0.2 0.3 0.4 0.5 0.6 0.8 1.0 1.3 I .6 2.0 2.5 3.3 3.7 4.7 6.2 8.1
10.5
-
-
z -
10
0.0 0.0 0.0 0.0 0.1 0.1 0. I 0. I 0. I 0.2 0.2 0.3 0.3 0.4 0.6 0.7 0.9 I .2 1.7 2.4 2.9 4.0 6.0 8.8
12.4
-
-.
- -10
0.0 0.0 0.0 0.0 0.0 0.1 0. I 0. I 0. I 0.2 0.3 0.4 0.6 0.9 I .2 I .7 2.4- 3.3 4.6 6.0 6.7 8.3
10.4 12.6 14.8
-
__ - 5
0.0 0.0 0.0 0.0 0.0 0.1 0.1 0.1 0.1 0.2 0.2 0.3 0.4 0.6 0.9 1.3 1.8 2.6 3.6 5.1 6.0 8.3
11.7 15.4
-
19.4
- 0
0.0 0.0 0.0 0.0 0.0 0.1 0. I 0.1 0. I 0. I 0.2 0.2 0.3 0.5 0.6 0.9 I .3 I .9 2.8 4.0 4.8 6.7 9.5
13.5
-
18.6
- 5
0.0 0.0 0.0 0.0 0.0 0. I 0. I 0. I 0. I 0.2 0.2 0.2 0.3 0.4 0.5 0.7 1.0 1.4 2. I 3.0 3.7 5.2 7.6
11.0 15.4
-
- 25
0.0 0.0 0.0 0. I 0. I 0. I 0.1 0.1 0.2 0.2 0.3 0.4 0.5 0.6 0.1 0.9 1.2 1.5 I .9 2.5 2.8 3.6 4.8 6.3 8.3
-
- 30
0.0 0.0 0. I 0.1 0.1 0.1 0.1 0.2 0.2 0.3 0.3 0.4 0.5 0.6 0.8 I .o 1.3 1.7 2.1 2.7 3.1 4.0 5.2 6.8 8.9
- H Z 35
50 63 80
100
0.0 0.0 0.1 0.1 0.1 0.1 0.1 0.2 0.2 0.3 0.3 0.4 0.6 0.7 0.9 1.1 I .4 1.8 2.3 3.0 3.4 4.3 5.7 1.4 9.6
125 I60 200 250 315 400 500 630 8W
IwO 1250 IMM 2wO 2500 3150 4wo 5w0 6300 8000
IWW 12500
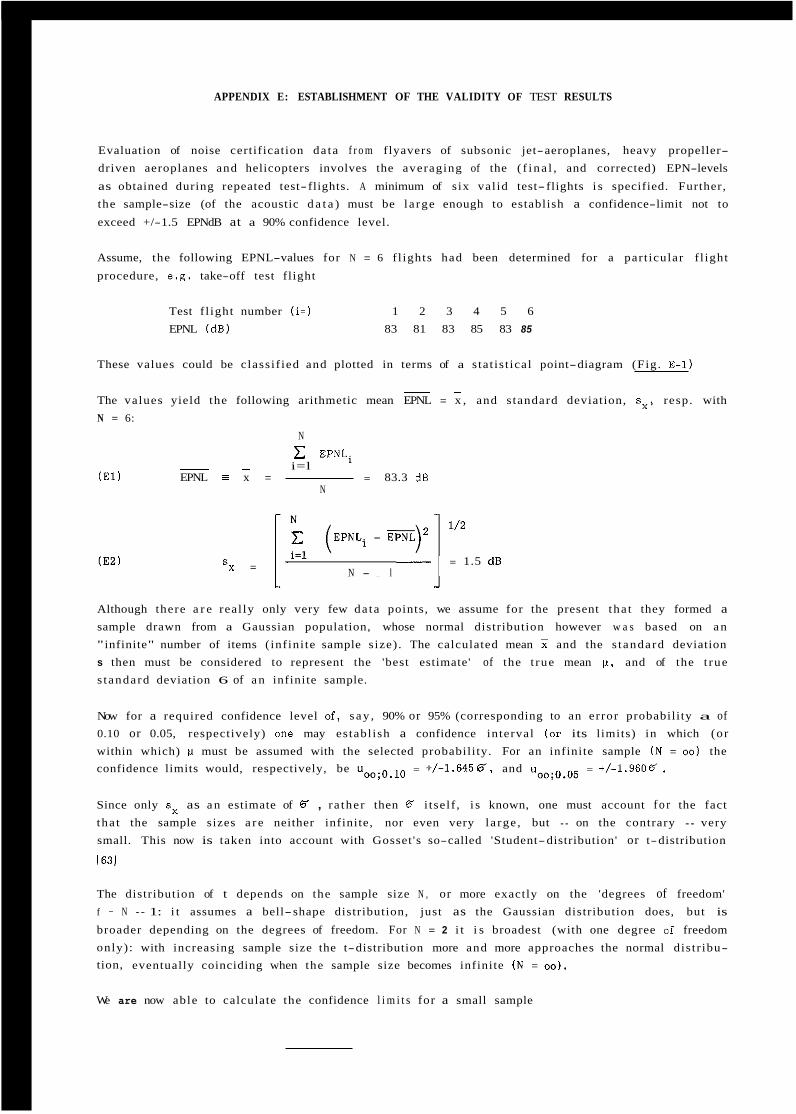
APPENDIX E: ESTABLISHMENT OF THE VALIDITY OF TEST RESULTS
Evaluation of noise certification da ta f r o m flyavers of subsonic jet-aeroplanes, heavy propeller- driven aeroplanes and helicopters involves the averaging of the ( f i na l , and corrected) EPN-levels
as obtained during repeated test-flights. A minimum of s ix val id test- flights i s specified. Further, the sample-size (of the acoustic d a t a ) must be la rge enough to establish a confidence-limit not to
exceed +/-1.5 EPNdB at a 90% confidence level.
Assume, the following EPNL-values for N = 6 f l ights had been determined for a part icular f l ight
procedure, e .g. take-off test flight
Test f l ight number ( i=) 1 2 3 4 5 6 EPNL (dB) 83 81 83 85 83 85
These values could be classif ied and plotted in terms of a s tat is t ical point-diagram (Fig. E-1)
_ _ The values yield the following arithmetic mean EPNL = x , and s tandard deviation, sx, resp. with N = 6:
N
~ - i=l c EPNLi
N ( E l ) EPNL x = = 83.3 dB
= 1.5 dB N - l sx =
Although there a r e real ly only very few da ta points, we assume for the present tha t they formed a sample drawn from a Gaussian population, whose normal distribution however w a s based on a n "infinite" number of items ( inf ini te sample s ize) . The calculated mean x and the s tandard deviation s then must be considered to represent the 'best estimate' of the t rue mean p , and of the t rue s tandard deviation 6 of a n infinite sample.
Now for a required confidence level of, s ay , 90% or 95% (corresponding to an error probability a of 0.10 or 0.05, respectively) one may establ ish a confidence interval (or its limits) in which (or within which) LI must be assumed with the selected probability. For an infinite sample ( N = 00) the confidence limits would, respectively, be u o o ~ o ~ l o = +/-1.6456, and u o o ~ o ~ 0 5 = +/-1.9606.
Since only sx as a n estimate of E , ra ther then 5 i tself , i s known, one must account f o r the fact tha t the sample sizes a r e neither infinite, nor even very la rge , but - on the contrary - very small. This now is taken into account with Gosset 's so-called 'Student-distribution' or t-distribution
1631
The distribution of t depends on the sample size N , or more exactly on the 'degrees of freedom' f = N - 1: i t assumes a bell-shape distribution, just as the Gaussian distribution does, but is
broader depending on the degrees of freedom. For N = 2 i t i s broadest (with one degree of freedom only): with increasing sample size the t-distribution more and more approaches the normal dis tr ibu- tion, eventually coinciding when the sample size becomes infinite ( N = 00) .
We are now able to calculate the confidence l i m i t s for a small sample
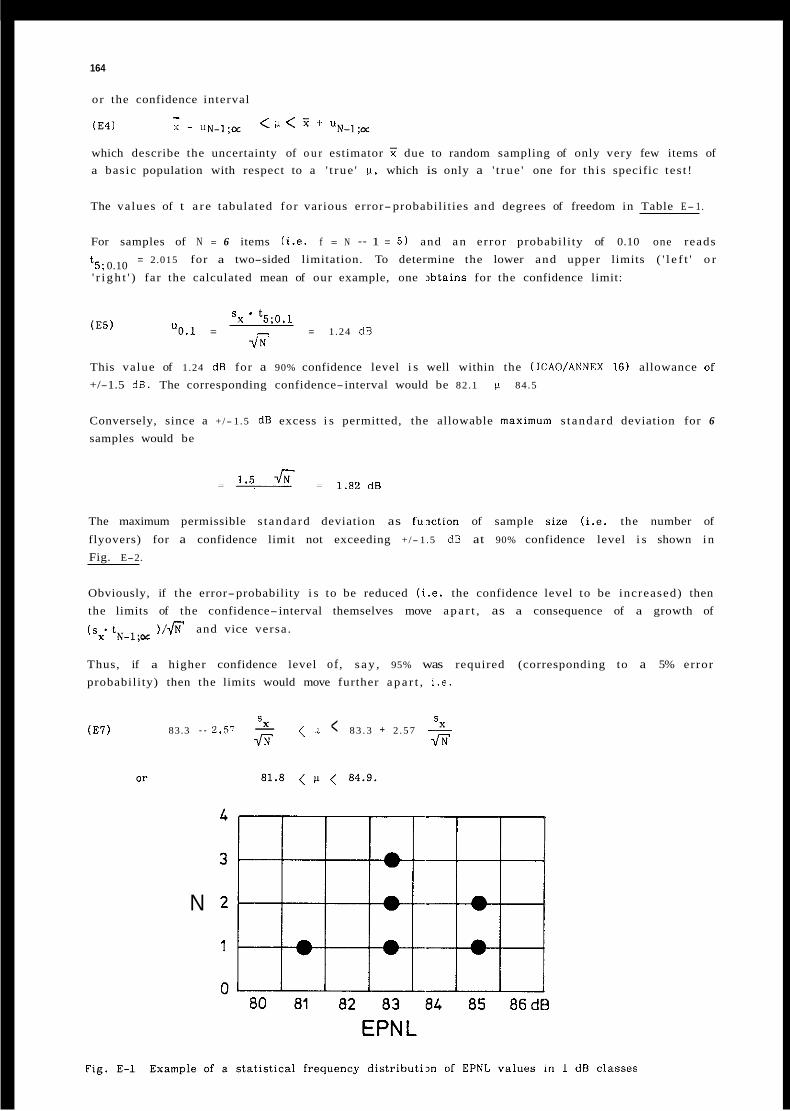
164
or the confidence interval -
(E41 x - u N - 1 ; z < fi < ' + 'N-1;-
which describe the uncertainty of o u r estimator x due to random sampling of only very few items of a basic population with respect to a ' t rue ' u , which is only a ' t rue ' one for th i s specific tes t !
The values of t a r e tabulated for various error-probabilit ies and degrees of freedom in Table E- 1.
For samples of N = 6 items ( i .e . f = N - 1 = 5 ) and a n error probability of 0.10 one reads = 2.015 for a two-sided limitation. To determine the lower and upper limits ( ' l e f t ' o r t5 ; 0.10
' r i g h t ' ) far the calculated mean of our example, one , ibtains for the confidence limit:
'x. %;0.1 uo.1 = - = 1.24 dB (E51
dN' This value of 1.24 dB for a 90% confidence level i s well within the (ICAO/ANNEX 16) allowance of +/-1.5 dB. The corresponding confidence-interval would be 82.1 & 84.5
Conversely, since a +/- 1.5 dB excess i s permitted, the allowable maximurn s tandard deviation for 6
samples would be
The maximum permissible s tandard deviation as f u x t i o n of sample size ( i .e . the number of
flyovers) for a confidence limit not exceeding +/- 1.5 dB at 90% confidence level i s shown in Fig. E-2.
Obviously, if the error-probability i s to be reduced ( i .e . the confidence level to be increased) then the limits of the confidence-interval themselves move a p a r t , as a consequence of a growth of
)/fi and vice versa . k l ; o r
Thus, if a higher confidence level of , s a y , 95% was required (corresponding to a 5% error probability) then the limits would move further a p a r t , i .e .
S < fi < 8 3 . 3 + 2 .57 2 sx
67 a 83.3 - 2.57 - ( E l )
N
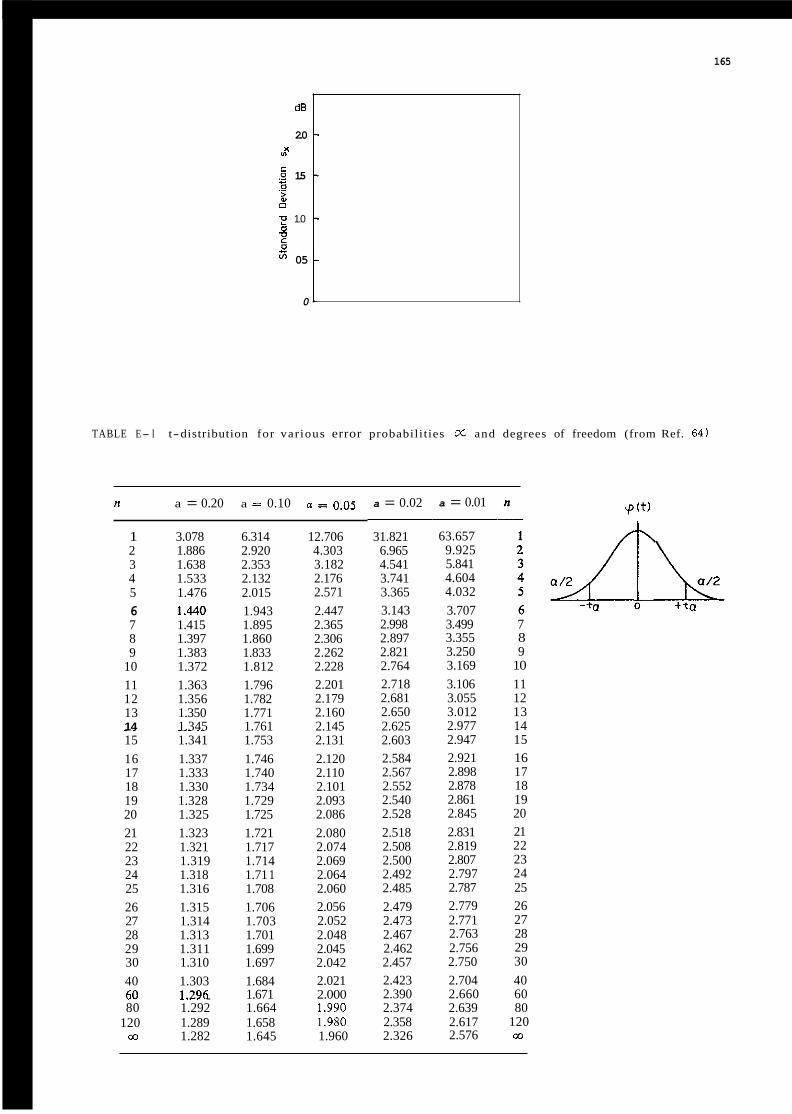
165
d8
2.0 v)
c
0
a
.B 1.5
2 E 1.0
5
- ._
0 v
05
0
TABLE E- l t-distribution for var ious error probabilities OC and degrees of freedom (from Ref. 64)
n a = 0.20 a = 0.10 a = 0.05
1 3.078 6.314 12.706 2 1.886 2.920 4.303 3 1.638 2.353 3.182 4 1.533 2.132 2.176 5 1.476 2.015 2.571 6 1.440 1.943 2.447 7 1.415 1.895 2.365 8 1.397 1.860 2.306 9 1.383 1.833 2.262
10 1.372 1.812 2.228 11 1.363 1.796 2.201 12 1.356 1.782 2.179 13 1.350 1.771 2.160 14 1.345 1.761 2.145 .. ~~
15 1.341 1.753 2.131 16 1.337 1.746 2.120 17 1.333 1.740 2.110 18 1.330 1.734 2.101 19 1.328 1.729 2.093 20 1.325 1.725 2.086 21 1.323 1.721 2.080 22 1.321 1.717 2.074 23 1.319 1.714 2.069 24 1.318 1.71 1 2.064 25 1.316 1.708 2.060 26 1.315 1.706 2.056 27 1.314 1.703 2.052 28 1.313 1.701 2.048 29 1.311 1.699 2.045 30 1.310 1.697 2.042
a = 0.02
31.821 6.965 4.541 3.741 3.365 3.143 2.998 2.897 2.821 2.764 2.718 2.681 2.650 2.625 2.603 2.584 2.567 2.552 2.540 2.528 2.518 2.508 2.500 2.492 2.485 2.479 2.473 2.467 2.462 2.457
a = 0.01
63.657 9.925 5.841 4.604 4.032 3.707 3.499 3.355 3.250 3.169 3.106 3.055 3.012 2.977 2.947 2.921 2.898 2.878 2.861 2.845 2.831 2.819 2.807 2.797 2.787 2.779 2.771 2.763 2.756 2.750
\
40 1.303 1.684 2.021 2.423 2.704 40 60 1.296 1.671 2.000 2.390 2.660 60 .~ . ~
80 1.292 1.664 1.990 2.374 2.639 80
7 8 9
10 11 12 13 14 15 16 17 18 19 20 21 22 23 24 25 26 27 28 29 30
120 1.289 1.658 1.980 2.358 2.617 120 m 1.282 1.645 1.960 2.326 2.576 m

L
Glossary olf Terms Acoustics Science of a l l aspects re la t ing to sound
Airframe Noise Noise generated by a n a i rc ra f t in flyover in the absence of engine noise by aerodynamic interaction of flow and s t ructural components
Ambient noise (see "Background Noise")
Audio frequency range Range of audible sound (approximately from 16 Hz to 16.000 Hz)
Background noise
Band pressure level (such B S 1/3-octave band or l/l-octave band)
Confidence l i m i t s Upper and lower values of the range over which a per-cent probability applies
Continuous spectrum Spectrum of a wave, whose compcsnents a r e continuously distributed over the frequency range
Crest factor Ratio of the peak value to the rms value of a n oscillating quantity
Decibel Ten times the common logarithm of the ra t io c,f two l ike quantities proportional to power or energy o r twenty times for amplitude o r pressure
Derived Version A 'Derived Version' of a n a i rc ra f t ( i n ICAO's definition) i.s similar to the prototype (from the point of airworthiness) but incorpcrates changes in type design which may affect i t s noise characteristics
Diffraction Directional change of propagation of sound energy near a boundary discontinuity such as the "edge" of a n aerodynamic shear layer
Diffuse sound field Sound field where the sound pressure level i s essentially the same everywhere
Direct sound field Regime where sound a r r ives directly from a source wil.hout any pr ior reflection
Directional microphone A microphone whose response d'spends on the direction of sound incidence
Directivity factor (for a n acoustic source) Ratio of sound intensity a t a remote point on a reference ax i s , to the average for a l l directions in s p , x e of the intensity of the sound a t the same distance from the effective centre of the source
Directivity factor (for a microphone) Square of the ra t io of the free-field sensitivity in a reference direction to the random incidence sensitivity
Dissipation Conversion of sound energy into heat
Doppler effect of the path between the source and the observer
Effective sound pressure The root-mean-square ( r m s ) s,ound pressure
Emission of Sound The radiation of sound away from the source
Excess attenuation Attenuation of the sound propagated which i s not accounted for by spherical spreading losses (e.g. atmospheric absorption or over ,ground absorption)
Far field Par t of the field of a source radiat ing sound in free-field conditions, where sound-pressure and particle velocity a r e in-phase
Free-field Soundfield i n a n acoustically essentially unobstructed environment
Harmonic Sinusoidal quantity of frequency t h a t i s a n integral multiple of the fundamental frequency of a periodic quantity to which i t i s related
Immission of Sound The impingement of sound a t the r'?cipient (observer, ground, microphone, e tc)
Level Logarithm of the ra t io of a quantity to a reference quantity of the same kind
Near field Par t of the field of a source rad ia t ing sound in free-field conditions, where the sound pressure and particle velocity a r e not in phase.
Noise Sound tha t i s undesired by or obtrusive to the recipient
Octave Frequency interval of 2 : 1
Omnidirectional microphone Microphone with response independent of the sound incidence direction
Peak sound pressure The maximum absolute value of. the instantaneous sound pressure for a specified time interval
Noise from sources unrelated to a par t icular sound that is the object of interest
Sound pressure level of the sounl energy within a specified frequency band
Change in the observed frequency caused by the time ra te of change in the length
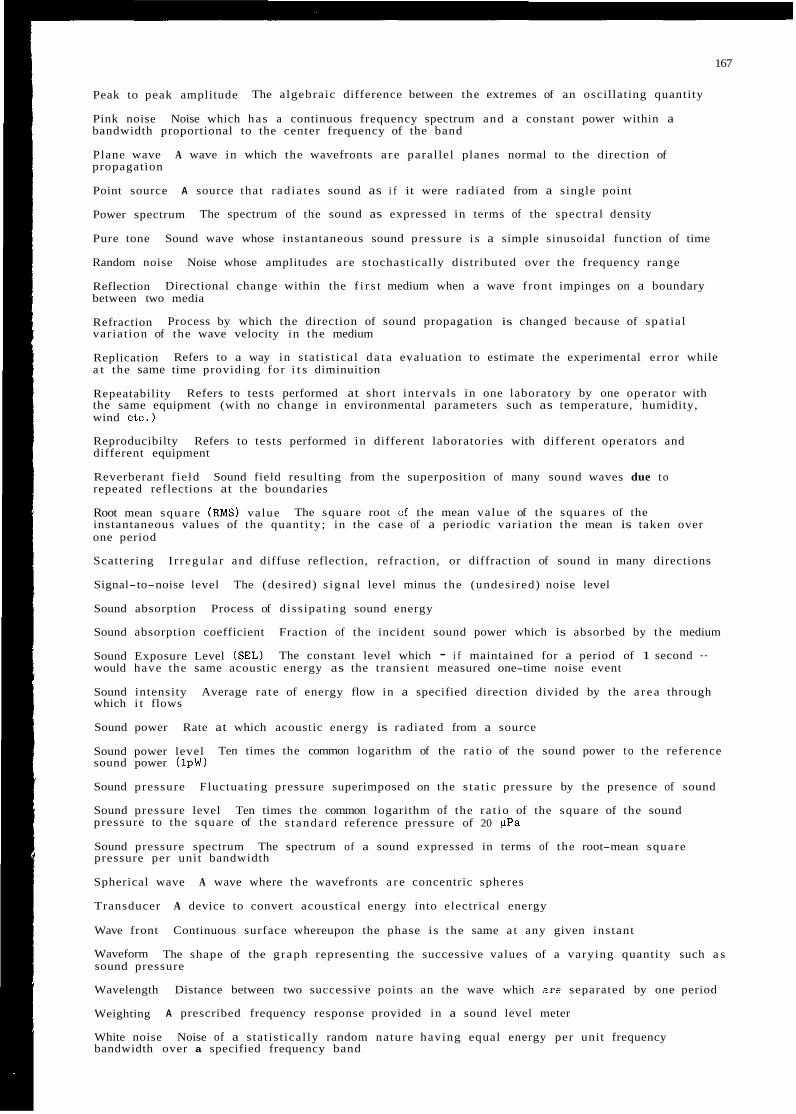
167
Peak to peak amplitude
Pink noise Noise which has a continuous frequency spectrum and a constant power within a bandwidth proportional to the center frequency of the band
Plane wave A wave in which the wavefronts a r e paral lel planes normal to the direction of propagation
Point source A source that rad ia tes sound as i f it were radiated from a single point
Power spectrum
Pure tone Sound wave whose instantaneous sound pressure i s a simple sinusoidal function of time
Random noise Noise whose amplitudes a r e stochastically distributed over the frequency range
Reflection between two media
Refraction variat ion of the wave velocity in the medium
Replication a t the same time providing for i t s diminuition
Repeatability the same equipment (with no change in environmental parameters such as temperature, humidity, wind e tc . )
Reproducibilty Refers to tests performed in different laboratories with different operators and different equipment
Reverberant f ie ld Sound field resulting from the superposition of many sound waves due t o repeated reflections at the boundaries
Root mean square (RMS) value instantaneous values of the quant i ty; in the case of a periodic variat ion the mean is taken over one period
Scattering I r regula r and diffuse reflection, refraction, or diffraction of sound in many directions
Signal-to-noise level The (desired) s igna l level minus the (undesired) noise level
Sound absorption Process of diss ipat ing sound energy
Sound absorption coefficient Fraction of the incident sound power which is absorbed by the medium
Sound Exposure Level (SEL) would have the same acoustic energy as the t ransient measured one-time noise event
Sound intensity Average ra te of energy flow in a specified direction divided by the a r ea through which i t flows
Sound power Rate at which acoustic energy is radiated from a source
Sound power level sound power (IpW)
Sound pressure Fluctuating pressure superimposed on the s ta t ic pressure by the presence of sound
Sound pressure level Ten times the common logarithm of the ra t io of the square of the sound pressure to the square of the s tandard reference pressure of 20 *Pa
Sound pressure spectrum The spectrum of a sound expressed in terms of the root-mean square pressure per unit bandwidth
Spherical wave A wave where the wavefronts a r e concentric spheres
Transducer A device to convert acoustical energy into electrical energy
Wave front Continuous surface whereupon the phase i s the same a t any given instant
Waveform sound pressure
Wavelength Distance between two successive points an the wave which a r e separated by one period
Weighting
White noise Noise of a s tat is t ical ly random nature having equal energy per unit frequency bandwidth over a specified frequency band
The algebraic difference between the extremes of an oscillating quantity
The spectrum of the sound as expressed in terms of the spectral density
Directional change within the f i r s t medium when a wave front impinges on a boundary
Process by which the direction of sound propagation is changed because of spat ial
Refers to a way in s tat is t ical d a t a evaluation to estimate the experimental error while
Refers to tests performed at short intervals in one laboratory by one operator with
The square root of the mean value of the squares of the
The constant level which - i f maintained for a period of 1 second -
Ten times the common logarithm of the ra t io of the sound power to the reference
The shape of the graph representing the successive values of a varying quantity such a s
A prescribed frequency response provided in a sound level meter
168
I l l
121
13al
1 %
141
151
161
I71
181
191
1101
1111
1121
1151
1161
Bibliography
International Standards and Recommended Practices ENVIRONMENTAL PROTECTION; ANNEX 16 to
the Convention on International Civil Aviation, Volume I 'Aircraft Noise', Second Edition - 1988
ICAO-CAEP Technical Issues Subgroup: "Environmental Technical Manual on the Use of Procedures in the Noise Certification of Aircraf.", to be published b,y ICAO, Montreal,
Canada
SAE Committee A-21, "Standard Values of Atmospheric Absorption as a Function of Tempera-
ture and Humidity", Aerospace Recommended PrE.ctice ARP 866A, revised 1915
"American National Standard Method for the Calculation of the Absorption of Sound by the Atmosphere", American National Standards Insti tute ANSI S1.26-1018 (issued 1918)
Marsh, A . : "Recommendations for Field Measurements of Aircraft Noise", NASA Contractor
Report 3540, 1582
Briiel, P.: "Sound Level Meters - The Atlantic Xvide", B&K Technical Review, No. 4 , 1983
Rickley , E , : "Magnetic Tape Recorder Influence on RMS Level Data", DOT-TSC-FA-453-Letter
Report 1 2 , May 1984
de Benque d'Agut, P . , Riebeek, H . , Pool, A,: "Trajectory Measurements for Take-off and
Landing Tests and Other Short-Range Applications", AGARDograph No. 160, AGARD Flight Test Instrumentation Series, Voi. 16, 1985
Weber, 0. : "Ground-based Equipment" in AGARDograph No. 160, AGAR11 Flight Test Instrumen- tation Series, Vol. 1 on 'Basic Principles of F1:ght Test Instrumentat,ian Engineering'
Newman, S. ; Rickley, E.: "Noise Levels and Flight Profiles of Eight Helicopters using Pro- posed International Certification Procedures", US Dep. of Transportation Rep. NO
FAA-EE-75-03, March 1519
"Infrared Trajectography Equipment for ILS - MLS VOR Monitorung (Category 3)", Societe Anonyme de Telecommunications ( P a r i s ) , SAT Tech. Report No. 6563/83/E Ed. I , 1986
Storm van Leeuwen, S. , Voskes, A , : "The Data .Acquisition System for the Fokker 100 Test Aircraft", NLR Report N L R MP 87041 U
DLR Anlagen-Handbuch 62.1-20 "Bahnverfolgungsradar MPS-36"
Perebom, P. , Lincoln, J . , Snow, R.: "An Extended Real-Time Airplane Position System",
AGARD Conference Proceedings No. 373
Irwin, W . : "Microwave System for Real Time Space Position Measurement", Boeing Commercial
Airplane Co. Paper (1982)
Pike, A . C . , Owen, S . : Helicopter Noise Measurenent Repeatability Program - UK/FRG Joint
Report: U K Final Report", Westland Research Paper RP-680 (1985)
Vedrunes, M . : "The Measurement of Engine Rotation Speed", AGARDograph No. 160, AGARD
Flight Test Instrumentation Series, Vol. 4
169
1171
1181
1191
1201
1211
1221
1231
1241
1251
1261
1271
1281
1291
1301
1311
1321
1331
Trenkle, F., Reinhardt, M . : "In-flight Temperature Measurements", AGARDograph No. 160,
AGARD Flight Test Instrumentation Series, Vol. 2
Jochum, A . , Reinhardt, E . , Willeke, H . : "Die drei Motorsegler der DFVLR - ein meteorolo- gisches Mensystem zur Untersuchung der atmospharischehn Grenzschicht",
DFVLR-Forschungsbericht FB 84-50, 1984
Splettstoesser, V i . , Schultz, K.-J., Spiegel, K.-H. : ICAO Helicopter Noise Measurement
Repeatability Program - German Final Report, DFVLR IB 129-85/24, (1985)
"Helicopter Noise Certification - Clarification of Helicopter Approach Requirements", ICAO CAEP WG-I1 Meeting, Working Paper 17 by ICCAIA-Observer, Washington, 1989
Kearsey, P.: "Procedure approved for application in noise certification by the British Airworthiness Authority, Civil Aviation Authority ( C A A ) " , Oral Communication 1982
Spettstoesser, W . , Anders, K . , Spiegel, K.- H.: "Schallmessungen a n der Hubschrauberneuent- wicklung BK 117 - Bewertete Liiirmpegel und Einflul3 der Fluggeschwindigkeit", DFVLR-Mitt.
81-18, 1981
Splettstoesser, W., Nagaraja, S.: "Acoustic Evaluation of the AGUSTA Helicopter 109A in Compliance with the Proposed ICAO ANNEX 16/Chapter 8 Regulations", DFVLR-Mitt. 81-24, 1981
Howell, G . , Bradley, A , , McCormick, M . , Brown, D.: "De-Dopplerization and Acoustic Imaging of Aircraft Flyover Measurements", J. of Sound and Vibration (1986), 105(1)
Stevens, R . , Bryce, W . , Scewczyk, W . : "Model and full-scale studies of the exhaust noise from a bypass engine in flight", AIAA 8th Aeroacoustics Conference, Atlanta, G a . April 1983, paper No AIAA-83-0751
Borchers, I . , Bartels, P., Zimmer, H. , Grasche F.-R.: "Akustische Untersuchungen im Rahmen der Entwicklung des ZKP-Experimentalpropellers der Leistungsklasse 750 PS", FASE/DAGA '82,
Fartschritte der Akustik; 1982
Allen R. , Plunkett, E . : "A Rivet Hole Sensor for Measuring Airplane Fuselage Acoustic Pressures", AIAA/NASA 9th Aeroacoustics Conference, Williamsburg/Va. 1984, Paper A I A A
84-2350
Allen, R. , Hofbeck, E . : "An In-flow Microphone Probe for Airplane Flight Testing", AIAA
10th Aeraacoustics conference, Seattle, Wa., July 1986, paper No AIAA-86-1890
Kallergis, M . : "Flugversuche zur Ermittlung des minimalen aerodynamisch induzierten Eigen-
gerausches von Mikrofonsonden", DLR-Gutachten G-84-SM/EA/TA-I, 1984
Hanson, D. : "Noise of Counter Rotating Propellers", AIAA/NASA 9th Aeroacoustics Conference, Williamsburg, V a . , 1984
Hanson, D., McColgan, C.: "Noise of Counter Rotating Propellers w i t h Noise-synchronous Rotors", J . of Aircraft Vol. 22 ( 1 2 ) , 1985
Kallergis, M. : "Flight Tests an Propeller Noise Time History Characteristics" , Noise Control Engineering Journal, Vol. 29, No. 2 (1987)
Kallergis, M . : "Propeller Noise Pressure-Time History Characteristics f r o m Quasistationary
Flyby Tests", DLR Interner Ber. 129-85/33, 1985
170
1341 Dahlen, H . , Dobrzynski, W . , Heller, H . : "Aeroakustische Untersuchungen zum L a r m von Ultraleichtflugzeugen",,, DFVLR-Forschungsbericht 38-88-03, 1988
1351 SAE AIR 16728 (1983): "Practical Methods to obtain Free-field Sound Pressure Levels from Acoustical Measurements over Ground Surfaces"
1361 Payne, R., Miller, G . : "A Theoretical Appraisal of the Use of Ground-Plane Microphones for Aircraft Noise Measurements", Nat. Phys. Lab, 'redington, NPL-AC-103, 1984
1371 Dobrzynski, W . : "Interferenzwirkung durch Bodenreflexion bei F1uglan"ssungen a n Propel- Ierflugzeugen", DFVLR-Forschungsbericht, FB 81--28, 1981.
I381 Dobrzynski, W . : "Bodenreflexionseffekte bei Flug:larmmessungen", Zeitschrift fiir Flugwissen- schaften (ZFW) 5, 1981/6,
1391 Chapkis, R . , Marsh, A , : "Investigation of Ground Reflection a n d Impedance from Flyover Noise Measurements", NASA Contractor Report CR--145302
1401 Dobrzynski, W . : "The Effect of Ground Reflections on the Propeller Aircraft Noise Measures
and EPNL", Paper 8th Symposium FASE'89, Zaragoza, Spanien, 1989 LAmax
1411 Schmitz, F., Yu, Y . : "Helicopter Impulsive Noisr:: Theoretical and Experimental Status",
NASA Tech. Mem. 84390 and USAAVRADCOM Tech. Rep. 83-A-2, 1983
1421 Nakamura, Y . : "Prediction of Blade Vortex Interaction Noise from Measured Blade Pressure", NASA Tech. Memorandum 81320 and USAAVRADCOM TR-81A-24, 1981
1431 Cross, J . , Watts, M . : "In-Flight Acoustic Testing Techniques Using the YO-3A Acoustic
Research Aircraft", NASA Tech. Mem 85895, 1984
Schmitz, F., Boxwell, D . : "In-flight Farfield Measurement of Helicopter Impulsive Noise", J . of the American Helicopter Society, Vol. 21, No. 4, Oct. 1976
Boxwell, D . , Schmitz, F.: "Full-scale Measuremeits of Blade-Vortex Interaction Noise",
J . of the American Helicopter Society, Vol 21, Ncs. 4, Oct. 1982
Grosche, F.-R., Stiewitt, H.: "Flight Effects on Jet Noise Sources Investigated by Model Experiments in the DNW", AIAA-83-0752, AIAA 8th Aeroacoustics Conference, Atlanta, G a . , 1983
Schlinker, R. : "Airfoil Trail ing Edge Noise Measurements with a Directional Mocrophone", AIAA-77-1269, AIAA 4th Aeroacoustics Conference, Atlanta G a . , 1917
Grosche, F.-R., Stiewitt, H., Hofer, H.: "Akustixhe und Aerodynamisohe Windkanalunter- suchungen a n 5 Modellpropellern i m 3-m Niedergeschwindigkeits-Windkanal der DFVLR Gottingen" DFVLR-Interner Bericht I B 222-82 A30, 1982.
Grkche , F.-R., Stiewitt, H. : "Aeroacoustic Wind Tunnel Measurements on Propeller Noise", AGARD Conference Proceedings No. 366, Paper Nr. 24, 1984
Dobrzynski, W . , Heller, H . , Powers, J. , DensmoI"?, J . : "DFVLR/FAA Propeller Noise Testing in the German Dutch Wind Tunnel DNW", DFVLR IB 1.29-86/3 and FAA Report No. AEE 86-3, 1986
Dobrzynski, W . : "Propeller Blade Tip Mach number Correction from IMeasurement to Reference Conditions", DFVLR IB 129-85/29
I521
1531
1541
I551
1561
I571
1581
1591
1601
1611
1621
I631
I641
1651
Dobrzynski, W.: "The Effect on Radiated Noise of Non-zero Propeller Rotational Plane
Attitude", AIAA 10th Aeroacoustics Conference, Seattle, W a . , 1986, Paper AIAA-86-1926,
Splettstoesser, W . , Schultz, K.- J., Boxwell D . , Schmitz F.: "Helicopter Model Rotor Blade
Vortex Interaction Impulsive Noise: Scalabili ty and Parametric Variations", Proc. Tenth Euro- pean Rotorcraft Forum, Paper No. 18, The Hague, The Netherlands, 1984, also NASA Technical
Memorandum 86007; TM-84-A-7, 1984
Schmitz, F., Boxwell, D . , Splettstoesser, W . , Schultz, K.- J.: "Modell-rotor High-speed Impulsive Noise: Full-scale Comparisons and Parametric Variations", VERTICA Vo1.8, No.4, 1984
Boxwell, D . , Schmitz, F., Splettstoesser, W . , Schultz, K.-J., Lewy, S . , Caplat, M . : "A
Comparison of the Acoustic and Aerodynamic Measurements of a Model Rotor Tested in Two
Anechoic Wind Tunnels", Proc. Twelfth European Rotorcraft' Forum, Paper No. 38, Garmisch-Partenkirchen, Germany, 1986
Schultz, K.- J., Splettstoesser, W. : "Prediction of Helicopter Rotor Impulsive Noise Using Measured Blade Pressures", Prac. 43rd AHS-Forum, St. Louis, Missouri, 1987
Schultz, K.- J., Splettstoesser, W . : "Measured and Predicted Impulsive Noise Directivity Characteristics" , Proc. 13th European Rotorcraft Forum, ArledFrance, 1987, Paper No. 1.2
Splettstoesser, W . , Martin R . : "Acoustic Results of the Blade-vortex Interaction Test of a 40 Percent Model Rotor in the DNW", Proc. AHS Special is t ' s Meeting an Aerodynamics and Aero- acoustics, Arl ingtodTexas, 1987,
Splettstoesser, W . , Schultz, K.-J., Martin, R.: "Rotor Blade-vortex Interaction Impulsive
Noise Source Identification and Correlation with Rotor Wake Predictions", Proc. AIAA 11th Aeroacoustic Conference, Sunnyvale, C a l . , Paper No. 87-2744, 1987
Martin, R . , Spiettstoesser, W . , Elliott, J . , Schultz, K . A . : "Advancing Side Directivity and Retreating Side Interactions of Model Rotor Blade-Vortex Interaction Noise", NASA Technical Paper 2784 and AVSCOM Technical Report 87-8-3, 1988
Dahlen, H . , Heller, H.: "Repeatability and Reproducibility of Flyover Noise Measurements of Propeller-driven Aircraft", Proc. INTERNOISE 1.981, Amsterdam, Vol. 2.
Dahlen, H.: "Statistical Significance Testing for the Proof of Aeroplane Noise Control
Measures", Proc. INTERNOISE 1983, Edinburgh.
Gosset, W.S.: "The Probable Error of a Mean", Biometrica 6 (1908)
Linder, A . , Berchtold W. : "Elementare s ta t is t ische Methoden", Birkhauser Verlag Basel, Boston, Stut tgar t , Uni-Taschenbficher ISBN 3-7643-0905-9, 1979
Harris, C.M.: "Handbook of Noise Control", 2nd ed . , 1979, McGraw-Hill
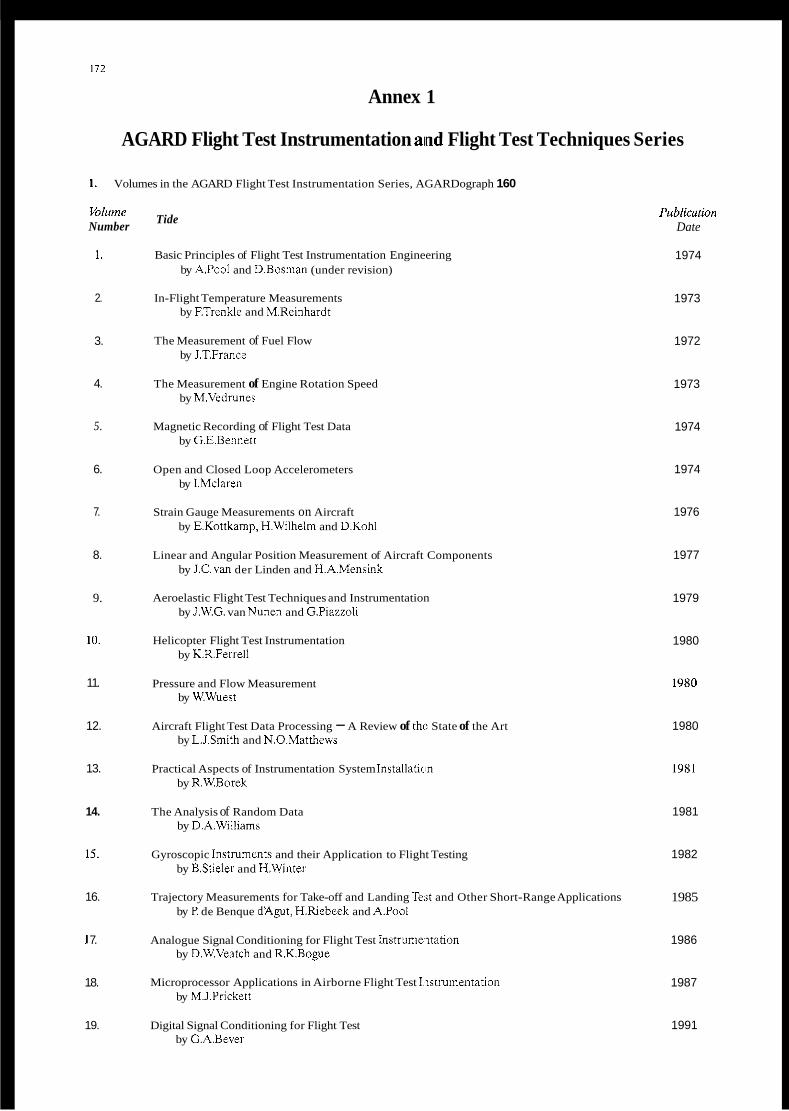
172
Annex 1
AGARD Flight Test Instrumentation aind Flight Test Techniques Series
1. Volumes in the AGARD Flight Test Instrumentation Series, AGARDograph 160
Vohme Number
1.
2.
3.
4.
5.
6.
7.
8.
9.
10.
11.
12.
13.
14.
15.
16.
1 7.
18.
19.
Tide
Basic Principles of Flight Test Instrumentation Engineering by A.Pool and D.Bosman (under revision)
In-Flight Temperature Measurements by ETrenkle and M.Reinhardt
The Measurement of Fuel Flow by J.T.France
The Measurement of Engine Rotation Speed by M.Vedrunes
Magnetic Recording of Flight Test Data by G.E.Bennett
Open and Closed Loop Accelerometers by LMclaren
Strain Gauge Measurements on Aircraft by E.Kottkamp, H.Wilhelm and D.Kohl
Linear and Angular Position Measurement of Aircraft Components by J.C.van der Linden and H.A.Mensink
Aeroelastic Flight Test Techniques and Instrumentation by J.W.G. van Nunen and G.Piazzoli
Helicopter Flight Test Instrumentation by K.R.Ferrel1
Pressure and Flow Measurement by W.Wuest
Aircraft Flight Test Data Processing - A Review of the State of the Art by L.J.Smith and N.O.Matthews
Practical Aspects of Instrumentation System Installatico by R.W.Borek
The Analysis of Random Data by D.A.Williams
Gyroscopic Instruments and their Application to Flight Testing by BStieler and H.Winter
Trajectory Measurements for Take-off and Landing Te,rt and Other Short-Range Applications by P. de Benque #Apt , H.Riebeek and A.Pool
Analogue Signal Conditioning for Flight Test 1nstrume.itation by D.W.Veatcb and R.K.Bogue
Microprocessor Applications in Airborne Flight Test Iiistrumentation by M.J.Pnckett
Digital Signal Conditioning for Flight Test by G.A.Bever
Publicmion Date
1974
1973
1972
1973
1974
1974
1976
1977
1979
1980
1980
1980
1981
1981
1982
1985
1986
1987
1991
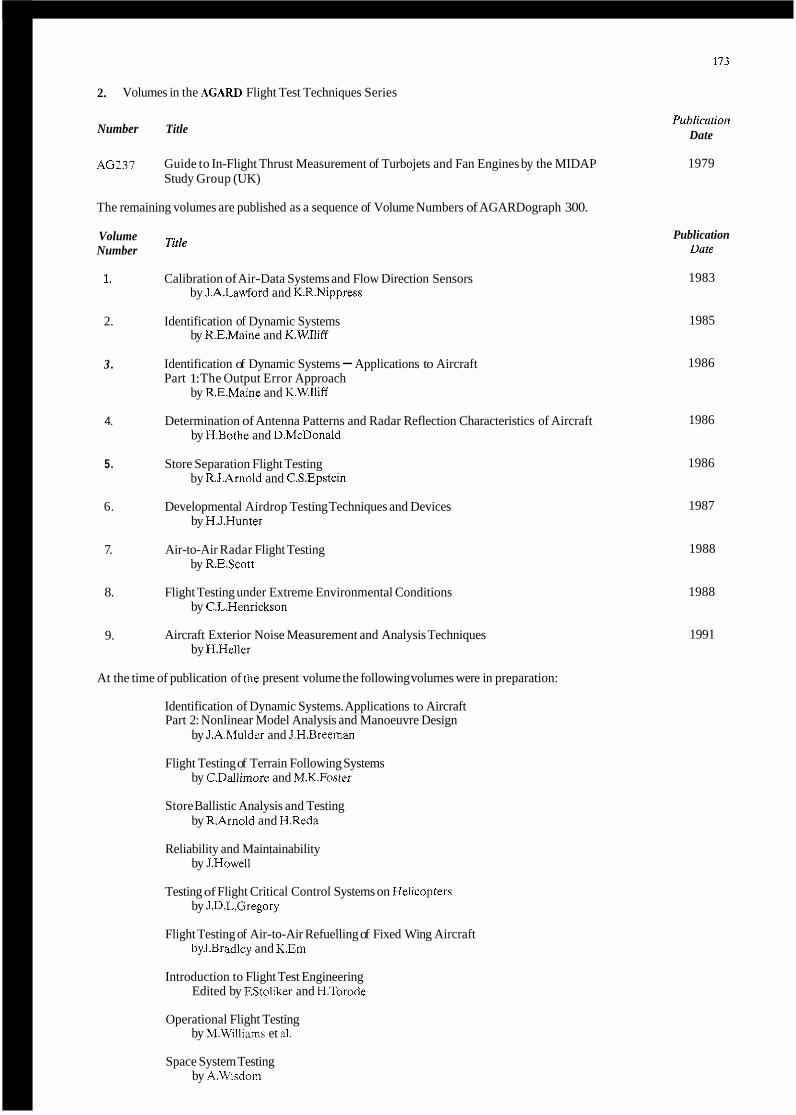
2. Volumes in the AGARD Flight Test Techniques Series
Number Title
173
Publicution Date
AG237 Guide to In-Flight Thrust Measurement of Turbojets and Fan Engines by the MIDAP 1979 Study Group (UK)
The remaining volumes are published as a sequence of Volume Numbers of AGARDograph 300.
Volume Number
1.
2.
3.
4.
5.
6.
7.
8.
9.
Title
Calibration of Air-Data Systems and Flow Direction Sensors by J.A.Lawford and K.R.Nippress
Identification of Dynamic Systems by R.E.Maine and K.W.1liff
Identification of Dynamic Systems - Applications to Aircraft Part 1: The Output Error Approach
by R.E.Maine and K.W.Iliff
Determination of Antenna Patterns and Radar Reflection Characteristics of Aircraft by H.Bothe and D.McDonald
Store Separation Flight Testing by R.J.Arnold and C.S.Epstein
Developmental Airdrop Testing Techniques and Devices by H.J.Hunter
Air-to-Air Radar Flight Testing by R.E.Scott
Flight Testing under Extreme Environmental Conditions by C.L.Henrickson
Aircraft Exterior Noise Measurement and Analysis Techniques by H.Heller
At the time of publication of the present volume the following volumes were in preparation:
Identification of Dynamic Systems. Applications to Aircraft Part 2: Nonlinear Model Analysis and Manoeuvre Design
by J.A.Mulder and J.H.Breeman
Flight Testing of Terrain Following Systems by C.Dallimore and M.K.Foster
Store Ballistic Analysis and Testing by R.Amold and H.Reda
Reliability and Maintainability by J.Howell
Testing of Flight Critical Control Systems on Helicopters by J.D.L.Gregory
Flight Testing of Air-to-Air Refuelling of Fixed Wing Aircraft byJBradley and K.Em
Introduction to Flight Test Engineering Edited by FStoliker and H.Torode
Operational Flight Testing by M.Williams et al.
Space System Testing by A.Wisdom
Publication Date
1983
1985
1986
1986
1986
1987
1988
1988
1991
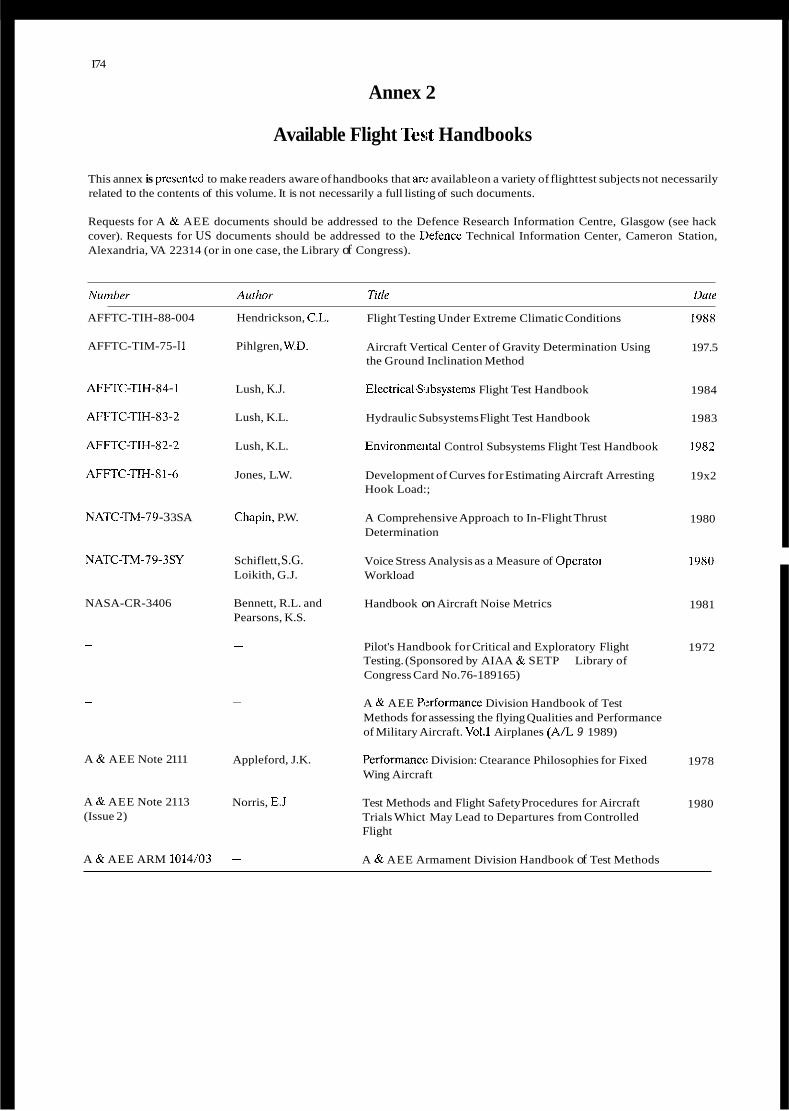
I74
Annex 2
Available Flight Test Handbooks
This annex is prcsented to make readers aware of handbooks that arc available on a variety of flight test subjects not necessarily related to the contents of this volume. It is not necessarily a full listing of such documents.
Requests for A & AEE documents should be addressed to the Defence Research Information Centre, Glasgow (see hack cover). Requests for US documents should be addressed to the Defcncc Technical Information Center, Cameron Station, Alexandria, VA 22314 (or in one case, the Library of Congress).
Number Aulhor Tilie Dote
AFFTC-TIH-88-004
AFFTC-TIM-75- I I
AFFTC-TIH-84-1
AFFTC-TIH-83-2
AFFTC-TIH-82-2
AFFTC-TIH-81-6
NATC-TM-7 9 -3 3SA
NATC-TV-79-3SY
NASA-CR-3406
A & AEE Note 2111
A & AEE Note 2113 (Issue 2)
Hendrickson, C.1
Pihlgren, W.D.
Lush, K.J.
Lush, K.L.
Lush, K.L.
Jones, L.W.
Chapin, P.W.
Schiflett, S.G. Loikith, G.J.
Bennett, R.L. and Pearsons, K.S.
-
Appleford, J.K.
Norris, E.J
Flight Testing Under Extreme Climatic Conditions
Aircraft Vertical Center of Gravity Determination Using the Ground Inclination Method
Electrica1,Sibsystems Flight Test Handbook
Hydraulic Subsystems Flight Test Handbook
Environmeiital Control Subsystems Flight Test Handbook
Development of Curves for Estimating Aircraft Arresting Hook Load:;
A Comprehensive Approach to In-Flight Thrust Determination
Voice Stress Analysis as a Measure of Operatoi Workload
Handbook on Aircraft Noise Metrics
Pilot's Handbook for Critical and Exploratory Flight Testing. (Sponsored by AIAA & SETP ~ Library of Congress Card No.76-189165)
A & AEE Paxformance Division Handbook of Test Methods for assessing the flying Qualities and Performance of Military Aircraft. Vol.1 Airplanes (A/L 9 1989)
Performana: Division: Ctearance Philosophies for Fixed Wing Aircraft
Test Methods and Flight Safety Procedures for Aircraft Trials Whict May Lead to Departures from Controlled Flight
A & AEE Armament Division Handbook of Test Methods
1988
197.5
1984
1983
1982
19x2
1980
19x0
1981
1972
1978
1980
A & AEE ARM 1014/03
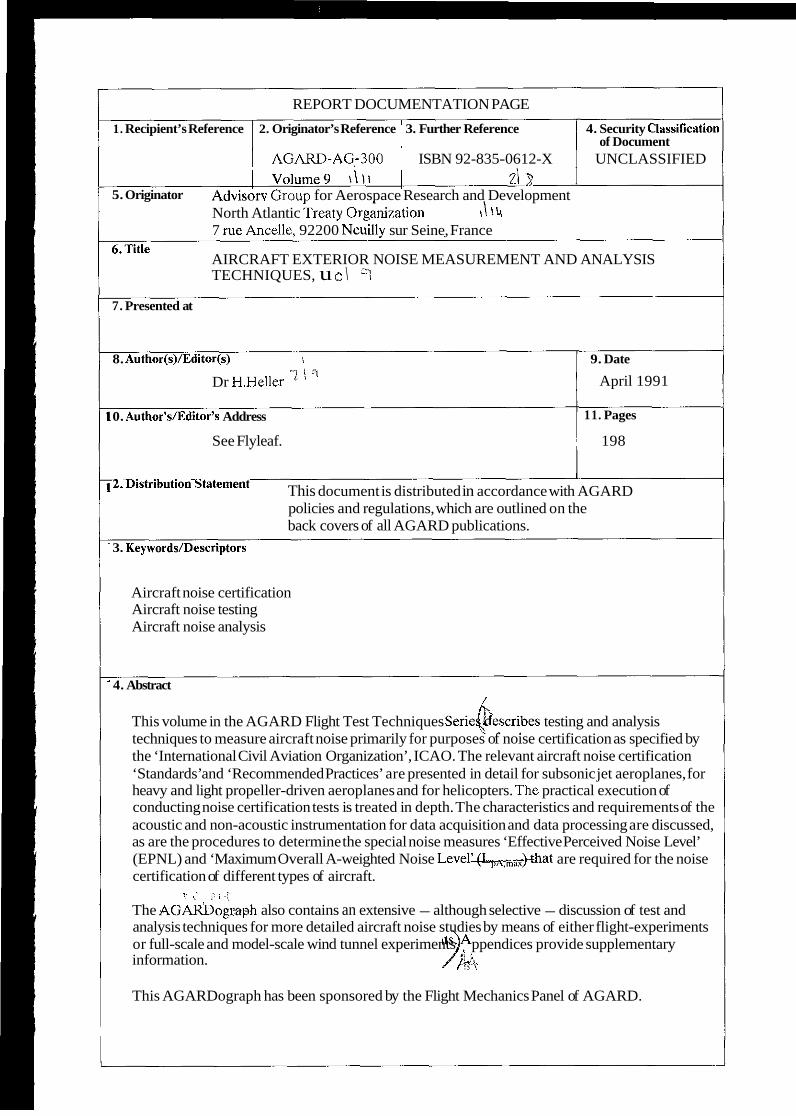
REPORT DOCUMENTATION PAGE
1. Recipient’s Reference 2. Originator’s Reference 3. Further Reference 4. Security Classificatior of Document
1 AGARt-AG-300 1 ISBN 92-835-0612-X I UNCLASSIFIED I ~ o l u m e 9 \ \ I \ I 71 3 I
5. Originator Advisorv GrouD for Aerospace Research and Development North Atlantic Treaty Orgkzation I \ 14 7 rue Ancelle. 92200 Neuillv sur Seine, France
6.Title AIRCRAFT EXTERIOR NOISE MEASUREMENT AND ANALYSIS TECHNIQUES, u Q \ “’I
7. Presented at
8. Author(s)/Editor(s) 1 9. Date
April 1991 “1 \ PI Dr H.Heller
0. Author’dEditor’s Address 1 1. Pages
See Flyleaf. 198
L
2. Distribution Statement This document is distributed in accordance with AGARD policies and regulations, which are outlined on the back covers of all AGARD publications.
3. KeyworddDescriptors
Aircraft noise certification Aircraft noise testing Aircraft noise analysis
4. Abstract
This volume in the AGARD Flight Test Techniques Seriebescribes testing and analysis techniques to measure aircraft noise primarily for purposes of noise certification as specified by the ‘International Civil Aviation Organization’, ICAO. The relevant aircraft noise certification ‘Standards’ and ‘Recommended Practices’ are presented in detail for subsonic jet aeroplanes, for heavy and light propeller-driven aeroplanes and for helicopters. The practical execution of conducting noise certification tests is treated in depth. The characteristics and requirements of the acoustic and non-acoustic instrumentation for data acquisition and data processing are discussed, as are the procedures to determine the special noise measures ‘Effective Perceived Noise Level’ (EPNL) and ‘Maximum Overall A-weighted Noise Level&cm&4hat are required for the noise certification of different types of aircraft.
The AGARbogrqh also contains an extensive - although selective - discussion of test and analysis techniques for more detailed aircraft noise studies by means of either flight-experiments or full-scale and model-scale wind tunnel experiments. ppendices provide supplementary
r < $ < .;:
information. )” /..+ /. ‘
This AGARDograph has been sponsored by the Flight Mechanics Panel of AGARD.

AGAKDograph No.300 Volume 9 Advisory Group for Aerospace Research and Development, NATO AIRCRAFT EXTERIOR NOISE MEASUREMENT AND ANALYSIS TECHNIQUES by H.Heller Published April 199 1 198 pages
This volumein the AGARD Flight Test TechniquesSeries describes testing and analysis techniques to measure aircraft noise primarily for purposes of noise certification as specified by the ‘International Civil Aviation Organization’, ICAO. The relevant aircraft noise certification ‘Standards’ and ‘Recommended Practices’ are presented in detail for subsonic jet aeroplanes, for heavy
P.T.O.
AGARDograph No.300 Volume 9 Advisory Group for Aerospace Research and Development, NATO AIRCRAFT EXTERIOR NOlSE MEASUREMENT AND ANALYSIS TECHNIQUES by H.Heller Published April 199 1 198 pages
This volume in the AGARD Flight Test Techniques Series describes testing and analysis techniques to measure aircraft noise primarily for purposes of noise certification as specified by the ‘International Civil Aviation Organization’, ICAO. The relevant aircraft noise certification ‘Standards’ and ‘Recommended Practices’ are presented in detail for subsonic jet aeroplanes, for heavy
P.T.O.
AGARD-AG-300 Volume 9
Lircraft noise certification kcraft noise testing k r a f t noise analysis
AGARD-AG-300 Volume 9
~ ~~ ~
Zircraft noise certification iircraft noise testing ‘xircraft noise analysis
AGARDograph No.300 Volume 9 Advisory Group for Aerospace Research and Development, NATO AIRCRAFT EXTERIOR NOISE MEASUREMENT AND ANALYSIS TECHNIQUES by H.Heller Published April 1991 198 pages
This volume in the AGAKD Flight Test Techniques Series describes testing and analysis techniques to measure aircraft noise primarily for purposes of noise certification as specified by the ‘International Civil Aviation Organization’, ICAO. The relevant aircraft noise certification ’Standards’ and ‘Recommended Practices’ are presented in detail for subsonic jet aeroplanes, for heavy
P.T.O.
AGARDograph No.300 Volume 9 Advisory Group for Aerospace Research and Development, NATO AIRCRAFT EXTERIOR NOISE MEASUREMENT AND ANALYSIS TECHNIQUES by H.Heller Published April 1991 19 8 pages
This volume in the AGARD Flight Test Techniques Series describes testing and analysis techniques to measure aircraft noise primarily for purposes of noise certification as specified by the ‘International Civil Aviation Organization’, ICAO. The relevant aircraft noise certification ‘Standards’ and ‘Recommended Practices’ are presented in detail for subsonic jet aeroplanes, for heavy
P.T.O.
AGARD-AG-300 Volume 9
~ ~
4ircraft noise certification 4ircraft noise testing 9ircraft noise analysis
AGARD-AG-300 Volume 9
4ircraft noise certification 4ircraft noise testing 4ircraft noise analysis
and light propeller-driven aeroplanes and for helicopters. The practical execution oi conducting noise certification tests is treated in depth. The characteristics anc requirements of the acoustic and nun-acoustic instrumentation for data acquisition anc data processing are discussed, as are the procedures to determine the special noise measures 'Effective Perceived Noise Level' (EPNL) and 'Maximum Overall A-weightec Noise Level' (LpA,n,aJ that are required for the noise certification of different types oi aircraft.
The AGARDograph a!so contains an extensive - although sclective - discussion oi iesi and analysis techniques for more detailed aircraft noise saidies by means of eiiher Sighr experiments or full-scale and model-scale wind tunnel experiments. Appendices providc supplementary information.
This AGARDograph has been spunsored by the Flight Mechanics Panel of AGARD.
92-835-06 12-X
and light propeller-driven aeroplanes and for helicopters. The practical execution o conducting noise certification tests is treated in depth. The characteristics an< requirements of the acoustic and nun-acoustic instrumentation for data acquisition an( data processing are discussed, as are the procedures to determine the special noist measures 'Effective Perceived Noise Level' (EPNL) and 'Maximum Overall A-weightec Noise Level' (LPA,",;,J that are required for the noise certification of different types o aircraft.
The AGARDograph also contains an extensive -although selective - discussion of tes and analysis techniques for more detailed aircraft noise studies by means of either flight cxprriments or full-scale and model-scale wind tunnel experiments Appendices providt supplemcntary information.
This AGARDograph has bccn sponsored by thc Flight Mechanics Panel of AGARD.
92-835-0612-X
and light propeller-driven aeroplanes and for helicopters. The practical execution of conducting noise certification tests is treated in depth. The Characteristics and requirements of the acoustic and non-acoustic instrumentation for data acquisition and data processing are discussed, as are the procedures to determine the special noise measures 'Effective Perceived Noise Level' (EPNL) and 'Maximum Overall A-weighted Noise Level' (L,,,,,,) that are required for the noise certification of different types of aircraft.
The AGARDograph also contains an extensive - although selective - discussion of test and analysis techniques for more detailed aircraft noise studies by means of either flight- experiments or full-scale and model-scale wind tunnel experiments. Appendices provide supplementary information.
This AGARDograph has been sponsored by the Flight Mechanics Panel of AGARD
9 ~ . g ~ ~ . ~ ~ : 2 - ~
and light propeller-driven aeroplanes and for helicopters. The practical execution of conducting noise certification tests is treated in depth. The characteristics and requirements of the acoustic and non-acoustic instrumentation for data acquisition and data processing are discussed, as are the procedures to determine the special noise measures 'Effective Perceived Noise Level' (EPNL) and 'Maximum Overall A-weighted Noise Level' (Lph,m;,x) that are required for the noise certification of different types oi aircraft.
The AGARDograph also contains an extensive - although selective - discussion of tcsi and analysis techniques for more detailed aircraft noise studies by means of cithcr flight- experiments or full-scale and model-scale wind tunnel experiments. Appendiccs provide supplementary information.
This AGARDograph has been sponsored by the Flight Mechanics Panel of AGARD
92-835-0612-X
NATO -@- OTAN
7 RUE ANCELLE '92200 NEUILLY-SUR-SEINE
FRANCE
DIFFUSION DES PUBLICATIONS AGARD NON CLASSIFIEES
TClephone (l)47.38.57.00 . Telex 610 176 Telecopie (1)47.38.57.99
LAGARDne ditient pas desrocksdesespublications, d a m un but de distributionginbrale BI'adresseci-dessus. La diffusion initiale des publications de I'AGARD est effectuie aupres des pays membres de cette organisation par I'intermbdiaire des Centres Nationaux de Distribution suivants. A I'exception des Etats-Unis, ces centres disposent parfois dexemplaires additionnels; dans les cas contraire, on peut se procurer ces exemplaires sous forme de microfiches ou de microcopies iuprt-s des Agences de Vente dont la liste suite.
CENTRES DE DIFFUSION NATIONAUX ALLEMAGNE ISLANDE
Fachinformationszentrum. Director of Aviation Karlsruhe D-I5 14 Eggenstein-Leopoldshafen 2
BELGIQUE Coordonnateur AGAIU-VSL Etat-Majorde la Force Abricnne Quartier Reine Elisaheth Rue #Evere, 1140 Bruxelles
CANADA Directeur du Service des Renseignements Scientifiques Ministere de la Dbfense Nationalc Ottawa, Ontario KIA OK2
DANEMARK Danish Defence Research Board Ved Idraetsparken 4 2100 Copenhagen 0
ESPAGNE INTA AGARD Publications)
28008 Madrid Pintor k osales 34
ETATS-UNIS National Aeronautics and Space Administration Langley Research Center M/S 180 Hampton, Virginia 23665
FRANCE O.N.E.R.A. (Direction) 29, Avenue de la Division Leclerc 92320, Chitillon sous Bagneux
Hellenic Air Force Air War College Scientific and Technical Library Dekelia Air Force Base Dekelia, Athens TGA 1010
GRECE
c/o Flugrad Reykjavik
Aeranautica Militaire Ufficio del Delegato Nazionale alI'AGARD 3 Piazzale Adenauer 00144 Roma EUR
Voir Belgiique
Norwegian Defence Research Establishment Attn: Biblioteket P.O. Box 25 N-2007 Kjeller
ITALIE
LUXEMBOURG
NORVEGE
ROYAUME UNI Defence Research Information Centre Kentigern House 65 Brown Street Glasgow G2 8EX
TURQUIE Milli Savunma Ba$kanligi (MSB) ARGE Daire Bagkanliii (ARGE) Ankara
AGENCES DE VENTE National Technical Information Service ESA/lnformation Retrieval Service (NTIS) 5285 Port Royal Road SDrinzfield, Virginia 22161
European Space Agency 10, rue Mario Nikis 75015 Paris
&Gunis France
The British Library Document Supply Division Boston Spa, Wetherby West Yorkshire LS23 7BQ Royaume Uni
Les demandesdemicrofichesoudephotocopies de documents AGARD (ycompris lesdemandesfaites aupres du NT1S)doivent comporter la dinomination AGARD, ainsi que le numero de sCrie de I'AGARD (par exemple AGARD-AG-315). Des informations analogues, telles quele titreet ladatedepublicationsontsouhaitables.Veuillernoterqu'i1yalieudespbcifierAGARD-R-nnnet AGARD-AR-nnnlorsdcla commande de rapports AGARDet des rapportsconsultatifs AGARD respectivement. Des rifbrences bibliographiquescomplelesainsique des rbsumbs des publications AGARD figurent dans les journaux suivants:
Scientifique and Technical Aerospace Reports (STAR) Government Reports Announcements and Index (GRA&I) publib par la NASA Scientific and Technical publii par le National Technical Information Servlce Information Division Springfield NASA Headquarters NlT) Virginia 2216 1
Etats-Unis (accessible egalement en made interactif dans la base de Etats-Unis donnees bibliographiques en ligne du NTIS, et sur CD-ROM)
Washington D.C. 205 d 6
Imprimi pur Speciuiised Printing Services Limited 40 Chigweli Lane, Loughron, Essex IGIO 3TZ
AAGamD NATO 6. OTAN
7 RUE ANCELLE ' 92200 NEUILLY-SUR-SEINE
FRANCE
Telephone (1)47.38.57.00 . Telex 610 176 Telefax (1)47.38.57.99
DISTRIBUTION OF UNCLASSIFIED AGARD PUBLICATIONS
AGARD does NOT hold stocks of AGARD publications at the above address for general distribution. Initial distribution of AGARD publications is made to AGARD Member Nations through the following National Distribution Centres.Further copies are sometimes available from these Centres (except in the United States), but if not may be purchased in Microfiche or Photocopy form from the Sales Agencies listed below.
NATIONAL DISTRIBLWION CENTRES BELGIUM LUXEMBOURG
Coordonnateur AGARD - VSL SeeBelgium
NETHERLANDS Etat-Major de la Force ABrienne Quartier Reine Elisabeth Rue d'Evere. I 1 40 Bruxelles Netherlands Delegation to AGARD
National Aerospace Laboratory, NLR CANADA Kluyverweg I
Director Scientific Information Services 2629 HS Delft Dept of National Defence Ottawa. Ontario KIA OK2
DENMARK Danish Defence Research Board Ved Idraetsparken 4 2100 Copenhagen 0
FRANCE O.N.E.R.A. (Direction) 29 Avenue de la Division Leclerc 92320 Chitillon
GERM ANY Fachinformationszenlrum Karlsruhe D-75 14 Eggenstein-Leopoldshafen 2
NORWAY Norwegian Defence Research Establishment Attn: Biblioteket P.O. Box 25 N-2007 Kjeller
FORTUGAL Portuguese National Coordinator to AGARD Gabinete de Estudos e Programas CLAFA Base de Alfragide Alfragide 2700 Amadora
INTA (AGARD Publications) Pintor Rosille; 34
SPAIN
.. Hellenic Air Force A i r War College Scientific and Technical Library Dekelia Air Force Base Dekelia,AthensTGA 1010
ICELAND Director of Aviation c/o Flugrad Reykjavik
ITALY Aeronautica Militare Uficio del Delegato Nazionale all'AGARD 3 Piarzale Adenauer 00144RomdEUR
T'URKEY Milli Savunma Bavkanligt (MSB
Ankara ARCE Daire Ba$kanIiki (ARC 4 )
LlNlTED KINGDOM Defence Research Inlbrination Centre Kentigern House 65 Brown Street Glasgow G2 8EX
UNITED STATES National Aeronautics and Space Administration (NASA) Langley Research Center M/S 180 Hampton, Virginia 23665
I HE UNITED sr,\TEs NATIONAI. i ) i s rRiwTioh CEVI'KI: ,MSA, 1 )ms KOI HOI . I ) STOCKS OF AGARD PUHl.lCA I'IONS. AND APPLI(.':VI IOhS tOK COPIES SHOULD H I : kl.Al)k.
DIRtCITO THE NATIONAL 'TECHNICAL INFORMATION SERVICE (NTIS) AT TIiE AI>I)KkSS UtLOW.
National Technical Information Service (NTIS) 52,pr ne_. "^_.^I ",."A
SALES AGENCIES
ESA/lnformation Retrieval Service European Space Agency t(1 m e Mirin Nikia
-
In N. Washin ton D.C. 20546 United $tales
The British Library Document Supply Centre Boston Spa, Wetherby
723 7B0
)'and the iote that :raphical
'1
"llllC" O L a C J
(also ivailable online in the NTIS Bibliographic Database or on CD-ROM)
Printed by Speciulised Prinfirig Services Limited 40 ChigweN Lane, Loughtort, Essex IGIOSTZ