Embed Size (px)
Citation preview

AFLPs and Mitochondrial Haplotypes Reveal LocalAdaptation to Extreme Thermal Environments in aFreshwater GastropodMarıa Quintela1,2*, Magnus P. Johansson2, Bjarni K. Kristjansson3, Rodolfo Barreiro1, Anssi Laurila2
1 Dept of Animal Biology, Plant Biology and Ecology, Faculty of Science, University of A Coruna, A Coruna, Spain, 2 Animal Ecology, Department of Ecology and Genetics,
Evolutionary Biology Centre, Uppsala University, Uppsala, Sweden, 3 Holar University College, Department of Aquaculture and Fish Biology, Sauðarkrokur, Iceland
Abstract
The way environmental variation shapes neutral and adaptive genetic variation in natural populations is a key issue inevolutionary biology. Genome scans allow the identification of the genetic basis of local adaptation without previousknowledge of genetic variation or traits under selection. Candidate loci for divergent adaptation are expected to showhigher FST than neutral loci influenced solely by random genetic drift, migration and mutation. The comparison of spatialpatterns of neutral markers and loci under selection may help disentangle the effects of gene flow, genetic drift andselection among populations living in contrasting environments. Using the gastropod Radix balthica as a system, weanalyzed 376 AFLP markers and 25 mtDNA COI haplotypes for candidate loci and associations with local adaptation amongcontrasting thermal environments in Lake Myvatn, a volcanic lake in northern Iceland. We found that 2% of the analysedAFLP markers were under directional selection and 12% of the mitochondrial haplotypes correlated with differing thermalhabitats. The genetic networks were concordant for AFLP markers and mitochondrial haplotypes, depicting distincttopologies at neutral and candidate loci. Neutral topologies were characterized by intense gene flow revealed by dense netswith edges connecting contrasting thermal habitats, whereas the connections at candidate loci were mostly restricted topopulations within each thermal habitat and the number of edges decreased with temperature. Our results suggestmicrogeographic adaptation within Lake Myvatn and highlight the utility of genome scans in detecting adaptivedivergence.
Citation: Quintela M, Johansson MP, Kristjansson BK, Barreiro R, Laurila A (2014) AFLPs and Mitochondrial Haplotypes Reveal Local Adaptation to ExtremeThermal Environments in a Freshwater Gastropod. PLoS ONE 9(7): e101821. doi:10.1371/journal.pone.0101821
Editor: Michael A. Russello, University of British Columbia Okanagan, Canada
Received April 29, 2014; Accepted June 11, 2014; Published July 9, 2014
Copyright: � 2014 Quintela et al. This is an open-access article distributed under the terms of the Creative Commons Attribution License, which permitsunrestricted use, distribution, and reproduction in any medium, provided the original author and source are credited.
Data Availability: The authors confirm that all data underlying the findings are fully available without restriction. DNA sequences are available under Genbankaccessions JN624782-JN624806. AFLP data are available under DRYAD entry doi:10.5061/dryad.3nd75.
Funding: Funding for this study was provided by the Swedish Research Council (to AL). The funders had no role in study design, data collection and analysis,decision to publish, or preparation of the manuscript.
Competing Interests: The authors have declared that no competing interests exist.
* Email: [email protected]
Introduction
Temperature influences all physiological processes from the
molecular level to that of the whole organism [1,2], affects
individual fitness and exerts a profound impact on the structure,
dynamics and functioning of populations [2–4]. Because of these
influences, the way organisms adapt to thermal variation has long
captivated the attention of scientists. In the last decades, the study
of thermal adaptation has evolved from studies focusing on simple
tolerance towards those dealing with mechanisms shaping the
temperature-dependent performance and the functional optimum
of species [5]. Studies focusing on physiological variation among
wild populations exposed to different thermal conditions improve
our knowledge of how populations adapt to different thermal
environments. Traditionally, thermal adaptation has been studied
by investigating clinal variation in physiological and fitness traits
along thermal gradients, in combination with reciprocal trans-
plants (e.g. [6,7]) or common garden experiments (e.g. [7–10]); but
the recent advances in molecular tools are now allowing us to
disentangle the evolutionary processes behind thermal adaptation.
Population genomics has become an increasingly useful
approach to detect adaptive genetic divergence in nonmodel
species see [11]. Genome scans allow the identification of loci with
atypical levels of genetic differentiation (e.g. [12,13]). These outlier
loci are potentially under directional selection (e.g. [14–17]) and
the distribution of neutral and non-neutral genomic regions
among contrasting thermal environments can aid understanding
of the evolutionary role of thermal selection and neutral
evolutionary processes. Identifying the way in which neutral
genomic regions and regions putatively under thermal selection
are distributed among thermal environments provides insights into
the genetic properties that allow and constrain thermal adaptation.
The distribution of genetic variation within and among
populations of a species is determined by the interaction between
natural selection and neutral evolutionary processes such as drift
and gene flow. While evolutionary change can be very fast with
measurable genetic change occurring over only a few generations
[18,19], the pace of evolution and its final outcome depends on
several factors such as genetic diversity [20,21], ecological and
evolutionary costs associated with adaptive change, and interac-
PLOS ONE | www.plosone.org 1 July 2014 | Volume 9 | Issue 7 | e101821

tions with other evolutionary forces. Specifically, gene flow and
genetic drift may disturb the effects of divergent selection and
prevent local adaptation (e.g. [22–26]). However, local adaptation
can evolve in the presence of gene flow when local selection is
strong (e.g. [27–30]), and can itself constrain gene flow through
selection against maladapted immigrants [31].
There is a long tradition of research on local adaptation in
freshwater and terrestrial habitats [32,33], and more recently in
the marine environment see [7]. In pond snails, a number of
studies have found local adaptation, especially in terms of
antipredator responses affecting shell morphology and behaviour
(e.g. [34–36]). Similarly, thermal adaptation has been found in
directly developing marine gastropods at both microgeographic
(0.05–15 Km) [37–39] and macrogeographic (400-.3500 Km)
[40–43] scales.
Lake Myvatn, a shallow eutrophic freshwater lake situated in an
area of active volcanism in northern Iceland, provides an
intriguing system to study thermal adaptation. The lake is
subjected to geothermal activity with several warm (up to 30uC)
and cold (ca. 5uC) springs running in the lake. In the areas
between these springs, water temperature follows the seasonal
fluctuations. Hence, the Lake Myvatn system consists of patches of
low or high temperatures, which are separated by large areas
where temperature fluctuates seasonally [44]. As fluctuations in
water temperature in the vicinity of the springs are small, aquatic
life close to the outflow of cold and warm water can be expected to
have adapted to these stable temperature environments.
In this paper, our objective was to investigate if the freshwater
gastropod Radix balthica showed signs of fine-grained thermal
adaptation in this system with strong temperature contrasts. For
this purpose we used AFLP markers and several outlier detection
procedures to quantify the proportion of the scanned genome
likely to be under divergent selection, and compared the patterns
of neutral and adaptive divergence between the thermal environ-
ments. In addition, we tested the association between temperature
and frequencies of AFLP markers and COI haplotypes by logistic
regression as implemented in the Spatial Analysis Method (SAM)
[45], and conducted network analyses [46] to assess how
geographic distance and temperature structure neutral and
adaptive genetic variation. AFLPs were the marker of choice
because, despite of being dominant, they are highly reproducible
and show advantages such as low development and genotyping
efforts in contrast with other more modern markers such as SNPs
[47].
Materials and Methods
Study systemLake Myvatn was created by a large basaltic lava eruption some
2300 years ago [48]. For a detailed description of the ecology of
Lake Myvatn, see Einarsson et al. [44]. The common pond snail
Radix balthica is a wide-spread directly-developing aquatic pulmo-
nate snail belonging to the Clade Hygrophila (Family Chilinidae
Dall, 1870) [49] and distributed throughout North-Western
Europe. It occupies slow-flowing rivers, littoral zones of lakes
and ponds [50] and has a relatively wide tolerance of pH, salinity
and temperature, but prefers calcareous waters [51]. As a
hermaphrodite it is capable of both self- and cross-fertilization,
but is considered to be a preferential outcrosser [52]. It has usually
one generation per year.
Sampling, AFLP genotyping, and COI sequencingWe sampled R. balthica, at six sites in Lake Myvatn on 20th and
21st June 2009. Being this species is common and widespread in
Iceland; no official permits are required to conduct sampling.
However, the snails used in this study were collected with the
permission from the local landowners. During the time of
collection, surface water temperature at these sites, measured
with a portable thermometer, ranged from 6 to 24uC (Fig. 1) and
represented the entire range of thermal environments within the
lake. Water temperatures were also measured at the same
locations between 18 May and 18 September 2011 with three
iButton thermochrons (DS1921G-F50) placed at the depth of ca.
50 cm each site. While the temperatures measured at cold (B and
Ho) and warm (He and K) locations in 2009 reflect the stable
temperatures near the cold (2011: 7.01uC60.58; 6.39uC60.70)
and warm springs (2011: 22.96uC61.40; 22.20uC61.08), respec-
tively; populations G (2009: 12uC; 2011: 8.89uC62.38) and V
(2009: 19uC; 2011: 8.59uC62.59) are subjected to wide seasonal
temperature fluctuations with water temperature ranging between
1 and 20uC (note that the mean temperatures for the seasonal sites
above are lower than average due to exceptionally cold weather in
late May and June 2011).
In the cold and warm locations the snails were collected in the
immediate vicinity of the springs. Samples of 30 individuals per
site were collected and stored in 70% ethanol at 220uC until
processing. Animals were dissected under a stereomicroscope and
a piece of the mantle was removed for DNA extraction. To avoid
cross contamination, each specimen was dissected using disposable
scalpels and tweezers that were flame-sterilized between individual
samples. Genomic DNA was isolated using Qiagen DNeasy Blood
& Tissue isolation kit (Qiagen Inc., Valencia, CA) following the
manufacturer’s instructions.
AFLPs were performed following the Tru1I/EcoRI protocol of
Vos et al. [53]. Fifteen selective primer combinations producing
376 repeatable loci (13–38 per primer pair) were selected for the
study. The reproducibility of AFLP profiles was assessed by
duplicate independent DNA from 10% of the individuals (three
per population). Furthermore, six extractions with no tissue were
included to obtain a ‘‘template’’ for the blanks. See Supporting
Information for further details.
A 643-bp region of the mitochondrial COI gene was amplified
in all the individuals using the universal primers described by
Folmer et al. [54]. Amplifications were performed in 25 ml of a
solution containing 0.5 mM of each primer, 0.2 mM of each
dNTP, 2 mM MgCl2, 1x AmpliTaq buffer, 1.25 U AmpliTaq
DNA polymerase (Applied Biosystems) and 1.5 ml DNA. Cycling
conditions were 2 min denaturing at 95uC followed by 30 cycles of
30 s at 95uC, 30 s at 45uC, and 1 min at 72uC. After removing the
excess of primers and nucleotides (with shrimp alkaline phospha-
tase and exonuclease I enzymes), samples were sequenced by
Macrogen Inc. (Macrogen, Seoul, South Korea) on ABI 3730
instruments (Applied Biosystems). Sequences were checked and
edited using the program ChromasPro (Technelysium Pty. Ltd.,
Eden Praire, MN) and aligned using BioEdit [55] with default
settings. After alignment and trimming, the final sequence length
was 643 bp. jModelTest 0.1 [56] identified HKY+I model as the
best-fit model of DNA evolution. Calculations of genetic diversity
indices were performed in DnaSP version 5.10 [57]. The
sequences of the 25 distinct COI haplotypes were deposited in
GenBank under accession numbers JN624782–JN624806.
AFLPs: Detection of loci under selectionTwo different basic approaches allow screening for loci that are
putatively under selection: (i) methods for detecting outlier loci that
show unexpectedly high or low differentiation [58–60]; and (ii)
correlative methods that look for associations between genetic
variation and environmental variables [61–63].
Thermal Adaptation in Snails from a Volcanic Lake
PLOS ONE | www.plosone.org 2 July 2014 | Volume 9 | Issue 7 | e101821
To minimize the risk of detecting false positives, we used three
different procedures to detect loci with a pattern deviating from
neutrality. First, we used the hierarchical Bayesian method
described in Beaumont & Balding [64] as implemented in
BayeScan software [59]. This method is based on the principle
that genetic differentiation among populations living in contrasting
environments is expected to be different for loci under selection
than for the rest of the genome. BayeScan estimates population-
specific FST coefficients and uses a cut-off based on the mode of
the posterior distribution [59]. The program was run by setting
sample size to 10000 and the thinning interval to 50 as suggested
by Foll & Gaggiotti [65], resulting in a total chain length of 550000
iterations. The loci with a posterior probability over 0.99 were
retained as outliers, corresponding to a Bayes Factor .2 (i.e.
‘‘decisive selection’’ [61]) and providing substantial support for the
model.
Secondly, we used the Fdist approach by Beaumont & Nichols
[58] implemented in Mcheza [66]. Loci with an unusually high
FST are putatively under directional selection, while loci with low
FST value are considered to be potentially under stabilizing
selection. We simulated the neutral distribution of FST with
100000 iterations at a significance level of 0.01. This method also
implements a multitest correction based on false discovery rates
(FDR) that is fundamental to avoid high overestimation of the
percentage of outliers (e.g. 1% of false positive with a threshold of
99%).
Finally, we used the Spatial Analysis Method (SAM) described
by Joost et al. [62] based on evaluation of the incidence of spatial or
environmental coincidence. SAM identifies alleles associated with
environmental variables without the need of populations to be
defined. However, it must be combined with the abovementioned
methods to differentiate between directional and stabilizing
selection. SAM calculates logistic regressions between all possible
marker-environmental pairs and determines if a model including
an environmental variable is more informative than a model
including only the constant. We tested for the effect of temperature
under a restrictive approach, which considered a model significant
only if both G and Wald Beta 1 tests rejected the corresponding
null hypothesis at the 0.0000505 confidence level after Bonferroni
correction, corresponding to P = 0.01.
BayeScan, Mcheza and SAM were used conservatively with the
analyses restricted to the loci with a dominant allele frequency
between 5% and 95% across the whole dataset. The rationale
behind this was to decrease the probability that differentiation, at a
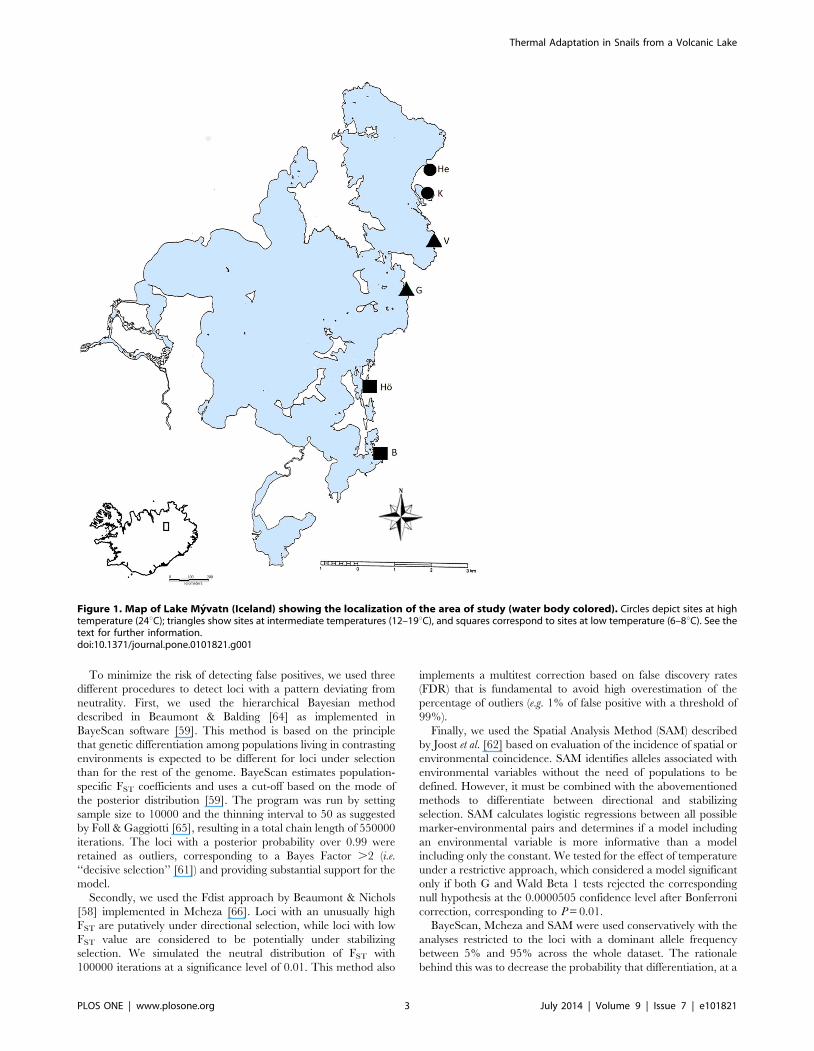
Figure 1. Map of Lake Myvatn (Iceland) showing the localization of the area of study (water body colored). Circles depict sites at hightemperature (24uC); triangles show sites at intermediate temperatures (12–19uC), and squares correspond to sites at low temperature (6–8uC). See thetext for further information.doi:10.1371/journal.pone.0101821.g001
Thermal Adaptation in Snails from a Volcanic Lake
PLOS ONE | www.plosone.org 3 July 2014 | Volume 9 | Issue 7 | e101821
given locus, would be mistakenly identified as a signature of
selection merely because it stood out against low levels of
background genetic variation resulting from the inclusion of low-
polymorphism markers.
AFLPs: Genetic structureAfter outlier detection, the original data set was partitioned into
two subsets: loci under selection and neutral loci. The subset of
neutral loci was produced by retaining the loci that were regarded
as non-selected by all three outlier detection methods. Allele
frequencies in the neutral data set were estimated using the
Bayesian method of Zhivotovsky [67] implemented in AFLP-SURV
v1.0 [68] under the option of non-uniform prior distributions of
allele frequencies. Overall FST was calculated with AFLP-SURV
both for neutral loci and for loci under selection, and significance
was based on 10000 permutations. Genetic differentiation among
populations was estimated separately for neutral and non-neutral
data sets by the Analysis of Molecular Variance, AMOVA [69]
implemented in the program GeneAlEx v6.4 [70].
To investigate population structure regardless of environmental
variation or geographic distance, we identified genetic clusters in
the AFLP-neutral dataset with the Bayesian model-based cluster-
ing algorithms implemented in STRUCTURE v. 2.3.3 [71–73]
under a model assuming admixture and correlated allele
frequencies without using population information. Ten runs with
a burn-in period of 100000 replications and a run length of
1000000 Markov chain Monte Carlo (MCMC) iterations were
performed for a number of clusters ranging from K 1 to 10. We
then applied the Evanno et al. [74] ad hoc summary statistic DK
which is based on the rate of change of the ‘estimated likelihood’
between successive K values. Furthermore, we compared the
posterior probabilities for the values of K with the highest P(X|K)
using a Wilcoxon two-samples test according to Rosenberg et al.
[75]. Runs of the selected K were averaged with CLUMPP version
1.1.1 [76] using the LargeKGreedy algorithm and the G9 pairwise
matrix similarity statistics and results were visualized as a barplot.
However, STRUCTURE algorithm may be poorly suited for
inferring the number of genetic clusters in data sets characterized
by isolation-by-distance relationships [71,74] and, also given that it
puts a strong prior on the existence of clusters, it may be prone to
errors when geographical sampling is discrete along clines [77].
Therefore we also performed this analysis using TESS, which has
been reported to be superior to other Bayesian clustering methods
under certain conditions [77]. Thus, the MCMC algorithm was
run for the AFLP-neutral dataset under CAR admixture model
with interaction parameter W = 0.6, 10000 burn-in and 50000
sweeps. Some 50 independent iterations were run for K = 1–6 and
after identifying the value of K that produced the highest
likelihood, this was ran 100 times and the 20 highest likelihood
runs were averaged using CLUMPP version 1.1.1 [76] applying
the LargeKGreedy algorithm and the G9 pairwise matrix
similarity statistics. Results were visualized as a barplot.
AFLPs: Population GraphsWe performed network analyses to investigate network structure
and genetic connectivity among sites. Graph theory is an area of
mathematics that deals with problems of connectivity and flow of
networks, with proven utility in population genetics and landscape
ecology see [46,78]. A graph represents a landscape of discrete
habitat patches as a set of nodes (sites) genetically interconnected
by edges (gene flow) between them [79]. The presence of an edge
in a Population Graph is determined by the genetic covariance of
the connected populations. If these are independent, conditional
on the remaining data in the model, the populations are not
connected. We applied a multivariate population graphing
approach [46,78] to compare the genetic networks generated by
neutral and non-neutral markers.
Networks were constructed using the online application
Population Graphs v2 (http://dyerlab.github.io/popgraph/. Ac-
cessed 2014 June 16), and the analyses were performed with the
software Genetic Studio [80]. For graph construction, we retained
the minimal edge set that sufficiently described the total among-
population covariance structure. Two sites will share an edge if
there is significant genetic covariance between them after
removing the covariance that each population has with all the
remaining populations in the network. Significance was evaluated
using edge exclusion deviance, which identifies the most important
edges for each node in terms of genetic covariance. For a full
mathematical and statistical description of genetic methods for
constructing graphs see Dyer & Nason [46] and references therein.
A binomial test for the existence of two subgraphs within the
dataset [46,81] was used for each network to determine whether
there was restricted gene flow between the populations from high
and low temperature. In partially reproductively isolated popula-
tions, we would expect to find two subgraphs for the loci under
directional selection but not for the neutral ones. Across the entire
Population Graph, graph distance was estimated as the minimal
topological distance connecting pairs of sites (nodes). The two
pairwise graph distances matrices obtained (for neutral markers
and markers under selection, respectively) were then regressed on
the shortest geographic distance within the lake to test for
Isolation-By-Graph Distance (IBGD). This test allows us to detect
the existence of genetic barriers to gene flow among populations.
Assuming a homogeneous IBD process, graph distances and
spatial distances should be proportional, but the relationship
between expected edge length and spatial distance may change if
migration is heterogeneous. A relatively small graph distance
between spatially distant sites indicates long-distance migration
(extended edges). Conversely, geographical or ecological barriers
that impede migration relative to other localities with similar
distance generate relatively high graph distances (compressed
edges: [82]). Correlations and detection of extended and
compressed edges were determined by regressing geographic and
Graph Distance [80].
Neutral and adaptive genetic variation distributed across space
are net products of different evolutionary mechanisms (genetic
drift, gene flow and selection), and it is important not to confound
these components and the mechanisms shaping their spatial
distribution. To evaluate whether genetic drift may explain the
spatial genetic patterns found in neutral markers, we performed a
Mantel [83] test between the matrices of genetic distance
(estimated as pairwise FST) and geographical distance (i.e. shortest
distance by water), expecting to find Isolation-by-Distance (IBD)
due to restricted gene flow. Similarly, a correlation with thermal
distance would produce an Isolation-by-Temperature (IBTe)
pattern. To detect a signature of selection and thereby local
adaptation, we correlated the genetic distance of non-neutral loci
with geographic distance and performed this analysis also using
Partial Mantel tests with covariance of neutral pairwise genetic
distance as a third matrix. Mantel and Partial Mantel tests were
conducted with PASSaGE [84] and significance was tested after
10000 permutations. A similar approach was used to substitute
FST with Graph Distance to test for the existence of Isolation-By-
Graph Distance (IBGD) and Isolation-By-Graph Distance-Tem-
perature (IBGDTe) patterns (results in Table H in File S1).
Thermal Adaptation in Snails from a Volcanic Lake
PLOS ONE | www.plosone.org 4 July 2014 | Volume 9 | Issue 7 | e101821
mtDNA: Population structure and correlation betweenhaplotype frequencies and temperature
Hierarchical AMOVA was used to test population structure
with COI haplotype frequencies using Arlequin version 3.5.1.2
[85]. Pairwise WSTs were calculated and their significance was
based on 10000 permutations. In an identical approach to the one
conducted with AFLPs, SAM was used to investigate the
correlation between haplotype frequencies and environmental
variables. The haplotypes that showed positive correlation with the
temperature were considered to be of particular importance for
adaptation to temperature. Likewise, population graphs were
conducted separately on mtDNA haplotypes that were related to
temperature and on those that were not. The correlations of
genetic distances over geographical and thermal distances for all
pairs of populations were tested with the Mantel and partial
Mantel permutation procedures with PASSaGE as explained
above for AFLPs. These tests were also performed regressing
Graph Distance against geographic and thermal distance (in
Supporting Information).
The evolutionary relationships between haplotypes were exam-
ined with the software Network 4.6.1.0 (http://fluxus-engineering.
com/accessed 2014 Jun 14) using the median-joining algorithm
(epsilon set to 10) and the connection cost distance method to build
an unrooted cladogram [86]. Transversions were weighted three-
fold to transitions because they are rarer in mitochondrial DNA.
Two hypermutable sites were identified by post-processing using
the Steiner (MP) algorithm, and their weight was halved (i.e. set to
5). The MJ network was maximum parsimony post-processed to
display the shortest tree.
Results
AFLPs: Selection tests198 of the 376 repeatable AFLP loci had dominant allele
frequencies ranging between $5% and #95%, and were included
in the outlier analyses. BayeScan identified ten loci exceeding the
threshold for ‘‘very strong’’ evidence of selection (log10BF.1.5),
none of them under stabilizing selection. Six out of the ten loci
under directional selection met our more stringent criterion for
evidence of ‘‘decisive’’ selection (log10BF.2) and were incorpo-
rated to the non-neutral data set. In contrast, the neutral data set
was composed of the loci that did not reach the threshold of
‘‘substantial’’ evidence of selection, i.e. loci with log10BF,0.5.
Diversity statistics for all markers and neutral markers alone can
be found in Table A in File S1.
Four out of the six markers that showed log10(BF).2 in
BayeScan were identified as being under directional selection with
Mcheza at 99% confidence (Table B in File S1). This approach
also identified two additional loci under directional selection as
well as eight loci under stabilizing selection.
After calculating logistic regressions between all possible
marker-environment pairs (a total of 198 models), and significance
threshold set to 99% (corresponding to P,0.00005), SAM
detected 60 loci associated with temperature. This set of 60
markers also included the ten outlier loci classified by BayeScan as
above ‘‘very strong selection’’ (i.e. log10(BF).1.5) as well as the six
loci identified by Mcheza (Table C in File S1). The analyses of the
four extreme populations shown in Table C in File S1 reported
signs of selection in four of the markers identified in the analyses of
the six total populations.
The final neutral data set consisted of 117 markers that were
identified as neutral by all three outlier detection methods.
Likewise, the final data set of loci under directional selection
consisted of the four loci that were detected by all three
approaches. The population wise frequency distributions for the
four markers under directional selection (Table D in File S1)
showed that C18_143 and C34_277 were linked to high
temperature environments, whereas C34_282 was mainly present
in low temperature populations.
AFLPs: Genetic structureMost of the variation detected by AMOVA for the set of 117
neutral markers was found among individuals within populations
(88%); however, population differentiation was still highly
significant (FST = 0.119, P,0.0001). For the set of four loci under
directional selection, the picture changed as the distribution of the
variance within populations decreased to 45% with more than four
times higher levels of genetic structuring among populations
(FST = 0.546, P,0.0001). The set of eight loci under stabilizing
selection showed no variance among populations (FST = 0.000,
P = 0.976).
Pairwise FST estimates (Table E in File S1) based on the 117
neutral AFLP markers ranged from 0.043 to 0.131, all of them
significantly different from zero at 1% confidence, whereas for loci
under directional selection they showed a general increasing trend
with increasing thermal differences between populations (ranging
between 0.007NS and 0.774***).
Applying the method of Evanno et al. [74] to STRUCTURE
runs, strong evidence (DK = 306) was found to assign the six
populations to two clusters following the thermal differences (Fig. 2,
upper barplot) with a clear discontinuity in the proportion of
membership to each cluster in the intermediate zone. Thus,
population V (19uC) joined the cluster of high temperature
whereas population G (12uC) clustered with the cold-temperature
group. Next, the same procedure was performed on each cluster
separately according to the hierarchical approach. In both clusters,
evidence was found to assign the individuals to three different
clusters (DK = 58 and DK = 242 for high and low temperature
respectively) (Fig. 2, lower barplots). Populations in the lower
range of temperature showed more distinct features with lesser
levels of admixture than the ones at higher temperature.
TESS revealed K = 6 as the most likely number of clusters, thus
supporting STRUCTURE hierarchical approach results and
neutral pairwise FST. After averaging the 20% best TESS runs
with CLUMPP, a variable degree of admixture was detected in all
the populations (Fig. A in File S1). The highest similarity was
found between K and V, which was coherent with these
populations showing the lowest yet significant pairwise FST
(0.0433***).
Mantel tests (Table 1) showed strong and positive correlation
between FST and geographic distance, revealing IBD at AFLP
neutral markers (r = 0.611, P = 0.022) and at loci under directional
selection (r = 0.864, P = 0.003). The same pattern was found when
considering the thermal habitats, and hence both neutral markers
(r = 0.684, P = 0.009) and loci under directional selection
(r = 0.917; P = 0.008) showed statistically significant IBTe. The
relations found when regressing FST vs. geographic or thermal
distance remained largely similar when testing FST against Graph
Distance (Table H in File S1). The only exception was the neutral
markers vs. geographic distance, which was found to be marginally
non-significant (P = 0.0617, Table H in File S1) and thus not
showing Isolation-by-Graph Distance (IBGD).
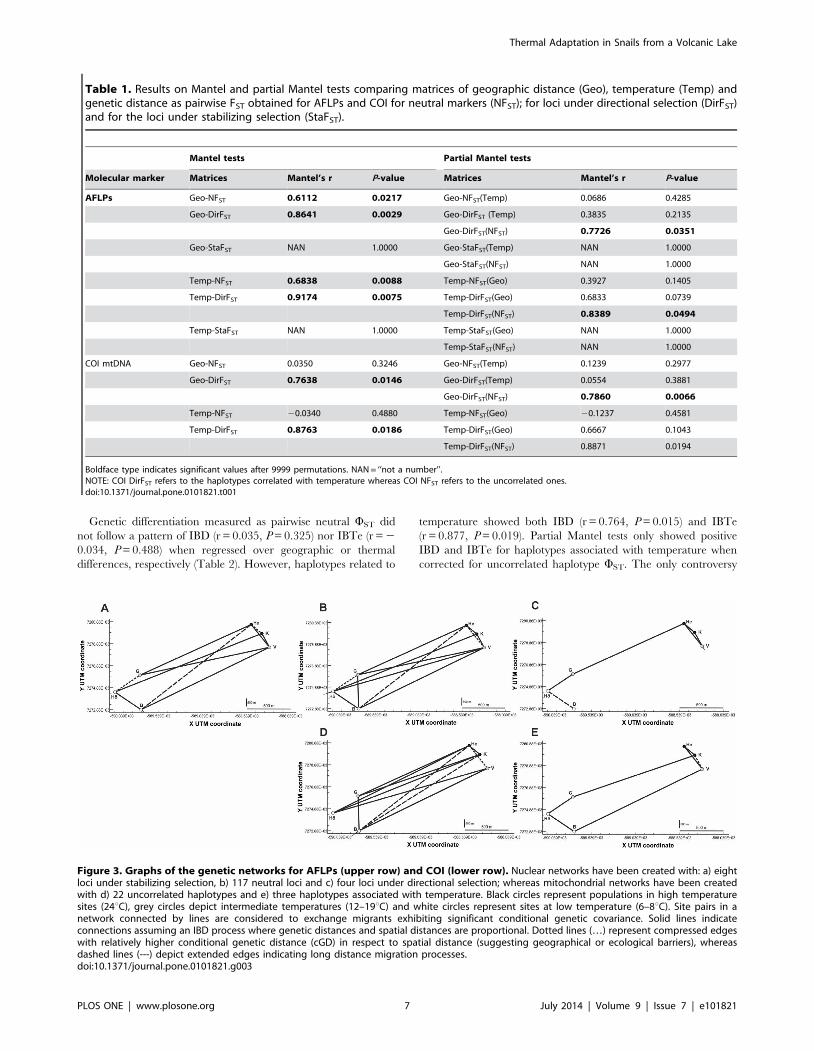
AFLPs: Network propertiesThe network that best depicted the behaviour of the neutral
markers data set (Fig. 3b) contained edges connecting almost all
the populations with each other (12 edges out of the 15 possible
ones). Topology generated by loci under stabilizing selection
Thermal Adaptation in Snails from a Volcanic Lake
PLOS ONE | www.plosone.org 5 July 2014 | Volume 9 | Issue 7 | e101821

(Fig. 3a) showed a similar morphology but with a slightly less dense
net of connections. In contrast, in the network for loci under
directional selection, not only was the total number of connections
halved, but there was only one edge connecting contrasting
thermal habitats (Fig. 3c). A Mantel test revealed the existence of
IBGD for markers under directional selection (r = 0.565,
P = 0.012), but this was not the case for neutral markers
(r = 0.189, P = 0.076) nor for markers under stabilizing selection
(r = 0.123, P = 0.164).
The network generated by neutral markers showed connections
within and between habitats (Fig. 3b). The connections between
contrasting habitats accounted for 67% of proportional edges and
33% of extended ones, whereas within similar habitats, 67% of
connections were proportional and 33% compressed. Likewise, the
stabilizing network (Fig. 3a) showed connections within and
between habitats: 60% of edges between contrasting habitats were
proportional and 40% extended, whereas 60% of edges between
similar habitats were proportional and 40% compressed. Loci
under directional selection showed proportional connections
among all the populations and only one extended edge joining
the sites at the lowest temperature (Fig. 3c).
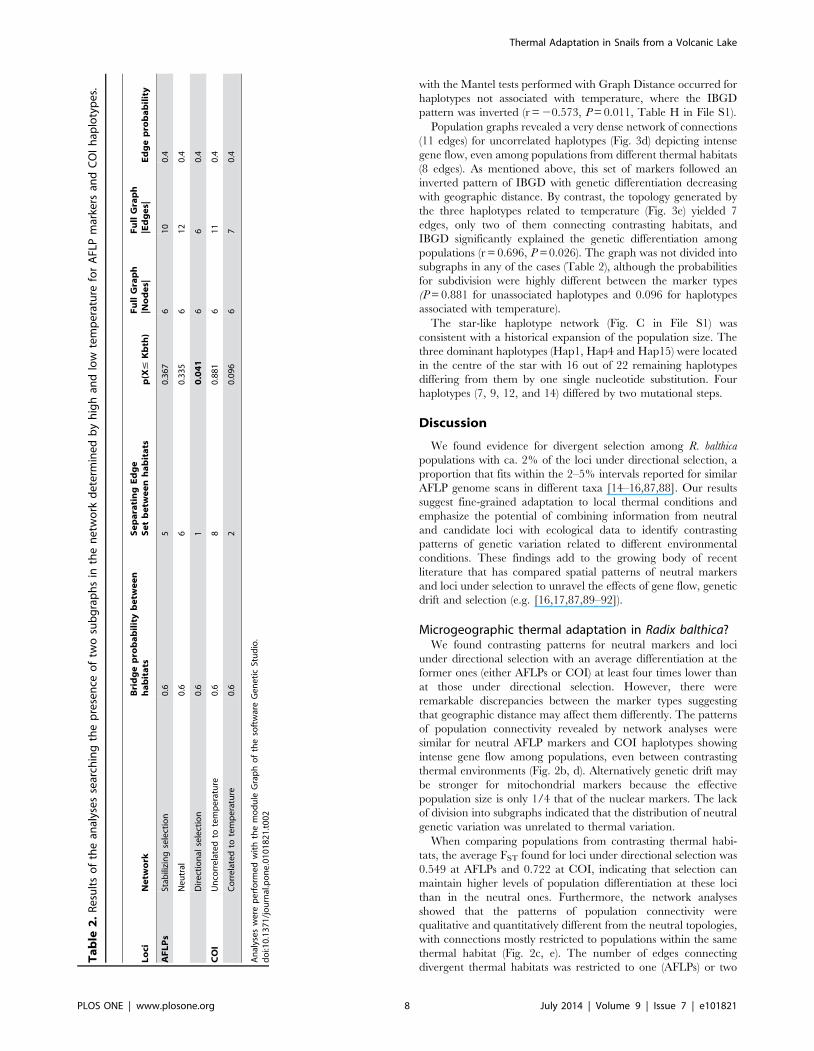
When testing the possibility that population structure was
composed of distinct genetic groups according to the habitat type,
the null hypothesis stated that the probability of obtaining an edge
connecting both subgraphs in the graph was 0.4 (binomial test).
Within graphs, a significant deficiency of edges between ‘‘high’’
and ‘‘low temperature’’ habitat sites, hence depicting two
subgraphs, was found for loci under directional selection (p(X#
Kbetween high and low temperature) = 0.041), but not for neutral markers
(p = 0.335) nor for loci under stabilizing selection (p = 0.367)
(Table 2).
mtDNA: Population structure and correlation betweenhaplotype frequencies and temperature
The 174 individuals successfully sequenced for COI showed 23
mutations in 22 polymorphic sites (8 of them parsimoniously
informative), which generated 25 different haplotypes within a
range of 10 km. Three of these haplotypes correlated with
temperature according to SAM (Table F in File S1), suggesting
that they may be of importance for temperature adaptation. Allele
frequencies for Hap_15 showed a clear cline of increasing
frequency with decreasing temperature starting from 19uC,
whereas the frequencies of Hap_4 and Hap_6 showed a tendency
to decrease with decreasing temperature.
An AMOVA was performed separately for the two sets of
haplotypes. At uncorrelated haplotypes, 9.25% of the genetic
variation was due to differences among populations with an
average fixation index significantly different from zero
(WST = 0.093, P = 0.002). At haplotypes correlated with tempera-
ture, variation among populations was seven times higher
(64.65%, WST = 0.646, P,0.0001).
The pairwise WST at haplotypes correlated with temperature
(Table G in File S1) ranged from 0.000NS to 0.903*** and showed
values significantly different from zero in all pairwise comparisons
between contrasting habitats as well as in the pair He vs. V (both
high temperature).
Figure 2. Hierarchical Bayesian clustering for the six populations genotyped at 117 neutral loci. First (upper barplot, Fig. 2A), inferredancestry of individuals was calculated after averaging ten STRUCTURE [71–73] runs with CLUMPP [76]. The number of clusters that best fits the totaldata was K = 2 after Evanno’s [74] correction (DK = 306). Then (lower barplots, Fig. 2B), the same procedure was performed again for every clusterobtaining K = 3 for each of the subsets (DK = 58 and DK = 242 for high and low temperature respectively). Sites are ordered in the barplots accordingto the N-S directions that corresponds to decreasing habitat temperatures.doi:10.1371/journal.pone.0101821.g002
Thermal Adaptation in Snails from a Volcanic Lake
PLOS ONE | www.plosone.org 6 July 2014 | Volume 9 | Issue 7 | e101821
Genetic differentiation measured as pairwise neutral WST did
not follow a pattern of IBD (r = 0.035, P = 0.325) nor IBTe (r = 2
0.034, P = 0.488) when regressed over geographic or thermal
differences, respectively (Table 2). However, haplotypes related to
temperature showed both IBD (r = 0.764, P = 0.015) and IBTe
(r = 0.877, P = 0.019). Partial Mantel tests only showed positive
IBD and IBTe for haplotypes associated with temperature when
corrected for uncorrelated haplotype WST. The only controversy
Table 1. Results on Mantel and partial Mantel tests comparing matrices of geographic distance (Geo), temperature (Temp) andgenetic distance as pairwise FST obtained for AFLPs and COI for neutral markers (NFST); for loci under directional selection (DirFST)and for the loci under stabilizing selection (StaFST).
Mantel tests Partial Mantel tests
Molecular marker Matrices Mantel’s r P-value Matrices Mantel’s r P-value
AFLPs Geo-NFST 0.6112 0.0217 Geo-NFST(Temp) 0.0686 0.4285
Geo-DirFST 0.8641 0.0029 Geo-DirFST (Temp) 0.3835 0.2135
Geo-DirFST(NFST) 0.7726 0.0351
Geo-StaFST NAN 1.0000 Geo-StaFST(Temp) NAN 1.0000
Geo-StaFST(NFST) NAN 1.0000
Temp-NFST 0.6838 0.0088 Temp-NFST(Geo) 0.3927 0.1405
Temp-DirFST 0.9174 0.0075 Temp-DirFST(Geo) 0.6833 0.0739
Temp-DirFST(NFST) 0.8389 0.0494
Temp-StaFST NAN 1.0000 Temp-StaFST(Geo) NAN 1.0000
Temp-StaFST(NFST) NAN 1.0000
COI mtDNA Geo-NFST 0.0350 0.3246 Geo-NFST(Temp) 0.1239 0.2977
Geo-DirFST 0.7638 0.0146 Geo-DirFST(Temp) 0.0554 0.3881
Geo-DirFST(NFST) 0.7860 0.0066
Temp-NFST 20.0340 0.4880 Temp-NFST(Geo) 20.1237 0.4581
Temp-DirFST 0.8763 0.0186 Temp-DirFST(Geo) 0.6667 0.1043
Temp-DirFST(NFST) 0.8871 0.0194
Boldface type indicates significant values after 9999 permutations. NAN = ‘‘not a number’’.NOTE: COI DirFST refers to the haplotypes correlated with temperature whereas COI NFST refers to the uncorrelated ones.doi:10.1371/journal.pone.0101821.t001
Figure 3. Graphs of the genetic networks for AFLPs (upper row) and COI (lower row). Nuclear networks have been created with: a) eightloci under stabilizing selection, b) 117 neutral loci and c) four loci under directional selection; whereas mitochondrial networks have been createdwith d) 22 uncorrelated haplotypes and e) three haplotypes associated with temperature. Black circles represent populations in high temperaturesites (24uC), grey circles depict intermediate temperatures (12–19uC) and white circles represent sites at low temperature (6–8uC). Site pairs in anetwork connected by lines are considered to exchange migrants exhibiting significant conditional genetic covariance. Solid lines indicateconnections assuming an IBD process where genetic distances and spatial distances are proportional. Dotted lines (…) represent compressed edgeswith relatively higher conditional genetic distance (cGD) in respect to spatial distance (suggesting geographical or ecological barriers), whereasdashed lines (---) depict extended edges indicating long distance migration processes.doi:10.1371/journal.pone.0101821.g003
Thermal Adaptation in Snails from a Volcanic Lake
PLOS ONE | www.plosone.org 7 July 2014 | Volume 9 | Issue 7 | e101821
with the Mantel tests performed with Graph Distance occurred for
haplotypes not associated with temperature, where the IBGD
pattern was inverted (r = 20.573, P = 0.011, Table H in File S1).
Population graphs revealed a very dense network of connections
(11 edges) for uncorrelated haplotypes (Fig. 3d) depicting intense
gene flow, even among populations from different thermal habitats
(8 edges). As mentioned above, this set of markers followed an
inverted pattern of IBGD with genetic differentiation decreasing
with geographic distance. By contrast, the topology generated by
the three haplotypes related to temperature (Fig. 3e) yielded 7
edges, only two of them connecting contrasting habitats, and
IBGD significantly explained the genetic differentiation among
populations (r = 0.696, P = 0.026). The graph was not divided into
subgraphs in any of the cases (Table 2), although the probabilities
for subdivision were highly different between the marker types
(P = 0.881 for unassociated haplotypes and 0.096 for haplotypes
associated with temperature).
The star-like haplotype network (Fig. C in File S1) was
consistent with a historical expansion of the population size. The
three dominant haplotypes (Hap1, Hap4 and Hap15) were located
in the centre of the star with 16 out of 22 remaining haplotypes
differing from them by one single nucleotide substitution. Four
haplotypes (7, 9, 12, and 14) differed by two mutational steps.
Discussion
We found evidence for divergent selection among R. balthica
populations with ca. 2% of the loci under directional selection, a
proportion that fits within the 2–5% intervals reported for similar
AFLP genome scans in different taxa [14–16,87,88]. Our results
suggest fine-grained adaptation to local thermal conditions and
emphasize the potential of combining information from neutral
and candidate loci with ecological data to identify contrasting
patterns of genetic variation related to different environmental
conditions. These findings add to the growing body of recent
literature that has compared spatial patterns of neutral markers
and loci under selection to unravel the effects of gene flow, genetic
drift and selection (e.g. [16,17,87,89–92]).
Microgeographic thermal adaptation in Radix balthica?We found contrasting patterns for neutral markers and loci
under directional selection with an average differentiation at the
former ones (either AFLPs or COI) at least four times lower than
at those under directional selection. However, there were
remarkable discrepancies between the marker types suggesting
that geographic distance may affect them differently. The patterns
of population connectivity revealed by network analyses were
similar for neutral AFLP markers and COI haplotypes showing
intense gene flow among populations, even between contrasting
thermal environments (Fig. 2b, d). Alternatively genetic drift may
be stronger for mitochondrial markers because the effective
population size is only 1/4 that of the nuclear markers. The lack
of division into subgraphs indicated that the distribution of neutral
genetic variation was unrelated to thermal variation.
When comparing populations from contrasting thermal habi-
tats, the average FST found for loci under directional selection was
0.549 at AFLPs and 0.722 at COI, indicating that selection can
maintain higher levels of population differentiation at these loci
than in the neutral ones. Furthermore, the network analyses
showed that the patterns of population connectivity were
qualitative and quantitatively different from the neutral topologies,
with connections mostly restricted to populations within the same
thermal habitat (Fig. 2c, e). The number of edges connecting
divergent thermal habitats was restricted to one (AFLPs) or two
Ta
ble
2.
Re
sult
so
fth
ean
alys
es
sear
chin
gth
ep
rese
nce
of
two
sub
gra
ph
sin
the
ne
two
rkd
ete
rmin
ed
by
hig
han
dlo
wte
mp
era
ture
for
AFL
Pm
arke
rsan
dC
OI
hap
loty
pe
s.
Lo
ciN
etw
ork
Bri
dg
ep
rob
ab
ilit
yb
etw
ee
nh
ab
ita
tsS
ep
ara
tin
gE
dg
eS
et
be
twe
en
ha
bit
ats
p(X
#K
bth
)F
ull
Gra
ph
|No
de
s|F
ull
Gra
ph
|Ed
ge
s|E
dg
ep
rob
ab
ilit
y
AF
LP
sSt
abili
zin
gse
lect
ion
0.6
50
.36
76
10
0.4
Ne
utr
al0
.66
0.3
35
61
20
.4
Dir
ect
ion
alse
lect
ion
0.6
10
.04
16
60
.4
CO
IU
nco
rre
late
dto
tem
pe
ratu
re0
.68
0.8
81
61
10
.4
Co
rre
late
dto
tem
pe
ratu
re0
.62
0.0
96
67
0.4
An
alys
es
we
rep
erf
orm
ed
wit
hth
em
od
ule
Gra
ph
of
the
soft
war
eG
en
eti
cSt
ud
io.
do
i:10
.13
71
/jo
urn
al.p
on
e.0
10
18
21
.t0
02
Thermal Adaptation in Snails from a Volcanic Lake
PLOS ONE | www.plosone.org 8 July 2014 | Volume 9 | Issue 7 | e101821

(COI), suggesting that temperature is a strong environmental axis
that conditions the genetic composition of the populations at both
thermal extremes. Thus, the distribution of the edges was in
agreement with former studies reporting relationships between
habitat features and functional genetic variation e.g [15,17,93–95].
Likewise, two subgraphs were detected for AFLPs (P = 0.041),
although there was only nonsignificant indication for two
subgraphs in COI (P = 0.096).
The fact that neutral and candidate markers depicted different
graph patterns suggests either no or limited gene flow at genomic
regions under directional selection, and supports the idea of local
thermal adaptation in the face of ongoing gene flow. This was
indicated by 1–2 edges connecting high and low temperature
habitats in the topology of loci under directional selection, which
sharply contrasted with the 6–8 edges found either in the neutral
topology or in the topology of loci under stabilizing selection.
Directional selection on fitness traits can be strong enough to
maintain divergence in these genomic regions by reducing the
effective recombination in genes affecting local adaptation, but
does not reduce recombination in other genomic regions [17]. For
instance, Kavanagh et al. [21] and Junge et al. [96] provided
evidence that natural selection is sufficiently powerful for
freshwater fish populations to adapt to novel temperature regimes
within 22 generations, even under conditions of low genetic
variation and under the influence of gene flow. The logical step for
future research would be, firstly, the characterization of anony-
mous outlier AFLP markers to detect any eventual underlying
genes with the further aim to associate candidate genes under
putative selection and experimental phenotypic data. Experiments
measuring thermal performance and tolerance of genotyped
individuals could confirm whether these genetic polymorphisms
play a role in thermal adaptation.
The evidence for divergent selection between different thermal
habitats in R. balthica at a scale of less than 10 km agrees with
former studies that have found thermal adaptation in ranges of
0.05–15 km in directly developing marine gastropods [37–39].
While our analyses clearly support thermal adaptation in R.
balthica, a pair of issues needs further consideration. Firstly, the
spatial distribution of loci under directional selection was
influenced also by spatial distance as significant IBGD was found
both for AFLPs (r = 0.565, P = 0.012) and COI (r = 0.458,
P = 0.025). The explanation for this is most likely the strong
correlation between thermal differentiation and geographic
distance (r = 0.8559, P = 0.0027), which hampers the efforts to
tease apart the contribution of these two factors. There may also
be other, co-varying factors affecting this correlation such as water
chemistry [97], but further studies are needed to elucidate this.
Secondly, the accurate detection of outliers is not free from
difficulties, one of them being that different procedures yield
different results. In our case, both BayeScan and Mcheza (the
latter merging DFDIST kernel with a user-friendly interface)
reported the same number of loci under directional selection,
although only four of them were detected by both methods. This
situation is similar to the one described by Nunes et al. [87] with
DFDIST and BayeScan detecting a similar proportion of outliers
(3–4%), but only a few of them being detected by both methods.
Caballero et al. [98] raised several concerns about the sensitivity of
DFDIST, and Perez-Figueroa et al. [99] performed a simulation
study to compare the efficiency of DFDIST, DETSELD and
BayeScan to detect loci under directional selection with dominant
markers, concluding that BayeScan was more effective under a
wide range of scenarios. However, when the ultimate aim of the
genome scan is to target candidate loci influenced by selection for
further research, it is advisable to combine several methods to
increase the power of the search despite increasing Type I error
rate.
In addition, a noteworthy feature in the discrepancies between
outlier detection approaches was that although both BayeScan and
Mcheza reported six markers to be under divergent selection (four
of them common) and almost identical strength of correlations for
IBD and IBTe (not shown), the network approach provided a
completely different picture of the relationships and connections
between populations (Table H, Fig. Ba,c in File S1). This
highlights the utility of network analyses as a tool that might
allow disentangle how evolutionary processes have acted on
interacting populations [46], while complementing the picture
provided by traditionally used methods such as pairwise F-
statistics, IBD models and spatial autocorrelations.
Non-neutrality of mtDNAThe use of SAM outlier detection procedure allowed us to
identify three mitochondrial haplotypes seemingly linked to
different thermal habitats (Table F in File S1), which yielded a
strongly significant pattern of IBTe. Hap_15 showed the clearest
trend of increasing allele frequency with decreasing temperature
starting at 19uC. By contrast, Hap_6 was present in high
frequency at 24uC but declined to zero at 12uC, and Hap_4 was
not present in the two coldest locations. To our knowledge, outlier
detection methods have not been formerly used on mitochondrial
DNA; however, mitochondrial haplotype frequencies strongly
associated with environmental variables have been reported in a
variety of systems (e.g. [31,100,101]).
As SAM only detects an association between habitat type and
haplotype, our results can be considered preliminary and leave a
lot of room for alternative, nonadaptive explanations. However, it
is interesting to note that while evolutionary and population
genetic studies have traditionally assumed that sequence variation
in mtDNA undergoes neutral or nearly neutral evolution [102],
the important roles of all thirteen mtDNA encoded peptides in
cellular ATP production suggest that mtDNA variation can have
significant metabolic and fitness consequences [103]. Indeed, a
growing body of evidence indicates that the assumption of
neutrality may not be valid, e.g [104] and references therein. In
this context, several authors have advocated the idea that mtDNA
and mito-nuclear gene complexes might evolve adaptively by
selection imposed from the prevailing thermal environment [105–
107]. The rationale behind is that mtDNA encodes multiple
subunits in four of the five respiratory enzyme complexes
[103,108] and that enzymatic processes are temperature sensitive.
Thus, adaptation to a novel thermal environment might result in
selection for gene products with different thermal properties [107].
Furthermore, COI is a protein encoding gene and selection on it
could be expected. However, the lack of recombination in mtDNA
complicates this scenario: with no recombination, the mitochon-
drial genome is particularly susceptible to genetic hitchhiking
accompanying selection at linked sites, and allele frequencies may
rarely be at the stationary neutral distribution [102]. In addition,
although statistical analyses of DNA sequences suggest that
evolution of mitochondrial proteins is not always neutral, the
functional significance of variation in these proteins has not been
extensively explored and biochemical and physiological studies are
required.
Finally, available data suggest that the driving force behind
evolutionary change is not always adaptation to the external
environment. Subtle genetic changes introduced into a popula-
tion’s gene pool by mutation face constant selection favoring the
maintenance of functional interactions among proteins encoded by
nuclear and mitochondrial genes. Hence, natural selection on
Thermal Adaptation in Snails from a Volcanic Lake
PLOS ONE | www.plosone.org 9 July 2014 | Volume 9 | Issue 7 | e101821

mtDNA-encoded peptides simultaneously results both in adapta-
tion to the environment and co-adaptation to the nuclear genome
[103].
In conclusion, the comparison of spatial patterns of neutral
markers and loci under selection among populations of the
gastropod Radix balthica living in contrasting environments
highlights the usefulness of complementing genome scans for
selection in natural populations with ecological data to disentangle
the effects of gene flow, genetic drift and selection. Our results
suggest microgeographic adaptation within Lake Myvatn and
highlight the utility of genome scans in detecting adaptive
divergence.
Data Archiving
DNA sequences: Genbank accessions JN624782–JN624806
AFLPs data: DRYAD entry doi:10.5061/dryad.3nd75
Supporting Information
File S1 Supporting Information. Supporting information
contains detailed description of the AFLPs reaction together with
the three figures (Fig. A-C) and eight tables (Table A-H). Figures:Fig. A. Histograms of assignment probabilities calculated by
TESS for the six populations genotyped at 117 neutral loci after
averaging the 20% best runs for K = 6 with CLUMPP [5]. Each
vertical bar represents an individual and its assignment proportion
into six clusters. Sites are ordered in the barplot according to the
N-S directions that corresponds to decreasing habitat temperature.
Fig. B. Graphs of the AFLPs genetic networks created with a) six
loci under directional selection detected by BayeScan with
log10(BF).2 (‘‘very strong selection’’); b) 60 loci under directional
selection detected by SAM, and c) six loci under directional
selection detected by Mcheza. Black circles represent populations
in high temperature sites (24uC), grey circles depict intermediate
temperatures (12–19uC) and white circles represent sites at low
temperature (6–8uC). Site pairs in a network connected by lines
are considered to exchange migrants exhibiting significant
conditional genetic covariance. Solid lines indicate connections
assuming an IBD process where genetic distances and spatial
distances are proportional. Dotted lines (…) represent compressed
edges with relatively higher conditional genetic distance (cGD) in
respect to spatial distance (suggesting geographical or ecological
barriers), whereas dashed lines (---) depict extended edges
indicating long distance migration processes. Fig. C. Median-
joining network of COI haplotypes. Each haplotype is represented
by a circle, and its area is proportional to its relative frequency;
shared haplotypes are represented as frequency diagrams. Smaller
black circle (mv) represents an unsampled hypothetical haplotype.
Numbers correspond to mutational positions in the studied 643-bp
fragment. Colors in the diagrams follow a decreasing thermal
trend (i.e. warmest populations are depicted in the darkest colors).
Tables: Table A. Diversity statistics by population for 376
repeatable AFLP markers, using Bayesian estimation of allele
frequencies with non-uniform priors [6]. Numbers in parenthesis
correspond to the values for the 117 neutral loci found
simultaneously with BayeScan, Mcheza and SAM. Table B.Shaded cells with numbers in bold depict loci detected to be under
directional selection by: SAM (P values for G and Wald Beta 1
with a significance threshold set to 95% corresponding to P,
0.000103093 after Bonferroni correction); BayeScan (log10(BF).
1.5 corresponding to ‘‘very strong selection’’) and MCHEZA at a
significance P value of 0.01. Table C. Analysis of four populations
at extreme temperatures.- Shaded cells with numbers in bold
depict loci detected to be under directional selection by: SAM (P
values for G and Wald Beta 1 with a significance threshold set to
95% corresponding to P,0.000103093 after Bonferroni correc-
tion); BayeScan (log10(BF).1.5 corresponding to ‘‘very strong
selection’’) and MCHEZA at a significance P value of 0.01. The
markers selected in the analyses with the total six populations are
depicted in bold italics. Table D. Distribution of frequencies (%)
per population for the four markers under directional selection
detected with the three approaches (BayeScan, Mcheza and SAM)
simultaneously. Table E. Pairwise FST between populations
calculated with AFLPSurv for the 117 neutral data (below
diagonal) and pairwise FST for the four loci under directional
selection (above diagonal). Pairwise FST for loci under stabilizing
selection took value of 0.000NS for every pair of populations.
Significance was based on 10000 permutations. Table F.mtDNA. Distribution of frequencies (%) per population for the
haplotypes showing correlation with temperature according to
SAM. Table G. Pairwise WST between populations calculated
with the 22 haplotypes not correlated with temperature (below
diagonal) and with the 3 correlated haplotypes (above) computed
from haplotype frequencies frequencies with Arlequin. Signifi-
cance was based on 10000 permutations. Table H. Results on
Mantel and partial Mantel tests comparing matrices of geographic
distance (Geo), temperature (Temp) and genetic distance (estimat-
ed as pairwise Graph Distance with GeneStudio) for AFLPs and
COI, and assessed for: neutral markers (NGD); loci under
directional selection (DirGD) and loci under stabilizing selection
(StaGD). Boldface type indicates significant values after 9999
permutations.
(DOCX)
Acknowledgments
We thank Katja Rasanen for help during field work, Lua Lopez for
sequencing COI, Alex Richter-Boix and Francois Besnier for insightful
comments and discussions, and Jonathan Barnaby for proofreading the
text.
Author Contributions
Conceived and designed the experiments: AL BKK. Performed the
experiments: AL BKK MQ. Analyzed the data: MQ. Contributed
reagents/materials/analysis tools: AL RB. Contributed to the writing of
the manuscript: MQ MPJ BKK RB AL.
References
1. Kingsolver JG, Ragland GJ, Diamond SE (2009) Evolution in a constant
environment: Thermal fluctuations and thermal sensitivity of laboratory and
field populations of Manduca sexta. Evolution 63: 537–541.
2. Angilletta MJ (2009) Thermal Adaptation. A Theoretical and Empirical
Synthesis. Oxford: Oxford University Press.
3. Morelissen B, Harley CDG (2007) The effects of temperature on producers,
consumers, and plant-herbivore interactions in an intertidal community.
Journal of Experimental Marine Biology and Ecology 348: 162–173.
4. Dillon ME, Wang G, Huey RB (2010) Global metabolic impacts of recent
climate warming. Nature 467: 704–706.
5. Portner HO, Peck L, Somero G (2007) Thermal limits and adaptation in
marine Antarctic ectotherms: an integrative view. Philosophical Transactions of
the Royal Society B: Biological Sciences 362: 2233–2258.
6. Niewiarowski PH, Roosenburg W (1993) Reciprocal transplant reveals sources
of variation in growth rates of the lizard Sceloporus undulatus. Ecology 74: 1992–
2002.
7. Sanford E, Kelly MW (2011) Local adaptation in marine invertebrates. Annual
Review of Marine Science 3: 509–535.
Thermal Adaptation in Snails from a Volcanic Lake
PLOS ONE | www.plosone.org 10 July 2014 | Volume 9 | Issue 7 | e101821

8. Sørensen JG, Norry FM, Scannapieco AC, Loeschcke V (2005) Altitudinal
variation for stress resistance traits and thermal adaptation in adult Drosophila
buzzatii from the New World. Journal of Evolutionary Biology 18: 829–837.
9. Baumann H, Conover DO (2011) Adaptation to climate change: contrasting
patterns of thermal-reaction-norm evolution in Pacific versus Atlantic
silversides. Proceedings of the Royal Society B: Biological Sciences 278:
2265–2273.
10. Sinervo B, Adolph SC (1989) Thermal sensitivity of growth rate in hatchling
Sceloporus lizards: environmental, behavioral and genetic aspects. Oecologia 78:
411–419.
11. Nosil P, Funk DJ, Ortiz-Barrientos D (2009) Divergent selection and
heterogeneous genomic divergence. Molecular Ecology 18: 375–402.
12. Luikart G, England PR, Tallmon D, Jordan S, Taberlet P (2003) The power
and promise of population genomics: from genotyping to genome typing.
Nature Reviews Genetics 4: 981–994.
13. Stinchcombe JR, Hoekstra HE (2007) Combining population genomics and
quantitative genetics: finding the genes underlying ecologically important traits.
Heredity.
14. Wilding CS, Butlin RK, Grahame J (2001) Differential gene exchange between
parapatric morphs of Littorina saxatilis detected using AFLP markers. Journal of
Evolutionary Biology 14: 611–619.
15. Bonin A, Taberlet P, Miaud C, Pompanon F (2006) Explorative genome scan
to detect candidate loci for adaptation along a gradient of altitude in the
common frog (Rana temporaria). Mol Biol Evol 23: 773–783.
16. Galindo J, Moran P, Rolan-Alvarez E (2009) Comparing geographical genetic
differentiation between candidate and noncandidate loci for adaptation
strengthens support for parallel ecological divergence in the marine snail
Littorina saxatilis. Molecular Ecology 18: 919–930.
17. Richter-Boix A, Quintela M, Segelbacher G, Laurila A (2011) Genetic analysis
of differentiation among breeding ponds reveals a candidate gene for local
adaptation in Rana arvalis. Molecular Ecology 20: 1582–1600.
18. Hendry AP, Kinnison MT (1999) Perspective: The pace of modern life:
measuring rates of contemporary microevolution. Evolution 53: 1637–1653.
19. Kinnison MT, Hendry AP (2001) The pace of modern life II: From rates of
contemporary microevolution to pattern and process. Genetica 112–113: 145–
164.
20. Hoffmann AA, Hallas RJ, Dean JA, Schiffer M (2003) Low potential for
climatic stress adaptation in a rainforest Drosophila species. Science 301: 100–
102.
21. Kavanagh K, Haugen T, Gregersen F, Jernvall J, Vollestad L (2010)
Contemporary temperature-driven divergence in a Nordic freshwater fish
under conditions commonly thought to hinder adaptation. BMC Evolutionary
Biology 10: 350.
22. Kawecki TJ, Ebert D (2004) Conceptual issues in local adaptation. Ecology
Letters 7: 1225–1241.
23. Lenormand T (2002) Gene flow and the limits to natural selection. Trends in
Ecology & Evolution 17: 183–189.
24. Slatkin M (1987) Gene flow and the geographic structure of natural
populations. Science 236: 787–792.
25. Garcıa-Ramos G, Kirkpatrick M (1997) Genetic models of adaptation and gene
flow in peripheral populations. Evolution 51: 21–28.
26. Garant D, Forde SE, Hendry AP (2007) The multifarious effects of dispersal
and gene flow on contemporary adaptation. Functional Ecology 21: 434–443.
27. Koskinen MT, Sundell P, Piironen J, Primmer CR (2002) Genetic assessment
of spatiotemporal evolutionary relationships and stocking effects in grayling
(Thymallus thymallus, Salmonidae). Ecology Letters 5: 193–205.
28. Peccoud J, Ollivier A, Plantegenest M, Simon J-C (2009) A continuum of
genetic divergence from sympatric host races to species in the pea aphid
complex. Proceedings of the National Academy of Sciences 106: 7495–7500.
29. Yeaman S, Jarvis A (2006) Regional heterogeneity and gene flow maintain
variance in a quantitative trait within populations of lodgepole pine.
Proceedings of the Royal Society B: Biological Sciences 273: 1587–1593.
30. Conover DO, Clarke LM, Munch SB, Wagner GN (2006) Spatial and
temporal scales of adaptive divergence in marine fishes and the implications for
conservation. Journal of Fish Biology 69: 21–47.
31. Cheviron ZA, Brumfield RT (2009) Migration-selection balance and local
adaptation of mitochondrial haplotypes in rufous-collared sparrows (Zonotrichia
capensis) along an elevational gradient. Evolution 63: 1593–1605.
32. Hereford J (2009) A quantitative survey of local adaptation and fitness trade-
offs. The American Naturalist 173: 579–588.
33. Leimu R, Fischer M (2008) A meta-analysis of loal adptation in plants. PLoS
ONE 3: e4010.
34. Bronmark C, Lakowitz T, Hollander J (2011) Predator-induced morphological
plasticity across local populations of a fresh water snail. PLoS ONE 6: e21773.
35. Dalesman S, Rundle SD, Bilton DT, Cotton PA (2007) Phylogenetic
relatedness and ecological interactions determine antipredator behavior.
Ecology 88: 2462–2467.
36. Dalesman S, Rundle SD, Cotton PA (2007) Predator regime influences innate
anti-predator behaviour in the freshwater gastropod Lymnaea stagnalis.
Freshwater Biology 52: 2134–2140.
37. Pardo LM, Johnson LE (2005) Explaining variation in life-history traits: growth
rate, size, and fecundity in a marine snail across an environmental gradient
lacking predators. Marine Ecology Progress Series 296: 229–239.
38. Behrens Yamada S (1989) Are direct developers more locally adapted thanplanktonic developers? Marine Biology 103: 403–411.
39. Kirby RR, Bayne BL, Berry RJ (1994) Phenotypic variation along a cline inallozyme and karyotype frequencies, and its relationship with habitat, in the
dog-whelk Nucella lapillus, L. Biological Journal of the Linnean Society 53: 255–275.
40. Kuo ESL, Sanford E (2009) Geographic variation in the upper thermal limits of
an intertidal snail: implications for climate envelope models. Marine EcologyProgress Series 388: 137–146.
41. Parsons KE (1997) Contrasting patterns of heritable geographic variation inshell morphology and growth potential in the marine gastropod Bembicium
vittatum: Evidence from field experiments. Evolution 51: 784–796.
42. Trussell GC (2000) Phenotypic clines, plasticity, and morphological trade-offs
in an intertidal snail. Evolution 54: 151–166.
43. Sokolova Portner (2001) Temperature effects on key metabolic enzymes in
Littorina saxatilis and L. obtusata from different latitudes and shore levels. MarineBiology 139: 113–126.
44. Einarsson A (2004) Lake Myvatn and the River Laxa: An introduction. AquaticEcology 38: 111–114.
45. Joost S, Kalbermatten M, Bonin A (2008) Spatial analysis method (SAM): asoftware tool combining molecular and environmental data to identify
candidate loci for selection. Molecular Ecology Resources 8: 957–960.
46. Dyer RJ, Nason JD (2004) Population Graphs: the graph theoretic shape ofgenetic structure. Molecular Ecology 13: 1713–1727.
47. Vignal A, Milan D, SanCristobal M, Eggen A (2002) A review on SNP andother types of molecular markers and their use in animal genetics. Genetic
Selection Evolution 34: 275–305.
48. Einarsson A (1982) The palaeolimnology of Lake Myvatn, northern Iceland:
plant and animal microfossils in the sediment. Freshwater Biology 12: 63–82.
49. Jorger K, Stoger I, Kano Y, Fukuda H, Knebelsberger T, et al. (2010) On the
origin of Acochlidia and other enigmatic euthyneuran gastropods, withimplications for the systematics of Heterobranchia. BMC Evolutionary Biology
10: 323.
50. Økland J (1990) Lakes and Snails: Environment and Gastropoda in 1500
Norwegian Lakes, Ponds and Rivers. Oegstegeest, The Netherlands: Backhuys
Publishers.
51. Welter-Schulte F (2009) Species summary for Omphiscola glabra. Available:
http://www.animalbase.uni-goettingen.de/zooweb/servlet/AnimalBase/home/species?id = 2200.
52. Coutellec-Vreto M-A, Jarne P, Guiller A, Madec L, Daguzan J (1998)Inbreeding and fitness in the freshwater snail Lymnaea peregra: An evaluation
over two generations of self-fertilization. Evolution 52: 1635–1647.
53. Vos P, Hogers R, Bleeker M, Reijans M, Lee vdT, et al. (1995) AFLP: a new
technique for DNA fingerprinting. Nucleic Acids Research 23: 4407–4414.
54. Folmer O, Black M, Hoeh W, Lutz R, Vrijenhoek R (1994) DNA primers for
amplification of mitochondrial cytochrome c oxidase subunit I from diverse
metazoan invertebrates. Molecular Marine Biology and Biotechnology 3: 294–299.
55. Hall T (1999) BioEdit 7.0.9.0.
56. Posada D, Crandall KA (1998) MODELTEST: testing the model of DNA
substitution. Bioinformatics 14: 817–818.
57. Rozas J, Sanchez-del Barrio JC, Messeguer X, Rozas R (2003) DnaSP, DNA
polymorphism analyses by the coalescent and other methods. Bioinformatics19: 2496–2497.
58. Beaumont M, Nichols R (1996) Evaluating loci for use in the genetic analysis ofpopulation structure. Proceedings: Biological Sciences 263: 1619–1626.
59. Foll M, Gaggiotti O (2008) A genome-scan method to identify selected lociappropriate for both dominant and codominant markers: A Bayesian
perspective. Genetics 180: 977–993.
60. Excoffier L, Hofer T, Foll M (2009) Detecting loci under selection in a
hierarchically structured population. Heredity 103: 285–298.
61. Foll M, Gaggiotti O (2006) Identifying the environmental factors that
determine the genetic structure of populations. Genetics 174: 875–891.
62. Joost S, Bonin A, Bruford MW, Despres L, Conord C, et al. (2007) A spatial
analysis method (SAM) to detect candidate loci for selection: towards a
landscape genomics approach to adaptation. Molecular Ecology 16: 3955–3969.
63. Eckert AJ, van Heerwaarden J, Wegrzyn JL, Nelson CD, Ross-Ibarra J, et al.(2010) Patterns of population structure and environmental associations to
aridity across the range of loblolly pine (Pinus taeda L., Pinaceae). Genetics 185:969–982.
64. Beaumont MA, Balding DJ (2004) Identifying adaptive genetic divergenceamong populations from genome scans. Molecular Ecology 13: 969–980.
65. Foll M, Beaumont MA, Gaggiotti O (2008) An approximate Bayesiancomputation approach to overcome biases that arise when using Amplified
Fragment Length Polymorphism markers to study population structure.
Genetics 179: 927–939.
66. Antao T, Lopes A (2011) Mcheza: A selection detection workbench for
dominant markers. Bioinformatics 27: 1717–1718.
67. Zhivotovsky LA (1999) Estimating population structure in diploids with
multilocus dominant DNA markers. Molecular Ecology 8: 907–913.
68. Vekemans X (2002) AFLP-SURV version 1.0. Distributed by the author.
Laboratoire de Genetique et Ecolgie Vegetale, Universite Libre de Bruxelles,Belgium
Thermal Adaptation in Snails from a Volcanic Lake
PLOS ONE | www.plosone.org 11 July 2014 | Volume 9 | Issue 7 | e101821

69. Excoffier L, Smouse PE, Quattro JM (1992) Analysis of molecular variance
inferred from metric distances among DNA haplotypes: Application to humanmitochondrial DNA restriction data. Genetics 21: 479–491.
70. Peakall R, Smouse PE (2006) GENALEX 6: genetic analysis in Excel.
Population genetic software for teaching and research. Molecular EcologyNotes 6: 288–295.
71. Falush D, Stephens M, Pritchard JK (2003) Inference of population structureusing multilocus genotype data: Linked loci and correlated allele frequencies.
Genetics 164: 1567–1587.
72. Pritchard JK, Stephens M, Donnelly P (2000) Inference of population structureusing multilocus genotype data. Genetics 155: 945–959.
73. Hubisz M, Falush D, Stephens M, Pritchard J (2009) Inferring weak populationstructure with the assistance of sample group information. Molecular Ecology
Resources 9: 1322–1332.74. Evanno G, Regnaut S, Goudet J (2005) Detecting the number of clusters of
individuals using the software STRUCTURE: a simulation study. Molecular
Ecology 14: 2611–2620.75. Rosenberg NA, Burke T, Elo K, Feldman MW, Freidlin PJ, et al. (2001)
Empirical evaluation of genetic clustering methods using multilocus genotypesfrom 20 chicken breeds. Genetics 159: 699–713.
76. Jakobsson M, Rosenberg NA (2007) CLUMPP: a cluster matching and
permutation program for dealing with label switching and multimodality inanalysis of population structure. Bioinformatics 23: 1801–1806.
77. Chen C, Durand E, Forbes F, Francois O (2007) Bayesian clustering algorithmsascertaining spatial population structure: a new computer program and a
comparison study. Molecular Ecology Notes 7: 747–756.78. Garroway CJ, Bowman J, Carr D, Wilson PJ (2008) Applications of graph
theory to landscape genetics. Evolutionary Applications 1: 620–630.
79. Minor ES, Urban DL (2007) Graph theory as a proxy for spatially explicitpopulation models in conservation planning. Ecological Applications 17: 1771–
1782.80. Dyer RJ (2009) GeneticStudio: a suite of programs for spatial analysis of
genetic-marker data. Molecular Ecology Resources 9: 110–113.
81. Giordano AR, Benjamin J R, Storfer A (2007) The influence of altitude andtopography on genetic structure in the long-toed salamander (Ambystoma
macrodactulym). Molecular Ecology 16: 1625–1637.82. Dyer RJ, Nason JD, Garrick RC (2010) Landscape modelling of gene flow:
improved power using conditional genetic distance derived from the topologyof population networks. Molecular Ecology 19: 3746–3759.
83. Mantel N (1967) The detection of disease of clustering and a generalized
regression approach. Cancer Research 27: 209–220.84. Rosenberg MS, Anderson CD (2011) PASSaGE: Pattern Analysis, Spatial
Statistics and Geographic Exegesis. Version 2. Methods in Ecology andEvolution 2: 229–232.
85. Excoffier L, Laval G, Schneider S (2005) Arlequin ver. 3.0: An integrated
software package for population genetics data analysis. Evolutionary Bioinfor-matics Online 1: 47–50.
86. Bandelt HJ, Forster P, Rohl A (1999) Median-joining networks for inferringintraspecific phylogenies. Molecular Biology and Evolution 16: 37–48.
87. Nunes VL, Beaumont MA, Butlin RK, Paulo OS (2011) Multiple approachesto detect outliers in a genome scan for selection in ocellated lizards (Lacerta
lepida) along an environmental gradient. Molecular Ecology 20: 193–205.
88. Collin H, Fumagalli L (2011) Evidence for morphological and adaptive geneticdivergence between lake and stream habitats in European minnows (Phoxinus
phoxinus, Cyprinidae). Molecular Ecology 20: 4490–4502.89. Luikart G, Pilgrim K, Visty J, Ezenwa VO, Schwartz MK (2008) Candidate
gene microsatellite variation is associated with parasitism in wild bighorn sheep.
Biology Letters 4: 228–231.
90. Gebremedhin B, Ficetola GF, Naderi S, Rezaei HR, Maudet C, et al. (2009)
Combining genetic and ecological data to assess the conservation status of the
endangered Ethiopian walia ibex. Animal Conservation 12: 89–100.
91. Lowry DB (2010) Landscape evolutionary genomics. Biology Letters 6: 502–
504.
92. Schwartz MK, Luikart G, McKelvey KS, Cushman SA (2010) Landscape
genomics: a brief perspective. In: Cushman SA, Huettmann F, editors. Spatial
Complexity, Informatics, and Wildlife Conservation: Springer. pp. 165–174.
93. Kane NC, Rieseberg LH (2007) Selective sweeps reveal candidate genes for
adaptation to drought and salt tolerance in common sunflower, Helianthus
annuus. Genetics 175: 1823–1834.
94. Steiner CC, Weber JN, Hoekstra HE (2007) Adaptive variation in beach mice
produced by two interacting pigmentation genes. PLoS Biol 5: e219.
95. Storz JF, Kelly JK (2008) Effects of spatially varying selection on nucleotide
diversity and linkage disequilibrium: insights from the deer mouse globin genes.
Genetics 180: 367–379.
96. Junge C, Vollestad LA, Barson NJ, Haugen TO, Otero J, et al. (2011) Strong
gene flow and lack of stable population structure in the face of rapid adaptation
to local temperature in a spring-spawning salmonid, the European grayling
(Thymallus thymallus). Heredity 106: 460–471.
97. Kristmannsdottir H, Armannsson H (2004) Groundwater in the Lake Myvatn
area, northern Iceland: Chemistry, origin and interaction. Aquatic Ecology 38:
115–128.
98. Caballero A, Quesada H, Rolan-Alvarez E (2008) Impact of AFLP fragment
size homoplasy on the estimation of population genetic diversity and the
detection of selective loci. Genetics 179: 539–554.
99. Perez-Figueroa A, Garcıa-Pereira MJ, Saura M, Rolan-Alvarez E, Caballero A
(2010) Comparing three different methods to detect selective loci using
dominant markers. Journal of Evolutionary Biology 23: 2267–2276.
100. Ribeiro AM, Lloyd P, Bowie RCK (2011) A tight balance between natural
selection and gene flow in a Southern African arid-zone endemic bird.
Evolution 65: 3499–3514.
101. Tobler M, DeWitt TJ, Schlupp I, Garcıa de Leon FJ, Herrmann R, et al.
(2008) Toxic hydrogen sulfide and dark caves: Phenotypic and genetic
divergence across two abiotic environmental gradients in Poecilia mexicana.
Evolution 62: 2643–2659.
102. Ballard JWO, Kreitman M (1995) Is mitochondrial DNA a strictly neutral
marker? Trends in Ecology & Evolution 10: 485–488.
103. Blier PU, Dufresne F, Burton RS (2001) Natural selection and the evolution of
mtDNA-encoded peptides: evidence for intergenomic co-adaptation. Trends in
Genetics 17: 400–406.
104. Dowling DK, Friberg U, Lindell J (2008) Evolutionary implications of
nonneutral mitochondrial genetic variation. Trends in Ecology and Evolution
23: 546–554.
105. Somero GN (2002) Thermal physiology and vertical zonation of intertidal
animals: Optima, limits, and costs of living. Integrative and Comparative
Biology 42: 780–789.
106. Blier PU, Lemieux H (2001) The impact of the thermal sensitivity of
cytochrome c oxidase on the respiration rate of Arctic charr red muscle
mitochondria. Journal of Comparative Physiology B: Biochemical, Systemic,
and Environmental Physiology 171: 247–253.
107. Ballard JWO, Whitlock MC (2004) The incomplete natural history of
mitochondria. Molecular Ecology 13: 729–744.
108. Rand DM, Haney RA, Fry AJ (2004) Cytonuclear coevolution: the genomics of
cooperation. Trends in Ecology and Evolution 19: 645–653.
Thermal Adaptation in Snails from a Volcanic Lake
PLOS ONE | www.plosone.org 12 July 2014 | Volume 9 | Issue 7 | e101821


![Application of modern methods for studing of gastropod shells [In Russian]](https://img.dokumen.tips/doc/110x75/6320f8138a1d893baa0cd80c/application-of-modern-methods-for-studing-of-gastropod-shells-in-russian.jpg)


