Embed Size (px)
Citation preview

ADULT ATTACHMENT AND SPOUSAL REACTIONS TO MILITARY
DEPLOYMENT SEPARATIONS AND REUNIONS
By
Valerie M. Wood
A dissertation submitted to the Department of Psychology
In conformity with the requirements for
the degree of Doctor of Philosophy
Queen’s University
Kingston, Ontario, Canada
(April, 2017)
Copyright © Valerie M. Wood, 2017
ii
Abstract
The purpose of my dissertation was to assess the relevance of adult attachment in
explaining spousal adjustment and relationship functioning in military deployment
experiences. Specifically, I was interested in identifying what attachment dimensions are
related to spousal coping and relationship perceptions during deployment separations and
reunions, when and how attachment dimensions are related to outcomes during across the
deployment cycle, and why attachment dimensions are related to such outcomes. This
project was sponsored by the Director General Military Personnel Research and Analysis
(Department of National Defence) and consisted of three phases. Phase One was cross-
sectional, examining civilian spouses/partners of military members experiencing a
deployment separation (Group A), and civilian spouses/partners of military members
experiencing a deployment reunion (Group B). Group A individuals were invited to
participate in a longitudinal study, following them monthly across the separation, as
Phase Two. Phase Three consisted of a large-scale survey sent to spouses/partners of
military members capturing several indices of coping and relationship functioning for
spouses of varying partner deployment status’. In Phase One, for Group A, attachment
anxiety was related to compromised coping and relationship perceptions during the
separation, and attachment avoidance related to increased coping, but negative
relationship perceptions. The relationships between attachment anxiety and relationship
perceptions were moderated by time deployed and experience with deployments. For
Group B, attachment anxiety was related to decreased coping and negative relationship
perceptions during the reunion. The relationships between attachment anxiety and
relationship perceptions were mediated by expectations of the return, and were moderated

iii
by time reunited. In Phase Two, attachment avoidance was related to negative
relationship perceptions including difficulties with emotional support. In Phase Three,
attachment anxiety, attachment avoidance, and their interaction was related to indices of
coping and relationship functioning. Further, some of these relationships were moderated
by environmental conditions. Notably, recent deployment status moderated relationships
among attachment dimensions and perceived relationship and coping outcomes. Finally, I
found that emotional fitness mediated relationships among attachment anxiety and coping
outcomes, and perceptions of partner support mediated relationships among attachment
anxiety and relationship outcomes. Practical and theoretical implications and future
directions are discussed.

iv
Acknowledgements
The road to my PhD completion has certainly been as smooth, sane, enjoyable,
and successful, as possible because of the incredible supervision of you, Dr. Tara
MacDonald. Thank you, a million times over, for being the best role model, friend, and
colleague a graduate student could ask for. Conducting research with you has been fun,
inspiring, and motivating, I haven’t stopped learning from you even at this point. Your
continued emotional support is beyond your role, but has been every bit a part of my
success, as has been your academic mentorship. I will look back on these years as some
of my best, because of you.
Dr. Lee Fabrigar, my second supervisor, your wisdom and continued passion for
the field is unparalleled and has been a major source of inspiration for me. I feel so
fortunate for the important lessons you have taught me, the time you have taken to do so,
and genuine desire to see me succeed. Your challenging approach, however
uncomfortable at times, has made me a more humble and wise researcher, which I will
forever value, thank you!
Dr. Ronald Holden, thank you for being on my committee, and for your continued
support and encouragement during my graduate years. I have appreciated your humorous
nature, wisdom, and great advice, thank you for making the dissertation defense process a
positive experience for me.
I would be remiss without acknowledging someone who, behind the scenes, has
been a huge source of support, encouragement, and knowledge throughout my graduate
studies, Dr. Danielle Charbonneau. You have been such an important part of my graduate
studies, and life in general. Thank you for all of your guidance and support, not to
v
mention my professional development at the Royal Military College, and for the
discussion that lead to this research idea entirely!
Mom, Dad, and Heather, you are the reason that I value education and
professional development to the extent that I do, I cannot thank you enough for instilling
these values in me, and encouraging my continued educational success. You have all
helped to keep me motivated and working towards my goals, thank you for all of your
love and support.
Finally, to Danny, my husband and very best supporter. It is hard to believe that
we met during my graduate studies, are now married, and about to start a family together.
Thank you for being such a stable, positive, and encouraging part of my life, which has
no doubt given me the efficacy and secure base that I have needed to accomplish all of
my goals. I find it very symbolic to have achieved a sense of attachment security that I
research, write, and teach about, through you.
vi
Disclaimer
The opinions expressed in this publication reflect the opinion of the author and do not
represent the opinion of the Canadian Armed Forces (CAF) or the Department of
National Defence. In addition, these findings may not be generalizable to all CAF
spouses/partners.

vii
Table of Contents
Abstract ............................................................................................................................... ii
Acknowledgements ............................................................................................................ iv
Disclaimer .......................................................................................................................... vi
Table of Contents .............................................................................................................. vii
List of Figures ..................................................................................................................... x
List of Tables ................................................................................................................... xiii
Chapter 1: General Introduction and Overview ................................................................ 14
Attachment Theory .................................................................................................. 15
Attachment and Reactions to Separations and Reunions ........................................ 18
The Relevance of Attachment Theory to Military Deployments ............................ 21
The Current Project ................................................................................................. 23
Hypotheses ..................................................................................................... 25
Separation ............................................................................................. 25
Stages of Spousal Adjustment to Military Deployments ............................... 27
Ongoing Separation .............................................................................. 28
Reunion ................................................................................................. 31
Large-Scale Survey............................................................................... 34
Chapter 2: Phase One - Separation Group ........................................................................ 37
Method ..................................................................................................................... 38
Participants and Procedure ............................................................................. 38
Measures ........................................................................................................ 39
Results ..................................................................................................................... 49
Discussion................................................................................................................ 55
Chapter 3: Phase One - Reunion Group ............................................................................ 59
Method ..................................................................................................................... 61
Participants and Procedure ............................................................................. 61
Measures ........................................................................................................ 62
Results ..................................................................................................................... 68
Discussion................................................................................................................ 79
Chapter 4: Phase Two - Longitudinal Study ..................................................................... 82
Method ..................................................................................................................... 83
Participants and Procedure ............................................................................. 83
Monthly Survey Measures ............................................................................. 84

viii
Reunion Survey Measures ............................................................................. 92
Results ..................................................................................................................... 97
Discussion.............................................................................................................. 107
Chapter 5: Phase Three - Large-Scale Survey ................................................................ 111
Method ................................................................................................................... 112
Participants and Procedure ........................................................................... 112
Measures ...................................................................................................... 113
Results ................................................................................................................... 130
Attachment Anxiety and Avoidance as Predictors ...................................... 131
Attachment Anxiety, Avoidance, and Deployment Status .......................... 140
Attachment Anxiety, Avoidance, and Recent Deployment Status .............. 145
Attachment Anxiety, Avoidance, and Months Deployed ............................ 155
Curvilinear Effects of Months Deployed as a Function of Attachment Anxiety
and Attachment Avoidance ................................................................ 161
Curvilinear Effects of Attachment Anxiety and Attachment Avoidance as a
Function of Months Deployed ............................................................ 164
Attachment Anxiety, Avoidance, and Deployment Prep Status .................. 165
Attachment Anxiety, Avoidance, and Recent Reunion Status ..................... 168
Attachment Anxiety, Avoidance, and Months Reunited ............................. 173
Curvilinear Effects of Months Reunited as a Function of Attachment Anxiety
and Attachment Avoidance ................................................................ 177
Mediation Models for Attachment Anxiety and Related Outcomes ............ 181
Discussion.............................................................................................................. 185
Deployment Separation Findings ................................................................. 188
Deployment Reunion Findings .................................................................... 195
Mechanisms of Attachment Anxiety on Intrapersonal and Relationship
Outcomes ............................................................................................ 198
Conclusions .................................................................................................. 198
Chapter 6: General Discussion........................................................................................ 202
Summary of Findings ............................................................................................ 202
Limitations ............................................................................................................. 215
Contribution to Previous Literature ....................................................................... 219
Implications and Future Directions ....................................................................... 225
Conclusion ............................................................................................................. 227
References ....................................................................................................................... 229
ix
Appendix A: The Experiences in Close Relationships Scale - Revised ......................... 242
Appendix B: The Rosenberg Self Esteem Scale ............................................................. 243
Appendix C: The Relationship Assessment Scale .......................................................... 244
Appendix D: The State Trait Anxiety Inventory ............................................................ 245
Appendix E: The Positive and Negative Affect Schedule .............................................. 246
Appendix F: Relationship Quality Measure ................................................................... 247
Appendix G: Coping Capacity Measure for Phase One ................................................. 248
Appendix H: Reunion Experiences Measure .................................................................. 249
Appendix I: Coping Capacity Measure for Phase Two .................................................. 251
Appendix J: Open-Ended Responses for Phase One Reunion Survey ........................... 252
Appendix K: Impact of Military Life on Career Measure for Phase Three .................... 253
Appendix L: Stress During Military Experiences Measure for Phase Three .................. 254
Appendix M: Stress Measure for Phase Three ............................................................... 255
Appendix N: The Satisfaction With Life Scale .............................................................. 256
Appendix O: The Kessler Psychological Distress Scale ................................................ 257
Appendix P: The Pearlin Mastery Scale ......................................................................... 258
Appendix Q: The Brief COPE Scale .............................................................................. 259
Appendix R: Support and Resiliency Inventory ............................................................. 261
Appendix S: Quality of Marriage Index ......................................................................... 263
Appendix T: The Revised Dyadic Adjustment Scale ..................................................... 264
Appendix U: Queen's General Research Ethics Board Letter of Approval for Phases
One and Two ......................................................................................................... 265
Appendix V: Queen's General Research Ethics Board Letter of Approval for Phase Three
......................................................................................................................................... 266

x
List of Figures
Figure 1: Deployment Cycle for Families (Egerton-Graham, 2009) ............................................ 28
Figure 2: Scree plot of the reduced correlation matrix for relationship quality items (Phase One
separation) ........................................................................................................................... 43
Figure 3: Scree plot of the reduced correlation matrix for coping capacity items (Phase One
separation) ........................................................................................................................... 46
Figure 4: Interaction between attachment anxiety and previous deployment status on perceived
relationship harmony during the deployment separation .................................................... 52
Figure 5: Interaction between attachment anxiety and number of days separated on relationship
satisfaction during the deployment separation. ................................................................... 54
Figure 6: Interaction between attachment anxiety and number of days separated on perceived
relationship harmony during the deployment separation .................................................... 54
Figure 7: Scree plot of the reduced correlation matrix for coping capacity items (Phase One
reunion)................................................................................................................................ 63
Figure 8: Interaction between attachment anxiety and number of days reunited on relationship
satisfaction ........................................................................................................................... 70
Figure 9: Interaction between attachment anxiety and number of days reunited on quality of
partner interactions .............................................................................................................. 71
Figure 10: Unstandardized regression coefficients for the relationship between attachment
anxiety and relationship satisfaction as mediated by expectations of the reunion being met
....................................................................................................................................................... 73
Figure 11: Unstandardized regression coefficients for the relationship between attachment
anxiety and quality of partner interactions as mediated by expectations of the reunion
being met ............................................................................................................................. 74
Figure 12: Unstandardized regression coefficients for the relationship between attachment
anxiety and satisfaction with one’s partner relative to the time before the deployment as
mediated by expectations of the reunion being met ............................................................ 76
Figure 13: Scree plot of the reduced correlation matrix for coping capacity items (Phase Two
first month) .......................................................................................................................... 85
Figure 14: Scree plot of the reduced correlation matrix for emotional support items (Phase Two
first month) .......................................................................................................................... 88
Figure 15: Scree plot of the reduced correlation matrix for expectations for the reunion items
(Phase Two first month) ...................................................................................................... 90
Figure 16: Scree plot of the reduced correlation matrix for coping capacity items (Phase Two
first month) .......................................................................................................................... 94
Figure 17: Interaction between attachment anxiety and attachment avoidance on relationship
satisfaction ......................................................................................................................... 100
Figure 18: Interaction between attachment anxiety and attachment avoidance on the extent to
which expectations of the reunion were met ..................................................................... 101

xi
Figure 19: Interaction between attachment anxiety and attachment avoidance on feeling more
versus less satisfied with one’s relationship relative to the time before the deployment .. 101
Figure 20: Interaction between attachment anxiety and attachment avoidance on feeling more
versus less emotionally connected to one’s partner relative to the time before the
deployment ........................................................................................................................ 102
Figure 21: Interaction between attachment anxiety and attachment avoidance on feeling as
though things are running more versus less smoothly around the house relative to the time
before the deployment ....................................................................................................... 103
Figure 22: Scree plot of the reduced correlation matrix for impact of military life on career items
(Phase Three) ..................................................................................................................... 115
Figure 23: Scree plot of the reduced correlation matrix for stress during military experiences
items (Phase Three) ........................................................................................................... 117
Figure 24: Scree plot of the reduced correlation matrix for stress items (Phase Three) ............. 119
Figure 25: Scree plot of the reduced correlation matrix for coping strategies items (Phase Three)
..................................................................................................................................................... 123
Figure 26: Interaction between attachment anxiety and attachment avoidance on the use of social
support as a coping strategy .............................................................................................. 135
Figure 27: Interaction between attachment anxiety and attachment avoidance on the use of self-
blame as a coping strategy ................................................................................................. 136
Figure 28: Interaction between attachment anxiety and attachment avoidance on the use of self-
distraction as a coping strategy.......................................................................................... 137
Figure 29: Interaction between attachment anxiety and attachment avoidance on perceived
relationship support ........................................................................................................... 138
Figure 30: Interaction between attachment anxiety and attachment avoidance on relationship
success ............................................................................................................................... 139
Figure 31: Interaction between attachment anxiety and attachment avoidance on relationship
satisfaction (QMI) ............................................................................................................. 139
Figure 32: Interaction between attachment avoidance and deployment status on perceived
relationship support ........................................................................................................... 144
Figure 33: Interaction between attachment avoidance and deployment status on cognitive fitness
..................................................................................................................................................... 145
Figure 34: Interaction between attachment avoidance and recent deployment status (< 1 mon) on
perceived relationship support ........................................................................................... 148
Figure 35: Interaction between attachment avoidance and recent deployment status (< 1 mon) on
cognitive fitness ................................................................................................................. 149
Figure 36: Interaction between attachment avoidance and recent deployment status (< 1 mon) on
perceived relationship success ........................................................................................... 150
Figure 37: Interaction between attachment avoidance and recent deployment status (< 1 mon) on
relationship satisfaction (RDAS) ....................................................................................... 151

xii
Figure 38: Interaction between attachment avoidance and recent deployment status (< 1 mon) on
relationship cohesion ......................................................................................................... 152
Figure 39: Interaction between attachment anxiety and recent deployment status (< 1 mon) on
perceived relationship support ........................................................................................... 153
Figure 40: Interaction between attachment anxiety and recent deployment status (< 1 mon) on
cognitive fitness ................................................................................................................. 154
Figure 41: Interaction between attachment anxiety and recent deployment status (< 1 mon) on
perceived relationship success ........................................................................................... 154
Figure 42: Interaction between attachment anxiety and recent deployment status (< 1 mon) on
relationship satisfaction (RDAS) ....................................................................................... 155
Figure 43: Interaction between attachment avoidance and number of months deployed
(transformed and mean centered) on reported stress during general military experiences159
Figure 44: Interaction between attachment anxiety and number of months deployed (transformed
and mean centered) on relationship success ...................................................................... 159
Figure 45: Interaction among attachment anxiety, attachment avoidance, and number of months
deployed (transformed and mean centered) on stress during general military experiences
..................................................................................................................................................... 160
Figure 46: Interaction between attachment anxiety, attachment avoidance, and number of months
deployed (transformed and mean centered) on coping success ......................................... 161
Figure 47: Interaction between attachment avoidance and number of months deployed
(transformed and mean-centered) squared on the use of self-blame as a coping strategy
..................................................................................................................................................... 163
Figure 48: Interaction between attachment anxiety and number of months deployed (transformed
and mean-centered) squared on relationship satisfaction (QMI) ...................................... 164
Figure 49: Interaction between attachment anxiety and recent reunion status on perceived
relationship success ........................................................................................................... 172
Figure 50: Interaction between attachment anxiety and recent reunion status on relationship
consensus ........................................................................................................................... 173
Figure 51: Interaction between attachment avoidance and months reunited on life mastery ..... 176
Figure 52: Interaction between attachment anxiety and months reunited on life mastery ......... 176
Figure 53: Interaction between attachment avoidance and months reunited squared on
relationship success ........................................................................................................... 178
Figure 54: Interaction between attachment avoidance and months reunited squared on
relationship satisfaction using the QMI measure .............................................................. 179
Figure 55: Interaction between attachment anxiety and months reunited squared on life readiness
..................................................................................................................................................... 180
Figure 56: Interaction between attachment anxiety and months reunited squared on relationship
success ............................................................................................................................... 181
xiii
List of Tables
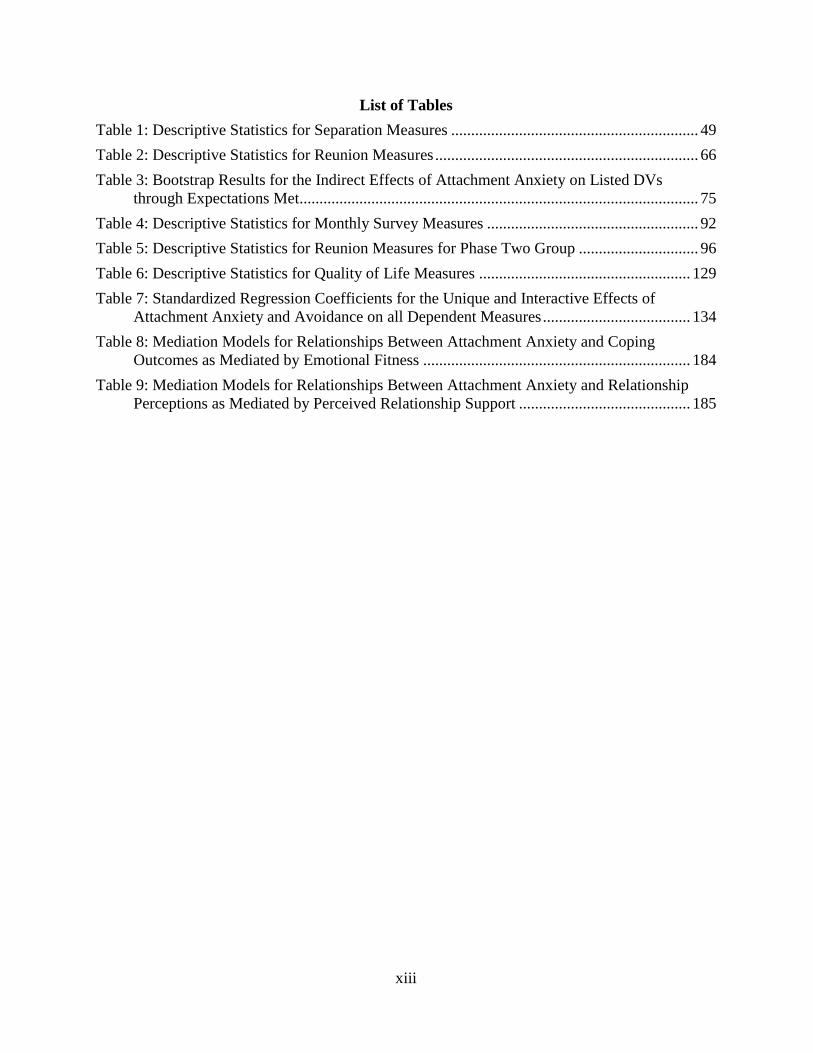
Table 1: Descriptive Statistics for Separation Measures .............................................................. 49
Table 2: Descriptive Statistics for Reunion Measures .................................................................. 66
Table 3: Bootstrap Results for the Indirect Effects of Attachment Anxiety on Listed DVs
through Expectations Met.................................................................................................... 75
Table 4: Descriptive Statistics for Monthly Survey Measures ..................................................... 92
Table 5: Descriptive Statistics for Reunion Measures for Phase Two Group .............................. 96
Table 6: Descriptive Statistics for Quality of Life Measures ..................................................... 129
Table 7: Standardized Regression Coefficients for the Unique and Interactive Effects of
Attachment Anxiety and Avoidance on all Dependent Measures ..................................... 134
Table 8: Mediation Models for Relationships Between Attachment Anxiety and Coping
Outcomes as Mediated by Emotional Fitness ................................................................... 184
Table 9: Mediation Models for Relationships Between Attachment Anxiety and Relationship
Perceptions as Mediated by Perceived Relationship Support ........................................... 185

14
Chapter 1
General Introduction and Overview
Why some individuals should recover, largely or completely, from experiences of
separation and loss while others seem not to is a central question, but one not easily
answered. (Bowlby, 1973, p. 23).
Although it is recognized that being deployed can affect the physical and psychological
well-being of military personnel, it is less appreciated that their absences also profoundly affect
family members who remain at home. Families of deployed personnel are often called the
“overlooked casualties of conflict” (The Royal Navy and Royal Marines Children’s Fund, 2009)
because they face a number of unique challenges over the course of a deployment. Indeed,
various challenges arise at different stages of the deployment process as couples prepare for
deployment, as they are separated for the duration of deployment, and when they are reunited.
Such difficulties include adjusting to the member’s deployment in a variety of domains (e.g.,
parenting styles, household and employment decisions, changes to the nature of the relationship)
and then readjusting upon the member’s return.
Previous work on the impact of deployments on spouses has often evaluated individuals
at one point in time during the deployment cycle (e.g., prior to deployment, during deployment,
or following reunion). Many researchers in this area, both inside and outside the Canadian
Armed Forces (CAF), have recognized this limitation (e.g., De Burgh et al., 2011; Chandra et
al., 2008). Therefore, they have stressed the need for research to follow military couples
throughout the deployment cycle to see whether specific stages of it are more difficult to
experience than others.
In addition to assessing whether particular deployment stages are especially challenging
for military couples, it is also valuable to investigate whether individual differences are

15
associated with adjustment to deployment. In other words, are specific traits associated with the
ability to cope emotionally, physically, and practically with life’s challenges before, during, and
after a partner has deployed? For my dissertation, I explore whether spouses’ attachment
orientations predict how they adjust to challenges faced at all stages of the deployment process
(at the initial separation, during the deployment, and at the reunion). Attachment theory has
contributed a great deal to the understanding of relationship processes and serves as the
theoretical framework for my research.
Attachment Theory
Attachment theory was originally proposed by Bowlby (1969, 1973) to explain the close
bonds that develop between infants and their primary caregivers. Bowlby believed that through
early interactions with their primary caregivers (called attachment figures) infants begin to
generate expectations and beliefs regarding their caregivers’ availability and responsiveness.
Here, an infant begins to learn whether he or she can depend on their caregiver for physical and
emotional security. Further, Bowlby explained that this process is universal such that all
individuals possess an attachment behavioural system which functions to regulate individuals’
emotions and behaviour under conditions of threat. The goal of all infants is to achieve
emotional security. Specifically, during infancy individuals do not yet possess the cognitive
capacity required to cope with environmental threats and will instinctively seek proximity to
their caregivers under stressful or dangerous conditions. Although some infants receive adequate
emotional support, others do not and develop insecurities regarding the availability of
attachment figures and display ineffective emotion regulation strategies in response to stressors.
A secure attachment occurs when the infant can successfully achieve emotional security by
seeking proximity to the attachment figure, and the attachment figure is consistently available
16
and responsive. An insecure attachment occurs when the infant seeks proximity to the
attachment figure, yet is not consistently met with an available or responsive attachment figure
(Cassidy, 2008). For these insecure infants, they develop other strategies to achieve security,
either by engaging in ‘hyperactivating’ strategies aimed at escalating attachment to ensure their
caregivers take notice (e.g., escalating distress-signalling behaviours), or by engaging in
‘deactivating’ strategies aimed at inhibiting signs of distress and experiencing potential rejection
from their caregiver (e.g., avoiding caregivers, learning to manage the threat independently, even
if ineffectively).
Ainsworth (Ainsworth, Blehar, Waters, & Wall, 1978) was the first to classify
differences in infant-parent attachment behaviour using the Strange Situation Procedure which
classifies infants according to their behavioural responses to a number of scenarios, involving
separations and reunions with the caregiver as well as encounters with a stranger. Secure infants
become noticeably upset when separated from their caregivers, however seek proximity to their
caregivers, and greet them warmly, upon reunion. These infants tend to have caregivers who are
more sensitive and responsive relative to caregivers of insecurely attached infants (De Wolff &
Van Ijzendoorn, 1997). Resistant infants demonstrate strong separation protest following
separation from a caregiver (albeit a sign of their use of hyperactivating strategies) and also
show ambivalence in desiring proximity to, yet resisting contact with, their caregivers upon
reunion. These infants often have mothers who are inconsistent in their caregiving and who are
often rejecting (De Wolff & Van Ijzendoorn, 1997; Isabella, 1993). Avoidant infants show little
separation protest (a sign of their use of deactivating strategies), and often ignore their caregiver
upon their return. Mothers of avoidant infants tend to be rejecting, insensitively under or over
stimulating, and tend to think quite negatively of their infants (Belsky, Rovine, & Taylor, 1984).
17
Finally, an infant is classified as disorganized in the Strange Situation when he/she shows
disorganized or disoriented behaviours because these infants have likely not developed a
coherent emotional regulation strategy in response to attachment-related threats. One predictor
of infant disorganized attachment is parental frightening behaviour (see Van Ijzendoorn,
Schuengel, & Bakermans-Kranenburg, 1999 for a review). Because this type of attachment is
associated with an absence of organized emotion regulation strategies, these infants (and later,
adults) experience the most poorly managed emotions (see Lyons-Ruth & Jacobvitz, 2008).
More recently, attachment theory has been applied to the understanding of adult romantic
love (Hazan & Shaver, 1987, 1994). Adult attachment theory is guided by the assumption that
the very motivational system which regulates emotional bonds between infants and their primary
caregivers also regulates the bonds that develop between adult romantic partners. This logic is
based on Bowlby’s assertion that we develop ‘internal working models’ (internalized
expectations and beliefs regarding the responsiveness and availability of others) that later shape
interactions with significant others. Indeed, much research supports the view that attachment
styles tend to be stable across time and relationships (Baldwin & Fehr, 1995; Fraley, 2002;
Scharfe & Bartholomew, 1994; Waters et al., 2000). In other words, individuals’ expectations
about how responsive others will be to their needs, how dependable others are, and how
relationships typically function, tend to be internalized and are fairly stable over time.
The way that attachment orientations are assessed in adults has evolved considerably
since the Hazan and Shaver’s seminal (1987) contribution. Currently, there is consensus that,
adult attachment is best assessed along two independent dimensions: attachment avoidance and
anxiety (Fraley, Waller, & Brennan, 2000). Attachment avoidance reflects the extent to which
individuals are uncomfortable with emotional closeness and intimacy and prefer emotional

18
independence in a relationship. Attachment anxiety represents the degree to which individuals
are preoccupied by thoughts of rejection and abandonment by their partners and, as a result, how
much they feel they must monitor their environment for signs of disapproval or loss of interest
(Mikulincer, Gillath, & Shaver, 2002). Attachment anxiety also captures the extent to which
individuals feel unworthy of love and, as a result, seek constant reassurance and validation from
their partners. For my dissertation, I focus on the role of attachment anxiety and attachment
avoidance in shaping spouses’ experience of a deployment.
Attachment and Reactions to Separations and Reunions
According to Bowlby (1982), upon encountering physical or psychological threats the
attachment system becomes activated such that infants become motivated to maintain or restore
proximity to their attachment figures. Mikulincer, Gillath, and Shaver (2002) demonstrated that
similar processes occur in adulthood. In particular, the adult attachment system becomes
activated under conditions of attachment-related threat (e.g., potential or experienced loss of an
attachment figure) as well as general threat (e.g., stress or physical danger). Such conditions
automatically and implicitly activate thoughts of attachment figures that can motivate an
individual to increase physical or psychological proximity to them. In other words, working
models of attachment should regulate attachment behaviour (e.g., proximity seeking strategies,
distress-signalling, or distancing). Indeed, individual differences in attachment behaviour should
be most pronounced under stressful conditions in the social or physical environment (Simpson &
Rholes, 1994).
By definition, attachment anxiety is associated with fears of rejection and abandonment
from attachment figures (Fraley & Waller, 1998). Due to their persistent insecurities and doubts
about others’ responsiveness, it is understood that highly anxious individuals experience chronic

19
hyperactivation of the attachment system (Mikulincer, Gillath, & Shaver, 2002; Mikulincer &
Shaver, 2007). In this sense, anxious individuals are preoccupied with thoughts of potential
rejection and therefore vigilantly monitor their environment for cues of disapproval or loss of
interest, and experience heightened cognitive accessibility of attachment figures (Mikulincer,
Gillath, & Shaver, 2002). Indeed, research has demonstrated that highly anxious individuals are
hypervigilant in the detection and processing of rejection-related threat cues (Mikulincer &
Shaver, 2003, 2007), can quickly access words related to proximity and distance (e.g.,
acceptance and rejection; Mikulincer, Birnbaum, Woddis, & Nachmias, 2000; Mikulincer,
Gillath, & Shaver, 2002), experience difficulty in inhibiting expectations for rejection (Baldwin
& Kay, 2003), as well as suppressing thoughts related to partner separation (Mikulincer, Dolev,
& Shaver, 2004) relative to individuals low in anxiety.
Given that attachment anxiety is associated with enhanced detection and processing of
rejection related stimuli, one might expect that highly anxious individuals would also be more
reactive to actual experiences of rejection and separation from one’s romantic partner.
Consistent with this idea, individuals high in attachment anxiety tend to become more distraught
following a romantic breakup than those lower in attachment anxiety (Davis, Shaver, & Vernon,
2003; Feeney & Noller, 1992). Attachment anxiety is also predictive of reactions to physical
separations from romantic partners. For example, Fraley and Shaver (1998) examined couples as
they parted in an airport (i.e., one partner was boarding a plane and the other one was staying
behind) and found that women high in attachment anxiety reported more distress as they bade
their partner good-bye relative to women low in attachment anxiety. In addition, an anxious
attachment style is associated with emotion-focused coping strategies in response to divorce and
increased signals of distress towards romantic partners (e.g., Birnbaum, Orr, Mikulincer, &

20
Florian, 1997; Meyer, Olivier, and Roth, 2005). Mayseless, Danieli, and Sharabany (1996) found
that an anxious attachment style was related to intense distress and self-blaming in response to
imagined separations. Thus, it seems as though highly anxious individuals are acting in
accordance with their internal working models. Specifically, just as anxious-resistant infants
show strong separation protest to separation with their mothers, anxious adults show similar
hyperactivating responses including greater distress when separated from their romantic
partners, relative to less anxious adults.
Attachment avoidance, on the other hand, should be associated with deactivating
strategies aimed at promoting interpersonal distance when the attachment system is activated
(e.g., stress or attachment-related threats). However, under conditions of low threat attachment
avoidance should not be as strongly related to distancing behaviours. Consistent with this idea,
Simpson, Rholes, and Nelligan (1992) found that avoidant women pulled away from their
partners only when they were anticipating a stressful task, but not when they were anticipating a
neutral task. In Fraley and Shaver’s airport study, avoidant women were also behaving in
accordance with their working models. The highly avoidant women who were anticipating a
separation did not report greater distress relative to less avoidant women, but they showed
distancing behaviours by pulling away from their partners more and avoiding close contact
relative to less avoidant women. Finally, in response to imagining separations with a partner
Mayseless and colleagues (1996) found that avoidant attachment was associated with refraining
to manage the threat. This suggests that highly avoidant individuals engage in distancing
behaviours when the attachment system is activated (i.e., in times of stress) in order to reduce
their physiological arousal and experienced distress.
21
Some researchers have questioned the success of deactivating strategies at regulating
emotional responses to threats, attachment-related threats in particular. Research with infants
(Sroufe & Waters, 1977) seems to suggest that defensive strategies are not associated with
decreases in physiological arousal, and that the pattern of heart rate acceleration for infants that
displayed defensive strategies (physical distancing from their attachment figure) following a
separation were similar to the infants who were highly distressed. However, research with
avoidant adults suggests that efforts to suppress thoughts of attachment-related threats like
separation or potential loss of a romantic partner are successful, and such strategies lead to
decreased activation of thoughts related to abandonment (Fraley & Shaver, 1997, Study 1), and
decreased skin conductance responses (Fraley & Shaver, 1997, Study 2) relative to thought
suppression about neutral stimuli. Therefore, deactivating strategies in response to threats seems
to result in successful de-activation of the attachment-related system for avoidant adults.
However, there is evidence to suggest that when facing a more serious stressor such as a
life transition, avoidant individuals may show ineffective coping strategies and psychological
distress, and may resemble anxious-ambivalent individuals in terms of affect and behaviour
(Mikulincer & Florian, 1998). Specifically, in a study examining the impact of mothers’
attachment styles on coping and adjustment to the birth of their first child, Mikulincer and
Florian (1998) found that, similar to anxious-ambivalent mothers, avoidant first-time mothers
reported higher levels of distress, and described the task of being a mother in more threatening
terms than control mothers.
The Relevancy of Attachment Theory to Military Deployments
The stages of a deployment can be viewed as analogous to those included in Ainsworth’s
Strange Situation Procedure (initial separation, introduction of a threat, and reunion with the

22
caregiver). Therefore, military deployments are a relevant and unique context within which to
study the principles of attachment theory in adult romantic relationships. Although some
research has shown that attachment styles predicts one’s cognitive and emotional reactions to
military and war-related stressors (e.g., Mikulincer, Florian, & Wellar, 1993; Mikulincer &
Florian, 1995), there has been little work done examining the role of attachment styles in
predicting reactions to a romantic partner’s military deployment. Although previous work has
shown that attachment anxiety predicts reactions to separations with romantic partners (Fraley
and Shaver, 1998), the separations examined in previous research were unlike those experienced
by military personnel and their partners. Indeed, the experiences of military families are unlike
those experienced by most civilian families (see Ainspan, Bryan, & Penk, 2016). Deployments
can occur for a number of reasons (e.g., training, peacekeeping, disaster relief, humanitarian
operations), can entail various and unpredictable levels of threat to one’s safety, and can occur
with little advance notice. Therefore, military couples are not always able to predict their
separations, how long their separations will last, what the separation will entail, and even the
possibility of psychological consequences such as posttraumatic stress disorder. Further,
deployments could entail periods of high operational tempo (high demand, long work hours,
unpredictable schedules) making communication efforts difficult. In other words, a partner’s
availability and responsiveness might be unpredictable, the crucial pillars of a secure attachment.
If military partners are experiencing endangerment or exposing a service member to traumatic
experiences, they may not be able to fulfill their spouses’ attachment needs.
Cafferty and colleagues (1994) examined the relevance of attachment orientations in the
functioning of couples four months after being reunited following a military deployment.
Specifically, the researchers looked at relationships between attachment orientations (assessed

23
using Hazan and Shaver’s typological approach), relationship satisfaction, and levels of positive
and negative affect in military male partners and their female spouses who remained at home.
Secure individuals in general (women and men) reported less conflict and more satisfaction than
preoccupied partners’ post-reunion, but secure men only (not their female spouses) reported
greater positive, and less negative, affect during the post-reunion period. Although these initial
findings suggest that attachment orientations are relevant in the context of military separations,
many answers remain. For example, these researchers used the typological approach that does
not allow for a more accurate assessment of the unique and interactive effects of attachment
anxiety and avoidance that is possible with the more recent dimensional approach. Second, these
researchers only captured the post-reunion period so did not explore the relevance of attachment
processes during the separation itself. Third, these researchers did not explore or identify
potential mechanisms that might explain the relationships between attachment security and post-
reunion difficulties. Finally, this study did not include a comparison group or a longitudinal
component so it is difficult to determine whether attachment dimensions are relevant in
explaining relationship outcomes during transitional periods or whether attachment dimensions
are chronically relevant across all deployment stages and relationship processes.
The Current Project
I initiated the current project in collaboration with the Royal Military College of Canada,
Director General Military Personnel Research and Analysis (DGMPRA), and Director Military
Family Services (Department of National Defence). The purpose of this project was to examine
how attachment anxiety and attachment avoidance predicted the functioning of at-home civilian
spouses who are being separated from partners due to a military deployment. More specifically, I
was interested in assessing how attachment anxiety and attachment avoidance predict the

24
affective, cognitive, and behavioural reactions of spouses across various stages of the
deployment cycle (i.e., initial separation, ongoing separation, and the reunion).
There are three phases to this project. The first phase consisted of a cross-sectional
design whereby DGMPRA recruited civilian spouses/partners of those who were Regular Force
(not Augmentees or Reservists1, or dual-service couples) who were separated from their military
spouses/partners due to deployment (Group A), and another similar group of civilian/civilian
spouses/partners who had recently experienced a reunion with their military spouses/partners
due to a deployment (Group B). The purpose of this first phase was to examine the effects of
adult attachment on reactions to both a deployment separation and reunion. At the end of Group
A’s separation questionnaire, these individuals were invited to participate in a longitudinal study
which comprised the second phase of this project. The purpose of this phase was to examine the
effects of attachment on spousal functioning during the ongoing separation. Group A
participants were also asked to complete a final questionnaire shortly after they were reunited
with their partners to assess functioning during the reunion phase similar to Group B. In the third
and final phase of the project I examined how attachment dimensions moderated the impact of
military life on spouses of military members in a large-scale survey. This survey captured a
number of indices of spouse’s perceptions of their intrapersonal and interpersonal (relationship)
functioning for spouses of varying partner deployment status’ (spouses of partners not currently
deployed, deployed, preparing for a deployment, and those recently reunited with their partners
from a deployment). The goal of this final project is to elucidate the relationships between
attachment styles and spousal functioning on a number of variables indicating their
1 The Reserve Force supports, augments, and sustains the Regular Force in international and domestic operations.
Many reservists are employed full-time outside of the CAF in civilian occupations, and others are full-time students
(see Canadian Army, 2017).
25
psychological adjustment, coping strategies, and relationship perceptions, but also to replicate
findings from the previous three phases. In particular, I was interested in testing whether the
effects of attachment anxiety and avoidance might be exacerbated for those currently
experiencing a deployment separation or reunion relative to those not experiencing a separation
or reunion, and the potential trajectory of such outcomes as a function of separation or reunion
length.
Hypotheses
Separation
In line with findings from Fraley and Shaver (1998), Mayseless and colleagues (1996),
and Cafferty and colleagues (1994), I predicted that individuals higher in attachment anxiety
would report greater difficulties during the separation relative to individuals lower in attachment
anxiety. To reiterate, individual differences in attachment behaviour should be most pronounced
under stressful conditions in the social or physical environment (Simpson & Rholes, 1994).
Further, the separation should be particularly stressful for anxious individuals given their strong
desires for closeness and intimacy and their reliance on attachment figures for emotional
regulation and support. Indeed, this is a situation that anxious individuals fear the most:
abandonment by an attachment figure. High anxiety individuals would likely experience greater
adjustments during this phase relative to low anxiety individuals as they learn to cope with being
separated from their partner and must be less reliant on their romantic partners for validation and
reassurance. High anxiety individuals would likely report higher levels of distress, negative
affect, decreased coping capacity and more maladaptive coping strategies (like self-blame:
Mayseless et al., 1996) relative to those lower in attachment anxiety. Further, I predicted that

26
attachment anxiety will be related to more negative relationship perceptions during the
separation in line with previous research (e.g., Collins & Read, 1990).
According to attachment theory, attachment avoidance should be associated with
deactivating strategies in response to environmental threats. Therefore, I predicted that
attachment avoidance should not be associated with reported distress or indices of well-being,
and, if anything, attachment avoidance might be associated with reports of enhanced emotional
well-being during a partner separation given that avoidance is related to self-reliance and
autonomy instead of a reliance on attachment figures for stress regulation. On the other hand, it
is possible to see some breakdowns in coping capacity and emotional well-being for highly
avoidant spouses if military separations are perceived to be high-stress experiences for these
individuals in line with findings by Mikulincer and Florian (1998).
It is difficult to make informed predictions regarding potential interactions between
anxiety and avoidance for a few reasons. First, researchers who have assessed relationships
between attachment styles and cognitive, affective, and behavioural responses to attachment-
related or attachment-unrelated threats have typically used categorical attachment measures such
as Hazen and Shaver’s (1987) typological approach (e.g., Burant, Mikulincer, & Shaver, 2008;
Fraley & Shaver, 1997; Mikulincer & Florian, 1998; Mikulincer, Florian, & Wellar, 1993). This
poses difficulty in assessing whether the effects of attachment anxiety in particular are
exacerbated for those low, relative to high, in attachment avoidance. Some research suggests that
both groups experience difficulty with adjustment to trauma or actual partner loss. For example,
in one study preoccupied individuals were the least well-adjusted group following the September
11th terrorist attacks (Fraley, Fazzari, Bonanno, & Dekel, 2006). However, other researchers
have found the fearful group to experience the greatest difficulties with psychological

27
adjustment and coping after the loss of a spouse (Fraley & Bonanno, 2004; Wijngaards-de-Meij
et al., 2007). Therefore, it is difficult to predict whether the effects of anxiety would be
exacerbated for those also high, or low, in avoidance, if interactions between avoidance and
anxiety were reported.
Stages of Spousal Adjustment to Military Deployments
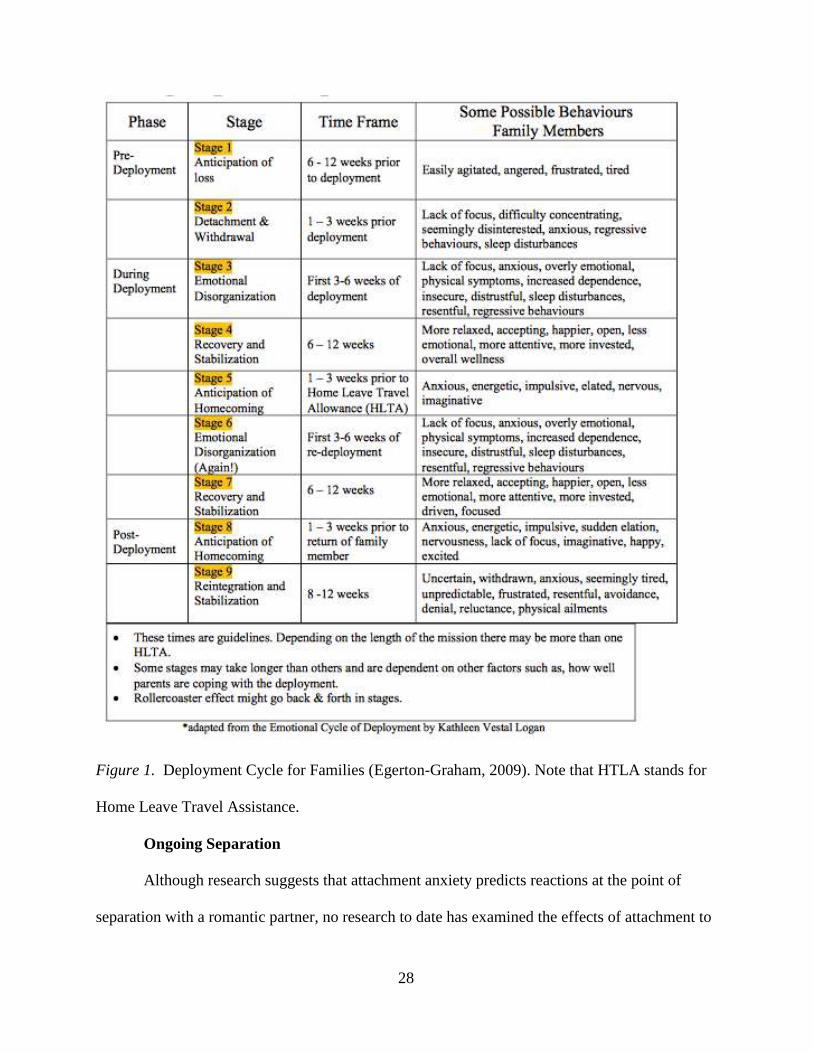
The Canadian Forces Deployment Handbook outlines what reactions are expected
throughout the deployment cycle including the initial and ongoing separation and reunion
periods (Egerton-Graham, 2009; see Figure 1). The stages and their associated typical responses
are based on an empirically-derived model by Logan (1987). Logan argues that one of the most
challenging stages is Stage 2 which occurs 1-3 weeks prior to the deployment called detachment
and withdrawal and is associated with cognitive, emotional, and relationship difficulties
including anxiety, sleep disturbances, regressive behaviours, and ambivalence with displays of
intimacy with one’s partner. Stage 3, emotional disorganization, occurs during the first 3-6
weeks of the deployment and is also associated with emotional and relationship difficulties
including anxiety, emotional instability, clinginess, distrust, and sleep disturbances. However,
spouses can expect to experience recovery and stabilization during Stage 4, or 6-12 weeks into
the deployment. Given that stages 2 and 3 are perceived to be the most stressful, one might
expect individual differences in attachment behaviours to be most pronounced during these
stages.
28
Figure 1. Deployment Cycle for Families (Egerton-Graham, 2009). Note that HTLA stands for
Home Leave Travel Assistance.
Ongoing Separation
Although research suggests that attachment anxiety predicts reactions at the point of
separation with a romantic partner, no research to date has examined the effects of attachment to
29
coping during periods of prolonged separations with one’s partner. Given that individuals high
in attachment anxiety are said to experience chronic activation of the attachment system, it may
be the case that such individuals will exhibit difficulties across the entire separation. In other
words, individuals high in attachment anxiety may never effectively adjust to their partner’s
separation and experience emotional, psychological, and physiological difficulties as a result
relative to low anxiety individuals. However, as outlined by Simpson and Rholes (1994) and
further reiterated by Campbell and Marshall (2010), attachment dimensions are interactive in
nature and are most relevant in contexts signalling attachment concerns. In particular,
individuals high in attachment anxiety do not always show relationship difficulties in more
neutral contexts. Therefore, it could also be argued that I should only really see the relevance of
attachment dimensions, particularly anxiety, during the more stressful and transitional periods of
separation and reunion. These transitional periods (such as stages 2 and 3 of the separation) are
typically fraught with more stress for the couple, which should make internal working models
more salient. In particular, as a result of heightened activation of the attachment system during
these periods, individuals high in attachment anxiety might exhibit less effective emotion
regulation leading to emotional and psychological difficulties, construe their partner’s behaviour
more negatively, and be less confident in their relationships relative to those low in attachment
anxiety. Consistent with the logic stated above, I predicted that attachment anxiety would be
related to greater distress during the prolonged separation given their chronic activation of the
attachment system, but that this distress would be most pronounced during the transitional stages
(closer to the initial separation and during the reunion period). On the other hand, in line with the
separation phase, I predicted that attachment avoidance would be less predictive of self-reported
distress during the prolonged separation as highly avoidant individuals tend to engage in

30
distancing behaviours when stressed and require less comfort and support from attachment
figures. In fact, attachment avoidance could be associated with enhanced well-being during
transition stages.
I also predicted that highly anxious individuals would report more unrealistically
optimistic expectations of their partners return across the prolonged separation, relative to less
anxious individuals. This would be consistent with findings that individuals higher in attachment
anxiety report being more dependent on their partners for validation and support in general,
regardless of the context (e.g., Davilla, 2001; Wei, Mallinckrodt, Larson, & Zakalik, 2005). If
individuals high in attachment anxiety are generally more in need of reassurance and validation,
regardless of whether their attachments are being threatened, they might be more prone to
idealizing their future reunion at all points during the separation period, such as fantasizing
about what the reunion period will be like. In other words, being more reliant on their partners
for validation and reassurance, and experiencing greater separation distress, should lead anxious
individuals to perceive the reunion phase more positively (e.g., “Everything will be better once
he’s home”) leading them to be less realistic about what the reunion phase might ultimately be
like.
Group A participants are also being asked to complete a final questionnaire shortly after
they are reunited with their partners to assess functioning during the reunion phase similar to
Group B. I expect similar findings with this group; because the reunion phase is a transitional
period, there should be increased activation of attachment systems during this time and the
increased relevance of attachment dimensions in predicting individual and relationship
functioning. In particular, individuals high in attachment anxiety might be prone to experiencing
emotional difficulties, lower quality partner interactions, decreased relationship satisfaction, and
31
some difficulties providing emotional support to one’s partner (Collins & Feeney, 2000).
Individuals high in attachment avoidance will be less prone to report emotional difficulties, but
will report more negative partner perceptions, lower quality partner interactions, decreased
relationship satisfaction, and more discomfort in seeking emotional support from one’s partner
(Collins & Read, 1990).
Reunion
Attachment anxiety seems to be related to greater fluctuations in daily interactions with
one’s partner such that individuals high in attachment anxiety seem to react more positively to
positive events, and more negatively to negative events, relative to those low in anxiety
(Campbell, Simpson, Boldry, & Kashy, 2005; Tidwell, Reis, & Shaver, 1996). Therefore, to be
able to predict how attachment anxiety might relate to reactions to the reunion phase (more
positive or negative reactions), one needs to first understand whether the reunion phase is
construed as a (mostly) positive or negative event, or whether the reunion phase is more
multifaceted with both negative and positive instances of intrapersonal coping, relationship
interactions, and relationship perceptions. Some research suggests that the reunion (or post-
deployment) phase is often identified by serving members as the “most stressful period” of the
deployment cycle with the three most stressful issues being difficulty re-establishing intimacy
with romantic partners, grieving the loss of independence and freedom, and the acceptance of
new family routines (e.g., De Burgh et al. 2011). However, The Canadian Forces Deployment
Handbook, informed by an empirically-derived model by Logan (1987), does describe the
reunion as being a multifaceted experience, characterized by periods of positive intrapersonal
and relationship functioning, and periods of negative intrapersonal and relationship functioning.
According to this handbook, in the first couple of weeks (0-2 weeks’ post reunion) most couples

32
experience ‘Elation’, a second honeymoon period filled with mostly positive emotions including
elation, happiness, and excitation. However, some spouses do report more negative emotional
states including impulsivity, and nervousness. If individuals high in attachment anxiety are
dependent on their partners for emotional comfort, reassurance, and validation, experience
increased distress in response to partner separations, and desire greater levels of closeness in
their relationships, it could be argued that those high in attachment anxiety should respond more
positively to this honeymoon period. Such individuals might report feeling more emotionally
connected to their partners, more satisfied in their relationships, and experience improved
emotional well-being relative to those lower in attachment anxiety. On the other hand, highly
avoidant individuals may be less satisfied with their partners’ behaviour during the Elation
period as they learn to cope with their partners being physically closer. Having one’s partner
home would naturally increase levels of intimacy in the relationship making avoidant individuals
uncomfortable and might potentially lead to conflict and more unpleasant partner interactions.
This would be in line with work by Tidwell, Reis, and Shaver (1996) that found that avoidant
individuals reported less intimacy, enjoyment and positive emotions with their partners, and that
avoidant individuals would structure social activities in ways that minimize intimacy and
closeness. In other words, avoidant individuals avoid intimacy-building opportunities within
their relationships, especially when they are stressed.
Couples then enter the ‘Reintegration’ (weeks 2-6) and ‘Renegotiation’ (weeks 6-12)
phases which are characterized by greater reactivity or increased stress and decreased coping
ability. Common emotions experienced during these phases include frustration, unpredictability,
withdrawal, anxiety, physical ailments and fatigue. With many spouses reporting difficulties
during these periods, it may be the case that these problems may be amplified for those high in
33
attachment anxiety. There is some research supporting this notion, that attachment anxiety
predicts a decline in marital functioning during major life transitions. For example, Rholes,
Simpson, Campbell and Grich (2001) examined married couples becoming parents for the first
time and found that anxious women perceived less support from their husbands during their
pregnancy than less anxious women, and that anxious women’s views of spousal support and
marital satisfaction continued to worsen (so a negative linear trend) across the transition to
parenthood. In explaining the findings by Rholes and colleagues (2001), Simpson and Rholes
(2008) proposed that the negative outcomes experienced by high anxiety individuals during the
transition to parenthood might be tied to their unrealistically optimistic views of their romantic
partners and relationships. Specifically, anxious individuals may become frustrated and
dissatisfied because they perceive that their partners are not living up to their expectations.
Military spouses high in attachment anxiety might be prone to similar overly optimistic views
about the post-deployment reunion phase, leading them to be disappointed when their partners’
return does not live up to their expectations. As a result, highly anxious individuals may feel less
close to their partners, less supported by them, less satisfied in their relationship, and they may
not be able to cope as effectively as less anxious individuals. In contrast, individuals higher in
attachment avoidance might show recovery from their initial difficulties with re-connection and
might not report the difficulties that those lower in avoidance might.
Lastly, I will test mediation models to try to understand the relationships between
attachment anxiety, in particular, and post-reunion difficulties. In line with findings by Rholes
and colleagues (2001), I predicted that such difficulties might be driven by unrealistically
optimistic expectations captured by reports that one’s expectations of the reunion period have
not been met.
34
Large-Scale Survey
This survey was broad in scope, capturing not only how spouses have been impacted by
military experiences personally (their own psychological and physical well-being), and in terms
of their interpersonal relationships (particularly with their military spouse), but also how they are
presently coping intrapersonally, as well as their perceptions of their relationship functioning
and success. This survey also captured details surrounding deployments currently or recently
experienced including time separated or reunited with a spouse due to a deployment. This
information allowed me to test how deployment status (separated or reunited) moderated the
effects of attachment orientations on intrapersonal and relationship functioning. In line with the
previous two phases, I predicted that attachment anxiety and avoidance would be related to
indices of intrapersonal and relationship functioning. In particular, I predicted attachment
anxiety to be related to reports that one’s partner’s military experiences such as deployments and
postings has had a more negative impact on the quality of their relationships, that various
military experiences will be perceived as significantly more stressful relative to those lower in
attachment anxiety. This would be in line with the findings of Fraley and Shaver (1998) and
Mayseless and colleagues (1996) that those with anxious attachment report greater distress with
experienced and imagined partner separations.
In line with phases one and two, I also predicted that the effects of attachment
orientations on perceptions of intrapersonal and interpersonal functioning might be moderated
by the presence or absence of an attachment-related threat (i.e., the deployment status of the
partner). Specifically, the relationship between attachment anxiety and intrapersonal and
relationship difficulties might be most pronounced for spouses who have been recently separated
from their partners, or reunited with their partners, due to a deployment. With respect to

35
attachment avoidance, I anticipate that the link between attachment avoidance and interpersonal
difficulties might not vary as strongly as a function of deployment status, with the assumption
that highly avoidant individuals report less distress upon experiencing attachment-related threats.
On the other hand, as previously mentioned, it is possible to see some breakdowns in coping
capacity and emotional well-being for highly avoidant spouses if military separations are
perceived to be high-stress experiences for these individuals in line with findings by Mikulincer
and Florian (1998).
Although the other two phases were assessed within a similar context across participants
(similar deployment experience for most participants), which provides greater control over the
effects of individual differences and extraneous variables on our key measures, the third phase of
the project provides a broader view on the relationships among attachment dimensions and the
impact of military experiences on relationship and interpersonal functioning with a larger sample
than the first two phases. Most importantly, as a result of this increased power relative to the
other phases, and with this being an independent design (not repeated measures) I was also able
to more easily assess the trajectory of the effects of attachment dimensions on intrapersonal and
relationship outcomes as a function of time separated, and time reunited. Finally, a number of
measures relevant to demographics, individual differences, and relationship variables included in
the survey (e.g., perceived partner support, relationship cohesion, relationship satisfaction), and
adequate sample size, I was able to use mediation models to identity consistent and powerful
mediators in the relationships between attachment orientations and intrapersonal and relationship
outcomes.
In summary, although one initial study points to the relevance of adult attachment in
spousal adjustment to deployment experiences, specifically the post-reunion period (Cafferty et

36
al., 1994), methodological concerns and lack of more complex statistical analyses leave many
questions unanswered. First, it is not clear what attachment dimensions specifically are related to
problems in emotional and relationship adjustment during deployment phases as previous
research did not assess the unique and interactive effects of attachment anxiety and attachment
avoidance, but instead used the Hazan and Shaver categorical approach. Next, it is not clear from
the current literature on attachment and long term separations and transition periods why
particular attachment dimensions are related to such outcomes (what mechanisms can explain
these relationships). Finally, we do not yet know when or how attachment dimensions are
relevant in predicting outcomes across the deployment cycle (during the separation, reunion, and
what trajectory?). These are the goals of my dissertation.

37
Chapter 2
Phase One – Separation Group
The main purpose of this study was to assess the unique and interactive effects of
attachment anxiety and avoidance on perceptions of individual and relationship functioning
during a major partner separation due to deployment. In line with findings from Fraley and
Shaver (1998) and Cafferty and colleagues (1994), I predicted that, given their strong desires for
closeness and intimacy and their reliance on attachment figures for emotional regulation and
support, individuals higher in attachment anxiety would report greater difficulties during the
separation relative to individuals lower in attachment anxiety. Specifically, I predicted that
attachment anxiety would be related to higher levels of distress, negative affect, decreased
coping capacity relative to those lower in attachment anxiety. Further, I predicted that
attachment anxiety would be related to more negative relationship perceptions during the
separation in line with previous research (e.g., Collins & Read, 1990).
In addition, I predicted that attachment avoidance should be associated with deactivating
strategies in response to environmental threats such that attachment avoidance should not be
associated with reported distress or indices of well-being. Alternatively, it is possible to see
some breakdowns in coping capacity and emotional well-being for highly avoidant spouses if
military separations are perceived to be high-stress experiences (Mikulincer & Florian (1998).
I also predicted that the effects of attachment dimensions might be amplified as a
function of stress experienced as they are interactive in nature (Simpson & Rholes, 1994;
Campbell & Marshall, 2010), and are most relevant in contexts signalling attachment concerns.
Therefore, we should see the greatest relevance of attachment dimensions, particularly anxiety,
during the more stressful and transitional periods of a separation (i.e., stages 2 and 3). Further,
38
perceptions of how stressful the deployment separation is also depends on one’s experience with
deployments. Indeed, the negative effects of deployment separations seem to be amplified for
those who are experiencing their first deployment (Padden, Connors, & Agazio, 2011; Frankel,
Snowden, & Nelson, 1993). Therefore, I expect that the effects of attachment dimensions might
be moderated by previous deployment status.
Method
Participants and Procedure
DGMPRA mailed surveys to civilian spouses/partners of those who were Regular Force
(not Augmentees or Reservists, or dual-service couples, and who had a listed home address as
surveys were administered using Canada Post. In total, surveys were sent to 373 spouses of CAF
Regular Force personnel who had been deployed. At the end of the survey, spouses were given
the option to be entered into one of five draws for $100. The remuneration was provided 100%
by external researchers at Queen’s University. A total of 85 spouses completed the survey, a
response rate of 23%, which is typical for military samples2. The spouses were all women
between 23-51 years of age (M = 34.52, SD = 7.70), and had been married or in a common-law
relationship with their partner3 for an average of 6.80 years (SD = 6.54 years). Spouses’ partners
were mostly in the Canadian Army (CA) (78%, 9% Royal Canadian Air Force (RCAF), 6%
Royal Canadian Navy (RCN), 7% undisclosed) and had recently deployed to Afghanistan (96%).
For many spouses, this was not the first time they had experienced a military deployment (53%),
and at the time of completing the survey had been separated from their partners for an average of
2 Researchers internal and external to the Department of National Defence (e.g., Newell, Rosenfeld, Harris, &
Hindelang, 2004; Lamerson, 2001) have reported decreasing response rates for military samples since the 1980s with
recent samples hovering around 30% compliance.
3 All partners were men between 20-50 years of age and were 6 months older than the female spouses on average (M
= 35.01, SD = 7.19). An age difference of less than 2 years is typical for married samples (e.g., Meltzer, McNulty,
Jackson, & Karney, 2014; Neff & Geers, 2014).

39
84.81 days (SD = 21.03, range = 22-189 days)4. Most of the women indicated that they had
children (69%), most were employed (70%) and, of those employed, 88% worked outside the
home.
Measures
Attachment Anxiety
The Experiences in Close Relationships Scale- Revised (ECR-R: Fraley, Waller, &
Brennan, 2000; see Appendix A) assesses an individual’s level of attachment anxiety and
avoidance in close relationships. This 36-item questionnaire includes 18 items that measure
anxiety (e.g., “I often worry that my partner doesn't really love me”) and 18 items that measure
avoidance (e.g., “I prefer not to show my partner how I feel deep down”). Responses are
indicated on a scale from 1 (Strongly Disagree) to 7 (Strongly Agree) and total scores for each
dimension are calculated using the mean of the respective 18 items with higher scores indicating
higher levels of attachment anxiety and avoidance (see Table 1 for descriptive statistics). In this
sample, scale scores for both anxiety (Cronbach’s alpha = .88) and avoidance (Cronbach’s alpha
= .88) were found to be reliable and were correlated, r(85) = .59, p < .001.
Self-Esteem
The Rosenberg Self Esteem Scale (RSE: Rosenberg, 1965; see Appendix B) contains 10
items that measure self-esteem (e.g., “On the whole, I am satisfied with myself”). Responses are
indicated on a scale from 1 (Strongly Disagree) to 7 (Strongly Agree) and total scores for self-
esteem are calculated using the mean of all 10 items (after reverse coding negatively phrased
items). Higher scores indicate higher levels of self-esteem (see Table 1 for descriptive
4 It should be noted that number of days separated was not significantly correlated with attachment anxiety nor
avoidance (rs = .13 and .07 respectively).

40
statistics). The scale scores for this measure of self-esteem were found to be reliable (Cronbach’s
alpha = .90).
Relationship Satisfaction
Relationship satisfaction was assessed using the Relationship Assessment Scale (RAS:
Hendrick, 1988; see Appendix C). This scale has 6 items (e.g., “How much do you love your
partner?”) and I included two additional items for added reliability (“How much do you trust
your spouse?” and “How often do you wish you hadn't gotten into this relationship?)”.
Responses are indicated on a scale from 1 (Strongly Disagree) to 7 (Strongly Agree) and total
scores for relationship satisfaction are calculated using the mean of all eight items (after reverse
coding negatively phrased items). Higher scores indicate greater relationship satisfaction (see
Table 1 for descriptive statistics). With this sample, the scale scores for relationship satisfaction
were found to be reliable (Cronbach’s alpha = .86).
State Anxiety
I used the State Trait Anxiety Inventory (STAI: Spielberger, Gorsuch, Lushene, Vagg, &
Jacobs, 1970; see Appendix D) to measure the extent to which individuals are experiencing state
(or current levels of) anxiety. Respondents are asked to indicate the appropriate response for
each of the 20 statements (e.g., “I feel tense”) on a scale from 1 (not at all) to 4 (very much so).
A total state anxiety score is calculated using the average of all 20 items once negatively worded
items are reverse scored, with higher scores indicating higher levels of state anxiety (see Table 1
for descriptive statistics). State anxiety scale scores were found to be reliable (Cronbach’s alpha
= .92).

41
Positive and Negative Affect
The Positive and Negative Affect Schedule (PANAS: Watson, Clark, & Tellegen, 1988;
see Appendix E) was used to measure current experiences of positive and negative affect. There
are 10 items that measure positive affect (e.g., “excited”) and 10 items that measure negative
affect (e.g., “irritable”). Respondents indicate the extent to which they are experiencing each
item on a scale from 1 (not at all) to 5 (extremely). Total scores for positive and negative affect
are calculated using the mean of the respective 10 items, with higher scores reflecting greater
positive and negative affect respectively (see Table 1 for descriptive statistics). For this sample,
positive affect scale scores (Cronbach’s alpha = .87) and negative affect scale scores
(Cronbach’s alpha = .87) were reliable.
Relationship Quality
Relationship quality was assessed using a measure developed by MacDonald and Ross
(1999; see Appendix F) and includes the following subscales: relationship harmony (12 items),
relationship importance (single item), ease of finding an alternative partner (single item),
predicting a positive future for the relationship (three items), negative future for the relationship
(three items), and feeling as though relationship events are within one’s control (single item).
Responses to each item are indicated on a scale from 1 (Strongly Disagree) to 7 (Strongly
Agree).
In order to determine whether I could uncover a fewer number of latent variables that
could account for bivariate correlations among these items (rs ranging from .003 to .756),
instead of performing a confirmatory factor analysis given that there was no strong theoretical
foundation behind the six factors discovered by MacDonald and Ross. I conducted exploratory

42
factor analyses (EFA) in accordance with procedures recommended by Fabrigar and Wegener
(2012).
In accordance with recommendations by Fabrigar and Wegener (2012), I then conducted
an EFA using Maximum Likelihood (ML) as the fitting model, relative to Principal Axis
Factoring, given the additional information that it provides (tests of fit, confidence intervals, and
statistical tests of parameters). In order to determine the number of factors present amongst these
21 variables, I first used the scree test, by examining the scree plot based on eigenvalues from
the reduced matrix (see Figure 2). Although the eigenvalue-greater-than-one rule (or Kaisan
criterion) is probably one of the more widely used procedures for assessing the number of
common factors, it’s meant to be used on eigenvalues from the unreduced correlation matrix,
and is therefore inappropriate in the context of common factor analysis (see Fabrigar &
Wegener, 2013). Using this method, the appropriate number of common factors corresponds to
the number of eigenvalues prior to the last major drop (Fabrigar & Wegener, 2012). According
this plot, there is a good case for the presence of 1 factor, with there being a substantial drop in
variance in explained among variables after the first factor (from 7.04 to 1.28). However, one
could also argue for a three-factor solution, with there being another visible drop in the
eigenvalues after the third factor (from 1.05 to .64).
As a secondary test for determining the appropriate number of common factors, I
performed a parallel analysis which compares the eigenvalues from the sample data with
eigenvalues obtained from random data. If the eigenvalues from the sample data are larger than
those produced randomly, this indicates the likely presence of ‘real’ common factors. I used the
following parameters: N = 85, number of variables = 21, number of datasets = 100, and
confidence interval = .95. According to this analysis, only one factor had an eigenvalue greater

43
than those produced by random data, either by the mean or 95th percentile values. Therefore,
according to this analysis, the one factor solution is more appropriate.
Figure 2. Scree plot of the reduced correlation matrix for relationship quality items (Phase One
separation).
The final method I used to determine the appropriate number of factors was computing
the root mean square error estimates for one, two, and three factor models. Using the RMSEA as
a fit index is recommended over the chi-square likelihood ratio test statistic, as the likelihood
ratio test statistic has a number of drawbacks. For example, the likelihood ratio test statistic can
make it likely to produce models that are overfactored with large samples, and underfactored
with small samples (see Fabrigar & Wegener, 2012). As a guideline, an RMSEA from .05-.08
indicates an acceptable fit, with RMSEAs below .05 indicating a close fit. Accordingly, all three
models indicated an acceptable fit for the data, (one-factor RMSEA = .077, two-factor RMSEA
= .065, three-factor RMSEA = .052). While the three-factor model certainly showed the best fit
index relative to the previous two models, all were in the acceptable range. In order to better
determine whether a three-factor model was appropriate, I next examined the interpretability of
the factor loadings.
-2
0
2
4
6
8
1 2 3 4 5 6 7 8 9 10 11 12 13 14 15 16 17 18 19 20
Eig
enval
ues
Factor
44
To interpret the three factors, I conducted a ML EFA with an oblique rotation given that
there is no substantive reason to assume that these factors are orthogonal to one another. I first
examined the communalities, which ranged from .07-.99, and only six communalities less than
.30, suggesting that the factors explained a good proportion of the variance in each of the items.
Further, some factors correlated with one another (factor correlation coefficients ranging from -
.20 to .37) suggesting that an oblique rotation was appropriate.
The first factor explained 33.5% of the variance across measures (Eigenvalue = 7.04),
was labelled wanting change (two items: e.g., “I do not like aspects of my partner’s
personality”), and reflects disliking aspects of a partner and desiring change in a partner. Scores
for these items were calculated taking the mean of the two items. The scale scores were found to
be reliable (Cronbach’s α = .77).
The second factor explained 6% of the variance amongst items (Eigenvalue = 1.28), was
labelled relationship harmony (10 items: e.g., “My partner and I have similar goals”), and
reflects feeling as though one is a good ‘match’ with their partner, that the couple communicates
well, and feeling valued and emotionally supported by one’s partner. Scores for relationship
harmony were calculated by taking the mean of the respective items with higher scores
indicating greater relationship harmony. The scale scores were found to be reliable (Cronbach’s
α = .90) and no items would improve reliability if deleted.
The third factor accounted for 5% of the variance across measures (Eigenvalue = 1.05),
was labelled commitment and closeness (six items: e.g., “I never tire of my spouse’s company,
no matter how much time we spend together”), and reflects feeling attracted to one’s partner,
never tiring of their company, and feeling sure about continuing the relationship. Scores for
commitment and closeness were calculated by taking the mean of respective items after reverse

45
coding necessary items with higher scores indicating more partner attraction. The scale scores’
reliability was questionable (Cronbach’s α = .66) and no items would improve reliability if
deleted. I decided to maintain this subscale instead of treating these variables as separate
subscales, given that the estimate was closer to the acceptable cut off than questionable cut-off,
and for model parsimony.
In addition to these factors, there were three items that did not load highly (loadings >
.30) onto any factors, and one item that loaded highly on more than one factor. Therefore, the
following three items were treated as separate variables: “Over time, it is likely that I will
discover areas in which my needs conflict with those of my partner” (conflict over time),
“Whether this relationship continues depends primarily on factors within my control”
(relationship within control), and “I could get by without a romantic relationship” (get by
without). Descriptive statistics for all relationship quality factors and items can be found in Table
1.
Coping Capacity
I created a total of 14 items (see Appendix G) that captured coping capacity or general
well-being with facets such as emotional (e.g., “I am feeling upbeat”), physical (e.g., “I have
been sleeping well”), social (e.g., “I feel good about my social life”), and practical (e.g., “I can
manage the ups and downs of everyday life”) functioning. Respondents indicated their
agreement with these items on a scale from 1(Strongly Disagree) to 7(Strongly Agree). I
performed an EFA to see if I could uncover a fewer number of latent variables that could
account for bivariate correlations among these items (rs ranging from .008 to .563) using ML as
the fitting model and other procedures outlined by Fabrigar and Wegener (2012), similar to the
relationship quality scale.

46
In order to determine the number of factors present amongst these 14 variables, I used the
scree test, by examining the scree plot based on eigenvalues from the reduced matrix (see Figure
3). According to this plot, there is a good case for the presence of one factor, with there being a
major drop in the eigenvalue after the first factor (from 4.97 to 0.79). However, one could also
argue for the presence of four factors, with the last major and visible drop in variance explained
occurring after the fourth eigenvalue (from .45 to .16).
Figure 3. Scree plot of the reduced correlation matrix for coping capacity items (Phase One
separation).
As a secondary test for determining the appropriate number of common factors, I
performed a parallel analysis. I used the following parameters: N = 85, number of variables = 14,
number of datasets = 100, and confidence interval = .95. According to this analysis, four factors
had an eigenvalue greater than those produced by random data, either by the mean or 95th
percentile values. Therefore, according to this analysis, the four-factor solution seems
appropriate.
The final method I used to determine the appropriate number of factors was assessing
model fit using the root mean square error estimates for one, two, three, and four factor models.
-1
0
1
2
3
4
5
6
1 2 3 4 5 6 7 8 9 10 11 12 13
Eig
enval
ues
Factor

47
The one-factor and two-factor models showed an acceptable fit for the data (RMSEAs = .075
and .058 respectively). However, the RMSEAs for the three and four factor models were zero,
because the chi-square values were less than the degrees of freedom for these models. Therefore,
while the scree test and parallel analysis indicated that four factors might be appropriate, the
model fit index was not consistent with this interpretation. In order to better determine whether a
four-factor model was appropriate, I next examined the interpretability of the factor loadings.
To interpret the three factors, I conducted a ML EFA with an oblique rotation given that
there is no substantive reason to assume that these factors are orthogonal to one another. I first
examined the communalities, which ranged from .31-.72, suggesting that the factors explained a
good proportion of the variance in each of the items. Further, some factors correlated with one
another (factor correlation coefficients ranging from .15 to -.54) suggesting that an oblique
rotation was appropriate.
The first factor explained 35.5% of the variance across measures (Eigenvalue = 4.97),
was labelled physical well-being (five items: e.g., “I am feeling healthy”), and reflects feeling
energetic, healthy, well rested, and socially active. Scores for this factor were calculated by
taking the mean of the respective items, with higher scores reflecting better physical well-being.
The scale scores were found to have good reliability (Cronbach’s α = .81).
The second factor explained 5.6% of the variance amongst items (Eigenvalue = 0.79),
was labelled emotional well-being (three items: e.g., “I feel overwhelmed”), and reflects feeling
depressed, anxious, and lonely. Scores for emotional well-being were calculated by reverse
scoring all items and then calculating the mean of these items such that higher scores indicated
better emotional well-being. The reliability for scale scores was acceptable (Cronbach’s α = .65).

48
The third factor accounted for 5.4% of the variance across measures (Eigenvalue = 0.76),
and was comprised of (two items: “I feel supported” and “I am satisfied with my marriage”).
The reliability of the scale scores was poor (Cronbach’s α = .48). For this reason, the items
should be treated as separate measures. However, given that I already had a measure of
relationship satisfaction, I decided to drop the marital satisfaction measure, and retain the
perceived social support item.
The fourth factor accounted for 3.2% of variance in measures (Eigenvalue = 0.45). There
were two items that loaded highly on this factor, and another two items that loaded highly on
this factor, and one other factor (cross-loadings). Conceptually, the items with cross-loadings
seemed to fit with the other items on factor four, capturing the extent to which individuals felt
like they were coping with daily life. For this reason, and to make the model more parsimonious,
I decided to retain the fourth factor with four items, and labelled it practical well-being (four
items: e.g., “I can manage the ups and downs of everyday life”). Specifically, this factor reflects
feeling good about one’s financial situation, completely managing daily life, and feeling good
about oneself. Scores for this factor were calculated by taking the mean of the four items with
higher scores indicating better practical well-being. The scale scores were reliable (Cronbach’s α
= .77). Descriptive statistics for all coping capacity factors can be found in Table 1.

49
Table 1
Descriptive Statistics for Separation Measures
M SD
Attachment anxiety1 2.27 0.90
Attachment avoidance1 2.07 0.77 Self-esteem1 5.81 0.93
Relationship satisfaction1 6.36 0.57
State anxiety2 1.70 0.49
Positive affect3 3.50 0.71
Negative affect3 1.52 0.55
Relationship quality1 Wanting change factor 3.75 1.59
Relationship harmony factor 6.25 0.74
Commitment closeness factor 6.05 0.75
Conflict over time 3.16 1.72
Relationship within control 4.04 2.00
Get by without 3.95 1.92
Coping capacity1 Physical well-being 5.23 1.17
Emotional well-being 4.31 1.36 Perceived social support 6.19 0.72
Practical well-being 5.70 0.93 1Response range = 1(Strongly Disagree) to 7 (Strongly Agree) 2Response range = 1 (not at all) to 4 (very much so) 3Response range = 1 (not at all) to 5 (extremely)
Results
First, I was interested in assessing the unique and interactive effects of attachment
anxiety and avoidance on perceptions of individual and relationship functioning during a major
partner separation due to deployment. To do so, I conducted a series of multiple linear
regressions with anxiety, avoidance, and their interaction term as predictors on the following
dependent variables: positive and negative affect, relationship satisfaction, relationship quality
(relationship harmony, partner attraction, wanting change, closer with events, satisfied over time,
conflict over time, partner gets along, find another partner, get by without, relationship within
control), and coping capacity (physical well-being, emotional well-being, social/marital support,
practical well-being). I tested for the presence of potential confounds that have been reported in
prior work on attachment anxiety including self-esteem (e.g., Collins & Read, 1990;

50
Bartholomew & Horowitz, 1991), relationship length (e.g., Duemmler & Kobak, 2001; Fraley &
Shaver, 1998), and whether or not the spouse had children (e.g., Medway, Davis, Cafferty,
Chappell, & O’Hearn, 1995). After conducting bivariate correlations between attachment
anxiety and all potential covariates, the only significant relationship that emerged was that
between attachment anxiety and self-esteem, (r(83) = -.53, p < .001). As a result, self-esteem
was included in all analyses as a covariate. Following the recommendations of Aiken and West
(1991), scores for anxiety, avoidance, and self-esteem were mean centered in order to reduce
multicollinearity5. Further, the anxiety and avoidance interaction term was calculated using the
mean centered scores.
Conducting regression analyses with 15 dependent variables, and three predictors can
raise concerns regarding inflation of alpha rates. Specifically, by chance I could find 2
significant effects. Although this is a real concern, I also did not have the statistical power to
compensate for this type I error inflation without also compromising power and increases in type
II error. Specifically, to maintain a .001 alpha rate (.05/45), and power at .90, with three
predictors, I would need a minimum of 145 participants. For this reason, I decided to not
implement an alpha correction and maintain the .05 alpha criterion. Therefore, any significant
findings should be interpreted with caution.
There were no significant interactions between attachment anxiety and avoidance on any
of the measures, but there were significant main effects. Specifically, attachment anxiety was
positively associated with state anxiety (B = .23, β = .46, t(80) = 3.44, p = .001), and negatively
associated with relationship satisfaction (B = -.32, β = -.50, t(80) = -4.77, p < .001), relationship
5 According to Aiken and West (1991), if first order variables are not centered, product terms can be highly correlated
with the first order terms, which can lead to large standard errors for the lower order terms when included in regression
analyses with higher order terms.

51
harmony (B = -.30, β = -.37, t(80) = -3.12 p = .003), emotional well-being (B = -.62, β = -.41
t(80) = -3.24, p = .002), and perceived social support (B = -.41, β = -.34, t(80) = -2.45, p = .016).
Attachment avoidance was negatively associated with relationship satisfaction (B = -.28,
β = -.38, t(80) = -3.76, p < .001), relationship harmony (B = -.40, β = -.41, t(80) = -3.69, p <
.001), and commitment and closeness (B = -.41, β = -.42, t(80) = -3.42, p = .001). Attachment
avoidance was also positively associated with desires to change a partner’s characteristics (B =
.58, β = .28, t(80) = 2.19, p = .032), feeling as though one could get by without a romantic
relationship (B = .77, β = .31, t(80) = 2.27, p = .026), and emotional well-being (B = .52, β = .29,
t(80) = 2.44, p = .017). In addition, attachment avoidance was marginally negatively related to
positive affect, B = -.24, β = -.25, t(80) = -1.88, p = .063.
I also predicted that the effects of attachment dimensions might be amplified for those
who are experiencing their first deployment. I tested this hypothesis, assessing whether the
significant relationships between attachment anxiety and state anxiety, relationship satisfaction,
relationship harmony, emotional well-being, and perceived social support are moderated by
whether or not couples had experienced deployments before, by adding the (centered) previous
deployment variable and the anxiety by previous deployment interaction term to the regression
models for all four dependent measures. I indeed found a significant two-way interaction
between anxiety and previous deployment status for relationship harmony, B = .16, β = .20, t(78)
= 2.22, p = .029, but none of the other interaction coefficients approached significance (ps
between .12-.75). I decomposed this interaction using simple slopes analysis (Aiken & West,
1991) in order to examine the effects of attachment anxiety on relationship harmony for those
who were experiencing their first deployment versus those who were not experiencing their first
deployment. For those who were experiencing a deployment for the first time, there was a

52
significant negative relationship between attachment anxiety and relationship harmony, B = -.46,
β = -.56, t(78) = -3.88, p < .001 (see Figure 4). However, for those who have experienced
deployments before, there was no significant relationship between attachment anxiety and
relationship harmony, B = -.14, β = -.17, t(78) = -1.14, p = .260.
Figure 4. Interaction between attachment anxiety and previous deployment status on perceived
relationship harmony during the deployment separation.
Next, I wanted to test whether the relationships between attachment anxiety and
perceptions of intrapersonal functioning and relationship quality are moderated by the stage of
the separation (stages 2 and 3 versus 4) which vary in the extent to which they are perceived as
being stressful or difficult. Unfortunately, I only had 3 individuals who were in the ‘reacting’
stage 3, and no participants who were experiencing stage 2. However, I was still interested in
assessing whether the effects of attachment dimensions might be moderated by the number of
days separated, even if most participants are in the recovery and stabilization period (stage 4). In
particular, I was interested in assessing whether the intrapersonal and relationship difficulties
β = -.17, p = .260
β = -.56, p < .001
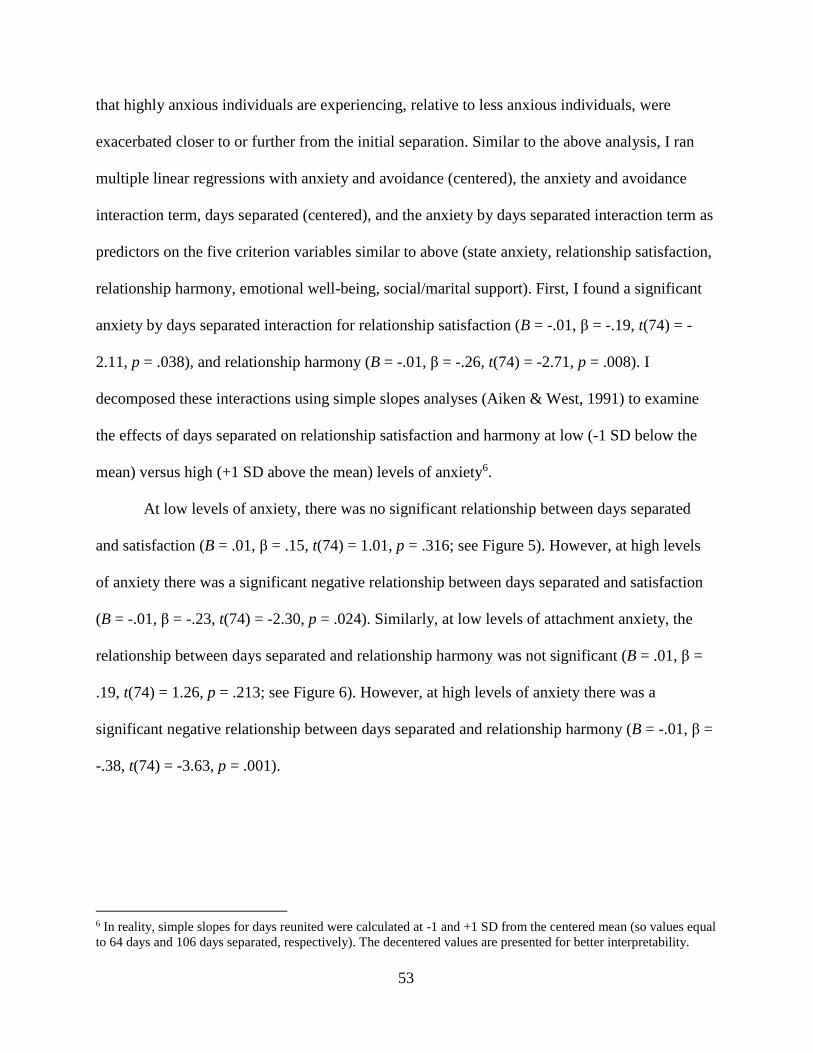
53
that highly anxious individuals are experiencing, relative to less anxious individuals, were
exacerbated closer to or further from the initial separation. Similar to the above analysis, I ran
multiple linear regressions with anxiety and avoidance (centered), the anxiety and avoidance
interaction term, days separated (centered), and the anxiety by days separated interaction term as
predictors on the five criterion variables similar to above (state anxiety, relationship satisfaction,
relationship harmony, emotional well-being, social/marital support). First, I found a significant
anxiety by days separated interaction for relationship satisfaction (B = -.01, β = -.19, t(74) = -
2.11, p = .038), and relationship harmony (B = -.01, β = -.26, t(74) = -2.71, p = .008). I
decomposed these interactions using simple slopes analyses (Aiken & West, 1991) to examine
the effects of days separated on relationship satisfaction and harmony at low (-1 SD below the
mean) versus high (+1 SD above the mean) levels of anxiety6.
At low levels of anxiety, there was no significant relationship between days separated
and satisfaction (B = .01, β = .15, t(74) = 1.01, p = .316; see Figure 5). However, at high levels
of anxiety there was a significant negative relationship between days separated and satisfaction
(B = -.01, β = -.23, t(74) = -2.30, p = .024). Similarly, at low levels of attachment anxiety, the
relationship between days separated and relationship harmony was not significant (B = .01, β =
.19, t(74) = 1.26, p = .213; see Figure 6). However, at high levels of anxiety there was a
significant negative relationship between days separated and relationship harmony (B = -.01, β =
-.38, t(74) = -3.63, p = .001).
6 In reality, simple slopes for days reunited were calculated at -1 and +1 SD from the centered mean (so values equal
to 64 days and 106 days separated, respectively). The decentered values are presented for better interpretability.
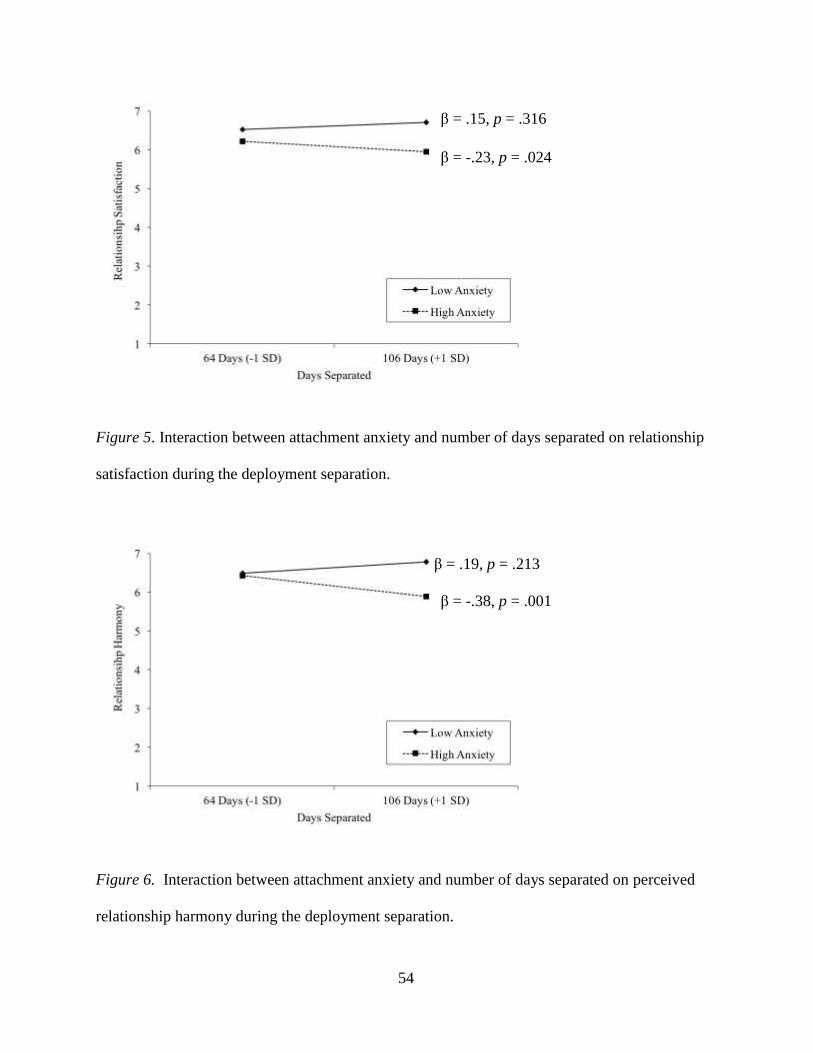
54
Figure 5. Interaction between attachment anxiety and number of days separated on relationship
satisfaction during the deployment separation.
Figure 6. Interaction between attachment anxiety and number of days separated on perceived
relationship harmony during the deployment separation.
β = .19, p = .213
β = -.38, p = .001
β = .15, p = .316
β = -.23, p = .024

55
Discussion
Consistent with findings from Fraley and Shaver (1998) and Cafferty and colleagues
(1994), I predicted that individuals higher in attachment anxiety would report greater difficulties
during the separation relative to individuals lower in attachment. Further, I predicted that
attachment anxiety would be related to more negative relationship perceptions (e.g., Collins &
Read, 1990). In line with my predictions, higher levels of attachment anxiety were associated
with decreased emotional well-being and more negative relationship perceptions during the
separation relative to lower levels of attachment anxiety. Specifically, attachment anxiety was
associated with higher levels of state anxiety, negative affect, and emotional well-being, as well
as less relationship satisfaction, less relationship harmony, and less perceived social support.
In addition, I predicted that attachment avoidance would be associated with deactivating
strategies in response to environmental threats such that attachment avoidance and as such
would not be associated with reported distress or compromised well-being. On the other hand, it
is possible to see some breakdowns in coping capacity and emotional well-being for highly
avoidant spouses if military separations are perceived to be high-stress experiences (Mikulincer
& Florian, 1998). Interestingly, and in line with the former theorizing, attachment avoidance was
actually associated with increased emotional well-being, but related to more negative
relationship perceptions compared to attachment anxiety. Specifically, attachment avoidance
was associated with less relationship satisfaction, less relationship harmony, less commitment
and closeness, a stronger desire to change a partner’s characteristics, and feeling more strongly
that one could get by without a romantic relationship.
I also predicted that the effects of attachment dimensions might be exacerbated by factors
that might amplify the magnitude of how stressful the deployment is perceived to be, or during

56
periods of the deployment that involve increased attachment concerns, given that attachment
orientations and attachment threats are interactive in nature (Simpson & Rholes, 1994; Campbell
& Marshall, 2010). Therefore, I predicted that the effects of attachment dimensions on
functioning during a deployment might to be amplified for those who are experiencing their first
deployment (Padden, Connors, & Agazio, 2011; Frankel, Snowden, & Nelson, 1993), and during
the more stressful periods of a separation (i.e., stages 2 and 3). I did find evidence to suggest that
the effects of attachment anxiety on relationship perceptions during a deployment separation are
exacerbated for those who are experiencing a deployment for the first time. Specifically, I found
that for those who were experiencing a deployment for the first time, there was a significant
negative relationship between attachment anxiety and relationship harmony. However, for those
who have experienced deployments before, there was no significant relationship between
attachment anxiety and relationship harmony. In other words, attachment anxiety is more
predictive of relationship perceptions during first experiences of a separation, and is less
predictive of relationship perceptions when a couple has had experience with previous
deployment separations. Previous deployment status did not, however, moderate the effects of
attachment avoidance on intrapersonal or relationship outcomes.
Following this logic, I predicted that the effects of attachment orientations might be
exacerbated during stages 2 (detachment and withdrawal: 1-3 weeks before the separation) and 3
(emotional disorganization: weeks 1-6 after the separation) relative to stage 4 (recovery and
stabilization: weeks 6-12 after separation). Unfortunately, I did not have enough responses at
stages 2 or 3 to test these predictions, with none completing the survey prior to the separation,
and only 3 who completed the survey during stage 2. However, I was still able to test linear
effects of time separated although the anchors (representing 1 standard deviation below and

57
above the mean) of comparison were technically both in the recovery and stabilization period or
stage 3 (weeks 9 and 15 respectively). Specifically, my findings suggest that the trajectory of
relationship perceptions across the deployment separation might not be the same for those low
versus high in attachment anxiety. For those lower in attachment anxiety, there was no
relationship between days separated and relationship harmony or satisfaction. In other words, for
those low in anxiety, their perceptions of their relationship harmony and satisfaction did not
change in a linear fashion across stage 3 of the separation. However, the relationship perceptions
of those higher in attachment anxiety became more negative the longer that they progressed in
stage 3. There is some research supporting this notion, that attachment anxiety predicts a decline
in marital functioning during major life transitions (Rholes et al., 2001) who found that anxious
women’s views of spousal support and marital satisfaction continued to worsen (so a negative
linear trend) across the transition to parenthood.
In conclusion, consistent with prior research, I found evidence to suggest that attachment
dimensions moderate intrapersonal and relationship perceptions during a long-term separation
from a spouse. Although prior research has assessed the relevance of attachment dimensions at
the actual point of separation (Fraley & Shaver, 1998), to date no research has assessed the
relevance of attachment dimension in predicting emotional or relationship functioning during the
ongoing separation particularly in the context of a military deployment. Therefore, extending
prior research I found not only that attachment dimensions uniquely predicted perceptions of
intrapersonal and relationship functioning, but also that the effects of attachment anxiety were
moderated by previous deployment experience and as a function of time separated. Therefore,
the effects of attachment anxiety in particular during a separation appear to be both chronic and,
for a subset of variables, situational in nature. Specifically, the effects of attachment anxiety on

58
relationship perceptions were moderated by (what I believe to be) situations that amplify signals
of attachment concerns to a greater extent than were perceptions of emotional well-being and
intrapersonal functioning.

59
Chapter 3
Phase One – Reunion Group
The main purpose of this study was to assess the relationships among attachment anxiety,
avoidance, and perceptions of one’s interpersonal well-being and relationship quality during the
reunion period. I predicted that, in line with the separation findings and with research by
Cafferty and colleagues (1994), attachment anxiety in particular would be relevant in predicting
how well spouses report that they are coping with the deployment reunion including decreased
emotional well-being and relationship perceptions. Further, I predicted that attachment anxiety
would be related to perceptions that the reunion period has not lived up to one’s original
expectations in line with theorizing by Simpson and Rholes (1998). Although Cafferty and
colleagues (1994) did not report any significant differences between secure and avoidant at-
home spouses in their post-reunion functioning, Tidwell, Reis, and Shaver (1996) found that
avoidant individuals reported less intimacy, enjoyment and positive emotions with their partners,
and that avoidant individuals would structure social activities in ways that minimize intimacy
and closeness. Therefore, I also predicted that attachment avoidance could be related to
difficulties during the reunion period including decreased emotional well-being and relationship
perceptions.
Next, I wanted to investigate whether the relationships between attachment anxiety and
post-reunion outcomes are moderated by the number of days they had been reunited with their
spouse. I ideally wanted to compare the effects of attachment dimensions at Stage 2 (‘Elation’)
versus stages 3 (‘Reintegration’: weeks 2-6) and stage 4 (‘Renegotiation’: weeks 6-12) which are
characterized by greater reactivity, increased stress, and decreased coping ability. If individuals
high in attachment anxiety are dependent on their partners for emotional comfort, reassurance,

60
and validation, experience increased distress in response to partner separations, and desire
greater levels of closeness in their relationships, it could be argued that those high in attachment
anxiety should respond more positively to stage 2 (‘Elation’). However, with more spouses
reporting difficulties during stages 3 and 4, it may be the case that these problems may be
amplified for those high in attachment anxiety particularly with respect to relationship outcomes
(Rholes et al., 2001). In addition, highly avoidant individuals may be less satisfied with their
partners’ behaviour during stage 2 (‘Elation’) as they learn to cope with their partners being
physically closer, increasing levels of intimacy in the relationship, leading avoidant individuals
to feel uncomfortable and potentially increasing conflicts and more unpleasant partner
interactions (Tidwell et al., 1996). On the other hand, individuals higher in attachment avoidance
might show recovery in stages 3 and 4 from their initial difficulties in stage 2 with the eventual
establishment of re-connection and therefore might not report the difficulties that those lower in
avoidance might.
For my main analyses, I was interested in testing the hypothesis that individuals with
higher levels of attachment anxiety are experiencing greater difficulties with their relationships
post-reunion that is mediated by their unrealistically optimistic expectations about what the
reunion period might be like. In other words, I was interested in testing whether the relationships
between attachment anxiety and difficulties post-reunion are mediated by perceptions that one’s
original expectations were not met.
Finally, spouses were asked how they felt, and what they did, when they saw their
partner for the first time after the deployment. Up until this point, there is little work examining
relationships between attachment dimensions and emotions felt during the moment spouses are
first reunited with their partners from a long term separation. The literature on mother-child

61
interactions indicates that the group of infants that greet their mothers most warmly and are
quickly soothed are the secure infants, and that highly anxious infants tend to display emotional
ambivalence, oscillating between displays of connection and displays of anger (Ainsworth et al.,
1978). Finally, the avoidant infants tend to ignore their mothers more than the other infants, in
efforts to suppress their attachment needs. Therefore, it is possible that those who are more
‘secure’ (lower in anxiety and avoidance) might report the strongest positive emotions during the
initial meeting, relative to those higher in attachment anxiety and avoidance.
Method
Participants and Procedure
Reunion surveys were sent to 296 spouses/partners of CAF Regular Force personnel (not
Augmentees or Reservists, or dual-service couples), who had been deployed, and who had a
listed home address as surveys were administered using Canada Post. At the end of the survey,
spouses were given the option to be entered into one of five draws for $100, as remuneration.
The remuneration was provided 100% by external researchers at Queen’s University. A total of
68 spouses completed the survey, a response rate of 23%. The spouses were all women between
22-55 years of age (M = 39.35, SD = 8.20), and had been married or in a common-law
relationship with their partner7 for 10.80 years (SD = 8.76 years). Out of these 68 spouses, most
had partners who were in the CA (71%, 14% RCAF, 3% RCN, 11% not disclosed) and had
recently returned from a deployment to Afghanistan (89%). For many of these spouses (65%),
this was not the first time they had been separated from (and reunited with) their partners due to
a military deployment, and at the time of completing the survey spouses and partners had been
7 Partners were all men between 24-54 years of age, and were 2 years older than the female spouses on average (M =
41.00, SD = 8.35) which is a typical age difference for married samples (e.g., Meltzer, McNulty, Jackson, & Karney,
2014; Neff & Geers, 2014).

62
reunited for an average of 70.95 days (SD = 26.63, range = 9-181 days)8. Most of the women
indicate that they had children (73%), most were employed (83%), and, of those employed, most
(79%) worked outside the home.
Measures
Attachment Anxiety and Avoidance
Attachment anxiety and avoidance were assessed using the same ECR-R measure from
the Separation Survey (see Appendix A). The scale scores for both anxiety (Cronbach’s α = .89)
and avoidance (Cronbach’s α = .92) were reliable and were highly correlated9, r(63) = .70, p <
.001. Descriptive statistics for both anxiety and avoidance are listed in Table 2.
Relationship Satisfaction
Relationship satisfaction was assessed using the same RAS measure from the Separation
Survey (see Appendix C). With this sample, scale scores for relationship satisfaction had good
reliability (Cronbach’s α = .89). Descriptive statistics for this sample are listed in Table 2.
Coping Capacity
Coping Capacity was assessed using the same 14-item scale from the Separation Survey
(see Appendix G). This was a measure developed by the research team so its reliability has not
been well established. For this reason, I decided to run a new EFA similar to my previous
analyses and in line with recommendations by Fabrigar and Wegener such as using ML as the
fitting procedure (2012).
8 It should be noted that number of days reunited was not significantly correlated with attachment anxiety nor
avoidance (rs = -.17 and -.10 respectively).
9 This correlation coefficient is higher than that typically reported in the literature. For example, based on an online
sample of over 22,000 individuals, Fraley reports a correlation coefficient between attachment anxiety and attachment
avoidance of .41 (Fraley, 2010).

63
In order to determine the number of factors present amongst these 14 variables, I used the
scree test, by examining the scree plot based on eigenvalues from the reduced matrix (see Figure
7). According to this plot, there is a good case for the presence of two factors, with the last final
visible drop in the eigenvalues occurring after the second factor (from 1.44 to 0.74). However,
one could also make a case for the presence of five common factors, with another visible drop in
the eigenvalue after factor five (from .48-.23).
Figure 7. Scree plot of the reduced correlation matrix for coping capacity items (Phase One
reunion).
As a secondary test for determining the appropriate number of common factors, I
performed a parallel analysis. I used the following parameters: N = 63, number of variables = 14,
number of datasets = 100, and confidence interval = .95. According to this analysis, two factors
had an eigenvalue greater than those produced by random data, either by the mean or 95th
percentile values. Therefore, according to this analysis, the two- factor solution seems
appropriate.
The final method I used to determine the appropriate number of factors was assessing
model fit by computing the root mean square error estimates for one, two, three, four, and five
-1
0
1
2
3
4
5
6
7
1 2 3 4 5 6 7 8 9 10 11 12 13
Eig
enval
ues
Factor

64
factor models. The one, two, three, and four factor models showed marginal to poor fit
(RMSEAs between .17-.09). However, the RMSEA for the five-factor model showed a close fit
(= .04). Therefore, while the scree test and parallel analysis indicated that two factors might be
appropriate, the model fit index was more consistent with a five-factor model being appropriate.
In order to better determine whether a two-factor or five-factor model was appropriate, I next
examined the interpretability of the factor loadings. Specifically, I performed EFAs using ML as
the extraction method and using an oblique rotation.
To summarize the differences between the two models, the two-factor model included
three complex loadings (loadings > .3 on more than one factor), and had three low
communalities indicating that three items were not strongly related to other items. For two of the
complex loadings, the items loaded more strongly onto one factor relative to the other (.98 and
.33; .32 and -.67). On the other hand, the five-factor model contained only one low
communality, but five complex loadings and one item that didn’t load highly onto any of the five
factors. I decided to retain the two-factor solution given the lower number of complex loadings,
and better conceptual interpretability relative to the five-factor model.
The communalities for the two-factor model ranged from .26-.87, suggesting that the
factors explained a good proportion of the variance in each of the items. Further, the two factors
correlated with one another (factor correlation coefficients = -.44) suggesting that an oblique
rotation was appropriate.
The first factor explained 44.5% of the variance across measures (Eigenvalue = 6.23),
was labelled general well-being (11 items: e.g., “I am satisfied with my life”), and reflects
feeling energetic, healthy, feeling good about one’s marriage, and being able to manage the ups
and downs of life. Scores for this factor were calculated by taking the mean of the respective
65
items, with higher scores reflecting better physical well-being. The reliability of these scale
scores was good (Cronbach’s α = .89).
The second factor explained 10.25% of the variance amongst items (Eigenvalue = 1.44),
was labelled perceived social support (three items: e.g., “I feel supported”) and reflects feeling
socially supported and less lonely. The scale scores were reliable (Cronbach’s α = .82).
Although one item would improve alpha by .06 if removed, the alpha was still sufficiently high
with this item included so I decided to leave the scale as is, rather than use the item as a separate
measure. Descriptive statistics for the coping measures are listed in Table 2.
Reunion Experiences
I also asked a number of questions about the reunion itself and how the deployment and
reunion has potentially affected their perceptions of their partner and the relationship (see
Appendix H). For example, spouses were asked whether the reunion met their original
expectations (1 = not at all, 7 = very much so), and relative to the time before the deployment
whether they now feel more or less emotionally connected and satisfied (1 = a lot less
connected/satisfied, 7 = a lot more connected/satisfied) with their partner, and whether things are
running more or less smoothly around the house relative to the time that their partner was away
(1 = much less smoothly, 7 = much more smoothly). Since the partner’s return, I asked spouses
to report the quality of their interactions (1 = extremely unpleasant, 7 = extremely pleasant), the
extent to which they experience conflict (1 = not at all, 7 = all the time), and when they do
experience conflict what issues are most pressing. Finally, I asked spouses in an open-ended
fashion to report what they did (in paragraph form) and how they felt (up to three
thoughts/emotions) when they saw their partners for the first time.

66
Table 2
Descriptive Statistics for Reunion Measures
M SD
Attachment anxiety 2.18 0.86 Attachment avoidance 2.34 1.01
Relationship satisfaction 6.36 0.57
Coping capacity General well-being 5.33 0.97
Perceived social support 3.50 0.71 Reunion experiences Expectations met 6.37 0.75
More emotionally connected 6.33 0.74
More satisfied 3.75 1.59
Things running more smoothly 5.31 1.54
Quality of partner interactions 6.06 1.16
Extent of conflict 3.16 1.72
Note. Response range = 1 - 7 (see scale descriptions for specific value
labels)
Open-Ended Responses
For the open-ended responses, I recruited an undergraduate student who was blind to the
hypotheses (and all other variables including attachment dimensions) to code these responses. In
addition, I recruited another undergraduate student to act as the reliability/validity check and
code a portion (30%) of the main rater’s responses. To assess and quantify the emotion/thought
list, the student used Shaver, Schwartz, Kirson, and O’Connor’s (1987) emotion labelling
taxonomy, which was developed after performing a hierarchical cluster analysis on 135 emotion
terms. These researchers reported a solution, which organizes emotion labels within an abstract-
to-concrete hierarchy with six ‘basic’ emotions comprising the broadest level: love, joy, surprise,
anger, sadness, and fear (see Appendix J). Therefore, when using this taxonomy the researcher’s
goal is to distil all emotion terms to these six basic terms (i.e., identifying which of the six
cluster categories the listed emotion belongs to). In total, 63 participants had listed one emotion,
53 had listed two emotions, and 48 had listed three emotions. There was no relationship between
67
attachment anxiety or avoidance and the number of emotions listed (rs equal to .05 and .10
respectively).
Prior to conducting my main analyses, I assessed the validity of the emotion/thought
listing coding by assessing the extent of inter-rater reliability. Inter-rater reliability for
categorical variables is typically assessed using either percent agreement or Cohen’s Kappa
(Cohen, 1960; McHugh, 2012). The benefits of using the percent agreement method is that it is
easy to calculate and interpret, however it does not take into account the possibility of raters
guessing so should be avoided if this possibility is likely. Although Cohen’s Kappa takes
chance into account, it may result in excessively low estimates given that its assumptions are not
well supported when put to the test (see McHugh, 2012). Cohen’s Kappa (κ) is similar to
correlation coefficients in that its values range from -1 to 1 with 0 representing the amount of
agreement that would be expected by chance. Cohen recommends the following as a guideline
for interpreting κ: .01-.20 indicates none to slight agreement, .21-.40 is fair, .41-.60 is moderate,
.61-.80 is substantial, and .81-1.00 is near perfect agreement. In this case, I used both estimates
to assess inter-rater reliability for the first emotion/thought listing as recommended by McHugh.
First, I calculated percent agreement by assigning the raters a 1 when their emotion coding
matched, and 0 when they were mismatched. Then, I divided the number of ‘1’s assigned by the
total number of subjects that listed an emotion/thought. This resulted in near perfect agreement
for the first emotion/thought listing (93% agreement). However, the Cohen’s Kappa estimate
suggested moderate agreement (κ = .64) as it takes into account chance agreement, which in this
case was 81%. Specifically, chance agreement for this variable was high given the little variation
across emotion listings (with most listing ‘joy’ related emotions). Overall, these estimates
suggest moderate to high agreement and a valid measure of primary emotions described.

68
Results
In order to test whether attachment anxiety, avoidance, and their interaction were
associated with difficulties during the reunion period, I conducted multiple linear regressions
with attachment anxiety, avoidance, and their interaction term as predictors on the following
dependent variables: relationship satisfaction, general well-being, perceived social support,
depressive symptoms, expectations met, and quality of partner interactions. Similar to the
separation analyses, I tested for the presence of previously reported covariates in the literature on
adult attachment and relationship functioning and reunion experiences. Specifically, I performed
bivariate correlations between attachment anxiety and relationship length (e.g., Duemmler &
Kobak, 2001; Fraley & Shaver, 1998) and the presence of children (e.g., Medway, Davis,
Cafferty, Chappell, & O’Hearn, 1995). Neither variable was significantly associated with
attachment anxiety (rs between .12-.14), so I was not concerned about either being potential
confounding variables. Following the recommendations of Aiken and West (1991), scores for
anxiety and avoidance were mean centered in order to reduce multicollinearity.
Conducting regression analyses with 9 dependent variables, and three predictors can raise
concerns regarding inflation of alpha rates. Specifically, by chance I could find 1.35 significant
effects. While this is a concern, I also did not have the statistical power to compensate for this
type I error inflation without also compromising power and increases in type II error.
Specifically, to maintain a .002 alpha rate (.05/27), and power at .90, with three predictors, I
would need a minimum of 120 participants. For this reason, I decided to not implement an alpha
correction and maintain the .05 alpha criterion. Therefore, any significant findings should be
interpreted with caution.

69
There were no significant two-way interactions but there were significant main effects of
anxiety and avoidance. Specifically, attachment anxiety was negatively associated with
relationship satisfaction (B = -.25, β = -.28, t(59) = -2.24, p = .029), general well-being (B = -.54,
β = -.48, t(59) = -3.12, p = .003), perceived social support (B = -.54, β = -.33, t(59) = -2.29, p =
.026), quality of partner interactions (B = -.38, β = -.30, t(59) = -2.02, p = .048), and feeling as
though the reunion lived up to expectations (B = -.64, β = -.45, t(59) = -2.85, p = .006).
Attachment avoidance was negatively associated with relationship satisfaction post-
reunion (B = -.33, β = -.44, t(59) = -2.76, p = .001).
Next, I wanted to investigate whether the relationships between attachment anxiety and
post-reunion outcomes are moderated by the number of days they had been reunited with their
spouse. I ideally wanted to compare the effects of attachment dimensions at Stage 2 (‘Elation’)
versus stages 3 (‘Reintegration’: weeks 2-6) and stage 4 (‘Renegotiation’: weeks 6-12) which are
characterized by greater reactivity, increased stress, and decreased coping ability. Unfortunately,
the data from this sample did not allow an adequate test of this hypothesis, because the majority
of participants (n = 43) completed the survey in stage 3, with only one participant captured in
Stage 2. Another comparison point for the reacting stages 3 and 4 would be stage 5 (‘Integration
and Acceptance’) but again only 10 participants completed the survey in this stage.
What I was able to test, similar to my analyses with the Separation Group, was whether
the effects of attachment dimensions are moderated by the number of days reunited. In other
words, are the less positive outcomes reported by those high in attachment anxiety (and
avoidance) exacerbated closer to or further from the reunion date, relative to those lower in
attachment anxiety (and avoidance)? To do this I added the (mean centered) days reunited
variable, and the anxiety by days reunited interaction term, to the regression models for outcome

70
variables that anxiety significantly predicted (satisfaction, general well-being, perceived social
support, depressive symptoms, to what extent expectations were met and quality of interactions).
I decomposed any interactions using simple slopes analyses (Aiken & West, 1991), examining
the effects of days reunited at low (-1 SD) and high (+1 SD) attachment anxiety10.
First, there was a marginally significant interaction between attachment anxiety and
number of days reunited on relationship satisfaction (B = -.01, β = -.19, t(52) = -1.98, p = .053).
While neither of the slopes reached significance, the simple slope for those high in anxiety was
marginal, such that among those high in attachment anxiety, relationship satisfaction decreased
across time following reunion (see Figure 8).
Figure 8. Interaction between attachment anxiety and number of days reunited on relationship
satisfaction.
I also found a significant interaction between attachment anxiety and days reunited on
quality of partner interactions (B = -.02, β = -.28, t(52) = -2.51, p = .015). At low levels of
10 In reality, simple slopes for anxiety were calculated at -1 and +1 SD from the centered mean (so values equal to -
26.63 and +26.63). The decentered values are presented for better interpretability.
β = .18, p = .239
β = -.27, p = .071

71
anxiety, there was no relationship between days reunited and quality of interactions (B = .01, β =
.14, t(52) = 0.85, p = .401; see Figure 9). However, at high levels of anxiety there was a
significant negative relationship between days reunited and quality of interactions (B = -.02, β =
-.50, t(52) = -3.04, p = .004).
Figure 9. Interaction between attachment anxiety and number of days reunited on quality of
partner interactions.
Mediation Models
For my main analyses, I was interested in testing whether the relationships between
attachment anxiety and difficulties post-reunion are mediated by perceptions that one’s original
expectations were not met. I used the bootstrapping method outlined by Preacher and Hayes
(2008) to test a number of mediation models using attachment anxiety as the predictor
(controlling for avoidance and the two-way interaction term), and expectations met as the
mediator, on all relevant dependent variables that anxiety alone predicted (relationship
satisfaction, quality of partner interactions, general well-being, perceived social support,
β = .14, p = .401
β = -.50, p = .004
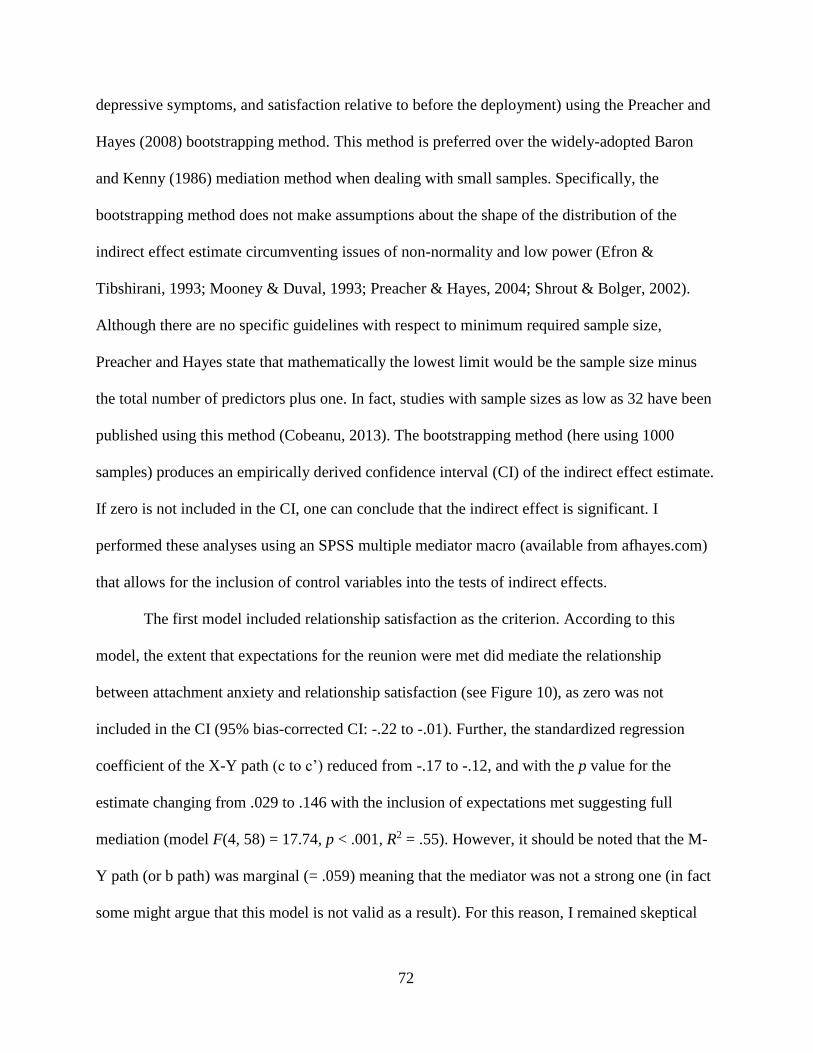
72
depressive symptoms, and satisfaction relative to before the deployment) using the Preacher and
Hayes (2008) bootstrapping method. This method is preferred over the widely-adopted Baron
and Kenny (1986) mediation method when dealing with small samples. Specifically, the
bootstrapping method does not make assumptions about the shape of the distribution of the
indirect effect estimate circumventing issues of non-normality and low power (Efron &
Tibshirani, 1993; Mooney & Duval, 1993; Preacher & Hayes, 2004; Shrout & Bolger, 2002).
Although there are no specific guidelines with respect to minimum required sample size,
Preacher and Hayes state that mathematically the lowest limit would be the sample size minus
the total number of predictors plus one. In fact, studies with sample sizes as low as 32 have been
published using this method (Cobeanu, 2013). The bootstrapping method (here using 1000
samples) produces an empirically derived confidence interval (CI) of the indirect effect estimate.
If zero is not included in the CI, one can conclude that the indirect effect is significant. I
performed these analyses using an SPSS multiple mediator macro (available from afhayes.com)
that allows for the inclusion of control variables into the tests of indirect effects.
The first model included relationship satisfaction as the criterion. According to this
model, the extent that expectations for the reunion were met did mediate the relationship
between attachment anxiety and relationship satisfaction (see Figure 10), as zero was not
included in the CI (95% bias-corrected CI: -.22 to -.01). Further, the standardized regression
coefficient of the X-Y path (c to c’) reduced from -.17 to -.12, and with the p value for the
estimate changing from .029 to .146 with the inclusion of expectations met suggesting full
mediation (model F(4, 58) = 17.74, p < .001, R2 = .55). However, it should be noted that the M-
Y path (or b path) was marginal (= .059) meaning that the mediator was not a strong one (in fact
some might argue that this model is not valid as a result). For this reason, I remained skeptical

73
about drawing inferences about the findings of this model.
Figure 10. Unstandardized regression coefficients for the relationship between attachment
anxiety and relationship satisfaction as mediated by expectations of the reunion being met. The
unstandardized regression coefficient between attachment anxiety and relationship satisfaction,
controlling for expectations being met, is in parentheses.
*p < .05, +p < .10.
The second model was tested with quality of interactions as the criterion, and was a
stronger model as the mediator more effectively predicted variance in the criterion (see Figure
11). More importantly, zero was not included in the CI (95% bias-corrected CI: -.65 to -.11).
Further, the standardized regression coefficient of the X-Y path (c to c’) reduced from -.38 to -
.03, and p values increasing from .048 to .803 with inclusion of expectations met suggesting full
mediation (model F(4, 58) = 21.32, p < .001, R2 = .60).
To better determine the nature of the relationships among attachment anxiety,
expectations met, and relationship indices, I also tested alternative models, swapping the order of
the dependent measures and mediator. Specifically, I tested models using attachment anxiety as
the predictor, extent of expectations met as the dependent measure, and relationship satisfaction
and then quality of interactions as the mediators. In both of these models, there were decreases in
the X-Y estimates when the mediators were included, however both of the CIs included zero,
Expectations
Met
Attachment
Anxiety
Relationship
Satisfaction
-.64* .12+
-.25* (-.17)
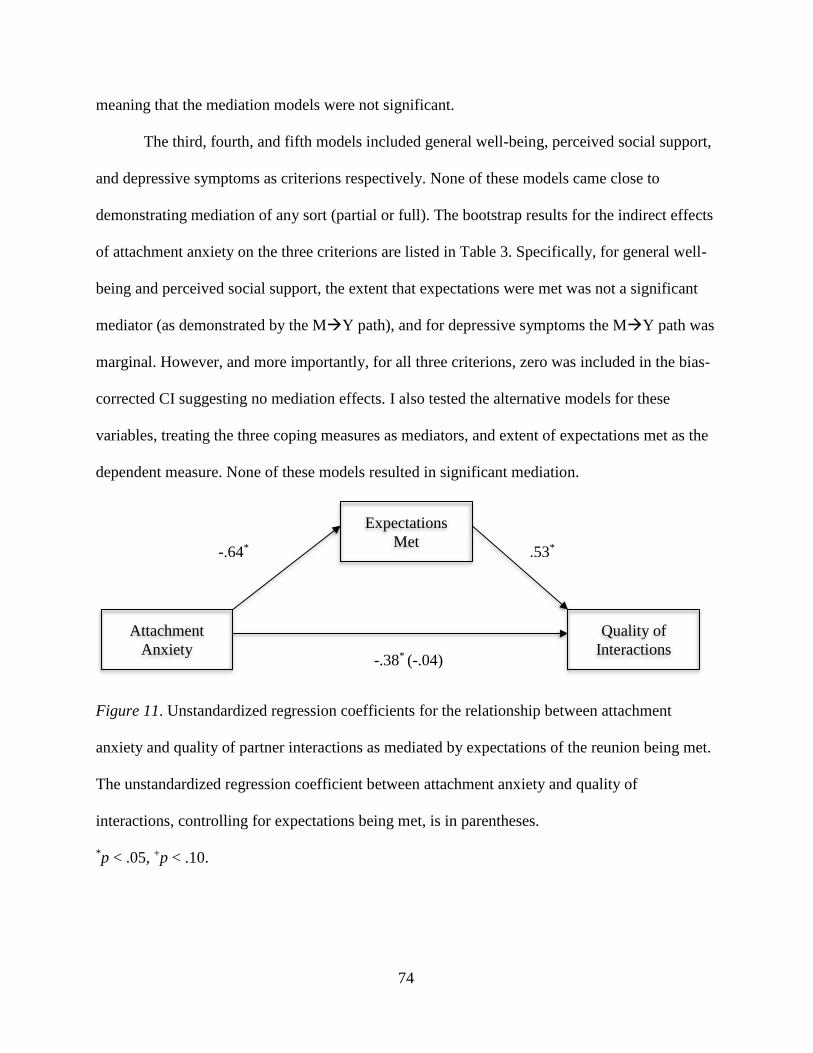
74
meaning that the mediation models were not significant.
The third, fourth, and fifth models included general well-being, perceived social support,
and depressive symptoms as criterions respectively. None of these models came close to
demonstrating mediation of any sort (partial or full). The bootstrap results for the indirect effects
of attachment anxiety on the three criterions are listed in Table 3. Specifically, for general well-
being and perceived social support, the extent that expectations were met was not a significant
mediator (as demonstrated by the MY path), and for depressive symptoms the MY path was
marginal. However, and more importantly, for all three criterions, zero was included in the bias-
corrected CI suggesting no mediation effects. I also tested the alternative models for these
variables, treating the three coping measures as mediators, and extent of expectations met as the
dependent measure. None of these models resulted in significant mediation.
Figure 11. Unstandardized regression coefficients for the relationship between attachment
anxiety and quality of partner interactions as mediated by expectations of the reunion being met.
The unstandardized regression coefficient between attachment anxiety and quality of
interactions, controlling for expectations being met, is in parentheses.
*p < .05, +p < .10.
Expectations
Met
Attachment
Anxiety
Quality of
Interactions
-.64* .53*
-.38* (-.04)

75
Table 3
Bootstrap Results for the Indirect Effects of Attachment Anxiety on Listed DVs through
Expectations Met
95% Bootstrapping
bias-corrected 95% CI
Dependent Variable Path a
(XM)
Path b
(MY)
Path c’
(XY.M)
Path c
(XY)
Lower limit Upper
limit
General well-being -.64* .05 -.46* -.49* -.20 .10
Perceived Social support -.64* .12 -.46* -.54* -.37 .10
Depressive symptoms -.64* -.32+ * p < .05. + p < .10.
Although attachment anxiety was only marginally predictive of satisfaction with one’s
partner relative to the time before the deployment, I decided to run the same mediation model
with this variable as a criterion to see if the observed findings would be consistent with the first
three models which were also relationship-specific outcomes. Similar to the prior models,
expectations met mediated the relationship (albeit marginal relationship) between attachment
anxiety and satisfaction with one’s partner relative to before the deployment (see Figure 12), as
zero was not included in the CI (95% bias-corrected CI: -.67 to -.05). Further, the standardized
regression coefficient of the X-Y path (c to c’) reduced from -.52 to -.27, and p values increased
from .058 to .329 with inclusion of expectations met suggesting full mediation (model F(4, 58) =
6.31, p < .001, R2 = .30).
I also tested the alternative model, with satisfaction relative to before the deployment as
the mediator, and extent of expectations met as the dependent measure. While there was a
decrease in the X-Y path (from -.64 to -.50), however the X-Y path remained significant with
inclusion of the mediator, implying evidence for only partial mediation. Therefore, the previous
model was a stronger one.
76
Figure 12. Unstandardized regression coefficients for the relationship between attachment
anxiety and satisfaction with one’s partner relative to the time before the deployment as
mediated by expectations of the reunion being met. The unstandardized regression coefficient
between attachment anxiety and satisfaction relative to before deployment, controlling for
expectations being met, is in parentheses.
Open-Ended Responses
Up until this point, there is little work examining relationships between attachment
dimensions and emotions felt during the moment spouses are first reunited with their partners
from a long term separation. The literature on mother-child interactions indicates that the group
of infants that greet their mothers most warmly and are quickly soothed are the secure infants,
and that highly anxious infants tend to display emotional ambivalence, oscillating between
displays of connection and displays of anger (Ainsworth et al., 1978). Finally, the avoidant
infants tend to ignore their mothers more than the other infants, in efforts to suppress their
attachment needs. Therefore, it is possible that those who are more ‘secure’ (lower in anxiety
and avoidance) might report the strongest positive emotions, relative to those higher in
attachment anxiety and avoidance. In order to assess relationships between attachment anxiety
and avoidance, and the nature of emotions listed at the time of the reunion, I performed a
discriminant analysis. This analysis assesses whether predictor variables (in this case the
Expectations
Met
Attachment
Anxiety
Satisfaction
Relative to Before
Deployment
-.64* .39*
-.52+ (-.27)
77
centered anxiety, avoidance, and interaction terms) can reliably determine group membership,
which in this case was the emotion described (out of the six previously outlined). In general,
only emotion labels indicating joy, fear, love, and anger were reported (emotion labels related to
surprise and sadness were not reported). For the first emotion/thought listing, 83% of
participants reported emotions indicative of joy, 14% fear, and 3% love. For the second
emotion/thought listing 81% reported feeling joy, 17% fear, and 2% anger. Finally, for the third
emotion/thought listing 77% reported joy, 13% fear and 10% love. Given the similar distribution
of emotions described in each thought listing and concern over low power for the second and
third emotion/thought listings, I will only report results for the assessment of variation in
reported emotions as a function of anxiety, avoidance, and their interaction for the first
emotion/thought listing which 63 participants completed11.
First, the assumption of homogeneity of group variances was upheld, with Box’s M =
9.72, F(6,1130) = 1.39, p = .217. Next, none of the tests of equality of group means were
significant, meaning that individuals who listed different emotions were not significantly
different in terms of levels of anxiety, avoidance, or an interaction between anxiety and
avoidance (Wilk’s Lambdas ranging from .95-.98, and p values ranging from .23-.56). These
initial tests suggest that variance in the predictor variables was not related to the different
emotions listed, or the predictor variables were not discriminating emotion labels. Two canonical
discriminant functions were produced, one that was largely driven by the prediction of anxiety
(with a loading of 1.19), and the other that was driven by the prediction of the anxiety by
avoidance interaction term (with a loading of .81). Neither of these functions were associated
11 I did conduct the same analyses on the second and third emotion/thought listings which both resulted in similar,
non-significant findings.

78
with strong canonical correlations (which squared is an estimate of effect size), with canonical
coefficients equal to .24 and .17 respectively, which are indices of the strength of the
relationships between the predictor variables and the dependent categorical variable. Further, the
two functions were not able to predict group membership at a statistically significant level
(Wilk’s Lambda’s = .92 and .97, and p values = .52 and .43 respectively). In other words, there
was no indication from this analysis that attachment anxiety, avoidance, or their interaction,
were associated with different emotions experienced when initially reunited with one’s partner.
Participants also described in an open-ended fashion what they did when they saw their
partner for the first time. These descriptions were coded by the same primary rater for the degree
of physical intimacy described in the initial meeting. Specifically, descriptions were given a
rating from 1-4, where 1 represented descriptions with little to no physical contact mentioned, 2
represented some physical intimacy mentioned (hugged or kissed), 3 represented a moderate
amount of physical intimacy (a long embrace, kissed and hugged, ran into the partner’s arms),
and 4 assigned to descriptions that were high in physical intimacy (ran into the partner’s arms
plus a long embrace or kissing, saying “I love you”, crying). This resulted in a variable that was
fairly normally distributed, with 7% assigned a ‘1’, 23% assigned a ‘2’, 49% assigned a ‘3’, and
21% assigned a ‘4’ for the extent of physical intimacy in the initial meeting.
Similar to prior analyses, I was interested in assessing the extent to which levels of
attachment anxiety, avoidance, or an interaction between anxiety and avoidance, are related to
reported levels of physical intimacy in seeing one’s partner for the first time after the
deployment. Fraley and Shaver (1998) found that attachment avoidance was related to decreased
physical displays of affection during airport separations. Indeed, attachment avoidance is
characterized by discomfort with physical and emotional intimacy. Therefore, I predicted that
79
attachment avoidance, more so than attachment anxiety, would be negatively related to lower
levels of reported physical intimacy during the initial meeting. To do this, I conducted a multiple
linear regression with mean centered anxiety, avoidance, and interaction terms as predictors on
the dependent measure physical intimacy during the reunion. Consistent with my predictions,
attachment avoidance was a significant predictor of physical intimacy, with avoidance
negatively related to intimacy at the reunion, B = -.32, β = -.38, t(53) = -2.04, p = .047. No other
effects approached significance.
Discussion
Initial research (Cafferty et al., 1994) examining the effects of adult attachment on
intrapersonal and relationship outcomes following a military deployment reunion found that
secure spouses reported less conflict and more satisfaction relative to insecure spouses, but there
were no effects of spousal attachment styles on spousal emotional well-being. The findings from
this study suggest that the effects of attachment anxiety, in particular, on outcomes during a
reunion period extend beyond relationship perceptions. Specifically, I found that attachment
anxiety was related to less effective emotional coping including decreased general well-being,
less perceived social support, and more depressive symptoms. In addition, attachment anxiety
was related to decreased relationship satisfaction, and feeling more strongly that the reunion has
not lived up to one’s original expectations. In addition, and extending previous findings,
attachment avoidance was also associated with less relationship satisfaction during the post-
reunion period.
Further extending prior work, and consistent with my separation findings, I found that
the effects of attachment anxiety on some relationship outcomes were moderated by time
reunited. For example, for highly anxious individuals their perceptions of their interactions with

80
their partners declined as a function of time reunited. However, there was no relationship
between quality of interactions and time reunited for those lower in attachment anxiety. This is
consistent with the findings of Rholes and colleagues (2001) who found that for anxious
spouses, their perceptions of their partner’s support declined across the transition into
parenthood.
In addition, I was able to identify one potential mechanism to explain why higher levels
of attachment anxiety are related to more negative relationship perceptions during the reunion
period – beliefs that one’s original expectations have not been met. Indeed, we found that the
relationships between attachment anxiety and decreased relationship satisfaction and quality of
partner interactions were fully mediated by beliefs that the reunion period has not lived up to
one’s original expectations. In explaining the findings by Rholes and colleagues (2001),
Simpson and Rholes (2008) speculate that the negative outcomes experienced by high anxiety
individuals during the transition to parenthood might be tied to their unrealistically optimistic
views of their romantic partners and relationships. Specifically, anxious individuals may become
frustrated and dissatisfied because they perceive that their partners are not living up to their
expectations.
Finally, consistent with the airport findings of Fraley and Shaver (1998), higher levels of
attachment avoidance were related to reports of less physical intimacy during the initial meeting
of the reunion relative to lower levels of avoidance. Increases in intimacy tend to make avoidant
individuals uncomfortable, so they often engage in distancing behaviours towards their partners
or structure activities such as to reduce intimacy and closeness (Tidwell et al., 1996). Again, this
is more evidence that highly avoidant individuals avoid intimacy-building opportunities within
their relationships, relative to those lower in avoidance.

81
Unfortunately, I was not able to test the relevance of attachment dimensions in predicting
intrapersonal adjustment and relationship perceptions according to identified reunion stages
(Egerton-Graham, 2009), some of which typically entail greater stress and emotional reactivity
than others. This was due to a lack of variance, or restricted range, in time reunited when the
spouses were surveyed. Too few spouses were surveyed outside of the stage 3 window, either in
the stages preceding or following that stage to allow for adequate testing as a function of stage
progression. Fortunately, however, these are questions that can be addressed with the larger and
more adequately powered large-scale survey described later.
Finally, some might question whether the effects of attachment dimensions have more
specific parameters, centered around the transition periods, and that the effects of attachment
dimensions become more or less irrelevant as time goes on. While some analyses as a function
of time separated and time reunited point to the continued importance of attachment anxiety, in
particular, in explaining spousal adjustment across time, the purpose of the next chapter was to
continue to assess the overall importance of attachment anxiety and attachment avoidance in a
longitudinal design that tracked the same group of participants over 4 months of an overseas
deployment. Most importantly, different from the other phases, this study assessed how
frequently and intimately partners communicated with one another from afar, spouse’s
perceptions of the quality of emotional support received by one’s partner, and provided to one’s
partner, how provision of emotional support is distributed within the relationship, and also the
extent to which spouses fantasize about their partners and their return.
82
Chapter 4
Phase Two – Longitudinal Study
Consistent with findings from Fraley and Shaver (1998) and Cafferty and colleagues
(1994), as well as the findings from Phase One, I predicted that individuals higher in attachment
anxiety would report greater difficulties during the separation relative to individuals lower in
attachment anxiety given their strong desires for closeness and intimacy and their reliance on
attachment figures for emotional regulation and support. Further, I predicted that attachment
anxiety will be related to more negative relationship perceptions (e.g., Collins & Read, 1990).
Specifically, I predicted that higher levels of attachment anxiety would be associated with
decreased coping capacity, and lower quality partner interactions, decreased relationship
satisfaction, and some difficulties providing emotional support to one’s partner (Collins &
Feeney, 2000) during the ongoing separation. In addition, I predict levels of attachment anxiety
to be related to greater fantasizing about the reunion, given that highly anxious individuals are
more dependent on their partners for validation and support in general, regardless of the context
(e.g., Davilla, 2001; Wei, Mallinckrodt, Larson, & Zakalik, 2005).
On the other hand, I predicted that attachment avoidance would be associated with
deactivating strategies in response to environmental threats such that attachment avoidance
would not be associated with decreased coping capacity, but would be related to more negative
partner perceptions, lower quality partner interactions, decreased relationship satisfaction, and
more discomfort in seeking emotional support from one’s partner (Collins & Read, 1990).
Further, individuals higher in attachment avoidance might be less likely to fantasize about their
partner’s return given their ability and motivation to decrease the activation of thoughts related
to abandonment (Fraley & Shaver, 1997, Study 1).

83
Next, I was interested in assessing the relationships among attachment dimensions and
post-reunion outcomes similar to Phase One. Consistent with previous research (Cafferty et al.,
1994; Rholes et al., 2001) and the findings from Phase One, I predicted that attachment anxiety
would be related to less effective emotional coping including self-blaming (Mayseless et al.,
1996), and more negative perceptions of relationship functioning including decreased
relationship satisfaction, and feeling more strongly that the reunion has not lived up to one’s
original expectations. Further, in line with my findings from Phase One, I predicted that
attachment avoidance would be associated with less relationship satisfaction during the post-
reunion period.
Finally, I was interested in testing mediation models to assess relationships between
attachment orientations and perceptions of relationship and intrapersonal functioning during the
ongoing separation (e.g. perceptions of emotional support provision and acceptance).
Method
Participants and Procedure
After completing their Separation Survey, participants were invited to participate in a
longitudinal study that entailed completing monthly surveys (up to a total of four) and an
additional reunion survey (identical to that used in Phase One) once their partners had returned
home. They were informed that for completion of each survey, and with their consent, their
names would be entered into one of two draws for $500 as remuneration. The remuneration was
provided 100% by external researchers at Queen’s University. Out of the 85 participants that
participated in the initial Separation Survey, 62 (71%) agreed to participate in this longitudinal
84
component12. Out of the 62 who agreed to participate, 50 (81%) completed at least one monthly
survey, 31 (50%) completed at least 3 monthly surveys, and 36 (66%) completed the final
reunion survey.
Monthly Survey Measures
Coping Capacity
I retained a total of 12 items from the Phase One survey coping measure, and added eight
more items to more adequately assess perceptions of one’s physical well-being (e.g., “I feel
nauseous most of the time.”). In addition, I also removed two items measuring perceptions of
one’s marriage (which I felt were already measured by relationship indices) and satisfaction with
life. Therefore, a total of 20 items were created by the researchers (see Appendix I) that assess
coping capacity or general well-being with facets such as emotional (e.g., “I feel content most of
the time.”), physical (e.g., “I feel nauseous most of the time”), social (e.g., “I feel good about my
social life”), and practical (e.g., “I wish I had more help around the house”) functioning.
Respondents indicated their agreement with these items on a scale from 1 (Strongly Disagree) to
7 (Strongly Agree). In order to assess the factor structure of these items (given the lack of
theoretical framework for the development of this scale), I decided to conduct an EFA on the
first month’s coping items and then calculate reliability estimates confirming the psychometric
properties of such latent variables for other months’ coping items. Although this is not the ideal
way to factor analyze multilevel data, multilevel factor analyses typically require a minimum of
50 groups (specifically between 50-100; see Muthen, 1994), of which I only had four (four
months).
12 There were no differences in levels of anxiety, avoidance, or relationship satisfaction between those who did and
did not participate in Phase 2
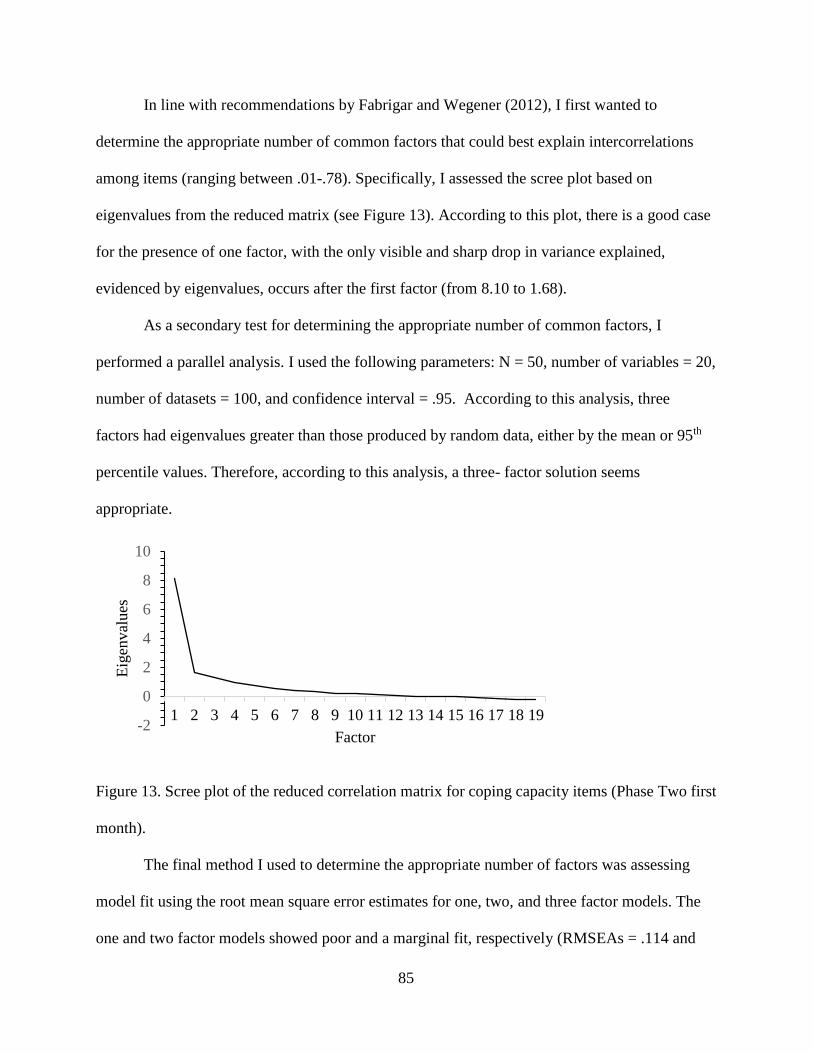
85
In line with recommendations by Fabrigar and Wegener (2012), I first wanted to
determine the appropriate number of common factors that could best explain intercorrelations
among items (ranging between .01-.78). Specifically, I assessed the scree plot based on
eigenvalues from the reduced matrix (see Figure 13). According to this plot, there is a good case
for the presence of one factor, with the only visible and sharp drop in variance explained,
evidenced by eigenvalues, occurs after the first factor (from 8.10 to 1.68).
As a secondary test for determining the appropriate number of common factors, I
performed a parallel analysis. I used the following parameters: N = 50, number of variables = 20,
number of datasets = 100, and confidence interval = .95. According to this analysis, three
factors had eigenvalues greater than those produced by random data, either by the mean or 95th
percentile values. Therefore, according to this analysis, a three- factor solution seems
appropriate.
Figure 13. Scree plot of the reduced correlation matrix for coping capacity items (Phase Two first
month).
The final method I used to determine the appropriate number of factors was assessing
model fit using the root mean square error estimates for one, two, and three factor models. The
one and two factor models showed poor and a marginal fit, respectively (RMSEAs = .114 and
-2
0
2
4
6
8
10
1 2 3 4 5 6 7 8 9 10 11 12 13 14 15 16 17 18 19
Eig
enval
ues
Factor
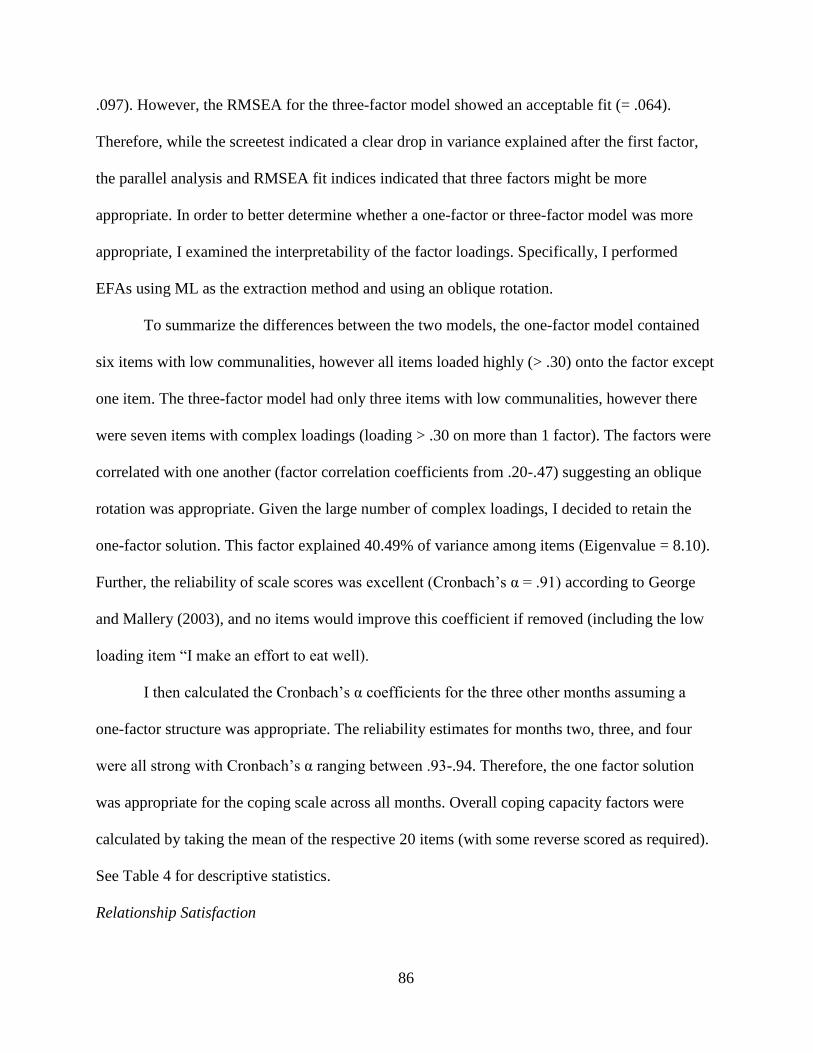
86
.097). However, the RMSEA for the three-factor model showed an acceptable fit (= .064).
Therefore, while the screetest indicated a clear drop in variance explained after the first factor,
the parallel analysis and RMSEA fit indices indicated that three factors might be more
appropriate. In order to better determine whether a one-factor or three-factor model was more
appropriate, I examined the interpretability of the factor loadings. Specifically, I performed
EFAs using ML as the extraction method and using an oblique rotation.
To summarize the differences between the two models, the one-factor model contained
six items with low communalities, however all items loaded highly (> .30) onto the factor except
one item. The three-factor model had only three items with low communalities, however there
were seven items with complex loadings (loading > .30 on more than 1 factor). The factors were
correlated with one another (factor correlation coefficients from .20-.47) suggesting an oblique
rotation was appropriate. Given the large number of complex loadings, I decided to retain the
one-factor solution. This factor explained 40.49% of variance among items (Eigenvalue = 8.10).
Further, the reliability of scale scores was excellent (Cronbach’s α = .91) according to George
and Mallery (2003), and no items would improve this coefficient if removed (including the low
loading item “I make an effort to eat well).
I then calculated the Cronbach’s α coefficients for the three other months assuming a
one-factor structure was appropriate. The reliability estimates for months two, three, and four
were all strong with Cronbach’s α ranging between .93-.94. Therefore, the one factor solution
was appropriate for the coping scale across all months. Overall coping capacity factors were
calculated by taking the mean of the respective 20 items (with some reverse scored as required).
See Table 4 for descriptive statistics.
Relationship Satisfaction

87
I used the RAS measure (Hendrick, 1988; see Appendix C) from the Phase One surveys.
This scale has six items (e.g., “How much do you love your partner?”) and responses are
indicated on a scale from 1 (Strongly Disagree) to 7 (Strongly Agree). Higher scores indicate
greater relationship satisfaction. Given this was an established scale, I simply calculated the
internal consistency of the scale for each month. The reliability across all months was good, with
Cronbach’s α coefficients for scale scores between .83 to .89. Total scores for relationship
satisfaction were then calculated using the mean of all 6 items (after reverse coding negatively
phrased items). Descriptive statistics can be found in Table 4.
Emotional Support
Spouses were asked to complete five items that tapped into perceptions of emotional
support in the relationship developed by the research team. Specifically, participants were asked
to report how the emotional support provision is divided in the relationship (using percentages
totalling 100), whether they are satisfied with the emotional support they receive, how
comfortable they are providing emotional support to their partners, whether they tend to “push”
their partners away when they provide emotional support, and whether they are comfortable
expressing vulnerability to their partners. Respondents indicated their agreement with these last
four items using a Likert-type scale from 1 (strongly disagree) to 7 (strongly agree).
The factor structure of the latter four items (similar scale) was not known, so I conducted
analyses similar to those reported for the scales above, in line with recommendations by Fabrigar
and Wegener (2012), to assess the psychometric properties of this scale. To determine the
appropriate number of common factors, I first examined the scree plot based on eigenvalues
from the reduced matrix (see Figure 14). According to this plot, there is a good case for the
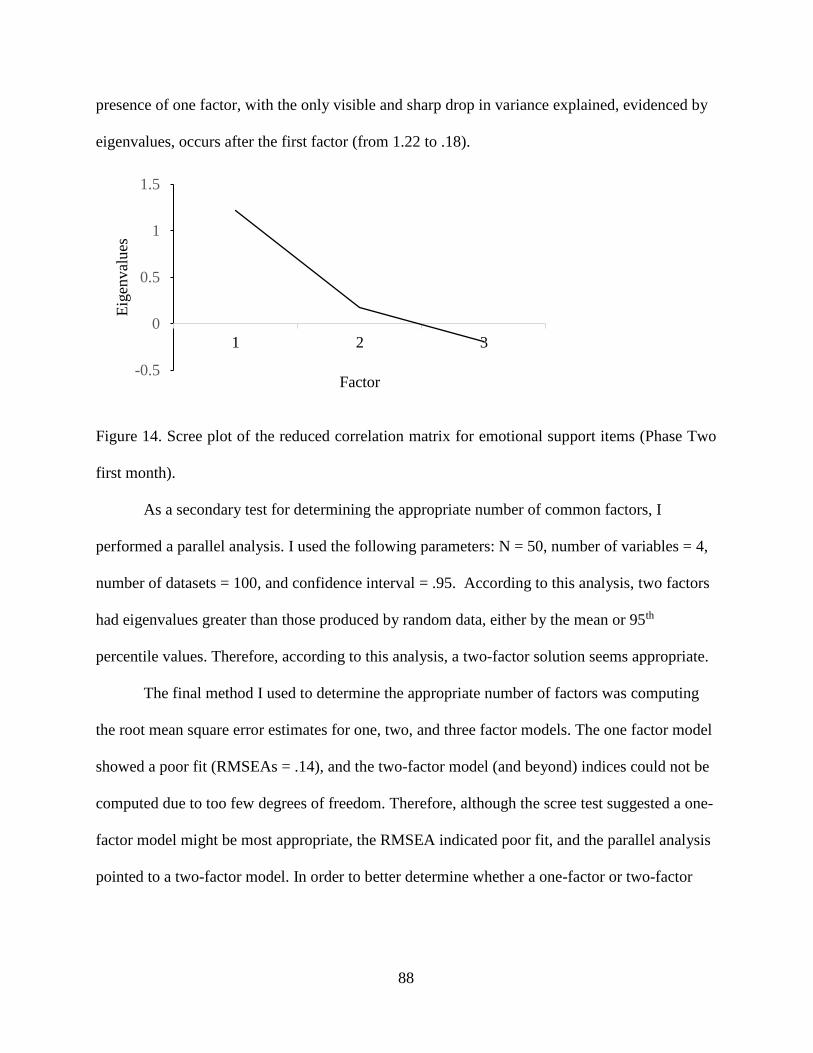
88
presence of one factor, with the only visible and sharp drop in variance explained, evidenced by
eigenvalues, occurs after the first factor (from 1.22 to .18).
Figure 14. Scree plot of the reduced correlation matrix for emotional support items (Phase Two
first month).
As a secondary test for determining the appropriate number of common factors, I
performed a parallel analysis. I used the following parameters: N = 50, number of variables = 4,
number of datasets = 100, and confidence interval = .95. According to this analysis, two factors
had eigenvalues greater than those produced by random data, either by the mean or 95th
percentile values. Therefore, according to this analysis, a two-factor solution seems appropriate.
The final method I used to determine the appropriate number of factors was computing
the root mean square error estimates for one, two, and three factor models. The one factor model
showed a poor fit (RMSEAs = .14), and the two-factor model (and beyond) indices could not be
computed due to too few degrees of freedom. Therefore, although the scree test suggested a one-
factor model might be most appropriate, the RMSEA indicated poor fit, and the parallel analysis
pointed to a two-factor model. In order to better determine whether a one-factor or two-factor
-0.5
0
0.5
1
1.5
1 2 3
Eig
enval
ues
Factor

89
model was more appropriate, I examined the interpretability of the factor loadings. Specifically,
I performed EFAs using ML as the extraction method and using an oblique rotation.
Unfortunately, and due to low power, the two-factor model could not be successfully run.
Regarding the one-factor model, two of the items had low communalities (< .30) suggesting that
some variables were not strongly related to other variables in the scale, although all variables
had decent factor loadings (> .30) on the single factor (loadings from .46-.73). However, when I
calculated the Cronbach’s α reliability estimate, the scale scores demonstrated questionable
internal consistency (α = .62) according to George and Mallery (2003). When I calculated the
reliability estimates for this four-item scale for the three other months, all estimates were in the
poor to questionable range (between .52-.62). I also examined bivariate correlations among all
items aggregating across all months, and the inter-item correlations ranged from .12-.44
suggesting only weak to moderate correlations. For this reason, I decided to treat all items as
separate measures for this scale (see Table 4 for descriptives).
Expectations for the Reunion
A total of four items tapped into expectations for the partner’s return. Spouses were
asked the extent to which they think about their partner often, fantasize about their partner and
their return, whether they believe life would improve once their partner is home, and how eager
they are for their return on a scale from 1 (strongly disagree) to 7 (strongly agree). Consistent
with my analyses for previous scales, I conducted EFAs in line with recommendations by
Fabrigar and Wegener (2012), to assess the psychometric properties of this scale. To determine
the appropriate number of common factors, I first examined the scree plot based on eigenvalues
from the reduced matrix (see Figure 15). According to this plot, there is a good case for the

90
presence of one factor, with the only visible and sharp drop in variance explained, evidenced by
eigenvalues, occurs after the first factor (from 1.44 to .11).
Figure 15. Scree plot of the reduced correlation matrix for expectations for the reunion items
(Phase Two first month).
As a secondary test for determining the appropriate number of common factors, I
performed a parallel analysis. I used the following parameters: N = 50, number of variables = 4,
number of datasets = 100, and confidence interval = .95. According to this analysis, only one
factor had an eigenvalue greater than those produced by random data, either by the mean or 95th
percentile values. Therefore, according to this analysis, a one-factor solution seems appropriate.
The final method I used to determine the appropriate number of factors was by
computing the root mean square error estimates for the one-factor model. The one factor model
showed a marginal fit (RMSEA = .10. I then examined the interpretability of the factor loadings,
by performing an EFA using ML as the extraction method and using an oblique rotation. The
factor explained 39% of variance among variables (Eigenvalue = 1.56), but one item had a low
communality (= .164). All factor loadings were above .30 (from .41-.78). However, this scale’s
scores demonstrated poor internal consistency (Cronbach’s α = .57). These findings were
-0.5
0
0.5
1
1.5
2
1 2 3
Eig
enval
ues
Factor

91
consistent across all months’ responses, with internal consistency estimates between .58-.69
which are in the poor to questionable range (George & Mallery, 2003). Further, inter-item
correlations aggregated across all months ranged from .32-.54 suggesting moderate correlations
between items. These findings indicate that items are distinct enough that they might be best
treated as separate measures. For this reason, I treated these items as separate measures (see
Table 4 for descriptive statistics).
Communication and Quality of Interactions
Spouses were asked questions about their communication with their partners.
Specifically, spouses were asked how often they communicated with their partners in an open-
ended fashion. Responses ranged from multiple times daily, to once a week. Therefore, these
responses were coded to represent the number of times they communicated with their partners
per week. Next, spouses were asked how they communicated with their partners. Methods of
contact were rank ordered from least intimate (1 = email) to most intimate (5 = in person).
Finally, spouses were asked to provide details about the last interaction they had with their
partners. For example, spouses were asked about the quality of that interaction from 1 (very
unpleasant) to 7 (very pleasant), and whether they felt worse or better immediately after the
interaction and the following day from 1 (much worse) to 7 (much better). Descriptive statistics
for all measures are listed in Table 4.

92
Table 4
Descriptive Statistics for Monthly Survey Measures
Month 1 Month 2 Month 3 Month 4
Measure M SD M SD M SD M SD
Coping capacity1 5.00 1.02 5.10 1.11 4.95 1.19 4.91 1.16
Relationship satisfaction1 6.26 0.81 6.42 0.57 6.53 0.46 6.43 0.63
Satisfaction with emotional
support received1
5.92 1.22 6.10 1.01 6.28 1.00 6.06 1.22
Push away partner1 2.39 1.50 2.57 1.66 2.36 1.51 2.33 1.63
Like providing support1 6.35 0.86 6.55 0.59 6.44 0.68 6.48 0.67
Comfort expressing
vulnerability1
5.53 1.66 5.86 1.37 5.69 1.44 5.91 1.18
Provision of emotional support
(% self)2
57.43 14.77 52.02 8.48 50.64 10.21 55.45 11.41
Think about partner often 6.78 0.47 6.76 0.48 6.69 0.52 6.82 0.39
Eager for partner’s return 6.78 0.47 6.71 0.64 6.85 0.37 6.88 0.33
Fantasize about partner’s
return1
5.92 1.34 5.90 1.48 5.95 1.41 5.94 1.37
Life will improve once home1 6.12 1.03 6.05 1.23 6.13 1.15 6.06 1.35 Frequency of communication
(times/week)3
6.90 4.80 6.55 2.58 6.74 3.68 7.85 5.11
Method of communication4 3.06 1.13 3.00 1.27 2.79 1.15 2.73 1.15
Quality of last interaction3 6.33 1.09 6.36 1.12 6.15 1.11 6.42 0.87
How did you feel immediately
after
5.73 1.15 5.79 1.20 5.33 1.24 5.67 1.32
How did you feel the next day 4.67 0.89 4.82 0.98 5.08 1.17 5.00 1.20
1Response range = 1-7 (see scale descriptions for specific value
labels) 2Response range = 1-100 3Response range = 1-21 4Response range = 1-4 4Response range = 1-5
Reunion Survey Measures
The following are the same measures from the reunion survey distributed in Phase One.
Attachment Anxiety and Attachment Avoidance

93
Attachment anxiety and avoidance were assessed using the same ECR-R measure from
Phase One (see Appendix A). The scale scores for both anxiety (Cronbach’s α = .93) and
avoidance (Cronbach’s α = .89) were reliable and were highly correlated, r(36) = .73, p < .001.
Descriptive statistics for both anxiety and avoidance are listed in Table 5.
Relationship Satisfaction
Relationship satisfaction was assessed using the RAS (Hendrick, 1988; see Appendix C).
With this sample, relationship satisfaction was a reliable measure (Cronbach’s α = .88).
Descriptive statistics for this sample are listed in Table 5.
Coping Capacity
Coping Capacity was assessed using the same 14-item scale from the Phase One surveys
(see Appendix G). This measure produced different factor structures for both the separation and
reunion samples, so a clear framework of latent variables was not yet well established. For this
reason, I decided to run EFA analyses similar to prior analyses.
To determine the appropriate number of common factors, I first examined the scree plot
based on eigenvalues from the reduced matrix (see Figure 16). According to this plot, there is a
good case for the presence of either three or four factors, with visible drops in eigenvalues
occurring both after the third (from 1.17 to .73) and fourth (from .73 to .38) factors.
As a secondary test for determining the appropriate number of common factors, I
performed a parallel analysis. I used the following parameters: N = 41, number of variables = 14,
number of datasets = 100, and confidence interval = .95. According to this analysis, only one
factor had an eigenvalue greater than those produced by random data, either by the mean or 95th
percentile values. Therefore, according to this analysis, a one-factor solution seems appropriate.
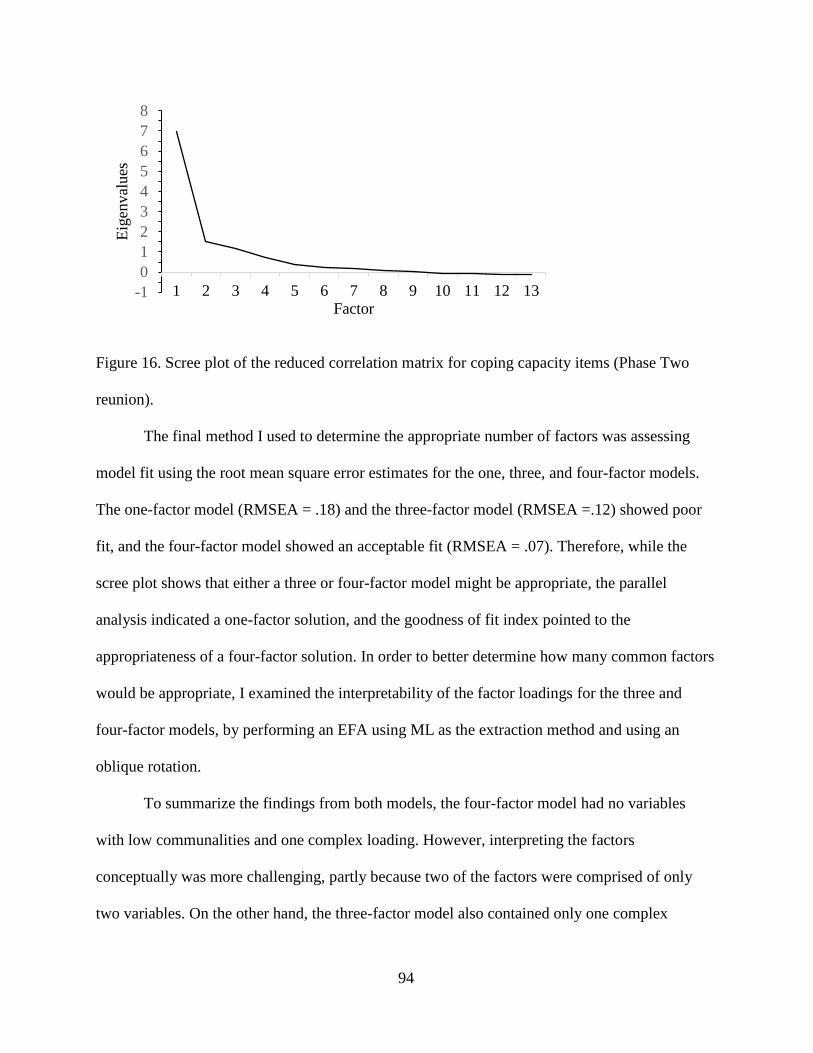
94
Figure 16. Scree plot of the reduced correlation matrix for coping capacity items (Phase Two
reunion).
The final method I used to determine the appropriate number of factors was assessing
model fit using the root mean square error estimates for the one, three, and four-factor models.
The one-factor model (RMSEA = .18) and the three-factor model (RMSEA =.12) showed poor
fit, and the four-factor model showed an acceptable fit (RMSEA = .07). Therefore, while the
scree plot shows that either a three or four-factor model might be appropriate, the parallel
analysis indicated a one-factor solution, and the goodness of fit index pointed to the
appropriateness of a four-factor solution. In order to better determine how many common factors
would be appropriate, I examined the interpretability of the factor loadings for the three and
four-factor models, by performing an EFA using ML as the extraction method and using an
oblique rotation.
To summarize the findings from both models, the four-factor model had no variables
with low communalities and one complex loading. However, interpreting the factors
conceptually was more challenging, partly because two of the factors were comprised of only
two variables. On the other hand, the three-factor model also contained only one complex
-1
0
1
2
3
4
5
6
7
8
1 2 3 4 5 6 7 8 9 10 11 12 13
Eig
enval
ues
Factor

95
loading, contained one variable with a low communality, but was more parsimonious and
conceptually more interpretable. Further, all factors contained at least three variables making it
easier to also calculate other estimates of internal consistency. For this reason, I decided to retain
the three-factor model and report the findings as follows.
Factor one explained 49.81% of variance in measures (Eigenvalue = 6.97), was labelled
well-rested (four items: e.g., “I have been sleeping well”), and reflects feeling energetic, well
rested, and the ability to manage daily tasks. Scores for this factor were calculated by taking the
mean of the respective items, with higher scores reflecting feeling more well-rested. This scale
was found to have good reliability (Cronbach’s α = .84), and no items would improve this value
if removed.
Factor two explained 10.76% of variance in measures (Eigenvalue = 1.51), was labelled
general well-being (seven items: e.g., “I am satisfied with my life”), and reflects feeling satisfied
with one’s self, financial situation, and social life. Scores for this factor were calculated by
taking the mean of the respective items, with higher scores reflecting feeling more well-rested.
This scale was found to have excellent reliability (Cronbach’s α = .91), and no items would
improve this value if removed.
Finally, factor three explained 8.34% of variance in measures (Eigenvalue = 1.17), was
labelled perceived relationship support (three items: e.g., “I am satisfied with my marriage”),
and reflects feeling satisfied with one’s marriage, feeling supported, and not lonely. Scores for
this factor were calculated by taking the mean of the respective items, with higher scores
reflecting feeling more well-rested. This scale was found to have good reliability (Cronbach’s α
= .83), and no items would improve this estimate if removed. Descriptive statistics for these
measures are provided in Table 5.
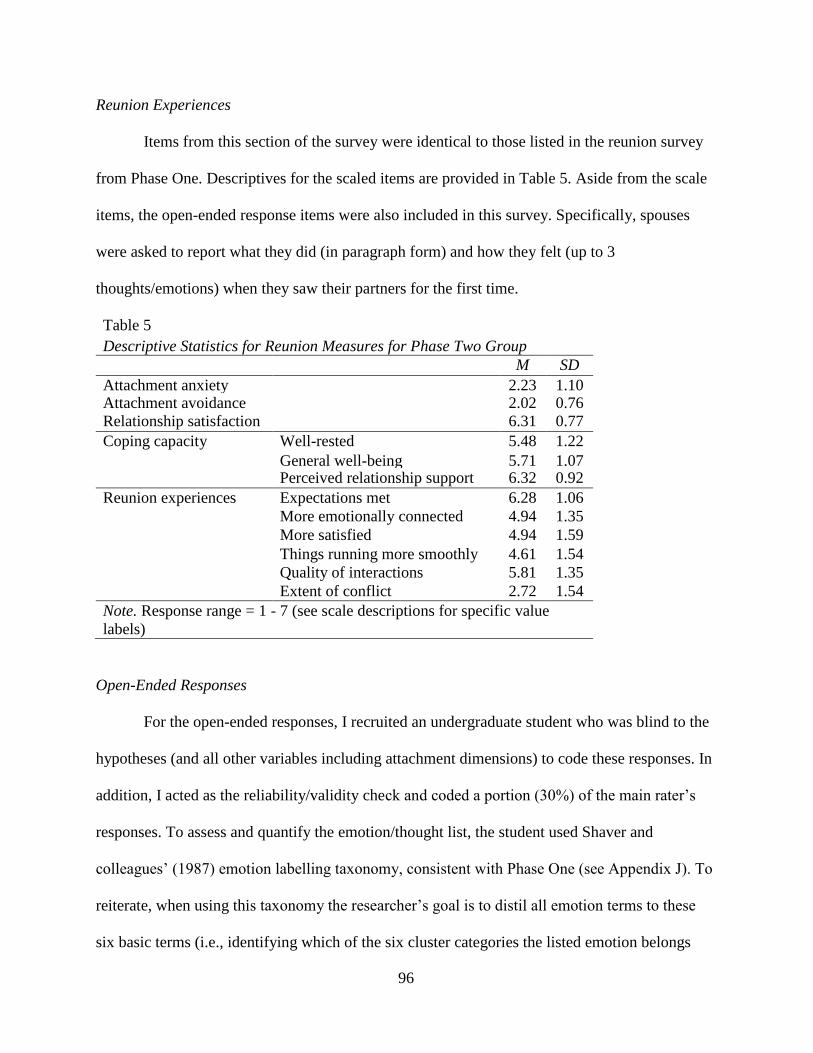
96
Reunion Experiences
Items from this section of the survey were identical to those listed in the reunion survey
from Phase One. Descriptives for the scaled items are provided in Table 5. Aside from the scale
items, the open-ended response items were also included in this survey. Specifically, spouses
were asked to report what they did (in paragraph form) and how they felt (up to 3
thoughts/emotions) when they saw their partners for the first time.
Table 5
Descriptive Statistics for Reunion Measures for Phase Two Group
M SD
Attachment anxiety 2.23 1.10 Attachment avoidance 2.02 0.76
Relationship satisfaction 6.31 0.77
Coping capacity Well-rested 5.48 1.22
General well-being 5.71 1.07 Perceived relationship support 6.32 0.92
Reunion experiences Expectations met 6.28 1.06
More emotionally connected 4.94 1.35
More satisfied 4.94 1.59
Things running more smoothly 4.61 1.54
Quality of interactions 5.81 1.35
Extent of conflict 2.72 1.54
Note. Response range = 1 - 7 (see scale descriptions for specific value
labels)
Open-Ended Responses
For the open-ended responses, I recruited an undergraduate student who was blind to the
hypotheses (and all other variables including attachment dimensions) to code these responses. In
addition, I acted as the reliability/validity check and coded a portion (30%) of the main rater’s
responses. To assess and quantify the emotion/thought list, the student used Shaver and
colleagues’ (1987) emotion labelling taxonomy, consistent with Phase One (see Appendix J). To
reiterate, when using this taxonomy the researcher’s goal is to distil all emotion terms to these
six basic terms (i.e., identifying which of the six cluster categories the listed emotion belongs

97
to). In total, 41 participants had listed one emotion, 41 had listed two emotions, and 39 had listed
three emotions. There was no relationship between attachment anxiety or avoidance and the
number of emotions listed (rs equal to .18 and .07 respectively).
Prior to conducting my main analyses, I assessed the validity of the emotion/thought
listing coding by assessing the extent of inter-rater reliability using percent agreement or
Cohen’s Kappa (McHugh, 2012; Cohen, 1960). Cohen’s Kappa (κ) is similar to correlation
coefficients in that its values range from -1 to 1 with 0 representing the amount of agreement
that would be expected by chance. In this case, I used both estimates to assess inter-rater
reliability for the first emotion/thought listing as recommended by McHugh. First, I calculated
percent agreement by assigning the raters a 1 when their emotion coding matched, and 0 when
they were mismatched. Then, I divided the number of ‘1’s assigned by the total number of
subjects that listed an emotion/thought. This resulted in a perfect agreement for the first
emotion/thought listing (100% agreement). Further, the Cohen’s Kappa estimate suggested near
perfect agreement (κ = 1.00) as it takes into account chance agreement, which in this case was
85%. Specifically, chance agreement for this variable was high given the little variation across
emotion listings (with most listing ‘joy’ related emotions). Overall, these estimates suggest
moderate to high agreement and a valid measure of primary emotions described.
Results
To assess the unique and interactive effects of attachment anxiety and attachment
avoidance on the monthly diary outcomes (i.e., coping, relationship satisfaction, emotional
support, quality of interactions), I used Multilevel Modelling (MLM) procedures. MLM
procedures are ideal for analyzing nested data sets such as diary data (i.e., where repeated
measures are nested within individuals). Prior to conducting any analyses, I first centered the
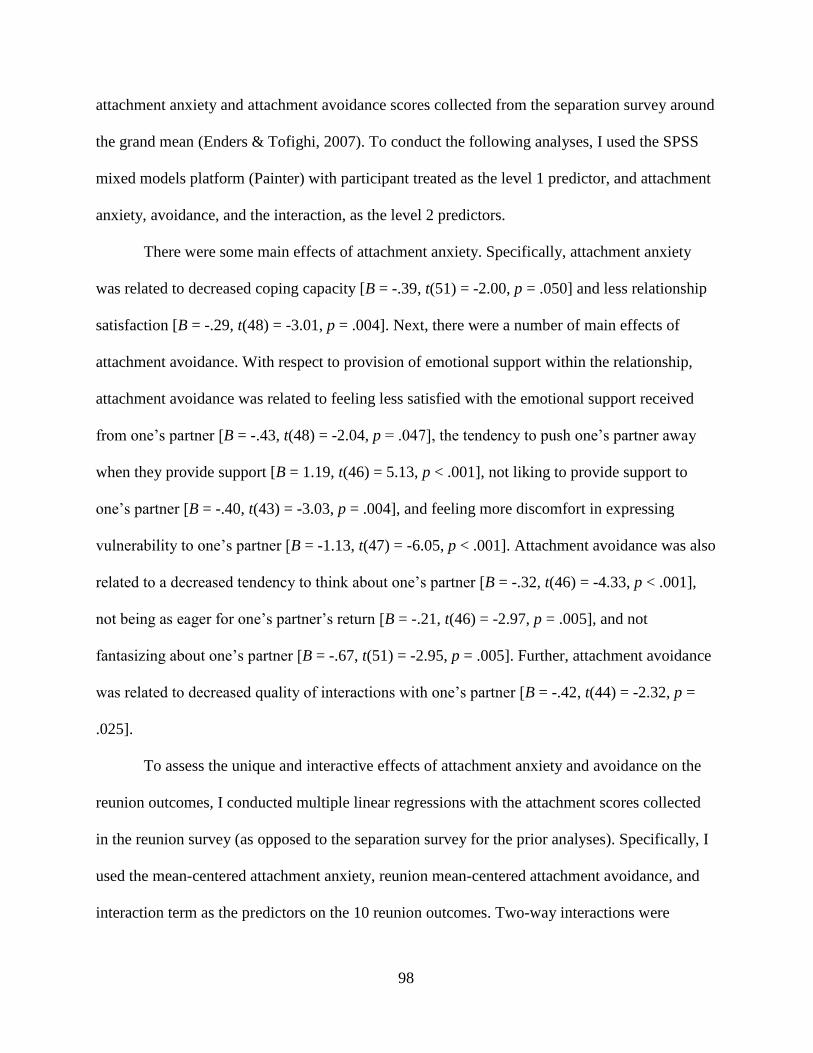
98
attachment anxiety and attachment avoidance scores collected from the separation survey around
the grand mean (Enders & Tofighi, 2007). To conduct the following analyses, I used the SPSS
mixed models platform (Painter) with participant treated as the level 1 predictor, and attachment
anxiety, avoidance, and the interaction, as the level 2 predictors.
There were some main effects of attachment anxiety. Specifically, attachment anxiety
was related to decreased coping capacity [B = -.39, t(51) = -2.00, p = .050] and less relationship
satisfaction [B = -.29, t(48) = -3.01, p = .004]. Next, there were a number of main effects of
attachment avoidance. With respect to provision of emotional support within the relationship,
attachment avoidance was related to feeling less satisfied with the emotional support received
from one’s partner [B = -.43, t(48) = -2.04, p = .047], the tendency to push one’s partner away
when they provide support [B = 1.19, t(46) = 5.13, p < .001], not liking to provide support to
one’s partner [B = -.40, t(43) = -3.03, p = .004], and feeling more discomfort in expressing
vulnerability to one’s partner [B = -1.13, t(47) = -6.05, p < .001]. Attachment avoidance was also
related to a decreased tendency to think about one’s partner [B = -.32, t(46) = -4.33, p < .001],
not being as eager for one’s partner’s return [B = -.21, t(46) = -2.97, p = .005], and not
fantasizing about one’s partner [B = -.67, t(51) = -2.95, p = .005]. Further, attachment avoidance
was related to decreased quality of interactions with one’s partner [B = -.42, t(44) = -2.32, p =
.025].
To assess the unique and interactive effects of attachment anxiety and avoidance on the
reunion outcomes, I conducted multiple linear regressions with the attachment scores collected
in the reunion survey (as opposed to the separation survey for the prior analyses). Specifically, I
used the mean-centered attachment anxiety, reunion mean-centered attachment avoidance, and
interaction term as the predictors on the 10 reunion outcomes. Two-way interactions were

99
assessed using simple slopes analyses (Aiken & West, 1991), examining the effects of
attachment anxiety at lower (-1 SD from the mean) and higher (+1 SD from the mean) levels of
attachment avoidance.
There were significant main effects of attachment anxiety. Specifically, attachment
anxiety was related to decreased relationship satisfaction, [B = -.30, β = -.43, t(32) = -2.69, p =
.011], however attachment anxiety was also related to reports that one is more satisfied with the
relationship now (during the reunion) relative to the time before the deployment [B = .59, β =
.48, t(32) = 2.21, p = .034].
There were also significant main effects of attachment avoidance. Specifically,
attachment avoidance was related to feeling less well-rested [B = -.98, β = -.59, t(37) = -2.74, p =
.009], less perceived relationship support [B = -.56, β = -.44, t(37) = -2.98, p = .005],
compromised general well-being [B = -1.04, β = -.71, t(37) = 3.77, p = .001], and lower quality
interactions with one’s partner [B = -1.06, β = -.59, t(32) = -3.16, p = .003].
These main effects were qualified by significant two-way interactions between
attachment anxiety and avoidance. First, there was a significant two-way interaction for
relationship satisfaction, B = -.21, β = -.28, t(32) = -2.11, p = .043 (see Figure 17). Specifically,
at low levels of attachment avoidance the relationship between attachment anxiety and
relationship satisfaction was not significant, B = -.14, β = -.20, t(32) = -0.97, p = .339. However,
at high levels of avoidance there was a significant negative relationship between attachment
anxiety and relationship satisfaction, B = -.46, β = -.66, t(32) = -3.75, p = .043.
100
Figure 17. Interaction between attachment anxiety and attachment avoidance on relationship
satisfaction.
Next, there was a significant two-way interaction for expectations met, B = -.34, β = -.33,
t(32) = -2.12, p = .042. Similar to the previous analysis, at low levels of avoidance the
relationship between attachment anxiety and expectations met was not significant, B = -.01, β = -
.01, t(32) = -0.05, p = .958 (see Figure 18). However, at higher levels of avoidance there was a
significant negative relationship between attachment anxiety and expectations met, B = -.54, β =
-.56, t(32) = -2.67, p = .012.
There was a significant two-way interaction for feeling more versus less satisfied relative
to the time before the deployment, B = -.76, β = -.58, t(32) = -3.21, p = .003 (see Figure 19).
This time, at low levels of avoidance there was a significant positive relationship between
attachment anxiety and feeling more satisfied relative to the time before the deployment, B =
1.17, β = .95, t(32) = 3.36, p = .002. However, at high levels of avoidance the relationship
between attachment anxiety and feeling more versus less satisfied relative to before the
deployment was not significant, B = .01, β = .01, t(32) = 0.04, p = .971.
β = -.20, p = .339
β = -.66, p = .043

101
Figure 18. Interaction between attachment anxiety and attachment avoidance on the extent to
which expectations of the reunion were met.
Figure 19. Interaction between attachment anxiety and attachment avoidance on feeling more
versus less satisfied with one’s relationship relative to the time before the deployment.
There was also a significant two-way interaction for feeling more versus less emotionally
connected relative to the time before the deployment, B = -.78, β = -.50, t(32) = -2.58, p = .015
β = -.01, p = .958
β = -.56, p = .012
β = .95, p = .002
β = .01, p = .971

102
(see Figure 20). While neither of the simple slopes reached significance, the simple slope for low
avoidance approached significance.
Figure 20. Interaction between attachment anxiety and attachment avoidance on feeling more
versus less emotionally connected to one’s partner relative to the time before the deployment.
Finally, there was a significant two-way interaction for feeling as though things are
running more versus less smoothly around the house relative to before the deployment, B = -.67,
β = -.45, t(32) = -2.29, p = .029 (see Figure 21). Again, neither of the simple slopes were
significant however the simple slope for low avoidance approached significance.
In summary, for those higher in attachment avoidance, attachment anxiety was
negatively related to relationship satisfaction and beliefs that one’s expectations of the reunion
were met. In contrast, for those lower in attachment avoidance, attachment anxiety was
positively related to one’s relationship satisfaction relative to before the deployment, and
somewhat related to feeling more emotionally connected to one’s partner, and that the household
was running more smoothly, relative to before the deployment
β = .57, p = .073
β = -.25, p = .337

103
Figure 21. Interaction between attachment anxiety and attachment avoidance on feeling as
though things are running more versus less smoothly around the house relative to the time before
the deployment.
Mediation Models
Next, I was interested in testing mediation models to assess relationships between
attachment orientations and perceptions of relationship and intrapersonal functioning during the
ongoing separation. Although attachment anxiety wasn’t predictive of many of the monthly
indices, attachment avoidance was associated with a number of indices intrapersonal, and
relationship indices. For this reason, the following analyses were focused on explaining some of
the relationships between attachment avoidance and perceptions of emotional support provision
and relationship and coping outcomes. Although MLM is an effective means to study
relationships between variables that are clustered, nested, and have some degree of dependence,
these same analyses cannot accurately or successfully accommodate testing of mediation
models. In particular, models involving more than the assessment of level 1 predictors,
mediators, and dependent variables (so the presence of at least one level 2 predictor) cannot be
β = .58, p = .070
β = -.15, p = .556

104
fit using MLM (see Preacher, Zhang, & Zyphur, 2011). Given that I was interested in assessing
relationships between level 2 predictors (attachment avoidance), and level 1 mediators
(provision of emotional support) and outcomes (coping capacity and relationship satisfaction),
using MLM procedures would not be appropriate. For this reason, I decided to calculate overall
scores on each of the monthly measures and conduct more conventional tests of indirect effects
using Preacher and Hayes (2008) bootstrapping method.
Specifically, I wanted to test whether (dis)comfort in expressing emotional vulnerability
(a defining feature of attachment avoidance) predicted the tendency to push one’s partner away
when they are providing support, satisfaction with the emotional support received, (dis)like for
providing support to one’s partner, as well as coping capacity, relationship satisfaction, and
quality of interactions during the separation (controlling for attachment anxiety and the two-way
interaction term. The Preacher and Hayes’s (2008) method was particularly appropriate given
the small sample size (n = 50), as it does not make assumptions about the shape of the
distribution of the indirect effect estimate circumventing issues of non-normality and low power
(Preacher & Hayes, 2004; Efron & Tibshirani, 1993; Mooney & Duval, 1993; Shrout & Bolger,
2002). To reiterate, the bootstrapping method (here using 1000 samples) produces an empirically
derived CI of the indirect effect estimate. If zero is not included in the CI, one can conclude that
the indirect effect is significant. I performed these analyses using an SPSS multiple mediator
macro (available from afhayes.com) that allows for the inclusion of control variables into the
tests of indirect effects.
Unfortunately, I was not able to test any of these models, as attachment avoidance was
not significantly related to most of the monthly aggregate measures including overall
relationship satisfaction, coping capacity, and satisfaction with emotional support received.
105
Attachment avoidance was only significantly related to the overall tendency to push one’s
partner away [B = .73, β = .51, t(48) = 2.96, p = .005] and being less likely to providing support
to one’s partner [B = -.21, β = -.37, t(48) = -2.12, p = .039. I do not have any reason to believe
that one of these variables might be mediating the effects of the other, so I did not test any
mediation models with these variables.13
Open-Ended Responses
In order to assess relationships between attachment anxiety and avoidance, and the nature
of emotions listed at the time of the reunion, I performed a discriminant analysis. This analysis
assesses whether predictor variables (in this case the centered anxiety, avoidance, and interaction
terms) can reliably determine group membership, which in this case was the emotion described
(out of the six previously outlined). In general, only emotion labels indicating joy, fear, love,
anger, and sadness were reported (emotion labels related to surprise and anger were not
reported). For the first emotion/thought listing, 90% of participants reported emotions indicative
of joy, 7.5% fear, and 2.5% love. For the second emotion/thought listing 78% reported feeling
joy, 19.5% fear, and 2.5% love. Finally, for the third emotion/thought listing 70% reported joy,
21% fear, 6% love, and 3% sadness. With this sample, there was more variation in the
distribution of emotions described in each thought listing and more participants reported all three
emotions (n = 33), so I am reporting results for the assessment of variation in reported emotions
as a function of anxiety, avoidance, and their interaction for all three emotion/thought listings.
13 I was originally interested in testing the trajectory of the relationships among attachment anxiety, attachment
avoidance, and separation outcomes and seeing whether the relationship is consistent (individuals with higher levels
of attachment anxiety or avoidance consistently report difficulties across the separation period) or if this relationship
changes as a function of time in a linear or non-linear fashion. Unfortunately, only 31 spouses completed a minimum
of 3 monthly surveys which would be required to test curvilinear patterns. Due to issues surrounding low power with
this particular sample, I decided to not assess linear and curvilinear effects of attachment anxiety as a function of time.
I was concerned about the generalizability and replicability of any observed effects if any were found. Also, the large
scale survey did allow me to test such trends with adequate power.
106
Unfortunately, for all three analyses, the assumption of homogeneity of group variances
could not be assessed, as there were fewer than two non-singular group covariance matrices.
This may be a result of too much shared variance between attachment anxiety and avoidance, too
few cases, or nonnormality with the dependent variables. Regardless, I decided not to proceed
with interpretation of the main analyses given potential issues with the group covariance
matrices.
Participants also described in an open-ended fashion what they did when they saw their
partner for the first time. These descriptions were coded by the same primary rater for the degree
of physical intimacy described in the initial meeting. Specifically, descriptions were given a
rating from 1-4, where 1 represented descriptions with little to no physical contact mentioned, 2
represented some physical intimacy mentioned (hugged or kissed), 3 represented a moderate
amount of physical intimacy (a long embrace, kissed and hugged, ran into the partner’s arms),
and 4 assigned to descriptions that were high in physical intimacy (ran into the partner’s arms
plus a long embrace or kissing, saying “I love you”, crying). This resulted in a variable that was
fairly normally distributed, with 17% assigned a ‘1’, 12% assigned a ‘2’, 56% assigned a ‘3’,
and 15% assigned a ‘4’ for the extent of physical intimacy in the initial meeting.
Similar to prior analyses, I was interested in assessing the extent to which levels of
attachment anxiety, avoidance, or an interaction between anxiety and avoidance, are related to
reported levels of physical intimacy in seeing one’s partner for the first time after the
deployment. In Phase One, I found that avoidance significantly predicted less intimacy reported
during the reunion. Therefore, I predicted that attachment avoidance, more so than attachment
anxiety, would be negatively related to lower levels of reported physical intimacy during the
initial meeting. However, neither attachment avoidance, attachment anxiety, nor their interaction
107
were significantly related to reports of physical intimacy during the reunion (ps ranging from
.17-.22).
Discussion
Consistent with previous findings (Collins & Read, 1990; Fraley & Shaver, 1998) and in
line with the findings from Phase One, attachment anxiety was related to a decreased ability to
cope and to decreased relationship satisfaction during the ongoing deployment (across four
months). This is intuitive given that attachment anxiety is associated with strong desires for
closeness and intimacy and their reliance on attachment figures for emotional regulation and
support. However, I also predicted that attachment anxiety might be related to some difficulties
providing emotional support to one’s partner during the ongoing separation (Collins & Feeney,
2000), but attachment anxiety was not predictive of indices of emotional support. I also
predicted that attachment anxiety would be related to greater fantasizing about the reunion, given
that highly anxious individuals are more dependent on their partners for validation and support
in general, regardless of the context (e.g., Davilla, 2001; Wei, Mallinckrodt, Larson, & Zakalik,
2005). With this particular sample, attachment anxiety and attachment avoidance were strongly
correlated. Attachment avoidance uniquely predicted perceptions in both of these domains
(emotional support and fantasizing), so it is possible that because avoidance was a better
predictor, there was not enough unique variance of attachment anxiety to be able to effectively
predict leftover variance in these indices once the relationship between anxiety and avoidance
was controlled for. This study was also underpowered due to a low response rate among invited
participants, so it is possible that the effects of attachment anxiety on these constructs might be
distinguishable with larger and different samples with less of an overlap between levels of
attachment anxiety and attachment avoidance.

108
Consistent with the theorizing that attachment avoidance would be associated with
deactivating strategies in response to environmental threats, I found that attachment avoidance
was not related to indices of emotional well-being but was related a decreased tendency to think
and fantasize about one’s partner and their return. Further, in line with findings by Collins and
Read (1990), attachment avoidance was related to lower quality partner interactions, and
difficulties with the provision of emotional support. Specifically, attachment avoidance was
related to a general discomfort in expressing vulnerability to one’s partner and not enjoying the
process of providing emotional support to one’s deployed partner. In addition, attachment
avoidance was related to less satisfaction with the emotional support received from one’s
partner, and to pushing one’s partner away when they do provide support.
The next part of the study was a replication of the phase one reunion survey. In line with
findings by Cafferty and colleagues (1994) and the reunion findings, attachment anxiety was
related to decreased relationship satisfaction, but not to coping capacity. On the other hand,
different from the reunion findings, attachment avoidance was now related to decreased coping
capacity as assessed by all three indices (feeling well-rested, general well-being, perceived
relationship support). This might be an indication of the breakdowns in coping abilities for
highly avoidant individuals as observed by Mikulincer and Florian (1998). On the other hand,
and similar to my explanation above, it is possible that due to a high degree of shared variance
between the attachment constructs with this sample, attachment anxiety was not able to predict
much unique variance once the effects of attachment avoidance were controlled for (and thus the
relationship between attachment anxiety and avoidance controlled for). In line with previous
research and the reunion findings, attachment avoidance was associated with lower quality
partner interactions.
109
It was interesting to find that those lower in attachment avoidance, attachment anxiety
was associated with decreased relationship satisfaction, but also that one is more satisfied with
the relationship now than before the deployment. Although seemingly contradictory, these
findings are consistent with those observed by Sprecher (1999) that although participants who
remained together over the course of a longitudinal study expressed a belief that their love and
satisfaction increased over time, their actual ratings of love and satisfaction over time were not
improving. Individuals with lower levels of avoidance desire higher levels of emotional and
physical intimacy, so it is understandable that lower levels of avoidance coupled with higher
levels of attachment anxiety (fears of abandonment, and in need of validation and reassurance)
would be associated with greater satisfaction in being reunited with one’s partner, and therefore
assume that they must be more satisfied as a result. In other words, those higher in anxiety and
lower in avoidance might believe that they are truly more satisfied with their relationship during
the reunion than in the past, driven mainly by their concerns for closeness and intimacy which
are now resolved.
Finally, although I predicted that attachment anxiety would be more related to
perceptions that the reunion period has not lived up to one’s original expectations, this
relationship was true but only for those with higher levels of attachment avoidance. I should note
that this sample was about half of the size of the Phase One sample (n = 36 and n = 68
respectively). Therefore, it is possible that such two-way interactions are spurious in nature, and
do not reflect accurate estimates of the parameters examined (Hinkle, Wiersma, & Jurs, 2003).
Tabachnick and Fidell (2007) recommend a minimum sample size of 104 plus a degree of
freedom for each independent variable. In this case, I should have sampled a minimum of 107
cases to adequately estimate parameter estimates.

110
For a number of reasons (restricted range of time of survey completion, lack of
appropriate analyses given the type of data and low sample size), I was not able to adequately
assess the trajectory (linear or curvilinear) of the relationships among attachment anxiety,
attachment avoidance, and outcomes across the ongoing deployment as a function of time
separated and time reunited. As such, this was one of the major goals of Phase Three.

111
Chapter 5
Phase Three – Large-Scale Survey
The purpose of this third and final phase of the project was to examine how attachment
dimensions moderated the impact of military life on spouses of military members in a large-scale
survey. Specifically, I wanted to elucidate the relationships between attachment styles and
spousal functioning on a number of variables indicating their psychological adjustment, coping
strategies, and relationship perceptions, but also to replicate findings from the previous three
phases. In particular, I was interested in testing whether the effects of attachment anxiety and
avoidance might be exacerbated for those currently experiencing a deployment separation or
reunion relative to those not experiencing a separation or reunion, and the potential trajectory of
such outcomes as a function of separation or reunion length. This survey captured a number of
indices of spouse’s perceptions of their intrapersonal and interpersonal (relationship) functioning
for spouses of varying partner deployment status’ (spouses of partners not currently deployed,
deployed, preparing for a deployment, and those recently reunited with their partners from a
deployment). Due to a more adequate sample size, and with this being an independent design
(not repeated measures), I was also able to more easily assess the trajectory of the effects of
attachment dimensions on intrapersonal and relationship outcomes as a function of time
separated, and time reunited (linear and curvilinear functions). Finally, I was able to use
mediation models to identity consistent and powerful mediators in the relationships between
attachment orientations and intrapersonal and relationship outcomes.
112
Method
Participants and Procedure
The third and final phase of this project consisted of a large-scale survey (titled ‘Quality
of Life Among Military Families: A Survey of Spouses and Partners of Canadian Forces
Members’) that was created and administered by DGMPRA and targeted to a sample of
spouses/partners of CAF Regular Force members in 201214. The population, all spouses or
common-law partners of CAF Regular Force members, was divided into subsets (called strata)
using stratified sampling before a sample of each of these subsets was selected. This method
increases the precision of the overall population estimates by ensuring that the number of
individuals selected from each stratum for the sample is proportional to the number of
individuals in each stratum in the population of interest (Statistics Canada, 2003). A sampling
frame was then extracted from the CAF administrative list of 39,104 CAF spouses. The
sampling frame consisted of three sub-populations: (1) CAF spouses whose military partners
were deployed (N = 1,435); (2) CAF spouses whose military partners were posted to the Joint
Personnel Support Unit15 (JPSU: N = 529); and (3) CAF spouses whose military partners were
neither deployed nor posted to JPSU (N = 37,140). The final sample included all CAF spouses in
the first two sub-populations and a stratified random sample of CAF spouses from the third.
After excluding invalid home addresses, 9,359 CAF spouses were contacted. The survey was
mailed to the home addresses of these 9,359 CAF spouses. Surveys could not be delivered to
14 The survey population excluded spouses of (1) Officer Cadets; (2) personnel with less than one year of service; (3)
personnel who are posted on foreign exchange; (4) untrained CAF personnel on the Basic Training List, the Subsidized
University Training List, or trained CAF personnel who are not considered effective strength (retirement leave); and
(5) personnel with no home address listed in the sampling frame.
15 The Joint Personnel Support Unit (JPSU) provides administrative support and programs to ill or injured CAF
members of the Regular and Reserve Force who are experiencing a medical condition that limits them from
performing their regular duties for more than six consecutive months (National Defence and the Canadian Armed
Forces, 2015).

113
1,062 home addresses, resulting in a final eligible survey sample of 8,297. A total of 1,895 CAF
spouses responded yielding an adjusted response rate of 23% (similar to the other phases).
However, 177 participants completed less than 50% of the attachment key, so were excluded
from relevant analyses. Therefore, the final sample consisted of 1,718 spouses.
Spouses were mostly women (1,586 or 93%) between the ages of 19 to 86 (M = 39.12,
SD = 9.17). Spouses had been in a common-law relationship or married to their partners for an
average of 14.23 years (SD = 8.55), and most had a partner of the opposite sex (99%). Most
spouses had a university degree (28%) or college diploma (24%), most were employed full-time
(51%), and had children (77%). A small number of spouses were CAF members (18%) but the
majority were civilian (82%). The spouses had partners in the RCN (30%), CA (39%), and the
RCAF (32%). On average partners had experienced 1.60 deployments (SD = 3.48), but most
were not currently deployed (89%). For the spouses of deployed partners, their partners had been
deployed an average of 6.62 months (SD = 9.91 months, range = 1-60 months). For the spouses
whose partners were not currently deployed, their partners had returned from their most recent
deployment an average of 14.92 months ago (SD = 22.14 months), with 14% (n = 212) of
partners having returned from a recent (< 12 months) deployment. Further, only 6% (n = 93) of
these non-deployed partners were currently preparing for another deployment.
Measures16
Attachment Anxiety and Avoidance
Attachment anxiety and avoidance were assessed using the ECR-R measure from Phases
One and Two. In this sample, anxiety and avoidance were found to be reliable (Cronbach’s α =
16 Prior to conducting any analyses, I requested the following measures from the lead internal researcher on the Quality
of Life project. Therefore, the following measures are only a subset of the original survey that was administered.
Measures were selected based on their perceived relevance to my research. Analyses were not conducted prior to my
selection of relevant variables.

114
.93 and .91 respectively), and were correlated, r(1742) = .66, p < .001 (see Table 6 for
descriptive statistics).
Impact of Military Life on Career
There were 6 items that captured the extent to which a partner’s military career has
impacted the participants’ employment or career opportunities for better or worse (e.g., “I have
made some employment or career sacrifices because of my partner’s military career”, see
Appendix K) from 1 (strongly disagree) to 5 (strongly agree). This was not an established scale,
but given that many items seem to be measuring related constructs I decided to conduct EFA
procedures in line with Fabrigar and Wegener (2012) to assess whether the items were capturing
a similar latent construct and could therefore be combined into an aggregate score.
To determine the appropriate number of common factors, I first examined the scree plot
based on eigenvalues from the reduced matrix (see Figure 22). According to this plot, there is a
good case for a one-factor model, with the only visible drop in eigenvalues occurring after the
first factor (from 2.16 to .18).
As a secondary test for determining the appropriate number of common factors, I
performed a parallel analysis using the following parameters: N = 1895, number of variables = 6,
number of datasets = 100, and confidence interval = .95. According to this analysis, only one
factor had an eigenvalue greater than those produced by random data, either by the mean or 95th
percentile values. Therefore, according to this analysis, and consistent with the scree plot, a one-
factor solution seems appropriate.

115
Figure 22. Scree plot of the reduced correlation matrix for impact of military life on career items
(Phase Three).
The final method I used to determine the appropriate number of factors was assessing
model fit using the root mean square error estimates for the one, three, and four-factor models.
The one-factor model showed a marginal fit (RMSEA = .102) and the two-factor model showed
an acceptable fit (RMSEA =.062). In order to better determine how many common factors
would be appropriate, I examined the interpretability of the factor loadings for the one and two-
factor models, by performing an EFA using ML as the extraction method and using an oblique
rotation.
To summarize the findings from both models, the two-factor model had one low
communality, and two complex loadings. The one-factor model also had one communality, and
one variable that loaded weakly on the factor (factor loading = .25) which was “I am under-
qualified for the work I am doing because of my spouse/partner’s military career”. Given the
results from the scree test and parallel analysis, and to reduce the problems associated with
cross-loadings (shared variance across factors), I decided to retain the one-factor model. This
factor explained 36.08% of variance in measures (Eigenvalue = 2.16), was labelled military life
-0.5
0
0.5
1
1.5
2
2.5
1 2 3 4 5
Eig
enval
ues
Factor
116
impacting career. When I performed a reliability analysis, the problematic item if removed
would only improve the overall alpha by .03. For this reason, I decided to include all items in the
overall scale, of which the reliability was acceptable (Cronbach’s α = .76). Overall scores for the
implications of military life on one’s career were calculated using the mean of all items, after
reverse scoring relevant items, with higher scores reflecting that military life has had a more
positive impact one one’s career (see Table 6 for descriptive statistics).
Stress During Military Experiences
Spouses were asked to indicate how stressful they found 10 different military experiences
to be if they had experienced that scenario in the past 12 months (e.g., “A combat-related
deployment” and “Uncertainty about future deployments”, see Appendix L) from 1 (not at all
stressful) to 4 (very stressful). In order to assess whether items were measuring a similar and
broader construct (and could therefore be aggregated), I performed EFA procedures similar to
previous scales and in line with recommendations by Fabrigar and Wegener (2012).
To determine the appropriate number of common factors, I first examined the scree plot
based on eigenvalues from the reduced matrix (see Figure 23). According to this plot, there is a
good case for a two-factor model, with the final visible drop in eigenvalues occurring after the
second factor (from 1.04 to .30).
As a secondary test for determining the appropriate number of common factors, I
performed a parallel analysis using the following parameters: N = 1895, number of variables =
10, number of datasets = 100, and confidence interval = .95. According to this analysis, two
factors had eigenvalues greater than those produced by random data, either by the mean or 95th
percentile values. Therefore, according to this analysis, and consistent with the scree plot, a two-
factor solution seems appropriate.

117
Figure 23. Scree plot of the reduced correlation matrix for stress during military experiences
items (Phase Three).
The final method I used to determine the appropriate number of factors was assessing
model fit using the root mean square error estimates for the one, three, and four-factor models.
The one-factor model showed an acceptable fit (RMSEA = .066) and the two, three, and four-
factor models showed a close fit (RMSEAs = .036, .023, and .008 respectively). To summarize,
the two-factor model seemed appropriate given the findings from the scree test, parallel analysis,
and the RMSEA index. In order to assess the interpretability of the two-factor model, I
performed an EFA using ML as the extraction method and using an oblique rotation. There were
no low communalities, and no complex loadings.
The first factor (Eigenvalue = 5.04) explained 50.4% of the variance across measures and
reflected stress experienced across general military experiences including a partner’s military
duties, deployments, and juggling military and family life (6 items: e.g., “Difficulty balancing
demands of family life and your spouse/partner’s military duties” and “Intensified training
schedule for your spouse/partner”). The 6 items were aggregated by taking the mean of all items,
with higher scores reflecting more stress experienced during general military experiences. This
-1
0
1
2
3
4
5
6
1 2 3 4 5 6 7 8 9 10
Eig
enval
ues
Factor
118
scale’s reliability was good (Cronbach’s α = .90) and no items would improve the scale if
removed.
The second factor explained 10.4% of the variance across measures (Eigenvalue = 1.04)
and reflected stress experienced as a result of injuries or a combat-related deployment (4 items:
e.g., “caring for your ill, injured, or disabled spouse/partner”). The 4 items were aggregated by
taking the mean of the respective items, with higher scores indicating greater stress experienced
as a result of partner injury or combat deployment. This scale had good reliability (Cronbach’s α
= .87) and no items would improve this result if removed. The two factors were moderately
correlated (factor correlation coefficient = .59) suggesting an oblique rotation was appropriate.
Descriptive statistics for the factors and single item can be found in Table 6.
Stress
Four items tapped into the amount of stress that spouses are currently experiencing (e.g.,
“Thinking about the amount of stress in your life, would you say that most days are”, see
Appendix M) and each item was associated with a response scale from 1 (e.g., Not at all
stressful) to 5 (e.g., Extremely Stressful). I performed an EFA on the items to see whether they
were capturing a broader construct and could therefore be aggregated, using procedures similar
to previous scales and in line with recommendations by Fabrigar and Wegener (2012). To
determine the appropriate number of common factors, I first examined the scree plot based on
eigenvalues from the reduced matrix (see Figure 24). According to this plot, a one-factor model
seems appropriate, the only visible drop in eigenvalues occurring after the first factor (from 1.30
to .08).

119
Figure 24. Scree plot of the reduced correlation matrix for stress items (Phase Three).
As a secondary test for determining the appropriate number of common factors, I
performed a parallel analysis using the following parameters: N = 1895, number of variables =
10, number of datasets = 100, and confidence interval = .95. According to this analysis, two
factors had eigenvalues greater than those produced by random data, either by the mean or 95th
percentile values. Therefore, while the scree plot indicates that a one-factor solution might be
appropriate, these results suggest that a two-factor solution might also be considered appropriate.
The final method I used to determine the appropriate number of factors was assessing
model fit by computing the root mean square error estimates for the one-factor model, which
showed an acceptable fit (RMSEAs = .053). To summarize, the scree test and RMSEA index
support a one-factor model, although results from the parallel analysis suggested that two factors
might be appropriate. In order to assess the interpretability of the one-factor model, I performed
an EFA using ML as the extraction method and using an oblique rotation.
The factor explained 32.4% of variance in measures (Eigenvalue = 1.30) and had two
items with low communalities (one as low as .008). In examining the factor loadings, three
measures had strong loadings (between -.32-.99), but one variable “Do you have the desire to eat
when stressed?” did not load strongly (loading = -.09). For this reason, I decided to aggregate the
0
0.5
1
1.5
1 2 3
Eig
enval
ues
Factor

120
three items together, into an overall ability to handle daily demands measure by taking the mean
of the two items, with the exception of eating when stressed which was left as a separate
measure. Descriptive statistics for the factor and items are listed in Table 6.
Subjective Well-Being
The Satisfaction With Life Scale (SWLS: Diener, Emmons, Larsen, & Griffin, 1985;
Pavot & Diener, 1993) was used to assess subjective well-being or life satisfaction. This scale
contains 5 items (e.g., “In most ways my life is close to my ideal”, see Appendix N) and
participants are to indicate their agreement with these items on a scale from 1 (strongly disagree)
to 7 (strongly agree). In this sample, the reliability was excellent (Cronbach’s α = .91) and total
scores were calculated by taking the mean of all five items with higher scores indicating better
subjective well-being or greater life satisfaction. Descriptive statistics for subjective well-being
are listed in Table 6.
Psychological Distress.
The Kessler Psychological Distress Scale (K10: Kessler et al., 2002) was used to assess
psychological distress, specifically the extent of anxiety and depressive symptoms experienced
in the most recent four-week period. This scale contains 10 items (e.g., “During the last 30 days,
about how often did you feel so sad that nothing could cheer you up?”, see Appendix O) and
respondents are to indicate the extent to which they experienced that symptom from 1 (none of
the time) to 5 (most of the time). This scale showed good reliability with this sample (Cronbach’s
α = .90). Overall distress scores are calculated by summing responses to all items, with total
scores ranging from 10 to 50. This scale is typically used as a screening instrument for
clinicians: scores under 20 indicate the patient is well, scores from 20-24 indicate a likely mild
mental disorder, scores from 25-29 indicate a likely moderate mental disorder, and scores over
121
30 indicate a likely severe mental disorder. Kessler and colleagues report that about 13% of the
adult population will score 20 and over, and about 25% of patients seen in primary care score 20
and over. Descriptives for psychological distress are listed in Table 6.
Mastery
The Pearlin Mastery Scale (PM: Pearlin & Schooler, 1981; Pearlin, Lieberman,
Menaghan, & Mullan, 1981) was used to assess spouse’s degree of mastery or the extent to
which they perceive life events as being under one’s control or a matter of fate. Mastery is seen
as a psychological resource that can help individuals cope in the face of environmental stressors.
This scale contains 7 items (e.g., “I often feel helpless in dealing with the problems of life”, see
Appendix P) and respondents are asked to indicate their agreement with these statements from 1
(strongly disagree) to 4 (strongly agree). Scores for mastery were calculated by taking the mean
of the respective items after reverse scoring relevant items, with higher scores reflecting greater
perceived mastery over life events. This scale showed good reliability (Cronbach’s α = .81).
Descriptives for mastery scores are listed in Table 6.
Coping Strategies
The Brief COPE scale (Carver, 1997) was used to assess the various ways that spouses
cope with disparate stressors. This scale contains 28 items that cover 14 coping strategies (2
items for each strategy, see Appendix Q). Respondents indicate the extent to which they use
each strategy on a scale from 1 (not at all) to 4 (a lot). The 14 strategies are self-distraction (e.g.,
“I've been turning to work or other activities to take my mind off things”), active coping (e.g.,
“I've been concentrating my efforts on doing something about the situation I'm in”), denial (e.g.,
“I've been saying to myself "this isn't real."”), substance use (e.g., “I've been using alcohol or
other drugs to make myself feel better”), use of emotional support (e.g., “I've been getting

122
emotional support from others”), use of instrumental support (e.g., “I’ve been getting help and
advice from other people”), behavioral disengagement (e.g., “I've been giving up trying to deal
with it”), venting (e.g., “I've been saying things to let my unpleasant feelings escape”), positive
reframing (e.g., “I've been trying to see it in a different light, to make it seem more positive),
planning (e.g., I've been trying to come up with a strategy about what to do), humor (e.g., “I've
been making jokes about it”), acceptance (e.g., “I've been accepting the reality of the fact that it
has happened”), religion (e.g., “I've been trying to find comfort in my religion or spiritual
beliefs”), and self-blame (e.g., “I’ve been criticizing myself”). Scores for the 14 strategies are
calculated by taking the mean of the respective two items, with higher scores reflecting greater
use of that strategy during stressful events.
Although a researcher may choose to analyze these strategies separately, Carver (2007)
also suggests creating second-order factors from the 14 strategies. Given the large number of
inter-correlations among scales (each strategy was correlated with at least seven other
strategies), I indeed decided to perform EFAs consistent with previous scales and see whether
there might be second-order factors that could explain such correlations.
To determine the appropriate number of common factors, I first examined the scree plot
based on eigenvalues from the reduced matrix (see Figure 25). According to this plot, a three-
factor model seems most appropriate, as the final most visible drop in eigenvalues occurring
after the third factor (from .50 to .24).

123
Figure 25. Scree plot of the reduced correlation matrix for coping strategies items (Phase Three).
As a secondary test for determining the appropriate number of common factors, I
performed a parallel analysis using the following parameters: N = 1895, number of variables =
14, number of datasets = 100, and confidence interval = .95. According to this analysis, two
factors had eigenvalues greater than those produced by random data, either by the mean or 95th
percentile values. Therefore, while the scree plot indicates that a three-factor solution might be
appropriate, these results suggest that a two-factor solution might also be considered appropriate.
The final method I used to determine the appropriate number of factors was assessing
model fit by computing the root mean square error estimates for the one, two, and three-factor
models. The one-factor model showed a poor fit (RMSEA = .121), the two-factor model showed
a marginal fit (RMSEA = .963), however the three-factor model showed an acceptable fit
(RMSEA = .0633). To summarize, the scree test and RMSEA index support a three-factor
model, although results from the parallel analysis suggested that two factors might be
appropriate. In order to assess the interpretability of the three-factor model, I performed an EFA
using ML as the extraction method and using an oblique rotation.
-1
0
1
2
3
4
5
1 2 3 4 5 6 7 8 9 10 11 12 13
Eig
enval
ues
Factor
124
The three-factor model contained three items that had low communalities (.11-.22)
suggesting weak inter-item correlations for these measures (religion, substance-use, humour).
The first factor accounted for 30.3% of the variance in measures (Eigenvalue = 4.24), was
labeled active coping and reflected individuals using strategies aimed at addressing the stressor
and managing the impact of that stressor. There were five strategies that loaded highly on this
factor alone (communalities > .30) which were positive reframing, acceptance, planning, active
coping, and using humour. This scale demonstrated good reliability (Cronbach’s α = .82), and no
items would improve reliability if removed. The second factor accounted for 8.3% of the
variance in measures (Eigenvalue = 1.16) and was labeled passive coping, reflecting the use of
strategies aimed at avoiding confronting the stressor and managing it effectively. Specifically,
the following four strategies loaded highly on this factor alone: behavioural disengagement, self-
blame, denial, and substance use. The reliability for this scale was questionable, but no items
would improve this value if removed (Cronbach’s α = .61). For this reason, I decided to leave
the four passive coping strategies as separate measures. The third factor accounted for 3.5% of
variance in measures (Eigenvalue = 0.50) and clearly reflected use of social support, with
instrumental support, emotional support, and venting all loading highly on this factor alone. This
scale had good reliability and no items would improve it if removed (Cronbach’s α = .81).
There were two problematic items that I decided to leave as separate measures. The use of
religion did not load highly on any factor (communalities between .01 to .27), and self-
distraction loaded highly on both active and passive coping factors (communalities = .42 and .30
respectively). Therefore, as a result of this analysis I settled on eight coping measures.
Descriptive statistics for the two factors and six items are provided in Table 6.
125
Perceived Support and Resiliency
Perceived support and resiliency was assessed using Bowen and Martin’s (2011) Support
and Resiliency Inventory for Spouses. Specifically, this measure examines military spouse’s
perceptions of support in their lives, their individual fitness, positive behaviours towards self and
others, and their success in adapting to life challenges (military and otherwise). While spouses
completed the full version, which contains 109 items that capture 37 dimensions, I selected to
examine only 10 of these dimensions that seemed most relevant to my research, captured with a
total of 30 items (see Appendix R). Responses to all items were indicated on a scale from 1
(strongly disagree) to 6 (strongly agree). In their own work, Bowen and Martin (2011) report
these scales to be valid and reliable with good to excellent indices of internal consistency. The
first dimension is relationship support and reflects feeling valued, cared for, and supported by
one’s partner (3 items: e.g., “I receive support and encouragement from my spouse/partner”).
This scale had excellent reliability with this sample (Cronbach’s α = .91) and no items would
improve it if removed. The second dimension is physical fitness and captures the extent to which
a spouse is maintaining a healthy and active lifestyle (3 items: e.g., “I exercise on a regular
basis”). The reliability for this scale was good and would not improve if items were deleted
(Cronbach’s α = .87). The third dimension is emotional fitness and reflects an optimistic outlook
and being able to enjoy life (3 items: e.g., “I look forward to beginning each day”). The
reliability for this scale was excellent, and removing items would not improve it (Cronbach’s α =
.90). The fourth dimension is cognitive fitness and captures the use of planning and critical
thinking when facing adversity (3 items: e.g., “When I face adversities, I think carefully about
the consequences of my response before I act”). The reliability for this scale`s scores was good
and would not be improved with items removed (Cronbach’s α = .88). The fifth factor is social

126
fitness capturing the extent to which a spouse is willing to solicit and accept support from others
in the community (3 items: e.g., “I am willing to turn to other people in the community for help
or assistance, if I need it). This scale had good reliability which would not improve with the
deletion of any items (Cronbach’s α = .78). The sixth factor called ethical fitness reflected the
extent to which spouses lived life and face challenges according to a guiding set of principles or
beliefs (3 items: e.g., “I draw strength from a guiding set of principles or beliefs when I face life
challenges”). The reliability for this scale was excellent and could not be improved with items
removed (Cronbach’s α = .95). The seventh dimension life readiness reflects feeling capable of
handling life challenges and daily matters, particularly when one’s partner is not available (3
items: e.g., “I know where to turn for assistance or support if my spouse/partner is unavailable”).
The reliability for this scale was acceptable (Cronbach’s α = .74) and no items would improve
this scale if deleted. The eighth dimension called partner support reflected the extent to which
spouses feel they are supportive of their partner and their military career (3 items: e.g., “I am
supportive of my spouse/partner in or working for the military”). This scale’s reliability was
good and wouldn’t improve with any items deleted (Cronbach’s α = .81). The ninth dimension
called coping success captured whether spouses felt that they could cope with life stressors (3
items: e.g., “I confront the problem directly when I face a challenge or difficulty”). The
reliability for this scale was good, and wouldn’t improve with items removed (Cronbach’s α =
.84). Finally, the 10th dimension relationship success assessed the extent to which spouses are
happy with their relationships and committed to making the relationship successful (3 items:
e.g., “I am committed to making my relationship with my spouse/partner a success”). The
reliability for this scale was excellent (Cronbach’s α = .90) that couldn’t be improved with any
127
items deleted. Scores for all 10 dimensions were calculated by taking the mean of the respective
three items (see Table 6 for descriptive statistics).
Relationship Satisfaction
There were two scales used to assess relationship satisfaction. The first scale is called the
Quality of Marriage Index (QMI: Norton, 1983) and contains 6 items17 that assess relationship
quality (e.g., “Our marriage/relationship is strong”, see Appendix S) on a scale from 1 (strongly
disagree) to 7 (strongly agree). The reliability for this scale was excellent (Cronbach’s α = .97)
and this would not improve with any items deleted. Scores for relationship satisfaction (QMI)
were calculated by taking the mean of all items, with higher scores reflecting greater relationship
satisfaction (see Table 6 for descriptive statistics).
The second scale used to assess relationship satisfaction was the Revised Dyadic
Adjustment Scale (RDAS: Busby, Christensen, Crane, & Larsen, 1995), which contains three
subscales18 that are captured using a total of 14 items (see Appendix T). The first subscale is
dyadic consensus, which asks spouses to rate the extent to which they agree with their partner on
six important matters (6 items: e.g., “demonstrations of affection”) on a scale from 1 (always
disagree) to 6 (always agree). The reliability for this scale was acceptable, and couldn’t be
improved with the removal of any items (Cronbach’s α = .76). Scores were calculated by taking
the mean of the respective items, with higher scores reflecting greater perceived agreement on
important issues (thus more satisfaction). The second subscale is dyadic satisfaction capturing
17 In its original form, the first five items of the QMI are answered on a 1-7 scale, and the sixth item (degree of
happiness in the relationship) on a 1-10 scale. However, responses for each item are typically standardized prior to
calculating overall scores to make the scales somewhat equivalent. Norton (1983) reports this scale to be reliable,
with uniformly strong inter-item correlation coefficients. For ease of responding and calculating scores, a 1-7 scale
was used for all 6 items here.
18 Results from an EFA using principal axis factoring and an oblique rotation confirmed the presence of 3 clear factors
that were moderately correlated with one another (rs between .55-.64), validating the use of the three subscales.

128
the degree to which spouses feel satisfied with their partner (4 items: e.g., “How often do you
discuss or have you considered divorce, separation, or terminating your relationship?”) on a
scale from 1 (never) to 6 (all the time). This scale’s reliability was good, and could not be
improved with any items deleted (Cronbach’s α = .82). Dyadic satisfaction scores were
calculated by calculating the mean of all items reverse-scored such that higher scores reflect
greater dyadic satisfaction (thus greater relationship satisfaction). The final subscale dyadic
cohesion contains 4 items, one item that asks spouses how often they participate in outside
activities together from 1 (never) to 5 (everyday), and three items that ask spouses how often
they engage in more specific activities (e.g., “have a stimulating exchange of ideas”) from 0
(never) to 5 (more often). These four items were first transformed into z scores to standardize the
response scales. Then, cohesion scores were calculated by taking the mean of the respective
items standardized given their different response scales, and then mean scores were calculated
with higher scores indicating greater cohesion. This scale’s reliability was acceptable, and could
not be improved with the removal of any items (Cronbach’s α = .79). Descriptives for all three
subscales are reported in Table 6.
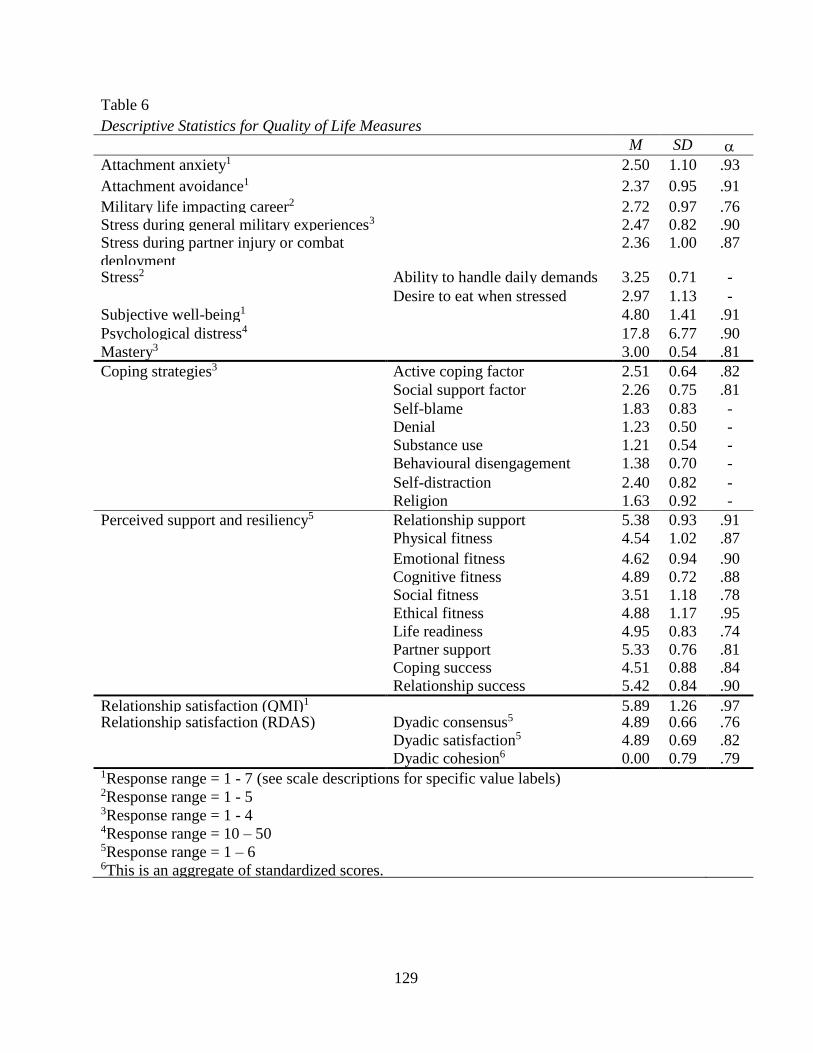
129
Table 6
Descriptive Statistics for Quality of Life Measures
M SD
Attachment anxiety1 2.50 1.10 .93
Attachment avoidance1 2.37 0.95 .91
Military life impacting career2 2.72 0.97 .76 Stress during general military experiences3 2.47 0.82 .90 Stress during partner injury or combat
deployment
2.36 1.00 .87
Stress2 Ability to handle daily demands 3.25 0.71 -
Desire to eat when stressed 2.97 1.13 -
Subjective well-being1 4.80 1.41 .91
Psychological distress4 17.8
5
6.77 .90
Mastery3 3.00 0.54 .81
Coping strategies3 Active coping factor 2.51 0.64 .82
Social support factor 2.26 0.75 .81
Self-blame 1.83 0.83 -
Denial 1.23 0.50 -
Substance use 1.21 0.54 -
Behavioural disengagement 1.38 0.70 -
Self-distraction 2.40 0.82 -
Religion 1.63 0.92 -
Perceived support and resiliency5 Relationship support 5.38 0.93 .91
Physical fitness 4.54 1.02 .87
Emotional fitness 4.62 0.94 .90
Cognitive fitness 4.89 0.72 .88 Social fitness 3.51 1.18 .78
Ethical fitness 4.88 1.17 .95
Life readiness 4.95 0.83 .74
Partner support 5.33 0.76 .81 Coping success 4.51 0.88 .84
Relationship success 5.42 0.84 .90
Relationship satisfaction (QMI)1 5.89 1.26 .97 Relationship satisfaction (RDAS) Dyadic consensus5 4.89 0.66 .76 Dyadic satisfaction5 4.89 0.69 .82
Dyadic cohesion6 0.00 0.79 .79 1Response range = 1 - 7 (see scale descriptions for specific value labels) 2Response range = 1 - 5 3Response range = 1 - 4 4Response range = 10 – 50 5Response range = 1 – 6 6This is an aggregate of standardized scores.

130
Results
Prior to conducting my main analyses, I examined the distributional properties of my
attachment dimensions including skewness, kurtosis, and the presence of outliers as such issues
can inflate and distort relationships between variables. Although there are no established
guidelines with respect to acceptable kurtosis and skewness values, West, Finch, and Curran
(1995) recommend conducting normality transformations on variables that have skewness values
above |2| and/or kurtosis values greater than 7. The skewness (.92 and .71) and kurtosis values
(.76 and -.128) for anxiety and avoidance were within this acceptable range. I then checked for
the presence of univariate outliers for anxiety and avoidance, specifically values in excess of z =
-/+ 3.29 (Tabachnick & Fidell, 2007). There were 10 cases that had avoidance z scores in excess
of 3.29, and three cases with anxiety z scores in excess of 3.29 (1 of these cases had outstanding
values for both variables). Therefore, there were 12 cases that had excess values on at least one
of the attachment dimensions. For univariate outliers, Tabachnick and Fidell (2007) recommend
changing the outliers such that they are still deviant scores, but just are not as deviant as before.
Indeed, Osborne (2001) has shown that treatment or removal of outliers can reduce the
probability of Type I and Type II errors. One way to handle outliers is the winsorized mean
method whereby the outlying scores are replaced by the next-to-highest value, or the next-to-
outlying value. In this case, the high scores would be replaced by the value closest to, but not
above a z score = 3.29. The avoidance score (in 7-scale units) closest to a z-score = 3.29 was
5.44. Therefore, I inputted an avoidance score of 5.44 for the 10 extreme cases. Next, the closest
anxiety score within the stated limits was 6, so 3 cases were assigned a value of 3 for anxiety.
Given the number of analyses that I performed in Phase Three, and in order to make the
following results more comprehensible, I decided to decompose all significant interactions yet

131
only incorporate figures for those with significant simple slopes in the thesis body. Figures
depicting interactions with non-significant simple slopes are presented in Appendices.
Attachment Anxiety and Avoidance as Predictors
I predicted that attachment anxiety and avoidance would be related to indices of
intrapersonal and relationship functioning. In particular, I predicted attachment anxiety to be
related to reports that one’s partner’s military experiences such as deployments and postings has
had a more negative impact on the quality of their relationships, that various military
experiences will be perceived as significantly more stressful relative to those lower in
attachment anxiety. This would be consistent with the findings of Fraley and Shaver (1998) that
women higher in attachment anxiety reported increased distress with long term separations.
Further, consistent with findings by Collins and Read (1990), I predicted that attachment
anxiety, in particular, would be related to more negative relationship perceptions. In line with
findings by Mayseless and colleagues (1996) I also predicted that attachment anxiety would be
related to emotion-focused coping strategies such as self-blame, and decreased coping outcomes.
On the other hand, I predicted that attachment avoidance would be related to deactivating and
distancing coping strategies (e.g., Mayseless et al., 1996), and would not as strongly be related to
reports of well-being.
To test these predictions, I conducted multiple linear regressions with the mean centered
attachment anxiety, avoidance, and interaction terms as predictors on all 30 dependent measures
(listed in Table 6). Again, prior to conducting these analyses, I tested for the presence of
reported confounds for attachment anxiety including self-esteem (e.g., Collins & Read, 1990;
Bartholomew & Horowitz, 1991) relationship length (e.g., Duemmler & Kobak, 2001; Fraley &
Shaver, 1998), whether or not the spouse had children (e.g., Medway, Davis, Cafferty, Chappell,

132
& O’Hearn, 1995), and awareness of military and/or local civilian community resources (e.g.,
Nurius, & Lester, 2013). Unfortunately, an established measure of self-esteem was not included
in this survey. However, one of the K10 (Kessler et al., 2010) items captures the assessment of
one’s worth, a defining characteristic of self-esteem (Baumeister, 1998; Rosenberg, 1965). For
this reason, this item was used as a proxy measure of self-esteem. I conducted bivariate
correlations between attachment anxiety and all potential covariates. There were significant
relationships between attachment anxiety and perceptions of self-worth [r(1737) = -.39, p <
.001], and awareness of military and/or local civilian community resources [r(1734) = -.10, p <
.001]. In addition, there was a significant relationship between avoidance and relationship length
[r(1732) = .06, p = .008], and awareness of support programs [r(1735) = -.10, p < .001]. As a
result, self-worth, awareness of support programs, and relationship length were included as
covariates in all analyses. Further, given that I was conducting regression analyses on 30
dependent measures and with three predictors, I decided to use the more stringent alpha criterion
of p < .001 (.05/90). Therefore, about .09 results would be expected by chance alone.
Main Effects of Attachment Anxiety
There were a number of significant main effects of attachment anxiety (see Table 7 for
all results). Specifically, attachment anxiety was associated with greater reported stress during
general military experiences [B = .15, β = .20, t(1578) = 6.13, p < .001], decreased ability to
handle daily demands [B = -.13, β = -.20, t(1712) = -6.93 p < .001], increased desire to eat when
stressed [B = .11, β = .11, t(1707) = 3.24, p = .001], decreased subjective well-being [B = -.13, β
= -.10, t(1713) = -3.29, p < .001], greater psychological distress [B = .954, β = .16 t(1713) =
6.86, p < .001], less mastery over one’s life [B = -.12, β = -.24, t(1712) = -8.33, p < .001], greater
use of self-blame as a coping strategy [B = .19, β = .26, t(1704) = 9.04, p < .001], greater use of
133
distraction as a coping strategy [B = .08, β = .11, t(1705) = 3.48, p = .001], less perceived
relationship support [B = -.19, β = -.22, t(1705) = -8.45, p < .001], less emotional fitness [B = -
.13, β = -.15, t(1706) = -5.42, p < .001], less cognitive fitness [B = -.09, β = -.14, t(1705) = -4.50,
p < .001], less life readiness [B = -.09, β = -.12, t(1710) = -3.97, p < .001], less coping success [B
= -.16, β = -.20, t(1709) = -6.92, p < .001], less perceived relationship success [B = -.07, β = -
.09, t(1710) = -3.39, p = .001], less relationship satisfaction according to two indices [QMI: B = -
.26, β = -.23, t(1712) = -9.08, p < .001; RDAS: B = -.15, β = -.25, t(1710) = -9.17, p < .001], less
perceived relationship consensus [B = -.12, β = -.20, t(1707) = -7.40, p < .001], and less
perceived relationship cohesion [B = -.07, β = -.10 t(1711) = -3.58, p < .001].
Main Effects of Attachment Avoidance
There also were a number of main effects for attachment avoidance. Attachment
avoidance was related to decreased subjective well-being [B = -.30, β = -.21, t(1713) = -7.18, p <
.001], p < .001], less perceived social support [B = -.10, β = -.09, t(1705) = -3.58, p < .001],
greater use of behavioural disengagement as a coping strategy [B = .09, β = .12, t(1703) = 3.86,
p < .001), less reliance on religion to cope [B = -.10, β = -.11, t(1689) = -3.21, p = .001], less
perceived relationship support [B = -.33, β = -.34, t(1705) = -12.98, p < .001], less emotional
fitness [B = -.18, β = -.18, t(1706) = -6.76, p < .001], less cognitive fitness [B = -.11, β = -.14,
t(1705) = -4.61, p < .001], less social fitness [B = -.23, β = -.18, t(1704) = -6.07, p < .001], less
ethical fitness [B = -.21, β = -.17, t(1544) = -5.09, p < .001], less perceived partner support [B = -
.14, β = -.18, t(1708) = -5.69, p < .001], less coping success [B = -.08, β = -.09, t(1709) = -3.20,
p = .001], less perceived relationship success [B = -.40, β = -.45, t(1710) = -16.75, p < .001], less
relationship satisfaction according to both indices (QMI: B = -.54, β = -.41, t(1712) = -16.19, p <
.001; RDAS: B = -.23, β = -.32, t(1710) = -11.54, p < .001], less perceived relationship

134
consensus [B = -.27, β = -.39, t(1707) = -14.52, p < .001], and less perceived relationship
cohesion [B = -.34, β = -.41, t(1711) = -14.43, p < .001].
Table 7
Standardized Regression Coefficients for the Unique and Interactive Effects of
Attachment Anxiety and Avoidance on all Dependent Measures.
Anxiety Avoidance Anx*Avo
Measure β t β t β t
Military life impacting career -.05 -1.51 .01 0.32 .00 -0.02
Stress during general military
experiences3
.20 6.13* -.04 -1.33 -.00 -0.13
Stress during partner injury or
combat deplopyment
.07 1.62 .02 0.34 -.01 -0.29
Ability to handle daily demands -.18 -5.81* -.08 -2.49 .07 2.76+
Desire to eat when stressed .11 3.29* -.03 -0.86 -.02 -0.66
Subjective well-being -.10 -3.43* -.21 -7.18* -.01 -0.33
Psychological distress .16 6.86* .04 1.57 -.04 -2.40
Mastery -.23 -8.33* -.08 -2.79* .05 2.37
Active coping factor .03 1.02 -.09 -2.78+ -.07 -2.68+
Social support coping factor .07 2.28 -.12 -3.58* -.10 -3.67*
Self-blame coping .26 9.07* -.02 -0.79 -.10 -4.56*
Denial coping .08 2.57+ .04 1.25 -.00 -0.18
Substance use coping .10 2.98+ .04 1.15 -.01 -0.40
Behavioural disengagement
coping
.03 1.04 .12 3.88* .01 0.54
Self-distraction coping .11 3.48* -.02 -0.53 -.08 -3.28*
Religion coping .03 0.82 -.11 -3.21* -.03 -1.08
Relationship support -.22 -8.45* -.34 -12.98* -.15 -7.37*
Physical fitness
-.09 -2.75+ -.09 -2.87+ .00 0.07
Emotional fitness -.15 -5.42* -.18 -6.80* .02 0.95
Cognitive fitness -.14 -4.50* -.14 -4.61* .02 0.93
Social fitness .02 0.50 -.18 -6.07* .02 0.74
Ethical fitness .01 0.31 -.17 -5.14* .09 3.55*
Life readiness -.12 -3.97* -.05 -1.61 .07 3.04
Partner support -.02 -0.48 -.18 -5.69* .06 2.61+
Coping success -.20 -6.92* -.09 -3.20* .05 2.21
Relationship success -.09 -3.39* -.45 -16.75* -.10 -4.54*
Relationship satisfaction -.23 -9.08* -.41 -16.19* -.08 -4.09*
Dyadic consensus -.20 -7.40* -.39 -14.52* -.02 -1.14
Dyadic satisfaction -.25 -9.17* -.31 -11.54* -.05 -2.36
Dyadic cohesion -.10 -3.58* -.41* -14.43* -.02 -0.96 *p < .002.
+
+p < .01.
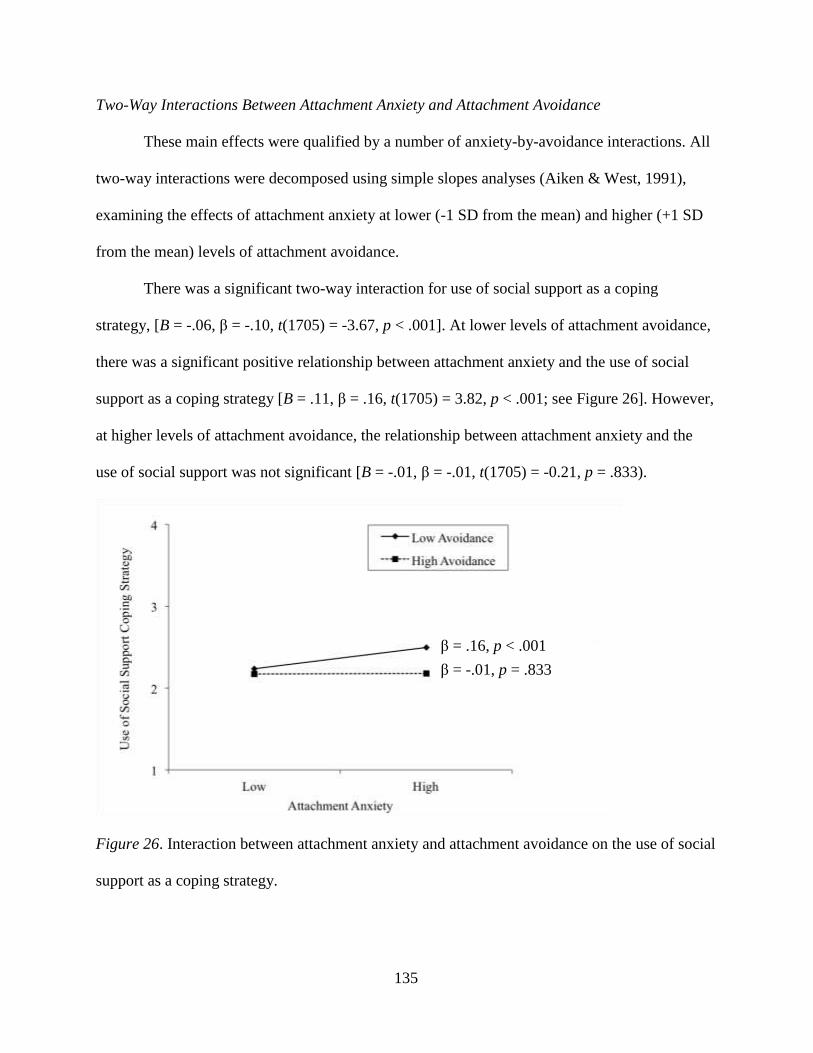
135
Two-Way Interactions Between Attachment Anxiety and Attachment Avoidance
These main effects were qualified by a number of anxiety-by-avoidance interactions. All
two-way interactions were decomposed using simple slopes analyses (Aiken & West, 1991),
examining the effects of attachment anxiety at lower (-1 SD from the mean) and higher (+1 SD
from the mean) levels of attachment avoidance.
There was a significant two-way interaction for use of social support as a coping
strategy, [B = -.06, β = -.10, t(1705) = -3.67, p < .001]. At lower levels of attachment avoidance,
there was a significant positive relationship between attachment anxiety and the use of social
support as a coping strategy [B = .11, β = .16, t(1705) = 3.82, p < .001; see Figure 26]. However,
at higher levels of attachment avoidance, the relationship between attachment anxiety and the
use of social support was not significant [B = -.01, β = -.01, t(1705) = -0.21, p = .833).
Figure 26. Interaction between attachment anxiety and attachment avoidance on the use of social
support as a coping strategy.
β = .16, p < .001
β = -.01, p = .833

136
Next, there was a significant two-way interaction for use of self-blame as a coping
strategy, [B = -.07, β = -.10, t(1704) = -4.56, p < .001]. At lower levels of attachment avoidance,
there was a significant positive relationship between attachment anxiety and the use of self-
blame [B = .26, β = .35, t(1704) = 9.69, p < .001; see Figure 27). Further, at higher levels of
attachment avoidance, there was a significant positive relationship, albeit weaker than the
previous, between attachment anxiety and the use of self-blame [B = .13, β = .17, t(1704) = 5.11,
p < .001].
Figure 27. Interaction between attachment anxiety and attachment avoidance on the use of self-
blame as a coping strategy.
There was a significant two-way interaction for use of self-distraction as a coping
strategy, [B = -.06, β = -.08, t(1705) = -3.28, p = .001]. At lower levels of attachment avoidance,
there was a significant positive relationship between attachment anxiety and the use of self-
distraction as a coping strategy [B = .14, β = .19, t(1705) = 4.53, p < .001; see Figure 28].
β = .35, p < .001
β = .17, p < .001

137
However, at higher levels of attachment avoidance, the relationship between attachment anxiety
and the use of self-distraction was not significant [B = .03, β = .04, t(1705) = 1.04, p = .296).
Figure 28. Interaction between attachment anxiety and attachment avoidance on the use of self-
distraction as a coping strategy.
Next, there was a significant two-way interaction for perceived relationship support [B =
-.11, β = -.15, t(1705) = -7.37, p < .001]. At lower levels of attachment avoidance, the
relationship between attachment anxiety and relationship support approached significance [B = -
.08, β = -.09, t(1705) = -2.69, p = .007; see Figure 29]. At higher levels of attachment avoidance,
there was a significant negative relationship between attachment anxiety and relationship
support [B = -.30, β = -.36, t(1705) = -11.58, p < .001].
Next, there was a two-way interaction for perceived relationship success [B = -.06, β = -
.09, t(1710) = -4.54, p < .001]. At lower levels of attachment avoidance, the relationship
between attachment anxiety and relationship success was not significant [B = -.01, β = -.01,
t(1710) = -0.22, p = .823; see Figure 30]. However, at higher levels of attachment avoidance
β = .19, p < .001
β = .04, p = .296
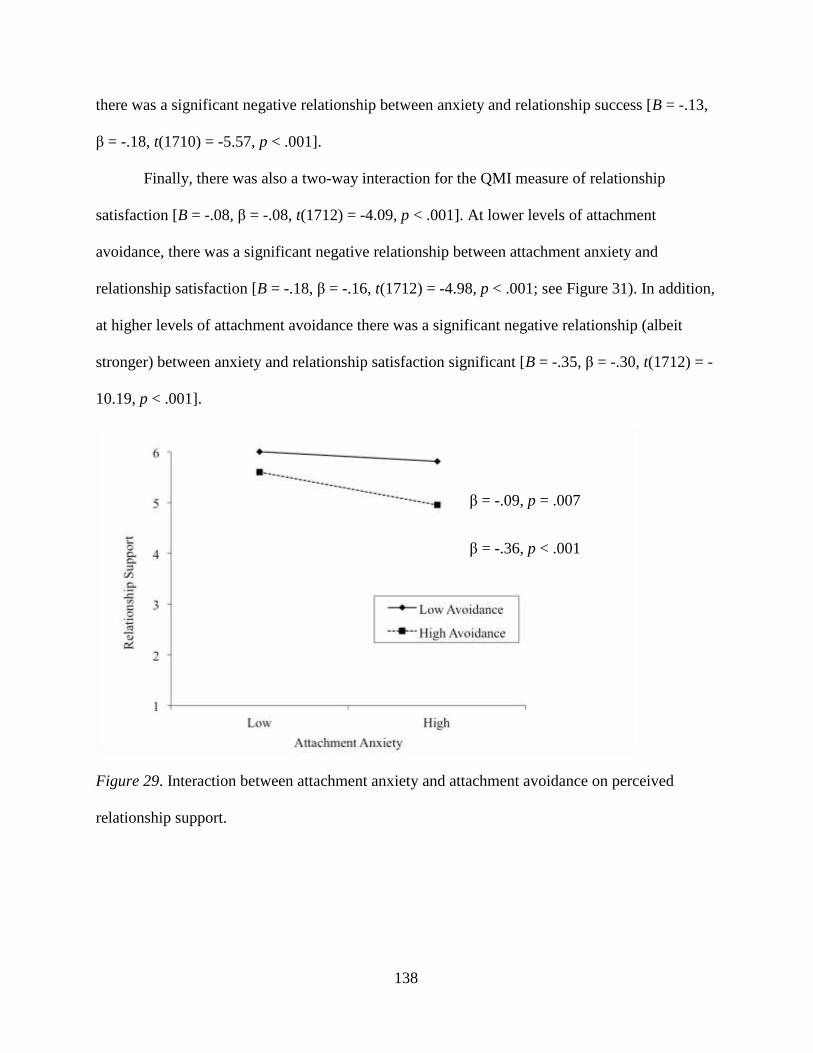
138
there was a significant negative relationship between anxiety and relationship success [B = -.13,
β = -.18, t(1710) = -5.57, p < .001].
Finally, there was also a two-way interaction for the QMI measure of relationship
satisfaction [B = -.08, β = -.08, t(1712) = -4.09, p < .001]. At lower levels of attachment
avoidance, there was a significant negative relationship between attachment anxiety and
relationship satisfaction [B = -.18, β = -.16, t(1712) = -4.98, p < .001; see Figure 31). In addition,
at higher levels of attachment avoidance there was a significant negative relationship (albeit
stronger) between anxiety and relationship satisfaction significant [B = -.35, β = -.30, t(1712) = -
10.19, p < .001].
Figure 29. Interaction between attachment anxiety and attachment avoidance on perceived
relationship support.
β = -.09, p = .007
β = -.36, p < .001
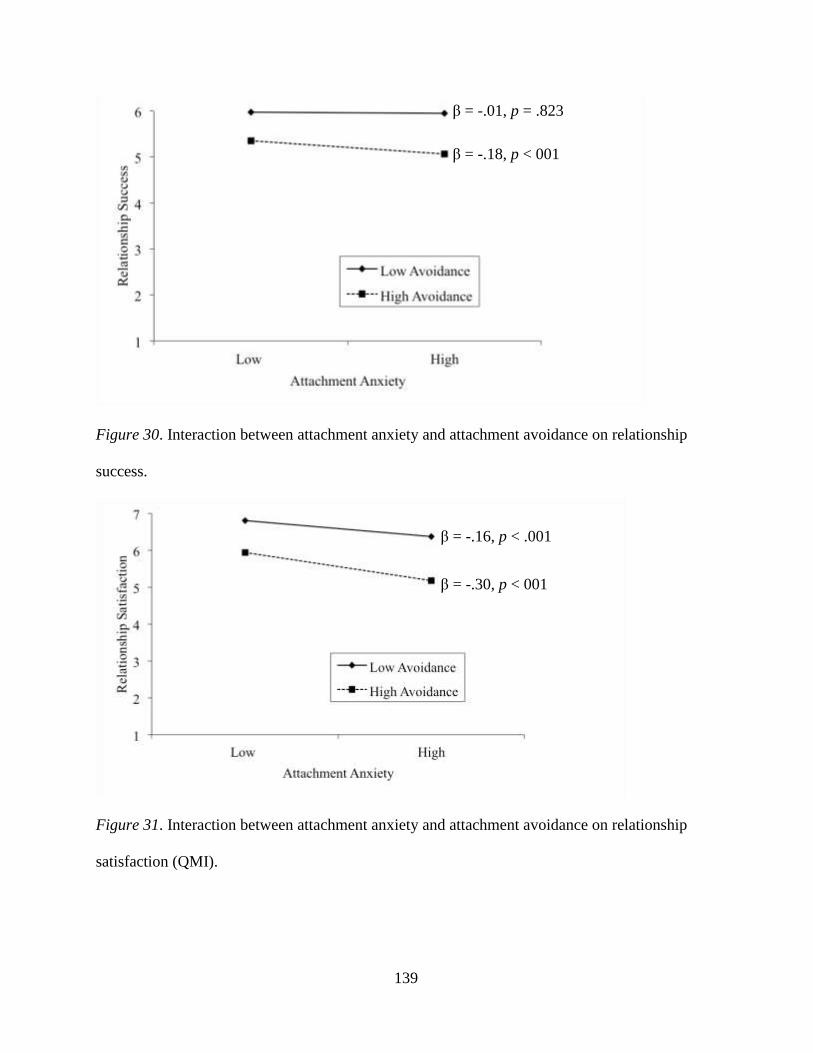
139
Figure 30. Interaction between attachment anxiety and attachment avoidance on relationship
success.
Figure 31. Interaction between attachment anxiety and attachment avoidance on relationship
satisfaction (QMI).
β = -.16, p < .001
β = -.30, p < 001
β = -.01, p = .823
β = -.18, p < 001

140
Attachment Anxiety, Avoidance, and Deployment Status
Although main effects of attachment dimensions are often reported and were therefore
expected, individual differences in attachment behaviour should be most pronounced under
stressful conditions in the social or physical environment (Simpson & Rholes, 1994). Therefore,
I predicted that the effects of attachment dimensions on intrapersonal coping and relationship
outcomes might be moderated by deployment status, or whether or not the spouses were
currently separated by their partners from a military deployment. Specifically, attachment
anxiety is associated with hyperactivating strategies in response including increased distress and
emotion-focused coping strategies in response to attachment threats (Birnbaum et al., 1997;
Fraley & Shaver, 1998; Mayseless et al., 1996, Meyer et al., 2005). However, attachment
avoidance should be associated with deactivating strategies aimed at promoting interpersonal
distance when the attachment system is activated (Fraley & Shaver, 1997; Fraley & Shaver,
1998; Mayseless et al., 1996; Simpson et al., 1992). Therefore, if deployment status entails
different levels of threat, attachment anxiety should be predictive of decreased well-being, the
use of emotion-focused coping strategies, and potentially more negative relationship perceptions
for those separated from their partners, relative to those that are not. On the other hand,
attachment avoidance might be less predictive of, or even associated with increased emotional
well-being, but perhaps more negative relationship perceptions for those experiencing a
deployment, relative to those not experiencing a deployment.
Specifically, I was interested in assessing how deployment status might moderate the
relationships between attachment anxiety, attachment avoidance, their interaction, and 18 of the
associated outcomes reported above. A total of 211 spouses had partners who were currently
deployed, while 1,301 had spouses who were not currently deployed, not preparing for a

141
deployment, and had not returned from a deployment in the last 12 months. When making
comparisons between samples or using grouping variables as moderators, large discrepancies in
sample sizes can compromise the validity of null hypothesis decisions. Specifically, differences
in sample sizes can lead to heterogeneity of variance, which in the case of regression analyses
may ultimately threaten the assumption of homoscedasticity if error variances are unequal across
levels of a moderator, and also potentially unequal across combinations of the IV and
moderating variables. In order to avoid such issues, I decided to use a random sample of 211
spouses with non-deployed partners (an n equal to that of the group of spouses whose partners
were deployed), whose spouses had not recently (last 12 months) experienced a deployment, and
who were not currently preparing for a deployment. After selecting my random sub sample of
211 spouses whose partners were not currently deployed, I decided to conduct t-tests (or chi-
square tests where appropriate) between my two groups to ensure that they did not differ in
important ways (demographics and attachment dimensions) other than the key dependent
variables and therefore to identify any potential control variables.
The two groups were not statistically different with respect to being married to a same or
opposite sex partner, gender, age, education, whether the spouse has children, the spouse’s
employment status, whether they were aware of support programs within their community, their
partner’s rank and element, and levels of attachment avoidance, or anxiety19 (ps between .24-
.85). However, deployed partners had experienced significantly more deployments in the past
five years (M = 2.50, SD = 2.79) relative to the non-deployed partners (M = 1.03, SD = 2.04),
t(374) = -6.1, p < .001). Further, the proportion of spouses who were currently CAF members
19 I also conducted t-tests or chi-square tests between my random sample of non-deployed partners and the rest of the
group on these same variables to ensure that my sample was representative. The random sample was not statistically
different from the rest of the group on any of these variables, suggesting it was indeed representative.

142
(regular or reserve force) or civilians was not consistent across the two groups, 2(3, N = 416) =
9.80, p = .020. Specifically, the deployed group had a greater proportion of at-home spouses
who were regular force members than expected, and the non-deployed group has fewer regular
force spouses than expected. Further, relationship status was not consistent across the two
groups, 2(5, N = 418) = 14.14, p = .15. Specifically, the deployed group had a greater
proportion of common-law relationships than expected, and the non-deployed group had a
greater proportion of legally married relationships than expected. For this reason, number of
deployments experienced in the past five years, spouse CAF status, and relationship status were
included as covariates in subsequent analyses. As in the previous analyses, a measure of self-
worth, relationship length, and awareness of support programs were also included as covariates.
Deployment status was coded such that spouses of non-deployed members were assigned a value
of -1, and spouses of deployed members were assigned a value of 1.
Given that I had already assessed the effects of attachment anxiety, avoidance, and their
interaction term on the following indices, I am only reporting below the moderating effects of
partner deployment status on the attachment dimensions. Specifically, in addition to reporting
main effects of deployment status, I am reporting whether there were significant two-way
interactions between deployment status and avoidance, deployment status and anxiety, or a
three-way interaction among deployment status, avoidance, and anxiety. Many of these analyses
were exploratory in nature, given the sparse amount of research assessing the moderating effects
of deployment-related experiences in the relationships among attachment dimensions and
intrapersonal and relationship outcomes. For this reason, I was hesitant to employ a conservative
Bonferroni correction like in previous analyses and risk inflating Type II error rates. However,
there is a trade off in not employing any correction at all, leading to inflations in Type I errors.
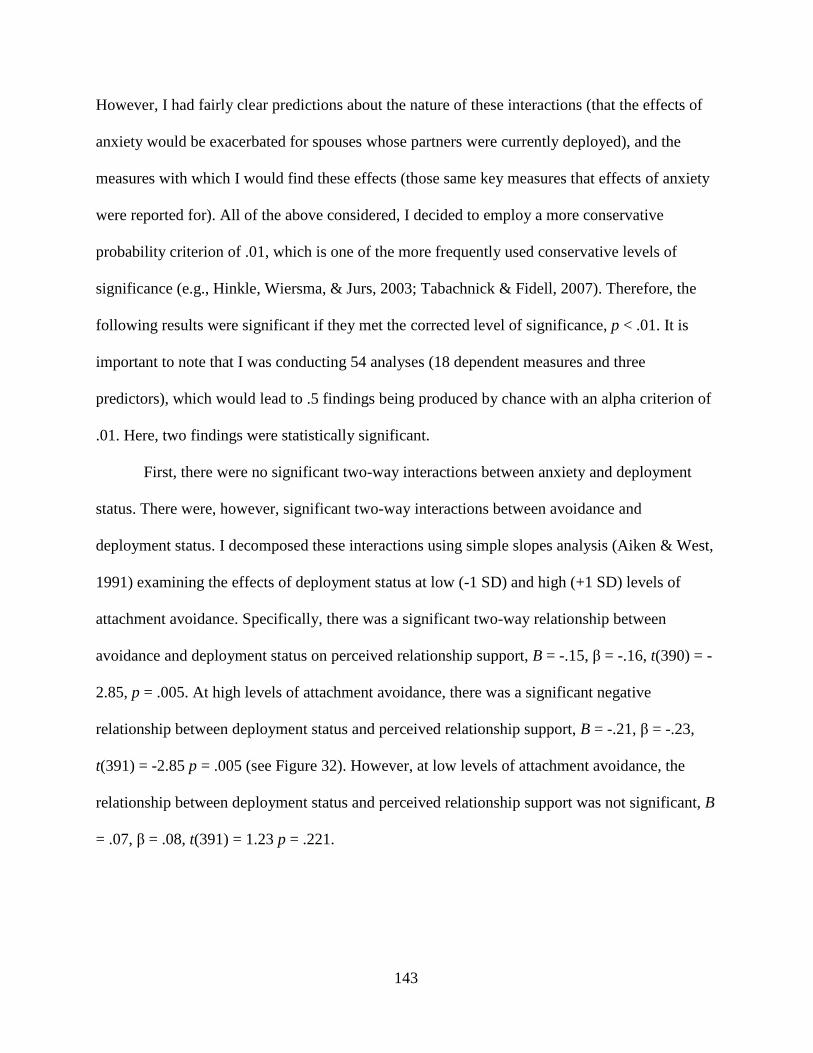
143
However, I had fairly clear predictions about the nature of these interactions (that the effects of
anxiety would be exacerbated for spouses whose partners were currently deployed), and the
measures with which I would find these effects (those same key measures that effects of anxiety
were reported for). All of the above considered, I decided to employ a more conservative
probability criterion of .01, which is one of the more frequently used conservative levels of
significance (e.g., Hinkle, Wiersma, & Jurs, 2003; Tabachnick & Fidell, 2007). Therefore, the
following results were significant if they met the corrected level of significance, p < .01. It is
important to note that I was conducting 54 analyses (18 dependent measures and three
predictors), which would lead to .5 findings being produced by chance with an alpha criterion of
.01. Here, two findings were statistically significant.
First, there were no significant two-way interactions between anxiety and deployment
status. There were, however, significant two-way interactions between avoidance and
deployment status. I decomposed these interactions using simple slopes analysis (Aiken & West,
1991) examining the effects of deployment status at low (-1 SD) and high (+1 SD) levels of
attachment avoidance. Specifically, there was a significant two-way relationship between
avoidance and deployment status on perceived relationship support, B = -.15, β = -.16, t(390) = -
2.85, p = .005. At high levels of attachment avoidance, there was a significant negative
relationship between deployment status and perceived relationship support, B = -.21, β = -.23,
t(391) = -2.85 p = .005 (see Figure 32). However, at low levels of attachment avoidance, the
relationship between deployment status and perceived relationship support was not significant, B
= .07, β = .08, t(391) = 1.23 p = .221.

144
Figure 32. Interaction between attachment avoidance and deployment status on perceived
relationship support.
In addition, there was a two-way relationship between avoidance and deployment status
on cognitive fitness, B = -.13, β = -.17, t(390) = -2.66, p = .008. At high levels of avoidance,
there was a significant negative relationship between deployment status and cognitive fitness, B
= -.16, β = -.22, t(391) = -2.33, p = .020 (see Figure 33). However, at low levels of avoidance,
the relationship between deployment status and cognitive fitness was not significant, B = .10, β =
.14, t(391) = 1.82, p = .069.
β = .08, p = .221
β = -.23, p = .005

145
Figure 33. Interaction between attachment avoidance and deployment status on cognitive fitness.
There were no significant two-way interactions between attachment anxiety and
deployment status, nor were there significant three-way interactions among attachment anxiety,
avoidance, and deployment status
Attachment Anxiety, Avoidance, and Recent Deployment Status
In summary, the above findings largely did not confirm my predictions, that the effects
of attachment anxiety (and avoidance) on intrapersonal and relationship functioning would be
exacerbated for the spouses whose partners are currently away on a military deployment.
Instead, although some effects for the interaction between anxiety and avoidance were reported,
overall deployment status did not seem to moderate the effects of attachment anxiety on most
intrapersonal functioning and relationship outcomes. I wondered if these results were in part due
to the fact that the spouses of deployed members had been separated from their partners for an
average of 6.62 months (SD = 9.91 months). Specifically, there is good reason to expect that the
effects of attachment dimensions should be most pronounced under conditions that threaten the
β = .14, p = .069
β = -.22, p = .020
146
attachment relationship (Feeney, 1999; Simpson & Rholes, 1994). In particular, attachment
anxiety should be associated with hyperactivating strategies to cope with the recent separation
such as increased reports of distress (Fraley & Shaver, 1998; Mayseless et al., 1996), and
perhaps even decreased relationship perceptions (Rholes et al., 2001). However, attachment
avoidance should be associated with deactivating strategies to manage the threat of being
separated from one’s partners such as pulling away from the partner emotionally and reporting
more negative relationship perceptions and refraining from managing the threat such as reporting
less issues with coping capacity (Mayseless et al., 1996; Simpson et al., 1992). There is the
possibility, however, that breakdowns in emotional well-being and coping capacity will be
observed with increases in attachment avoidance, if this initial separation period is characterized
by high enough levels of stress that deactivating strategies are less effective (Mikulincer &
Florian, 1998).
As outlined in the Canadian Forces Deployment Handbook (Egerton-Graham, 2009), the
most challenging stage of the separation is stage 3, occurring during weeks 3-6 of the separation,
and consisting of emotional disorganization. Our questionnaire did not assess time separated in
weeks, therefore I decided to examine the group of spouses who had most recently (≤ 1 month)
separated from their partners (n = 64) and who were likely experiencing emotional
disorganization, and see whether these spouses demonstrate more pronounced attachment effects
than those not currently experiencing a partner separation. In order to compare this group of
spouses with an equal number of spouses with non-deployed partners, I again selected a random
sample of 64 spouses of non-deployed partners, with the conditions that they also could not have
returned from a deployment in the last 12 months, and were not currently preparing for a
deployment (n = 1293). I also conducted t-tests (or chi-squared tests where appropriate) on the

147
same key demographic items and attachment dimensions that I tested between my samples
earlier, but now between both my random sub-sample of non-deployed spouses against the rest
of the non-deployed group, and between my non-deployed and deployed partner groups. There
were no significant differences between the non-deployed sub-sample and rest of the non-
deployed sample and recently deployed samples, suggesting this sub-sample was representative
of the main sample of spouses of non-deployed partners. However, there was a significant
difference between my recently deployed and non-deployed groups such that the spouses of
recently deployed partners had experienced more deployments in the past five years (M = 3.21,
SD = 4.14), relative to the spouses of partners not deployed (M = 1.00, SD = 1.23), t(73) = -4.05,
p < .001. Therefore, number of deployments in the past five years was included as a covariate in
subsequent analyses, along with relationship status, self-worth, relationship length, and
awareness of support programs consistent with prior analyses. Specifically, I ran the same
multiple regressions for the 18 DVs that attachment anxiety significantly predicted earlier.
Similar to the previous analyses, recent deployment status (≤ 1 month) was coded such that
spouses of partners deployed were assigned a value of 1, and those not deployed were assigned a
value of -1. Also, simple slopes analyses were used to decompose any two and three-way
interactions. Similar to previous analyses, I employed an alpha correction, such that the
following results were significant if they met the corrected level of significance, p < .01. Again,
because I was conducting 54 analyses (18 dependent measures and three predictors), .5 findings
would be produced by chance with an alpha criterion of .01. Here, 9 findings were statistically
significant.
There was one significant main effect of recent deployment status, such that one’s ability
to handle daily hassles was positively related to one’s partner being recently deployed (relative
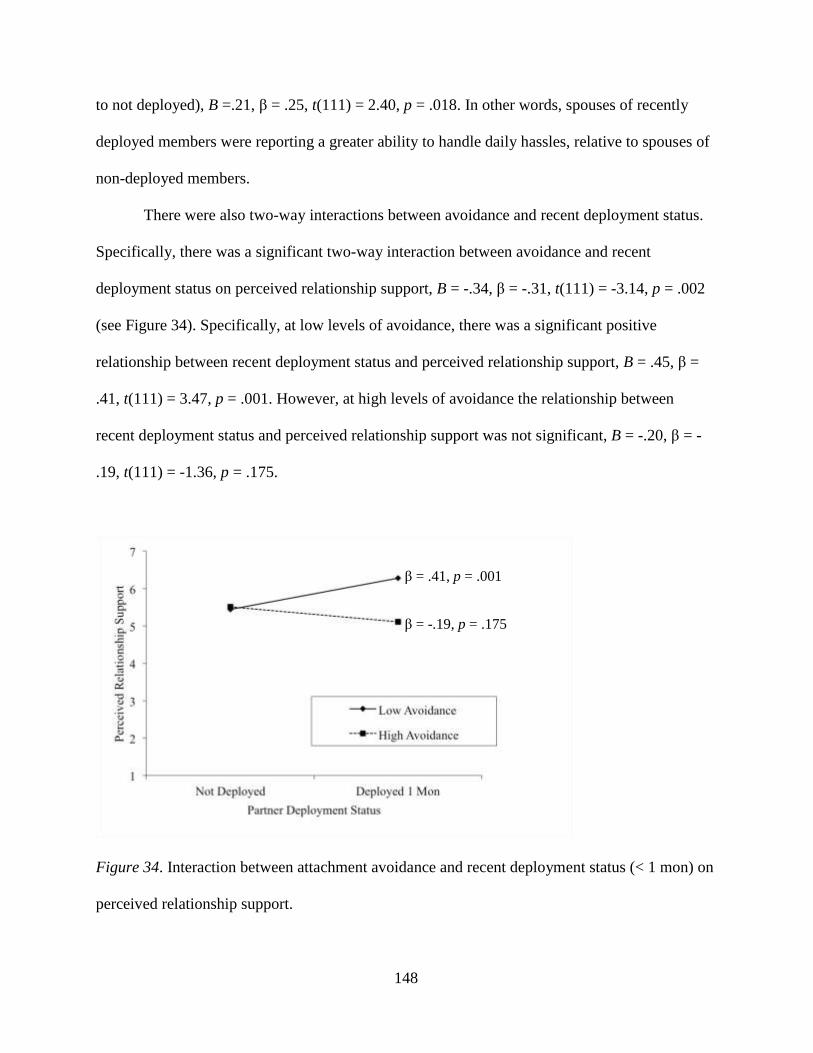
148
to not deployed), B =.21, β = .25, t(111) = 2.40, p = .018. In other words, spouses of recently
deployed members were reporting a greater ability to handle daily hassles, relative to spouses of
non-deployed members.
There were also two-way interactions between avoidance and recent deployment status.
Specifically, there was a significant two-way interaction between avoidance and recent
deployment status on perceived relationship support, B = -.34, β = -.31, t(111) = -3.14, p = .002
(see Figure 34). Specifically, at low levels of avoidance, there was a significant positive
relationship between recent deployment status and perceived relationship support, B = .45, β =
.41, t(111) = 3.47, p = .001. However, at high levels of avoidance the relationship between
recent deployment status and perceived relationship support was not significant, B = -.20, β = -
.19, t(111) = -1.36, p = .175.
Figure 34. Interaction between attachment avoidance and recent deployment status (< 1 mon) on
perceived relationship support.
β = .41, p = .001
β = -.19, p = .175

149
There was also a significant two-way interaction between attachment avoidance and
recent deployment status on cognitive fitness, B = -.31, β = -.36, t(111) = -3.30, p = .001 (see
Figure 35). Consistent with the above findings, at low levels of avoidance, there was a
significant positive relationship between recent deployment status and cognitive fitness, B = .29,
β = .35, t(111) = 2.58, p = .011. This time, at high levels of avoidance there was a significant
negative relationship between recent deployment status and cognitive fitness, B = -.28, β = -.34,
t(111) = -2.20, p = .030.
Figure 35. Interaction between attachment avoidance and recent deployment status (< 1 mon) on
cognitive fitness.
In addition, there was a significant two-way interaction between avoidance and recent
deployment status for perceived relationship success, B = -.35, β = -.39, t(111) = -3.63, p < .001
(see Figure 36). Consistent with the prior analyses, at low levels of avoidance, there was a
significant positive relationship between recent deployment status and relationship success, B =
.37, β = .41, t(111) = 3.11, p = .002. However, at high levels of avoidance there was a significant
β = .35, p = .011
β = -.34, p = .030

150
negative relationship between recent deployment status and relationship success, B = -.31, β = -
.35, t(111) = -2.32, p = .022.
Figure 36. Interaction between attachment avoidance and recent deployment status (< 1 mon) on
perceived relationship success.
There was also a significant two-way interaction between attachment avoidance and
deployment status for relationship satisfaction using the RDAS measure, B = -.23, β = -.27,
t(111) = -2.75, p = .009 (see Figure 37). Specifically, at low levels of attachment avoidance,
there was a significant positive relationship between recent deployment status and relationship
satisfaction, B = .25, β = .31, t(111) = 2.55, p = .012. However, at high levels of avoidance, the
relationship between recent deployment status and relationship satisfaction was not significant, B
= -.21, β = -.25, t(111) = -1.82, p = .072.
β = .41, p = .002
β = -.35, p = .022

151
Figure 37. Interaction between attachment avoidance and recent deployment status (< 1 mon) on
relationship satisfaction (RDAS).
Lastly, there was a significant two-way interaction between attachment avoidance and
recent deployment status for perceived relationship cohesion, B = -.26, β = -.35, t(111) = -3.55, p
< .001 (see Figure 38). Specifically, at low levels of attachment avoidance, there was a
significant positive relationship between recent deployment status and relationship cohesion, B =
.31, β = .43, t(111) = 3.52, p = .001. Further, at high levels of avoidance, there was a significant
negative relationship between recent deployment status and relationship cohesion, B = -.21, β = -
.29, t(111) = -2.04, p = .044.
β = .31, p = .012
β = -.25, p = .072
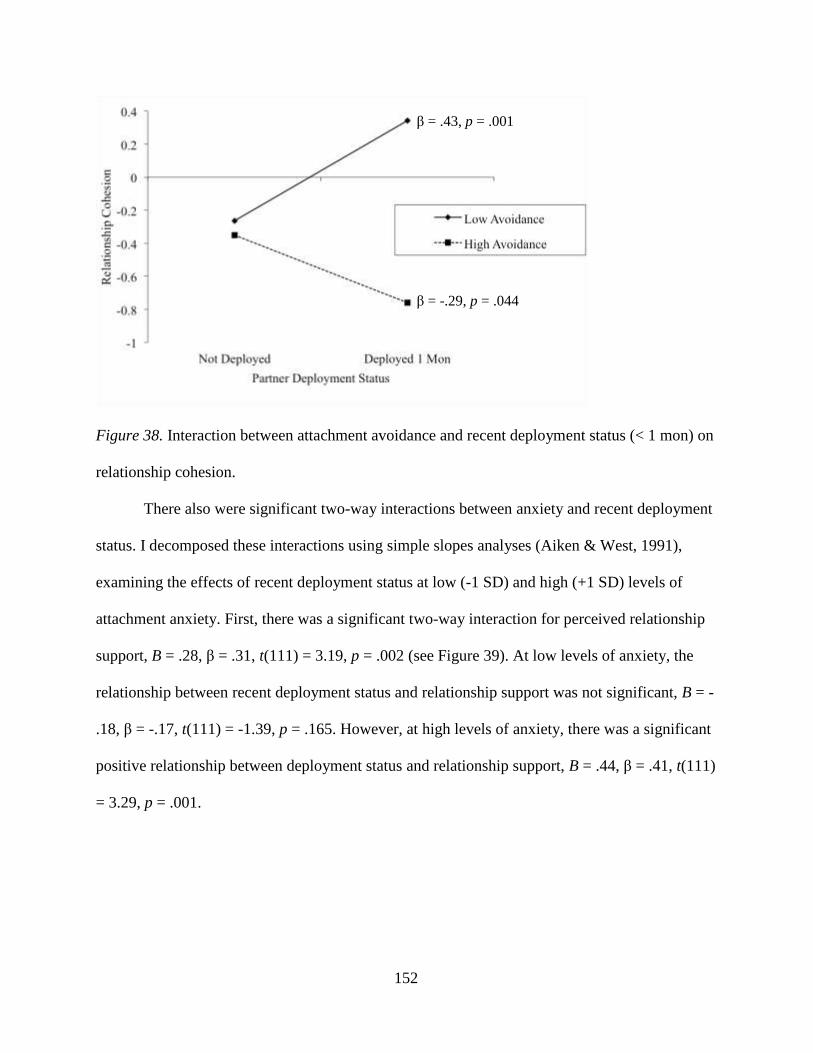
152
Figure 38. Interaction between attachment avoidance and recent deployment status (< 1 mon) on
relationship cohesion.
There also were significant two-way interactions between anxiety and recent deployment
status. I decomposed these interactions using simple slopes analyses (Aiken & West, 1991),
examining the effects of recent deployment status at low (-1 SD) and high (+1 SD) levels of
attachment anxiety. First, there was a significant two-way interaction for perceived relationship
support, B = .28, β = .31, t(111) = 3.19, p = .002 (see Figure 39). At low levels of anxiety, the
relationship between recent deployment status and relationship support was not significant, B = -
.18, β = -.17, t(111) = -1.39, p = .165. However, at high levels of anxiety, there was a significant
positive relationship between deployment status and relationship support, B = .44, β = .41, t(111)
= 3.29, p = .001.
β = .43, p = .001
β = -.29, p = .044
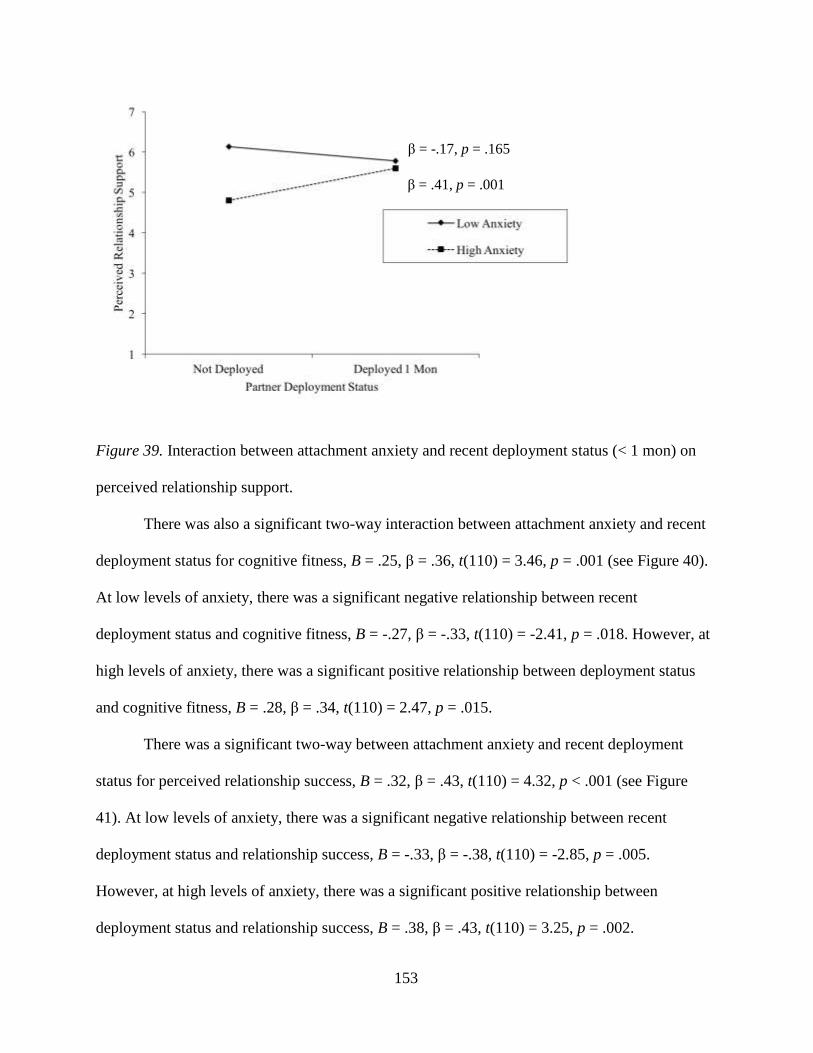
153
Figure 39. Interaction between attachment anxiety and recent deployment status (< 1 mon) on
perceived relationship support.
There was also a significant two-way interaction between attachment anxiety and recent
deployment status for cognitive fitness, B = .25, β = .36, t(110) = 3.46, p = .001 (see Figure 40).
At low levels of anxiety, there was a significant negative relationship between recent
deployment status and cognitive fitness, B = -.27, β = -.33, t(110) = -2.41, p = .018. However, at
high levels of anxiety, there was a significant positive relationship between deployment status
and cognitive fitness, B = .28, β = .34, t(110) = 2.47, p = .015.
There was a significant two-way between attachment anxiety and recent deployment
status for perceived relationship success, B = .32, β = .43, t(110) = 4.32, p < .001 (see Figure
41). At low levels of anxiety, there was a significant negative relationship between recent
deployment status and relationship success, B = -.33, β = -.38, t(110) = -2.85, p = .005.
However, at high levels of anxiety, there was a significant positive relationship between
deployment status and relationship success, B = .38, β = .43, t(110) = 3.25, p = .002.
β = -.17, p = .165
β = .41, p = .001

154
Figure 40. Interaction between attachment anxiety and recent deployment status (< 1 mon) on
cognitive fitness.
Figure 41. Interaction between attachment anxiety and recent deployment status (< 1 mon) on
perceived relationship success.
β = .43, p = .002
β = -.38, p = .005
β = .34, p = .015
β = -.33, p = .018

155
Finally, there was a two-way interaction for relationship satisfaction using the RDAS
measure, B = .19, β = .27, t(111) = 2.96, p = .004 (see Figure 42). At low levels of anxiety the
relationship between recent deployment status and relationship satisfaction was not significant, B
= -.19, β = -.23, t(111) = -1.89, p = .062. However, at high levels of anxiety there was a
significant positive relationship between recent deployment status and relationship satisfaction,
B = .24, β = .28, t(111) = 2.28, p = .025.
Figure 42. Interaction between attachment anxiety and recent deployment status (< 1 mon) on
relationship satisfaction (RDAS).
There were no significant three-way interactions among anxiety, avoidance, and recent
deployment status on any of the 19 outcomes.
Attachment Anxiety, Avoidance, and Months Deployed
Many of the above findings were surprising, specifically that higher levels of attachment
anxiety were related to more positive relationship perceptions and indices of well-being.
However, individuals higher in attachment anxiety do tend to be more variable in their responses
β = -.23, p = .062
β = .28, p = .025
156
to relationship conflicts (Tidwell, Reis, & Shaver, 1996; Campbell, Simpson, Boldry, & Kashy,
2005; MacDonald, Wood, and Fabrigar, submitted for publication). In particular, evidence from
Phase One, and consistent with findings by Rholes and colleagues (2001), indicates that
perceptions of relationship well-being and emotional well-being declines across the separation
period for those higher in attachment anxiety. The analyses in this section were intended to test
this prediction, that attachment anxiety in particular would interact with the number of months
deployed in predicting relationship and intrapersonal outcomes.
Therefore, next I assessed the potential trajectory of the relationships among attachment
anxiety, avoidance, and perceptions of one’s intrapersonal functioning and relationship
perceptions as a function of months deployed. Specifically, I wanted to examine potential linear
and curvilinear effects of anxiety and avoidance as a function of months deployed. Recall from
earlier that, as outlined in the Canadian Forces Deployment Handbook (Egerton-Graham, 2009),
the most challenging stage of the separation is stage 3, occurring during weeks 3-6 of the
separation, and consisting of emotional disorganization. Spouse’s well-being typically improves
when they enter stage 4, recovery and stabilization, which occurs 6-12 weeks into the separation
as they have adjusted to their new way of life and distant relationship with their spouse. The next
stage after that is the anticipation of homecoming which occurs 1-3 weeks prior to the spouse’s
arrival home and is fraught with excitement elation and fantasizing.
Although I was interested in examining the potential trajectory of the relationships
among anxiety, avoidance, and intrapersonal and interpersonal outcomes as a function of the
duration of the deployment, this was challenging with this particular set of data for the following
reasons. First, to adequately map the effects of attachment anxiety and avoidance as a function
of deployment stages most accurately, I would need to know not only the number of months that

157
spouses have been separated from their partners for, but also the projected return date. The
return date would allow me to more accurately identify when spouses are likely experiencing the
anticipation of homecoming, but unfortunately I didn’t have this information. Further, not all
deployments are the same in length, so any findings must be interpreted with caution given the
variance in deployment length and not being able to adequately infer that the longer the duration,
the closer a partner is to returning home.
Nonetheless, assessing the unique and interactive effects of anxiety and avoidance on
outcomes as a function of number of months deployed (both linear and curvilinear) gives me an
idea about the effects of separation duration on an individual’s intrapersonal functioning and
relationship perceptions as a function of attachment dimensions. Prior to conducting any
analyses, I checked the descriptive properties of the months deployed variable (as I did all
variables prior to conducting regressions). This variable was found to be positively skewed
(skewness index = 3.57) and with particular descriptive statistics indicating a deviation from
normality (e.g., kurtosis index = 12.06), both indicates out of the acceptable ranges proposed by
West and colleagues (1995). Therefore, I conducted a normality transformation to the months
deployed variable, specifically a Logarithmic (Log 10) transformation that is appropriate when
dealing with a substantial positive skewness. After performing the transformation, this variable
had skewness (= 0.40) and kurtosis (= -0.43) values that were in an acceptable range, indicating
a distribution within normal parameters.
I then conducted multiple linear regressions to assess the unique and interactive effects of
(mean centered) attachment anxiety and avoidance, and the number of months deployed
(transformed and mean centered) on the same 18 outcomes previously found to be predicted by
anxiety in particular. Consistent with previous analyses, relationship length, self-worth, and

158
awareness of support programs were included as covariates in these analyses. A simple slopes
analyses were used to decompose interactions, examining the effects of deployment months at
high (+1 SD) and low (-1 SD) levels of anxiety and avoidance. Similar to previous analyses, I
employed an alpha correction, such that the following results were significant if they met the
corrected level of significance, p < .01. Again, because I was conducting 54 analyses (18
dependent measures and three predictors), .5 findings would be produced by chance with an
alpha criterion of .01. Here, 4 findings were statistically significant.
There was one main effect of months on the desire to eat when stressed [B = -.52, β = -
.20, t(186) = -2.48, p = .014].
In addition, there was one significant two-way interaction between avoidance and months
deployed on stress reported during general military experiences, B = -.45, β = -.23, t(177) = -
2.71, p = .008 (see Figure 43). At low levels of avoidance, the relationship between months
deployed and stress during general military experiences was not significant, B = .21, β =.13,
t(177) = 1.13, p = .262. However, at high levels of avoidance there was a significant negative
relationship between months deployed and stress during general military experiences, B = -.63, β
= -.38, t(177) = -2.95, p = .004.
There was also one significant two-way interaction between attachment anxiety and
months deployed on perceived relationship success [B = -.41, β = -.25, t(186) = -3.46, p = .001;
see Figure 44]. At low levels of anxiety, there was a significant positive relationship between
months deployed and relationship success, B = .49, β =.25, t(186) = 2.72, p = .007. Further, at
high levels of anxiety, there was a significant negative relationship between months deployed
and relationship success, B = -.42, β = -.22, t(186) = -2.25, p = .026. ]

159
Figure 43. Interaction between attachment avoidance and number of months deployed
(transformed and mean centered) on reported stress during general military experiences.
Figure 44. Interaction between attachment anxiety and number of months deployed (transformed
and mean centered) on relationship success.
There were two significant higher-order three-way interactions among anxiety,
avoidance, and months deployed. Interactions were decomposed using simple slopes analysis
β = .13, p = .262
β = -.38, p = .004
β = .25, p = .007
β = -.22, p = .026

160
(Aiken & West, 1991), examining the effects of months deployed at high (+1 SD) and low (-1
SD) levels of anxiety and avoidance.
First, there was a significant three-way interaction for stress during general military
experiences [B = .28, β = .22, t(177) = 2.73, p = .007; see Figure 45]. There was only one simple
slope that was significant. Specifically, at high levels of avoidance and low levels of anxiety,
there was a significant negative relationship between number of months deployed and reported
stress during general military experiences, B = -1.15, β = -.69, t(177) = -3.57, p < .001.
Figure 45. Interaction among attachment anxiety, attachment avoidance, and number of months
deployed (transformed and mean centered) on stress during general military experiences.
Second, there was a significant three-way interaction between anxiety, avoidance, and
months deployed for coping success [B = -.36, β = -.24, t(185) = -3.29, p = .001; see Figure 46].
There were two simple slopes that were significant. At high levels of avoidance and low levels
of anxiety, there was a significant positive relationship between months deployed and coping
success, B = .97, β = .49, t(185) = 2.80, p = .006. Further, at low levels of avoidance and low
β = .21, p = .282
β = .17, p = .123
β = -.01, p = .913
β = -.69, p < .001

161
levels of anxiety (the ‘secure’ group), there was a significant negative relationship between
months deployed and coping success, B = -.47, β = -.24, t(185) = -2.46, p = .015.
Figure 46. Interaction between attachment anxiety, attachment avoidance, and number of
months deployed (transformed and mean centered) on coping success.
Curvilinear Effects of Months Deployed as a Function of Attachment Anxiety and
Attachment Avoidance
I was interested in testing whether there were curvilinear effects of months deployed as a
function of attachment anxiety and avoidance on the 18 dependent measures. According to the
Canadian Forces Deployment Handbook (Egerton-Graham, 2009), the nature of emotional
reactivity across the separation is curvilinear. Specifically, spouses progress from more
emotional ‘reacting’ stages (Stages 1-3) to emotional stabilization (Stages 4-5), and then into
another reacting stage, Stage 1 of their reunion, which is the anticipation of their partner’s
homecoming. Therefore, it makes sense to test how the relationships between attachment
dimensions and intrapersonal coping and relationship outcomes across the separation might be
β = .49, p = .006
β = -.24, p = .015 β = -.07, p = .713
β = -.10, p = .283
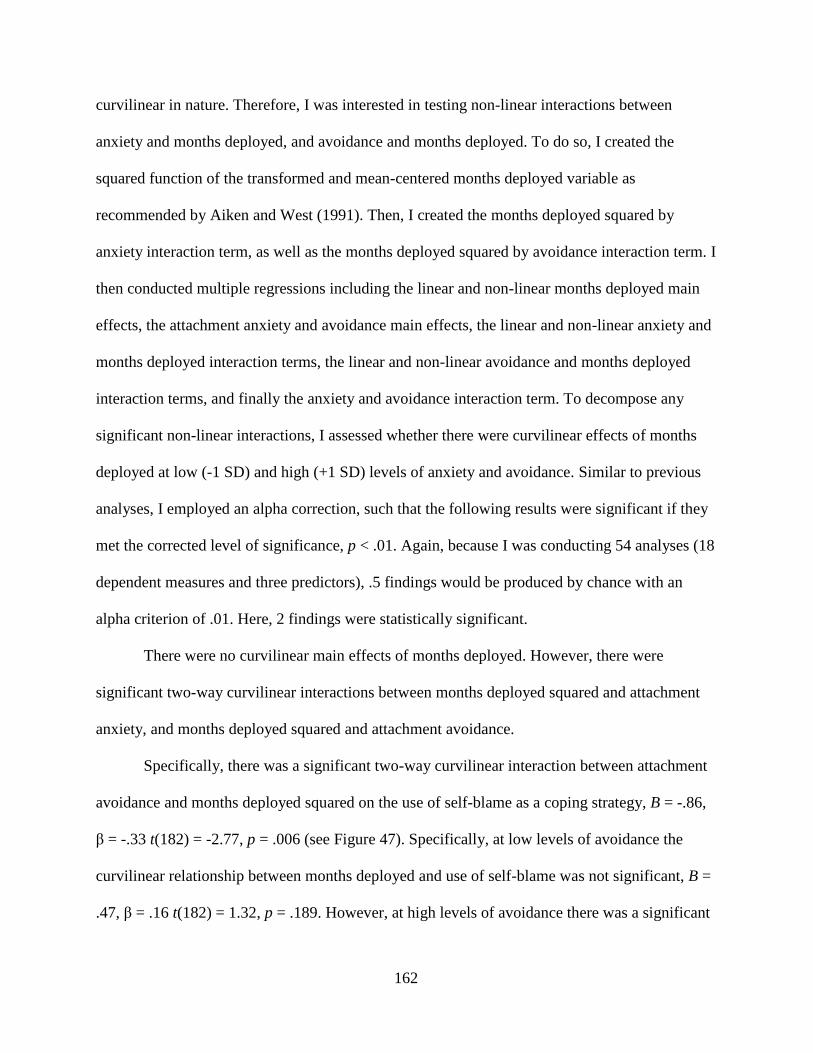
162
curvilinear in nature. Therefore, I was interested in testing non-linear interactions between
anxiety and months deployed, and avoidance and months deployed. To do so, I created the
squared function of the transformed and mean-centered months deployed variable as
recommended by Aiken and West (1991). Then, I created the months deployed squared by
anxiety interaction term, as well as the months deployed squared by avoidance interaction term. I
then conducted multiple regressions including the linear and non-linear months deployed main
effects, the attachment anxiety and avoidance main effects, the linear and non-linear anxiety and
months deployed interaction terms, the linear and non-linear avoidance and months deployed
interaction terms, and finally the anxiety and avoidance interaction term. To decompose any
significant non-linear interactions, I assessed whether there were curvilinear effects of months
deployed at low (-1 SD) and high (+1 SD) levels of anxiety and avoidance. Similar to previous
analyses, I employed an alpha correction, such that the following results were significant if they
met the corrected level of significance, p < .01. Again, because I was conducting 54 analyses (18
dependent measures and three predictors), .5 findings would be produced by chance with an
alpha criterion of .01. Here, 2 findings were statistically significant.
There were no curvilinear main effects of months deployed. However, there were
significant two-way curvilinear interactions between months deployed squared and attachment
anxiety, and months deployed squared and attachment avoidance.
Specifically, there was a significant two-way curvilinear interaction between attachment
avoidance and months deployed squared on the use of self-blame as a coping strategy, B = -.86,
β = -.33 t(182) = -2.77, p = .006 (see Figure 47). Specifically, at low levels of avoidance the
curvilinear relationship between months deployed and use of self-blame was not significant, B =
.47, β = .16 t(182) = 1.32, p = .189. However, at high levels of avoidance there was a significant

163
curvilinear (inverted U) relationship between months deployed and use of self-blame as a coping
strategy, B = -1.16, β = -.39 t(182) = -3.22, p = .002.
Figure 47. Interaction between attachment avoidance and number of months deployed
(transformed and mean-centered) squared on the use of self-blame as a coping strategy.
There was also a significant two-way curvilinear interactions between attachment anxiety
and months deployed squared on relationship satisfaction using the QMI measure, B = -.90, β = -
.26 t(184) = -2.64, p = .009. At low levels of anxiety, the curvilinear relationship between
months deployed squared and relationship satisfaction was not significant, B = .88, β = .17
t(184) = 1.80, p = .074 (see Figure 48). However, at high levels of anxiety there was a significant
curvilinear relationship (inverted U) between months deployed and relationship satisfaction, B =
-1.10, β = -.21 t(184) = -2.32, p = .021.
β = .16, p = .189
β = -.39, p = .002
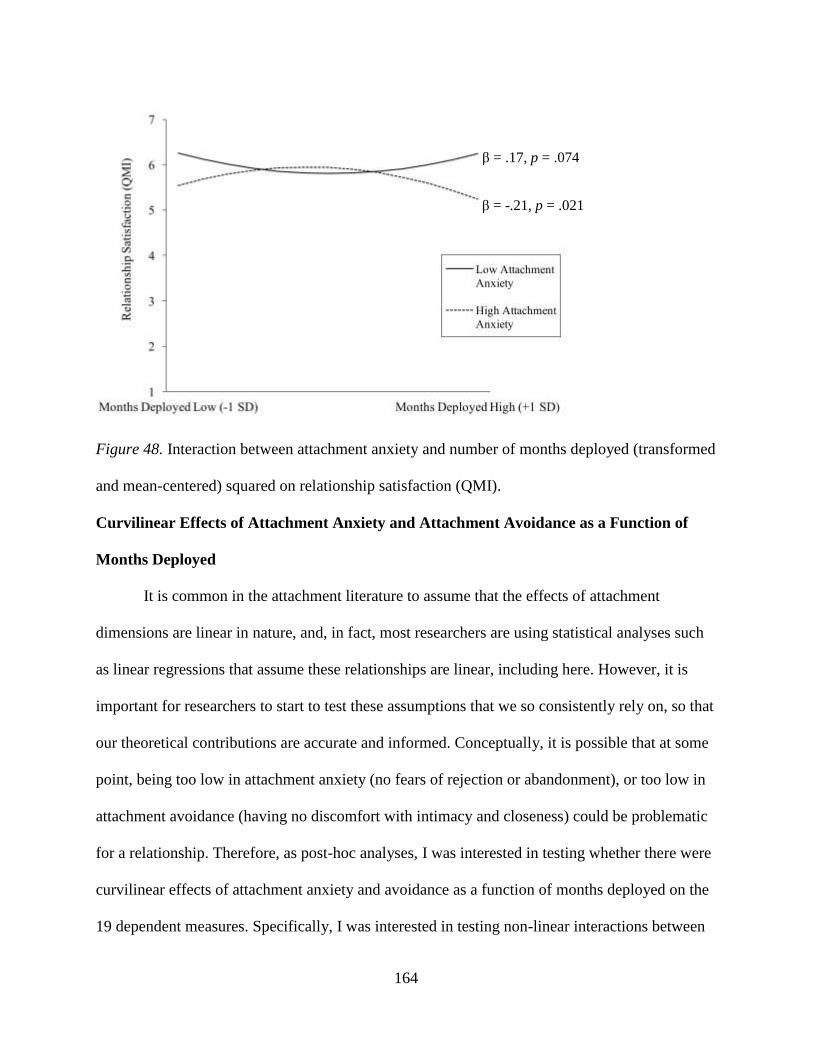
164
Figure 48. Interaction between attachment anxiety and number of months deployed (transformed
and mean-centered) squared on relationship satisfaction (QMI).
Curvilinear Effects of Attachment Anxiety and Attachment Avoidance as a Function of
Months Deployed
It is common in the attachment literature to assume that the effects of attachment
dimensions are linear in nature, and, in fact, most researchers are using statistical analyses such
as linear regressions that assume these relationships are linear, including here. However, it is
important for researchers to start to test these assumptions that we so consistently rely on, so that
our theoretical contributions are accurate and informed. Conceptually, it is possible that at some
point, being too low in attachment anxiety (no fears of rejection or abandonment), or too low in
attachment avoidance (having no discomfort with intimacy and closeness) could be problematic
for a relationship. Therefore, as post-hoc analyses, I was interested in testing whether there were
curvilinear effects of attachment anxiety and avoidance as a function of months deployed on the
19 dependent measures. Specifically, I was interested in testing non-linear interactions between
β = .17, p = .074
β = -.21, p = .021

165
anxiety and months deployed, and avoidance and months deployed. While the bulk of the
attachment literature treats the two attachment dimensions as linear, and in fact assumes linear
effects of these variables, I wanted to assess the validity of this assumption and test for potential
non-linear effects of attachment dimensions in the context of military deployments. To do so, I
created the squared function of the mean-centered attachment anxiety and avoidance variables as
recommended by Aiken and West (1991). Then, I created the anxiety squared by months
deployed interaction term, as well as the avoidance squared by months deployed squared
interaction term. I then conducted multiple regressions including the linear and non-linear
attachment anxiety and avoidance main effects, the months deployed main effect, the linear and
non-linear anxiety and months deployed interaction terms, the linear and non-linear avoidance
and months deployed interaction terms, and finally the anxiety and avoidance interaction term.
To decompose any significant non-linear interactions, I assessed whether there were curvilinear
effects of attachment anxiety and avoidance at low (-1 SD) and high (+1 SD) points of months
deployed. Similar to previous analyses, I employed an alpha correction, such that the following
results were significant if they met the corrected level of significance, p < .01. Again, because I
was conducting 54 analyses (18 dependent measures and three predictors), .5 findings would be
produced by chance with an alpha criterion of .01. Here, no findings were statistically
significant.
Attachment Anxiety, Avoidance, and Deployment Prep Status
Logan (1987) argues that one of the most challenging stages is Stage 2 which occurs 1-3
weeks prior to the deployment called detachment and withdrawal and is associated with
cognitive, emotional, and relationship difficulties including anxiety, sleep disturbances,
regressive behaviours, and ambivalence with displays of intimacy with one’s partner. Therefore,

166
I predicted that the effects of attachment anxiety on relationship and emotional functioning
might be exacerbated for those preparing for a partner’s deployment, relative to those not
experiencing or preparing for a deployment. Specifically, I examined whether the effects of
preparing, versus not preparing, for a deployment moderate the effects of anxiety and avoidance
on spousal functioning. To do this, I first collected a different subsample of non-deployed
spouses whose partners were not currently preparing for a deployment, and had not returned
from a deployment in the past 12 months. Although there were 93 spouses that indicated that
their partners were currently preparing for a deployment, 19 were excluded from the subsequent
analyses because a) they had also indicated their partners were currently deployed, or b) their
partners had returned from a deployment less than 12 months ago. Thus, there were 74 spouses
whose partners were currently preparing for a deployment, and were not currently deployed, or
had not recently returned from a deployment. For this reason, I collected a sample of 74 non-
deployed spouses whose partners had also not returned from a deployment in the past 12
months. This variable was coded such that non-deployed spouses were assigned a value of -1
and spouses preparing for a deployment a value of 1.
Prior to conducting any analyses, I conducted t-tests (or chi-square tests) first between
my non-deployed (n = 74) against the larger non-deployed group (n = 1293) to ensure that it was
a representative sample. Specifically, the groups were compared on the same DVs that were
tested between prior groups: being married to same or opposite sex partner, relationship status
and duration, gender, age, education, whether the spouse has children, the spouse’s employment
status, whether the spouse was currently a CAF member, whether they were aware of support
programs within their community, their partner’s rank and element, and levels of attachment
avoidance, or anxiety. The two groups were not statistically different in on any of the DVs.

167
Next, I conducted t-tests (or chi-square tests) between the random sample of non-
deployed spouses (the ‘baseline’ group) and the group of spouses currently preparing for a
partner’s deployment on the same DVs as above. The two groups were not different with respect
to being married to the same or opposite sex partner, relationship status, gender, education,
whether they have children, whether the spouse is current a serving CAF member, awareness of
support programs, or levels of attachment avoidance or anxiety. There were, however, some
differences between these two groups. Specifically, the group preparing for a deployment was
younger (M = 36.12, SD = 7.63) than the baseline group [M = 38.76, SD = 8.24; t(171) = 2.63, p
= .033], had been with their partners for less time (M = 10.57, SD = 6.95) than the baseline
group [M = 14.77, SD = 8.41; t(166) = 4.20, p < .001), and had deployed more times in the past
five years (M = 1.33, SD = 1.48) relative to the baseline group (M = .89, SD = .96; t(109) = -
2.18, p = .032). Given the above, age, relationship length, number of times deployed in the past
5 years were included as covariates in subsequent analyses.
I then conducted multiple linear regressions to examine the unique and interactive effects
of attachment anxiety, avoidance, and deployment prep status on the 18 DVs that were
significant for the main effects of anxiety, consistent with the analyses for deployment status,
recent deployment status, and months deployed. The following were included as covariates
given the above findings: age, relationship length, number of times deployed in the past five
years, along with self-worth (which correlated with anxiety), relationship length, and awareness
of support programs (which both correlated with avoidance) again consistent with previous
analyses. Simple slopes analyses were used to decompose interactions, examining the effects of
deployment prep status at high (+1 SD) and low (-1 SD) levels of anxiety and avoidance.
Similar to previous analyses, I employed an alpha correction, such that the following results

168
were significant if they met the corrected level of significance, p < .01. Again, because I was
conducting 54 analyses (18 dependent measures and three predictors), .5 findings would be
produced by chance with an alpha criterion of .01. Here, no findings were statistically
significant.
Attachment Anxiety, Avoidance, and Recent Reunion Status
According to the Canadian Forces Deployment Handbook (Egerton-Graham, 2009),
couples are in ‘reacting’ stages 2-6 weeks (‘reintegration’) and 6-12 weeks (‘renegotiation’)
post-reunion. I wanted to assess whether attachment anxiety and avoidance moderated the
effects of post-reunion experiences relative to a ‘baseline’ or couples not experiencing a reunion
or separation. With the Phase One reunion group, I found that the effects of attachment anxiety
on some relationship outcomes were moderated by time reunited. For example, for highly
anxious individuals their perceptions of their interactions with their partners declined as a
function of time reunited. However, there was no relationship between quality of interactions
and time reunited for those lower in attachment anxiety. This is consistent with the findings of
Rholes and colleagues (2001) who found that for anxious spouses, their perceptions of their
partner’s support declined across the transition into parenthood. This is also consistent with my
findings in this study reported earlier, that individuals higher in attachment anxiety, while
initially report higher adjustment and well-being at the first stage of the separation relative to a
baseline group, these individuals showed declines in relationship perceptions and indices of
well-being as the separation progressed. Therefore, I predicted that, in line with the previous
findings from this Phase, attachment anxiety would be associated with increased perceptions of
relationship functioning and intrapersonal well-being for those recently reunited with their
partners, relative to those not experiencing a reunion. Theoretically this makes sense, that if

169
individuals high in attachment anxiety are dependent on their partners for emotional comfort,
reassurance, and validation, experience increased distress in response to partner separations, and
desire greater levels of closeness in their relationships, it could be argued that those high in
attachment anxiety should respond more positively to this honeymoon period. Such individuals
might report feeling more emotionally connected to their partners, more satisfied in their
relationships, and experience improved emotional well-being relative to those lower in
attachment anxiety.
On the other hand, highly avoidant individuals may be less satisfied with their partners’
behaviour during the Elation period as they learn to cope with their partners being physically
closer. Having one’s partner home would naturally increase levels of intimacy in the relationship
making avoidant individuals uncomfortable and might potentially lead to conflict and more
unpleasant partner interactions. This would be consistent with work by Tidwell, Reis, and
Shaver (1996) that found that avoidant individuals reported less intimacy, enjoyment and
positive emotions with their partners, and that avoidant individuals would structure social
activities in ways that minimize intimacy and closeness.
To test these predictions, I compared the group of spouses who had been reunited with
their partner from a military deployment for 1-2 months (n = 76) and were not preparing for
another deployment, to a group of spouses who were not currently experiencing a reunion or
separation with their partner, were not preparing for a deployment and had not deployed in the
past 12 months (n = 1293). Given the differences in sample sizes, and consistent with previous
analyses, I randomly selected a subsample of 76 individuals from this latter group to use for
comparison against the reunion group.
170
I then conducted t-tests (and chi-square where appropriate) to determine whether the
random sample of non-reunion spouses were representative of the larger non-reunion group on
key demographic and predictor variables. Results from these analyses showed that these two
groups were statistically different on only one out of the 14 variables. Specifically, the random
non-reunion sample was more likely to have children (M = 1.00, SD = .18) relative to the recent
reunion group (M = .97, SD = .00), t(1236) = -6.34, p < .001. However, the two groups were not
statistically different on the following variables: whether the spouses were married to a same or
opposite sex partner, relationship status, relationship length, gender, age, education, number of
partner deployments in the past five years, partner’s military element, partner’s rank, whether the
spouse is currently a CAF member, awareness of support programs, or levels of avoidance or
anxiety. Therefore, this sample was fairly representative of the larger non-reunion group.
I also conducted the same t-tests (and chi-square tests) to compare scores on the same
variables above between the baseline and reunion groups to rule out potential confounding
variables. The two groups were statistically different on two variables. First, the recently
reunited group had experienced more deployments in the past five years (M = 3.59, SD = 3.60)
relative to the non-reunited group [M = 0.75, SD = .90; t(83) = -6.63, p < .001). Second, the
proportion of spouses who were currently CAF members (regular or reserve force) or civilians
was not consistent across the two groups, 2(2, N = 149) = 8.84, p = .012. Specifically, the
recently reunited group had fewer at-home spouses who were regular force members and more
that were civilian than expected, and the non-reunited group has more spouses who were regular
force members and fewer spouses who were not military members than expected. For the above
reasons, number of deployments in the past five years and whether the spouses were CAF
members were included as covariates in the following analyses along with self-worth,

171
relationship length, and awareness of support programs consistent with prior analyses. Simple
slopes analyses (Aiken & West, 1991) were used to decompose any interactions, assessing the
effect of recent reunion status at high (+1 SD) and low (-1 SD) levels of attachment anxiety and
avoidance. Similar to previous analyses, I used the corrected level of significance of p < .01.
Again, because I was conducting 54 analyses (18 dependent measures and three predictors), .5
findings would be produced by chance with an alpha criterion of .01. Here, 2 findings were
statistically significant.
There was a main effect of recent reunion status on self-distraction as a coping strategy
such that those who were recently reunited with their partners engaged in greater self-distraction
than those not recently reunited, B = .27, = .33, t(99) = 2.58, p = .011. There was also a main
effect for life readiness, such that those who were recently reunited with their partners reported
more life readiness than those not recently reunited, B = .26, = .32, t(99) = 2.69, p = .008.
Next, there was a significant two-way interaction between anxiety and recent reunion
status on perceived relationship success, B = .41, = .46, t(99) = 3.29, p = .001 (see Figure 49).
At low levels of anxiety, there was a significant negative relationship between reunion status and
perceived relationship success such that those who were recently reunited reported less
relationship success than those not recently reunited, B = -.39, = -.40, t(99) = -2.14, p = .035.
However, at high levels of anxiety there was a significant positive relationship between recent
reunion status and perceived relationship success such that spouses recently reunited with their
partners reported higher levels of relationship success relative to those not recently reunited, B =
.52, = .54, t(99) = 3.29, p = .001.

172
Figure 49. Interaction between attachment anxiety and recent reunion status on perceived
relationship success.
There was also a significant two-way interaction for relationship consensus, B = .24, =
.38, t(100) = 2.73, p = .007 (see Figure 50). Again, at low levels of anxiety the relationship
between recent reunion status and relationship consensus was not significant, B = -.23, = -.35,
t(100) = -1.86, p = .066. However, at high levels of anxiety there was a significant positive
relationship between recent reunion status and relationship consensus such that spouses recently
reunited with their partners reported higher levels of relationship consensus relative to those not
recently reunited, B = .30, = .44, t(100) = 2.57, p = .012.
β = -.40, p = .035
β = .54, p = .001
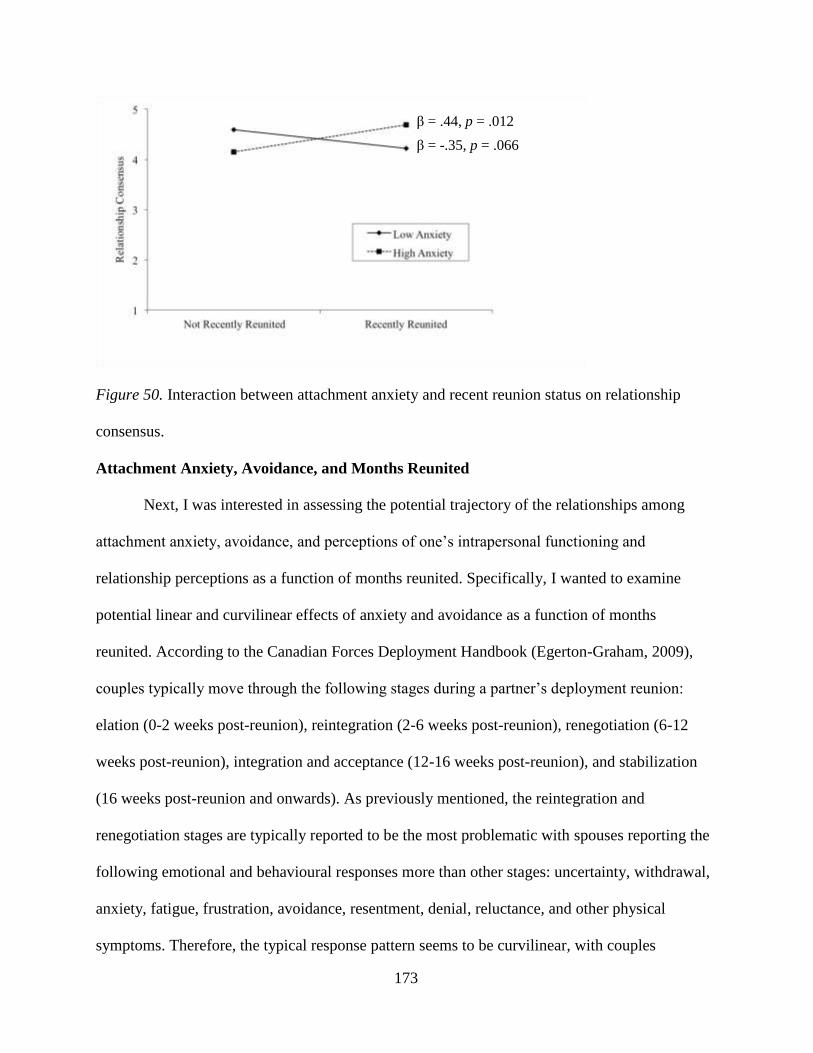
173
Figure 50. Interaction between attachment anxiety and recent reunion status on relationship
consensus.
Attachment Anxiety, Avoidance, and Months Reunited
Next, I was interested in assessing the potential trajectory of the relationships among
attachment anxiety, avoidance, and perceptions of one’s intrapersonal functioning and
relationship perceptions as a function of months reunited. Specifically, I wanted to examine
potential linear and curvilinear effects of anxiety and avoidance as a function of months
reunited. According to the Canadian Forces Deployment Handbook (Egerton-Graham, 2009),
couples typically move through the following stages during a partner’s deployment reunion:
elation (0-2 weeks post-reunion), reintegration (2-6 weeks post-reunion), renegotiation (6-12
weeks post-reunion), integration and acceptance (12-16 weeks post-reunion), and stabilization
(16 weeks post-reunion and onwards). As previously mentioned, the reintegration and
renegotiation stages are typically reported to be the most problematic with spouses reporting the
following emotional and behavioural responses more than other stages: uncertainty, withdrawal,
anxiety, fatigue, frustration, avoidance, resentment, denial, reluctance, and other physical
symptoms. Therefore, the typical response pattern seems to be curvilinear, with couples
β = -.35, p = .066
β = .44, p = .012
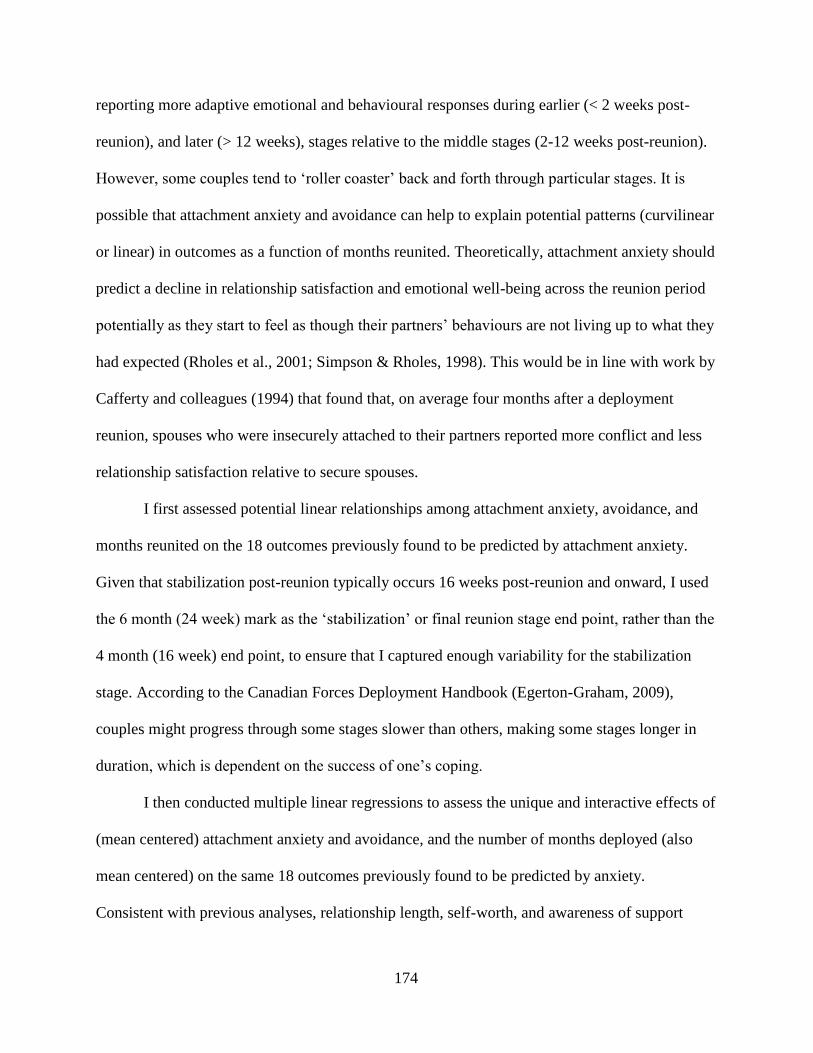
174
reporting more adaptive emotional and behavioural responses during earlier (< 2 weeks post-
reunion), and later (> 12 weeks), stages relative to the middle stages (2-12 weeks post-reunion).
However, some couples tend to ‘roller coaster’ back and forth through particular stages. It is
possible that attachment anxiety and avoidance can help to explain potential patterns (curvilinear
or linear) in outcomes as a function of months reunited. Theoretically, attachment anxiety should
predict a decline in relationship satisfaction and emotional well-being across the reunion period
potentially as they start to feel as though their partners’ behaviours are not living up to what they
had expected (Rholes et al., 2001; Simpson & Rholes, 1998). This would be in line with work by
Cafferty and colleagues (1994) that found that, on average four months after a deployment
reunion, spouses who were insecurely attached to their partners reported more conflict and less
relationship satisfaction relative to secure spouses.
I first assessed potential linear relationships among attachment anxiety, avoidance, and
months reunited on the 18 outcomes previously found to be predicted by attachment anxiety.
Given that stabilization post-reunion typically occurs 16 weeks post-reunion and onward, I used
the 6 month (24 week) mark as the ‘stabilization’ or final reunion stage end point, rather than the
4 month (16 week) end point, to ensure that I captured enough variability for the stabilization
stage. According to the Canadian Forces Deployment Handbook (Egerton-Graham, 2009),
couples might progress through some stages slower than others, making some stages longer in
duration, which is dependent on the success of one’s coping.
I then conducted multiple linear regressions to assess the unique and interactive effects of
(mean centered) attachment anxiety and avoidance, and the number of months deployed (also
mean centered) on the same 18 outcomes previously found to be predicted by anxiety.
Consistent with previous analyses, relationship length, self-worth, and awareness of support

175
programs were included as covariates in these analyses. These analyses would determine
potential linear effects of attachment dimensions as a function of months reunited. I decomposed
interactions using simple slopes analyses (Aiken & West, 1991), examining the effects of
months reunited at low (-1 SD) and high (+1 SD) levels of attachment avoidance and anxiety.
Consistent with previous analyses, I employed an alpha correction, such that the following
results were significant if they met the corrected level of significance, p < .01. Again, because I
was conducting 54 analyses (18 dependent measures and three predictors), .5 findings would be
produced by chance with an alpha criterion of .01. Here, 2 findings were statistically significant.
There were no significant main effects of months reunited on any of the 19 outcomes.
However, there a significant two-way interaction between avoidance and months
reunited on life mastery, B = -.12, = -.46, t(131) = -3.60, p < .001 (see Figure 51). At low
levels of avoidance, there was a significant positive relationship between months reunited and
feeling a sense of mastery over one’s life, B = .10, = .34, t(131) = 2.49, p = .014. However, at
high levels of avoidance there was a significant negative relationship between months reunited
and mastery, B = -.12, = -.43, t(131) = -2.91, p = .004.
In addition, there was a significant two-way interaction between attachment anxiety and
months reunited on life mastery, B = .08, = .31, t(131) = 2.65, p = .009 (see Figure 52). At low
levels of anxiety, there was a significant negative relationship between months reunited and
mastery, B = -.10, = -.35, t(131) = -2.51, p = .013. However, at high levels of anxiety the
relationship between months reunited and mastery was not significant, B = .08, = .27, t(131) =
1.68, p = .094.
176
Figure 51. Interaction between attachment avoidance and months reunited on life mastery.
Figure 52. Interaction between attachment anxiety and months reunited on life mastery.
β = .34, p = .014
β = -.43, p = .004
β = -.35, p = .013
β = .27, p = .094
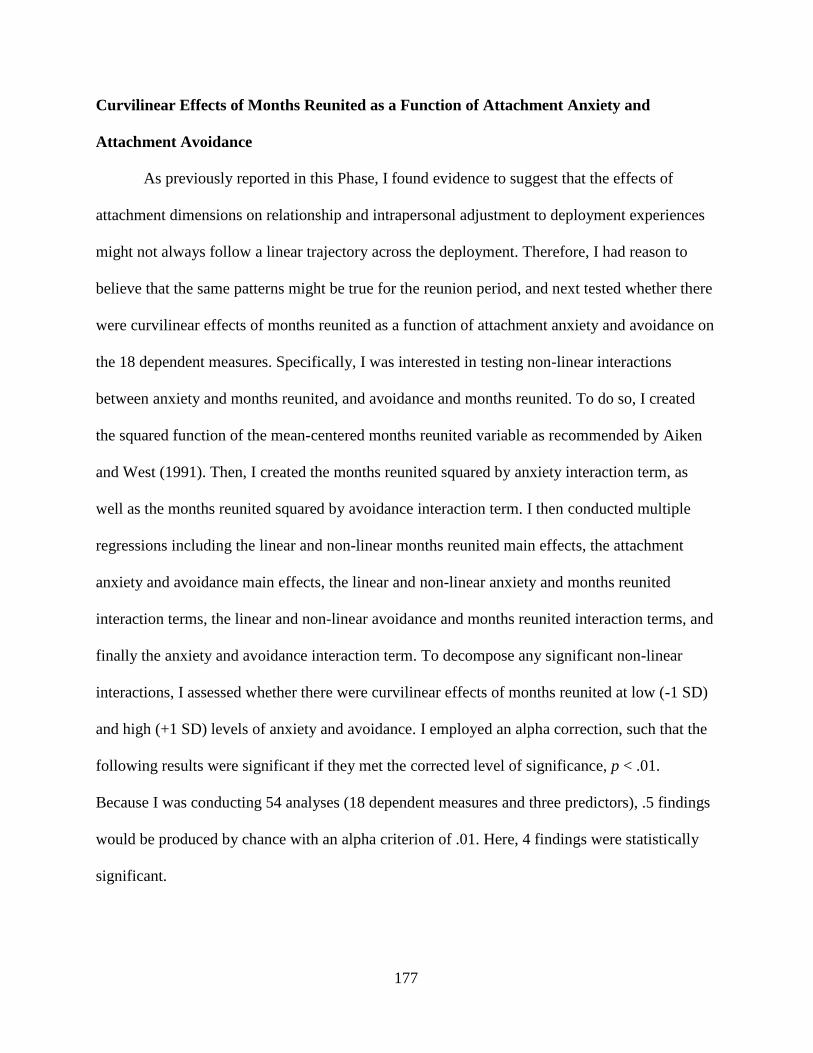
177
Curvilinear Effects of Months Reunited as a Function of Attachment Anxiety and
Attachment Avoidance
As previously reported in this Phase, I found evidence to suggest that the effects of
attachment dimensions on relationship and intrapersonal adjustment to deployment experiences
might not always follow a linear trajectory across the deployment. Therefore, I had reason to
believe that the same patterns might be true for the reunion period, and next tested whether there
were curvilinear effects of months reunited as a function of attachment anxiety and avoidance on
the 18 dependent measures. Specifically, I was interested in testing non-linear interactions
between anxiety and months reunited, and avoidance and months reunited. To do so, I created
the squared function of the mean-centered months reunited variable as recommended by Aiken
and West (1991). Then, I created the months reunited squared by anxiety interaction term, as
well as the months reunited squared by avoidance interaction term. I then conducted multiple
regressions including the linear and non-linear months reunited main effects, the attachment
anxiety and avoidance main effects, the linear and non-linear anxiety and months reunited
interaction terms, the linear and non-linear avoidance and months reunited interaction terms, and
finally the anxiety and avoidance interaction term. To decompose any significant non-linear
interactions, I assessed whether there were curvilinear effects of months reunited at low (-1 SD)
and high (+1 SD) levels of anxiety and avoidance. I employed an alpha correction, such that the
following results were significant if they met the corrected level of significance, p < .01.
Because I was conducting 54 analyses (18 dependent measures and three predictors), .5 findings
would be produced by chance with an alpha criterion of .01. Here, 4 findings were statistically
significant.
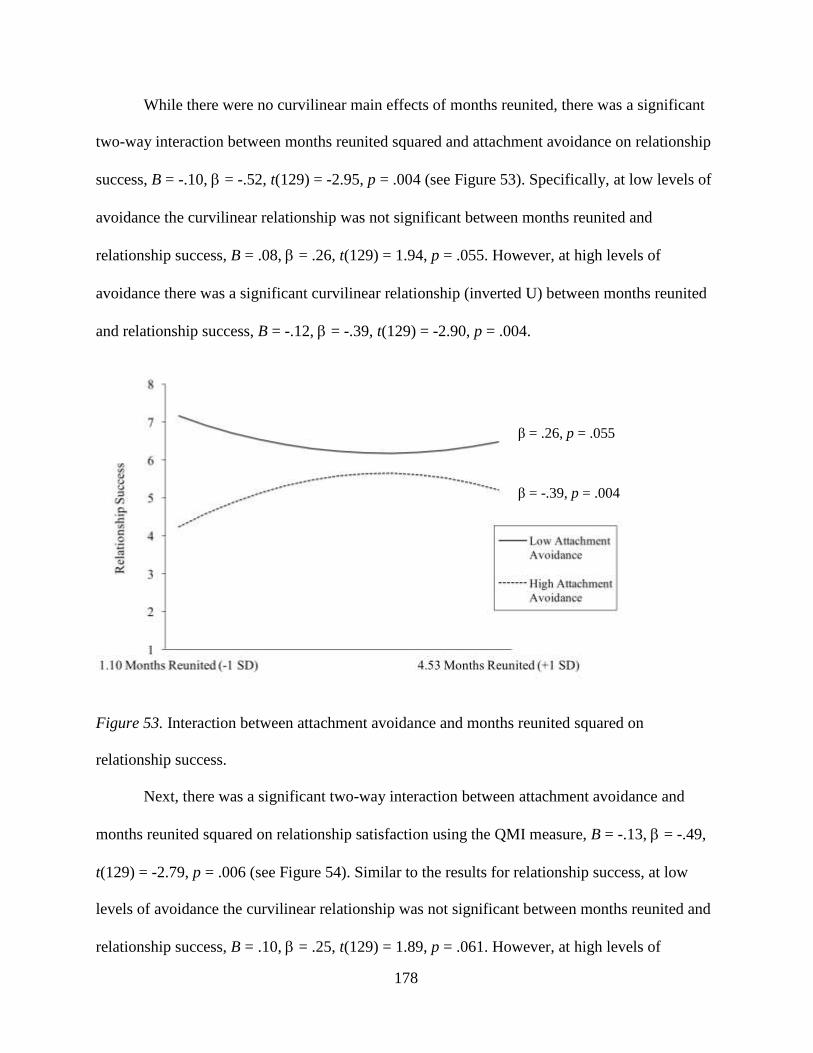
178
While there were no curvilinear main effects of months reunited, there was a significant
two-way interaction between months reunited squared and attachment avoidance on relationship
success, B = -.10, = -.52, t(129) = -2.95, p = .004 (see Figure 53). Specifically, at low levels of
avoidance the curvilinear relationship was not significant between months reunited and
relationship success, B = .08, = .26, t(129) = 1.94, p = .055. However, at high levels of
avoidance there was a significant curvilinear relationship (inverted U) between months reunited
and relationship success, B = -.12, = -.39, t(129) = -2.90, p = .004.
Figure 53. Interaction between attachment avoidance and months reunited squared on
relationship success.
Next, there was a significant two-way interaction between attachment avoidance and
months reunited squared on relationship satisfaction using the QMI measure, B = -.13, = -.49,
t(129) = -2.79, p = .006 (see Figure 54). Similar to the results for relationship success, at low
levels of avoidance the curvilinear relationship was not significant between months reunited and
relationship success, B = .10, = .25, t(129) = 1.89, p = .061. However, at high levels of
β = .26, p = .055
β = -.39, p = .004
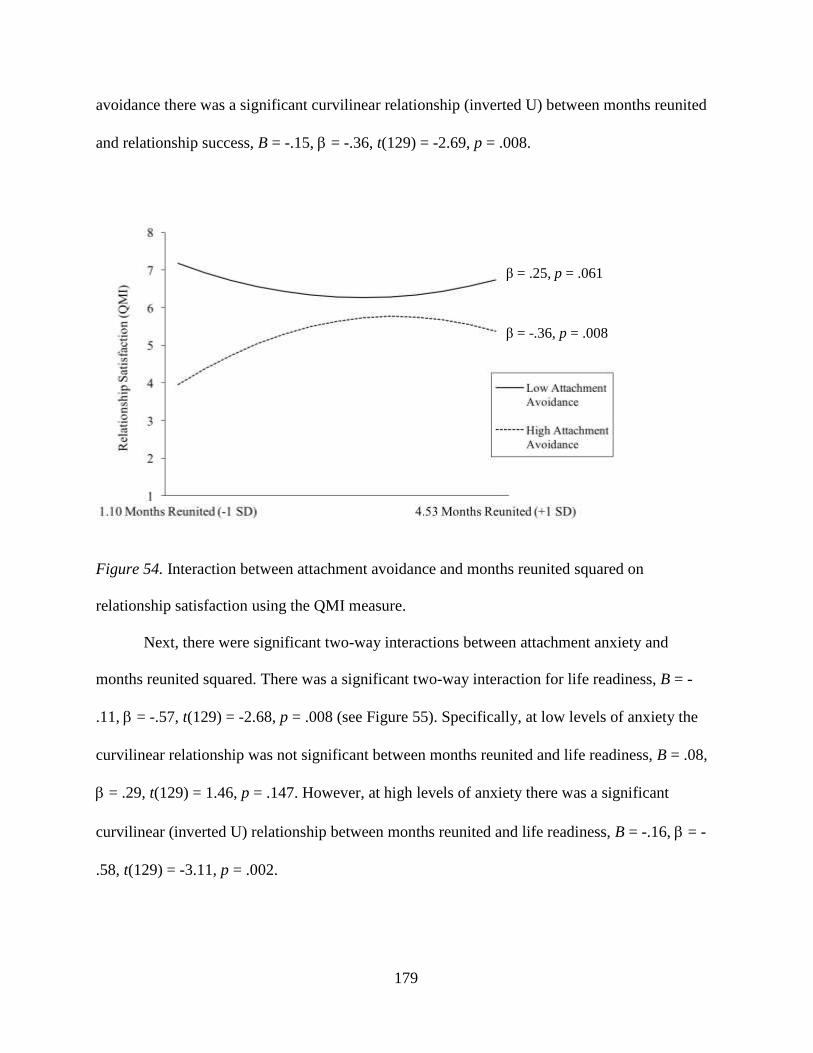
179
avoidance there was a significant curvilinear relationship (inverted U) between months reunited
and relationship success, B = -.15, = -.36, t(129) = -2.69, p = .008.
Figure 54. Interaction between attachment avoidance and months reunited squared on
relationship satisfaction using the QMI measure.
Next, there were significant two-way interactions between attachment anxiety and
months reunited squared. There was a significant two-way interaction for life readiness, B = -
.11, = -.57, t(129) = -2.68, p = .008 (see Figure 55). Specifically, at low levels of anxiety the
curvilinear relationship was not significant between months reunited and life readiness, B = .08,
= .29, t(129) = 1.46, p = .147. However, at high levels of anxiety there was a significant
curvilinear (inverted U) relationship between months reunited and life readiness, B = -.16, = -
.58, t(129) = -3.11, p = .002.
β = .25, p = .061
β = -.36, p = .008

180
Figure 55. Interaction between attachment anxiety and months reunited squared on life
readiness.
There was also a significant two-way interaction for relationship success, B = .09, =
.46, t(129) = 2.94, p = .004 (see Figure 56). This time, at low levels of anxiety there was a
significant curvilinear relationship (inverted U) between months reunited and relationship
success, B = -.12, = -.42, t(129) = -2.87, p = .005. In addition, at high levels of anxiety there
was a significant curvilinear relationship (U shaped) between months reunited and relationship
success, B = .08, = .28, t(129) = 2.06, p = .042.
β = .29, p = .147
β = -.58, p = .002

181
Figure 56. Interaction between attachment anxiety and months reunited squared on relationship
success.
Mediation Models for Attachment Anxiety and Related Outcomes
Finally, I was interested in identifying potential cognitive mechanisms that might explain
the relationships between attachment anxiety and intrapersonal outcomes and relationship
perceptions post-hoc. Specifically, I was interested in more closely examining the relationships
between attachment anxiety and coping and relationship measures that were significantly related
to anxiety in previous models. The nine coping outcomes that were significantly related to
anxiety were amount psychological distress, subjective well-being, the ability to handle daily
hassles, life mastery, coping success, cognitive fitness, emotional fitness, and the use of self-
blame and self-distraction coping strategies. In addition, the six relationship outcomes that were
significantly related to anxiety were perceived relationship support, perceived relationship
success, relationship satisfaction (QMI and RDAS), relationship consensus, and relationship
cohesion.
β = -.42, p = .005
β = .28, p = .042

182
For the following mediation analyses, I used Preacher and Hayes’ (2008) bootstrapping
method (here using 1000 samples) which produces an empirically derived CI of the indirect
effect estimate. If zero is not included in the CI, one can conclude that the indirect effect is
significant. I performed these analyses using an SPSS multiple mediator macro (available from
afhayes.com) that allows for the inclusion of control variables into the tests of indirect effects.
The two measures that best capture one’s ability to manage stressors (coping capacity),
rather than coping outcomes themselves, are emotional fitness (having an optimistic outlook)
and cognitive fitness (use of planning and critical thinking when facing adversity). Further, the
specific coping strategies that were related to anxiety were the use of self-blame and self-
distraction. I was interested in identifying which of these four variables best acted as a mediator
between attachment anxiety and coping outcomes and relationship perceptions. When each of
these four variables was entered into the mediation model, the other three variables were treated
as dependent measures. Therefore, the predictor in all models was attachment anxiety, one of the
four fitness/coping strategies as the mediator, and with 14 dependent measures.
Self-Blame Coping Strategy as a Mediator
When the use of self-blame as a coping strategy was treated as the mediator in the
relationship between attachment anxiety on the 14 dependent measures, there was partial
mediation for nine of the 14 dependent measures, full mediation for the use of self-distraction as
a coping strategy, but no evidence of mediation for four variables (cognitive fitness, relationship
support, consensus, and cohesion). Therefore, for self-blame there was evidence of mediation for
six out of eight coping outcomes, and three out of six relationship outcomes.
Self-Distraction Coping Strategy as a Mediator

183
When the use of self-distraction as a coping strategy was treated as the mediator in the
relationship between attachment anxiety and the 14 dependent measures, there was partial
mediation for seven variables, but no evidence of mediation for seven variables. Specifically,
there was partial mediation for six out of eight coping measures and one out of six relationship
measures.
Cognitive Fitness as a Mediator
Next, when cognitive fitness was treated as the mediator in the relationship between
attachment anxiety and the 14 dependent measures, there was partial mediation for 11 out of 14
variables, but no evidence of mediation for two variables (self-blame coping strategy,
relationship support, relationship satisfaction using the RDAS measure). Specifically, there was
partial mediation for seven out of eight coping measures, and three out of six relationship
variables.
Emotional Fitness as a Mediator
When emotional fitness was treated as the mediator in the relationship between
attachment anxiety and the 14 dependent measures, there was partial mediation for 13 out of 14
measures, and with no mediation for relationship satisfaction (RDAS). Therefore, emotional
fitness partially mediated eight out of eight coping outcomes, and partially mediated five out of
six relationship outcomes.
In summary, emotional fitness was the best mediator in the relationships between
attachment anxiety and coping outcomes, specifically psychological distress, subjective well-
being, the ability to handle daily hassles, life mastery, coping success, cognitive fitness, and the
use of self-blame and self-distraction coping strategies (see Table 8). However, none of the
coping strategies or coping fitness indices completely mediated the relationships between
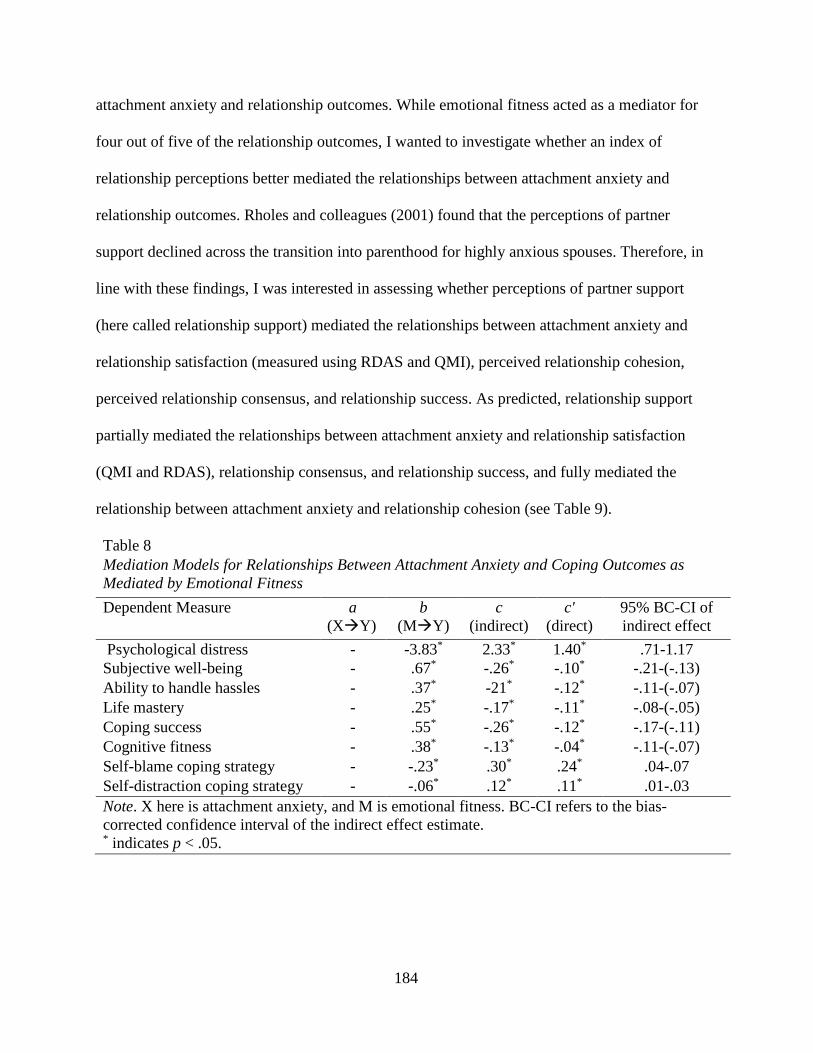
184
attachment anxiety and relationship outcomes. While emotional fitness acted as a mediator for
four out of five of the relationship outcomes, I wanted to investigate whether an index of
relationship perceptions better mediated the relationships between attachment anxiety and
relationship outcomes. Rholes and colleagues (2001) found that the perceptions of partner
support declined across the transition into parenthood for highly anxious spouses. Therefore, in
line with these findings, I was interested in assessing whether perceptions of partner support
(here called relationship support) mediated the relationships between attachment anxiety and
relationship satisfaction (measured using RDAS and QMI), perceived relationship cohesion,
perceived relationship consensus, and relationship success. As predicted, relationship support
partially mediated the relationships between attachment anxiety and relationship satisfaction
(QMI and RDAS), relationship consensus, and relationship success, and fully mediated the
relationship between attachment anxiety and relationship cohesion (see Table 9).
Table 8
Mediation Models for Relationships Between Attachment Anxiety and Coping Outcomes as
Mediated by Emotional Fitness
Dependent Measure a
(XY)
b
(MY)
c
(indirect)
c'
(direct)
95% BC-CI of
indirect effect
Psychological distress - -3.83* 2.33* 1.40* .71-1.17
Subjective well-being - .67* -.26* -.10* -.21-(-.13)
Ability to handle hassles - .37* -21* -.12* -.11-(-.07)
Life mastery - .25* -.17* -.11* -.08-(-.05)
Coping success - .55* -.26* -.12* -.17-(-.11)
Cognitive fitness - .38* -.13* -.04* -.11-(-.07)
Self-blame coping strategy - -.23* .30* .24* .04-.07
Self-distraction coping strategy - -.06* .12* .11* .01-.03
Note. X here is attachment anxiety, and M is emotional fitness. BC-CI refers to the bias-
corrected confidence interval of the indirect effect estimate. * indicates p < .05.
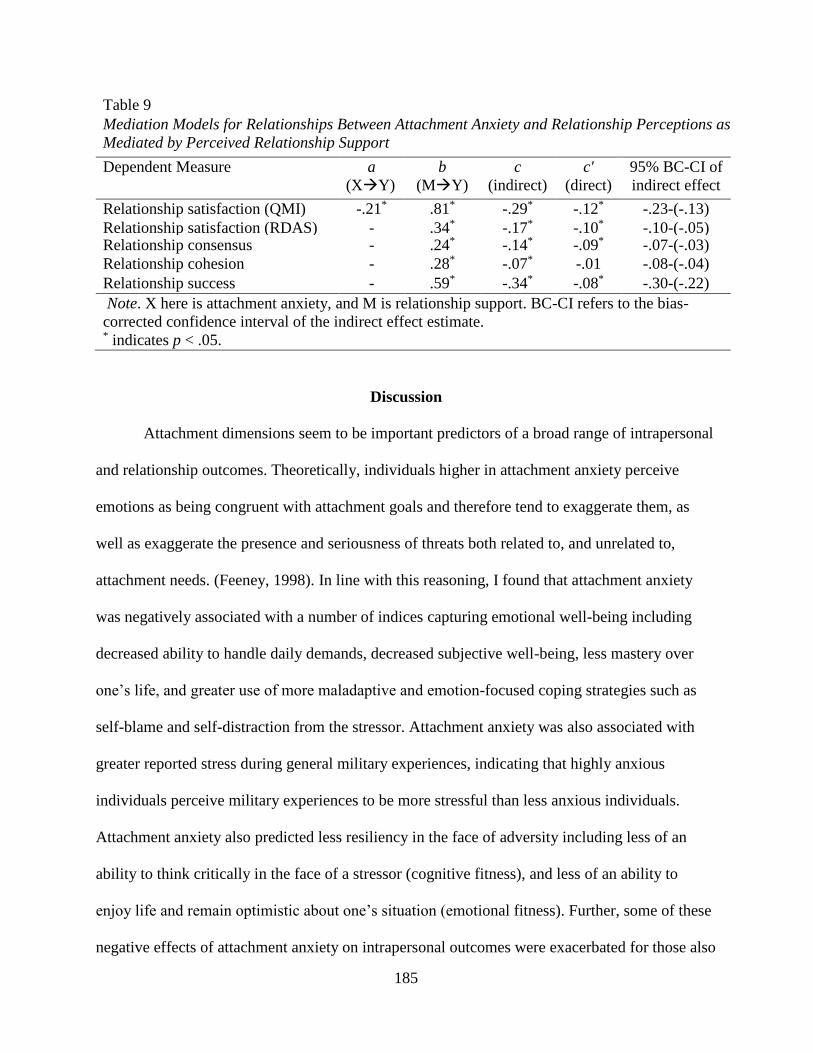
185
Table 9
Mediation Models for Relationships Between Attachment Anxiety and Relationship Perceptions as
Mediated by Perceived Relationship Support
Dependent Measure a
(XY)
b
(MY)
c
(indirect)
c'
(direct)
95% BC-CI of
indirect effect
Relationship satisfaction (QMI) -.21* .81* -.29* -.12* -.23-(-.13)
Relationship satisfaction (RDAS) - .34* -.17* -.10* -.10-(-.05) Relationship consensus - .24* -.14* -.09* -.07-(-.03)
Relationship cohesion - .28* -.07* -.01 -.08-(-.04)
Relationship success - .59* -.34* -.08* -.30-(-.22)
Note. X here is attachment anxiety, and M is relationship support. BC-CI refers to the bias-
corrected confidence interval of the indirect effect estimate. * indicates p < .05.
Discussion
Attachment dimensions seem to be important predictors of a broad range of intrapersonal
and relationship outcomes. Theoretically, individuals higher in attachment anxiety perceive
emotions as being congruent with attachment goals and therefore tend to exaggerate them, as
well as exaggerate the presence and seriousness of threats both related to, and unrelated to,
attachment needs. (Feeney, 1998). In line with this reasoning, I found that attachment anxiety
was negatively associated with a number of indices capturing emotional well-being including
decreased ability to handle daily demands, decreased subjective well-being, less mastery over
one’s life, and greater use of more maladaptive and emotion-focused coping strategies such as
self-blame and self-distraction from the stressor. Attachment anxiety was also associated with
greater reported stress during general military experiences, indicating that highly anxious
individuals perceive military experiences to be more stressful than less anxious individuals.
Attachment anxiety also predicted less resiliency in the face of adversity including less of an
ability to think critically in the face of a stressor (cognitive fitness), and less of an ability to
enjoy life and remain optimistic about one’s situation (emotional fitness). Further, some of these
negative effects of attachment anxiety on intrapersonal outcomes were exacerbated for those also

186
low in avoidance, particularly for the use of emotion-focused coping strategies and social
support, but also life readiness. In other words, the individuals who seem to struggle the greatest
with coping with adversities and managing emotions are those low in avoidance but higher in
attachment anxiety, relative to those low in avoidance and low in anxiety. These findings extend
the current literature on the relationship between attachment anxiety and coping strategies and
subjective well-being which have not previously reported such interactions (Birnbaum, Orr,
Mikulincer, & Florian, 1997; Meyer, Olivier, and Roth, 2005). Finally, attachment anxiety was
negatively associated with a number of relationship perceptions such as perceiving less support
from one’s partner, being less satisfied in their relationships (on a few measures), and
disagreeing more with one’s spouse on various issues. However, most of these effects were
exacerbated for those high in attachment avoidance. Indeed, for those low in attachment
avoidance, higher levels of anxiety were associated with more negative relationship perceptions.
This is consistent with work by Collins and Feeney (2004) who found that fearfully attached
individuals (high in attachment anxiety and avoidance) perceived their partners’ personal
messages of encouragement to be less supportive, controlling for the independent ratings of their
partners’ support in the messages. Further, these findings generally support a number of studies
showing that attachment security is associated with greater relationship satisfaction and
communication styles (e.g., Rholes et al., 2001; Simpson, 1990; Kobak & Hazen, 1991).
On the other hand, individuals with higher levels of attachment avoidance should view
negative emotions and opportunities to express vulnerability as being incompatible with their
need for self-reliance (Feeney, 1998). Specifically, highly avoidant individuals are known to
effectively mask verbal and nonverbal emotional expressions, to suppress emotion-related action
tendencies, or beliefs that one can manage emotions effectively on their own (e.g., Kobak, Cole,

187
Forenz-Gillies, Fleming, & Gamble, 1993; Mikulincer & Shaver, 2003). Further, attachment
avoidance is typically associated with distancing coping, however some studies have also shown
emotion-focused strategies used by highly avoidant individuals when managing conflicts with
their romantic partners (e.g., Lussier, Sabourin, & Turgeon, 1997). Interestingly, I found that
attachment avoidance was indeed related to a type of distancing coping, but also with a number
of indices of intrapersonal well-being and coping capacity. Specifically, attachment avoidance
was associated with decreased subjective well-being, the extent to which they can manage
stressors, having a more negative life outlook, and decreased ability to think critically in the face
of a stressor. Consistent with their working models of distrust, and consistent with work by
Collins and Read (1990), attachment avoidance was also associated with negative relationship
perceptions including perceiving less support from one’s partner, being less satisfied (on a few
measures), disagreeing more with one’s spouse on various issues, and feeling as though one
engages in fewer activities with one’s partner.
Mikulincer, Gillath, and Shaver (2002) demonstrated that the adult attachment system
becomes activated under conditions of attachment-related threat (e.g., potential or experienced
separation from an attachment figure) as well as general threat (e.g., stress or physical danger).
Such conditions automatically and implicitly activate thoughts of attachment figures that can
motivate an individual to increase (or in the case of avoidance, decrease) physical or
psychological proximity to them. In other words, working models of attachment should regulate
attachment behaviour (e.g., proximity seeking strategies, distress-signalling, or distancing).
Indeed, individual differences in attachment behaviour should be most pronounced under
stressful conditions in the social or physical environment (Simpson & Rholes, 1994).
Specifically, under threatening conditions (characterized by increased stress or emotional

188
reactivity), attachment anxiety should be associated with hyperactivating strategies such as
increased distress, emotion-focused coping strategies, and perhaps even more negative
relationship perceptions (Birnbaum et al., 1997; Fraley & Shaver, 1998; Mayseless et al., 1996;
Meyer et al., 2005). However, attachment avoidance should be associated with deactivating
strategies aimed at promoting interpersonal distance when the attachment system is activated
such as potential reports of increased well-being (or a lack of decreased well-being), use of
distancing coping strategies, and more negative relationship perceptions (Fraley & Shaver, 1997;
Fraley & Shaver, 1998; Mayseless et al., 1996; Simpson et al., 1992). There is the possibility,
however, that breakdowns in emotional well-being and coping capacity will be observed with
increases in attachment avoidance, if environmental conditions are characterized by high enough
levels of stress such that deactivating strategies are less effective (Mikulincer & Florian, 1998).
Therefore, I next assessed the extent to which attachment anxiety and avoidance interacted with
a number of deployment-related moderating variables that should correspond to variations in
levels of experienced threat.
Deployment Separation Findings
First, I focused on deployment-related separations. I first reasoned that the effects of
attachment dimensions on intrapersonal coping and relationship outcomes might be moderated
by deployment status, or whether the spouses were currently separated from their partners by a
military deployment. However, there were no main effects of deployment status on any coping
indices. Therefore, overall whether or not one’s spouse is deployed isn’t a great predictor of
overall well-being. Accordingly, I did not find that deployment status moderated any effects of
attachment anxiety. However, deployment status did moderate some effects of attachment
avoidance. Specifically, low levels of avoidance were associated with greater use of self-

189
distraction as a coping strategy and the ability to think critically in the face of a stressor for those
whose spouses were deployed, relative to those whose spouses were not deployed. This is some
support for the notion that increased levels of avoidance are associated with some breakdowns in
emotional well-being and coping capacity, particularly for those also high in anxiety.
As outlined in the Canadian Forces Deployment Handbook (Egerton-Graham, 2009), the
most challenging stage of the separation is stage 3, occurring during weeks 3-6 of the separation,
and consisting of emotional disorganization. Using this logic, I compared responses of spouses
who had most recently (≤ 1 month) separated from their partners, and therefore most likely
experiencing emotional disorganization, relative to an equal number of spouses who were not
currently separated from their partners. There was more support for this variable as a threat-
related moderator as spouses whose partners were recently deployed reported a decreased ability
to handle daily hassles relative to those not separated from their partners. Interestingly, I found
that at lower levels of avoidance, those who were recently separated from their partners reported
greater perceived relationship support, relationship success, relationship satisfaction, and feeling
as though one agrees with one’s partner on various issues, and an increased ability to think
critically in the face of a stressor, relative to those whose partners were not deployed. However,
at higher levels of avoidance, those who were recently separated from their partners reported a
decreased ability to think critically in the face of stressors, decreased perceived relationship
support, relationship satisfaction, and feeling more as though one does not agree with one’s
partner on a number of issues, relative to those not currently separated. In other words, low
levels of avoidance are associated with greater emotional and relationship functioning, and
higher levels of avoidance are associated with more relationship difficulties, during a high-stress
period typically associated with emotional difficulties.

190
The nature of the relationships among attachment anxiety and intrapersonal and
relationship outcomes also differed depending on whether one was recently separated from one’s
partner or not. Specifically, lower levels of attachment anxiety were associated with greater
psychological distress, a decreased ability to think critically when facing stressors, and decreased
perceived relationship success for those recently separated relative to those not separated.
However, higher levels of anxiety were associated with more positive coping and relationship
perceptions for those recently separated relative to those not separated such as a greater ability
to think critically when faced with a stressor, greater perceived relationship success, and
relationship satisfaction. In other words, those lower in anxiety are struggling more with
intrapersonal coping and relationship functioning during the emotional disorganization period
relative to a baseline, whereas those with higher levels of anxiety seem to be experiencing better
coping and relationship outcomes during this period.
In general, these findings suggest that those struggling the greatest with the high-stress
Stage 3 (initial 3-6 weeks after separation) relative to a baseline state (partner not deployed) are
those with higher levels of attachment avoidance or greater discomfort with emotional closeness,
and those with lower levels of attachment anxiety, or less fears of rejection and abandonment.
Further, those adjusting better during this high-stress period are those with higher levels of
attachment anxiety, or greater fears of rejection and abandonment, and those with low levels of
attachment avoidance, or more comfort with emotional intimacy. Attachment anxiety is
associated with needs for reassurance and validation, which corresponds with a desire for
emotional dependency. Therefore, it is possible that those with greater needs for connection and
reassurance in this initial period are faring better because they might be making more efforts to
connect with their partners, and establish intimacy, or are engaging in more proximity-seeking

191
and intimacy-building activities with their partners. This might be reflected in increased attempts
to contact one’s partner, more intimate conversations involving support seeking and provision,
and successfully gaining that reassurance they so desperately desire. It is also possible that their
partners are more accepting of the spouse’s ‘neediness’ during this stage, relative to those at
home together, and so highly anxious, or less avoidant, individuals are receiving the attention
they desire normally but perhaps do not receive to the same extent. However, those with greater
levels of discomfort with emotional intimacy and dependency, or less fears of rejection and
abandonment are less motivated to connect with their partners, and maintain intimacy, from afar.
In other words, tendencies to engage in de-activating strategies to reduce psychological
dependency on one’s partner, or less of a concern about rejection and abandonment, might lead
these individuals to not reach out to one’s partner as often or as intimately, to not provide nor
seek as much emotional support from one’s partner, and maintain more of a ‘out of sight out of
mind’ mentality.
Admittedly, some of these findings were surprising, specifically that higher levels of
attachment anxiety were related to more positive relationship perceptions and indices of well-
being. Although, individuals higher in attachment anxiety do tend to be more variable in their
responses to relationship conflicts (Campbell, Simpson, Boldry, & Kashy, 2005; MacDonald,
Wood, & Fabrigar, submitted for publication; Simpson, & Kashy, 2005; Tidwell, Reis, &
Shaver, 1996). In particular, evidence from Phase One, and findings by Rholes and colleagues
(2001), indicates that perceptions of relationship well-being and emotional well-being declines
across the separation period for those higher in attachment anxiety. The analyses in this section
were intended to test this prediction, that attachment anxiety in particular would interact with the
number of months deployed in predicting relationship and intrapersonal outcomes. I tested both

192
linear and curvilinear functions of time as a moderator of attachment avoidance, anxiety, and
their interaction.
There were not many effects of attachment avoidance or attachment anxiety as a linear
function of time deployed on outcomes, but one finding consistent with those from Phase One,
was that low levels of anxiety were associated with increases in perceived relationship success
over time, whereas higher levels of anxiety were associated with decreases in perceived
relationship success across the separation. Finally, there were some areas where attachment
anxiety and avoidance interacted as a function of time. Specifically, for those with lower levels
of attachment anxiety and avoidance, perceptions of the extent to which one is coping
successfully, decreased across the separation. Also, for those with higher levels of avoidance and
lower levels of anxiety, perceptions of stress experienced during general military experiences
became more positive over time. Finally, for those with higher levels of avoidance but lower
levels of anxiety, coping success improved over the course of the separation. Given that these
findings were not consistent across more measures of coping outcomes, and the same slope was
not significant across measures, it is premature to speculate about the importance of these
interactions to predict relationship and intrapersonal functioning. However, they do illustrate that
interactions between these constructs are important to assess and account for, so that accurate
interpretations of results, and accurate theoretical contributions, can be made.
According to the Canadian Forces Deployment Handbook (Egerton-Graham, 2009), the
nature of emotional reactivity across the separation is curvilinear. Specifically, spouses progress
from more emotional ‘reacting’ stages (Stages 1-3) to emotional stabilization (Stages 4-5), and
then into another reacting stage, Stage 1 of their reunion, which is the anticipation of their
partner’s homecoming. Therefore, it makes sense to test how the relationships between

193
attachment dimensions and intrapersonal coping and relationship outcomes across the separation
might be curvilinear in nature. I found only weak evidence for curvilinear effects of attachment
anxiety and avoidance across the separation (2 significant effects out of 54). Specifically, at high
levels of attachment avoidance the use of self-blame during the separation assumed an inverted
U shape (starting low, increasing over time, and ending low near the end of the separation). This
suggests that those high in avoidance tended to use self-blame (a typically attachment anxiety-
related coping strategy) in the middle of a separation period, but less so during those transition
periods. In contrast, higher levels of attachment anxiety were only predictive of curvilinear
patterns across time for relationship satisfaction. Specifically, for those with higher levels of
attachment anxiety, perceived relationship satisfaction assumed an inverted-U shape. In other
words, for those with higher levels of anxiety, relationship satisfaction was less positive near the
beginning and end of the separation surveys, but more positive near the middle of the separation.
This might be perceived as being inconsistent with the finding that for those higher in
attachment anxiety, relationship quality is higher for those recently separated relative to those
not recently separated. However, it is possible that relationship quality indices continue to
improve after the 1 month mark, but then at some point decline, and then begin to improve again
closer to the homecoming. Again, because there was only one curvilinear finding for attachment
anxiety on relationship quality as a function of time, it really is too premature to speculate about
its significance.
It is common in the attachment literature to assume that the effects of attachment
dimensions are linear in nature, and, in fact, most researchers are using statistical analyses such
as linear regressions that assume these relationships are linear, including here. However, it is
important for researchers to start to test these assumptions that we so consistently rely on, so that

194
our theoretical contributions are accurate and informed. Conceptually, it is possible that at some
point, being too low in attachment anxiety (no fears of rejection or abandonment), or too low in
attachment avoidance (having no discomfort with intimacy and closeness) could be problematic
for a relationship. Therefore, I wanted to test for the potential non-linear effects of attachment
dimensions in the context of military deployments. While none of the interactions met the
corrected level of statistical significance (< .01), there were some interactions that were
statistically significant at the .05 level (not reported), demonstrating that it may be possible for
some effects of attachment dimensions to be curvilinear in nature, and that future researchers
should continue to test curvilinear effects, and the validity of the assumption of linearity of
attachment dimensions.
Logan (1987) argued that one of the most challenging stages is Stage 2 which occurs 1-3
weeks prior to the deployment called detachment and withdrawal and is associated with
cognitive, emotional, and relationship difficulties including anxiety, sleep disturbances,
regressive behaviours, and ambivalence with displays of intimacy with one’s partner. Therefore,
I predicted that the effects of attachment anxiety on relationship and emotional functioning
might be exacerbated for those preparing for a partner’s deployment, relative to those not
experiencing a deployment, given that highly anxious individuals should by nature be more
fearful of an experience of abandonment relative to less anxious individuals. While I found some
support that this period is challenging for spouses, with deployment preparation status associated
with decreased subjective well-being, there were no other main effects of deployment
preparation status on other coping indices. Further, I found no support for the notion that
attachment dimensions (or their interaction) moderate spousal functioning during this period.

195
Deployment Reunion Findings
Next, I focused on deployment-related reunion experiences. According to the Canadian
Forces Deployment Handbook (Egerton-Graham, 2009), couples are in ‘reacting’ stages 2-6
weeks (‘reintegration’) and 6-12 weeks (‘renegotiation’) post-reunion. I wanted to assess
whether attachment anxiety and avoidance moderated the effects of post-reunion experiences in
a group of spouses who were likely in the middle of these stages (1-2 months reunited) relative
to a ‘baseline’ or couples not experiencing a reunion or separation. I did not find much support
for the notion that recent reunion status moderates relationships among attachment dimensions
and spousal functioning. Regarding the findings that were significant, and in line with my
predictions and the findings from Phase One, those with higher levels of attachment anxiety
reported higher levels of relationship success, and the extent to which one agrees with their
partner on various issues, for those recently reunited relative to those not recently reunited. This
is consistent with findings from Phase one that attachment anxiety was associated with increased
perceptions of relationship functioning and intrapersonal well-being for those recently reunited
with their partners, relative to those not experiencing a reunion. Theoretically this makes sense,
that if individuals high in attachment anxiety are dependent on their partners for emotional
comfort, reassurance, and validation, experience increased distress in response to partner
separations, and desire greater levels of closeness in their relationships, those high in attachment
anxiety should respond more positively to this honeymoon period. Such individuals might report
feeling more emotionally connected to their partners, more satisfied in their relationships, and
experience improved emotional well-being relative to those lower in attachment anxiety.
Next, I was interested in assessing the potential trajectory of the relationships among
attachment anxiety, avoidance, and perceptions of one’s intrapersonal functioning and

196
relationship perceptions as a function of months reunited (both linear and curvilinear
trajectories). While I did not find much support for the notion that attachment dimensions
interact with months deployed in a linear fashion, I did find more support for curvilinear effects
across time according to levels of attachment avoidance and anxiety. Specifically, for those with
higher levels of attachment avoidance, perceptions of relationship success and relationship
satisfaction were lower near the beginning of the reunion, increased over time, and then
decreased after the 4.5-month mark (inverted-U shape). These findings are in line with my
predictions that highly avoidant individuals might have difficulty in reconnecting with one’s
partner emotionally, and that having one’s partner home would naturally increase levels of
intimacy in the relationship making avoidant individuals uncomfortable and might potentially
lead to conflict and more unpleasant partner interactions (Tidwell et al., 1996). However, these
findings indicate that some degree of adjustment eventually takes place for highly avoidant
individuals such that over time their relationship perceptions improve.
Regarding attachment anxiety, for those with lower levels of anxiety, perceptions of life
mastery decreased across the reunion. The simple slopes for higher levels of attachment anxiety
did not reach statistical significance. There were also curvilinear effects of attachment anxiety on
intrapersonal and relationship indices across time. For example, at higher levels of attachment
anxiety, perceptions of life readiness were lower near the beginning of the reunion period,
improved over time, but then declined again near the 4.5-month mark (inverted-U shape). In
contrast, perceptions of relationship success were U-shaped in nature. At higher levels of
attachment anxiety, perceptions of relationship success were initially higher, decreased over
time, and then started to increase again near the 4.5-month mark. These findings are again
consistent with those from Phase One, where attachment anxiety was associated with increased

197
perceptions of relationship functioning and intrapersonal well-being for those recently reunited
with their partners, relative to those not experiencing a reunion, but that these relationship
perceptions decrease across the reunion. However, these findings suggest that at some point
(here the 4.5 month mark), relationship perceptions might improve again.
Certainly, the number of curvilinear relationships between attachment dimensions and
spousal outcomes as a function of time reunited were few, therefore, any conclusions should be
interpreted with caution. With that in mind, conceptually, it may be the case that the more one is
dependent on their partners for emotional comfort, reassurance, and validation, and the more one
experiences increased distress in response to partner separations (so higher in attachment
anxiety), the more one might respond positively to this honeymoon period. Indeed, those with
greater needs for connection and reassurance in this initial reunion period might fare better
because they might make more efforts to connect with their partners, and establish intimacy, or
engage in more proximity-seeking and intimacy-building activities with their partners. However,
the opposite might be true for those lower in attachment anxiety. For them, perceptions of
relationship success and satisfaction was lower near the beginning of the reunion period,
increased over time, and then began to decrease once again near the 4.5-month mark. It has been
a fairly consistent pattern to find that the findings of those with lower levels of anxiety mirror
those with higher levels of attachment avoidance. Individuals with less fear of rejection and
abandonment, and those with greater discomfort with emotional intimacy might be engaging in
less proximity-seeking behaviours, less of a desire for reconnection, and less initiation of, or
enjoyment of, intimacy-building activities.

198
Mechanisms of Attachment Anxiety on Intrapersonal and Relationship Outcomes
The final goal of Phase Three was to identify potential cognitive mechanisms that might
explain the relationships between attachment anxiety and intrapersonal outcomes and
relationship perceptions. As a result of a number of post-hoc mediation models (Preacher &
Hayes, 2008), I found that emotional fitness or the extent to which one maintains an optimistic
outlook and is able to enjoy life, partially mediated the relationships between attachment anxiety
and all coping outcomes including amount of daily psychological distress, subjective well-being,
the ability to handle daily hassles, life mastery, coping success, one’s ability to think critically in
the face of stressors, and the use of self-blame and self-distraction as coping strategies. In
addition, and in line with findings by Rholes and colleagues (2001), perceptions of partner
support partially mediated the relationships between attachment anxiety and relationship
satisfaction (two indices), perceived relationship success, and the extent to which one agrees
with one’s partner on a number of issues, and fully mediated the relationship between
attachment anxiety and the extent to which partners engage in outside activities together.
Conclusions
In summary, the findings revealed in this final phase have corroborated and extended
prior research in several ways. Consistent with previous research, I found that both attachment
anxiety and attachment avoidance were relevant in explaining perceptions of intrapersonal
coping and relationship functioning, particularly in the context of military experiences. I also
found that attachment anxiety was related to emotion-focused coping strategies and decreased
subjective well-being (on several indices), and attachment avoidance was associated with
distancing coping strategies. However, extending prior research, attachment avoidance was
associated with breakdowns in coping capacity and subjective well-being. Both attachment

199
anxiety and avoidance were related to more negative relationship perceptions, consistent with
previous research. Further, little research has reported interactions between anxiety and
avoidance on intrapersonal coping. Extending prior research, I found that some of these negative
effects of attachment anxiety on intrapersonal outcomes were exacerbated for those also low in
avoidance, and most of the effects of attachment anxiety on relationship outcomes were
exacerbated for those high in attachment avoidance.
Although the other two phases were assessed within a similar context across participants,
this third phase of the project provided a broader view on the relationships among attachment
dimensions and the impact of military experiences on relationship and interpersonal functioning
with a larger sample than the first two phases and assessed couples at various phases of
deployment-related experiences (preparing for a deployment, current separated, currently
reunited, and neither separated nor recently reunited). Consistent with phases One and Two, I
found that some of the effects of attachment orientations on perceptions of intrapersonal and
interpersonal functioning were moderated by the presence or absence of an attachment-related
threat (i.e., the deployment status of the partner) such as various stages of deployment
separations and reunions. However, it is important to mention that many of the relationships
among attachment dimensions and intrapersonal and relationship outcomes were not moderated
by the deployment-related variables tested here. Indeed, once an alpha-rate correction was
employed, many interactions among attachment dimensions and various deployment experiences
were not statistically significant. With that in mind, with respect to deployment separations, my
findings corroborate those of Egerton-Graham (2009) that the most challenging stage of the
separation is stage 3 (weeks 3-6 of the separation) typically consisting of emotional
disorganization. Indeed, whether or not spouses were experiencing this stage of a separation

200
moderated many relationships among attachment dimensions and relationship outcomes
specifically. In particular, lower levels of avoidance, and higher levels of anxiety, were
associated with more positive relationship perceptions during this stage, while higher levels of
avoidance, and lower levels of anxiety, were associated with more negative relationship
perceptions during this stage.
Most importantly, because of this increased power relative to the other phases, I was
also able to more easily assess the trajectory of the effects of attachment dimensions on
intrapersonal and relationship outcomes as a function of time separated, and time reunited. With
respect to the separation, there were not many effects of attachment avoidance or attachment
anxiety as a linear function of time deployed on outcomes, but one finding consistent with those
from Phase One, was that low levels of anxiety were associated with increases in perceived
relationship success over time, whereas higher levels of anxiety were associated with decreases
in perceived relationship success across the separation.
With respect to the reunion, I did not find much support for the notion that recent reunion
status moderates relationships among attachment dimensions and spousal functioning.
Regarding the findings that were significant, and in line with my predictions and the findings
from Phase One, those with higher levels of attachment anxiety reported higher levels of
relationship success, and the extent to which one agrees with their partner on various issues, for
those recently reunited relative to those not recently reunited. While I did not find much support
for the notion that attachment dimensions interact with months deployed in a linear fashion, I did
find more support for curvilinear effects across time according to levels of attachment avoidance
and anxiety and are worthy of highlighting for potential future research. In particular, for those
with higher levels of attachment avoidance, perceptions of one’s partner and the relationship
201
were lower near the beginning of the reunion, increased over time, and then decreased after the
4.5-month mark (inverted-U shape). This makes sense, as having one’s partner home would
naturally increase levels of intimacy in the relationship making avoidant individuals
uncomfortable and might potentially lead to conflict and more unpleasant partner interactions
(Tidwell et al., 1996). However, at higher levels of attachment anxiety, perceptions of one’s
partner and the relationship were initially higher, decreased over time, and then started to
increase again near the 4.5-month mark. It appears that the more one is dependent on their
partners for emotional comfort, reassurance, and validation, and the more one experiences
increased distress in response to partner separations, the more one responds positively to this
honeymoon period. Indeed, those with greater needs for connection and reassurance (higher in
attachment anxiety) in this initial reunion period are faring better because they might be making
more efforts to connect with their partners, and establish intimacy, or are engaging in more
proximity-seeking and intimacy-building activities with their partners.
Finally, with the plethora of measures included in the survey, and adequate sample size, I
was able to use mediation models to identity consistent and powerful mediators in the
relationships between attachment orientations and intrapersonal and relationship outcomes.
Specifically, I found that the mediator that could best explain the relationships between
attachment anxiety and the use of emotion-focused coping strategies, and decreased subjective
well-being and increased psychological distress was decreased emotional fitness, or having a
less optimistic outlook on life and less of an ability to enjoy life. Further, consistent with Rholes
and colleagues (2001), perceptions of decreased partner support was the best explanation for the
relationships between attachment anxiety and more negative relationship perceptions.
202
Chapter 6
General Discussion
In summary, using different methodologies (longitudinal and cross-sectional), the most
current measures of adult attachment that allows for more precise statistical and theoretical
inferences, and three separate samples of Canadian spouses in married or common-law
relationships, allowing me to test the robustness of any observed effects with replication, I was
able to address the three major issues above. Specifically, I assessed 1) what adult attachment
dimensions are relevant in explaining spousal reports of intrapersonal coping and perceptions of
their partner and their relationship in various deployment-related contexts, 2) when such
attachment dimensions are relevant in explaining spousal reports of intrapersonal and
relationship functioning, and 3) how attachment dimensions explain reports of intrapersonal and
relationship functioning across the separation and reunion (what trajectories) and finally 4) why
attachment dimensions, particularly attachment anxiety, predicts spousal reports of intrapersonal
and relationship functioning.
Summary of Findings
Phase One
I first examined a group of civilian spouses who were currently separated from their
military partners, most of which had been deployed to Afghanistan. With this group currently
experiencing a military deployment separation, higher levels of attachment anxiety were
associated with reports of more compromised emotional well-being and more negative
relationship perceptions relative to lower levels of attachment anxiety. This is consistent with
prior research examining the relationship between anxious attachment and perceptions of
emotional and relationship adjustment during attachment-related threats such as real or imagined
203
partner separations, a deployment post-reunion period, and a stressful experience (Fraley &
Shaver, 1998; Cafferty et al., 1994; Collins & Read, 1990). It would appear as though highly
anxious individuals are acting in accordance with their internal working models. Specifically,
just as anxious-resistant infants show strong separation protest to separation with their mothers,
highly anxious adults show similar hyperactivating responses including emotional escalation,
ineffective coping strategies in response to stress (emotion-focused strategies), and more
negative relationship perceptions, relative to less anxious adults.
On the other hand, I found that attachment avoidance was associated with increased
emotional well-being, but related to more negative relationship perceptions in this separated
group. Highly avoidant individuals seem to be acting in accordance with their working models
of attachment, effectively deactivating their attachment needs and engaging in distancing coping
strategies (Simpson et al., 1992; Mayseless et al., 1996). Although some have suggested that
breakdowns in the emotional well-being and coping capacity might be observed with increases
in attachment avoidance with high enough levels of stress (Mikulincer & Florian, 1998), this
research suggests that the experience of a deployment separation overall is not a highly stressful
event, at least when collapsing across all points of the separation.
One potential shortcoming of this study was the lack of a baseline, or control group.
Specifically, it is understood that those who are insecurely attached typically experience less
relationship satisfaction (Feeney, 2008; Rholes et al., 2001; Simpson, 1990), more negative
affect and destructive communication patterns when interacting with their partners (Feeney,
2008; Simpson et al., 1996), than those who are securely attached. However, the fact that
environmental variables moderated some of the relationships between attachment dimensions
and relationship outcomes provides some evidence that stress moderates the effects of

204
attachment dimensions, over and above their normal functioning. In other words, these findings
are consistent with the notion that attachment orientations and attachment threats are interactive
in nature (Campbell & Marshall, 2010; Simpson & Rholes, 1994). Indeed, extending prior
research, I found that the effects of attachment anxiety were amplified depending on what point
in the separation spouses were experiencing, and whether they were experiencing deployments
for the first time. For example, I found that the effects of attachment dimensions on relationship
perceptions were exacerbated for those experiencing their first deployment (Frankel, Snowden,
& Nelson, 1993; Padden, Connors, & Agazio, 2011), and that perceptions of relationship quality
continued to worsen in a linear fashion across the separation for those higher in attachment
anxiety. Although no prior research has examined the effects of attachment anxiety during a
prolonged partner separation, these findings do converge with those by Rholes and colleagues
(2001) that found that perceptions of partner support continued to worsen for highly anxious
women across the transition to parenthood for the first time.
Therefore, there are unique effects of both attachment anxiety and attachment avoidance
on perceptions of emotional well-being and relationship functioning during a deployment
separation, and the effects of both attachment dimensions seem to be somewhat chronic in nature
(regardless of stage of the separation). However, I also found the effects of attachment anxiety
on some perceptions of relationship quality and satisfaction were interactive in nature,
exacerbated by certain environmental moderators (previous deployment experience and point in
the separation).
I also examined a group of spouses who had been reunited with their military member
partners, who for the most part had returned from an overseas deployment to Afghanistan
(however a different group than the separation group). Initial research (Cafferty et al., 1994)

205
examining the effects of adult attachment on intrapersonal and relationship outcomes following a
military deployment reunion found that secure spouses reported less conflict and more
satisfaction relative to insecure spouses, but there were no effects of spousal attachment styles
on spousal emotional well-being. The findings from this study suggest that the effects of
attachment anxiety specifically on outcomes during a reunion period extend beyond simply
relationship perceptions. Specifically, I found that attachment anxiety was related to less
effective emotional coping including decreased general well-being, less perceived social support,
and more depressive symptoms. In addition, attachment anxiety was related to decreased
relationship satisfaction, and feeling more strongly that the reunion has not lived up to one’s
original expectations. In addition, and extending previous findings, attachment avoidance was
also associated with less relationship satisfaction during the post-reunion period.
Further extending prior work, and consistent with my separation findings, I found that
the effects of attachment anxiety on some relationship outcomes were moderated by time
reunited. For example, for highly anxious individuals their perceptions of their interactions with
their partners declined as a function of time reunited. In addition, I was able to identify one
potential mechanism to explain why higher levels of attachment anxiety are related to more
negative relationship perceptions during the reunion period – beliefs that one’s original
expectations have not been met. Indeed, the relationships between attachment anxiety and
decreased relationship satisfaction and quality of partner interactions were fully mediated by
beliefs that the reunion period has not lived up to one’s original expectations. This is consistent
with the explanation proposed by Simpson and Rholes (2008) that the negative outcomes
experienced by high anxiety individuals during the transition to parenthood reported by Rholes
and colleagues (2001) might be tied to their unrealistically optimistic views of their romantic

206
partners and relationships, and that highly anxious individuals may become frustrated and
dissatisfied because they perceive that their partners are not living up to their expectations.
Finally, consistent with the airport findings of Fraley and Shaver (1998), higher levels of
attachment avoidance were related to reports of less physical intimacy during the initial first
meeting of the reunion relative to lower levels of avoidance. Again, this is more evidence that
highly avoidant individuals avoid intimacy-building opportunities within their relationships,
relative to those lower in avoidance (Tidwell et al., 1996).
Phase Two
Consistent with previous findings (Fraley & Shaver, 1998; Collins & Read, 1990) and in
line with the findings from Phase One, attachment anxiety was related to a decreased ability to
cope and to decreased relationship satisfaction during the ongoing deployment (across four
months). However, I predicted that attachment anxiety would be related to difficulties in
providing emotional support (Collins & Feeney, 2000), and to greater fantasizing about the
reunion (e.g., Davilla, 2001; & Wei, Mallinckrodt, Larson, & Zakalik, 2005), but neither of these
predictions were supported. Although I predicted that attachment anxiety would be more related
to perceptions that the reunion period has not lived up to one’s original expectations in line with
Phase One findings, and those reported by Rholes and colleagues (2001), this relationship was
true but only for those with higher levels of attachment avoidance (those who are ‘fearful’).
In fact, the most notable findings for this group of spouses were regarding the effects of
attachment avoidance. Specifically, in line with my predictions that attachment avoidance would
be associated with deactivating strategies in response to environmental threats (e.g., Fraley &
Shaver, 1997), attachment avoidance was not related to indices of emotional well-being but was
related to a decreased tendency to think and fantasize about one’s partner and their return.

207
Further, in line with findings by Collins and Read (1990), attachment avoidance was related to
lower quality partner interactions, and difficulties with the provision of emotional support.
Specifically, attachment avoidance was related to a general discomfort in expressing
vulnerability to one’s partner and not enjoying the process of providing emotional support to
one’s deployed partner. In addition, attachment avoidance was related to less satisfaction with
the emotional support received from one’s partner, and to pushing one’s partner away when they
do provide support.
With respect to the separated group’s responses at the reunion, consistent with findings
by Cafferty and colleagues (1994) and the Phase One reunion findings, attachment anxiety was
related to decreased relationship satisfaction, but not to coping capacity. On the other hand,
different from the reunion findings, attachment avoidance was now related to decreased coping
capacity as assessed by all three indices (general well-being, perceived social support, and more
depressive symptoms) suggesting a potential breakdown in coping abilities for this group of
highly avoidant individuals as observed by Mikulincer and Florian (1998).
Phase Three
This phase was not only integrative and summative in nature, allowing me to replicate
tests of hypotheses from earlier phases with a larger data set, but also allowed for a
comprehensive view of the relationships among attachment dimensions and perceptions of
current intrapersonal coping and relationship perceptions in spouses of Canadian military
members. The number of variables that I had access to in this phase was extensive. This allowed
me to more adequately assess the relevance of attachment dimensions, treated as stable and
chronically accessible frameworks that guide one’s ability to manage stressors (particularly
those relevant to military spouses), and guide the strategies that individuals use to do so,

208
regardless of environmental threats. However, I was also able to assess the alternative view that I
have also been testing in previous phases, that attachment working models are interactive in
nature and should mainly be expressed under conditions of threat (Campbell & Marshall, 2010;
Mikulincer et al., 2002), particularly under conditions that threaten the attachment bond such as
deployments. The Phase Three survey contained several scales that tapped into indices of
intrapersonal coping and well-being, but also several scales that tapped into perceptions of
relationship functioning and quality. This allowed me to more effectively assess whether one
view of the workings of attachment dimensions (chronic versus interactive) is more accurate for
one type of outcome relative to another. In other words, I could assess whether the effects of
attachment dimensions on perceptions of intrapersonal coping and perceptions of relationship
functioning are more chronic in nature, or are more interactive with environmental threats.
Finally, researchers have only recently started assessing attachment orientations with continuous
measures, which allows for the simultaneous assessment of the unique and interactive effects of
these constructs (attachment anxiety and attachment avoidance). This is an additional strength of
this current line of research, that I can more effectively examine whether the effects of these
dimensions on intrapersonal and relationship outcomes are unique or more interactive in nature.
Further, this allows one to more accurately conclude whether it is truly attachment anxiety,
attachment avoidance, or both, that can more adequately explain intrapersonal or relationship
functioning and at what stages of a deployment. In addition, by treating both attachment anxiety
and avoidance as continuous dimensions, one can more effectively assess nonlinear relationships
between attachment dimensions and outcomes over time, and can also assess whether at any
given point in time the effects of attachment dimensions on intrapersonal and relationship
outcomes are nonlinear.

209
First, I did find that attachment anxiety, attachment avoidance, and their interaction
predicted responses to indices of emotional well-being and relationship functioning. In other
words, regardless of context or the presence of environmental threats, attachment orientations
explain perceptions of intrapersonal and relationship functioning. Specifically, attachment
anxiety was associated with decreased emotional well-being and coping capacity (12/23 indices
of well-being, coping capacity, and coping strategies), as well as more negative relationship
perceptions (6/7 indices) in line with previous phases and previous work. Attachment avoidance
was also associated with decreased emotional well-being (10/23), and more negative relationship
perceptions (7/7 indices). These unique effects of attachment avoidance on indices of emotional
well-being regardless of context are surprising given that such breakdowns in emotional well-
being and coping capacity have only been observed in conditions of high stress (Mikulincer &
Florian, 1998). I also found that some of the negative intrapersonal coping outcomes observed
for those higher in attachment anxiety relative to those lower in anxiety, were exacerbated for
those also lower in attachment avoidance. Further, most of the negative relationship outcomes
observed for those higher relative to lower in attachment anxiety were exacerbated for those also
high in attachment avoidance. This latter finding is consistent with work by Collins and Feeney
(2004) who found that fearfully attached individuals (high in attachment anxiety and avoidance)
perceived their partners’ personal messages of encouragement to be less supportive, controlling
for the independent ratings of their partners’ support in the messages. However, the interaction
between anxiety and avoidance on coping outcomes have not previously been reported
(Birnbaum, Orr, Mikulincer, & Florian, 1997; Meyer, Olivier, & Roth, 2005) and suggest that
researchers should continue to examine potential interactions of the attachment dimensions in
the future.

210
To assess whether the effects of attachment dimensions on intrapersonal and relationship
outcomes were also (and more or less so) interactive in nature, that is being most relevant in
explaining responses to indices of intrapersonal coping and well-being and relationship quality
under conditions of threat, I used the Canadian Deployment Handbook (Egerton-Graham, 2009)
informed by work by Logan (1987) as a reference guide. This handbook very precisely has the
stages of a deployment (including the deployment separation and reunion) identified that vary in
the extent to which they are perceived to be stressful or emotionally ‘reactive’ in nature. Even
more detailed, this handbook provides typical emotional responses that spouses can expect to
feel during each stage, with the qualifier included that some spouses oscillate between stages or
do not experience emotions typical in a particular stage (are even more or less reactive than the
norm).
According to this handbook, the most challenging stage of the separation is stage 3
(weeks 3-6 of the separation) and consists of emotional disorganization (anxiety, emotional
instability, clinginess, distrust, etc.). I assessed whether attachment dimensions interacted with
the experience of this stage by comparing a group of individuals currently separated from their
partners due to a deployment for one month to a group of spouses not currently separated or
reunited with their partners due to a deployment. I did find that this variable, more than any
other deployment-related variable, moderated relationships between attachment dimensions and
relationship outcomes specifically, lending support to the notion that this period is a potentially
threatening one. Surprisingly, those who perceive more relationship dysfunction during the high-
stress stage 3 relative to a baseline state (partner not deployed) are those with higher levels of
attachment avoidance or greater discomfort with emotional closeness, and those with lower
levels of attachment anxiety, or less fears of rejection and abandonment. Further, those with
211
more positive perceptions of relationship functioning during this high-stress period are those
with higher levels of attachment anxiety, or greater fears of rejection and abandonment, and
those with low levels of attachment avoidance, or more comfort with emotional intimacy. This
was in direct contradiction to the findings by Fraley and Shaver (1998), which showed that those
who reported the greatest distress during an airport separation from a partner were anxiously
attached women. This suggests that the trajectory of adjustment might not be linear and
consistent for the same individuals. Indeed, some initial work on the relationship between
attachment orientations and adjustment to life transitions suggests that perceptions of partner
support for anxious attached individuals decline over time.
Following up on the logic above, I also tested both linear and curvilinear functions of
time as a moderator of attachment avoidance, anxiety, and their interaction. There was little
support for linear and curvilinear effects across time according to levels of attachment anxiety
and avoidance, in that many findings did not meet my conservative threshold for statistical
significance. However, the findings that were significant tended to be in line with those from
Phase One, that low levels of anxiety were associated with increases in perceived relationship
success over time, whereas higher levels of anxiety were associated with decreases in perceived
relationship success across the separation. Further, given that the nature of emotional reactivity
across the separation is curvilinear according to the Canadian Forces Deployment Handbook
(Egerton-Graham, 2009), it wouldn’t be surprising to see some curvilinear effects of outcomes
according to attachment dimensions, across time separated and reunited. Specifically, spouses
progress from more emotional ‘reacting’ stages (Stages 1-3) to emotional stabilization (Stages 4-
5), and then into another reacting stage, Stage 1 of their reunion, which is the anticipation of
their partner’s homecoming. There were few curvilinear effects of attachment dimensions as a

212
function of time separated. One finding was that for those higher in attachment anxiety (the same
conceptual ‘group’ as those in the Rholes and colleagues 2001 study) perceived relationship
satisfaction assumed an inverted-U shape, being less positive near the beginning and end of the
separation reports, but more positive near the middle of the separation. Taken together, a group
that showed variability in relationship perceptions across the separation were those with higher
levels of anxiety. These findings are very much in line with work showing that individuals
higher in attachment anxiety do tend to be more variable in their responses to relationship
conflicts (Campbell, Simpson, Boldry, & Kashy, 2005; MacDonald, Wood, and Fabrigar,
submitted for publication; Tidwell, Reis, & Shaver, 1996). It appears that these individuals are
also those more variable in their responses to deployment separations.
With respect to the reunion, I did not find much support for the notion that recent reunion
status moderates relationships among attachment dimensions and spousal functioning.
Regarding the findings that were significant, and in line with my predictions and the findings
from Phase One, those with higher levels of attachment anxiety reported higher levels of
relationship success, and the extent to which one agrees with their partner on various issues, for
those recently reunited relative to those not recently reunited. While I did not find much support
for the notion that attachment dimensions interact with months deployed in a linear fashion, I did
find more support for curvilinear effects across time according to levels of attachment avoidance
and anxiety. In particular, for those with higher levels of attachment avoidance, perceptions of
one’s partner and the relationship were lower near the beginning of the reunion, increased over
time, and then decreased after the 4.5-month mark (inverted-U shape). This makes sense, as
having one’s partner home would naturally increase levels of intimacy in the relationship
making avoidant individuals uncomfortable and might potentially lead to conflict and more

213
unpleasant partner interactions (Tidwell et al., 1996). However, at higher levels of attachment
anxiety, perceptions of one’s partner and the relationship were initially higher, decreased over
time, and then started to increase again near the 4.5-month mark. It appears that the more one is
dependent on their partners for emotional comfort, reassurance, and validation, and the more one
experiences increased distress in response to partner separations, the more one responds
positively to this honeymoon period. Indeed, those with greater needs for connection and
reassurance (higher in attachment anxiety) in this initial reunion period are faring better because
they might be making more efforts to connect with their partners, and establish intimacy, or are
engaging in more proximity-seeking and intimacy-building activities with their partners.
It is common in the attachment literature to assume that the effects of attachment
dimensions are linear in nature. However, it is important for researchers to start to test these
assumptions that we so consistently rely on, so that our theoretical contributions are accurate and
informed. Therefore, I wanted to test for the potential non-linear effects of attachment
dimensions in the context of military deployments. There were no statistically significant (at
least that met my conservative alpha criteria) curvilinear effects of attachment dimensions on
indices of well-being as a function of low and high points of months deployed. However, I do
encourage researchers to continue to assess potential nonlinear effects of attachment dimensions
on intrapersonal and relationship outcomes, as there may be particular contexts where such
interactions are valid and should be acknowledged.
Finally, it is not clear from the current literature on attachment and long term separations
and major life transition periods why particular attachment dimensions are related to such
outcomes, or what mechanisms can explain these relationships. As a result of a number of post-
hoc mediation models (Preacher & Hayes, 2008), I found that emotional fitness or the extent to

214
which one maintains an optimistic outlook and is able to enjoy life, partially mediated the
relationships between attachment anxiety and all coping outcomes. In addition, and in line with
findings by Rholes and colleagues (2001), perceptions of partner support partially mediated the
relationships between attachment anxiety and most relationship outcomes, and fully mediated
the relationship between attachment anxiety and the extent to which partners engage in outside
activities together.
In summary, the findings from this phase are extensive, corroborating and contributing to
our awareness of attachment processes during major life transitions, specifically military
deployments in several ways. First, attachment anxiety and avoidance have unique and
interactive relationships with indices of intrapersonal coping and relationship functioning. In
addition, the attachment anxiety dimension seemed more reactive with environmental threats
such that those higher in attachment anxiety seemed the most variable in their responses and
adjustment to military deployment. Interestingly, these individuals showed better relationship
perceptions during periods typically described as more ‘reactive’ and stressful, but showed
declines in relationship perceptions during periods that are typically associated with recovery
and stabilization. Further, there were similarities in the ways that individuals with higher levels
of anxiety and those lower in avoidance responded to deployment experiences, and the ways that
those lower in anxiety and those higher in avoidance responded to these same experiences which
might be of theoretical importance in the future. Finally, I identified two major mechanisms that
explained variation in perceptions of intrapersonal coping and relationship functioning according
to levels of attachment anxiety, namely emotional fitness and perceived partner support,
respectively.

215
Limitations
Although there were several consistencies across phases with respect to which
attachment dimensions seemed most relevant, the areas with which they were relevant, and
whether the effects of attachment dimensions should best be considered chronic or more
interactive with environmental stressors, these findings should of course be qualified by some
important limitations.
Perhaps most importantly, these data are exclusively self-report. In other words, the
spouses are reporting about their perceptions of their relationship and intrapersonal adjustment
which may or may not accurately reflect their true state of adjustment or relationship quality. In
fact, it is characteristic for those higher in attachment anxiety to amplify their signals and
experiences of distress perhaps to elicit care from their attachment figures. On the other hand,
individuals higher in attachment avoidance characteristically under report their experiences of
distress, but perhaps overstate their negative relationship perceptions, in efforts to deactivate
experiences of distress and avoid rejection from an attachment figure. Therefore, it is possible
that individuals higher in attachment anxiety are faring better than they are reporting, with
respect to actual coping and relationship experiences, and that those higher in attachment
avoidance are faring much worse than they are projecting.
To put this view into perspective, an abundance of research has shown that secondary or
insecure attachment styles are associated with perceptions of one’s ability to regulate emotions,
one’s coping capacity, and stress management, and that these strategies can place a person at an
increased risk for psychopathology. In other words, rather than being limited to simply
perceptions of one’s ability to manage threats (particularly related to the relationship), insecure
attachment styles can place an individual at risk for more several psychological and health

216
disturbances. Clinicians have observed that those who engage in hyperactivating attachment
strategies (higher in attachment anxiety) have higher levels of clinical diagnoses of global
distress, depression, anxiety, eating disorders, and substance abuse (see Mikulincer & Shaver,
2008). On the other hand, while deactivating strategies might be associated with successful
suppression of rejection-related thoughts and behavioural distancing towards a romantic partner,
other research suggests that the deactivating form of a secondary attachment strategy might
place an individual at risk for more serious psychological and physiological health diagnoses
including mood disorders and somatic complaints (see Mikulincer & Shaver, 2008). However,
the list of more severe psychological or health disturbances for those with more anxious relative
to avoidant attachment orientations is more extensive. In other words, those who tend to show
greater subjective distress and heightened reactions to attachment-related threats do tend to be
more at risk for more severe psychological and health disturbances relative to those who show
emotional and behavioural distancing in response to attachment-related threats. Further, self-
reported attachment dimensions are correlated with observer’s reports of communication styles
and hostility during conflict with romantic partners (Kobak & Hazan, 1991), behavioural
displays of affection and avoiding contact with a partner during an interaction (Feeney, 1998),
and attachment orientations are related to relationship outcomes like its stability over time
(Kirkpatrick & Davis, 1994; Kirkpatrick & Hazan, 1994). Therefore, the predictive validity of
attachment orientations to relationship outcomes and more objective measures of relationship
behaviour is well established.
One of the major limitations of Phases One and Two were the sample sizes. Therefore, I
was limited in the extent to which I could generalize such findings to the larger population of
Canadian married couples in married or common-law relationships with a CAF member, and test

217
more complex statistical analyses. Further, both samples were homogenous in nature, capturing
spouses going through similar military experiences and at a similar point in time. This made it
challenging for me to assess linear or curvilinear effects of time given the restricted ranges of
time separated or reunited, and to generalize to beyond the experiences of this particular sample.
In addition, little research has assessed how attachment dimensions are predictive of subjective
accounts of intrapersonal and relationship functioning during military separations and reunions,
so there was a not a lot of literature that I could compare my results against and confidently
challenge or support a theoretical framework of attachment processes during military
deployments. Fortunately, however, Phase Three was well powered and allowed me to more
effectively observe consistencies and inconsistencies in findings across all phases. Phase Three
contained a more heterogenous sample comprised of civilian and military spouses of military
members in the RCN, CA, and the RCAF. More importantly, this survey captured spouses at all
stages of deployments and separations, including those not currently separated nor recently
reunited. Related to this point, one might question the extent to which findings from Phases One
and Two are truly an effect of deployment separations and reunions, or whether we might find
similar patterns of relationships between attachment dimensions and reports of intrapersonal and
relationship functioning in those not currently reunited or separated from their partners. In other
words, to what extent are the findings observed in Phases One and Two limited to separations
and reunions, or do they extend to more mundane relationship experiences? Again, Phase Three
allowed me to compare responses of those currently experiencing the most reportedly stressful
separation and reunited stages against baseline groups, or those not currently preparing for, nor
experiencing a separation or a recent reunion with their partners. Indeed, there were some
important differences between those experiencing stressful separation/reunion periods and
218
baseline groups in outcomes per attachment dimensions. Therefore, this final Phase Three
allowed me to more accurately assess when attachment dimensions are predictive of outcomes,
and in what way.
In addition, this research was exclusively focused on the perceptions of the spouse. For
this reason, it is difficult to determine to what extent intrapersonal and relationship perceptions
are driven by internalized working models, and to what extent reports of spousal functioning are
influenced by partner behaviour. Theoretically, and demonstrated empirically, internal working
models tend to be fairly stable across time and relationships (Baldwin & Fehr 1995; Scharfe &
Bartholomew, 1994; Waters et al., 2000). While it is possible that partner behaviour can
influence both attachment orientations and intrapersonal and relationship functioning, partner
behaviour more realistically might be adding error variance, or variance in intrapersonal and
relationship outcomes that attachment orientations therefore cannot account for. Some
researchers in the field of adult attachment have assessed and controlled for partner effects in
their investigations of relationships among attachment orientations and relationship perceptions
and behaviours and found that the relationships between attachment dimensions and relationship
outcomes do not fluctuate much (significant findings remain significant) once partner behaviour
is considered (Feeney, 1998; Rholes et al., 2001). However, theoretically it is important to
continue to assess the role of partner behaviour in various attachment-related relationship
processes, and how partner behaviour interacts with attachment orientations in explaining
relationship behaviours and perceptions of functioning and quality.
Lastly, while the response rate across all phases might seem low (ranging from relative to
21-23%) these rates are typical for military samples that have hovered around 30% compliance
since the 1980s (e.g., Lamerson, 2001; Newell, Rosenfeld, Harris, & Hindelang, 2004). These

219
rates are also consistent with results of other studies using home address mailings to contact
married couples (e.g., 16.7% in Banse, 2004; 17.8% in Davila, Karney, & Bradbury, 1999; 18%
in Kurdek, 1991). Further, other studies of married individuals previously discussed relied
mainly on the use of convenience sampling such as recruiting through advertisements or
community centres and therefore cannot accurately assess nor report response rates (e.g.,
Birnbaum et al., 1997; Lussier et al., 1997; Meltzer et al., 2014; Neff & Geers, 2013; Rholes et
al., 2001). However consistent with previous research, our response rate indicates that our
findings may not be representative of the typical married/common-law population, or the typical
military spousal population. With this mind, it is important to consider that the main focus of
this research was to assess relationships among variables of interest. Although it is possible that
limitations in sampling methods, size, and characteristics might impact the findings in a way that
range of responses are restricted, inflated, or constants added (the typical response is lower or
higher than typical), it is less likely for such sampling issues to change the nature of
relationships among variables from what is expected theoretically. In other words, I do not
expect such sampling issues to significantly impact the nature of relationships among attachment
orientations and indices of intrapersonal and relationship functioning.
Contribution to Previous Literature
Past literature on the relevance and nature of effects of attachment dimensions on spousal
functioning during military deployments is fairly limited in amount, scope, measurement of
adult attachment, and complexity of statistical analyses. These findings contribute to this
literature in a number of ways. Although the literature on affect regulation and coping with stress
is fairly extensive and does find that anxious and avoidant attachment styles predict different
methods of affect regulation and coping strategies and success in responses to stressors, I found
220
fairly consistent evidence for the interactive effects of anxiety and avoidance on perceptions of
intrapersonal coping and relationship outcomes. Specifically, I found that some of the negative
effects of attachment anxiety on intrapersonal outcomes were exacerbated for those also low in
avoidance, and most of the effects of attachment anxiety on relationship outcomes were
exacerbated for those high in attachment avoidance. Further, most of the literature assessing
attachment styles and coping outcomes finds less evidence for a positive relationship between
attachment avoidance and breakdowns in coping capacity and subjective well-being, and when
researchers have reported such breakdowns, they have been limited to very stressful experiences
(Mikulincer & Florian, 1998). Contrary to these findings, in my more extensive (in sample and
measures) Phase Three study, I found that attachment avoidance was related to a number of
indices capturing coping capacity and subjective well-being. Although this might in part be
explained by differences in the individuals sampled (military spouses relative to civilian spouses
in the previous literature), what might also explain this inconsistency is the use of typological
versus continuous measures of attachment orientations.
The bulk of research examining relationships among attachment orientations and coping
outcomes has used the typological approach (e.g., Birnbaum et al., 1997; Lussier et al., 1997;
Mikulincer et al., 1993). Using the continuous approach, I was able to simultaneously consider
the unique and interactive effects of attachment anxiety and attachment avoidance on indices of
intrapersonal functioning and perceptions of relationship functioning in my statistical models. It
is possible that the relationships between attachment avoidance and coping outcomes can more
effectively be observed once one accounts for the unique effects of attachment anxiety, and their
interaction terms together. Therefore, in questioning what attachment dimensions are relevant in
explaining differences in coping and relationship perceptions overall (regardless of deployment
221
status), it appears that attachment anxiety, attachment avoidance, and their interaction are
important predictors.
In terms of what attachment dimensions are relevant at various deployment stages, both
attachment anxiety and attachment avoidance seem to be relevant in explaining decreased coping
and more negative relationship perceptions during deployment separations, avoidance may
uniquely predict difficulties with provision and acceptance of emotional support during the
ongoing separation, and anxiety seems to better predict outcomes during deployment reunions
(Phases One and Three). The only study assessing relationships among spousal attachment
orientations and adjustment following a military reunion (Cafferty et al., 1994) found that an
anxious attachment was related to perceptions of relationship functioning, but not indices of
emotional well-being. Phases One, Two, and Three found evidence that anxiety was predictive
of more than just relationship outcomes, that attachment anxiety also predicted decreased
emotional adjustment and coping capacity outcomes. Further, in Phase One I demonstrated that
perceptions that the reunion period has not lived up to one’s expectations fully mediated the
relationships among attachment anxiety and relationship outcomes (just not indices of emotional
adjustment). Although this is in line with theorizing by Simpson and Rholes (2008), this is a
novel finding. Finally, as previously mentioned, attachment avoidance was related to more
negative perceptions about one’s provision of and acceptance of emotional support with one’s
partner, and less fantasizing and thinking about one’s partner during a deployment separation.
Although these findings might be consistent with a larger literature on attachment avoidance and
support provision/acceptance and attachment-related thoughts, these findings have not been
extended to the more serious context of an ongoing deployment-related separation.
222
As outlined by Simpson and Rholes (1994) and further reiterated by Campbell and
Marshall (2010), attachment dimensions are interactive in nature and are therefore most relevant
in contexts signalling attachment concerns. In situations that threaten the attachment bond,
including threats to the well-being of either the individual or attachment figure, we should see
internal working models and attachment strategies most salient, pronounced, and expressed. In
other words, attachment dimensions should be most predictive of attachment-related cognitions,
emotions, and behaviours under threatening conditions relative to neutral conditions. I found
some evidence to support this notion, that there are some deployment-related events that
moderate the effects of attachment dimensions on intrapersonal and relationship outcomes. In
other words, I was able to further determine when attachment dimensions are most relevant
across the deployment cycle.
First, the negative effects of deployment separations seem to be amplified for those who
are experiencing their first deployment (Frankel, Snowden, & Nelson, 1993; Padden, Connors,
& Agazio, 2011). I further found that the relationship between attachment anxiety and more
negative relationship perceptions during a deployment separation were amplified for those
experiencing their first deployment. In fact, after the first deployment the relationship between
attachment anxiety and relationship perceptions was no longer significant. These findings
suggest that attachment anxiety, in particular, might be most relevant in predicting relationship
outcomes in contexts that one has less experience and cannot adjust their expectations.
I also found that, across the three phases, the dependent measures that appeared to be
less related to, or interactive with, deployment-related contexts were reports of emotional well-
being and coping capacity, while reports of relationship satisfaction and quality were more
dependent on, or interactive with, deployment-related contexts. Specifically, one deployment
223
context that was particularly interactive with attachment dimensions in predicting relationship
outcomes was whether or not spouses were recently separated (≤ 1 month) from their romantic
partners. Some of these findings were consistent for Phases One and Three. Specifically, those
lower in attachment avoidance or those higher in attachment anxiety had more positive
relationship perceptions during this time, relative to those not separated, however those higher in
avoidance had more negative relationship perceptions for those also recently separated relative
to those not separated. I speculate that those with greater needs for connection and reassurance
(lower avoidance or higher anxiety) in this initial period are faring better because they might be
making more efforts to connect with their partners, and establish intimacy, or are engaging in
more proximity-seeking and intimacy-building activities with their partners. This might be
reflected in increased attempts to contact one’s partner, more intimate conversations involving
support seeking and provision, and successfully gaining that reassurance they so desperately
desire. It is also possible that their partners are more accepting of their partners’ ‘neediness’
during this stage, relative to those at home together, and so highly anxious, or less avoidant,
individuals are receiving the attention they desire normally but perhaps do not receive to the
same extent. However, those with greater levels of discomfort with emotional intimacy and
dependency, or less fears of rejection and abandonment are less motivated to connect with their
partners, and maintain intimacy, from afar. In other words, tendencies to engage in de-activating
strategies to reduce psychological dependency on one’s partner, or less of a concern about
rejection and abandonment, might lead these individuals to not reach out to one’s partner as
often or as intimately, to not provide nor seek as much emotional support from one’s partner,
and more of a ‘out of sight out of mind’ mentality.

224
In addition, my research provides some clarification surrounding how attachment
dimensions predict intrapersonal and relationship functioning during deployment stages. In other
words, I found evidence to suggest that the trajectories of intrapersonal and relationship
outcomes across deployment separations and reunions differ according to levels of attachment
anxiety and attachment avoidance, both in linear and nonlinear fashions. However, I need to
preface these findings by mentioning that the number of interactions among attachment
dimensions and deployment-related moderators were few after making an alpha criterion
correction, and therefore any interpretations should be made caution. However, these findings
are worthy of some attention, as they might be able to point to interesting avenues for future
research, if they are replicated.
One consistent pattern across Phases One and Three was that relationship perceptions for
those higher in attachment anxiety became more negative (so linear) across the separation and
reunion periods. Indeed, attachment anxiety was related to decreases in relationship satisfaction
and harmony across the separation in Phase One, and decreased relationship success across the
separation in Phase Three. In addition, I found some evidence to suggest that some of the
relationships among attachment dimensions and relationship and coping outcomes might vary in
a curvilinear nature across the separation and reunion periods. However, because I could only
adequately test these functions in Phase Three, and there were too few effects found, further
research in this area is needed before any conclusions can should be drawn. Finally, the current
literature portrays those with anxious attachments as most distressed by long term separations
(e.g., Fraley & Shaver, 1998; Mayseless et al., 1996), however this research suggests that this is
too general an understanding, and that there are points in a long-term separation where highly

225
anxious individuals could potentially be functioning better than lower anxiety individuals, or at
least better than they typically do in relationships (i.e., not separated).
Finally, I was able to more adequately identify why attachment dimensions are related to
intrapersonal coping and relationship outcomes which at this point is not well understood. In
Phase Three, I conducted a number of mediation models to determine which indices most
effectively explained relationships between attachment dimensions and intrapersonal and
relationship outcomes. My findings suggest that the best mediator to explain the relationships
between attachment anxiety and the use of emotion-focused coping strategies, and decreased
subjective well-being and increased psychological distress is decreased emotional fitness, or
having a less optimistic outlook on life and less of an ability to enjoy life. Further, and consistent
with Rholes and colleagues (2001), perceptions of decreased partner support was the best
explanation for the relationships between attachment anxiety and more negative relationship
perceptions. This is a novel contribution to the understanding of the relationships among
attachment dimensions and intrapersonal and relationship functioning during military
deployments. These findings suggest that fluctuations in perceptions of subjective well-being
and relationship quality during long term separations and reunions are functions of fluctuations
in optimism and the extent to which you feel your partner is supportive of you and the
relationship.
Implications and Future Directions
This research has the potential to make significant contributions to current governmental
programs, policies, and services that support the quality of life of CAF families such as the
mandated Family Separation and Reunion service provided by Military Family Resource Centres
(MFRCs). The Road to Mental Readiness (R2MR) is a program provided to CAF members and
226
their families with the goal of improving soldiers’ short term performance and long term mental
health outcomes (Department of National Defence, 2015). Part of this training involves
preparing CAF members and their families for military deployments, with guidelines and
information based on research internal and external to the Department of National Defence. This
program helps spouses in particular to understand the phases of a deployment and typical
thoughts, behaviours, and emotions experienced during each of these stages. Although the
current R2MR does acknowledge variation amongst spouses in their functioning during each of
the stages, and the progression or oscillation between stages, this research could help provide
more accurate guidelines with adult attachment as the theoretical framework. Specifically, this
research could help explain some of that variance, and reduce some of this ambiguity by helping
spouses to identify their attachment orientations and then provide them with more accurate
trajectories and expected outcomes as a function of such orientations. By identifying and adding
predictors of spousal adjustment to such programs, we can help to maximize the extent to which
spouses can be effectively assisted and supported, and ensure that governmental resources such
as the R2MR are most effectively utilized (see Canadian Forces Moral and Welfare Services for
information on current programs for CAF personnel and their families).
For example, aside from being able to identify who might be most at risk for
experiencing difficulties in intrapersonal and relationship functioning during particular phases of
the deployment cycle, programs could also be aimed at also targeting identified mechanisms or
mediators of intrapersonal and relationship functioning. This research suggests that having
unrealistically optimistic expectations of a partner’s return might be problematic when a
partner’s return does not live up to one’s original expectations, and that those higher in
attachment anxiety are most likely to report such beliefs. In addition, emotional fitness might
227
well explain relationships among attachment anxiety and coping outcomes. Future interventions
could be developed whereby spouses could be randomly assigned to receive the current spousal
support programs for deployment preparation, and another group of spouses randomly assigned
to a program with a module specifically designed to address problems associated with unrealistic
expectations of the reunion, and to develop expectations that are more realistic, and a more
optimistic outlook. This would allow researchers and agencies to assess the effectiveness of
expectation modification in spousal adjustment and relationship functioning in couples
experiencing a deployment, and lead to the development of optimally effective spousal support
programs.
Conclusion
John Bowlby, the founder of attachment theory, created one of the most complete
theoretical accounts of how infants react to the experience of separation from an attachment figure
(Bowlby, 1973), how this experience is moderated by internal working models of attachment
figure responsiveness and availability, and how repeated experiences of separations impact an
infant’s development. Bowlby also speculated that attachments are ‘from the cradle to the grave’,
that our attachment models follow us through life and impact later relationships with important
others, which lead to the development of adult attachment theory. To this day, attachment
researchers are still gaining an understanding of how attachment processes operate in adulthood.
John Bowlby (1973) and his graduate student Mary Ainsworth (1978) demonstrated how
separations and reunions with attachment figures are contexts within which attachment processes
are activated and therefore most pronounced. The military deployment contains elements
comparable to Mary Ainsworth’s Strange Situation used to classify infant attachment styles,
involving separations from an attachment figure, introduction of a potential threat (stranger for

228
infants, injury for adults), and a reunion. In other words, a military deployment is akin to the adult
version of the Strange Situation.
Unfortunately, little research has assessed the relevance of attachment orientations in
explaining spousal adjustment and relationship functioning in this context. Although one initial
study points to the relevance of adult attachment in spousal adjustment to the post-reunion period
(Cafferty et al., 1994), methodological concerns and lack of more complex statistical analyses
leave many questions unanswered. This three-phased research project was able to clarify what
attachment dimensions specifically are related to problems in emotional and relationship
adjustment during deployment stages, when attachment dimensions are relevant in predicting
outcomes across the deployment cycle, how attachment dimensions predict intrapersonal and
relationship functioning during deployment stages (what the trajectories of outcomes look like
across time as moderated by attachment dimensions), and finally I was able to more specifically
understand why attachment dimensions are related to intrapersonal coping and relationship
outcomes which at this point is not well understood. As Bowlby (1973) so eloquently articulated,
while it is not easy to understand why some individuals should recover from experiences of
separation while others do not, we are starting to gain a better understanding thanks to the
theoretical framework that is attachment theory.
229
References
Aiken, L. S., & West, S. G. (1991). Multiple regression: Testing and interpreting interactions.
Newbury Park, CA: Sage.
Ainspan, C.J. Bryan, & W.E. Penk (Eds.). Handbook of Psychosocial Interventions for
Veterans: A Guide for the Non-Military Mental Health Clinician. New York, NY: Oxford
University Press.
Ainsworth, M. S., Blehar, M. C., Waters, E., & Wall, S. (1978). Patterns of attachment: A
psychological study of the strange situation. Oxford, England: Lawrence Erlbaum.
Bartholomew, K., & Horowitz, L. M. (1991). Attachment styles among young adults: A test of a
four-category model. Journal of Personality and Social Psychology, 61(2), 226-244.
Baldwin, M. W., & Fehr, B. (1995). On the instability of attachment style ratings. Personal
Relationships, 2, 247-261.
Baldwin, M. W., & Kay, A. C. (2003). Adult attachment and the inhibition of rejection. Journal
of Social and Clinical Psychology, 22(3), 275-293.
Banse, R. (2004). Adult attachment and marital satisfaction: Evidence for dyadic configuration
effects. Journal or Social and Personal Relationships, 21(2), 273-282.
Baumeister, R. F. (1998). The self. In D. T. Gilbert, S. T. Fiske, & G. Lindzey (Eds.), Handbook
of social psychology (4th ed., pp. 680–740). New York, NY: McGraw-Hill.
Belsky, J., Rovine, M., & Taylor, D. G. (1984). The Pennsylvania infant and family
development project: III. The origins of individual differences in infant–mother attachment:
Maternal and infant contributions. Child Development, 55(3), 718-728.

230
Birnbaum, G. E., Orr, I., Mikulincer, M., & Florian, V. (1997). When marriage breaks up: Does
attachment style contribute to coping and mental health? Journal of Social and Personal
Relationships, 14, 643-654.
Bowen, G. L., & Martin, J. A. (2011). Support and Resiliency Inventory (SRI) for civilian
spouses of U.S. Air Force members (active duty only): Descriptive summary (October 1,
2009 to December 31, 2010). Charlotte, NC: Flying Bridge Technologies, Inc.
Bowlby, J., (1969, 1982). Attachment and loss: Vol.1. Attachment. New York: Basic Books.
Bowlby, J. (1973). Attachment and loss: Vol. 2: Separation: Anxiety and anger. New York:
Basic Books.
Burant, E., Mikulincer, M., & Shaver, P. R. (2008). Mothers’ attachment style, their mental
health, and their children’s emotional vulnerabilities: A 7-year study of children with
congenital heart disease. Journal of Personality, 76(1), 31-66.
Busby, D. M., Christensen, C., Crane, D. R., & Larson, J. H. (1995). A revision of the dyadic
adjustment scale for use with distressed and nondistressed couples: Construct hierarchy
and multidimensional scales. Journal of Marital and Family Therapy, 21(3), 289-308.
Canadian Army, Government of Canada. (2017). Reserve Jobs. Retrieved from
http://www.army-armee.forces.gc.ca/en/jobs-careers/reserve.page
Canadian Forces Moral and Welfare Services. (nd). Programs and Services. Retrieved from
https://www.cafconnection.ca/National/Programs-Services.aspx.
Cafferty, T. P., Davis, K. E., Medway, F. J., O’Hearn, R. E., & Chappell, K. D. (1994). Reunion
dynamics among couples separated during Operation Desert Storm: An attachment theory
analysis. In K. Bartholomew & D. Perlman (Eds.), Advances in Personal Relationships:
Attachment Processes in Adulthood (Vol. 5, pp. 309–330). London, UK: Jessica Kingsley.
231
Campbell, L., & Marshall, T. (2011). Anxious attachment and relationship processes: An
interactionist perspective. Journal of Personality, 79, 917-947.
Campbell, L., Simpson, J.A., Boldry, J.G., & Kashy, D. (2005). Perceptions of conflict and
support in romantic relationships: The role of attachment anxiety. Journal of Personality
and Social Psychology, 88, 510-531.
Carver, C. S. (1997). You want to measure coping but your protocol’s too long: Consider the
Brief COPE. International Journal of Behavioral Medicine, 4, 92-100.
Carver, C. S. (2007). Brief COPE. Retrieved from
http://www.psy.miami.edu/faculty/ccarver/sclBrCOPE.html.
Cassidy, J. (2008). The nature of the child’s ties. In J. Cassidy & P. R. Shaver (Eds.), Handbook
of attachment: Theory, research, and clinical applications (pp. 3- 20). New York: Guilford
Press.
Chandra, A., Burns, R. M., Tanielian, T., Jaycock, L. H., & Scott, M. (2008). Understanding the
impact of deployment on children and families – findings from a pilot study of operation
purple camp participants. Rand Working Paper Prepared for the National Military Family
Association.
Cobeanu, O. (2013). Irrational beliefs and somatosensory amplification in breast cancer patients
undergoing treatment: impact on general distress. Journal of Cognitive and Behavioral
Psychotherapies, 13, 547-556.
.Cohen, J. (1960) A coefficient of agreement for nominal scales. Educational and Psychological
Measurement 20, 37-46.
232
Collins, N. L., & Feeney, B. C. (1991). Working models of attachment shape perceptions of
social support. Evidence from experimental and observational studies. Journal of
Personality and Social Psychology, 87(3), 363-383.
Collins, N. L., & Read, S. J. (1990). Adult attachment, working models, and relationship quality
in dating couples. Journal of Personality and Social Psychology, 58(4), 644-663.
Davila, J. (2001). Refining the association between excessive reassurance seeking and
depressive symptoms: The role of related interpersonal constructs. Journal of Social and
Clinical Psychology, 20,538-559.
Davila, J., Karney, B. R., & Bradbury, T. N. (1999). Attachment change processes in the early
years of marriage. Journal of Personality and Social Psychology, 76(5), 783-802.
Davis, D., Shaver, P. R., & Vernon, M. L. (2003). Physical, emotional, and behavioral reactions
to breaking up: The roles of gender, age, emotional involvement, and attachment style.
Personality and Social Psychology Bulletin, 29(7), 871-884.
De Burgh, T. H., White, C. J., Fear, N. T., & Iverson, A. C. (2011). The impact of development
to Iraq or Afghanistan on partners and wives of Military personnel. International Review
of Psychiatry, 23(2), 192-200.
De Wolff, M.S., & van Ijzendoorn, M.H. (1997). Sensitivity and attachment: A meta-analysis on
parental antecedents of infant attachment. Child Development, 68, 571-591.
Department of National Defence. (2015). Road to Mental Readiness (R2MR). Retrieved from
http://www.forces.gc.ca/en/caf-community-health-services-r2mr/index.page.
Diener, E., Emmons, R. A., Larsen, R. J., & Griffin, S. (1985). The satisfaction with life scale.
Journal of Personality Assessment, 49(1), 71-75.
233
Duemmler, S. L., & Kobak, R. (2001). The development of commitment and attachment in
dating relationships: attachment security as relationship construct. Journal of
Adolescence, 24(3), 401-415.
Efron, B., & Tibshirani, R. J. (1993): An introduction to the bootstrap. Chapman & Hall.
Egerton-Graham, M. (2009). A practical guide for families. Canadian Forces Reunion
Handbook. Retrieved from https://www.cafconnection.ca/getmedia/ed11832b-b5d5-
4ea0-ba60-6a6e3d8e16b9/Reunion-Handbook.aspx.
Enders, C. K., & Tofighi, D. (2007). Centering predictor variables in cross-sectional multilevel
models: a new look at an old issue. Psychological Methods, 12(2), 121-138.
Fabrigar, L. R. & Wegener, D. T. (2012). Exploratory Factor Analysis. New York: NY, Oxford
University Press.
Fabrigar, L. R., Wegener, D. T., MacCallum, R. C., & Strahan, E. J. (1999). Evaluating the use
of exploratory factor analysis in psychological research. Psychological Methods, 4(3),
272-299.
Feeney, J. A. (1998). Adult romantic attachment: Developments in the study of couple
relationships. In J. Cassidy & P. R. Shaver (Eds,). Handbook of attachment: Theory,
research, and clinical applications (pp. 456-481). New York: Guilford Press.
Feeney, J. A., & Noller, P. (1992). Attachment style and romantic love: Relationship dissolution.
Australian Journal of Psychology, 44(2), 69-74.
Fraley, L. R. (2002). Attachment stability from infancy to adulthood. Journal of Personality and
Social Psychology Review, 6(2), 123-151.

234
Fraley, L. R. (2010). Information on the Experiences in Close Relationships-Revised (ECR-R)
Adult Attachment Questionnaire. Retrieved from
http://internal.psychology.illinois.edu/~rcfraley/measures/ecrr-oldernorms.htm.
Fraley, R. C., & Bonanno, G. A. (2004). Attachment and loss: A test of three competing models
on the association between attachment-related avoidance and adaptation to bereavement.
Personality and Social Psychology Bulletin, 30, 878-890.
Fraley, R. C., Fazzari, D. A., Bonanno, G. A., & Dekel, S. (2006). Attachment and
psychological adaptation in high exposure survivors of September 11th attach on the World
Trade Center. Personality and Social Psychology Bulletin, 32, 538-551.
Fraley, R. C., & Shaver, P. R. (1997). Adult attachment and the suppression of unwanted
thoughts. Journal of Personality and Social Psychology, 73, 1080-1091.
Fraley, R. C., & Shaver, P. R. (1998). Airport separations: A naturalistic study of adult
attachment dynamics in separating couples. Journal of Personality and Social Psychology,
75(5), 1198-1212.
Fraley, R. C., & Waller, N. G. (1998). Adult attachment patterns: A test of the typological
model. In J. A. Simpson & W. S. Rholes (Eds.), Attachment theory and close relationships
(pp. 77-114). New York: Guilford Press.
Fraley, R. C., Waller, N. G., & Brennan, K. A. (2000). An item response theory analysis of self-
report measures of adult attachment. Journal of Personality and Social Psychology, 78, 350-
365.
Frankel, H., Snowden, L. R., & Nelson, L. S. (1993). Wives adjustment to military deployment:
An empirical evaluation of a family stress model. International Journal of Sociology of the
Family, 22, 93-117.
235
George, D., & Mallery, P. (2003). SPSS for Windows step by step: A simple guide and reference.
11.0 update (4th ed.). Boston: Allyn & Bacon.
Green, S., Nurius, P. S., & Lester, P. (2013). Spouse psychological well-being: A keystone to
military family health. Journal of Human Behavior in The Social Environment, 23(6), 10-
24.
Hazan, C., & Shaver, P. R. (1987). Romantic love conceptualized as an attachment process.
Journal of Personality and Social Psychology, 52, 511–524.
Hazan, C., & Shaver, P.R. (1994). Attachment as an organizational framework for research on
close relationships. Psychological Inquiry, 5, 1-22.
Hendrick, S. S. (1988). A generic measure of relationship satisfaction. Journal of Marriage and
the Family, 50, 93–98.
Hinkle, D. E., Wiersma, W., & Jurs, S. G. (2003). Applied statistics for the behavioural sciences
(5th ed.). Boston, MA: Houghton Mifflin Company.
Isabella, R. A. (1993). Origins of attachment: Maternal interactive behavior across the first year.
Child Development, 64(2), 605-621.
Kessler, R. C., Andrews, G., Colpe, L. J., et al. (2002). Short screening scales to monitor
population prevalences and trends in non-specific psychological distress. Psychological
Medicine, 32(6), 959-956.
Kirkpatrick, L. A., & Davis, K. E. (1994). Attachment style, gender, and relationship stability: A
longitudinal analysis. Journal of Personality and Social Psychology, 66, 502-512.
Kirkpatrick, L. A., & Hazan, C. (1994). Attachment styles and close relationships: A four-year
prospective study. Personal Relationships, 1, 123-142.
Kline, P. (2000). The handbook of psychological testing (2nd ed.). London: Routledge.
236
Kobak, R., Cole, H. E., Ferenz-Gillies, R., Fleming, W. S., & Gamble, S. Attachment and
emotion regulation during mother-teen problem solving. A control theory analysis. Child
Development, 64, 231-245.
Kobak, R. R., & Hazan, C. (1991). Parents and spouses: Attachment strategies and marital
functioning. University of Delaware, Newark.
Kurdek, L. A. (1991). Correlates of relationship satisfaction in cohabitating gay and lesbian
couples: Integration of contextual, investment, and problem-solving models. Journal of
Personality and Social Psychology, 61(6), 910-922.
Lamerson, C. D. (2001, September). Survey issues in TTCP nations (Report No.
TTCP.HUM/01/10). Ottawa, Ontario, Canada: Department of National Defence, Directorate
of Human Resource Research & Evaluation.
Logan, K. V. (1987). The emotional cycle of deployment. Proceedings, U.S. Naval Institute.
Lussier, Y., Sabourin, S., & Turgeon, C. (1999). Coping strategies as moderators of the
relationship between attachment and marital adjustment. Journal of Social and Personal
Relationships, 14, 777-791.
Lyons-Ruth, K., & Jacobvitz, D. (2008). Attachment disorganization: Genetic factors, parenting
contexts, and developmental transformation from infancy to adulthood. In J. Cassidy & P.
R. Shaver (Eds.), Handbook of attachment: Theory, research, and clinical applications (pp.
3- 20). New York: Guilford Press.
MacDonald, T. K., & Ross, M. (1999). Assessing the accuracy of predictions about dating
relationships: How and why do lovers' predictions differ from those made by observers?
Personality and Social Psychology Bulletin, 25, 1417-1429.
Mayseless, O., Danieli, R., & Sharbany, R. (1996). Adults’ attachment patterns: Coping with

237
separations. Journal of Youth and Adolescence, 25, 667-690.
McHugh, M. L. (2012). Interrater reliability: the kappa statistic. Biochemia Medica, 22(3), 276-
282.
Meltzer, A. L., McNulty, J. K., Jackson, G. L., & Karney, B. L. (2014). Sex differences in the
implications of partner physical attractiveness for the trajectory of marital satisfaction.
Journal of Personality and Social Psychology, 106(3), 418-428.
Medway, F. J., Davis, K. E., Cafferty, T. P., Chappell, K. D., & O’Hearn, R. E. (1995). Family
disruption and adult attachment correlates of spouse and child reactions to separation and
reunion due to Operation Desert Storm. Journal of Social and Child Psychology, 14, 97-
118.
Meyer, B., Olivier, L., & Roth, D. A. (2005). Please don’t leave me! BIS/BAS, attachment
styles, and responses to a relationship threat. Personality and Individual Differences, 38,
151-162.
Mikulincer, M. (1998). Adult attachment style and individual differences in functional versus
dysfunctional experiences of anger. Journal of Personality and Social Psychology, 74, 513-
524.
Mikulincer, M., Birnbaum, G., Woddis, D., & Nachmias, O. (2000). Stress and accessibility of
proximity-related thoughts: Exploring the normative and intraindividual components of
attachment theory. Journal of Personality and Social Psychology, 78(3), 509-523.
Mikulincer, M., Dolev, T., & Shaver, P. R. (2004). Attachment-related strategies during thought
suppression: Ironic rebounds and vulnerable self-representations. Journal of Personality
and Social Psychology, 87(6), 940-956.

238
Mikulincer, M., & Florian, V. (1998). The relationship between adult attachment styles and
emotional and cognitive reactions to stressful events. In J. A. Simpson & W. S. Rholes
(Eds.), Attachment theory and close relationships, (pp. 143-165). New York: Guilford
Press.
Mikulincer, M., Florian, V., & Wellar, A. (1993). Attachment styles, coping strategies, and
posttraumatic psychological distress: The impact of the Gulf War in Israel. Journal of
Personality and Social Psychology, 64, 817-826.
Mikulincer, M., Gillath, O., & Shaver, P. R. (2002). Activation of the attachment system in
adulthood: Threat-related primes increase the accessibility of mental representations of
attachment figures. Journal of Personality and Social Psychology, 83, 881-895.
Mikulincer, M., Orbach, I., & Iavnieli, D. (1998). Adult attachment style and affect regulation:
Strategic variations in self-other similarity. Journal of Personality and Social Psychology,
75, 436-448.
Mikulincer, M., & Shaver, P.R. (2003). The attachment behavioral system in adulthood:
Activation, psychodynamics, and interpersonal processes. In M.P. Zanna (Ed.),
Advances in experimental social psychology (pp. 53–152). New York: Academic Press.
Mikulincer, M., & Shaver, P.R. (2007). Attachment in adulthood: Structure, dynamics, and
change. New York: Guilford Press.
Mooney, C. Z., & Duval, R. D. (1993). Bootstrapping : a nonparametric approach to statistical
inference. Newbury Park, CA: Sage.
National Defence and the Canadian Armed Forces. (2015). Casualty Support. Retrieved from
http://www.forces.gc.ca/en/caf-community-support-services-casualty-support/contact-
info.page.

239
Neff, L. A. & Geers, A. L. (2014). Optimistic expectations in early marriage: A resource or
vulnerability for adaptive relationship functioning? Journal of Personality and Social
Psychology, 105(1), 38-60.
Newell, C. E., Rosenfeld, P., Harris, R. W., & Hindelang, R. L. (2004). Reasons for non-
response on U.S. Navy surveys: a closer look. Military Psychology, 16(4), 265-276.
Norton, R. (1983). Measuring marital quality: A critical look at the dependent variable.
Journal of Marriage and the Family, 45, 141–151.
Padden, D. L., Connors, R. A., & Agazio, J. G. (2010). Stress, coping, and well-being in military
spouses during deployment separation. Western Journal of Nursing Research, 33(2), 247-
267.
Painter, J. (year). Designing multilevel models using SPSS 11.5 mixed model. Retrieved from
http://www.unc.edu/~painter/SPSSMixed/SPSSMixedModels.PDF
Pearlin, L. I., Liberman, M. A., Menaghan, E. G., & Mullin, J. T. (1981). The stress process.
Journal of Health and Social Behavior, 22(4), 337– 56.
Pearlin, L. I. & Schooler, I. (1981). The structure of coping. Journal of Health and Social
Behavior, 19(1), 2–21.
Preacher, K. J., & Hayes, A. F. (2008). Asymptotic and resampling strategies for assessing and
comparing indirect effects in multiple mediator models. Behavior Research Methods, 40,
879-891.
Preacher, K. J., Zhang, Z., & Zyphur, M. J. (2011). Alternative methods for assessing mediation
in multilevel data: The advantages of multilevel SEM. Structural Equation Modeling, 18,
161-182.

240
Rholes, W. S., Simpson, J. A., Campbell, L., & Grich, J. (2001). Adult attachment and the
transition to parenthood. Journal of Personality and Social Psychology, 81, 421-435.
Rosenberg, M. (1965). Society and the adolescent self-image. Princeton, NJ: Princeton
University Press.
Scharfe, E., & Bartholomew, K. (1994). Reliability and stability of adult attachment patterns.
Personal Relationships, 1(1), 23-43.
Shaver, P., Schwartz, J., Kirson, D., & O’Connor, C. (1987). Emotion knowledge: Further
exploration of a prototype approach. Attitudes and Social Cognition, 52(6), 1061-1086.
Shrout, P. E., & Bolger, N. (2002). Mediation in Experimental and Nonexperimental Studies:
New Procedures and Recommendations. Psychological Methods, 7(4), 422-445.
Simpson, J. A. (1990). Influence of attachment styles on romantic relationships. Journal of
Personality and Social Psychology, 59(5), 971-980.
Simpson, J. A., Rholes, W. S., & Phillips, D. (1996). Conflict in close relationships: An
attachment perspective. Journal of Personality and Social Psychology, 71(5), 899-914.
Spielberger, C. D., Gorsuch, R. L., Lushene, R., Vagg, P. R., & Jacobs, G. A. (1983). Manual
for the State-Trait Anxiety Inventory. Palo Alto, CA: Consulting Psychologists Press.
Sroufe, L. A., & Waters, E. (1977). Heart rate as a convergent measure in clinical and
developmental research. Merrill-Palmer Quartlery, 23, 3-27.
Tabachnick B. G., Fidell L. S. (2007). Using multivariate statistics (4th ed.). Needham Heights,
MA: Allyn and Bacon.
Tidwell, M. O., Reis, H. T., & Shaver, P. R. (1996). Attachment, attractiveness, and social
interaction: A diary study. Journal of Personality and Social Psychology, 71(4), 729-745.
241
The Royal Navy and Royal Marines Children’s Fund. (2009). The overlooked casualties of
conflict. A Report Commissioned by the Royal Navy and Royal Marine’s Children’s Fund.
Van Ijzendoorn, M. H., Schuengel, C., & Bakermans-Kranenburg, M. J. (1999). Disorganized
attachment in early childhood: Meta-analysis of precursors, concomitants, and sequelae.
Developmental and Psychopathology, 11(2), 225-250.
Waters, E., Merrick, S., Treboux, D., Crowell, J., & Albersheim, L. (2000). Attachment security
in infancy and early adulthood: A twenty-year longitudinal study. Child Development, 71,
684-689.
Watson, D., Clark, L. A., & Tellegen, A. (1988). Development and validation of brief measures
of positive and negative affect: The PANAS scales. Journal of Personality and Social
Psychology, 54(6), 1063-1070.
Wei, M., Mallinckrodt, B., Larson, L. M., & Zakalik, B. (2005). Adult attachment, depressive
symptoms, and validation from self versus others. Journal of Counseling Psychology,
52(3), 368-277.
West, S. G., Finch, J. F., & Curran, P. J. (1995). Structural equation models with nonnormal
variables: Problems and remedies. In R. H. Hoyle (Ed.), Structural equation modeling:
Concepts, issues and applications (pp. 56-75). Thousand Oaks, CA: Sage.
Wijngaards-de-Meij, L., Stroebe, M., Schut, H., Stroebe, W., van den Bout, J., van der Heijden,
P. G. M., et al. (2007). Patterns of attachment and parents’ adjustment to the death of their
child. Personality and Social Psychology Bulletin, 33, 537-548.

242
Appendix A
Instructions: Please respond to each statement by indicating how much you agree or disagree with it and
checking the appropriate circle for each item.
Strongly
Disagree Disagree
Slightly
Disagree
Neither
agree nor
disagree
Slightly
Agree Agree
Strongly
Agree
O O O O O O O
1. I prefer not to show a partner how I feel deep down.
2. I often worry that my partner will not want to stay with me.
3. I am very comfortable being close to romantic partners.
4. I worry a lot about my relationships.
5. My partner really understands me and my needs.
6. I worry that romantic partners won't care about me as much as I care about them.
7. I get uncomfortable when a romantic partner wants to be very close.
8. I am afraid that I will lose my partner’s love.
9. I don't feel comfortable opening up to romantic partners.
10. I often wish that my partner's feelings for me were as strong as my feelings for him/her.
11. It’s not difficult for me to get close to my partner.
12. When I show my feelings for romantic partners, I’m afraid they will not feel the same about me.
13. I am nervous when partners get too close to me.
14. I rarely worry about my partner leaving me.
15. I feel comfortable sharing my private thoughts and feelings with my partner.
16. My desire to be very close sometimes scares people away.
17. It’s easy for me to be affectionate with my partner.
18. I often worry that my partner doesn’t really love me.
19. I find it relatively easy to get close to my partner.
20. I worry that I won’t measure up to other people.
21. I find it difficult to allow myself to depend on romantic partners.
22. I do not often worry about being abandoned.
23. I prefer not to be too close to romantic partners.
24. It makes me mad that I don’t get the affection and support that I need from my partner.
25. I tell my partner just about everything.
26. I find that my partner(s) don’t want to get as close as I would like.
27. I usually discuss my problems and concerns with my partner.
28. My romantic partner makes me doubt myself.
29. I feel comfortable depending on romantic partners.
30. My partner only seems to notice me when I’m angry.
31. I find it easy to depend on romantic partners.
32. Sometimes romantic partners change their feelings about me for no apparent reason.
33. It helps to turn to my romantic partner in times of need.
34. I’m afraid that once a romantic partner gets to know me, he or she won’t like who I really am.
35. I talk things over with my partner.
36. When my partner is out of sight, I worry that he or she might become interested in someone else.

243
Appendix B
Instructions: Please respond to each statement by indicating how much you agree or disagree
with it and checking the appropriate circle for each item.
Strongly
Disagree Disagree
Slightly
Disagree
Neither
agree nor
disagree
Slightly
Agree Agree
Strongly
Agree
O O O O O O O
1. On the whole, I am satisfied with myself.
2. At times I think I am no good at all.
3. I feel that I have a number of good qualities.
4. I am able to do things as well as most other people.
5. I feel that I do not have much to be proud of.
6. I certainly feel useless at times.
7. I feel that I am a person of worth, at least equal with others.
8. I wish that I could have more respect for myself.
9. I usually feel that I am a failure.
10. I take a positive attitude toward myself.

244
Appendix C
Instructions: These questions ask about your perceptions of your relationship with your current
spouse/partner. Please respond to each statement by checking the appropriate circle for each
item.
Strongly
Disagree Disagree
Slightly
Disagree
Neither
agree nor
disagree
Slightly
Agree Agree
Strongly
Agree
O O O O O O O
1. How well does your partner meet your needs?
2. In general, how satisfied are you with your relationship?
3. How good is your relationship compared to most?
4. How often do you wish you hadn't gotten into this relationship?
5. To what extent has your relationship met your original expectations?
6. How much do you love your partner?
7. How many problems are there in your relationship?
8. How much do you trust your spouse?

245
Appendix D
Instructions: Read each statement and select the appropriate response to indicate how you feel
right now, that is, at this very moment. There is no right or wrong answer. Do not spend too
much time on any one statement but select the answer which seems to describe your present
feelings best.
Not at all A little Somewhat Very much so
O O O O
1. I feel calm
2. I feel secure
3. I feel tense
4. I feel strained
5. I feel at ease
6. I feel upset
7. I am presently worrying over possible misfortunes
8. I feel satisfied
9. I feel frightened
10. I feel uncomfortable
11. I feel self-confident
12. I feel nervous
13. I feel jittery
14. I feel indecisive
15. I am relaxed
16. I feel content
17. I am worried
18. I feel confused
19. I feel steady
20. I feel pleasant
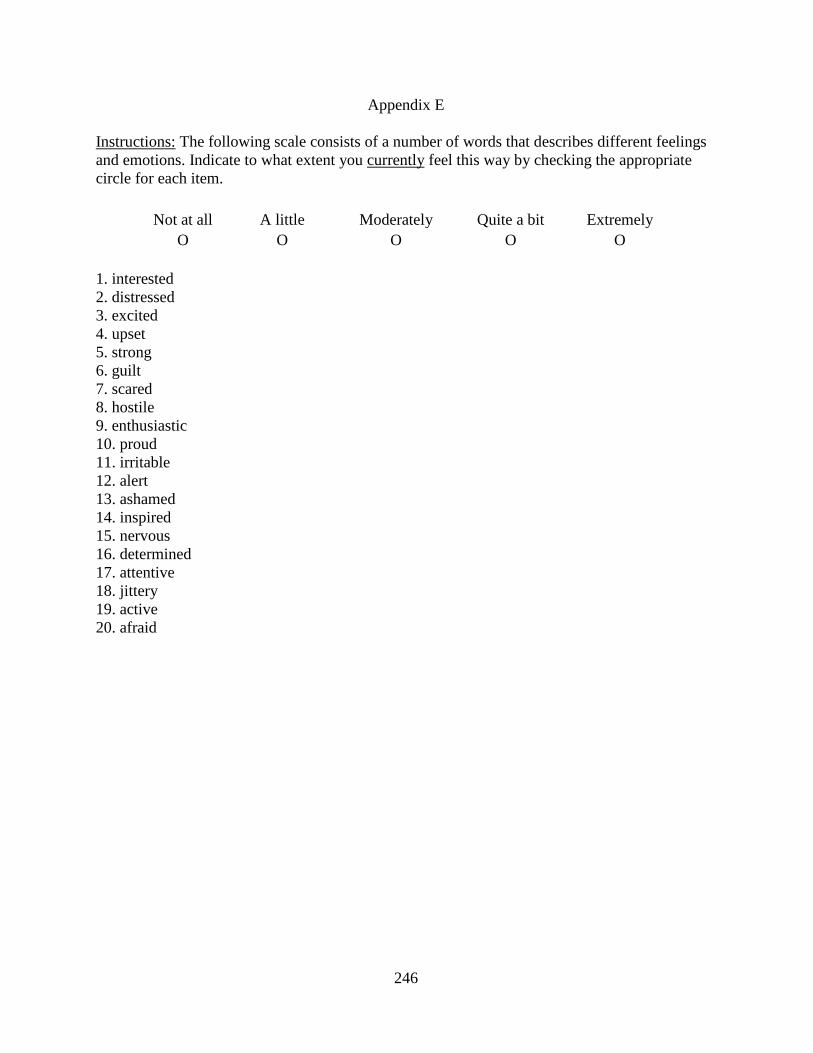
246
Appendix E
Instructions: The following scale consists of a number of words that describes different feelings
and emotions. Indicate to what extent you currently feel this way by checking the appropriate
circle for each item.
Not at all A little Moderately Quite a bit Extremely
O O O O O
1. interested
2. distressed
3. excited
4. upset
5. strong
6. guilt
7. scared
8. hostile
9. enthusiastic
10. proud
11. irritable
12. alert
13. ashamed
14. inspired
15. nervous
16. determined
17. attentive
18. jittery
19. active
20. afraid
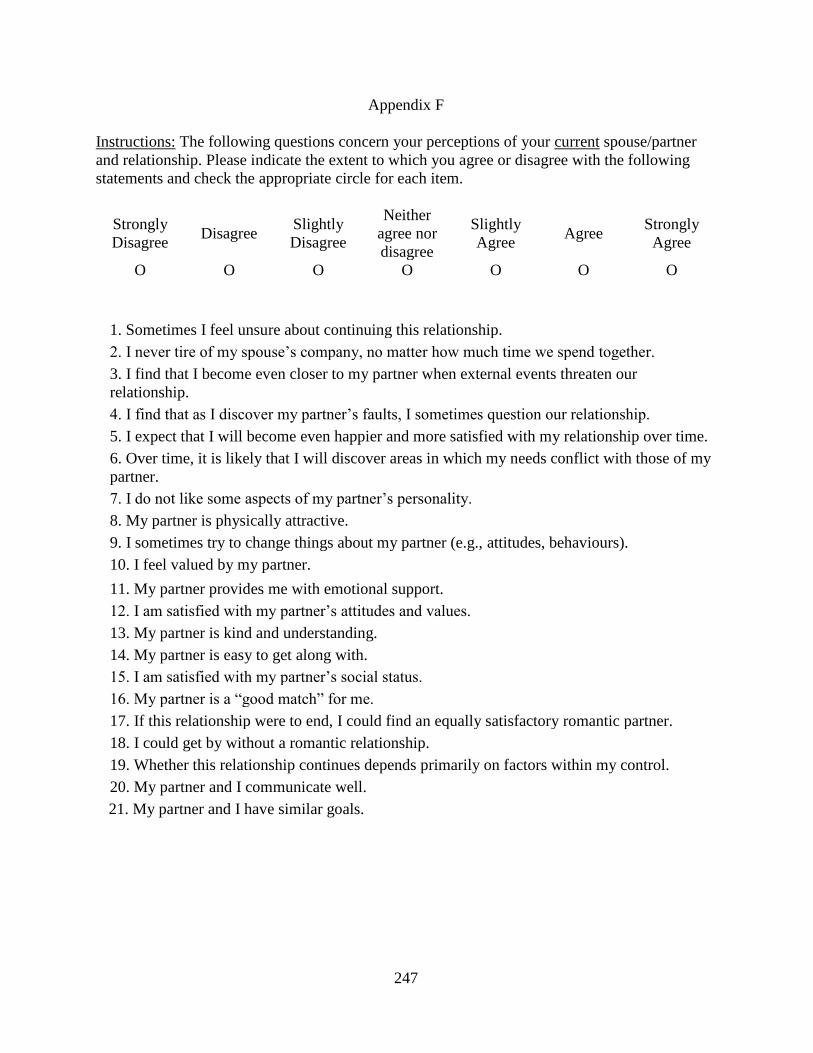
247
Appendix F
Instructions: The following questions concern your perceptions of your current spouse/partner
and relationship. Please indicate the extent to which you agree or disagree with the following
statements and check the appropriate circle for each item.
Strongly
Disagree Disagree
Slightly
Disagree
Neither
agree nor
disagree
Slightly
Agree Agree
Strongly
Agree
O O O O O O O
1. Sometimes I feel unsure about continuing this relationship.
2. I never tire of my spouse’s company, no matter how much time we spend together.
3. I find that I become even closer to my partner when external events threaten our
relationship.
4. I find that as I discover my partner’s faults, I sometimes question our relationship.
5. I expect that I will become even happier and more satisfied with my relationship over time.
6. Over time, it is likely that I will discover areas in which my needs conflict with those of my
partner.
7. I do not like some aspects of my partner’s personality.
8. My partner is physically attractive.
9. I sometimes try to change things about my partner (e.g., attitudes, behaviours).
10. I feel valued by my partner.
11. My partner provides me with emotional support.
12. I am satisfied with my partner’s attitudes and values.
13. My partner is kind and understanding.
14. My partner is easy to get along with.
15. I am satisfied with my partner’s social status.
16. My partner is a “good match” for me.
17. If this relationship were to end, I could find an equally satisfactory romantic partner.
18. I could get by without a romantic relationship.
19. Whether this relationship continues depends primarily on factors within my control.
20. My partner and I communicate well.
21. My partner and I have similar goals.

248
Appendix G
Instructions: Please answer these questions considering how you feel right now by indicating the
extent to which you agree or disagree with the following statements and checking the appropriate
circle for each item.
Strongly
Disagree Disagree
Slightly
Disagree
Neither
agree nor
disagree
Slightly
Agree Agree
Strongly
Agree
O O O O O O O
1. I am satisfied with my life.
2. I am satisfied with my marriage.
3. I am feeling healthy.
4. I am feeling upbeat.
5. I have been feeling “down”.
6. I feel good about myself.
7. I feel good about my financial situation.
8. I feel good about my social life.
9. I feel supported.
10. I can manage the ups and downs of everyday life.
11. I am full of energy.
12. I feel overwhelmed.
13. I have been sleeping well.
14. I feel lonely.
Items added for monthly survey:
14. I feel content most of the time.
15. I have been sleeping well.
16. I cope with physical pain daily.
17. I feel nauseous most of the time.
18. My body often aches.
19. I make an effort to eat well.
20. I make an effort to eat well.
20. I exercise regularly (i.e., 3x/week).
I wish I had more help around the house.
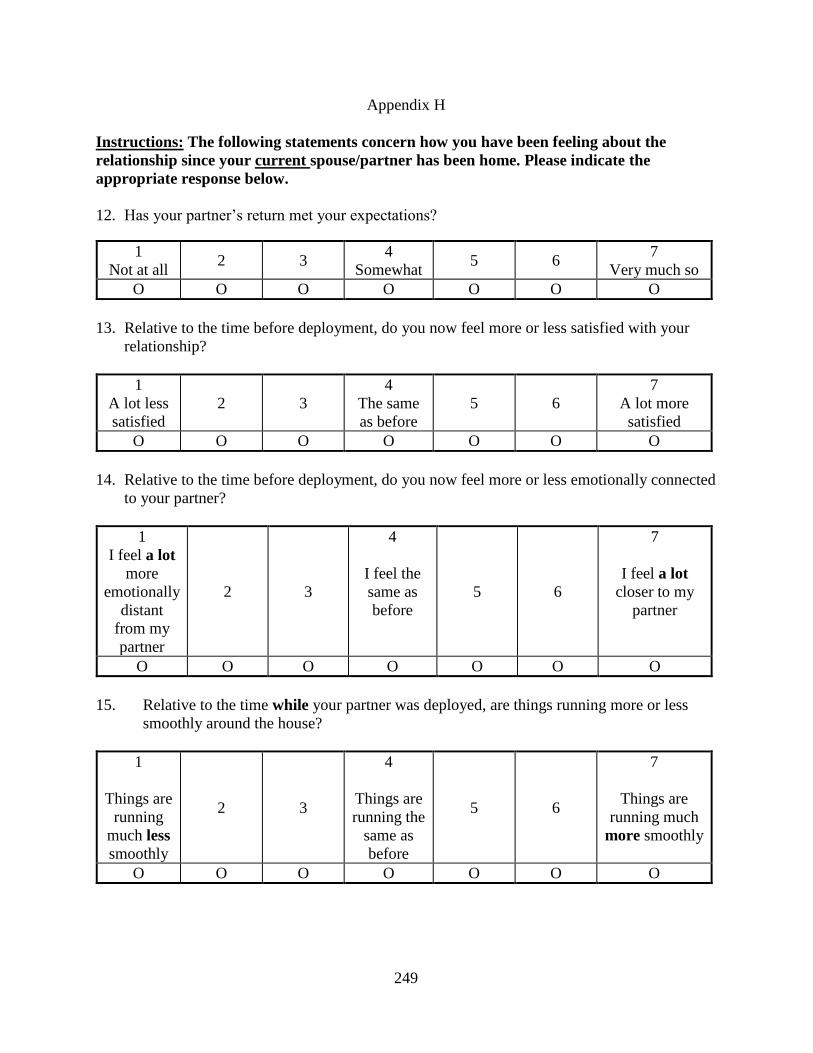
249
Appendix H
Instructions: The following statements concern how you have been feeling about the
relationship since your current spouse/partner has been home. Please indicate the
appropriate response below.
12. Has your partner’s return met your expectations?
1
Not at all 2 3
4
Somewhat 5 6
7
Very much so
O O O O O O O
13. Relative to the time before deployment, do you now feel more or less satisfied with your
relationship?
1
A lot less
satisfied
2 3
4
The same
as before
5 6
7
A lot more
satisfied
O O O O O O O
14. Relative to the time before deployment, do you now feel more or less emotionally connected
to your partner?
1
I feel a lot
more
emotionally
distant
from my
partner
2 3
4
I feel the
same as
before
5 6
7
I feel a lot
closer to my
partner
O O O O O O O
15. Relative to the time while your partner was deployed, are things running more or less
smoothly around the house?
1
Things are
running
much less
smoothly
2 3
4
Things are
running the
same as
before
5 6
7
Things are
running much
more smoothly
O O O O O O O

250
16. Overall, how have your interactions been with your partner?
1
Extremely
Unpleasant
2 3
4
Neutral 5 6
7
Extremely
pleasant
O O O O O O O
17. Since your partner’s return, how often have you experienced conflict?
1
Not at all 2 3
4
Sometimes 5 6
7
All the time
O O O O O O O
18. If you have experienced conflict with your spouse/partner, what are the main issues of
conflict?
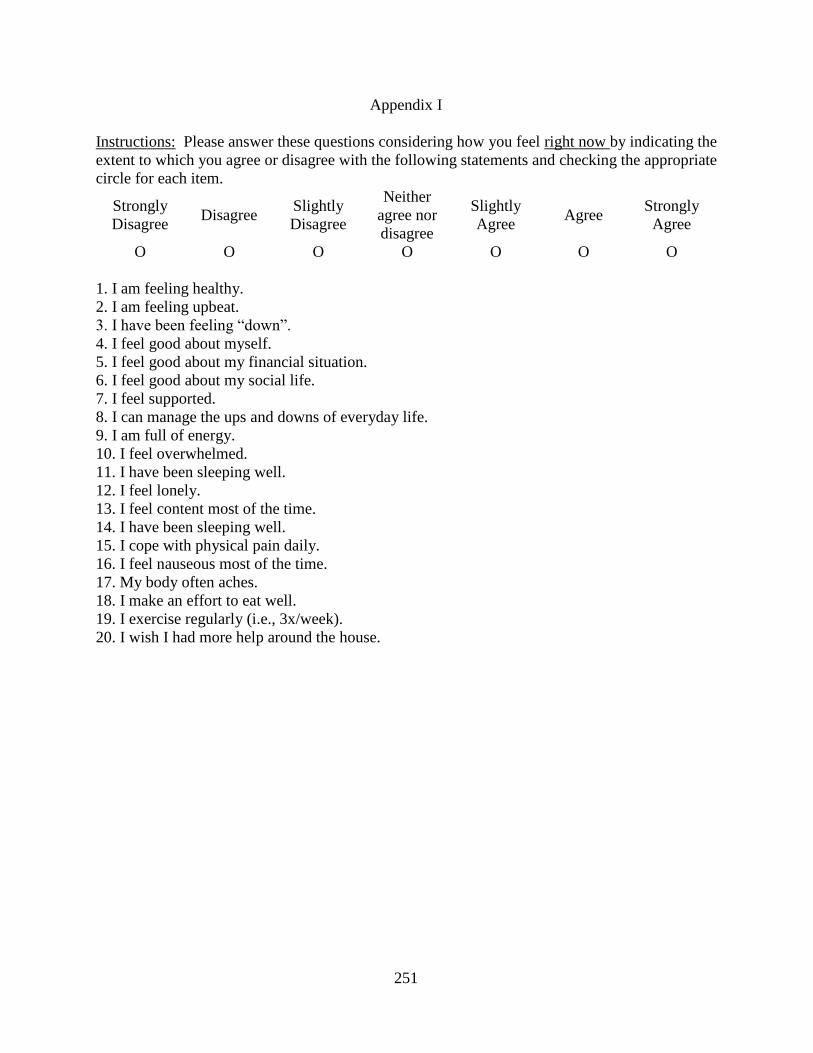
251
Appendix I
Instructions: Please answer these questions considering how you feel right now by indicating the
extent to which you agree or disagree with the following statements and checking the appropriate
circle for each item.
Strongly
Disagree Disagree
Slightly
Disagree
Neither
agree nor
disagree
Slightly
Agree Agree
Strongly
Agree
O O O O O O O
1. I am feeling healthy.
2. I am feeling upbeat.
3. I have been feeling “down”.
4. I feel good about myself.
5. I feel good about my financial situation.
6. I feel good about my social life.
7. I feel supported.
8. I can manage the ups and downs of everyday life.
9. I am full of energy.
10. I feel overwhelmed.
11. I have been sleeping well.
12. I feel lonely.
13. I feel content most of the time.
14. I have been sleeping well.
15. I cope with physical pain daily.
16. I feel nauseous most of the time.
17. My body often aches.
18. I make an effort to eat well.
19. I exercise regularly (i.e., 3x/week).
20. I wish I had more help around the house.

252
Appendix J
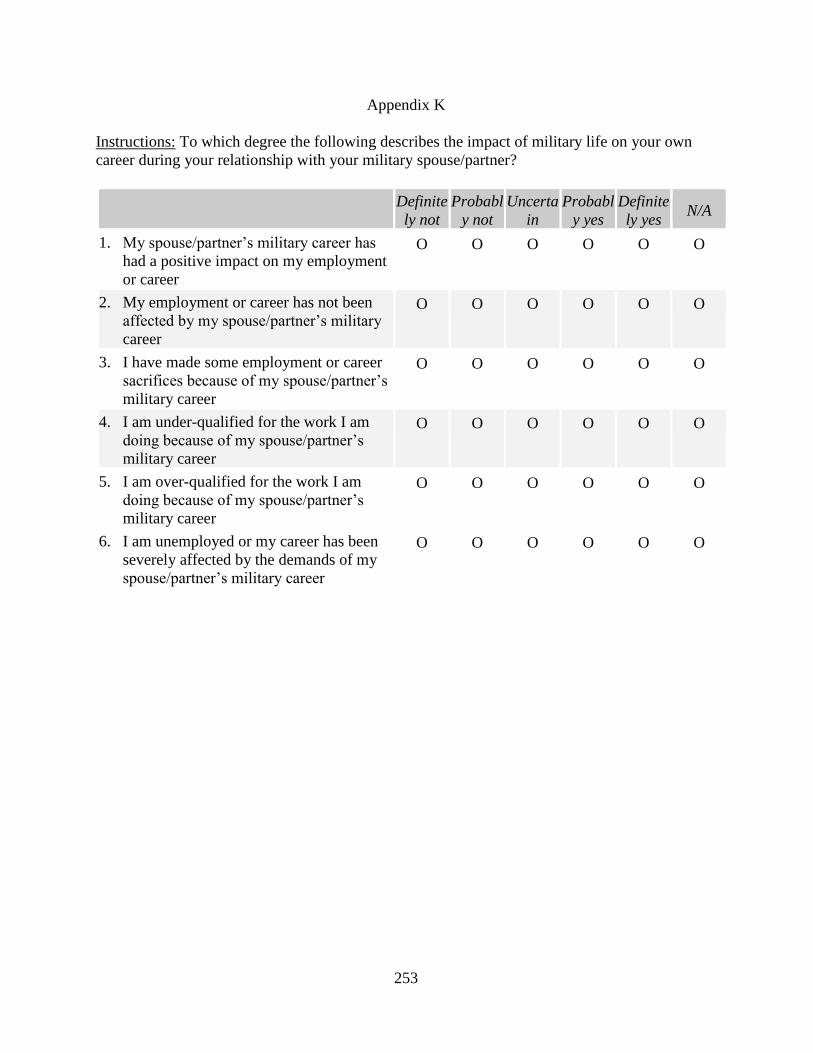
253
Appendix K
Instructions: To which degree the following describes the impact of military life on your own
career during your relationship with your military spouse/partner?
Definite
ly not
Probabl
y not
Uncerta
in
Probabl
y yes
Definite
ly yes N/A
1. My spouse/partner’s military career has
had a positive impact on my employment
or career
O O O O O O
2. My employment or career has not been
affected by my spouse/partner’s military
career
O O O O O O
3. I have made some employment or career
sacrifices because of my spouse/partner’s
military career
O O O O O O
4. I am under-qualified for the work I am
doing because of my spouse/partner’s
military career
O O O O O O
5. I am over-qualified for the work I am
doing because of my spouse/partner’s
military career
O O O O O O
6. I am unemployed or my career has been
severely affected by the demands of my
spouse/partner’s military career
O O O O O O

254
Appendix L
Instructions: For each of the following possible stressful situations you and your family
experienced in the past 12 months, please indicate how stressful you felt it was for you and your
family.
Very
stressful
Moderate
ly
stressful
Slightly
stressful
Not at all
stressful
Never
experienc
ed
1. A combat-related deployment or duty
assignment for your spouse/partner O O O O O
2. A non-combat-related deployment or
duty assignment requiring your
spouse/partner to be away from home
O O O O O
3. Uncertainty about future deployments or
duty assignments O O O O O
4. Combat-related injury to your
spouse/partner O O O O O
5. A non-combat-related injury to your
spouse/partner from carrying out his/her
military duties
O O O O O
6. Caring for your ill, injured, or disabled
spouse/partner O O O O O
7. Intensified training schedule for your
spouse/partner O O O O O
8. Increased time your spouse/partner spent
away from family, or missed family
celebrations, while performing military
duties
O O O O O
9. Family conflict over whether
spouse/partner should remain in the
military or reserves
O O O O O
10. Difficult balancing demands of family
life and your spouse/partner’s military
duties
O O O O O

255
Appendix M
Instructions: The following questions ask about stress you may experience on a day-to-day basis.
Please select the one that best describes your answer.
1. Thinking about the amount of stress in your life, would you say that most days are:
2. In general, how would you rate your ability to handle unexpected and difficult problems
(e.g., a family or personal crisis)?
3. In general, how would you rate your ability to handle the day-to-day demands in your life
(e.g., handling work, family and volunteer responsibilities)?
4. Do you have the desire to eat when you are stressed or emotionally upset?
1
Not at all
stressful
2
Not very
stressful
3
A bit
stressful
4
Quite a bit
stressful
5
Extremely
stressful
O O O O O
1
Poor
2
Fair
3
Good
4
Very good
5
Excellent
O O O O O
1
Poor
2
Fair
3
Good
4
Very good
5
Excellent
O O O O O
1
Never 2
Seldom
3
Sometimes
4
Often
5
Very
often
O O O O O

256
Appendix N
Instructions: Please respond to the following statements by indicating how much you agree or
disagree with them.
Strongly
disagree Disagree
Slightly
disagree
Neither
agree nor
disagree
Slightly
agree
Agree Strongly
agree
1. In most ways my life is
close to ideal. O O O O O O O
2. The conditions of my
life are excellent. O O O O O O O
3. I am satisfied with my
life. O O O O O O O
4. So far I have gotten the
important things I want
in life.
O O O O O O O
5. If I could live my life
over, I would change
almost nothing.
O O O O O O O
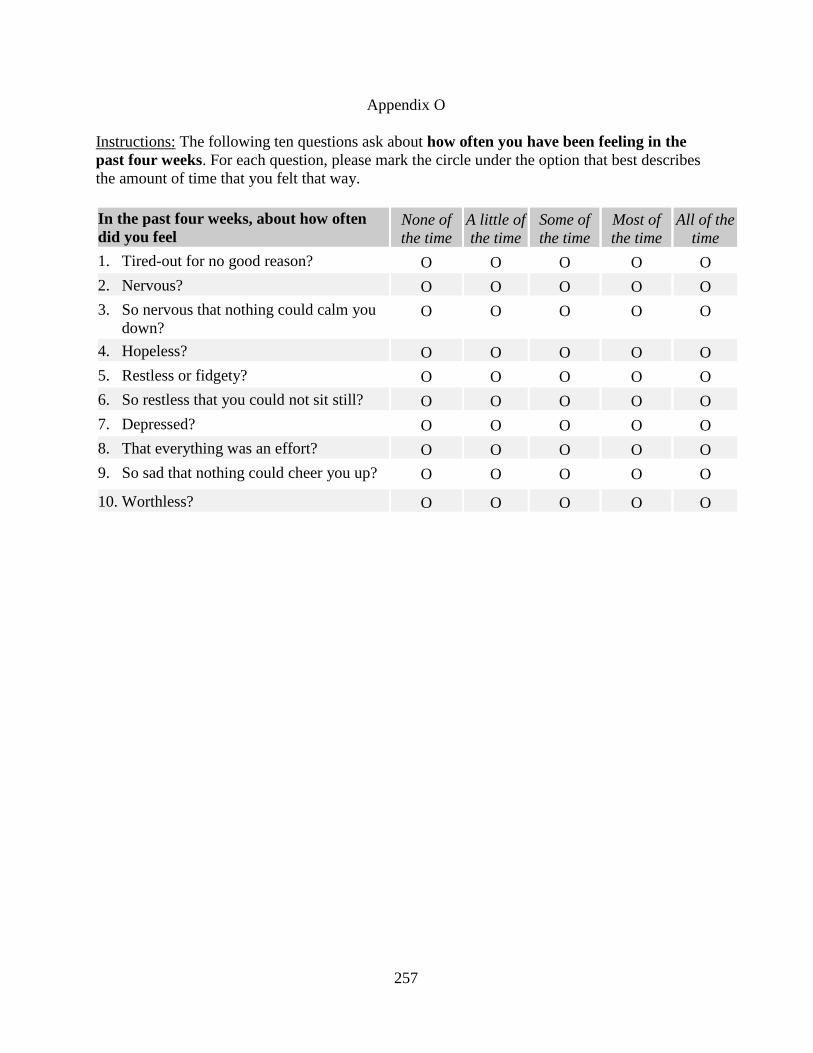
257
Appendix O
Instructions: The following ten questions ask about how often you have been feeling in the
past four weeks. For each question, please mark the circle under the option that best describes
the amount of time that you felt that way.
In the past four weeks, about how often
did you feel None of
the time
A little of
the time
Some of
the time
Most of
the time
All of the
time
1. Tired-out for no good reason? O O O O O
2. Nervous? O O O O O
3. So nervous that nothing could calm you
down? O O O O O
4. Hopeless? O O O O O
5. Restless or fidgety? O O O O O
6. So restless that you could not sit still? O O O O O
7. Depressed? O O O O O
8. That everything was an effort? O O O O O
9. So sad that nothing could cheer you up? O O O O O
10. Worthless? O O O O O
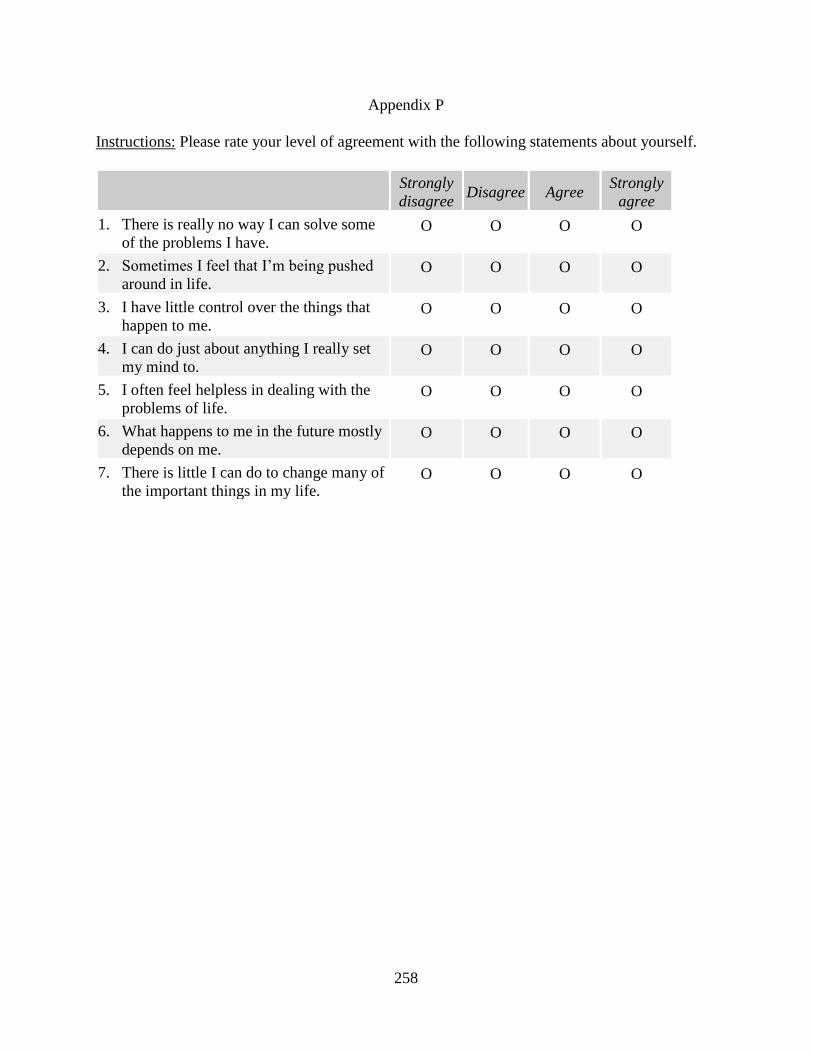
258
Appendix P
Instructions: Please rate your level of agreement with the following statements about yourself.
Strongly
disagree Disagree Agree
Strongly
agree
1. There is really no way I can solve some
of the problems I have. O O O O
2. Sometimes I feel that I’m being pushed
around in life. O O O O
3. I have little control over the things that
happen to me. O O O O
4. I can do just about anything I really set
my mind to. O O O O
5. I often feel helpless in dealing with the
problems of life. O O O O
6. What happens to me in the future mostly
depends on me. O O O O
7. There is little I can do to change many of
the important things in my life. O O O O

259
Appendix Q
Instructions: We are interested in how people respond when they confront difficult or stressful
events in their lives. Different events can bring out somewhat different responses, but think
about what you have been doing while you are under a lot of stress. Please indicate to what
extent you have been engaging in the following ways to deal with stress.
Not at all A little
bit
A
medium
amount
A lot
1. I've been turning to work or other
activities to take my mind off things. O O O O
2. I've been concentrating my efforts on
doing something about the situation I'm
in.
O O O O
3. I've been saying to myself "this isn't
real.". O O O O
4. I've been using alcohol or other drugs to
make myself feel better. O O O O
5. I've been getting emotional support from
others. O O O O
6. I've been giving up trying to deal with it. O O O O
7. I've been taking action to try to make the
situation better. O O O O
8. I've been refusing to believe that it has
happened. O O O O
9. I've been saying things to let my
unpleasant feelings escape. O O O O
10. I’ve been getting help and advice from
other people. O O O O
11. I've been using alcohol or other drugs to
help me get through it. O O O O
12. I've been trying to see it in a different
light, to make it seem more positive. O O O O
13. I’ve been criticizing myself. O O O O
14. I've been trying to come up with a
strategy about what to do. O O O O
15. I've been getting comfort and
understanding from someone. O O O O
16. I've been giving up the attempt to cope. O O O O
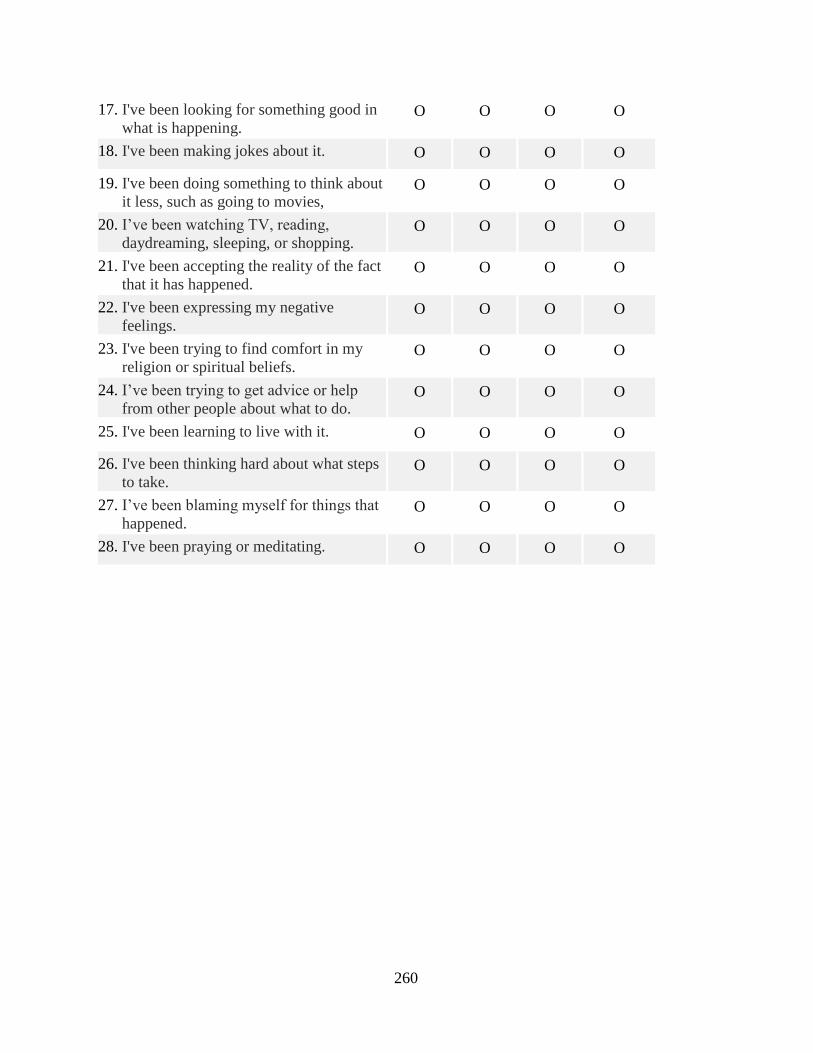
260
17. I've been looking for something good in
what is happening. O O O O
18. I've been making jokes about it. O O O O
19. I've been doing something to think about
it less, such as going to movies, O O O O
20. I’ve been watching TV, reading,
daydreaming, sleeping, or shopping. O O O O
21. I've been accepting the reality of the fact
that it has happened. O O O O
22. I've been expressing my negative
feelings. O O O O
23. I've been trying to find comfort in my
religion or spiritual beliefs. O O O O
24. I’ve been trying to get advice or help
from other people about what to do. O O O O
25. I've been learning to live with it. O O O O
26. I've been thinking hard about what steps
to take. O O O O
27. I’ve been blaming myself for things that
happened. O O O O
28. I've been praying or meditating. O O O O
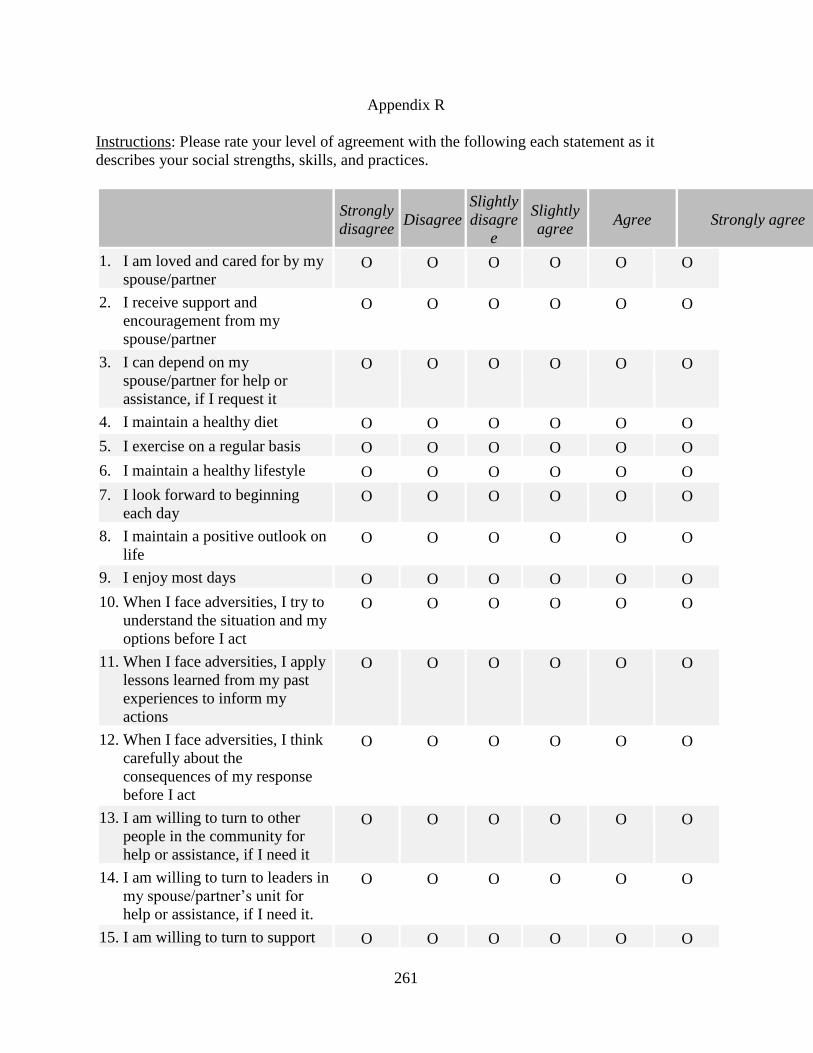
261
Appendix R
Instructions: Please rate your level of agreement with the following each statement as it
describes your social strengths, skills, and practices.
Strongly
disagree Disagree
Slightly
disagre
e
Slightly
agree Agree Strongly agree
1. I am loved and cared for by my
spouse/partner O O O O O O
2. I receive support and
encouragement from my
spouse/partner
O O O O O O
3. I can depend on my
spouse/partner for help or
assistance, if I request it
O O O O O O
4. I maintain a healthy diet O O O O O O
5. I exercise on a regular basis O O O O O O
6. I maintain a healthy lifestyle O O O O O O
7. I look forward to beginning
each day O O O O O O
8. I maintain a positive outlook on
life O O O O O O
9. I enjoy most days O O O O O O
10. When I face adversities, I try to
understand the situation and my
options before I act
O O O O O O
11. When I face adversities, I apply
lessons learned from my past
experiences to inform my
actions
O O O O O O
12. When I face adversities, I think
carefully about the
consequences of my response
before I act
O O O O O O
13. I am willing to turn to other
people in the community for
help or assistance, if I need it
O O O O O O
14. I am willing to turn to leaders in
my spouse/partner’s unit for
help or assistance, if I need it.
O O O O O O
15. I am willing to turn to support O O O O O O

262
agencies and organizations for
help or assistance, if I need it.
16. I have a guiding set of principles
or beliefs O O O O O O
17. I attempt to live in accordance
with a guiding set of principles
or beliefs
O O O O O O
18. I draw strength from a guiding
set of principles or beliefs when
I face life challenges
O O O O O O
19. I am able to handle day-to-day
family matters if my
spouse/partner is unavailable
O O O O O O
20. I am able to cope emotionally if
my spouse/partner is unavailable O O O O O O
21. I know where to turn for
assistance or support if my
spouse/partner is unavailable
O O O O O O
22. I understand the demands of my
spouse/partner’s military job O O O O O O
23. I am supportive of my
spouse/partner serving in or
working for the military
O O O O O O
24. I am proud to be the
spouse/partner of a person
serving in or working for the
military
O O O O O O
25. I keep a positive perspective
when I am going through a
difficult time
O O O O O O
26. I confront the problem directly
when I face a challenge or
difficulty
O O O O O O
27. I cope successfully with stress
in my life O O O O O O
28. I look forward to spending time
together with my spouse/partner O O O O O O
29. I am happy with my relationship
with my spouse/partner O O O O O O
30. I am committed to making my
relationship with my
spouse/partner a success
O O O O O O
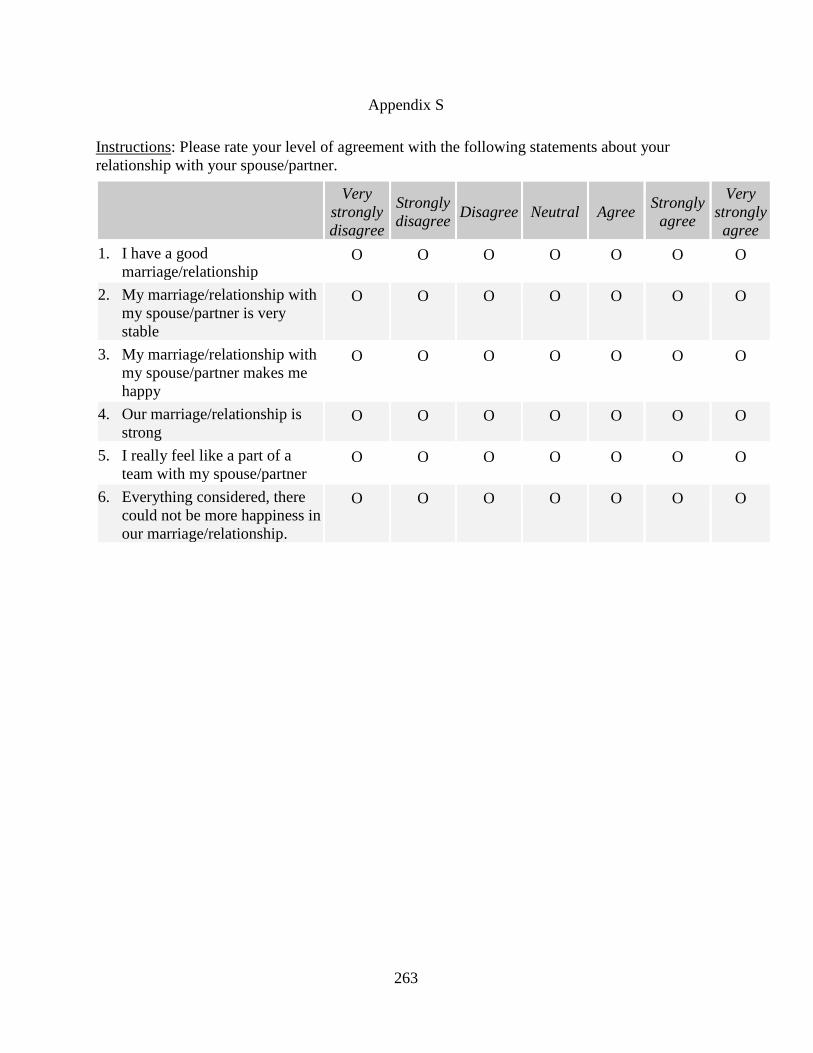
263
Appendix S
Instructions: Please rate your level of agreement with the following statements about your
relationship with your spouse/partner.
Very
strongly
disagree
Strongly
disagree Disagree Neutral Agree
Strongly
agree
Very
strongly
agree
1. I have a good
marriage/relationship O O O O O O O
2. My marriage/relationship with
my spouse/partner is very
stable
O O O O O O O
3. My marriage/relationship with
my spouse/partner makes me
happy
O O O O O O O
4. Our marriage/relationship is
strong O O O O O O O
5. I really feel like a part of a
team with my spouse/partner O O O O O O O
6. Everything considered, there
could not be more happiness in
our marriage/relationship.
O O O O O O O
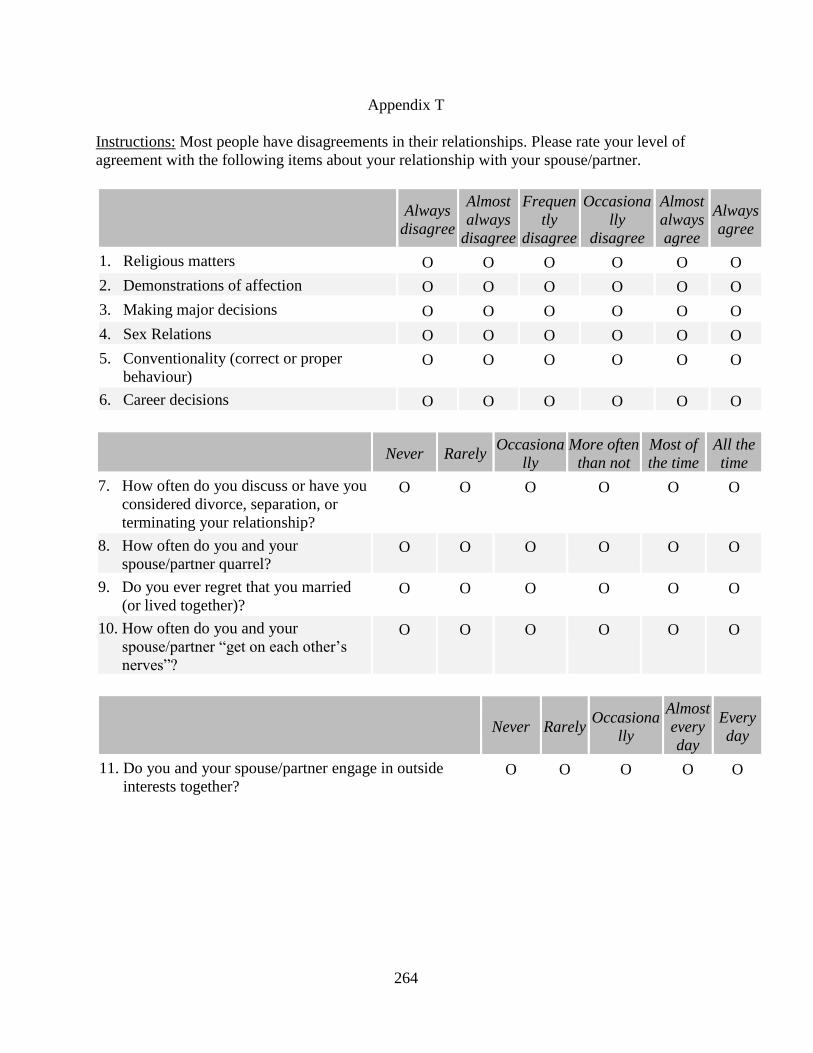
264
Appendix T
Instructions: Most people have disagreements in their relationships. Please rate your level of
agreement with the following items about your relationship with your spouse/partner.
Always
disagree
Almost
always
disagree
Frequen
tly
disagree
Occasiona
lly
disagree
Almost
always
agree
Always
agree
1. Religious matters O O O O O O
2. Demonstrations of affection O O O O O O
3. Making major decisions O O O O O O
4. Sex Relations O O O O O O
5. Conventionality (correct or proper
behaviour) O O O O O O
6. Career decisions O O O O O O
Never Rarely
Occasiona
lly
More often
than not
Most of
the time
All the
time
7. How often do you discuss or have you
considered divorce, separation, or
terminating your relationship?
O O O O O O
8. How often do you and your
spouse/partner quarrel? O O O O O O
9. Do you ever regret that you married
(or lived together)? O O O O O O
10. How often do you and your
spouse/partner “get on each other’s
nerves”?
O O O O O O
Never Rarely Occasiona
lly
Almost
every
day
Every
day
11. Do you and your spouse/partner engage in outside
interests together? O O O O O

265
Appendix U
General Research Ethics Board Letter of Approval for Phases One and Two
266
Appendix V
General Research Ethics Board Letter of Approval for Phase Three


