Embed Size (px)
Citation preview
t\ ^-ì^
Adolescents' Adherence to Chronic Medical Regimens:
Parent-Adolescent Conflict and Adolescent Autonomy in
Relation to Adherence to Insulin Dependent Diabetes
Tleatment Regimens.
Volume One.
Michael Fotheringham.B.A. (Honours - Psychology). University of Adelaide
A thesis submitted in fulfilment of the requirements of the degree ofDoctor of Philosophy, Department of Psychiatry,
University of Adelaide.
VOLUME ONE.
Contents
Abstract
2.0 Introduction. ........
2.1 Aims of This Thesis.
11
Ll
vu
Declaration yul
Acknowledgements tx
List of Abbreviations ..... x
Preface: The Nature and Management of Insulin-Dependent Diabetes Mellitus ........ xi
Chapter 1. Literature Review. 1
1.0 Introduction. 2
1.1 The Historical Context of Research into Patient Adherence to Medical
Recommendations
I.2 Factors Influencing Patient Adherence to Medical Recommendations................ 50
1.3 Adolescents' Adherence to Medical Regimens. 66
1.4 Summary. ................. 100
Chapter 2. The Aims and Hypotheses of this Thesis.- 102
J
..103
Chapter 3. Methodology.
105
r07
3 1 Subjects
3.2 Procedure......
3.3 Measures
108
...109
ll4
3.4 Statistical Analyses............ 130
Chapter 4. Demographic and Psychosocial Characteristics of the Sample. -
135
4. I Sample Characteristics. ....... ..t36
4.2 Descnptive Statistics of Sample Responses' I4T
Chapter 5. Results: The Assessment of Patient Adherence. 160
5.1 The Relationship Between Different Measures of Adherence....'..,
5.2 The Variation in Reported Adherence According to Demographic
Characteristics. .
5.3 The Variation in Adherence Over Time
Chapter 6. Discussion: The Assessment of Patient Adherence.
6.1 The Relationship Between Different Measures of Adherence. .
6.2 TheVariation in Reported Adherence According to Demographic
Characteristics. ..........
6.3 The Variation in Adherence Over Time.
6.4 Summary
.161
,t61
,187
202
.203
.2r3
.226
.240
Chapter 7. Results: The Relationship Between Patient Adherence and
Parent- Adolescent Conflict. 244
7.1 The Reporting of Parent-Adolescent conflict in Relation to Sample
Characteristics. ......... .245
7 .2 The Level of Association Between Measures of Parent-Adolescent Conflict
and Adherence...... 250
7.3 Differences in Associations Between Parent-Adolescent Conflict and
Adherence According to Sample Characteristics ..258
1 .4 The Level of Association Between Measures of Parent-Adolescent Conflictand Adolescents' Metabolic Control. .......262
1V
266Chapter 8. Discussion: The Relationship Between Patient Adherence and
Parent-Adolescent Conflict.
8.1 The Reporting of Parent-Adolescent Conflict in Relation to Sample
Characteristics. ..............
8.2 The Level of Association Between Measures of Parent-Adolescent Conflictand Adherence. ...........
8.3 Differences in Associations Between Parent-Adolescent Conflict and
10.4 Summary and Future Directions: The Relationship Between Patient
Adherence and Adolescent Autonomy' ...'.'.'.
..261
279
Adherence According to S ample Characteristics
8.4 The Level of Association Between Measures of Parent-Adolescent Conflictand Adolescents' Metabolic Control' 295
8.5 Summary and Future Directions: The Relationship Between Patient
Adherence and Parent-Adolescent Conflict. 299
Chapter 9. Results: The Relationship Between Patient Adherence andAdolescent Autonomy. 307
9.1 The Reporting of Adolescent Autonomy in Relation to Sample308
9.2 Thelevel of Association Between Measures of Adolescent Autonomy and
Adherence 3t4
9.3 The Level of Association Between Measures of Adolescent Autonomy and
Adolescents' Metabolic Control. '.............322
chapter L0. Results: The Relationship Between Patient Adherence
and Adolescent Autonomy. 323
10.1 The Reporting of Adolescent Autonomy in Relation to Sample
Characteristics. . 324
10.2 The Level of Association Between Measures of Adolescent Autonomy
and Adherence...... 329
10.3 The I-evel of Association Between Measures of Adolescent Autonomy
and Adolescents' Metabolic Control.
289
35t
Chapter 1L. Results: The Relationship Between Patient Adherence and the
Proposed Antecedents Of Adherence. 343
363
11.0 Introduction. .344
11.1 The Reporting of The Proposed Antecedents of Adherence in Relation to
Sample Characteristics. ....... 345
11.2 The Level of Association Between Measures of Proposed Antecedents
of Adherence, and Adherence 351
11.3 The I-evel of Association Between Measures of Proposed Antecedents ofAdherence and Adolescents' Metabolic Control..... 360
Chapter 12. Discussion: The Relationship Between Patient Adherenceand the Proposed Antecedents Of Adherence.
l2.I The Reporting of The Proposed Antecedents of Adherence in Relation to
Sample Characteristics. ........ 364
I2.2 The Level of Association Between Measures of Proposed Antecedents
of Adherence, and Adherence 369
I2.3 Thelevel of Association Between Proposed Antecedents of Adherence
and Adolescents' Metabolic Control.... ..379
12.4 Summary and Future Directions: The Relationship Between Patient
Adherence and Proposed Antecedents of Adherence
Chapter L3. Results: The Multivariate Prediction of Patient Adherence.
-
391
13.1 Evaluation of the Six-Factor Model of Adherence. '..'..'...'. -'.......".392
13.2 Evaluation of the Six-Factor Model of Adherence With the Addition
of Adolescent Variables. ... 396
13.3 The Maximal Prediction of Adherence 401
vl
chapter 14. Discussion: The Multivariate Prediction of PatientAdherence. 405
14.1 Evaluation of the Six-Factor Model of Adherence. ..'.....
14.2 Evaluation of the Six-Factor Model of Adherence With the Additionof Adolescent Variables. .4t2
14.3 The Maximal Prediction of Adherence and Metabolic Control......
14.4 Summary and Future Directions: The Multivariate Prediction of Medical
406
Adherence by Adolescents. ..... 425
Chapter 15. Conclusions.
15.0 A Review of the Aims of This Thesis. .438
15.1 A Synthesis of the Thesis Findings in Light of these Aims.
15.2 Limitations of the Thesis Findings 448
VOLUME TWO.
Tables and Figures Cited in the Text......... Volume 2: 1
Appendices. ...................... .........Volume2 168
Bibliography. ............ ....Volume 2:334
The contents of Volume Two are described in more detail at the start of the volume.
437
439
vu
Abstract.
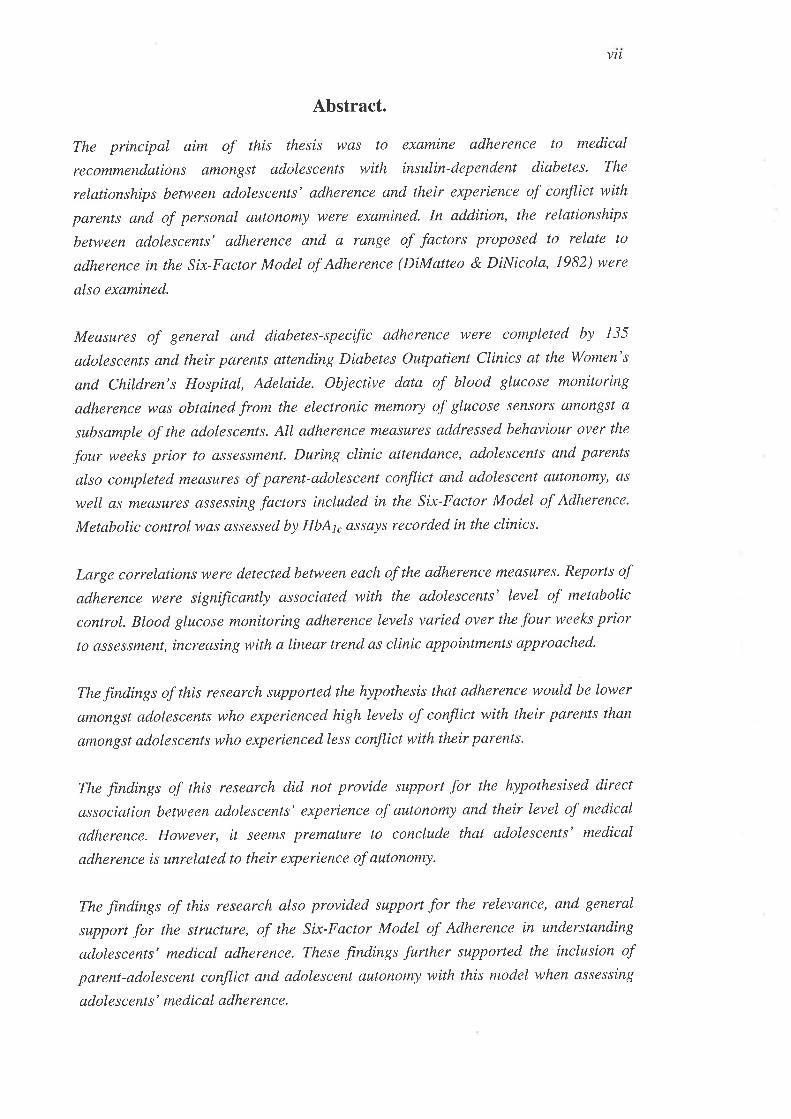
The principal aim of thís thesis was to examine adherence to medical
recommendations amongst adolescents with insulin-dependent diabetes. The
relationships between adolescents' adherence and their experience of conflict with
parents and of personal autonomy were examined. In addition, the relationships
between adolescents' adherence and a range of factors proposed to relate to
adherence in the Six-Factor Model of Adherence (DiMatteo & DiNicola, 1982) were
also examined.
Measures of general and diabetes-specific adherence were completed by 135
adolescents and their parents attending Diabetes Outpatient Clinics at the Women's
and Children's Hospital, Adelaide. Objective data of blood glucose monitoring
adherence was obtained from the electronic memory of glucose sensors amongst a
subsample of the adolescents. All adherence measures addressed behaviour over the
four weeks prior to assessment. During clinic atlendctnce, adolescents and parents
also completed measures of parent-adolescent conflict and adolescent autonomy, as
well as measures assessing factors included in the Six-Factor Model of Adherence.
Metabolic control was assessed by HbAlc assays recorded in the clinics.
Large correlations were detected between each of the adherence measures. Reports of
adherence were significantly associated with the adolescents' level of metabolic
control Btood glucose monitoring adherence levels varied over the four weeks prior
to assessment, increasing with a linear trend as clinic appointments approached.
The findings of this research supported the hypothesis that adherence would be lower
amongst adolescents who experienced high levels of conflict with their parents than
amongst adolescents who experienced less conflict with their parents.
The findings of this research did not provide support for the hypothesised direct
association between adolescents' experience of autonomy and their level of medical
aclherence. However, it seems premature to conclude that adolescents' medical
adherence is unrelated to their experience of autonomy.
The findings of this research also provided support for the relevance, and general
support for the structure, of the Six-Factor Model of Adherence in understanding
adolescents' medical adherence. These findings further supported the inclusion of
parent-adolescent conflíct and adolescent autonomy with this model when assessing
adole s c ents' me dical adhe renc e.

tx
Acknowledgments.
I wish to acknowledge the support of a number of people who helped with this thesis.
The supervision offered by Associate Professor Michael Sawyer and Associate
Professor Helen Winefield has been invaluable in completing this thesis. I am
grateful to Professor Robert Kosky for allowing me the opportunity to undertake the
thesis. The involvement of Dr Jenny Couper in the formulation of the study is
gratefully acknowledged. I am indebted to Professor David L. Streiner, of McMaster
University, Ontario, Canada, and Dr. Peter Baghurst, of the Public Health Research
Unit,'Women's and Children's Hospital, Adelaide, for advice and guidance regarding
the statistical analyses used in this thesis.
The financial support of the Women's and Children's Hospital Foundation, and the
M.S. Mcleod Research Trust, through Clinical Research Fellowships, was greatly
appreciated. The co-operation and support of MediSense Australia, and in particular
Mr Kevin Jones, in the provision of equipment grants, was vital for the development
of this research.
The co-operation of the Diabetes Outpatient staff, and in particular of Dr James
Penfold and Dr David Corlis was most appreciated. Thanks are also extended to Ms
Jenny Taylor, who provided valuable help with the collection of data.
I would also like to thank Joanna Gowland and Judith V/hite for their support, both
administrative and personal, throughout the completion of this thesis.
This thesis could not have been completed without the personal support of my family,
as well as my friends, parlicularly Chor and Luke. Finally, I want to thank Fiona, for
her boundless support, enthusiasm, and faith.
x
ADQ
AFC
ANOVA
BGM
CBQ
CIIBM
DFBC
DSAS
FACES-M
FES
GAS
HbA1.
IIBM
HMRA
IDDM
IMCHB
NIDDM
PARQ
PM
SD
SFMA
SMRA
TRA
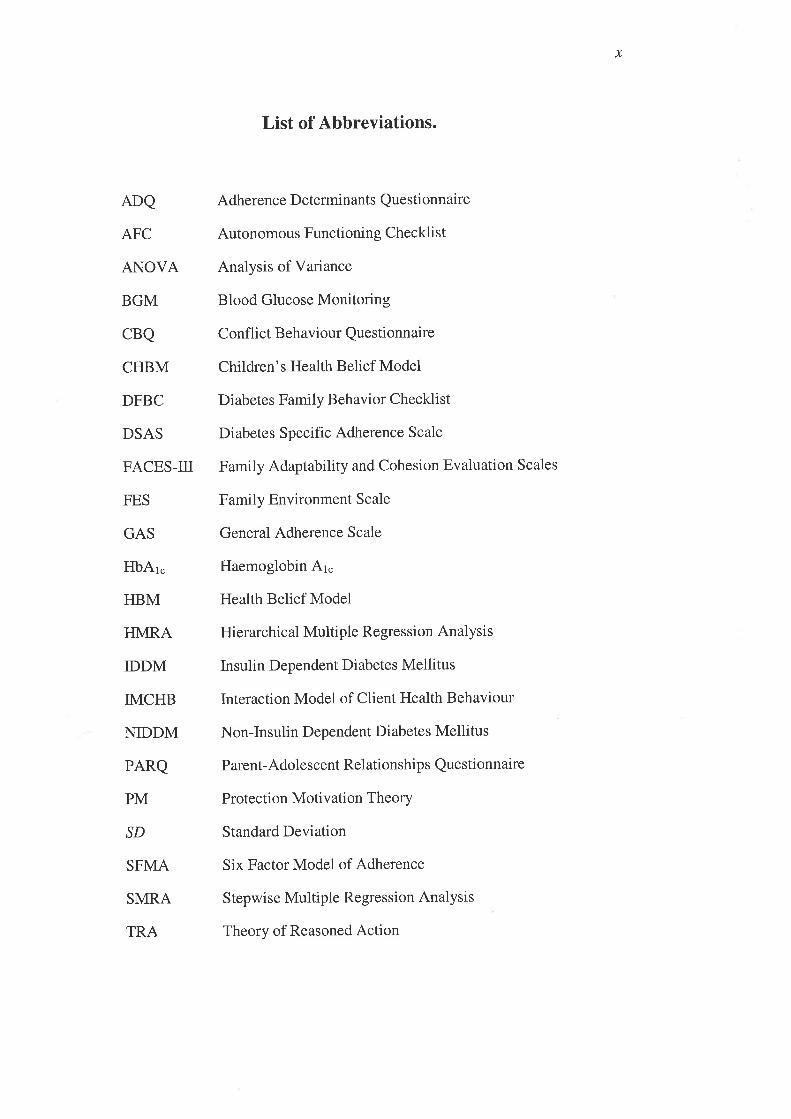
List of Abbreviations.
Adherence Determinants Questionnaire
Autonomous Functioning Checklist
Analysis of Variance
Blood Glucose Monitoring
Conflict Behaviour Questionnaire
Children's Health Belief Model
Diabetes Family Behavior Checklist
Diabetes Specific Adherence Scale
Family Adaptability and Cohesion Evaluation Scales
Family Environment Scale
General Adherence Scale
Haemoglobin 41"
Health Belief Model
Hierarchical Multiple Regression Analysis
Insulin Dependent Diabetes Mellitus
Interaction Model of Client Health Behaviour
Non-Insulin Dependent Diabetes Mellitus
Parent-Adolescent Relationships Questionnaire
Protection Motivation Theory
Standard Deviation
Six Factor Model of Adherence
Stepwise Multiple Regression Analysis
Theory of Reasoned Action
xt
PREFACE: THE NATI.]RE AND MANAGEMENT OF INSULIN-DEPENDENT
DIABETES MELLITUS.
This preface is intended to provide a brief background on the nature and management
of Insulin-Dependent Diabetes Mellitus (IDDM). It is not intended to be
comprehensive, but to furnish the reader with an essential understanding of the nature
of the illness and its management by young people and their families. The
development of this thesis, including the review of the previous literature and the
research design, is based on an understanding of the importance of these issues.
The Ns.ture of Insulin-Dependent Di.abetes Mellitus.
Diabetes Mellitus is a metabolic disorder caused by insufficient insulin action (Silink,
1990). Insulin is normally produced by the pancreas, and released into the
bloodstream. In IDDM, the pancreas produces decreased amounts of insulin (Krall &
Beaser, 1989). This condition is characterised by insulinopenia (lack of insulin) and
dependence on exogenous insulin to prevent ketoacidosis and preserve life (Sperling,
Igg2). Hence, this condition is termed Insulin Dependent Diabetes Mellitusr.
Complications associated with IDDM can be categorised as acute and long-term
(Krall &. Beaser, 1989). Acute complications include Hypoglycaemia and
I In the United States of America, the term IDDM has recently been abandoned in favour of "Type Idiabetes" (Expert Committee on the Diagnosis and Classification of Diabetes Mellitus, 1997).
However, this change in nomenclature has not been widely adopted in Australian clinical practice. Inthis thesis, the terms IDDM, insulin dependent diabetes, and diabetes will be used to identify thiscondition.
Jilt
Ketoacidosis. Long-term complications include Retinopathy, Neuropathy, and
Nephropathy
Hypoglycaemia, meaning low blood glucose, occurs when too much insulin has been
taken, not enough food has been consumed, or too much exercise has been performed
without adjusting food intake (Silink, 1990). This is treated by eating or drinking
something with a high level of sugar, or by injection of glucagon - a hormone that
releases stored glucogen from the liver and helps convert it into glucose in the
bloodstream (Krall & Beaser, 1989).
Ketoacidosis is defined by absolute insulin deficiency (H Fishbein & Palumbo, 1995).
When insulin levels are low, the body uses fat as a source of energy; a by-product of
this is the production of ketones in the bloodstream, making the blood more acidic
(i.e., ketoacidosis). Dehydration also occurs. Untreated, this process will lead to
coma and death (H Fishbein & Palumbo, 1995). Treatment involves hospitalisation,
and the urgent replacement of insulin and fluids (Krall & Beaser, 1989).
The microvascular complications of IDDM are retinopathy, neuropathy, and
nephropathy. Macrovascular complications are coronary artery disease, cerebral
artery disease, and peripheral artery disease. Adolescents attending the Women's and
Children's Hospital (WCH) Diabetes Outpatient clinics afe aware of these
complications and are regularly screened for early signs of these complications.
xut
The risk of long-term microvascular complications of IDDM is reduced optimal
metabolic control (Diabetes Control and Complications Trial Research Group, 1993).
The accepted method of assessing metabolic control is by haemoglobin A1ç assa].
Haemoglobin 41" GIbAr") comprises 3 to 6 per cent of the total haemoglobin in
persons without IDDM, and is increased to between 6 to 12 per cent of the total
haemoglobin in those with IDDM (Koenig, et aL 1976). HbA1" assays provide an
indication of the patient's level of blood glucose control over the preceding weeks, in
effect giving a value that integrates the blood glucose concentration over that period
(Koenig, et al.1976; Olson, 1988; Scobie & Sönksen,1984; Sperling, 1992).
Good metabolic control is achieved by the careful management of IDDM. As with
many chronic illnesses, the responsibility for the management of IDDM rests largely
with the patient and their family, under the guidance of health professionals.
The Behavíoural Management of Insulin-Dependent Diabetes Mellítus.
Children and adolescents with IDDM are recom.mended to adhere to a range of
management activities to control their illness. These behaviours include insulin
administration, the monitoring of blood glucose, the observance of nutritional
planning, and regular exercise (Hanson & Onikul-Ross, 1990; Scobie & Sönksen,
1e84).
Blood glucose monitoring (BGM) is an important aspect of IDDM management.
Adolescents are typically recommended to test their blood glucose level at least twice
xtv
each day (Scobie & Sönksen, 1984). This is the recommendation given to the
adolescents attending the WCH outpatient clinics. In addition, blood glucose should
be tested when the adolescent is unwell, symptomatic (high or low blood glucose) and
with increased exercise.
Insulin injection is the most crucial aspect of IDDM management. Human insulin is
laboratory manufactured, including short-acting, intermediate-acting and long-acting
preparations (Davidson, 199lb; Hanson & Onikul-Ross, 1990; SB Johnson, 1995).
Actual schedules of insulin doses vary, though adolescents typically are prescribed
two, three or four daily injections, using a combination of short-acting and
intermediate-acting preparations. When blood glucose levels are increased or
decreased over several days, insulin doses should be adjusted.
Dietary management of IDDM consists of three parts: the quantity of food eaten, the
type of food eaten, and the timing of eating (Krall & Beaser, 1989). The quantity of
food eaten is important because this dictates the amount of sugar absorbed into the
bloodstream (Davidson & Botnick, l99I; Krall & Beaser, 1989). The type of food
consumed is important because of the differing carbohydrate content in various foods.
Foods with complex carbohydrates are absorbed more slowly, whereas foods with
simple carbohydrates are absorbed rapidly, causing faster increases in blood glucose
concentrations. Exchange lists and the Glycemic Index are two approaches that have
been used to rate the influence of different foods on blood glucose (e.g., Davidson &
Botnick, I99I; Foster-Powell & Miller,1995; Hanson & Onikul-Ross, 1990; 'Wolever
& Bolognesi, 1996; Wolever, Jenkins, Jenkins, & Josse, 1991). The regularity of
meal timing is important because meals should be timed to coincide with peak periods
xv
of insulin action (Hanson & Onikul-Ross, 1990). For this reason, unplanned snacks,
particularly when high in sugar, may be problematic for children and adolescents with
IDDM
Exercise is another important component of IDDM management. During exercise, the
muscles use the glucose available in the bloodstream for fuel. The increased use of
blood glucose can increase the risk of hypoglycaemia if food intake and insulin levels
are not appropriately balanced. The balance of exercise with food and insulin levels is
easiest if exercise is regular, although unusual amounts of exercise can be prepared for
by the adjustment of insulin levels and dietary consumption (Hanson & Onikul-Ross,
1990). For this reason, the testing of blood glucose levels (i.e., BGM) before or after
exercise is important.
In addition, proper management of IDDM involves preventative behaviours, such as
the maintenance of good foot hygiene and carrying a supply of glucose in case of
hypoglycaemia. Cigarette smoking increases the risk of long-term complications in
IDDM, including neuropathy and retinopathy, and must therefore be avoided
(Chaturvedi, Stephenson, & Fuller, 1995; Reichard, et a7. l99I; Spallone &.
Menzinger, 1997 ; Zoppini, et al. 1996).
As this brief overview has indicated, the management of IDDM is complex; involving
a range of inter-related behaviours. Further, this management is vital to prevent (or
minimise risk of) severe long-term complications. As such, the assessment of IDDM
management, and influences on the management of IDDM by adolescents, are worthy
of investigation.
CHAPTER ONB.
LITERATURB REVIBW.
This chapter reviews the published literature relating to the
development of this thesis. Three major topics are addressed in this
chapter. First, the historical context of patient adherence research is
discussed, including the definitíon and assessment of patient adherence,
and the use of theoretical models of health behaviour to describe
patient adherence. Second, factors reported to influence patientadherence are discussed, including patients' characteristics, the nature
of the illness and its regimen, and patients' relationships with health
professionals. Third, issues in adolescent development are discussed inrelation to regimen adherence.
Parts of this chapter were published in:
Fotheringham MJ, Sawyer MG. (1995). Adherence to medical recommendations in childhood and
adolescence. Iournal of Paediatrics and Child Health, 3I: '72-18'
Fotheringham MJ, Couper JJ, Taylor JD, Sawyer MG. (submitted). Assessment of adherence in poorly
controlled Type 1 diabetes. Journal ofPediatric Psychology.
Fotheringham MJ, Owen N. (ln press). Applying psychological theories to promote healthy lifestyles.
In: JM Rippe (Ed.). Textbook of medicine, exercise, nutrition and health. Shrewsbury, MA:Blackwell Science.
1. LITERATI.]RE REVIEW.
L.0 Introduction.
This literature review was conducted initially by searching citation databases
(MedLine and PsycLIf for publications addressing the issue of patient adherence.
These searches took two forms. First, keywords such as adherence, compliance,
co-operation, self-care, self-management, regimen, recommendation, aulonomy,
responsibility, and conflict, were used to establish a database of publications relating
to these topics. Second, Medline Index Terms such as adherence, compliance, and
parent-child-relations were used in conjunction with more specific keywords to
further probe the databases.
Subsequent searches were performed to gather further publications produced by the
authors whose work was identified in the initial searches. Relevant citations in the
gathered publications were also collected. In addition, peer-reviewed journals with
foci relevant to the issues addressed by this thesis were examined issue by issue,
including Diabetes, Diabetes Care, Health Psychology, Journal of Adolescence,
Journal of Adolescent Health, Journal of Adolescent Health Care, Journal of
Behavioral Medicine, Journal of Child Psychology and Psychiatry, Journal of
Chronic Diseases, Journal of Pediatric Psychology, Journal of Pediatrics, Medical
Care, and Social Science and Medicine.
2
1.1 The Historical Context of Research into Patient Adherence to Medical
Recommendations.
This section discusses the historical context of research into patient adherence. This
section consists of three parts. The first part discusses the merits and use of different
definitions of patient adherence. The second part discusses the assessment of patient
adherence. The third part discusses the use of explanatory models of health behaviour
to explain patient adherence.
1.1.1 The Definition of Patient Adherence.
Adherence to medical regimens has become an important focus of psychological and
medical research in recent years. Previously, the term compliance has been used to
describe the extent to which patients correctly manage their treatment. As patients
have become increasingly regarded as decision makers, rather than passive recipients
of treatment, the term compliance has been superseded by the term adherence. The
term compliance is disfavoured because of its implication that the patient's role is to
obey the orders of the practitioner, rather than act as a member of a partnership
(Dunbar, 1979, 1980; Janis, 1984a; Iæventhal, 1983; Shope, 1981). The term
adherence is intended to change the focus of researchers, from examining what
patients are (i.e., compliers or noncompliers), to examining what patients do
(Leventhal, Zimmerman, & Gutmann, 1 984).
aJ
A methodological limitation characteristic of the patient adherence literature is the
inconsistent manner in which adherence has been defined (DiMatteo, Sherbourne, et
al. 1993 Dunbar-Jacob, Dwyer, & Dunning, I99I; Marston, 1970). Adherence has
been defined in three fundamental ways by various researchers; ratio, category, and
index definitions (Cromer & Tarnowski, 1989; Dunbar, 19'79, 1980). Ratio
definitions focus on the ratio of behaviours completed to behaviours prescribed. This
form of definition is usually measured by counts of pills remaining from prescriptions
after a set interval.
Category definitions involve classification of patients. For example, patients may be
classified as good, fair or poor adherers, or as nonadherers. Unfortunately, most
research using this form of adherence definition has failed to specify the criteria by
which these categories are delimited. These are probably the most common
definitions of adherence, although specific characteristics vary between investigations.
For example, adherence has been defined as "the degree to which an individual's
behaviour coincides with medical advice relative to lifestyle changes, following diets,
or taking medicine" (Rickert, Jay, &. Gottlieb, 1990). Other researchers have added
components to this definition including medication knowledge, appointment
attendance or prescription filling (Becker, Drachman, & Kirscht, L972; Nessman,
Carnahan, & Nugent, 1980). Gordis (1976) described a criterion definition of
adherence, in which adherence was conceptualised as "the point below which the
desired preventive or therapeutic result is unlikely to be achieved" (p 52).
The third type of adherence definition is the index definition. Index definitions are
used to rate patients' adherence to a series of recommended activities. This form of
4
definition, used in Health Belief Model research, assesses adherence involving vanous
aspects of the patients' regimen, such as keeping appointments and knowledge of the
treatment. Individual components of the regimen are weighted according to the
importance attributed to them by the investigator, and combined to form an overall
index of the patient's adherence.
The lack of uniformity with which adherence is defined in the literature has been an
impediment to the advancement of adherence research (Marston, I9l0; Rapoff &
Christophersen, 1982).
Adherence to medical regimens requires patients to undertake a range of activities
including attending clinic appointments, pill taking and dietary modifications (Gordis,
1979: Kirscht & Rosenstock, L979). Often patients' level of adherence to the
different components of a regimen are poorly related to one another and are unstable
over time (Kasl, 1983). Given the wide spectrum of activities involved in patient
adherence research, it is possible for patients to be fully adherent to one aspect of a
medical regimen, whilst being partially or completely nonadherent with other aspects
of the treatment (Ome & Binik, 1989).
Because various forms of health behaviour are involved in patient adherence, different
methods have to be used to measure different aspects of patients' adherence. A range
of methods has been employed by researchers with varying levels of success. The
most common of these methods are discussed in Section 1.1,.2.1of this chapter.
5
Unfortunately, the majority of investigations of patient adherence have described
patients as either "adherent" or "nonadherent". This approach ignores the continuum
along which adherence can vary. Describing patients as either adherent or
nonadherent to a treatment program ignores the complexity and range of adherence
behaviour; adhering to a medical regimen involves a wide range of activities, each of
which can be adhered to to varying extents by the patient. Patients who are highly
adherent to some aspects of a regimen may at the same time adhere very poorly to
other aspects of the regimen (La Greca, 1990a). Due in part to these considerations,
and in part to the measurement issues discussed in the next part of this chapter, there
is at present no single highly reliable, valid method of predicting adherence or
nonadherence before the initiation of treatment, or of evaluating adherence during
treatment (Cockburn, Gibberd, Reid, & Sanson-Fisher, 1987; TG Wilson, 1981).
LI.z The Assessment of Patient Adherence.
The measurement of patient adherence has been the topic of considerable controversy
in recent years (RD Hays & DiMatteo, 1987; La Greca, 1990a). The methods used to
assess adherence and the experimental design of studies focusing on adherence have
received attention in a number of reviews (e.g., Dunbar, 1980, 1983; LH Epstein &
Cluss, 1982; Gntz, DiMatteo & Hays, 1989; RD Hays & DiMatteo, 1987; LaGreca,
1988a, 1990a). This section provides an overview of the main methods employed to
assess adherence that have been referred to in the literature, as well as discussing key
research design features appropriate to the investigation ofpatient adherence.
6
I.l.2.l Measures of Patient Adherence.
The most commonly used methods of assessing patient adherence are self-reports,
collateral reports, behavioural observations, perTnanent products, health provider
estimates, and biological assays. These methods are reviewed in turn.
Self-Reports.
Self-Report measures are the patients' own reports of their adherence to their
treatment regimen. Several basic forms of self-report have been used, such as diary
keeping, questionnaires, and scenario testing. Diaries or Log books can be maintained
by patients as a regular record of their regimen-related behaviours, as they occur.
Questionnaires or Interviews can be used for patients to report on their past behaviour
in relation to their regimen.
Self-report questionnaires are probably the most commonly used assessment of
adherence, and can be used to measure adherence with any form of health behaviour.
For example, questionnaires may be used to assess adherence to medication
prescriptions, exercise recommendations and dietary restrictions. Advantages of self-
report questionnaires include that they are easy to use and inexpensive, and that their
reliability and validity may readily be tested. However, self-report measures may be
vulnerable to bias or falsification. (SB Johnson, I99La).
Self-report interviews are another commonly used form of adherence assessment. A
benefit of interviews is that they are able to examine more closely the issues detected
7
by self-report measures, and are adaptable to each patient's needs. A disadvantage of
using interviews is that as well as being vulnerable to the self-report biases which
limit questionnaire self-reports, interviews also are limited by possible interviewer
biases
Colla.teral Reports.
Collateral reports of adherence include reports obtained from the patients' family
members or friends, These measures may take the same forms as the self-report
measures. These measures, like the self-reports are typically easy to administer, and
are vulnerable to the same biases as the self-reports. The accuracy of collateral reports
also is likely to be influenced by the level of familiarity of the respondent with the
patient. That is, reports from parents about the adherence of their children are likely
to be comparatively accurate, while the reports of friends or more distant family
members may be less accurate (RD Hays & DiMatteo, 1987).
B ehavíourøl Ob s erv atío n.
Behavioural Observation has been used in a select number of studies. In this instance
the patients' actual adherence behaviour is observed by the researcher. The benefit of
this measure is that it provides a more complete picture of the adherence behaviour of
the individual, potentially covering all aspects of adherence to the treatment regimen.
A disadvantage of using behavioural observation as a measure of adherence is that this
method can only be used with certain limited groups of patients. Also, the presence of
an observer may influence the behaviour of patients. Finally, the expense and
8
difficulty of obtaining this form of information make direct observations prohibitive
(I-ny, L992).
Permønent Products.
In recent years a number of products have become available that are supplied to
patients and employed both in the assessment of adherence and for health care
puryoses. An early version of a permanent product is the performance of pill counts,
that is, counting the amount of medication left in a pill bottle after a defined period
(Caron, 1985; RD Hays & DiMatteo, 1987). Pill counts are vulnerable to poor
co-operation from patients. For example, patients may forget to bring pill bottles to
clinic visits, or may throw away medication they have not consumed. A further
disadvantage of the pill count is that no information about the timing of medication
use is available.
More recently, microprocessors were employed in pill bottles to record the timing of
each opening of the bottle, and presumed dose (e.g., Cramer, Mattson, Prevey,
Scheyer, & Ouellette, 1989; Cramer, Scheyer, & Mattson, 1990: Eisen, I99l;
Feinstein, 1990). These devices were limited by their expense and cumbersome
nature. Further, their assessment was of a presumed dose rather than of an actual dose
- patients may have opened the bottle and not consumed an appropriate dose (Iæe,
Nicholson, Souhami, & Deshmukh, 1992).
Another device developed to record objectively the performance of a regimen
behaviour is the Nebuliser Chronolog. The Nebuliser Chronolog may be used to
9
assess objectively the use of metered-dose inhalers, principally used in the treatment
of asthma. The Nebuliser Chronolog is a small portable device that houses a standard
metered-dose inhaler. Each actuation of the inhaler is recorded in the electronic
memory of the chronolog according to date and time, records can be read out using a
Chronolog Interpreter (Mawhinney, et al. 1991; Rand, et al. 1992; Spector, et al. 1986;
Spector & Mawhinney, 1991). A shortcoming of the Nebuliser Chronolog is that its
use involves some level of change in routine for the patient - the device is larger than
the basic inhaler, and the process of obtaining records is cumbersome. It is possible,
therefore, that the use of the Nebuliser Chronolog is reactive, that is, it may influence
the behaviour being assessed - inhaler use (Rand, 1990; Rand, et al., 1992; Spector &
Mawhinney, 1991).
A more recent development in this line includes monitors for testing blood glucose
levels for patients with insulin-dependent diabetes mellitus. These monitors are
designed with large memory capacities to record the timing and results of blood
glucose tests (e.g., MediSense, 1995; Tieszen, Burton, Dornan, Matthews, &'
McMurray, 1995; Wysocki, Green, & Huxtable, 1991). An advantage of these
monitors is their ability to measure variations of adherence over time. Further, data
can be obtained from these monitors in an unobtrusive manner. Previous studies have
found that the use of new sensors with electronic memories has not influenced blood
glucose monitoring (BGM) adherence (Mazze, et al. 1984; DP Wilson & Endres,
1986). A limitation of the monitors is that they focus on only one aspect of regimen
adherence.
10
He alth Provider B stimate s.
Health provider estimates are descriptions of the adherence of the patient from the
perspective of the health provider. These estimates of adherence are obtained using
the same methods as self-reports or interviews, except that the clinician, rather than
the patient, is involved in the process. The only advantage gained by using clinician
estimates is that they are less reactive than most forms of adherence measure, as
patients may be kept unaware of the examination of their adherence. However,
clinician estimates are perhaps the poorest measure of patient adherence (Caron &
Roth, 1968; SB Johnson, I99la). These reports typically confound adherence with
health status (SB Johnson,lggIa; La Greca & Schuman, 1995).
Bíologícal Assøys.
Biological assays are direct measures of the level of drug present in the body. Assays
are taken by recording the amount of prescribed drug present in blood, urine, etc, as an
indication of the amount of medication that has been taken, or how closely patients
have adhered to dietary restrictions. Biological assays are a direct measure of the
presence of medicine. However, although they are a direct measure, assays are a
measure of the physiological results of treatment not of behaviour. There are several
disadvantages in using assays as measures of adherence. First, assays are only
applicable to a limited range of drugs, so adherence with many regimens cannot be
determined by this measure (Dahlquist, 1990). Second, assays are only measures of
the level of drug present, and so do not provide any indication of the frequency with
which doses have been taken (La Greca, 1988a). Finally, inter- and intra-individual
11
variation in the rate of absorption or metabolism of the drugs makes this a poor
indication of the adherence to drug treatment @unbar, 1980).
LI.2.2 The Comparison of Patient Adherence to Differing Regimens.
This section reports on studies addressing the variation of adherence to different
regimen demands. There are two points to be considered in relation to this issue.
First, the variation in the extent to which patients adhere to different regimen
demands. This includes the variation in adherence levels between different treatment
regimens, as well as the variation in adherence to different components of complex
regimens such as diabetes self-management. Second, the measurement of adherence
across different regimen demands should be considered. For example, global
measures of adherence do not account for the variation in adherence levels to different
components of complex regimens. These topics will be considered in turn.
The Consístency of Adherence Across Regimen Demsnds.
Previous studies have reported widely varying adherence rates, ranging from almost
complete nonadherence to complete adherence (Burke & Dunbar-Jacob, 1991;
DiMatteo, 1994; DiNicola & DiMatteo, 1984; SB Johnson, 1992a, I992c; La Greca,
1988a). This variation is partly accounted for by the inconsistency in the manner in
which adherence has been assessed (see Section 1,.1.2.1). However, this inconsistency
does not account fully for the variation in reported adherence. Studies using identical
adherence measures have produced varied estimates of adherence, as have single
l2
studies examining more than one group of patients. One of the reasons for the
variation in adherence rates reported in different studies is the variation in the degree
to which patients adhere to different regimens, and different regimen components.
Patient adherence is not a unidimensional construct or personality trait (Becker, 1985;
Cox, Gonder-Frederick, Pohl, & Pennebaker, 1986; SB Johnson, l99Ia; Orme &
Binik, 1989). Health behaviours requiring adherence range from simple, one-off
activities such as immunisations, to changes in lifestyle that include numerous
components and are lifelong, such as IDDM self-management (Becker, 1985).
Further, individual patients are likely to adhere to different regimen activities to
different degrees.
For example, Schafer, Glasgow, McCaul and Dreher (1983) found that adolescents'
adherence to seven components of the IDDM regimen, including diet, insulin
injection, glucose testing, and exercise components, were not related. Similarly,
SB Johnson and her colleagues (1986) reported that a factor analysis of adherence by
children and adolescents with IDDM to thirteen diabetes management behaviours
produced five independent factors. These authors point out that if adherence to
diabetes treatment were a unitary construct, this analysis would have produced a
single factor. In sum, patients' adherence to one aspect of a multicomponent regimen
is not necessarily predictive of adherence to other aspects of the regimen (see also
RE Glasgow, 1991; SB Johnson,l991.a,I99lb; Orme and Binik, 1989).
One of the more commonly reported findings in reviews of patient adherence is that
adherence levels vary between regimen demands. This finding may be considered at
t3
two levels. First, adherence levels are likely to vary between treatment regimens for
different illnesses. Second, and particularly for complex treatments such as diabetes
self-management, adherence levels are likely to vary between individual components
of regimens.
Reviews of the literature suggest that there are at least five major characteristics of
medical regimens that influence patients' adherence (Fotheringham &. Sawyer, 1995).
These are the regimen's complexity, duration, side-effects or discomfort, costs, and
need for lifestyle changes or limitations (Becker & Maiman, 1975, 1980; Brand,
Smith, & Brand, 1977; La Greca, I990a; Rorer, Tucker, & Blake, 1988). The
influence of these regimen characteristics on patient adherence are addressed
individually in Section 1.2.2.
The Measurement of Adherence Across Regimen Demands.
Most studies of patient adherence have been small scale, and have focused on only a
single condition (preventing cross-illness comparisons). Typically these studies have
focused on a single treatment activity within the illness group under consideration,
and have employed arbitrary definitions of adherence, often with minimal or no
clinical relevance (Kravitz, et al. L993). For several years reviewers have called for
more methodologically sophisticated investigations into patient adherence, yet these
calls largely have gone unheeded.
Further, the lack of a consistent methodology between studies inhibits the pooling of
information from different trials. Definitions of adherence, even within similar
t4
patient samples, typically have been divergent, as have the means employed to collect
adherence information (Fotheringham & Sawyer, 1995).
The lack of consistency between studies is perhaps most visible in investigations into
the adherence of child and adolescent patients. Research into the medical adherence
of children and adolescents is complicated by the triadic nature of the doctor-parent-
child relationship. The management of childhood illnesses involves more complex
relationships than the treatment of illness in adults (La Greca, 1988a, 1988b). Young
children often lack the skills required to follow their regimen without the guidance
and assistance of an adult. As a result, adherence to the young child's regimen
depends on both the adherence of the adult and the adherence of the child (Litt &
Cuskey, 1930). Further, as children grow older, they are expected to take greater
responsibility for their illness management. Most studies have examined the
adherence of parents, without addressing the adherence of the child. This approach is
likely to be appropriate for young children, but is clearly inadequate for the study of
adolescent adherence (Fotheringham & Sawyer, 1995; Tebbi, 1993; Tebbi, et al.
1986).
One of the primary reasons for the lack of a consistent methodology in adherence
research has been the debate over which form of data gathering is most appropriate.
The use of global measures to assess adherence to complex regimens such as IDDM
self-management may not be adequate (Fotheringham, Couper, Taylor, & Sawyer,
submitted; SB Johnson, 1984). Measures which assess adherence to specific
components of complex regimens provide greater insight into the adherence behaviour
of patients.
15
An approach that has been developed recently, and which has proved efficacious, is
the combination of general and specific measures of adherence. 'When used in
combination, these self-report measures overcome one of the principal limitations of
previous self-reports - their lack of comparability between investigations. A general
measure of adherence may be used across a diversity of patient populations, without
limitation to specific treatment regimens. These measures provide broad assessments
of adherence, using a standardised measure. The chief benefit of these measures is
their facilitation of comparisons between groups. In contrast, and as a complement to
the general measure, specific adherence measures can be developed for each patient
population or treatment group. The specific measures provide detailed information
about adherence to individual components of complex treatment programs. The
combination of these two approaches greatly enhances the level of information
obtained (DiMatteo, Hays, & Sherboune,Igg2; RD Hays & DiMatteo, 1987).
I.1.2.3 The Employment of Multiple Measures of Adherence.
An important development in the investigation of patient adherence to medical
recoÍLmendations is the inclusion of multiple measures of adherence (Dunbar, 1983;
Dunbar-Jacob, Dwyer, &. Dunning, L99l; Eraker, Kirscht, &. Becker, 1984;
Fotheringham, et al. submitted; RE Glasgow & Osteen, 1992; Gitz, et al. 1989;
RD Hays & DiMatteo,1987; SB Johnson,I99Ia,I99lb; La Greca, 1990b). There are
several reasons why the use of multiple measures of adherence is important. First, as
reviewed in Section 1..1,2.2, adherence to one aspect of a complex regimen is
t6
typically independent of adherence to other aspects of the regimen. The use of
multiple measures of adherence allows the examination of adherence to diverse
activities involved in multifaceted regimens such as IDDM self-care (SB Johnson,
1991a).
As discussed in Section 1.1.2.1, each form of adherence measure has inherent
limitations. The use of multiple forms of adherence measure in combination has
benefits in that the information gathered by the different sources is supplementary,
rather than duplicative (Dunbar, 1983; Dunbar-Jacob, et al. l99l; Fotheringham, et al.
submitted; RD Hays & DiMatteo, 1987; La Greca, 1990b). For example, the use of
self-reports and parent reports in addition to behavioural observations provides a
multi-person perspective of adherence behaviour (Dunbar, 1983).
Eraker, et al. (1984) suggested that the accuracy of adherence reports, particularly self-
reports, may be improved by making respondents aware that other forms of adherence
assessments are being used to verify the information collected. Further, it has been
suggested that the use of collateral reports in addition to self-reports may overcome
one of the major problems associated with the use of self-reports: effors of memory
(SB Johnson, 1991b).
RD Hays and DiMatteo (1987) recommended that more studies be conducted using
multiple sources of adherence information. For example, studies employing self-
reports can also include spouse reports or sibling reports without greatly increasing the
difficulty or cost of collecting data. The inclusion of multiple sources of adherence
L7
information will help to establish the validity of adherence repofis from each source
under various conditions (RD Hays & DiMatteo, 1987).
Consideration also should be given to which combination of measures is employed.
Including more than one measure that duplicates information adds little to the
assessment of adherence. The use of a combination of measures that provides
supplementary information would be more beneficial. For example, the combination
of an interview or self-report measure of adherence with some form of direct
observation or electronic monitoring of behaviour. This combination allows for the
collection of in-depth information from the perspective of the patient as well as
providing an objective validation of adherence to one aspect of the regimen (Dunbar,
1983). Rand (1990) cautioned that the addition of an objective measure to a self-
report might be reactive. At the time of Rand's review, the Permanent Products
available for use by researchers were somewhat obtrusive - requiring a change in
routine for the patient. Electronic monitors, such as the blood glucose sensors, are
now available which are unobtrusive - their use is part of the normal self-care of
chronically ill patients (CS Rand, personal communication, 18 June, 1997).
As in many other areas of behavioural assessment, the assessment of regimen
adherence amongst children and adolescents is more complex than the assessment of
adults. La Greca (1990b) contended that the first principle of child assessment is that
it involves the perspective of multiple informants, that is, child self-reports are
typically employed in conjunction with reports from parents, teachers, siblings or
peers. La Greca further contended that in most areas of child assessment, multiple
methods of assessment are desirable (La Greca, 1990b). These contentions are
18
particularly applicable to the assessment of regimen adherence amongst children.
Bush, Iannotti and Davidson (1985) noted that most studies of children's use of
medicine have obtained information from the mother or primary caretaker only.
These authors reported finding that children also were a valuable source of
information about their medicine use.
Parents' reports of their children's adherence are especially important when
examining younger children. Older children and adolescents tend to act somewhat
independently of their parents, but younger children are more often dependent on their
parents for the performance of regimen activities. When the parent is the individual
responsible for the administration of insulin or the observation of dietary restrictions,
their report of adherence is of primary importance. For older children, where
responsibility for regimen activities may be shared with the child, reports of adherence
from both the parent and the child are essential. For older adolescents, who take
responsibility for their regimen, parents' reports of adherence provide useful
validations of the adolescents' self-reports.
I.1.2.4 The Use of Longitudinal Research Designs
Another key issue in the assessment of patient adherence is the use of longitudinal
research designs. Most studies examining patient adherence have been cross-
sectional, examining the relationship between adherence levels and demographic
characteristics of study participants (RE Glasgow, 1991; RE Glasgow & Anderson,
L995; SB Johnson, I992c; Rapoff & Christophersen, 1982; Youngleson & Joubert,
19
1991). In recent years, a number of reviewers have called for more widespread use of
longitudinal study designs to examine the relationship over time of adherence with a
variety of factors (RE Glasgow, 1991; RE Glasgow & Anderson, 1995; SB Johnson,
1985, 1990,I992c; Kobasa, 1985; Rapoff & Christophersen, 1982).
This should not imply that only longitudinal studies are informative, or that cross-
sectional studies are of little benefit. Both approaches have benefits and limitations.
The examination of patient adherence is best conducted using a variety of research
designs under varying conditions (SB Johnson, 1985). As Rutter (1994) put it,
"longitudinal studies are expensive, time-consuming, and need to be reserved for
circumstances when their considerable research power can be used to maximum
advantage and not wasted on exploratory investigative forays into new territories"
(p e28).
One of the strengths of cross-sectional designs is that they are relatively inexpensive,
when compared with longitudinal studies. Tracking groups of study participants for
extended periods of time incurs considerable expense. Further, in planning
longitudinal designs participant attrition rates must be considered, often necessitating
oversampling when collecting initial samples to ensure that final samples are
sufficiently large for the performance of meaningful analysis (HA Feldman &.
McKinlay, 1994). Participant attrition and resistance aÍe likely to become
increasingly problematic over the duration of a study, particularly for extended
investigations where many assessments are planned (Farrington, 1991). Further,
participant attrition can be particularly problematic when investigating adolescent
study populations (e.g., Hansen, Collins, Malotte, Johnson, & Fielding, 1985; kwin,
20
Millstein, & Ellen, 1993; Kosky, Sawyer, & Fotheringham, t996; Snow, Tebes, &
Arthur, 1992; AH Winefield, Tiggemann,'Winefield, 1991)
Cross-sectional designs can be used to determine whether associations exist between
adherence and other factors. Relationships which have been demonstrated in cross-
sectional studies can then be more closely examined in longitudinal investigations.
Relationships which demonstrate no association with adherence need not be explored
in more expensive studies using longitudinal methods. Replication of association in
repeated cross-sectional studies in different settings provides evidence that
relationships between variables are genuine, rather than the result of unmeasured
confounding variables (Rutter, 1994). This evidence should be treated as a
prerequisite to the use of longitudinal research designs (Rutter, 1994). For example,
SB Johnson and colleagues examined the relationship between regimen adherence and
health status amongst children and adolescents with IDDM in a series of cross-
sectional studies (Freund, Johnson, Silverstein, & Malone, I99l; SB Johnson, Freund,
Silverstein, Hansen, & Malone, 1990; SB Johnson, et al. 1986; Spevack, Johnson,
Riley, & Silverstein, 1991). Only after the association between these variables had
been examined in different study populations was a longitudinal analysis of the
relationship between IDDM regimen adherence and health performed (SB Johnson, et
al.1992).
Cross-sectional designs are limited, however, in that they can only determine
correlational relationships. The direction of cause and effect cannot be established.
Causal inferences can only be drawn from longitudinal studies (Rapoff &
Christophersen, 1982). Longitudinal designs enable the researcher to determine the
2l
time ordering of events. Causal effects can be demonstrated by showing that changes
in one variable are followed by changes in another variable (Farrington, I99l; Rutter,
1994). For example, previous research has noted a correlation between family
functioning and metabolic control in children with IDDM (e.g., Hanson, Henggeler,
Harris, Burghen, & Moore, 1989; Marteau, Bloch, & Baum, 1987). This correlation is
generally assumed to indicate that family functioning influences adherence, which in
turn affects disease control. However, as illustrated by Baranowski & Nader (1985), it
is equally possible that poor diabetes control leads to additional problems to be faced
by the family, which in turn leads to poorer family functioning. Alternatively, some
other variable may influence both metabolic control and family functioning. The use
of a longitudinal study design would enable the researcher to determine the causal
relations amongst these variables.
There are à number of advantages to using longitudinal data. For example,
longitudinal data provides multiple assessment points over time; having multiple data
points increases the reliability and decreases vulnerability to biases due to situational
influences or reporting variations (S Epstein, 1983; Rutter, 1994). Further, unlike
cross-sectional data, longitudinal data can provide information about cumulative
phenomena and sequential patterns (Farrington, 1991; Rutter, 1994).
Longitudinal studies allow the testing of interventions designed, for instance, to
improve patient adherence. These interventions are typically based upon knowledge
drawn from previous cross-sectional studies. For example, Delamater (1993)
reviewed 14 interventions designed to improve adherence to IDDM regimens amongst
children and adolescents. These interventions were all based on an understanding,
22
drawn from previous cross-sectional investigations, of factors which influence
adherence.
Cross-sectional studies are restricted to making comparisons between individuals,
whereas longitudinal studies can be used to examine changes within individuals over
time, as well as variation between individuals (Farrington, 1988, I99I; Kobasa, 1985;
Robinson & Marsland,1994; Rutter, 1988; Uncles, 1988). For example, longitudinal
studies can examine the variation in adherence over time. Further, longitudinal
studies may be used to examine the interaction between variables over time, in order
to better understand the relationships amongst them. This may be particularly
important in areas associated with the functioning and behaviour of children and
adolescents. The behaviour of young people is not static; longitudinal studies allow
the examination of the development over time of adolescents' regimen adherence in
relation to the presence of other 'predicting' factors (Hanson, De Guire, Schinkel,
Henggeler, & Burghen,1992; SB Johnson, 1985).
The Varíatíon of Patient Adherence Over Tíme.
Few studies have examined the variation of adherence over time. Most longitudinal
studies of patient adherence have focused on the influence of psychosocial factors on
adherence over time (e.g., Hauser, et al. 1990; Jacobson, et al. 1990; Kovacs, et al.
1990). Hauser, et al. (1990), in examining the long-term regimen adherence of
adolescents with IDDM, noted that initial adherence assessment rates were
significantly related to adherence over a prospective four-year period. However, the
size of the association between initial adherence and long-term adherence suggested
23
that fluctuation in adherence occurred. This possibility was not explored by the
authors (La Greca, 1990a).
One of the few studies to examine the variation of adherence over time was conducted
by Youngleson and Joubert (1991). These authors examined the adherence of
tuberculosis patients to their treatment, using both a cross-sectional and a longitudinal
research design. The results of this study suggested that the cross-sectional
assessment of adherence produced overestimates of adherence, and that adherence
levels varied over time. This finding has not been tested in subsequent investigations.
The longitudinal assessment of adherence to IDDM self-care regimens, and more
specifically to blood glucose monitoring, is greatly facilitated by the development in
recent years of blood glucose sensors with electronic memory capacities (see Section
l.l.2.l). These products objectively record blood glucose monitoring behaviour, and
their records can be downloaded, with minimal intrusion or impact upon the
participant. In addition, the ongoing use of this data is less vulnerable to response
bias resulting from practice effects or resistance to the ongoing study. Further, as
noted by Farrington (1991) and Rutter (1994),longitudinal data does not have to be
collected prospectively. With the large memories built into commercially available
blood glucose sensors, downloaded records of BGM can provide an accurate
assessment of monitoring behaviour extending back over a number of weeks or
months.
The utilisation of blood glucose sensors in the published literature is increasing
(BJAnderson, Ho, Brackett, Finkelstein, & Laffel, 1997; Brodows, 1992; Gonder-
24
Frederick, Julian, Cox, Clarke , & Carter,1988; Hoskins, Alford, Handelsman, Yue, &
Turtle, 1988;NB Johnson, Klonz, Fineberg, & Golden, 1992; Landon, Langer, Gabbe,
Schick, & Brustman, 1992; N Langer & O Langer, 1994; O Langer, et al. 1994;
Lustman, et al. 1995; Meyerhoff, Bischof, & Pfeiffer, 1994; Parfitt, Clark, Tutner, &
Hartog, 1992, 1993; Rosenn, Miodovnik, Holcberg, Khoury, & Siddiqi, 1995; Tate,
Clements, & Walters, 1992; Wolfsdorf, Laffel, Pasquarello, Vemon, & Herskowitz,
1991; Wysocki, Hough, et al. 1992). However, these studies have not used this
information to assess participants' variation in BGM adherence over time. For
example,'Wysocki, Hough, et al. (1992) examined the BGM adherence over 28 days
of forty-seven children and adolescents with IDDM. The mean number of blood
glucose tests performed over the 28 day period was reported, but variation over time,
or within-subject variation, was not reported.
One study which did report variations in adherence to BGM over time was conducted
by Wysocki and colleagues (1991). In this study, the authors examined the adherence
to blood glucose monitoring of a group of 30 adolescents with IDDM over a period of
16 weeks. This study assessed the impact of an intervention designed to improve
adherence to BGM, using the blood glucose sensors with memory capabilities as a
tool in the intervention. This study did report the variation of adherence to BGM over
time, however this reporting was in relation to the intervention being performed at the
time. Data relating to the variation in BGM adherence prior to the intervention, or
after the intervention was completed, were not reported.
Perhaps the only study to have reported on the variation in adherence over time
without the influence of an intervention was conducted by Cramer and colleagues
25
(1990). These authors examined the variation over time of adherence to pill+aking
recommendations amongst a sample of 20 adults prescribed an antiepileptic
medication. In this study, sharp declines in adherence between clinic visits were
observed, with increased adherence observed in the days immediately before and after
outpatient clinic attendance.
Clearly, the use of this technology offers the opportunity to objectively assess the
variation in adherence over time of an important aspect of adherence to IDDM self-
care regimens.
1.I.2.5 The Relationship Between Patient Adherence and Health Status.
It often has been assumed in the patient adherence literature that patients' adherence is
associated with their health status, that is, that high levels of adherence are associated
with good health and that low levels of adherence are associated with poor health.
However, studies which have examined this relationship have produced inconsistent
results (e.g., BJ Anderson, Auslander, Jung, Miller & Santiago, 1990; Auslander,
Anderson, Bubb, Jung, & Santiago, L990; Bond, Aiken, & Somerville, 1992;
Brownlee-Duffeck, et al. l98l; Freund, et al. 1991; RE Glasgow, McCaul, & Schafer,
1987; Gonder-Frederick, et al. 1988; Hanson, et al. 1996; Hanson, Henggeler, &
Burghen, I981a,1987b, I987c; Hanson, Henggeler, et al. 1992; SB Johnson, Freund,
et al. 1990; SB Johnson, Kelly, et al. 1992; SB Johnson, et al. 1986; RM Kaplan,
Chadwick, & Schimmel, 1985; Kovacs, Goldston, Obrosky, & Iyengar, 1992;
LaGreca, Swales, Klemp, Madigan, & Skyler, 1995; Miller-Johnson, et al. 1994;
26
Schafer, et al. 1983; Schafer, McCaul, & Glasgow, 1986; Spevack, et al. 1991; Weist,
Finney, Barnard, Davis, & Ollendick, 1.9931, DP Wilson & Endres, 1986; 'Wing, et al.
1985; Wysocki, Hough, Ward, Allen, & Murgai, 1992).
It has been suggested that much of this inconsistency is due to variations in the
methods employed by researchers to assess adherence (Freund, et al. I99l; Hanson, et
al. 1996; SB Johnson, 1990). While some of the inconsistency may be attributed to
methodological variations in study design and particularly variations in the adherence
measures employed, this variation does not appear to provide a complete explanation
for the incongruity of adherence-health relationships reported in different studies.
For example, the explanation of this inconsistency is complicated by the confounded
measurements employed in some studies. Research progress has been retarded by
some investigations in which the measurement of adherence and health status has
been confounded (Dahlquist, l99O; Eraker, et al. 1984; SB Johnson, 1985, I99la).
Further, some studies have employed health status as an assessment of adherence
(e.g., Clarke, Snyder, & Nowacek, 1985;Herskowitz, Wertlieb, & Watt, 1987).
In short, the relationship between patients' adherence and their health status has been
the source of some confusion in the published literature (SB Johnson, l99Ia, 1993).
This section reviews the available literature examining this relationship. First, studies
which have inferred a relationship between health and adherence without any
empirical testing are reviewed. Second, studies which have shown a significant
relationship between these variables are discussed, followed by a review of studies
2l
which have failed to establish this link. Finally, methodological considerations
important to the consolidation of research of this relationship are considered.
Studíes Whích Hqle Inferred u Relatíonship Between Patíent Adherence and
Health Status.
A large proportion of studies investigating patient adherence have implied that
adherence is closely, and causally, related to patients' health status (e.g., La Greca,
Auslander, et al. 1995). However, the proportion of adherence studies which have
actually examined this presumed link is small. SB Johnson's (1984) review of the
literature examining correlates of health in childhood insulin-dependent diabetes
mellitus (IDDM) reported that few studies had directly assessed the relationship
between adherence and diabetic control. Similarly, Spevack and colleagues (1991)
noted that few of the studies examining adherence to diabetes management regimens
have documented the association of adherence to this regimen with the metabolic
control of patients with IDDM. SB Johnson (1992b) noted that the number of studies
documenting the prevalence of poor adherence to IDDM self-care regimens outweighs
the number of studies which explore the relationship between adherence to these
regimens and the health outcomes of patients.
A number of studies have reported collecting information about the adherence of
young people with insulin dependent diabetes, as well as about their health status (i.e.,
metabolic control), but have not reported whether or not a (clinically or statistically)
significant relationship existed between these variables (e.g., Bobrow, AvRuskin &
Siller, 1985; Ingersoll, Orr, Herrold & Golden, 1986; Jacobson, et al. I98l;
28
SB Johnson, Silverstein, Rosenbloom, Carter & Cunningham, 1986; Schlenk & Harl,
1984).
Other authors have reported collecting information about study participants'
adherence, but have only reported its association with illness control indirectly. For
example, La Greca, Swales, et al. (1995) used a self-care inventory and a measure of
blood glucose monitoring to assess the adherence of adolescents with IDDM.
Metabolic control was assessed by HbA1" assay. Although a direct association
between adherence and metabolic control was not reported, adherence was introduced
into analyses intended to explain gender differences in metabolic control. The
inability of the adherence variables to explain the gender difference in HbA1" suggests
that these measures may not have been correlated, but this issue was not explored.
Instead the authors stated that similar adherence measures had been associated with
metabolic control in previous studies.
The assumption of a direct link between adherence and health status extends beyond
studies addressing adherence directly. For example, the implications of this
assumption can be seen in the work of Jessop and Stein (1985), who discussed the
impact of chronic illnesses on the psychological and social functioning of children and
their families. These authors suggested that the health behaviour, adherence, and
health outcomes of these children were influenced by the children's functioning. This
last suggestion implies a correspondence between the health behaviour and adherence
of children with chronic illnesses, and their health outcomes. This implied link was
not tested by the authors.
29
Another example of studies based on the assumed relationship between adherence and
health are those studies which employ indices of health as methods of assessing
adherence. For example, estimates of adherence to IDDM regimens often have been
based upon glycosylated haemoglobin (HbArJ assays (Clarke, et al. 1985;
SB Johnson, I99la, 1991b). The use of IIbA1" as an estimate of adherence would
only be appropriate if a one-to-one coffespondence had been established between
HbA1. and adherence. This correspondence has not been found (RE Glasgow, et al.
1989; SB Johnson, 1990, I99la, 1991b, I992a, 1992b). Another method of
estimating patient adherence that is likely to be dependent on the assumed association
between adherence and health status is the health provider estimate. These estimates
of adherence are frequently based upon, or confounded with, patients' health status
(SB Johnson, I99Ia, 1991b).
The published literature now contains many reports of interventions designed to
improve adherence to medical recommendations (e.g., Agras, 1993; BJ Anderson,
'Wolf, Burkhart, Cornell, & Bacon, 1989; Delamater, et al. 1990; LH Epstein, et al.
1981; Gilbert, et al. 1982; Janis, I984b; RM Kaplan, et al. 1985; Méndez &Beléndez,
1997; Satin, La Greca, Zigo, &. Skyler, 1989; Stratton, Wilson, Endres, & Goldstein,
1987 Wysocki, Green, & Huxtable, 1989, l99I; Wysocki, White, Bubb, Harris, &
Greco, 1995). The import with which these interventions are credited is based upon
the assumption that improvements in adherence will result in improvements in health
status (e.g., Dahlquist, 1990). Delamater (1993) reviewed the literature of
interventions intended to improve adherence to paediatric chronic illness regimens.
This author recommended that adherence interventions be guided by an understanding
of the importance of adherence to individual aspects of a regimen - the expense and
30
effort involved in intervention programs may be wasted if these interventions target
behaviours which have little influence on the health outcomes of the patients.
Similarly, some research has been designed with the assumption that patients'
satisfaction with their medical treatment influences their health status by impacting
upon their medical adherence, that is, that dissatisfied patients adhere poorly to their
treatment, and consequently experience poor health, while satisfied patients adhere
closely to their treatment and as a result experience good health (e.9., SH Kaplan,
Greenfield, & Ware, 1989). The assumption of the mediating link between
satisfaction with medical services and health status exacerbates the methodological
weakness of assuming a causal relationship between adherence and health.
Studíes Which Have Shown a Reløtíonship Between Patient Adherence and Health
Status.
A number of studies have reported significant relationships between the adherence
and health status of patients. This section briefly reviews studies which have reported
significant relationships between these factors. The focus of this review is directed
toward studies examining children and adolescents with insulin dependent diabetes.
A series of studies by Hanson and colleagues have examined the association between
metabolic control and adherence in adolescents with insulin dependent diabetes (e.g.,
Hanson, Cigrang, et al. 1989; Hanson, De Guire, Schinkel, & Kolterman, 1995;
Hanson, Henggeler & Burghen, 1987a, 1987b). In these studies, significant
relationships were observed between adherence, assessed with a semistructured
31
interview addressing dietary behaviours, insulin adjustment, glucose testing, and
hypoglycaemia preparedness, and metabolic control, assessed using IIbA1. assays.
SB Johnson and colleagues have reported on a number of studies which have
examined the association between adherence and health status of children with IDDM
(Freund, et al. I99I; SB Johnson, 1984, 1985, 1990, l99la, 1'99Ib, 1992a, 1992b,
L994, 1995; SB Johnson, Freund, et al. 1990; SB Johnson, et al. 1992; SB Johnson, et
al. 1982; SB Johnson, et al. 1986; SB Johnson, Tomer, Cunningham, &'Henretta,
1990; Spevack, et al. 1987; Spevack, et al. 1991). These studies examined adherence
using a 24-hour recall interview completed by the participating children and their
mothers, developed by SB Johnson and colleagues (1986). Haemoglobin 41" assays
were used as indices of metabolic control. In two of these studies, reported linkages
between adherence and metabolic control were significant, but weak.
Significant relationships between adherence and health status have been shown tn
several other studies. The regimen adherence of adolescents with IDDM has been
related to metabolic control in studies by Bond, Aiken and Somervllle (1992),
Brownlee-Duffeck, et al. (1987), RM Kaplan and colleagues (1985), La Greca (1982),
and Schafer, and colleagues (1983). Studies involving children with IDDM by BJ
Anderson and colleagues (1990), Auslander and colleagues (1990), and Kovacs and
colleagues (1992) have detected significant associations between the children's
adherence and their metabolic control.
32
Studíes Whích Have Shown No Relatíonship Between Patíent Adherence and
Health Status.
A number of studies have reported finding no significant relationships between the
adherence and health status of patients, or very limited relationships.
One of the most prolific groups of investigators examining adherence and health
status amongst children and adolescents with insulin dependent diabetes is that of
SB Johnson and colleagues (Freund, et al. 1991; SB Johnson, 1984, 1985, 1990,
l99Ia, 1991b, I992a, I992b, 1994, 1995; SB Johnson, Freund, et al. 1990;
SB Johnson, et al. 1992; SB Johnson, et al. L982; SB Johnson, et al. 1986;
SB Johnson, Tomer, et al. 1990; Spevack, et al. 1987; Spevack, et al. l99l)
SB Johnson and coworkers have completed a number of studies which have examined
the relationship between adherence and health status in children and adolescents with
IDDM. These studies have included the development of a 24-hour recall interview
assessing adherence to 13 dimensions of the IDDM self-care regimen. However, the
association between this measure of adherence to aspects of IDDM treatment and the
metabolic control (IIbAr") of participants in these studies, has been inconsistent. Two
studies were described in the previous section which found significant relationships
between these measures of adherence and the measure of metabolic control.
However, other studies by these authors have not detected associations between
adherence and metabolic control in IDDM. SB Johnson recently published a review
of psychosocial aspects of Insulin Dependent Diabetes Mellitus in childhood
(SB Johnson, 1995). This review suggested that the majority of studies which have
examined the relationship between adherence and health status amongst young people
JJ
with IDDM had either reported no relationship between adherence and metabolic
control, or a weak association.
Another group to report a series of studies examining the adherence-health status
relationship amongst children and adolescents with insulin dependent diabetes is that
of Hanson and colleagues. These authors have developed a semistructured adherence
interview, which assesses adherence to dietary recommendations, insulin adjustment,
glucose testing, and hypoglycaemia preparedness. As in many other studies of IDDM,
health status is assessed using HbAlç assays. In the previous section, four studies by
this group were described which found significant relationships between measures of
adherence and metabolic control. However, three other studies by the same group of
researchers were unable to detect significant relationships between adherence and
health status amongst children and adolescents with IDDM (Hanson, et al. L98lc;
Hanson, De Guire, Schinkel, & Henggeler, 1992; Hanson, et al. 1996). The authors
suggest that the inconsistency between the findings of these three studies and the four
studies identified in the previous section may be due to the nature of the adherence
measures. The more specific measures used here may relate to glycaemic control over
the previous few days, while the broader measures may be better associated with
glycaemic control over longer periods. This issue is worthy of further investigation.
Other studies of children and adolescents with IDDM have also been unable to relate
adherence to metabolic control (e.g., Gonder-Frederick, et al. 1988; Miller-Johnson, et
al. 1994: Weist, et al. 1993; DP Wilson & Endres, 1986; Wing, et al. 1985; Wysocki,
Hough, et al. 1992). Two studies by RE Glasgow, Schafer and their colleagues
examined the adherence and health of adolescents and adults with insulin dependent
34
diabetes (RE Glasgow, et al. 1987; Schafer, et al. 1986). Despite the complex
assessment methods employed and the rigorous analyses used in these studies, the
expected relationship between adherence and glycaemic control was not detected.
One of the few criticisms that can be made of the design of this study is that the
measures of adherence and glycaemic control were not temporally congruent - the
time frame addressed by the adherence measures was not the same as that addressed
by the measure of glycaemic control. However, this criticism may be directed at
almost all published investigations of adherence and health status. The move toward
temporally congruent measures is a recent one. This development offers the
opportunity to improve our understanding of the relationship between adherence and
health outcomes amongst groups of chronically ill patients such as these.
Studies in Whích the Measurement of Patient Adherence snd Health Status were
Confounded.
In many studies that have reported on the relationship between adherence and health
status, the measurement of adherence and of health status has been confounded. That
is, the methods used to assess adherence in some studies are not measures of actual
behaviour, but are indices of health outcome. For example, some studies have
reported the use of biological assays as measures of adherence (e.g., Allen, Tennen,
McGrade, Affleck, & Ratzan, 1983; Hill & Holmbeck, 1986). SB Johnson (1991a)
refers to this concept as "Construct Independence," that is, the measures of different
constructs, in this case adherence and health status, should be independent. Put
simply, the relationship between two variables cannot be determined if a single
measure is used to assess both variables. The use of HbA1" assays as a measure of
35
IDDM patients' adherence is an example of construct dependence: the use of this
assay to assess adherence prevents the relationship between adherence and metabolic
control from being examined (SB Johnson, 1985).
Examples of investigations which are limited by a lack of construct independence in
their assessments of adherence and health status are readily observed. For example, a
study of 34 children and adolescents with IDDM and their parents used diabetes clinic
staff ratings to assess adherence (Allen, et al. 1983). These ratings were moderately
correlated with observed metabolic control (IIbAr"), but not with parents' estimates of
metabolic control. It should be noted that the association between health workers'
estimates of adherence and the observed health of patients may be the artifice of the
assessment method - these adherence estimates may be based in part on the patients'
level of health (SB Johnson, l99la; La Greca & Schuman, 1995)
For example, MR Sanders, Gravestock, Wanstall and Dunne (1991) examined the
adherence of children with cystic fibrosis. Parent ratings of adherence problems and
physician ratings of adherence were employed, as well as physician ratings of health
status. Not surprisingly, physician ratings of adherence and health status were
correlated, although the physician estimates of health status were not associated with
parent reports of adherence. While this result was reported as an association between
adherence and health status, this result is better interpreted as evidence that health
providers' estimates of adherence are influenced by their perceptions of patients'
health status. If the parents' reports of adherence had also been associated with the
physicians' health estimates, this may have suggested that these measures were valid,
but the lack of association found suggests a confounded assessment of adherence and
36
health. Other studies have used similarly confounded measures of adherence and
health (e.g., Cockburn, Gibberd, et al. 1987; Gaut & Kieckhefer, 1988; Herskowitz, et
al. L98l; Kurtin, Landgraf & Abetz, 1994). Health provider ratings of adherence
typically confound adherence with health status (Caron and Roth, 1968; Charney, et
al.1967; Davis, 1968; SB Johnson 1991a)
The interpretation of medical indices as measures of adherence stems from the
assumption of a direct correspondence between adherence and health outcomes
(SB Johnson, 1991a). This assumption has not been justified by the findings of
research to date. There are several problems with this use of medical indices as
adherence measures. First, the results of assays such as HbA1" levels for IDDM
patients are insensitive to fluctuations over the short-term in adherence levels
(Dahlquist, 1990; La Greca, 1988a). Second, the assumption that patients' adherence
to a regimen determines their health status ignores that possibility that the regimen
may be inappropriate. For example, patients' prescribed inappropriate dosages of a
medication may adhere closely to their prescription and experience poor health as a
result of the unsuitable prescription. Third, individual patients' physiological
responses to treatments may vary. As such, two patients prescribed the same regimen
and adhering equally to their regimens, may experience differing levels of health
(Dahlquist, 1990; La Greca, 1988a).
Further, because many studies have not carefully assessed the relationship between
adherence and health status, or have simply reported correlational statistics, the
direction of the relationship between adherence and health status is unclear. Although
it often is assumed that good health is the consequence of a high level of adherence, it
37
also is possible that high levels of adherence are encouraged by the patients'
experience of good health - or that poor health causes patients' to become discouraged
and abandon their treatment (RE Glasgow, 1991; SB Johnson, 1984).
Appropriøte Method.ologíes for the Examination of the Reløtíonshíp Between
Patíent Adherence and Health Status.
The merits of various types of adherence measure were addressed in Section l.l.2.l
However, there are specific considerations that should be acknowledged in the
examination of the relationship between adherence and health status. Previous studies
have often been limited by their failure to consider these issues
First, the measures of adherence and health status employed should be temporally
congruent (SB Johnson, 1990, 1992b). To properly assess the relationship between
these factors, it is important that the measures used examine the same time frame. For
example, the commonly accepted measure of metabolic control in IDDM is
glycosylated haemoglobin (HbA1.), a measure of blood glucose levels during the
previous 4-6 weeks (Diabetes Control and Complications Trial Research Group, L995;
Nathan, Singer, Hurxthal, & Goodson, 1984; Olson, 1988). To assess the relationship
between this measure and adherence, the adherence measure should address the past
4-6 weeks, and be administered at the time of the IIbA1" assay. The comparison of
HbA1" assays with adherence measures addressing only the past 1-3 days would not be
expected to reveal the true relationship between adherence and metabolic control
(Freund, et al. I99l;Hanson, et al. 1996; SB Johnson, 1990, 1992b)
38
Second, the use of multiple measures of adherence and health status would provide
additional information about the nature of the link between adherence and health (see
also Section 1.1,2.3 for a discussion on the use of multiple measures). Some authors
have noted that different regimen activities have varying associations with health
status. For example, RE Glasgow and Anderson (1995) and SB Johnson (1990) noted
that adherence to insulin injection regimens related poorly to health status because of
the lack of variability in adherence to this aspect of IDDM treatment. That is,
adherence to insulin administration recommendations tends to be complete or near
complete; poor adherence to this aspect of IDDM management is rare (RE Glasgow &
Anderson, 1995; SB Johnson, 1990). Further, Schmidt and colleagues (1992) found
that dietary intake was weakly associated with metabolic control in adolescents with
IDDM, but that adherence to other aspects of the regimen may be more closely linked
with control (Schmidt, Klover, Arfken, Delamater, & Hobson, 1992).
The variation in associations between different regimen activities and health outcomes
is associated with the variation in adherence to these different activities. Section
1.L,2.2 addressed the issue of variations in adherence to different regimens and
regimen activities
1.1.3 Explanatory Models of Health Behaviour - Applicability to Patient Adherence.
Over the past three decades, various theoretical frameworks have been proposed to
explain health behaviour. None of these theories can be considered comprehensive.
In fact it may not be possible for a truly comprehensive model of all health behaviour
39
to develop in a form that can be applied feasibly in empirical research (GC Stone,
1979a). One form of health behaviour that has received increasing attention in the
literature is patient adherence to medical recommendations. Research into patient
adherence almost exclusively has been atheoretical (McKevitt, Jones, Lane, &.
Marion, 1990; Wolcott, Maida, Diamond, & Nissenson, 1986). As a result, the
adherence literature generally is unintegrated, with little or no ability to explain or
predict patient adherence (Dunbar-Jacob, et al. I99I; Fotheringham & Sawyer, 1995).
This pattern is echoed in research into other forms of health behaviour
In the late 1970s, reviewers described the general characteristics of health behaviour
research as being oriented toward either psychological or sociological paradigms
(Kirscht & Rosenstock, 1979; GC Stone, l9l9b). Today a more multidisciplinary
approach is appropriate as other disciplines and subdisciplines, such as nursing, health
promotion and epidemiology, contribute to the wider understanding of health
behaviour. A synopsis of multidisciplinary developments is particularly important as
the need for multidisciplinary approaches to research and practice increasingly is
recognised (Addleton, Tratnack, & Donat, 19911. George & Hancock, 1993; Hinde,
1992; Perry, Klepp, & Shultz, 1988; Suedfeld, 1982). This section provides a
multidisciplinary perspective on health behaviour research, paying particular attention
to research investigating patient adherence.
Clearly, a model or theory of adherence behaviour is needed for research to progress,
and to integrate the various influences with which adherence behaviour has been
associated (Godin & Shepard, 1990; Leventhal, Meyer, & Nerenz, 1980; Ried &
Christensen, 1988). A more unifotm approach to the investigation of patient
40
adherence potentially would increase the rate of progress made in understanding this
form of health behaviour (Fotheringham & Sawyer, 1995). The employment of
theoretically-sound research designs would facilitate this uniformity. The purpose of
this section is not to advance a new theory; the preponderance of theories already
available has led to their being used inconsistently or not at all. Put simply, there are
too many theories from which to choose, and researchers can waste valuable time
trying to determine the appropriate model from which to operate. This section will
present four of the most useful and potentially useful theories of adherence and health
behaviour
The models that will be examined are (1) the Health Belief Model, (2) the Theory of
Reasoned Action, (3) Protection Motivation Theory, and (4) the Six-Factor Model of
Adherence. These models were chosen on the basis of their contributions to
adherence research. Some of the models, such as the Health Belief Model and the
Theory of Reasoned Action, have strongly influenced research into patient adherence
across a range of disciplines. Other models, such as the Six Factor Model of
Adherence, represent noteworthy improvements upon earlier formulations, and have
been included for this reason. The structure of each model as well as its strengths and
deficiencies will be reviewed, and examples of its use in research will be cited. The
final part of this section will discuss the relative value of these models, and their
potential importance to future developments in health behaviour research.
Many other models could have been included in this review, such as Bandura's
Learning Theory, Self-Regulation Theory, the Trans-theoretical Model, Triandis'
Theory of Social Behaviour, the Interaction Model of Client Health Behaviour, or the
4I
Health Promotion Model (Bandura, 1986; Cox, 1982; Cox & Roghmann, 1984;
Leventhal, et al. 1984; Pender L987; Prochaska & DiClemente, 1983; Triandis, 1964,
1977). While these models have merit, the intention of this paper is to describe
interdisciplinary influences, rather than focusing exclusively on the theories developed
within one perspective, as other reviews have done (e.g. Cummings, Becker, & Maile,
1980;BS Wallston & KA'Wallston, 1984)
1.1.3.1 The Health Belief Model
The most influential model of health behaviour in the literature has been the Health
Belief Model (HBM; Becker, 1974; Becker &. Maiman, 1983; Rimer, 1990;
Rosenstock, 1960, 1974; Rosenstock & Kirscht, 1974). The FIBM takes a value-
expectancy approach, which holds that behaviour is determined by beliefs, including
an expectation of the value of the behaviour (Feather, 19591' Lewin, Dembo, Festinger,
& Sears, L944). The IIBM suggests that people's beliefs about health consist of the
dimensions "perceived susceptibility", "perceived severity", "perceived benefits", and
"perceived barriers" (Figure 1.1)
Unfortunately, researchers from a range of disciplines have accepted the model
without criticism, so refinement of the model has been minimal. One study attempted
to increase the explanatory power of the FIBM by expanding the model to include self-
efficacy (Rosenstock, Strecher, & Becker, 1988). Self-efficacy can be described as
one's confidence in one's ability to perform a required action (Bandura, 1977). This
notion was not included in the original IIBM because the focus of the model had been
42
on short term, one-shot actions, where self-efficacy was not considered an influence
(Rosenstock, 1990).
Criticisms of the IIBM centre on several key deficiencies. First, the relationship
between the model's variables has not been clearly defined. Second, some
determinants have not received sufficient empirical testing, such as "cue to action" or
"intention to comply" as described by Becker and Maiman (1975). Third, there has
been little standardisation of the measurement of psychosocial variables described in
the model (Ried & Christensen, 1988; BS Wallston & KA Wallston, 1984). It may be
questioned whether the IIBM is a model at all; there are too many variables involved
to be tested in a single study, and the relationships between the variables are
unspecified, so the theory is impossible to falsify (de Groot, 1969; Shaw & Costanzo,
1910). Further, the FIBM is a multiplicative model, though most studies testing the
model have been conducted in a linear fashion (BS Wallston & KA Wallston, 1984).
A Children's Health Belief Model (CIIBM), based upon the IIBM, was proposed by
Bush and Iannotti (1988). The CFIBM places children's health beliefs and behavtours
in a family and social context (Iannotti & Bush, 1993; Rapoff, 1996). In this model,
children's health beliefs are derived from their primary caretaker's beliefs (usually the
children's mothers). As children grow older, their health beliefs are posited to
become more like those of their caretaker. This model is suggested to be especially
applicable to health behaviours, but also to health beliefs (Bush & Iannotti, 1988).
The CFIBM is illustrated in Figure 1.2. At present the CFIBM has received little
empirical testing. One investigation of the CHBM examining medicine use of school
43
children has provided support for the model (Bush & Iannotti, 1988, 1990). Further
empirical testing of this model is needed.
1.1.3.2 The Theory of Reasoned Action.
Fishbein and Ajzen's Theory of Reasoned Action (TRA) is a theory of behaviour
developed from cognitive psychological traditions (Ajzen &. Fishbein, 1980;
M Fishbein, 1965, 1912, L980; M Fishbein & Ajzen, 197 5). According to this model,
an individual's performance of a volitional health behaviour may be predicted from
their intention to perform that behaviour (Egger, Spark, & Lawson, \99I). The
individual's intention to perform a health behaviour is a function of their attitudes to
that behaviour, and of the relevant social norrns. These authors describe the
individual's attitudes to the health behaviour as their beliefs in the consequence of that
behaviour, weighed by the value of that consequence. In turn, the social norrns are
described as the expectations of the individual's significant others, modified by the
individual's desire to comply with those expectations (Figure 1.3)
In contrast to the lack of structural relationships of the FIBM variables, the
formulation of the Theory of Reasoned Action is highly specific, both in the
relationship between the elements of the model, and in the measurement of these
elements (Kippax & Crawford, 1993; Mullen, Hershey, & Iverson, 1987; Ried &
Christensen, 1988). While this specificity eases cross-study comparisons, it also
means that new belief items must be generated when investigating new behaviours
(Mullen, et al. 1987). The TRA, unlike other models of health behaviour, describes
44
health behaviour in purely rational or cognitive terms; there is no emotional
component in this model. Personality and other psychosocial variables only influence
behaviours and behavioural intentions indirectly by influencing the weighting of the
model's components (MFishbein, L972; Mullen, et al. 1987; BSWallston 8.
KA Wallston, 1984). Fufther, the TRA does not take into account the barriers and
supports to the individual in carrying out their behavioural intentions (BS Wallston &
KA Wallston, 1984)
1.1.3.3 Protection Motivation Theory
Protection Motivation theory (PM; Maddux & Rogers, 1983; Prentice-Dunn &
Rogers, 1986; Rogers, I915,1983) was originally developed to explain the use of fear
appeals used in health promotion messages, and was later expanded to encompass all
health-related behaviour. According to this model, fear appeals consist of three
components: (l) the degree of noxiousness of a threatened event; (il) the probability of
the event; and (iii) the efficacy of a protective response (Rogers, I975).
The PM model posits that information of various sources, both environmental and
intrapersonal, initiate two cognitive processes: threat appraisal and coping appraisal,
which appraise maladaptive and adaptive responses respectively. The threat appraisal
consists of intrinsic and extrinsic rewards to the maladaptive response, minus the
severity of the threat and the probability of being exposed to it. Coping appraisal
consists of an appraisal of one's ability to cope with or avert a health threat, mediated
by the costs of the adaptive response. The amount of protection motivation elicited by
45
an information source is described as a function of the threat and coping appraisals. It
is suggested that protection motivation is best measured in terms of behavioural
intentions, as described in the Theory of Reasoned Action (Rogers, 1983). A recent
revision of the PM model included the sequential ordering of the appraisal
components, and the social context of the health threat (Tanner, Hunt, & Eppright,
I99l; Figure 1.4). The introduction of sequential ordering is consistent with the
finding that the processing of appraisal information and the appraisal outcome are
sequentially ordered (Scherer, 1984, 1988).
Unlike the Theory of Reasoned Action, Protection Motivation theory does not assume
that the individual acts in a purely rational manner. This model adds an emotional
component to the constructs of the TRA. A limitation of the PM model is its focus on
fear appeals and other health promotion messages. As such, the application of this
model is restricted to intervention studies, where patients' health behaviour is
examined before and after a health education campaign. The PM model is less
applicable to long-term maintenance of health behaviour in the absence of
intervention
LL3/ The Six-FactorModel of Adherence
The Six-Factor Model of Adherence (SFMA) has been developed by researchers at the
University of California to explain adherence behaviour (DiMatteo & DiNicola,1982;
DiMatteo, et al. 1992; DiMatteo, Sherbourne, Hays, et al. 1993; Gntz, et al. 1989;
Sherbourne, et al. 1992). In this model, six factors provide a heuristic framework for
46
1.s)
understanding adherence behaviour. The factors involved arei (1) effective
communication of information; (2) rapport with the health professional; (3) client's
beliefs and attitudes; (4) client's social climate and norms; (5) behavioural intentions;
and (6) supports for and barriers to adherence. The first two factors are prerequisites
for the last four factors, which are sequentially ordered (Gntz, et al. 1989; Figure
According to the SFMA, patients' understanding of what is expected of them is an
essential requirement for their adherence to the treatment. Given this understanding,
the model holds that the doctor-patient relationship is a primary ingredient in
maintaining patient adherence. Central to this factor is the notion of rapport, "a
relationship of mutual trust, caring, understanding" (DiMatteo & DiNicola, 1982, p
82). This suggests that the interaction between physician and patient is not under the
sole control of the physician, but is characterised by mutuality. If the characteristics
required by the first two factors are met, adherence is facilitated. However, the SFMA
postulates further influences on the likelihood of adherence. The third factor relates to
the beliefs and attitudes of the patient, which must be consistent with regimen
demands. This factor bears a close resemblance to the Health Belief Model described
in Section 1.1.3.1. A closely related factor is the social climate surrounding the
patient, including the attitudes and values of the patient's family and friends and the
wider cultural nonns. Social expectations that support adherence have a facilitative
effect on the adherence of the individual patient (Gntz, et al. 1989). Next, the
patient's adherence to his or her regimen is dependent on his or her behavioural
intentions, which are shaped by the above factors. This model posits that these
intentions are strengthened by the patient making an overt commitment to adhere to
47
the treatment (Gritz, et al. 1989; cf. I-evy, Yamashita, & Pow, 1979). Even if all of
the above factors are supportive of the patient's adherence the expected behaviour
may not occur. The final component in the SFMA accounts for barriers that may
prevent adherent behaviour, including physical factors, habituation, locus of control,
and coping (Gntz, et al. 1989)
It can be seen that the Six-Factor Model of Adherence bears a close resemblance to
the Theory of Reasoned Action; both models include social noÍns and expectations
along with behavioural intention. Unlike the TRA, however, the SFMA takes as its
final factor the barriers to adherence which may prevent an individual's intention from
being enacted. As previously mentioned, the lack of attention given to this factor has
been a criticism of the TRA. In light of this, the Six-Factor Model may be viewed as
an improvement upon Fishbein's theory; by including factors found lacking in the
TRA.
Use of the Six-Factor Model of Adherence in the literature has been limited. More
studies using the SFMA are needed to determine the generalisability of this model, for
example its value with younger patients.
1.1.3.5 Summary: Models of Health Behavrour
The purpose of this section has been to describe a selection of theories of health
behaviour relevant to the investigation of patient adherence. This final section
48
highlights key considerations in interpreting the models presented here, and makes
recommendations regarding their importance to further research
Two primary cautions should be considered in understanding the models presented in
this section. The first applies to the Health Belief Model, the Theory of Reasoned
Action, and the Protection Motivation model, These models all relate to the
psychosocial characteristics of the patient, an emphasis upon which tends to limit the
explanatory power of the models insofar as these characteristics explain health
behaviour (Janz &. Becker, 1984; Rosenstock, 1990). That is, factors external to the
patient, such as the social expectations of others and the quality of the doctor-patient
relationship, appear to influence health behaviour (Fotheringham & Sawyer, 1995).
To the extent that these factors are predictive of health behaviour, models which
exclude them limit their ability to account for health behaviour. The second
consideration is related to the first: by focusing on aspects of the individual these
models may facilitate victim-blaming (Rosenstock, 1990). The need for an integration
of research findings and a more systematic approach to health behaviour research has
been noted elsewhere (Ried & Christensen, 1988). This review of models of health
behaviour has adopted a multidisciplinary approach, in recognition of the various
research traditions that have contributed to the investigation of adherence behaviour.
Of the models presented in this section, the Health Belief Model has thus far been the
most influential on adherence research. However, refinement of the HBM has been
minimal and some aspects of the model have rarely been applied in empirical
evaluations. The Theory of Reasoned Action, in contrast, has been tested in a more
specific manner, a process made easier by the more detailed formulation of this
49
model. The Six-Factor model is closely related to the Theory of Reasoned Action, but
with the additional consideration of supports and barriers to health behaviour, a factor
omitted in the TRA. Protection Motivation theory has developed from a perspective
similar to that of the HBM, but has focused on the use of fear arousal in health-
promoting messages
The value of the HBM and TRA may be diminishing in light of the more recent
models presented in this section. The later models build on the foundations of these
early formulations, with the added perspectives of the various disciplines from which
they have emerged. This has enabled the more recent theories to broaden their scope,
and therefore better account for health behaviour. An emphasis of future
investigations should be the evaluation of these largely untested but more theoretically
advanced formulations. Perhaps the most promising of this new generation of models
is the Six-Factor Model of Adherence. However, this model remains largely untested,
particularly with younger patients. Future investigations implementing this model
should include patients of various backgrounds, experiencing both acute and chronic
conditions, selected from a variety of health care settings and communities. This
represents a potentially valuable line of future investigation.
1.2 Factors Influencing Patient Adherence to Medical Recommendations.
Studies investigating patient adherence have reported widely varying estimates of the
number of patients who fail to adhere to their treatment regimens (LH Epstein &
Cluss, 1982; Jones, Jones, &.Katz, 1987). This variation is due in part to the broad
50
range of regimen demands that are involved in treatment. Some treatment activities
are more easily, and more frequently, adhered to than others. As a result, a patient
may be fully adherent to some aspects of a medical regimen, while being partially or
completely nonadherent to other aspects of the same regimen (RM Kaplan & Simon,
1990; Kasl, 1983; Orme & Binik, 1989). For example, patients whose regimen
involves dietary restrictions and regular exercise may follow their recommended diet
closely, but fail to perform their recommended exercise. In light of this, a study may
classify the same patient as adherent or nonadherent depending upon which aspect of
the regimen it focuses. This is an important issue as most research investigating
patient adherence has focused on only one element of patients' treatment behaviour,
that of patients' adherence with prescribed medications (Caron, 1985; DiMatteo,
Sherbourne, et al. 1993;Kravitz, et al. 1993).
Several methodological limitations have made it difficult to interpret the results of
research into patient adherence. Most studies have been cross-sectional, examining
only a single treatment condition with only one measure of patient adherence (Caron,
1985; DiMatteo, Sherbourne, et al. 1993; Ikavitz, et al. 1993). The use of
longitudinal study designs would assist in the examination of these relationships.
Most studies have focused on patient variables such as regimen knowledge, health
beliefs and motivation for health, while physician variables have largely been ignored.
Studies employing measures of more than one such variable have been rare, and
represent an important step toward a scientific understanding of the relationship
between adherence behaviour and its antecedents (DiMatteo, Hays, et al. 1993).
51
This section reviews current knowledge in three key areas of research examining
factors which influence patient adherence to medical regimens. These areas are: (1)
characteristics of the patient; (2) characteristics of the treatment; and (3) the nature of
the doctor-patient relationship. In each area the quality of the research underpinning
current knowledge will be considered. The final part of this section suggests
directions for the further development of adherence research.
1.2.1 The Influence of Patient Characteristics on Patient Adherence.
The major patient characteristics which influence adherence are the patients' age and
knowledge of their treatment, their motivation to achieve good health, the value they
assign to health, their perceptions of their ability to control their level of health, and
their experience of social support (Abella & Heslin, 1984; Becker, 1985; Becker &
Maiman, L975; Christensen, et al. 'J,992; Creer & Burns, 1979; Dunbar, 1990; Dunbar
& Agras, 1980; SB Johnson, et al. 1982; La Greca, 1988a; Lewis, Morisky, & Flynn,
I9l8; Litt & Cuskey, 1980; Schlenk & Haft, 1984; KA V/allston & BS Wallston,
1982)
l.2.l.l Patients'Age.
Two principal findings have been reported which describe the relationship between
patients' age and their level of adherence. First, several studies have reported that the
level of adherence of children and adolescents is lower than that of adults (Blackwell,
1973; RB Stewart & Caranasos, 1989; Weintraub, 1990). A possible reason for this is
52
that the management of childhood illness involves more complex relationships than
the treatment of adults. Young children often lack the skills required to follow their
regimen without the guidance and assistance of an adult. As a result, adherence to the
young child's regimen depends on both the adherence of the adult and the adherence
of the child (Creer & Burns, 1979; Korsch, Fine, & Negrete, 1978; Litt &. Cuskey,
1e80).
Second, in many studies adolescents have been found to be less adherent than younger
children (Dolgin, Katz, Doctors, & Siegel, 1986; Hanson, et al. 1987a; SB Johnson,
1984; SB Johnson, et al. 1986; La Greca, 1982;Litt &. Cuskey, 1980; Litt, Cuskey, &
Rudd, 1980; Weinberger, 1987). For example, AM Glasgow and colleagues (1991)
found that adolescents with IDDM missed insulin injections and fabricated blood
glucose results more often than younger children. Garrison and coworkers reported
that adherence by adolescents to dietary, glucose monitoring, and insulin injection
recommendations for IDDM was poorer than adherence by younger children
(Garrison, Biggs, & Morris, 1988).
As children enter and progress through adolescence, they struggle for greater
autonomy (Lid2,1981). The authority of their parents is increasingly challenged, and
the importance of negotiation between parents and children increases. In light of this,
the nonadherence of adolescents may reflect rebellion against the regimens' control
over their lives (Dolgin, et al. 1986; Dunbar, 1983; SB Johnson, 1984; LaGrcca,
1982, I99Oa;Litt & Cuskey, 1980; Litt, Cuskey, & Rudd, 1980; Weinberger, I98l;
Zeltzer,1980). Further, in the families of adolescent patients there is often confusion
53
over the allocation of responsibility for medicine-taking (Tebbi, 1993; Tebbi, et al
1986).
Hanson and colleagues (1987a) suggested that as adolescents mature and are given
more responsibility for their illness management, they may test the extent to which
they can deviate from the regimen without serious consequences to their health.
These authors hypothesise that older adolescents may be showing increasing rebellion
against regimen demands, or may simply be less adherent because they are spending
more time with peers and do not want to be seen to be different (Hanson, et al.
1981a).
I.2.L2 Understanding of the Illness
Patient's possession of a sound knowledge of their regimen is not consistently
associated with good adherence. Patients' prior experience of a treatment regimen
may enhance their adherence, by virtue of their understanding of the behaviour
required. However, it appears that while patients must have a reasonable knowledge
of their regimen, the possession of this knowledge alone does not guarantee their
adherence (Becker, 1985; Dunbar & Agras, 1980; Stuart, 1982). Knowledge of the
regimen may be thought of as a necessary, but not sufficient, antecedent to adherence.
This interpretation is consistent with the long-recognised finding that knowledge,
attitudes and behaviour are not causally linked (e.g., Bettinghaus, 1986; LaPiere,
1934; Raven & Rubin, 1983). That is, a patient may have a sound knowledge of their
regimen, but this knowledge does not guarantee that the patient will hold a favourable
54
attitude toward the regimen, or that the knowledge will be translated into action.
However, it is clear that patients are unlikely to adhere to regimens about which their
knowledge is limited or inaccurate.
1.2.1.3 Health Motivation.
A number of empirical investigations have found that patients' level of adherence is
positively associated with their motivation to achieve or maintain good health (Becker
& Maiman,l9l5; Creer & Burns, 1979; Dishman, 1982; Dishman & Gettman, 1980;
Dishman & Ickes, 1981). For example, Creer and Burns (1979) reported that many
paediatric asthma patients were nonadherent to their regimens as a result of basic
indifference to their level of health. Dishman and his colleagues have found that long-
term regimen adherence is related to motivational factors (Dishman, 1982; Dishman
& Gettman, 1980; Dishman & Ickes, 1981). Patient adherence also may be motivated
by factors other than health. For example, adolescents in particular may be motivated
to adhere to their treatment by their desires to be socially and physically active (R
Anderson, 1983; IM Friedman &.Litt,1986; Gochman, 1982; Research Unit in Health
and Behavioural Change, 1989). However, such motivations also may conflict with
treatment adherence. For example, adolescents may wish to eat popular foods that
violate the restrictions of their regimen (Caplan, Robinson, French, Caldwell, &
Shinn, 1976; Maslow, 1968).
55
I.2.I.4 Health Locus of Control.
The basis of Locus of Control theory is that individuals differ in generalised
expectancies regarding the control of events. People with intemal control orientations
tend to expect themselves to be in control of situations, whereas people with external
control orientations expect not to have such control (Lefcourt, 1981, 1983; Rotter,
re66)
Nowicki and Duke (1983) reviewed the relationship between health behaviour and
locus of control and found that there was a close relationship "between locus of
control and how people respond to and take part in their treatment programs" (p 32).
Specifically, people with internal loci of control adhere more closely to their treatment
regimens. This concept has been refined with the development of the Health Locus of
Control (fil-C) construct: one's locus of control expectations regarding one's health.
The relationship between HLC and adherence behaviour has been investigated,
including the development of Health Locus of Control measures for adults (O'Looney
& Barrett, 1983; BS Wallston, KA Wallston, Kaplan, & Maides, 1916; KA Wallston
& BS 'Wallston, 1981; KA Wallston, BS Wallston, & DeVellis, L978; HR Winefield,
1982) and children (Parcel & Meyer, 1981). The results of studies employing these
measures suggest that patients with internal HLC orientations have better adherence
than patients with external HLC orientations (Abella & Heslin, 1984; Dabbs &
Kirscht, l97l1, Harvey, 1992; Kristiansen, 1986;Lau, Hartman, &. 'Ware, 1986; Lewis,
et al. 1978; Rokeach, 1913; Seeman & Seeman, 1983; BS Wallston & KA'Wallston,
I9l8; KA Wallston & BS Wallston, 1982)
56
I.2.I.5 Health Value
Health value has been described as the importance people assign to their health
(Kristiansen, 1986). Health value was largely neglected by research until the mid-
1980s. Earlier research conducted by Rokeach (1973) into the measurement of human
values ignored health as a value, assuming that all people uniformly placed a high
value on health (Lau, et al. 1986). This assumption led early researchers to
presuppose that health value was not worthy of investigation. However, since the
value of health has come under the scrutiny of investigators it has proven to be a
fertile area of research (Kristiansen, 1986; Lau, et al. 1986; Lonnquist, Weiss, &
Larsen, 1992; Schlenk & Hart, 1984; KA Wallston & BS Wallston, 1980; Ware &
Young, 1979). For example, persons who are relatively healthy have been found not
to place a uniformly high value on health (Ware & Young, I9l9).
Several studies have shown that patient adherence may be explained partially in terms
of the value patients attribute to their health, in combination with their Health Locus
of Control (Abella & Heslin, 1984; Kennedy, Probart, & Dorman, I99I; Schlenk &
Hart, 1984; Ware & Young, L919). For example, Abella and Heslin (1984) proposed
that the adherence of persons with internal HLC orientations was influenced by the
value they placed on health, while the adherence of persons with external HLC
orientations was influenced more strongly by the behaviour of their family and
friends. This possibility has clear implications for the usefulness of health education
interventions with internally and externally oriented individuals. That is, externally
oriented individuals are more likely to be influenced by health education messages
than are internally oriented individuals.
57
1.2.1.6 Social Support.
Cobb and Jones (1984) suggested that social support encompasses (i) the supportive
behaviour of individuals' family and friends; (ii) the nature of the social network
surrounding individuals; and (iii) the individuals' perceptions of the support provided
by their family and friends. Some of the most methodologically sound research into
patient adherence has dealt with the influence of social support. Studies conducted in
this area have more often used longitudinal designs than perhaps any other area of
adherence research
These studies have found that patients who perceive their families or friends to be
supportive are more adherent than patients whose family members are not seen to be
supportive (Christensen, et al. 1992 Langlie, 1977; GS Sanders, 1982; Schlenk &
Hart, 1984). The effect of social support on adherence has been particularly evident
with children and individuals with external loci of control (Abella & Heslin, 1984;
Caplan, 1979; Dunbar & Agras, 1980). Social support also has been found to
indirectly influence patient adherence by enabling patients to overcome barriers to
adherence such as psychological strain or environmental stressors (R Anderson, 1983;
Christensen, et al. 1992; DiNicola & DiMatteo, 1984). However, social support also
may exert a stressful influence on the patient when the level of support is perceived as
threatening to the patient's autonomy (Caplan, et al. 1976). This influence is likely to
be of greatest importance with adolescent patients. Also, the influence of social
58
support may be directed against adherence, if members of one's social network are
opposed to the regimen
L.2.2 The Influence of Illness and Regimen Characteristics on Patient Adherence.
Current evidence suggests that there are five major characteristics of medical
regimens that influence patients' adherence: (1) the duration of the treatment; (2) the
complexity of the regimen; (3) the level of discomfort or unwanted side-effects; (4)
the requirements for lifestyle changes; and (5) the financial costs of the regimen
(Becker & Maiman,1975, 1980; Brand, et al. I9ll; LaGreca, I990a; Rorer, et al.
1988)
1.2.2.I Duration of the Regimen - Acute versus Chronic Regimens.
Several studies have found that adherence to long-term regimens is poorer than
adherence to short-term regimens (Blackwell,l976a, l9l6b; Dowse & Futter, 1991;
Rorer, et al. 1988). This finding appears to contradict the finding noted in Section
1.2.I.2 that experience with an illness and its treatment is positively related to
adherence. A possible explanation is that patients' adherence is improved by
experience as they develop mastery over the regimen, so long as the regimen remains
challenging or novel. As the regimen becomes familiar, it requires less of the
patients' attention, and adherence wanes. This explanation is supported by the finding
that adherence to long-term regimens is boosted by periodic modifications of the
59
treatment pattern, designed to maintain novelty, and thus attention (Becker &
Maiman, 1980)
I.2.2.2 Complexity of the Regimen.
Evidence that the complexity of the regimen is an influence on adherence is based on
the observation that simplifying the regimen leads to improved adherence (Cockburn,
Reid, Bowman, & Sanson-Fisher, 1987; Corrigan, Liberman, & Engel, 1990; Dunbar
& Stunkard,1979; Hulka, Cassel, Kupper, & Burdette,l9l6; Matthews & Hingson,
I97l; Tinkelman, Vanderpool, Carroll, Page, & Spangler, 1980). For example, one
study found that the number of medication errors made by patients increased with the
number of drugs involved in their regimen (Hulka, et al. 1976). This observation is
supported by the finding that when components of a regimen are introduced gradually,
patients are more adherent than when the entire regimen is introduced at once (Becker
& Maiman, 1980; Matthews & Hingson, 1977). In other words, adherence is
facilitated by making the regimen less difficult for the patient to understand. This
interpretation is likely to be linked to the finding reported in Section 1.2.1.2 that
regimen knowledge is a necessary antecedent to adherence (Becker, 1985;
Bettinghaus, 1986;Dunbar & Agras, 1980; Stuart, f982).
1.2.2.3 Regimen Side-Effects and Regimens that Cause Discomfort.
Patients prescribed a treatment program that is painful or aversive tend to be less
adherent than patients prescribed a regimen that is not aversive (Creer & Burns,
60
1979). Patients also adhere less well to regimens that have side effects than to
regimens with no side-effects (Cockburn, Reid, et al.1987; Dolgin, et al. 1986; Litt &
Cuskey, 1980; Ruley, 1978)
L2.2.4 Lifestyle Changes
Regimens that involve major lifestyle changes or otherwise are inconvenient to the
patient (or to their family) also are less likely to be adhered to than regimens that can
be readily absorbed into daily routines (Becker, Drachman, Kirscht, L9l2; Dunbar &
Stunkard, 1979; Tinkelman, et al. 1980). This last finding may be associated with the
finding noted in Section 1.2.1.3 that patients who are more motivated to maintain or
achieve good health are more likely to be adherent to their regimen. The level of
health motivation required for a patient to make a behavioural change varies in direct
relation to the magnitude of the behavioural change. Thus, patients who are highly
motivated to maintain good health will be willing to make substantial changes to their
lifestyle, while patients who are less health motivated will be unwilling to make major
changes to their lifestyle, but may be willing to make less substantial changes. This is
a potentially profitable area of investigation for patient adherence research.
I.2.2.5 Expense of the Regimen.
Finally, the financial cost to patients of medical treatment may be a barrier to their
adherence, particularly in filling medication prescriptions and attending medical
appointments (Brand, et al. 1977; Creer & Burns, 1979). Intuitively, it is appealing to
6l
conclude from this finding that socio-economically disadvantaged patients are less
likely to adhere to their treatment than patients of higher socio-economic status.
However, research has failed to establish a consistent relationship between patient
adherence and patient socio-economic status (Becker & Maiman, L975; Kirscht &
Rosenstock, 1979; Rapoff & Christophersen, 1982). One interpretation of these
findings is that more expensive treatments require a greater motivation to maintain
good health, whereas cheaper treatments require less health motivation. This
interpretation has not been tested by empirical research to date.
L23 The Influence of the Doctor-Patient Relationship on Patient Adherence.
The quality of patients' relationships with their doctors influences their adherence in
several ways. For example, patients who perceive their doctors to be friendly and
attentive are more likely to adhere to their treatment than patients who feel that their
doctors are indifferent to their problems (I-ey,1992). Further, patients who are treated
consistently by the same physician show higher adherence rates than patients treated
by different physicians on different occasions (Litt & Cuskey, 1980). In contrast,
when the doctor-patient encounter is brief and is characterised by impersonality,
patient adherence is reduced (Becker, 1985; Becker & Maiman,1975; Coe &'Wessen,
1965). When doctors are excessively formal, rejecting, or controlling, their patients
are less likely to agree with them and to follow their recommendations than when they
do not display these patterns (Davis, 1968; Engel, 1977). Doctors' verbal and
nonverbal communication skills, as well as doctors' satisfaction with clinic
encounters, have been associated with patient adherence (DiMatteo, Hays, & Prince,
62
1986; DiMatteo, Taranta, Friedman, & Prince, 1980; RM Kaplan & Simon, 1990).
Friedman has found that patients are very sensitive to these aspects of care
(HS Friedm an, 197 9, 1982)
In many studies patient adherence has been related to how satisfied patients feel about
their treatment (Barsky, 1976; Hall, Roter, & Katz, 1988; RM Kaplan, et al. 1989;
I-ey,1982,1992; Meichenbaum & Turk, 1987). Patients who are dissatisfied with the
way their doctors explain their illnesses or treatments are less likely to adhere to their
treatment than patients who are happy with the manner in which explanations are
given (Barsky, 1916).
I.2.3.1The Doctor-Patient-Parent Relationship: Interpersonal Aspects of Paediatric
Care.
Adherence to paediatric regimens is complicated by the triadic nature of the doctor-
parent-child relationship. The adherence of children and parents to the
recommendations of the doctor must be considered, as well as the adherence of the
child to the parent's directions (Forehand, 1977; Kochanska, Kuczynski, Radke-
Yarrow, & Welsh, 1987; Kuczynski & Kochanska, 1990; McMahon, Forehand, &
Griest, L982). This complication has not been adequately considered in the design of
research examining children's adherence to treatment regimens. Most investigations
have simply examined parents' understanding, parents' satisfaction, or parents'
repofis of adherence with paediatric treatment regimens. They have not included an
examination of the views of the child (e.g., Deaton, 1985; Peri, Molinan, & Taverna,
63
l99l; Reimers &I-ne,l99l Wasserman, Inui, Barriatua, Carter, & Lippincott, 1984).
Approaches that ignore the involvement of children are particularly inappropriate with
older children and adolescents, who are likely to take more responsibility for their
adherence (Tebbi, 1993; Tebbi, et al. 1986). As children adopt greater responsibility
for their health behaviour, the understanding, satisfaction and reports of parents
become less relevant, and children's views assume greater importance.
f .2.4 Current Status of Investigations of Factors Influencing Patient Adherence.
Five key issues deserve greater attention in patient adherence research. First, the
examination of both parents' and children's (or adolescents') beliefs, knowledge, or
perceptions of adherence should be incorporated into future study designs. As
discussed, many studies have been limited by examining only the views of parents, to
the exclusion of the views of children, thereby only looking at half of the picture.
Future studies should investigate the health related behaviour and beliefs of both
parents and children. The adherence of both children and parents to doctors'
recommendations should be assessed, as well as the adherence of children to parents'
directions (Forehand, 1977; Kochanska, et al. L987; Kuczynski & Kochanska, 1990).
The second issue deserving greater research attention is the allocation of responsibility
for the performance of therapeutic activities. When investigating child adherence,
future research should examine the allocation of responsibility between children and
parents, and the perceptions of children and parents regarding this allocation (Dolgin,
et al. 1986; Tebbi, 1993; Tebbi, et al. 1986). Obviously, the age or level of cognitive
64
development of the child is an important consideration in allocating this
responsibility
Third, a limitation of current research that should be addressed in future studies is the
tendency to depict adherence as a univariate, dichotomous phenomenon, rather than as
a continuum varying along multiple dimensions (Inui, Carter, Pecoraro, Pearlman, &
Dohan, 1980; LaGreca, I990a; Roth & Caron, 1978). Describing adherence as a
univariate phenomenon masks differences in the level of adherence to various
therapeutic activities, which are likely to vary in importance (Cromer & Tarnowski,
1989; Dunbar, 1979, 1980).
Fourth, research to date that has investigated patient adherence almost exclusively has
been cross-sectional. A limitation of this approach is that these studies are unable to
establish the direction of causal relationships between the variables investigated and
the level of patient adherence. Future investigations need to employ longitudinal
study designs to explore these causal relationships. These longitudinal studies should
be able to determine the variation in influence of a variety of factors, and the
interaction between their effects (Kirscht &. Rosenstock, 1979; Rapoff &.
Christophersen, 1982). The short periods of time over which most studies have been
conducted may have limited the accuracy of their findings regarding overall patient
adherence levels, as adherence rates are likely to vary over time (La Greca, 1988a).
One study found that cross-sectional designs produce higher rates of adherence in a
population, when compared with the outcomes produced by longitudinal measures
(Youngleson & Joubert, 199\).
65
Finally, because different investigations have used different criteria for measuring
adherence, it is not possible to interpret the meaning of results across studies
(La Greca, 1990a). A more uniform approach to the measurement of patient
adherence would greatly assist the accumulation of results from different studies.
This accumulation would potentially increase the rate of progress made in patient
adherence research.
1.3 Adolescents'AdherencetoMedicalRegimens.
This section reviews the literature addressing issues of particular importance to
adolescents, and in particular to the medical treatment of adolescents. The medical
treatment of adolescents differs in many respects from the treatment of children or
adults (Black, Sawyer, & Fotheringham, 1995). It has been suggested that the greatest
threats to the health of adolescents are behavioural, rather than biomedical (Adger &
DeAngelis, 1994). Certainly, the health behaviour of adolescents can be expected to
differ from that of adults or young children. Factors relating to the adherence or lack
of adherence of adolescents to medical recoÍìmendations are likely to differ from
those relating to the adherence or nonadherence of younger children, or of adults (Litt
& Cuskey, 1980).
Studies designed to assess the health behaviour of adolescents need to consider the
particular issues relevant to this stage of life. Adolescence is a stage of life in which
young persons seek greater autonomy from their parents. Conflict with parents is
often perceived to be greatest at this stage of development (Coupey & Cohen, 1984;
66
Eiser &. Havermans, 1992; Honess &. Lintern, 1990; Ingersoll, et al. 1986;
Montemayor & Hanson, 1985; EC Perrin & Gerrity, 1984; JM Perrin, I99I; Ryan &
Lynch, 1989; Steinberg, 1990; Steinberg & Silverberg, 1986; Varni & Wallander,
1984; Wysocki, 1993). The occurrence of a chronic illness during adolescence has
implications for the development of the young person (Litt & Cuskey, 1980). Many
studies investigating the adherence of adolescents to medical recoÍrmendations have
not accounted for issues such as these (IM Friedman, et al. 1986)
This section reviews current knowledge in three key areas of research examining
issues in adolescent medicine. These areas are: (1) chronic illnesses in adolescence;
(2) adolescent autonomy; and (3) parent-adolescent conflict. In each area the current
status of research is reviewed, and approaches needed for the further development of
adherence research are identified.
1.3.1 Chronic Illness.
Chronic illnesses attract an increasing proportion of the practice of health
professionals. This is due to two trends. First, advances in medical practice have
ensured that acute and infectious conditions are more effectively prevented or treated
than in the past (Blum, 1992; Coupey & Cohen, L984; Garrison & McQuiston, 1989;
Varni, 1983). Second, the management of chronic illnesses has advanced, so that
many conditions which previously were rapidly fatal are now associated with longer
survival (Bicknell & Parks, 1989; Coupey & Cohen, 1984; Gaut & Keickhefer, 1988;
German, 1988; Newacheck & Taylor, 1992).
67
The shifting emphasis of practice onto chronic conditions adds to the importance of
behavioural medicine, as many of the risk factors associated with the prevention or
management of chronic illnesses are a function of health behaviours (Brown, 1980;
Haggerty, L9l7; Varni, 1983; Williams, Carter, Arnold, & Wynder,l9l9). Further,
adolescents with chronic conditions are more likely to be made responsible for the
management of their illnesses than adolescents with acute conditions - because of the
greater importance of behavioural aspects in the management of chronic conditions
(Varni, 1983; Varni & Wallander, 1984). With the onus for the management of
illnesses more heavily placed on the adolescent, chronic illnesses are more vulnerable
to the impact of poor regimen adherence (Amir, Rabin, & Galatzer, 1990).
An adolescent's chronic illness can have a disruptive influence on the family. The
behavioural restrictions of a chronic illness, such as dietary limitations, exercise
requirements, and the use of medications or other treatments, are likely to impact upon
the rest of the family. The involvement of parents in meal planning, and the
coordination of other regimen activities, can place considerable burden on the family
as a whole (Howe, Feinstein, Reiss, Molock, & Berger, 1993; Newacheck, McManus,
& Fox, I99l; Stein & Jessop, 1984a; Varni & 'Wallander, 1984). Successful
management of a child's chronic illness may force parents to redistribute
responsibilities, reorganise daily routines and renegotiate family rules (Hauser,
DiPlacido, Jacobson, Willett, & Cole, 1993).
It has been argued that the burdens and stresses associated with a child or an
adolescent having a chronic illness are cofiìmon to a variety of different illnesses
68
(Coupey & Cohen, 1984; Eiser & Havermans,1992; Jessop & Stein, 1985; Stein &
Jessop, 1982a, 1982b, 1984a, 1984b; Stein, 'Westbrook, & Bauman, 1997). An
advantage of this 'noncategorical' view is that it focuses on the common processes of
adaptation to chronic illnesses that are required of children and families with chronic
illnesses (Garrison & McQuiston, 1989). This is not to say, however, that there are
not unique features of each chronic illness, such as the individual components of the
therapeutic regimens, which vary in their impact upon the ill individual and their
family (Garrison & McQuiston, 1989)
This section addresses the developmental and psychosocial impact of the expenence
of a chronic illness on adolescents, as well as the impact of the chronic illness on the
family.
1.3.1.1 The Impact of Chronic Illness on the Adolescent.
The experience of a chronic illness during adolescence can impact upon the
development of the young person. During adolescence, the young person develops
more autonomous ways of behaving (Hill & Holmbeck, 1986; Ryan & Lynch, 1989;
D Shapiro, 1981). The development of autonomy is a salient issue for adolescents and
its accomplishment is often seen as a central task of this developmental stage
(SS Feldman & Rosenthal, I99I; Pardeck & Pardeck, 1990). This process involves
moving away from dependency on parents toward independence in decision making,
values, emotional attachment, and behaviour (Small, Eastman, & Cornelius, 1988;
Steinberg, 1985). Early adolescence is a coÍìmon time for experimentation in new
69
behaviours (Turner, kwin, Tschann, & Millstein, 1993). Conflict with parents,
particularly in relation to autonomy issues, typically becomes more common during
mid-adolescence. Opportunities for self-determination and exercise of choice tend to
become more important to the young person. (Hofmann & Gabriel, 1989)
Adolescents not experiencing chronic illness engage in a struggle to define their
emerging identity, and to gain increasing independence (EC Perrin & Gerrity, 1984).
At the same time, these adolescents continue to rely heavily on their parents, causing
tension in their relationships with their parents (EC Perrin & Gerrity, 1984). The
addition of a chronic illness to the adolescents' experiences during this period of
tension and confusion adds to the difficulties that need to be addressed (Blum, et al
1993). The social and psychological functioning of the adolescent may be negatively
influenced, as may the family dynamics. These impacts in turn can negatively
influence health behaviour, including the management of the chronic illness (Jessop &
srein, 1985).
Previous studies have found that the experience of a chronic illness during
adolescence is associated with an increased risk of social, academic, and behavioural
difficulties (Eiser, 1990; Eiser & Havermans, 1992). The development of autonomy
may be inhibited by the need for dependence on others, particularly parents, for
assistance in the management of the chronic condition. This may lead to frustration
and resentment (EC Perrin & Gerrity, 1984)
The development of autonomy from parental control also may be described in terms
of the increasing influence of peers on the behaviour of adolescents (Armsden &
70
Greenberg, 19871, Blum, 1992; Hauser, et al. 1993). SB Johnson (1984) noted that the
presence of a chronic illness is likely to impede the adolescent's ability to conform
with the behaviour of peers. The necessity of, for example, daily insulin injections
and dietary restrictions (avoiding unplanned Junk' food) for adolescents with insulin
dependent diabetes, may limit the chronically ill adolescent's sense of belonging
within their peer group (Garrison & McQuiston, 1989; Wolfish & Mclean,l9l4).
This sense of isolation may in turn lead to frustration and resentment directed at the
chronic illness itself
It has been suggested that feelings of resentment associated with restrictions imposed
on the autonomy of chronically ill adolescents, and on their conformity with peer
behaviour, may lead some chronically ill adolescents to refuse to adhere to their
treatment regimen (Garrison & McQuiston, 1989; EC Perrin & Gerrity, 1984)
Adolescent noncompliance with parental requests is often viewed as a 'normal'
behaviour (Garrison & McQuiston, 1989). Health practitioners often assume that
adolescents also are poorly adherent to medical recommendations (Blum, 1984)
Empirical studies have shown adolescents to be less adherent to medical regimens
than younger children or adults (Dunbar, 1983; La Greca, 1982,1990a; Litt & Cuskey,
1980)
1.3.I.2 The Impact of Chronic Illness on the Family
The experience of a chronic illness during adolescence can also impact upon the
functioning of the family, both as a system and as individuals. The influence of the
1I
illness on the family is reciprocated by the influence of family characteristics on the
progress and management of the illness (Bloch, Hafner, Harari, & Szmukler, 1994;
Burlew, Evans, & Oler, 1989; Burr, 1985; Fiese, 1997; Hauser, et aI. 1993; Kazak,
L997; Marteau, et al. 1987:' J Shapiro, 1983). Previous research has primarily focused
on the impact of the child's chronic illness on the family, however a body of research
does exist which has examined the effect of the child's family on the child's
adjustment to the illness.
'When examining the literature exploring the relationships between children's chronic
illness and family functioning, a caveat that needs to be considered is what is meant
by the term 'family'. Increasingly, single-parent families and households containing
unrelated adults are included in this definition, while the prevalence of the traditional
nuclear family declines. Many studies examining family aspects of health behaviours
have not defined what is considered to be a family, and what is excluded. While this
issue is beyond the focus of this chapter, for the purpose of this review the approach
adopted by Baranowski and Nader (1985) will be followed, so that "a family will ... be
defined as two or more individuals who reside in the same household, who can
identify some common emotional bond, and who are interrelated by performing some
social tasks in common" (Baranowski & Nader, 1985, p 54).
A child, whether a young child or an adolescent child, experiencing a chronic illness
presents a stressor for the entire family (JL Wallander, personal communication, 5
November, 1997). The chronic illness influences the relationships between the
chronically ill child and the parents, the relationship between the parents, and the
relationship between the parents and other children, as well as relationships between
72
family members and people outside the family (Burlew, et al. 1989; Bun, 1985;
JM Perrin, Shayne, & Bloom, 1993). The lifestyle of the chronically ill child is
affected, as is the lifestyle of other family members. Routines such as meal
preparation, parents' work schedules and family transportation may be affected. For
example, dietary restrictions for a child with Insulin-Dependent Diabetes may
necessitate special meals being prepared for the ill child, and parents may have to alter
work schedules to transport the ill child to treatment visits or to outpatient clinics tn
hospital (Kazak, 1989)
Childhood chronic illness is a potential source of tension and conflict. Conflict
between chronically ill children and their parents, particularly primary care-givers,
may be caused by the restriction of the children's autonomy, and the imposition of the
requirements of illness treatments on parents (Burlew, et al. 1989). Conflict between
parents and other children in these families may also result from a chronic illness, as
extra attention and resources are dedicated to the care of the chronically ill children
(Kazak, 1989; Rae-Grant, 1985). Stress caused by the occurrence of children's
chronic illness also may cause tension and conflict between parents (Burlew, et al.
1989; Rae-Grant, 1985).
The influence of the characteristics of the family on the course of a child's chronic
illness also needs to be considered. Baranowski and Nader (1985) reviewed the
literature examining the relationship between family variables and adherence to
children's chronic medical regimens. These authors found that family structure
variables, such as the number of children, whether the family was a single-parent or
dual-parent household, and parental education level, were not well related to regimen
t3
adherence. Conversely, family process characteristics, such as the level of family
cohesiveness, and the ability of the family to adapt to changes in routine, were more
likely to be associated with regimen adherence. These authors noted that negative
aspects of family process were more often related to adherence than positive aspects.
For example, a common finding in the literature is that marital conflict, or the
interference in the social roles of parents caused by the child's chronic illness, was
likely to be associated with poor adherence. Findings relating positive aspects of
family interaction, such as cohesiveness, with adherence levels, were rare
(Baranowski & Nader, 1985). The reviewers concluded that regimen adherence does
not occupy a high priority in the family, and that although no aspects of family life
serve to maximise adherence, many aspects play an inhibitory role (Baranowski &
Nader, 1985). A review of more recent publications suggests that the pattern of
findings reported by these authors has not changed markedly since their review was
conducted.
The ways in which family functioning influences children's regimen adherence is
clear. Parents are responsible for forming many behaviour patterns in children and
young adolescents, including health behaviour (Baranowski 8. Nader, 1985;
Gochman, 1985; Sallis & Nader, 1988). Further, the parent usually plays the role of
intermediary contact between the ill child and health care providers. For parents,
having a child with a chronic illness involves a number of additional challenges.
First, the illness itself needs to be managed, and the child gradually taught to assume
responsibility for that management. Second, the psychological adjustment of the child
needs to be considered, and normal development encouraged. Third, family routines
74
must be adapted to deal with disruptions imposed by the illness regimen, and family
functioning must be normalised (SB Johnson, 1985)
It can be seen that the presence of the child's chronic illness impacts upon the
functioning of the child and the child's family. It also can be seen that the functioning
of the child and of the child's family in turn influences the management of the chronic
illness, and therefore the health outcomes of the child (Jessop & Stein, 1985)
Previous research has noted that family functioning is associated with disease control,
and with the adjustment of the child (BJ Anderson & Auslander, 1980; Burr, 1985;
Pless, 1984).
Most studies of family functioning in relation to chronic illness have addressed
parents and chronically ill children, to the exclusion of other family members. More
often than not, this has involved only the mothers, so that in most research the role of,
and impact upon, fathers and siblings of the ill child has been ignored (Sabbeth,
1984). This is in part due to the difficulty involved in recruiting fathers into such
studies. Mothers remain the primary care-givers in the majority of families, and
attendance at, for example, outpatient clinics by fathers is typically less frequent than
that of mothers (Bailey, I99I; Turner-Henson, Holaday, & Swan, 1992). A few
recent studies have investigated the impact of a child's chronic illness on siblings.
Siblings of children with chronic, life-threatening illnesses have been found to report
more negative relations with their fathers, and more distal relations with their mothers,
than children with no chronically ill siblings (DA Stewafi, Stein, Forrest & Clark,
1992)
75
Several studies have examined the relationship between family functioning or family
relations and metabolic control for children and adolescents with IDDM. Hanson,
Henggeler, and colleagues (1989) examined family relations of 94 families with an
adolescent child diagnosed with IDDM. Family members completed a series of
questionnaires assessing relations, and adolescents' metabolic control was assessed by
IIbA1" assay. This study revealed significant associations between high marital
satisfaction and good metabolic control, and between family flexibility and good
metabolic control. Family cohesion was marginally associated with good metabolic
control. These effects were moderated by the duration of time since the child's
diagnosis with IDDM, such that the link between family relations and metabolic
control was strongest when the diagnosis of IDDM was recent, but that this link
attenuated as the duration of IDDM increased. Marteau and colleagues (1987)
examined the metabolic control of children and adolescents with IDDM in relation to
their (1) family structure and family functioning, (2) parcnts' management of the
children's IDDM, and (3) children's psychological adjustment. The findings of this
study suggested that the psychological functioning of a family is related to their
child's diabetic control. Families characterised by cohesion, emotional expressiveness,
lack of conflict, and marital satisfaction had children with better metabolic control
than families without these characteristics (Marteau, et al. 1987).
A small body of research has investigated the relationship between adolescent
autonomy and regimen adherence. The following section, Section 1.3.2, reviews the
literature relating to adolescent autonomy, and particularly its relationship with
adolescents' adherence to chronic medical regimens and health outcomes with chronic
illness.
16
The subsequent section, Section 1.3.3, reviews the literature relating to parent-
adolescent conflict, and its association with adolescents' regimen adherence
1.3.2 Adolescent Autonomy.
The literature addressing adolescent and family functioning is vast. A considerable
portion of this literature is focused on the development of autonomy in adolescents.
The development of autonomy by adolescents is widely conceived as a feature of
normal development (Chassin, Presson, Sherman, & McConnell, 1995; SS Feldman &
Quatman, 1988; SS Feldman & Rosenthal, I99I; Honess & Lintern, 1990; Ryan &
Lynch, 1989; Sigafoos, Feinstein, Damond, & Reiss, 1988; Steinberg, 1990; Steinberg
& Silverberg,1936; Tumer, et al. 1993).
This section reviews the literature exploring issues related to the development of
adolescents' autonomy. First, the nature of adolescents' striving for autonomy is
addressed, including consideration of the impact of this striving on the management of
chronic illnesses, and the reciprocal influence of the illness on the development of
autonomy. Second, the role of parents and peers in the development of autonomy is
discussed, including the influence of chronic illness. Third, theoretical perspectives
on the link between adolescents' adherence to chronic illness regimens and their
desire for autonomy are considered. The final part of this section discusses future
directions for research examining the link between adolescent autonomy and regimen
adherence.
17
L3.2.I The Impact of Adolescents' Autonomy Seeking
Adolescence is a stage in life characterised by transitions (Papini & Roggman, 1992;
Yee & Flanagan, 1985). The adolescent seeks greater independence, experiences
changing relationships with parents and with peers, and experiments with new
behaviours (Honess & Lintern, 1990; EC Perrin & Gerrity, 1984; Turner, et al. 1993).
Research interest in adolescence has focused on the nature of these transitions.
Recent authors have noted the development in adolescents of an interest in increasing
independence. At the same time these adolescents maintain emotional attachments
with parents (Chassin, et al. 1995; Honess & Lintern, L990; EC Perrin & Gerrity,
1984; Steinberg, L990; Turner, et al. 1993). Grotevant and Cooper (1986) have
described this process as the renegotiation of adolescent-parent relations, that is, a
disengagement of the parents' control over the adolescents' behaviour without the
severance of the emotional bond. Steinberg and Silverberg (1986) described this
transition in terms of the adolescent relinquishing childish dependencies on, and
conceptualisations of, parents, rather than detachment from them. The development
of more autonomous forms of behaviour by adolescents also has been described in
terms of experimentation with new behaviours (Turner, et al. 1993).
It should be noted that in this section, and throughout this thesis, the term autonomy is
used to refer to behavioural autonomy. A number of authors have identified several
distinct forms of autonomy. Although the nomenclature has varied, essentially these
78
authors have identified emotional, behavioural, and moral domains of autonomy
(Douvan and Adelson, 1966; SS Feldman & Rosenthal, I99L; Pardeck & Pardeck,
1990; Peterson, 1986; Steinberg, 1985; Steinberg & Silverberg, 1986). Behavioural
autonomy, or functional autonomy, refers to the adolescents' independence of actions
- their freedom to behave in the manner they choose. This form of autonomy includes
their freedom to perform illness regimen activities for themselves, or to choose not to
perform them. Ryan and Lynch (1989) described autonomy as "self-governance and
self-regulation" (p 340). The use of the term autonomy in this thesis is consistent with
this definition
The development of autonomy by adolescents is likely to be impeded by the presence
of a chronic illness. The restrictions of the illness regimen and the impact of illness
on the health of the adolescent tend to force the adolescent into a dependent and
passive role, preventing them from behaving autonomously (Blum, et al. 1993;
IM Friedman, et al. 1986; Hoare, L984; EC Perrin & Gerrity, 1984). For example,
Hoare (1984) found that adolescents with chronic epilepsy were significantly more
dependent on their parents than adolescents in the general population.
One way in which chronically ill adolescents can achieve a sense of autonomy is by
adopting the responsibility for the management of the chronic illness (Coupey &
Cohen, 1984). The transferral of responsibility for the performance of regimen
activities is an important development for the chronically ill adolescent. The
successful transferral of responsibility allows adolescents autonomy in their routine
health care (Gaut & Kieckhefer, 1988). However, the adolescent's need for autonomy
may clash with the restrictions imposed by the regimen. The adolescent may respond
79
by refusing to comply with the regimen (SB Johnson, et al. 1992; EC Perrin &
Gerrity, 1984). Some authors have suggested that during periods of transition in
adolescent roles, the sub-optimal management of the illness may be less harmful than
delaying the development of autonomous behaviour patterns (Coupey & Cohen,
1984).
As noted in Section 1.2.1.1, the adherence of adolescents to medical regimens has
been found to be worse than that both of younger children and of adults. A common
explanation for this finding, which has received little empirical testing, is that the poor
adherence observed in adolescents is the result of the autonomy seeking of the young
person (La Greca, 1982, 1988b, 1990a). For example, La Greca (1982) found that
adolescents with IDDM who were given more responsibility for the performance of
regimen activities were in poorer metabolic control than other adolescents. However,
although this finding is consistent with the assumption that autonomy seeking
impedes adherence to illness regimens, this association has not been assessed directly
in the literature (LaGreca,1990a)
Other authors have hypothesised that parents who are overprotective of their
chronically ill adolescents, and who place unnecessary restrictions on their behaviour
may cause feelings of resentment in the adolescents because of the interference with
their autonomous development, and that this in turn may prompt the adolescents to be
less adherent to their medication regimens (IM Friedman, et al. 1986; Hazzard,
Hutchinson, & Krawiecki, 1990)
80
Another hypothesis relating autonomy with (poor) adherence is that put forward by
Conrad and others (Conrad, 1985, 1987; Greenfield, Kaplan, &'Ware, 1985; McCrea,
Ranelli, Boyce, & Erwin, 1993; Warner, I98l;Zeltzer, 1980). These authors suggest
that patients may choose not to adhere to medical reconìmendations as a means of
maintaining control over their health cafe - patients may choose not to perform
regimen activities that restrict their lifestyle, believing that their quality of life is better
maintained by not allowing their illness to control their lives, even though this
decision may place their long-term health at risk (McCrea, et al. 1993). It has been
suggested that adolescents are especially likely to choose not to perform regimen
activities which inhibit their lifestyle. The passive role of the patient clashes with the
adolescent's need for autonomy (Blum, et al. 1993; IM Friedman, et al. 1986; Hoare,
1e84)
Further, adolescents' seeking of autonomy has been characterised as shifting
dependency away from parents and onto peers (Armsden & Greenberg, 1987;
Greenberg, Siegel, & I-eitch, 1983; Hill & Holmbeck, 1986; Steinberg & Silverberg,
1986). Adolescents' desires to conform with peers may influence them to choose to
ignore aspects of their illness regimens which prevent them from behaving in the
manner of their peers (Garrison & McQuiston, 1989; Hanson, et al. 1987a;
SB Johnson, 1984).
81
1.3.2.2 The Impact of Adolescents' Autonomy on the Family.
The adolescents' movement toward greater autonomy necessarily involves the family
in several ways. As adolescents become more autonomous, parents must learn to
accept diminished involvement in many aspects of their adolescents' daily lives
Parents must concede control over much of their adolescent's behaviour (Eccles, et al
l99I; Holmbeck & O'Donnell, 1991; Small, et al. 1988). Adolescents' establishment
of increased autonomy also requires the adoption of personal and social
responsibilities, for the management of their daily lives (Greenberger, 1984)
For adolescents with chronic illnesses, the acquisition of increasing autonomy
includes the adoption of responsibility for the daily management of the illness. The
health care of younger children is likely to be the responsibility of the parents, but as
the child develops, this responsibility must be transferred over to the child. However,
as Gaut and Kieckhefer (1988) explain: "Because adolescents with chronic health
problems are as concerned with establishing an independent lifestyle as they are with
improving or maintaining their health status, the process of establishing self-reliance
may interfere with the adolescent's willingness to follow prescribed therapy" (p 56).
In addition to the ordinary demands of rearing adolescents, parents of chronically ill
adolescents need to understand the nature of the illness and its management, to
determine which aspects of the management should become the adolescents'
responsibility, and when, and to teach their adolescents to manage these tasks
appropriately (SB Johnson, 1985). The transfer of responsibility for illness
management is frequently a source of confusion between parents and adolescents
82
(Allen, et al. 1983). A number of researchers have found that adolescents and parents
hold differing notions about who is responsible for regimen activities (BJ Anderson,
et al. 1990; La Greca, I990a; Tebbi, 1993; Tebbi, et al. 1986)
Confusion over the responsibility for regimen activities has been identified as a
possible cause of the poor adherence observed amongst adolescents compared with
other age groups (La Greca, I990a; Tebbi, 1993; Tebbi, et al. 1986; Tebbi, Zevon,
Richards, & Cummings, 1989; Wysocki, Meinhold, et al. 1992). For example,
Ingersoll and colleagues (1986), found that parents of adolescents with IDDM
decreased their involvement and ultimately discontinued managing their adolescent's
illness, but the adolescents did not assume the management of the illness as expected.
In contrast, the successful transfer of responsibility, when both adolescent and parent
agree on who is responsible for regimen activities, promotes adherence to the regimen
(Tebbi, 1993; Tebbi, Richards, Cummings,Zevon, & Mallon, 1988).
Adolescents cannot achieve autonomy without the co-operation of parents. Unless
parents reduce their control over adolescents' activities, autonomy is restricted (Small,
et al. 1988). Refusal by parents to release control, or expectations by the adolescent
for greater levels of freedom than parents are willing to grant, is likely to be a source
of conflict between adolescents and parents (Eccles, et al. l99l; Holmbeck &
O'Donnell, I99I). The management of an adolescent's chronic illness may require
the co-operation of the parent in allowing the ill adolescent freedom to manage their
illness. Restriction of adolescents' autonomy in relation to illness management may
result in poor adherence or rebellion from the regimen (IIvI Friedman, et al. 1986;
Hauser, et al.l993;Hazzard, et al. 1990).
83
I.3.2.3 Empirical Studies of the Link Between Adolescents' Adherence and their
Autonomy
There have been few empirical studies of adolescents' adherence to chronic medical
regimens which have directly addressed the issue of adolescents' autonomy. While
some studies have examined broader psychosocial issues relating to adolescence, a
paucity of studies exist which provide detailed examinations of the link between
adherence and autonomy. The absence of research in this area is perhaps due to the
lack of appropriate measures. For example, some studies which have been intended to
examine this relationship have employed general measures of personality to assess
autonomy, rather than measures designed to assess the specific domain of interest.
Allen and coworkers (1983) examined the perceptions of adolescents and parents
about responsibility for the adolescents' IDDM regimen activities. Responses from
adolescent-parent dyads indicating that neither member of the dyad was taking
responsibility for the regimen were negatively associated with health providers'
estimates of adherence.
Litt, Cuskey and Rosenberg (1982) examined the regimen adherence of a group of 38
adolescents with Rheumatoid Arthritis, in relation to their autonomy. In this study,
adherence was assessed on the basis of serum salicylate assay levels. Autonomy \¡/as
assessed using a modified 5-item scale based on Eysenk's (1975) previous work.
Adolescents reporting greater autonomy were rated as more adherent than adolescents
84
reporting lower levels of autonomy. The authors interpreted this finding as consistent
with Hill's (1980) framework of adolescent autonomy, which posits that autonomy is
associated with smooth relations with parents, rather than rebellion (e.g., Hill and
Holmbeck, 1986). Unfortunately, this study employed a biological assay as the
measure of adherence. As discussed in Section 1.1.2.1, assays are physiological
rather than behavioural measures, and as such are poor measures of adherence.
Further, the reliability and validity of the measure of autonomy used by Litt and
colleagues in this study was not reported.
Another study examining the association between adolescents' adherence and their
autonomy was conducted by IM Friedman and colleagues (1986). This study
demonstrated significant associations between medication compliance and perceived
autonomy in a group of adolescents with epilepsy. Adherence was assessed by
interview, while autonomy was determined using the "Personal Freedom (Teen)"
scale of the California Test of Personality (Thorpe, Clark, & Tiegs, 1953). Parents
completed a scale devised by Friedman and colleagues to assess parents' perceptions
of their adolescents' autonomy. This scale was intended to verify the data collected
from the adolescents. This study represented a methodological improvement on the
previous study, by its use of a behavioural assessment of adherence. However, this
study did not employ a specific measure of autonomy, using instead a generic
personality test.
BJ Anderson and coworkers (1990) examined the family sharing of responsibility for
adolescents' IDDM management. The Diabetes Family Responsibility Questionnaire,
completed separately by adolescents and parents, was developed to assess which
85
family member was responsible for each component of the regimen. Metabolic
control was assessed by HbA1. assays. Responses indicating that adolescents and
parents each thought the other to be responsible for the management were associated
with poor metabolic control. While this study does not directly assess autonomy,
these results suggest that the development of increasing autonomy in the adolescent
may be linked to increased confusion about adolescents' and parents' roles in the
management of the adolescents' chronic illness
1.3.2.4 Current Status of Investigations of the Link Between Adolescents' Adherence
and their Autonomy.
At present, research examining the link between adolescents' adherence to chronic
medical regimens and their experience of autonomy is limited. The few studies which
have been conducted in this area have assessed these issues indirectly. The
assessment of adherence in these studies has not been methodologically advanced, and
the adolescents' autonomy has been measured using broadly conceived measures in
which autonomy information is collected indirectly.
The lack of research in this area is surprising, as the issue of adolescent autonomy is
frequently cited as a cause of adolescents' poor adherence or poor illness
management. Hill and Holmbeck (1986) noted that autonomy has been connotatively
associated with a variety of other variables, but that research in this area has for the
most part been atheoretical and noncumulative.
86
Further investigation of the link between adolescents' autonomy and their adherence
is warranted. The use of a more specific assessment of adolescents' autonomy would
add to the understanding of this link. Further, the use of a measure of autonomy
designed to be completed by both adolescents and parents would facilitate the
examination of the perceptions of both groups of respondents. This would allow the
examination of the relationship between adolescents' and parents' views, and
determine whether agreement between adolescents and parents about autonomy and
responsibility issues is associated with regimen adherence. Future studies also should
incorporate multiple measures of adherence, with an emphasis on methodologically
sophisticated assessments of adherence, as discussed in Section 1.1.2 of this thesis.
Previous studies have been limited by their use of less reliable assessments of
adherence.
One of the few measures specifically designed to assess adolescents' autonomy was
developed by Sigafoos and colleagues (1988). The Autonomous Functioning
Checklist (AFC) was developed to study adolescents' transition from reliance on
parents for caretaking to self-reliance. Subscales reflecting autonomous functioning
in several specific domains of daily life, including self-care, avocations,
communication, money handling, and initiative in social interaction are included
(Howe, et al. 1993). This measure has demonstrated reasonable interrater reliability
and scores show predicted developmental changes over time (Howe, et al. 1993;
Sigafoos, et al. 1988)
Howe and colleagues (1993) assessed the autonomy of adolescents with a range of
chronic medical conditions, using parent and adolescent responses on the AFC.
87
Adolescents with neurological conditions reported significantly less autonomy than
adolescents without chronic conditions, while those with chronic conditions not
relating to neurological functioning reported levels of autonomy between the two
groups. This study suggests that the presence of a chronic illness does impede the
development of autonomy in adolescents. The significant associations found in this
study suggests that this line of investigation may be fruitful. Further studies are
required to determine the relationship between autonomous functioning and regimen
adherence.
I.3.3 Parent-Adolescent Conflict.
Another aspect of adolescent and family functioning that has generated considerable
interest in the research literature is conflict between adolescents and parents. Studies
of families have frequently included an examination of conflict between adolescents
and their parents. The considerable research interest in this topic has included the
development of a number of different, and at times contradictory, theories.
Before reviewing the literature relating to parent-adolescent conflict, and its relevance
to regimen adherence and illness control during adolescence, it is necessary to
understand what is meant by the term "conflict"
Definitions used in previous studies have varied. Hall (1987) wrote:
88
Parent-adolescent conflict is more than just disagreement. Conflict
connotes greater hostility, aggression, and emotion than does
disagreement. In other words, a parent and teenager can have a
disagreement that can be handled and solved calmly and without much
effort. However, by definition, conflict between a parent and teenager
means disagreement coupled with hostility. (p 768).
Hill and Holmbeck (1986), on the other hand, used a classical laboratory definition,
that is, any interpersonal process that occurs when the actions of two people interfere
with one another. This approach is clearly broader than that of Hall. Hill and
Holmbeck (1986) suggest that their approach is more appropriate for research,
because it does not involve an emotional component, thereby facilitating empirical
measurement. The latter approach will, of course, produce higher estimates of
conflict levels than the former. Paikoff and Brooks-Gunn (1991) noted that most
studies have not explicitly defined conflict, and have relied on self-report measures to
assess the level of conflict. This approach leaves the definition of conflict in the
hands of the respondent. It is likely that different individual respondents will hold
different personal definitions.
An often noted feature of conflict between parents and their children is that the level
of this conflict increases as children enter adolescence (Flanagan, 1990; Paikoff &
Brooks-Gunn, 1991; Papini, Clark, Bamett, & Savage, 1989; Steinberg, 1989, 1990)
Robin and Foster (1989) suggested that conflict between adolescents and parents was
a developmentally normal phenomenon, characteristic of the adolescents' emerging
need for autonomy and the parents' need to maintain family stability.
89
Previous research has assessed the prevalence of conflict, and the prevalence of
conflict in relation to different issues. For example, studies examining the nature of
parent-adolescent conflict have typically observed that the topics of conflict are often
mundane and everyday issues, such as curfew times, household chores, the use of
spare time, and school work (Ellis-Schwabe & Thornburg, 1986; Hill & Holmbeck,
1987; Montemayor, 1983, 1986; Montemayor & Hanson, 1985; Paikoff & Brooks-
Gunn, l99L; Papini & Sebby, 1988). This approach, however, has not determined
whether these issues are organised around aspects or phases of the psychosocial
development of the adolescent (Papini, et al. 1989).
The focus of parent-adolescent conflict around mundane issues has implications for
the relationship between this form of conflict and adolescents' adherence to chronic
medical regimens. If the issues most likely to be the subject of conflict are those
which occur on a daily basis, and which relate to responsibility for behaviour and
lifestyle, then the long-term regimen necessary for the management of a chronic
illness such as IDDM is likely to become a subject of conflict. Daily insulin
injections, blood glucose monitoring, and dietary restrictions fit well into the
description of mundane issues which researchers have identified as the source of most
frequent conflict. Conflict surrounding the adolescents' health behaviour could have a
negative influence on the medical outcomes for the adolescent (Wysocki, 1993). This
in turn could exacerbate the conflict between adolescents and parents about regimen
activities
90
1.3.3.1 Theoretical Links Between Adolescents' Adherence and their Conflict with
Parents.
Several authors have addressed the theoretical links between parent-adolescent
conflict and adolescent adherence. to chronic medical regimens. Montemayor and
Hanson (1985) reported that only around 15 7o of conflicts between adolescents and
parents were resolved through direct communication, and that the remainder were
ended by withdrawal from the discussion or authoritarian decision. Wysocki (1993)
suggested that if this pattern also held for conflicts relating to regimen activities in
chronically ill adolescents, then the failure to resolve effectively the conflict could
lead to confusion about who is responsible for regimen activities (i.e., the adolescent
or the parent; cf. Ingersoll, et al. 1986; La Greca, Follansbee, & Skyler, 1990;
Wysocki, Meinhold, et al.1992).
Some researchers have used a Social I-earning Theory perspective to conceptualise the
relationship between adolescents' adherence and their conflict with parents. This
perspective suggests that specific illness-related parental behaviour forms illness-
specific support, which aids the management of the illness (Hanson, De Guire, et al.
1992). Empirical studies of this association have produced varied results (e.g,
Schafer, et al. 1983, Schafer, et al. 1986).
Another theoretical standpoint that has been used to investigate the link between
adolescents' adherence and their conflict with parents is a Systems Theory approach
This approach suggests that the adolescents' adaptation is influenced by their
relationships with other family members, and by the relationships between other
91
family members. This view approaches the family as a system, rather than a group of
individuals. Studies using this approach have used a systems view of family relations
to predict adolescents' adherence to their regimens (e.g., Hanson, et al. 1987a,1987b;
Kazak,1989).
L3,3.2 Empirical Investigations of the Link Between Adolescents' Adherence and
their Conflict with Parents.
A number of authors have explored the theoretical underpinnings of the association
between adolescents' adherence to chronic medical regimens and their experienced
level of conflict with parents. This section provides a brief review of studies
empirically investigating the link between adolescents' adherence and the level of
conflict they experience with their parents.
BJ Anderson, Miller, Auslander and Santiago (1981) compared the family
environments of adolescents with IDMM in good, fair, or poor control. Fifty-eight
adolescents, aged between 11 and 19 years, and their families participated in this
study. The Moos Family Environment Scale (FES; Moos & Moos, 1981) was
completed by adolescents and some of the parents. Diabetes control was assessed by
FIbA1" assay; good control was defined as HbA1.less than I0 7o, fair control as
FIbA1" between l0 7o and 14 %o, and poor control as FIbA1" above 14 7o. Adolescents
with well controlled diabetes reported more family cohesion and less family conflict
than those with fair or poor control. Parents of adolescents with good IDDM control
stated that their family members were encouraged to behave independently. A later
92
study by this research group examined risk factors to the health of children with
IDDM (Auslander, et al. 1990). This study also used the FES to assess the social-
environmental characteristics of the families, and HbA1" assays to assess metabolic
control. Unlike the previous study, this study found that neither family conflict nor
the encouragement of independence differentiated children with good or poor
metabolic control.
Another study using the Moos Family Environment Scale was conducted by Schafer
and colleagues (1983), who examined 34 adolescents with IDDM, assessing regimen
adherence and metabolic control in relation to family environment. A diabetes-
specific measure of family interaction also was employed, the Diabetes Family
Behavior Checklist (DFBC). Family conflict was significantly associated with
regimen adherence (poor adherence was linked with high levels of conflict, good
adherence with low levels of conflict). Negative interactions between adolescents and
parents on the DFBC was associated with poor adherence. In another study by this
group of researchers, Schafer and coworkers (1986) assessed the IDDM regimen
adherence and metabolic control of adults and adolescents in relation to family
interactions specific to the IDDM regimen. Adherence and metabolic control were
assessed by the same measures as were used in the previous study. Negative family
interactions were predictive of poor adherence amongst adults, but not adolescents,
while positive interactions were not predictive of adherence amongst either group.
This result is consistent with the conclusion drawn by Baranowski and Nader (1985),
that positive aspects of family life do not maximise adherence, while negative aspects
play an inhibitory role (see Section 1.3.1.2).
93
Klemp and La Greca (1987) examined the family cohesion and organisation of 50
adolescents with IDDM. Measures also assessed family conflict, and disruption due
to diabetes. HbA1" levels were used to assess metabolic control. Family cohesion and
organisation were positively associated with good metabolic control, while conflict
and family disruption were associated with poor metabolic control. Hauser and
colleagues (1990) examined 52 children and adolescents with IDDM and their
families. This study assessed adherence using a series of health provider ratings over
four years. The family environment was rated using the Moos FES. Adolescents' and
parents' reports of family conflict were associated with diminished concurrent
adherence. Parents' perceptions of family cohesion were associated with good
concurrent adherence. Longitudinal analyses revealed that adolescents' reports of
family conflict were predictive of future poor adherence, and that their perceptions of
family cohesion were predictive of good adherence.
Bobrow and coworkers (1985) explored the relationship between mother-daughter
interactions and the daughters' adherence to IDDM regimens. Adherence was
assessed by separate interviews of mothers and daughters, with regard to diet, insulin
injection, glucose testing, exercise, and carrying glucose for emergency use.
Measures of mother-daughter conflict, discussion of feelings, and concerns about
diabetes also were collected. Poor adherence to IDDM self-care was associated with
high levels of conflict, and particularly with confrontational and emotionally charged
interactions between mothers and daughters.
Holden, Friend, and coworkers, (1991) examined the family functioning of 120
children attending diabetes summer camps, using the Family Adaptability and
94
Cohesion Evaluation Scales (FACES-Itr; Olson, 1986). Regimen adherence was
assessed using observational measures of blood glucose monitoring and insulin
injection, including the use of BGM records obtained from the electronic memory of
blood glucose sensors. Family functioning prior to camp attendance was not
associated with regimen adherence during camp, although children from poorly
functioning families showed more improvement in diabetes control during camp than
those from better functioning families. However, the children from poorly
functioning families did not maintain their improved control after camp, while
children from better functioning families maintained their control after camp
experience. The authors suggest that these results indicate that camp experience is
most beneficial for children with poorly functioning families, but that the maintenance
of improvement in diabetes control achieved during camp is inhibited by the poor
functioning of these families.
Hanson, Henggeler and Burghen (1987a) examined the association between global
measures of adherence, metabolic control and family relations, using a series of
measures to assoss each domain. This study found the adherence to the IDDM
regimen was 'marginally' associated with family relations. In a separate study the
same authors reported that adolescents' perceptions of illness-specific parental
support were associated with regimen adherence, but not illness control (Hanson, et
al. 1987b). Hanson, and colleagues (1992) assessed family conflict surrounding a
sample of 95 adolescents with IDDM, using parents' and adolescents' perceptions of
conflict in the mother-adolescent, father-adolescent, and mother-father dyads.
Adherence was assessed using a semi-structured interview. Illness-specific support
95
and family flexibility were predictive of adolescents' concurrent adherence, while
high levels of conflict were associated with poor adherence.
Wysocki, Hough, and colleagues (1992) examined regimen adherence and parent-
adolescent conflict experienced by adolescents with IDDM. Adherence was assessed
using blood glucose monitoring data recorded on blood glucose sensors with
electronic memories and by a behaviour checklist, while conflict was assessed by
means of a standardised questionnaire (the Diabetes Responsibility and Conflict
Scale; Rubin, Peyrot, & Young-Hyman, 1989). In this study, regimen adherence was
significantly associated with parent-adolescent conflict, so that high levels of conflict
were linked to poor adherence, and low levels of conflict to good adherence. Wysocki
(1993) evaluated the relationship between parent-adolescent relations and metabolic
control in a group of 115 adolescents with IDDM. Correlational analyses showed that
better metabolic control was associated with more effective family communication
skills and clear differentiation of family roles and boundaries. Further, "adolescents
from families with conflictual parent-adolescent relations were more likely to exhibit
poor diabetic control and IDDM-related maladjustment" ('Wysocki, 1993, p a5\.
1.3.3.3 Current Status of Investigations of the Link Between Adolescents' Adherence
and their Conflict with Parents
The previous section provided a brief review of studies examining the relationship
between adolescents' adherence to their IDDM self-care regimens and their
experience of conflict with parents. It should be noted, of course, that this review is
96
not exhaustive, but is an overview of some of the more prominent studies conducted
to date, and is intended to be representative of other studies in this area. Nonetheless,
when looking at these studies, a number of features typical of the published literature
become apparent.
First, the majority of studies examining the relationship between parent-adolescent
conflict or other aspects of family functioning and regimen adherence have employed
general or global measures of family functioning. Most prominently, the Family
Environment Scale (Moos & Moos, 1981) and the Family Adaptability and Cohesion
Evaluation Scales (Olson, 1986) have been used. Although these measures benefit
from having established psychometric properties, their design is intended for global
assessments of the family environment. To examine the relationship between
adherence and specific aspects of family functioning, such as parent-adolescent
conflict, measures with more specific foci are appropriate (Drotar, l99l). For
example, Hanson, Henggeler, and coworkers (1989) examined the metabolic control
of adolescents' with IDDM in association with (1) marital relations, using the Marital
Adjustment Scale, a scale designed to assess this specific relationship, and (2) the
Family Adaptabilit¡1 and Cohesion Evaluation Scales to assess family relations. A
specific measure of adolescent-parent relations was not employed, although the
adolescents' metabolic control may be expected to be most influenced by the
adolescents' relations with other family members
Second, although a few of these studies had moderately large samples (e.g., 100
families), most involved only around fifty families. The use of small samples may
limit the ability of researchers to determine the true extent of any associations between
97
adolescents' adherence and their conflict with their parents. That is, by restricting
studies to small samples, the range of responses obtained on measures may also be
restricted, which in turn limits the likelihood of detecting relationships between
adherence and conflict
Third, studies examining adolescents' adherence to IDDM regimens have not always
employed the most methodologically sound assessments of adherence. Multiple
assessments of adherence have been infrequent in this area of investigation, and the
use of objective assessments, such as BGM data recorded in the memory of blood
glucose sensors, has been limited. Hauser, et al. (1990), for example, used health
provider ratings of adherence. As noted in Section 1.1.2.1, health provider estimates
of adherence are liable to confound adherence with the health status of patients
Further investigation of the relationship between parent-adolescent conflict and
adolescent adherence is warranted. The use of measures specifically addressing the
issue of parent-adolescent conflict would be of benefit. Future studies should also
incorporate multiple measures of adherence, with an emphasis on methodologically
sophisticated assessments of adherence, as discussed in Section 1.."1..2 of this thesis
Measures including the perspective of both adolescents and parents are important, and
the combination of these with objective evaluations of adherence must be of value.
Robin and Foster (1984, 1989; Foster & Robin, 1988) have worked extensively in the
area of parent-adolescent relations. These authors characterise parent-adolescent
conflict as a function of (1) the adolescents' and parents' skill in problem solving
communication and negotiation skills, (2) the adolescents' and parents' possession of
98
unreasonable beliefs and expectations about the other person, and (3) the functioning
of paths of authority and influence within the family system. Robin and Foster have
developed a series of assessment tools based upon this framework. These measures
have been used to assess a variety of features of parent-adolescent relations. For
example, the Issues Checklist is a self-report measure, completed separately by
adolescents and parents, assessing the frequency and intensity with which specific
issues are disputed between adolescents and their parents (Robin & Foster, 1988b).
This measure has been used to examine reliably systematic variations in conflictual
family issues during adolescence (Papini, et al. 1989). Similarly, the Conflict
Behavior Questionnaire (CBQ) is a measure of perceived communication-conflict
behaviour between adolescents and their parents. It provides an assessment of how
much conflict and negative communication the family experiences. Parents and
adolescents complete parallel versions (Robin & Foster, 1988a, 1989). The 20 item
form of the CBQ has shown strong criterion-related and construct validity, and has a
high level of internal consistency (Grace, Kelley, & McCain, 1993; Robin, 1980;
Robin & Weiss, 1980; Schubiner & Robin, 1990)
Wysocki (1993) suggested that investigations of regimen adherence amongst
adolescents with IDDM, based upon Robin and Foster's model of adolescent-parent
relations, would provide an important development in research of the association
between adolescent-parent relations and regimen adherence and metabolic control
This author used the Parent-Adolescent Relationships Questionnaire, (PARQ; Robin,
Koepke, Moye, 1990) to examine the relationship between adolescents relations with
their parents and their metabolic control. This study found that better metabolic
control was associated with more effective family communication skills and clear
99
differentiation of family roles (Wysocki, 1993). The PARQ is a multidimensional
scale assessing multiple components of adolescent-parent relations. Studies using
measures addressing specific aspects of these relationships will further elucidate the
link between adolescent-parent relations and adolescents regimen adherence and
metabolic control.
1.4 Summary
This chapter reviewed the published literature relating to this thesis. The topics
addressed in this review relate to four major topics. The first section of this chapter
examined issues relevant to the assessment of patient adherence. The definition of
patient adherence was discussed. Strategies to measure patient adherence were
reviewed. The relationship between adherence and health outcomes in previous
research was discussed, and future directions for work in this area were identified.
Issues relating to adherence assessment including the variation in adherence between
regimens and between individual regimen characteristics were identified, as was the
importance of multiple assessments of adherence. The benefits of longitudinal studies
of adherence were identified. Also, theoretical models of health behaviour were
reviewed, including the applicability of these models to patient adherence research.
The use of these models in future studies also was addressed.
Second, factors reported to influence patient adherence were discussed. Current
knowledge about factors relating to patient adherence to medical regimens was
reviewed. Empirical studies and theories relating patient attributes such as age,
100
knowledge of the disease and health motivation with patient
discussed. Characteristics of the regimen, including its complexity and
addressed in association with patient adherence. The nature of the
between health practitioners and their patients, and the interaction between health
practitioners, paediatric patients and their parents, were discussed in relation to
adherence. The communication, openness, and warmth in these relationships have
been associated with patient adherence. Methodological limitations in research
published to date were reviewed. These include the use of cross-sectional research
designs and the failure to examine children's reports of adherence. Opportunities to
extend current knowledge of patient adherence were addressed, and areas deserving
greater research attention identified.
Third, issues in adolescent medicine were explored. The impact of chronic illness on
adolescents and their families was discussed, as well as the influence of family
functioning on the progress of the chronic illness. The few studies which have
examined the relationship between adolescents' autonomy and their illness
management were reviewed, in light of the theoretical associations between these
domains. Prospects for further investigation were identified. The literature
examining family conflict, and specifically parent-adolescent conflict, was examined,
including the link between this form of conflict and adolescents' adherence to medical
regimens. Again, the current status of research was reviewed, including gaps in the
literature
were
101
CHAPTER TWO.
THE AIMS AND HYPOTHBSES OF THIS THESIS.
The previous chapter, in reviewing the published literature, hasidentified a number of issues worthy of further investigation. Thischapter summarises these issues, and describes the major aims of thisthesis. The hypotheses under examination are then detailed.
2 THE AIMS AND HYPOTHESES OF THIS THESIS.
2.0 Introduction.
First, the review of the adherence literature identified a number of issues in the
assessment of adherence that deserve consideration in further investigation
The examination of both parents' and adolescent's perceptions of adherence should be
assessed. Many studies have been limited by examining only the views of parents
Future studies are needed to investigate the health related behaviour and beliefs of
both parents and children. The use of multiple measures of adherence is an important
consideration in the design of future studies. There are several reasons why the use of
multiple measures of adherence is important. First, adherence to one aspect of a
complex regimen is typically independent of adherence to other aspects of the
regimen; multiple measures of adherence allow the examination of adherence to
diverse regimen activities. Further, each form of adherence measure has inherent
limitations. The use of complementary forms of adherence measure can overcome the
limitations of individual methods
A limitation of research reported in the literature to date that should be addressed in
future studies is the tendency to depict adherence as univariate. This tendency masks
differences in adherence levels to various regimen activities. Further, the use of a
uniform approach to the measurement of patient adherence would improve the
accumulation of results from different studies.
103
The measurement of the relationship between adherence and health status should be
considered. As the literature review identified, measures of these constructs should be
temporally congruent. That is, to assess the relationship between adherence and
health status properly, the measures used to examine these constructs must examine
the same time frame
Most studies have focused on patient variables such as regimen knowledge and health
beliefs. Studies employing measures of more than one such variable permit a more
comprehensive view of health behaviour, and facilitate the development of
multivariate models to explain patient adherence.
The review of the literature also identified a number of issues relating to adolescent
medicine.
Research examining the link between adolescents' adherence to chronic medical
regimens and their experience of autonomy is limited; further investigation is
warranted. The use of a specific assessment of adolescents' autonomy, designed to be
completed by both adolescents and parents would add to the understanding of this
link.
The relationship between parent-adolescent conflict and adolescent adherence also
deserves further investigation. To examine the relationship between adherence and
parent-adolescent conflict, measures with a specific focus on parent-adolescent
relations must be used. Measures including the perspective of both adolescents and
parents are important.
t04
Finally, future investigations should be developed in a manner consistent with
theoretical conceptions of adherence behaviour. This includes the use of models such
as the Six-Factor Model of Adherence, as well as theories relating to adolescent
development and adolescent medicine, such as the role of adolescents' autonomy and
conflict with parents in their regimen adherence.
2.1 Aims of This Thesis.
The principal aim of this thesis is to examine adherence to medical recommendations
amongst adolescents with Insulin-Dependent Diabetes Mellitus (IDDM). In
particular, the influence of two specific aspects of adolescent / family functioning will
be studied. These are: (1) adolescent autonomy, and (2) parent-adolescent conflict.
This thesis will investigate several components of adolescents' adherence. Measures
include (1) their adherence to a range of specific aspects of their medical
recommendations, (2) their general tendency to adhere or not to adhere to medical
recommendations, and (3) an objective assessment of their Blood Glucose
Monitoring, an impofiant component of their IDDM regimen.
Each of the measures of adherence, as well as the measures of adolescent autonomy
and parent-adolescent conflict, will be completed by adolescents and the parent
identified as their primary caregiver
105
The relationship between adolescents' adherence and a range of factors related to
adults' adherence in the Six-Factor Model of Adherence also will be examined, to
determine the applicability of this model to adolescents' regimen adherence. Finally,
adolescents' health status will be measured in a manner temporally congruent with the
assessments of adherence, to test the association between these constructs in this
study
2.I.I Thesis Hypotheses.
Two hypotheses will be tested in the study:
1. Adolescents for whom reports of greater levels of conflict with their parents are
obtained will be less adherent to their diabetes treatment recommendations than
adolescents for whom reports of lower levels of conflict with their parents are
obtained.
2. Adolescents for whom reports of greater levels of autonomy are obtained will be
more adherent to their diabetes treatment recommendations than adolescents for,
whom reports of lower levels of autonomy are obtained.
106
CHAPTER THREE.
SAMPLING AND METHODOLOGY.
This chapter describes the methods of the main study of this thesis.This chapter consists of four major sections. These sectíons address:(1) the sampling strategy; Q) the procedures used to collect data; (3)the measures employed; and (4) the fundamental statistical analyses tobe used in the study.

3 SAMPLING AND METHODOLOGY.
3.1. Subjects.
The sampling frame for this study included all adolescents aged between 12 and 17
years, and their parents, attending the Women's and Children's Hospital (WCH)
Diabetes Outpatient Clinic. Subjects were recruited into the study between June 1995
and June 1996. Additional entry criteria for the study were as follows:
o participating adolescents must have been diagnosed with Insulin Dependent
Diabetes for a minimum of 12 months.
participating adolescents needed to attend the Outpatient Clinics in the companyo
o
of a parent or guardian.
participating adolescents and their parents needed to have sufficient
comprehension of written English to complete the questionnaires. This critenon
was not formally assessed; potential participants were excluded from the study if
they reported that they were unable to complete the questionnaires because of
language or literacy difficulties.
Adolescents were approached at the time of their routine appointment at the Diabetes
Outpatient Clinic. All adolescents were prescribed similar regimens for their IDDM
management, including daily injections of a mixture of intermediate- and slow-acting
insulins, two daily blood glucose tests (i.e., morning and evening), a dietary plan that
108
included three regular meals and one or two snacks, and exercise recommendations.
Adolescents were routinely followed at approximately 3-monthly intervals for their
medical care. The treatment recornmendations of these adolescents were similar to
those of other groups of adolescents with IDDM (e.g., Jacobson, et al. 1987;
SB Johnson, et al. 1986; SB Johnson, et al. 1990; La Greca, Swales, et al. 1995;
Weissberg-Benchell, et al. 1995).
The demographic characteristics of the obtained sample are described in Chapter 4.
3,2 Procedure.
Several forms of data collection were employed to obtain data for the study. These
included: self-reports from adolescents and parent reports completed in clinic waiting
areas; electronic monitoring of adherence to blood glucose monitoring; and HbA1"
assays. Details of the pilot testing are given in Appendix A..L
The Diabetes Outpatient Clinic of the WCH involves three Endocrinologists and an
Endocrinology Registrar. In addition, a Diabetes Nurse Educator and a Dietitian
participate in the clinic. A Podiatrist and a Social Worker visit the clinic on a
rotational basis. Approximately thirty children or adolescents attend each weekly
clinic.
Participants were approached to participate in the study when they attended the
Diabetes Outpatient Clinic. The investigator described the nature and purpose of the
109
study, and provided information brochures which included names and telephone
numbers of investigators to cater for later enquiries. A copy of the Information Sheet
is included in Appendix A¡.2. Informed consent was obtained from all participants -both adolescents and parents. The Consent Form is included in Appendix 4.3.
Verbal instructions were given about the completion of questionnaires. Appendix
A..4 details the verbatim instructions given to participants
3.2.I Questionnaire Administration.
Adolescent self-reports and parent reports were used in this study to collect data about
adolescents' adherence to their IDDM regimen, as well as their autonomy and their
conflict with parents. Additional measures assessed IDDM treatment knowledge and
predicted antecedents of adherence. The questionnaire measures were completed
independently by the adolescents and their parents in the main waiting area of the
clinic
3.2.2 Collection of Objective Blood Glucose Monitoring Adherence Data.
Prior to their participation in the study, 75 adolescents with poor metabolic control
were provided with new Companion 2rM blood glucose sensors. Poor metabolic
control was clinically defined as a mean annual HbA1" of greater than IO 7o. The
sensors were provided four weeks prior to Clinic attendance. Data was then collected
from the electronic memory of these sensors during Clinic attendance.
110
The blood glucose sensors were supplied by their manufacturer, MediSense Australia,
for research purposes. The allocation of these sensors to adolescents with poor
metabolic control was based upon two factors. First, these adolescents were
considered to be in greater need of additional help in the management of their IDDM.
It was believed that the use of these monitors would facilitate this process. Second,
these sensors were intended for later use in an investigation of an intervention
designed to improve the metabolic control of adolescents with poor metabolic control.
This intervention was conducted after the collection of the data presented in this thesis
(Taylor, Fotheringham, Couper, Sawyer, 1996, l99l).
The demographic characteristics of the adolescents supplied with new blood glucose
sensors are compared with those of the remaining adolescents in Chapter 4.
The electronic recording of BGM was employed in this study as an objective measure
of the adolescents' adherence. The MediSense Companion 2rM sensors were used to
obtain this data. BGM data was retrieved from participants' monitors upon attendance
at the Diabetes Outpatient Clinics at the Women's and Children's Hospital. Retrieval
was performed by means of the MediSense SensorlinkrM system (MediSense, 1995)
The SensorlinkrM system was connected to individual participants' Companion 2rM
sensors by cable, and results uploaded. The data was stored on the SensorlinkrM
system, along with identification data. This data was then downloaded as a database
onto an IBM-compatible personal computer for the purpose of statistical analysis.
A major advantage of these devices was that they automatically record and store the
date and time at which tests were undertaken, along with the test results. Previously,
111
this information was only available from diaries maintained by adolescents. The
electronic storage of this information greatly improves its accuracy and reliability
(Dunbar-Jacob, et al. 1991).
The MediSense SensorlinkrM system is capable of retrieving up to I25
Companion 2rM sensor test results. Records stored in the SensorlinkrM system are
downloaded to an IBM-compatible Personal Computer (PC). Each downloaded test
result appears in the form of one line of ASCtr text, with each field of information
separated by a tab. This recording method provided the timing (date and time) of
tests, as well as the test results (Figure 3.1). This standard format is readable to
spreadsheet and statistical software packages (MediSense, 1995)
The implementation of this form of assessment was designed to facilitate the
comparison of results from the objective assessment of adherence to BGM with the
results obtained using the self-reports and parent reports of BGM adherence. The data
collected through the electronic recordings were coded to determine the number of
appropriate days of BGM achieved during the previous four weeks, that is, to examine
the same time period as the questionnaire assessment of adherence to this component
of the IDDM self-care regimen
l12
3.2.3 Collection of Metabolic Control Data.
The metabolic control of the adolescents was determined by venous haemoglobin 41"
(HbAr") assays. These assays are recorded as a routine procedure in the Diabetes
Outpatient Clinics to provide a standardised index of clinical status for IDDM.
The haemoglobin A1ç assals were collected using two Bayer Diagnostics DCA 2000@
Analysers. The DCA 2000@ analyser measures the level of concentration of HbA1.
and the concentration of total haemoglobin, and displays the ratio of the two as
VoIIbA.¡. HbA1. is calculated using a method based on inhibition of latex
agglutination. In this process, an agglutination reaction causes increased scattering of
light which is measured as an increase in absorbtion at 531 nm. HbA1" competes for
antibody-latex binding sites causing an inhibition of agglutination and a decreased
scattering of light. The HbArc concentration is then quantified using a standard
calibration curve of absorbance versus IIbA1. concentration (Guthrie, et al. 1992;
John, Edwards, Price, 1994; Pope, et al. 1993; Rumley, Kilpatrick, Dominiczak,
Small, 1993; Thai, Ng, Lui, Cheah,1993). The reagents needed for this process are
contained in a reagent cartridge; with the addition of 1 ¡rl of capillary blood the
measurement of HbA1" is completed in six minutes.
Uniform measurement of HbAls \ryâS ensured by the use of the same analysers to
perform all of the assays. Only one technician was involved in the performance of
these assays, which were all taken at the Diabetes Outpatient Clinic at the V/CH.
113
3.3 Measures.
Three forms of measure were employed in this study. First, questionnaire measures,
which were completed by participating adolescents and parents. Second, an objective
measure of the adolescents' Blood Glucose Monitoring adherence, which was
obtained from the electronic memories of blood glucose sensors. Third, the
adolescents' metabolic control, assessed by Haemoglobin 41. assay
3.3.I Questionnaire Measures
The measures described in this section were administered to participating adolescents
and parents. These measures are shown in Appendices 4.5 and 4.6 respectively
This section describes the purpose, nature, and psychometric properties of the
questionnaire measures employed.
3.3.1.1 Adherence to Medical Regimens.
This study employed two questionnaire measures of adherence to medical
recommendations; the Diabetes Specific Adherence Scale and the General Adherence
Scale.
114
The Diahetes Specific Adherence Scale.
Adherence to specific aspects of IDDM self-care recommendations was assessed
using the Diabetes Specific Adherence Scale (DSAS; DiMatteo, et al. 1992;
Sherbourne, et al. 1992). The DSAS is a nine item measure of adherence to specific
IDDM self-care recommendations. Respondents used a six-point Likert scale ranging
from None of the time to AII of the time (Figure 3.2). High scores indicate high levels
of adherence to IDDM self-care recommendations. The items of the DSAS were
structured to assess adherence over the previous four weeks.
The DSAS employed in this study was tailored to the specific treatment
recommendations received by participants (DiMatteo, et al. 1992; Sherbourne, et al.
1992). Other disease-specific adherence scales have been employed in Medical
Outcomes Study (MOS), in parallel with the General Adherence Scale (DiMatteo, et
al. 1992; Sherbourne, et al. 1992)
Prior to the present study, a disease-specific adherence scale had not been developed
for use with adolescents with IDDM. However, a scale for use with adults with
diabetes had been employed in the Medical Outcomes Study (DiMatteo, et aI. 1992)
After communication with Professor DiMatteo and Dr Hays, the authors of this scale,
items from the MOS adult diabetes scale were adapted for use with Australian
adolescents. A number of the items included in the MOS scale were inapplicable to
adolescents with IDDM in this country, and were removed. Similarly, several aspects
of the medical recommendations typically received by the target group were not found
in the MOS scale, and had to be added. A draft version of the new questionnaire was
115
devised by the investigator, before being examined by members of the 'Women's and
Children's Hospital Diabetes Team; including the Diabetes Clinical Nurse Consultant,
the Diabetes Educator, and physicians participating in Diabetes Clinics. Several
revisions were made to the wording of individual items, and one item, pertaining to
dietary "exchanges" was deleted because clinicians were no longer emphasising this
procedure. The second draft of the scale was then circulated to the WCH Diabetes
Team, who endorsed the revisions.
In the present study, internal reliability was tested using Chronbach's alpha. The
adolescent and parent responses to the DSAS produced coefficients of 0.64 and 0.71,
respectively. These ratings compare favourably with those of previous studies using
disease-specific adherence scales designed by DiMatteo and colleagues (DiMatteo, et
al. L992; Sherbourne, et al. 1992). For example, measures of adherence to Non-
Insulin Dependent Diabetes, Hypertension, and Heart Disease have produced
Chronbach's alphas of 0.69 and0.67,0.50 and 0.50, and 0.53 and 0.47 (Sherboume, et
al.1992).
The General Adherence Scale.
General tendencies to adherence to medical recommendations were assessed using the
General Adherence Scale (GAS; DiMatteo, et al. 1992; Sherbourne, et al. L992). The
GAS is a five item measure of general adherence tendencies. Respondents used a six-
point Likert scale ranging from None of the time to AII of the time (Figure 3.3). High
scores indicate tendencies to adhere closely to medical recoÍr.mendations. The items
of the GAS were structured to assess adherence over the previous four weeks
tt6
The GAS has been employed in the large scale Medical Outcomes Study (MOS) in the
United States, and has a reported internal consistency of clt, = 0.80, along with a two-
year test-retest correlation of 0.41 (DiMatteo, et al. 1992; Sherbourne, et al. 1992). In
the present study, adolescent and parent responses to the GAS produced Chronbach's
alphas of 0.79 and 0.81, respectively
The GAS was employed to examine participants' overall intentions to adhere. Items
in the GAS did not identify specific recommendations, but focused on the overall
tendencies of participants to adhere to medical recommendations. This design
allowed the direct comparison of participants' responses to identical questions without
regard for the specific recommendations given.
The GAS was selected in light of developments in the adherence literature which
point to the advantage of employing multiple forms of adherence assessment (Dunbar,
1983). More particularly, some authors have advocated the systematic use of both
generalised and specific self-report measures of adherence, as each form of adherence
measure provides unique information, their combined use therefore gives a more
complete representation of patient adherence (RD Hays & DiMatteo, 1987).
3.3 .L.2 Psychosocial Functioning.
This study employed two measures of specific aspects of psychosocial functioning;
the Conflict Behavior Questionnaire and the Autonomous Functioning Checklist.
t77
The Conflíct B ehøvíor Que stionnøire.
Parent-adolescent conflict was assessed using the Conflict Behavior Questionnaire
(CBQ; Robin & Foster, 1988a). The CBQ is a twenty item measure of conflict and
communication between adolescents and parents. Respondents use a true-false format
to indicate acceptance of statements describing interactions between adolescents and
parents (Figure 3.4). Parents and adolescents completed parallel versions of the
CBQ. High scores indicated high levels of conflict between adolescents and parents.
Items ask about interactions over the previous two to three weeks. The CBQ has been
designed for use with adolescents aged between 10 and 19 years, and their parents
The Original version of the CBQ (Prinz, Foster, Kent, O'I-nary, 1919) contained 75
items. A subsequent 2O-item short form has been constructed through item analysis,
retaining the items most strongly correlated with scale scores and best discriminating
distressed and non-distressed families. The 20-item short form, used in the present
study, yields a single summary score that correlates highly (r=0.96) with scores on
the original long form (Robin & Foster, 1988a). In the present study, adolescent and
parent responses to the CBQ produced Chronbach's alphas of 0.80 and 0.91,
respectively
Evidence for the discriminant and criterion validity of the CBQ is available from three
studies comparing the responses from members of families referred to family therapy
clinics with responses from members of non-referred families (Prinz, et al. 1,919;
Robin & Foster, 1984; Robin & Weiss, 1980). Clinic referred mothers, fathers, and
118
adolescents reported significantly more negative appraisals of the dyadic relationship
Data from these studies were pooled with preassessment data from two treatment
studies to product-aggregated normative data for 137 clinic-referred and 68 non-clinic
families (Robin & Foster, 1984). The CBQ reports also showed significant decreases
in parent and adolescent scores following both behavioural and nonbehavioural family
interventions (Foster, Pnnz & O'læary, 1983; Robin, 1981). In addition, the CBQ
correlates strongly (r = -0.52) with problem-solving communication behaviour coded
from audiotaped interaction tasks, and with the Dissatisfaction with Childrearing
Scale of the Marital Satisfaction Inventory, yielding evidence for construct validity
(Robin & Foster, 1984, 1988a).
The Autonomous Functioning Checklíst.
Adolescents' autonomy was assessed using the Autonomous Functioning Checklist
(AFC; Sigafoos, et al. 1988), completed by adolescents and parents. The AFC is a 78
item measure which generates a total score as well as four subscale scores: Self- and
Family-Care, Management Activity, Recreational Activity, and Social / Vocational
Activity. Respondents used a five-point rating scale ranging from Does not do to
Does every time there is an opportunity for each of the first three subscales (Figure
3.5). For the final subscale, respondents used a dichotomous yes-no response format,
whereby the performance of specific activities is indicated. High scores on each of the
subscales indicated high levels of autonomy experienced by the adolescent. The AFC
is designed to measure the transition from reliance on parents for care-taking to self-
reliance amongst twelve- to eighteen-year olds.
t19
The first subscale, Self- and Family-Care , is a 22 item measure of the extent to which
the adolescent performs activities related to self-care and daily maintenance activities
for family members (e.g., medical care, meal preparation, household chores). Possible
scores on this subscale range from 0 to 88
The second subscale, Management Activity, is a 20 item measure of adolescents' use
of resources within their environment, and the adoption of responsibility for
obligations (e.g., using banking services, planning transportation to special activities).
Possible scores range from 0 to 80.
The third subscale, Recreational Activity, is a 16 item measure of the ways in which
adolescents spend free time. For example, spending time in shopping areas, listening
to music, or engaging in extra-curricular learning activities. The possible range of
scores for this subscale is 0 to 64.
The final subscale, Social and Vocational Activity, is a 20 item measure of
involvement in social and potentially career-related activities. Items for this subscale
were scored dichotomously. Examples of activities described include maintaining
close friendships with teenagers of the opposite sex, performing volunteer work, and
participating in extracurricular groups. The scoring range was 0 to 20
The psychometric properties of the Autonomous Functioning Checklist were
evaluated in a study of 349 families (Sigafoos, et al. 1988). The four subscales were
reportedtohaveinternalconsistenciesof cr-0.82,cr=0.86, a=0.J9, andcr=0.76
respectively. Scorss on each subscale were significantly correlated with adolescents'
t20
age (p < 0.05), suggesting appropriate concuffent validity. In a subsample of 52
families, both parents completed the AFC, inter-rater reliabilities were statistically
significant for all subscales (p < 0.01; Sigafoos, et al. 1988). The range of obtained
scores in these studies was broad, suggesting acceptable discriminant validity
(Sigafoos, et al. 1988).
In the present study, adolescent responses to the four subscales of the AFC produced
Chronbach's alphas of 0.85, 0.84, 0.78 and 0.66, respectively. Parent responses to the
four subscales of the AFC produced Chronbach's alphas of 0.84, 0.85, 0.69 and 0.75,
respectively. Chronbach's alphas for the total AFC scales by adolescents and parents
in this study were 0.90 and 0.91 respectively.
3.3.1.3 Antecedents of Adherence.
This study employed three measures of factors reported to be antecedents of adherence
in adults. These measures were included to test the applicability of these factors to
adolescents' adherence. These measures were: the Adherence Determinants
Questionnaire, the Health Value Scale, and the Diabetes Knowledge Questionnaire.
Demographic information was also collected. In addition, the Socially Desirable
Response Set was included to determine whether measures employed in the study
were influenced by socially desirable responding.
T2I
The Adherence Determínants Questionnaíre.
A range of proposed antecedents of adherence were assessed using the Adherence
Determinants Questionnaire (ADQ; DiMatteo, Hays, et al. 1993; Sherbourne, et al.
1992). The ADQ is a 38 item measure consisting of seven scales: (a) Interpersonal
Aspects of Care, (b) Perceived Utility, (c) Perceived Severity, (d) Perceived
Susceptibility, (e) Subjective Norms, (fl Intentions to Adhere, and (g) Supports /
Barriers. Respondents use a five-point Likert scale ranging from Strongly Agree to
Strongly Disagree (Figure 3.6).
A number of items in the ADQ (items 15, 11-24) are designed to be tailored to the
specific regimen involved; for example, in a study of cancer patients performed by
DiMatteo, Hays, and colleagues (1993), item 17 read: "There are many diseases more
severe than the kind of cancer I have," The same item read "There are many diseases
more severe than the kind of diabetes I have," in the present study of adolescents with
IDDM.
Interpersonal Aspects of Care. The first scale of the ADQ is an eight item measure of
rapport between patients and health professionals. Higher scores indicate greater
rapport; the possible range of scores for this scale is 8 to 40
Perceived Utilíty. The second scale of the ADQ is an eight item measure of
respondents' perceptions of the usefulness of their medical treatment. This scale
includes two sections, the first relating to the benefits and costs of treatment, the
r22
second relating to the efficacy of treatment. High scores on this scale indicate greater
perceived utility of prescribed treatment; the possible range of scores is 8 to 40.
Perceived Severity. The third scale of the ADQ is a four item measure of respondents'
perceptions of the seriousness of their illness. Higher scores indicate greater
perceived severity, scores for this scale have a possible range of 4 to 20.
Perceived Susceptibility. The fourth scale of the ADQ is a four item measure of
respondents' beliefs about their vulnerability to illness. In the case of chronic
illnesses, perceived susceptibility relates to respondents' beliefs about their
vulnerability to relapses. Higher scores indicate greater perceived susceptibility; the
possible scoring range for this scale is 4 to 20.
Subjective Norms. The fifth scale of the ADQ is a six item measure of respondents'
beliefs about the expectations of their families and friends, as well as the importance
of these expectations to the respondent. Following the recommendations of Ajzen and
Fishbein (1980), the Subjective Norms section contains three pairs of statements,
relating to the expectations of the respondents' immediate family, close friends, and
relatives. The first statement in each pair (Normative beliefl described the
expectations of others, for example "My close friends think I should follow my
treatment plan." The second statement (Motivation) described the importance of these
expectations to the respondentS, o.g.: "I want to do what my close friends think I
should do about my treatment plan." As recommended by Ajzen and Fishbein (1980),
scores on the two statements were multiplied to form a score for each of three social
norrn sources: family, friends, and relatives. Responses were re-coded as follows:
r23
Normative belief, Strongly àSrea = +2, Agree - +1, Neither agree nor disagree = 0,
Disagree = -1, Strongly Disagree=-2); Motivation, Strongly âfroo = 3, Agree = 2,
Neither agree not disagree - 1, Disagree = 0, Strongly Disagree = 0. High positive
scores on this range indicate a positive social influences, high negative scores indicate
negative social influences. The possible range of scores for this section is -18 to +18.
Intentions to Adhere. The sixth scale of the ADQ is a four 4 item measure of
respondents' commitment to their treatment plans. High scores on this scale indicate
strong intentions to adhere to treatment in the future; the possible range of scores for
this scale is 4 to 20.
Supports / Barriers. The seventh scale of the ADQ is a four item measure of barriers
preventing respondents from adhering to their treatment plans, and supports which
assist their adherence. High scores indicate a supportive environment for regimen
adherence; the possible scoring range is 4 to 20.
The psychometric properties of the Adherence Determinants Questionnaire were
assessed in a series of studies employing this measure to examine groups with three
different chronic illnesses (DiMatteo, Hays, et al. 1993). As shown in Table 3.1,,
these scales produced reasonable alpha reliability and homogeneity estimates. In the
present study, the alpha reliabilities of these scales were similar to those reported by
DiMatteo, Hays, and colleagues (Table 3.2).
t24
The Heølth Value Scøle.
Respondents' value of good health was assessed using the Health Value Scale (IIVS;
Lau, Hartman & Ware, 1986). The HVS is a four item measure of the importance
attached to good health. Respondents use a five-point Likert scale ranging from
Strongly Agree to Strongly Disagree (Figure 3.6). High scores indicate a high value
attributed to maintaining good health.
A series of studies reported by Lau and coworkers (1986) examined the reliability of
the HVS. Alpha reliabilities ranged from cx = 0.63 to or = 0.73, and the test-retest
reliability of the scale over an l8-month period was 0.86. In the present study,
adolescent and parent responses to the IfVS produced Chronbach's alphas of 0.69 and
0.72, respectively
The Diab ete s Knowledge Questíonnaire.
Knowledge of IDDM treatment was assessed using the Diabetes Knowledge
Questionnaire (DKQ). The DKQ is a 15 item measure assessing knowledge of
diabetes treatment. Respondents identify correct answers to questions asking about
aspects of IDDM management, using a multiple choice format. High scores indicate
good knowledge of IDDM management.
The DKQ used in this study was a slightly modified version of the original Diabetes
Knowledge (DKN) scale developed by Dunn and colleagues (1984). IDDM
management practices have advanced since the DKN scale was first developed,
125
making some of the items redundant. Despite an extensive review of the literature, no
more suitable diabetes knowledge assessment device was located. In light of this, the
investigator made slight adaptations the DKN to suit current diabetes management
techniques
Items in the original questionnaire which related to aspects of self-management that
are no longer practiced were deleted (e.g., insulin testing of urine). New items were
added after consultation with the Diabetes Clinical Nurse Consultant at the Diabetes
Outpatient Clinic at the WCH. These items were designed to reflect the current
management practices most equivalent to those deleted from the original scale.
Similarly, items relating to diet were updated to reflect current practice, after
consultation with the Dietitian attached to the Diabetes Team at the Women's and
Children's Hospital. As with the Diabetes Specific Adherence Scale, a draft version
of the new knowledge assessment device was circulated to members of the WCH
Diabetes Team
These procedures resulted in the new Diabetes Knowledge Questionnaire (DKQ). The
DKQ consists of the same number of items as the original scale. The internal
reliability of the revised scale was assessed using Chronbach's alpha; adolescent and
parent responses to the scale generated alpha reliabilities of 0.62 and 0.64,
respectively.
126
D e mo graphíc I nformation.
To provide information about the demographic characteristics of the sample, parents
completing the questionnaires were asked to provide information about participating
adolescents and their families. The questions asked in this section of the
questionnaire are shown in Appendix 4.6.
The Socínlly Desirable Response Set.
The influence of socially desirable responding on the measures used in this study was
assessed using the Socially Desirable Response Set (SDRS; RD Hays, Hayashi &
Stewart, 1939). The Socially Desirable Response Set is a five item measure designed
to estimate whether self-reports are associated with a tendency to portray an image of
desirable behaviour. Respondents use a five-point Likert scale ranging from
Definitely True to Definitely False (Figure 3.7). High correlations between scores on
self-reports and the SDRS are indicative of socially desirable responding on the self-
report measure.
RD Hays and colleagues (1989) reported the psychometric properties of the SDRS to
be satisfactory; finding alpha reliabilities of 0.66 and 0.68 in two different samples,
with a one-month test-retest reliability of 0.75.
I27
3.3.2 Objective Measure of Blood Glucose Monitoring.
Self monitoring of blood glucose is an important aspect of IDDM self-care (Newton &
Greene, 1995). Adolescents with IDDM are typically recoÍìmended to monitor blood
glucose at least twice daily. The results obtained from self-monitoring are used to
adjust insulin doses, and provide an indication of the current health status of the
adolescent.
The data downloaded from the electronic memories of blood glucose sensors were
coded to examine the tests performed in the four weeks prior to clinic attendance.
This data reflected the same time period as the self-report and parent reports of
adherence. The data were coded to assess BGM adherence in two ways: (1) the
number of days in the previous four weeks in which two or more blood glucose tests
were performed, and (2) the total number of blood glucose tests performed in the
previous four weeks. The former system of data coding was intended to reflect the
number of days on which the adolescents had adhered to their BGM recommendations
(see Section 3.1,).
3.3.3 Metabolic Control Measure.
Adolescents' level of metabolic control was determined by Glycosylated
Haemoglobin Al. (IIbAr") assays. These assays are recorded as a part of routine
clinical care in the hospital.
r28
HbA1" measurement provides a more stable indication of metabolic control than blood
glucose monitoring, which may vary from day to day. The level of haemoglobin 41"
present in blood provides an indication of the mean blood glucose concentration of the
preceding two or three months (Olson, 1988). HbAl" is widely accepted as the most
informative measure of metabolic control and health status amongst diabetic patients,
and is predictive of long term health outcomes for diabetic patients (Diabetes Control
and Complications Trial Research Group, 1995; Nathan, Singer, Hurxthal, Goodson,
1984). HbA1" is present at increased levels in people with diabetes mellitus (Olson,
1988; Scobie & Sönksen, 1984).
Glycosylation is the chemical reaction between glucose and haemoglobin, whereby
glucose and haemoglobin are joined together once the haemoglobin has been
synthesised by the erythrocyte (or red blood cell). A single blood sample that
measures glycosylated haemoglobin reflects the time-averaged blood glucose over the
preceding four to six weeks - the average age of the erythrocyte (Brink, 1987). The
erythrocyte is permeable to glucose, and within each erythrocyte glycosylated
haemoglobin is continuously formed at a rate proportional to the levels of ambient
glucose during its lifetime (Brink, 1987).
Glycosylation is a gradual process, and is irreversible. As a consequence, the results
of glycosylated haemoglobin (FIbAr.) assays, unlike blood glucose levels, are not
susceptible to fluctuations because of temporary changes in activity or food intake. A
reduction in HbAr. levels is interpreted as an indication of improved metabolic
control. This is achieved by monitoring blood glucose levels and adjusting insulin
dosage accordingly.
r29
Haemoglobin A1. typically comprises 3 to 6 per cent of the total haemoglobin in
persons without diabetes, and in excess of 6 Vo in persons with diabetes (Koenig, et al.
1916). For adolescents with IDDM,6 to 8 7oIIbA1" is considered to indicate good
control, 8 to 10 7o to indicate moderate control, and over l0 Vo to signify poor control
(Diabetes Control and Complications Trial Research Group, 1995). The measurement
of HbA1. was performed using Bayer Diagnostics DCA 2000@ Analysers, which have
a measurement range of 2.5 7o to 14 7o.
3.4 Statistical Analyses.
This section provides an overview of the data handling and statistical analyses
employed in this study. The specific techniques used for analyses are described in
greater detail in the text at the point at which they are utilised. A summary of the
statistics employed is given in Table 3.3.
3.4.1 Data Entry
The self-report, parent report, and HbA1" data were all entered into a database using
the FORMS data entry module for SIR database software version 3.2 (SIR, 1993). All
data was entered and re-entered for verification purposes. Blood Glucose Monitoring
data was downloaded from the sensors' memories and entered directly into the
database. The data was then exported into SPSS for'Windows, version 6.1 (SPSS,
tee4).
130
3.4.2 Basic Statistics.
Means, standard deviations (SDs), maxima, minima, and 95%o confidence intervals
(CI) were calculated for measures of adherence, adolescent autonomy, parent-
adolescent conflict, and other proposed antecedents of adherence. These are
presented, along with statistics about the demographic characteristics of the sample, in
Chapter 4. Where possible, demographic characteristics of the sample are compared
with Australian population data.
3.4.3 Exploratory Analyses.
Exploratory analyses in this thesis examined four major issues.
The first set of analyses are presented in Chapter 5 and discussed in Chapter 6.
These analyses examine the relationships between the different adherence measures
employed in this thesis. Correlations between adolescent self-reports, parent reports,
and BGM adherence observations are described. Further, the variation in reported
adherence according to demographic characteristics such as adolescents' age and
gender is reported. Other analyses in this chapter examine the variation in observed
adherence over time. These analyses are based upon the objective BGM adherence
data obtained from the blood glucose sensors. A Repeated Measures Analysis of
Variance (ANOVA) is employed to determine whether the observed BGM adherence
level varied over the time leading up to clinic attendance. The level of association
131
between each of the adherence measures and HbA1., the measure of metabolic control,
is examined
The second set of analyses, which are presented in Chapter 7 and discussed in
Chapter 8, test the first hypothesis of this thesis. The levels of association between
adolescents' and parents' reports of conflict and each of the measures of adherence are
examined. Further, the associations between reports of parent-adolescent conflict and
adolescents' metabolic control are examined, including multivariate analyses of the
relationship between metabolic control, adherence, and parent-adolescent conflict.
The third set of exploratory analyses are presented in Chapter 9 and discussed in
Chapter 10. These analyses test the second hypothesis of this thesis. The levels of
association between adolescents' and parents' reports of the adolescents' autonomy
and each of the measures of adherence are examined. Further, the associations
between reports of adolescent autonomy and adolescents' metabolic control are
examined, including multivariate analyses of the relationship between metabolic
control, adherence, and adolescent autonomy.
Finally, exploratory analyses examine the association between each of the measures of
adherence and the proposed antecedents of adherence obtained from previous studies
of adherence amongst adult populations. These analyses are presented in Chapter LL
and discussed in Chapter 12. The purpose of these analyses is to determine the utility
of these factors in predicting adherence in a sample of adolescents with a chronic
illness. Previous research has identified each of these issues as predictive of
adherence amongst adults with chronic illnesses.
132
In some instances, multiple comparisons were made between groups of respondents
involved in the study. For example, the variation in parent-adolescent concordance on
the Diabetes Specific Adherence Scale according to adolescents' age is examined in
Section 5.2.1,; this analysis involves a total of fifteen comparisons. Feild and
Armenakis (1974) have pointed out that in such circumstances the probability of
obtaining significant results (by making a Type I error) is increased. These authors
argue against the use of multiple tests without taking this increase into account. One
approach used to account for this is to proceed with the multiple significance tests, but
to regard as significant only those differences that are significant at a level lower than
the conventional 0.05 level. For example, the cr = 0.01 level may be used instead of
the g = 0.05 level. While this approach does have the disadvantage of increasing the
probability of making a Type II error (failing to reject the null hypothesis when it is
false), the benefit of the reduction in risk of Type I errors may be considered to be
more important (cf. Snedecor & Cochran, 1980; Winer, I91l). The statistical tests for
group differences become more conservative under this approach (Feild & Armenakis,
I974). This approach was generally used in the analyses presented in this thesis.
Similarly, where analyses of variance have detected significant variations between
groups, post hoc analyses were conducted to determine the location of the group
differences. In this thesis, Tukey's Honestly Significant Difference was used to
examine pairs of means to determine where group differences were located. Although
a range of other post hoc analyses are available, this approach has been recommended
by several authors, because of its broad applicability, moderate conservatism, and
t33
simplicity (Hatcher & Stepanski,1994; WL Hays, 1988; Norman & Streiner,1994;
'Winer, I97I)
3.4.4 Advanced Analyses.
More advanced analyses are also reported in each of the subsequent chapters. These
analyses build on the exploratory analyses overviewed in Section 3.4.3. As such,
these analyses are not described in detail here, but are detailed in the appropriate
sections of the subsequent chapters.
Finally, a multivariate model of adherence prediction is developed in Chapter L3 and
discussed in Chapter 14, by examining variance in adherence explained by the
combination of measures of psychosocial functioning and of proposed antecedents of
adherence.
t34
CHAPTER FOUR.
DEMOGRAPHIC AND PSYCHOSOCIALCHARACTBRISTICS OF THB SAMPLE.
This chapter describes the characteristics of the participants in the
study. This chapter consists of two sections. First, the demographiccharacteristics of the sample are described. Second, descriptivestatistics of the particípants' responses to the measures used in the
study are described.
4 DEMOGRAPHIC AND PSYCHOSOCIAL CHARACTERISTICS OF
THE SAMPLE
4.1 Sample Characteristics.
Subject recruitment was conducted in the Diabetes Outpatient Clinic at the WCH for a
period of twelve months, between June, 1995 and June 1996. During this time, every
adolescent meeting the eligibility criteria described in Chapter 3 was approached to
participate in the study. In total, 135 adolescents and their parents agreed to
participate. Only three eligible adolescents declined to participate, giving a response
rate of 97.8 7o.
Two caveats about the generalisability of this sample should be considered. First, four
adolescents who met the age and IDDM duration entry criteria for inclusion were
excluded from the sample due to intellectual (n = 3) or language (n - 1) difficulties.
Second, the adolescents involved in this sample all attended the Outpatient Clinics; it
is possible that other adolescents, who did not attend any Outpatient Clinics during the
study period, may have differed from those involved in the study. Although no
adolescents were known to have missed all of their Outpatient appointments during
this interval, it is possible that some adolescents who receive IDDM care only through
private medical practices may have differed from those involved in the sample.
However, there are believed to be very few adolescents in South Australia fitting this
category.
t36
Table 4.1 provides descriptive statistics of the obtained sample, Table 4.3 details the
occupational prestige and educational attainment of the parents of sample adolescents
Adolescents' Age and Gender Distributíons.
The distribution of the sample across the target age range was even, with
approximately equal groups of adolescents in each age strata (i.e., 12 year olds, 13
year olds, etc). A higher percentage of female than male adolescents were recruited
into the study (Table 4.1). Table 4.2 displays the adolescents' age by gender
distributions. The sample included larger numbers of 12 and 15 year old females than
males, although the gender distributions in the other age strata were approximately
balanced.
IDDM Duration.
The adolescents' time since diagnosis with IDDM was reported by parents.
Examination of a random selection of medical charts suggested that this information
was reported accurately. The impact of IDDM diagnosis on the functioning of
families, and on parents and adolescents, is thought to recede with time (Sheeran, et
al.1997). Adolescents diagnosed for less than one year were excluded from the study
because of the variable nature of the illness during the first 6-12 months after
diagnosis, when natural insulin may be sporadically produced (Burcelin, et aI. 1993;
Dorchy, 1995).
t37
period.
The mean duration of IDDM diagnosis is shown in Table 4.L. The distribution of
IDDM duration is slightly positively skewed (skewness = 0.54). This finding is not
surprising, as younger adolescents are unlikely to have been diagnosed for a long
Marital Status of Pørents.
A high proportion of the adolescents involved in the study were from two-parent
households, the majority of the remainder were living in single-mother households
(Table 4.1). This pattern was similar to South Australian (dual parent ='79.6 7o,
single mother = 18.1 7o, single father = 2.3 7o) and Australian (dual parent = 81.0 7o,
single mother = 16.6 7o, single father = 2.3 7o) data for families with dependent
children collected by the Australian Bureau of Statistics at the time of the study
(Australian Bureau of Statistics, 1996).
Information about whether the parents involved in the study had entered second (or
later) marriages, and if so whether these marriages had been formed before or after the
adolescents' diagnosis with IDDM, was not collected. This could be an informative
point for future investigations.
Famíly Síze.
Families ranged in size from one to six children under the age of twenty. The average
size of families was 239 children (SD = 1.04). Due to differences in the classification
138
system used by the Australian Bureau of Statistics, it was not possible to compare
these data with general population figures.
Occapatíonøl Prestige and Educatíonal Attainment of Parents.
The distribution of occupational prestige of parents was coded using Daniel's (1983)
Australian Occupational Prestige Scale. Lower ratings on the scale equate with more
prestigious occupations. A large proportion of mothers, and one father, identified
"home duties" or "domestic duties" as their occupation. The Daniel Scale codes this
response as a separate category. Parents identified as students, unemployed, retired or
pensioners were grouped into a single category (Table 4.3)
The majority of fathers were identified in occupations of middle prestige, while most
mothers were identified as performing home duties or occupations of middle prestige.
Due to differences in the classification system used by the Australian Bureau of
Statistics and the Daniel scale, it was not possible to make meaningful comparisons of
this sample with the general population.
4.1.1 Comparison of Complete Thesis Sample and Sample Providing BGM Data,
As described in Chapter 3, BGM data were obtained on seventy-five adolescents.
BGM data were only obtained from those participants using a MediSenserM blood
glucose sensor. Because these sensors were supplied to adolescents with poor
metabolic control (see Chapter 3), it was expected that the mean l{bArc of these
739
adolescents would be higher than that of the remaining 60 adolescents. Further, it is
possible that the adherence of the adolescents supplied with MediSenserM sensors may
have differed from the other adolescents
Student's r tests were performed to determine whether the adolescents from whom
BGM data were collected differed from those adolescents from whom this data could
not be collected.
Table 4.4 displays the means (t SDs) for each group, and the significance levels of the
/ tests. The adolescents from whom BGM data were collected did not differ
significantlyl from the rest of the sample in terms of age or gender distributions.
Reports of diabetes-specific adherence (DSAS) obtained from the adolescents in each
group and from their parents were similar.
However, the mean duration of diagnosis of IDDM was significantly greater for those
adolescents from whom BGM data were collected than for those from whom this
information could not be obtained. This suggests that poor metabolic control in these
adolescents may be linked to the amount of time elapsed since diagnosis
As expected, the mean HbA1. result amongst the adolescents from whom BGM data
were collected was significantly higher than that of the remaining adolescents.
Interestingly, the reports of general adherence to medical treatment (GAS) obtained
from the adolescents from whom BGM data were collected, as well as the reports
from the parents of these adolescents, were significantly lower than the reports
r40
obtained from the remaining adolescents and parents. It is possible that the lower
level of adherence reported by the adolescents from whom BGM data were collected
was responsible for their poorer metabolic control
4.2 Descriptive Statistics of Sample Responses.
This section provides basic statistics for the data obtained in the study. Descriptive
statistics (e.g., means and SDs) are provided for the various measures used in the
study, initially in relation to the entire sample, and subsequently in relation to various
demographic characteristics. Responses to each of the measures in the present study
will be compared with responses obtained on these measures in previous research.
Finally, the relationship between scores of Socially Desirable Responding with the
various questionnaire-based measures will be presented.
4.2.I Measures of Adherence to Medical Recommendations.
This study used two questionnaire measures of adherence to medical regimens, the
General Adherence Scale (GAS), and the Diabetes Specific Adherence Scale (DSAS)
A third measure of adherence, specific to blood glucose monitoring, was assessed by
means of the electronic recording of BGM on blood glucose sensors designed with
this capacity. In this section the descriptive statistics of responses to each of these
measures by the study participants are presented.
I Throughout this thesis, except where otherwise stated, a = 0.05 significance levels are employed.
r4r
4.2.1.1 The General Adherence Scale.
The range of responses obtained on the GAS from adolescents and parents, and their
mean scores ( t SDs) are shown in Table 4.5. Responses on the GAS ranged widely,
with mean scores falling above the scale centre-point.
Responses to the GAS were not associated with adolescents' gender or age. A
summary of responses by adolescents and parents to the GAS according to the
adolescents' gender and age is shown in Table 4.5.
The GAS has been used in several previous investigations in North America. First,
the Medical Outcomes Study prospectively investigated the health of 2l8I adults with
chronic conditions (RD Hays, et al. 1994; AL Stewart, et al. 1989; AL Stewart &
'Ware, 1992: Tarlov, et al. 1989; Wells, et al. 1989). In this study, mean responses to
the GAS according to age strata varied between zI.L (SD = 5.8) for 18 - 44 year olds,
and 25.4 (,SD = 4.9) for those over 75 years of age (DiMatteo, et aI. 1992). The mean
responses and the degree of variation found in the present study were consistent with
these results. The Medical Outcomes Study did not investigate 12 to 18 years olds,
preventing direct comparison with the present study
DiMatteo, Hays, and colleagues (1993) also examined the adherence of several groups
of adult patients (total n = 465). The level and distribution of adherence reported in
these samples were similar to those found in the present study. Although, the
investigation by DiMatteo and colleagues examined adult patients with conditions
other than IDDM, the similar spread of responses obtained, both from the adolescents
t42
and parents in this study, suggests that this scale is acceptable for use with adolescent
populations
An Australian study has employed the GAS in an investigation of parents' adherence
to their young children's asthma treatment (Jilbert, 1995). This study examined
parents' adherence to asthma regimens prescribed for children between 5 and 12 years
of age. In this study, parents' reported adherence levels were higher than in the
previous investigations, with a mean GAS score of 27.2 (SD = 3.2). However, the
sample in this study was small (n = 47). It is possible that the higher reported
adherence in this study may reflect parents' greater concern for their child's health
than for their own health.
The present study found that parents' and adolescents' reports of adherence were very
similar, and that the level of adherence described was consistent with the previous
studies by DiMatteo and colleagues (DiMatteo, Hays, et al. 1993; DiMatteo, et al.
1992). The very similar mean responses to the adherence measures suggests that these
measures may be reliably completed by adolescents and parents. Adolescents and
parents completed the measures independently.
4.2.1.2 The Diabetes Specific Adherence Scale.
As may be seen in Table 4.6, the range of responses obtained on the DSAS from
adolescents and parents were similar. Mean responses were above the centre-point for
143
both groups of respondents, indicating that adherence had typically been reported for
A good bit of the time on this questionnaire
Table 4.6 displays a summary of responses by adolescents and parents to the DSAS
according to adolescents' gender and age. There was no significant association
between adolescents' gender and responses made on the DSAS, although male
adolescents and their parents reported slightly higher levels of adherence than did
female adolescents and their parents. Responses to the DSAS by adolescents and
parents were also unrelated to the adolescents' age. The link between adolescents'
demographic characteristics and adherence reporting is more closely examined in
Chapter 5.
Because the DSAS was slightly modified to address current treatment of Insulin-
Dependent Diabetes, it is not possible to compare the responses obtained from
adolescents and parents on this scale with responses obtained in previous research.
4.2.1.3 Blood Glucose Monitoring.
Blood Glucose Monitoring data were coded in two forms: (1) the number of
appropriate days of blood glucose monitoring in the previous four weeks; and (2) the
total number of blood glucose tests performed in the previous four weeks. As
described in Chapter 3, and following the recommendations given to the participating
adolescents, appropriate days of blood glucose monitoring were clinically defined as a
minimum of two blood glucose tests per day.
144
A summary of the obtained BGM data is presented in Tables 4.7 and 4.8. It should be
noted that the maximum possible number of tests is shown as one hundred and twenty
five, as this is the memory capacity of the Companion 2rM sensors. Table 4.7 displays
the BGM data as number of tests performed in the previous four weeks, while Table
4.8 displays the data as appropriate days of BGM in the previous four weeks.
The observed level of adherence to BGM varied widely. These adolescents performed
a mean of 37.I blood glucose tests in the previous four weeks (SD = 28.5),
representing a mean of 11.9 days of appropriate testing (SD = 10.3).
In contrast to the questionnaire based measures of adherence, observed BGM
adherence was slightly higher amongst female adolescents than male adolescents.
This difference was not large; a /-test analysis of these results did not reach statistical
significance. Adherence to BGM was significantly related to adolescents' age;
younger adolescents' displaying greater adherence to BGM than older adolescents (F
= 3.08; df = 5,69:. p = 0.02).
4.2.2 Measures of Psychosocial Functioning
This study involved the use of two measures of psychosocial functioning, the Conflict
Behavior Questionnaire (CBQ), and the Autonomous Functioning Checklist (AFC).
In this section the descriptive statistics of responses to each of these measures by the
study participants are presented.
t45
4.2.2.1 The Conflict Behavior Questionnaire.
Summary statistics for responses to the CBQ are shown in Table 4.9. Obtained scores
on the parent and adolescent forms of this measure varied widely. However, the mean
scores produced by both groups of respondents were low - the mean score obtained
from parents was 5.2, and from adolescents was 5.7 - from a possible scoring range of
0 - 20. Responses on the CBQ were not significantly related to adolescents gender or
age. The CBQ also generates a combined score, by summing the responses of
adolescents and parents. Table 4.10 displays the scoring distributions of the
combined CBQ scores.
Normative data for the CBQ, produced in the United States, are presented in Table
4.L1. Normative data for this scale produced in Australia are not currently available
This data presents mean (t SD) scores for families rated as exhibiting clinically
significant levels of distress and conflict, and for families without this level of
conflict. Previous studies have found that the CBQ discriminates families with
clinically significant levels of distress and conflict from families with less conflict
(Pnnz, et al. 1979; Robin & Foster, 1984; Robin & Weiss, 1980). Note that although
the normative data distinguishes mother-adolescent and father-adolescent conflict, in
the present study the number of participating fathers was small, so the data were
merged to produce parent-adolescent data (see also Chapter 7)
t46
The data obtained in the present study indicate that the level of conflict reported by
adolescents and parents was lower than in the families deemed clinically distressed in
the normative data. The present data also suggest that the level of conflict
experienced by participants in this study was greater than that of the normative sample
of families with subclinical levels of distress. This finding suggests that the families
of adolescents with IDDM may experience more conflict than the general population
of families with adolescents, but less conflict than those families requiring clinical
intervention.
4.2.2.2 The Autonomous Functioning Checklist.
Summary statistics for responses to the Autonomous Functioning Checklist are
displayed in Table 4.L2. The scoring distributions and scoring ranges on the total
scale of the AFC according to adolescents' gender and age are shown in Table 4.13.
To determine whether adolescents' autonomy, as reported by adolescents and parents,
was associated with the adolescents' age, a One-Way Analysis of Variance was
performed. Adolescents' and parents' reports of adolescents' autonomy were both
significantly associated with the adolescents' age, such that older adolescents were
reported to behave more autonomously (Adolescents: F = 5.I3; df = 5,126i p <
0.0003. Parents: F = 7.99; df = 5,133; p < 0.001). Similarly, to test the relationship
between reports of autonomy and adolescents' gender, /-tests were performed.
Adolescents' reports of autonomy \ryere higher amongst female adolescents than male
adolescents (t = -2.38, df = 125, p = 0.02); parents' of female and male adolescents did
not provide significantly different reports of their adolescents' autonomy. The finding
t47
that adolescents' reported autonomy was associated with their age was consistent with
the findings reported by Sigafoos and colleagues (1988) in developing the scale. This
finding also provides evidence for the concurrent validity of this measure in this
population (Sigafoos, et al. 1988)
Mean scores on each of the four subscales were similar for adolescents and parents.
The distributions of responses to the four AFC subscales in relation to adolescents'
gender and age are displayed in Tables 4.14 to 4.17
Table 4.14 displays summary statistics for the first subscale of the AFC, Self- and
Family-Care. Responses on this autonomy subscale by both adolescents and parents
were significantly related to adolescents' age, responses from older adolescents and
their parents indicating greater autonomy than those of younger adolescents
(Adolescents: F = 2.43; dÍ = 5,126; p = 0.04. Parents: F = 5.94; df = 5,128;
p < 0.001). No significant differences were found between responses from male
adolescents and female adolescents, nor between their respective parents.
Summary statistics for the second subscale of the AFC, Management Activity, are
displayed in Table 4.15. One-way analysis of variance of responses to this AFC
subscale according to adolescents' age produced significant results, both from
adolescents' and parents' responses, indicating greater autonomy in older adolescents
than in younger adolescents (Adolescents: F = 12.68; df = 5,125; p < 0.001. Parents:
F = 9.06; df = 5,129; p < 0.001). For this subscale, adolescent responses differed
significantly between males and females, with female adolescents typically achieving
r48
higher scores (t = -2.84, df = I29, p = 0.005). In contrast, parent responses for female
and male adolescents did not significantly differ
Table 4.L6 presents the summary statistics for the third subscale of the AFC,
Recreational Activity. Responses to this subscale, both from adolescents and from
parents, were not significantly related to adolescents' gender or age.
Table 4.17 presents the summary statistics for responses to the final subscale of the
AFC, Social and Vocational Activity. Adolescents' age was significantly related to
the responses of both parents and adolescents, both groups of respondents indicating
greater autonomy on this subscale for older adolescents than for younger adolescents
(Adolescents: F= 3.62;df =5,I2J;P=0.004. Parents: F=4.141. df =5,I2);p=
0.002). Adolescents' gender, however, did not significantly relate to responses on this
subscale.
Table 4.18 displays the normative mean (t SDs) scores produced by parents in a
sample of 349 families (Sigafoos, et al. 1988). The comparison of the mean results
for each age strata in the present study with the normative data presented by Sigafoos
and coworkers suggests that the adolescents in the present study experienced lower
levels of autonomy than adolescents of the same age in the previous study. There are
at least three possible explanations for this finding. First, the sample of adolescents
involved in the Sigafoos study were not selected on the basis of chronic medical
conditions. It is possible that the lower level of autonomy reported in the present
study is the result of the limitations imposed by the chronic illness experienced by
these adolescents. A second possible explanation is that the difference in mean scores
149
produced in these studies is the result of the different locations in which the studies
were conducted. Sigafoos and colleagues collected their data in the United States,
while the present study was conducted in Australia. It is possible that American
adolescents experience, or are perceived to experience, greater autonomy than
Australian adolescents. Further use of this measure with Australian samples will
clarify this point. A third possible explanation for this finding is that the clinic setting
in which the AFC was completed in the present study influenced the responses of
participants. Sigafoos and colleagues recruited families from a variety of
organisations. Unfortunately, these authors do not indicate whether the AFC was
completed at home or in the institutions through which families were contacted.
Another study employing the AFC was conducted by Howe and colleagues (1993).
This study involved families of 214 adolescents aged 12 to 18 years; 80 with chronic
neurological conditions (cerebral palsy, epilepsy, hydrocephalus and spina bifida), 85
with non-neurological chronic conditions (vision impairment, cystic fibrosis, IDDM
and arthritis), and 49 controls. Adolescents with chronic conditions showed
significantly lower levels of autonomy than their peers. Unfortunately, Howe and
colleagues used a different scoring system, preventing the direct comparison of
results. However, the reduced autonomy shown by adolescents with chronic
conditions in the study by Howe and colleagues suggests that the lower levels of
autonomy reported for adolescents in the present study when compared with Sigafoos'
normative data may be the result of the limiting influence of their IDDM.
150
4.2.3 Measures of Proposed Antecedents of Adherence
As described in Chapter 3, this study utilised three measures of antecedents of
adherence, which have been found to be predictive of adherence in samples of
chronically ill adults. These were the Adherence Determinants Questionnaire (ADQ),
the Health Value Scale (HVS), and the Diabetes Knowledge Questionnaire (DKQ).
This section describes the distributions of scores produced by study participants on
each of these measures.
4.2.3.1 The Adherence Determinants Questionnaire.
Mean (t SD) scores for each scale of the Adherence Determinants Questionnaire are
displayed in Table 4.19. Parent and adolescent responses were largely similar, in
terms of mean scores and scoring distributions. The ADQ consists of seven scales.
The distributions of parents' and adolescents' responses to each of these scales,
according to the adolescents' gender and age are displayed in Tables 4.20 to 4.26.
Table 4.20 displays summary statistics for the first scale of the ADQ, Interpersonal
Aspects of Care. Scores obtained on this scale tended to be above the midpoint,
indicating good reported rapport between health professionals and adolescents and
their parents. Scores obtained on this scale by both adolescent and parent respondents
were not related to adolescents' age. Similarly, scores obtained by both groups of
respondents were not significantly related to adolescents' gender.
151
The second scale of the ADQ is Perceived Utility. Summary statistics from this scale
are displayed in Table 4.2L Responses from both groups of informants indicated
generally high levels of perceived utility. Adolescent age was not significantly related
to scores on the Perceived Utility scale from either adolescents or parents. Similarly,
adolescent gender was not significantly related to adolescent or parent scores on this
scale.
The third scale of the ADQ is Perceived Severity. Table 4.22 presents the summary
statistics of results obtained from this measure. Adolescent respondents typically
produced scores in the lower half of this scale, as did their parents. However, patents
more frequently produced scores approaching the scale midpoint. This result suggests
that adolescents in the study tended to consider diabetes to be a less severe disease
than their parents. Scores on the Perceived Severity scale obtained by adolescent and
parents were unrelated to the adolescents' age. Scores obtained by adolescents on this
measure were unrelated to gender, although parent scores were significantly related to
their adolescent's gender, the parents of male adolescents reporting higher levels of
perceived severity than the parents of female adolescent (t = 2.56, df = 130,p = 0.01).
Perceived Susceptibility is the fourth scale of the ADQ. Summary statistics of the
results obtained on this measure are shown in Table 4.23. Responses obtained from
both adolescents and parents, were generally distributed within the upper half of the
scoring range. This result suggests that both participating adolescents and their
parents deem it likely that the adolescents will experience hyperglycaemia or
hypoglycaemia in the future. Results on this measure were unrelated to adolescents'
age or gender.
r52
The fifth scale of the ADQ is Subjective Norms. The scoring of this scale differs from
the other scales of the ADQ, as described in Chapter 3. Both adolescent and parent
scores on this scale were narrowly distributed; mean scores produced from both
groups of respondents were slightly below zero, the scale midpoint (Table 4.24). The
most common score produced by both adolescents and parents was zero, a score
which suggests minimal influence from respondents' social environment on adherence
to medical recommendation to the diabetes regimen. The distributions of scores
produced by adolescents and parents on this scale were not related to adolescents' age.
Similarly, the distributions of scores produced by male and female adolescents and
their parents were not significantly different.
The penultimate scale of the ADQ is Intentions to Adhere. Table 4.25 displays the
summary statistics of the results obtained using this scale. Scores on this scale were
most frequently above the scale midpoint, suggesting that most informants did intend
to adhere to their regimen in the future. Adolescent age was not significantly related
to adolescent or parent scores on this scale. Similarly, adolescent gender did not relate
to scores obtained on this scale.
The final scale of the ADQ is Supports / Barriers. Adolescent and parent responses on
this scale are described in Table 4.26. Scores on this scale were generally above the
midpoint, indicating the presence of supports to adherence and/or the absence of
barriers to adherence. Adolescent age was not related to either adolescent or parent
scores on this scale. Similarly, adolescent gender did not relate significantly to scores
on this scale by either group ofrespondents.
153
Table 4.27 displays mean scores (t SDs) for the scales of the ADQ in a series of
studies reported by DiMatteo and colleagues, in developing this measure @iMatteo,
Hays, et al. 1993). The ADQ was used in samples of patients with various chronic
conditions. Normative data for this measure cannot be reported for these scales, as
they are used in relation to specific regimens. However, by comparing the data
reported in Table 4.19 with the adult self-report data obtained by DiMatteo and
coworkers (Table 4.27), it may be seen that the mean level and distributions of
responses to the scales of the ADQ in the present study were generally consistent with
those in the studies reported by DiMatteo and colleagues. Responses to the
Interpersonal Aspects of Care, Perceived Utility, and Supports / Barriers scales were
similar to those in the studies of DiMatteo and colleagues. Adolescents' reports of
Perceived Severity were lower in the present study than the responses obtained by
DiMatteo and colleagues, although parents' responses were similar to those in the
previous work. Perceived Susceptibility, as reported by adolescents and parents in the
present study, was higher than in the previous investigation, while Intentions to
Adhere were reported to be lower amongst the adolescents in the present study than
amongst the participants in the previous work. These differences may be a function of
the differing nature of IDDM and its treatment from the conditions examined in the
previous investigation, or may reflect the different perceptions and influences on
adherence for adolescents and adults.
t54
4.2.3.2 The Health Value Scale.
The Health Value Scale was employed in this study as a measure of the importance of
health to participants. Table 4.28 contains the suÍìmary statistics of the results
obtained with this measure. Scores obtained from both adolescents and parents most
frequently indicated a high value attributed to health. This result was unrelated to
adolescent age or gender.
Table 4.29 displays the mean scores (t SDs) for the Health Value Scale in studies
performed by Lau and colleagues (1986), and by DiMatteo, Hays, and coworkers
(1993). The samples utilised by Lau and colleagues completed the four-item HVS,
with scoring ranges of either 4 to 20 or 4 to 28 (see notes to Table 4.29). The samples
utilised by DiMatteo and coworkers completed a longer six-item version, with a
scoring range of 6 to 30. The present study employed the original four-item, 5-point
Likert version, with the resulting scoring range of 4 to 20. The original version was
used in this study because of the availability of more data relating to its reliability and
validity.
An examination of the mean scores in each of the previous samples shows that mean
responses on each version of the scale were close to the three-quarter point of the
scale. The mean scores produced by parents and adolescents in the present study were
also close to the scale's three-quarter point. This finding suggests that the health
value of the adolescents and parents participating in this study was similar to that of
155
the previous samples examined by Lau, et al. (1986) and DiMatteo, Hays, et al.
(1ee3).
4.2.3.3 The Diabetes Knowledge Questionnalre
The final questionnaire addressing antecedents of adherence in this study was the
Diabetes Knowledge Questionnaire. Summary statistics of the results obtained on this
measure are shown in Table 4.30. Parent knowledge of diabetes was on average
slightly higher than adolescent knowledge, as assessed by this measure
Adolescent age did not significantly relate to the scores obtained by either adolescents
or their parents. However, although the scores obtained by male and female
adolescents did not significantly differ, the scores obtained by parents of male
adolescents were significantly higher than those produced by the parents of female
adolescents (t = 2.91, df = 132,p = 0.004)
These results could not be compared with any normative data, for two reasons. First,
the original Diabetes Knowledge Scale produced by Dunn and colleagues (1984) was
not published with normative results. Second, the knowledge questionnaire used in
this study had been slightly modified to reflect current IDDM treatment practices (see
Chapter 3)
156
4.2.4 Metabolic Control
Adolescents' metabolic control was assessed in this study by venous Haemoglobin
A1s, âssâ)ed in Outpatient Clinics. Mean assay values, and distributions of assay
levels, are displayed in Table 4.31. The mean fIbA1. for the study sample was 9.6 7o
(S¿ = 1.8). There was no significant relationship between adolescent age and HbA1"
results. Male adolescents produced a mean HbA1. 0.5 percent higher than female
adolescents; this difference was not statistically significant.
4.2.5 Socially Desirable Responding.
The Socially Desirable Response Set (SDRS) was included in this study as a measure
of the extent to which participants gave socially desirable answers. Socially Desirable
responding has been defined in terms of providing responses which project an image
that one behaves in a socially approved manner or feels socially approved feelings
(RD Hays, et al. 1989)
This measure is employed to estimate whether the various questionnaire measures
involved in the study appear to be associated with socially desirable responding. The
level of correlation between self-report measures and the SDRS is interpreted as an
indication of the degree to which respondents are responding in a socially desirable
manner on that measure.
ß1
This section presents the analyses of correlations between the SDRS and the
questionnaire measures. The Pearson correlations between scores on the adolescent
completed and parent completed questionnaires and scores on the SDRS are shown in
Table 4.32.
Socially Desírable Respondíng in Measures of Adherence to Medícal
Recommendations
As may be seen in Table 4.32, the questionnaire measures of adherence did not
strongly correlate with the SDRS. Adolescent scores on the Diabetes Specific
Adherence Scale correlated significantly with SDRS scores at the p < 0.05 level, but
not at the p < 0.01 level. Adolescent scores on the General Adherence Scale, as well
as parent scores on both the General Adherence Scale and the Diabetes Specific
Adherence Scale, were not statistically significantly correlated with SDRS scores.
Socíally Desirable Responding in Measures of Psychosocíøl Functioning.
The correlations between the SDRS and the psychosocial measures are shown in
Table 4.32. Adolescent scores on the AFC were associated with the SDRS at
statistically significant levels; the Management Activity and Social & Vocational
Activity subscales were particularly closely related to the measure of socially desirable
responding. Parent scores on the AFC were less closely associated with scores on the
measure of socially desirable responding, although both the Management Activity and
the Recreational Activity subscales were significantly correlated with SDRS scores.
158
Correlations between scores on the CBQ and the SDRS by both adolescents and
parents did not reach the traditional cutoffs for statistical significance.
Socíally Desírable Respondíng in Measures of Antecedents of Adherence.
As may be seen in Table 4.32, adolescent scores on several subscales of the ADQ
were significantly correlated with scores on the SDRS. In particular, the Perceived
Utility and Intentions to Adhere subscales, when completed by adolescents, were
strongly associated with responses to the SDRS. In contrast, responses to the ADQ
subscales obtained from parents were not associated with their responses to the SDRS
at traditional statistically significant cutoff levels.
Similarly, adolescent responses to the Health Value Scale were strongly correlated
with responses to the SDRS, while parent responses on the same scale were only
weakly correlated with SDRS scores.
The Influence of Socially Desirøble Respondíng in the Present Study.
In sum, the levels of association between responses on the SDRS and on the
adolescent and parent report measures in this study were not large. Although some
statistically significant associations were detected, this was not unexpected with the
large number of associations being examined. Overall, these results suggest that
socially desirable responding had a minor influence on the responses of participants,
and that the responses of the parents were less likely to be influenced by socially
desirable responding than those of the adolescents.
159
CHAPTBR FIVE.
RESULTS: THE ASSESSMENT OF PATIENTADHERENCE.
This chapter presents the results pertaining to the measurement ofpatient adherence. The first section of this chapter, Sectíon 5.7,
describes the relationship between the scores obtained on each of the
adherence measures employed in this study. The second section of the
chapter, Sectíon 5.2, describes the relationship between adherence anddemographic characteristics of the sample. The third section, Section5,3, examines the variation in adherence over time, using the observedBGM adherence data. The results presented in this chapter arediscussed in Chapter 6.
Parts of this chapter were published in:
Fotheringham MJ, Couper JJ, Sawyer MG. (1997). Associations between adolescents' metaboliccontrol, IDDM adherence and objective data of blood glucose monitoring. Proceedings of the
Australian Diabetes Society, 1997 A93.
5 RESULTS: THE ASSESSMENT OF PATIENT ADHERENCE.
5.1 The Relationship Between Different Measures of Adherence.
Pearson product-moment correlations were employed to examine the level of
association between scores on the different measures of adherence. These analyses
are presented to examine (1) the relationships between scores on the questionnaire
measures of adherence, and (2)the relationships between scores on the questionnaire
measures of adherence and observed blood glucose monitoring adherence.
Distributions of scores on each of the measures of adherence are displayed in Table
5.1.
The relationships between questionnaire measures of adherence were grouped into
three sections, (1) relations between adolescent repofis of adherence, (2) relations
between parent reports of adherence, and (3) relations between adolescent and parent
reports of adherence. These relationships are examined in turn. The relationship
between questionnaire measures of adherence and the observed BGM adherence is
then examined.
t6r
5.1.1 The Relationship Between Adolescent Reports of Adherence.
The effect sizel of the relationship between adolescent reports of diabetes-specific
adherence (DSAS) and adolescent reports of general adherence (GAS) was large
(Table 5.2). Possible interpretations of this association are discussed in Chapter 6.
To investigate the possibility that adolescents' responses to these measures were
similarly influenced by social desirability biases, the variation in reported adherence
level to the different regimen activities identified in the DSAS was examined. The
mean responses (t SDs) for each of the items of the DSAS and to the items of the
GAS are displayed in Appendices 8.1 and 8.2. Mean scores obtained from
adolescents for the items of the DSAS varied. The highest mean rating was found on
the item asking about adherence to insulin administration (item 1). The lowest mean
rating of adherence was found for the item asking about BGM before or after exercise
(item 8). Correlations between adolescent responses to items of the DSAS and GAS
are shown in Appendices 8.3 and B.4.
To further explore the variations in adolescents' reports of adherence levels, a
Wilcoxon Matched-Pairs Signed-Ranks tests was performed. This nonparametric
statistic was developed for use with paired-sample data. It has the advantage of
making few assumptions about the distributions of scores, and has been described as
the nonparametric counterpart to the Student's r rcst (Gibbons & Chakraborti, 1,992).
The Wilcoxon test requires that the paired scores under investigation be on the same
I In this thesis, correlational effect sizes will be described according to the conventions recommended
by Cohen (1988). These are: small, r= 0.10; medium, r= 0.30; large, r = 0.50.
t62
scale. To facilitate the comparison of reports obtained on the different adherence
measures, the scores obtained on each measure were transformed linearly onto a
0 - 100 scoring range. This methodology was employed by DiMatteo, Hays and
colleagues (1993), the developers of the GAS and the original DSAS. The
transformations ensure that each of the measures are on the same metric, without
changing the underlying properties of the score distributions (central tendency and
variability) (Nunnally & Bernstein, 1994). These transformations are of the form
X'=bX +ø, where X' is the transformed score, X is the original score, and b and a
are the multiplicative and additive consonants of the equation. Table 5.3 displays the
scoring distributions of each of the measures of adherence, before and after linear
transformation.
The Wilcoxon signed-ranks test compared the scores produced by adolescents on the
DSAS and on the GAS. Ninety-seven participating adolescents produced higher
scores on the General Adherence Scale than on the Diabetes Specific Adherence Scale
(mean rank 72.1), while only 33 of the adolescents produced higher scores on the
specific measure than on the general scale (mean runk 46.2). There was one case that
produced equal scores on the two scales, while four cases had missing data making
them ineligible for this analysis. These results indicate a significant difference
between adherence levels indicated on the GAS and DSAS k= -6.35, p<0.0001,
Table 5.4).
r63
s.2)
5.I.2 The Relationship Between Parent Reports of Adherence.
The effect size of the positive relationship between parent reports of diabetes-specific
adherence (DSAS) and parent reports of general adherence (GAS) was large (Table
The examination of the parents' responses to the individual regimen activities
identified in the DSAS provides further information about this association.
Appendices 8.L and 8.2 displays the parents' mean responses (+ SDs) to each of the
items of the DSAS and to the items of the GAS.
Mean responses to these items, obtained from parents, were varied. As with the
adolescent responses, the highest mean rating for an item by parents was found on the
item addressing adherence to insulin administration (item 1). The lowest mean parent
score was found on the item asking about adherence to BGM before or after exercise
(item 8). Correlations between parent responses to items of the DSAS and GAS are
shown in Appendices 8.5 and 8.6
To further explore the variations in parents' reports of adherence levels, a'Wilcoxon
Matched-Pairs Signed-Ranks test was performed. Ninety-six of the participating
parents produced higher scores on the General Adherence Scale than on the Diabetes
Specific Adherence Scale (mean rank 71.1), while 31 of the parents produced higher
scores on the specific measure than on the general scale (mean rank 56.5). There were
no cases that produced equal scores on the two scales. Two cases had missing data
164
making them ineligible for this analysis. These results indicate a significant
difference between adherence levels indicated by parents on the GAS and DSAS
(Table 5.4).
The consistency of the association between the DSAS and GAS amongst both
adolescents and parents suggests that these groups of respondents answered the two
measures of adherence in similar ways. Section 5.L.3 presents the examination of the
association between adolescent and parent reports of adherence.
5.1.3 The Relationship Between Adolescent and Parent Reports of Adherence.
The relationship between adolescent and parent reports on the GAS was examined
using a Pearson correlation. The relationship between adolescent and parent reports
on the DSAS was also examined in this manner (Table 5.2). The effect size of the
association between adolescent and parent reports on the GAS was large, as was the
effect size of the association between adolescent and parent reports on the DSAS.
Similar patterns of responses were produced by adolescents and parents to each item
of the DSAS. Appendix 8.7 displays the frequency of responses to each item of the
DSAS by adolescents and parents. Correlations between adolescent and parent
responses to items of the DSAS and GAS are shown in Appendix 8.8 and 8.9.
The significance of differences between scores obtained from adolescents and parents
was examined, using the Wilcoxon Matched-Pairs Signed-Ranks Test. These
165
analyses were perfotmed separately for the General Adherence Scale and the Diabetes
Specific Adherence Scale
There were 55 adolescent-parent dyads in which the adolescent produced a lower
GAS score than did their parent (mean rank 53.1), and 58 dyads in which the
adolescent produced the higher score (mean rank 60.7). Seventeen dyads elicited
equal scores from adolescents and parents, and there were five dyads in which scores
could not be calculated for at least one member (4 cases of missing adolescent data; 1
case of missing parent data). These results did not indicate a significant pattern of
differentiation between adolescents' and parents' ratings of adherence on the GAS
(Table 5.4).
The results of the'Wilcoxon test of adolescent and parent responses to the DSAS were
similar to the analysis of responses obtained on the GAS. Again, adolescents
produced neither consistently higher nor lower scores than their parents. There were
62 cases of adolescents scoring more highly on the DSAS than their parents (mean
rank 57.1), while in 55 cases the adolescents produced lower scores than their parents
(mean rank 61.2). Again, in 17 of the adolescent-parent dyads the scores produced by
each participant were equal. The analysis was not performed on one dyad for which
the parent score was missing. These results also did not indicate a significant pattern
of differentiation between adolescents' and parents' ratings of adherence (Table 5.4).
r66
5.1.4 The Relationship Between Questionnaire Measures of Adherence and the
Observed BGM Adherence.
The next set of analyses performed were designed to examine the relationship
between adolescents' and parents' responses to the DSAS and GAS and the BGM
adherence information obtained from the electronic memory of blood glucose sensors.
BGM adherence was coded in terms of the number of days of appropriate blood
glucose monitoring during the prior four weeks. This process is described in Chapter
3. The initial analyses performed to explore these relationships were Pearson
correlations.
The adolescent reported general adherence (GAS) was moderately correlated with the
observed BGM adherence, while parent reports of general adherence were slightly
more closely associated with observed BGM adherence (Table 5.5). The correlations
between both adolescent reported diabetes-specific adherence (DSAS) and observed
BGM, and between parent reported diabetes-specific adherence and obse¡ved BGM
adherence data, were large (Table 5.5).
5.2 The Variation in Reported Adherence According to Demographic
Characteristics.
This section presents a series of analyses which were performed to determine whether
the level of reported adherence varied in relation to demographic characteristics of the
sample, such as adolescents' age or gender. These analyses included Pearson
r67
correlations, Analyses of Variance, and Student's /-tests. Where significant
associations were detected, further analyses were employed to explore these
associations
The analyses presented in this section address (1) the variation of reported adherence
according to adolescent age, (2) the variation of reported adherence according to
adolescent gender, (3) the variation of reported adherence according to adolescent
IIbAls level, (4) the variation in reported adherence according to the combination of
adolescents' demographic characteristics, and (5) the variation of reported adherence
according to parental work status, that is, whether parents were primarily in the home
(home duties, pensioners, or working from home) or working outside the home
environment
5.2.I The Variation in Reported Adherence According to Adolescent Age.
The first demographic characteristic of the sample to be considered in this section is
adolescents' age. The variation in reported adherence according to adolescent age
will be addressed in four ways: First, the variation in adolescents' reports of adherence
according to their age. Second, the variation in parents' reports of adherence
according to their adolescents' age. Third, the variation in the level of agreement
between adolescent and parent reports of adherence according to the adolescents' age.
Fourth, the variation in observed Blood Glucose Monitoring adherence according to
the adolescents' age.
168
Table 5.6 displays the correlations between each measure of adherence and the
adolescents' age.
Adolescent Reports.
A summary of responses by adolescents to the GAS according to the adolescents' age
is shown in Table 5.7. Adolescents' responses to the GAS were not associated with
adolescents' age. A one-way Analysis of Variance (ANOVA) was performed using
adolescent responses to the GAS as the dependent variable and adolescent age level
(l2year old, 13 yearold, 14year old, 15 yearold, 16year old, and L7 year old) asthe
independent factor. The result of this analysis was not statistically significant.
Table 5.8 displays a summary of responses by adolescents and parents to the DSAS
according to adolescents' age. Responses to the DSAS by adolescents were not
strongly associated with adolescents' age. One-way ANOVA of adolescent responses
to the DSAS as the dependent variable and adolescent age level as the independent
factor was not statistically significant.
Pørent Reports.
A summary of responses by parents to the GAS according to the adolescents' age is
shown in Table 5.7. Parents' responses to the GAS were not strongly associated with
adolescents' age. One-way ANOVA of parent responses to the GAS and adolescent
age was not significant. Table 5.8 displays a summary of responses by parents to the
DSAS according to adolescents' age. Parent scores on the DSAS were not
r69

significantly correlated with adolescents' age. One-way ANOVA of parent responses
to the DSAS and adolescent age level was not significant.
The Level of Agreement Between Adolescent and Parent Reports.
The next analyses were designed to determine whether the level of agreement between
adolescent and parent reports of adherence differed according to the age of the
adolescent2. Adolescent age data were stratified into year levels (I2 year olds, 13 year
olds, 14 year olds, 15 year olds, 16 year olds and l7 year olds). A statistical test for
differences between correlations of parent and adolescent scores across the six age
levels was conducted for the GAS and for the DSAS (Snedecor & Cochran, 1980).
The first of these analyses examined the variation in parent-adolescent agreement on
the GAS according to adolescent age. The details of this test are shown in Table 5.9.
Following the methodology outlined in Snedecor and Cochran (1980), the conelation
coefficients were converted to z scores using the formula:
z = (tlz)lroz"(t+ r)-ros"(t - ')]
Weights w¡ = (n - 3) values calculated. The test of significance is performed as a Chi-
square analysis
2 The author is indebted to Professor David L. Streiner, McMaster University, Canada, for his advice
and support on these analyses.
r70
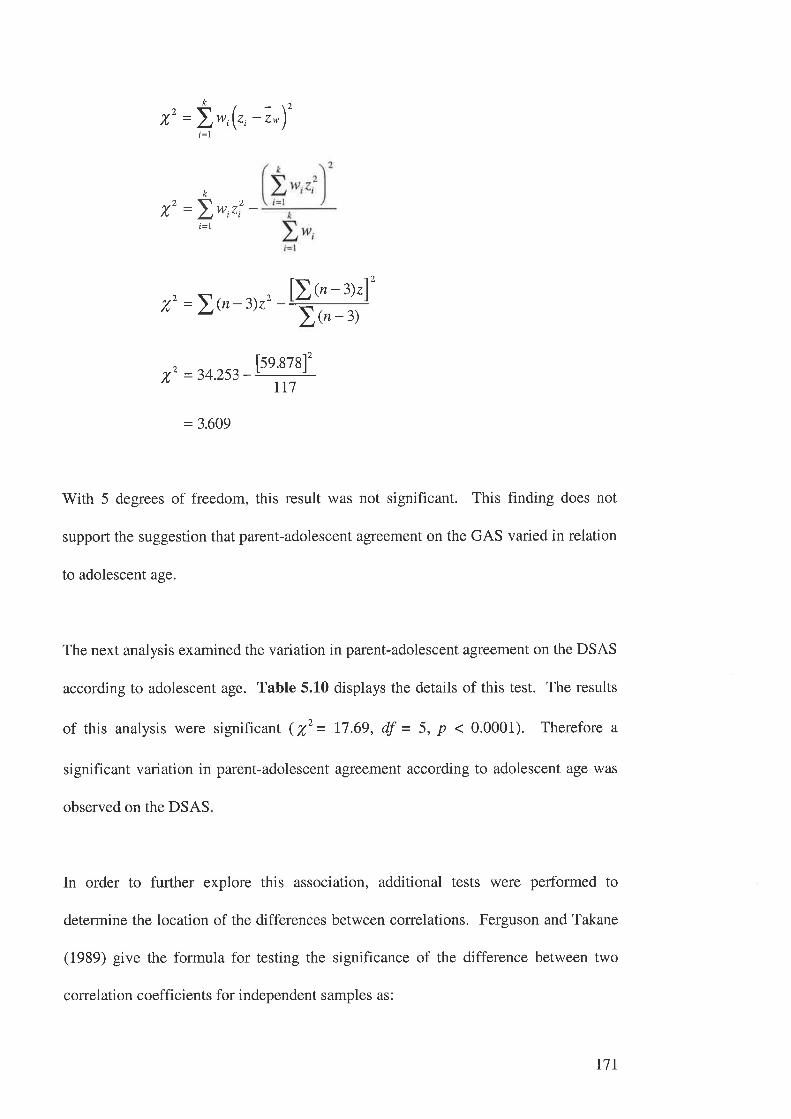
x' =tr,(r, - r,)'i=1
k
Xt =2w,2? -i=1
x,, =Z@-3)zz- [àr'- o']'2r"-z>
" lse.878l'zv" =34.253-' 'ln
= 3.609
With 5 degrees of freedom, this result was not significant. This finding does not
support the suggestion that parent-adolescent agreement on the GAS varied in relation
to adolescent age.
The next analysis examined the variation in parent-adolescent agreement on the DSAS
according to adolescent age. Table 5.10 displays the details of this test. The results
of this analysis were significant (X'= 17.69, df = 5, p < 0.0001). Therefore a
significant variation in parent-adolescent agreement according to adolescent age was
observed on the DSAS
In order to further explore this association, additional tests were performed to
determine the location of the differences between correlations. Ferguson and Takane
(1989) give the formula for testing the significance of the difference between two
correlation coefficients for independent samples as:
t7l^
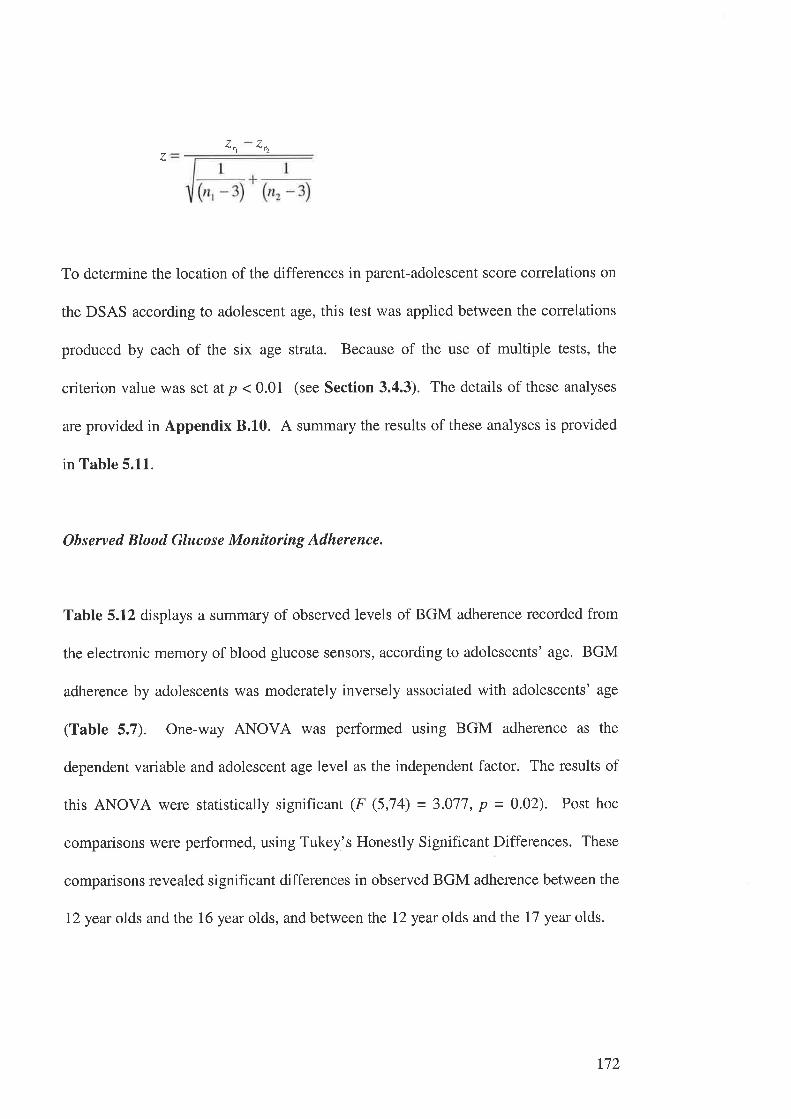
2,,
To determine the location of the differences in parent-adolescent score colrelations on
the DSAS according to adolescent age, this test was applied between the correlations
produced by each of the six age strata. Because of the use of multiple tests, the
criterion value was set atp <0.0I (see Section 3.4.3). The details of these analyses
are provided in Appendix 8.10. A summary the results of these analyses is provided
in Table 5.11.
Ohserved Blood Glucose Monítoring Adherence.
Table 5.12 displays a summary of observed levels of BGM adherence recorded from
the electronic memory of blood glucose sensors, according to adolescents' age. BGM
adherence by adolescents was moderately inversely associated with adolescents' age
(Tabte 5.7). One-way ANOVA was performed using BGM adherence as the
dependent variable and adolescent age level as the independent factor. The results of
this ANOVA were statistically significant (F (5,74) = 3.0J7, p = 0.02). Post hoc
comparisons were performed, using Tukey's Honestly Significant Differences. These
comparisons revealed significant differences in observed BGM adherence between the
12 year olds and the 16 year olds, and betweenthe 12 year olds and the 17 year olds.
zf1
z
n2
To determine whether the association between BGM adherence and adolescents' age
was indicated by the questionnaire responses addressing this specific regimen activity,
additional analyses were performed on the adolescents' and parents' responses to the
item of the DSAS specifically addressing this activity (item 2). This item was worded
to address the behaviour in the same manner as it was coded - performing at least two
blood glucose tests each day. Adolescent responses to the BGM item of the DSAS
were weakly, and not significantly, associated with the adolescents' age (r - -0.15, p =
0.07). Parent responses to this item were not associated with the adolescents' age
(r = -0.04, p = 0.6). Similarly, one-way ANOVAs examining responses to the BGM
item of the DSAS (dependent variable) and adolescent age (independent variable), did
not produce significant relationships (Adolescent: F (5,L34) = 1.279, p = 0.3. Parent:
F (5,I34) = 0.617, p = 0.1)
In order to determine whether the adolescent and parent reports of BGM adherence tn
the DSAS failed to reveal a true relationship with the adolescents' age as the result of
socially desirable responding, further analyses were employed. The associations
between the measure of socially desirable responding (SDRS) and adolescent and
parent repotrs of adherence were assessed according to adolescent age strata. The
level of association between these measures was determined separately for young
adolescents (aged 12 - 13 years), middle adolescents (aged 14 - 15 years) and older
adolescents (aged 16 - 11 years)
While this stratification was some\ilhat arbitrary, these age groups appeared to cluster
naturally in terms of adherence to BGM (Figure 5.1). That is, the distribution of the
number of observed days of BGM adherence for adolescents aged 16 and 17 was
n3
narrow, with the majority of these adolescents adhering to their BGM
recommendations on average less than seven of the previous 28 days. The
distribution of BGM adherence by the 14 and 15 year old adolescents was very wide,
spanning the entire 28 day assessment period. The 12 and 13 year olds adolescents
produced a nanower distribution of BGM adherence, and typically adhered to their
BGM recommendations on more days during the previous four weeks than the older
groups of adolescents.
The associations between each of the questionnaire measures of adherence and the
observed BGM adherence according to this age stratification are reported in Table
5.L3. As may be seen from this table, the level of association between measures of
socially desirable responding and adolescent and parent reports of adherence was not
large amongst the young adolescents and middle adolescents. The responses to the
adherence measures by older adolescents were, however, more closely associated with
the measure of socially desirable responding.
Further analyses were performed to test the possibility that the adolescents from
whom BGM data as well as questionnaire measures were collected may have differed
from the adolescents from whom only questionnaire data was collected. The
associations between adolescents' age and adolescent and parent reports of adherence
were again examined, selecting only those study participants for whom BGM data had
been collected. These analyses are detailed in Appendices 8.11 and 8.12. The level
of association between adolescents' age and adolescents' and parents' reports of
adherence was greater amongst this subsample than in the wider sample, with
adolescents' responses on the DSAS significantly inversely related to their age (r =
174
-0.26, p = 0.02). However, the other questionnaire measures of adherence were not
significantly associated with the adolescents' age in this subsample. One-way
ANOVAs between each of the questionnaire measures of adherence (as dependent
variables) and adolescents' age (as the independent variable) produced results
amongst this subsample that were comparable with the results examining the wider
sample.
5.2.2 The Variation in Reported Adherence According to Adolescent Gender.
The second demographic characteristic of the sample to be considered in this section
is adolescent gender. The variation in reported adherence according to adolescent
gender will be addressed in four ways: First, the variation in adolescents' reports of
adherence according to their gender. Second, the variation in parents' reports of
adherence according to their adolescents' gender. Third, the variation in the level of
agreement between adolescent and parent reports of adherence according to the
adolescents' gender. Fourth, the variation in observed Blood Glucose Monitoring
adherence according to the adolescents' gender.
Adolescent Reports.
A summary of responses by adolescents to the GAS according to the adolescents'
gender is shown in Table 5.14. To determine whether responses on the GAS differed
between male and female adolescents, a Student's / test was performed. The results of
this test were not significant (t (I29) = I.I7, p = 0.3), indicating that adolescents'
175
responses to the GAS did not significantly vary according to the gender of the
adolescent.
A summary of responses by adolescents to the DSAS according to the adolescents'
gender is shown in Table 5.15. Differences between male adolescent and female
adolescent responses to the DSAS were examined using a Student's / test. The results
of this test indicate that adolescent responses on this scale were not associated with
the adolescents' gender (r (133) = 0.82, p = 0.4).
Parent Reports.
A summary of responses by parents to the GAS according to the adolescents' gender
is shown in Table 5.14. To determine whether parent responses on the GAS differed
between the parents of male and female adolescents, a Student's / test was performed.
Again, the results of this test were not signific ant (t (132) - 0.39, p = 0.7), indicating
that parents' responses to the GAS were not significantly associated with adolescents'
gender
A summary of responses by parents to the DSAS according to the adolescents' gender
is shown in Table 5.15. Differences between reports obtained from parents of male
adolescents and parents of female adolescents on the DSAS were examined using a
Student's / test. The results of this test indicate that parent responses on this scale
were not associated with the adolescents' gender (t (I32) = 0.67 ,p = 0.5).
n6

The Level of Agreement Between Adolescent and Parent Reports.
The next series of analyses were designed to determine whether the level of agreement
between adolescent and parent reports of adherence differed according to the gender
of the adolescent. A test for differences in correlations of parent and adolescent scores
between male and female adolescent samples was also performed on the GAS and
DSAS (Snedecor & Cochran, 1980).
The first of these analyses examined the difference in parent-adolescent agreement on
the GAS between the female and male adolescent samples. The details of this test are
shown in Table 5.16. As outlined in Snedecor and Cochran (1980), the test of
significance between two correlation coefficients differs from the test examining
several correlations, employed in Section 5.2.1. Again, the correlation coefficients
are converted to z scores, and weights (w¡ = n - 3) calculated. The variance of the
difference (D) betweenthe z scores is the sum of their individual variances. Hence
t-
t = o.tTolJaß2
= 0.950
This result is not significant, suggesting that parent-adolescent agreement on the GAS
is not varied according to the gender of the adolescent.
r7l
The next analysis examined the difference in parent-adolescent agreement on the
DSAS between the female and male adolescent samples. The details of this test are
shown in Table 5.17. The result of this analysis was not significant (t = 1.46),
suggesting that parent-adolescent agreement on the DSAS is not varied according to
the gender of the adolescent.
Observed Blood Glucose Monitoring Adherence.
Table 5.L8 displays a summary of observed levels of BGM adherence recorded from
the electronic memory of blood glucose sensors, according to adolescents' gender. A
Student's / test was performed to determine whether BGM adherence differed
between male and female adolescents. It should be acknowledged that these data were
slightly skewed. However, the / test has previously been found to be highly robust to
violations of normality and homogeneity of variance (Boneau, 1960; WL Hays, 1988;
Pagano, 1986). The results of the / test examining BGM adherence by male and
female adolescents indicate that BGM adherence did not significantly differ between
male and female adolescents (t (73) = -0.88, p = 0.4).
5.2.3 The Relationship Between Measures of Adherence and the Measure of
Metabolic Control (IIbAr.).
This section presents the analysis of the relationship between the measures of
adherence to medical recommendations and the measure of the metabolic control of
participating adolescents, their HbA1" assay levels.
178
Pearson correlations were employed to examine the level of association between these
measures. Separate analyses examined the associations between adolescent responses
on each of the measures and parent responses on the measures. These analyses are
presented separately for each of the measures of adherence to medical
recommendations; the General Adherence Scale, the Diabetes Specific Adherence
Scale, and the observed Blood Glucose Monitoring adherence.
Adolescent Reports.
The level of correlation between adolescents' FIbA1" levels and the adolescent
completed General Adherence Scale are shown in Table 5.19. The negative
correlation indicates that greater levels of adherence were associated with lower
HbA1" levels, that is, with better metabolic control. This correlation was small, and
failed to reach statistical significance at the 0.05 level.
However, to determine whether a curvilinear or complex relationship existed between
adolescents' scores on the GAS and their HbA1" levels, a one-way ANOVA was also
performed. The one-way ANOVA was performed using adolescents' reports of
general adherence (GAS) as the dependent variable and their metabolic control
(IIbAr") as the independent variable. HbA1. assay level data were reduced from one
decimal point into integers, for use in this analysis (value range 6 to 14). Although
this process reduces the amount of information provided by the data, the process is
necessary for the calculation of the ANOVA. The results of this analysis were
statistically significant, F (8,127) = 2.98 (p = 0.01). A scatterplot illustrating the
r79
distribution of scores on the GAS according to HbA1" assay results (as integers) is
shown in Figure 5.2. Post hoc comparisons were performed, using Tukey's Honestly
Significant Differences. These comparisons revealed significant differences in GAS
scores between adolescents with FIbArc assays of '7 7o and adolescents with HbA1"
assays of 10 or 11 Vo (those with lower IIbA1. assays reported higher levels of
adherence on the GAS)
The level of correlation between adolescents' scores on the DSAS and their recorded
HbA1, levels are shown in Table 5.19. Again, the negative correlation indicates that
greater adherence was associated with lower levels of HbA1", that is, with better
metabolic control. This correlation was small, and did not reach statistical
significance. A one-way ANOVA was performed to more closely examine the
association between adolescents' reports of diabetes-specific adherence (DSAS; the
dependent variable) and their metabolic control (the independent variable). The
results of this analysis were not statistically significant, F (7 ,I33) = 0.64 (p = 0.7).
Parent Reports.
The correlation between parents' scorss on the GAS and their adolescents' HbA1.
levels is shown in Table 5.19. These variables showed a moderate negative
association. This correlation was greater than the correlation between adolescents'
scores on the GAS and their FIbA1. levels. One-way ANOVA was performed to more
closely examine this association. The results of this analysis did not reach the
p < 0.05 significance threshold (F (1,132) = 1.94, p = 0.07).
180
The level of correlation between parents' scores on the DSAS and their adolescents'
HbA1" levels are shown in Table 5.19. This correlation was moderately small,
although larger than the correlation between adolescents' DSAS scores and their
HbA1. levels. The association between parents' reports of diabetes-specific adherence
and adolescents' metabolic control was statistically significant. Again, a one-way
ANOVA was performed to more closely examine the association (dependent variable:
parents' DSAS; independent variable: adolescents' HbA1"). The results of this
analysis were not statistically significant (F (1,132) = 1.39, p = 0.2).
Observed Blood Glucose Monítoríng Adherence.
Table 5.L9 displays the correlation between observed levels of BGM adherence
recorded from the electronic memory of blood glucose sensors and adolescent HbA1"
levels. BGM adherence by adolescents was moderately inversely associated with their
metabolic control. One-way ANOVA of BGM adherence and adolescent HbA1" level
did not produce a statistically significant result (F (6,13) = 2.02,p = 0.08).
5.2.4 The Combined Effect of Adolescents' Demographic Characteristics on
Reported Adherence.
The next set of analyses reported in this chapter were intended to examine the
variation in reported adherence according to adolescents' demographic characteristics.
The examination of a dependent variable (adherence) according to multiple
independent variables (demographic variables) would usually be performed using
181
ANOVA methods. However, because multiple measures of adherence are being
considered, a multivariate technique is appropriate.
The extension of analysis of variance to the case of multiple dependent variables is the
multivariate analysis of variance (MANOVA). In MANOVA, a new dependent
variable that maximises group differences is created from the set of dependent
variables (Harris, 1985; Tabachnick & Fidell, 1989). Although ANOVA tests could
be computed separately for each of the adherence measures, this approach ignores the
interrelation among the adherence measures. This approach would suffer from the
loss of substantial information when correlations between adherence variables were
ignored. Further, although groups may not differ on individual measures of
adherence, they may do so when a number of related individual adherence measures
are examined jointly (cf. Bryman & Cramer, 1990).
MANOVA techniques represent an improvement on performing a series of ANOVAs
for several reasons. First, they reduce the likelihood of making Type I effors
(deciding there is a difference when there is none) when making a number of
comparisons. A second advantage of MANOVA analyses over repeated ANOVAs is
that by measuring several dependent variables instead of only one, the researcher
improves the chance of discovering what it is that changes as a result of different
treatments and their interactions (Tabachnick & Fidell, 1989).
The behavioural measure of adherence, Blood Glucose Monitoring, was not included
in the MANOVA, because this information was only collected for 75 of the 135
participating adolescents, the inclusion of this variable in the multivariate analysis
182
would have introduced too great a proportion of missing data, thereby distorting the
results of the analysis. Instead, a separate ANOVA was performed examining the
relationship between this aspect of adherence and the demographic variables included
in the MANOVA. The necessity of performing a separate analysis for this measure is
unfortunate, as its introduction into the multivariate analysis would provide valuable
information about the relationship between this measure and the questionnaire
assessments of adherence.
Que stíonnøíre Me asure s of Adherenc e.
A 6 x 2 between-subjects MANOVA was performed on four dependent variables:
adolescent completed DSAS, adolescent completed GAS, parent completed DSAS
and parent completed GAS. Independent variables were adolescent age (I2 to 17) and
adolescent gender. Entry of independent variables was ordered (1) adolescent age,
then (2) adolescent gender. This analysis was performed on 129 subjects; 6 subjects
had to be excluded from the analysis because of missing data.
To examine the Adolescent Age by Adolescent Gender interaction effect, Tabachnick
and Fidell (1939) recommend the use of Wilk's lambda (1") as the assessment
criterion. In this analysis, 'Wilk's lambda produced an F ratio (20,319.05) of 1.43
This result was not significant at the 0.05 level. Univariate tests of the dependent
variables with adolescent age and gender were also not significant at the 0.05 level,
with F ratios ranging from 0.94 to 2.07 (Table 5.20). While none of these univariate
assessments reached the 0.05 level of significance, adolescent reports on the DSAS
produced a strong F ratio, which approached this traditional statistical cut-off,
183
suggesting the possibility of a weak relationship between this aspect of adherence and
adolescents' demographic characteristics
Observed Blood Glucose Monitoríng Adherence
Because the Blood Glucose Monitoring data were only available for a subset of
seventy-five adolescents, this data could not be included in the MANOVA. Instead,
the BGM data were examined in a separate Two-Way Simple Factorial ANOVA, in
relation to adolescents' age and gender. The results of this analysis are presented in
Table 5.21.
Neither the main effects variations for adolescent age and adolescent gender, nor the
two-way interaction effect were significant. Blood glucose monitoring behaviour was
not systematically varied in relation to adolescents' age or gender.
5.2.5 The Variation in Reported Adherence According to Parental Work Status.
The next demographic characteristic of the sample to be considered in this section is
parental work status. This term is used to indicate whether the parent completing the
parent questionnaire measures in the study was primarily at home or primarily out of
the home. The variation in reported adherence according to parental work status will
be addressed in four ways: First, the variation in adolescents' reports of adherence
according to parental work status. Second, the variation in parents' repofts of
adherence according to their work status. Third, the variation in the level of
184
agreement between adolescent and parent reports of adherence according to the
parent's work status. Fourth, the variation in observed Blood Glucose Monitoring
adherence according to the parent's work status.
Adolescent Reports.
A summary of responses by adolescents to the GAS according to parents' work status
is shown in Table 5.22. To determine whether responses on the GAS differed
between adolescents of parents primarily at home and adolescents of parents working
primarily outside the home environment, a Student's / test was performed. The results
of this test were not significant (t (128) = -0.29, p = 0.8), indicating that adolescents'
responses to the GAS were not significantly associated with parental work status.
A summary of responses by adolescents to the DSAS according to parental work
status is shown in Table 5.23. Differences between responses obtained on the DSAS
from adolescents of parents primarily at home and adolescents of parents primarily out
of the home were examined using a Student's / test. The results of this test indicate
that adolescent responses on this scale were not significantly associated with parental
work status (t (L32) = 0.64, p = 0.5)
Parent Reports.
A summary of responses by parents to the GAS according to their work status is
shown in Table 5.22. To determine whether responses on the GAS differed between
parents primarily at home and parents primarily out of the home, a Student's / test was
185
performed. The results of this test were not significant (t (131) = -0.38, p = 0.7),
indicating that parents' responses to the GAS were not significantly associated with
their work status
A summary of responses by parents to the DSAS according to their work status is
shown in Table 5.23. Differences between responses obtained on the DSAS from
parents primarily at home and parents primarily out of the home were examined using
a Student's t test. The results of this test indicate that parents' responses on this scale
were not significantly associated with their work status (r (131) = 0.58, p = 0.6)
The Level of Agreement Between Adolescent and Parent Reports.
The next analysis performed was designed to examine the variation in parent-
adolescent agreement on the adherence measures according to whether parents were
employed out of home or were at home. This analysis was performed to determine
whether parents who were at home were more familiar with the adherence behaviour
of their adolescents.
The analysis of parent-adolescent agreement on the GAS was performed to examrne
the relationship to parental work status. The details of this test are shown in Table
5.24. This result (t =2.07) was not statistically significant at the 0.05 level.
The analysis of parent-adolescent agreement on the DSAS was also performed to
examine the relationship to parental work status. The details of this test are shown tn
186
Table 5.25. This result (t = 3.07) is significant at the p < 0.05 level, suggesting that
parent-adolescent agreement about adherence to diabetes treatment recommendations
is greater amongst parent-adolescent dyads where the parent works out of the home
environment than in dyads where the parent is at home.
Observed Blood Glucose Monitoríng Adherence.
Table 5.26 displays a summary of observed levels of BGM adherence recorded from
the electronic memory of blood glucose sensors, according to parents' work status. A
Student's / test was performed to determine whether BGM adherence differed
between the adolescents of parents primarily in the home and the adolescents of
parents primarily out of the home. The results of this / test (/ (73) = I.45, p=0.2)
indicate that BGM adherence did not significantly differ between these groups of
adolescents
5.3 The Variation in Adherence Over Time.
This section examines the variation in adherence over time. The analyses presented
examine the data obtained from the electronic memory of the blood glucose sensors.
These data represent an objective assessment of adherence to an important aspect of
diabetes self-management. The analyses in this section will focus on the variation of
adherence by adolescents in the sample over the 28 days prior to assessment.
r87
The analyses fall into two broad categories. First, analyses are presented which
examine the variation in the level of adherence to Blood Glucose Monitoring
recommendations. Second, analyses are presented which examine the relations
between adolescent and parent reports of adherence and assessment of Blood Glucose
Monitoring adherence over different time spans
5.3.1 Variation in Adherence Over Time.
The first analyses presented in this chapter examine the variation in the level of
adherence to Blood Glucose Monitoring recommendations. The purpose of these
analyses is to determine whether adherence to this aspects of diabetes management
remains consistent over time. These analyses were performed on the electronically
recorded BGM data obtained from the blood glucose sensors.
The first of these analyses employed a Repeated Measures ANOVA technique to
determine whether a significant variation in the frequency of blood glucose testing is
evident. The second analysis employed Trend Analysis techniques to examine the
nature of the variation in BGM over time.
Varíønce ín Blood Glucose Monítoring Frequency Over Time.
The analysis of the variance in blood glucose monitoring over time was performed on
two sets of data. First, the BGM data were coded into seven consecutive four-day
blocks. The analysis of these data provided information about the frequency of BGM
188
over short time periods. Second, the BGM data were coded into blocks of one week.
This coding created four blocks. Although this smaller number of observational units
provides a less detailed assessment, the week-long blocks account for possible
variations between weekday and weekend activity. These analyses are presented
separately.
Analysis of Four-Day Blocks of Blood Glucose Monitoring
The BGM data obtained spanned the 28 days prior to assessment. In order to examine
the variation in frequency of BGM within subjects over time, the days were grouped
into blocks, each consisting of 4 days. The blocks were treated as the observational
units. Hence the data were analysed as if there were 7 observations on each subject,
an observation being the number of tests performed during a block of four consecutive
days. Figure 5.3 displays the distributions of the number of tests performed each day
during the seven blocks. The adolescents were given recommendation to test their
blood glucose at least twice each day.
As illustrated in Figure 5.3, the frequency of BGM was higher during the days
immediately prior to assessment than earlier in the month before assessment. A
Repeated Measures ANOVA was used to assess the variation in BGM frequency over
time. This variation was statistically significant, the Repeated Measures ANOVA
produced an F ratio (6,13) of 5.62 (p < 0.001; Table 5.27).
This significant result suggests a change in the frequency of BGM by participating
adolescents. Inspection of Figure 5.3 would suggest that this variation takes the form
189
of a systematic increase in BGM frequency as the assessment time approaches. An
increase in mean BGM frequency is observed in the final blocks, and most notably in
the final block.
Analysis of Seven-Day Blocks of Blood Glucose Monitoring.
To examine further the variation in BGM over time, the BGM data were re-coded into
blocks of seven days. Again, these blocks were treated as observational units in a
Repeated Measures ANOVA. Hence in this analysis there were 4 observations on
each subject. Figure 5.4 displays the mean number of tests performed each day
during the four weeks blocks
As illustrated in Figure 5.4, the frequency of BGM was higher during the week
immediately prior to assessment than earlier in the month before assessment. The
Repeated Measures ANOVA of this variation was significant, with an F ratio (3,73)
of 9.00 (p < 0.001; Table 5.28).
This significant result again suggests a change in the frequency of BGM by
participating adolescents. The pattern illustrated in Figure 5.4, consistent with that
observed in Figure 5.3, suggests that the variation represents an increase in BGM
frequency as the assessment time approaches, especially in the final week prior to
assessment.
190
Trends ín Blood Glucose Monítoríng Variation Over Tíme.
In order to formally assess the form of the variation in BGM frequency, Trend
Analyses were performed. These analyses were intended to determine the nature of
the variation - that is, whether the change in BGM frequency over time was linear, or
whether reversals in the trend were evident (i.e., quadratic or cubic trends).3
The analyses were performed on the BGM data obtained from seventy-four of the
adolescents. The BGM data from 1 adolescent had to be discarded due to missing
data - this adolescent had performed more tests during the previous 28 days than the
memory of the sensor was able to record, as a result the data from the first few days
were deleted as more recent tests were performed.
The Trend Analyses were performed following the methodology described by Winer
(I97I). Two sets of Trend Analysis were performed, the first utilising the four-day
blocks of BGM data, the second using the seven-day blocks of BGM data. These are
reported separately.
Trend Analysís of Four-Day Blocks of Blood Glucose Monitoring.
The mean squares corresponding to the linear and quadratic trends are computed in
Table 5.29. The block totals for these experimental data are given near the top of
Table 5.29. Each of these totals is the sum over 74 observations. Since there are
3 The author is indebted to Professor David L. Streiner, McMaster University, Canada, for his adviceand support on these analyses.
191
seven blocks, the coefficients corresponding to linear and quadratic trends are
obtained from the set of coefficients for which k = 7 in Pearson and Hartley (1910;
Table 47). Following the nomenclature employed by Winer (197I), the entries under
the column headed Ic2 represent the sums of squares of the coefficients in the
corresponding rows. The entries under the column headed C represent the numerical
value of the comparisons. For example, in the linear comparison, C is calculated as:
(-3)(344) + (-2X3ss) + (-1X373) + (0X377) + (1X3es) + (ÐØ3t) + (3x4es) = 62L
The mean square corresponding to the linear comparison is calculated as
MS,,, - ,2r,
= 186.12
The test of significance for the linear trend is calculated by the F ratio
186.t2
6.44
= 28.90
192
The sampling distribution of this statistic (assuming no linear trend) may be
approximated by an F distribution having (I,432) degrees of freedom. The linear
trend is significant beyond the 0.01 level
The analyses of the quadratic and higher order trends are presented in Appendix 8.13.
The quadratic and higher order trends did not add significant predictability to that of
the linear trend. The conclusions drawn from these analyses, and their implications
for the assessment of adherence, are discussed in Chapter 6.
Trend Analysis of Seven-Day Blocks of Blood Glucose Monitoring
The Trend Analysis was then performed using the four 1-day blocks. The mean
squares corresponding to the linear and quadratic trends are computed in Table 5.30.
The block totals for these experimental data are given near the top of Table 5.30.
Each of these totals is the sum over 74 observations. Since there are four blocks, the
coefficients coffesponding to linear and quadratic trends are obtained from the set of
coefficients for which k = 4 in Pearson and Hartley (1970; Table 47). Again,
following Winer's (Ig7I) nomenclature, the entries under the column headed )c2
represent the sums of squares of the coefficients in the corresponding rows. The
entries under the column headed C represent the numerical value of the comparisons.
For example, in the linear comparison, C is calculated as
(-3X60s) + (-1X664) + (1)(686) + (3X824) = 679
193
The mean square corresponding to the linear and higher trends are calculated in the
same manner as in the previous analyses. These analyses are detailed in Appendix
8.14. Again, the linear trend was the only trend relevant to the observed variation in
BGM adherence. The conclusions drawn from these analyses, and their implications
for the assessment of adherence, are discussed in Chapter 6.
5.3.2 Relations Between Adolescent and Parent Reports of Adherence and Measures
of Blood Glucose Monitoring Adherence Over Different Time Periods.
This section presents a series of analyses designed to examine the relationship
between the reports of adherence (GAS and DSAS) obtained from adolescents and
parents, and the BGM adherence data. Each of these measures were framed to assess
adherence over the past four weeks. The analyses presented in this section were
intended to assess whether the adolescents' and parents' reports of adherence were
more representative of adherence levels over a shorter time-frame. To assess this, the
level of association between these reports and the observed level of BGM over various
time-frames is examined.
These analyses were conducted on the basis of the finding that the observed level of
blood glucose monitoring adherence varied over time, and was significantly higher
immediately before assessment.
Previous authors have suggested that responses to measures which address behaviour
over long time frames may suffer from biases such that the respondents' recall reflects
194
their behaviour over only the previous few days, extrapolated to represent the entire
time frame addressed (Streiner & Norman, 1995; Foddy, 1993; Meany, et al. 1989)
That is, the adherence reported by adolescents and parents may reflect the increased
level of BGM adherence observed in the final few days before clinic attendance.
The second item of the DSAS directly addresses BGM adherence. As identified in
Section 5.2.1, this item was worded to address the behaviour in the same manner as it
was coded - performing at least two blood glucose tests each day. Responses to this
item were used to determine the relationship between adolescents' and parents'
reports of BGM adherence in the previous four weeks, and the observed BGM
adherence over the previous four weeks.
In order to test the possibility that responses to this item were biased by behaviour
over the previous few days, BGM adherence data were reanalysed to examine the
following time frames:
o twenty-eight days prior to assessment (all seven sequential four-day blocks
identified in Section 5.3.1);
o twenty days prior to assessment (the final five blocks);
o twelve days prior to assessment (the final three blocks);
o eight days prior to assessment (the final two blocks); and
195
o four days prior to assessment (the final block).
Pearson correlations were utilised to examine the level of association between
adolescent and parent reports of adherence and the measures of BGM adherence over
different time spans. The results of these correlations are shown in Table 5.31.
The associations between adolescent and parent reports of BGM adherence and the
observed BGM adherence over the different time frames do not provide strong
support for the suggestion that these reports were biased by the most recent adherence
behaviour
Adolescent reports of BGM adherence on the DSAS (Item 2) were highly correlated
with observed BGM adherence in each of the time frames considered, with Pearson r
values ranging from 0.54 (the last 4 days) to 0.66 (the last 28 days). The pattern of
correlations produced between these variables did not support the suggestion that
adolescents' responses to this item were biased by their most recent adherence
behaviour; the adolescents' responses were most closely associated with observed
BGM adherence over the 28-day time frame originally addressed by the questionnaire.
Parent responses to this item also showed large associations with observed BGM
adherence. Again, these associations were greater over the larger time frames than
over the last few days before assessment. The implications of these results are
discussed in Chapter 6.
t96
As a further test of the relationship between observed BGM adherence and
adolescents' and parents' reports of adherence to this aspect of IDDM management,
the responses of adolescents and parents were re-coded as a dichotomous variable.
That is, responses of 1 (none of the time) to 3 (some of the time) were coded as Low
BGM adherence, and responses of 4 (a good bit of the time) to ó (all of the time) were
coded as High BGM adherence. The mean number of days of observed BGM
adherence in each of the time intervals was calculated for adolescents rated with Low
or High BGM adherence, according to the adolescent and parent responses (Tables
5.32 and 5.33 respectively).
The mean number of days of observed BGM adherence in each time frame was lower
amongst the adolescents who reported Low BGM adherence than amongst those who
reported High BGM adherence. These relationships were tested using Student's /-
tests, and were significant in each time frame (Table 5.32)
Similarly, the mean number of days of observed BGM adherence in each time frame
was lower amongst the adolescents for whom parents reported Low BGM adherence
than amongst those for whom parents reported High BGM adherence. Again, these
relationships were tested, and were significant in each time frame (Table 5.33).
This pattern was further analysed by the re-coding of responses on the DSAS item
assessing BGM adherence (item 2), into trichotomous responses. That is, responses
of 1 (none of the time) or 2 (alittle of the time) were rated as Low BGM adherence;
Responses of 3 (some of the time) or 4 (a good bit of the time) were rated as Moderate
BGM adherence; and responses of 5 (most of the time) and 6 (all of the time) were
r97
rated as High BGM adherence. The mean number of days of observed BGM
adherence in each of the time intervals was calculated for adolescents rated with Low,
Moderate or High BGM adherence, according to the adolescent and parent responses
(Tables 5.34 and 5.35 respectively).
As shown on Table 5.34, the variation in mean observed days of BGM adherence in
relation to adolescents' reports of Low, Moderate, or High levels of BGM adherence
was significant in each assessed time frame. Post hoc comparisons were performed,
using Tukey's Honestly Significant Differences. These comparisons revealed
significant differences in observed BGM adherence over each of the time frames
between the adolescents who reported Low BGM adherence and those who reported
High BGM adherence, as well as between those reporting Moderate BGM adherence
and those reporting High BGM adherence. There were no significant differences in
the mean number of observed days of BGM adherence over any time frames by the
adolescents reporting Low and Moderate BGM adherence.
Similarly, Table 5.35 indicates that the variations in observed BGM adherence in
relation to parents' reports of Low, Moderate or High levels of BGM adherence were
significant over each time frame assessed. Post hoc comparisons were performed,
using Tukey's Honestly Significant Differences. These comparisons revealed
significant differences in observed BGM adherence over the 28 day and 20 day time
frames between the adolescents whose parents reported Moderate BGM adherence
levels and the adolescents of parents who reported High BGM adherence levels.
Significant differences in observed BGM were revealed between the adolescents of
198
parents reporting Low BGM adherence and High BGM adherence for all of the time
frames assessed.
Patterns of variation in BGM by each adolescent were assessed as a final examination
of the data of BGM variation over the four weeks prior to assessment. Adolescents'
adherence to BGM in each of the four weeks was rated as high (appropriate BGM on
four or more days of the week) or low (appropriate BGM on three or fewer days of the
week). The adolescents were then grouped as:
. (A) Consistently high BGM adherence (i.e., four or more days of appropriate BGM
in all four weeks),
. (B) Consistently low BGM adherence (i.e., three or fewer days of appropriate BGM
in all four weeks),
. (C) Rising BGM adherence (i.e., initially low BGM adherence, but high BGM
adherence by the final week before assessment),
. (D) Other (i.e., BGM adherence not consistent with the above patterns).
Twenty-two adolescents were coded as Consistently high, 33 as Consistently low, 12
as Rising, and 8 as Other. Figures 5.5 to 5.8 display the mean number of days of
appropriate BGM each week over the four weeks prior to assessment, for the
adolescents in each of these groups.
199
A Repeated Measures ANOVA contrasting the variation in BGM over time was
performed involving the adolescents rated with (a) Consistently High, (b) Consistently
Low, or (c) Rising BGM adherence. The results of this analysis are reported in Table
5.36; significant variation in BGM adherence over time was detected, as well as a
significant variation in BGM adherence between these groups. The interaction effect
was also significant. These results suggest that these groups define significantly
different patterns of blood glucose monitoring adherence.
The responses by adolescents and parents to the questionnaire measures of adherence
were examined separately for the four groups. The distributions of scores on the
GAS, DSAS and the BGM item of the DSAS (item 2) by adolescents and parents are
reported for each group in Table 5.37
The responses of adolescents and parents to the questionnaire measures of adherence
were examined in relation to membership in these groups. ANOVAs were used to
examine differences in responses to these measures amongst adolescents exhibiting
Consistently High, Consistently Low and Rising BGM adherence. These analyses are
summarised in Tables 5.38 and 5.39.
Post hoc comparisons were performed, using Tukey's Honestly Significant
Differences. These comparisons revealed significant differences in reported
adherence between the Consistently High and Consistently Low BGM adherence
groups on all of the questionnaire adherence measures. Significant differences were
also detected between the Consistently Low and Rising BGM adherence groups on the
parent completed DSAS, and on adolescent and parent responses to the BGM item of
200
the DSAS. No significant differences in responses to the questionnaire measures were
detected between the Consistently High and Rising groups
5.3.3 The Relationship Between Measures of Blood Glucose Monitoring Adherence
Over Different Time Periods and the Measure of Metabolic Control (HbArJ
The distributions of HbA1" assay levels for each of the BGM adherence groups are
reported in Table 5.40. The group categorised by Consistently High levels of BGM
displayed a slightly lower median IIbAle value than the Consistently Low, Rising, and
Other BGM adherence groups. However, an ANOVA of HbA1. results according to
BGM adherence group found that this variation was not significant.
20r
CHAPTBR SIX.
DISCUSSION: THE ASSESSMBNT OF PATIBNTADHERENCB.
Parts of this chapter were published in:
Fotheringham MJ, Couper JJ, Sawyer MG. (1997). Associations between adolescents' metaboliccontrol, IDDM adherence and objective data of blood glucose monitoring. Proceedings of the
Australian Diøbetes Society, 1997 A93.
This chapter discusses the results presented in Chapter 5, describingthe measurement of patient adherence in the present study. In parallelwith Chapter 5, the sections of this chapter address: first, the
relationship between each of the measures of adherence, second, the
variation in reported adherence in relation to demographiccharacteristics, and third, the variation in adherence over time.
6 DISCUSSION: THE ASSESSMENT OF PATIENT ADHERENCE.
6.1 The Relationship Between Different Measures of Adherence.
This section discusses the results presented in Section 5.1, examining the associations
between each of the measures of adherence.
Before interpreting these associations, a caveat should first be acknowledged. The
General Adherence Scale is a measure of an individual's "tendency to adhere to
medical recommendations" (DiMatteo, et al. 1992, p 52). In contrast, the Diabetes
Specific Adherence Scale is a measure of adherence to a range of specific
recommended activities. The measure of blood glucose monitoring adherence
assessed adherence to only one of the recommended regimen activities. While each of
these measures are not intended to assess the same actual behaviour, they are expected
to each assess aspects of the same behavioural construct; adherence to medical
recommendations. As such, the scales would not be expected to produce identical
results. However, as each of these measures assess aspects of the same construct, it
would be expected that the results obtained on each of these measures would be
correlated. That is, adolescents with a general tendency to adhere well to medical
recommendations (GAS) would be expected to adhere well to the specific regimen
activities in the DSAS, and to adhere well to BGM recoÍìmendations. Adolescents
with a tendency not to adhere closely to medical recommendations (assessed on the
GAS) would be expected to rate poorly on the DSAS and in their BGM adherence.
As an analogy, these measures might be expected to be associated in the same way
that height and weight are associated - that is, the correlation between them is not
203
perfect, but people who are tall are often heavier than people who are shorter, and
both height and weight can be seen as measures of a more general construct: people's
SIZE
6.IJ The Relationship Between Adolescent Reports of Adherence
The large association detected between the different adolescent reports of adherence,
the DSAS and the GAS, may be interpreted in several ways.
First, adolescents' perceptions of general adherence may be largely defined by their
adherence to IDDM management activities. This interpretation seems reasonable in
light of the considerable impact of diabetes management activities on the lifestyle of
these adolescents, making these activities the most common activities performed in
relation to medical advice. Nonetheless, it is important to recognise that the
adolescents may have completed the GAS within a wider frame of reference. The
general tendency to adhere to medical recommendations may obviously include
adherence to medical recoÍrmendations received by the adolescents in relation to
other illnesses. However, none of the adolescents involved in this study were
experiencing other chronic conditions. Further, because the questionnaires were
completed as part of a study of adolescents with IDDM, and were completed in the
Diabetes Outpatients Clinics, participating adolescents are likely to have answered the
General Adherence Scale only in relation to their IDDM treatment.
204
A second possible interpretation of this association is that the adolescents' responses
to the DSAS and the GAS were similarly influenced by social desirability biases.
However, this interpretation is made less likely by the finding, reported in Chapter 3,
that these measures have only a small association with the measure of socially
desirable responding, the Socially Desirable Response Set.
The finding that mean levels of reported adherence to individual items of the DSAS
and GAS varied widely suggests that adolescents' reports were not uniformly biased
by social desirability influences. Further, this finding provides support for the
suggestion that adherence varies between regimen demands (Fotheringham & Sawyer,
1995; La Greca, 1990). The finding that the mean level of reported adherence to
insulin administration was higher than the mean level of repofied adherence for the
other regimen activities is consistent with the findings of previous researchers, such as
RE Glasgow and Anderson (1995) and SB Johnson (1990), who have reported that
adherence to this aspect of IDDM management tends to be complete or near complete.
The frequency of response options to this item are detailed in Appendix C. The vast
majority of adolescents reported adhering to insulin administration all or most of the
trme.
A significant difference between adherence levels indicated on the GAS and DSAS
was observed, with generally higher levels of reported adherence on the GAS. There
are several possible interpretations of this result. However, it should again be
recognised that the GAS and the DSAS do not assess the same activity, but are simply
intended to tap the same general construct of adherence to medical recommendations.
The level of adherence indicated on the two measures would not necessarily be
205
expected to be equal, but would be expected to be correlated. Nonetheless, possible
meanings of the difference in levels of adherence rating obtained from these measures
should be examined.
The first possible interpretation of this finding is that the adolescents may have
perceived their overall adherence to be good, eliciting high scores on the General
Adherence Scale, but at the same time perceived their adherence to the specific
activities detailed on the DSAS to be poorer. This may reflect differing criteria held
by the adolescents as to what behaviour is important to diabetes management. For
example, the activities mentioned in the specific measure may be considered
unimportant by the adolescents, who instead attributed importance to activities not
included in the specific measure.
A second possible interpretation of this finding is that only a few of the activities
mentioned in the DSAS were considered important criteria of adherence by
participating adolescents. For instance, adherence to blood glucose monitoring or
insulin administration may have been used as the basis of responses to the GAS, while
the other seven activities listed in the DSAS may not have been considered in the
GAS responses.
A third possible interpretation of this outcome is related to the nature of the two
measures. It is possible that respondents were more inclined to respond in socially
desirable manners to the general questions than to the questionnaire addressing
specific aspects. However, as reported in Chapter 4, the associations between
responses to the adherence measures and the measure of socially desirable responding
206
were not high. In fact, the only significant association between a measure of
adherence and socially desirable responding was for the adolescent completed DSAS.
These results therefore do not support the interpretation that the differences in scores
between the general and the specific measure of adherence were the result of socially
desirable responding.
It should also be noted that participants completed the Diabetes Specific Adherence
Scale first, followed by the General Adherence Scale. It is possible that the ordering of
the questionnaires influenced the pattern of responses provided. A randomised
ordering of questions would determine the importance of this possibility, although this
procedure was not performed in the present study. However, the trend to respond
more favourably to the second of the adherence questionnaires would suggest that the
ordering of the questionnaires was not influential.
The variation in reported levels of adherence on these measures is consistent with the
finding, reported elsewhere, that adherence to one aspect of a regimen is not
necessarily indicative of adherence to other aspects of the regimen (Fotheringham &
Sawyer, 1995, La Greca, 1990).
6.I.2 The Relationship Between Parent Reports of Adherence.
The strong association detected between parent reports of adherence on the DSAS and
on the GAS also may be interpreted in several ways.
201
First, parents' perceptions of their adolescents' general adherence levels may be
dominated by their perceptions of the adolescent's adherence to diabetes-specific
health behaviours. The same arguments that support this interpretation of the
adolescent reports also apply to the parent reports.
A second possible interpretation of this result is that socially desirable responding
influenced both the GAS and DSAS reports from parents. However, like the
adolescent responses on these scales, the effect sizes of the associations between
parents' responses to the adherence scales and the Socially Desirable Response Set
were small. This suggests that the parents' responses on the DSAS and GAS were not
biased by socially desirable responding.
A third interpretation of the close association between parents reports on the DSAS
and the GAS is that because the parents' were less involved in the performance of
regimen activities than the adolescents, their reports were based on only a general
impression of the adherence of their adolescents. As such, parents' reports on the
DSAS would be influenced by this general impression, along with the GAS responses.
The examination of the variation in parent reported adherence to individual regimen
activities identified in the DSAS refutes the second and third interpretations described
in this section of the close association between parents' reports of adherence on the
DSAS and the GAS. That is, this variation suggests that these reports were not
uniformly biased by socially desirable responding. Further, the variation in reported
adherence levels to the different regimen activities suggests that parents' responses on
the DSAS were not dictated by a general impression of adherence - parents were able
208
to distinguish activities which were closely adhered to and activities to which
adherence was less strict. Like the results of the examination of adolescents'
responses to items of the DSAS, these results are supportive of the suggestion that
patients' level of adherence varies between regimen demands.
A caveat that should be considered when examining the variation between response
trends to different items of the DSAS is that this scale was designed to produce a total
score, and as such the psychometric properties of individual items may not be
appropriate for these comparisons. A detailed examination of the psychometric
properties of each item of the DSAS is beyond the scope of this thesis. However, it
may be noted that the variation in responses to items of the DSAS by adolescent
respondents was similar to the variation in responses to the DSAS items by parent
respondents. Appendix C displays the frequency with which responses were selected
for each DSAS item by the adolescent and parent respondents. The pattern of
responses produced by the adolescents was very similar to that produced by the
parents.
The results of the Wilcoxon Matched-Pairs Signed-Ranks test employed to compare
the scores produced by parents on the DSAS and GAS were very similar to the results
produced in the Wilcoxon test examining the adolescents' reports on these measures.
Again, a significant difference between adherence levels indicated on the GAS and
DSAS was observed, with generally higher levels of reported adherence on the GAS.
It should again be recognised that the GAS and the DSAS to not assess the same
activity, but are simply intended to tap the same general construct of adherence to
209
medical recofitmendations. However the possible meanings of the difference in levels
of reported adherence obtained from these measures should be considered.
First, it is possible that the parents perceived their adolescents' overall adherence to be
good, therefore eliciting high scores on the General Adherence Scale, but perceived
that their adolescents' adherence to the specific activities detailed on the DSAS was
poorer. This may reflect differing criteria held by the parents as to what behaviour is
important to diabetes management. For example, the activities mentioned in the
specific measure may be considered unimportant by the parents, who instead
attributed importance to activities not included in the specific measure.
A second possible interpretation of this result is that only a few of the activities
mentioned in the DSAS were considered important criteria of adherence by
participating parents; for instance adherence to blood glucose monitoring and to
insulin administration may be deemed important, while the other seven activities
listed in the measure may not have been considered when responding to the general
measufe.
A third possible interpretation of this outcome is related to the nature of the two
measures. It is possible that respondents were more inclined to respond in socially
desirable manners to the general questions than to the questionnaire addressing
specific aspects. However, as reported in Chapter 4, the association between
responses to the adherence measures and the measure of socially desirable responding
were low, neither of the parent completed adherence measures were significantly
associated with the measure of socially desirable responding. These results therefore
2lo
do not support the interpretation that the differences in scores between the general and
the specific measure of adherence were the result of socially desirable responding.
Again it should also be noted that participants completed the Diabetes Specific
Adherence Scale first, followed by the General Adherence Scale. It is possible that
this ordering of the questionnaires influenced the pattern of responses provided.
6.1.3 The Relationship Between Adolescent and Parent Reports of Adherence
A strong association was detected between adolescents' and parents' responses on the
GAS. Similarly, a strong association was detected between adolescents' and parents'
responses on the DSAS. The close associations between adolescents' and parents'
responses on these measures provide support for their validity - the large association
between adolescent and parent reports represents good cross-informant concordance
on both of the questionnaire measures. This finding is supported by the patterns of
responses elicited from adolescents and parents on each item of the DSAS, as
illustrated in Appendix C.
The results of the Wilcoxon Matched-Pairs Signed-Ranks tests examining the
differences between adolescents' and parents' responses on the adherence
questionnaires suggest that the information obtained from each of these groups of
respondents was not unique. This result may be interpreted as an indication that the
views of parents and adolescents are not uniformly discrepant - parents do not rate
adherence as consistently higher or lower than do adolescents. This is an important
2tr
result. The cross-informant concordance on both the GAS and the DSAS provides
support for the convergent validity of the measures (AL Stewart, Hays, & Ware,
tee2)
These results are consistent with the finding of a previous study, conducted by
SB Johnson and colleagues (1986). In the previous study, high levels of parent-
adolescent agreement were found on 24-hour recall measures of adherence assessing a
range of IDDM management activities. The results of this previous study supported
the use of 24-hour recall adolescent self-reports of adherence when used in
conjunction with parent reports. The results of the current study extend on this
finding, and supports the use of adolescent self-reports of adherence over longer time
frames, when used in conjunction with parent reports.
6.1.4 The Relationship Between Questionnaire Measures of Adherence and the
Observed BGM Adherence.
The moderate and strong correlations detected between observed BGM adherence and
adolescent and parent ratings of adherence on the GAS and DSAS provide support for
the criterion validity of the adolescent and parent completed measures of adherence.
It should again be acknowledged that the questionnaire measures of adherence are
intended to measure general adherence tendencies (GAS) and adherence to a range of
specific regimen activities (DSAS). The observed BGM adherence provides
212
information only about adherence to one aspect of the IDDM management
recommendations.
However, one of the specific activities addressed in the DSAS is blood glucose
monitoring. The relationships between adolescents' and parents' reports of BGM
adherence and the observed BGM adherence, are reported in Chapter 7, and
discussed in Chapter 8. Further analyses of the relationship between observed BGM
adherence and GAS and DSAS responses by adolescents and parents are therefore not
addressed in this chapter.
6.2 The Variation in Reported Adherence According to Demographic
Characteristics.
This section discusses the findings of the analyses performed to determine whether
adherence reports varied in relation to demographic characteristics. These findings
were presented in Section 5.2.
The demographic characteristics of the sample considered in these findings are: first,
the adolescents' age; second, the adolescents' gender; third, the combined influence of
adolescents' age and gender; and fourth, participating parents' work status.
213
6.2.I The Variation in Reported Adherence According to Adolescent Age.
The first demographic characteristic of the sample to be considered in this section was
adolescents' age. Adolescents' and parents' reports of general adherence (GAS) were
not associated with the adolescents' age. Similarly, the reports of adolescents and
parents on the DSAS did not correlate with or vary according to the adolescents' age
These results are surprising; previous studies have determined that rates of adherence
to various regimens vary according to the age of adolescents (e.g., Dunbar, 1983;
LaGreca, 1982; Litt & Cuskey, 1980). For example,La Greca (1982) reported that
adherence to IDDM treatment was poorer amongst older adolescents than amongst
younger adolescents. The lack of association between adolescents' age and their
reports of adherence in this study is therefore unexpected.
The lack of association between adolescents' age and their adherence cannot be traced
to an imbalance in the age distribution in the sample; approximately equal numbers of
adolescents at each age level were involved in the study. The previous studies in
which adherence was found to vary with adolescents' age did not employ the GAS or
DSAS as measures of adherence. La Greca (1982) did not report how adherence was
assessed, so it cannot be determined whether this difference in findings is the result of
the instruments employed.
In contrast, observed BGM adherence was found to vary significantly in relation to
adolescents' age. Lower levels of BGM adherence were observed in the older
adolescents than in the younger adolescents. An analysis of variance indicated that
214
this variation was significant. Post hoc comparisons of BGM adherence by adolescent
age groups indicated that significant differences in BGM adherence were found
between the 12 year old adolescents and the 16 and 17 year old adolescents. These
findings are consistent with the results of previous studies, in which adherence was
reported to be lower amongst older adolescents than amongst younger adolescents and
children (Dunbar, 1983; La Greca, 1982; Litt &. Cuskey, 1980; Weinberger, 1987).
There are several possible explanations for the inconsistency of age-adherence
relations observed between this result and the results obtained with the adolescent and
parent reports of adherence.
First, it is important to recognise that the adolescent and parent reports of adherence
were not focused on blood glucose monitoring alone, but addressed a range of
diabetes regimen activities, either assessing adherence in general (GAS) or to a range
of specific activities (DSAS). As such, it is possible that adherence to other diabetes
care activities was not associated with adolescents' age - that this relationship only
occurred with blood glucose monitoring. This interpretation is facilitated by the
finding that adherence to one aspect of a complex treatment regimen is not necessarily
associated with adherence to other aspects of the regimen (Section 5.1.1;
Fotheringham & Sawyer, 1995).
As a further test of this interpretation, additional analyses were performed to
determine whether the relationship between BGM adherence and adolescents' age was
demonstrated in the adolescents' and parents' responses to the item of the DSAS that
specifically addressed this activity. Pearson correlations and one-way ANOVAs did
not detect significant relationships between adolescents' or parents' responses on this
215
item and the adolescents' age. These additional results do not provide support for the
interpretation that BGM adherence is associated with adolescent age, while adherence
to other aspects of the regimen are not. That is, a significant relationship between
adolescents' age and responses on this item would have supported the finding from
the observed BGM data that adherence to this regimen activity is associated with
adolescents' ug", and would have suggested that the lack of association between
adolescents' age and scores on the GAS and DSAS indicate that adherence to other
aspects of the IDDM management regimen are not associated with adolescents' age.
A second possible explanation for the reported inconsistency in age-adherence
relations observed between different measures of adherence is that the adolescent and
parent reports of adherence failed to reveal a true relationship between adherence and
adolescents' age as a result of socially desirable responding. This interpretation is not
supported, however, by the finding reported in Chapter 4, that these measures were
not closely associated with measures of socially desirable responding.
Nonetheless, in order to more closely examine this possibility, associations between
the measure of socially desirable responding (SDRS) and adolescent and parent
reports of adherence were assessed according to adolescent age strata. The responses
to the adherence measures by older adolescents (16 and L7 year olds) were more
closely associated with the measure of socially desirable responding than the
responses of the younger adolescents, suggesting that these older adolescents may
have responded to the adherence questionnaires in socially desirable manners. This
finding may explain some of the difference in age-adherence relations detected
amongst the different adherence measures. However, it is noteworthy that the
2t6
responses of the parents of the older adolescents were not associated with the SDRS
This suggests that while socially desirable responding may have made some
contribution to the variation in age-adherence relations, this type of responding does
not fully account for the observed variation in results.
A third potential explanation for this contrast in results is that the significant
association with age found in the BGM data was influenced by the smaller sample
size involved in this analysis. The GAS and DSAS reports were collected from 135
adolescent-parent dyads, while the BGM data could only be collected from 75 of the
adolescents' blood glucose monitors. The difference in sample size obtained from
these measures may have influenced the results in two ways: (1) the reduced sample
size available for the BGM data may have influenced the power of the association
between age and adherence; (2) the adolescents from whom BGM data as well as
questionnaire measures were collected may have differed from the adolescents from
whom only questionnaire data was collected.
The former influence is unlikely to be relevant to the current sets of data, as the
reduced sample size available for the BGM data would make a real association more
difficult to detect than the larger sample available for the questionnaire data.
The latter influence also appears to be unlikely, as the subsample for whom BGM data
were available was drawn from within the greater sample. However, to test this
possibility, the associations between adolescents' age and adolescent and parent
reports of adherence \ryere again examined, selecting only those study participants for
whom BGM data had been collected. The results of these analyses suggest that the
2r7
variation in age-adherence relations detected between the questionnaire measures of
adherence and the BGM adherence data is not explained by the difference in
sampling.
A fourth possible explanation for the differences in association with adolescents' age
of the BGM adherence data and the questionnaire measures lies in the selection of
adolescents for supply with the MediSense monitors. These monitors were supplied
to a selection of adolescents with poor metabolic control. It is possible that the
adolescents with poor metabolic control differed from the other adolescents in terms
of the factors which influence their adherence. That is, adherence amongst
adolescents with poor metabolic control may be influenced by age-associated factors,
while adherence of adolescents with good metabolic control may not be influenced by
such factors. Reasons for such a contrast in influences on adherence are unclear.
None of the explanations discussed here appear to properly account for the variation
in results found in this study when examining the relations of different adherence
measures with the adolescents' age. It is possible that some combination of the
factors discussed here are responsible for the inconsistent findings, or that another
factor, not considered here, would account for the inconsistency. Replication of these
findings in future studies would offer the opportunity to more systematically explore
this issue.
Further analysis of adolescents' and parents' adherence reports in relation to the
adolescents' age determined that the level of agreement between adolescent and
parent reports of adherence on the GAS did not differ according to the age of the
2r8
adolescent. However, the level of agreement between adolescent and parent reports
on the DSAS did vary according to the adolescents' age. The level of agreement
between adolescents and parents on this scale was greater amongst the sample of 17
year olds than amongst the younger adolescents, aged between 12 and 14 years.
These results are consistent with those of a study conducted by SB Johnson and
colleagues (1986), in which parent-adolescent agreement on a range of IDDM
adherence measures amongst adolescents aged between 12 and 17 was inconsistent.
The results of this previous study suggest that parent-adolescent agreement was more
consistent amongst a subsample of younger adolescents (age 12 to 15 years) than
amongst the older (16 and I7 year old) adolescents.
The finding in the current study that parent-adolescent agreement was highest
amongst the older adolescents was somewhat surprising. These adolescents would be
expected to behave more independently than the younger adolescents, and their
parents to therefore be less aware of their regimen adherence. This finding does not
support this expectation. The association between adolescents' autonomy and their
adherence will be examined in more detail in Chapters 9 and 10.
It is noteworthy that although adolescents' and parents' reports of adherence were not
associated with adolescents' age, observed BGM adherence was. Older adolescents'
BGM adherence was poorer than that of the younger and middle adolescents, and the
level of agreement between adolescents' and parents' on adherence was greatest at
this age. This combination of results suggests the possibility that parent-adolescent
agreement on the GAS and DSAS was high because parents had assumed that
219
adolescents were taking responsibility for, and were adhering closely to, the regimen.
Adolescents' responses to the DSAS and GAS were consistent with this view.
However, the observed BGM suggested that the adherence of these older adolescents
may have been poorer than the adolescents and parents reported. In contrast, the
parents of younger adolescents were likely to have been more involved in the
management of their adolescents' regimen. The responses of these parents to the
GAS and DSAS were less closely associated with their adolescents' responses. These
findings are consistent with the finding, reported in Chapter 4, that adolescents'
responses on the GAS and DSAS were more closely associated with the measure of
socially desirable responding than the responses of the parents.
These results are also consistent with the finding of previous researchers, that
confusion over the responsibility for regimen activities is associated with poor
adherence (e.g., BJ Anderson, et al. 1990; La Greca, I990a; Tebbi, 1993; Tebbi, et al.
1986; Tebbi, et al. 1988; Tebbi, et al. 1989; Wysocki, Meinhold, et al. 7992). For
example, Ingersoll and colleagues (1986) reported that parents of adolescents with
IDDM decreased and ultimately discontinued their involvement in their adolescent's
illness regimen, but the adolescents did not assume the illness management. The
present study does not include an assessment of perceived responsibility for regimen
activities between adolescents and parents. The collection of this information in
further studies would be beneficial for the understanding of adolescents' adherence.
220
6.2.2 The Variation in Reported Adherence According to Adolescent Gender.
The second demographic characteristic of the sample to be considered in this section
is adolescents' gender. Adolescent and parent responses on both the GAS and the
DSAS were not differentiated according to the adolescents' gender. Similarly, the
level of observed BGM adherence was not significantly different amongst the male
adolescents when compared with the female adolescents.
Further analyses examined the level of agreement between adolescent and parent
reports of adherence on the GAS and DSAS. The results of these analyses suggested
that parent-adolescent agreement on these questionnaires was not varied according to
the gender of the adolescent.
Previous studies have also reported no association between adolescents' adherence to
medical recommendations and their gender (Brooks-Gunn, 1993; Iannotti & Bush,
1993; SB Johnson, et al. 1986). However, as RE Glasgow and Anderson (1995) point
out, many previous studies have not involved large enough samples to stratify
participants according to characteristics such as gender and perform meaningful
subgroup analyses.
The findings in this study consistently demonstrated that adherence \ryas not
differentiated according to adolescents' gender. The uniformity of these results across
all measures of adherence, and in the level of agreement between adolescent and
parent reports of adherence, suggests that gender may be considered to have little
influence on adolescents' adherence.
22t
6.2.3 The Relationship Between Measures of Adherence and the Measure of
Metabolic Control (IIbAr.).
The next set of findings examined the relationship between adolescents' adherence
and their level of metabolic control. The purpose of examining this relationship was
to test the assumption that adherence is associated with health outcomes, that is, that
poor adherence is associated with poor health status, while high levels of adherence
are associated with good health. For adolescents with IDDM, metabolic control
(HbAl.) is the most widely accepted measure of health status.
The first of these analyses examined the relationship between the adolescents' GAS
reports and their HbA1. levels. This correlation did not reach statistical significance.
However, an Analysis of Variance was performed to examine the relationship further.
This analysis showed a significant variation in metabolic control in relation to
adolescent reported adherence on this measure.
The lack of significance of the correlation between HbA1" and adolescent GAS scores,
and the significance of the ANOVA of these variables, is explained by the scatterplot,
shown in Figure 5.2. The distribution of scores by adolescents on the GAS was
naffow for those adolescents with IIbA1. assay values of around 7 7o', these
adolescents all produced high scored on the GAS. The adolescents with HbA1" assays
around l0 7o and ll7o produced a much wider distributions of scores on the GAS.
Adolescents with HbA1. assays of 12 Vo or higher produced a somewhat narrower
222
distribution of GAS scores, although the number of adolescents at this end of the
HbA1. range was limited. The variation in the spread of GAS scores along the range
of HbA1. values appears to explain the significance of the ANOVA, and the
nonsignificance of the correlation. Post hoc analyses of the ANOVA results revealed
this to be the case; significant differences were found in GAS scores between the
adolescents who had HbA1. assay results of 7 7o and those with assays results of I0 7o
and II Vo.
Adolescents' scores on the DSAS were not significantly related to their HbAlç assa)
levels. Parents' scores on the GAS and their adolescents' HbA1. assay levels were
moderately associated. That is, high scores on the GAS were moderately associated
with low HbAlc levels - indicating good metabolic control. The association is in the
expected direction, indicating that parents' perceptions of general adherence were
moderately linked with good metabolic control by these adolescents. The relationship
between parents' reports of diabetes-specific adherence and adolescents' metabolic
control did reach significance, although the correlation coefficient was moderately
small.
Similarly, recorded BGM adherence by adolescents was moderately inversely
associated with their metabolic control. This result indicates that adherence to BGM
recommendations was directly associated with the metabolic control of these
adolescents.
The association between adolescents' metabolic control and the measures of
adherence is an important one. Previous studies have produced inconsistent results
223
when relating health status or health outcomes with adherence. The importance of
adherence assessment lies in the assumption that good adherence leads to good health,
and that poor adherence leads to poor health. The findings in this study suggest that
the measures used to assess adherence were generally associated with the adolescents'
level of metabolic control. Had the adherence assessments in this study been
unrelated to metabolic control, the importance of factors associated with adherence
would have been diminished. The significant relationship between the various
measures of adherence and metabolic control suggests that factors associated with
adherence are likely to influence the metabolic control of these adolescents.
6.2.4 The Combined Effect of Adolescents' Demographic Characteristics on
Reported Adherence.
The next set of findings examined the variation in reported adherence according to
adolescents' demographic characteristics.
The variation in responses to the four questionnaire measures of adherence in relation
to adolescents' age and gender was insignificant. Similarly, the variation in observed
BGM adherence in relation to adolescents' age and gender, and the interaction effect
between these factors, was not significant.
These findings are consistent with those discussed in Sections 6.2.I and 6.2.2. These
results indicate that the adherence of adolescents in this study was not predicted by
their age or gender
224
6.2.5 The Variation in Reported Adherence According to Parental'Work Status.
The next demographic characteristic of the sample to be considered in this section is
parental work status. This term is used to indicate whether the parent completing the
parent questionnaire measures in the study was primarily at home (i.e., performing
home duties, pensioner, or working from home) or primarily out of the home (i.e.,
working outside the home environment).
The purpose of these analyses was to determine whether parents who worked outside
the home were able to report on their adolescents' adherence in the same manner as
parents who were primarily based inside the home environment. These analyses are
intended to determine whether parents' perceptions of their adolescents' behaviour,
and their level of agreement with their adolescents on that behaviour, are influenced
by their level of contact with the adolescents (JM Landgraf, personal communication,
20 August, 1996).
These analyses first examined adolescents' and parents' responses on the GAS and
DSAS in relation to the work status of the parent-informant. There were no
significant differences between the reports obtained from parents who were working
outside the home and those who were primarily at home. There also were no
differences between the reports obtained from adolescents whose participating parents
worked outside the home or were primarily at home.
225
Similarly, an examination of the observed BGM adherence according to whether or
not the parent-informant was primarily at home did not reveal significant differences
in BGM adherence.
Also, the level of parent-adolescent agreement on the GAS and on the DSAS was not
varied according to whether or not the responding parent was primarily at home or
was working outside the home.
These results suggest that the level of contact parents experienced with their
adolescents, as indicated by their work status, did not effect their reporting of their
adolescents' adherence. The finding that the level of agreement between adolescents
and parents was not differentiated by parental work status suggests that this factor
does not influence adolescent-parent relations in terms of the adolescents' health care.
6.3 The Variation in Adherence Over Time.
This section discusses the results presented in Section 5.3, describing the variation of
adolescents' adherence over time.
It should be recognised that the sample involved in these analyses was not the
complete sample assessed using the questionnaire measures. BGM data were only
obtained from the seventy-five participants who possessed a MediSense
Companion 2rM blood glucose monitor. It is possible that this restriction creates a
bias in the sample. These monitors were supplied to adolescents with poor metabolic
226
control (see Chapter 3). A comparison of the adolescents from whom BGM data
were obtained and those who did not provide this data, is presented in Chapter 4.
6.3.1 Variation in Adherence Over Time
The next findings examined the variation over time of the level of adherence to Blood
Glucose Monitoring recommendations. The variation in BGM over time was
examined in two ways. First, the BGM data were coded into seven consecutive four-
day blocks. The analysis of this data provided information about the frequency of
BGM over short time periods. The selection of four day blocks of data provides a
workable dataset - the analysis of 28 separate days was considered inappropriate for
two reasons: (1) the degree of variation of BGM on individual days was more likely to
vary widely (e.g., a noise effect), and (2) the interpretation of a significant result of an
analysis of 28 separate days would be difficult (DL Streiner, personal communication,
24 March, 1997). The division of this data into seven blocks of four days was
designed to provide a sufficient number of observational units to detect a variation,
while keeping the dataset to a manageable proportion.
A second coding of the original data also was performed. In this case, the BGM data
were coded into four blocks of one week. Although this smaller number of
observations units provides a less detailed assessment, the week-long blocks account
for possible variations between weekday and weekend activity. These analyses are
presented separately. This coding was performed because of the possibility that BGM
adherence may be differentiated between weekdays and weekends. That is, adherence
227
may be poorer on weekends because of the less structured lifestyle experienced by
adolescents on weekends. The coding of the BGM data into four blocks of seven days
overcomes the possible distortion created by this cycle
A significant variation in BGM adherence was detected using both sets of data. These
significant results indicate that the frequency of BGM by participating adolescents
changed over the 28 days prior to Outpatient Clinic attendance. The graphical
representation of these datasets suggest that the variation takes the form of an increase
in BGM frequency as assessment time approaches, especially in the final days before
assessment (Figures 5.3 and 5.4).
In order to formally assess the form of this variation in BGM, Trend Analyses were
performed. A linear trend was detected. This finding means that the variation in
BGM was monotonic. The frequency of BGM increased with each consecutive block;
there was no reversal of this trend.
The finding that blood glucose monitoring adherence varied over time, increasing
linearly as clinic attendance approaches, suggests several possible interpretations
Figures 6.1 and 6.2 illustrate five possible models describing the variation in
adherence levels over time. These models are described in turn; factors supporting or
contradicting each of the models are then considered. In these figures, BGM
adherence variation over time is represented by a black line, travelling from left to
right. The grey box in this model, and in each of the remaining models, represents the
time frame of the BGM data collected in this study. In each of the models the level of
228
BGM adherence rises during the time frame of the study. The point of data collection
(clinic attendance) is represented by the right edge of the grey box
The first interpretation of the observed variation in BGM adherence is illustrated in
Model A of Figure 6.'1... This model posits that the adolescents' level of adherence
steadily increases with time.
A second possible interpretation, related to the first, is illustrated as Model B in
Figure 6.1. According to this interpretation, adolescents' adherence levels increase
for a time, before reaching a plateau.
A third model of adherence variation over time is shown as Model C in Figure 6.1.
Like Models A and B, in this model the adolescents' adherence increases for a time.
However, instead of continuing to rise or reaching a plateau, in this model the
adolescents' adherence level decreases at some point after the time frame of the study.
A fourth possible model of BGM adherence variation over time is illustrated as Model
D in Figure 6.2. This interpretation is that adherence levels rise and fall in a cyclic
fashion, in relation to the timing of outpatient clinics - for example, adherence
increases before each clinic attendance, and declines again after attendance.
The fifth model of BGM adherence variation is illustrated as Model E in Figure 6.2.
This model is similar to Model D, in that the adherence level rises and falls in a cyclic
manner, based around the timing of clinic attendance. However, in this model the
level of adherence remains high for a brief time after each clinic attendance.
229
It should be recognised that these models provide a simplified representation of
patterns of variations in adherence levels over time. Of course, actual adherence
levels are likely to fluctuate considerably, both between individuals, and within
individuals on a day to day basis. Like most health behaviours, adherence to BGM is
likely to be influenced by daily events in the adolescents' lives. Nonetheless, the
consideration of trends such as those depicted in these four models provides an insight
into adherence behaviour.
A number of considerations should be recognised in examining these models. For
example, the first interpretation, Model A, is unlikely to be an accurate representation
of adherence variation over time, as this trend would show strong associations
between adherence and illness duration. Adolescents' BGM adherence was not
strongly related to the length of time they had been diagnosed with IDDM (r = -0.04,
p = 0.8).
It is possible that, rather than a straightforward practice effect based upon the duration
of treatment, the increase shown in BGM adherence over time indicated a practice
effect associated with the new MediSense Companion 2rM blood glucose sensors.
The adolescents from whom the BGM adherence data were obtained had only recently
acquired these new monitors. This practice effect is unlikely, however, as the
behaviour involved in monitoring blood glucose with these monitors is the same as
that involved in the use of other monitors. All of the adolescents involved in the study
has been in possession of a blood glucose monitor for at least twelve months before
the study commenced.
230
It may be suggested that the variation in BGM adherence seen in the four weeks prior
to assessment indicates a novelty effect associated with the new blood glucose
SENSOTS This effect is unlikely, for at least two reasons. First, as already stated, the
behaviour involved in blood glucose testing with these monitors was essentially the
same as that involved with other blood glucose sensors. Second, it is unlikely that the
pattems shown in Figures 5.3 and 5.4 arc the result of a novelty effect; if the variation
were due to novelty it is more plausible that a decrease would be evident over the four
weeks, as depicted in Figure 6.3. That is, if novelty were responsible for the variation
in BGM adherence, there would be an increase in adherence shortly after the
adolescents' acquired the new monitors, followed by a gradual (or rapid) drop-off.
A more plausible explanation for the significant variation in BGM adherence level
relates to the adolescents' attendance at the Diabetes Outpatient Clinics at the
hospital. The data collected indicate that BGM frequency increased as the
adolescents' clinic appointment approached. Two explanations relating the proximity
of clinic appointments with adherence levels are suggested.
First, that the adherence increased prior to the clinic attendance during which data
were collected, but that this pattern was not repeated prior to further clinic attendances
(i.e., Models B and C in Figure 6.L). According to this explanation, the adolescents'
adherence was influenced by clinic attendance only because of the prompt of receiving
a new blood glucose monitor.
23r
Second, that adherence increases prior to each clinic attendance, and decreases after
the clinic visit. This explanation is depicted in Models D and E of Figure 6.2. This
interpretation is consistent with the finding of a previous study by Cramer and
colleagues (1990), who reported that adherence to antiepileptic medication declined
between clinic visits
A cyclic variation appears to be the most plausible interpretation of the observed
variation in blood glucose monitoring adherence. To determine whether this pattern is
repeated before each clinic attendance, a longitudinal study design would be required.
A study of this nature would also be able to determine whether such a variation
followed the pattern of Model D, Model E, or some other pattem. The design of the
present study does not allow for a longitudinal assessment of this kind, however, the
author is collaborating in an ongoing study of adolescents with IDDM, in which these
data are being collected over a period of nineteen months (Taylor, Fotheringham,
Couper, Sawyer, 1996, 1991). These adolescents are scheduled to attend outpatient
clinics at three-monthly intervals, so the data collected in that study should provide an
insight into the nature of the variation in BGM adherence between a number of clinic
attendances.
6.3.2 Relations Between Adolescent and Parent Reports of Adherence and Measures
of Blood Glucose Monitoring Adherence Over Different Time Periods
This section discusses the series of findings relating the reports of adherence (General
Adherence Scale and Diabetes Specific Adherence Scale) obtained from adolescents
232
and parents, and the BGM adherence data. Each of these measures were framed to
assess adherence over the past four weeks. The findings discussed in this section,
which were presented in Section 5.3.2, were intended to determine whether the
adolescents' and parents' reports of adherence were more representative of adherence
levels over a shorter time-frame. To assess this, the level of association between these
reports and the observed level of BGM over various time-frames was examined.
Adolescent and parent ratings of adherence to BGM were obtained as part of the
DSAS. The second item of this scale asks how often in the past four weeks
adolescents have "self monitored blood glucose at least twice a day."
The associations between adolescent and parent reports of adherence and the observed
BGM adherence over the different time frames do not provide strong support for the
suggestion that these reports were biased by the most recent adherence behavrour
That is, adolescent and parent reports were not more highly correlated with observed
BGM adherence over the shorter time frames than over the complete time frame. The
level of association between reports of BGM and observed BGM did not vary widely
depending on the duration of BGM data examined. This finding does not provide
support for the suggested response bias. However, a number of caveats should be
considered when interpreting this finding.
First, as was identified in Section 6.1, the DSAS and GAS are measures of adherence
to diabetes treatment activities and to medical treatment in general. These measures
were not designed to assess adherence to blood glucose monitoring alone. As such,
the differences shown between reported adherence levels on these measures and the
observed level of adherence to BGM may reflect the variation in adherence to
233
different regimen activities. That is, the finding that the level of BGM adherence
observed was lower than the reported levels of adherence on these measures may
simply reflect that adherence to this activity was poorer than adherence to other
regrmen actrvrtres.
In order to explore this possibility, patterns of responses to Item 2 of the DSAS, which
directly assesses adherence to blood glucose monitoring, were examined. This
approach leads to the second caveat to be considered. That is, the BGM item of the
DSAS was not designed to be used as a scale in isolation from the other items of the
DSAS. The psychometric properties of this item as a stand-alone item are not known.
V/hile the findings relating this item to the observations of the same behaviour
provide interesting additional information, they should be interpreted with caution.
Another consideration that should be noted when interpreting these findings is that the
degree of variation in the correlations presented in Table 5.28 is small. With the
exception of responses to the GAS, the correlations of questionnaire measures with
BGM measures of different duration did not vary in terms of significance levels. In
light of this, the interpretations of these variations should be made with caution. This
is an issue worthy of further investigation.
A final caveat to consider is that when examining the BGM adherence over shorter
time frames, the degree of continuity of the data declines. For example, the BGM
adherence assessment which spans only the last 4 days can only produce scores of
O 7o, 25 7o, 5O 7o, 75 7o or lO0 7o. Given this lack of continuity, the level of
234
correlation between this measure and the adolescent and parent reports is likely to be
reduced in comparison to more continuous assessments of BGM adherence
This consideration should also be applied to the adolescent and parent ratings of
BGM. The item asking about BGM in the DSAS was constructed with a six-point
Likert answering format. This limited range of response options restricts the
continuity of the adolescent and parent reported BGM information. This caution is
related to the abovementioned absence of known psychometric properties for these
reports of monitoring behaviour.
In light of this final caution, a further examination of the relationship between
observed blood glucose monitoring and adolescents' and parents' reports of BGM was
performed. The reports of BGM adherence from adolescents and from parents were
each split according to the midpoint of the response options. That is, adolescents who
responded using options 1,2 or 3 on this item (None of the time, A little of the time,
or Some of the time ["Low BGM Adherence"]) were separated from those who
responded using options 4, 5 or 6 (A good bit of the time, Most of the time, or All of
the time ["High BGM Adherence"]). This dichotomous categorisation was used to
examine the level of observed BGM amongst the two groups in each of the assessed
time frames. This analysis was repeated by examining the response of parents to the
BGM item of the DSAS, again dividing the sample according to reports of Low or
High BGM adherence.
The difference between the mean number of days of appropriate BGM in these groups
was tested for each of the time frames employed in the previous analyses. In each
235
time frame, the difference in mean days of BGM adherence between those categorised
as Low BGM adherence and those as High BGM adherence was significant; this
pattern was evident for both adolescent and parent ratings.
A second approach used to examine this relationship was to categorise the adolescent
and parent ratings of BGM adherence into "Low BGM Adherence" (responses of I
None of the time, or 2: Alittle of the time), "Moderate BGM Adherence" (responses
of 3: Some of the time, or 4: A good bit of the time), and "High BGM Adherence"
(responses of 5: Most of the time, or 6: All of the time). This trichotomous
categorisation was again used to examine the mean number of days of observed BGM
adherence in each group for each of the time intervals. These analyses were
completed separately for adolescent and parent responses.
Again, the differences in mean numbers of days of appropriate BGM amongst these
groups were significant, according to both the adolescent and the parent ratings. Post
hoc analyses revealed that the differences between groups were significant between
the adolescent-rated High BGM Adherence group and the adolescent-rated Low and
Moderate BGM Adherence groups, but were not significant between the adolescent-
rated Low BGM adherence and Moderate BGM adherence groups. Post hoc analyses
revealed similar variations in observed BGM adherence in relation to parents' ratings
of BGM adherence. Significant differences in observed BGM were revealed between
adolescents of parents reporting Low BGM adherence and High BGM adherence for
all of the time frames assessed, and between those reporting Moderate BGM
adherence and High BGM adherence over the 28 day and20 day time frames.
236
These results suggest that the adolescents' and parents' responses to the BGM item of
the DSAS were able to distinguish adolescents who were poorly adherent to this self-
care recommendation from those who were more adherent. The significance of these
tests, using both the dichotomous and trichotomous categorisation of responses,
supports the accuracy of these ratings. Further, the significance of these differences
when examining each of the time frames included (the last 28,20, 12, I or 4 days)
provides further evidence that responses to this item of the DSAS were not unduly
biased by the behaviour of the final week before Outpatient Clinic attendance.
However, in interpreting these results, a number of considerations and limitations
should be recognised. First, although the mean number of days of BGM adherence
was significantly different between groups, the actual number of days of BGM
adherence in the "High BGM Adherence" group in the dichotomous categorisation, or
in the "Moderate BGM Adherence" and "High BGM Adherence" groups in the
trichotomous categorisations, was quite low. For example, the mean number of days
of BGM adherence in the High BGM Adherence in the dichotomous analyses, for
adolescent and parent responses, were 16.4 (t 9.6) and 15.2 (t 10.0) respectively
during the past 28 days (Tables 5.32 and 5.33). These mean figures represent only
slightly greater than half of the days in the time frame.
This pattern is consistent with the findings of other studies, which have noted that
reports of poor adherence are often more accurate than reports of high levels of
adherence (e.g., Dunbar, 1980; Dunbar & Agras, 1980).
237
These analyses are also limited by the imbalanced distribution of respondents into the
Low and High, or Low, Moderate and High, BGM adherence groups. For example,
the adolescent responses produced groups of 27 participants in the Low BGM
adherence group and 48 in the High BGM adherence group for the dichotomous
analysis (Table 5.32), and groups of 16, 18 and 4l lor Low, Moderate and High BGM
adherence groups in the trichotomous assessment (Table 5.34). The sample sizes for
these analyses may have distorted the significance of the differences in observed
adherence between groups.
A further consideration with these analyses is that the BGM item of the DSAS was
intended for use as part of a broader scale. The psychometric properties of this item
when used in isolation have not been tested. Further, the response options for the item
are not specific - including such options as "some of the time" and "a good bit of the
time" rather than, for example "10-15 days" or "3 days per week."
Nonetheless, the consistently significant results obtained in these analyses in
distinguishing levels of adherence to BGM provides strong support for the utility of
these tests. The consistency of the relations between observed BGM adherence over a
variety of time frames with both adolescent and parent responses, supports the
previous finding that these responses were not biased by the participants' adherence in
only the final days before assessment.
The final examination of the variation in BGM adherence over time involved the
classification of the observed patterns of BGM adherence in the four weeks prior to
assessment. Adolescents were categorised with Consistently High BGM adherence
238
(at least four days of appropriate BGM in each of the four weeks prior to assessment),
Consistently Low BGM adherence (three or fewer days of appropriate BGM in each
of the four weeks prior to assessment), Rising BGM adherence (three or fewer days of
appropriate BGM per week at the beginning of the assessment period, increasing to
four or more days of appropriate BGM adherence by the final week before
assessment), or Other patterns of BGM adherence.
The variation in BGM adherence over time according to membership in the first three
of these groups indicated that the groups were distinguished in terms of their BGM
adherence pattems over time. Further analysis determined that responses from
adolescents and their parents to the GAS, DSAS, and to the item of the DSAS
specifically asking about blood glucose monitoring were differentiated between the
Consistently High and Consistently Low BGM adherence groups, and between the
Rising and Consistently Low groups. However, the Consistently High and the Rising
groups were not differentiated on any of the questionnaire measures of adherence
completed by adolescents or parents.
This finding suggests that the responses of the adolescents (and their parents)
classified in the Rising BGM adherence group may have been based upon their
adherence behaviour in the week or two before assessment, rather than on the entire
four weeks or the early part of this assessment period.
The limited size of these groups should be noted. Although the Consistently Low
group includes 33 cases, the Consistently High group has only 22 cases, and the
Rising group includes only 12 of the adolescents (eight adolescents were coded as
239
"Other," and not included in the subsequent analyses). The small group sizes,
particularly in the last of these groups, may limit the generalisability of these findings
6,4 Summary
This chapter discussed the results presented in Chapter 5. These results relate to the
measurement of adolescents' adherence. The discussion presented in this chapter
addressed the relationship between each of the measures of adherence employed in
this study, and the relationship between these measures and demographic
characteristics of the sample.
The measures of adherence employed in this thesis were: adolescent completed
reports of adherence on the GAS and DSAS, parent completed reports on the GAS
and DSAS, and observations of BGM adherence. Large correlations \ryere detected
between each of these measures, suggesting that these measures were assessing the
same general construct: patient adherence. However, as has been reported in previous
studies, the reported level of patient adherence varied between different regimen
activities (Fotheringham & Sawyer, 1995).
In light of these findings, and the issues raised at the start of Section 6.1,, each of the
measures of patient adherence employed in this study will be analysed separately in
subsequent analyses. A combined measure formed on the basis of each of the separate
measures will not be created. The hypotheses of this thesis will be tested separately
240
using general adherence (GAS) and diabetes-specific adherence (DSAS) measures
separately, by adolescents and parents, as well as the objective BGM adherence data.
The level of adherence reported by adolescents and parents was not associated with
the adolescents' age. Further, the level of agreement between adolescents and parents
on the adherence measures was only weakly associated with adolescents' age -
agreement on the GAS was not associated with adolescents' ug", while agreement on
the DSAS showed greater agreement between the eldest adolescents and their parents
than between young adolescents and their parents. The level of observed BGM
adherence was varied according to adolescent age, with greater adherence observed in
the younger adolescents than in the older adolescents.
The association between adherence reports and adolescent gender was more
straightforward. The level of adherence reported by adolescents and parents was not
varied according to the gender of the adolescent. Further, the level of agreement
between adolescents and parents on the adherence measures was not influenced by the
adolescents' gender. The observed level of BGM adherence was also not associated
with adolescents' gender.
Reports of adherence obtained from adolescents were only weakly associated with the
adolescents' HbA1" levels, while reports obtained from parents, and observations of
BGM adherence were moderately associated with the adolescents' FfbAl.levels.
Reports of adherence were not associated by the combined effect of adolescent age
and gender. Reports of adherence from adolescents and parents, and observed BGM
241
adherence, were not varied according to whether the parent was primarily in the home
or outside the home, however, the level of agreement between adolescent and parent
reports of diabetes-specific adherence (DSAS) was greater when the parent was
primarily outside the home than when the parent was primarily at home. This pattern
was not repeated with the GAS.
In sum, reported and observed levels of adherence were generally not varied in
relation to demographic characteristics of the sample. While some associations were
detected, these associations were often weak. Further, by performing multiple tests
among the five different measures of adherence and the various demographic criteria,
the probability of finding at least one statistically significant association is increased
(see Section 3.4.3). The lack of strong associations between demographic
characteristics of the sample and their adherence ratings suggests that the analyses
performed in the subsequent results chapters of this thesis do not need to be performed
separately for each demographic group on the basis of their adherence ratings.
Blood glucose monitoring adherence levels varied over the 4 weeks prior to
assessment, becoming increasingly high as clinic appointments approached. The
variation in BGM adherence levels formed a linear trend. That is, the variation with
time was consistently in the same direction - increasing, rather than increasing and
then decreasing.
In light of this finding, subsequent analyses involving the BGM adherence
information will be performed using data spanning a variety of time frames. That is,
the data assessing BGM adherence will be used separately in analyses involving BGM
242
adherence in the 28 days, 20 days, 12 days,8 days and 4 days prior to Outpatient
Clinic attendance. The use of sets of BGM adherence data covering different time
spans should provide a more detailed illustration of the association between this
measure of adherence and the other variables assessed in this investigation.
Finally, patterns of BGM adherence over the four weeks prior to Outpatient Clinic
attendance were coded as Consistently High, Consistently Low, Rising or Other.
Responses to questionnaire measures of adherence were found to be differentiated by
these groups. Therefore, analyses involving BGM adherence in subsequent chapters
will also be performed separately for adolescents classified with Consistently High
BGM adherence, Consistently Low BGM adherence, Rising BGM adherence and
Other BGM adherence patterns.
243
CHAPTER SEVEN.
RESULTS: THB RELATIONSHIP BETWEEN PATIENTADHBRBNCB AND PARBNT.ADOLESCENT
CONFLICT.
This chapter examines the relationship between measures ofadolescents' adherence to their diabetes treatment recommendationsand reports of parent-adolescent conflict. These analyses weredesigned to test the first hypothesis of this thesis. This chapter consists
of four sections. First, adolescents' and parents' reports of parent-adolescent conflict are presented in relation to sample characteristics.Second, analyses are presented that examine the association betweenreports of parent-adolescent conflict and reports of adherence. Third,analyses are presented reporting dffirences in the level of associationbetween reports of parent-adolescent conflict and reports of adherenceaccording to sample characteristics. Finally, the association between
reports of parent-adolescent conflict and adolescents' metaboliccontrol (HbAù is examined.
Parts of this chapter were published in:
Fotheringham MJ, Couper JJ, Sawyer MG. (1996). Adolescents' adherence to IDDM treatment:Relation to parent-adolescent conflict and adolescent autonomy. Proceedings ofthe AustralianDiabetes Society, 1996 A89.
7 RESULTS: THE RELATIONSHIP BETWEEN PATIENT
ADHERENCE AND PARENT.ADOLESCENT CONFLICT.
7.L The Reporting of Parent-Adolescent Conflict in Relation to Sample
Characteristics.
This section examines obtained data from the measure of parent-adolescent conflict.
The CBQ was completed by participating adolescents and parents; an aggregate score
was generated by adding the adolescent and parent scores. Table T.L displays
distributions of scores on this measure by adolescents and parents, as well as
aggregate scores. The scoring ranges for the adolescent completed and parent
completed CBQs are 0 to 20, with higher scores indicating higher levels of conflict.
The scoring range for the aggregate score is 0 to 40. As may be seen from this table,
mean responses on this scale from adolescents and parents were in the lower half of
the scale, indicating generally low levels of conflict. Further, the level of conflict
reported by adolescents was similar to that reported by parents.
The scoring distributions of these measures are examined in relation to: (1)
adolescents' ug", (2) adolescents' gender, (3) parents' age, (4) parents' gender, (5)
parents' work status, and (6) household structure (i.e., single or dual parent
households).
245
7 .I.L The Reporting of Parent-Adolescent Conflict in Relation to Adolescents' Age.
The distributions of scores on the CBQ according to adolescents' age are reported in
Table 7.2. Slightly lower levels of parent-adolescent conflict were reported amongst
younger adolescents (i.e., 12 and 13 year olds) and their parents, than amongst older
adolescents and their parents. One-way ANOVA of this variation revealed that these
differences were not statistically significant. The correlations between the adolescent,
parent, and combined CBQ forms and adolescents' age are shown in Table 7.3.
To explore further the association between reports of parent-adolescent conflict and
adolescents' ug", the level of agreement between adolescents' and parents' reports of
conflict was examined in relation to this characteristic. These analyses are detailed in
Appendices D.L and D.2. The level of agreement between adolescents and parents
was particularly high amongst the 13 year old adolescents. This variation was
significant.
7.I.2 The Reporting of Parent-Adolescent Conflict in Relation to Adolescents'
Gender
The distributions of scores on the CBQ by adolescents and parents according to
adolescents' gender are reported in Table 7.4. Although female adolescents' mean
scores on this scale were slightly higher than male adolescents' scores, this difference
was not significant. Similarly, mean scores obtained from the parents of male and
female adolescents were not significantly different; combined scores produced by
246
adolescents and parents were not significantly differentiated according to adolescent
gender
To explore further the association between reports of parent-adolescent conflict and
adolescents' gender, the level of agreement between adolescents' and parents' reports
of conflict was examined in relation to this characteristic. This analysis is detailed in
Appendix D.3. Overall, adolescents' and parents' responses on the CBQ were highly
correlated. The size of this correlation did not significantly vary according to
adolescents' gender.
1 .1.3 The Reporting of Parent-Adolescent Conflict in Relation to Parents' Age
The distributions of scores on the CBQ by adolescents and parents according to
parents' age Me reported in Table 7.5. Parents' age was grouped into (a) those under
40 years old, (b) those aged 40 to 45 years old, and (c) those aged over 45 years old.
This division meant that almost half of the sample were in the second group.
However, the concentrated distribution of parents' age around the early 40s made this
imbalance unavoidable.
A oneway ANOVA was used to examine the variation in adolescents' scores on the
CBQ according to parents' age groups. The results of this analysis were not
significant. Similarly, parents' scores on the CBQ were not significantly varied
according to their age. Combined adolescent and parent CBQ scores were not
significantly varied according to parents' age.
247
7,1.4 The Reporting of Parent-Adolescent Conflict in Relation to Parents' Gender
The distribution of CBQ scores according to whether the parent-form was completed
by the adolescents' mother or father is reported in Table 7.6. Similar levels of
conflict were reported between adolescents and participating mothers, and adolescents
and participating fathers. The distribution of CBQ scores according to adolescent
gender and age depending on whether parent reports were obtained from mothers or
fathers are reported in Tables 7.7r7.8 and7.9.
Item responses to individual items of the Conflict Behavior Questionnaire by
adolescents completing the adolescent-mother conflict and adolescent-father conflict
versions, as well as item responses by parents, are described in Appendices D.4, D.5
and D.6. It should be noted that the number of fathers involved in this study was very
limited. Because of these small sample sizes, formal analyses were not performed on
this data.
1.1.5 The Reporting of Parent-Adolescent Conflict in Relation to Parents' Work
Status
The distributions of scores on the CBQ by adolescents and parents according to
parents' work status are reported in Table 7.L0. Parental work status was defined on
the basis of whether the participating parent was working primarily in the home or
outside the home environment (see also Chapter 4). Similar levels of parent-
248
adolescent conflict were reported by parents working inside and outside the home
environment, and by their respective adolescents. Students' / test analyses revealed
that mean scores on the adolescent, parent, and combined scales of the CBQ were not
significantly different on the basis of parental work status.
To explore further the association between reports of parent-adolescent conflict and
parents' work status, the level of agreement between adolescents' and parents' reports
of conflict was examined in relation to this factor. These analyses are detailed in
Appendix D.7. Interestingly, greater parent-adolescent agreement on the CBQ was
observed amongst dyads in which the parent worked primarily outside the home
environment than amongst dyads where the participating parent was primarily in the
home.
The distribution of CBQ scores according to parent gender and work status is reported
in Table 7.11. Again, similar levels of parent-adolescent conflict were reported in
each of these groups. However, it should again be noted that the groups defined by
fathers (father working at home and father working outside the home) contain very
limited numbers of participants. Because of these small sample sizes, formal analyses
were not performed on this data.
249

7.1.6 The Reporting of Parent-Adolescent Conflict in Relation to Household
Structure.
The distributions of scores on the CBQ by adolescents and parents according to
participants' household structure are reported in Table 7.12. Hoasehold structure was
defined by the number of parents in the household. That is, these analyses compared
the level of parent-adolescent conflict reported in single parent and dual parent
households.
Adolescents reported very similar mean levels of conflict with parents in single and
dual parent households. The mean level of parent-adolescent conflict reported by
parents in single parent households was slightly higher than that reported by parents in
dual parent households. This difference was not statistically significant.
7.2 The Level of Association Between Measures of Parent-Adolescent Conflict
and Adherence.
The analyses presented in this section were designed to examine the association
between the measures of parent-adolescent conflict and the measures of adherence to
medical recommendations. Pearson correlations were employed to examine the level
of association between these measures.
Separate analyses examined the associations between (1) adolescent reports of
adherence and conflict, (2) parent reports of adherence and conflict, (3) adolescent and
250
parent reports of adherence and the combined measure of parent-adolescent conflict.
Further analyses examined (4) cross-informant associations between reports of
conflict and adherence (e.g., between adolescent reports of conflict and parent reports
of adherence), and (5) associations between observed blood glucose monitoring
adherence and reports of conflict between adolescents and parents.
7 .2.I Adolescent Reports of Parent-Adolescent Conflict and of Adherence.
The level of correlation between the adolescent completed measure of parent-
adolescent conflict and the adolescent completed GAS is shown in Table 7.13. The
effect size of the correlation between adolescents' GAS scores and their CBQ scores
was moderately large and in the predicted direction.
The level of correlation between the adolescent completed measure of parent-
adolescent conflict and the adolescent completed DSAS is shown in Table 7.L3. The
correlation between the adolescent completed DSAS and the adolescent completed
CBQ was moderately strong, and in the direction predicted by the first hypothesis.
1 .2.2 Parent Reports of Parent-Adolescent Conflict and of Adherence.
The correlation between parent scores on the CBQ and on the GAS is reported in
Table 7.13. The association between these reports was moderate, and in the direction
predicted by the first hypothesis.
25t
The correlation between the parent completed DSAS and the parent completed CBQ
was also moderately strong and in the predicted direction (Table 7.13).
7 .2.3 Combined Reports of Parent-Adolescent Conflict and Reports of Adherence.
The correlations between combined parent and adolescent CBQ scores and adolescent
scores on the GAS and DSAS are reported in Table 7.13. Conelations between these
combined CBQ scores and parents' scores on the GAS and the DSAS are also
reported in Table 7.13.
These associations were all moderately strong, and in the direction predicted by the
first hypothesis. That is, higher levels of reported adherence were associated with
lower levels of reported conflict between adolescents and parents. The levels of
association between the adolescent and parent completed GAS and the combined
CBQ were greater than the levels of associations of the adolescent and parent
completed DSAS with the combined CBQ.
1.2.4 Cross-Informant Associations Between Reports of Parent-Adolescent Conflict
and Adherence.
The next analyses examined the association between (1) adolescents' reports of
conflict with their parents, and the parents' reports of the adolescents' adherence, and
(2) adolescents' reports of adherence, and their parents' reports of conflict with the
adolescents. These analyses were performed to examine from another angle the
252
association between reported conflict and adherence. The examination of cross-
informant associations also reduces the vulnerability of the analyses to shared method
variances (see Chapter 8 for a discussion of this point).
Adolescent Reports of Conflíct and Pørent Reports of Adherence.
The levels of association between adolescent responses on the CBQ and parent scores
on the GAS and DSAS are reported in Table 7.I3. The effect sizes of these
associations are consistent with the associations between adolescent responses on each
of these measures, as well as between parent responses between these measures
These results suggest that the associations detected in the previous analyses (Sections
7.2.1, 7 .2.2 and 7 .2.3) between scores on the CBQ and the GAS and DSAS were not
the result of respondent biases. These findings provide further support for the first
hypothesis of this thesis.
Parent Reports of Conflict and Adolescent Reports of Adherence.
The levels of association between parent responses on the CBQ and adolescent scores
on the GAS and DSAS are reported in Table 7.13. The effect size of the association
between the parent completed CBQ and adolescents' scores on the GAS was
consistent with the association between these questionnaires as completed by the
adolescents (Section 7.2.1) and by the parents (Section 7.2.2).
253
The level of association between the parent completed CBQ and adolescent scores on
the DSAS was smaller than that reported in the within-informant analyses. This
association was not significant at the 0.05 cr level. This result was the only
association between the reports of adherence and the reports of parent-adolescent
conflict not to reach this level of significance.
7.2.5 Reports of Parent-Adolescent Conflict and Observed Blood Glucose
Monitoring Adherence
The next analyses examined the relationship between reports of parent-adolescent
conflict and observed blood glucose monitoring adherence. These analyses took three
forms. First, the relationship between scores on the CBQ and the observed BGM
adherence was examined using the complete BGM adherence dataset. Second,
relationships between CBQ scores and observed BGM adherence over the ftnal20,
12,8, and 4 days before assessment were examined separately. Third, the relationship
between CBQ scores and observed BGM adherence over the previous 28 days was
examined separately for adolescents coded with Consistently High, Consistently Low,
Rising, or Other patterns of BGM adherence over the assessment period.
The Relationshíp Between Reports of Parent-Adolescent Conflict and Observed
Blo od. Gluc os e Monítoríng Adherence.
The correlations between the objective recording of Blood Glucose Monitoring and
the measures of parent-adolescent conflict are reported in Table 7.14. These
254
correlations were weaker than those found between the questionnaire measures of
adherence and the conflict measures
The effect size of the association between adolescent reports of parent-adolescent
conflict and observed blood glucose monitoring was moderately small. The effect
size of the association between parent reports of parent-adolescent conflict and
observed blood glucose monitoring was smaller. The effect size of the association
between the combined CBQ score and the observed blood glucose monitoring was
slightly smaller than that of the adolescent reports. Of these associations, only the
correlation between the adolescent reports of conflict and the observed BGM
approached the 0.05 significance level.
However, these correlations were all in the direction consistent with the first
hypothesis of this thesis. These results, when considered independently of the
previous analyses, do not provide strong support for the hypothesised inverse relation
between parent-adolescent conflict and adolescents' adherence to medical treatment.
However, the consistent direction of effect that has been observed in these and the
preceding results, is supportive of the hypothesis. The strong relationship observed
between adolescents' and parents' reports of adherence and parent-adolescent conflict
provides considerable support for the acceptance of the hypothesised inverse
relationship between parent-adolescent conflict and adolescent adherence to medical
treatment.
255
The Reløtionshíp Between Reports of Parent-Adolescent Conflict and Observed
Blood Glucose Monitoring Adherence Over Dffirent Time Frames.
The correlations between the BGM adherence data spanning different time frames and
the measures of parent-adolescent conflict are reported in Table 7.15. These
correlations are reported for the observed BGM adherence over the final 28, 20, 12,8
and 4 days prior to assessment. These analyses were intended to examine the
relationship between reports of conflict between adolescents and parents and
adherence to BGM over different time frames. As reported in Chapter 5, observed
BGM adherence varied significantly over the four weeks prior to assessment,
increasing as attendance to the clinic approached.
The magnitude of the correlations between each of the measures of conflict and the
observed BGM adherence did not vary greatly when the time frame examined by this
data was adjusted.
The Relationshíp Between Reports of Parent-Adolescent Conflíct and Blood
Glucose Monitoring Adherence, According to Ohserved Patterns of Adherence Over
Tíme
Table 7.L6 reports the distribution of scores on the adolescent, parent and combined
scales of the CBQ for each blood glucose monitoring adherence group (Consistently
High, Consistently Low, Rising, Other). The mean scores obtained on each of these
scales of the conflict measure were highest amongst the group whose adolescents were
categorised with Consistently Low BGM adherence. The mean scores obtained on
256
each of these scales of the conflict measure were lowest amongst the group whose
adolescents were categorised with Consistently High BGM adherence. The mean
reported levels of conflict obtained from the remaining adolescents (categorised with
Rising or Other patterns of BGM adherence) and their parents were distributed
between the Consistently High and Consistently Low BGM adherence groups' mean
scores.
Oneway ANOVAs were performed for each of the conflict scales (as dependent
variables) against the four BGM adherence groups (the independent variable). These
analyses were use to determine whether the level of conflict reported between
adolescents and parents varied between these groups. The results of these ANOVAs
are reported in Table 7.17. Reported levels of parent-adolescent conflict, on the
adolescent, parent, and combined scales of the CBQ, were not significantly varied
according to the BGM adherence groups.
A second approach employed to analyse the possible variation in reported conflict
according to the BGM adherence profiles was pursued. This approach involved the
combination of the Rising and Other BGM adherence groups into a single group. The
levels of conflict reported by these adolescents and their parents were compared with
those reported amongst the Consistently High and Consistently Low BGM adherence
groups using oneway ANOVAs. The results of these analyses are reported in Table
7.18. Although this process increased the F ratios produced in the analyses, reported
levels of parent-adolescent conflict on each of the scales were again not significantly
varied according to these BGM adherence groups.
257
7.3 Differences in Associations Between Parent-Adolescent Conflict and
Adherence According to Sample Characteristics.
The analyses presented in this section were designed to examine the variation in the
associations between the measures of parent-adolescent conflict and the measures of
adherence according to demographic characteristics of the sample. These associations
are examined in relation to: (1) adolescents' age, (2) adolescents' gender, (3) parents'
age, (4) parents' gender, (5) parents' work status, and (6) household structure (i.e.,
single or dual parent households)
7.3.I Variations in Associations Between Parent-Adolescent Conflict and
Adherence in Relation to Adolescents' Age
The associations between reports of parent-adolescent conflict and regimen adherence,
separated by adolescent age levels (I2 year olds, 13 year olds, 14 year olds, 15 year
olds, 16 year olds and l7 year olds) are reported in Tables 7.19 and 7.20. The levels
of association between reports of conflict and reports of adherence were greatest
amongst the 13 year olds and their parents.
However, the small sample sizes produced by this division of the sample limited the
variation in scores obtained on each measure. To overcome this limitation, the sample
was examined using broader age divisions. First, the sample was separated into 12
and 13 years olds, 14 and 15 yearolds, and 16 and 17 year olds (Table7.2l). This
division created three sub-samples of around 40 adolescents and parents. The greater
258
sample sizes produced by this division, and the greater variation in scores on the
adherence and conflict measures, meant that the correlations produced for these
groups more often reached statistical significance. The largest correlations were
obtained amongst the youngest adolescents (aged 12 and 13) and their parents.
As a second examination of this pattern, the sample was divided into adolescents aged
12 to 14 years, and adolescents aged 15 to 17 years. The associations between the
measures of adherence and the measures of conflict for these groups are reported in
Table 7,22. In line with the results reported in Tables 7.19,7.20 and 7.21, the
associations between reports of adherence and reports of parent-adolescent conflict
were greater among the younger adolescents and their parents than among the sample
of older adolescents and their parents.
1.3.2 Variations in Associations Between Parent-Adolescent Conflict and
Adherence in Relation to Adolescents' Gender
The associations between reports of parent-adolescent conflict and regimen adherence
are reported separately according to adolescent gender inTable7.23. The levels of
association between reports of conflict and reports of adherence were very similar
amongst the samples of male and female adolescents and their parents. However, the
levels of association between parent reports of diabetes-specific adherence and the
reports of conflict were greater for the male adolescents than for the female
adolescents.
259
7.3.3 Variations in Associations Between Parent-Adolescent Conflict and
Adherence in Relation to Parents' Age.
The associations between reports of parent-adolescent conflict and regimen adherence
are reported separately according to parents'age inTable7.24. Parents'age was
grouped into (a) those under 40, (b) those aged 40 to 45, and (c) those aged over 45; in
the same manner as that described in Section 7,1.3.
The levels of association between reports of conflict and reports of adherence were
similar amongst the samples defined by parents' age. The level of significance of
these correlations was greatest amongst the sample characterised by parents aged 40 to
45 years, because of the larger sample size for this group. However the levels of
association generally were not larger in this group than in the groups defined by older
or younger parents.
7.3.4 Variations in Associations Between Parent-Adolescent Conflict and
Adherence in Relation to Parents' Gender
The associations between reports of parent-adolescent conflict and regimen adherence
are reported separately according to parents' gender in Table 7.25. The levels of
associations produced amongst the sample of mothers and their adolescents were
greater and had more statistical significance than those produced by the participating
fathers and their adolescents.
260
However, the number of fathers involved in the study was very limited. As such, the
variation in obtained scores on the adherence and conflict scales by this sub-sample
was limited.
7.3.5 Variations in Associations Between Parent-Adolescent Conflict and
Adherence in Relation to Parents' 'Work
Status.
The associations between reports of parent-adolescent conflict and regimen adherence
are reported separately according to parents' work status in Table 7.26. The levels of
association between the conflict reported by adolescents and the adherence measures
were slightly greater amongst the sample categorised by the parent working outside
the home environment than amongst the sample categorised by parents who were
primarily at home. The conflict reports obtained from parents were more closely
associated with reports of general adherence amongst those parents who were
primarily at home than amongst the parents working outside the home. The combined
adolescent and parent repofts of parent-adolescent conflict were more closely
associated with the adolescents' and parents' reports of adherence amongst the sample
defined by the participating parent working outside the home, than amongst the
sample in which parents were primarily at home.
26r
7.3.6. Variations in Associations Between Parent-Adolescent Conflict and
Adherence in Relation to Household Structure.
The associations between reports of parent-adolescent conflict and regimen adherence
are reported separately according to household structure in Table 7.27. Household
structure was classified in terms of single parent (whether mother or father) versus
dual parent households.
The levels of associations produced amongst the sample categorised by dual parent
households were generally more statistically significance than those produced by the
members of single parent households. However, the effect sizes of the associations
between these measures were generally larger in the single parent group than in the
dual parent group.
7.4 The Level of Association Between Measures of Parent-Adolescent Conflict
and Adolescents' Metabolic Control.
The analyses presented in this section were designed to examine the association
between the measures of parent-adolescent conflict and adolescents' HbAls assa]
levels - the measure of their metabolic control. These analyses were performed to
examine further the hypothesised relationship between parent-adolescent conflict and
adolescents' adherence.
262
Correlations of the adolescent completed, parent completed, and combined CBQ
scores with adolescents' HbA1" are displayed in Table 7.28. The correlations between
both the adolescent completed CBQ and the combined adolescent-parent score with
adolescents' IfbA1" levels were moderately small, but statistically significant. The
parent completed CBQ was less strongly correlated with adolescents' HbA1" levels,
This association did not reach statistical significance.
The final analyses that were conducted examined whether the parent-adolescent
conflict ratings accounted for unique variance in IIbA1. assay levels once the
adherence reports were entered into regression equations first. Eight such hierarchical
multiple regression analyses (HMRAs) were conducted, using adolescents' HbA1.
assay results as the dependent variable. These analyses are reported in Table 7.29.
The first two of these HMRAs involving the adolescent form of the CBQ (Step 2),
entered after the adolescent completed GAS (Srep 1 in the first regression equation),
or the adolescent completed DSAS (Step I in the second regression equation). Two
further HMRAs were conducted, entering the parent responses to the CBQ $tep 2),
after (1) the parent completed GAS (S/ep 1), and (2) the parent completed DSAS
(Step l). The final four HMRAs involved the combined score on the CBQ $tep 2),
entered after (1) the adolescent completed GAS, (2) the adolescent completed DSAS,
(3) the parent completed GAS, and (4) the parent completed DSAS (each as Step 1 rn
separate regressions)
263
Adolescent Reports of Adherence and Conflíct.
As reported in Table 7.29, adolescent reports of parent-adolescent conflict added a
significant amount of the variance in Step 2 after the adolescent reports of general
adherence had been entered. The regression analyses involving adolescent responses
to the DSAS were halted before the conflict measure was entered, because of the lack
of predictive power of these adherence reports to the adolescents' metabolic control
levels.
Parent Reports of Adherence and Conflict.
As reported in Table 7.29, parent reports of parent-adolescent conflict did not
significantly predict adolescents' metabolic control, as assessed by FIbA1" assays.
Combined Adolescent and Parent Reports of Conflict and Reports of Adherence.
As reported in Table 7.29, combined adolescent and parent reports of parent-
adolescent conflict added a significant amount of the variance to adolescents'
metabolic control in Step 2 after the adolescent reports of general adherence had been
entered. The regression analyses involving adolescent responses to the DSAS were
halted before the combined conflict measure was entered, because of the lack of
predictive power of these adherence reports to the adolescents' metabolic control
levels.
264

The combined adolescent and parent reports of conflict added a significant amount of
the variance in Step 2, after the parent reports of diabetes-specific adherence (DSAS)
had been entered. However, the combined adolescent and parent reports of conflict
did not add a significant amount of the variance to adolescents' metabolic control in
Step 2, after the parent reports of general adherence (GAS) had been entered.
265
CHAPTER EIGHT.
DISCUSSION: THE RBLATIONSHIP BET\ryBENPATIENT ADHERENCB AND PARENT.ADOLESCENT
CONFLICT.
Parts of this chapter were published in:
Fotheringham MJ, Couper JJ, Sawyer MG. (1996). Adolescents' adherence to IDDM treatment:Relation to parent-adolescent conflict and adolescent autonomy. Proceedings of the AustralianDiabetes Society, 1996 1^89.
This chapter discusses the resuhs presented in Chapter 7, describingthe relationship between the measures of patient adherence and parent-adolescent conflict in the present study. In parallel with Chapter 7, the
sections of this chapter address: (1) the reporting of parent-adolescentconflict in relation to sample characteristics; (2) the level ofassociation between measures of parent-adolescent conflict andadherence; (3) dffirences in associations betvveen parent adolescentconflict and adherence according 1o sample characteristics; and (4) the
level of association between meesures of parent-adolescent conflict andadolescents' metabolic control.
8 DISCUSSION: THE RELATIONSHIP BETWEEN PATIENT
ADHERENCE AND PARENT.ADOLESCENT CONFLICT.
8.1 The Reporting of Parent-Adolescent Conflict in Relation to Sample
Characteristics.
This section discusses the results presented in Section 7.1, examining the reporting of
parent-adolescent conflict by adolescents and parents in this study. These reports are
examined in relation to respondents' demographic characteristics.
In examining the obtained reports of parent-adolescent conflict, it may be noted that
that the mean score on the Combined form of the CBQ is not equal to the sum of the
mean adolescent score and the mean parent score (Table 7.L). Similarly, the
minimum score obtained by adolescents was 0, as was the minimum score obtained by
parents, whereas the minimum score produced on the combined scale was 1. This
occurred because, although the responses of adolescents and parents on this measure
were highly correlated, the adolescent reporting the lowest CBQ score may not have
belonged to the same dyad as the parent reporting the lowest CBQ score. Similarly,
adolescents who reported a level of conflict equal to the obtained mean score may
have been paired with parents who reported levels of conflict higher than or lower
than the mean score on the parent fom.
The scoring distributions of these measures are examined in relation to: (1)
adolescents' ug", (2) adolescents' gender, (3) parents' age, (4) parents' gender, (5)
267
parents' work status, and (6) household structure (i.e., single or dual parent
households)
8.1.1 The Reporting of Parent-Adolescent Conflict in Relation to Adolescents' Age
Previous studies have reported that conflict between adolescents and parents increases
as adolescents enter middle adolescence (Montemayor, 1983; Paikoff & Brooks-
Gunn, l99I; Papini, et al. 1989; Papini & Sebby, 1988). In the present study, slightly
higher mean levels of parent-adolescent conflict were reported for the adolescents
aged 14 years and above than for the 12 and 13 year old adolescents, although this
variation was not significant.
There are several possible explanations for the absence of differences in parent-
adolescent conflict according to age in this study. First, although the full sample was
quite large, it is possible that the number of adolescents involved in the study at each
age level was too small to detect a significant variation in conflict reporting. The
largest age sample involved in the study included only 24 adolescents and parents
The smallest age sample included only 16 adolescents and parents. It is possible that
larger samples would have revealed a significant variation. However, the effect sizes
of the associations between reported conflict and reported adherence, were very small
As such, it is unlikely that the lack of significant differences in reported conflict
according to adolescents' age is due to limited sample sizes
268
Another possible explanation for the inconsistency in results between this study and
previous research is that the age ranges included in this study and the previous studies
varied. That is, some previous studies have examined younger age groups than were
included in this study. Few studies have examined this issue in adolescents up to 17
years of age. A related explanation for the inconsistency in findings between this
study and previous research is that some studies have based their age comparisons on
pubertal status. That is, prepubertal and pubertal adolescents were compared in terms
of conflict with parents. In the present study, pubertal status was not examined. The
lack of variation in parent-adolescent conflict may reflect a uniformity in pubertal
status amongst the adolescents involved in this study. However, it is very unlikely
that the pubertal status of the adolescents involved in this study was uniform, given
the age range of these adolescents.
The inconsistency in results may also be an artifact of the different methodologies
used to assess parent-adolescent conflict. For example, previous studies have used (1)
questionnaires completed only by adolescents, (2) interviews of adolescents, or (3)
projective measures of conflict (Montemayor, 1983). The difference in results found
in this study may be a product of the approach used to assess conflict. Future studies
should be able to clarify this point.
One final interpretation for the difference in age-conflict relationships between this
study and previous studies is the cultural base of each of the studies. The previously
mentioned studies by Montemayor (1983), Paikoff & Brooks-Gunn (1991), and Papini
and colleagues (Papini, et al. 1989; Papini & Sebby, 1988) were all conducted in
North America, whereas the current study was conducted in Australia. It is possible
269
that parent-adolescent conflict is more dependent on adolescents' age in North
American societies than in Australia. Some studies have examined differences in
parent-adolescent conflict between western and eastern cultures (DeRosier &.
Kupersmidt, I99l; Zahn-Waxler, et al. L996). However, comparisons of parent-
adolescent conflict between American and Australian societies have not been reported
in the literature.
The reasons for the differences in the level of agreement between adolescents and
parents on the conflict measure according to the adolescents' age are unclear. If the
level of parent-adolescent agreement had varied in a systematic manner, such as that
agreement was higher amongst younger adolescents than amongst older adolescents,
then the results may have been meaningfully interpreted. However, in this study the
level of agreement was much higher amongst the 13 year old adolescent sample than
any other age group. As reported in Table D.2 of Appendix D.2, the correlation
between the conflict reports of adolescents and parents amongst the 13 year old group
was r = 0.9. This was the only correlation over 0.5. It appears that this extreme result
is due to chance, rather than a systematic variation in relation to adolescents' age.
Previous studies using the CBQ have not reported such a variation in parent-
adolescent agreement in relation to adolescents' age.
270
8.1.2 The Reporting of Parent-Adolescent Conflict in Relation to Adolescents'
Gender
Previous studies have reported conflicting findings about the variation in parent-
adolescent conflict in relation to adolescents' gender. For example, Papini and Sebby
(19SS) found that female adolescents experienced more conflict with parents than
male adolescents. In contrast, Papini and colleagues (1989), using the same measures
of conflict, reported that male adolescents experienced more conflict with parents
than female adolescents. Other investigations of parent-adolescent conflict have not
addressed gender differences in conflict levels, but have focused on different issues
involved in adolescent males' conflict with their parents and adolescent females'
conflict with their parents. These studies have typically reported similar overall levels
of parent-adolescent conflict amongst male and female adolescents (e.g., Flanagan,
1990;Montemayor, 1983; Montemayor & Hanson, 1985).
In this study, the mean level of conflict reported amongst female adolescents and their
parents was slightly, but not significantly, higher than the mean level of conflict
reported amongst male adolescents and their parents. These results were consistent
with the results of most previous investigations. The information collected in this
study does not assess the nature or topic of conflict between adolescents and parents.
This information would probably provide a more complete picture of variations in
conflict between female and male adolescents and their parents.
271
8.1.3 The Reporting of Parent-Adolescent Conflict in Relation to Parents' Age.
Previous investigations have not reported variation in the level of conflict between
adolescents and parents in relation to the parents' age. In this study, parents' age was
grouped into (a) those under 40 years old, (b) those aged 4O to 45 years old, and (c)
those aged over 45 years old. Conflict between adolescents and parents was not found
to vary according to these parental age groups
It is intuitively appealing to suggest that conflict may be greater between adolescents
and older parents than between adolescents and young parents, because of the greater
age gap between adolescent and older parents than between adolescents and younger
parents. However, the results of this study do not support this suggestion. The
measures used in this study did not determine whether the nature (i.e., topic, method
ofresolution) ofparent-adolescent conflict varied according to parents' age.
8.1.4 The Reporting of Parent-Adolescent Conflict in Relation to Parents' Gender
Previous authors have noted the difficulty of recruiting fathers into research
investigating aspects of their children's health-care (e.g., Bailey, I99I; Turner-
Henson, Holaday, & Swan, 1992). Only a small number of fathers participated in this
study. As was identified in Chapter 4, the responses of participating fathers to the
CBQ were similar to those of participating mothers. In light of these findings,
obtained conflict reports from mothers and from fathers were treated as equivalent in
this study, that is, these reports were treated as parent responses.
272

The finding of similar ratings of conflict between adolescents and fathers, and
adolescents and mothers in this study differs from the findings reported by
Montemayor and Hanson (1985). These authors reported higher levels of conflict
between adolescents and mothers than between adolescents and fathers in a sample of
10th grade students and their families. There are at least three possible explanations
for this difference in findings.
First, the methods used to obtain parent-adolescent conflict information in the two
studies differed. In the present study, questionnaires were completed by pafiicipating
adolescents and the parents accompanying the adolescents to the Diabetes Outpatient
Clinics. In Montemayor and Hanson's study, conflict was assessed solely on the basis
of telephone interviews with participating adolescents. It is possible that the
difference in findings relating to adolescents' levels of conflict with mothers and
fathers may be a result of these differing methods
Second, the fathers around whom father-adolescent conflict information was obtained
in this study were more likely to be those fathers who were more involved in their
adolescents' health care, that is, these fathers were identified as the primary carer in
the Outpatient Clinics. Further, two of these fathers were single parent fathers. In
contrast; in the Montemayor and Hanson study, father-adolescent conflict information
was obtained for all of the participating families. Participation in Montemayor and
Hanson's investigation only involved the adolescents, who were interviewed by
telephone. The level of contact or involvement of the fathers with their adolescents
273

was not determined in the Montemayor and Hanson study. Parents' reports of conflict
were not obtained.
Third, there were differences in the family structures of the participants in the present
study and the study by Montemayor and Hanson. In the study by Montemayor and
Hanson, all of the participants were in dual parent households. In the present study,
nearly one-in-five of the participants resided in single parent households. It is
possible that this difference was responsible for the contrasting findings of these
studies.
However, two caveats should be recognised when examining these contrasting
findings. First, it should also be recognised that Montemayor and Hanson were able
to compare the level of conflict between adolescents and their mothers and
adolescents and their fathers, in the same households. In the present study,
information was only collected about adolescents' conflict with one of their parents.
It is possible that the adolescents in dual parent households in the present study would
have repofted different levels of conflict with the parent not involved in the study.
Second, the adolescents who participated in the present study who were from single
parent households were reporting on conflict with their only household parent. Sole
parent households were excluded from the Montemayor and Hanson study. It is
possible that the nature or reporting of conflict with sole parents differs from that of
dual parents. This issue is discussed further in Section 8.1.6.
214
8.1.5 The Reporting of Parent-Adolescent Conflict in Relation to Parents' Work
Status
The next demographic characteristic by which reports of parent-adolescent conflict
were examined was parents' work status. Previously, Flanagan (1990) reported that
conflict between adolescents is greater when parents are unemployed than when
parents are employed. In the present study, parental work status was defined in terms
of whether the participating parent was working primarily in the home or outside the
home environment (this process is explained in Chapter 4)
The level of parent-adolescent conflict reported in this study amongst dyads with
parents working inside the home environment was similar to that reporled amongst
dyads with parents working outside the home. This finding appears to contradict that
of Flanagan (1990). However, it should be recognised that the parents in Flanagan's
study who were unemployed had all been made redundant. In the present study,
parents who were primarily at home included the unemployed, as well as students,
pensioners, retirees, and those performing home duties. The nature of the work status
definitions in this study and in the study conducted by Flanagan can therefore be seen
to differ. It is likely that this difference in sampling approaches is the cause of the
difference in findings
Greater parent-adolescent agreement was observed on the CBQ amongst dyads in
which the parent worked primarily outside the home environment than amongst dyads
where the participating parent worked primarily in the home. There are at least two
possible explanations for this finding. First, the level of contact or involvement
275

between adolescents and parents primarily at home is likely to be greater than that
between adolescents and parents working outside the home. As such, parents who are
primarily in the home environment may have a greater experience of harmonious
relations with their adolescent children than parents who work outside the home.
Information about the level of involvement of parents with their adolescents was not
collected as a part of this investigation. This issue may be worthy of further
investigation.
A second possible explanation for the variation in parent-adolescent agreement on the
CBQ according to parents' work status relates to the amount of time parents spend in
the home environment. Parents who work outside the home may be expected to spend
less time in the home environment than parents who are primarily at home. As such,
the occurrence of conflict between adolescent and parent is likely to represent a
greater proportion of the time spent in the home by the parent. In contrast, for parents
who work in the home environment, the occuffence of conflict with their adolescents
is likely to represent a smaller proportion of time spent in the home. Adolescents,
with school, extracurricular, and social commitments, are likely to spend less time in
the home than home-based parents. The experience of parent-adolescent conflict by
adolescents would likely occupy a similar proportion of time spent at home to that of
parents working outside the home. This behavioural pattern may be responsible for
the greater agreement between the conflict reports of adolescents with parents
working outside the home than with parents primarily at home.
276
8.1.6 The Reporting of Parent-Adolescent Conflict in Relation to Household
Structure.
The final demographic characteristic by which reports of parent-adolescent conflict
were examined was household structure. In this study, household structure was
defined in terms of single parent or dual parent households. Information about
whether dual parents were remarried (i.e., step-parents), or were natural parents of
participating adolescents, was not collected. Surprisingly little previous research has
compared the level of parent-adolescent conflict in single parent and dual parent
households. MK Stone and Hutchinson (1992) reported that college students of
divorced parents retrospectively reported more family conflict than students from
intact families. However, their study examined general family conflict, rather than
adolescent-parent conflict. Family conflict may also include marital conflict, which
may be expected to have been greater in mariages ending in divorce than in intact
marriages.
In this study, reports of conflict were only collected to assess conflict between the
participating adolescent and the participating parent, usually the mother. In dual
parent households, which comprise over 80 Vo of the sample, conflict between the
adolescent and the parent not involved in the study was not assessed. It may be
argued that the parents who participated in the study, the parents who attended the
Diabetes Outpatient Clinic with the adolescents, are likely to have been more involved
in their adolescents' diabetes management and had greater contact with their
adolescents than the parents who did not attend the clinic. It is possible that the level
of conflict between the adolescents and these parents was different to that between the
277
adolescents and the parents not involved in the study. This view is consistent with the
findings of Montemayor and Hanson (1985), who reported higher levels of conflict
between adolescents and mothers than between adolescents and fathers in dual parent
households. The vast majority of parents involved in the present study were mothers.
However, information about each parents' level of involvement in the adolescents'
IDDM management, or about each parents' level of contact with the adolescents was
not formally collected as part of this study. The results obtained on the conflict
measure may have differed if the other parents (usually the fathers) had also been
involved in the study. Previous authors have also noted the difficulty of recruiting
fathers into research of this kind (Bailey, I99I; Turner-Henson, Holaday, & Swan,
ree2).
Further, it is possible that the reports of parent-adolescent conflict obtained from study
participants residing in single-parent households provides different information to that
obtained from study participants residing in dual households. That is, the information
obtained about parent-adolescent conflict in single parent households represents the
conflict between the adolescent and the only parent in the household - there is no other
conflict between these adolescents and other parents in the house. In contrast, the
information obtained about parent-adolescent conflict in the dual parent households
represents the conflict between the adolescent and only one of the two parents in the
house
Because of the possibility that these reports may be different in single parent
households than in dual parent households, differences in reports of parent-adolescent
278
conflict according to household structure were examined. Household structure was
defined by the number of parents in the household. Adolescents repofied very similar
mean levels of conflict with parents in single and dual parent households. The mean
level of parent-adolescent conflict reported by parents in single parent households was
slightly higher than that reported by parents in dual parent households. This
difference was not statistically significant.
8.2 The Level of Association Between Measures of Parent-Adolescent Conflict
and Adherence.
This section discusses the results presented in Section 7.2, examining the association
between the measures of parent-adolescent conflict and the measures of adherence to
medical recommendations. Adolescent, parent and combined reports are examined, as
well as cross-informant comparisons.
The associations between (1) adolescent reports of adherence and conflict, (2) parent
reports of adherence and conflict, (3) adolescent and parent reports of adherence and
the combined measure of parent-adolescent conflict, (4) cross-informant associations
between reports of conflict and adherence (e.g., between adolescent reports of conflict
and parent reports of adherence), and (5) associations between observed blood glucose
monitoring adherence and reports of conflict between adolescents and parents, are
discussed.
279
8.2.1 Adolescent Reports of Parent-Adolescent Conflict and of Adherence.
The statistically significant associations between adolescents' scores on the CBQ and
both the GAS and the DSAS may be interpreted in several ways
First, these significant associations are consistent with the first hypothesis. That is,
adolescents' reports of conflict and adherence were inversely associated.
Adolescents' reports of high levels of adherence were associated with their reports of
low levels of parent-adolescent conflict. The consistency of these associations adds
further support for this finding. The adolescents' scores on the CBQ were correlated
with their scores on the GAS and DSAS to very similar extents.
This consistency suggests that parent-adolescent conflict is related to both general
tendencies to adhere to medical treatment and to adherence to specific aspects of the
IDDM self-management regimen. However, the observed consistency in results also
suggests an alternative interpretation of the moderate associations between
adolescents' scores on the CBQ and the GAS and DSAS.
The second interpretation of these results is that the consistently significant
correlations between adolescents reports of conflict and their reports of adherence
may be the result of a shared method variance. Some adolescents may have responded
in socially desirable råanners to each of these measures. Alternatively, some
adolescents may have responded according to a tendency to give positive responses,
i.e., an acquiescence bias, or yea-saying (Streiner & Norman, 1995).
280
The likelihood that an acquiescence bias influenced these associations is reduced by
the direction of the correlation; more high frequency responses on the adherence scale
(i.e., greater reported adherence) were associated with fewer yes responses on the
CBQ (i.e., reports of lower conflict levels - or more negative responses).
The likelihood that socially desirable responding influenced these associations is
reduced by the finding, reported in Chapter 4, that adolescents' responses to the CBQ
and to the GAS were not associated with the measure of socially desirable responding.
However, in order to avoid the possibility of this type of bias, cross-informant
comparisons were made between responses on the CBQ and the adherence measures.
That is, adolescents' reports on the CBQ were examined in relation to parents'
responses on the GAS and DSAS, and vice versa. These analyses were presented in
Section 7.2.4, and are discussed in Section 8.2.4 of this chapter.
The reports of conflict obtained in this study ask about conflict between adolescents
and parents in general. These reports are not limited to conflict about diabetes
management. Future investigations could determine whether the association between
reports of IDDM-related conflict are more closely associated with adolescents'
adherence to their IDDM regimens. Rubin, et al. (1989) have developed a Diabetes
Responsibility and Conflict Scale. To date, investigations employing this measure
have not collected adolescents' reports of IDDM adherence. This is aî aÍea worthy of
further investigation.
281
8.2.2 Parent Reports of Parent-Adolescent Conflict and of Adherence.
Significant associations between parent scores on the CBQ and on the GAS and
DSAS were also detected. The correlation between the GAS and the CBQ was
slightly greater than the correlation between the DSAS and the CBQ. Again, these
statistically significant associations may be interpreted in several ways.
First, like the associations between adolescent reports of adherence and conflict, these
associations support the first hypothesis of this thesis. That is, parents' reports of
conflict and adherence were inversely associated. Parents' reports of high levels of
adherence were associated with reports of low levels of parent-adolescent conflict.
The consistency of the associations between respondents' reports of conflict and of
adherence adds further support for this finding.
However, parents' scores on the CBQ were correlated with their scores on the GAS to
a greater extent than with their scores on the DSAS. This finding suggests that
parents' perceptions of conflict with their adolescents were more closely related to
their perceptions of their adolescents' general tendencies to adhere to treatment than
to perceptions of the adolescents' adherence to specific IDDM management
recommendations.
Again, these associations may be interpreted in terms of a possible shared method
variance. However, parent responses to these measures were not related to the
measure of socially desirable responding used in the study. As mentioned in the
previous section, the use of cross-informant analyses avoids this potential bias.
282
Another approach that reduces this potential influence is the examination of combined
adolescent and parent reports. The following section discusses the relationship
between combined adolescent reports of conflict and reports of adherence obtained
from both of these groups of participants.
8.2.3 Combined Reports of Parent-Adolescent Conflict and Reports of Adherence.
All of the associations between combined parent and adolescent reports of parent-
adolescent conflict and each of the repofts of adherence collected from these
respondents were statistically significant.
Again, these associations were all in the direction predicted by the first hypothesis.
The use of a combined parent and adolescent scale of the CBQ reduces the likelihood
that these associations are the result of a shared method variance. These findings
provide support for the first hypothesis of this thesis.
Like the associations between parent reports of conflict and adherence, the
associations between the combined CBQ and adolescent and parent reports of
adherence were greater for the General Adherence Scale than for the Diabetes Specific
Adherence Scale. Again, this finding may be interpreted as an indication that parent-
adolescent conflict was more closely related to the adolescents' general tendencies to
adhere to treatment than to the adolescents' adherence to specific IDDM management
recoÍìmendations.
283
Hanson, De Guire, et al. (1992) used combined adolescent and parent reports of
relationships between adolescents and parents on the Family Relationship
Questionnaire (Henggeler & Tavormina, 1980) in a study of the IDDM self-
management of adolescents attending outpatient clinics. In this study, family relations
were significantly associated with the adolescents' dietary adherence, as assessed by
patient interviews. The findings of the present study are consistent with those of
Hanson, De Guire, and colleagues, and extend on the previous study by examining a
specific aspect ofparent-adolescent relations; parent-adolescent conflict.
8.2.4 Cross-Informant Associations Between Reports of Parent-Adolescent Conflict
and Adherence.
Cross-informant analyses further examined associations between reports of adherence
and reports of conflict.
The associations between adolescents' reports of conflict and parents' reports of
adherence are consistent with the associations obtained within informants. The
consistency of these findings with the within-informant analyses suggests that the
associations detected in the previous analyses between scores on the CBQ and the
GAS and DSAS were not the result of shared method biases. These findings provide
further support for the first hypothesis of this thesis.
Further, the association between parent reports of conflict and adolescent reports of
general adherence was consistent with the association between these questionnaires as
284
completed by the adolescents and by the parents. Again, this finding suggests that the
associations detected between measures of adherence and conflict within informants
were not the result of shared method variances.
However, the association between parent reports of conflict and adolescent reports of
IDDM-specific adherence was weaker, and was not significant. This association was
the only one of the twelve associations considered between the measures of adherence
and conflict that did not reach statistical significance. This inconsistent finding may
be interpreted in two ways.
First, this result may indicate that shared method variances did contribute to the
significant findings discussed in the previous sections. The significant cross-
informant associations detected between the other measures suggests that this form of
bias was not solely responsible for the significant within-informant associations. It is
possible, however, that shared method biases added to the associations between
adherence and conflict. Second, it may be noted from Table7.l3 that the parents'
conflict reports were less strongly associated with the other measures of adherence
than the adolescent or combined measures of conflict. In particular, the parent report
of conflict was not strongly associated with the parent report of IDDM-specific
adherence - the association conceptually closest to the non-significant association.
In sum, the cross-informant analysis of associations between adolescents' and parents'
reports of adherence and parent-adolescent conflict add considerable support for the
first hypothesis of this thesis. Cross-informant analyses of parent-adolescent conflict
and adolescents' IDDM regimen adherence have not been previously reported in the
285
literature. The findings obtained in this study support the use of these analyses to
examine the relationship between adolescents' regimen adherence and their
experience of conflict with their parents
8.2.5 Reports of Parent-Adolescent Conflict and Observed Blood Glucose
Monitoring Adherence.
Reports of parent-adolescent conflict were less closely related to observed blood
glucose monitoring adherence than to the parent and adolescent reports of adherence.
The associations between observed BGM and conflict reports were not statistically
significant. Further, the effect sizes of the associations between each of the measures
of adherence and the observed BGM adherence did not vary greatly when the time
frame examined by this data was adjusted. Reported levels of parent-adolescent
conflict were not significantly varied between groups of adolescents categorised by
Consistently High, Consistently Low, Rising or Other BGM adherence patterns over
the four weeks prior to assessment. These results may be interpreted in a number of
ways.
First, these findings may indicate that the results obtained relating reports of
adherence with reports of conflict were in part the result of shared method variances.
However, the cross-informant relationships between these reports reduce the
plausibility of this interpretation. Further, the relative strengths of these associations -
involving the adolescent, parent, and combined conflict reports - reflect the same
pattern as was found with the associations involving adolescents' and parents' reports
286
of adherence. That is, the parent CBQ scale was less closely related with the
adherence measures than were the adolescent or combined CBQ scales. This
consistency refutes the interpretation of the non-significant associations as an
indication of shared method variances.
Second, the lower levels of association between reports of parent-adolescent conflict
and observed BGM adherence than between these conflict reports and questionnaire
measures of adherence may reflect the specific nature of this adherence measure. It
may be seen that for all of the analyses examining adolescent and parent reports of
adherence, presented in Table 7.l3,the level of association with the conflict measures
was greater for the GAS than for the DSAS. It is possible that parent-adolescent
conflict is closely related to general tendencies to adhere to treatment, and less closely
to adherence to a range of specific IDDM management activities. In turn, the
observed BGM adherence measure, which is even more specific than the DSAS, may
be expected to be less closely associated with reports of parent-adolescent conflict. It
should again be noted that the conflict measure employed in this study assessed
conflict in general, not specifically in relation to IDDM management. An examination
of these associations using an lDDM-specific measuro of conflict would further the
understanding of these relationships.
Third, as has already been noted, the observed blood glucose monitoring adherence
information only assesses adherence to one aspect of a multi-component regimen.
While parent-adolescent conflict may be poorly related to adherence to this aspect of
the IDDM management regimen, this form of conflict may be more closely linked
with adherence to other aspects of the regimen. For example, parent-adolescent
287
conflict may be more closely linked with adherence to insulin administration
recommendations or dietary recommendations
A fourth interpretation of the lack of association between the observed BGM
adherence and the measures of parent-adolescent conflict relates to the sample from
which BGM data were obtained. These data were collected from a group of
adolescents with poor metabolic control. It is possible that the weaker associations
found using the BGM data may be the result of a sample bias. This possibility is
supported by the finding that reports of parent-adolescent conflict were associated
with metabolic control (Section 7.4). However, an examination of separate
associations between the measures of adherence and the measures of conflict
according to whether or not BGM data were available does not support this
possibility. These associations are shown in Appendix E.
Finally, the associations reported in Appendix E suggest one other interpretation of
the lack of associations between observed BGM adherence and reports of parent-
adolescent conflict. When the adolescent and parent reports of adherence are
examined separately according to whether or not the BGM data were available, the
associations with reports of conflict were smaller, and less significant than when the
sample was examined as a whole. It is possible that the non-significant findings
involving BGM observations and reports of conflict were weakened by the smaller
sample size involved in this analysis. This is an issue that could be resolved by
further investigation.
288
Previously, Wysocki, Hough, and colleagues (1992) investigated the use of BGM
data, in relation to aspects of family functioning. In this study, the Diabetes Conflict
Scale (DCS; Rubin, et al. 1989) was completed by adolescents and parents. Scores on
this scale were significantly related to BGM data use. Unfortunately, Wysocki and
colleagues do not specify whether it was the adolescent or the parent form of the DCS
that was associated with BGM use, or whether it was a combined DCS scale. Further,
these authors reported on BGM data use, controlling for BGM frequency. In this
context, BGM data use refers to the use of BGM information to adjust insulin
administration. Therefore the findings of the present study extend on those of
Wysocki, Hough and colleagues by determining that adolescents' frequency of blood
glucose monitoring was not associated with their conflict with parents
8.3 Differences in Associations Between Parent-Adolescent Conflict and
Adherence According to Sample Characteristics.
This section discusses the results presented in Section 7.3, examining the differences
in association levels between measures of parent-adolescent conflict and measures of
medical adherence, in relation to the demographic characteristics of the sample.
These associations are examined in relation to: (1) adolescents' ug", (2) adolescents'
gender, (3) parents' ug", (4) parents' gender, (5) parents' work status, and (6)
household structure (i.e., single or dual parent households)
289
8.3.1 Variations in Associations Between Parent-Adolescent Conflict and
Adherence in Relation to Adolescents' Age.
The associations between reports of parent-adolescent conflict and medical adherence,
performed according to adolescents' age, revealed greater associations amongst the 13
year olds and their parents than any other age group. There are at least two possible
meanings of this result.
First, the greater association between adherence and conflict amongst 13 year olds
may reflect a transition point in adolescent development. Previous research has
identified that parent-adolescent conflict increases dramatically during mid-
adolescence (Montemayor, 1983; Paikoff & Brooks-Gunn, l99I; Papini, et al. 1989;
Papini & Sebby, 1938). In the present study, the level of conflict reported by
adolescents and parents was lower amongst the 12 and 13 year olds than amongst the
14 to l7 year old adolescents. This combination of findings leads to the suggestion
that older adolescents, who experience more conflict with their parents, may be more
immune to the impact of this conflict, and as a result may be less influenced in their
adherence level by the conflict. Previous research has examined the impact of
different forms of family conflict on adolescents' depressive symptoms (Amato &
Keith, 1991). However, studies examining the psychological impact of parent-
adolescent conflict on adolescents of different ages have not been reported in the
literature to date.
This interpretation, however, does not account for the difference in associations
between measures of adherence and conflict amongst the 12 and 13 year old
290
adolescents. These groups reported similar levels of parent-adolescent conflict, so an
'immunity' model would not account for the difference in association between the
reported conflict experienced by these groups and their reported adherence.
A second interpretation of the greater levels of association detected with the 13 year
old adolescents than with the other adolescents is that this result may simply be a
chance finding, that is, this finding may be the result of random variation. The small
sample sizes involved at each age level lend support to this possibility. Future
investigation could further explore this issue. The replication of these finding using
larger samples of adolescents of different ages could clarify this possible relationship.
8.3.2 Variations in Associations Between Parent-Adolescent Conflict and
Adherence in Relation to Adolescents' Gender
The associations between reports of parent-adolescent conflict and medical adherence,
performed according to adolescents' gender, revealed very similar levels of
association amongst the samples of male and female adolescents and their parents.
This finding suggests that the link between adolescents' adherence and their
experience of conflict with parents is not gender dependent.
29t
8.3.3 Variations in Associations Between Parent-Adolescent Conflict and
Adherence in Relation to Parents' Age
The associations between reports of parent-adolescent conflict and medical adherence,
performed according to parents' age, revealed no significant variations in association.
This finding suggests that the relationship between adolescents' adherence and their
experience of parent-adolescent conflict is not influenced by the age of their parents.
8.3.4 Variations in Associations Between Parent-Adolescent Conflict and
Adherence in Relation to Parents' Gender
The associations between reports of parent-adolescent conflict and medical adherence,
performed according to parents' gender, revealed greater associations amongst the
participating mothers and their adolescents than amongst the participating fathers and
their adolescents. This finding may be interpreted as an indication of mothers taking a
more central role compared with fathers in the management of adolescents' IDDM
regimens. It may be argued that mothers are more likely to engage in conflict with
their adolescent children about their IDDM regimen than fathers, for the same reasons
that it is difficult to recruit fathers into studies of their children's healthcare (see
Section 1.3.1.22 The Impact of Chronic lllness on the Family for a further discussion
of this point). As such, the greater association of adolescent-mother conflict with
adolescents' IDDM adherence than adolescent-father conflict with this adherence, is
plausible.
292
However, the number of fathers involved in the study was very limited. As such, the
variation in obtained scores on the adherence and conflict scales by this sub-sample
was also limited. It is possible that a larger sample of fathers and their adolescents
would produce a greater association between their conflict and the adolescents'
adherence than was obtained in the present study.
8.3.5 Variations in Associations Between Parent-Adolescent Conflict and
Adherence in Relation to Parents' Work Status.
The associations between reporfs of parent-adolescent conflict and medical adherence,
performed according to parents' work status, revealed mixed results. The levels of
association between the conflict reported by adolescents and the adherence measures
were slightly greater amongst the sample categorised by the parent working outside
the home environment than amongst the sample categorised by parents who were
primarily at home. The conflict reports obtained from parents were more closely
associated with reports of adherence amongst those parents who were primarily at
home than amongst the parents working outside the home. The combined adolescent
and parent reports of parent-adolescent conflict were more closely associated with the
adolescents' and parents' reports of adherence amongst the sample defined by the
participating parent working outside the home, than amongst the sample in which
parents were primarily at home.
The sample included approximately even numbers of participating parents who
worked outside the home and who were primarily in the home, so the results cannot
293
be attributed to an imbalance in the sample sizes. The most plausible explanation for
this mixture of results is that parental work status is not influential on the relationship
between parent-adolescent conflict and adolescents' adherence to medical
recommendations.
8.3.6. Variations in Associations Between Parent-Adolescent Conflict and
Adherence in Relation to Household Structure.
The associations between reports of parent-adolescent conflict and medical adherence,
performed according to household structure, also revealed a mixture of results.
The levels of associations produced amongst the sample categorised by dual parent
households were generally more statistically significant than those produced by the
members of single parent households. However, the effect sizes of the associations
between these measures were generally larger in the single parent group than in the
dual parent group.
Like the number of fathers involved in the study, the number of single parents
involved was limited. Because of this limited sample size, the significance of small
associations amongst these study participants were inflated. Further, the level of
variation in scores produced by single parents was smaller than that of the dual
parents, limiting the effect sizes of these associations.
294
The imbalance of sample sizes in the dual parent and single parent groups prevent the
meaningful comparison of conflict-adherence relations in this study. This issue is
worthy of further exploration. Future investigations should examine the differential
influence of parent-adolescent conflict in single and dual parent households.
8.4 The Level of Association Between Measures of Parent-Adolescent Conflict
and Adolescents' Metabolic Control.
This section discusses the results presented in Section 7.4, examining the relationship
between reports of parent-adolescent conflict and adolescents' level of metabolic
control
In light of the conceptual link between regimen adherence and health outcomes, the
association between metabolic control and parent-adolescent conflict was examined as
an extension of the first hypothesis of this thesis. The importance of studying patient
adherence lies in its association with the health outcomes of patients. The importance
of the association between parent-adolescent conflict and adherence is reduced if this
form of conflict is unrelated to patients' health outcomes. The hypothesised
relationship between parent-adolescent conflict and health outcomes includes patient
adherence as a mediating factor, nonetheless the direct association of parent-
adolescent conflict with health outcome is pertinent to the understanding of the
relationship between conflict and adherence. Adolescents' IIbA1. assay levels were
treated as the measure of health outcome for these analyses.
295
The initial analyses performed to examine the relationship between parent-adolescent
conflict and adolescents' metabolic control revealed statistically significant relations
between these constructs. Interestingly, the adolescents' reports of conflict were more
closely associated with their metabolic control than were their parents' reports of
conflict. This finding is consistent with the suggestion that adolescents' illness
control is linked to their perceptions of their family relations, that is, their perceptions
of conflict are associated with their illness control. Earlier findings demonstrate that
adolescents' and parents' perceptions of conflict àre related to their illness
management practices (i.e., adherence). This finding suggests that this influence
extends to their experienced level of health (i.e., metabolic control). It is not
surprising that parents' perceptions of conflict were less closely associated with
adolescents' metabolic control than the adolescents' own perceptions. The parents'
perceptions would not be expected to link directly to the adolescents' IDDM control.
While these results do not provide direct support for the first hypothesis of this thesis,
they are consistent with its tenet. These results suggest that parent-adolescent conflict
is weakly associated with decreased health status amongst the adolescents.
The final analyses that were conducted therefore examined whether the parent-
adolescent conflict ratings accounted for unique variance in HbA1" assay levels after
the adherence reports had been entered into hierarchical regression equations
Adolescents' reports of parent-adolescent conflict uniquely predicted their level of
metabolic control, above that of the adolescents' reports of general adherence. In
contrast, parents' reports of conflict did not account for any of the variance in
296
adolescents' level of metabolic control, above that of the parents' reports of
adherence. In light of these findings, it is not surprising that the addition of combined
adolescent and parent reports of conflict to the individual adolescent and parent
reports of adherence produced mixed results. The combined conflict repofts added
unique prediction of the adolescents' metabolic control when added to their reports of
general adherence. Further, the combined conflict score added unique prediction of
the adolescents' metabolic control when added to parents' reports of diabetes-specific
adherence. However, these conflict reports did not account for additional variance
when added to the regression of parents' general adherence reports with adolescents'
metabolic control.
The regression analyses which involved the entry of adolescents' reports of diabetes-
specific adherence (DSAS) as the first step were not pursued, as this measure did not
have significant predictive power for the adolescents' level of metabolic control (see
Cliff (1987) for a discussion of the statistical implications of this point).
Before interpreting these findings, it should be recognised that reports of general
adherence (GAS) accounted for greater proportions of variance in adolescents'
metabolic control than reports of diabetes-specific adherence (DSAS). This pattern
was evident in both the adolescent and parent reports. With this point in mind, it
appears reasonable to suggest that reports of parent-adolescent conflict added to the
predictability of adolescents' metabolic control established from the reports of
adherence obtained from the adolescents and their parents. This finding again
provides additional indirect support for the first hypothesis of this thesis.
297
However, an alternative interpretation of these findings must be considered. It is
possible that parent-adolescent conflict is directly associated with metabolic control,
that is, conflict could influence the metabolic functioning of the adolescents, or vice
versa. This view would suggest that adherence, rather than being directly related to
conflict, could be associated though a mediating effect of metabolic control (i.e., poor
metabolic control leading to abandonment of the regimen, or poor adherence). There
is, however, little support for this alternate view. The associations between conflict
and metabolic control are weak. A direct effect of conflict on metabolic control has
been proposed (Minuchin, et al. L975). However, in the two decades since this effect
was proposed, no empirical support for the effect has been reported, and the findings
of a recent study suggest that no such effect exists (Miller-Johnson, et al. 1994).
Wysocki (1993) found that mothers' and adolescents' reports of conflictual parent-
adolescent relations were associated with adolescents' metabolic control. This
investigation involved 242 North American families of adolescents aged between 11
and 18 years, with insulin dependent diabetes. The results of the present study
replicated these findings in an Australian sample, using a different measure of parent-
adolescent conflict.
298
8.5 Summary and Future Directions: The Relationship Between Patient
Adherence and Parent-Adolescent Conflict.
This section provides a synthesis of the findings discussed in this chapter, in light of
the published literature. The implications of these findings to the wider literature and
to future research are addressed.
8.5.1 The Relationship Between Patient Adherence and Parent-Adolescent Conflict
The findings discussed in this chapter examined the first hypothesis of this thesis.
This hypothesis states that higher levels of reported conflict will be associated with
lower levels of reported adherence, that is, an inverse association between parent-
adolescent conflict and adolescents' medical adherence.
In previous studies by Hauser and colleagues (1990), Hanson, De Guire, and
colleagues (L992) and Miller-Johnson and colleagues (1994), various measures of
family relations have been associated with measures of adolescents' adherence to
IDDM management recommendations
Hauser and colleagues (1990) used the Moos Family Environment Scale (Moos &
Moos, 1981) to assess adolescents' and mothers' perceptions of family relations.
Reports of adherence to three specific aspects of IDDM management
recommendations, as well as a composite measure of adherence, were completed by
299
health care workers. Adolescents' reports of family conflict were associated with
physicians' perceptions of poor adherence.
Hanson, De Guire, and colleagues (1992) assessed the family functioning of families
of adolescents with IDDM using the Family Adaptability and Cohesion Scales (Olson,
1986), the Marital Adjustment Scale (Locke & Wallace, 1959), and the Family
Relationship Questionnaire (FRQ; Henggeler & Tavormina, 1980). Adherence to
dietary recommendations for IDDM was evaluated with a semistructured interview of
adolescents. Adolescent and mother responses on the FRQ were combined to form a
composite measure of family conflict. The ratings of dietary adherence used in this
study were significantly related to family adaptability and the absence of illness-
specific nonsupport, but not to reports of family conflict.
Miller-Johnson and colleagues (L994) assessed parent-child conflict amongst a sample
of children and adolescents with IDDM and their mothers using the Parent-Child
Scales conflict subscale (Hetherington & Clingempeel,1992). In this study, regimen
adherence was assessed by children, parents, and nurse coordinators. These measures
of adherence were all associated with the measures of parent-child conflict completed
by children (and adolescents) and parents. Further, this study found that these ratings
of conflict were also associated with the children and adolescents' metabolic control
Studies conducted by BJ Anderson and colleagues (1990), Hanson, De Guire, and
colleagues (1992), and Wysocki (1993), also examined relationships between
measures of family functioning and adolescents' metabolic control in IDDM
300
BJ Anderson and colleagues (1981) used the Moos Family Environment Scale (Moos
& Moos, 1981) to assess adolescents' and mothers' perceptions of the social climate
in their households. Adolescents with well-controlled diabetes (low HbA1" levels)
reported lower levels of household conflict and greater family cohesion than
adolescents with poorly controlled diabetes (high HbA1" levels)
Wysocki (1993) used the Parent-Adolescent Relationship Questionnaire (Robin, et al.
1990) to assess a range of aspects of family functioning, including parent-adolescent
conflict, amongst a large sample of adolescents with IDDM and their mothers
Responses on the Overt-Conflict subscale of this measure, as completed by
adolescents and their mothers, were significantly associated with the adolescents'
metabolic control.
However, Hanson, De Guire, and colleagues (1992) reported that parent-adolescent
conflict, rated using the Family Relationship Questionnaire, was not associated with
metabolic control amongst a sample of adolescents with insulin dependent diabetes
In the present study, adolescent, parent and combined measures of parent-adolescent
conflict were associated with adolescents' adherence, as reported by the adolescents
and their parents. Observations of BGM adherence were not related to these reports
of conflict. Additional analysis revealed significant relationships between reports of
parent-adolescent conflict and adolescents' metabolic control. Hierarchical multiple
regression analyses deterrnined that adolescent and combined adolescent and parent
reports of conflict added to the variance in metabolic control accounted for by reports
of adherence.
301
These results extend on previous research in several respects.
First, these findings replicate the findings of Hauser and colleagues (1990) and Miller-
Johnson and colleagues (1994). These studies reported that adherence is related to
parent-adolescent conflict. Further, the assessment of parent-adolescent conflict in
this study was performed using a validated measure designed to assess this aspect of
parent-adolescent relations. The use of a measure specifically addressing this aspect
of family relations extends on the previous studies, which employed more general
assessments of family relations. In addition, the assessment of adherence in this study
involved independent reports from adolescents and parents, both of general tendencies
to adhere to treatments and of adherence to specific aspects of IDDM management.
Hauser and colleagues (1990) employed health provider ratings of adherence, while
Miller-Johnson and colleagues (1994) used unvalidated child, parent, and nurse
ratings of adherence. The more methodologically sophisticated assessments of
adherence in this study add considerable weight to the findings of these previous
investigations. The finding that these relations were detected using different measures
than those employed in these previous studies indicates that these associations are not
a product of the particular measures employed.
Second, the findings in this study relating parent-adolescent conflict to adolescents'
metabolic control support the findings reported by BJ Anderson and colleagues
(1981), Wysocki (1993), and Miller-Johnson and colleagues (1994). These authors
reported significant associations between various measures of family functioning and
adolescents' metabolic control. The findings of the present study offer a more specific
302
perspective, linking parent-adolescent conflict in particular with the adolescents' level
of metabolic control. Again, the detection of these relations using different measures
than those employed in these previous studies indicates that these associations are not
a product of the particular measures employed.
Third, the finding that reports of parent-adolescent conflict contributed to the
prediction of adolescents' metabolic control, when added to reports of adherence,
extends upon the findings of Miller-Johnson and colleagues (1994), and Hanson,
De Guire, and colleagues (1992). Miller-Johnson and colleagues (1994) detected
significant associations between metabolic control and conflict, but found that the
addition of conflict reports to adherence assessments did not improve the
predictability of adolescents' metabolic control. Hanson, De Guire, and colleagues
(L992) did not detect significant relations between adolescents' metabolic control and
a measure of family relationships. The findings of the present study suggest that the
more specific assessment of parent-adolescent conflict, rather than general parent-
adolescent relations, or family conflict, is a more direct assessment of an aspect of
family functioning influencing adolescents' metabolic control. The less significant
relationships found using the conceptually broader measures in these previous studies
may be due to a noise effect, that is, the inclusion in these assessments of aspects of
family relations not linked to adolescents' metabolic control.
Finally, this study examined the variation in the association between parent-adolescent
conflict and adolescents' adherence in relation to demographic characteristics of the
study participants. This is an issue seldom addressed in the literature. Surprisingly,
the association between these measures showed little variation in relation to
303
demographic characteristics. Although some of these characteristics showed variation
in conflict-adherence associations, these could generally be attributed to imbalances in
sample sizes according to these characteristics. Future studies could explore this issue
using larger samples.
In sum, the results presented in this chapter supported the hypothesis that adherence
would be lower amongst adolescents who experienced high levels of conflict with
their parents than amongst adolescents who experienced less conflict with their
parents.
8.5.2 Limitations of the Present Study and Future Directions for Investigations of
the Relationship Between Patient Adherence and Parent-Adolescent Conflict
The discussion of the results in this study examining the relationship between
measures of adherence and measures of parent-adolescent conflict has identified a
number of limitations of the study, and identified avenues for further investigation
First, information about pubertal status was not collected in this study. This
information could provide valuable information about the changes in parent-child
relations, and the influence of these relations on adherence, as children progress
through this developmental stage.
Second, this study employed measures that rated the level of conflict experienced
between adolescents and parents. The nature of this conflict, and the nature of its
304
resolution, were not assessed. Further, the topic of the conflict was not assessed.
Measures assessing the nature of conflict and subject of the conflict would further the
understanding of the relationship between parent-adolescent conflict and adolescents'
adherence to medical regimens. For example, the nature of the relationship between
conflict and adherence would be clarified by the use of a diabetes-specific conflict
measure, as well as a general measure of conflict between adolescents and parents.
Third, an assessment of the parents' level of involvement with their adolescents would
potentially provide additional information about the role of conflict in adolescents'
regimen adherence. For example, conflict with parents who were closely involved in
the day to day activities of the adolescents may relate to adherence differently than
conflict with parents who were less involved in their adolescents' lives. The parents'
level of involvement in the adolescents' IDDM management would be of particular
interest in this assessment.
Fourth, future investigations should examine the differential influence of parent-
adolescent conflict in single and dual parent households. Whether conflict with single
parents influences adolescents' adherence differently than conflict with parents in
intact marriages would be of interest to researchers and potentially useful information
for adherence intervention strategies.
Finally, the comparison of adherence-conflict relations in this study were hampered by
small sample sizes in certain demographic groups. In particular, the involvement of
such a limited number of fathers in the study limited the ability of this investigation to
examine the different roles played by mothers and fathers in their adolescents'
305
healthcare. Future studies should emphasise the recruitment of fathers into research of
this kind. Further, the comparison of adolescents' behavioural patterns at different
age levels or developmental stages, requires larger numbers of participants in each
study group. For research investigating illnesses such as insulin dependent diabetes,
recruitment of larger study samples may best be achieved through multi-site
investigations. Investigations conducted on multiple sites also increase the
generalisability of their results. This is an interesting avenue for future research.
306
CHAPTER NINE.
RESULTS: THE RELATIONSHIP BETWEBN PATIENTADHERBNCE AND ADOLBSCENT AUTONOMY.
Parts of this chapter were published in
Fotheringham MJ, Couper JJ, Sawyer MG. (1996). Adolescents' adherence to IDDM treatment:Relation to parent-adolescent conflict and adolescent autonomy. Proceedings of the AustralianDiabetes Society, 1996 A89.
This chapter examines the relationship between mea;ures ofadolescents' adherence to their diabetes treatment recommendationsand reports of adolescents' autonomy. These analyses were designedto test the second hypothesis of this thesis. This chapter consists ofthree sections. First, adolescents' and parents' reports of adolescentautonomy are presented in relation to sample characteristics. Second,analyses are presented that examine the association between reports ofadolescent autonomy and reports of adherence. Third, the associationbetween reports of adolescent autonomy and adolescents' metaboliccontrol (Hbfu,) is examined.
9 RESULTS: THE RELATIONSHIP BET\ryEEN PATIENT
ADHERENCE AND ADOLESCENT AUTONOMY.
9.1 The Reporting of Adolescent Autonomy in Relation to Sample
Characteristics.
This section examines obtained data from the measure of adolescent autonomy. The
AFC was completed by participating adolescents and parents. The scoring of the AFC
generates a total scale score as well as four sub-scales; Self- and Family-Care,
Management Activity, Recreational Activity, and Social and Vocational Activity
Table 9.L displays distributions of scores on the AFC by adolescents and parents
The scoring range of the adolescent completed and parent completed AFCs are 0 to
252, where higher scores indicate a higher level of autonomy in the adolescents
Table 9.2 reports distributions of scores on the AFC subscales completed by
adolescents and parents. The scoring ranges on the Self- and Family-Care,
Management Activity, Recreational Activity, and Social / Vocational Activity
subscales are 0 to 88, 0 to 80, 0 to 64, and 0 to 20, respectively.
As may be seen from these tables, although the scores obtained by adolescents and
parents did vary, this variance was not wide - almost all of the scores produced by
both groups of informants fell between the 25 7o and 75 7o marks of the possible
scoring range (i.e., scores between 63 and 189 on a total scale of 0 to 252). This lack
of variation in obtained scores may limit the level of association between scores on
this scale and other study variables.
308
The scoring distributions of these measures are examined in relation to: (1)
adolescents' ug", (2) adolescents' gender, (3) parents' age, (4) parents' gender, (5)
parents' work status, and (6) household structure (i.e., single or dual parent
households)
9.1.1 The Reporting of Adolescent Autonomy in Relation to Adolescents' Age
The distributions of scores on the AFC according to adolescents' age are reported in
Table 9.3. Distributions of scores on the subscales of the AFC according to
adolescents' age are reported in Tables 9.4 and 9.5. Lower levels of autonomy were
reported by younger adolescents and their parents than by older adolescents and their
parents. One-way ANOVA of this variation revealed that these differences were
statistically significant for the total AFC, (Adolescent: F (5,121) = 5.14, p = 0.0003
Parent: F (5,128) = 7.99, p < 0.0001), as well as for the Self- and Family-Care
(Adolescent: F (5,126) = 2.42, p = 0.04. Parent: F (5,128) = 5.94, p = 0.0001),
Management Activity, (Adolescent: F (5,125) = L2.68,p < 0.0001. Parent: F (5,129)
= 9.06, p < 0.0001) and Social / Vocational Activity subscales (Adolescent: F (5,I27)
- 3.62, p = 0.004. Parent: F (5,129) = 4.14, p < 0.002). However, the variations in
reports of Recreational Activity according to adolescents' age were not significant.
To determine whether these variations were linear (i.e., increasing autonomy with
increasing age) or not (e.g., higher autonomy in L3 year olds than in other
adolescents), correlations were calculated between adolescents' age and scores on the
309
AFC and its subscales by adolescents and parents. These associations are reported in
Table 9.6. The effect sizes of the relationships between adolescents' age and scores
on each of these measures varied, from small effects for the Recreational Activity
subscale, to large effects for the Management Activity subscales. The total AFC
showed moderately large effects according to adolescent age.
To further explore the association between reports of adolescents' autonomy and their
age, the level of agreement between adolescents' and parents' reports of autonomy
was examined in relation to these variables. These analyses aÍe detailed in
Appendices F.l and F.2. Overall, adolescents' and parents' responses on the AFC
and its subscales were highly correlated. This correlation did not significantly vary
according to adolescents' age
9.I.2 The Reporting of Adolescent Autonomy in Relation to Adolescents' Gender
The distributions of scores on the AFC by adolescents and parents according to
adolescents' gender are reported in Table 9.7. Distributions of scores on the
subscales of the AFC according to adolescents' gender are reported in Table 9.8.
Female adolescents reported a higher mean level of autonomy on the total AFC than
male adolescents. This pattern was not the result of a large difference in reporting on
any one subscale, but because of slight differences in mean responses on each of the
subscales between female and male adolescents. This pattern was not shown between
the responses obtained from the parents of female adolescents and the parents of male
adolescents
310
Students' / test analyses revealed that mean scores on the adolescent completed AFC
were significantly higher amongst the female adolescents than amongst the male
adolescents (t (I25) = 2.38, p = 0.02). Responses of the parents of male and female
adolescents were not significantly different. Further / tests revealed significant
differences in mean scores on the subscales of the AFC between female and male
adolescents only for the adolescent reports of Management Activity (t (I29) - 2.84, p
= 0.005), for which the female adolescents produced a higher mean score than the
male adolescents. On the remaining subscales, adolescent gender differences were not
detected.
To further explore the association between reports of adolescents' autonomy and their
gender, the level of agreement between adolescents' and parents' reports of autonomy
was examined in relation to these variables. These analyses are detailed in Appendix
F.3. Overall, adolescents' and parents' responses on the AFC and its subscales were
highly correlated. This correlation did not significantly vary according to adolescents'
gender
9.1.3 The Reporting of Adolescent Autonomy in Relation to Parents' Age.
The distributions of scores on the AFC by adolescents and parents according to
parents' age are reported in Table 9.9. Distributions of scores on the subscales of the
AFC according to parents' age are reported in Table 9.10. As in previous chapters,
311
parents' age was grouped into (a) those under 40 years old, (b) those aged 40 to 45
years old, and (c) those aged over 45 years.
One-way ANOVAs examined the variation in adolescents' and parents' scores on the
AFC and its subscales according to parents' age groups. The results of these analyses
were not significant, with two exceptions. Adolescent and parent responses to the
Management Activity subscale of the AFC were both significantly varied according to
parents' age (Adolescent: F (2,128) = 5.14, p = 0.001. Parent: F (2,132) = 3.60,
p = 0.03). Reports of adolescents' autonomy in Management Activity were higher
amongst adolescents with older parents than amongst adolescents with younger
parents
9.1.4 The Reporting of Adolescent Autonomy in Relation to Parents' Gender.
The distributions of AFC scores according to whether the parent-form was completed
by the adolescents' mother or father is reported in Table 9.11. Distributions of scores
on the subscales of the AFC according to parents' gender are reported in Table 9.12.
Adolescents reported very similar levels of autonomy, regardless of whether their
mother or father completed the parent questionnaire. The mean level of autonomy
reported by fathers was lower than the mean level reported by mothers. This
difference was not significant. Similarly, responses by adolescents and parents to the
four subscales of the AFC were not differentiated according to the gender of the
participating parent.
312
9.1.5 The Reporting of Adolescent Autonomy in Relation to Parents' Work Status.
The distributions of AFC scores according to parents' work status are reported in
Table 9.13. Distributions of scores on the subscales of the AFC according to parents'
work status are reported in Table 9.14. Similar levels of autonomy were reported by
and about adolescents whose participating parent worked outside the home and
adolescents whose parents were primarily at home. Students' / tests revealed that
mean scores by adolescents and parents on the AFC and its subscales were not
significantly differentiated on the basis of participating parents' work status.
9.L.6 The Reporting of Adolescent Autonomy in Relation to Household Structure.
The distributions of scores on the AFC by adolescents and parents according to
participants' household structure are reported in Table 9.15. Distributions of scores
on the AFC subscales according to household structures are reported in Table 9.16.
Adolescents reported similar levels of autonomy in single and dual parent households.
The mean level of adolescent autonomy reported by parents residing in single parent
households was slightly greater than that reported by parents in dual parent
households. This difference was not significant. However, parents' reports on the
Management Activity subscale indicated greater autonomy in this aspect of
functioning for adolescents residing in dual parent households than adolescents living
in single parent households (/ (133) = 2.73, p = 0.007). Further, adolescents' reports
3t3
of autonomy in Self- and Family-Care were significantly higher amongst adolescents
in single parent households than in dual parent households (r (130) = 2.08, p = 0.04).
9.2 The Level of Association Between Measures of Adolescent Autonomy and
Adherence.
The analyses presented in this section were designed to examine the association
between the measures of adolescent autonomy and the measures of adherence to
medical recommendations. Pearson correlations were employed to examine the level
of association between these measures
Separate analyses examined the associations between (1) adolescent reports of
adherence and autonomy, (2) parent reports of adherence and autonomy, (3) cross-
informant associations between reports of autonomy and adherence (e.g., between
adolescent reports of autonomy and parent reports of adherence), and (5) associations
between observed blood glucose monitoring adherence and reports of autonomy by
adolescents and parents
9.2.L Adolescent Reports of Autonomy and of Adherence.
The level of correlation between the adolescent completed measure of autonomy and
the adolescent completed GAS is shown in Table 9.17. The levels of correlation
between the adolescent completed subscales of the AFC and the adolescent completed
GAS are shown in Table 9.18. The effect size of the correlation between adolescents'
3r4
GAS scores and their total AFC scores was small, and not statistically significant.
Effect sizes between the adolescent completed GAS and adolescent scores on each of
the subscales of the AFC were also small. Adolescent GAS responses were only
significantly associated with responses to the Recreational Activity subscale of the
AFC, although the effect size of this association was moderately small.
The level of correlation between the adolescent completed measure of autonomy and
the adolescent completed DSAS is shown in Table 9.17. The levels of correlation
between the adolescent completed subscales of the AFC and the adolescent completed
DSAS are shown in Table 9.18. The effect size of the correlation between
adolescents' DSAS scores and their total AFC scores was small, and not statistically
significant. Effect sizes between the adolescent completed DSAS and adolescent
scores on each of the subscales of the AFC were also small. Like their GAS scores,
adolescent DSAS responses were only significantly associated with responses to the
Recreational Activity subscale of the AFC, although the effect size of this association
was moderately small
9.2.2 Parent Reports of Adolescent Autonomy and of Adherence
The level of correlation between the parent completed measure of autonomy and the
parent completed GAS is shown in Table 9.17. The levels of correlation between the
parent completed subscales of the AFC and the parent completed GAS are shown rn
Table 9.18. The effect size of the correlation between parents' GAS scores and their
total AFC scores was small, and not statistically significant. Effect sizes between the
315
parent completed GAS and parent scores on each of the subscales of the AFC were
also small. Parent GAS responses were only significantly associated with responses
to the Management Activity subscale of the AFC, although the effect size of this
association was moderately small.
The level of correlation between the parent completed measure of autonomy and the
parent completed DSAS is shown in Table 9.17. The levels of correlation between
the parent completed subscales of the AFC and the parent completed DSAS are shown
in Table 9.18. The effect size of the correlation between parents' DSAS scores and
their total AFC scores was small, and not statistically significant. Effect sizes
between the parent completed DSAS and parent scores on each of the subscales of the
AFC were also small. Parents' DSAS responses were not significantly associated
with their responses to any of the subscales of the AFC.
9.2.3 Cross-Informant Associations Between Reports of Adolescent Autonomy and
Adherence.
The next analyses examined the association between (1) adolescents' reports of
autonomy, and parents' reports of the adolescents' adherence, and (2) adolescents'
reports of adherence, and their parents' reports of the adolescents' autonomy. These
analyses were performed to examine from another angle the association between
reported adolescent autonomy and adherence. The examination of cross-informant
associations also reduces the vulnerability of the analyses to respondent biases (see
Section 8.2.4 for a discussion of this point).
316
Adolescent Reports of Autonomy and Parent Reports of Adherence
The levels of association between adolescent reports on the AFC and parent scores on
the GAS and DSAS are reported in Table 9.17. Associations between adolescent
reports on the subscales of the AFC and parent scores on the GAS and DSAS are
reported in Table 9.18. The effect sizes of these associations are consistent with the
associations between adolescent responses on each of these measures, as well as
between parent responses between these measures. None of these associations were
stati stic ally si gnificant.
Parent Reports of Adolescent Autonomy and Adolescent Reports of Adherence.
The levels of association between parent reports on the AFC and adolescent scores on
the GAS and DSAS are reported in Table 9.17. Associations between parent reports
on the subscales of the AFC and adolescent scores on the GAS and DSAS are
reported in Table 9.L8. The effect sizes of these associations are consistent with the
associations between parent responses on each of these measures, as well as between
adolescent responses between these measures. Again, none of these associations were
stati stic ally si gnificant.
317
9.2.4 Reports of Adolescent Autonomy and Observed Blood Glucose Monitoring
Adherence.
The next analyses examined the relationship between reports of adolescent autonomy
and observed blood glucose monitoring adherence. These analyses took three forms
First, the relationship between scores on the AFC and the observed BGM adherence
was examined using the complete BGM adherence dataset. Second, relationships
between AFC scores and observed BGM adherence over the final 20, 12, 8, and 4
days before assessment were examined separately. Third, the relationship between
AFC scores and observed BGM adherence over the previous 28 days was examined
separately for adolescents coded with Consistently High, Consistently Low, Rising, or
Other patterns of BGM adherence over the assessment period. Each of these analyses
were also performed separately for each of the four subscales of the AFC.
The Relationship Between Reports of Adolescent Autonomy and Observed. Blood
Glucos e Monítoríng Adherenc e.
The correlations between the objective recording of Blood Glucose Monitoring and
the measures of adolescent autonomy are reported in Table 9.19
The correlations between adolescent reports of autonomy and the BGM data were all
weak - none of these associations reached the p - 0.05 significance level. The levels
of association between BGM data and the parent reports of adolescent autonomy were
slightly stronger. Nonetheless, only the parent responses to the first subscale of the
318
AFC, 'Self- & Family-Care' were significantly negatively correlated with BGM
adherence at the 0.05 level
The negative correlations reported here indicate that higher levels of reported
autonomy v/ere associated with lower levels of BGM adherence. These results are
not in the direction predicted by the second hypothesis of this study - that greater
levels of autonomy would be associated with greatt levels of adherence. However,
there were only two significant correlations out of ten comparisons made - a result
only slightly greater than would be expected by chance alone.
The Relationship Between Reports of Adolescent Autonomy and Observed Blood
Glucose Monítoríng Adherence Over Dffirent Tíme Frames.
The correlations between the BGM adherence data spanning different time frames and
total scores on the AFC are reported in Table 9.20. These correlations are reported
for the observed BGM adherence over the final 28, 20, 12,8 and 4 days prior to
assessment. The correlations between the BGM adherence data spanning different
time frames and scores on each of the subscales of the AFC are reported in Table
9.21. These analyses were intended to examine the relationship between reports of
adolescents' autonomy and adherence to BGM over different time frames. As
reported in Chapter 5, observed BGM adherence varied significantly over the four
weeks prior to assessment, increasing as attendance to the clinic approached.
31.9
The magnitude of the correlations between each of the measures of autonomy and the
observed BGM adherence did not vary greatly when the time frame examined by this
data was adjusted.
The Relationshíp Between Reports of Adolescent Autonomy and. Observed Blood
Glucose Monítoríng Adherence, According to Observed Patterns of Adherence Over
Tíme
Table 9.22 reports the distribution of scores on the adolescent and parent scales of the
AFC for each blood glucose monitoring adherence group (Consistently High,
Consistently Low, Rising, Other). Table 9.23 reports the distribution of scores on the
adolescent and parent completed subscales of the AFC for each blood glucose
monitoring adherence group (Consistently High, Consistently Low, Rising, Other).
The mean scores obtained on the adolescent completed AFC were similar amongst the
groups of adolescents who were categorised with Consistently High, Consistently
Low, and Other BGM adherence; the mean adolescent AFC score obtained by the
adolescent categorised with Rising BGM adherence was lower. This pattern was
reflected in the adolescent responses to the Self- and Family-Care subscale of the
AFC, but not in their responses to the other subscales. The mean scores obtained on
the parent completed AFC were highest amongst the parents of adolescents who were
categorised with Other BGM adherence. The distributions of scores on the parent
completed subscales of the AFC did not appear to vary systematically in relation to
BGM adherence groups.
320
Oneway ANOVAs were performed for the adolescent and parent completed AFC
scales (as dependent variables) against the four BGM adherence groups (the
independent variable). These analyses were use to determine whether the level of
autonomy reported between adolescents and parents varied between these groups.
These analyses were also performed on the adolescent and parent completed subscales
of the AFC in relation to BGM adherence groups. Reported levels of adolescent
autonomy by adolescents and parents on the AFC were not significantly varied
according to the BGM adherence groups. Similarly, responses on the subscales of the
AFC by adolescents and parents were not significantly varied according to the BGM
adherence groups
A second approach employed to analyse the possible variation in reported adolescent
autonomy according to the BGM adherence profiles was pursued. This approach
involved the combination of the Rising and Other BGM adherence groups into a
single group. The levels of autonomy reported by these adolescents and their parents
wero compared with those reported amongst the Consistently High and Consistently
Low BGM adherence groups using oneway ANOVAs. Reported levels of adolescent
autonomy on each of the scales were again not significantly varied according to these
BGM adherence groups on any of the AFC reports.
Analyses of differences in the level of association between reports of adolescent
autonomy and reports of adherence according to sample characteristics were not
performed, because of the lack of association found between the measures of
adherence and autonomy.
32r
9.3 The Level of Association Between Measures of Adolescent Autonomy and
Adolescents' Metabolic Control.
The analyses presented in this section were designed to examine the association
between the measures of adolescent autonomy and adolescents' IfbA1" levels - the
measure of their metabolic control. These analyses were performed to further
examine the hypothesised relationship between adolescent autonomy and adolescents'
adherence.
Correlations of the adolescent and parent completed AFC scales with adolescents'
IIbA1. are displayed in Table 9.24. The correlations between both the adolescent and
parent completed scales of the AFC and adolescents' HbA1. levels were not
significant. Correlations of the subscales of the AFC, as completed by adolescents
and parents, with adolescents' IfbA1" are also displayed in Table 9.24. The
correlations between these subscales and adolescents' FIbA1" levels were not
significant, with the exception of parents' reports of Management Activity
Because of the lack of association between the measures of autonomy and the
measures of adherence and metabolic control, hierarchical regressions of the
contributions of autonomy measures to the prediction of metabolic control by
adherence assessments were not pursued.
322
CHAPTBR TEN.
DISCUSSION: THB RELATIONSHIP BETWEENPATIENT ADHERBNCE AND ADOLBSCENT
AUTONOMY.
This chapter discusses the results presented in Chøpter 9, describingthe relationship between measures of patient adherence and adolescentautonomy in the present study. In parallel with Chapter 9, the sectíonsof this chapter address: (1) the reporting of adolescent autonomy inrelation to sample characteristics; (2) the level of association betweenmeasures of adolescent autonomy and adherence; and (3) the level ofassociation between measures of adolescent autonomy and adolescents'metabolic control.
Parts of this chapter were published in:
Fotheringham MJ, Couper JJ, Sawyer MG. (1996). Adolescents' adherence to IDDM treatment:Relation to parent-adolescent conflict and adolescent autonomy. Proceedings of the AustralianDiabetes Society, 1996 A89.
10 RESULTS: THE RELATIONSHIP BETWEEN PATIENT
ADHERENCE AND ADOLESCENT AUTONOMY.
10.1 The Reporting of Adolescent Autonomy in Relation to Sample
Characteristics.
This section discusses the results presented in Section 9.L, examining the reporting of
adolescent autonomy by adolescents and parents in this study. These reports are
examined in relation to respondents' demographic characteristics.
The scoring distributions of these measures are discussed in relation to: (1)
adolescents' ug", (2) adolescents' gender, (3) parents' age, (4) parents' gender, (5)
parents' work status, and (6) household structure
10.1.1 The Reporting of Adolescent Autonomy in Relation to Adolescents' Age.
Previous studies have reported that adolescents' autonomy increases with their age
(Howe, et al. 1993; Sigafoos, et al. 1988; Small, et al. 1988). In the present study,
reports of autonomy obtained from adolescents and their participating parents were
associated with the adolescents' age. Older adolescents reported higher levels of
reported autonomy than younger adolescents. Correlations of adolescents' and
parents' scores on the total scale of the Autonomous Functioning Checklist with the
adolescents' age were significant. Correlations of adolescents' and parents' scores on
324
the Self- and Family-Care, Management Activity, and Social / Vocational Activity
subscales with the adolescents' age were also significant.
This finding is consistent with the results of previous studies using other measures of
adolescent autonomy, and other studies using the AFC to assess autonomy in
adolescents (Hauser, et al. 1993; Howe, et al. 1993; Sigafoos, et al. 1988; Small, et al.
r988).
10.L2 The Reporting of Adolescent Autonomy in Relation to Adolescents' Gender
Previous studies examining adolescents' autonomy in relation to their gender have
provided mixed results. Enright, Lapsley, Drivas & Fehr (1980) reported two studies
examining the parental influences on adolescent identity and autonomy development.
In these studies, the most crucial variable mediating autonomy development during
adolescence was gender. In these studies males had higher autonomy scores than
females. Enright and colleagues attributed this finding to differential sex-role
socialisation, suggesting that males are encouraged to be assertive and autonomous,
while females are rewarded for passivity and dependence. These findings were
consistent with Blos' (1979) psychoanalytic theory, which, as Hill & Holmbeck
(1986) noted, differentiates male and female adolescents' development of autonomy
However, Sigafoos and colleagues (1988), using the AFC, reported that scores on the
Self- and Family-Carc, Recreational Activity and Social / Vocational Activity
subscales, as well as on the total AFC scale, were higher for the female adolescents
325
than for the male adolescents in their sample. Howe and colleagues (1993), using the
same measure to examine the autonomy of chronically ill adolescents, found that
reports of autonomy were higher amongst male adolescents than amongst females
In the present study, the autonomy reports obtained from adolescents revealed a
similar gender difference as was reported in the study by Sigafoos and colleagues
(1988). Female adolescents reported a higher mean level of autonomy on the total
AFC than male adolescents. In contrast, the reports of adolescent autonomy obtained
from parents did not indicate significant gender differences in adolescent autonomy.
The most probable explanation for the inconsistency in gender differences in reported
adolescent autonomy lies in the varying methods used to assess autonomy in these
studies. Enright and colleagues (1980) employed Kurtines' (1978) measure of
autonomy, completed by seventh and eleventh grade adolescents. It is possible that
the higher reported autonomy amongst males than females in this study was
influenced by the measure employed. The studies by Sigafoos and colleagues (1988)
and Howe and colleagues (1993) both involved the Autonomous Functioning
Checklist. However, the study by Sigafoos and colleagues examined a normative
sample of adolescents, whereas the Howe, et al. study examined the autonomy of
adolescents with chronic medical conditions. It is possible that this difference in
sampling foci was responsible for the observed variation in gender differences in
autonomy
The gender differences in autonomy reported in this study and the previous studies,
although statistically significant, have not been large. It is also possible that these
326
differences were the result of chance alone. No studies have been reported in the
literature which focus directly on gender differences in adolescent autonomy. The
systematic investigation of this issue would clarify the relationship between the
development of adolescent autonomy and adolescent gender
10.1.3 The Reporting of Adolescent Autonomy in Relation to Parents' Age.
Previous studies have not reported variation in adolescents' autonomy in relation to
parents' age. In the present study, adolescents of older parents reported higher levels
of autonomy than adolescents of younger parents. Similarly, older parents reported
higher levels of autonomy in their adolescents than younger parents. These variations
were significant.
Although previous research has not investigated this issue, there is at least one
possible account for this finding. It is intuitively appealing to suggest that older
parents were more autonomy granting than younger parents. It is likely that amongst
the sample of older parents, the adolescents involved in the study were positioned
later in the household birth order than the adolescents of younger parents. This
information was not collected as a part of this study; parents were only asked about
the number of children under the age of twenty in the household. It is possible that
parents are more autonomy granting of later children than of first born children. A
previous study by Small and colleagues (1988) reported that parents of first-born
children were more stressed and had less autonomous adolescents than parents of
327
later-born children. This issue, although outside the focus of the present study, may
be worthy of further investigation.
10.1.4 The Reporting of Adolescent Autonomy in Relation to Parents' Gender
As discussed in Section 8.1.4, the recruitment of fathers into research investigating
children's health care is problematic. In this study, the small number of fathers
involved reported a slightly, but not significantly, lower level of autonomy in their
adolescents than did the participating mothers.
The generally similar reports of autonomy are consistent with the findings of Sigafoos
and colleagues (1988), using the Autonomous Functioning Checklist. In the previous
study, interrater reliability between mothers and fathers was high.
10.1.5 The Reporting of Adolescent Autonomy in Relation to Parents' Work Status.
The consistent level of reported adolescent autonomy between parents working
outside the home and those primarily at home suggests that parental work status did
not influence their ability to report on their adolescents' level of autonomy. This issue
has not received previous empirical investigation.
328
10.1.6 The Reporting of Adolescent Autonomy in Relation to Household Structure
Adolescents' level of autonomy did not vary in relation to their household structure
Adolescents' of single parents reported similar levels of autonomy to adolescents with
two parents in the home. Parents' reports of autonomy were also not varied according
to household structure.
These findings are consistent with those of previous studies using the AFC (Howe, et
al. 1993; Sigafoos, et al. 1988). Other investigations of adolescent autonomy have
also reported finding no variation according to household structure (e.g., SS Feldman
& Quatman, 1988; Frank, Pirsch, & Wright, 1990; Pardeck & Pardeck, 1990;
Silverberg & Steinberg,7987; Small, et al. 1988). However, this absence of reported
findings is partially due to sampling strategies in some studies, which have only
included families with two resident parents (i.e., "intact families," ".9.,
Frank, et al.
1990; Silverberg & Steinberg, 1987)
10.2 The Level of Association Between Measures of Adolescent Autonomy and
Adherence.
This section discusses the results presented in Section 9.2, examining the association
between the measures of adolescent autonomy and the measures of adherence to
medical recommendations. Adolescent, parent and cross-informant comparisons are
examined.
329
The associations between (1) adolescent reports of adherence and autonomy; (2)
parent reports of adherence and autonomy; (3) cross-informant associations between
reports of autonomy and adherence (e.g., between adolescent reports of autonomy and
parent reports of adherence); and (4) associations between observed blood glucose
monitoring adherence and reports of autonomy are discussed.
L0.2.1 Adolescent Reports of Autonomy and of Adherence.
The lack of significant relationships between the adolescents' reports of their
autonomy and their scores on the GAS and DSAS may be interpreted in a number of
ways
First, these results do not provide support for the hypothesised relationship between
adolescents' autonomy and their adherence to medical treatment, that is, adolescents'
reports of autonomy and adherence were not directly associated. The consistency of
this lack of association between each of the adolescent completed measures supports
this interpretation. Adolescents' scores on the total AFC displayed very similar
correlations with their scores on the GAS and on the DSAS.
Second, it is possible that the lack of association between adolescents' reports of
autonomy and adherence \ryere caused by limitations in the measures. As reported in
Section 9.L, the scores obtained on the AFC did not vary widely, and this lack of
variation may impede associations of this measure with other measures used in this
study. The relative insensitivity of the AFC in this study may have obscured a
330
genuine relationship between adolescents' autonomy and their adherence. Further
investigation, employing a variety of measures of adolescent autonomy, would seem
to be warranted.
A third interpretation of this observed lack of association is based on the pattern of
associations between adolescents' responses to the subscales of the AFC and their
responses to the GAS and DSAS. Adolescents' reports of autonomy in Recreational
Activity were significantly associated with their ratings of adherence, whereas their
responses to each of the other AFC subscales were not associated with their adherence
reports. Previous studies, such as that by Hauser and colleagues (1993) have reported
significant relationships between measures of adolescent autonomy and adolescent
regimen adherence. The focus of the autonomy measure in this previous study was
primarily toward recreational autonomy. Hence it may be suggested that the
difference in findings between the present study and that of Hauser and colleagues
does not represent an inconsistency, but reflects the differing foci of the autonomy
measures employed. Further, the finding in the present study that adolescents' ratings
on the Recreational Activity autonomy subscale (i.e., their ratings of recreational
autonomy) were associated with their ratings of adherence is consistent with the
findings in the previous investigation.
A fourth interpretation, also based upon the pattern of associations between these
measures, may also be forwarded. That is, adolescents' adherence may be associated
with their experience of recreational autonomy but not their experience of other
aspects of their autonomous functioning because their recreational autonomy is
adversely influenced by their diabetes. It is conceivable that the adolescents' diabetes
33t
does not influence their experience of vocational autonomy, or of the aspects defined
by the management activity subscale, while their recreational activities are restricted
by their illness. This issue has not been addressed in previous empirical research. In
light of these later interpretations, it may be suggested that the association between
different aspects of adolescents' autonomous functioning and their adherence is
worthy of further investigation.
I0.2.2 Parent Reports of Adolescent Autonomy and of Adherence
The lack of significant relationships between the parent reports of their adolescents'
autonomy and their scores on the GAS and DSAS may also be interpreted in several
ways. These interpretations correspond with those described in relation to the
adolescent reports of autonomy and adherence.
First, like the relationships between the adolescent reports of adherence and
autonomy, these associations do not provide support for the second hypothesis of this
thesis. That is, parents' reports of their adolescents' autonomy and adherence were
not directly associated. Again, the consistency of the lack of association between each
of the parent completed measures further supports this interpretation. Further, the
associations between the parent completed measures of adolescent autonomy and
adherence were of very similar magnitude to those obtained between the adolescent
completed reports.
332
Second, it is also possible that this lack of association is due to limitations of the
measures employed. The AFC may have failed to detect a genuine association
between adolescents' adherence and their experience of autonomy.
An examination of the level of association between parent-responses to the subscales
of the AFC and to the adherence measures elicits different findings from those
obtained using the adolescent reports. None of the subscales of the AFC completed
by parents were associated with their reports of adherence. These findings are not
consistent with the findings examining the associations between adolescents'
responses on these measures. One interpretation of this inconsistency is that
adolescents who experience restrictions in their autonomy may be more aware of these
restrictions than are their parents, although this issue has yet to be examined in the
published literature. The inconsistency in associations between responses to the AFC
subscales and the adherence measures by adolescents and parents suggests that future
investigations of the relationship between different aspects of adolescents'
autonomous functioning and their medical adherence should incorporate reports from
both adolescents and their parents.
t0.2.3 Cross-Informant Associations Between Reports of Adolescent Autonomy and
Adherence.
Cross informant analyses further examined associations between reports of adherence
and reports of adolescents' autonomy
333
The associations between adolescents' reports of autonomy and parents' reports of
adherence are consistent with the associations obtained within informants. The
associations between parents' reports of their adolescents' autonomy and the
adolescents' reports of adherence are again consistent with these findings.
The interpretation of these findings reflects the interpretation of the previously
discussed associations between adolescents' responses on these measures, as well as
the interpretation of the parents' responses on the same measures. That is, these
findings may be interpreted as a lack of support for the hypothesised relationship
between adolescents' autonomy and their adherence, or may be attributed to
weaknesses in the measures used to assess autonomy and adherence in this study.
10.2.4 Reports of Adolescent Autonomy and Observed Blood Glucose Monitoring
Adherence.
Observed blood glucose monitoring adherence was also poorly associated with
adolescents' and parents' scores on the AFC. Again, these associations were not
significant. Further, adolescents' responses on each of the subscales of the AFC were
not related to observations of their BGM adherence. Parents' responses to the
Management Activity, Recreational Activity, and Social / Vocational Activity
subscales were not significantly associated with their adolescents' observed BGM
adherence. Parents' responses to the Self- and Family-Care subscale of the AFC were
significantly negatively correlated with their adolescents' observed BGM adherence.
This association is in the opposite direction to that predicted by the second hypothesis
334
of this thesis. The finding of one significant association out of the ten comparisons
made is only slightly greater than would be expected on the basis of chance alone.
Further analysis indicated that the level of association between reports of adolescents'
autonomy and their observed BGM adherence did not vary greatly when the time
frame examined by the BGM data was adjusted. Reports of adolescents' autonomy
were not varied in relation to observed pattems of BGM adherence.
The lack of predicted association between observed BGM adherence and reports of
adolescents' autonomy may be interpreted in the same ways as the previous findings
that adolescents' and parents' reports of adherence were not related to their reports of
autonomy. These findings may be seen to provide little support for the second
hypothesis of this thesis, or they may be interpreted as an indication that the measures
employed in this study were too insensitive to detect a real association between
adolescents' adherence and their experience of autonomy
An additional consideration which should be identified in relation to the analyses
examining BGM adherence is that this information was only available from a group of
adolescents with poor metabolic control. It is possible that the associations found
using the BGM data may have been influenced by a sample bias. However, two other
findings reported in Chapter 9 refute this possibility. First, the associations between
observed BGM adherence and reports of autonomy were of a similar magnitude to the
associations between the other measures of adherence and the measures of autonomy
Second, amongst the whole sample (i.e., those from whom BGM data were obtained
335
and those from whom this data was not obtained), the adolescents' level of metabolic
control was not associated with their level of reported autonomy (Section 9.3).
10.3 The Level of Association Between Measures of Adolescent Autonomy and
Adolescents' Metabolic Control.
This section discusses the results presented in Section 9.3, examining the relationship
between reports of adolescent autonomy and adolescents' level of metabolic control.
In light of the conceptual link between regimen adherence and health outcomes, the
association between metabolic control and adolescent-autonomy was examined as an
extension of the second hypothesis of this thesis. The importance of studying patient
adherence lies in its association with the health outcomes of patients. The importance
of the association between adolescent autonomy and adherence is reduced if the
adolescents' autonomy is unrelated to their health outcomes. The hypothesised
relationship between adolescent autonomy and health outcomes includes patient
adherence as a mediating factor, nonetheless the direct association of autonomy with
health outcome is pertinent to the understanding of the relationship between autonomy
and adherence. Adolescents' IIbA1. assay levels were treated as the measure of health
outcome for these analyses. To examine the level of association between adolescent
autonomy and HbA1" levels, Pearson correlations were used.
The initial analyses performed to examine the relationship between adolescents'
autonomy and their metabolic control revealed only one significant association.
336

Parents' responses to the Management Activity subscale of the AFC were significantly
negatively correlated with their adolescents' recorded FIbA1" assay levels. The
direction of this association indicates that parents' reported greater Management
autonomy in adolescents with better metabolic control (lower IIbA1" levels).
In a previous investigation, Ingersoll and colleagues (1992) observed that adolescents'
level of cognitive maturity, which they equated with autonomy, was significantly
associated with their level of metabolic control in insulin dependent diabetes. The
results of the present study failed to replicate these findings using a different form of
autonomy assessment. This inconsistency is likely to be the result of the different
measures used in the present study and that of Ingersoll and colleagues (1992).
Further investigation is needed to elucidate the relationship between adolescents'
autonomy and their metabolic control.
Because of the general lack of association between reports of adolescents' autonomy
and their level of metabolic control, further analysis of the relationships between
adolescents' autonomy, adherence and metabolic control were not pursued.
10.4 Summary and Future Directions: The Relationship Between Patient
Adherence and Adolescent Autonomy.
This section provides a synthesis of the findings discussed in this chapter, in light of
the published literature. The implications of these findings to the wider literature and
to future research are addressed.
331
10.4.1 The Relationship Between Patient Adherence and Adolescent Autonomy
The findings discussed in this chapter examined the second hypothesis of this thesis.
This hypothesis states that higher levels of reported adolescent autonomy will be
associated with higher levels of reported adherence, that is, a direct association exists
between adolescents' autonomy and adolescents' medical adherence.
In previous studies by Hauser and colleagues (1993) and Ingersoll and colleagues
(1986), measures of adolescents' autonomy have been associated with measures of
adolescents' adherence to IDDM regimens.
Ingersoll and colleagues (1986) used a paragraph completion measure to assess
adolescents' cognitive maturity, which they equated with autonomy. Adherence to
IDDM recommendations was assessed with "a set of psychologic, behavioural and
achievement instruments" (p 621). Autonomy was positively associated with the
adolescents' IDDM adherence.
Hauser and colleagues (1993) reported on the basis of three case studies that
adolescents' adherence to IDDM recommendations was associated with their self-
reliance, a concept closely linked to autonomy
Although empirical investigation of this issue has been limited, a number of authors
have suggested that adolescents' adherence and autonomy are likely to be linked. For
example, La Greca (1990a) reviewed the adherence literature and suggested that
338
adolescents' adherence may be positively associated with their taking responsibility
for their own medical care. Similarly, Hazzard and colleagues (1990) suggested that
children of restrictive parents may be less adherent to their medical regimen because
of resentment over interference in their autonomous development. Other authors have
also endorsed the proposed association (e.g., Allen, et al. 1983; Coupey & Cohen,
1984; SB Johnson, et al. 1992).
Investigation involving adolescents experiencing illnesses other than IDDM have
supported this association. For example, IM Friedman and colleagues (1986)
examined the adherence of adolescents with epilepsy, using saliva phenobarbital
assays as well as interviews. Autonomy was measures using a "Personal Freedom"
scale of the California Test of Personality (see Section 1.3.2.3). This study
demonstrated significant associations between medication compliance and perceived
autonomy in a group of adolescents with epilepsy. However, this study did not
employ a specific measure of autonomy, using instead a generic personality test.
Further, Litt and colleagues (1982) examined the regimen adherence of adolescents
with rheumatoid arthritis, using serum salicylate levels. Autonomy was assessed
using a modified Eysenk Autonomy Scale. Adherence was positively related to
autonomy in this study.
In the present study, adolescent and parent reports of the adolescents' autonomy were
not associated with the adolescents' adherence, as reported by adolescents and their
parents. Observations of BGM adherence were not related to these reports of
adolescent autonomy. Additional analyses revealed no significant relationships
between reports of adolescent autonomy and adolescents' metabolic control.
339
These results extend on previous research in several respects
First, these findings varied from those reported by Hauser and colleagues (1993) and
Ingersoll and colleagues (1986). There are a number of possible explanations for this
variation in finding. Hauser and colleagues (1993) based their report on three single
case studies. The explanatory power of case studies is limited. It is possible that the
different findings in the present study result from the greater sample size employed.
Further, the measures of autonomy used in these studies differed. Hauser and
colleagues (1993) used more global assessments of family members' functioning,
whereas the present study used a more specific assessment of adolescent autonomy. It
is possible that general functioning is associated with adolescents' adherence, but the
particular aspect of functioning assessed in the present study - adolescent autonomy -
is not related to adherence. Ingersoll and colleagues (1986) used an assessment of
cognitive maturity to assess adolescents' autonomy. Again, the assessment of
autonomy in the present study specifically addressed autonomy, rather than a related
construct.
In sum, the findings discussed in this chapter do not provide support for the second
hypothesis of this thesis. However, it would be premature to conclude that
adolescents' medical adherence is unrelated to their experience of autonomy. The
following section discusses the limitations of the present study, and identifies avenues
for further investigation
340
10.4.2 Limitations of the Present Study and Future Directions for Investigations of
the Relationship Between Patient Adherence and Adolescent Autonomy
The discussion of the results in this study examining the relationship between
measures of adherence and measures of adolescent autonomy has identified a number
of limitations of the study, and identified several avenues for future research.
First, the measure of autonomous functioning employed in this study did not detect
wide variations in autonomy levels amongst the participating adolescents. Given the
size of the sample involved in this study (n = 135), and the age range involved (12 to
17 years of age), the lack of variability in obtained scores on the AFC may indicate a
lack of sensitivity in this measure. The use of a more sensitive measure of
adolescents' autonomous functioning would facilitate a more sensitive assessment of
the relationship between adolescents' autonomy and their adherence to medical
reglmens.
Second, as discussed in Chapter 8, the small sample size in certain demographic
groups in this study limited the examination of the different roles played by, for
example, mothers and fathers. The recruitment of larger samples of fathers into
research investigating their children's health care requires at least one of two
approaches: (1) the collection of data from multiple sites, or (2) the development of
specific approaches that are likely to increase the participation rate of fathers. Clearly,
studies which include fathers' participation as well as that of mothers, rather than
instead of mothers, will be better able to examine the differing roles of these family
members in children and adolescents' health behaviour
34r
Third, the findings of this study suggest that adolescents of older parents may be
granted more autonomy than adolescents of younger parents. This pattern may be
concomitant with the birth order of adolescents; previous research has suggested that
first born adolescents are granted less autonomy (i.e., experience more parental
restriction) than later born adolescents. These issues aÍe worthy of further
investigation.
Fourth, associations between responses to the subscales of the AFC suggest that
different aspects of adolescents' autonomous functioning relate differently to their
regimen adherence. For example, adolescents' reported autonomy in Recreational
Activity was most closely associated with their reported adherence. This suggestion
provides some explanation for the inconsistency in adherence-autonomy relations
observed between this study and some previous investigations (e.g., Hauser, et al.
1993; Ingersoll, et al. 1986). The relationship between different aspects of
adolescents' psychosocial functioning and their medical adherence is worthy of
further investi gation.
Clarification of the relationships between different aspects of adolescents' autonomy
may also lead to more fruitful examinations of the association between adolescents'
autonomy and their level of metabolic control. The assessment of this association in
the present study was limited by the measure of autonomy employed. Further
investigation, using other measures of autonomy, is needed to elucidate the
relationship between adolescents' autonomy and their metabolic control
342
CHAPTER ELBVEN.
RESULTS: THE RELATIONSHIP BBTWBEN PATIENTADHERBNCE AND THB PROPOSBD ANTBCBDENTS
OF ADHERBNCE.
Parts of this chapter were published in
Fotheringham MJ, Couper JJ, Sawyer MG. (i996). Adolescents' adherence to IDDM treatment:Relation to parent-adolescent conflict and adolescent autonomy. Proceedings of the AustralianDiabetes Society, 1996 A89.
Fotheringham MJ, Couper JJ, Sawyer MG. (1997). Associations between adolescents' metaboliccontrol, IDDM adherence and objective data of blood glucose monitoring. Proceedings of theAustralian Diabetes Society, 1997 A93.
This chapter examines the relationship between measures ofadolescents' adherence to their diabetes treatment recommendationsand the measures of proposed antecedents of patient adherence. These
analyses were conducted as part of the secondary aims of this thesis; 1o
examine the applicability of the Six-Factor Model of Adherence toadolescents' adherence. This chapter consists of three sections. First,adolescents' and parents' reports of antecedents of adherence arepresented in relation to sample characteristics. Second, analyses arepresented that examine the association between reports of theseproposed antecedents and reports of adherence. FinaIIy, theassociations between reports of proposed antecedents of adherence andadolescents' metabolic control (HbAh) are examined.
1.1. RESULTS: THE RELATIONSHIP BETWEEN PATIENT
ADHERENCE AND THE PROPOSED ANTECEDENTS OF
ADHERENCE.
11.0 Introduction.
The proposed antecedents of adherence examined in this study were based upon the
framework of the Six-Factor Model of Adherence. These antecedents include: (1)
effective communication of information; (2) rapport with health professionals; (3)
client's beliefs and attitudes; (4) client's social climate and norms; (5) behavioural
intentions; and (6) supports for and barriers to adherence. According to the heuristic
framework of the model, the first two factors are prerequisites for the last four factors,
which are sequentially ordered (Gritz, et al. 1989). These factors are assessed using
the Adherence Determinants Questionnaire (ADQ) and the Health Value Scale (IIVS)
(DiMatteo, Hays, et al. 1993; Lau, et al. 1986). In addition, knowledge of IDDM
treatment was assessed using the Diabetes Knowledge Questionnaire (based on Dunn,
et al. 1984).
The analyses presented in this chapter examined the bivariate associations between
each of the measures of these proposed antecedents and the measures of adherence.
Chapter 13 presents results examining the multivanate association between the
measures of these antecedents and the measures of adherence. These analyses were
conducted as part of the secondary aim of this thesis; to examine the applicability of
the Six-Factor Model of Adherence to adolescents' adherence.
344
11.1 The Reporting of The Proposed Antecedents of Adherence in Relation to
Sample Characteristics.
This section examines obtained data from the measures of antecedents of adherence
The ADQ, IIVS, and DKQ were completed by participating adolescents and parents
The ADQ consists of seven scales: (ø) Interpersonal Aspects of Care, (b) Perceived
Utility, (c) Perceived Severity, (d) Perceived Susceptibility, (e) Subjective Norms, (fl
Intentions to Adhere, and (g) Supports / Barriers. Table 11.1 displays distributions of
scores on the ADQ by adolescents and parents.
As may be seen from Table 1L.L, mean reports of Interpersonal Aspects of Care by
adolescents and parents indicated generally good rapport between these respondents
and health professionals involved in the adolescents' IDDM care. Adolescents and
parents reported high mean levels of perceived utility of IDDM treatment. Reports of
perceived severity of IDDM indicated that, on average, respondents did not rate
IDDM as a very severe illness. Adolescents perceived themselves to be relatively
highly susceptible to hypoglycaemia or hyperglycaemia, as did their parents. Reports
on the Subjective Norms scale indicated that expectations held by members of the
adolescents' social networks were not influential on their adherence. The distribution
of scores on this scale was narow. Mean reports from adolescents and parents
indicated strong Intentions to Adhere to IDDM treatment in the future. Finally, mean
responses to the Supports / Barriers scale indicated the presence of supports to
adherence, and the absence of barriers to adherence (i.e., responses to this scale
indicated general support for adherence).
345
Table ll.2 reports distributions of scores on the FfVS and DKQ scales completed by
adolescents and parents. As may be seen from this table, mean responses to the
Health Value Scale by adolescents and parents indicated a high level of importance
attributed to having good health. Responses to the Diabetes Knowledge
Questionnaire indicated good knowledge of IDDM treatment.
The scoring distributions of these measures are examined in relation to: (1)
adolescents' ug", (2) adolescents' gender, (3) parents' age, (4) parents' gender, (5)
parents' work status, and (6) household structure.
11.1.1 The Reporting of The Proposed Antecedents of Adherence in Relation to
Adolescents' Age.
The distributions of scores on the scales of the ADQ and on the Health Value Scale
and the Diabetes Knowledge Questionnaire according to adolescents' age are reported
in Tables 11.3 to 11.7. Responses on these scales by adolescents and parents did not
vary greatly according to adolescents' age. Associations between responses to these
measures by adolescents and parents and adolescents' age are reported in Table 11.8.
Parents' responses to the Subjective Norms scale were significantly associated with
adolescents' age. This association was negative, indicating that parents' perception of
the influence of adolescents social networks on their adherence was increasingly
unfavourable to adherence with the adolescents' increasing age. Adolescents'
responses to the DKQ were significantly associated with their age, indicating that
346
older adolescents possessed greater knowledge of diabetes management than younger
adolescents.
To further explore the association between adolescents' age and responses to the
scales of the ADQ and the IfVS, the levels of agreement between adolescents' and
parents' responses were examined in relation to this characteristic. These analyses are
detailed in Appendices G.l and G.2. Overall, adolescents' and parents' responses on
the ADQ and IfVS were highly correlated. These correlations did not significantly
vary according to adolescents' age.
ll.l.2 The Reporting of The Proposed Antecedents of Adherence in Relation to
Adolescents' Gender
The distributions of scores on the scales of the ADQ and on the Health Value Scale
and the Diabetes Knowledge Questionnaire according to adolescents' gender are
reported in Tables 11.9, 11.10 and 11.11. Responses on these scales by adolescents
and parents did not vary greatly according to adolescents' gender.
Students' / tests were employed to examine differences in responses to these measures
according to adolescents' gender. Overall, 18 tests of this nature were undertaken. If
all 18 tests were independent of each other there is a probability of 0.60 that one or
more of the tests would be statistically signific ant at p = 0.05 when in fact there are no
true differences with respect to all 18 variables under scrutiny. The assumption that
the tests are all independent of one another is a poor one, however, because many of
347
these variables 'overlap' in terms of what they measure and are correlated with one
another. If one were to 'tighten' the significance level for the individual tests to
0.003, the overall probability of finding a significant result where one does not exist is
0.05. Due to the inadequacy of the assumption this overly strict criteria has not been
applied here, but the reader should be aware of this potential problem.
Students' / test analyses revealed that mean scores on the parent completed Perceived
Severity scale were significantly higher amongst the parents of the male adolescents
than amongst the parents of the female adolescents (/ (130) = 2.56, p = 0.01).
Responses of the male and female adolescents were not significantly different.
Further / tests revealed differences in mean scores on the DKQ between parents of
female and male adolescents (t (I32) = 2.9I, p = 0.004), for which the parents of male
adolescents produced a higher mean score than the parents of female adolescents.
Again, male and female adolescents' responses to this scale were not significantly
different. On the remaining scales, adolescent gender differences were not detected.
To further explore the association between adolescents' gender and responses to the
scales of the ADQ and the HVS, the levels of agreement between adolescents' and
parents' responses were examined in relation to this characteristic. These analyses are
detailed in Appendix G.3. Overall, adolescents' and parents' responses on the ADQ
and IfVS were highly correlated. These correlations did not significantly vary
according to adolescents' gender.
348
11.1.3 The Reporting of The Proposed Antecedents of Adherence in Relation to
Parents'Age.
The distributions of scores on the ADQ, HVS, and DKQ by adolescents and parents
according to parents' age group are reported in Tables II.12, L1.13 and tl,lL. As in
previous chapters, parents' age was grouped into (a) those under 40 years, (b) those
between 40 and 45 years old, and (c) those over 45 years old.
One-way ANOVAs examined the variation in adolescents' and parents' scores on the
ADQ scales and the HVS and DKQ according to parents' age groups. The results of
these analyses were not significant.
Il.I.4 The Reporting of The Proposed Antecedents of Adherence in Relation to
Parents'Gender
The distributions of scores on the ADQ, HVS and DKQ according to the gender of the
participating parent are reported in Tables 1L.L5, 11.16 and lL.I7. Responses by
adolescents and parents to these measures were similar, regardless of whether the
parent participating in the study was the adolescents' mother or father.
Because of the small number of fathers participating in this study, formal analyses of
differences in scores obtained on these measures according to parent gender were not
performed.
349
11.1.5 The Reporting of The Proposed Antecedents of Adherence in Relation to
Parents' Work Status.
The distributions of scores on the ADQ, FfVS and DKQ according to the participating
parents' work status are reported in Tables 11.18, Il.l9 andll.20. Similar responses
by adolescents and parents were obtained on these measures, regardless of whether the
parent participating in the study worked outside the home or was primarily in the
home
Students' / test analyses revealed that mean scores on the parent completed Subjective
Norms scale were significantly lower amongst the parents working outside the home
than amongst the parents who were primarily at home (/ (131) = 2.26, p = 0.03).
Further / tests revealed differences in mean scores on the DKQ between parents
working outside the home and those primarily at home (/ (131) = -2.0J, p = 0.04), for
which the parents working outside the home produced a higher mean score. On the
remaining scales, differences were not detected according to parental work status.
11.1.6 The Reporting of The Proposed Antecedents of Adherence in Relation to
Household Structure.
The distributions of scores on the ADQ, IfVS and DKQ according to participants'
household structure are reported in Tables ll.2l, 11.22 and 11..23. Again, very
similar mean responses were obtained from each of these measures by adolescents and
350
parents regardless of whether these respondents resided in single parent or dual parent
households
Students' / test analyses did not reveal differences in mean scores on adolescent or
parent completed ADQ, FfVS and DKQ scales according to household structure; with
one exception. Parents' responses to the Supports / Barriers scale were higher
amongst those residing in dual parent households than those residing in single parent
households (/ (130) = 2.04, p = 0.04).
ll.2 The Level of Association Between Measures of Proposed Antecedents of
Adherence, and Adherence.
The analyses presented in this section were designed to examine the association
between the measures of proposed antecedents of adherence and the measures of
adherence to medical recommendations employed in this study. Pearson correlations
were employed to examine the level of association between these measures.
Separate analyses examined the associations between (1) adolescent reports of
adherence and the proposed antecedents, (2) parent reports of adherence and the
proposed antecedents, (3) cross-informant associations between reports of proposed
antecedents and adherence (e.g., between adolescent reports of adherence and parent
reports of antecedent factors), and (4) associations between observed blood glucose
monitoring adherence and reports of proposed adherence antecedents by adolescents
and parents.
351
Il.2.I Adolescents Reports of Antecedents and of Adherence.
The levels of correlation between the adolescent completed measures of proposed
antecedents of adherence and the adolescent completed GAS are reported in Table
l'1..24. The effect sizes of the correlations between adolescents' responses to the
scales of the ADQ and the GAS were moderate to large, with the exceptions of
Perceived Susceptibility and Subjective Norms, which showed no association with
adolescents' reports of general adherence. The associations of the remaining scales of
the adolescent completed ADQ with the adolescent completed GAS were all
statistically significant. Further, adolescents' responses to the IfVS were significantly
associated with their responses to the GAS. However, adolescents' scores on the
DKQ were not significantly related to their repofts of general adherence.
The level of correlation between the adolescent completed measures of proposed
antecedents of adherence and the adolescent completed DSAS are reported in Table
11.24. The effect sizes of the correlations between adolescents' responses to the
scales of the ADQ and the DSAS were moderate to small. The associations of DSAS
scores with scores on the Perceived Utility, Perceived Severity, Intentions to Adhere,
and Supports / Barriers scales were statistically significant. The associations of DSAS
scores with the Interpersonal Aspects of Care, Perceived Susceptibility, and
Subjective Norms scales were not significant. Adolescents responses to the IfVS
were significantly associated with their responses to the DSAS. However,
352
adolescents' scores on the DKQ were not significantly related to their reports of
diabetes-specific adherence.
1I.2.2 Parents Reports of Antecedents and of Adherence
The level of correlation between the parent completed measures of proposed
antecedents of adherence and the parent completed GAS are reported in Table 11,25.
The effect sizes of the correlations between parents' responses to the scales of the
ADQ and the GAS ranged from small (e.g., Perceived Susceptibility) to large (e.g.,
Intentions to Adhere). Only the Perceived Susceptibility and Subjective Norms scales
completed by parents were not significantly associated with their responses to the
GAS. Parent reports of health value (HVS) produced a moderately small, but
statistically significant, association with parent reports of general adherence (GAS).
Parents' diabetes knowledge scores (DKQ were not associated with their reports of
general adherence (GAS).
The level of correlation between the parent completed measures of proposed
antecedents of adherence and the parent completed DSAS are reported in Table
11.25. The effect sizes of the correlations between parents' responses to the scales of
the ADQ and the DSAS were generally small. Parent responses to the Perceived
Utility, Intentions to Adhere, and Supports / Barriers scales were significantly
associated with their responses to the DSAS. Parents responses to the remaining
scales of the ADQ were not associated with their reports of diabetes-specific
adherence (DSAS). Parent reports of health value (HVS) produced a small, but
353
statistically significant, association with parent reports of diabetes-specific adherence
(DSAS). Parents' diabetes knowledge scores (DKO were not associated with their
reports of diabetes-specific adherence (DSAS).
11.2.3 Cross-Informant Associations Between Reports of Antecedents and
Adherence.
The next analyses examined the association between (1) adolescents' reports of
proposed antecedents of adherence, and parents' reports of the adolescents' adherence,
and (2) adolescents' reports of adherence, and their parents' reports of the proposed
antecedents of adherence. These analyses were performed to examine from another
angle the association between reported adherence and its proposed antecedents. The
examination of cross-informant associations also reduces the vulnerability of the
analyses to respondent biases (see Section8.2.4 for a discussion of this point).
Adolescent Reports of Antecedents and Parent Reports of Adherence.
The levels of correlation between the adolescent completed measures of proposed
antecedents of adherence and the parent completed GAS are reported in Table 11.24.
The effect sizes of the correlations between adolescents' responses to the scales of the
ADQ and their parents' responses to the GAS were moderate, and significant, with the
exceptions of the Perceived Susceptibility and Subjective Norms scales, which were
not significantly associated with parent reports of general adherence. Adolescents'
reports of health value (IrvS) produced a small but significant association with their
354
parents' reports of general adherence (GAS). Adolescents' diabetes knowledge scores
(DKO were not associated with their parents' reports of general adherence (GAS).
The level of correlation between the adolescent completed measures of proposed
antecedents of adherence and the parent completed DSAS are reported in Table
11.24. The effect sizes of the correlations between adolescents' responses to the
scales of the ADQ and the DSAS were smaller than those associated the measures of
antecedent with the GAS. Only the Perceived Utility and Intentions to Adhere scales
of the ADQ completed by adolescents were significantly associated with their parents'
reports of diabetes-specific adherence (DSAS). Adolescents' reports of health value
(HVS) produced a small but significant association with their parents' reports of
diabetes-specific adherence (DSAS). Adolescents' diabetes knowledge scores (DKQ)
were not associated with their parents' reports of diabetes regimen adherence (DSAS).
Parent Reports of Antecedents and Adolescent Reports of Adherence.
The levels of correlation between the parent completed measures of proposed
antecedents of adherence and the adolescent completed GAS are reported in Table
11.25. The effect sizes of the comelations between parents' responses to the scales of
the ADQ and their adolescents' responses to the GAS were small to moderate. Only
the Perceived Utility, Intentions to Adhere, and Supports / Barriers scales completed
by adolescents were significantly associated with parents' reports of general adherence
(GAS). Parents' reports of health value (HVS) produced a small but significant
association with their adolescents' reports of general adherence (GAS). Parents'
355
diabetes knowledge scores (DKQ) produced a small, but statistically significant
association with their adolescents' reports of general adherence (GAS)
The level of correlation between the parent completed measures of proposed
antecedents of adherence and the adolescent completed DSAS are reported in Table
11.25. The effect sizes of the correlations between adolescents' responses to the
scales of the ADQ and the DSAS were also small. Only the Intentions to Adhere
scale of the ADQ completed by parents was significantly associated with the
adolescents' reports of diabetes-specific adherence (DSAS). Parents' reports of health
value (HVS) produced a small but significant association with their adolescents'
reports of diabetes-specific adherence (DSAS). Parents' diabetes knowledge scores
(DKQ) were not associated with their adolescents' reports of diabetes regimen
adherence (DSAS).
11.2.4 Reports of Antecedents and Observed Blood Glucose Monitoring.
The next analyses examined the relationship between reports of proposed antecedents
of adherence and observed blood glucose monitoring adherence. These analyses took
three forms. First, the relationships between scores on the ADQ, FfVS and DKQ and
the observed BGM adherence were examined using the complete BGM adherence
dataset. Second, relationships between scores on these scales and observed BGM
adherence over the final 20, 12, 8, and 4 days before assessment were examined
separately. Third, the relationship between these scale scores and observed BGM
adherence over the previous 28 days was examined separately for adolescents coded
356
with Consistently High, Consistently Low, Rising, or Other pattems of BGM
adherence over the assessment period.
The Relationshíp Between Reports of Antecedents ønd Observed Blood Glacose
Monitoring Adherence.
The correlations between the objective recording of Blood Glucose Monitoring and
the measures of proposed antecedents of adherence are reported in Table 11.26.
The correlations between reports of antecedents of adherence and the BGM data were
generally small. Only adolescent responses to the Intentions to Adhere scale, and
parent responses to the Subjective Norms and Intentions to Adhere scales of the ADQ
were significantly related to observed levels of BGM adherence. Responses by
adolescents and parents to the FIVS and DKQ were not significantly associated with
observed BGM adherence levels
The Relatíonship Between Reports of Antecedents and Observed Blood Glucose
Monitoríng Adherence Over Dffirent Time Períods.
The correlations between the BGM adherence data spanning different time frames and
adolescent scores on the scales of the ADQ, as well as the FfVS and DKQ, are
reported in Table 11.27. The correlations between the BGM adherence data spanning
different time frames and parent scores on the scales of the ADQ, as well as the IIVS
and DKQ, are reported in Table 1I.28. As in previous chapters, these correlations are
reported for the observed BGM adherence over the final28,20, 12,8 and 4 days prior
357
to assessment. These analyses were intended to examine the relationship between
reports of the proposed antecedents of adherence and observed adherence to BGM
over different time frames. As reported in Chapter 5, observed BGM adherence
varied significantly over the four weeks prior to assessment, increasing as attendance
to the clinic approached.
The magnitude of the correlations between each of the measures of adherence
antecedents and the observed BGM adherence did not vary greatly when the time
frame examined by this data was adjusted. Adolescents' reports of Intentions to
Adhere were significant over each of the time frames assessed. Adolescents'
responses to the Perceived Utility and Perceived Severity scales were associated with
observed BGM adherence over the final 12,8 and 4 days before clinic attendance, but
not with observed BGM adherence over the longer time frames. Parents' responses to
the Subjective Norms and Intentions to Adhere scales of the ADQ were significantly
associated with observed BGM adherence over each of the time frames assessed.
None of the other parent responses to these measures were associated with observed
BGM adherence over any of the assessed time frames.
The Relatíonshíp Between Reports of Antecedents and Observed Blood Glucose
Monitoríng Adherence, Accordíng to Observed Patterns of Adherence Over Tíme.
Table 11.29 reports the distributions of scores on the adolescent completed ADQ,
IryS and DKQ for each of the blood glucose monitoring adherence groups
(Consistently High, Consistently Low, Rising, and Other). Table 11.30 reports the
358
distributions of scores on the parent completed ADQ, HVS and DKQ for each blood
glucose monitoring adherence group
The mean scores on the adolescent completed measures of antecedents were similar
amongst the groups of adolescents who were categorised with Consistently High,
Consistently Low, Rising and Other BGM adherence. Mean scores obtained on the
parent completed measures were not greatly varied according to BGM adherence
group
Oneway ANOVAs were performed for the adolescent and parent completed measures
(as dependent variables) against the four BGM adherence groups (the independent
variable). These analyses were used to determine whether the reports of antecedents
of adherence by adolescents and parents varied between these groups.
Responses by adolescents and parents on most scales of the ADQ were not
significantly varied according to the BGM adherence groups. However, responses by
parents to the Intentions to Adhere scale were significantly varied by BGM adherence
group (F (3,14) - 3.66, p = 0.02). Post hoc analyses using Tukey's Honestly
Significant Difference revealed significant differences between the responses obtained
from parents of adolescents exhibiting Consistently High and Consistently Low BGM
adherence. Responses to the IfVS and DKQ by adolescents and parents were not
significantly varied according to the BGM adherence groups.
As in previous chapters, a second approach was employed to analyse the possible
variation in reported adolescent autonomy according to the BGM adherence profiles.
359
This approach involved the combination of the Rising and Other BGM adherence
groups into a single group. The responses on the antecedent scale by these
adolescents and their parents were compared with those reported amongst the
Consistently High and Consistently Low BGM adherence groups using oneway
ANOVAs.
Again, only parent responses to the Intentions to Adhere scale were significantly
varied by BGM adherence group (F (2,74) = 5.56, p = 0.01). Post hoc analyses using
Tukey's Honestly Significant Difference revealed significant differences between the
responses obtained from parents of adolescents exhibiting Consistently High and
Consistently Low BGM adherence, and between the adolescents exhibiting Rising and
Consistently Low BGM adherence patterns.
11.3 The Level of Association Between Measures of Proposed Antecedents of
Adherence and Adolescents' Metabolic Control.
The analyses presented in this section were designed to examine the association
between the measures of proposed antecedents of adherence and adolescents' HbA1.
levels - the measure of their metabolic control. These analyses were performed to
further examine the relationship between the proposed antecedents of adherence and
the adolescents' adherence. The correlations between both the adolescent and parent
completed measures of antecedents and adolescents' FfbA1. levels were generally
small (Table 11.31).
360
Adolescent scores on the Interpersonal Aspects of Care, Perceived Utility, and
Supports / Barriers scales were significantly correlated with the adolescents' IIbAls
levels. Parent scores on the Interpersonal Aspects of Care, Perceived Utility,
Perceived Severity, Intentions to Adhere and Supports / Barriers scales were all
significantly correlated with adolescents' HbA1" levels. Adolescent and parent scores
on the Health Value Scale and Diabetes Knowledge Questionnaire were not
significantly related to the adolescents' level of metabolic control.
The final analyses that were conducted examined whether the ratings of proposed
adherence antecedents accounted for unique variance in HbA1. assay levels once the
adherence reports were entered into regression equations first. Four hierarchical
multiple regression analyses (HMRAs) were conducted, using adolescents' IfbA1"
assay results as the dependent variable. The first of these analyses involved the
adolescent responses to the antecedent measures, entered after the adolescent
completed GAS (Table 11.32). The second of these analyses involved the adolescent
responses to the antecedent measures, entered after the adolescent completed DSAS
(Table 11.33). The third of these analyses involved the parent responses to the
antecedent measures, entered after the parent completed GAS (Table 11.34). The
final of these analyses involved the parent responses to the antecedent measures,
entered after the parent completed DSAS (Table 11.35)
Adolescent Reports of Adherence ønd Proposed Antecedents.
As reported in Table 1I.32, adolescent responses to the proposed antecedents of
adherence measures added a significant amount of the variance in Step 2 after the
36r
adolescent reports of general adherence had been entered. Specifically, responses to
the Supports / Barriers scale accounted for additional variance in IIbA1. results after
the adolescents' adherence reports had been included in the regressions. As indicated
in Table 11.33, adolescent responses to the DSAS did not have great enough
predictive power for the HMRA to be conducted; this analysis was halted at Step 1.
Parent Reports of Adherence and Proposed Antecedents.
As reported in Table 11.34, parent responses to the proposed antecedents of
adherence measures did not significantly improve prediction of adolescents' metabolic
control, above the prediction afforded by parents' responses to the General Adherence
Scale. Similarly, as reported in Table 11.35, parent responses to the proposed
antecedents of adherence measures did not significantly improve the prediction of
adolescents' metabolic control, above the prediction afforded by parents' responses to
the Diabetes Specific Adherence Scale.
362
CHAPTER TWBLVB.
DISCUSSION: THE RELATIONSHIP BETWEENPATIBNT ADHBRENCE AND THB PROPOSED
ANTECEDENTS OF ADHERENCB.
Parts of this chapter were published in:
Fotheringham MJ, Couper JJ, Sawyer MG. (1996). Adolescents' adherence to IDDM treatment:Relation to parent-adolescent conflict and adolescent autonomy. Proceedings of the AustralianDiabetes Society, 1996 A89.
Fotheringham MJ, Couper JJ, Sawyer MG. (1997). Associations between adolescents' metaboliccontrol, IDDM adherence and objective data of blood glucose monitoring. Proceedings of theAustralian Diabetes Society, 1997 1^93.
This chapter discusses the results presented in Chapter 17, describingthe relationship between the measures of patient adherence and a seriesof proposed antecedents of adherence in the present study. In parallelwith Chapter 77, the sections of this chapter address: (I) the reportingof the proposed antecedents of adherence in relation to samplecharacteristics; (2) the level of association between measures ofproposed antecedents and adherence; and (3) the level of associationbetween measures of proposed antecedents of adherence andadolescents' metabolic control.
12 DISCUSSION: THE RELATIONSHIP BETWEEN PATIENT
ADHERENCE AND THE PROPOSED ANTECEDENTS OF
ADHERENCE.
l2.l The Reporting of The Proposed Antecedents of Adherence in Relation to
Sample Characteristics.
This section discusses the results presented in Section 11.1, examining the reporting
of proposed antecedents of adherence by adolescents and parents in this study. These
reports are examined in relation to respondents' demographic characteristics.
The scoring distributions of these measures are examined in relation to: (1)
adolescents' ug"; (2) adolescents' gender; (3) parents' age; (4) parents' gender; (5)
parents' work status; and (6) household structure
I2.Ll The Reporting of The Proposed Antecedents of Adherence in Relation to
Adolescents' Age.
The findings of the present study suggest that adolescents' and parents' perceptions of
their diabetes treatment (i.e., the utility of the treatment and interpersonal aspects of
medical care) did not vary with the adolescents' age. Further, adolescents' and
parents' health beliefs (i.e., perceived susceptibility and severity of diabetes) did not
appear to vary with the adolescents' age. Adolescents' and parents' intentions to
adhere in the future and their perceptions of supports and barriers to adherence were
364
not varied according to the adolescents' àg:. Parents' perceptions, but not
adolescents' perceptions, of the adolescents' social influences were slightly negatively
associated with the adolescents' ug", indicating that parents' of older adolescents
perceived the social influences of their adolescents to be less supportive of regimen
adherence than did the parents of the younger adolescents. The reported health value
of adolescents and parents was not varied according to the adolescents' age. Diabetes
knowledge amongst adolescents and parents was not associated with the adolescents'
age.
Few previous studies have reported on the variation of these factors in relation to
adolescents' age. Previous investigations using the ADQ have involved adult samples
of patients. These studies have not reported age influences on responses to these
measures. Schlenk and Hart (1984) reported that patients with diabetes held a
uniformly high value on health. SB Johnson, and colleagues (1982) reported that
adolescents' diabetes knowledge was not varied according to their age; the diabetes
knowledge of parents was not assessed.
The findings of the present study suggest that adolescents' age was not a strong
influence on their health beliefs and perceptions of medical treatment. This finding
extends upon previously published research, which has not directly addressed this
issue.
365
12.L2 The Reporting of The Proposed Antecedents of Adherence in Relation to
Adolescents' Gender
With the exceptions of parents' perceptions of the severity of diabetes and knowledge
of diabetes (both higher amongst the parents of male adolescents), reports of
adolescents' and parents' health beliefs and perceptions of treatment were not varied
according to the adolescents' age.
tiVhile previous research has not reported on this issue, the lack of variation is not
surprising. There is little basis for expectations of gender differences in health beliefs
or perceptions of diabetes treatment.
12.L.3 The Reporting of The Proposed Antecedents of Adherence in Relation to
Parents'Age.
Similarly, the lack of variation in adolescents' and parents' reports of health beliefs
and perceptions of treatment according to parents' age is not unexpected. No previous
studies examining adolescents with insulin dependent diabetes have examined the
variation in these perceptions, but there is no theorised link between health beliefs and
parental age.
366
12.1.4 The Reporting of The Proposed Antecedents of Adherence in Relation to
Parents'Gender.
Again, adolescents' and parents' reports of health beliefs and perceptions of treatment
were not varied according to parents' gender. As has been noted in previous chapters,
the number of male parents involved in this study was small, so the ability of the
present study to detect differences in reports according to parents' gender was limited.
Previous investigations have not identified parental gender as a source of variation in
health beliefs.
L2.I.5 The Reporting of The Proposed Antecedents of Adherence in Relation to
Parents' Work Status.
Parents employed outside of the home produced lower scores on the Subjective Norms
scale than parents who were primarily at home. The reports of the adolescents of
these groups of parents did not vary in this manner. Parents employed outside the
home produced higher Diabetes Knowledge scores than those primarily at home,
although their adolescents' diabetes knowledge was not varied. Responses on the
remaining scales by adolescents and parents did not vary according to the parents'
work status
Variations in these reports were not expected. No previous studies have identified
variations in health beliefs or perceptions of IDDM treatment according to parental
work status. The reason for the more negative perceptions of adolescents' social
367
influences on adherence by parents employed outside the home than by parents at
home is unclear. It is possible that this result was due to chance, or to some factor not
considered in the present study. This issue could be resolved by further investigation
If replicated, this finding would suggest that this was not due to chance, and further
examination of this issue could clarify the causes of this variation.
The finding that parents employed outside the home had a higher level of knowledge
about diabetes treatment than parents who were at home is surprising. It may have
been expected that parents who were primarily in the home were the adolescents'
primary care-givers, and that they would therefore have a greater knowledge of
diabetes treatment than parents employed outside the home. The finding that the
reverse pattern has occurred is difficult to interpret. It should be noted that the mean
levels of knowledge displayed in these groups, although statistically significantly
different, were similar. However, the distribution of scores obtained by parents who
were primarily at home was wider than the distribution obtained by those who worked
outside the home. One possible explanation for this finding is that the parents who
participated in the study who were working outside the home were more strongly
motivated toward the management of their adolescents' diabetes. These parents left
work to attend the clinic, whereas those parents who were primarily at home required
less motivation to attend the clinics. It is possible that more motivated parents have a
better understanding of diabetes treatment than less motivated parents. This issue is
beyond the focus of the present study, however future investigation could clarify this
point. Further, the replication of the present finding in future studies would suggest
that this relationship was not due to chance alone.
368
L2.I.6 The Reporting of The Proposed Antecedents of Adherence in Relation to
Household Structure.
The final demographic characteristic by which reports of health beliefs and
perceptions of treatment were examined was household structure. The only variation
in reports by adolescents or parents according to this characteristic was that parents
residing in dual parent households reported higher levels of support for their
adolescents' adherence than single parents. This finding has not been reported in
previous investigations. It is possible that this difference occulred because of the
additional support for the adolescent's adherence supplied by the second parent in the
household. However, this interpretation is refuted by the lack of differentiation in
reports by adolescents on this measure according to household structure. An
alternative interpretation is that the participating parents who resided in two-parent
households reported more support for adherence as a consequence of the marital
support they received, which the single parents would be unlikely to receive. This
interpretation extends beyond the focus of the present study, but could be tested by
future investigations.
12.2 The Level of Association Between Measures of Proposed Antecedents of
Adherence, and Adherence.
This section discusses the results presented in Section 11.2, examining the association
between the measures of proposed antecedents of adherence and the measures of
adherence to medical recommendations. The associations between (1) adolescent
369
reports of adherence and proposed antecedents of adherence, (2) parent reports of
adherence and proposed antecedents of adherence, (3) cross-informant associations
between reports of proposed antecedent of adherence and reports of adherence, and (4)
associations between observed blood glucose monitoring adherence and reports of
proposed antecedents of adherence are discussed.
12.2.1 Adolescent Reports of Proposed Antecedents of Adherence, and Adherence.
Significant associations were detected between adolescents' reports of general and
diabetes-specific adherence and (1) their perceptions of the utility of IDDM treatment,
(2) their intentions to adhere to treatment, (3) their reports of supports and barriers to
adherence, and (4) their health value. A significant association was detected between
adolescents' reports of interpersonal aspects of their care and their general adherence,
but not their diabetes-specific adherence. Significant negative associations \ryere
found between adolescents' reports of illness severity and general and diabetes-
specific adherence. Adolescents' reports of Perceived Susceptibility, Subjective
Norms, and Diabetes Knowledge were not associated with their reports of adherence.
These findings may be interpreted in several ways.
First, the significant associations between adolescents' reports of adherence and
responses on several of the measures of proposed antecedents of adherence may be
interpreted in similar ways to the significant association found between the measures
of adherence and parent-adolescent conflict, which were discussed in Chapter 8.
These findings may be interpreted as indicating a genuine relationship between these
310
proposed antecedent factors and adolescents' medical adherence. These findings may
also be interpreted in terms of a shared method variance. For example, some
adolescents may have responded in socially desirable manners to each of these
measures. Alternatively, some adolescents may have responded according to a
tendency to give positive responses, i.e., an acquiescence bias, or yea-saying (Streiner
& Norman, 1995). The likelihood of this interpretation is reduced by the finding that
some of the adolescent completed measures of proposed antecedents were not
significantly associated with the adolescent completed measures of adherence.
Second, the lack of significant associations between adolescents' reports of adherence
and some of the measures of proposed antecedents of adherence may be interpreted in
ways similar to the lack of association between the measures of adherence and
adolescent autonomy, which were discussed in Chapter 10. These results may
indicate that there is no relationship between these proposed antecedents and the
adolescents' medical adherence. However, these findings may also reflect a lack of
sensitivity in the measures employed. This interpretation is particularly plausible in
the case of the Subjective Norms scale, for which the distribution of scores obtained
by adolescents was very naffow.
The most plausible interpretation of the mixed findings relating adolescent completed
measures of proposed antecedents of adherence and adolescent completed measures of
adherence is that some of the proposed antecedents of adherence were in fact related
to the adolescents' adherence, but other proposed antecedents were not linked to the
adolescents' adherence. That is, adolescents' adherence was associated with their
rapport with health professionals, their perceptions of the utility of their IDDM
31t
treatment, their intention to adhere to their treatment in the future, and their
experience of adherence supports or the absence of barriers to adherence.
Adolescents' health value also appeared to be linked to their adherence. In contrast,
adolescents' perceptions of their susceptibility to their diabetes, their perceptions of
subjective norlns for adherence, and their knowledge of their IDDM regimen, were
not linked to their adherence.
12.2.2 Parent Reports of Proposed Antecedents of Adherence, and Adherence.
Parents' responses to the measures of the proposed antecedents of adherence were
associated with their reports of adherence in a manner extremely consistent with
adolescents' responses. Significant associations were detected between parents'
reports of general and diabetes-specific adherence and (1) their perceptions of the
utility of IDDM treatment, (2) their intentions to adhere to treatment, (3) their reports
of supports and barriers to adherence, and (4) their health value. A significant
association was detected between parents' reports of interpersonal aspects of their
adolescents' cate and general adherence, but not diabetes-specific adherence. A
significant negative association was found between parents' reports of illness severity
and general adherence but not diabetes-specific adherence. Parents' reports of
Perceived Susceptibility, Subjective Norms, and Diabetes Knowledge were not
associated with their reports of adherence. These findings may be interpreted in
several \üays.
312
First, the significant associations between parents' reports of adherence and responses
on several of the measures of proposed antecedents of adherence may be interpreted in
similar ways to the significant association found between the measures of adherence
and parent-adolescent conflict, which were discussed in Chapter 8. These findings
may be interpreted as indicating a genuine relationship between these proposed
antecedent factors and adolescents' medical adherence. These findings may also be
interpreted in terms of a shared method variance. These correlations may be the result
of the participating parents completing these measures with a form of response bias
The likelihood of this interpretation is reduced by the finding that some of the parent
completed measures of proposed antecedents were not significantly associated with
the parent completed measures of adherence.
Second, the lack of significant associations between parents' reports of adherence and
some of the measures of proposed antecedents of adherence may be interpreted in
ways similar to the lack of association between the measures of adherence and
adolescent autonomy, which were discussed in Chapter 10. These results may
indicate that there is no relationship between these proposed antecedents and the
adolescents' medical adherence. However, these findings may also reflect a lack of
sensitivity in the measures employed. This interpretation is particularly plausible in
the case of the Subjective Norms scale, for which the distribution of scores obtained
by parents was very naffow.
The most plausible interpretation of the mixed findings relating parent completed
measures of proposed antecedents of adherence and parent completed measures of
adherence is that some of the proposed antecedents of adherence were in fact related
313
to the adolescents' adherence, but other proposed antecedents were not linked to the
adolescents' adherence. The plausibility of this interpretation is further enhanced by
the great consistency in associations between parent responses on these measures and
adolescent responses on the same measures. That is, the same antecedent factors
which were related to adherence according to adolescent responses were also related
to adherence according to parent responses, and the same antecedent factors were
unrelated to adherence according to both adolescent and parent reports
According to the participating parents' reports, adolescents' adherence was associated
with their rapport with health professionals, their parents' perceptions of the utility of
their IDDM treatment, their parents' intention that they adhere to their treatment in the
future, and their experience of adherence supports or the absence of barriers to
adherence (as perceived by parents). Parents' health value also appeared to be linked
to the adolescents' adherence.
In contrast, parents' perceptions of their adolescents' susceptibility to diabetes,
parents' perceptions of their adolescents' subjective nofins for adherence, and parents'
knowledge of the IDDM regimen, were not linked to their adolescents' adherence.
12.2.3 Cross-Informant Associations Between Reports of Proposed Antecedents of
Adherence, and Adherence.
Cross-informant analyses further examined the associations between reports of
adherence and of proposed antecedents of adherence. As discussed in previous
374
chapters, these analyses provide a more stringent examination of the relationships
between measures by eliminating the potential influence of respondent biases
The first cross-informant analyses examined the associations between adolescents'
responses to the measures of proposed antecedents of adherence and parents'
responses to the adherence measures. These associations were extremely consistent
with the within-informant associations discussed in the previous two sections.
All of the adolescent completed antecedent measures which were significantly
associated with adolescent reports of adherence were also significantly associated with
parent reports of adherence, although the adolescent completed Perceived Severity and
Supports / Barriers measures were only significantly linked with parent reported
general adherence, and the Health Value scale was only significantly related to parent
reported diabetes-specific adherence. The adolescent completed antecedent measures
which were not associated with adolescent completed measures of adherence were
also not associated with parent completed measures of adherence
The next cross-informant analyses examined the associations between parents'
responses to the measures of proposed antecedents of adherence and adolescents'
responses to the adherence measures. Again, these associations were extremely
consistent with the within-informant associations discussed in the previous two
sections
The parent completed antecedent measures which were significantly associated with
parent reports of adherence, were also significantly associated with adolescent reports
375
of adherence. The parent completed antecedent measures which were not significantly
associated with parent reports of adherence, were not significantly associated with
adolescent reports of adherence.
These findings strongly support the interpretation that the observed associations
between some of the antecedent measures of adherence and adherence were not the
result of shared method variances, but were indications of links between the assessed
variables. That is, these findings support the contention that adolescents' regimen
adherence was associated with (1) rapport with health professionals, (2) perceptions of
the utility of their IDDM treatment, (3) intentions to adhere to treatment in the future,
(4) the experience of adherence supports or the absence of barriers to adherence, and
(5) the value attributed to good health by adolescents and parents. These findings
further support the contention that adolescents' regimen adherence was not related to
(1) perceptions of their susceptibility to diabetes, (2) perceptions of subjective norrns
for adherence, and (3) knowledge of their IDDM regimen.
12.2.4 Reports of Proposed Antecedents of Adherence and Observed Blood Glucose
Monitoring Adherence
Observed blood glucose monitoring adherence was less closely related to reports of
the proposed antecedents of adherence. In fact, significant associations between these
reports and observed BGM adherence were only detected for the Intentions to Adhere
scale as completed by adolescents and parents, and the Subjective Norms scale
completed by parents
316
Further analysis indicated that the level of association between reports of the proposed
antecedents and observed BGM adherence did not vary greatly when the time frame
examined was adjusted. However, adolescents' reports of Perceived Utility and
Perceived Severity were significantly associated with observed BGM adherence over
the final days before Outpatient Clinic attendance. This finding could indicate that
adolescents' responses to these scales were influenced by their adherence over the
final days before assessment.
Other analyses revealed that most reports of proposed antecedents of adherence were
not varied according to observed BGM adherence groups (Consistently High,
Consistently Low, Rising, and Other BGM adherence groups). The exception to this
pattern was parent reports of Intentions to Adhere, which indicated significantly
greater intentions to adhere to treatment in the future amongst parents of adolescents
exhibiting consistently high BGM adherence than amongst parents of adolescents
exhibiting consistently low BGM adherence
These findings are considerably different from those relating reports of proposed
adherence antecedents with adolescent and parent reports of adherence. There arc at
least four possible explanations for these contrasting findings.
First, these findings may indicate that the results obtained relating reports of
adherence with reports of proposed antecedents were in part the result of shared
method variances. However, the cross-informant relationships between these reports
reduce the plausibility of this interpretation. This consistency refutes the
377
interpretation of the non-significant associations as an indication of shared method
vanances
Second, the lower levels of association between reports of proposed antecedents and
observed BGM adherence than between these antecedent reports and the questionnaire
measures of adherence may reflect the specific nature of the BGM adherence measure.
It may be seen that for all of the analyses examining adolescent and parent reports of
adherence, the level of association with the antecedent measures was greater for the
GAS than for the DSAS. It is possible that the proposed antecedents of adherence are
closely related to general tendencies to adhere to treatment, but less closely related to
adherence to a range of specific IDDM management activities, including blood
glucose monitoring.
Third, as has already been noted, the observed blood glucose monitoring adherence
information only assesses adherence to one aspect of a multi-component regimen
While the proposed antecedents of adherence may be poorly related to adherence to
this aspect of the IDDM management regimen, these factors may be more closely
linked with adherence to other aspects of the regimen. For example, adolescents'
rapport with health professionals may be more closely linked with adherence to
insulin administration recommendations or dietary recommendations, than to blood
glucose monitoring adherence.
A fourth interpretation of the inconsistency in associations of the proposed
antecedents of adherence with the reports of adherence and the observed BGM
adherence relates to the sample from which BGM data was obtained. These data were
318
collected from a group of adolescents with poor metabolic control. It is possible that
the weaker associations found using the BGM data may be the result of a sample bias
Results of the analyses examining the association between reports of proposed
antecedents of adherence and the adolescents' metabolic control provide little support
for this interpretation (Section 1L.3). Although some reports of antecedents of
adherence were significantly related to adolescents' metabolic control, the patterns of
association did not reflect either the associations between these antecedent measures
and adolescent and parent reports of adherence or the observed BGM adherence
12.3 The Level of Association Between Proposed Antecedents of Adherence
and Adolescentst Metabolic Control.
This section discusses the results presented in Section 1L.3, examining the
relationship between reports of proposed antecedents of adherence and adolescents'
level of metabolic control.
As has been discussed in regard to the assessments of adolescents' metabolic control
in relation to reports of parent-adolescent conflict and adolescent autonomy, the value
of these analyses is based in the conceptual link between regimen adherence and
health outcomes. The relevance of this link to the analyses in this study is discussed
in Chapters 8 and 10, and the examination of this influence is discussed in Section
1.1.2.5 The Relationship Between Patient Adherence and Health Status in the
Literature Review. Metabolic control is the most commonly used index of health
outcomes for insulin dependent diabetes
379
The initial analyses performed to examine the relationship between proposed
antecedents of adherence and adolescents' metabolic control revealed associations
which were generally consistent with, but weaker than, the associations between these
reports of adherence antecedents and reports of adherence. The associations between
adolescent and parent responses to the Interpersonal Aspects of Care, Perceived
Utility, and Supports / Barriers scales, and parent responses to the Perceived Severity
and Intentions to Adhere scales were significantly corelated with adolescents'
metabolic control.
On the basis of these findings, further analyses were conducted which examined
whether reports of proposed antecedents of adherence accounted for unique variance
in metabolic control, after reports of adherence had already been entered into
regression equations
Adolescents' reports of each of the proposed antecedents were entered into
hierarchical regression analyses of metabolic control, after their reports of adherence
had been entered first. The addition of these reports of proposed antecedents
accounted for significant additional variance in metabolic control, after the reports of
general adherence were considered. In this analysis, only one proposed antecedent
scale was a significant predictor in the final equation, the Supports / Barriers scale.
The analysis of the addition of adolescents' reports of proposed antecedents of
adherence after the reports of diabetes-specific adherence were entered into the
regression of adolescents' metabolic control could not be performed, because of the
lack of significant prediction of metabolic control by this measure of adherence (Cliff,
380
1987). Parents' reports of proposed antecedents did not significantly add to the
understanding of metabolic control provided by their reports of general and diabetes-
specific adherence.
Before interpreting these findings, it should be recognised that parents' reports of
adherence (both general and specific) accounted for greater proportions of the
variation in adolescents' metabolic control than the adolescents' reports of adherence.
As such, the requirements for parents' reports of the proposed antecedents of
adherence to significantly add to the predictability of metabolic control over their
adherence reports was more stringent than for the adolescents' reports. With this
point in mind, it appears reasonable to suggest that adolescents' reports of the
proposed antecedents of adherence added to the predictability of adolescents'
metabolic control established from the reports of adherence obtained from the
adolescents.
This finding provides some additional support for the proposed influence of these
factors on the adherence of these adolescents. However, only adolescents' reports of
the presence of supports for, and the absence of barriers to, adherence added to the
accountability of their metabolic control. Each of the other proposed antecedents, as
reported by adolescents, and all of the proposed antecedents as reported by parents,
did not add to the prediction of adolescents' metabolic control. Therefore the support
for the influence of these antecedents is not strong.
381
12.4 Summary and Future Directions: The Relationship Between Patient
Adherence and Proposed Antecedents of Adherence.
This section provides a synthesis of the findings discussed in this chapter, in light of
the published literature. The implications of these findings to the wider literature and
to future research are addressed.
I2.4.I The Relationship Between Patient Adherence and Proposed Antecedents of
Adherence
The findings discussed in this chapter examined the relationship between a series of
proposed antecedents of adherence, derived from studies of adult patients, and
adolescents' adherence. As identified by Litt and Cuskey (1980), the factors which
influence medical adherence in adults may also influence the medical adherence of
adolescents. The examination of the relationship of these variables with adolescents'
adherence was performed to determine whether factors associated with adults'
medical adherence also influenced the adherence of these adolescents. Chapter L3
presents analyses which examine the applicability of a model of adult medical
adherence to this group of adolescents, with the inclusion of factors hypothesised to
influence adherence amongst adolescents in particular
The literature examining relationships between health beliefs and regimen adherence
is considerable. Some previous studies have used the Adherence Determinants
Questionnaire to assess factors most frequently associated with adherence. DiMatteo,
Hays, and colleagues (1993) reported on the development and validation of the
382
Adherence Determinants Questionnaire, in studies of the adherence of adult patients
with cancer. This study also employed the General Adherence Scale and an illness
specific measure of adherence to cancer-treatment recommendations. In their study,
significant correlations were detected between reports of general adherence and
responses to the Supports / Barriers, Intentions to Adhere, Perceived Utility, and
Interpersonal Aspects of Care scales. Further, the Supports / Barriers and Intentions to
Adhere scales were significantly associated with objective assessments of adherence
(DiMatteo, Hays, et al. 1993)
DiMatteo, Sherbourne, and colleagues (L993) examined the adherence of groups of
adult patients with diabetes, hypertension or heart disease in relation to their health
beliefs and their rapport with health professionals. Illness severity was positively
associated with regimen adherence, as was rapport between patients and health
professionals.
Ried and Christensen (1988) found that adherence by adult female patients to drug-
taking recommendations was significantly associated with their reports of the presence
of supports and the absence of barriers to adherence. Further, in this study, patients'
reports of intentions to adhere to treatment and perceptions of the utility of treatment
were significantly related to their self-reported adherence. Patients' reports of
subjective norrns for adherence were not associated with their reports of adherence.
SH Kaplan and colleagues (1989) reported that rapport between patients and health
professionals was associated with the patients' health outcomes. This association was
383
interpreted as being mediated by patient satisfaction and adherence, although these
issues were not directly examined
Studies examining the relationship between health value and regimen adherence have
provided mixed results. Schlenk and Hart (1984) reported that the adherence of adults
with IDDM was not strongly related to their value of health. This study used a
modified version of Rokeach's (1973) value ranking list; the range of responses
obtained on this measure by pafticipants in the study was very naffow. It is likely that
the findings of the Schlenk and Hart study were limited by the measure employed.
Abella and Heslin (1984) reported that adults' adherence to preventive health
behaviour recoÍr.mendations was strongly related to their health value, such that those
who attributed a higher value to health were more adherent. This study used the same
measure of health value as the study by Schlenk and Hart (1984), however, the range
of responses obtained in the more recent study was wider. This greater range of
responses may have caused the inconsistency in findings between the two studies.
Lau and colleagues (1986) developed and validated a measure of health value, which
was used in the present study, as well as in a study by Kennedy and colleagues (1991).
The study by Kennedy and colleagues reported that adherence to preventive health
behaviours was mildly associated with health value. Similarly, Lonnquist and
colleagues (1992) reported that health value was related to participation in preventive
health behaviours.
384
Several studies have noted that diabetes knowledge is not directly predictive of IDDM
regimen adherence or metabolic control (e.g., Auslander, Bubb, Rogge, & Santiago,
1993; Beeney & Dunn, 1990; Dunn, Beeney, Hoskins, & Turtle, 1990; McCaul,
Glasgow, & Schafer, 1987). Nonetheless, knowledge of the regimen is considered a
necessary prerequisite to adherence (Fotheringham & Sawyer, 1995; SB Johnson, et
al.1982).
In the present study, adolescent and parent measures of both general and diabetes-
specific adherence were associated with reports of perceived treatment utility, health
value, intentions to adhere in the future, and the presence of supports for or the
absence of barriers to adherence. Reports of the perceived severity of illness by
adolescents and parents were negatively associated with their reports of general and
diabetes-specific adherence (i.e., higher adherence levels were associated with lower
perceived severity). Adolescents' and parents' perceptions of the interpersonal
aspects of the adolescents' medical care were associated with their reports of general
adherence, but not with reports of diabetes-specific adherence. Reports by adolescents
and parents of diabetes knowledge, social influences (subjective norms) on adherence,
and perceptions of susceptibility to hypoglycaemia or hyperglycaemia, were not
related to reports of adherence. Objective assessments of BGM adherence were
associated with adolescent and parent responses to the Intentions to Adhere and
Subjective Norms scales, but not to the other scales in the ADQ. Adolescents' level
of metabolic control (HbAt") was associated with reports from adolescents and
parents of interpersonal aspects of diabetes care, the perceived utility of diabetes
treatment, and the presence of supports for adherence or absence of barriers to
adherence
385
The results ofthe present study extend on previous research in several respects
First, these findings replicate the findings of DiMatteo, Hays, and colleagues (1993),
using an adolescent sample of patients. The associations between each of the scales of
the ADQ and the measures of adherence were very similar in the study by DiMatteo,
Hays and colleagues (1993) and the present study: significant associations were found
in both studies between the Perceived Utility, Intentions to Adhere, and Supports /
Barriers scales. The previous study detected a significant association between
responses to the Interpersonal Aspects of Care scale and reports of general adherence,
using the General Adherence Scale; the present study also detected significant
associations between responses to this scale and reports by adolescents and parents to
the General Adherence Scale. Further, the present study and the study by DiMatteo,
Hays, and colleagues (1993) both found that responses to the Subjective Norms and
Perceived Susceptibility scales were not directly associated with reports of adherence.
However, the findings of the present study differed from those of DiMatteo, Hays, and
colleagues (1993) in some respects. In the present study, repofis of health value were
significantly associated with reports of adherence; this association was not found in
the previous study. Further, the objective assessments of adherence in the two studies
were associated with different ADQ scales: DiMatteo, Hays, and colleagues (1993)
found associations between objective assessments of adherence and the Supports /
Barriers and Intentions to Adhere scales, whereas the present study found associations
with the Intentions to Adhere and Subjective Norms scales.
386
The very strong consistency in findings between the present study and the study by
DiMatteo, Hays, and colleagues (1993) may be interpreted in two ways. The great
consistency in findings may be the result of a shared bias - both studies used the same
measures of general adherence (GAS) and of antecedents of adherence (ADQ). It is
possible that the consistency in findings is the result of biases in these measures. This
interpretation is supported by the different findings in this and the previous study
regarding health value. The previous study did not find health value to be related to
adherence, using a modified version of the Health Value Scale. The present study did
find health value to be related to adherence, using the original Health Value Scale (see
Chapter 3). However, the study samples in the two studies were very different:
DiMatteo, Hays, and colleagues (1993) investigated adult samples of patients with
various forms of cancer, using self-report measures only; whereas the present study
investigated adolescents with IDDM, using adolescent self-reports as well as parent
reports
It is also possible that the consistent findings in the two studies were caused by
genuine associations between factors assessed by the ADQ and regimen adherence.
This possibility is supported by consistent findings in other investigations that have
used other measures of adherence and its proposed antecedents (e.g., DiMatteo,
Sherbourne, et al. 1993; Ried & Christensen, 1988; SH Kaplan, et al. 1989)
Second, the present study extends on previous research by assessing the relationship
between factors which have been found to be associated with medical adherence in
adult samples, in a sample of chronically ill adolescents. This is an important
development, as previous research involving the medical adherence of adolescents has
381
not addressed these associations. An understanding of what factors influence
adolescents' medical adherence is important to the development of strategies to
improve this adherence.
Third, the findings in the present study that diabetes knowledge was not a strong
influence on adherence, and that the general level of knowledge in this sample was
high, is consistent with the findings of previous investigations (e.g., Auslander, et al.
L993; Beeney & Dunn, 1990; Dunn, et al. 1990; McCaul, et al. 1987). These findings
suggest that patient education should not be the major focus of interventions intended
to improve regimen adherence. Further, the finding that perceptions of the severity of
the illness were negatively associated with adherence suggests that interventions
which focus on the serious consequences of nonadherence to IDDM regimens may
have a deleterious effect on adolescents' adherence. Instead, these results suggest that
education and intervention should focus on positive aspects of the manageability of
insulin dependent diabetes. This suggestion is consistent with findings of some other
recent investigations (e.g., Aversa & Kimberlin, 1996; Dracup, et al. 1994; Gudas,
Koocher, & Wypij, 1991)
In sum, the findings discussed in this chapter support the applicability of factors
associated with medical adherence in adults to the investigation of adherence in
adolescent patients.
388
12.4.2 Limitations of the Present Study and Future Directions for Investigations of the
Relationship Between Patient Adherence and Proposed Antecedents of
Adherence.
The discussion of the results of this study examining the relationship between the
measures of the proposed antecedents of adherence and the measures of adherence has
identified a number of limitations of the study, and identified several avenues for
future investigation.
First, only a small number of fathers participated in this study. The need for
recruitment of larger samples of fathers into research investigating their children's
health care was discussed in Chapter 8.
Second, the finding in this study that parents who were employed outside the home
reported more negative perceptions of their adolescents' social influences than parents
who were primarily at home is intriguing. The replication of this finding, and the
exploration of the causes of this effect, could prove valuable.
Third, the finding that parents employed outside the home had a higher level of
knowledge about diabetes treatment than parents who were at home is surprising. The
examination of this finding in future studies could determine (1) whether this trend is
replicable, and (2) what other factors influence this trend. It is possible that parents
who leave paid employment to attend Outpatient Clinics are more motivated toward
their child's health-care than parents who leave home to attend these clinics. This
issue could be a fruitful avenue for future investigation
389
Fourth, the finding that parents in two-parent households perceived greater support for
their adolescent children's adherence than parents in single-parent households
deserves further investigation. 'Whether this variation was influenced by parents'
experience of marital support or some other influence could not be determined in the
present study
Finally, the findings presented in this chapter have examined a series of factors related
to adherence amongst adults, using an adolescent sample. This examination should be
replicated in further investigations of adolescents with conditions other than IDDM, to
determine whether the consistency in results found between the present study and
previous research is influenced by the diagnostic group under scrutiny. For example,
it is possible that the adherence of adolescents with asthma or cystic fibrosis may not
be influenced by these factors. This issue deserves further examination
390
CHAPTER THIRTEEN.
RBSULTS: THB MULTIVARIATE PREDICTION OFPATIBNT ADHBRENCE.
Parts of this chapter were published in:
Fotheringham MJ, Couper JJ, Taylor JD, Sawyer MG. (submitted). Prediction of regimen adherenceand metabolic control in adolescents with IDDM. Psychology and Health.
This chapter examines the relationship between measures ofadolescents' adherence and measures of all of the variableshypothesised in this thesis to relate to adherence. These variablesinclude: parent-adolescent conflict, adolescent autonomy, and each ofthe proposed antecedents of adherence. The multivariate analysespresented in this chapter build on the bivariate analyses reported inprevious chapters. This chapter consists of three sections. First,adolescents' and parents' reports of adherence are examined inrelation to the variables of the Six-Factor Model of Adherence. Second,analyses are presented which ass¿ss the improvement of this model foradolescent adherence by the addition of measures of parent-adolescentconflict and adolescent autonomy. Third, adolescents' metaboliccontrol and the reports of their adherence are examined in relation tothe predictor variables assessed in this study, without the constraints ofa heuristic model, to determine the closest prediction of adherence andmetabolic control by these measures.
13 RESULTS: THE MULTIVARIATE PREDICTION OF PATIENT
ADHERENCE.
13.1 Evaluation of the Six-Factor Model of Adherence.
The analyses presented in this section were designed to examine the association
between the measures of adherence to medical recommendations and the combined
measures of the proposed antecedents of adherence (i.e., the Six-Factor Model of
Adherence). The heuristic framework of the SFMA is provided by Gritz and
colleagues (1989); this framework is illustrated in Figure L.5. Separate analyses
examining the associations between these variables were conducted for adolescent and
parent reports.
13.1.1 Adolescent Reports of Adherence and Factors of the Six-Factor Model of
Adherence.
Hierarchical multiple regression analyses (HMRAs) were performed with adolescents'
reports of adherence as the dependent measures, and adolescents' responses to the
scales of the Adherence Determinants Questionnaire, the Health Value Scale and the
Diabetes Knowledge Questionnaire as the independent variables. These analyses were
performed separately for adolescents' general (GAS) and diabetes-specific (DSAS)
adherence reports.
392
The first step of the regression equations involved the entry of reports of Supports /
Barriers, as these were defined by Gritz and colleagues (1989) as having the most
direct influence on adherence (Step 1, Figure 13.1; see Tabachnick & Fidell (1989)
for a discussion of this methodology). Hierarchical blocks were then entered into the
regression equation in order of proximity of theorised effect on adherence. The
improvement of the prediction of adherence by the addition of reports of Intentions to
Adhere (Step 2), followed by health beliefs (Step 3; including Perceived Utility,
Perceived Severity, Perceived Susceptibility, Subjective Norms, and Health Value),
and then Interpersonal Aspects of Care and Diabetes Knowledge (Step 4) was
assessed.
Tables L3.L and L3.2 display the Beta coefficients of each variable at its point of
entry, the R2 for each Step of the regression, as well as the change in R2 caused by the
entry of each block (i.e., each Step), and the results of the test of significance of this
change. Tables L3.L and 13.2 report this information for the prediction of adolescent
responses to the GAS and DSAS, respectively.
Predíctíon of Adolescents' Reports of General Adherence (GAS).
At Step 1, with Supports / Barriers in the equation, R2 was significantly predicted; so
further tests were made (Table 13.1). In Step 2, the addition of Intentions to Adhere
into the regression equation, resulted in a significant increment in R2. At Step 3, the
entry of a block of health belief variables (Perceived Utility, Perceived Severity,
Perceived Susceptibility, Subjective Norms, and Health Value), resulted in a further
393
significant increment in R2. The addition of the fourth block of variables,
Interpersonal Aspects of Care and Diabetes Knowledge, did not improve R2.
Predíctíon of Adolescents' Reports of Díøbetes-Specific Adherence (DSAS).
At Step 1, with Supports / Barriers in the equation, R2 was significantly predicted; so
further tests were made (Table 13.2). In Step 2, the addition of Intentions to Adhere
into the regression equation, resulted in a significant increment in R2. At Step 3, the
entry of a block of health belief variables (Perceived Utility, Perceived Severity,
Perceived Susceptibility, Subjective Norms, and Health Value), resulted in a further
significant increment in R2. The addition of the fourth block of variables,
Interpersonal Aspects of Care and Diabetes Knowledge, did not improve R2. At each
step of this regression, the level of prediction afforded by the independent variables
was smaller than that obtained in the analysis examining adolescents' reports of
general adherence.
1,3.L.2 Parent Reports of Adherence and Factors of the Six-Factor Model of
Adherence
Hierarchical multiple regressions were next performed with parents' reports of
adherence as the dependent measures, and parents' responses to the scales of the
Adherence Determinants Questionnaire, the Health Value Scale and the Diabetes
Knowledge Questionnaire as the independent variables. These analyses were
394
performed separately for parents' general (GAS) and diabetes-specific (DSAS)
adherence reports.
These analyses followed the same framework as the analyses examining adolescents'
responses to these measures, illustrated in Figure 13.1,. Tables 13.3 and 13.4 report
the results of these analyses, examining parent reports of general adherence and
di abetes-specific adherence, respectively
Prediction of Parents' Reports of General Adherence (GAS).
At Step 1, with Supports / Barriers in the equation, R2 was significantly predicted; so
further tests were made (Table 13.3). In Step 2, the addition of Intentions to Adhere
into the regression equation, resulted in a significant increment in R2. The addition of
a third block of variables, measuring health beliefs (Perceived Utility, Perceived
Severity, Perceived Susceptibility, Subjective Norms, and Health Value), did not
result in a significant increment in R2. In light of the lack of predictive power in the
third block, the fourth block was not entered into the equation (Cliff, 1987).
Predíction of Parents' Reports of Dìabetes-Specífic Adherence (DSAS).
At Step 1, with Supports / Barriers in the equation, R2 was significantly predicted; so
further tests were made (Table 13.4). In Step 2, the addition of Intentions to Adhere
into the regression equation, resulted in a significant increment in R2. At Step 3, the
entry of a block of health belief variables (Perceived Utility, Perceived Severity,
Perceived Susceptibility, Subjective Norms, and Health Value), did not result in a
395
further significant increment in R2, so no further variables were entered into the
regression equation (Cliff, 1987).
In parallel with the adolescent HMRAs, at each step of the regression of parents'
DSAS responses the level of prediction afforded by the independent variables was
smaller than that obtained in the analysis examining parents' reports of general
adherence
13.2 Evaluation of the Six-Factor Model of Adherence With the Addition of
Adolescent Variables.
The analyses presented in this section were designed to examine the possible
improvement in the prediction of adherence by the addition of two aspects of
adolescent functioning to the factors of the Six-Factor Model of Adherence; parent-
adolescent conflict and adolescent autonomy. Separate analyses examining the
associations between these variables were conducted for the adolescent and parent
reports
13.2.1 Adolescent Reports of Adherence, Parent-Adolescent Conflict, Adolescent
Autonomy and Factors of the Six-Factor Model of Adherence
Hierarchical multiple regressions were performed using adolescents' reports of
adherence as the dependent measures, and adolescents' responses to the scales of the
Adherence Determinants Questionnaire, the Health Value Scale, the Diabetes
396
Knowledge Questionnaire, the Conflict Behavior Questionnaire and the subscales of
the Autonomous Functioning Checklist as the independent variables. These analyses
were performed separately for adolescents' general (GAS) and diabetes-specific
(DSAS) adherence reports.
The framework defined by Gritz and colleagues (1989), employed in the analyses
detailed in Section 13.1, was modified to include the reports of parent-adolescent
conflict and adolescent autonomy. In the current analyses, as in the previous analyses,
adolescents' reports of adherence were first regressed with their reports of Supports /
Barriers to adherence (Step 1). The second block of variables entered into the
regression differed in these analyses: reports of Intentions to Adhere were entered
along with reports of parent-adolescent conflict and responses to each of the subscales
of the AFC (Self- and Family-Care, Management Activity, Recreational Activity, and
Social / Vocational Activity). The decision was made to enter the conflict and
autonomy variables at this point in the regression because these variables were
expected to have a more direct influence on adherence than the health belief variables.
These variables were expected to have a similar influence on adolescents' adherence
as intentions to adhere. Therefore these variables were included in the second step of
the regression. The third and fourth blocks of these hierarchical regression analyses
were the same as those detailed in Section 13.1: In the third step, measures of health
beliefs (Perceived Utility, Perceived Severity, Perceived Susceptibility, Subjective
Norms, and Health Value) were entered, followed by Interpersonal Aspects of Care
and Diabetes Knowledge (Step 4). This process is illustrated in Figure L3.2.
397
Tables 13.5 and 13.6 report the results of these analyses, examining adolescent
reports of general adherence and diabetes-specific adherence, respectively
Predictíon of Adolescents' Reports of Generul Adherence (GAS).
At Step 1, with Supports / Barriers entered into the regression equation, R2 was
significantly predicted; so further tests were made (Table 13.5). In Step 2, the
addition of Intentions to Adhere, the Conflict Behavior Questionnaire, and the
subscales of the Autonomous Functioning Checklist (Self- and Family-Care,
Management Activity, Recreational Activity, and Social / Vocational Activity) into
the regression equation, resulted in a significant increment in R2. At Step 3, the entry
of the block of health belief variables (Perceived Utility, Perceived Severity,
Perceived Susceptibility, Subjective Norms, and Health Value), resulted in a further
significant increment in R2. The addition of the fourth block of variables,
Interpersonal Aspects of Care and Diabetes Knowledge, did not improve R2.
Predíctíon of Adole s cents' Rep orts of Diab ete s- Spe cífic Adherenc e (D SAS ).
At Step 1, with Supports / Barriers in the equation, R2 was significantly predicted; so
further tests were made (Table 13.6). In Step 2, the addition of Intentions to Adhere,
the Conflict Behavior Questionnaire, and the subscales of the Autonomous
Functioning Checklist (Self- and Family-Care, Management Activity, Recreational
Activity, and Social / Vocational Activity) into the regression equation, resulted in a
significant increment in R2. At Step 3, the entry of the block of health belief variables
(Perceived Utility, Perceived Severity, Perceived Susceptibility, Subjective Norms,
398
and Health Value), resulted in a further small but significant increase in R2. The
addition of the fourth block of variables, Interpersonal Aspects of Care and Diabetes
Knowledge, did not improve R2 significantly. Like the analyses reported in Section
13.1.1, at each step of this regression, the level of prediction afforded by the
independent variables was smaller than that obtained in the analysis examining
adolescents' reports of general adherence.
13.2.2 Parent Reports of Adherence, Parent-Adolescent Conflict, Adolescent
Autonomy and Factors of the Six-Factor Model of Adherence.
Hierarchical multiple regressions were next performed with parents' reports of
adherence as the dependent measures, and parents' responses to the scales of the
Adherence Determinants Questionnaire, the Health Value Scale, the Diabetes
Knowledge Questionnaire, the Conflict Behavior Questionnaire and the subscales of
the Autonomous Functioning Checklist as the independent variables. These analyses
were performed separately for parents' general (GAS) and diabetes-specific (DSAS)
adherence reports.
These analyses followed the same framework as the analyses examining adolescents'
responses to these measures. Tables L3.l and 13.8 report the results of these analyses,
examining parent reports of general adherence and diabetes-specific adherence,
respectively
399
Pred.íctíon of Pørents' Reports of General Adherence (GAS).
Ãt Step 1, with Supports / Barriers in the equation, R2 was significantly predicted; so
further tests were made (Table 13.7). At Step 2, the addition of Intentions to Adhere,
the Conflict Behavior Questionnaire, and the subscales of the AFC into the regression
equation, resulted in a significant increment in R2. The addition of the third block of
variables, measuring health beliefs, did not result in a significant increment in R2. In
light of the lack of predictive power in the third block, the fourth block was not
entered into the equation (Cliff, 1987).
Predíctíon of Parents' Reports of Diabetes-Specífic Adherence (DSAS).
At Step 1, with Supports / Barriers in the equation, R2 was significantly predicted; so
further tests were made (Table 13.8). In Step 2, the addition of Intentions to Adhere,
the Conflict Behaviour Questionnaire, and the subscales of the Autonomous
Functioning Checklist into the regression equation resulted in a significant increment
in R2. At Step 3, the entry of the block of health belief variables did not result in a
further significant increment in R2, so no further variables were entered into the
regression equation (Cliff, 1987).
400
13.3 The Maximal Prediction of Adherence and Metabolic Control.
The analyses presented in this section were designed to determine the best possible
prediction of adolescents' adherence and metabolic control on the basis of the reports
collected from the adolescents and their parents in this study
13.3.I The Maximal Prediction of Reported Adherence.
The analyses presented in this section, unlike the previous analyses reported in this
chapter, were not constrained by a heuristic model. As such, the analyses presented in
this section involved Stepwise Multiple Regressions, not Hierarchical Multiple
Regressions, because the former type of regression analysis is appropriate for
exploratory analysis where the goal is the maximal prediction of the dependent
variable (Cliff, 1987; WLHays, 1988; Nunnally & Bernstein, 1994; Tabachnick &
Fidell, 1989). In Stepwise Multiple Regression Analysis, the equation "starts out
empty and independent variables are added one at a time if they meet statistical
criteria, but they may also be deleted at any step where they no longer contribute
significantly to regressionl ... stepwise regression is considered the surest path to the
best prediction equation" (Tabachnick & Fidell, 1989,p I47).
I In the SMRAs presented in this chapter, the signifìcance criterion for entry into the equation was p <0.05, and for removal from the equation was p > 0. 1.
40r
The Maxímal Prediction of Adolescents' Reports of General Adherence.
The first Stepwise Multiple Regression Analysis (SMRA) examined the prediction of
adolescents' reports of general adherence. The predictor variables included in this
analysis were those measures that had revealed significant bivariate associations with
reported adherence in the analyses reported in previous chapters. Specifically,
adolescent reports of parent-adolescent conflict, recreational autonomy, Interpersonal
Aspects of Care, Perceived Utility of treatment, Perceived Severity, Intentions to
Adhere, Supports / Barriers, and Health Value were regressed against reports of
general adherence. This analysis accounted for a significant proportion (57.0 7o) of
the variance in adherence reports (F (2,122) = 19.04, p < 0.0001). The significant
predictors of adolescents' reports of general adherence were Perceived Utility,
Supports / Barriers, and Health Value (Table 13.9).
The Maxímal Prediction of Adolescents' Reports of Diabetes-Specífic Adherence.
The second SMRA examined the prediction of adolescents' reports of diabetes-
specific adherence. The predictor variables included in this analysis were the same as
those in the previous analysis. This analysis also accounted for a significant
proportion (40.0 7o) of the variance in adherence reports (F (2,122) = II.44, p <
0.0001). The significant predictors of adolescents' reports of diabetes-specific
adherence were recreational autonomy and intention to adhere in the future (Table
13.10).
402
The Maximal Prediction of Parents' Reports of General Adherence
The third SMRA examined the prediction of parents' reports of general adherence.
The predictor variables included in this analysis were the same as those in the
previous analyses, with the exception of recreational autonomy, which was excluded
from this analysis because parent reports on this measure were not associated with the
parents' adherence reports. This analysis accounted for a significant proportion
(58.8Vo) of the variance in adherence reports (F (2,122) = 64.4J, p < 0.0001). The
significant predictor of parents' reports of general adherence was intention to adhere
in the future (Table 13.11).
The Maxímal Predíctíon of Parents' Reports of Diabetes-Specífic Adherence.
The fourth SMRA examined the prediction of parents' reports of diabetes-specific
adherence. The predictor variables included in this analysis were the same as those rn
the previous analysis. This analysis accounted for a significant proportion (4I.1 7o) of
the variance in adherence reports (F (2,122) = 24.76, p < 0.0001). The significant
predictor of parents' reports of diabetes-specific adherence was intention to adhere in
the future (Table 13.12).
13.3.2 The Maximal Prediction of Metabolic Control.
The final analysis presented in this thesis examined the prediction of adolescents'
metabolic control on the basis of the reports obtained from adolescents and parents.
403
The reports employed as predictor variables in this regression were the reports of
adherence and all other reports that had revealed significant bivariate associations
with the adolescents' metabolic control in the analyses reported in previous chapters.
Specifically, adolescent reports of Interpersonal Aspects of Care, Perceived Utility,
and Supports / Barriers, parent reports of Management Activity, Interpersonal Aspects
of Care, Perceived Utility, Perceived Severity, Intentions to Adhere, and Supports /
Barriers, and combined reports of parent-adolescent conflict were regressed against
the adolescents' metabolic control. This analysis accounted for a significant
proportion (48.4 7o) of the variance in metabolic control (F (3,119) = 12.11,
p < 0.0001). The significant predictors of adolescents' metabolic control in this
regression were parents' reports of management autonomy, parents' reports of
perceived severity of diabetes, and adolescents' reports of supports and barriers to
adherence (Tabte 13.13).
404
CHAPTER FOURTEEN.
DISCUSSION: THE MULTIVARIATE PREDICTION OFPATIENT ADHERBNCE.
Parts of this chapter were published in:
Fotheringham MJ, Couper JJ, Taylor JD, Sawyer MG. (submitted). Prediction of regimen adherence
and metabolic control in adolescents with IDDM. Psychology and Health.
This chapter discusses the results presented in Chapter 73, describingthe relationship between meûsures of adolescents' adherence andmeasures of each of the variables hypothesised in this thesis to relate toadherence. In parallel with Chapter 73, the sections of this chapteraddress: (1) adolescents' and parents' reports of adherence in relationto the variables of the Six-Factor Model of Adherence; (2) the
improvement of this model for adolescent adherence by the addition ofmeasures of parent-adolescent conflict and adolescent autonomy; and(3) the maximal prediction of adherence and metabolic control from thepredictor variables assessed in this study.
14 DISCUSSION: THE MULTIVARIATE PREDICTION OF PATIENT
ADHERENCE.
I4.l Evaluation of the Six-Factor Model of Adherence.
This section discusses the results presented in Section 13.L, examining the association
between the measures of adherence to medical recommendations and the combined
measures of the proposed antecedents of adherence. The heuristic framework of the
SFMA is provided by Gritz and colleagues (1989)
The SFMA was first described by DiMatteo and DiNicola (1982). The framework for
this model is illustrated in Figure 1.5, based on the structure described by Gritz and
colleagues (1989). The construction of the hierarchical regression analyses used in
this study to test this model is illustrated in Figure 13.1. As may be seen from this
figure, there is at least one limitation to this analysis. Previous adherence, which is
included as part of the model, is not assessed in this study, and so this test is not
complete, It may be argued that the adolescents' level of metabolic control is an index
of their previous adherence. However, as discussed in Section 1.1.2.1 of the
Literature Review, biological assays make poor indicators of adherence. Although
adherence is often a strong predictor of metabolic control in insulin dependent
diabetes, other factors may influence these assays; metabolic control is a measure of
biological functioning, not of behaviour (Dunbar, 1980). Previous adherence could be
assessed using a longitudinal design; this form of assessment is outside the scope of
this thesis. However, the author is examining adherence over a period of 19 months,
as part of another study of adolescents' adherence to IDDM self-care
406
recommendations. This longitudinal study will allow the examination of prevrous
adherence in a sample of adolescents with IDDM (Taylor, et a7.1996,1991)
Despite this limitation, the examination of the applicability of the heuristic structure
of the SFMA to the adherence of the adolescents involved in this study was
considered to be of value. These analyses examined adolescents' and parents' reports
separately. Hierarchical Multiple Regression Analyses (HMRAs) were used to
examine the prediction of adherence reports by the variables of the SFMA, entered
according to the structure of the model. Hierarchical analyses were employed because
these analyses are the most appropriate form of multiple regression to test the
structure of theoretical models (Cliff, 1987: WLHays, 1988; Nunnally & Bernstein,
1994; Tabachnick & Fidell, 1989). This form of regression examines the prediction of
a dependent variable according to the predictive variables of a theory, in accordance
to the relational structure defined by the theory (Tabachnick & Fidell, 1989)1.
It should be noted that the analyses discussed in this chapter only examined
adolescents' and parents' reports of adherence; the objective blood glucose monitoring
adherence data were not included in these analyses. This decision was made for two
reasons. First, as discussed in Chapters 3 and 4, these data were only collected from
a subsample of 75 of the adolescents involved in the study. The regressions reported
in Chapter L3, and discussed in this chapter examine as many as 14 predictor
variables. Norman and Streiner (1994) recommend for multiple regression analyses
that the number of cases examined "be a minimum of 5 or 10 times the number of
407
variables entered into the equation" (p 116). Tabachnick and Fidell (1989) suggest
that the regression's "power may be unacceptably low no matter what the case-to
independent variables ratio if you have fewer than 100 cases" (p 128-9). In light of
these recommendations, the sample of adolescents from whom BGM adherence data
was obtained was considered to be too small. Second, as discussed in Chapter 4, the
adolescents from whom the BGM adherence data were obtained differed from those
who did not provide this information in terms of their (poorer) metabolic control. In
light of this consideration, the analysis of this data could be expected to provide
different information than was the focus of this chapter and of the previous chapter.
I .I.L Adolescent Reports of Adherence and Factors of the Six-Factor Model of
Adherence.
The findings of the analysis of the variation in adolescent reported general adherence
according to the variables of the SFMA provide partial support for the structure of the
model. The first three steps of the regression provided statistically significant
increases in the prediction of variance in reported adherence. These steps included the
entry of the supports and barriers to adherence, intentions to adhere, health beliefs
(i.e., Perceived Utility, Perceived Severity, Perceived Susceptibility), social norms and
health value aspects of the model. However, the final step of the regression
(interpersonal aspects of care) did not add to the prediction of adolescents' general
adherence reports. According to Gntz and colleagues' (1989) description of the
t It ir r"cognised that other statistical procedures, such as Structural Equation Modeling, could also be
considered appropriate for this analysis (e.g., Bollen, 1989; Goldberger & Duncan, 1973). However, inthis thesis hierarchical regression analyses were chosen to examine these relations.
408
model, interpersonal aspects of care, including communication of information (i.e.,
patients' regimen knowledge), is a "critical prerequisite" to adherence (p 712)
Further, the overall level of variance in adolescents' reports of adherence accounted
for by this regression was not large2. In this analysis, the variables of the SFMA
predicted less than 40 7o of the variance in adolescents' reports of general adherence.
Although this result is not very high, it does compare favourably with the findings
reported by DiMatteo, Hays, and colleagues (1993), who used the same measures.
These authors reported that these measures of the variables of the SFMA, with the
addition of a measure of previous adherence, accounted for around 25 7o of thrc
variance in adherence to a range of different cancer treatment regimens in adults.
In the present analysis of the prediction of variance of adolescents' general adherence
ratings, the Supports / Barriers and Health Value scales were significant predictors of
general adherence in the final equation. These findings are similar to those reported
by DiMatteo, Hays, and colleagues (1993), who also found that the Supports / Barriers
scale was the greatest predictor of reported adherence in their multivariate analyses.
The findings of DiMatteo, Hays and colleagues (1993) differed from those of the
present study in that the previous study did not find Health Value to be a close
predictor of reported adherence. However, in the previous study Health Value was
measured using a modified version of the Health Value Scale, with two additional
items (see Section 4.2.3.2). This modified version appeared to be a less accurate
' Cohen (19SS) recommends the following conventions for the description of multiple regression effectsizes: small, R2 =O.O2;medium, R2 =0.13;large,R2 = 0.51.
409
predictor of adherence than the original scale devised by Lau and colleagues (1986).
The present study used the original form of the Health Value Scale.
The findings of the analysis of the variation in adolescent reported diabetes-specific
adherence according to the variables of the SFMA also provide partial support for the
structure of the model. Again, the first three steps of the regression provided
statistically significant increases in the prediction of variance in reported adherence,
and the final step of the regression did not significantly increase this prediction.
Overall, the amount of variance accounted for by the variables of the SFMA was
smaller in the present analyses than in the analysis of adolescents' reports of general
adherence. In this regression, the model variables accounted for approximately one
quarter of the variance in adolescents' reports of diabetes-specific adherence.
The level of prediction afforded by each step of the regression was more consistent in
the analysis of DSAS responses than in the analysis of responses to the GAS. In the
analysis accounting for responses to the DSAS, each of the first three steps accounted
for around 7 or 8 7o of the variance in adherence reports. In the analysis accounting
for responses to the GAS, the first step (Supports / Barriers) accounted for almost
25 7o of the variance, and was improved by around 6 7o in the subsequent two steps.
The moderately large effect size of the regression of adolescents' DSAS responses is
consistent with the findings reported by DiMatteo, Hays, and colleagues (1993)
examining the reports of adherence to specific aspects of a series of cancer control
regimens, which involved the regression of the same SFMA variables
4r0
Interestingly, adolescents' responses to the Perceived Susceptibility scale were a
significant predictor of their responses to the DSAS in this multivariate analysis. This
result differs from the findings examining responses to the GAS, in which Supports /
Barriers and Health Value were the significant predictors.
L4.I.2 Parent Reports of Adherence and Factors of the Six-Factor Model of
Adherence.
The findings of the analysis of the variation in parents' reports of adherence according
to the variables of the Six-Factor Model of Adherence provide less support for this
model. The regressions of parents' responses to the General Adherence Scale and
Diabetes Specific Adherence Scale were halted at the third step, due to the absence of
significant changes in the proportion of variance in GAS and DSAS responses
accounted for by the independent variables with the entry of the variables of this step
That is, the addition of the health beliefs, social norrns, and health value variables did
not improve the prediction of parents' reports of adherence over the prediction
afforded by the supports / barriers and intentions to adhere variables (Steps I & 2). In
light of this finding, the interpersonal aspects of care variables (Step 4) were not
entered into the regression. This requirement is one of the basic assumptions of
hierarchical regression analysis (Cliff, 1987)
This does not imply that the variables of the SFMA were unrelated, or poorly related,
to parents' reports of adherence. The Supports / Barriers scale accounted for 2O 7o of
the variance in GAS reports, and 9 7o of the variance in DSAS reports. The Intentions
4rt
to Adhere scale accounted for a further l'7 7o of the variance in GAS responses and
another I0 7o of the variance in parents' response to the DSAS. However, the entry of
the third step of the regression did not greatly improve on this level of predictive
power
The lack of improvement in the prediction of parents' adherence reports by the
addition of their reports of health beliefs does not stem from poor associations
between these variables and the adherence reports. As reported in Chapter L1, the
bivariate associations between these measures and the adherence measures were, in
general, moderately strong. Instead, the lack of significant improvement in prediction
of adherence reports by the entry of the third block of variables in these HMRAs
stems from the tendency toward multicollinearity in the predictor variables, that is,
some of these variables were highly correlated. Appendices H.L andfI.2 contain the
correlations between responses to each of these scales by adolescents and parents.
The correlations between these variables means that variables entered into the
regression at alater point did not account for unique variance in adherence. Although
this result does not refute the influence of the variables of the SFMA on adherence, it
does not support the structure of the model.
14.2 Evaluation of the Six-Factor Model of Adherence With the Addition of
Adolescent Variables.
Because of the mixed support for the structure of the Six-Factor Model of Adherence
provided by the analyses in Section 13.1, the decision was made to proceed with
4t2
further analyses. These analyses examined the accountability of variation in reports of
adherence according to the variables of the SFMA with the addition of parent-
adolescent conflict and adolescent autonomy variables. This section discusses the
findings of these analyses, which were presented in Section 13.2
Again, these analyses examined adolescents' and parents' reports separately
Hierarchical Multiple Regression Analyses were again used to examine the prediction
of adherence reports. The new variables in the regression, parent-adolescent conflict
and adolescent autonomy, were entered into the regression at the second step, that is,
at the same point as the Intentions to Adhere variable of the SFMA (Figure 13.2)
I4.2.I Adolescent Reports of Adherence, Parent-Adolescent Conflict, Adolescent
Autonomy and Factors of the Six-Factor Model of Adherence
The findings of the analysis of the variation in adolescent reported general adherence
according to the variables of the SFMA with the addition of parent-adolescent conflict
and adolescent autonomy support the inclusion of these later variables. Overall, the
level of prediction of adolescents' general adherence reports was similar to, but
slightly greater than, that discussed in Section I4.1. Again, the first three steps of the
regression significantly improved the prediction of adolescents' general adherence
reports over that afforded by the previous step. However, in the analysis involving
parent-adolescent conflict and adolescent autonomy in the second step, the
improvement in the proportion of variance in GAS scores explained by the regression
rose by almost 12 7o, compared with an improvement of only 5 %o in the equivalent
4t3
analysis which did not include conflict or autonomy variables. The third and fourth
steps of the equation provided similar increments in improvement of prediction of
adolescents' general adherence reports in the equations including and excluding the
conflict and autonomy reports
Overall, the level of prediction of adolescents' general adherence ratings afforded by
the modified model accounted for over 42 7o of the variance in these reports. By
comparison, the variables of the SFMA alone (i.e., without the conflict or autonomy
variables) accounted for 37 7o of this variance. This result compares favourably with
previous studies examining the multivariate prediction of IDDM adherence in groups
of adolescent patients. For example, two studies by Hanson and colleagues (Hanson,
et al. 1987a; Hanson, De Guire, et al. 1992) using a variety of family relations and
psychosocial functioning variables, were able to account for only I7 %o and 19 7o of
the variances in adherence self-reports.
As discussed in Section 14.1.1, the significant predictors of adolescents' reports of
general adherence in the final regression of SFMA variables \ /ere supports and
barriers to adherence and health value. In the regression of adolescents' reports of
adherence with the SFMA variables and parent-adolescent conflict and adolescent
autonomy, the significant predictors were again supports and barriers to adherence and
health value, as well as recreational autonomy. As reported in Chapter 9,
adolescents' reports of recreational autonomy (i.e., the Recreational Activity subscale
of the AFC) were the only adolescent reports of autonomy that were significantly
correlated with the adolescents' reports of adherence. However, this correlation was
414
smaller than the correlation, reported in Chapter 7, between adolescents' reports of
conflict with their parents and their reports of adherence.
The explanation for the lack of a significant prediction of adolescents' general
adherence reports by their reports of parent-adolescent conflict in the multivariate
analyses lies in the correlation of these conflict reports with the adolescents' responses
to the scales measuring variables in the SFMA. That is, as reported in Appendix H.3,
adolescents' conflict reports were significantly correlated with their responses to most
of the subscales of the ADQ. In particular, adolescents' responses to the CBQ and the
Supports / Barriers and Intentions to Adhere scales were significant. Given the
influence of these variables on the regression equation, the association of CBQ scores
with these scales meant that CBQ scores did not account for unique variance in
reports of adherence (Tabachnick & Fidell, 1989). Another way to look at this
relationship is to say that the bivariate association between adolescents' reports of
general adherence and parent-adolescent conflict was significant, but that when the
variables of the SFMA were controlled for, the effect of this relationship was stifled
(PA B aghurst, personal communication, 22 December, 1997 ).
The finding that recreational autonomy was a significant predictor of general
adherence in the multivariate analysis provides some support for the second
hypothesis of this thesis. This finding adds further weight to the suggestion made in
Chapter 10, that although the measures of autonomy used in this study did not have
strong bivariate relationships with the measures of adherence, the issue of autonomy is
worthy of further investigation in relation to adolescents' adherence.
4r5
The findings of the analysis of the variation in adolescent reported diabetes-specific
adherence according to the variables of the SFMA with the addition of parent-
adolescent conflict and adolescent autonomy further support the inclusion of the
additional variables. The overall level of prediction of adolescents' diabetes-specific
adherence reports was slightly greater than that discussed in Section l4.l.l. Again,
the first three steps of the regression significantly improved the prediction of
adolescents' general adherence reports over that afforded by the previous step.
However, in the analysis involving parent-adolescent conflict and adolescent
autonomy in the second step, the improvement in the proportion of variance in DSAS
scores explained by the regression rose by 14 Vo, compared with an improvement of
less than 8 Vo in the equivalent analysis which did not include conflict or autonomy
variables. The third and fourth steps of the equation provided similar increments in
improvement of prediction of adolescents' diabetes-specific adherence reports in the
equations including and excluding the conflict and autonomy reports.
Overall, the level of prediction of adolescents' diabetes-specific adherence ratings
afforded by the modified model accounted for 32 7o of the variance in these reports.
By comparison, the variables of the SFMA alone (i.e., without the conflict or
autonomy variables) accounted for less than 24 Eo of this variance. This result also
compares favourably with the level of prediction of adherence self reports achieved by
Hanson and colleagues in two separate investigations (Hanson, et al. 1987a:' Hanson,
De Guire, et al. 1992).
As discussed in Section l4.l.l, the significant predictor of adolescents' reports of
diabetes-specific adherence in the final regression of SFMA variables was perceived
4r6
susceptibility. In the regression of adolescents' reports of diabetes-specific adherence
with SFMA variables and parent-adolescent conflict and adolescent autonomy, the
significant predictors were perceived susceptibility and recreational autonomy. Again,
adolescents' reports of parent-adolescent conflict, which demonstrated strong
bivariate correlations with reported adherence in Chapter 7, were not significant
predictors of adherence when the variables of the SFMA were controlled.
The finding that recreational autonomy was a significant predictor of diabetes-specitic
adherence in the multivariate analysis provides further support for the suggestion that
adolescents' autonomy is an issue worthy of further investigation in relation to their
adherence.
14.2.2 Parent Reports of Adherence, Parent-Adolescent Conflict, Adolescent
Autonomy and Factors of the Six-Factor Model of Adherence.
The findings of the analysis of the variance in parent reported general adherence
according to the variables of the SFMA with the addition of parent-adolescent conflict
and adolescent autonomy provide little support for the inclusion of these later
variables. Overall, the level of prediction of parents' general adherence reports was
similar to that discussed in Section L4.1.2. Again, the first two steps of the regression
significantly improved the prediction of parents' general adherence reports. In the
analysis that involved only the variables of the SFMA, the second step of the
hierarchical regression accounted for 17 7o of the variance in adherence reports above
that accounted for by the previous step. In the new analysis, involving the variables of
417
the SFMA as well as parent-adolescent conflict and adolescent autonomy, the second
step (which included these additional variables) accounted for 18 7o of the variance
above that afforded by the first step. The inclusion of parent-adolescent conflict and
adolescent autonomy in the regression therefore provided a very marginal
improvement in the prediction of parents' reports of general adherence.
Overall, the level of prediction of parents' general adherence ratings afforded by the
modified model when the regression was halted accounted for 39 7o of the variance in
these reports. By comparison, the variables of the SFMA alone (i.e., in the regression
that did not include conflict or autonomy variables) accounted for 37 7o of this
variance. Again, this result compares favourably with previously published studies
that have examined the multivariate prediction of adolescents' IDDM adherence (e.g.,
Hanson, et al. I987a; Hanson, De Guire, et al. 1992; Ried & Christensen, 1988).
Further, this level of prediction compares favourably with the level of prediction
achieved in some larger studies of groups of adult patients (e.g., DiMatteo, Hays, et al.
1993; Sherbourne, et al. 1992).
Parents' reports of conflict and autonomy were not among the significant predictors of
general adherence in the final regression involving these variables. The same
variables were found to be significant predictors of parents' general adherence reports
in the regression equations involving and not involving conflict and autonomy; these
were supports / barriers to adherence and intentions to adhere.
Parents' reports of parent-adolescent conflict displayed strong, significant bivariate
correlations with the parent reports of adherence, as was identified in Chapter 7. The
418
finding that these reports of conflict were not significant predictors of adherence in the
multivariate analyses is worthy of examination
Like the adolescent reports of parent-adolescent conflict, the parent reports of parent-
adolescent conflict were corelated with these respondents' responses to many of the
scales of the Adherence Determinants Questionnaire. Particularly strong associations
were detected between parents' responses to the Conflict Behavior Questionnaire and
the Intentions to Adhere and Supports / Barriers scales of the ADQ (Appendix H.4).
These scales were the first predictor variables entered into the hierarchical regression
involving the conflict scores. As such, although the parents' reports of conflict would
have accounted for a proportion of the variance in adherence ratings (based on the
bivariate association), this variance was not unique. The Supports / Barriers and
Intentions to Adhere scales had already been entered into the regression, and their
close correlation with the conflict score prevented this later variable from predicting
unique variance in adherence reports (Tabachnick & Fidell, 1989).
Like the adolescents' reports discussed in Section 14.2.1, these reports could also be
described so that the bivariate association between the parents' reports of general
adherence and parent-adolescent conflict was significant, but that when the variables
of the SFMA were controlled for, the effect of this relationship was stifled (PA
B aghurst, personal communic at ion, 22 December, 1997 ).
The findings of the analysis of the variation in parent reported diabetes-specific
adherence according to the variables of the SFMA with the addition of parent-
adolescent conflict and adolescent autonomy provide support for the inclusion of the
4t9
additional variables. The overall level of prediction of parents' diabetes-specific
adherence reports was greater than that discussed in Section 14.1.2. Again, the first
two steps of the regression significantly improved the prediction of parents' general
adherence repofts over that afforded by the previous step. However, in the analysis
involving parent-adolescent conflict and adolescent autonomy in the second step, the
improvement in the proportion of variance in DSAS scores explained by the
regression rose by L8 7o, compared with an improvement of less than 10 7o in the
equivalent analysis which did not include conflict or autonomy variables. The third
step of the equation provided similar increments of improvement in prediction of
parents' diabetes-specific adherence reports in the equations including and excluding
the conflict and autonomy reports.
Overall, the level ofprediction ofparents' diabetes-specific adherence ratings afforded
by the modified model accounted for 32 Eo of the variance in these reports. By
comparison, the variables of the SFMA alone (i.e., without the conflict or autonomy
variables) accounted for less than 20 7o of this variance. Remarkably, the proportion
of the variance in parents' reports of diabetes-specific adherence accounted for by the
modified model of adherence is the same as the proportion of variance in adolescents'
reports of diabetes-specific adherence accounted for by this modified model. This
consistency supports the utility of the addition of parent-adolescent conflict and
adolescent autonomy to the SFMA when examining adolescents' medical adherence.
Further, this result compares favourably with previous studies examining the
multivariate prediction of adherence in groups of patients with chronic illnesses (e.g.,
DiMatteo, Hays, et al.1993; Hanson, eT al. 1987a: Hanson, De Guire, et al. 1992; Ried
& Christensen, 1988 Sherbourne, et al. 1992).
420
As discussed in Section 14.1.2, the significant predictor of parents' reports of
diabetes-specific adherence in the regression of SFMA variables was Intentions to
Adhere. In the regression of parents' reports of diabetes-specific adherence with the
SFMA variables and the measures of parent-adolescent conflict and adolescent
autonomy, the significant predictors were Supports / Barriers and Intentions to
Adhere.
Again, parents' reports of parent-adolescent conflict and adolescent autonomy were
not significant predictors in the regression with reports on the DSAS. The explanation
for the lack of significant prediction by conflict reports of adherence reports, despite
the significant bivariate relationship between these measures, has been addressed in
previous sections. However, it is interesting to note that although these variables were
not found to be significant predictors of parents' reports of diabetes-specific
adherence in this analysis, their inclusion in the analysis substantially increased the
proportion of variance in these adherence reports that was accounted for by the
regression equation. This finding provides support for the inclusion of these variables
in the examination of adolescents' adherence to medical regimens.
L4.3 The Maximal Prediction of Adherence and Metabolic Control.
This section discusses the results presented in Section 13.3; the analyses discussed in
this section were intended to determine the greatest possible prediction of adolescents'
reported adherence and of their metabolic control
42r
I4.3.I The Maximal Prediction of Reported Adherence.
The analysis of the variation in adolescent reports of general adherence, according to
the factors assessed in this thesis that demonstrated significant bivariate relationships
with reported adherence, accounted for a large proportion of the variance in adherence
reporting (57 7o). The measures that were found to be significant multivariate
predictors of adolescents' reports of general adherence were Perceived Utility,
Supports / Barriers, and Health Value. These results are similar to those discussed in
the first section of this chapter, examining the predictive value of the SFMA. In
particular, it should be noted that two variables of the SFMA, Supports / Barriers and
Health Value, were significant predictors of general adherence in both of these
regressions.
The analysis of the variation in adolescent reports of diabetes-specific adherence
accounted for a considerable proportion ofthe variance in adherence reporting (40 Eo).
The measures that were found to be significant multivariate predictors of adolescents'
reports of diabetes-specific adherence were Recreational Activity and Supports /
Barriers. These results differ from those discussed in the first section of this chapter
examining the prediction of diabetes-specific adherence on the basis of the SFMA. In
the previous analysis, Perceived Susceptibility was a significant predictor of
adolescents' reports of this adherence. However, this finding is consistent with the
findings of the regressions of adolescents' reports of general adherence.
422
The analyses of the variation in parents' reports of general adherence and diabetes-
specific adherence accounted for very similar proportions of variance in these reports
as the analyses ofthe adolescents'reports.
The analysis of the variation in parent reports of general adherence accounted for a
large proportion of the variance in adherence reporting (59 7o). The sole variable that
was found to be a significant multivariate predictor of parents' reports of general
adherence was intention to adhere in the future. This finding is similar to that
discussed in the first section of this chapter, examining the predictive value of the
SFMA. In the examination of parents' reports of general adherence in relation to the
SFMA, Intentions to Adhere and Supports / Barriers were significant predictors of
general adherence in the regression.
The analysis of the variation in parent reports of diabetes-specific accounted for a
considerable proportion of the variance in adherence reporting (417o). The variable
that was found to be significant multivariate predictors of parents' reports of diabetes-
specific adherence was intention to adhere in the future. This finding is again similar
to that discussed in the first section of this chapter. In the examination of parents'
reports of general adherence in relation to the SFMA, Intentions to Adhere was the
significant predictor of diabetes-specific adherence in the regression.
Like the findings presented in Sections 14.1 and 14.2, these findings compare well
with those of previous investigations (e.g., Brownlee-Duffeck, et al. 1987; Hanson, et
al. 1987a; Jacobson, et aL 1987; Jacobson, et al. 1990). Section L4.4 discusses these
findings in light of the published literature
423
14.3.2 The Maximal Prediction of Metabolic Control
The analysis of the variation in adolescents' metabolic control, according to the
factors assessed in this thesis that demonstrated significant bivariate relationships with
this metabolic control, accounted for a large proportion of the variance (48 7o). This
is a strong finding. Previous investigations of adolescents' IDDM adherence have
typically accounted for less than 20 7o of the variance in IIbA1. results (e.g.,
BJ Anderson, et al. 1990; Brownlee-Duffeck, et al. 1987; Hanson, De Guire, et al.
1992; Hanson, et al.I987a).
These findings suggest that the understanding of adolescents' metabolic control in
insulin dependent diabetes is improved by the measures employed in this thesis.
However, the replication of these findings in another setting would reinforce the
strength of this conclusion. These findings also suggest that certain aspects of
adolescents' and parents' health beliefs should be the focus of interventions intended
to improve adolescents' metabolic control. For example, adolescents' perceptions of
supports to adherence were a significant predictor of adolescents' metabolic control.
While a direct association between this perception and the metabolic control of
adolescents is not postulated, these perceptions do appear to be linked to the
adolescents' health status. These perceptions could be targeted in future intervention
research designed to improve metabolic control.
424
L4.4 Summary and Future Directions: The Multivariate Prediction of
Adolescents' Adherence and Metabolic Control.
This section provides a synthesis of the findings discussed in this chapter, in light of
the published literature. The implications of these findings to the wider literature and
to future research are addressed.
I4.4.I The Multivariate Prediction of Adherence and Metabolic Control by
Adolescents.
The first findings discussed in this chapter examined the multivaiate prediction of
adherence, based on a series of variables theorised to influence adherence (DiMatteo
& DiNicola, 1982; Gntz, et al. 1989). The findings discussed in this chapter also
examined the potential improvement in the prediction of adherence by the addition of
assessments of parent-adolescent conflict and adolescent autonomy to the predictor
variables defined by the model. These later findings were intended to gain a clearer
insight into adherence amongst adolescents with chronic illnesses. Further findings
examined the maximal prediction of adolescents' adherence and metabolic control,
using the reports collected in this study
In previous studies by Schlenk and Hart (1984), Hanson and colleagues (1987a,
Hanson, De Guire, et al. 1992), Brownlee-Duffeck and colleagues Q987), and
Jacobson and colleagues (1987, 1990), multivariate analyses have been reported to
account for the variation in adherence of adolescents with IDDM. Further studies by
425
IM Friedman and colleagues (1986), Ried and Christensen (1988), and DiMatteo and
colleagues (DiMatteo, Hays, et al. 1993; Sherbourne, et al. 1992) have performed
similar analyses to predict adherence in other groups of patients
Schlenk and Hart (1984) examined the prediction of IDDM adherence amongst a
group of 30 adults, using measures of health locus of control, health value, and social
support. These authors were able to account for 53 Vo of the variance in reported
general adherence and between 8 7o and 58 7o of the adherence to specific aspects of
IDDM management. However, the small sample size involved in this study made the
use of multiple regression analyses inadvisable (WL Hays, 1988; Norman & Streiner,
1994; Tabachnick & Fidell, 1989).
Hanson and colleagues (1987a) examined the prediction of adolescents' IDDM
regimen adherence and HbA1" by the use of measures of stress, social competence,
family relations, diabetes knowledge, and the adolescents' age. These analyses
accounted for almost 19 7o of the variance in self-reported adherence and nearly 15 7o
of the variance in metabolic control. A more recent study by this group of researchers
examined the prediction of adolescents' IDDM adherence and IIbA1" using illness-
specific and general family relations measures. In this study, the predictor variables
were able to account for l7 7o of the variance in self-reported adherence, although
metabolic control could not be significantly predicted (Hanson, De Guire, et al. 1992).
Brownlee-Duffeck and colleagues (1987) examined the prediction of adolescents' and
adults' IDDM regimen adherence, as well as their metabolic control, according to
variables of the health belief model (i.e., health beliefs). These variables accounted
426
for 52 7o of the variance in adherence amongst the participating adolescents and 40 Vo
of the variance in adherence amongst the participating adults. Overall, these variables
accounted for 41 7o of the variance in self-reported adherence of the combined
sample. The same variables accounted for 2O 7o of the variance in the adolescents'
metabolic control, and 19 7o of the variance in the adults' metabolic control (16 7o for
the combined sample).
Jacobson and colleagues (1987) examined the prediction of children and adolescents'
adherence to IDDM self-care recommendations using measures of self-esteem, health
locus of control, social functioning, and age. These variables accounted for 55 7o of
the variance in adherence. This study was limited by the small sample size involved
(19 children and 38 adolescents with recent onset IDDM), and by the measurement of
adherence employed: in this study, health provider estimates of adherence were used,
the methodological weakness of this form of adherence assessment was discussed in
Section l.l.2.l of the Literature Review.
In another study by this group of researchers, adolescents' adherence to IDDM self-
care recommendations was examined in relation to locus of control, adaptive strength,
ego defence, adolescent age, and adjustment (Jacobson, et al. 1990). Using
hierarchical multiple regression, these variables accounted for 47 7o of the variance in
the health provider estimated adherence of the 61 participating adolescents. This
finding was weakened by two aspects of the design of the study. First, the sample size
involved in the study was too small to test this number of variables in a multiple
regression analysis (WLHays, 1988; Norman & Streiner,1994; Tabachnick & Fidell,
421
1989). Second, as in the previous study by this group of researchers, adherence was
assessed using a health provider estimate.
Anderson and colleagues (1990) were able to account for 13 7o of the variance in
metabolic control of adolescents with IDDM, using a measure of family responsibility
for diabetes management. Johnson and colleagues (1992) accounted for 28 Vo of the
variance in metabolic control of children and adolescents with IDDM using structural
equation modeling of age, diabetes duration, and adherence measures in a longitudinal
study.
Investigations of adherence amongst other groups of patients have revealed similar
levels of prediction of adherence. IM Friedman and colleagues (1986) accounted for
36 7o of the variance in adherence to epilepsy medication of a group of 25 adolescents,
using measures of autonomy and self-esteem. Unfortunately, this study involved only
a very small number of participants, and used an unreliable measure of autonomy, as
discussed in Section 10.4.1. Further, adherence was assessed in this study using
biological assays; as discussed in Section 1.1.2.I, assays are measures of
physiological functioning, not of behaviour
Ried and Christensen (1988) examined the predictive power of Health Belief Model
GßM) and Theory of Reasoned Action (TRA) variables for the adherence of
adolescents to medication prescriptions. The FIBM variables accounted for only I0 7o
of the variance in self-reported adherence. The addition of the TRA variables in a
hierarchical regression improved the prediction of adherence; the combined predictive
428

power of these models accounted for 29 Vo of the variance in these adolescents'
adherence
Sherbourne and colleagues (1992) examined the adherence of 1198 adults with non-
insulin dependent diabetes, hypertension, or heart disease, in relation to variables in
the SFMA. In this large scale study, 26 7o of the variation in self-reports of general
adherence were accounted for by the SFMA variables, as was L5 7o of the variation in
illness-specific adherence. In another study by this group of authors, DiMatteo, Hays,
and colleagues (1993) examined the general and illness-specific adherence of four
groups of adult patients with abnormal pap smears (n = 56), breast cancer (n = I3I),
head I neck cancer (n - 91), and obesity (n = 87). The Adherence Determinants
Questionnaire and Health Value Scale were used to measure the variables of the
SFMA, and predict adherence. Using standard multiple regressions, the SFMA
variables accounted for 26 7o,29 Vo,2J 7o, and IO Vo of the variation in reported
general adherence in the four groups of patients, respectively. Further, the SFMA
variables accounted for 26 7o, 0 7o, 63 %o, and 49 7o of the variation in reported
illness-specific adherence in these respective groups of patients. In this study, the
Supports / Barriers variable was the significant predictor of general adherence in all
groups, and of illness-specific adherence in all groups other than breast cancer.
Intentions to Adhere was a significant predictor of illness-specific adherence amongst
the head/neck group. Unfortunately, standard multiple regression analyses were used,
so that although the predictive power of the SFMA variables could be determined, the
structure of the model could not be tested.
429
The present study examined the prediction of IDDM adherence amongst a group of
135 adolescents, using measures of variables from the Six-Factor Model of Adherence
(supports and barriers to adherence, intentions to adhere, health beliefs, social norTns,
health value, and interpersonal aspects of care), completed by adolescents and parents.
These variables, entered into a hierarchical regression according to the structure of the
SFMA, were able to account for 37 7o and 24 7o of the variances in adolescent
reported general and diabetes-specific adherence, and37 7o and20 7o of the variances
in parent reported general and diabetes-specific adherence, respectively. The present
study further examined the prediction of IDDM adherence amongst this group of
adolescents, using the measures of variables from the SFMA, with the addition of
measures of parent-adolescent conflict and adolescent autonomy. This more
comprehensive model of adherence prediction was able to account for 42 Vo and32 7o
of the variances in adolescent reported general and specific adherence, and 39 7o and
32Vo of the variances in parent reported general and specific adherence, respectively.
Using Stepwise regressions, the present study was able to account lor 51 7o and 59 7o
of the variances in adolescents' and parents' reports of general adherence, and 40 Vo
and 41 7o of these respondents' reports of diabetes-specific adherence. The findings
of the present study were also able to account for 48 Eo of the variance in adolescents'
metabolic control.
The findings discussed in this chapter extend on previous research in several respects
First, the findings discussed in this chapter provide some empirical support for the
predictive power and the structure of the Six-Factor Model of Adherence, when
applied to a sample of chronically ill adolescents. Previous research has identified the
430
utility of this model in relation to large adult samples of patients (DiMatteo, Hays, et
al. 1993; Sherbourne, et al. 1992). The present study extends on these studies by
determining that this model can be successfully applied to adolescents' medical
adherence.
Further, in the present study the supports / barriers variable was a significant predictor
of adherence in all of the regression equations predicting general adherence, and in
one regression of diabetes-specific adherence. Intentions to Adhere was also a
significant predictor of parents' reports of adherence. These results closely replicate
the pattern of findings reported by DiMatteo, Hays and colleagues (1993) examining
these variables. It may be argued that the significant influence of Supports / Barriers
was caused by its early introduction to the Hierarchical Regressions discussed in this
chapter. However, the consistency of these findings with those of DiMatteo, Hays and
colleagues (1993), who used only a standard multiple regression, tends to refute this
argument. Further, the finding that Supports / Barriers was also a significant predictor
of adolescent reported general adherence in the Stepwise Regression further refutes
the argument that this variable's influence on adherence was caused by its early entry
into the Hierarchical Regression. Rather, these findings suggest that perceptions of
support for adherence and the absence of barriers to adherence is important to the
adherence of these adolescents.
Second, the findings presented in this chapter suggest that the prediction of
adolescents' adherence by the SFMA may be improved by the addition of measures of
parent-adolescent conflict and adolescent autonomy. In this study, these measures
were included in the model at the same point as the Intentions to Adhere variable.
43r
The addition of these variables to the SFMA has not been examined in previously
published research
Third, the use of parents' reports in this study provided additional support for the
influence of the variables of the Six-Factor Model of Adherence. Previous studies
have employed only self-report measures to test the SFMA. (DiMatteo, Hays, et al.
L993; Sherbourne, et al. 1992). The finding in this study that the level of prediction of
adherence by parents' reports was similar to the level of prediction obtained using
adults' self-reports in previous studies provides further support for the relevance of
this model.
However, although the findings involving parents' reports supported the influence of
the variables of the SFMA, these findings were less supportive of the structure of the
model. The hierarchical regressions used to examine the model's structure, although
providing a reasonably strong level of prediction of adherence, did not support the
structure of the model. Previous studies examining the SFMA have not tested the
heuristic structure proposed for the model by Gntz and colleagues (1989). For
example, as already mentioned, DiMatteo, Hays, and colleagues (1993) used standard
multiple regressions rather than hierarchical regressions to examine the relationship
between SFMA variables and adherence. Standard multiple regressions, while able to
determine the relative predictive power of different predictive variables, are not able
to test the structure of the model (WL Hays, 1988; Tabachnick & Fidell, 1989).
Further, parents' reports provided mixed support for the addition of parent-adolescent
conflict and adolescent autonomy variables to the model. The analyses involving the
432
prediction of parents' reports of general adherence accounted for 37 7o of the variance
in these reports using the SFMA variables alone, and 39 7o of this variance using the
SFMA variables with the addition of the conflict and autonomy measures. The
analyses involving the prediction of parents' reports of diabetes-specific adherence
accounted for 20 Eo of the variance in these reports using the SFMA variables alone,
and 32 Vo of this variance using the SFMA variables with the addition of the conflict
and autonomy measures.
Fourth, the analyses discussed in this chapter accounted for around 30 - 40 Vo of the
variance in reports of adherence reports using variables of the Six-Factor Model of
Adherence as well as parent-adolescent conflict and adolescent autonomy variables.
This result is consistent with previous studies of adolescents' adherence using other
predictive measures. However, a number of previous studies examining the
multivariate prediction of adolescents' adherence have employed small samples,
limiting the interpretability of these analyses (e.g., IM Friedman, et al. 1986;
Jacobson, et al. 1987; Jacobson, et al. 1990; Schlenk & Hart, 1984). The present
study examined the multivariate prediction of adolescents' adherence using a sample
size of sufficient magnitude to meaningfully conduct these analyses (WL Hays, 1988;
Tabachnick & Fidell, 1989; Norman & Streiner, 1994).
Further, the findings of this study extend on previous studies that have examined the
predictive utility of theoretical models of health behaviour for the understanding of
adolescents' medical adherence. The proportion of variance in adherence accounted
for in the present study was greater than that found by Ried and Christensen (1988),
who accounted for l0 7o of the variance in adolescents' medication adherence using
433
the Health Belief Model, and 19 7o of this variance using the Theory of Reasoned
Action. Brownlee-Duffeck and colleagues (1987) accounted for 52 7o of the variance
in adolescents' adherence to IDDM self-care recommendations, using health belief
variables derived from the IIBM. The findings of the present study suggest that the
SFMA is at least as useful as the HBM in understanding adolescents' medical
adherence.
Finally, the findings of this study indicated that the measures employed here were able
to provide a high level of prediction of adolescents' adherence and metabolic control.
The level of prediction of metabolic control, in particular, was greater than has been
reported in a number of previously published investigations. These findings suggest
that the factors examined in this study are important to the understanding of
adolescents' IDDM adherence and metabolic control, and that these factors are worthy
of examination in intervention studies designed to improve adherence and metabolic
control.
14.4.2 Limitations of the Present Study and Future Directions for the Multivariate
Prediction of Medical Adherence by Adolescents
The discussion of the results in this study examining the multivariate prediction of
adolescents' adherence has identified several limitations of the study, and identified
some avenues for future research.
434
First, this study used a cross-sectional design. The testing of the Six-Factor Model of
Adherence should include a measure of previous adherence. This measurement
requires a longitudinal design. The examination of adolescents' adherence in relation
to the variables of the SFMA in a longitudinal investigation would allow a more
complete examination of the utility of this model in understanding adherence. This
type of investigation could potentially improve the level of prediction of adherence
afforded by the present study. As has already been identified, the author is presently
involved in a longitudinal investigation of adolescents' IDDM adherence, including an
intervention program designed to improve this adherence (Taylor, et a\.1996,1997).
A second limitation of the analyses discussed in this chapter related to the use of
multiple regression. Multiple regression analyses are only able to examine linear
relationships between variables (Cliff, 1987; WLHays, 1988; Tabachnick & Fidell,
1989). It is possible that curvilinear or nonlinear relationships exist between
adherence and the predictor variables assessed, which provide a more accurate
understanding of the relationship between these variables. These relationships were
not assessed by the regression analyses conducted in this study. The analysis of
nonlinear relationships between reported adherence and the variables of the SFMA is
beyond the scope of this thesis. This issue could be investigated in future studies of
adolescents' medical adherence.
Third, no previous studies have published examinations of the utility of the SFMA in
understanding adolescents' medical adherence. The findings of the present study
examining parents' reports of adherence did not provide the same level of support for
the inclusion of the conflict and autonomy variables to the regressions as the findings
435
examining the adolescents' reports. Future studies should also examine reports from
adolescents and parents, to determine whether the results obtained in this study are
replicable, or whether the patterns discussed in this chapter differ with other samples
of adolescents. Future studies could also explore the possible causes of the
differences in findings observed between the adolescent and parent reports.
Finally, the replication of these findings, particularly the findings addressing the
prediction of metabolic control, would reinforce the strength of the conclusions drawn
in this chapter. The present findings suggest that the factors investigated in this study
should be the focus of interventions intended to improve adolescents' metabolic
control. This appears to be a valuable avenue for future investigation.
436
CHAPTER FIFTEBN.
CONCLUSIONS.
This chapter reviews the aims of this thesis, and provides a synthesis ofthe fi.ndings of the study ín light of these aims. The implications ofthese findings for future research and for clinical practice are
addressed. Limitatíons of the study are identified.
15 CONCLUSIONS.
L5.0 A Review of the Aims of This Thesis.
The principal aim of this thesis was to examine adherence to medical
recommendations of adolescents with IDDM. In particular, the influences of two
specific issues were studied; these were parent-adolescent conflict and adolescent
autonomy.
This thesis investigated several components of adolescents' adherence. Measures
included (1) their adherence to a range of specific aspects of their medical
recommendations, (2) their general tendency to adhere or not to adhere to medical
recommendations, and (3) an objective assessment of their blood glucose monitoring
adherence. Each of the measures of adherence, as well as the measures of adolescent
autonomy and parent-adolescent conflict, were completed by participating adolescents
and parents. Adolescents' metabolic control was assessed by IIbA1" assay.
The relationship between adolescents' adherence and a range of factors related to
adults' adherence in the Six-Factor Model of Adherence were also examined, to
determine the applicability of this model to adolescents' regimen adherence.
438
15.0.1 Thesis Hypotheses
Two hypotheses were tested in the study:
1. Adolescents for whom reports of greater levels of conflict with their parents are
obtained will be less adherent to their diabetes treatment recommendations than
adolescents for whom reports of lower levels of conflict with their parents are
obtained.
2. Adolescents for whom reports of greater levels of autonomy are obtained will be
more adherent to their diabetes treatment recommendations than adolescents for
whom reports of lower levels of autonomy are obtained.
15.1 A Synthesis of the Thesis Findings in Light of these Aims.
This section summarises the main findings of this thesis, in reference to the thesis
alms.
15.1.1 The Assessment of Patient Adherence
The measures of adherence employed in this thesis were: adolescent completed reports
of adherence on the General Adherence Scale (GAS) and Diabetes Specific Adherence
Scale (DSAS); parent completed reports on the GAS and DSAS; and observations of
439
BGM adherence. In Chapters 5 and 6,large correlations were detected between each
of these measures, suggesting that these measures were assessing the same general
construct: patient adherence
The level of adherence reported by adolescents and parents was not associated with
the adolescents' age. The level of observed BGM adherence varied according to
adolescents' ug", with greater adherence observed in the younger adolescents than in
the older adolescents. The level of adherence reported by adolescents and parents did
not vary according to the gender of the adolescent. The observed level of BGM
adherence was also not associated with adolescents' gender. Reports of adherence
obtained from adolescents were only weakly associated with the adolescents' HbA1.
levels, while reports obtained from parents, and observations of BGM adherence were
moderately associated with the adolescents' IIbA1" levels.
Blood glucose monitoring adherence levels varied over the four weeks prior to
assessment, becoming increasingly high as clinic appointments approached. The
variation in BGM adherence levels formed a linear trend. In light of this finding,
subsequent analyses involving the BGM adherence information were performed using
data spanning a variety of time frames. Finally, patterns of BGM adherence over the
four weeks prior to Outpatient Clinic attendance were coded as Consistently High,
Consistently Low, Rising, or Other. Responses to questionnaire measures of
adherence were found to be differentiated by these groups. Therefore, subsequent
analyses involving BGM adherence were also performed separately for adolescents
classified with Consistently High BGM adherence, Consistently Low BGM
adherence, Rising BGM adherence and Other BGM adherence patterns.
440
In sum, these findings suggest that the assessment of patient adherence in this study
was comprehensive, and relevant to the health outcomes of the adolescents assessed.
15.1.2 The Relationship Between Patient Adherence and Parent-Adolescent Conflict'
In Chapters 7 and 8, adolescent, parent and combined measures of parent-adolescent
conflict were associated with adolescents' adherence, as reported by the adolescents
and their parents. Observations of BGM adherence were not related to these reports
of conflict. Additional analyses revealed significant relationships between reports of
parent-adolescent conflict and adolescents' metabolic control. Hierarchical multiple
regression analyses determined that adolescent and combined adolescent and parent
reports of conflict added to the variance in metabolic control accounted for by reports
of adherence
In sum, the results summarised in this section supported the first hypothesis of this
thesis; that adherence would be lower amongst adolescents who experienced high
levels of conflict with their parents than amongst adolescents who experienced less
conflict with their parents.
These finding have implications for future investigations. The findings of this thesis
suggest that adolescents' conflict with their parents is linked to their medical
adherence. This is a valuable contribution. Little previous research has addressed this
issue directly. It may be suggested on the basis of these findings that future
441
investigations of patient adherence that involve adolescent samples should consider
this issue. Further, this issue should be examined in relation to the adherence of
adolescents to other medical regimens, for example, the influence of conflict on
adolescents' adherence to asthma treatment. It is unlikely that conflict is only
associated with adherence to diabetes treatment. However, this finding should be
replicated with other diagnostic groups.
These findings also have implications for clinical practice and interventions for
adolescents with diabetes. These findings indicate that the medical adherence and
metabolic control of adolescents with diabetes are associated with their level of
conflict with their parents. The medical care of adolescents with IDDM should also
appreciate the potential influence of parent-adolescent conflict. Interventions
designed to improve adolescents' adherence, or their level of metabolic control,
should include a consideration of conflict resolution strategies for adolescents and
their parents.
15.1.3 The Relationship Between Patient Adherence and Adolescent Autonomy
In Chapters 9 and 10, adolescent and parent reports of the adolescents' autonomy
were not associated with the adolescents' adherence, as reported by adolescents and
their parents. Observations of BGM adherence were not related to these reports of
adolescent autonomy. Additional analyses revealed no significant relationships
between reports of adolescent autonomy and adolescents' metabolic control.
442
In sum, the findings summarised in this section do not provide support for the second
hypothesis of this thesis. However, as discussed in Chapter 1,0, it seems premature to
conclude that adolescents' medical adherence is unrelated to their experience of
autonomy.
These finding have implications for future investigations. The lack of a direct
association between adolescents' autonomy and their regimen adherence in this study
suggests that adolescents' adherence is not associated with their overall level of
autonomy. However, the finding that adolescents' perceptions of their recreational
autonomy were associated with their adherence suggests that this form of autonomy
may be related to their medical adherence. The investigation of this issue is worthy of
future research, particularly in light of the finding, reported in Chapters 13 and 14,
that this adherence measure significantly added to the prediction of the adolescents'
adherence when examined in conjunction with reports of adherence and its
antecedents
I5.L4 The Relationship Between Patient Adherence and Proposed Antecedents of
Adherence.
In Chapters 11 and 12, adolescent and parent measures of both general and diabetes-
specific adherence were associated with reports of perceived treatment utility, health
value, intentions to adhere in the future, and the presence of supports for or the
absence of barriers to adherence. Reports of the perceived severity of illness by
adolescents and parents were negatively associated with their reports of general and
443
diabetes-specific adherence (i.e., higher adherence levels were associated with lower
perceived severity). Adolescents' and parents' perceptions of the interpersonal
aspects of the adolescents' medical care were associated with their reports of general
adherence, but not with reports of diabetes-specific adherence. Reports by adolescents
and parents of diabetes knowledge, social influences (subjective norms) on adherence,
and perceptions of susceptibility to hypoglycaemia or hyperglycaemia, were not
related to reports of adherence. Objective assessments of BGM adherence were
associated with adolescent and parent responses to the Intentions to Adhere and
Subjective Norms scales, but not to the other scales in the ADQ. Adolescents' level
of metabolic control (HbAr.) was associated with reports from adolescents and
parents of interpersonal aspects of diabetes care, the perceived utility of diabetes
treatment, and the presence of supports for or the absence of barriers to adherence.
In sum, the findings summarised in this section support the applicability of factors
associated with medical adherence in adults to the investigation of adherence in
adolescent patients.
These findings have implications for future investigations and for clinical practice and
interventions for adolescents with diabetes. The influence of these issues should be
examined in relation to the adherence of adolescents to other medical regimens. It is
possible that these influences vary in their importance in relation to different types of
medical recommendation. For example, interpersonal aspects of care may have a
more positive influence on adherence to medical recommendations that are simple,
and less influence on recoÍìmendations that are difficult to follow or are painful. This
suggestion is supported by the finding in this study that interpersonal aspects of care
444
were more closely associated with general adherence tendencies than with adherence
to specific aspects of diabetes self-care. This is an interesting avenue for future
research
The implications of these findings for clinical practice include the highlighting of the
relevance of the doctor-patient relationship to the adherence of adolescents. The
finding that diabetes knowledge was not associated with regimen adherence or
metabolic control suggests that interventions intended to improve adherence or
metabolic control should not focus exclusively on this knowledge, although it may be
noted that the general level of diabetes knowledge in this sample was high. Similarly,
the finding that perceptions of the severity of diabetes were inversely associated with
adherence suggests that interventions with too great a focus on the serious
consequences of diabetes (i.e., long-term complications) could have a
counterproductive effect. For example, excessive attention to the severity of diabetes
may promote a sense of hopelessness in these adolescents.
The findings of this study also suggest that interventions should focus on perceptions
of the utility of diabetes treatment, which were associated with the adherence and
metabolic control of the participating adolescents. This suggests that adherence-
promoting interventions should highlight, for example, the positive findings from the
Diabetes Control and Complications Trial, which suggests that careful glycaemic
control can greatly reduce the risk of long-term complications (e.g., DCCT, 1993).
445
15.1.5 The Multivariate Prediction of Adolescents' Adherence and Metabolic
Control
Chapters 13 and 14 examined the prediction of adolescents' IDDM adherence, using
measures of variables from the Six-Factor Model of Adherence (supports and barriers
to adherence, intentions to adhere, health beliefs, social nofins, health value, and
interpersonal aspects of care), completed by adolescents and parents. These variables,
entered into a hierarchical regression according to the structure of the SFMA, were
able to account for 37 Vo and24 Vo of the variances in adolescent reported general and
diabetes-specific adherence, and 37 7o and 20 7o of the variances in parent reported
general and diabetes-specific adherence, respectively. These chapters further
examined the prediction of IDDM adherence amongst this group of adolescents, using
the measures of variables from the SFMA, with the addition of measures of parent-
adolescent conflict and adolescent autonomy. This more comprehensive model of
adherence prediction was able to account for 42 7o and 32 7o of the variances in
adolescent reported general and specific adherence, and 39 7o and 327o of the
variances in parent reported general and specific adherence, respectively.
Using Stepwise regressions, the present study was able to account for 57 7o and 59 7o
of the variances in adolescents' and parents' reports of general adherence, and 40 7o
and 417o of these respondents' reports of diabetes-specific adherence. The findings
of the present study were also able to account for 48 7o of the variance in adolescents'
metabolic control.
446
In sum, these findings provide support for the structure and relevance of the SFMA in
the understanding of adolescents' medical adherence, although the findings obtained
from parents' reports provided less support for the structure of the model than the
findings obtained from the adolescents' reports. These findings also supported the
inclusion of parent-adolescent conflict and adolescent autonomy with this model when
assessing the medical adherence of adolescents. Further, these findings indicate a
high level of prediction of adherence repofts and metabolic control.
These findings have implications for adherence research. The high level of prediction
of adherence reports found in this study suggests that the factors examined in the
study, including parent-adolescent conflict and adolescent autonomy, were important
to the understanding of these adolescents' adherence. The examination of the
adherence of adolescents with other chronic conditions, and the adherence of
adolescents to acute treatment regimens, in relation to these factors, could improve
our understanding of this health behaviour. Further, the high level of prediction of the
adolescents' metabolic control suggests that these factors are relevant to the
understanding of psychosocial influences on adolescents' health status. The
examination of specific issues identified in this thesis, including, for example,
adolescents' recreational autonomy, could further inform this understanding.
These findings also have implications for clinical practice and intervention strategies.
The findings from this study suggest that an appreciation of the importance of
psychosocial issues such as parent-adolescent conflict and adolescent autonomy, and
of health beliefs and the presence of a supportive environment for adherence are
relevant to the clinical management of adolescents. The promotion of adherence
447
should take into account these influences. The improvement of adolescents' illness
control should address the issues identified in this thesis, as these issues have
accounted for a large proportion in the variation in the participating adolescents' level
of metabolic control.
L5.2 Limitations of the Thesis Findings.
The findings of this thesis were limited by a number of aspects of the study design.
This section summarises these limitations.
A range of characteristics of participants and their functioning have been identified
which could have further informed the analyses conducted in this thesis. These
include: pubertal status, the nature of parent-adolescent conflict and its resolution,
parents' level of involvement with their adolescents (Chapter 8), and adolescents'
birth order (Chapter 10).
The small number of fathers involved in the study limited the ability of this
investigation to examine the different roles played by mothers and fathers in their
adolescents' health-care. Future studies should emphasise the recruitment of fathers
into research of this kind.
The measure of autonomous functioning employed in this study did not detect wide
variations in autonomy levels amongst the participating adolescents. Given the size of
the sample involved in this study and the age range involved, the lack of variability in
448
obtained scores on the AFC may indicate a lack of sensitivity in this measure. The use
of a more sensitive measure of adolescents' autonomous functioning would facilitate a
more sensitive assessment of the relationship between adolescents' autonomy and
their adherence to medical regimens. Further, associations between responses to the
subscales of the AFC suggest that different aspects of adolescents' autonomous
functioning relate differently to their regimen adherence. This issue may be worthy of
further investigation.
Finally, this study used a cross-sectional design. The examination of adolescents'
adherence in relation to the variables involved in this study in a longitudinal
investigation would allow a more complete understanding of adolescents' adherence.
449
lr-t - '\ ^
Adolescents' Adherence to Chronic Medical Regimens:
Parent-Adolescent Conflict and Adolescent Autonomy in
Relation to Adherence to Insulin Dependent Diabetes
Tfeatment Regimens.
Volume Two.
Michael Fotheringham.B.A. (Honours - Psychology). University of Adelaide.
A thesis submitted in fulfilment of the requirements of the degree ofDoctor of Philosophy, Department of Psychiatry,
University of Adelaide.
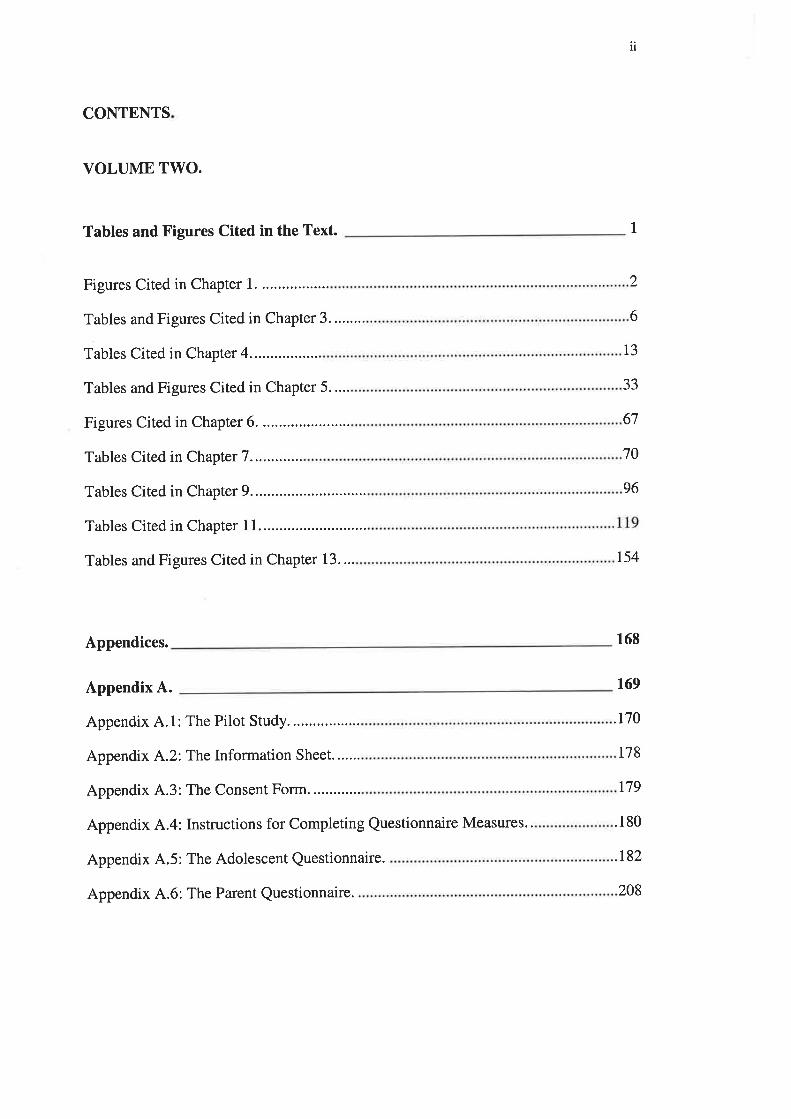
lt
CONTENTS
VOLUME TWO.
Tables and Figures Cited in the Text.
Figures Cited in Chapter 1. .................
Tables and Figures Cited in Chapter 3.........
Tables Cited in Chapter 4..................
Tables and Figures Cited in Chapter 5.....
Figures Cited in Chapter 6. ......................
Tables Cited in Chapter 7 .............
Tables Cited in Chapter 9...............
Tables Cited in Chapter 11..............
Tables and Figures Cited in Chapter 13....
Appendices.
Appendix A.
Appendix 4.1: The Pilot Study
Appendix A.2: The Information Sheet.......
Appendix 4.3: The Consent Form.
Appendix 4.4: Instructions for Completing Questionnaire Measures..
Appendix 4.5: The Adolescent Questionnaire.
Appendix 4.6: The Parent Questionnaire.
1
2
6
r54
168
13
33
67
70
96
169
.r70
178
t79
.180
..r82
208
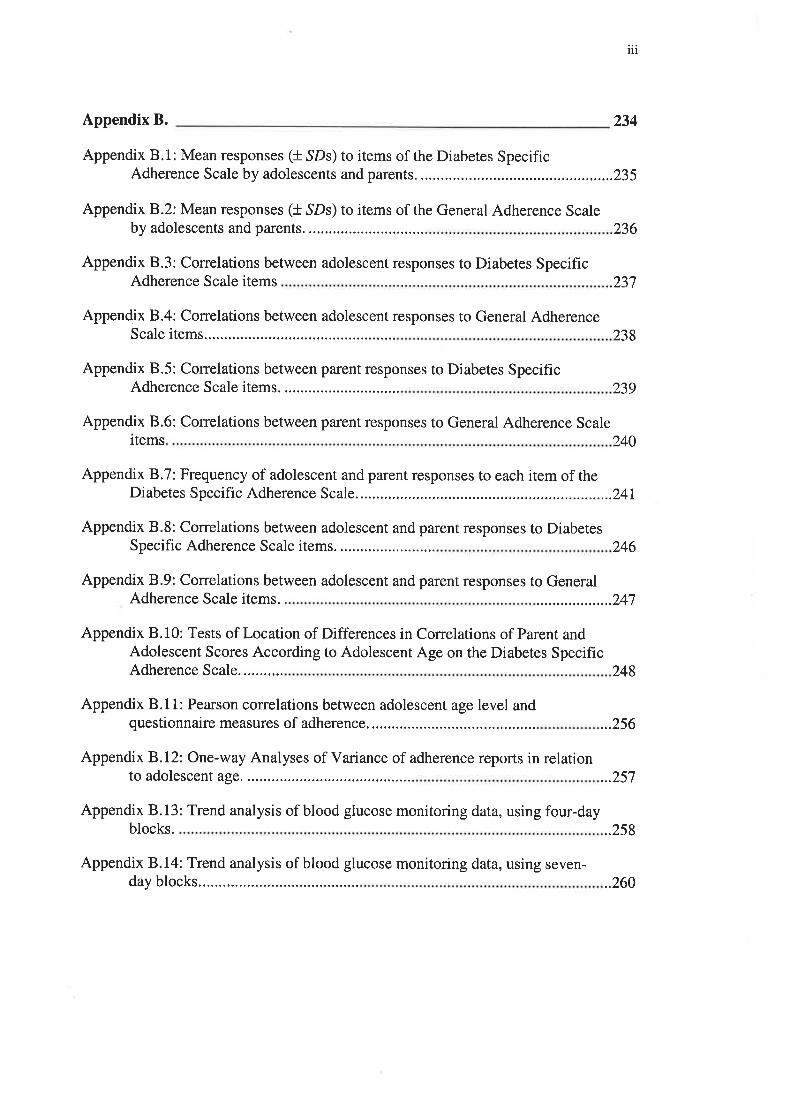
lll
234Appendix B.
Appendix B.1: Mean responses (l SDs) to items of the Diabetes SpecificAdherence Scale by adolescents and parents. ............235
Appendix B.2: Mean responses (t SDs) to items of the General Adherence Scaleby adolescents and parents. 236
Appendix B.3: Correlations between adolescent responses to Diabetes SpecificAdherence Scale items ..237
Appendix B.4: Correlations between adolescent responses to General AdherenceScale items......... 238
Appendix 8.5: Conelations between parent responses to Diabetes SpecificAdherence Scale items. 239
Appendix 8.6: Correlations between parent responses to General Adherence Scaleltems 240
Appendix 8.7: Frequency of adolescent and parent responses to each item of theDiabetes Specific Adherence Scale. .........241
Appendix 8.8: Correlations between adolescent and parent responsss to DiabetesSpecific Adherence Scale items. 246
Appendix 8.9: Correlations between adolescent and parent responses to GeneralAdherence Scale items. ,.,.,,.,...........247
Appendix B.10: Tests of Location of Differences in Correlations of Parent andAdolescent Scores According to Adolescent Age on the Diabetes SpecificAdherence Scale. 248
Appendix 8.11: Pearson correlations between adolescent age level andquestionnaire measures of adherence. ...........
Appendix B.12: One-way Analyses of Variance of adherence reports in relationto adolescent age.
Appendix 8.13: Trend analysis of blood glucose monitoring data, using four-dayblocks.
Appendix B.14: Trend analysis of blood glucose monitoring data, using seven-day blocks
...256
...257
..258
..260
IY
263Appendix C.
Appendix C.l: Frequency of adolescent response options to items of the DiabetesSpecific Adherence Scale. ......264
Appendix C.2: Frequency of parent response options to items of the DiabetesSpecific Adherence Scale. ........ .265
Appendix D.
Appendix D.1: The Iævel of Agreement Between Adolescent and Parent Reportsof Parent-Adolescent Conflict. 267
Appendix D.2:Yanation in Parent-Adolescent Agreement on the ConflictBehaviour Questionnaire According to Adolescent Age. ......... ...268
Appendix D.3: Variation in Parent-Adolescent Agreement on the ConflictBehaviour Questionnaire According to Adolescent Gender..... ...278
266
Appendix D.4: Frequency of response options to items of the ConflictBehaviour Questionnaire: Adolescent responses to mother version
Appendix D.5: Frequency of response options to items of the ConflictBehaviour Questionnaire: Adolescent responses to father version.
Appendix D.7: Variation in Parent-Adolescent Agreement on the ConflictBehaviour Questionnaire According to Parental'Work-Status. .......
Appendix D.6: Frequency of response options to items of the ConflictBehaviour Questionnaire: Parent responses ...............283
...279
281
..285
Appendix E.
Appendix E.l: Associations Between the Measures of Adherence and theMeasures of Conflict According to Whether or not Blood GlucoseMonitoring Data was Obtained. ..288
Appendix F.1: The Level of Agreement Between Adolescent and Parent Reportsof Autonomy...... ..290
Appendix F.2: Variation in Parent-Adolescent Agreement on the AutonomousFunctioning Checklist According to Adolescent Age. .................292
Appendix F.3: Variation in Parent-Adolescent Agreement on the AutonomousFunctioning Checklist According to Adolescent Gender...............................297
287
Appendix F. 289
Appendix G.
Appendix G.l: Level of Agreement Between Adolescent and Parent Reports of
The Proposed Antecedents of Adherence
Appendix G.2: Variation in Parent-Adolescent Agreement on the Adherence
Determinants Questionnaire and Health Value Scale According to
Adolescent Age. .........
Appendix G.3: Variation in Parent-Adolescent Agreement on the Adherence
Determinants Questionnaire and Health Value Scale According to
Adolescent Gender.
Appendix H.1: Correlations between adolescent responses to scales of the
Adherence Determinants Questionnaire, Health Value Scale and
Diabetes Knowledge Questionnaire.'..............'
Appendix H.2: Correlations between parent responses to scales of the Adherence
Determinants Questionnaire, Health Value Scale and Diabetes Knowledge
Questionnaire.
Appendix H.3: Correlations between adolescent responses of Conflict Behaviour
euestionnaire and subscales of the Autonomous Functioning Checklist
with scales of the Adherence Determinants Questionnaire, Health Value
Scale and Diabetes Knowledge Questionnaire.....
Appendix H.4: Correlations between parent responses of Conflict Behaviour
Questionnaire and subscales of the Autonomous Functioning Checklist
with scales of the Adherence Determinants Questionnaire, Health Value
Scale and Diabetes Knowledge Questionnaire.......'....
Appendix I: Publications Arising From the Thesis.
Appendix I.1: Fotheringham MJ, Sawyer MG. (1995). Adherence to
reconìmended medical regimens in childhood and adolescence. Journal
of Paediatrics and Child Health, 31: 72-78'
Appendix I.2: Fotheringham MJ, Couper JJ, Sawyer MG. (1996)' Adolescents'
adherence to IDDM treatment: Relation to parent-adolescent conflict
and adolescent autonomy. Proceedings of the Australian Diabetes
Society, 1996 A 89. ............
..302
304
301
.311
317Appendix H.
318
319
320
.321
322
Appendix I.3: Taylor JD, Fotheringham MJ, Sawyer MG, Couper JJ. (1996).
Ambulatory intervention in adolescents with insulin dependent diabetes:
Impact of metabolic control and psychosocial functioning. Proceedings
of the Austalian Diabetes Society, 1996 A62' """""'
...323
..330
..331
Appendix I.4: Fotheringham MJ, Couper JJ, Sawyer MG. (1997). Associations
between adolescents' metabolic control, IDDM adherence and objective
data of blood glucose monitoring . Proceedings of the Australian Diabetes
Society, 1997 A 93. .....
vl
332
333
Appendix I.5: Taylor JD, Fotheringham MJ, Sawyer MG, Couper JJ. (L997).
Followup of ambulatory intervention in adolescents with poorly
controlled insulin dependent diabetes. Proceedings of the Australian
Diabetes Society, 1997 A69.
Bibliography 334

TABLES AND FIGURES CITED IN THE TEXT.

FIGURES CITED IN CHAPTER 1..
2
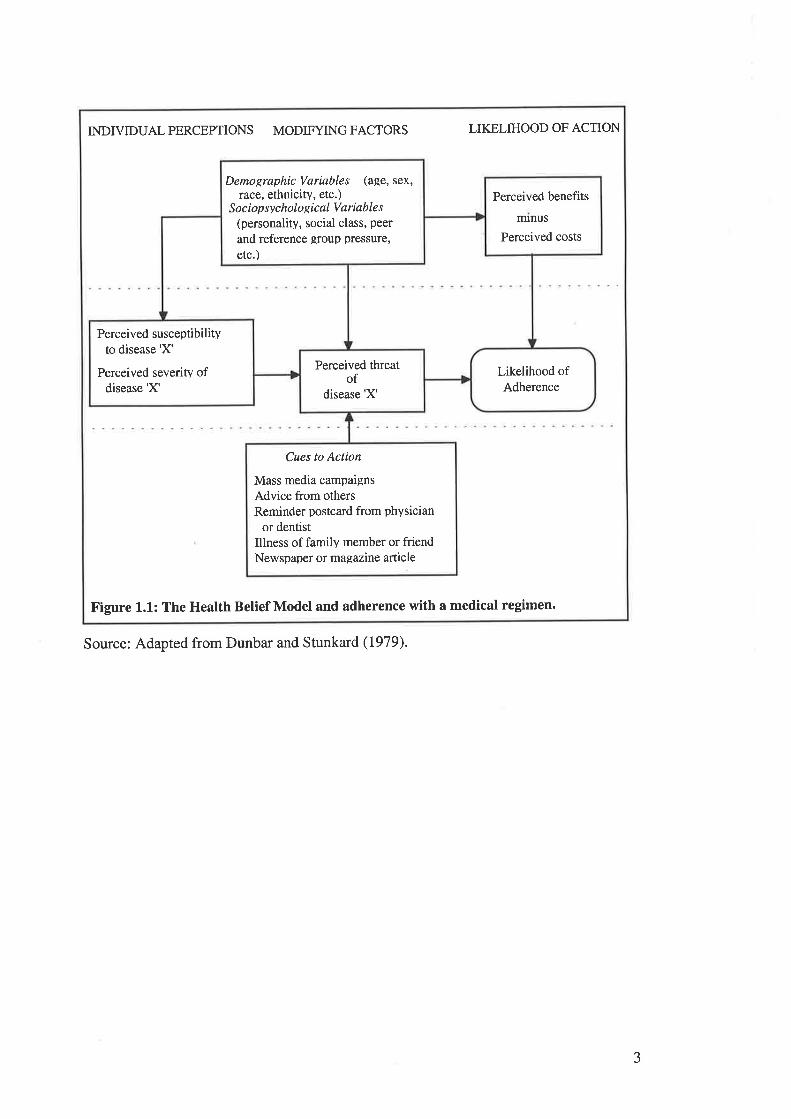
Perceived benefits
nunus
Perceived costs
Demographic Variables (age, sex,race, ethnicity, etc.)
S o c i op sy c holo R ic al V a riab Ie s
(personalitv, social class, peer
and reference group pressure,
etc.)
Perceived susceptibilityto disease 'X'
Perceived severity ofdisease'X'
Likelihood ofAdherence
Perceived threatof
disease'X'
Mass media campaignsAdvice from othersReminder postcard from physician
or dentistIllness of family member or friendNewspaper or magazine article
Cues to Action
INDIVIDUALPERCEPTIONS MODIFYINGFACTORS LIKELIHOOD OF ACTION
Figure 1.1: The Health Belief Model and adherence with a medical regimen.
Source: Adapted from Dunbar and Stunkard (1979).
3
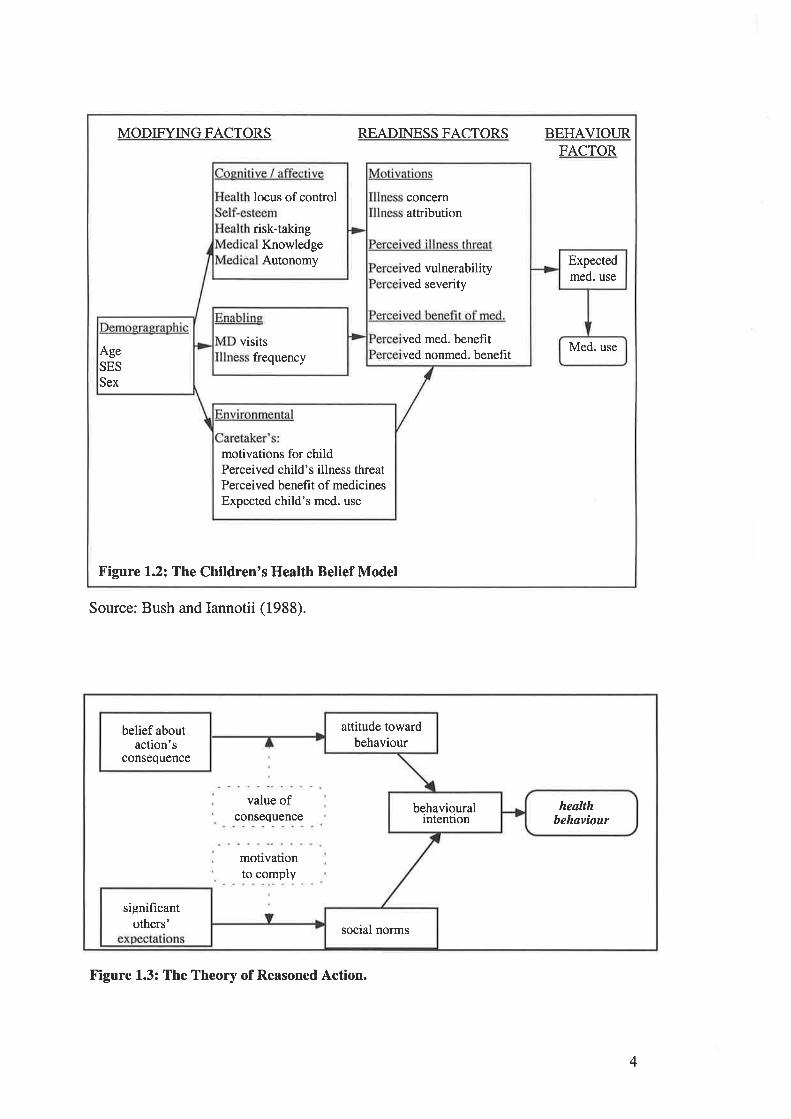
MODIFYING FACTORS READINESS FACTORS BEHAVIOURFACTOR
Figure 1.2: The Children's Health Belief Model
locus of control
KnowledgeAutonomy
risk-taking
Expectedmed. use
Med. use
ved vulnerabilityved severity
ved med. benefitved nonmed. beneht
concernattribution
visitsfrequencyAge
SES
Sex
motivations for childPerceived child's illness threatPerceived benefit of medicinesExpected child's med. use
Source: Bush and Iannotii (1988).
4
attitude towardbehaviour
belief aboutaction's
consequence
behaviouralintention
healthbehaviour
significantothers' social norms
value ofconsequence
motlvatlonto comply
Figure 1.3: The Theory of Reasoned Action.
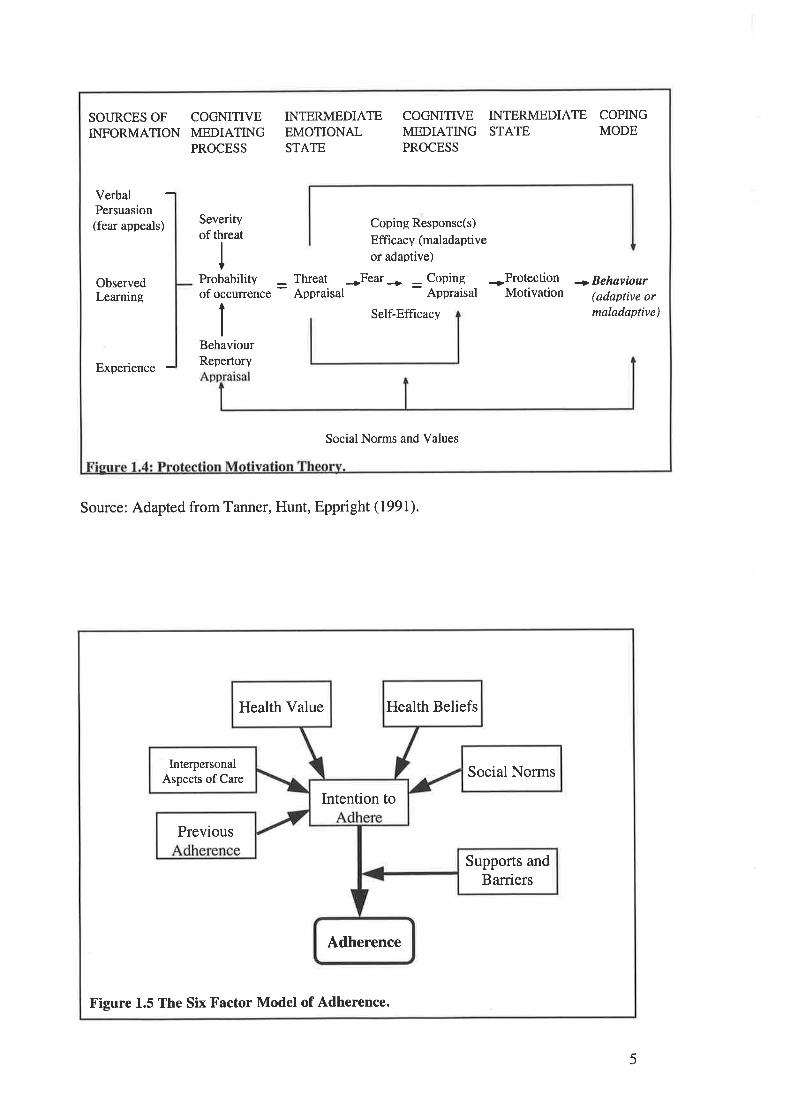
SOURCES OF COGMTIVEINFORMATION MEDIATING
PROCESS
INTERMEDIATEEMOTIONALSTATE
COGNITIVE INTERMEDIATE COPINGMEDIATING STATE MODEPROCESS
Verbal -Persuasion(fear appeals)
Severityof threat
Coping Response(s)
Efficacy (maladaptive
or adaptive)
*Fear+ = Coping *ProtectionAppraisal Motivation
ObservedLearning
Probabilityof occunence
ThreatAppraisal
+ Behaviour(adaptive ormaladaptive)Self-Efficacy
Experience -BehaviourRepertory
Social Norms and Values
Source: Adapted from Tanner, Hunt, Eppright (1991).
Health Value Health Beliefs
Social NormsInterpersonal
Aspects of Care
Intention to
Previous
Supports andBarriers
Adherence
Figure 1.5 The Six Factor Model of Adherence.
5

TABLES AND FIGURES CITED IN CHAPTER 3.
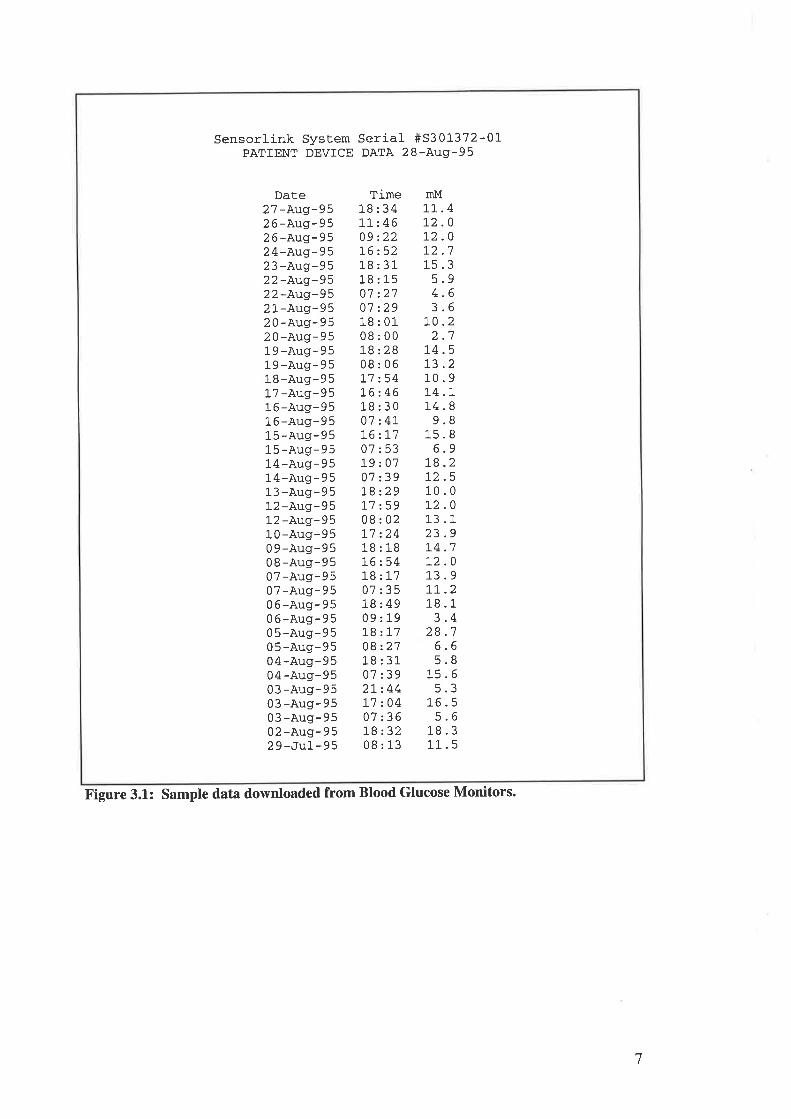
Sensorlink System Serial #S301-372-01-PATIENT DEVICE DATA 28-Aug-95
Date2 7 -Aug-9 5
2 6 -Aug-9 52 6 -Aug- 9524-Aug-952 3 -Augr-9 5
22-Aug-9522-Aug-952l--Aug-9520-Aug-952 0-Aug-9519-Aug-95l-9 -Aug- 9 5
18-Augr-9517 -Aug-951 6 -Aug-9 5
16-Aug-951 5 -Aug- 9515-Aug-9514-Aug-9514-Aug-95l-3 -Aug-9512 -Aug- 9512 -Aug-95l-0-Aug-9509-Aug-950 8 -Aug- 9507 -Aug-9 507 -Aug- 9 50 6 -Aug-9506-Aug-9505-Aug-9505 -Aug-9 5
04-Aug-9504-Aug-9503 -Aug-9 5
0 3 -Augr- 9503 -Aug-9502 -Aug- 9 529-Ju1-95
Time18:341,1, -.46
09 2221,6:5218:3118:1507:2707 :29l-8:0108:00t8:2808:06t7:54t6:4618:3007 z4L16 zL707:53l-9:070'7 239l.8:.29L'7:5908:02I1 :2418 : l-876254]-8:L707:3518:4909:19l-8 : 1708:2718 : 31-
07:392L244L7 20407:36t8:3208:13
InM
11 .4.0.0
'1
.9
.6
.6
.2'1
L2L2L2t_5
543
L0)
L4.513.210.9L4.L14.89.8
15.86.9
L8.272.510.0L2.013.123.9L4.7L2.013.9LL.21.8.13.4
28.76.65.8
l_5.65.3
r-6.55.6
18.3l-l_ . 5
Figure 3.1: Sample data downloaded from Blood Glucose Monitors.
7
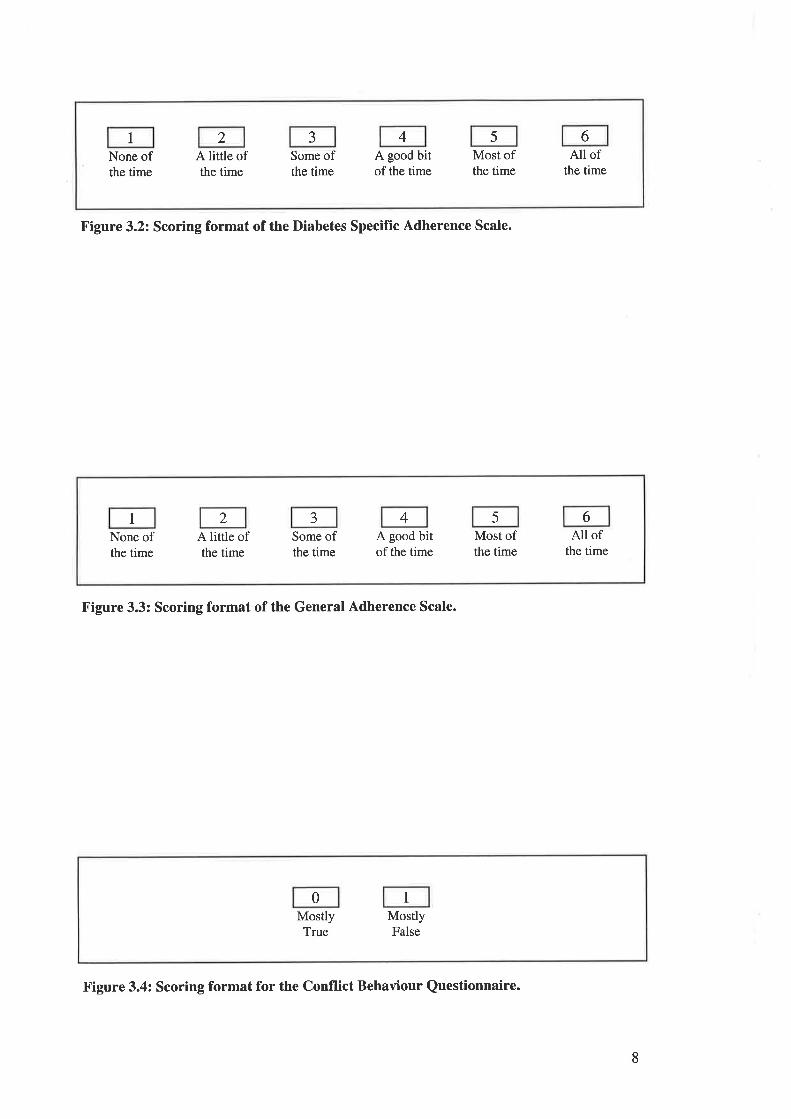
I 2 J 4 5 6None ofthe time
A little ofthe time
Some ofthe time
A good bitof the time
Most ofthe time
All ofthe time
Figure 3.2: Scoring format of the Diabetes Specific Adherence Scale.
Figure 3.3: Scoring format of the General Adherence Scale.
0 1
MostlyTrue
MostlyFalse
8
1 2 J 4 5 6
None ofthe time
A little ofthe time
Some ofthe time
A good bitof the time
Most ofthe time
All ofthe time
Figure 3.4: Scoring format for the Conflict Behaviour Questionnaire.
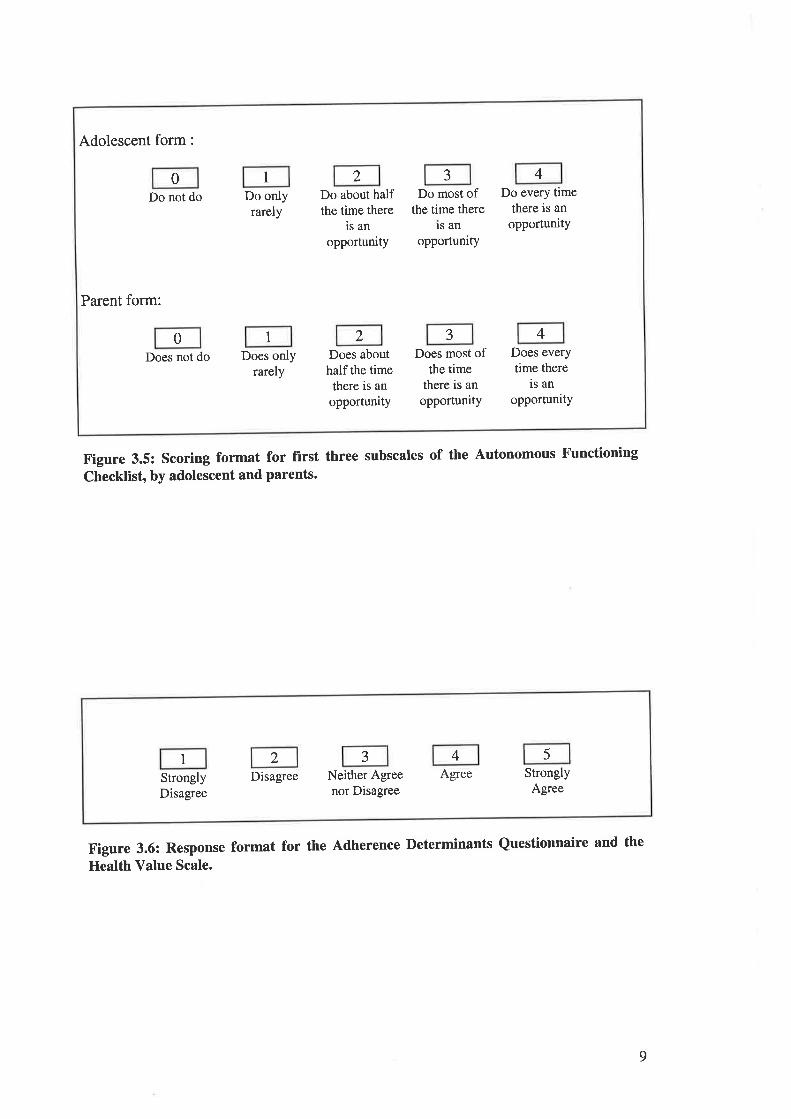
Adolescent form :
Do not do Do onlyrarely
Do about halfthe time there
is an
opportunity
Do most ofthe time there
ls an
opportunity
Do every timethere is an
opportunitY
Parent form:
Does not do Does onlyrarely
Does abouthalf the time
there is an
opportunity
Does most ofthe time
there is an
opportunity
Does everytime there
is an
opportunity
10 2 3 4
0 1 2 J 4
Figure 3.5: Scoring format for first three subscales of the Autonomous Functioning
Checklist, by adolescent and parents.
Figure 3.6: Response format for the Adherence Determinants Questionnaire and the
Health Value Scale.
9
1 2 -J 4 5
StronglyDisagree
Disagree Neither Agreenor Disagree
Agree StronglyAgree
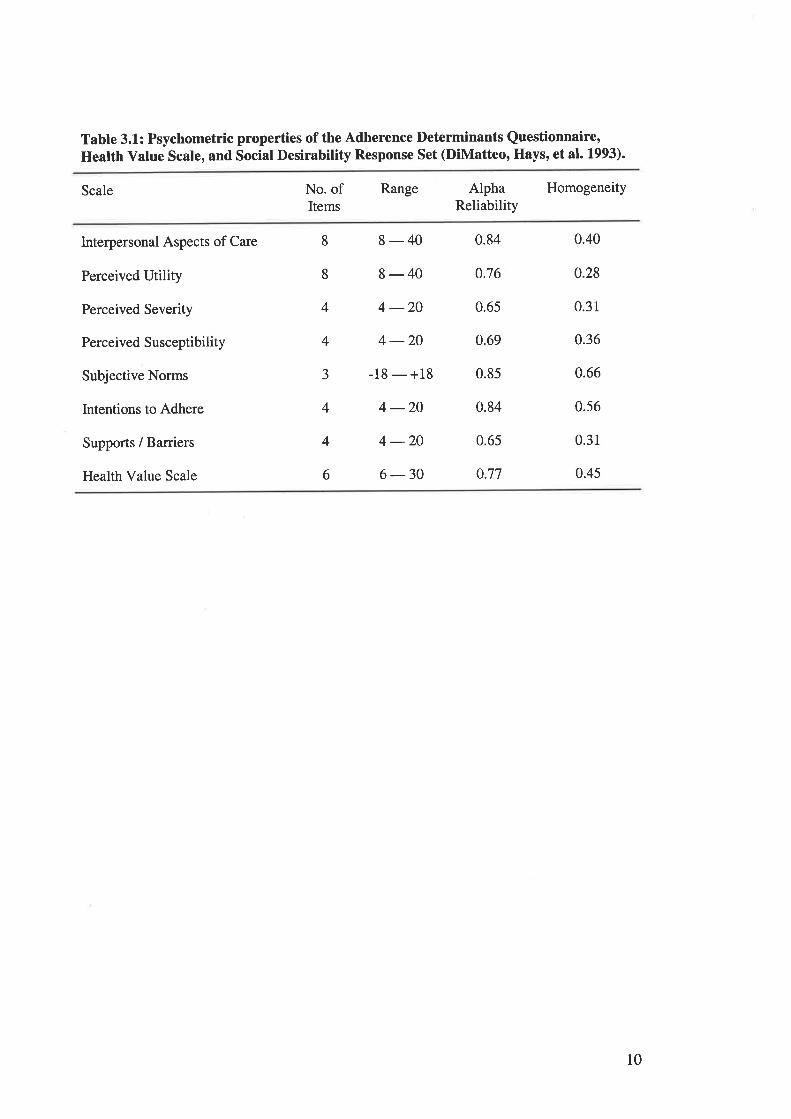
Tabte 3.1: Psychometric properties of the Adherence Determinants Questionnaire,Heatth Value Scale, and Social Desirability Response Set (DiMatteo, Hays, et at. 1.993).
Scale No. ofItems
Range AlphaReliability
Homogeneity
Interpersonal Aspects of Care
Perceived Utility
Perceived Severity
Perceived Susceptibility
Subjective Norms
lntentions to Adhere
Supports / Barriers
Health Value Scale
8-40 0.84
8-40 0.76
4 -204 -20 0.69
-18 - +18 0.85
4 -20 0.84
4 -20 0.65
6-30 0.77
8
8
4
4
J
4
4
6
0.65
0.40
0.28
0.31
0.36
0.66
0.56
0.31
0.45
l0
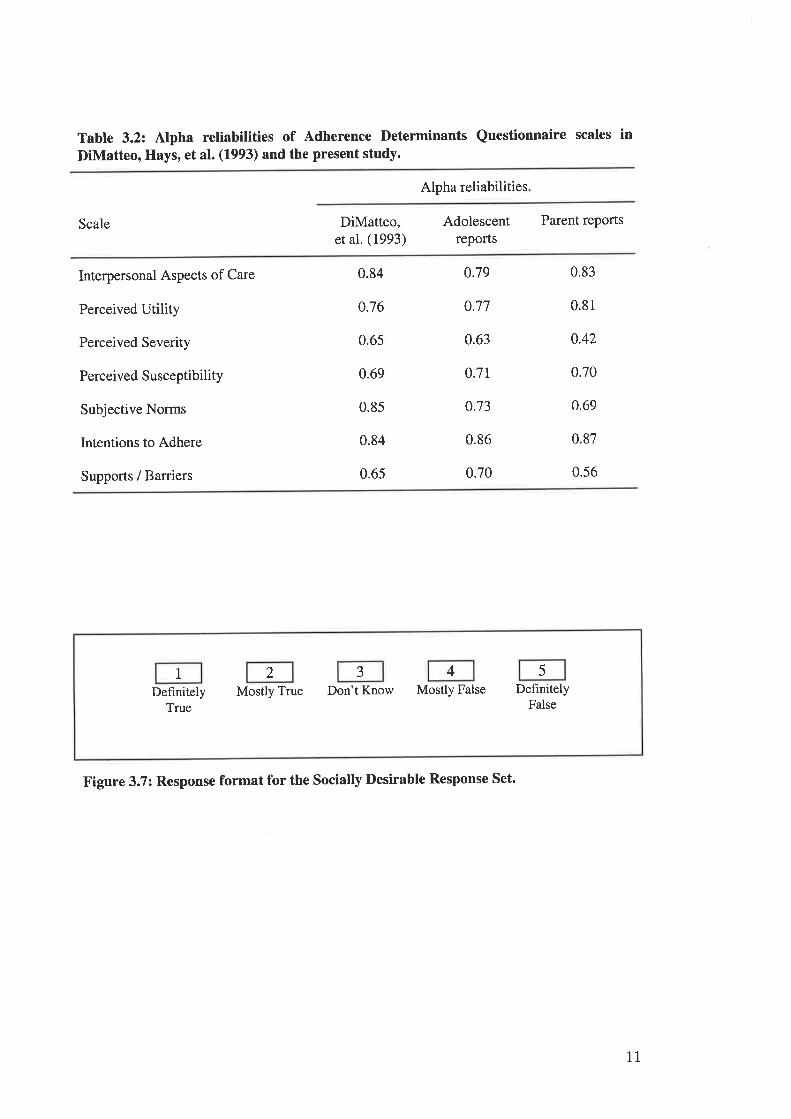
Table 3.2: Alpha reliabilities of Adherence Determinants Questionnaire scales inDiMatteo, Hays, et al. (1993) and the present study.
Alpha reliabilities
Scale DiMatteo,et al. (1993)
Adolescentreports
Parent reports
lnterpersonal Aspects of Care
Perceived Utility
Perceived Severity
Perceived Susceptibility
Subjective Norms
Intentions to Adhere
Supports / Barriers
0.84
o.76
0.65
0.69
0.85
0.84
0.65
0.79
0.77
0.63
o.7t
o.73
0.86
0.70
0.83
0.81
0.42
0.70
0.69
0.87
0.56
I 2 J 4 5
DefinitelyTrue
Mostly True Don't Know Mostly False DefinitelyFalse
Figure 3.7: Response format for the socially Desirable Response Set.
11
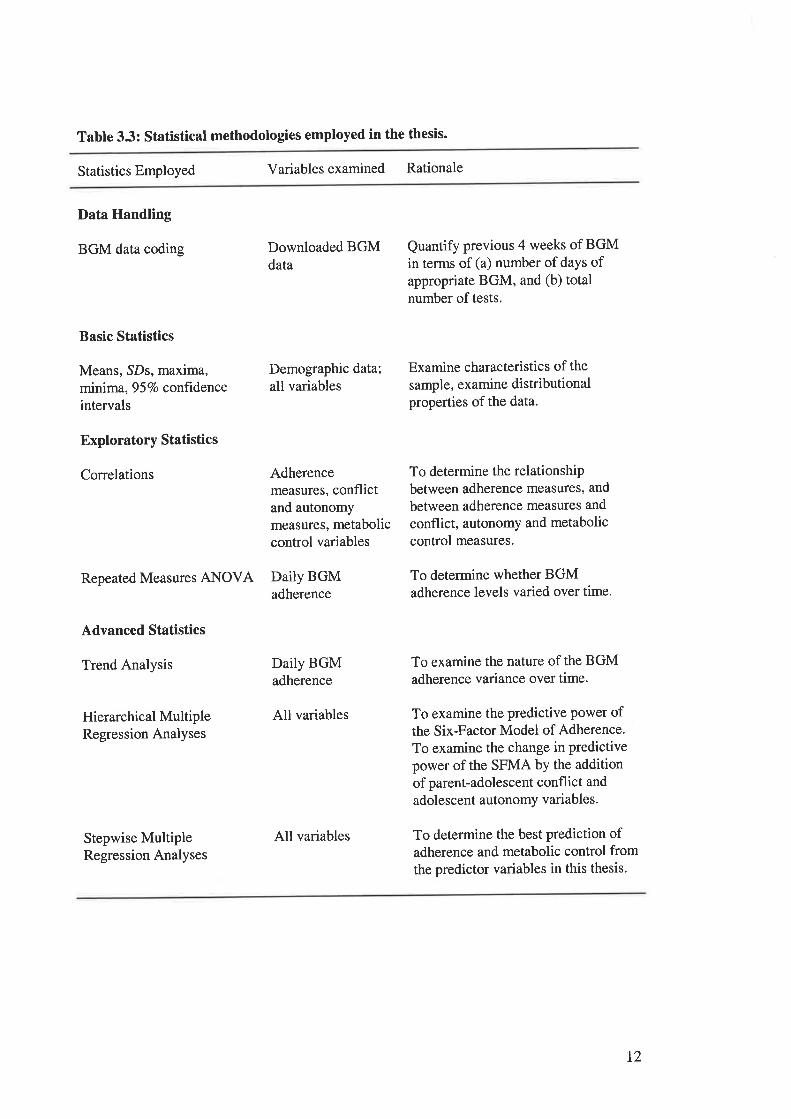
Table 3.3: Statistical methodologies employed in the thesis.
Statistics Employed Variablesexamined Rationale
Data Handling
BGM data coding
Basic Statistics
Means, SDs, maxima,minima, 957o conftdenceintervals
Exploratory Statistics
Correlations
Hierarchical MultipleRegression Analyses
Stepwise MultipleRegression Analyses
Downloaded BGMdata
Demographic data;
all variables
Quantify previous 4 weeks of BGMin terms of (a) number of daYs ofappropriate BGM, and (b) totalnumber of tests.
Examine characteristics of the
sample, examine distributionalproperties of the data.
Repeated Measures ANOVA DailY BGMadherence
Advanced Statistics
Trend Analysis Daily BGMadherence
Adherencemeasures, conflictand autonomymeasures, metaboliccontrol variables
All variables
All variables
To determine the relationshipbetween adherence measures, and
between adherence measures and
conflict, autonomy and metaboliccontrol measures.
To determine whether BGMadherence levels varied over time.
To examine the nature of the BGMadherence variance over time.
To examine the predictive Power ofthe Six-Factor Model of Adherence.
To examine the change in predictivepower of the SFMA by the additionof parent-adolescent conflict and
adolescent autonomy variables.
To determine the best prediction ofadherence and metabolic control fromthe predictor variables in this thesis.
L2

TABLES CITED IN CHAPTBR 4.
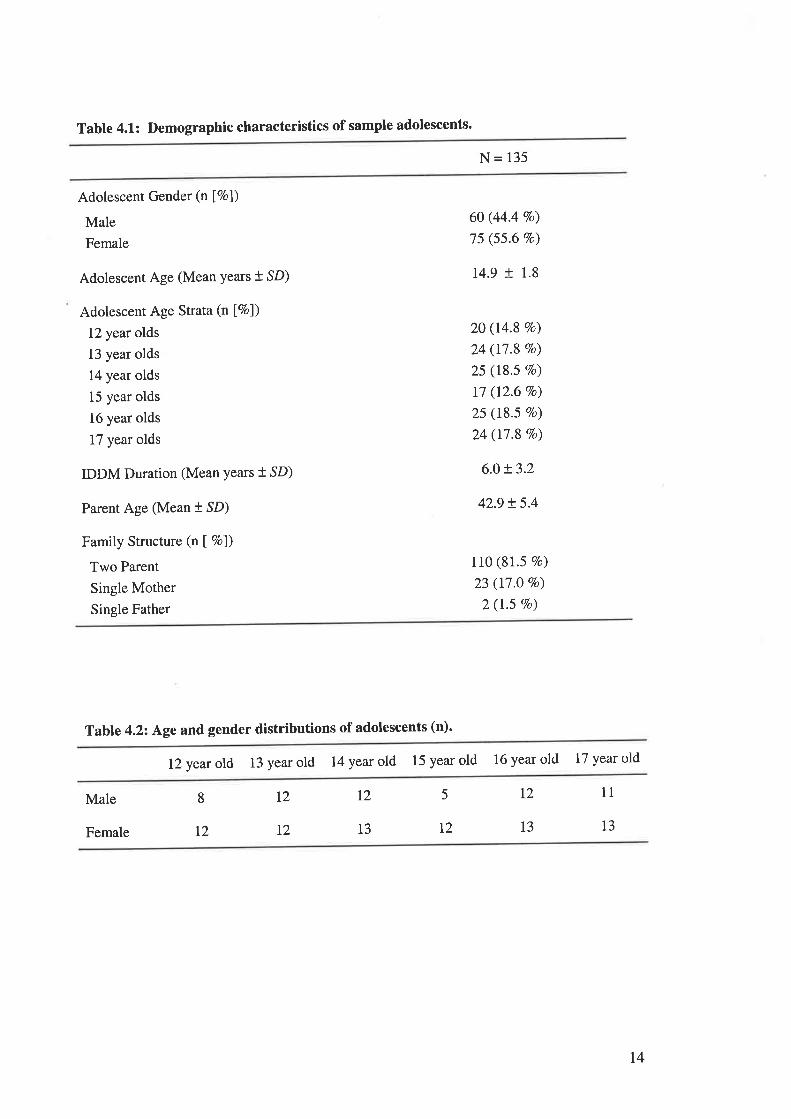
Tabte 4.1: Demographic characteristics of sample adolescents.
N= 135
Adolescent Gender (n Í7ol)
Male
Female
Adolescent Age (Mean Years +,SD)
Adolescent Age Strata (n [Vo])
12 year olds
13 year olds
14 year olds
15 year olds
16 year olds
17 year olds
IDDM Duration (Mean Years + SD)
Parent Age (Mean t SD)
Family Structure (n I Vo])
Two Parent
Single Mother
Single Father
6O (44.4 Vo)
75 (55.6 7o)
14.9 t 1.8
2O (14.8 Vo)
24 (17.8 7o)
25 (18.5 7o)
17 (12.6 7o)
25 (18'5 Vo)
24 (17.8 Vo)
6.0 !3.2
42.9 t 5.4
110 (81.5 7o)
23 (17.O 7o)
2 (1.5 Vo)
Table 4.22 Ãge and gender distributions of adolescents (n)'
12 year old 13 year old 14 year old 15 year old 16 year old 17 year old
Male
Female
115L28 T2
13 12
12
13 13T2 T2
t4
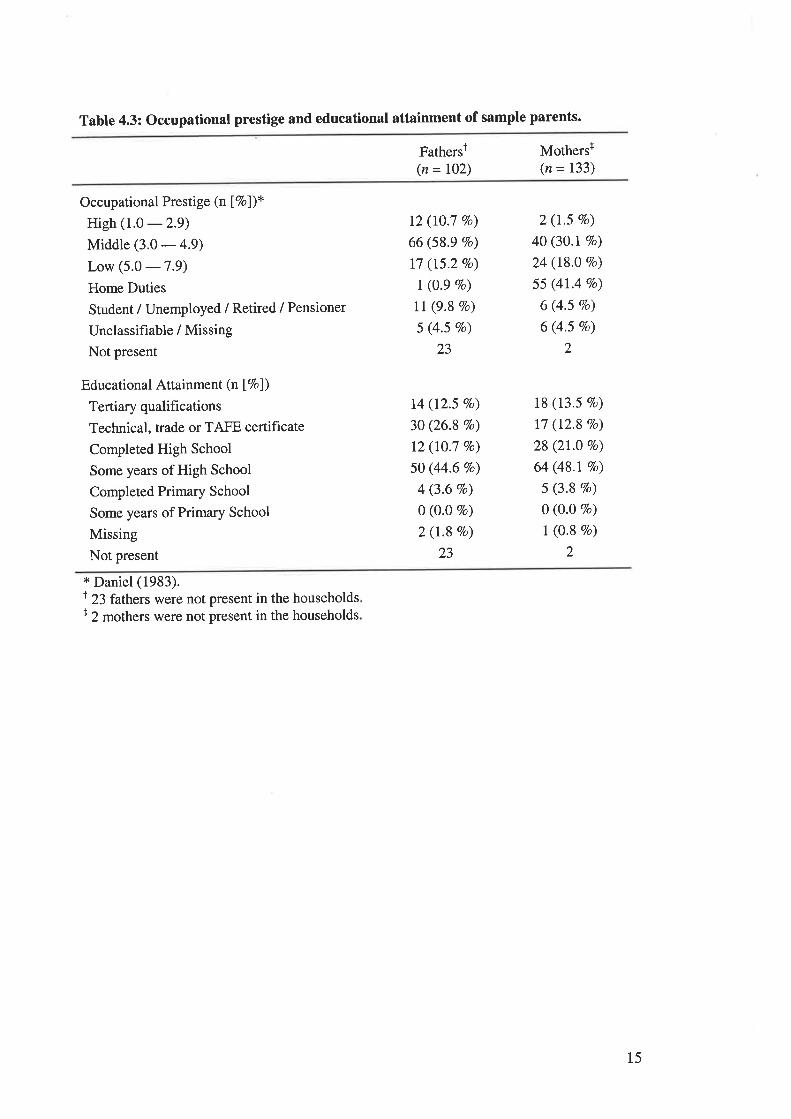
Table 4.3: Occupational prestige and educational attainment of sample parents.
Fathersr(n = 102)
Mothersr(n = 133)
Occupational Prestige (n Í7ol)*High (1.0 -29)Middle (3.0 - 4.9)
Low (5.0 -7.9)Home Duties
Student / Unemployed / Retired / Pensioner
Unclassifiable / Missing
Not present
Educational Attainment (n Í7ol)
Tertiary qualifications
Technical, trade or TAFE certificate
Completed High School
Some years of High School
Completed Primary School
Some years of Primary School
Missing
Not present
12 (10.7 Vo)
66 (58.9 Vo)
l7 (15.2 Vo)
I (0.9 Vo)
ll (9.8 Vo)
5 (4.5 Vo)
23
14 (12.5 7o)
30 (26.8 7o)
12 (10.7 Vo)
50 (44.6 7o)
4 (3.6 Vo)
0 (0.0 7o)
2 (r.8 Vo)
23
2 (1.5 7o)
40 (30.1Vo)
24 (18.0 Vo)
55 (4t.4 Vo)
6 (4.5 Vo)
6 (4.5 7o)
2
18 (13.5 7o)
17 (12.8 7o)
28 (21.0 Vo)
64 (48.17o)
5 (3.8 Vo)
0 (O.o Vo)
I (0.8 Vo)
2
x Daniel (1983).t 23 fathers were not present in the householdsr 2 mothers were not present in the households
15
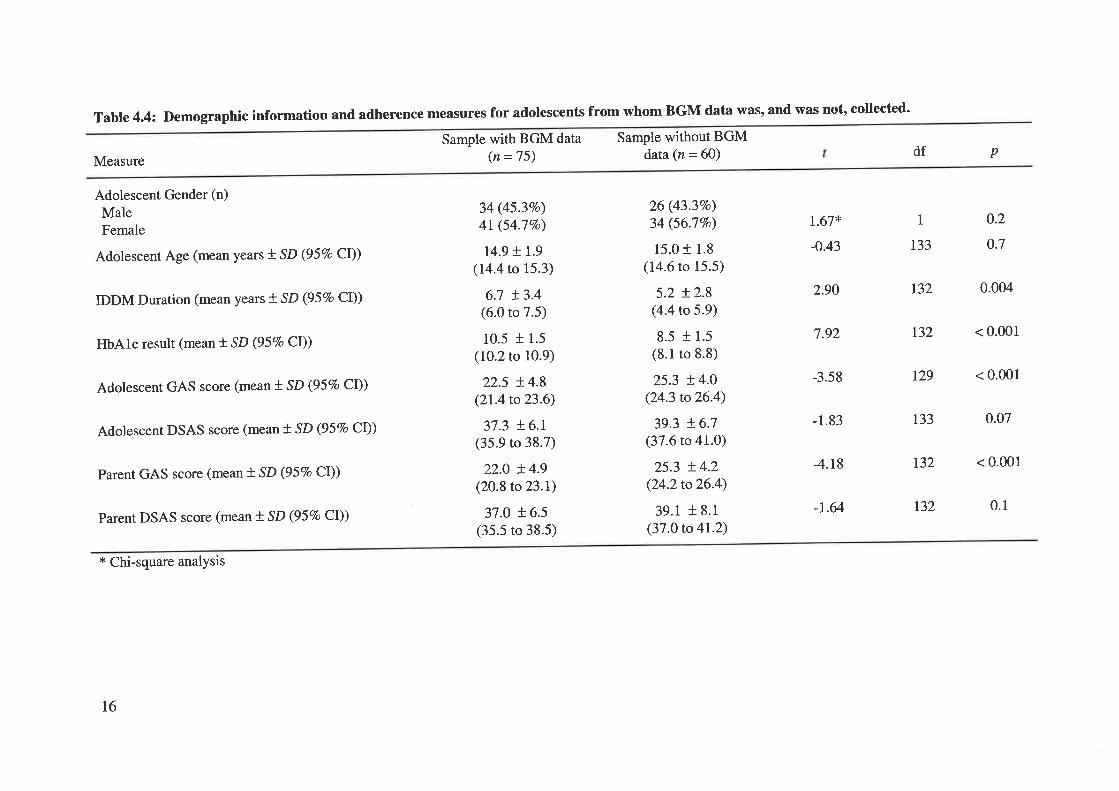
Table 4.4: Demographic
Measure
Adolescent Gender (n)
MaleFemale
Adolescent Age (mean years t SD (95Vo CI))
IDDM Duration (mean years + SD (957o CI))
HbAlc result (mean f SD Q57o Cl))
Adolescent GAS score (mean t SD (95Vo Cl))
Adolescent DSAS score (mean t SD (95Vo CI))
Parent GAS score (mean t SD (957o Cl))
Parent DSAS score (mean f' SD (957o CI))
* Chi-square analysis
information and adherence measures for adolescents from whom BGM data was, and was not, collected'
Sample with BGM data(n =75)
34 (45.37o)
4l (54.7Vo)
r4.9 + 1.9
(14.4 to 15.3)
6.7 !3.4(6.0 to 7.5)
10.5 t 1.5
(10.2 to 10.9)
22.5 + 4.8(2L4to23.6)
37.3 + 6.r(35.9 to 38.7)
22.0 !4.9(20.8 to 23.1)
37.0 ! 6.5(35.5 to 38.5)
Sample without BGMdata (n = 60)
26 (43.3Vo)
34 (56.77o)
15.0 + 1.8
(14.6 to 15.5)
5.2 + 2.8(4.4 to 5.9)
8.5 l 1.5
(8.1 to 8.8)
25.3 + 4.0(24.3 to26.4)
39.3 + 6.7(37.6 to 41.0)
25.3 + 4.2(24.2to26.4)
39.1 t 8.1
(37.0 to 41.2)
df p
r.67*
-0.43
2.90
7.92
-3.58
-1.83
4.18
-1.64
0.2
o.7
1
r33
r32 0.004
r32 < 0.001
129 < 0.001
133 0.07
r32 < 0.001
0.1t32
16
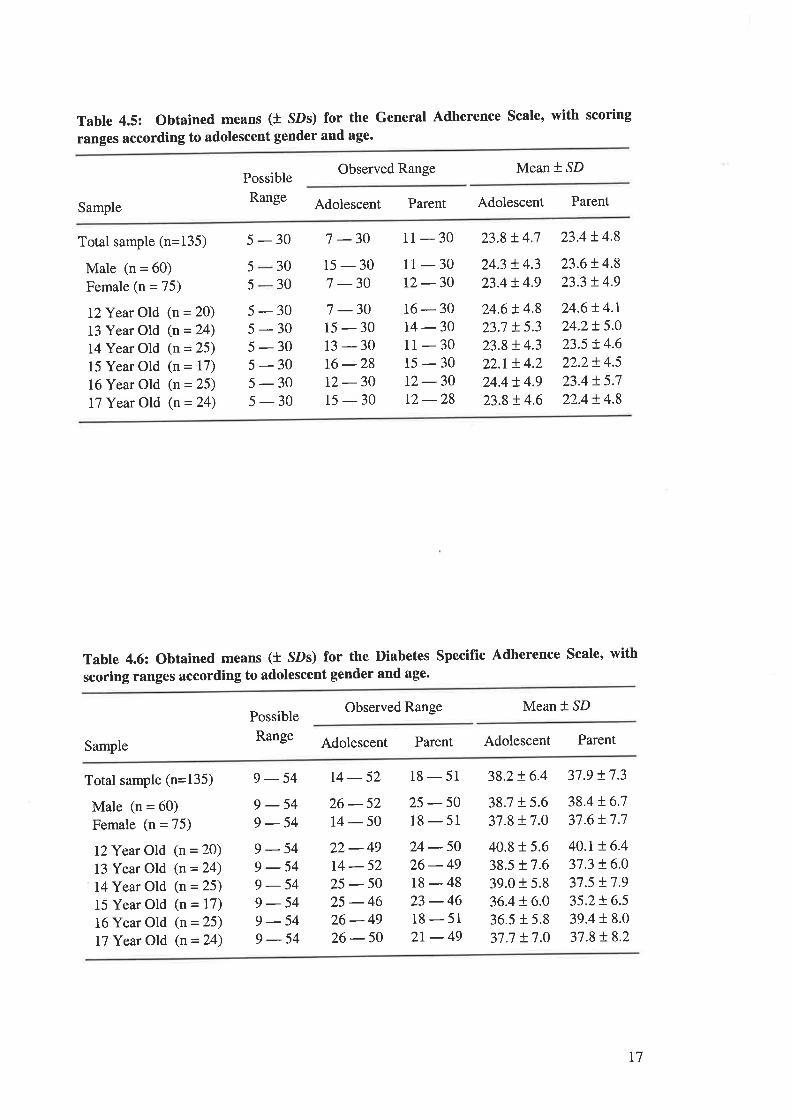
Table 4.5: Obtained means (t SDs) for the General Adherence Scale, with scoring
ranges according to adolescent gender and age.
Possible
Range
Observed Range Mean * SD
Sample Adolescent Parent Adolescent Parent
Total sample (n=135)
Male (n = 60)Female (n = 75)
I2Year Old (n = 20)
13 Year Old (n = 24)
14 Year Old (n = 25)
15 Year Old (n = 17)
16 Year Old (n = 25)
17 Year Old (n = 24)
5-30 7-30 11-30 23.8+4.7 23.4+4.8
5
5 30
30
5-305-305-305-305-30s-30
15-307 -30
11-3012 -3016-30t4 -3011-3015-3012 -30t2-28
24.3 + 4.3
23.4 !4.9
24.6 ! 4.8
23.7 !5.323.$ + 4.3
22.r t4.224.4 + 4.9
23.8 ! 4.6
23.6t4.823.3 !4.9
24.6!4.r24.2!5.023.5 !4.622.2+ 4.5
23.4 !.5.722.4 t 4.8
7 -3015-3013-3016 -2812-3015-30
Table 4.6: Obtained means (t SDs) for the Diabetes Specific Adherence Scale, with
scoring ranges according to adolescent gender and age'
Observed Range Mean + SD
Sample
Possible
Range Adolescent Parent Adolescent Parent
Total sample (n=135)
Male (n = 60)
Female (n = 75)
IZYear Old (n = 20)
13 Year Old (n = 24)
14Year Old (n = 25)
15 Year Old (n = 17)
16 Year Old (n = 25)
17 Year Old (n = 24)
g - 54 14 - 52 18 - 51 38.2+ 6.4 37.9 !7.3
9-549-549-549-549-549-549-549-54
26-5214-5022-4914-5225-5025-4626-4926-50
25 -5018-5124-5026-4918-4823 -4618 - 51
2r-49
38.7 !5.637.8 + 7.0
40.8 r 5.6
38.5 r 7.6
39.0 + 5.8
36.4 + 6.0
36.5 + 5.8
37.7 !.7.0
38.4 t6.737.6+ 7.7
40.t + 6.4
37.3 + 6.0
37.5 !7.935.2r6.539.4 r 8.0
37.8 !8.2
t7
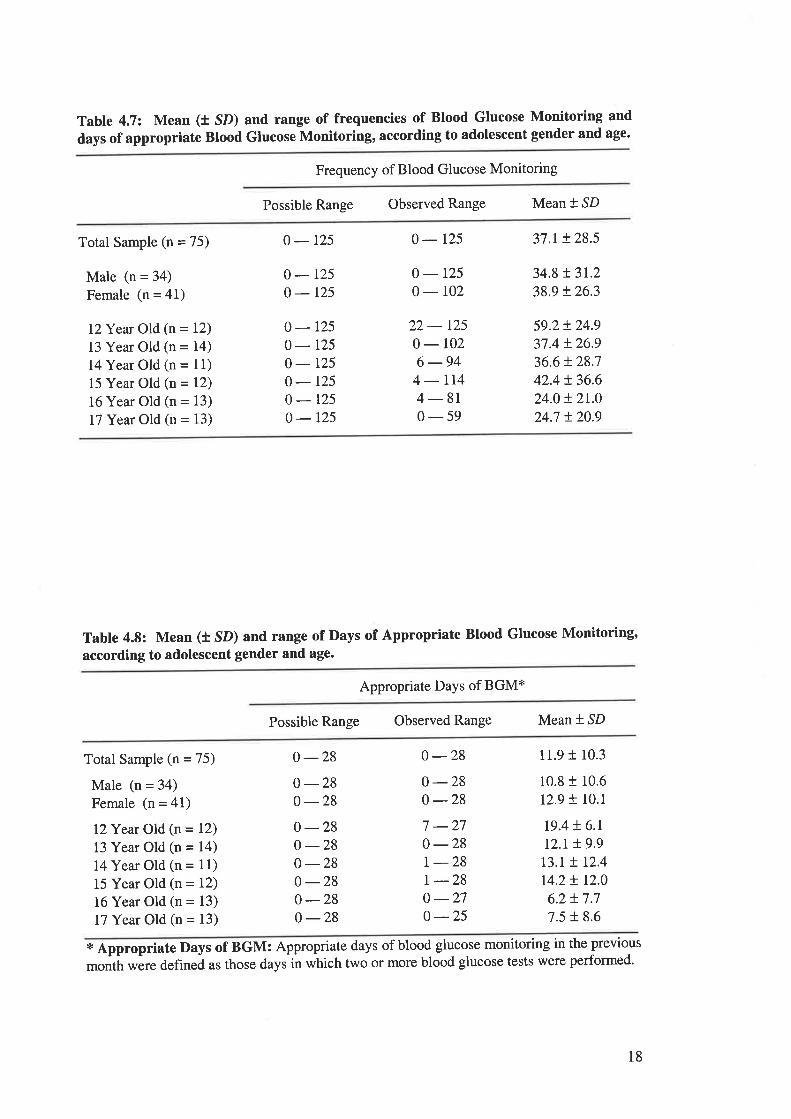
Table 4.7: Mean (t SD) and range of frequencies of Blood Glucose Monitoring and
days of appropriate Blood Glucose Monitoring, according to adolescent gender and age.
Frequency of Blood Glucose Monitoring
Possible Range Observed Range Mean * SD
Total Sample (n = 75)
Male (n = 34)
Female (n = 41)
I?Year Old (n = 12)
13 Year Old (n = 14)
14 Year Old (n = l1)15 Year Old (n = 12)
16 Year Old (n = 13)
I7 Year Old (n = 13)
o-r25
0-1250-r25
0-r250-r250-r250-r250-t250-r25
0-t25
0-1250-r02
22 - r250- 102
6 -944-lr44-810-59
37.r + 28.5
34.8 t 3r.238.9 + 26.3
59.2 + 24.9
37.4 + 26.9
36.6 t 28.7
42.4 t36.624.0 + 21.0
24.7 + 20.9
Table 4.8: Mean (t SD) and range of Days of Appropriate Blood Glucose Monitoring,
according to adolescent gender and age.
Appropriate Days of BGM*
Possible Range Observed Range Mean * SD
Total Sample (n = 75)
Male (n = 34)
Female (n = 41)
I?Year Old (n = 12)
13 Year Old (n = 14)
I4Year Old (n = 11)
15 Year Old (n = 12)
16 Year Old (n = 13)
17 Year Old (n = 13)
0 -280 -280 -280 -280-280 -280 -280-280 -28
0-280 -28o -287 -270-28| -28r -28o -270 -25
11.9 t 10.3
10.8 t 10.6
12.9 f 10.1
r9.4 ! 6.rt2.r t9.9t3.L + 12.4
t4.2 t 12.0
6.2 !7.77.5 + 8.6
* Appropriate Days of BGM: Appropriate days of blood glucose monitoring in the previous
more blood glucose tests were performed'month were defined as those days in which t'wo or
18
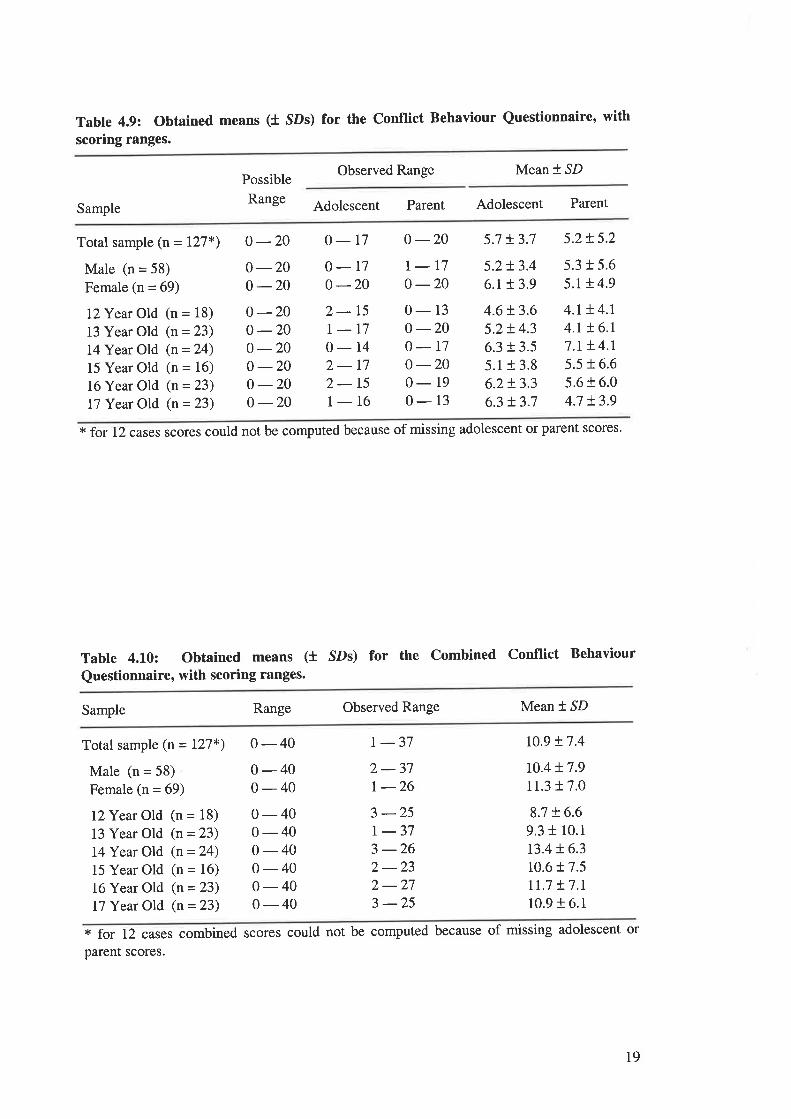
Table 4.9: Obtained means (t SDs) for the Conflict Behaviour Questionnaire, with
scoring ranges.
Possible
Range
Observed Range Mean * SD
Sample Adolescent Parent Adolescent Parent
Total sample (n= 127*)
Male (n = 58)
Female (n = 69)
l?Year Old (n = 18)
13 Year Old (n = 23)
I4Year Old (n = 24)
15 Year Old (n = 16)
16 Year Old (n = 23)
I7 Year Old (n = 23)
0-20 o-17 0-20 5.7 !3.7 5.2t5.2
0 -200 -200 -200 -200 -200 -200 -200 -20
o-r70 -202-15I_170- 14
2-172-151- 16
r-t70 -200-13o -200-r70 -200- 19
0-13
5.2!3.46.1 r 3.9
4.6 t3.65.2+ 4.3
6.3 r 3.5
5.1+ 3.8
6.2+ 3.3
6.3 + 3.7
5.3 t 5.6
5.1 ! 4.9
4.r !4.r4.r !6.17.r !.4.r5.5 t 6.6
5.6 t 6.0
4.7 L3.9
* for 12 cases scores could not be computed because of missing adolescent or parent scores.
Table 4.10: Obtained means (f SDs) for the Combined Conflict Behaviour
Questionnaire, with scoring ranges.
Sample Range Observed Range Mean * SD
Total sample (n = L27*)
Male (n = 58)
Female (n = 69)
I2Year Old (n = 18)
13 Year Old (n = 23)
l4Year Old (n = 24)
15 Year Old (n = 16)
16 Year Old (n = 23)
17 Year Old (n = 23)
0-400-400-400-400-400-400-400-400-40
| -372-37r -263 -25| -373 -262-232-273 -25
10.9 + 7.4
t0.4 + 7.9
11.3 t 7.0
8.7 + 6.6
9.3 t 10.1
r3.4 !6.310.6 t 7.5
tr.1 + 7.r10.916.1
* for 12 cases combined scores could not be computed because of missing adolescent or
parent scores.
t9
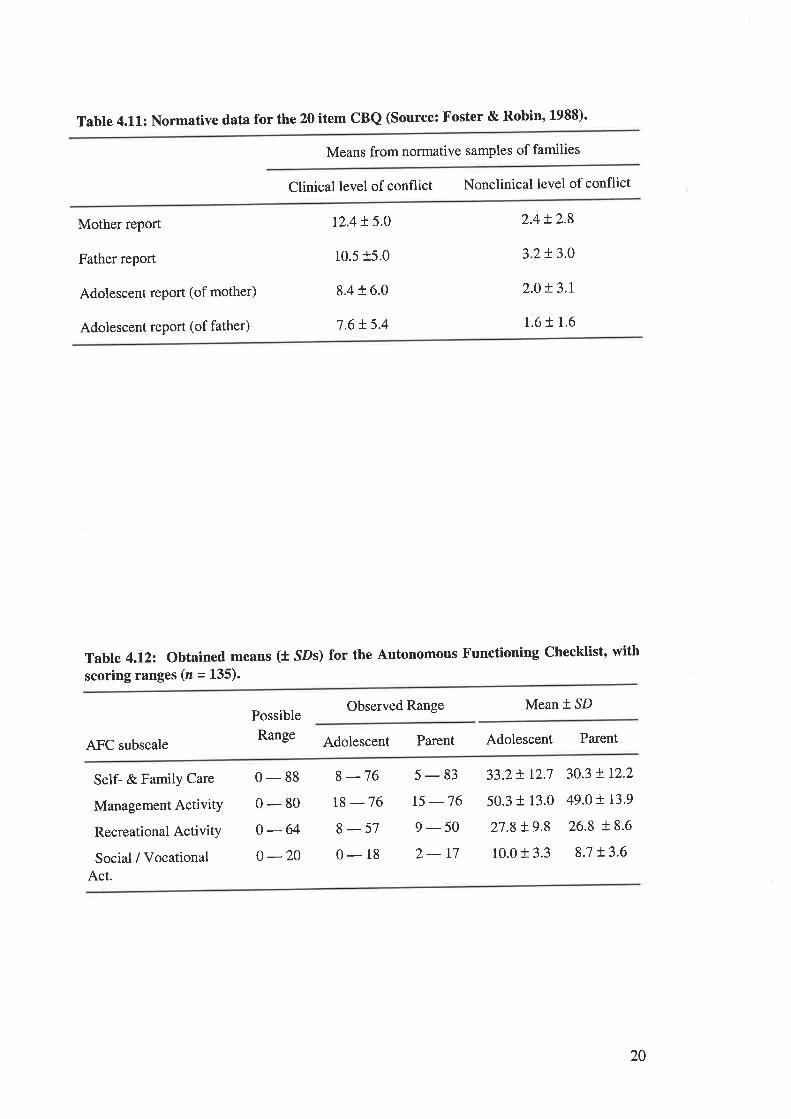
Table 4.11: Normative data for the 20 item CBQ (Source: Foster & Robin, 1988)'
Means from normative samples of families
Clinical level of conflict Nonclinical level of conflict
Mother report
Father report
Adolescent report (of mother)
Adolescent report (of father)
12.4 !.5.0
10.515.0
8.416.0
7.6 L 5.4
2.4t2.8
3.2t3.0
2.0!3.r
1.6 t 1.6
Table 4.122 Obtained means (t sDs) for the autonomous Functioning checklist, with
scoring ranges (z = 135).
Observed Range Mean * SD
AFC subscale
Possible
Range Adolescent Parent Adolescent Parent
Self- & Family Care
Management ActivitY
Recreational ActivitY
Social / VocationalAct.
0-880-800-64o -20
8 -7618 -768-570-18
5-83t5 -769-502- 17
33.2+ 12.7 30.3 t12.2
50.3 + 13.0 49.0 r. r3.9
27.8+9.8 26.8 +8.6
10.0 + 3.3 8.7 t3.6
20
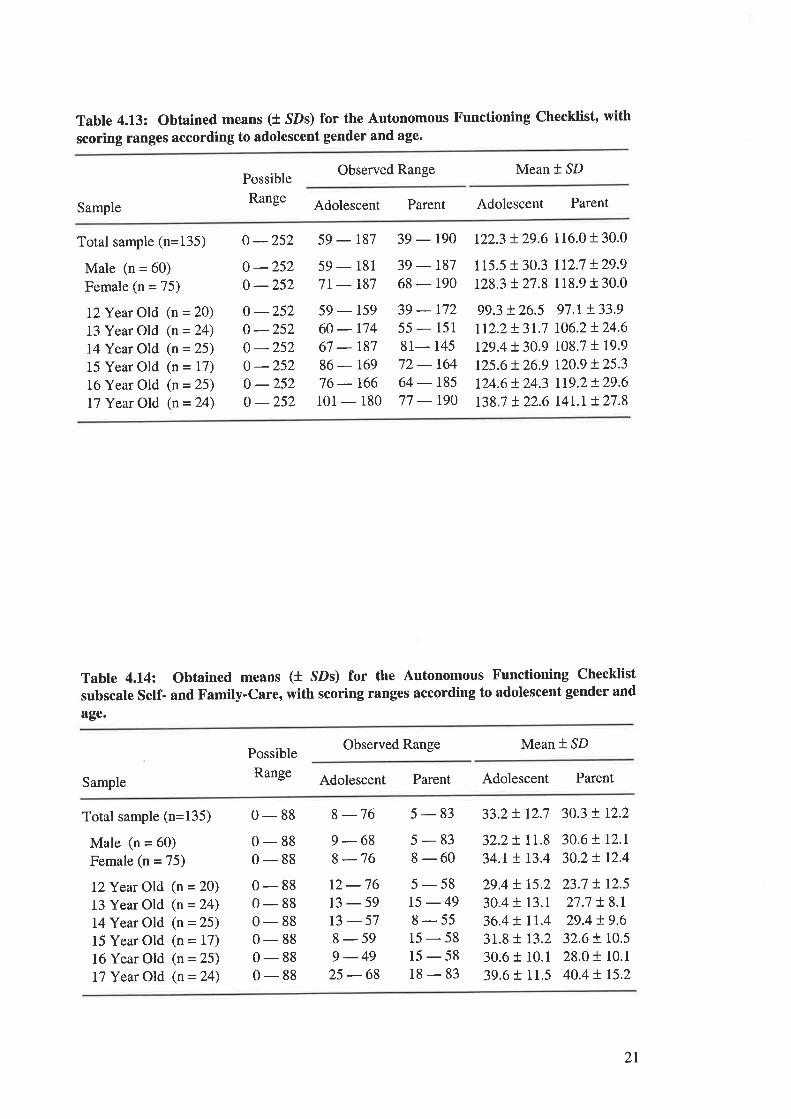
Table 4.13: Obtained means (t SDs) for the Autonomous Functioning Checklist, with
scoring ranges according to adolescent gender and age.
Possible
Range
Observed Range Mean * SD
Sample Adolescent Parent Adolescent Parent
Total sample (n=135)
Male (n = 60)
Female (n = 75)
l2Year Old (n = 20)
13 Year Old (n=24)14 Year Old (n = 25)
15 Year Old (n = 17)
16 Year Old (n = 25)
17 Year Old (n = 24)
o -252 59 - 187 39 - 190 122.3 t29.6 116.0 t 30.0
0 -2520 -252
59 - 181
7t - r87
59 - 159
60 - r7467 - 187
86 - 169
76 - 166101 - 180
39 - 187
68 - 190
39 - 172
55 - 151
81- 145
72 - t6464 - t8577 - r90
115.5 r 30.3 112.7 !29.9128.3 t27.8 118.9 t 30.0
0 -252o -2520 -2520 -2520 -2520 -252
99.3 t26.5rr2.2t31.7t29.4 !30.9125.6 t 26.9
t24.6!24.3t38.7 t22.6
97.1+ 33.9
t06.2L24.6108.7 t 19.9
t20.9 !25.3rr9.2!29.6t4r.t + 27.8
Table 4.14: Obtained means (l SDs) for the Autonomous Functioning Checklist
subscale Self- and Family-Care, with scoring ranges according to adolescent gender and
age.
Possible
Range
Observed Range Mean * SD
Sample Adolescent Parent Adolescent Parent
Total sample (n=135)
Male (n = 60)
Female (n = 75)
l2Year Old (n = 20)
13 Year Old (n = 24)
14 Year Old (n = 25)
15 Year Old (n = 17)
16 Year Old (n = 25)
17 Year Old (n = 24)
0 - 88 8 -76 5 - 83 33.2 ! 12.7 30.3 t r2.2
0-880-880-880-880-880-880-880-88
9-68I -76
5-838-605-5815-498-5515-5815-5818-83
32.2t1r.8 30.6tr2.134.r!13.4 30.2!r2.4
12 -7613-5913-578-599-49
25 -68
29.4 ! 15.2
30.4 + 13.1
36.4 ! rt.431.8 + t3.230.6 r 10.1
39.6 r 11.5
23.7 t r2.527.7 ! 8.1
29.4 t9.632.6 ! t0.528.0 r 10.1
40.4 t r5.2
2I
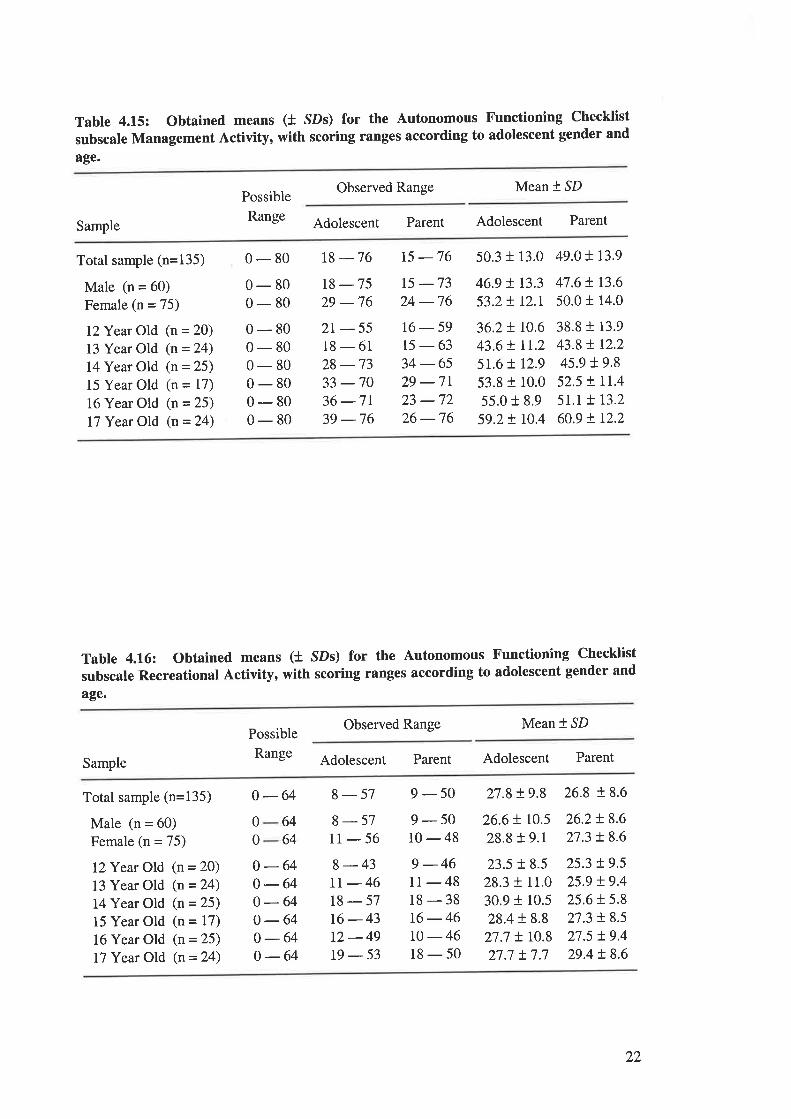
Table 4.15: Obtained means (t SDs) for the Autonomous Functioning Checklist
subscale Management Activity, with scoring ranges according to adolescent gender and
age.
Observed Range Mean * SD
Sample
Possible
Range Adolescent Parent Adolescent Parent
Total sample (n=135)
Male (n = 60)
Female (n = 75)
lZYear Old (n = 20)
13 Year Old (n = 24)
14Year Old (n = 25)
15 Year Old (n = 17)
16 Year Old (n = 25)
17 Yeæ Old (n = 24)
0 - 80 18 -76 15 -76 50.3 + 13.0 49.0! r3.9
46.9 t r3.3 47.6 !. 13.6
53.2 t r2.l 50.0 t 14.00-800-800-800-800-800-800-800-80
18-7529 -762r-5518-6128 -7333 -7036 -7r39 -76
t5 -7324 -7616-5915-6334 -6529 -7r23 -7226 -76
36.2 t 10.6
43.6 ! lt.25r.6 ! 12.9
53.8 + 10.0
55.0 r 8.9
59.2 + r0.4
38.8 r 13.9
43.8 ! r2.245.9 19.852.5 ! LL.4
5r.r L 13.2
60.9 t 12.2
Table 4.16: Obtained means (t SDs) for the Autonomous Functioning Checklist
subscale Recreational Activity, with scoring ranges according to adolescent gender and
age.
Observed Range Mean * SD
Sample
Possible
Range Adolescent Parent Adolescent Parent
Total sample (n=135)
Male (n = 60)
Female (n = 75)
IZYear Old (n = 20)
13 Year Old (n = 24)
14 Year Old (n = 25)
15 Year Old (n = 17)
16 Year Old (n = 25)
17 Year Old (n = 24)
8-43tt-4618-5716-4312-49t9-53
9 -4611-4818-3816-46r0 -4618-50
26.6 ! 10.5
28.8 f 9.1
23.5 + 8.5
28.3 r 11.0
30.9 + 10.5
28.4 t 8.8
27.7 ! r0.827.7 t7.7
o-64 8-57 9-50 27.8+9.8 26.8+8.6
00
0-64o-640 -640 -640-640-64
8-5711-56
9-5010-48
26.2!8.627.3 ! 8.6
6464
25.3 t9.525.9 !9.425.6 + 5.8
27.3 t 8.5
27.5 !9.429.4 t8.6
22
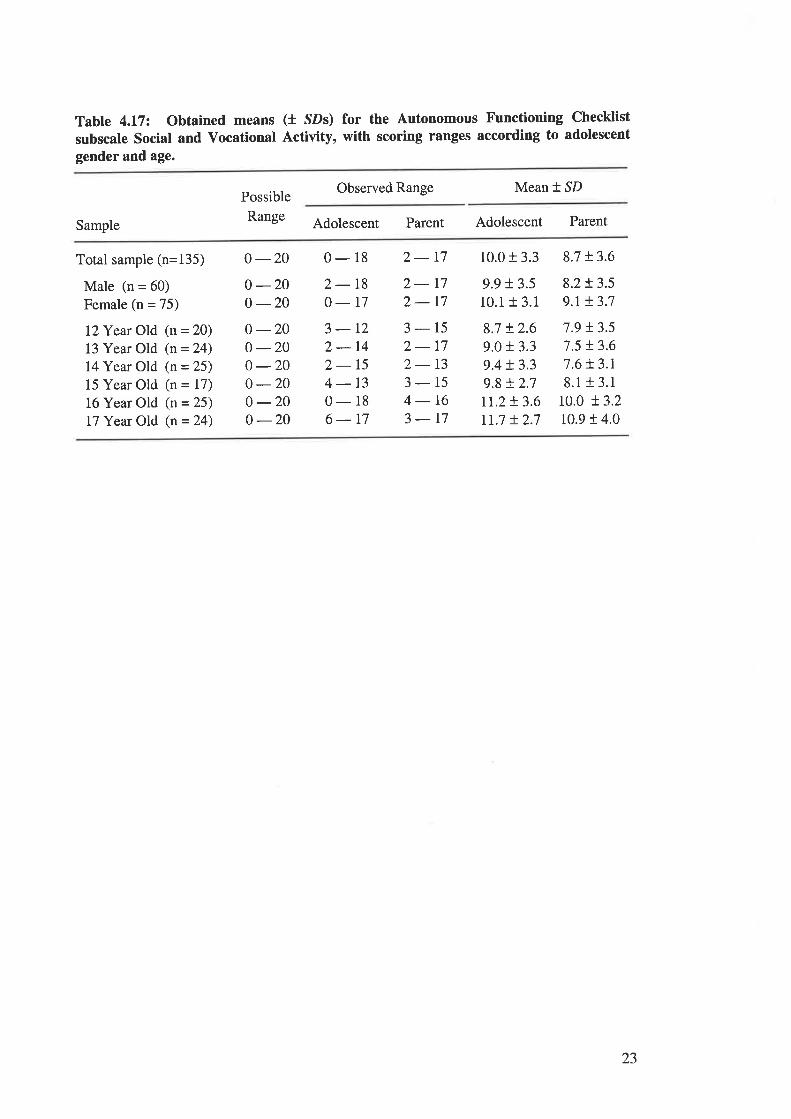
Table 4.17: Obtained means (l SDs) for the Autonomous Functioning Checklist
subscale Social and Vocational Activity, with scoring ranges according to adolescent
gender and age.
Possible
Range
Observed Range Mean * SD
Sample Adolescent Parent Adolescent Parent
Total sample (n=135)
Male (n = 60)
Female (n = 75)
lZYear Old (n = 20)
13 Year Old (n = 24)
14Year Old (n = 25)
15 Year Old (n = 17)
16 Year Old (n = 25)
17 Year Old (n = 24)
0 -200 -200 -200 -200 -200 -200 -200 -200 -20
0-182-180-173-122-142-154-130-186-t7
2-172- r72-173-152-172- 13
3-154-t63-r7
10.0 + 3.3
9.9 + 3.5
10.1 + 3.1
8.7 !2.69.0 i 3.3
9.4 !3.39.8 !.2.7rr.2 t 3.6rr.7 + 2.7
8.7 !3.6
8.2!3.59.t + 3.7
7.9 !3.57.5 !3.67.6 t 3.r8.1 r 3.1
r0.0 !3.210.9 r 4.0
23
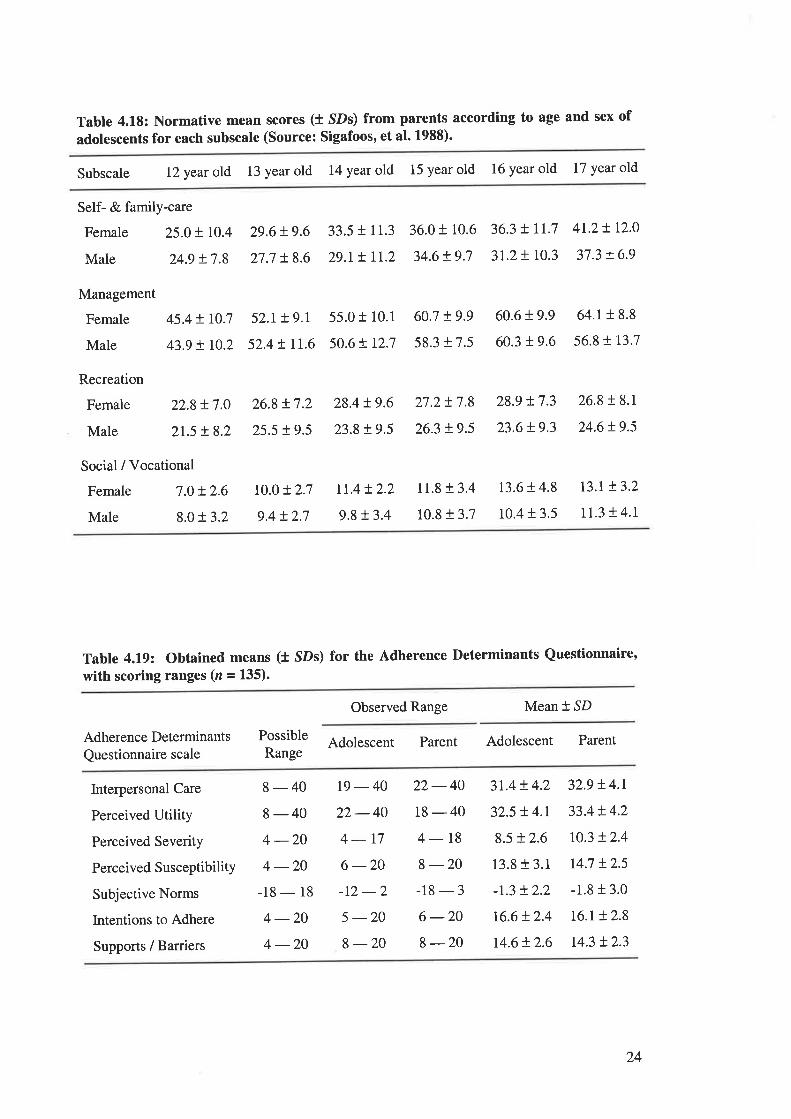
Tabte 4.L8: Normative mean scores (l SDs) from parents according to age and sex of
adolescents for each subscale (Source: Sigafoos, et al. 1988)'
Subscale 12 year old 13 year old 14 year old 15 year old 16 year old 17 year old
Self- & family-care
Female 25.0 t I0.4
Male 24.9 + 7.8
29.6 + 9.6
27.7 + 8.6
33.5 t 11.3
29.r ! lr.2
36.0 + 10.6
34.6!9.7
36.3 + rr.7
3t.2+ 10.3
4r.2 ! r2.0
37.3 t6.9
Management
Female
Male
Recreation
Female
Male
45.4 ! r0.7
43.9 t r0.2
52.1+ 9.r
52.4 t rI.655.0 t 10.1
50.6tr2.7
60.7 !9958.317.5
60.6 + 9.9
60.3 t 9.6
64.1 r 8.8
56.8 r 13.7
Social / Vocational
Female 7.0 + 2.6
Male 8.01 3.2
22.8 !7.0
2r.5 !8.2
26.8 !7.2
25.5 t9.5
28.4 t9.6
23.8 t9.5
27.2!7.8
26.3 + 9.5
11.8 + 3.4
10.8 + 3.7
28.9 t 7.3
23.6 + 9.3
13.6 + 4.8
10.4 + 3.5
26.8 r 8.1
24.6t9.5
t3.t t3.2
11.3 t 4.1
r0.0 + 2.7
9.4!2.7
rr.4!2.2
9,8 t 3.4
Table 4.19: Obtained means (t SDs) for the Adherence I)eterminants Questionnaire,with scoring ranges (z = 135).
Observed Range Mean * SD
Adherence Determinants
Questionnaire scaleAdolescent Parent Adolescent ParentPossible
Range
Interpersonal Care
Perceived Utility
Perceived Severity
Perceived SusceptibilitY
Subjective Norms
Intentions to Adhere
Supports / Barriers
8-408-404 -204 -20
-18 - 18
4 -204 -20
t9-4022-404-r76 -20-t2-25 -208-20
22-4018-404- 18
8 -20-18-36 -20I -20
3t.4 + 4.2
32.5 !4.r8.5 + 2.6
13.8 f 3.1
-r.3 t2.2
16.6r.2.4
14.6 t 2.6
32.9 !4.r33.4 !4.2
r0.3 + 2.4
r4.7 !25-1.8 r 3.0
16.r !2.8
r4.3 t2.3
24
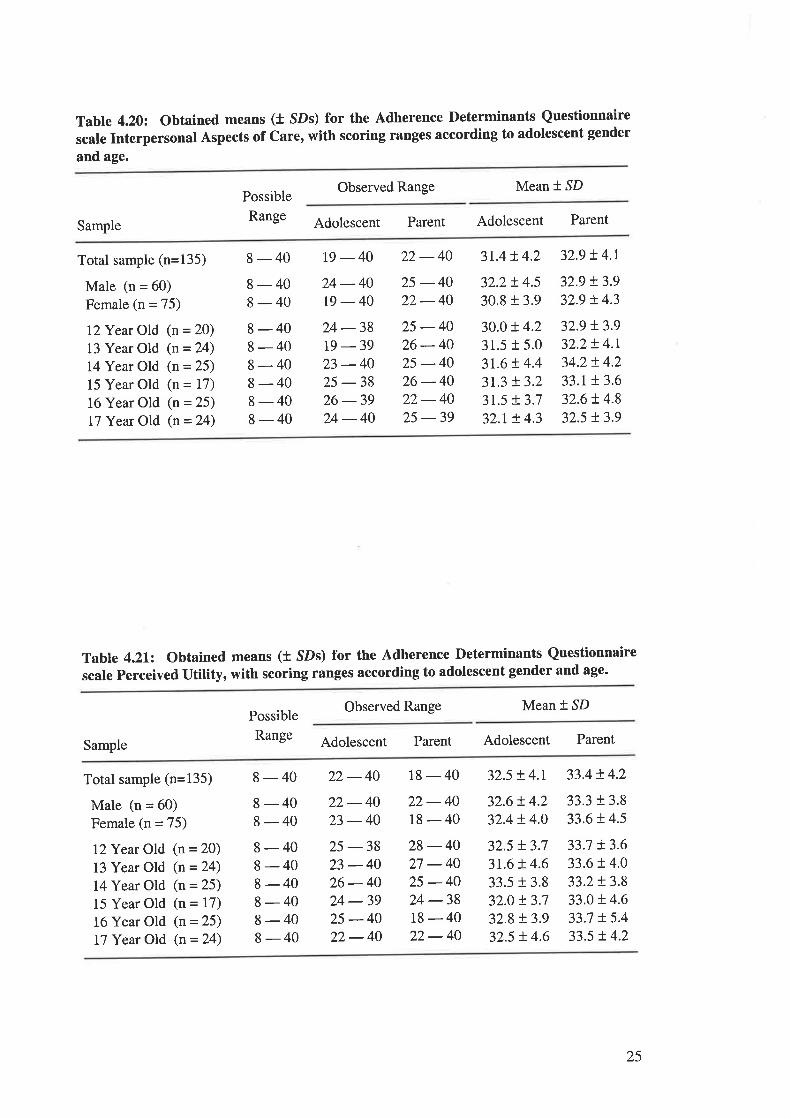
Table 4.20: Obtained means (t SDs) for the Adherence Determinants Questionnaire
scale Interpersonal Aspects of Care, with scoring ranges according to adolescent gender
and age.
Possible
Range
Observed Range Mean * SD
Sample Adolescent Parent Adolescent Parent
Total sample (n=135)
Male (n = 60)
Female (n = 75)
12Year Old (n = 20)
13 Year Old (n = 24)
14Year Old (n = 25)
15 Year Old (n = 17)
16 Year Old (n = 25)
17 Year Old (n = 24)
8 - 40 19 - 40 22 - 40 31.4 r.4.2 32.9 ! 4.r
8-408-408-408-408-408-408-408-40
24 -4019-4024 -3819 -3923 -4025 -3826 -3924-40
25 -4022 -4025-4026-4025 -4026-4022- 4025 -39
32.2 ! 4.5
30.8 t 3.9
30.0 ! 4.231.5 t 5.0
3r.6 !.4.43r.3 t3.23t.5 X3.732.t ! 4.3
32.9 !3.932.9 t 4.3
32.9 !3.932.2 t 4.1
34.2 ! 4.2
33.1!3.632.6 ! 4.8
32.5 t3.9
Table 4.2L2 Obtained m€ans (t SDs) for the Adherence Determinants Questionnaire
scale Perceived utility, with scoring ranges according to adolescent gender and age.
Observed Range Mean * SD
Sample
Possible
Range Adolescent Parent Adolescent Parent
Total sample (n=135)
Male (n = 60)
Female (n = 75)
I2Year Old (n = 20)
13 Year Old (n = 24)
14Year Old (n = 25)
15 Year Old (n = 17)
16 Year Old (n = 25)
17 Year Old (n = 24)
8 - 40 22 - 40 18 - 40 32.5 ! 4.r 33.4 t 4.2
8-408-408-408-408-408-408-408-40
22-4023 -4025 -3823 -4026-4024 -3925 -4022-40
22-4018-4028-4027 -4025 -4024 -3818-4022- 40
32.6 ! 4.232.4 + 4.0
33.3 t 3.8
33.6 t 4.5
32.5 t3.73r.6 ! 4.6
33.5 r 3.8
32.0 t3.732.8 !3.932.5 ! 4.6
33.7 + 3.6
33.6 t 4.0
33.2!3.833.0 + 4.6
33.7 + 5.4
33.5 r.4.2
25
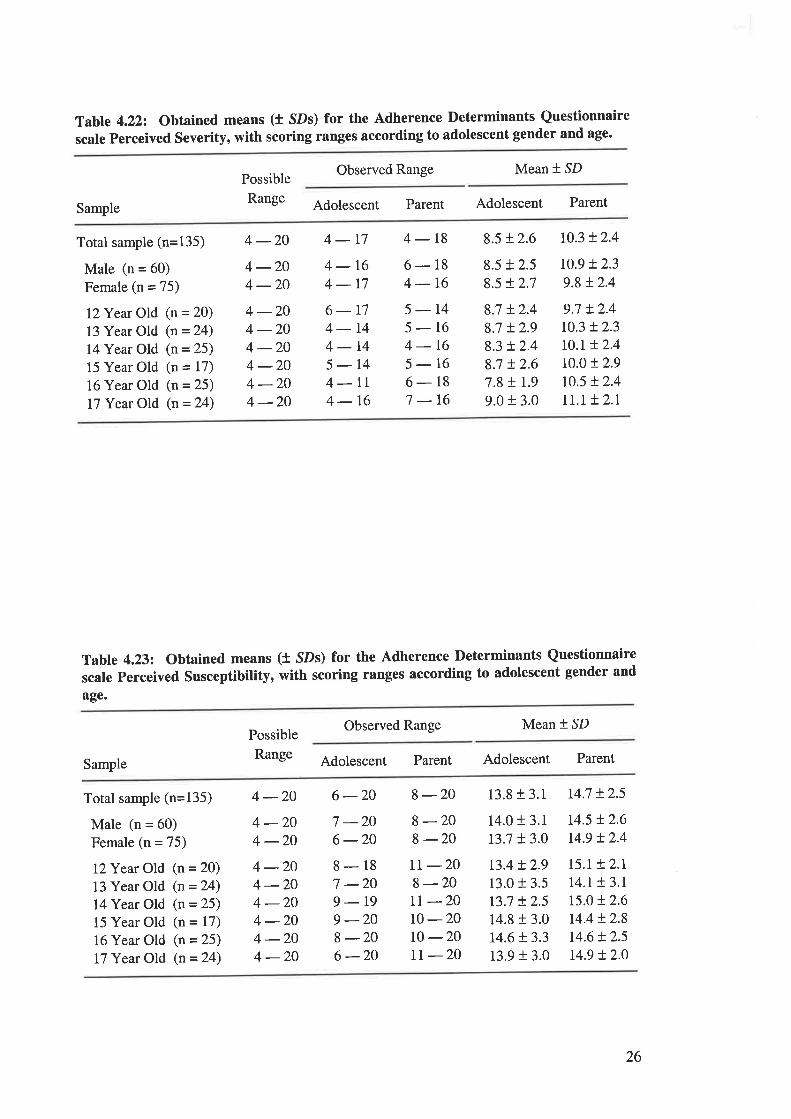
Table 4.222 Obtained means (t SDs) for the Adherence Determinants Questionnaire
scale perceived Severity, with scoring ranges according to adolescent gender and age.
Observed Range Mean * SD
Sample
Possible
Range Adolescent Parent Adolescent Parent
Total sample (n=135)
Male (n = 60)
Female (n = 75)
l2Year Old (n = 20)
13 Year Old (n = 24)
14Year Old (n = 25)
15 Year Old (n = 17)
16 Year Old (n = 25)
17 Year Old (n = 24)
4-20 4-17 4- 18 8.5t2.6 r0.3!2.4
4 -204 -204 -204 -204 -204 -204 -204 -20
4-164-r76-r74-144-145-144-lr4-16
6-184-t65-145-164-165-166-187 -16
8.5 + 2.5
8.5 r2.7
8.7 + 2.4
8.7 !2.98.3 !2.48.7 !2.67.8 t r.99.0 r 3.0
r0.9 t2.39.8 t2.4
9.7 t2.4t0.3 !2.3t0.r !2.410.0 t 2.9
10.5 t 2.4
rt.t !2.1
Table 4.232 Obtained means (t SDs) for the Adherence Determinants Questionnaire
scale perceived Susceptibility, with scoring ranges according to adolescent gender and
age.
Observed Range Mean * SD
Sample
Possible
Range Adolescent Parent Adolescent Parent
Total sample (n=135)
Male (n = 60)
Female (n = 75)
I2Year Old (n = 20)
13 Year Old (n = 24)
I4Year Old (n = 25)
15 Year Old (n = 17)
16 Year Old (n = 25)
17 Year Old (n = 24)
4 -20 6 -20 8 -20 13.8 + 3.1 r4.7 t254 -204 -204 -204 -204 -204 -204 -204 -20
7 -206 -208-187 -209-r99 -208 -206 -20
I -208-2014.0 t 3.1
13.7 + 3.0
r3.4 !2.913.0 + 3.5
t3.7 + 2.5
14.8 r 3.0t4.6 + 3.3
13.9 + 3.0
r4.5 t2.6r4.9 !2.4
r5.r t2.Lr4.r t 3.l15.0 r 2.6
r4.4 t2.814.6 !2.5t4.9 + 2.0
II -208-20rt -2010-20t0 -20IT -2O
26
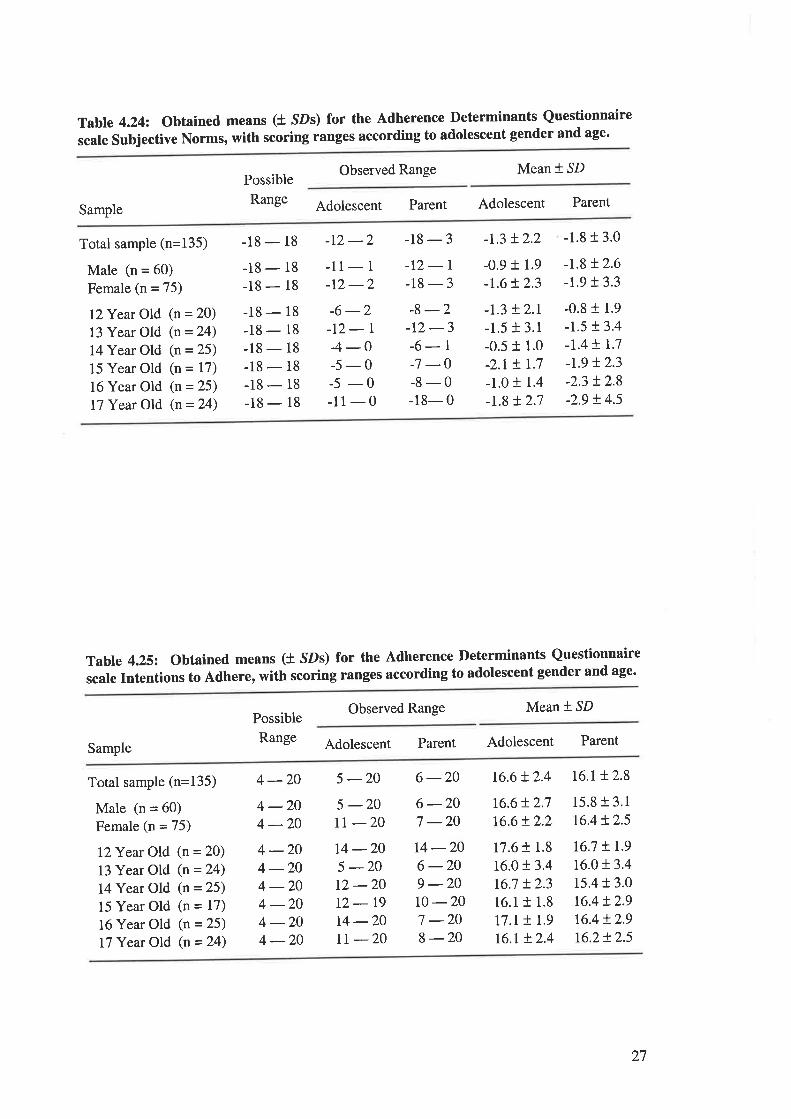
Table 4.242 Obtained means (t SDs) for the Adherence Determinants Questionnaire
scale Subjective Norms, with scoring ranges according to adolescent gender and age'
Possible
Range
Observed Range Mean *.SD
Adolescent Parent Adolescent ParentSample
Total sample (n=135)
Male (n = 60)
Female (n = 75)
I2Year Old (n = 20)
13 Year Old (n = 24)
14Year Old (n = 25)
15 Year Old (n = 17)
16 Year Old (n = 25)
17 Year Old (n = 24)
-18 - 18
-18 - 18
-18 - 18
-18 - 18
-18 - l8-18 - 18
-18 - 18
-18 - 18
-18 - 18
_1) -')
-11- 1
-r2 -2-12-r-18-3-8 -2-r2 -3-6- 1
-7 -0-8-0-18- 0
-0.9 + 1.9
-r.6 !2.3
-1.3 + 2.r-1.5 + 3.1
-0.5 t 1.0
-2.r + 1.7
-1.01 1.4
-r.8 + 2.7
-r.8 L2.6-1.91 3.3
-0.8 t 1.9
-1.5 t 3.4
-t.4 t 1.7
-L9 !2.3-2.3 !2.8-2.9 ! 4.5
-18-3 -1.3+2.2 -1.8t3.0
-6 -2-t2-l4-0-5-0-5 -0-11-0
Table 4.25: Obtained means (t SDs) for the Adherence Determinants Questionnaire
scale Intentions to Adhere, with scoring ranges according to adolescent gender and age'
Observed Range Mean * SD
Sample
Possible
Range Adolescent Parent Adolescent Parent
Total sample (n=135)
Male (n = 60)
Female (n = 75)
I2Year Old (n = 20)
13 Year Old (n = 24)
14 Year Old (n = 25)
15 Year Old (n = 17)
16 Year Old (n = 25)
17 Year Old (n = 24)
4 -20 5 -20 6 -20 t6.6 + 2.4 16.l !.2.8
15.8 t 3.1
16.4 t 2.54 -204 -204 -204 -204 -204 -204 -204 -20
5 -20rt -206 -207 -20t4 -206 -209 -20r0 -207 -208 -20
t6.6!2.716.6!2.2
14 -205 -2012 -2012-1914 -20lr -20
17.6 + 1.8
16.01 3.4
16.7 t2.316.1r 1.8
I7,I ! 1.9
t6.r + 2.4
t6.7 !r.916.0 t 3.4
15.4 + 3.0
16.4 + 2.9
16.4 !2.916.2+ 2.5
27
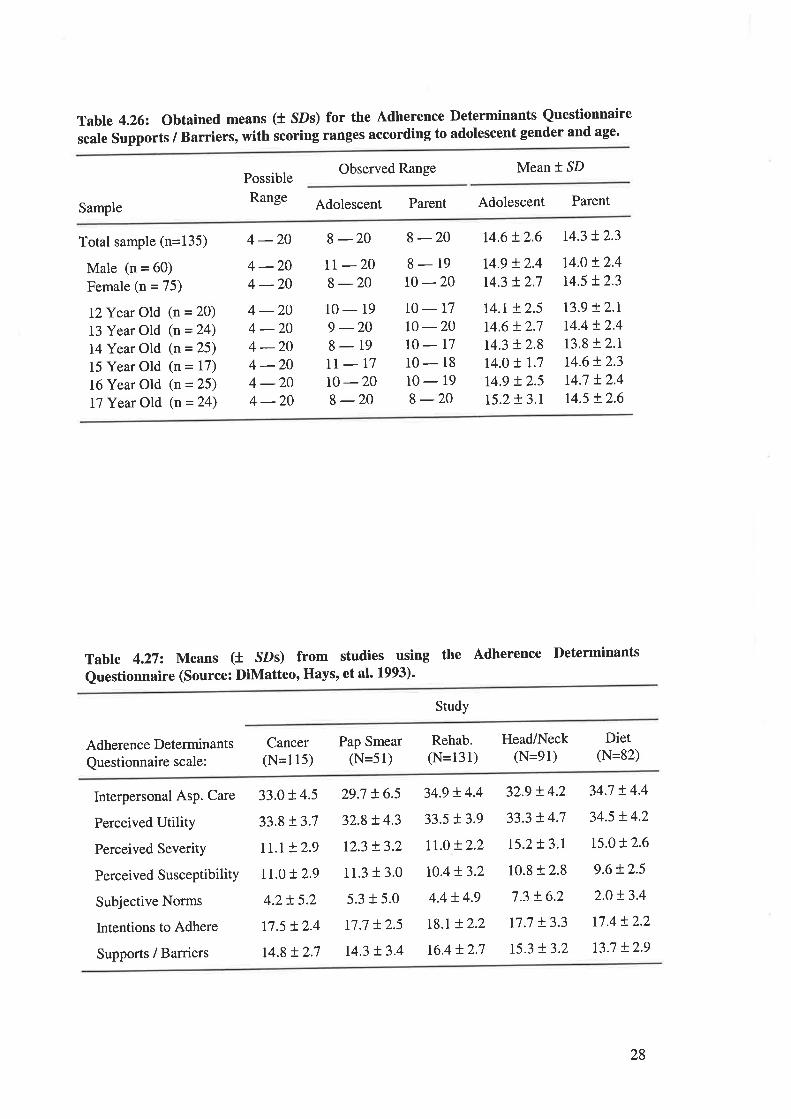
Table 4.262 Oscale Supports
btained means (t SDs) for the Adherence Determinants Questionnaire
/ Barriers, with scoring ranges according to adolescent gender and age.
Possible
Range
Observed Range Mean * SD
Adolescent Parent Adolescent ParentSample
Total sample (n=135)
Male (n = 60)
Female (n = 75)
l}Year Old (n = 20)
13 Year Old (n = 24)
14Year Old (n = 25)
15 Year Old (n = 17)
16 Year Old (n = 25)
17 Year Old (n = 24)
4 -20 8 -20 8 -20 14.6 + 2.6 t4.3 !2.3
t4.0 t2.4r4.5 t 2.3
4 -204 -204 -204 -204 -204 -204 -204 -20
tr -208 -2010-199 -208-19II-1710-208 -20
8-1910-2010-1710-20IO-T710- 18
10- 19
8 -20
t4.9 + 2.4
r4.3 t2.7
r4.r + 2.5
14.6 + 2.7
r4.3 + 2.8
t4.o + 1.7
t4.9 + 2.5
t5.2 + 3.r
r3.9 +2.rr4.4 !2.4r3.8 !2.tt4.6 + 2.3
14.7 t2.4r4.5 + 2.6
Tabte 4.272 Means (t sDs) from studies using the Adherence Determinants
Questionnaire (Source: DiMatteo, Hays, et al' 1993)'
Study
Adherence Determinants
Questionnaire scale:
Cancer(N=115)
Pap Smear(N=51)
Rehab.(N=131)
Head/Neck(N=91)
Diet(N=82)
Interpersonal Asp. Care
Perceived Utility
Perceived Severity
Perceived SusceptibilitY
Subjective Norms
Intentions to Adhere
Supports / Barriers
33.0t4.5
33.8!3.7
rr.t !2.9
rr.0 + 2.9
4.2!5.2
t7.5 t 2.4
t4.8 !2.7
29.7 + 6.5
32.8+ 4.3
r2.3 !3.2
11.3 t 3.0
5.3 t 5.0
r7.7 !25r4.3 t3.4
34.9 !.4.4
33.5 13.9
It.o + 2.2
r0.4t 3.2
4.4 + 4.9
r8.t + 2.2
16.4 !2.7
32.9 !4.2
33.3 + 4.7
r5.2t3.r
10.8 + 2.8
7.3 + 6.2
17.7 + 3.3
r5.3 !3.2
34.7 t4.4
34.5 + 4.2
ts.o!2.6
9.6 + 2.5
2.0 !3.4
r7.4 !2.2
t3.7 L2.9
28
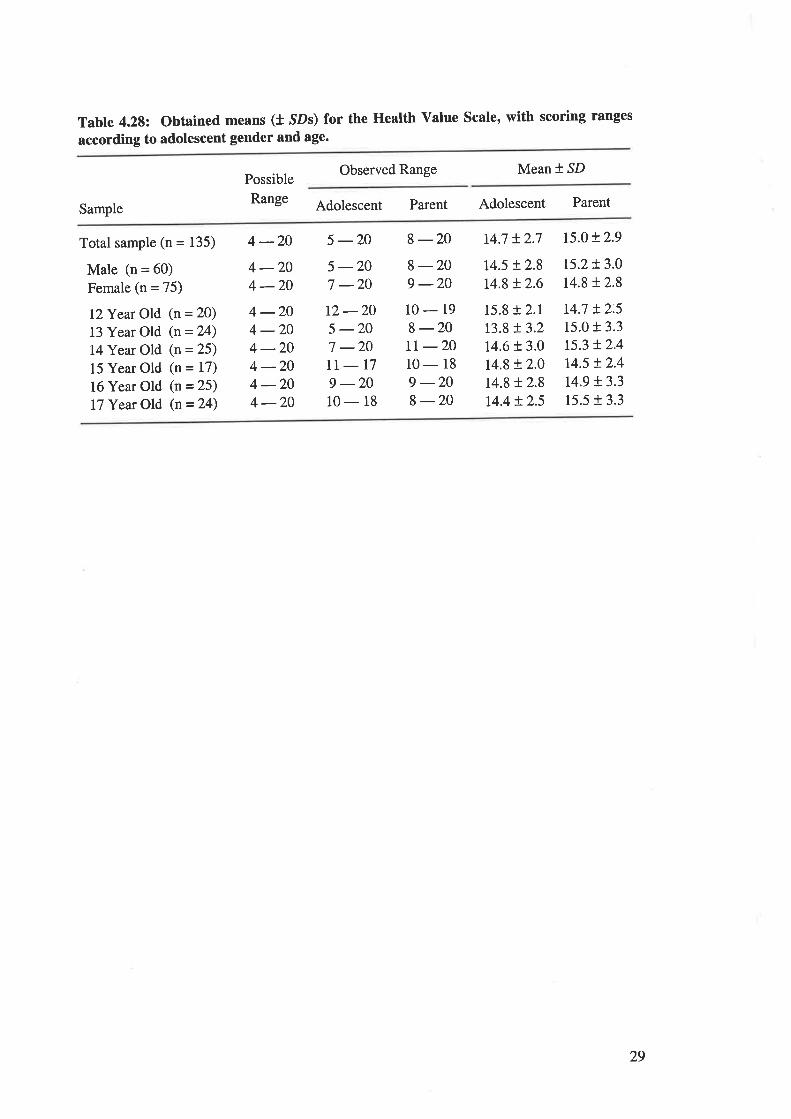
Table 4.28: Obtained means (t SDs) for the Health Value Scale, with scoring ranges
according to adolescent gender and age.
Observed Range Mean I SD
Sample
Possible
Range Adolescent Parent Adolescent Parent
Total sample (n = 135)
Male (n = 60)
Female (n = 75)
I2Year Old (n = 20)
13 Year Old (n = 24)
14Year Old (n = 25)
15 Year Old (n = 17)
16 Year Old (n = 25)
17 Year Old (n=24)
4-20 5-20 8-20 14.7 +2.7 r5.o!2.9
4 -204 -204 -204 -204 -204 -204 -204 -20
5 -207 -20t2-205 -207 -20IT-T79 -2010-18
8-209 -2010-198-20IT -2010-189 -208 -20
t4.5 + 2.8
r4.8 t2.6t5.2t3.0r4.8 t2.8
r4.7 !2.515.0 t 3.3
15.3 + 2.4
14.5 t2.4t4.9 t3.315.5 r 3.3
15.8 t 2.1
r3.8 !3.214.6 t 3.0
r4.8 !2.014.8 t 2.8
14.4 + 2.5
29
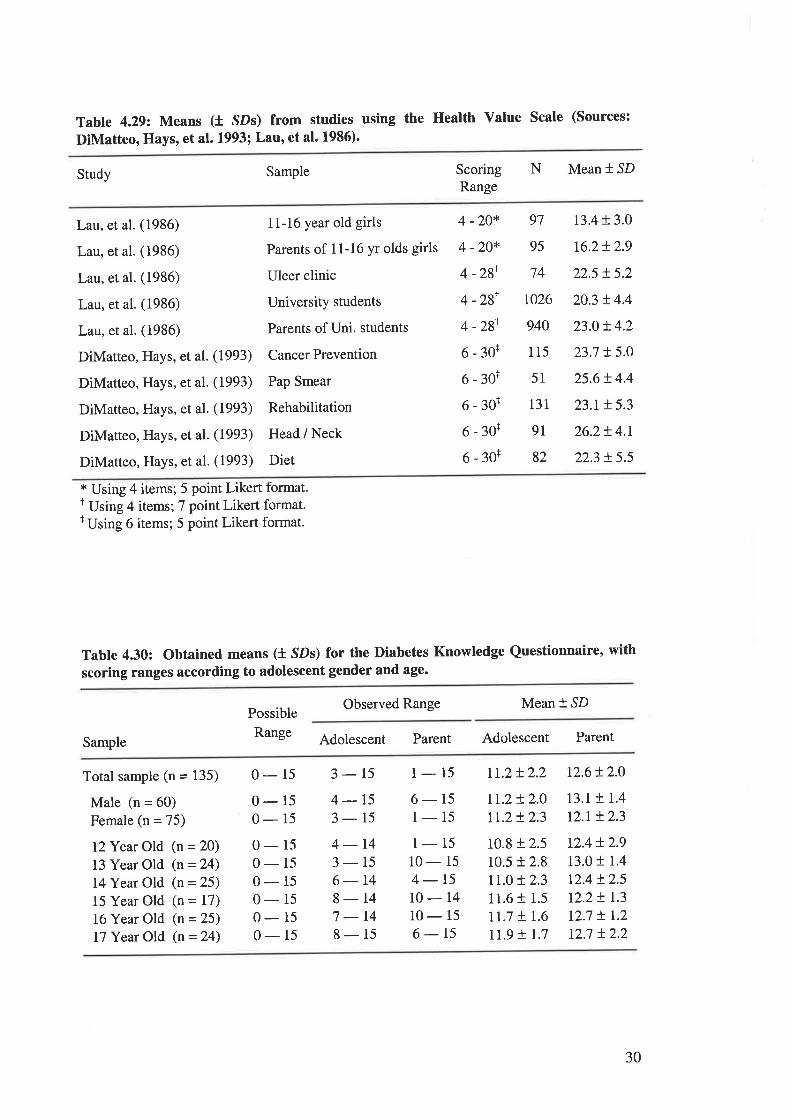
Table 4.292 Means (t SDs) from studies using the Health Value Scale (Sources:
DiMatteo, Hays, et al. L993; Lau, et al. 1986).
Study Sample ScoringRange
N Mean * SD
Lau, et al. (1986)
Lau, et al. (1986)
Lau, et al. (1986)
Lau, et al. (1986)
Lau, et al. (1986)
DiMatteo, Hays, et al. (1993)
DiMatteo, Hays, et al. (1993)
DiMatteo, Hays, et al. (1993)
DiMatteo, Hays, et al. (1993)
DiMatteo, Hays, et al. (1993)
1 1-16 year old girls
Parents of 1 1-16 yr olds girls
Ulcer clinic
University students
Parents of Uni. students
Cancer Prevention
Pap Smear
Rehabilitation
Head / Neck
Diet
4 -20*
4 -20*
4 -2gI
4 -2gr
4 -zgt
6-30r
6-30+
6-30+
6-30+
6-30+
97
95
74
t026
940
115
51
131
9I
82
13.4 t 3.0
t6.2+ 2.9
225 t5.2
20.3 t4.4
23.0r.4.2
23.7 !5.0
25.6+ 4.4
23.r !5.3
26.2t4.r
22.3 t 5.5
* Using 4 items; 5 point Likert format.I Using 4 items; 7 point Likert format.r Using 6 items; 5 point Likert format.
Tabte 4.30: Obtained means (t SDs) for the Diabetes Knowledge Questionnaire, with
scoring ranges according to adolescent gender and age.
Possible
Range
Observed Range Mean +,SD
Sample Adolescent Parent Adolescent Parent
Total sample (n = 135)
Male (n = 60)
Female (n = 75)
I2Year Old (n = 20)
13 Year Old (n = 24)
14 Year Old (n = 25)
15 Year Old (n = 17)
16 Year Old (n = 25)
I7 Year Old (n = 24)
0-15 3-15 1-15 Lr.2+2.2 12.6!2.0
0-150- 15
0-150-150-150- 15
0- 15
0-15
4-153-154-143-156-148-147 -148-15
6- 15
1-151-1510- 15
4-t510-1410-156-15
tr.2 + 2.0
lt.2+ 2.3
10.8 + 2.5
10.5 t 2.8
rt.o !2.311.6 + 1.5
Lt.j + 1.6
rr.9 t r.7
13.1 + 1.4
r2.r !2.3
t2.4 t 2.9
13.0 f 1.4
r2.4 t2.5r2.2! 1.3
12.7 ! 1.2
r2.7 t2.2
30
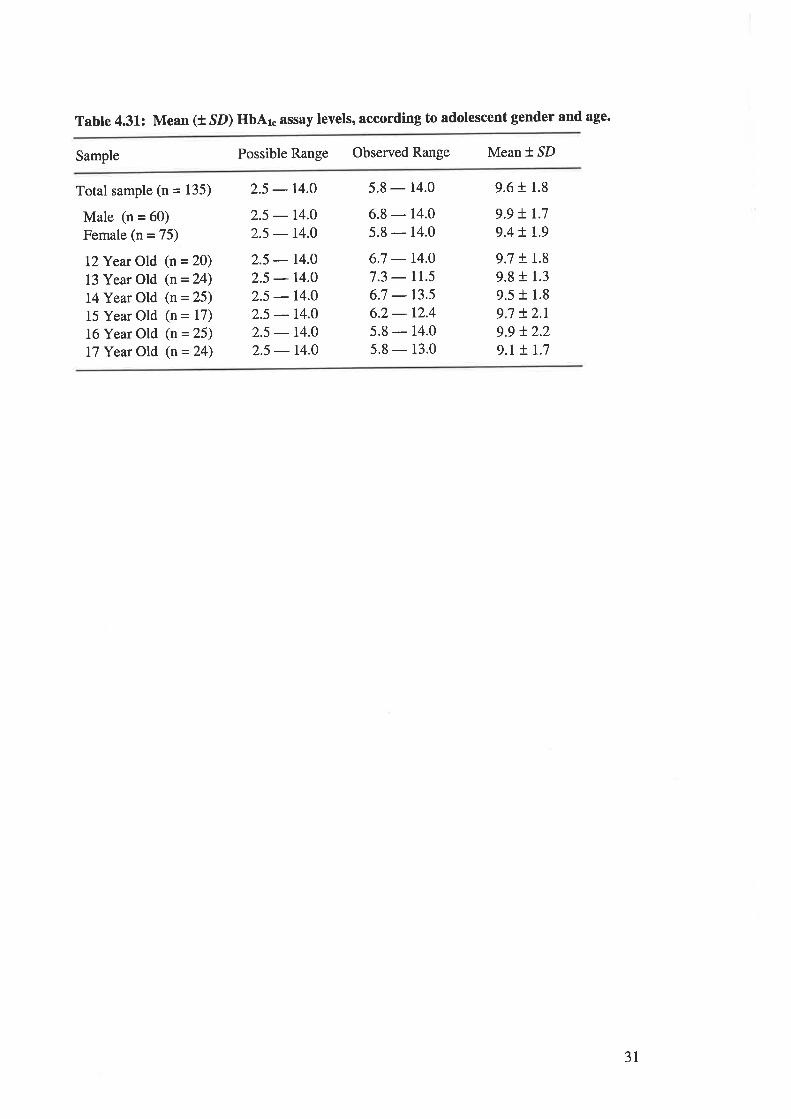
Table 4.31: Mean (t SD) HbAr. assay levels, according to adolescent gender and age.
Sample Possible Range Observed Range Mean * SD
Total sample (n = 135)
Male (n = 60)
Female (n = 75)
l2Year Old (n = 20)
13 Year Old (n = 24)
14 Year Old (n = 25)
15 Year Old (n = 17)
16 Year Old (n = 25)
17 Year Old (n = 24)
2.5 - r4.O 5.8 - 14.0
2.5 - 14.0
2.5 - r4.O
2.5 - r4.O
2.5 - r4.O
2.5 - r4.O
2.5 - l4.O
2.5 - r4.02.5 - r4.O
6.8 - 14.0
5.8 - 14.0
6.7 - r4.07.3 - rr.56.7 - r3.s6.2- 12.4
5.8 - 14.0
5.8 - 13.0
9.6 t 1.8
9.9 + 1.7
9.4 + r.9
9.7 + 1.8
9.8 t 1.3
9.5 + 1.8
9.7 + 2.r9.9 !2.29.r + r.7
31
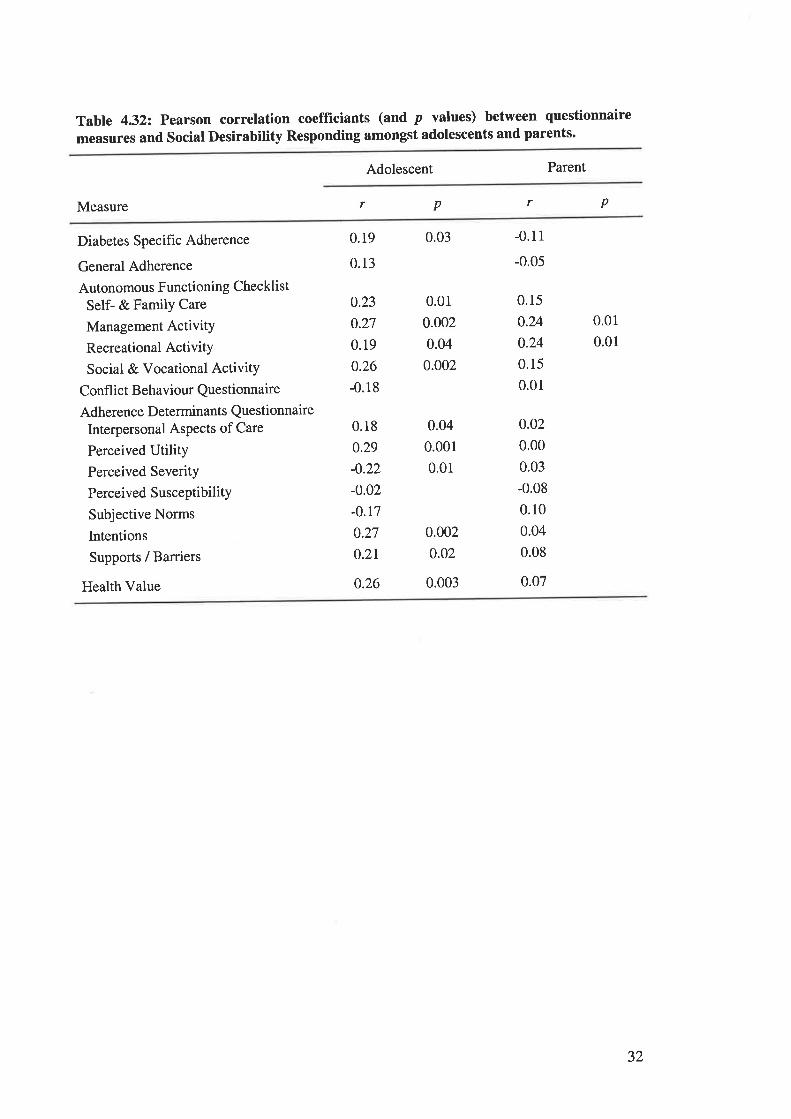
Table 4.322 Pearson correlation coefficiants (and p values) between questionnaire
measures and Social Desirability Responding amongst adolescents and parents.
Adolescent Parent
Measure r p r p
Diabetes Specific Adherence
General Adherence
Autonomous Functioning Checklist
Self- & Family Care
Management ActivitY
Recreational ActivitY
Social & Vocational ActivitY
Confl ict Behaviour Questionnaire
Adherence Determinants QuestionnaireInterpersonal AsPects of Care
Perceived UtilityPerceived Severity
Perceived SusceptibilitY
Subjective Norms
Intentions
Supports / Barriers
Health Value
0.19
0.13
0.23
0.27
0.19
0.26
-0.18
0.18
0.29
-0.22
-0.02
-0.17
0.27
0.2r
0.26
0.03
0.01
0.002
0.04
0.002
0.04
0.001
0.01
0.002
0.02
0.003
-0.11
-0.05
0.15
0.24
0.24
0.15
0.01
0.01
0.01
0.o2
0.00
0.03
-0.08
0.10
0.04
0.08
0.07
32

TABLBS AND FIGURES CITED IN CHAPTER 5.
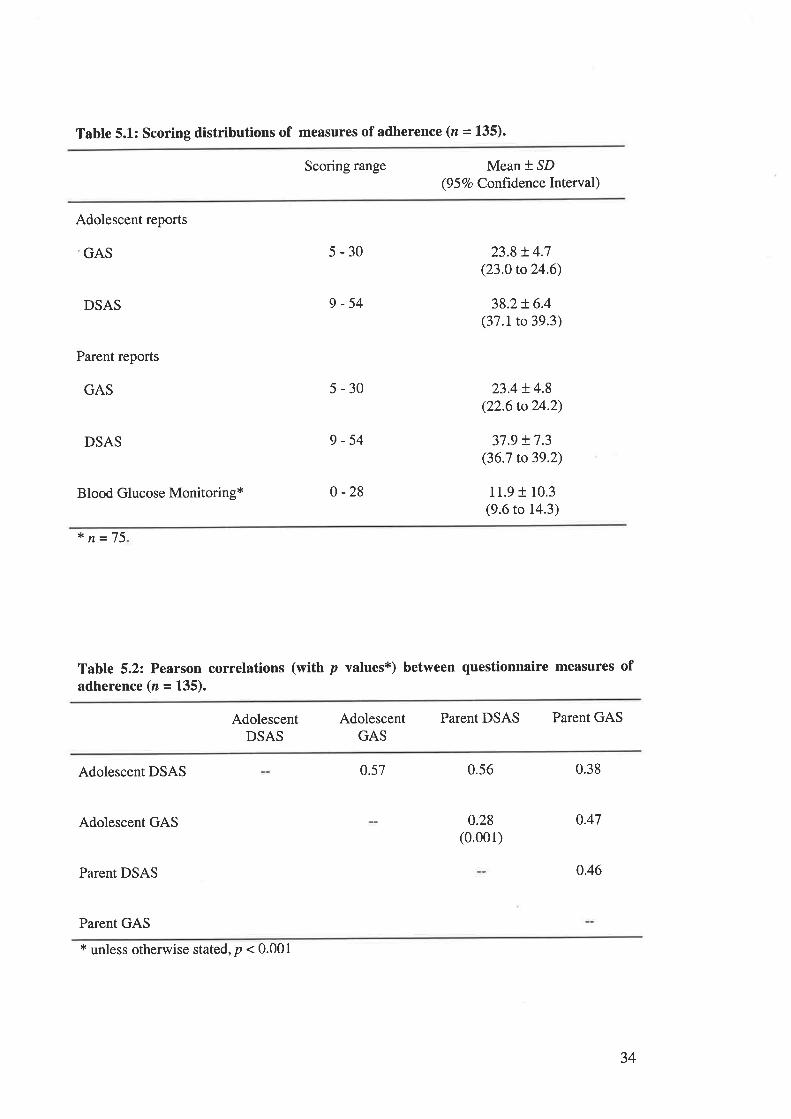
Tabte 5.1: Scoring distributions of measures of adherence (n = 135).
Scoring range Mean * SD(9 5 Vo Confidence Interval)
Adolescent reports
GAS
DSAS
Parent reports
GAS
DSAS
Blood Glucose Monitoring+
s-30
9-54
5-30
9-54
0 -28
23.8 !4.7(23.0 to 24.6)
38.2+ 6.4(37.1 to 39.3)
23.4 + 4.8(22.6 to24.2)
37.9 + 7.3(36.7 to39.2)
11.9 + 10.3(9.6 to 14.3)
* n=75
Table 5.2: Pearson correlations (with p values*) between questionnaire measures ofadherence (n = 135).
Parent DSAS Parent GASAdolescentDSAS
AdolescentGAS
Adolescent DSAS
Adolescent GAS
Parent DSAS
Parent GAS
0.57 0.56
0.28(0.001)
0.38
0.47
0.46
* unless otherwise stated, p < 0.001
34
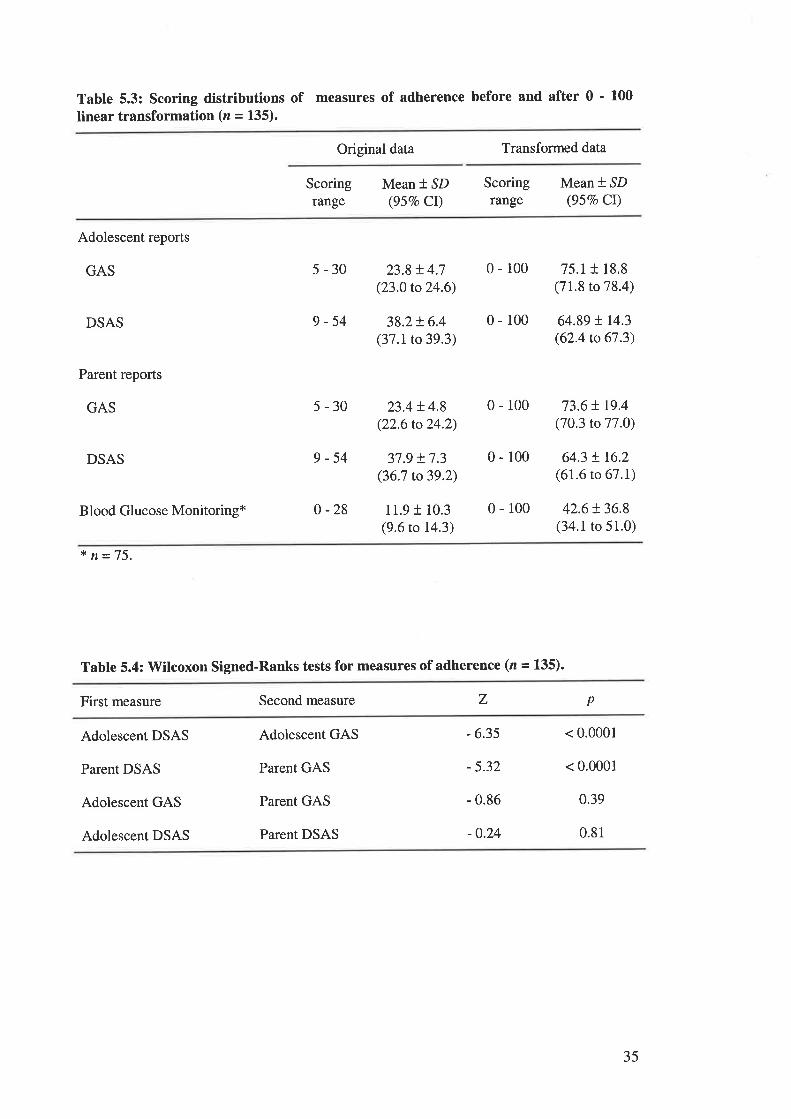
Table 5.3: Scoring distributions of measures of adherence before and after 0 ' 100
linear transformation (n = 135).
Original data Transformed data
Scoringrange
Mean * SD(957o CI)
Scoringrange
Mean * SD(95Vo Cr)
Adolescent reports
GAS
DSAS
Parent reports
GAS
5-30
9-54
5-30
23.8 t 4.7(23.0 to 24.6)
38.2t6.4(37.1 to 39.3)
23.4 t4.8(22.6 to 24.2)
37.9 !7.3(36.7 to39.2)
11.9 I 10.3(9.6 to 14.3)
75.1 t 18.8(71.8 to 78.4)
64.89 tt4.3(62.4 to 67.3)
73.6 t 19.4(70.3 to 77.0)
64.3 ! 16.2(61.6 to 67.1)
42.6t36.8(34.1 to 51.0)
0-r00
0-100
0-100
0-100
0-100
DSAS 9-54
Blood Glucose Monitoring* 0-28
* n=75.
Table 5.4: Wilcoxon Signed-Ranks tests for measures of adherence (n = 135).
First measure Second measure z p
Adolescent DSAS
Parent DSAS
Adolescent GAS
Adolescent DSAS
Adolescent GAS
Parent GAS
Parent GAS
Parent DSAS
- 6.35
- 5.32
- 0.86
-0.24
< 0.0001
< 0.0001
0.39
0.81
35
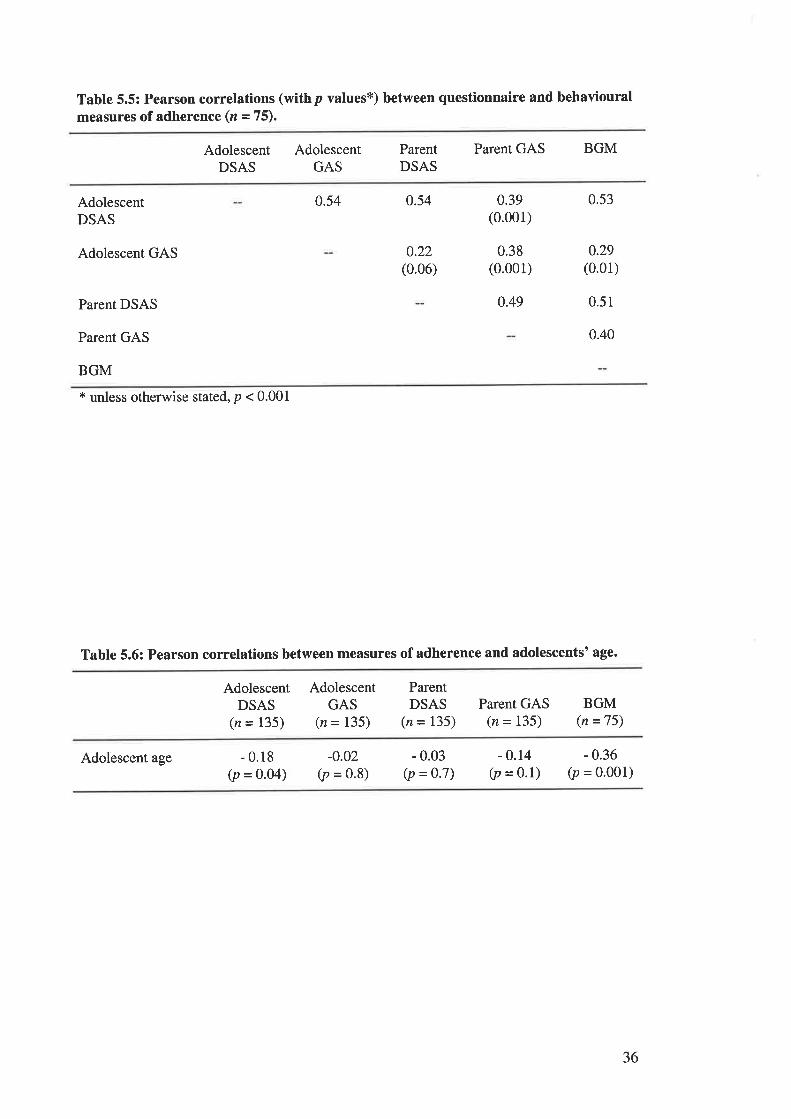
Table 5.5: Pearson correlations (withp values*) between questionnaire and behaviouralmeasures of adherence (z = 75).
Parent GAS BGMAdolescentDSAS
AdolescentGAS
ParentDSAS
AdolescentDSAS
Adolescent GAS
Parent DSAS
Parent GAS
BGM
0.54 0.54
0.22(0.06)
0.39(0.001)
0.49
0.53
0.29(0.01)
0.51
0.40
0.38(0.001)
t unless otherwise stated, p < 0.001
Table 5.6: Pearson correlations between measures of adherence and adolescents' age.
AdolescentDSAS
(n = 135)
AdolescentGAS
(n = I35)
ParentDSAS
(n = 135)Parent GAS
(n = I35)BGM
(n =75)
Adolescent age - 0.18(p = 0.04)
-o.02(p = 0.8)
- 0.03(p = 0.7)
- 0.14(p = 0.1)
- 0.36(p = 0.001)
36
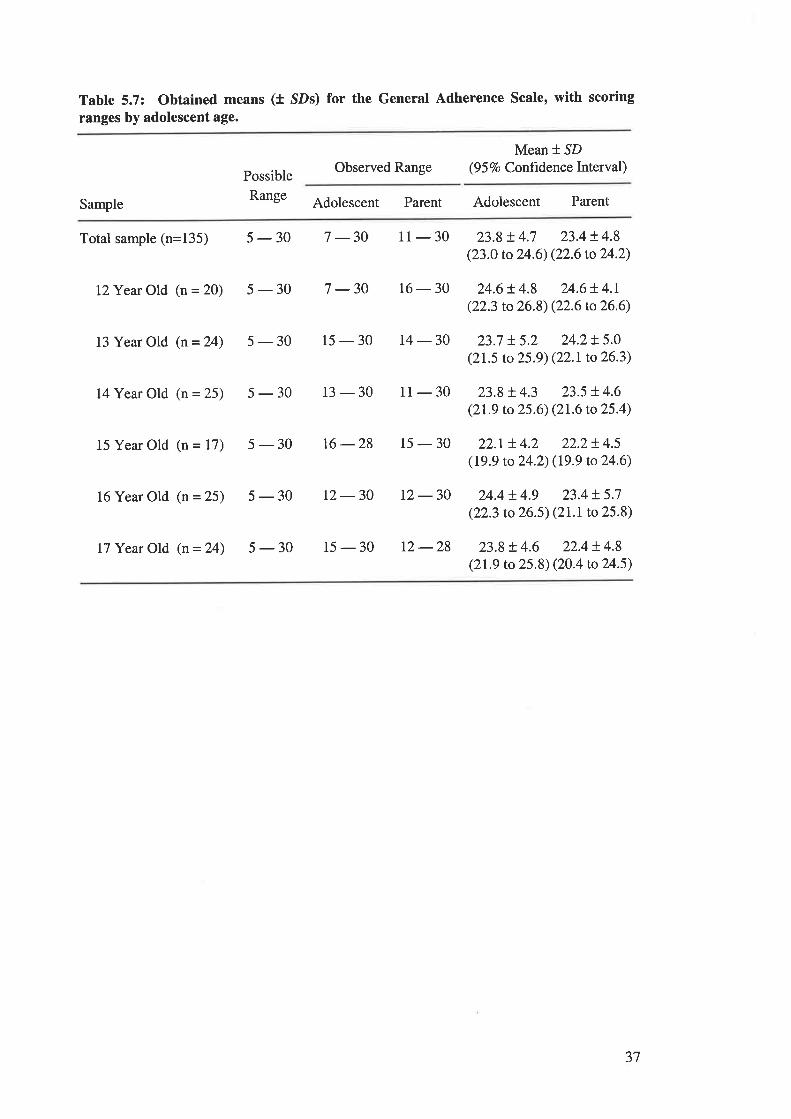
Table 5.7: Obtained means (t SDs) for the General Adherence Scale, with scoring
rânges by adolescent age.
Possible
Range
Observed RangeMean *.SD
(9 5 7o Confrdenc e Interval )
Sample Adolescent Parent Adolescent Parent
Total sample (n=135) 5 - 30 7 -30
L2Year Old (n = 20) 5 - 30 7 -30
13 Year Old (n = 24) 5 - 30 15 - 30
11 - 30 23.9 + 4.7 23.4 ! 4.8(23.0 to 24.6) (22.6 to 24.2)
16 - 30 24.6 ! 4.8 24.6 ! 4.r(22.3 to 26.8) (22.6 to 26.6)
14-30 23.7 t5.2 24.2!5.0(21.5 to 25.9) (22.1 to 26.3)
14 Year Old (n = 25) 5 - 30 13 - 30
15 Year Old (n = 17) 5 - 30 16 -28
16 Year Old (n = 25) 5 - 30 12 - 30
11 - 30 23.8t4.3 23.5 !4.6(2L9 to 25.6) (21.6 to 25.4)
15 - 30 22.r + 4.2 22.2t4.5(19.9 to 24.2) (19.9 to24.6)
12 - 30 24.4 !4.9 23.4 ! 5.7
(22.3 to 26.5) (21.1to 25.8)
17 Year Old (n = 24) 5 - 30 15 - 30 12 -28 23.8 ! 4.6 22.4 ! 4.8(2L9 to 25.8) (20.4 to 24.5)
37
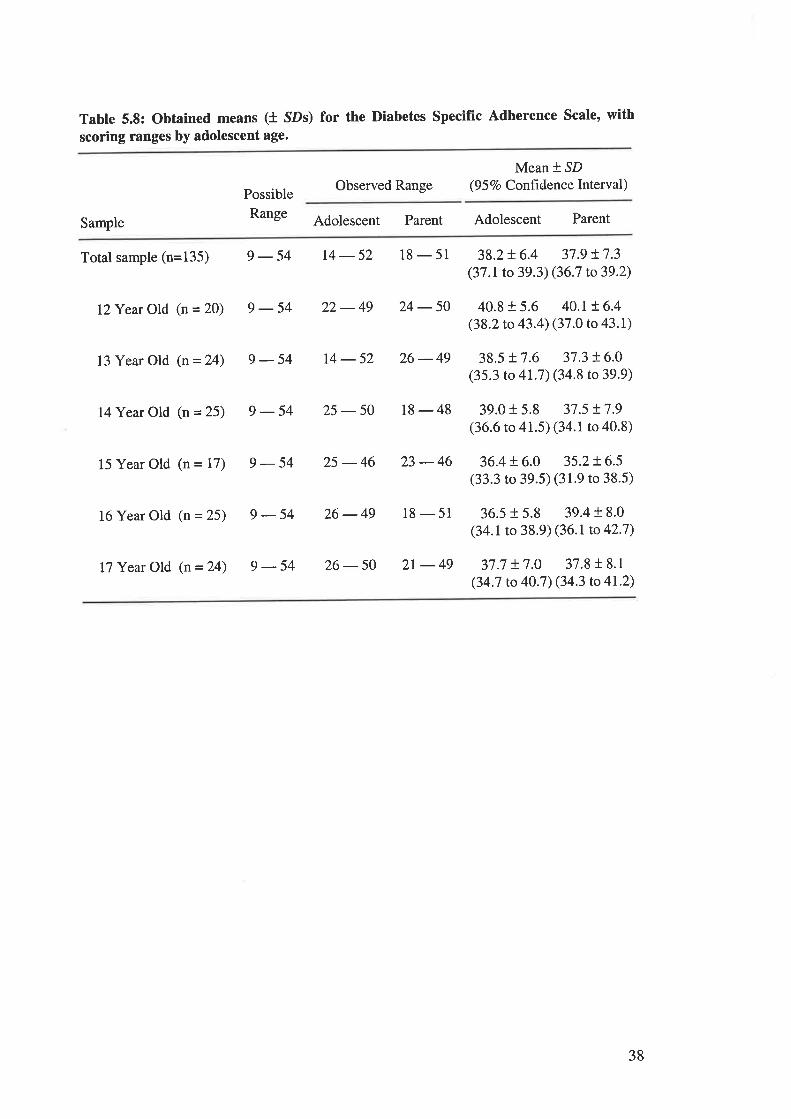
Table 5.8: Obtained means (t SDs) for the Diabetes Specific Adherence Scale, with
scoring ranges by adolescent age.
Possible
Range
Observed RangeMean + SD
(9 5 Vo Confrdence Interval)
Sample Adolescent Parent Adolescent Parent
Total sample (n=135) 9 - 54 14 - 52 18 - 51 38.2 + 6.4 37 .9 r.7 .3(37 .I to 39.3) (36.7 to 39.2)
I?Year Old (n = 20) 9 - 54 22 - 49
13 Year Old (n = 24) 9 - 54 14 - 52
24 - 50 40.8 t 5.6 40.1!6.4(38.2 to 43.4) (37 .o to 43. 1)
26-49 38.5+7.6 37.3!6.0(35.3 to 41.7) (34.8 to 39.9)
14 Year Old (n = 25) 9 - 54 25 - 50 18 - 48 39.0 r 5.8 37.5 !7.9(36.6 to 41.5) (34.r to 40.8)
15 Year Old (n = 17) 9 - 54 25 - 46 23 - 46 36.4 + 6.0 35.2 ! 6.5
(33.3 to 39.5) (31.9 to 38.5)
16 Year Old (n = 25) 9 - 54 26 - 49
I7 Year Old (n = 24) 9 - 54 26 - 50
18 - 51 36.5 + 5.8 39.4 I 8.0
(34.1 to 38.9) (36.1 to 42'7)
2r - 49 37.7 + 7.0 37.8 t 8.1
(34.7 to 40.7) (34.3 to 4I'2)
38
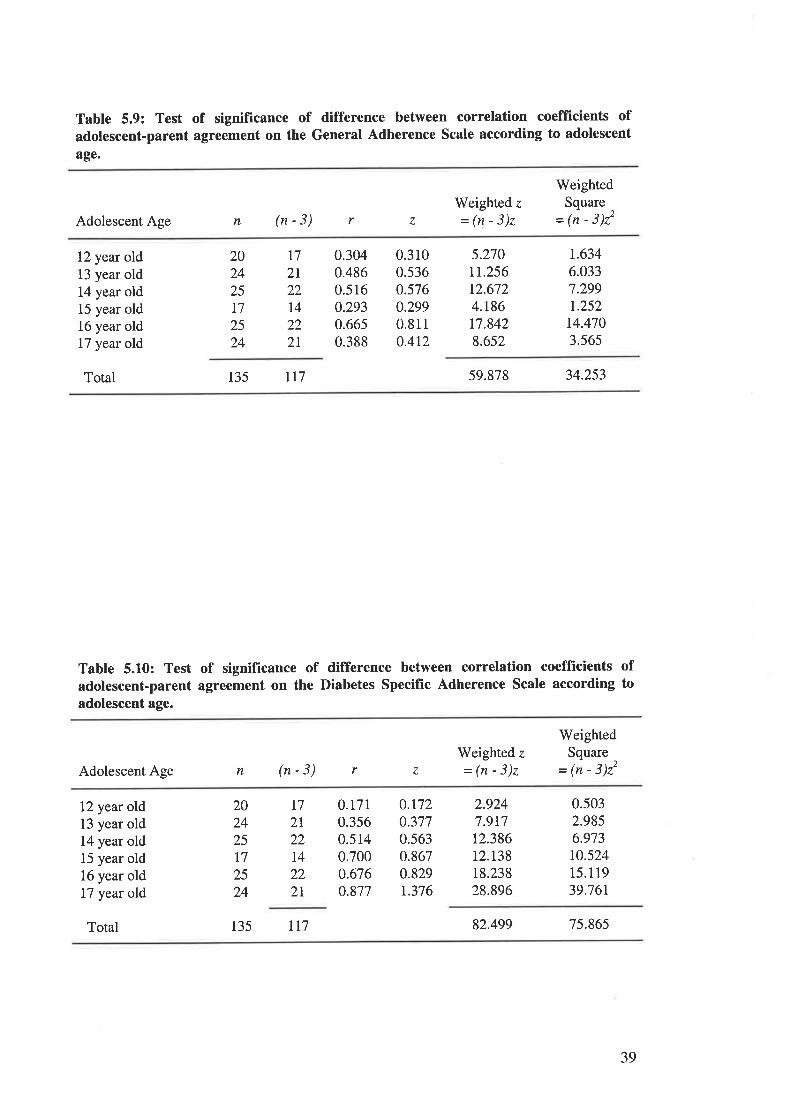
Table 5.9: Test of significance of difference between correlation coefficients ofadolescent-parent agreement on the General Adherence Scale according to adolescent
age.
Adolescent Age n (n-3)Weighted z
=(n-3)z
WeightedSquare
- (n - 3)22r z
12 year old13 year old14 year old15 year old16 year old17 year old
Total 135 lr7 59.878 34.253
2024
2517
2524
I72I22I422
2I
0.3040.4860.5160.2930.6650.388
0.3r00.5360.5760.2990.8110.4r2
5.270rr.256t2.6724.186t7.8428.652
r.6346.0337.299t.25214.4703.565
Table 5.10: Test of significance of difference between correlation coefficients ofadolescent-parent agreement on the Diabetes Specific Adherence Scale according toadolescent age.
Adolescent Age n (n-3)Weighted z
=(n-3)z
WeightedSquare
= (n - 3)22r z
12 year old13 year old14 year old15 year old16 year old17 year old
0.t7r0.3560.5140.7000.676o.877
0.r720.3770.5630.8670.829r.376
2.9247.9t712.38612.t3818.23828.896
0.5032.9856.973r0.52415.1 19
39.761
t72I22I4222l
202425t72524
Total 135 rr7 82.499 75.865
39
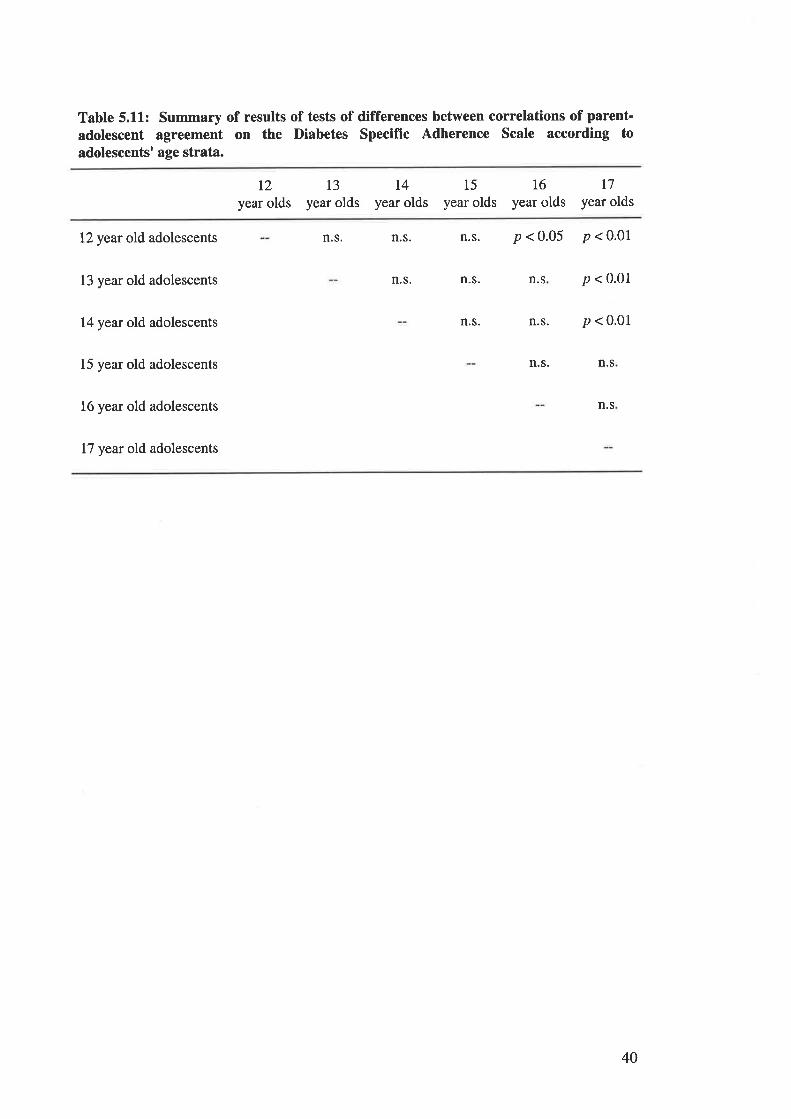
Table 5.11: Summary of results of tests of differences between correlations of parent-
adolescent agreement on the Diabetes Specific Adherence Scale according toadolescents' age strata.
12
year olds13
year oldsl4
year olds15
year olds16
year oldst7
year olds
12 year old adolescents
13 year old adolescents
14 yeat old adolescents
15 year old adolescents
16 year old adolescents
17 year old adolescents
n.s. n.s.n.s. p<0.05 p<0.01
n.s p < 0.01
p < 0.01
n.s. n.s
n.s
n.s. n.s.
n.s.n.s.
40
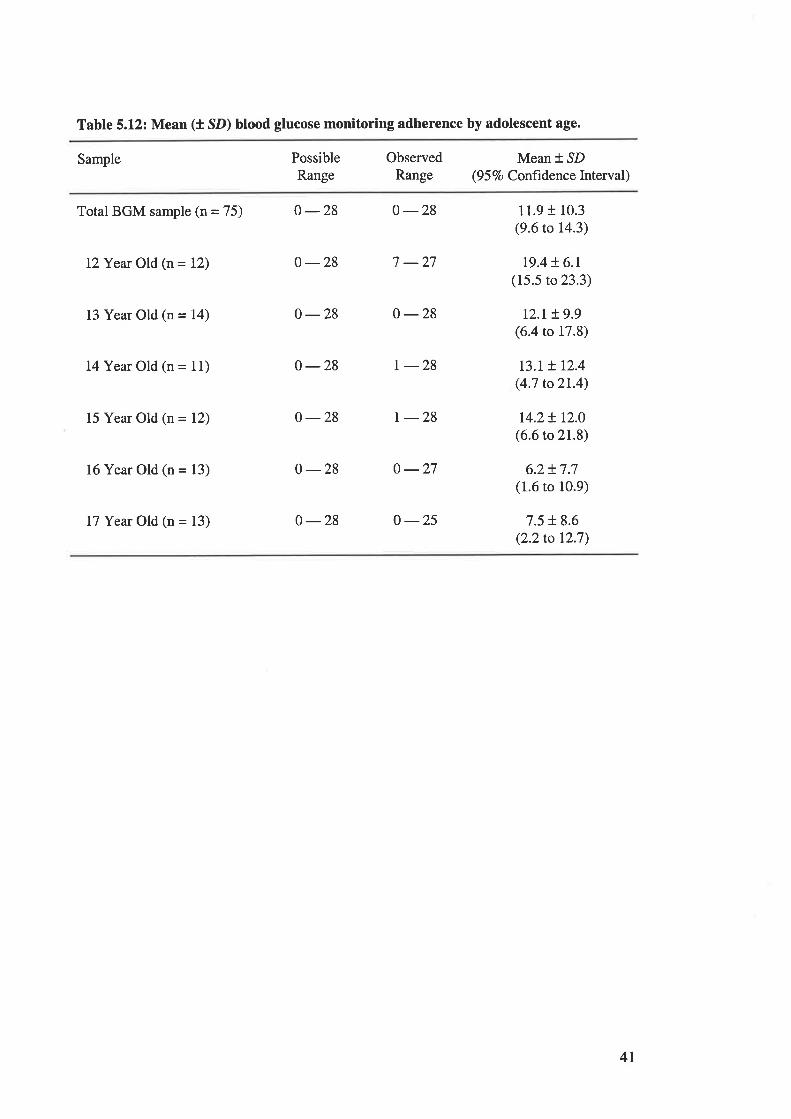
Table 5.12: Mean (t SD) blood glucose monitoring adherence by adolescent age.
Sample PossibleRange
ObservedRange
Mean *.SD(9 5 7o Confrdenc e Interval )
Total BGM sample (n = 75) 0 -28 0 -28
I2Year Old (n = 12) 0 -28 7 -27
13 Year Old (n = 14) 0 -28 0 -28
I{Year Old (n = 11) 0 -28 r -28
15 Year Old (n = 12) 0 -28 r -28
16 Year Old (n = 13) 0-28 0 -27
L7 Year Old (n = 13) 0 -28 o -25
11.9 t 10.3(9.6 to 14.3)
t9.4 + 6.1(15.5 to 23.3)
r2.L t 9.9(6.4 to 17.8)
r3.t + 12.4(4.7 to2l.4)
r4.2! r2.0(6.6 to 21.8)
6.2+ 7.7(1.6 to 10.9)
7.5 + 8.6(2.2to 12.7)
4I
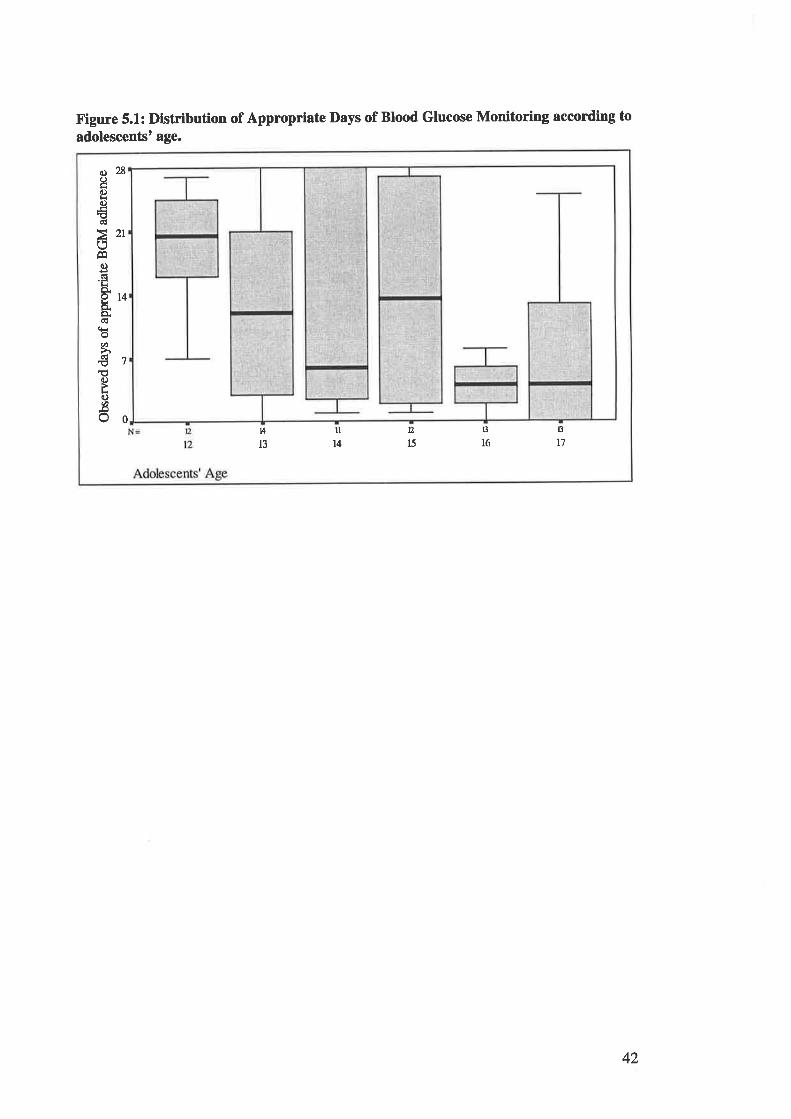
o28I6)lro€ctl
>21OÊqc)dLô.AAo,ÈCË
(Ê
ø
€7€C)
LC)Ø-oOo
D,
l513
16
13
t'lIA
llIt4
Figure 5.1: Distribution of Appropriate Days of Blood Glucose Monitoring according to
adolescentst age.
42
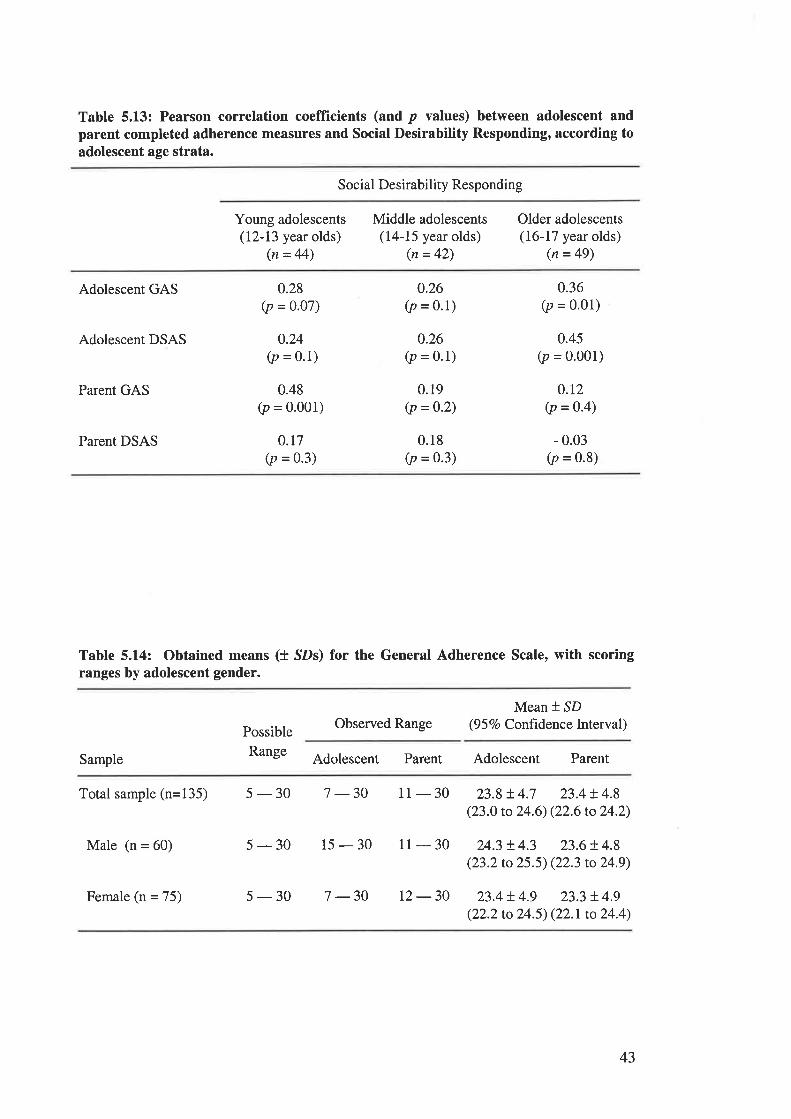
Table 5.1.3: Pearson correlation coeffïcients (and p values) between adolescent andparent completed adherence measures and Social Desirability Responding, according toadolescent age strata.
Social Desirability Responding
Young adolescents(12-13 year olds)
(n = 44)
Middle adolescents(14-15 year olds)
(n = 42)
Older adolescents(16-17 year olds)
(n = 49)
Adolescent GAS
Adolescent DSAS
Parent GAS
0.28(p = o.o7)
o.24(p = 0.1)
0.48(p = 0.001)
0.r7(p = 0.3)
0.26(p = 0.1)
0.26(p = 0.1)
0.19(p =0.2)
0.18(p = 0.3)
0.36(p = 0.01)
0.45(p = o.oo1)
0.r2(p = 0.4)
- 0.03(p = 0.8)
Parent DSAS
Table 5.14: Obtained means (t SDs) for the General Adherence Scale, with scoringranges by adolescent gender.
Possible
Range
Observed RangeMean * SD
(9 5 7o Conftdence Interval)
Sample Adolescent Parent Adolescent Parent
Total sample (n=135) 5 - 30 7 -30
Male (n = 60) 5-30 15-30
Female (n = 75) 5-30 7-30
11 - 30 23.8 t 4.7 23.4 t 4.8(23.0 to 24.6) (22.6 to 24.2)
11 - 30 24.3 ! 4.3 23.6 + 4.8(23.2 to 25.5) (22.3 to 24.9)
12-30 23.4!.4.9 23.3 + 4.9(22.2 to 24.5) (22.1 to 24.4)
43
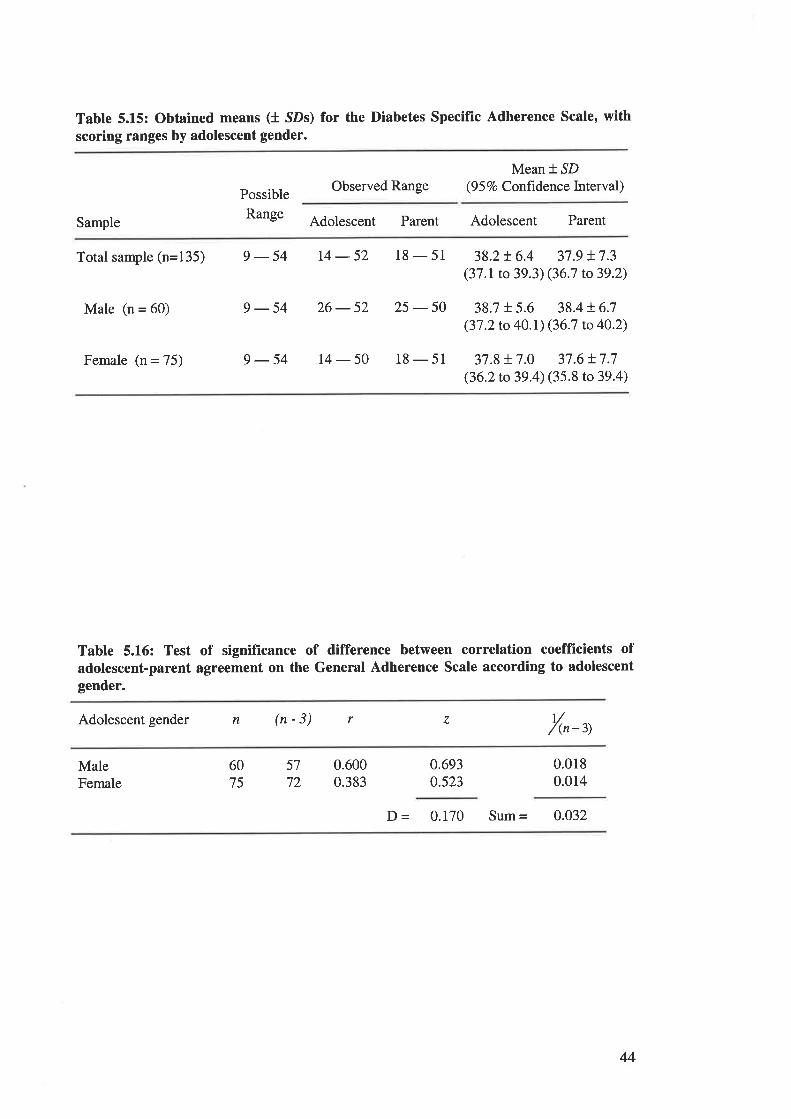
Table 5.15: Obtained means (t SDs) for the Diabetes SpecifÎc Adherence Scale' withscoring ranges by adolescent gender.
Possible
Range
Observed RangeMean * SD
(9 5 7o Conftdence Interval)
Sample Adolescent Parent Adolescent Parent
Total sample (n=135) 9 - 54 14 - 52 18 - 51 38.2 r 6.4 37 .9 + 7.3(37 .1 to 39.3) (36.7 to 39.2)
Male (n = 60) 9 -54 26-52 25 - 50 38.7 t 5.6 38.4 !6.7(37.2 to 40.r) (36.7 to 40.2)
Female (n = 75) 9-54 14-50 18-51 37 .8 + 7.0 37.6 !7.7(36.2to 39.4) (35.8 to39.4)
Table 5.L6: Test of significance of difference between correlation coeffÏcients ofadolescent-parent agreement on the General Adherence Scale according to adolescentgender.
Adolescent gender n (n-3) r z v/(n -3)
MaleFemale
6075
5772
0.6000.383
0.693o.523
0.0180.014
þ = 0.170 Sum = 0.032
44
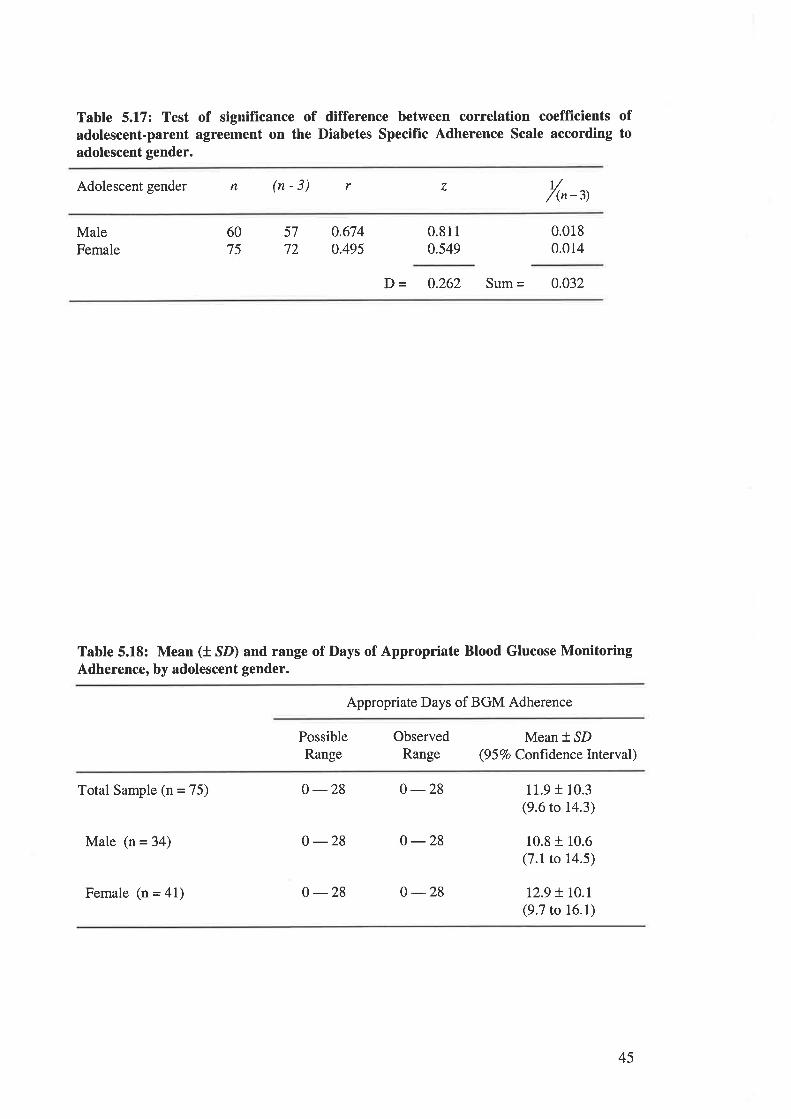
Table 5.17: Test of significance of difference between correlation coefficients ofadolescent-parent agreement on the Diabetes Specific Adherence Scale according toadolescent gender.
Adolescent gender n (n-3) r z r//(n-3)
MaleFemale
6075
57
72
0.6740.495
0.8110.549
0.0180.014
D - 0.262 Sum = 0.032
Table 5.18: Mean (t SD) and range of Days of Appropriate Blood Glucose MonitoringAdherence, by adolescent gender.
Appropriate Days of BGM Adherence
PossibleRange
ObservedRange
Mean * SD(9 5 Vo Conftdence lnterval)
Total Sample (n = 75)
Male (n = 34)
Female (n = 41)
0 -28 0-28
0 -28 o -28
0 -28 0 -28
11.9 f 10.3(9.6 to 14.3)
10.8 r 10.6(7.1 to 14.5)
12.9 t r0.l(9.7 to 16.1)
45
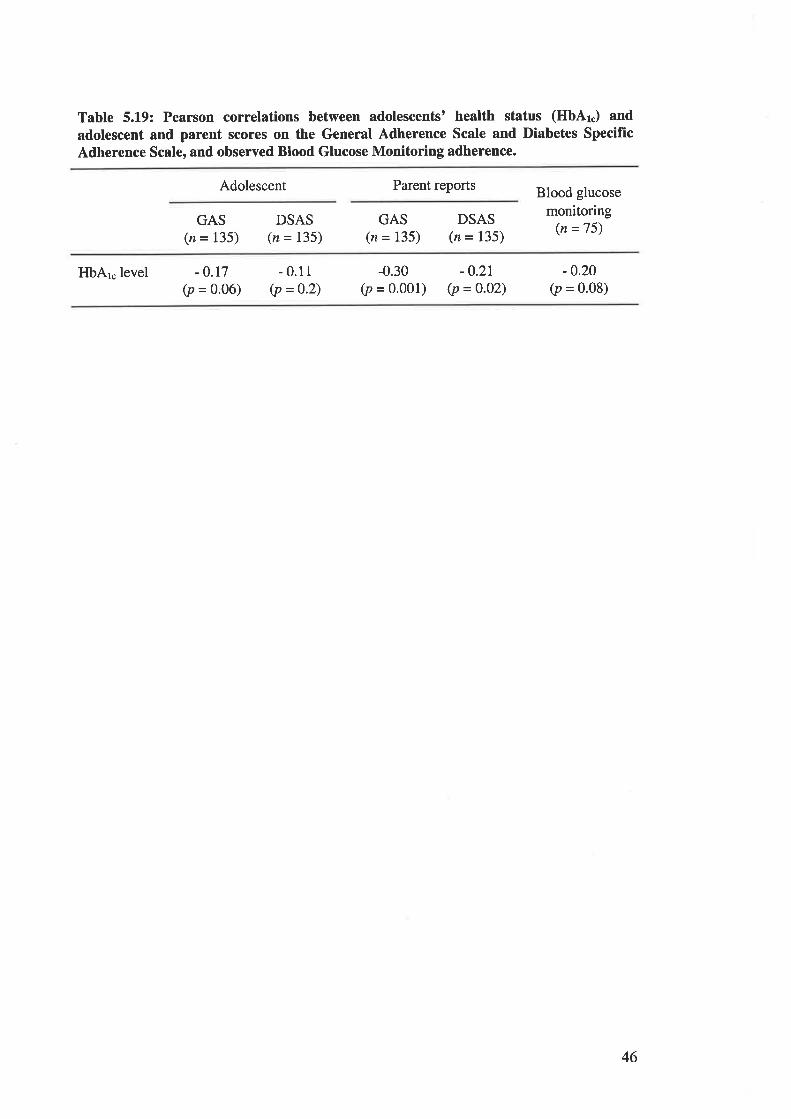
Table 5.L9: Pearson correlations between adolescents' health status (HbAr.) andadolescent and parent scores on the General Adherence Scale and Diabetes Specifrc
Adherence Scale, and observed Blood Glucose Monitoring adherence.
Adolescent Parent reports Blood glucose
monitoring(n =75)
GAS(z = 135)
DSAS(n = 135)
GAS(n = 135)
DSAS(n = 135)
HbAr.level -o.t1(p = o.o6)
- 0.11(p =0.2)
-0.30(p = o'ool)
-0.21(p = 0.02)
-0.20(p = 0.08)
46
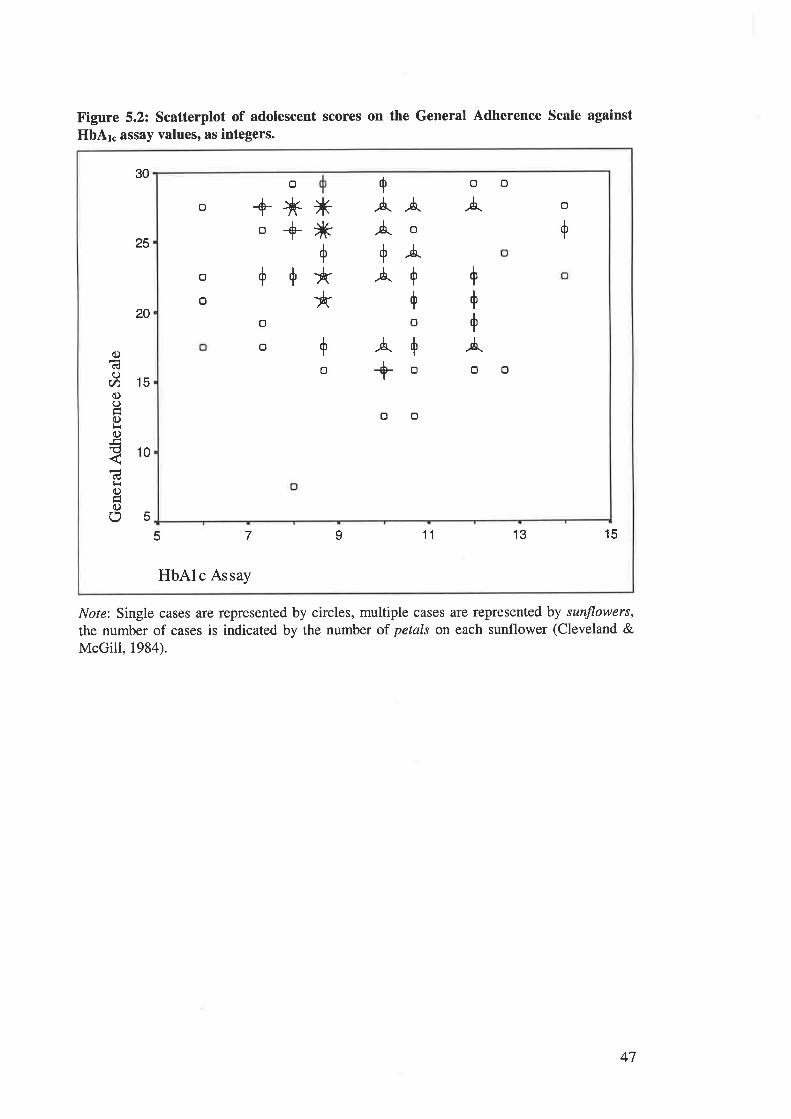
Figure 5.2: Scatterplot of adolescent scores on the General Adherence Scale against
HbAr. assay values, as integers.
Nore: Single cases are represented by circles, multiple cases are represented by sunflowers,
the number of cases is indicated by the number of petals on each sunflower (Cleveland &McGill, 1984).
+
Ä .ó.
Äo+ÀÄ+
+o
/.++ooo
o
+
+
o
o
o
o
À
+
+
+
Ä
o
o
o
o
oo
*ìÉ+
**
o+*o+++
30
25
20
15
10
5
ocËO
V)oC)Êoc)
cË
c)
oo13 157
HbAlc Assay
I 115
47
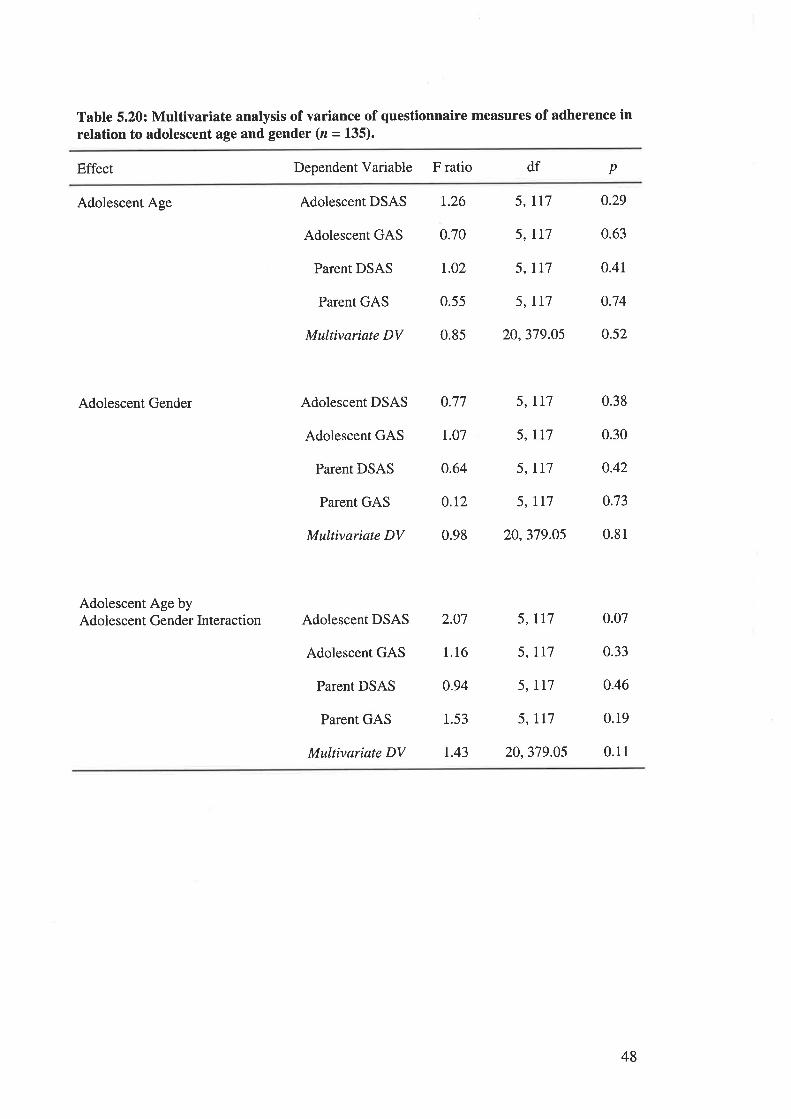
Table 5.20: Multivariate analysis of variance of questionnaire measures of adherence inrelation to adolescent age and gender (z = 135).
Effect Dependent Variable F ratio df p
Adolescent Age
Adolescent Gender
Adolescent Age byAdolescent Gender Interaction
Adolescent DSAS 1.26
Adolescent GAS 0.70
Parent DSAS r.02
Parent GAS 0.55
Multivariate DV 0.85
Adolescent DSAS 0.77
Adolescent GAS 1.07
Parent DSAS o.64
Parent GAS 0.12
Multivariate DV 0.98
Adolescent DSAS 2.O7
Adolescent GAS 1.16
Parent DSAS 0.94
Parent GAS 1.53
Multivariate DV L43
5, II7
5, II7
5, Ll7
5, II7
20,379.05
5, lr7
5, rl7
5, IT7
5, II7
20,379.05
0.29
0.63
0.41
0.74
0.52
0.38
0.30
o.42
0.73
0.81
0.07
0.33
o.46
0.19
0.11
5, II7
5, Il7
5, II7
5, LL7
20,379.05
48
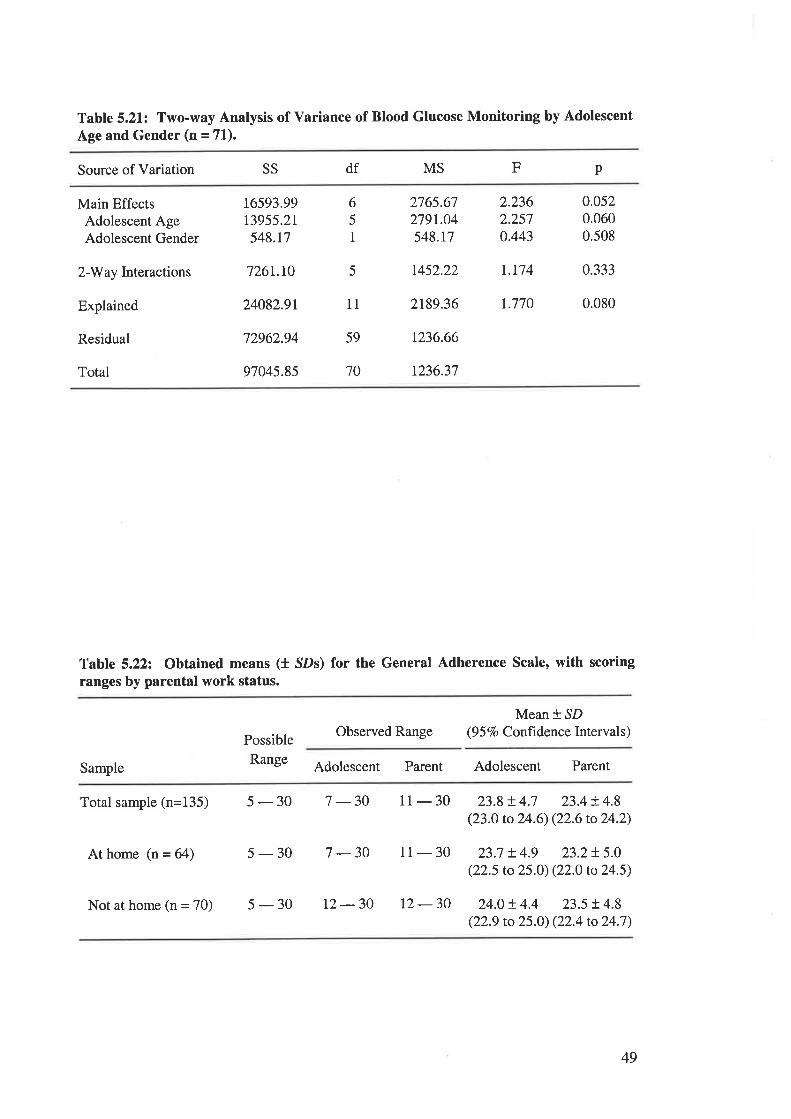
Table 5.21: Two-way Analysis of Variance of Blood Glucose Monitoring by Adolescent
Age and Gender (n = 71).
Source of Variation SS df MS pF
Main EffectsAdolescent AgeAdolescent Gender
2-Way Interactions
Explained
Residual
Total
16593.99t3955.2r548.t7
726r.10
24082.9r
72962.94
97045.85
6
5
I
5
11
59
70
2765.67279r.04548.t7
2.2362.2570.443
0,0520.0600.508
t452.22 1.174 0.333
2189.36 r.770 0.080
t236.66
t236.37
Table 5.222 Obtained means (1 SDs) for the General Adherence Scale, with scoring
ranges by parental work status.
Possible
Range
Observed RangeMean * SD
(9 5 Vo Confrdence Interval s)
Sample Adolescent Parent Adolescent Parent
Totalsample(n=135) 5-30 7-30
At home (n = 64) 5-30 7-30
11 - 30 23.8!4.7 23.4!4.8(23.0 to 24.6) (22.6 to 24.2)
11- 30 23.7 t4.9 23.2r.5.0(22.5 to 25.O) (22.0 to 24.5)
t2 - 30 24.0 t 4.4 23.5 !. 4.8(22.9 to 25.0) (22.4 to 24.7)
Not at home (n = 70) 5 - 30 L2 - 30
49
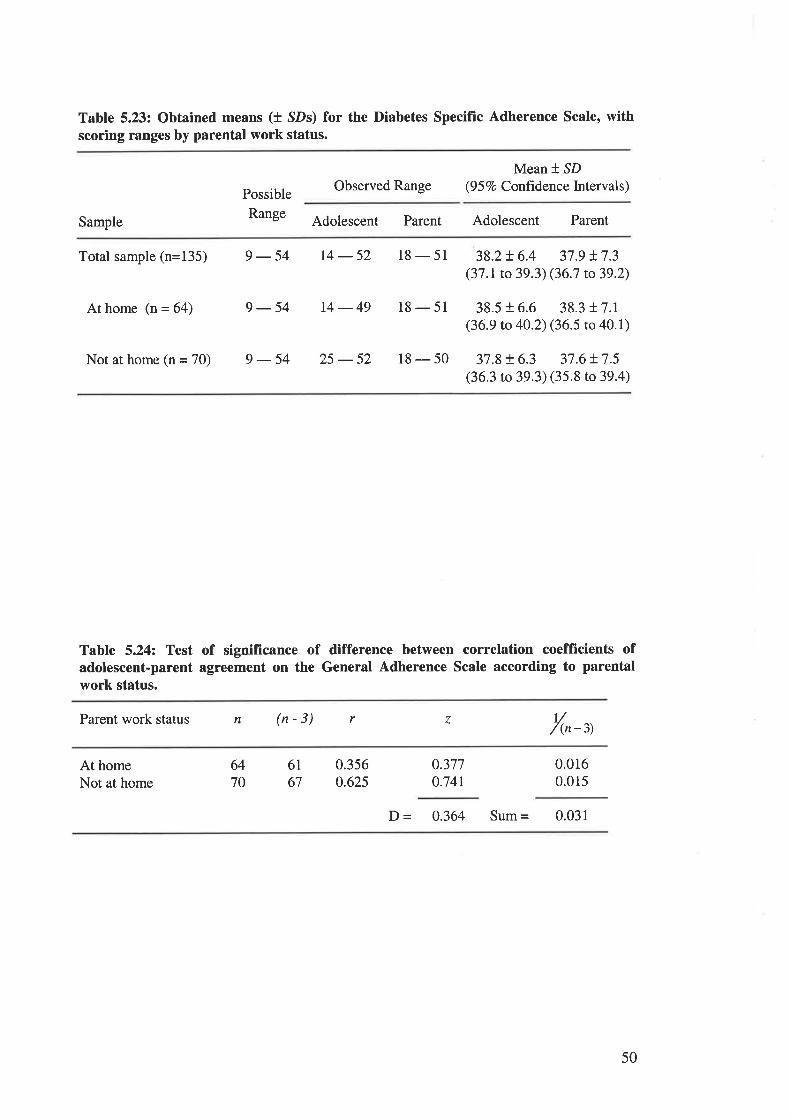
Table 5.23: Obtained means (t SDs) for the Diabetes Specific Adherence Scale, withscoring ranges by parental work status.
Possible
Range
Observed RangeMean *,SD
(9 5 7o Confrdence Intervals)
Sample Adolescent Parent Adolescent Parent
Total sample (n=135) 9 - 54 14 - 52 18 - 51 38.2+ 6.4 37.9 t7.3(37.1 to 39.3)(36.7 to39.2)
At home (n = 64) 9 -54 14 -49 18 - 51 38.5 r 6.6 38.3 r 7.1(36.9 to 40.2) (36.5 to 40.1)
Not at home (n = 70) 9 - 54 25 - 52 18 - 50 37.8 + 6.3 37.6 !7.5(36.3 to 39.3) (35.8 to 39.4)
Table 5.24: Test of significance of difference between correlation coefficients ofadolescent-parent agreement on the General Adherence Scale according to parentalwork status.
Parent work status n (n-3) r z t//(n-3)
At homeNot at home
6470
6I67
0.3560.625
0.377o.741
0.0160.015
D = 0.364 Sum = 0.031
50
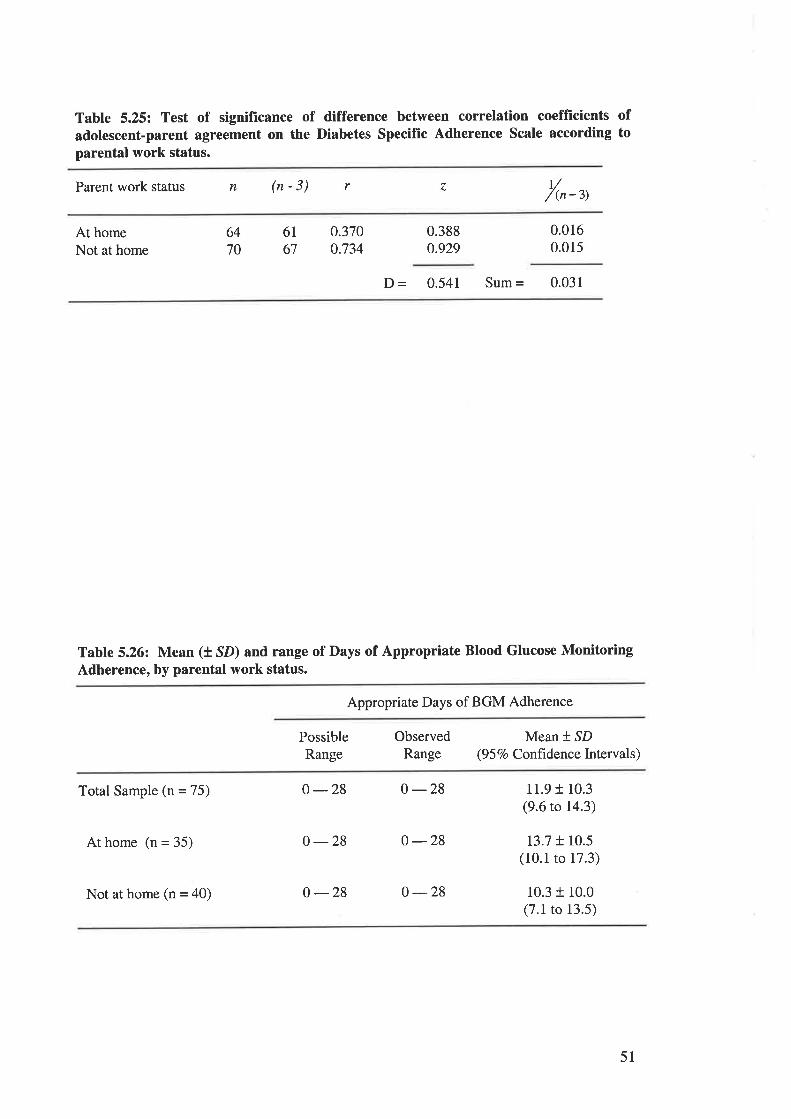
Table 5.25: Test of signifrcance of difference between correlation coefflrcients ofadolescent-parent agreement on the Diabetes Specific Adherence Scale according toparental work status.
Parent work status n (n-3) r z ú/(n-3)
At homeNot at home
6470
6167
0.3700.734
0.3880.929
0.0160.015
D - 0.541 Sum = 0.031
Table 5.26: Mean (t SD) and range of Days of Appropriate Blood Glucose MonitoringAdherence, by parental work status.
Appropriate Days of BGM Adherence
PossibleRange
ObservedRange
Mean * SD(9 5 Vo Confrdence Intervals)
Total Sample (n = 75)
At home (n = 35)
Not at home (n = 40)
o -28 0-28
0 -28 o -28
0 -28 0 -28
11.9 + 10.3(9.6 to 14.3)
13.7 + 10.5(10.1 to 17.3)
10.3 r 10.0(7.1 to 13.5)
51
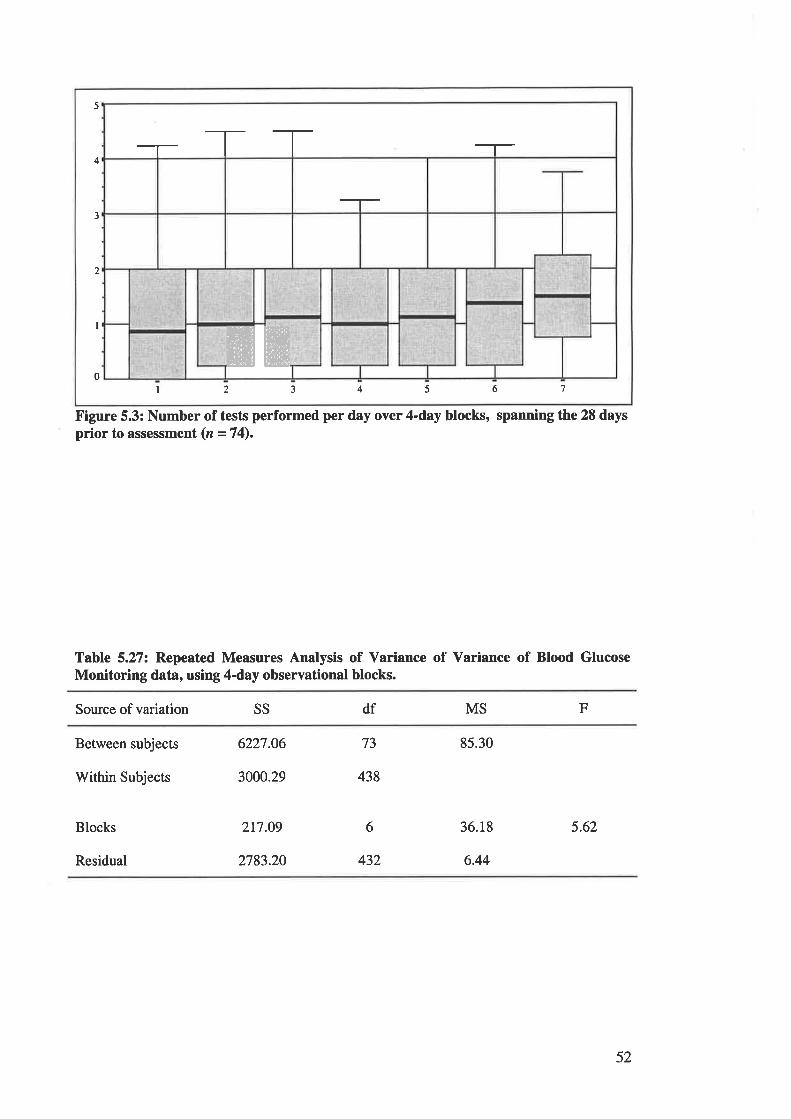
5
4
3
,,
I
0I 2 3 4 5 6 7
TT
ffiffiFigure 5.3: Number of tests performed per day over 4-day blocks, spanning the 28 daysprior to assessment (n = 74).
Table 5.27: Repeated Measures Analysis of Variance of Variance of Blood GlucoseMonitoring data, using 4-day observational blocks.
Source of variation SS df MS F
Between subjects
Within Subjects
Blocks
Residual
6227.06
3000.29
217.09
2783.20
73
438
85.30
36.18
6.44
5.626
432
52
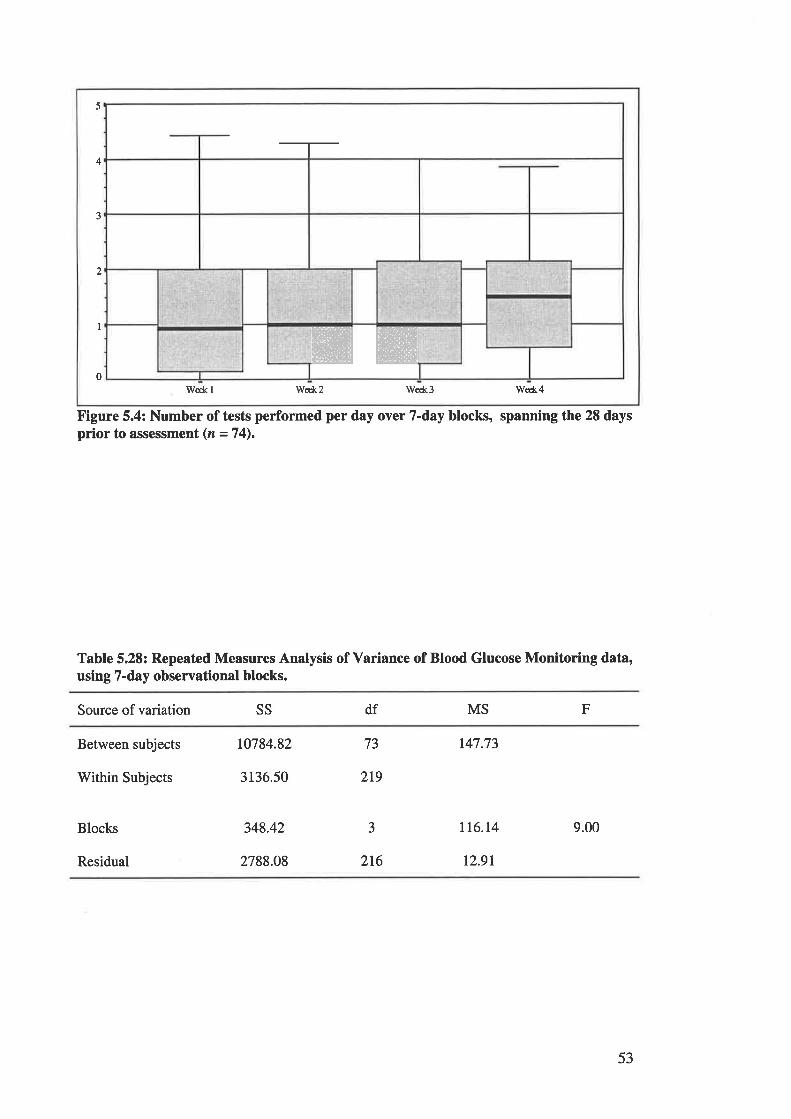
5
4
ffiW
3
2
I
0W€&l Wed<2 We*3 We*4
Figure 5.4: Number of tests performed per day over 7-day blocks, spanning the 28 daysprior to assessment (n =74).
Table 5.28: Repeated Measures Analysis of Variance of Blood Glucose Monitoring data,using 7-day observational blocks.
Source of variation ss df MS F
Between subjects
Within Subjects
Blocks
Residual
10784.82
3136.50
348.42
2788.08
73
3
2r9
216
t47.73
tt6.l4
12.91
9.00
53
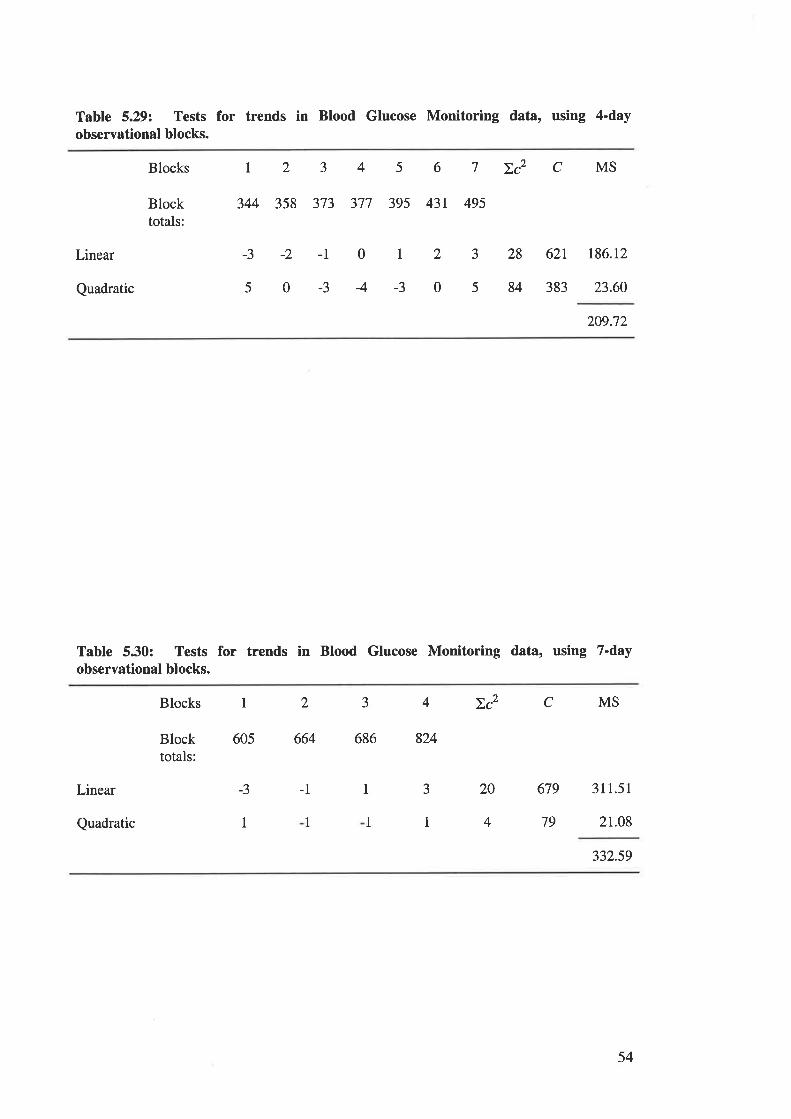
Table 5.29: Tests for trends in Blood Glucose Monitoring data, using 4-dayobservational blocks.
Blocks
Blocktotals:
I234567Zc2CMS
344 358 373 377 395 43r 495
Linear
Quadratic
-3 -2 -l 0 r 2 3 28 62t t86.r2
s0-34-3058438323.60209.72
Table 5.30: Tests for trends in Blood Glucose Monitoring data, using 7-dayobservational blocks.
Blocks 1 2 J
Blocktotals:
605 664 686 824
-3 -1 1
1 1
4Dc2CMS
Linear
Quadratic I
3
1
20 679 311.51
4 79 21.08
332.59
54
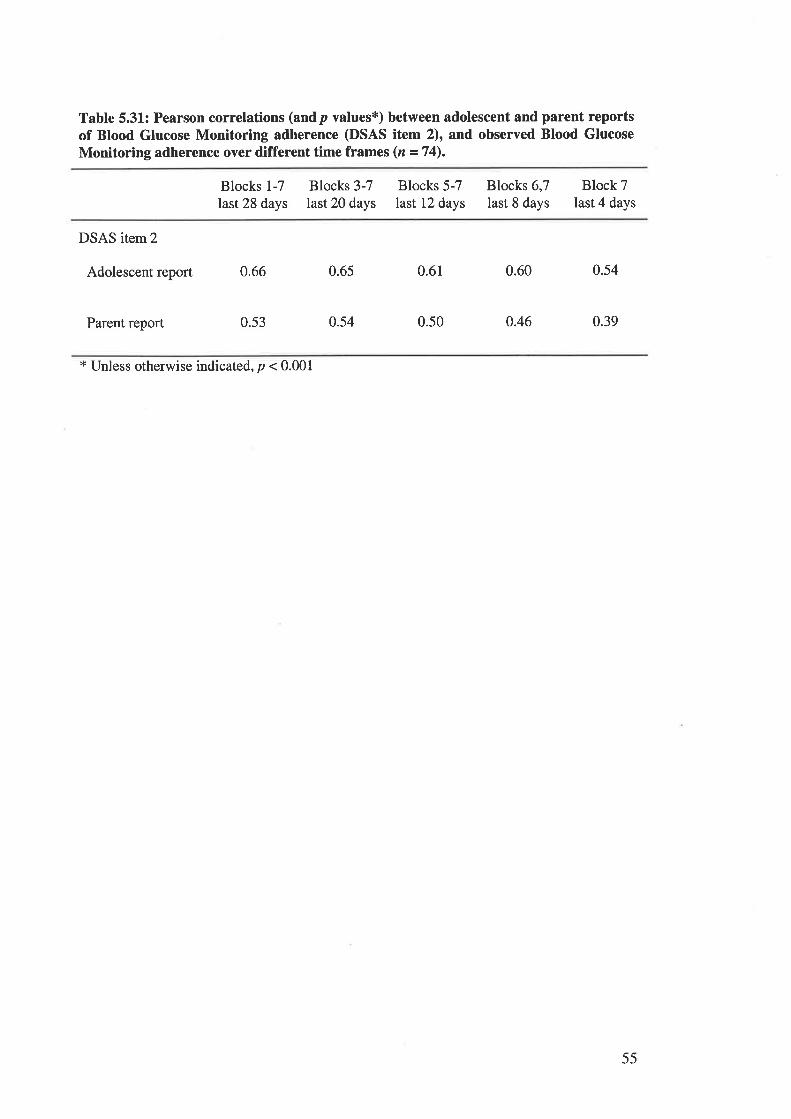
Table 5.31: Pearson correlations (andp values*) between adolescent and parent reportsof Blood Glucose Monitoring adherence (DSAS item 2), and observed Blood GlucoseMonitoring adherence over different time frames (n =74).
Blocks 1-7
last 28 days
Blocks 3-7last 20 days
Blocks 5-7last 12 days
Blocks 6,7last 8 days
Block 7last 4 days
DSAS item2
Adolescent report 0.66
Parent report 0.53
0.65
0.54
0.61
0.50
0.60
o.46
0.54
0.39
* Unless otherwise indicated, p < 0.001
55
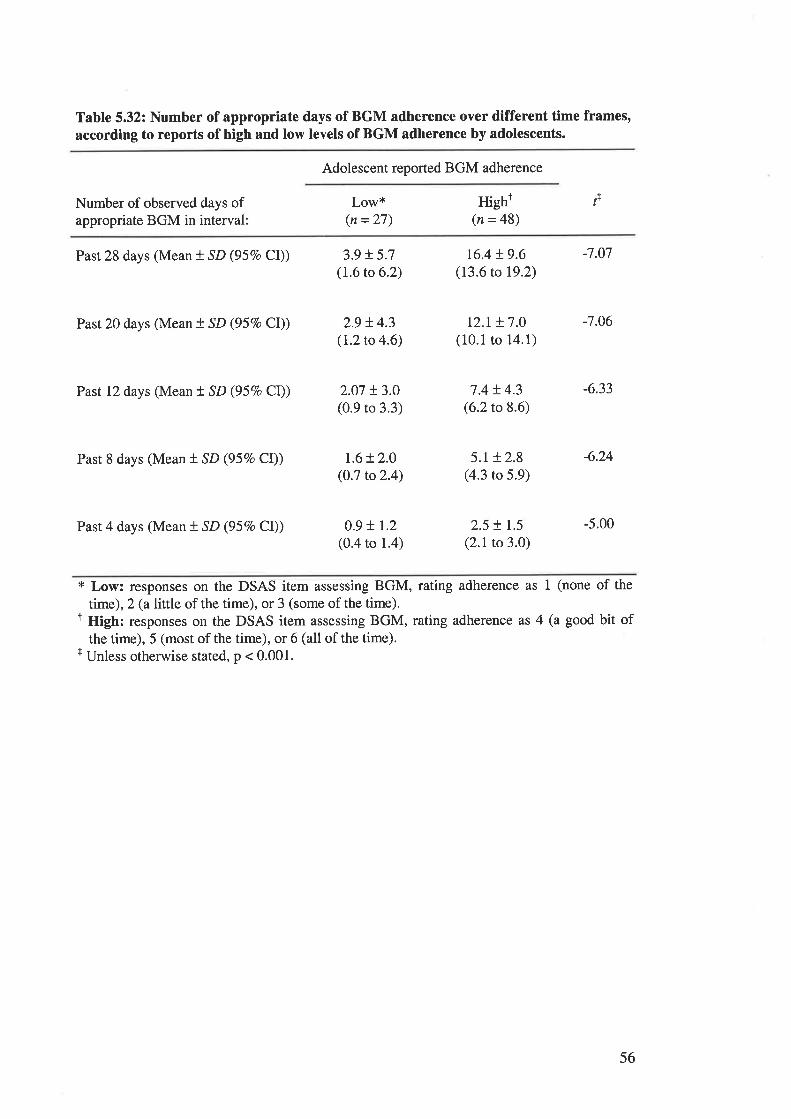
Table 5.32: Number of appropriate days of BGM adherence over different time frames,according to reports of high and low levels of BGM adherence by adolescents.
Adolescent reported BGM adherence
Number of observed days ofappropriate BGM in interval:
Low*(n = 27)
Hight(n = 48)
f
Past 28 days (Mean t SD (95Vo Cl))
Past 20 days (Mean t SD (957o CI))
Past 12 days (Mean t SD (957o Cl))
Past 8 days (Mean t SD (957o CI))
Past 4 days (Mean t SD (95%o Cl))
3.9 t 5.7(1.6 to 6.2)
2.9 t4.3(I.2to 4.6)
2.07 t3.0(0.9 to 3.3)
r.6!2.0(0.7 to2.4)
0.9 !r.2(0.4 to 1.4)
16.4 r.9.6(13.6to 19.2)
tz.r t7.0(10.1 to 14.1)
7.4 t 4.3(6.2 to 8.6)
5.1 r 2.8(4.3 to 5.9)
2.5 t 1.5
(2.1 to 3.0)
-7.07
-7.06
-6.33
-6.24
-5.00
* Low: responses on the DSAS item assessing BGM, rating adherence as 1 (none of the
time), 2 (a little of the time), or 3 (some of the time).r High: responses on the DSAS item assessing BGM, rating adherence as 4 (a good bit of
the time), 5 (most of the time), or 6 (all of the time).t Unless otherwise stated, p < 0.001.
56
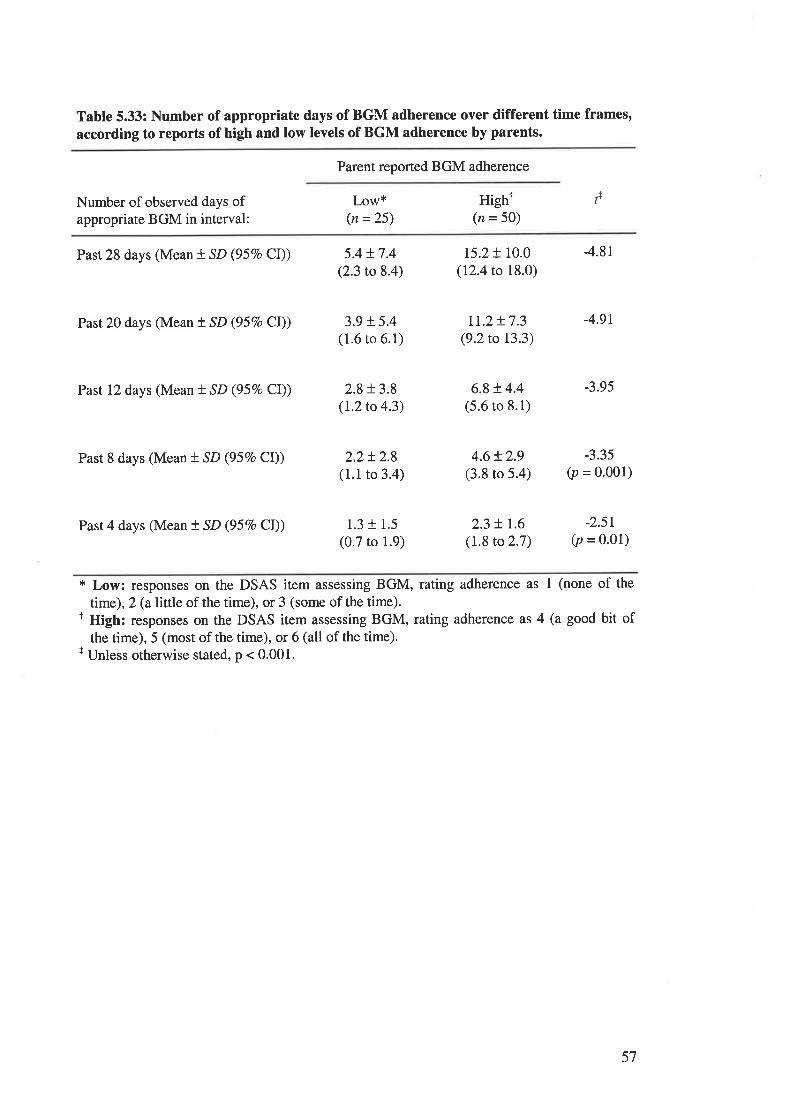
Table 5.33: Number of appropriate days of BGM adherence over different time frames,according to reports of high and low levels of BGM adherence by parents.
Parent reported BGM adherence
Hight(n = 50)
fNumber of observed days ofappropriate BGM in interval:
Low*(n =25)
Past 28 days (Mean t SD (95Vo CI))
Past 20 days (Mean t SD (95Vo CI))
Past 12 days (Mean t SD (95Vo CI))
Past 8 days (Mean t SD (95Vo Cl))
Past 4 days (Mean t SD (957o CI))
5.4t7.4(2.3 to 8.4)
3.9 + 5.4(1.6 to 6.1)
2.8 + 3.8(L2to 4.3)
2.2!2.8(1.1 to 3.4)
1.3 r 1.5
(0.7 to 1.9)
15.2 + 10.0(12.4 to 18.0)
tr.z t7.3(9.2to 13.3)
6.8+ 4.4(5.6 to 8.1)
4.6!2.9(3.8 to 5.4)
2.3 + r.6(1.8 to 2.7)
4.81
4.9r
-3.95
-3.35(p = o.oo1)
-2.5r(p = 0.01)
* Low: responses on the DSAS item assessing BGM, rating adherence as I (none of the
time), 2 (al\ttle of the time), or 3 (some of the time).I High: responses on the DSAS item assessing BGM, rating adherence as 4 (a good bit of
the time), 5 (most of the time), or 6 (all of the time).r Unless otherwise stated, p < 0.001.
57
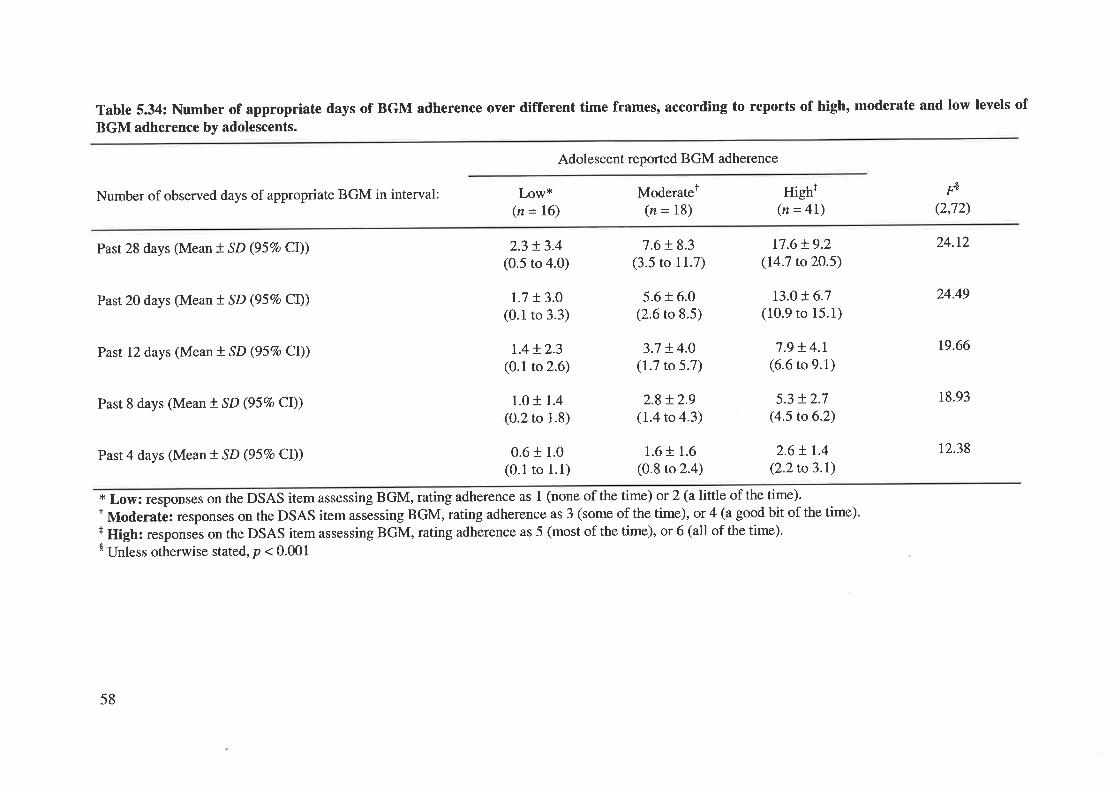
Table 5.34: Number of appropriate days of BGM adherence over different time frames, according to reports of high, moderate and low levels of
BGM adherence by adolescents.
Adolescent reported BGM adherence
Number of observed days of appropriate BGM in interval: Low*(n = 16)
Past 28 days (Mean t SD (957o CI)) 2.3 !3.4(0.5 to 4.0)
Past 20 days (Mean t SD (95Vo Cl)) t.7 t3.0(0.1 to 3.3)
Past 12 days (Mean ! SD (957o CI)) 1.4!2.3(0.1 to 2.6)
Past 8 days (Mean t SD (957o CI)) 1.0 r 1.4(0.2 to 1.8)
Past 4 days (Mean ! SD (95Vo CI)) 0.6 r 1.0(0.1 ro 1.1)
* Low: responses on the DSAS item assessing BGM, rating adherence as 1 (nonet Moderate: responses on the DSAS item assessing BGM, rating adherence as 3 (+ High: responses on the DSAS item assessing BGM, rating adherence as 5 (most$ Unless otherwise stated, p < 0.001
2.6+ 1.4
(2.2to3.1)
of the time) or 2 (a little of the time).some of the time), or 4 (a good bit of the time).of the time), or 6 (all of the time).
Moderatet(n = 18)
7.6 + 8.3(3.5 to 11.7)
5.6 + 6.0(2.6 to 8.5)
3.7 + 4.0(1.7 to 5.7)
2.8 + 2.9(1.4 to 4.3)
1.6 + 1.6
(0.8 to 2.4)
High+(n = 4l)
17.6+ 9.2(14.7 to2O.5)
r3.0 t6.7(10.9 to 15.1)
7.9 + 4.1(6.6 to 9.1)
5.3 + 2.7(4.5 to 6.2)
rå(2,72)
24.12
24.49
t9.66
18.93
t2.38
58
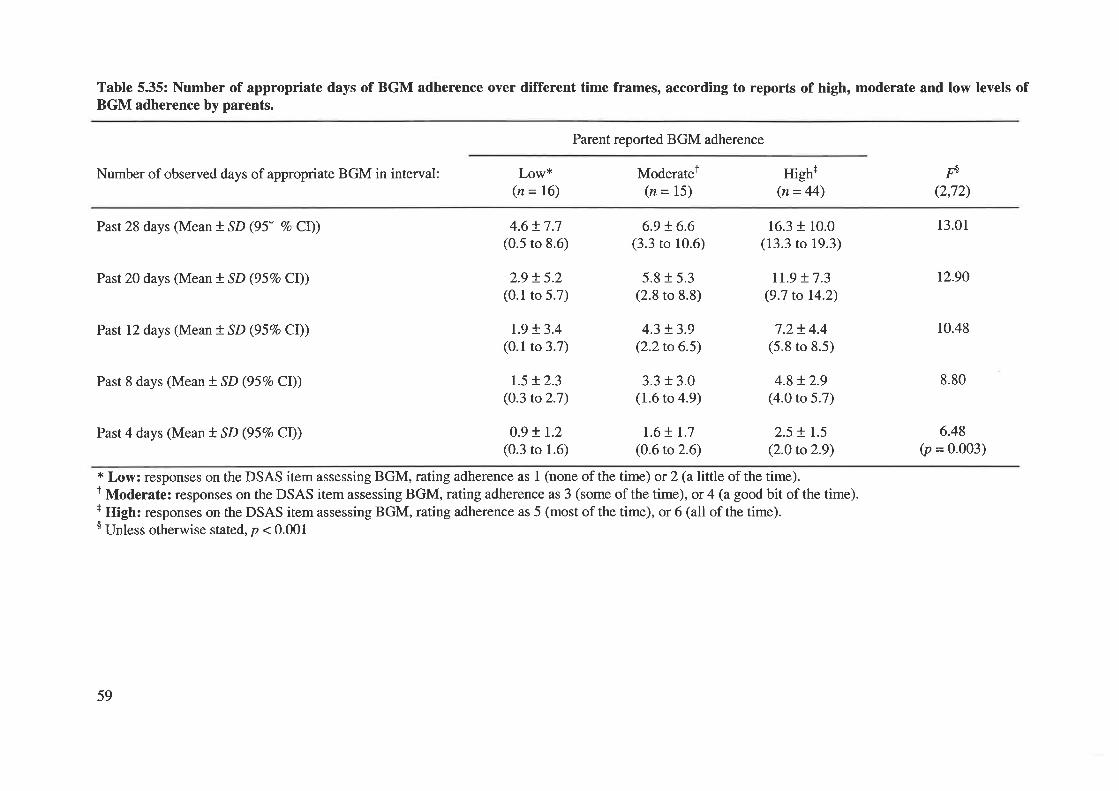
Table 5.35: Number of appropriate days of BGM adherence over different time frames, according to reports of high, moderate and low levels ofBGM adherence by parents.
Parent reported BGM adherence
Number of observed days of appropriate BGM in interval:
Past 28 days (Mean t SD (95" Vo Cl))
Past 20 days (Mean ! SD (95Vo Cl))
Past 12 days (Mean f SD (957o Cl))
Past 8 days (Mean ! SD (95Vo Cl))
Past 4 days (Mean t SD (957o Cl))
Low*(n = 16)
4.6 t7.7(0.5 to 8.6)
2.9 !5.2(0.1 to 5.7)
r.9 !3.4(0.1 to 3.7)
r.5 !2.3(0.3 to 2.7)
0.9 ! 1.2(0.3 to 1.6)
Moderatel(n = 15)
6.9 !6.6(3.3 to 10.6)
5.8 r 5.3(2.8 to 8.8)
4.3 + 3.9(2.2to 6.5)
3.3 + 3.0(1.6 to 4.9)
1.6+ r.7(0.6 to 2.6)
High+(n= 44)
16.3 + 10.0(13.3 to 19.3)
rl.9 + 7.3(9.7 to 14.2)
7.2t4.4(5.8 to 8.5)
4.8 + 2.9(4.0 to 5.7)
2.5 ! 1.5
(2.0 to 2.9)
Fð
(2,72)
13.01
12.90
10.48
8.80
6.48(p = 0.003)
* Low: responses on the DSAS item assessing BGM, rating adherence as I (none of the time) or 2 (a little of the time).1 Moderate: responses on the DSAS item assessing BGM, rating adherence as 3 (some of the time) , or 4 (a good bit of the time).r High: responses on the DSAS item assessing BGM, rating adherence as 5 (most of the time), or 6 (all of the time).$ Unless otherwise stated, p < 0.001
59
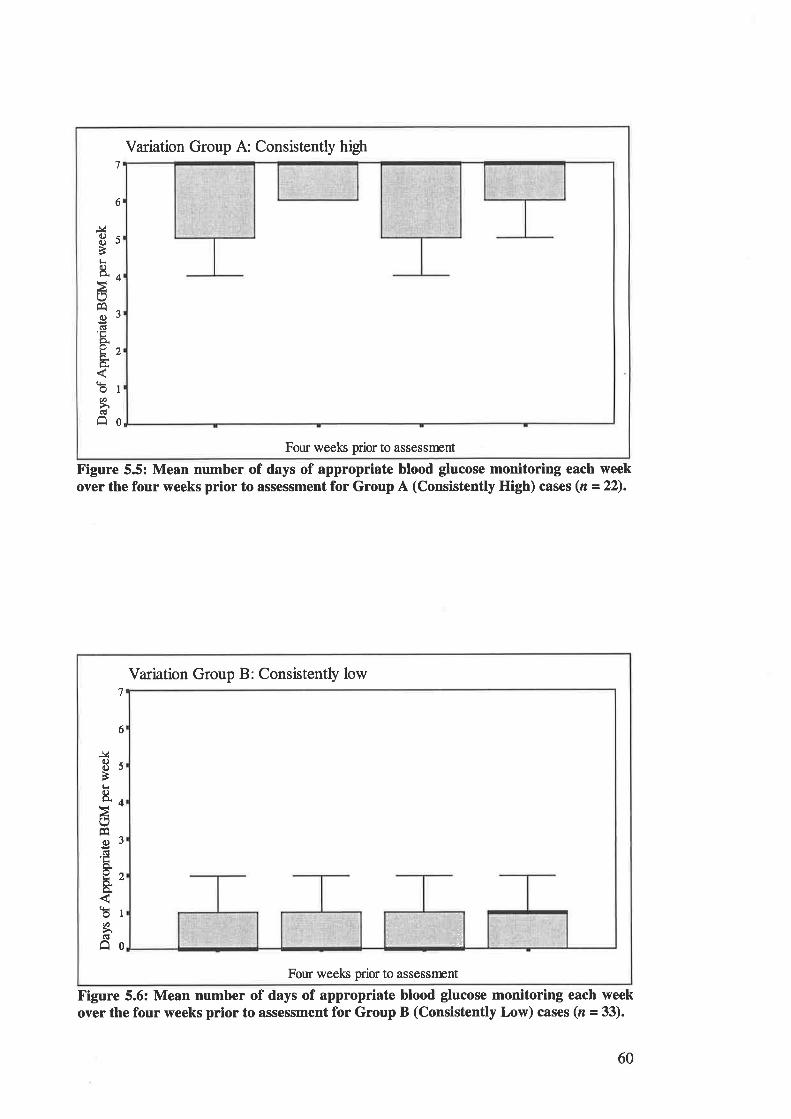
Variation Group A: Consistently high7
6
J¿c)C)
Ètr8"
oFA
cct'trcio!
t1
bØCÉ
o
5
4
3
2
I
0
Four weeks prior to assessrrent
Figure 5.5: Mean number of days of appropriate blood glucose monitoring each weekover the four weeks prior to assessment for Group A (Consistently High) cases (n =22).
Variation Group B: Consistentþ low7
6
J¿a)C)
È¡r&
Éo)clLÞ.ou&
oØ
Ê
5
4
3
2
I
0
Four weeks prior to assessfrrnt
,. '.i ,al
': ,'!t; ,*Á
Figure 5.6: Mean number of days of appropriate blood glucose monitoring each weekover the four weeks prior to assessment for Group B (Consistently Low) cases (r - 33).
60
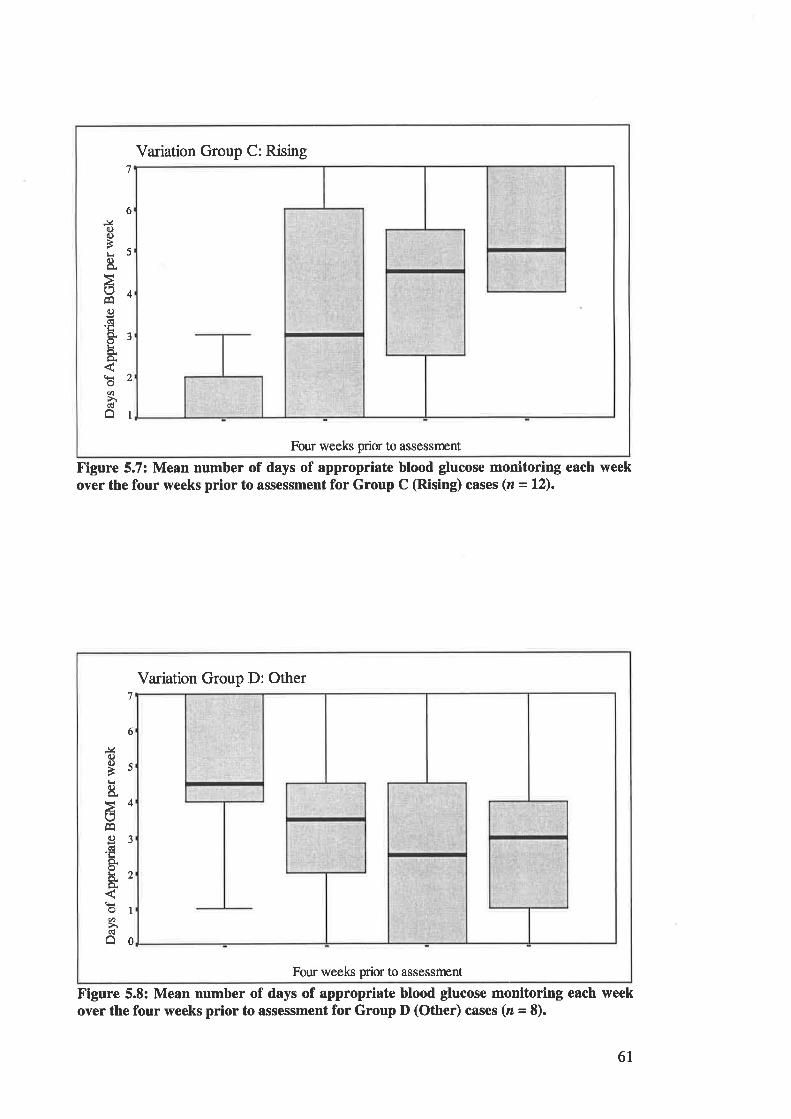
Variation Group C: Rising7
6J¿ooBL
8.
(]cc)(ËLo.oL
oØ
â
5
4
3
a
I
Four weeks prior to assessnent
Figure 5.7: Mean number of days of appropriate blood glucose monitoring each weekover the four weeks prior to assessment for Group C (Rising) cases (z - l2).
Variation Group D: Other7
6
J40.)a)Èl-r
ts
EC)dLo.oLíä.o.
Øhâ
5
4
3
2
I
0
Four weels prior to assessnrnt
Figure 5.8: Mean number of days of appropriate blood glucose monitoring each weekover the four weeks prior to assessment for Group D (Other) cases (z = 8).
6I
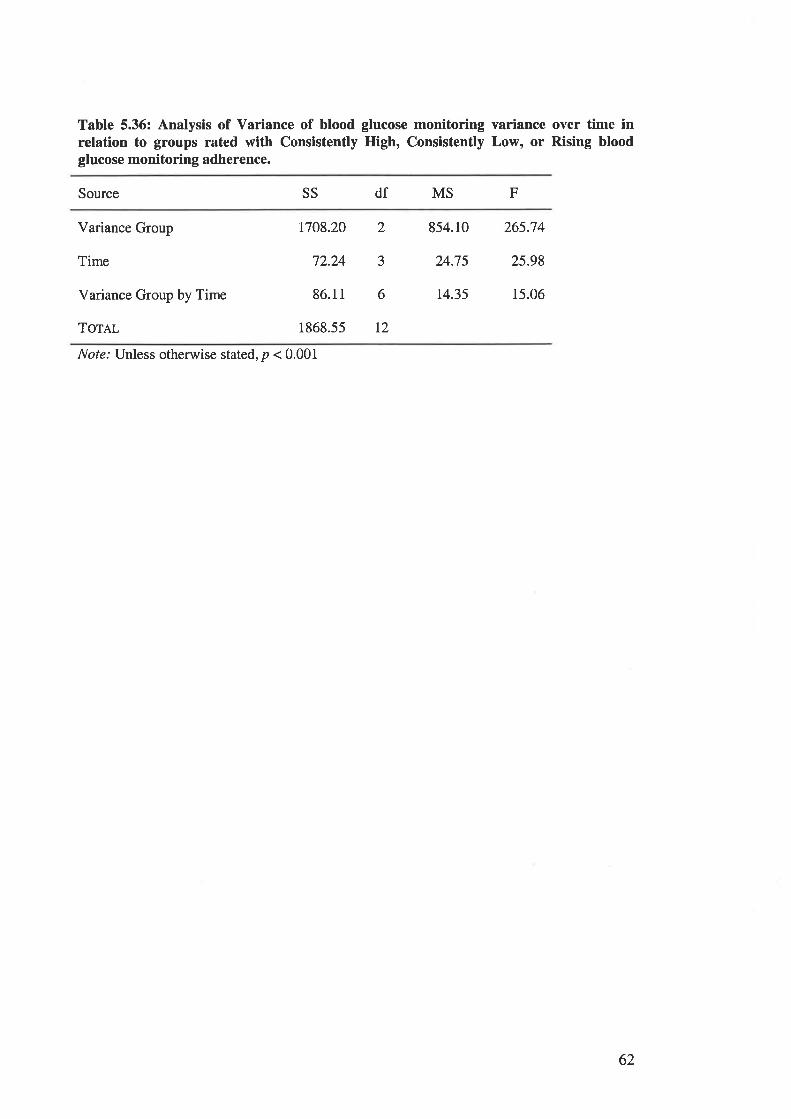
Table 5.36: Analysis of Variance of blood glucose monitoring variance over time inrelation to groups rated with Consistently High, Consistently Low, or Rising bloodglucose monitoring adherence.
Source SS df MS F
Variance Group
Time
Variance Group by Time
Torer
1708.20 2 854.10 265.74
72.24 3 24.7s 25.98
86.11 6 14.35 15.06
1868.55 L2
Note: Unless otherwise stated, p < 0.001
62
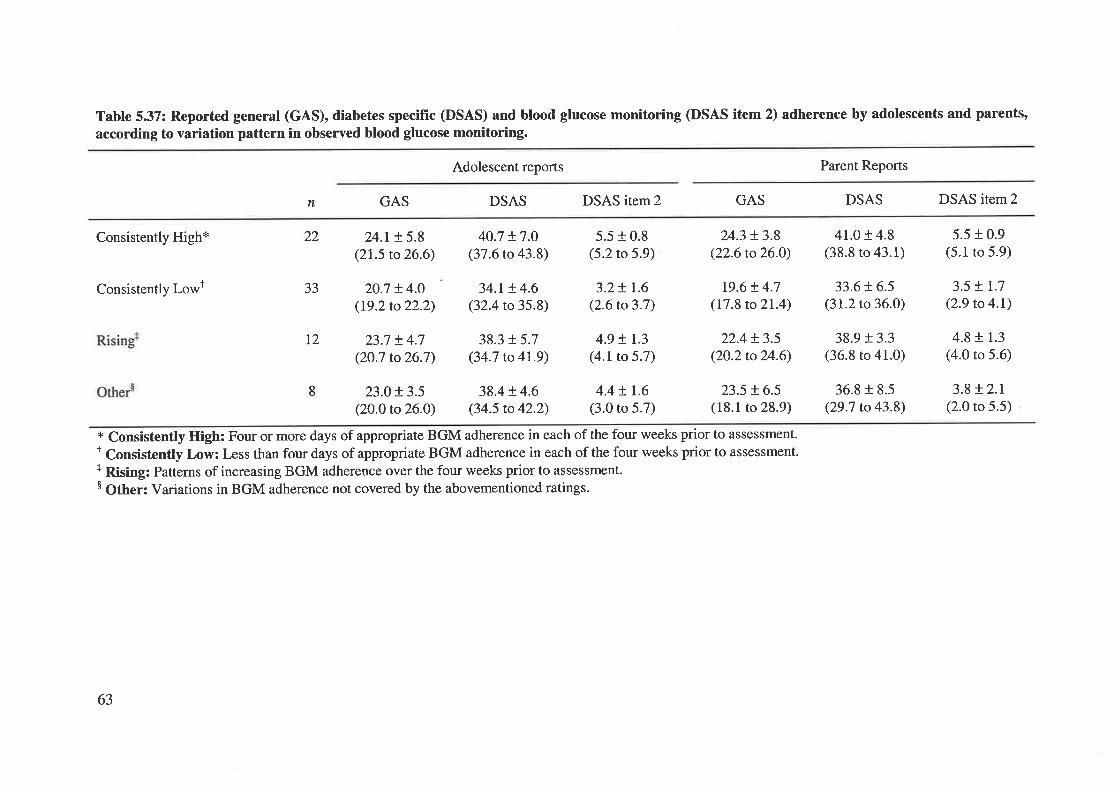
Table 537: Reported general (GAS), diabetes specific (DSAS) and blood glucose monitoring (DSAS item 2) adherence by adolescents and parents,
according to variation pattern in observed blood glucose monitoring.
Adolescent reports Parent Reports
n GAS DSAS DSAS itern2 GAS DSAS DSAS item2
Consistently High*
Consistently Lowt
24.r !5.8(21.5 to 26.6)
20.7 + 4.O
(19.2to22.2)
23.7 + 4.7(2O.7 to26.7)
23.0 t3.5(20.0 to 26.O)
40.7 t7.O(37.6 to 43.8)
34.t + 4.6(32.4 to 35.8)
38.3 f 5.7(34.7 to 4r.9)
38.4 + 4.6(34.5 to 42.2)
5.5 + 0.8(5.2 to 5.9)
3.2 ! r.6(2.6 to 3.7)
4.9 + r.3(4.1 to 5.7)
4.4 ! r.6(3.0 to 5.7)
24.3 + 3.8(22.6 to 26.0)
t9.6 t 4.7(17.8 to 21.4)
22.4 + 3.5(20.2to24.6)
23.5 !6.5(18.1 to 28.9)
41.0 r 4.8(38.8 to 43.1)
33.6!6.5(31.2 to 36.0)
38.9 + 3.3(36.8 to 41.0)
36.8 r 8.5(29.7 to 43.8)
5.5 + 0.9(5.1 to 5.9)
3.5 + t.7(2.9 to 4.1)
4.8 + 1.3
(4.0 to 5.6)
3.8 !2.r(2.0 to 5.5)
22
33
T2
8
* Consistently High: Four or more days of appropriate BGM adherence in each of the four weeks prior to assessment.t Consistently Low: Less than four days of appropriate BGM adherence in each of the four weeks prior to assessment.+ Rising: Patterns of increasing BGM adherence over the four weeks prior to assessment.$ Other: Variations in BGM adherence not covered by the abovementioned ratings.
63
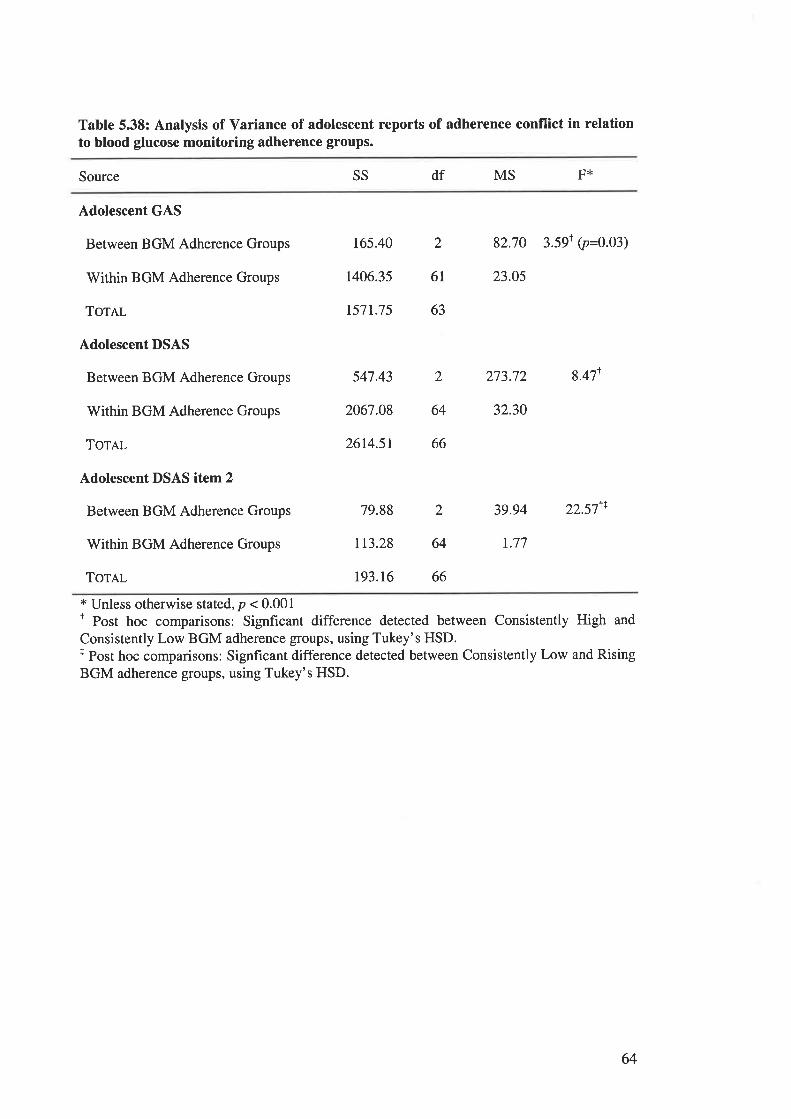
Table 5.38: Analysis of Variance of adolescent reports of adherence conflict in relationto blood glucose monitoring adherence groups.
Source SS df MS F*
Adolescent GAS
Between BGM Adherence Groups
Within BGM Adherence Groups
TorRr-
Adolescent DSAS
Between BGM Adherence Groups
Within BGM Adherence Groups
ToTAL
Adolescent DSAS item 2
Between BGM Adherence Groups
Within BGM Adherence Groups
ToTAL
t65.40 2 82.70 3.59T ip=9.93¡
1406.35 61 23.05
r57t.75 63
547.43 2 273.72 8.47r
2067.08 64 32.30
26t4.5r 66
tr3.28 64 r.77
79.88 2 39.94 22.571r
193.16 66
t Unless otherwise stated, p < 0.001t Post hoc comparisons: Signficant difference detected between Consistently High and
Consistently Low BGM adherence groups, using Tukey's HSD.t Post hoc comparisons: Signficant difference detected between Consistently Low and RisingBGM adherence groups, using Tukey's HSD.
64
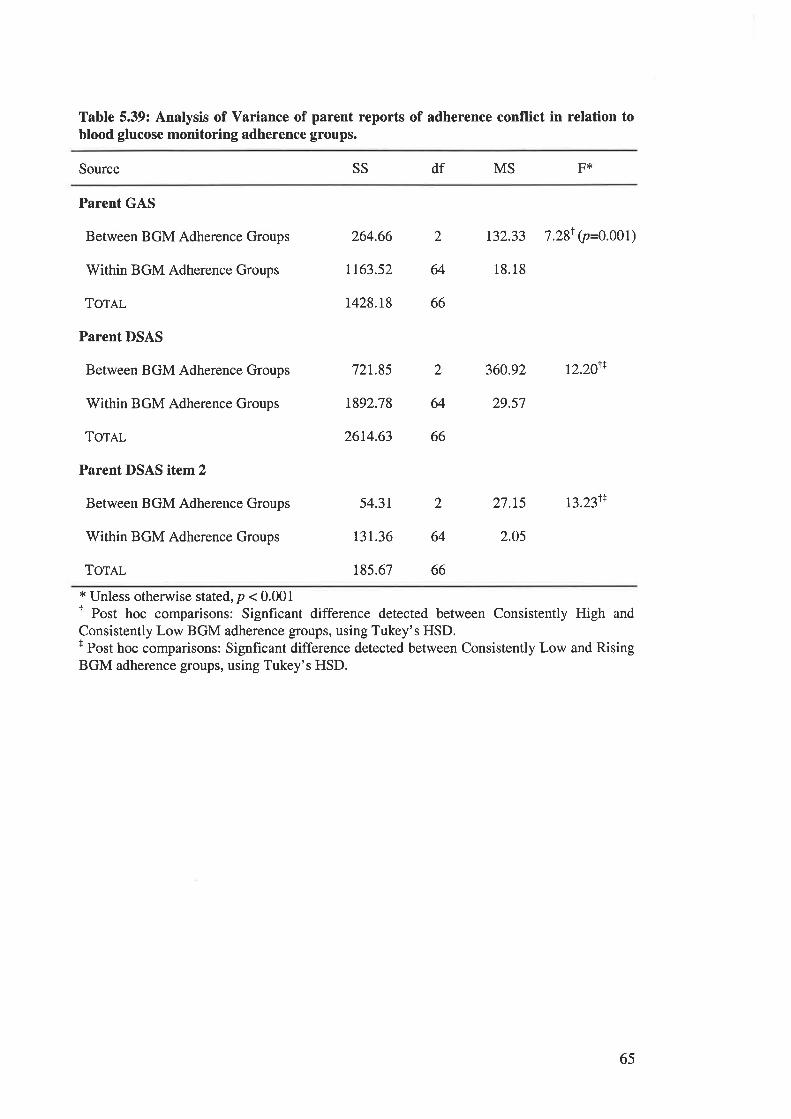
Table 5.39: Analysis of Variance of parent reports of adherence conflict in relation toblood glucose monitoring adherence groups.
Source SS df MS F*
Parent GAS
Between BGM Adherence Groups
Within BGM Adherence Groups
ToTAL
Parent DSAS
Between BGM Adherence Groups
Within BGM Adherence Groups
TOTAL
Parent DSAS item 2
Between BGM Adherence Groups
Within BGM Adherence Groups
Tornr-
264.66 2 132.33 7.28T 9=6.961;
t163.52 64 18.18
r428.r8 66
721.85 2 360.92 r2.20r+
1892.78 64 29.57
26t4.63 66
54.31 2 27.L5 t3.231+
131.36 64 2.05
185.67 66
* Unless otherwise stated, p < 0.001I Post hoc comparisons: Signficant difference detected between Consistently High and
Consistently Low BGM adherence groups, using Tukey's HSD.f Post hoc comparisons: Signficant difference detected between Consistently Low and RisingBGM adherence groups, using Tukey's HSD.
65
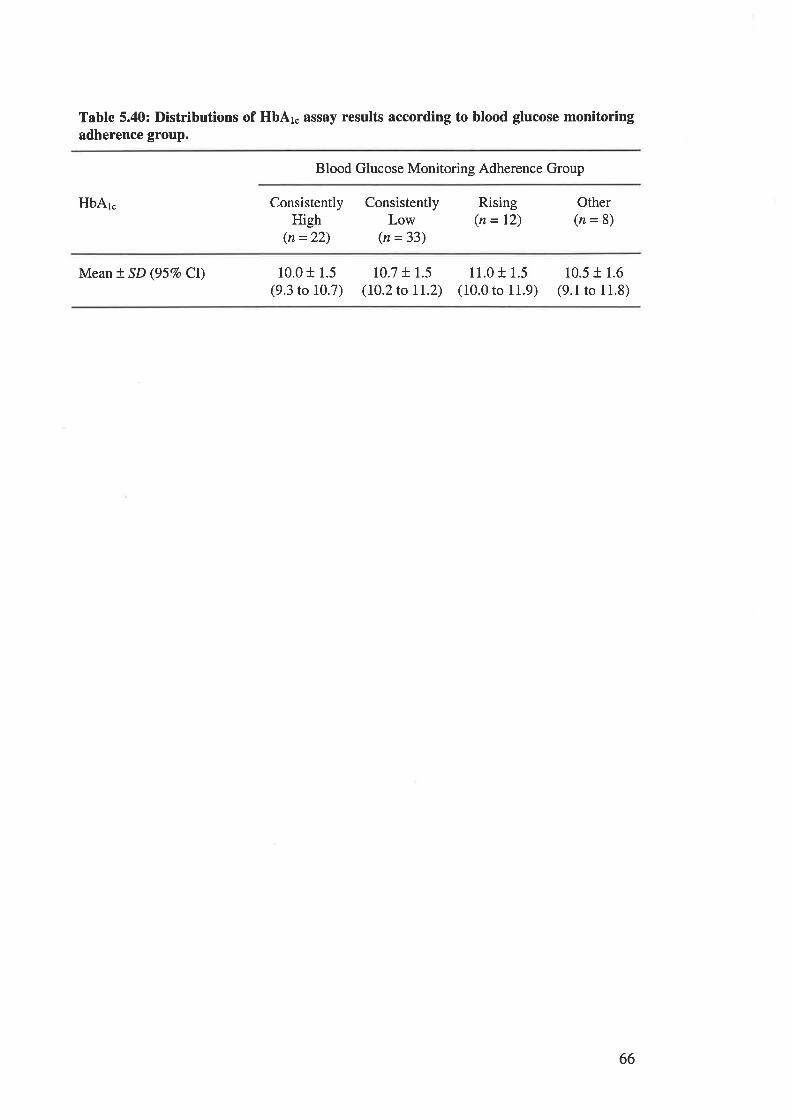
Table 5.40: Distributions of HbAr. assay results according to blood glucose monitoringadherence group.
Blood Glucose Monitoring Adherence Group
HbAr" ConsistentlyHigh
(n =22)
ConsistentlyLow
(n =33)
Rising(n = 12)
Other(n=8)
Mean t SD (957o Cl) 10.0 + 1.5(9.3 to 10.7)
10.7 + 1.5(l0.2to IL2)
11.0 t 1.5(10.0 to 11.9)
10.5 + 1.6
(9.1 to 11.8)
66

FIGURES CITED IN CHAPTER 6.
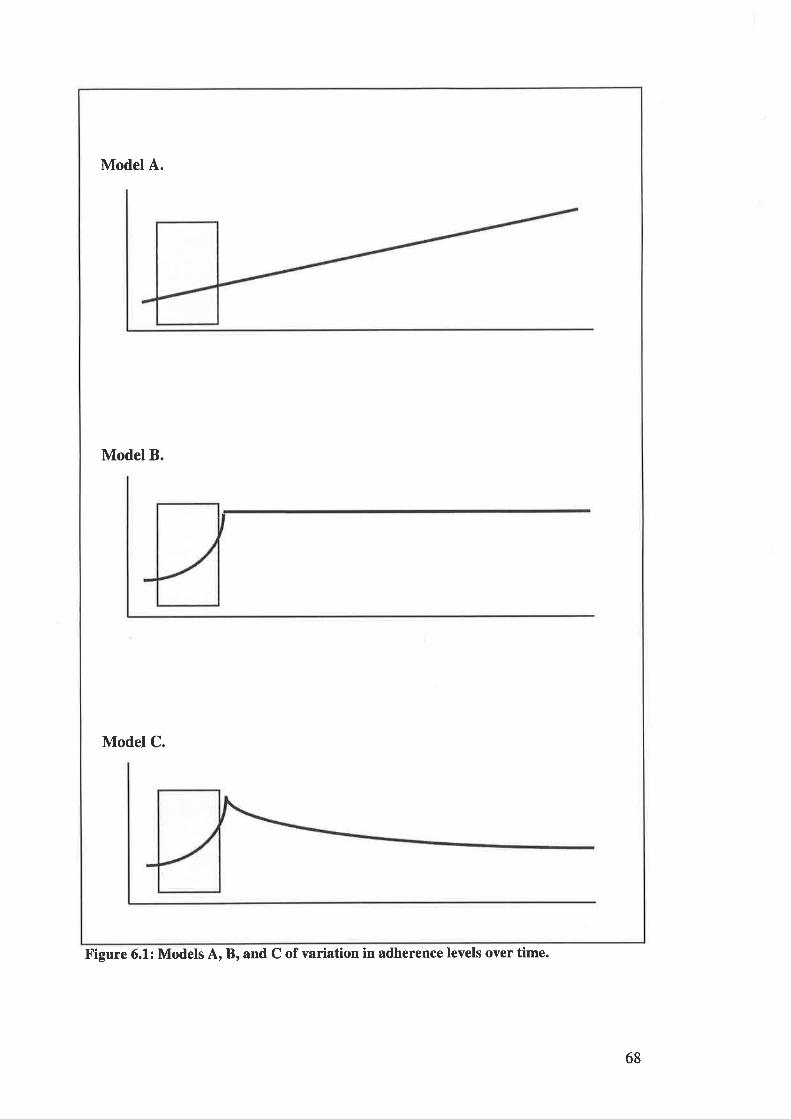
Model A.
Model B.
Model C.
Figure 6.1: Models A, B, and C of variation in adherence levels over time.
68
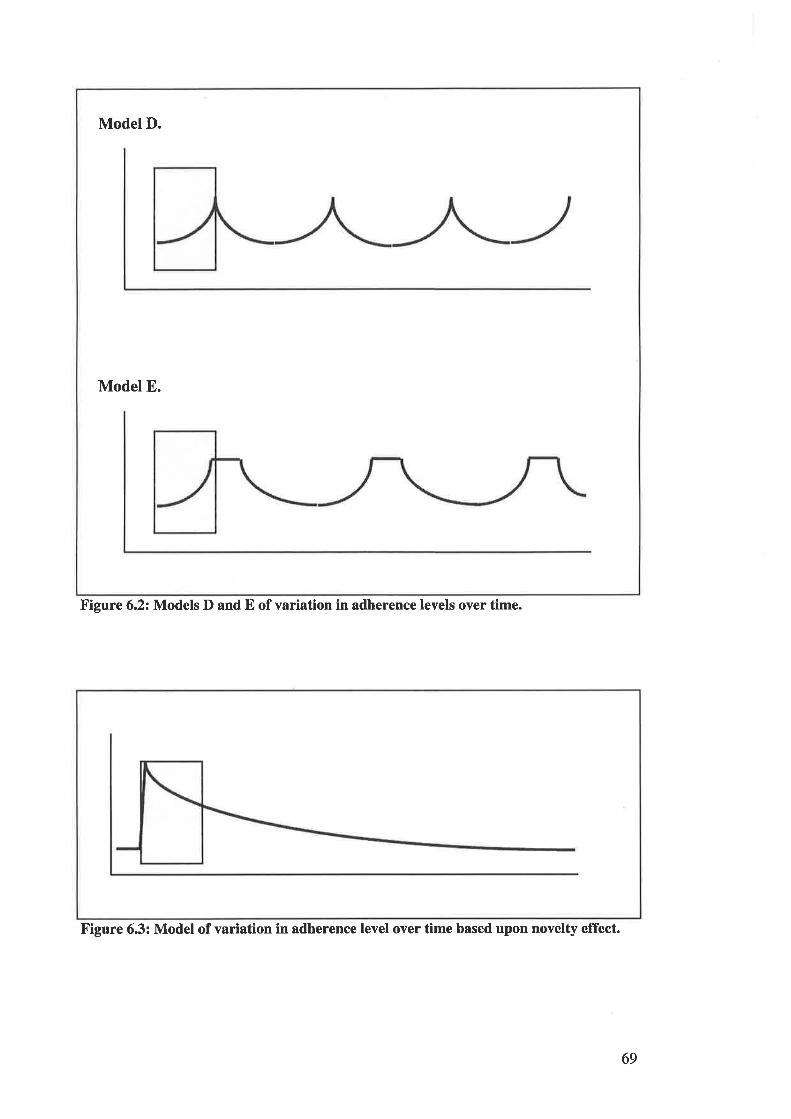
Model D.
Model E.
Figure 6.2: Models D and E of variation in adherence levels over time.
Figure 6.3: Model of variation in adherence level over time based upon novelty effect.
69

TABLES CITED IN CHAPTER 7.
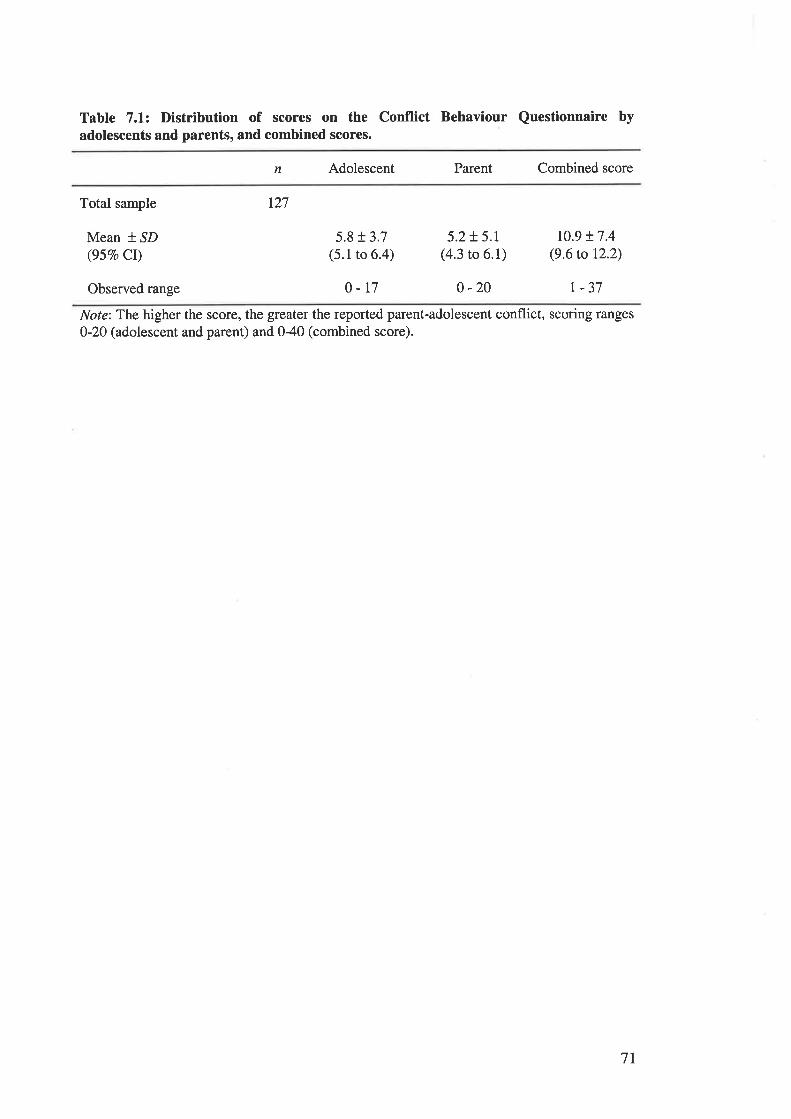
Table 7.1: Distribution of scores on the Conflict Behaviour Questionnaire byadolescents and parents, and combined scores.
n Adolescent Parent Combined score
Total sample
Mean * SD(957o Cr)
Observed range
r27
5.8 r 3.7(5.1 to 6.4)
o-t7
5.2!5.r(4.3 to 6.1)
0 -20
10.9 + 7.4(9.6 to 12.2)
| -37
Note:The higher the score, the greater the reported parent-adolescent conflict, scoring ranges
0-20 (adolescent and parent) and 0-40 (combined score).
7T
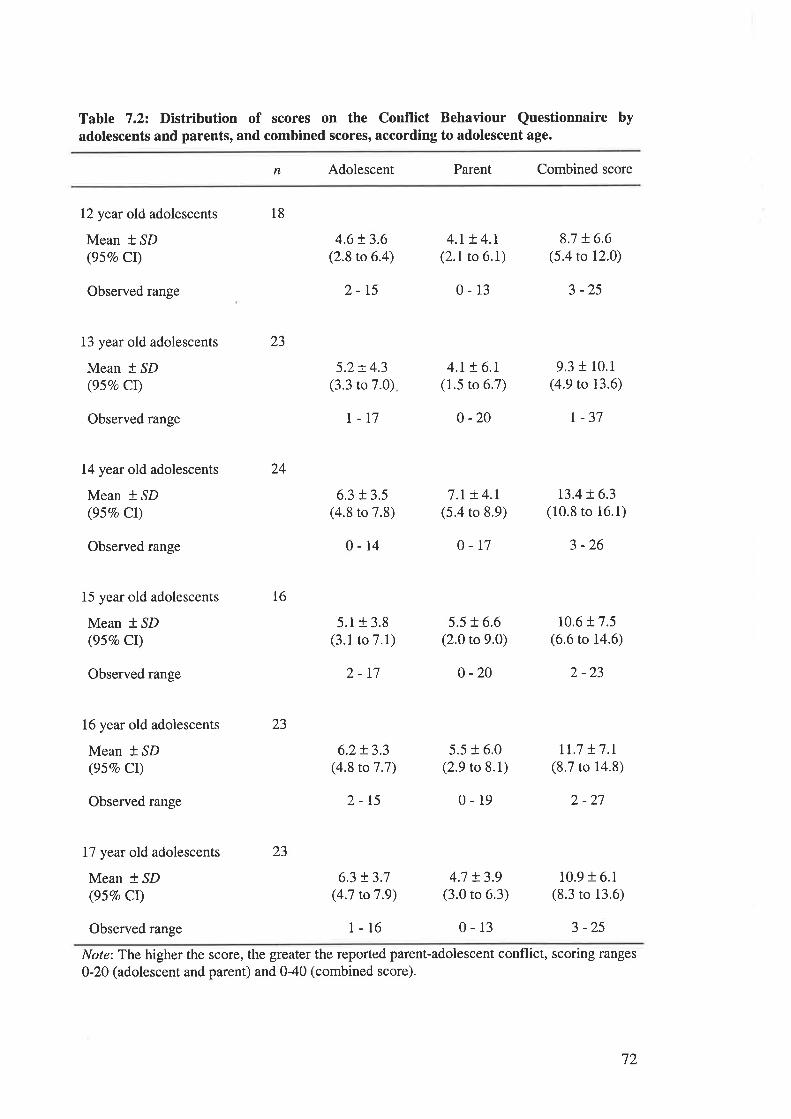
Tabte 7.22 Distribution of scores on the Conflict Behaviour Questionnaire byadolescents and parents, and combined scores, according to adolescent age.
n Adolescent Parent Combined score
12 year old adolescents
Mean t SD(957o Cl)
Observed range
13 year old adolescents
Mean * SD(95Vo Cl)
Observed range
14 year old adolescents
Mean * SD(95Vo Cl)
Observed range
15 year old adolescents
Mean f SD(957o CI)
Observed range
16 year old adolescents
Mean * SD(957o CI)
Observed range
17 year old adolescents
Mean t SD(95Vo Cl)
23
18
l6
4.6t3.6(2.8 to 6.4)
2-t5
5.2!4.3(3.3 to 7.0)
r-t7
6.3 t 3.5(4.8 to 7.8)
0-14
5.1r 3.8(3.1 to 7.1)
2-r7
6.2t3.3(4.8 to 7 .7)
2-15
6.3 t3.7(4.7 to 7 .9)
1-16
4.r ! 4.r(2.1 to 6.1)
0-13
4.t + 6.r(1.5 to 6.7)
0 -20
7.r t 4.1(5.4 to 8.9)
0-17
5.5 + 6.6(2.0 to 9.0)
0 -20
5.5 r 6.0(2.9 to 8.1)
0-19
4.7 t3.9(3.0 to 6.3)
0-13
8.7 + 6.6(5.4 to 12.0)
3 -25
9.3 t 10.1
(4.9 to 13.6)
r -37
t3.4 ! 6.3(10.8 to 16.1)
3 -26
10.6 t 7.5(6.6 to 14.6)
2 -23
rr.7 !7.r(8.7 to 14.8)
2 -27
10.9 r 6.1(8.3 to 13.6)
3 -25
24
23
23
Observed range
Note: The higher the score, the gteater the reported parent-adolescent conflict, scoring ranges
0-20 (adolescent and parent) and 0-40 (combined score).
72
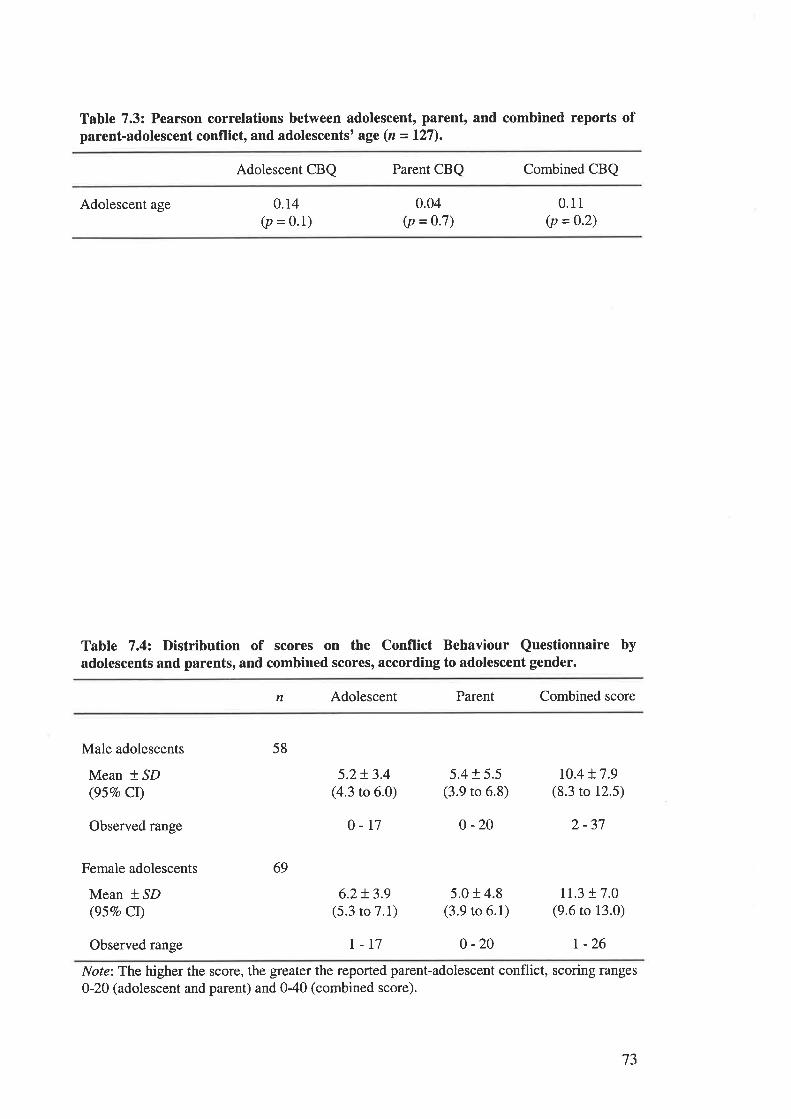
Table 7.3: Pearson correlations between adolescent, parent, and combined reports ofparent-adolescent conflict, and adolescents' age (n =127).
Adolescent CBQ Parent CBQ Combined CBQ
Adolescent age 0.r4(p = 0.1)
0.04(p = 0.7)
0.11(p = 0.2)
Table 7.42 Distribution of scores on the Conflict Behaviour Questionnaire byadolescents and parents, and combined scores, according to adolescent gender.
n Adolescent Parent Combined score
Male adolescents
Mean * SD(957o Cr)
Observed range
Female adolescents
Mean * ^SD(95Vo Ct)
58
69
5.2+ 3.4(4.3 to 6.0)
o-r7
6.2+ 3.9(5.3 to 7.1)
5.4 r 5.5(3.9 to 6.8)
0 -20
5.0 r 4.8(3.9 to 6.1)
r0.4 t7.9(8.3 to 12.5)
2 -37
11.3 r 7.0(9.6 to 13.0)
Observed range I-17 0 -20 r -26
Note:The higher the score, the greater the reported parent-adolescent conflict, scoring ranges
0-20 (adolescent and parent) and 040 (combined score).
73
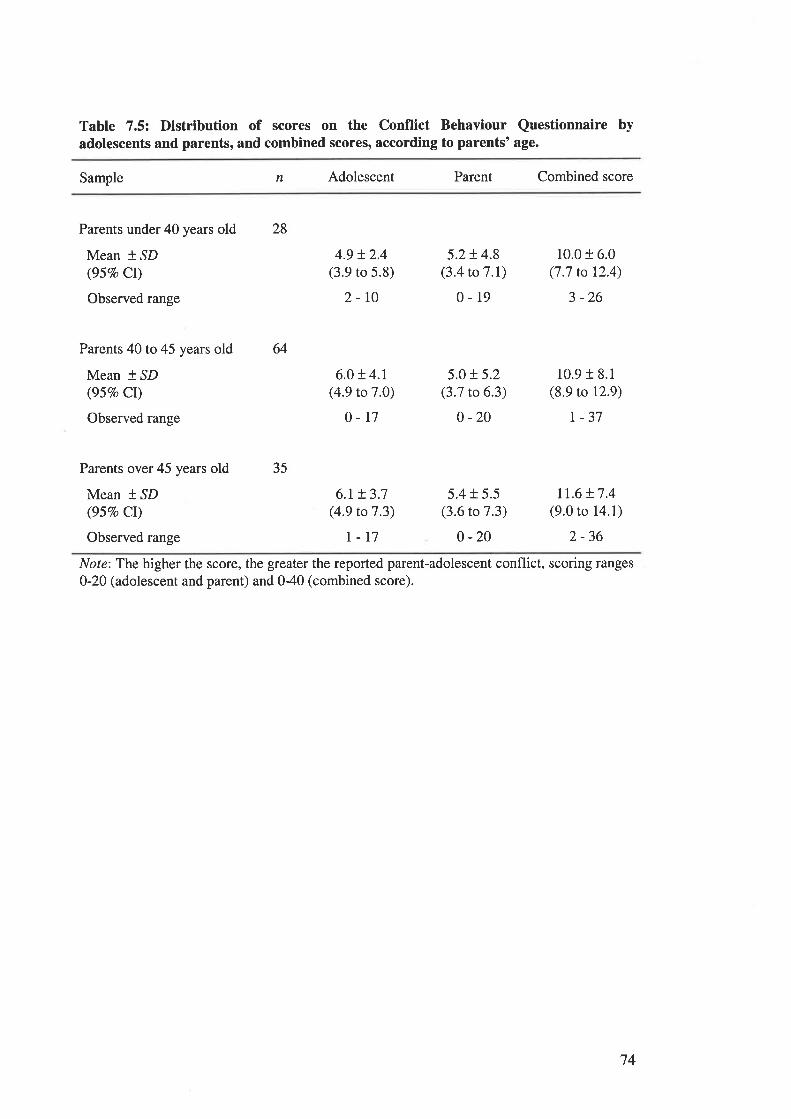
Table 7,5'. Distribution of scores on the Conflict Behaviour Questionnaire byadolescents and parents, and combined scores, according to parents'age.
Sample n Adolescent Parent Combined score
Parents under 40 years old
Mean * SD(95Vo Cr)
Observed range
Parents 40to45 years old
Mean * SD(957o CI)
Observed range
Parents over 45 years old
Mean * SD(95Vo CI)
Observed range
28
64
35
4.9 t2.4(3.9 to 5.8)
2-r0
6.0 t 4.1(4.9 to 7 .0)
0-r7
6.r + 3.7(4.9 to 7.3)
I-T7
5.2!4.8(3.4 to 7 .I)
0-19
5.0 t 5.2(3.7 to 6.3)
0 -20
5.4 + 5.5(3.6 to 7.3)
o -20
10.0 t 6.0(7.7 to 12.4)
3 -26
10.9 r 8.1
(8.9 to 12.9)
| -37
tr.6 t7.4(9.0 to 14.1)
2-36
Note:The higher the score, the greater the reported parent-adolescent conflict, scoring ranges
0-20 (adolescent and parent) and 0-40 (combined score).
t4
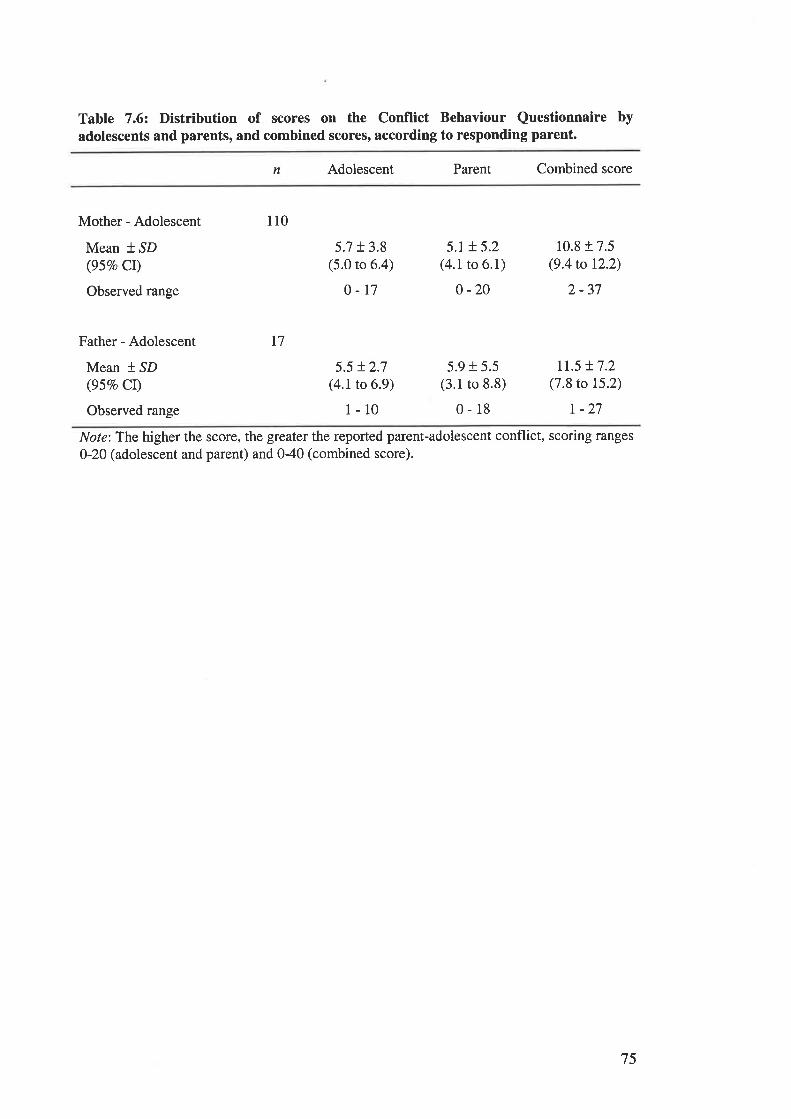
Table 7.62 Distribution of scores on the Conflict Behaviour Questionnaire byadolescents and parents, and combined scores' according to responding parent.
n Adolescent Parent Combined score
Mother - Adolescent
Mean t SD(95Vo Cr)
Observed range
Father - Adolescent
Mean * SD(957o CI)
Observed range
5.7 r 3.8(5.0 to 6.4)
0-t7
5.5 t2.7(4.1 to 6.9)
1-10
5.r + 5.2(4.1 to 6.1)
0 -20
5.9 r 5.5(3.1to 8.8)
0-18
10.8 r 7.5(9.4to 12.2)
2 -37
II.5 !7.2(7.8 to 15.2)
r -27
110
T7
Note:The higher the score, the greater the reported parent-adolescent conflict, scoring ranges
0-20 (adolescent and parent) and 040 (combined score).
75
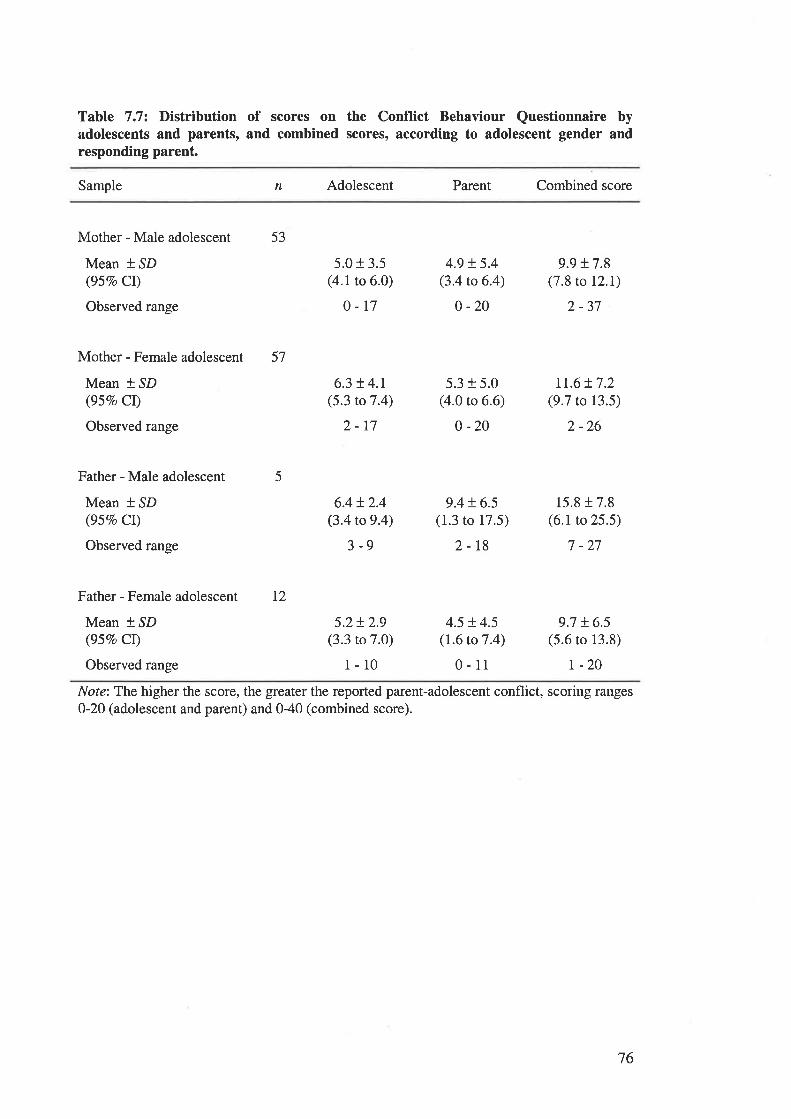
Table 7.72 Distribution of scores on the Conflict Behaviour Questionnaire byadolescents and parents, and combined scores, according to adolescent gender andresponding parent.
Sample n Adolescent Parent Combined score
Mother - Male adolescent
Mean t SD(95Vo Cl)
Observed range
Mother - Female adolescent
Mean t SD(957o Cl)
Observed range
Father - Male adolescent
Mean * SD(95Vo CI)
Observed range
Father - Female adolescent
Mean * ^SD
(95Vo CI)
Observed range
53
57
I2
5
5.0 r 3.5(4.1 to 6.0)
0-17
6.3 !4.1(5.3 to 7 .4)
2-17
6.4!2.4(3.4 to 9.4)
3-9
5.2!2.9(3.3 to 7.0)
l-10
4.9 + 5.4(3.4 to 6.4)
0 -20
5.3 + 5.0(4.0 to 6.ó)
0 -20
9.4 t 6.5(1.3 to 17.5)
2-18
4.5 !.4.5(1.6 to 7.4)
0-11
9.9 + 7.8(7.8 to 12.1)
2 -37
Lt.6 !7.2(9.7 to 13.5)
2 -26
15.8 r 7.8(6.1 to 25.5)
7 -27
9.7 !6.5(5.6 to 13.8)
r -20
Note:The higher the score, the greater the reported parent-adolescent conflict, scoring ranges0-20 (adolescent and parent) and 0-40 (combined score).
76
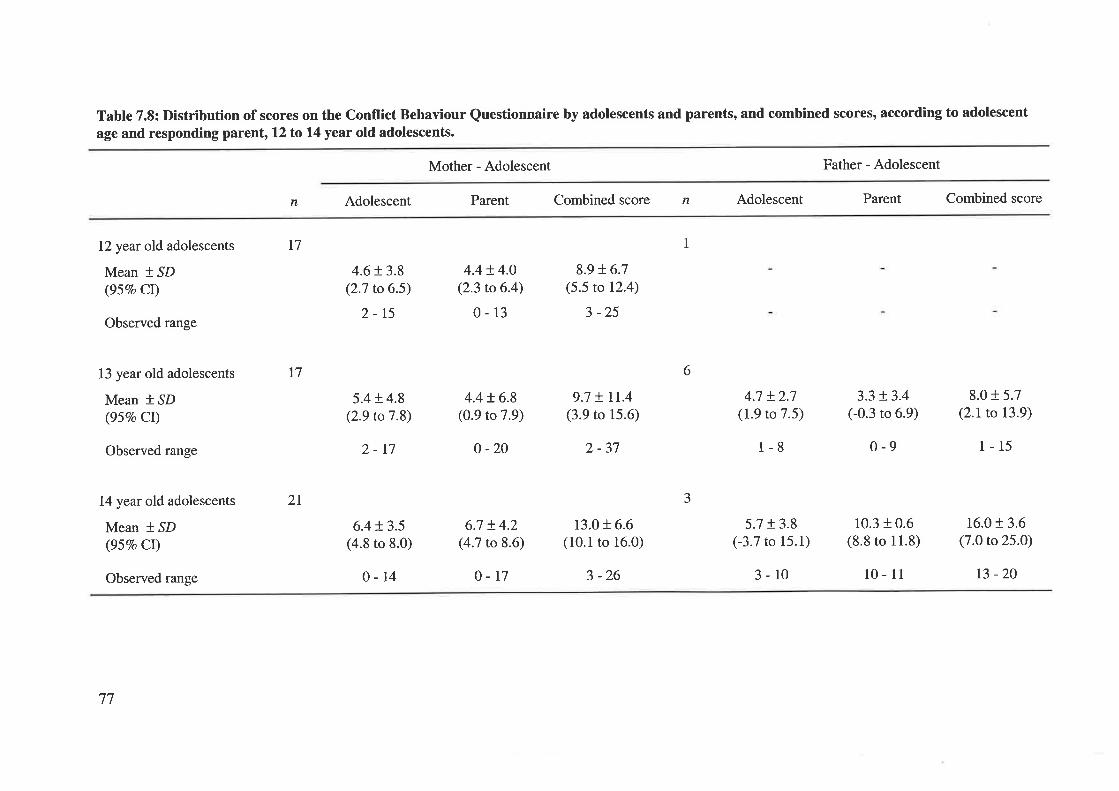
Table 7.8: Distribution of scores on the Conflict Behaviour Questionnaire by adolescents and parents, and combined scores' according to adolescent
age and responding parent, 12 to 14 year old adolescents.
Mother - Adolescent Father - Adolescent
n Adolescent Parent Combined score n Adolescent Parent Combined score
12 year old adolescents
Mean + SD(957o Cl)
Observed range
13 year old adolescents
Mean * SD(95Vo Cl)
Observed range
14 year old adolescents
Mean * SD(95Vo Cr)
Observed range
17
l7
2I
1
4.6 r 3.8(2.7 to 6.5)
2-15
5.4 + 4.8(2.9 to7.8)
2-r7
6.4 + 3.5(4.8 to 8.0)
0-14
4.4!4.0(2.3 to 6.4)
0-13
4.4 + 6.8(0.9 to 7.9)
o -20
6.7 + 4.2(4.7 to 8.6)
0-r7
8.9 + 6.7(5.5 to 12.4)
3 -25
9.7 + tr.4(3.9 to 15.6)
2 -37
13.0 + 6.6(10.1 to 16.0)
3 -26
4.7 + 2.7(1.9 to 7.5)
1-8
5.7 r 3.8(-3.7 to 15.1)
3-10
3.3 !3.4(-0.3 to 6.9)
0-9
10.3 + 0.6(8.8 to 11.8)
10 - 11
8.0 + 5.7(2.1 to 13.9)
1-15
16.0 r 3.6(7.0 to 25.0)
t3 -20
6
J
77
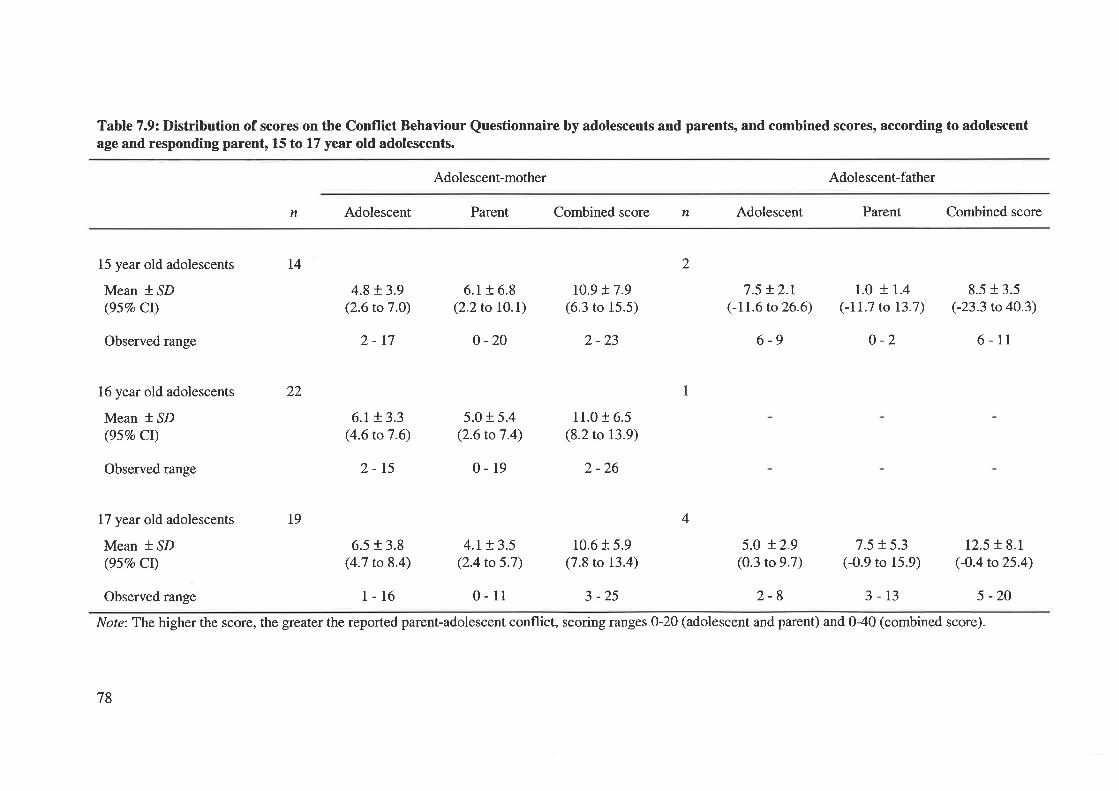
Table 7.9: Distribution of scores on the Conflict Behaviour Questionnaire by adolescents and parents, and combined scores, according to adolescentage and responding parent, 15 to 17 year old adolescents.
Adolescent-mother Adolescent-father
n Adolescent Parent Combined score n Adolescent Parent Combined score
15 year old adolescents
Mean * SD(95Vo Cl)
Observed range
16 year old adolescents
Mean * SD(95Vo Cl)
Observed range
I7 year old adolescents
Mean * SD(95Vo Ct)
t4
19
2
122
4.8+ 3.9(2.6 to7.0)
2-17
6.r + 3.3(4.6 to 7 .6)
2-15
6.5 + 3.8(4.7 to 8.4)
1-16
6.1 + 6.8(2.2to l0.D
0 -20
5.0 + 5.4(2.6 to 7 .4)
0-19
4.r + 3.5(2.4 to 5.7)
0-11
t0.9 t7.9(6.3 to 15.5)
2 -23
11.0 + 6.5(8.2 to 13.9)
2 -26
10.6 + 5.9(7.8 to 13.4)
3 -25
7.5 + 2.t(-11.6 to26.6)
6-9
5.0 t2.9(0.3 to 9.7)
2-8
1.0 + 1.4(-11.7 to 13.7)
o-2
7.5 + 5.3(-0.9 to 15.9)
3-13
8.5 r 3.5(-23.3 to 40.3)
6-11
12.5 r 8.1(-0.4 to25.4)
5 -20
4
Observed range
Note:The higher the score, the greater the reported parent-adolescent conflict, scoring ranges 0-20 (adolescent and parent) and 040 (combined score).
78
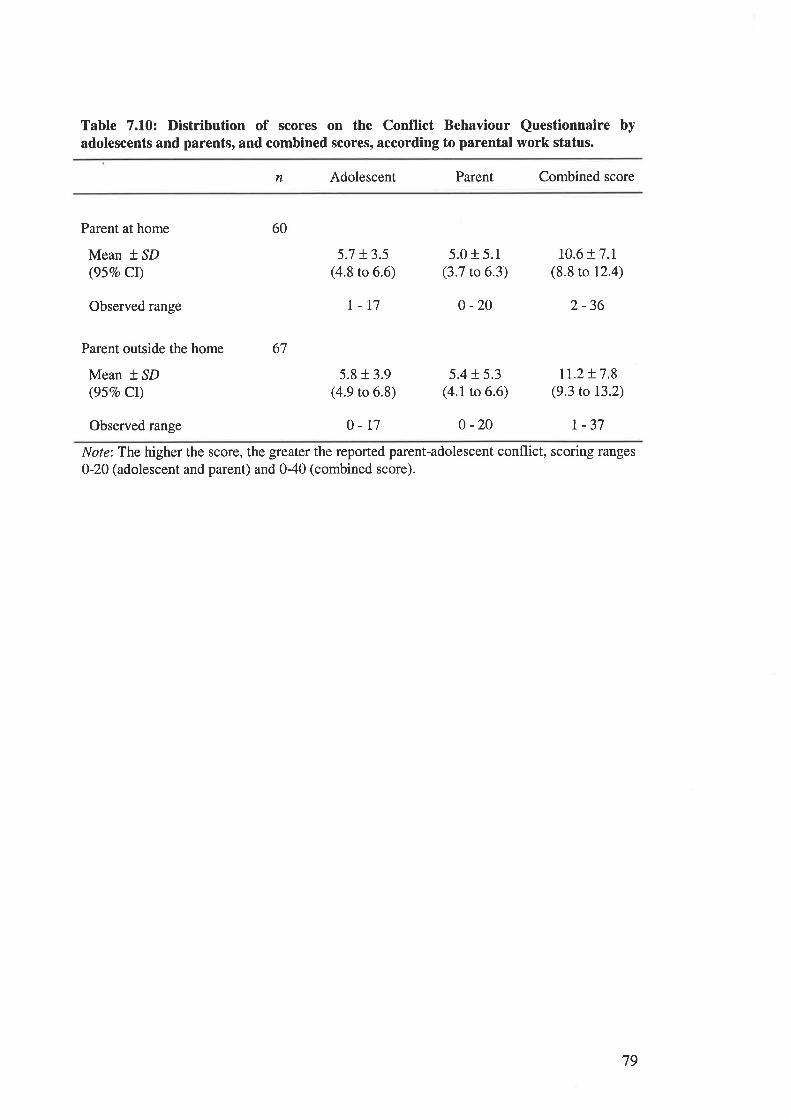
Table 7.10: Distribution of scores on the Conflict Behaviour Questionnaire byadolescents and parents, and combined scores, according to parental work status.
n Adolescent Parent Combined score
Parent at home
Mean t.lD(95Vo Cl)
Observed range
Parent outside the home
Mean * SD(95Vo CI)
Observed range
60
67
5.7 t3.5(4.8 to 6.6)
I-17
5.8 t 3.9(4.9 to 6.8)
0-r7
5.0 r 5.1(3.7 to 6.3)
0 -20
5.4 r 5.3(4.1 to 6.6)
0 -20
10.6 t7.r(8.8 to 12.4)
2 -36
IL.2 !7.8(9.3 to 13.2)
| -37
Note:Tbe higher the score, the greater the reported parent-adolescent conflict, scoring ranges
0-20 (adolescent and parent) and 0-40 (combined score).
79
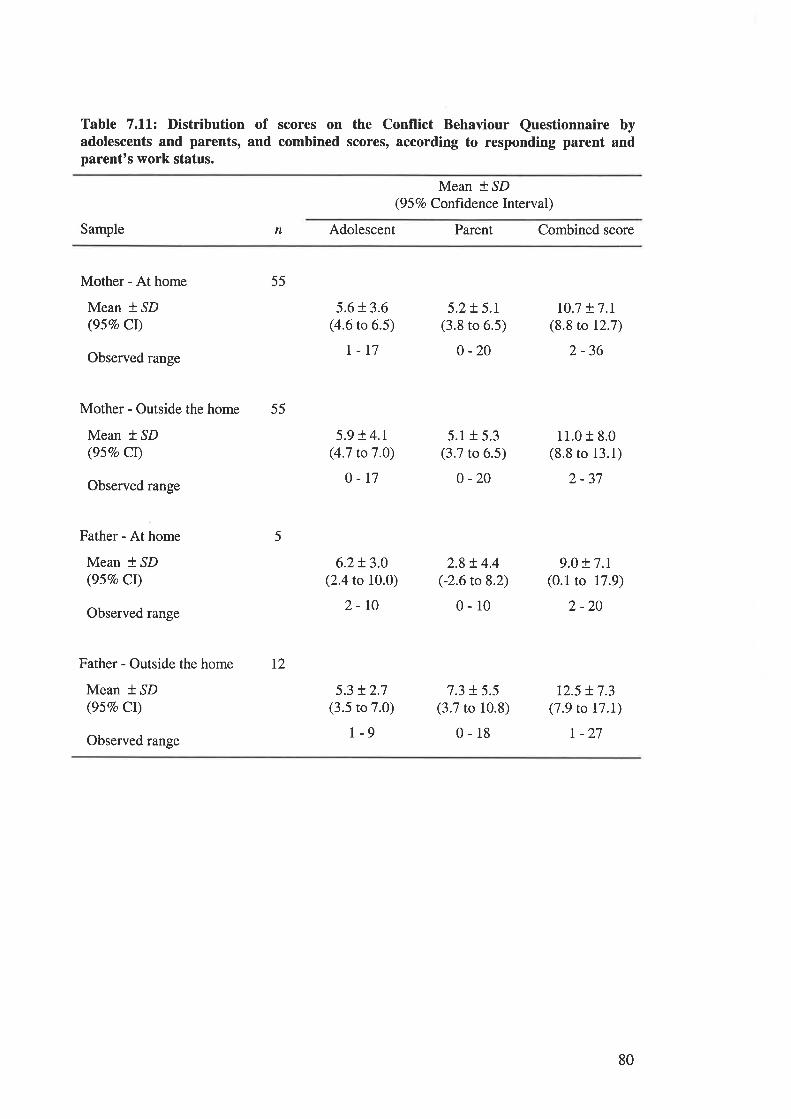
Table 7.11: Distribution of scores on the Conflict Behaviour Questionnaire byadolescents and parents, and combined scores, according to responding parent andparent's work status.
Mean * SD(9 5 Vo Confrdence Interval)
Sample n Adolescent Parent Combined score
Mother - At home
Mean *,SD(95Vo Cl)
Observed range
Mother - Outside the home
Mean * SD(95Vo CI)
Observed range
Father - At home
Mean * ^SD
(957o CI)
Observed range
Father - Outside the home
Mean * ^SD
(95Vo CI)
Observed range
55
55
12
5
5.6 r 3.6(4.6 to 6.5)
t-r7
5.9 ! 4.r(4.7 to 7 .O)
o-t7
6.2!3.0(2.4 to 10.0)
2-r0
5.3 !2.7(3.5 to 7.0)
r-9
5.2+ 5.1(3.8 to 6.5)
0 -20
5.1 + 5.3(3.7 to 6.5)
0 -20
2.8 t 4.4(-2.6 to 8.2)
0-10
7.3 + 5.5(3.7 to 10.8)
0-18
10.7 t7.r(8.8 ro 12.7)
2 -36
11.0 r 8.0(8.8 ro 13.1)
2-37
9.0 + 7.1(0.1 to 17.9)
2 -20
r2.5 + 7.3(7.9 to t7.I)
r -27
80
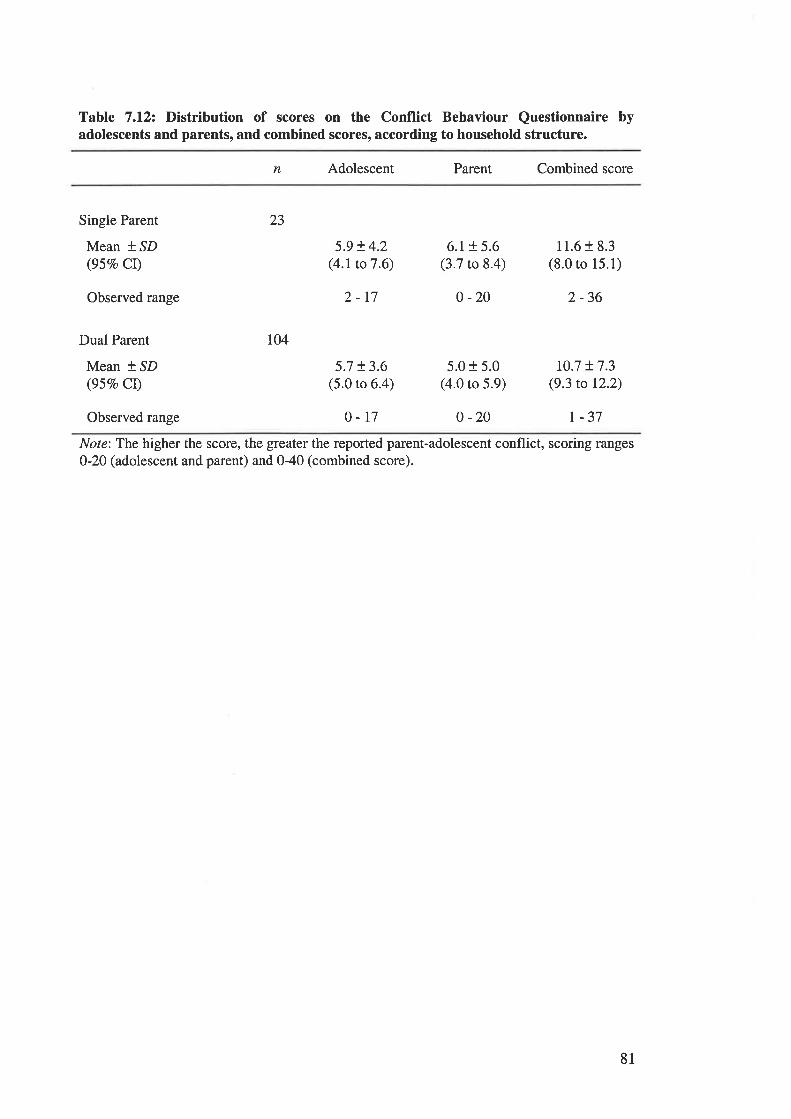
Table 7.12: Distribution of scores on the Conflict Behaviour Questionnaire byadolescents and parents, and combined scores, according to household structure.
n Adolescent Parent Combined score
Observed range
Single Parent
Mean *,SD(957o CI)
Dual Parent
Mean f SD(95Vo Cl)
5.9 t 4.2(4.1to7.6)
2-17
5.7 t3.6(5.0 to 6.4)
6.1 r 5.6(3.7 to 8.4)
0 -20
5.0 + 5.0(4.0 to 5.9)
11.6 + 8.3(8.0 to 15.1)
2 -36
10.7 + 7.3(9.3 to 12.2)
23
ro4
Observed range 0-r7 0 -20 r -37
Note: The higher the score, the greater the reported parent-adolescent conflict, scoring ranges
0-20 (adolescent and parent) and 040 (combined score).
81
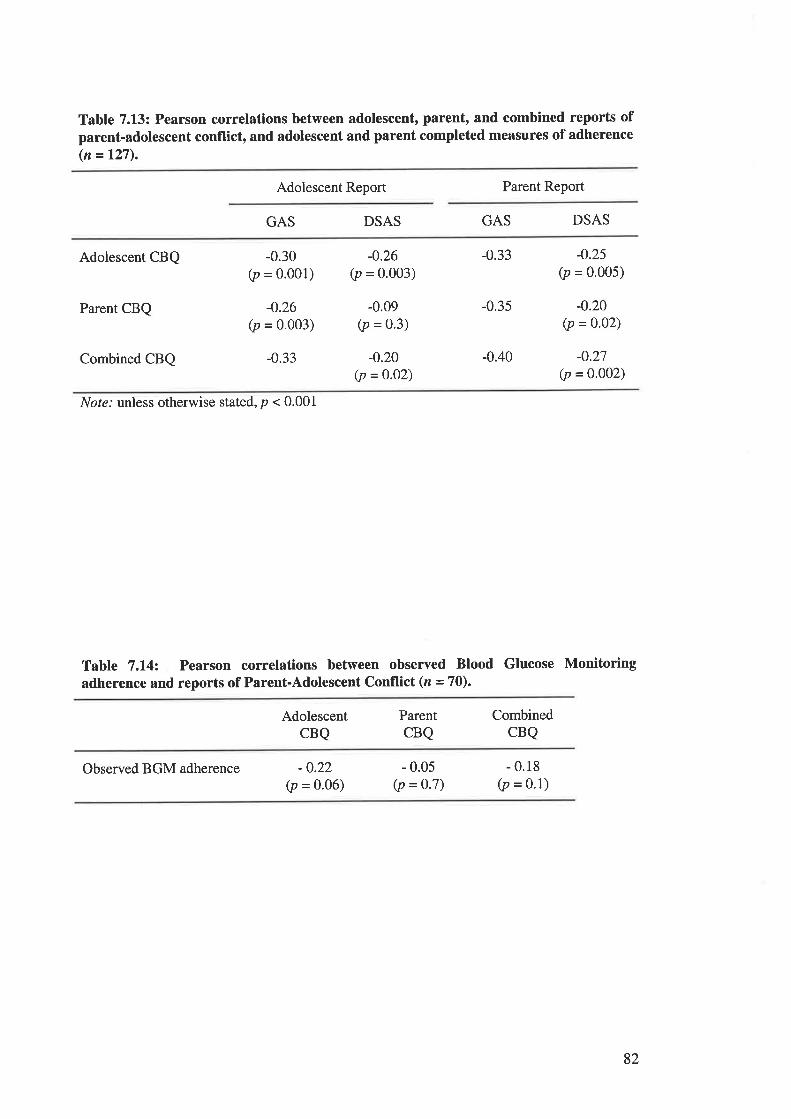
Table 7.13: Pearson correlations between adolescent, parent, and combined reports ofparent-adolescent conflict, and adolescent and parent completed measures of adherence(n = t27).
Adolescent Report Parent Report
GAS DSAS GAS DSAS
Adolescent CBQ
Parent CBQ
Combined CBQ
-0.30(p = o.oo1)
-0.26(p = 0.003)
-0.33
-0.26(p = 0.003)
-0.09(p = 0.3)
-0.20(p = 0.02)
-0.33
-0.35
-0.40
-0.25
G, = 0.005)
-0.20(p = 0.02)
-0.27(p = 0.002)
Not¿.' unless otherwise stated, p < 0.001
Table 7.14: Pearson correlations between observed Blood Glucose Monitoringadherence and reports of Parent-Adolescent Conflict (n =70).
AdolescentCBQ
ParentCBQ
CombinedCBQ
Observed BGM adherence -0.22(p = o.o6)
- 0.05(p = 0.7)
- 0.18(p = o'1)
82
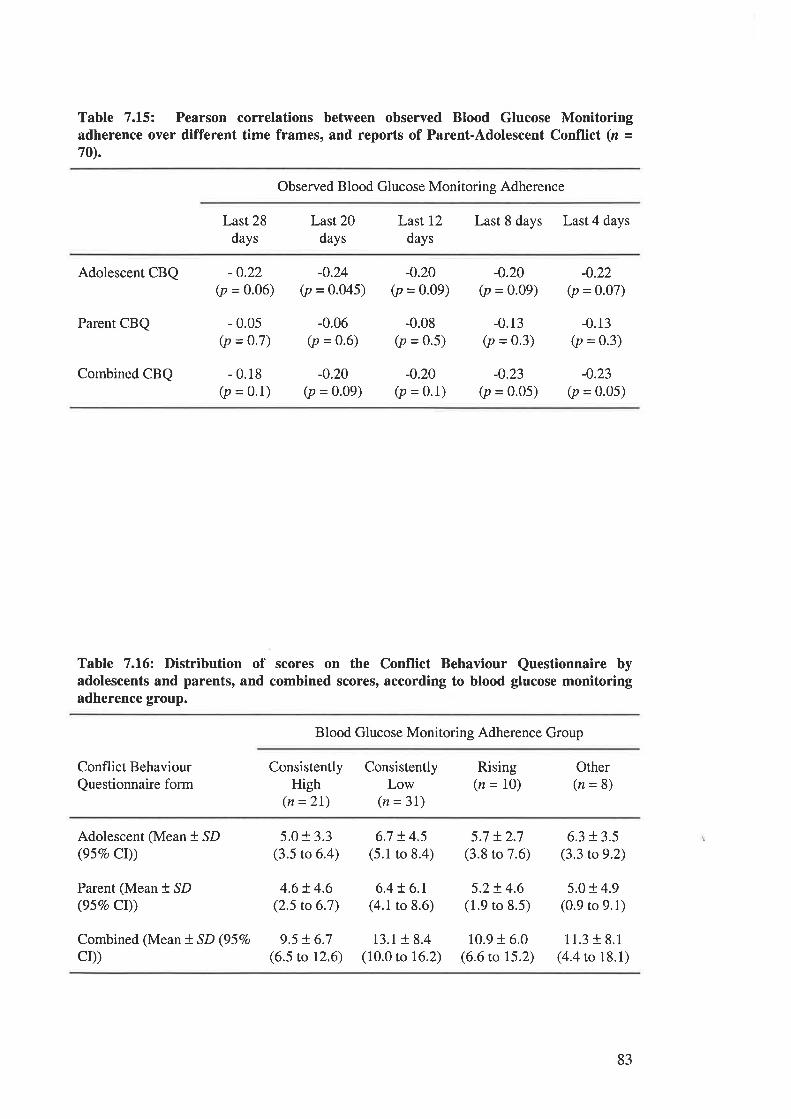
Table 7.15: Pearson correlations between observed Blood Glucose Monitoringadherence over different time frames, and reports of Parent-Adolescent Conflict (n =70).
Observed Blood Glucose Monitoring Adherence
Last 28
days
Last20days
Last 12
days
Last 8 days Last 4 days
Adolescent CBQ
Parent CBQ
Combined CBQ
-0.22(p = 0.06)
- 0.05(p = 0.7)
- 0.18(p = 0.1)
-0.24(p = 0.045)
-0.06(p = 0.6)
-0.20(p = 0.09)
-0.20(p = 0.09)
-0.08(p = 0.5)
-0.20(p = 0'1)
-0.20(p = 0.09)
-0.13(p = 0.3)
-0.23(p = 0'05)
-0.22(p = 0.07)
-0.13(p = 0.3)
-0.23(p = 0.05)
Table 7.16: Distribution of scores on the Conflict Behaviour Questionnaire byadolescents and parents, and combined scores, according to blood glucose monitoringadherence group.
Blood Glucose Monitoring Adherence Group
Conflict Behaviour
Questionnaire formConsistently
High(n =21)
ConsistentlyLow
(n = 3l)
Rising(n = 10)
Other(n=8)
Adolescent (Mean + SD(gsEo Cr))
Parent (Mean + SD(95vo Cr))
Combined (Mean ! SD (95Vo
CD)
5.0 r 3.3(3.5 to 6.4)
4.6!4.6(2.5 to 6.7)
9.5 t6.7(6.5 to 12.6)
6.7 !4.5(5.1 to 8.4)
6.4 + 6.1(4.1 to 8.6)
13.1 18.4(10.0 to 16.2)
5.7 + 2.7(3.8 to 7.6)
5.2+ 4.6(1.9 to 8.5)
10.9 + 6.0(6.6 to 15.2)
6.3 r 3.5(3.3 to 9.2)
5.0 r 4.9(0.9 to 9.1)
11.3 f 8.1(4.4 to 18.1)
83
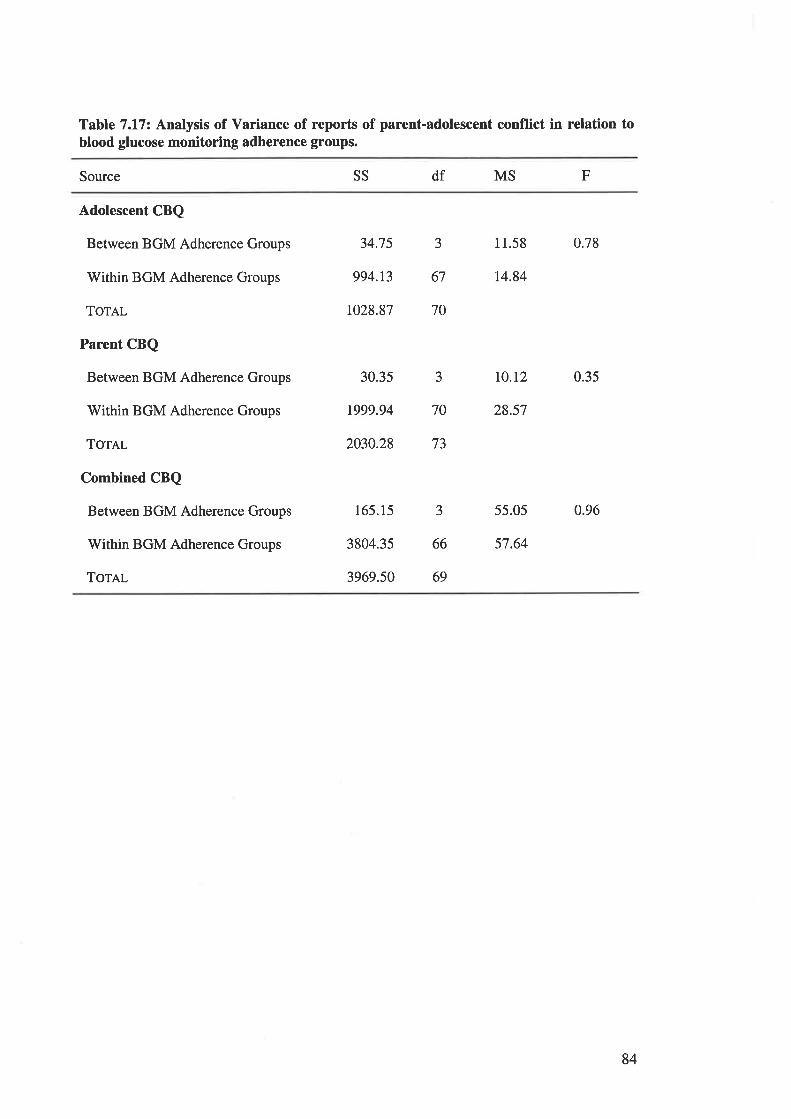
Table 7.1.7: Analysis of Variance of reports of parent-adolescent conflict in relation toblood glucose monitoring adherence groups.
Source SS df MS F
Adolescent CBQ
Between BGM Adherence Groups
Within BGM Adherence Groups
ToreL
Parent CBQ
Between BGM Adherence Groups
Within BGM Adherence Groups
Tor¡¡-
Combined CBQ
Between BGM Adherence Groups
Within BGM Adherence Groups
ToTAL
34.75 3 11.58 0.78
994.13 67 14.84
1028.87 70
30.3s 3 TO.I2 0.35
1999.94 70 28.57
2030.28 73
165.15 3 55.05 0.96
3804.35 66 57.64
3969.50 69
84
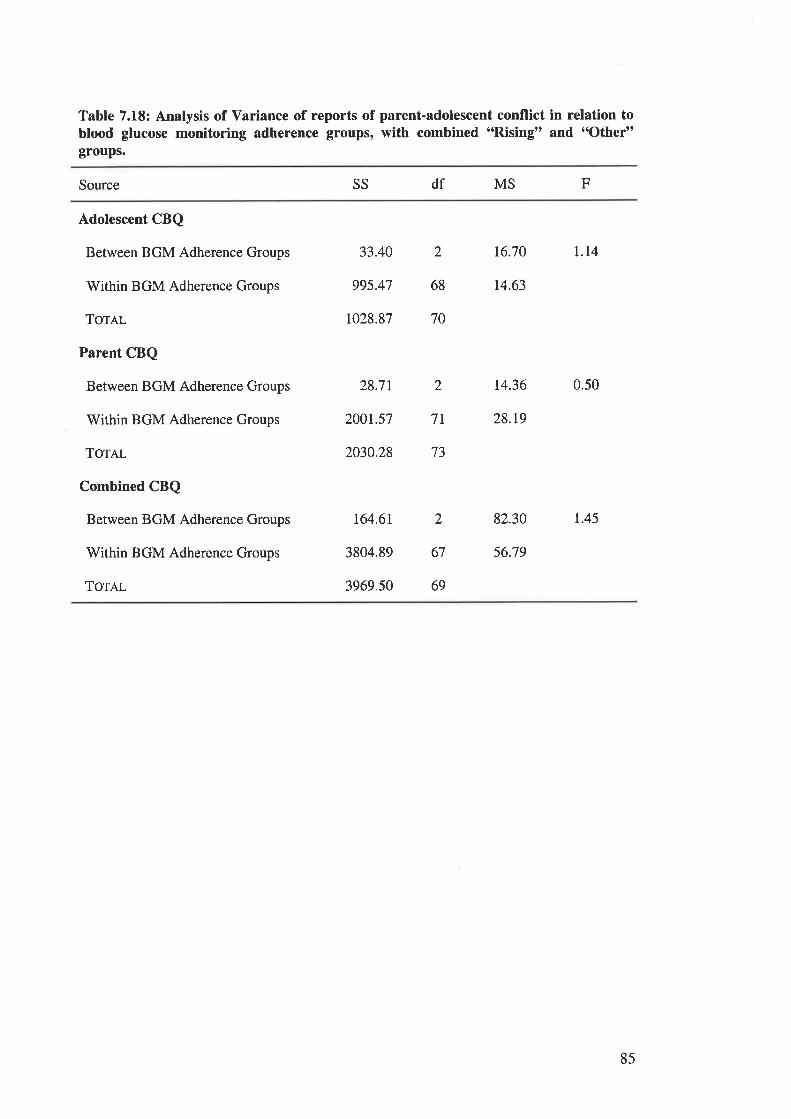
Table 7.18: Analysis of Variance of reports of parent-adolescent conflict in relation toblood glucose monitoring adherence groups, with combined "Rising" and "Other"groups.
Source SS df MS F
Adolescent CBQ
Between BGM Adherence Groups
Within BGM Adherence Groups
ToTAL
Parent CBQ
Between BGM Adherence Groups
Within BGM Adherence Groups
Torel
Combined CBQ
Between BGM Adherence Groups
Within BGM Adherence Groups
Tornl
33.40 2 16.70 I.I4
995.47 68 14.63
1028.87 70
28.71 2 14.36 0.50
200r.57 7L 28.r9
2030.28 73
t64.6r 2 82.30 1.45
3804.89 67 56.79
3969.50 69
85
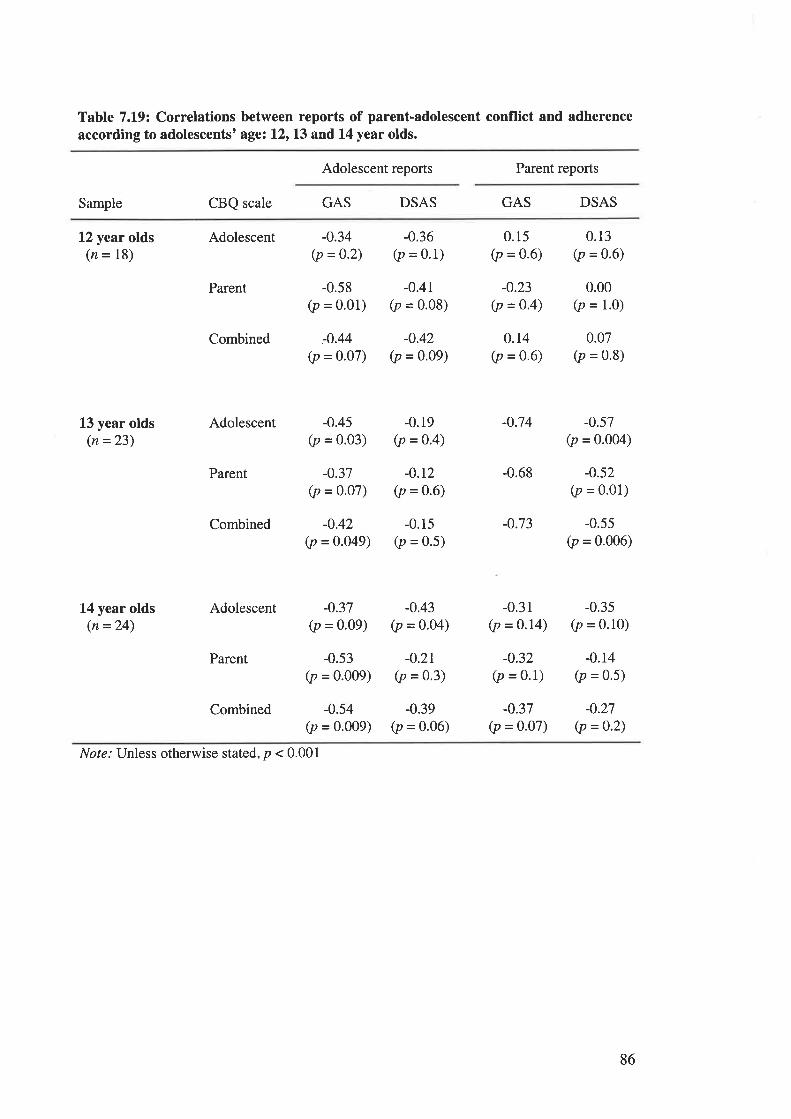
Table 7.19: Correlations between reports of parent-adolescent conflict and adherenceaccording to adolescents' age: l2r13 and 14 year olds.
Adolescent reports Parent reports
Sample CBQ scale GAS DSAS GAS DSAS
12 year olds(n = 18)
L3 year olds(n =23)
L4 year olds(n =24)
Adolescent
Parent
Combined
Adolescent
Parent
Combined
Adolescent
Parent
Combined
-0.34(p =0.2)
-0.58(p = 0.01)
-.0.44
(p = 0.07)
-0.36(p = 0.1)
-0.41(p = 0.08)
-0.42(p = 0'09)
0.15(p = 0.6)
-0.23(p =o.4)
o.r4(p = 0.6)
-0.74
-0.68
-0.73
-0.31(p = 0.14)
-0.32(p = 0.1)
-0.37(p = 0.07)
0.13(p = 0.6)
0.00(p = 1.0)
0.07(p = 0.8)
-0.57(p = 0.004)
-0.52(p = o.o1)
-0.55(p = 0.006)
-0.35(p = 0.10)
-0.14(p = 0.5)
-0.27(p =0.2)
-0.45(p = 0.03)
-0.37(p = o.o7)
-0.42(p = 0.049)
-0.19(p = 0.4)
-0.r2(p =0.6)
-0.15(p = 0.5)
-0.37(p = o.o9)
-0.53(p = 0.009)
-0.54(p = 0.009)
-0.43(p = 0.04)
-0.2r(p = 0.3)
-0.39(p = 0.06)
Nol¿.' Unless otherwise stated, p < 0.001
86
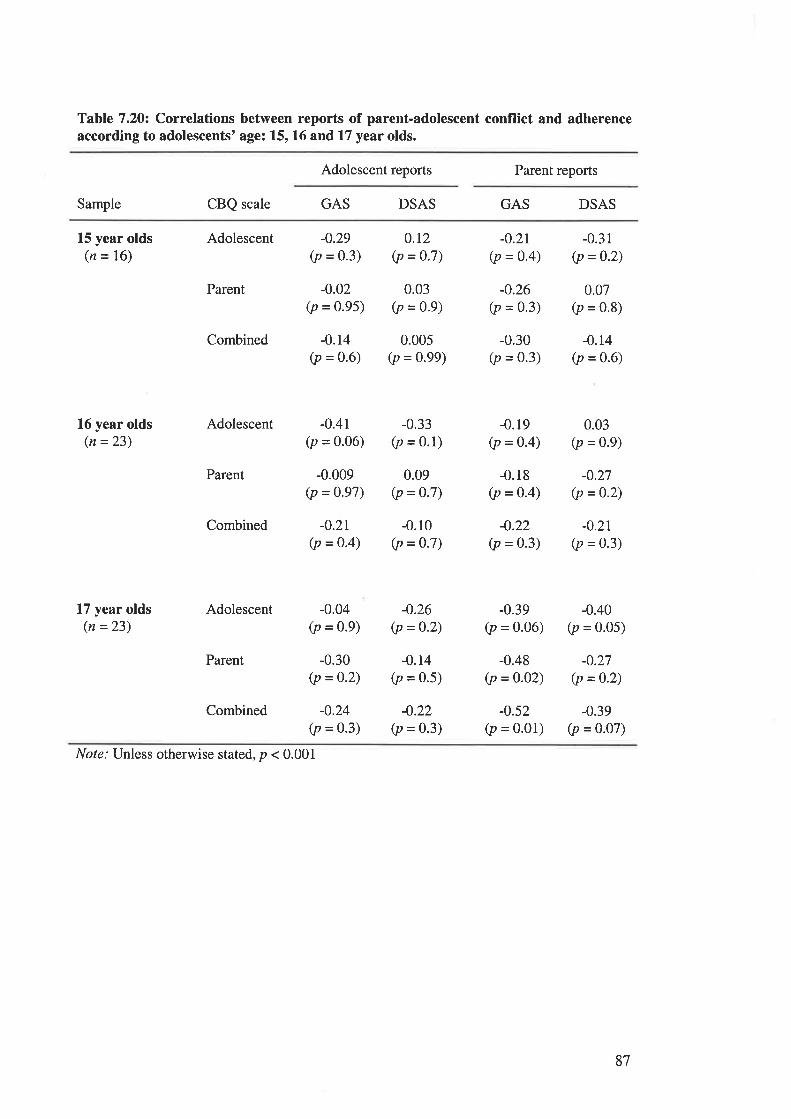
Table 7.20: Correlations between reports of parent-adolescent conflict and adherenceaccording to adolescents' age: 15, 16 and 17 year olds.
Adolescent reports Parent reports
Sample CBQ scale GAS DSAS GAS DSAS
15 year olds(n = 16)
16 year olds(n =23)
L7 year olds(n =23)
Adolescent
Parent
Combined
Adolescent
Parent
Combined
Adolescent
Parent
Combined
-0.29(p = 0.3)
-0.02(p = 0.95)
-0.14(p = 0.6)
-0.4r(p = 0'06)
-0.009(p = 0.97)
-0.2r(p = 0.4)
-0.04(p = 0.9)
-0.30(p = 0.2)
-0.24(p = 0.3)
0.r2(p = 0.7)
0.03(p = 0.9)
0.005(p = 0.99)
-0.33(p = 0.1)
0.09(p = 0.7)
-0.10(p = 0.7)
-0.26(p = 0.2)
-0.r4(p = 0.5)
-0.22(p = 0.3)
-0.2r(p = 0.4)
-0.26(p = 0.3)
-0.30(p = 0.3)
-0.19(p = 0.4)
-0.18(p = 0-4)
-0.22(p = 0.3)
-0.39(p = 0.06)
-0.48(p = 0.02)
-0.52(p = 0.01)
-0.31(p = 0.2)
0.07(p = 0.8)
-0.t4(p = 0.6)
0.03(p = 0.9)
-0.27(p = 0'2)
-0.21
(p = 0.3)
-0.40(p = 0.05)
-0.27(p =0.2)
-0.39(p = 0.07)
Nore: Unless otherwise stated, p < 0.001
87
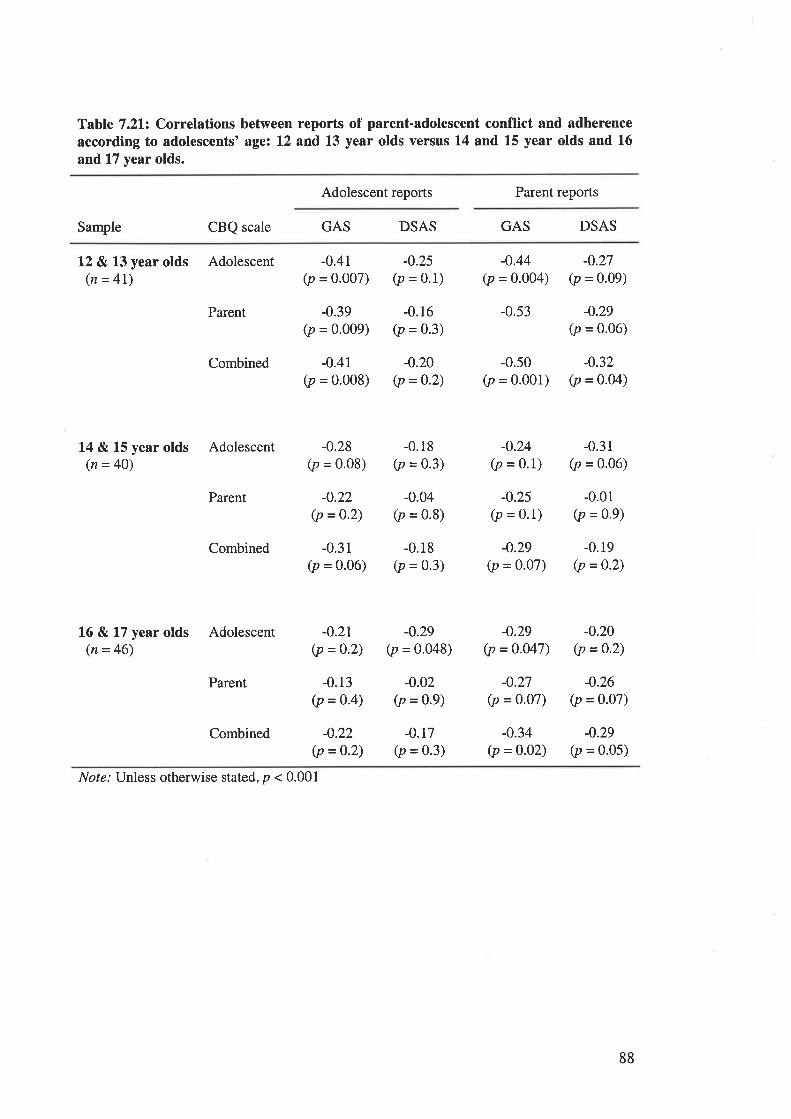
Table 7.212 Correlations between reports of parent-adolescent conflict and adherenceaccording to adolescents' age: 12 and 13 year olds versus 14 and L5 year olds and 16
and 17 year olds.
Adolescent reports Parent reports
Sample CBQ scale GAS DSAS GAS DSAS
L2 & 13 year olds Adolescent(n = 4l)
Parent
Combined
14 & 15 year olds Adolescent(n = 40)
Parent
Combined
16 & 17 year olds Adolescent(n = 46)
Parent
Combined
-0.41(p = o.oo7)
-0.39(p = 0'009)
-0.41(p = 0.008)
-0.25(p = 0.1)
-0.16(p = 0.3)
-0.20(p =0-2)
-0.44(p = 0.004)
-0.53
-0.50(p = 0.001)
-0.27(p = 0.09)
-0.29(p = 0'06)
-0.32(p = 0-04)
-0.28(p = 0.08)
-0.22(p =0.2)
-0.31(p = 0.06)
-0.2t(p =o'2)
-0.13(p =0.4)
-0.22(p = 0.2)
-0.18(p = 0.3)
-0.04(p = 0.8)
-0.18(p = 0.3)
-0.29(p = 0'048)
-0.02(p = 0.9)
-0.17(p = 0.3)
-0.24(p = 0.1)
-0.25(p = 0.1)
-0.29(p = o.o7)
-0.29(p = 0.047)
-o.27(p = 0.07)
-0.34(p =o.02)
-0.31(p = 0.06)
-0.01(p = 0.9)
-0.19(p =0.2)
-0.20(p =0'2)
-0.26(p = 0.07)
-0.29(p = 0.05)
No¡e.' Unless otherwise stated, p < 0.001
88
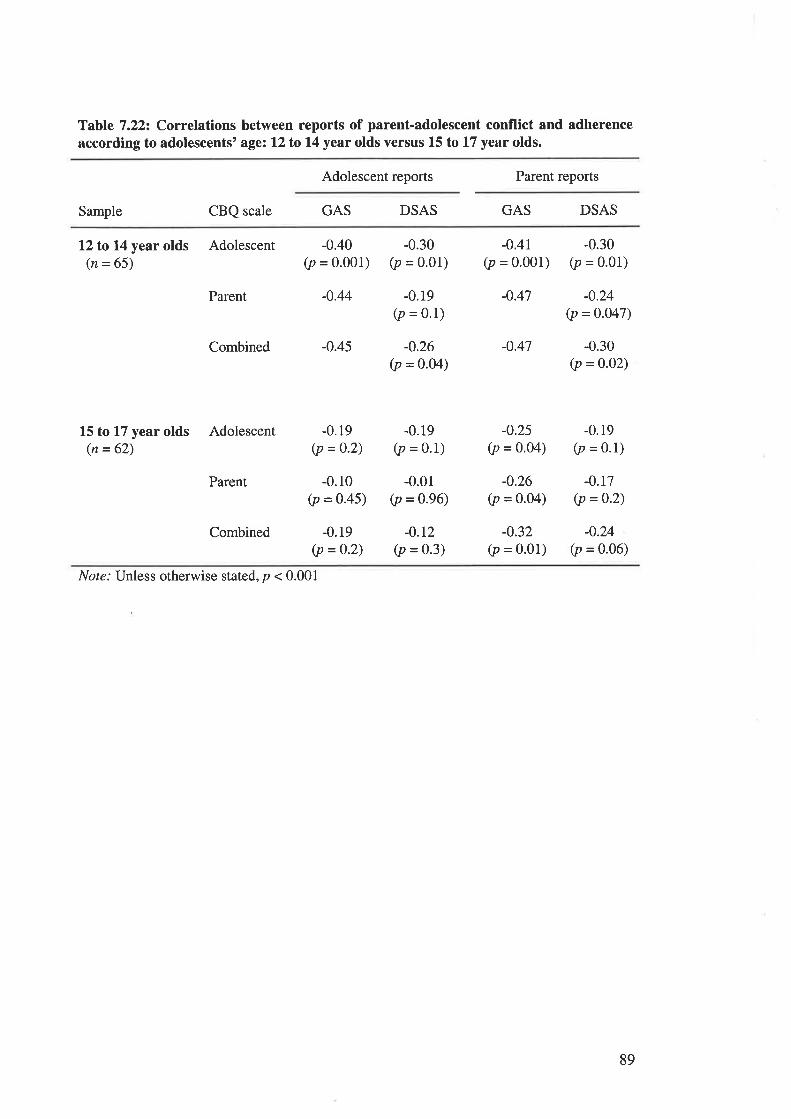
Table 7.222 Correlations between reports of parent-adolescent conflict and adherenceaccording to adolescents' age: 12to14 year olds versus 15 to 17 year olds.
Adolescent reports Parent reports
Sample CBQ scale GAS DSAS GAS DSAS
12to14 year olds Adolescent(n = 65)
Parent
-0.40(p = 0.001)
-0.44
-0.19(p = 0.2)
-0.10(p = 0.45)
-0.19(p = 0.2)
-0.30(p = 0.01)
-0.19(p = 0.1)
-0.26(p = o.o4)
-0.19(p = 0.1)
-0.01(p = 0.96)
-0.r2(p = 0.3)
-0,41(p = o.oo1)
-0.47
-0.47
-0.25(p = 0.04)
-0.26(p = o.o4)
-0.32(p = 0.01)
-0.30(p = 0.01)
-0.24(p = 0.047)
-0.30(p =0.02)
-0.19(p = 0.1)
-0.17(p =0.2)
-0.24(p = o.o6)
Combined -0.45
L5 to L7 year olds Adolescent(n = 62)
Parent
Combined
Nol¿.' Unless otherwise stated, p < 0.001
89
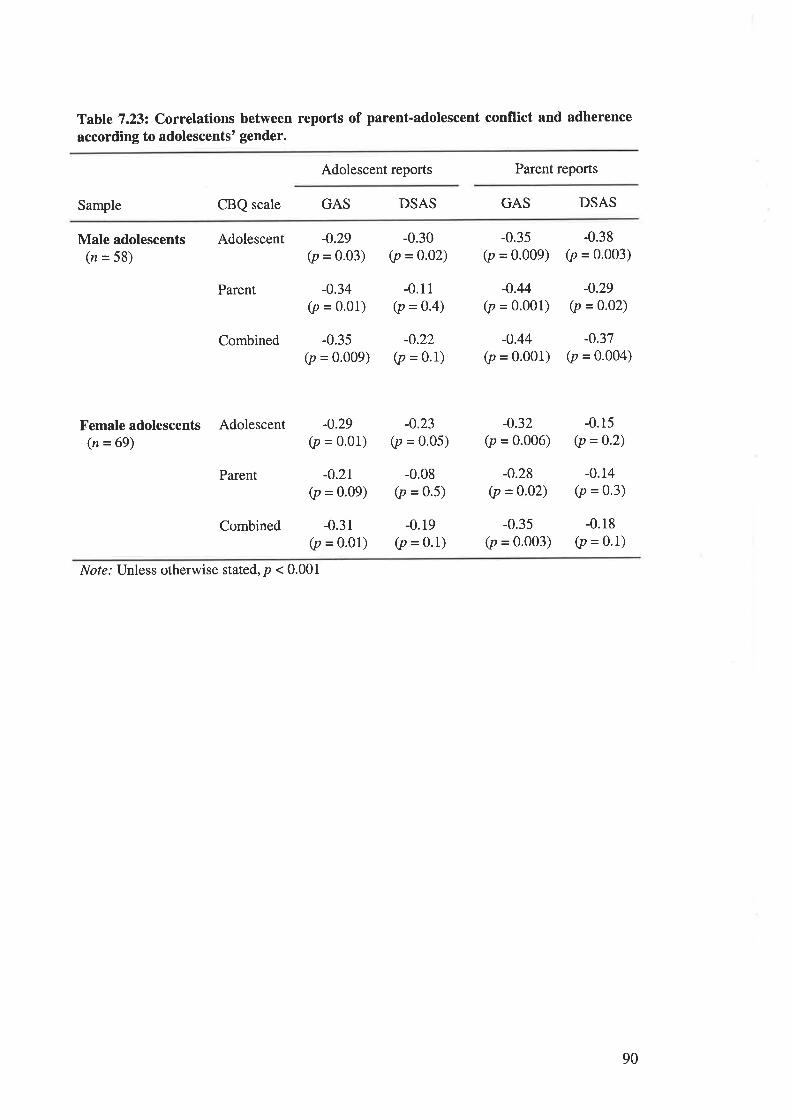
Table 7.232 Correlations between reports of parent-adolescent conflict and adherence
according to adolescents' gender.
Adolescent reports Parent reports
Sample CBQ scale GAS DSAS GAS DSAS
Male adolescents(n = 58)
Adolescent
Parent
Combined
Femaleadolescents Adolescent(n = 69)
Parent
Combined
-0.29(p = 0'03)
-0.34(p = o.o1)
-0.35(p = 0.009)
-0.30(p =0.02)
-0.11(p =0.4)
-0.22(p = o.l)
-0.3s(p = 0.009)
-0.44(p = o.oo1)
-0.44(p = 0.001)
-0.38(p = 0.003)
-0.29(p = o.o2)
-0.37(p = 0.004)
-0.29(p = 0'01)
-0.21(p = 0.09)
-0.31(p = o.o1)
-0.23(p = 0.05)
-0.08(p = 0.5)
-0.19(p = 0.1)
-0.32(p = 0.006)
-0.28(p =0'02)
-0.35(p = o.oo3)
-0.15(p = 0.2)
-0.14(p = 0.3)
-0.18(p = 0'1)
Not¿.' Unless otherwise stated, p < 0.001
90
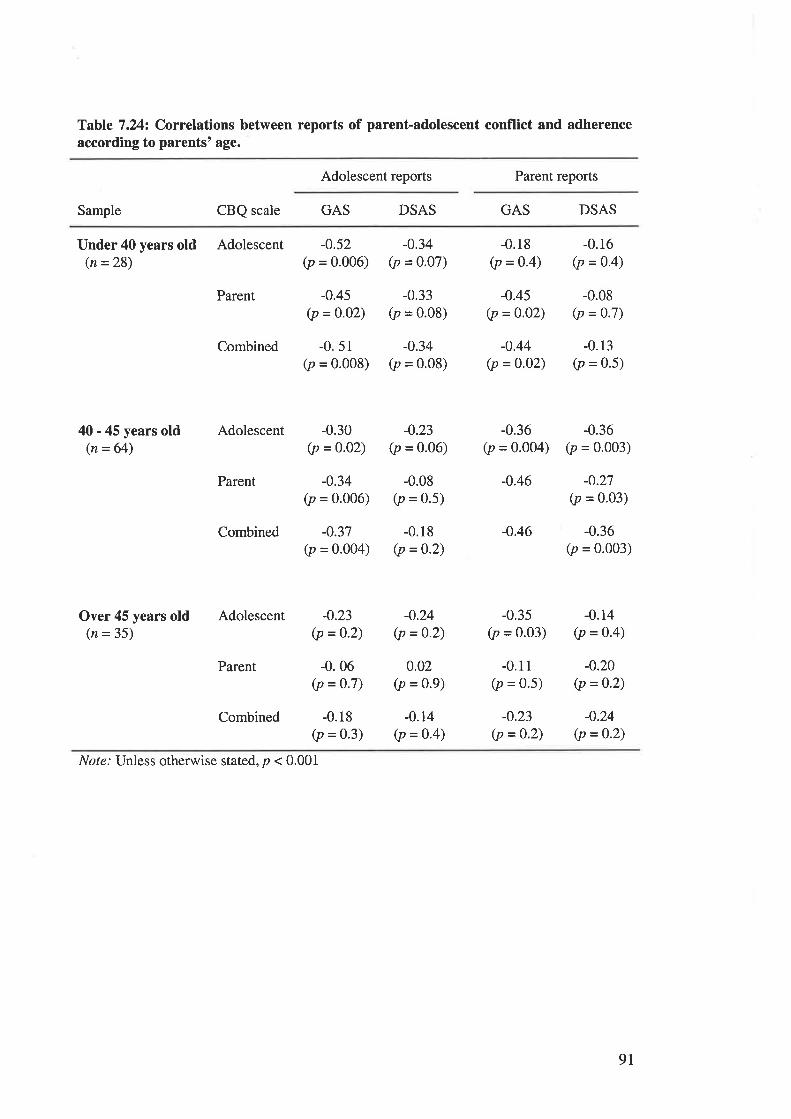
Table 7.242 Correlations between reports of parent-adolescent conflict and adherenceaccording to parents' age.
Adolescent reports Parent reports
Sample CBQ scale GAS DSAS GAS DSAS
Under 40 years old Adolescent(n =28)
Parent
Combined
-0.52(p = 0.006)
-0.45(p = 0.02)
-0.34(p = 0.07)
-0.33(p = 0'08)
-0.34(p = 0.08)
-0.18(p = 0.4)
-0.45(p = o.o2)
-0.44(p = 0.o2)
-0.36(p = 0.004)
-0.46
-0.46
-0.35(p = 0.03)
-0.11(p = 0.5)
-0.23(p =0'2)
-0.16(p = 0'4)
-0.08(p = 0.7)
-0.13(p = 0.5)
-0.36(p = 0.003)
-0.27(p = 0.03)
-0.36(p = 0.003)
-0.14(p = 0.4)
-0.20(p = 0.2)
-0.24(p =0.2)
51
0.008)-0
(p=
40 - 45 years old(n = 64)
Over 45 years old(n = 35)
Adolescent
Parent
Combined
Adolescent
Parent
Combined
-0.30(p = 0'02)
-0.34(p = 0.006)
-0.37(p = 0.004)
-0.23(p = 0.06)
-0.08(p = 0.5)
-0.18(p =0.2)
-0.23(p =o.2)
-0.06(p = o'7)
-0.24(p =0'2)
0.02(p = 0.9)
-0.14(p = 0'4)
-0.18(p = 0'3)
Nol¿.' Unless otherwise stated, p < 0.001
9I
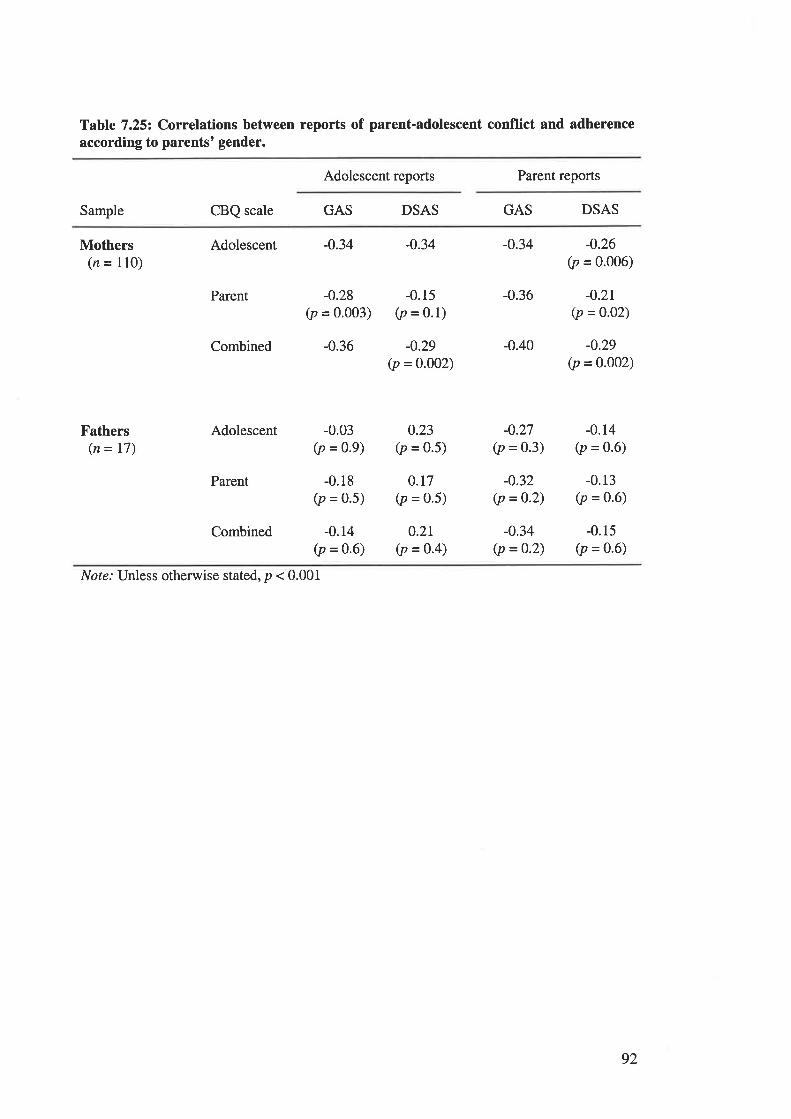
Table 7.252 Correlations between reports of parent-adolescent conflict and adherenceaccording to parents' gender.
Adolescent reports Parent reports
Sample CBQ scale GAS DSAS GAS DSAS
Mothers(n = 110)
Fathers(n = 17)
Parent
Combined
Adolescent
Parent
Combined
-0.28(p = 0.003)
-0.36
-0.03(p = 0.9)
-0.18(p = 0.5)
-0.14(p = 0.6)
-0.34
-0.15(p = 0.1)
-0.29(p = 0.002)
0.23(p = 0.5)
0.17(p = 0.5)
0.21(p = 0.4)
-0.34
-0.36
-0.40
-0.27(p = 0.3)
-0.32(p =0.2)
-o.34(p =0.2)
-0.26(p = 0.006)
-0.2r(p = 0.02)
-0.29(p = 0.002)
-0.14(p = 0.6)
-0.13(p = 0.6)
-0.15(p = 0.6)
Adolescent -0.34
Nor¿: Unless otherwise stated, p < 0.001
92
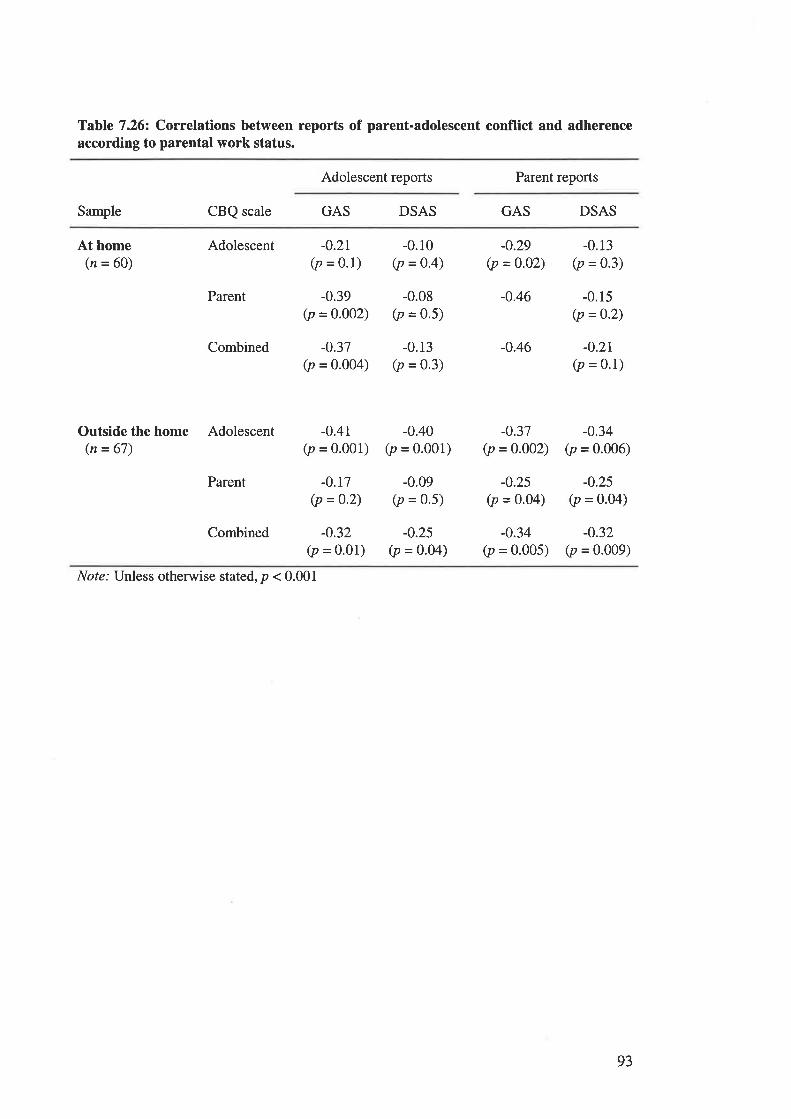
Table 7.262 Correlations between reports of parent-adolescent conflict and adherenceaccording to parental work status.
Adolescent reports Parent reports
Sample CBQ scale GAS DSAS GAS DSAS
At home(n = 60)
Adolescent -0.2r(p = 0.1)
-0.39(p = 0'002)
-0.37(p = 0'004)
-0.r0(p =0.4)
-0.08(p = 0'5)
-0.13(p = 0.3)
-0.29(p = 0.02)
-0.46
-0.46
-0.37(p =0.002)
-0.25(p = 0.04)
-0.34(p = 0'005)
-0.13(p = 0.3)
-0.15(p = 0.2)
-o.2r(p = 0.1)
-0.34(p = 0.006)
-o.25(p = o.o4)
-0.32(p = 0.009)
Parent
Combined
Outside the home Adolescent(n = 67)
Parent
Combined
-0.41(p = o.ool)
-0.r7(p = 0'2)
-0.32(p = 0.01)
-0.40(p = 0.001)
-0.09(p = 0.5)
-0.25(p = o.o4)
Nof¿.' Unless otherwise stated, p < 0.001
93
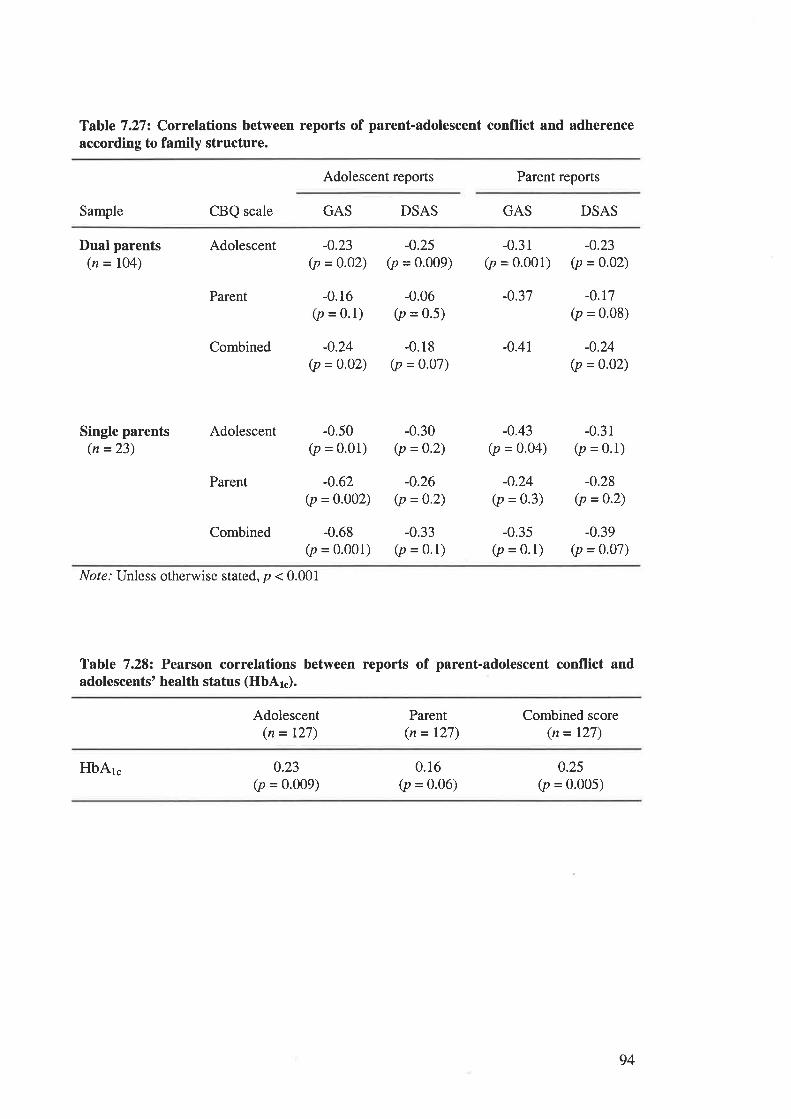
Table 7.272 Correlations between reports of parent-adolescent conflict and adherenceaccording to family structure.
Adolescent reports Parent reports
Sample CBQ scale GAS DSAS GAS DSAS
Dual parents(n = I04)
Single parents(n =23)
Adolescent
Parent
Combined
Adolescent
Parent
Combined
-0.23(p = o.o2)
-0.16(p = o.l)
-0.24(p = 0.02)
-0.25(p = 0.009)
-0.06(p = 0.5)
-0.18(p = 0.07)
-0.31(p = 0'001)
-0.37
-0.41
-0.43(p = o.o4)
-0.24(p = 0.3)
-0.35(p = 0.1)
-0.23(p = 0.02)
-0.r7(p = 0'08)
-o.24(p =0.02)
-0.31(p = 0.1)
-0.28(p =0.2)
-0.39(p = o.o7)
-0.50(p = 0.01)
-0.62(p = 0.002)
-0.68(p = 0.001)
-0.30(p =0.2)
-0.26(p = 0.2)
-0.33(p = 0.1)
Note.' Unless otherwise stated, p < 0.001
Table 7.282 Pearson correlations between reports of parent-adolescent conflict andadolescents' health status (HbAl").
Adolescent(n = 127)
Parent(n = 127)
Combined score(n = 127)
HbA1. 0.23(p = 0.009)
0.16(p = 0.06)
0.25(p = 0.005)
94
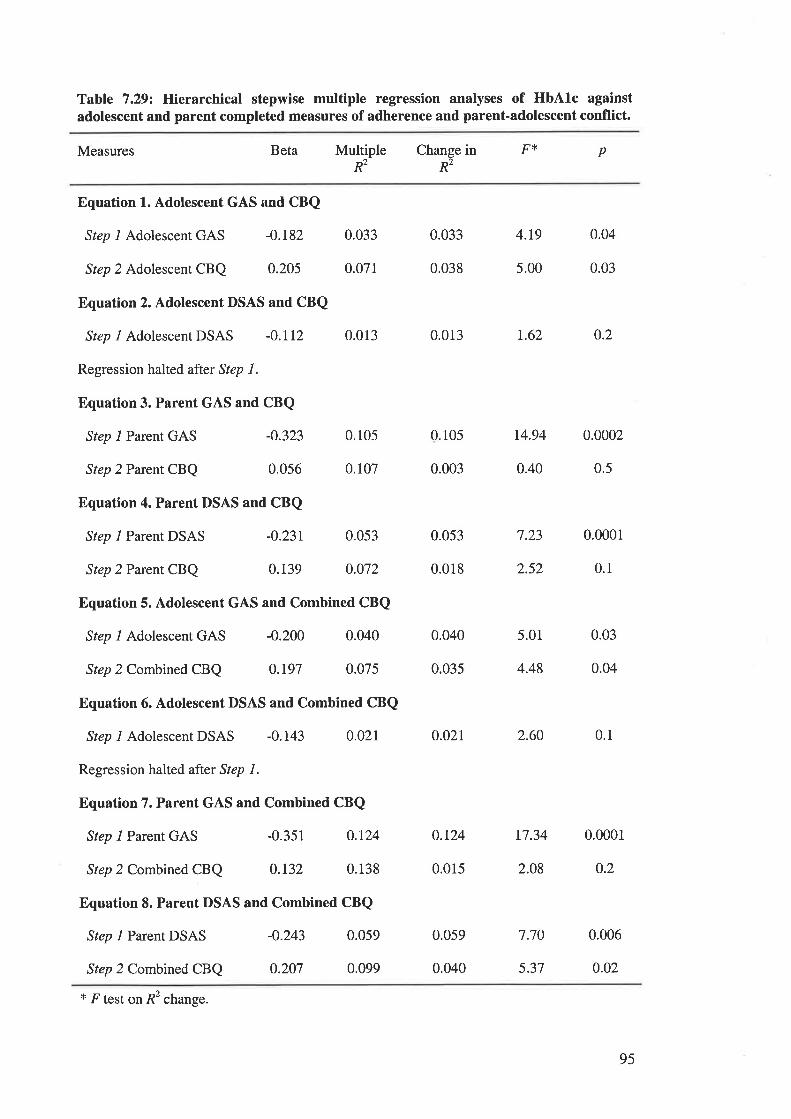
Table 7.29¿ Hierarchical stepwise multiple regression analyses of HbAlc againstadolescent and parent completed measures of adherence and parent-adolescent conflict.
Multiple Change in F{<
Rz R2
Measures Beta p
Equation 1. Adolescent GAS and CBQ
Step 1 Adolescent GAS -0.182 0.033
Step 2 Adolescent CBQ 0.205 0.071
Equation 2. Adolescent DSAS and CBQ
Step I Adolescent DSAS -0.112 0.013
Regression halted after Step 1.
Equation 3. Parent GAS and CBQ
Step l Parent GAS -0.323 0.105
Step 2 Parent CBQ 0.056 0.107
Equation 4. Parent DSAS and CBQ
Step l Parent DSAS -0.231 0.053
Step 2 Parent CBQ 0.139 0.072
Equation 5. Adolescent GAS and Combined CBQ
Step l Adolescent GAS -0.200 0.040
Step 2 Combined CBQ 0.197 0.075
Equation 6. Adolescent DSAS and Combined CBQ
Step I Adolescent DSAS -0.143 0.02I
Regression halted after Step l.
Equation 7. Parent GAS and Combined CBQ
Step l Parent GAS -0.351 0.L24
Step 2 Combined CBQ 0.132 0.138
Equation 8. Parent DSAS and Combined CBQ
Step I Parent DSAS -0.243 0.059
Step 2 Combined CBQ 0.207 0.099
0.033 4.r9 0.04
0.038 5.00 0.03
0.013 r.62 0.2
0.105
0.003
14.94 0.0002
0.40 0.5
0.053 7.23 0.0001
0.018 2.52 0.1
0.040 5.01 0.03
0.035 4.48 0.04
0.02r 2.60 0.1
0.124 17.34 0.0001
0.015 2.O8 0.2
0.0060.059
0.040
7.70
* F test on Ã2 change.
5.37 0.02
95

TABLES CITED IN CHAPTER 9.
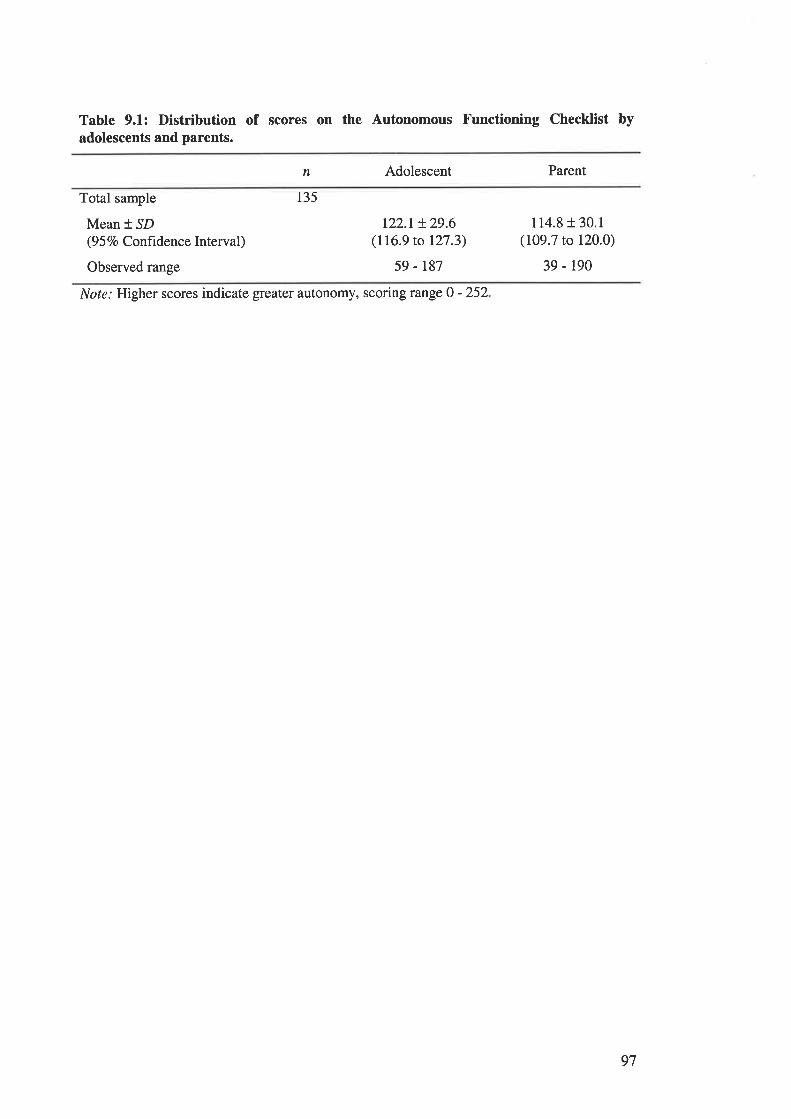
Table 9.1: Distribution of scores on the Autonomous Functioning Checklist byadolescents and parents.
n Adolescent Parent
Total sample
Mean * SD(9 5 Vo Confrdenc e Interval )
Observed range
r22.r !29.6(116.9 to 127.3)
59 - 187
114.8 r 30.1(109.7 to 120.0)
39 - 190
135
Note: Higher scores indicate greater autonomy, scoring range 0 - 252
97
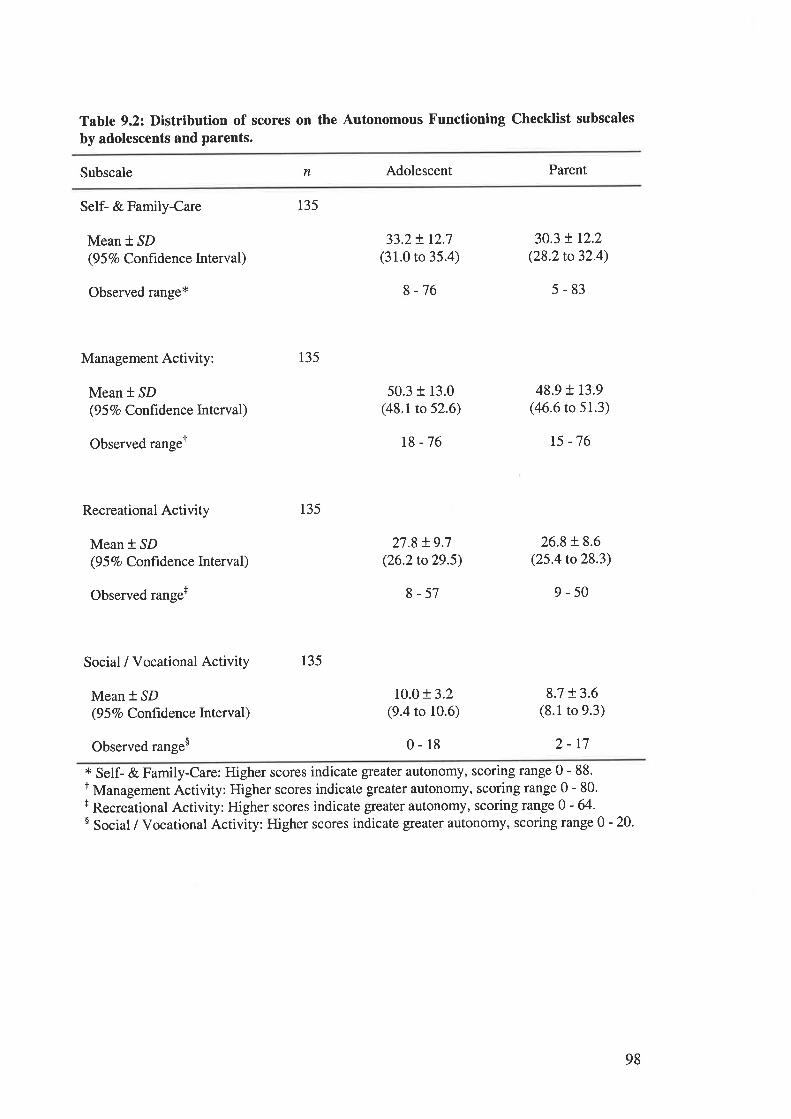
Table 9.2: Distribution of scores on the Autonomous Functioning Checklist subscales
by adolescents and parents.
Subscale n Adolescent Parent
Self- & Family-Care
Mean * SD(9 5 7o Confrdence Interval)
Observed range*
Management Activity:
Mean * SD(9 5 7o Confidence Interval)
Observed rangeT
Recreational Activity
Mean * SD(9 5 7o Confrdence lnterval)
Observed range+
Social / Vocational Activity
Mean * SD(9 5 Vo Confidence Interval)
Observed range$
135
135
135
135
33.2+ r2.7(31.0 to 35.4)
8-76
50.3 + 13.0(48.1to 52.6)
18 -76
27.8 t9.7(26.2to29.5)
8-57
10.0 r 3.2(9.4 to 10.6)
0-18
30.3 ! r2.2(28,2 to 32.4)
5-83
48.9 t r3.9(4ó.6 to 51.3)
t5 -76
26.8 + 8.6(25.4 to28.3)
9-50
8.7 t 3.6(8.1 to 9.3)
2-t7* Self- & Family-Care: Higher scores indicate gleater autonomy, scoring range 0-88.I Management Activity: Higher scores indicate greater autonomy, scoring range 0 - 80.+ Recreational Activity: Higher scores indicate gleater autonomy, scoring range 0 - 64'$ Social / Vocational Activity: Higher scores indicate greater autonomy, scoring range 0 - 20'
98
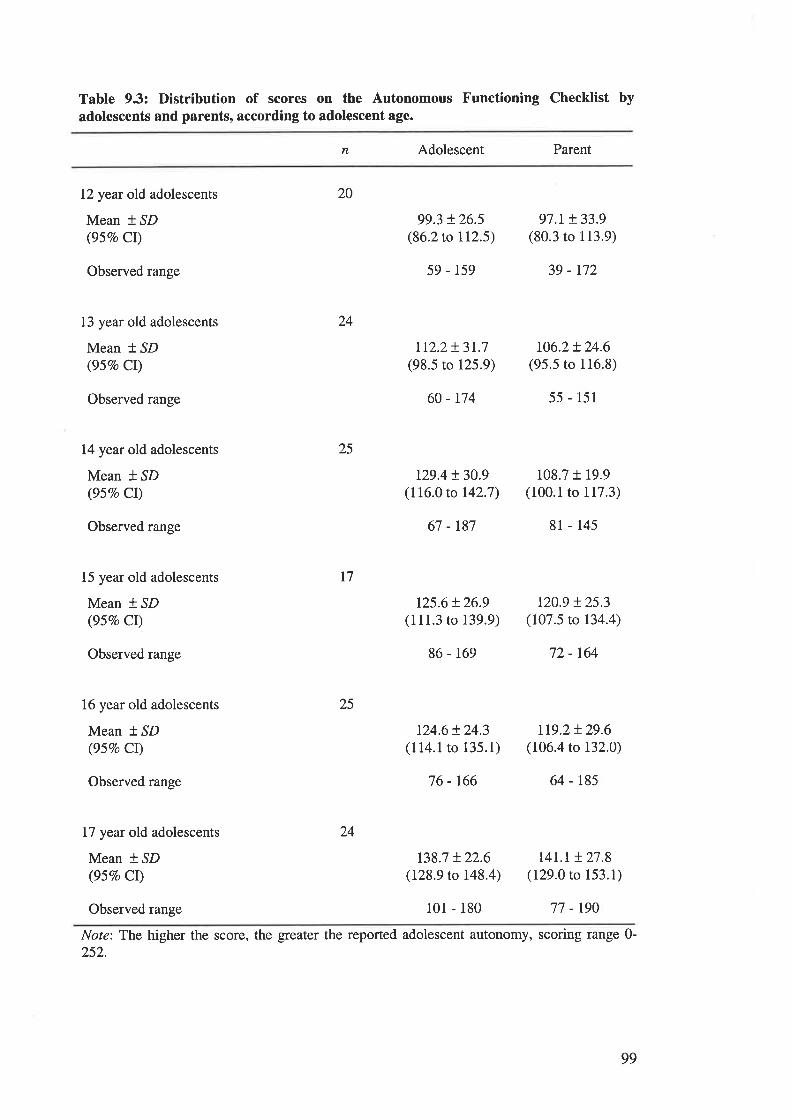
Tabte 9.3: Distribution of scores on the Autonomous Functioning Checklist byadolescents and parents, according to adolescent age.
n Adolescent Parent
12 year old adolescents
Mean * ^SD
(95Vo CI)
Observed range
13 year old adolescents
Mean t SD(95Vo CI)
Observed range
14 year old adolescents
Mean * ^SD
(95Vo Cl)
Observed range
15 year old adolescents
Mean * SD(957o CI)
Observed range
16 year old adolescents
Mean * SD(95Vo Cl)
Observed range
17 year old adolescents
Mean * SD(95Vo CI)
20
24
25
I7
25
24
99.3 t26.5(86.2 to 112.5)
59 - 159
tr2.2+ 3r.7(98.5 to 125.9)
60 - r74
t29.4 !30.9(116.0 to 142.7)
67 -t87
125.6t26.9(111.3 to 139.9)
86 - 169
124.6 + 24.3(114.1to 135.1)
76 - 166
t38.7 t 22.6(128.9 to 148.4)
97.1+ 33.9(80.3 to 113,9)
39 - r72
106.2!24.6(95.5 to 116.8)
55 - 151
108.7 t 19.9(100.1 to 117.3)
8l - 145
t20.9 !25.3(107.5 to 134.4)
72 - 164
1t9.2!29.6(106.4 to 132.0)
64 - 185
t4L.r !27.8(129.0 to 153.1)
Observed range 101 - 180 77 - r90
Note: The higher the score, the greater the reported adolescent autonomy, scoring range 0-252.
99
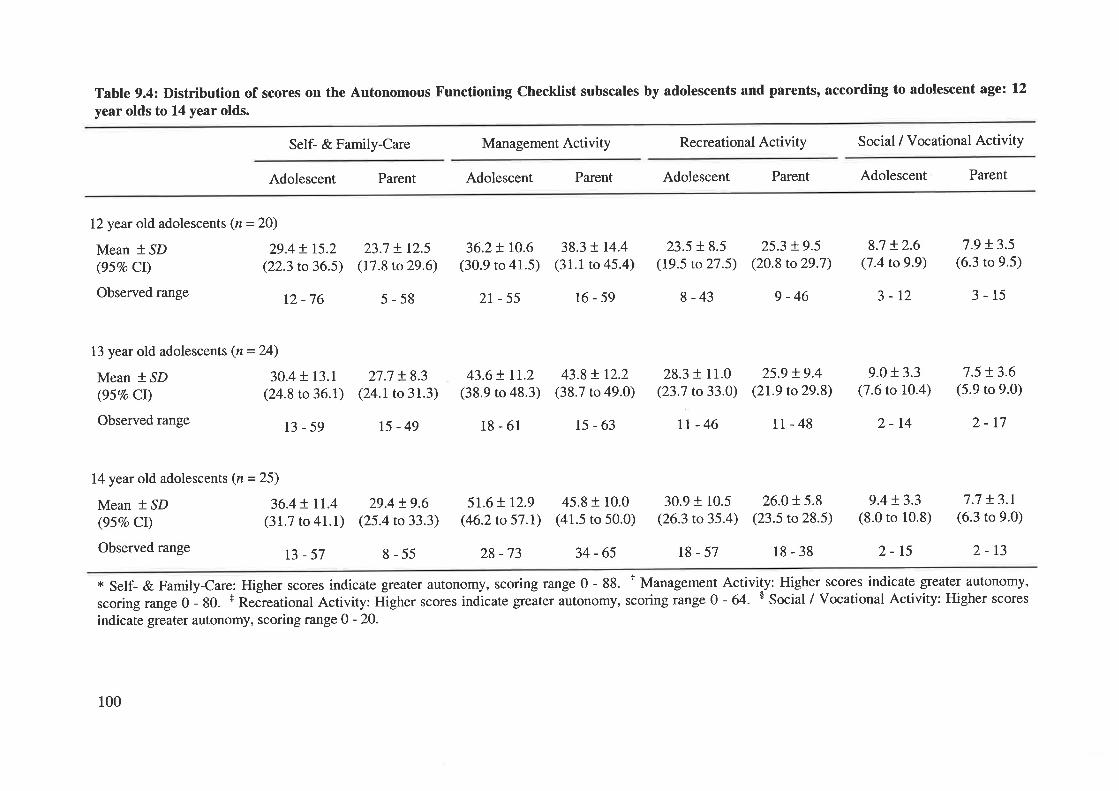
Table 9.4: Distribution of scores on the Autonomous Functioning Checklist subscales by adolescents and parents, according to adolescent age: 12
year olds to 14 year olds.
Self- & Family-Care Management Activity Recreational Activity Social / Vocational Activity
Adolescent Parent Adolescent Parent Adolescent Parent Adolescent Parent
12year old adolescents (n = 20)
Mean + ,SD 29.4 t I5.2(95Vo CI) (22.3 to 36.5)
Observed range 12 _76
13 year old adolescents (n=24)
Mean * SD 30.4 + 13.1
(957o Cl) (24.8 to 36.t)
Observed range 13 _ 59
14year old adolescents (n = 25)
Mean t SD 36.4 ! II.4(95Vo Cl) (31.7 to 41.1)
Observedrange ß _57
23.7 + 12.5
(17.8 to 29.6)
5-58
27.7 !8.3(24.1to3r.3)
15-49
29.4 !9.6(25.4 to 33.3)
8-55
36.2+ 10.6(30.9 to 41.5)
2r-55
43.6+ tr.z(38.9 to 48.3)
18-61
5r.6 + r2.9(46.2 to 57.1)
28 -73
38.3 ! r4.4(31.1 to 45.4)
t6-59
43.8 t r2.2(38.7 to 49.0)
15-63
45.8 + 10.0(41.5 to 50.0)
34-65
23.5 + 8.5(19.5 to 27.5)
8 -43
28.3 + 11.0(23.7 to33.0)
rt-46
25.3 !9.5(20.8 to29.7)
9-46
25.9 !9.4(21.9 to29.8)
11-48
8.7 !2.6(7 .4 to 9.9)
3-12
9.0 + 3.3(7.6 to 10.4)
2-14
9.4 !3.3(8.0 to 10.8)
2-15
7.9 !3.5(6.3 to 9.5)
3-15
7.5 + 3.6(5.9 to 9.0)
2-t7
7.7 !3.t(6.3 to 9.0)
2-13
30.9 + 10.5(26.3 to 35.4)
t8-57
26.0 + 5.8(23.5 to28.5)
18-38
+ Self- & Family-Care: Higher scores indicate greater autonomy, scoring range 0 - 88. r Management Activity: Higher scores indicate greater autonomy,
scoringrange0- 80. t ReãreationalActivity: ftigherscores indìcategreaterautonomy, scoringrange0- 64. $ Social/Vocational Activity: Higherscores
indicate greater autonomy, scoring range 0 - 20.
100
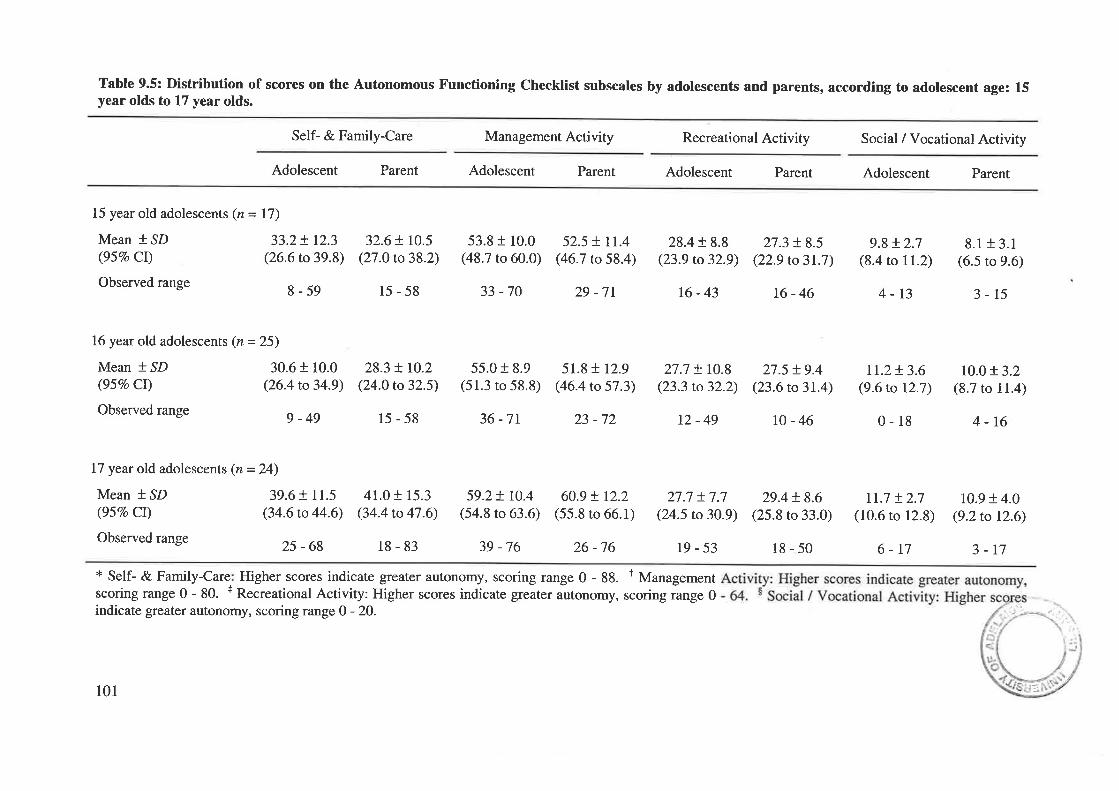
Table 9.5: Distribution of scores on the Autonomous Functioning Checklist subscales by adolescents and parents, according to adolescent age: 15year olds to 17 year olds.
Self- & Family-Care Management Activity Recreational Activity Social / Vocational Activity
Adolescent Parent Adolescent Parent Adolescent Parent Adolescent Parent
15 year old adolescents (n = 17)
Mean *,SD 33.2+ 12.3(95Vo CI) (26.6 to 39.8)
Observedrange g_59
16 year old adolescents (n = 25)
Mean + SD 30.6 + 10.0(95Vo Ct) (26.4 to 34.9)
Observedrange g_4g
15-58 33 -70
32.6+ 10.5(27.0 to 38.2)
28.3 + t0.2(24.0 to 32.5)
15-58
53.8 f 10.0(48.7 to 60.0)
55.0 + 8.9(51.3 to 58.8)
36 -7r
59.2! r0.4(54.8 to 63.6)
39 -76
52.5 + tr.4(46.7 to 58.4)
29 -7r
51.8+ r2.9(46.4 to 57.3)
23 -72
60.9 ! r2.2(55.8 to 66.1)
26-76
28.4 r 8.8(23.9 to 32.9)
16-43
27.7 + r0.8(23.3 to 32.2)
t2-49
27.7 +7.7(24.5 to 30.9)
t9-53
27.3 + 8.5(22.9 to3l.7)
t6-46
27.5 + 9.4(23.6 to 31.4)
r0-46
29.4 + 8.6(25.8 to 33.0)
18-50
9.8+ 2.7(8.4 ro 11.2)
4-13
II.2+ 3.6(9.6 to 12.7)
0-18
II.7 t2.7(10.6 to 12.8)
6-r7
8.1 + 3.1(6.5 to 9.6)
3-15
10.0!3.2(8.7 to 11.4)
4-16
10.9 + 4.0(9.2to t2.6)
3-r7
17 year old adolescents (n=24)
Mean *.SD 39.6 + 11.5(957o Cl) (34.6 to 44.6)
Observed range 25 _ 6g
41.0 + 15.3(34.4 to 47.6)
18-83
* Self- & Family-Care Higher scores indicate greater autonomy, scoring range 0 - 88. I Managementscoring range 0 - 80. + Recreational Activity: Higher scores indicate greater autonomy, scoring range 0indicate greater autonomy, scoring range O - 20.
101
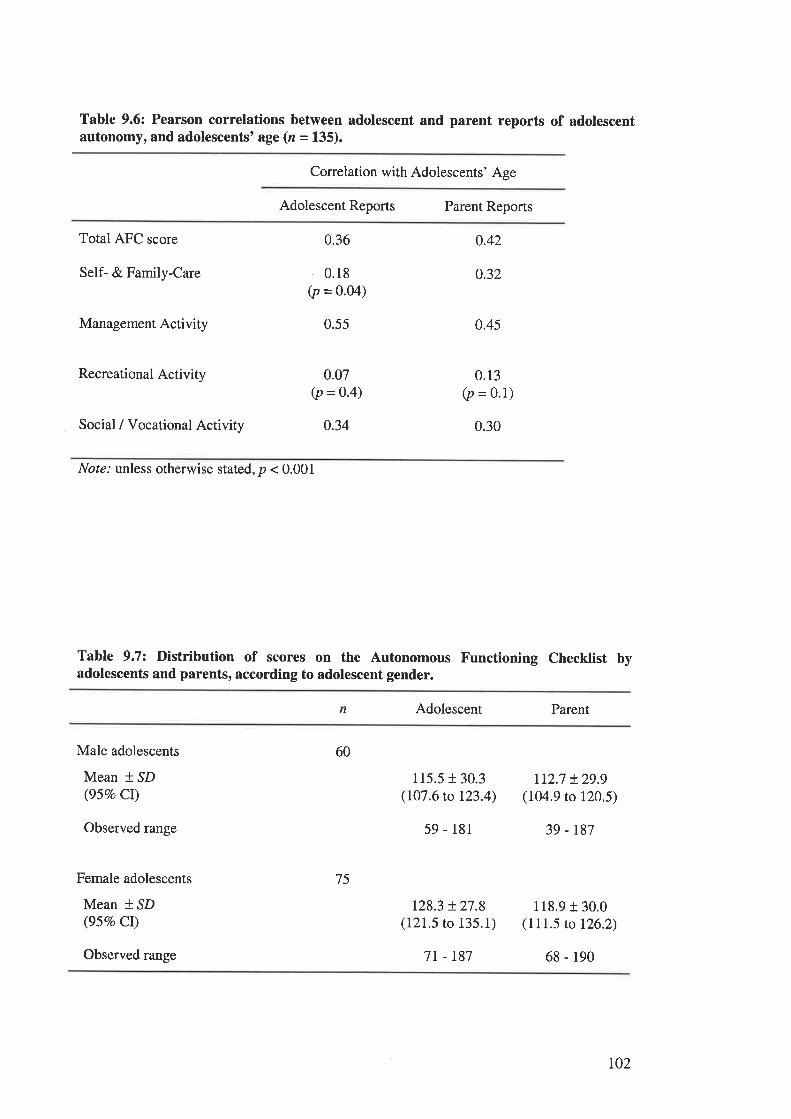
Table 9.6: Pearson correlations between adolescent and parent reports of adolescentautonomy, and adolescents'age (n = 135).
Conelation with Adolescents' Age
Adolescent Reports Parent Reports
Total AFC score
Self- & Family-Care
Management Activity
Recreational Activity
Social / Vocational Activity
0.36
0.18(p = 0.04)
0.55
0.07(p = O.4)
0.34
0.42
0.32
0.45
0.13(p = 0.1)
0.30
Nof¿.' unless otherwise stated, p < 0.001
Table 9.7: Distribution of scores on the Autonomous Functioning Checklist byadolescents and parents, according to adolescent gender.
n Adolescent Parent
Male adolescents
Mean * SD(957o Cl)
Observed range
Female adolescents
Mean * SD(95Vo Cl)
60
75
115.5130.3(107.6 to 123.4)
59 - 181
128.3 !27.8(121.5 to 135.1)
1t2.7 + 29.9(104.9 to 120.5)
39 - r87
118.9 r 30.0(111.5 to 126.2)
Observed range 7t - r87 68 - 190
r02
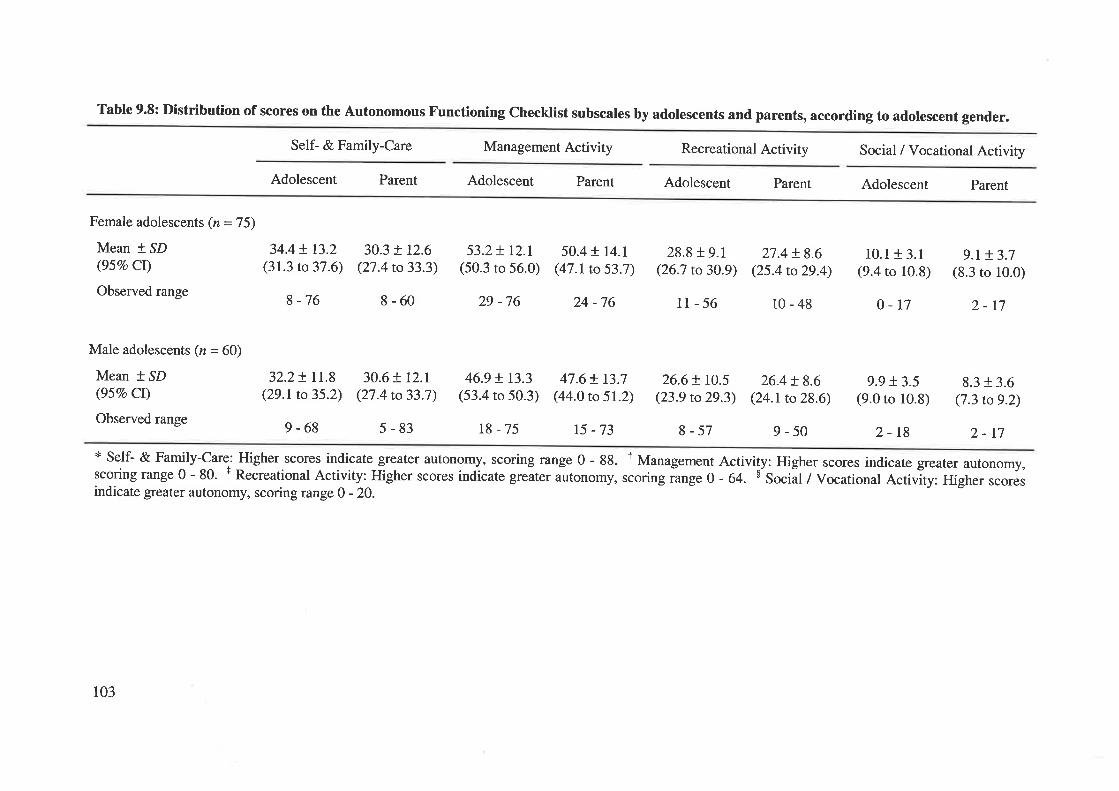
Table 9.8: Distribution of scores on the Autonomous Functioning Checktist subscales by adolescents and parents, according to adolescent
Self- & Family-Care Management Activity Recreational Activity Social / Vocational Activity
Adolescent Parent Adolescent Parent Adolescent Parent Adolescent Parent
30.3 + 12.6(27.4 ro 33.3)
8-60
30.6 + t2.r(27.4 to 33.7)
5-83
53.2+ r2.I(50.3 to 56.0)
29 -76
50.4 ! r4.I(47.I to 53.7)
24 -76
28.8 f 9.1(26.7 to 30.9)
11-56
26.6 ! 10.5(23.9 to 29.3)
8-57
27.4 + 8.6(25.4 to 29.4)
10-48
26.4 + 8.6(24.1to 28.6)
9-50
10.1 + 3.1(9.4 to 10.8)
0-17
9.9 + 3.5(9.0 to 10.8)
2-18
gender.
9.M.7(8.3 to 10.0)
2-17
8.3 + 3.6(7.3 to 9.2)
Female adolescents (n = 75)
Mean * ,SD 34.4 ! 13.2(95Vo Cl) (31.3 to 37.6)
Observedrange g_76
Male adolescents (n = 60)
Mean + SD(95Vo Cl)
Observed range
32.2! rI.8(29.1 to 35.2)
9-68
46.9 ! r3.3(53.4 to 50.3)
18-75
47.6+ 13.7(44.0 to 51.2)
15 -73 2-17* Self- & Family-Care: Higher scores indicate greater autonomy, scoring range 0 - 88. T Management Activity: Higher scores indicate greater autonomy,scoringrange0- 80. t RecreationalActivity: Higherscores indicateg.*t"r*torro-y, scoringiange0 - 64. $ Sociãl¡vo"uiionalActivity: Higherscoresindicate greater autonomy, scoring range 0 - 20.
103
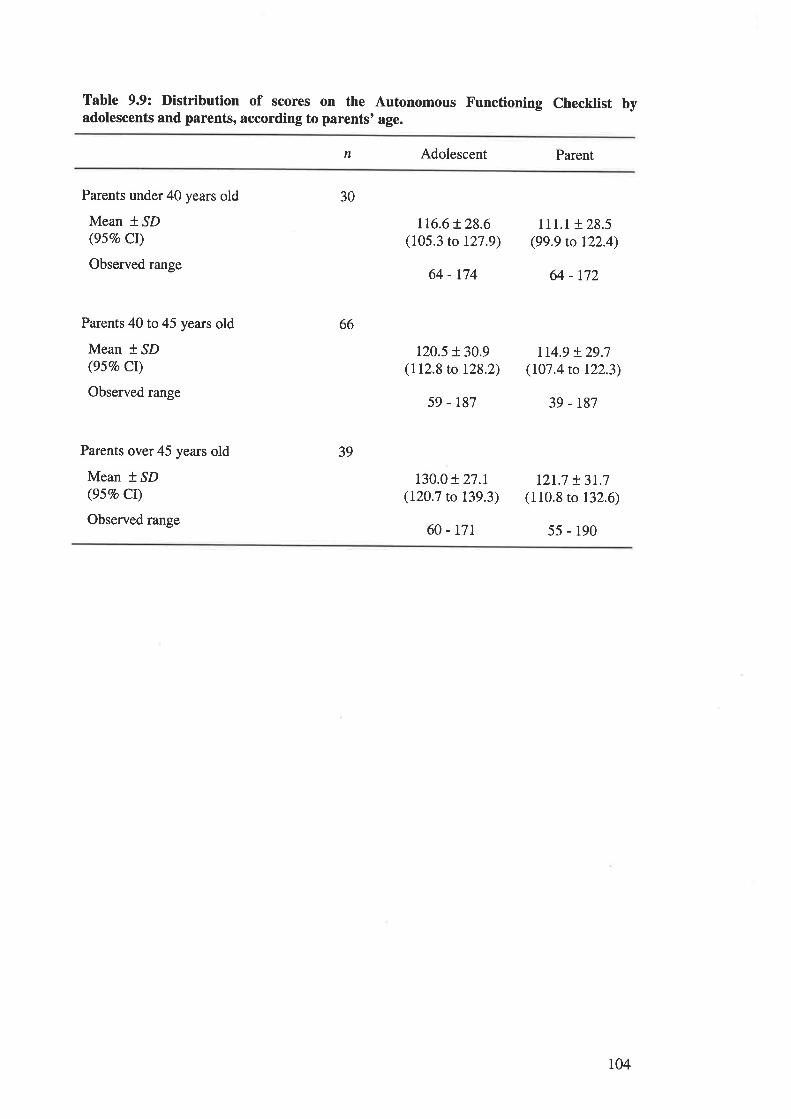
Table 9.9: Distribution of scores on the Autonomous Functioning Checklist byadolescents and parents, according to parents' age.
n Adolescent Parent
Parents under 40 years old
Mean * SD(95Vo CI)
Observed range
Parents 40to45 years old
Mean * SD(95Vo Cr)
Observed range
Parents over45 years old
Mean t ^SD
(95Vo CI)
Observed range
30
66
39
116.6t28.6(105.3 to 127.9)
64 - 174
120.5 r 30.9(112.8 to 128.2)
59 - r87
130.0 + 27.1(120.7 to 139.3)
60 - t7r
111.1 + 28.5(99.9 to 122.4)
64 - 172
114.9 + 29.7(107.4 to 122.3)
39 - r87
12r.7 t3t.7(110.8 to 132.6)
5s - 190
r04
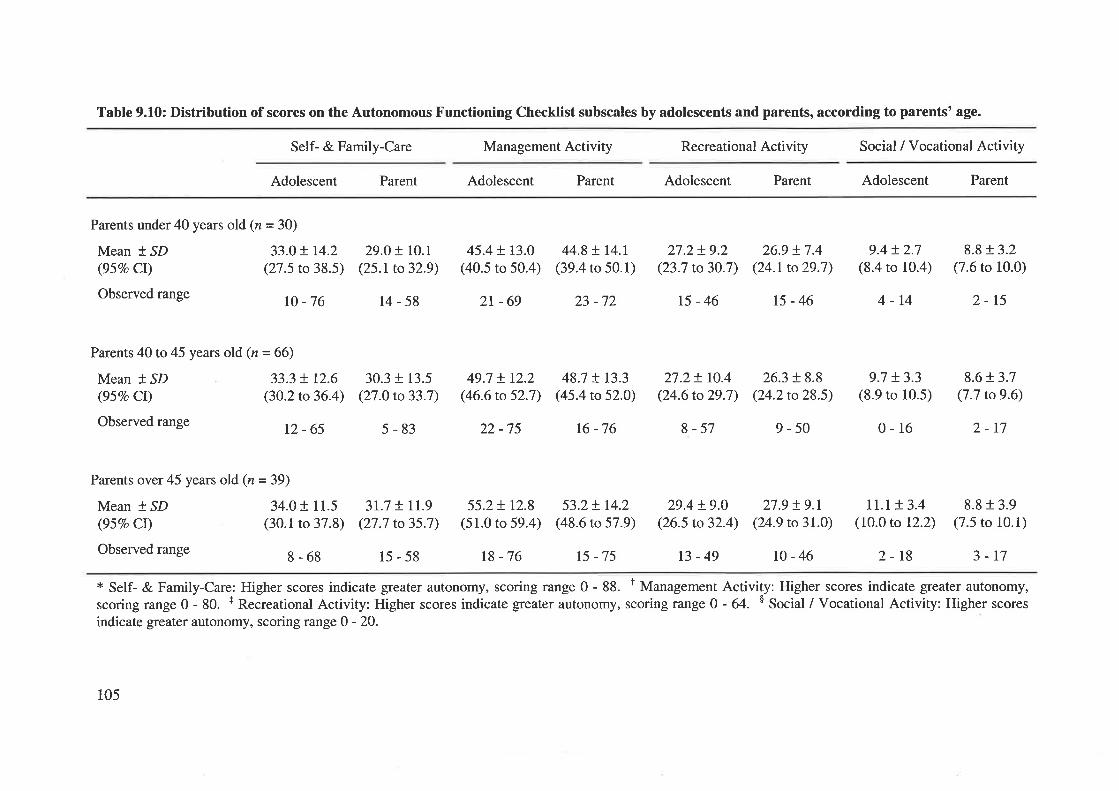
Table 9.10: Distribution of scores on the Autonomous Functioning Checklist subscales by adolescents and parents, according to parents' age.
Self- & Family-Care Management Activity Recreational Activity Social / Vocational Activity
Adolescent Parent Adolescent Parent Adolescent Parent Adolescent Parent
Parents under40 years old (n=3O)
Mean * SD 33.0 t I4.2(95Vo CI) (27.5 to 38.5)
Observed range rc _76
29.O! rc.I(25.1to32.9)
14-58
45.4+ 13.0(40.5 to 50.4)
2t-69
44.8 ! r4.r(39.4 to 50.1)
23 -72
27.2+ 9.2(23.7 to30.7)
15-46
26.9 + 7.4(24.1to29.7)
15-46
9.4!2.7(8.4 to 10.4)
4-14
9.7 + 3.3(8.9 to 10.5)
0-16
rr.r !3.4(10.0 to 12.2)
8.8 + 3.2(7.6 to 10.0)
2-15
8.6r.3.7(7.7 to 9.6)
2-17
8.8 r 3.9(7.5 to 10.1)
Parents 40to45 years old (n=66)
Mean + SD 33.3 + L2.6(95Vo Cl) (30.2 to 36.4)
Observed range 12 _ 65
Parents over45 years old (n=39)
Mean * SD 34.01 11.5(95Vo Cr) (30.1 to 37.8)
Observedrange g_6g
30.3 + 13.5(27.0 to 33.7)
5-83
3r.7 t rr.9(27.7 to 35.7)
15-58
49.7 !r2.2(46.6 to 52.7)
22 -75
48.7 ! r3.3(45.4 to 52.0)
16 -76
27.2+ tO.4(24.6 to 29.7)
8-57
29.4 + 9.0(26.5 to 32.4)
26.3 + 8.8(24.2 to 28.5)
9-50
27.9 !9.r(24.9 to 31.0)
55.2+ r2.8(51.0 to 59.4)
r8 -76
53.2+ r4.2(48.6 to 57.9)
15 -75
* Self- & Family-Care: Higher scores indicate greater autonomy, scoring range 0 - 88. t Managementscoring range 0 - 80. r Recreational Activity: Higher scores indicate greater autonomy, scoring range 0indicate greater autonomy, scoring range 0 - 20.
13-49 r0-46 2-18 3-17
Activity: Higher scores indicate greater autonomy,- 64. $ Social / Vocational Activity: Higher scores
105
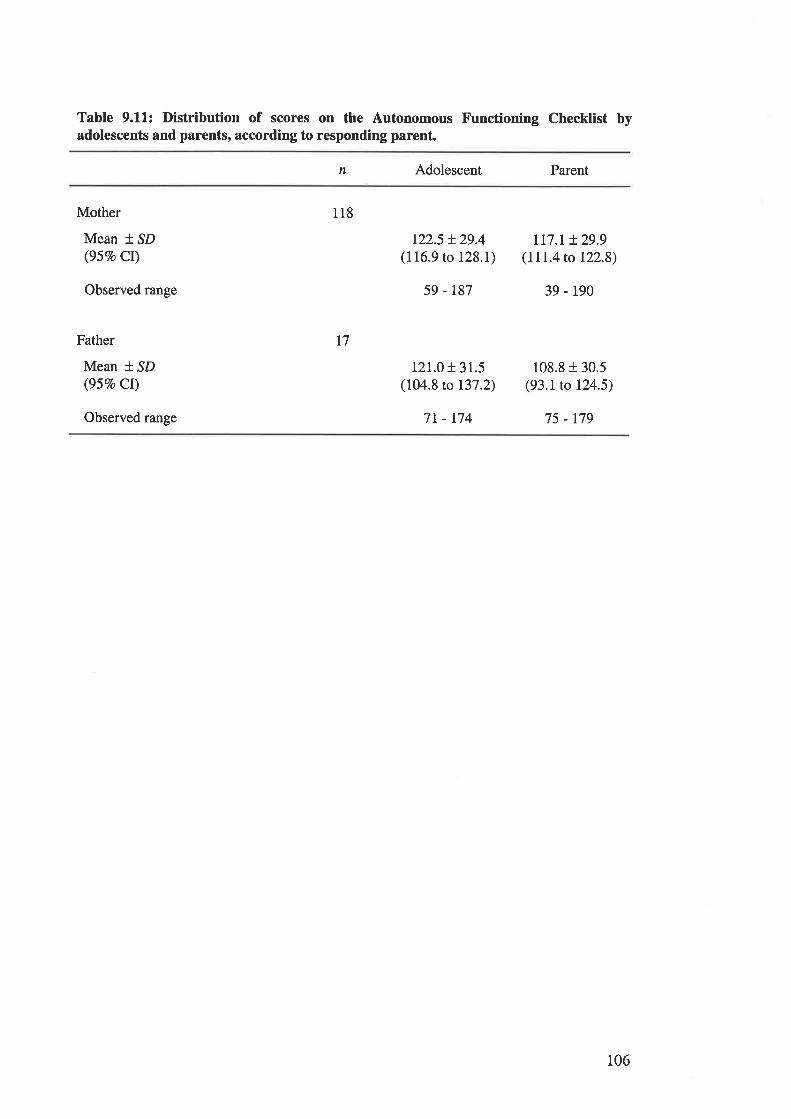
Table 9.11: Distribution of scores on the Autonomous Functioning Checklist byadolescents and parents, according to responding parent.
Adolescent Parentn
Observed range
Mother
Mean * SD(95Vo CI)
Father
Mean f SD(95Eo CI)
122.5 + 29.4(116.9 to 128.1)
59 - 187
121.0 + 31.5(104.8 to 137.2)
7t - r74
rr7.r + 29.9(111.4 to t22.8)
39 - 190
108.8 + 30.5(93.1 to 124.5)
75 - 179
118
17
Observed range
106
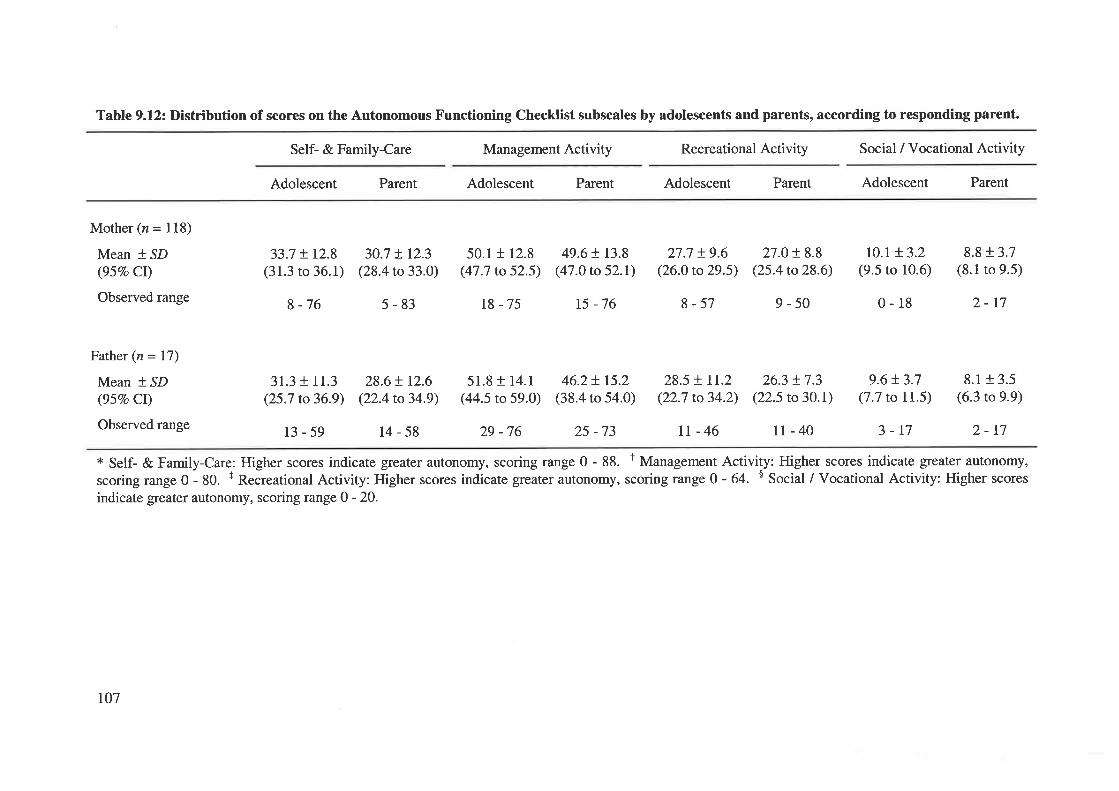
Table 9.12: Distribution of scores on the Autonomous Functioning Checklist subscales by adolescents and parents, according to responding parent.
Self- & Family-Care Management Activity Recreational Activity Social / Vocational Activity
Adolescent Parent Adolescent Parent Adolescent Parent Adolescent Parent
Mother (n = 118)
Mean * SD(95Vo CI)
Observed range
Father (n = I7)
Mean * SD(95Vo Ct)
Observed range
33.7 + 12.8(31.3 to 36.1)
8 -76
31.3 + 11.3(25.7 to 36.9)
30.7 + r2.3(28.4 to 33.0)
5-83
28.6+ t2.6(22.4 to 34.9)
50.1 r 12.8(47.7 to 52.5)
18 -75
51.8 t 14.1
(44.5 to 59.0)
29 -76
49.6 t r3.8(47.0 to 52.1)
15 -76
46.2+ r5.2(38.4 to 54.0)
25 -73
27.7 + 9.6(26.0 to 29.5)
8-57
27.0+ 8.8(25.4 to 28.6)
9-50
ro.r t3.2(9.5 to 10.6)
0-18
9.6t3.7(7.7 to 11.5)
8.8 r 3.7(8.1 to 9.5)
2-r7
8.1+ 3.5(6.3 to 9.9)
2-t7
28.5 + lr.2(22.7 to 34.2)
26.3 !7.3(22.5 to 30.1)
II-46 II-40 3-17
* Self- & Family-Care: Higher scores indicate greater autonomy, scoring range 0 - 88. t Management Activity: Higher scores indicate greater autonomy,
scoringrange0-80. + ReðreationalActivity: Higherscores indicate grcater autonomy, scoringrange0-64. $ Social/Vocational Activity: Higherscoresindicate greater autonomy, scoring range 0 - 20.
13-59 14-58
t07
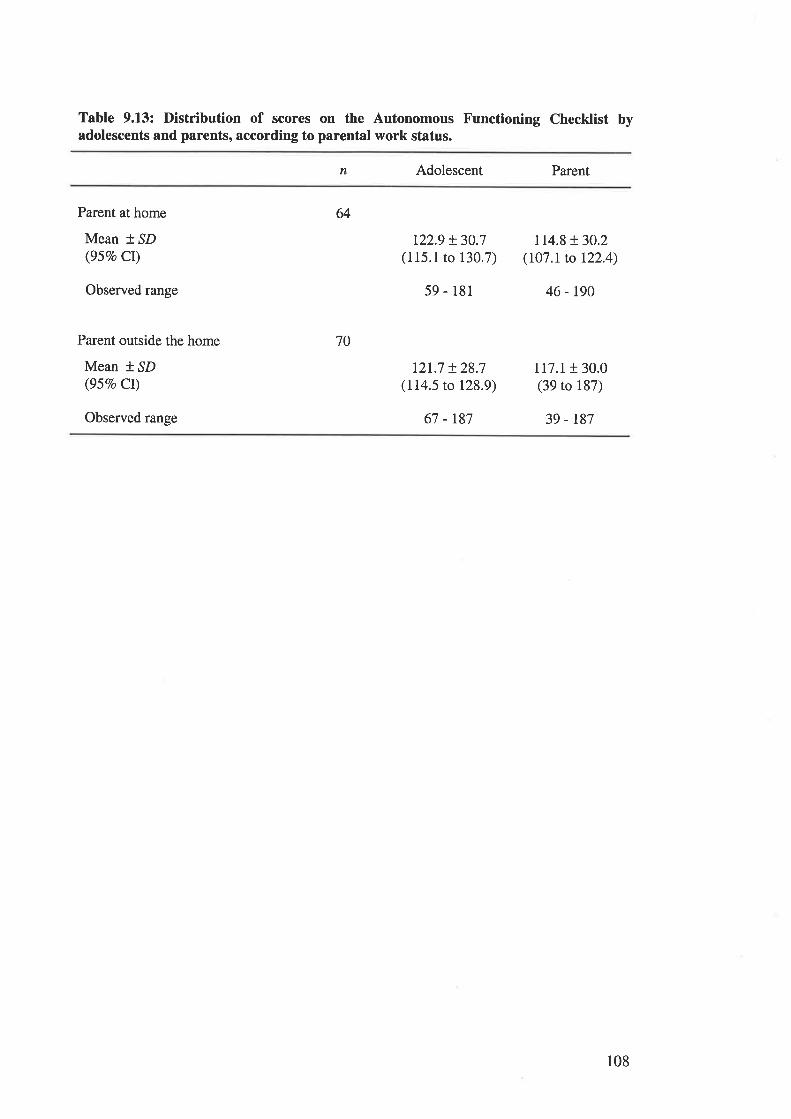
Table 9.13: Distribution of scores on the Autonomous Functioning Checklist byadolescents and parents, according to parental work status.
n Adolescent Parent
Parent at home
Mean * SD(gsqo cr)
Observed range
Parent outside the home
Mean * SD(95Vo Cr)
Observed range
64
70
122.9 + 30.7(115.1 to 130.7)
59 - 181
121.7 + 28.7(114.5 to 128.9)
67 -r87
114.8 !30.2(107.1 to 122.4)
46 - 190
117.1r 30.0(39 to 187)
39 - t87
108
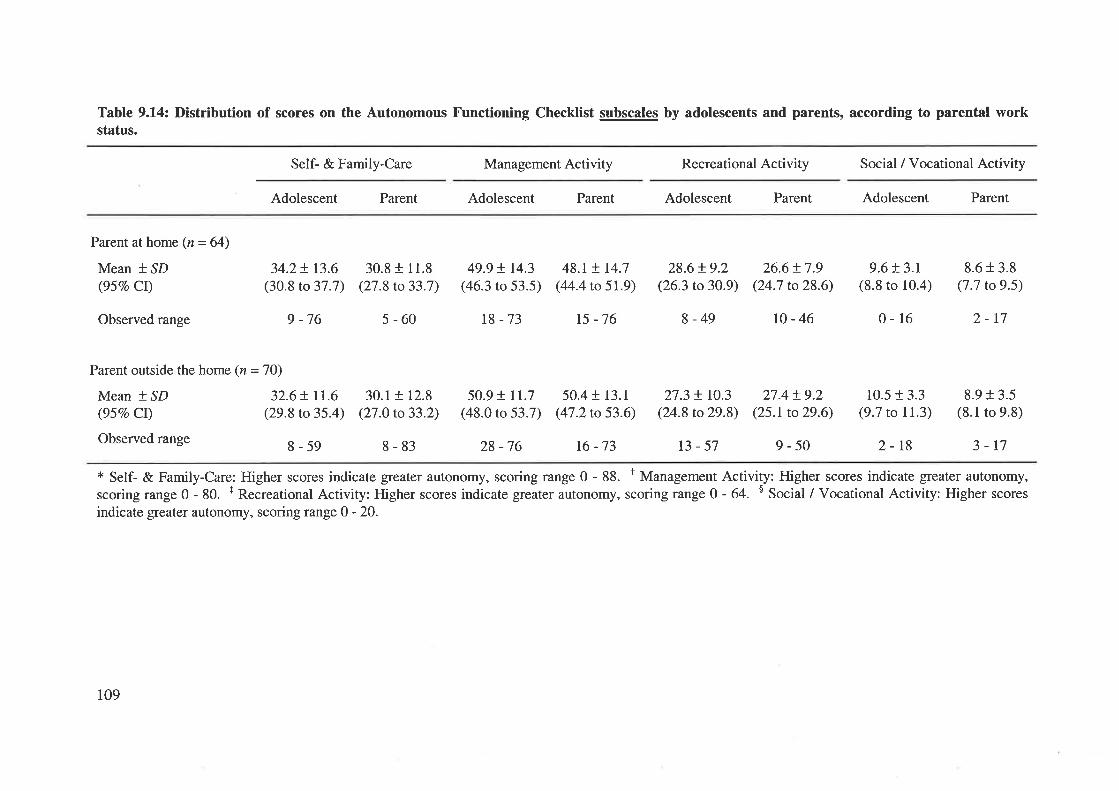
Table 9.14: Distribution of scores on the Autonomous Functioning Checklist subscales by adolescents and parents, according to parental workstatus.
Self- & Family-Care Management Activity Recreational Activity Social / Vocational Activity
Adolescent Parent Adolescent Parent Adolescent Parent Adolescent Parent
Parent at home (n = 64)
Mean * SD(95Vo CI)
34.2+ t3.6(30.8 to 37.7)
9 -76
30.8 t 11.8(27.8 to 33.7)
5-60
49.9 ! 14.3(46.3 to 53.5)
18-73
48.t !. t4.7(44.4 to 5r.9)
15 -76
28.6 !9.2(26.3 to 30.9)
8-49
26.6t7.9(24.7 to 28.6)
27.4!9.2(25.t to29.6)
9.6 f 3.1
(8.8 to 10.4)
0-16
10.5 t 3.3(9.7 to 11.3)
8.6 + 3.8(7.7 to9.5)
Parent outside the home (n = 70)
Mean * SD 32.6+ ll.6(957o Cr) (29.8 to 35.4)
Observedrange g_59
Observed range r0-46 2-r7
8-83 28 -76 16 -73 2-18
8.913.5(8.1 to 9.8)
3-t7* Self- & Family-Care: Higher scores indicate greater autonomy, scoring range 0 - 88. I Management Activity: Higher scores indicate greater autonomy,
scoringrange 0 - 80. r Recreational Activity: Higher scores indicate greaterautonomy, scoringrange 0 - 64. s Social / Vocational Activity: Higher scores
indicate greater autonomy, scoring range 0 - 20.
30.1 t 12.8(27.0 to 33.2)
50.9 t 11.7(48.0 to 53.7)
50.4 r 13.1
(47.2 to 53.6)27.3 ! rO.3
(24.8 to29.8)
13-57 9-50
109
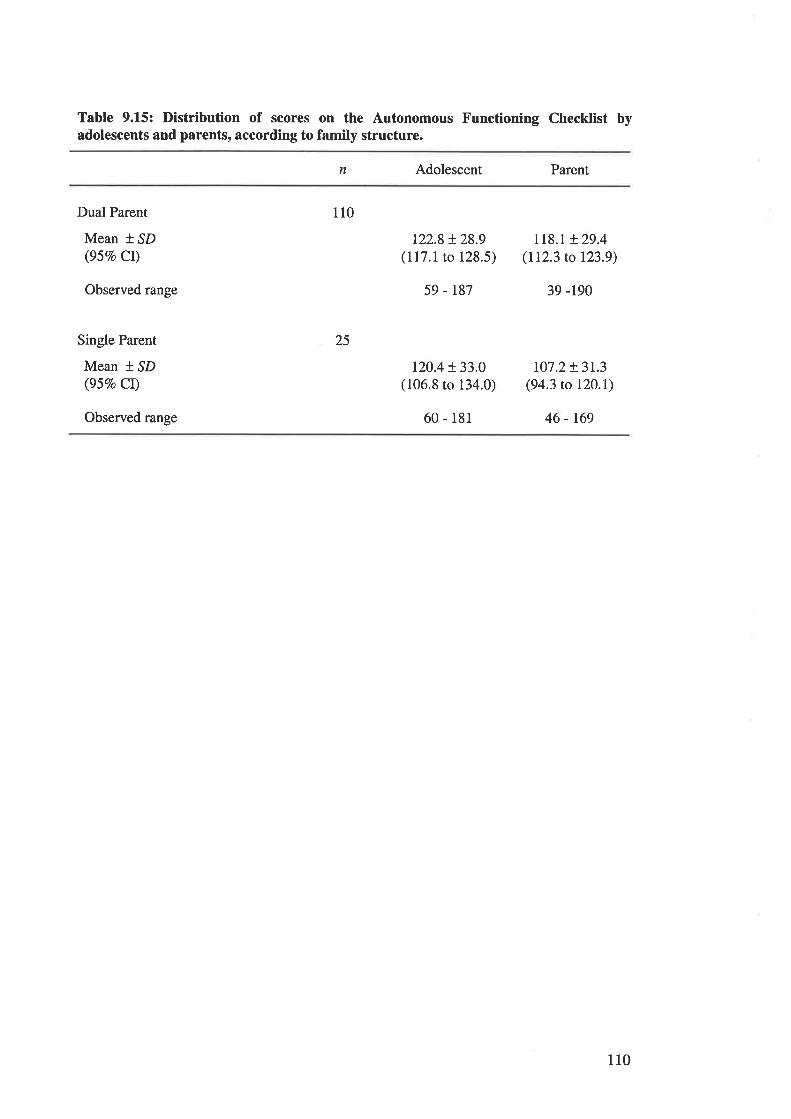
Table 9.15: Distribution of scores on the Autonomous Functioning Checklist byadolescents and parents, according to family structure.
n Adolescent Parent
Dual Parent
Mean t SD(95Vo Cr)
110
25
t22.8 t28.9(117.1 to 128.5)
59 - r87
120.4 + 33.0(106.8 to 134.0)
60 - 181
Ll8.t + 29.4(112.3 to 123.9)
39 -r90
107.2+ 3L3(94.3 to 120.\)
46 - 169
Observed range
Single Parent
Mean * ^SD
(95Vo Cr)
Observed range
110
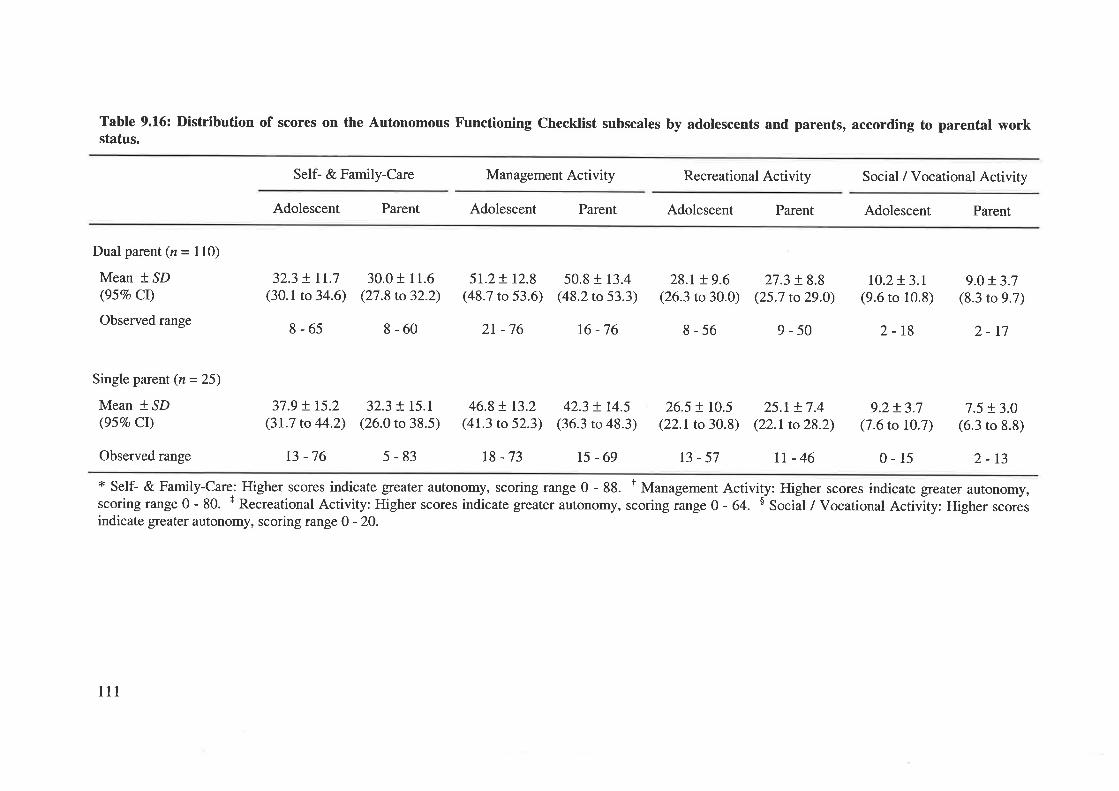
Table 9.16: DistrÍbution of scores on the Autonomous Functioning Checklist subscales by adolescents and parents, according to parental workstatus.
Self- & Family-Care Management Activity Recreational Activity Social / Vocational Activity
Adolescent Parent Adolescent Parent Adolescent Parent Adolescent Parent
Dual parent (n = 110)
Mean * SD(95Vo Cl)
Observed range
Single parent (n = 25)
Mean * SD(95Eo CI)
Observed range
32.3 + It.7(30.1 to 34.6)
8-65
37.9 + 15.2(31.7 to 44.2)
30.0 r 11.6(27.8 to 32.2)
8-60
32.3 + I5.I(26.0 to 38.5)
51.2+ 12.8(48.7 to 53.6)
46.8 ! 13.2(41.3 to 52.3)
r8 -73
50.8 + 13.4(48.2 to 53.3)
42.3 + 14.5(36.3 ro 48.3)
15-69
28.r + 9.6(26.3 to 30.0)
8-56
26.5 ! rcs(22.r to 30.8)
27.3 + 8.8(25.7 to29.0)
9-50
25.1+ 7.4(22.1 to 28.2)
tt-46
10.2t3.t(9.6 to 10.8)
2-18
9.2+ 3.7(7.6 to 10.7)
9.0+ 3.7(8.3 to 9.7)
2-17
7.5 ! 3.0(6.3 to 8.8)
2r -76 16-76
13-57 0-15 2-13
* Self- & Family-Care: Higher scores indicate greater autonomy, scoring range 0 - 88. t Management Activity: Higher scores indicate greater autonomy,scoringrange0- 80. + RecreationalActivity: Higherscores indicategreaterautonomy, scoringrange0- 64. $ Socii/VocationalActivity: Higher scoresindicate greater autonomy, scoring range 0 - 20.
t3 -76 5-83
lll
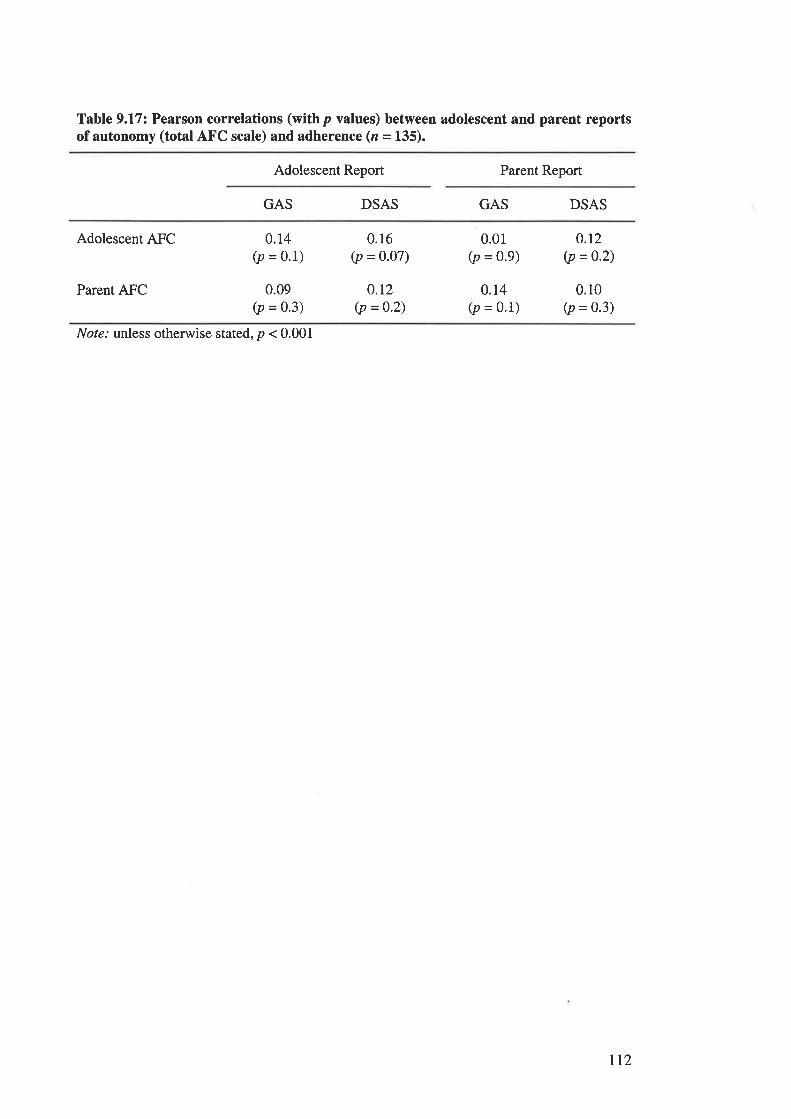
Table 9.17: Pearson correlations (withp values) between adolescent and parent reportsof autonomy (total AFC scale) and adherence (z = 135).
Adolescent Report Parent Report
GAS DSAS GAS DSAS
Adolescent AFC
Parent AFC
0.14(p = 0.1)
0.09(p = 0.3)
0.16(p = 0.07)
o.t2(p =0.2)
0.01(p = 0.9)
0.14(p = 0'1)
o.r2(p =0.2)
0.10(p = 0.3)
Nol¿.' unless otherwise stated, p < 0.001
tt2
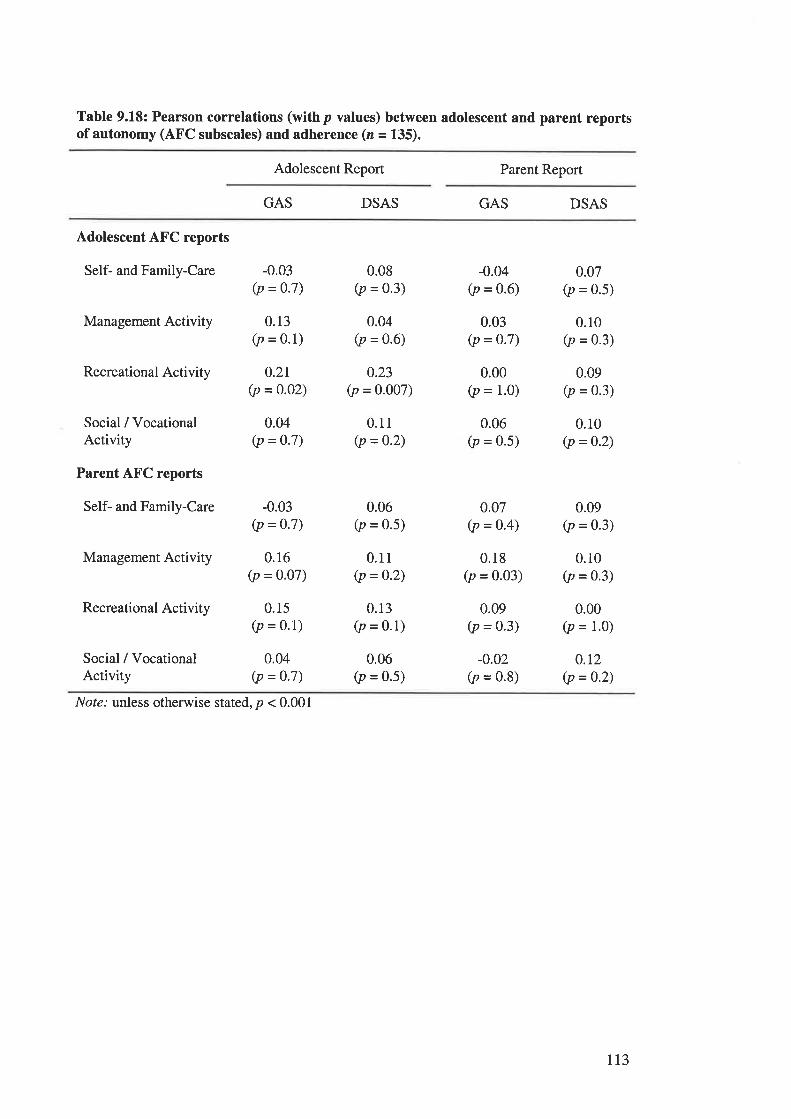
Table 9.18: Pearson correlations (withp values) between adolescent and parent reportsof autonomy (AFC subscales) and adherence (z = 135).
Adolescent Report Parent Report
GAS DSAS GAS DSAS
Adolescent AFC reports
Self- and Family-Care
Management Activity
Recreational Activity
Social / VocationalActivity
Parent AFC reports
Self- and Family-Care
Management Activity
Recreational Activity
Social / VocationalActivity
-0.03(p = 0.7)
0.13(p = 0.1)
0.2r(p = 0.02)
0.04(p = 0.7)
-0.03(p = 0.7)
0.16(p = 0'07)
0.15(p = 0.1)
0.04(p = 0.7)
0.08(p = 0.3)
0.04(p = 0.6)
0.23(p = 0.007)
0.11(p = 0.2)
0.06(p = 0.5)
0.11(p = 0.2)
0.13(p = 0.1)
0.06(p = 0.5)
-0.04(p = 0.6)
0.03(p = 0-7)
0.00(p = 1.0)
0.06(p = 0.5)
0.07(p = o.4)
0.18(p = 0.03)
0.09(p = 0.3)
-0.02(p = 0.8)
0.07(p = 0.5)
0.10(p = 0.3)
0.09(p = 0.3)
0.10(p = 0.2)
0.09(p = 0.3)
0.10(p = 0.3)
0.00(p = 1.0)
0.t2(p = 0.2)
Nol¿.' unless otherwise stated, p < 0.001
113
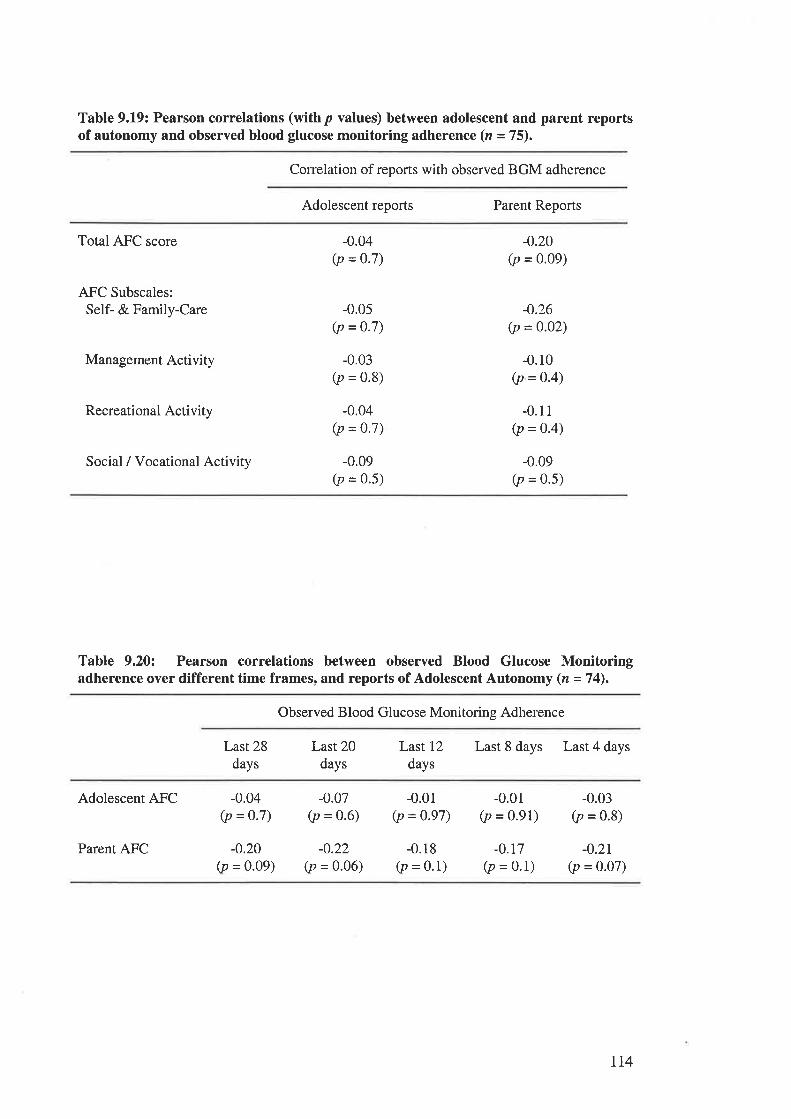
Table 9.19: Pearson correlations (withp values) between adolescent and parent reportsof autonomy and observed blood glucose monitoring adherence (n =75).
Correlation of reports with observed BGM adherence
Adolescent reports Parent Reports
Total AFC score
AFC Subscales:Self- & Family-Care
Management Activity
Recreational Activity
Social / Vocational Activity
-0.04(p = 0.7)
-0.0s(p = 0.7)
-0.03(p = 0.8)
-0.04(p =0.7)
-0.09(p = 0.5)
-0.20(p = 0.09)
-0.26(p = 0.02)
-0.10(p =0'4)
-0.11(p = 0.4)
-0.09
Ø = 0.5)
Table 9.20: Pearson correlations between observed Blood Glucose Monitoringadherence over different time frames, and reports of Adolescent Autonomy (n =74).
Observed Blood Glucose Monitoring Adherence
Last 28days
Last 20days
Last 12
days
Last 8 days Last 4 days
Adolescent AFC
Parent AFC
-0.04(p = 0.7)
-0.20(p = 0.09)
-0.07(p = 0.6)
-0.22(p = 0.06)
-0.01(p = 0'97)
-0.18(p = 0.1)
-0.01(p = 0.91)
-0.r7(p = 0.1)
-0.03(p = 0.8)
-0.2r(p = 0.07)
r14
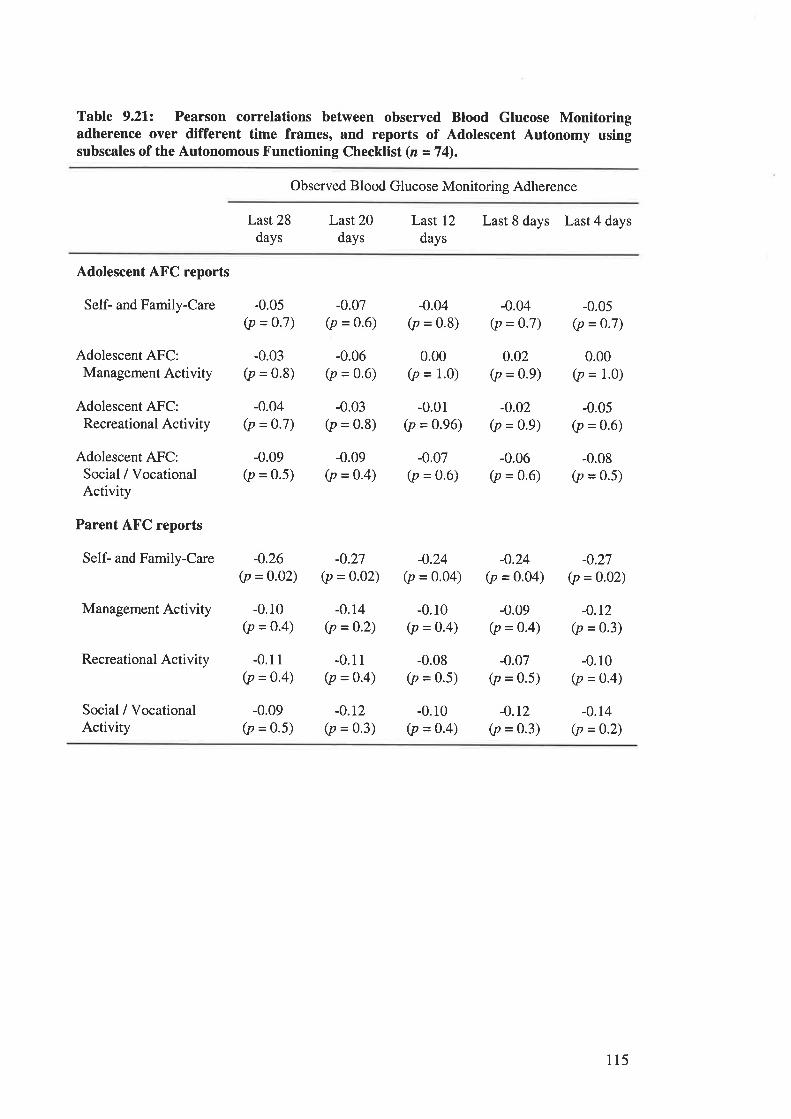
Table 9.21: Pearson correlations between observed Blood Glucose Monitoringadherence over different time frames, and reports of Adolescent Autonomy usingsubscales of the Autonomous Functioning Checklist (n =74).
Observed Blood Glucose Monitoring Adherence
Last 28days
Last 20days
Last 12
daysLast 8 days Last 4 days
Adolescent AFC reports
Self- and Family-Care
Adolescent AFC:Management Activity
Adolescent AFC:Recreational Activity
Adolescent AFC:Social / VocationalActivity
Parent AFC reports
Self- and Family-Care
Management Activity
Recreational Activity
Social / VocationalActivity
-0.05(p = o.7)
-0.03(p = 0.8)
-0.04(p = 0.7)
-0.09(p = 0.5)
-0.26(p = 0.02)
-0.10(p =o.4)
-0.11(p = 0.4)
-0.09(p = 0.5)
-0.07(p = 0.6)
-0.06(p = 0.6)
-0.03
Ø = 0.8)
-0.09(p = 0.4)
-0.27(p = 0.02)
-0.04(p = 0.8)
0.00(p = 1.0)
-0.01(p = 0.96)
-0.07(p = 0.6)
-0.24(p = o.o4)
-0.10(p = 0'4)
-0.08(p = 0.5)
-0.10(p = o.4)
-0.04(p = 0.7)
0.02(p = 0.9)
-0.02(p = 0.9)
-0.06(p = 0.6)
-0.24(p = 0.04)
-0.09(p = 0.4)
-0.07(p = 0.5)
-0.r2(p = 0.3)
-0.05(p = 0.7)
0.00(p = 1.0)
-0.0s(p = 0.6)
-0.08(p = 0.5)
-0.27(p = 0.02)
-0.r2(p = 0.3)
-0.10(p = 0.4)
-0.14(p = 0.2)
-o.r4(p =0.2)
-0.11(p = 0.4)
-0.12(p = 0.3)
115
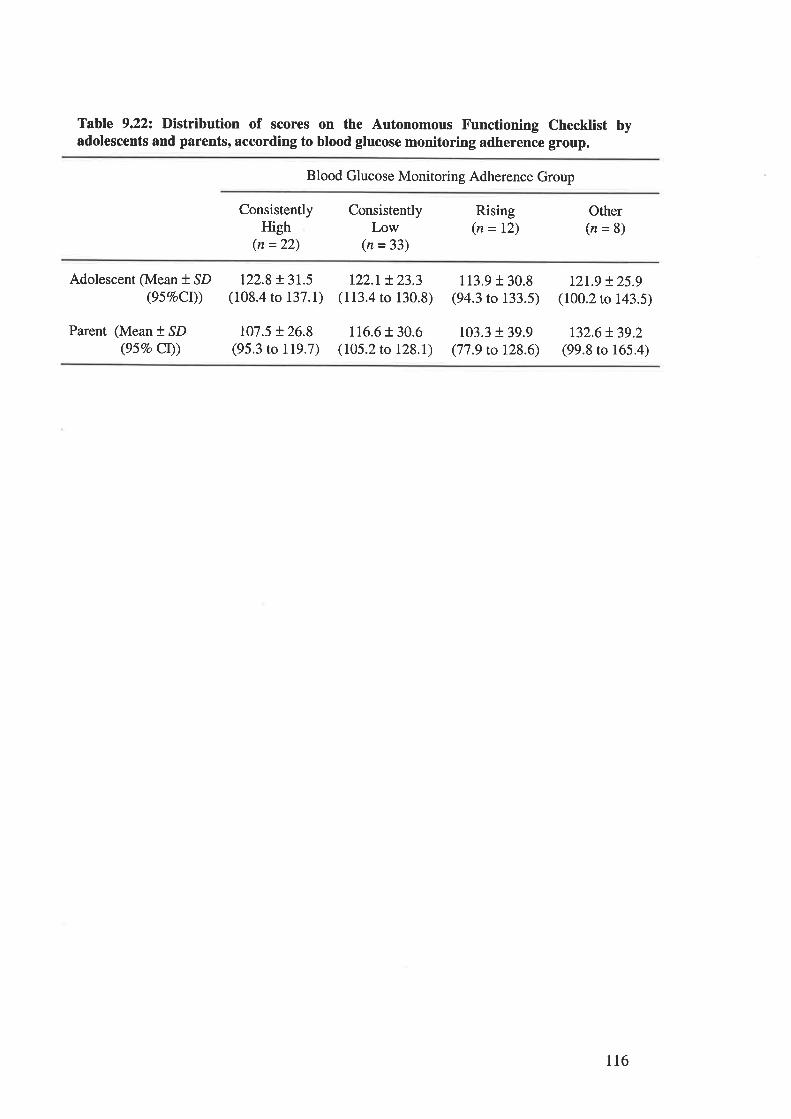
Table 9.22: Distribution of scores on the Autonomous Functioning Checklist byadolescents and parents, according to blood glucose monitoring adherence group.
Blood Glucose Monitoring Adherence Group
ConsistentlyHigh
(n =22)
ConsistentlyLow
(n = 33)
Rising(n = 12)
Other(n=8)
Adolescent (Mean + SD(95%oCr))
Parent (Mean + SD(95Eo Ct))
122.8 + 3r.5(108.4 to 137.1)
t07.5 + 26.8(95.3 to 119.7)
t22.t t23.3(113.4 to 130.8)
116.6 r 30.6(105.2 to 128.1)
1r3.9 r 30.8(94.3 to 133.5)
103.3 + 39.9(77.9 to 128.6)
t21.9 t25.9(100.2 to 143.5)
132.6!39.2(99.8 to 165.4)
116
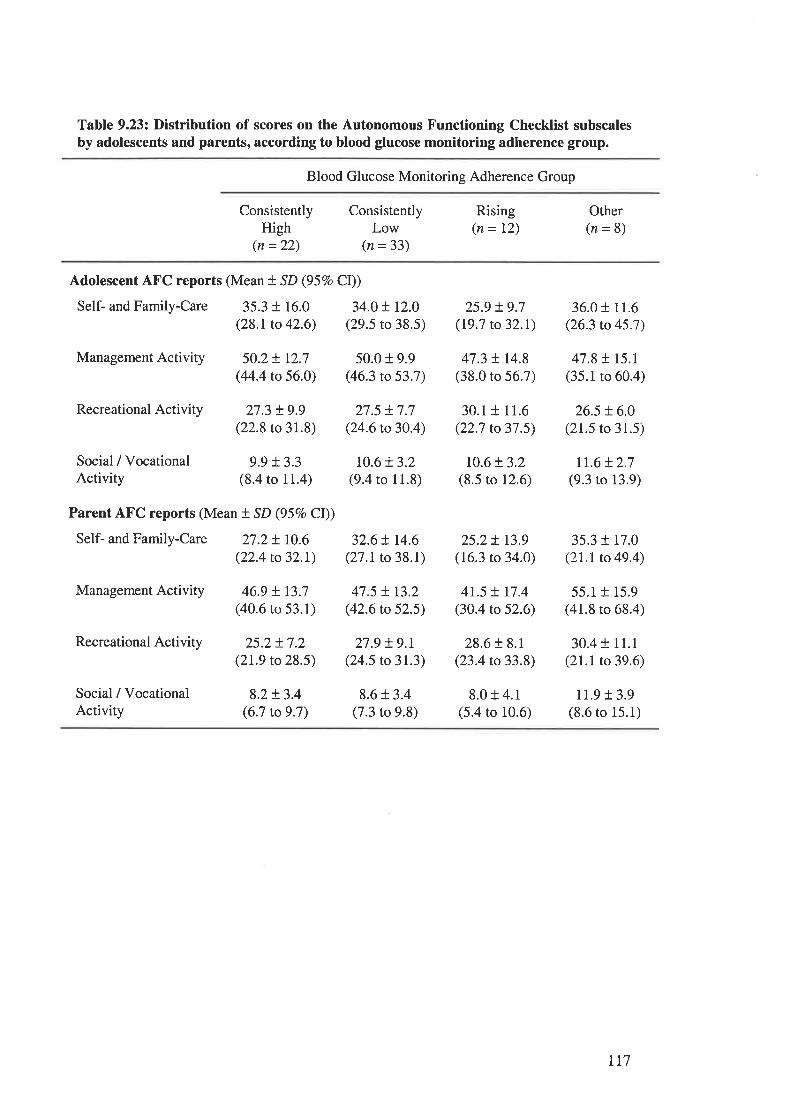
Table 9.23: Distribution of scores on the Autonomous Functioning Checklist subscalesby adolescents and parents, according to blood glucose monitoring adherence group.
Blood Glucose Monitoring Adherence Group
ConsistentlyHigh
(n =22)
ConsistentlyLow
(n = 33)
Rising(n= 12)
Other(n=8)
Adolescent AFC reports (Mean t SD (957o CI))
Self- and Family-Care 35.3 t 16.0 34.0 t I2.0(28.1to 42.6) (29.5 to 38.5)
Management Activity 50.2 + t2.7 50.0 t 9.9(44.4 to 56.O) (46.3 to 53.7)
Recreational Activity
Social / VocationalActivity
8.2 + 3.4(6.7 to 9.7)
27.5 t7.7(24.6 to 30.4)
10.6t3.2(9.4 to 11.8)
32.6 t 14.6(27.1 to 38.1)
47.5 t r3.2(42.6 to 52.5)
27.9 !9.r(24.5 to 31.3)
8.6 + 3.4(7.3 to 9.8)
25.9 !9.7(19.7 to 32.1)
47.3 t r4.8(38.0 to 56.7)
30.1 + 11.6(22.7 to 37.5)
10.6t3.2(8.5 to 12.6)
25.2t r3.9(16.3 to 34.0)
41.5 ! 17.4(30.4 to 52.6)
28.6 r 8.1(23.4 to 33.8)
8.0 + 4.1(5.4 to 10.6)
36.0 r 11.6(26.3 to 45.7)
47.8115.1(35.1 to 60.4)
26.5 t6.0(21.5 to 31.5)
It.6 t2.7(9.3 to 13.9)
35.3 t 17.0(21.1to 49.4)
55.1 + 15.9(41.8 to 68.4)
30.4 + 11.1(21.1to 39.6)
11.9 r 3.9(8.6 to 15.1)
27.3 t9.9(22.8 to 31.8)
Social / Vocational 9.9 + 3.3Activity (8.4 to 11.4)
Parent AFC reports (Mean t SD (95Vo CI))
Self- and Family-Care 27.2 + 10.6(22.4 to 32.1)
Management Activity 46.9 + t3.7(40.6 ro 53.1)
Recreational Activity 25.2t7.2(2t.9 to 28.5)
777
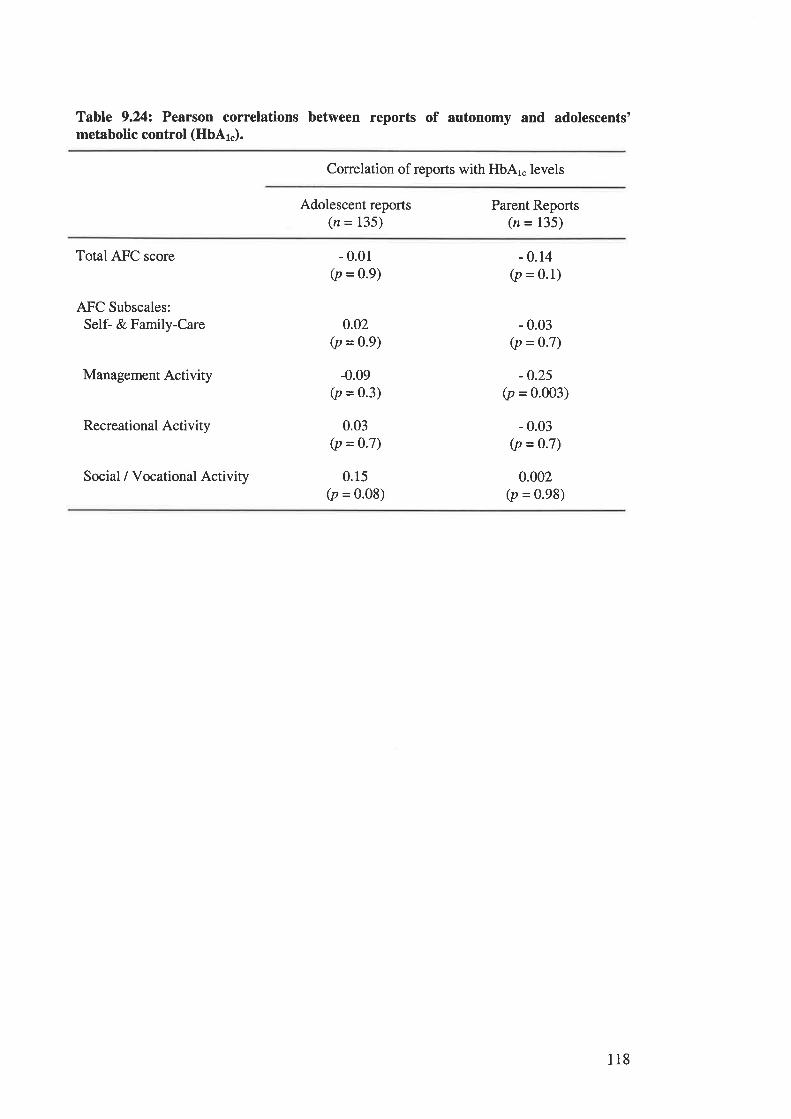
Table 9.242 Pearson correlations between reports of autonomy and adolescents'metabolic control (HbAl").
Correlation of reports with HbAr" levels
Adolescent reports(n = 135)
Parent Reports(n = 135)
Total AFC score
AFC Subscales:Self- & Family-Care
Management Activity
Recreational Activity
Social / Vocational Activity
- 0.01(p = 0.9)
0.02(p = 0.9)
-0.09(p = 0'3)
0.03(p = 0'7)
0.15(p = 0.08)
- 0.14(p = 0.1)
- 0.03(p = 0.7)
-0.25(p = 0.003)
- 0.03(p = 0.7)
0.002(p = 0.98)
118

TABLES CITED IN CHAPTER 1.1..
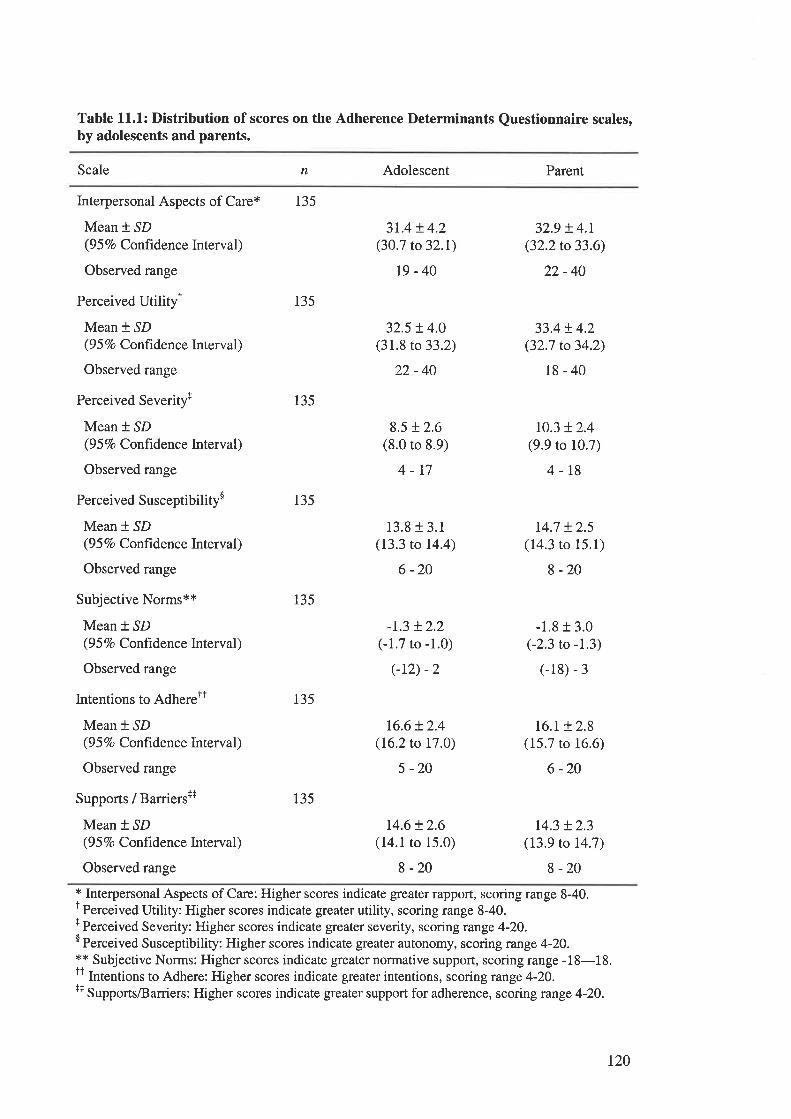
Table 11.1: Distribution of scores on the Adherence Determinants Questionnaire scales,by adolescents and parents.
Scale n Adolescent Parent
Interpersonal Aspects of Care*
Mean * SD(9 5 Vo Confidence Interval)
Observed range
Perceived Utilityr
Mean * SD(9 5 Vo Confidence Interval)
Observed range
Perceived Severityr
Mean * SD(9 5 Vo Confrdence Interval)
Observed range
Perceived Susceptibility$
Mean * SD(9 5 %o Confrdence Interval)
Observed range
Subjective Norms**
Mean t SD(9 5 Vo Confrdence Interval )
Observed range
Intentions to AdhereTt
Mean *.SD(9 5 7o Conftdence Interval)
Observed range
Supports / Barriersr+
Mean * SD(9 5 Vo Confidenc e Interval)
Observed range
135
135
135
135
r35
135
135
3L4 t 4.2(30.7 to 32.1)
19-40
32.5 ! 4.0(31.8 to 33.2)
22-40
8.5 !2.6(8.0 to 8.9)
4-17
13.8 t 3.1(13.3 to 14.4)
6 -20
-r.3 t2.2(-1.7 to -1.0)
(-r2) -2
16.6!2.4(16.2 to 17.0)
5 -20
14.6 !2.6(14.1 to 15.0)
8-20
32.9 t 4.r(32.2 to 33.6)
22-40
33.4t4.2(32.7 to 34.2)
18-40
to.3 !2.4(9.9 to 10.7)
4-r8
r4.7 t2.5(14.3 to 15.1)
8 -20
-1.8 r 3.0(-2.3 to -L3)
(-18) - 3
16.r + 2.8(15.7 to 16.6)
6 -20
14.3 t2.3(13.9 to 14.7)
8 -20* Interpersonal Aspects of Care: Higher scores indicate greater rapport, scoring range 8-40.' Perceived Utility: Higher scores indicate greater utility, scoring range 8-40.f Perceived Severity: Higher scores indicate greater severity, scoring range 4-20.I Perceived Susceptibility: Higher scores indicate greater autonomy, scoring range 4-20.** Subjective Norms: Higher scores indicate greater normative support, scoring range -18-18.I I Intentions to Adhere: Higher scores indicate greater intentions, scoring range 4-20.++ Supports/Barriers: Higher scores indicate greater support for adherence, scoring range 4-20.
t20
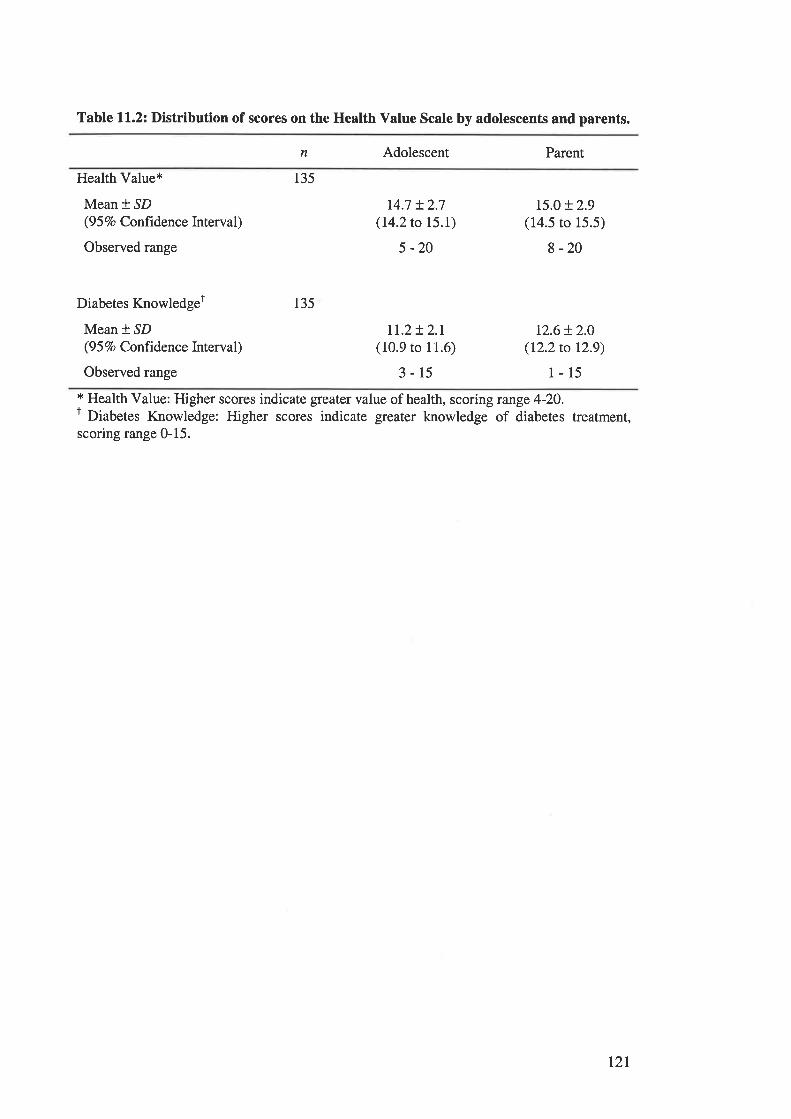
Table 11.2: Distribution of scores on the Health Value Scale by adolescents and parents.
n Adolescent Parent
Health Value*
Mean * ^SD(9 5 Vo Confrdenc e In terval)
Observed range
Diabetes Knowledger
Mean * SD(9 5 Vo Conftdenc e Interval )
Observed range
135
135
r4.7 + 2.7(14.2 to 15.1)
5 -20
rI.2+ 2.1(10.9 to 11.6)
3-15
r5.o + 2.9(14.5 to 15.5)
8 -20
12.6 + 2.O
(12.2 to 12.9)
1-15* Health Value: Higher scores indicate greater value of health, scoring runge 4-20.r Diabetes Knowledge: Higher scores indicate gfeater knowledge of diabetes treatment,scoring range 0-15.
r2t
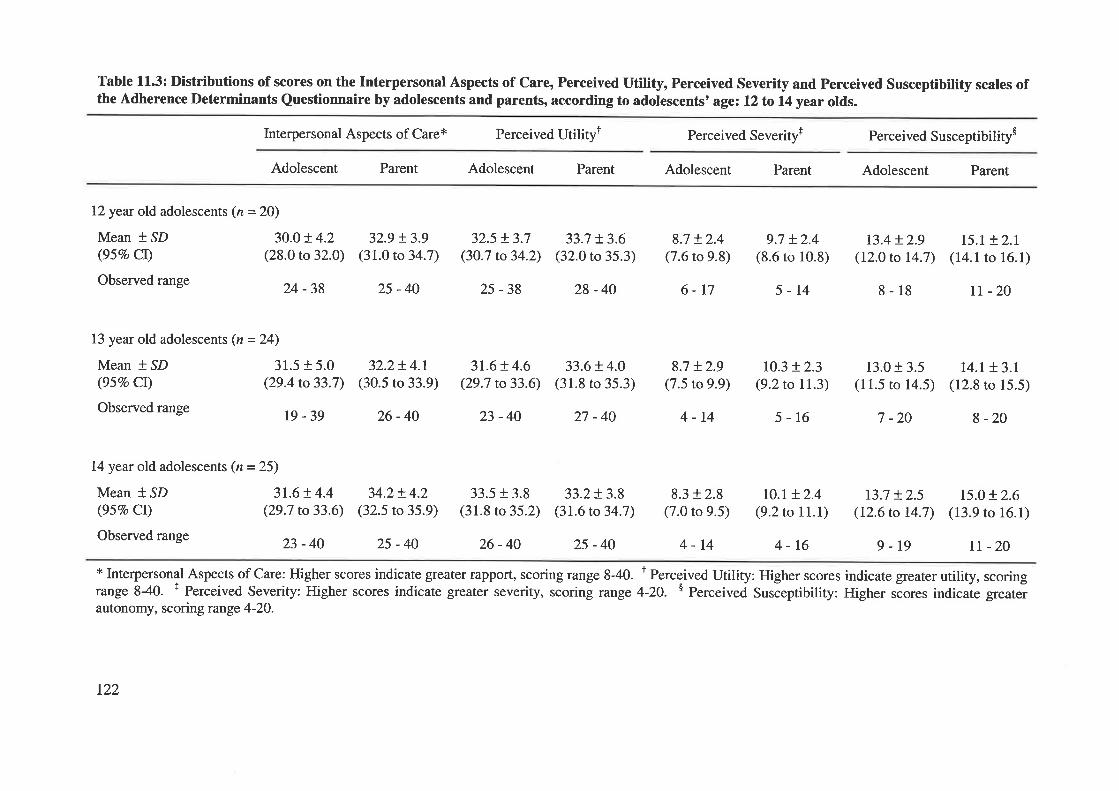
Table 113: Distributions of scores on the Interpersonal Aspects of Care, Perceived Utility, Perceived Severity and Perceived Susceptibility scales ofthe Adherence Determinants Questionnaire by adolescents and parents, according to adolescents' age: 12 to 14 year olds.
Interpersonal Aspects of Care* Perceived Utiliryr Perceived Severityt Perceived Susceptibility$
Adolescent Parent Adolescent Parent Adolescent Parent Adolescent Parent
12year old adolescents (n = 20)
Mean * SD 3O.O+ 4.2(95Vo Cl) (28.0 to 32.0)
Observed range 24 _3g
13 year old adolescents (n = 24)
Mean * SD 31.5 + 5.0(95Vo CI) (29.4 to 33.7)
Observed range Ig - 39
32.9 !3.9(31.0 to 34.7)
25 -40
32.2t4.1(30.5 to 33.9)
26-40
32.5 + 3.7(30.7 to 34.2)
25-38
31.6 + 4.6(29.7 to33.6)
33.5 + 3.8(31.8 to 35.2)
26-40
33.7 + 3.6(32.0 to 35.3)
28 -40
33.6+ 4.0(31.8 to 35.3)
33.2+ 3.8(31.6 to 34.7)
25-40
8.7 r.2.4(7.6 to 9.8)
6-r7
8.7 + 2.9(7.5 to 9.9)
4-14
8.3 + 2.8(7.0 to 9.5)
4-14
9.7 +2.4(8.6 to 10.8)
5-t4
10.3 + 2.3(9.2 to 11.3)
5-16
r0.r + 2.4(9.2 to 11.1)
4-t6
t3.4 !2.9(12.0 to 14.7)
8-18
13.0 + 3.5(11.5 to 14.5)
7 -20
r3.7 + 2.5(t2.6 to 14.7)
I5.I + 2.t(14.1 to 16.1)
tt -20
14.1 + 3.1(12.8 ro 15.5)
I -20
15.0 + 2.6(13.9 to 16.1)
tl -20
23 -40 27 -40
14year old adolescents (n = 25)
Mean * SD 3I.6t4.4(95Vo Cl) (29.7 to33.6)
Observed range 23 _ 40
34.2+ 4.2(32.5 to 35.9)
25 -40 9-19* Interpersonal Aspects of Care: Higher scores indicate greater rapport, scoring range 8-40. t Perceived Utility: Higher scores indicate greater utility, scoringrange 840. + Perceived Severity: Higher scores indicate greater severity, scoring range 4-20. $ Perceived Susõeptibility: Higher scores indicate greaterautonomy, scoring range 4-20.
122
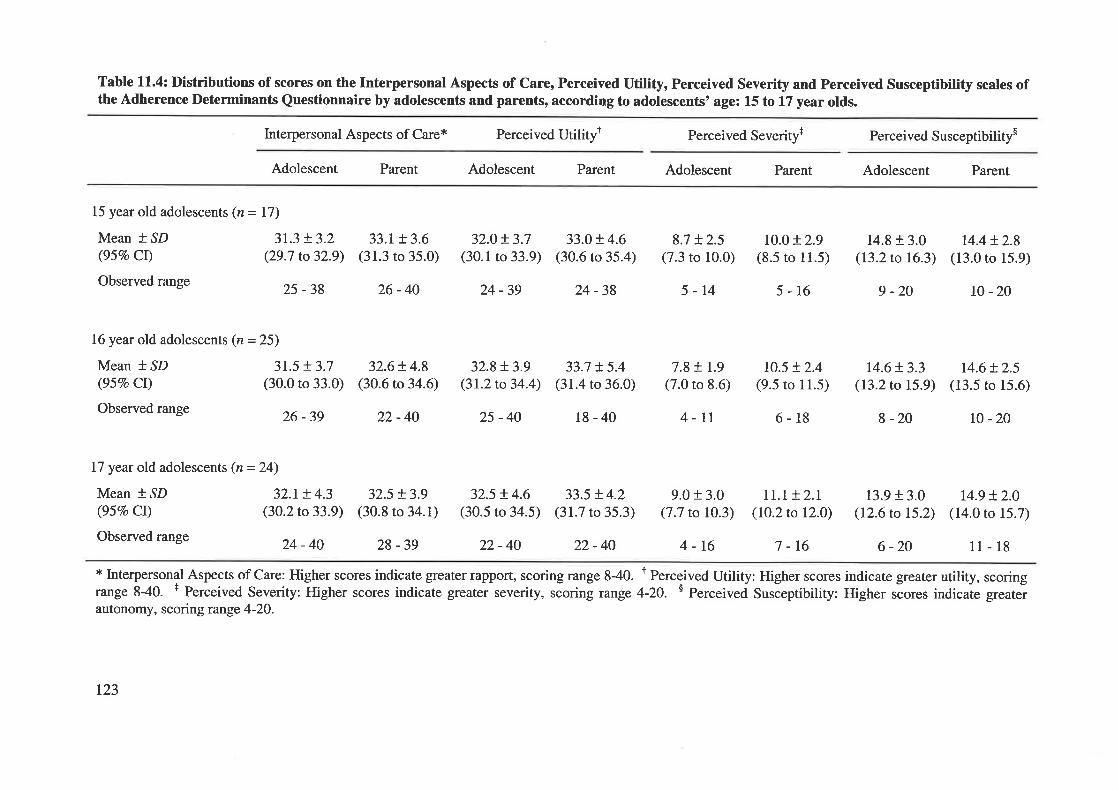
Table 11.4: Distributions of scores on the Interpersonal Aspects of Care, Perceived Utility, Perceived Severity and Perceived Susceptibility scales ofthe Adherence Determinants Questionnaire by adolescents and parents, according to adolescents' age: 15 to 17 year olds.
Interpersonal Aspects of Care* Perceived Utilityt Perceived Severityt Perceived Susceptibilitys
Adolescent Parent Adolescent Parent Adolescent Parent Adolescent Parent
15 year old adolescents (n = 17)
Mean * ^SD 3I.3 + 3.2(95Vo CI) (29.7 to32.9)
Observed range 25 _ 3g
33.1+ 3.6(31.3 to 35.0)
26-40
32.0+ 3.7(30.1 to 33.9)
24 -39
32.8+ 3.9(3t.2to34.4)
25 -40
32.5 t4.6(30.5 to 34.5)
22-40
33.Ot4.6(30.6 to 35.4)
24 -38
33.7 + 5.4(31.4 to 36.0)
18-40
33.5 + 4.2(31.7 to 35.3)
22-40
8.7 + 2.5(7.3 to 10.0)
5-14
7.8+ I.9(7.0 to 8.6)
4-11
9.0 + 3.0(7.7 to 10.3)
ro.0 + 2.9(8.5 to ll.5)
5-16
t0.5 + 2.4(9.5 to 11.5)
6-18
II.T + 2.1(I0.2to 12.0)
7 -t6
14.8 + 3.0(I3.2to 16.3)
9 -20
14.6 + 3.3(13.2 to 15.9)
I -20
14.4!2.8(13.0 to 15.9)
t0 -20
14.6 + 2.5(13.5 to 15.6)
r0 -20
16year old adolescents (n = 25)
Mean * SD 3I.5 + 3.7(95Vo Cl) (30.0 to 33.0)
Observed range 26 _3g
I7 year old adolescents (n =24)
Mean * SD 32.1+ 4.3(95Vo CI) (30.2to33.9)
Observed range 24 _ 40
32.6+ 4.8(30.6 to 34.6)
22-40
32.5 + 3.9(30.8 to 34.1)
28 -39
13.9 + 3.0(12.6 to 15.2)
6 -20
14.9 + 2.0(14.0 to 15.7)
11-184-16* Interpersonal Aspects of Care: Higher scores indicate greater rapport, scoring range 840. r Perceived Utility: Higher scores indicate greater utility, scoringrange 8-40. + Perceived Severity: Higher scores indicate greater severity, scoring range 4-20. s Perceived Susóeptibility: Higher .óo.", indicate greaterautonomy, scoring range 4-2O.
t23
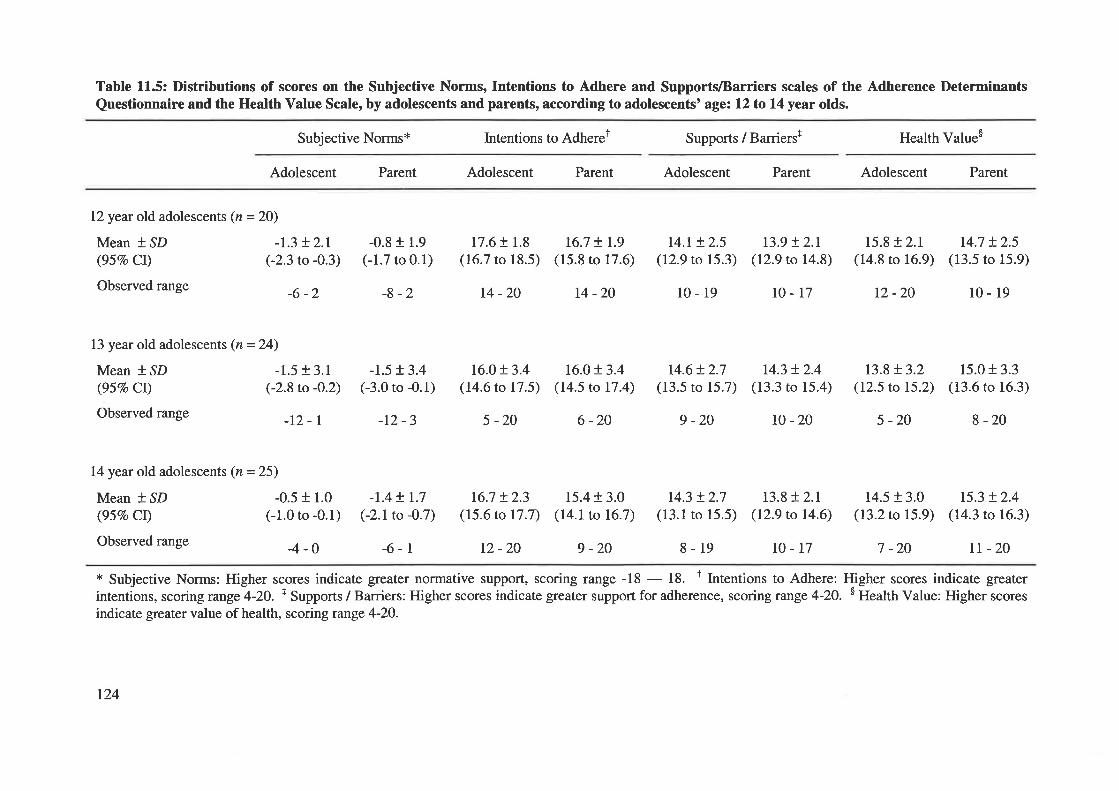
Table 11.5: Distributions of scores on the Subjective Norms, Intentions to Adhere and SupportlBarriers scales of the Adherence DeterminantsQuestionnaire and the Health Value Scale, by adolescents and parents, according to adolescents' age: 12 to 14 year olds.
Subjective Norms* Intentions to Adherer Supports / Barrierst Health Valueo
Adolescent Parent Adolescent Parent Adolescent Parent Adolescent Parent
12 year old adolescents (n = 20)
Mean * .SD -I.3 + 2.1(957o Cl) (-2.3 to -0.3)
Observed range _6 _ z
13 year old adolescents (n = 24)
Mean I ^SD -1.5 + 3.1
(95Vo CI) (-2.8 to -0.2)
Observed range _lZ _ I
14 year old adolescents (n = 25)
Mean * SD -0.5 + 1.0(95Vo Cl) (-1.0 to -0.1)
Observed range _4 _ 0
-0.8 r 1.9
(-1.7 to 0.1)
-8 -2
-1.5 + 3.4
G3.0 to -0.1)
-r2 -3
-1.4+ r.7(-2.1to -0.7)
-6-l
17.6 r 1.8(16.7 to 18.5)
t4 -20
16.0t3.4(14.6 to 17.5)
5 -20
16.7 t2.3(15.6 to 17.7)
12 -20
t6.7 t 1.9(15.8 to 17.6)
14-20
16.0!3.4(14.5 to 17.4)
6 -20
15.4 r 3.0(r4.1to 16.7)
9 -20
t4.l + 2.5(12.9 to 15.3)
l0-19
14.6+ 2.7(13.5 to 15.7)
9 -20
14.3 + 2.7(13.1 to 15.5)
8-19
r3.9 t2.t(12.9 to 14.8)
l0-r7
r4.3 + 2.4(13.3 to 15.4)
l0-20
13.8+ 2.1(12.9 to 14.6)
15.8 + 2.1(14.8 to 16.9)
12 -20
r3.8+ 3.2(12.5 to 15.2)
5 -20
14.5 + 3.0(13.2 to 15.9)
r4.7 + 2.5(13.5 to 15.9)
10-19
15.0 + 3.3(13.6 to 16.3)
8 -20
t5.3 + 2.4(14.3 to 16.3)
tr -20r0-17 7 -20
* Subjective Norms: Higher scores indicate greater normative support, scoring range -18 - 18. t Intentions to Adhere: Higher scores indicate greaterintentions, scoring range 4-20. + Supports / Barriers: Higher scores indicate greater support for adherence, scoring range 4-2O. s Health Value: Higher scores
indicate greater value of health, scoring runge 4-2O.
124
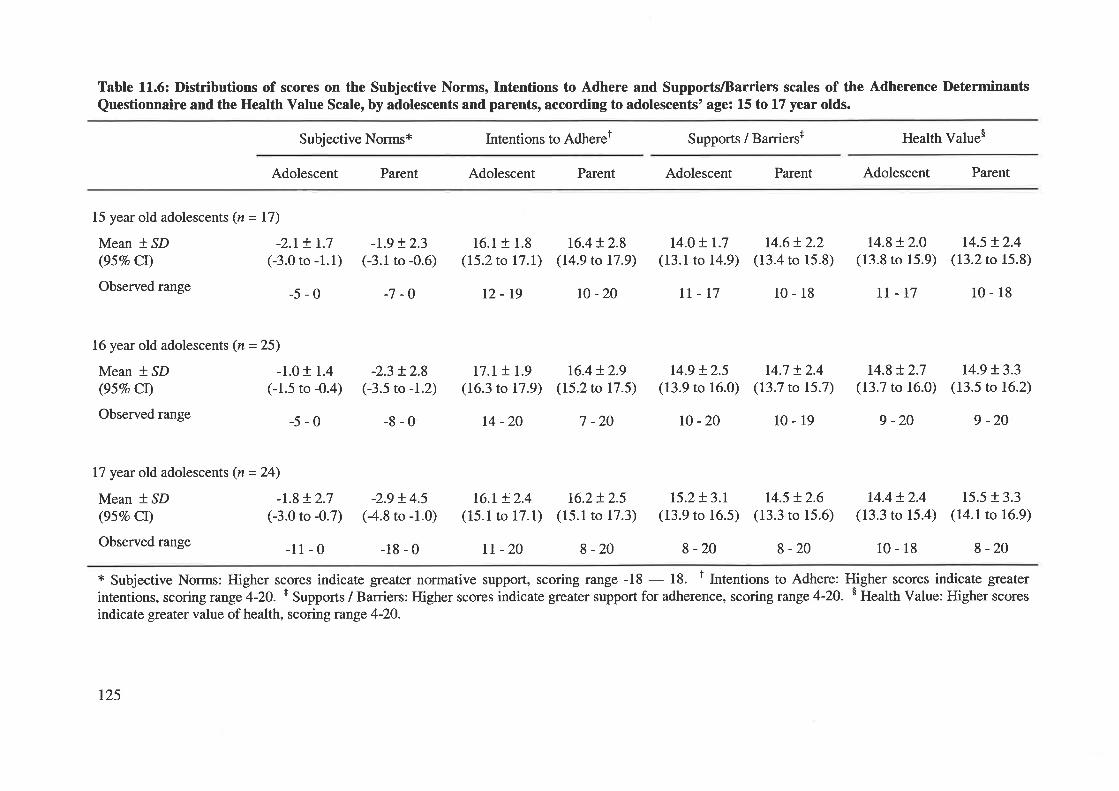
Table 11.6: Distributions of scores on the Subjective Norms, Intentions to Adhere and Supports/Barriers scales of the Adherence Determinants
Questionnaire and the Health Value Scale, by adolescents and parents, according to adolescents' age: 15 to 17 year olds.
Subjective Norms* Intentions to Adheret Supports / Barrierst Health Value$
Adolescent Parent Adolescent Parent Adolescent Parent Adolescent Parent
15 year old adolescents (z = 17)
Mean * SD -2.1+ 1.7
(95Vo CI) (-3.0 to -1.1
Observed range _5 _ 0
16 year old adolescents (n = 25)
Mean * SD -1.0 + 1.4
(957o CI) (-1.5 to -0.4)
Observed range _5 _ 0
17 year old adolescents (n =24)
Mean * ,SD -I.8 + 2.7(95Vo CI) (-3.0 to -0.7)
Observed range _l I _ 0
-t.9 + 2.3
) (-3.1 to -0.6)
-7 -O
-2.3 !2.8(-3.5 to -1.2)
-8-0
-2.9 !4.5(4.8 to -1.0)
-18-0
16.1+ 1.8(I5.2to 17.I)
12-19
r7.r + 1.9(16.3 to 17.9)
t4 -20
t6.r + 2.4(15.1 to 17.1)
rt -20
16.4+ 2.8(14.9 to 17.9)
l0 -20
t4.o + 1.7
(13.1 to 14.9)
II-17
t4.6t2.2(13.4 to 15.8)
10-18
t4.7 + 2.4(13.7 to 15.7)
10-19
14.8 + 2.0(13.8 to 15.9)
rt-17
14.8 + 2.7(13.7 to 16.0)
9 -20
14.4 + 2.4(13.3 to 15.4)
10-18
r4.5 + 2.4(13.2 to 15.8)
10-18
14.9 !3.3(13.5 to 16.2)
9 -20
15.5 + 3.3(14.1to 16.9)
8 -20
16.4 + 2.9(15.2 to 17.5)
7 -20
16.2+ 2.5(l5.1to 17.3)
8 -20
14.9 + 2.5(13.9 to 16.0)
r0 -20
15.2+ 3.r(13.9 to 16.5)
8 -20
r4.5 + 2.6(13.3 to 15.6)
8 -20
* Subjective Norms: Higher scores indicate greater normative support, scoring range -18 - 18. f Intentions to Adhere: Higher scores indicate greater
intentions, scoring range 4-2O. I Supports / Barriers: Higher scores indicate greater support for adherence, scoring range 4-20. $ Health Value: Higher scores
indicate greater value of health, scoring range 4-2O.
t25
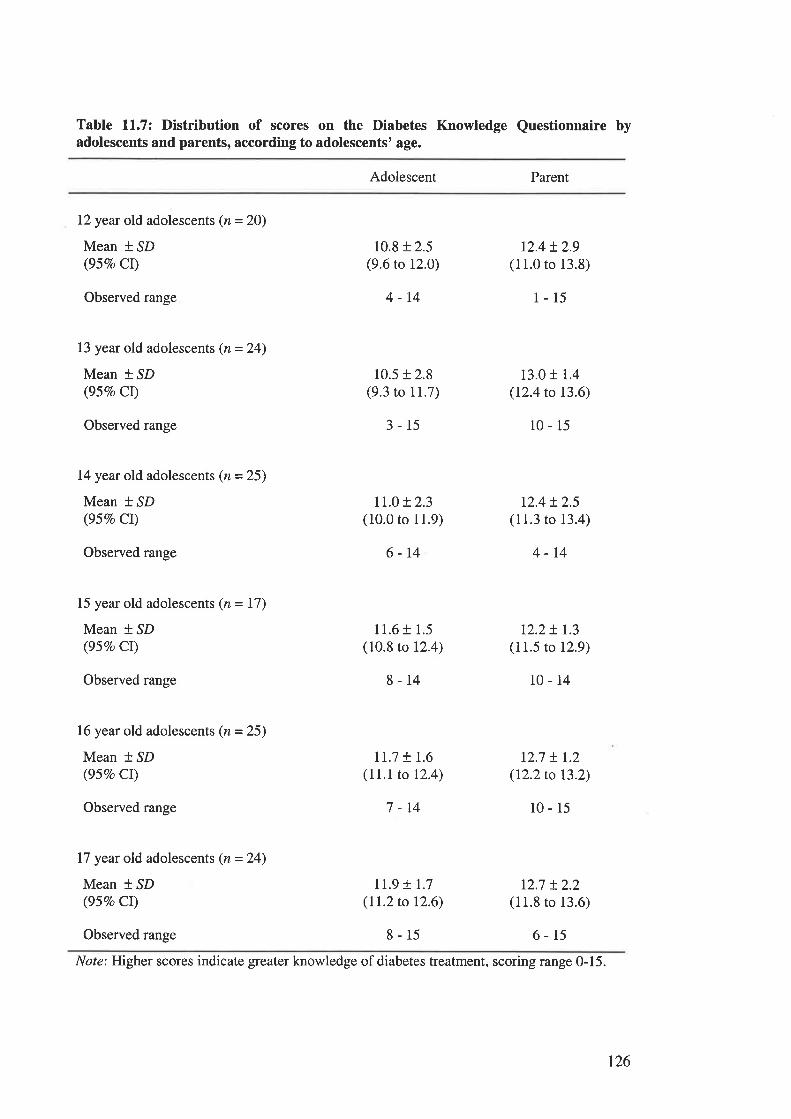
Table 11.7: Distribution of scores on the Diabetes Knowledge Questionnaire byadolescents and parents, according to adolescents' age.
Adolescent Parent
12year old adolescents (n = 20)
Mean * SD(95Eo Cr)
Observed range
13 year old adolescents (n = 24)
Mean * SD(95Vo CI)
Observed range
14year old adolescents (n = 25)
Mean * SD(95Vo CI)
Observed range
15 year old adolescents (z = 17)
Mean * SD(95Vo CI)
Observed range
16 year old adolescents (n = 25)
Mean * SD(95Vo CI)
Observed range
17 year old adolescents (n=24)
Mean i.SD(95Vo Cr)
Observed range
10.8 + 2.5(9.6 to 12.0)
4-14
10.5 + 2.8(9.3 to 11.7)
3-15
11.0 r 2.3(10.0 to 11.9)
6-14
11.6 + 1.5(10.8 to 12.4)
8-14
Ir.7 t t.6(11.1to 12.4)
7 -14
Il.9 t 1.7(II.2to 12.6)
8-15
r2.4+ 2.9(11.0 to 13.8)
1-15
13.0 r 1.4
(12.4 to 13.6)
10-15
r2.4 + 2.5(11.3 to 13.4)
4-t4
12.2+ 1.3(11.5 to 12.9)
10-14
12.7 ! r.2(I2.2to 13.2)
10-15
12.7 !2.2(11.8 to 13.6)
6-15
Note: Higher scores indicate greater knowledge of diabetes treatment, scoring range 0-15.
t26
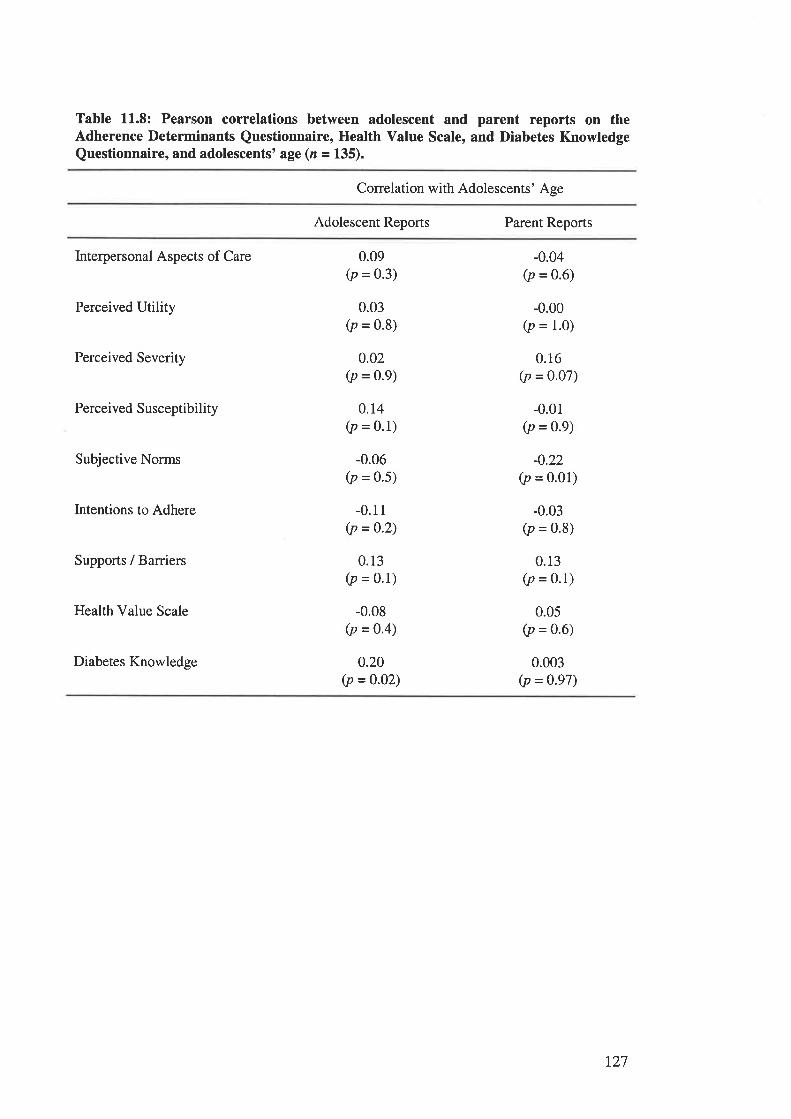
Table 11.8: Pearson correlations between adolescent and parent reports on theAdherence Determinants Questionnaire, Health Value Scale, and Diabetes KnowledgeQuestionnaire, and adolescents' age (n = 135).
Correlation with Adolescents' Age
Adolescent Reports Parent Reports
Interpersonal Aspects of Care
Perceived Utility
Perceived Severity
Perceived Susceptibility
Subjective Norms
Intentions to Adhere
Supports / Barriers
Health Value Scale
Diabetes Knowledge
0.09(p = 0.3)
0.03(p = 0.8)
0.02(p = 0.9)
0.r4(p = 0.1)
-0.06(p = 0.5)
-0.11(p = 0.2)
0.13(p = 0.1)
-0.08(p = o'4)
0.20(p =0.02)
-0.04(p = 0.6)
-0.00(p = 1.0)
0.16(p = 0.07)
-0.01(p = 0.9)
-0.22(p = 0.01)
-0.03(p = 0.8)
0.13(p = 0.1)
0.05(p = 0.6)
0.003(p = 0.97)
r27
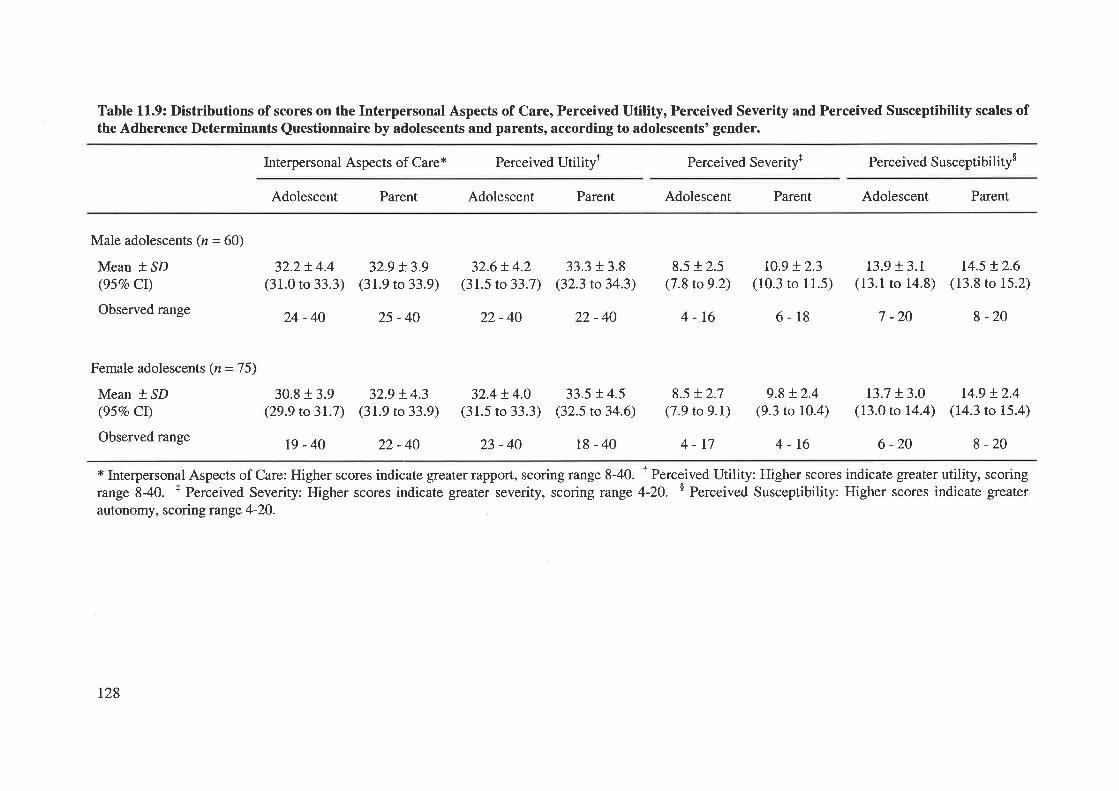
Table 11.9: Distributions of scores on the Interpersonal Aspects of Care, Perceived Utility, Perceived Severity and Perceived Susceptibility scales ofthe Adherence Determinants Questionnaire by adolescents and parents, according to adolescents' gender.
Interpersonal Aspects of Care* Perceived Utilityt Perceived Severity+ Perceived Susceptibility$
Adolescent Parent Adolescent Parent Adolescent Parent Adolescent Parent
Male adolescents (n = 60)
Mean + SD(95Vo CI)
Observed range
32.2!4.4(31.0 to 33.3)
24-40
32.9 + 3.9(31.9 to 33.9)
25-40
32.6+ 4.2(31.5 to 33.7)
22-40
33.3 + 3.8(32.3 to 34.3)
22-40
33.5 !4.5(32.5 to 34.6)
18-40
ro.9 + 2.3(10.3 ro 11.5)
6-18
9.8 + 2.4(9.3 to 10.4)
4-16
r3.9 + 3.1(13.1 to 14.8)
7 -20
r3.7 t3.0(13.0 ro 14.4)
6 -20
r4.5 !2.6(13.8 ro 15.2)
8 -20
t4.9 !2.4(14.3 ro 15.4)
8 -20
30.8 + 3.9(29.9 to 31.7)
19-40
32.9 + 4.3(31.9 ro 33.9)
22-40
32.4 ! 4.0(31.5 to 33.3)
23-40
8.5 !2.5(7.8 to 9.2)
4-16
8.5 + 2.7(7.9 to 9.1)
4-17
* Interpersonal Aspects of Care: Higher scores indicate greater rapport, scoring range 8-40. r Perceived Utility: Higher scores indicate greater utility, scoringrange 840. + Perceived Severity: Higher scores indicate greater severity, scoring range 4-20. $ Perceived Susceptibility: Higher scores indicate greater
autonomy, scoring range 4-20.
Female adolescents (n = 7 5)
Mean * SD(957o CI)
Observed range
t28
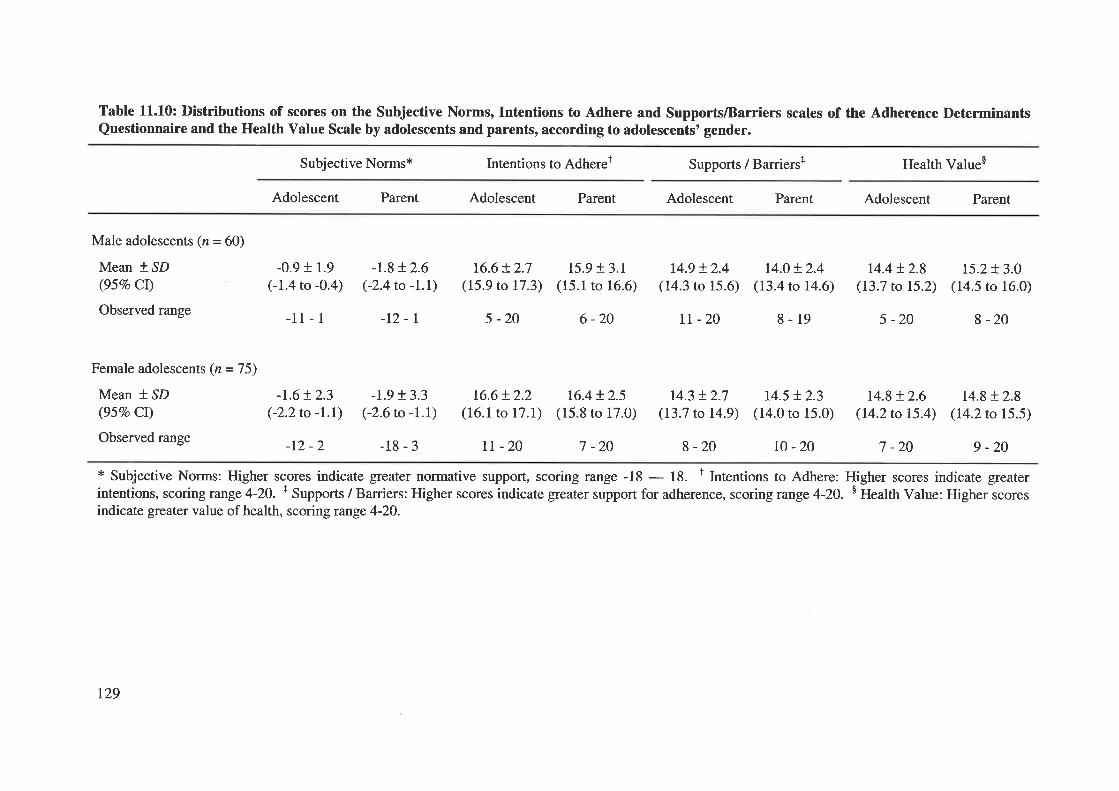
Table 11.10: Distributions of scores on the Subjective Norms, Intentions to Adhere and Supports/Barriers scales of the Adherence DeterminantsQuestionnaire and the Health Value Scale by adolescents and parents, according to adolescents' gender.
Subjective Norms* Intentions to Adherer Supports / Barriers+ Health Value$
Adolescent Parent Adolescent Parent Adolescent Parent Adolescent Parent
Male adolescents (n = 60)
Mean * SD(95Vo CI)
Observed range
Female adolescents (n = 7 5)
Mean t.SD(95Vo CI)
Observed range
-0.9 + 1.9
(-1.4 to -0.4)
-11- 1
-r.6+ 2.3(-2.2to -t.D
-12 -2
-1.8 t2.6(-2.4to -I.l
-t2-r
-1.9 t3.3(-2.6to -1.\
-18-3
t6.6+ 2.7(15.9 to 17.3)
5 -20
15.9 + 3.1(15.1 to 16.6)
6 -20
14.9 + 2.4(14.3 to 15.6)
II -20
r4.0 + 2.4(13.4 to 14.6)
8-19
14.4 t 2.8(13.7 to 15.2)
5 -20
r4.8 + 2.6(14.2 to 15.4)
7 -20
15.2+ 3.0(14.5 to 16.0)
8 -20
r4.8t2.8(14.2 to 15.5)
9 -20
t6.6+ 2.2(16.1 to 17.1)
tt -20
t6.4 t2.5(15.8 to 17.0)
7 -20
t4.3 t2.7(13.7 to 14.9)
8-20
14.5 t2.3(14.0 to 15.0)
t0 -20
* Subjective Norms: Higher scores indicate greater normative support, scoring range -18 - 18. t lntentions to Adhere: Higher scores indicate greaterintentions, scoring range 4-20. + Supports / Barriers: Higher scores indicate greater support for adherence, scoring range 4-20. $ Health Value: Higher scoresindicate greater value of health, scoring range 4-20.
t29
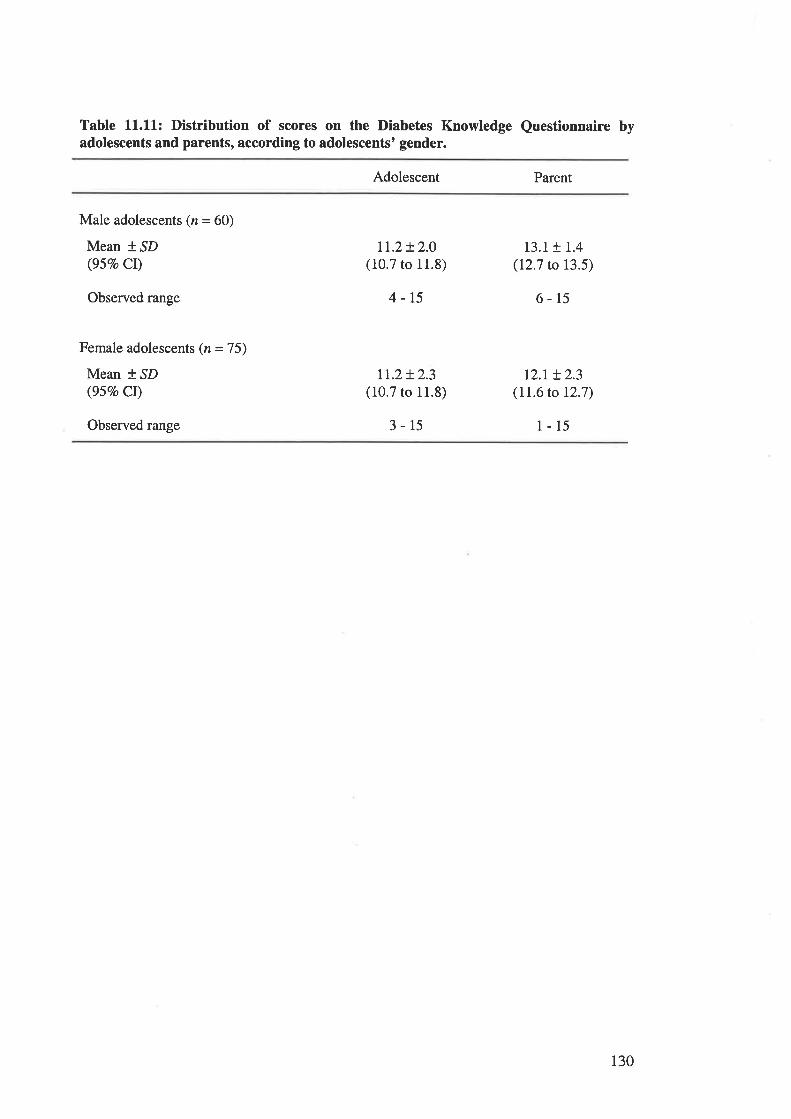
Table 11.11: Distribution of scores on the Diabetes Knowledge Questionnaire byadolescents and parents, according to adolescents' gender.
Adolescent Parent
Male adolescents (n = 60)
Mean *,SD(95Vo CI)
Observed range
Female adolescents (n = 75)
Mean *.SD(95Vo Cr)
Observed range
t1.2t2.0(10.7 to 11.8)
4-15
Lt.2+ 2.3(10.7 to 11.8)
3-15
13.1+ 1.4(12.7 to 13.5)
6-15
tz.r + 2.3(11.6 to 12.7)
1-15
130
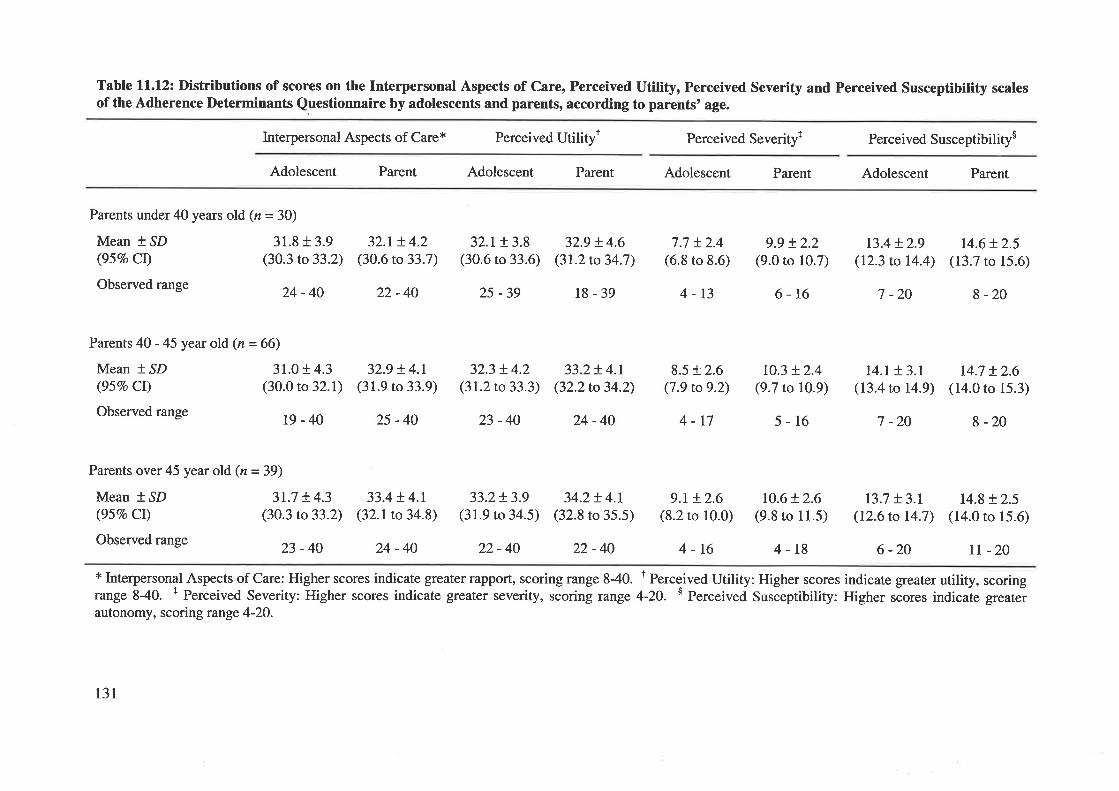
Table ll.l2: Distributions of scores on the Interpersonal Aspects of Care, Perceived Utility, Perceived Severity and Perceived Susceptibility scalesof the Adherence Determinants Questionnaire by adolescents and parents, according to parents' age.
Interpersonal Aspects of Care* Perceived Utilityt Perceived Severity+ Perceived Susceptibilitys
Adolescent Parent Adolescent Parent Adolescent Parent Adolescent Parent
Parents under40 years old (n=30)
Mean * SD 31.8 + 3.9(957o Cl) (30.3 to 33.2)
Observed range 24 _ 40
Parents 40 - 45 year old (n = 66)
Mean * SD 31.0 + 4.3(95Vo Cl) (30.0 to 32.1)
Observedrange ß_4O
32.1+ 4.2(30.6 to 33.7)
22-40
32.9 + 4.I(31.9 to 33.9)
25-40
32.t !3.8(30.6 ro 33.6)
2s -39
32.3 + 4.2(31.2to33.3)
23-40
32.9 + 4.6(31.2 to 34.7)
l8-39
33.2!4.1(32.2 to 34.2)
24-40
34.2+ 4.1(32.8 to 35.5)
22-40
7.7 t2.4(6.8 to 8.6)
4-13
8.5 + 2.6(7.9 ro 9.2)
4-r7
9.t + 2.6(8.2 to 10.0)
4-16
9.9 !2.2(9.0 to 10.7)
6-16
r0.3 + 2.4(9.7 to 10.9)
5-16
10.6+ 2.6(9.8 to 11.5)
4-18
r3.4 + 2.9(12.3 to 14.4)
7 -20
t4.I t3.t(13.4 to 14.9)
7 -20
13.7 + 3.1(12.6 to 14.7\
6 -20
14.6 + 2.5(13.7 ro 15.6)
8 -20
14.7 + 2.6(14.0 to 15.3)
I -20
14.8 + 2.5(14.0 ro 15.ó)
tI -20
Parents over 45 year old (n=39)
Mean * SD 3I.7 + 4.3(95Vo CI) (30.3 to33.2)
Observedrange 23 _4O
33.4 + 4.1(32.1to 34.8)
24 -40
33.2!3.9(31.9 to 34.5)
22-40
* Inte¡personal Aspects of Care: Higher scores indicate greater rapport, scoring range 840. t Perceived Utility: Higher scores indicate greater utility, scoringrange 840. + Perceived Severity: Higher scores indicate greater severity, scoring range 4-20. $ Perceived Susóeptibility: Higher ,óor", indicaie greaterautonomy, scoring range 4-20.
131

Table 11.13: Distributions of scores on the Subjective Norms, Intentions to Adhere and SupportlBarriers scales of the Adherence DeterminantsQuestionnaire and the Health Value Scale, by adolescents and parents, according to parents'age.
Subjective Norms* Intentions to Adheret Supports / Barriersf Health Values
Adolescent Parent Adolescent Parent Adolescent Parent Adolescent Parent
Parents under 40 years old (n = 30)
Mean *,SD -1.2+ 2.6(957o CI) (-2.2to -O.3)
Observed range _IZ _ z
-1.0 + 1.6(-1.6 to -0.4)
-7 -l
17.3 + 2.1(16.5 ro 18.1)
14-20
15.5 + 3.0(t4.4 to 16.7)
7 -20
16.0t2.7(15.4 to 16.7)
6 -20
16.8 + 2.8(15.9 to 17.7)
8 -20
14.5 + 2.4(13.6 ro 15.4)
14.4 + 2.7(13.7 to 15.l)
8 -20
r4.9 !2.6(14.0 to 15.7)
11-19 tr-17
13.9 !2.0(13.1 to 14.6)
14.2+ 2.3(13.7 to 14.8)
I -20
r4.7 + 2.5(13.8 to 15.5)
14.8 + 2.5(13.8 to 15.7)
9 -20
r4.2t2.9(13.1 to 15.3)
9 -20
Parents 40 - 45 year old (n = 66)
Mean +.lD -1.4 + 1.8(95Vo Cl) (-1.8 to -0.9)
Observed range _6 _ 1
Parents over45 yearold (n=39)
Mean * SD -I.4 t2.5(95Vo Ct) (-2.2to -0.5)
Observed range _ll _ I
-2.1+ 3.6(-3.0 to -1.2)
-18-3
-2.0+ -2.6(-2.8 to -1.1)
-8-0
16.2+ 2.3(15.6 to 16.7)
tt -20
16.8 + 2.8(15.8 to 17.7)
5 -20
r4.7 !2.7(14.0 to 15.4)
7 -20
14.5 + 2.8(13.6 to 15.4)
r5.t + 2.7(14.4 to 15.7)
I -20
15.6 + 3.1(14.5 ro 16.6)
9 -20I -20 r0 -20 5 -20
* Subjective Norms: Higher scores indicate greater normative support, scoring range -18 - 18. t Intentions to Adhere: Higher scores indicate greaterintentions, scoring range 4-20. t Supports / Barriers: Higher scores indicate greater support for adherence, scoring range 4-20. s Health Value: Higher scoresindicate greater value of health, scoring range 4-20.
t32
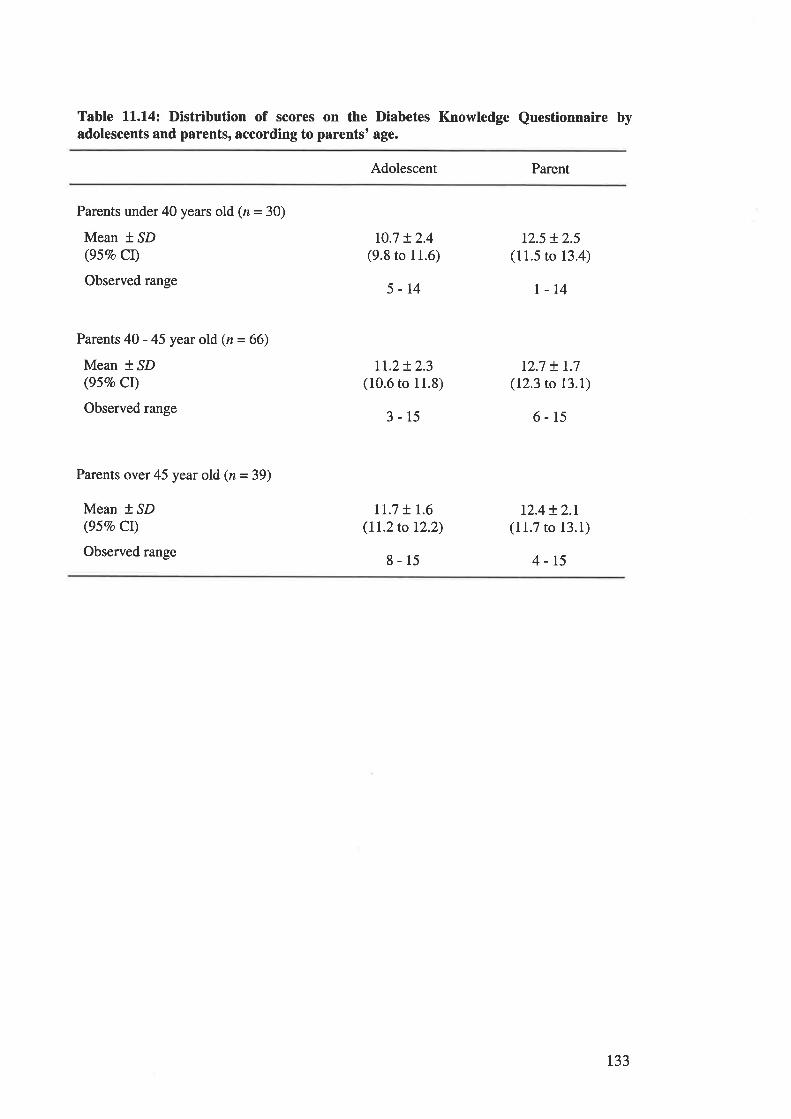
Table ll.l4z Distribution of scores on the Diabetes Knowledge Questionnaire byadolescents and parents, according to parents' age.
Adolescent Parent
Parents under 40 years old (z = 30)
Mean t SD(95Vo Cr)
Observed range
Parents 40 -45 year old (n=66)
Mean t,SD(95Vo CI)
Observed range
Parents over45 year old (n=39)
Mean t SD(95Eo Cr)
Observed range
r0.7 + 2.4(9.8 to 11.6)
5-14
rt.z+ 2.3(10.6 to 11.8)
3-15
tI.7 t I.6(ll.2to 12.2)
8-15
12.5 + 2.5(11.5 to 13.4)
l-14
12.7 + t.7(12.3 to 13.1)
6-15
12.4t2.1(11.7 to 13.1)
4-15
133
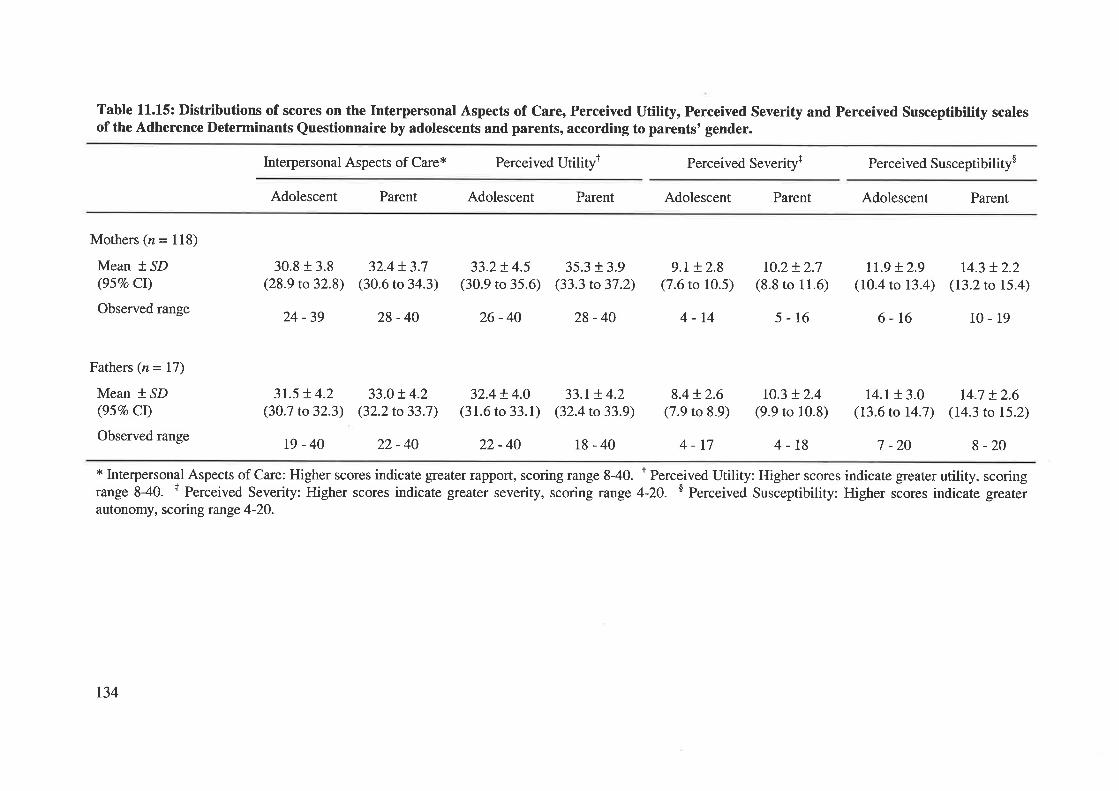
Table 11.15: Distributions of scores on the Interpersonal Aspects of Care, Perceived Utility, Perceived Severity and Perceived Susceptibility scalesof the Adherence Determinants Questionnaire by adolescents and parents, according to parents' gender.
Interpersonal Aspects of Care* Perceived Utilityl Perceived Severity+ Perceived Susceptibilitys
Adolescent Parent Adolescent Parent Adolescent Parent Adolescent Parent
Mothers (n = 118)
Mean * SD(95Vo CI)
Observed range
Fathers (n = 17)
Mean * SD(957o Ct)
Observed range
30.8 r 3.8(28.9 to32.8)
24 -39
3r.5 + 4.2(30.7 to32.3)
t9-40
32.4 + 3.7(30.6 to 34.3)
28 -40
33.0!4.2(32.2 to 33.7)
22-40
33.2!4.5(30.9 to 35.6)
26-40
35.3 + 3.9(33.3 to 37.2)
28 -40
9.1+ 2.8(7.6 to 10.5)
4-14
8.4 t2.6(7.9 to 8.9)
r0.2 + 2.7(8.8 to 11.6)
5-16
r0.3 + 2.4(9.9 ro 10.8)
tr.g + 2.9(10.4 to 13.4)
6-16
14.1 + 3.0(t3.6 to 14.7)
7 -20
r4.3 + 2.2(13.2 to 15.4)
10- 19
I4.7 + 2.6(14.3 to 15.2)
I -20
32.4+ 4.0(31.ó to 33.1)
33.1+ 4.2(32.4 to 33.9)
4-17 4-18
* Interpersonal Aspects of Care: Higher scores indicate greater rapport, scoring range 840. I Perceived Utility: Higher scores indicate gïeater utility, scoringrange 840. + Perceived Severity: Higher scores indicate greater severity, scoring range 4-20. s Perceived Susceptibility: Higher ."or"s indicaie greaterautonomy, scoring range 4-20.
22-40 18-40
134
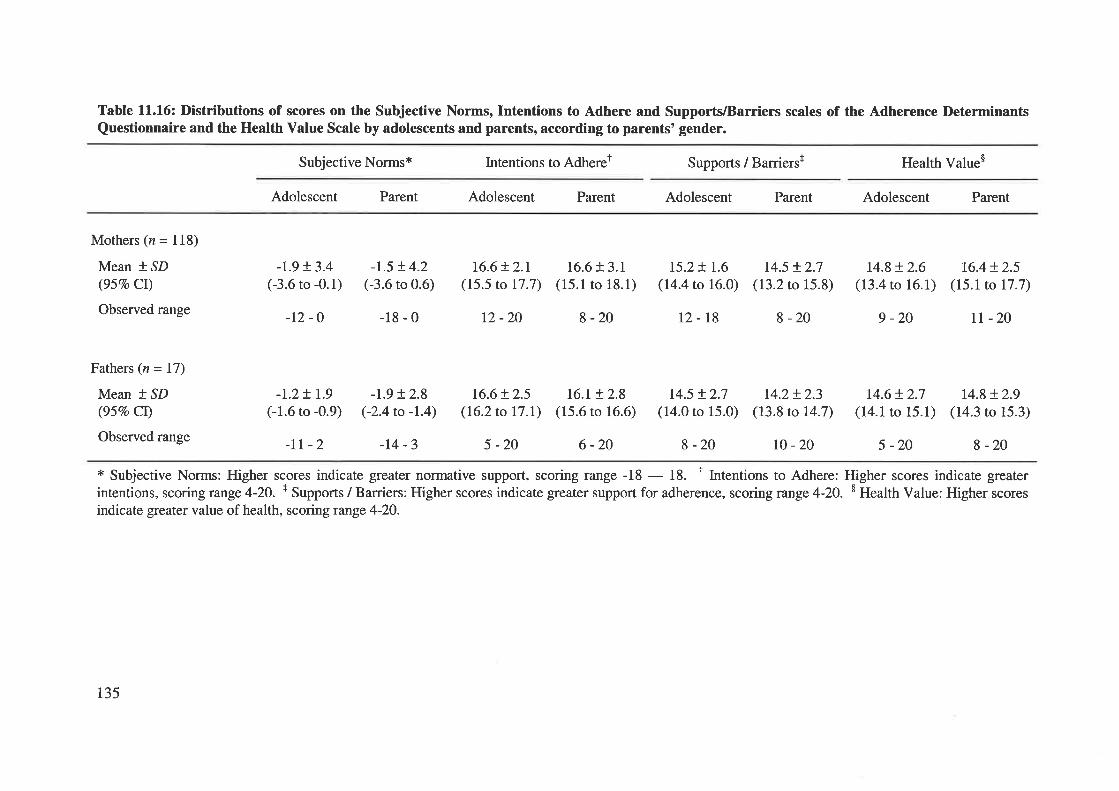
Table 11.16: Distributions of scores on the Subjective Norms, Intentions to Adhere and Supports/Barriers scales of the Adherence DeterminantsQuestionnaire and the Health Value Scale by adolescents and parents, according to parents' gender.
Subjective Normsx Intentions to Adheret Supports / Barriersr Health Value$
Adolescent Parent Adolescent Parent Adolescent Parent Adolescent Parent
Mothers (n = 118)
Mean *,SD(957o CI)
Observed range
Fathers (n = 17)
Mean +.SD
(95Vo Cl)
Observed range
-t.9 + 3.4(-3.6 to -0.1)
-r2 -o
-t.5 !4.2(-3.6 to 0.6)
-18-0
16.6 + 2.r(15.5 to 17.7)
12 -20
16.6 + 3.1(15.1 to 18.1)
8 -20
I5.2+ 1.6
(14.4 to 16.0)
t2-18
r4.5 + 2.7(13.2 to 15.8)
8 -20
14.8+ 2.6(13.4 to 16.1)
9 -20
16.4+ 2.5(15.1to 17.7)
TI -20
14.8 + 2.9(14.3 to 15.3)
8 -20
-r.2t r.9(-1.6 to -0.9)
-II -2
-1.9 + 2.8(-2.4 to -1.4)
-r4-3
16.6 + 2.5(16.2 to 17.I)
5 -20
l6.t + 2.8(15.6 to 16.6)
6 -20
14.5 t2.7(14.0 to 15.0)
8 -20
14.2+ 2.3(13.8 to 14.7)
14.6t2.7(14.1 to 15.1)
r0 -20 5 -20
* Subjective Norms: Higher scores indicate greater normative support, scoring range -18 - 18. r Intentions to Adhere: Higher scores indicate gïeaterintentions, scoring range 4-2O. + Supports / Barriers: Higher scores indicate greater support for adherence, scoring range 4-2O. $ Health Value: Higher scoresindicate greater value of health, scoring runge 4-20.
135
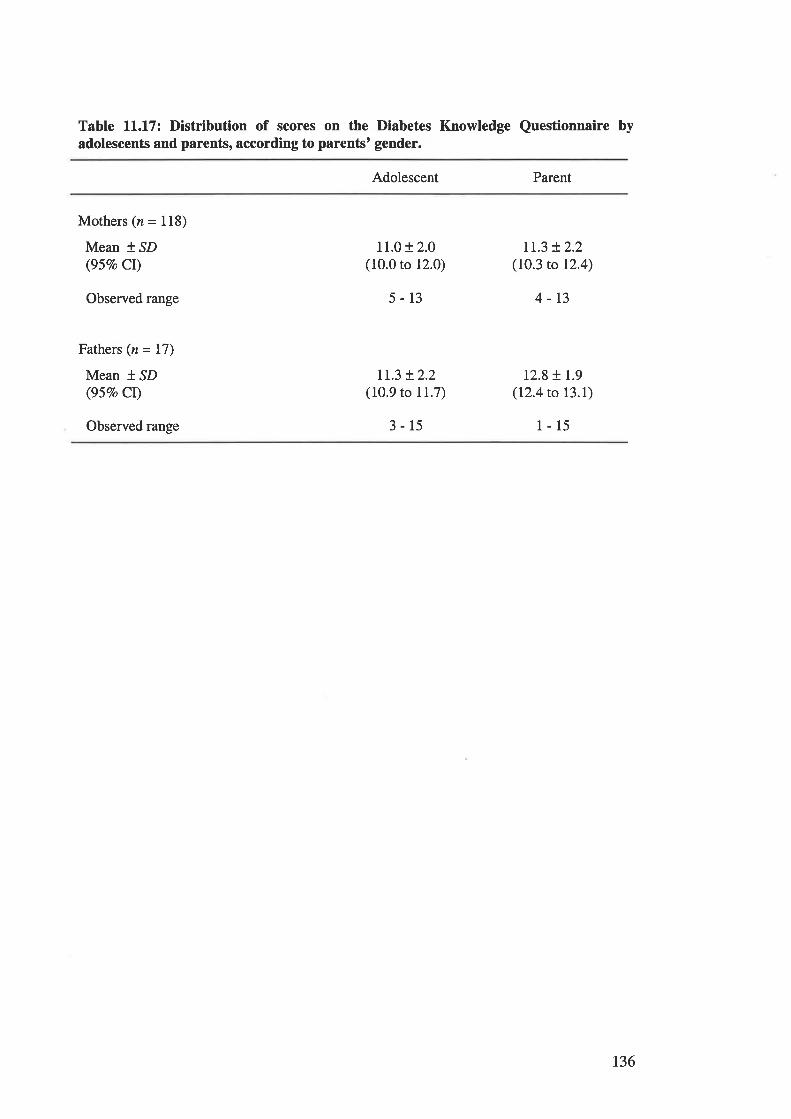
Table ll.l7z Distribution of scores on the Diabetes Knowledge Questionnaire byadolescents and parents, according to parentst gender.
Adolescent Parent
Mothers (n = 118)
Mean * SD(95Vo Cl)
Observed range
Fathers (n = 17)
Mean t SD(95Vo Ct)
Observed range
11.0 + 2.0(10.0 to 12.0)
5-13
Ir.3 + 2.2(10.9 to 11.7)
3-15
tr.3 + 2.2(10.3 to 12.4)
4-13
12.8 + 1.9(12.4 to I3.I)
l-15
136
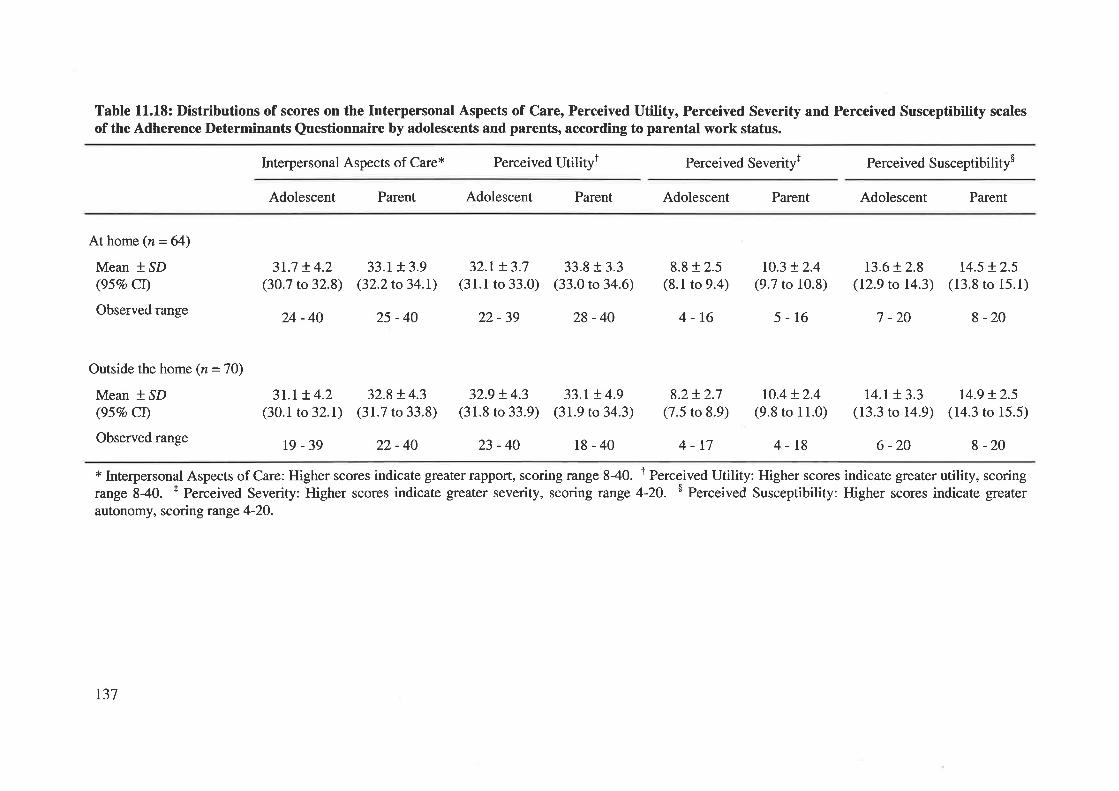
Table 11.18: Distributions of scores on the Interpersonal Aspects of Care, Perceived Utility, Perceived Severity and Perceived Susceptibility scalesof the Adherence Determinants Questionnaire by adolescents and parents, according to parental work status.
Interpersonal Aspects of Care* Perceived Utilityt Perceived Severityt Perceived Susceptibility$
Adolescent Parent Adolescent Parent Adolescent Parent Adolescent Parent
At home (n = 64)
Mean * SD(95Vo CI)
Observed range
Outside the home (n = 7O)
Mean +,SD(957o CI)
Observed range
3r.7 t4.2(30.7 to 32.8)
24-40
33.r + 3.9(32.2to 34.t)
25-40
32.1+ 3.7(31.1 to 33.0)
32.9 !4.3(31.8 to 33.9)
23-40
22-39 28 -40
33.8 f 3.3(33.0 to 34.6)
33.r !4.9(31.9 to 34.3)
18-40
13.6+ 2.8(12.9 to 14.3)
7 -20
t4.5 + 2.5(13.8 ro 15.1)
8-20
3t.l !4.2(30.1 to 32.1)
19 -39
32.8 + 4.3(31.7 to 33.8)
22-40
8.8 t 2.5(8.1 to 9.4)
4-16
8.2!2.7(7.5 to 8.9)
4-17
r0.3 + 2.4(9.7 to 10.8)
5-16
ro.4 + 2.4(9.8 to 11.0)
4-t8
r4.r + 3.3(13.3 ro 14.9)
6 -20
r4.9 + 2.5(14.3 to 15.5)
8 -20
* Interpersonal Aspects of Care: Higher scores indicate greater rapport, scoring range 840. I Perceived Utility: Higher scores indicate greater utility, scoringrange 840. + Perceived Severity: Higher scores indicate greater severity, scoring range 4-20. $ Perceived Susceptibility: Higher scores indicate greaterautonomy, scoring range 4-20.
137
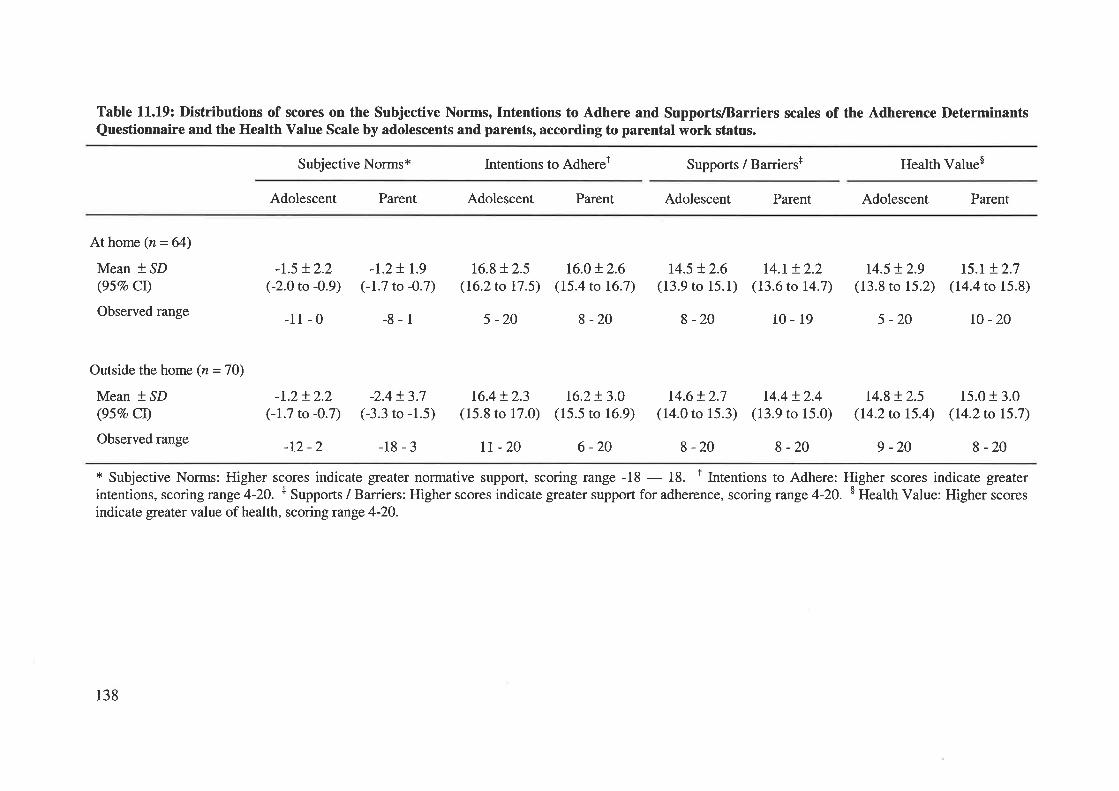
Table 11.19: Distributions of scores on the Subjective Norms, Intentions to Adhere and SupportslBarriers scales of the Adherence DeterminantsQuestionnaire and the Health Value Scale by adolescents and parents, according to parental work status.
Subjective Norms* lntentions to Adheret Supports / Barriers+ Health Value$
Adolescent Parent Adolescent Parent Adolescent Parent Adolescent Parent
Athome (n=64)
Mean * SD(95Vo CI)
Observed range
Outside the home (n =70)
Mean *,SD(95%o CI)
Observed range
-r.5 + 2.2(-2.0 to -0.9)
-11-0
-1.2!2.2(-1.7 to -0.7)
-12 -2
-1.2! r.9(-1.7 to -0.7)
-8-1
-2.4+ 3.7(-3.3 to -1.5)
16.8 t2.5(16.2 to 17 .5)
5 -20
16.4 + 2.3(15.8 to 17.0)
rt -20
16.0+ 2.6(15.4 to 16.7)
8 -20
16.2+ 3.0(15.5 to 16.9)
6 -20
14.5 + 2.6(13.9 ro 15.1)
8 -20
14.6 + 2.7(14.0 to 15.3)
8 -20
t4.t + 2.2(13.6 to 14.7)
t0- 19
r4.4 t2.4(13.9 to 15.0)
8 -20
r4.5 + 2.9(13.8 to 15.2)
5 -20
14.8 !2.5(14.2 to 15.4)
9 -20
t5.r t2.7(14.4 ro 15.8)
ro -20
15.0 + 3.0(I4.2to 15.7)
-18-3 8 -20
* Subjective Norms: Higher scores indicate greater normative support, scoring range -18 - 18. t Intentions to Adhere: Higher scores indicate greaterintentions, scoring range 4-20. t Supports / Barriers: Higher scores indicate greater support for adherence, scoring range 4-20. $ Health Value: Higher scoresindicate greater value of health, scoring range 4-20.
138

Table 11.20¿ Distribution of scores on the Diabetes Knowledge Questionnaire byadolescents and parents, according to parental work status.
Adolescent Parent
At home (n=64)
Mean t ^SD
(95Vo CI)
Observed range
Outside the home (n = 7O)
Mean * SD(957o CI)
Observed range
11.1 t 2.0(10.6 to 11.7)
6-14
1r.4t2.2(10.8 to 11.9)
3-15
12.2!2.5(11.6 to 12.8)
1-15
12.9 + 1.3(12.6 to 13.2)
9-15
r39
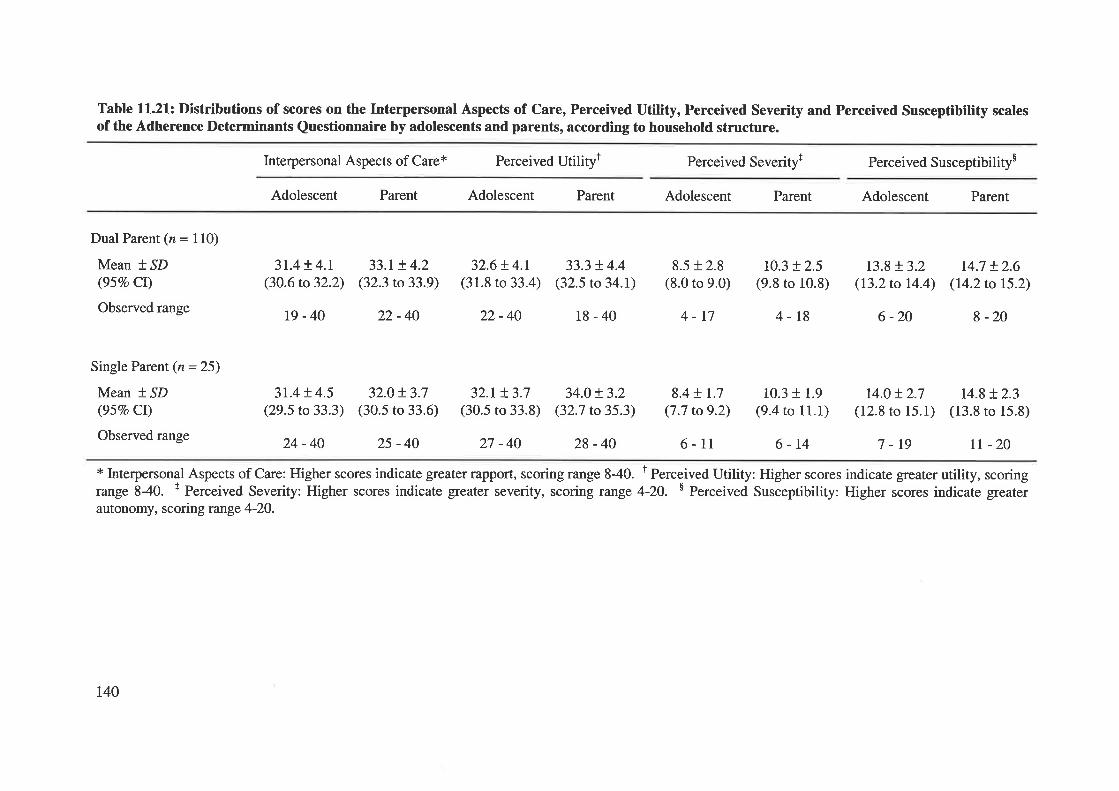
Table ll.2l: Distributions of scores on the Interpersonal Aspects of Care, Perceived Utility, Perceived Severity and Perceived Susceptibility scalesof the Adherence Determinants Questionnaire by adolescents and parents, according to household structure.
Interpersonal Aspects of Care* Perceived Utilityt Perceived Severityr Perceived Susceptibility$
Adolescent Parent Adolescent Parent Adolescent Parent Adolescent Parent
Dual Parent (n = 110)
Mean * SD(95Vo Cr)
Observed range
Single Parent (n = 25)
Mean * SD(95Vo CI)
Observed range
3r.4 + 4.r(30.6 to 32.2)
31.4 t 4.5(29.5 to 33.3)
24 -40
33.1+ 4.2(32.3 to33.9\
32.0t3.7(30.5 to 33.6)
25 -40
32.6 ! 4.1(31.8 to 33.4)
22-40
32.1+ 3.7(30.5 to 33.8)
33.3 + 4.4(32.5 to 34.1)
18-40
34.0 + 3.2(32.7 to35.3)
8.5 + 2.8(8.0 to 9.0)
4-17
8.4 + 1.7(7.7 to9.2)
6-11
10.3 + 2.5(9.8 to 10.8)
4-18
10.3 + 1.9(9.4 to 11.1)
6-14
r3.8 + 3.2(l3.2to 14.4)
6 -20
r4.0t2.7(12.8 to 15.1)
7 -19
14.7 + 2.6(t4.2to 15.2)
I -20
14.8 + 2.3(13.8 to 15.8)
rt -20
t9-40 22-40
27 -40 28-40
* Interpersonal Aspects of Care: Higher scores indicate greater rapport, scoring range 840. t Perceived Utility: Higher scores indicate greater utility, scoringrange 840. t Perceived Severity: Higher scores indicate greater severity, scoring range 4-20. $ Perceived Susceptibility: Higher scores indicate greaterautonomy, scoring range 4-20.
r40
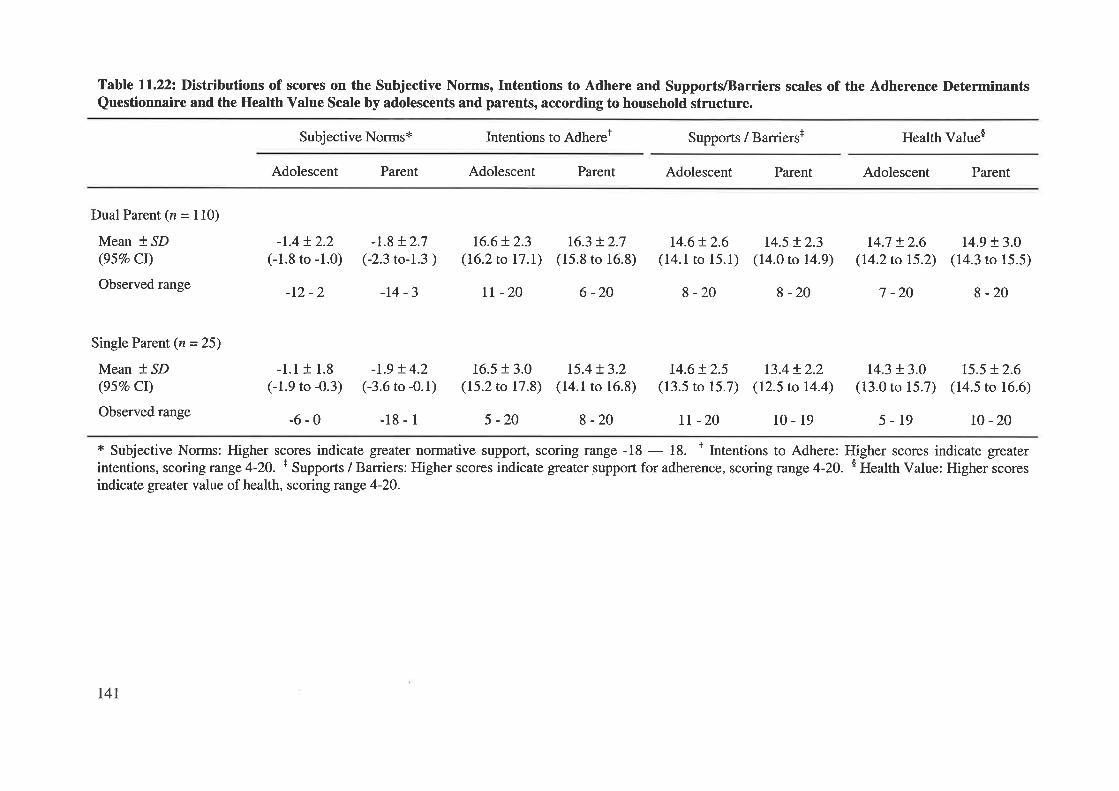
Table 11.22: Distributions of scores on the Subjective Norms, Intentions to Adhere and SupportVBarriers scales of the Adherence DeterminantsQuestionnaire and the Health Value Scale by adolescents and parents, according to household structure.
Subjective Norms* Intentions to Adhereï Supports / Barriers+ Health Value$
Adolescent Parent Adolescent Parent Adolescent Parent Adolescent Parent
Dual Parent (n = 110)
Mean * SD(95Vo CI)
Observed range
Single Parent (n = 25)
Mean t SD(95Vo Ct)
Observed range
-1.4t2.2(-1.8 to -1.0)
-12 -2
-1.8 + 2.7(-2.3 to-l.3 )
-t4 -3
t6.6+ 2.3(16.2 to 17.t)
rt -20
16.3 !2.7(15.8 to 16.8)
r5.4 + 3.2(14.1 to 16.8)
8 -20
6 -20 8 -20
14.6!2.6(14.1 to 15.1)
14.6 + 2.5(13.5 to 15.7)
tr -20
t4.5 !2.3(14.0 to 14.9)
8 -20
r3.4+ 2.2(12.5 to 14.4)
10-19
t4.7 + 2.6(I4.2to 15.2)
7 -20
r4.3 + 3.0(13.0 to 15.7)
5-19
14.9 + 3.O
(14.3 to 15.5)
8-20
15.5 + 2.6(14.5 to 16.6)
l0 -20
-1.1 + 1.8
(-1.9 to -0.3)
-6-0
-r.9 + 4.2(-3.6 to -0.1)
-18-1
16.5 r 3.0(15.2 to 17.8)
5 -20
* Subjective Norms: Higher scores indicate greater normative support, scoring range -18 - 18. t Intentions to Adhere: Higher scores indicate greaterintentions, scoring range 4-20. + Supports / Barriers: Higher scores indicate greater support for adherence, scoring range 4-2O. $ Health Value: Higher scoresindicate greater value of health, scoring range 4-20.
t4l
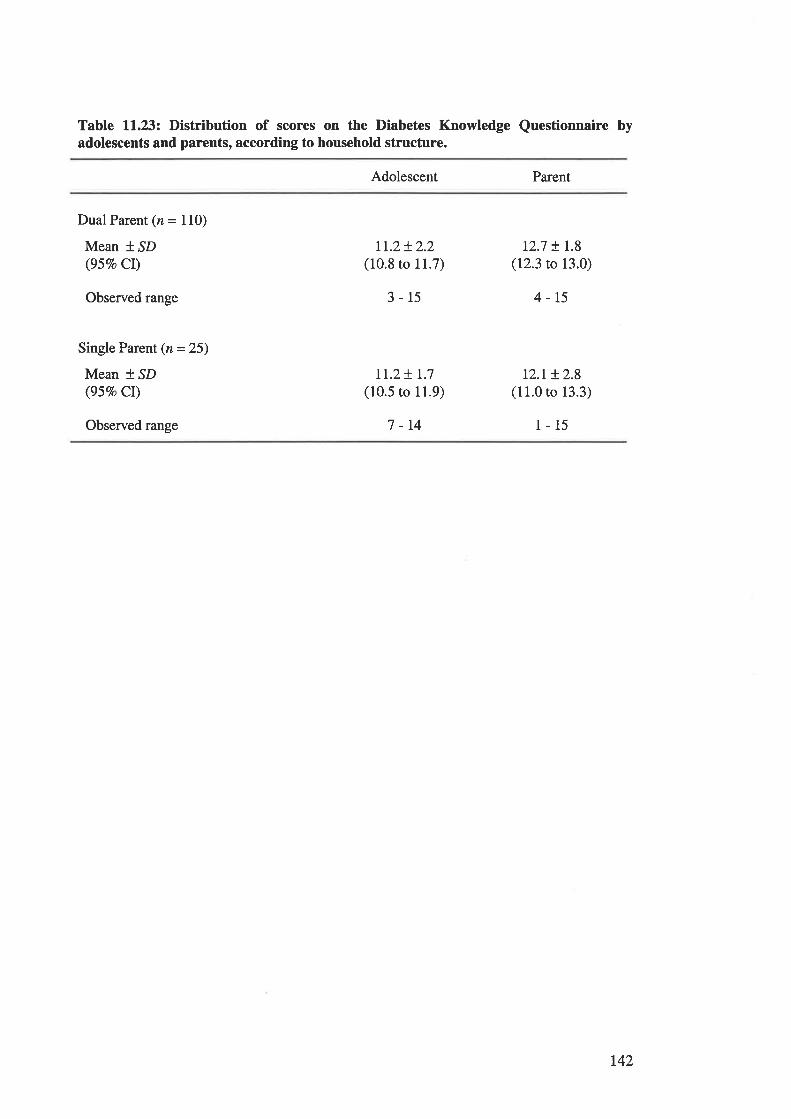
Table ll.23z Distribution of scores on the Diabetes Knowledge Questionnaire byadolescents and parents, according to household structure.
Adolescent Parent
Dual Parent (n = 110)
Mean t ^SD
(95Vo CI)
Observed range
Single Parent (n = 25)
Mean f SD(95Vo Cl)
Observed range
tr.z+ 2.2(10.8 to ll.7)
3-15
It.2+ 1.7
(10.5 to 11.9)
7 -14
12.7 !1.8(12.3 to 13.0)
4-15
t2.M.8(11.0 to 13.3)
1-15
742
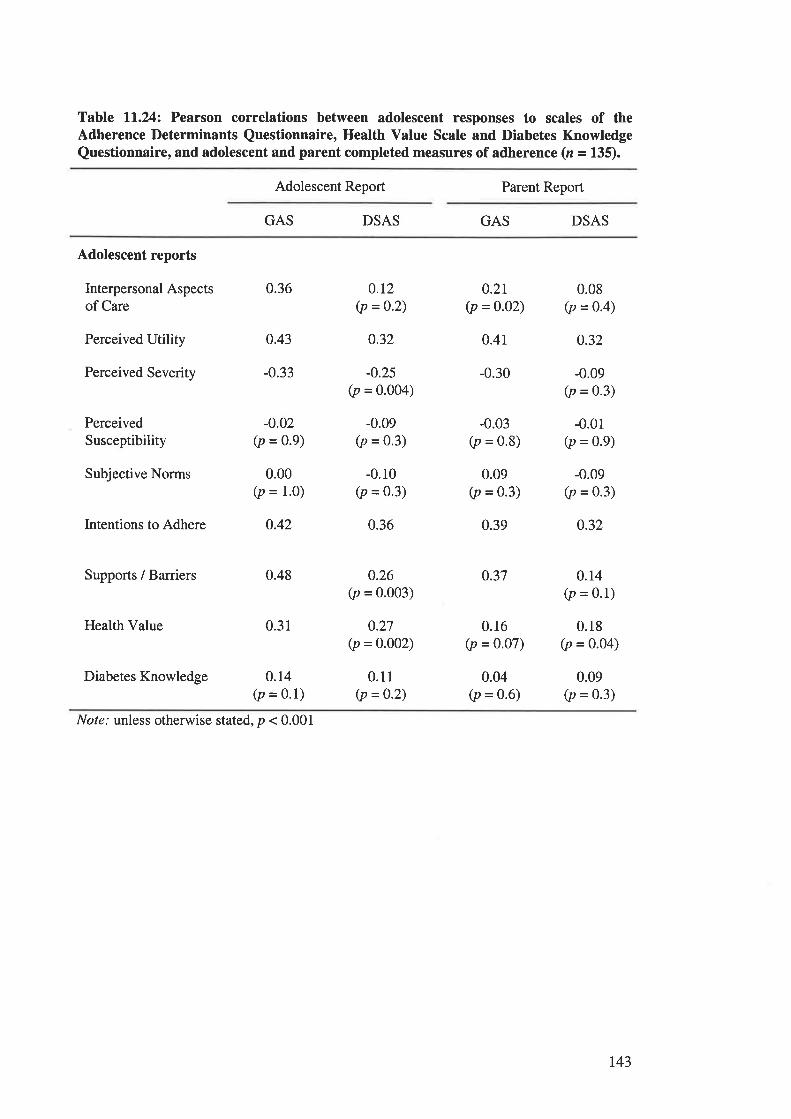
Table ll.24z Pearson correlations between adolescent responses to scales of theAdherence l)eterminants Questionnaire, Health Value Scale and Diabetes KnowledgeQuestionnaire, and adolescent and parent completed measures of adherence (z = 135).
Adolescent Report Parent Report
GAS DSAS GAS DSAS
Adolescent reports
Interpersonal Aspectsof Care
Perceived Utility
Perceived Severity
PerceivedSusceptibility
Subjective Norms
Intentions to Adhere
Supports / Barriers
Health Value
Diabetes Knowledge
0.36
0.43
-0.33
-o.02(p = 0.9)
0.00(p = 1.0)
0.42
0.48
0.31
0.14(p = 0'1)
0.r2(p =o'2)
0.32
-0.25(p = 0.004)
-0.09(p = 0.3)
-0.r0(p = 0.3)
0.36
0.26(p = 0.003)
0.27(p = 0.002)
0.11(p =0.2)
0.21(p =0.02)
0.41
-0.30
-0.03(p = 0.8)
0.09(p = 0.3)
0.39
0.37
0.16(p = 0.07)
0.04(p = 0.6)
0.08(p = 0.4)
o.32
-0.09(p = 0.3)
-0.01(p = 0.9)
-0.09(p = 0.3)
o.32
o.r4(p = 0.1)
0.18(p = 0.04)
0.09(p = 0.3)
Nof¿.' unless otherwise stated, p < 0.001
r43
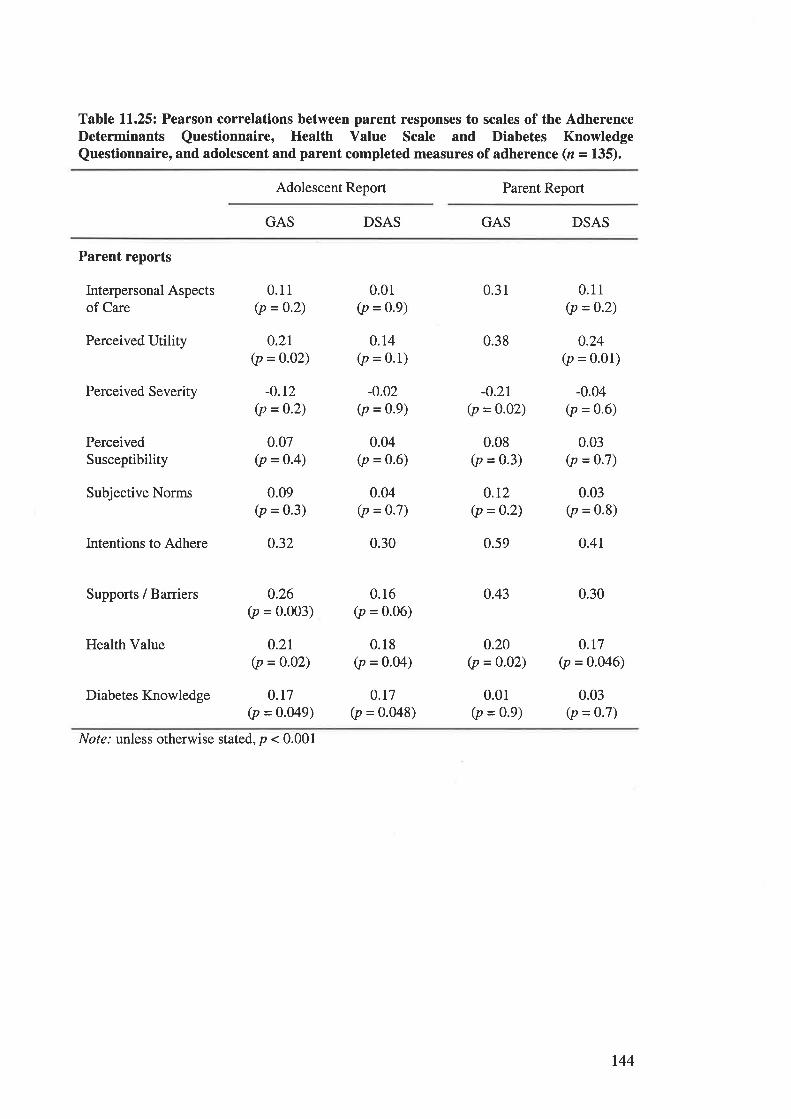
Table ll.25z Pearson correlations between parent responses to scales of the AdherenceI)eterminants Questionnaire, Health Value Scale and Diabetes KnowledgeQuestionnaire, and adolescent and parent completed measures of adherence (n = 135).
Adolescent Report Parent Report
GAS DSAS GAS DSAS
Parent reports
Interpersonal Aspectsof Care
Perceived Utility
Perceived Severity
PerceivedSusceptibility
Subjective Norms
Intentions to Adhere
Supports / Barriers
Health Value
Diabetes Knowledge
0.11(p = 0.2)
0.2r(p = 0.02)
-0.r2(p = 0'2)
0.07(p = 0.4)
0.09(p = 0.3)
0.32
0.26(p = 0.003)
o.2L(p = o.02)
0.r7(p = 0.049)
0.01(p = 0.9)
0.14(p = 0.1)
-0.02(p = 0.9)
0.04(p = 0.6)
0.04(p = 0.7)
0.30
0.16(p = 0.06)
0.18(p = o.o4)
o.r7(p = 0.048)
0.31
0.38
-0.21(p = 0.02)
0.08(p = 0.3)
0.r2(p = 0-2)
0.59
0.43
o.20(p = 0.02)
0.0r(p = 0.9)
0.11(p = 0.2)
0.24(p = 0.01)
-0.04(p = 0.6)
0.03(p = 0'7)
0.03(p = 0.8)
o.4r
0.30
0.r7(p = 0.046)
0.03(p -- 0.7)
Not¿.' unless otherwise stated, p < 0.001
r44
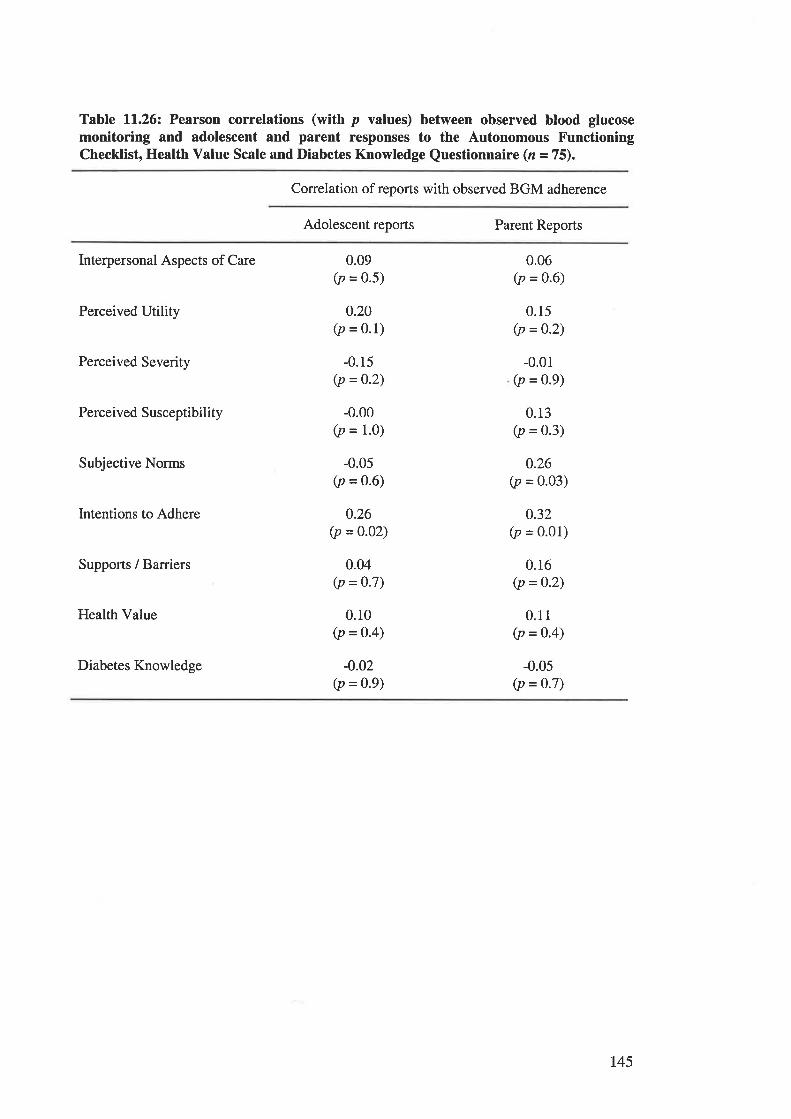
Table ll.26z Pearson correlations (with p values) between observed blood glucosemonitoring and adolescent and parent responses to the Autonomous FunctioningChecklist, Health Value Scale and Diabetes Knowledge Questionnaire (n = 75).
Correlation of reports with observed BGM adhe¡ence
Adolescent reports Parent Reports
Interpersonal Aspects of Care
Perceived Utility
Perceived Severity
Perceived Susceptibility
Subjective Norms
Intentions to Adhere
Supports / Barriers
Health Value
Diabetes Knowledge
-0.00(p = 1.0)
0.09(p = 0.5)
0.20(p = 0.1)
-0.15(p = 0.2)
0.06(p = 0.6)
0.15(p =0.2)
-0.01(p = 0.9)
0.13(p = 0.3)
0.26(p = o.o3)
0.32(p = 0.01)
0.16(p =0.2)
0.11(p = 0.4)
-0.05(p = 0.7)
-0.05(p = 0.6)
0.26(p =0.02)
0.04(p = 0.7)
0.10(p =0.4)
-0.02(p =0.9)
r45
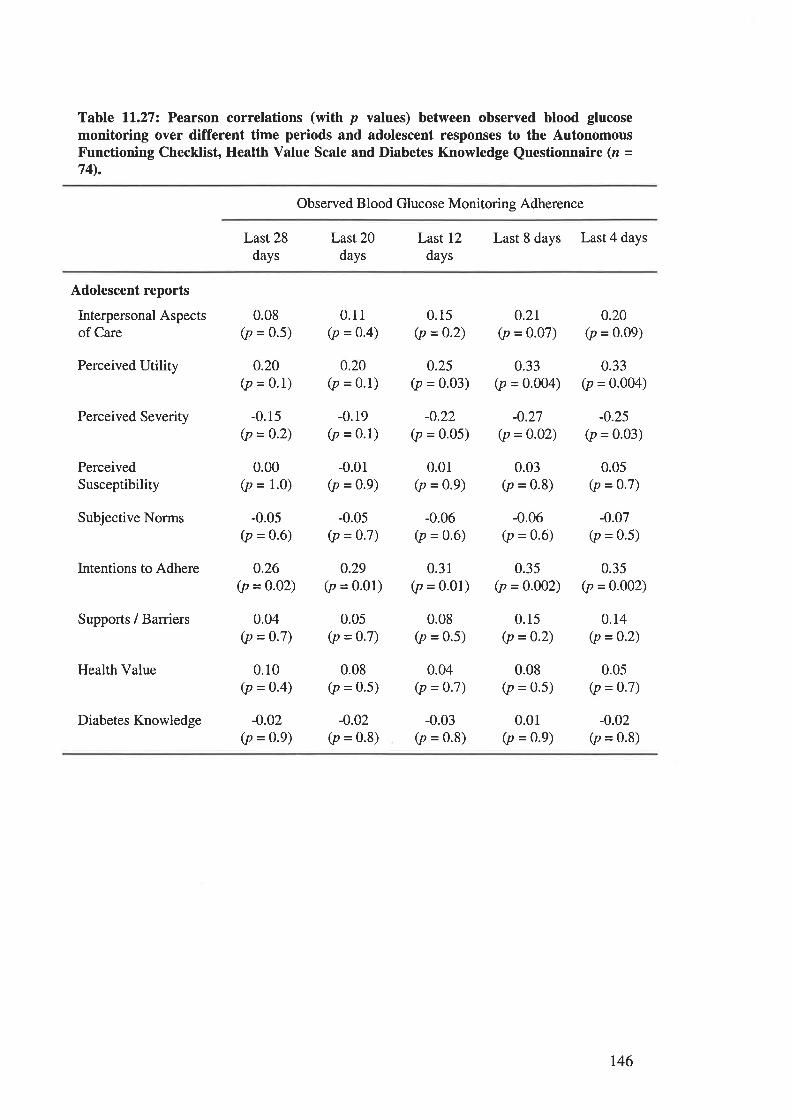
Table ll.27z Pearson correlations (with p values) between observed blood glucosemonitoring over different time periods and adolescent responses to the AutonomousFunctioning Checklist, Health Value Scale and Diabetes Knowledge Questionnaire (z =74).
Observed Blood Glucose Monitoring Adherence
Last 28
daysLast 20
daysLast 12
daysLast 8 days Last 4 days
Adolescent reports
Interpersonal Aspectsof Care
Perceived Utility
Perceived Severity
PerceivedSusceptibility
Subjective Norms
Intentions to Adhere
Suppons / Barriers
Health Value
Diabetes Knowledge
0.08(p = 0.5)
0.20(p = 0.1)
-0.15(p = 0.2)
0.00(p = 1.0)
-0.0s(p = 0.6)
o.26(p = 0.02)
0.04(p = 0.7)
0.10(p = 0.4)
-0.02(p = 0.9)
0.11(p = 0'4)
0.20(p = 0.1)
-0.19(p = 0.1)
-0.01(p = 0.9)
-0.05(p = 0'7)
0.29(p = 0.01)
0.05(p = 0.7)
0.08(p = 0.5)
-0.02(p = 0.8)
0.15(p =0.2)
0.25(p = o.o3)
-0.22(p = 0.05)
0.01(p = 0.9)
-0.06(p = 0.6)
0.31(p = 0.01)
0.08(p = 0.5)
0.04(p = 0.7)
-0.03(p = 0.8)
0.2r(p = o.o7)
0.33(p = 0.004)
-0.27(p =0.02)
0.03(p = 0.8)
-0.06(p = 0.6)
0.35(p = 0.002)
0.15(p = 0.2)
0.08(p = 0.5)
0.01(p = 0.9)
0.20(p = o.o9)
0.33(p = 0.004)
-0.25(p = 0.03)
0.05(p = 0.7)
-0.07(p = 0.5)
0.35(p = 0'002)
0.14(p =0.2)
0.05(p = 0.7)
-0.02(p = 0.8)
t46
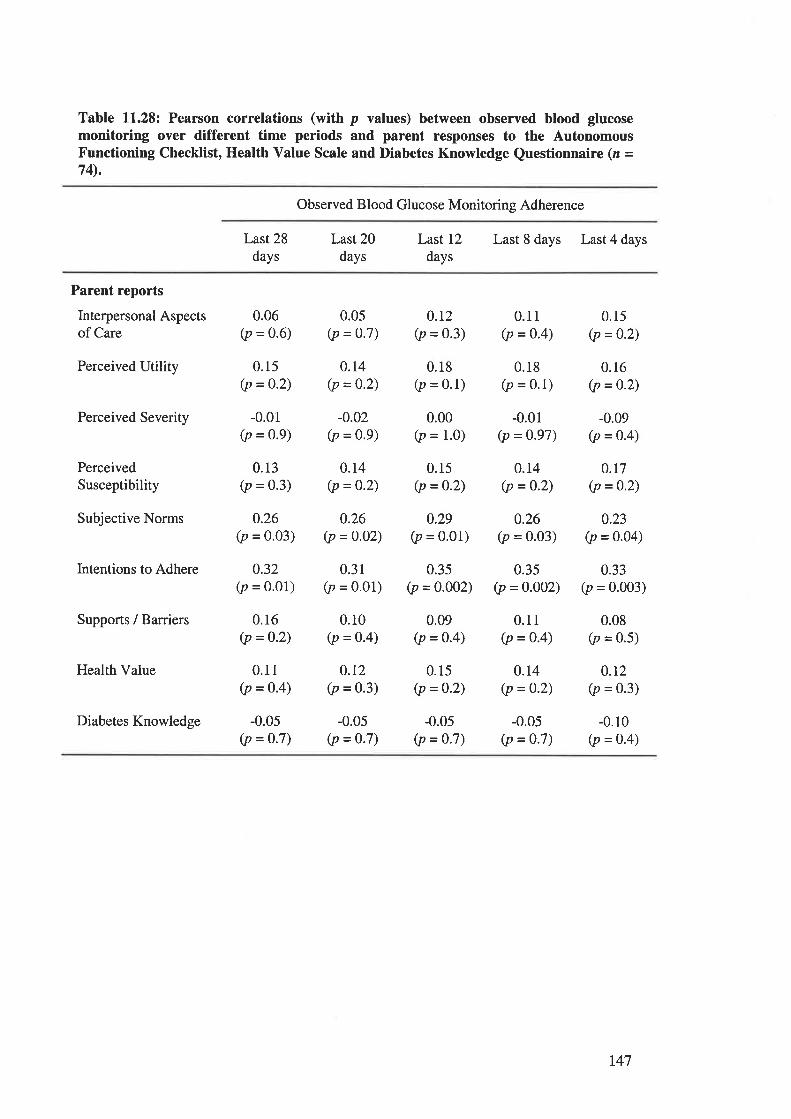
Table 11.28: Pearson correlations (with p values) between observed blood glucosemonitoring over different time periods and parent responses to the AutonomousFunctioning Checklist, Health Value Scale and Diabetes Knowledge Questionnaire (z =74).
Observed Blood Glucose Monitoring Adherence
Last 28
daysLast 20
daysLast 12
daysLast 8 days Last 4 days
Parent reports
Interpersonal Aspectsof Care
Perceived Utility
Perceived Severity
PerceivedSusceptibility
Subjective Norms
Intentions to Adhere
Supports / Barriers
Health Value
Diabetes Knowledge
0.06(p = 0.6)
0.15(p = 0.2)
-0.01(p = 0.9)
0.13(p = 0.3)
0.26(p = 0.03)
0.32(p = o.o1)
0.16(p =0.2)
0.11(p =o.4)
-0.05(p = o.7)
0.0s(p = 0.7)
0.14(p = 0.2)
-0.02(p = 0.9)
0.14(p =0.2)
0.26(p = 0.o2)
0.31(p = 0.01)
0.10(p = o.4)
0.12(p = 0.3)
-0.05(p = 0.7)
0.r2(p = 0.3)
0.18(p = 0.1)
0.00(p = 1.0)
0.15(p =0.2)
0.29(p = 0'01)
0.35(p =0.002)
0.09(p = 0.4)
0.15(p =0.2)
-0.05(p = 0.7)
0.11(p = 0.4)
0.18(p = 0.1)
-0.01(p = 0.97)
0.14(p = 0.2)
0.26(p = 0.03)
0.35(p =o.o02)
0.11(p = 0.4)
0.14(p = 0.2)
-0.05(p = 0.7)
0.15(p = 0.2)
0.16(p =0'2)
-0.09(p = 0.4)
0.r7(p =0.2)
0.23(p = 0.04)
0.33(p = 0.003)
0.08(p = 0'5)
0.r2(p = 0.3)
-0.10(p = 0.4)
t47
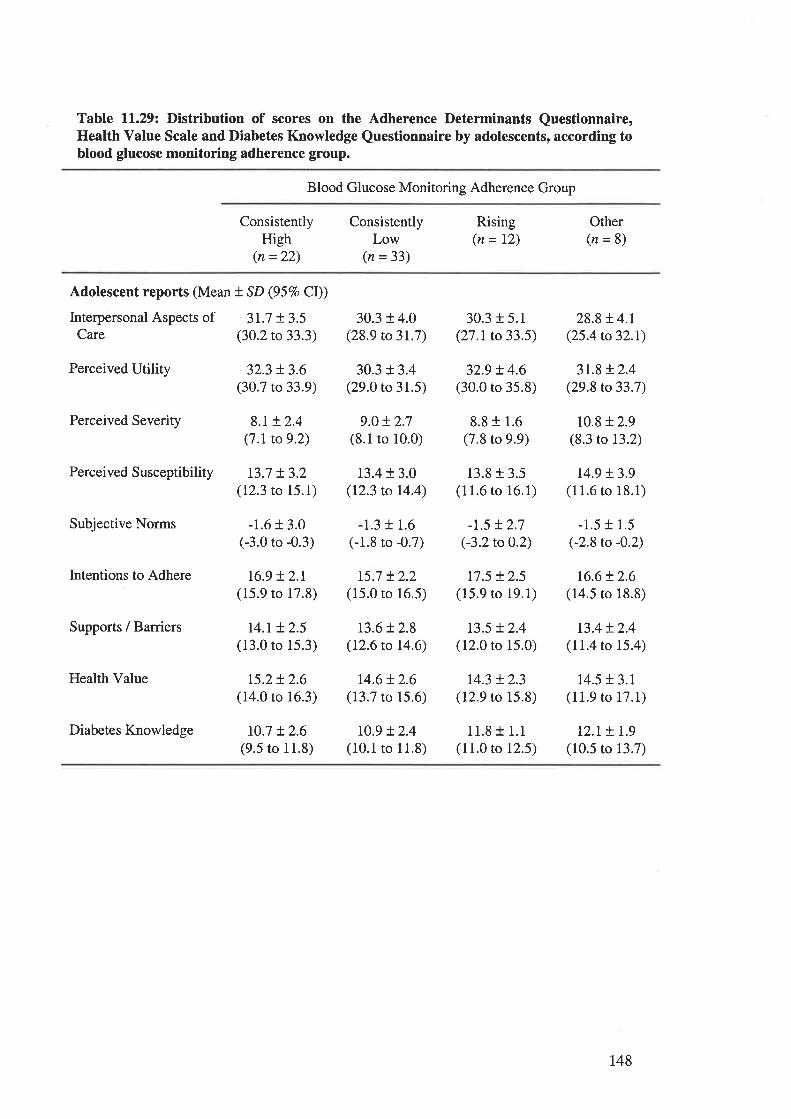
Table ll.29z Distribution of scores on the Adherence Determinants Questionnaire,Health Value Scale and Diabetes Knowledge Questionnaire by adolescents, according toblood glucose monitoring adherence group.
Blood Glucose Monitoring Adherence Group
ConsistentlyHigh
(n =22)
ConsistentlyLow
(n = 33)
Rising(n= 12)
Other(n=8)
Adolescent reports (Mean t SD (957o CI))
Interpersonal Aspects of 3L7 t3.5Care (30.2 to 33.3)
Perceived Utility 32.3 t 3.6(30.7 to 33.9)
Perceived Severity 8.t + 2.4(7.1 to 9.2)
Perceived Susceptibility t3.7 + 3.2(12.3 to 15.1)
Subjective Norms -1.6 + 3.0(-3.0 to -0.3)
Intentions to Adhere 16.9 + 2.r(15.9 to 17.8)
Supports / Barriers l4.r + 2.5(13.0 to 15.3)
Health Value 15.2+ 2.6(14.0 to 16.3)
Diabetes Knowledge 10.7 t2.6(9.5 to 11.8)
30.3 t 4.0(28.9 to 3r.7)
30.3 t 3.4(29.0 to 31.5)
9.0 + 2.7(8.1 to 10.0)
t3.4+ 3.0(12.3 to 14.4)
-1.3 + 1.6(-1.8 to -0.7)
15.7 !2.2(15.0 to 16.5)
13.6t 2.8(12.6 to 14.6)
14.6!2.6(13.7 to 15.6)
10.9 !2.4(10.1 to 11.8)
30.3 r 5.1(27.1 to 33.5)
329 + 4.6(30.0 ro 35.8)
8.8 t 1.6(7.8 to 9.9)
13.8 + 3.5(11.6 to 16.1)
-1.5 t2.7(-3.2 to 0.2)
r7.5 + 2.5(15.9 to 19.1)
13.5 + 2.4(12.0 to 15.0)
t4.3 + 2.3(12.9 to 15.8)
11.8 + 1.1(11.0 to 12.5)
28.8 !4.1(25.4 to32.I)
3r.8 !2.4(29.8 to 33.7)
10.8 + 2.9(8.3 to 13.2)
14.9 t3.9(11.6 to 18.1)
-1.5 r 1.5(-2.8 to -0.2)
16.6t2.6(14.5 to 18.8)
t3.4t2.4(11.4 to 15.4)
14.5 r 3.1(11.9 to 17.1)
L2.r + r.9(10.5 to 13.7)
148
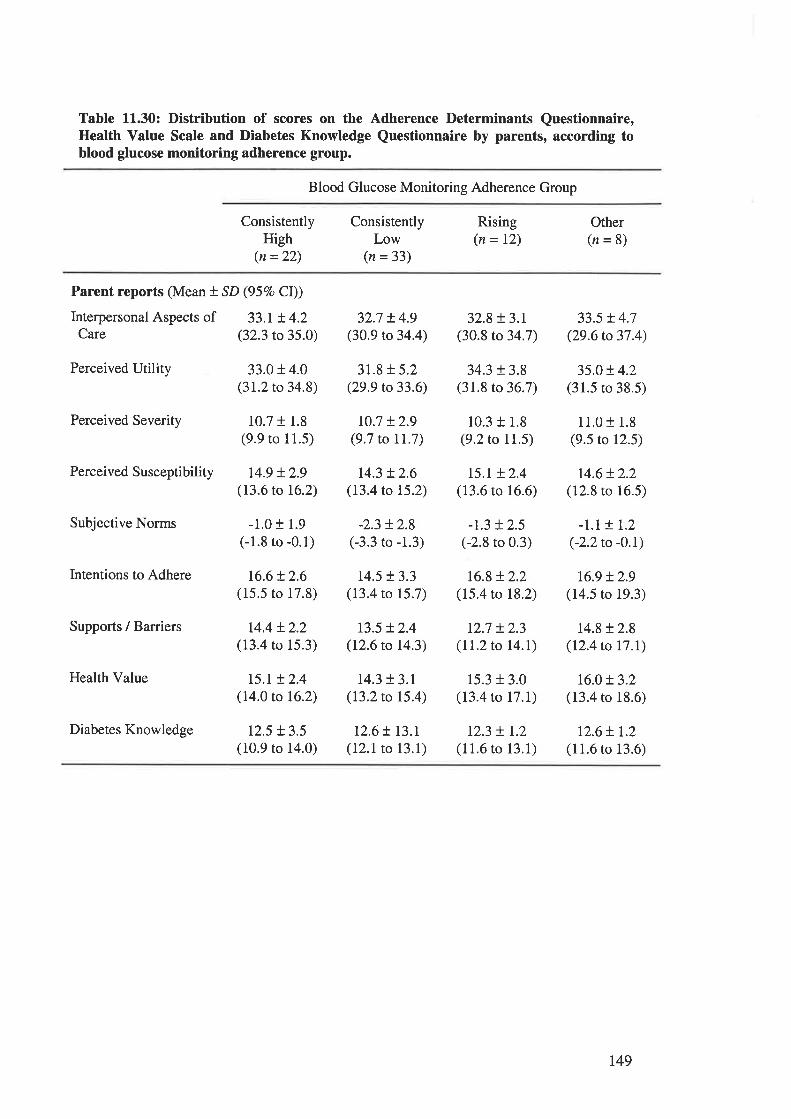
Table 11.30: Distribution of scores on the Adherence Determinants Questionnaire,Health Value Scale and Diabetes Knowledge Questionnaire by parents, according toblood glucose monitoring adherence group.
Blood Glucose Monitoring Adherence Group
ConsistentlyHigh
(n =22)
ConsistentlyLow
(n =33)
Rising(n = 12)
Other(n=8)
Parent reports (Mean t SD (95Eo Cl))
Interpersonal Aspects of 33.I t 4.2Care (32.3 to 35.0)
Perceived Utility 33.0 + 4.0(31.2 to 34.8)
Perceived Severity 10.7 r 1.8(9.9 to 11.5)
Perceived Susceptibility t4.9 + 2.9(13.6 to 16.2)
Subjective Norms -1.0 t 1.9(-1.8 to -0.1)
Intentions to Adhere t6.6+ 2.6(15.5 to 17.8)
Supports / Barriers r4.4 + 2.2(13.4 ro 15.3)
Health Value 15.r + 2.4(14.0 to 16.2)
Diabetes Knowledge 12.5 + 3.5(10.9 to 14.0)
32.7 r4.9(30.9 to 34.4)
31.8 + 5.2(29.9 to 33.6)
t0.7 t2.9(9.7 to IL.7)
14.3 !2.6(13.4 to 15.2)
-2.3 t2.8(-3.3 to -1.3)
t4.5 !3.3(13.4 to 15.7)
13.5 + 2.4(12.6 to 14.3)
14.3 + 3.1(13.2 to 15.4)
12.6 ! I3.I(12.1 to 13.1)
32.8 + 3.r(30.8 to 34.7)
34.3 t3.8(31.8 to 36.7)
10.3 + 1.8(9.2 to 11.5)
r5.I + 2.4(13.6 to 16.6)
-t.3 + 2.5(-2.8 to 0.3)
16.8 + 2.2(15.4 to 18.2)
r2.7 + 2.3(11.2 to I4.I)
15.3 + 3.0(13.4 to 17.1)
r2.3 + 1.2(11.6 to 13.1)
33.5 t 4.7(29.6 to 37.4)
35.0!4.2(31.5 to 38.5)
11.0 t 1.8(9.5 to 12.5)
14.6!2.2(12.8 to 16.5)
-L.M.2(-2.2to -0.\
16.9 t2.9(14.5 to 19.3)
14.8t2.8(12.4 to 17.I)
16.0t3.2(13.4 ro 18.6)
12.6+ L2(11.6 to 13.6)
t49
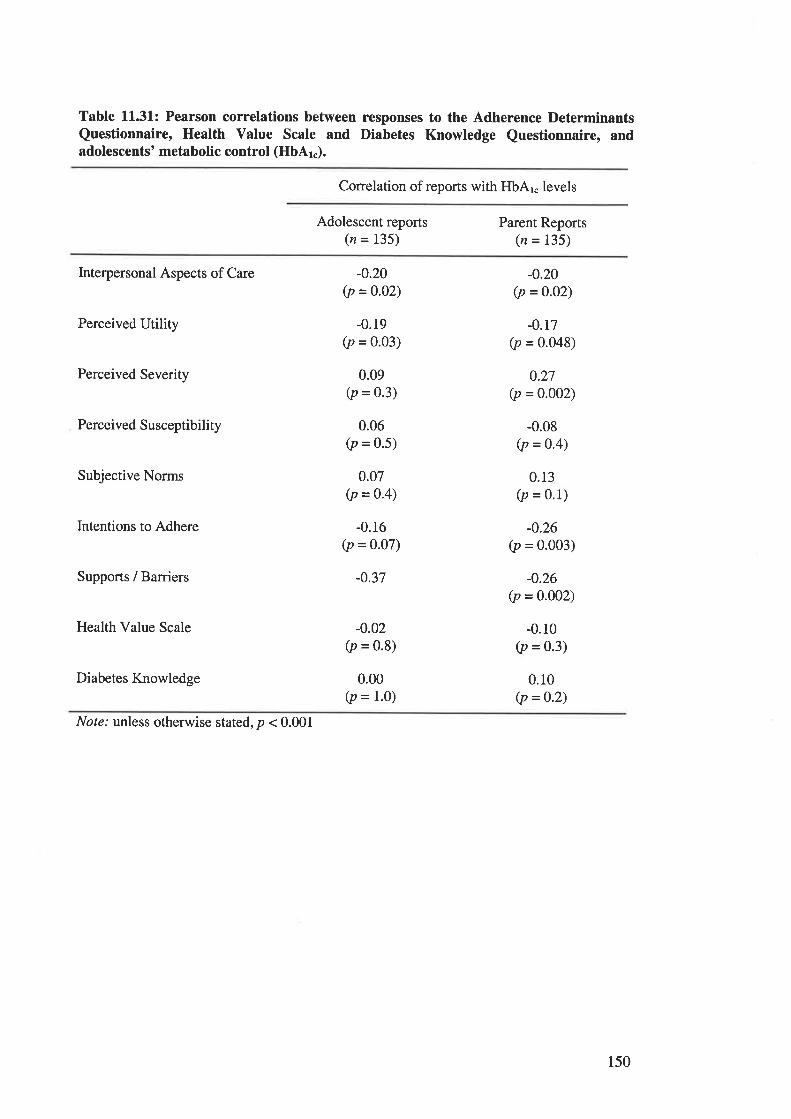
Table 11.31.: Pearson correlations between responses to the Adherence DeterminantsQuestionnaire, Health Value Scale and Diabetes Knowledge Questionnaire, andadolescents' metabolic control (HbAr").
Correlation of reports with HbAr" levels
Adolescent reports(n = 135)
Parent Reports(n = 135)
Interpersonal Aspects of Care
Perceived Utility
Perceived Severity
Perceived Susceptibility
Subjective Norms
Intentions to Adhere
Supports / Barriers
Health Value Scale
Diabetes Knowledge
-0.20(p = 0.o2)
-0.19(p = 0'03)
0.09(p = 0.3)
0.06(p = 0.5)
0.07(p = 0.4)
-0.16(p = 0.07)
-0.37
-0.02(p = 0.8)
0.00(p = 1.0)
-0.20(p =o.o2)
-0.r7(p = 0.048)
0.27(p = 0.002)
-0.08(p = 0.4)
0.13(p = 0.1)
-0.26(p = 0.003)
-0.26(p = 0.0o2)
-0.10(p = 0.3)
0.10(p =0.2)
Note.' unless otherwise stated, p < 0.001
150
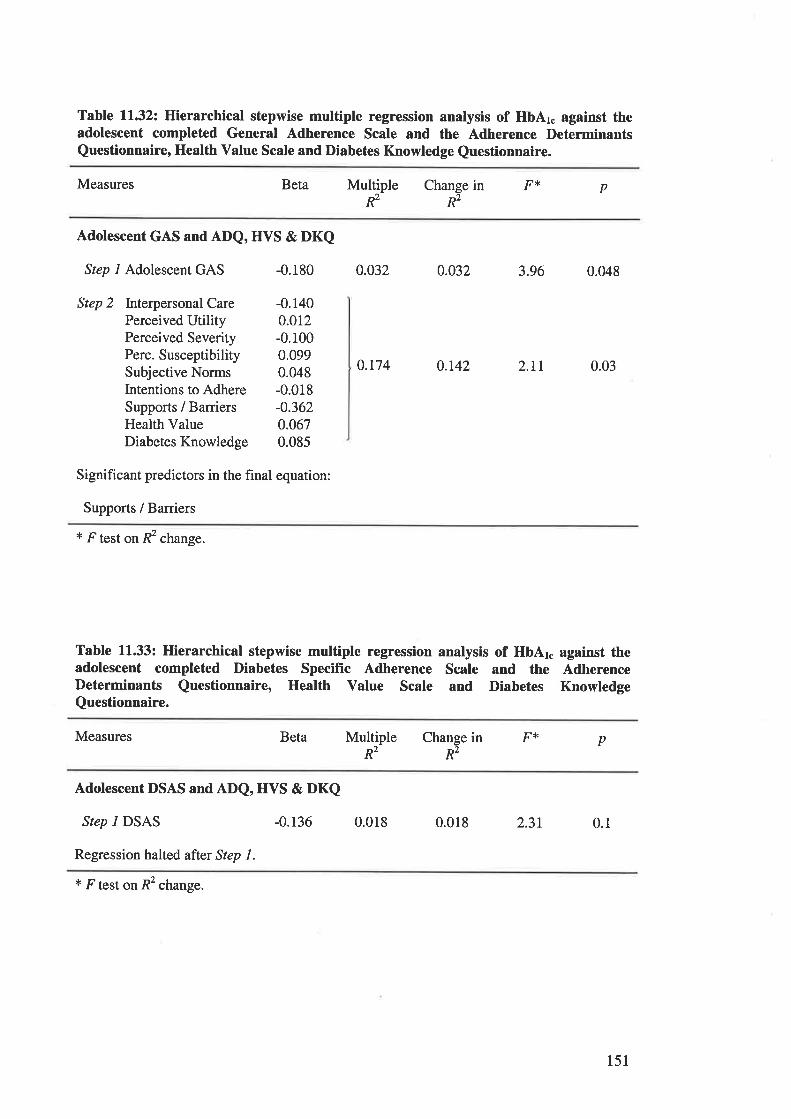
Table l1.32z Hierarchical stepwise multiple regression analysis of HbAr" against theadolescent completed General Adherence Scale and the Adherence DeterminantsQuestionnaire, Health Value Scale and Diabetes Knowledge Questionnaire.
Measures Beta pMultipleR2
Change in F'É
R2
Adolescent GAS and ADQ, HVS & DKQ
Step l Adolescent GAS -0.180
Step 2 Interpersonal Care -0.140Perceived Utility 0.012Perceived Severity -0.100Perc. Susceptibility 0.099Subjective Norms 0.048Intentions to Adhere -0.018Supports / Barriers -0.362Health Value 0.067Diabetes Knowledge 0.085
Significant predictors in the final equation:
Supports / Barriers
0.032 0.032 3.96 0.048
0.174 0.142 2,LI 0.03
* F test on R2 change.
Table 11.33: Hierarchical stepwise multiple regression analysis of HbAr. against theadolescent completed Diabetes Specific Adherence Scale and the AdherenceDeterminants Questionnaire, Health Value Scale and Diabetes KnowledgeQuestionnaire.
Measures in F* pBeta Multiple ChangeR2 R2
Adolescent DSAS and ADQ, HVS & DKQ
Step I DSAS -0.136
Regression halted after Step L
0.018 0.018 2.31 0.1
* F test on R2 change.
151
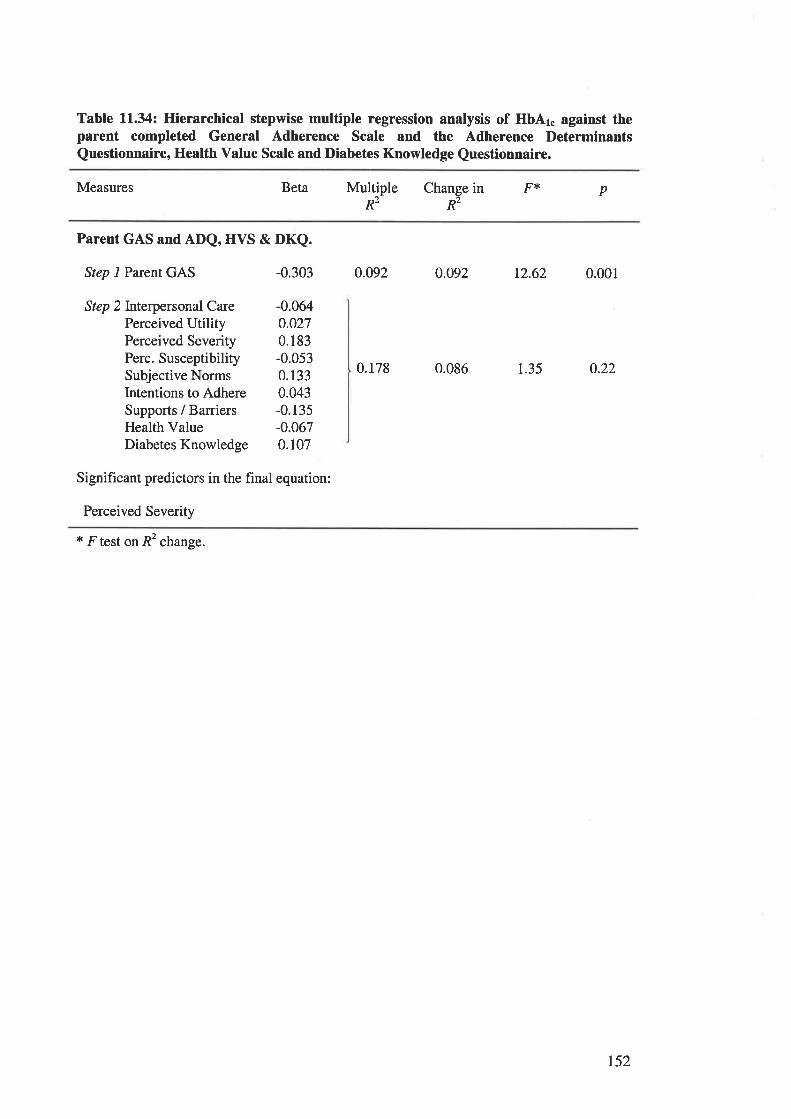
Table 11.34: Hierarchical stepwise multiple regression analysis of HbAr" against theparent completed General Adherence Scale and the Adherence DeterminantsQuestionnaire, Health Value Scale and Diabetes Knowledge Questionnaire.
Measures Beta pMultiple Change in F*R2 R2
Parent GAS and ADQ, HVS & DKQ.
Step l Parent GAS -0.303
Step 2Interpersonal Care -0.064Perceived Utility 0.027Perceived Severity 0.183Perc. Susceptibility -0.053Subjective Norms 0.133Intentions to Adhere 0.043Supports / Barriers -0. 135
Health Value -0.067DiabetesKnowledge 0.107
Significant predictors in the final equation:
Perceived Severity
0.092 0.o92 12.62 0.001
0.178 0.086 1.35 0.22
t F test on R2 change.
t52

Table 11.35: Hierarchical stepwise multiple regression analysis of HbAr. against theparent completed Diabetes Specific Adherence Scale and the Adherence DeterminantsQuestionnaire, Health Value Scale and Diabetes Knowledge Questionnaire.
Measures Beta pMultiple Change in F'(R2 R2
Parent DSAS and ADQ, HVS & DKQ
Step l Parent DSAS -0.22I
Step 2Interpersonal Care -0.101
Perceived Utiliry 0.029Perceived Severity 0.176Perc. Susceptibility -0.054Subjective Norms 0.109lntentions to Adhere 0.019Supports / Barriers -0.160Health Value -0.059Diabetes Knowledge 0.120
Significant predictors in the final equation:
0.049 0.049 6.42
0.155 0.106
0.01
t.6l 0.r2
+ F test on R2 change.
153

TABLES AND FIGURES CITBD IN CHAPTER 1.3.
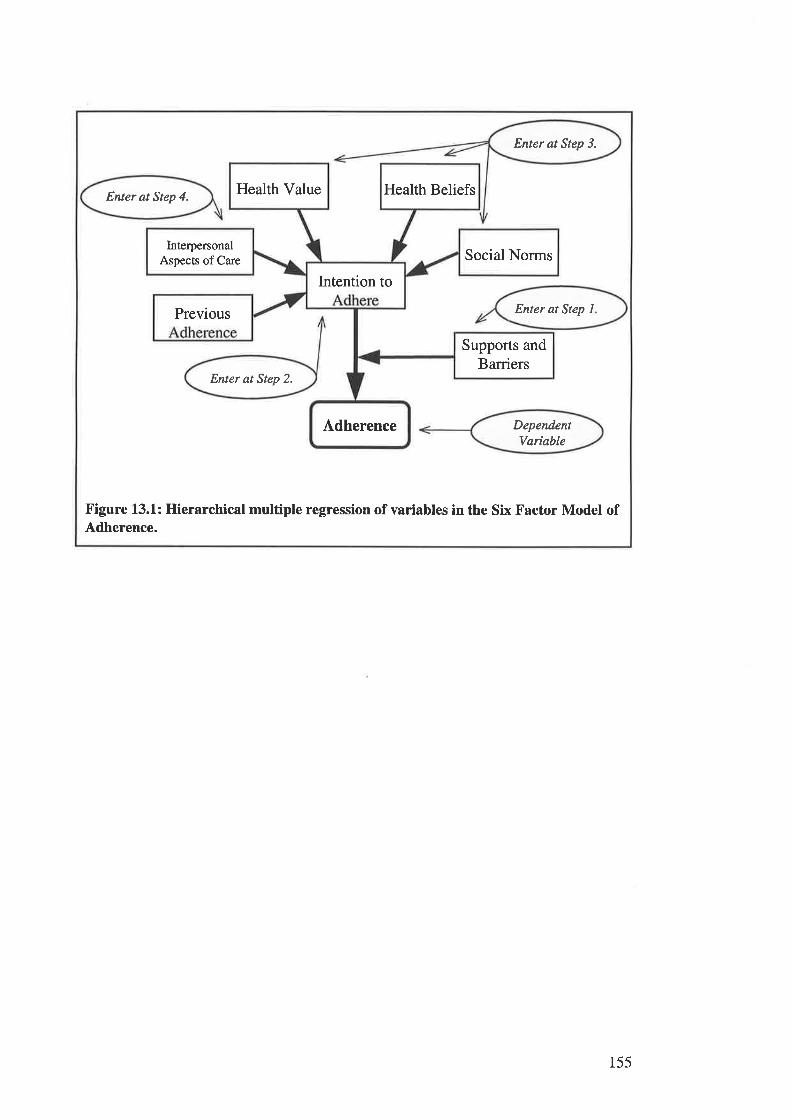
Enter at Step 3.
Enter øt Step 4.
DependentVariqble
Enter at Step 2.
Health Value Health Beliefs
InterpersonalAspects of Ca¡e Social Norms
Intention to
Enter at Step 1Previous
Supports andBarriers
Adherence
Figure 13.1.: Hierarchical multiple regression of variables in the Six Factor Model ofAdherence.
155
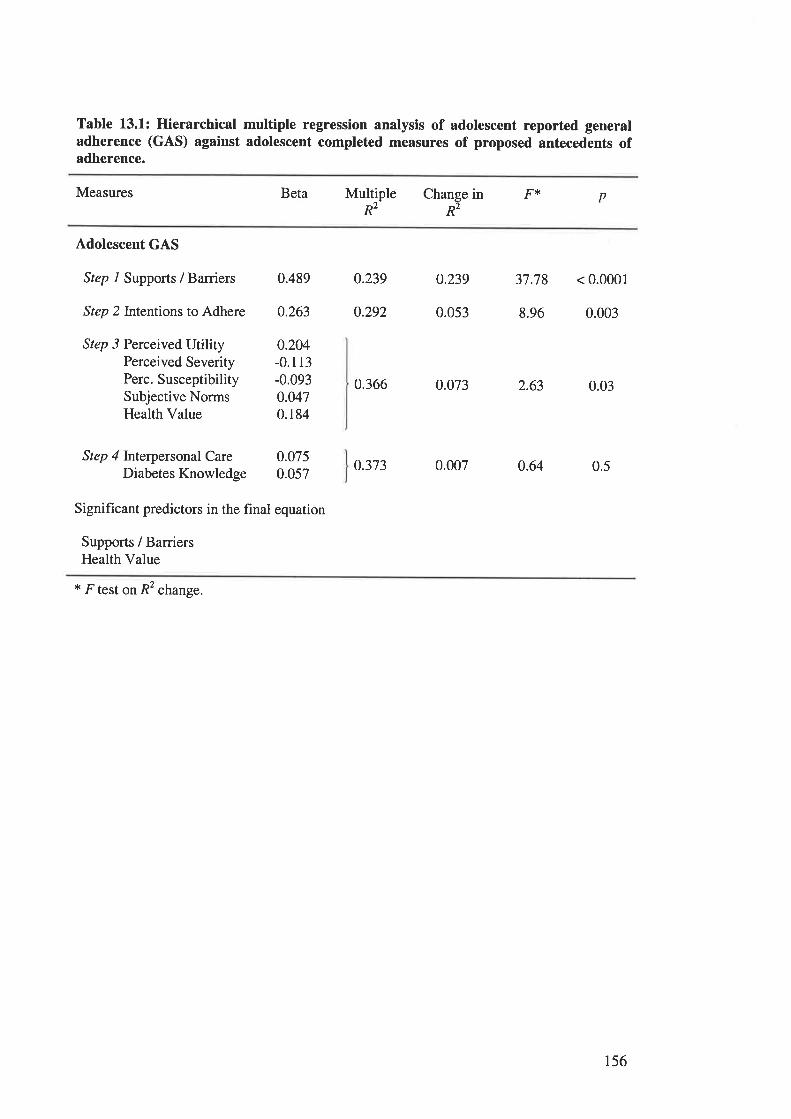
Table 13.1: Hierarchical multiple regression analysis of adolescent reported generaladherence (GAS) against adolescent completed measures of proposed antecedents ofadherence.
Measures Beta F{< pMultiple Change inR2 R2
Adolescent GAS
Step 1 Supports / Barriers 0.489 0.239 0.239 37.78 < 0.0001
Step 2Intentions to Adhere 0.263 0.292 0.053 8.96 0.003
Step 3 Perceived UtilityPerceived SeverityPerc. SusceptibilitySubjective NormsHealth Value
Step 4 Interpersonal CareDiabetes Knowledge
0.366 0.073 2.63 0.03
0.373 0.007 0.64 0.5
0.204-0.113-0.0930.0470.184
0.0750.057
Significant predictors in the final equation
Supports / BarriersHealth Value
x F test on R2 change.
156
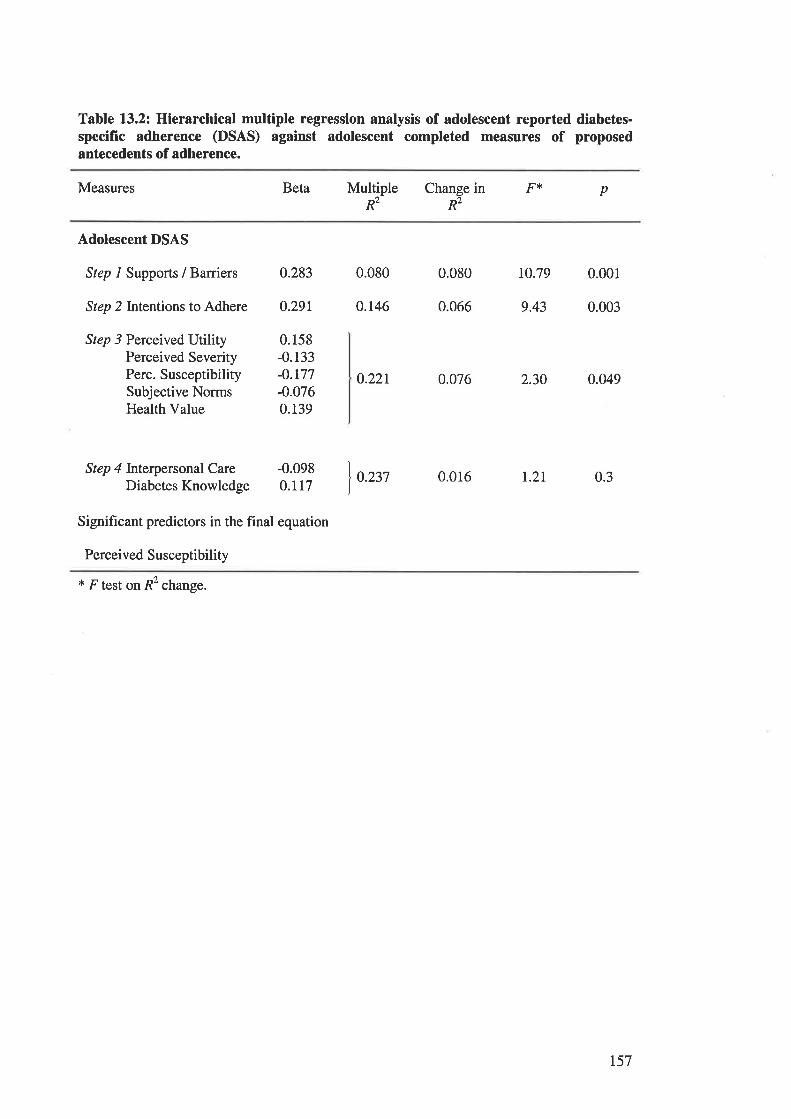
Table 13.2: Hierarchical multiple regression analysis of adolescent reported diabetes-specific adherence (DSAS) against adolescent completed measures of proposedantecedents of adherence.
Measures Beta pMultiple Change in F{'<
R2 R2
Adolescent DSAS
Step 1 Supports / Barriers
Step 2Intentions to Adhere
Step 3 Perceived UtilityPerceived SeverityPerc. SusceptibilitySubjective NormsHealth Value
Step 4 Interpersonal CareDiabetes Knowledge
0.283 0.080 0.080 10.79 0.001
0.291 0.146 0.066 9.43 0.003
0.158-0.133-0.177-0.0760.139
0.221 0.076 2.30 0.049
-0.0980.117
0.237 0.016 t.2r 0.3
Significant predictors in the final equation
Perceived Susceptibility
t F test on R2 change.
t57
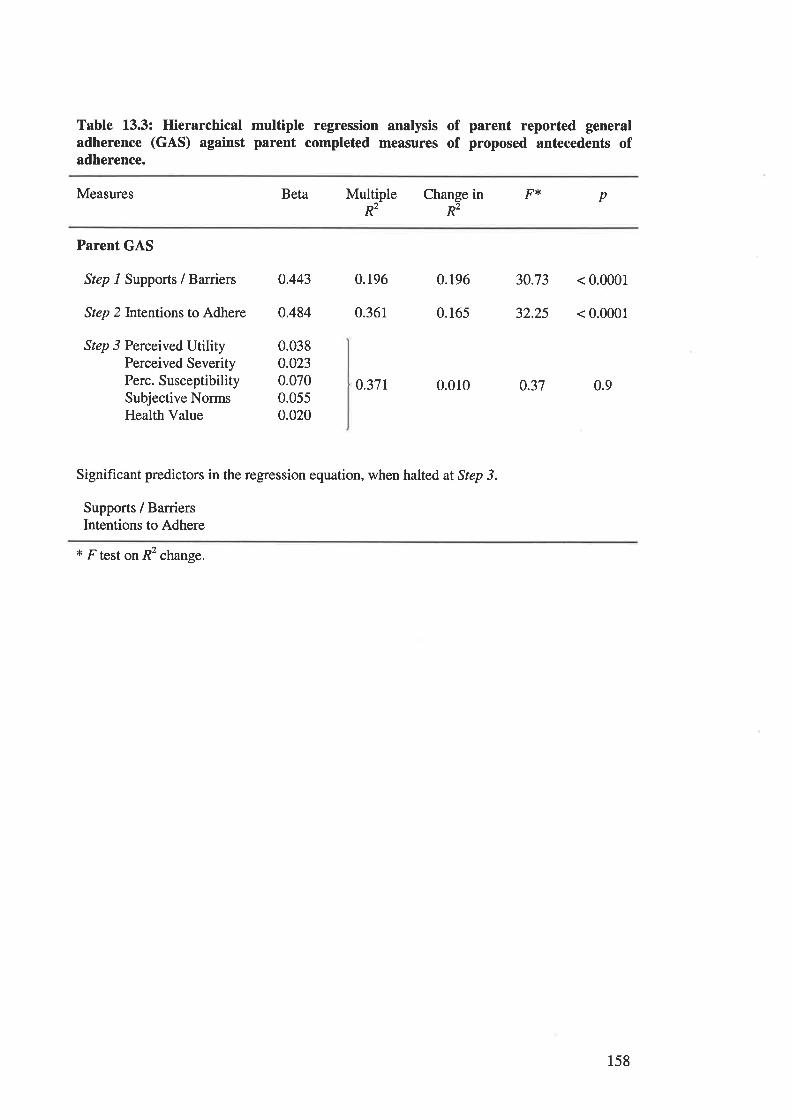
Table 13.3: Hierarchical multiple regression analysis of parent reported generaladherence (GAS) against parent completed measures of proposed antecedents ofadherence.
Measures Beta pMultiple Change in FtÉ
R2 R2
Parent GAS
Step 1 Supports / Barriers
Step 2Intentions to Adhere
Step 3 Perceived UtilityPe¡ceived SeverityPe¡c. SusceptibilitySubjective NormsHealth Value
0.37r 0.010 0.37
0.443 0.196 0.196 30.73 < 0.0001
0.484 0.361 0.165 32.25 < 0.0001
0.038o.0230.0700.0550.020
0.9
Significant predictors in the regression equation, when halted at Step 3.
Supports / BarriersIntentions to Adhere
* F test on R2 change.
158
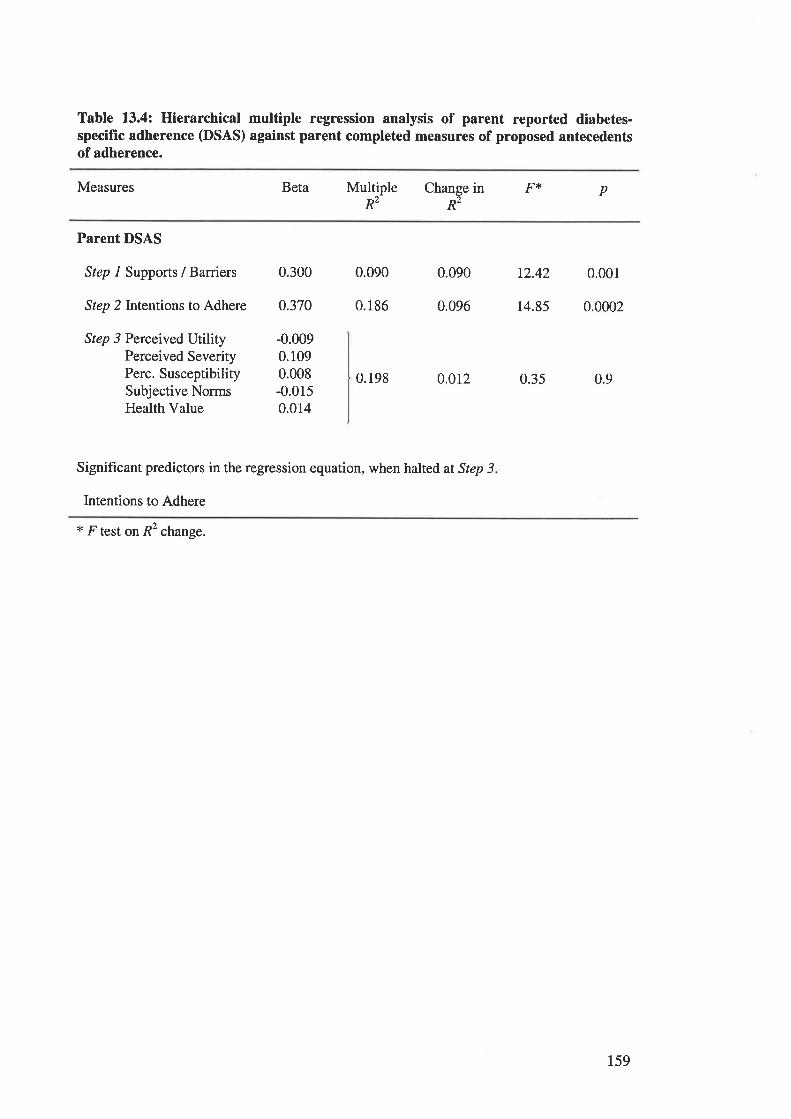
Table 13.4: Hierarchical multiple regression analysis of parent reported diabetes-specific adherence (DSAS) against parent completed measures of proposed antecedentsof adherence.
Measures Beta pMultiple Change in F{'R2 R2
Parent DSAS
Step I Supports / Barriers
Step 2Intentions to Adhere
Step 3 Perceived UtilityPerceived SeverityPerc. SusceptibilitySubjective NormsHealth Value
0.300 0.090 0.090 t2.42 0.001
0.370 0.186 0.096 14.85 0.0002
-0.0090.1090.008-0.0150.014
0.198 0.012 0.35 0.9
Significant predictors in the regression equation, when halted at Step 3
Intentions to Adhere
* F test on R2 change.
159
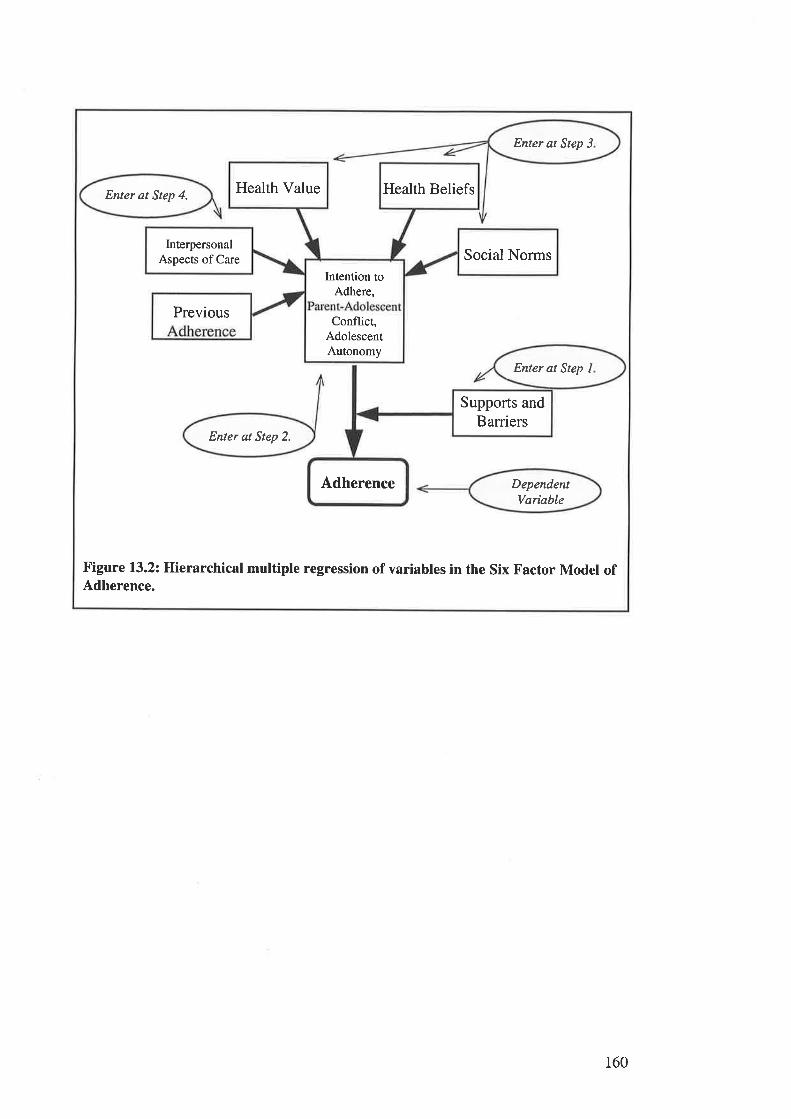
Enter at Step 3
Enter at Step 4.
DependentVarioble
Enter at Step 2.
Health Value Health Beliefs
InterpersonalAspects of Care Social Norms
Intention toAdhere,
PreviousConflict,
AdolescentAutonomy
Enter at Step I
Supports andBarriers
Adherence
Figure 13.2: Hierarchical multiple regression of variables in the Six Factor Model ofAdherence.
160
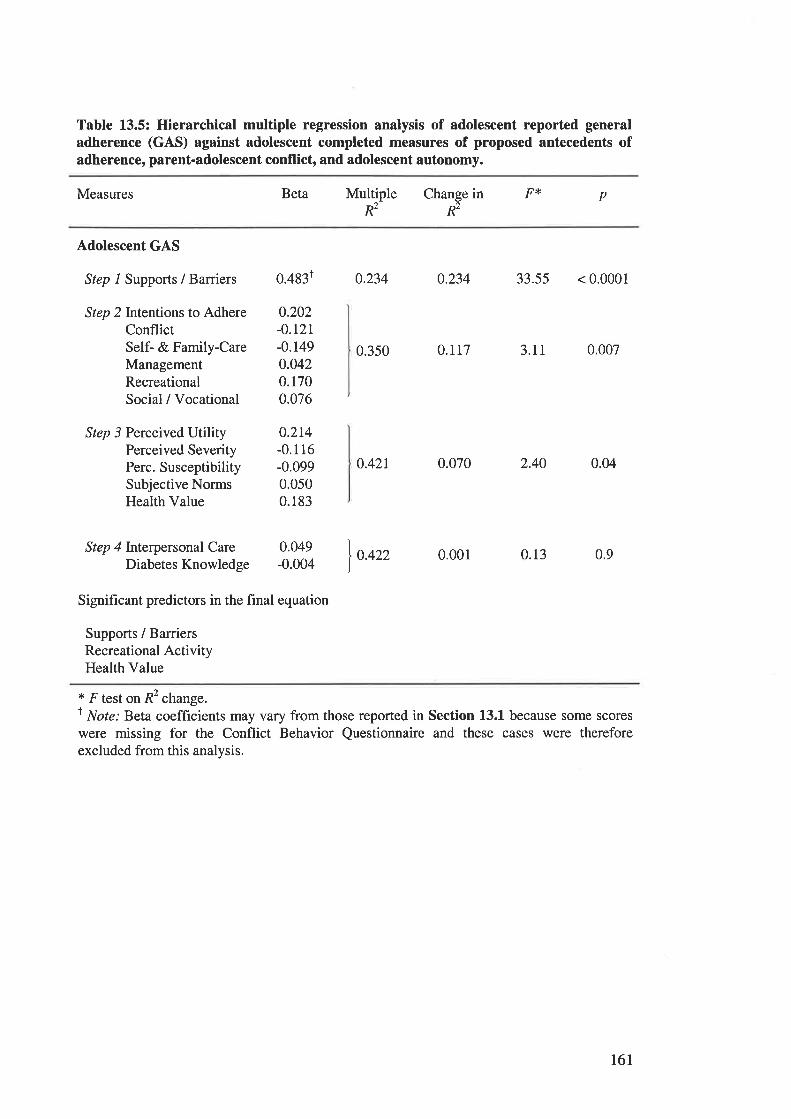
Table 13.5: Hierarchical multiple regression analysis of adolescent reported generaladherence (GAS) against adolescent completed measures of proposed antecedents ofadherence, parent-adolescent conflict, and adolescent autonomy.
Measures Beta pMultipleR2
Change in F*R2
Adolescent GAS
Step 1 Suppons / Barriers
Step 2Intentions to AdhereConflictSelf- & Family-CareManagementRecreationalSocial / Vocational
Step 3 Perceived UtilityPerceived SeverityPerc. SusceptibilitySubjective NormsHealth Value
Step 4 lnterpersonal CareDiabetes Knowledge
0.350 0.rt1 3.11 0.007
0.42r 0.070 2.40 0.04
0.422 0.001 0.13 0.9
0.4831 0.234 o.234 33.55 < 0.0001
0.202-0.121-0.1490.0420.1700.076
0.214-0.116-0.0990.0500.183
0.049-0.004
Significant predictors in the final equation
Supports / BarriersRecreational ActivityHealth Value
* F test on R2 change.r Not": Beta coefficients may vary from those reported in Section 13.1 because some scores
were missing for the Conflict Behavior Questionnaire and these cases were thereforeexcluded from this analysis.
16l
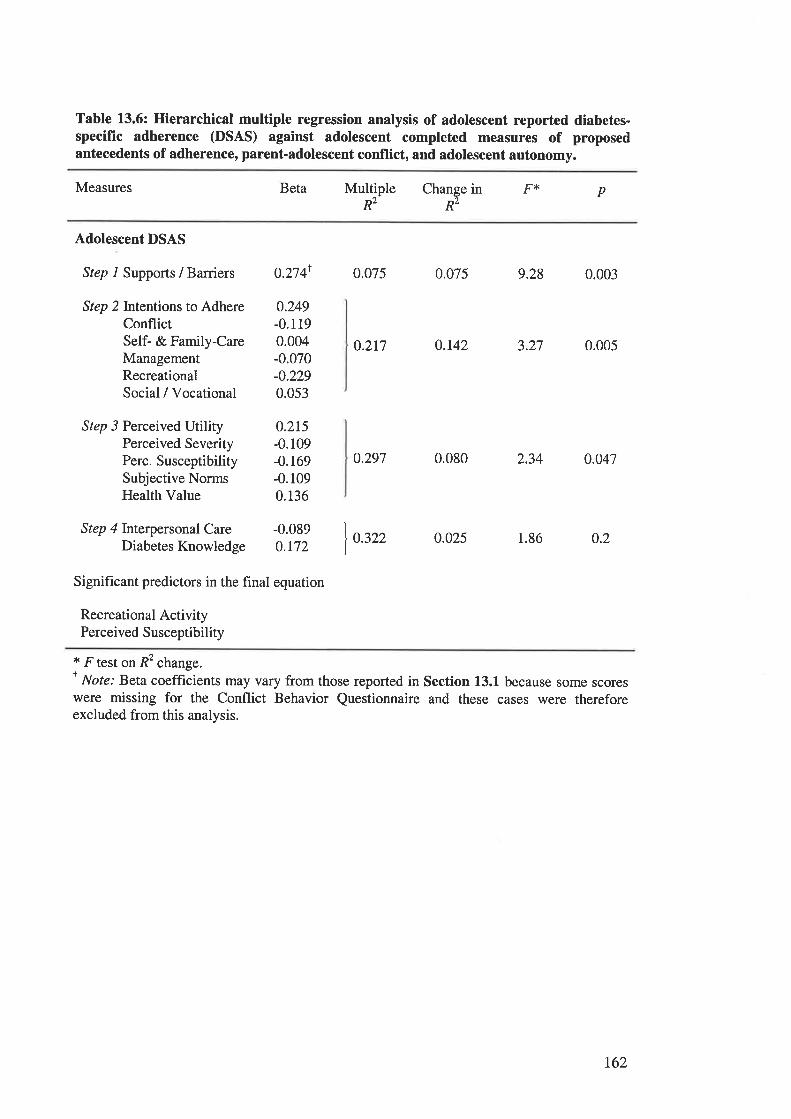
Table 13.6: Hierarchical multiple regression analysis of adolescent reported diabetes-specific adherence (DSAS) against adolescent completed measures of proposedantecedents of adherence, parent-adolescent conflict, and adolescent autonomy.
Measures Beta Fr pMultipleR2
Change inR2
Adolescent DSAS
Step 1 Supports / Barriers 0.2741 0.075 0.075 9.28 0.003
0.217 0.142 3.27 0.005
o.297 0.080 2.34 0.047
0.322 0.025 1.86 0.2
Step 2Intentions to AdhereConflictSelf- & Family-CareManagementRecreationalSocial / Vocational
Step 3 Perceived UtilityPerceived SeverityPerc. SusceptibilitySubjective NormsHealth Value
Step 4 Interpersonal CareDiabetes Knowledge
0.249-0.1190.004-0.070-0.2290.053
0.215-0.109-0.169-0.1090.136
-0.0890.r72
Signifrcant predictors in the final equation
Recreational ActivityPerceived Susceptibility
* F test on R2 change.I Note: Beta coefficients may vary from those reported in Section 13.1 because some scoreswere missing for the Conflict Behavior Questionnaire and these cases were thereforeexcluded from this analysis.
t62
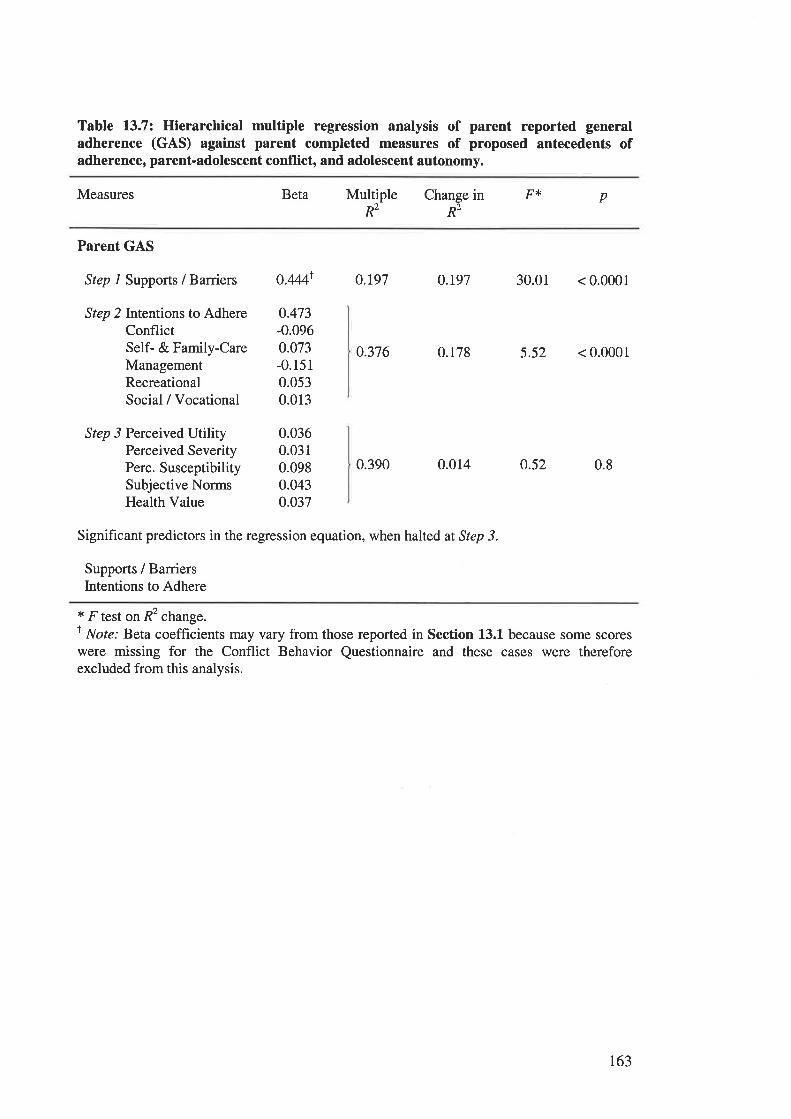
Table 13.7: Hierarchical multiple regression analysis of parent reported generaladherence (GAS) against parent completed measures of proposed antecedents ofadherence, parent-adolescent conflict, and adolescent autonomy.
Measures Beta pMultiple Change in F{<
R2 Rz
Parent GAS
Step 1 Suppons / Barriers
Step 2Intentions to AdhereConflictSelf- & Family-CareManagementRecreationalSocial / Vocational
Step 3 Perceived UtilityPerceived SeverityPerc. SusceptibilitySubjective NormsHealth Value
0.376 0.178 5.52 < 0.0001
0.390 0.014 o.52 0.8
o.444r O.r97 0.t97 30.01 < 0.0001
0.473-0.0960.073-0.1510.0530.013
0.0360.0310.0980.0430.037
Significant predictors in the regression equation, when halted at Step 3.
Supports / BarriersIntentions to Adhere
* F test on R2 change.I Note: Beta coefficients may vary from those reported in Section 13.1 because some scoreswere missing for the Conflict Behavior Questionnaire and these cases were thereforeexcluded from this analysis.
r63
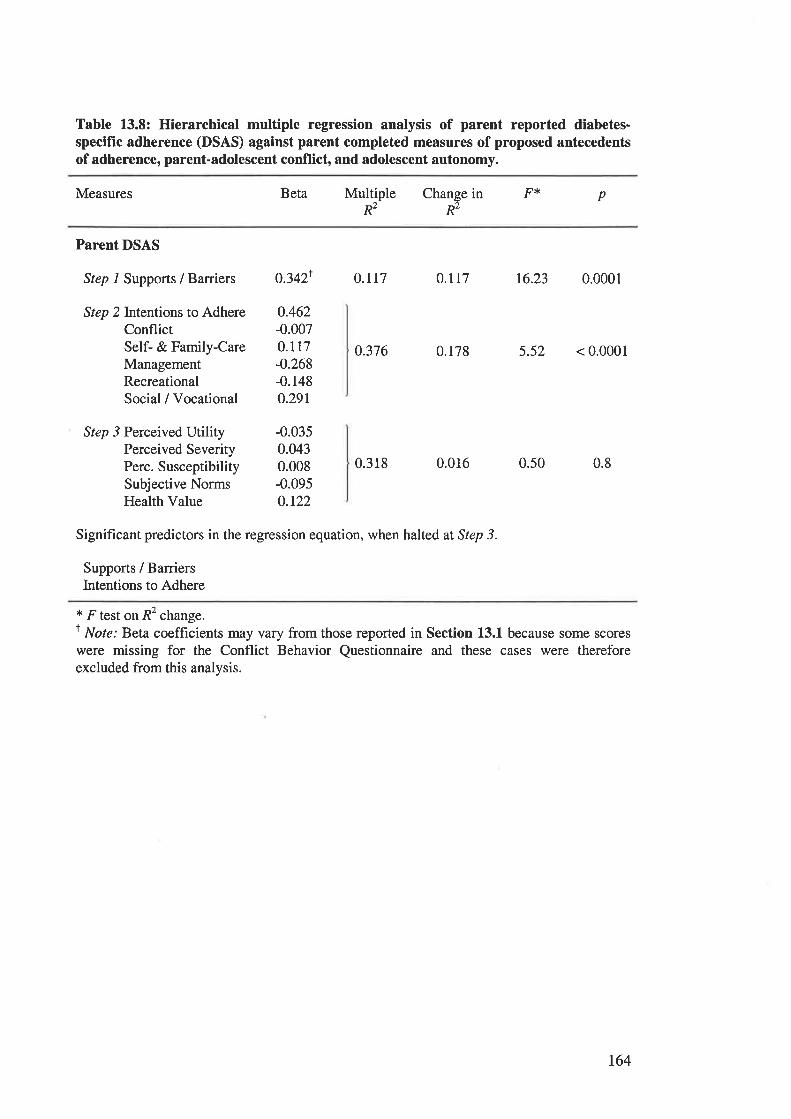
Table 13.8: Hierarchical multiple regression analysis of parent reported diabetes-specific adherence (DSAS) against parent completed measures of proposed antecedentsof adherence, parent-adolescent conflict, and adolescent autonomy.
Measures Beta Multiple pR2
Change in F>t'
R2
Parent DSAS
Step 1 Supports / Barriers
Step 2Intentions to AdhereConflictSelf- & Family-CareManagementRecreationalSocial / Vocational
Step 3 Perceived UtilityPerceived SeverityPerc. SusceptibilitySubjective NormsHealth Value
03421 O.rr7
0.462-0.0070.117-0.268-0.1480.291
-0.0350.0430.008-0.0950.t22
0.117 16.23 0.0001
0.376 0.178 5.52 < 0.0001
0.318 0.016 0.50 0.8
Significant predictors in the regression equation, when halted at Step 3.
Supports / BarriersIntentions to Adhere
* F test on R2 change.t Note: Beta coefficients may vary from those reported in Section 13.1 because some scoreswere missing for the Conflict Behavior Questionnaire and these cases were thereforeexcluded from this analysis.
164
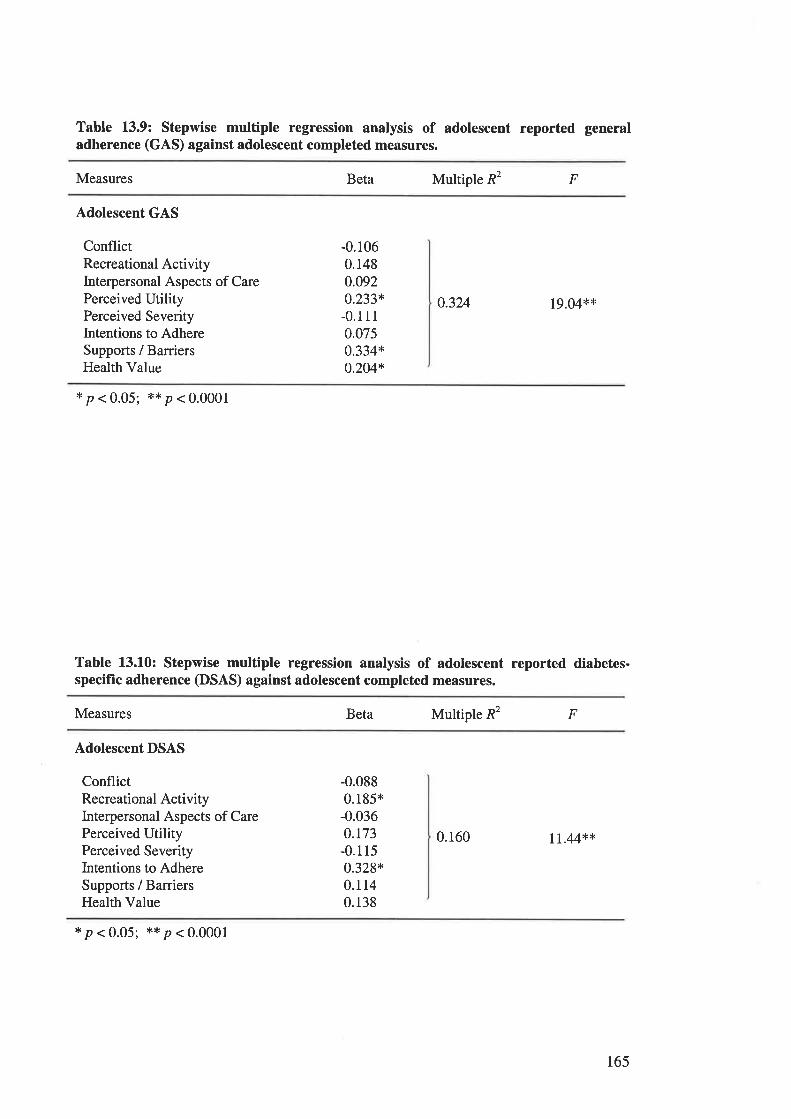
Table 13.9: Stepwise multiple regression analysis of adolescent reported generaladherence (GAS) against adolescent completed measures.
Measures Beta Multiple R2 F
Adolescent GAS
ConflictRecreational ActivityInterpersonal Aspects of CarePerceived UtilityPerceived SeverityIntentions to AdhereSupports / BarriersHealth Value
-0.1060.1480.0920.233*-0.1110.0750.334*o.204*
0.324 19.04**
*p<0.05; **p<0.0001
Table 13.10: Stepwise multiple regression analysis of adolescent reported diabetes-specific adherence (DSAS) against adolescent completed measures.
Measures Beta Multiple R2 F
Adolescent DSAS
ConflictRecreational ActivityInterpersonal Aspects of CarePerceived UtilityPerceived SeverityIntentions to AdhereSupports / BarriersHealth Value
-0.0880.185*-0.0360.r73-0.1150.328*0.1140.138
0.160 rr.44**
*p<0.05; **p<0.0001
165
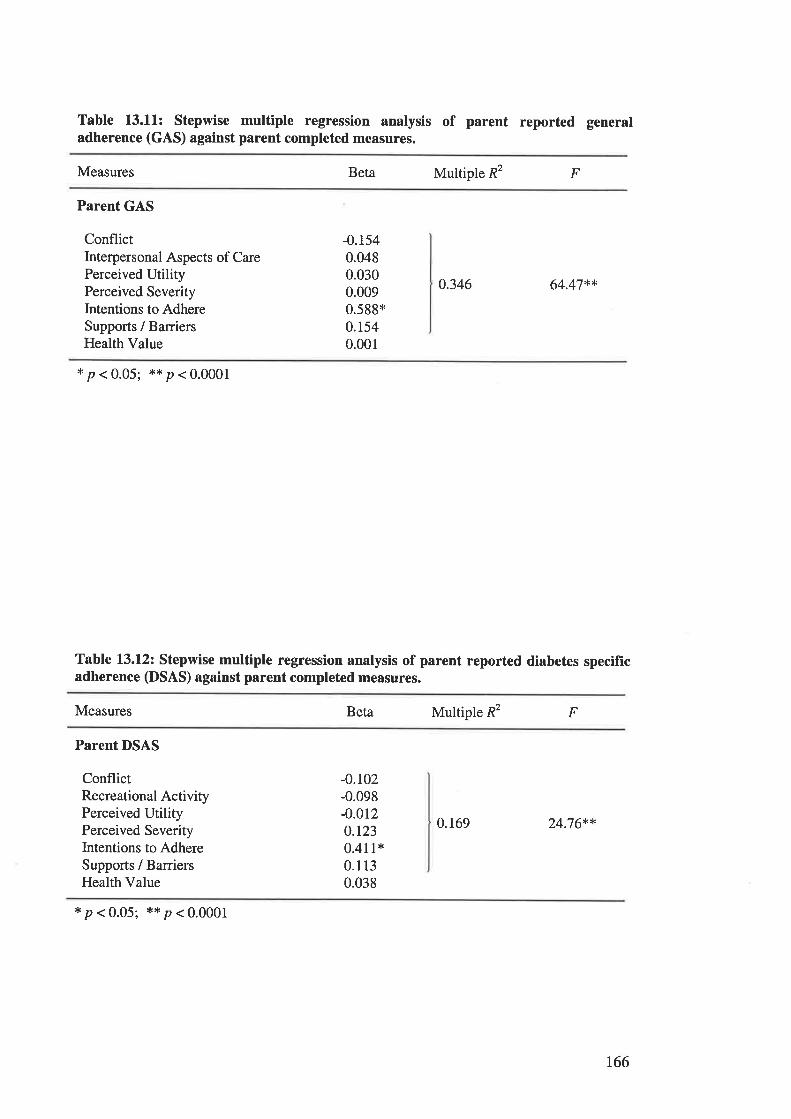
Table 13.11: Stepwise multiple regression analysis of parent reported generaladherence (GAS) against parent completed measures.
Measures Beta Multiple R2 F
Parent GAS
ConflictInterpersonal Aspects of CarePerceived UtilityPerceived SeverityIntentions to AdhereSupports / BarriersHealth Value
-0.1540.0480.0300.0090.599*0.1540.001
0.346 64.47**
*p<0.05; **p<0.0001
Table l3.l2z Stepwise multiple regression analysis of parent reported diabetes specificadherence (DSAS) against parent completed measures.
Measures Beta Multiple R2 F
Parent DSAS
ConflictRecreational ActivityPerceived UtilityPerceived SeverityIntentions to AdhereSupports / BarriersHealth Value
-0.102-0.098-0.0t20.1230.411+0.1 13
0.038
0.169 24.76**
*p<0.05; **p<0.0001
t66
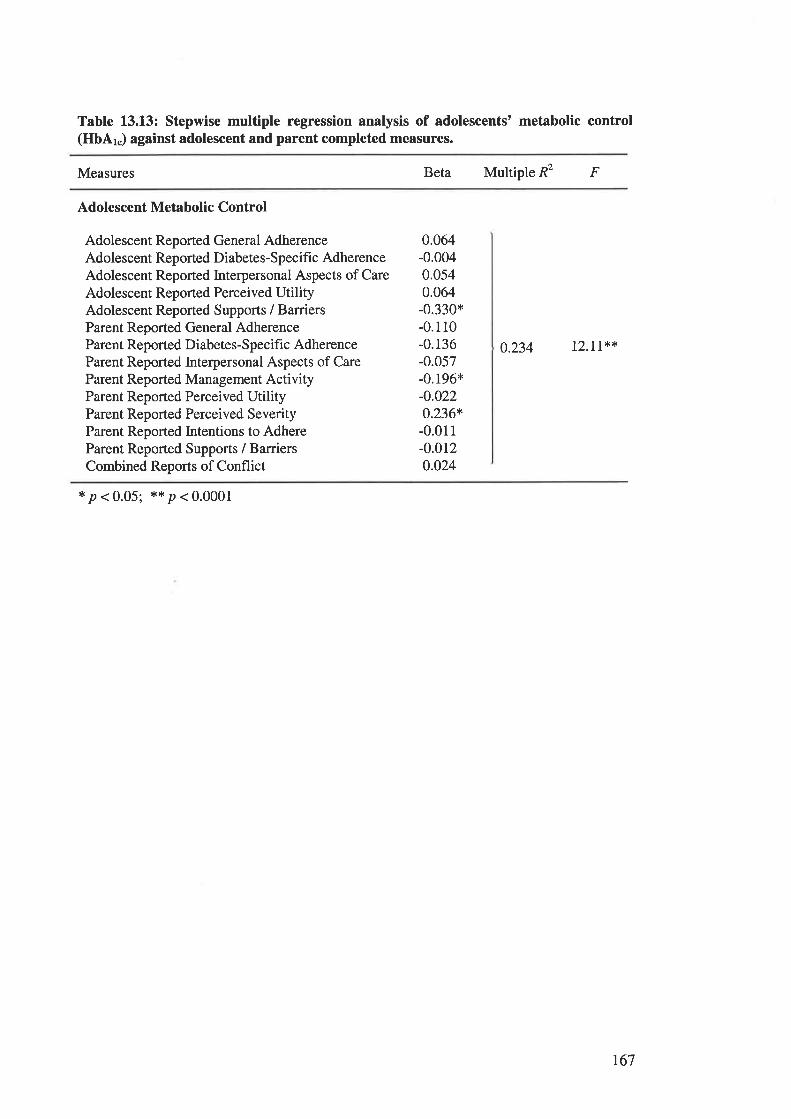
Table 13.L3: Stepwise multiple regression analysis of adolescents' metabolic control(HbAk) against adolescent and parent completed measures.
Measures Beta Multiple R2 F
Adolescent Metabolic Control
Adolescent Reported General AdherenceAdolescent Reported Diabetes-Specific AdherenceAdolescent Reported Interpersonal Aspects of CareAdolescent Reported Perceived UtilityAdolescent Reported Supports / BarriersParent Reported General AdherenceParent Reported Diabetes-Specific AdherenceParent Reported Interpersonal Aspects of CareParent Reported Management ActivityParent Reported Perceived UtilityParent Reported Perceived SeverityParent Reported Intentions to AdhereParent Reported Supports / BarriersCombined Reports of Conflict
0.064-0.0040.0s40.064-0.330*-0.110-0.136-0.057-0.196*-0.022o.236+-0.011-0.0120.024
0.234 12.11**
*p<0.05; **p<0.0001
r67

APPENDICES.

APPEI\DIX A.
Appendix A.1The Pilot Study.
4.1.0 Introduction.
Pilot testing of the questionnaires began on 20 April, 1995, in the Diabetes
Outpatients Clinic at the Women's and Children's Hospital.
The questionnaires were administered to a consecutive sample of 13 parent-adolescent
dyads attending the Diabetes Outpatient Clinics. The demographic characteristics of
the pilot sample are described in Tables 4.1 and 4.2. Adolescents were selected for
inclusion in the pilot study if they met the criteria for entry into the main study. That
is, the adolescents were aged between 12 and 17 years, and attending the Women's
and Children's Hospital Diabetes Outpatients Clinics with a parent or guardian.
Additional entry criteria for the study were as follows:
o participating adolescents needed to have been diagnosed with Insulin Dependent
Diabetes for a minimum of 12 months.
o participating adolescents needed to attend the Outpatient Clinics in the company
of a parent or guardian.
o participating adolescents and their parents needed to have sufficient
comprehension of written English to complete the questionnaires.
The pilot testing was conducted for four weeks. Participants in the pilot study were
excluded from the main study, to prevent possible learning effects.
t70
4.1.1 Pilot Study Procedures.
Subjects were approached by the investigator to participate in the study while
attending outpatient clinic sessions. The collection of questionnaire data was
conducted in the outpatient clinic waiting area. The investigator was present during
the completion of the questionnaires, to answer any questions with which participants
experienced difficulties.
^.1.2 Pilot Testing of Questionnaire Measures.
A.l.2.lMeasures Employed in the Pilot Questionnaire.
Pilot testing examined the acceptability and utility of all of the questionnaire measures
proposed for use in the main study. These measures are, with one exception, identical
to those used in the main study. A detailed description of these measures may be
found in Chapter 3. The exception is the Self-Efficacy for Diabetes Scale (SED;
Grossman, Brink, Hauser, 1987), which was employed in the pilot study but excluded
from the main study. This measure, and its exclusion from the main study, are
described in detail in this chapter.
t7r
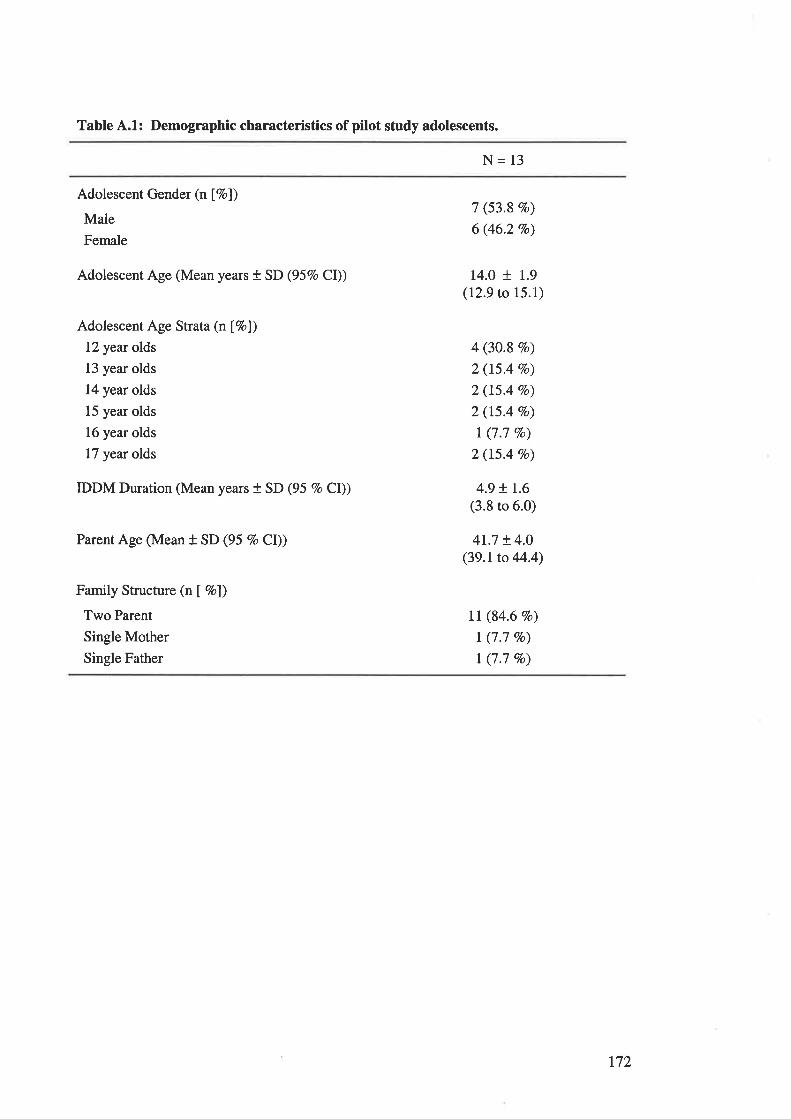
Table 4.1: Demographic characteristics of pilot study adolescents.
N= 13
Adolescent Gender (n [7o))
Male
Female
Adolescent Age (Mean years t SD (957o CD)
Adolescent Age Strata (nÍ7ol)
12 year olds
13 year olds
14 year olds
15 year olds
16 year olds
17 year olds
IDDM Duration (Mean years + SD (95 Vo Cl))
Parent Age (Mean + SD (95 7o Cl))
Family Structure (n I Vo])
Two Parent
Single Mother
Single Father
7 (53.8 Vo)
6 (46.2 Vo)
14.0 + 1.9(12.9 to 15.1)
4 (30.8 %o)
2 (t5.4 Vo)
2 (15.4 7o)
2 (15.4 Vo)
I (7.7 Vo)
2 (15.4 7o)
4.9 + r.6(3.8 to 6.0)
4r.7 + 4.0(39.1to 44.4)
Il (84.6 7o)
I (7.7 c/o)
t (7.7 7o)
t72
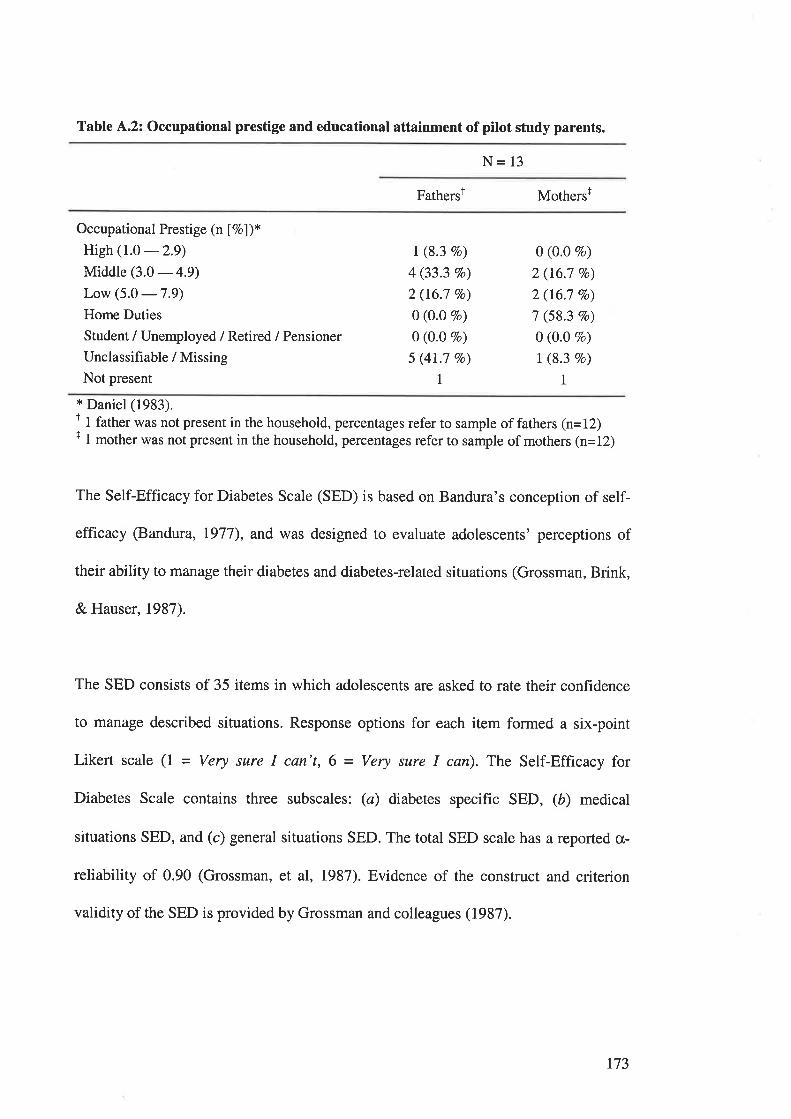
Table 4.2: Occupational prestige and educational attainment of pitot study parents.
N= 13
FathersÌ Mothersr
Occupational Prestige (n Í7ol)*High (1.0
-2.9)Middle (3.0 - 4.9)
Low (5.0 -7.9)
Home Duties
Student / Unemployed / Retired / Pensioner
Unclassifiable / Missing
Not present
I (8.3 Vo)
4 (33.3 7o)
2 (16.7 Vo)
0 (O.0 7o)
0 (0.0 Vo)
5 (41.7 Vo)
I
0 (0.0 Vo)
2 (16.7 7o)
2 (16.7 Vo)
7 (58.3 vo)
0 (0.0 Vo)
I (8.3 7o)
I* Daniel (1983).t I father was not present in the household, percentages refer to sample of fathers (n=12)t I mother was not present in the household, percentages refer to sample of mothers (n=12)
The Self-Efficacy for Diabetes Scale (SED) is based on Bandura's conception of self-
efficacy (Bandura, 1977), and was designed to evaluate adolescents' perceptions of
their ability to manage their diabetes and diabetes-related situations (Grossman, Brink,
& Hauser, 1987).
The SED consists of 35 items in which adolescents are asked to rate their confidence
to manage described situations. Response options for each item formed a six-point
Likert scale (1 - Very sure I can't, 6 = Very sure I can). The Self-Efficacy for
Diabetes Scale contains three subscales: (ø) diabetes specific SED, (å) medical
situations SED, and (c) general situations SED. The total SED scale has a reported cr-
reliability of 0.90 (Grossman, et al, 1987). Evidence of the construct and criterion
validity of the SED is provided by Grossman and colleagues (1987).
t73
4.1.3 Results of the Pilot Study
The analysis performed on the pilot questionnaires was not extensive. Pilot analyses
examined the distributions of scores on each of the questionnaire measures, with the
intention of determining whether these measures were suitable for use with the target
population. Table 4.3 displays the obtained mean scores, with standard deviation, as
well as the minimum and maximum obtained scores on each measure.
4.1.4 Modifications Made to the Pilot Study Questionnaires.
In light of the results obtained in the pilot study, several changes were made to the
questionnaire measures. First, the Self-Efficacy for Diabetes Questionnaire was
removed from the questionnaire measures. As can be seen in Table 4.3, The
responses obtained for this measure were consistently high, particularly responses
made by the adolescents. High responses on this measure indicate a perceived high
level of Self-Efficacy in relation to diabetes management, and the small range of
obtained responses for this measure limit the utility of the measure for the present
research. In addition, given the total length of the questionnaire measures employed
in the pilot study, the SED was removed to reduce respondent burden.
A second modification made to the questionnaire measures as a result of the Pilot
Study was the rephrasing of item 9 of the Diabetes Knowledge questionnaire. The
third response option was changed from "Use diabetic tablets instead of insulin" to
"Take less insulin." This change was made to update the question to current paediatric
diabetes management practices, and to improve the comprehensibility of the question.
174
Similarly, the wording of items I,5,'7 and 9 of the Diabetes Specific Adherence Scale
were modified to make these items more comprehensible, particulady to younger
adolescents. These changes were made on the basis of feedback from adolescents and
parents participating in the Pilot Study, in consultation with members of the Women's
and Children's Hospital Diabetes Team.
L75
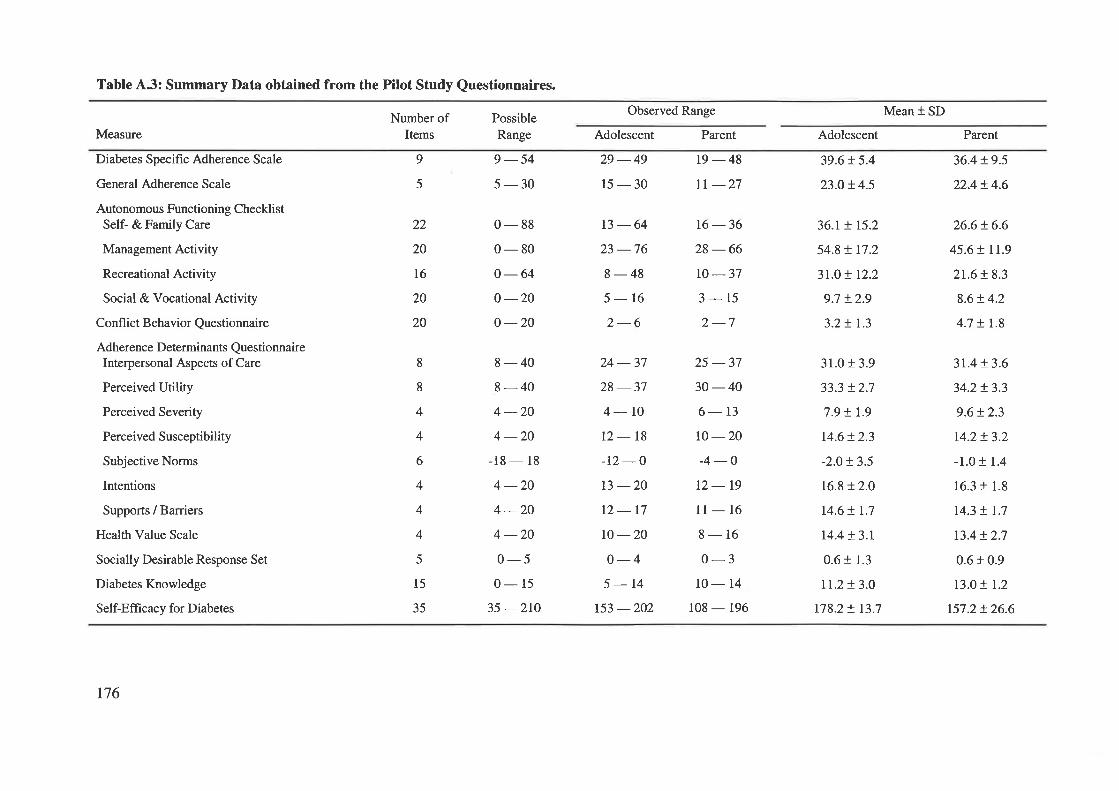
Table 4.3: Summary Data obtained from the Pilot Study Questionnaires.
Number ofItems
PossibleRange
9-545-30
0-880-800 -64o -20o -20
Observed Range Mean + SD
Measure
Diabetes Specific Adherence Scale
General Adherence Scale
Autonomous Functioning ChecklistSelf- & Family Care
Management Activity
Recreational Activity
Social & Vocational Activity
Confl ict Behavior Questionnaire
Adherence Determinants QuestionnaireInterpersonal Aspects of Care
Perceived Utility
Perceived Severity
Perceived Susceptibility
Subjective Norms
Intentions
Supports / Barriers
Health Value Scale
Socially Desirable Response Set
Diabetes Knowledge
Self-Effi cacy for Diabetes
9
5
Adolescent
29 -4915-30
13-6423 -768-485-162-6
Pa¡ent
19-48tr -27
16 -3628-66ro-373-152-7
Adolescent
39.6 ! 5.4
23.0 ! 4.5
36.r + r5.2
54.8 ! t7.2
31.0 ! 12.2
9.7 t2.9
3.2 ! 1.3
Parent
36.4 + 9.5
22.4+ 4.6
26.6+ 6.6
45.6 t rr.9
2t.6!8.3
8.6!4.2
4.7 + I.8
22
20
t6
20
20
8
8
4
4
6
4
4
4
5
15
35
8-408-404 -204 -20
-18 - l8
4 -204-204 -200-50- 15
35 -2rO
24 -3728 -374-LOt2-18-12 -ot3 -2012-17ro -20o-45-14
t53 -202
25 -3730-406- 13
to -20-4 -Ot2-19l1- 16
8-160-3
10- 14
108 - 196
31.0 t 3.9
33.3 t2.7
7.9 t r.9
14.6!2.3
-2.O!3.5
16.8 12.0
14.6 ! r.7
r4.4!3.1
0.6 r 1.3
tt.2!3.o178.2 ! 13.7
3r.4t3.6
34.2!3.3
9.6!2.3
r4.2+ 3.2
-1.0 + 1.4
16.3 t 1.8
14.3 ! 1.7
t3.4 !2.7
0.6 + 0.9
13.0 ! 1.2
157.2 !26.6
r76
The final change to the Pilot Study Questionnaire related to the Demographic
information. At the conclusion of the Pilot Study, an item addressing the educational
attainment of the non-participating parent, which was not included in the Pilot Study
questionnaire, was added. This item was included to provide a more comprehensive
description of the demographic characteristics of participating families, as well as to
ensure that matching information was obtained from parents, whether mothers or
fathers completed the questionnaire.
4.1.5 Pilot Testing of Electronic Monitoring of Self-Monitoring of Blood
Glucose.
Two adolescents already using Medisense Companion 2rM Blood Glucose Monitors
attended Outpatient Clinics during the pilot study period. The BGM tests recorded on
these monitors were downloaded onto the SensorlinkrM machines as a trial of this
procedure. Formal analyses were not conducted on these results, which were used only
as a trial of the procedures involved in obtaining this data.
177
Appendix A'.2 The Information Sheet.
INFORMATION SHEET.
DIABETES AND FAMILIES STUDY.
The aim of this study is to examine adherence to medical treatment amongst
adolescents with diabetes. Patient adherence to medical treatment is acritical factor in managing chronic illnesses. Previous studies have suggested
that adolescents who are very dependent on their parents, and who frequently
fight with their parents will not follow their medical treatment as well as other
adolescents. This study is intended to examine these factors.
lf you and your parent agree to take part in the study, you will be given a
questionnaire that will take less than half an hour to complete. The
questionnaire asks a number of questions about the way you follow your
medical treatment, and about your relationship with your parent. A separate
questionnaire will also be given to your parent to complete.
The information you and your parent provide will be kept in the strictest
confidence, and will be used only for the purpose of this study. It will in no
way effect your medical treatment. The answers that you provide will not
be seen by the clinicians who are treating you.
lf you have any questions about the study, please feel free to contact
Mr Michael Fotheringham (Phone: 239 0133) or Dr Michael Sawyer
(Phone: 239 0133) at the Women's and Children's Hospital.
Your help and cooperation are greatly appreciated.
Michael Fotheringham.PhD Student.Women's and Children's Hospital
t78
1
Appendix A.3The Consent Form.
CONSENT FORM.
ADOLESCENTS' AND DIABETES.
The nature and purpose of the study has been explained to me, and the timerequired to complete the questionnaire/s has been made clear.
I understand that I (my child) may not be directly benefited by taking part inthis study.
I understand that while information gained form the study will be published, I
(my child) will not be identified.
I understand that I (my child) can withdraw from the study at any stage andthat this will not effect my (child's) treatment.
I understand that there will be no payment to me (or my child) for taking partin this study.
I have had the opportunity to discuss taking part in this investigation with afamily member or friend.
I am aware that I should retain a copy of the Consent Form when completedand the lnformation Sheet.
Signed:
Date:
ParenUGuardian:
Signed:
Relationship to patient:
Full name of patient:
Date:
I certify that I have explained the study to the patient (and/or parent) and considerthat he/she understands what is involved.
2.
3.
4.
5.
6.
7
Signed:
179
Appendix 4.4 Instructions for Completing Questionnaire Measures.
4.4.1 Instructions for Adolescents Completing Questionnaire Measures.
This questionnaire asks about your diabetes management, independence, and
about your relationship, with your [mother / father]. The questionnaire includes
several sections.
The first section is called the Diabetes Specific Adherence Scale, please
complete this scale by indicating how much each of the activities have been performed
in the past four weeks, whether you do these things yourself or with help from [one ofl
your parent[s].
The second section is called the General Adherence Scale, again, please
complete this scale by indicating how much each of the activities have been performed
in the past four weeks, whether you get help with them.
The next section is the Autonomous Functioning Checklist, please complete
this scale by indicating what you do.
Next is the Conflict Behaviour Questionnaire, please complete this by
answering whether you think each statement is true or false
The next section is the Adherence Determinants Questionnaire. Please
complete this scale by answering how much you think each statement applies.
The final scale is the Diabetes Knowledge Questionnaire, please tick the one
response for each question that you think is most correct.
180

^.4.2 Instructions for Parents Completing Questionnaire Measures.
This questionnaire asks about your teenagers' diabetes management,
independence, and about your relationship with your teenager. The questionnaire
includes several sections.
The first section is called the Diabetes Specific Adherence Scale, please
complete this scale by indicating how much each of the activities have been performed
in the past four weeks, whether you help with them or not.
The second section is called the General Adherence Scale, again, please
complete this scale by indicating how much each of the activities have been performed
in the past four weeks, whether you help with them or not.
The next section is the Autonomous Functioning Checklist, please complete
this scale by indicating what your teenager does.
Next is the Conflict Behaviour Questionnaire, please complete this by
answering whether you think each statement is true or false
The next section is the Adherence Determinants Questionnaire. Please
complete this scale by answering each question in relation to your teenager - that is,
how much you think each statement applies to your teenager.
The final scale is the Diabetes Knowledge Questionnaire, please tick the one
response for each question that you think is most correct.
At the end of the questionnaire there are some questions about you and you
family.
181
Appendix 4.5 The Adolescent Questionnaire.
Diabetes and Families.
Adolescent Questionnaire.
r82
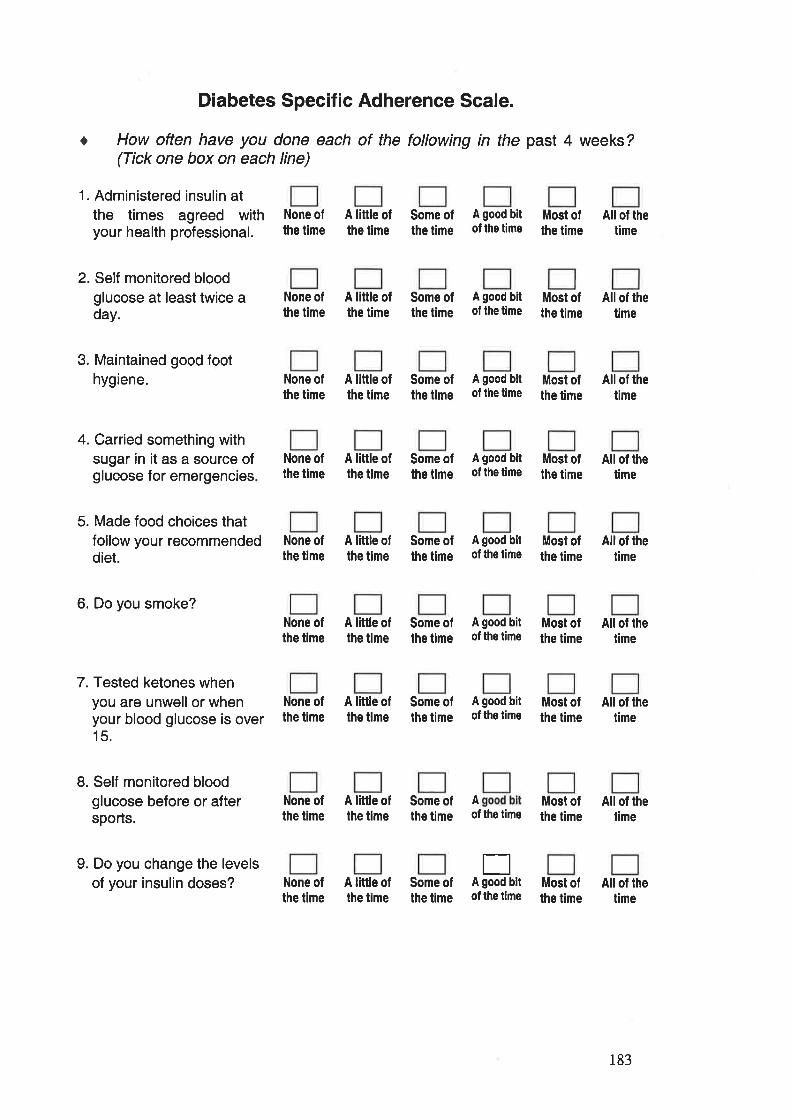
t
Diabetes Specific Adherence Scale.
How often have you done each of the following in the past 4 weeks?(Tick one box on each line)
1. Administered insulin atthe times agreed withyour health professional.
2. Self monitored bloodglucose at least twice aday.
3. Maintained good foothygiene.
4. Carried something withsugar in it as a source ofglucose for emergencies
5. Made food choices thatfollow your recommendeddiet.
6. Do you smoke?
7. Tested ketones whenyou are unwell or whenyour blood glucose is over15.
L Self monitored bloodglucose before or aftersports.
9. Do you change the levelsof your insulin doses?
None ofthe time
A little ofthe time
Some ofthe time
A good bitof the time
Most ofthe time
All of thetime
All of thetime
None ofthe time
A little ofthe time
Some ofthe time
A good bitof lhe time
Most ofthe time
None ofthe time
A little ofthe time
Some ofthe time
A good bitof the time
Most ofthe time
All of thetime
None ofthe time
A little ofthe time
Some ofthe time
A good bitof the time
Most ofthe lime
All of thetime
None ofthe time
None ofthe time
A little ofthe time
Some ofthe time
A good bitof the time
Most ofthe time
Allof thetime
None ofthe time
A little ofthe time
Some ofthe lime
A good bitof the time
Most ofthe time
A little ofthe time
Some ofthe time
A good bitof the time
Most ofthe time
Allof thetime
All of thetime
None ofthe time
A little ofthe time
Some ofthe time
Aof the time
Most ofthe time
All of thetime
None ofthe time
A little oflhe time
Some ofthe time
EA good bitof the time
Most ofthe time
All of lhetime
183
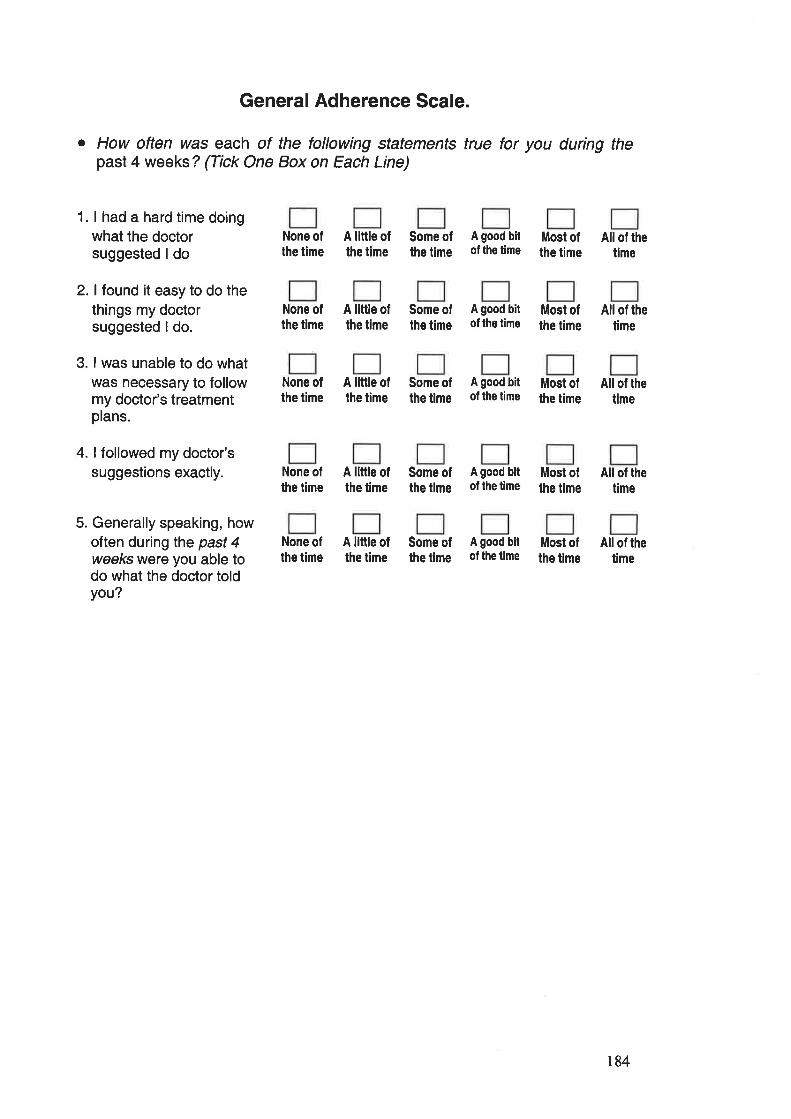
General Adherence Scale.
o How often was each of the tollowing statements true for you during thepast 4 weeks ? (Tick One Box on Each Line)
1. I had a hard time doingwhat the doctorsuggested I do
2. I found it easy to do thethings my doctorsuggested I do.
3. I was unable to do whatwas necessary to followmy doctor's treatmentplans.
4. I followed my doctor'ssuggestions exactly.
5. Generally speaking, howoften duringlhe past 4weeks were you able todo what the doctor toldyou?
None ofthe time
A little ofthe time
Some ofthe time
A good bitof the time
Most ofthe time
All of thetime
None oflhe time
A little ofthe time
Some oflhe time
A good bitof the time
Most ofthe time
All of thetime
None ofthe time
A little ofthe time
Some ofthe time
A good bitof lhe time
Most ofthe time
All of thetime
None ofthe time
A little ofthe time
Some ofthe time
A good bitof the time
Most ofthe time
All of thetime
None ofthe time
A little ofthe time
Some ofthe time
A good bitof lhe time
Most ofthe time
All of thetime
184
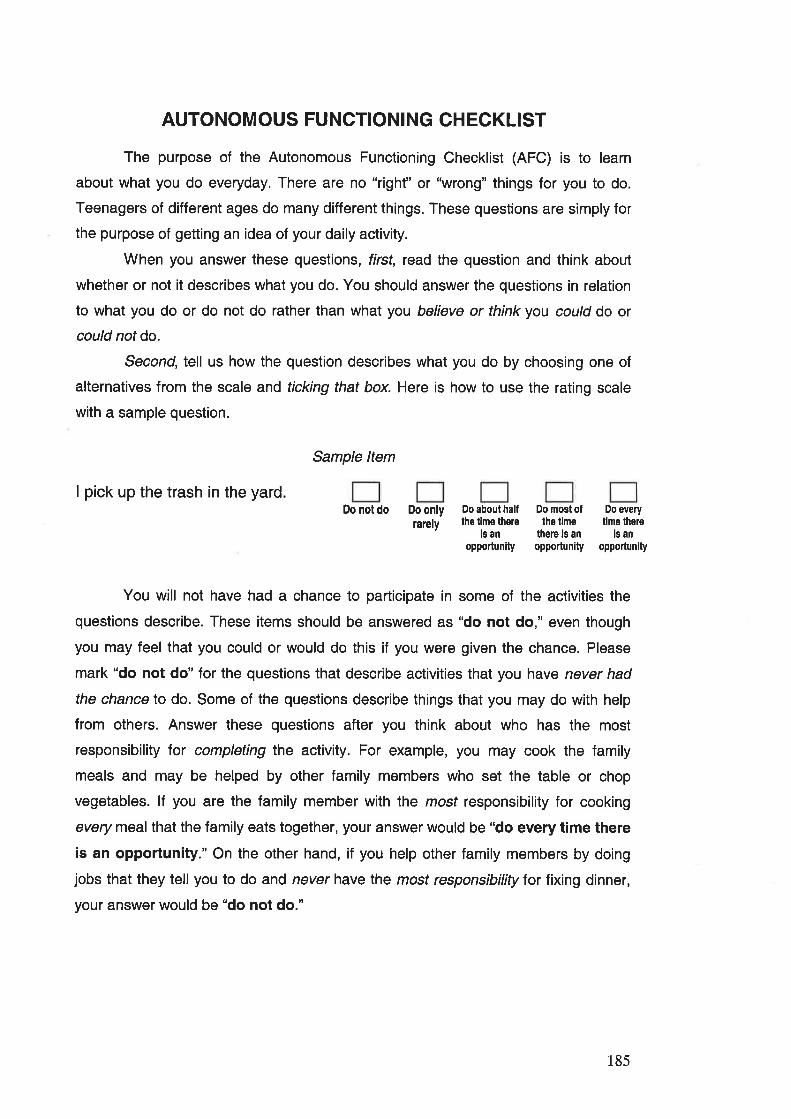
AUTONOMOUS FUNCTIONING CHECKLIST
The purpose of the Autonomous Functioning Checklist (AFC) is to learn
about what you do everyday. There are no "righf' or "wrong" things for you to do.
Teenagers of different ages do many different things. These questions are simply for
the purpose of getting an idea of your daily activity.
When you answer these questions, first, read the question and think about
whether or not it describes what you do. You should answer the questions in relation
to what you do or do not do rather than what you believe or think you could do or
could not do.
Second, tell us how the question describes what you do by choosing one of
alternatives from the scale and ticking that box. Here is how to use the rating scale
with a sample question.
Sample ltem
I pick up the trash in the yardDo notdo Do only
larelyDo about halfthe time there
is anopportun¡ty
Do most oflhe time
there is anopportunity
Do everytlme there
is anopportunlty
You will not have had a chance to participate in some of the activities the
questions describe. These items should be answered as "do not do," even though
you may feel that you could or would do this if you were given the chance. Please
mark "do not do" for the questions that describe activities that you have never had
the chance to do. Some of the questions describe things that you may do with help
from others. Answer these questions after you think about who has the most
responsibility for completing the activity. For example, you may cook the family
meals and may be helped by other family members who set the table or chop
vegetables. lf you are the family member with the mosf responsibility for cooking
every meal that the family eats together, your answer would be "do every time there
is an opportunity." On the other hand, if you help other family members by doing
jobs that they tell you to do and never have the most responsibility for fixing dinner,
your answer would be "do not do."
185
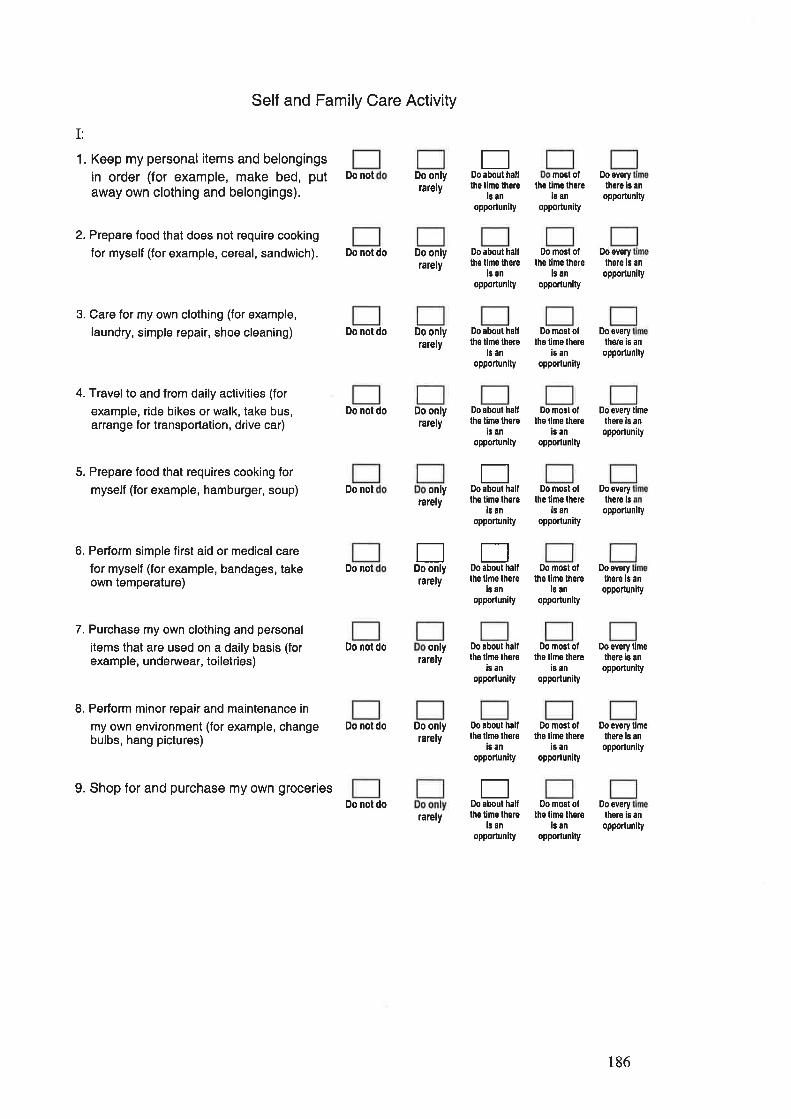
I:
1. Keep my personal items and belongingsin order (for example, make bed, putaway own clothing and belongings).
2. Prepare food that does not require cooking
for myself (for example, cereal, sandwich).
3. Care for my own clothing (for example,
laundry, simple repair, shoe cleaning)
4. Travelto and from daily activities (for
example, ride bikes or walk, take bus,arrange for transportation, drive car)
5. Prepare food that requires cooking for
myself (for example, hamburger, soup)
6. Perform simple first aid or medical care
for myself (for example, bandages, takeown temperature)
7. Purchase my own clothing and personal
items that are used on a daily basis (forexample, underwear, toiletries)
8. Perform minor repair and maintenance in
my own environment (for example, changebulbs, hang pictures)
9. Shop for and purchase my own grocer¡es
Self and Family Care Activity
Do not Do onlyrarely
Do not do Do onlyrarely
Do not do Do onlyrarely
Do not do Do onlyrarely
Do notrarely
Do notrarely
Do nol dorarely
Do not do Do onlyralely
Do not dorarely
Eaboul hallDo
lhe lime lherels an
oppodun¡ty
most ol O,o overy
thê tlme thêrei¡ an
opPortunity
there is ân
opportunity
Do everylhore is an
opportunity
Do about halftho tlmo lherê
is an
opportunity
Do most oflhe time lhsre
is an
opporlunity
Do aboul halllhe time there
ls an
opporlunlty
Do most oflhe time lhere
ie an
opportunity
Do overythere iE an
Do aboul halllhe time there
ls an
oppodun¡ty
Do mosl ollhe llms therê
is anopportunity
opporlunlty
Do êvery timelhere ¡s an
opportunity
only
tlDo only
only
ED,o about halflhe t¡me lhere
is anopportunity
EDo aboul halllhe llme there
is an
opportunity
Do most ofthe timo there
is an
opporlunity
Do most oltho limo thero
is an
opportunity
opportunity
Do everythero is
Do everythêro ls an
opporlunity
Do about halllho tlmo lhor6
is an
oppoflunity
Do mosl o,lhe tlmê lhêre
is anopportunity
Do every timethere ¡5 an
opportunity
tþ aboul hålllhs llmo lhorê
i¡ an
opportun¡ty
Do most ottho time lhere
is an
opporlunity
Do êvêry llmethere is an
opporlunlty
tlDo about halftho t¡me thsre
ls an
opportunity
Do most olthe lime thore
is anopporlun¡ty
Do everythere is an
opporlunlty
186
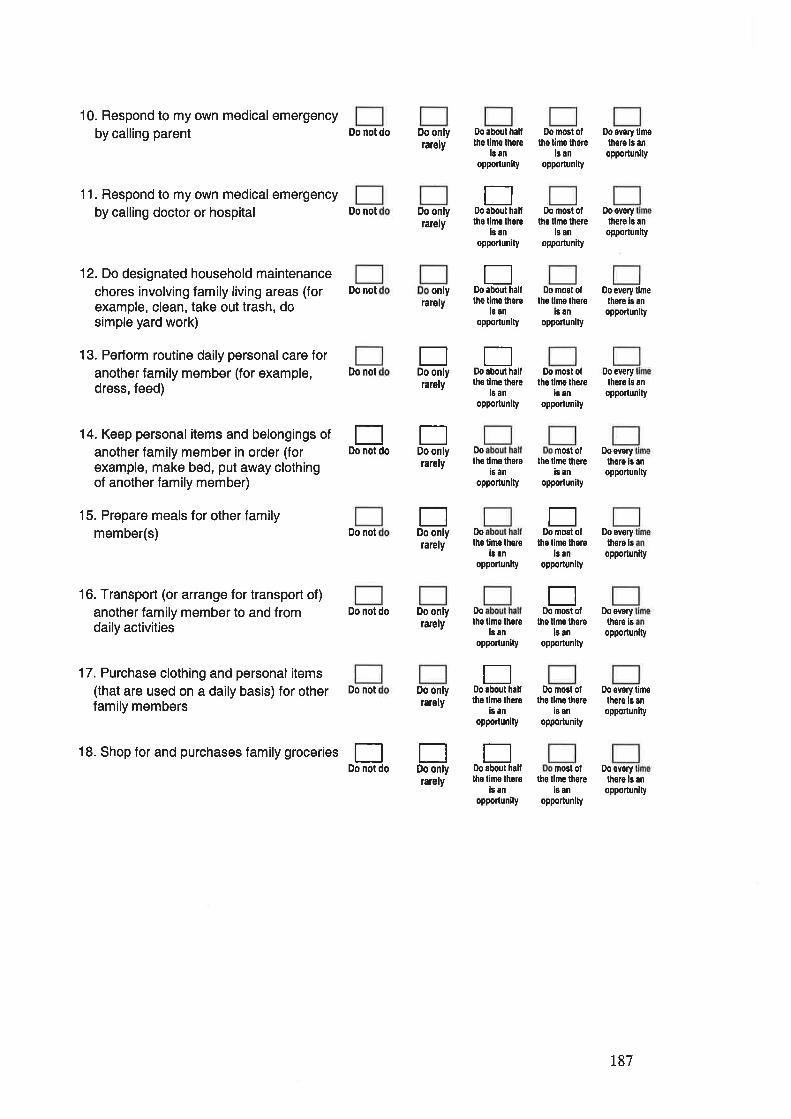
10. Respond to my own medical emergencyby calling parent
11. Respond to my own medical emergencyby calling doctor or hospital
12. Do designated household maintenancechores involving family living areas (forexample, clean, take out trash, dosimple yard work)
13. Perform routine daily personal care foranother family member (for example,dress, feed)
14. Keep personal items and belongings of
another family member in order (forexample, make bed, put away clothingof another family member)
15. Prepare meals for other familymember(s)
16. Transport (or arrange for transport of)
another family member to and fromdaily activities
17. Purchase clothing and personalitems(that are used on a daily basis) for otherfamily members
18. Shop for and purchases family groceries
Do not do
Do not
Do not
Do not
Do onlylarely
Do onlyrarely
Do about halllhe time thsre
ls anoppoftunlly
D,O mOSl Oltho tlmo lhare
is anoPportunity
Do overy tlmelhere ls an
oPporlun¡ty
EDo about halftho tlmo lhore
is an
opporlunity
Do most oftho llme thore
is anopponun¡ty
Do ovorythere is an
opponun[y
0o every timelhere is an
opporlunity
flaboul hallonly Do
rarely lhe timo lhêrei¡ an
opporlunity
EflDo only Doabout hall
rarely ths tine thofêls an
opporlunlty
Do
rarely lhe tlme lhsreis an
opporlunlty
Do
talely lhe l¡ne lherels an
opporlunity
mGgtOl Doovery
Do mosl ollhe llme thêro
16 an
opportunity
EDo not do
tlDo only
EDo only
Do most ollhe t¡mo lhere
ls anopporlun¡ty
Do everylhsfo is an
opponunity
lhors is an
opportunity
Do sverylhsre ls
oppoilunity
Do overylhsre lsopporlunity
Do svory limelhere is an
oppoÌlunlty
tho time lhereis an
opporlunity
Do not
Do not do
Do not
Do onlyrarely
Do onlyrarely
rarely
Do
lhe lime thorels an
opportun¡ty
EDo about halflhe tirne lhero
is ân
opporlunity
EDo mosl ot
lhe lime lherel¡ an
opportunlty
EDo most ol
the tlmo lhoreis an
opporlunlty
Do mosl olthe lime lhors
is an
oppoftunity
tlDo not do
EDo only
EDo about halfthe lime thore
i¡ an
oPportun¡ty
mostot Dooverythe tlme th€re
ls anopporlunlly
lhero ls an
opportun¡ty
187

19. Perform minor repairs and maintenancein family living areas (for example,change light bulbs, hang pictures)
20. Repair and maintain (or makearrangements for repair andmaintenance of) major householdneeds (for example, plumbing, yardwork, electrical wiring)
21. Respond to household emergency (for
example, stove fire, plumbing problem)by calling parent or neighbour
22. Respond to household emergency (for
example, stove fire, plumbing problem)by calling fire department, using fireextinguisher, calling repair service, orshutting off water)
rately
Do notdo Do Do
tlDo not do
EDo not do
EDo about half
E0o mo3t of
lho timo th€rels an
opporlunity
Do everylhån ls
EDo only
EDo only
EDo only
rarely
rarely
rarely
rarely
Do onlyrarely
Do onlyrarely
rarely
lhe llme lhsrol¡ an
opportunity
Do
the llmo th€reis an
opportunlty
opporlunltyan
ED,o mosl of
the timo thereis an
opporlunlty
Do overythoro is an
opPorlunity
Do not do
Do not do
Do not do
Do
lh6 llmo thsreis an
opporlunity
mostof Doevery
lhe tln¡e thereis an
opportunity
0o most ollho tlmo lhere
is an
opporlunity
lhe lime thsreig an
opporlunity
thgre ¡s anopportunlty
Do svery limelhere is an
opporlunlty
Do svorylhe.e is
opporlünlty
I:
23. Use the telephone and telephonedirectories
24. Carry out transactions with salespeople(for example, listen to information, askquestions, give payment, receivechange)
25. Use postalservices (for example, usepostage, mail letters, packages)
26. Use bank (for example, fill out deposit orwithdrawal slips, use passbook)
Management Activity
EDo not do
tlDo only
EDo only
ED,o aboul halllhe lime thsre
l¡ anoPportunlty
Do olthe lime there
ls an
opportunity
O,o about halflhe llmo thgre
is anoppodunlty
f¡,0 most otthe llme lhere
l¡ anopporlunlty
oppoftun¡ty
Do svorythere is
Do everylhore ¡s
llmean
timean
EDo not do
EDo about halflho tlme lhore
is anoppo¡lunity
Do mcat oflhe lime thore
i3 anopporlunlty
Do aboul haltlhe tirne lhere
is anopportunity
Do most ofthe time thsro
banopportunity
oppoilunlty
Do everylhore ls en
opportunity
188
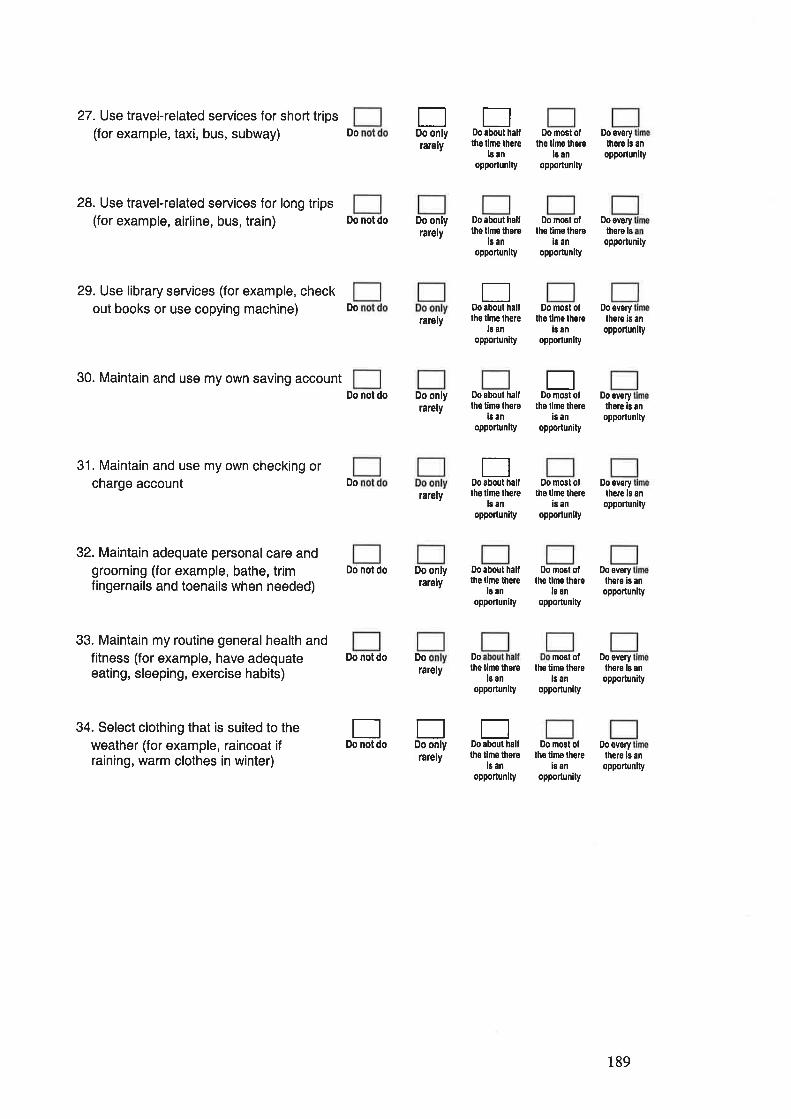
27. Use travel-related services for short trips(for example, taxi, bus, subway)
28. Use travel-related services for long trips(for example, airline, bus, train)
29. Use library services (for example, checkout books or use copying machine)
30. Maintain and use my own saving account
31. Maintain and use my own checking orcharge account
32. Maintain adequate personal care andgrooming (for example, bathe, trimfingernails and toenails when needed)
33. Maintain my routine general health andfitness (for example, have adequateeating, sleeping, exercise habits)
34. Select clothing that is suited to theweather (for example, raincoat ifraining, warm clothes in winter)
Do notdo Do Do
DoEDo onlyrarely
Do onlyrarely
rarely
Do onlyrarely
rarely
Do onlytarely
rarely
rarely
ED,o about hâllthe tlme lhere
banopporlunlty
Do most ollho t¡mo lhsre
le anopporlunity
Do everythoro is an
opponunity
Do ovsrythere ls
oppoftun¡ty
Do overylhere ¡s ân
opporlunity
Do everylhore ¡s anopportunity
Do not do
Do
Do about haltthe tlme lhere
is an
opportunlty
Do most ollhe t¡me lhere
is an
opportunity
Ef¡,0 aboul halflhe lime lh€re
lô anopporlunity
Do mosl ottho tlme lhere
ls anopportunlty
Do not do Do about hallthe t¡me lhere
is anopporlunlty
E0o mosl ot
tho llme thereis an
opporlunity
Dotlabout halfDo
lhs lirne therels an
opportun¡ty
Ilo most olths lim€ there
is an
opporlun¡ty
Do everylhe¡e ¡s an
opporlunity
Do not do Do about halllhe time lhere
ls ân
opporlun¡ty
0,0 nost oflhê tlme lhs¡e
is an
oPPortunity
Do everylhere is an
the timo thereie an
opporlunity
the tine thoreis an
opportun¡ty
mostof Doevery
opportun¡ty
lhsro b an
opporlunity
Do sverythere is an
opporlunity
EDo not do
tlDo only
EDo âbout halftho llme thele
is anopporlunity
Do most ollhe limo there
ls an
opporlun¡ty
189
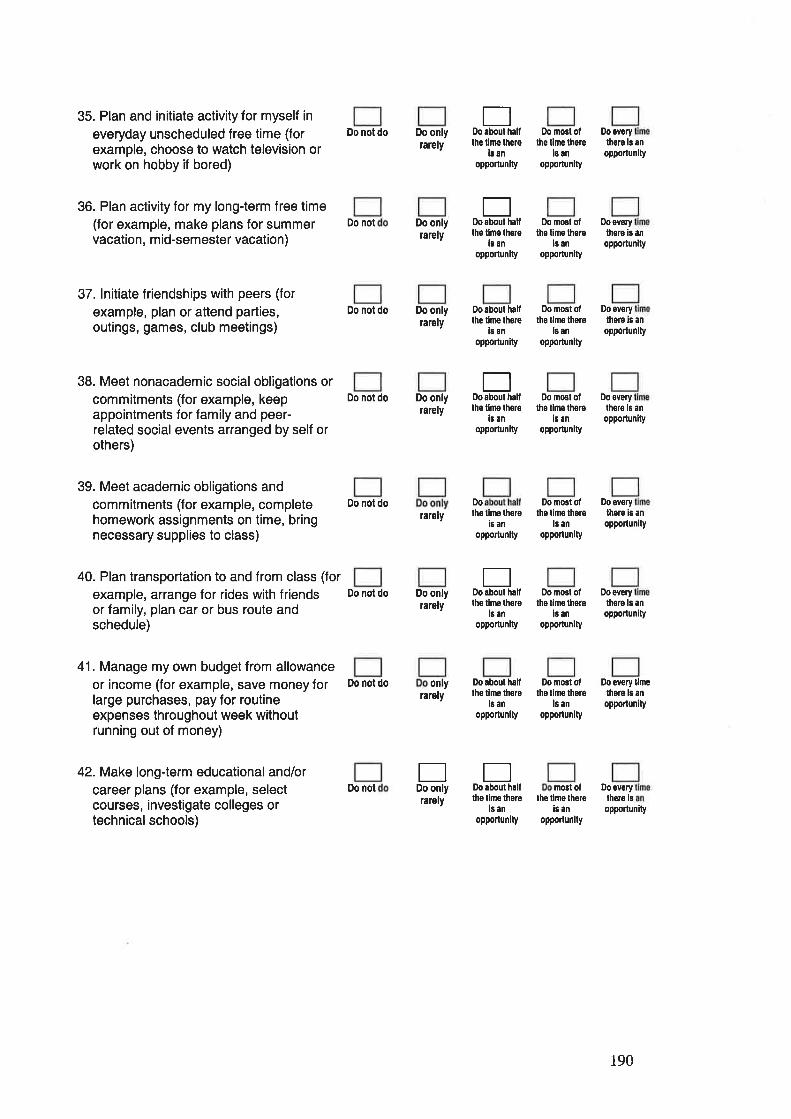
35. Plan and initiate activity for myself in
everyday unscheduled free time (forexample, choose to watch television orwork on hobby if bored)
36. Plan activity for my long-term free time(for example, make plans for summervacation, m id-semester vacation)
37. lnitiate friendships with peers (for
example, plan or attend parties,outings, games, club meetings)
38. Meet nonacademic social obligations orcommitments (for example, keepappointments for family and peer-related social events arranged by self orothers)
39. Meet academic obligations andcommitments (for example, completehomework assignments on time, bringnecessary supplies to class)
40. Plan transportation to and from class (for
example, arrange for rides with friendsor family, plan car or bus route andschedule)
41. Manage my own budget from allowanceor income (for example, save money forlarge purchases, pay for routineexpenses throughout week withoutrunning out of money)
42. Make long-term educational and/orcareer plans (for example, selectcourses, investigate colleges ortechnical schools)
Do not do
Do not
Do not do
Do not do
Do not do
Do not do
Do not do
0o not
Do onlyrarely
Do onlyrarely
Do onlyrarely
Do onlyrarely
lalely
Do onlyrarely
rarely
rarely
flDo about halflhe lime lhero
l¡ anoppo¡lunity
Do most ofthe time there
ls an
opPortun¡ty
Do most ofthe time lhers
ls an
opportun¡ty
Do ovorylhoro is an
oppoñunlty
Do åvorylhere ¡s an
oPPonunlty
Do overylhsre ls an
opporlunlty
tþ evsrylhorâ ls an
oppodunity
Do evsrythore is an
opportunity
D,o ovefylhors ls an
opportunity
Eabout haltDo
thê tlrþ lhsreis an
opporlunity
Do about hallthe t¡me lhsre
is an
opporlunity
Do most olthe tlmê the¡e
ls an
opportunlty
EDo about haillhs tlmo lhere
i¡ anopportunlty
Do most ollhe limo lhsre
i¡ an
oPPorlunity
Do
the lims thsreis an
opponunlty
Do most olthe linê lhsrê
ls an
opportunity
Eabout hålfDo
the time lhoreis an
opportunity
Do most oflhs t¡m€ there
ls an
oPportun¡ty
0ny
EDo only
tlo about halflhe tine there
ls anopportunlly
Do most ollhe time lhere
ls anopporlunity
opporlun¡ty
Do overylhere ls
opporlunity
Do everylhsre lô
llmean
EDo about halfthe lime there
ls anopporlunily
most ollhe tlmo lhere
iô anoppodunlty
190
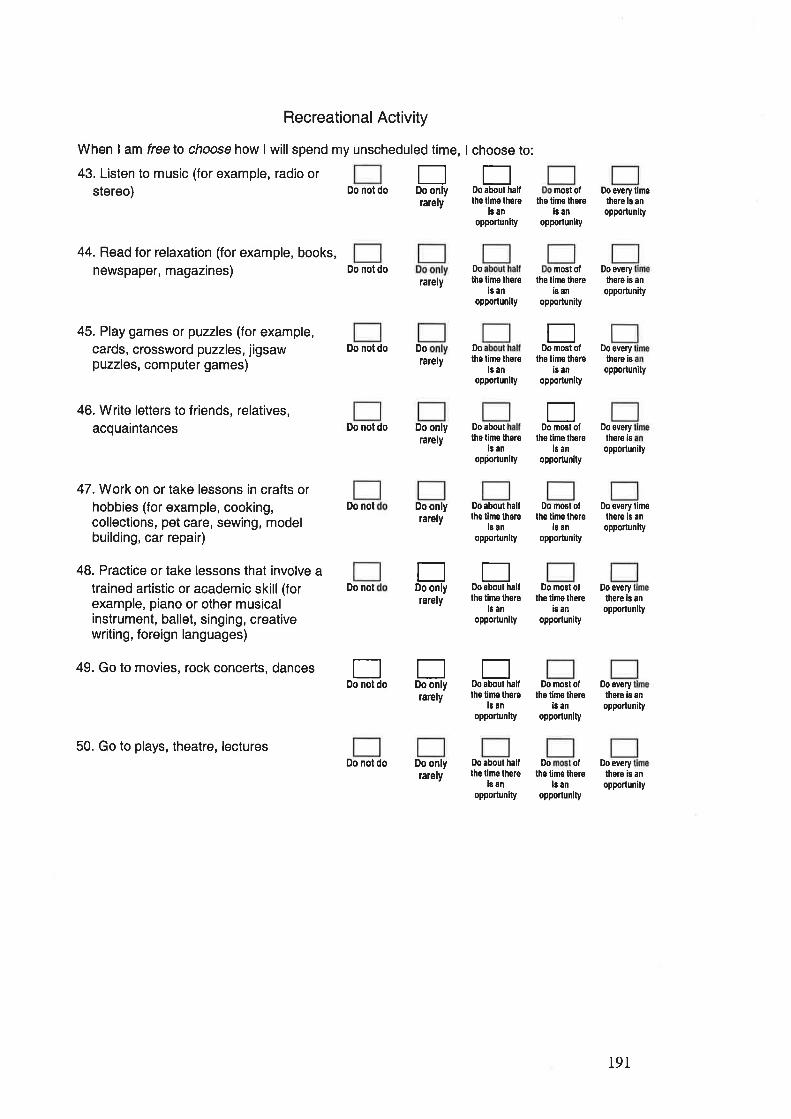
Recreational Activity
When I am freelo choose how I willspend my unscheduled time, I choose to:
43. Listen to music (for example, radio orstereo)
44. Read for relaxation (for example, books,newspaper, magazines)
45. Play games or puzzles (for example,cards, crossword puzzles, jigsawpuzzles, computer games)
46. Write letters to friends, relatives,acquaintances
47.Work on or take lessons in crafts orhobbies (for example, cooking,collections, pet care, sewing, modelbuilding, car repair)
48. Practice or take lessons that involve atrained artistic or academic skill (forexample, piano or other musicalinstrument, ballet, singing, creativewriting, foreign languages)
49. Go to movies, rock concerts, dances
50. Go to plays, theatre, lectures
rarely
Do notdo Do Do
EDo only
Eaboul hallDo not do
Do not do
Do not do
Do not
Do not
Do not do
rarely
larely
Do onlyrately
Do onlylarely
rarely
rarely
Do onlylarely
Do
lhe llme thsrei¡ an
opportunity
mosl ollhe t¡me there
i¡ anopportunlty
Do êvêry limelhsrê is anopporlunity
Do
the t¡me lhêreis an
opporlunity
lhe time lherels an
opportunlty
Do aboullhe time there
is ân
opportunlty
nostof Doeverylhe timo there
is an
opporlunity
there is an
opporlunity
Do about halfthe lime thore
ls anopporlunlty
Do most otlhe time there
is an
opportunlty
EDo most ol
the time thereis an
opportun¡ty
EDo most of
lhe time therels an
opportunity
Do everythere iB
opportunity
Do every
there ¡s
opportunity
Do ev€ry limethere is an
oPPotlunity
EDo not do
Eabout half
EDo only
EDo only
E0o about hallthe lime thore
ls ân
oppo¡tunlty
Do most oftho lino lhere
is an
opportunity
Do every
lh€re is anopportunlty
Do svorythero ¡s an
opportunity
Do everylhero is an
opportun¡ty
Do
lhe time lhsrei¡ an
opportunlty
0o mosl oflhe t¡me there
ls ân
opporlunity
Do about halflhe lime lhere
is anopportunlty
D,O olthe time there
ls an
opporlunity
191
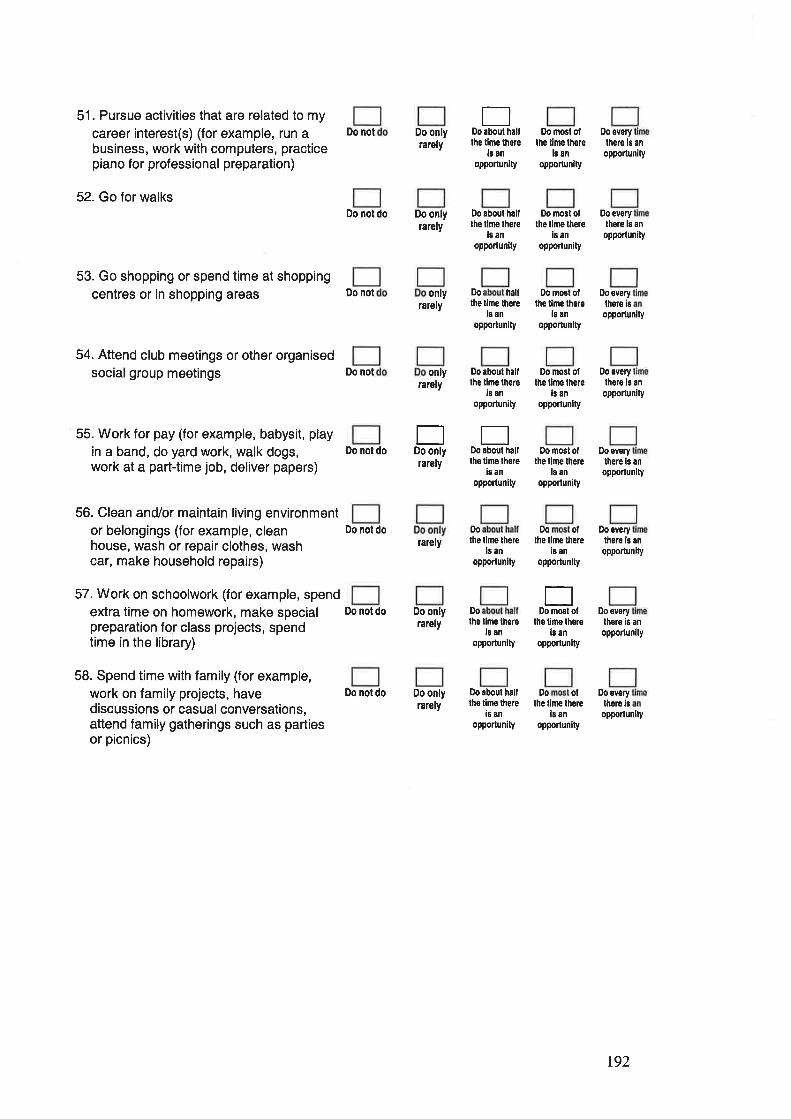
51. Pursue activities that are related to my
career interest(s) (for example, run abusiness, work with computers, practicepiano for professional preparation)
52. Go for walks
53. Go shopping or spend time at shoppingcentres or in shopping areas
54. Attend club meetings or other organisedsocialgroup meetings
55. Work for pay (for example, babysit, playin a band, do yard work, walk dogs,work at a part-time job, deliver papers)
56. Clean and/or maintain living environmentor belongings (for example, cleanhouse, wash or repair clothes, washcar, make household repairs)
57. Work on schoolwork (for example, spendextra time on homework, make specialpreparation for class projects, spendtime in the library)
58. Spend time with family (for example,work on family projects, havediscussions or casual conversations,attend family gatherings such as partiesor picnics)
Do not
Do not do
Do not
Do not
Do not do
Do nol do
Do nol do
Do not do
Do onlyrarely
Do onlyrarely
EDo about haltthe lime thsre
is anopportun¡ty
Do most oflhe lime thore
i¡ anopporlunity
Do overy
thers is an
opportun¡ty
Do everythere ls an
opporlunity
Do everythere isopporlunity
Do every
thero ls an
opportunity
Do everylhere ls an
opporlunlty
¡¡,0 about halflhe tlme lhere
16 ân
opporlun¡ty
Do mosl otths lime there
is an
oPPotlunity
Do nost olthe tlme lhere
is anopportunlty
only
EDo only
only D,o half
rarely the tlne thorels an
opporlunity
rarely
Do about halllhe lime there
ls anopporlun¡ty
rarely
EDo about hallths timo lhêro
i¡ anoPporlunlty
Do
rarely lhe lime lhsrels an
opportun¡ty
D,o most otthe lime lhere
is anopporlunlty
Do mosl oflhe time lhere
ls an
opportunity
Do ofthe time lhere
is anopporlunity
Do everylhere is ân
opporlunity
Do onlyrarely
Do onlyrarcly
Dolhe lime there
¡8 an
opportun¡ty
tlDomñtof
the lim€ lhereis an
opportunity
D,o everythere is an
opportunity
Do aboul hallthe tlme there
i¡ an
opporlun¡ty
Do ollhe time thore
is anopporlunity
Do everythoro ¡s
opportun¡ty
t92
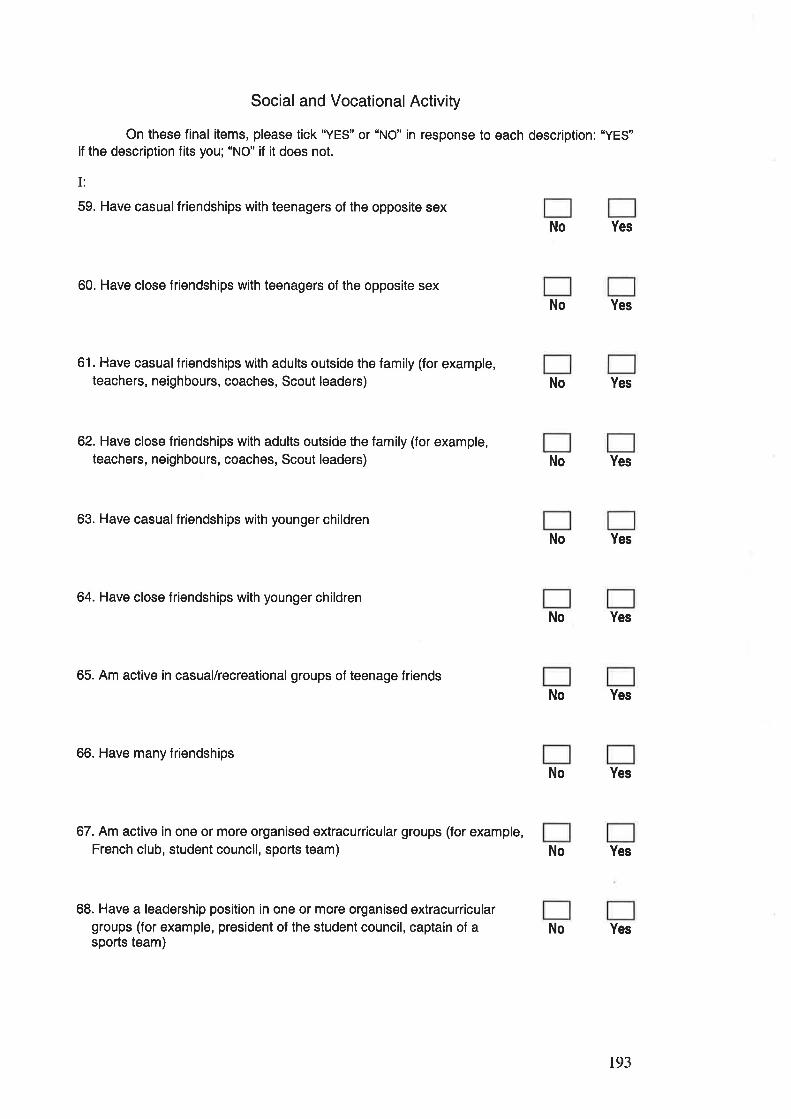
Social and Vocational Activity
On these final items, please tick "YES" or "NO" in response to each description: "YES"if the description fits you; "NO" if it does not.
I:
59. Have casualfriendships with teenagers of the opposite sex
60. Have close friendships with teenagers of the opposite sex
61. Have casual friendships with adults outside the family (for example,teachers, neighbours, coaches, Scout leaders)
62. Have close friendships with adults outside the family (for example,teachers, neighbours, coaches, Scout leaders)
63. Have casual friendships with younger children
64. Have close friendships with younger children
65. Am active in casual/recreational groups of teenage friends
66. Have many friendships
67. Am active in one or more organised extracurricular groups (for example,French club, student council, sports team)
68. Have a leadership position in one or more organised extracurriculargroups (for example, president of the student council, captain of asports team)
No Yes
No Yes
No Yes
No Yes
No Yes
No Yes
No Yes
No Yes
Yes
No Yes
No
193
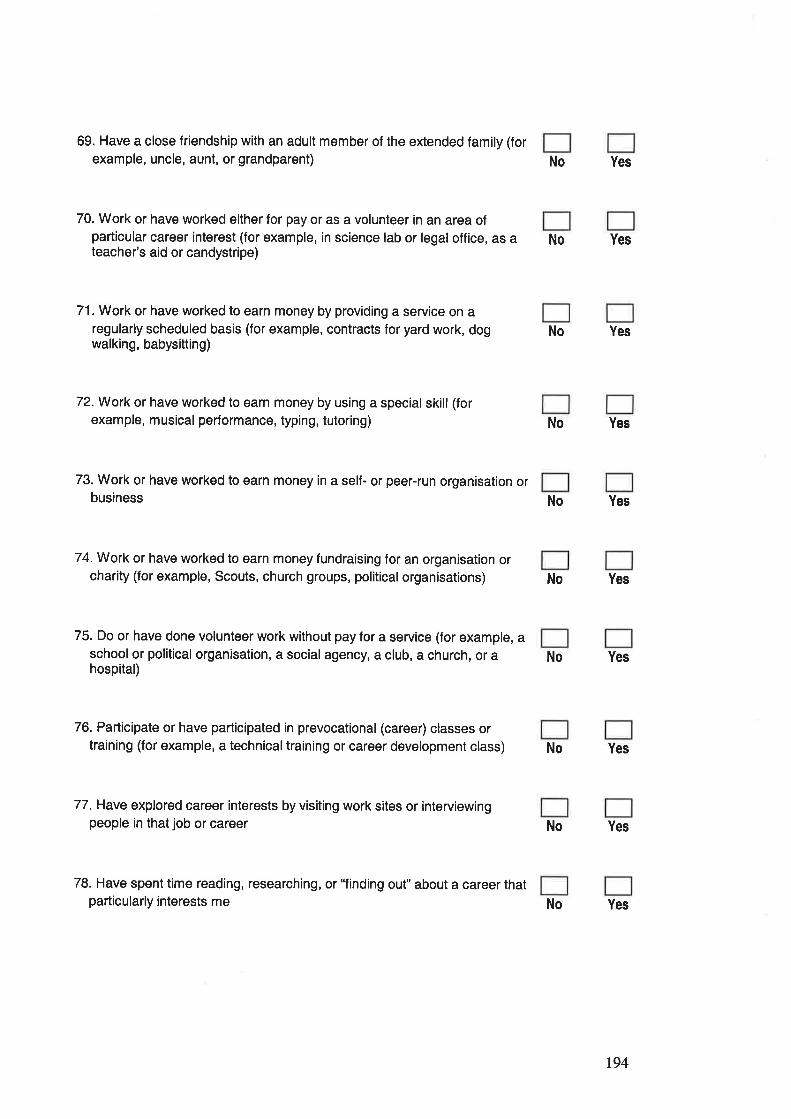
69. Have a close friendship with an adult member of the extended family (forexample, uncle, aunt, or grandparent)
70. Work or have worked either for pay or as a volunteer in an area ofparticular career interest (for example, in science lab or legal office, as ateacher's aid or candystripe)
71. Work or have worked to earn money by providing a service on aregularly scheduled basis (for example, contracts for yard work, dogwalking, babysitting)
74.Work or have worked to earn money fundraising for an organisation orcharity (for example, Scouts, church groups, political organisations)
75. Do or have done volunteer work without pay for a service (for example, aschool or political organisation, a social agency, a club, a church, or ahospital)
72.Work or have worked to earn money by using a special skill (forexample, musical performance, typing, tutoring) No Yes
73. Work or have worked to earn money in a self- or peer-run organisation orbusiness No Yes
No Yes
No Yes
No Yes
No Yes
No Yes
76. Participate or have participated in prevocational (career) classes ortraining (for example, a technicaltraining or career development class)
77. Have explored career interests by visiting work sites or interviewingpeople in that job or career
78. Have spent time reading, researching, or'Tinding out" about a career thatparticularly interests me
No Yes
No Yes
No Yes
194
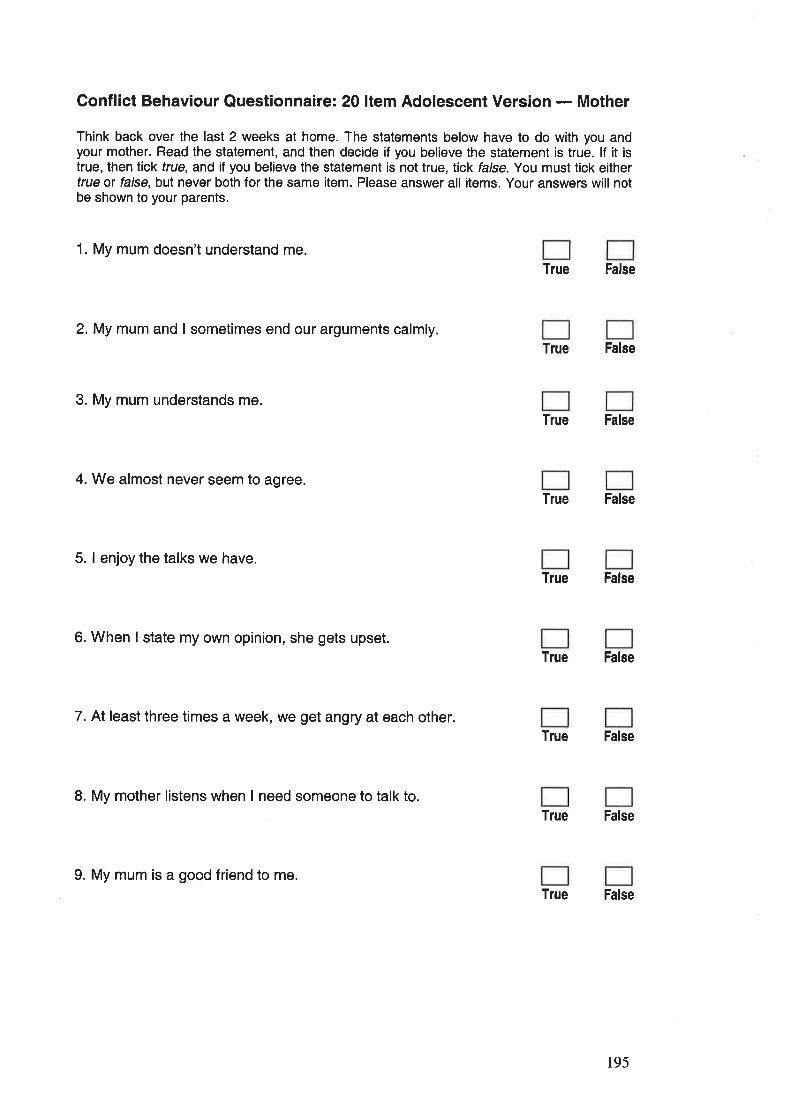
Conflict Behaviour Questionnaire: 20 ltem Adolescent Version - Mother
Think back over the last 2 weeks at home. The statements below have to do with you andyour mother. Read the statement, and then decide if you believe the statement is true. lf it istrue, then lick true, and if you believe the statement is not true, tick false. You must tick eithertrue or false, but never both for the same item. Please answer all items. Your answers will notbe shown to your parents.
1. My mum doesn't understand me.True False
2.My mum and I sometimes end our arguments calmlyTrue False
3. My mum understands me.
True False
4. We almost never seem to agree.True False
5. I enjoy the talks we have.
True False
6. When I state my own opinion, she gets upset.True False
7. At least three times a week, we get angry at each other.True False
L My mother listens when I need someone to talk to.True False
9. My mum is a good friend to me.True False
195
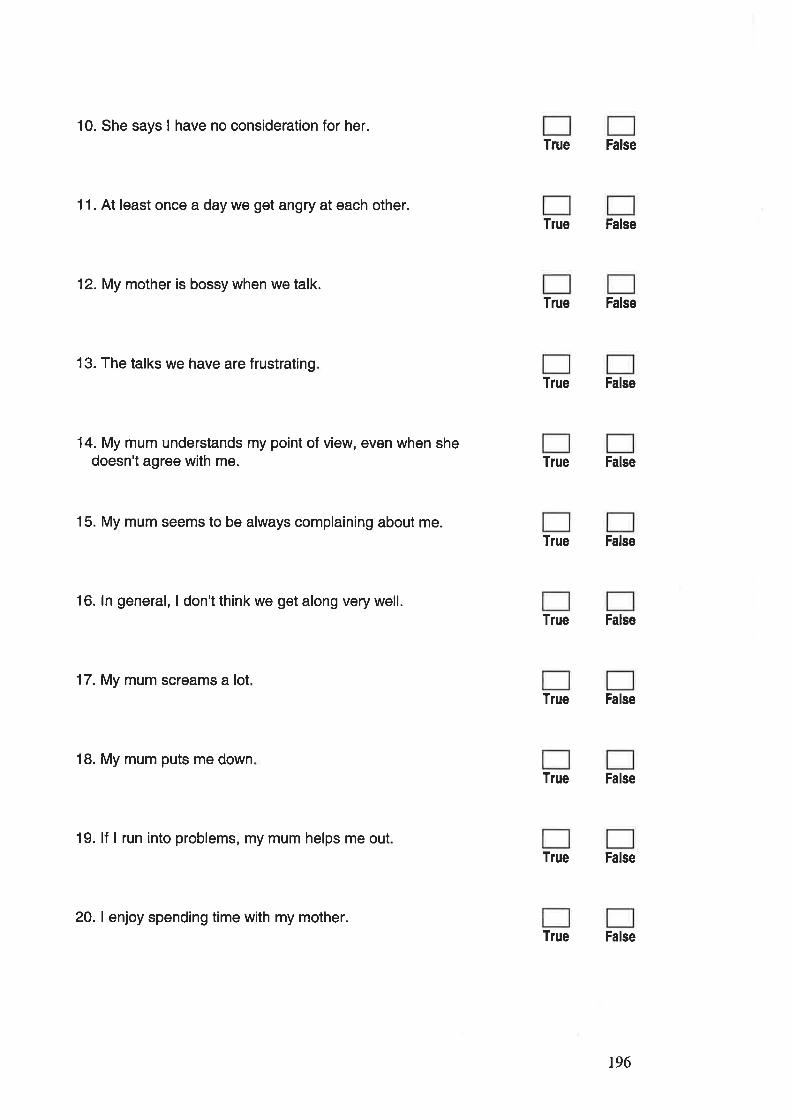
10. She says I have no consideration for her.
11. At least once a day we get angry at each other.
12. My mother is bossy when we talk.
13. The talks we have are frustrating
14. My mum understands my point of view, even when shedoesn't agree with me.
15. My mum seems to be always complaining about me.
16. ln general, I don't think we get along very well.
17. My mum screams a lot
18. My mum puts me down
19. lf I run into problems, my mum helps me out
True False
True False
True False
True False
True False
True False
True False
True False
True False
True False
True False
20. I enjoy spending time with my mother.
196
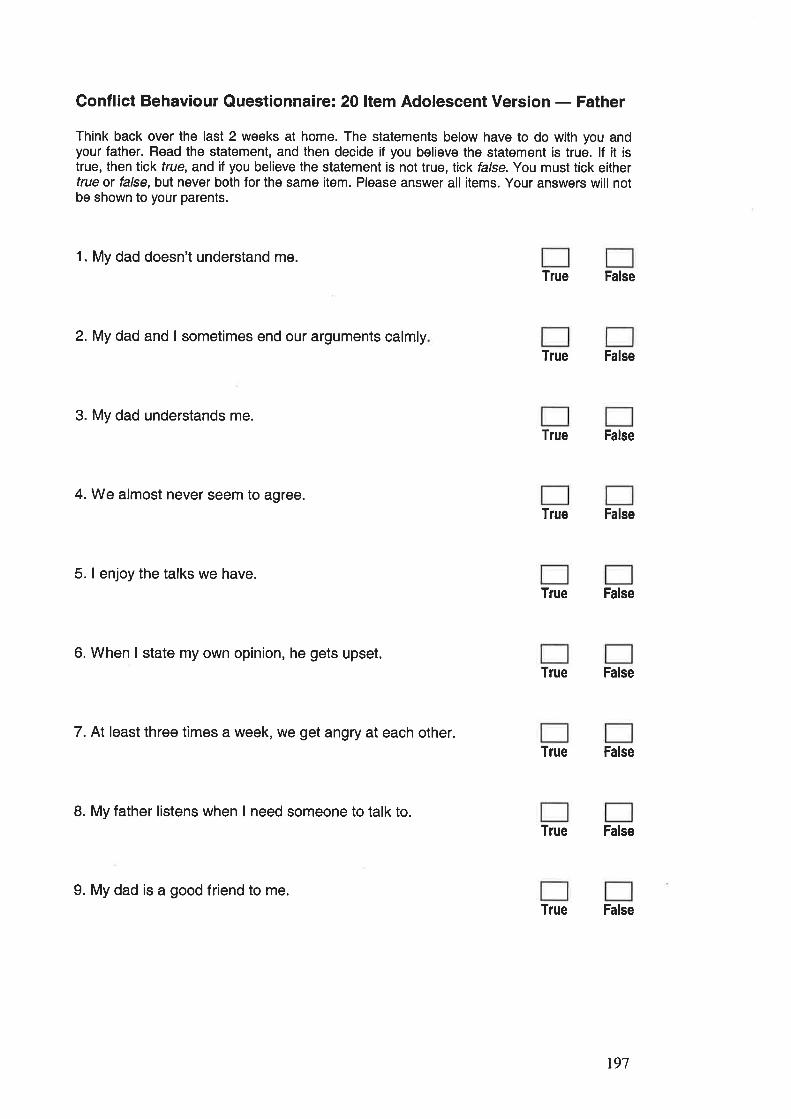
Conflict Behaviour Questionnaire: 20 ltem Adolescent Version - Father
Think back over the last 2 weeks at home. The statements below have to do with you andyour father. Read the statement, and then decide if you believe the statement is true. lf it istrue, then tick frue, and if you believe the statement is not true, tick false.You must tick eithertrue ü false, but never both for the same item. Please answer all items. Your answers will notbe shown to your parents.
1. My dad doesn't understand me.True False
2.My dad and I sometimes end our arguments calmlyTrue False
3. My dad understands me.
True False
4. We almost never seem to agree.True False
5. I enjoy the talks we have.True False
6. When I state my own opinion, he gets upset.True False
7. At least three times a week, we get angry at each other.True False
8. My father listens when I need someone to talk to.True False
9. My dad is a good friend to me.True False
r97

10. He says I have no consideration for him
11. At least once a day we get angry at each other.
12. My father is bossy when we talk
13. The talks we have are frustrating.
14. My dad understands my point of view, even when he doesn'tagree with me.
15. My dad seems to be always complaining about me.
16. ln general, I don't think we get along very well.
17. My dad screams a lot.
18. My dad puts me down
19. lf I run into problems, my dad helps me out.
True False
True False
True False
True False
True False
True False
True False
True False
True False
True False
True False
20. I enjoy spending time with my father.
198
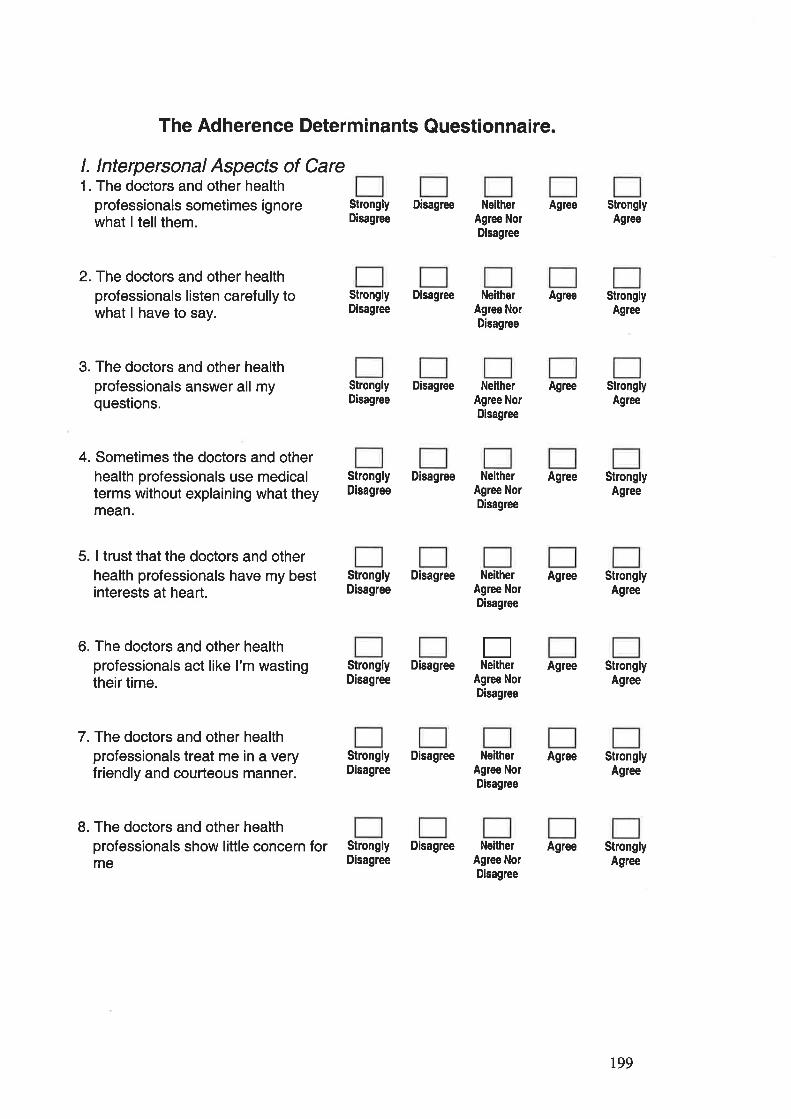
The Adherence Determinants Questionnaire.
l. Interpersonal Aspects of Care1. The doctors and other health
professionals sometimes ignorewhat I tellthem.
Strongly DisagreeDisagrce
2. The doctors and other healthprofessionals listen carefully towhat I have to say.
3. The doctors and other healthprofessionals answer all myquestions.
4. Sometimes the doctors and otherhealth professionals use medicalterms without explaining what theymean.
5. I trust that the doctors and otherhealth professionals have my bestinterests at heart.
6. The doctors and other healthprofessionals act like I'm wastingtheir time.
7.The doctors and other healthprofessionals treat me in a veryfriendly and courteous manner.
8. The doctors and other healthprofessionals show little concern forme
Strongly DisagreeDisagree
NeitherAgree NorDisagree
NeitherAgree NorDisagree
Agree
Agree
Agree
Agree
Agree
Agree
Agree
Agree
StronglyAgree
StronglyAgre€
StronglyAgree
StronglyAgree
StronglyAgree
StronglyAgree
StronglyAgree
StronglyAgree
Strongly DisagreeDisagree
NeitherAgree NorDisagree
Strongly DisagreeDisagree
NeitherAgree NorDisagree
Strongly DisagreeDisagree
NeitherAgree NorDisagree
ENeitherStrongly Disagree
Disagree Agree NorDisagree
Strongly DisagreeDisagree
NeitherAgree NorDisagree
Strongly DisagreeDisagree
NeitherAgree NorDisagree
r99
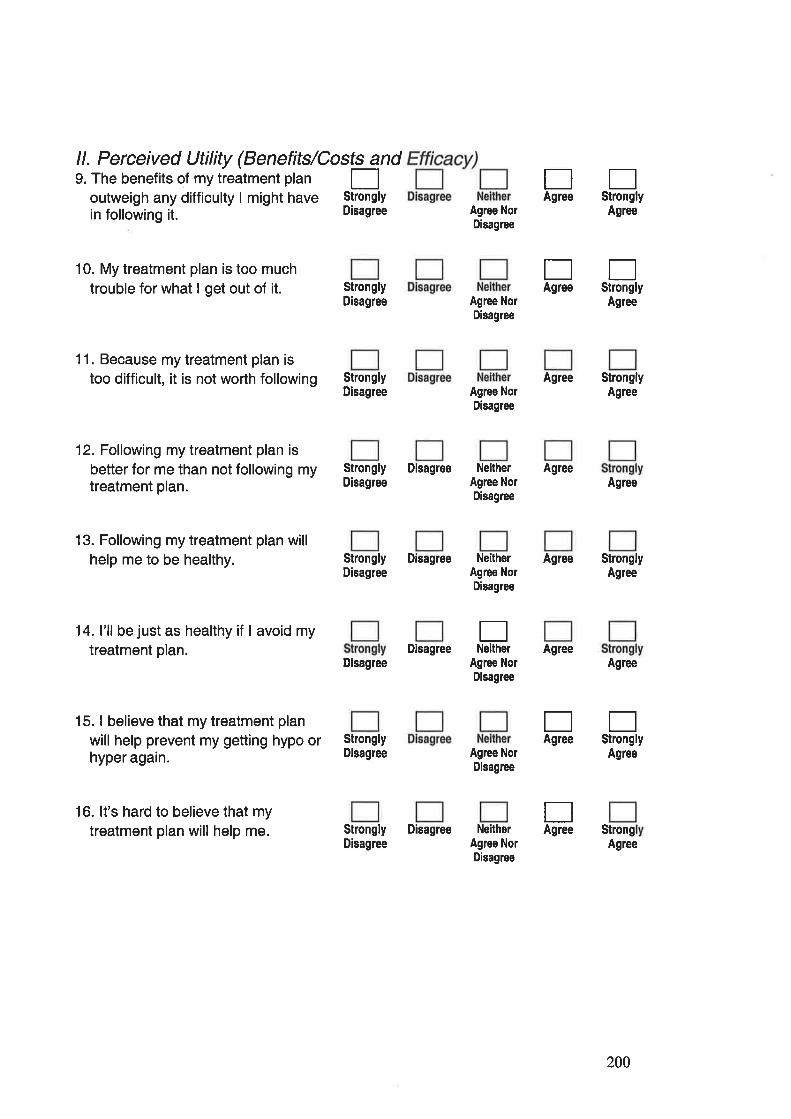
ll. Perceived Utility (Benefits/Costs and9. The benefits of my treatment plan |-]
outweigh any difficulty I might have Stronglv
in following it. - Disagree
EStrongly
EStrongly
Agree
EAgree
EAgree
10. My treatment plan is too muchtrouble for what I get out of it.
11. Because my treatment plan istoo difficult, it is not worth following
12. Following my treatment plan is
better for me than not following mytreatment plan.
13. Following my treatment plan willhelp me to be healthy.
14. l'll be just as healthy if I avoid mytreatment plan.
15. I believe that my treatment plan
will help prevent my getting hypo orhyper again.
StronglyDisagree
StronglyDisagree
Strongly DisagreeDisagree
Agree NorDisagree
Agree NorDisagree
Agree NorDisagree
NeitherAgree NorDisagree
Agree
Agree
Agree
StronglyAglee
Agree
StronglyAgree
Agree
Agree
StrongAgree
Agree
Strongly DisagreeDisagree
NeitherAgree NorDisagree
DisagreeENelther
StronglyDisagree
Disagree Agree NorDisagree
Agree NorDisagree
NeitherAgree NorDisagree
ESttongly
Agree
EAgree
TAgree
16. lt's hard to believe that mytreatment plan will help me. Strongly Disagree
Disagree
200
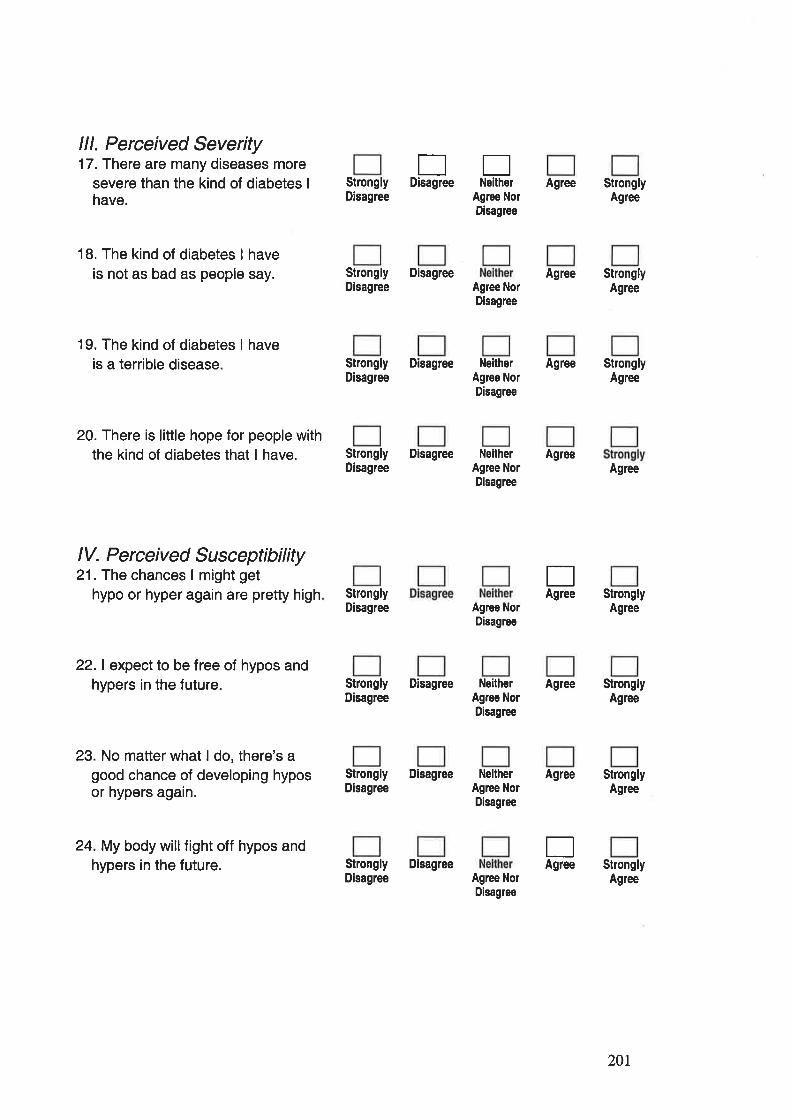
lll. Perceived Severity17. There are many diseases more
severe than the kind of diabetes I
have.
18. The kind of diabetes I haveis not as bad as people say.
19. The kind of diabetes I haveis a terrible disease.
20. There is little hope for people withthe kind of diabetes that I have.
t]EDisagree NeitherStrongly
Disagree
Strongly DisagreeDisagree
Agree NorDisagree
Agree NorDisagree
Agree
Agree
Agree
Agree
Agree
Agree
StronglyAgree
StronglyAgree
StronglyAgree
Agree
StronglyAgree
StronglyAgree
StronglyAgree
StronglyAgree
Strongly DisagreeDisagree
NeitherAgree NorDisagree
Strongly DisagreeDisagree
NeitherAgree NorDisagrce
lV. Perceived Susceptibility21. The chances I might get
hypo or hyper aga¡n are pretty high
22.1 expect to be free of hypos andhypers in the future.
23. No matter what I do, there's agood chance of developing hyposor hypers again.
24. My body willfight off hypos andhypers in the future.
StronglyDisagree
Strongly DisagreeDisagree
Agree NorDisagree
NeitherAgrce NorDisagree
EAgree
EAgree
Strongly DisagreeDisagree
NeitherAglee NorDisagree
Strongly DisagreeDisagree Agree Nor
Disagree
201
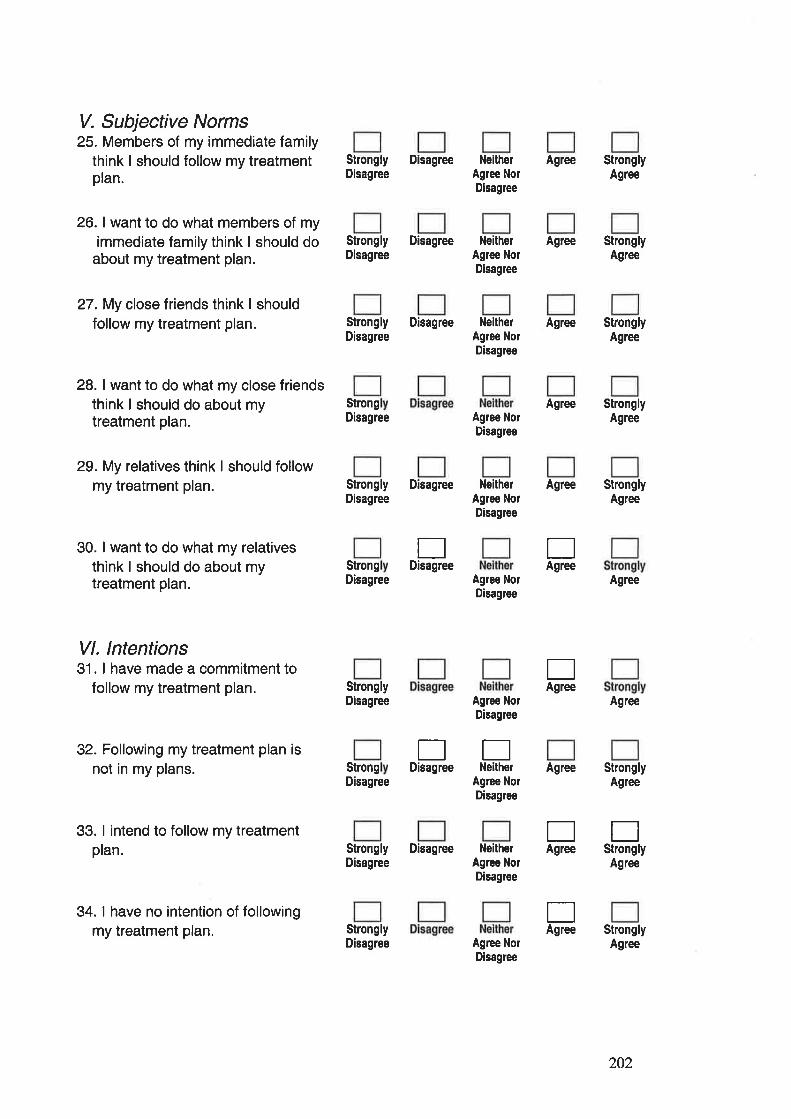
V. Subjective Norms25. Members of my immediate family
think I should follow my treatmentplan.
26. I want to do what members of myimmediate family think I should do
about my treatment plan.
27. My close f riends think I shouldfollow my treatment plan.
28. I want to do what my close friendsthink I should do about mytreatment plan.
Strongly DisagreeDisagree
NeitherAgree NorDisagree
Agree
Agree
Agree
Agree
Agree
StronglyAgree
StronglyAgree
StronglyAgree
StronglyAgree
StronglyAgree
Agree
Agree
StronglyAgree
StronglyAgree
Strongly DisagreeDisagree
NeitherAgree NorDisagree
Strongly DisagreeDisagree
NeitherAgree NorDisagree
29. My relatives think I should followmy treatment plan.
30. I want to do what my relativesthink I should do about mytreatment plan.
Vl. lntentions31. I have made a commitment to
follow my treatment plan.
32. Following my treatment plan isnot in my plans.
33. I intend to follow my treatmentplan.
34. I have no intention of followingmy treatment plan.
Strongly DisagreeDisagree
StrongDisagree
StronglyDisagree
StrongDisagree Agree Nor
Disagree
NeitherAgree NolDisagree
Agree NolDisagree
Agree NorDisagree
Agree NorDisagree
NeitherAgree NorDisagree
EDisagree
EStrongly
Agree
EAgree
ttEDisagree Neither
EAgree
Agree
EAgree
EAgree
StrongDisagree
Strongly DisagreeDisagree
StronglyDisagree Agree Nor
Disagree
202
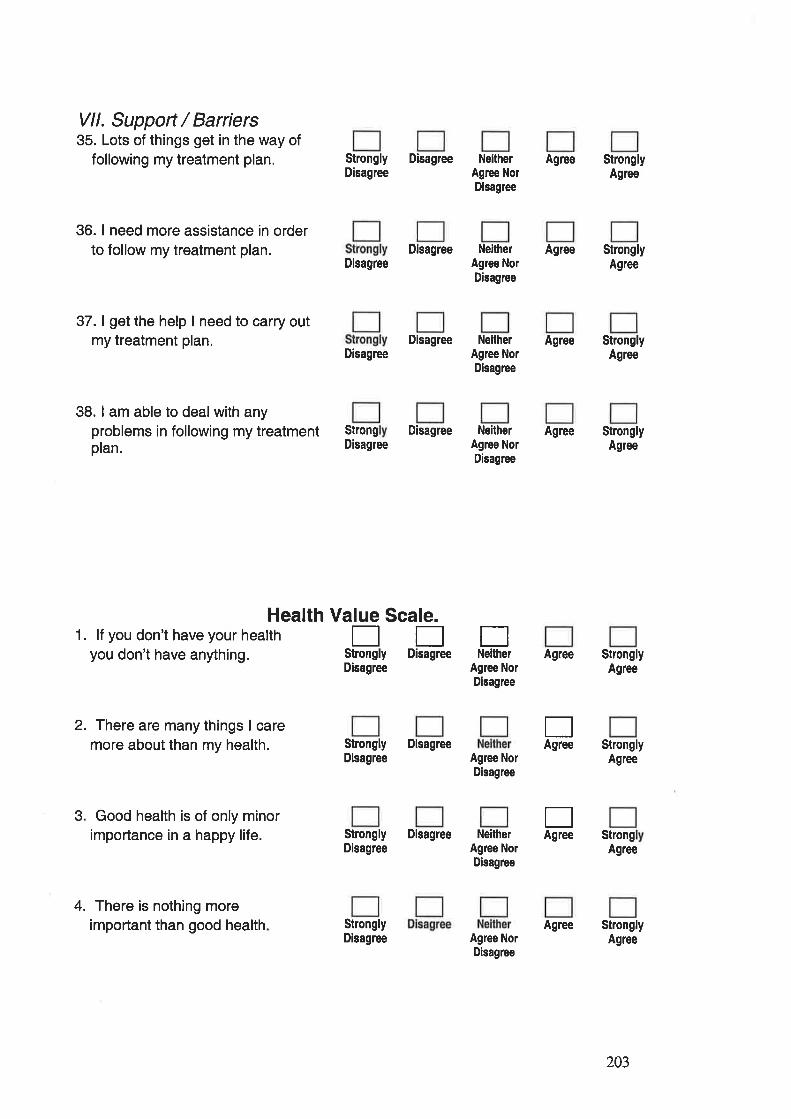
Vll. Support / Barriers35. Lots of things get in the way of
following my treatment plan.
36. I need more assistance in orderto follow my treatment plan.
37. I get the help I need to carry outmy treatment plan.
38. I am able to deal with anyproblems in following my treatmentplan.
NeitherAgree NorDisagree
Agree
Disagree NeitherAgree NorDisagree
Agree
Disagree Neither AgreeAgree NorDisagree
Strongly DisagreeDisagree
Agree NorDisagree
Agree NorDisagree
StronglyAgree
StronglyAgree
StronglyAgree
StronglyAgree
StronglyAgree
StronglyAgree
StrongAgree
StronglyAgree
Disagree
Disagree
StrongDisagree
Disagree Neither AgreeAgree NorDisagree
Health Value Scale.1. lf you don't have your health
you don't have anything.
2. There are many things I caremore about than my health.
3. Good health is of only minorimportance in a happy life.
4. There is nothing moreimportant than good health
EEEStrongly Disagree Neithe¡Disagree
Strongly DisagreeDisagree
Agree
EAgree
EAgreeStrongly Disagree
DisagreeNeither
Agree NorDisagree
StronglyDisagree Agree Nor
Disagree
Agree
203
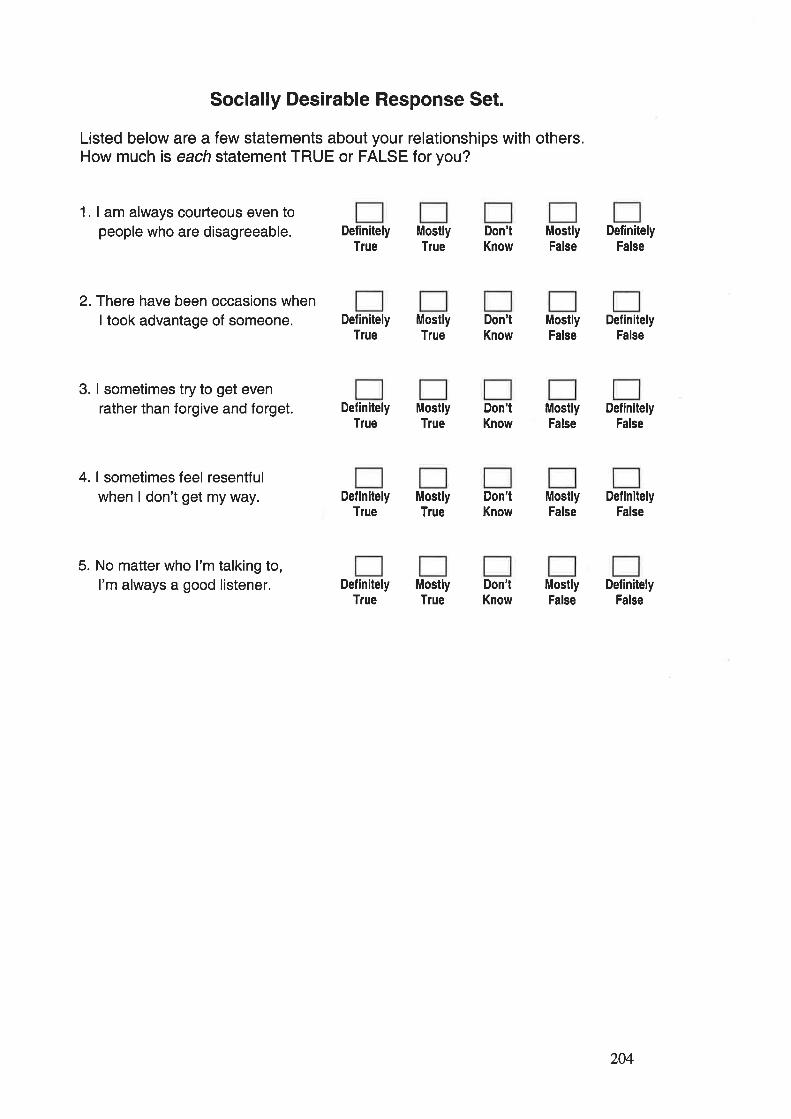
Socially Desirable Response Set.
Listed below are a few statements about your relationships with others.How much is each statement TRUE or FALSE for you?
1. I am always courteous even topeople who are disagreeable.
2.There have been occasions whenI took advantage of someone.
3. I sometimes try to get evenrather than forgive and forget.
4. I sometimes feel resentfulwhen I don't get my way.
5. No matter who I'm talking to,I'm always a good listener.
DefinitelyTlue
DefinitelyTlue
DefinitelyTrue
DefinitelyTlue
DefinitelyTrue
MostlyTlue
MostlyTrue
MostlyTlue
MostlyTrue
MostlyTlue
Don'lKnow
Don'tKnow
Don'tKnow
Don'tKnow
Don'tKnow
MostlyFalse
MostlyFalse
MostlyFalse
MostlyFalse
MostlyFalse
DefinitelyFalse
DefinitelyFalse
DefinitelyFalse
DefinitelyFalse
DefinitelyFalse
204
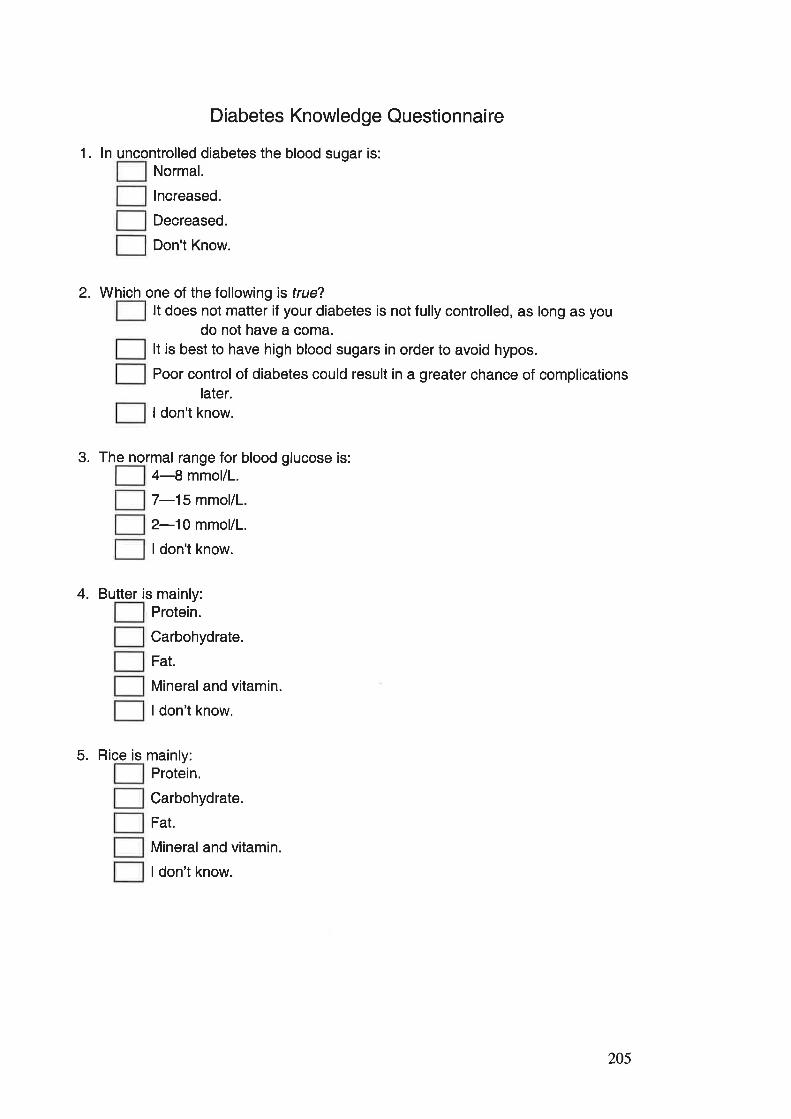
Diabetes Knowledge Questionnaire
1. ln uncontrolled diabetes the blood sugar is:Normal.
lncreased.
Decreased.
Don't Know.
2. Which one of the followi ng is lrue?It does not maüer if your diabetes is not fully controlled, as long as you
do not have a coma.It is best to have high blood sugars in order to avoid hypos.
Poor control of diabetes could result in a greater chance of complicationslater.
I don't know.
3. The normal range for blood glucose is:4-8 mmol/l.
7-15 mmol/L.
2-10 mmol/L.
I don't know.
4. Butter is main ly:Protein.
Carbohydrate.
Fat.
Mineral and vitamin.
I don't know.
5. Rice is main ly:Protein.
Carbohydrate.
Fat.
Mineral and vitamin.
I don't know.
205
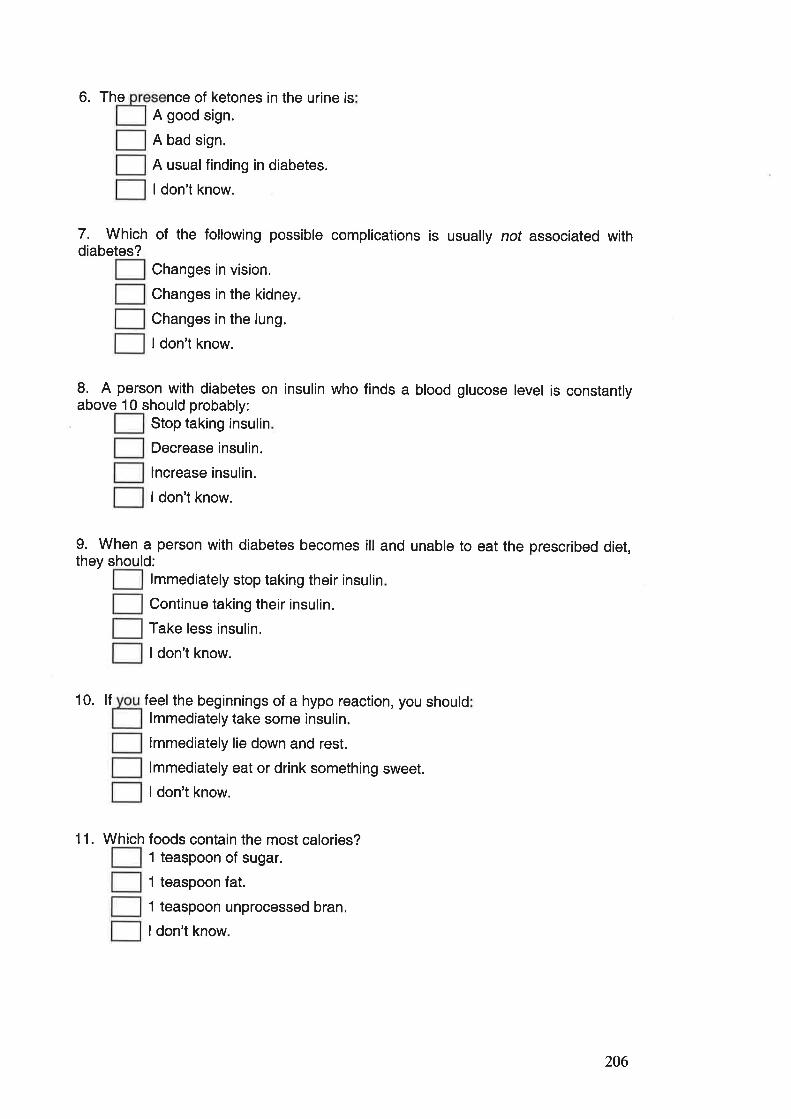
6. The nce of ketones in the urine isA good sign.
A bad sign.
A usualfinding in diabetes.
I don't know.
7. Which of the following possible complications is usually not associated withdiabetes?
Changes in vision.
Changes in the kidney
Changes in the lung.
ldon't know.
8. A person with diabetes on insulin who finds a blood glucose level is consta ntlyabove 10 should probably:
Stop taking insulin
Decrease insulin.
lncrease insulin.
I don't know.
9. When a person with diabetes becomes ill and unable to eat the prescribed diet,they should:
lmmediately stop taking their insulin
Continue taking their insulin.
Take less insulin.
I don't know.
10. lf feel the beginnings of a hypo reaction, you shouldlmmediately take some insulin.
lmmediately lie down and rest.
lmmediately eat or drink something sweet.
I don't know.
11. Which foods contain the most calories?1 teaspoon of sugar.
1 teaspoon fat.
1 teaspoon unprocessed bran.
I don't know.
206
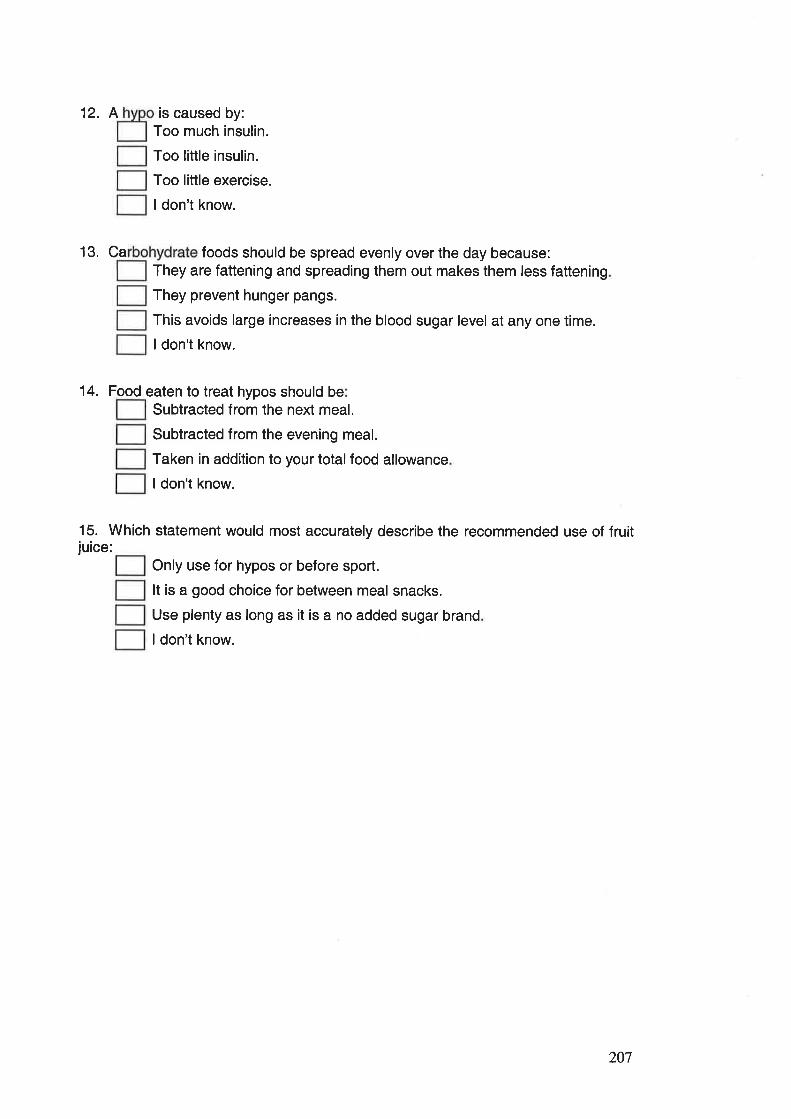
12. A is caused by:Too much insulin.
Too little insulin.
Too little exercise.
ldon't know.
13. Ca foods should be spread evenly over the day because:They are fattening and spreading them out makes them less fattening
They prevent hunger pangs.
This avoids large increases in the blood sugar level at any one time.
ldon't know.
14. Food eaten to treat hypos should beSubtracted from the next meal.
Subtracted from the evening meal.
Taken in addition to your total food allowance
ldon't know.
15. Which statement would most accurately describe the recommended use of fruitjuice:
Only use for hypos or before sport.
It is a good choice for between meal snacks.
Use plenty as long as it is a no added sugar brand
ldon't know.
207
Appendix 4.6 The Parent Questionnaire.
Diabetes and Families.
Parent Questionnaire.
208
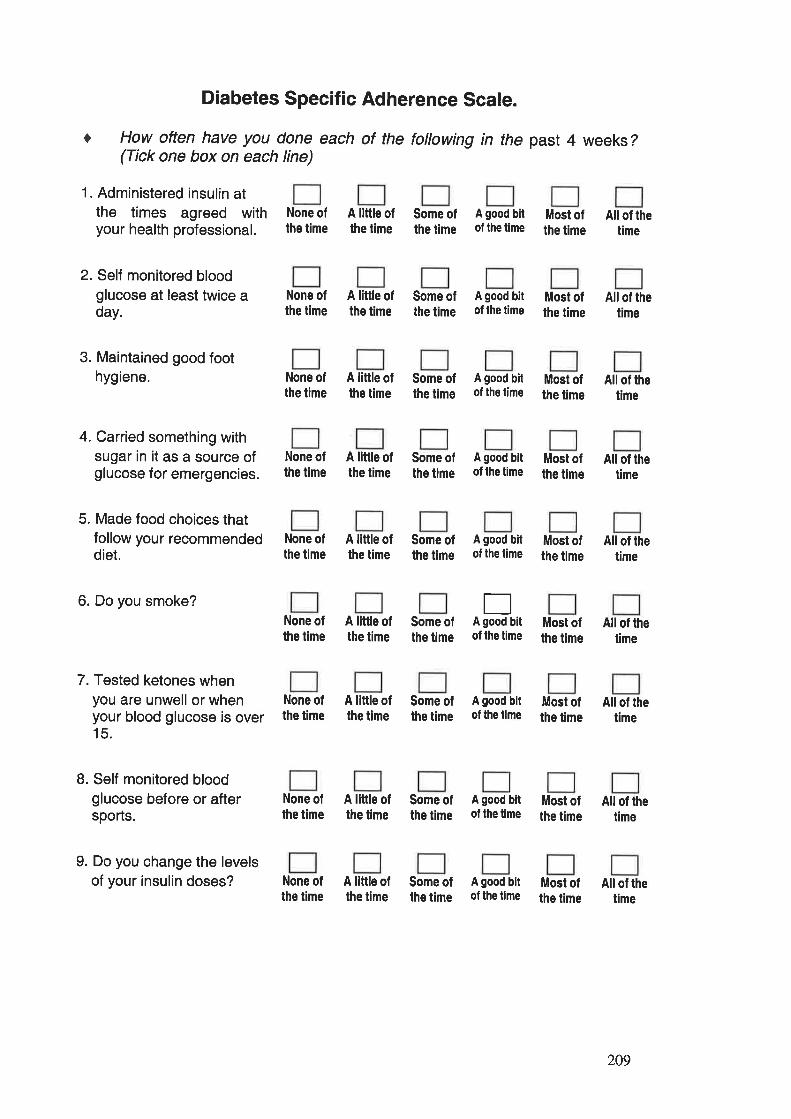
O
Diabetes Specific Adherence Scale.
How often have you done each of the following in the past 4 weeks?(Tick one box on each line)
1. Administered insulin atthe times agreed withyour health professional.
2. Self monitored bloodglucose at least twice aday.
3. Maintained good foothygiene.
4. Carried something withsugar in it as a source ofglucose for emergencies.
5. Made food choices thatfollow your recommendeddiet.
6. Do you smoke?
7. Tested ketones whenyou are unwell or whenyour blood glucose is over15.
8. Self monitored bloodglucose before or aftersports.
9. Do you change the levelsof your insulin doses?
None ofthe time
A little ofthe time
Some ofthe time
A good bitof the time
Most ofthe time
All of lhetime
None ofthe time
A little ofthe time
Some ofthe time
A good bitof the lime
Most ofthe time
Allof thetime
None ofthe time
A little ofthe time
Some ofthe time
A good bitof the tíme
Most ofthe time
All of thetime
None ofthe time
A little ofthe time
Some ofthe time
A good bitof the time
Most ofthe time
All of thetime
None ofthe time
A little ofthe time
Some ofthe time
A good bitof the lime
Most ofthe time
Allof thetime
None ofthe time
A little ofthe time
Some ofthe time
EA good bitof the time
A good bitof the time
Most ofthe time
All of thetime
None oflhe time
None ofthe time
A little ofthe time
Some ofthe time
Most ofthe time
AII of thetime
A little ofthe time
Some ofthe time
A good bitof the time
Most ofthe time
All of thetime
None ofthe time
A little ofthe time
Some ofthe time
A good bitof the time
Most ofthe time
All of thetime
209
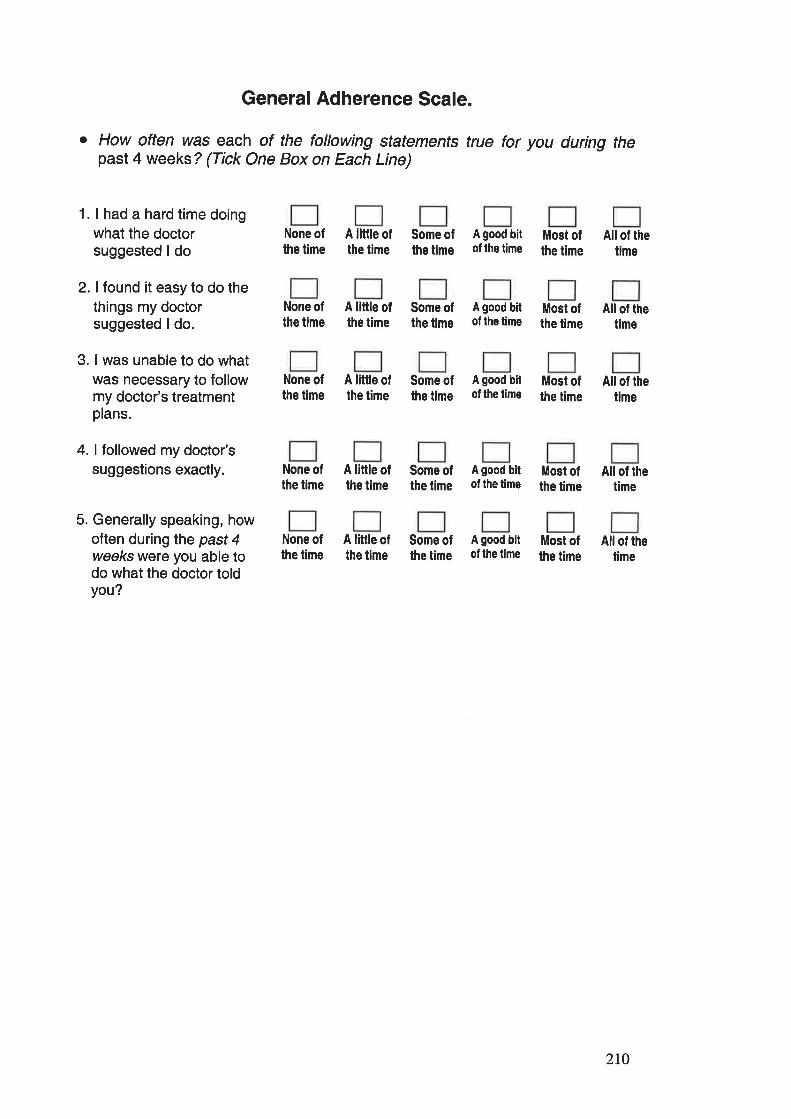
General Adherence Scale.
o How often was each of the following statements true for you during thepast 4 weeks ? (Tick One Box on Each Line)
1. I had a hard time doingwhat the doctorsuggested I do
2. I found it easy to do thethings my doctorsuggested I do.
3. I was unable to do whatwas necessary to followmy doctor's treatmentplans.
4. I followed my doctor'ssuggestions exactly.
5. Generally speaking, howoften duringthe past 4weeks were you able todo what the doctor toldyou?
None ofthe time
A little ofthe time
Some ofthe time
A good bitof the t¡me
Most ofthe time
Allof thetime
None ofthe time
A little ofthe time
Some ofthe time
A good bitof the lime
Most ofthe time
All of thetime
None ofthe time
A little ofthe t¡me
Some ofthe time
A good bitof the time
Most ofthe time
All of thetime
None ofthe time
A little ofthe time
Some ofthe time
A good bitof the time
Most ofthe time
All of thetime
None ofthe time
A little ofthe time
Some ofthe time
A good bitof lhe time
Most ofthe time
Allof thetime
210

AUTONOMOUS FUNCTIONING CHECKLIST
The purpose of the Autonomous Functioning Checklist (AFC) is to learn
about what your teenager does everyday. There are no "right" or'\ürong" things foryour teenager to do. Teenagers of different ages do many different things. These
questions are simply for the purpose of getting an idea of your teenager's daily
activity.
When you answer these questions, frrsf, read the question and think about
whether or not it describes what you see or have seen your teenager do. You should
answer the questions in relation to what you know your teenager does or does not do
rather than what you believe or think he or she could do or could not do.
Second, tell us how the question describes what your teenager does by
choosing one of alternatives from the scale and ticking that box. Here is how to use
the rating scale with a sample question.
Sample ltem
My teenager picks up the trash in the yard
Does notdo
Does onlyrarely
Doês abouthall lhs limethere is an
Doês most otlhe lime there
ls an
Does everyllme lhere ¡s
enoppoftunlty opportunity opporlunity
Your teenager will not have had a chance to participate in some of the
activities the questions describe. These items should be answered as "does not
do," even though you may feel that your teenager could or would do this if he or she
were given the chance. Please mark "does not do" for the questions that describe
activities that your teenager has never had the chance to do. Some of the questions
describe things that your teenager may do with help from others. Answer these
questions after you think about who has the most responsibility Íor completing the
activity. For example, your teenager may cook the family meals and may be helped
by other family members who set the table or chop vegetables. lf your teenager is
the family member with the mosf responsibility for cooking every meal that the family
eats together, your answer would be "does every time there is an opportunity."On the other hand, if your teenager helps other family members by doing jobs that
they tell him or her to do and never has the most responsibility for fixing dinner, your
answer would be "does not do."
2tt
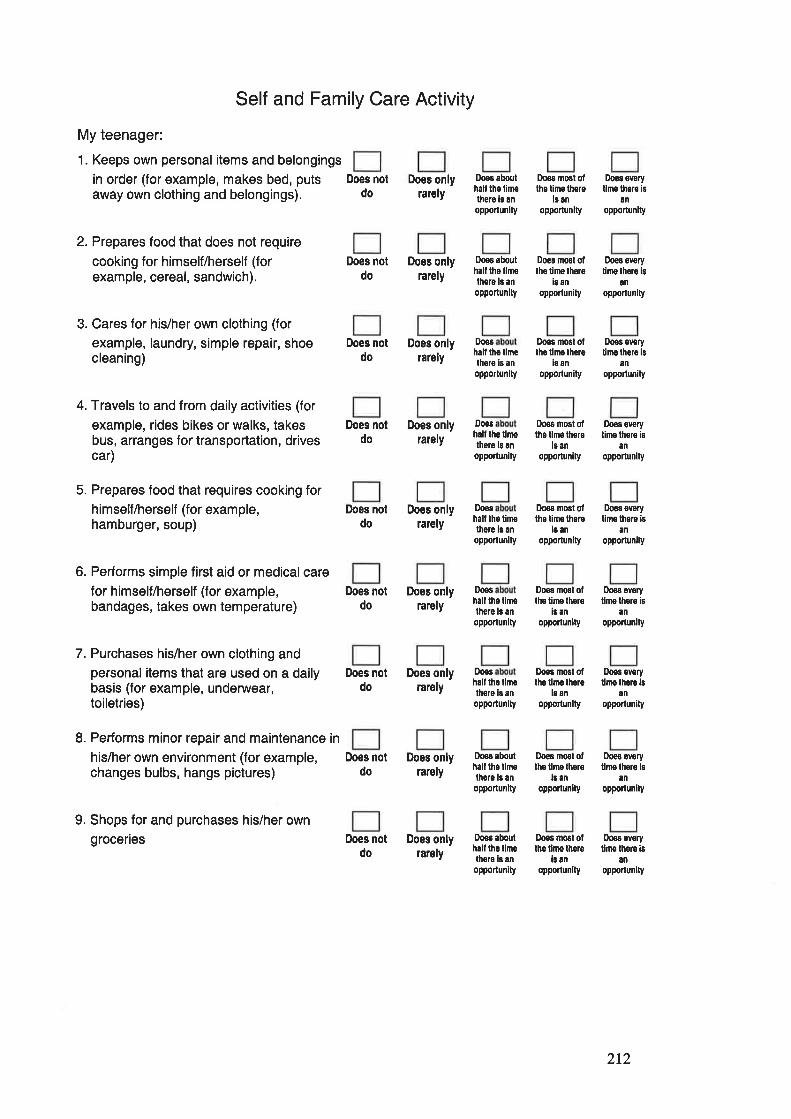
Self and Family Care Activity
My teenager:
1. Keeps own personal items and belongings
in order (for example, makes bed, putsaway own clothing and belongings).
2. Prepares food that does not require
cooking for himself/herself (forexample, cereal, sandwich).
3. Cares for his/her own clothing (for
example, laundry, simple repair, shoecleaning)
4. Travels to and from daily activities (for
example, rides bikes or walks, takesbus, arranges for transportation, drivescar)
5. Prepares food that requires cooking forhimself/herself (for example,hamburger, soup)
6. Performs simple first aid or medicalcarefor himself/herself (for example,bandages, takes own temperature)
7. Purchases his/her own clothing andpersonal items that are used on a dailybasis (for example, underwear,toiletries)
8. Performs minor repair and maintenance in
his/her own environment (for example,changes bulbs, hangs pictures)
9. Shops for and purchases his/her owngroceries
Does notdo
Does notdo
Does notdo
Does notdo
Does notdo
Does notdo
Does onlyrarely
Does onlyrarely
Does onlyrarely
Does onlyralely
Does onlyrarely
Does onlyrarely
Does onlyrarely
Does onlyrarely
Does onlyrarely
Doos aboulhall lho linethero is an
oPPorlunity
Does abouthalt lho llmethero ls an
opporlunlty
D,oes
hall lhs limelhere ¡s an
opportunlty
Does
hall lhe limethers ls an
opportunity
Dooshall lhe timelhoro ls an
opporlunity
Doos
half lhe llmelhere ls an
opporlunity
Doos
halt lho tim6thers is anopporlunlty
Doos abouthaf lhe limethore ls anopporlunity
Doos abouthâll ths limethero is an
opporlun¡ty
Does most ollhe time lhsre
ls anopporlunity
Does most ollhe time lhore
is an
opportunity
Doês most oflho tlme lhere
i¡ an
opPoflunity
Does most ofths time lhere
l¡ an
opporlunlty
Dogs most olthe time thsre
lô anopportunity
Does most ollhe time lhere
i¡ anopponun¡ty
Doæ most ollhe ti¡ns lhgre
l¡ an
oppoflunlty
Does most ofthe tlme thore
l¡ an
opporlunlty
Does most olthe time there
ls anopporlunlty
Doos evsrytims there is
an
opportunity
Does every
limo lhoro isan
opportunlty
Doæ every
tims there lsan
opponunity
f¡oos ovsrytime thoro is
ân
opporlünity
Doos ovsrytlme lhsre ¡s
an
opporlunlty
Doos sv€ryllmo thero is
an
opportunlty
Does ovory
llme lhere ¡san
opporlun¡ty
Does everytlm€ lhors ls
an
oPponun¡ty
Does everyllm€ thore ¡s
anopportunlty
Does notdo
Does notdo
lþes notdo
212
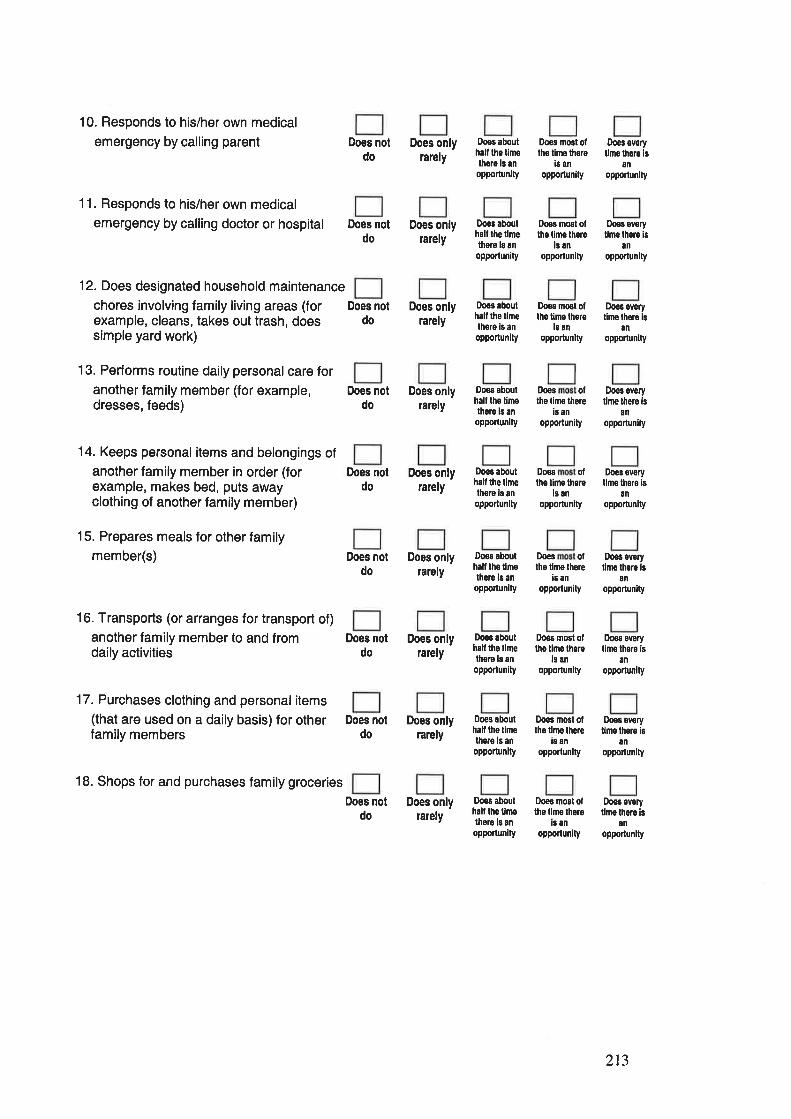
10. Responds to his/her own medical
emergency by calling parent
11. Responds to his/her own medicalemergency by calling doctor or hospital
12. Does designated household maintenance
chores involving family living areas (forexample, cleans, takes out trash, doessimple yard work)
13. Performs routine daily personal care foranother family member (for example,dresses, feeds)
14. Keeps personalitems and belongings ofanother family member in order (forexample, makes bed, puts awayclothing of another family member)
15. Prepares meals for other familymember(s)
16. Transports (or arranges for transport of)
another family member to and fromdaily activities
17. Purchases clothing and personalitems(that are used on a daily basis) for otherfamily members
18. Shops for and purchases family groceries
Does notdo
Does notdo
Does notdo
Does notdo
Does notdo
Does notdo
Does notdo
Does notdo
Does notdo
Does onlyrarely
Does onlyrarely
Does onlyrarely
Does onlyrarely
Does onlyrarely
Does onlyrarely
Does onlyrarely
Does onlyrarely
Does onlyrarely
floss abouthalf tho t¡melhere ls anopporlunlty
Doos aboulhall the limelhero ls anopporlunity
Doos âbouthalt ths tlÍlethsro is an
opportunity
Doos abouthall the limethere is an
opportunity
D,oes abouthall ths tlmethere is anopporlunlty
Does aboulhalt lhs llmelhere b an
oppo¡tunity
Doos aboulhall the llmelhere ls anopporlunity
Does abouthall the tlmethere ls an
opponunity
Doos abouthall the limolhsre is anopportunity
Ihes most olths limo thore
is anopponunity
lloes most oflhs time lhore
ls anopporlunity
Does everytimo thors ls
anopportunlty
Does svorytlme lhsre is
an
opportunlty
Does most ollho t¡me lhore
is anopportunlty
D,oes ofthe limo thore
is anopportunity
Doos everylimo thoro is
anoppolunlty
Does every
lime lhero isan
opporlunity
D,oes ofthe tim€ there
is an
opportunity
Do€ ovsrytlmo thêrs is
anopportunlty
I)oos ollhe tlme lhore
is anoppoflunity
Doeo everylimo lhere 16
anopportun¡ty
Doos mo6l ollhe llms there
is an
opporlunity
Does most ofthe tlme lhere
ßanopporlunlty
Dooô most ofths llme thero
i¡ an
opponunity
Does everylime lhore is
8n
oppoflunity
Doos ovoryllme lhsrs is
an
opporlunlty
Doee everytimo thors is
an
opportünlty
2r3
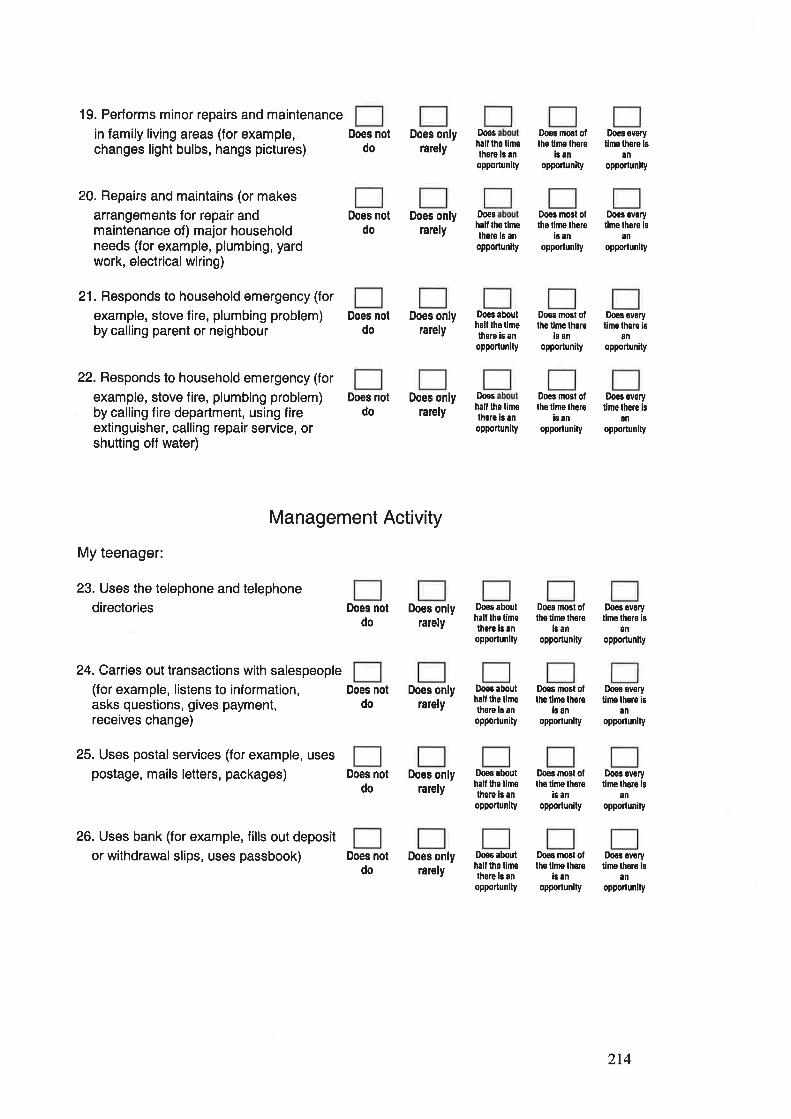
19. Performs minor repairs and maintenance
in family living areas (for example,changes light bulbs, hangs pictures)
20. Repairs and maintains (or makesarrangements for repair andmaintenance of) major householdneeds (for example, plumbing, yardwork, electrical wiring)
21. Responds to household emergency (for
example, stove fire, plumbing problem)by calling parent or neighbour
22. Responds to household emergency (for
example, stove fire, plumbing problem)by calling fire department, using fireextinguisher, calling repair service, orshutting off water)
Does notdo
Does noldo
Does notdo
Does notdo
Does noldo
Does notdo
Does notdo
Does onlyrarely
Does onlyrarely
Does onlyralely
Does onlyrarely
Does onlyrarely
Does onlyrarely
Does onlyrarely
Does onlyrarely
Doos
hail th6 t¡nelhore 13 an
opporlunity
Dooshâlílho llmethore 16 anopporlunity
Doe3 aboulhalf ths limelhsre ¡s an
opporlunlty
Do€shall the limethore is an
opporlunlty
ooos abouthalt lhe tinelhere ¡s anopporlunlty
Doos abouthall the llm€there ls an
opportunity
Doos abouthalf tho tlmethero is an
opPorlunity
Does abouthalf tho timelhsre ls anopporlunlty
Doos most olths tlme lhore
is ¡nopportun¡ty
Doos mosl ollhe llmê there
i¡ anopporlunlty
Doos most olthê t¡me thsro
ls an
opportun¡ty
Do€s most otlhe lime thero
is anopponunlty
Does most otthg tlme thore
ls anopporlun¡ty
Does nost ollhe llmê thore
i¡ anopporlunlty
Doos most oflhe time thsre
¡s anopporlunity
Doos most ollhe tlmê lhsro
¡s anopportunlty
Does everytime lhere ls
an
opporlun¡ty
Doos evsryt¡mê lhere is
an
opporlunlty
Does ovefyline lhsre ¡B
anopportun¡ty
Does everyline lhere is
an
opporlunity
Doos overyllmê lhero is
anopporlunlty
Does ovêrytims lhsre ¡s
an
opponunity
Does everylimê lhsre ls
an
opporlunity
Doo! ovorytime lhers ls
¡nopponunity
Management Activity
My teenager:
23. Uses the telephone and telephone
directories
24. Carries out transactions with salespeople(for example, listens to information,asks questions, gives payment,receives change)
25. Uses postal services (for example, usespostage, mails letters, packages)
26. Uses bank (for example, fills out deposit
or withdrawal slips, uses passbook) Does notdo
2r4
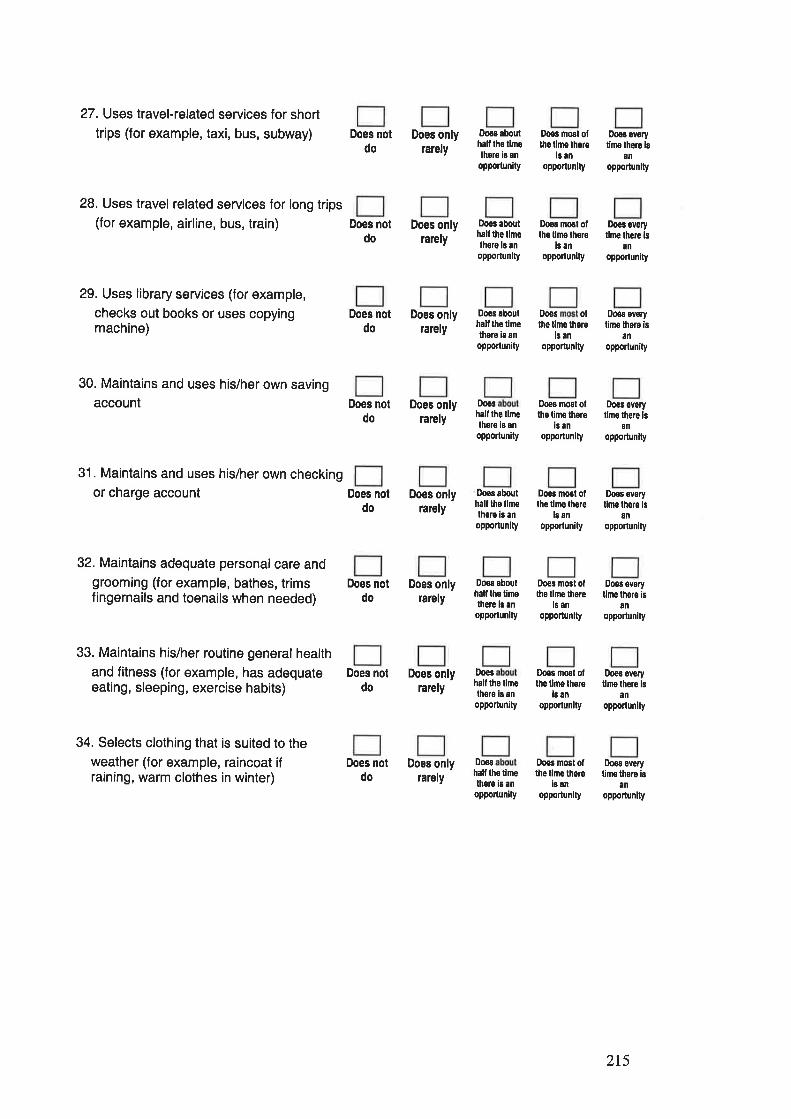
27. Uses travel-related services for short
trips (for example, taxi, bus, subway)
28. Uses travel related services for long trips(for example, airline, bus, train)
29. Uses library services (for example,
checks out books or uses copyingmachine)
30. Maintains and uses his/her own savingaccount
31. Maintains and uses his/her own checkingor charge account
32. Maintains adequate personalcare andgrooming (for example, bathes, trimsfingernails and toenails when needed)
33. Maintains his/her routine general healthand fitness (for example, has adequateeating, sleeping, exercise habits)
34. Selects clothing that is suited to theweather (for example, raincoat ifraining, warm clothes in winter)
Does notdo
Does notdo
Does notdo
Does notdo
Does notdo
Does notdo
Does notdo
Does notdo
Does onlyrarely
Does onlylarely
Does onlyrarely
Does onlyrarely
Does onlyrarely
Does onlyrarely
Does onlyrarely
Does onlyrarely
Doo¡ abouthalt lhe timothere ls anoppoftunity
Doos abouthall lhe limelhore ls anopporlunity
Doos abouthalt the timêthore is anoppoftunity
Doos
half lhe limelhere is anoppoflunity
f¡oos aboulhalt lhe llmelhere is anopporlunlty
Does aboulhall lhe limelhere ls en
opportunity
D,oes
hall tho tlmethoro is an
opportun¡ty
Dooshall lhs limethsro i8 an
opponun¡ty
Dogs nosl ollhs lhîe lhsre
ls anopponun¡ty
Doos most olthe tlme lhere
is anoppoftunity
Does ofthe tlme lhere
ls anopporlunity
Doea overytime lhere ls
ånopponunlty
Does everyllme there ¡s
anopponunity
Does every
time lhero isan
opporlunity
Does most oflhs time thore
is anopportunity
Does most oflhe llrns lhere
l¡ an
opporlunity
DoÀs most ollho tlme thore
ls anopporlunlty
0,095 most oflhe tlme lhsre
i¡ anopportun¡ty
Do€s most olths t¡ne thoro
is anopporlunlty
Does overyt¡ms lhere is
an
opporlunity
Does everylimo lhors ls
an
opporlunity
Doos everyt¡me lhore is
anopportunity
Does everyllme lhere is
an
opporlunlty
Does everytime thors is
ånopporlunity
215
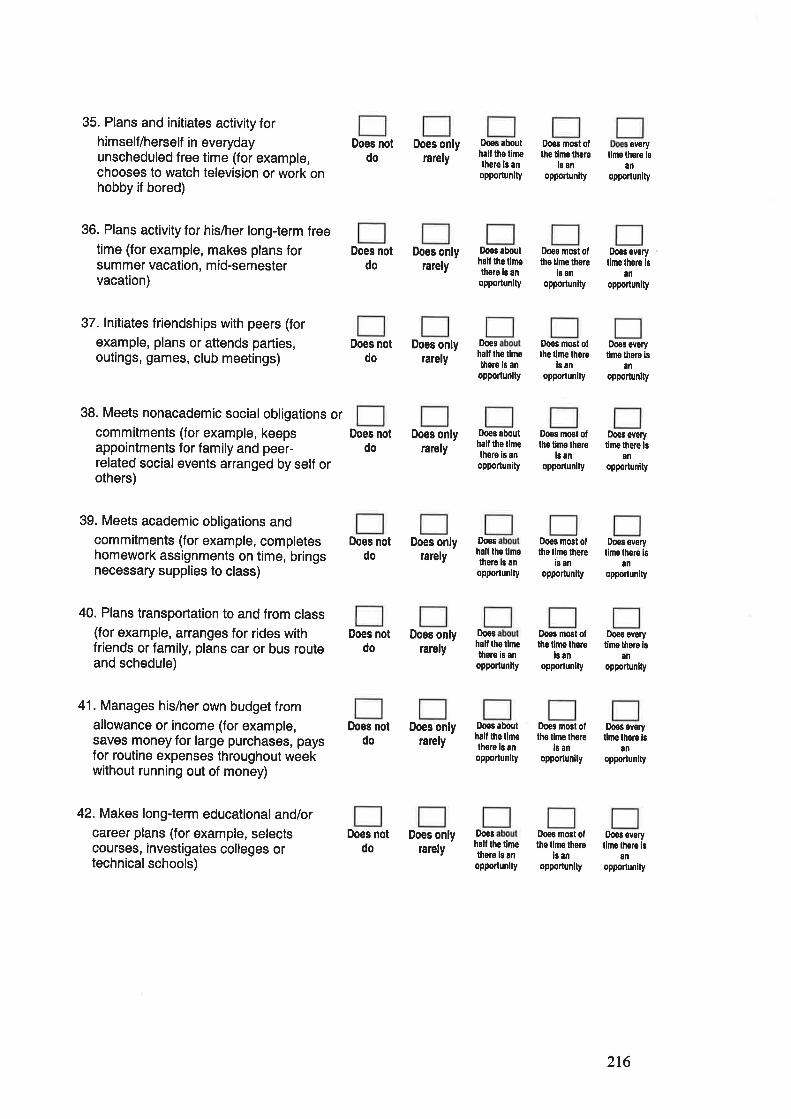
35. Plans and initiates activity forhimself/herself in everydayunscheduled free time (for example,chooses to watch television or work onhobby if bored)
36. Plans activity for his/her long-term freetime (for example, makes plans forsummer vacation, m id-semestervacation)
37. lnitiates friendships with peers (for
example, plans or attends parties,outings, games, club meetings)
38. Meets nonacademic social obligations orcommitments (for example, keepsappointments for family and peer-related social events arranged by self orothers)
39. Meets academic obligations andcommitments (for example, completeshomework assignments on time, bringsnecessary supplies to class)
40. Plans transportation to and from class(for example, arranges for rides withfriends or family, plans car or bus routeand schedule)
41. Manages his/her own budget fromallowance or income (for example,saves money for large purchases, paysfor routine expenses throughout weekwithout running out of money)
42. Makes long-term educational and/orcareer plans (for example, selectscourses, investigates colleges ortechnical schools)
Does notdo
Does notdo
Does notdo
Does notdo
Does notdo
Does notdo
Does notdo
Does notdo
Does onlyrarely
Does onlyrarely
Does onlyrarely
Does onlyrarely
Does onlyrarely
Does onlyrarely
Does onlyrarely
Does onlyrarely
Does abouthalf lhe timethere ls an
oppo.tun¡ty
Doeô aboulhalf the l¡melherg ls an
opportunity
Does
half lhe liÍìethore ls anopporlunlty
Does aboulhall the llmelhsre is anopporlunity
Iheshall the llmolhere ls ânopporlunlty
Doos
half the llmethors is an
opportunity
Doos abouthall the llmêthere i6 anopporlunlty
Doeshall the limethsro ls anopporlunlty
Does mG3t ofthe tlme there
i¡ anoppoftunity
D,oeS m06l ofthe tlme lhere
l¡ anoppoflunity
Does most oflhe time there
is ân
opportunlty
Does most ofthe l¡mo there
ls anopponunlty
Doo3 most oflhe llme lherc
i¡ anopporlunity
Doos mosl ollhe l¡rno lhero
¡s anopporlun¡ty
Doeg most olths lime lhore
ls anopporlun¡ty
Does most olthe lhle lhero
is anopporlunlly
everytimê thsre ls
an
oPPortunlty
Does everytime lhore 16
an
oppoflunity
Does everyllme therê ¡s
an
opporlun¡ty
Does sverytime lhsre is
anopportunity
Does everylime lhore ls
anopponunlty
Does everyllme thsro is
8n
opporlunlty
Doos everylime lhore ls
anopporlunlty
Does everylim€ thsre ls
¿nopporlunity
216
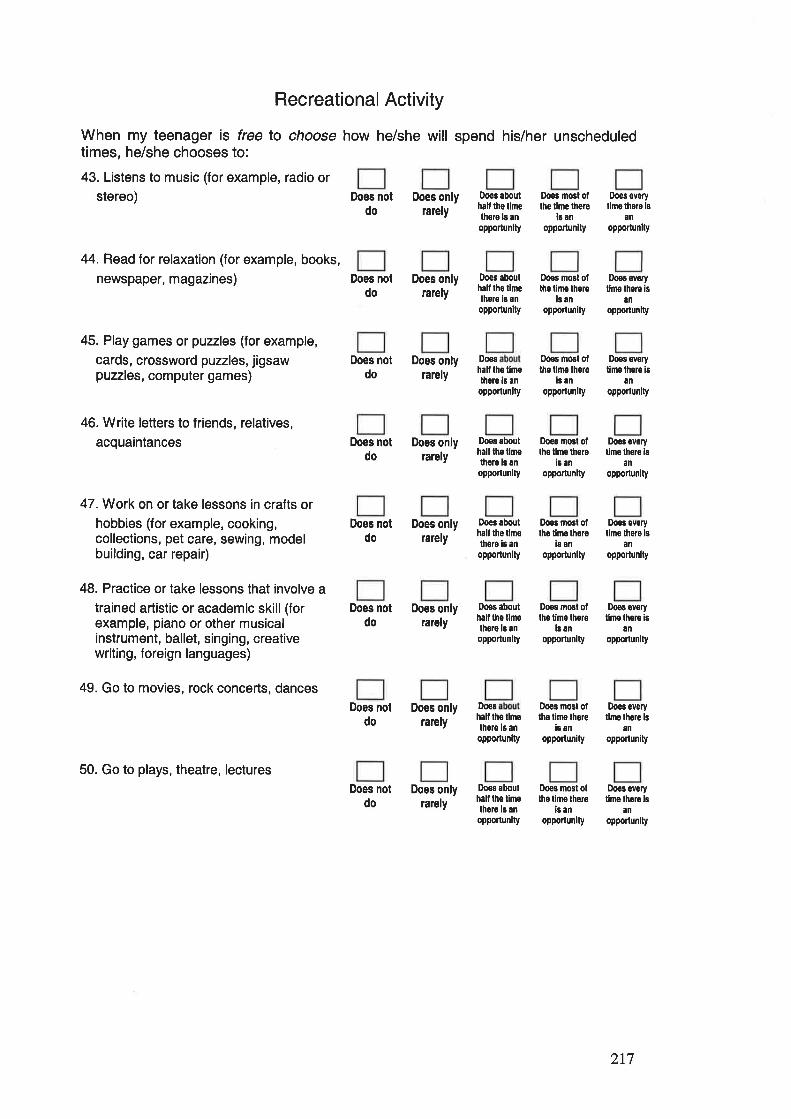
Recreational Activity
When my teenage¡ is free lo choose how he/she will spend his/her unscheduledtimes, he/she chooses to:
43. Listens to music (for example, radio or
stereo) DOes nOt DOes onlv Doos ¡bout Does mo6t of Does ovory
do rarely iiÏlt'J'if the rimelhere r¡mo thoro ls
opportunlty opponun¡ty opporlunlly
44. Read for relaxation (for example, books,
newspaper, magazines)
45. Play games or puzzles (for example,
cards, crossword puzzles, jigsawpuzzles, computer games)
46. Write letters to friends, relatives,
acquaintances
47. Work on or take lessons in crafts orhobbies (for example, cooking,collections, pet care, sewing, modelbuilding, car repair)
48. Practice or take lessons that involve a
trained artistic or academic skill (forexample, piano or other musicalinstrument, ballet, singing, creativewriting, foreign languages)
49. Go to movies, rock concerts, dances
50. Go to plays, theatre, lectures
Does notdo
Does notdo
Does notdo
Does notdo
Does notdo
Does notdo
Does notdo
Does onlyrarely
Does onlyrarely
Does onlyrarely
Does onlyrarely
Does onlyrarely
Does onlyrarely
Does onlyrarely
Does abouthall lho timelhore iB anopportunlty
Do€s
hall the tlm€there ¡s an
opporlunity
Doe3 abouthâll the llmelhoro ls an
opportunlty
Does aboulhalf lhe tlmothoro ¡s anopportunlly
lhês abouthall tho tlmelh3re is an
oppolunlty
Doe¡hall lhe tlmethore ls an
opportunity
Do€s most otthe l¡me lhere
is anopponunity
Does most ofthe tlme lhere
ls an
opporlunlty
Does mo6l otlho llme thers
is anopponunlty
Does most oltho tims thors
i¡ an
opportunlly
Does most otlhe tine thers
l¡ an
opporlunity
Doo3 most ollho t¡me thgre
is ¡noppoftunity
Does every
tlmo thare ls
ånopporlunity
Does every
time there isan
opportunlty
Do€s svsrytime lhere ¡B
an
opportunity
Does sverytlme thsro ¡s
an
oppoíunlty
Does evoryllme lhere is
an
opporlunity
Does everytlms lhore is
an
opportunlty
Do€s abouthall tho limelhsro ls an
opportunity
Does mosl olths time lhere
is anopportunity
Does everyt¡mo thors ls
an
oPPortun¡ty
217
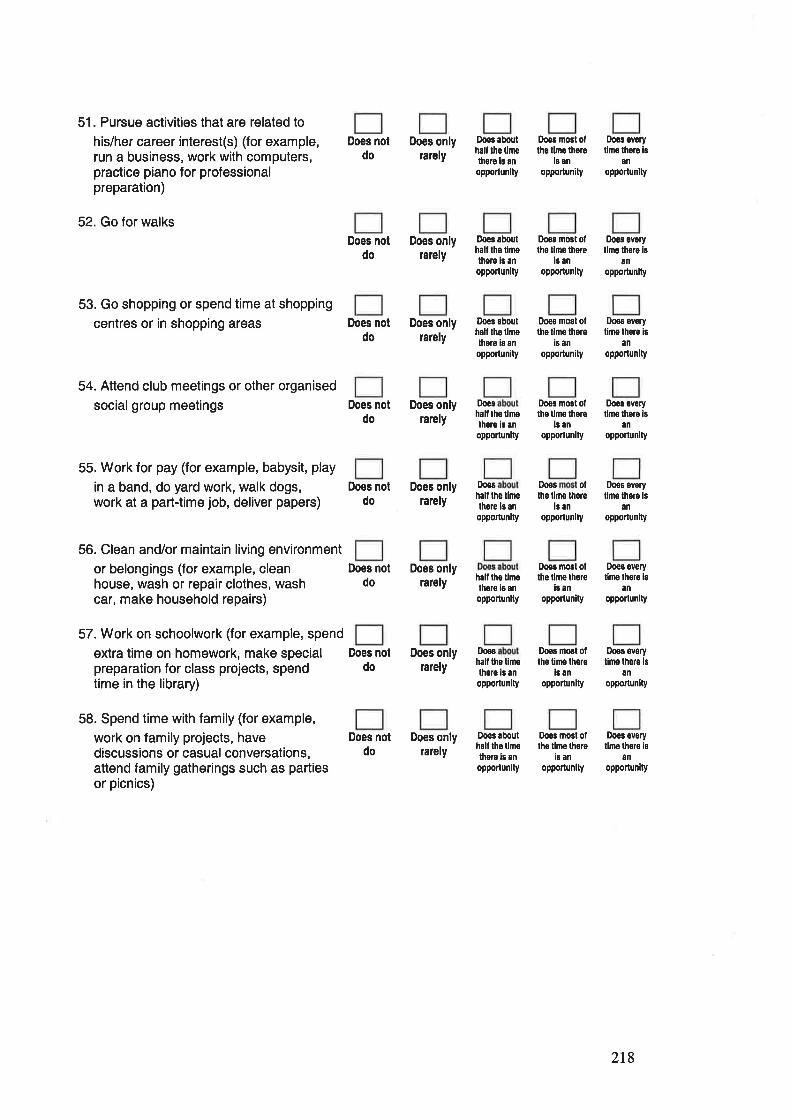
51. Pursue activities that are related to
his/her career interest(s) (for example,run a business, work with computers,practice piano for professionalpreparation)
52. Go for walks
53. Go shopping or spend time at shopping
centres or in shopping areas
54. Attend club meetings or other organised
socialgroup meetings
55. Work for pay (for example, babysit, play
in a band, do yard work, walk dogs,work at a part-time job, deliver papers)
56. Clean and/or maintain living environment
or belongings (for example, cleanhouse, wash or repair clothes, washcar, make household repairs)
57. Work on schoolwork (for example, spend
extra time on homework, make specialpreparation for class projects, spendtime in the library)
58. Spend time with family (for example,
work on family projects, havediscussions or casual conversations,attend family gatherings such as partiesor picnics)
Does notdo
Does notdo
Does notdo
Does onlyrarely
Does onlyrarely
Does onlylarely
Does onlyrarely
Dooc aboulhall lhe limethgrs b anopporlunlty
Doos abouthall the tlmolhe¡e is an
opportunity
Doês abouthalf lhe tlmolhero is an
oppodunity
Doeshalt lhs llmolhgre is an
opportunlty
Doos most ollhe timo lhsrg
l¡ anopportunity
Doos mosl oflho time thsre
l¡ anopportunity
Ihês evgrytimo thoro is
an
opponunlty
Does evoryllno lhore is
anopportunlty
Does notdo
Does mosl otthe t¡me there
is anopportunity
Does most oflho llmo lhore
ls anopporlunity
Doos oftho limo thor'e
ls an
opportunity
Does ovofylimê lhere is
anoppodunity
Does svoryllmo lhsro is
an
opporlunlty
Does everyllme thoro ls
an
opporlunity
Does notdo
Does onlyrarely
Does onlyrarely
f)oeshall the llmolhore b an
oppoftunity
Does notdo
Does notdo
Does notdo
hall lho tlmothore ¡s an
opportunlty
Do€s most ofthe tlme thsre
¡3 an
opportun¡ty
Dose most otlhe timo lhefe
is anopporlunity
Ooos most olthe tlme thore
i¡ an
opporlunlty
Does overylimo there i8
anopPorlun¡ty
Does evgrytimo thsrs is
an
opporlunity
Doeô svorytlme thore is
anopportunity
Does onlylarely
Does onlyrarely
Doarhalf lhe t¡methsre is an
oppoftunlty
Doos abouthall lho tlmolhsre ls ¿n
opporlunlty
218
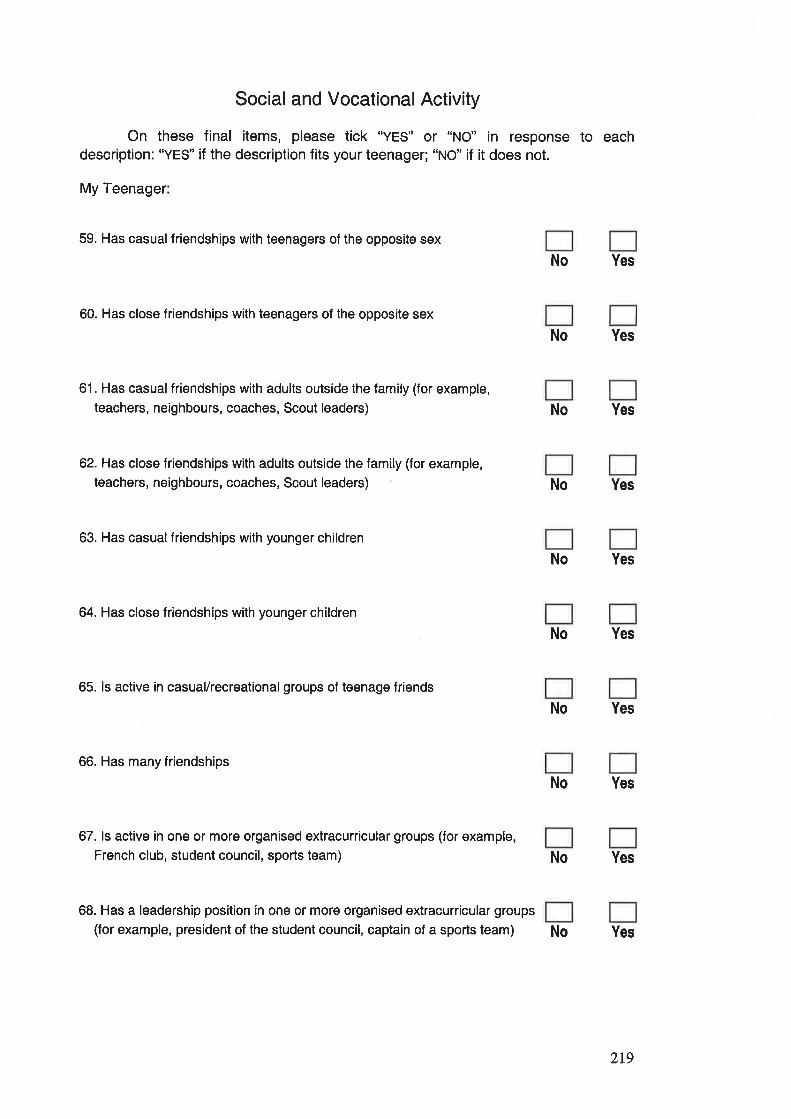
Social and Vocational Activity
On these final items, please tick "YES" or "NO" in response to eachdescription: "YES" if the description fits your teenager; "NO" if it does not.
My Teenager
59. Has casual friendships with teenagers of the opposite sex
Yes
60. Has close friendships with teenagers of the opposite sex
No Yes
61. Has casual friendships with adults outside the family (for example,
teachers, neighbours, coaches, Scout leaders) No Yes
62. Has close friendships with adults outside the family (for example,
teachers, neighbours, coaches, Scout leaders) No Yes
63. Has casual friendships with younger children
Yes
64. Has close friendships with younger children
No Yes
65. ls active in casual/recreational groups of teenage friends
No Yes
66. Has many friendships
No Yes
67. ls active in one or more organised extracurricular groups (for example,
French club, student council, sports team) No Yes
68. Has a leadership position in one or more organised extracurricular groups
(for example, president of the student council, captain of a sports team) Yes
No
No
No
2r9
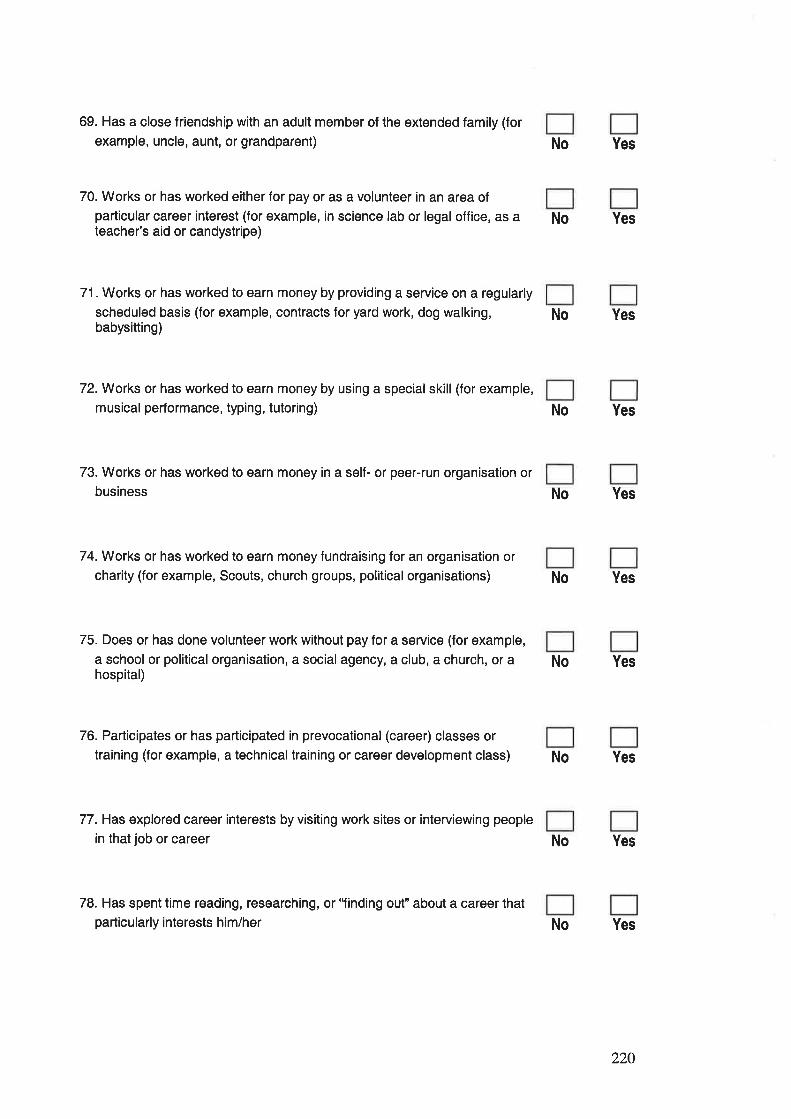
69. Has a close friendship with an adult member of the extended family (for
example, uncle, aunt, or grandparent)
70. Works or has worked either for pay or as a volunteer in an area of
particular career interest (for example, in science lab or legal office, as ateacher's aid or candystripe)
71. Works or has worked to earn money by providing a service on a regularly
scheduled basis (for example, contracts for yard work, dog walking,babysitting)
YesNo
No Yes
No Yes
72. Works or has worked to earn money by using a specialskill (for example,
musical performance, typing, tutoring) No Yes
73. Works or has worked to earn money in a self- or peer-run organisation or
business No Yes
74. Works or has worked to earn money fundraising for an organisation or
charity (for example, Scouts, church groups, political organisations)
75. Does or has done volunteer work without pay for a service (for example,
a school or political organisation, a social agency, a club, a church, or ahospital)
No Yes
No Yes
76. Participates or has participated in prevocational (career) classes or
training (for example, a technical training or career development class)
77. Has explored career interests by visiting work sites or interviewing people
in that job or career
No Yes
No Yes
78. Has spent time reading, researching, or'Iinding out" about a career thatparticularly interests him/her No Yes
220
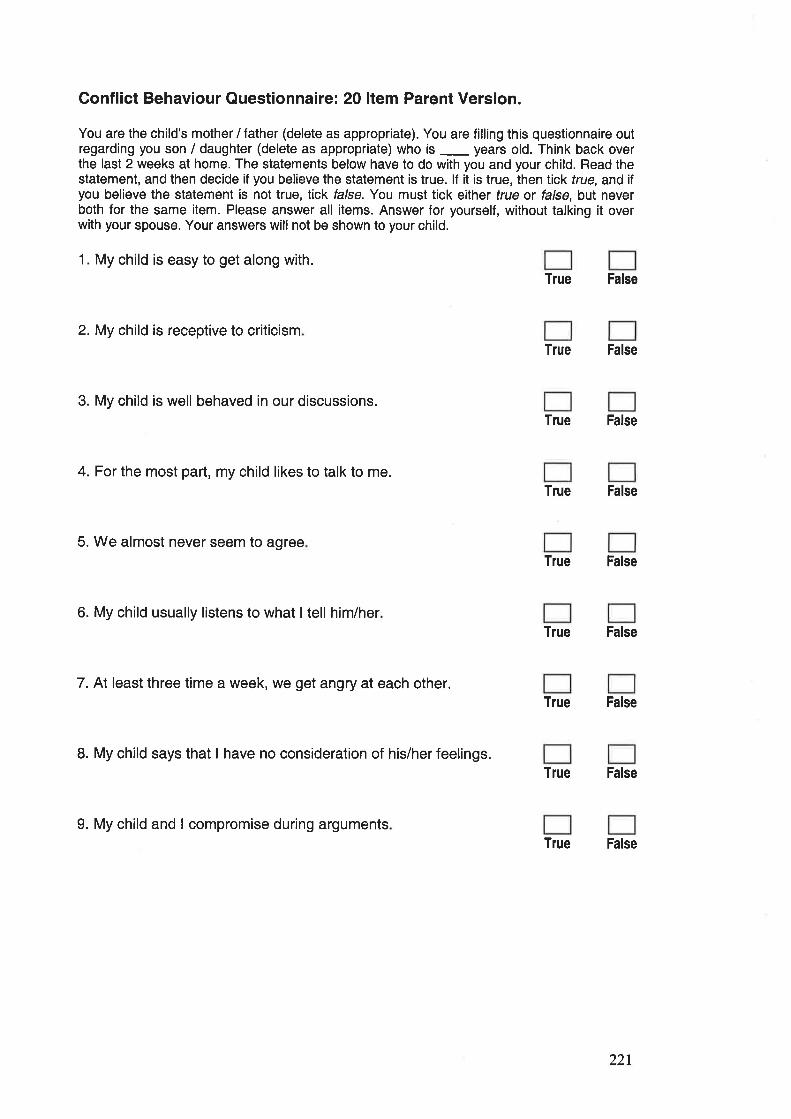
Conflict Behaviour Questionnaire: 20 ltem Parent Version.
You are the child's mother / father (delete as appropriate). You are filling this questionnaire outregarding you son / daughter (delete as appropriate) who is _ years old. Think back overthe last 2 weeks at home. The statements below have to do with you and your child. Read thestatement, and then decide if you believe the statement is true. lf it is true, then tick true, and iÎyou believe the statement is not true, tick false. You must tick either frue or false, but neverboth for the same item. Please answer all items. Answer for yourself, without talking it overwith your spouse. Your answers will not be shown to your child.
1. My child is easy to get along w¡th.
True False
2.My child is receptive to criticismTrue False
3. My child is well behaved in our discussions.True False
4. For the most part, my child likes to talk to me.True False
5. We almost never seem to agreeTrue False
6. My child usually listens to what I tell him/herTrue False
7. At least three time a week, we get angry at each other.True False
8. My child says that I have no consideration of his/her feelings.True False
9. My child and I compromise during argumentsTrue False
221
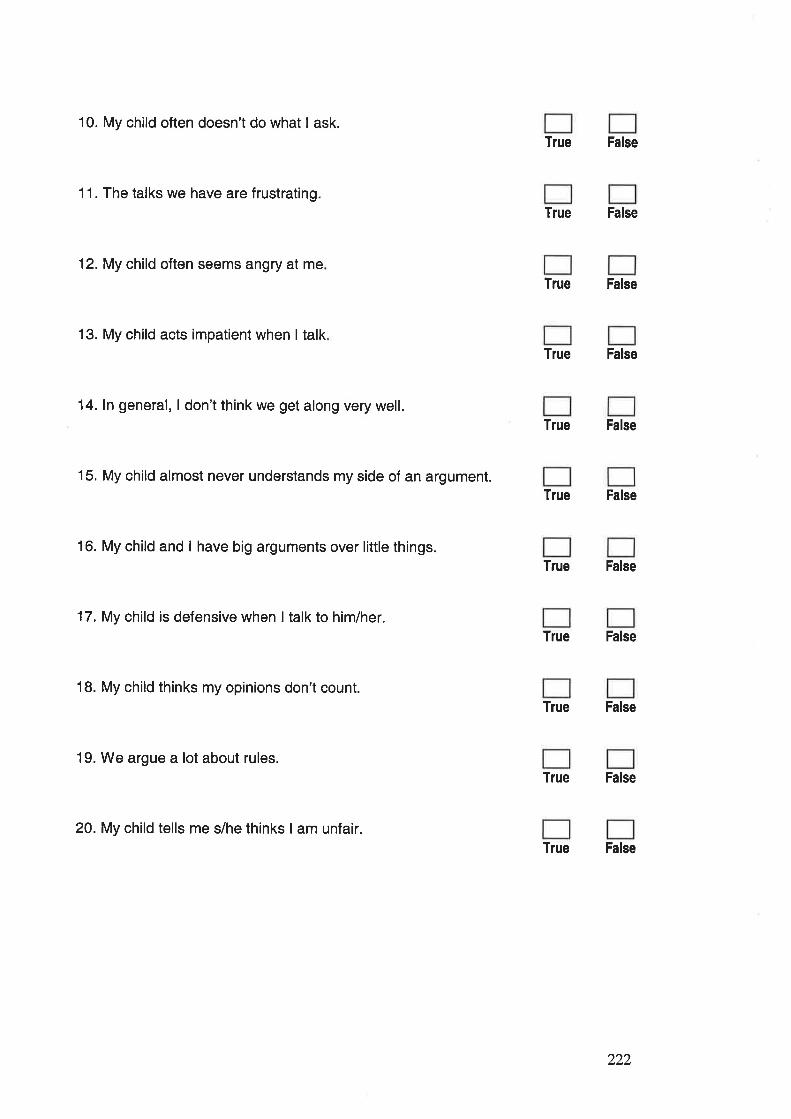
10. My child often doesn't do what I ask.
11. The talks we have are frustrating.
12. My child often seems angry at me
13. My child acts impatient when I talk
14. ln general, I don't think we get along very well.
15. My child almost never understands my side of an argument.
16. My child and I have big arguments over little things.
17. My child is defensive when I talk to him/her.
18. My child thinks my opinions don't count.
19. We argue a lot about rules.
20. My child tells me s/he thinks I am unfair.
True False
True False
True False
True False
True False
True False
True False
True False
True False
True False
True False
222
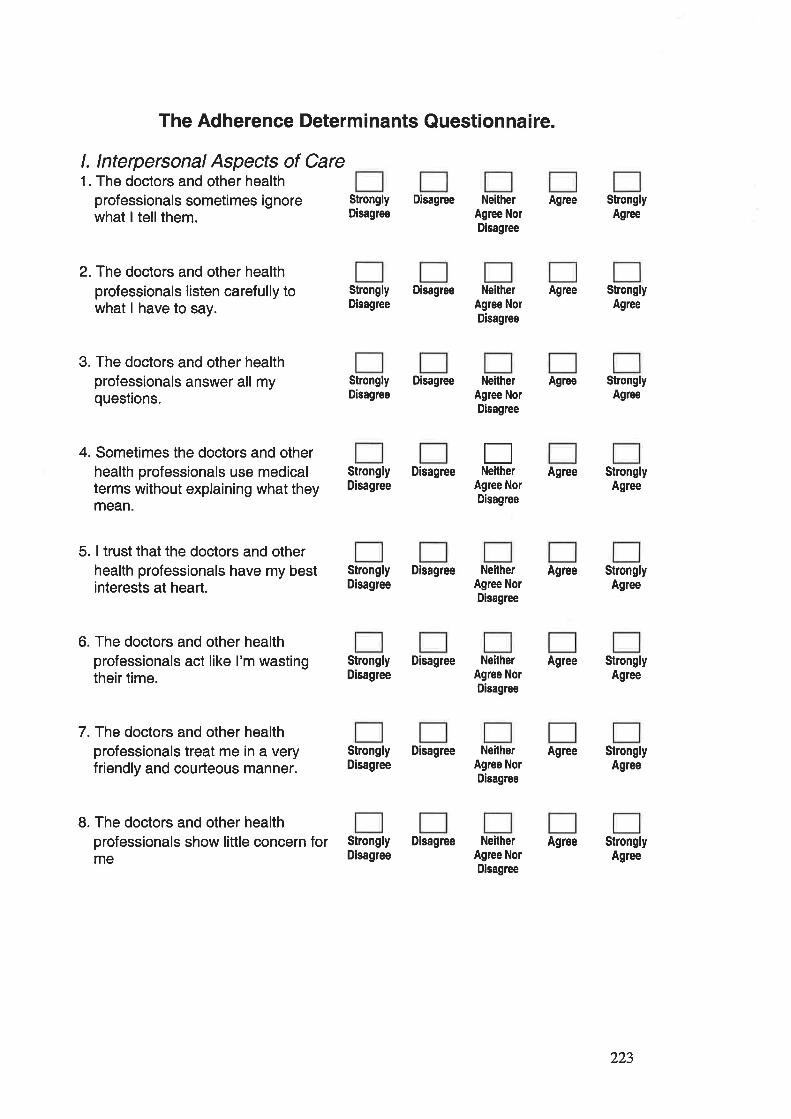
The Adherence Determinants Questionnaire.
l. lnterpersonal Aspects of Care1. The doctors and other health
professionals sometimes ignorewhat I tellthem.
Strongly DisagreeDisagree
2. The doctors and other healthprofessionals listen carefully towhat I have to say.
3. The doctors and other healthprofessionals answer all myquestions.
4. Sometimes the doctors and otherhealth professionals use medicalterms without explaining what theymean.
5. I trust that the doctors and otherhealth professionals have my bestinterests at heart.
6. The doctors and other healthprofessionals act like I'm wastingtheir time.
7. The doctors and other healthprofessionals treat me in a veryfriendly and courteous manner.
8. The doctors and other healthprofessionals show little concern forme
Strongly DisagreeDisagree
NeitherAgree NorDisagree
NeitherAgree NorDisagree
Agree
Agree
Agree
Agree
Agree
Agree
Agree
Agree
StronglyAgree
StronglyAgree
StronglyAgree
StronglyAgree
StronglyAgree
StronglyAgree
StronglyAgree
StronglyAgree
Strongly DisagreeDisagree
Neithe¡Agree NorDisagree
ENeltherStrongly Disagree
Disagree Agree NorDisagree
Strongly DisagreeDisagree
NeitherAgree NorDisagree
Strongly DisagreeDisagree
NeitherAgree NorDisagree
Strongly DisagreeDisagree
NeitherAgree NorDisagree
Strongly DisagreeDisagree
NeitherAgree NorDisagree
223
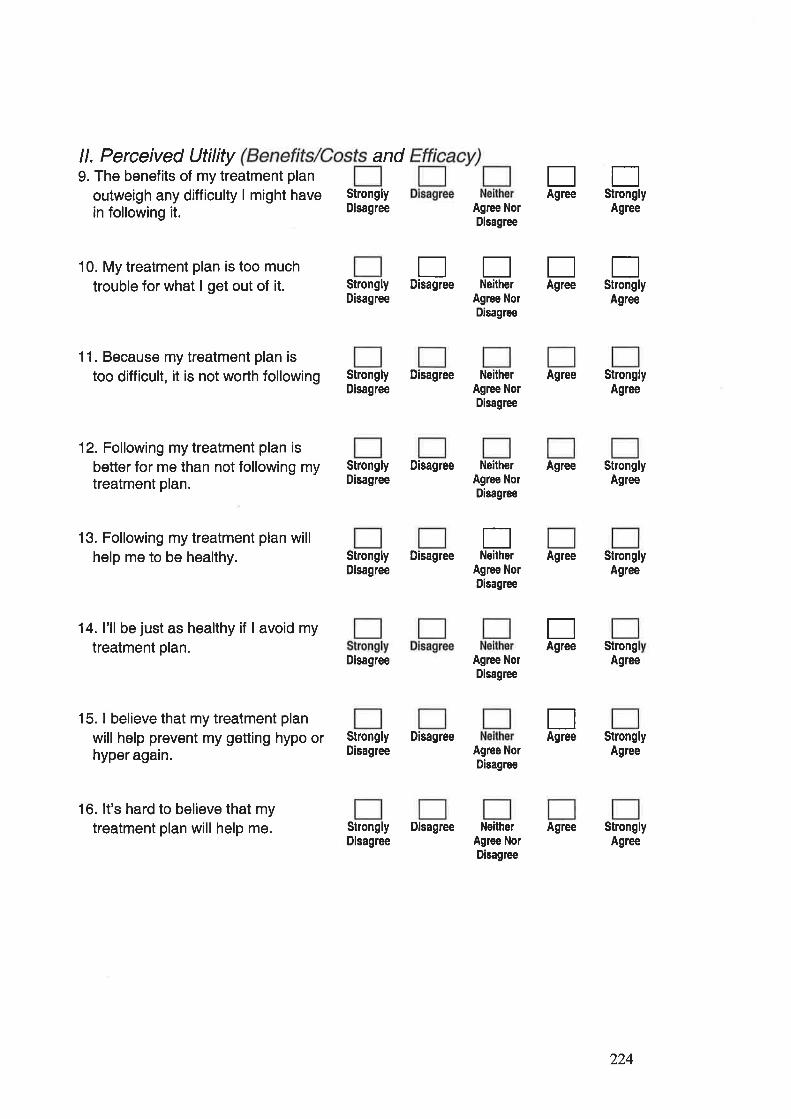
ll. Perceived Utility9. The benefits of my treatment plan
outweigh any difficulty I might havein following it.
10. My treatment plan is too muchtrouble for what I get out of it.
11. Because my treatment plan istoo difficult, it is not worth following
12. Following my treatment plan isbetter for me than not following mytreatment plan.
13. Following my treatment plan willhelp me to be healthy.
14. I'll be just as healthy if I avoid mytreatment plan.
15. I believe that my treatment plan
will help prevent my getting hypo orhyper again.
Agree NorDisagree
Agree
EEEt]Disagree Neither Agree Strongly
Agree NorDisagree
Agree
and
StronglyDisagree
StronglyDisagree
Strongly DisagreeDisagree
EAgree
EStrongly
Strongly DisagreeDisagree
NeitherAglee NorDisagree
NeitherAgree NorDisagree
Agree
Agree
Agree
StronglyAgree
StronglyAgree
StronglyAgree
StrongAgree
StronglyAgree
StronglyAgree
ENeitherStrongly Disagree
DisagreeAgree
EAgree
EAgree
Agree NorDisagree
Disagree
Strongly DisagreeDisagree
Agree NorDisagree
Agree NorDisagree
16. lt's hard to believe that mytreatment plan will help me. Strongly Disagree
DisagreeNeither
Agree NorDisagree
224
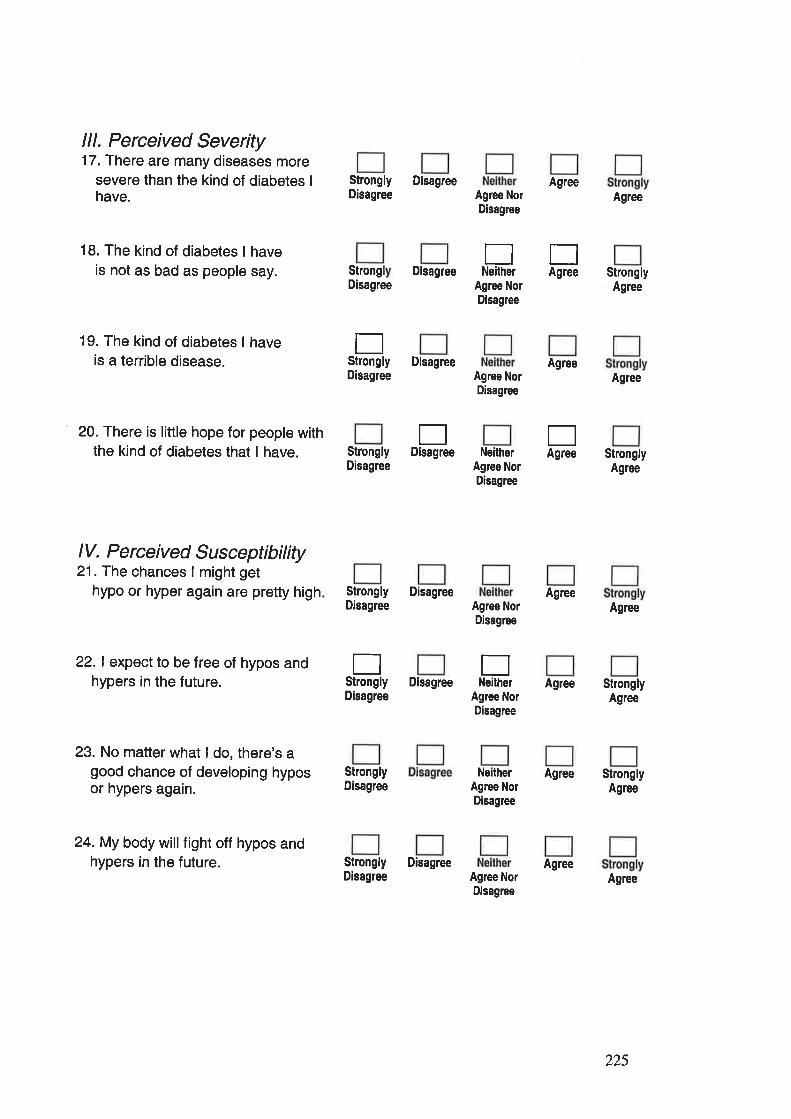
lll. Perceived Severity17. There are many diseases more
severe than the kind of diabetes I
have.
18. The kind of diabetes I haveis not as bad as people say.
19. The kind of diabetes I haveis a terrible disease.
20. There is little hope for people withthe kind of diabetes that I have.
StronglyDisagree
Disagree
Strong DisagreeDisagree
DisagreeDisagree
StronglyDisagree
ETNeither Agree
EStrongly
TAgree
EDisagree
Agree NorDisagree
Agree NorDisagree
Agree NorDisagree
NeitherAgree NorDisagree
Agree NorDisagree
Agree
Agree
Agree
Agree
Agree
Agree
Agree
StronglyAgree
Agree
StronglyAgree
Agree
StronglyAgree
StronglyAgree
Agree
lV. Perceived Susceptibility21. The chances I might get
hypo or hyper again are pretty high
22.1 expect to be free of hypos andhypers in the future.
23. No matter what I do, there's agood chance of developing hyposor hypers again.
24. My body will fight off hypos andhypers in the future.
Strongly DisagreeDisagree
EStrongly
ENeilherDisagree
Disagree
StronglyDisagree
Strongly DisagreeDisagree
Agree NorDisagree
NeilherAgree NorDisagree
Agree NorDisagree
225
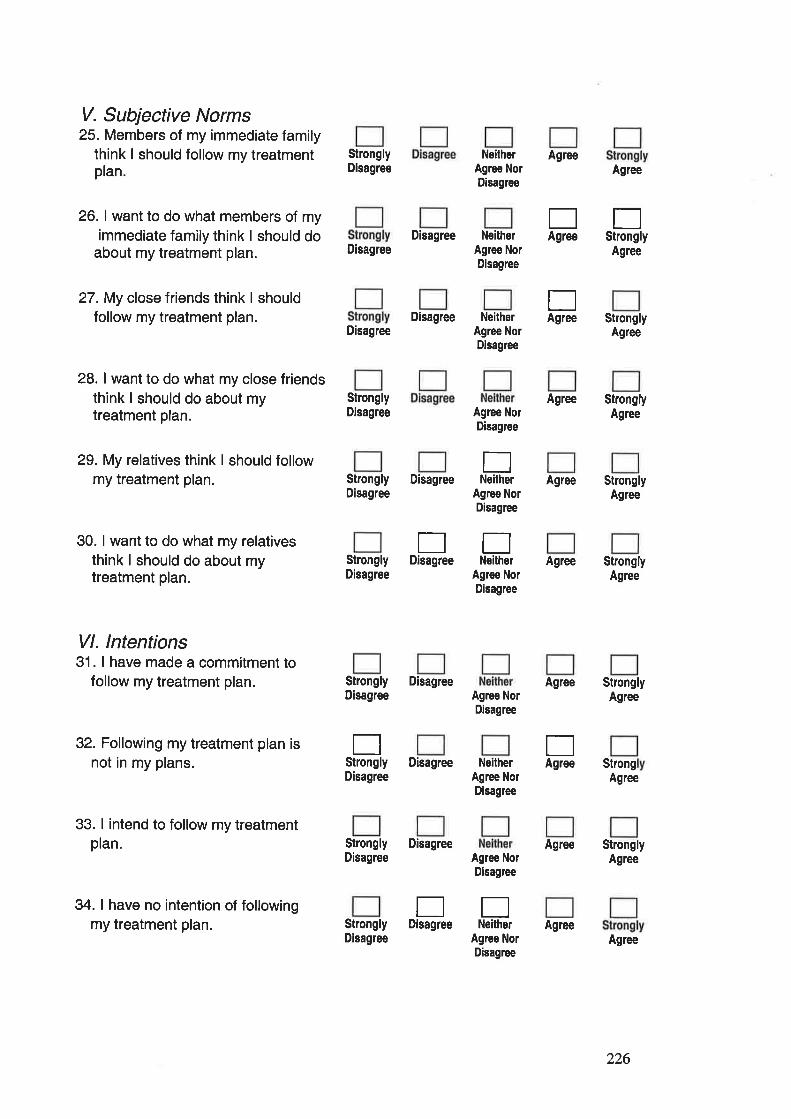
V. Subjective Norms25. Members of my immediate family
think I should follow my treatmentplan.
26. I want to do what members of myimmediate family think I should do
about my treatment plan.
27. My close friends think I shouldfollow my treatment plan.
28. I want to do what my close friendsthink I should do about mytreatment plan.
EStrongly
StronglyDisagree
Disagree
NeitherAgree NorDisagree
Disagree NeitherAgree NorDisagree
Agree
StronglyDisagree Agree Nor
Disagree
Agree
Agree
Agree
Agree
Agree
Agree
Agree
StronglyAgree
StronglyAgree
StronglyAgree
StronglyAgree
StronglyAgree
StrongAgree
StronglyAgree
Agree
EAgree
EAgree
DisagreeDisagree Neither
Agree NorDisagree
29. My relatives think I should followmy treatment plan.
30. I want to do what my relativesthink I should do about mytreatment plan.
Vl. lntentions31. I have made a commitment to
follow my treatment plan.
32. Following my treatment plan isnot in my plans.
33. I intend to follow my treatmentplan.
34. I have no intention of followingmy treatment plan.
ENeitherStrongly Disagree
Disagree
rrDisagree NeitherStrongly
Disagree
Strongly DisagreeDisagree
Disagree
Agree NorDisagree
Agree NorDisagree
EAgree
flStrongly
Agree NorDisagree
Disagree Ne¡therAgree NorDisagree
Strongly DisagreeDisagree
StronglyDisagree
Agree NorDisaglee
Agree NorDisagree
EEDisaglee Neither Agree
226
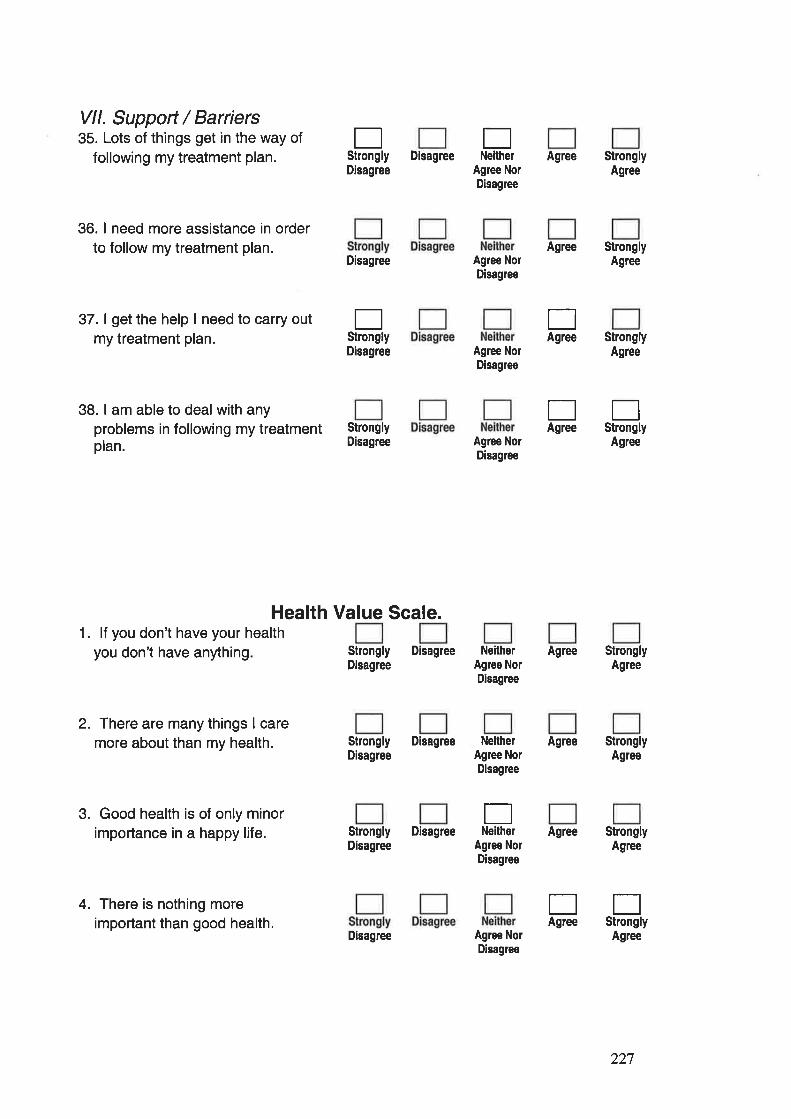
Vll. Support / Barriers35. Lots of things get in the way of
following my treatment plan.
36. I need more assistance in orderto follow my treatment plan.
37. I get the help I need to carry outmy treatment plan.
38. I am able to deal with anyproblems in following my treatmentplan.
DisagreeDisagree
Disagree
Disagree
StronglyDisagree
Health Value Scale.
Strongly DisagreeDisagree
Strongly DisagreeDisagree
Strongly DisagreeDisagree
EStrongly
ENeither
EStrongly
Agree NorDisagree
Agree NorDisagree
Agree NorDisagree
Agree NorDisagree
NeilherAgree NorDisagree
Agree
Agree
Agree
Agree
StronglyAgree
StronglyAgree
StronglyAgree
StronglyAgree
StronglyAgree
StronglyAgree
Agree
Agree
EAgree
EAgree
EStrongly
Agree
1. lf you don't have your healthyou don't have anything
2. There are many things I caremore about than my health.
3. Good health is of only minorimportance in a happy life.
4. There is nothing moreimportant than good health.
NeithelAgree NorDisagree
ENeither
Agree NorDisagree
TStrongly
EAgree
Agree NorDisagree
Disagree
227
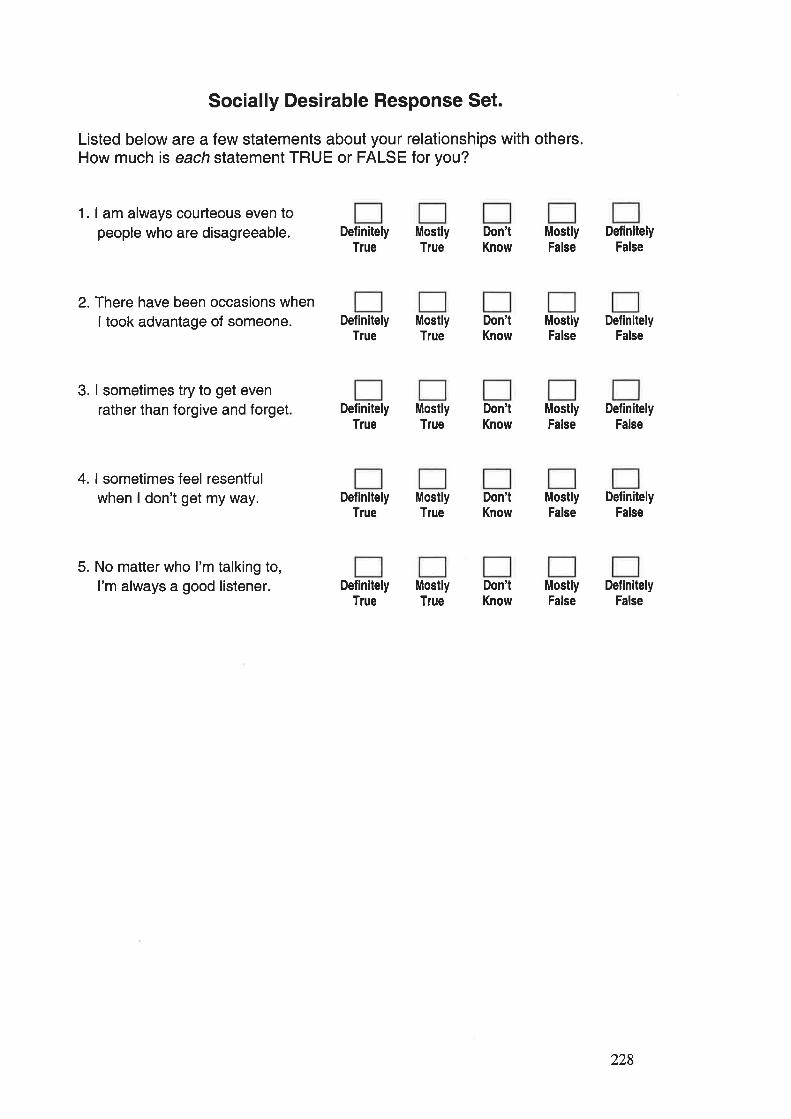
Socially Desirable Response Set.
Listed below are a few statements about your relationships with others.How much is each statement TRUE or FALSE for you?
1. I am always courteous even topeople who are disagreeable.
2. There have been occasions whenI took advantage of someone.
3. I sometimes try to get evenrather than forgive and forget
4. I sometimes feel resentfulwhen I don't get my way.
5. No matter who I'm talking to,I'm always a good listener.
DefinitelyTlue
DefinitelyTrue
DefinitelyTrue
DefinitelyTrue
MostlyTrue
MostlyTrue
MostlyTrue
MostlyTrue
DefinitelyTrue
MostlyTrue
Don'tKnow
Don'tKnow
Don'tKnow
Don'tKnow
Don'tKnow
MostlyFalse
MostlyFalse
MostlyFalse
MostlyFalse
MostlyFalse
DefinitelyFalse
DefinitelyFalse
DefinitelyFalse
DefinitelyFalse
DefinitelyFalse
228
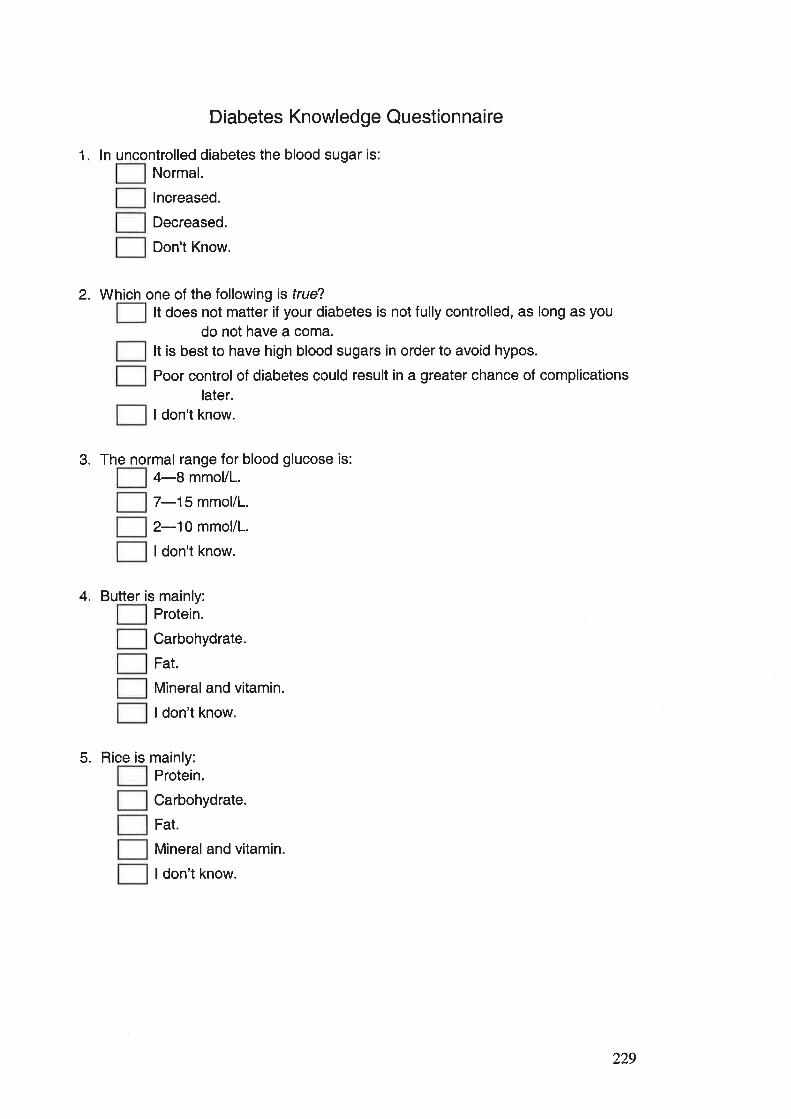
Diabetes Knowledge Questionnaire
1. ln uncontrolled diabetes the blood sugar rs:
Normal.
lncreased.
Decreased.
Don't Know.
2. Which one of the followi ng is frue?It does not matter if your diabetes is not fully controlled, as long as you
do not have a coma.It is best to have high blood sugars in order to avoid hypos.
Poor control of diabetes could result in a greater chance of complicationslater.
I don't know.
3. The normal range for blood glucose is:4-B mmol/L.
7-15 mmol/L.
2-10 mmol/1.
I don't know.
4. Butter is mainly:Protein.
Carbohydrate.
Fat.
Mineraland vitamin.
I don't know.
5. Rice is mai nly:Protein.
Carbohydrate.
Fat.
Mineral and vitamin
I don't know.
229
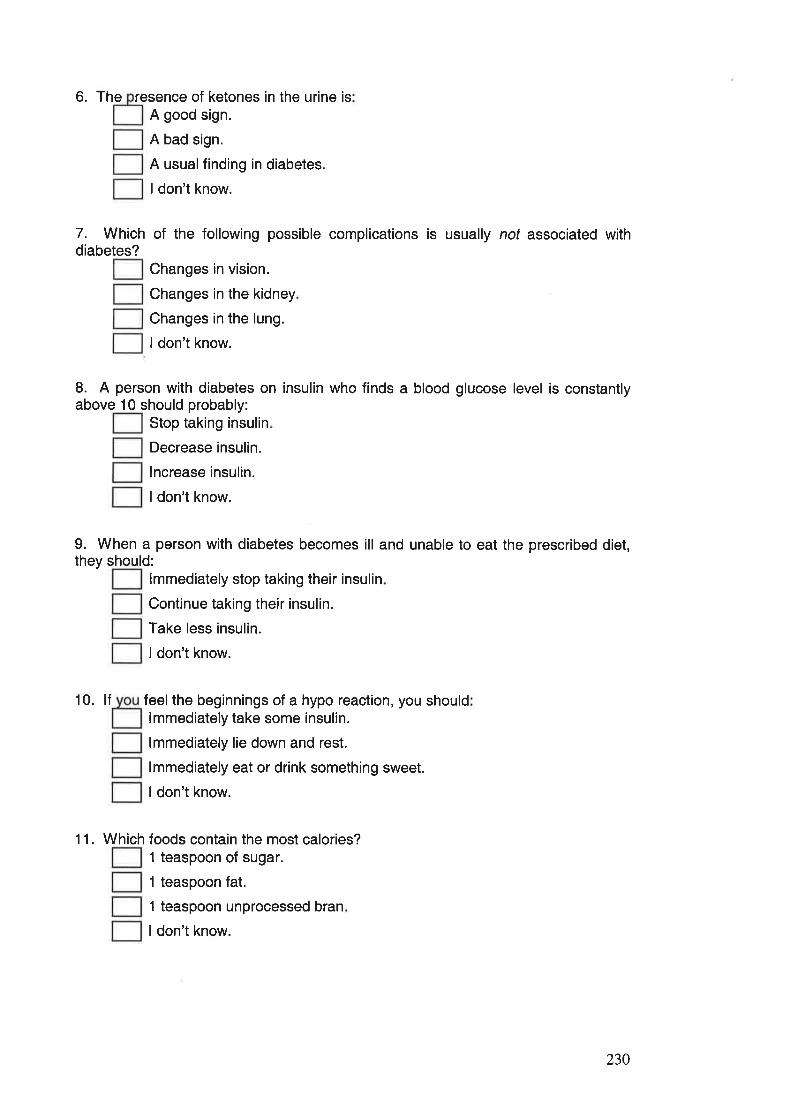
6. The resence of ketones in the urine isA good sign.
A bad sign.
A usualfinding in diabetes.
I don't know.
7. Which of the following possible complications is usually not associated withdiabetes?
Changes in vision.
Changes in the kidney
Changes in the lung.
I don't know.
L A person with diabetes on insulin who finds a blood glucose level is constantlyabove 10 should probably:
Stop taking insulin
Decrease insulin.
lncrease insulin.
ldon't know.
9. When a person with diabetes becomes ill and unable to eat the prescribed diet,they should:
lmmediately stop taking their insulin
Continue taking their insulin.
Take less insulin.
ldon't know.
10. lf feelthe beginnings of a hypo reaction, you shouldlmmediately take some insulin.
lmmediately lie down and rest.
lmmediately eat or drink something sweet.
I don't know.
11. Which foods contain the most calories?1 teaspoon of sugar.
1 teaspoon fat.
1 teaspoon unprocessed bran
ldon't know.
230
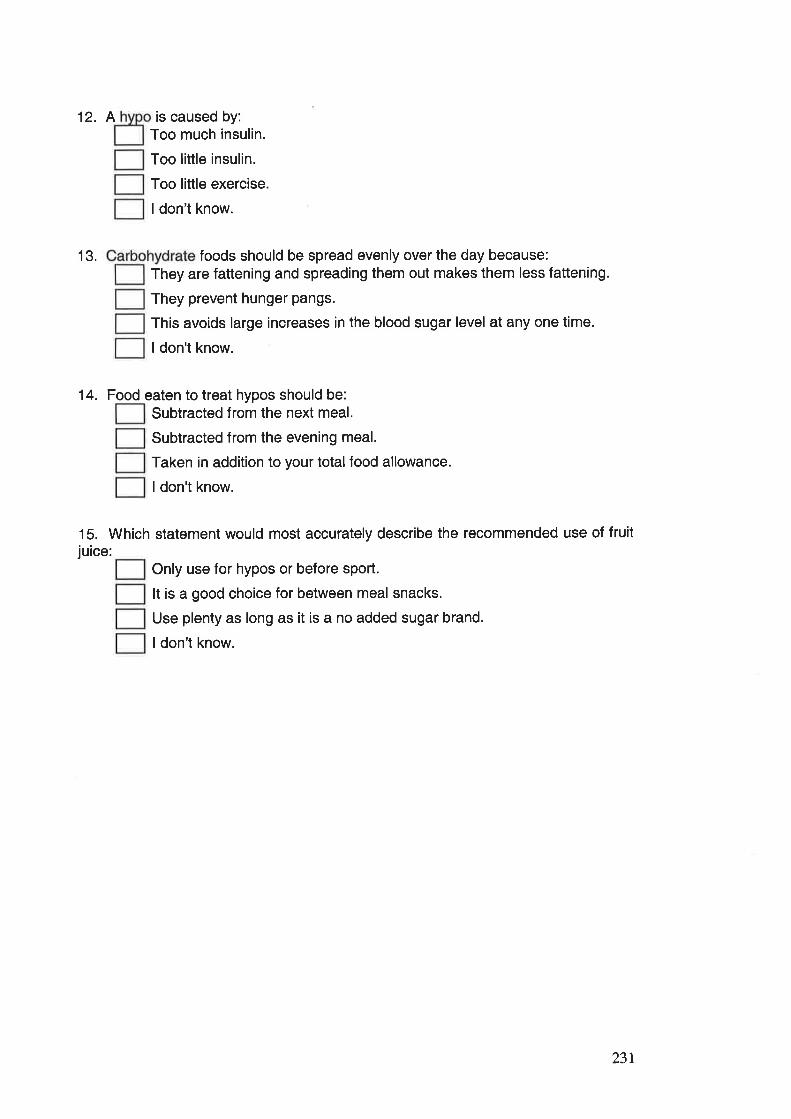
12. A is caused by:Too much insulin.
Too little insulin.
Too little exercise.
ldon't know.
13. foods should be spread evenly over the day because:They are fattening and spreading them out makes them less fattening.
They prevent hunger pangs.
This avoids large increases in the blood sugar level at any one time.
I don't know.
14. Food eaten to treat hypos should be:Subtracted from the next meal.
Subtracted from the evening meal.
Taken in addition to your total food allowance.
I don't know.
15. Which statement would most accurately describe the recommended use of fruitjuice:
Only use for hypos or before sport.
It is a good choice for between meal snacks.
Use plenty as long as it is a no added sugar brand.
ldon't know.
231

Background lnformation.
o To be completed by the parent guardian
1. Your sex:
2. Your age:
3. What is the sex of the child in this study:
4. What is the age of the child in this study:
5. How old was this child when diagnosedwith diabetes?
years.
years,
years,
Male
Female
Male
Female
months.
months
6. Which one of the following best describes your relationship to the child in this study?
Naturalmolher
Natural father
Stepmother
Stepfather
Other (please describe)
7. What are the ages of ALL other childrenunder the age of 20 in your home?
8. What is the main language spoken athome?
9. Which one of the following best applies to you? (Ttcr orulv orue)
Employed
Unemployed
Home duties
Student
Pensioner
Retired
Other. (please describe)
232
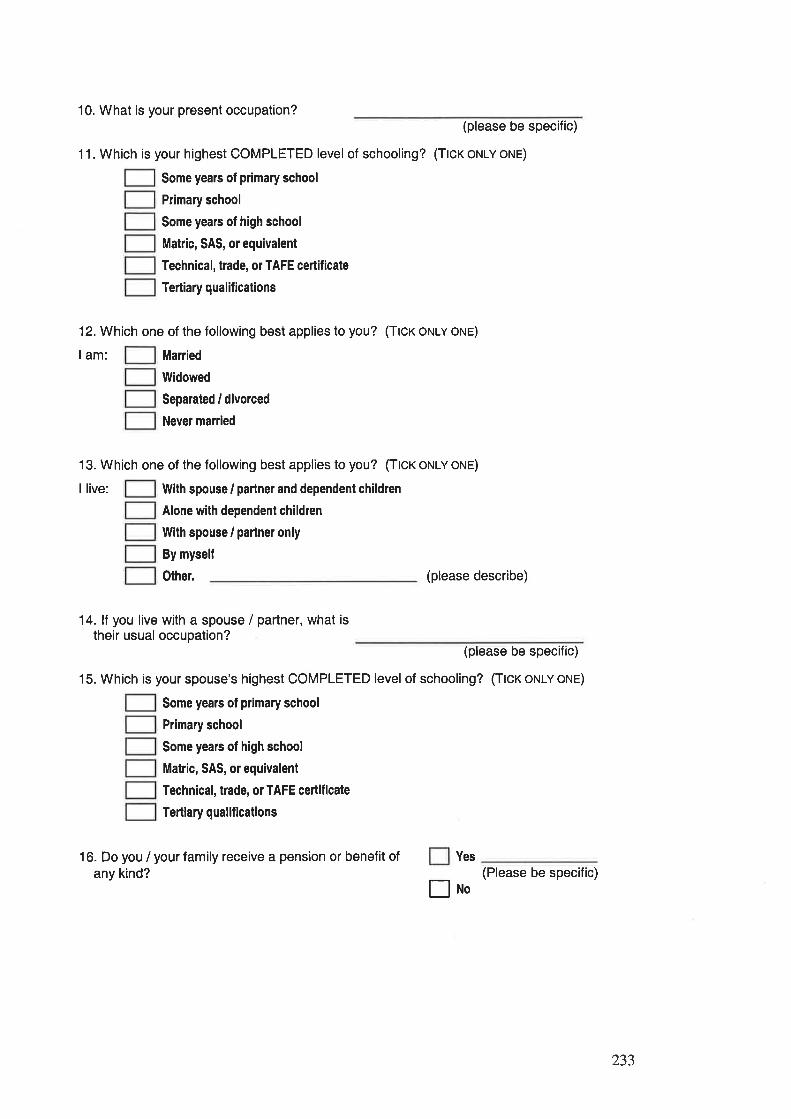
10. What is your present occupation?(please be specific)
11. Which is your highest COMPLETED level of schooling? (Ttcx ot'tlv orue)
Some yeals of prlmary school
Primary school
Some years of high school
Matric, SAS, or equivalent
Technical, trade, or TAFE ceilificate
Tertiary qualifications
12. Which one of the following best applies to you? (Ttcr orulv orue)
lam: Manied
llVidowed
Separated / divorced
Never married
13. Which one of the following best applies to you? (Ttcr orulv orue)
I live: With spouse / partner and dependent children
Alone with dependent children
With spouse / partner only
By mysell
Other. (please describe)
14. lf you live with a spouse / partner, what istheir usual occupation?
(please be specific)
15. Which is your spouse's highest COMPLETED level of schooling? (Ttcr oNLY oNE)
Some years of plimary school
Primary school
Some years of high school
Matric, SAS, or equivalent
Technical, trade, or TAFE ceilificate
Tertiary qualif ications
16. Do you / your family receive a pension or benefit ofany kind?
Yes
Eno(Please be specific)
233

APPENDIX B.
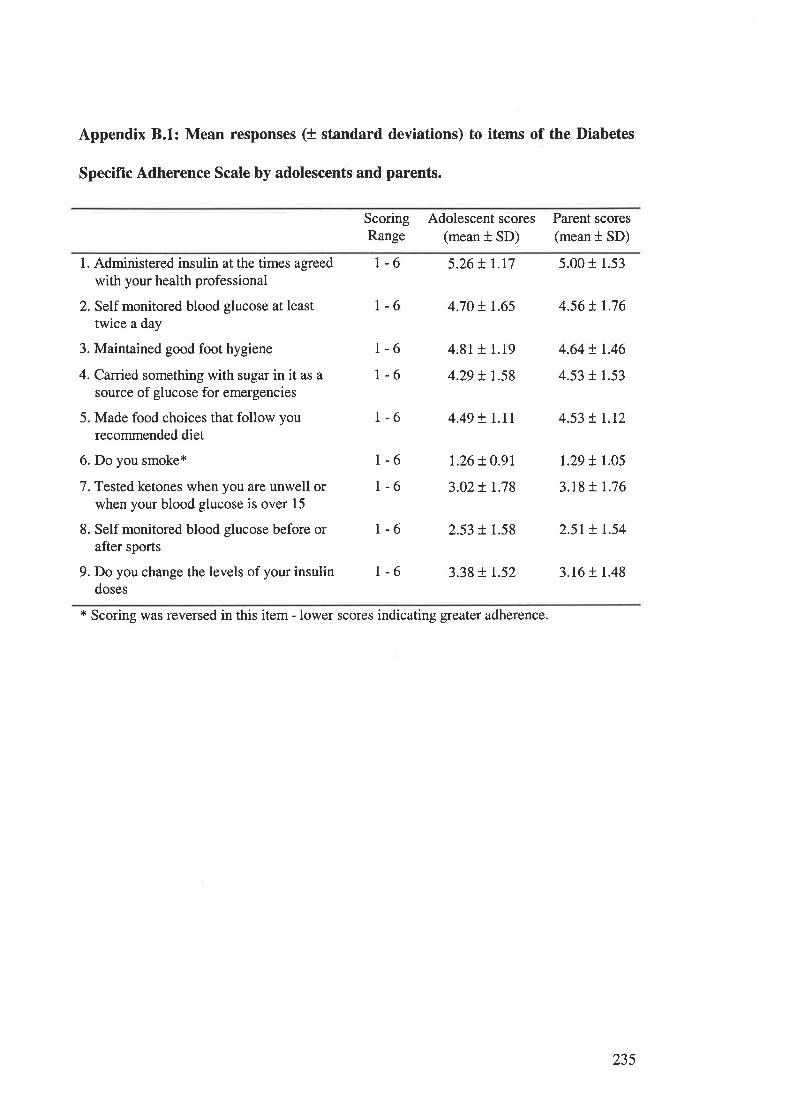
Appendix 8.1: Mean responses (+ standard deviations) to items of the Diabetes
Specific Adherence Scale by adolescents and parents.
ScoringRange
Adolescent scores(mean t SD)
Parent scores(mean t SD)
1. Administered insulin at the times agreed
with your health professional
2. Self monitored blood glucose at leasttwice a day
3. Maintained good foot hygiene
4. Carried something with sugar in it as a
source of glucose for emergencies
5. Made food choices that follow yourecommended diet
6. Do you smoke*
7. Tested ketones when you are unwell orwhen your blood glucose is over 15
8. Self monitored blood glucose before orafter sports
9. Do you change the levels of your insulindoses
L-6 5.26t1.r7 5.00r 1.53
r-6 4.70 ! r.65 4.56 ! r.76
r-6r-6
4.81+ 1.19
4.29 + t.58
r.26+ O.9l
3.02+ r.78
4.64 ! r.46
4.53 r 1.53
1.29 t 1.05
3.18 t 1.76
1-6 4.49 t l.tt 4.53 ! r.r2
r-61-6
1-6 2.53 + 1.58 2.5r t r.54
1-6 3.38 + t.52 3.16 t 1.48
* Scoring was reversed in this item - lower scores indicating greater adherence.
235
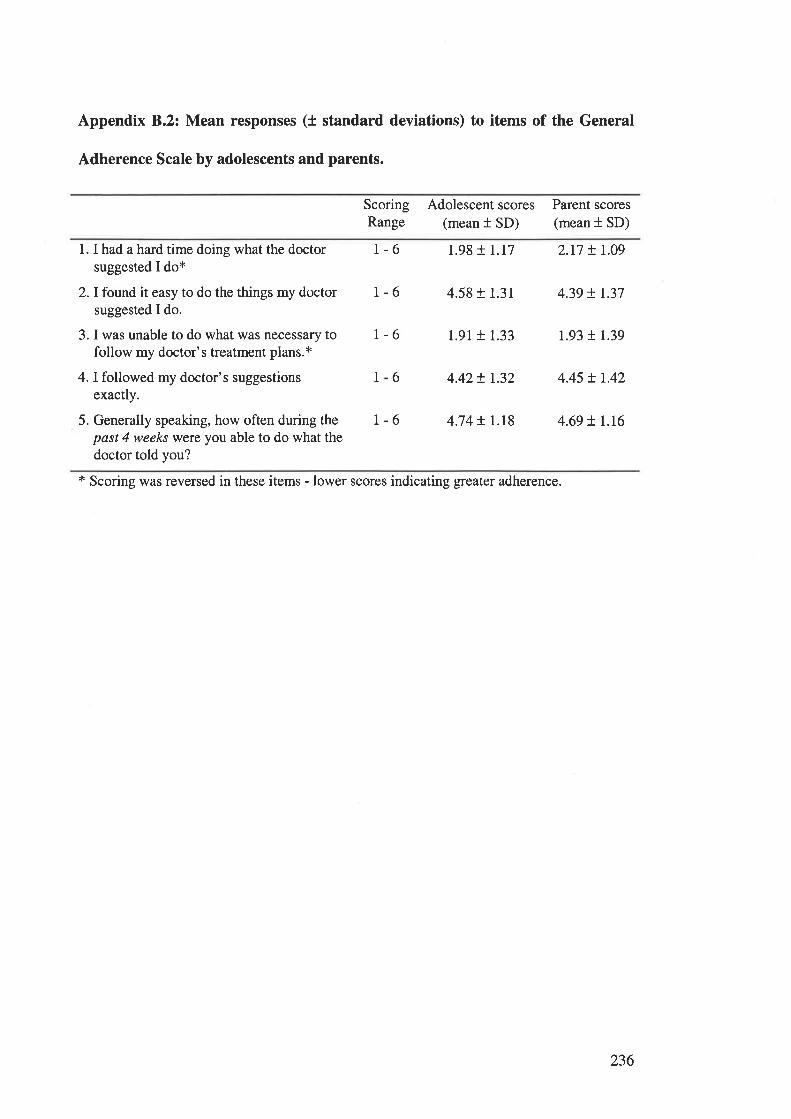
Appendix 8.2: Mean responses (t standard deviations) to items of the General
Adherence Scale by adolescents and parents.
ScoringRange
Adolescent scores(mean t SD)
Parent scores(mean t SD)
1. I had a hard time doing what the doctorsuggested I do*
2. I found it easy to do the things my doctorsuggested I do.
3. I was unable to do what was necessary tofollow my doctor's treatment plans.x
4. I followed my doctor's suggestionsexactly.
5. Generally speaking, how often during thepast 4 weeks were you able to do what thedoctor told you?
r-6 1.98 r 1.17 2.17 t 1.09
r-6 4.58 + 1.31 4.39 t L37
1-6 1.91 + 1.33 1.93 t 1.39
6 4.42+ r.32 4.45 + t.42
r-6 4.74 + r.r8 4.69 ! L.I6
1
* Scoring was reversed in these items - lower sco¡es indicating greater adherence.
236
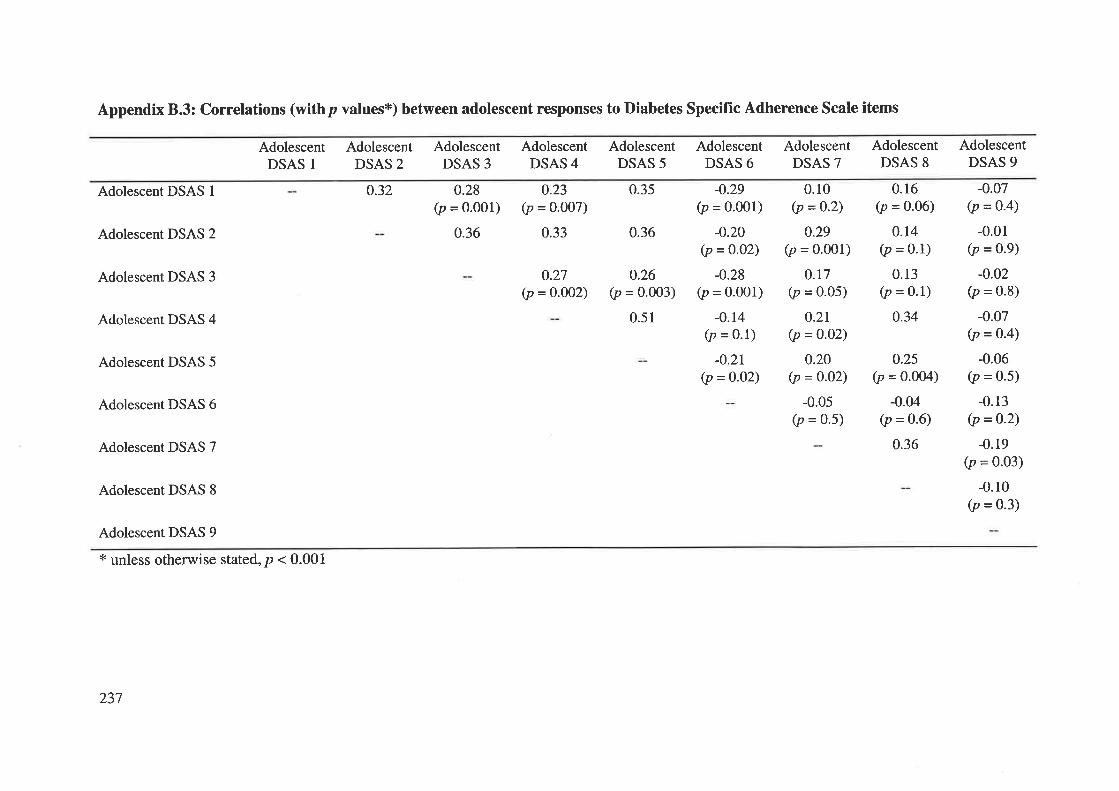
Appendix 8.3: Correlations (withp values*) between adolescent responses to Diabetes Specific Adherence Scale items
AdolescentDSAS I
Adolescent DSAS 1
Adolescent DSAS 2
Adolescent DSAS 3
Adolescent DSAS 4
Adolescent DSAS 5
Adolescent DSAS 6
Adolescent DSAS 7
Adolescent DSAS 8
Adolescent DSAS 9
x unless otherwise stated, p < 0.001
AdolescentDSAS 2
0.32
AdolescentDSAS 3
0.28(p = o.ool)
0.36
AdolescentDSAS 4
o.23(p = 0.007)
0.33
AdolescentDSAS 5
0.35
0.36
o.26(p = 0.003)
0.51
AdolescentDSAS 6
AdolescentDSAS 7
AdolescentDSAS 8
AdolescentDSAS 9
0.27(p = o.O02)
-0.29(p = 0.001)
-0.20(p = 0.02)
-0.28(p = 0.001)
-0.14(p = 0.1)
-0.2t(p = 0-O2)
0.10(p =O-2)
0.29(p = 0.001)
0.r7(p = 0.05)
0.2r(p = 0-o2)
0.20(p = 0-02)
-0.05(p = 0.5)
0.16(p = 0.06)
0.14(p = 0.1)
0.13(p = 0.1)
0.34
-0.07(p = o-4)
-0.01(p = 0.9)
-0.02(p = 0.8)
-0.07(p = o'4)
-0.06(p = 0.5)
-0.13(p = 0.2)
-0.19(p = 0.03)
-0.10(p = 0.3)
0.25(p = 0.004)
-0.04(p = 0.6)
0.36
237
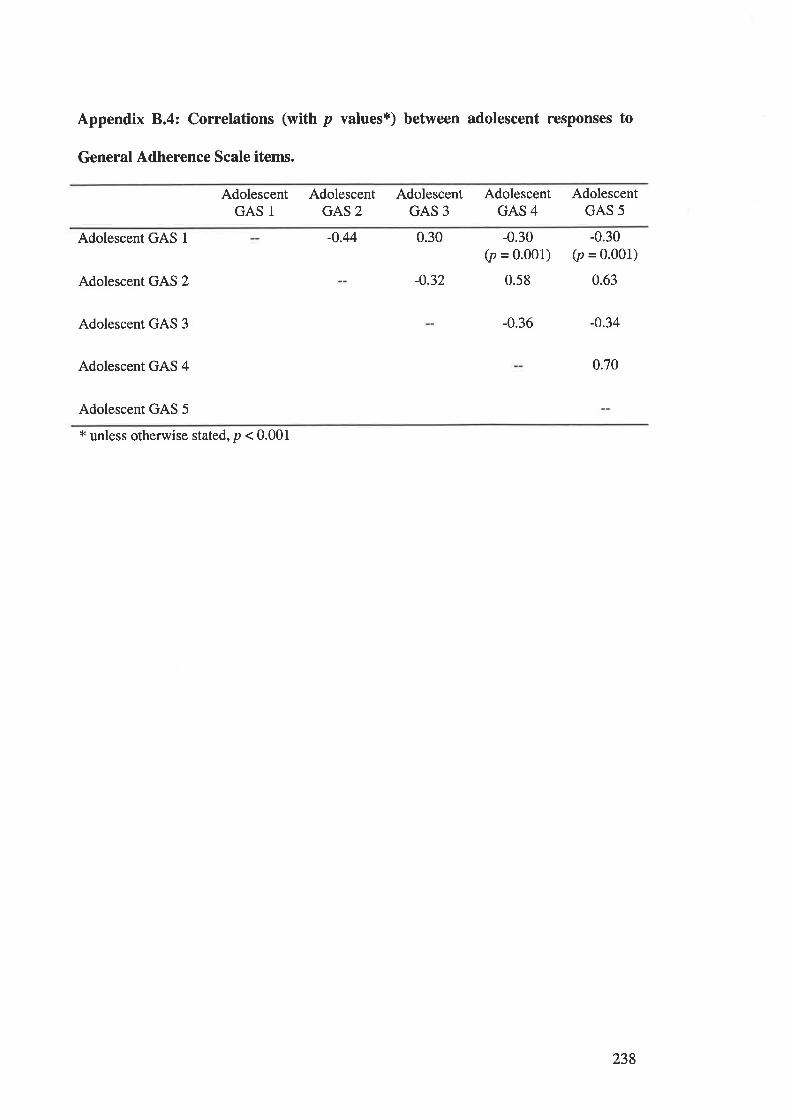
Appendix 8.4: Correlations (with p values*) between adolescent responses to
General Adherence Scale items.
AdolescentGAS 1
AdolescentGAS 2
AdolescentGAS 3
AdolescentGAS 4
AdolescentGAS 5
Adolescent GAS I
Adolescent GAS 2
Adolescent GAS 3
Adolescent GAS 4
Adolescent GAS 5
-0.44 0.30
-0.32
-0.30(p = 0'001)
0.58
-0.30(p = 0.001)
0.63
-0.36 -0.34
0.70
* unless otherwise stated, p < 0.001
238
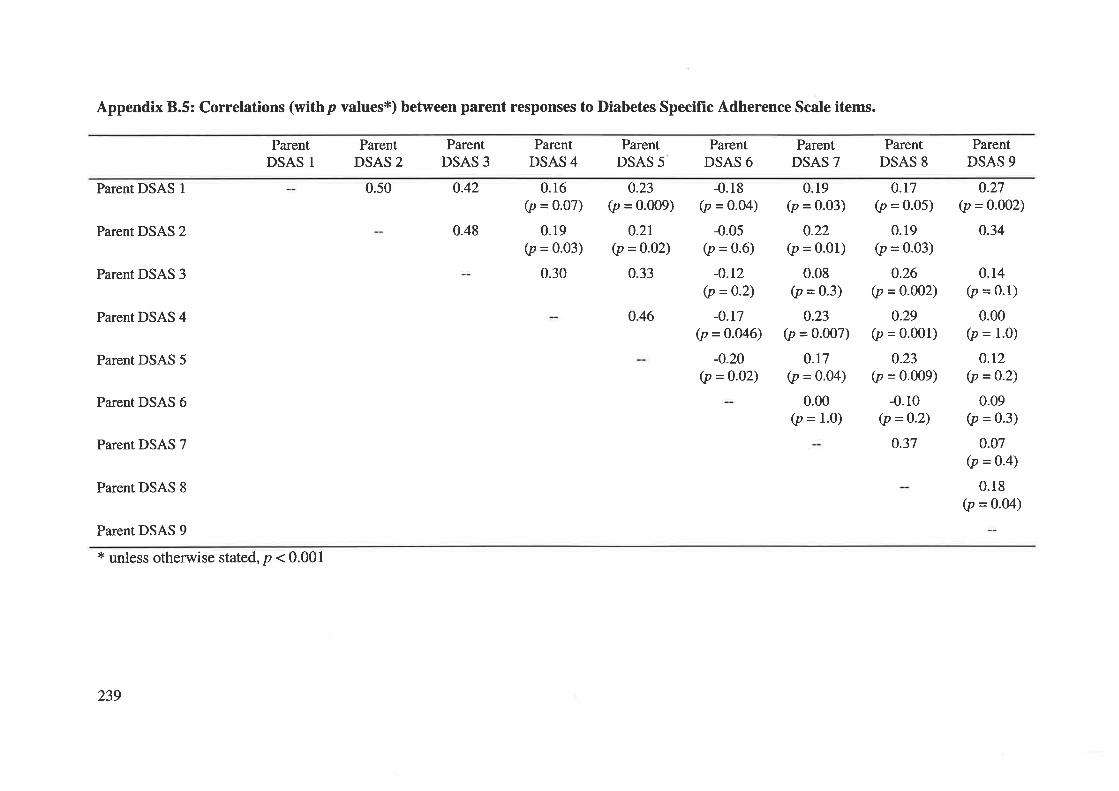
Appendix 8.5: Correlations (withp values*) between parent responses to Diabetes Speciflrc Adherence Scale items.
ParentDSAS 1
Parent DSAS I
Parent DSAS 2
Parent DSAS 3
Parent DSAS 4
Parent DSAS 5
Parent DSAS 6
Parent DSAS 7
Parent DSAS 8
Parent DSAS 9
* unless otherwise stated, p < 0.001
ParentDSAS 2
0.50
ParentDSAS 3
0.42
0.48
ParentDSAS 4
0.16(p = o.o7)
0.19(p = 0.03)
0.30
ParentDSAS 5
0.23(p = 0.@9)
0.2r(p =0.02)
0.33
ParentDSAS 6
-0.05(p = 0.6)
-0.r2(p =0.2\
-0.t7(p = 0.046)
-o.20(p = 0-02)
ParentDSAS 7
ParentDSAS 8
ParentDSAS 9
0.27(p = 0.002)
0.34
-0.18(p = 0.04)
0.19(p = 0.03)
0.22(p = 0'01)
0.08(p = 0.3)
0.23(p = o.oo7)
0.r7(p = 0.04)
0.00(p = 1.0)
0.r7(p = 0.05)
0.19(p = 0.03)
0.26(p =O.OO2)
0.29(p = 0.001)
0.23(p = 0.009)
-0.10(p = 0-2)
0.37
0.14(p = 0.1)
0.00(p = 1.0)
o.t2(p =0-2)
0.09(p = 0.3)
0.07(p =o-4)
0.18(p = 0.04)
0.46
239
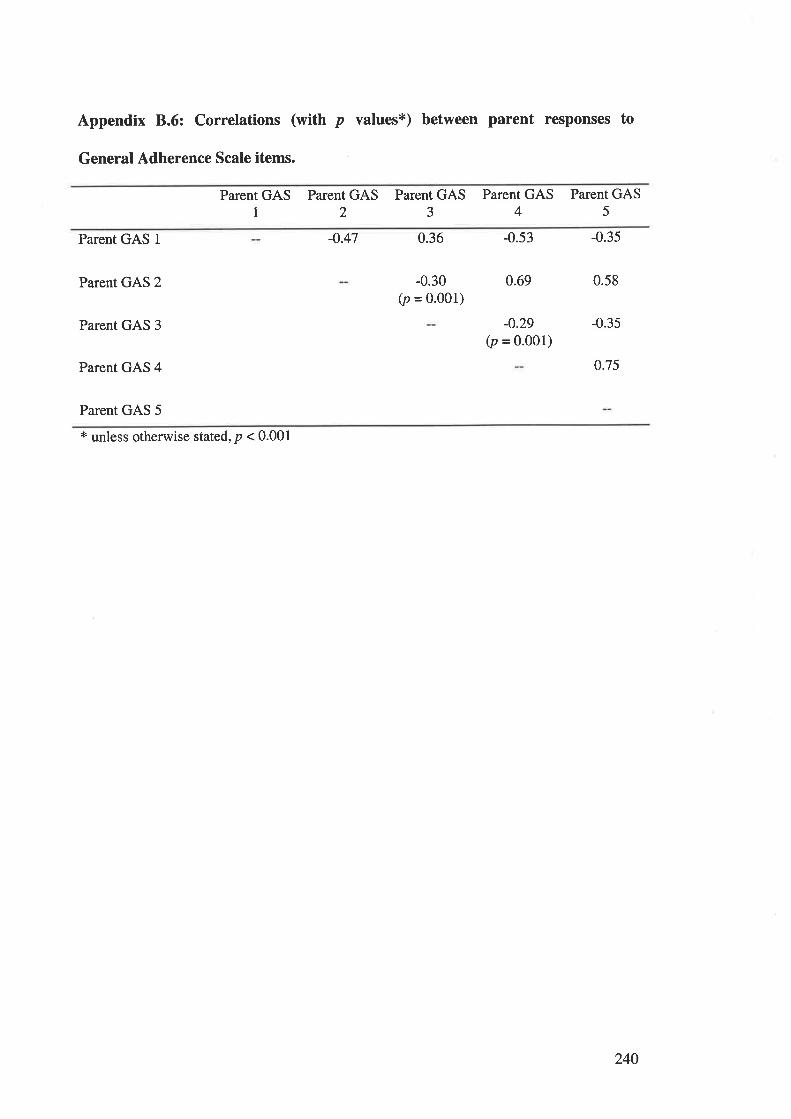
Appendix 8.6: Correlations (with p values*) between parent responses to
General Adherence Scale items.
Parent GAS1
Parent GAS2
Parent GASJ
Parent GAS4
Parent GAS5
Parent GAS 1
Parent GAS 2
Parent GAS 3
Parent GAS 4
Parent GAS 5
-o.47 0.36
-0.30(p = 0.001)
-0.53
0.69
-0.29(p = 0.001)
-0.35
0.58
-0.35
0.75
t unless otherwise stated, p < 0.001
240
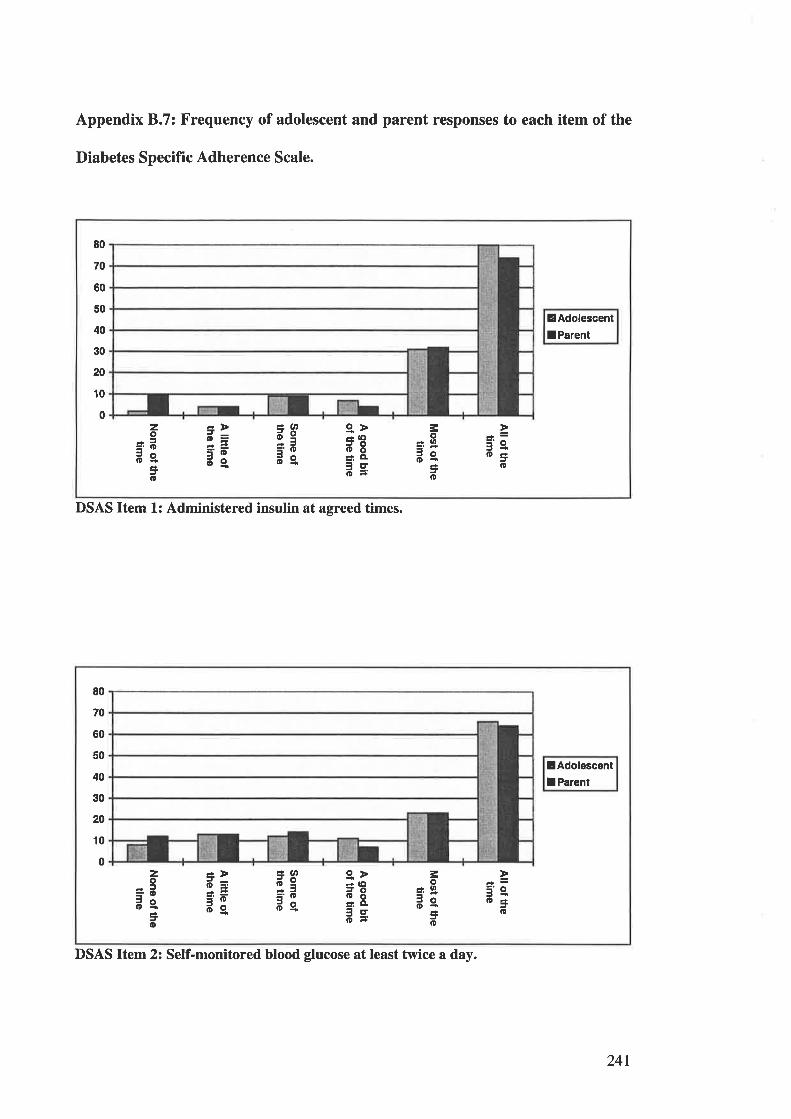
Appendix 8.7: Frequency of adolescent and parent responses to each item of the
Diabetes Specific Adherence Scale.
DSAS Item 1: Administered insulin at agreed times.
EAdolescent
lParent
80
70
60
50
40
30
20
10
0¿Þd=3Ëdg
¿lDd9='oãe.
gÞÉaOil8â,ÍI
ãs
-'e.o3
o
zo
=.oãeÊ!o
=oJO
=o
lAdolescentI Parent
80
70
60
50
40
30
20
10
0zo
=ãde=o
:rÞd=
=Êdg
¿(tË95'odg
g>* (llã8=.êãs
3o¿O
3ôo-=o
3'e.o3o
DSAS ltem2z Self-monitored blood glucose at least twice a day.
241
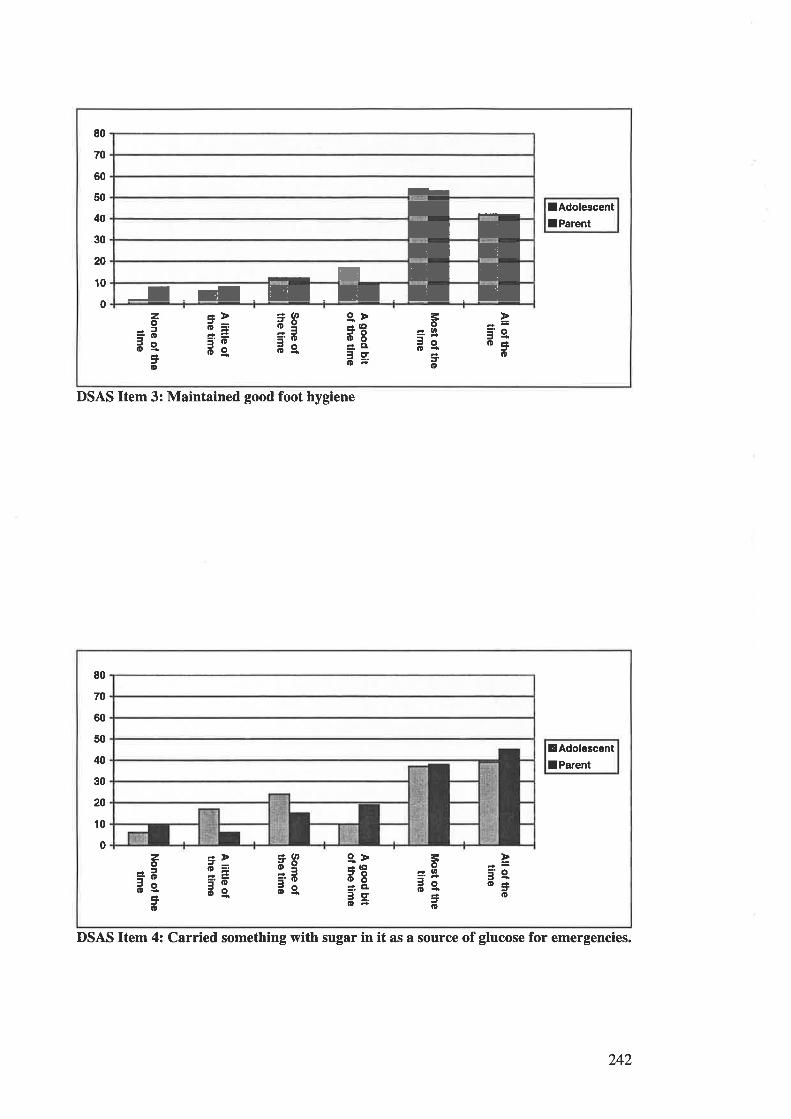
80
70
60
50
40
30
20
10
0
!AdolescentlParent
zo
=.ããs=o
=>d==Ëd9.
¿atdg='.Dãe.
g>* lllJOooÉ'. Cl¡cto-
=o3oo{
to
3'e.o=o
h
IIIEE
-
I rEIdENEE
DSAS Item 3: Maintained good foot hygiene
DSAS Item 4: Carried something with sugar in it as a source of glucose for emergencies.
EAdolescentI Parent
80
70
60
50
40
30
20
10
0zo
=.oãeJo
É,>o=í.Ëd9.
¿atãg='.Dãe
g>3€oÕ=',
Cl
ã=
=o='-JO
¿lD
5'e.o=o
242
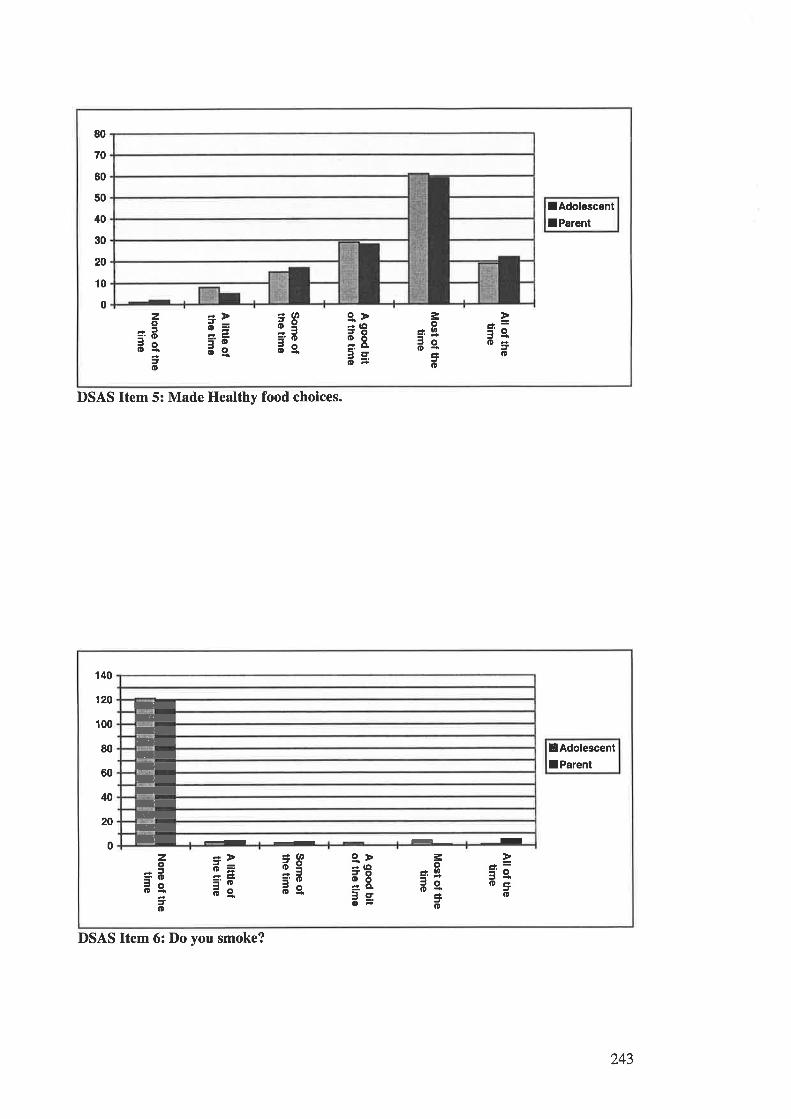
co+ô¡
+.é)
5o(toâ\oq)
rt)
rt)â
at)oC
)
9Eo-oq)
¡tq)€cÉ
11roq)
(n(nâ
All of thet¡m
e
Most of the
t¡me
A good bit
of the time
Som
e ofthe tim
e
A little of
the time
None of the
t¡me
co(,ttfocõEÞß<
o.T
I
IT
IT
IIoooooooo+
olOaO
(o!t(\¡F
cooOv
oc=
c,Ë
È<
Ètl
None of the
time
Most of the
t¡me
A good b¡t
of the t¡me
A little of
the t¡me
All of thet¡m
e
Som
e ofthe t¡m
e
êocrctoocoo(D
NloLt!t¡tt.\¡F
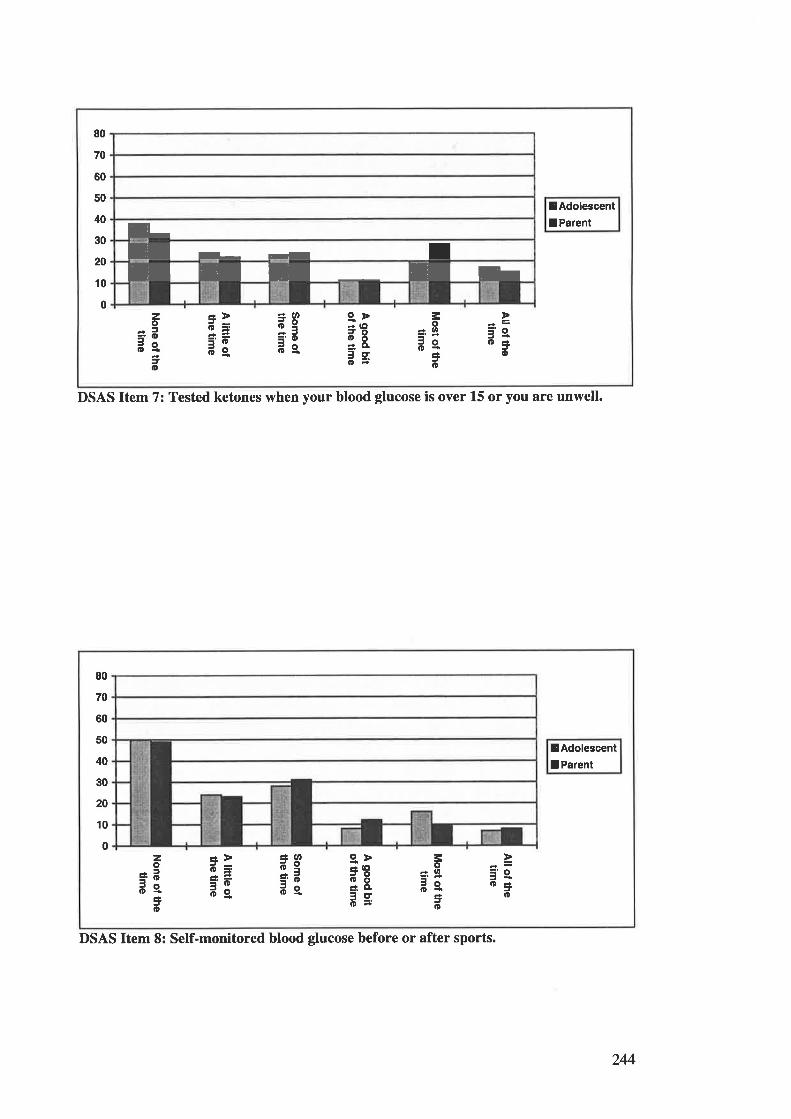
80
70
60
50
40
30
20
10
0
I-E I- t IEETEh
¡AdolescentIParent
zo
=.ots¿o
¿.>d=3ãdg
4atd9='ods
g>* (llã8éìll
ãs
=oàln='tJO
Jo
3's.o3o
DSAS Item 7: Tested ketones when your blood glucose is over L5 or you are unwell.
¡AdolescentIParent
80
70
60
50
40
30
20
10
0
=Þd=3Édg
¿ (r,
e3='od9.
9.ÞãEÉ: ßL
ãs
=o¿ lll='ÉJo|D-
=o
¿¡'e.o3
o
zo=Eãe
=o
DSAS Item 8: Self-monitored blood glucose before or after sports.
244
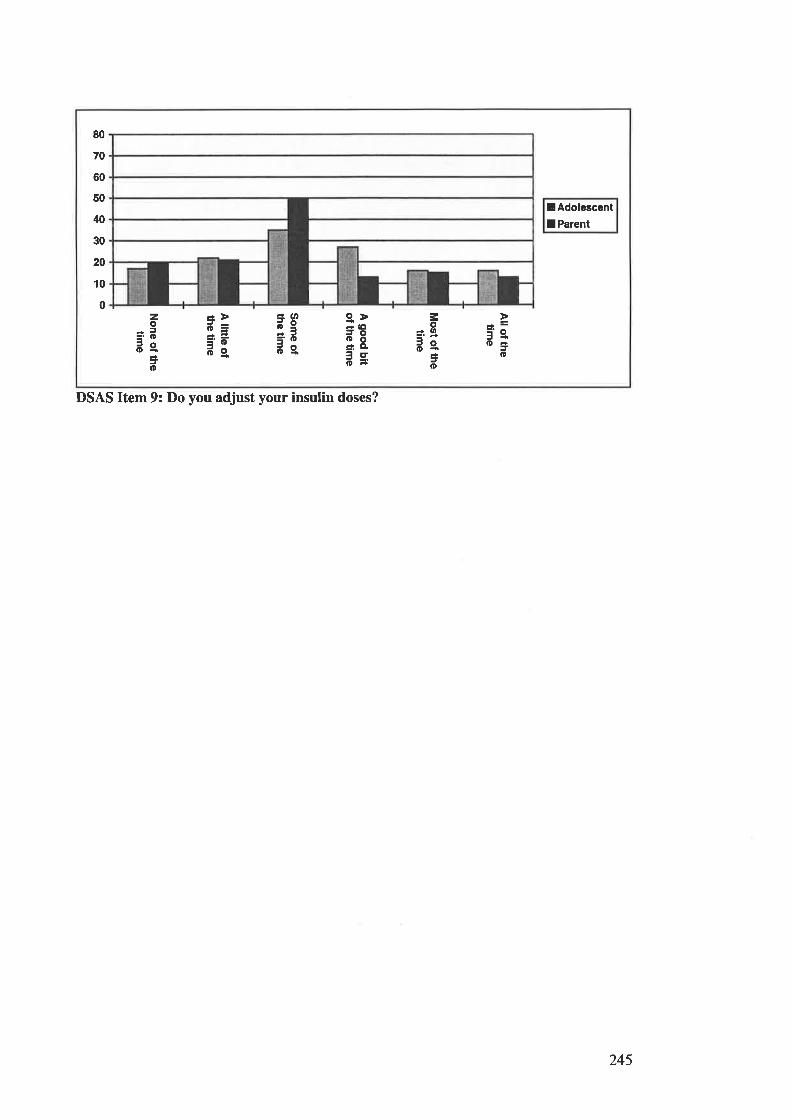
lAdolescentI Parent
80
70
60
50
40
30
20
10
0 g>* (ltil8á.. cl
ãs5'e,
Jo
zo
=ããejo
=Þd=3ãdg
¿ (t,d9='od9.
=o* lll='dJoo-
=o
DSAS Item 9: Do you adjust your insulin doses?
245
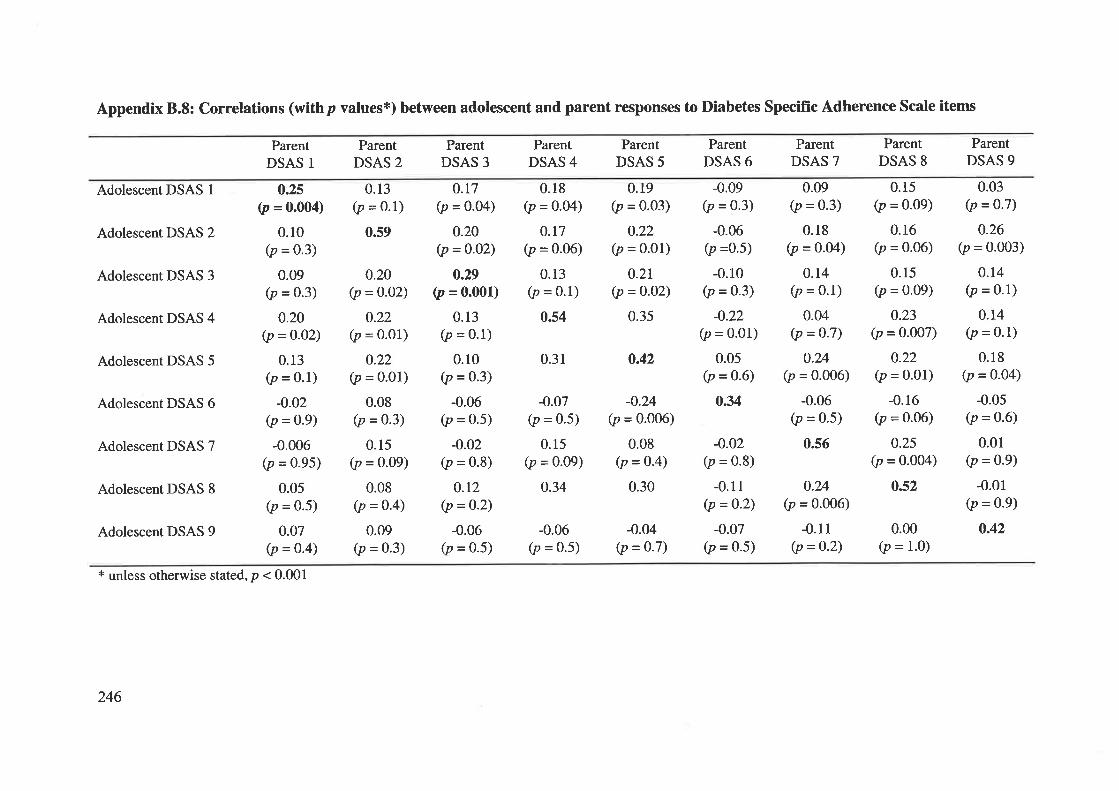
Appendix 8.8: Correlations (withp values*) between adolescent and parent responses to Diabetes Specific Adherence Scale items
Adolescent DSAS 1
Adolescent DSAS 2
Adolescent DSAS 3
Adolescent DSAS 4
Adolescent DSAS 5
Adolescent DSAS 6
Adolescent DSAS 7
Adolescent DSAS 8
Adolescent DSAS 9
ParentDSAS 1
ParentDSAS 2
0.13(p = 0.1)
0.59
ParentDSAS 3
ParentDSAS 4
0.31
-0.07(p = 0.5)
0.15(p = 0.09)
0.34
ParentDSAS 5
ParentDSAS 6
-o.02(p = 0.8)
-0.11(p = 0-2)
-0.07(p = 0.5)
ParentDSAS 7
ParentDSAS 8
ParentDSAS 9
o.2s(p = 0.004)
0.10(p = 0.3)
0.09(p = 0.3)
0.20(p =o.02)
0.13(p = 0'1)
-o.02(p = 0.9)
-0.006(p = 0.95)
0.05(p = 0.5)
0.07(p = 0.4)
0.t7(p = 0.04)
0.20(p =0-02)
0.29(p = 0.001)
0.13(p = 0.1)
0.10(p = 0'3)
-0.06(p = 0.5)
-o.o2(p = 0.8)
o.r2(p =o-2)
-0.06(p = 0.5)
0.18(p = 0.04)
0.17(p = 0.06)
0.13(p = 0.1)
0.s4
0.19(p = 0.03)
0.22(p = 0.01)
0.2t(p =o-o2)
0.35
-0.09(p = 0.3)
-0.06(p =0.5)
-0.10(p = 0.3)
-0.22(p = 0.01)
0.05(p =o-6)
0.34
0.09(p = 0'3)
0.18(p =o-o4)
0.14(p = 0.1)
0.04(p = 0-7)
0.24(p = 0.006)
-0.06(p = 0.5)
0.s6
0.15(p = 0.09)
0.16(p = 0.06)
0.15(p = 0.09)
0.23(p = 0.007)
o.22(p = 0.01)
-0.16(p = 0.06)
0.25(p = 0.004)
0.s2
0.03(p = 0.7)
0.26(p = 0.003)
0.r4(p = 0.1)
0.14(p = 0.1)
0.18(p = 0-04)
-0.05(p = 0.6)
0.01(p = 0.9)
-0.01(p = 0.9)
0.42
0.20(p =0-o2)
0.22(p = 0.01)
0.22(p = 0.01)
0.08(p =0.3)
0.15(p = 0.09)
0.08(p = 0-4)
0.09(p = 0.3)
o.42
-o.24(p = 0.006)
0.08(p = 0.4)
0.30 o.24(p = 0.006)
-0.11(p =0.2)
-0.06(p = 0.5)
-0.04(p = o.7)
0.00(p = 1.0)
* unless otherwise stated, p < 0.001
246
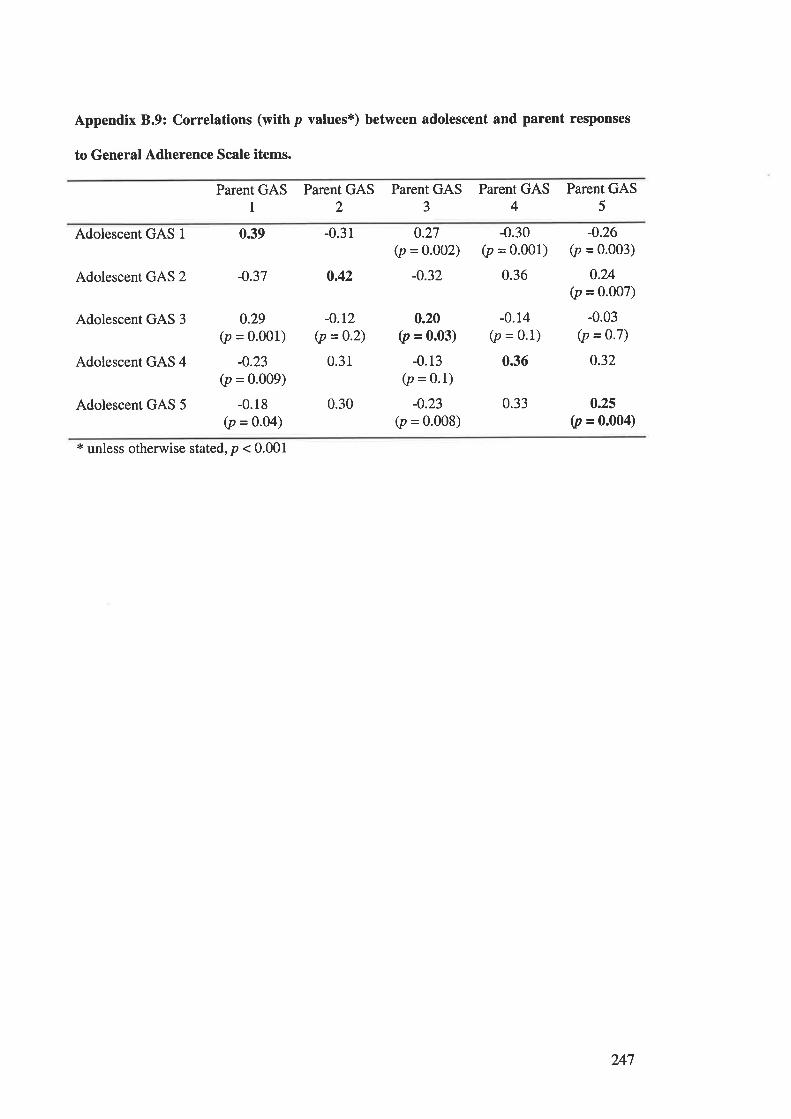
Appendix 8.9: Correlations (with p values*) between adolescent and parent responses
to General Adherence Scale items.
Parent GAS1
Parent GAS2
Parent GAS3
Parent GAS4
Parent GAS5
Adolescent GAS 1 0.39
Adolescent GAS 2 -0.37
Adolescent GAS 3
-0.31
0.42
-0.12(p =0.2)
0.31
0.30
0.27(p = 0.002)
-0.32
-0.30(p = 0.001)
0.36
-0.26(p = o.oo3)
0.24(p = 0.007)
-0.03(p = 0'7)
0.32
0.25
0, = o.oo4)
Adolescent GAS 4
Adolescent GAS 5
0.29(p = 0.001)
-0.23
0, = 0.009)
-0.18(p = 0.04)
0.20(p = 0.03)
-0.13(p = 0.1)
-0.23(p = 0.008)
-0.14(p = 0.1)
0.36
0.33
* unless otherwise stated, p < 0.001
247
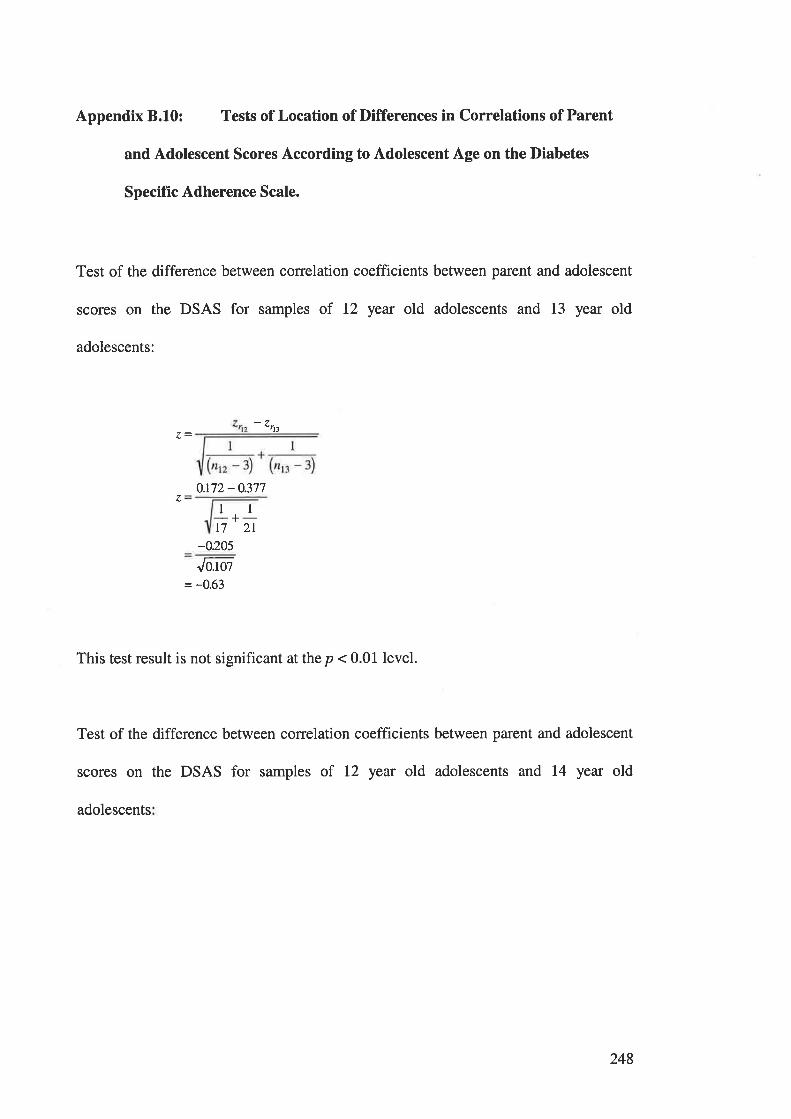
Appendix 8.10: Tests of Location of Differences in Correlations of Parent
and Adolescent Scores According to Adolescent Age on the Diabetes
Specifïc Adherence Scale.
Test of the difference between correlation coefficients between parent and adolescent
scores on the DSAS for samples of 12 year old adolescents and 13 year old
adolescents:
4nt
0.t72 - 0.377z
ll-+-t7 2r
-o.205
Jutol= -0.63
This test result is not significant at the p < 0.01 level.
Test of the difference between correlation coefficients between parent and adolescent
scores on the DSAS for samples of 12 year old adolescents and 14 year old
adolescents
248

0.172-0563
+-t7 22
-0.391
Jo:ø= -1.2I
This test result is not significant at the p < 0.01 level.
Test of the difference between correlation coefficients between parent and adolescent
scores on the DSAS for samples of 12 year old adolescents and 15 year old
adolescents:
1l
zz
o.r72 - 0.867
11-+-t7 t4
-0.695-:Jo.t¡o
= -1.93
This test result is not significant at the p < 0.01 level.
Test of the difference between correlation coefficients between parent and adolescent
scores on the DSAS for samples of 12 year old adolescents and 16 year old
adolescents:
249
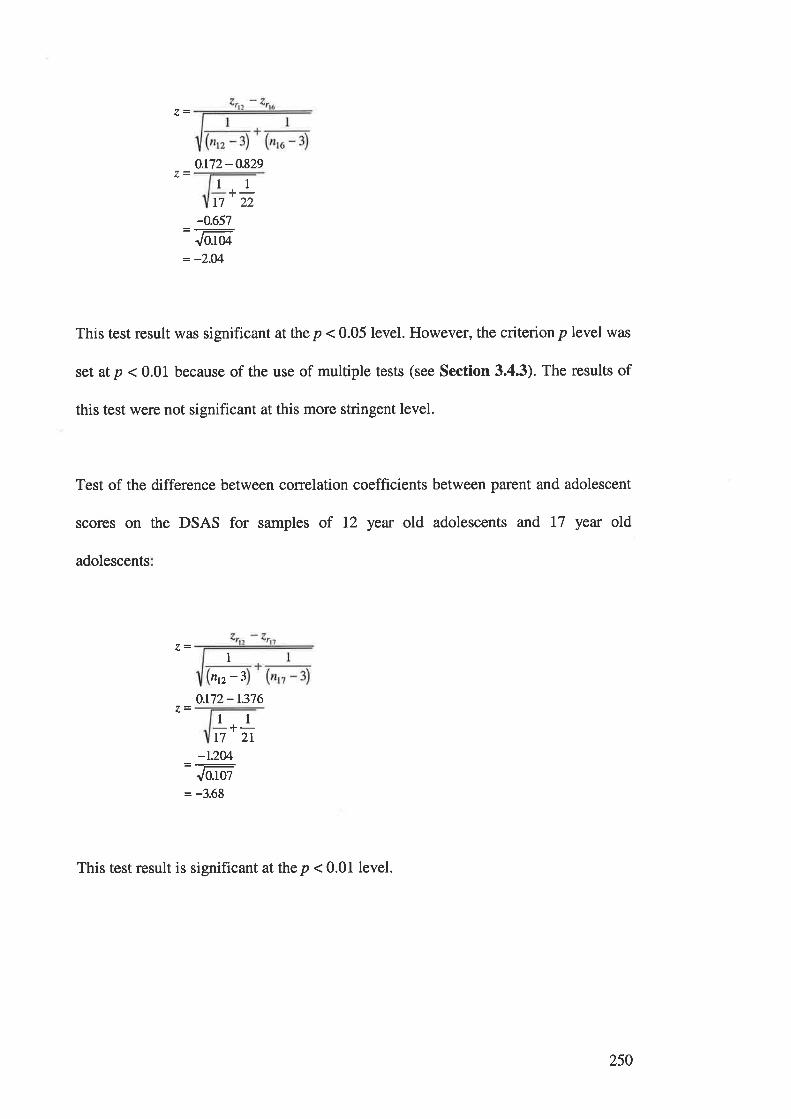
0.t72-0.829
11t7
+-22
-0.657
Jo.to¿
= -2.04
This test result was significant at the p < 0.05 level. However, the criterionp level was
set at p < 0.01 because of the use of multiple tests (see Section 3.4.3). The results of
this test were not significant at this more stringent level.
Test of the difference between correlation coefficients between parent and adolescent
scores on the DSAS for samples of 12 year old adolescents and 17 year old
adolescents
Intz -3
0.t72-1.376
l1-+-I7 2I
-1.2M=:Jo.toz
= -3.68
This test result is significant at the p < 0.01 level.
250
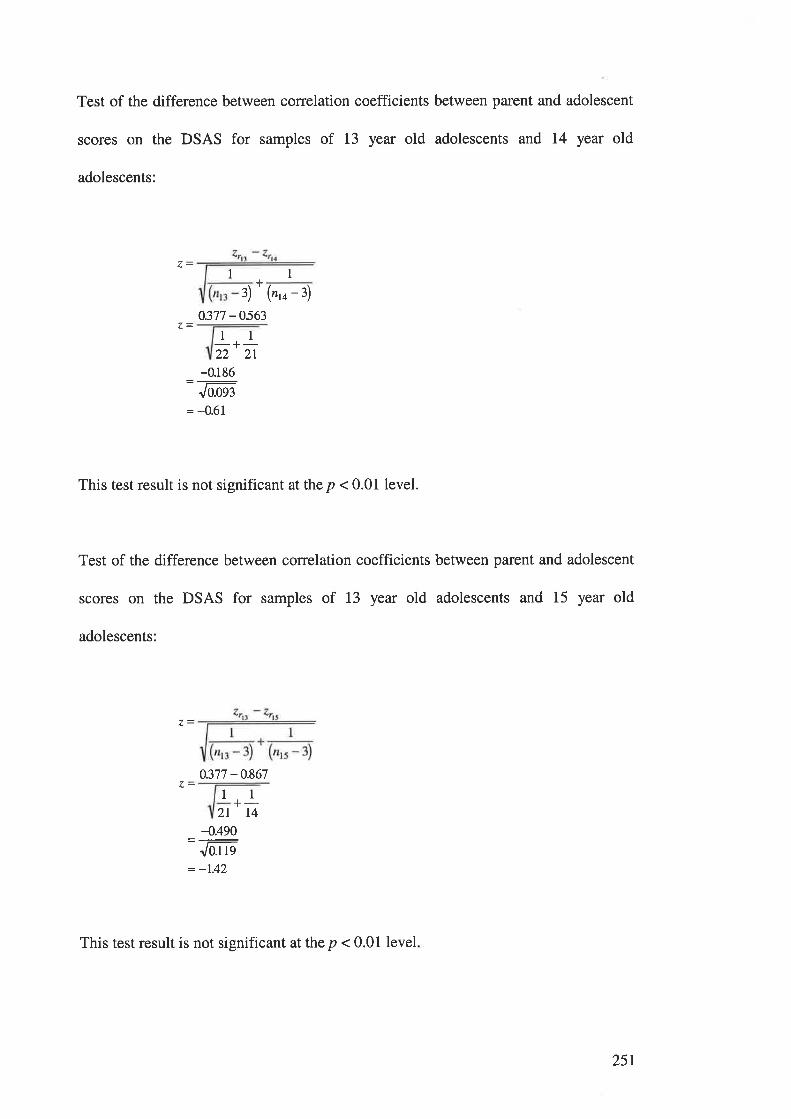
Test of the difference between correlation coefficients between parent and adolescent
scores on the DSAS for samples of 13 year old adolescents and 14 year old
adolescents:
1
("'o - 3)
0.377 -056311
-+-22 2r
-0.186
Jo.oq¡
= -0.61
This test result is not significant at the p < 0.01 level.
Test of the difference between correlation coefficients between parent and adolescent
scores on the DSAS for samples of 13 year old adolescents and 15 year old
adolescents:
I+
Ð
0.377 -0.867ll +-2l t4
-{.490=:Jo.t ts
= -1.42
This test result is not significant at the p < 0.01 level
25r

Test of the difference between correlation coefficients between parent and adolescent
scores on the DSAS for samples of 13 year old adolescents and 16 year old
adolescents:
1 1
-r-
(r,r-3)'(n,u-3)0.377 -0.829
1 1+-))2L
-0.452
= -1.48
This test result is not significant atthe p < 0.01 level.
Test of the difference between correlation coefficients between parent and adolescent
scores on the DSAS for samples of 13 year old adolescents and l7 year old
adolescents:
a.-I
nß-0.377 -r.376
11-+-2T 2T
4.999Jo.oqo
- _7,4.,
This test result is significant at the p < 0.01 level.
252
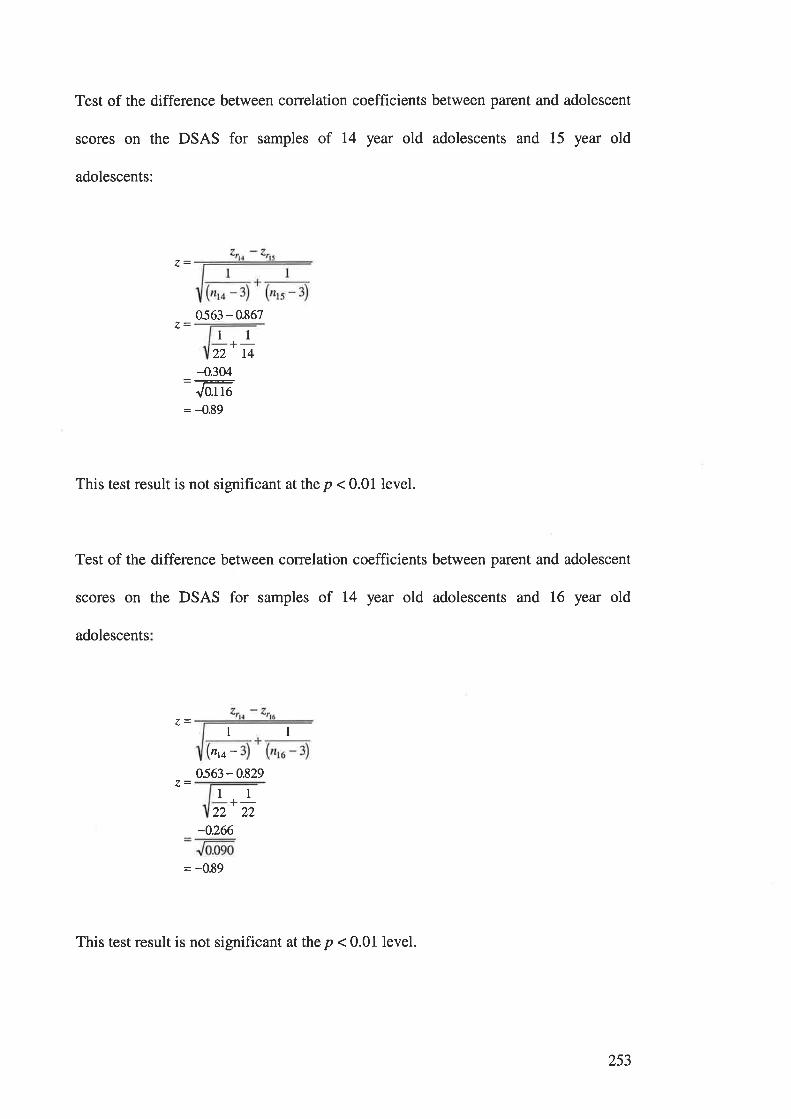
Test of the difference between correlation coefficients between parent and adolescent
scores on the DSAS for samples of 14 year old adolescents and 15 year old
adolescents:
0563 - 0.867
+-22 t4
-0.304
J0.116
= -0.89
This test result is not significant at the p < 0.01 level.
Test of the difference between correlation coefficients between parent and adolescent
scores on the DSAS for samples of 14 year old adolescents and 16 year old
adolescents
l1
l1
I 1
flt4 -
0563 - 0.829
+-22 22
-0.266
= -0.89
This test result is not significant at the p < 0.01 level.
253
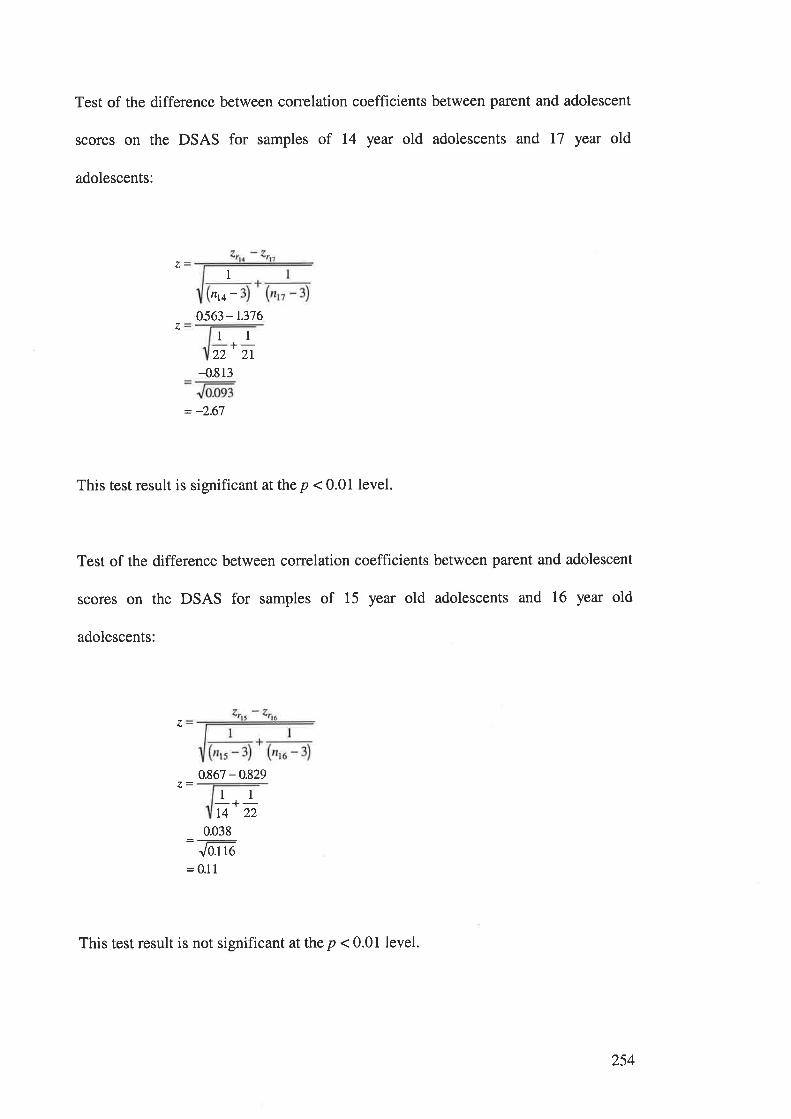
Test of the difference between correlation coefficients between parent and adolescent
scores on the DSAS for samples of 14 year old adolescents and 17 year old
adolescents:
z1
nt4 -0563-t.376
z 1l+-22 2l-{.813
= -2.67
This test result is significant at the p < 0.01 level.
Test of the difference between correlation coefficients between parent and adolescent
scores on the DSAS for samples of 15 year old adolescents and 16 year old
adolescents:
0.867 -0.8291l-+-t4 22
0.038
Jo.t to
=0.1 1
z
This test result is not significant at the p < 0.01 level.
254

Test of the difference between correlation coefficients between parent and adolescent
scores on the DSAS for samples of 15 year old adolescents and l7 year old
adolescents:
nrs - 3)
0.867 -r.37611-+-14 2t
-0509Jo.t ls
= -1.48
This test result is not significant at the p < 0.01 level.
Test of the difference between correlation coefficients between parent and adolescent
scores on the DSAS for samples of 16 year old adolescents and 17 year old
adolescents
1_r-(n,u-3)'(n,r-3)
0.829 - t.376
z
zll-+-22 2L
4547
= -1.79
This test result is not significant at the p < 0.01 level.
A summary of the results of these tests is provided in Table 5.11.
255
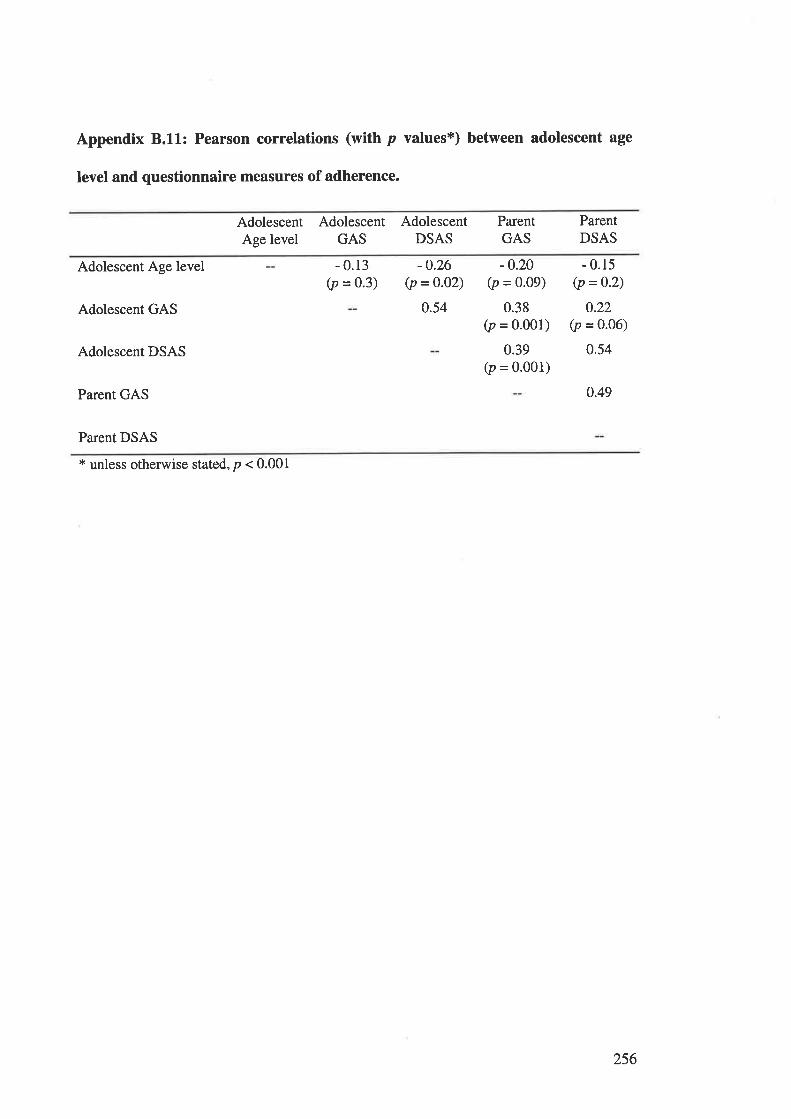
Appendix 8.11: Pearson correlations (with p values*) between adolescent age
level and questionnaire measures of adherence.
AdolescentAge level
AdolescentGAS
AdolescentDSAS
ParentGAS
ParentDSAS
Adolescent Age level
Adolescent GAS
Adolescent DSAS
Parent GAS
Parent DSAS
- 0.13(p = 0.3)
-0.26(p =o.02)
0.54
-0.20(p = 0.09)
0.38(p = 0.001)
0.39(p = 0.001)
- 0.15(p =0'2)
0.22(p = 0.06)
0.54
0.49
* unless otherwise stated, p < 0.001
256
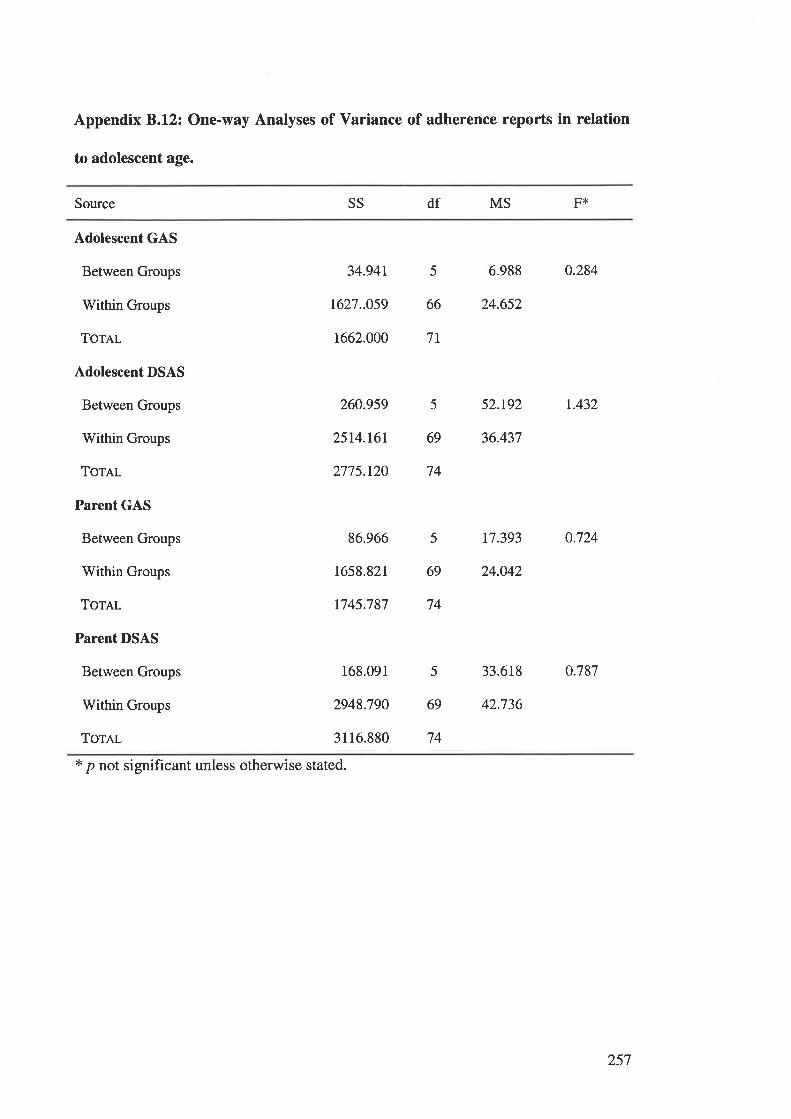
Appendix B.l2z One-way Analyses of Variance of adherence reports in relation
to adolescent age.
Source SS df MS F*
Adolescent GAS
Between Groups
rWithin Groups
Tor¿,1
Adolescent DSAS
Between Groups
Within Groups
ToTAL
Parent GAS
Between Groups
Within Groups
Tornr.
Parent DSAS
Between Groups
Within Groups
ToTAL
34.94t 5 6.988 0.284
1627..059 66 24.652
1662.000 7r
260959 5 52.t92 r.432
2514.161 69 36.437
2775.120 74
86.966 5 t7.393 0.724
1658.821 69 24.042
1745.787 74
168.091 5 33.618 0.787
2948.790 69 42.736
3116.880 74
* p not significant unless otherwise stated.
257
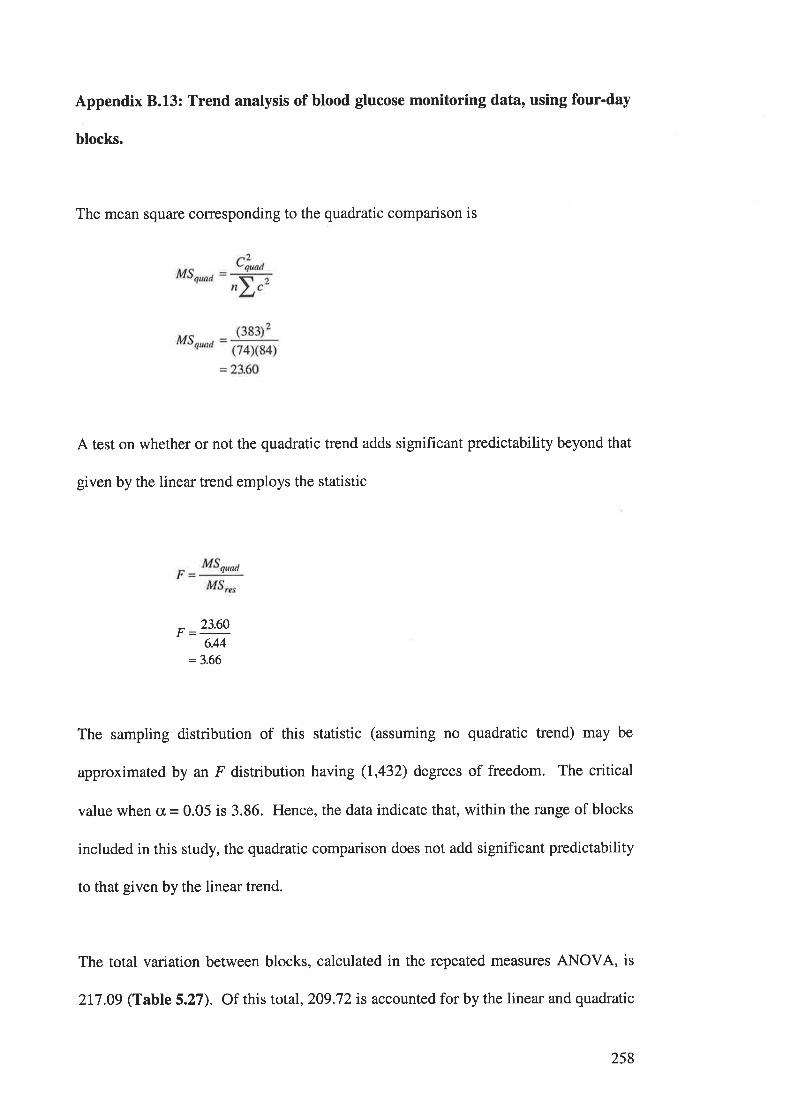
Appendix 8.13: Trend analysis of blood glucose monitoring data, using four-day
blocks.
The mean square corresponding to the quadratic comparison is
A test on whether or not the quadratic trend adds significant predictability beyond that
given by the linear trend employs the statistic
^ 23.60
6.44
=3.66
The sampling distribution of this statistic (assuming no quadratic trend) may be
approximated by an F distribution having (1,432) degrees of freedom. The critical
value when cx, = 0.05 is 3.86. Hence, the data indicate that, within the range of blocks
included in this study, the quadratic comparison does not add significant predictability
to that given by the linear trend.
The total variation between blocks, calculated in the repeated measures ANOVA, is
2I7 .09 (Table 5.27). Of this total,2O9.72 is accounted for by the linear and quadratic
258
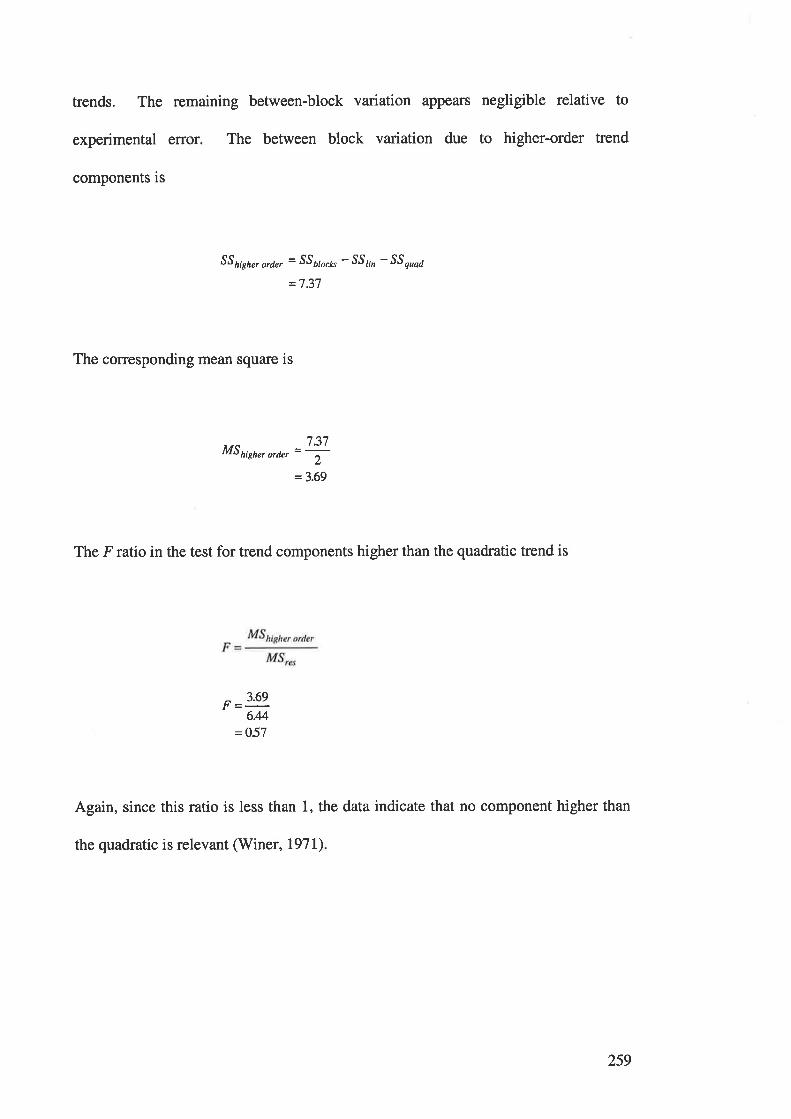
trends. The remaining between-block variation appears negligible relative to
experimental error. The between block variation due to higher-order trend
components is
SS hish", ord", = SSå,o"k" - SS¡¡n - SS ouaa
=7.37
The corresponding mean square is
MShigh"rorrt, =ry=3.69
The Fratio in the test for trend components higher than the quadratic trend is
3.69F=-
644=O57
Again, since this ratio is less than 1, the data indicate that no component higher than
the quadratic is relevant (Winer, I97I)
259
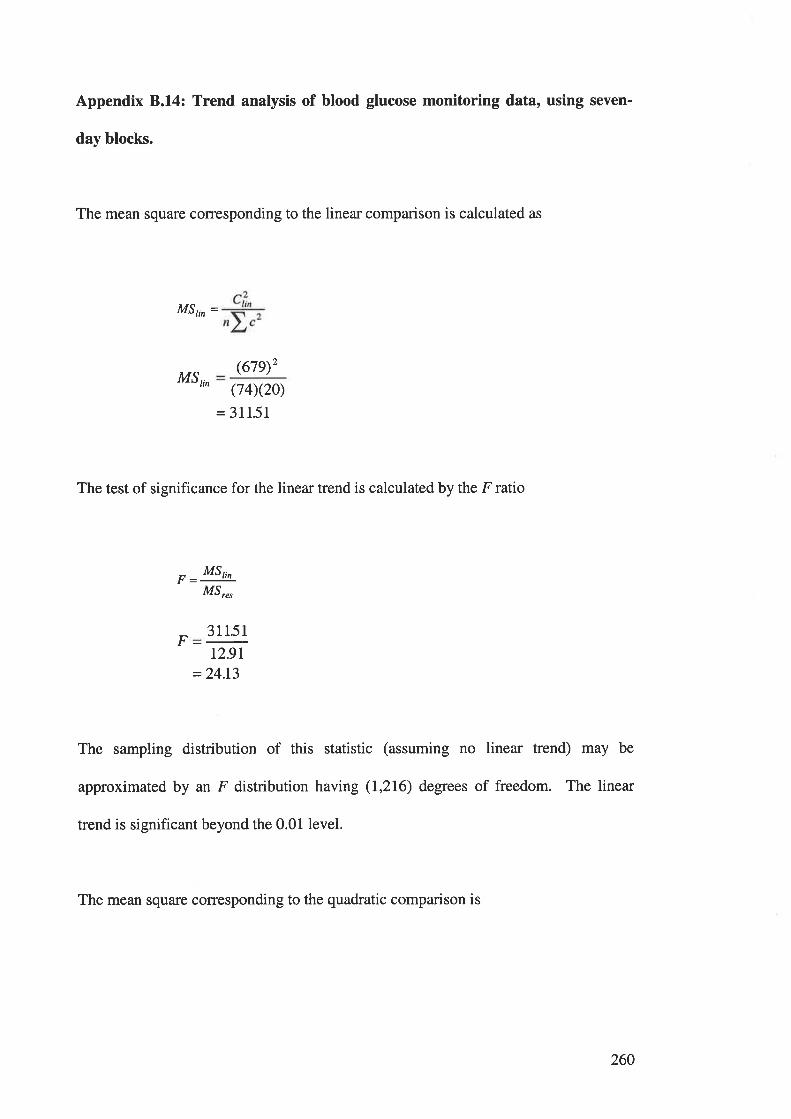
Appendix B.l4z Trend analysis of blood glucose monitoring data, using seven-
day blocks.
The mean square corresponding to the linear comparison is calculated as
MSt,n =
M5,,,(f7Ð2
(74)(20)
= 31151
The test of significance for the linear trend is calculated by the F ratio
- MSt,,
M5,",
F 31151
t2.9r=24.13
The sampling distribution of this statistic (assuming no linear trend) may be
approximated by an F distribution having (I,216) degrees of freedom. The linear
trend is significant beyond the 0.01 level.
The mean square corresponding to the quadratic comparison is
260
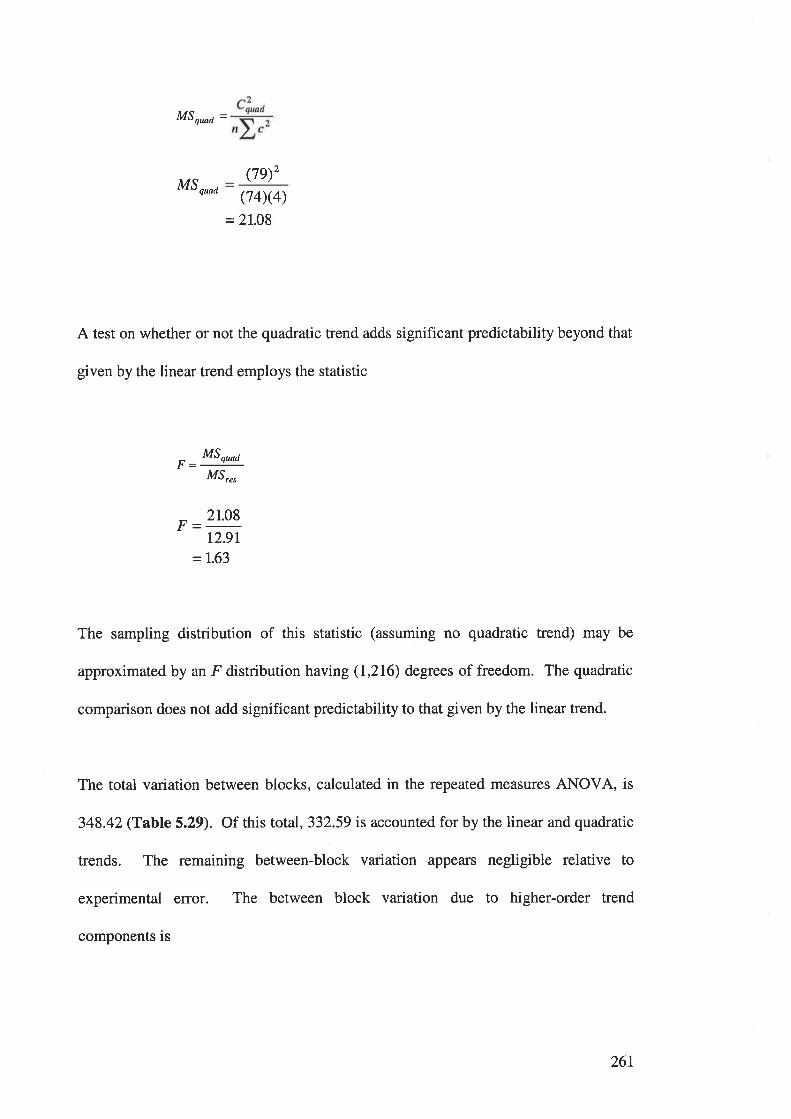
MSq^d =
MS quoa
(7e)'(74)(4)
=2I.08
A test on whether or not the quadratic trend adds significant predictability beyond that
given by the linear trend employs the statistic
^ MSquad
M5,",
2t.08
12.9t
=1.63
The sampling distribution of this statistic (assuming no quadratic trend) may be
approximated by an F distribution having (1,216) degrees of freedom. The quadratic
comparison does not add significant predictability to that given by the linear trend.
The total variation between blocks, calculated in the repeated measures ANOVA, is
348.42 (Table 5.29). Of this total,332.59 is accounted for by the linear and quadratic
trends. The remaining between-block variation appears negligible relative to
experimental error. The between block variation due to higher-order trend
components is
26t
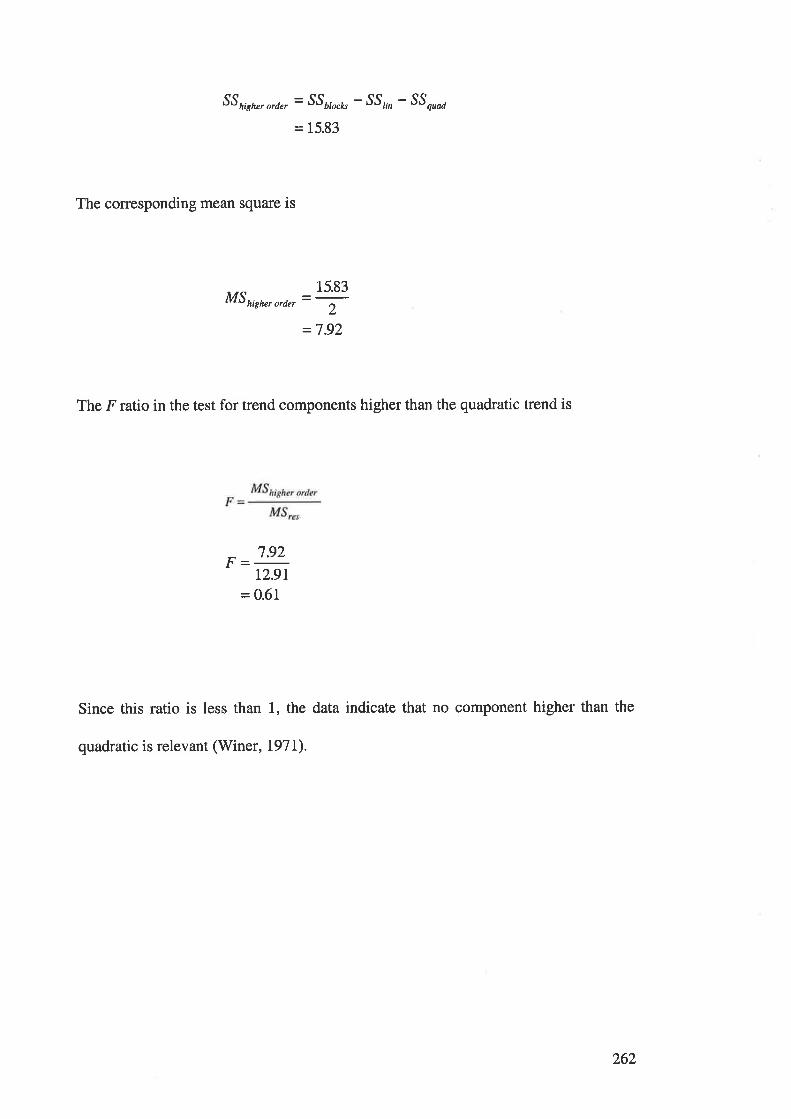
SS high", ord", = SS¿¡r"¿, - SS,,, - SS nroa
= 15.83
The corresponding mean square is
MShigher order
15.83=-
2_,7 o,
The F ratio in the test for trend components higher than the quadratic trend is
7.92
12.91
= 0.61
Since this ratio is less than 1, the data indicate that no component higher than the
quadratic is relevant (Winer, I97L).
262

APPENDIX C.

2
Appendix C.1: Frequency of adolescent response options to items of the DiabetesSpecific Adherence Scale.
l. Administered insulin atthe agreed times.
2. Self monitored bloodglucose at least twice a day
3. Maintained good foothygiene.
4. Canied something withsugar in it as a source ofglucose for emergencies.
5. Made healthy foodchoices.
6. Do you smoke?
7. Tested ketones whenyour blood glucose is over15 or when you are unwell.
8. Self monitored bloodglucose before or aftersports.
9. Do you adjust your insulindoses?
3t 80
None ofthe time
None ofthe time
None ofthe time
None ofthe time
None ofthe time
l2lNone ofthe time
None ofthe time
None ofthe time
None ofthe time
A little ofthe time
A little ofthe time
A little ofthe time
A little ofthe time
A little ofthe time
A little ofthe time
A little ofthe time
A little ofthe time
A little ofthe time
Some ofthe time
Some ofthe time
t2
Some ofthe time
Some ofthe time
Some ofthe time
Some ofthe time
Some ofthe time
Some ofthe time
Some ofthe time
A goodbit of the
time
llA good
bit of thetime
t7
A goodbit of the
time
A goodbir of rhe
time
A goodbit of the
time
A goodbit of the
time
llA good
bir of thetime
A goodbit of the
time
A goodbir of rhe
time
Most ofthe time
Most ofthe time
Most ofthe time
Most ofthe time
Most ofthe time
Most ofthe time
Most ofthe time
t6
Most ofthe time
Most ofthe time
All of thetime
All of thetime
All of thetime
All of thetime
All of thetime
All of the
time
All of thetime
All of thetime
l6All of the
time
l3 t2 23 66
54 42
17 24 10 37 39
l5 29 6l l9
38 24 23 20 t7
50 24 28
t7 22 35 t1 t6
4 9 7
8
2 6
6
I 8
2 2 4 I
8 7
264
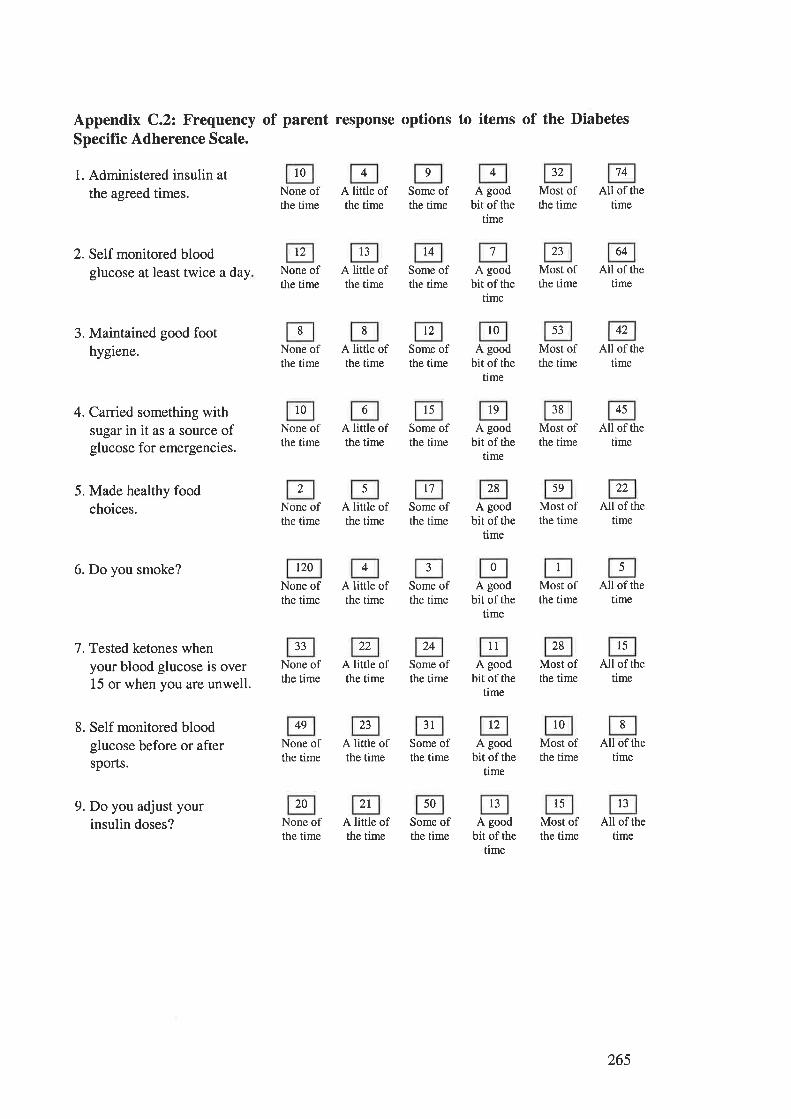
Appendix C.2: Frequency of parent response options to items of the DiabetesSpecifïc Adherence Scale.
1. Administered insulin at
the agreed times.
2. Self monitored bloodglucose at least twice a day
3. Maintained good foothygiene.
4. Canied something withsugar in it as a source ofglucose for emergencies.
5. Made healthy foodchoices.
6. Do you smoke?
7. Tested ketones whenyour blood glucose is over15 or when you are unwell.
8. Self monitored bloodglucose before or aftersports.
9. Do you adjust yourinsulin doses?
t2 l3 14
10
None ofthe time
None ofthe time
None ofthe time
10
None ofthe time
None ofthe time
120
None ofthe time
None ofthe time
49
None ofthe time
None ofthe time
A little ofthe time
A little ofthe time
A little ofthe time
A little ofthe time
A little ofthe time
A little ofthe time
A little ofthe time
23
A little ofthe time
A little ofthe time
Some ofthe time
Some ofthe time
t2
Some ofthe time
15
Some ofthe time
Some ofthe time
Some ofthe time
Some ofthe time
3lSome ofthe time
Some ofthe time
A goodbir of the
time
A goodbit of the
time
l0A good
bit of thetime
19
A goodbir of the
time
A goodbit of the
time
A goodbir of the
time
A goodbit of rhe
time
A goodbit of the
time
A goodbit of the
time
32
Most ofthe time
23
Most ofthe time
Most ofthe time
38
Most ofthe time
Most ofthe time
Most ofthe time
28
Most ofthe time
Most ofthe time
Most ofthe time
74
All of thetime
64
All of thetime
All of the
time
45
All of thetime
All of thetime
All of thetime
15
All of thetime
All of thetime
All of thetime
53 42
l7 28 59 22
33 22 24 1l
t2 t0
20 2l 50 l3 l5 l3
4 9 4
7
8 8
6
2 5
4 0 I 5
8
265

APPENDIX D.
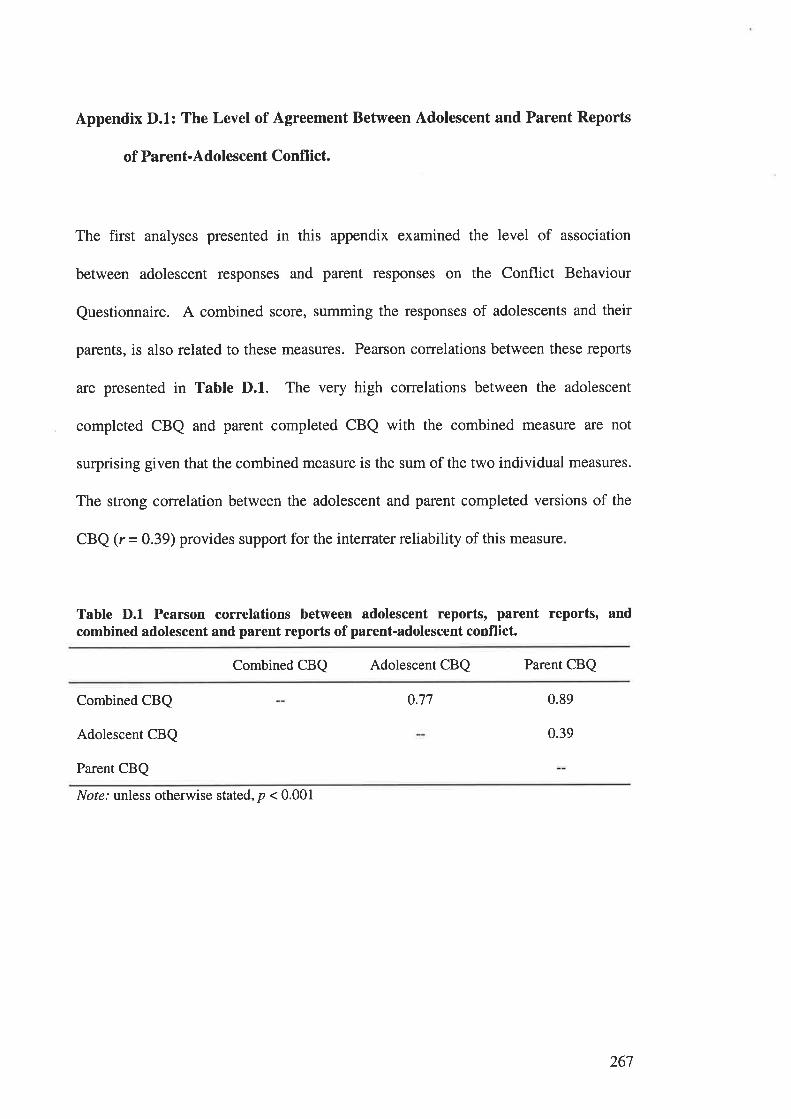
Appendix D.1: The Level of Agreement Between Adolescent and Parent Reports
of Parent-Adolescent Conflict.
The first analyses presented in this appendix examined the level of association
between adolescent responses and parent responses on the Conflict Behaviour
Questionnaire. A combined score, summing the responses of adolescents and their
parents, is also related to these measures. Pearson correlations between these reports
are presented in Table D.1. The very high conelations between the adolescent
completed CBQ and parent completed CBQ with the combined measure are not
surprising given that the combined measure is the sum of the two individual measures.
The strong correlation between the adolescent and parent completed versions of the
CBQ (r = 0.39) provides support for the interrater reliability of this measure.
Table D.l Pearson correlations between adolescent reports, parent reports, andcombined adolescent and parent reports of parent-adolescent conflict.
Combined CBQ Adolescent CBQ Parent CBQ
Combined CBQ
Adolescent CBQ
Parent CBQ
0.77 0.89
0.39
Nof¿.' unless otherwise stated, p < 0.001
267
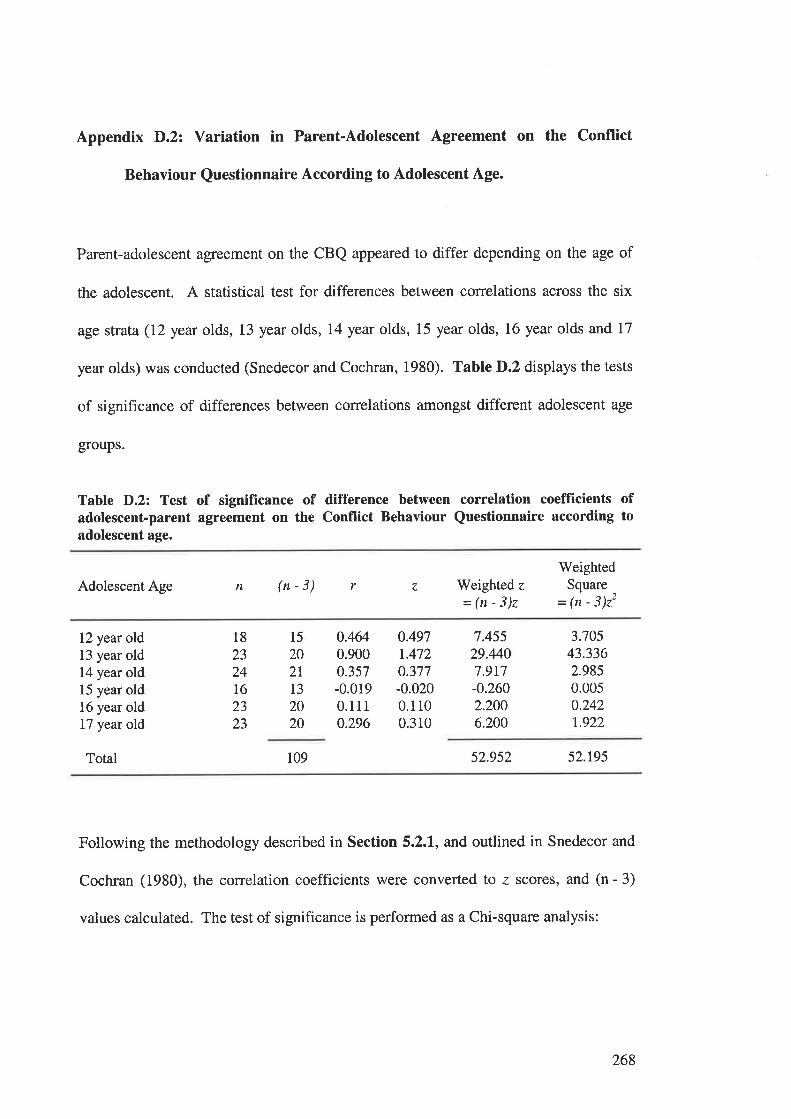
Appendix D.2: Variation in Parent-Adolescent Agreement on the Conflict
Behaviour Questionnaire According to Adolescent Age.
Parent-adolescent agreement on the CBQ appeared to differ depending on the age of
the adolescent. A statistical test for differences between correlations across the six
age strata (I2 year olds, 13 year olds, 14 year olds, 15 year olds, 16 year olds and 17
year olds) was conducted (Snedecor and Cochran, 1980). Table D.2 displays the tests
of significance of differences between correlations amongst different adolescent age
groups.
Table D.2: Test of significance of difference between correlation coefficients ofadolescent-parent agreement on the Conflict Behaviour Questionnaire according toadolescent age.
Adolescent Age Weighted z
=(n-3)z
WeightedSquare
- (n - 3)22
n (n-3) r z
12 year old13 year old14 year old15 year old16 year old17 year old
Total
0.4640.9000.357-0.0190.1110.296
0.4971.4720.377-0.0200.1100.310
7.45529.4407.9r7-0.2602.2006.200
3.70543.3362.9850.0050.242t.922
15
202T
13
2020
18
2324L62323
109 52.952 52.r95
Following the methodology described in Section 5.2.I, and outlined in Snedecor and
Cochran (1980), the correlation coefficients were converted to z scores, and (n - 3)
values calculated. The test of significance is performed as a Chi-square analysis:
268
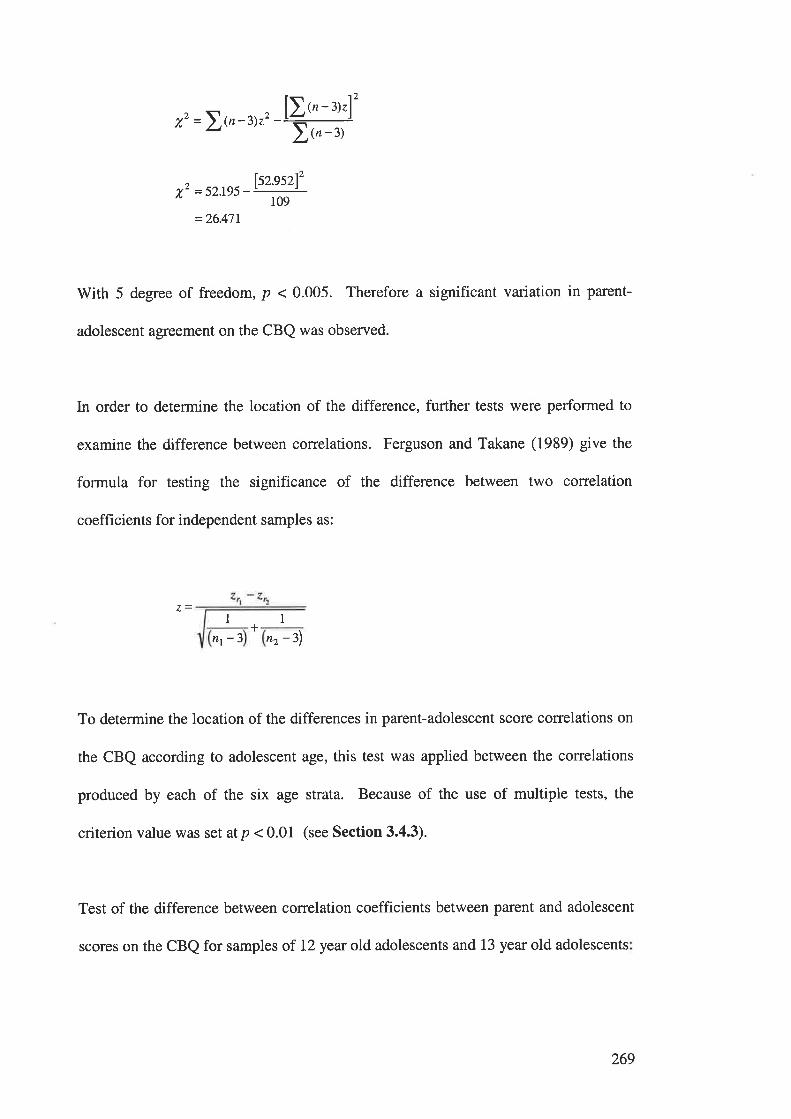
,z=l{n-rrrr-ffit
^ l-sz.gszl'T =52.te5_Ë
=26.471
With 5 degree of freedom, p < 0.005. Therefore a significant variation in parent-
adolescent agreement on the CBQ was observed.
In order to determine the location of the difference, further tests were performed to
examine the difference between correlations. Ferguson and Takane (1989) give the
formula for testing the significance of the difference between two correlation
coefficients for independent samples as:
II+
nt -3 "t -3)
To determine the location of the differences in parent-adolescent score colrelations on
the CBQ according to adolescent age, this test was applied between the correlations
produced by each of the six age strata. Because of the use of multiple tests, the
criterion value was set at p < 0.01 (see Section 3.4.3).
Test of the difference between correlation coefficients between parent and adolescent
scores on the CBQ for samples of 12 year old adolescents and 13 year old adolescents
269

z
o.49',7 -t47211-+-15 20
-0975=:Jo.ttt
= -2.85
This test result is significant at thep < 0.01 level.
Test of the difference between correlation coefficients between parent and adolescent
scores on the CBQ for samples of 12 year old adolescents and 14 year old adolescents:
I1
0.497 -0.377lt-+-15 2l
0.120
Jo.tts= 0.35
This test result is not significant at the p < 0.01 level.
Test of the difference between correlation coefficients between parent and adolescent
scores on the CBQ for samples of 12 year old adolescents and 15 year old adolescents:
270

0.497 - (-0.020)a.- 11
-+-15 13
0517=:Jolu= I.36
This test result is not significant at the p < 0.01 level.
Test of the difference between correlation coefficients between parent and adolescent
scores on the CBQ for samples of L2 year old adolescents and 16 year old adolescents
0.497 - 0.110
ll-+-15 20
0.387
Jo.t tz= 1.13
This test result is not significant at the p < 0.01 level.
Test of the difference between correlation coefficients between parent and adolescent
scores on the CBQ for samples of 12 year old adolescents and I7 year old adolescents:
271

0.497 -O.3tOl1-+-15 20
0.187
J0.117
= 055
This test result is not significant at the p < 0.01 level.
Test of the difference between correlation coefficients between parent and adolescent
scores on the CBQ for samples of 13 year old adolescents and 14 year old adolescents:
I 1
tA72-0.377
11-+-20 2r
1.095
= 350
This test result is significant at the p < 0.01 level
Test of the difference between correlation coefficients between parent and adolescent
scores on the CBQ for samples of 13 year old adolescents and 15 year old adolescents:
272
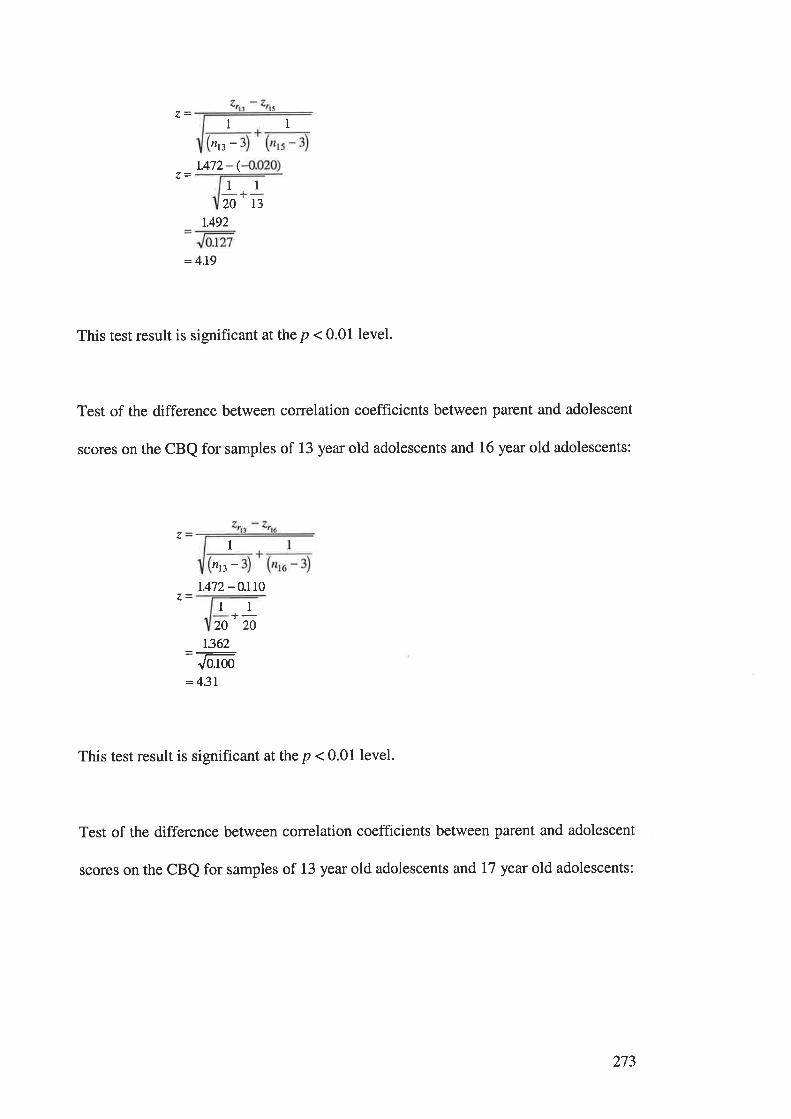
II
20 13
r.492
= 4.19
This test result is significant at the p < 0.01 level.
Test of the difference between correlation coefficients between parent and adolescent
scores on the CBQ for samples of 13 year old adolescents and 16 year old adolescents:
ntr -t.472 - (
1l-+-
ll
/,I
\i-t.472-O.trc
20+-
20
t362
Jo.too= 4.3I
This test result is significant at the p < 0.01 level.
Test of the difference between correlation coefficients between parent and adolescent
scores on the CBQ for samples of 13 year old adolescents and l7 year old adolescents:
273

Itll.z -
r.472-0.3rO
1l-+-20 20
t.162=m= 3.68
This test result is significant at the p < 0.01 level.
Test of the difference between correlation coefficients between parent and adolescent
scores on the CBQ for samples of 14 year old adolescents and 15 year old adolescents:
+I
(n'' - 3)
0.377 - -0.020)
("ro -3)I
1l-+-2r 13
o397
= LJ2
This test result is not significant at the p < 0.01 level.
Test of the difference between correlation coefficients between parent and adolescent
scores on the CBQ for samples of 14 year old adolescents and 16 year old adolescents:
274

0.377 -O.LLO
l1-+-2t 20
0.267
Jo.oss
= 0.85
This test result is not significant at the p < 0.01 level
Test of the difference between correlation coefficients between parent and adolescent
scores on the CBQ for samples of 14 year old adolescents and L7 year old adolescents:
n\t nrt:.
Int+-3
0377 - 0.310
11-+-21 20
This test result is not significant at the p < 0.01 level.
Test of the difference between correlation coefficients between parent and adolescent
scores on the CBQ for samples of 15 year old adolescents and 16 year old adolescents:
275

(-0.020) - 0.110
11-+-t3 20
-o.130
Jo.tzt= -0.37
This test result is not significant at the p < 0.01 level.
Test of the difference between correlation coefficients between parent and adolescent
scores on the CBQ for samples of 15 year old adolescents and I7 year old adolescents:
nts -3
nts-3
z
(-0.020) - 0.310
1113
-0.330
= -0.93
This test result is not significant at the p < 0.01 level.
Test of the difference between correlation coefficients between parent and adolescent
scores on the CBQ for samples of l6 year old adolescents and I7 year old adolescents:
+-20
276
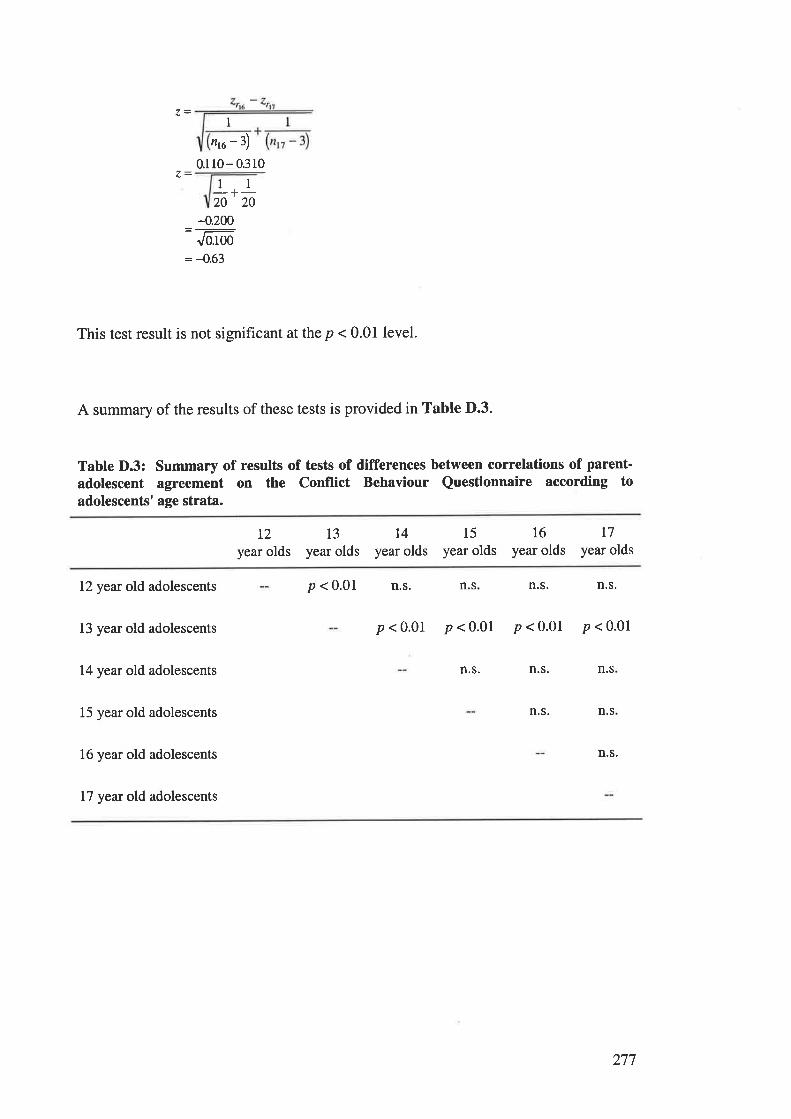
1
,rc-3)0.110- 0.310
11-+-20 20
-0.200
Jo.too= -0.63
This test result is not significant at the p < 0.01 level.
A summary of the results of these tests is provided in Table D.3.
Table D.3: Summary of results of tests of differences between correlations of parent-
adolescent agreement on the Conflict Behaviour Questionnaire according toadolescents' age strata.
L2
year olds13
year oldsI4
year olds15
year olds16
year oldst7
year olds
12 year old adolescents
13 year old adolescents
14 year old adolescents
15 year old adolescents
16 year old adolescents
17 year old adolescents
p < 0.01 n.s. n.s n.s. n.s.
p<0.01 p<0.01 p<0.01 p<0.01
n.s. n.s. n.s
n.s. n.s
n.s.
277
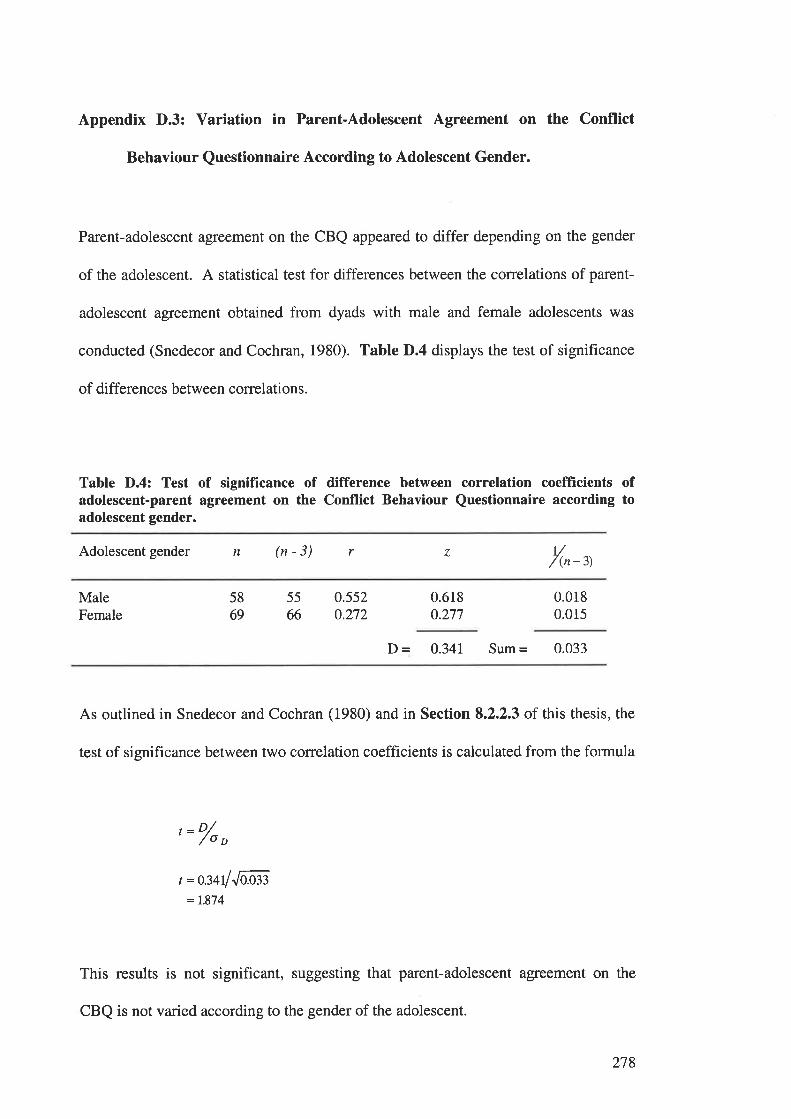
Appendix D.3: Variation in Parent-Adolescent Agreement on the Conflict
Behaviour Questionnaire According to Adolescent Gender.
Parent-adolescent agreement on the CBQ appeared to differ depending on the gender
of the adolescent. A statistical test for differences between the correlations of parent-
adolescent agreement obtained from dyads with male and female adolescents was
conducted (Snedecor and Cochran, 1980). Table D.4 displays the test of significance
of differences between correlations.
Table D.4: Test of significance of difference between correlation coefficients ofadolescent-parent agreement on the Conflict Behaviour Questionnaire according toadolescent gender.
Adolescent gender n (n - 3) r r//(n -3)
4
MaleFemale
5869
55
660.552o.272
0.618o.277
0.0180.015
D = 0.34I Sum = 0.033
As outlined in Snedecor and Cochran (1980) and in Section 8.2.2.3 of this thesis, the
test of significance between two correlation coefficients is calculated from the formula
'= o/o
o
t =m4lJoæ= 7.874
This results is not significant, suggesting that parent-adolescent agreement on the
CBQ is not varied according to the gender of the adolescent.
278
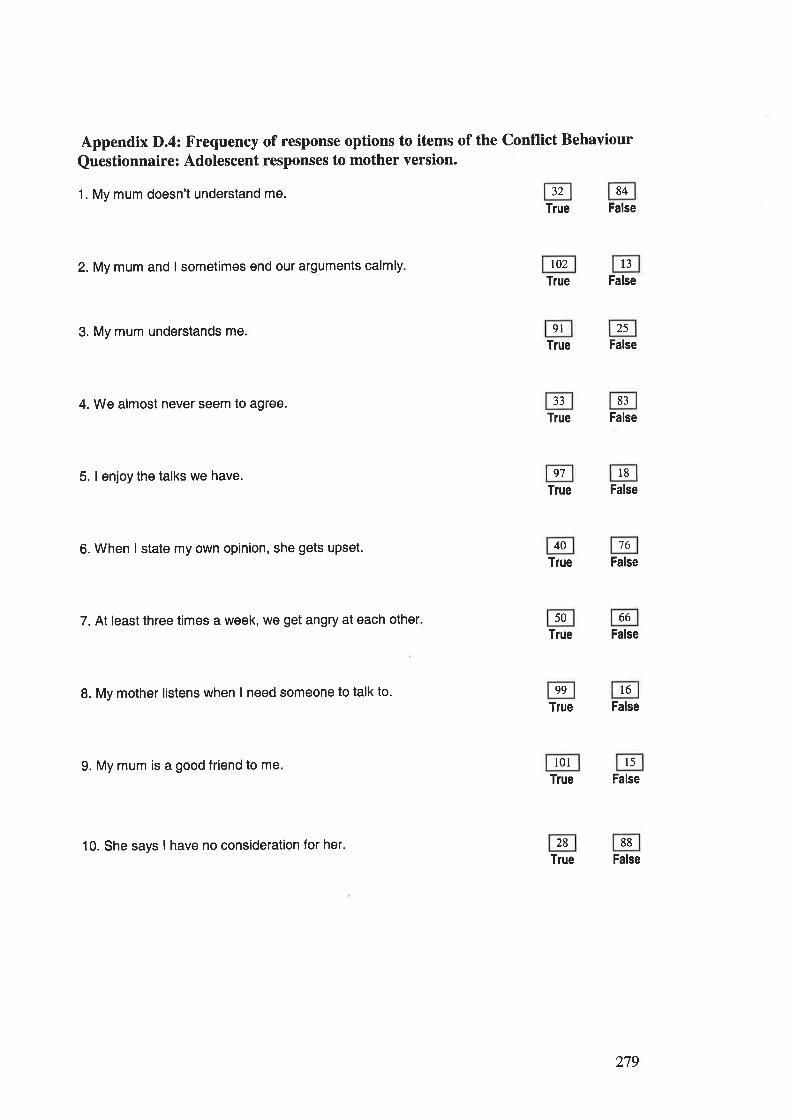
Appendix D.4: Frequency of response options to items of the Conflict Behaviour
Questionnaire: Adolescent responses to mother version.
1. My mum doesn't understand me.True False
2. My mum and I sometimes end our arguments calmly t02 13
True False
3. My mum understands me 9l 25
True False
4. We almost never seem to agree. 33 83
True False
5. I enjoy the talks we have. 97 18
True False
6. When I state my own opinion, she gets upset. 40 76
True False
7. At least three times a week, we get angry at each other 50 66
Tlue False
8. My mother listens when I need someone to talk to. 99 l6True False
9. My mum is a good friend to me 101 l5True False
10. She says I have no consideration for her 28 88
True False
32 84
279
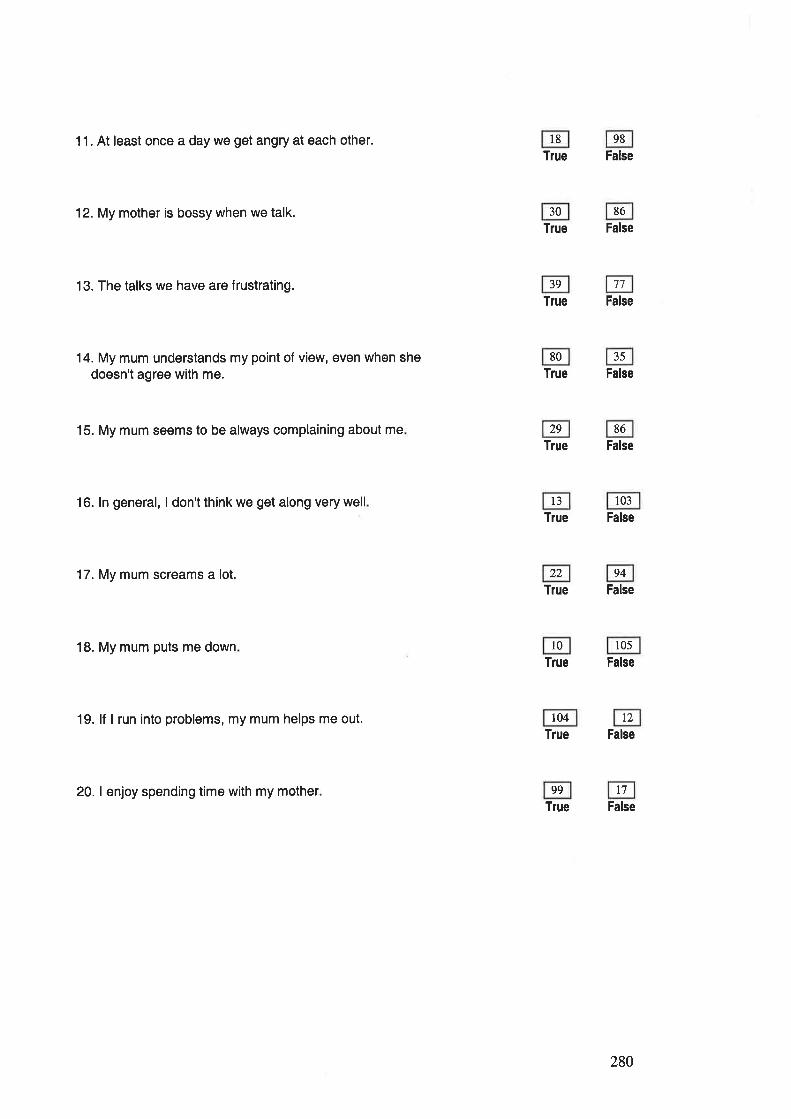
11. At least once a day we get angry at each other.
12. My mother is bossy when we talk.
13. The talks we have are f rustrating.
14. My mum understands my point of view, even when shedoesn't agree with me.
15. My mum seems to be always complaining about me
16. ln general, I don't think we get along very well
17. My mum screams a lot.
18. My mum puts me down
19. lf I run into problems, my mum helps me out.
20. I enjoy spending time with my mother
l8 98
True False
30 86
True False
39 77
True False
80 35
True False
29 86
True False
l3 103
True False
22 94
True False
l0 r05
True False
104 12
True False
99 t7True False
280
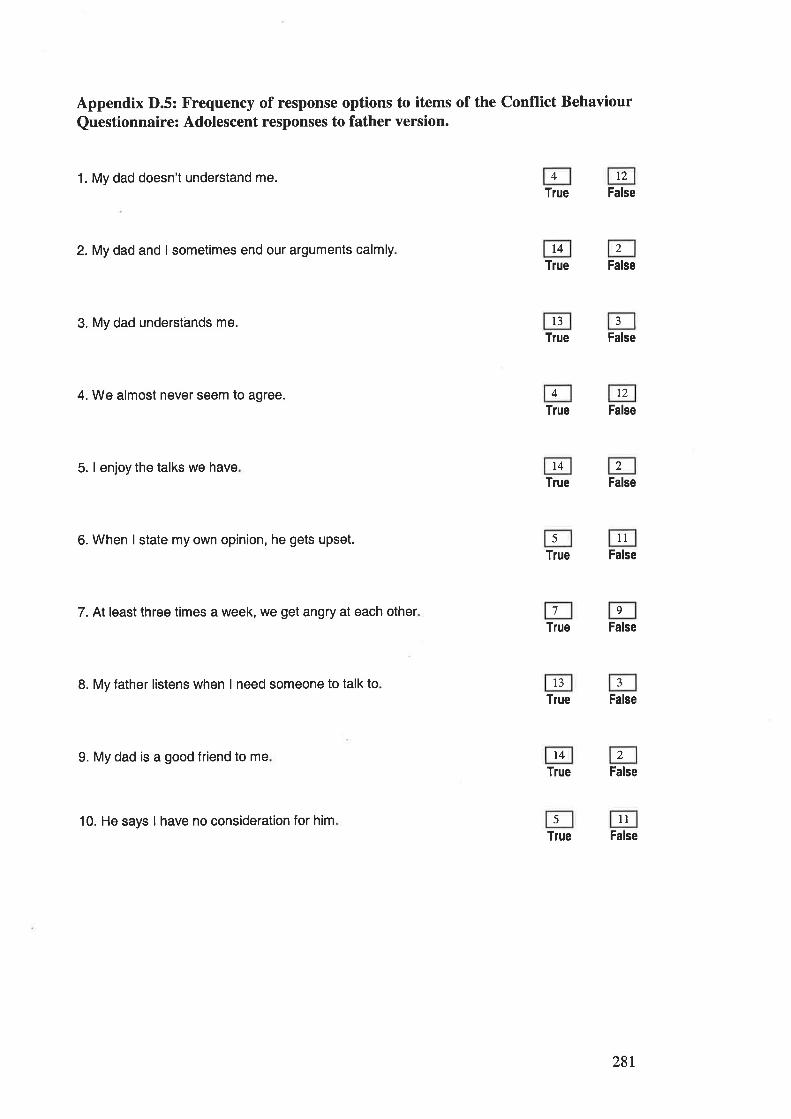
Appendix D.5: Frequency of response options to items of the Conflict Behaviour
Questionnaire: Adolescent responses to father version.
1. My dad doesn't understand me. t2
True False
2. My dad and I sometimes end our arguments calmly t4True False
3. My dad understands me. 13
True False
4. We almost never seem to agree. 12
True False
5. I enjoy the talks we have t4True False
6. When I state my own opinion, he gets upset. llTrue False
7. At least three times a week, we get angry at each otherTrue False
8. My father listens when I need someone to talk to l3Tlue False
9. My dad is a good friend to me t4True False
10. He says I have no consideration for him llTrue False
4
2
4
2
5
7 9
2
5
28r
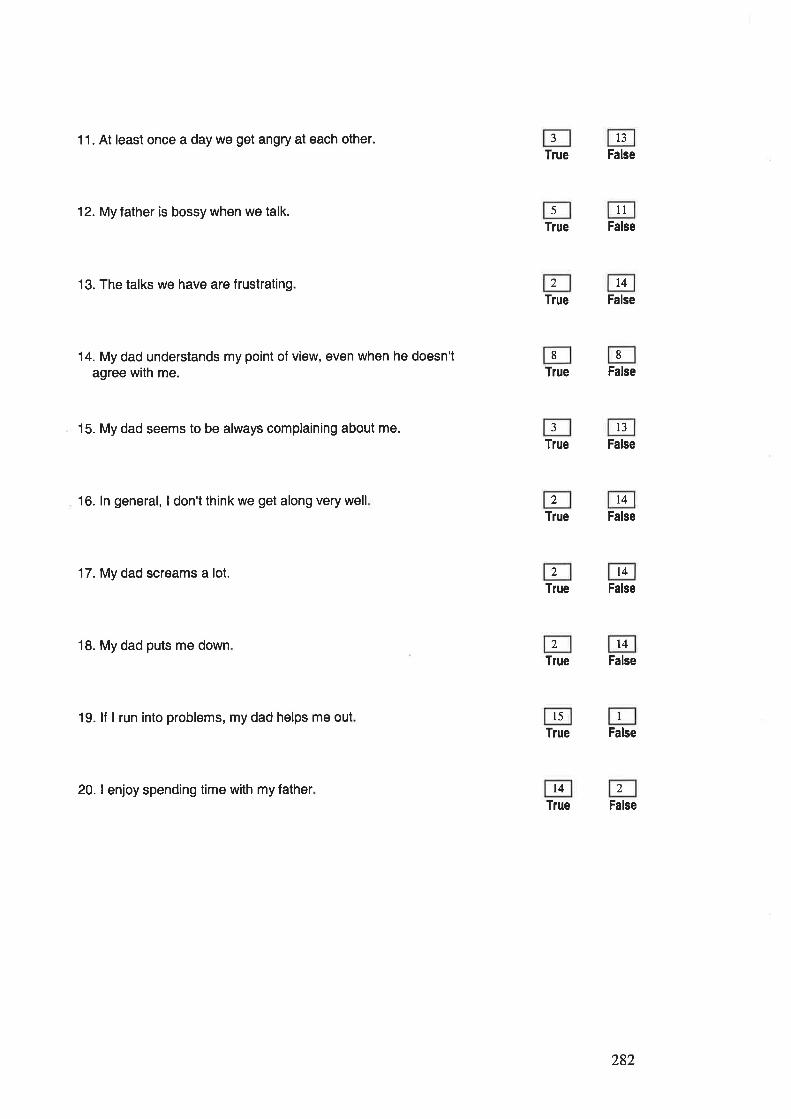
11. At least once a day we get angry at each other.
12. My father is bossy when we talk.
13. The talks we have are f rustrating
14. My dad understands my point of view, even when he doesn'tagree with me.
15. My dad seems to be always complaining about me.
16. ln general, I don't think we get along very well
17. My dad screams a lot.
18. My dad puts me down
19. lf I run into problems, my dad helps me out
20. I enjoy spending time with my father
13
True False
l1True False
t4True False
True False
13
True False
t4True False
14
True False
t4True False
l5Tlue False
t4True False
J
5
2
8 8
3
)
2
2
I
,)
282
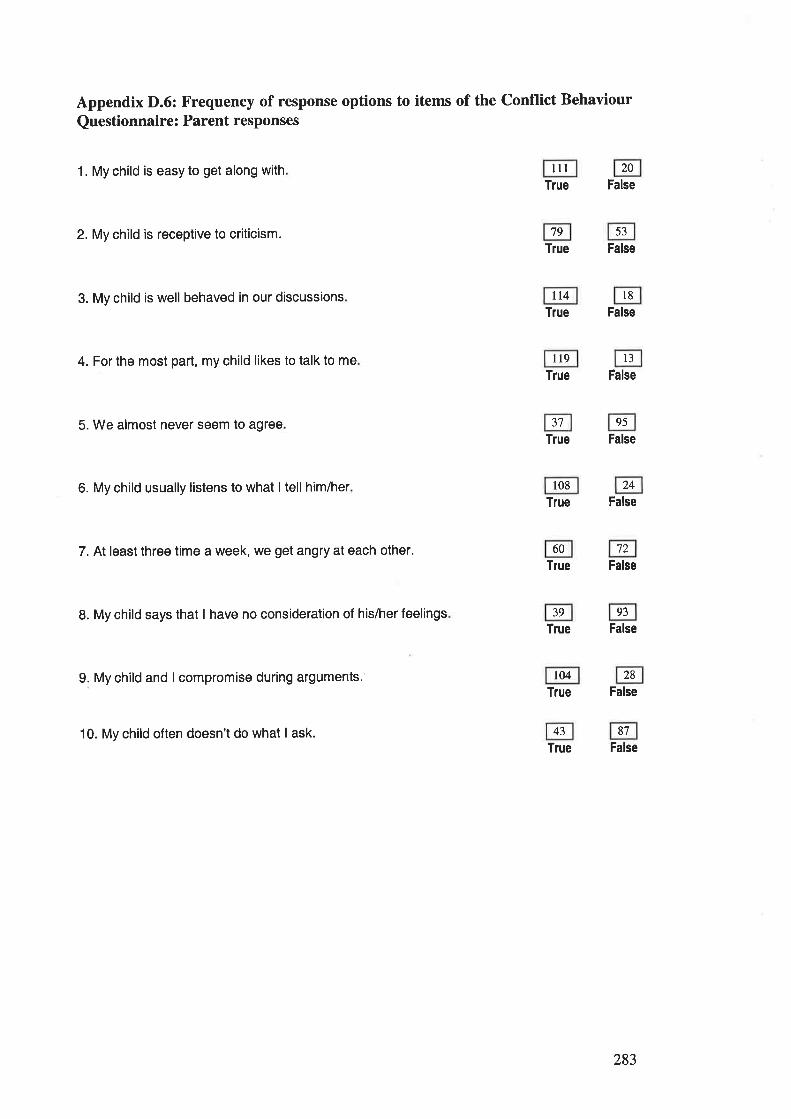
Appendix D.6: Frequency of response options to items of the Conflict Behaviour
Questionnaire: Parent responses
1. My child is easy to get along with lll 20
True False
2. My child is receptive to criticism. 79 53
True False
3. My child is well behaved in our discussions tt4 l8True False
4. For the most part, my child likes to talk to me 119 l3True False
5. We almost never seem to agree 3t 95
True False
6. My child usually listens to what I tell him/her r08 24
True False
7. At least three time a week, we get angry at each other. 60 72
True False
B. My child says that I have no consideration of his/her feelings 39 93
True False
9. My child and I compromise during arguments. 104 28
True False
10. My child often doesn't do what I ask. 43 87
True False
283
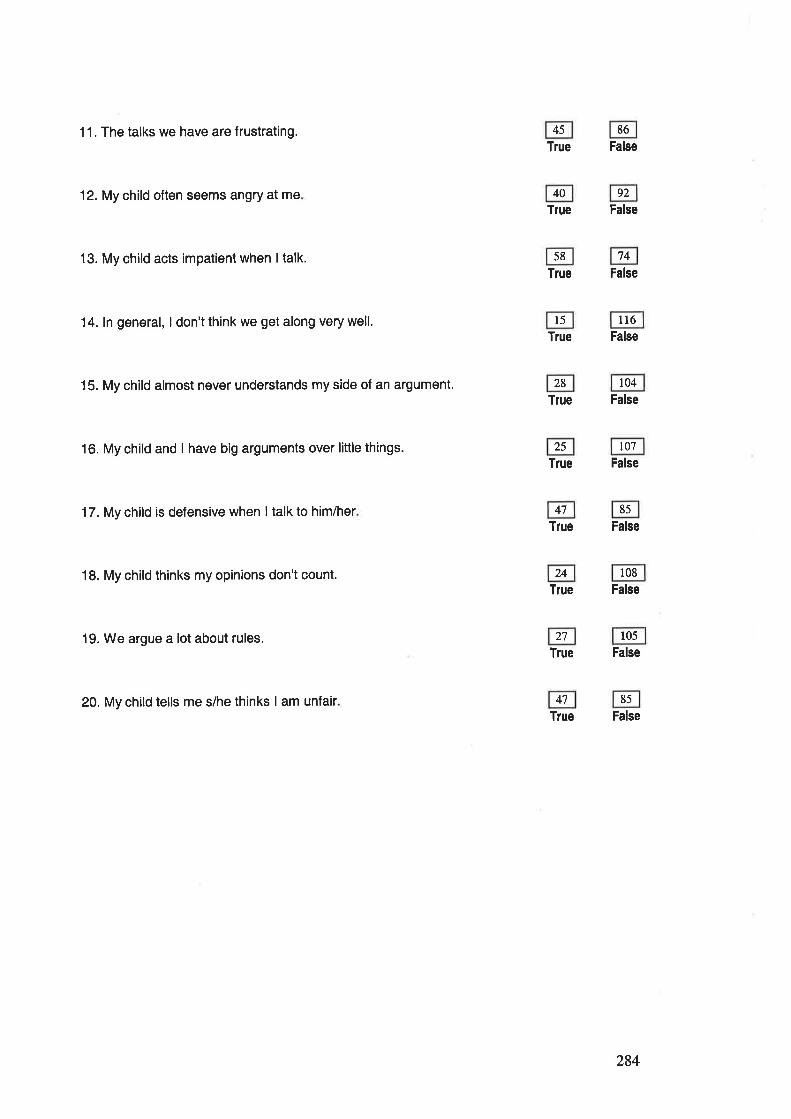
11. The talks we have are frustrating.
12. My child often seems angry at me
13. My child acts impatient when ltalk.
14. ln general, I don't think we get along very well.
15. My child almost never understands my side of an argument.
16. My child and I have big arguments over little things.
17.My child is defensive when I talk to him/her
18. My child thinks my opinions don't count.
19. We argue a lot about rules.
20. My child tells me s/he thinks I am unfair
45 86
True False
40 92
True False
58 74
True False
l5 tt6True False
28 t04Tlue False
25 t07
True False
47 85
True False
24 108
Tlue False
27 105
True False
4',1 85
True False
284
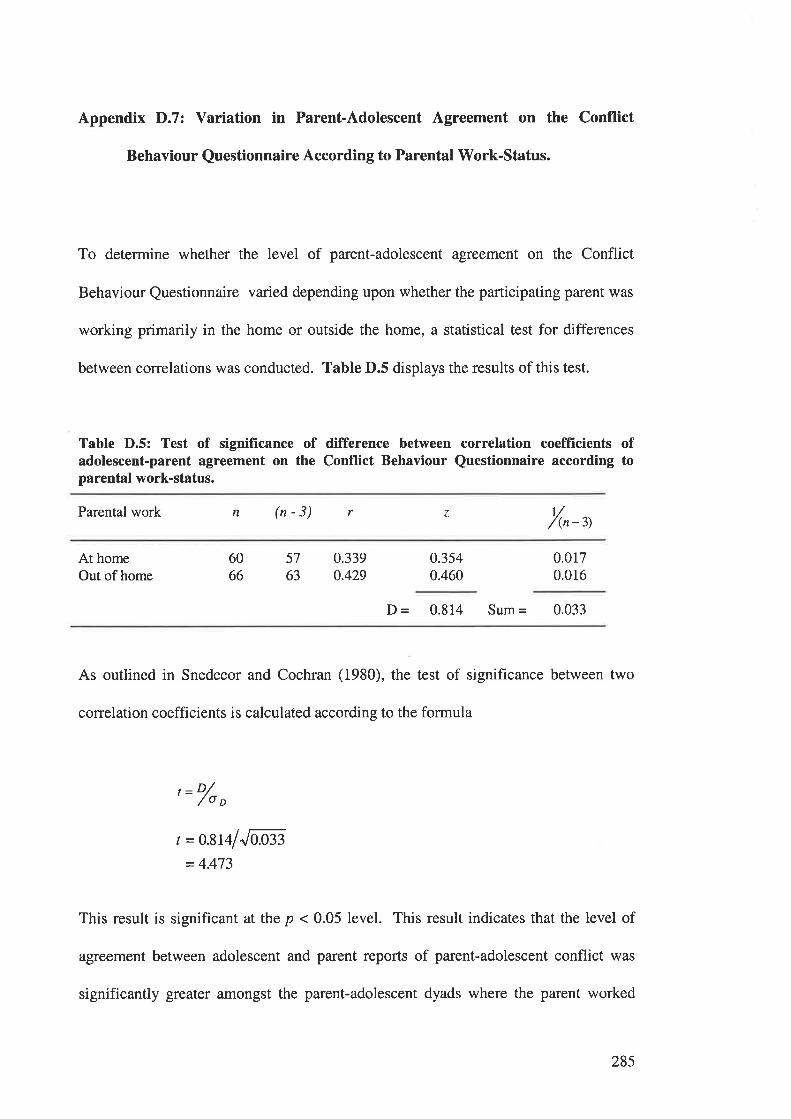
Appendix D.7: Variation in Parent-Adolescent Agreement on the Conflict
Behaviour Questionnaire According to Parental Work-Status.
To determine whether the level of parent-adolescent agreement on the Conflict
Behaviour Questionnaire varied depending upon whether the participating parent was
working primarily in the home or outside the home, a statistical test for differences
between correlations was conducted. Table D.5 displays the results of this test.
Table D.5: Test of significance of difference between correlation coefficients ofadolescent-parent agreement on the Conflict Behaviour Questionnaire according toparental work-status.
Parental work n (n-3) r z t//(n -3)
At homeOut of home
6066
57
63
0.3390.429
0.3540.460
0.0170.016
D = 0.814 Sum = 0.033
As outlined in Snedecor and Cochran (1980), the test of significance between two
correlation coefficients is calculated according to the formula
, = o/o,
t = o.81al"laß3
= 4.473
This result is significant at the p < 0.05 level. This result indicates that the level of
agreement between adolescent and parent reports of parent-adolescent conflict was
significantly greater amongst the parent-adolescent dyads where the parent worked
285

primarily outside the home, than in those dyads where the parent was primarily in the
home
286

APPBNDIX E.
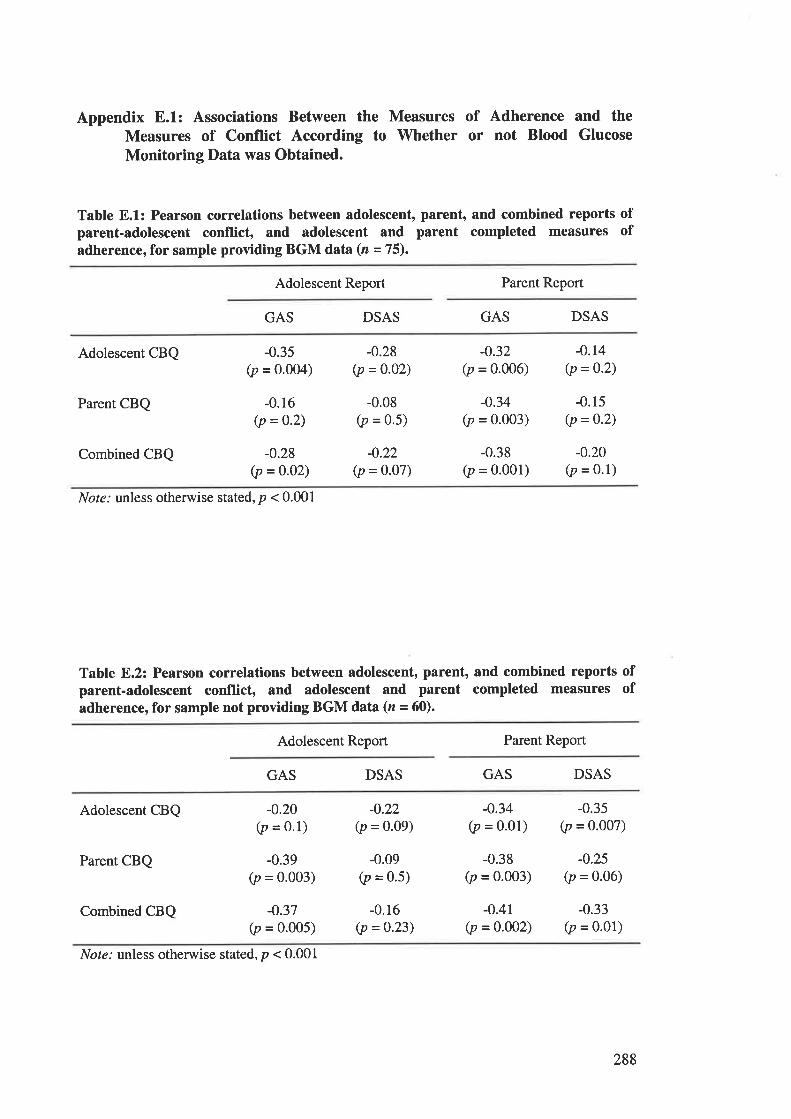
Appendix E.1: Associations Between the Measures of Adherence and theMeasures of Conflict According to Whether or not Blood Glucose
Monitoring Data was Obtained.
Table E.1: Pearson correlations between adolescent, parent, and combined reports ofparent-adolescent conflict, and adolescent and parent completed measures ofadherence, for sample providing BGM data(n - 75).
Adolescent Report Parent Report
GAS DSAS GAS DSAS
Adolescent CBQ
Parent CBQ
Combined CBQ
-0.35(p = 0.004)
-0.r6(p = 0.2)
-0.28(p = 0-02)
-0.28(p = 0.02)
-0.08(p = 0.5)
-0.22(p = o.o7)
-0.32(p = 0.006)
-0.34(p = 0.003)
-0.38(p = 0.001)
-0.14(p = 0.2)
-0.15(p = 0'2)
-0.20(p = 0.1)
Not¿.' unless otherwise stated, p < 0.001
Table 8.2: Pearson correlations between adolescent, parent, and combined reports ofparent-adolescent conflict, and adolescent and parent completed measures ofadherence, for sample not providing BGM data (z - 60).
Adolescent Report Parent Report
GAS DSAS GAS DSAS
Adolescent CBQ
Parent CBQ
Combined CBQ
-0.20(p = 0.1)
-0.39(p = 0.003)
-o.37(p = 0.005)
-0.22(p = 0.09)
-0.09(p = 0'5)
-0.16(p =0.23)
-0.34(p = 0.01)
-0.38(p = 0.003)
-0.41(p = 0.002)
-0.35(p = 0.007)
-0.25(p = 0.06)
-0.33(p = 0.01)
Not¿.' unless otherwise stated, p < 0.001
288

APPENDIX F.
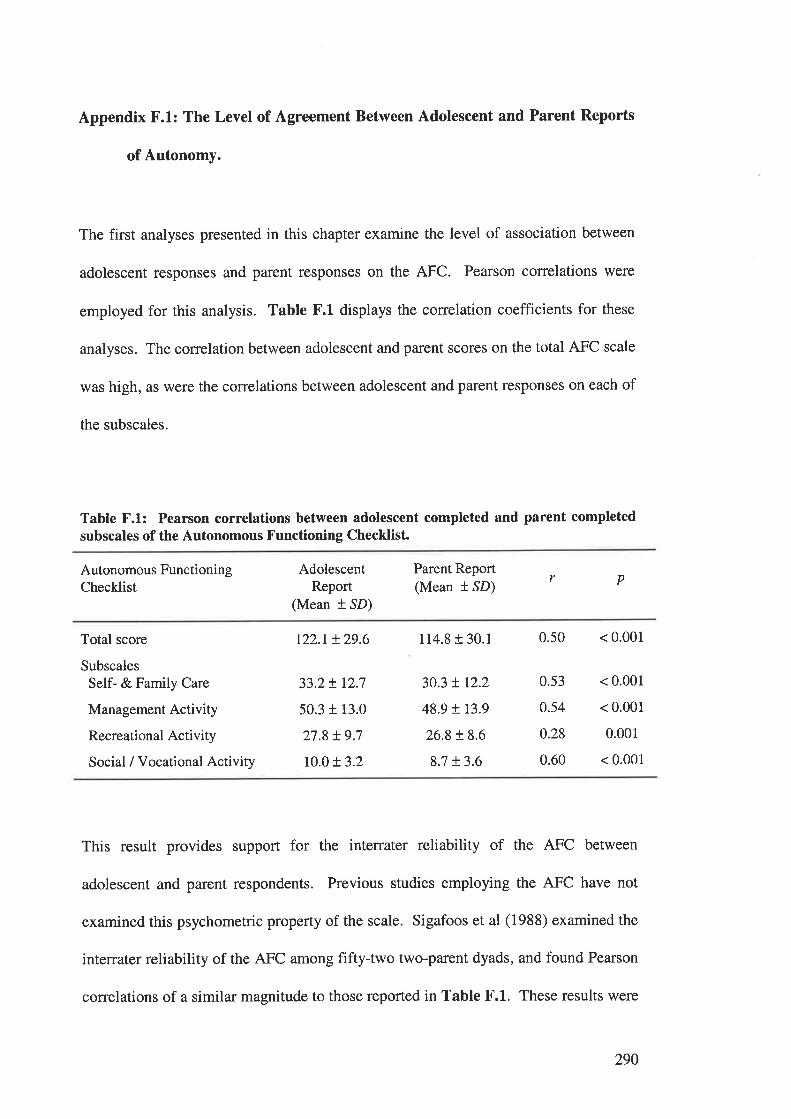
Appendix F.1: The Level of Agreement Between Adolescent and Parent Reports
of Autonomy.
The first analyses presented in this chapter examine the level of association between
adolescent responses and parent responses on the AFC. Pearson correlations were
employed for this analysis. Table F.1 displays the correlation coefficients for these
analyses. The correlation between adolescent and parent scores on the total AFC scale
was high, as were the correlations between adolescent and parent responses on each of
the subscales.
Table F.l: Pearson correlations between adolescent completed and parent completedsubscales of the Autonomous Functioning Checklist.
Autonomous FunctioningChecklist
AdolescentReport
(Mean t SD)
Parent Report(Mean l SD)
r p
Total score
SubscalesSelf- & Family Care
Management Activity
Recreational Activity
Social / Vocational Activity
t22.r t29.6 114.8 r 30.1 0.50 < 0.001
33.2t 12.7
50.3 + 13.0
27.8 + 9.7
10.0 t 3.2
30.3 ! r2.2
48.9 r 13.9
26.8 t 8.6
83 t3.6
0.53
0.54
0.28
0.60
< 0.001
< 0.001
0.001
< 0.001
This result provides support for the interrater reliability of the AFC between
adolescent and parent respondents. Previous studies employing the AFC have not
examined this psychometric property of the scale. Sigafoos et al (1988) examined the
interrater reliability of the AFC among fifty+wo two-parent dyads, and found Pearson
correlations of a similar magnitude to those reported in Table F.1. These results were
290
interpreted as supportive of the interrater reliability of the measure. The authors
suggested that the coefficients underestimated the interrater reliability of the measure
because of the naturally occurring variations in perceptions of autonomy held by the
parents. The same interpretation may be made of the data reported here - the
correlations between adolescent and parent responses were high, but the differences
between the scores are likely to reflect the naturally different views of the respondents,
rather than a weakness of the measure.
29r
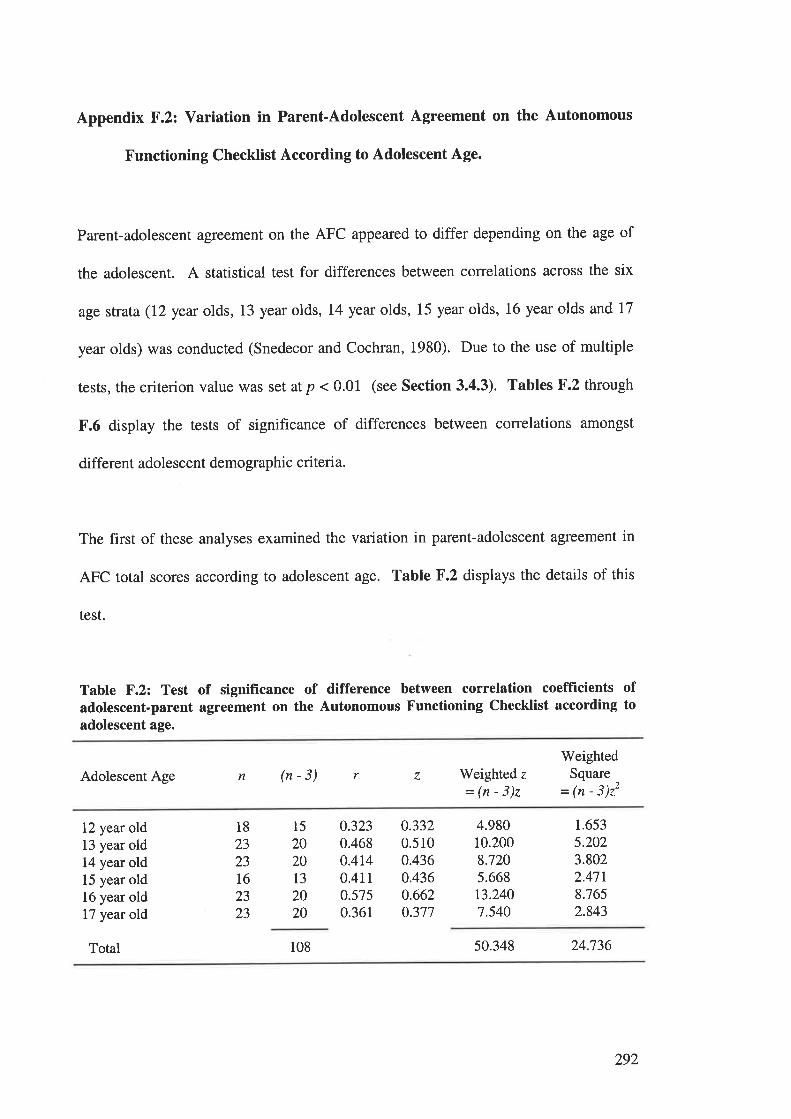
Appendix F.2: Variation in Parent-Adolescent Agreement on the Autonomous
Functioning Checklist According to Adolescent Age.
Parent-adolescent agreement on the AFC appeared to differ depending on the age of
the adolescent. A statistical test for differences between correlations across the six
age strata (I2year olds, 13 year olds, 14yeat olds, 15 year olds, 16 year olds and 17
year olds) was conducted (Snedecor and Cochran, 1980). Due to the use of multiple
tests, the criterion value was set at p < 0.01 (see Section 3.4.3). Tables F.2 through
F.6 display the tests of significance of differences between correlations amongst
different adolescent demographic criteria.
The first of these analyses examined the variation in parent-adolescent agreement in
AFC total scores according to adolescent age. Table F.2 displays the details of this
test.
Table F.2: Test of significance of difference between correlation coefficients ofadolescent-parent agreement on the Autonomous Functioning Checklist according toadolescent age.
Adolescent Age n (n-3) r z Weighted z
=(n-3)z
WeightedSquare
= ¡n - 3)22
12 year old13 year old14 year old15 year old16 year old17 year old
18
23
2316
2323
15
202013
2020
0.3230.468o.4140.4110.5750.361
0.3320.5100.4360.4360.6620.377
4.98010.2008.7205.66813.2407.540
1.653
5.2023.8022.47t8.7652.843
Total 108 50.348 24.736
292
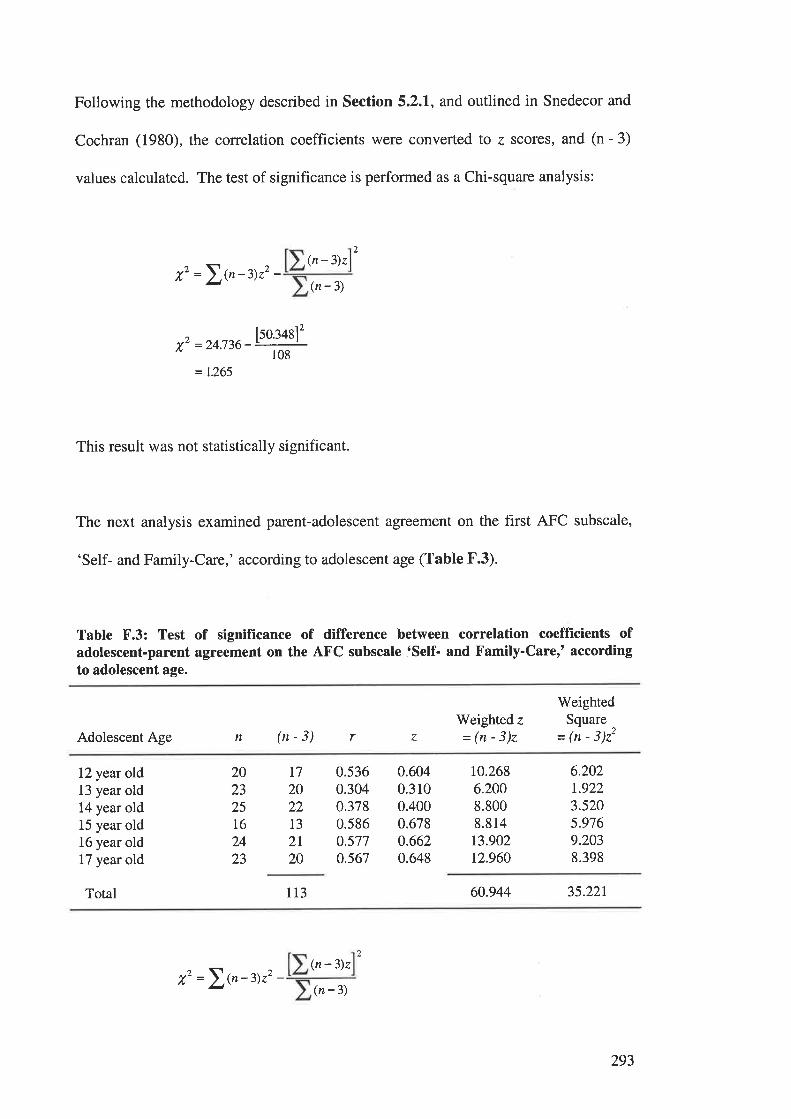
Following the methodology described in Section 5.2.1, and outlined in Snedecor and
Cochran (1980), the correlation coefficients were converted to z scores, and (n - 3)
values calculated. The test of significance is performed as a Chi-square analysis:
)
,z =\{n-z)22 -(n - 3)z
(n-3)
7'--z+.136-þ0.:+sl'
108
= L.265
This result was not statistically significant.
The next analysis examined parent-adolescent agreement on the first AFC subscale,
'Self- and Family-Care,' according to adolescent age (Table F.3).
Table F.3: Test of significance of difference between correlation coefficients ofadolescent-parent agreement on the AFC subscale lSelf- and Family-Carer' accordingto adolescent age.
Adolescent Age n (n-3)Weighted z
=(n-3)z
WeightedSquare
= (n - 3)22r z
12 year old13 year old14 year old15 year old16 year old17 year old
Total
0.5360.3040.3780.5860.577o.567
0.6040.3100.4000.678o.6620.648
r0.2686.2008.8008.81413.90212.960
6.202r.9223.5205.9769.2038.398
202325t624
23
T7
202213
2t20
113 60.944 35.221
(n - 3)z
,z =\{n-3)zz -(n -3)
1
293
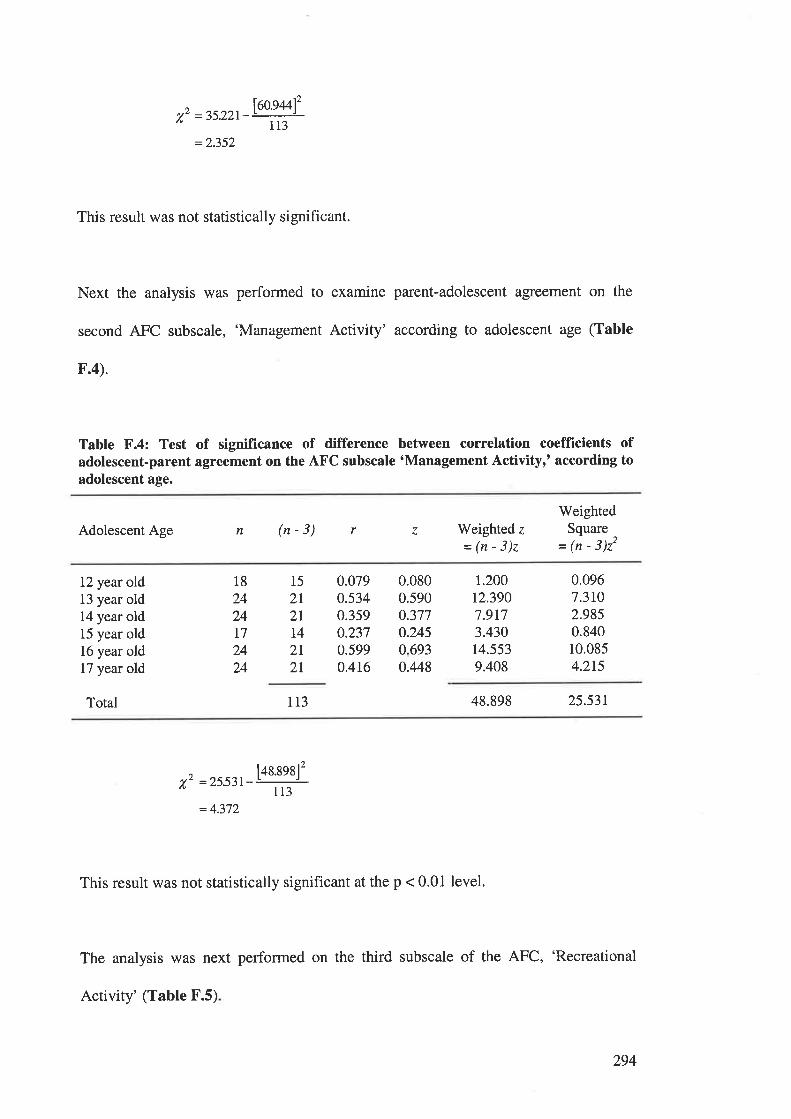
X,2 =35.221-
=2.352
leo.gulz113
This result was not statistically significant.
Next the analysis was performed to examine parent-adolescent agreement on the
second AFC subscale, 'Management Activity' according to adolescent age (Table
F.4).
Table F.4: Test of significance of difference between correlation coefficients ofadolescent-parent agreement on the AFC subscale 'Management Activityr' according toadolescent age.
Adolescent Age n (n-3) Weighted z
=(n-3)z
WeightedSquare
= (n - 3)22
r z
12 year old13 year old14 year old15 year old16 year old17 year old
18
2424I72424
15
2I2T
t42l2I
0.0790.5340.3590.2370.5990.416
0.0800.5900.3770.2450.6930.448
r.20012.3907.9173.43014.5539.408
0.0967.3rO2.9850.84010.0854.2r5
Total 113 48.898 25.53t
^ t48.89812v" =2553I-
113
= 4.372
This result was not statistically significant at the p < 0.01 level.
The analysis was next performed on the third subscale of the AFC, 'Recreational
Activity' (Table F.5)
294
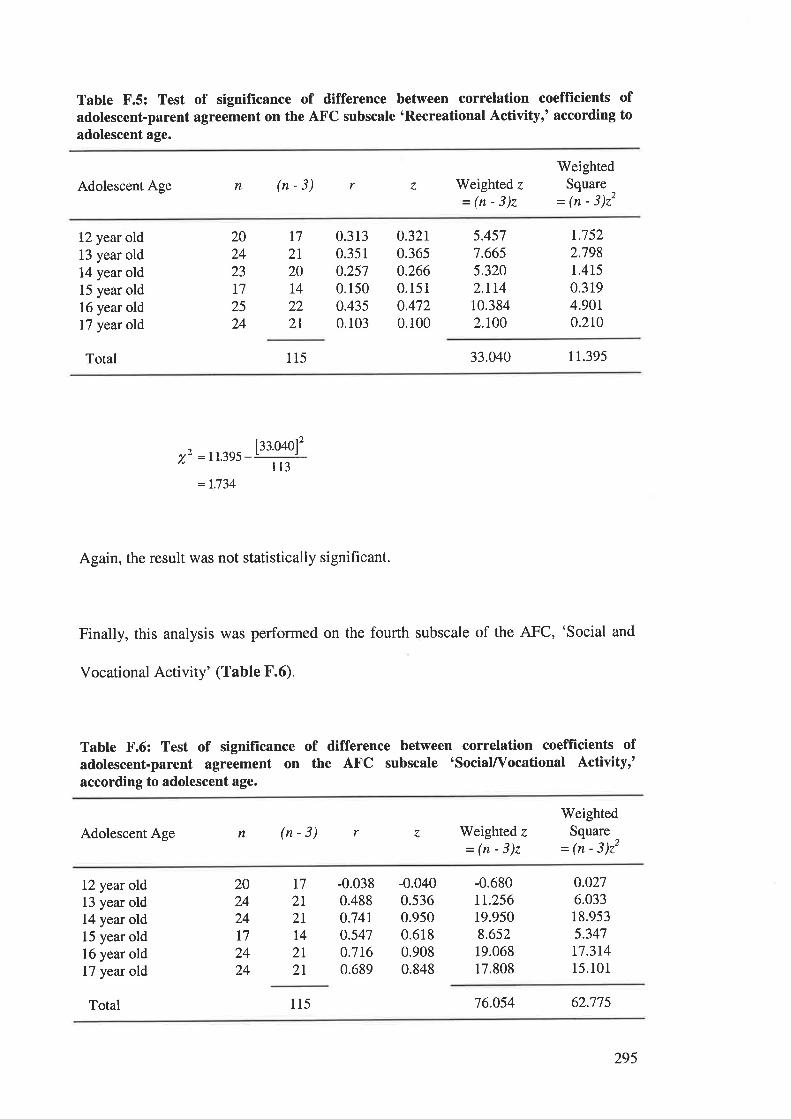
Table F.5: Test of signiflrcance of difference between correlation coeffÎcients ofadolescent-parent agreement on the AFC subscale 'Recreational Activityr' according toadolescent age.
Adolescent Age n (n-3) Weighted z
=(n-3)z
WeightedSquare
= (n - 3)22
r z
12 year old13 year old14 year old15 year old16 year oldl7 year old
Total
202423
17
2524
T7
2I20t4222I
0.3130.351
0.2570.1500.4350.103
0.32r0.3650.2660.1510.4720.100
5.4577.6655.3202.rt410.3842.r00
r.7522.7981.4150.3194.9010.210
115 33.040 I 1.395
^ I::.o4ol2v¿ = 11.395
ll3=L.734
Again, the result was not statistically significant.
Finally, this analysis was performed on the fourth subscale of the AFC, 'Social and
vocational Activity' (Table F.6).
Table F.6: Test of signifïcance of difference between correlation coefficients ofadolescent-parent agreement on the AFC subscale 'social/Vocational Activityr'according to adolescent age.
Adolescent Age n (n-3) Weighted z
=(n-3)z
WeightedSquare
= 1n - 3)22
r z
12 year old13 year old14 year old15 year old16 year old17 year old
-0.0380.4880.74r0.5470.7160.689
-0.0400.5360.9500.6180.9080.848
-0.680rr.25619.9508.65219.06817.808
0.0276.03318.9535.347t7.3r415.101
20242417
2424
t72l2tT4
2l2l
Total 115 76.054 62.775
295
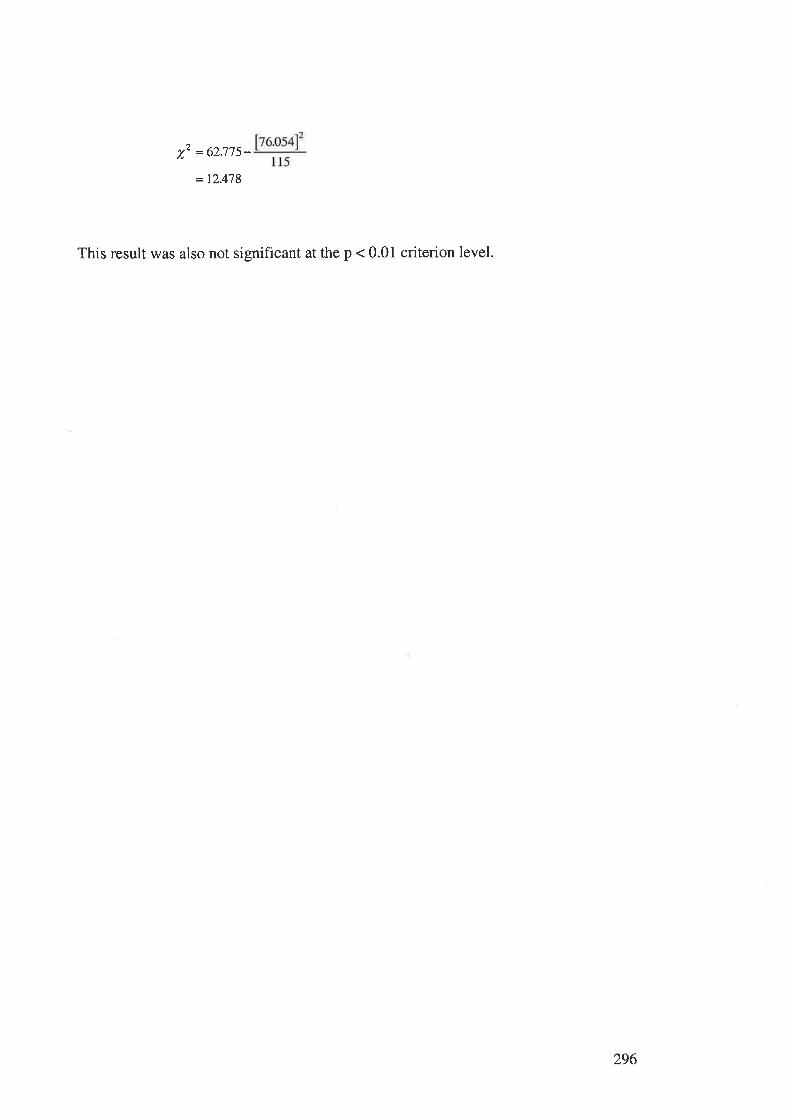
= L2.478
This result was also not significant at the p < 0.01 criterion level.
1,2 = 62.775-
296
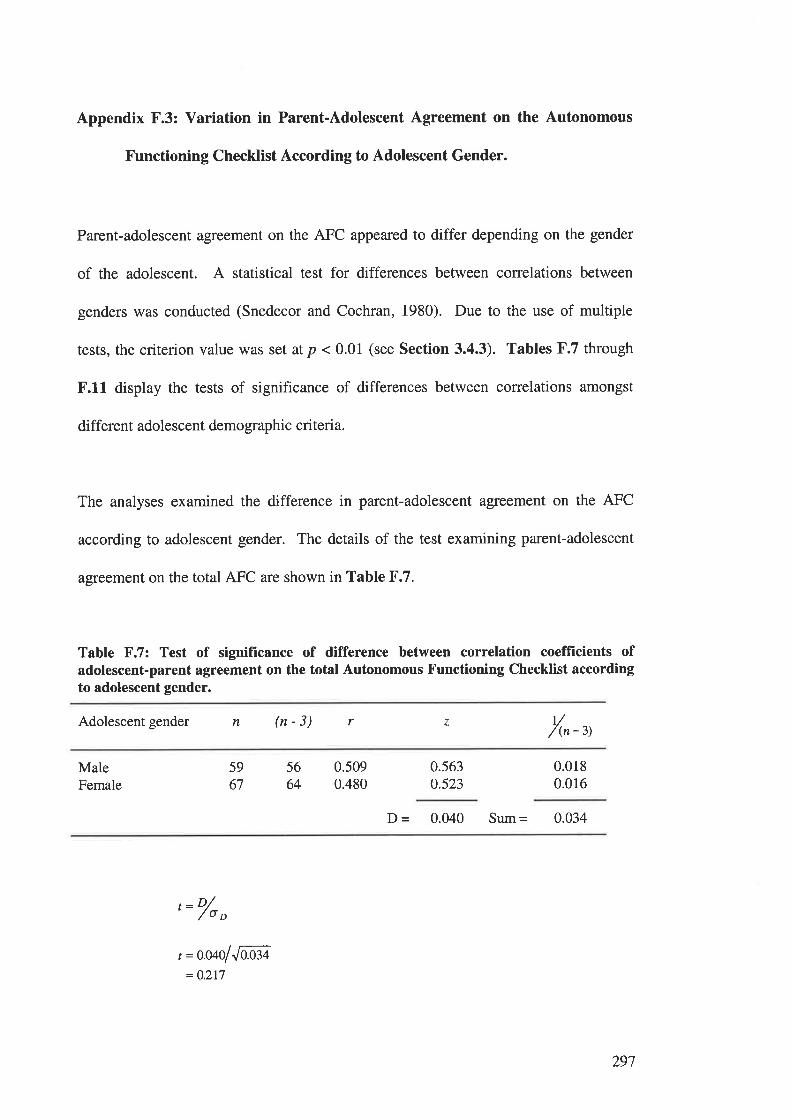
Appendix F.3: Variation in Parent-Adolescent Agreement on the Autonomous
Functioning Checklist According to Adolescent Gender.
Parent-adolescent agreement on the AFC appeared to differ depending on the gender
of the adolescent. A statistical test for differences between correlations between
genders was conducted (Snedecor and Cochran, 1980). Due to the use of multiple
tests, the criterion value was set at p < 0.01 (see Section 3.4.3). Tables F.7 through
F.11 display the tests of significance of differences between correlations amongst
different adolescent demographic criteria.
The analyses examined the difference in parent-adolescent agreemsnt on the AFC
according to adolescent gender. The details of the test examining parent-adolescent
agreement on the total AFC are shown in Table F.7.
Table F.7: Test of significance of difference between correlation coefficients ofadolescent-parent agreement on the total Autonomous Functioning Checklist accordingto adolescent gender.
Adolescent gender n (n-3) r z t//(n - 3)
MaleFemale
5664
5967
0.5090.480
0.5630.523
0.0180.016
D = 0.040 Sum = 0.034
'= o/o
o
t =o.oaolJffi= O.217
297
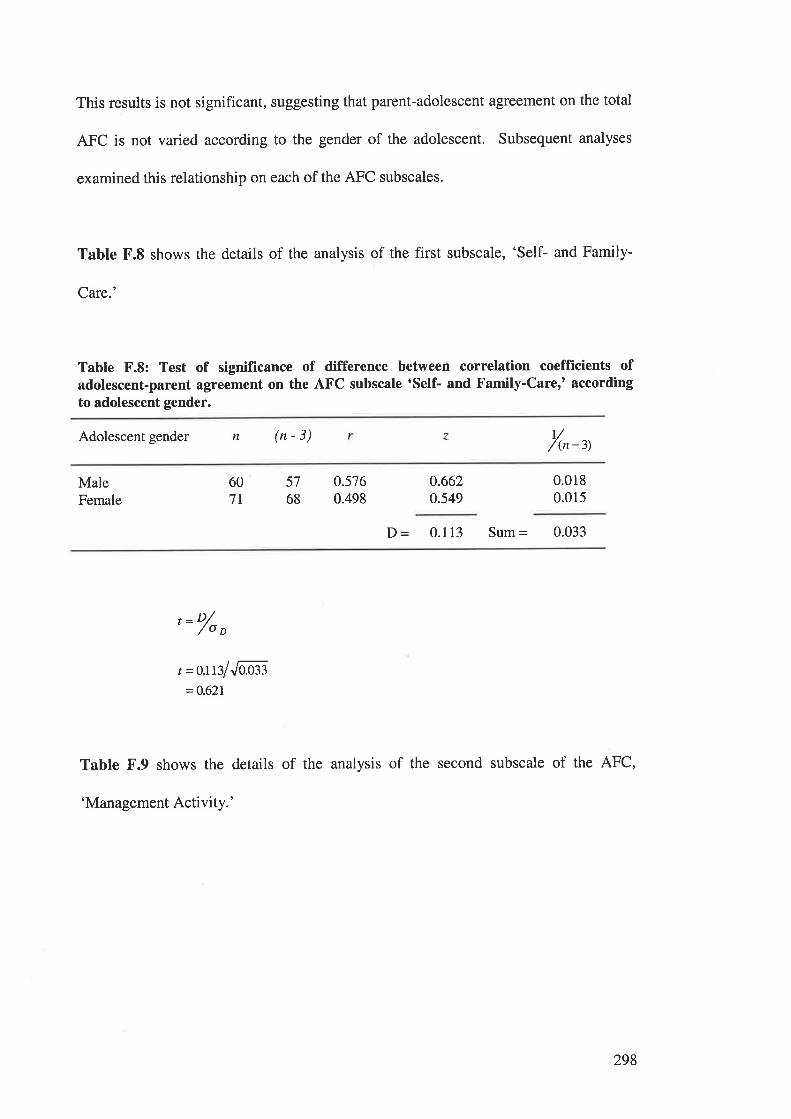
This results is not significant, suggesting that parent-adolescent agreement on the total
AFC is not varied according to the gender of the adolescent. Subsequent analyses
examined this relationship on each of the AFC subscales.
Table F.8 shows the details of the analysis of the first subscale, 'Self- and Family-
Care.'
Table F.8: Test of significance of difference between correlation coefficients ofadolescent-parent agreement on the AFC subscale 'Self- and Family-Care,' accordingto adolescent gender.
t//(n-3)Adolescent gender n (n-3) z
MaleFemale
607I
5768
0.5760.498
0.662o.549
0.0180.015
D = 0.113 Sum = 0.033
, ='/o o
t =oJßlJaæ3=0.621
Table F.9 shows the details of the analysis of the second subscale of the AFC,
'Management Activity.'
298
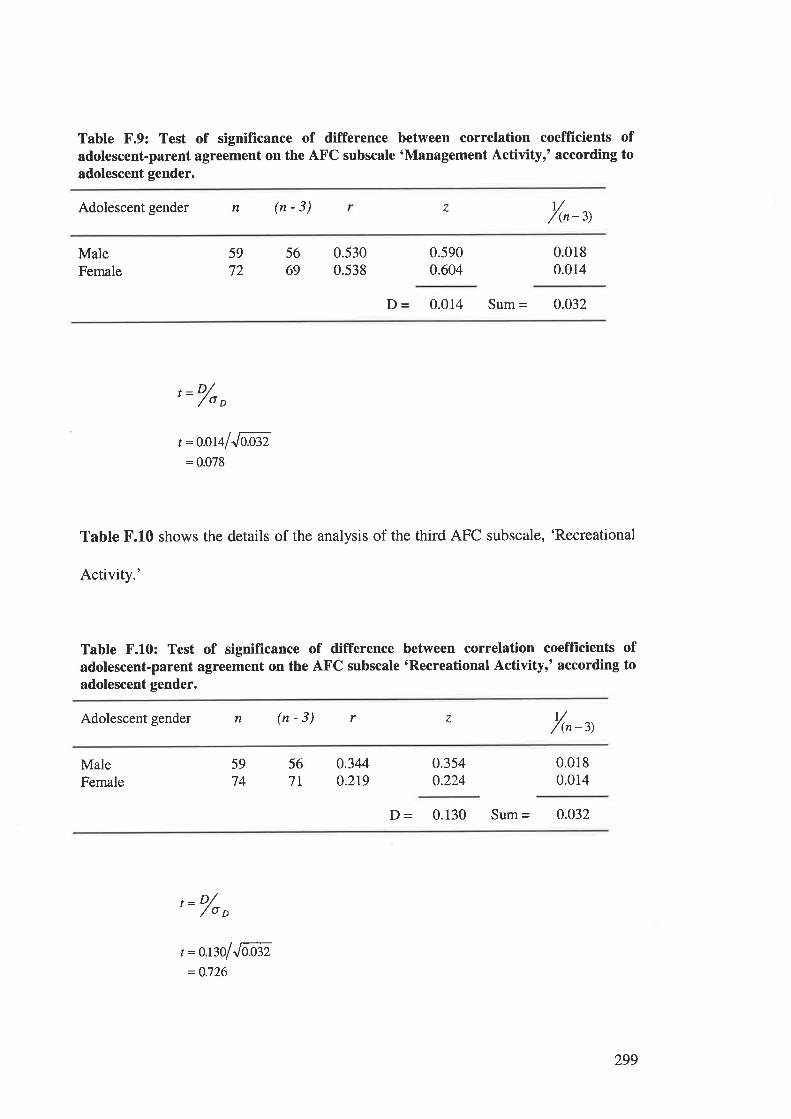
Table F.9: Test of significance of difference between correlation coeffÏcients ofadolescent-parent agreement on the AFC subscale 'Management Activityr' according toadolescent gender.
Adolescent gender n (n-3) r//(n-3)
7
MaleFemale
5669
59
720.5300.538
0.5900.604
0.0180.014
D - 0.014 Sum = 0.032
, ='/o,
t =o.oralJaß2= 0.078
Table F.10 shows the details of the analysis of the third AFC subscale, 'Recreational
Activity.'
Tabte F.10: Test of significance of difference between correlation coefficients ofadolescent-parent agreement on the AFC subscale 'Recreational Activityr' according toadolescent gender.
Adolescent gender n (n-3) r z r//(n -3)
MaleFemale
5974
567l
0.3440.2r9
0.354o.224
0.0180.014
D - 0.130 Sum = 0.032
'= o/o
o
t =o.ßolJlÑ,=0.726
299
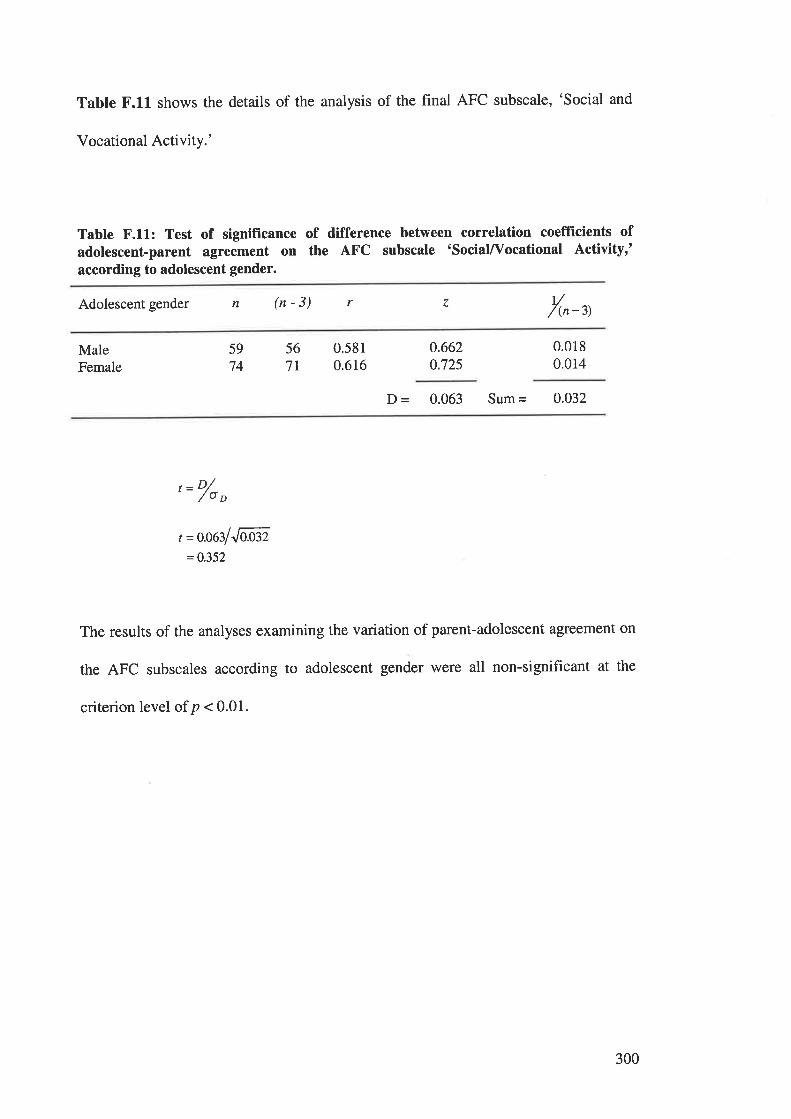
Table F.11 shows the details of the analysis of the final AFC subscale, 'Social and
Vocational Activity.'
Table F.11: Test of significance of difference between correlation coefficients ofadolescent-parent agreement on the AFC subscale 'sociaL/Vocational Activity,'according to adolescent gender.
Adolescent gender n (n-3) t//(n -3)
r z
MaleFemale
5974
567T
0.5810.616
0.6620.725
0.0180.014
þ = 0.063 Sum = 0.032
t ='/o o
t =oo$lJÑ,=0.352
The results of the analyses examining the variation of parent-adolescent agreement on
the AFC subscales according to adolescent gender were all non-significant at the
criterion level of p < 0.01.
300

APPBNDIX G.
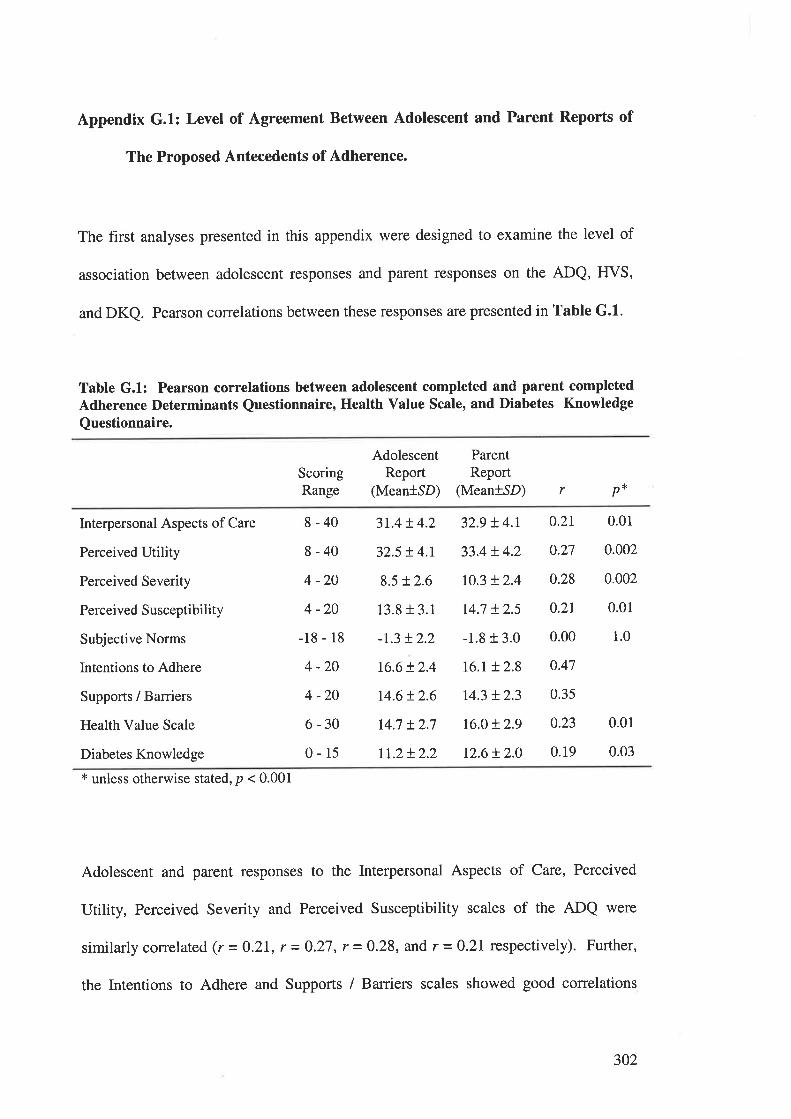
Appendix G.1: Level of Agreement Between Adolescent and Parent Reports of
The Proposed Antecedents of Adherence.
The first analyses presented in this appendix were designed to examine the level of
association between adolescent responses and parent responses on the ADQ, ffVS,
and DKQ. Pearson correlations between these responses are presented in Table G.l.
Table G.1: Pearson correlations between adolescent completed and parent completedAdherence Determinants Questionnaire, Heatth Value Scale, and Diabetes Knowledge
Questionnaire.
ScoringRange
AdolescentReport
(Mean+SD)
ParentReport
(Mean+SD) r p*
Interpersonal Aspects of Care
Perceived Utility
Perceived Severity
Perceived Susceptibility
Subjective Norms
Intentions to Adhere
Supports / Barriers
Health Value Scale
Diabetes Knowledge
8-40
8-40
4 -20
4 -20
-18 - 18
4 -20
4 -20
6-30
0-15
3r.4!4.2
32.5 !4.r
8.5 !2.6
13.813.1
-r.3 !2.2
16.6!2.4
14.6t2.6
r4.7 + 2.7
rI.2!2.2
32.9 !4.r
33.4 + 4.2
r0.3 + 2.4
14.7 !2.5
-1.8 r 3.0
16.r + 2.8
r4.3 !2.3
t6.o+ 2.9
12.6 !2.0
0.01
0.002
0.002
0.01
1.0
0.01
0.03
0.2r
0.27
0.28
0.2r
0.00
0.47
0.35
0.23
0.19
x unless otherwise stated, p < 0.001
Adolescent and parent responses to the Interpersonal Aspects of Care, Perceived
Utility, Perceived Severity and Perceived Susceptibility scales of the ADQ were
similarlycorrelated (r=0.21, r=0.27,r=0.28, and r =0.2L respectively). Further,
the Intentions to Adhere and Supports / Barriers scales showed good correlations
302
between adolescent and parent responses (r = 0.47 and r = 0.35 respectively). The
only ADQ scale to show poor correlations between adolescent and parent responses
was Subjective Norms (r = 0.004). This poor association is likely to reflect the
differing views held by adolescent and parents about the social norrns or the
adolescents' peers and families, and the importance of these norTns.
The adolescent and parent responses to the IfVS were moderately correlated (r =
0.23), indicating reasonable agreement between informants about the importance of
good health. Finally, the correlation between adolescent and parent scores on the
DKQ was not high, but did reach statistical significance (r = 0.I9, p < 0.05). This
result indicates that adolescents' knowledge about diabetes treatment was associated
with their parents' knowledge about the regimen. However, this result does not
provide evidence for a causal relationship.
303
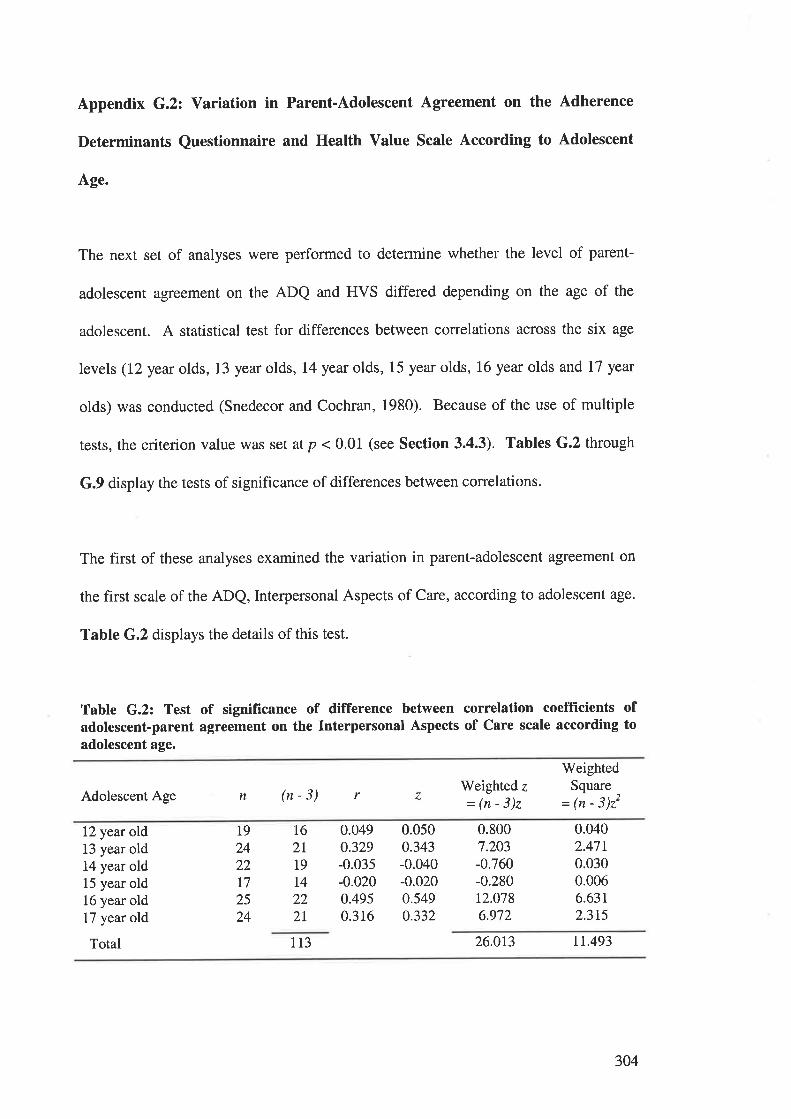
Appendix G.2: Variation in Parent-Adolescent Agreement on the Adherence
Determinants Questionnaire and Health Value Scale According to Adolescent
age.
The next set of analyses were performed to determine whether the level of parent-
adolescent agreement on the ADQ and FIVS differed depending on the age of the
adolescent. A statistical test for differences between correlations across the six age
levels (l2year olds, 13 yearolds, L4year olds, 15 yearolds, 16year olds and L7 yeat
olds) was conducted (Snedecor and Cochran, 1980). Because of the use of multiple
tests, the criterion value was set at p < 0.01 (see Section 3.4.3). Tables G.2 through
G.9 display the tests of significance of differences between correlations.
The first of these analyses examined the variation in parent-adolescent agreement on
the first scale of the ADQ, Interpersonal Aspects of Care, according to adolescent age.
Table G.2 displays the details of this test.
Table G.2: Test of significance of difference between correlation coefficients ofadolescent-parent agreement on the Interpersonal Aspects of Care scale according toadolescent age.
Adolescent AgeWeighted z=(n-3)z
WeightedSquare
= ¡n - 3)22n (n-3) r z
12 year old13 year old14 year old15 year old16 year old17 year old
Total
19
2422I72524
I62lt9I4222I
0.0490.329-0.035-0.0200.4950.316
0.0500.343-0.040-0.0200.549o.332
0.8007.203-0.760-0.28012.0786.972
0.0402.4710.0300.0066.63t2.3r5
113 26.0r3 rt.493
304
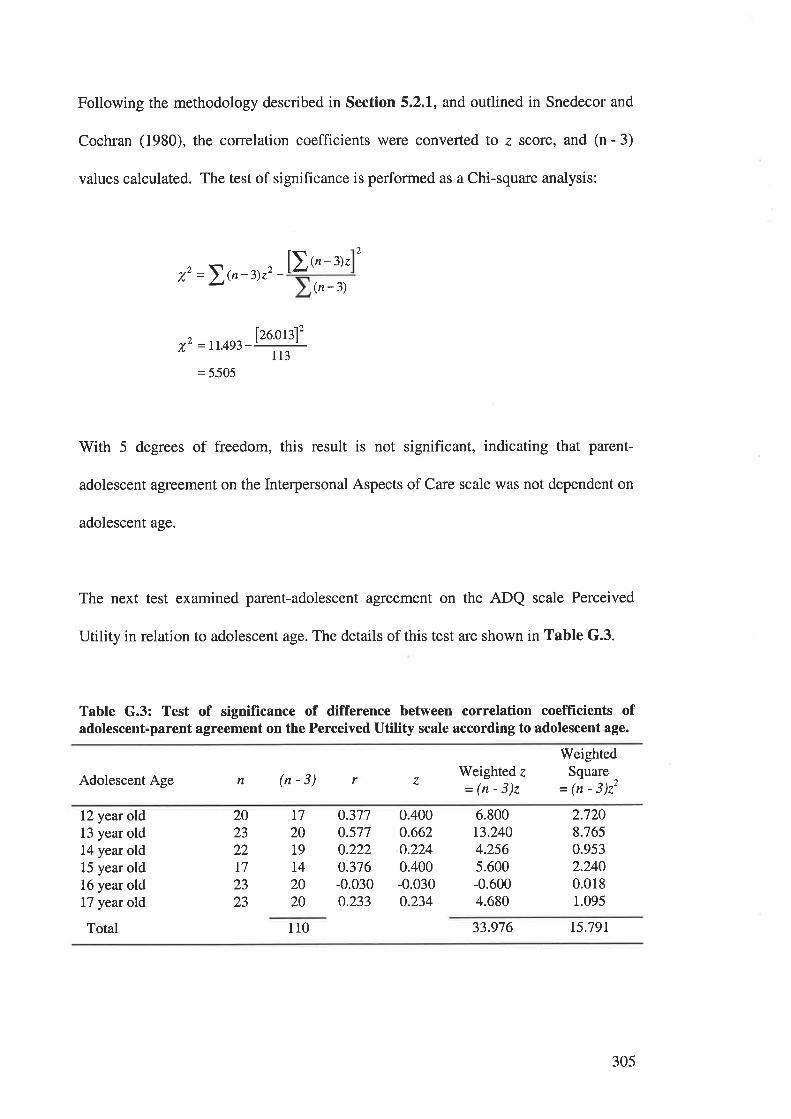
Following the methodology described in Section 5.2.1, and outlined in Snedecor and
Cochran (1980), the correlation coefficients were converted to z score, and (n - 3)
values calculated. The test of significance is performed as a Chi-square analysis:
2
[)t'-'r.,z =\{n-3)zz - (n-3)
^ 126.0ß12v' =11.493-' 'I 13
= 5505
With 5 degrees of freedom, this result is not significant, indicating that parent-
adolescent agreement on the Interpersonal Aspects of Care scale was not dependent on
adolescent age.
The next test examined parent-adolescent agreement on the ADQ scale Perceived
Utility in relation to adolescent age. The details of this test are shown in Table G.3.
Table G.3: Test of significance of difference between correlation coefficients ofadolescent-parent agreement on the Perceived Utility scale according to adolescent age.
Adolescent AgeWeighted z
=(n-3)z
WeightedSquare
-= (n - j)ztn (n-3) r 7
12 year old13 year old14 year old15 year old16 year old17 year old
Total
0.3770.5770.2220.376-0.030o.233
0.4000.662o.2240.400-0.0300.234
6.800t3.2404.2565.600-0.6004.680
2.7208.7650.9532.2400.0181.095
202322t72323
L7
2019
I42020
110 33.976 15.79r
305
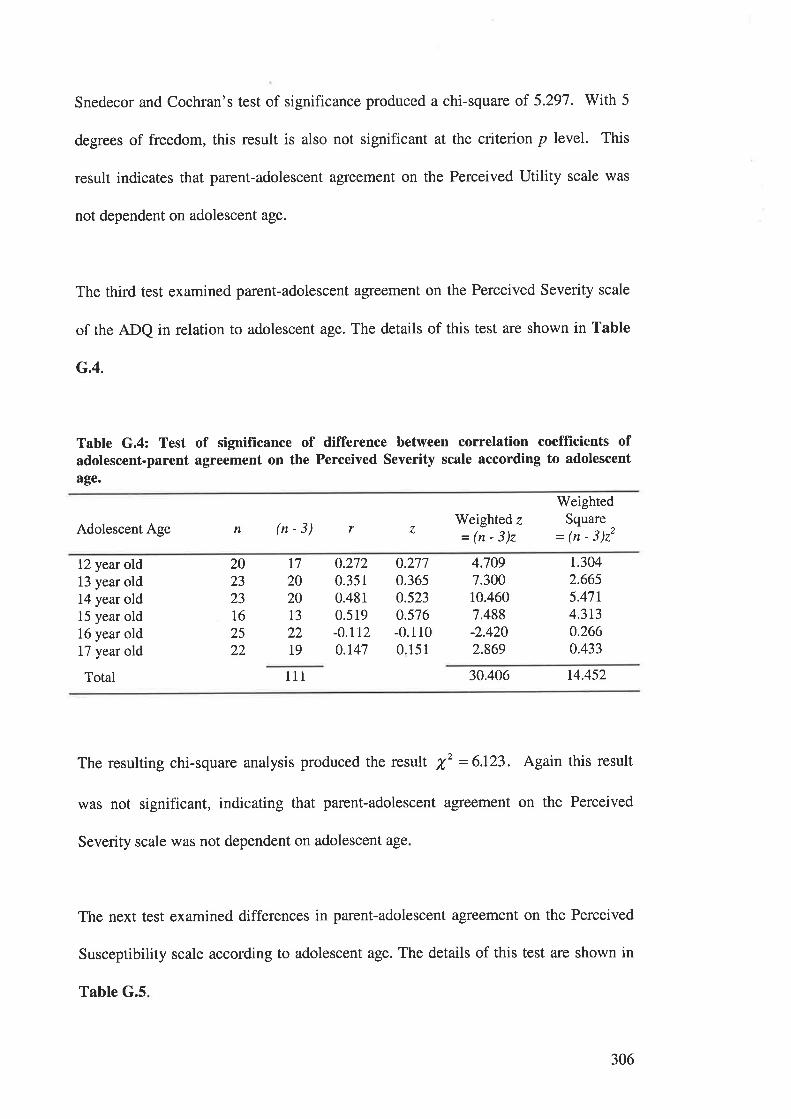
Snedecor and Cochran's test of significance produced a chi-square of 5.297. With 5
degrees of freedom, this result is also not significant at the criterion p level. This
result indicates that parent-adolescent agreement on the Perceived Utility scale was
not dependent on adolescent age.
The third test examined parent-adolescent agreement on the Perceived Severity scale
of the ADQ in relation to adolescent age. The details of this test are shown in Table
G.4.
Table G.4: Test of signifïcance of difference between correlation coefficients ofadolescent-parent agreement on the Perceived Severity scale according to adolescent
age.
WeightedSquare
- (n - 3)22Adolescent Age n (n-3) r Weighted z
=(n-3)z
12 year old13 year old14 year old15 year old16 year old17 year old
Total
0.2720.3510.48r0.519-0.rr20.147
o.2770.3650.5230.576-0.1100.151
4.7097.30010.4607.488-2.4202.869
t.3042.6655.47r4.3t30.2660.433
t7202323
I62522
202013
2219
111
The resulting chi-square analysis produced the result X,2 = 6.123. Again this result
was not significant, indicating that parent-adolescent agreement on the Perceived
Severity scale was not dependent on adolescent age
The next test examined differences in parent-adolescent agreement on the Perceived
Susceptibility scale according to adolescent age. The details of this test are shown in
30.406 14.452
Table G.5
306
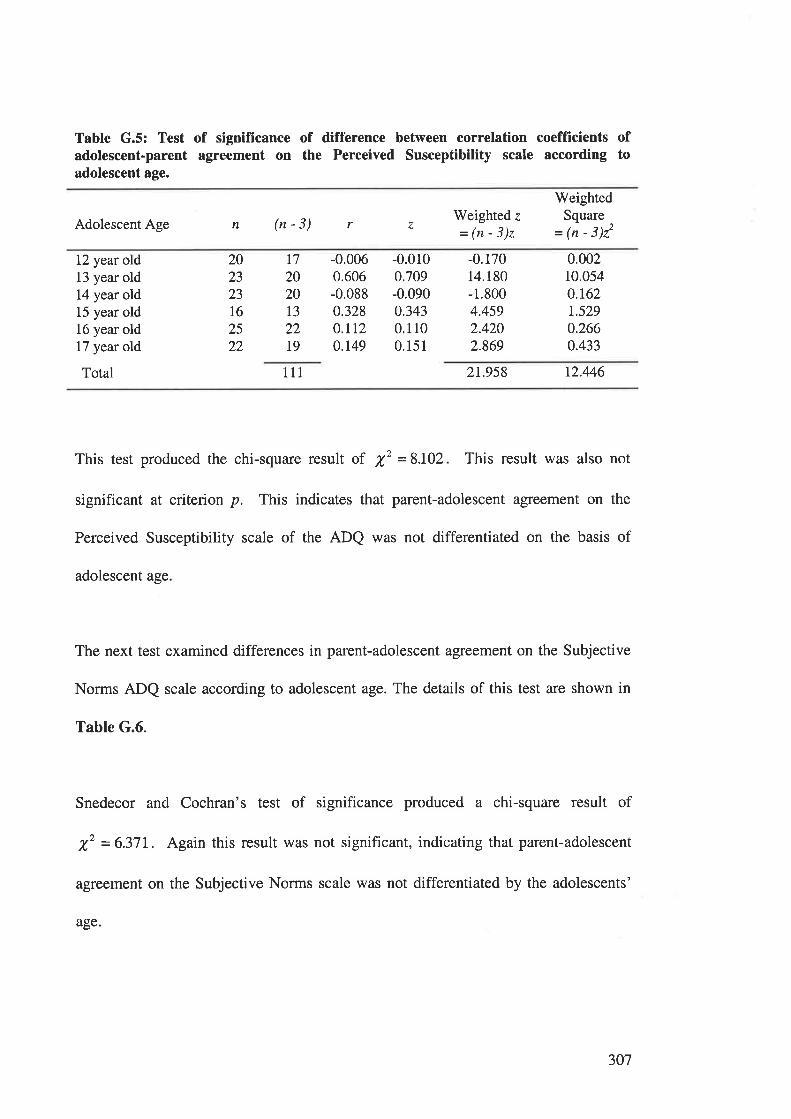
Table G.5: Test of significance of difference between correlation coefficients ofadolescent-parent agreement on the Perceived Susceptibility scale according toadolescent age.
Adolescent Age n (n-3) Weighted z
=(n-3)z
WeightedSquare
= 1n - 3)22r z
12 year old13 year old14 year old15 year old16 year old17 year old
Total
-0.0060.606-0.0880.328O.TI20.149
-0.0100.709-0.0900.3430.1100.15 1
-0.17014.180-1.8004.4592.4202.869
0.00210.0540.162r.5290.2660.433
202323t62522
t7202013
22t9
111 2r.958 12.446
This test produced the chi-square result of X' = 8.102 This result was also not
significant at criterion p. This indicates that parent-adolescent agreement on the
Perceived Susceptibility scale of the ADQ was not differentiated on the basis of
adolescent age
The next test examined differences in parent-adolescent agreement on the Subjective
Norms ADQ scale according to adolescent age. The details of this test are shown in
Table G.6.
Snedecor and Cochran's test of significance produced a chi-square result of
f = 6.37L. Again this result was not significant, indicating that parent-adolescent
agreement on the Subjective Norms scale was not differentiated by the adolescents'
age.
307
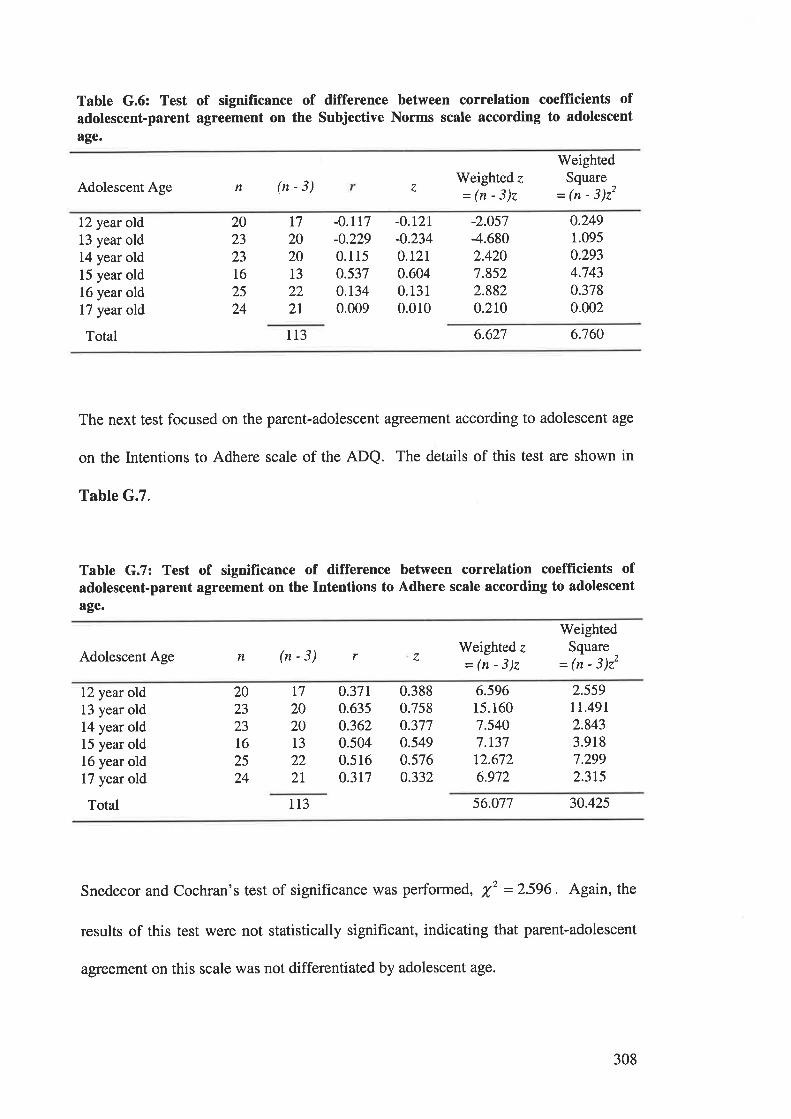
Table G.6: Test of signifrcance of difference between correlation coefficients ofadolescent-parent agreement on the Subjective Norms scale according to adolescent
age.
n (n-3)
WeightedSquare
= (n - 3)22Adolescent Age z
Weighted z
=(n-3)z
12 year old13 year old14 year old15 year old16 year old17 year old
Total
-0.117-0.229
0.1150.5370.r340.009
-0.t21-0.234O.L2I0.6040.1310.010
-2.0s7-4.6802.4207.8522.8820.210
0.2491.095
0.2934.7430.3780.002
202323
16
25
24
t7202013
222I
113 6.627 6.760
The next test focused on the parent-adolescent agreement according to adolescent age
on the Intentions to Adhere scale of the ADQ. The details of this test are shown in
Table G.7.
Table G.7: Test of significance of difference between correlation coefficients ofadolescent-parent agreement on the Intentions to Adhere scale according to adolescent
age.
WeightedSquare
= (n - 3)22Adolescent Age n (n-3) r 7
Weighted z
=(n-3)z
12 year old13 year old14 year old15 year old16 year old17 year old
Total
o.37t0.6350.3620.5040.5160.3r7
0.3880.7580.3770.5490.5760.332
6.59615.1607.5407.13712.6726.972
2.559tL.49r2.8433.9187.2992.3r5
202323I62524
L7
2020T3
222T
113 56.077 30.425
Snedecor and Cochran's test of significance was performed, X2 =2596. Again, the
results of this test were not statistically significant, indicating that parent-adolescent
agreement on this scale was not differentiated by adolescent age.
308
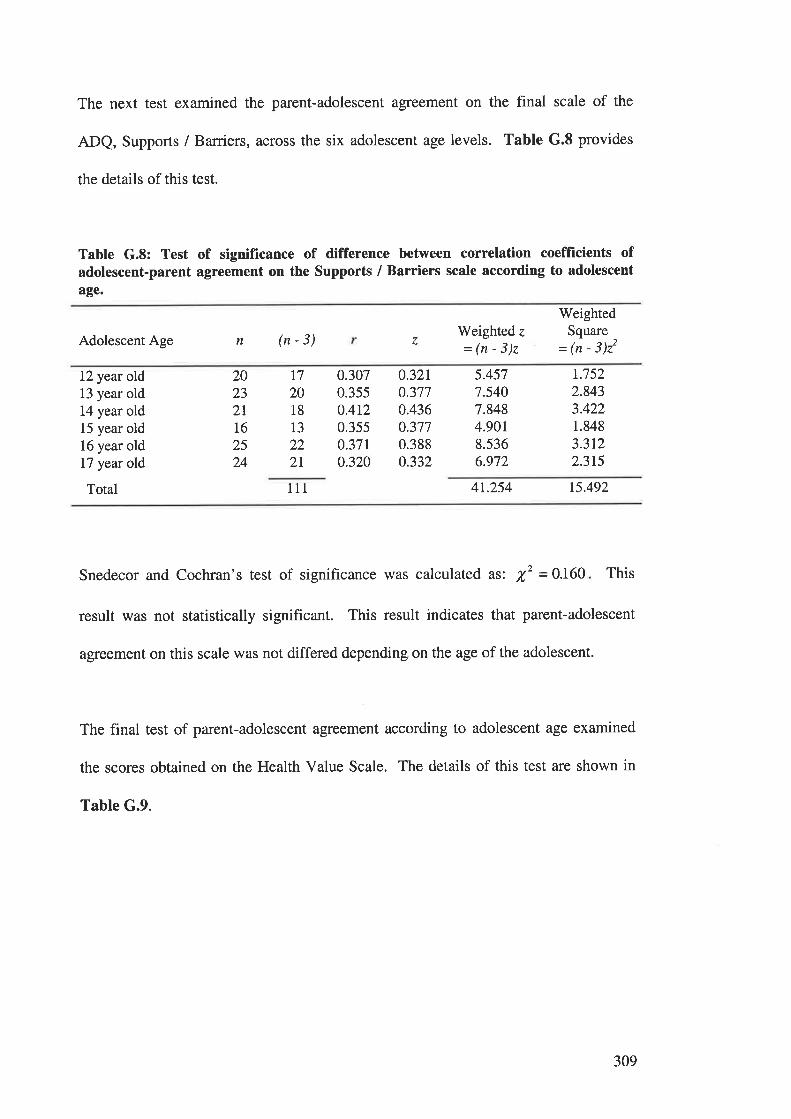
The next test examined the parent-adolescent agreement on the final scale of the
ADQ, Supports / Barriers, across the six adolescent age levels. Table G.8 provides
the details of this test.
Table G.8: Test of significance of difference between correlation coefficients ofadolescent-parent agreement on the Supports / Barriers scale according to adolescent
age.
Adolescent Age
WeightedSquare
= (n - 3)22n (n-3) z
Weighted z
=(n-3)z
12 year old13 year old14 year old15 year old16 year old17 year old
Total
2023
2II62524
T7
2018
13
222I
0.3070.3550.4r20.35s0.37r0320
0.3210.3770.4360.3770.3880.332
5.4577.5407.8484.90r8.5366.972
r.7522.8433.4221.848
3.3122.3t5
111 4r.254 15.492
Snedecor and Cochran's test of significance was calculated as: X,2 =0.160 This
result was not statistically significant. This result indicates that parent-adolescent
agreement on this scale was not differed depending on the age of the adolescent.
The final test of parent-adolescent agreement according to adolescent age examined
the scores obtained on the Health Value Scale. The details of this test are shown in
Table G.9.
309
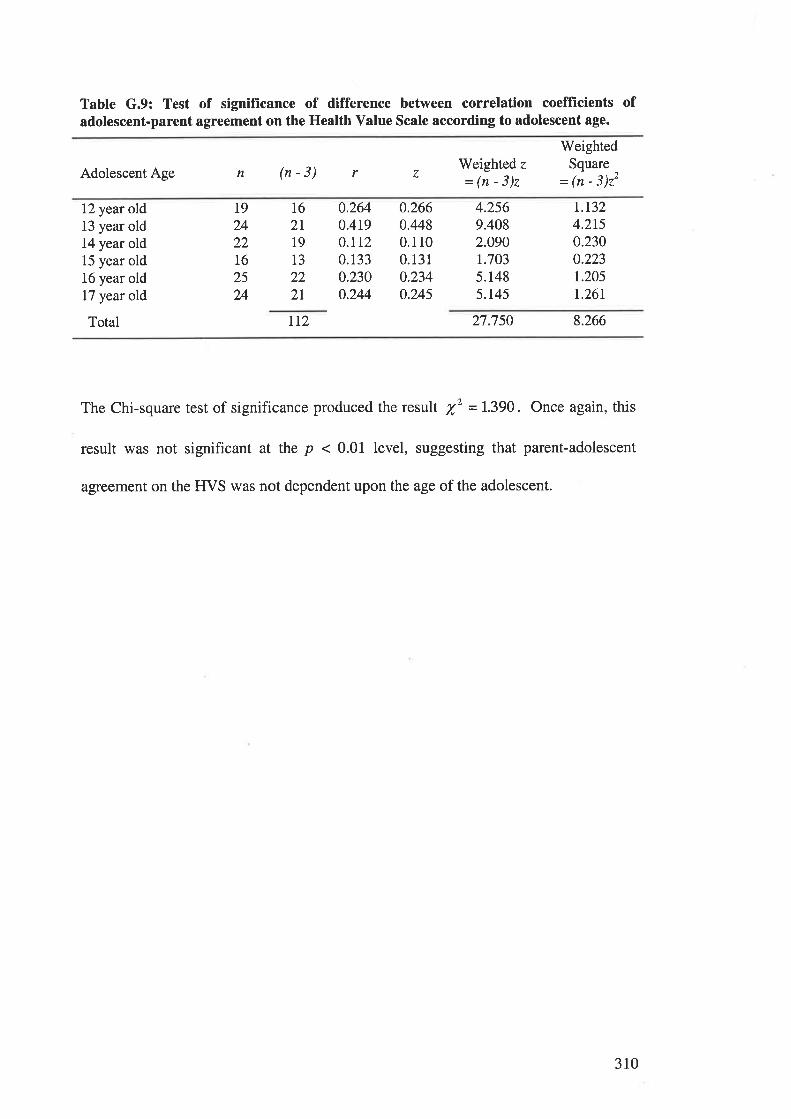
Table G.9: Test of signifïcance of difference between correlation coefflrcients ofadolescent-parent agreement on the Health Value Scale according to adolescent age.
Adolescent Age n (n-3) Weighted z
=(n-3)z
WeightedSquare
= (n - 3)22r 7
12 year old13 year old14 year old15 year old16 year old17 year old
Total
t9242216
25
24
16
2I19
13
222L
0.2640.4t9O.ILz0.1330.2300.244
0.2660.4480.1 10
0.13 1
0.2340.245
4.2569.4082.090r.7035.1485.r45
t.r324.2r5o.2300.223r.2051.26r
I12 27.750 8.266
The Chi-square test of significance produced the result X' = 1.390. Once again, this
result was not significant at the p < 0.01 level, suggesting that parent-adolescent
agreement on the FfVS was not dependent upon the age of the adolescent.
310
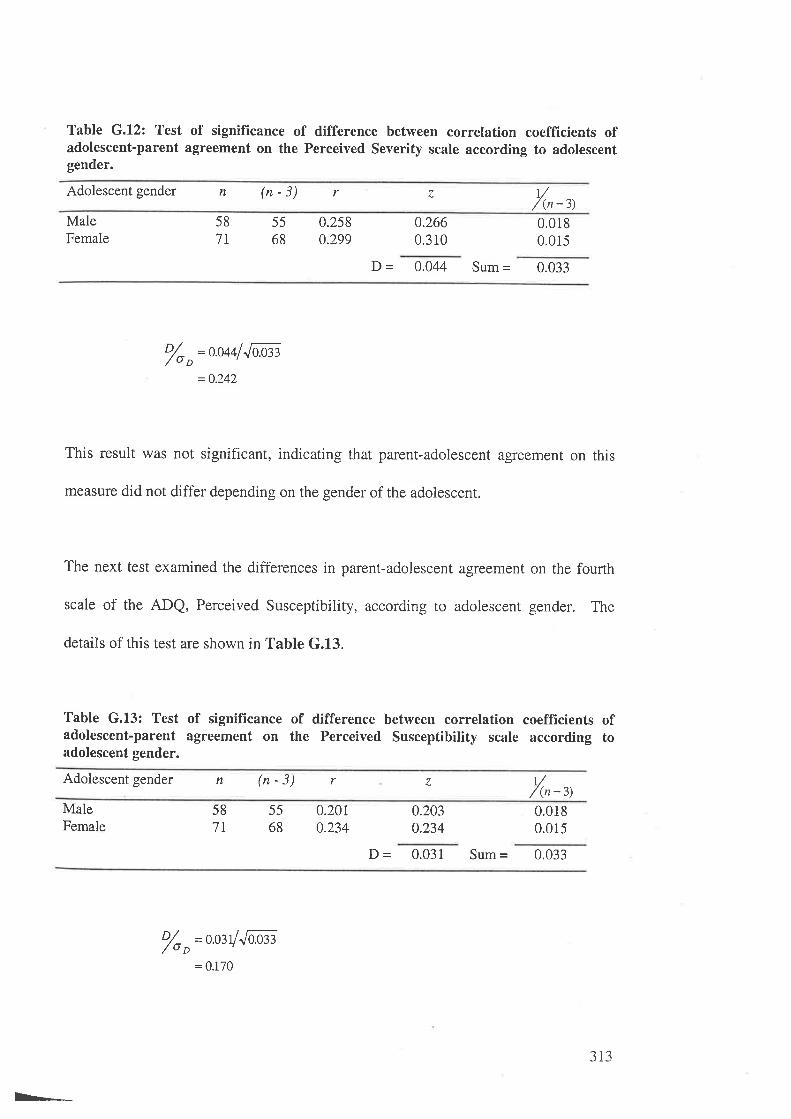
Table G.12: Test of significance of difference between correlation coefficients ofadolescent-parent agreement on the Perceived Severity scale according to adolescentgender.
Adolescent gender n (n-3) r z t//(n -3)
MaleFemale
58
7L
5568
0.2580.299
0.2660.310
0.0180.015
D - 0.044 Sum = 0.033
o/o o=o.o44f Jùo:n
=0.242
This result was not significant, indicating that parent-adolescent agreement on this
measure did not differ depending on the gender of the adolescent.
The next test examined the differences in parent-adolescent agreement on the fourth
scale of the ADQ, Perceived Susceptibility, according to adolescent gender. The
details of this test are shown in Table G.13.
Table G.L3: Test of significance of difference between correlation coeffïcients ofadolescent-parent agreement on the Perceived Susceptibitity scale according toadolescent gender.
Adolescent gender n (n-3) 1//(n-3)
r z
MaleFemale
58
7T
5568
0.2010.234
0.2030.234
0.0180.015
D - 0.031 Sum = 0.033
'/o o=o'03y''fi'or
E-.
= 0.170
313
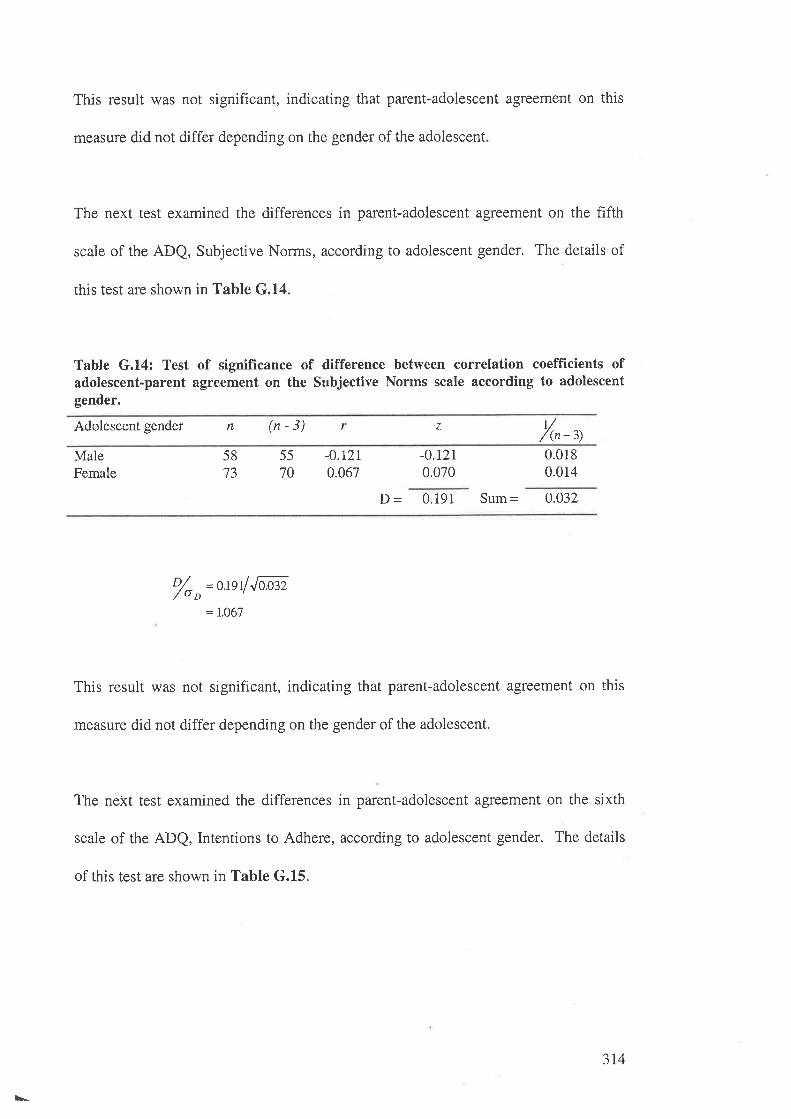
This result was not significant, indicating that parent-adolescent agreement on this
measure did not differ depending on the gender of the adolescent
The next test examined the differences in parent-adolescent agreement on the fifth
scale of the ADQ, Subjective Norms, according to adolescent gender. The details of
this test are shown in Table G.14.
Table G.14: Test of significance of difference between correlation coefficients ofadolescent-parent agreement on the Subjective Norms scale according to adolescentgender.
1//(n -3)
Adolescent gender n (n-3) z
MaleFemale
5873
5570
-0.r2r0.067
-0.r2r0.070
0.0180.014
D - 0.191 Sum= 0.032
o/o ,= usl Jaæ2
= 1.O67
This result was not significant, indicating that parent-adolescent agreement on this
measure did not differ depending on the gender of the adolescent.
The next test examined the differences in parent-adolescent agreement on the sixth
scale of the ADQ, Intentions to Adhere, according to adolescent gender. The details
of this test are shown in Table G.15.
\-
314
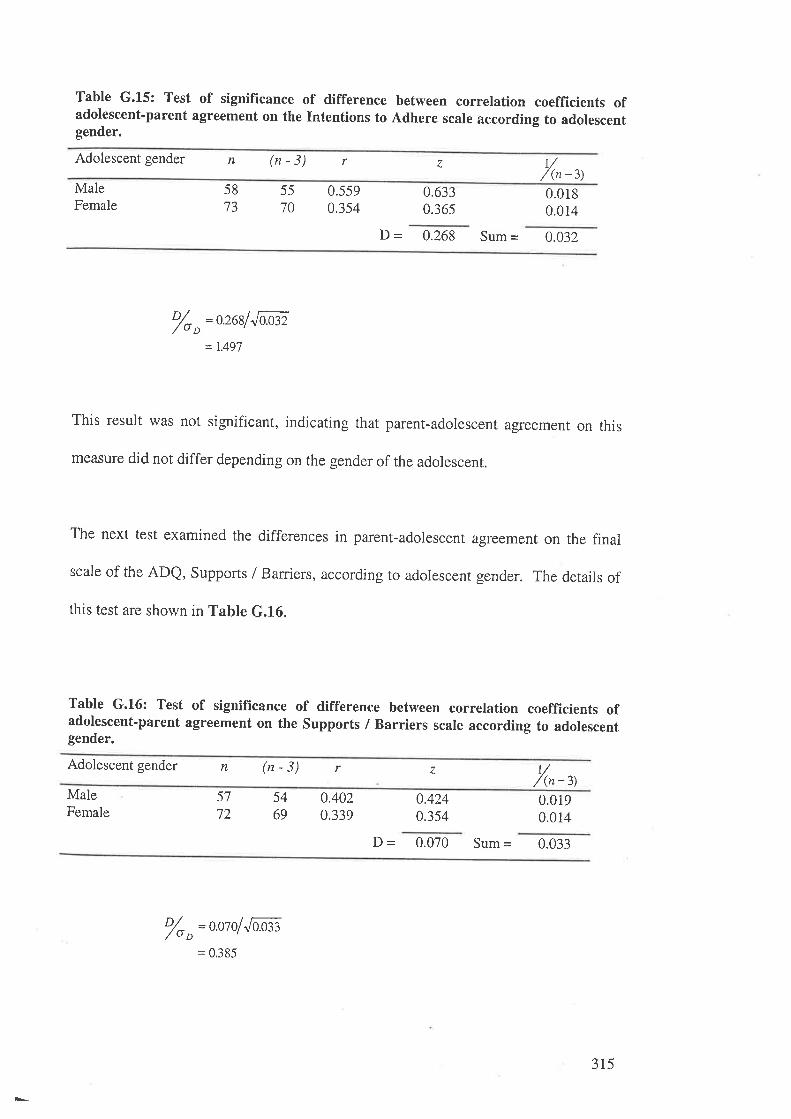
Table G.15: Test of signifïcance of difference between correlation coefficients ofadolescent'parent agreement on the Intentions to Adhere scale according to adolescentgender.
Adolescent gender n (n - 3) r v/(n -3)
z
MaleFemale
5570
58t-)
0.5590.354
0.6330.365
0.0180.014
D - 0.268 Sum = 0.032
% "=o.26lf
Jl.æ2
= 1.49'7
This result was not significant, indicating that parent-adolescent agreement on this
measure did not differ depending on the gender of the adolescent.
The next test examined the differences in parent-adolescent agreement on the final
scale of the ADQ, Supports / Barriers, according to adolescent gender. The details of
this test are shown in Table G.16.
Table G.16: Test of significance of difference between correlation coefficients ofadolescent-parent agreement on the Supports / Barriers scale according to adolescentgender.
Adolescent gender n ("-3) r z 1// (n -3)
MaleFemale
54
69
57
720.4020.339
0.4240.354
0.0190.014
D - 0.070 Sum = 0.033
'/oo=o.olofJaæ3:0.385
3r5
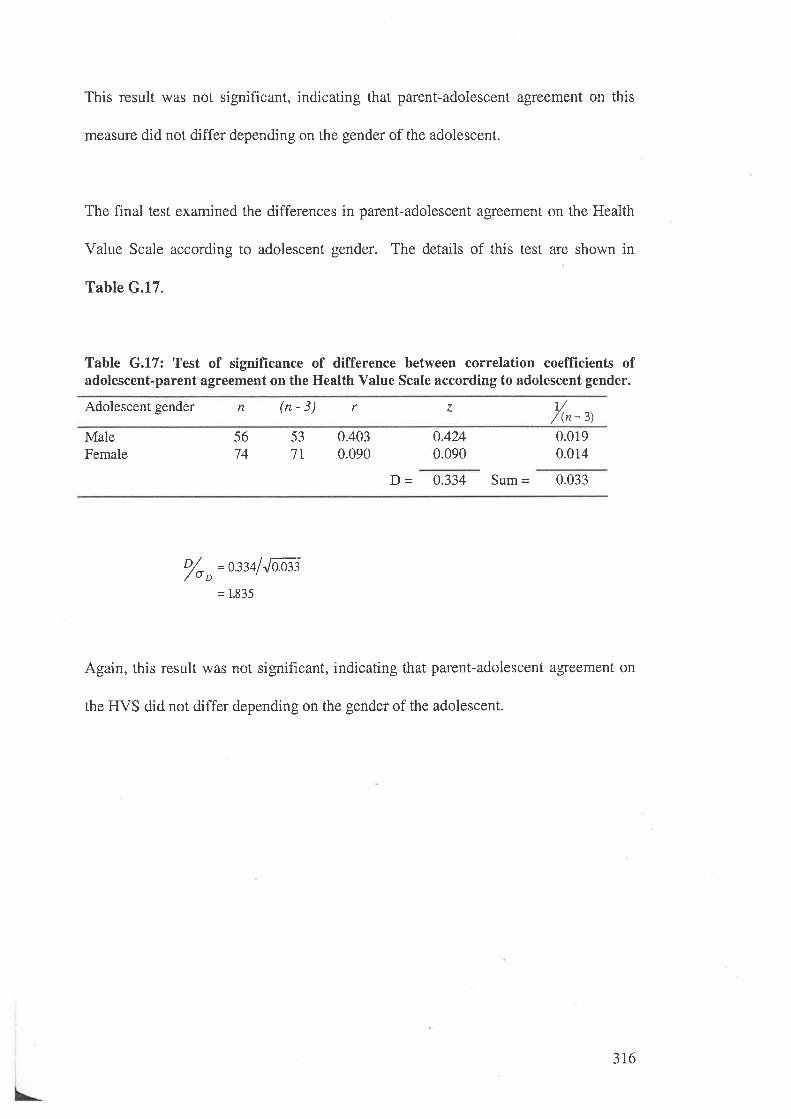
This result was not significant, indicating that parent-adolescent agreement on this
measure did not differ depending on the gender of the adolescent.
The final test examined the differences in parent-adolescent agreement on the Health
Value Scale according to adolescent gender. The details of this test are shown in
Table G.17.
Table G.17: Test of signifïcance of difference between correlation coefficients ofadolescent-parent agreement on the Health Value Scale according to adolescent gender.
Adolescent gender n (n-3) r z /r-',MaleFemale
5674
537I
0.4030.090
0.4240.090
0.0190.014
D - 0.334 Sum = 0.033
o/o o=ß34f Jaæ3
= 1.835
Again, this result was not significant, indicating that parent-adolescent agreement on
the IIVS did not differ depending on the gender of the adolescent.
316

APPENDIX H.
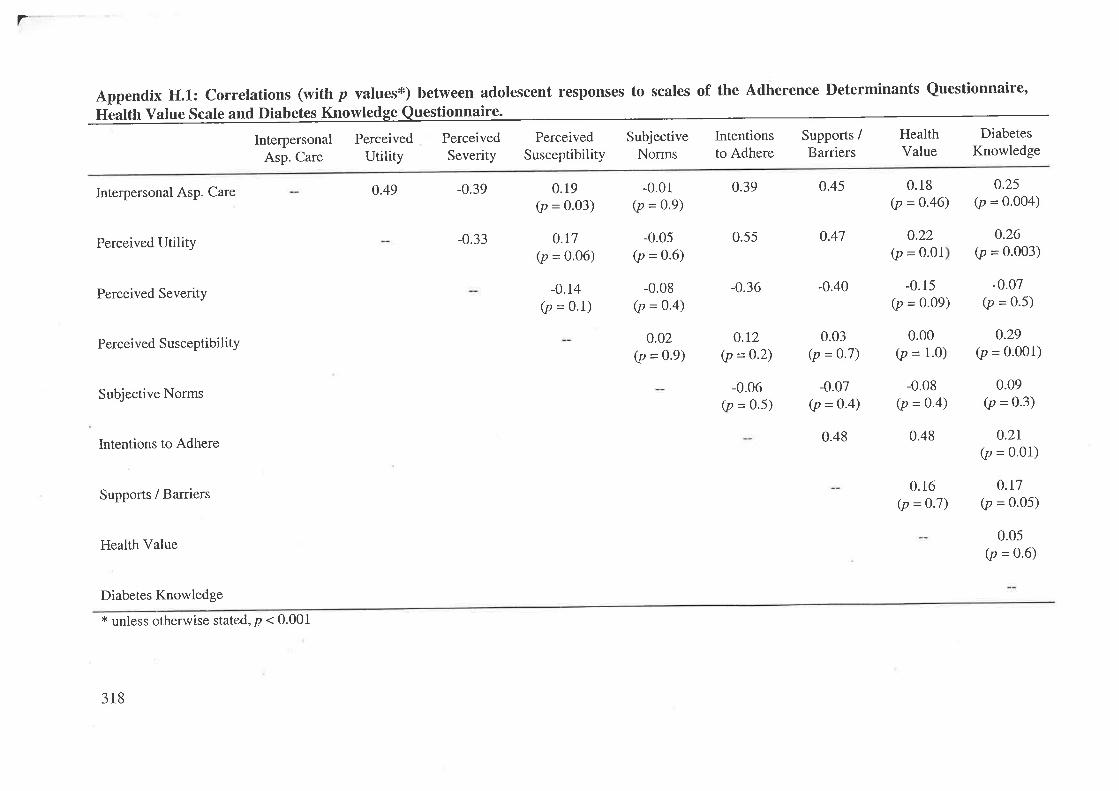
r
Appendix H.l.: Correlations (wittr p valuest) between adolescent responses to scales of the Adherence Determinants Questionnaire,
Health Value Scale and Diabetes Knowledge Questionnaire.
Interpersonal Perceived Perceived Perceived Subjective Intentions Supports / Health Diabetes
esp. Care Utility Severity Susceptibility Norms to Adhere Barriers Value Knowledge
0.25(p = 0.004)
0.49Interpersonal Asp. Care
Perceived Utility
Perceived Severity
Perceived Susceptibility
Subjective Norms
Intentions to Adhere
Supports / Barriers
Health Value
Diabetes Knowledge
* unless otherwise stated, B < 0.001
-0.39
-0.33
0.19(p = 0.03)
0.r7(p = 0.06)
-0.14
Ø = 0.1)
-0.01(p = 0.9)
-0.05(p = 0.6)
-0.08(p = 0.4)
0.02(p = 0.9)
0.39 0.45
0.55 o.47
-0.36 -0.40
0.18(p =0.46)
-0.15(p = 0-09)
0.00(p = 1.0)
-0.08(p = 0.4)
0.48
0.16(p = 0.7)
o.26(p = 0.003)
-0.07(p = 0.5)
0.29(p = 0.001)
0.09(p = 0.3)
0.21(p = 0.01)
0.r7(p = 0.05)
0.05(p = 0.6)
4.22(p = o.ol
0.r2(p =0-2)
-0.06(p = 0.5)
0.03(p = 0.7)
-0.07(p = 0"4)
0.48
318
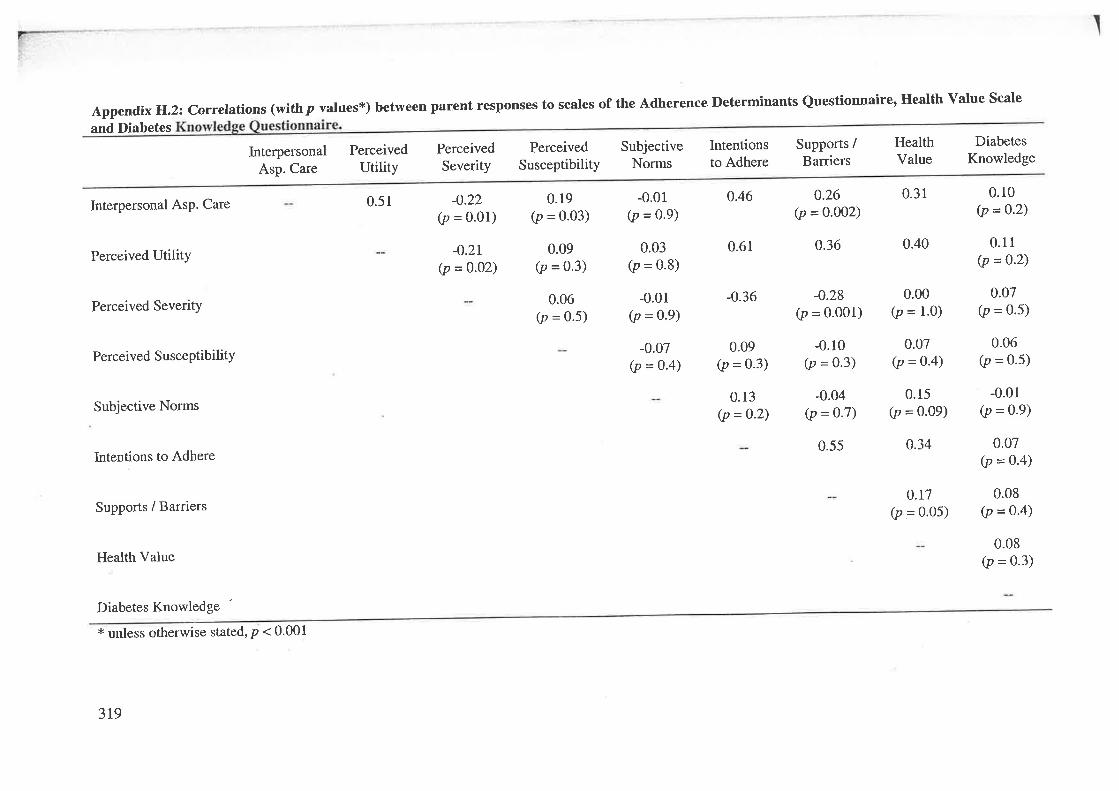
Appendix H.2: correlations (withp values*) between parent responses to scales of the Adherence neterminants Questionnaire, Health value Scale
and Diabetes
Interpersonal AsP. Care
Perceived Utility
Perceived SeveritY
Perceived SusceptibilitY
Subjective Norms
Intentions to Adhere
Supports / Barriers
Health Value
Diabetes Knowledge
lnterpersonalAsp. Care
PerceivedUtility
0.51
PerceivedSeverity
-0.22(p = 0'01)
-0.2r(p =0.02)
PerceivedSusceptibility
0.19(p = 0.03)
0.09(p = 0.3)
0.06(p = 0'5)
SubjectiveNorms
-0.01(p = 0.9)
0.03(p = 0.8)
-0.01(p = 0.9)
-0.07(p = o-4)
Intentionsto Adhere
0.46
0.61
-0.36
0.09(p = 0-3)
0.13(p =o-2)
Supports /Barriers
0.26(p = 0.002)
o.36
-0.28(p = o.oo1)
-0.10(p = 0.3)
-0.04(p =Q.7)
0.55
HealthValue
0.31
0.40
0.00(p = 1.0)
0.07(p = 0-4)
0.15(p = 0.09)
o.34
0.t7(p = 0.05)
DiabetesKnowledge
0.10(p =0-2)
0.11(p = 0.2)
0.07(p = 0.5)
-0.01(p = 0.9)
0.07(p = 0-4)
0.08(p = 0.4)
0.08(p = 0.3)
0.06(p = 0.5)
* unless otherwise stated, p < 0.001
3t9
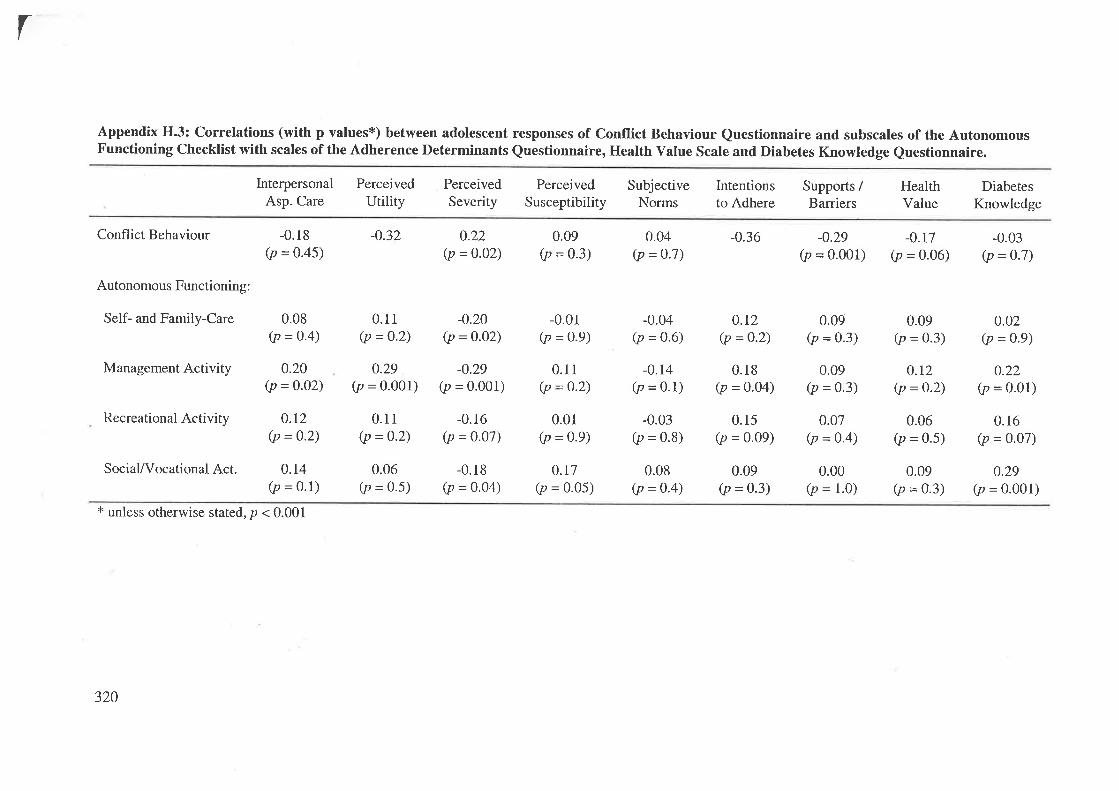
r
Appendix H.3: Correlations (with p values*) between adolescent responses of Conflict Behaviour Questionnaire and subscales of the AutonomousFunctioning Checklist with scales of the Adherence Determinants Questionnaire, Health Value Scale and Diabetes Knowledge Questionnaire.
Conflict Behaviour
Autonomous Functioning:
Self- and Family-Care
Management Activity
Recreational Activity
Social/Vocational Act.
InterpersonalAsp. Care
-0.18(p = 0.45)
0.08(p = o.4)
0.20(p = o.o2)
0.t2(p = 0.2)
0.14(p = 0.1)
PerceivedUtility
-0.32
0.11(p = o.2)
0.29(p = 0.001)
0.11(p = 0.2)
0.06(p = 0.5)
PerceivedSeverity
0.22(p = 0.02)
-0.20(p = 0.o2)
-0.29(p = 0.001)
-0.16(p = 0.07)
-0.18(p = o.o4)
PerceivedSusceptibility
0.09(p = 0.3)
-0.01(p = 0.9)
0.1r(p = 0.2)
0.01(p = 0.9)
o.t7(p = 0.05)
SubjectiveNorms
-0.04(p = 0.6)
-0.14(p = 0.1)
-0.03(p = 0.8)
0.08(p = 0.4)
Intentionsto Adhere
-0.36
0.r2(p = 0.2)
0.18(p = o.o4)
0.15(p = 0.09)
0.09(p = 0.3)
Supports /Barriers
-0.29(p = 0.001)
HealthValue
-0.r7(p = 0.06)
DiabetesKnowledge
-0.03(p = 0.7)
0.02(p = 0.9)
o.22(p = 0.01)
0.r6(p = 0.07)
0.29(p = 0.001)
0.04(p = 0.7)
0.09(p = 0.3)
0.09(p = 0.3)
0.00(p = 1.0)
0.09(p = 0.3)
0.t2(p = o.2)
0.06(p = 0.5)
0.09(p = 0.3)
0.07(p = 0.4)
* unless otherwise stated, p < 0.001
320
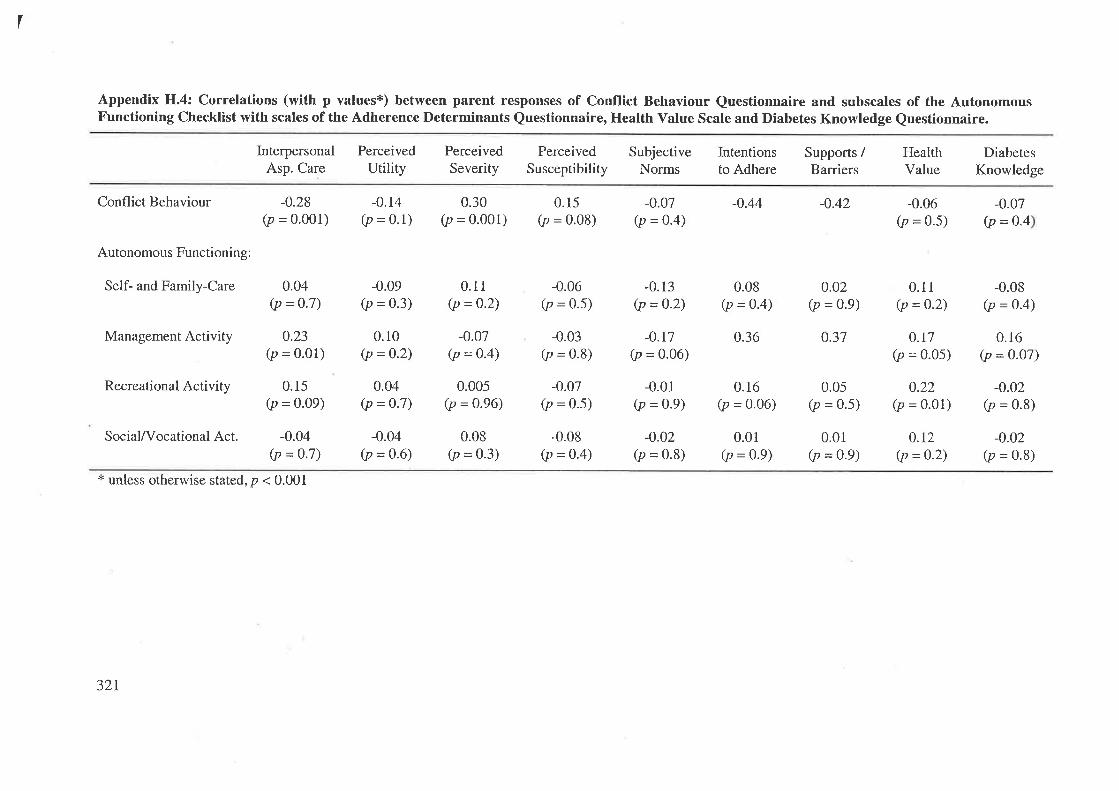
I
Appendix H.4: Correlations (with p values*) between parent responses of Conflict Behaviour Questionnaire and subscales of the AutonomousFunctioning Checklist with scales of the Adherence Determinants Questionnaire, Health Value Scale and Diabetes Knowledge Questionnaire.
Conflict Behaviour
Autonomous Functioning:
Self- and Family-Care
Management Activity
Recreational Activity
Social/Vocational Act.
InterpersonalAsp. Care
-0.28(p = 0.001)
0.04(p = 0-7)
0.23(p = 0.01)
0.15(p = 0.09)
-0.04(p = 0.7)
PerceivedUtility
-0.14(p = 0.1)
-0.09(p = 0.3)
0.r0(p = 0.2)
0.04(p = 0.7)
-0.04(p = 0.6)
PerceivedSeverity
0.30(p = 0.001)
0.11(p =0.2)
-0.07(p = 0.4)
0.005(p = 0.96)
0.08(p = 0.3)
PerceivedSusceptibility
0.15(p = 0'08)
-0.06(p = 0.5)
-0.03(p = 0.8)
-0.07(p = 0.5)
-0.08(p = 0.4)
SubjectiveNorms
-0.07(p = 0.4)
-0.r7(p = 0.06)
-0.01(p = 0.9)
-0.02(p = 0.8)
Intentionsto Adhere
-0.44
0.08(p = 0.4)
0.36
0.16(p = 0.06)
0.01(p = 0.9)
Supports /Barriers
-0.42
0.02(p = 0.9)
0.37
0.05(p = 0.5)
0.01(p = 0.9)
HealthValue
-0.06(p = 0.5)
0.1I(p = 0.2)
0.t7(p = o.o5)
0.22(p = 0.01)
0.12(p = 0.2)
DiabetesKnowledge
-0.08(p = 0-4)
0.16(p = 0.07)
-0.02(p = 0.8)
-0.02(p = 0.8)
-0.07(P = 0.4
-0.13(p = 0-2)
* unless otherwise stated, p < 0.001
321

APPENDIX I.
PUBLICATIONS ARISING FROM THE THESIS.
L
A Fotheringham, M.J. & Sawyer, M.G. (1995) Review Article: Adherence to recommended medical regimens in childhood and adolescence. Journal of Paediatrics and Child Health, v. 31(2), pp. 72-78
NOTE:
This publication is included on pages 323-329 in the print copy of the thesis held in the University of Adelaide Library.
A Fotheringham, M.J., Couper, J.J. & Sawyer, M.G. (1996) Adherence to IDDM treatment: relation to parent-adolescent conflict and adolescent autonomy. Presented at: Proceedings of the Australian Diabetes Society, A 89
NOTE:
This publication is included on page 330 in the print copy of the thesis held in the University of Adelaide Library.
A Taylor, J.D., Fotheringham, M.J., Sawyer, M.G. & Couper, J.J. (1996) Ambulatory intervention in adolescents with insulin dependent diabetes: impact of metabolic control and psychosocial functioning. Presented at: Proceedings of the Australian Diabetes Society, A 62
NOTE:
This publication is included on page 331 in the print copy of the thesis held in the University of Adelaide Library.
A Fotheringham, M.J., Couper, J.J. & Sawyer, M.G. (1997) Associations between adolescents' metabolic control, IDDM adherence and objective data of blood glucose monitoring. Presented at: Proceedings of the Australian Diabetes Society, A 93
NOTE:
This publication is included on page 332 in the print copy of the thesis held in the University of Adelaide Library.
NOTE:
This publication is included on page 333 in the print copy of the thesis held in the University of Adelaide Library.
A Taylor, J.D., Fotheringham, M.J., Sawyer, M.G. & Couper, J.J. (1997) Followup of ambulatory intervention in adolescents with poorly controlled insulin dependent diabetes. Presented at: Proceedings of the Australian Diabetes Society, A 69

BIBLIOGRAPHY.
Abella R, Heslin R. (1984). Health, locus of control, values, and the behavior of
family and friends: an integrated approach to understanding preventive health
behaviour. Basic and Applied Social Psychology,5: 283-293.
Addleton RL, Tratnack SA, Donat DC. (1991). Hospital-based multidisciplinary
training in the care of seriously mentally ill patients. Hospital and Community
Psychiatry, 42: 60-61.
Adger H, DeAngelis CD. (1994). Adolescent Medicine. Jountal of the American
Medical Association, 27 I : 165 1-1653.
Agras WS. (1993). Adherence intervention research: the need for a multilevel
approach. In: NA Krasnegor, L Epstein, SB Johnson, SJ yaffe (eds).
Developmental aspects of health compliance behavior. Hillsdale, New Jersey:
Erlbaum. 285-301.
Ajzen I, Fishbein M. (1980). Understandíng attitudes and predicting social behavior.
Englewood Cliffs, NJ: Prentice-Hall.
Allen DA, Tennen H, McGrade BJ, Affleck G, Ratzan s. (19s3). parent and child
perceptions of the management of juvenile diabetes. Journal of Pediatric
Psychology, 8 : I29-14L.
Amato PR, Keith B. (1991). Parental divorce and the well-being of children: A meta-
analysis. Psychological Bulletin, I l0: 26-46.
335
Amir S, Rabin C, Galatzer A. (1990). Cognitive and behavioral determinants of
compliance in diabetes . Health and Social Work, 15: 144-l5I
Anderson B, Ho J, Brackett J, Finkelstein D, LaffelL. (1997). Parental involvement in
diabetes management tasks: Relationships to blood glucose monitoring
adherence and metabolic control in young adolescents with insulin-dependent
diabetes mellitus. Journal of Pediatrics, 130:257-265.
Anderson BJ, Auslander WF. (1980). Research on diabetes management and the
family: a critique. Diabetes Care, 3: 696-702.
Anderson BJ, Auslander WF, Jung KC, Miller JP, Santiago JV. (1990). Assessing
family sharing of diabetes responsibility. Journal of Pediatric Psychology, 15:
477-492.
Anderson BJ, Miller JP, Auslander'WF, Santiago JV. (1981). Family characteristics of
diabetic adolescents: relationship to metabolic control. Diabetes Care, 4: 586-
594.
Anderson BJ, Wolf RM, Burkhart l\{T, Cornell RG, Bacon GE. (1989). Effects of
peer-group intervention on metabolic control of adolescents with IDDM:
randomized outpatient study. Diabetes Care, 12: I79-I83.
Anderson R. (1983). How have people changed their health behaviour? Health
Education J ournal, 42: 82-86.
336
Armsden GC, Greenberg MT. (1987). The inventory of parent and peer attachment:
individual differences and their relationship to psychological well-being in
adolescence. Journal of Youth and Adolescence, 16: 427-454.
Auslander WF, Anderson BJ, Bubb J, Jung KC, Santiago JV. (1990). Risk factors to
health in diabetic children: a prospective study from diagnosis. Health and
Social Work, 15: I33-L42
Auslander wF, Bubb J, Rogge M, Santiago JV. (1993). Family stress and resources
Potential areas of intervention in children recently diagnosed with diabetes.
Health and Social Work, 18; 101-113
Australian Bureau of Statistics. (1996). Australian social trends: 1996. Canberra:
Australian Government Publishing Service.
Aversa SL, Kimberlin C. (1996). Psychosocial aspects of antiretroviral medication use
amongst HIV patients. Patient Education and Counselling, 29: 207-2L9.
Bailey WT. (1991). Fathers' involvement in their children's healthcare. Journal of
Genetic Psychology, I 52 : 289-293
Bandura A. (1977). Self-efficacy: Toward a unifying theory of behavioral change.
P sycholo gical Review, 84 : I9l-215.
Bandura A. (1986). Social foundations of thought and action: a social cognitive
theory. Englewood Cliffs, NJ: Prentice-Hall.
337
Baranowski T, Nader PR. (1985). Family health behaviour. In: DC Turk, RD Kerns
(Eds.). Health, illness, and famílíes: a liþ span perspective. New York: John
V/iley & Sons. 5l-80.
Barsky AJ. (1976). Patient heal thyself: activating the ambulatory medical patient.
Journal of Chronic Diseases, 29: 585-597 .
Becker MH. (1974). (Ed.). The health belief model and personal health behavior
Health Education Monographs, 2 : 324-473.
Becker MH. (1985). Patient adherence to prescribed therapies. Medical Care,23: 539-
5s5.
Becker MH, Drachman RH, Kirscht JP. (1972). Predicting mothers' compliance with
pediatric medical regimens. Journal of Pediatrics, 8I: 843-854.
Becker MH, Maiman LA. (1975). Sociobehavioral determinants of compliance with
health and medical care recommendations. Medical Care, 13: 10-24.
Becker MH, Maiman LA. (1980). Strategies for enhancing patient compliance
Journal of Community Health, 6: lL3-135.
Becker MH, Maiman LA. (1983). Models of health related behavior. In: D Mechanic
(Ed.). Handbook of health, health care, and the health proþssions. New York:
Free Press. 539-568
338
Beeney LI, Dunn SM. (1990). Knowledge improvement and metabolic control in
diabetes education: Approaching the limits? Patient Educatíon and
Counseling, I 6 : 2I7 -229.
Bettinghaus E. (1986). Health promotion and the knowledge-attitude-behaviour
continuum. Preventíve Medicine, I 5 : 47 5-49I.
Bicknell IVJ, Parks CL. (1989). As children survive: dilemmas of aging in the
developing world. Social Science and Medicine, 28: 59-67.
Black W, Sawyer M, Fotheringham M. (1995). Paediatric hospital services: are we
satisfying our adolescent patients? Journal of Quality in Clinical Practice, l5:
t6t-r67.
Blackwell B. (1973). Drug therapy: patient compliance. New England Journal of
Medicine, 289 : 249-252.
Blackwell B. (I976a). Treatment adherence in hypertension. American Journal of
Pharmacy, 148:75-85.
Blackwell B. (1976b). Treatment adherence. British Journal of Psychiatry, 129: 5L3-
531.
Bloch S, Hafner J, Harari E, Szmukler GI. (1994). The family in clinical psychiatry.
Oxford, UK: Oxford University Press.
339
Blos P. (1979). The adolescent passag¿. New York: International Universities Press
Blum RW. (1984). Compliance with therapeutic regimens among children and youths.
In: R Blum (Ed.). Chronic illness and disabilities in childhood and
adolescenc¿. New York: Grune & Stratton. 143-158.
Blum RW. (1992). Chronic illness and disability in adolescence. Journal of
Adolescent Health, I 3 : 364-368
Blum RW, Garell D, Hodgman CH, Jorrisen TW, Okinow NA, Orr DP, Slap GB.
(1993). Transition from child-centred to adult health-care systems for
adolescents with chronic conditions. Journal of Adolescent Health, 14: 570-
576.
Bobrow E, AvRuskin T, Siller J. (1985). Mother-daughter interaction and adherence
to diabetes regimens. Diabetes Care, 8: 146-I5L.
Bollen KA. (1989). Structural equations with latent variables. New York: Wiley
Bond GG, Aiken LS, Somerville SC. (L992). The health belief model and adolescents
with insulin-dependent diabetes mellitus. Health Psychology, I l: L90-198
Boneau CA. (1960). The effects of violations of assumptions underlying the t test.
P sycholo gical Bulletin, 57 : 49-64.
340
Brand F, Smith R, Brand P. (1977). Effect of economic barriers to medical care on
patients' noncompliance. Public Health Reports, 92: 72-78
Brink SJ. (1987). Pediatric and adolescent diabetes mellitus. Chicago, IL: Year Book
Medical Publishers.
Brodows RG. (1992). Benefits and risks with glyburide and glipizide in elderly
NIDDM patients. Diabetes Care, 15:75-80.
Brooks-Gunn J. (1993). Why do adolescents have difficulty adhering to health
regimes? In: NA Krasnegor, L Epstein, SB Johnson, SJ yaffe. Developmental
aspects of health compliance behavior. Hillsdale, NJ: Lawrence Erlbaum . 125-
r52.
Brown JB. (1980). child health maintenance. Nurse practitioner, 5:33-43.
Brownlee-Duffeck M, Peterson L, Simonds JF, Goldstein D, Kilo C, Hoette S. (19g7).
The role of health beliefs in the regimen adherence and metabolic control of
adolescents and adults with diabetes mellitus. Journal of Consulting and
Clinical Psychology, 55: 139-144.
Bryman A, Cramer D. (1990). Quantitative data analysis for social scientists.
London: Routledge.
347
Burcelin RG, Eddouks M, Beylot M, Normand S, Boitard c, Feutren G, Landais p,
Riou JP, Girard JR, Bach JF, Assan RI. (1993). Hypersensitivity to insulin
during remissions in cyclosporin-treated IDDM patients. Diabetes Care, 16:
881-888.
Burke TF, Dunbar-Jacob J. (L997). Adherence to medication, diet, and activity
reconìmendations: from assessment to maintenance. Journal of
Cardiovascular Nursing, 9 : 62-79.
Burlew AK, Evans R, Oler C. (1989). The impact of a child with sickle cell disease on
family dynamics. Annals of the New York Academy of Sciences, 565: 161-17I.
Burr CK. (1985). Impact on the family of a chronically ill child. In: N Hobbs, JM
Perrin (eds). Issues in the care of children with chronic illness. San Francisco:
Jossey-Bass. 24-40.
Bush PJ, Iannotti RJ. (1988). Origins and stability of children's health belief's relative
to medicine use. Social Science and Medicine, 27: 345-352.
Bush PJ, Iannotti RJ. (1990). A children's health belief model. Medical Care, 28: 69-
86.
Bush PJ, Iannotti RJ, Davidson FR. (1985). A longitudinal study of children and
adolescents. In: DD Breimer, P Speiser (Eds.). Topics in pharmaceutical
scienc e s. Amsterdam: Elsevier Science Publishers. 39L-403.
342
Caplan RD. (1979). Patient, provider, pnd organization: hypothesized determinants of
adherence. In: SJ Cohen (Ed.), New directions in patient compliance.
Iæxington, MA: Iæxington Books. 75-110.
caplan RD, Robinson EAR, French JRP, caldwell JR, Shinn M. (1976). Adhering to
medical regimens: pilot experiments in patient education and social support.
Ann Arbor: University of Michigan.
Caron HS. (1985). Compliance: the case for objective measures. Journal of
Hypertension, 3 : lI-I7 .
Caron HS, Roth I{P. (1968). Patient's cooperation with a medical regimen. Journal of
the American M edical As sociation, 20 3 : 922-926.
Charney E, Bynum R, Eldredge D, Frank D, MacWhinney JB, McNabb N, Scheiner
A, Sumpter EA, Iker H. (1967). How well do patients take oral penicillin? A
collaborative study in private practice. Pediatyics, 40: 188-195.
Chassin L, Presson CC, Sherman SJ, McConnell AR. (1995). Adolescent health
issues. In: MC Roberts (Ed.). Handbook of pediatric psychology. second
Edition. New York: Guilford. 723-740
Chaturvedi N, Stephenson JM, Fuller JH. (1995). The relationships between smoking
and microvascular complications in the EURODIAB IDDM Complications
Study. Diabetes Care, 18:785-792.
343
christensen AJ, smith rw, Turner cw, Holman JM, Gregory MC, Rich MA. (1992).
Family support, physical impairment, and adherence in hemodialysis: an
investigation of main and buffering effects. Journal of Behavioral Medicine,
I5:313-325.
Clarke W, Snyder A, Nowacek G. (1985). Outpatient pediatric diabetes: I. current
practices. Journal of Chronic Diseases,33; 85-90.
Cleveland WS, McGill R. (1934). The many faces of a scatterplot. Journal of the
American Statistical As s o ciation, 79 : 807 -822.
Cliff N. (1987). Analyzing multivariate data. Orlando, FL: Harcourt Brace
Jovanovich
Cobb S, Jones JM. (1984) Social support, support groups and marital relationships. In:
SW Duck (Ed.). Personal Relationships. Vol.5. London; Academic Press. 47-
66.
Cockburn J, Gibberd RW, Reid AL, Sanson-Fisher Rw. (1987). Determinants of
noncompliance with short term antibiotic regimens. British Medical Journal,
295:814-818.
cockburn J, Reid AL, Bowman JA, Sanson-Fisher Rlv. (1987). Effects of
intervention on antibiotic compliance in patients in general practice. Medical
Journal of Australia, 147 : 324-328.
344
Coe RM, Wessen A. (1965). Socio-psychological factors influencing the use of
community health resources. American Journal of Public Health, 55: 1024-
1031
Cohen J. (1988). Statistical power analysis for the behavioral sciences. Second
Edition. Hillsdale, NJ: Lawrence Erlbaum.
Conrad P. (1985). The meaning of medications: another look at compliance. Social
Science and Medicine, 20: 29-37.
Conrad P. (1987). The noncompliant patient in search of autonomy. Hastings Center
Report, 17: L5-17.
Corrigan PW, Liberman RP, Engel JD. (1990). From noncompliance to collaboration
in the treatment of schizophrenia. Hospital and Communiry Psychiatry, 4I:
r203-r2lt.
Coupey SM, Cohen MI. (1984). Special considerations for the health care of
adolescents with chronic illnesses. Pediatric Clinics of North America, 3I:
2tI-219.
Cox CL. (1982). An interaction model of client health behavior: theoretical
prescription for nursing. Advances in Nursing Science, 5: 4l-56.
Cox CL, Roghmann K. (1984). Empirical test of the interaction model of client health
behavior. Research in Nursing and Health, T: 275-285
345
Cox DJ, Gonder-Frederick L, Pohl S, Pennebaker JV/. (1986). Diabetes. In: KA
Holroyd, TL Creer (Eds.). Self-management of chronic disease. New York:
Academic. 305-346.
Cramer JA, Mattson RH, Prevey ML, Scheyer RD, Ouellette IR. (1989). How often is
medication taken as prescribed? A novel assessment technique. Journal of the
American M edical As s ociation, 26 I : 327 3 -327 7 .
Cramer JA, Scheyer RD, Mattson RH. (1990). Compliance declines between clinic
visits. Archives of Internal Medicine, 150: 1509-1510.
Creer TL, Burns KI-. (1979). Self-management training for children with chronic
bronchial asthma. P sychotherap eutic s and P sycho s omatics, 32 : 27 O-27 8.
Cromer BA, Tarnowski KJ. (1989). Noncompliance in adolescents: a review.
D evelopmental and B ehavioral P ediatric s, I 0 : 207 -215.
cummings KM, Becker MH, Maile MC. (1980). Bringing the models together: an
empirical approach to combining variables used to explain health actions.
Journal of Behavioral Medicine, 3: L23-145.
Dabbs J, Kirscht JP. (1971). Internal control and the taking of influenza shots
Psycholo gical Reports, 28 : 959-962.
346
Dahlquist LM. (1990). Obtaining child reports in health care. In: AM La Greca (Ed.).
Through the eyes of the child: obtaining self-reports from children and
adolescents. Boston: Allyn and Bacon. 395-439.
Daniel A. (1983). Power, prívelege and prestige: Occupations in Australia.
Melbourne: Longman Cheshire.
Davidson MB. (1991). Insulin therapy. In: MB Davidson (Ed.). Diabetes mellitus:
diagnosis and treatment. Third Edition. New York: Churchill Livingstone Inc
95-145.
Davidson MB, Botnick TD. (1991). Dietary therapy. In: MB Davidson (Ed.). Diabetes
mellitus: diagnosis and treatment. Third Edition. New York: Churchill
Livingstone Inc. 35-93.
Davis MS. (1968). Variations in patients' compliance with doctors' advice: an
empirical analysis of patterns of communication. American Journal of Public
Health, 58: 274-288.
de Groot A. (1969). Methodology: foundations of inference and research in the
behavioral sciences. Trans. JAA SpiekeÍnan. The Hague: Mouton.
Deaton AV. (1985). Adaptive noncompliance in pediatric asthma: the parent as
expert. Journal of Pediatric Psychology, 10: I-I4.
347
Delamater AM. (1993). Compliance interventions for children'with diabetes and other
chronic conditions. In: NA Krasnegor, L Epstein, sB Johnson, sJ Yaffe (Eds.).
Developmental aspects of health compliance behavior. Hillsdale, New Jersey:
Erlbaum. 335-354.
Delamater AM, Bubb J, Davis sG, smith JA, Schmidt L, white NH, santiago JV.
(1990). Randomized propsective study of self-management training of newly
diagnosed diabetic children. Diabetes Care, l3: 492-498.
DeRosier ME, Kupersmidt JB. (1991). Costa Rican children's perceptions of their
social networks. Dev elopmental P sycholo gy, 27 : 656-662.
Diabetes Control and Complications Trial Research Group. (1993). The effect of the
intensive treatment of diabetes on the development and progression of long
term complications in insulin-dependent diabetes mellitus. New England
Journal of Medicine, 329: 977-986.
Diabetes Control and Complications Trial Research Group. (1995). The relationship
of glycemic exposure (HbArr) to the risk of development and progression of
retinopathy in the Diabetes Control and Complications Trial. Diabetes, 44:
968-983.
DiMatteo MR. (1994). Enhancing patient adherence to medical recommendations.
Journal of the American Medical Association,2Tl:79,83.
e
348
DiMatteo MR, DiNicola DD. (1982). Achieving patient compliance: the psychology of
the medical practitioner's role. New York: Pergamon.
DiMatteo MR, Hays RD, Gritz ER, Bastani R, Crane L, Elashoff R, Ganz p, Heber D,
McCarthy W, Marcus A. (1993). Patient adherence to cancer control regimens:
scale development and initial validation. Psychological Assessment, 5: 102-
lLz.
DiMatteo MR, Hays RD, Prince LM. (1986). Relationship of physicians' nonverbal
communication skill to patient satisfaction, appointment noncompliance, and
physician workload. Health Psychology, 5; 581-594.
DiMatteo MR, Hays RD, Sherbourne CD. (1992). Adherence to cancer regimens:
implications for treating the older patient. Oncology, 6: 50-57.
DiMatteo MR, Sherbourne CD, Hays RD, Ordway L, Kravitz RL, McGlynn EA,
Kaplan S, Rogers WH. (1993). Physicians characteristics influence patients'
adherence to medical treatment: results from the Medical Outcomes Study.
Health P sycholo gy, I 2 : 93-102.
DiMatteo MR, Taranta A, Friedman HS, Prince LM. (1980). Predicting patient
satisfaction from physicians' nonverbal communication skills. Medical Care,
18: 376-387.
349
DiNicola DD, DiMatteo MR. (1984). Practitioners, patients, and compliance with
medical regimens: a social psychological perspective. In: A Baum, SE Taylor,
JE Singer (Ed.). Handbook of psychology and health. Vol. 4: Social
psychological aspects of health. Hillsdale, NJ: Lawrence Erlbaum. 55-84.
Dishman RK. (1982). Compliance I adherence in health-related exercise. Health
Psychology, I : 237 -267 .
Dishman RK, Gettman LR. (1980). Psychobiological influences on exercise
adherence. Journal of Sporr Psychology,2: 295-310.
Dishman RK, Ickes W. (1981). Self-motivation and adherence to therapeutic exercise.
Journal of Behavioural Medicine,4: 42I-438.
Dolgin MJ, Katz ER, Doctors SR, siegel sE. (19s6). caregivers' perceptions of
medical compliance in adolescents with cancer. Journal of Adolescent Health
Care, 7: 22-27.
Dorchy H. (1995). Hemoglobin 41" levels in young patients with diabetes beyond the
"honeymoon" period (letter). Journal of Pediatrics, 126: I020-I02L.
Douvan E, Adelson J. (1966). The adolescent experience.New York: Wiley
Dowse R, Futter WT. (1991). Outpatient compliance with theophylline and phenytion
therapy. South African Medical Journal, S0: 550-553.
350
Dracup K, Baker DW, Dunbar SB, Dacey RA, Brooks NH, Johnson JC, Oken C,
Massie BM. (1994). Management of heart failure. II. Counseling, education,
and lifestyle modifications. Journal of the American Medical Association, 272:
1442-t446.
Drotar D. (1997). Relating parent and family functioning to the psychological
adjustment of children with chronic health conditions: What have we learned?
What do we need to know? Journal of Pediatric Psychology,22: 149-165.
Dunbar J. (1979).Issues in assessment. In: SJ Cohen (Ed.). New directions in patient
compliance. I-exington, MA: I-exington Books. 4l-57.
Dunbar J. (1980). Adhering to medical advice: a review. International Journal of
Mental Health, 9: 7O-87.
Dunbar J. (1983). Compliance in pediatric populations: a review. In: PJ McGrath, P
Firestone (eds). Pediatric and adolescent behavioural medicine: Issues in
treatment. New York: Springer. 2L0-230.
Dunbar J. (1990). Predictors of patient adherence: patient characteristics. In: SA
schumaker, EB Schron, JK ockene (Eds.). The handbook and health behavior
change. New York: Springer. 348-360.
Dunbar J, Agras W. (1980). Compliance with medical instructions. In: JM Ferguson,
CB Taylor (eds). The comprehensive handbook of behavioural medicine. Vol
3: Extended applications and issues. Lancaster, UK: MTP Press. 115-145.
351
Dunbar J, Stunkard AJ. (1979). Adherence to diet and drug regimen. In: RI Iævy, BM
Rifkind, BH Dennis, N Ernst (Eds.). Nutrition, Iipids, and coronary heart
disease: a global yl¿w. New York: Raven Press. 3gL-423.
Dunbar-Jacob J, Dwyer K, Dunning EJ. (1991). Compliance with antihypertensive
regimen: a review of the research in the 1980s. Annals of Behavioral
Medicine, I3:31-39.
Dunn SM, Beeney LI, Hoskins PL, Turtle JR. (1990). Knowledge and attitude change
as predictors of metabolic improvement in diabetes education. Social Science
and Medicine, 3l: 1135-1141.
Dunn SM, Bryson JM, Hoskins PL, Alford JB, Handelsman DJ, Turtle JR. (19s4).
Development of the Diabetes Knowledge @KN) scales: Forms DKNA,
DKNB, and DKNC. Diabetes Care, 7: 36-41.
Eccles JS, Buchanan cM, Flanagan c, Fuligni A, Midgley c, Yee D. (1991). control
versus autonomy during early adolescence. Journal of Social Issues, 47: 53-68.
Egger G, Spark R, Lawson J. (1991). Health promotion strategies and methods.
Sydney: McGraw-Hill.
Eisen SA. (1991). Developing more clinically meaningful definitions of medication
compliance. In: JA Cramer, B Spilker (Eds.). Patient compliance in medical
practice and clinical trials. New York: Raven. 225-23L.
352
Eiser C. (1990). Chronic childhood disease: an introduction to psychological theory
and researcl¿. Cambridge, UK: Cambridge University Press.
Eiser C, Havermans T. (1992). Mothers' and fathers' coping with chronic childhood
disease. Psychology and Health, T: 249-257.
Ellis-Schwabe M, Thornburg HD. (1986). Conflict areas between parents and their
adolescents. Journal of Psychology, 120: 59-68.
Engel GL. (1977). The need for a new medical model: a challenge for biomedicine.
Science, 196: 129-136.
Enright RD, Lapsley DK, Drivas AE, Fehr LA (1980). Parental influences on the
development of adolescent autonomy and identity. Journal of youth and
Adolescence, 9 : 529-545.
Epstein LH, Beck S, Figueroa J, Farkas G, Kazdin AE, Daneman D, Becker D.
(1981). The effects of targeting improvements in urine glucose on metabolic
control in children with insulin dependent diabetes. Journal of Apptied
Behavior Analysis, I 4 : 365-37 5.
Epstein LH, Cluss PA. (1982). A behavioural perspective on adherence to long-term
medical regimens. Journal of Consultíng and Clinical Psychology,50; 950-
971
353
Epstein S. (1983). Aggregation and beyond: some basic issues on the prediction of
behavior. Journal of Personality, 5l: 360-392.
Eraker SA, Kirscht JP, Becker MH. (1984). Understanding and improving patienr
compliance. Annals of Internal Medicine, 100: 258-268.
Expert Committee on the Diagnosis and Classification of Diabetes Mellitus. (1997).
Report of the Expert Committee on the Diagnosis and Classification of
Diabetes Mellitus. Diabetes Care, 20: I 183-1 197.
Eysenk HJ. (1975). Know your own personality. New York: penguin.
Farrington DP. (1988). Studying changes within individuals: the causes of offending.
In: M. Rutter (Ed.). Studies of psychosocial risk. Cambridge, LIK: Cambridge
University Press. 158-1 83.
Farrington DP. (1991). Longitudinal research strategies: advantages, problems, and
prospects. Joumal of the American Academy of Child and Adolescent
P sychiatry, 30 : 369-37 4.
Feather NT. (1959). Subjective probability and decision under uncerrainty
Psychological Review, 66: 150-164.
Feild HS, Armenakis AA. (1974). Use of multiple tests of significance in
psychological research . P sycholo gical Bulletin, 3 5 : 427 -43L.
354
Feinstein AR. (1990). On white-coat effects and the electronic monitoring of
compliance. Archives of Internal Medicine, 150: 1377-1378.
Feldman HA, McKinlay SM. (1994). Cohort versus cross-sectional design in large
field trials: precision, sample size, and a unifying model. Statistics in
Medicine, 13: 6l-78.
Feldman SS, Quatman T. (1988). Factors influencing age expectations for adolescent
autonomy: a study of early adolescents and parents. Journal of Eaþ
Adolescence, 8: 325-343.
Feldman SS, Rosenthal DA. (1991). Age expectations of behavioural autonomy in
Hong Kong, Australian and American youth: the influence of family variables
and adolescents' values. International Journal of Psychology,26: I-23.
Ferguson GA, Takane Y. (1989). Statistical analysis in psychology and education.
Sixth Edition. New York: McGraw-Hill.
Fiese BH. (1997). Family context in pediatric psychology from a transactional
perspective: family rituals and stories as examples. Journal of Pediatric
Psychology, 22 : 183-196.
Fishbein H, Palumbo PJ. (1995). Acute metabolic complications in diabetes. In: MI
Harris, CC Cowie, MP Stem, EJ Boyko, GE Reiber, PH Bennett @ds.).
Diabetes in America. Second Edition. (NIH Publication No. 95-1468,283-
292).Washington DC: U.S. Department of Health and Human Services.
355
Fishbein M. (1965). A consideration of beliefs, attitudes, and their relationships. In:
JD Steiner, MA Fishbein (Eds.). Current studies in social psychology. New
York: Holt, Rinehart & Winston.I0T-120.
Fishbein M. (1972). Toward an understanding of family planning behavior. Journal of
Applied Social Psychology, 2 : 214-227 .
Fishbein M. (1980). A theory of reasoned action: some applications and implications,
In: MM Page (Ed.). 1979 Nebaska Symposium on motivation Lincoln:
University of Nebraska Press.
Fishbein M, Ajzen L (L975). Beliefs, attitudes, intentíon and behavior: an
introduction to theory and re searcl¿. Massachusetts : Addison-Wesley.
Flanagan CA. (1990). Change in family work status: effects on parent-adolescent
decision making. Child Development, 6I: 163-177.
Foddy \ry. (1993). Constructing questions for interviews and questionnaires: theory
and practice in social research. Cambridge University Press, Cambridge, UK.
Forehand R. (1977). Child noncompliance to parental requests: behavioural analysis
and treatment. In: M Hersen, RM Eister, PM Miller (Eds.). progress in
behavior modification. vol.5. New York: Academic press. Lrr-r47.
356
Foster SL, Prinz RJ, O'I-eary KD. (1983). Impact of problem-solving communication
training and generalization procedures on family conflict. Child and Family
Behavior Therapy, 6: 2-I4.
Foster SL, Robin AL. (1988). Family conflict and communication in adolescence. In:
EJ Mash, LG Terdal (Eds.). Behavioral assessment of childhood disorders
Second Edition. New York: Guilford. 717-775
Foster-Powell K, Miller JB. (1995). International tables of glycemix index. American
Journal of Clinical Nutrition, ó2; 871S-890S.
Fotheringham MJ, Couper JJ, Sawyer MG. (1996). Adolescents' adherence to IDDM
treatment: Relation to parent-adolescent conflict and adolescent autonomy.
Proceedings of the Australian Diabetes Society, 1996 A89.
Fotheringham MJ, Couper JJ, Sawyer MG. (1997). Associations between adolescents'
metabolic control, IDDM adherence and objective data of blood glucose
monitoring. Proceedings of the Australian Diabetes Society, 1997 A93.
Fotheringham MJ, Couper JJ, Taylor JD, Sawyer MG. (submitted). Assessment of
adherence in poorly controlled Type 1 diabetes. Journal of Pediatric
Psychology.
Fotheringham MJ, Couper JJ, Taylor JD, Sawyer MG. (submitted). Prediction of
regimen adherence and metabolic control in adolescents with IDDM.
Psychology and Health
357
Fotheringham MJ, Owen N. (in press). Applying psychological theories to promote
healthy lifestyles. In: JM Rippe (Ed.). Textbook of medicine, Øcercise, nutrition
and health. Shrewsbury, MA: Blackwell Science.
Fotheringham MJ, Sawyer MG. (1995). Adherence to medical recommendations in
childhood and adolescence. Journal of Paediatrics and Child Health, 3I: 72-
Frank SJ, Pirsch LA, Wright VC. (1990). Late adolescents' perceptions of their
relationships with their parents: relationships among deidealization, autonomy,
relatedness, and insecurity and implications for adolescent adjustment and ego
identity status. Journal of Youth and Adolescence, 19: 571-588.
Freund A, Johnson SB, Silverstein J, Malone J. (1991). The relationship between
adherence beahviours and metabolic control in childhood diabetes. In: JH
Johnson, sB Johnson, (Eds.). Advances in chíld Health psychology.
Gainesville: University of Florida Press. 277-284.
Friedman HS. (1979). Nonverbal communication between patients and medical
practitioners. Journal of Social Issues, 35: 82-99.
Friedman HS. (1982). Nonverbal communication in medical interaction. In: HS
Friedman, MR DiMatteo @ds.), Interpersonal issues in health car¿. New
78.
York: Academic. 5L-66
358
Friedman IM, Litt IF. (1986). Promoting adolescents' compliance with therapeutic
regimens. Pediatric Clinics of North America, 33:955-973.
Friedman IM, Litt IF, King DR, Henson R, Holtzman D, Halverson D, Kraemer HC.
(1986). compliance with anticonvulsant therapy by epileptic youth:
relationships to psychosocial aspects of adolescent development. Journal of
Adolescent Health Care, 7: L2-17.
Garrison W, Biggs D, Morris A. (1988). Longitudinal prediction of compliance and
control in very young children with insulin-dependent diabetes mellitus
(Abstract). Diabetes, 37: 54A.
Garrison WT, McQuiston S. (1989). Chronic illness during childhood and
adolescence: psychological aspecrs. Newbury park, CA: Sage.
Gaut DA, Kieckhefer GM. (1983). Assessment of self-care agency in chronically ill
adolescents. Journal of Adolescent Health Care, 9:55-60.
George A, Hancock J. (1993). Reducing pediatric burn pain with parent participation
Journal of Burn Care and Rehabilitation, 14: lO4-107
German PS. (1988). compliance and chronic disease. Hypertension, 1l: 56-60.
Gibbons JD, Chakraborti S. (1992). Nonparametric statistical inference. Third
Edition. New York: M. Dekker.
359
Gilbert Bo, Johnson SB, Spillar R, McCallum M, Silverstein JH, Rosenbloom A.
(1982). The effects of a peer-modeling film on children learning to self-inject
insulin. Behavior Therapy, I 3: 786-L93.
Glasgow AM, Tynan wD, v/eissberg-Benchell J, Turek J, Driscoll c, Beliveau E,
Epstein S. (1991). Diabetes mismanagment in adolescents (Abstract).
Diabetes, 40: 352A
Glasgow RE. (1991). Compliance to diabetes regimens: conceptualization,
complexity, and determinants. In: JA cramer, B Spilker (Eds.). patient
compliance in medical practice and clinical trials. New York: Raven. 209-
224.
Glasgow RE, Anderson BJ. (1995). Future directions for research on pediatric chronic
disease management: Iæssons from diabetes. Journal of Pediatric Psychology,
20:389-402.
Glasgow RE, McCaul KD, Schafer LC. (1937). Self-care behaviors and glycemic
control in type I diabetes. Journal of Chronic Diseases, 40: 399-412.
Glasgow RE, Osteen VL. (1992). Evaluating diabetes education: Are we measuring
the most important outcomes? Diabetes Care, I5: 1423-L432.
Glasgow RE, Toobert DJ, Riddle M, Donnolly J, Mitchell DL, calder D. (19g9).
Diabetes-specific social learning variables and self-care behaviours among
persons with Type tr diabetes. Health Psychology, d: 285-303.
360
Gochman DS. (1982). Labels, systems and motives: some perspectives for future
research and programs. Health Education Quarteþ, 9: 167-174.
Gochman DS. (1985). Family determinants of children's concepts of health and
illness. In: DC Turk, RD Kerns (Eds.). Health, illness, andfamilies: a life span
perspective. New York: John Wiley & Sons. 23-50.
Godin G, Shepard RJ. (1990). Use of attitude-behaviour models in exercise
promotion. Sports Medicine, 1 0: 103-L2I.
Goldberger AS, Duncan OD. (L973). Structural equation models in the social
sciences. New York: Seminar Press.
Gonder-Frederick LA, Julian DM, cox DJ, clarke wL, carter wR. (19s8). Self-
measurement of blood glucose: Accuracy of self-reported data and adherence
to recommended regimen. Diabetes Care, I I: 579-585.
Gordis L. (1976). Methodological issues in the measurement of patient compliance.
In: DL Sackett, RB Haynes (Eds.). Compliance with therapeutic regimens.
Baltimore: Johns Hopkins University Press. 5L-66,
Gordis L. (1979). Conceptual and methodologic problems in measuring patient
compliance. In: RB Haynes, DW Taylor, DL Sackett (Eds.). compliance in
health care.Baltimore: Johns Hopkins University press. 23-45.
361
Grace NC, Kelley ML, McCain AP. (1993). Attribution processes in mother-
adolescent conflict. Journal of Abnormal child Psychology,2I: 199-211.
Greenberg MT, siegel JM, I-eitch cJ. (19s3). The nature and importance of
attachment relationships to parents and peers during adolescence. Journal of
Youth and Adolescence, 12: 373-386.
Greenberger E. (1984). Defining psychosocial maturity in adolescence. In: P Karoly,
JJ Steffen (Eds.). Adolescent behavior disorders: foundations and
contemporary concerns. Iæxington, MA: Iæxington Books. 3-37.
Greenfield S, Kaplan S, Vy'are J. (1985). Expanding patients' involvement in care:
effect on patient outcomes. Annals of Internal Medicine, 102: 520-528.
Gritz ER, DiMatteo MR, Hays RD. (1939). Methodological issues in adherence to
cancer control regimens. Preventive Medicine, 18: 7ll-720.
Grossman HY, Brink S, Hauser ST. (1987). Self-efficacy in adolescent girls and boys
with insulin-dependent diabetes mellitus. Diabetes Care, l0: 324-329.
Grotevant HD, Cooper CR. (1986). Individuation in family relationships: a
perspective on individual differences in the development of identity and role-
taking skill in adolescence. Human Development, 29:82-100.
362
Gudas LI, Koocher GP, wypij D. (1991). Perceptions of medical compliance in
children and adolescents with cyctic fibrosis. Jountal of Developmental and
Behavioral Pediatrics, I 2 : 236-242.
Guthrie R, Hellman R, Kilo C, Hiar CE, Crowley T F., Childs B, Fisher R, Pinson MB,
suttner A, vittori c. (1992). A multisite physician's office laboratory
evaluation of an immunological method for the measurement of HbA1..
Diabetes Care, l5: 1494-1498.
Haggerty RJ. (1977). Changing lifestyles to improve health. Preventive Medicine, 6:
276-289.
Hall JA. (1987). Parent-adolescent conflict: an empirical review. Adolescence, 22:
767-789.
Hall JA, Roter DL, Katz NR. (1988). Meta-analysis of correlates of provider
behaviour in medical encounters. Medical Care, 26: 657-675.
Hansen v/8, collins LM, Malotte cK, Johnson CA, Fielding JE. (1985). Attrition in
prevention research. J ournal of B ehavioral Medicine, I : 261 -27 5
Hanson CL, Cigrang JA, Harris MA, Carle DL, Relyea G, Burghen GA. (1989).
Coping styles in youths with insulin-dependent diabetes mellitus. Journal of
Consulting and Clinical Psychology, 57: 644-65L.
363
Hanson CL, De Guire MJ, Schinkel AM, Henggeler SW, Burghen GA. (1992).
Comparing social learning and family systems correlates of adaptation in
youths with IDDM. Journal of Pediatric Psychology, 17: 555-572.
Hanson cL, De Guire MJ, Schinkel AM, Kolterman oG, Goodman JP, Buckingham
BA. (1996). Self-care behaviors in insulin-dependent diabetes: Evaluative
tools and their associations with glycemic control. Journal of Pediatric
P sycholo gy, 2 I : 467 -482.
Hanson CL, De Guire MJ, Schinkel AM, Kolterman OG. (1995). Empirical validation
for a family-centered model of care. Diabetes Care, l8: 1347-1356.
Hanson CL, Henggeler SW, Burghen GA. (19S7a). Model of associations between
psychosocial variables and health-outcome measures of adolescents with
IDDM. Diabetes Care, l0:752-758.
Hanson CL, Henggeler SW, Burghen GA. (l9S7b). Social competence and parental
suppoft as mediators of the link between stress and metabolic control in
adolescents with insulin-dependent diabetes mellitus. Journal of Consulting
and Clinical Psychology, 52: 529-533.
Hanson CL, Henggeler SW, Burghen GA. (1987c). Race and sex differences in
metabolic control of adolescents with IDDM: A function of psychosocial
variables. Diabetes Care, l0: 313-318.
364
Hanson cL, Henggeler SW, Harris MA, Burghen GA, Moore M. (1989). Family
system variables and the health status of adolescents with Insulin dependent
diabetes mellitus. Health P sycholo gy, I : 239 -253.
Hanson cL, Henggeler s'w, Harris MA, cigrang JA, schinkel AM, Rodrigue JR,
Klesges RC. (1992). Contributions of sibling relations to the adaptation of
youths with insulin-dependent diabetes mellitus. Journal of Consulting and
Clinical Psychology, 60: 104-112.
Hanson CL, Onikul-Ross SR. (1990). Developmental issues in the lives of youths with
insulin-dependent diabetes mellitus. In: SB Morgan, TM Okwumabua (Eds.).
Child and adolescent disorders: developmental and health psychology
p erspectiv es. Hillsdale, NJ: Lawrence Erlbau m. 201 -240.
Harris RJ. (1985). A primer of multivariate statistics. Second Edition. Orlando,
Florida: Academic Press.
Harvey RM. (1992). The relationship of values to adjustment in illness: a model for
nursing practice. Journal of Advanced Nursing, 17: 467-472.
Hatcher L, Stepanski EJ. (1994). A step-by-step approach to using the SAf system
for univariate and multivariate statistics. Cary, NC: SAS Institute Inc.
Hauser ST, DiPlacido J, Jacobson AM, willett J, Cole C. (1993). Family coping with
an adolescent's chronic illness: an approach and three studies. Journal of
Adolescence, I 6 : 305-329.
365
Hauser ST, Jacobson AM, Lavori P,'wolfsdorf JI, Herskowitz RD, Milley JE, Bliss R,
Wertlieb D, Stein J. (1990). Adherence among children and adolescents with
insulin-dependent diabetes mellitus over a four-year longitudinal follow-up: tr.
Immediate and long-term linkages with the family milieu. Journal of Pediatric
Psychology, I 5 : 527 -542.
Hays RD, DiMatteo MR. (1987). Key issues and suggestions for patient compliance
assessment: sources of information, focus of measures, and nature of response
options. Journal of Compliance in Health Care, 2: 37-53.
Hays RD, Hayashi T, Stewart AL. (1989). A five-item measure of socially desirable
response set. Educational and Psychological Measurement, 49: 629-636.
Hays RD Kravitz RL, Mazel RM, Sherbourne CD, DiMatteo MR, Rogers WH,
Greenfield S. (1994). The impact of patient adherence on health outcomes for
patients with chronic disease in the medical outcomes study. Journal of
Behavioural Medicine, I 7 : 347 -360.
Hays WL. (1988). Statistics. Fourth Edition. New York: Holt, Rinehart and Winston.
Hazzard A, Hutchinson SJ, Krawiecki N. (1990). Factors related to adherence to
medication regimens in pediatric seizure patients. Journal of Pediatric
Psychology, I 5 : 543-555.
Hetherington M, Clingempeel WG. (1992). Coping with marital transitions.
Monographs of the socíety for Research in child Development, 57: r-238.
366
Henggeler S'W, Tavormina JB. (1980). Social class and race differences infamily
interaction: Pathological, normative, or coufounding methodological factors.
Journal of Genetic Psychology, 137:2Il-222.
Herskowitz RD, Wertlieb D, Watt E. (1987). Psychologic predictors of compliance in
children with recent onset of diabetes mellitus. Journal of Pediatrics, ll0:
805-81 l.
Hill JP. (1980). Understanding adolescent autonomy: A framework. Corrboro, NC:
Center for Early Adolescence.
Hill JP, Holmbeck GN. (1986). Attachment and autonomy during adolescence. Annals
of Child Development, 3: 745-189.
Hill JP, Holmbeck GN. (1987). Familial adaptation to biological change during
adolescence. In: RM Iærner, TT Foch (Eds.). Biological-psychosocial
interactions in earþ adolescence: a life-span perspective. Hillsdale, NJ:
Erlbaum. 207-223.
Hinde RA. (1992). Developmental psychology in the context of other behavioral
sciences. Developmental Psychology, 28: 1018-1029.
Hoare P. (1984). Does illness foster dependency? A study of epileptic and diabetic
children. Developmental Medicine and Child Neurology, 26: ZO-24.
367
Hofmann AD, Gabriel HP. (1989). Managing chronic illness in adolescence: a
paradigm. In: A Hofmann, D Greydanus @ds.). Adolescent Medicine. Second
Edition. Norwalk, Connecticut: Appleton & Lange. 507-5I7.
Holden EW, Friend M, Gault C, Kagar V, Foltz L, White L. (1991). Family
functioning and parental coping with chronic childhood illness: relationships
with self-competence, illness adjustment, and regimen adherence behaviors in
children attending diabetes summer camp. In: JH Johnson, SB Johnson, @ds.).
Advances in Child Health Psychology. Gainesville: University of Florida
Press.265-276.
Holmbeck GN, O'Donnell K. (1991). Discrepancies between perceptions of decision
making and behavioral autonomy. New Directions for Child Development, 51:
51-69.
Honess TM, Lintern F. (1990). Relational and systems methodologies for analysing
parent-child relationships: an exploration of conflict, support and
independence in adolescence and post-adolescence. British Journal of Sociat
Psychology, 29 : 33I-347 .
Hoskins PL, Alford JB, Handelsman DJ, Yue DK, Turtle JR. (198s). comparison of
different models of diabetes care on compliance with self-monitoring of blood
glucose by memory glucometer. Diabetes Cøre, I I: 719-724.
368
Howe GW, Feinstein C, Reiss D, Molock S, Berger K. (1993). Adolescent adjustment
to chronic physical disorders L Comparing neurological and non-
neurological conditions. Journal of child Psychology and Psychiatry, 34:
I 153-1 171.
Hulka BS, cassel JC, Kupper T T , Burdette JA. (1976). communication, compliance,
and concordance between physicians and patients with prescribed medications.
American Journal of Public Health, 66: 847-853.
Iannotti RJ, Bush PJ. (1993). Toward a developmental theory of compliance. In: NA
Krasnegor, L Epstein, SB Johnson, SJ Yaffe (Eds.). Developmental aspects of
health compliance behavior. Hillsdale, NJ: Lawrence Erlbaum.59-76.
Ingersoll GM, Orr DP, Herrold AJ, Golden MP. (1986). Cognitive maturity and self-
management among adolescents with insulin-dependent diabetes mellitus.
Journal of Pediatrics, 108: 620-623.
Inui rs, carter'wB, Pecoraro RE, Pearlman RA, Dohan JJ. (1980). variations in
patient compliance with common long-term drugs. Medical care, 18: 986-
993.
kwin cE, Millstein SG, Ellen JM. (1993). Appointment-keeping behaviour in
adolescents: factors associated with follow-up appointment-keeping.
Pediatrics, 92: 20-23.
369
Jacobson AM, Hauser sr, Lavori P, 'wolfsdorf JI, Herskowitz RD, Milley JE, Bliss R,
Gelfand E, wertlieb D, stein J. (1990). Adherence among children and
adolescents with insulin-dependent diabetes mellitus over a four-year
longitudinal follow-up: I. the influence of patient coping and adjustment.
Journal of Pediatric Psychology, I5: 511-526.
Jacobson AM, Hauser ST, Wolfsdorf J, Houlihan J, Milley J, Herskowitz R, rWertlieb
D, Watt E. (1987). Psychologic predictors of compliance in children with
recent onset of diabetes mellitus. Journal of Pediatrics, ll0:805-811.
Janis IL. (1984a). The patient as decision maker. In: WD Gentry (Ed.). Handbook of
behavioral medicine. New York: Guilford. 326-368.
Janis IL. (1984b). Improving adherence to medical recommendations: prescriptive
hypotheses derived from recent research in social psychology. In: A Baum, SE
Taylor, JE Singer (Eds.), Handbook of psychology and health. vol. 4: social
psychological aspects of health. Hillsdale, NJ: Lawrence Erlbaum. 113-148.
Janz NK, Becker MH. (1984). The health belief model: a decade later. Health
Education Quarteþ, 11: 1-47.
Jessop DJ, Stein REK. (1985). Uncertainty and its relation to the psychological and
social correlates of chronic illness in children. Social Science and Medicine,
20:993-999.
370
Jilbert K. (1995). Parental psychological characteristics that influence asthma
management behaviours and adherence in childhood asthma. Unpublished
master's thesis, University of South Australia, Adelaide, Australia.
John v/G, Edwards R, Price CP. (1994). Laboratory evaluation of the DCA 2000
clinic HbA1" immunoassay analyser. Annals of Clinical Biochemistry, 3I:
367-370.
Johnson NB, Kronz KK, Fineberg NS, Golden l\æ. (L992). Twice-daily humulin
insulin decreases morning fasting hlperglycemia. Diabetes Care, 15: l03I-
1033.
Johnson SB. (1984). Knowledge, attitudes, and behavior: correlates of health in
childhood diabetes. Clinícal P sy cholo gy Review, 4 : 503 -524.
Johnson SB. (1985). The family and the child with chronic illness. In: DC Turk, RD
Kerns (Eds.). Health, illness, and families: a liþ-span perspecliv¿. New York:
Wiley.220-254.
Johnson SB. (1990). Adherence behaviours and health status in childhood diabetes.
In: C Holmes (Ed.). Neuropsychological and behavioral aspects of diabetes
New York: Springer-Verlag. 30-57.
Johnson SB. (1991a). Methodological considerations in pediatric behavioral research:
Measurement. Journal of Developmental and Behavioral Pediatrics, 12: 361-
369.
37r
Johnson sB. (1991b). compliance in Pediatric Psychology. In: JH Johnson, SB
Johnson (Eds.). Advances in child health psychology. Gainesville: University
of Florida Press. 249-264.
Johnson SB. (I992a). Methodological issues in diabetes research: Measuring
adherence. Diabetes Care, l5: 1658-L667.
Johnson SB. (1992b). Compliance and control in insulin-dependent diabetes: Does
behaviour really make a difference? In: N Schneiderrnan, P McCabe, A Baum
(Eds.). Stress and disease processes. Hillsdale, NJ: Lawrence Erlbaum.275-
297.
Johnson SB. (1992c). Behavioral aspects of diabetes. In: DG Byrne, GR Caddy (Eds.).
Behavioral medicine: international perspectives. Volume I. Norwood, NJ:
Ablex Publishing Corporation. 317 -353.
Johnson SB. (1993). Chronic diseases of childhood: assessing compliance with
complex medical regimens. In: NA Krasnegor, L Epstein, SB Johnson, SJ
Yaffe (Eds.). Developmental aspects of health complíance behavior. Hillsdale,
NJ: Lawrence Erlbaum. L57-184.
Johnson SB. (1994). Health behavior and health status: Concepts, methods, and
applications. Journal of Pediatric Psychology, 19: L29-L41.
372
Johnson SB. (1995). Insulin Dependent Diabetes Mellitus in Childhood. In: Roberts
MC (Ed.). Handbook of Pediatric Psychology. Second Edition. New York:
Guilford. 263-285.
Johnson SB, Freund A, Silverstein J, Hansen CA, Malone J. (1990). Adherence-health
status relationships in childhood diabetes. Health Psychology, 9: 606-631.
Johnson SB, Kelly M, Henretta JC, Cunningham WR, Tomer A, Silverstein JHA.
(1992). Longitudinal analysis of adherence and health status in childhood
diabetes. Journal of Pediatric Psychology, 17: 537-553
Johnson SB, Pollak T, Silverstein JH, Rosenbloom AL, Spillar R, McCallum M,
Harkavy J. (1982). Cognitive and behavioural knowledge about insulin-
dependent diabetes ¿ìmong children and parents. Pediatrics, 69: 708-713.
Johnson SB, Silverstein J, Rosenblooffi A, Carter R, Cunningham W. (1986).
Assessing daily management in childhood diabetes. Health Psychology, 5:
545-564.
Johnson SB, Tomer A, Cunningham WR, Henretta JC. (1990). Adherence in
childhood diabetes: results of a confirmatory factor analysis. Health
Psychology, 9 : 493-50L.
Jones PK, Jones SL, Katz J. (1987). Improving compliance for asthmatic patients
visiting the emergency department using a health belief model intervention.
Journal of Asthma,24: 199-206.
373
Kaplan RM, Chadwick MW, Schimmel LE. (1985). Social learning intervention to
promote metabolic control in Type 1 diabetes mellitus: pilot experiment
results. Diabetes Care,8: 152-155
Kaplan RM, Simon IIJ. (1990). Compliance in medical care: reconsideration of self-
predictions. Annals of Behavioral Medicine, 12: 66-71.
Kaplan SH, Greenfield S, Ware JE. (1989). Assessing the effects of physician-patient
interactions on the outcomes of chronic disease. Medical Care,27: S1l0-
5127.
Kasl SV. (1983). Social and psychological factors affecting the course of disease: an
epidemiological perspective. In: D Mechanic (Ed.). Handbook of health,
health care, and the health professions. New York: Free Press. 683-708.
Kazak AE. (1989). Families of chronically ill children: a systems and social-
ecological model of adaptation and challenge. Journal of Consulting and
Clinical Psycholo gy, 57 : 25-3O.
Kazak AE,. (1997). A contextual family/systems approach to pediatric psychology:
introduction to the special issue. Journal of Pediatric Psychology, 22: 74I-
148.
Kennedy CJ, Probart CK, Dorman SM. (1991). The relationship between radon
knowledge, concern and behaviour, and health values, health locus of control
and preventive health behaviors. Health Education Quarterly, 18: 319-329.
374
Kippax S, Crawford J. (1993). Flaws in the theory of reasoned action. In: DJ Terry, C
Gallois, M McCamish (Eds.). The theory of reasoned action: its application to
AI D S - p rev ent iv e b ehav io ur. Oxford : Pergamon. 253 -269 .
Kirscht JP, Rosenstock IM. (1979). Patients' problems in following recommendations
of health experts. In: GC Stone, F Cohen, NE Adler (Eds.). Health
P sychology : a handboofr. San Francisco: Jossey-Bass. 1 89-21 5.
Klemp SB, La Greca AM. (1987). Adolescents with IDDM: the role of family
cohesion and conflict (Abstract). Diabetes, 3ó; 184
Kobasa SCO. (1985). Longitudinal and prospective methods in health psychology. In:
P Karoly (Ed.), Measurement strategies in health psychology. New York: John
Wiley & Sons. 235-260.
Kochanska G, Kuczynski L, Radke-Yarrow M, Welsh JD. (1987). Resolutions of
control episodes between well and affectively ill mothers and their young
children. Journal of Abnormal Child Psychology, 15: 441-456
Koenig RJ, Peterson CM, Jones RL, Saudek C, Lehrman M, Cerami A. (1976).
Correlation of glucose regulation and hemoglobin 41. in diabetes mellitus.
New England Journal of Medicine, 295: 417-420.
Korsch BM, Fine RN, Negrete VF. (1978). Noncompliance in children with renal
transplants . Pediatrics, 6 I : 87 2-87 6.
375
Kosky RJ, Sawyer MG, Fotheringham M. (1996). The mental health status of
adolescents released from custody: a preliminary study. Australian and New
Zealand Journal of Psychiatry, 30: 326-33L
Kovacs M, Goldston D, Obronsky DS, Iyengar S. (1992). Prevalence and predictors of
pervasive noncompliance with medical treatment among youths with insulin-
dependent diabetes mellitus. Journal of the American Academy of Child and
Adolescent Psychiatry, 3 I : l7L2-11L9.
Kovacs M, Iyengar S, Goldston D, Obrosky DS, Stewart J, Marsh J. (1990).
Psychological functioning among mothers of children with insulin-dependent
diabetes mellitus: a longitudinal study. Journal of Consulting and Clinical
Psychology, 58; 189-195
Krall LP, Beaser RS. (1989). Joslin diabetes manual Twelfth Edition. Philadelphia,
PA: I-ea & Febiger.
ISavitz RL, Hays RD, Sherbourne CD, DiMatteo MR, Rogers WH, Ordway L,
Greenfield S. (1993). Recall of recommendations and adherence to advice
among patients with chronic medical conditions. Archives of Internal
Medicine, /53: 1 869-1878.
Kristiansen CM. (1986). A two-value model of preventive health behavior. Basic and
Applied Social Psychology, 7 : I73-I83
376
Kuczynski L, Kochanska G. (1990). Development of children's noncompliance
strategies from toddlerhood to age five. Developmental Psychology, 26: 398-
Kurtin PS, Landgraf JM, Abetz L. (1994). Patient-based health status measurements in
pediatric dialysis: expanding the assessment of outcome. American Journal of
Kidney Diseases, 24 : 37 6-382.
Kurtines WM. (1978). A measure of autonomy. Journal of Personality Assessment,
42:253-256
La Greca AM. (1982). Behavioural aspects of diabetes management in children and
adolescents (Abstract). Diabetes Care, 3I: 47
La Greca AM. (1988a). Adherence to prescribed medical regimens. In: Handbook of
pediatric psychology. DK Routh (Ed.). New York: Guilford. 299-320.
La Greca AM. (1988b). Children with diabetes and their families: coping and disease
management. In: TM Field, PM McCabe, N Schneiderman (Eds.). Stress and
coping across developmer¿1. Hillsdale, NJ: Erlbaum. 139-159
La Greca AM. (1990a). Issues in adherence with pediatric regimens. Journal of
Pediatric Psychology, 15: 423-436
408
377
La Greca AM. (1990b). Issues and perspectives on the child assessment process. In:
AM La Greca (Ed.). Through the eyes of the child. Boston: Allyn & Bacon. 3-
17.
La Greca AM, Auslander WF, Greco P, Spetter D, Fisher EB, Santiago JV. (1995). I
get by with a little help from my family and friends: Adolescents' support for
diabetes care. J ournal of P ediatric P sycholo gy, 20 : 449 -47 6.
La Greca AM, Follansbee DM, Skyler JS. (1990). Developmental and behavioral
aspects of diabetes management in youngsters. Children's Health Care, 19:
132-139.
La Greca AM, Schuman WB. (1995). Adherence to prescribed medical regimens. In:
MC Roberts (Ed.). Handbook of pediatric psychology. Second Edition. New
York: Guilford Press. 55-83.
La Greca AM, Swales T, Klemp S, Madigan S, Skyler J. (1995). Adolescents with
diabetes: Gender differences in psychosocial functioning and glycemic control.
Children's Health Care,24: 6l-78.
Landon MB, Langer O, Gabbe SG, Schick C, Brustman L. (L992). Fetal surveillance
in pregnancies complicated by insulin-dependent diabetes mellitus. American
Journal of Obstetics and Gynecology, 167: 617-62I.
Langer N, Langer O. (1994). Emotional adjustment to diagnosis and intensified
treatment of gestational diabetes. Obstetrics and Gynecology, 84: 329-334.
378
Langer O, RodriguezD{, Xenakis EM, McFarland MB, Berkus MD, Arrendondo F.
(1994). Intensified versus conventional management of gestational diabetes.
American Journal of Obstetrics and Gynecology, 170: t036-1047
Langlie JK. (1977). Social networks, health beliefs, and preventive health behaviour.
Journal of Health and Social behaviour, 18: 244-260.
LaPiere RT. (1934). Attitudes versus actions. Social Forces, I3: 230-237.
Lau RR, Hartman KA, 'Ware JE. (1986). Health as a value: methodologic and
theoretical considerati ons. Health P sy cholo gy, 5 : 25 -43.
Iæe CR, Nicholson PW, Souhami RL, Deshmukh AA. (1992). Patient compliance
with oral chemotherapy as assessed by a novel electronic technique. Journal of
Clinical Oncology, 10: L007-10I3.
Iæfcourt HM. (198L). Research with the locus of control construct. Volume 1:
Assessment methods. New York: Academic Press.
I-efcourt HM. (1983). Research with the locus of control construct. Volume 2
Developments and Social Problems. New York: Academic Press.
Iæventhal H, Meyer D, Nerenz D. (1980). The common sense representations of
illness danger. In: S Rachman @d.). Contributions to medical psychology.
New York: Pergamon. 7 -30.
379
Leventhal H, Zimmerman R, Gutmann M. (1984). Compliance: a self-regulation
perspective, In: WD Gentry @d.). Handbook of behavioral medicine. New
York: Guilford. 369-436.
I-eventhal H. (1983). Behavioral medicine: psychology in health care. In: D Mechanic
(Ed.). Handbook of health, health care, and the health professions. New York
Free Press. 709-743.
Iævy RL, Yamashita D, Pow G. (1979). The relationship of an overt commitment to
the frequency and speed of compliance with symptom reporting. Medical
Care, 17:281-284.
I-ewin K, Dembo T, Festinger I, Sears PS. (1944). Level of aspiration. In: JMcV Hunt
(Ed.). Personality and behavíor disorders. New York: Ronald Press. 333-378.
Lewis FM, Morisky DE, Flynn BS. (1978). A test of the construct validity of health
locus of control: effects on self-reported compliance for hyperactive patients.
Health Education Mono graphs, 6 : I 38-148.
I-ey P. (1982). Satisfaction, compliance and communication. British Journal of
Clinical Psychology, 2 I : 24I-254
Ley P. (1992). Communícating with patients: improving communication, satisfaction
and compliance.I-ondon: Chapman and Hall
LidzT. (1981). The Person New York: Basic Books.
380
Litt IF, Cuskey WR. (1980). Compliance with medical regimens during adolescence.
Pediatric Clinics of Norrh America,2T: 3-15.
Litt IF, Cuskey WR, Rosenberg A. (1982). Role of self-esteem and autonomy in
determining medication compliance among adolescents with juvenile
rheumatoid arthritis. Pediatrics, 69: 15-17
Litt IF, cuskey wR, Rudd s. (1980). Identifying adolescents at risk for
noncompliance with contraceptive therapy. Journal of Pediatrics, g6:742-745
Locke HJ, Wallace KM. (1959). Short marital adjustment and prediction tests: their
reliability and validity. Marriage and Family Living, 21: 25I-255.
Lonnquist T F, Weiss GL, Larsen DL. (1992). Health value and gender in predicting
health protective behaviour. Women and Health, 19: 69-85.
Lustman PJ, Griffith LS, Clouse RE, Freedland KE, Eisen SA, Rubin EH, Carney
RM, McGill JB. (1995). Effects of alprazolam on glucose regulation in
diabetes. Results of double-blind, placebo-controlled trial. Diabetes Care, l8:
1 133-1 139.
Maddux JE, Rogers RW. (1983). Protection motivation and self-efficacy: a revised
theory of fear appeals and attitude change. Journal of Experimental Social
Psycholo gy, I 9: 469-47 9.
381
Marston M. (1970). Compliance with medical regimens: a review of the literature.
Nursing Research, I 9 : 312-323.
Marteau TM, Bloch S, Baum JD. (1987). Family life and diabetic control. Journal of
Child Psychology and Psychiatry,28: 823-833.
Maslow AH. (1968). Toward a psychology of being. Second Edition. New York: Van
Nostrand.
Matthews D, Hingson R. (L977). Improving patient compliance: a guide for
physicians. Medical Clinics of North America, 61: 879-889.
Mawhinney H, Spector SL, Kinsman RA, Siegal SC, Rachelefsky GS, Katz RM, Rohr
AS. (1991). Compliance in clinical trials of two bronchodilator, antiasthma
medications. Annals of Allergy,66: 294-299.
Mazze RS, Shamoon H, Pasmantier R, Lucido D, Murphy J, Hartmann K, Kuykendall
V, Lopatin W. (1984). Reliability of blood glucose monitoring by patients with
diabetes mellitus. American Journal of Medicine, TT: 2II-217.
McCaul KD, Glasgow RE, Schafer LC. (1987). Diabetes regimen behaviors:
predicting adherence. Medical Care, 25 : 868-881
McCrea JB, Ranelli PL, Boyce EG, Erwin WG. (1993). Preliminary study of
autonomy as a factor influencing medication-taking by elderly patients.
American Journal of Hospital Pharmacy, 50: 296-298.
382
McKevitt PM, Jones JF, Lane DA, Marion RR. (1990). The elderly on dialysis: some
considerations in compliance. American Journal of Kidney Disease, 16: 346-
350.
McMahon RJ, Forehand R, Griest DL. (1982). Parent behavioral training to modify
child noncompliance: factors in generalization and maintenance. In: RB Stuart
(Ed.). Adherence, compliance and generalization in behavioral medicine.New
York: Brunner l Mazel. 213-238.
Means B, Nigam A, zarrow M, Loftus EF, Donaldson MS. (1989). Autobiographical
memory for health-related events. Vital and Health Statistics, Series 6:
Cognition and Survey Measurement, No. 2. Public Health Service, Hyattsville,
MD.
Medisense, Inc. (1995). sensorLink system: operator's manual. waltham,
Massachusetts: Medisense, Inc.
Meichenbaum D, Turk DC. (1987). Facilitating treatment adherence: a practitioner's
guidebook New York: Plenum.
Méndez FJ, Beléndez M. (1997). Effects of a behavioral intervention on treatment
adherence and stress management in adolescents with IDDM. Diabetes Care,
20:1370-1375.
383
Meyerhoff C, Bischof F, Pfeiffer EF. (1994). Long-term experiences with a
computerized diabetes management and glucose monitoring system in insulin-
dependent diabetic patients. Diabetes Research and Clinical Practice,24: I-7.
Miller-Johnson S, Emery RE, Marvin RS, Clarke W, Lovinger R, Martin M. (L994).
Parent-child relationships and the management of Insulin-Dependent Diabetes
Mellitus. Journal of Consulting and Clinical Psychology,62: 603-610.
Minuchin S, Baker L, Rosman BL, Liebman R, Lilman L, Todd T. (1975). A
conceptual model of psychosomatic illness in children. Archives of General
Psychiatry, 32 : 103I-1038.
Montemayor R. (1983). Parents and adolescents in conflict: all families some of the
time and some families most of the time. Journal of Eaþ Adolescence, 3: 83-
103.
Montemayor R. (1986). Family variation in parent-adolescent storm and stress.
Journal of Adolescent Research,4: 15-3I.
Montemayor R, Hanson E. (1985). A naturalistic view of conflict between adolescents
and their parents and siblings. Journal of Earþ Adolescence, 5: 23-30.
Moos RH, Moos BS. (1981). Family environment scale manual. Palo Alto, CA:
Consulting Psychologists Press.
384
Mullen PD, Hersey JC, Iverson DC. (1987). Health behavior models compared. Social
Science and Medicine, 24: 973-98I.
Nathan DM, Singer DE, Hurxthal K, Goodson JD. (1984). The clinical information
value of the glycosylated hemoglobin assay. New England Journal of
Medicine, 3 10 : 347-346.
Nessman DG, Carnahan JE, Nugent CA. (1980). Increasing compliance: patient-
operated hypertension groups. Archives of Internal Medicine, 140: 1427 -1430
Newacheck PW, McManus MA, Fox IIB. (1991). Prevalence and impact of chronic
illness among adolescents. American Journal of Diseases in Children, 145:
1367-t373.
Newacheck PW, Taylor WR. (L992). Childhood chronic illness: prevalence, severity,
and impact. American Journal of Public Health, 82:364-371.
Newton RW, Greene SA. (1995). Diabetes in the adolescent. In: CJH Kelnar (Ed.)
Childhood and adolescent diabet¿s. London: Chapman and Hall. 367-374.
Norman GR, Streiner DL. (1994). Biostatistics: The bare essentials. St. Louis, MO:
Mosby
385
Nowicki S, Duke MP. (1983). The Nowicki-Strickland life-span locus of control
scales: construct validation. In: HM I-efcourt (Ed.). Research with the locus of
control construct: Vol. 2. Developments and socíal problems. New York:
Academic Press. 9-51.
Nunnally JC, Bernstein IH. (1994). Psychometric theory. 3rd Edition. New York:
McGraw-Hill.
o'Looney BA, Barett PT. (1983). A psychometric investigation of the
multidimensional health locus of control questionnaire. British Journal of
Clinical P sycholo gy, 22: 2I7 -218.
Olson DL. (1986). Manual for the Family AdaptabíIity and Cohesion Evaluation
Scales - III (FACES - Iil). Minneapolis, MN: University of Minnesota Press.
Olson OC. (1988). Diagnosis and management of diabetes mellitus. Second Edition.
New York: Raven.
Orme CM, Binik YM. (1989). Consistency of adherence across regimen demands.
Health Psychology, 8: 27-43.
Pagano RR. (1986). Understanding statistics in the behavioural sciences. Second
International Edition. St. Paul, MN: 'West Publishing Company
Paikoff RL, Brooks-Gunn J. (1991). Do parent-child relationships change during
puberty? Psychological Bulletin, I l0: 47-66.
386
Papini DR, Clark S, Bamett JK, Savage CL. (1939). Grade, pubertal status, and
gender-related variations in conflictual issues among adolescents.
Adolescence, 24 : 977 -987 .
Papini DR, Roggman LA. (1992). Adolescent perceived attachment to parents in
relation to competence, depression, and anxiety: a longitudinal study. Journal
of Early Adolescence, 12: 420-440.
Papini DR, Sebby RA. (1988). Variations in conflictual family issues by adolescent
pubertal status, gender, and family member. Journal of Early Adolescence, 8:
1-15.
Parcel GS, Meyer MP. (1981). Development of an instrument to measure children's
health locus of control. Health Educatíon Monographs, 6: 749-159
Pardeck JA, Pardeck JT. (1990). Family factors related to adolescent autonomy
Adolescence, 25 : 3lI-319.
Parfitt VJ, Clark JD, Turner GM, Hartog M. (1992). Maternal postprandial blood
glucose levels influence infant birth weight in diabetic pregnancy. Diabetes
Research, 19:133-135.
Parfitt VJ, Clark JD, Turner GM, Hartog M. (1993). Use of fructosamine and glycated
haemoglobin to verify self blood glucose monitoring data in diabetic
pregnancy. Diabetic Medicine, 10: L62-L66.
387
Pearson ES, Hartley HO. (Eds). (1970). Biometrika tables for statisticians. Third
Edition. Volume 1. New York: Cambridge University Press
Pender NJ. (1987). Health promotion in nursing practice. Second Edition. Norwalk,
Connecticut: Appleton and Lange.
Peri G, Molinari E, Taverna A. (1991). Parental perceptions of childhood illness.
Journal of Asthma, 28 : 9 l-L01.
Perrin EC, Gerrity PS. (1984). Development of children with a chronic illness.
Pediatric Clinics of North America, 31 : I9-3L.
Perrin JM. (1991). Adolescents with chronic illness. American Journal of Diseases in
Children, I 45 : 136I-1362.
Perrin JM, Shayne MW, Bloom SR. (1993). Home and community care for
chronically íll children New York: Oxford University Press.
Perry CL, Klepp KI, Shultz JM. (1988). Primary prevention of cardiovascular disease:
communitywide strategies for youth. Journal of Consulting and Clinical
Psychology, 56 : 358-364.
Peterson GW. (1986). Parent-youth power dimensions and the behavioral autonomy of
adolescents . J ournal of Adole s cent Re s e arch, I : 231 -249.
388
Pless IB. (1984). Clinical assessment: physical and psychological functioning
Pediatric Clinics of North America, 31 : 33-45.
Pope RM, Apps JM, Page MD, Allen K, Bodansky HJ. (1993). A novel device for the
rapid in-clinic measurement of haemoglobin 41.. Diabetic Medicine, 10: 260-
Prentice-Dunn S, Rogers RW. (1986). Protection motivation theory and preventive
health: beyond the health belief model. Health Education Research: Theory
and Practice, 1: 153-161.
Prinz RJ, Foster S, Kent RN, O'Iæary KD. (1979). Multivariate assessment of conflict
in distressed and nondistressed mother-adolescent dyads. Journal of Applied
Behavior Anølysis, 12: 69I-7O0.
Prochaska JO, DiClemente CC. (1983). Stages and processes of self-change of
smoking: toward an integrative model of change. Journal of Consulting and
Clinical Psychology, 5 I : 390-395.
Rae-Grant Q. (1985). Psychological problems in the medically ill child. Pediatric
Clinics of North America, 8: 653-663.
Rand CS. (1990). Issues in the measurement of adherence. In: SA Shumaker, EB
Schron, JK Ockene (Eds.). The handbook of health behavior change. New
263
York: Springer. 102-1 10.
389
Rand CS, Wise RA, Nides M, Simmons MS, Bleecker ER, Kusek JTV, Li VC,
Tashkin DP. (1992). Metered-dose inhaler adherence in a clinical trial.
American Review of Respiratory Diseases, 146: l55g-L564.
Rapoff M. (1996). V/hy comply? Theories in pediatric medical adherence research.
Society for Pediatric Psychology: Progress Notes, Summer: 2,3,6.
Rapoff MA, Christophersen ER. (1982). Compliance of pediatric patients with
medical regimens: a review and evaluation. In: RB Stuart (Ed.), Adherence,
compliance and generalization in behavioral medicine. New York:
B runner/IVI azel. 7 9 - I24.
Raven BH, Rubin JZ. (1983). social psychology. Second Edition. Singapore: wiley
Reichard P, Berglund B, Britz A, cars I, Nilsson By, Rosenqvist u. (1991).
Intensified conventional insulin treatment retards the microvascular
complications of insulin-dependent diabetes mellitus (IDDM): The Stockholm
Diabetes Intervention Study (SDIS) after 5 years. Journal of Internal
Medicine, 230: I0I-I08.
Reimers TM, I-ee J. (1991). Parental acceptability of treatments for children's
hypercholesterolemia. Journal of Behavioral Medicine, 14: 225-239.
Research Unit in Health and Behavioural Change. (1989). Changing the Public
Health. New York: John V/iley and Sons.
390
Rickert VI, Jay MS, Gottlieb AA. (1990). Adolescent wellness: facilitating
compliance in social morbidities. Medical Clinics of North America, 74: II35-
1 148.
Ried LD, Christensen DB. (1988). A psychosocial perspective in the explanation of
patient's drug taking behaviour. Social Science and Medicine, 27: 277-285.
Rimer BK. (1990). Perspectives on intrapersonal theories in health education and
health behavior. In: K Glanz, FM Iæwis, BK Rimer (Eds.). Health behaviour
and health education: theory, resea,rch, and practic¿. San Francisco: Jossey-
Bass. 140-157
Robin A. (1980). Parent-adolescent conflict: a skill-training approach. In: DP Rathjen,
JP Foreyt (Eds.). Social competence: interventions for children and adults.
New York: Pergamon. 147-2II.
Robin AL. (1981). A controlled evaluation of problem-solving communication
training with parent-adolescent conflict. Behavior Therapy, 12: 593-609.
Robin AL, Foster SL. (1984). Problem-solving communication training: a behavioral-
family systems approach to parent-adolescent conflict. In: P Karoly, JJ Steffen
(Eds.). Adolescent behøvior disorders: foundations and contemporary
concerns.I-exington, Massachusetts: D.C. Heath & Co. L95-240.
391
Robin AL, Foster SL. (1988a). Conflict behaviour questionnaire. In: M Hersen, AS
Bellack (Eds.). Dictionary of behavioural assessment techniques. New York:
Pergamon. 148-150.
Robin AL, Foster SL. (1988b). Issues checklist. kr: M Hersen, AS Bellack (Eds.).
Dictionary of behavioural assessment techniques. New York: Pergamon.
278-279.
Robin AL, Foster SL. (1989). Negotiating parent-adolescent conflict: a behavioral-
family systems approach. New York: Guilford.
Robin AL, Koepke T, Moye A. (1990). Multidimensional assessment of parent-
adolescent relations. P sycholo gical As s e s sment, 2 : 45 L -459.
Robin AL, Weiss JG. (1980). Criterion-related validity of behavioral and self-report
measures of problem-solving communication skills in distressed and non-
distressed parent-adolescent dyads. B ehavioral As s e s sment, 2 : 339 -352.
Robinson S, Marsland L. (1994). Approaches to the problem of respondent attrition in
a longitudinal panel study of nurses' careers. Journal of Advanced Nursing,
20:729-741.
Rogers RW. (1975). A protection motivation theory of fear appeals and attitude
change. Journal of Psychology, 91 : 93-II4.
392
Rogers RW. (1983). Cognitive and physiological processes in fear appeals and
attitude change: a revised theory of protection motivation. In: JT Cacioppo, RE
Petty, D Shapiro (Eds.). Social psychophysiology: a sourcebooft. New York:
Guilford. L53-176.
Rokeach M. (1973). The nature of humanvalues. New York: Free Press.
Rorer B, Tucker CM, Blake H. (1988). Long-term nurse-patient interactions: factors in
patient compliance or noncompliance to the dietary regimen. Health
Psychology, T: 35-46.
Rosenn BM, Miodovnik M, Holcberg G, Khoury JC, Siddiqi TA. (1995).
Hypoglycemia: the price of intensive insulin therapy for pregnant women with
insulin-dependent diabetes mellitus. Obstetrics and Gynecology, 85: 417-422.
Rosenstock IM. (1960). What research in motivation suggests for public health.
American Journal of Public Health, 50: 295-3O1.
Rosenstock M. (1974). Historical origins of the health belief model. Health
Education Mono graphs, 2 : 328-335.
Rosenstock IM. (1990). The health belief model: explaining health behavior through
expectancies. In: K Glanz, FM Iæwis, BK Rimer (Eds.). Health behavíour and
health education: theory, research, and practic¿. San Francisco: Jossey-Bass.
39-62.
393
Rosenstock IM, Kirscht JP. (1974). The health belief model and personal health
behaviour. H ealth Education Mono graphs, 2 : 47 0-47 3.
Rosenstock IM, Strecher VJ, Becker MH. (1988). Social learning theory and the
health belief model. Health Education Quarterþ, 15: 175-183.
Roth HP, Caron HS. (1978). Accuracy of doctor's estimates and patient's statements
on adherence to a drug regimen. Clinical Pharmacology and Therapeutics, 23:
361-369.
Rotter JB. (1966). Generalized expectancies for internal versus external control of
reinforcem ent. P sy chol o gi c øI M ono g r aphs, 80 : L -28.
Rubin RR, Peyrot M, Young-Hyman D. (1989). Parent-child responsibility and
conflict in diabets care (Abstract). Diabetes, 38: 7 A.
Ruley EJ. (1978). Compliance in young hypertensive patients. Pediatric Clinics of
North America, 25: I75-I82
Rumley AG, Kilpatrick ES, Dominiczak MH, Small M. (1993). Evaluation of
glycaemic control using the Ames DCA 2000 HbA1" analyser. Diabetic
Medicine, 10:976-979.
Rutter M. (1988). Longitudinal data in the study of causal processes: some uses and
some pitfalls. In: M Rutter (Ed.). Studies of psychosocial risk: the power of
longitudinal data. Cambridge, UK: Cambridge University Press. 1-28.
394
Rutter M. (1994). Beyond longitudinal data: causes, consequences, changes, and
continuity. Journal of Consulting and Clinical Psychology, 62: 928-940.
Ryan RM, Lynch JH. (1989). Emotional Autonomy versus detachment: revisiting the
vicissitudes of adolescence and young adulthood. Child Development, 60: 340-
356
Sabbeth B. (1984). Understanding the impact of chronic childhood illness on families
Pediatric Clinics of North America, 31 : 47 -57
Sallis JF, Nader PR. (1988). Family determinants of health behaviors. In: DS
Gochman (Ed.). Health behavior: emerging research perspectiv¿s. New York:
Plenum. 107-124.
Sanders GS. (1982). Social comparison and perceptions of health and illness. In: GS
Sanders, J Suls (Eds.). Social Psychology of Health and IIIness. New Jersey:
Lawrence Erlbaum. I29-I57.
Sanders MR, Gravestock FM, Wanstall K, Dunne M. (1991). The relationship
between children's treatment-related behaviour problems, age and clinical
status in cystic fibrosis. Journal of Paediatrics and Child Health, 27: 290-
294.
Satin W, La Greca AIÀf,Zigo MA, Skyler JS. (1989). Diabetes in adolescence: effects
of multifamily group intervention and parent simulation of diabetes. Journal of
Pediatric P sycholo gy, I 4 : 259-27 6.
395
Schafer LC, Glasgow RE, McCaul KD, Dreher M. (1983). Adherence to IDDM
regimens: relationship to psychosocial variables and metabolic control.
Diabetes Care, 6: 493-498.
Schafer LC, McCaul KD, Glasgow RE. (1986). Supportive and nonsupportive family
behaviors: Relationships to adherence and metabolic control in persons with
Type I diabetes. Diabetes Care, 9: 179-185.
Scherer KR. (1984). Emotions as a multicomponent process: a model and some cross-
cultural data. In: P Scherer (Ed.). Revíew of Personality and Social
Psychology. VoI5. California: Sage. 37-63.
Scherer KR. (1988). Criteria for emotion-antecedent appraisal: a review. In: V
Hamilton, GH Bower, NH Frijda (Eds.). Cognitive perspectives in emotion
and mot iv at í on. Massachusetts : Kluwer Ac ademic Public ation s. 8 9- 1 26.
Schlenk EA, Hart LK. (1984). Relationship between health locus of control, health
value, and social support and compliance of persons with diabetes mellitus.
Diabetes care, 7 : 566-57 4.
Schmidt T F, Klover RV, Arfken cL, Delamater AM, Hobson D. (1992). compliance
with dietary prescriptions in children and adolescents with insulin-dependent
diabetes mellitus. Journal of the American Diatetic Association, g2: 567-570.
396
Schubiner H, Robin A. (1990). Screening adolescents for depression and parent-
teenager conflict in an ambulatory medical setting: a preliminary investigation.
Pediatrics, 85; 8 l3-8 1 8.
Scobie IN, Sönksen PH. (1984). Methods of achieving better diabetic control. In: M
Nattrass, JV Santiago (Eds.). Recent advances in Diabetes.' 1. New York:
Churchill Livingston. 107 -L25.
Seeman M, seeman TE. (1983) Health behaviour and personal autonomy: a
longitudinal study of the sense of control in illness. Journal of Health and
Social Behaviour, 24 : 144-160.
Shapiro D. (1981). Autonomy and rigid character. New York: Basic.
Shapiro J. (1983). Family reactions and coping strategies in response to the physically
ill or handicapped child: a review. Social Science and Medicine, 17: 9I3-93I.
shaw ME, costanzo PR. (1970). Theories of social psychology. New York: McGraw-
Hill.
Sherbourne CD, Hays RD, Ordway L, DiMatteo MR, Kravitz RL. (1992)
Antecedents of adherence to medical recommendations: results from the
medical outcomes study. Journal of Behavioral Medicíne, l5: 447-468.
Shope JT. (1981). Medication compliance. Pediatríc Clinics of Norrh America, 28: 5-
21.
397
Sigafoos AD, Feinstein CB, Damond M, Reiss D. (1988). The measurement of
behavioural autonomy in adolescence: The Autonomous Functioning
Checklist. In: SC Feinstein, AH Esman, JG Looney, GH Orvin, JL Schimel,
AZ Schwartzenberg, AD Sorosky, M Sugar (Eds.). Adolescent psychiatry:
developmental and clinical studies. Vol 15. Chicago, IL: University of Chicago
Press. 432-462.
Silink M. (1990). Childhood diabetes and hypoglycaemia. In: MJ Robinson (Ed.).
Practical paediatrics. Second Edition. Singapore: Churchill Livingstone. 480-
487.
Silverberg SB, Steinberg L. (1987). Adolescent autonomy, parent-adolescent conflict,
and parental well-being. Journal of Youth and Adolescence, 16: 293-3L2.
SIR, Pty Ltd. (1993). FORMS reþrence manual. Sydney: SIR Pry. Lrd.
Small SA, Eastman G, Cornelius S. (1988). Adolescent autonomy and parental stress.
Journal of Youth and Adolescence, 17 : 377 -39I
Snedecor GW, Cochran WG. (1980). Statistical methods. Seventh Edition. Ames, IA:
Iowa State University Press.
Snow DL, Tebes JK, Arthur MW. (1992). Panel attrition and external validity in
adolescent substance use research. Journal of Consulting and Clinical
Psychology, 60: 804-807 .
398
Spallone V, Menzinger G. (1997). Diagnosis of cardiovascular autonomic meuropathy
in diabetes. Diabetes,46: 567-576
Spector SL, Kinsman R, Mawhinney H, Siegel SC, Rachelefsky GS, Katz RM, Rohr
AS. (1986). Compliance of patients with asthma with an experimental
aerosolized medication: implications for controlled clinical trials. Journal of
Allergy and Clinical Immunology, TT: 65-70
Spector SL, Mawhinney H. (1991). Aerosol inhaler monitoring of asthmatic
medication. In: JA Cramer, B Spilker (Eds.). Patient compliance in medical
practice and clinical trials. New York: Raven. 149-162.
Sperling MA. (1992). Diabetes Mellitus. In: RE Behrman, RM Kliegman, WE Nelson,
VC Vaughan (Eds.). Nelson textbook of pediatrics. Fourteenth Edition
Philadelphia, PA: Harcourt Brace Jovanovich . 390-409.
Spevack M, Johnson SB, Harkavy JM, Silverstein J, Shuster J, Rosenbloom A,
Malone J. (1987). Diabetologists' judgments of diabetic control: Reliability
and mathematical simulation. Diabetes Care, l0:217-224.
Spevack M, Johnson SB, Riley W, Silverstein J. (1991). The effect of diabetes
sunÌmer camp on adherence behaviours and glycemic control. In: Johnson JH,
Johnson SB, (Eds.). Advances in Child Health Psychology. Gainesville:
University of Florida Press. 285-292.
SPSS, Inc. (1994). SPSS 6.1@ for WindowsrM. Chicago, IL: SPSS Inc.
399
Stein RE, Jessop DJ. (1982a). What diagnosis does not tell: the case for a non-
categorical approach to chronic physical illness. Pediatric Research, 16 (Part
2):188¿. (Abstract).
Stein REK, Jessop DJ. (1982b). A noncategorical approach to chronic childhood
illness. Public Health Reports, 97: 354-362.
Stein REK, Jessop DJ. (198aa). General issues in the care of children with chronic
physical conditions. Pediatric Clinics of N orth America, 31 ; I 89- 198.
Stein REK, Jessop DJ. (1984b). Does pediatric home care make a difference for
children with chronic illness? Findings from the pediatric ambulatory care
treatment study. Pediatrics, 73: 845-853.
Stein REK, Westbrook I.F., Bauman U. (1997). The questionnaire for identifying
children with chronic conditions: a measure based on a noncategorical
approach. Pediatric, 99 : 513-52I.
Steinberg L. (1985). Adolescenc¿. New York: Alfred A Knopf.
Steinberg L. (1989). Pubertal maturation and parent-adolescent distance: An
evolutionary perspective. In: G Adams, R Montemayor, T Gullotta (Eds.).
Biology of adolescent behavior and development: Advances in adolescent
development, Volume 1. Beverly Hills, CA: Sage. 7l-97 .
400
Steinberg L. (1990). Autonomy, conflict, and harmony in the family relationship. In:
SS Feldman, GR Elliott @ds.), At the threshold: the developing adolescent.
Cambridge, Massachusetts : Harvard University Press. 255 -27 6
Steinberg L, Silverberg SB. (1986). The vicissitudes of autonomy in early
adolescence. Child Development, 57: 841-851
Stewart AL, Greenfield S, Hays RD, Wells K, Rogers WH, Berry SD, McGlynn EA,
'Ware JE. (1989). Functional status and well-being of patients with chronic
conditions: results from the medical outcomes study. Journal of the American
Medícal Association, 262 : 907 -9I3
Stewart AL, Hays RD, Ware fE. Q992). Methods of validating MOS health measures
In: AL Stewart, JE Ware. (Eds.). Measuring functioning and well-being: The
Medical Outcomes Study approach. Durham, NC: Duke University Press
309-324.
Stewart AL, 'Ware JE. (Eds.). (1992). Measuring functioning and well-being: The
Medical Outcomes Study approach. Durham, NC: Duke University Press
Stewart DA, Stein A, Forrest GC, Clark Di[l4.. (1992). Psychosocial adjustment in
siblings of children with chronic life-threatening illness: a research note.
Journal of Child Psychology and Psychiatry, 33:779-784.
Stewart RB, Caranasos GJ. (1989). Medication compliance in the elderly. Medical
Clinics of North America, 73: L55l-I563.
40r
Stone GC. (1979a). Psychology and the health system. In: GC Stone, F Cohen, NE
Adler (Eds.). Health psychology: a handbook. San Francisco: Jossey-Bass.
47-75.
Stone GC. (1979b). Patient compliance and the role of the expert. Journal of Social
Issues, 35:34-59
Stone MK, Hutchinson RL. (1992). Family conflict and attitudes toward marriage: A
psychological wholeness perspective. Special Issue: Divorce and the next
generation: Effects on young adults' patterns of intimacy and expectations of
marriage. Journal of Divorce and Remarríage, 18:79-9L.
Stratton R, V/ilson DP, Endres RK, Goldstein DE. (1987). Improved glycemic control
after supervised 8-week exercise program in insulin-dependent diabetic
adolescents. Diabetes Care, l0: 589-593.
Streiner DL, Norman GR. (1995). Health measurement scales: A practical guide to
their development and use. Second Edition. Oxford, New York.
Stuart RB. (1982). A natural history of health behavior decision-making. In: RB Stuart
(Ed.). Adherence, compliance and generalization ín behavioral medicine. New
York: Brunner I lV'[¿zel. 3-27
Suedfeld P. (1982). Environmental factors influencing maintenance of lifestyle
change. In: RB Stuart (Ed.). Adherence, compliance and generalization in
behavioral medicine. New York: BrunnerAyIazel. L25-I44.
402
Tabachnick BG, Fidell LS. (1989). Using multivariate statistics. Second Edition.
New York: Harper & Row
Tanner JF, Hunt JB, Eppright DR. (1991). The protection motivation model: a
normative model of fear appeals. Journal of Marketing, 55: 36-45
Tarlov AR, 'Ware JE, Greenfield S, Nelson EC, Perrin E, Zubkoff M. (1989). The
medical outcomes study: an application of methods for monitoring the results
of medical care. Journal of the American Medical Association, 262: 925-930
Tate PF, Clements CA, Walters JE. (1992). Accuracy of home glucose monitors.
Diabetes Care, I 5 : 536-538.
Taylor JD, Fotheringham MJ, Sawyer MG, Couper JJ. (L996). Ambulatory
intervention in adolescents with insulin dependent diabetes: Impact of
metabolic control and psychosocial functioning. Proceedings of the Australian
Diabetes Society, 1996 A62.
Taylor JD, Fotheringham MJ, Sawyer MG, Couper JJ. (1997). The enduring impact of
an ambulatory intervention on adolescents with insulin dependent diabetes.
Proceedings of the Australian Diabetes Society, 1997 A 69
Tebbi CK. (1993). Treatment compliance in childhood and adolescence. Cancer, TI:
3447-3449
403
Tebbi CK, Cummings KM, Zevon MA, Smith L, Richards M, Mallon J. (1986).
Compliance of pediatric and adolescent cancer patients. Cancer, 58: Il79-
I 184.
Tebbi CK, Richards ME, Cummings KM, Zevon MA, Mallon JC. (1988). The role of
parent-adolescent concordance in compliance with cancer chemotherapy.
Adolescence, 23 : 599-6L1.
Tebbi CK, Tnvon MA, Richards ME, Cummings KM. (1939). Attributions of
responsibility in adolescent cancer patients and their parents. Journal of
Cancer Education, 4 : 135-142.
Thai AC, Ng WY, Lui KF, Cheah JS. (1993). Rapid desktop method for the
measurement of glycated haemoglobin HbA1.. Singapore Medical Journal, 34:
493-495.
Thorye LP, Clark WW, Tiegs EW. (1953). Caliþrnia test of personality. Monterey,
CA: CTP / McGraw Hill.
Tieszen KL, Burton SF, Dornan TL, Matthews DR, McMurray JR. (1995). Evaluation
of a second-generation electrochemical blood glucose monitoring system.
Diabetic Medicine, 12: 173-176.
Tinkelman DG, Vande¡pool GE, Canoll MS, Page EG, Spangler DL. (1930).
Compliance differences following administration of theophylline at six- and
twelve-hour intervals. Annals of Allergy, 44: 283-286.
404
Triandis HC. (1964). Exploratory factor analyses of the behavioral component of
social attitudes. Journal of Abnormal and Social Psychology, 68: 420-430.
Triandis HC. (1977).Interpersonal behavior. Monterey, CA: Brooks / Cole.
Turner RA, kwin CE, Tschann JM, Millstein SG. (1993). Autonomy, relatedness, and
the initiation of health risk behaviours in early adolescence. Health
Psycholo gy, I 2 : 200-208
Turner-Henson A, Holaday B, Swan J}J. (1992). When parenting becomes caregiving:
caring for the chronically ill child. Family and Community Health, /5; 19-30
Uncles MD. (1988). Issues in longitudinal data analysis. In: MD Uncles @d.).
lnngitudinal data analysis: methods and applications. London: Methuen. 1-
12.
Varni JW. (1983). Clinical behavioral pediatrics: an interdisciplinary biobehavioral
approach. New York: Pergamon.
Varni JW, Wallander JL. (1984). Adherence to health-related regimens in pediatric
chronic disorders. Clinical P sycholo gy Review, 4 : 585 -596.
Wallston BS, Wallston KA. (1978). Locus of control and health: a review of the
literature. Health Education Monographs, 6: lO7-IL7.
405
Wallston BS, Wallston KA. (1984). Social psychological models of health behaviour:
an examination and integration. In: A Baum, SE Taylor, JE Singer (Ed.).
Handbook of psychology and health: Vol 4: Social psychological aspects of
health. Hillsdale, New Jersey: Lawrence Erlbaum. 23-53
Wallston BS, Wallston KA, Kaplan GD, Maides SA. (1976). Development and
validation of the Health Locus of Control (Fil-C) Scale. Journal of Consulting
and Clinical Psychology, 44 : 580-585
Wallston KA, Wallston BS. (1980). Health locus of control scales. In: H Iæfcourt
(Ed.). Advances and innovations in locus of control research. New York:
Academic. 198-234
Wallston KA, 'Wallston BS. (1981). Health locus of control scales. In: HM I-efcourt
(Ed.). Research with the locus of control construct. Vol. l: assessment
methods. New York: Academic Press. 189-243
Wallston KA, Wallston BS. (1982). Who is responsible for your health? The construct
of health locus of control. In: GS Sanders, J Suls (Eds.). Social Psychology of
Health and lllness. New Jersey: Lawrence Erlbaum. 65-95
Wallston KA, Wallston BS, DeVellis R. (1978). Development of the
multidimensional health locus of control (MHLC) scale. Health Education
Mono graphs, 6 : 160-170.
406
Ware JE, Young J. (1979).Issues in the conceptualization and measurement of value
placed on health. In: SJ Muskin, DW Dunlap (Eds.), Health: Wat is it worth?
New York: Pergamon. I4l-L66.
Warner MM. (1981). The consumer and family physician relationship: power,
autonomy, compliance, and negotiation. Marriage and Family Review,4: 135-
155.
'Wasserman RC, Inui TS, Barriatua RD, Carter WB, Lippincott PL. (19S4). Pediatric
clinicians' support for parents makes a difference: an outcome based analysis
of clinician-patient interaction . Pediatrics, 74: 1047 -1053.
Weinberger M. (1987). Pharmacologic management of asthma. Journal of Adolescent
Health Care, 8:74-83.
Weintraub M. (1990). Compliance in the elderly. Clinics in Geriatric Medicine, 6:
445-452.
'Weissberg-Benchell J, Glasgow AM, Tynan WD, Wirtz P, Turek J, Ward J. (1995).
Adolescent diabetes management and mismanagement. Diabetes Care, 18: 77-
Weist MD, Finney JW, Barnard MU, Davis CD, Ollendick TH. (1993). Empirical
selection of psychosocial treatment targets for children and adolescents with
82.
diabetes. Journal of Pediatric Psychology, I8: LI-28
407
Wells K, Stewart A, Hays RD, Burnam MA, Rogers W, Daniels M, Berry S,
Greenfield S, Ware JE. (1989). The functioning and well-being of depressed
patients: results from the medical outcomes study. Journal of the American
Medical Association, 262 : 914-919.
Williams CL, Carter BJ, Arnold CB, Wynder EL. (1979). Chronic disease risk factors
among children: the "know your body" study. Journal of Chronic Diseases,
32:505-513.
Wilson DP, Endres RK. (1986). Compliance with blood glucose monitoring in
children with Type 1 diabetes mellitus. Pediatrics, 108: 1022-1024.
Wilson TG. (1987). Compliance: a review of the literature with possible applications
to periodontics. Jountal of Periodontology, 58: 706-714.
Winefield AH, Tiggemann M, \Minefield HR. (1991). Attrition bias and internal
validity in a longitudinal study of youth unemployment. Australian Journal of
Psychology,43: 69-73.
Winefield HR. (1982). Reliability and Validity of the health locus of control scale.
J ournal of P ersonality As s es sment, 46 : 614-619.
Winer BJ. (1971). Statistical principles experimental design Second Edition. New
York: McGraw Hill
408
Wing RR, Lamparski DM, Zaslow S, Betschart J, Siminerio L, Becker D. (1985).
Frequency and accuracy of self-monitoring of blood glucose in children:
relationship to glycemic control. Diabetes Care, 8: 2I4-2I8.
Wolcott DL, Maida CA, Diamond R, Nissenson AR. (1986). Treatment compliance in
end-stage renal disease patients on dialysis. American Journal of Nephrology,
6:329-338.
V/olever TM, Bolognesi C. (1996). Prediction of glucose and insulin response of
normal subjects after consuming mixed meals varying in energy, protein, fat,
carbohydrate, and glycemic index. Journal of Nutrition, 126:2807-2812.
wolever TM, Jenkins DJ, Jenkins AL, Josse RG. (1991). The glycemic index:
methodology and clinical implications. American Journal of Clínical
Nutrition, 54: 846-854.
Wolfish MG, Mclæan JA. (L974). Chronic Illness in Adolescents. Pediatric Clinics of
North America, 21: lO43-I049.
Wolfsdorf JI, Laffel LM, Pasquarello C, Vernon A, Herskowitz RD. (1991). Split-
mixed insulin regimen with human ultralente before supprt and NPH
(isophane) before breakfast in children and adolescent with IDDM. Diabetes
Care, 14:1100-1106.
409
Wysocki T. (1993). Associations among teen-parent relationships, metabolic control,
and adjustment to diabetes in adolescents. Journal of Pediatric Psychology,
18:441-452.
Wysocki T, Green L, Huxtable K. (1989). Blood glucose monitoring by diabetic
adolescents: compliance and metabolic control. Health Psychology, 8: 267-
284.
Wysocki T, Green L, Huxtable K. (1991). Reflectance meters with memory:
aplications in behavioral assessment and intervention in juvenile diabetes. In:
IH Johnson, SB Johnson (Eds.). Advances in child health psychology.
Gainesville: University of Florida Press. 307-319.
Wysocki T, Hough BS, TVard KM, Allen AA, Murgai N. (1992). Use of blood glucose
data by families of children and adolescents with IDDM. Diabetes Care, 15:
r04t-t044.
Wysocki T, Meinhold PA, Abrams KC, Barnard MU, Clarke WL, Bellando BJ,
Bourgeois MJ. (1992). Parental and professional estimates of self-care
independence of children and adolescents with IDDM. Diabetes Care, 15: 43-
52
4ro
wysocki r, white NH, Bubb J, Harris MA, Greco p. (1995). Family adaptation to
diabetes: a model for intervention research. In: JL Wallander, LI Siegel (Eds.).
Adolescent health problems: behavioral perspectives. New York: Guilford.
289-304.
Yee DK, Flanagan C. (1985). Family environment and self-consciousness in early
adolescence. Journal of Early Adolescence, 5: 59-68.
Youngleson SM, Joubert G. (1991). A comparison of cross-sectional and longitudinal
survey methods in measuring patient compliance with tuberculosis treatment.
South African Medical Journal, 80: 33I-335
zahn-waxler c, Friedman RJ, cole PM, Mizuta I, Hiruma N. (1996). Japanese and
United States preschool children's responses to conflict and distress. Chitd
Development, 67 : 2462-2477 .
Zeltzer LK. (1980). The adolescent with cancer. In: J Kellerman (Ed.). Psychological
aspects of childhood cancer. Springfield,Illinios: Thomas Books. 70-99.
zoppini G, Targher G, Monauni r, Faccini G, Pasqualini E, Martinelli c,zenanlvn-,
Muggeo M. (1996). Increase in circulating products of lipid peroxidation in
smokers with IDDM. Diabetes Care, 19: I233-L236.
4Lt