Embed Size (px)
Citation preview
Submitted 11 August 2020Accepted 22 January 2021Published 23 March 2021
Corresponding authorVíctor Cuadrado-Peñafiel,[email protected]
Academic editorJustin Keogh
Additional Information andDeclarations can be found onpage 16
DOI 10.7717/peerj.10942
Copyright2021 Jiménez-Reyes et al.
Distributed underCreative Commons CC-BY 4.0
OPEN ACCESS
Differences between adjusted vs. non-adjusted loads in velocity-based training:consequences for strength trainingcontrol and programmingPedro Jiménez-Reyes1, Adrian Castaño-Zambudio1, Víctor Cuadrado-Peñafiel2,Jorge M. González-Hernández3, Fernando Capelo-Ramírez4, Luis M. Martínez-Aranda5 and Juan J. González-Badillo6
1Centre for Sport Studies, Rey Juan Carlos University, Madrid, Spain2Department of Physical Education, Sport and Human Motricity, Universidad Autónoma de Madrid, Madrid,Spain
3 Faculty of Health Sciences, Universidad Europea de Canarias, La Orotava, Tenerife, Spain4 Faculty of Education Sciences, SPORT Research Group (CTS-1024), CERNEP, University of Almeria,Almeria, Spain
5 Faculty of Sport.Neuromove Research Group, Catholic University of San Antonio, Murcia, Spain6Physical Performance & Athletic Research Center, Faculty of Sports Science, Pablo de Olavide University,Sevilla, Spain
ABSTRACTStrength and conditioning specialists commonly deal with the quantification andselection the setting of protocols regarding resistance training intensities. Althoughthe one repetition maximum (1RM)method has been widely used to prescribe exerciseintensity, the velocity-based training (VBT) method may enable a more optimal toolfor better monitoring and planning of resistance training (RT) programs. The aim ofthis study was to compare the effects of two RT programs only differing in the trainingload prescription strategy (adjusting or not daily via VBT) with loads from 50 to 80%1RM on 1RM, countermovement (CMJ) and sprint. Twenty-four male students withprevious experience in RT were randomly assigned to two groups: adjusted loads (AL)(n= 13) andnon-adjusted loads (NAL) (n= 11) and carried out an 8-week (16 sessions)RT program. The performance assessment pre- and post-training program includedestimated 1RM and full load-velocity profile in the squat exercise; countermovementjump (CMJ); and 20-m sprint (T20). Relative intensity (RI) and mean propulsivevelocity attained during each training session (Vsession) was monitored. Subjects in theNAL group trained at a significantly faster Vsession than those in AL (p < 0.001) (0.88–0.91 vs. 0.67–0.68 m/s, with a∼15% RM gap between groups for the last sessions), anddid not achieve themaximumprogrammed intensity (80%RM). Significant differenceswere detected in sessions 3–4, showing differences betweenprogrammed andperformedVsession and lower RI and velocity loss (VL) for the NAL compared to the AL group(p < 0.05). Although both groups improved 1RM, CMJ and T20, NAL experiencedgreater and significant changes than AL (28.90 vs.12.70%, 16.10 vs. 7.90% and−1.99 vs.−0.95%, respectively). Load adjustment based on movement velocity is a useful way tocontrol for highly individualised responses to training and improve the implementationof RT programs.
How to cite this article Jiménez-Reyes P, Castaño-Zambudio A, Cuadrado-Peñafiel Ví, González-Hernández JM, Capelo-Ramírez F,Martínez-Aranda LM, González-Badillo JJ. 2021. Differences between adjusted vs. non-adjusted loads in velocity-based training: conse-quences for strength training control and programming. PeerJ 9:e10942 http://doi.org/10.7717/peerj.10942
Subjects Anatomy and Physiology, Cardiology, Kinesiology, Science and Medical EducationKeywords Velocity-based strength training, Full squat, Performance, Velocity specificity,Resistance training
INTRODUCTIONResistance training (RT) is recognized as an effective method for increasing strength, powerandmuscle hypertrophy. It has also been considered a key component of exercise programsdesigned for improving health status and overall fitness (Pareja-Blanco et al., 2014). Theadaptations achieved through RT depend on the applied stimulus (Spiering et al., 2008).Therefore, it is important to monitor variables such as volume, absolute and relativeintensity (RI), number of repetitions, sets and resting time between sets according toFITT principles during RT programs. For this reason, the optimal combination of trainingvariables is especially interesting to strength and conditioning coaches and researchersaiming to maximize dynamic strength gains (Marshall, McEwen & Robbins, 2011).
Intensity generally has been acknowledged as an essential variable in terms of improvingstrength (Kraemer & Ratamess, 2004). Several authors and strength and conditioningcoaches have shown their interest on how to monitor and establish RT intensity in a dailycontext objectively (Baechle & Earle, 2008). Traditionally, the one-repetition maximum(1RM) approach has been widely used to prescribe and monitor exercise intensity duringconventional loading-based RT. In recent years, this method has been one of the mostwidely recognized tools for prescribing and designing RT programs because of the easeof programming RI in training sessions. However, during the training process, athletesexperience daily variations in performance, and the 1RM values for a given subject andexercise may vary between sessions (González-Badillo et al., 2011; Dorrell, Smith & Gee,2019). Thus, it cannot be guaranteed that the loads (%1RM) being used in each particulartraining session truly represent the intended ones if the 1RM is not measured at thebeginning of each session. Testing 1RM several times to adjust loads during the trainingperiod may interfere with the estimated training stimulus due to the significant effortthat 1RM represents, resulting in a non-specific stimulus that could interfere negatively inphysical performance improvement (González-Badillo & Sánchez-Medina, 2010). For thisreason, the difficulty of determining the differences between performed and previouslyprogrammed intensities represents a typical concern for practitioners and training decisionmaking processes are very limited due to the existing lack of knowledge of the actual shapeand fatigue state of the athlete.
Considering that maximal strength measured by 1-RM can fluctuate daily due to fatigueor increase in short-time due to training adaptation, an outdated 1-RM as a referenceto prescribe training loads can represent an important limitation for coaches. Overall,practitioners using traditional %1RM load prescription methods within a periodisedmodel, will aim to account for fluctuations in maximal strength, however given theirhighly individualised nature it can be near impossible to predict the magnitude of thesefluctuations. For example, during a high volume and high frequency training block,coaches may reduce the load used as they understand individuals are likely carrying
Jiménez-Reyes et al. (2021), PeerJ, DOI 10.7717/peerj.10942 2/21
residual training-induced fatigue session-to-session. Yet precisely the specific fatigueresponse, and its impact of maximal strength is impossible to quantify without methodssuch as some authors have proposed as the use of the recently developed velocity-basedRT method (VBT). Although recent researches have proposed adjusting training loadsconsidering the method known as ‘‘Rating of Perceived Exertion Repetitions-in-Reserve’’(RPE-RIR) as an alternative to account the possible individual’s day-to-day fluctuation(Zourdos et al., 2016; Helms et al., 2016; Helms et al., 2017) recent evidence has highlightedsome limitations of these methods (Mansfield et al., 2020). To address these issues, someauthors have proposed the use of the well-known velocity-based RT method (VBT)which could allow for manipulating training loads within a training session objectively(Weakley et al., 2020a). Therefore, the daily training load can be matched to the previouslyprogrammed intensity, since it is acknowledged that each %1RM corresponds to a specificmean concentric velocity. This finding has been reported and used in several studies thatachieved similar results, although some studies propose individualizing the load-velocityrelationship for each subject (González-Badillo & Sánchez-Medina, 2010; Sánchez-Medinaet al., 2017; García-Ramos et al., 2019; García-Ramos & Janicijevic, 2020). In this sense,VBT differs from traditional approaches by modifying training load variables to matchthe pre-programmed ones prior to a given training session, rather than assigning thembased on a 1RM pre-test. Together with 1-RM, a common practice to assess strengthgains is the measurement of explosive performance via countermovement jump (CMJ)height and sprint time after a training period (Pareja-Blanco et al., 2017b). Furthermore,neuromuscular fatigue generated during resistance training sessions has been monitoredthrough velocity loss (VL) (Sánchez-Medina & González-Badillo, 2011, Sánchez-Morenoet al., 2017).These parameters may contribute to improving current knowledge of theadaptations produced using VBT protocols. Since resistance training is used by a widerange of populations and its benefits to non-athletes have been well documented (Ratamesset al., 2009)
However, despite the potential usefulness of VBT in strength training, to the best ofour knowledge one study by Banyard et al. (2020) has used the VBT method to comparethe effects of matching the absolute load to a previously programmed RI with the sametraining program without adjusting the RI, on training stimulus and adaptations. To date,Banyard et al. (2020) analyzed the effects of a periodized intervention comparing 1RMload percentage-based training (PBT) vs. VBT on maximal strength, CMJ and sprint.Banyard’s study used a similar experimental approach comparing the PBT vs. VBT inhighly experienced resistance-trained males with a ratio of 1RM squat/body mass of 1.60.Note that the VBT method may be highly accurate in this population since the 1RM islikely to be quite consistent across the training intervention. However, in non-experiencedsubjects, this tendency could be different due to an evolution of the 1RM during thetraining intervention presenting a gap between what has been programmed and actuallyperformed because of the inexperience and potential strength gains due to the learningeffects compared to such experienced athletes. In addition, those high performance athleteswho combine endurance and resistance training and those whose performance dependsdirectly on the weight lifted as in Weightlifting or Crossfit need a better understanding
Jiménez-Reyes et al. (2021), PeerJ, DOI 10.7717/peerj.10942 3/21
of the control of their training loads. Thus, to date, no previous studies have investigatedthe development in physical performance generated from the use of two different stimuliderived fromeither a previously planned programor the daily adjustments in load accordingto VBT related decisions in non-experienced subjects. Therefore, The main purpose ofthis study was to analyze and compare training-induced adaptations in 8-week squat RTprograms with different training load prescriptions strategies; one group using 1RM as areference to prescribe each training session load and the other using VBT to adjust eachtraining session load andmonitor the evolution of RI and the attainedmean velocity duringeach training session in unexperienced males. Thus, one group would use the initial 1RMas a reference to prescribe loads for every training session and the VBT group would adjustindividual training loads in each training session. The secondary purpose was to comparethe effects of both training programs on maximal strength, load velocity profile, sprintperformance and CMJ height. We hypothesized that intensity (in both groups) woulddiffer between groups in each training session over the 8-weeks because the group withoutsession-adjusted individuals training loads would train with an outdated 1-RM referencein few sessions. In addition, that would negatively affect the neuromuscular adaptationsachieved during the program likely due to the use of either lower or greater RI than optimaland, in the latter case, an increase in accumulated fatigue throughout the interventionprogram.
METHODSParticipantsTwenty-four physically active male sport sciences students aged 23.1 ± 4.1 years, bodymass 76.3 ± 6.4 kg, height 1.81 ± 0.06 m and SQ 1RM load 80.3 ± 15.2 kgs voluntarilyparticipated in the study. All participants had at least 2 years of RT experience with aminimum of 3 sessions per week. During the duration of this research, the participantswere only doing the training prescribed by us. Participants had to prove they could performa strict and correct technique to be accepted in this investigation. No physical limitations,health problems or musculoskeletal injuries that could affect testing or training werefound after a medical examination. No participants declared the use of drugs, medicationsor dietary supplements known to influence physical performance. Participants wererandomly assigned to one of the two designated groups, which were counterbalancedusing the subjects’ initial 1-RM in pre-test and allocated to either the AL (n= 13) or NAL(n= 11) group. Initially, both groups had the same number of participants (13), but twoparticipants had to abandon the study during the training period; one got a foot injury,and one dropped out due to incompatibility with training times. One group performedprogrammed VBT with relative loads, ranging from 50 to 80%, adjusting the relative loadsin each session according to velocity (AL), while the other group did not adjust relativeloads and worked using absolute programmed loads (NAL). Once informed about thepurpose, testing procedures and research potential risks, all subjects gave their writteninformed consent to participate in this study, which was approved by the local ethicalcommittee and conducted in agreement with the Declaration of Helsinki. The Catholic
Jiménez-Reyes et al. (2021), PeerJ, DOI 10.7717/peerj.10942 4/21
University of San Antonio of Murcia UCAM Ethics Committee granted ethical approval tocarry out the study within its facilities. No physical limitations or musculoskeletal injuriesthat could affect the study were reported.
Study designThe present study used a longitudinal pre-post design with testing sessions separated by 8weeks. All tests were conducted at the same time, from 17:00 to 21:00 to the pre and post -test week. Subjects trained twice a week for 8 weeks, completing a total of 16 sessionswith a minimum 48-hour rest period between sessions. One week after the final trainingsession, the pos t -test was performed. A progressive RT program that comprised onlythe SQ exercise was used (Table 1). RI programmed ranged between 50% (session 1) to80% (session 16). NAL group lifted the corresponding absolute load to match with theprogrammed RI based on their initial 1-RM with velocity monitored, but not used forprescription. However, the AL group lifted with loads adjusted to the programmed RIin each session to reach the planned sessional target. For example, in session one, NALgroup trained with the absolute load that corresponded to 50% 1-RM load, whereas ALgroup used the load necessary to achieve the sessional target velocity of 1.13 m/s whichcorresponded to 50% 1-RM as determined at baseline. The RT program was designed withthe same relative loading magnitude (%1RM) expressed with a target velocity to attain ineach training session. Both groups trained with the same matched sets and repetitions. TheAL group matched the programmed RI to the target velocity by modifying the absoluteloads in each training session (Table 1). The NAL group performed the programmedtraining without adjusting the absolute load to the programmed target velocity. Theirtraining only took into account the initial 1RM as a reference and used absolute loadsthat represented the pre-programmed relative intensities (based on the initial 1RM test)for each session. Velocity was monitored for both groups for all repetitions during allthe training sessions. Sessions were performed in a research laboratory under the directsupervision of the investigators, at the same time of day (±1 h) for each subject and undercontrolled environmental conditions (20 ◦C and 60% humidity). Subjects were requirednot to engage in any other type of strenuous physical activity or exercise training while theywere involved in the present investigation. Every session was supervised by the researchers(specialist in strength and conditioning) in order to certify proper technique was used andto help with the selection of loads.
Equipment and data acquisitionThe SQ test was performed in a Smith machine (Multipower Fitness Line, Peroga, Spain)that allowed a smooth vertical displacement of the bar along a fixed vertical path. Thevelocity values were measured with a linear velocity transducer (T-Force System, Ergotech,Murcia, Spain) providing immediate feedback and saving the data in the program for lateranalysis. To measure the jump height was used an infrared timing system (Optojump,Microgate, Bolzano, Italy) and sprint times were measured using photocells (PolifemoRadio Light, Microgate, Bolzano, Italy).
Testing procedures
Jiménez-Reyes et al. (2021), PeerJ, DOI 10.7717/peerj.10942 5/21
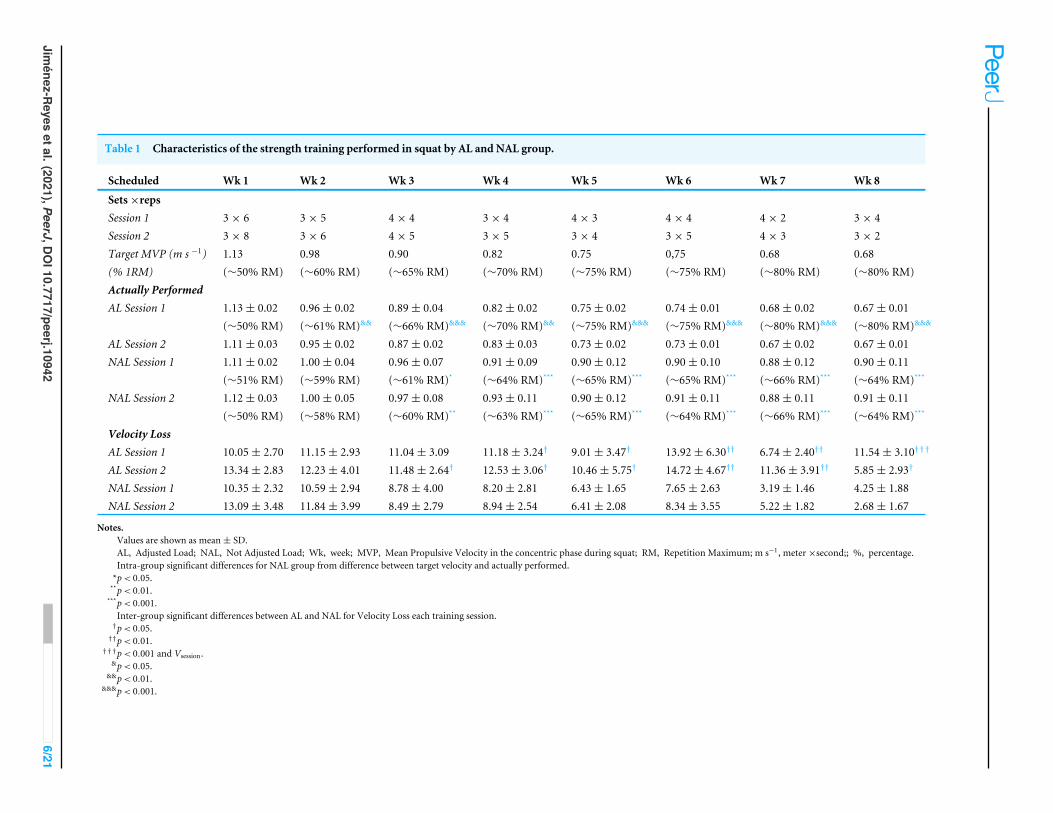
Table 1 Characteristics of the strength training performed in squat by AL and NAL group.
Scheduled Wk 1 Wk 2 Wk 3 Wk 4 Wk 5 Wk 6 Wk 7 Wk 8
Sets×repsSession 1 3× 6 3× 5 4× 4 3× 4 4× 3 4× 4 4× 2 3× 4Session 2 3× 8 3× 6 4× 5 3× 5 3× 4 3× 5 4× 3 3× 2Target MVP (m s −1) 1.13 0.98 0.90 0.82 0.75 0,75 0.68 0.68(% 1RM) (∼50% RM) (∼60% RM) (∼65% RM) (∼70% RM) (∼75% RM) (∼75% RM) (∼80% RM) (∼80% RM)Actually PerformedAL Session 1 1.13± 0.02 0.96± 0.02 0.89± 0.04 0.82± 0.02 0.75± 0.02 0.74± 0.01 0.68± 0.02 0.67± 0.01
(∼50% RM) (∼61% RM)&& (∼66% RM)&&& (∼70% RM)&& (∼75% RM)&&& (∼75% RM)&&& (∼80% RM)&&& (∼80% RM)&&&
AL Session 2 1.11± 0.03 0.95± 0.02 0.87± 0.02 0.83± 0.03 0.73± 0.02 0.73± 0.01 0.67± 0.02 0.67± 0.01NAL Session 1 1.11± 0.02 1.00± 0.04 0.96± 0.07 0.91± 0.09 0.90± 0.12 0.90± 0.10 0.88± 0.12 0.90± 0.11
(∼51% RM) (∼59% RM) (∼61% RM)* (∼64% RM)*** (∼65% RM)*** (∼65% RM)*** (∼66% RM)*** (∼64% RM)***
NAL Session 2 1.12± 0.03 1.00± 0.05 0.97± 0.08 0.93± 0.11 0.90± 0.12 0.91± 0.11 0.88± 0.11 0.91± 0.11(∼50% RM) (∼58% RM) (∼60% RM)** (∼63% RM)*** (∼65% RM)*** (∼64% RM)*** (∼66% RM)*** (∼64% RM)***
Velocity LossAL Session 1 10.05± 2.70 11.15± 2.93 11.04± 3.09 11.18± 3.24† 9.01± 3.47† 13.92± 6.30†† 6.74± 2.40†† 11.54± 3.10†††
AL Session 2 13.34± 2.83 12.23± 4.01 11.48± 2.64† 12.53± 3.06† 10.46± 5.75† 14.72± 4.67†† 11.36± 3.91†† 5.85± 2.93†
NAL Session 1 10.35± 2.32 10.59± 2.94 8.78± 4.00 8.20± 2.81 6.43± 1.65 7.65± 2.63 3.19± 1.46 4.25± 1.88NAL Session 2 13.09± 3.48 11.84± 3.99 8.49± 2.79 8.94± 2.54 6.41± 2.08 8.34± 3.55 5.22± 1.82 2.68± 1.67
Notes.Values are shown as mean± SD.AL, Adjusted Load; NAL, Not Adjusted Load; Wk, week; MVP, Mean Propulsive Velocity in the concentric phase during squat; RM, Repetition Maximum; m s−1, meter×second;; %, percentage.Intra-group significant differences for NAL group from difference between target velocity and actually performed.*p< 0.05.**p< 0.01.***p< 0.001.Inter-group significant differences between AL and NAL for Velocity Loss each training session.
†p< 0.05.††p< 0.01.
†††p< 0.001 and Vsession.&p< 0.05.
&&p< 0.01.&&&p< 0.001.
Jiménez-R
eyesetal.(2021),PeerJ,D
OI10.7717/peerj.10942
6/21
Load-velocity squat profileFull-squat 1RM strength was determined using an incremental loading test. Warm-upconsisted of 5 min of treadmill running at 10 km/h, 5 min of lower body joint mobilizationexercises, and two sets of eight and six SQ repetitions (3-min rests) with loads of 20 and30 kg, respectively. Exactly the same warm-up and progression of absolute loads for eachsubject was used at Pre and Post-tests. The SQ was performed as described in recentstudies (Pareja-Blanco et al., 2014; Pareja-Blanco et al., 2017a; Pareja-Blanco et al., 2017b);(González-Badillo et al., 2016). Auditory feedback based on eccentric distance travelled wasprovided to help each subject in both groups to reach his previously determined squatdepth. While the eccentric phase was performed at a controlled mean velocity (Vmean)(∼0.50–0.65 m/s), subjects were required to execute the concentric phase at maximalintended velocity. Initial load was set at 20 kg and was progressively increased in 10 kgincrements until the attained mean propulsive velocity (MPV) was <0.8 m s−1. Thereafter,the load was individually adjusted with smaller increments (5 down to 2.5 kg) so that 1RMcould be precisely determined. Three repetitions were executed for light (≤ 50% 1RM), twofor medium (50–80% 1RM) and only one for heavy loads (>80% 1RM) (Sanchez-Medina,Perez & Gonzalez-Badillo, 2010; Pareja-Blanco et al., 2017b). Strong verbal encouragementwas provided to motivate participants to give a maximal effort. Inter-set recoveries rangedfrom 3 min (light) to 5 min (heavy loads). As suggested by recent studies (Pareja-Blanco etal., 2014; Pareja-Blanco et al., 2017b; González-Badillo et al., 2016), only the best repetitionat each load, according to the criterion of fastest MPV, was considered for subsequentanalysis. All velocity measures reported in this study corresponded to the Vmean of thepropulsive phase of each repetition. The propulsive phase was defined as the fraction ofthe concentric phase where the barbell acceleration was greater than the acceleration dueto gravity (Sanchez-Medina, Perez & Gonzalez-Badillo, 2010). In addition to 1RM strength,three other variables obtained from this progressive loading test were used to analyse theextent to which the two training interventions (AL vs NAL) affected different parts of theload-velocity relationship: Average MPV of (a) all absolute loads, as well as loads whichresulted in an MPV (b) above or equal too, and (c) below 1 m s−1.
Sprinting and jumping testsJump height and sprint time can be used as indicators of explosive performance, becauseimproved explosive performance is related to an increase in the jump height and bettersprint performance times (Pareja-Blanco et al., 2017b). After a standardized warm-up,consisting of 10 min of jogging, dynamic stretching and preparatory vertical jumps,participants performed five maximal CMJs. During the CMJ, the subject was instructed torest his hands on his hips while performing a downward movement to 90◦ of knee flexionfollowed by a vertical jump with maximum effort. Since the depth and the velocity of thedescent affects performance in the CMJ (Pérez-Castilla et al., 2019b), we proposed thatthe subjects should arrive at the same angle of knee flexion prior to the jump, which inaddition, means an individualized depth. All subjects were instructed to keep their kneesstraight during the flight phase of the jump and to land in an upright position. Attemptswere separated by 20 s of passive rest. The highest and lowest CMJ height values were
Jiménez-Reyes et al. (2021), PeerJ, DOI 10.7717/peerj.10942 7/21
discarded, and the resulting average was kept for analysis (Claudino et al., 2017). Afterthe jump test, two maximal 20m sprints separated by a 3 min rest were performed on anindoor running track. Photocell timing gates were placed at 0 and 20 m to determine thetime to cover 0–20 m (T20). A standing start with the lead-off foot placed 1 m behindthe first timing gate was used. Subjects were required to give an all-out maximal effort ineach sprint and the best of both trials was kept for analysis. The same warm-up protocolincorporating several sets of progressively faster 20 m running accelerations was followedat Pre and Post.
Resistance training programDescriptive characteristics of the RT program are shown in Table 1. Both AL and NALgroups trained using only the SQ exercise as previously described. The programmed RTwas the same in terms, number of sets (three), and inter-set recoveries (4 min) for bothgroups in each training session. All repetitions were objectively quantified and monitoredby the velocity achieved in each repetition for both groups during the whole RT programfor all training sessions. In order to individualize the training load, MPV was used duringthe warm-up exercises to adjust the load via the load-velocity relationship proposed bySanchez Medina et al. 2011. Thus, a target MPV to be attained in the first (usually thefastest) repetition of the set in each session was used as an estimation of % 1RM, as follows:1.13 m s−1 (∼50% 1RM), 0.98 m s−1 (∼60% 1RM), 0.90 m s−1 (∼65% 1RM), 0.82 ms−1 (∼70% 1RM), 0.75 m s−1 (∼75% 1RM), and 0.68 m s−1 (∼80% 1RM). This MPVattained during each training session was summarised as (Vsession). The difference betweenAL and NAL groups was that for the AL group, the absolute load (kg) was individuallyadjusted to match the velocity associated (±0.03 m s−1) with the %1RM intended for eachsession. For the NAL group, the absolute load for each session was established beforehandby taking the initial 1RM in the Pre-test as a reference. Thus, both groups performed thesame number of repetitions per set and completed the same total number of repetitionsduring the training program but differed in whether or not the training loads were adjustedduring training. Thus, for both groups, velocity was monitored in every training session.In NAL this was done only to analyse the mismatch between what was programmedand what was actually performed during RT. For AL, velocity was checked to match theprogrammed RI with that performed daily, ensuring there was no mismatch in this group.This mismatch is what we considered to be the ‘‘gap’’ between pre-programmed RI and RIactually performed. Moreover, in each session, the VL (difference between the fastest andslowest repetition in each set) was calculated for each group as a measure of neuromuscularfatigue (Sánchez-Medina & González-Badillo, 2011).
Finally, during training, subjects received immediate velocity feedback from themeasurement system while being encouraged to perform each repetition at maximalintended velocity (Weakley et al., 2018).
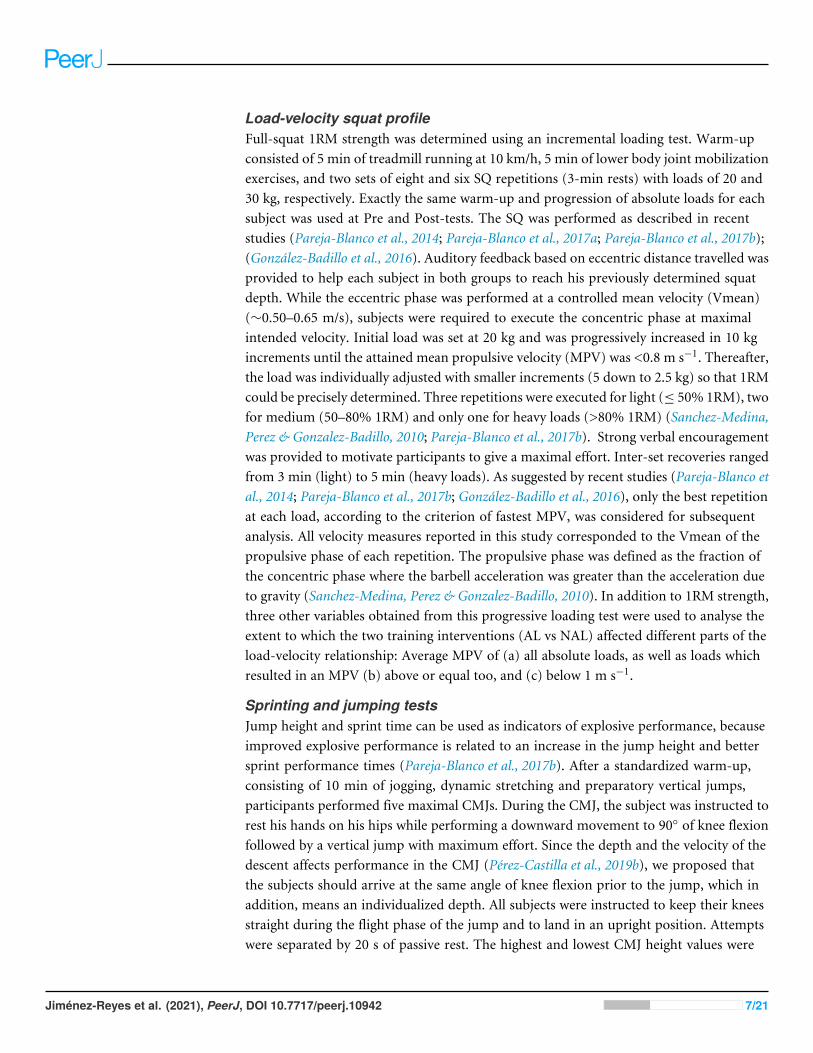
Statistical analysesAll data are shown as mean ± standard deviation (SD). Normality was checked with theShapiro–Wilk test before analyses. Data were analysed using a 2 × 2 factorial ANOVA
Jiménez-Reyes et al. (2021), PeerJ, DOI 10.7717/peerj.10942 8/21
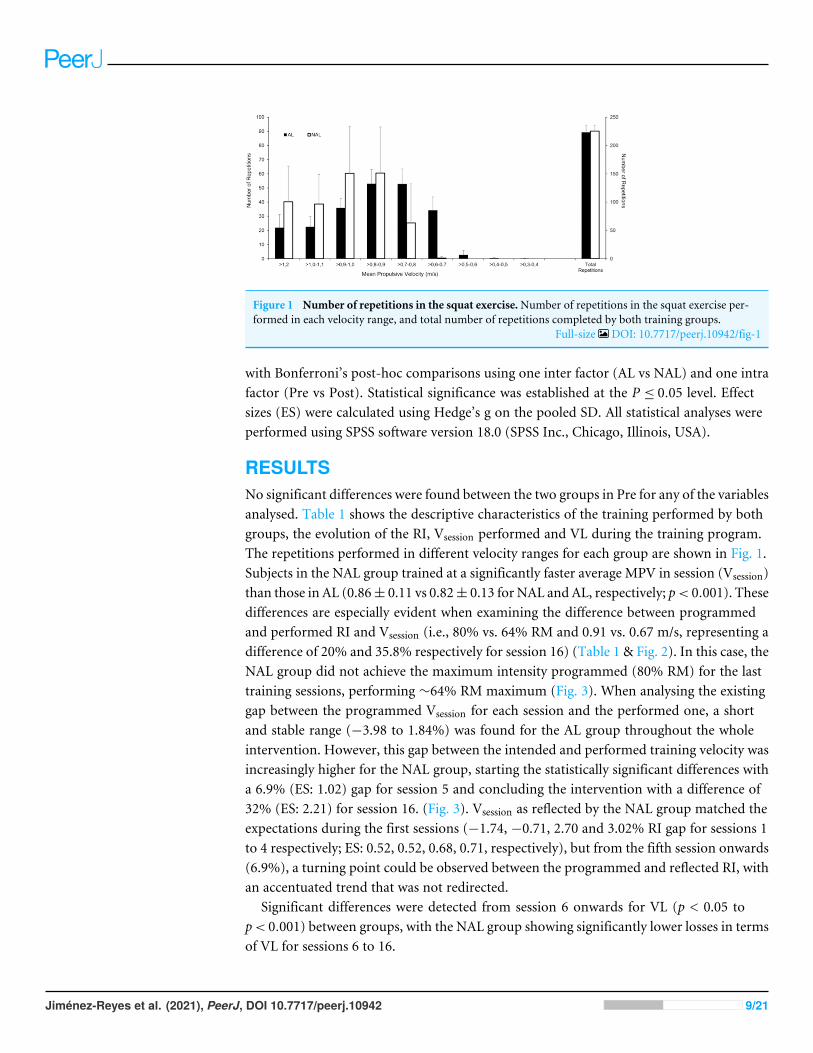
Figure 1 Number of repetitions in the squat exercise.Number of repetitions in the squat exercise per-formed in each velocity range, and total number of repetitions completed by both training groups.
Full-size DOI: 10.7717/peerj.10942/fig-1
with Bonferroni’s post-hoc comparisons using one inter factor (AL vs NAL) and one intrafactor (Pre vs Post). Statistical significance was established at the P ≤ 0.05 level. Effectsizes (ES) were calculated using Hedge’s g on the pooled SD. All statistical analyses wereperformed using SPSS software version 18.0 (SPSS Inc., Chicago, Illinois, USA).
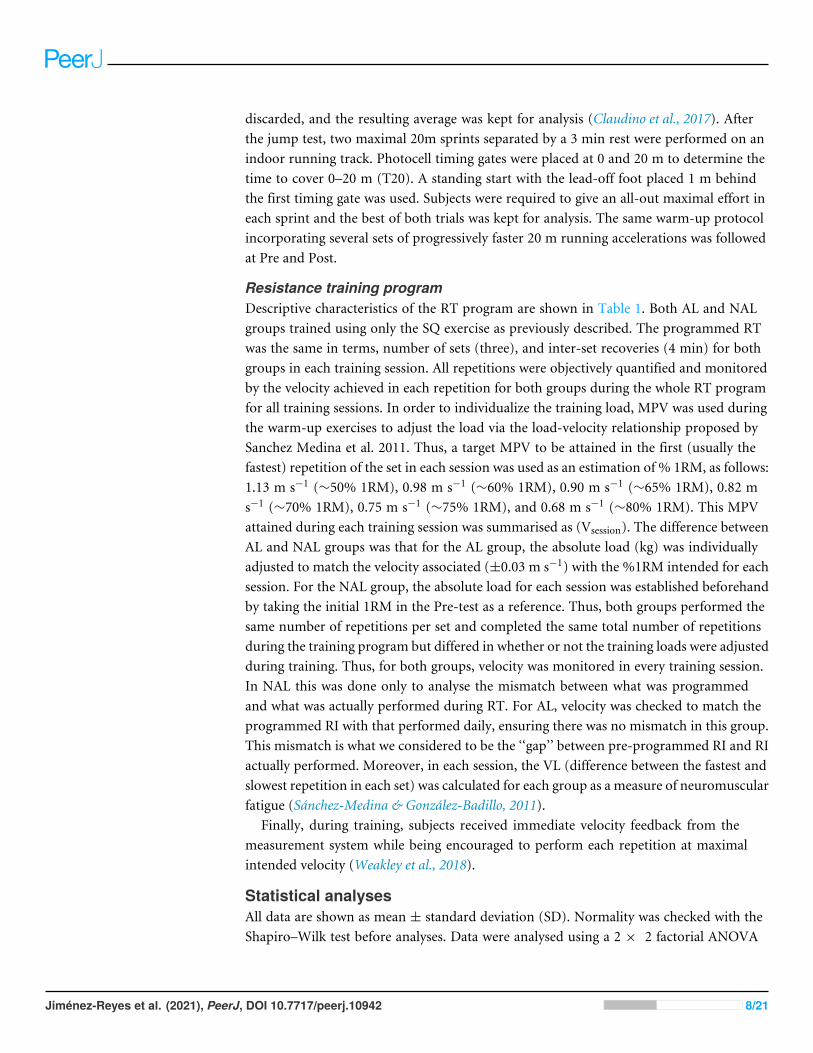
RESULTSNo significant differences were found between the two groups in Pre for any of the variablesanalysed. Table 1 shows the descriptive characteristics of the training performed by bothgroups, the evolution of the RI, Vsession performed and VL during the training program.The repetitions performed in different velocity ranges for each group are shown in Fig. 1.Subjects in the NAL group trained at a significantly faster average MPV in session (Vsession)than those in AL (0.86± 0.11 vs 0.82± 0.13 for NAL and AL, respectively; p< 0.001). Thesedifferences are especially evident when examining the difference between programmedand performed RI and Vsession (i.e., 80% vs. 64% RM and 0.91 vs. 0.67 m/s, representing adifference of 20% and 35.8% respectively for session 16) (Table 1 & Fig. 2). In this case, theNAL group did not achieve the maximum intensity programmed (80% RM) for the lasttraining sessions, performing ∼64% RM maximum (Fig. 3). When analysing the existinggap between the programmed Vsession for each session and the performed one, a shortand stable range (−3.98 to 1.84%) was found for the AL group throughout the wholeintervention. However, this gap between the intended and performed training velocity wasincreasingly higher for the NAL group, starting the statistically significant differences witha 6.9% (ES: 1.02) gap for session 5 and concluding the intervention with a difference of32% (ES: 2.21) for session 16. (Fig. 3). Vsession as reflected by the NAL group matched theexpectations during the first sessions (−1.74, −0.71, 2.70 and 3.02% RI gap for sessions 1to 4 respectively; ES: 0.52, 0.52, 0.68, 0.71, respectively), but from the fifth session onwards(6.9%), a turning point could be observed between the programmed and reflected RI, withan accentuated trend that was not redirected.
Significant differences were detected from session 6 onwards for VL (p < 0.05 top< 0.001) between groups, with the NAL group showing significantly lower losses in termsof VL for sessions 6 to 16.
Jiménez-Reyes et al. (2021), PeerJ, DOI 10.7717/peerj.10942 9/21
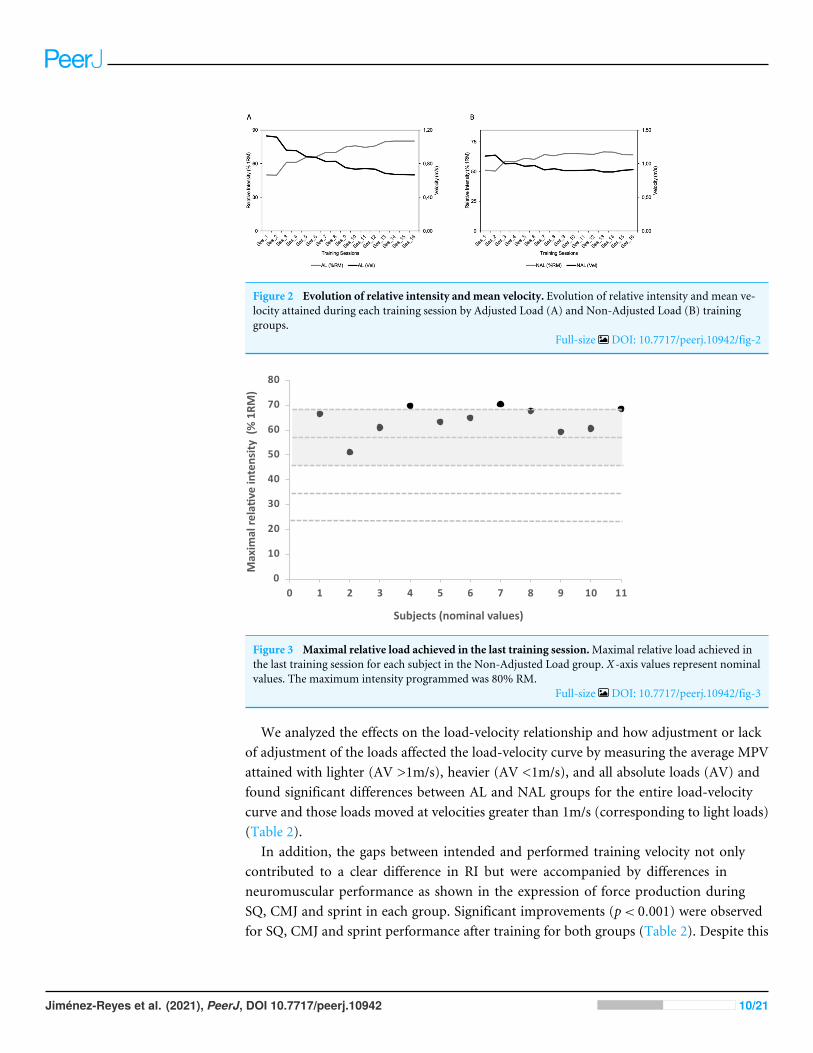
Figure 2 Evolution of relative intensity andmean velocity. Evolution of relative intensity and mean ve-locity attained during each training session by Adjusted Load (A) and Non-Adjusted Load (B) traininggroups.
Full-size DOI: 10.7717/peerj.10942/fig-2
0
10
20
30
40
50
60
70
80
0 1 2 3 4 5 6 7 8 9 10 11
Max
imal
rela
*ve
inte
nsity
(%
1RM
)
Subjects (nominal values)
Figure 3 Maximal relative load achieved in the last training session.Maximal relative load achieved inthe last training session for each subject in the Non-Adjusted Load group. X-axis values represent nominalvalues. The maximum intensity programmed was 80% RM.
Full-size DOI: 10.7717/peerj.10942/fig-3
We analyzed the effects on the load-velocity relationship and how adjustment or lackof adjustment of the loads affected the load-velocity curve by measuring the average MPVattained with lighter (AV >1m/s), heavier (AV <1m/s), and all absolute loads (AV) andfound significant differences between AL and NAL groups for the entire load-velocitycurve and those loads moved at velocities greater than 1m/s (corresponding to light loads)(Table 2).
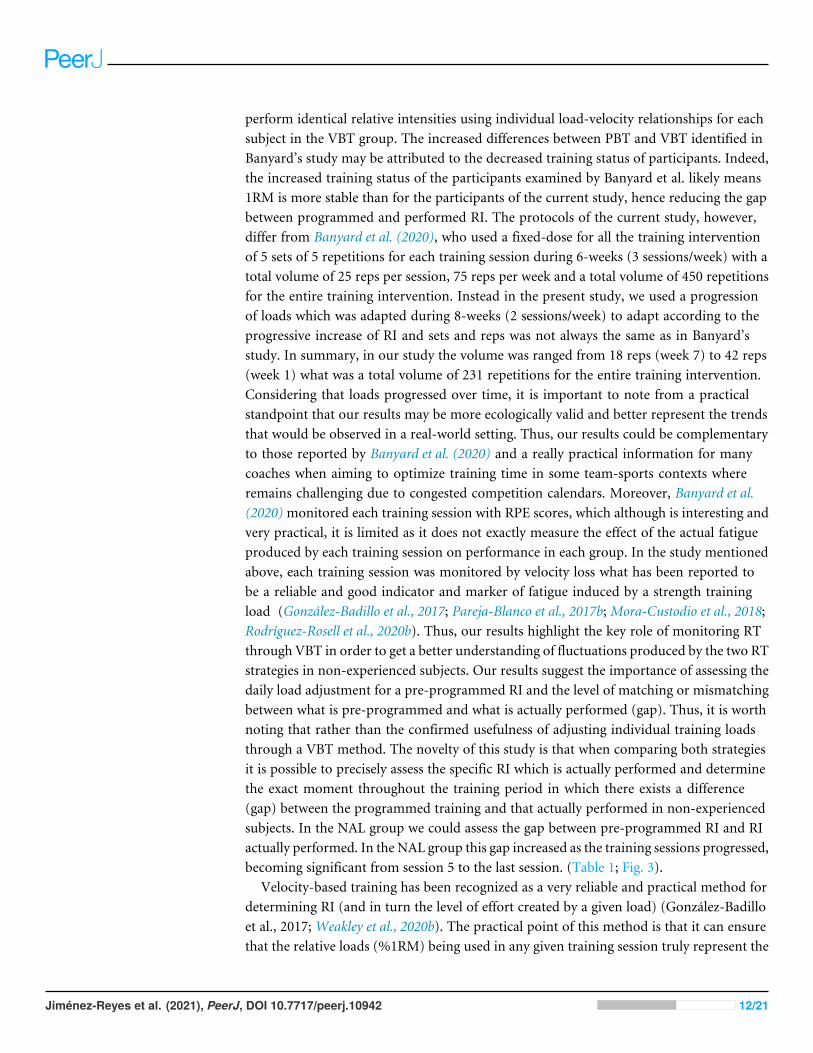
In addition, the gaps between intended and performed training velocity not onlycontributed to a clear difference in RI but were accompanied by differences inneuromuscular performance as shown in the expression of force production duringSQ, CMJ and sprint in each group. Significant improvements (p< 0.001) were observedfor SQ, CMJ and sprint performance after training for both groups (Table 2). Despite this
Jiménez-Reyes et al. (2021), PeerJ, DOI 10.7717/peerj.10942 10/21
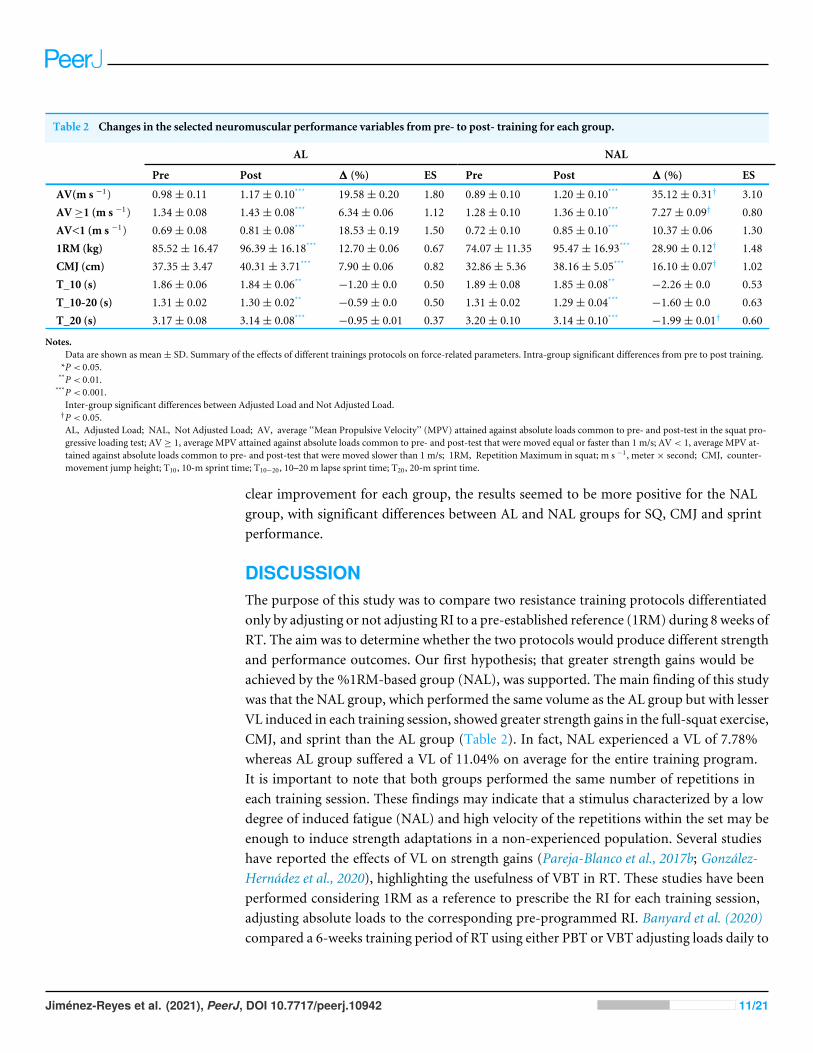
Table 2 Changes in the selected neuromuscular performance variables from pre- to post- training for each group.
AL NAL
Pre Post 1 (%) ES Pre Post 1 (%) ES
AV(m s −1) 0.98± 0.11 1.17± 0.10*** 19.58± 0.20 1.80 0.89± 0.10 1.20± 0.10*** 35.12± 0.31† 3.10AV≥1 (m s −1) 1.34± 0.08 1.43± 0.08*** 6.34± 0.06 1.12 1.28± 0.10 1.36± 0.10*** 7.27± 0.09† 0.80AV<1 (m s −1) 0.69± 0.08 0.81± 0.08*** 18.53± 0.19 1.50 0.72± 0.10 0.85± 0.10*** 10.37± 0.06 1.301RM (kg) 85.52± 16.47 96.39± 16.18*** 12.70± 0.06 0.67 74.07± 11.35 95.47± 16.93*** 28.90± 0.12† 1.48CMJ (cm) 37.35± 3.47 40.31± 3.71*** 7.90± 0.06 0.82 32.86± 5.36 38.16± 5.05*** 16.10± 0.07† 1.02T_10 (s) 1.86± 0.06 1.84± 0.06** −1.20± 0.0 0.50 1.89± 0.08 1.85± 0.08** −2.26± 0.0 0.53T_10-20 (s) 1.31± 0.02 1.30± 0.02** −0.59± 0.0 0.50 1.31± 0.02 1.29± 0.04*** −1.60± 0.0 0.63T_20 (s) 3.17± 0.08 3.14± 0.08*** −0.95± 0.01 0.37 3.20± 0.10 3.14± 0.10*** −1.99± 0.01† 0.60
Notes.Data are shown as mean± SD. Summary of the effects of different trainings protocols on force-related parameters. Intra-group significant differences from pre to post training.*P < 0.05.**P < 0.01.***P < 0.001.Inter-group significant differences between Adjusted Load and Not Adjusted Load.
†P < 0.05.AL, Adjusted Load; NAL, Not Adjusted Load; AV, average ‘‘Mean Propulsive Velocity’’ (MPV) attained against absolute loads common to pre- and post-test in the squat pro-gressive loading test; AV ≥ 1, average MPV attained against absolute loads common to pre- and post-test that were moved equal or faster than 1 m/s; AV < 1, average MPV at-tained against absolute loads common to pre- and post-test that were moved slower than 1 m/s; 1RM, Repetition Maximum in squat; m s −1, meter× second; CMJ, counter-movement jump height; T10, 10-m sprint time; T10−20, 10–20 m lapse sprint time; T20, 20-m sprint time.
clear improvement for each group, the results seemed to be more positive for the NALgroup, with significant differences between AL and NAL groups for SQ, CMJ and sprintperformance.
DISCUSSIONThe purpose of this study was to compare two resistance training protocols differentiatedonly by adjusting or not adjusting RI to a pre-established reference (1RM) during 8 weeks ofRT. The aim was to determine whether the two protocols would produce different strengthand performance outcomes. Our first hypothesis; that greater strength gains would beachieved by the %1RM-based group (NAL), was supported. The main finding of this studywas that the NAL group, which performed the same volume as the AL group but with lesserVL induced in each training session, showed greater strength gains in the full-squat exercise,CMJ, and sprint than the AL group (Table 2). In fact, NAL experienced a VL of 7.78%whereas AL group suffered a VL of 11.04% on average for the entire training program.It is important to note that both groups performed the same number of repetitions ineach training session. These findings may indicate that a stimulus characterized by a lowdegree of induced fatigue (NAL) and high velocity of the repetitions within the set may beenough to induce strength adaptations in a non-experienced population. Several studieshave reported the effects of VL on strength gains (Pareja-Blanco et al., 2017b; González-Hernádez et al., 2020), highlighting the usefulness of VBT in RT. These studies have beenperformed considering 1RM as a reference to prescribe the RI for each training session,adjusting absolute loads to the corresponding pre-programmed RI. Banyard et al. (2020)compared a 6-weeks training period of RT using either PBT or VBT adjusting loads daily to
Jiménez-Reyes et al. (2021), PeerJ, DOI 10.7717/peerj.10942 11/21
perform identical relative intensities using individual load-velocity relationships for eachsubject in the VBT group. The increased differences between PBT and VBT identified inBanyard’s study may be attributed to the decreased training status of participants. Indeed,the increased training status of the participants examined by Banyard et al. likely means1RM is more stable than for the participants of the current study, hence reducing the gapbetween programmed and performed RI. The protocols of the current study, however,differ from Banyard et al. (2020), who used a fixed-dose for all the training interventionof 5 sets of 5 repetitions for each training session during 6-weeks (3 sessions/week) with atotal volume of 25 reps per session, 75 reps per week and a total volume of 450 repetitionsfor the entire training intervention. Instead in the present study, we used a progressionof loads which was adapted during 8-weeks (2 sessions/week) to adapt according to theprogressive increase of RI and sets and reps was not always the same as in Banyard’sstudy. In summary, in our study the volume was ranged from 18 reps (week 7) to 42 reps(week 1) what was a total volume of 231 repetitions for the entire training intervention.Considering that loads progressed over time, it is important to note from a practicalstandpoint that our results may be more ecologically valid and better represent the trendsthat would be observed in a real-world setting. Thus, our results could be complementaryto those reported by Banyard et al. (2020) and a really practical information for manycoaches when aiming to optimize training time in some team-sports contexts whereremains challenging due to congested competition calendars. Moreover, Banyard et al.(2020)monitored each training session with RPE scores, which although is interesting andvery practical, it is limited as it does not exactly measure the effect of the actual fatigueproduced by each training session on performance in each group. In the study mentionedabove, each training session was monitored by velocity loss what has been reported tobe a reliable and good indicator and marker of fatigue induced by a strength trainingload (González-Badillo et al., 2017; Pareja-Blanco et al., 2017b; Mora-Custodio et al., 2018;Rodríguez-Rosell et al., 2020b). Thus, our results highlight the key role of monitoring RTthrough VBT in order to get a better understanding of fluctuations produced by the two RTstrategies in non-experienced subjects. Our results suggest the importance of assessing thedaily load adjustment for a pre-programmed RI and the level of matching or mismatchingbetween what is pre-programmed and what is actually performed (gap). Thus, it is worthnoting that rather than the confirmed usefulness of adjusting individual training loadsthrough a VBT method. The novelty of this study is that when comparing both strategiesit is possible to precisely assess the specific RI which is actually performed and determinethe exact moment throughout the training period in which there exists a difference(gap) between the programmed training and that actually performed in non-experiencedsubjects. In the NAL group we could assess the gap between pre-programmed RI and RIactually performed. In the NAL group this gap increased as the training sessions progressed,becoming significant from session 5 to the last session. (Table 1; Fig. 3).
Velocity-based training has been recognized as a very reliable and practical method fordetermining RI (and in turn the level of effort created by a given load) (González-Badilloet al., 2017; Weakley et al., 2020b). The practical point of this method is that it can ensurethat the relative loads (%1RM) being used in any given training session truly represent the
Jiménez-Reyes et al. (2021), PeerJ, DOI 10.7717/peerj.10942 12/21
intended ones (González-Badillo & Sánchez-Medina, 2010). With this novel approach, thetraining load for each session is set to match a given %1RM, which has a correspondingmean concentric velocity. The vast majority of research studies in the sport sciences field(Griffiths et al., 2019; Pritchard et al., 2019) have prescribed training intensities accordingto 1RM values from which each relative load was obtained prior to exercise. This approachis understandable since authors such as (Seo et al., 2012) established the reliability ofmaximum strength capabilities after evaluation using the RM test. However, it should benoted that these results were obtained by maintaining the subjects in a stable assessmentenvironment, which can rarely be found once the dynamics of training and competitioncome into play (Bishop, Jones & Woods, 2008; Doeven et al., 2018; Hughes et al., 2019).Hence, it is essential to understand that human neuromuscular performance is exposed toan endless number of external variables (e.g., mood, sleep, motivation or stress) capableof modifying the potential gains of performance both acutely and chronically (Dalgas etal., 2010). Thus, training with pre-set/pre-established loads may involve different levels ofeffort than desired, given the daily modification of the 1RM (Banyard et al., 2020).
Despite the great interest in new resistance training approaches such as VBT (Courel-Ibáñez et al., 2019; Pareja-Blanco et al., 2019; Pérez-Castilla et al., 2019a; Weakley et al.,2020a), there is limited scientific data measuring the real effort applied in each trainingsession (by monitoring movement velocity). This study presented the novelty of assessingVL of a daily adjustment of training loads based on velocity, to match the relativeprogrammed intensity (for the AL group) or using previously determined absoluteloads corresponding to the programmed RI without modifying loads daily (for the NALgroup) in two RT programs identical with regard to volume (Fig. 1). Generally, studiesusing percentage-based approaches cannot provide information about the real intensityperformed in each training session since athletes are using a pre-programmed RI based on1RM as the reference for prescribing training. Using the VBT approach means that thisproblem can be solved since coaches know the real relative intensity performed. Identifyingthe gap between prescribed and performed RI might indicate whether some individualscould benefit from adjusting or not adjusting the RI in each session as a loading strategy.Considering our results, at the group level the NAL group trained at a higher averagemean velocity than AL and showed a progressive gap between the RI performed and thepre-programmed value (Table 2; Fig. 2). Specifically, NAL diverged from AL from session4 onwards for programmed RI. This resulted in smaller velocity losses and higher meanvelocities in each training session (from session 6) that remained higher throughout therest of the study. Practically, it must be noted that without the use of VBT, the gap betweenprogrammed and performed RI observed from the fourth session onwards would havegone undetected. It is worth to note that when this mismatch occurs, different level offatigue and potential adaptations are experienced to those planned. Thus, this informationwill be relevant for coaches and practitioners to check the existing individual mismatchbetween subjects and adapt training accordingly, always knowing the real stimuli inducedand performed. The findings of our study suggest that in a moderately trained populationat the beginning of a structured strength and conditioning programme, it seems that qualitygoes over quantity. Interestingly, significant gains in strength and increases in CMJ and
Jiménez-Reyes et al. (2021), PeerJ, DOI 10.7717/peerj.10942 13/21

sprint performance occurred in both groups, although the majority of the training in NALoccurred with higher velocity and reduced fatigue compared to AL. This provides furtherevidence that training with less VLmay be enough to make significant gains in strength andperformance outcomes (Pareja-Blanco et al., 2017b; Galiano et al., 2020), which may allowfor a fast recovery when training with moderate to heavy loads (Ogasawara et al., 2013).Thus, our research shows how a daily adjustment of the training load could significantlyimpact previously designed training programmes (the gap between what is planned andwhat is actually performed).
The gap in training between the initially tested 1RM (not adjusted) and adjusting to theload based on a daily 1RM showed a significant difference in Vsession, being lower for theunadjusted load group (from session 4) (Table 1; Fig. 3). These results illustrated that notadjusting the load on a daily basis resulted in an increase in the effectiveness of the training,coupled with the use of a load lower than that scheduled for the training session. Whileboth groups completed the volume of training initially planned, RI progressively decreasedover time for the NAL group when compared to the AL group, resulting in lesser fatigue(represented by a lower VL in each training session) as the load represented a reducedpercentage of the pre-established 1RM (Sánchez-Medina & González-Badillo, 2011) (Fig. 2).This fact has not only been linked to a decrease in neuromuscular andmetabolic fatigue butalso to a faster rate of neuromuscular recovery and a more suitable hormonal environment(Pareja-Blanco et al., 2018). Although on this occasion, a lower RI brought greater benefits,coaches should be aware that if the adequacy and adaptation of the loads is not correct,the results are likely to be unexpected. This fact can alter considerably the achievement ofestablished objectives in short-, medium-, and even long-term programming, mainly dueto the training being carried out in a different way from the programmed approach.
Our results suggest that the implementation or lack of implementation of daily trainingload adjustment resulted in two training programs that, although otherwise identical,differed in the stimuli provided from the early stages. While most training programs arebased on the principles of overload, periodization and load progression, the analysis ofthese results highlights the major role of a daily assessment and adjustment of the trainingload, since RM values can be influenced both (i) by the state of readiness -mainly definedby accumulated fatigue and the quality of recovery (short term); and (ii) by adaptationsproduced as a consequence of training (medium and long term). Thus, the results of thisstudy reinforce the necessity not only of monitoring athletes’ training sessions, but also ofadjusting training loads in order to achieve the established plan. This could help to controlunderlying mismatches in the training process, and increase awareness of the factors thatinduce neuromuscular adaptations.
It is worth noting that the RI actually performed by NAL was not programmedbeforehand since it was the consequence of changing the absolute load in each session,based on an initial 1-RM measurement. Thus, it seems reasonable to program the increasein absolute load according to individual responses through a VBT method. Lastly, from apractical standpoint the increase in absolute load should be a sufficient stimulus to improveperformance at the same time as RI remains similar or even decreases. However, if theRI increases at the same pace as the absolute load, performance does not improve and
Jiménez-Reyes et al. (2021), PeerJ, DOI 10.7717/peerj.10942 14/21
monitoring of movement velocity would be needed in order to improve performance andexperience positive training adaptations.
We acknowledge that some limitations exist within this study. Note that a Smithmachine has been employed for developing this study and it has been reported differencesin load-velocity profiles compared to free-weight exercise (Hughes, Peiffer & Scott, 2020)and it would be considered. If it is well known that a free weight back squat is commonlyused in trained population, however novice subjects may benefit from using a Smithmachine since it restricts the movement in a strictly vertical motion. Another limitationof this study is that the strength improvement may have been greater in NAL becausethe actual intensities of 1RM performed were lower than those performed by AL, whoworked with adapted relative loads in each training session rather than loads programmedin advance. Interestingly, it could be reasonable to think that this greater improvement inNAL could be due to the use of lighter loads than AL, as Torres-Torrelo et al. reported(Torres-Torrelo, Rodríguez-Rosell & González-Badillo, 2017), but the most likely reasonwould be that NAL experimented a lower degree of fatigue and also were able to displacethe loads at faster velocities (González-Badillo et al., 2017; Pareja-Blanco et al., 2017c;Mora-Custodio et al., 2018; Rodríguez-Rosell et al., 2020a; Rodríguez-Rosell et al., 2020b) ateach training session. However, the adaptations in NAL would differ due to the lesser levelof fatigue induced in each training session, as supported by several studies (Pareja-Blanco etal., 2017b; Pareja-Blanco et al., 2017a). However, if this is a limitation of the study, it mightalso be a limitation of percentage 1RM-based loading in general, as the actual RI performeddiffered from the intended RI and adaptation through training would be substantiallydifferent between individuals. Thus, if we do not check and monitor movement velocity inorder to determine the RI during RT it will be hard to control and understand mismatchesin the training process, and to understand the mechanisms inducing neuromuscularadaptations.
CONCLUSSIONThis intervention was not intended to test whether one method was better than another.AlthoughNALprovided a slight strength gains in, this does notmean that either adjusting ornot adjusting training loads should be considered mutually exclusive for load prescription.Combining these two strategies in strength training could be determinant since it allowsstrength gains and optimizes adaptation regarding the aims of specific populations, time ofthe season, the needs for performance, etc. These two strategies in isolation could neitherensure to train with fatigue nor continue with a training based on an outdated 1-RMreference to allow the optimization of training stimuli and to maximize adaptation. Usinga NAL strategy would allow for training with each absolute load until this load does notrepresent the RI programmed. From that time onwards, using an AL strategy in whichthe new absolute load representing the planned RI may be optimal to keep on the desiredevolution. Thus, using AL or NAL strategies could be complementary, and it worth tonote that this combination could be effective since it is based on VBT. Thus, this study isexpected to contribute to the resistance training field by providing a novel insight on the
Jiménez-Reyes et al. (2021), PeerJ, DOI 10.7717/peerj.10942 15/21
influence of adjusting or not adjusting the load during a training program. Monitoring RTthrough VBT in order to get a better understanding of fluctuations produced by RT shouldbe considered by coaches and practitioners, and could result in objective informationabout the mismatch between what is pre-programmed and what is actually performed.This could provide greater knowledge and control of the underlying adaptive reality foreach athlete during the training period, with such applications particularly important forhigh-performance athletes competing in strength sports or sports involving large amountsof concurrent training. This could provide greater knowledge and control of the underlyingadaptive reality for each athlete during the training period. Specially for high performanceathletes such as those competing in strength sports or concurrently trained team sportathletes. For this reason, the use of VBT approaches should be considered as a usefultool in optimizing the decision-making process during the planning and implementationof training programs. Lastly, and considering all together, future research should takethese adaptations into account when designing training programs since yet a number ofunanswered questions with respect to the VBT research should be considered.
ACKNOWLEDGEMENTSThe authors thank all the athletes who participated as subjects in this study.
ADDITIONAL INFORMATION AND DECLARATIONS
FundingThe authors received no funding for this work.
Competing InterestsThe authors declare there are no competing interests.
Author Contributions• Pedro Jiménez-Reyes conceived and designed the experiments, performed theexperiments, authored or reviewed drafts of the paper, and approved the final draft.• Adrian Castaño-Zambudio performed the experiments, analyzed the data, preparedfigures and/or tables, authored or reviewed drafts of the paper, and approved the finaldraft.• Víctor Cuadrado-Peñafiel and Juan J. González-Badillo conceived and designed theexperiments, authored or reviewed drafts of the paper, and approved the final draft.• Jorge M. González-Hernández analyzed the data, prepared figures and/or tables,authored or reviewed drafts of the paper, and approved the final draft.• Fernando Capelo-Ramírez performed the experiments, authored or reviewed drafts ofthe paper, and approved the final draft.• LuisM.Martínez-Aranda analyzed the data, prepared figures and/or tables, and approvedthe final draft.
Jiménez-Reyes et al. (2021), PeerJ, DOI 10.7717/peerj.10942 16/21
Human EthicsThe following information was supplied relating to ethical approvals (i.e., approving bodyand any reference numbers):
The Catholic University of Murcia UCAM Ethics Committee granted ethical approvalto carry out the study within its facilities.
Data AvailabilityThe following information was supplied regarding data availability:
Raw data are available as a Supplementary File.
Supplemental InformationSupplemental information for this article can be found online at http://dx.doi.org/10.7717/peerj.10942#supplemental-information.
REFERENCESBanyard HG, Tufano JJ, Weakley JJ, Wu S, Jukic I, Nosaka K. 2020. Superior changes
in jump, sprint, and change-of-direction performance but not maximal strengthfollowing 6 weeks of velocity-based training compared with 1-repetition-maximumpercentage-based training. International Journal of Sports Physiology and Performance1(aop):1–11 DOI 10.1123/ijspp.2019-0999.
Baechle TR, Earle RW. 2008. Essentials of strength and conditioning. Edition 3rd. Cham-paign: Human Kinetics DOI 10.1017/CBO9781107415324.004.
Bishop PA, Jones E, Woods AK. 2008. Recovery from training: a brief review. Journal ofStrength and Conditioning Research 22:1015–1024DOI 10.1519/JSC.0b013e31816eb518.
Claudino JG, Cronin J, Mezêncio B, McMaster DT, McGuiganM, Tricoli V, AmadioAC, Serrão JC. 2017. The countermovement jump to monitor neuromuscularstatus: a meta-analysis. Journal of Science and Medicine in Sport 20:397–402DOI 10.1016/j.jsams.2016.08.011.
Courel-Ibáñez J, Martínez-Cava A, Morán-Navarro R, Escribano-Peñas P, Chavarren-Cabrero J, González-Badillo JJ, Pallarés JG. 2019. Reproducibility and repeatabilityof five different technologies for bar velocity measurement in resistance training.Annals of Biomedical Engineering 47:1523–1538 DOI 10.1007/s10439-019-02265-6.
Dalgas U, Stenager E, Jakobsen J, Petersen T, Hansen HJ, Knudsen C, OvergaardK, Ingemann-Hansen T. 2010. Fatigue, mood and quality of life improve inMS patients after progressive resistance training.Multiple Sclerosis 16:480–490DOI 10.1177/1352458509360040.
Doeven SH, BrinkMS, Kosse SJ, Lemmink KAPM. 2018. Postmatch recovery of physicalperformance and biochemical markers in team ball sports: A systematic review. BMJOpen Sport and Exercise Medicine 4:e000264 DOI 10.1136/bmjsem-2017-000264.
Dorrell HF, SmithMF, Gee TI. 2019. Comparison of velocity-based and traditionalpercentage-based loading methods on maximal strength and power adaptations.
Jiménez-Reyes et al. (2021), PeerJ, DOI 10.7717/peerj.10942 17/21
Journal of Strength and Conditioning Research 34:46–53DOI 10.1519/jsc.0000000000003089.
Galiano C, Rocha L, Blanco FP, Hidalgo DeMora J, Sáez De Villarreal E. 2020.Low-velocity loss induces similar strength gains to moderate-velocity loss duringresistance training. Article in The Journal of Strength and Conditioning Research (InPress) DOI 10.1519/JSC.0000000000003487.
García-Ramos A, Janicijevic D. 2020. Reliability of the velocity achieved during the lastrepetition of sets to failure and its association with the velocity of the 1-repetitionmaximum. Peerj 2020:e8760 DOI 10.7717/peerj.8760.
García-Ramos A, Ulloa-Díaz D, Barboza-González P, Rodríguez-Perea Á, Martínez-García D, Quidel-CatrilelbúnM, Guede-Rojas F, Cuevas-Aburto J, Janicijevic D,Weakley J. 2019. Assessment of the load-velocity profile in the free-weight pronebench pull exercise through different velocity variables and regression models. PLOSONE 14:e0212085 DOI 10.1371/journal.pone.0212085.
González-Badillo JJ, Marques MC, Marques MC, Sánchez-Medina L. 2011. The im-portance of movement velocity as a measure to control resistance training intensity.Journal of Human Kinetics 29A:15–19 DOI 10.2478/v10078-011-0053-6.
González-Badillo JJ, Rodríguez-Rosell D, Sánchez-Medina L, Ribas J, López-López C,Mora-Custodio R, Yañez García JM, Pareja-Blanco F. 2016. Short-term recoveryfollowing resistance exercise leading or not to failure. International Journal of SportsMedicine 37:295–304 DOI 10.1055/s-0035-1564254.
González-Badillo JJ, Sánchez-Medina L. 2010.Movement velocity as a measure ofloading intensity in resistance training. International Journal of Sports Medicine31:347–352 DOI 10.1055/s-0030-1248333.
González-Badillo JJ, Yañez-García JM, Mora-Custodio R, Rodríguez-Rosell D. 2017.Velocity loss as a variable for monitoring resistance exercise. International journal ofsports medicine 38(03):217–225.
González-Hernádez J, García-Ramos A, Capelo-Ramírez F, Castaño Zambudio A, Mar-quez G, Boullosa D, Jiménez-Reyes P. 2020.Mechanical, metabolic, and perceptualacute responses to different set configurations in full squat. Journal of Strength andConditioning Research 34:1581–1590 DOI 10.1519/jsc.0000000000002117.
Griffiths B, Grant J, Langdown L, Gentil P, Fisher J, Steele J. 2019. The effect of in-season traditional and explosive resistance training programs on strength, jumpheight, and speed in recreational soccer players. Research Quarterly for Exercise andSport 90:95–102 DOI 10.1080/02701367.2018.1563276.
Helms ER, Cronin J, Storey A, Zourdos MC. 2016. Application of the Repetitions inReserve-Based Rating of Perceived Exertion Scale for Resistance Training. Strengthand Conditioning Journal 38:42–49 DOI 10.1519/SSC.0000000000000218.
Helms ER, Storey A, Cross MR, Brown SR, Lenetsky S, Ramsay H, Dillen C, ZourdosMC. 2017. RPE and velocity relationships for the back squat, bench press, anddeadlift in powerlifters. Journal of Strength & Conditioning Research 31(2):292–297.
Jiménez-Reyes et al. (2021), PeerJ, DOI 10.7717/peerj.10942 18/21
Hughes LJ, Banyard HG, Dempsey AR, Peiffer JJ, Scott BR. 2019. Using load-velocity re-lationships to quantify training-induced fatigue. Journal of Strength and ConditioningResearch 33:762–773 DOI 10.1519/JSC.0000000000003007.
Hughes LJ, Peiffer JJ, Scott BR. 2020. Load–velocity relationship 1RM predictions: acomparison of Smith machine and free-weight exercise. Journal of Sports Sciences38:2562–2568 DOI 10.1080/02640414.2020.1794235.
KraemerWJ, Ratamess NA. 2004. Fundamentals of resistance training, progressionand exercise prescription.Medicine and Science in Sports and Exercise 36:674–688DOI 10.1249/01.MSS.0000121945.36635.61.
Mansfield SK, Peiffer JJ, Hughes LJ, Scott BR. 2020. Estimating Repetitions inReserve for Resistance Exercise: An Analysis of Factors Which Impact onPrediction Accuracy. The Journal of Strength and Conditioning ResearchDOI 10.1519/JSC.0000000000003779.
Marshall PWM,McEwenM, Robbins DW. 2011. Strength and neuromuscularadaptation following one, four, and eight sets of high intensity resistance exer-cise in trained males. European Journal of Applied Physiology 111:3007–3016DOI 10.1007/s00421-011-1944.
Mora-Custodio R, Rodríguez-Rosell D, Yáñez García JM, Sánchez-MorenoM,Pareja-Blanco F, González-Badillo JJ. 2018. Effect of different inter-repetitionrest intervals across four load intensities on velocity loss and blood lactate con-centration during full squat exercise. Journal of Sports Sciences 36:2856–2864DOI 10.1080/02640414.2018.1480052.
Ogasawara R, Loenneke JP, Thiebaud RS, Abe T. 2013. Low-load bench press trainingto fatigue results in muscle hypertrophy similar to high-load bench press training.International Journal of Clinical Medicine 4:114–121 DOI 10.4236/ijcm.2013.42022.
Pareja-Blanco F, Rodríguez-Rosell D, Aagaard P, Sánchez-Medina L, Ribas-SernaJ, Mora-Custodio R, Otero-Esquina C, Yáñez García JM, González-BadilloJJ. 2018. Time Course of recovery from resistance exercise with different setconfigurations. Journal of Strength and Conditioning Research 34:2867–2876DOI 10.1519/jsc.0000000000002756.
Pareja-Blanco F, Rodríguez-Rosell D, Sánchez-Medina L, Gorostiaga EM, González-Badillo JJ. 2014. Effect of movement velocity during resistance training on neu-romuscular performance. International Journal of Sports Medicine 35:916–924DOI 10.1055/s-0033-1363985.
Pareja-Blanco F, Rodríguez-Rosell D, Sánchez-Medina L, Ribas-Serna J, López-LópezC, Mora-Custodio R, Yáñez García JM, González-Badillo JJ. 2017a. Acute anddelayed response to resistance exercise leading or not leading to muscle failure.Clinical Physiology and Functional Imaging 37:630–639 DOI 10.1111/cpf.12348.
Pareja-Blanco F, Rodríguez-Rosell D, Sánchez-Medina L, Sanchis-Moysi J, DoradoC, Mora-Custodio R, Yáñez García JM, Morales-Alamo D, Pérez-Suárez I, CalbetJA, González-Badillo JJ. 2017b. Effects of velocity loss during resistance training onathletic performance, strength gains and muscle adaptations. Scandinavian Journal ofMedicine and Science in Sports 27:724–735 DOI 10.1111/SMS.12678.
Jiménez-Reyes et al. (2021), PeerJ, DOI 10.7717/peerj.10942 19/21
Pareja-Blanco F, Sánchez-Medina L, Suárez-Arrones L, González-Badillo JJ. 2017. Ef-fects of velocity loss during resistance training on performance in professional soccerplayers. International journal of sports physiology and performance 12(4):512–519.
Pareja-Blanco F, Villalba-Fernández A, Cornejo-Daza P, Sánchez-Valdepeñas J,González-Badillo J. 2019. Time course of recovery following resistance exer-cise with different loading magnitudes and velocity loss in the set. Sports 7:59DOI 10.3390/sports7030059.
Pérez-Castilla A, Piepoli A, Garrido-Blanca G, Delgado-García G, Balsalobre-Fernández C, García-Ramos A. 2019a. Precision of 7 commercially available devicesfor predicting the bench press 1-repetition maximum from the individual load-velocity relationship. International Journal of Sports Physiology and Performance14(10):1442–1446 DOI 10.1123/ijspp.2018-0801.
Pérez-Castilla A, Rojas FJ, Gómez-Martínez F, García-Ramos A. 2019b. Vertical jumpperformance is affected by the velocity and depth of the countermovement. SportsBiomechanics 14:1442–1446 DOI 10.1080/14763141.2019.1641545.
Pritchard HJ, Barnes MJ, Stewart RJ, Keogh JW,McGuiganMR. 2019.Higher-Versus lower-intensity strength-training taper: effects on neuromuscular perfor-mance. International Journal of Sports Physiology and Performance 14:458–463DOI 10.1123/ijspp.2018-0489.
Ratamess NA, Alvar BA, Evetoch TE, Housh TJ, KiblerWBen, KraemerWJ, TriplettNT. 2009. Progression models in resistance training for healthy adults.Medicine andScience in Sports and Exercise 41(3):687–708 DOI 10.1249/MSS.0b013e3181915670.
Rodríguez-Rosell D, Yáñez García JM, Mora-Custodio R, Pareja-Blanco F, Ravelo-García AG, Ribas-Serna J, González-Badillo JJ. 2020a. Velocity-based resistancetraining: impact of velocity loss in the set on neuromuscular performance andhormonal response. Applied Physiology, Nutrition and Metabolism 45:817–828DOI 10.1139/apnm-2019-0829.
Rodríguez-Rosell D, Yáñez García JM, Sánchez-Medina L, Mora-Custodio R, González-Badillo JJ. 2020b. Relationship between velocity loss and repetitions in reserve in thebench press and back squat exercises. Journal of Strength and Conditioning Research34:2537–2547 DOI 10.1519/JSC.0000000000002881.
Sánchez-Medina L, González-Badillo JJ. 2011. Velocity loss as an indicator of neu-romuscular fatigue during resistance training.Medicine and Science in Sports andExercise 43:1725–1734 DOI 10.1249/MSS.0b013e318213f880.
Sánchez-Medina L, Pallarés J, Pérez C, Morán-Navarro R, González-Badillo J. 2017.Estimation of relative load from bar velocity in the full back squat exercise. SportsMedicine International Open 01:80–88 DOI 10.1055/s-0043-102933.
Sanchez-Medina L, Perez CE, Gonzalez-Badillo JJ. 2010. Importance of the propulsivephase in strength assessment. International Journal of Sports Medicine 31:123–129DOI 10.1055/s-0029-1242815.
Sánchez-MorenoM, Rodríguez-Rosell D, Pareja-Blanco F, Mora-Custodio R,González-Badillo JJ. 2017.Movement velocity as indicator of relative intensity and
Jiménez-Reyes et al. (2021), PeerJ, DOI 10.7717/peerj.10942 20/21
level of effort attained during the set in pull-up exercise. International Journal ofSports Physiology and Performance 12:1378–1384 DOI 10.1123/ijspp.2016-0791.
Seo II D, Kim E, Fahs CA, Rossow L, Young K, Ferguson SL, Thiebaud R, Sherk VD,Loenneke JP, KimD, Lee MK, Choi KH, Bemben DA, BembenMG, SoWY. 2012.Reliability of the one-repetition maximum test based on muscle group and gender.Journal of Sports Science and Medicine 11:221–225.
Spiering B, KraemerW, Anderson J, Armstrong L, Nindl B, Volek J, Maresh C. 2008.Resistance exercise biology: manipulation of resistance exercise programme variablesdetermines the responses of cellular and molecular signalling pathways. SportsMedicine 38:527–540 DOI 10.2165/00007256-200838070-00001.
Torres-Torrelo J, Rodríguez-Rosell D, González-Badillo JJ. 2017. Light-load max-imal lifting velocity full squat training program improves important physicaland skill characteristics in futsal players. Journal of Sports Sciences 35:967–975DOI 10.1080/02640414.2016.1206663.
Weakley J, Mann B, Banyard H, McLaren S, Scott T, Garcia-Ramos A. 2020a. Velocity-based training: from theory to application. Strength & Conditioning Journal. Epubahead of print May 19 2020 DOI 10.1519/SSC.0000000000000560.
Weakley J, McLaren S, Ramirez-Lopez C, García-Ramos A, Dalton-Barron N, BanyardH, Mann B,Weaving D, Jones B. 2020b. Application of velocity loss thresholdsduring free-weight resistance training: responses and reproducibility of perceptual,metabolic, and neuromuscular outcomes. Journal of Sports Sciences 38:477–485DOI 10.1080/02640414.2019.1706831.
Weakley J, Wilson K, Till K, Banyard H, Dyson J, Phibbs P, Read D, Jones B. 2018.Show me, tell me, encourage me: the effect of different forms of feedback onresistance training performance. Journal of Strength and Conditioning Research34:3157–3163 DOI 10.1519/JSC.0000000000002887.
Zourdos MC, Klemp A, Dolan C, Quiles JM, Schau KA, Jo E, Helms E, Esgro B,Duncan S, Merino SGarcia, Blanco R. 2016. Resistance training-specific rating ofperceived exertion scale measuring repetitions in rereserve. Journal of Strength andConditioning Research 30:267–275 DOI 10.1519/JSC.0000000000001049.
Jiménez-Reyes et al. (2021), PeerJ, DOI 10.7717/peerj.10942 21/21


