Embed Size (px)
Citation preview
An Exploratory Study of Gambling Motives, Severity and
Behaviour of Gamblers in Sikkim
A Thesis Submitted
To
Sikkim University
In Partial Fulfilment of the Requirement for the
Degree of Doctor of Philosophy
By
Adarsh Rai
Department of Management
School of Professional Studies
March 2021
i

ii
iii
iv
Acknowledgement
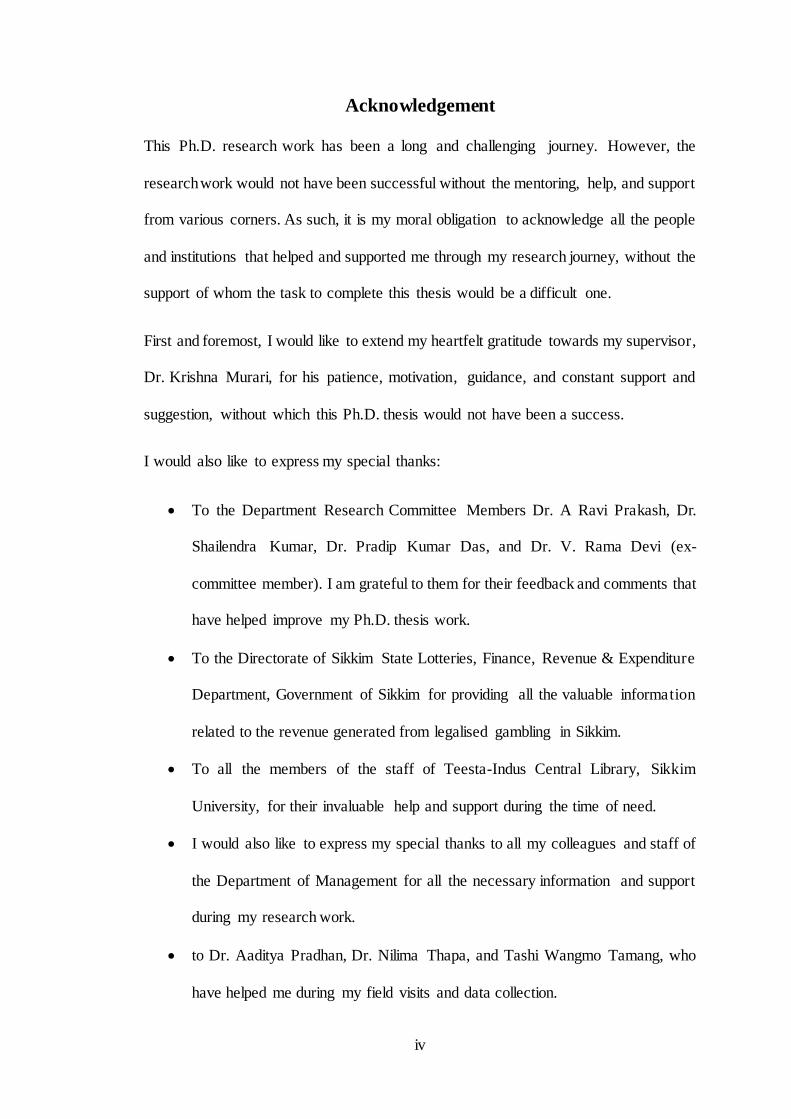
This Ph.D. research work has been a long and challenging journey. However, the
research work would not have been successful without the mentoring, help, and support
from various corners. As such, it is my moral obligation to acknowledge all the people
and institutions that helped and supported me through my research journey, without the
support of whom the task to complete this thesis would be a difficult one.
First and foremost, I would like to extend my heartfelt gratitude towards my supervisor,
Dr. Krishna Murari, for his patience, motivation, guidance, and constant support and
suggestion, without which this Ph.D. thesis would not have been a success.
I would also like to express my special thanks:
To the Department Research Committee Members Dr. A Ravi Prakash, Dr.
Shailendra Kumar, Dr. Pradip Kumar Das, and Dr. V. Rama Devi (ex-
committee member). I am grateful to them for their feedback and comments that
have helped improve my Ph.D. thesis work.
To the Directorate of Sikkim State Lotteries, Finance, Revenue & Expenditure
Department, Government of Sikkim for providing all the valuable information
related to the revenue generated from legalised gambling in Sikkim.
To all the members of the staff of Teesta-Indus Central Library, Sikkim
University, for their invaluable help and support during the time of need.
I would also like to express my special thanks to all my colleagues and staff of
the Department of Management for all the necessary information and support
during my research work.
to Dr. Aaditya Pradhan, Dr. Nilima Thapa, and Tashi Wangmo Tamang, who
have helped me during my field visits and data collection.

v
To Mr. Dorjee Tamang for his invaluable service in getting Xerox and print outs
of the materials required during my research work. I would also like to
acknowledge his support in getting the final printout and binding of my Ph.D.
thesis.
Finally, I am eternally grateful to my parent's Mom, and Dad, my brothers, sister-in-
law, and my sister for all of their blessings, love, and support throughout my life. To
my brothers, Ashik Rai and Sewak Rai, having two elder brothers who took care of
everything and spared me from facing any difficulty have helped me complete my Ph.D.
thesis.
I shall remain indebted to all of my mentors and well-wishers for their constant support
and motivation. Thank you all.
vi
Table of Content
Plagiarism Check Certificate _________________________________________ i
Declaration _________________________________________________ ii
Certificate from Supervisor__________________________________________ iii
Acknowledgement_________________________________________________ iv
Table of Content _________________________________________________ vi
List of Tables _________________________________________________ ix
List of Figures ________________________________________________ xii
List of Abbreviation ______________________________________________ xiii
CHAPTER 1. INTRODUCTION ____________________________________ 1
1.1 Gambling: Historical Evolution ________________________________ 1
1.2 Gambling definitions ________________________________________ 2
1.3 Gambling Industry Around the World ___________________________ 4
1.4 Gambling in India __________________________________________ 9
1.4.1 History of Gambling in India______________________________________ 9
1.4.2 Gambling Laws in India ________________________________________ 10
1.4.3 Gambling Industry in India ______________________________________ 15
1.4.4 Status of Indian Gambler________________________________________ 24
1.5 Gambling in Sikkim ________________________________________26
1.5.1 Lotteries in Sikkim ____________________________________________ 28
1.5.2 Casinos and Online Gambling in Sikkim____________________________ 28
1.5.3 Gambling Laws and Acts in Sikkim _______________________________ 30
1.6 Economic and Social Implications of Gambling ____________________32
1.7 Problem Statement _________________________________________34
CHAPTER 2. REVIEW OF LITERATURE ___________________________ 36
2.1 Gambling Motivation________________________________________36
2.2 Severity / Problem Gambling __________________________________39
2.2.1 Tools for Measuring Severity/ Problem Gambling ____________________ 40
2.2.2 Prevalence of Problem Gambling _________________________________ 48
2.2.3 Association between Problem Gambling and Forms of Gambling ________ 53
2.2.4 Problem Gambling among the Internet Gamblers _____________________ 57
2.2.5 Impacts of Problem Gambling____________________________________ 61
2.3 Gambling Behaviour ________________________________________71
vii
2.4 Research Gap _____________________________________________73
2.5 Conceptual Model Framework _________________________________73
2.6 Objectives of the Study ______________________________________75
2.7 Hypothesis of the Study ______________________________________76
2.8 Scope of the Study__________________________________________77
2.9 Significance of the study _____________________________________77
CHAPTER 3. RESEARCH METHODOLOGY _________________________ 78
3.1 Research Design ___________________________________________78
3.1.1 Population of the Study _________________________________________ 78
3.1.2 Sample Size and Sampling Approach ______________________________ 78
3.1.3 Data Collection Approach _______________________________________ 80
3.1.4 Survey Instrument - Questionnaire ________________________________ 81
3.1.5 Statistical Tools Used for Analysis ________________________________ 83
3.1.6 Construct Reliability ___________________________________________ 83
3.2 Profile of the Respondents ____________________________________84
3.2.1 Demographic Profile ___________________________________________ 84
3.2.2 Leading Reasons Behind Starting Gambling Among the Respondents _____ 89
3.2.3 Participation Rate in Different Forms of Gambling____________________ 90
3.2.4 Rate of Winnings Among the Respondents __________________________ 91
CHAPTER 4. DATA ANALYSIS AND INTERPRETATION ______________ 92
4.1 Exploring the Gambling Motives _______________________________92
4.1.1 Confirmatory Factor Analysis of the Five Factor Gambling Motivation Model
92
4.1.2 Exploratory Factor Analysis _____________________________________ 93
4.1.3 Confirmatory Factor Analysis of the 20-items Five Factor Gambling Motivation
Model. 97
4.2 Problem Gambling among the Gamblers in Sikkim_________________ 104
4.3 Problem Gambling Severity across Demographic Variables __________ 105
4.3.1 Age of the Respondents and PGSI Category ________________________ 105
4.3.2 Hometown of the Respondents and PGSI Category __________________ 106
4.3.3 Gender of the respondent and the PGSI Category: ___________________ 107
4.3.4 Marital Status of the respondent and the PGSI Category: ______________ 108
4.3.5 Educational Qualification of the respondent and the PGSI Category: _____ 109
4.3.6 Employment Status of the respondent and the PGSI Category: __________ 110
4.3.7 Monthly Income of the respondent and the PGSI Category: ____________ 111
viii
4.3.8 Test of Hypothesis for Association Between Problem Gambling Severity and
the Demographic Variables ____________________________________________ 112
4.4 Gambling Forms and the Problem Gambling _____________________ 114
4.4.1 Association Between Gambling Forms and Problem Gambling Severity __ 115
4.5 Frequency of Visitation to Gambling Houses and the Prevalence Rate of
Problem Gambling Severity _______________________________________ 116
4.6 Gambling Motives and the Problem Gambling Severity _____________ 118
4.6.1 Testing of Hypothesis for identifying the relationship between the Non-
Financial Motives and Financial Motives in Explaining Problem Gambling Severity 119
4.6.2 Testing of Hypothesis Between Gambling Motives and the Level of Problem
Gambling Severity ___________________________________________________ 122
4.7 Exploring Gambling Behaviour _______________________________ 123
4.7.1 Confirmatory Factor Analysis of the 20 Item Gambling Behaviour Scale__ 123
4.7.2 Exploratory Factor Analysis ____________________________________ 124
4.7.3 Confirmatory Factor Analysis of the 13 Item Gambling Behaviour Scale__ 126
4.8 Problem Gambling Severity and Gambling Behaviour ______________ 129
4.8.1 Testing of Hypothesis for Identifying Significant Relationship Between
Problem Gambling Severity and Gambling Behaviour ________________________ 129
4.9 Conceptual Model Test _____________________________________ 132
4.2 Revenue Generated from the Legalised Gambling in Sikkim __________ 134
4.2.1 Amount of Revenue Generated from Sikkim State Lotteries____________ 135
4.2.2 Amount of Revenue Generated from Casinos in Sikkim _______________ 136
4.2.3 Amount of Revenue Generated from Online Gaming in Sikkim _________ 137
CHAPTER 5. FINDINGS, SUGGESTIONS AND CONCLUSION ________ 143
5.1 Findings of the Study_______________________________________ 143
5.1.1 Summary of Testing of Hypothesis _______________________________ 145
5.2 Suggestions ______________________________________________ 146
5.3 Policy Implications ________________________________________ 148
5.4 Conclusion ______________________________________________ 149
References ___________________________________________________ 151
Appendix _______________________________________________ 171
ix
List of Tables
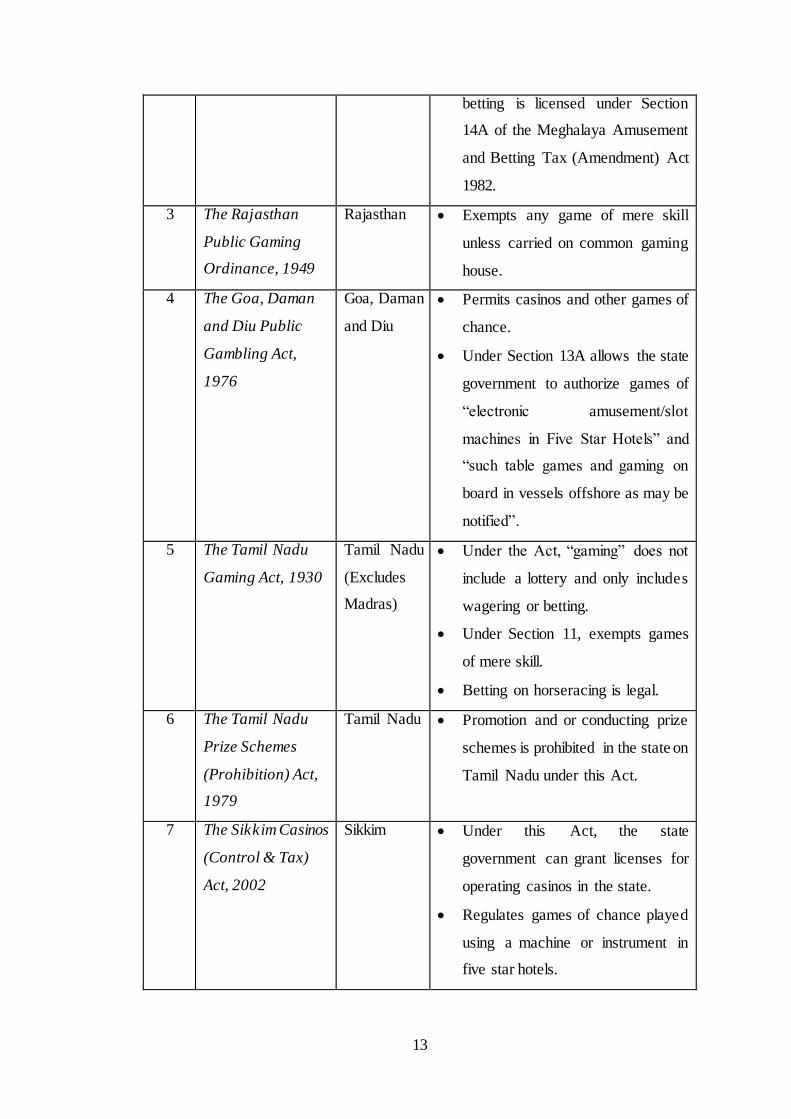
Table 1.1 States and Union Territories adopting The Public Gambling Act, 1867 .....12
Table 1.2 States in India that have enacted their own gambling laws. .......................12
Table 1.3 States in India in which Lotteries are Legal ..............................................16
Table 1.4 Revenue and Profit of Kerala State Lotteries from the period between 2007-
08 and 2016-17 ......................................................................................................17
Table 1.5 Horse Racecourses in India ......................................................................18
Table 1.6 Land Based and Offshore Based Casinos in Goa ......................................21
Table 1.7 Gambling Participation in different forms of Gambling among the Indian
Gamblers ...............................................................................................................25
Table 1.8 Total Visits of Indian Gamblers at Macau and Las Vegas .........................26
Table 1.9 On-line Games Legal under the Sikkim On-line Gaming (Regulation) Rules,
2009 ......................................................................................................................27
Table 2.1 Prevalence Rate of Problem Gambling around the world ..........................49
Table 2.2 Prevalence Study on Problem Gambling in India. .....................................51
Table 2.3 Estimated Social Cost of Gambling (Amount in U.S. Dollars) ..................69
Table 3.1 Plan of data collection from Gamblers in Sikkim ......................................80
Table 3.2 Reliability of Constructs ..........................................................................84
Table 3.3 Age of the Respondents ...........................................................................85
Table 3.4 Hometown of the Respondents ................................................................85
Table 3.5 Gender of the Respondents ......................................................................86
Table 3.6 Marital Status of the Respondents ............................................................86
Table 3.7 Educational Qualification of the Respondents ..........................................87
Table 3.8 Employment Status of the Respondents ....................................................87
Table 3.9 Source of Gambling Money for the Respondents ......................................88
Table 3.10 Monthly Income of the Respondents ......................................................89
Table 3.11 Respondents response to what lead them to starting gambling .................89
Table 3.12 Respondents response to which form of gambling they frequently play ...90
Table 3.13 Respondents Response for how often do they win while gambling ..........91
Table 4.1 Model Fit Indices for the 35-Item Five Factor Gambling Motivation Model
..............................................................................................................................93
Table 4.2 KMO and Bartlett's Test - Gambling Motivation ......................................94
x
Table 4.3 Summary of Exploratory Factor Analysis Results for the 20-Items Five-
Factor Gambling Motivation Model ........................................................................95
Table 4.4 Model Fit Indices for the 20 Item Five-Factor Gambling Motivation Model
..............................................................................................................................97
Table 4.5 Fit Indices for the Model Performed Under Three Different Settings ....... 102
Table 4.6 Chi Square Test of Independence Between Different Gambling Motives and
Level of Income ................................................................................................... 103
Table 4.7 Chi Square Test of Independence Between Gambling Motives Mean Score
and the Level of Income ....................................................................................... 104
Table 4.8 Prevalence Rates of Problem Gambling Among the Gamblers in Sikkim. 104
Table 4.9 Age of the Respondents and Gambling Behaviour by Risk Categories..... 106
Table 4.10 Hometown of the Respondents and Gambling Behaviour by Risk Categories
............................................................................................................................ 107
Table 4.11 Gender of the Respondents and Gambling Behaviour by Risk Categories
............................................................................................................................ 108
Table 4.12 Marital Status of the Respondents and Gambling Behaviour by Risk
Categories ............................................................................................................ 109
Table 4.13 Educational Qualification of the Respondents and Gambling Behaviour by
Risk Categories .................................................................................................... 110
Table 4.14 Employment Status of the Respondents and Gambling Behaviour by Risk
Categories ............................................................................................................ 111
Table 4.15 Monthly Income of the respondent and the PGSI Category ................... 112
Table 4.16 Test of Association Between Different Demographic Variables and the
Levels of Problem Gambling Severity ................................................................... 113
Table 4.17 Gambling Forms and the level of Problem Gambling Severity .............. 115
Table 4.18 Test of Significance between different gambling forms and the level of
problem gambling severity ................................................................................... 116
Table 4.19 Frequency of Gambling Engagement Among the Gamblers in Sikkim... 116
Table 4.20 Gambling Frequency Among the Gamblers in Sikkim and the Levels of
Problem Gambling Severity .................................................................................. 117
Table 4.21 Correlation Between Five Gambling Motivation Factors and Problem
Gambling Severity ............................................................................................... 120
Table 4.22 Correlation Between the Non-Financial Gambling Motives and the
Financial Gambling Motives and Problem Gambling Severity ............................... 121
xi
Table 4.23 Correlation Between Gambling Motives and Problem Gambling Severity
............................................................................................................................ 122
Table 4.24 Model Fit Indices for the 20-Item Gambling Behaviour Scale ............... 123
Table 4.25 KMO and Bartlett's Test of Sphericity for Gambling Behaviour Scale ... 124
Table 4.26 Summary of Exploratory Factor Analysis Results for Gambling Behaviour
............................................................................................................................ 125
Table 4.27 Model Fit Indices of the 13-Item Gambling Behaviour Scale ................ 126
Table 4.28 Model Fit Indices of the 13 Item Gambling Behaviour Scale After Adding
Covariance ........................................................................................................... 129
Table 4.29 Correlation Between Five Gambling Behaviour Traits and Problem
Gambling Severity ............................................................................................... 130
Table 4.30 Correlation Between Gambling Behaviour and Problem Gambling Severity
............................................................................................................................ 131
Table 4.31Regression Weights Between Gambling Motives and PGSI and Between
PGSI and Gambling Behaviour ............................................................................. 134
Table 4.32 Amount of Revenue Generated from Sikkim State Lotteries during the
period between 2011-12 and 2017-18 (Figures in Rs Million) ................................ 136
Table 4.33 Amount of Revenue Generated from the Casinos in Sikkim During the
Period between 2011-12 and 2018-19 (Figures in Rs Million) ................................ 137
Table 4.34 Amount of Revenue Generated from Online Gaming in Sikkim from 2015-
16 to 2018-19 (Rs in Million) ............................................................................... 138
Table 5.1 Summary of Hypothesis Testing. ........................................................... 146
xii
List of Figures
Figure 1.1Gambling by Market, 2018....................................................................... 5
Figure 1.2 Gross Gaming Revenue (GGR) as a share of GDP in select European
countries in 2018. .................................................................................................... 6
Figure 1.3 Size of the Online Gambling Market Worldwide from 2012-2018, by region
(in US Billion Dollar). ............................................................................................. 8
Figure 1.4 Distribution of Online Gaming Revenues in Europe in 2018, by type. ....... 8
Figure 2.1 Conceptual Model..................................................................................75
Figure 4.1 Factorial Structure Model of the 20-Item Five Factor Gambling Motivation
Model ....................................................................................................................98
Figure 4.2 Model 1: Factorial Model Structure After Adding a Covariance between
items AV_2 and AV_5 ...........................................................................................99
Figure 4.3 Model 2: Factorial Model Structure After Removing the item AV_2..... 100
Figure 4.4Model 3: Factorial Model Structure After Removing the item AV_5...... 101
Figure 4.5 Factorial Structure Model of the 13-Item Gambling Behaviour Scale ..... 127
Figure 4.6 Factorial Structure Model of the 13-Item Gambling Behaviour Scale After
Adding Covariance Between IC_4 and IC_5 ......................................................... 128
Figure 4.7Testing Conceptual Model .................................................................... 133
xiii
List of Abbreviation
AM Amusement Motive
APA American Psychiatric Association
AV Avoidance Motive
BC Before Christ
BPO Business Process Outsourcing
CAGR Compound Annual Growth Rate
CFA Confirmatory Factor Analysis
CFI Comparative Fit Index
CMIN Chi-Square
CPGI Canadian Problem Gambling Index
DF Degrees of Freedom
DSM Diagnostic and Statistical Manual
EFA Exploratory Factor Analysis
EGMs Electronic Gaming Machines
EM Excitement Motive
FM Financial Motive
GDP Gross Domestic Product
GFI Goodness of Fit
GGR Gross Gambling Revenue
GGY Gross Gaming Yield
GMQ Gambling Motives Questionnaire
GMS Gambling Motivation Scale
H2GC H2 Gambling Capital
ICC International Cricket Council
IPV Intimate Partner Violence
IT Information Technology
KMO Kaiser Meyer Olkin

xiv
NH National Highway
NPAR Number of Parameters in the model
PCA Principle Component Analysis
PGSI Problem Gambling Severity Index
RMSEA Root Mean Square Error of Approximation
SM Social Motive
SOGS South Oaks Gambling Screen
1
CHAPTER 1. INTRODUCTION
1.1 Gambling: Historical Evolution
Gambling has been in existence since the beginning of human civilizations (Law
Commission of India, 2018). Gambling perhaps is as old as mankind (Schwartz, 2008)
and remains a controversial subject even today as it used to be during the early periods
(Fact Research Inc., 1974). The second oldest profession in the world, gambling, has
ceased to exist in different forms with various ancient artefacts providing evidence of
the existence of gambling in the early period (Schwartz, 2008).
The earliest recorded history of gambling comes from China, where the game of Circa
was played around 2300 BC (Fact Research Inc., 1974). However, McMillen has
pointed out the earliest recorded history of gambling in China to around 4000 BC
(McMillen 1996 as cited in Chan et al., 2016). The archaeological discovery
of Astragali, a dice-like object dated around 40,000 years and made from the bones of
sheep or dogs, providing the earliest evidence of gambling in ancient Europe (Law
Commission of India, 2018). Many archaeological surveys have unearthed primitive
dices and gambling devices in the ancient Mesopotamian and Egyptian Civilizations as
well (Schwartz, 2008). The ancient Indian Literature Rig Veda, written around 1500
BC, provides the earliest evidence of the existence of gambling in India (Law
Commission of India, 2018).
Several early civilizations regulated gambling to generate revenue by collecting the
proceeds of the profits and investing them in various state works. Lotteries were
conducted in France and England to create funds for funding several state projects. The
early works of the British Museum in London, England, were financed by lottery money
(Fact Research Inc., 1974). Harvard and Yale universities, two of the premium
2
educational institutes in the world, were also initially funded by the lottery money
(Cormack, 2018).
The history of casinos and gambling houses dates back to around the 17th century in
Europe (Cormack, 2018). Gambling houses similar to casinos of the modern world
started appearing in Europe around the 17th century, when in 1638 Ridotto was
established in Venice, Italy (Cormack, 2018). The first legal land-based casino in
Europe was opened in Baden, Austria during the year 1765 (Law Commission of India,
2018).
The legalised gambling industry continues to grow and flourish, resulting in an
introduction and expansion of new forms of gambling. Today people can and do gamble
on almost anything. However, the most common forms of gambling popular around the
world include lotteries, casino games, online gaming, poker, bingo, sports betting,
Electronic Gaming Machines (EGMs), and slot machines (Holtgraves, 2009b).
Although the legalised gambling industry continues to grow, there still exists a debate
among the critics of gambling based on their own sets of philosophical standpoints. The
proponents of gambling base their argument from the point of economic development
in terms of revenue generation and employment opportunities. While, opponents of
gambling oppose gambling on moral grounds and focus on the negative implications of
gambling, such as problem gambling and its impact upon gamblers, family members,
and society.
1.2 Gambling definitions
Before going into much detail about gambling and gambling products, it is essential to
understand and identify what constitutes gambling. There are several definitions of the
3
term gambling throughout the literature. The following paragraphs will uncover some
of the ways in which gambling has been defined.
The Encyclopaedia Britannica defines gambling as,
"The betting or staking of something of value, with consciousness of risk and
hope of gain, on the outcome of a game, a contest, or an uncertain event
whose result may be determined by chance or accident or have an unexpected
result by reason of the bettor’s miscalculation."
The Business Dictionary defines gambling as, "Betting (wagering) that must result
either in a gain or a loss."
The Meghalaya Prevention of Gambling Act, 1970 defines gambling as,
“Gambling” or “gaming” means a play or game for money, including betting
and wagering, by which a person intentionally exposes money to the risk or
hazard of loss by chance; but does not include- a lottery or wagering or
betting upon a horse race, when such wagering or betting takes place on the
date on which the race is to be run.
In the case of Dr. K.R. Lakshmanan vs State of Tamil Nadu and Anr, 1996, the Supreme
Court of India has defined gambling as,
“Gambling in a nut-shell is payment of a price for a chance to win a prize.
Games may be of chance, or of skill or of skill and chance combined. A game
of chance is determined entirely or in part by lot or mere luck. The throw of
the dice, the turning of the wheel, the shuffling of the cards, are all modes of
chance. In these games the result is wholly uncertain and doubtful. No human
mind knows or can know what it will be until the dice is thrown, the wheel
4
stops its revolution or the dealer has dealt with the cards. A game of skill, on
the other hand - although the element of chance necessarily cannot be entirely
eliminated. (Dr. K.R. Lakshmanan vs State of Tamil Nadu and Anr, 1996,
p.2)
From the above definitions of gambling, some characteristics of gambling can be
identified. These are as follows:
Gambling involves wagering or betting something of monetary value
(which is usually money).
Gaming games of different types can be classified into a game of skill, a
game of chance, or both.
A gambler is exposed to the highest risk and a high return.
While gambling, a gambler either wins or loses a bet. There is no such thing
called a tie in gambling.
1.3 Gambling Industry Around the World
The gambling industry is one of the major industries in the world. The global gambling
market grew at a compound annual growth rate of 4.1% since 2014, and the globa l
gambling market size was valued at nearly $449.3 billion in 2018 (“Gambling Global
Market Opportunities And Strategies To 2022,” 2019). The global gambling market
size is expected to reach $565.4 billion by 2022 growing at a compound annual growth
rate of about 5.9%. While according to the H2 Gambling Capital (H2GC), the Gross
Gambling Revenue (GGR) grew at a compound annual growth rate of 2.3% from 342.6
billion euros in 2012 to 392.4 billion euros in 2018 (Playtech plc Annual Report and
Accounts, 2018), Land-based gambling made approximately around 89% of the total
GGR in 2018 in comparison to the online forms of gambling which made around 11%
5
of the total GGR. According to the H2 Gambling Capital (H2GC) estimates there was
an increase of 4.5% of the Gross Gambling Revenue from 375.6 billion euros in 2017
to 392.4 billion euros in 2018 for casino, poker, sports betting, skill based gambling
and lotteries (Playtech plc Annual Report and Accounts, 2018).
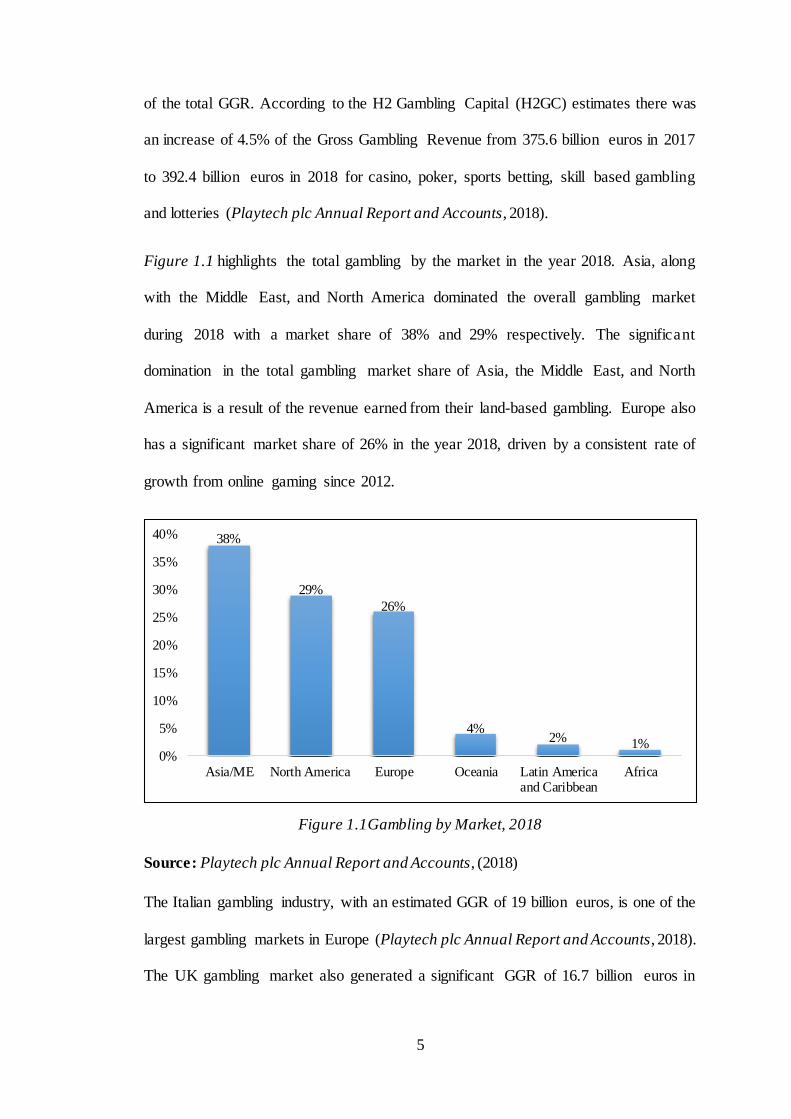
Figure 1.1 highlights the total gambling by the market in the year 2018. Asia, along
with the Middle East, and North America dominated the overall gambling market
during 2018 with a market share of 38% and 29% respectively. The significant
domination in the total gambling market share of Asia, the Middle East, and North
America is a result of the revenue earned from their land-based gambling. Europe also
has a significant market share of 26% in the year 2018, driven by a consistent rate of
growth from online gaming since 2012.
Figure 1.1Gambling by Market, 2018
Source: Playtech plc Annual Report and Accounts, (2018)
The Italian gambling industry, with an estimated GGR of 19 billion euros, is one of the
largest gambling markets in Europe (Playtech plc Annual Report and Accounts, 2018).
The UK gambling market also generated a significant GGR of 16.7 billion euros in
38%
29%
26%
4%2% 1%
0%
5%
10%
15%
20%
25%
30%
35%
40%
Asia/ME North America Europe Oceania Latin Americaand Caribbean
Africa
6
2018, with a notable revenue generated from online gaming, which generated a GGR
of approximately 7.1 billion euros (Playtech plc Annual Report and Accounts, 2018).
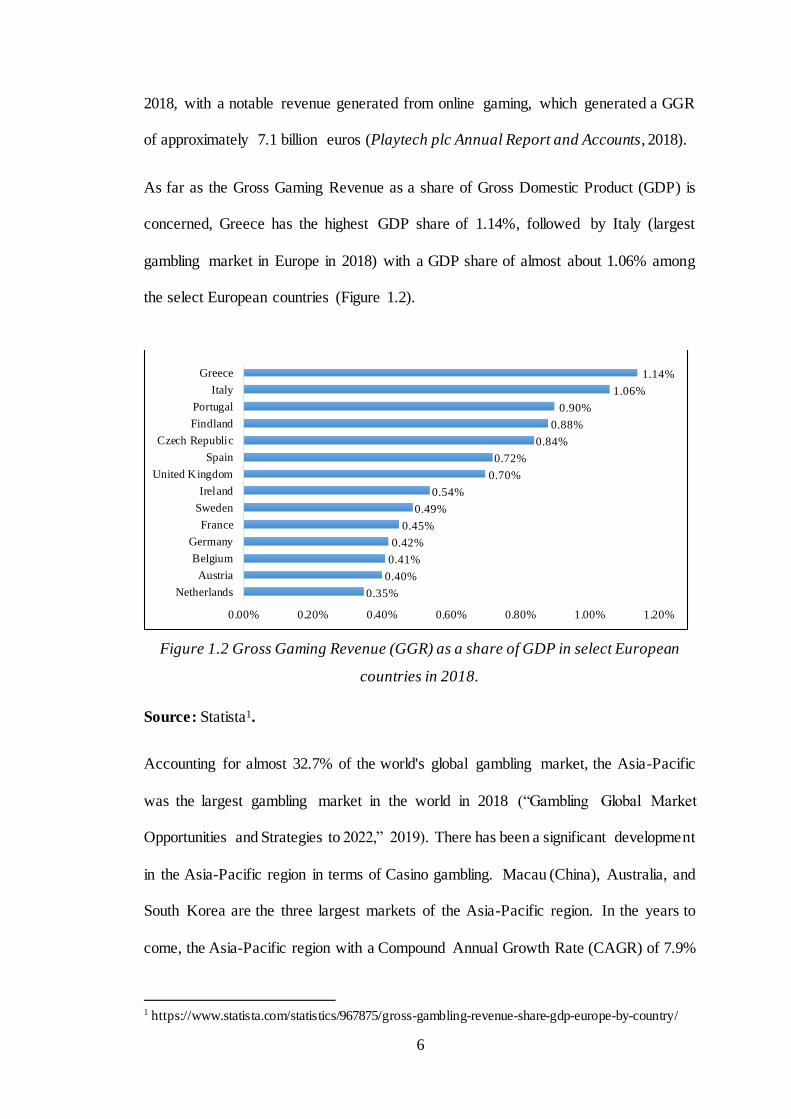
As far as the Gross Gaming Revenue as a share of Gross Domestic Product (GDP) is
concerned, Greece has the highest GDP share of 1.14%, followed by Italy (largest
gambling market in Europe in 2018) with a GDP share of almost about 1.06% among
the select European countries (Figure 1.2).
Figure 1.2 Gross Gaming Revenue (GGR) as a share of GDP in select European
countries in 2018.
Source: Statista1.
Accounting for almost 32.7% of the world's global gambling market, the Asia-Pacific
was the largest gambling market in the world in 2018 (“Gambling Global Market
Opportunities and Strategies to 2022,” 2019). There has been a significant development
in the Asia-Pacific region in terms of Casino gambling. Macau (China), Australia, and
South Korea are the three largest markets of the Asia-Pacific region. In the years to
come, the Asia-Pacific region with a Compound Annual Growth Rate (CAGR) of 7.9%
1 https://www.statista.com/statistics/967875/gross-gambling-revenue-share-gdp-europe-by-country/
0.35%
0.40%
0.41%
0.42%
0.45%
0.49%
0.54%
0.70%
0.72%
0.84%
0.88%
0.90%
1.06%
1.14%
0.00% 0.20% 0.40% 0.60% 0.80% 1.00% 1.20%
Netherlands
Austria
Belgium
Germany
France
Sweden
Ireland
United Kingdom
Spain
Czech Republic
Findland
Portugal
Italy
Greece
7
will be the fastest-growing gambling market in the world (“Gambling Global Market
Opportunities And Strategies To 2022,” 2019).
The Gross Global Revenue (GGR) generated by online gambling accounted for about
11% of the total GGR in the year 2018. Even though online gambling forms a small
segment of the global gambling market, it has the highest rate of growth in the industry.
The online gambling market grew from 40.5 billion euros in 2017 to 44.6 billion euros
in 2018, witnessing a substantial growth rate of almost 10.2%. According to H2GC
estimates, the online gambling market is expected to grow at a CAGR of 7.4% until
2021 in comparison to a 2% CAGR estimated for the land-based gambling market
(Playtech plc Annual Report and Accounts, 2018).
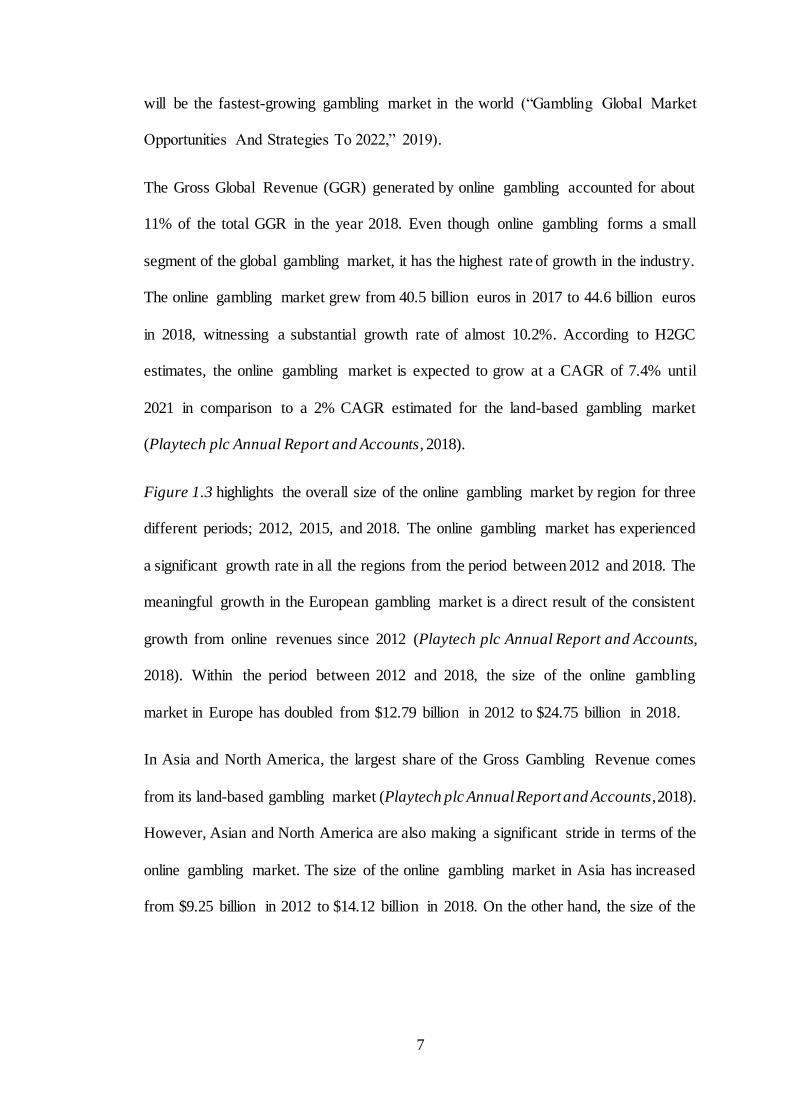
Figure 1.3 highlights the overall size of the online gambling market by region for three
different periods; 2012, 2015, and 2018. The online gambling market has experienced
a significant growth rate in all the regions from the period between 2012 and 2018. The
meaningful growth in the European gambling market is a direct result of the consistent
growth from online revenues since 2012 (Playtech plc Annual Report and Accounts,
2018). Within the period between 2012 and 2018, the size of the online gambling
market in Europe has doubled from $12.79 billion in 2012 to $24.75 billion in 2018.
In Asia and North America, the largest share of the Gross Gambling Revenue comes
from its land-based gambling market (Playtech plc Annual Report and Accounts, 2018).
However, Asian and North America are also making a significant stride in terms of the
online gambling market. The size of the online gambling market in Asia has increased
from $9.25 billion in 2012 to $14.12 billion in 2018. On the other hand, the size of the
8
online gambling market in North America has increased from $3.95 billion in 2012 to
$8.66 billion in 20182.
Figure 1.3 Size of the Online Gambling Market Worldwide from 2012-2018, by region
(in US Billion Dollar).
Source: Statista3.
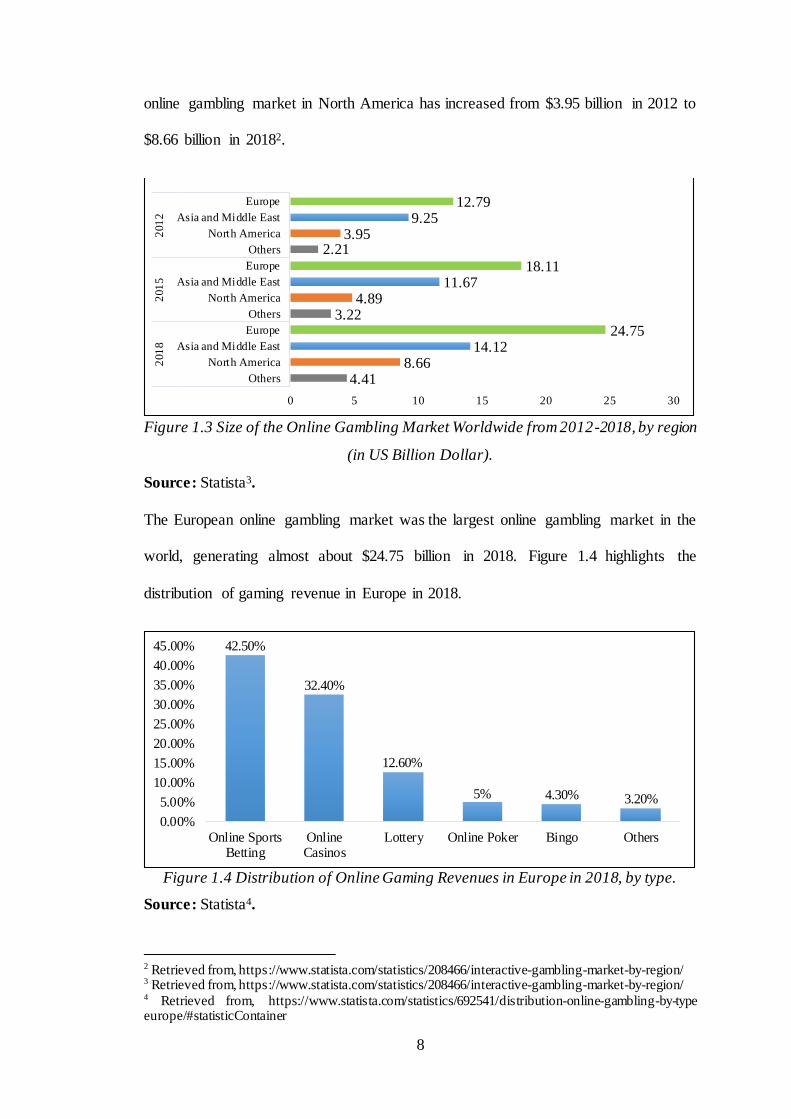
The European online gambling market was the largest online gambling market in the
world, generating almost about $24.75 billion in 2018. Figure 1.4 highlights the
distribution of gaming revenue in Europe in 2018.
Figure 1.4 Distribution of Online Gaming Revenues in Europe in 2018, by type.
Source: Statista4.
2 Retrieved from, https://www.statista.com/statistics/208466/interactive-gambling-market-by-region/ 3 Retrieved from, https://www.statista.com/statistics/208466/interactive-gambling-market-by-region/ 4 Retrieved from, https://www.statista.com/statistics/692541/distribution-online-gambling-by-type europe/#statisticContainer
4.418.66
14.1224.75
3.224.89
11.6718.11
2.213.95
9.2512.79
0 5 10 15 20 25 30
Others
North America
Asia and Middle East
Europe
Others
North America
Asia and Middle East
Europe
Others
North America
Asia and Middle East
Europe
201
82
01
52
01
2
42.50%
32.40%
12.60%
5% 4.30% 3.20%
0.00%
5.00%
10.00%
15.00%
20.00%
25.00%
30.00%
35.00%
40.00%
45.00%
Online SportsBetting
OnlineCasinos
Lottery Online Poker Bingo Others
9
As per the type of online gambling is concerned, online sports betting generated the
highest amount of revenue with a contribution of almost 42.50% of the total online
gambling revenue. Online sports betting was closely followed by online casinos, which
also had a notable contribution of almost 32.40%. While the lottery contributed almost
12.60% of the total online gambling revenue, Online poker, Bingo, and others had a
contribution of 5%, 4.30%, and 3.20% respectively.
1.4 Gambling in India
Prevalent across multiple cultures and societies, Gambling has been the most popular
pastime activity among the Indians during the ancient period (George et al., 2017) and
remains a popular pastime in the present day as well. Gambling in India is frowned
upon by various cultures, societies, and the religious codes and conducts. However, the
popularity of gambling in India continues to grow, even when the social and religious
beliefs frown upon gambling.
1.4.1 History of Gambling in India
Gambling has long been a part of Indian culture and society. There are several
references to the existence of gambling in India in ancient Indian texts and literature.
The Dyuta Sukta (Ode to the Dice) a part of the hymn from Rig Veda, ancient Indian
literature written between 1700 and 1000 BC, provides evidence of gambling in India
(Bhide, 2007; George et al., 2017). The ancient prehistoric epic Mahabharata is a story
about the Pandava brothers and their wife who had to go into exile after losing their
fortunes, which was decided by a game of dice (Benegal, 2013; Palai et al., 2006).
Kautilya's Arthashatra has highlighted the role of gambling as a source for generating
revenue for the state. The gambling industry during Kautilya's era was a state-regulated
industry with a 5 percent tax on the winnings (Srinivasan, 2014). The popularity of
10
gambling continued in India during the medieval period between the 8th and 18th
centuries (George et al., 2017). There was a structured gambling industry in India
during the 15th century, and gambling and gambling houses were legal. Gambling took
place legally, and part of the profit made from gambling went out to the King. From the
early 16th to 18th century, the Mughal Empire ruled India. Islam forbids gambling, and
yet during the Islamic rule, people still gambled in India. Babur, the founder of the
Mughal Empire in India, introduced ganjifa,5 which were widely popular during the
Mughal period (Benegal, 2013). Even during British rule, gambling such as Satta or
number gambling that included betting on cotton prices, opium, and gold prices were
widely popular. (George et al., 2017). Gambling halls were legal in India until the
British colonial authorities banned gambling in India in 1867 (Szybala, 2016). The
British Empire outlawed gambling in India through the Public Gambling Act of 1867,
which banned all forms of gambling in India except for Horseracing, rummy, and
lotteries. The Public Gambling Act of 1867 still governs the gambling laws in India.
1.4.2 Gambling Laws in India
The origin of gambling laws in India can be traced back to the British rule in India.
Gambling laws in India at its initial stage were confusing and vague. Section 290 of the
Indian Penal Code of 1860, was the only provision in India that prohibited any forms
of gambling activities. This initial confusion about the gambling laws in India led to
the passing of the Public Gambling Act of 1867 to prevent public gambling in India.
The Public Gambling Act of 1867 was derived from the British Gaming Act 1845, and
the Betting Act 1853.
5 An ancient Indian card game introduced and popularized by the Mughal Empire.
11
The Public Gambling Act of 1867 is a general law governing gambling in India. The
act provides a provision for the punishment of public gambling, and for keeping
common gaming houses. The Public Gambling Act of 1867 defined gaming houses as:
“…any house, walled enclosure, room or place in which cards, dice, tables
or other instruments of gaming are kept or used for the profit or gain of the
person owning, occupying, using or keeping such house, enclosure, room or
place, whether by way of charge for the use of the instruments of gaming, or
of the house, enclosure, room or place, or otherwise howsoever.” (Section 1,
p. 2)
In general, the act banned all forms of gambling in India other than the lottery,
horseracing, and rummy (G3 Newswire, 2014). The act banned operating gambling
houses and visiting gambling houses. A fine of Rs 200 or up to three months’
imprisonment is imposed if found guilty of operating a gambling house, and a fine of
Rs 100 and one-month imprisonment is imposed if found guilty of visiting gambling
houses.
The Public Gambling Act of 1867 is no longer applicable to the whole of India after
1935. The Indian states got exclusive power to enact their gambling laws after 1935.
Although several states enacted gambling laws after independence, the Public
Gambling Act of 1867 remains significant as 10 states and 4 union territories in India
have adopted the act to be applicable within their territory via Article 252 of the
Constitution of India. The states and Union territories that have adopted the Public
Gambling Act of 1867 are:
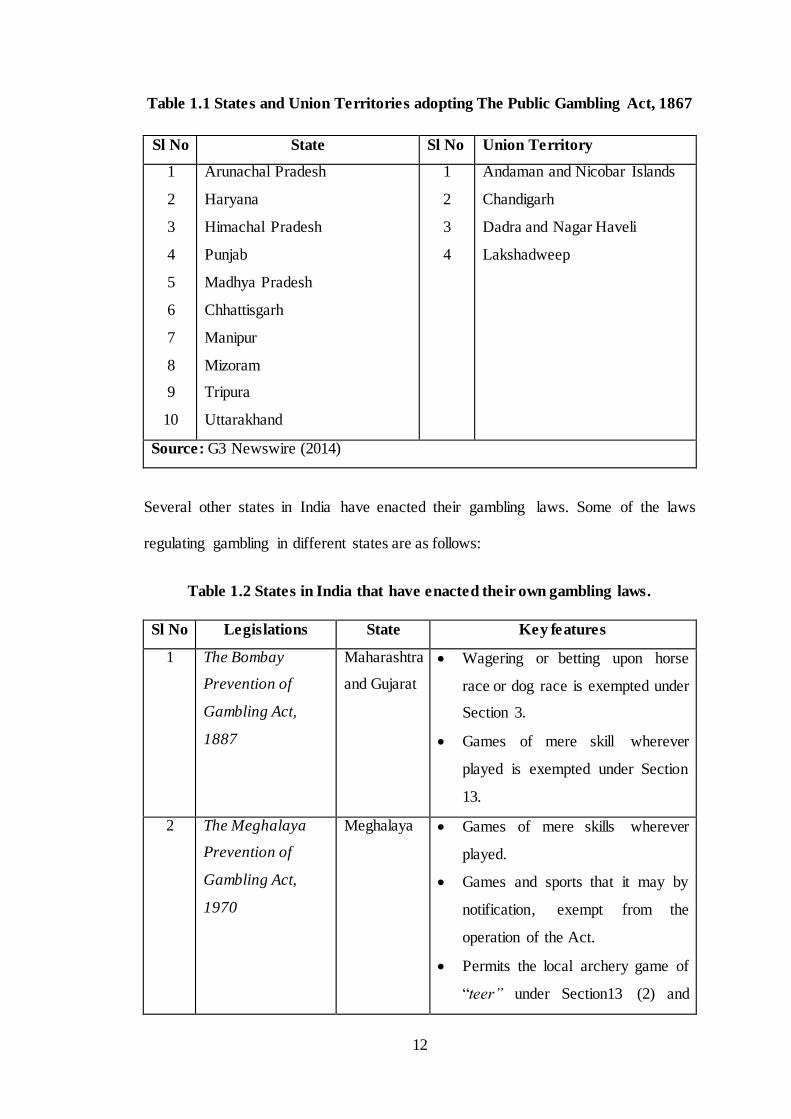
12
Table 1.1 States and Union Territories adopting The Public Gambling Act, 1867
Sl No State Sl No Union Territory
1
2
3
4
5
6
7
8
9
10
Arunachal Pradesh
Haryana
Himachal Pradesh
Punjab
Madhya Pradesh
Chhattisgarh
Manipur
Mizoram
Tripura
Uttarakhand
1
2
3
4
Andaman and Nicobar Islands
Chandigarh
Dadra and Nagar Haveli
Lakshadweep
Source: G3 Newswire (2014)
Several other states in India have enacted their gambling laws. Some of the laws
regulating gambling in different states are as follows:
Table 1.2 States in India that have enacted their own gambling laws.
Sl No Legislations State Key features
1 The Bombay
Prevention of
Gambling Act,
1887
Maharashtra
and Gujarat
Wagering or betting upon horse
race or dog race is exempted under
Section 3.
Games of mere skill wherever
played is exempted under Section
13.
2 The Meghalaya
Prevention of
Gambling Act,
1970
Meghalaya Games of mere skills wherever
played.
Games and sports that it may by
notification, exempt from the
operation of the Act.
Permits the local archery game of
“teer” under Section13 (2) and
13
betting is licensed under Section
14A of the Meghalaya Amusement
and Betting Tax (Amendment) Act
1982.
3 The Rajasthan
Public Gaming
Ordinance, 1949
Rajasthan Exempts any game of mere skill
unless carried on common gaming
house.
4 The Goa, Daman
and Diu Public
Gambling Act,
1976
Goa, Daman
and Diu
Permits casinos and other games of
chance.
Under Section 13A allows the state
government to authorize games of
“electronic amusement/slot
machines in Five Star Hotels” and
“such table games and gaming on
board in vessels offshore as may be
notified”.
5 The Tamil Nadu
Gaming Act, 1930
Tamil Nadu
(Excludes
Madras)
Under the Act, “gaming” does not
include a lottery and only includes
wagering or betting.
Under Section 11, exempts games
of mere skill.
Betting on horseracing is legal.
6 The Tamil Nadu
Prize Schemes
(Prohibition) Act,
1979
Tamil Nadu Promotion and or conducting prize
schemes is prohibited in the state on
Tamil Nadu under this Act.
7 The Sikkim Casinos
(Control & Tax)
Act, 2002
Sikkim Under this Act, the state
government can grant licenses for
operating casinos in the state.
Regulates games of chance played
using a machine or instrument in
five star hotels.
14
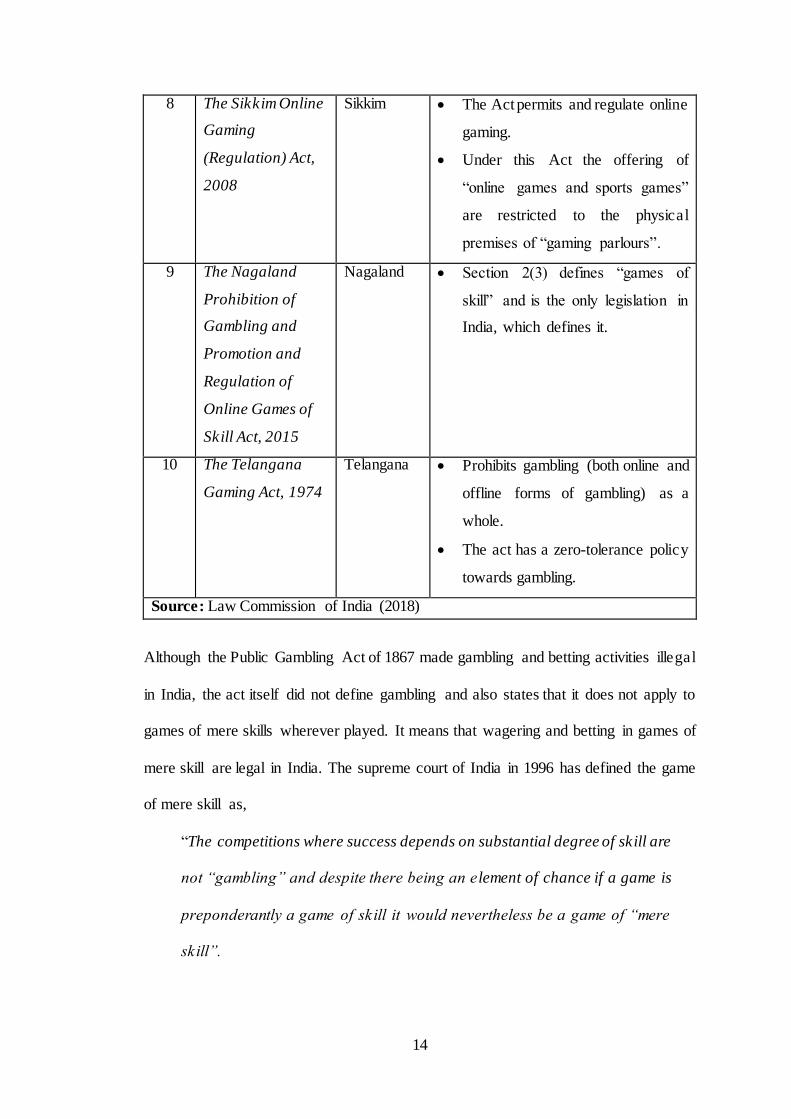
8 The Sikkim Online
Gaming
(Regulation) Act,
2008
Sikkim The Act permits and regulate online
gaming.
Under this Act the offering of
“online games and sports games”
are restricted to the physical
premises of “gaming parlours”.
9 The Nagaland
Prohibition of
Gambling and
Promotion and
Regulation of
Online Games of
Skill Act, 2015
Nagaland Section 2(3) defines “games of
skill” and is the only legislation in
India, which defines it.
10 The Telangana
Gaming Act, 1974
Telangana Prohibits gambling (both online and
offline forms of gambling) as a
whole.
The act has a zero-tolerance policy
towards gambling.
Source: Law Commission of India (2018)
Although the Public Gambling Act of 1867 made gambling and betting activities illegal
in India, the act itself did not define gambling and also states that it does not apply to
games of mere skills wherever played. It means that wagering and betting in games of
mere skill are legal in India. The supreme court of India in 1996 has defined the game
of mere skill as,
“The competitions where success depends on substantial degree of skill are
not “gambling” and despite there being an element of chance if a game is
preponderantly a game of skill it would nevertheless be a game of “mere
skill”.
15
One of the essential constituents of the legislations (be it central or state) dealing with
gambling in India is that it has excluded lotteries from their purview. There were no
laws related to state lotteries until 1998 when the Indian parliament enacted the Central
Lotteries Act of 1998. The act, which extends to the whole of India governs lotteries in
India and provides authority to the states to run lotteries, with a restriction of a
maximum of one draw per week. As per The Lotteries (Regulation) Act, 1998, the state
government within its territory can prohibit the sale of lottery tickets organized by every
other state.
1.4.3 Gambling Industry in India
The gambling industry in India can be bifurcated into segments; legal and illegal
gambling market. The estimates suggest that the gambling market in India is worth
US$60 billion per year, with almost $40 billion being the value of the illegal gambling
market (G3 Newswire, 2014).
The legal gambling industry only exists among a handful of states in India. While the
lottery and horse racing have been in existence for a long time, casinos and online
gambling have come into existence only a couple of decades ago. The state of Goa and
Sikkim are the pioneers in introducing casinos and online forms of gambling in India
and are the major gambling destination in India.
Another important segment of the gambling industry in India is the festival and fairs
gambling. Gambling at festivals and fairs, also known as “festival gambling,” is very
familiar among many Indian gamblers (George et al., 2016; Jaisoorya et al., 2017) .
Festival gambling provides Indian gamblers an opportunity to gamble in a wide range
of legal and illegal gambling (Jaisoorya et al., 2017).
The following subsections highlight in detail the existing segments of the legal
gambling industry in India.
16
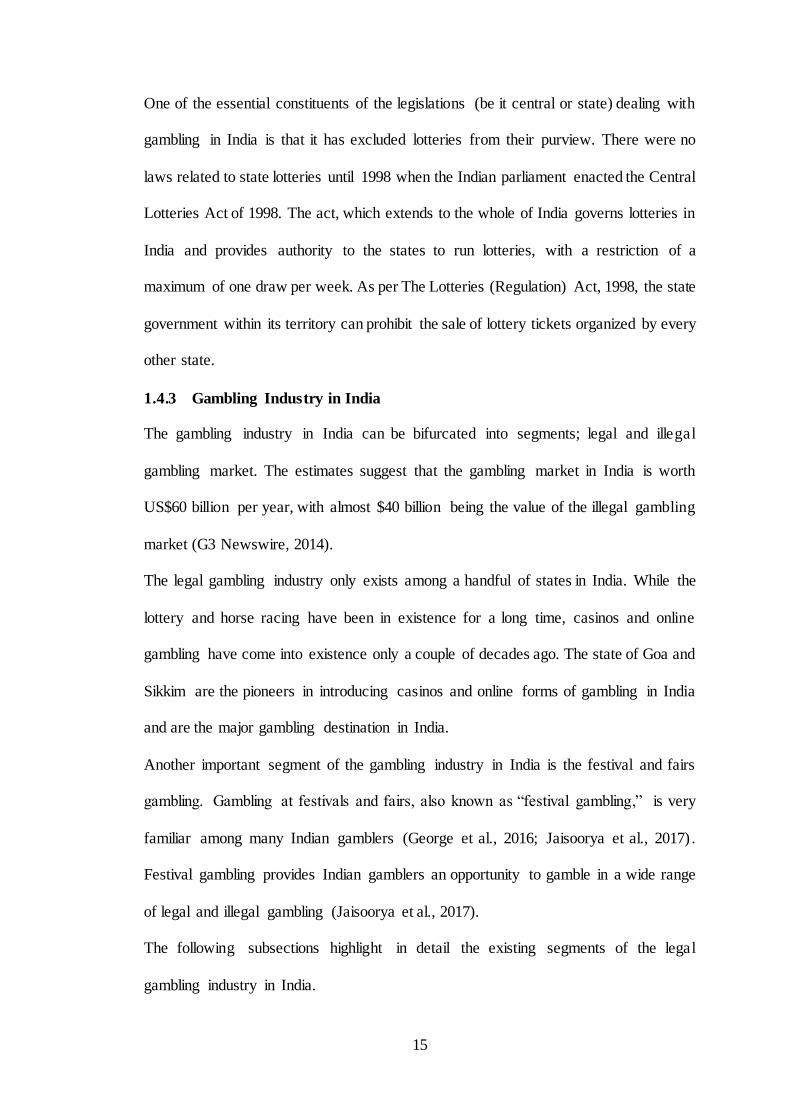
1.4.3.1 Lottery Industry in India
The lottery is one of the few forms of gambling that is legal under the Public Gambling
Act of 1967. The history of the lottery in India dates back to around 300 years old when
it was introduced in Goa during the Portuguese rule (G3 Newswire, 2014). The
Lotteries (Regulations) Act, 1998, and the Lotteries (Regulations) Rules, 2010 governs
lotteries and provides the regulations for conducting state-run lotteries in India
(Comptroller and Auditor General of India, 2017). As per the estimates, the lotteries in
India generate an estimated revenue of about Rs 12000 crore (G3 Newswire, 2014).
Today there are 12 states in which lottery is legal. The 12 states in which the lottery is
legal are highlighted in Table 1.3.
Table 1.3 States in India in which Lotteries are Legal
Sl No State Sl No State
1
2
3
4
5
6
Maharashtra
Punjab
West Bengal
Kerala
Goa
Sikkim
7
8
9
10
11
12
Manipur
Meghalaya
Tripura
Mizoram
Arunachal Pradesh
Nagaland
Source: Szybala (2016)
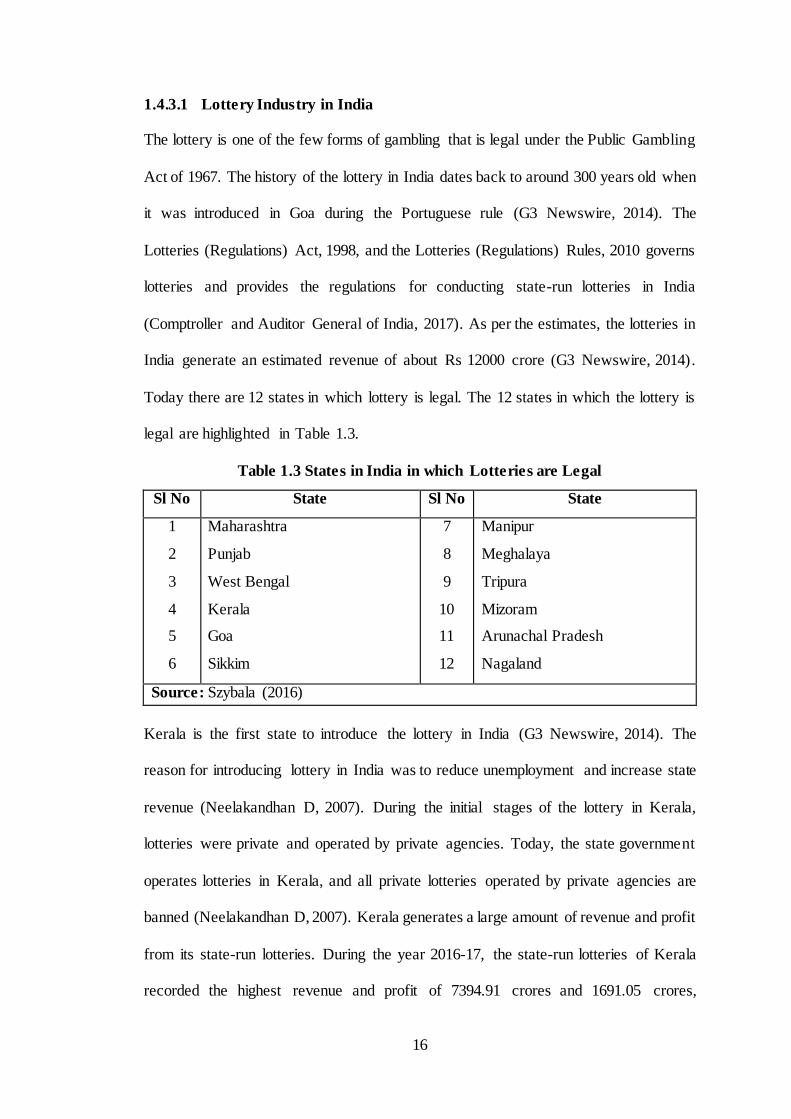
Kerala is the first state to introduce the lottery in India (G3 Newswire, 2014). The
reason for introducing lottery in India was to reduce unemployment and increase state
revenue (Neelakandhan D, 2007). During the initial stages of the lottery in Kerala,
lotteries were private and operated by private agencies. Today, the state government
operates lotteries in Kerala, and all private lotteries operated by private agencies are
banned (Neelakandhan D, 2007). Kerala generates a large amount of revenue and profit
from its state-run lotteries. During the year 2016-17, the state-run lotteries of Kerala
recorded the highest revenue and profit of 7394.91 crores and 1691.05 crores,
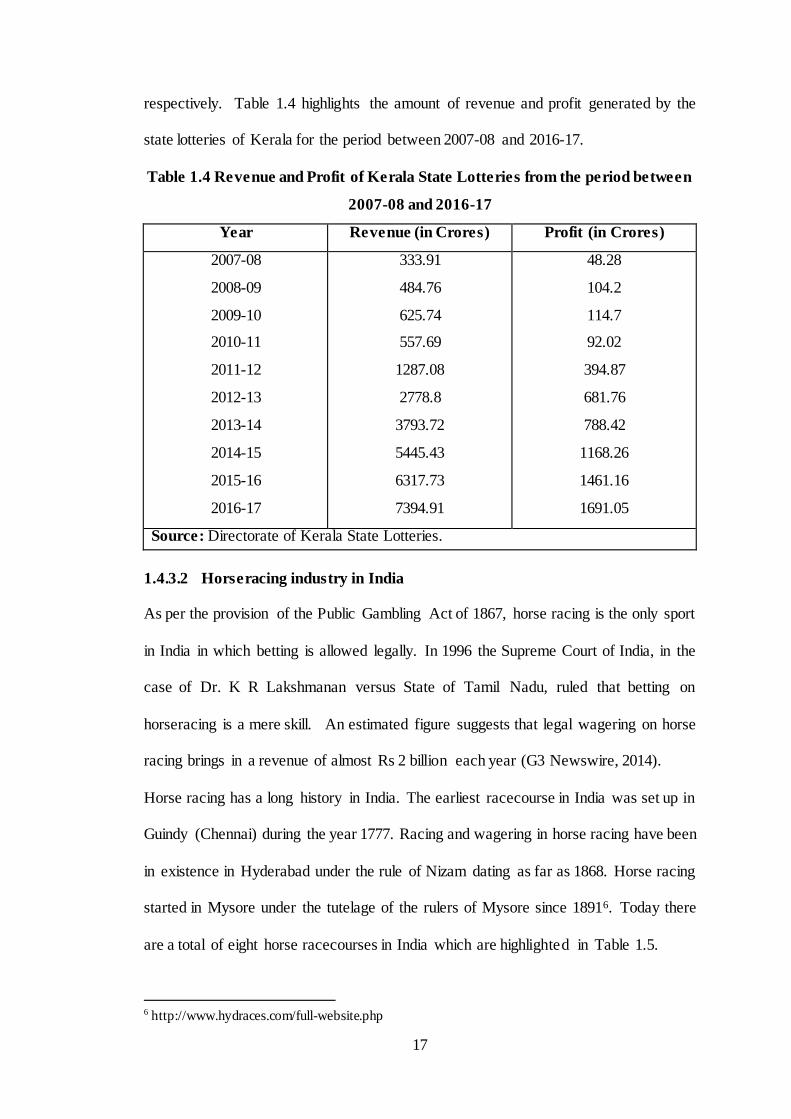
17
respectively. Table 1.4 highlights the amount of revenue and profit generated by the
state lotteries of Kerala for the period between 2007-08 and 2016-17.
Table 1.4 Revenue and Profit of Kerala State Lotteries from the period between
2007-08 and 2016-17
Year Revenue (in Crores) Profit (in Crores)
2007-08
2008-09
2009-10
2010-11
2011-12
2012-13
2013-14
2014-15
2015-16
2016-17
333.91
484.76
625.74
557.69
1287.08
2778.8
3793.72
5445.43
6317.73
7394.91
48.28
104.2
114.7
92.02
394.87
681.76
788.42
1168.26
1461.16
1691.05
Source: Directorate of Kerala State Lotteries.
1.4.3.2 Horseracing industry in India
As per the provision of the Public Gambling Act of 1867, horse racing is the only sport
in India in which betting is allowed legally. In 1996 the Supreme Court of India, in the
case of Dr. K R Lakshmanan versus State of Tamil Nadu, ruled that betting on
horseracing is a mere skill. An estimated figure suggests that legal wagering on horse
racing brings in a revenue of almost Rs 2 billion each year (G3 Newswire, 2014).
Horse racing has a long history in India. The earliest racecourse in India was set up in
Guindy (Chennai) during the year 1777. Racing and wagering in horse racing have been
in existence in Hyderabad under the rule of Nizam dating as far as 1868. Horse racing
started in Mysore under the tutelage of the rulers of Mysore since 18916. Today there
are a total of eight horse racecourses in India which are highlighted in Table 1.5.
6 http://www.hydraces.com/full-website.php
18
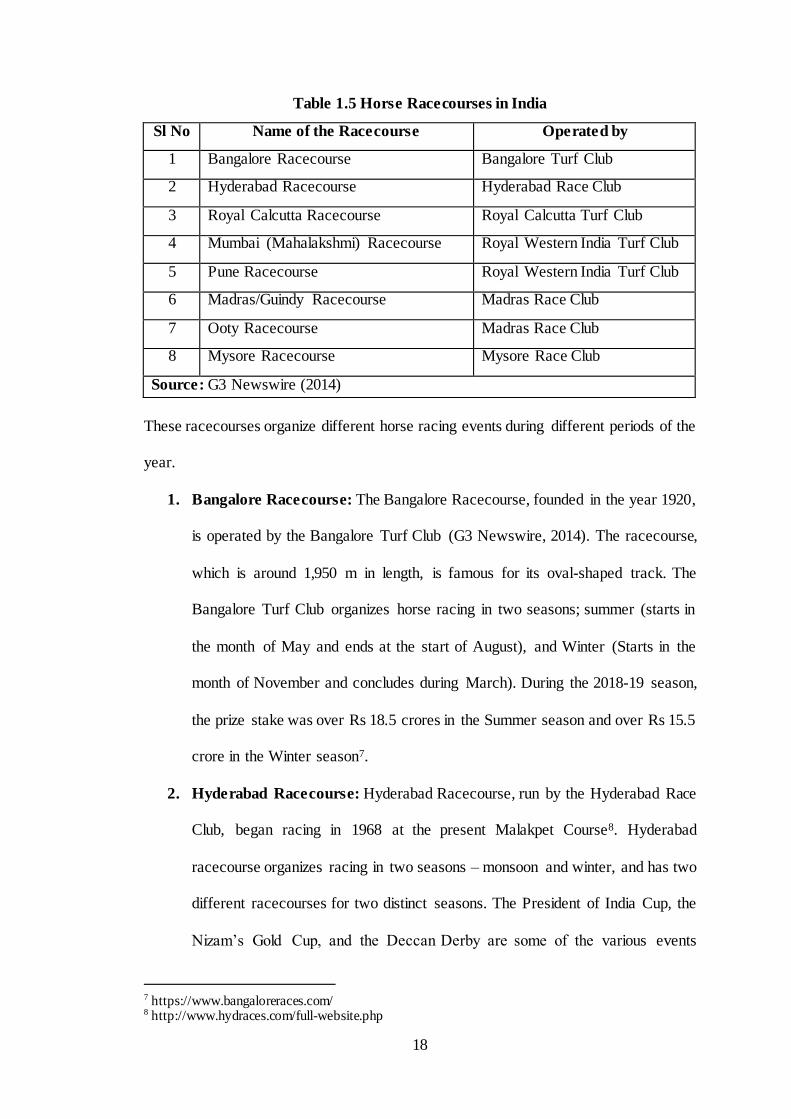
Table 1.5 Horse Racecourses in India
Sl No Name of the Racecourse Operated by
1 Bangalore Racecourse Bangalore Turf Club
2 Hyderabad Racecourse Hyderabad Race Club
3 Royal Calcutta Racecourse Royal Calcutta Turf Club
4 Mumbai (Mahalakshmi) Racecourse Royal Western India Turf Club
5 Pune Racecourse Royal Western India Turf Club
6 Madras/Guindy Racecourse Madras Race Club
7 Ooty Racecourse Madras Race Club
8 Mysore Racecourse Mysore Race Club
Source: G3 Newswire (2014)
These racecourses organize different horse racing events during different periods of the
year.
1. Bangalore Racecourse: The Bangalore Racecourse, founded in the year 1920,
is operated by the Bangalore Turf Club (G3 Newswire, 2014). The racecourse,
which is around 1,950 m in length, is famous for its oval-shaped track. The
Bangalore Turf Club organizes horse racing in two seasons; summer (starts in
the month of May and ends at the start of August), and Winter (Starts in the
month of November and concludes during March). During the 2018-19 season,
the prize stake was over Rs 18.5 crores in the Summer season and over Rs 15.5
crore in the Winter season7.
2. Hyderabad Racecourse: Hyderabad Racecourse, run by the Hyderabad Race
Club, began racing in 1968 at the present Malakpet Course8. Hyderabad
racecourse organizes racing in two seasons – monsoon and winter, and has two
different racecourses for two distinct seasons. The President of India Cup, the
Nizam’s Gold Cup, and the Deccan Derby are some of the various events
7 https://www.bangaloreraces.com/ 8 http://www.hydraces.com/full-website.php
19
organized in the Hyderabad racecourse9. The racecourse also paved the way for
the Invitation Cup, considered the premier classic of Indian racing10.
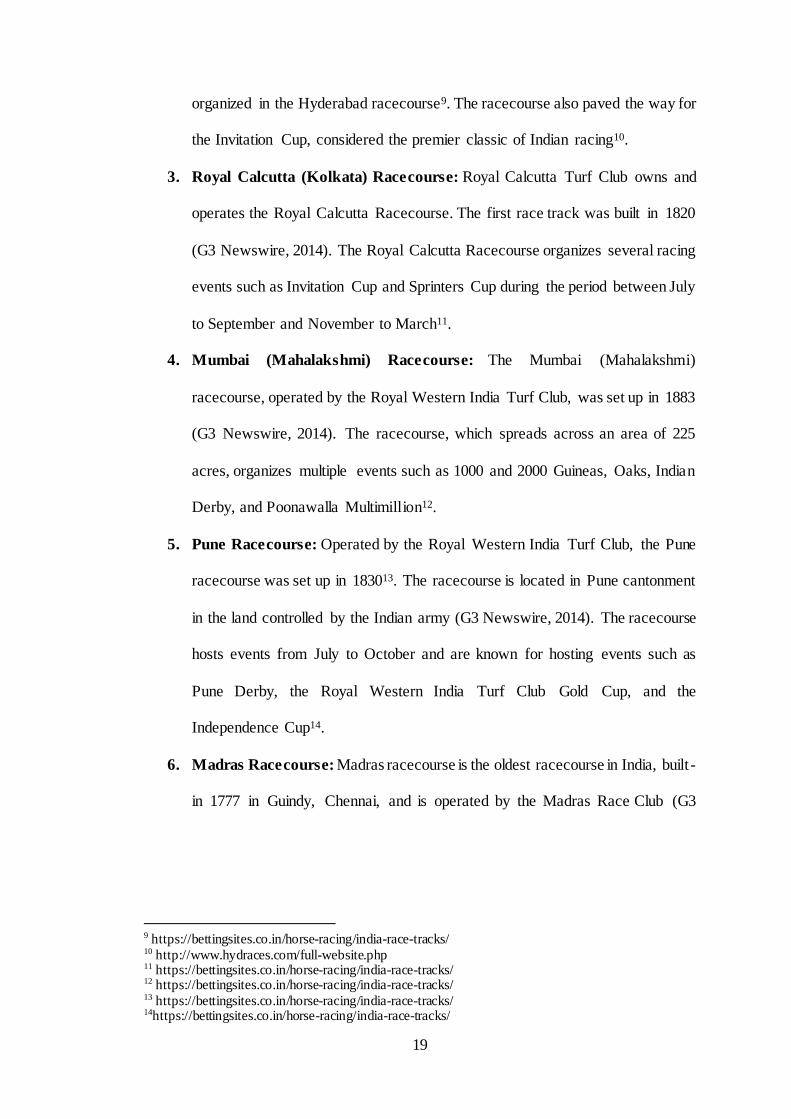
3. Royal Calcutta (Kolkata) Racecourse: Royal Calcutta Turf Club owns and
operates the Royal Calcutta Racecourse. The first race track was built in 1820
(G3 Newswire, 2014). The Royal Calcutta Racecourse organizes several racing
events such as Invitation Cup and Sprinters Cup during the period between July
to September and November to March11.
4. Mumbai (Mahalakshmi) Racecourse: The Mumbai (Mahalakshmi)
racecourse, operated by the Royal Western India Turf Club, was set up in 1883
(G3 Newswire, 2014). The racecourse, which spreads across an area of 225
acres, organizes multiple events such as 1000 and 2000 Guineas, Oaks, Indian
Derby, and Poonawalla Multimillion12.
5. Pune Racecourse: Operated by the Royal Western India Turf Club, the Pune
racecourse was set up in 183013. The racecourse is located in Pune cantonment
in the land controlled by the Indian army (G3 Newswire, 2014). The racecourse
hosts events from July to October and are known for hosting events such as
Pune Derby, the Royal Western India Turf Club Gold Cup, and the
Independence Cup14.
6. Madras Racecourse: Madras racecourse is the oldest racecourse in India, built -
in 1777 in Guindy, Chennai, and is operated by the Madras Race Club (G3
9 https://bettingsites.co.in/horse-racing/india-race-tracks/ 10 http://www.hydraces.com/full-website.php 11 https://bettingsites.co.in/horse-racing/india-race-tracks/ 12 https://bettingsites.co.in/horse-racing/india-race-tracks/ 13 https://bettingsites.co.in/horse-racing/india-race-tracks/ 14https://bettingsites.co.in/horse-racing/india-race-tracks/
20
Newswire, 2014). The racecourse organizes Horse racing during the month of
November and March15.
7. Ooty Racecourse: Ooty racecourse located in the Nilgiris, Tamil Nadu is one
of the smaller horse racing racetracks in India16. Like the Madras Racecourse,
the Ooty racecourse is also operated by the Madras Race Club. Ooty racecourse
organizes events during the summer period during the month of April and
June.17.
8. The Mysore Racecourse: The Mysore Turf Club Ltd operates the Mysore
racecourse located at the foothills of the Chamundi hills. The Mysore
racecourse is the most exclusive in India and only allows 250 members each
year (G3 Newswire, 2014).
1.4.3.3 Casino Industry in India
Casino gambling in India is currently offered in two Indian states Goa and Sikkim, and
one union territory Daman and Diu. According to Jaydev Mody, the chairman of the
Delta Corp, the revenue generated from the Indian casinos accounts for approximately
Rs 500 crore (Szybala, 2016).
Casinos in Goa
The state of Goa, which is the smallest in terms of area and fourth-smallest in terms of
population, is the largest destination for gambling in India and accounts for almost 95%
of the total Indian casino gaming revenue. The annual gross gaming revenue generated
by the casinos in Goa is currently poised at $150 million and has a massive growth
projection with a predicted $1 billion annual forecast (Beckett, 2018).
15 https://bettingsites.co.in/horse-racing/india-race-tracks/ 16 https://bettingsites.co.in/horse-racing/india-race-tracks/ 17 https://bettingsites.co.in/horse-racing/india-race-tracks/
21
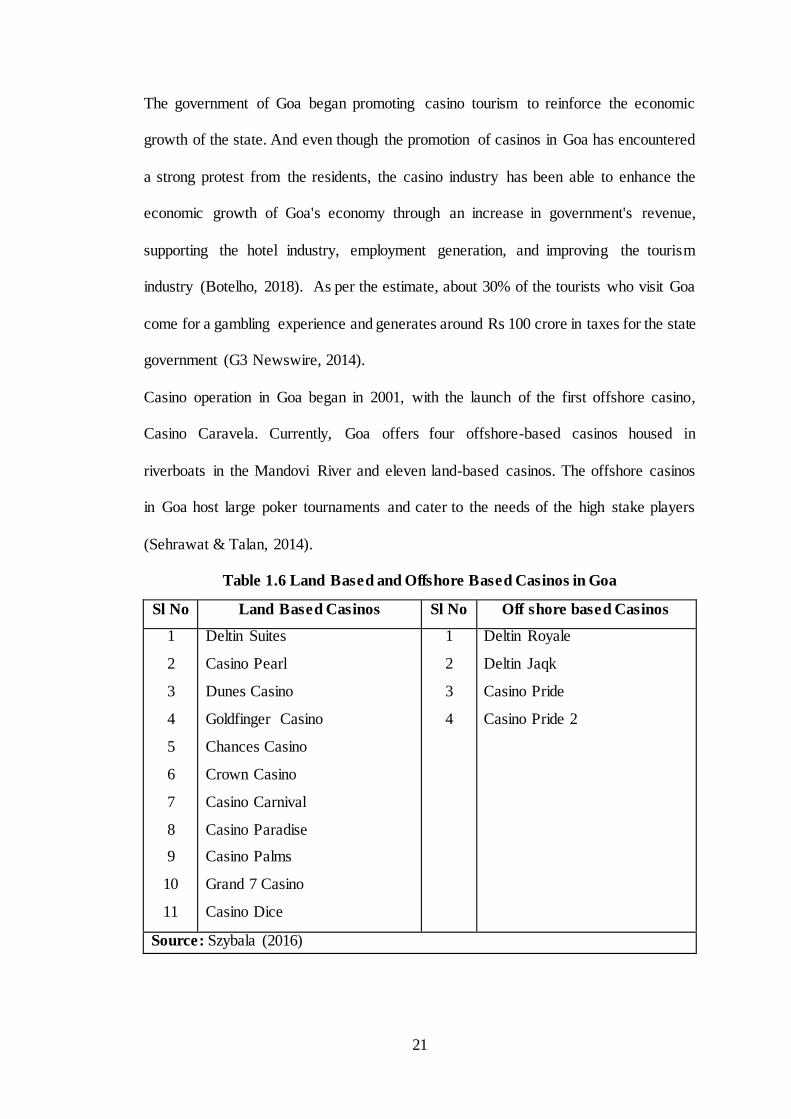
The government of Goa began promoting casino tourism to reinforce the economic
growth of the state. And even though the promotion of casinos in Goa has encountered
a strong protest from the residents, the casino industry has been able to enhance the
economic growth of Goa's economy through an increase in government's revenue,
supporting the hotel industry, employment generation, and improving the tourism
industry (Botelho, 2018). As per the estimate, about 30% of the tourists who visit Goa
come for a gambling experience and generates around Rs 100 crore in taxes for the state
government (G3 Newswire, 2014).
Casino operation in Goa began in 2001, with the launch of the first offshore casino,
Casino Caravela. Currently, Goa offers four offshore-based casinos housed in
riverboats in the Mandovi River and eleven land-based casinos. The offshore casinos
in Goa host large poker tournaments and cater to the needs of the high stake players
(Sehrawat & Talan, 2014).
Table 1.6 Land Based and Offshore Based Casinos in Goa
Sl No Land Based Casinos Sl No Off shore based Casinos
1
2
3
4
5
6
7
8
9
10
11
Deltin Suites
Casino Pearl
Dunes Casino
Goldfinger Casino
Chances Casino
Crown Casino
Casino Carnival
Casino Paradise
Casino Palms
Grand 7 Casino
Casino Dice
1
2
3
4
Deltin Royale
Deltin Jaqk
Casino Pride
Casino Pride 2
Source: Szybala (2016)
22
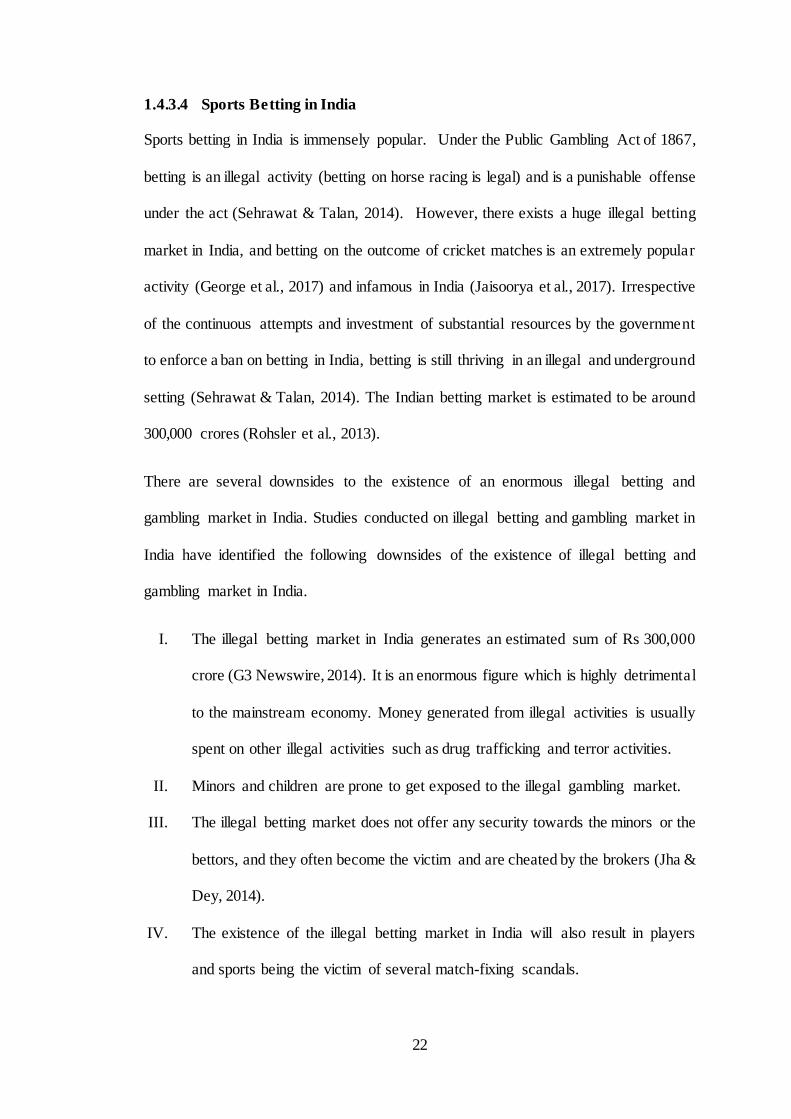
1.4.3.4 Sports Betting in India
Sports betting in India is immensely popular. Under the Public Gambling Act of 1867,
betting is an illegal activity (betting on horse racing is legal) and is a punishable offense
under the act (Sehrawat & Talan, 2014). However, there exists a huge illegal betting
market in India, and betting on the outcome of cricket matches is an extremely popular
activity (George et al., 2017) and infamous in India (Jaisoorya et al., 2017). Irrespective
of the continuous attempts and investment of substantial resources by the government
to enforce a ban on betting in India, betting is still thriving in an illegal and underground
setting (Sehrawat & Talan, 2014). The Indian betting market is estimated to be around
300,000 crores (Rohsler et al., 2013).
There are several downsides to the existence of an enormous illegal betting and
gambling market in India. Studies conducted on illegal betting and gambling market in
India have identified the following downsides of the existence of illegal betting and
gambling market in India.
I. The illegal betting market in India generates an estimated sum of Rs 300,000
crore (G3 Newswire, 2014). It is an enormous figure which is highly detrimental
to the mainstream economy. Money generated from illegal activities is usually
spent on other illegal activities such as drug trafficking and terror activities.
II. Minors and children are prone to get exposed to the illegal gambling market.
III. The illegal betting market does not offer any security towards the minors or the
bettors, and they often become the victim and are cheated by the brokers (Jha &
Dey, 2014).
IV. The existence of the illegal betting market in India will also result in players
and sports being the victim of several match-fixing scandals.
23
With the rising popularity of sports betting in India, there has been a call for legalising
sports betting and bringing it under the purview of the law. Sir Ronnie Flanagan, ICC
Chairman of the Anti-Corruption Unit and the committee headed by Justice R. M.
Lodha, former Chief Justice of India, called for the legalisation of a regulated betting
market to deal with the issues of sport and match-fixing (Law Commission of India,
2018). According to a survey conducted by The Federation of Indian Chambers of
Commerce and Industry, 83% of the respondents feel regulating sports betting with
appropriate laws is better than banning it, and 74% of the respondents agree that
regulation of sports in India will minimise match-fixing issues in India.
There are several positive outcomes of regulating sports betting in India, and the
government should consider reforming the sports betting laws in India. Betting is
considered a vice in the Indian culture, and the legalisation of betting and gambling is
a challenging and controversial topic (Rohsler et al., 2013). However, irrespective of
challenges, efforts should be directed towards reforming sports betting, as betting and
gambling will continue to exist within the social structure, even when a ban is enforced
upon it. Some of the positive outcomes of legalising the sports betting are given below:
I. Legalisations of sports betting in India will help in generating revenue for the
state by taxing the income and the earnings made by the brokers and the bettors
under Section 115BB of the Income Tax Act, 1995 (Jha & Dey, 2014). The
revenue generated from sports betting in India can be invested in the
development of sporting facilities, thus improving and developing the growth
of Indian athletes (Jha & Dey, 2014).
II. There will be an increase in employment resulting from the legalisation of sports
betting in India. Legalising sports betting in India will attract a large number of
bettors, thereby generating significant employment opportunities for the people.
24
India has the potential to become an influential destination for outsourcing
sports betting, backed by the availability of a large number of skilled manpower
in the field of IT and BPO (Jha & Dey, 2014).
III. Legalizing and regulating sports betting in India will provide a layer of
protection to the younger and vulnerable bettors who are exposed to more risk
while betting in an illegal betting market (Rohsler et al., 2013).
IV. Illegal betting and the sports market in India generate a large sum of money,
further used for other illegal activities such as drug trafficking and terrorist
activities. Regulating betting and sports market in India will help to curtail the
growth of illegal funds and control the rise of any organized crimes.
Legalising and bringing sports betting under the ambit of law may provide a better
solution for the rising illegal betting markets in India. According to Palai et al. (2006),
the Indian gambling market should be reformed, and legalised through stringent
regulations ensuring transparency and fair play in the gambling business. Regulating
sports betting in India will ensure the accountability of large sums of money generated
through the illegal betting market, thereby reducing the number of match-fixing
scandals, money laundering, and other crimes (The Federation of Indian Chambers of
Commerce & Industry, 2012).
1.4.4 Status of Indian Gambler
Gambling is a widely popular activity among Indians. Looking at the history of ancient
India, it is evident that the Indians gambled in almost anything. Betting on bullfight ing,
cockfights, and goat fights, betting on rainfall, and figuring out the prices of opium,
jute, and cotton were quite prevalent in India, and are still in existence in some parts of
the country.
25
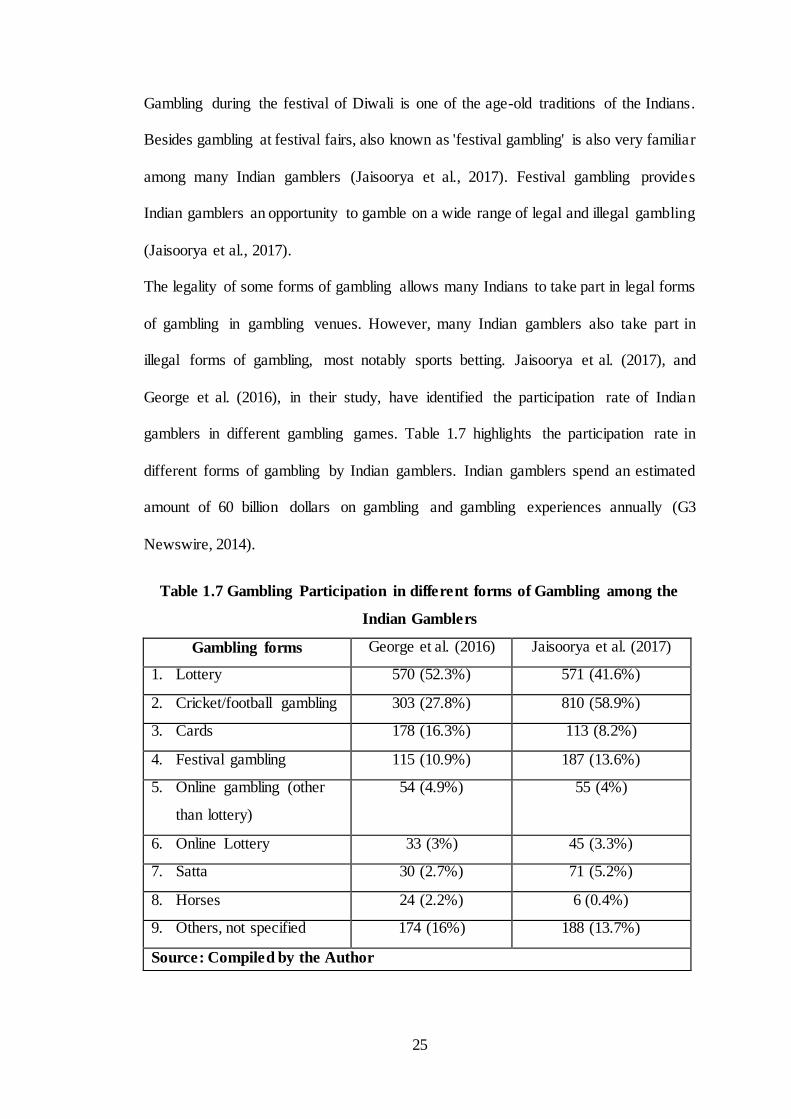
Gambling during the festival of Diwali is one of the age-old traditions of the Indians.
Besides gambling at festival fairs, also known as 'festival gambling' is also very familiar
among many Indian gamblers (Jaisoorya et al., 2017). Festival gambling provides
Indian gamblers an opportunity to gamble on a wide range of legal and illegal gambling
(Jaisoorya et al., 2017).
The legality of some forms of gambling allows many Indians to take part in legal forms
of gambling in gambling venues. However, many Indian gamblers also take part in
illegal forms of gambling, most notably sports betting. Jaisoorya et al. (2017), and
George et al. (2016), in their study, have identified the participation rate of Indian
gamblers in different gambling games. Table 1.7 highlights the participation rate in
different forms of gambling by Indian gamblers. Indian gamblers spend an estimated
amount of 60 billion dollars on gambling and gambling experiences annually (G3
Newswire, 2014).
Table 1.7 Gambling Participation in different forms of Gambling among the
Indian Gamblers
Gambling forms George et al. (2016) Jaisoorya et al. (2017)
1. Lottery 570 (52.3%) 571 (41.6%)
2. Cricket/football gambling 303 (27.8%) 810 (58.9%)
3. Cards 178 (16.3%) 113 (8.2%)
4. Festival gambling 115 (10.9%) 187 (13.6%)
5. Online gambling (other
than lottery)
54 (4.9%)
55 (4%)
6. Online Lottery 33 (3%) 45 (3.3%)
7. Satta 30 (2.7%) 71 (5.2%)
8. Horses 24 (2.2%) 6 (0.4%)
9. Others, not specified 174 (16%) 188 (13.7%)
Source: Compiled by the Author
26
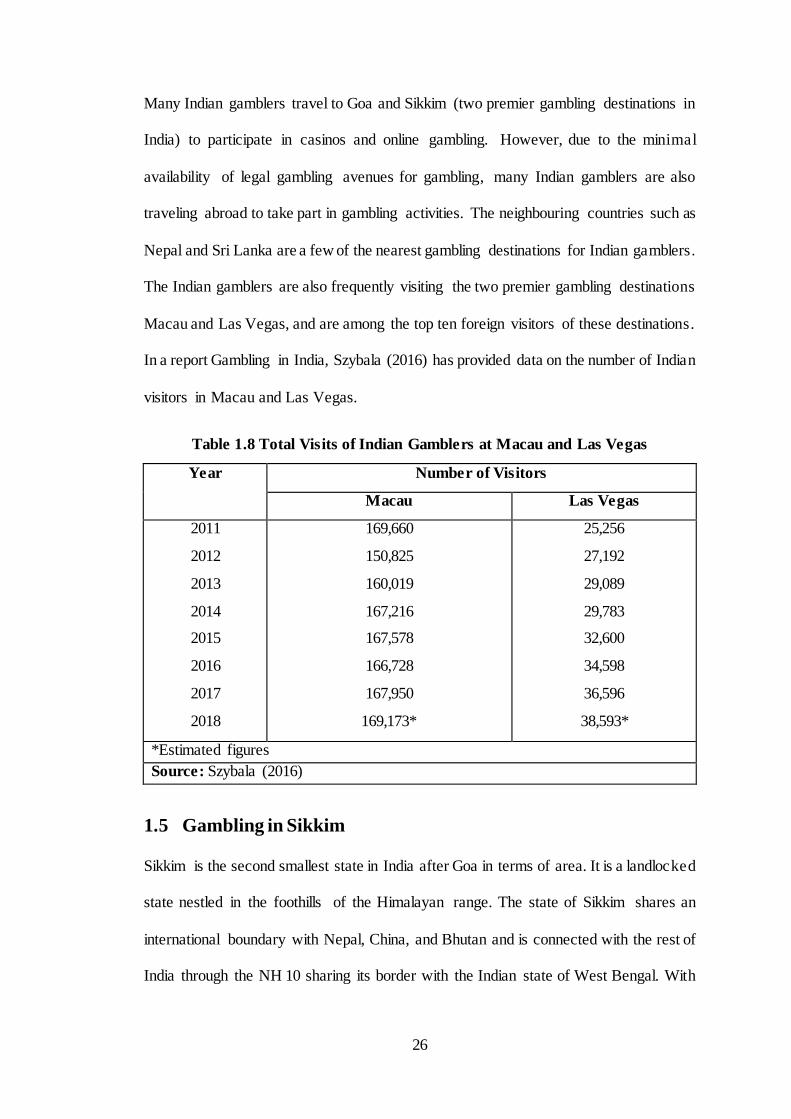
Many Indian gamblers travel to Goa and Sikkim (two premier gambling destinations in
India) to participate in casinos and online gambling. However, due to the minimal
availability of legal gambling avenues for gambling, many Indian gamblers are also
traveling abroad to take part in gambling activities. The neighbouring countries such as
Nepal and Sri Lanka are a few of the nearest gambling destinations for Indian gamblers.
The Indian gamblers are also frequently visiting the two premier gambling destinations
Macau and Las Vegas, and are among the top ten foreign visitors of these destinations.
In a report Gambling in India, Szybala (2016) has provided data on the number of Indian
visitors in Macau and Las Vegas.
Table 1.8 Total Visits of Indian Gamblers at Macau and Las Vegas
Year Number of Visitors
Macau Las Vegas
2011
2012
2013
2014
2015
2016
2017
2018
169,660
150,825
160,019
167,216
167,578
166,728
167,950
169,173*
25,256
27,192
29,089
29,783
32,600
34,598
36,596
38,593*
*Estimated figures
Source: Szybala (2016)
1.5 Gambling in Sikkim
Sikkim is the second smallest state in India after Goa in terms of area. It is a landlocked
state nestled in the foothills of the Himalayan range. The state of Sikkim shares an
international boundary with Nepal, China, and Bhutan and is connected with the rest of
India through the NH 10 sharing its border with the Indian state of West Bengal. With
27
total inhabitants of 610,577 people as per the 2011 census, the economy of the state is
dependent upon tourism and agriculture.
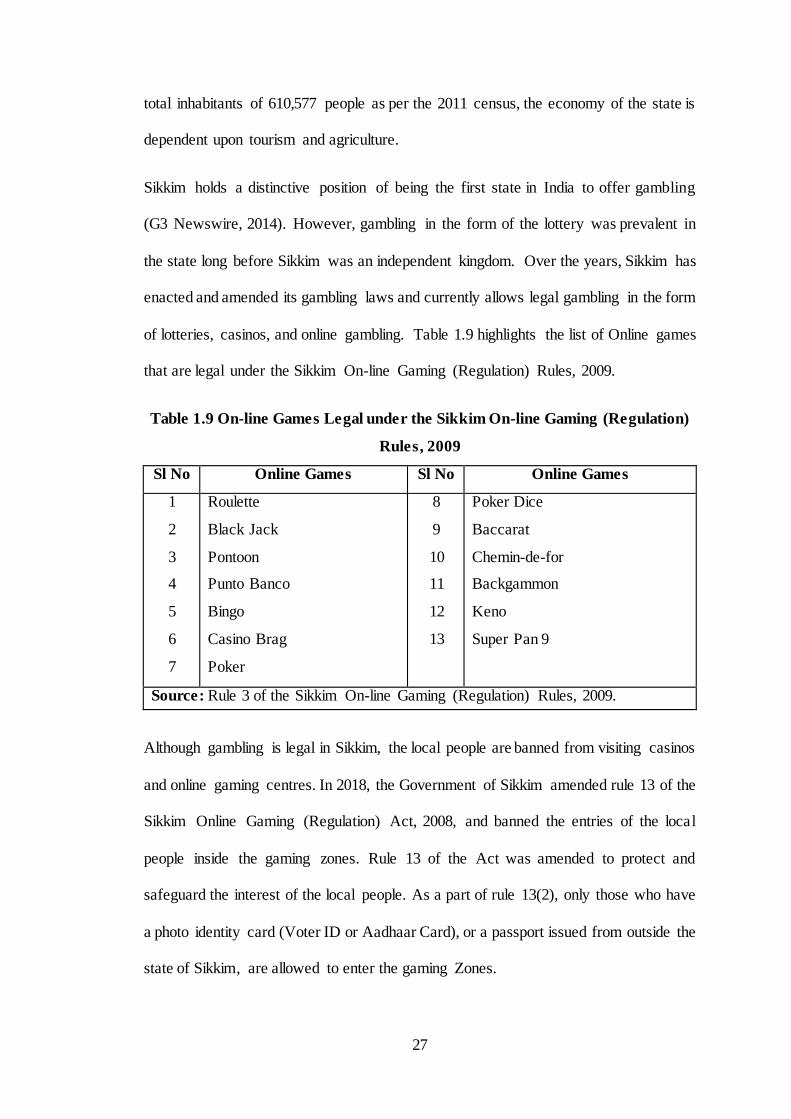
Sikkim holds a distinctive position of being the first state in India to offer gambling
(G3 Newswire, 2014). However, gambling in the form of the lottery was prevalent in
the state long before Sikkim was an independent kingdom. Over the years, Sikkim has
enacted and amended its gambling laws and currently allows legal gambling in the form
of lotteries, casinos, and online gambling. Table 1.9 highlights the list of Online games
that are legal under the Sikkim On-line Gaming (Regulation) Rules, 2009.
Table 1.9 On-line Games Legal under the Sikkim On-line Gaming (Regulation)
Rules, 2009
Sl No Online Games Sl No Online Games
1
2
3
4
5
6
7
Roulette
Black Jack
Pontoon
Punto Banco
Bingo
Casino Brag
Poker
8
9
10
11
12
13
Poker Dice
Baccarat
Chemin-de-for
Backgammon
Keno
Super Pan 9
Source: Rule 3 of the Sikkim On-line Gaming (Regulation) Rules, 2009.
Although gambling is legal in Sikkim, the local people are banned from visiting casinos
and online gaming centres. In 2018, the Government of Sikkim amended rule 13 of the
Sikkim Online Gaming (Regulation) Act, 2008, and banned the entries of the local
people inside the gaming zones. Rule 13 of the Act was amended to protect and
safeguard the interest of the local people. As a part of rule 13(2), only those who have
a photo identity card (Voter ID or Aadhaar Card), or a passport issued from outside the
state of Sikkim, are allowed to enter the gaming Zones.
28
1.5.1 Lotteries in Sikkim
The history of the lottery in Sikkim dates back to 1972 before Sikkim became a state
of India. The Sikkim government introduced the first lottery scheme in Sikkim in 1978
after its merger with India in 1975. Since then, the government has been conducting
lotteries, and Sikkim is one of the 12 states conducting the lotteries in India. The
government began operating lotteries to generate revenue for investment in various
developmental activities and the prosperity of the retired armed personnel in the state.
The overall head of the Sikkim state lottery is the Principal Secretary, Finance,
Revenue, and Expenditure Department, Government of Sikkim. While the functioning
of the state lotteries in Sikkim is overseen by the Director, Directorate of the Sikkim
State Lotteries.
Since its inception in 1978, the government began organizing lotteries in Sikkim
through the organizing agents (also referred to as marketing agents). The government
organizes both the paper lottery and online lottery (introduced in 2001) and sells them
through Marketing Agents. During 2010 and 2016, the government has appointed as
many as three different Marketing Agents, one for the paper lottery and two for the
online lottery (Comptroller and Auditor General of India, 2017). The lotteries in Sikkim
are organized as per the Lotteries (Regulation) Rule, 2010. As per the Lotteries
(Regulation) Rule 2010, the directorate of the Sikkim State Lotteries organizes 24
draws per day, and six bumper draws in a calendar year.
1.5.2 Casinos and Online Gambling in Sikkim
After Goa, Sikkim is the second significant hub for casino gambling in India. Casino
operators are granted the license to operate gambling through The Sikkim Casino
Games (Control and Tax Rules), 2002. The Sikkim Regulation of Gambling
29
(Amendment) Act, 2005, provides the state with the power to authorize casinos within
the state.
Applicants are provided the license to operate casino gambling in Sikkim, under rule
17 of the Sikkim Casino Games (Control and Tax) Rules, 2007. A license is granted for
a duration of five years. For applying for a license, the applicants must have a hotel
with a standard of 5 stars and the necessary infrastructure to operate casino games. As
per section 7 of the Sikkim Casinos (Control and Tax) Act, 2002, the licensee of the
casinos has to pay to the government of Sikkim an annual gaming fees of Rs One crore
or an amount at the rate of 10% of the Gross Gaming Yield (GGY) whichever is higher
for the first year. For the remaining four years, the gaming fees are increased by 15%
per year. According to the Act Gross Gaming Yield Means
“…the total amount of all bets or stakes made, and the price of all chances
sold, less the value of all winnings and prizes due, in all the course of gaming
during the period in question.” (Rule 2 Sub-rule (e))
At present, three land-based casinos are fully functional within the state of Sikkim.
Those are Casino Sikkim, Casino Mahjong, and Deltin Denzong. Of the three casinos,
Casino Sikkim, located at Hotel Royal Plaza in Gangtok, is the oldest casino and has
been in operation since 2009 (Pramanik, 2018). Casino Sikkim houses 15 gaming
machines and 5 table games.
Casino Mahjong, owned and operated by Trio Ventures and located at Mayfair Spa and
Resort, started its operation in 2011. Casino Mahjong is spread across an area of about
7,000 square feet and houses 15 live gaming tables, a poker room with 7 tables, VIP
Gaming rooms, and Slots18. The casino offers games such as Roulette, Blackjack,
18 http://www.casinomahjongsikkim.com/
30
Baccarat, Flush, Texas Hold’em Poker, Kitty, Marriage, Slot Machines, and Mini
Flush19.
Deltin Denzong is the youngest among the three casinos located in Sikkim. It is owned
and operated by Delta Corp and started its operation in January 2017. Deltin Denzong
offers three casino packages; a regular package of Rs 2,500, a premium package of Rs
3,500, and a VIP package of Rs 7,000. (Pramanik, 2018).
In terms of online gambling, Sikkim has led the way through the legalisation of online
gambling. The Sikkim Online Gaming (Regulation) Act 2008 was passed in 2008 and
paved the way for online gambling in Sikkim. The first regular license to operate online
gaming was provided to a subsidiary of M/s. Future Gaming Solutions Private Limited
(Lemberg, 2014). Golden gaming International Pvt Ltd. today is the most prominent
company in Sikkim that offers online gaming from its three gaming centres, located in
MG Marg Gangtok, Zero point Gangtok, and Rangpo.
1.5.3 Gambling Laws and Acts in Sikkim
Sikkim perhaps is the most progressive state in India in terms of gambling laws are
concerned. Sikkim allows lottery, casino, and online gambling, within the state
governed by various acts. The Acts that govern the gambling laws in the state are:
1. The Sikkim Casinos (Control and Tax) Act, 2002.
2. The Sikkim Online Gaming (Regulation) Act, 2008.
The Sikkim Casinos (Control and Tax) Act, 2002
The Sikkim Casinos (Control and Tax) Act 2002 regulates and frames the rules for
casinos in Sikkim. The act was previously referred to as The Sikkim Electronic
Entertainment Games (Control and Tax) Act 2002, until 2010, when it was amended.
19 http://www.casinomahjongsikkim.com/
31
The act extends to the whole of Sikkim and controls and regulates Electronic
Entertainment Games or Casinos Games and imposes a tax on such in the state of
Sikkim. The act defined Electronic Entertainment Centre as:
“Electronic Entertainment Centre” means a public place which provides or
is used or is intended to be used for playing, organizing or exhibiting
Electronic Entertainment Games.” (Section 2 sub section (a))
The act defined Electronic Entertainment Games as:
“…all or any of such games of entertainment of chance played by means of
any machine or instrument, as may be prescribed from time to time.” (Section
2 sub section (b))
The Act was amended in 2005, wherein the words “Electronic Entertainment Centre”
and Electronic Entertainment Games” were substituted by “Casino” and "Casino
Games" respectively. The act was once again amended in 2011, wherein clause (b) of
section 2 which defined Electronic Entertainment Games was substituted with a
definition of Casino Games defined as
“….all or any such games of entertainment or chance as may be notified by
the State Government from time to time and which is played by means of any
machine or instrument.” Section 2 (b)
The Sikkim Online Gaming (Regulation) Act, 2008
The Sikkim Online Gaming (Regulation) Act 2008, which extends to the whole of the
state of Sikkim was passed by the Sikkim Legislative Assembly on 28th June 2008 and
came into force on 1st July 2009. The act regulates and controls online gaming, and
32
imposes a tax on such games conducted within the state of Sikkim. The act defines
online games as:
“…all or any games of chance or a combination of skill and chance, including
but not limited to Poker, Roulette, blackjack or any game, played with cards,
dice or by means of any machine or instrument for money or money’s worth,
as may be prescribed from time to time.” Section 2 (d)
The act defines online gaming as:
“…any gaming, where any player enters or may enter the game or takes or
may take any step in the game or acquires or may acquire or may acquire a
chance in any on-line gaming or Sport Gaming, by means of a
telecommunication device including the negotiating or receiving of any bet
by means of a telecommunication device.” Section 2 (k)
As per the powers conferred by section 23 of the Sikkim Online Gaming (Regulation)
Act, 2008, the state government of Sikkim framed The Sikkim On-line Gaming
(Regulation) Rules, 2009.
1.6 Economic and Social Implications of Gambling
Gambling legalisation and regularisation have an enormous impact on the economic
development of a country. The development of casinos and other forms of gambling
increases the revenue in the form of taxes, creates employment opportunities for the
people, and helps in economic development. The liberalisation of casinos in Macau and
Las Vegas had a significant economic impact on their respective economy. Casino
liberalization in 2002 has significantly influenced the GDP growth of Macau's
economy. Before liberalisation, from 1999 to 2002, revenue generated from the casinos
in Macao increased at a rate of 66.1% (Zheng & Hung, 2012). However, after the
33
liberalisation the revenue generated from casinos increased by four-fold from 2002-
2009 (Zheng & Hung, 2012). Macau was also able to cope with the global financial
recession due to the income generated from its casino industry (Wan et al., 2011). The
Canadian government also generates substantial revenues from its numerous state-run
lotteries and casino, and the revenues have been increasing year-by-year (Basham &
White, 2002). Similarly, the Australian government also generated enormous revenue
from lotteries, and it was one of the significant sources of revenue generation (Basham
& White, 2002).
Another significant contribution of the gambling industry has been an increase in
employment opportunities for the locals. The gambling industry has been a principal
employer in many countries such as Canada, Macao, United Kingdom, and Australia.
Jobs creation has increased at a rate of 20.6% in the casino sector alone in Macao
(Zheng & Hung, 2012). An increase in the number of jobs in the casinos has increased
the monthly income of the employees (Wan et al., 2011; Zheng & Hung, 2012).
However, there are a large number of opponents of the development of the gambling
industry. The opponents of gambling seek to highlight the negative consequences by
explaining the personal and social impacts resulted from legalised gambling. Several
studies on the estimation of the social cost of gambling have identified different social
costs of gambling. Some of the identified social costs of gambling are, Employment
costs, Bad debts and bankruptcy, civil suits, welfare and social costs, thefts and crime,
high school dropouts, traffic problems, impose constraints on small businesses.
Studies related to the estimation of the social costs of gambling have a fair share of
critiques. Walker (2008) has criticized the inclusion of some of the social costs of
gambling identified by Thompson & Schwer (2005). The social costs identified by
34
Thompson & Schwer (2005) while calculating the social cost of gambling are
Employment costs, Debt, Bankruptcy and Civil suits, Thefts and Criminal system
actions, treatment, and welfare services. Among these costs, Walker (2008) criticized
the inclusion of employment costs, debts, bankruptcies and civil suits, thefts, and
criminal systems. According to Walker (2008), these costs are either private or merely
involves a transfer of ownership. Walker (2008) has thereby suggested the exclusion of
these costs while estimating the social cost of gambling.
According to Walker and Sobel (2016), estimating the social cost of gambling is far
more complicated than estimating the economic benefits of gambling. Studies on the
estimation of the social cost of gambling have different estimated costs and results.
Research on the estimation of the social cost of gambling lacks a distinctive
methodology that is ideal in identifying and estimating the social cost of gambling. The
disparity in the methodology applied in different studies has resulted in the differences
in the estimated values of social costs of gambling. However, irrespective of the various
critiques, it is quite understandable that the existence of the gambling industry in a
region does have a fair share of negative impact upon society.
1.7 Problem Statement
Since the beginning of human civilizations, gambling has ceased to exist in one form
or the other. Throughout history, gambling was an activity that was considered a vice
and was frowned upon by different religions, yet, gambling was a popular activity and
continues to remain a popular activity among the people. Gambling has grown and
evolved throughout human history, and people are always finding a new way or the
other to engage in gambling. Over a few decades, with the introduction of the Internet
and the advancement of technology, gambling has become more available to people
who wish to engage in betting and wagering.
35
India has a rich history of gambling. The reference of gambling in ancient Indian texts
such as Mahabharata and Rigveda provides evidence of gambling in ancient India.
However, despite such a rich history of gambling in India, studies related to gambling
are rare and scanty.
Sikkim is the most liberal state in India when it comes to gambling. State lottery,
Casino, and online gambling are legal within the state. The state also hosts several
festival gambling games such as Bingo (also referred to as Tambola or Housie in
Sikkim). Gambling has been present in the state for almost four decades, but when it
comes to scientific study, there is only one study that has been conducted by the
Comptroller and Auditor General of India (2017) to evaluate the performance of the
lottery in Sikkim.
The present study will identify the motives for gambling, the prevalence rate of problem
gambling, and gambling behaviour among the gamblers in Sikkim. The present study
is the first empirical study conducted in India that seeks to identify gambling motives
and behaviour among Indian gamblers. The present study is also the first empirical
study conducted in Sikkim to find out the prevalence rate of problem gambling among
the gamblers in Sikkim. The present study will also highlight the revenue generated
from the legal gambling games in Sikkim.
36
CHAPTER 2. REVIEW OF LITERATURE
Gambling has been present in every culture and civilization and is played by people
across various generations. It is one of the oldest industries in the world played in
different forms, and the popularity of gambling keeps increasing (Chantal et al., 1995).
Liberalization and development of gambling and gambling products have had a
significant implication on economic development in several countries. Development of
casinos and other forms of gambling have paved the way towards economic growth in
different economies through an increase in the revenue in the form of tax, increased
employment opportunities, and development of ancillary industries (Chhabra, 2007;
Wan et al., 2011; Zheng & Hung, 2012).
A large number of research studies have been conducted around the world related to
the gambling industry. However, the focus of this section will be the research studies
conducted around the world to identify the gambling motives, prevalence of problem
gambling, the impacts of problem gambling, and to identify the pattern of gambling
behaviour among the gamblers. The research articles and reports that have been
reviewed for the study have been identified using google scholar, Pubmed, and different
open access journals. The literature review is divided into three main sections,
Gambling motivation, Problem gambling/severity, and gambling behaviour.
2.1 Gambling Motivation
People have different motives for gambling. Gambling behaviour of the gamblers is
majorly affected by motivation, and it is an important element of gambling involvement
(Chantal et al., 1995). Gambling motivation significantly influences the intention to
gamble and greater gambling involvement among the gamblers (Wu & Tang, 2011).
Different gamblers have different gambling motivation, and it varies according to the
social demographic factors of the gamblers (Francis et al., 2015). Motives for gambling
37
not only vary depending upon the social demographic factors, but it also varies
according to the forms of gambling products (Lam, 2007a).
Neighbors et al. (2002) identified as many as 16 different motives for gambling. While
playing the lottery, casino, and track betting, gamblers were motivated by excitement,
challenge, and a chance to win, whereas, while playing games such as bingo, card room,
and unlicensed gambling, social factor was the significant motivator (Lam, 2007a). On
the other hand, monetary, excitement, entertainment, and social values were some of
the factors motivating Baccarat20 players to gamble in a game of Baccarat (Lam,
2007b).
Different authors have identified and developed several motivation scales to identify
the factors motivating gambling among the various gamblers and types of gambling
games. The Gambling Motivation Scale (GMS) identifies seven different motives
among the gamblers (Chantal et al., 1994, as cited in Wu & Tang, 2011). Among these
seven distinct motives for gambling, three of them are intrinsic motivation towards
knowledge, accomplishment, and stimulation, three of them are extrinsic motivation
resulted from identified regulation, external regulation, and introjected regulation, and
the final one is amotivation. These seven factors are classified into three factors self-
determined motivation, non-self-determined motivation, and amotivation. The result of
the confirmatory factor analysis by Wu and Tang (2011) among the Chinese gamblers
supported these classifications to simplify the seven motivation factors of the Gambling
Motivation Scale into three subscales.
Tao et al. (2011) developed an indigenous Gambling Motives, Attitudes and Behaviour
(GMAB) Scale to identify the factors motivating gambling among the Chinese
gamblers. The result of the factor analysis revealed five different motives for gambling
20 Baccarat is a gambling game played with cards.
38
viz, self-worth, Monetary gains, Sensation seeking, Boredom alleviation, and Learning.
Binde (2013) developed a gambling motivational model for better understanding the
gambling behaviour and problem gambling most suitable for leisure gambling. The five
motivational dimensions identified in the gambling motivation model are the dream of
hitting the jackpot and transforming one’s life, Social rewards, Intellectual challenge,
Mood change induced by playing, and the chance of winning.
Stewart and Zack (2008) developed and evaluated the Gambling Motives Questionnaire
(GMQ), exhibited from the three-dimensional Drinking Motives Questionnaire. The
Gambling Motives Questionnaire consists of 15 items, of which 14 were directly
adapted from the Drinking Motives Questionnaire, and only one of the item “to get a
high feeling” has been changed from “to get high”. Stewart and Jack (2008) developed
the Gambling Motives Questionnaire to assess three distinct gambling motives:
Enhancement motives (internal), Coping motives (internal), and Social motives
(external) in predicting gambling frequency. The three subscales viz Enhancement,
Coping, and Social motives indicated a good internal consistency (Cronbach’s alpha
0.80), and the three-factor structure correlated with each other. The reliability and
validity of the GMQ were evaluated by Lambe et al. (2015), and their result indicated
that the GMQ is a valid measure for identifying motives among emerging adults.
However, one of the significant gaps in the GMQ model was the exclusion of financial
motives. Including financial motives in the GMQ model and its modification into the
GMQ-F model improved the internal consistency of the enhancement motives (Dechant
& Ellery, 2011), and also improved the estimation of gambling frequency by the GMQ-
F model (Dechant, 2014).
A five-factor gambling motivation model to determine the influence of gambling
motives on gambling severity was developed by Lee et al. (2007), using a self-reported
39
questionnaire among college students in Korea. The five factor-gambling model
identified five different motives for gambling, socialization, amusement, excitement,
avoidance, and financial motives. Lee et al. (2007) found out that financial motives
have a direct positive impact in explaining gambling severity, and the avoidance and
excitement motives have an indirect influence on gambling severity through financial
motives.
Gambling motives play a crucial role in explaining gambling behaviour and severity
among gamblers (Francis et al., 2015; Lee et al., 2007; Stewart & Zack, 2008). The
desire to win big influences gambling involvement and results in severity among the
gamblers (Lee et al., 2007). The desire to win big is one of the primary reasons for
gambling (Binde, 2013; McGrath et al., 2010). Winning big money is a primary reason
for persistent gambling among the problem gamblers, and winning small amounts
encourages them to chase their earlier losses (Clarke et al., 2007). The monetary
motives have a direct positive influence among the gamblers and their gambling
severity (Lee et al., 2007), but escape and excitement motives also play a crucial role
when gambling-related problems emerge among the gamblers (Flack & Morris, 2014).
Enhancement motive, along with coping motive, is also a significant predictor of
problem gambling severity (Francis et al., 2015; Lambe et al., 2015). However, the
influence of gambling motives on gambling severity varies across genders. A coping
motive has been found to be a significant predictor of problem gambling among the
female gamblers, while the enhancement motive is a significant predictor of problem
gambling among the male gamblers (Stewart & Zack, 2008).
2.2 Severity / Problem Gambling
According to recent Diagnostic and Statistical Manual 5th Edition (American
Psychiatric Association, 2013) problem gambling is defined as ‘persistent and
40
recurrent problematic gambling behaviour leading to clinically significant impairment
or distress, as indicated by the individual exhibiting four (or more) symptoms in a 12 -
month period:
a. Needs to gamble with increasing amounts of money in order to achieve the
desired excitement.
b. Is restless or irritable when attempting to cut down or stop gambling.
c. Has made repeated unsuccessful efforts to control, cut back, or stop gambling.
d. Is often preoccupied with gambling (e.g., having persistent thoughts of reliving
past gambling experiences, handicapping or planning the next venture, thinking
of ways to get money with which to gamble).
e. Often gambles when feeling distressed (e.g., helpless, guilty , anxious,
depressed).
f. After losing money gambling, often returns another day to get even (“chasing”
one’s losses).
g. Lies to conceal the extent of involvement with gambling.
h. Has jeopardized or lost a significant relationship, job, or educational or career
opportunity because of gambling.
i. Relies on others to provide money to relieve desperate financial situations
caused by gambling.
Ferris and Wynne (2001) defined the problem gambling as
“Gambling behaviour that creates negative consequences for the gambler,
others in his or her social network, or for the community .”
2.2.1 Tools for Measuring Severity/ Problem Gambling
Multiple tools are available for identifying the level of severity among those who have
ever gambled. Of all the screening tools, widely accepted and regularly used screening
41
tools for identifying the problem and pathological gambling include Diagnostic and
Statistical Manual for Pathological Gambling (American Psychiatric Association,
2013), South Oaks Gambling Screen (Lesieur & Blume, 1987) and, Problem Gambling
Severity Index (Ferris & Wynne, 2001). Each instrument has been designed in different
settings and produces significantly different groups of problem gamblers (Young &
Stevens, 2008). The following paragraph will highlight the origin, nature, validity, and
reliability in identifying and measuring the problem and pathological gambling.
1. Diagnostic and Statistical Manual for Mental Disorder
Diagnostic and Statistical Manual for Mental Disorder or DSM, published by the
American Psychological Association, is the official documentation of all the conditions
for recognizing mental disorders (American Psychiatric Association, 2013). It is a
primary diagnostic tool used by clinicians to identify and treat psychiatric disorders
(Weinstock & Rash, 2014). The introduction of the diagnosis of pathological
gambling21 as a psychiatric disorder in DSM-III in 1980 set the foundation stone for the
recognition of diagnostic criteria for gambling disorder (Stinchfield et al., 2016)
(Stinchfield et al., 2016; Weinstock & Rash, 2014). Since its introduction as a
psychiatric disorder in DSM III in 1980, it has been revised three times in 1987 for
DSM-III-R, 1994 for DSM-IV, and recently in 2013 for DSM-V (Weinstock & Rash,
2014).
The DSM-IV consists of ten criteria for the diagnosis of pathological gambling. The
ten criteria for pathological gambling diagnosis are preoccupation, increased bets,
unable to control, irritability, escape, chasing, lying to family, illegal acts, negative
effects, and bailed out by others. Among the ten criteria, five of them signifies the outset
21 Pathological gambling, also known as compulsive gambling or disordered gambling, is a recognized
mental disorder characterized by a pattern of continued gambling despite negative physical, psychological, and social consequences.
42
for the determination of pathological gambling (Zimmerman et al., 2006). Multiple
studies have been conducted to study the validity and reliability of DSM-IV criteria in
the diagnosis of pathological gambling. A common reoccurring theme in most of these
studies was the improvement in the overall classification of the DSM-IV criteria after
the reduction of the cut-off points from five to four criteria. Jiménez-Murcia et al.
(2009) in there study found out that the DSM-IV instrument had a major weakness and
predicted comparatively high false-negative rates. High false-negative errors indicate
an error in terms of considering a person not having a disorder when they have a
disorder. This weakness in the DSM-IV instrument has been resolved by reducing the
cut-off points, which also improved the overall classification accuracy of the DSM-IV
instrument.
The negligible contribution of illegal criteria in the accurate diagnosis of pathological
gamblers was another significant conclusion drawn from several studies on the validity
and reliability of the DSM-IV instrument. Illegal criteria such as fraud, theft, forgery,
and embezzlement to finance gambling can be a strong predictor of the severity of
pathological gambling (Weinstock & Rash, 2014), however, its inclusion in the DSM-
IV instrument does not result in a proper diagnosis of pathological gambling
(Zimmerman et al., 2006).
The publication of the Diagnostic and Statistical Manual for Mental Disorder (DSM-
V) in 2013 brought about significant changes in the evaluation of diagnostic criteria for
gambling disorder. Gambling disorder (previously known as pathological gambling in
DSM-IV) which was a part of the Impulse Control Disorders category of the DSM-III
and DSM-IV, was moved in the category Substance-Related and Addictive Disorders
along with substance use disorders (Clark, 2014). In addition to that, some of the
significant changes incorporated in the DSM-V included the elimination of criterion
43
related to committing illegal crimes, renaming pathological gambling as gambling
disorder, reducing the threshold from five to four criteria on prevalence rates and
classification accuracy and reclassification of gambling disorder as an addictive
disorder from an impulse control disorder (Stinchfield et al., 2016; Weinstock & Rash,
2014). The suggestions from previous studies to reduce the cut-off points from five to
four criteria and the elimination of the illegal criteria from the DSM-IV instrument was
incorporated and, changes were made accordingly in the new DSM-V instrument.
Stinchfield et al. (2016) conducted a study to address the reliability and validity of the
new DSM-V instrument and examined the effects of the elimination of illegal criteria
and reduction of the cut-off points in the DSM-IV instrument in terms of diagnostic
accuracy. Some of the significant findings from the studies are as follows:
When comparing the validity, reliability and classification accuracy between
DSM-IV and DSM-V, DSM-V exhibited better internal consistency and
classification accuracy. The result of the validity test identical among both the
instrument. DSM-V thus displayed satisfactory reliability, validity and,
classification accuracy and yielded better results in terms of reduced false
negatives as a direct result of reduction of the cutoff points.
The elimination of the illegal acts criterion from the DSM-IV instrument only
resulted in the change in the diagnosis of five gamblers out of 3247 individua ls,
a mere change of 0.15% of the sample. It further provided a piece of evidence
upon previous studies (Weinstock & Rash, 2014; Zimmerman et al., 2006),
which suggested that illegal acts criterion adds little in the diagnosis of
gambling disorder.
Another significant improvement upon the DSM-V instrument is the better
results yielded by DSM-V in terms of the notable reduction in false negatives
44
achieved as a direct result of lowering the cutoff points. This result was similar
to the study conducted by Jiménez-Murcia et al. (2009), which also found out a
similar reduction in the rate false-negative rate.
2. South Oaks Gambling Screen
Lesieur and Blume (1987) developed the South Oaks Gambling Screen (SOGS) as an
instrument to identify pathological gambling and help in identification, intervention,
and treatment of pathological gambling. The South Oaks Gambling Screen developed
from the original DSM-III diagnostic tool for pathological gambling, was constructed
to identify pathological gambling in a clinical setting (Lesieur & Blume, 1987;
Stinchfield, 2002). Since the origination of the South Oaks Gambling Screen, it has
been used and translated to recognize pathological gambling in several countries
(Lesieur & Blume, 1987). The instrument is a widely used screening tool for
pathological gambling across the world and used in many prevalence studies in
different contexts (Stinchfield, 2002).
The South Oaks Gambling Screen consists of 16 questions and includes 37 items out
of which 20 are scoring items with equal-weighted items requiring yes or no response
(Battersby et al., 2002). A point is assigned if the participant indicates yes against the
scoring items and a total score is calculated, after the conclusion of the questionnaire.
Participant scoring five or more is categorized as having probable pathological
gambling (Lesieur & Blume, 1987).
The South Oaks Gambling Screen was designed in three stages.
The first stage of the screen development included the collection of information
from a group of 458 alcohol and drug abuse inpatients, related to the family,
jobs, financial condition, behaviour, attitudes, and problem associated with
45
gambling (Holtgraves, 2009a; Lesieur & Blume, 1987; Young & Stevens,
2008). Following which an index consisting of seven components based on the
DSM III criteria for the diagnosis of pathological gambling was designed. Those
seven components consisted of family disruption, job disruption, lying about
gambling results, debts default, approaching someone during a desperate
financial situation resulted from gambling, borrowing from an illegal source,
and committing crimes (Lesieur & Blume, 1987).
Development of the screening tool took place during the second stage, which
consisted of 60 items and included the opinions of the counselors. Counselors
conducted the interviews and screened to identify the potential pathological
gamblers. Result of the discriminant analysis during this stage resulted in the
elimination of irrelevant items and items with lower frequency. The result of
the discriminant analysis decreased the items in the screening tool from 60 items
to 20 items (Lesieur & Blume, 1987).
During the final stage, the SOGS tool was cross validated with the DSM-III-R,
among a sample consisting of 213 Gamblers anonymous, 384 university
students and, 152 hospital employees. The SOGS classified 98% of gamblers
anonymous, 5% of university students and, 2% of hospital employees as
pathological gamblers. The SOGS screening tool was also found to be highly
correlated with the DSM-III-R diagnostic tool for pathological gambling
(Lesieur & Blume, 1987). A score of 5 was found to be an optimal cutoff point
for categorizing the pathological gamblers (Lesieur & Blume, 1987, 1993).
Although the South Oaks Gambling Screen is a popular screening tool for recognizing
pathological gambling, it has its fair share of criticism as well. Some of the striking
46
issues identified in several studies about the effectiveness of the South Oaks Gambling
Screen in recognizing probable pathological gambling are as follows:
One of the early setbacks of the SOGS was the use of a lifetime frame and its failure in
differentiating between current gamblers and those who are in remission (Holtgraves,
2009a; Tang et al., 2010). To address this issue, Lesieur and Blume (1993) have
suggested the revision of the SOGS and screen the severity of pathological gambling
based on 6 months or 12 months’ period.
Multiple studies have stressed on the overestimation of pathological gamblers and high
false positive rates by the South Oaks Gambling Screen (Oliveira et al., 2009;
Stinchfield, 2002; Tang et al., 2010). Stinchfield (2002) conducted a study to examine
the classification accuracy of the South Oaks Gambling Screen among a sample of the
general population and gambling treatment sample, using DSM-IV as a standard against
measuring the classification accuracy. The study found out that although the
classification accuracy of the SOGS was excellent among treatment samples, the
instrument exhibited a high false-positive rate of about 50% among the general
population. Oliveira et al. (2009) too found a significant difference in the categorization
of pathological gamblers using DSM-IV and South Oaks Gambling Screen as a tool for
screening pathological gambling in Brazil. The DSM-IV diagnostic tool classified 12%
of the Bingo playing sample as pathological gamblers, whereas the South Oaks
Gambling Screen classified 44% of the Bingo playing sample as pathological gamblers.
Another issue related to the South Oaks Gambling screen is the cut-off points for
categorizing pathological gambling. The South Oaks Gambling Screen defines an
individual having pathological gambling who scores five or more during screening. A
cut-off point of five was determined to eliminate false-positive rates (Lesieur & Blume,
47
1987). However, in multiple studies, a different cut-off score has ideally lowered the
false positive rate irrespective of the cut-off point determined by Lesieur and Blume
(1987). In a separate study conducted in Brazil (Oliveira et al., 2009), China (Tang et
al., 2010) and Turkey (Duvarci et al., 1997), a cut-off point of 8 improved the
classification accuracy and a reduced percentage of false positives. Similarly, Goodie
et al. (2015) also recommended a cut-off point of 8 to be used in clinical screening
useful with DSM-V criteria.
3. The Canadian Problem Gambling Index
Ferris and Wynne (2001) developed a new instrument referred to as The Canadian
Problem Gambling Index (CPGI), for assessing the level of problem gambling among
the gamblers, intended to be used among the general population that provided a more
holistic view of gambling, and incorporated indicators related to the social paradigm.
The inception of the instrument began with a definition of problem gambling as defined
by Ferris and Wynne (2001),
"…gambling behaviour that creates negative consequences for the
gambler, others in his or her social network, or for the community."
CPGI is composed of 31 items containing the items from both the Diagnostic and
Statistical Manual (DSM) and South Oaks Gambling Screen (SOGS) (Ferris & Wynne,
2001). Only 9 out of all the 31 items included in the CPGI is scored and forms a subset
of CPGI most commonly referred to in the literature as The Problem Gambling Severity
Index (PGSI) (Holtgraves, 2009a). Of the nine items which are score able in the PGSI,
five items address adverse results of gambling and the four-address problem gambling
behaviour (Ferris & Wynne, 2001; Holtgraves, 2009a). PGSI uses a four-point Likert
scale, quite different from both the DSM and SOGS that can produce a score ranging
from 0-27 to categorize the level of problem gambling severity among the gamblers
(Young & Stevens, 2008). The four-point Likert scale used in the PGSI and their
48
subsequent scores are, Never (0), Sometimes (1), Most of the time (2), and almost
always (3) (Ferris & Wynne, 2001). The PGSI defines four categories of gamblers
namely, non-problem gambler, low risk gamblers, moderate risk gamblers and problem
gamblers (Currie et al., 2013). Out of the maximum of 27 points that can be scored in
the PGSI, those scoring 0 are classified as non-problem gamblers, 1-2 are classified as
low risk gamblers, 3-7 are classified as moderate risk gamblers and those scoring 8 and
above are classified as problem gamblers (Ferris & Wynne, 2001).
The reliability levels of the CPGI scale in the past studies have ranged from 0.77
(Arthur et al., 2008) to 0.92 (Loo et al., 2011). Earlier studies on the psychometric
analysis of the CPGI, SOGS, and the DSM-IV scales have highlighted that the
reliability level of the CPGI scale is significantly better than the SOGS and the DSM-
IV scale. In terms of the reliability of the CPGI scale, Ferris and Wayne (2001) found
that the reliability levels of the PGSI scale (α=0.84) were more prominent in
comparison to the reliability levels of the SOGS (α=0.81) and the DSM-IV scale
(α=0.76). Orford et al. (2010) also had a similar conclusion related to the reliability
levels of the CPGI scale. In their study Orford et al. (2010) found that the reliability
levels of the CPGI scale (α=.90) were more prominent than the reliability of the DSM-
IV scale (α=0.73). Arthur et al. (2008) reported that the CPGI Scale was the most
reliable instrument for identifying problem gambling among Singapore university
students. The CPGI index was found to be significant in distinguishing other issues
related to gambling, such as suicide, depression, drinking, and financial problems
(Arthur et al., 2008).
2.2.2 Prevalence of Problem Gambling
Studies on the prevalence of problem gambling are significant as it highlights the degree
to which gambling has affected the society. These studies provide policymakers,
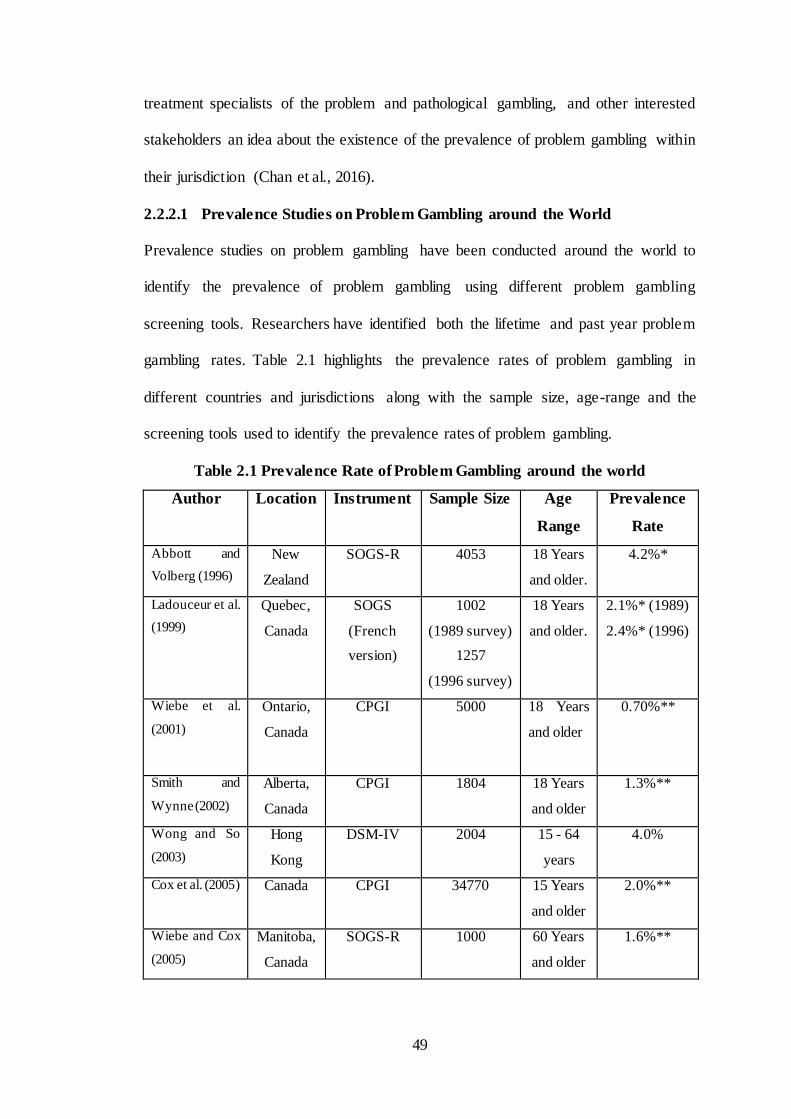
49
treatment specialists of the problem and pathological gambling, and other interested
stakeholders an idea about the existence of the prevalence of problem gambling within
their jurisdiction (Chan et al., 2016).
2.2.2.1 Prevalence Studies on Problem Gambling around the World
Prevalence studies on problem gambling have been conducted around the world to
identify the prevalence of problem gambling using different problem gambling
screening tools. Researchers have identified both the lifetime and past year problem
gambling rates. Table 2.1 highlights the prevalence rates of problem gambling in
different countries and jurisdictions along with the sample size, age-range and the
screening tools used to identify the prevalence rates of problem gambling.
Table 2.1 Prevalence Rate of Problem Gambling around the world
Author Location Instrument Sample Size Age
Range
Prevalence
Rate
Abbott and
Volberg (1996)
New
Zealand
SOGS-R 4053 18 Years
and older.
4.2%*
Ladouceur et al.
(1999)
Quebec,
Canada
SOGS
(French
version)
1002
(1989 survey)
1257
(1996 survey)
18 Years
and older.
2.1%* (1989)
2.4%* (1996)
Wiebe et al.
(2001)
Ontario,
Canada
CPGI
5000
18 Years
and older
0.70%**
Smith and
Wynne (2002)
Alberta,
Canada
CPGI
1804 18 Years
and older
1.3%**
Wong and So
(2003)
Hong
Kong
DSM-IV 2004 15 - 64
years
4.0%
Cox et al. (2005) Canada CPGI 34770 15 Years
and older
2.0%**
Wiebe and Cox
(2005)
Manitoba,
Canada
SOGS-R
1000
60 Years
and older
1.6%**
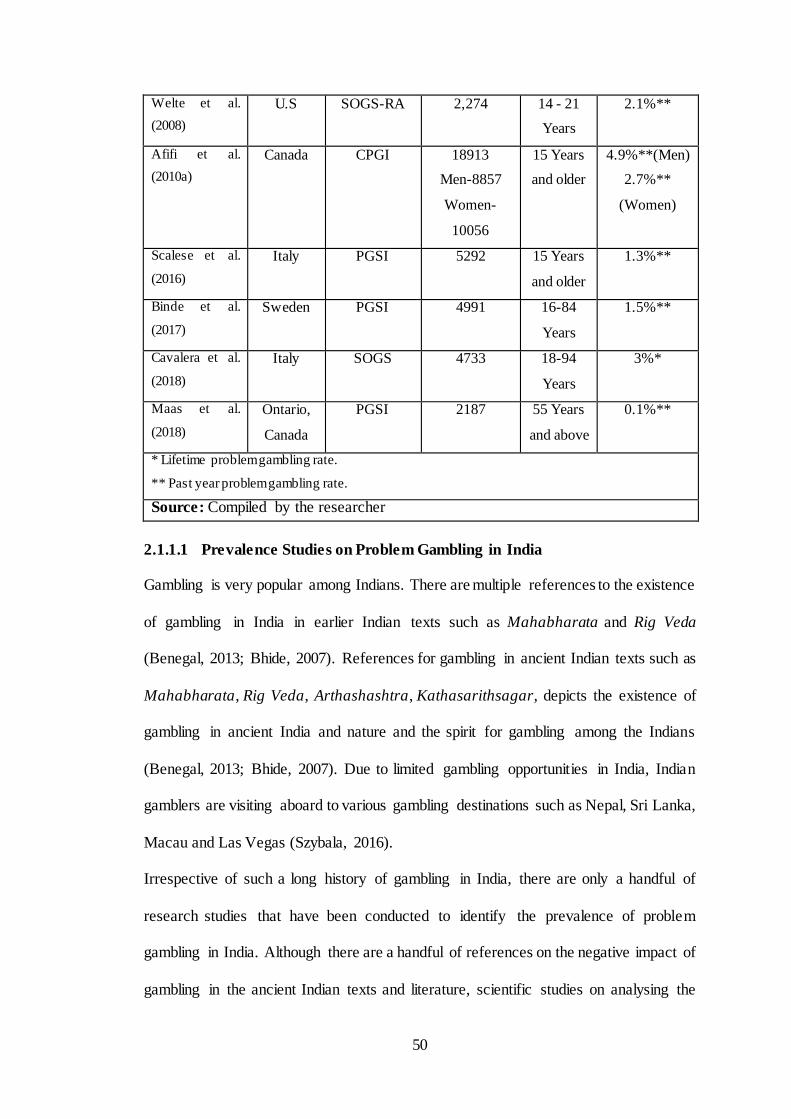
50
Welte et al.
(2008)
U.S
SOGS-RA
2,274
14 - 21
Years
2.1%**
Afifi et al.
(2010a)
Canada
CPGI
18913
Men-8857
Women-
10056
15 Years
and older
4.9%**(Men)
2.7%**
(Women)
Scalese et al.
(2016)
Italy
PGSI
5292
15 Years
and older
1.3%**
Binde et al.
(2017)
Sweden
PGSI
4991
16-84
Years
1.5%**
Cavalera et al.
(2018)
Italy
SOGS
4733
18-94
Years
3%*
Maas et al.
(2018)
Ontario,
Canada
PGSI 2187 55 Years
and above
0.1%**
* Lifetime problem gambling rate.
** Past year problem gambling rate.
Source: Compiled by the researcher
2.1.1.1 Prevalence Studies on Problem Gambling in India
Gambling is very popular among Indians. There are multiple references to the existence
of gambling in India in earlier Indian texts such as Mahabharata and Rig Veda
(Benegal, 2013; Bhide, 2007). References for gambling in ancient Indian texts such as
Mahabharata, Rig Veda, Arthashashtra, Kathasarithsagar, depicts the existence of
gambling in ancient India and nature and the spirit for gambling among the Indians
(Benegal, 2013; Bhide, 2007). Due to limited gambling opportunities in India, Indian
gamblers are visiting aboard to various gambling destinations such as Nepal, Sri Lanka,
Macau and Las Vegas (Szybala, 2016).
Irrespective of such a long history of gambling in India, there are only a handful of
research studies that have been conducted to identify the prevalence of problem
gambling in India. Although there are a handful of references on the negative impact of
gambling in the ancient Indian texts and literature, scientific studies on analysing the
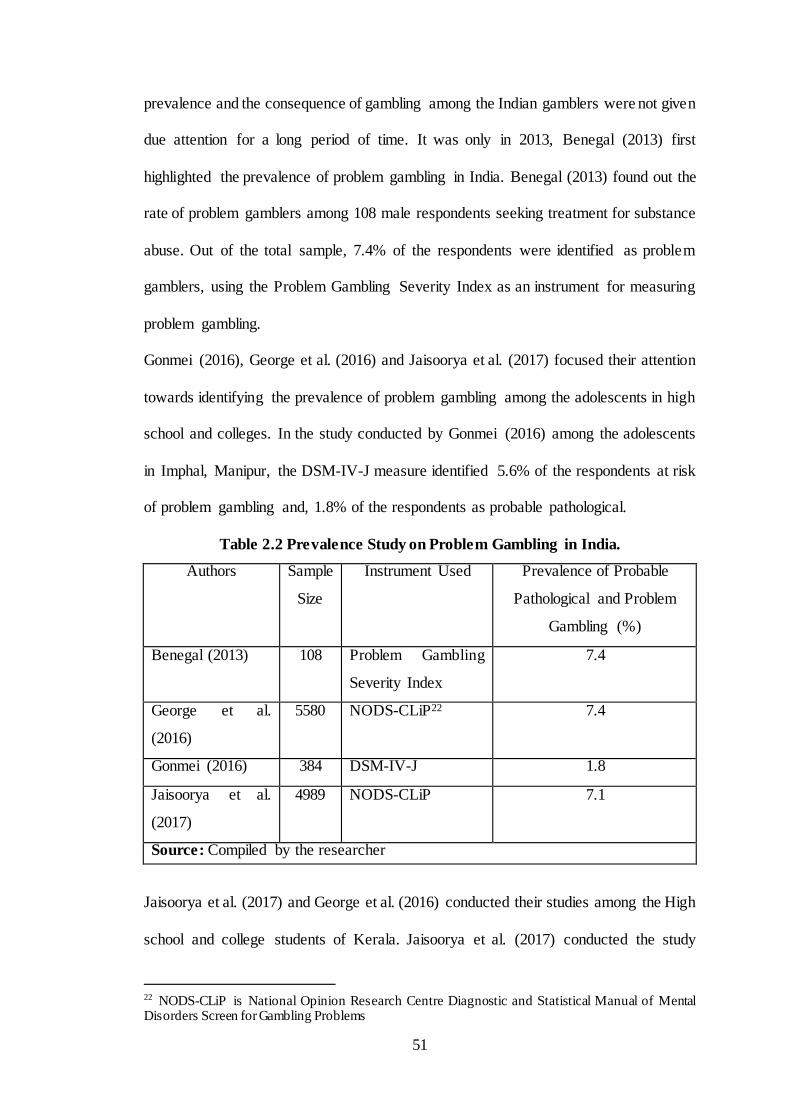
51
prevalence and the consequence of gambling among the Indian gamblers were not given
due attention for a long period of time. It was only in 2013, Benegal (2013) first
highlighted the prevalence of problem gambling in India. Benegal (2013) found out the
rate of problem gamblers among 108 male respondents seeking treatment for substance
abuse. Out of the total sample, 7.4% of the respondents were identified as problem
gamblers, using the Problem Gambling Severity Index as an instrument for measuring
problem gambling.
Gonmei (2016), George et al. (2016) and Jaisoorya et al. (2017) focused their attention
towards identifying the prevalence of problem gambling among the adolescents in high
school and colleges. In the study conducted by Gonmei (2016) among the adolescents
in Imphal, Manipur, the DSM-IV-J measure identified 5.6% of the respondents at risk
of problem gambling and, 1.8% of the respondents as probable pathological.
Table 2.2 Prevalence Study on Problem Gambling in India.
Authors Sample
Size
Instrument Used Prevalence of Probable
Pathological and Problem
Gambling (%)
Benegal (2013) 108 Problem Gambling
Severity Index
7.4
George et al.
(2016)
5580 NODS-CLiP22 7.4
Gonmei (2016) 384 DSM-IV-J 1.8
Jaisoorya et al.
(2017)
4989 NODS-CLiP 7.1
Source: Compiled by the researcher
Jaisoorya et al. (2017) and George et al. (2016) conducted their studies among the High
school and college students of Kerala. Jaisoorya et al. (2017) conducted the study
22 NODS-CLiP is National Opinion Research Centre Diagnostic and Statistical Manual of Mental Disorders Screen for Gambling Problems
52
among the high school students of Kerala and found the prevalence of lifetime gambling
to be 27.9% and the rate of problem gambling was 7.1%. Similarly, George et al. (2016)
conducted their study among the college students in Kerala and found out the
prevalence of lifetime gambling to be 19.5% and the rate of problem gambling was
7.4%. However, significantly high rates of problem gambling were found among those
who have ever gambled in both these studies. Problem gambling among those who had
gambled was found to be 38% and 25.2% respectively (George et al., 2016; Jaisoorya
et al., 2017).
Problem gamblers in India are more likely to be male, 66.6% (George et al., 2016),
92.6% (Jaisoorya et al., 2017) and belong to the rural regions 59% (George et al., 2016),
78% (Jaisoorya et al., 2017). While the lottery (42.4%) is the most common form of
gambling among college student’s problem gamblers followed by cricket and football
gambling (29.9%) (George et al., 2016). It is just opposite in case of high school
students. High school problem gamblers are more engaged in cricket and football
gambling (70.3%) followed by the lottery (43.9%) (Jaisoorya et al., 2017). However, it
is necessary to understand that in the state of Kerala lottery is the only legal form of
gambling, betting on cricket and football gambling resulting in problem gambling could
be a direct result of the existence of illegal gambling markets.
Bhatia et al. (2019) has conducted the most recent study on the prevalence of gambling
in India in a large community-based sample of adult men in the state of Goa, where
state-run lotteries and privately run offshore and land-based casinos are legal. Some of
the important highlights of the study were as follows:
1. The prevalence rate of lifetime gambling among the male gamblers in Goa was
49.9%, with 45.4% of the reporting gambling within the past 12 months.
53
2. The study also found out that work-related problems, interpersonal violence,
tobacco use, and alcohol use disorders are associated with lifetime and current
gambling.
3. The lottery is the most common form of gambling among the gamblers with
almost 67.8% of the respondents gambling in the lottery in the past 12 months.
Of these 67.8%, 93.7% of the gambles in the lottery up to once in a month, 6.1%
of them gambling up to more than once a month and up to thrice a week
followed by 0.2% of the gamblers gambling in the lottery more than thrice in a
week.
Systematic research on gambling as a problem has not caught the attention of the
researchers and enthusiasts in India. It is imperative to carry out regular and a
systematic prevalence study to monitor gambling participation and the prevalence of
problem gambling (Volberg, 2004). Even though there are a limited number of studies
on the prevalence of problem gambling in India, the existing studies do highlight the
prevailing rates of problem gambling among the Indian gamblers. Although the rate of
participation among the Indian high school and college students is less in
correspondence to the western equivalents, among those who participated in, the rate
of problem gambling was found to be high (George et al., 2016). The rate of problem
gambling has been found to be significantly higher among those who gamble in India
(Jaisoorya et al., 2017).
2.2.3 Association between Problem Gambling and Forms of Gambling
The continued rise of legalised gambling has resulted in the availability of various
forms of gambling resulting from different factors such as market changes, cultural,
legal and, technological causes (Goodie, 2015). As the forms of gambling have evolved
and expanded, it is imperative to understand its association with problem gambling.
54
Results of the prevalence studies suggest that problem gambling is closely linked with
some forms of gambling and have comparatively higher participation rate in these
forms of gambling (Binde, 2011; Phillips et al., 2013). Frequent gambling in one form
of gambling is strongly associated with an increased level of problem gambling.
Gambling in several forms of games is more significantly associated with a higher level
of problem gambling among the gamblers (Phillips et al., 2013). Problem gamblers are
more likely to gamble in multiple games and, a higher level of problem gambling is
associated with higher engagement in gambling (Binde et al., 2017; Holtgraves, 2009b;
Scalese et al., 2016).
An analysis of eighteen prevalence surveys (thirteen from Europe, two from the USA
and one each from Australia, New Zealand and Canada) was conducted to identify, the
pertinent harmfulness of different forms of gambling (Binde, 2011). Some of the major
highlights of the study were as follows:
1. Interactive internet gambling, Electronic Gaming Machines, casino gambling,
and high-stakes unregulated/illegal gambling are comparatively more harmful
than other forms of gambling.
2. Sports betting and pools, horse betting, bingo constitute as a form of gambling
that belongs to an intermediate category and reasonably linked with problem
gambling. While lotteries are found to be a relatively harmless form of
gambling.
Several studies have found that problem gambling is strongly associated with casino
gambling and Electronic Gaming Machines (M. Abbott et al., 2016; Binde, 2011; Binde
et al., 2017; Scalese et al., 2016). M. Abbott et al. (2016) carried out a study to analyse
the changes in gambling participation and problem gambling among the adult
population of Victoria over a period of five years (2003-2018). Data from the study

55
suggested that an estimated 62% of the table games participants (Casino gamblers) and
35% of the Electronic Gaming Machines participants were at a higher risk of a problem
and moderate risk gambling. Currie et al. (2013) have highlight that the percentage of
gamblers who plays Electronic Gaming Machines and casino games is significant ly
higher among the problem gamblers sub types than the moderate-risk gamblers. Casino
gambling is, in fact, one of the highest contributors to problem gambling among the
gamblers (Welte et al., 2009). In a meta-regression analysis of 41 cross-sectional
Australian problem gambling estimates conducted by Markham et al. (2017) have
found a correlation between Electronic Gaming Machines loses and problem gambling
prevalence. The results from the study suggested that a 1% increase in household
disposable income spent on Electronic Gaming Machines and casinos was associated
with around 1.3 times greater prevalence estimates (Markham et al., 2017). The
prevalence of problem gambling rises with the addition of Electronic Gaming
Machines, resulting in an increase of 0.8 problem gamblers per Electronic Gaming
Machines. Electronic Gaming Machines is the primary form of gambling that causes
more problem among the Finnish gamblers than other forms of gambling (Salonen et
al., 2018).
A few studies have highlighted that the easy availability of some forms of gambling
results in an increase in the number of problem gamblers. In a study conducted by Cox
et al. (2005) in Canada, reported that the provinces with permanent casinos and larger
availability of Video Lottery Terminals observed higher rates of problem gamblers than
other provinces. Cox et al. (2005) found out that four out of the five provinces, which
had both Video Lottery Terminals and Casino gambling, had the four highest rates of
problem gambling in Canada. Video Lottery Terminals inside and outside of the casinos
and casino games had significant odds of problem gambling among women gamblers
56
in Canada (Afifi et al., 2010b). Video Lottery Terminals and Slot Machines had the
strongest association between the level of problem gambling and forms of gambling
among the Canadian gamblers (MacLaren, 2016).
Among various forms of gambling, the lottery is found to be associated with a lower
level of problem gambling in comparison to other forms of gambling. It is one of the
most popular forms of gambling (Costes et al., 2018; Welte et al., 2002; Williams et
al., 2013) and is also least associated with the level of problem gambling (Costes et al.,
2018; Welte et al., 2002). Participants of the lottery do not spend excessive amounts
while playing the lottery, and even though it is the most regularly played forms of
gambling, it is not strongly associated with the problem and pathological gambling
(MacLaren, 2016). With some exceptions, the relationship between lottery participation
and the level of problem gambling was found to be weakest in case of the lotteries and
in no case the association between lottery participation and problem gambling was
strong (Binde, 2011). In a study conducted by Subramaniam et al. (2015) comparing
lottery gamblers and gamblers gambling in other forms of gambling, it has been found
that lottery gamblers are less likely to be a problem and, pathological gamblers. Not
only that, but it was also seen that lottery gamblers had a significantly lower probability
of having depression, mental health disorders, and alcohol use disorder (Subramaniam
et al., 2015). However, it is found that gamblers who have more severe gambling
problems participate more in the lotteries (Castrén et al., 2013).
From the related literature on the association between forms of gambling and problem
gambling, it is quite evident that some forms of gambling have a stronger association
with the problem and pathological gambling than other forms of gambling. Gambling
forms such as the casinos, Electronic Gaming Machines, and internet gambling poses a
higher probability of developing problem gambling among the participants, whereas
57
even though the lottery is the most popular form of gambling, it had the least association
with the level of problem gambling. However, gamblers gambling in casinos and
Electronic Gaming Machines are few in numbers their overall societal impact is
confined.
Increasing the availability of some forms of gambling results in an increased rate of
participation in those forms of gambling among the gamblers (Welte et al., 2002)
resulting in an increased rate of problem gambling in the region (Cox et al., 2005).
However, the availability of gambling is not the only factor affecting the association
between different forms of gambling and problem gambling. Any alteration or changes
in the features of the games, such as rewards can simply alter its association with the
level of problem gambling (Binde et al., 2017). Marketability and the attitude towards
the game among the gamblers also influence the general strength of the association
between forms of gambling and problem gambling (Binde et al., 2017).
2.2.4 Problem Gambling among the Internet Gamblers
The advent and the rise of Internet gambling has provided an easy access to gambling
for the gamblers. Easier access to online gambling develops a substantial risk of
developing problem gambling among the online gamblers (Hopley et al., 2012; Olason
et al., 2011). The considerable improvement in the quality of online gambling and better
connectivity has made it much easier for young adults and students to have an easy
access to gambling, resulting in an increase in the number of online gamblers (Olason
et al., 2011) and problem gambling among young adults and students (Griffiths &
Barnes, 2008). The rate of gambling, the amount of money wagered, the amount of time
spent while gambling, and the number of gambling played over the internet is on the
higher side among the internet gamblers (Hopley et al., 2012; Kim et al., 2017; Petry &
Gonzalez-Ibanez, 2013). Easier access and 24-hour availability of internet gambling
58
represent an enormous concern among young adults and students (Mcbride &
Derevensky, 2012).
Problem gamblers gambling over the internet have cited several features such as 24-
hour availability and convenience, privacy, and better game experiences for choosing
internet gambling and also highlighted the internet gambling as too convenient, more
addictive than land-based gambling and much easier to spend more money (Gainsbury
et al., 2015; Wood & Williams, 2009). Companies offering internet gambling provides
an opportunity for online gamblers to gamble online without wagering any real money
through numerous practices set and involve themselves in gambling, which establishes
a sense of false confidence among the gamblers (Mcbride & Derevensky, 2012;
McBride & Derevensky, 2009). McBride and Dervensky (2009) in their study found
that almost 77% percent of the online gamblers engaging in such free practice sessions.
Several studies on the prevalence of problem gambling among the internet gamblers
have highlighted that internet gamblers are more likely to be problem gamblers in
comparison to non-internet gamblers (Canale et al., 2016; Chóliz et al., 2019; Griffiths
& Barnes, 2008; Olason et al., 2011; Petry & Gonzalez-Ibanez, 2013). The percentage
of prevalence of problem gambling among the internet gamblers is approximately 6
times higher than the percentage of problem gambling among the non-internet gamblers
(Mcbride & Derevensky, 2012; Valleur, 2015). While some studies, have reported the
rate of problem gambling among internet gamblers to be 10 times higher than the non-
internet gamblers (Chóliz et al., 2019; Wood & Williams, 2009). Participation in online
gambling is more prevalent among adolescents (Olason et al., 2011) and younger
gamblers (Chóliz et al., 2019; McBride & Derevensky, 2009; Welte et al., 2009; Wood
& Williams, 2009), who are more prone and vulnerable to problem gambling severity
than elder gamblers (Chóliz et al., 2019). Evidence from a study among the adolescent
59
internet gamblers in Iceland suggests that more and more adolescents are adopting
internet gambling due to free access and weak age restriction over the internet, which
is a primary concern in terms of adolescent gambling, is concerned (Olason et al.,
2011). Adolescents gambling over the internet has a higher association between their
gambling behaviour and problem gambling, and the rate of problem gambling among
them is twice in comparison to the non-internet adolescent gamblers (Canale et al.,
2016).
Online poker, a game of poker played over the internet is one of the popular and fastest
growing forms of online gambling (Griffiths et al., 2010; McCormack & Griffiths,
2012; Wood & Williams, 2009). The increasing popularity of online poker throughout
the world have resulted in an increase in the number of professional poker players
(McCormack & Griffiths, 2012). A large amount of money is involved while playing
poker with a high prevalence rate of problem gambling (Dufour et al., 2018; Griffiths.,
2010). The relative amount of time spent on playing multiple session predicted the rate
of problem gambling among online poker players (Griffiths et al., 2010; Hopley et al.,
2012).
There are several ill effects of gambling over the internet. There is often a risk factor
associated with the development of problem gambling among the internet gamblers,
due to the lack of social control of their gambling behaviour (Molde et al., 2017). The
significant development of problem gambling influenced by gambling on the internet
results in a direct health cost of up to 27.24 million euros per year (Effertz et al., 2018).
Some of the most significant adverse consequences of internet gambling include
financial loses, prolonged gambling, usage of drugs. Problem gamblers gambling over
the internet have upheld that the use of the electronic payment system for gambling has
increased their expenditures (Gainsbury et al., 2015). In addition to that, gamblers
60
suffering from stress, anxiety, and depression is a rather common sight among internet
gamblers (Barrault et al., 2017; Hopley et al., 2012). In a study conducted by Barrault
et al. (2017) among the regular online poker player, problem gamblers experienced a
significantly higher level of anxiety and depression problems than non-problem
gamblers. In another study by Hopley et al. (2012), stress was found to be a significant
predictor of problem gambling among online poker players.
Substance abuse and usage of other illicit drugs, consumption of alcohol, cannabis, and
tobacco are very prevalent among the internet gamblers (Kairouz et al., 2012; McBride
& Derevensky, 2009; Wood & Williams, 2009). Kairouz et al. (2012) in their study
have found that online gamblers are more predisposed with risky behaviour and alcohol
and cannabis usage in contrast to offline gamblers. Internet gamblers have mentioned
the freedom to smoke while gambling in solitude as a motivating factor for gambling
over the internet (Wood & Williams, 2009).
Even though several studies suggest that internet gamblers are more likely to be
problem gamblers than the non-internet gamblers, some studies have highlighted that
those internet problem gamblers also often spend in other land-based forms of gambling
(Olason et al., 2011). Although internet gambling does contribute towards problem
gambling, it is not the main patron among most of the problem gamblers (Wood &
Williams, 2009). The impact on the severity of problem gambling is a result of the
engagement in multiple forms of gambling rather than specifically engaging in online
forms of gambling (Gainsbury et al., 2015). Most of the research study have used the
cross-sectional study to derive the conclusion on the impact of internet gambling and
its effect on the severity of problem gambling. The cross-sectional study only provides
information related to a particular period and as such may not reflect the actual
influence of internet gambling among the gamblers. Longitudinal research was
61
suggested to better provide a complete picture of the negative impact of internet
gambling among online and offline gamblers (Kairouz et al., 2012).
2.2.5 Impacts of Problem Gambling
Many countries around the world have been dealing with a high rate of prevalence of
problem gambling resulting in recognizing problem gambling as a significant public
health issue (Delfabbro, 2013; Stucki & Rihs-Middel, 2007). Concerns arising from
excessive gambling behaviour can have a notable impact on the life of the individua l
gambler and their family members who live in closer proximity with the problem
gamblers resulting in severe adverse consequences for both the individual and their
family members (George et al., 2017; Griffiths, 2004; Smith & Wynne, 2002). Even
the whole society is affected by the existence of problem gambling and has to bear the
consequences of problem gambling (Smith & Wynne, 2002; Thompson et al., 1997b,
1997a; Thompson & Schwer, 2005; Walker, 2008; Walker & Barnett, 1999).
The following subsection will highlight the findings of different studies conducted to
identify the effects of problem gambling on gamblers, their family members, and
society.
2.1.1.2 Impact of Problem Gambling on Gamblers
Gamblers experiencing severe problem gambling tends to experience a wide range of
problem in their day-to-day life because of their gambling behaviour. Problems
encountered by a problem gambler because of their gambling behaviour include loss of
income and an increase in debts (J. Wiebe et al., 2001), bankruptcies (Thompson &
Schwer, 2005), relationship problems (J. Wiebe et al., 2001; Williams et al., 2013) ,
isolation (J. Wiebe et al., 2001), and health problem (including depression, anxiety, and
stress) (Sagoe et al., 2017; Smith & Wynne, 2002; J. Wiebe et al., 2001; Williams et
62
al., 2013), and a loss of control (J. Wiebe et al., 2001). Among different subtypes of
gambling severity, problem gamblers are significantly more likely to indicate that their
gambling behaviour is causing them health problems (stress and anxiety), difficulty in
sleeping, restlessness, financial difficulty, and relationship problems (Smith & Wynne,
2002). In some cases, gamblers with a severe gambling problem have also been found
engaging themselves in illegal activities to fund their gambling activities (J. Wiebe et
al., 2001; Williams et al., 2013). J. Wiebe et al. (2001) have found that as the severity
of gambling increases, the probability of experiencing a wide range of problem also
increases because of the gambling behaviour of the gamblers.
Mental health problems among gamblers are significantly associated with an increased
level of gambling severity among the gamblers. Problem gamblers are likely to be more
depressed than the non-problem gamblers (Clarke, 2004). In a study conducted by
Barrault et al. (2017) to analyse the degree of depression and anxiety among regular
poker players, the levels of severity of anxiety and depression were significantly higher
among those with severe gambling problems. Sagoe et al. (2017) in their study, have
highlighted the existence of a higher level of symptoms of anxiety and depression
among adolescents with severe problem gambling symptoms.
Thompson and Schwer (2005) estimated the volume of money losses, debts and sources
of fund among 99 Gambler Anonymous members in Southern Nevada. They found that
gambling losses among the respondents averaged about $112400, which is a very
significant amount. In the same study, it was found that 45.4% of the respondents had
to apply for bankruptcy and had an average debt of $121,646.
Relationship between the use of drugs and alcohol and gambling demonstrate a
significant association between substance use and abuse and problem gambling severity
63
(Smith & Wynne, 2002). Substance use and abuse are likely to be higher among those
with an increased level of severity of gambling problems (Smith & Wynne, 2002).
Consumption of alcohol and drugs affects the health of gamblers, but at the same time,
it also affects their gambling behaviour making them more involved in gambling and
increase their betting limits (Bussu & Detotto, 2015).
The professional work-life of problem gamblers are also significantly affected by their
gambling behaviour (Downs & Woolrych, 2010). Problem gamblers are often
distracted from their workplace and remain absent for a prolonged period, which often
results in problem gamblers losing their jobs (Downs & Woolrych, 2010). Thompson
and Schwer (2005) have reported the incidents of quitting up of a job by a gambler
because of their gambling behaviour. Gambling severity also results in problem
gamblers distancing themselves from family lives with mostly being preoccupied with
their gambling activities (Downs & Woolrych, 2010). Such preoccupation with
gambling has affected the personal lives of problem gamblers, often resulting in
separation and divorce.
2.1.1.3 Impact of Problem Gambling on Family Members
Gambling behaviour of a problem gambler not only affects his/her health and wellbeing
but their behaviour also significantly affects the life of the people living around him.
Gambling behaviour of an individual can be problematic for their family members and
can impose immense challenges in their lives as well (Kalischuk et al., 2006). Gambling
behaviour of the problem gambler primarily affects the lives of those family members
who live in closer proximity and are dependent upon them, both financially and
emotionally (Goodwin et al., 2017). Goodwin et al. (2017) have identified that a
problem gambler can typically affect 4 to 6 persons. The negative impact of problem
gambling behaviour of an individual often results in family members experiencing a
64
wide range of impact, such as financial impact (Banks et al., 2018; Dickson-Swift et
al., 2005; Holdsworth et al., 2013; McComb et al., 2009); emotional well-being (Banks
et al., 2018; Dickson-Swift et al., 2005; Holdsworth et al., 2013; McComb et al., 2009) ;
mental and physical health (Banks et al., 2018; Dickson-Swift et al., 2005; Holdsworth
et al., 2013; McComb et al., 2009); impact in a relationship (Banks et al., 2018;
Dickson-Swift et al., 2005; Downs & Woolrych, 2010; Holdsworth et al., 2013;
McComb et al., 2009); family violence (Banks et al., 2018; Palmer du Preez et al., 2018;
Roberts et al., 2016); feeling of shame, and engaging in petty theft and dishonesty
(Banks et al., 2018).
Family members are more likely to encounter the issues related to financial distress
caused by the gambling behaviour of a gambler. A problem gambler can cause a
substantial financial impact within minutes, which can be a life-altering experience for
the members of a family (McComb et al., 2009). A substance abuser can take several
weeks or even years to create the same level of financial impact, which a problem
gambler can cause within minutes (McComb et al., 2009). Problem gamblers often
spend their savings and pensions in gambling activities requiring the assistance of the
family members in paying off their gambling debts and bail them out of their financial
problems (Anderson et al., 2018). The financial instability caused by the gambling
behaviour of a problem gambler resulted in an increased pressure among the partners
of a problem gambler to provide financial support in terms of paying off debts and
incurring household expenses (Holdsworth et al., 2013). The financial burden created
by a problem gambler often results in spouses looking for employment and working
extra hours and shifts to meet the financial needs of their family (Holdsworth et al.,
2013; Mathews & Volberg, 2013). The financial impact caused by a problem gambler
results in family members having to deal with paying off the gambling debts using their
65
savings, selling properties and houses to generate money for either paying off gambling
debts or raising cash to meet their daily ends, working extra shifts, borrowing from their
friends and families, and altering their lifestyle (Holdsworth et al., 2013; Mathews &
Volberg, 2013). Members of a family of a problem gambler experience financial
distress caused by the problem gambler for many years or even for a lifetime,
highlighting the negative consequences of problem gambling (McComb et al., 2009).
Banks et al. (2018) conducted a study to investigate the adverse consequence of
problem gambling among the family members. The study found out that members of a
family living with a problem gambler are significantly affected by their gambling
behaviours. Some of the significant findings from the study in terms of the negative
consequence of problem gambling on the family members are highlighted as follows:
1. Problem gambling behaviour of a family member had a significant impact on
financial security, with almost 64% of the respondents highlighting the
influence to be a significant one. The effect of financial security resulted in
members of the family, losing their assets such as cars, house, and business.
12% of the respondents even highlighted being bankrupt because of the
gambling behaviour of their family members.
2. The work-life of the family members were also significantly affected by
problem gambling, with 37% of the respondents stating the effect to be
significant.
3. 83% of the respondents reported having a significant emotional and
psychological impact with most of them experiencing distress, anger, shame,
hopelessness, and insecurity.
4. Relationship between problem gambler and their family members were also
majorly affected, with 67% of the respondents highlighting the impact to be
66
significant. Problem gambling resulted in 33% of the respondents being
separated and ending the relationship with the problem gambler.
5. 21% of the respondents also highlighted the incidence of violence because of
problem gambling.
In several studies conducted to identify the negative impact of problem gambling,
partners are found to be most affected and vulnerable to problem gambling (Holdsworth
et al., 2013). Partners of a problem gambler are most likely to experience financial loss,
emotional anguish, mental and physical impact, and impact on their relationship
(Holdsworth et al., 2013; McComb et al., 2009).
The significant negative impact of problem gambling on partners is the financial impact
caused by the gambling of a problem gambler (Dickson-Swift et al., 2005; Holdsworth
et al., 2013; McComb et al., 2009). Partners often get entangled in the financial distress
caused by the problem gambling behaviour of their significant others and have to bear
the burden of providing financial support to problem gamblers and their family
(Holdsworth et al., 2013). Such a scenario often results in partners taking up extra shifts
or looking for new jobs to find out solutions for the financial distress caused by a
problem gambler (Holdsworth et al., 2013; Mathews & Volberg, 2013). Problem
gambling also generates increased pressure among partners to meet the daily expenses
and purchase food for themselves, resulting from the gambling losses (Dickson-Swift
et al., 2005).
Partners of problem gamblers also experience a wide range of mental and physical
health problem as a direct result of their partner's problem gambling behaviour. Few
studies have found out that partners of problem gamblers generate a wide range of
mental and emotional stress after the discovery of their partner's problem gambling
67
behaviour (Holdsworth et al., 2013). Stress resulting from the partner's problem
gambling behaviour have caused partners suffering a wide range of physical health
issues such as insomnia, headaches, and stomach upsets (Dickson-Swift et al., 2005).
In a study conducted by Holdsworth et al. (2013), partners of problem gamblers have
reported encountering a multitude of mental health problems such as stress, anxiety,
and depression, further triggering anger, panic, shock, fear, guilt, and embarrassment
among the partners of a problem gambler (Holdsworth et al., 2013). To cope up with
mental and physical stress partners are likely to indulge themselves in self-harming
activities such as overeating, drinking, and smoking (Dickson-Swift et al., 2005).
Few studies have also taken into consideration the impact of problem gambling on the
relationship among the partners. Problem gamblers often hide their gambling losses and
the extent of their gambling debts with their partners (Downs & Woolrych, 2010). As
a consequence of which partners of a problem gambler feels cheated, and this results in
a loss of trust among the partners of a problem gambler (Dickson-Swift et al., 2005;
Downs & Woolrych, 2010). Problem gamblers are often preoccupied with their
gambling activity resulting in lesser communication and intimacy with their partners
(Downs & Woolrych, 2010). All these factors often result in breaking up a relationship
between the partners either through separation or divorce (Dickson-Swift et al., 2005;
Downs & Woolrych, 2010; Holdsworth et al., 2013). Holdsworth et al. (2013) in their
study, have found that partners continue to suffer from mental and physical health
problems even after separation with their problem gambler partners.
Children of problem gamblers are also equally likely to suffer from the gambling
behaviour of their parents. A positive attitude of parents towards gambling can play a
significant role in the acquisition and maintenance of gambling behaviour among
children (Gupta & Derevensky, 1997; Kalischuk et al., 2006). Research has shown that
68
individuals whose parents have a history with gambling tends to be associated more
with problem gambling than those with non-gambling parents (Cavalera et al., 2018).
Adolescents having family members gambling tend to develop favourable attitudes
towards gambling (Hanss et al., 2014). Children of problem gamblers often learn about
gambling from their parents are four times more likely to gamble themselves
(Kalischuk et al., 2006). Besides engaging in gambling at a very young age, children of
problem gambler also feel abandoned, neglected, anxious, and deprived, resulting in
poor coping skills, illness, and deteriorating academic performance (Kalischuk et al.,
2006).
Violence among family members is another significant negative impact of problem
gambling (Banks et al., 2018; Griffiths, 2004; Palmer du Preez et al., 2018; Roberts et
al., 2016). The occurrence of family violence resulting from a high level of conflict
between gamblers and their family members is a very familiar sight in the lives of a
problem gambler (Palmer du Preez et al., 2018). Problem gamblers are likely to commit
crimes such as domestic violence and child abuse as a direct result of their gambling
behaviour (Griffiths, 2004). However, it is essential to discuss that a gambler can be
both; a perpetrator and a victim, and perpetrating violence is prevalent among both the
gambler and affected others. In a study conducted by Palmer du Preez et al. (2018)
41.2% of the gamblers and 57.1% of the affected others have reported committing
violence in the past 12 months, while 46.8% of the gamblers and 65.5% of affected
others have reported being a victim of violence (Palmer du Preez et al., 2018). Roberts
et al. (2016) have reported 6.3% of the problem gamblers hitting a child while 4.1% of
problem gamblers committing Intimate Partner Violence (IPV). In a study conducted
by Korman et al. (2008) among problem gamblers, 62.9% of the respondents reported
being either perpetrator or a victim of IPV during the past year. Some of the common
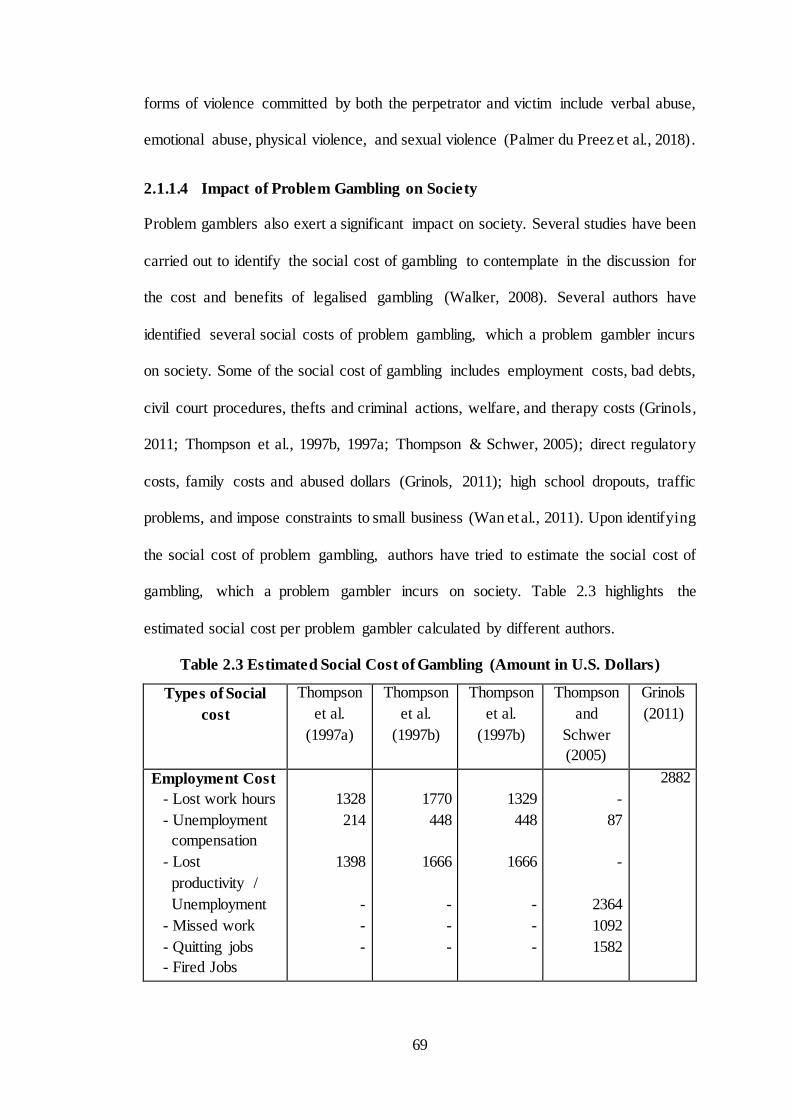
69
forms of violence committed by both the perpetrator and victim include verbal abuse,
emotional abuse, physical violence, and sexual violence (Palmer du Preez et al., 2018).
2.1.1.4 Impact of Problem Gambling on Society
Problem gamblers also exert a significant impact on society. Several studies have been
carried out to identify the social cost of gambling to contemplate in the discussion for
the cost and benefits of legalised gambling (Walker, 2008). Several authors have
identified several social costs of problem gambling, which a problem gambler incurs
on society. Some of the social cost of gambling includes employment costs, bad debts,
civil court procedures, thefts and criminal actions, welfare, and therapy costs (Grinols,
2011; Thompson et al., 1997b, 1997a; Thompson & Schwer, 2005); direct regulatory
costs, family costs and abused dollars (Grinols, 2011); high school dropouts, traffic
problems, and impose constraints to small business (Wan et al., 2011). Upon identifying
the social cost of problem gambling, authors have tried to estimate the social cost of
gambling, which a problem gambler incurs on society. Table 2.3 highlights the
estimated social cost per problem gambler calculated by different authors.
Table 2.3 Estimated Social Cost of Gambling (Amount in U.S. Dollars)
Types of Social
cost
Thompson
et al.
(1997a)
Thompson
et al.
(1997b)
Thompson
et al.
(1997b)
Thompson
and
Schwer
(2005)
Grinols
(2011)
Employment Cost
- Lost work hours
- Unemployment
compensation
- Lost
productivity /
Unemployment
- Missed work
- Quitting jobs
- Fired Jobs
1328
214
1398
-
-
-
1770
448
1666
-
-
-
1329
448
1666
-
-
-
-
87
-
2364
1092
1582
2882
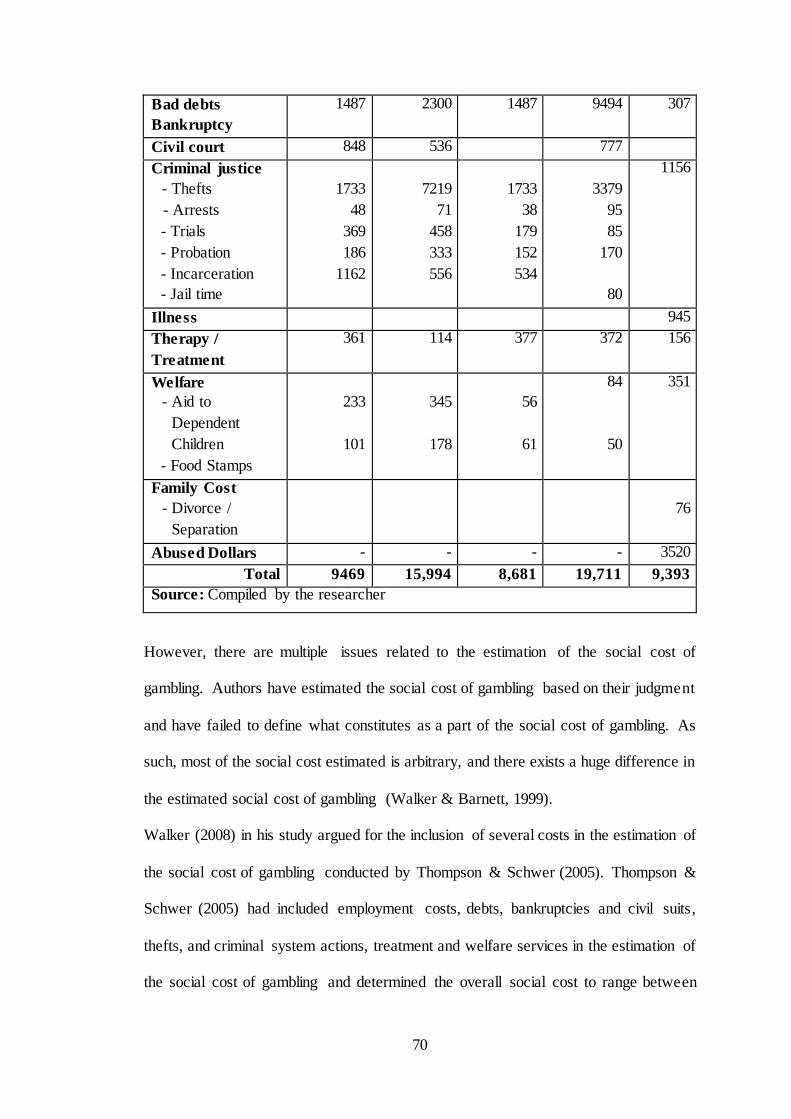
70
Bad debts
Bankruptcy
1487 2300 1487 9494 307
Civil court 848 536 777
Criminal justice
- Thefts
- Arrests
- Trials
- Probation
- Incarceration
- Jail time
1733
48
369
186
1162
7219
71
458
333
556
1733
38
179
152
534
3379
95
85
170
80
1156
Illness 945
Therapy /
Treatment
361 114 377 372 156
Welfare
- Aid to
Dependent
Children
- Food Stamps
233
101
345
178
56
61
84
50
351
Family Cost
- Divorce /
Separation
76
Abused Dollars - - - - 3520
Total 9469 15,994 8,681 19,711 9,393
Source: Compiled by the researcher
However, there are multiple issues related to the estimation of the social cost of
gambling. Authors have estimated the social cost of gambling based on their judgment
and have failed to define what constitutes as a part of the social cost of gambling. As
such, most of the social cost estimated is arbitrary, and there exists a huge difference in
the estimated social cost of gambling (Walker & Barnett, 1999).
Walker (2008) in his study argued for the inclusion of several costs in the estimation of
the social cost of gambling conducted by Thompson & Schwer (2005). Thompson &
Schwer (2005) had included employment costs, debts, bankruptcies and civil suits,
thefts, and criminal system actions, treatment and welfare services in the estimation of
the social cost of gambling and determined the overall social cost to range between
71
$314 to $545 million per year. However, Walker (2008) raised questions over the
inclusion of employment cost, debts, bankruptcies and civil suits, thefts and criminal
system in the estimation of the social cost of gambling. He argued that these costs
should not be included in the estimation of the social cost of gambling as these costs
were private or merely represented a transfer of ownership (Walker, 2008).
Studies related to the estimation of the social cost of gambling is subject to issues such
as failure to define the social cost of gambling (Walker & Barnett, 1999), and the
inclusion of some forms of cost in the social cost estimate (Walker, 2008). However,
problem gamblers do incur a cost on society. A problem gambler can incur a cost on
the society ranging from $9,393 (Grinols, 2011) to $19,711 (Thompson & Schwer,
2005).
2.3 Gambling Behaviour
Throughout the literature on gambling, very little focus has been diverted towards
understanding the behavioural pattern of the gamblers and identify the behavioural
factors that help promote and sustain gambling among the gamblers. Gamblers exhibit
different customs and behavioural patterns while gambling. The gambling behaviour is
largely influenced by the presence and absence of gambling peers, gambling
motivation, and also the types of gambling. Gamblers with a high motivation to win
take higher risks while gambling, and place excessive bets usually higher than the
minimum bet table and seek excitement from such gambling behaviour (Lam, 2007a).
Lam (2007b), found out that Chinese baccarat players had certain rituals such as
shouting and peeling their cards, with the hope of controlling the outcome of the
gambling events. Casino gamblers normally have weaker control on their gambling
behaviour and have a heavier gambling involvement.
72
The behaviour of the gamblers is significantly affected by the presence and absence of
peers while gambling. When gambling alone, gamblers are more likely to place their
bets faster than those gamblers who gamble in an unfamiliar (gamblers participating in
gambling with other unfamiliar gamblers) or familiar (gamblers participating with other
familiar gamblers) condition. Khazaal et al. (2017) conducted a study to find out the
patterns of gambling behaviour among internet gamblers. Based on latent class analysis
gamblers were divided into three groups, lonely indebted, not lonely no indebted, and
not lonely indebted. Among the three groups, gamblers belonging to lonely indebted
and not lonely indebted had a significantly higher score for financial and coping
motives and were more frequently associated with problem gambling.
Tao et al. (2011) analysed the behavioural pattern among the Chinese gamblers
gambling in Hong Kong and identified six key behavioural traits that a gambler exhibits
while gambling. The six behavioural traits identified by Tao et al. (2011) are:
1. Impaired control explained behavioural traits such as loss of control, higher
wagering, increasing debts, and an indication of different problems related to
deteriorating relationships.
2. Gambling involvement described the behavioural traits related to gambling
often and regularly, playing different games and the amount of money spent on
gambling.
3. Arousal reaction explained behavioural traits related to the level of excitement
and frustrations when winning or losing.
4. Superstitious behaviour explained the behavioural traits associated with rituals
and customs followed by gamblers for winning the bets.
73
5. Controlled gambling described the behavioural traits of a gambler that is
associated with the control over their bet size and the amount of time spent on
gambling.
6. Casino exploration described gamblers' behaviours related to taking a break and
wandering around the casinos.
2.4 Research Gap
Gambling in India has been in existence since ancient ages, and the practice of gambling
is profoundly followed in the Indian cultures even today. Gambling has a rich history
in India, and although gambling is frowned upon and is culturally opposed, it still ceases
to exist in Indian society. However, despite such a rich history of gambling in India, the
research on gambling in India remains relatively unexplored.
Much of the studies on gambling in India focus on the illegal gambling market and its
impact. While few studies have also addressed the issue of the existence of the level of
gambling severity, most notably among a sample of adolescent gamblers. Sikkim is one
of the premier gambling destinations in India. However, there has not been any effort
put forward to identify the level of gambling severity among the gamblers in Sikkim.
And also, studies have shown that gambling motivation plays an important role in
explaining the level of gambling severity among gamblers. However, there exists a
major gap in identifying gambling motives among the gamblers in India and its role in
explaining the levels of gambling severity. The research study will also provide an
insight on the gambling behaviour among the gamblers in Sikkim and identify the
factors related to gambling severity among the gamblers.
2.5 Conceptual Model Framework
Peoples may have different motives for gambling. Neighbors et al. (2002) identified 16
different motives for gambling, which are money, enjoyment/fun, excitement, social,
74
occupy time/boredom, winning, competition, conformity, risk, skill, interest, coping,
challenge, drinking, luck, and chasing. The GMQ model evaluated the motives for
gambling into three different factors Enhancement Motive, Social Motive, and Coping
Motive. GMQ model was validated among emerging adulthood (18 – 25 years) in a
study conducted by Lambe et al. (2015).
Lambe et al. (2015), in their work, found out that the Enhancement Motive was a
significant predictor of gambling than social and coping motives. Lambe et al. (2015)
also found that the Enhancement Motive was crucial in predicting problem gambling,
while the Social Motive, and the Coping Motive was a significant measure for time,
and money spent on gambling.
However, the factors motivating gambling are not limited to enhancement motive,
social motive, and coping motive. Financial incentive is also important in predicting
frequent gambling behaviour among the gamblers (Dechant, 2014). In addition to
Financial Motive, McGrath et al. (2010) identified two additional motives for gambling
viz, Charitable, and Recreation Motive. The two new motives for gambling also have
an impact on gambling motivations.
The following research will implement The Five-Factor Gambling Motivation Model
designed by Lee et al. (2007). The five factors that were identified by Lee et al. (2007)
are Socialization, Amusement, Avoidance, Excitement, and Monetary Motives. A
comparison between the “Monetary motive version” and “Parallel version” found out
that the monetary motive was a better model in explaining the influence of gambling
motivations. According to the ‘Monetary Motive Version’, Amusement, Excitement,
and Avoidance motives facilitated by the Financial incentives induces gambling among
the gamblers.
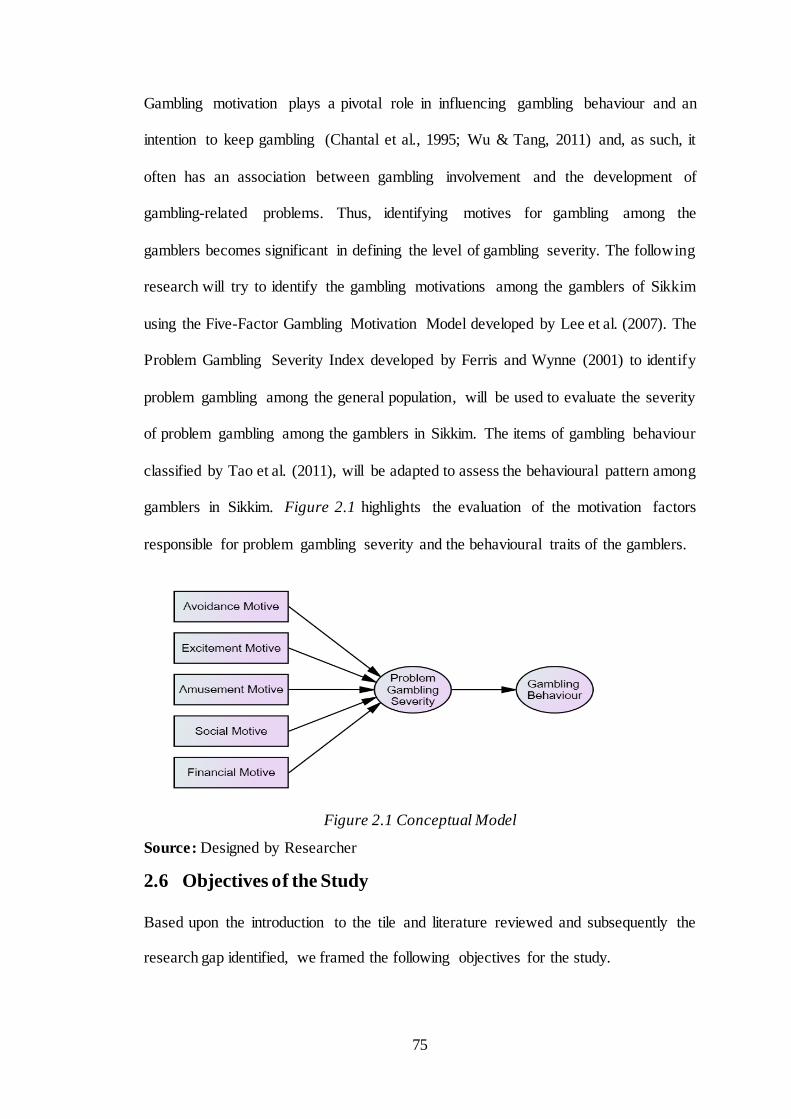
75
Gambling motivation plays a pivotal role in influencing gambling behaviour and an
intention to keep gambling (Chantal et al., 1995; Wu & Tang, 2011) and, as such, it
often has an association between gambling involvement and the development of
gambling-related problems. Thus, identifying motives for gambling among the
gamblers becomes significant in defining the level of gambling severity. The following
research will try to identify the gambling motivations among the gamblers of Sikkim
using the Five-Factor Gambling Motivation Model developed by Lee et al. (2007). The
Problem Gambling Severity Index developed by Ferris and Wynne (2001) to identify
problem gambling among the general population, will be used to evaluate the severity
of problem gambling among the gamblers in Sikkim. The items of gambling behaviour
classified by Tao et al. (2011), will be adapted to assess the behavioural pattern among
gamblers in Sikkim. Figure 2.1 highlights the evaluation of the motivation factors
responsible for problem gambling severity and the behavioural traits of the gamblers.
Figure 2.1 Conceptual Model
Source: Designed by Researcher
2.6 Objectives of the Study
Based upon the introduction to the tile and literature reviewed and subsequently the
research gap identified, we framed the following objectives for the study.
76
1. To explore the factors that motivate the gamblers for engaging in gambling
activities.
2. To portray the levels of problem gambling severity among gamblers.
3. To find out the relationship between gambling motivation and problem
gambling severity.
4. To find out whether financial motives or non-financial motives plays a
significant role in explaining problem gambling severity.
5. To confirm the gambling motives and their relationship with problem gambling
severity and gambling behaviour.
6. To find out the different types of gambling behaviour caused due to problem
gambling severity.
7. To highlight the status of revenue generated from gambling business in the state
of Sikkim.
8. To highlight the social, economic, political and legal issues related to gambling
business in India.
2.7 Hypothesis of the Study
Given the literature reviewed above and streamlined objectives, we hypothesize the
following:
1. H0a: There is no factor defining the gambling motives other than those
mentioned in the conceptual framework.
2. H0b: Gambling motives are independent of the levels of income.
3. H0c: There is no significant association of problem gambling severity with the
demographic variables.
4. H0d: There is no significant relationship of the Non-financial motives and the
Financial motives with the problem gambling severity.
5. H0e: All the identified financial and non-financial gambling motives are not
significant in explaining the problem gambling severity.
6. H0f: There is no significant relationship between problem gambling severity and
gambling behaviour.
77
2.8 Scope of the Study
The scope of the study is to understand the motives for gambling, the level of problem
gambling severity, and the gambling behaviour among the gamblers gambling in legal
gambling games in Sikkim. The study also tries to highlight the revenue generated from
all the legal gambling games operating in Sikkim.
Three different districts, East, West, and South Sikkim, have been covered for the study.
North Sikkim has been excluded from the study due to non-accessibility and also due
to limited gambling venues in the region.
2.9 Significance of the study
Concerning research in the field of gambling in the state of Sikkim, it is the first
empirical study that tries to identify the motives, the prevalence rate of problem
gambling, and the gambling behaviour among the gamblers in Sikkim, along with
highlighting the revenue generated from the legal gambling games. As such, the
findings of the study will be of immense significance in understanding the social issues
and the economic benefits derived from legalised gambling. The results will provide an
update and a timely reminder for all the stakeholders, the policymakers, and the
government to analyse the impact of legalised gambling.
The findings of the research study will also be beneficial to those states in India that are
trying to emulate the legal policies adopted by the government of Sikkim with respect
to gambling. The findings of the study will help the policymakers of the state that wish
to adopt the policies and practices related to gambling similar to Sikkim, and will give
them an idea about the nature of impact of legalised gambling.
78
CHAPTER 3. RESEARCH METHODOLOGY
3.1 Research Design
The research design for the study is exploratory and descriptive. Exploratory research
involves investigating a problem or a phenomenon that is yet to be studied. The
Exploratory research design has been used to identify the factors motivating gamblers
to engage themselves in gambling activities, to find out the level of gambling severity,
and to identify gambling behaviour caused due to gambling severity in the context of
Indian gamblers with special reference to Sikkim. The descriptive research design has
been used to highlight the revenue-generated from the legal gambling business in
Sikkim.
3.1.1 Population of the Study
The universe of the study comprises gamblers gambling in gambling venues, which is
legal under the gambling laws in Sikkim. Gamblers gambling in the fair during the
Hindu festival of Maghe Sankranti has also been included in the universe of the study
because the gambling games conducted during the fair are legal, and licenses are issued
for carrying out different forms of gambling games. No gamblers gambling in games
that are not under the purview of the law have not been included in the study.
3.1.2 Sample Size and Sampling Approach
The sample for the study consisted of gamblers gambling in the three districts of
Sikkim. The three districts chosen for the study are East, West, and South Sikkim. The
universe for the study comprised of all the gamblers gambling in legal gambling venues,
and gamblers gambling at fairs organized during Maghe Sankranti.
The sample size has been calculated at a 95% level of confidence, a confidence interval
of 5% for estimating the population proportion from unknown population of gamblers
79
in Sikkim. The sample has been calculated with help of the following formula
(Zikmund et al., 2016).
𝑛 =𝑍𝑐.𝑙.2 𝑝𝑞
𝐸2
Where n= number of sample items
𝑍𝑐.𝑙.2
= square of the confidence level
𝑝 = estimated proportion of gamblers in Sikkim
𝑞 = estimated proportion of non-gamblers in Sikkim
𝐸2 = confidence interval
The calculation of the sample size for the study is as follows:
𝑛 =𝑍𝑐.𝑙.2 𝑝𝑞
𝐸2
𝑛 =(1.96)2(0.5)(0.5)
(0.05)2
𝑛 =(3.8416)(0.25)
0.0025
𝑛 = 384.16
Based on the result of the calculation of the sample size, 385 samples were collected
for the study. A purposive sampling method has been used to select the sample of the
gamblers from the three districts in Sikkim East, South, and West Sikkim. The
composition of the gamblers collected from the three districts is highlighted in Table
3.1.
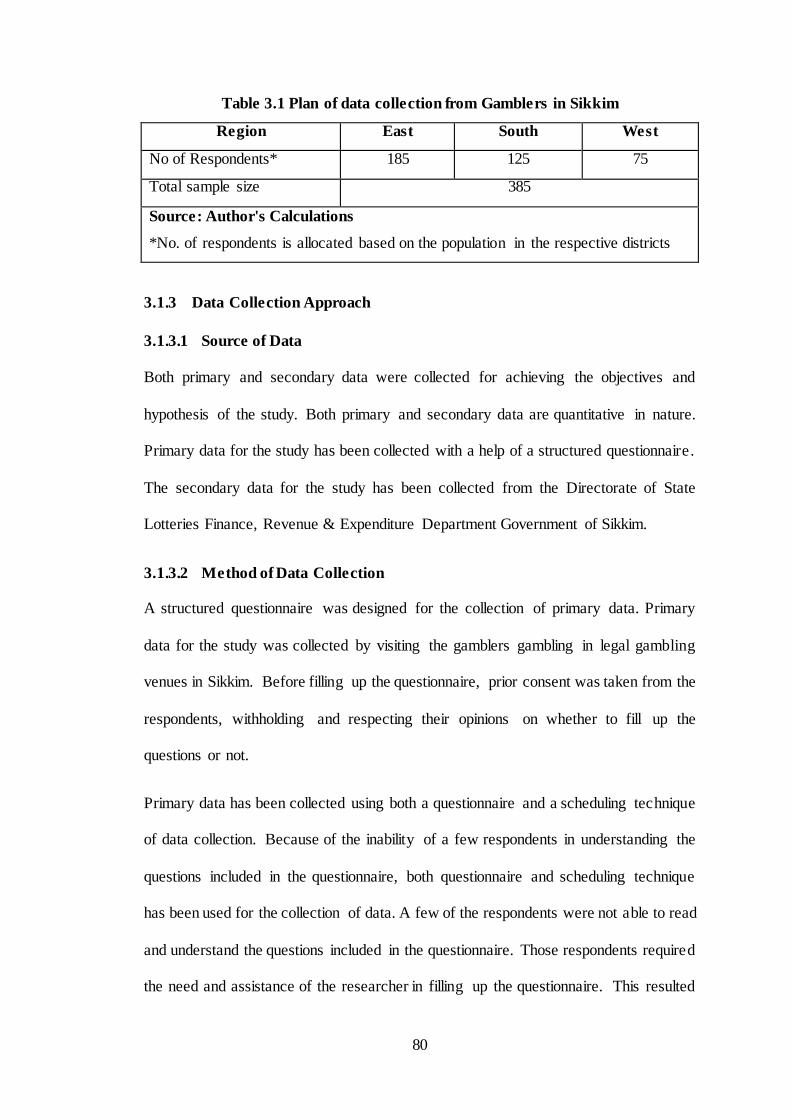
80
Table 3.1 Plan of data collection from Gamblers in Sikkim
Region East South West
No of Respondents* 185 125 75
Total sample size 385
Source: Author's Calculations
*No. of respondents is allocated based on the population in the respective districts
3.1.3 Data Collection Approach
3.1.3.1 Source of Data
Both primary and secondary data were collected for achieving the objectives and
hypothesis of the study. Both primary and secondary data are quantitative in nature.
Primary data for the study has been collected with a help of a structured questionnaire.
The secondary data for the study has been collected from the Directorate of State
Lotteries Finance, Revenue & Expenditure Department Government of Sikkim.
3.1.3.2 Method of Data Collection
A structured questionnaire was designed for the collection of primary data. Primary
data for the study was collected by visiting the gamblers gambling in legal gambling
venues in Sikkim. Before filling up the questionnaire, prior consent was taken from the
respondents, withholding and respecting their opinions on whether to fill up the
questions or not.
Primary data has been collected using both a questionnaire and a scheduling technique
of data collection. Because of the inability of a few respondents in understanding the
questions included in the questionnaire, both questionnaire and scheduling technique
has been used for the collection of data. A few of the respondents were not able to read
and understand the questions included in the questionnaire. Those respondents required
the need and assistance of the researcher in filling up the questionnaire. This resulted
81
in a need to adopt a scheduling technique of data collection to collect data from those
respondents who faced difficulty in understanding and filling up the questionnaire.
The secondary data for the study was collected from the Directorate of State Lotteries
Finance, Revenue & Expenditure Department Government of Sikkim. The Sikkim state
lotteries, casino gaming, and online and sports gaming are all under the administrative
control of the Directorate of State Lotteries Finance, Revenue & Expenditure
Department.
3.1.3.3 Period of Data Collection
Primary data for the study were collected during the period between September 2019
till March 2020.
For collecting the data related to the amount of revenue generated from the legal
gambling games in Sikkim, an approach was made in September 2018 to the Directorate
of State Lotteries Finance, Revenue & Expenditure Department Government of Sikkim.
The concerned department provided all the requested data in a print form to the
researcher in February 2019.
3.1.4 Survey Instrument - Questionnaire
A structured questionnaire was designed and pre-tested by conducting a pilot study.
The survey instrument consists of the following questions:
Section A of the questionnaire consisted of questions concerning the demographic
variables of the respondents. The demographic variables considered for the study
included age, hometown, gender, marital status, educational qualification, employment
status, source of gambling money, and monthly income.
82
Section B consisted of questions related to the frequency of visitation and gambling
plays, participation in different types of gambling, reasons behind gambling, and how
often they win while gambling.
Section C consisted of questions related to the Five-Factor Gambling Motivation
Model. All the 35 items of the Five-Factor Gambling Motivation Model has been
adopted, and the same five-point Likert scale (Strongly disagree=1, Disagree=2,
Neutral= 3, Agree=4, and Strongly agree=5), as in the instrument designed by Lee et
al. (2007) has been used.
One of the glaring issues in The Five-Factor Gambling Motivation Model is that Lee et
al. (2007) have wrongly defined the Social motives and the Financial motives. Factor 2
of The Five-Factor Gambling Motivation Model contains items such as, win big money
with small money, make money easily, win big money immediately, need big money,
heard that they won the jackpot, have a financial difficulty and no money, can't change
my life without gambling, and may win big money. However, Lee et al. (2007) defined
these items as Social motives. Similarly, Factor 4 contains items such as socialize with
others, make the atmosphere comfortable for meeting people, makes it easy to meet new
people, join with gathering in spite of no intention of gambling, friends insisted
gambling and get along with others favourably. However, Lee et al. (2007) defined
these items as Financial motives. Looking at the loadings of the items in Factor 2 and
Factor 4, it is apparent that Factor 2 consists of variables related to Financial motive,
and Factor 4 consists of variables associated with Social motive.
Section D consists of questions related to the Problem Gambling Severity Index. For
the assessment of the problem gambling severity among the gamblers in Sikkim, the
Problem Gambling Severity Index designed by Ferris and Wynne (2001) has been
83
adopted for this study. The PGSI measure is a 9-item scale used for assessing the level
of gambling severity. The Problem Gambling Severity Index identifies four different
categories of gamblers viz., non-problem gambler, low-risk gambler, moderate-risk
gambler, and problem gamblers. The items in the PGSI measure are measured on a
four-point Likert scale ranging from never (0) to almost always (3). The categorization
of the gamblers based on the score that they score are as follows:
1. A Gambler scoring 0 - Non-problem gamblers.
2. A Gambler scoring between 1 and 2 - Low-risk gamblers.
3. A Gambler scoring between 3 and 7 - Moderate-risk gamblers.
4. A Gambler scoring eight or more - Problem gamblers.
Section E consisted of questions related to gambling behaviour with all the 20 items of
the gambling behaviour identified by Tao et al. (2011) adopted for the study. All the 20
items are measured on a four-point Likert scale (Never=1, Rarely=2, Often=3, and
Always=4).
3.1.5 Statistical Tools Used for Analysis
The various statistical tools used for the purpose of the study includes Descriptive
statistics (frequency, mean, standard deviation), Chi-Square analysis, Correlation,
Factor analysis, and Confirmatory Factor Analysis.
3.1.6 Construct Reliability
A pilot study was conducted to evaluate the reliability of the constructs. The pilot study
was conducted by collecting responses from 80 respondents. Table 3.2 highlights the
Cronbach’s alpha value of the constructs Gambling Motivation, Problem Gambling
Severity Index and Gambling Behaviour. The results of the pilot study highlighted a
good measure of internal consistency (α>0.70) for all the constructs under study.
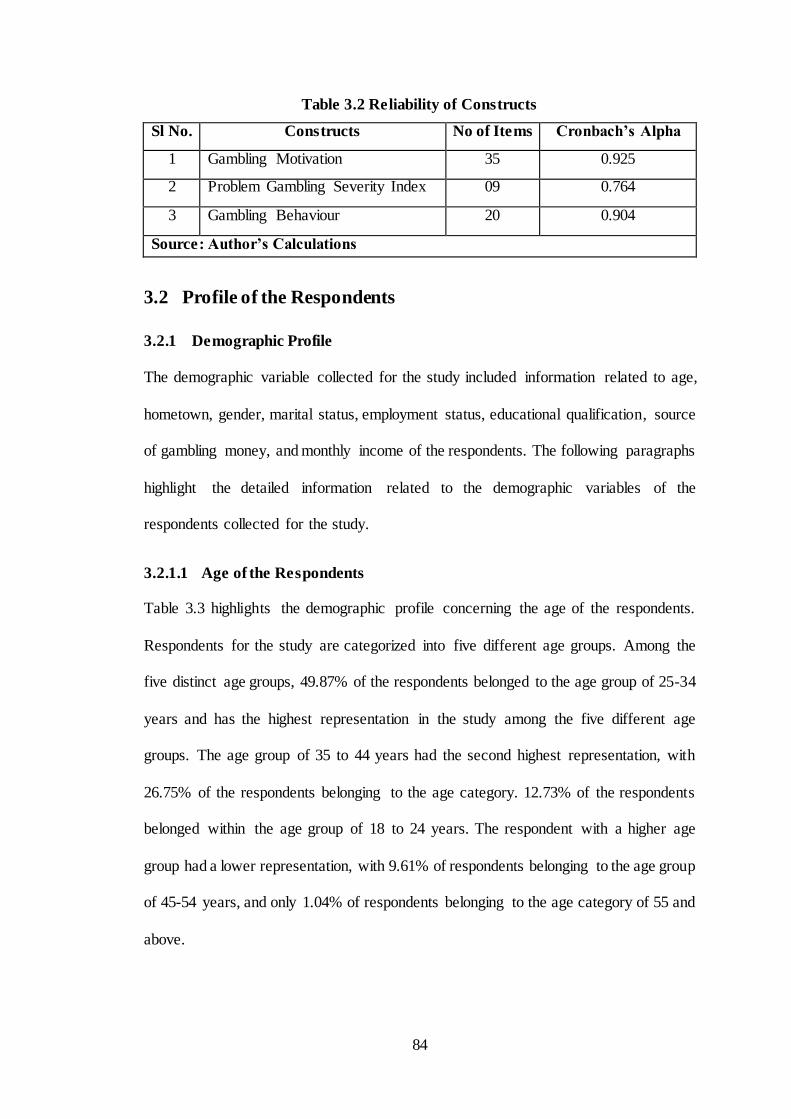
84
Table 3.2 Reliability of Constructs
Sl No. Constructs No of Items Cronbach’s Alpha
1 Gambling Motivation 35 0.925
2 Problem Gambling Severity Index 09 0.764
3 Gambling Behaviour 20 0.904
Source: Author’s Calculations
3.2 Profile of the Respondents
3.2.1 Demographic Profile
The demographic variable collected for the study included information related to age,
hometown, gender, marital status, employment status, educational qualification, source
of gambling money, and monthly income of the respondents. The following paragraphs
highlight the detailed information related to the demographic variables of the
respondents collected for the study.
3.2.1.1 Age of the Respondents
Table 3.3 highlights the demographic profile concerning the age of the respondents.
Respondents for the study are categorized into five different age groups. Among the
five distinct age groups, 49.87% of the respondents belonged to the age group of 25-34
years and has the highest representation in the study among the five different age
groups. The age group of 35 to 44 years had the second highest representation, with
26.75% of the respondents belonging to the age category. 12.73% of the respondents
belonged within the age group of 18 to 24 years. The respondent with a higher age
group had a lower representation, with 9.61% of respondents belonging to the age group
of 45-54 years, and only 1.04% of respondents belonging to the age category of 55 and
above.
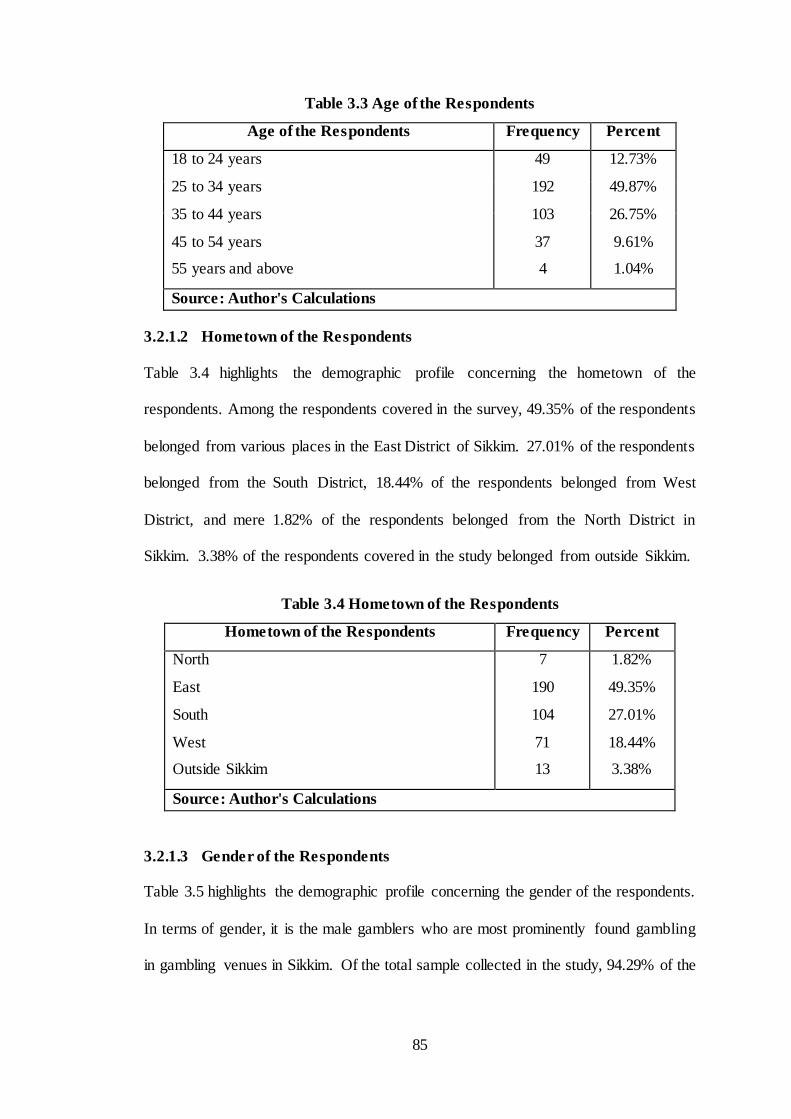
85
Table 3.3 Age of the Respondents
Age of the Respondents Frequency Percent
18 to 24 years
25 to 34 years
35 to 44 years
45 to 54 years
55 years and above
49
192
103
37
4
12.73%
49.87%
26.75%
9.61%
1.04%
Source: Author's Calculations
3.2.1.2 Hometown of the Respondents
Table 3.4 highlights the demographic profile concerning the hometown of the
respondents. Among the respondents covered in the survey, 49.35% of the respondents
belonged from various places in the East District of Sikkim. 27.01% of the respondents
belonged from the South District, 18.44% of the respondents belonged from West
District, and mere 1.82% of the respondents belonged from the North District in
Sikkim. 3.38% of the respondents covered in the study belonged from outside Sikkim.
Table 3.4 Hometown of the Respondents
Hometown of the Respondents Frequency Percent
North
East
South
West
Outside Sikkim
7
190
104
71
13
1.82%
49.35%
27.01%
18.44%
3.38%
Source: Author's Calculations
3.2.1.3 Gender of the Respondents
Table 3.5 highlights the demographic profile concerning the gender of the respondents.
In terms of gender, it is the male gamblers who are most prominently found gambling
in gambling venues in Sikkim. Of the total sample collected in the study, 94.29% of the
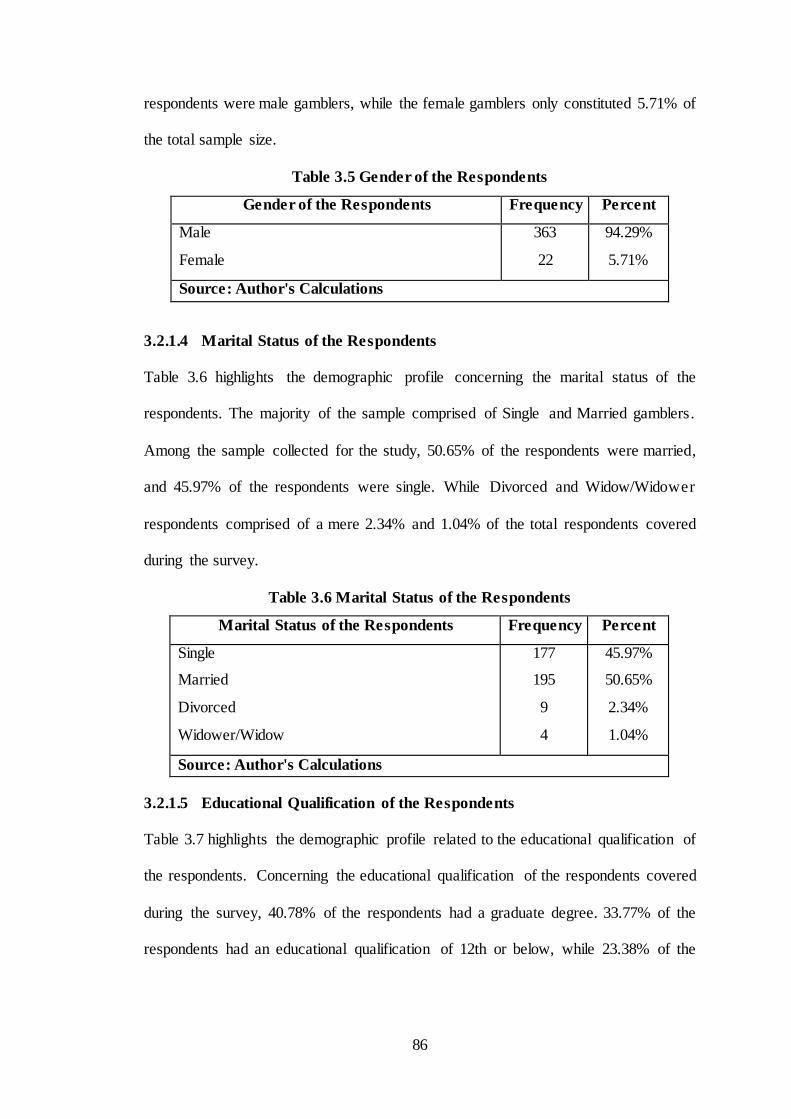
86
respondents were male gamblers, while the female gamblers only constituted 5.71% of
the total sample size.
Table 3.5 Gender of the Respondents
Gender of the Respondents Frequency Percent
Male
Female
363
22
94.29%
5.71%
Source: Author's Calculations
3.2.1.4 Marital Status of the Respondents
Table 3.6 highlights the demographic profile concerning the marital status of the
respondents. The majority of the sample comprised of Single and Married gamblers.
Among the sample collected for the study, 50.65% of the respondents were married,
and 45.97% of the respondents were single. While Divorced and Widow/Widower
respondents comprised of a mere 2.34% and 1.04% of the total respondents covered
during the survey.
Table 3.6 Marital Status of the Respondents
Marital Status of the Respondents Frequency Percent
Single
Married
Divorced
Widower/Widow
177
195
9
4
45.97%
50.65%
2.34%
1.04%
Source: Author's Calculations
3.2.1.5 Educational Qualification of the Respondents
Table 3.7 highlights the demographic profile related to the educational qualification of
the respondents. Concerning the educational qualification of the respondents covered
during the survey, 40.78% of the respondents had a graduate degree. 33.77% of the
respondents had an educational qualification of 12th or below, while 23.38% of the
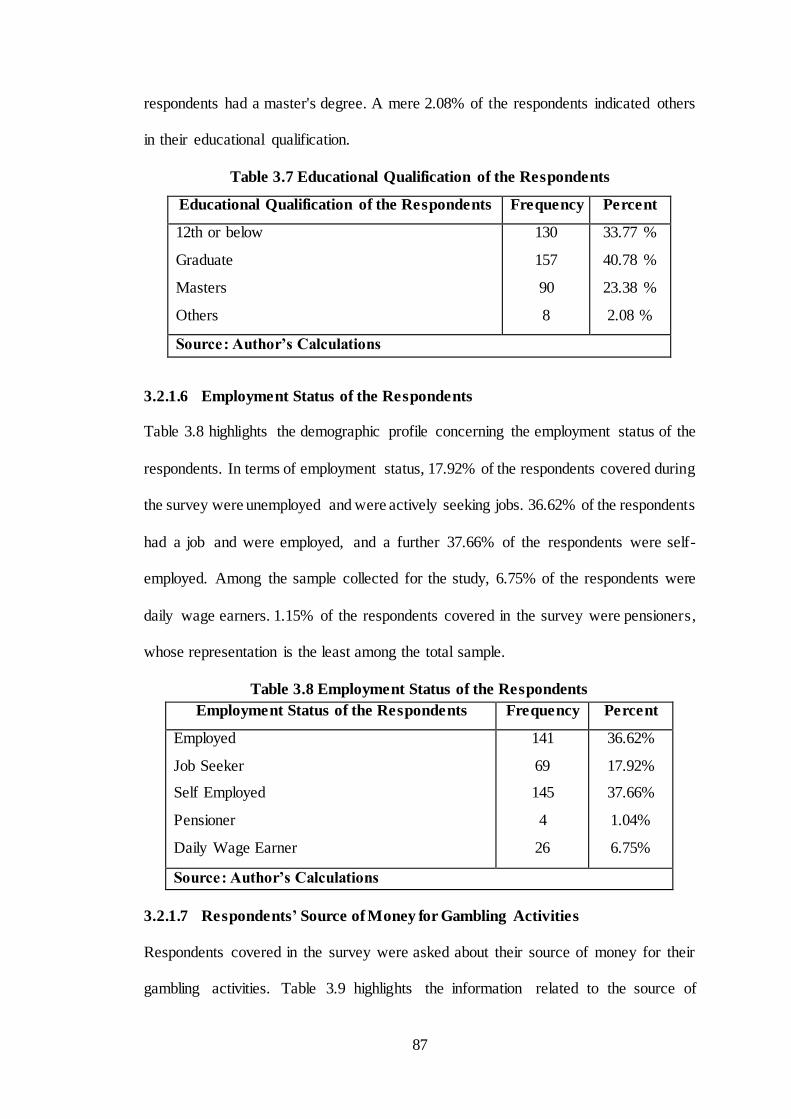
87
respondents had a master's degree. A mere 2.08% of the respondents indicated others
in their educational qualification.
Table 3.7 Educational Qualification of the Respondents
Educational Qualification of the Respondents Frequency Percent
12th or below
Graduate
Masters
Others
130
157
90
8
33.77 %
40.78 %
23.38 %
2.08 %
Source: Author’s Calculations
3.2.1.6 Employment Status of the Respondents
Table 3.8 highlights the demographic profile concerning the employment status of the
respondents. In terms of employment status, 17.92% of the respondents covered during
the survey were unemployed and were actively seeking jobs. 36.62% of the respondents
had a job and were employed, and a further 37.66% of the respondents were self-
employed. Among the sample collected for the study, 6.75% of the respondents were
daily wage earners. 1.15% of the respondents covered in the survey were pensioners,
whose representation is the least among the total sample.
Table 3.8 Employment Status of the Respondents
Employment Status of the Respondents Frequency Percent
Employed
Job Seeker
Self Employed
Pensioner
Daily Wage Earner
141
69
145
4
26
36.62%
17.92%
37.66%
1.04%
6.75%
Source: Author’s Calculations
3.2.1.7 Respondents’ Source of Money for Gambling Activities
Respondents covered in the survey were asked about their source of money for their
gambling activities. Table 3.9 highlights the information related to the source of
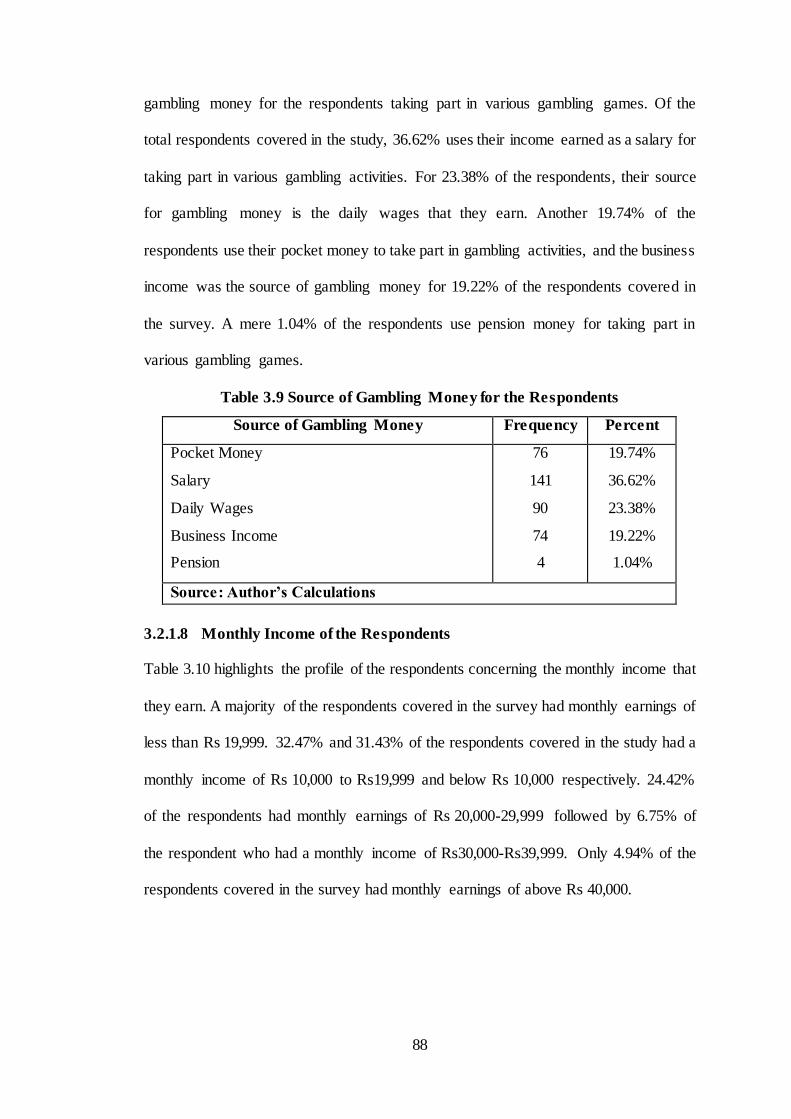
88
gambling money for the respondents taking part in various gambling games. Of the
total respondents covered in the study, 36.62% uses their income earned as a salary for
taking part in various gambling activities. For 23.38% of the respondents, their source
for gambling money is the daily wages that they earn. Another 19.74% of the
respondents use their pocket money to take part in gambling activities, and the business
income was the source of gambling money for 19.22% of the respondents covered in
the survey. A mere 1.04% of the respondents use pension money for taking part in
various gambling games.
Table 3.9 Source of Gambling Money for the Respondents
Source of Gambling Money Frequency Percent
Pocket Money
Salary
Daily Wages
Business Income
Pension
76
141
90
74
4
19.74%
36.62%
23.38%
19.22%
1.04%
Source: Author’s Calculations
3.2.1.8 Monthly Income of the Respondents
Table 3.10 highlights the profile of the respondents concerning the monthly income that
they earn. A majority of the respondents covered in the survey had monthly earnings of
less than Rs 19,999. 32.47% and 31.43% of the respondents covered in the study had a
monthly income of Rs 10,000 to Rs19,999 and below Rs 10,000 respectively. 24.42%
of the respondents had monthly earnings of Rs 20,000-29,999 followed by 6.75% of
the respondent who had a monthly income of Rs30,000-Rs39,999. Only 4.94% of the
respondents covered in the survey had monthly earnings of above Rs 40,000.
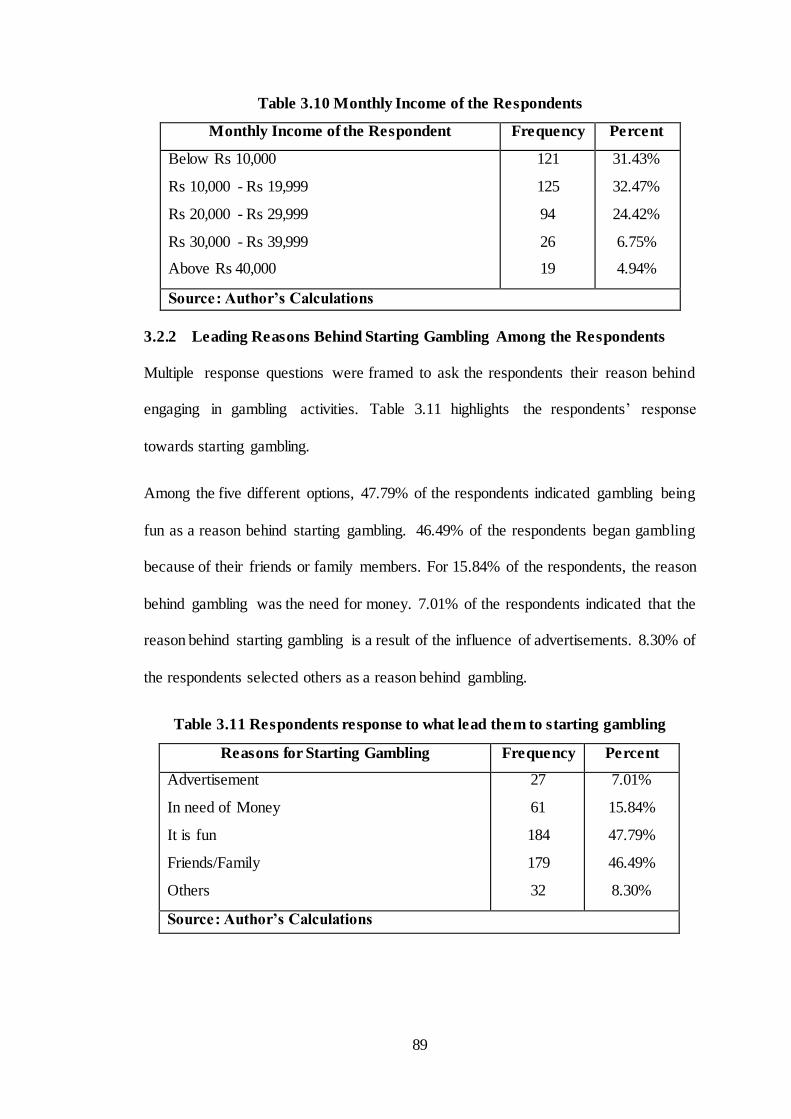
89
Table 3.10 Monthly Income of the Respondents
Monthly Income of the Respondent Frequency Percent
Below Rs 10,000
Rs 10,000 - Rs 19,999
Rs 20,000 - Rs 29,999
Rs 30,000 - Rs 39,999
Above Rs 40,000
121
125
94
26
19
31.43%
32.47%
24.42%
6.75%
4.94%
Source: Author’s Calculations
3.2.2 Leading Reasons Behind Starting Gambling Among the Respondents
Multiple response questions were framed to ask the respondents their reason behind
engaging in gambling activities. Table 3.11 highlights the respondents’ response
towards starting gambling.
Among the five different options, 47.79% of the respondents indicated gambling being
fun as a reason behind starting gambling. 46.49% of the respondents began gambling
because of their friends or family members. For 15.84% of the respondents, the reason
behind gambling was the need for money. 7.01% of the respondents indicated that the
reason behind starting gambling is a result of the influence of advertisements. 8.30% of
the respondents selected others as a reason behind gambling.
Table 3.11 Respondents response to what lead them to starting gambling
Reasons for Starting Gambling Frequency Percent
Advertisement
In need of Money
It is fun
Friends/Family
Others
27
61
184
179
32
7.01%
15.84%
47.79%
46.49%
8.30%
Source: Author’s Calculations
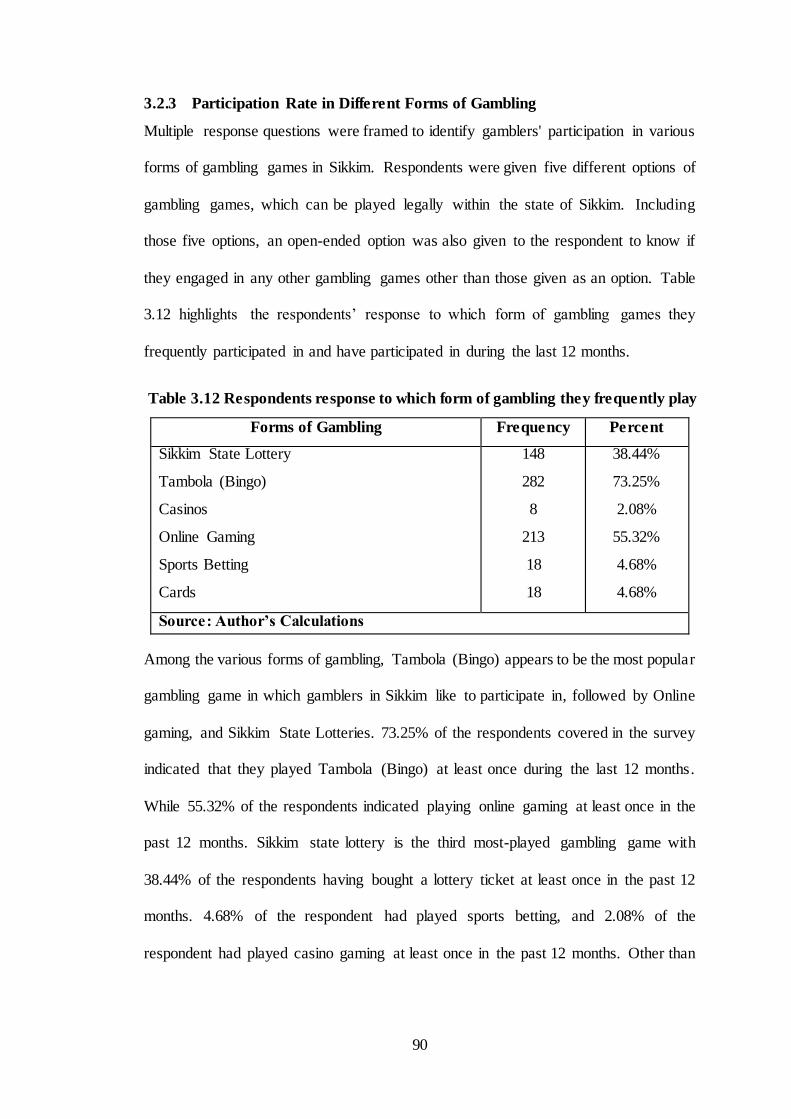
90
3.2.3 Participation Rate in Different Forms of Gambling
Multiple response questions were framed to identify gamblers' participation in various
forms of gambling games in Sikkim. Respondents were given five different options of
gambling games, which can be played legally within the state of Sikkim. Including
those five options, an open-ended option was also given to the respondent to know if
they engaged in any other gambling games other than those given as an option. Table
3.12 highlights the respondents’ response to which form of gambling games they
frequently participated in and have participated in during the last 12 months.
Table 3.12 Respondents response to which form of gambling they frequently play
Forms of Gambling Frequency Percent
Sikkim State Lottery
Tambola (Bingo)
Casinos
Online Gaming
Sports Betting
Cards
148
282
8
213
18
18
38.44%
73.25%
2.08%
55.32%
4.68%
4.68%
Source: Author’s Calculations
Among the various forms of gambling, Tambola (Bingo) appears to be the most popular
gambling game in which gamblers in Sikkim like to participate in, followed by Online
gaming, and Sikkim State Lotteries. 73.25% of the respondents covered in the survey
indicated that they played Tambola (Bingo) at least once during the last 12 months.
While 55.32% of the respondents indicated playing online gaming at least once in the
past 12 months. Sikkim state lottery is the third most-played gambling game with
38.44% of the respondents having bought a lottery ticket at least once in the past 12
months. 4.68% of the respondent had played sports betting, and 2.08% of the
respondent had played casino gaming at least once in the past 12 months. Other than
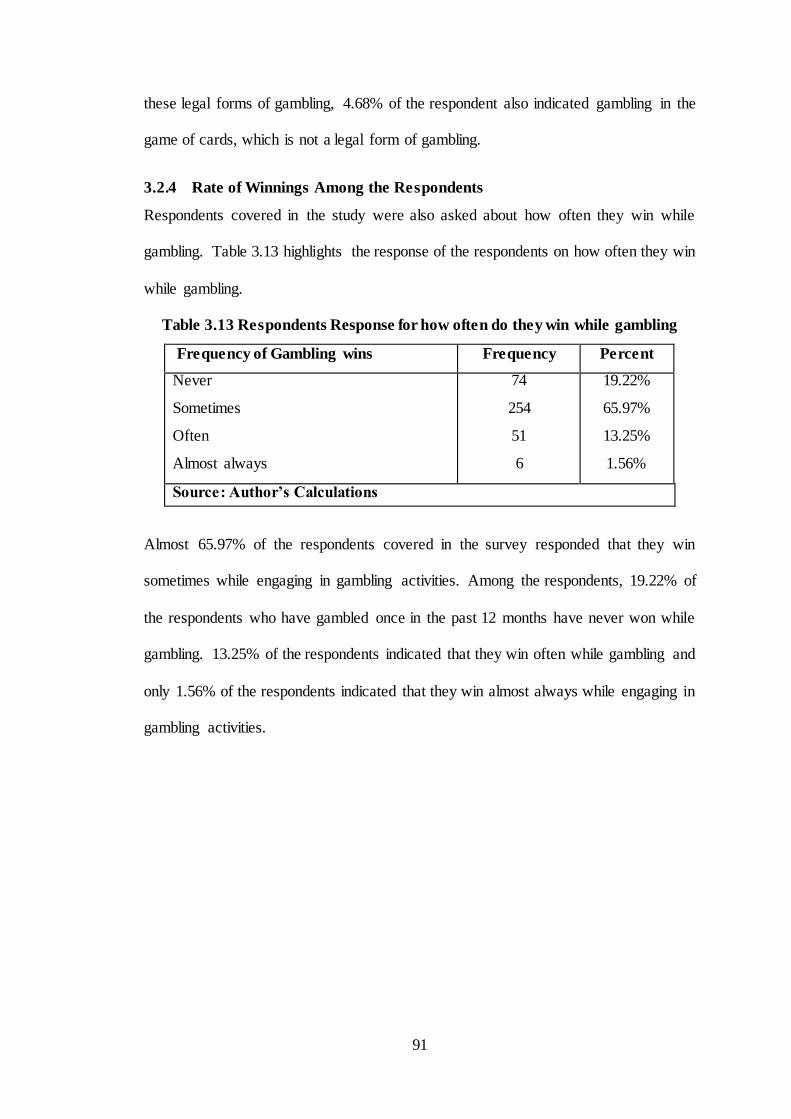
91
these legal forms of gambling, 4.68% of the respondent also indicated gambling in the
game of cards, which is not a legal form of gambling.
3.2.4 Rate of Winnings Among the Respondents
Respondents covered in the study were also asked about how often they win while
gambling. Table 3.13 highlights the response of the respondents on how often they win
while gambling.
Table 3.13 Respondents Response for how often do they win while gambling
Frequency of Gambling wins Frequency Percent
Never
Sometimes
Often
Almost always
74
254
51
6
19.22%
65.97%
13.25%
1.56%
Source: Author’s Calculations
Almost 65.97% of the respondents covered in the survey responded that they win
sometimes while engaging in gambling activities. Among the respondents, 19.22% of
the respondents who have gambled once in the past 12 months have never won while
gambling. 13.25% of the respondents indicated that they win often while gambling and
only 1.56% of the respondents indicated that they win almost always while engaging in
gambling activities.
92
CHAPTER 4. DATA ANALYSIS AND INTERPRETATION
4.1 Exploring the Gambling Motives
Studies have found that gambling motives play a significant role in gambling
involvement and engagement in different gambling activities. According to Lambe et
al. (2015), gambling motive is often associated with gambling involvement and the
development of gambling-related problems among gamblers. Identifying gambling
motives is essential as the motives play a significant role in influencing gamblers to
continue gambling and explains the behaviour and severity of problem gambling
(Chantal et al., 1995; Wu & Tang, 2011).
4.1.1 Confirmatory Factor Analysis of the Five Factor Gambling Motivation
Model
The item scale of the Five-Factor Gambling Motivation Model by Lee et al. (2007) was
adopted to identify the gambling motives among the gamblers in Sikkim. The Five -
Factor Gambling Motivation Model by Lee et al. (2007) identifies five different motives
for gambling. They are Excitement motives, Social motives, Amusement motives,
Avoidance motives, and Financial motives. A Confirmatory Factor Analysis was
performed on all the original 35 items of the Five-Factor Gambling Motivation Model
to test the model fit. Table 4.1 highlights the result of the fit indices for the 35 items
Five-Factor Gambling Motivation Model.
The results derived from the Model Fit Indices for the 35-item Five-Factor Gambling
Motivation Model for the study revealed a poor fit to the data. The CMIN/DF value of
5.56, Comparative Fit Index (CFI) value of 0.74, Goodness of Fit (GFI) value of 0.67,
and Root Mean Square Error of Approximation (RMSEA) value of .11, all represents
a poor fit to the data.
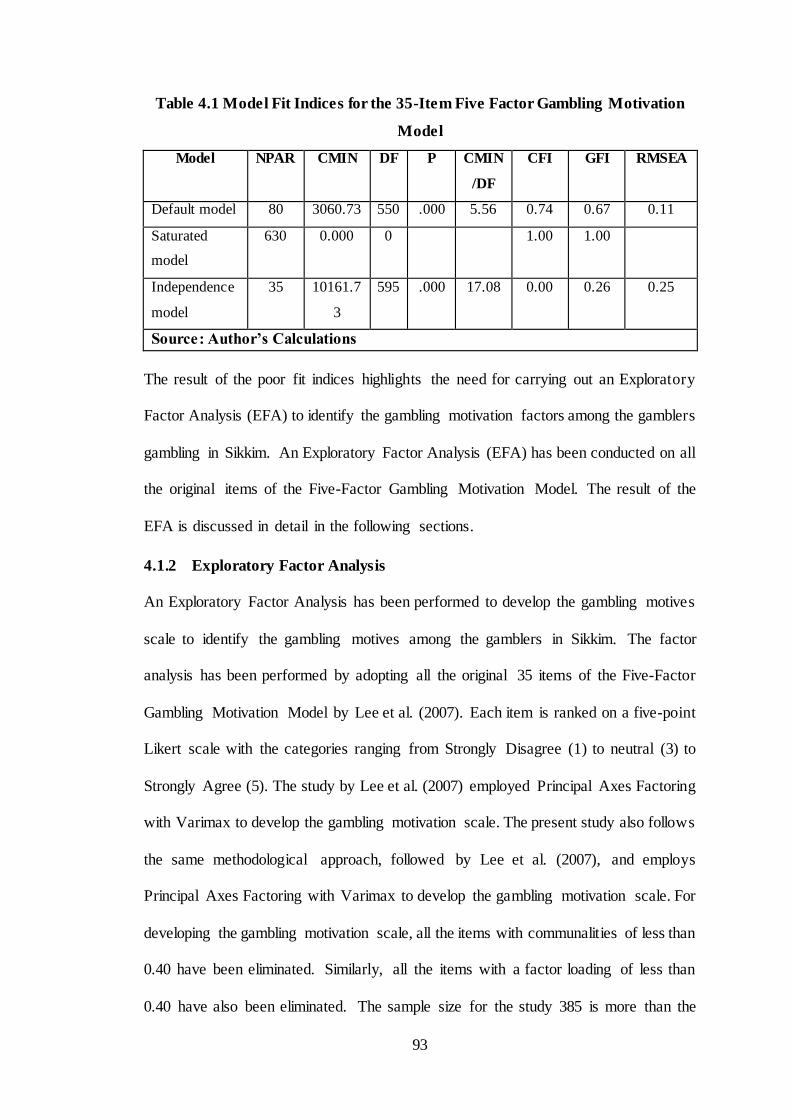
93
Table 4.1 Model Fit Indices for the 35-Item Five Factor Gambling Motivation
Model
Model NPAR CMIN DF P CMIN
/DF
CFI GFI RMSEA
Default model 80 3060.73 550 .000 5.56 0.74 0.67 0.11
Saturated
model
630 0.000 0 1.00 1.00
Independence
model
35 10161.7
3
595 .000 17.08 0.00 0.26 0.25
Source: Author’s Calculations
The result of the poor fit indices highlights the need for carrying out an Exploratory
Factor Analysis (EFA) to identify the gambling motivation factors among the gamblers
gambling in Sikkim. An Exploratory Factor Analysis (EFA) has been conducted on all
the original items of the Five-Factor Gambling Motivation Model. The result of the
EFA is discussed in detail in the following sections.
4.1.2 Exploratory Factor Analysis
An Exploratory Factor Analysis has been performed to develop the gambling motives
scale to identify the gambling motives among the gamblers in Sikkim. The factor
analysis has been performed by adopting all the original 35 items of the Five-Factor
Gambling Motivation Model by Lee et al. (2007). Each item is ranked on a five-point
Likert scale with the categories ranging from Strongly Disagree (1) to neutral (3) to
Strongly Agree (5). The study by Lee et al. (2007) employed Principal Axes Factoring
with Varimax to develop the gambling motivation scale. The present study also follows
the same methodological approach, followed by Lee et al. (2007), and employs
Principal Axes Factoring with Varimax to develop the gambling motivation scale. For
developing the gambling motivation scale, all the items with communalities of less than
0.40 have been eliminated. Similarly, all the items with a factor loading of less than
0.40 have also been eliminated. The sample size for the study 385 is more than the
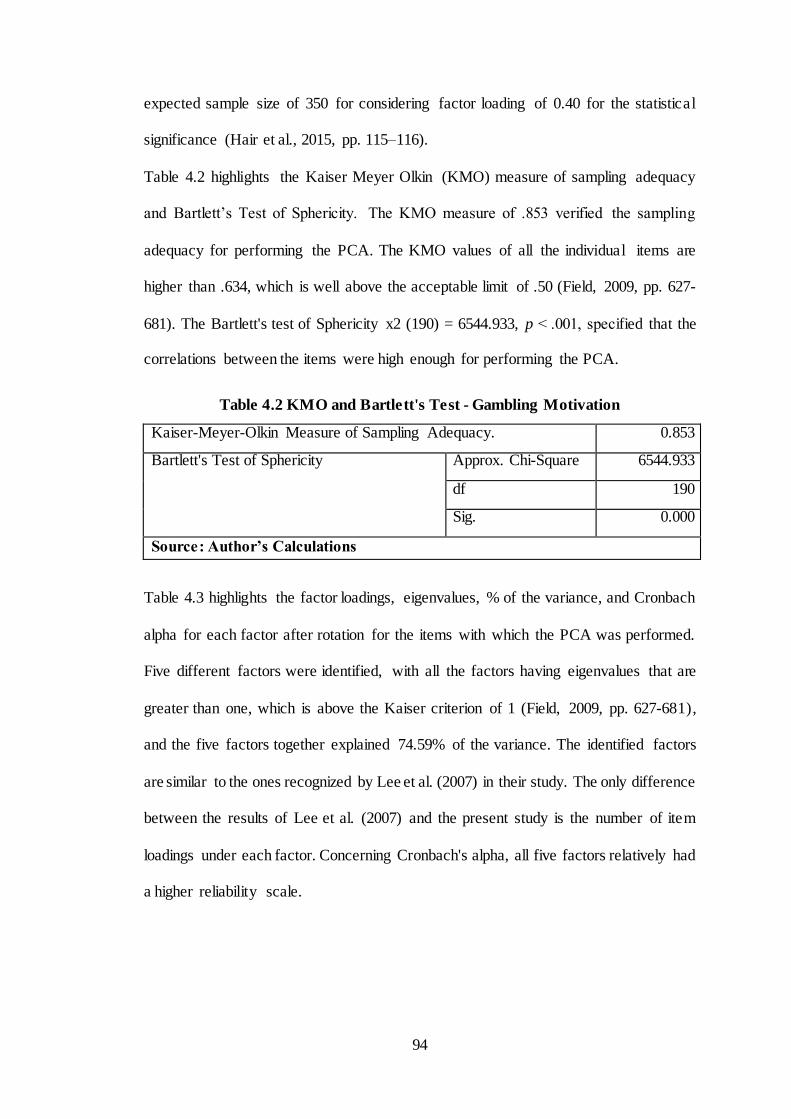
94
expected sample size of 350 for considering factor loading of 0.40 for the statistical
significance (Hair et al., 2015, pp. 115–116).
Table 4.2 highlights the Kaiser Meyer Olkin (KMO) measure of sampling adequacy
and Bartlett’s Test of Sphericity. The KMO measure of .853 verified the sampling
adequacy for performing the PCA. The KMO values of all the individual items are
higher than .634, which is well above the acceptable limit of .50 (Field, 2009, pp. 627-
681). The Bartlett's test of Sphericity x2 (190) = 6544.933, p ˂ .001, specified that the
correlations between the items were high enough for performing the PCA.
Table 4.2 KMO and Bartlett's Test - Gambling Motivation
Kaiser-Meyer-Olkin Measure of Sampling Adequacy. 0.853
Bartlett's Test of Sphericity Approx. Chi-Square 6544.933
df 190
Sig. 0.000
Source: Author’s Calculations
Table 4.3 highlights the factor loadings, eigenvalues, % of the variance, and Cronbach
alpha for each factor after rotation for the items with which the PCA was performed.
Five different factors were identified, with all the factors having eigenvalues that are
greater than one, which is above the Kaiser criterion of 1 (Field, 2009, pp. 627-681),
and the five factors together explained 74.59% of the variance. The identified factors
are similar to the ones recognized by Lee et al. (2007) in their study. The only difference
between the results of Lee et al. (2007) and the present study is the number of item
loadings under each factor. Concerning Cronbach's alpha, all five factors relatively had
a higher reliability scale.
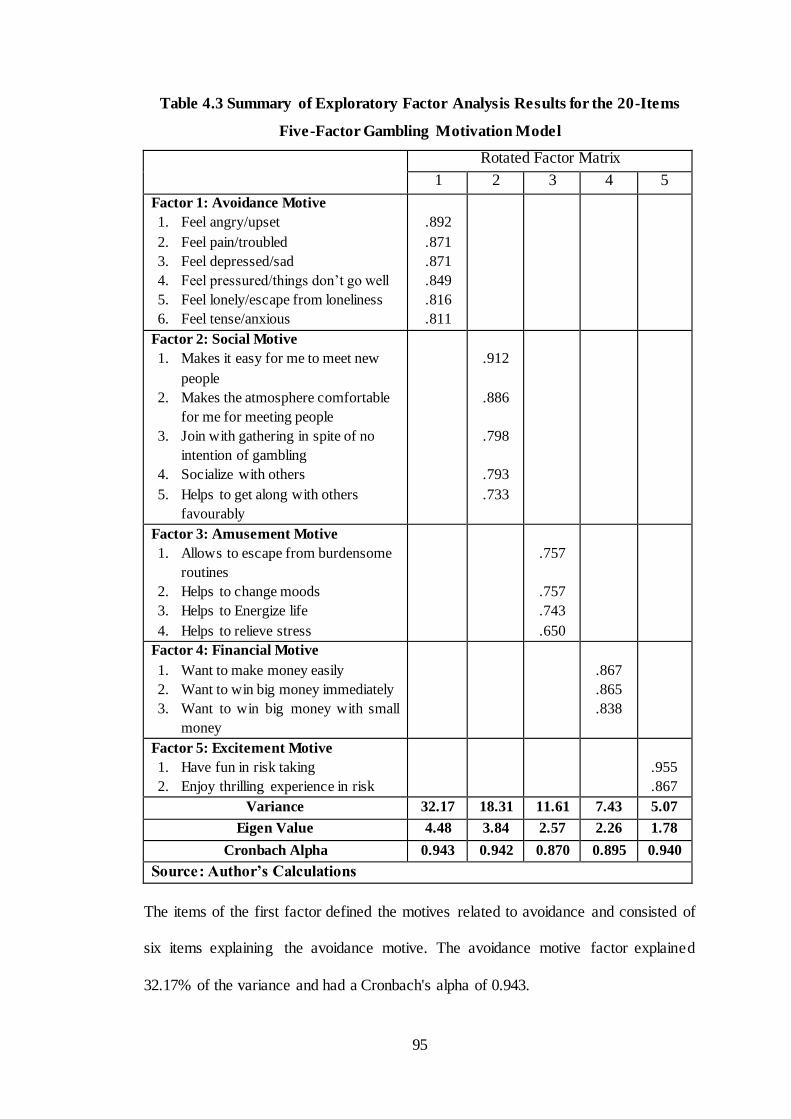
95
Table 4.3 Summary of Exploratory Factor Analysis Results for the 20-Items
Five-Factor Gambling Motivation Model
Rotated Factor Matrix
1 2 3 4 5
Factor 1: Avoidance Motive
1. Feel angry/upset
2. Feel pain/troubled
3. Feel depressed/sad
4. Feel pressured/things don’t go well
5. Feel lonely/escape from loneliness
6. Feel tense/anxious
.892
.871
.871
.849
.816
.811
Factor 2: Social Motive
1. Makes it easy for me to meet new
people
2. Makes the atmosphere comfortable
for me for meeting people
3. Join with gathering in spite of no
intention of gambling
4. Socialize with others
5. Helps to get along with others
favourably
.912
.886
.798
.793
.733
Factor 3: Amusement Motive
1. Allows to escape from burdensome
routines
2. Helps to change moods
3. Helps to Energize life
4. Helps to relieve stress
.757
.757
.743
.650
Factor 4: Financial Motive
1. Want to make money easily
2. Want to win big money immediately
3. Want to win big money with small
money
.867
.865
.838
Factor 5: Excitement Motive
1. Have fun in risk taking
2. Enjoy thrilling experience in risk
.955
.867
Variance 32.17 18.31 11.61 7.43 5.07
Eigen Value 4.48 3.84 2.57 2.26 1.78
Cronbach Alpha 0.943 0.942 0.870 0.895 0.940
Source: Author’s Calculations
The items of the first factor defined the motives related to avoidance and consisted of
six items explaining the avoidance motive. The avoidance motive factor explained
32.17% of the variance and had a Cronbach's alpha of 0.943.
96
The items in the second factor consisted of five variables that defined the properties of
a social motive for gambling. The social motive factor explained 18.31% of the variance
and had a measure of internal consistency of 0.942.
The third factor consisted of four items that defined the motives related to amusement.
The amusement motive factor explained 11.61% of the variance and had a measure of
internal consistency of 0.870.
The fourth factor consisted of three items and explained the financial motives for
gambling. The measure of internal consistency for the financial motive factor was
0.895, and the factor explained 7.43 % of the variance.
The final and the fifth factor consisted of only two items for explaining the gambling
motives and explained 5.07% of the variance and had an internal measure of
consistency of 0.940.
4.1.1.1 Testing of Hypothesis for Factors Defining the Gambling Motives
The following null hypothesis related to the factors defining the gambling motives had
been tested using the Principle Component Analysis (PCA).
H0a: There is no factor defining the gambling motives other than those mentioned in
the conceptual framework.
The result of the PCA highlighted the five factors defining gambling motives among
the gamblers in Sikkim, and it is identical to the factors identified by Lee et al. (2007).
Therefore, based on the results of the PCA, we fail to reject the null hypothesis and
conclude that there are no other factors defining gambling motives among the gamblers
in Sikkim other than those mentioned in the conceptual framework of the study.
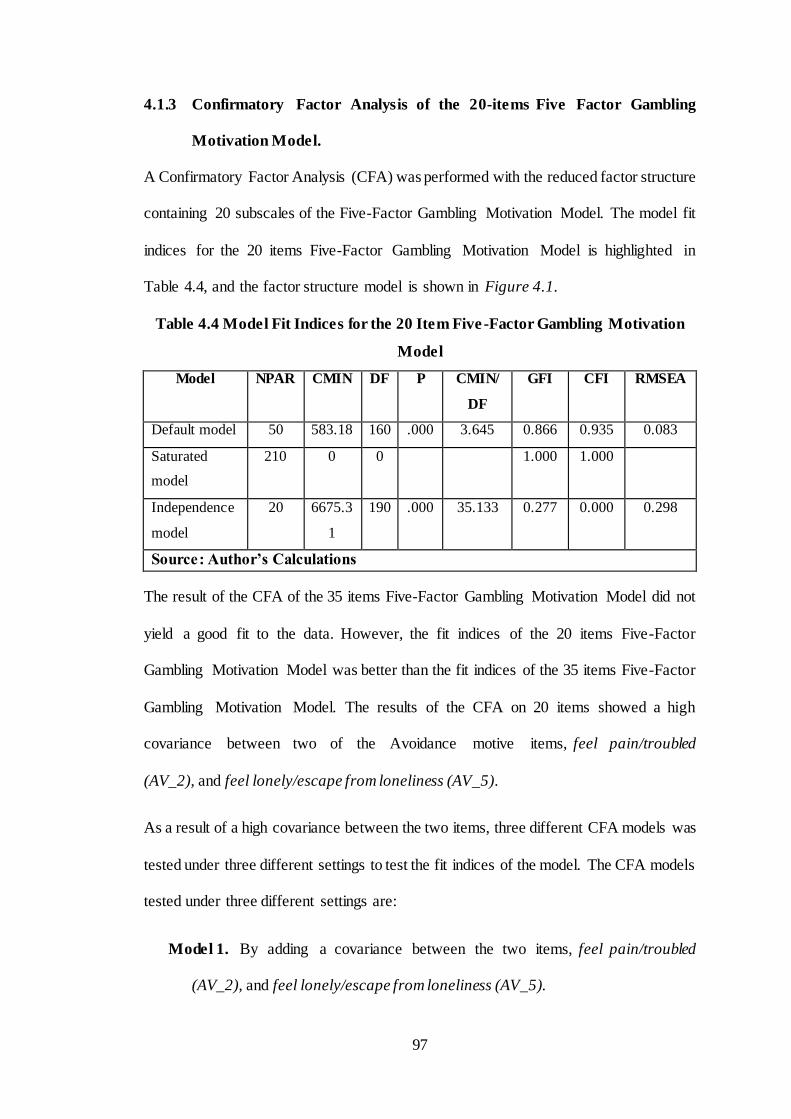
97
4.1.3 Confirmatory Factor Analysis of the 20-items Five Factor Gambling
Motivation Model.
A Confirmatory Factor Analysis (CFA) was performed with the reduced factor structure
containing 20 subscales of the Five-Factor Gambling Motivation Model. The model fit
indices for the 20 items Five-Factor Gambling Motivation Model is highlighted in
Table 4.4, and the factor structure model is shown in Figure 4.1.
Table 4.4 Model Fit Indices for the 20 Item Five -Factor Gambling Motivation
Model
Model NPAR CMIN DF P CMIN/
DF
GFI CFI RMSEA
Default model 50 583.18 160 .000 3.645 0.866 0.935 0.083
Saturated
model
210 0 0 1.000 1.000
Independence
model
20 6675.3
1
190 .000 35.133 0.277 0.000 0.298
Source: Author’s Calculations
The result of the CFA of the 35 items Five-Factor Gambling Motivation Model did not
yield a good fit to the data. However, the fit indices of the 20 items Five-Factor
Gambling Motivation Model was better than the fit indices of the 35 items Five-Factor
Gambling Motivation Model. The results of the CFA on 20 items showed a high
covariance between two of the Avoidance motive items, feel pain/troubled
(AV_2), and feel lonely/escape from loneliness (AV_5).
As a result of a high covariance between the two items, three different CFA models was
tested under three different settings to test the fit indices of the model. The CFA models
tested under three different settings are:
Model 1. By adding a covariance between the two items, feel pain/troubled
(AV_2), and feel lonely/escape from loneliness (AV_5).
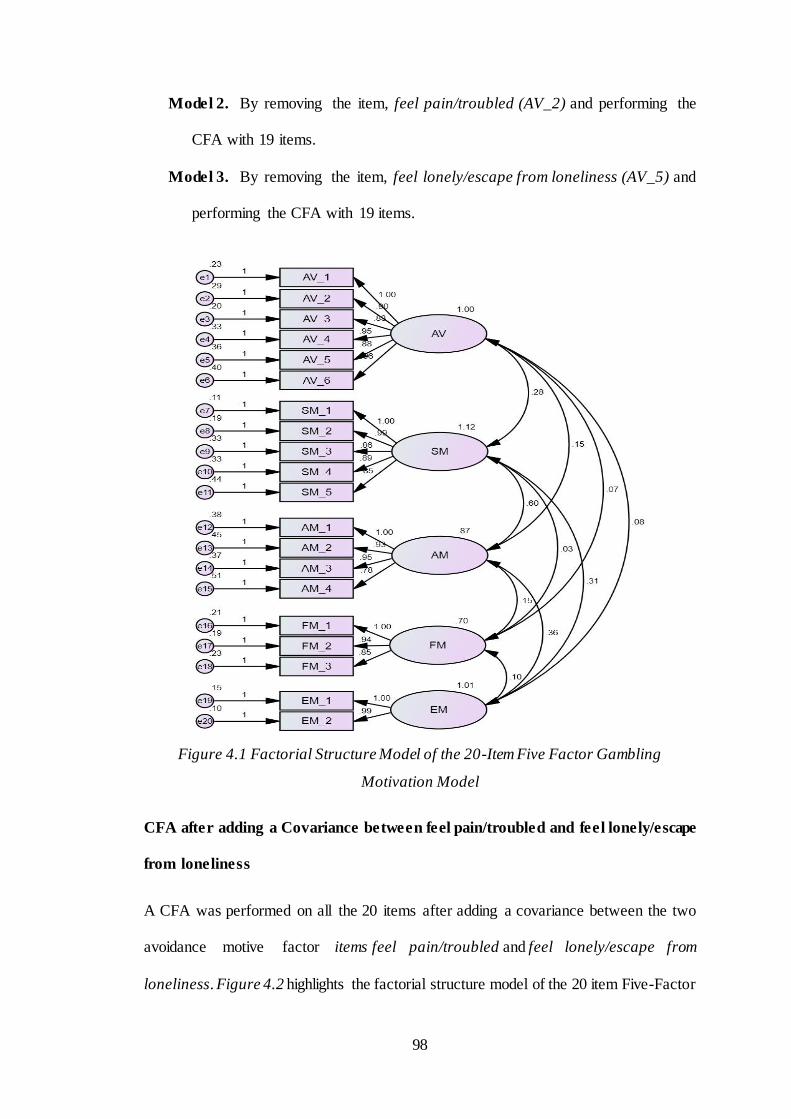
98
Model 2. By removing the item, feel pain/troubled (AV_2) and performing the
CFA with 19 items.
Model 3. By removing the item, feel lonely/escape from loneliness (AV_5) and
performing the CFA with 19 items.
Figure 4.1 Factorial Structure Model of the 20-Item Five Factor Gambling
Motivation Model
CFA after adding a Covariance between feel pain/troubled and feel lonely/escape
from loneliness
A CFA was performed on all the 20 items after adding a covariance between the two
avoidance motive factor items feel pain/troubled and feel lonely/escape from
loneliness. Figure 4.2 highlights the factorial structure model of the 20 item Five-Factor
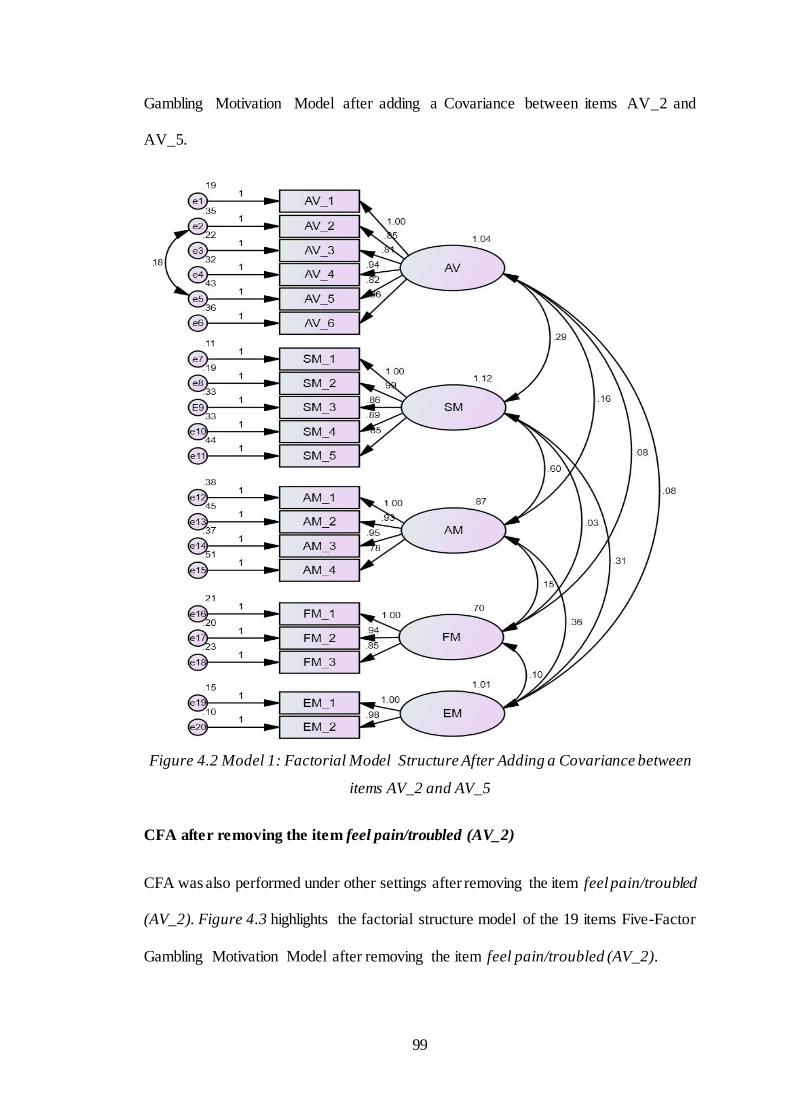
99
Gambling Motivation Model after adding a Covariance between items AV_2 and
AV_5.
Figure 4.2 Model 1: Factorial Model Structure After Adding a Covariance between
items AV_2 and AV_5
CFA after removing the item feel pain/troubled (AV_2)
CFA was also performed under other settings after removing the item feel pain/troubled
(AV_2). Figure 4.3 highlights the factorial structure model of the 19 items Five-Factor
Gambling Motivation Model after removing the item feel pain/troubled (AV_2).
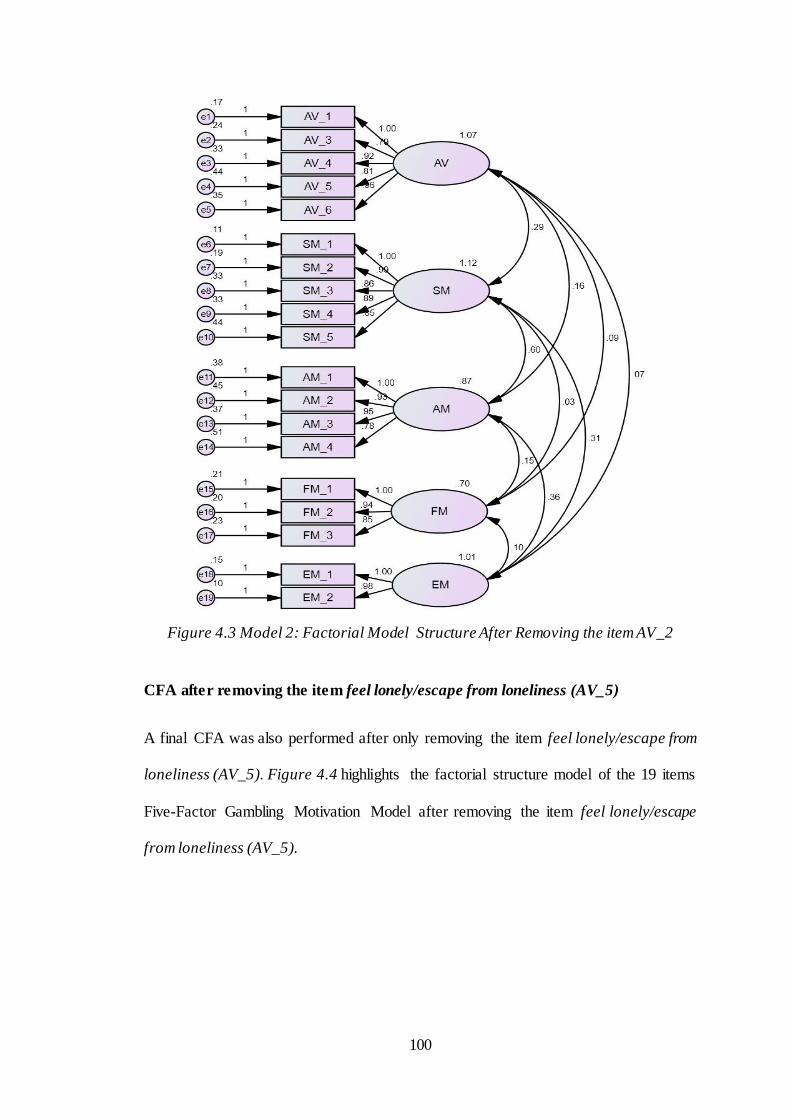
100
Figure 4.3 Model 2: Factorial Model Structure After Removing the item AV_2
CFA after removing the item feel lonely/escape from loneliness (AV_5)
A final CFA was also performed after only removing the item feel lonely/escape from
loneliness (AV_5). Figure 4.4 highlights the factorial structure model of the 19 items
Five-Factor Gambling Motivation Model after removing the item feel lonely/escape
from loneliness (AV_5).
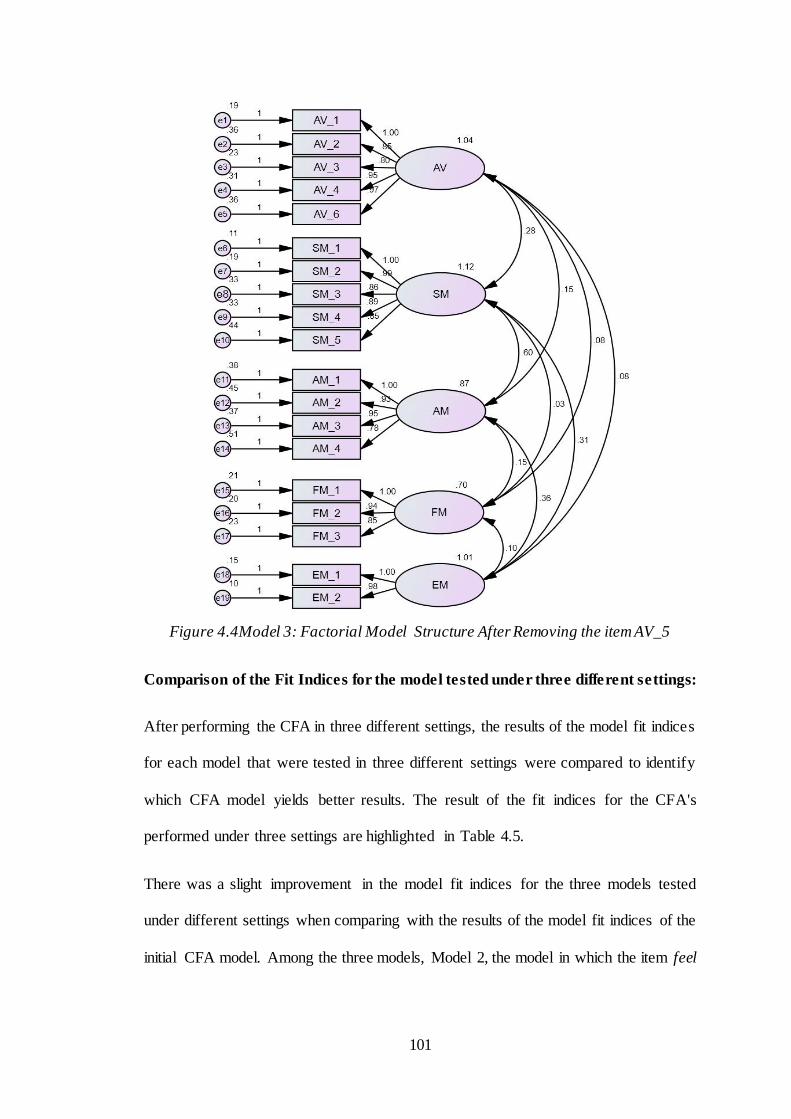
101
Figure 4.4Model 3: Factorial Model Structure After Removing the item AV_5
Comparison of the Fit Indices for the model tested under three different settings:
After performing the CFA in three different settings, the results of the model fit indices
for each model that were tested in three different settings were compared to identify
which CFA model yields better results. The result of the fit indices for the CFA's
performed under three settings are highlighted in Table 4.5.
There was a slight improvement in the model fit indices for the three models tested
under different settings when comparing with the results of the model fit indices of the
initial CFA model. Among the three models, Model 2, the model in which the item feel
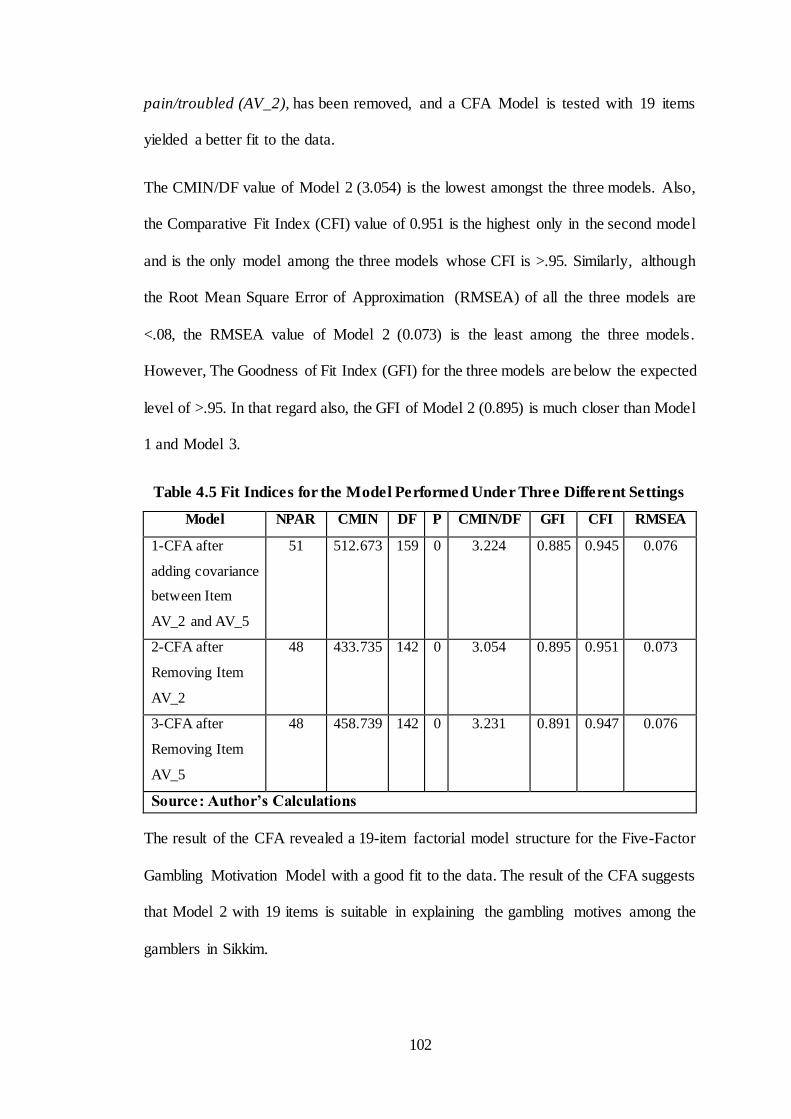
102
pain/troubled (AV_2), has been removed, and a CFA Model is tested with 19 items
yielded a better fit to the data.
The CMIN/DF value of Model 2 (3.054) is the lowest amongst the three models. Also,
the Comparative Fit Index (CFI) value of 0.951 is the highest only in the second model
and is the only model among the three models whose CFI is >.95. Similarly, although
the Root Mean Square Error of Approximation (RMSEA) of all the three models are
<.08, the RMSEA value of Model 2 (0.073) is the least among the three models.
However, The Goodness of Fit Index (GFI) for the three models are below the expected
level of >.95. In that regard also, the GFI of Model 2 (0.895) is much closer than Model
1 and Model 3.
Table 4.5 Fit Indices for the Model Performed Under Three Different Settings
Model NPAR CMIN DF P CMIN/DF GFI CFI RMSEA
1-CFA after
adding covariance
between Item
AV_2 and AV_5
51 512.673 159 0 3.224 0.885 0.945 0.076
2-CFA after
Removing Item
AV_2
48 433.735 142 0 3.054 0.895 0.951 0.073
3-CFA after
Removing Item
AV_5
48 458.739 142 0 3.231 0.891 0.947 0.076
Source: Author’s Calculations
The result of the CFA revealed a 19-item factorial model structure for the Five-Factor
Gambling Motivation Model with a good fit to the data. The result of the CFA suggests
that Model 2 with 19 items is suitable in explaining the gambling motives among the
gamblers in Sikkim.
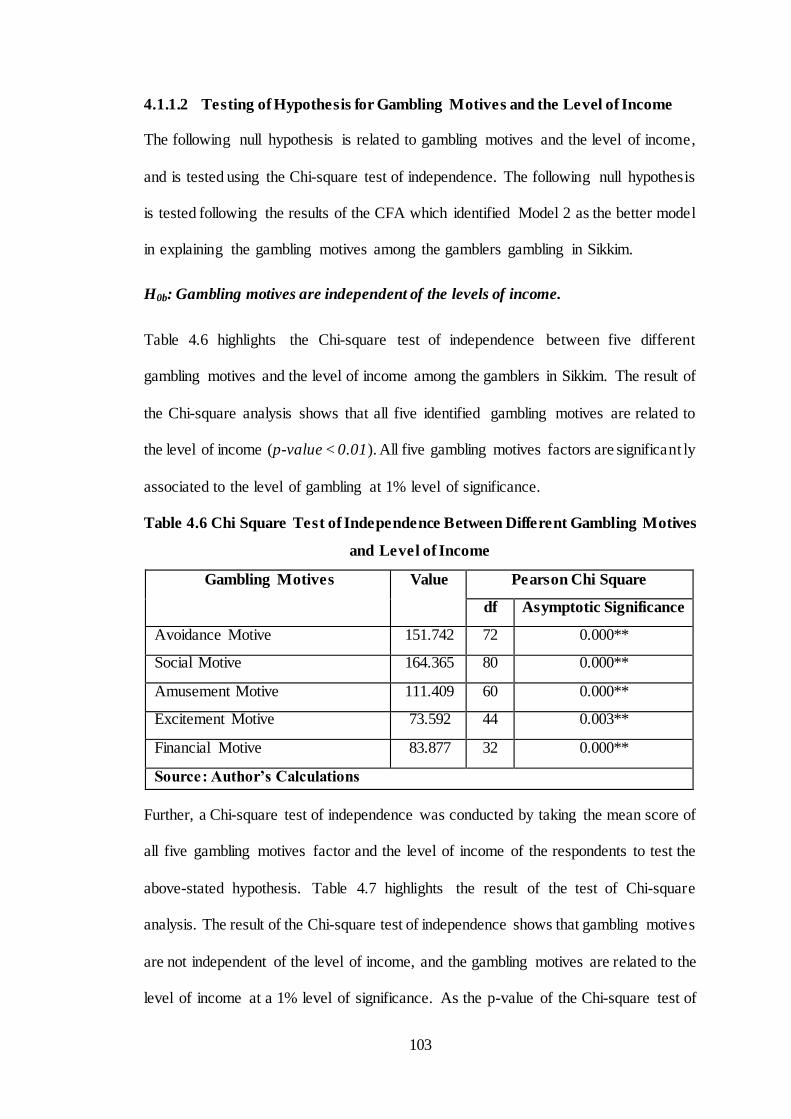
103
4.1.1.2 Testing of Hypothesis for Gambling Motives and the Level of Income
The following null hypothesis is related to gambling motives and the level of income,
and is tested using the Chi-square test of independence. The following null hypothesis
is tested following the results of the CFA which identified Model 2 as the better model
in explaining the gambling motives among the gamblers gambling in Sikkim.
H0b: Gambling motives are independent of the levels of income.
Table 4.6 highlights the Chi-square test of independence between five different
gambling motives and the level of income among the gamblers in Sikkim. The result of
the Chi-square analysis shows that all five identified gambling motives are related to
the level of income (p-value < 0.01). All five gambling motives factors are significant ly
associated to the level of gambling at 1% level of significance.
Table 4.6 Chi Square Test of Independence Between Different Gambling Motives
and Level of Income
Gambling Motives Value Pearson Chi Square
df Asymptotic Significance
Avoidance Motive 151.742 72 0.000**
Social Motive 164.365 80 0.000**
Amusement Motive 111.409 60 0.000**
Excitement Motive 73.592 44 0.003**
Financial Motive 83.877 32 0.000**
Source: Author’s Calculations
Further, a Chi-square test of independence was conducted by taking the mean score of
all five gambling motives factor and the level of income of the respondents to test the
above-stated hypothesis. Table 4.7 highlights the result of the test of Chi-square
analysis. The result of the Chi-square test of independence shows that gambling motives
are not independent of the level of income, and the gambling motives are related to the
level of income at a 1% level of significance. As the p-value of the Chi-square test of
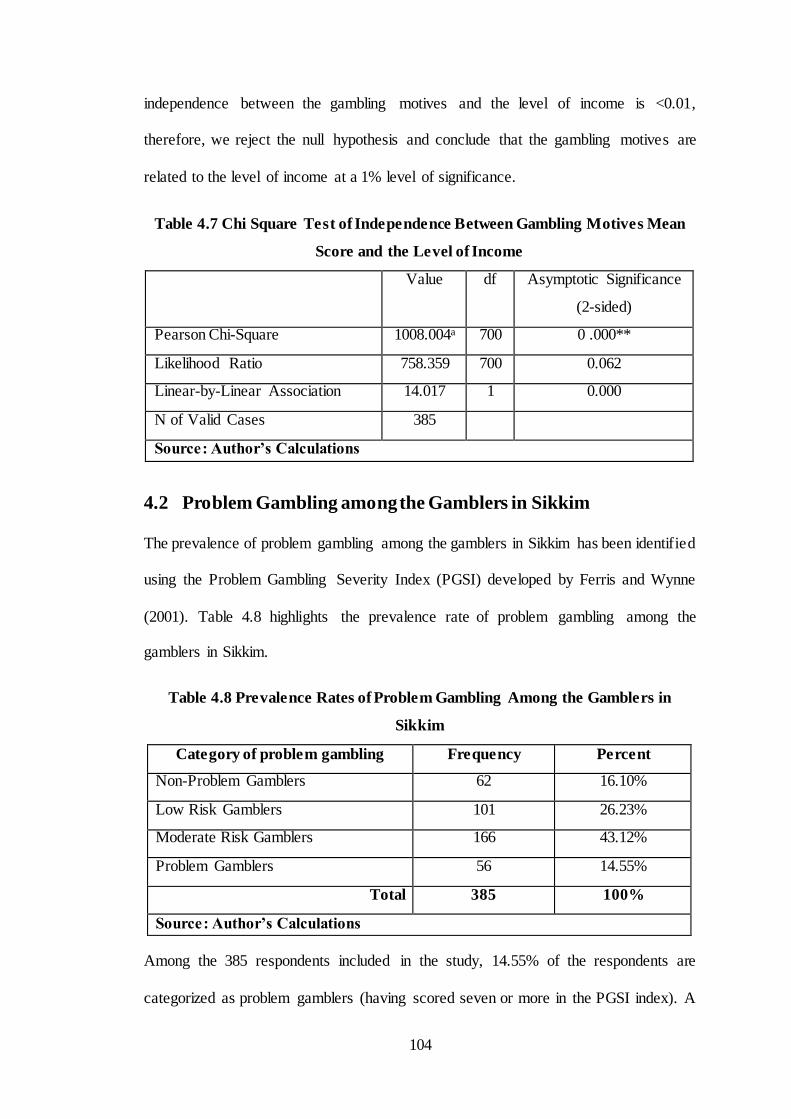
104
independence between the gambling motives and the level of income is <0.01,
therefore, we reject the null hypothesis and conclude that the gambling motives are
related to the level of income at a 1% level of significance.
Table 4.7 Chi Square Test of Independence Between Gambling Motives Mean
Score and the Level of Income
Value df Asymptotic Significance
(2-sided)
Pearson Chi-Square 1008.004a 700 0 .000**
Likelihood Ratio 758.359 700 0.062
Linear-by-Linear Association 14.017 1 0.000
N of Valid Cases 385
Source: Author’s Calculations
4.2 Problem Gambling among the Gamblers in Sikkim
The prevalence of problem gambling among the gamblers in Sikkim has been identified
using the Problem Gambling Severity Index (PGSI) developed by Ferris and Wynne
(2001). Table 4.8 highlights the prevalence rate of problem gambling among the
gamblers in Sikkim.
Table 4.8 Prevalence Rates of Problem Gambling Among the Gamblers in
Sikkim
Category of problem gambling Frequency Percent
Non-Problem Gamblers 62 16.10%
Low Risk Gamblers 101 26.23%
Moderate Risk Gamblers 166 43.12%
Problem Gamblers 56 14.55%
Total 385 100%
Source: Author’s Calculations
Among the 385 respondents included in the study, 14.55% of the respondents are
categorized as problem gamblers (having scored seven or more in the PGSI index). A
105
further 43.12% of the respondents are categorized as moderate-risk gamblers. The
prevalence rate of problem gambling of 14.55% is much higher than the prevalence
rates of 7.4% identified by Benegal (2013) and George et al. (2016), 7.1% identified by
Jaisoorya et al. (2017), and 1.8% identified by Gonmei (2016) in India. However, these
prevalence studies were conducted in the state of Kerala and Manipur, where the lottery
is the only legal form of gambling. As opposed to these two states, gambling avenues
in Sikkim is available in plentiful, and the gamblers have easy access to gambling
venues.
However, a higher prevalence rate of problem gambling is a source of significant
concern for society. Even though Sikkim is reaping in the benefits of legalised gambling
from an economic standpoint, the higher prevalence rate of problem gambling does
raise a serious question related to the societal cost of gambling.
4.3 Problem Gambling Severity across Demographic Variables
The following analysis highlights the prevalence rate of problem gambling across the
demographic variables related to the study. The several demographic variables
associated with the study are age, hometown, gender, marital status, educational
qualification, employment status, and monthly income. The prevalence rate of proble m
gambling is calculated for all the demographic variables. A chi-square statistic is also
calculated to identify the demographic variables that are significantly associated with
the prevalence rate of problem gambling among the gamblers in Sikkim.
4.3.1 Age of the Respondents and PGSI Category
Table 4.9 highlights prevalence rate of problem gambling among the different age
categories of the gamblers in Sikkim. The prevalence rate is the highest among the
gamblers between the age group of 35 and 44 years, with 24.27% of the respondents
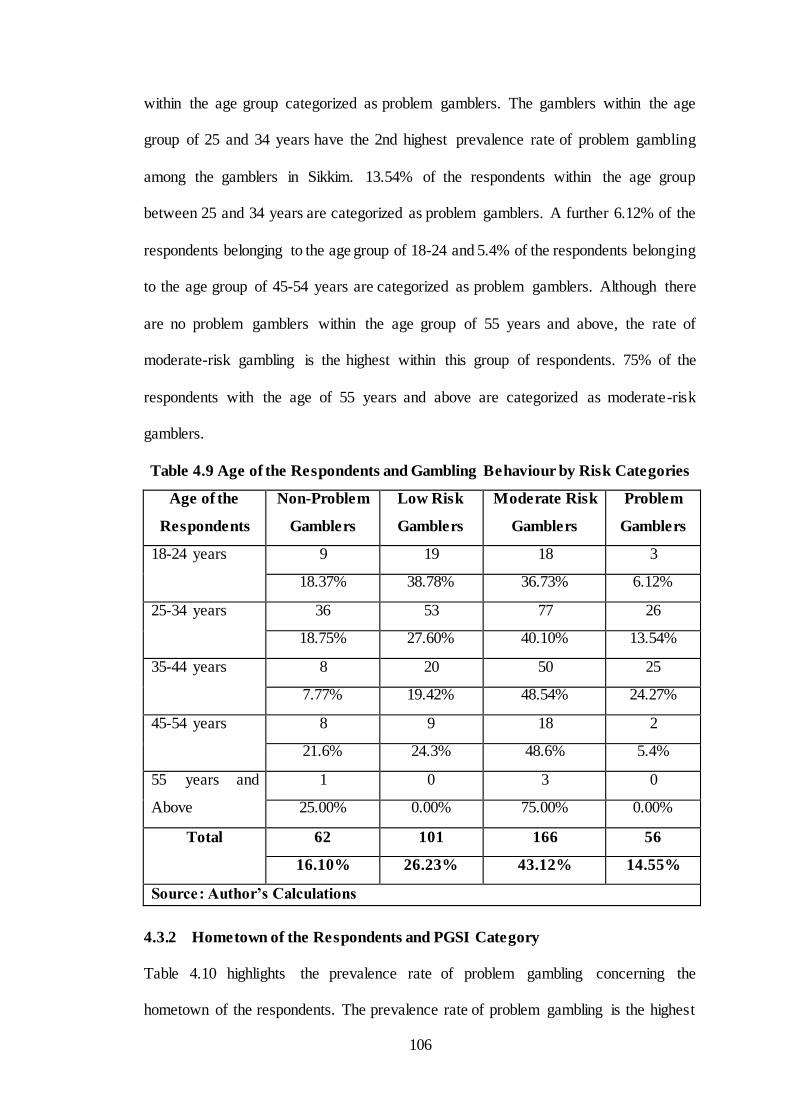
106
within the age group categorized as problem gamblers. The gamblers within the age
group of 25 and 34 years have the 2nd highest prevalence rate of problem gambling
among the gamblers in Sikkim. 13.54% of the respondents within the age group
between 25 and 34 years are categorized as problem gamblers. A further 6.12% of the
respondents belonging to the age group of 18-24 and 5.4% of the respondents belonging
to the age group of 45-54 years are categorized as problem gamblers. Although there
are no problem gamblers within the age group of 55 years and above, the rate of
moderate-risk gambling is the highest within this group of respondents. 75% of the
respondents with the age of 55 years and above are categorized as moderate-risk
gamblers.
Table 4.9 Age of the Respondents and Gambling Behaviour by Risk Categories
Age of the
Respondents
Non-Problem
Gamblers
Low Risk
Gamblers
Moderate Risk
Gamblers
Problem
Gamblers
18-24 years 9 19 18 3
18.37% 38.78% 36.73% 6.12%
25-34 years 36 53 77 26
18.75% 27.60% 40.10% 13.54%
35-44 years 8 20 50 25
7.77% 19.42% 48.54% 24.27%
45-54 years 8 9 18 2
21.6% 24.3% 48.6% 5.4%
55 years and
Above
1 0 3 0
25.00% 0.00% 75.00% 0.00%
Total 62 101 166 56
16.10% 26.23% 43.12% 14.55%
Source: Author’s Calculations
4.3.2 Hometown of the Respondents and PGSI Category
Table 4.10 highlights the prevalence rate of problem gambling concerning the
hometown of the respondents. The prevalence rate of problem gambling is the highest
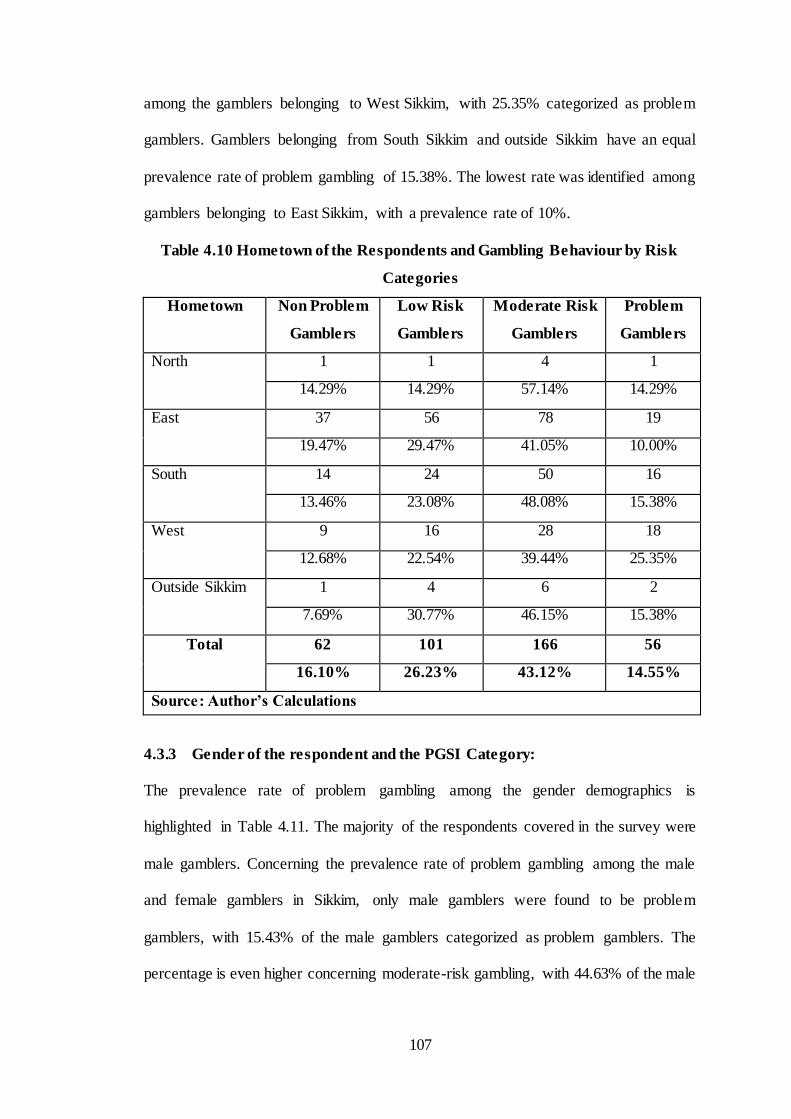
107
among the gamblers belonging to West Sikkim, with 25.35% categorized as problem
gamblers. Gamblers belonging from South Sikkim and outside Sikkim have an equal
prevalence rate of problem gambling of 15.38%. The lowest rate was identified among
gamblers belonging to East Sikkim, with a prevalence rate of 10%.
Table 4.10 Hometown of the Respondents and Gambling Behaviour by Risk
Categories
Hometown Non Problem
Gamblers
Low Risk
Gamblers
Moderate Risk
Gamblers
Problem
Gamblers
North 1 1 4 1
14.29% 14.29% 57.14% 14.29%
East 37 56 78 19
19.47% 29.47% 41.05% 10.00%
South 14 24 50 16
13.46% 23.08% 48.08% 15.38%
West 9 16 28 18
12.68% 22.54% 39.44% 25.35%
Outside Sikkim 1 4 6 2
7.69% 30.77% 46.15% 15.38%
Total 62 101 166 56
16.10% 26.23% 43.12% 14.55%
Source: Author’s Calculations
4.3.3 Gender of the respondent and the PGSI Category:
The prevalence rate of problem gambling among the gender demographics is
highlighted in Table 4.11. The majority of the respondents covered in the survey were
male gamblers. Concerning the prevalence rate of problem gambling among the male
and female gamblers in Sikkim, only male gamblers were found to be problem
gamblers, with 15.43% of the male gamblers categorized as problem gamblers. The
percentage is even higher concerning moderate-risk gambling, with 44.63% of the male
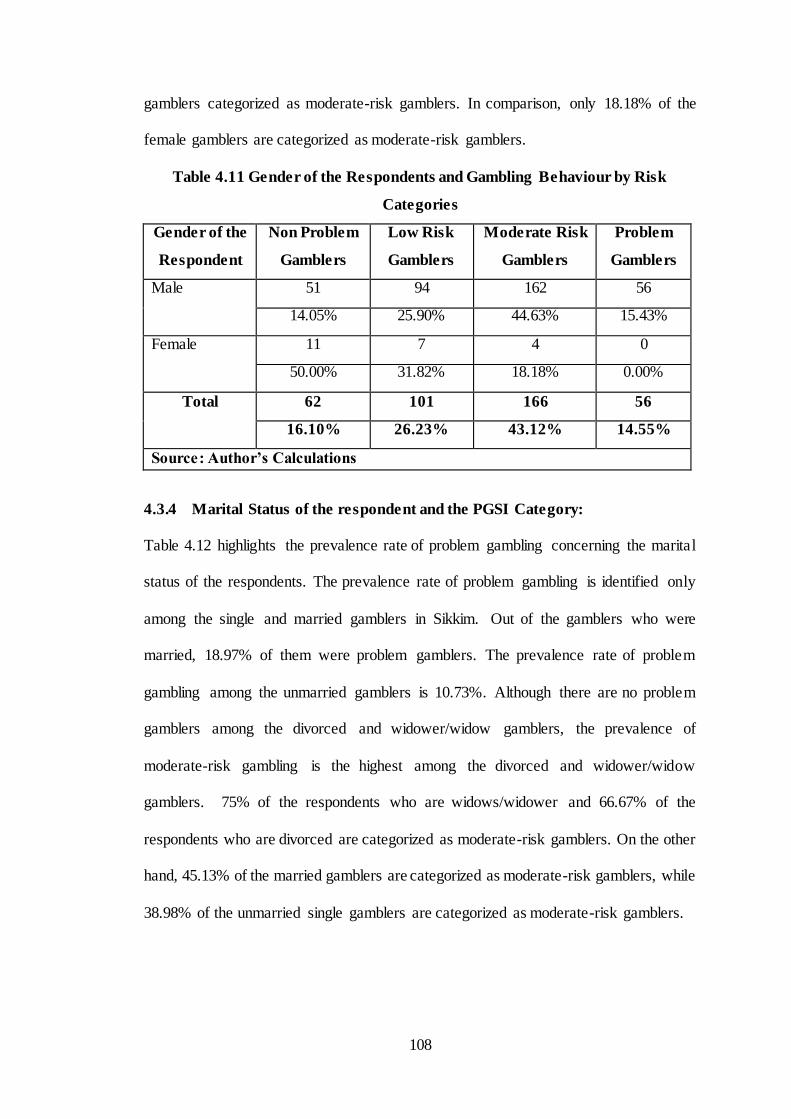
108
gamblers categorized as moderate-risk gamblers. In comparison, only 18.18% of the
female gamblers are categorized as moderate-risk gamblers.
Table 4.11 Gender of the Respondents and Gambling Behaviour by Risk
Categories
Gender of the
Respondent
Non Problem
Gamblers
Low Risk
Gamblers
Moderate Risk
Gamblers
Problem
Gamblers
Male 51 94 162 56
14.05% 25.90% 44.63% 15.43%
Female 11 7 4 0
50.00% 31.82% 18.18% 0.00%
Total 62 101 166 56
16.10% 26.23% 43.12% 14.55%
Source: Author’s Calculations
4.3.4 Marital Status of the respondent and the PGSI Category:
Table 4.12 highlights the prevalence rate of problem gambling concerning the marital
status of the respondents. The prevalence rate of problem gambling is identified only
among the single and married gamblers in Sikkim. Out of the gamblers who were
married, 18.97% of them were problem gamblers. The prevalence rate of problem
gambling among the unmarried gamblers is 10.73%. Although there are no problem
gamblers among the divorced and widower/widow gamblers, the prevalence of
moderate-risk gambling is the highest among the divorced and widower/widow
gamblers. 75% of the respondents who are widows/widower and 66.67% of the
respondents who are divorced are categorized as moderate-risk gamblers. On the other
hand, 45.13% of the married gamblers are categorized as moderate-risk gamblers, while
38.98% of the unmarried single gamblers are categorized as moderate-risk gamblers.
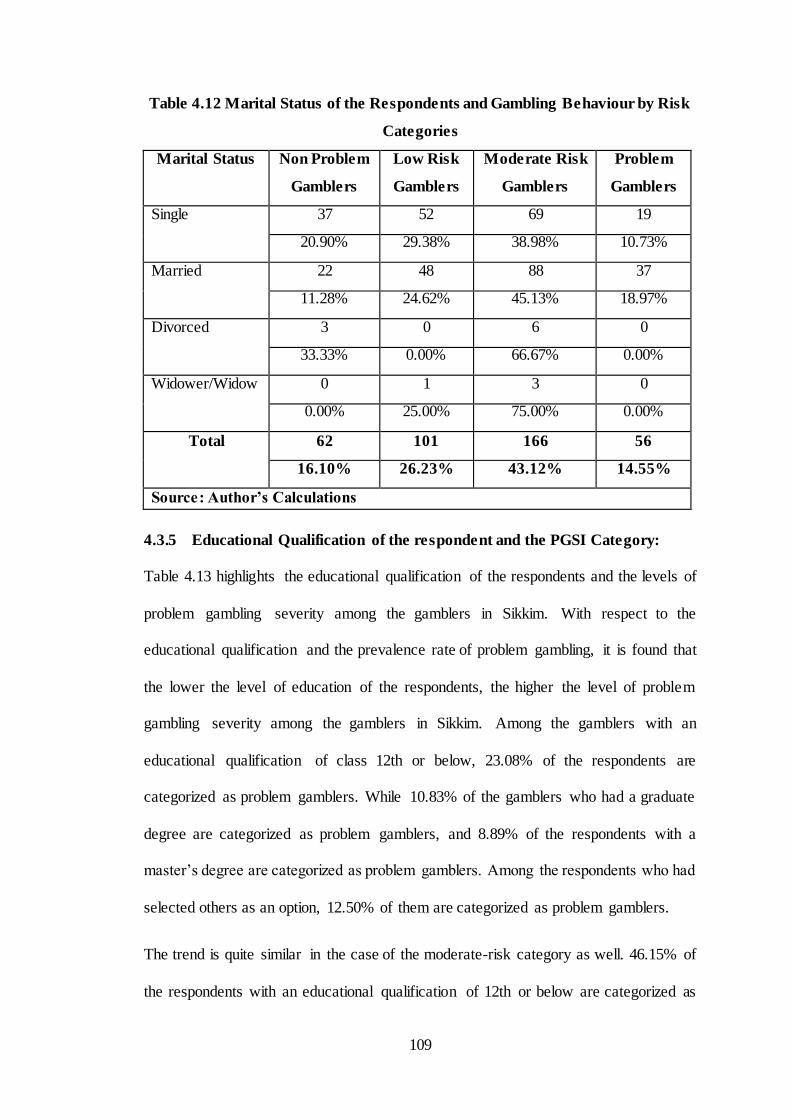
109
Table 4.12 Marital Status of the Respondents and Gambling Behaviour by Risk
Categories
Marital Status Non Problem
Gamblers
Low Risk
Gamblers
Moderate Risk
Gamblers
Problem
Gamblers
Single 37 52 69 19
20.90% 29.38% 38.98% 10.73%
Married 22 48 88 37
11.28% 24.62% 45.13% 18.97%
Divorced 3 0 6 0
33.33% 0.00% 66.67% 0.00%
Widower/Widow 0 1 3 0
0.00% 25.00% 75.00% 0.00%
Total 62 101 166 56
16.10% 26.23% 43.12% 14.55%
Source: Author’s Calculations
4.3.5 Educational Qualification of the respondent and the PGSI Category:
Table 4.13 highlights the educational qualification of the respondents and the levels of
problem gambling severity among the gamblers in Sikkim. With respect to the
educational qualification and the prevalence rate of problem gambling, it is found that
the lower the level of education of the respondents, the higher the level of problem
gambling severity among the gamblers in Sikkim. Among the gamblers with an
educational qualification of class 12th or below, 23.08% of the respondents are
categorized as problem gamblers. While 10.83% of the gamblers who had a graduate
degree are categorized as problem gamblers, and 8.89% of the respondents with a
master’s degree are categorized as problem gamblers. Among the respondents who had
selected others as an option, 12.50% of them are categorized as problem gamblers.
The trend is quite similar in the case of the moderate-risk category as well. 46.15% of
the respondents with an educational qualification of 12th or below are categorized as
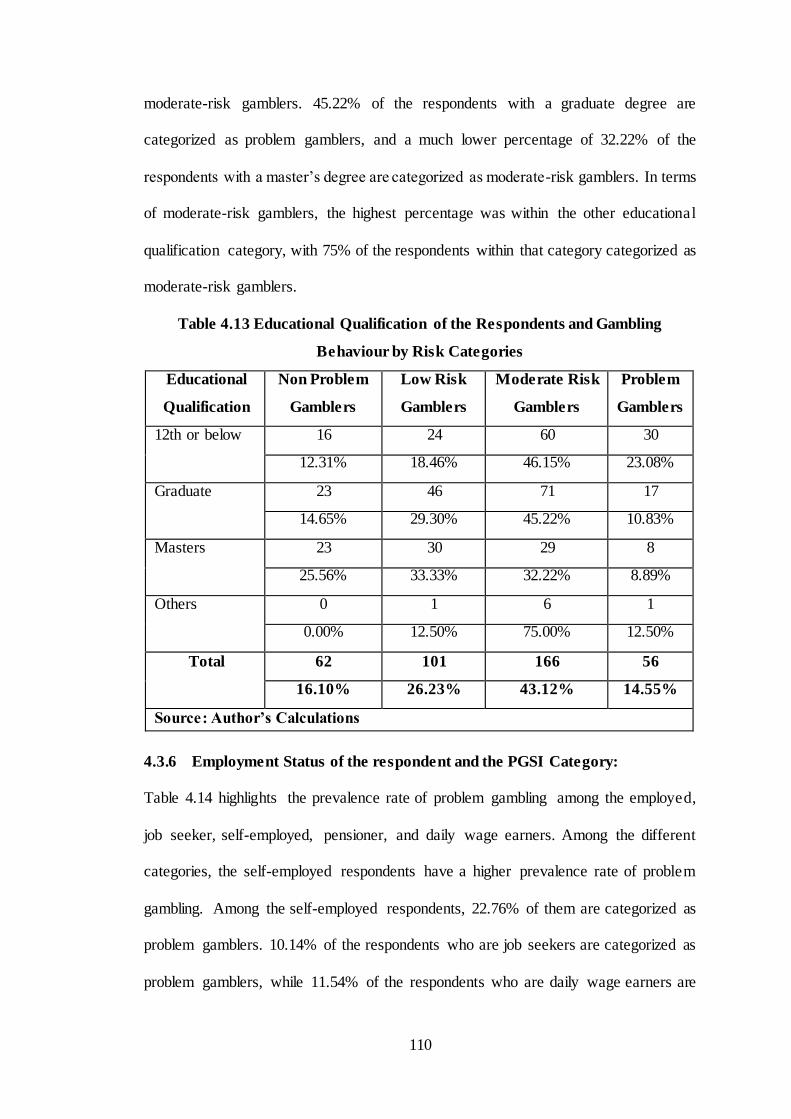
110
moderate-risk gamblers. 45.22% of the respondents with a graduate degree are
categorized as problem gamblers, and a much lower percentage of 32.22% of the
respondents with a master’s degree are categorized as moderate-risk gamblers. In terms
of moderate-risk gamblers, the highest percentage was within the other educational
qualification category, with 75% of the respondents within that category categorized as
moderate-risk gamblers.
Table 4.13 Educational Qualification of the Respondents and Gambling
Behaviour by Risk Categories
Educational
Qualification
Non Problem
Gamblers
Low Risk
Gamblers
Moderate Risk
Gamblers
Problem
Gamblers
12th or below 16 24 60 30
12.31% 18.46% 46.15% 23.08%
Graduate 23 46 71 17
14.65% 29.30% 45.22% 10.83%
Masters 23 30 29 8
25.56% 33.33% 32.22% 8.89%
Others 0 1 6 1
0.00% 12.50% 75.00% 12.50%
Total 62 101 166 56
16.10% 26.23% 43.12% 14.55%
Source: Author’s Calculations
4.3.6 Employment Status of the respondent and the PGSI Category:
Table 4.14 highlights the prevalence rate of problem gambling among the employed,
job seeker, self-employed, pensioner, and daily wage earners. Among the different
categories, the self-employed respondents have a higher prevalence rate of problem
gambling. Among the self-employed respondents, 22.76% of them are categorized as
problem gamblers. 10.14% of the respondents who are job seekers are categorized as
problem gamblers, while 11.54% of the respondents who are daily wage earners are
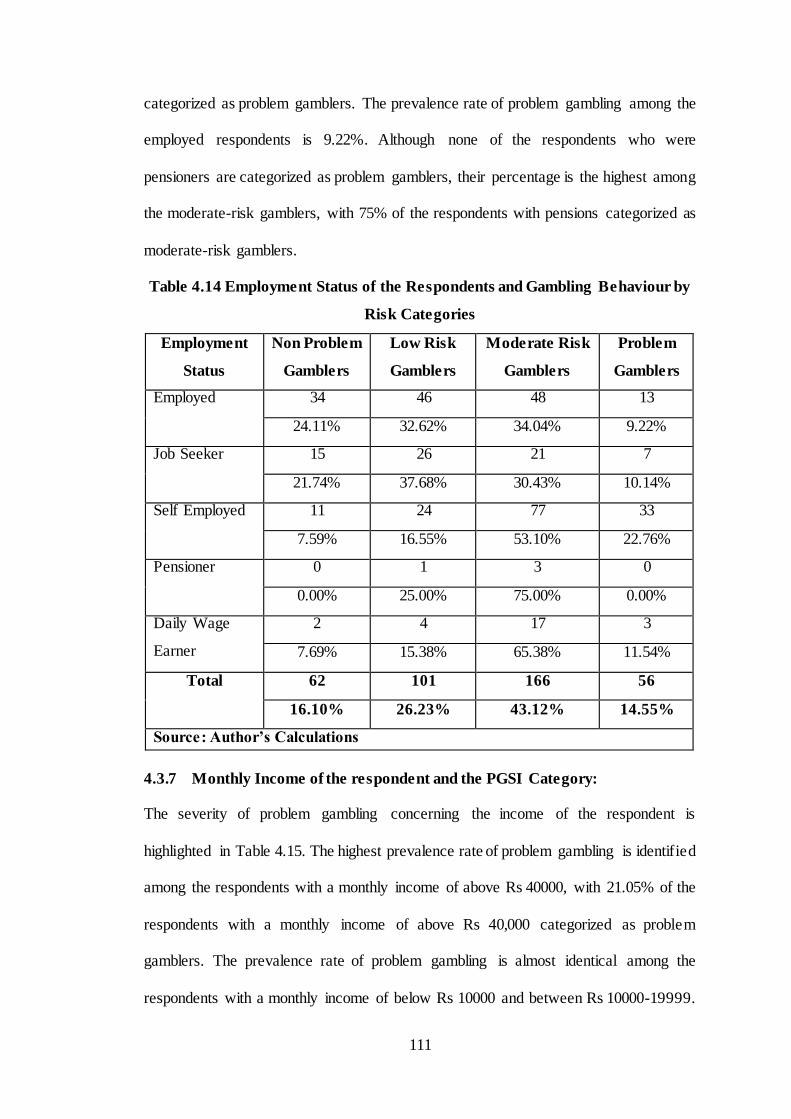
111
categorized as problem gamblers. The prevalence rate of problem gambling among the
employed respondents is 9.22%. Although none of the respondents who were
pensioners are categorized as problem gamblers, their percentage is the highest among
the moderate-risk gamblers, with 75% of the respondents with pensions categorized as
moderate-risk gamblers.
Table 4.14 Employment Status of the Respondents and Gambling Behaviour by
Risk Categories
Employment
Status
Non Problem
Gamblers
Low Risk
Gamblers
Moderate Risk
Gamblers
Problem
Gamblers
Employed 34 46 48 13
24.11% 32.62% 34.04% 9.22%
Job Seeker 15 26 21 7
21.74% 37.68% 30.43% 10.14%
Self Employed 11 24 77 33
7.59% 16.55% 53.10% 22.76%
Pensioner 0 1 3 0
0.00% 25.00% 75.00% 0.00%
Daily Wage
Earner
2 4 17 3
7.69% 15.38% 65.38% 11.54%
Total 62 101 166 56
16.10% 26.23% 43.12% 14.55%
Source: Author’s Calculations
4.3.7 Monthly Income of the respondent and the PGSI Category:
The severity of problem gambling concerning the income of the respondent is
highlighted in Table 4.15. The highest prevalence rate of problem gambling is identified
among the respondents with a monthly income of above Rs 40000, with 21.05% of the
respondents with a monthly income of above Rs 40,000 categorized as problem
gamblers. The prevalence rate of problem gambling is almost identical among the
respondents with a monthly income of below Rs 10000 and between Rs 10000-19999.
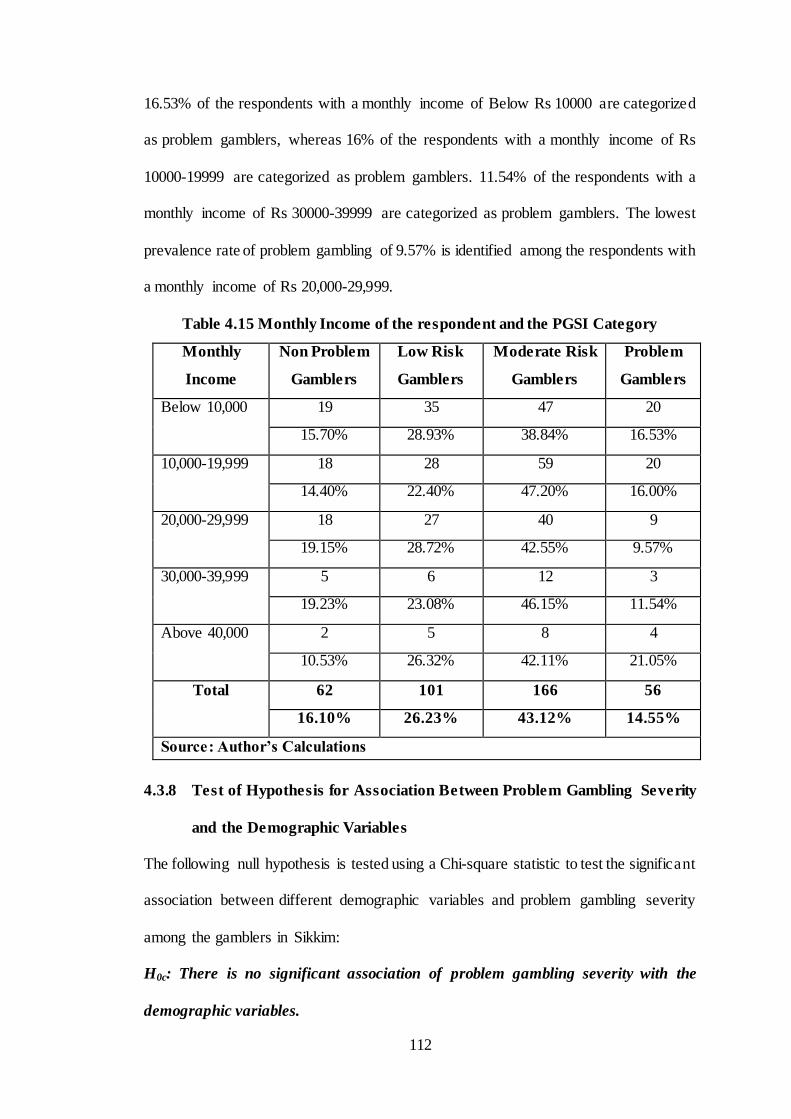
112
16.53% of the respondents with a monthly income of Below Rs 10000 are categorized
as problem gamblers, whereas 16% of the respondents with a monthly income of Rs
10000-19999 are categorized as problem gamblers. 11.54% of the respondents with a
monthly income of Rs 30000-39999 are categorized as problem gamblers. The lowest
prevalence rate of problem gambling of 9.57% is identified among the respondents with
a monthly income of Rs 20,000-29,999.
Table 4.15 Monthly Income of the respondent and the PGSI Category
Monthly
Income
Non Problem
Gamblers
Low Risk
Gamblers
Moderate Risk
Gamblers
Problem
Gamblers
Below 10,000 19 35 47 20
15.70% 28.93% 38.84% 16.53%
10,000-19,999 18 28 59 20
14.40% 22.40% 47.20% 16.00%
20,000-29,999 18 27 40 9
19.15% 28.72% 42.55% 9.57%
30,000-39,999 5 6 12 3
19.23% 23.08% 46.15% 11.54%
Above 40,000 2 5 8 4
10.53% 26.32% 42.11% 21.05%
Total 62 101 166 56
16.10% 26.23% 43.12% 14.55%
Source: Author’s Calculations
4.3.8 Test of Hypothesis for Association Between Problem Gambling Severity
and the Demographic Variables
The following null hypothesis is tested using a Chi-square statistic to test the significant
association between different demographic variables and problem gambling severity
among the gamblers in Sikkim:
H0c: There is no significant association of problem gambling severity with the
demographic variables.
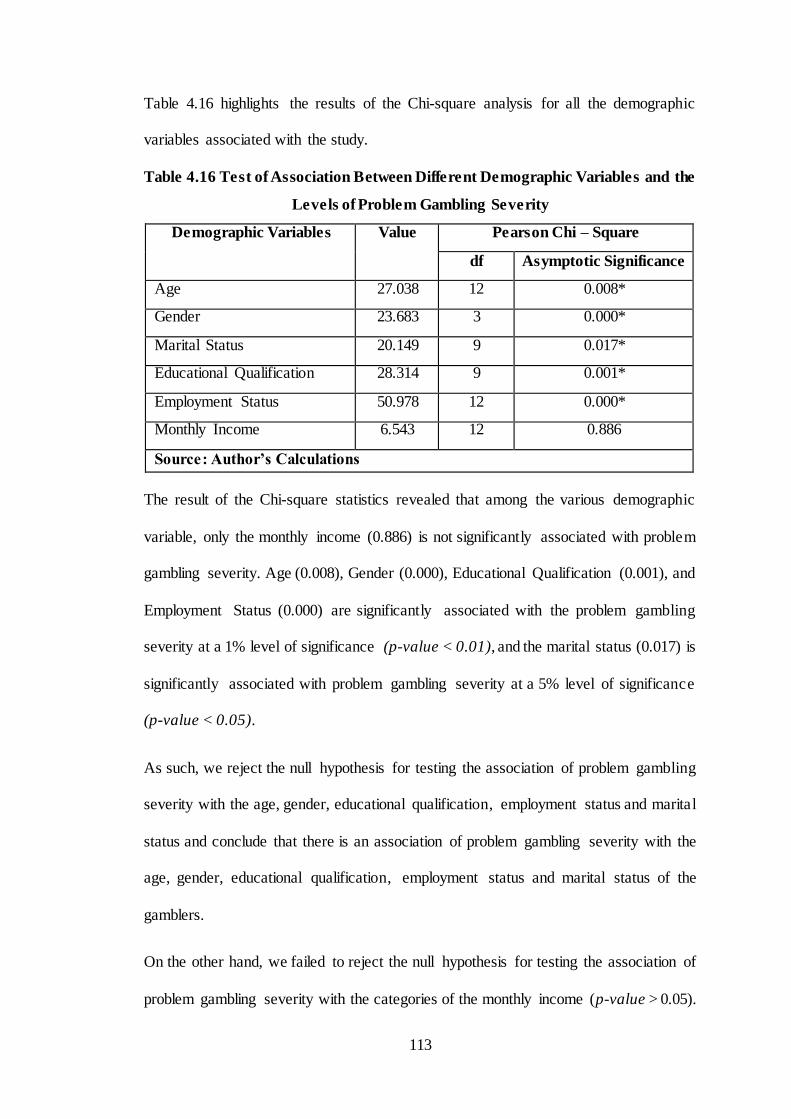
113
Table 4.16 highlights the results of the Chi-square analysis for all the demographic
variables associated with the study.
Table 4.16 Test of Association Between Different Demographic Variables and the
Levels of Problem Gambling Severity
Demographic Variables Value Pearson Chi – Square
df Asymptotic Significance
Age 27.038 12 0.008*
Gender 23.683 3 0.000*
Marital Status 20.149 9 0.017*
Educational Qualification 28.314 9 0.001*
Employment Status 50.978 12 0.000*
Monthly Income 6.543 12 0.886
Source: Author’s Calculations
The result of the Chi-square statistics revealed that among the various demographic
variable, only the monthly income (0.886) is not significantly associated with problem
gambling severity. Age (0.008), Gender (0.000), Educational Qualification (0.001), and
Employment Status (0.000) are significantly associated with the problem gambling
severity at a 1% level of significance (p-value < 0.01), and the marital status (0.017) is
significantly associated with problem gambling severity at a 5% level of significance
(p-value < 0.05).
As such, we reject the null hypothesis for testing the association of problem gambling
severity with the age, gender, educational qualification, employment status and marital
status and conclude that there is an association of problem gambling severity with the
age, gender, educational qualification, employment status and marital status of the
gamblers.
On the other hand, we failed to reject the null hypothesis for testing the association of
problem gambling severity with the categories of the monthly income (p-value > 0.05).
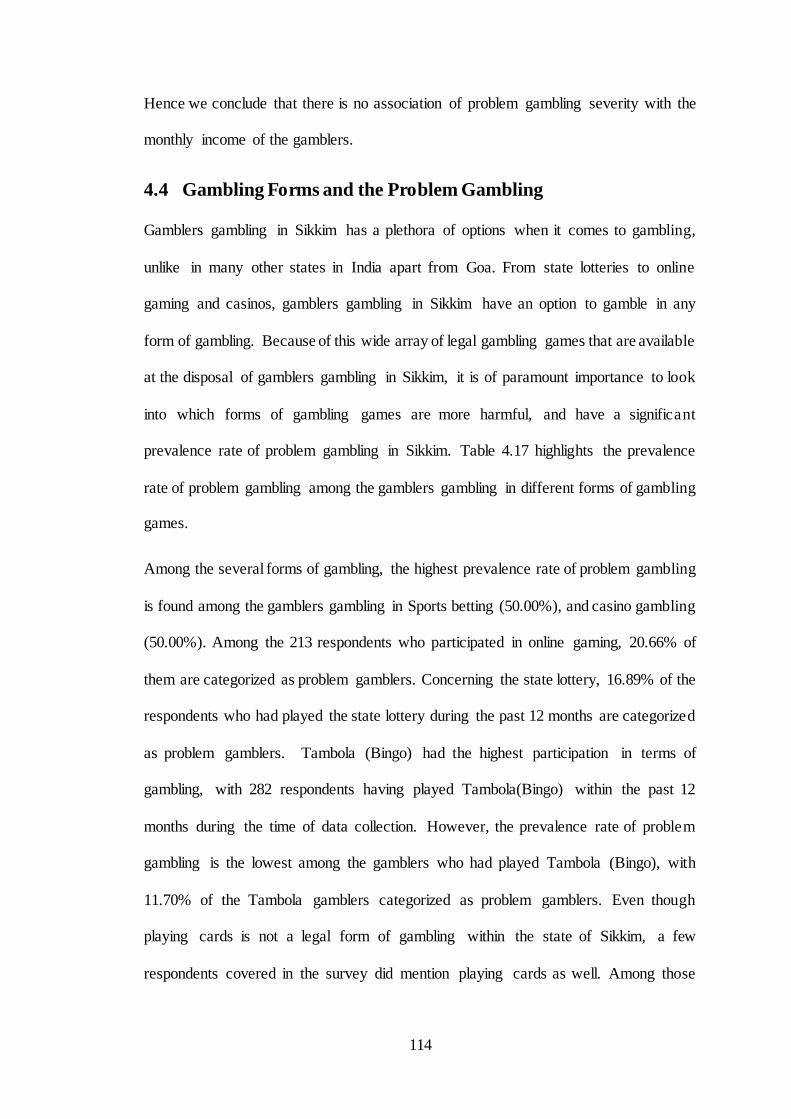
114
Hence we conclude that there is no association of problem gambling severity with the
monthly income of the gamblers.
4.4 Gambling Forms and the Problem Gambling
Gamblers gambling in Sikkim has a plethora of options when it comes to gambling,
unlike in many other states in India apart from Goa. From state lotteries to online
gaming and casinos, gamblers gambling in Sikkim have an option to gamble in any
form of gambling. Because of this wide array of legal gambling games that are available
at the disposal of gamblers gambling in Sikkim, it is of paramount importance to look
into which forms of gambling games are more harmful, and have a significant
prevalence rate of problem gambling in Sikkim. Table 4.17 highlights the prevalence
rate of problem gambling among the gamblers gambling in different forms of gambling
games.
Among the several forms of gambling, the highest prevalence rate of problem gambling
is found among the gamblers gambling in Sports betting (50.00%), and casino gambling
(50.00%). Among the 213 respondents who participated in online gaming, 20.66% of
them are categorized as problem gamblers. Concerning the state lottery, 16.89% of the
respondents who had played the state lottery during the past 12 months are categorized
as problem gamblers. Tambola (Bingo) had the highest participation in terms of
gambling, with 282 respondents having played Tambola(Bingo) within the past 12
months during the time of data collection. However, the prevalence rate of problem
gambling is the lowest among the gamblers who had played Tambola (Bingo), with
11.70% of the Tambola gamblers categorized as problem gamblers. Even though
playing cards is not a legal form of gambling within the state of Sikkim, a few
respondents covered in the survey did mention playing cards as well. Among those
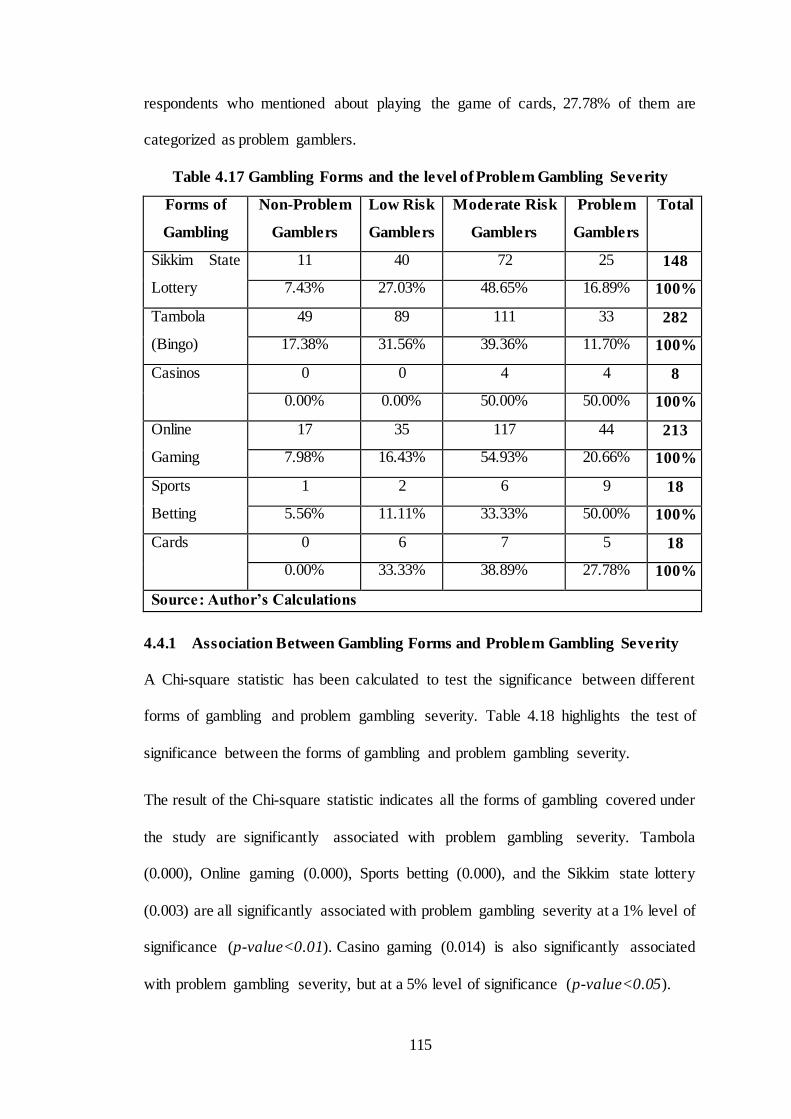
115
respondents who mentioned about playing the game of cards, 27.78% of them are
categorized as problem gamblers.
Table 4.17 Gambling Forms and the level of Problem Gambling Severity
Forms of
Gambling
Non-Problem
Gamblers
Low Risk
Gamblers
Moderate Risk
Gamblers
Problem
Gamblers
Total
Sikkim State
Lottery
11 40 72 25 148
7.43% 27.03% 48.65% 16.89% 100%
Tambola
(Bingo)
49 89 111 33 282
17.38% 31.56% 39.36% 11.70% 100%
Casinos 0 0 4 4 8
0.00% 0.00% 50.00% 50.00% 100%
Online
Gaming
17 35 117 44 213
7.98% 16.43% 54.93% 20.66% 100%
Sports
Betting
1 2 6 9 18
5.56% 11.11% 33.33% 50.00% 100%
Cards 0 6 7 5 18
0.00% 33.33% 38.89% 27.78% 100%
Source: Author’s Calculations
4.4.1 Association Between Gambling Forms and Problem Gambling Severity
A Chi-square statistic has been calculated to test the significance between different
forms of gambling and problem gambling severity. Table 4.18 highlights the test of
significance between the forms of gambling and problem gambling severity.
The result of the Chi-square statistic indicates all the forms of gambling covered under
the study are significantly associated with problem gambling severity. Tambola
(0.000), Online gaming (0.000), Sports betting (0.000), and the Sikkim state lottery
(0.003) are all significantly associated with problem gambling severity at a 1% level of
significance (p-value<0.01). Casino gaming (0.014) is also significantly associated
with problem gambling severity, but at a 5% level of significance (p-value<0.05).
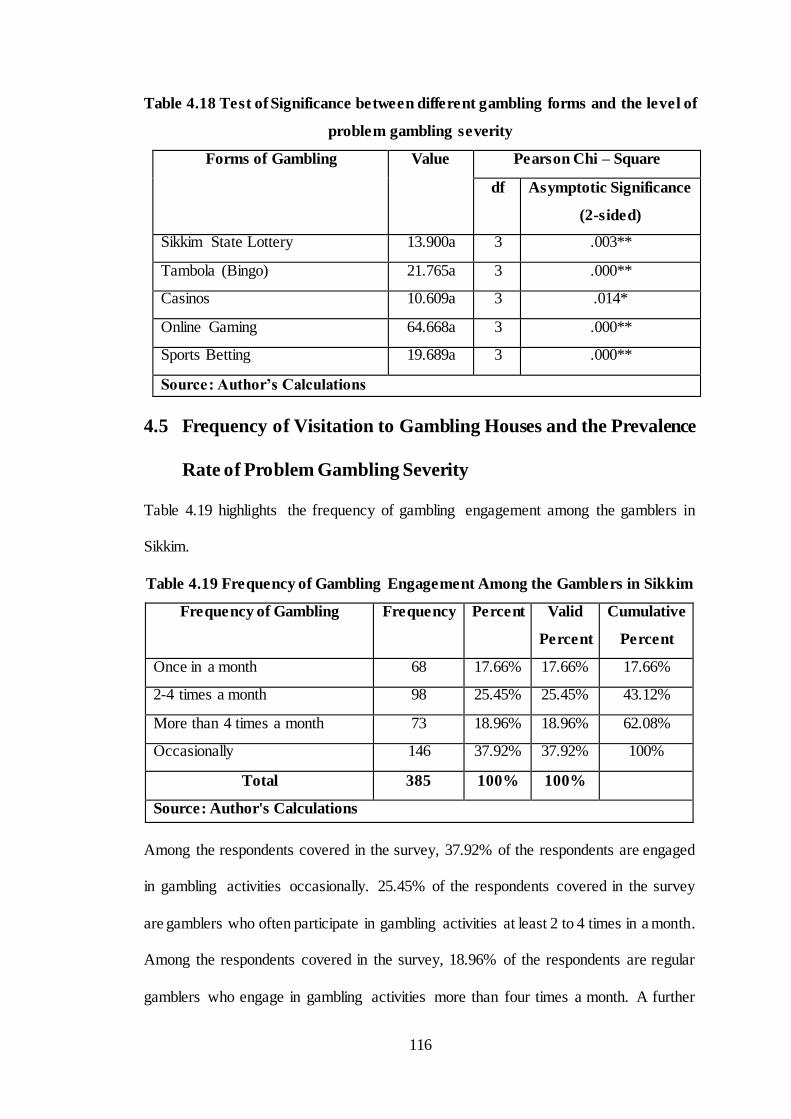
116
Table 4.18 Test of Significance between different gambling forms and the level of
problem gambling severity
Forms of Gambling Value Pearson Chi – Square
df Asymptotic Significance
(2-sided)
Sikkim State Lottery 13.900a 3 .003**
Tambola (Bingo) 21.765a 3 .000**
Casinos 10.609a 3 .014*
Online Gaming 64.668a 3 .000**
Sports Betting 19.689a 3 .000**
Source: Author’s Calculations
4.5 Frequency of Visitation to Gambling Houses and the Prevalence
Rate of Problem Gambling Severity
Table 4.19 highlights the frequency of gambling engagement among the gamblers in
Sikkim.
Table 4.19 Frequency of Gambling Engagement Among the Gamblers in Sikkim
Frequency of Gambling Frequency Percent Valid
Percent
Cumulative
Percent
Once in a month 68 17.66% 17.66% 17.66%
2-4 times a month 98 25.45% 25.45% 43.12%
More than 4 times a month 73 18.96% 18.96% 62.08%
Occasionally 146 37.92% 37.92% 100%
Total 385 100% 100%
Source: Author's Calculations
Among the respondents covered in the survey, 37.92% of the respondents are engaged
in gambling activities occasionally. 25.45% of the respondents covered in the survey
are gamblers who often participate in gambling activities at least 2 to 4 times in a month.
Among the respondents covered in the survey, 18.96% of the respondents are regular
gamblers who engage in gambling activities more than four times a month. A further
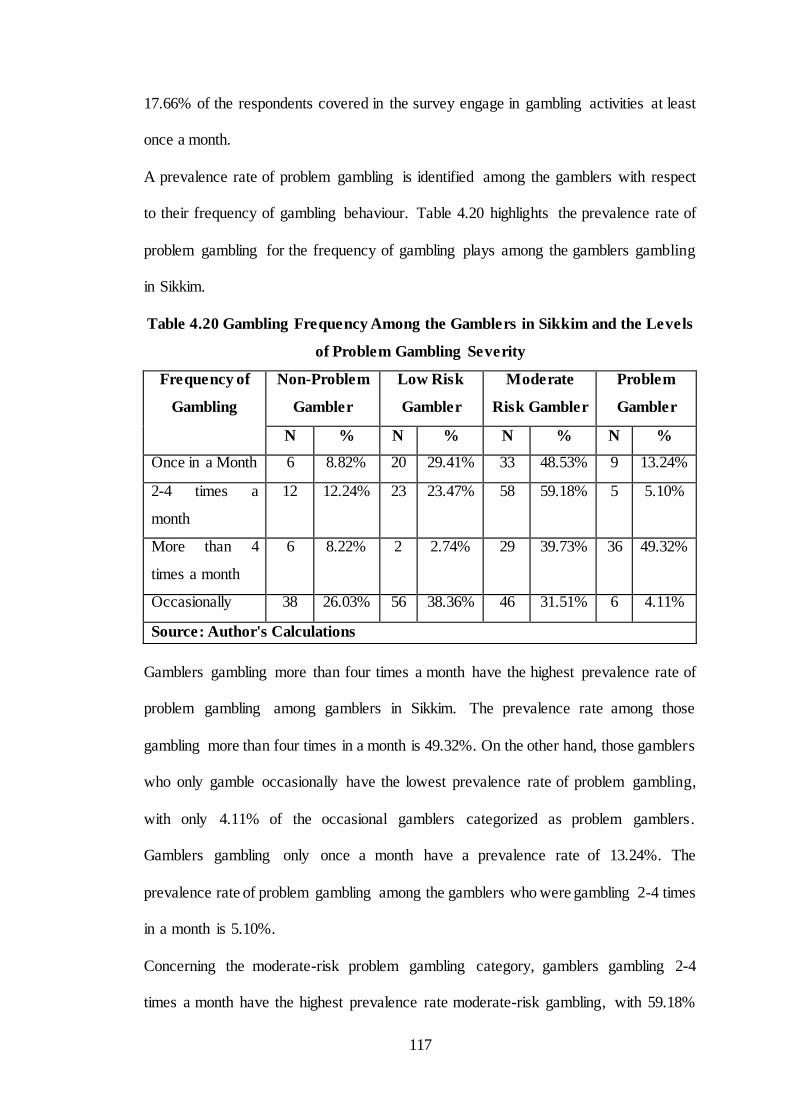
117
17.66% of the respondents covered in the survey engage in gambling activities at least
once a month.
A prevalence rate of problem gambling is identified among the gamblers with respect
to their frequency of gambling behaviour. Table 4.20 highlights the prevalence rate of
problem gambling for the frequency of gambling plays among the gamblers gambling
in Sikkim.
Table 4.20 Gambling Frequency Among the Gamblers in Sikkim and the Levels
of Problem Gambling Severity
Frequency of
Gambling
Non-Problem
Gambler
Low Risk
Gambler
Moderate
Risk Gambler
Problem
Gambler
N % N % N % N %
Once in a Month 6 8.82% 20 29.41% 33 48.53% 9 13.24%
2-4 times a
month
12 12.24% 23 23.47% 58 59.18% 5 5.10%
More than 4
times a month
6 8.22% 2 2.74% 29 39.73% 36 49.32%
Occasionally 38 26.03% 56 38.36% 46 31.51% 6 4.11%
Source: Author's Calculations
Gamblers gambling more than four times a month have the highest prevalence rate of
problem gambling among gamblers in Sikkim. The prevalence rate among those
gambling more than four times in a month is 49.32%. On the other hand, those gamblers
who only gamble occasionally have the lowest prevalence rate of problem gambling,
with only 4.11% of the occasional gamblers categorized as problem gamblers.
Gamblers gambling only once a month have a prevalence rate of 13.24%. The
prevalence rate of problem gambling among the gamblers who were gambling 2-4 times
in a month is 5.10%.
Concerning the moderate-risk problem gambling category, gamblers gambling 2-4
times a month have the highest prevalence rate moderate-risk gambling, with 59.18%
118
of the respondents categorized as moderate-risk gamblers. 48.53% of the respondents
who participated in gambling once a month are categorized as moderate-risk gamblers.
Among the respondents who gambled more than four times a month, 39.73% of them
are categorized as moderate-risk gamblers. Similar to the problem gambling category,
those gamblers who were gambling occasionally have the lowest prevalence rate of
moderate-gambling, with 31.51% of the occasional gamblers categorized as moderate-
risk gamblers.
4.6 Gambling Motives and the Problem Gambling Severity
Gambling motive plays a significant role in predicting the levels of problem gambling
severity among the gamblers. As such, it becomes prominent to identify the gambling
motives that are significant in predicting the level of problem gambling severity.
The result of the factor analysis revealed five different motives for gambling among the
gamblers in Sikkim. The five distinct motives extracted through factor analysis are
avoidance motive, social motive, amusement motive, excitement motive, and financial
motive. Among the five different motives for gambling, avoidance, social, amusement
and excitement are grouped to form the non-financial motives for gambling.
A hypothesis has been framed to identify the significant relationship between the
gambling motives and problem gambling severity. The following paragraph will
discuss in detail the test of the hypothesis and identify the significant relationship
between gambling motives and problem gambling severity among the gamblers in
Sikkim.
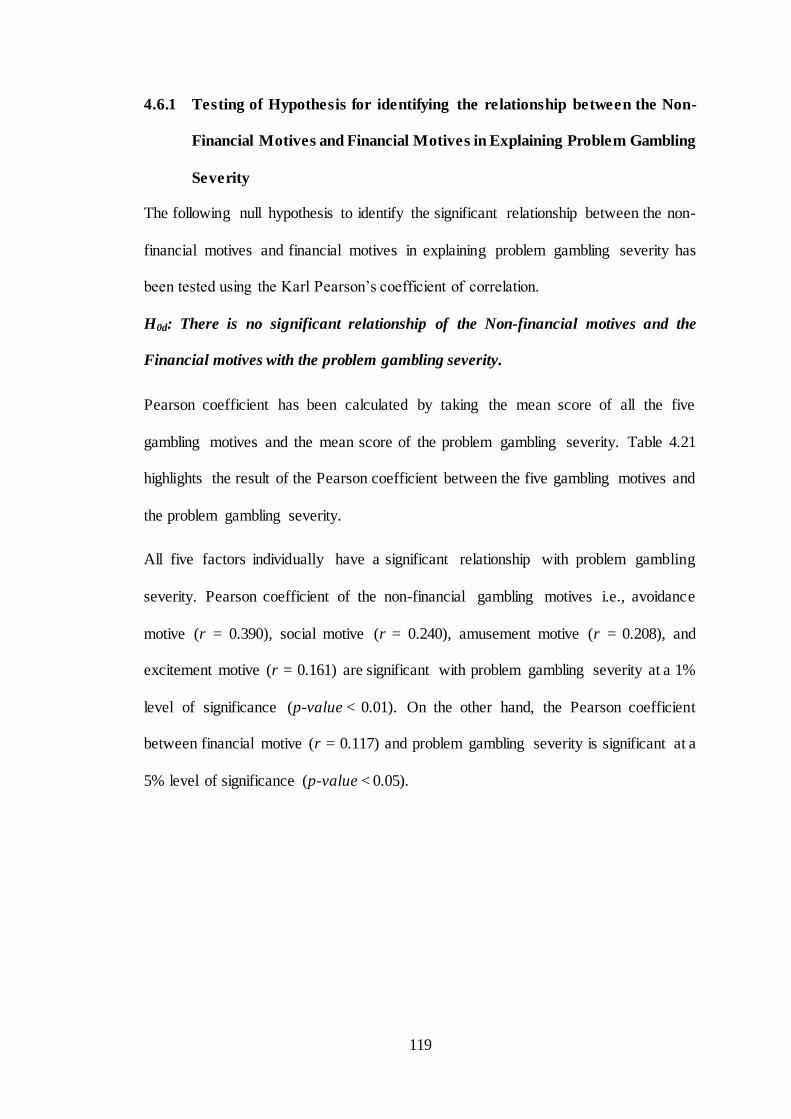
119
4.6.1 Testing of Hypothesis for identifying the relationship between the Non-
Financial Motives and Financial Motives in Explaining Problem Gambling
Severity
The following null hypothesis to identify the significant relationship between the non-
financial motives and financial motives in explaining problem gambling severity has
been tested using the Karl Pearson’s coefficient of correlation.
H0d: There is no significant relationship of the Non-financial motives and the
Financial motives with the problem gambling severity.
Pearson coefficient has been calculated by taking the mean score of all the five
gambling motives and the mean score of the problem gambling severity. Table 4.21
highlights the result of the Pearson coefficient between the five gambling motives and
the problem gambling severity.
All five factors individually have a significant relationship with problem gambling
severity. Pearson coefficient of the non-financial gambling motives i.e., avoidance
motive (r = 0.390), social motive (r = 0.240), amusement motive (r = 0.208), and
excitement motive (r = 0.161) are significant with problem gambling severity at a 1%
level of significance (p-value < 0.01). On the other hand, the Pearson coefficient
between financial motive (r = 0.117) and problem gambling severity is significant at a
5% level of significance (p-value < 0.05).
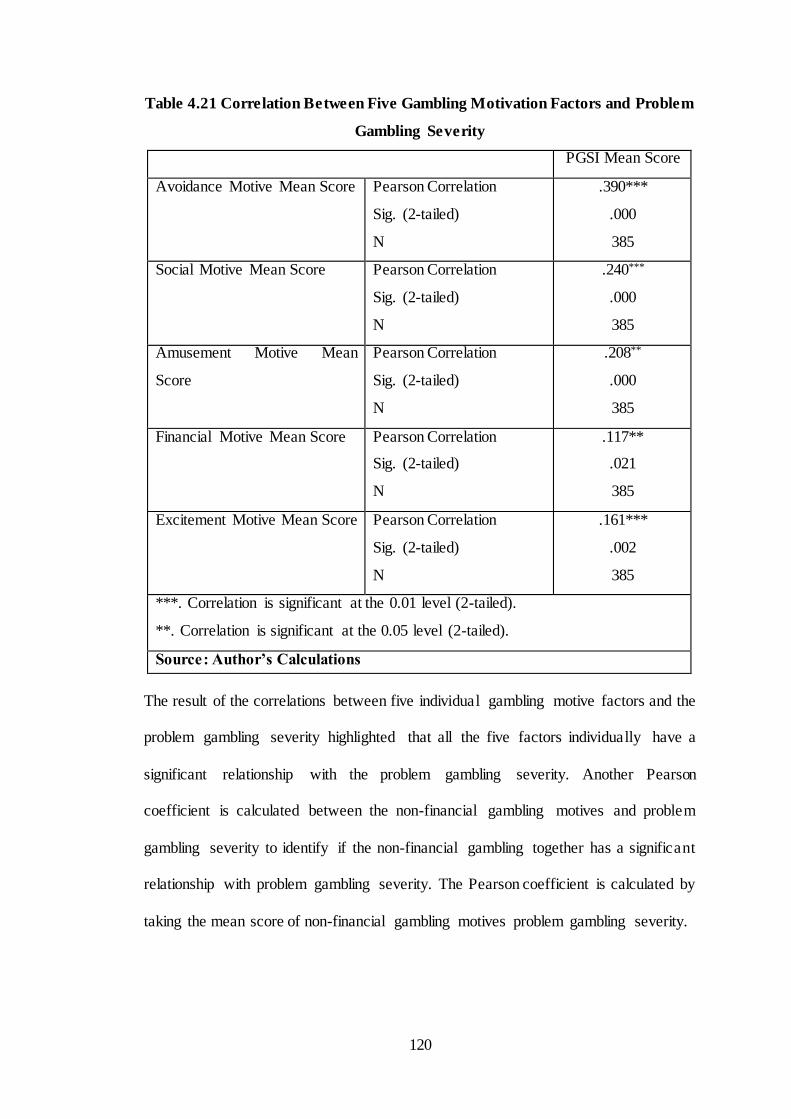
120
Table 4.21 Correlation Between Five Gambling Motivation Factors and Problem
Gambling Severity
PGSI Mean Score
Avoidance Motive Mean Score Pearson Correlation
Sig. (2-tailed)
N
.390***
.000
385
Social Motive Mean Score Pearson Correlation
Sig. (2-tailed)
N
.240***
.000
385
Amusement Motive Mean
Score
Pearson Correlation
Sig. (2-tailed)
N
.208**
.000
385
Financial Motive Mean Score Pearson Correlation
Sig. (2-tailed)
N
.117**
.021
385
Excitement Motive Mean Score Pearson Correlation
Sig. (2-tailed)
N
.161***
.002
385
***. Correlation is significant at the 0.01 level (2-tailed).
**. Correlation is significant at the 0.05 level (2-tailed).
Source: Author’s Calculations
The result of the correlations between five individual gambling motive factors and the
problem gambling severity highlighted that all the five factors individually have a
significant relationship with the problem gambling severity. Another Pearson
coefficient is calculated between the non-financial gambling motives and problem
gambling severity to identify if the non-financial gambling together has a significant
relationship with problem gambling severity. The Pearson coefficient is calculated by
taking the mean score of non-financial gambling motives problem gambling severity.
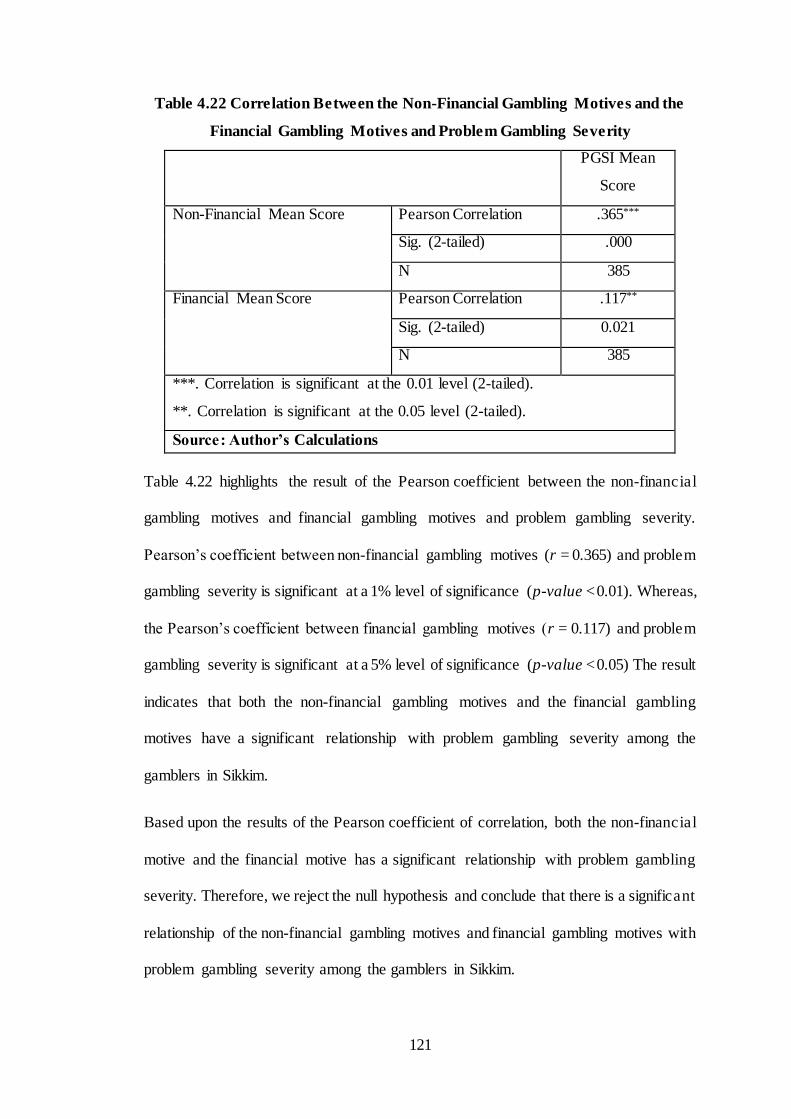
121
Table 4.22 Correlation Between the Non-Financial Gambling Motives and the
Financial Gambling Motives and Problem Gambling Severity
PGSI Mean
Score
Non-Financial Mean Score Pearson Correlation .365***
Sig. (2-tailed) .000
N 385
Financial Mean Score Pearson Correlation .117**
Sig. (2-tailed) 0.021
N 385
***. Correlation is significant at the 0.01 level (2-tailed).
**. Correlation is significant at the 0.05 level (2-tailed).
Source: Author’s Calculations
Table 4.22 highlights the result of the Pearson coefficient between the non-financial
gambling motives and financial gambling motives and problem gambling severity.
Pearson’s coefficient between non-financial gambling motives (r = 0.365) and problem
gambling severity is significant at a 1% level of significance (p-value < 0.01). Whereas,
the Pearson’s coefficient between financial gambling motives (r = 0.117) and problem
gambling severity is significant at a 5% level of significance (p-value < 0.05) The result
indicates that both the non-financial gambling motives and the financial gambling
motives have a significant relationship with problem gambling severity among the
gamblers in Sikkim.
Based upon the results of the Pearson coefficient of correlation, both the non-financial
motive and the financial motive has a significant relationship with problem gambling
severity. Therefore, we reject the null hypothesis and conclude that there is a significant
relationship of the non-financial gambling motives and financial gambling motives with
problem gambling severity among the gamblers in Sikkim.
122
4.6.2 Testing of Hypothesis Between Gambling Motives and the Level of
Problem Gambling Severity
The following null hypothesis to identify the significant relationship between gambling
motives and gambling severity has been tested using the Karl Pearson coefficient
correlation.
H0e: All the identified financial and non-financial gambling motives are not
significant in explaining the problem gambling severity.
Table 4.23 highlights the result of Pearson correlation between gambling motives and
problem gambling severity among the gamblers in Sikkim. Pearson coefficient is
calculated by taking the mean score of the gambling motives and problem gambling
severity among the gamblers in Sikkim. Pearson correlation (r = 0.369) between the
gambling motives and problem gambling severity is significant at a 1% level of
significance (p-value < 0.01). The result of the Pearson correlation coefficient indicates
that there exists a significant relationship between gambling motives and problem
gambling severity. As such, we reject the null hypothesis and conclude that there is a
significant relationship between gambling motives and problem gambling severity.
Table 4.23 Correlation Between Gambling Motives and Problem Gambling
Severity
Gambling Motives
Mean Score
PGSI
Mean
Gambling
Motives Mean
Score
Pearson Correlation
Sig. (2-tailed)
N
1
385
.369***
.000
385
PGSI Mean Score Pearson Correlation
Sig. (2-tailed)
N
.369***
.000
385
1
385
***. Correlation is significant at the 0.01 level (2-tailed).
Source: Author’s Calculations
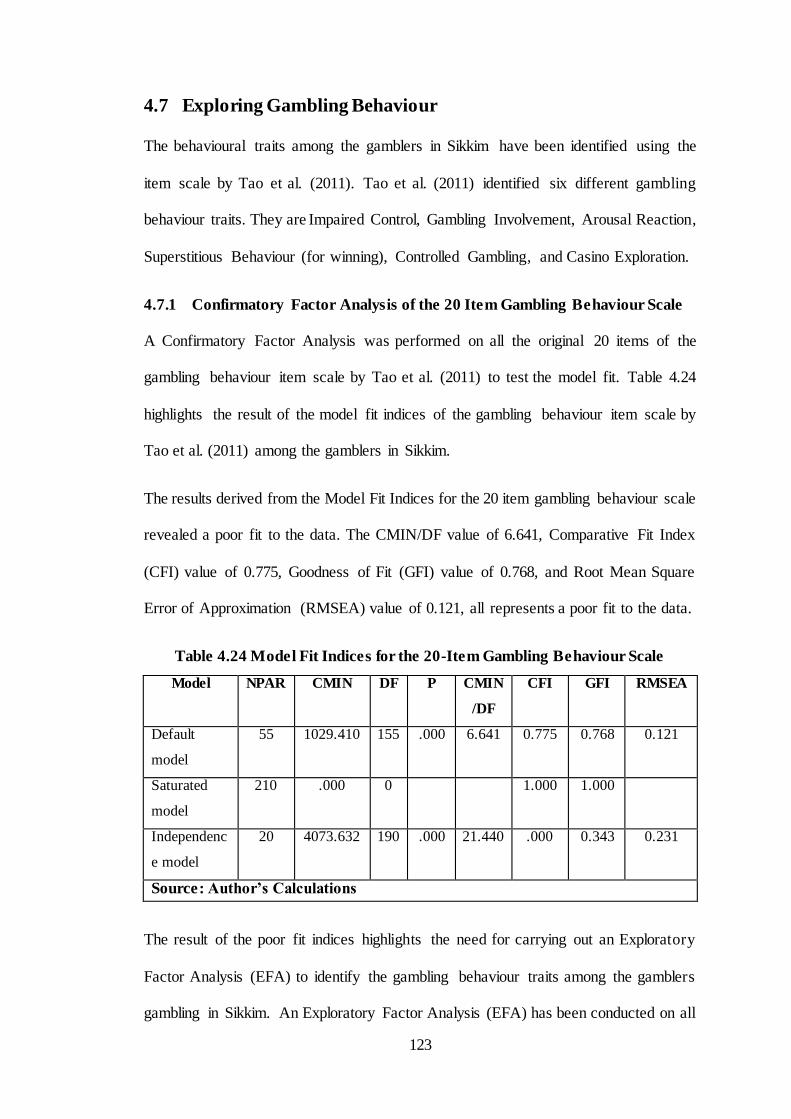
123
4.7 Exploring Gambling Behaviour
The behavioural traits among the gamblers in Sikkim have been identified using the
item scale by Tao et al. (2011). Tao et al. (2011) identified six different gambling
behaviour traits. They are Impaired Control, Gambling Involvement, Arousal Reaction,
Superstitious Behaviour (for winning), Controlled Gambling, and Casino Exploration.
4.7.1 Confirmatory Factor Analysis of the 20 Item Gambling Behaviour Scale
A Confirmatory Factor Analysis was performed on all the original 20 items of the
gambling behaviour item scale by Tao et al. (2011) to test the model fit. Table 4.24
highlights the result of the model fit indices of the gambling behaviour item scale by
Tao et al. (2011) among the gamblers in Sikkim.
The results derived from the Model Fit Indices for the 20 item gambling behaviour scale
revealed a poor fit to the data. The CMIN/DF value of 6.641, Comparative Fit Index
(CFI) value of 0.775, Goodness of Fit (GFI) value of 0.768, and Root Mean Square
Error of Approximation (RMSEA) value of 0.121, all represents a poor fit to the data.
Table 4.24 Model Fit Indices for the 20-Item Gambling Behaviour Scale
Model NPAR CMIN DF P CMIN
/DF
CFI GFI RMSEA
Default
model
55 1029.410 155 .000 6.641 0.775 0.768 0.121
Saturated
model
210 .000 0 1.000 1.000
Independenc
e model
20 4073.632 190 .000 21.440 .000 0.343 0.231
Source: Author’s Calculations
The result of the poor fit indices highlights the need for carrying out an Exploratory
Factor Analysis (EFA) to identify the gambling behaviour traits among the gamblers
gambling in Sikkim. An Exploratory Factor Analysis (EFA) has been conducted on all
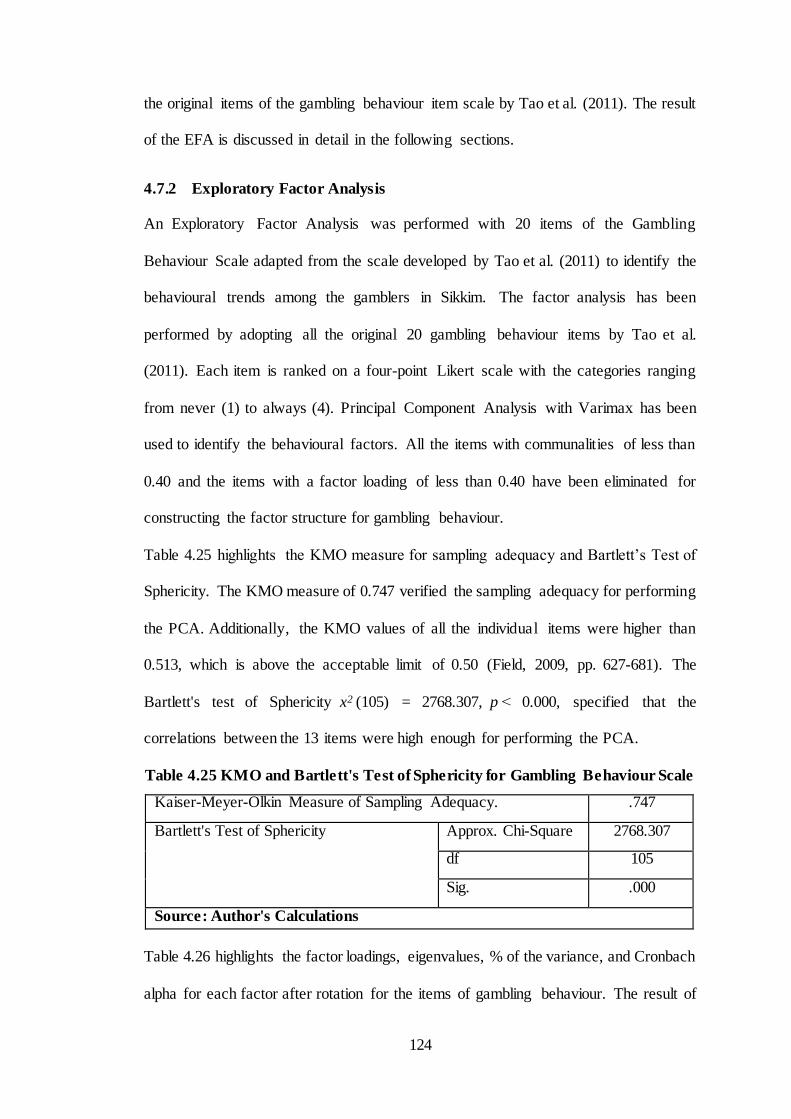
124
the original items of the gambling behaviour item scale by Tao et al. (2011). The result
of the EFA is discussed in detail in the following sections.
4.7.2 Exploratory Factor Analysis
An Exploratory Factor Analysis was performed with 20 items of the Gambling
Behaviour Scale adapted from the scale developed by Tao et al. (2011) to identify the
behavioural trends among the gamblers in Sikkim. The factor analysis has been
performed by adopting all the original 20 gambling behaviour items by Tao et al.
(2011). Each item is ranked on a four-point Likert scale with the categories ranging
from never (1) to always (4). Principal Component Analysis with Varimax has been
used to identify the behavioural factors. All the items with communalities of less than
0.40 and the items with a factor loading of less than 0.40 have been eliminated for
constructing the factor structure for gambling behaviour.
Table 4.25 highlights the KMO measure for sampling adequacy and Bartlett’s Test of
Sphericity. The KMO measure of 0.747 verified the sampling adequacy for performing
the PCA. Additionally, the KMO values of all the individual items were higher than
0.513, which is above the acceptable limit of 0.50 (Field, 2009, pp. 627-681). The
Bartlett's test of Sphericity x2 (105) = 2768.307, p ˂ 0.000, specified that the
correlations between the 13 items were high enough for performing the PCA.
Table 4.25 KMO and Bartlett's Test of Sphericity for Gambling Behaviour Scale
Kaiser-Meyer-Olkin Measure of Sampling Adequacy. .747
Bartlett's Test of Sphericity Approx. Chi-Square 2768.307
df 105
Sig. .000
Source: Author's Calculations
Table 4.26 highlights the factor loadings, eigenvalues, % of the variance, and Cronbach
alpha for each factor after rotation for the items of gambling behaviour. The result of
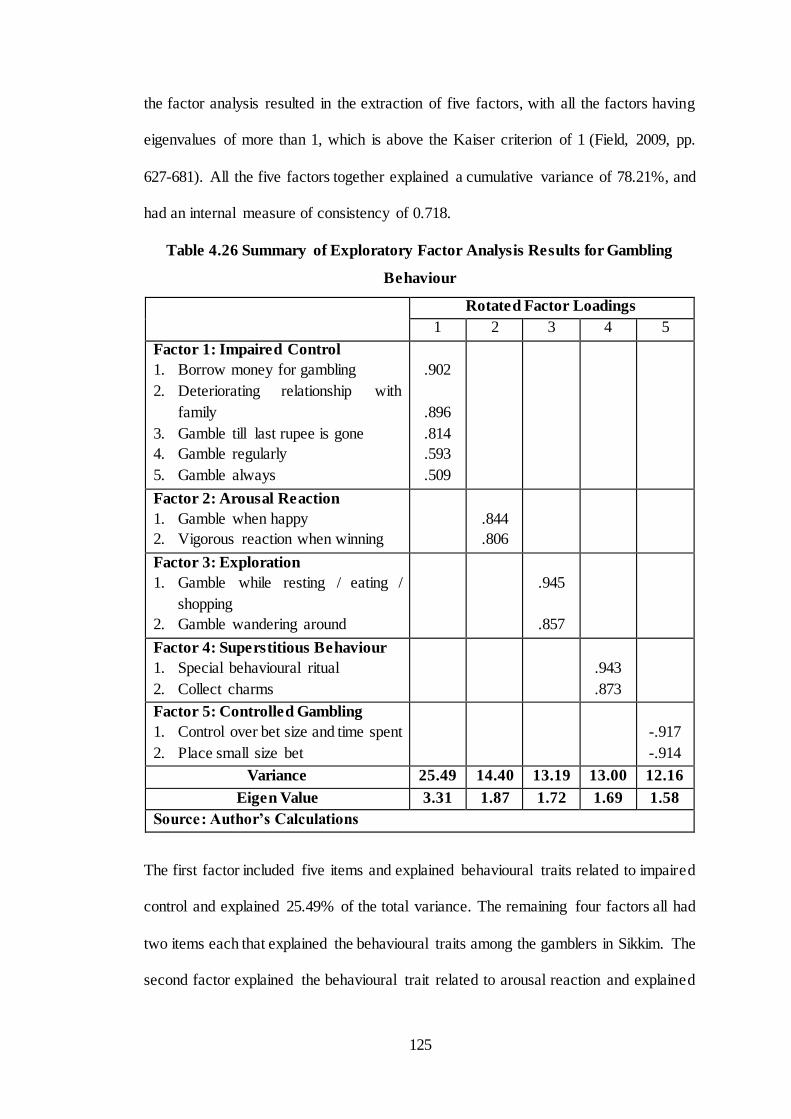
125
the factor analysis resulted in the extraction of five factors, with all the factors having
eigenvalues of more than 1, which is above the Kaiser criterion of 1 (Field, 2009, pp.
627-681). All the five factors together explained a cumulative variance of 78.21%, and
had an internal measure of consistency of 0.718.
Table 4.26 Summary of Exploratory Factor Analysis Results for Gambling
Behaviour
Rotated Factor Loadings
1 2 3 4 5
Factor 1: Impaired Control
1. Borrow money for gambling
2. Deteriorating relationship with
family
3. Gamble till last rupee is gone
4. Gamble regularly
5. Gamble always
.902
.896
.814
.593
.509
Factor 2: Arousal Reaction
1. Gamble when happy
2. Vigorous reaction when winning
.844
.806
Factor 3: Exploration
1. Gamble while resting / eating /
shopping
2. Gamble wandering around
.945
.857
Factor 4: Superstitious Behaviour
1. Special behavioural ritual
2. Collect charms
.943
.873
Factor 5: Controlled Gambling
1. Control over bet size and time spent
2. Place small size bet
-.917
-.914
Variance 25.49 14.40 13.19 13.00 12.16
Eigen Value 3.31 1.87 1.72 1.69 1.58
Source: Author’s Calculations
The first factor included five items and explained behavioural traits related to impaired
control and explained 25.49% of the total variance. The remaining four factors all had
two items each that explained the behavioural traits among the gamblers in Sikkim. The
second factor explained the behavioural trait related to arousal reaction and explained
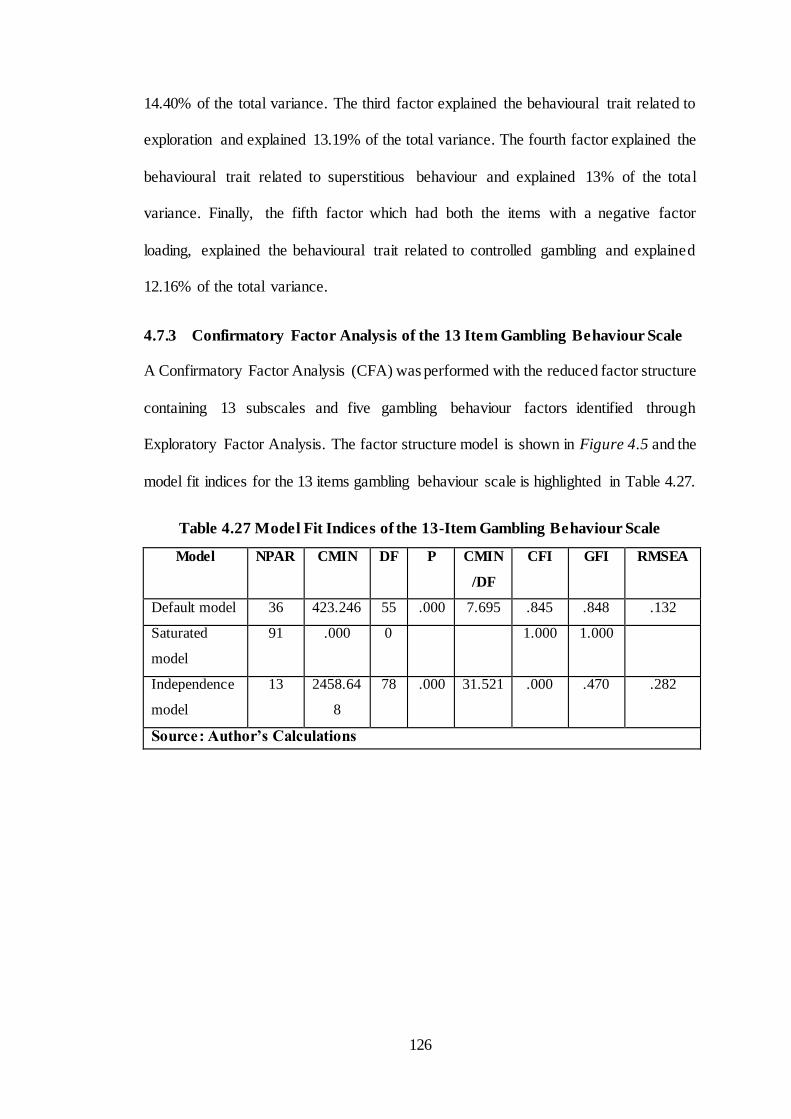
126
14.40% of the total variance. The third factor explained the behavioural trait related to
exploration and explained 13.19% of the total variance. The fourth factor explained the
behavioural trait related to superstitious behaviour and explained 13% of the total
variance. Finally, the fifth factor which had both the items with a negative factor
loading, explained the behavioural trait related to controlled gambling and explained
12.16% of the total variance.
4.7.3 Confirmatory Factor Analysis of the 13 Item Gambling Behaviour Scale
A Confirmatory Factor Analysis (CFA) was performed with the reduced factor structure
containing 13 subscales and five gambling behaviour factors identified through
Exploratory Factor Analysis. The factor structure model is shown in Figure 4.5 and the
model fit indices for the 13 items gambling behaviour scale is highlighted in Table 4.27.
Table 4.27 Model Fit Indices of the 13-Item Gambling Behaviour Scale
Model NPAR CMIN DF P CMIN
/DF
CFI GFI RMSEA
Default model 36 423.246 55 .000 7.695 .845 .848 .132
Saturated
model
91 .000 0 1.000 1.000
Independence
model
13 2458.64
8
78 .000 31.521 .000 .470 .282
Source: Author’s Calculations
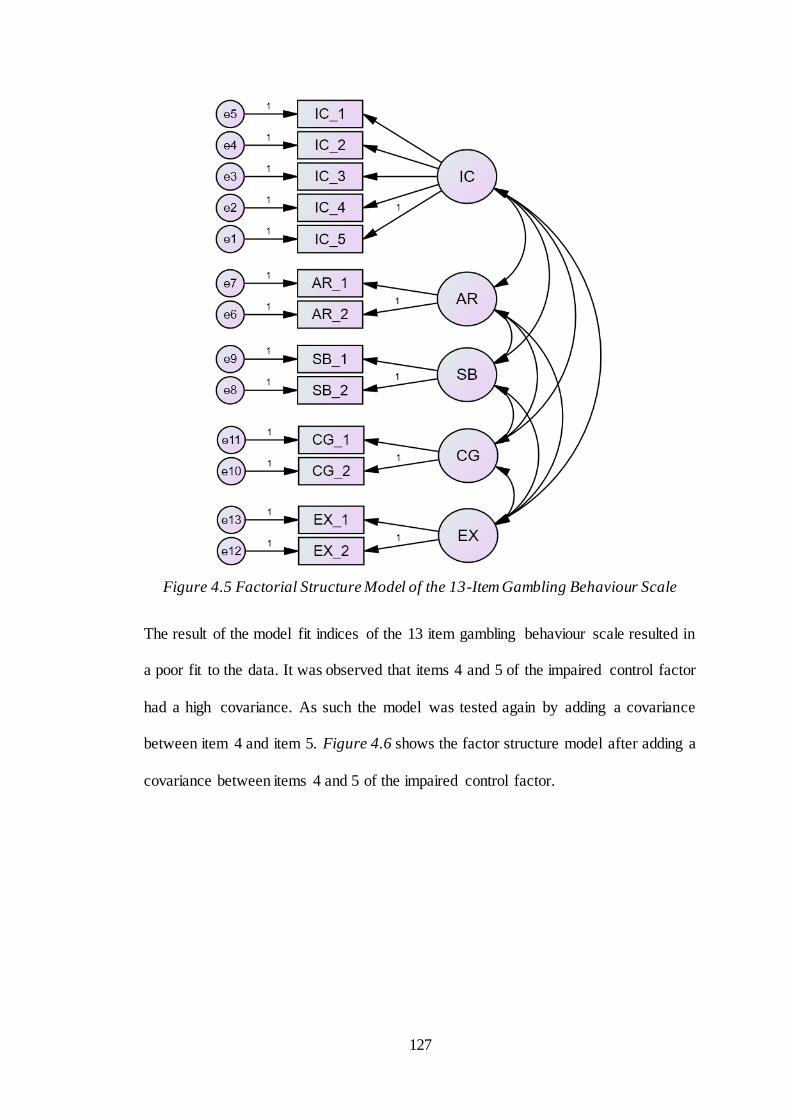
127
Figure 4.5 Factorial Structure Model of the 13-Item Gambling Behaviour Scale
The result of the model fit indices of the 13 item gambling behaviour scale resulted in
a poor fit to the data. It was observed that items 4 and 5 of the impaired control factor
had a high covariance. As such the model was tested again by adding a covariance
between item 4 and item 5. Figure 4.6 shows the factor structure model after adding a
covariance between items 4 and 5 of the impaired control factor.
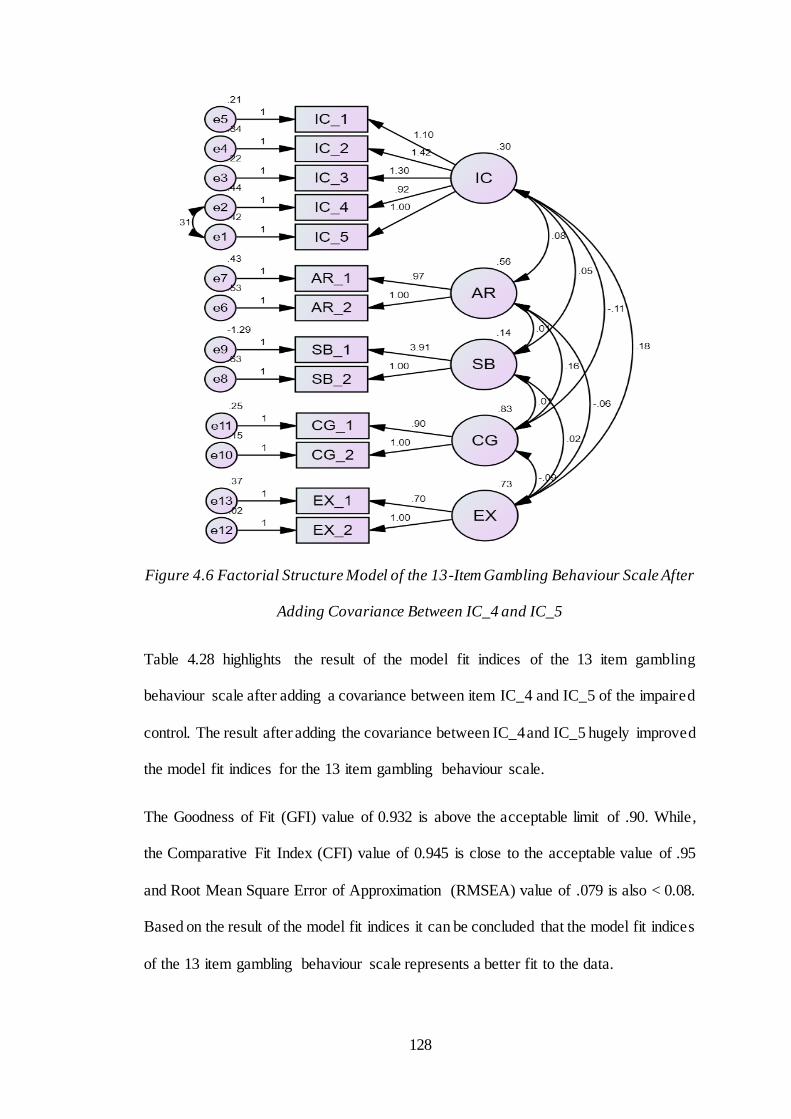
128
Figure 4.6 Factorial Structure Model of the 13-Item Gambling Behaviour Scale After
Adding Covariance Between IC_4 and IC_5
Table 4.28 highlights the result of the model fit indices of the 13 item gambling
behaviour scale after adding a covariance between item IC_4 and IC_5 of the impaired
control. The result after adding the covariance between IC_4 and IC_5 hugely improved
the model fit indices for the 13 item gambling behaviour scale.
The Goodness of Fit (GFI) value of 0.932 is above the acceptable limit of .90. While,
the Comparative Fit Index (CFI) value of 0.945 is close to the acceptable value of .95
and Root Mean Square Error of Approximation (RMSEA) value of .079 is also < 0.08.
Based on the result of the model fit indices it can be concluded that the model fit indices
of the 13 item gambling behaviour scale represents a better fit to the data.
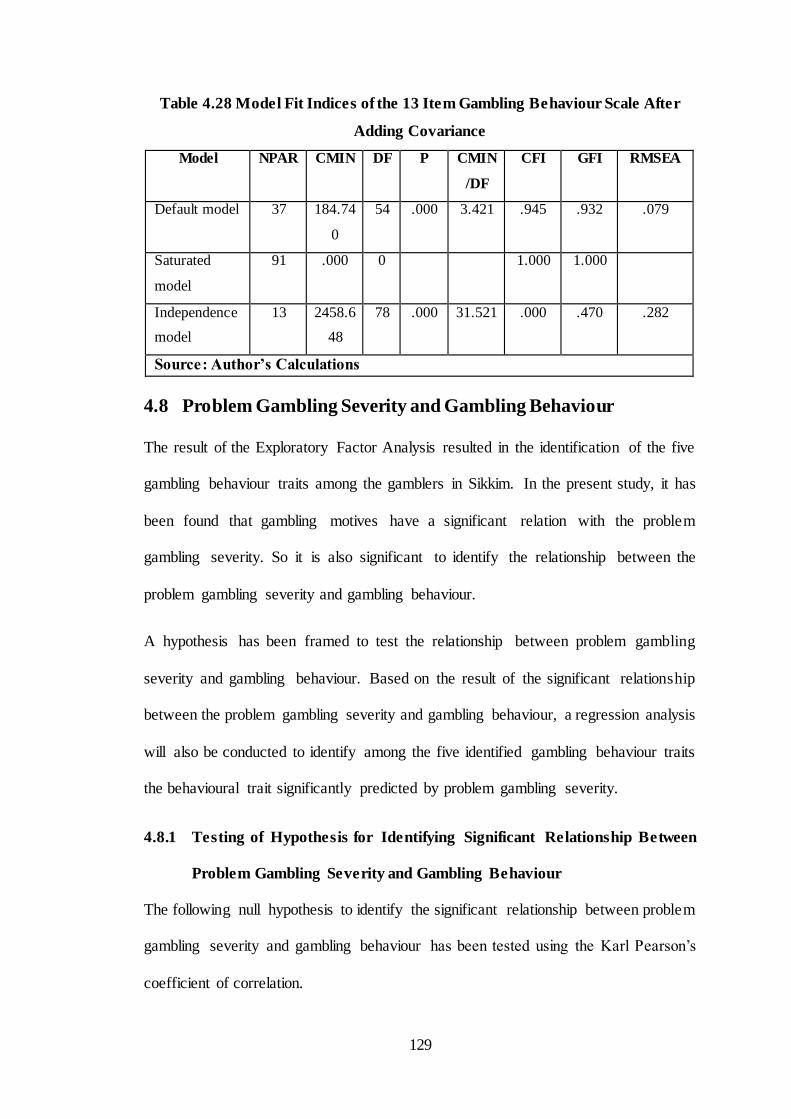
129
Table 4.28 Model Fit Indices of the 13 Item Gambling Behaviour Scale After
Adding Covariance
Model NPAR CMIN DF P CMIN
/DF
CFI GFI RMSEA
Default model 37 184.74
0
54 .000 3.421 .945 .932 .079
Saturated
model
91 .000 0 1.000 1.000
Independence
model
13 2458.6
48
78 .000 31.521 .000 .470 .282
Source: Author’s Calculations
4.8 Problem Gambling Severity and Gambling Behaviour
The result of the Exploratory Factor Analysis resulted in the identification of the five
gambling behaviour traits among the gamblers in Sikkim. In the present study, it has
been found that gambling motives have a significant relation with the problem
gambling severity. So it is also significant to identify the relationship between the
problem gambling severity and gambling behaviour.
A hypothesis has been framed to test the relationship between problem gambling
severity and gambling behaviour. Based on the result of the significant relationship
between the problem gambling severity and gambling behaviour, a regression analysis
will also be conducted to identify among the five identified gambling behaviour traits
the behavioural trait significantly predicted by problem gambling severity.
4.8.1 Testing of Hypothesis for Identifying Significant Relationship Between
Problem Gambling Severity and Gambling Behaviour
The following null hypothesis to identify the significant relationship between problem
gambling severity and gambling behaviour has been tested using the Karl Pearson’s
coefficient of correlation.
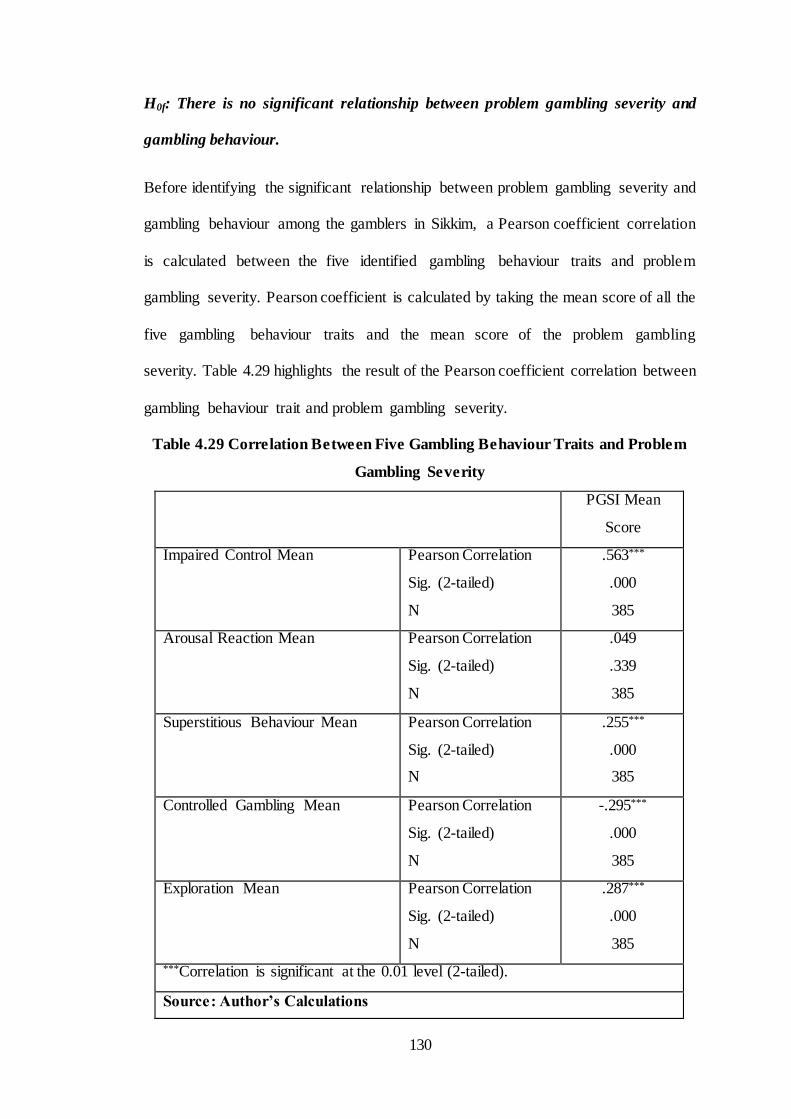
130
H0f: There is no significant relationship between problem gambling severity and
gambling behaviour.
Before identifying the significant relationship between problem gambling severity and
gambling behaviour among the gamblers in Sikkim, a Pearson coefficient correlation
is calculated between the five identified gambling behaviour traits and problem
gambling severity. Pearson coefficient is calculated by taking the mean score of all the
five gambling behaviour traits and the mean score of the problem gambling
severity. Table 4.29 highlights the result of the Pearson coefficient correlation between
gambling behaviour trait and problem gambling severity.
Table 4.29 Correlation Between Five Gambling Behaviour Traits and Problem
Gambling Severity
PGSI Mean
Score
Impaired Control Mean Pearson Correlation
Sig. (2-tailed)
N
.563***
.000
385
Arousal Reaction Mean Pearson Correlation
Sig. (2-tailed)
N
.049
.339
385
Superstitious Behaviour Mean Pearson Correlation
Sig. (2-tailed)
N
.255***
.000
385
Controlled Gambling Mean Pearson Correlation
Sig. (2-tailed)
N
-.295***
.000
385
Exploration Mean Pearson Correlation
Sig. (2-tailed)
N
.287***
.000
385
***Correlation is significant at the 0.01 level (2-tailed).
Source: Author’s Calculations
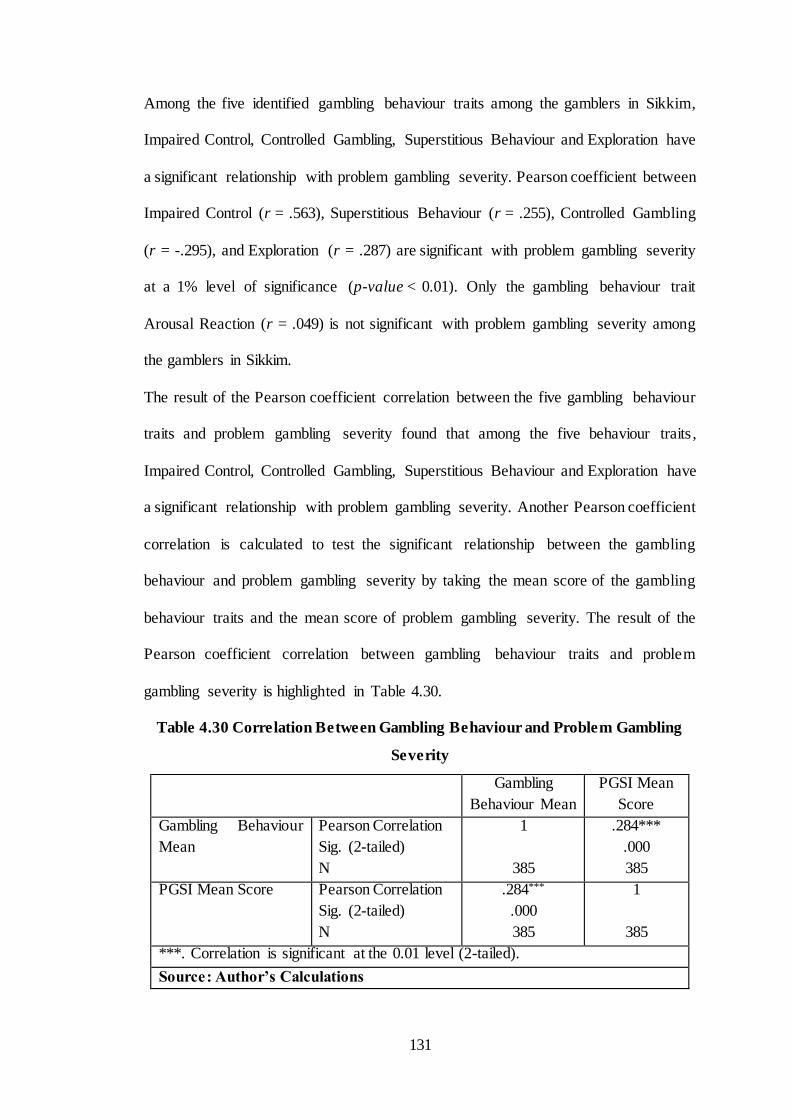
131
Among the five identified gambling behaviour traits among the gamblers in Sikkim,
Impaired Control, Controlled Gambling, Superstitious Behaviour and Exploration have
a significant relationship with problem gambling severity. Pearson coefficient between
Impaired Control (r = .563), Superstitious Behaviour (r = .255), Controlled Gambling
(r = -.295), and Exploration (r = .287) are significant with problem gambling severity
at a 1% level of significance (p-value < 0.01). Only the gambling behaviour trait
Arousal Reaction (r = .049) is not significant with problem gambling severity among
the gamblers in Sikkim.
The result of the Pearson coefficient correlation between the five gambling behaviour
traits and problem gambling severity found that among the five behaviour traits ,
Impaired Control, Controlled Gambling, Superstitious Behaviour and Exploration have
a significant relationship with problem gambling severity. Another Pearson coefficient
correlation is calculated to test the significant relationship between the gambling
behaviour and problem gambling severity by taking the mean score of the gambling
behaviour traits and the mean score of problem gambling severity. The result of the
Pearson coefficient correlation between gambling behaviour traits and problem
gambling severity is highlighted in Table 4.30.
Table 4.30 Correlation Between Gambling Behaviour and Problem Gambling
Severity
Gambling
Behaviour Mean
PGSI Mean
Score
Gambling Behaviour
Mean
Pearson Correlation
Sig. (2-tailed)
N
1
385
.284***
.000
385
PGSI Mean Score Pearson Correlation
Sig. (2-tailed)
N
.284***
.000
385
1
385
***. Correlation is significant at the 0.01 level (2-tailed).
Source: Author’s Calculations
132
The result of the Pearson coefficient highlights that there is a significant relationship
between gambling behaviour and problem gambling severity among the gamblers in
Sikkim. Pearson correlation (r = .284) between gambling behaviour and problem
gambling severity is significant at a 1% level of significance (p-value < 0.01).
Therefore, based on the result of the Pearson coefficient, we reject the null hypothesis
and conclude that there is a significant relationship between problem gambling severity
and gambling behaviour.
4.9 Conceptual Model Test
In the present study, the relationship between the gambling motives, problem gambling
severity, and gambling behaviour among the gamblers have been studied. Previous
studies have found that gambling motives significantly predicts the level of problem
gambling severity among the gamblers. Based on that premise, the present study tries
to identify the significant relationship between gambling motives and problem
gambling severity and between problem gambling severity and gambling behaviour
among the gamblers in Sikkim. Figure 4.7 highlights the conceptual model tested for
identifying the relationship between the identified gambling motives, problem
gambling severity and gambling behaviour among the gamblers in Sikkim. The model
was tested using the item scale of the 19-item Five-Factor Gambling Motivation Model
identified through the EFA and CFA, the mean score of the problem gambling severity
and the item scale of the 13-item Gambling Behaviour Scale identified through the EFA
and CFA.
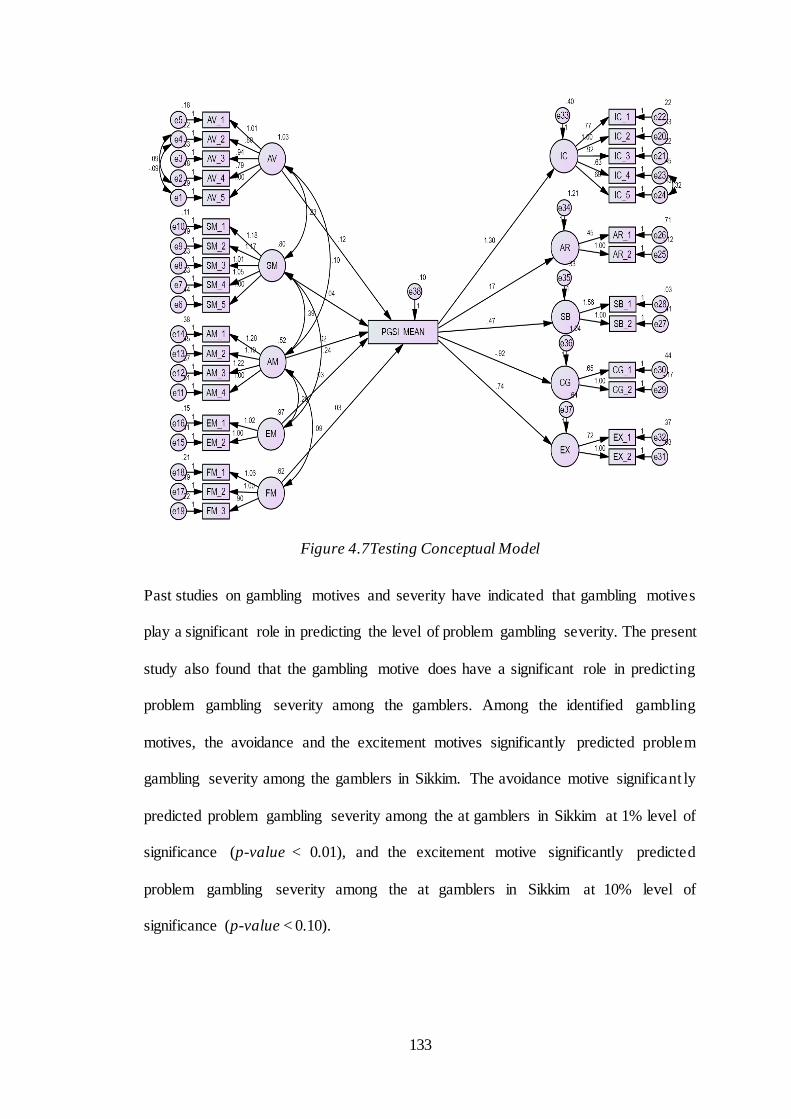
133
Figure 4.7Testing Conceptual Model
Past studies on gambling motives and severity have indicated that gambling motives
play a significant role in predicting the level of problem gambling severity. The present
study also found that the gambling motive does have a significant role in predicting
problem gambling severity among the gamblers. Among the identified gambling
motives, the avoidance and the excitement motives significantly predicted problem
gambling severity among the gamblers in Sikkim. The avoidance motive significant ly
predicted problem gambling severity among the at gamblers in Sikkim at 1% level of
significance (p-value < 0.01), and the excitement motive significantly predicted
problem gambling severity among the at gamblers in Sikkim at 10% level of
significance (p-value < 0.10).
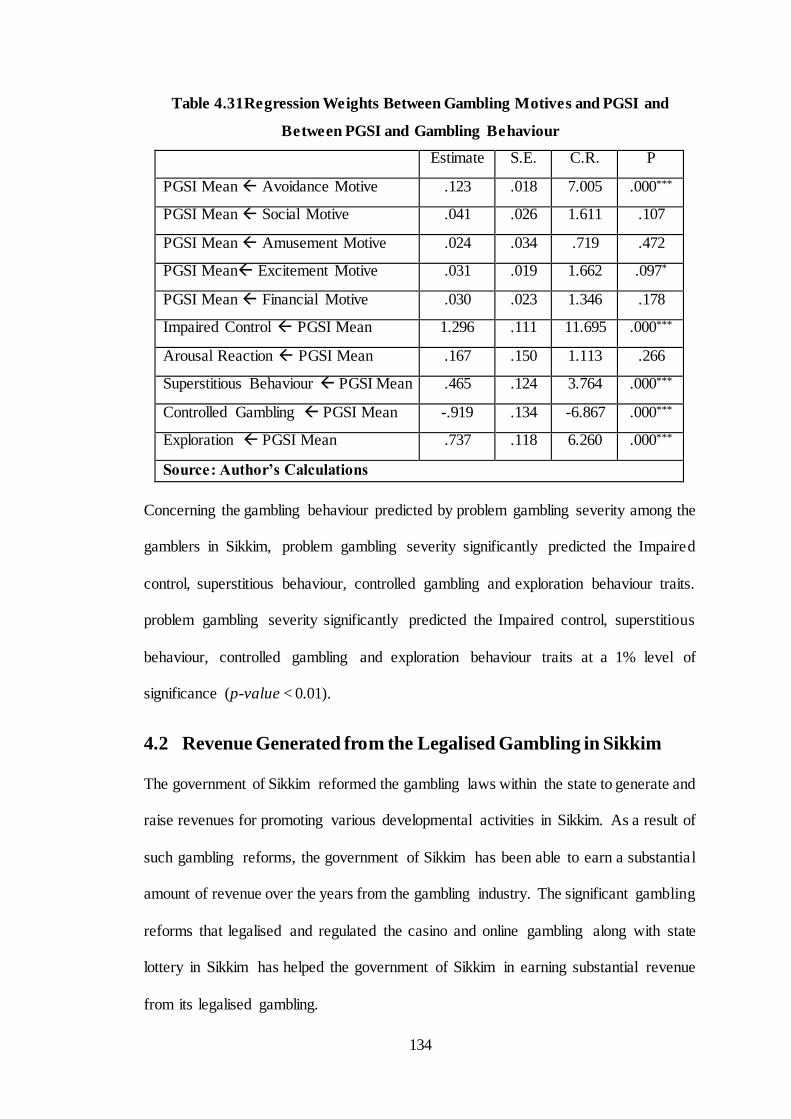
134
Table 4.31Regression Weights Between Gambling Motives and PGSI and
Between PGSI and Gambling Behaviour
Estimate S.E. C.R. P
PGSI Mean Avoidance Motive .123 .018 7.005 .000***
PGSI Mean Social Motive .041 .026 1.611 .107
PGSI Mean Amusement Motive .024 .034 .719 .472
PGSI Mean Excitement Motive .031 .019 1.662 .097*
PGSI Mean Financial Motive .030 .023 1.346 .178
Impaired Control PGSI Mean 1.296 .111 11.695 .000***
Arousal Reaction PGSI Mean .167 .150 1.113 .266
Superstitious Behaviour PGSI Mean .465 .124 3.764 .000***
Controlled Gambling PGSI Mean -.919 .134 -6.867 .000***
Exploration PGSI Mean .737 .118 6.260 .000***
Source: Author’s Calculations
Concerning the gambling behaviour predicted by problem gambling severity among the
gamblers in Sikkim, problem gambling severity significantly predicted the Impaired
control, superstitious behaviour, controlled gambling and exploration behaviour traits.
problem gambling severity significantly predicted the Impaired control, superstitious
behaviour, controlled gambling and exploration behaviour traits at a 1% level of
significance (p-value < 0.01).
4.2 Revenue Generated from the Legalised Gambling in Sikkim
The government of Sikkim reformed the gambling laws within the state to generate and
raise revenues for promoting various developmental activities in Sikkim. As a result of
such gambling reforms, the government of Sikkim has been able to earn a substantial
amount of revenue over the years from the gambling industry. The significant gambling
reforms that legalised and regulated the casino and online gambling along with state
lottery in Sikkim has helped the government of Sikkim in earning substantial revenue
from its legalised gambling.
135
The data related to the amount of revenue generated from Sikkim state Lotteries, Casino
and Online gaming has been collected from the Directorate of Sikkim State Lotteries,
Finance, Revenue, and Expenditure Department, Government of Sikkim. The following
section will present a detailed analysis of the amount of revenue generated from Sikkim
State Lotteries, Casino, and Online gaming.
4.2.1 Amount of Revenue Generated from Sikkim State Lotteries
Since the first lottery scheme was introduced in Sikkim in 1978 by the government of
Sikkim, the government has been organizing the lottery to generate and raise revenue
for investment in various developmental activities within the state. Sikkim state
lotteries are organized for a total of 24 draws per day, and a total of 6 bumper draws in
a calendar year, adhering to the rules outlined in the Lottery Regulation Rule, 2010.
Sikkim state lotteries are organized in both paper-based and online forms. Table 4.32
highlights the total amount of revenue generated from the Sikkim state lotteries during
the period between 2011-12 and 2017-18.
The legal lottery in Sikkim is generating a large sum of revenue for the state
government. During the period of analysis (between 2011-12 and 2017-18), the
government of Sikkim generated total revenue of Rs 2,274 million. Revenue generated
from the Sikkim state lottery has increased from Rs 286.3 million in 2011-12 to Rs
419.8 million in 2017-18. Only during the years 2014-15 (Rs 313.7 Million) and 2015-
16 (Rs 248.1 Million), the revenue generated from Sikkim state lottery has declined
from the previous year, with a sharp decline in revenue observed during 2015-16. Paper
lottery in Sikkim was suspended from July 2015 till June 2016, due to which the
revenue generated during 2015-16 witnessed a sharp decline in comparison to the
previous year. The revenue generated from the lotteries once again started to increase
following the period of suspension of the paper lotteries in Sikkim.
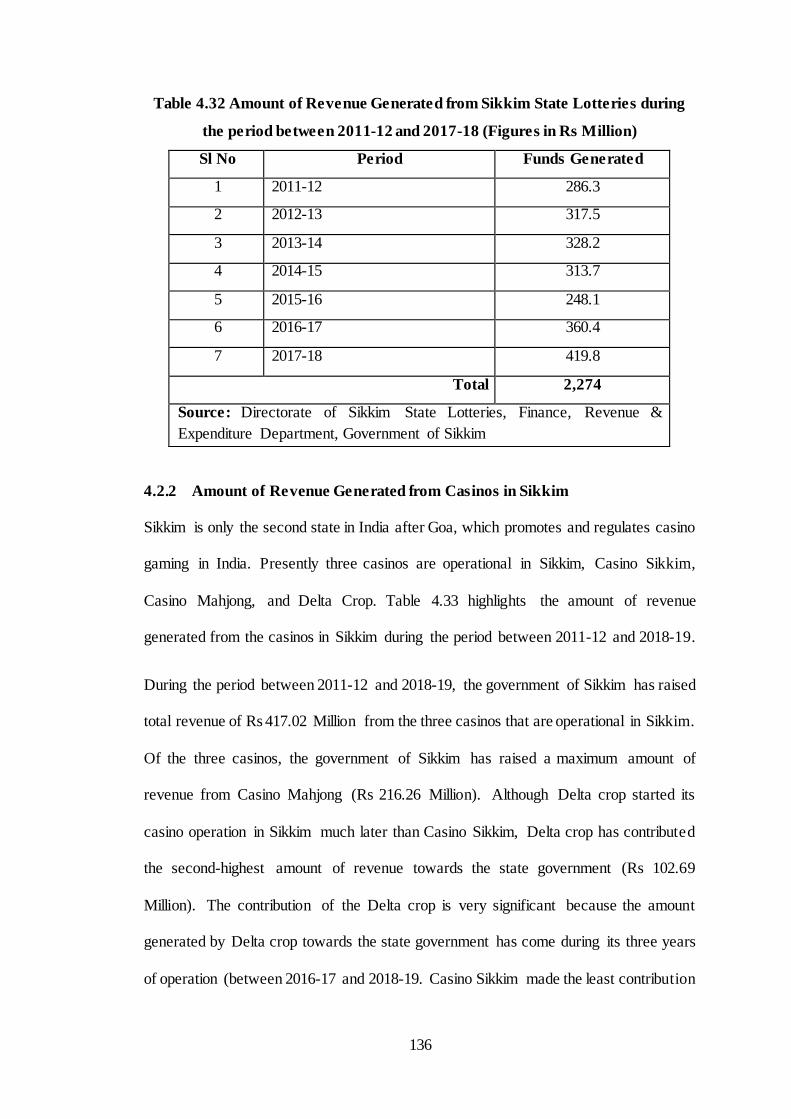
136
Table 4.32 Amount of Revenue Generated from Sikkim State Lotteries during
the period between 2011-12 and 2017-18 (Figures in Rs Million)
Sl No Period Funds Generated
1 2011-12 286.3
2 2012-13 317.5
3 2013-14 328.2
4 2014-15 313.7
5 2015-16 248.1
6 2016-17 360.4
7 2017-18 419.8
Total 2,274
Source: Directorate of Sikkim State Lotteries, Finance, Revenue &
Expenditure Department, Government of Sikkim
4.2.2 Amount of Revenue Generated from Casinos in Sikkim
Sikkim is only the second state in India after Goa, which promotes and regulates casino
gaming in India. Presently three casinos are operational in Sikkim, Casino Sikkim,
Casino Mahjong, and Delta Crop. Table 4.33 highlights the amount of revenue
generated from the casinos in Sikkim during the period between 2011-12 and 2018-19.
During the period between 2011-12 and 2018-19, the government of Sikkim has raised
total revenue of Rs 417.02 Million from the three casinos that are operational in Sikkim.
Of the three casinos, the government of Sikkim has raised a maximum amount of
revenue from Casino Mahjong (Rs 216.26 Million). Although Delta crop started its
casino operation in Sikkim much later than Casino Sikkim, Delta crop has contributed
the second-highest amount of revenue towards the state government (Rs 102.69
Million). The contribution of the Delta crop is very significant because the amount
generated by Delta crop towards the state government has come during its three years
of operation (between 2016-17 and 2018-19. Casino Sikkim made the least contribution
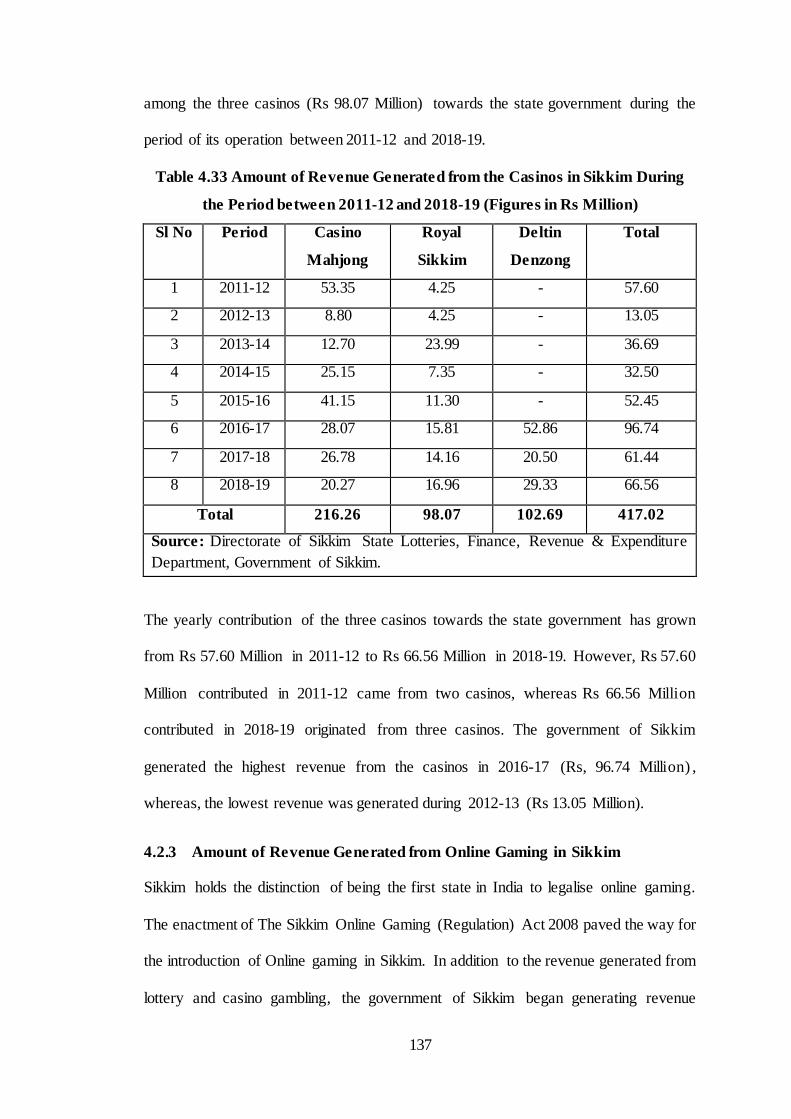
137
among the three casinos (Rs 98.07 Million) towards the state government during the
period of its operation between 2011-12 and 2018-19.
Table 4.33 Amount of Revenue Generated from the Casinos in Sikkim During
the Period between 2011-12 and 2018-19 (Figures in Rs Million)
Sl No Period Casino
Mahjong
Royal
Sikkim
Deltin
Denzong
Total
1 2011-12 53.35 4.25 - 57.60
2 2012-13 8.80 4.25 - 13.05
3 2013-14 12.70 23.99 - 36.69
4 2014-15 25.15 7.35 - 32.50
5 2015-16 41.15 11.30 - 52.45
6 2016-17 28.07 15.81 52.86 96.74
7 2017-18 26.78 14.16 20.50 61.44
8 2018-19 20.27 16.96 29.33 66.56
Total 216.26 98.07 102.69 417.02
Source: Directorate of Sikkim State Lotteries, Finance, Revenue & Expenditure
Department, Government of Sikkim.
The yearly contribution of the three casinos towards the state government has grown
from Rs 57.60 Million in 2011-12 to Rs 66.56 Million in 2018-19. However, Rs 57.60
Million contributed in 2011-12 came from two casinos, whereas Rs 66.56 Million
contributed in 2018-19 originated from three casinos. The government of Sikkim
generated the highest revenue from the casinos in 2016-17 (Rs, 96.74 Million) ,
whereas, the lowest revenue was generated during 2012-13 (Rs 13.05 Million).
4.2.3 Amount of Revenue Generated from Online Gaming in Sikkim
Sikkim holds the distinction of being the first state in India to legalise online gaming.
The enactment of The Sikkim Online Gaming (Regulation) Act 2008 paved the way for
the introduction of Online gaming in Sikkim. In addition to the revenue generated from
lottery and casino gambling, the government of Sikkim began generating revenue
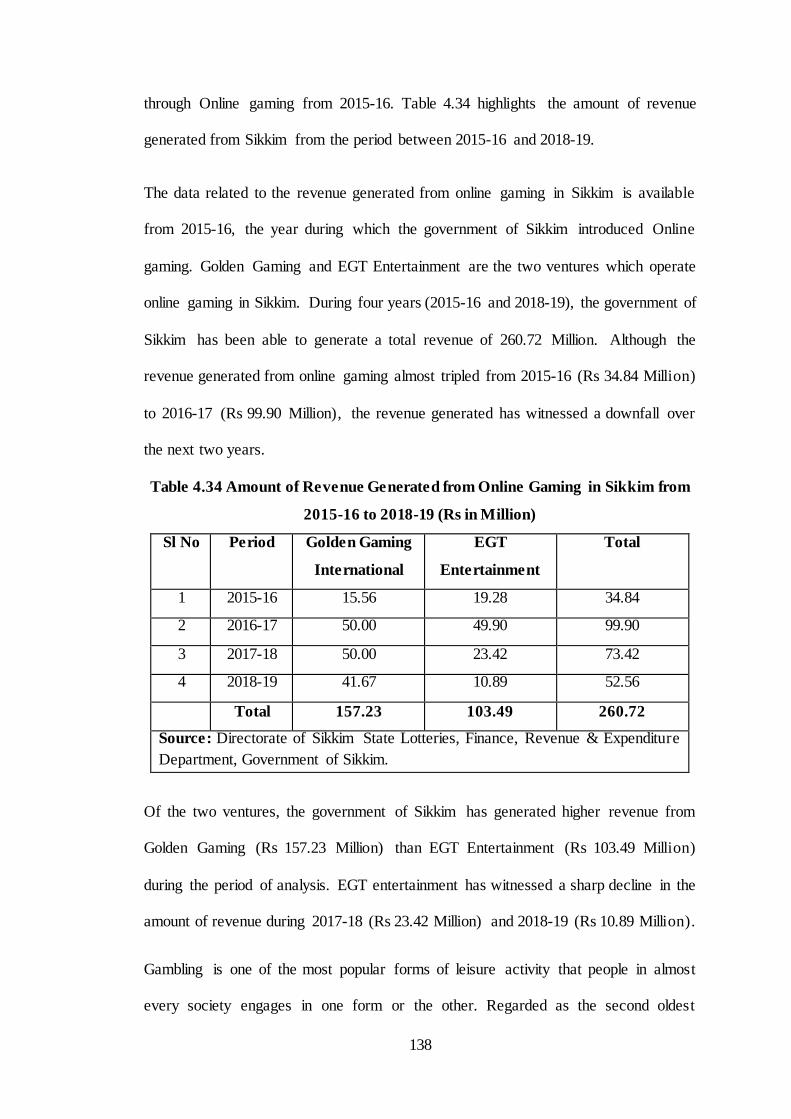
138
through Online gaming from 2015-16. Table 4.34 highlights the amount of revenue
generated from Sikkim from the period between 2015-16 and 2018-19.
The data related to the revenue generated from online gaming in Sikkim is available
from 2015-16, the year during which the government of Sikkim introduced Online
gaming. Golden Gaming and EGT Entertainment are the two ventures which operate
online gaming in Sikkim. During four years (2015-16 and 2018-19), the government of
Sikkim has been able to generate a total revenue of 260.72 Million. Although the
revenue generated from online gaming almost tripled from 2015-16 (Rs 34.84 Million)
to 2016-17 (Rs 99.90 Million), the revenue generated has witnessed a downfall over
the next two years.
Table 4.34 Amount of Revenue Generated from Online Gaming in Sikkim from
2015-16 to 2018-19 (Rs in Million)
Sl No Period Golden Gaming
International
EGT
Entertainment
Total
1 2015-16 15.56 19.28 34.84
2 2016-17 50.00 49.90 99.90
3 2017-18 50.00 23.42 73.42
4 2018-19 41.67 10.89 52.56
Total 157.23 103.49 260.72
Source: Directorate of Sikkim State Lotteries, Finance, Revenue & Expenditure
Department, Government of Sikkim.
Of the two ventures, the government of Sikkim has generated higher revenue from
Golden Gaming (Rs 157.23 Million) than EGT Entertainment (Rs 103.49 Million)
during the period of analysis. EGT entertainment has witnessed a sharp decline in the
amount of revenue during 2017-18 (Rs 23.42 Million) and 2018-19 (Rs 10.89 Million).
Gambling is one of the most popular forms of leisure activity that people in almost
every society engages in one form or the other. Regarded as the second oldest
139
profession in the world, the archaeological findings across different civilizations around
the globe suggest that gambling has been in existence throughout the centuries.
However, the engagement in gambling activities among the people has many different
adverse social and economic impacts. The social and economic effects of excessive
gambling not only affect the individual gamblers but also affects the people and the
family members living close to them and the society at large. As such, gambling impact
studies are pivotal, as it helps in identifying and evaluating the gambling reforms
existing within society and help to find out both the negative impact and the benefits
derived from gambling.
The present study is the first empirical study conducted in the state of Sikkim to identify
the gambling motives, prevalence rate of problem gambling and the gambling
behaviour among the gamblers in Sikkim. Sikkim being only the second state in India
after Goa, where almost every forms of gambling is legal, is an ideal state for
performing such studies.
Among the few studies that are conducted to identify the prevalence rate of problem
gambling in India, the prevalence rate of problem gambling is the highest among the
gamblers gambling in Sikkim. The prevalence rate of 14.55% is the highest recorded
prevalence rate of problem gambling that has ever been recorded in India . This could
be due to the easy accessibility of the gambling games among the gamblers gambling
in Sikkim. But it is important to note that in the present study, the sample consists of
gamblers who had participated in at least one form of gambling in the past 12 months
during the period of data collection.
Concerning the demographic profile of the problem gamblers in Sikkim, the prevalence
rate of problem gambling is found high among the male gamblers . Problem gamblers
140
are more likely to be within the age group of 35-44 years, followed by 25-34 years.
They are more likely to be married and single rather than divorced or widower/widow.
Among the gamblers in Sikkim, problem gambling is more likely to be among the
gamblers who are self-employed and those gamblers who have an educational
qualification of 12th or below.
Concerning the economic returns of the legalised gambling in Sikkim, the government
of Sikkim has been generating a large sum of revenue from its gambling industry. In a
state like Sikkim, where the key sectors are agriculture and tourism, the development
of the gambling industry has helped the government of Sikkim to boost its economy.
The government of Sikkim during the period between 2011-12 and 2017-18 have
generated Rs 2,274 Million from its legalised state lottery. During the period between
2011-12 and 2018-19, the government of Sikkim generated a sum of Rs 417.02 Million
from its Casino industry. While online gaming in Sikkim stated from 2015-16, the
government of Sikkim generated a sum of Rs 260.72 Million during the period between
2015-16 and 2018-19 from online gaming. Looking at the amount of revenue generated
from the legalised gambling in Sikkim, the economic returns to the state has been
immense.
The result of this study confirms the presence of problem gambling among the gamblers
in Sikkim. As such the government should play its role in intervening and controlling
the growth of prevalence rate of problem gambling in the state. The government should
intervene and come up with a public health approach that will help reduce gambling-
related harm.
141
To prevent gambling-related harms, George et al. (2017) have proposed a three-level
prevention strategy consisting of primary, secondary, and tertiary levels of prevention.
The approach proposed by George et al. (2017) are as follows:
1. Primary prevention measure: In this level, the main aim is to target all the
gamblers and non-gamblers together and help prevent gambling from becoming
a problem. Gambling can be prevented from becoming a problem by raising
awareness about gambling-related harms, limiting the availability of gambling
opportunities, restricting and limiting promotions and advertisement of
gambling products, and through legislative and regulatory frameworks, where
risk factors including low-income groups, unemployment, age, and mental
health problems are identified and addressed.
2. Secondary Prevention Measure: the secondary prevention measure includes
the identification of the at-risk and problem gamblers who are reluctant to speak
out about their gambling problems. According to George et al. (2017), reducing
the size of the prize money and attractiveness of gambling machines can help
gamblers to reduce their gambling habits. Also, giving training to the staff
working in gambling houses and the health care workers can assist in identifying
early signs of problem gambling among the gamblers.
3. Tertiary Prevention Measure: Tertiary prevention measure is for those
gamblers and the family members and close ones who are experiencing harm
from gambling habits of the gamblers. Providing psychological and cognitive
behaviour therapy can help prevent gambling-related harms among the
gamblers and their family members.
An approach similar to the one provided by George et al. (2017) can be adopted by the
government of Sikkim in dealing with the issues of problem gambling . However,
142
designing such an approach towards dealing with the issue of problem gambling and
gambling-related harms is a challenge and requires further studies and planning on the
matters related to identifying problem gambling and gambling-related harms.
In retrospect, the government of Sikkim, through the amendment of Sikkim Online
Gaming (Regulation) Rules 2009, has already prohibited the entry of the local
Sikkimese people inside of the Gaming zones in Sikkim in 2018. The prohibition of the
local people inside the gaming zones will help in minimizing the problem of gambling
among the gamblers in Sikkim. However, the local people in Sikkim still have access
to online forms of gambling, notably through small online gaming houses, purchase of
lottery tickets, and gambling during the festive fairs organized in Sikkim. As such, easy
accessibility to gambling does pose a threat to an increase in the prevalence rate of
problem gambling in Sikkim and a subsequent rise in gambling-related harms among
the gamblers. As such, constituting and developing an approach to deal with the
increase in the prevalence of problem gambling is a challenge in Sikkim and needs
attention before the problem manifests and reaches beyond everyone's control.
143
CHAPTER 5. FINDINGS, SUGGESTIONS AND
CONCLUSION
5.1 Findings of the Study
Some of the findings of the present study are as follows:
1. The result of the Confirmatory Factor Analysis identified five different
gambling motives among the gamblers gambling in Sikkim, which is similar to
gambling motives identified by Lee et al. (2007). The five identified gambling
motives are Avoidance, Social, Amusement, Financial and Excitement Motives.
2. The 19 items five factor model was more appropriate in capturing the gambling
motives of gamblers in Sikkim than the 35-items as proposed by Lee et al.
(2007).
3. The prevalence rate of problem gambling of 14.55% identified among the
gamblers gambling in Sikkim is the highest prevalence rate of problem
gambling ever recorded in India. A higher prevalence of problem gambling may
be because the sample consisted of only the gamblers who were actively
participating in some forms of gambling, and many of the gamblers do have
easy accessibility to legal gambling in Sikkim. However, the prevalence rate of
14.55% is still high, and efforts are required to control the further growth of
problem gambling in Sikkim.
4. One of the worrying statistics regarding the problem gambling severity among
the gamblers gambling in Sikkim is the prevalence rate of moderate-risk
gamblers, with as many as 43.12% of the respondents covered in the survey
categorized as moderate-risk gamblers. The percentage of moderate-risk
gamblers is very high and requires immediate attention to the problem. In the
144
due passage of time, if these gamblers continue with their same gambling habit,
may become a problem gambler, and start experiencing gambling-related harms
to himself and his family members and the society.
5. In the present study, the prevalence of problem gambling was found only among
the male gamblers. The findings of the study are similar to the study by George
et al. (2016) and Jaisoorya et al. (2017). In their study, George et al. (2016) and
Jaisoorya et al. (2017) found that problem gambling among Indian gamblers to
be more likely among male gamblers than female gamblers.
6. Every legal form of gambling covered in the study was significantly associated
with problem gambling severity among the gamblers gambling in Sikkim.
Tambola, Online gaming, Sports betting, and the Sikkim state lottery was
significantly associated with problem gambling severity at a 1% level of
significance (p-value<0.01), and Casino gaming was significantly associated
with problem gambling severity at a 5% level of significance (p-value<0.05).
7. Concerning the frequency of gambling among the gamblers gambling in
Sikkim, the highest prevalence rate of problem gambling was identified among
the gamblers gambling more than four times a month (49.32%). The lowest
prevalence rate of problem gambling was identified among gamblers gambling
occasionally (4.11%).
8. Among the five identified gambling motives, only avoidance and excitement
motive significantly predicted the prevalence of problem gambling severity
among the gamblers in Sikkim. The avoidance motive significantly predicted
the prevalence of problem gambling severity at a 1% level of significance and
the excitement motive significantly predicted the prevalence of problem
gambling severity at a 10% level of significance.
145
9. As opposed to the six gambling behaviour traits identified by Tao et al. (2011),
the present study identified five gambling behaviour traits among the gamblers
gambling in Sikkim. The five identified behaviour traits are Impaired control,
Gambling involvement, Controlled gambling, Superstitious behaviour, and
exploration.
10. Problem gambling severity significantly predicted the four behavioural traits
among the gamblers in Sikkim. Impaired Control, Superstitious Behaviour, and
exploration were significantly predicted by problem gambling severity at a 1%
level of significance (p-value<0.01). Gambling Involvement behaviour was
also significantly predicted (p-value<0.05) by problem gambling severity at a
5% level of significance.
11. Concerning the amount of revenue generated from legalised gambling in Sikkim
the government of Sikkim generated a sum of:
I. Rs 2,274 Million during the period between 2011-12 and 2017-18
generated from its legalised state lottery.
II. Rs 417.02 Million during the period between 2011-12 and 2018-19 from
its Casino industry.
III. Rs 260.72 Million during the period between 2015-16 and 2018-19 from
online gaming.
5.1.1 Summary of Testing of Hypothesis
The test of a hypothesis performed in the present study are highlighted in Table 5.1.
Among all the hypothesis that was tested, the Null hypothesis H0a: There is no factor
defining the gambling motives other than those mentioned in the conceptual
framework was the only null hypothesis that was not rejected.
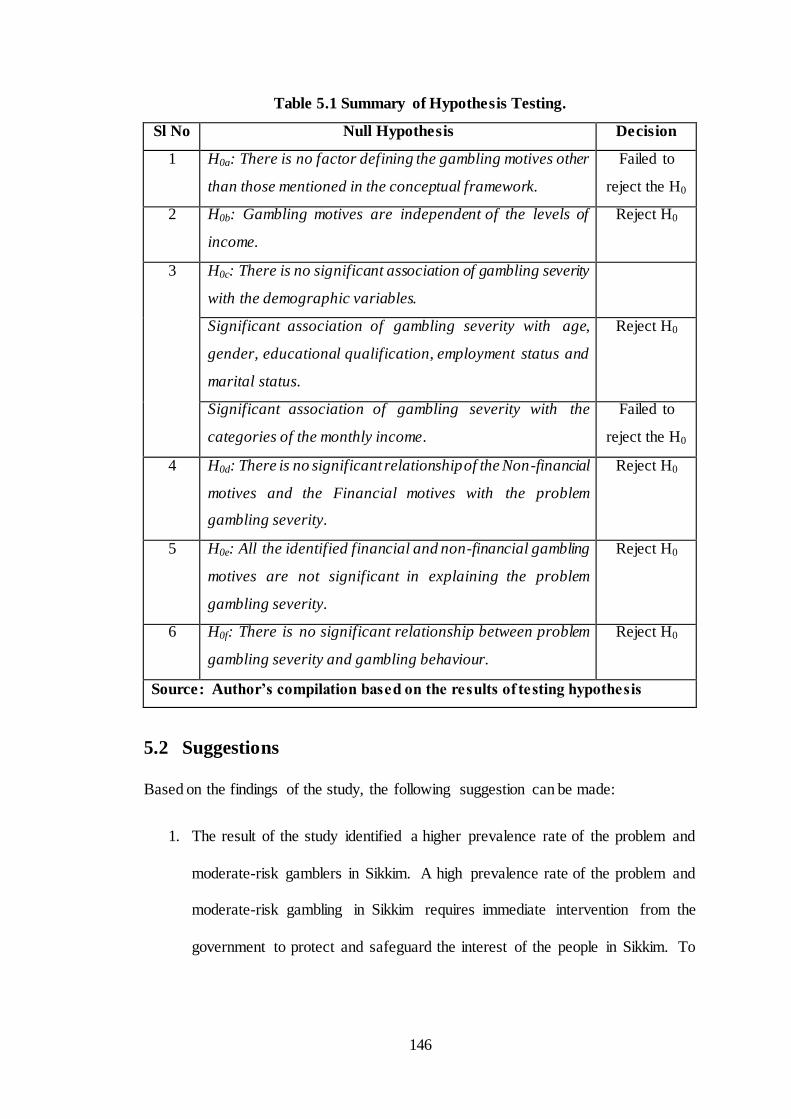
146
Table 5.1 Summary of Hypothesis Testing.
Sl No Null Hypothesis Decision
1 H0a: There is no factor defining the gambling motives other
than those mentioned in the conceptual framework.
Failed to
reject the H0
2 H0b: Gambling motives are independent of the levels of
income.
Reject H0
3 H0c: There is no significant association of gambling severity
with the demographic variables.
Significant association of gambling severity with age,
gender, educational qualification, employment status and
marital status.
Reject H0
Significant association of gambling severity with the
categories of the monthly income.
Failed to
reject the H0
4 H0d: There is no significant relationship of the Non-financial
motives and the Financial motives with the problem
gambling severity.
Reject H0
5 H0e: All the identified financial and non-financial gambling
motives are not significant in explaining the problem
gambling severity.
Reject H0
6 H0f: There is no significant relationship between problem
gambling severity and gambling behaviour.
Reject H0
Source: Author’s compilation based on the results of testing hypothesis
5.2 Suggestions
Based on the findings of the study, the following suggestion can be made:
1. The result of the study identified a higher prevalence rate of the problem and
moderate-risk gamblers in Sikkim. A high prevalence rate of the problem and
moderate-risk gambling in Sikkim requires immediate intervention from the
government to protect and safeguard the interest of the people in Sikkim. To
147
minimise the issue related to a higher prevalence rate of problem gambling, the
government can adopt the following strategies:
I. Organize awareness campaign on the impact of excessive gambling on
the mental, emotional and physical well-being of the gamblers and its
influence on their family members and the society.
II. Make it mandatory for all the gambling houses in Sikkim to have posters
and frame that describes and discuss about the harmful effects of
excessive gambling.
III. Minimise access to gambling and gambling products. Small online
gaming houses and the sale of lottery tickets should be closed during the
dry days, state and national holidays, which will minimise the
opportunity for gambling for the local people from Sikkim. However,
casinos can be exempted from being closed down during the dry day,
state, and national holidays, as the locals from Sikkim are not allowed
to visit the casinos for gaming purposes.
2. During the period of data collection, it was observed that the adolescents23 had
access to gambling in the fairs organized during the festival of Maghe Sankranti.
There is a need for strong vigilance during such fairs to restrict access to
gambling to the adolescents.
3. Problem gambling is a public health issue and is prevalent among gamblers in
India. However, George & Jaisoorya (2016), in their study on Indian
psychiatrists, identified that many psychiatrists in India do not possess the
requisite knowledge and skills to handle the issues of problem gambling.
23 Any person who falls between the age group of 10 and 19 years as defined by the World Health Organisation.
148
George & Jaisoorya (2016) found out that only 19.1% of the psychiatrist in India
had the requisite knowledge and skill to deal with the issue of problem
gambling. It is a source of primary concern, and as such, efforts should be made
towards providing training and knowledge to the psychiatrist to deal with the
issue of problem gambling.
4. The legalisation of gambling and gambling products has a significant impact on
the vulnerable sections of society. As such, there is a need for further research
in this field to identify the people who are most affected by legalised gambling
and ensure safety measures to safeguard and protect the interest of the people
belonging to the vulnerable sections of society.
5.3 Policy Implications
Gambling is a sensitive topic that will continue being a matter of discussion and debate
among the proponents and opponents of gambling. Even if gambling continues to divide
the opinions of people living in a society, it will cease to exist in one form or the other.
In many Indian societies, cultures, and religions, gambling is considered an immoral
activity and frowned upon, and yet, gambling has been a part of the Indian culture since
ancient ages. The ever-presence of gambling and gambling products warrants a need
for identifying the various social and economic issues related to gambling and framing
policies to subdue the negative impact of gambling within a society.
Sikkim is one of the most liberal states in India when it comes to gambling and
gambling products. Sikkim, along with the state of Goa, has become a premier
destination for gambling in India. Through the liberal reforms of gambling laws and the
development of Casinos and online gaming, the state of Sikkim has gone on to serve
and cater to the needs and demands of the gamblers in India.
149
The findings of the study highlight the most significant issue concerning the prevalence
of problem gambling. Problem gambling is a public health issue and requires the
immediate attention of the policymakers, shareholders, and all the stakeholders
associated with the gambling industry. A high rate of prevalence of problem gambling
and even a higher rate of moderate-risk gambling in Sikkim is a matter of great concern
for the state.
To address the issue of the prevalence of problem gambling among the gamblers
gambling in Sikkim, the government should come with an approach to reform the
existing laws within the state. The government's role in prohibiting the entry of local
Sikkimese people into Casinos and the gaming parlour in Sikkim through the
amendment of Sikkim Online Gaming (Regulation) Rules, 2009 deserves immense
appreciation. But still, people in Sikkim do have access to other forms of gambling. As
such government should ensure that they limit the opportunity for gambling and
gambling products limit the frequency of gambling plays among the gamblers in
Sikkim.
5.4 Conclusion
Gambling is a sensitive issue and evokes plenty of debate when it comes to the question
of whether to legalise it or not. In a country like India, where gambling has been a part
of its culture throughout history, banning gambling entirely may not be a viable solution
to the problem. Irrespective of bans on gambling and gambling products in many
different states in India, one can see that the illegal gambling and betting industry has
been flourishing in India, which is a much bigger problem.
Sikkim, as a state, has been very progressive towards gambling and gambling products.
Along with the state of Goa, Sikkim is the premier destination for gambling in India.
150
The gambling reforms and the legalisation of casino and online gaming has helped the
government of Sikkim to generate a large sum of revenue for the state. The development
of Casinos and online gaming parlours and the sale of lottery tickets in Sikkim has also
helped the government to create employment opportunities for the people. These are
some of the economic benefits which every state derives from having a legal gambling
avenue within the state.
However, identification of social issues related to the legalisation of gambling and
gambling products is essential to judge the overall impact legal gambling is having on
society. Gambling has been present in Sikkim, even before Sikkim became the 22nd
state of India in 1975. But there has not been a study in Sikkim that sought to identify
the prevalence rate of problem gambling among the gamblers in Sikkim. With such
liberal laws and the availability of legal gambling avenues in Sikkim, gambling impact
studies are essential to understand the social and economic impact of legalised
gambling in Sikkim. Such studies will help the government in identifying issues related
to gambling and its adverse consequence on gamblers, their families, and society.
Identifying the problem will help the government and the policymakers in formulating
laws and practices that will help prevent the adverse effect of gambling.
151
References
Abbott, M., Stone, C. A., Billi, R., & Yeung, K. (2016). Gambling and Problem
Gambling in Victoria, Australia: Changes over 5 years. Journal of Gambling
Studies, 32(1), 47–78. https://doi.org/10.1007/s10899-015-9542-1
Abbott, M. W., & Volberg, R. A. (1996). The New Zealand national survey of problem
and pathological gambling. Journal of Gambling Studies, 12(2), 143–160.
https://doi.org/10.1007/BF01539171
Afifi, T. O., Cox, B. J., Martens, P. J., Sareen, J., & Enns, M. W. (2010a). Demographic
and social variables associated with problem gambling among men and women in
Canada. Psychiatry Research, 178(2), 395–400.
https://doi.org/10.1016/j.psychres.2009.10.003
Afifi, T. O., Cox, B. J., Martens, P. J., Sareen, J., & Enns, M. W. (2010b). The Relation
Between Types and Frequency of Gambling Activities and Problem Gambling
Among Women in Canada. The Canadian Journal of Psychiatry, 55(1), 21–28.
https://doi.org/10.1177/070674371005500104
American Psychiatric Association. (2013). Diagnostic and statistical manual of mental
disorders (5th ed.).
Anderson, T. L., Rempusheski, V. F., & Leedy, K. N. (2018). Casino Gambling and the
Family: Exploring the Connections and Identifying Consequences. Deviant
Behavior, 39(9), 1109–1119. https://doi.org/10.1080/01639625.2017.1409484
Arthur, D., Tong, W. L., Chen, C. P., Hing, A. Y., Sagara-Rosemeyer, M., Kua, E. H.,
& Ignacio, J. (2008). The Validity and Reliability of Four Measures of Gambling
Behaviour in a Sample of Singapore University Students. Journal of Gambling
152
Studies, 24(4), 451–462. https://doi.org/10.1007/s10899-008-9103-y
Banks, J., Andersson, C., Best, D., Edwards, M., & Waters, J. (2018). Families Living
with Problem Gambling : Impacts , Coping Strategies and Help- Seeking.
Retrieved from https://about.gambleaware.org/
Barrault, S., Bonnaire, C., & Herrmann, F. (2017). Anxiety, Depression and Emotion
Regulation Among Regular Online Poker Players. Journal of Gambling Studies,
33(4), 1039–1050. https://doi.org/10.1007/s10899-017-9669-3
Basham, P., & White, K. (2002). Gambling with Our Future ? The Costs and Benefits
of Legalized Gambling.
Battersby, M. W., Thomas, L. J., Tolchard, B., & Esterman, A. (2002). The South Oaks
Gambling Screen: A Review with Reference to Australian Use. Journal of
Gambling Studies, 18(3), 257–271. https://doi.org/10.1023/A:1016895221871
Beckett, S. (2018). Union Gaming: Goa Casinos Could Generate $1 Billion in Annual
Gross Revenue. Retrieved from https://www.casino.org/news/goa-casinos-could-
generate-1-billion-in-annual-gross-revenue/
Benegal, V. (2013). Gambling experiences, problems and policy in India: A historical
analysis. Addiction, 108(12), 2062–2067. https://doi.org/10.1111/j.1360-
0443.2012.04068.x
Bhatia, U., Bhat, B., George, S., & Nadkarni, A. (2019). The prevalence, patterns, and
correlates of gambling behaviours in men: An exploratory study from Goa, India.
Asian Journal of Psychiatry, 43(March), 143–149.
https://doi.org/10.1016/j.ajp.2019.03.021
Bhide, A. V. (2007). Compulsive Gambling in Ancient Indian Texts. Indian Journal of
153
Psychiatry, 49(4), 294–295. https://doi.org/10.4103/0019-5545.37674
Binde, P. (2011). What are the most harmful forms of gambling? Analyzing problem
gambling prevalence surveys. CEFOS Working Paper 12, pp. 1–27. Retrieved
from http://www.cefos.gu.se/digitalAssets/1327/1327132_cefos-wp12.pdf
Binde, P. (2013). Why people gamble : a model with five motivational dimensions.
International Gambling Studies, 13(1), 81–97.
https://doi.org/10.1080/14459795.2012.712150
Binde, P., Romild, U., & Volberg, R. A. (2017). Forms of gambling, gambling
involvement and problem gambling: evidence from a Swedish population survey.
International Gambling Studies, 17(3), 490–507.
https://doi.org/10.1080/14459795.2017.1360928
Botelho, A. (2018). Casinos in Goa: The Challenge Ahead is to Implement Sustainable
Strategies to Minimize Their Ill-Effects. International Journal of Hospitality and
Tourism Systems, 11(2), 56–62. https://doi.org/10.26643/rb.v117i11.3884
Bussu, A., & Detotto, C. (2015). The bidirectional relationship between gambling and
addictive substances. International Gambling Studies, 15(2), 285–308.
https://doi.org/10.1080/14459795.2015.1042493
Canale, N., Griffiths, M. D., Vieno, A., Siciliano, V., & Molinaro, S. (2016). Impact of
Internet gambling on problem gambling among adolescents in Italy: Findings from
a large-scale nationally representative survey. Computers in Human Behavior, 57,
99–106. https://doi.org/10.1016/j.chb.2015.12.020
Castrén, S., Basnet, S., Pankakoski, M., Ronkainen, J. E., Helakorpi, S., Uutela, A., …
Lahti, T. (2013). An analysis of problem gambling among the Finnish working-
154
age population: A population survey. BMC Public Health, 13(1), 1–9.
https://doi.org/10.1186/1471-2458-13-519
Cavalera, C., Bastiani, L., Gusmeroli, P., Fiocchi, A., Pagnini, F., Molinari, E., …
Molinaro, S. (2018). Italian Adult Gambling Behavior : At Risk and Problem
Gambler Profiles. Journal of Gambling Studies, 34(3), 647–657.
https://doi.org/10.1007/s10899-017-9729-8
Chan, C. C., Li, W. W. L., & Leung, E. C. I. (2016). The State of Gambling in Hong
Kong and Macao. In Problem Gambling in Hong Kong and Macao: Etiology,
Prevalence and Treatment (pp. 37–59). https://doi.org/10.1007/978-981-10-1068-
2
Chantal, Y., Vallerand, R. J., & Vallieres, E. F. (1995). Motivation and Gambling
Involvement. The Journal of Social Psychology, Vol. 135, pp. 755–763.
https://doi.org/10.1080/00224545.1995.9713978
Chhabra, D. (2007). Estimating benefits and costs of casino gambling in Iowa, United
States. Journal of Travel Research, 46(2), 173–182.
https://doi.org/10.1177/0047287507299591
Chóliz, M., Marcos, M., & Lázaro-Mateo, J. (2019). The Risk of Online Gambling: a
Study of Gambling Disorder Prevalence Rates in Spain. International Journal of
Mental Health and Addiction. https://doi.org/10.1007/s11469-019-00067-4
Clark, L. (2014). Disordered gambling: The evolving concept of behavioral addiction.
Annals of the New York Academy of Sciences, 1327(1), 46–61.
https://doi.org/10.1111/nyas.12558
Clarke, D. (2004). Impulsiveness, Locus of Control, Motivation and Problem
155
Gambling. Journal of Gambling Studies, 20(4), 319–345.
https://doi.org/10.1007/s10899-004-4578-7
Clarke, D., Tse, S., Abbott, M. W., Townsend, S., Kingi, P., & Manaia, W. (2007).
Reasons for Starting and Continuing Gambling in a Mixed Ethnic Community
Sample of Pathological and Non-problem Gamblers. International Gambling
Studies, 7(3), 299–313. https://doi.org/10.1080/14459790701601455
Comptroller and Auditor General of India. (2017). Performance Audit on Sikkim State
Lotteries.
Cormack, R. (2018). A Brief History of Gambling. Retrieved from
https://medium.com/edgefund/a-brief-history-of-gambling-a7f46dbf4403
Costes, J., Kairouz, S., Monson, E., & Eroukmanof, V. (2018). Where Lies the Harm
in Lottery Gambling? A Portrait of Gambling Practices and Associated Problems.
Journal of Gambling Studies, 34(4), 1293–1311. https://doi.org/10.1007/s10899-
018-9761-3
Cox, B. J., Yu, N., Afifi, T. O., & Ladouceur, R. (2005). A National Survey of
Gambling Problems in Canada. Canadian Journal of Psychiatry, 50(4), 213–217.
https://doi.org/10.1177/070674370505000404
Currie, S. R., Hodgins, D. C., & Casey, D. M. (2013). Validity of the Problem Gambling
Severity Index Interpretive Categories. Journal of Gambling Studies, 29(2), 311–
327. https://doi.org/10.1007/s10899-012-9300-6
Dechant, K. (2014). Show Me the Money: Incorporating Financial Motives into the
Gambling Motives Questionnaire. Journal of Gambling Studies, 30(4), 949–965.
https://doi.org/10.1007/s10899-013-9386-5
156
Dechant, K., & Ellery, M. (2011). The Effect of Including a Monetary Motive Item on
the Gambling Motives Questionnaire in a Sample of Moderate Gamblers. Journal
of Gambling Studies, 27(2), 331–344. https://doi.org/10.1007/s10899-010-9197-x
Delfabbro, P. (2013). Problem and Pathological Gambling: A Conceptual Review. The
Journal of Gambling Business and Economics, 7(3), 35–53.
https://doi.org/10.5750/jgbe.v7i3.817
Dickson-Swift, V. A., James, E. L., & Kippen, S. (2005). The experience of living with
a problem gambler: Spouses and partners speak out. Journal of Gambling Issues,
(13), 1–12. https://doi.org/10.4309/jgi.2005.13.6
Downs, C., & Woolrych, R. (2010). Gambling and debt: The hidden impacts on family
and work life. Community, Work and Family, 13(3), 311–328.
https://doi.org/10.1080/13668803.2010.488096
Dufour, M., Morvannou, A., Brunelle, N., & Roy, É. (2018). Are Poker Players Aware
of the Change in Their Poker Habits? Point of View of the Players and the PGSI.
International Journal of Mental Health and Addiction , 16(5), 1140–1155.
https://doi.org/10.1007/s11469-017-9837-9
Duvarci, I., Varan, A., Coskunol, H., & Ersoy, M. A. (1997). DSM-IV and the South
Oaks Gambling Screen : Diagnosing and Assessing Pathological Gambling in
Turkey. Journal of Gambling Studies, 13(3), 193–206.
https://doi.org/10.1023/A:1024927115449
Effertz, T., Bischof, A., Rumpf, H. J., Meyer, C., & John, U. (2018). The effect of
online gambling on gambling problems and resulting economic health costs in
Germany. The European Journal of Health Economics, 19(7), 967–978.
https://doi.org/10.1007/s10198-017-0945-z
157
Fact Research Inc. (1974). Gambling in Perspective: A Review of the Written History
of Gambling and an Assessment of its Effect on Modern American Society.
Retrieved from https://www.ncjrs.gov/pdffiles1/Digitization/44064NCJRS.pdf
Ferris, J., & Wynne, H. (2001). The Canadian Problem Gambling Index : Final report.
In Canadian Centre on Substance Abuse.
Field, A. (2009). Discovering statistics using SPSS (and sex and drugs and rock’ n’
roll) (3rd ed.). Sage.
Flack, M., & Morris, M. (2014). Problem Gambling: One for the Money…? Journal of
Gambling Studies, 31(4), 1561–1578. https://doi.org/10.1007/s10899-014-9484-z
Francis, K. L., Dowling, N. A., Jackson, A. C., Christensen, D. R., & Wardle, H. (2015).
Gambling motives: Application of the reasons for gambling questionnaire in an
Australian population survey. Journal of Gambling Studies, 31(3), 807–823.
https://doi.org/10.1007/s10899-014-9458-1
G3 Newswire. (2014). G3-247 Report Searching for Symmetry. 46–62. Retrieved from
https://g3newswire.com/magazines/g3-september-2014/
Gainsbury, S. M., Russell, A., Wood, R., Hing, N., & Blaszczynski, A. (2015). How
risky is Internet gambling? A comparison of subgroups of Internet gamblers based
on problem gambling status. New Media and Society, 17(6), 861–879.
https://doi.org/10.1177/1461444813518185
Gambling Global Market Opportunities And Strategies To 2022. (2019). Retrieved
from The Business Research Company website: www.researchandmarkets.com
George, S., Jaisoorya, T., Nair, S., Rani, A., Menon, P., Madhavan, R., … Petry, N. M.
(2016). A cross-sectional study of problem gambling and its correlates among
158
college students in South India. BJPsych Open, 2(3), 199–203.
https://doi.org/10.1192/bjpo.bp.115.002519
George, S., & Jaisoorya, T. S. (2016). Gambling addiction in India: A survey of Indian
psychiatrists. Internet Journal of Medical Update, 11(2), 7–10.
https://doi.org/10.4314/ijmu.v11i2.3
George, S., Velleman, R., & Nadkarni, A. (2017). Gambling in India: Past, present and
future. Asian Journal of Psychiatry, 26(2017), 39–43.
https://doi.org/10.1016/j.ajp.2017.01.018
Gonmei, P. (2016). Adolescent Gambling In Imphal (Manipur), India. IOSR Journal Of
Humanities And Social Science, 21(1), 32–57. https://doi.org/10.9790/0837-
21153257
Goodie, A. S. (2015). Associations Between Gambling Games and Gambling
Problems: Whole Games Compared with Temporal, Skill Characteristics, and
Other Structural Characteristics. Current Addiction Reports, 2(3), 249–253.
https://doi.org/10.1007/s40429-015-0068-5
Goodwin, B. C., Browne, M., Rockloff, M., & Rose, J. (2017). A typical problem
gambler affects six others. International Gambling Studies, 17(2), 276–289.
https://doi.org/10.1080/14459795.2017.1331252
Griffiths, M. (2004). Betting Your Life On It: Problem Gambling Has Clear Health
Related Consequences. BMJ: British Medical Journal, 329(7474), 1055–1056.
Griffiths, M., & Barnes, A. (2008). Internet Gambling : An Online Empirical Study
Among Student Gamblers. International Journal of Mental Health and Addiction,
8(1), 194–204. https://doi.org/10.1007/s11469-007-9083-7
159
Griffiths, M., Parke, J., Wood, R., & Rigbye, J. (2010). Online Poker Gambling in
University Students: Further Findings from an Online Survey. International
Journal of Mental Health and Addiction , 8(1), 82–89.
https://doi.org/10.1007/s11469-009-9203-7
Grinols, E. L. (2011). The Hidden Social Costs of Gambling. The Gambling Culture,
19–28. Retrieved from
http://www.baylor.edu/content/services/document.php/144584.pdf
Gupta, R., & Derevensky, J. (1997). Familial and Social Influences on Juvenile
Gambling Behavior. Journal of Gambling Studies, 13(3), 179–192.
https://doi.org/10.1023/A:1024915231379
Hair, J. F., Black, W. C., Babin, B. J., & Anderson, R. E. (2015). Multivariate Data
Analysis (Seventh). Pearson India Education Services Pvt Ltd.
Hanss, D., Mentzoni, R. A., Delfabbro, P., Myrseth, H., & Pallesen, S. (2014). Attitudes
toward gambling among adolescents. International Gambling Studies, 14(3), 505–
519. https://doi.org/10.1080/14459795.2014.969754
Holdsworth, L., Nuske, E., Tiyce, M., & Hing, N. (2013). Impacts of gambling
problems on partners: partners’ interpretations. Asian Journal of Gambling Issues
and Public Health, 3(1), 11. https://doi.org/10.1186/2195-3007-3-11
Holtgraves, T. (2009a). Evaluating the Problem Gambling Severity Index. Journal of
Gambling Studies, 25(1), 105–120. https://doi.org/10.1007/s10899-008-9107-7
Holtgraves, T. (2009b). Gambling, Gambling Activities, and Problem Gambling.
Psychology of Addictive Behaviors, 23(2), 295–302.
https://doi.org/10.1037/a0014181
160
Hopley, A. A. B., Dempsey, K., & Nicki, R. (2012). Texas Hold’em Online Poker: A
Further Examination. International Journal of Mental Health and Addiction,
10(4), 563–572. https://doi.org/10.1007/s11469-011-9353-2
Jaisoorya, T. S., Beena, K. V., Beena, M., Ellangovan, K., Thennarassu, K., Bowden-
Jones, H., … George, S. (2017). Do High School Students in India Gamble? A
Study of Problem Gambling and Its Correlates. Journal of Gambling Studies,
33(2), 449–460. https://doi.org/10.1007/s10899-016-9651-5
Jha, I., & Dey, S. (2014). Legalization of Gambling on Outcomes of Sporting Events -
A Farcical Solution To an Uncontrollable Problem? Nirma University Law
Journal, 3(2), 15–34.
Jiménez-Murcia, S., Stinchfield, R., Álvarez-Moya, E., Jaurrieta, N., Bueno, B.,
Granero, R., … Vallejo, J. (2009). Reliability, validity, and classification accuracy
of a spanish translation of a measure of DSM-IV diagnostic criteria for
pathological gambling. Journal of Gambling Studies, 25(1), 93–104.
https://doi.org/10.1007/s10899-008-9104-x
Kairouz, S., Paradis, C., & Nadeau, L. (2012). Are Online Gamblers More At Risk Than
Offline Gamblers? Cyberpsychology, Behavior, and Social Networking , 15(3),
175–180. https://doi.org/10.1089/cyber.2011.0260
Kalischuk, R. G., Nowatzki, N., Cardwell, K., Klein, K., & Solowoniuk, J. (2006).
Problem Gambling and its Impact on Families: A Literature Review. International
Gambling Studies, 6(1), 31–60. https://doi.org/10.1080/14459790600644176
Khazaal, Y., Chatton, A., Achab, S., Monney, G., Thorens, G., Dufour, M., … Rothen,
S. (2017). Internet Gamblers Differ on Social Variables: A Latent Class Analysis.
Journal of Gambling Studies, 33(3), 881–897. https://doi.org/10.1007/s10899-
161
016-9664-0
Kim, H. S., Wohl, M. J. A., Gupta, R., & Derevensky, J. L. (2017). Why do young
adults gamble online? A qualitative study of motivations to transition from social
casino games to online gambling. Asian Journal of Gambling Issues and Public
Health, 7(1–11). https://doi.org/10.1186/s40405-017-0025-4
Korman, L. M., Collins, J., Dutton, D., Dhayananthan, B., Littman-Sharp, N., &
Skinner, W. (2008). Problem Gambling and Intimate Partner Violence. Journal of
Gambling Studies, 24(1), 13–23. https://doi.org/10.1007/s10899-007-9077-1
Ladouceur, R., Jacques, C., Ferland, F., & Giroux, I. (1999). Prevalence of Problem
Gambling: A Replication Study 7 Years Later. Canadian Journal of Psychiatry,
44(8), 802–804. https://doi.org/10.1177/070674379904400807
Lam, D. (2007a). An Exploratory Study of Gambling Motivations and Their Impact on
the Purchase Frequencies of Various Gambling Products. Psychology &
Marketing, 24(9), 815–827. https://doi.org/10.1002/mar.20185
Lam, D. (2007b). An Observation Study of Chinese Baccarat Players. UNLV Gaming
Research & Review Journal, 11(2), 63–73. https://doi.org/10.1542/peds.2012-
1281
Lambe, L., Mackinnon, S. P., & Stewart, S. H. (2015). Validation of the Gambling
Motives Questionnaire in Emerging Adults. Journal of Gambling Studies, 31(3),
867–885. https://doi.org/10.1007/s10899-014-9467-0
Law Commission of India. (2018). Legal Framework: Gambling and Sports Betting
Including in Cricket in India. Retrieved from
http://lawcommissionofindia.nic.in/reports/Report276.pdf
162
Lee, H. P., Chae, P. K., Lee, H. S., & Kim, Y. K. (2007). The Five-Factor Gambling
Motivation Model. Psychiatry Research, 150(1), 21–32.
https://doi.org/10.1016/j.psychres.2006.04.005
Lemberg, J. (2014). Sikkim online gaming , betting websites to go live very soon as
government issues first regular license. Retrieved from
https://cricketprediction.com/gambling/online-gaming-live-very-soon-
government-issues- license/
Lesieur, H. R., & Blume, S. B. (1987). The South Oaks Gambling Screen (SOGS): A
New Instrument for the Identification of Pathological Gamblers. American
Journal of Psychiatry, 144(9), 1184–1188. https://doi.org/10.1176/ajp.144.9. 1184
Lesieur, H. R., & Blume, S. B. (1993). Revising the South Oaks Gambling Screen in
Different Settings. Journal of Gambling Studies, 9, 213–223.
Loo, J. M. Y., Oei, T. P. S., & Raylu, N. (2011). Psychometric Evaluation of the
Problem Gambling Severity Index-Chinese Version (PGSI-C). Journal of
Gambling Studies, 27(3), 453–466. https://doi.org/10.1007/s10899-010-9221-1
Maas, M. van der, Mann, R. E., Turner, N. E., Matheson, F. I., Hamilton, H. A., &
McCready, J. (2018). The prevalence of problem gambling and gambling-related
behaviours among older adults in Ontario. Journal of Gambling Issues, 2018(39),
67–84. https://doi.org/10.4309/jgi.2018.39.3
MacLaren, V. V. (2016). Video Lottery is the Most Harmful Form of Gambling in
Canada. Journal of Gambling Studies, 32(2), 459–485.
https://doi.org/10.1007/s10899-015-9560-z
Markham, F., Young, M., Doran, B., & Sugden, M. (2017). A meta-regression analysis
163
of 41 Australian problem gambling prevalence estimates and their relationship to
total spending on electronic gaming machines. BMC Public Health, 17(1), 1–11.
https://doi.org/10.1186/s12889-017-4413-6
Mathews, M., & Volberg, R. (2013). Impact of problem gambling on financial,
emotional and social well-being of Singaporean families. International Gambling
Studies, 13(1), 127–140. https://doi.org/10.1080/14459795.2012.731422
Mcbride, J., & Derevensky, J. (2012). Internet gambling and risk-taking among
students: An exploratory study. Journal of Behavioral Addictions, 1(2), 50–58.
https://doi.org/10.1556/JBA.1.2012.2.2
McBride, J., & Derevensky, J. (2009). Internet gambling behavior in a sample of online
gamblers. International Journal of Mental Health and Addiction , 7(1), 149–167.
https://doi.org/10.1007/s11469-008-9169-x
McComb, J. L., Lee, B. K., & Sprenkle, D. H. (2009). Conceptualizing and Treating
Problem Gambling as a Family Issue. Journal of Marital and Family Therapy,
35(4), 415–431. https://doi.org/10.1111/j.1752-0606.2009.00146.x
McCormack, A., & Griffiths, M. D. (2012). What Differentiates Professional Poker
Players from Recreational Poker Players? A Qualitative Interview Study.
International Journal of Mental Health and Addiction , 10(2), 243–257.
https://doi.org/10.1007/s11469-011-9312-y
McGrath, D. S., Stewart, S. H., Klein, R. M., & Barrett, S. P. (2010). Self-generated
motives for gambling in two population-based samples of gamblers. International
Gambling Studies, 10(2), 117–138.
https://doi.org/10.1080/14459795.2010.499915
164
Molde, H., Mentzoni, R., Hanss, D., Sagoe, D., Andersen, S. L., & Pallesen, S. (2017).
People around you–do they matter? An experimental gambling study.
International Gambling Studies, 17(3), 349–365.
https://doi.org/10.1080/14459795.2017.1333130
Neelakandhan D. (2007). Kerala State Lotteries - An Economic and Financial
Evaluation. Cochin University of Science and Technology.
Neighbors, C., Cronce, J. M., & Larimer, M. E. (2002). Exploring College Student
Gambling Motivation. Journal of Gambling Studies, 18(4), 361–370.
https://doi.org/10.1023/A:1021065116500
Olason, D. T., Kristjansdottir, E., Einarsdottir, H., Haraldsson, H., Bjarnason, G., &
Derevensky, J. L. (2011). Internet Gambling and Problem Gambling Among 13 to
18 Year Old Adolescents in Iceland. International Journal of Mental Health and
Addiction, 9(3), 257–263. https://doi.org/10.1007/s11469-010-9280-7
Oliveira, M. P. M. T. de, Silveira, D. X. da, Carvalho, S. V. B. de, Collakis, S. T.,
Bizeto, J., & Silva, M. T. A. (2009). Reliability , Validity and Classification
Accuracy of the South Oaks Gambling Screen in a Brazilian Sample. Journal of
Gambling Studies, 25(4), 557–568. https://doi.org/10.1007/s10899-009-9152-x
Orford, J., Wardle, H., Griffiths, M., Sproston, K., & Erens, B. (2010). PGSI and DSM-
IV in the 2007 British Gambling Prevalence Survey : reliability , item response ,
factor structure and inter-scale agreement. International Gambling Studies, 10(1),
31–44. https://doi.org/10.1080/14459790903567132
Palai, N. K., Mishra, S., & Das, K. (2006). GAMBLING VS STATE A study of
problems and prospects of gambling industry In india under globalization regime.
XIV International Economic History Congress, Helsinki 2006, Session 24, 1–16.
165
Palmer du Preez, K., Bellringer, M., Pearson, J., Dowling, N., Suomi, A., Koziol-
Mclain, J., … Jackson, A. (2018). Family violence in gambling help-seeking
populations. International Gambling Studies, 18(3), 477–494.
https://doi.org/10.1080/14459795.2018.1480648
Petry, N. M., & Gonzalez-Ibanez, A. (2013). Internet gambling in problem gambling
college students. Journal of Gambling Studies, 31(2), 397–408.
https://doi.org/10.1007/s10899-013-9432-3
Phillips, J. G., Ogeil, R., Chow, Y.-W., & Blaszczynski, A. (2013). Gambling
Involvement and Increased Risk of Gambling Problems. Journal of Gambling
Studies, 29(4), 601–611. https://doi.org/10.1007/s10899-012-9325-x
Playtech plc Annual Report and Accounts. (2018). Retrieved from
http://www.investors.playtech.com/annual-reports/2018.aspx
Pramanik, P. (2018). Welcome To Gangtok, The Las Vegas Of India. Outlook.
Retrieved from https://magazine.outlookindia.com/story/welcome-to-gangtok-
the-las-vegas-of-india/300584
Roberts, A., Coid, J., King, R., Murphy, R., Turner, J., Bowden-Jones, H., … Landon,
J. (2016). Gambling and violence in a nationally representative sample of UK men.
Addiction, 111(12), 2196–2207. https://doi.org/10.1111/add.13522
Rohsler, C., Singh, R., & Singhania, V. (2013). Regulating Sports Betting in India.
Sagoe, D., Pallesen, S., Hanss, D., Leino, T., Molde, H., Mentzoni, R. A., & Torsheim,
T. (2017). The Relationships between Mental Health Symptoms and Gambling
Behavior in the Transition from Adolescence to Emerging Adulthood. Frontiers
in Psychology, 8(March), 1–11. https://doi.org/10.3389/fpsyg.2017.00478
166
Salonen, A. H., Kontto, J., Perhoniemi, R., Alho, H., & Castrén, S. (2018). Gambling
expenditure by game type among weekly gamblers in Finland. BMC Public
Health, 18(1), 1–12. https://doi.org/10.1186/s12889-018-5613-4
Scalese, M., Bastiani, L., Salvadori, S., Gori, M., Lewis, I., Jarre, P., & Molinaro, S.
(2016). Association of Problem Gambling with Type of Gambling Among Italian
General Population. Journal of Gambling Studies, 32(3), 1017–1026.
https://doi.org/10.1007/s10899-015-9579-1
Schwartz, D. G. (2008). Roll the Bones: The History of Gambling. Journal of Gambling
Issues, (21), 135–137. https://doi.org/10.4309/jgi.2008.21.18
Sehrawat, K., & Talan, G. (2014). Sports Betting in India (if you can’t stop it, legalize
it?). IRACST – International Journal of Commerce, Business and Management,
3(3), 475–480.
Smith, G. J., & Wynne, H. J. (2002). Measuring gambling and problem gambling in
Alberta using the Canadian Problem Gambling Index (CPGI) : Final Report.
Srinivasan, V. (2014). Gambling in India: The Journey Ahead. Madras Law Journal
(Criminal), 82(2).
Stewart, S. H., & Zack, M. (2008). Development and psychometric evaluation of a
three-dimensional Gambling Motives Questionnaire. Addiction, 103(7), 1110–
1117. https://doi.org/10.1111/j.1360-0443.2008.02235.x
Stinchfield, R. (2002). Reliability, validity, and classification accuracy of the South
Oaks Gambling Screen (SOGS). Addictive Behaviors, 27(1), 1–19.
https://doi.org/10.1016/S0306-4603(00)00158-1
Stinchfield, R., McCready, J., Turner, N. E., Jimenez-Murcia, S., Petry, N. M., Grant,
J., … Winters, K. C. (2016). Reliability, Validity, and Classification Accuracy of
167
the DSM-5 Diagnostic Criteria for Gambling Disorder and Comparison to DSM-
IV. Journal of Gambling Studies, 32(3), 905–922. https://doi.org/10.1007/s10899-
015-9573-7
Stucki, S., & Rihs-Middel, M. (2007). Prevalence of adult problem and pathological
gambling between 2000 and 2005: An update. Journal of Gambling Studies, 23(3),
245–257. https://doi.org/10.1007/s10899-006-9031-7
Subramaniam, M., Abdin, E., Shahwan, S., Vaingankar, J. A., Picco, L., Browning, C.
J., … Chong, S. A. (2015). Culture and age influences upon gambling and problem
gambling. Addictive Behaviors Reports, 1, 57–63.
https://doi.org/10.1016/j.abrep.2015.04.004
Szybala, K. (2016). An Evaluation of the Potential of the Indian Gaming Market.
Retrieved from http://globalmarketadvisors.com/wp-
content/uploads/2016/04/GMA_Gaming-In-India-White-Paper_April28.pdf
Tang, C. S., Wu, A. M. S., Tang, J. Y. C., & Yan, E. C. W. (2010). Reliability, Validity,
and Cut Scores of the South Oaks Gambling Screen (SOGS) for Chinese. Journal
of Gambling Studies, 26(1), 145–158. https://doi.org/10.1007/s10899-009-9147-7
Tao, V. Y. K., Wu, A. M. S., Cheung, S. F., & Tong, K. K. (2011). Development of an
Indigenous Inventory GMAB (Gambling Motives, Attitudes and Behaviors) for
Chinese Gamblers: An Exploratory Study. Journal of Gambling Studies, 27(1),
99–113. https://doi.org/10.1007/s10899-010-9191-3
The Federation of Indian Chambers of Commerce & Industry. (2012). Regulating
Sports Betting in India- A vice to be tamed ? Retrieved from
http://ficci.in/SEDocument/20208/report-betting-conference.pdf
168
Thompson, W. N., Gazel, R., & Rickman, D. (1997a). Social and Legal Costs of
Compulsive Gambling. Gaming Law Review, 1(1), 81–89.
https://doi.org/10.1089/glr.1997.1.81
Thompson, W. N., Gazel, R., & Rickman, D. (1997b). Social Costs Of Gambling : A
Comparative Study Of Nutmeg And Cheese State Gamblers. Gaming Research &
Review Journal, 5(1), 1–16.
Thompson, W. N., & Schwer, R. K. (2005). Beyond the limits of recreation: social costs
of gambling in Southern Nevada. Journal of Public Budgeting, Accounting &
Financial Management, 17(1), 62–93. https://doi.org/10.1108/JPBAFM-17- 01-
2005-B004
Valleur, M. (2015). Gambling and gambling-related problems in France. Addiction,
110(12), 1872–1876. https://doi.org/10.1111/add.12967
Volberg, R. A. (2004). Fifteen years of problem gambling prevalence research: What
do we know? Where do we go? Journal of Gambling Issues, (10), 1–10.
https://doi.org/10.4309/jgi.2004.10.12
Walker, D. M. (2008). Clarification of the social costs of gambling. Journal of Public
Budgeting, Accounting & Financial Management, 20(2), 141–152.
https://doi.org/10.1108/JPBAFM-20-02-2008-B001 Downloaded
Walker, D. M., & Barnett, A. H. (1999). The Social Costs of Gambling: An Economic
Perspective. Journal of Gambling Studies, 15(3), 181–212.
https://doi.org/10.1023/A:1023093211933
Walker, D. M., & Sobel, R. S. (2016). Social and Economic Impacts of Gambling.
Current Addiction Reports, 3(3), 293–298. https://doi.org/10.1007/s40429-016-
169
0109-8
Wan, Y. K. P., Li, X. C., & Kong, W. H. (2011). Social impacts of casino gaming in
Macao: A qualitative analysis. Tourism, 59(1), 63–82.
Weinstock, J., & Rash, C. J. (2014). Clinical and Research Implications of Gambling
Disorder in DSM-5. Current Addiction Reports, 1(3), 159–165.
https://doi.org/10.1007/s40429-014-0026-7
Welte, J. W., Barnes, G. M., Tidwell, M. C. O., & Hoffman, J. H. (2008). The
Prevalence of Problem Gambling Among U.S. Adolescents and Young Adults:
Results from a National Survey. Journal of Gambling Studies, 24(2), 119–133.
https://doi.org/10.1007/s10899-007-9086-0
Welte, J. W., Barnes, G. M., Tidwell, M. C. O., & Hoffman, J. H. (2009). The
Association of Form of Gambling With Problem Gambling Among American
Youth. Psychology of Addictive Behaviors, 23(1), 105–112.
https://doi.org/10.1037/a0013536
Welte, J. W., Barnes, G. M., Wieczorek, W. F., Tidwell, M. C., & Parker, J. (2002).
Gambling Participation in the U.S.—Results from a National Survey. Journal of
Gambling Studies, 18(4), 313–337. https://doi.org/10.1023/A:1021019915591
Wiebe, J. M. D., & Cox, B. J. (2005). Problem and Probable Pathological Gambling
Among Older Adults Assessed by the SOGS-R. Journal of Gambling Studies,
21(2), 205–221. https://doi.org/10.1007/s10899-005-3032-9
Wiebe, J., Single, E., & Ham, A. F. (2001). Measuring Gambling and Problem
Gambling in Ontario. https://doi.org/http://dx.doi.org/10.11575/PRISM/9667
Williams, R. J., Lee, C. K., & Back, K. J. (2013). The prevalence and nature of
170
gambling and problem gambling in South Korea. Social Psychiatry and
Psychiatric Epidemiology, 48(5), 821–834. https://doi.org/10.1007/s00127-012-
0580-z
Wong, I. L. K., & So, E. M. T. (2003). Prevalence estimates of problem and
pathological gambling in Hong Kong. American Journal of Psychiatry, 160(7),
1353–1354. https://doi.org/10.1176/appi.ajp.160.7.1353
Wood, R. T., & Williams, R. J. (2009). Internet Gambling: Prevalence, Patterns,
Problems, and Policy Options. In Final Report prepared for the Ontario Problem
Gambling Research Centre, Guelph, Ontario, CANADA.
Wu, A. M. S., & Tang, C. S. (2011). Validation of the Chinese Version of the Gambling
Motivation Scale (C-GMS). Journal of Gambling Studies, 27(4), 709–724.
https://doi.org/10.1007/s10899-010-9234-9
Young, M., & Stevens, M. (2008). SOGS and CGPI: Parallel Comparison on a Diverse
Population. Journal of Gambling Studies, 24(3), 337–356.
https://doi.org/10.1007/s10899-007-9087-z
Zheng, V., & Hung, E. P. W. (2012). Evaluating the Economic Impact of Casino
Liberalization in Macao. Journal of Gambling Studies, 28(3), 541–559.
https://doi.org/10.1007/s10899-011-9251-3
Zikmund, W. G., Babin, B. J., Carr, J. C., Adhikari, A., & Griffin, M. (2016). Business
Research Methods A South-Asian Perspective. Cengage Learning India Pvt.
Ltd.
Zimmerman, M., Chelminski, I., & Young, D. (2006). A Psychometric Evaluation of
the DSM-IV Pathological Gambling Diagnostic Criteria. Journal of Gambling
Studies, 22(3), 329–337. https://doi.org/10.1007/s10899-006-9020-x
171
Appendix
Questionnaire
Respected Sir/Madam, my name is Adarsh Rai and I am a PhD Research scholar from
the Department of Management, Sikkim University. I am conducting a research study
for my PhD thesis and as such, I request you to kindly spare your precious time and fill
the questionnaire. You are requested to feel free and be frank in your responses. The
information you are going to give will be kept strictly confidential and will be used for
academic purpose only. Once again, I request you to kindly fill the questionnaire and
co-operate in my research work.
A. General Information
I. Age:
II. Hometown:
III. Gender
a. Male b. Female
IV. Marital Status
a. Single b. Married
c. Divorced d. Widower/Widow
V. Educational Qualification
a. 12th or below b. Graduate
c. Masters d. Others
VI. Employment status
a. Employed b. Job seeker c. Self employed
d. Pensioner e. Daily wage earner
VI. A. Source of money for gambling activities
a. Pocket money b. Salary
c. Daily wages d. Business income
e. any other________________
VII. Monthly Income
a. Below 10,000 b. 10,000 – 19,999 c. 20,000 – 29,999
d. 30,000 – 39,000 e. Above 40,000

172
B. Based on your gambling please tick against one of the options for the next set of questions.
1. How frequently do you visit a gambling house in a month?
a. Once in a month b. 2 – 4 times a month
c. More than 4 times a month d. Occasionally
2. How often your weekly visitation results in gambling.
a. Once in a month b. 2 – 4 times a month
c. More than 4 times a month d. Occasionally
3. What made you start gambling? (tick as many as applicable)
a. Advertisement b. In need of money
c. It is fun d. Friends/Family
e. Others
4. What form(s) of gambling do you usually or frequently play? (Tick as many
as applicable)
Sikkim state lottery
Tambola (Bingo)
Casinos
Online Gaming
Sports Betting
Others ___________________________
5. How often do you win while gambling?
a. Never b. Sometimes
c. Often d. Almost always
C. Based on your gambling experience of the past 12 months please
tick against any of the option for each of the statements.
Statements Strongly
Disagree
Disagree Neutral Agree Strongly
Agree
1. I enjoy thrilling experience
in risk
SD D N A SA
2. I have fun in risk taking SD D N A SA
3. I have fun competing with
others
SD D N A SA
4. I enjoy intense feelings
while gambling
SD D N A SA
5. I want to enjoy uncertainty SD D N A SA
173
6. I have fun in guessing the
results
SD D N A SA
7. I want to experience
excitement and pleasure
SD D N A SA
8. I want to feel triumph when
winning
SD D N A SA
9. I am easily absorbed in
gambling
SD D N A SA
10. I want to win big money
with small money
SD D N A SA
11. I want to make money easily SD D N A SA
12. I want to win big money
immediately
SD D N A SA
13. I need big money SD D N A SA
14. I have heard that they won
jackpot
SD D N A SA
15. I have a financial difficulty
and no money
SD D N A SA
16. I can’t change my life
without gambling
SD D N A SA
17. I may win big money SD D N A SA
18. I feel pain/troubled SD D N A SA
19. I feel lonely/escape from
loneliness
SD D N A SA
20. I feel depressed/sad SD D N A SA
21. I feel angry/upset SD D N A SA
22. I feel tense/anxious SD D N A SA
23. I feel pressured/things don’t
go well
SD D N A SA
24. Gambling makes me forget
about stressful reality
SD D N A SA
25. Through gambling I
socialize with others
SD D N A SA
26. Gambling makes the
atmosphere comfortable for
me for meeting people
SD D N A SA
27. Gambling makes it easy for
me to meet new people
SD D N A SA
28. It helps me to join with
gathering in spite of no
intention of gambling
SD D N A SA
29. My friends insisted
gambling
SD D N A SA
174
30. Gambling helps me to get
along with others favorably
SD D N A SA
31. Gambling helps me to
change moods
SD D N A SA
32. Gambling allows me to
escape from burdensome
routines
SD D N A SA
33. Gambling helps me to
Energize life
SD D N A SA
34. I gamble to enjoy leisure
time and activity
SD D N A SA
35. Gambling helps me to
relieve stress
SD D N A SA
D. Thinking about the last 12 months’ tick against the options. 1. Have you bet more than you could really afford to lose?
A. Never B. Sometimes
C. Most of the time D. Almost always
2. Still thinking about the last 12 months, have you needed to gamble with larger
amounts of money to get the same feeling of excitement?
A. Never B. Sometimes
C. Most of the time D. Almost always
3. When you gambled, did you go back another day to try to win back the money you
lost?
A. Never B. Sometimes
C. Most of the time D. Almost always
4. Have you borrowed money or sold anything to get money to gamble?
A. Never B. Sometimes
C. Most of the time D. Almost always
5. Have you felt that you might have a problem with gambling?
A. Never B. Sometimes
C. Most of the time D. Almost always
6. Has gambling caused you any health problems, including stress or anxiety?
A. Never B. Sometimes
C. Most of the time D. Almost always
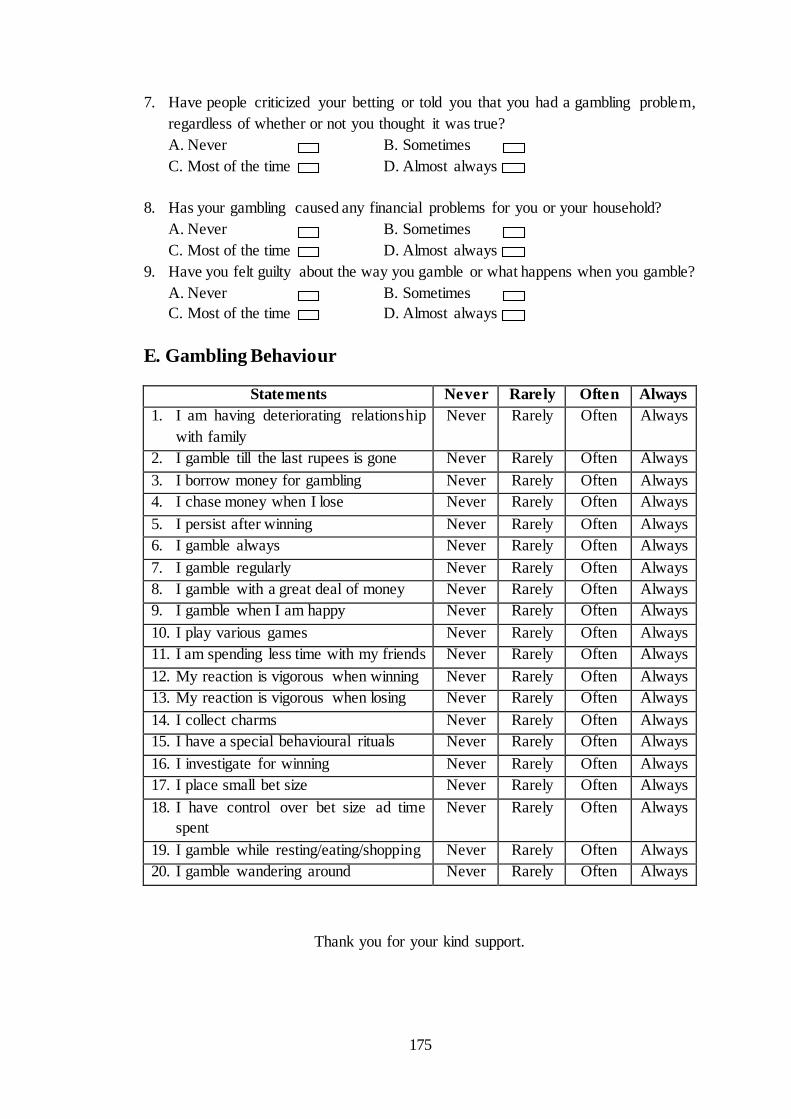
175
7. Have people criticized your betting or told you that you had a gambling problem,
regardless of whether or not you thought it was true?
A. Never B. Sometimes
C. Most of the time D. Almost always
8. Has your gambling caused any financial problems for you or your household?
A. Never B. Sometimes
C. Most of the time D. Almost always
9. Have you felt guilty about the way you gamble or what happens when you gamble?
A. Never B. Sometimes
C. Most of the time D. Almost always
E. Gambling Behaviour
Statements Never Rarely Often Always
1. I am having deteriorating relationship
with family
Never Rarely Often Always
2. I gamble till the last rupees is gone Never Rarely Often Always
3. I borrow money for gambling Never Rarely Often Always
4. I chase money when I lose Never Rarely Often Always
5. I persist after winning Never Rarely Often Always
6. I gamble always Never Rarely Often Always
7. I gamble regularly Never Rarely Often Always
8. I gamble with a great deal of money Never Rarely Often Always
9. I gamble when I am happy Never Rarely Often Always
10. I play various games Never Rarely Often Always
11. I am spending less time with my friends Never Rarely Often Always
12. My reaction is vigorous when winning Never Rarely Often Always
13. My reaction is vigorous when losing Never Rarely Often Always
14. I collect charms Never Rarely Often Always
15. I have a special behavioural rituals Never Rarely Often Always
16. I investigate for winning Never Rarely Often Always
17. I place small bet size Never Rarely Often Always
18. I have control over bet size ad time
spent
Never Rarely Often Always
19. I gamble while resting/eating/shopping Never Rarely Often Always
20. I gamble wandering around Never Rarely Often Always
Thank you for your kind support.