Embed Size (px)
Citation preview
Nutrition Research Reviews (1990), 3, 49-74 49
PHYSIOLOGICAL MECHANISMS IN THE ADAPTIVE RESPONSE OF METABOLIC RATES TO ENERGY RESTRICTION
P. S. SHETTY Nutrition Research Centre, Department of Physiology, St John’s Medical College, Bangalore 560 034, India
CONTENTS
INTRODUCTION . . 49 MECHANISMS OF ADAPTATION OF METABOLIC RATE D U R I N G
ACUTE ENERGY RESTRICTION . . 52 SYMPATHETIC NERVOUS SYSTEM ACTIVITY A N D CATECHOLAMINES . . 52 THYROID HORMONES . . 55 IODOTH Y RON I N E - C A TE C HOL AM I NE INTER A C T I O N S . . 57 I N S U L I N . . . 58 C A TECHOL A M I NE S, IODOTHY RON I NES A N D INSU L I N
ROLE IN ALTERING METABOLIC RATE . . 59 OTHER CALORIGENIC HORMONES . . 6 0
Glucagon . . 6 0 Growth hormone . . 6 0 Glucocorticoids . . 61
Progesterone . . . 61 SUBSTRATES A N D FUELS . . 62
Free fatty acids . . 62 Triacylglycerols and fatty acid cycling . . . 63
Protein catabolism and protein turnover . . 63
THE1 R INTEGRATED
RESPONSES OF METABOLIC RATES TO ACUTE ENERGY RESTRICTION INTERACTIONS . . . 6 4
MECHANISMS INVOLVED IN THE METABOLIC RATE CHANGES D U R I N G CHRONIC ENERGY DEFICIENCY , . 65
SUMMARY . . 68 REFERENCES . . 69
TI M E RE LATI O N S A N D HO R M O N E-S U BSTR AT E
INTRODUCTION
When individuals subsist on energy-restricted diets adaptive changes to the limitation in energy intake must occur in order to permit the prolongation of the life of the individual (Mitchell, 1944). The monumental studies on human semi-starvation by Keys et al. (1950) have amply demonstrated that following a period of restricted energy intake it is possible to attain energy balance at the new, low level. This new plane of energy balance is attained in part by a reduction in energy output, but is also a consequence of changes in body
https://www.cambridge.org/core/terms. https://doi.org/10.1079/NRR19900006Downloaded from https://www.cambridge.org/core, IP address: 65.21.229.84, on subject to the Cambridge Core terms of use, available at
50 P. S. S H E T T Y
composition. Reductions in energy expenditure either by physiological (Keys et al. 1950) and/or behavioural responses (Brozek, 1955) are active processes in contrast to the decrease in body tissue which appears to be almost entirely passive and an automatic consequence of the use of body tissues as fuel (Taylor & Keys, 1950). Since these changes, actively or passively induced, permit the prolongation of the life of the individual, they must be considered as beneficial, adaptive responses.
Dietary energy is needed by an individual merely to offset his total daily energy expenditure when he is in energy balance. There are traditionally three physiological components of total daily energy expenditure : ( I ) basal (BMR) or resting metabolic rate (RMR), (2) thermogenesis, and (3) physical activity. RMR is the minimal rate of energy expenditure at rest compatible with life. BMR refers to the RMR measured under defined conditions of rest after a night’s sleep. The RMR, because it includes the small, additional energy expended by postural muscles or movements is usually slightly higher than BMR. The terms BMR and RMR will be used interchangeably in the present review since the differences between the two measurements are negligible. RMR accounts for between 60 and 75 YO of daily energy expenditure. Thermogenesis is defined as the energy expenditure above BMR or RMR; this includes the effects of food intake, thermogenic agents, cold exposure and psychological influences such as stress. The contribution of physical activity to total daily energy expenditure will depend on the duration and intensity of the physical activity.
Reduction in RMR is one of the more constant findings in experimentally induced semi- starvation or during therapeutic energy restriction. Apfelbaum (1978) has summarized the studies since the beginning of the 20th century which have demonstrated a decrease in BMR as an effect of restricted intake either spontaneously, experimentally or the- rapeutically. This summary provides data on a number of subjects studied, duration of restricted diet, the percentage weight loss and the decrease in percentage oxygen consumption. Sims (1986) in a comprehensive review has also provided a tabular summary of the more recent studies of the response of obese subjects to a reduction of energy intake, most studies showing a significant reduction in RMR expressed per unit lean body mass, except two which show no change.
The consistent finding of a reduced RMR in the experimental semi-starvation studies on human volunteers undertaken in this century by Benedict et al. (1919), Keys et al. (1950) and subsequently by Grande et al. (1958) resulted in two alternative, but not mutually exclusive, explanations being put forward to explain the decrease in RMR (Grande et al. 1958): ( I ) a decrease per se in the metabolic rate or activity of the metabolically active tissues and (2) a decrease in RMR as a consequence of loss of metabolically active tissue mass due to a loss of body-weight. The former response was considered to be an indication of an increased ‘metabolic efficiency ’ of the residual active tissue mass.
Early investigations favoured a reduction in metabolic activity of the body cells and an enhanced metabolic efficiency as being more important since the decline in RMR was relatively greater than that accounted for by body-weight loss. Taylor & Keys (1950), however, considered the decrease in the mass of metabolically active tissue as the main factor responsible for the reduced RMR. From an analysis of their Minnesota semi- starvation data, they concluded that about 65% of the reduction in RMR could be attributed to the shrinkage of the metabolizing mass of body cells and only about 35 YO to an actual decrease in cellular metabolic rate. Grande et al. (1958) applied identical methods of computation to data from another series of experimental human semi-starvation studies. They found quite the reverse distribution with the actual decrease in metabolic activity of the cells contributing to a greater percentage (i.e. 65-73) of the reduction in RMR. These differences in the two series of experimental semi-starvation studies were attributed to the
https://www.cambridge.org/core/terms. https://doi.org/10.1079/NRR19900006Downloaded from https://www.cambridge.org/core, IP address: 65.21.229.84, on subject to the Cambridge Core terms of use, available at
A D A P T A T I O N TO E N E R G Y R E S T R I C T I O N 51
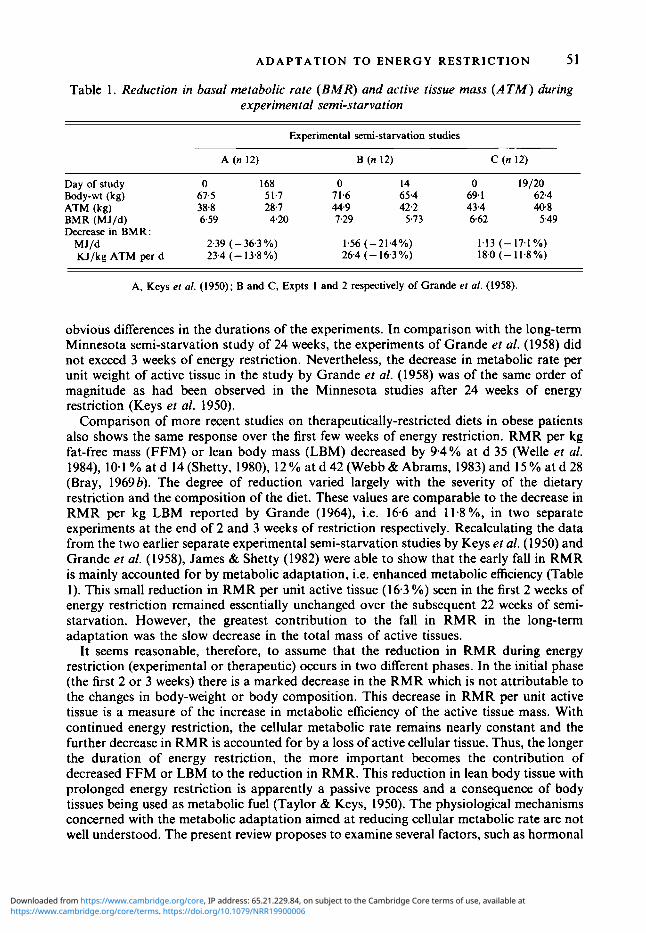
Table 1. Reduction in basal metabolic rate (BMR) and active tissue mass ( A T M ) during experimental semi-starvation
Experimental semi-starvation studies
A (n 12) B (n 12) C (n 12)
Day of study 0 168 0 14 0 19/20 Body-wt (kg) 67.5 51.7 71.6 65.4 69. I 62.4 ATM (kg) 3 8 8 28.7 44.9 42.2 43.4 40.8
Decrease in BMR: BMR (MJ/d) 6.59 4.20 7.29 5.73 6.62 5.49
MJ/d 2.39 (- 36.3 Yo) 1.56 ( -214%) 1.13 (-17.1%) KJ/kg ATM per d 23.4 (- 13.8 Yo) 26.4 (- 16.3 %) 18.0 (-11.8%)
A, Keys er al. (1950); B and C, Expts I and 2 respectively of Grande er al. (1958).
obvious differences in the durations of the experiments. In comparison with the long-term Minnesota semi-starvation study of 24 weeks, the experiments of Grande et al. (1958) did not exceed 3 weeks of energy restriction. Nevertheless, the decrease in metabolic rate per unit weight of active tissue in the study by Grande et al. (1958) was of the same order of magnitude as had been observed in the Minnesota studies after 24 weeks of energy restriction (Keys et al. 1950).
Comparison of more recent studies on therapeutically-restricted diets in obese patients also shows the same response over the first few weeks of energy restriction. RMR per kg fat-free mass (FFM) or lean body mass (LBM) decreased by 9.4% at d 35 (Welle et al. 1984), 10.1 % at d 14 (Shetty, 1980), 12 % at d 42 (Webb & Abrams, 1983) and 15 % at d 28 (Bray, 19696). The degree of reduction varied largely with the severity of the dietary restriction and the composition of the diet. These values are comparable to the decrease in RMR per kg LBM reported by Grande (1964), i.e. 16.6 and 11.8%, in two separate experiments at the end of 2 and 3 weeks of restriction respectively. Recalculating the data from the two earlier separate experimental semi-starvation studies by Keys et al. (1950) and Grande et al. (1958), James & Shetty (1982) were able to show that the early fall in RMR is mainly accounted for by metabolic adaptation, i.e. enhanced metabolic efficiency (Table I ) . This small reduction in RMR per unit active tissue (16.3 %) seen in the first 2 weeks of energy restriction remained essentially unchanged over the subsequent 22 weeks of semi- starvation. However, the greatest contribution to the fall in RMR in the long-term adaptation was the slow decrease in the total mass of active tissues.
It seems reasonable, therefore, to assume that the reduction in RMR during energy restriction (experimental or therapeutic) occurs in two different phases. In the initial phase (the first 2 or 3 weeks) there is a marked decrease in the RMR which is not attributable to the changes in body-weight or body composition. This decrease in RMR per unit active tissue is a measure of the increase in metabolic efficiency of the active tissue mass. With continued energy restriction, the cellular metabolic rate remains nearly constant and the further decrease in RMR is accounted for by a loss of active cellular tissue. Thus, the longer the duration of energy restriction, the more important becomes the contribution of decreased FFM or LBM to the reduction in RMR. This reduction in lean body tissue with prolonged energy restriction is apparently a passive process and a consequence of body tissues being used as metabolic fuel (Taylor & Keys, 1950). The physiological mechanisms concerned with the metabolic adaptation aimed at reducing cellular metabolic rate are not well understood. The present review proposes to examine several factors, such as hormonal
https://www.cambridge.org/core/terms. https://doi.org/10.1079/NRR19900006Downloaded from https://www.cambridge.org/core, IP address: 65.21.229.84, on subject to the Cambridge Core terms of use, available at
52 P. S. SHETTY
and substrate alterations, that may operate and interact to alter this adaptive component of the RMR. Since reduction in this component is manifest in the early phase of semi- starvation, the related physiological mechanisms must be apparent and, hence, critically evaluated during the first 2-3 weeks of energy restriction.
MECHANISMS OF ADAPTATION OF METABOLIC RATE D U R I N G ACUTE ENERGY RESTRICTION
The obvious choice for the regulatory mechanisms that contribute to an adaptive response which results in a decrease in the rate of cellular metabolism and thereby enhances the metabolic efficiency of the active cellular mass ought to be endocrine in nature. Several hormones are now known to be sensitive to changes in the level of energy intake, the dietary composition and the status of energy balance of the individual (Danforth & Landsberg, 1983). Changes in sympathetic nervous system (SNS) activity and catecholamines, alterations in thyroid hormone metabolism and changes in pancreatic peptide hormones such as insulin and glucagon play an important role in the metabolic response to energy restriction. These changes are not only aimed at lowering the metabolic activity of the active cell mass, but are also essential for the orderly mobilization of endogenous substrates and fuels during a period of restricted availability of exogenous energy.
There are several factors that have to be kept in mind while attributing a regulatory role to hormones in the metabolic adaptation to energy restriction (Danforth, 1989). These include (a) hormonal interactions, synergic or additive, (b) the possibility that substrates and/or products may produce effects (direct and indirect) independently of the hormones themselves, (c) hormones produce their effects by first binding to membrane-bound receptors or nuclear receptors, which are also altered by the change in nutrition; this is particularly true in the case of peptide or thyroid hormones since their receptor sensitivity and receptor responsiveness may be altered by the nutritional status, and (d) post-receptor events may also be influenced by the altered state of nutrition, thus modulating the final outcome. Simple quantitative approaches to alterations in plasma hormone concentrations or plasma appearance rates may be neither meaningful nor conclusive. While trying to understand the mechanisms that may be responsible for modulating 0, consumption of tissues during energy restriction, and when attributing regulatory roles to the hormones involved, the previously-mentioned factors have to be constantly considered.
SYMPATHETIC NERVOUS SYSTEM ACTIVITY A N D C A T E C H O L A M I N E S
The thermogenic effects of catecholamines like noradrenaline (NA) when administered intravenously to human subjects are well documented (Steinberg et al. 1964; Jung et al. 19796; Katzeff et al. 1986; Kurpad et al. 1989a, 6). Infusions of adrenaline have also been shown to be thermogenic in human subjects (Sjostrom ef al. 1983; Sjostrom, 1985). The calorigenic actions of catecholamines are mediated by two major mechanisms : (a) by increasing the rate of cellular thermogenesis (Himms-Hagen, 1976) and (b) by stimulating the conversion of complex fuels into readily usable substrates (Young & Landsberg, 1977~). The increased rate of cellular metabolism induced by catecholamines manifests itself in an elevation in heat production, fuel utilization and 0, consumption, while its stimulatory effect on the breakdown of complex fuels supplies the energy required for the increased cellular metabolism. Since catecholamines stimulate metabolism, it is conceivable that changes in SNS activity may at least in part explain the reduction in metabolic rate that
https://www.cambridge.org/core/terms. https://doi.org/10.1079/NRR19900006Downloaded from https://www.cambridge.org/core, IP address: 65.21.229.84, on subject to the Cambridge Core terms of use, available at
ADAPTATION TO ENERGY RESTRICTION 53 occurs with energy restriction. The alteration in sympatho-adrenal activity may become manifest as changes in the circulating levels of catecholamines and their turnover rates, and also result in changes in the responsiveness at the hormone receptor and post-receptor levels. A number of recent reviews have demonstrated this close relationship between energy intake and SNS activity (Landsberg & Young, 1978, 1 9 8 3 ~ ; Jung et al. 1980a; Shetty & Kurpad, 1990).
The most important evidence linking energy intake with SNS activity has been provided by animal experiments. Young & Landsberg (1977b) reported a significant decrease in the NA turnover of cardiac tissues in 48 h-fasted rats on adequate intakes of fluid and electrolytes. Their studies suggested that the NA turnover of pancreatic and liver tissues was also sensitive to changes in energy intake (Young & Landsberg, 1979) and demonstrated that overfeeding normal and previously fasted rats by providing them free access to sucrose solutions increased the NA turnover of cardiac tissue. This series of studies linked changes in catecholamine turnover with alterations in energy intake, more specifically carbohydrate intake. This concept of a reduced catecholaminergic drive during energy restriction, developed by Landsberg & Young (1978), was counter to many of the accepted ideas on the control of substrate mobilization during starvation. Traditionally, the increase in lipolysis, maintenance of glucose homeostasis and the increase in glucagon output on fasting have been considered as being indicative of an enhanced sympathetic drive. Emerging evidence shows that these responses are not dependent on an increased catecholamine activity. Adrenalectomy or adrenergic blockade does not prevent an increase in free fatty acid (FFA) output on fasting (Levy & Ramey, 1958; Goodman & Knobil, 1959). Several studies summarized by Jung et al. (1980~) suggest that the adrenergic component of lipolysis rapidly declines, while the lipolytic activity of energy restriction is under the dominant control of declining plasma insulin levels.
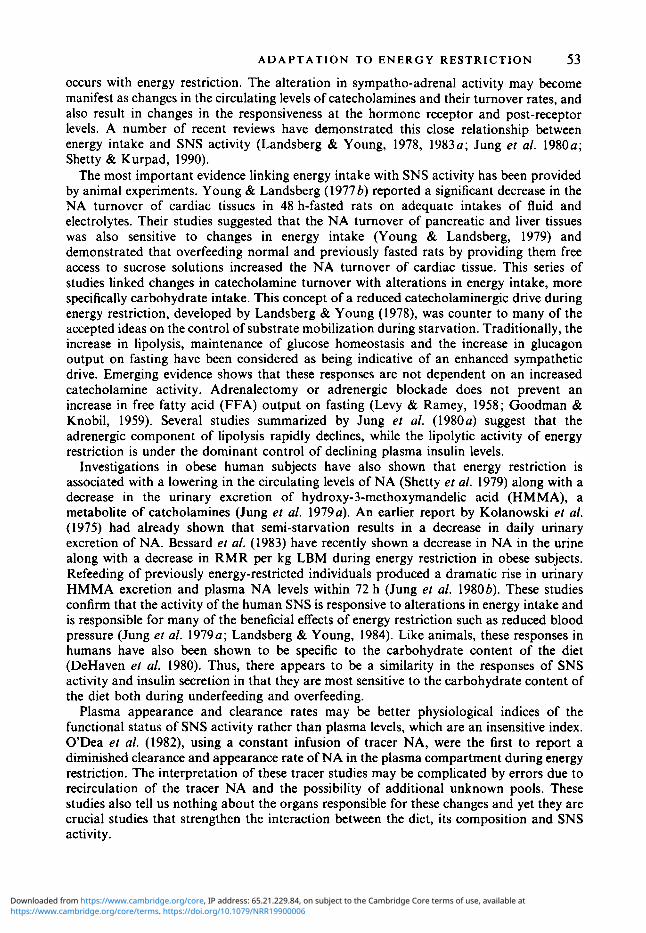
Investigations in obese human subjects have also shown that energy restriction is associated with a lowering in the circulating levels of NA (Shetty et al. 1979) along with a decrease in the urinary excretion of hydroxy-3-methoxymandelic acid (HMMA), a metabolite of catcholamines (Jung et al. 1979~) . An earlier report by Kolanowski et al. (1975) had already shown that semi-starvation results in a decrease in daily urinary excretion of NA. Bessard et al. (1983) have recently shown a decrease in NA in the urine along with a decrease in RMR per kg LBM during energy restriction in obese subjects. Refeeding of previously energy-restricted individuals produced a dramatic rise in urinary HMMA excretion and plasma NA levels within 72 h (Jung et al. 1980b). These studies confirm that the activity of the human SNS is responsive to alterations in energy intake and is responsible for many of the beneficial effects of energy restriction such as reduced blood pressure (Jung et al. 1979a; Landsberg & Young, 1984). Like animals, these responses in humans have also been shown to be specific to the carbohydrate content of the diet (DeHaven et al. 1980). Thus, there appears to be a similarity in the responses of SNS activity and insulin secretion in that they are most sensitive to the carbohydrate content of the diet both during underfeeding and overfeeding.
Plasma appearance and clearance rates may be better physiological indices of the functional status of SNS activity rather than plasma levels, which are an insensitive index. ODea et al. (1982), using a constant infusion of tracer NA, were the first to report a diminished clearance and appearance rate of NA in the plasma compartment during energy restriction. The interpretation of these tracer studies may be complicated by errors due to recirculation of the tracer NA and the possibility of additional unknown pools. These studies also tell us nothing about the organs responsible for these changes and yet they are crucial studies that strengthen the interaction between the diet, its composition and SNS activity.
https://www.cambridge.org/core/terms. https://doi.org/10.1079/NRR19900006Downloaded from https://www.cambridge.org/core, IP address: 65.21.229.84, on subject to the Cambridge Core terms of use, available at
54 P. S. S H E T T Y
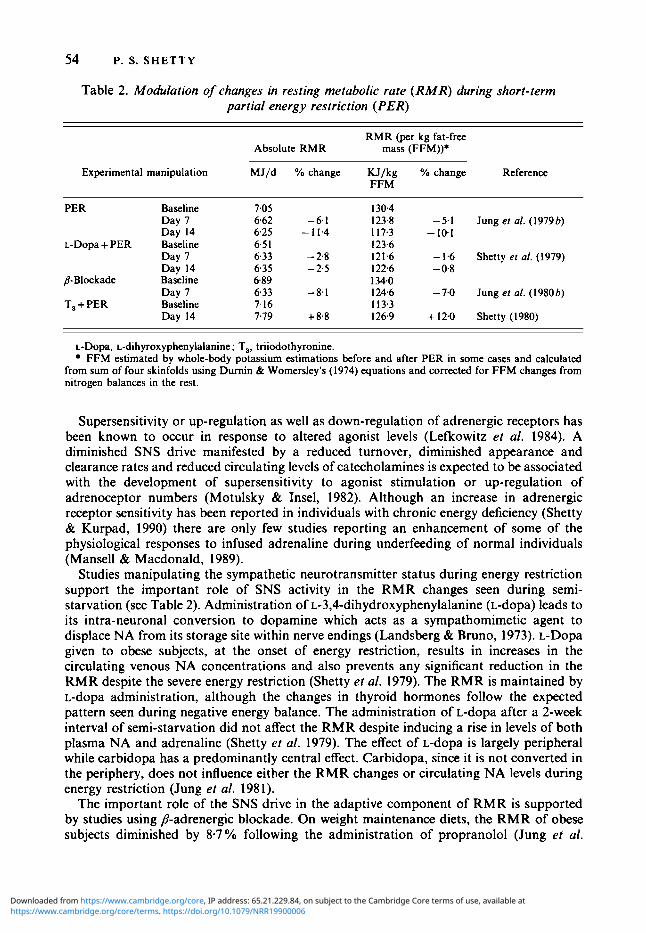
Table 2. Modulation of changes in resting metabolic rate (RMR) during short-term partial energy restriction (PER)
RMR (per kg fat-free Absolute RMR mass (FFM))*
Experimental manipulation MJ/d YO change KJ/kg YO change Reference FFM
PER Baseline Day 7 Day 14
L-Dopa + PER Baseline Day I Day 14
8-Blockade Baseline Day 7
T, + PER Baseline Day 14
7.05 662 -6.1 6.25 - 11.4 6.5 1 6.33 - 2.8 635 - 2 3 6.89
7.16 7.79 + 8.8
6.33 -8.1
130.4 123.8 - 5.1 Jung et al. (1 979 b) I 17.3 - 10.1 123.6 121.6 - 1.6 Shetty el al. (1979)
134.0 124.6 - 7.0 Jung er al. (I980 b) 1 13.3 126.9 + 12.0 Shetty (1980)
122.6 - 0.8
L-Dopa, L-dihyroxyphenylalanine; T,, triiodothyronine. FFM estimated by whole-body potassium estimations before and after PER in some cases and calculated
from sum of four skinfolds using Durnin & Womersley's (1974) equations and corrected for FFM changes from nitrogen balances in the rest.
Supersensitivity or up-regulation as well as down-regulation of adrenergic receptors has been known to occur in response to altered agonist levels (Lefkowitz et al. 1984). A diminished SNS drive manifested by a reduced turnover, diminished appearance and clearance rates and reduced circulating levels of catecholamines is expected to be associated with the development of supersensitivity to agonist stimulation or up-regulation of adrenoceptor numbers (Motulsky & Insel, 1982). Although an increase in adrenergic receptor sensitivity has been reported in individuals with chronic energy deficiency (Shetty & Kurpad, 1990) there are only few studies reporting an enhancement of some of the physiological responses to infused adrenaline during underfeeding of normal individuals (Mansell & Macdonald, 1989).
Studies manipulating the sympathetic neurotransmitter status during energy restriction support the important role of SNS activity in the RMR changes seen during semi- starvation (see Table 2). Administration of ~-3,4-dihydroxyphenylalanine (L-dopa) leads to its intra-neuronal conversion to dopamine which acts as a sympathomimetic agent to displace NA from its storage site within nerve endings (Landsberg & Bruno, 1973). L-Dopa given to obese subjects, at the onset of energy restriction, results in increases in the circulating venous NA concentrations and also prevents any significant reduction in the RMR despite the severe energy restriction (Shetty et al. 1979). The RMR is maintained by L-dopa administration, although the changes in thyroid hormones follow the expected pattern seen during negative energy balance. The administration of L-dopa after a 2-week interval of semi-starvation did not affect the RMR despite inducing a rise in levels of both plasma NA and adrenaline (Shetty et al. 1979). The effect of L-dopa is largely peripheral while carbidopa has a predominantly central effect. Carbidopa, since it is not converted in the periphery, does not influence either the RMR changes or circulating NA levels during energy restriction (Jung et al. 1981).
The important role of the SNS drive in the adaptive component of RMR is supported by studies using P-adrenergic blockade. On weight maintenance diets, the RMR of obese subjects diminished by 8-7 % following the administration of propranolol (Jung et al.
https://www.cambridge.org/core/terms. https://doi.org/10.1079/NRR19900006Downloaded from https://www.cambridge.org/core, IP address: 65.21.229.84, on subject to the Cambridge Core terms of use, available at

ADAPTATION TO ENERGY RESTRICTION 55
1980~). This reduction in RMR was comparable to the RMR reduction seen following energy restriction alone for 3 weeks (9.1 "/o). Similar doses of propranolol produced only a < 2 % drop in RMR after 1 week on an energy-restricted diet. P-Adrenergic blockade produced changes in thyroid hormone metabolism both on maintenance diets and energy- restricted diets, similar to those seen during energy restriction. Although P-adrenergic blockade affects peripheral thyroid metabolism, the major action of the blocking agent on RMR was by direct inhibition of SNS-mediated stimulation of metabolism rather than indirectly by its effects on peripheral thyroid metabolism (Jung et al. 1980~). A recent study has confirmed the effects of P-adrenergic blockade on resting metabolism; it does not, however, seem to prevent the increase in RMR seen consequent to overfeeding (Welle et al. 1989).
The adrenal medulla, unlike the SNS, is stimulated by energy restriction (Young et al. 1984). This small increase in adrenaline helps substrate mobilization with the lipolytic activity in man being sensitive to variations in adrenaline within the physiological range (Galster et al. 1981). The increase in adrenaline has no effect on thermogenesis since the levels needed to stimulate RMR are considerably higher. Thus, the SNS shut down associated with adrenal medullary stimulation will aid substrate mobilization with no effect on the RMR.
T H Y R O I D H O R M O N E S The thermogenic effects of thyroid hormones, thyroxine (T,) and triiodothyronine (T,), in man are undisputed. Hollingsworth et al. (1970) gave T, to hospitalized obese patients and observed an increase in 0, consumption. T, in doses of l00pg or more consistently increases metabolic rates and, although the effect is small, it is readily measurable (Bray er al. 197 I , 1973). Administration of 80 ,ug T,/d even while on an energy-restricted diet raised the metabolic rates of obese subjects by 9-10% over a period of 2 weeks (Shetty, 1980).
The stimulation of thermogenesis by thyroid hormones can be demonstrated both in vivo and in vitro in isolated tissues such as muscle, liver, kidney and intestine (Guernsey & Edelman, 1983). This action is mediated primarily through nuclear T, receptors in most tissues and is the result of increased membrane-bound Na+-K+ ATPase (EC 3.6.1 .37) activity. There is also evidence that T, has direct mitochondria1 effects which could mediate its thermogenic actions (Sterling, 1979). Clausen & Chinet (1986) have shown, however, that the contribution of the Na pump to total cellular energy turnover was insufficient to account for changes in whole-body thermogenesis. Shulman et al. (1985) recently demon- strated an increase in futile cycling of glucose to glucose-6-phosphate and fructose- 1 -phosphate to fructose- 1,6-phosphate in muscle by thyroid hormones.
Thyroid hormones are important components of the metabolic adaptations associated with energy restriction and overfeeding and they influence both carbohydrate and lipid metabolism (Minderop et al. 1987; Oppenheimer et al. 1987). The thyroid hormone changes seen in response to restricted intakes of energy have been well reviewed in recent years (Jung et al. 1980a; Danforth & Burger, 1989) and are summarized here.
Energy restriction does not seem to affect the circulating levels of total T, (free and bound) which usually remain unchanged since there is no evidence of a change in the production rates of T,. When T, levels show a tendency to fall they return to prefasting levels as the fast continues. Free T, may show a rise transiently during starvation and this is secondary to the inhibitory effects of a high plasma FFA concentration on plasma protein binding of T, (Spencer et al. 1983). There is a rapid decline in serum T, during fasting or partial energy restriction (Shetty et al. 1979). The response of T, to energy restriction seems to be most specific to restriction of carbohydrate (O'Brian et al. 1980;
3 NTR 3
https://www.cambridge.org/core/terms. https://doi.org/10.1079/NRR19900006Downloaded from https://www.cambridge.org/core, IP address: 65.21.229.84, on subject to the Cambridge Core terms of use, available at
56 P. S. SHETTY
26 25 24
I 23 * 22 0 21
lz
2
- E, 20- U
f 18 17
z l9
16 15 l6
Insulin: (IU L)
- - - - - -
- - - - - L--
Energy-restricted diet
Glucagon: (pg rnl)
Catecholamines: NA (n9 mi) ADR ng ml)
22.4
226
0.17 0.04
7.0
287
Period of study (d)
0.07 0.03
125 r
L 0 +5 +10+13
- - 300- 290 -
2 280- ' 270 - 0)
% 5 260- 250 - 240 - 230 -
u 0 +5 +10+13 0 +5 +10+13
Period of study (d)
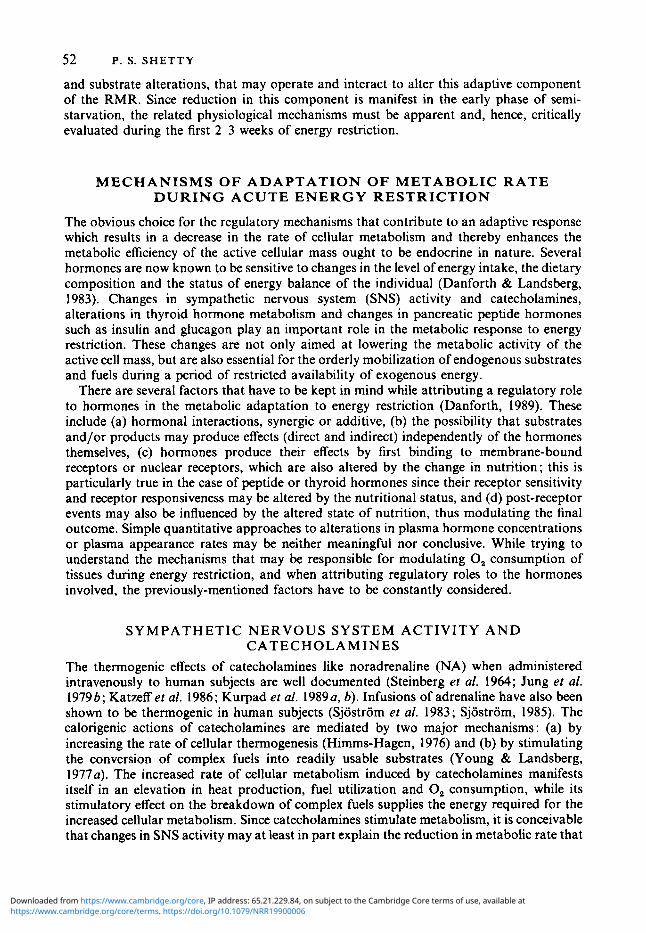
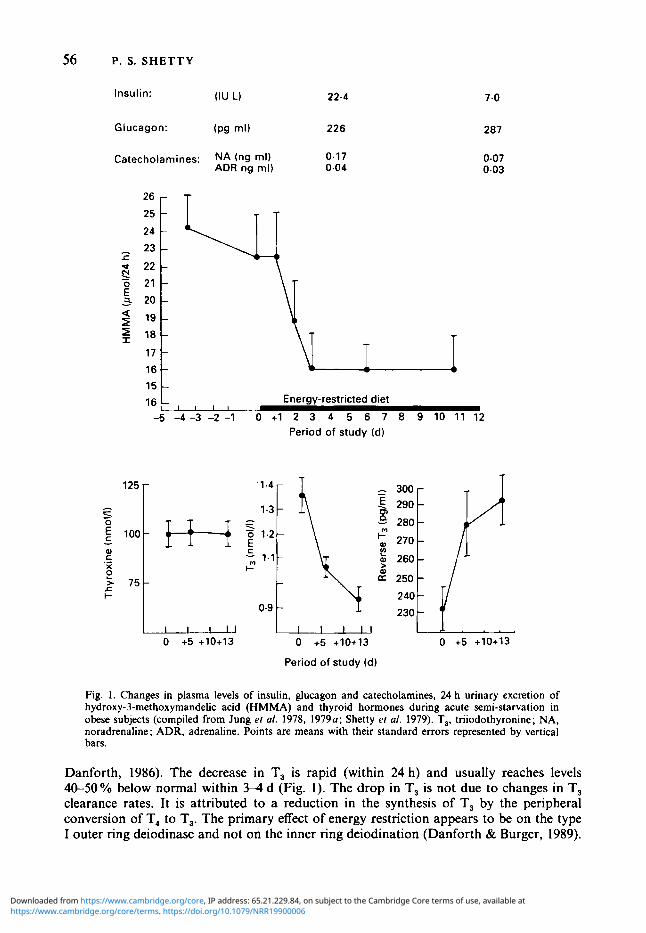
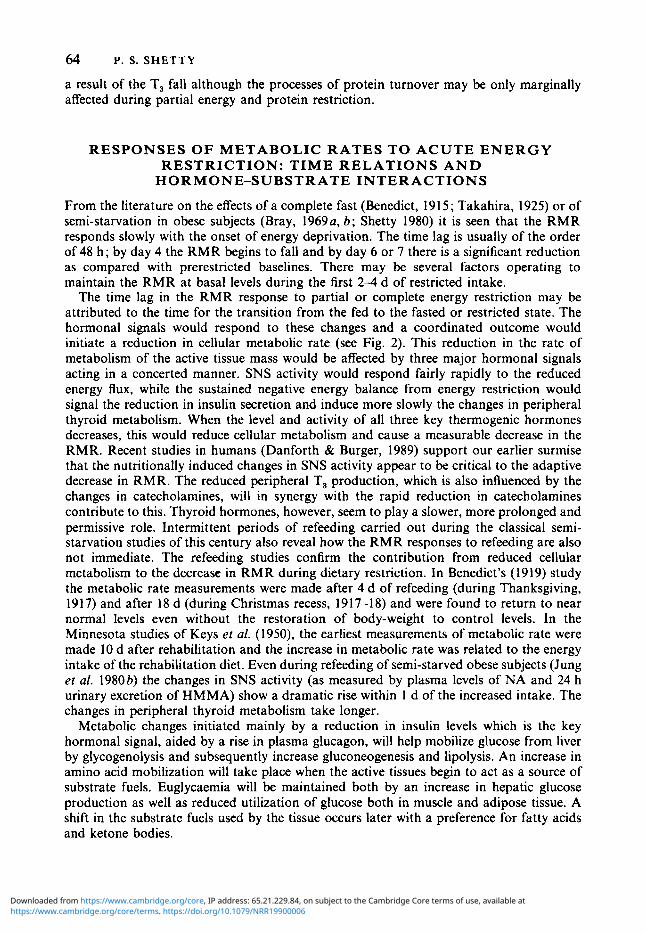
Fig. I . Changes in plasma levels of insulin, glucagon and catecholamines, 24 h urinary excretion of hydroxy-3-methoxymandeEc acid (HMMA) and thyroid hormones during acute semi-starvation in obese subjects (compiled from Jung ef a/ . 1978, 1979~; Shetty ef al. 1979). T,, triiodothyronine; NA, noradrenaline; ADR, adrenaline. Points are means with their standard errors represented by vertical bars.
Danforth, 1986). The decrease in T, is rapid (within 24 h) and usually reaches levels 40-50% below normal within 3-4 d (Fig. 1). The drop in T, is not due to changes in T, clearance rates. It is attributed to a reduction in the synthesis of T, by the peripheral conversion of T, to T,. The primary effect of energy restriction appears to be on the type I outer ring deiodinase and not on the inner ring deiodination (Danforth & Burger, 1989).
https://www.cambridge.org/core/terms. https://doi.org/10.1079/NRR19900006Downloaded from https://www.cambridge.org/core, IP address: 65.21.229.84, on subject to the Cambridge Core terms of use, available at
A D A P T A T I O N TO E N E R G Y RESTRICTION 57 Associated with the reduction in T, there is an increase in reverse T, (rT,) during fasting (Chopra, 1977). The increase in rT, is progressive, beginning much later than the fall in serum T, seen during energy restriction. After 2-3 weeks of fasting or semi-starvation the rT, returns to normal levels (Carlson er al. 1977) at a time when the concentrations of T, are being maintained at a low level. The peripheral kinetics of T, and rT, are dissociated. T, production rates decrease during starvation while the transient changes in rT, depend not on changes in production but on decreased clearance of rT,. This is partly due to reduced hepatic deiodinase which catabolizes rT, (Danforth & Burger, 1989). However, the catabolic rate of rT, is much higher (Chopra, 1977) than the rate of T, breakdown, thus accounting for the smaller changes in the circulating concentrations of rT, as compared with the plasma changes in T,.
Normally fed subjects are expected to show an increase in pituitary thyroid-stimulating hormone (TSH) concentrations and an augmented TSH response to thyrotrophin-releasing hormone (TRH) following a reduction in circulating concentrations of T, or T,. This, however, does not appear to be the case when either fasting, semi-starvation or low carbohydrate intakes decrease T, concentrations. During starvation or energy restriction TSH concentrations seem to either increase (durger er al. 1980) or remain unaltered (Carlson ef al. 1977). The TSH response to TRH is also either unaltered (Gardner et al. 1979) or appears to be blunted (Burger et al. 1980). These observations are indicative of an alteration in the sensitivity of the hypothalamo-hypophyseal feedback systems during energy restriction.
The reciprocal changes in T, and rT, concentrations during energy restriction are bound to contribute to the reduction in metabolic rate. The tissue responsiveness to T, may not be altered since exogenous administration of T, increases the metabolic rate and reverses the RMR fall during energy restriction and weight loss (Hollingsworth et al. 1970; Bray et al. 1971; Shetty, 1980; Welle & Campbell, 1986). There is evidence, however, which suggests that prolonged energy restriction can decrease the nuclear T, receptors (Schussler & Orlando, 1978); this reduction in receptor numbers is not necessarily a direct consequence of the fall in T, levels (Bernal et al. 1978). There is also a reduction in the binding capacity of nuclear T, receptors which seems to be an independent but synergic adaptation to energy restriction (Burman et al. 1977).
IODOTHYRONINE-CATECHOLAMINE I N T E R A C T I O N S Thyroid hormones, i.e. the iodothyronines, and catecholamines demonstrate synergic potentiation of each others’ activities, at the periphery. This synergic interaction may be important when nutritionally modulated changes are induced in either or both hormone systems. Iodothyronine-catecholamine interactions can occur at several levels : (1) the effects of one on the synthesis and secretion of the other, (2) the effect of catecholamines on the peripheral conversion of T, to T, and (3) the effect of thyroid hormones on the sensitivity of the effector tissues to catecholamines.
Thyroid follicles are innervated by sympathetic nerve fibres which may influence and regulate thyroid hormone secretion (Young & Landsberg, 1983). Thyroid status affects the functional state of the SNS, the relationship contrary to common belief being an inverse one. Thyroid hormone deficiency is associated with an enhanced SNS activity since both NA turnover rate and plasma NA appearance rate are markedly increased when thyroid hormone is deficient (Landsberg & Axelrod, 1968).
Catecholamines have an effect on the peripheral thyroid hormone metabolism. Adrenaline is known to enhance the peripheral conversion of T, to T, (Galton, 1965). p- Adrenergic blockers such as propranolol decrease the production of T, (Jung er al. 1980~);
_ _
https://www.cambridge.org/core/terms. https://doi.org/10.1079/NRR19900006Downloaded from https://www.cambridge.org/core, IP address: 65.21.229.84, on subject to the Cambridge Core terms of use, available at
58 P. S. SHETTY
this suppression of the peripheral T, to T, conversion was seen in obese subjects both during a weight maintenance diet and an energy-restricted diet. Kinetic tracer studies have also demonstrated a suppression of peripheral conversion of thyroid hormones (Lumholtz et al. 1978). Administration of L-dopa, a precursor of catecholamines, failed to influence the T, changes associated with energy restriction, although the expected rise in rT, with semi- starvation was prevented (Shetty et al. 1979).
Thyroid hormones have an effect on the peripheral tissue sensitivity to catecholamines and this is possibly mediated via the P-adrenergic receptor as well as the receptor-linked adenylate cyclase (EC 4.6.1 . 1) - cyclic AMP system. Thyroid hormones increase the number of P-adrenergic receptors in several tissues such as myocardium, skeletal muscle, adipose tissue and lymphocytes and also affect the adenylate cyclase - cyclic AMP system (Bilezikian & Loeb, 1983). They may enhance the coupling of P-receptor and cyclic AMP generation. These changes are expected to result in increased tissue sensitivity to cat- echolamines. The thermogenic effects of thyroid hormone are mediated by Na+-K+ ATPase ; this enzyme is also a target for catecholamines through stimulation of P-adrenergic receptors (Swann, 1984).
The interactions between thyroid hormones and catecholamines may influence their mutual roles in regulation of thermogenesis. Thyroid hormones are the principal regulators of basal metabolic rates (Himms-Hagen, 1983), while the regulation of adaptive thermo- genesis is mediated largely by catecholamines (Landsberg & Young, 1983 b). However, thyroid hormones do have a permissive and synergic role in the adaptive component. While administration of T, even in low doses can prevent the drop in metabolic rate seen during energy restriction (Welle & Campbell, 1986), administration of catecholamines fails to stimulate metabolic heat production in hypothyroid rats (Rothwell et al. 1982). SNS-mediated thermogenesis in response to carbohydrate intake also requires thyroid hormones (Rothwell et al. 1982) and adrenaline-mediated thermogenesis in the newborn pig is enhanced by thyroid hormone administration in a dose-dependent manner (Kaciuba- Uscilko, 1973).
I N S U L I N Insulin is another pre-eminent hormone that regulates energy balance. Insulin is needed to permit glucose uptake into the cells for oxidation as well as for storage. Insulin can increase energy expenditure in several ways. It has a direct stimulating effect on Na+-K+ pumping across the cell membrane (Moore, 1981). Increased Na pump activity in skeletal muscle has been demonstrated following insulin administration (Clausen & Kohn, 1977 ; Landsberg & Young, 1985). Insulin also stimulates the SNS ; during the euglycaemic-hyperinsulinaemic clamp, variations in the insulin concentrations resulted in a dose-dependent change in the concentrations of plasma NA without alterations in plasma glucose (Rowe et af. 1981). The enhancement by insulin of the sympathetic tone has been confirmed by subsequent studies using the hyperinsulinaemic clamps (Acheson et af. 1984; Christin et af. 1986). These studies have also confirmed the thermogenic role of insulin. In a series of clamp studies utilizing somatostatin to block endogenous insulin secretion, the group in Lausanne showed that step-wise increase in glucose uptake alone, with insulin concentrations kept constant, caused an increase in thermogenesis comparable to that found when plasma insulin was allowed to rise. When insulin alone was increased without changes in glucose uptake, plasma NA levels increased and this increase correlated with the thermogenic response. Insulin is thus said to mediate cellular thermogenesis by either of two mechanisms, the former obligatory by increasing glucose uptake, and the latter facultative by increasing catecholamine activity (Sims, 1986).
Starvation or partial energy restriction brings about a significant lowering in circulating
https://www.cambridge.org/core/terms. https://doi.org/10.1079/NRR19900006Downloaded from https://www.cambridge.org/core, IP address: 65.21.229.84, on subject to the Cambridge Core terms of use, available at
ADAPTATION TO ENERGY RESTRICTION 59 insulin levels. This is the primary hormonal signal that allows for an orderly transition from the fed to the fasted state without the development of hypoglycaemia. As the fasted state extends beyond 12-14 h the decline in circulating insulin levels results in the stimulation of amino acid mobilization, gluconeogenesis, lipolysis and ketogenesis all of which are aimed at the mobilization of endogenous fuels as substrates (Sherwin & Felig 1987). This reduction in plasma insulin levels is also bound to influence the metabolic rate at rest.
C A T E C H O L A M I N E S , I O D O T H Y R O N I N E S A N D I N S U L I N : T H E I R I N T E G R A T E D R O L E I N A L T E R I N G M E T A B O L I C R A T E
An interesting model inter-relating the contributions of the three most important thermo- genic hormones, i.e. catecholamines, iodothyronines and insulin in regulating the metabolic rate has been outlined by Danforth (1989). Changes in energy intake influence SNS activity, thyroid hormone metabolism, and insulin secretion. The nutritional signal is not the same for these three key energy-regulating hormones. Energy balance can be attained at many levels of intake and expenditure. When intakes are lowered (or increased), energy balance is attainable with a proportionate reduction (or increase) in energy expenditure. Alterations in peripheral thyroid metabolism are seen only when there is an energy imbalance, i.e. energy deficit or surfeit. In one study two groups of obese subjects were given the same restricted diet while one of the groups was also exercised to enhance the energy deficit (Phinney et al. 1988). T, concentrations decreased in both groups but the decrease was more marked as was the decline in RMR in the group which had a greater negative energy deficit, i.e. the energy-restricted and exercised group. In an earlier study by Danforth’s group (Woo et al. 1985), no change was observed in T, concentrations when overfeeding was associated with a compensatory increase in physical activity. However, T, concentrations increased when overfeeding was not accompanied by an increase in physical activity, i.e. a state of positive energy balance. In both groups of overfed subjects (with and without compensatory increase in physical activity) the RMR increased. Whether energy deficit was induced by energy restriction or by increase in physical exercise the decline in T, levels was similar. This suggests that peripheral thyroid metabolism is altered in conditions of energy imbalance irrespective of the levels of intake or expenditure. When energy imbalance is incurred, the changes in peripheral thyroid hormone metabolism vary in the direction of the energy imbalance, i.e. negative energy balance will lead to decreased T, levels and vice versa. Peptide hormones like insulin also behave in the same manner as do thyroid hormones. In the case of nutrition-induced alterations in SNS activity, the SNS response is determined by the energy flux irrespective of whether the subject is in energy balance or not. An increase in energy flux can be induced by increase in energy intake. When this increase is accompanied by a compensatory increase in energy expenditure energy balance will be maintained. This state will, however, be associated with an increase in SNS activity and an increase in RMR but with no alterations in T, and insulin levels. Catecholamines may, thus, play the more important role in modulating the adaptive component of RMR as a metabolic response to energy restriction.
Danforth’s (1989) hypothesis attempts to uncouple the nutrition-induced alterations in thyroid hormones and insulin from the changes in SNS activity and RMR. SNS activity is mainly responsible for the RMR changes associated with alterations in energy balance. The level of energy intake or expenditure determines the SNS activity while the energy balance status determines the peripheral thyroid metabolism and peptide hormone secretion. According to this model, the definitive reduction in RMR seen during energy restriction can only be associated with a decrease in T, and insulin as well as NA levels. This inter- relationship is of considerable importance in unravelling the mechanisms associated with the reduction in metabolic rate seen during starvation or partial energy restriction.
https://www.cambridge.org/core/terms. https://doi.org/10.1079/NRR19900006Downloaded from https://www.cambridge.org/core, IP address: 65.21.229.84, on subject to the Cambridge Core terms of use, available at
60 P. S . SHETTY
O T H E R C A L O R I G E N I C H O R M O N E S Hormones with potential metabolic and calorigenic activity, such as glucagon and growth hormone, also change rapidly during the early phase of semi-starvation or total fast. These hormones, though of secondary importance in terms of their thermogenic role, are capable of influencing the metabolic rate during energy restriction and, hence, need to be considered.
Glucagon Glucagon infusions have been shown to be calorigenic in man (Trisotto et al. 1970). We
have been unable to demonstrate any change in RMR in obese euthyroid women during a slow intravenous infusion of 40 pg glucagon at 081 pg/min over a period of 45 min despite a doubling of plasma glucagon levels (Shetty, 1980). In a recent study, Nair (1987) has reported a 15 YO increase in RMR during a combined administration of somatostatin and glucagon compared with the RMR observed during the infusion of somatostatin alone which induces an insulin deficiency. In this study, there was a 3.5-fold increase in plasma glucagon levels which increased the 0, consumption by 15 YO and the protein oxidation rates by 29%. The mechanism by which glucagon exerts its calorigenic effect is not clear.
Plasma glucagon concentrations increase early in starvation (Kolanowski et al. 1975 ; Cahill, 1976) and this rise is associated with a drop in plasma insulin levels. These reciprocal changes in pancreatic peptide hormones are generally considered to be an essential adaptive mechanism aimed at maintaining adequate glucose production during the first days of starvation. Similar changes in glucagon levels have also been reported during semi- starvation on hypo-energetic protein diets in normal subjects, a peak rise in levels being reached by day 5 of energy restriction (Weisswange et al. 1975). There are no specific studies showing the effect of the composition of the diet on glucagon concentrations during energy restriction, although it is generally believed that like other counter-regulatory hormones, glucagon also responds to the carbohydrate content of the diet which may be the primary substrate signal of the fed v. the fasted state (Danforth, 1989).
The hyperglucagonaemia seen during early starvation or energy restriction results primarily from decreased glucagon removal rather than secretion. With prolongation of the fast, plasma glucagon levels return towards basal values because of a reduction in secretion and a progressive decline in metabolic clearance (Danforth, 1985, 1989). The increased glucagon secretion associated with the insulin deficiency in the early phase of energy restriction may contribute a little to increase the metabolic rates.
Growth hormone GH is also thermogenic and is known to produce a small but significant effect on the
RMR in human subjects (Henneman et al. 1960). In obese subjects, administration of 5 mg human GH/d, produced a significant increase in basal 0, consumption after only 3 d of administration (Bray, 1969~). The mechanism by which GH induces thermogenesis is not yet clearly understood ; it does not, however, depend on the secretion or presence of thyroid hormones. It is likely that this calorigenic effect of G H is mediated by the release of FFA (Bray, 1976). GH increases the mobilization of FFA from adipose tissue as a result of increased triacylglycerol lipolysis ; it also increases the sensitivity of catecholamine-mediated lipolytic activity (Isaksson et al. 1985).
Starvation is known to stimulate G H secretion and an increase in the levels of G H during fasting is well documented (Cahill et al. 1966). There is considerable variation in human GH levels during fasting, some subjects showing no increase while others show a marked increase during the fast. The inconsistent response of GH to energy restriction has been
https://www.cambridge.org/core/terms. https://doi.org/10.1079/NRR19900006Downloaded from https://www.cambridge.org/core, IP address: 65.21.229.84, on subject to the Cambridge Core terms of use, available at
A D A P T A T I O N TO ENERGY RESTRICTION 61 confirmed by subsequent studies (Kolanowski et al. 1975) which would considerably undermine the role of GH as a thermogenic agent during fasting.
There are no systematic studies on G H levels during any period of semi-starvation and the effects of partial energy restriction on G H secretion were only recently investigated. GH increases transiently with energy restriction and its secretion appears to be sensitive both to the level of carbohydrate which suppresses secretion and to protein which stimulates secretion (Danforth, 1989). Arginine-stimulated GH secretion is markedly reduced by the high carbohydrate content of the diet. The suppression in GH secretion is present even if the total energy intake is reduced but the carbohydrate content is kept constant. The importance of the composition of the diet on G H secretion was best demonstrated when healthy subjects were fed on a weight-maintenance diet completely devoid of carbohydrate for 10 d. They showed a decline in blood glucose and insulin levels mimicking the fasted state, but without the transient increase in GH normally seen in a briefly fasted subject (Danforth, 1985). The lack of a rise in G H supports the idea that the normal relationship between glucose and insulin during starvation is not dependent on GH. The increase in GH seen during energy restriction may have a role to play in the conservation of the active tissue mass since short-term GH administration is known to conserve LBM during dietary restriction in obese subjects (Clemmons et al. 1987). A recent report indicates that this effect too is sensitive to carbohydrate intake (Snyder et al. 1989).
Glucocorticoids Glucocorticoids are not known to be thermogenic, although recent suggestions indicate
that, along with catecholamines and glucagon, adrenal corticoids may stimulate futile cycling of substrates in muscle (Newsholme, 1980). Adrenal glucocorticoids will influence the metabolic pathways concerned with the ready availability of substrate fuels including the mobilization of muscle protein as gluconeogenic precursors. Glucocorticoids may have little to do with the metabolic adaption to a fast; they may, however, exert a permissive role on other important hormonal signals that accompany restricted intakes of energy. For instance, basal levels of cortisol and GH contribute to the gluconeogenic response initiated by the decline in plasma insulin levels and the rise in plasma glucagon levels that occur during a short-term fast. Glucocorticoids are also now known to modulate the sensitivity of tissues to T, by increasing the affinity of the nuclear receptors to the hormone (De Nayer et al. 1987).
A small rise in plasma cortisol has been noticed during fasting (Galvao-Teles et al. 1976), while Schultz et al. (1964) have reported no change in cortisol secretion rate in fasted obese subjects. Most recent reports indicate that cortisol secretion does not alter during a total fast (Sabeh et al. 1969; Kolanowski et al. 1975) and that no change occurs either in the diurnal pattern of plasma cortisol or in the daily excretion of 17-hydroxy-corticosteroids or urinary cortisol (Croxson et al. 1977). A decline in the urinary excretion of cortisol metabolites like 17-keto-steroids is also known to occur with fasting (Schachner et al. 1965; Cahill et al. 1966) and has been attributed to a decrease in cortisol removal from plasma due to an increase in transcortin capacity (Kolanowski et al. 1975)
Progesterone Progesterone has been shown to be thermogenic when administered either to normal or
ovariectomized women (Barton & Wiesner, 1945; Kappas & Palmer 1965). Increased progesterone secretion during the luteal phase of the menstrual cycle has been implicated in the rise in sleeping metabolic rate expressed per kg FFM seen when energy expenditure measurements were made serially during a menstrual cycle (Bisdee er al. 1989). Little is known about the changes in ovarian hormones during semi-starvation. However, SNS
https://www.cambridge.org/core/terms. https://doi.org/10.1079/NRR19900006Downloaded from https://www.cambridge.org/core, IP address: 65.21.229.84, on subject to the Cambridge Core terms of use, available at
62 P. S . SHETTY
activity is known to influence progesterone production by the ovary. During the menstrual cycle, elevated catecholamines have been reported in the luteal phase (Davidson, 1985). p- Adrenergic activation stimulates ovarian progesterone production (Jordan et al. 1978) while p-adrenergic blockade abolishes the rise in the plasma progesterone associated with cervical dilatation in the first trimester of pregnancy (Fylling, 1971). The reduction in SNS activity and the drop in catecholamines during energy restriction may indirectly influence progesterone production and its likely thermogenic contribution.
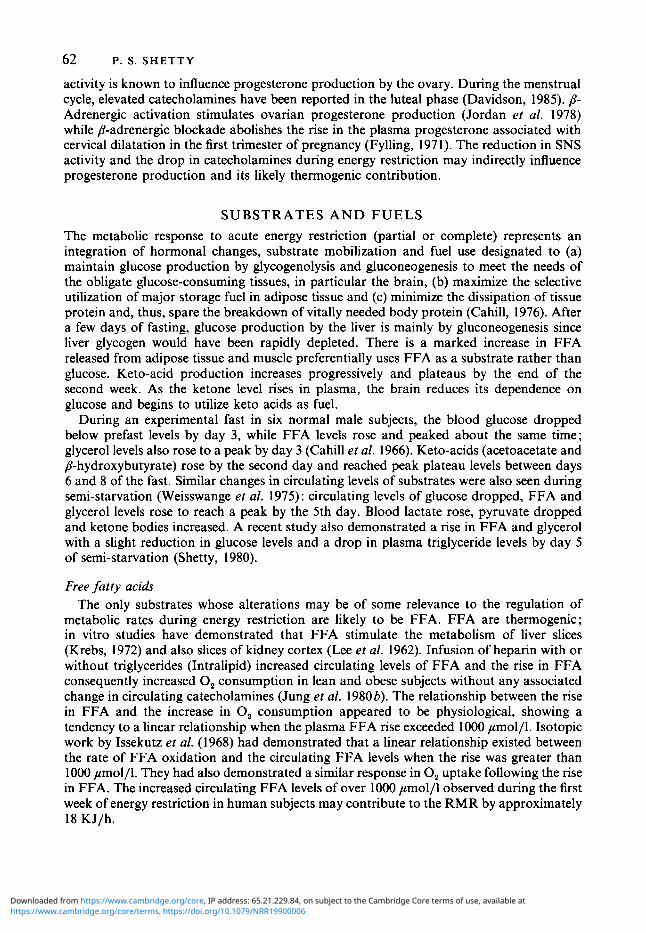
SUBSTRATES A N D F U E L S The metabolic response to acute energy restriction (partial or complete) represents an integration of hormonal changes, substrate mobilization and fuel use designated to (a) maintain glucose production by glycogenolysis and gluconeogenesis to meet the needs of the obligate glucose-consuming tissues, in particular the brain, (b) maximize the selective utilization of major storage fuel in adipose tissue and (c) minimize the dissipation of tissue protein and, thus, spare the breakdown of vitally needed body protein (Cahill, 1976). After a few days of fasting, glucose production by the liver is mainly by gluconeogenesis since liver glycogen would have been rapidly depleted. There is a marked increase in FFA released from adipose tissue and muscle preferentially uses FFA as a substrate rather than glucose. Keto-acid production increases progressively and plateaus by the end of the second week. As the ketone level rises in plasma, the brain reduces its dependence on glucose and begins to utilize keto acids as fuel.
During an experimental fast in six normal male subjects, the blood glucose dropped below prefast levels by day 3, while FFA levels rose and peaked about the same time; glycerol levels also rose to a peak by day 3 (Cahill et al. 1966). Keto-acids (acetoacetate and P-hydroxybutyrate) rose by the second day and reached peak plateau levels between days 6 and 8 of the fast. Similar changes in circulating levels of substrates were also seen during semi-starvation (Weisswange et al. 1975) : circulating levels of glucose dropped, FFA and glycerol levels rose to reach a peak by the 5th day. Blood lactate rose, pyruvate dropped and ketone bodies increased. A recent study also demonstrated a rise in FFA and glycerol with a slight reduction in glucose levels and a drop in plasma triglyceride levels by day 5 of semi-starvation (Shetty, 1980).
Free fatty acids The only substrates whose alterations may be of some relevance to the regulation of
metabolic rates during energy restriction are likely to be FFA. FFA are thermogenic; in vitro studies have demonstrated that FFA stimulate the metabolism of liver slices (Krebs, 1972) and also slices of kidney cortex (Lee et al. 1962). Infusion of heparin with or without triglycerides (Intralipid) increased circulating levels of FFA and the rise in FFA consequently increased 0, consumption in lean and obese subjects without any associated change in circulating catecholamines (Jung et al. 1980b). The relationship between the rise in FFA and the increase in 0, consumption appeared to be physiological, showing a tendency to a linear relationship when the plasma FFA rise exceeded lo00 ymolll. Isotopic work by Issekutz et al. (1968) had demonstrated that a linear relationship existed between the rate of FFA oxidation and the circulating FFA levels when the rise was greater than lo00 pmolll. They had also demonstrated a similar response in 0, uptake following the rise in FFA. The increased circulating FFA levels of over lo00 ymol/l observed during the first week of energy restriction in human subjects may contribute to the RMR by approximately 18 KJ/h.
https://www.cambridge.org/core/terms. https://doi.org/10.1079/NRR19900006Downloaded from https://www.cambridge.org/core, IP address: 65.21.229.84, on subject to the Cambridge Core terms of use, available at
A D A P T A T I O N T O ENERGY RESTRICTION 63
Triacylglycerols and fatty acid cycling Some evidence has recently been presented to show that the energy cost of
triacylglycerol-fatty acid cycling which accounts only for a small proportion of the resting energy expenditure ( < 0 5 "/o) in overnight fasted individuals increases sixfold following a 4 d starvation (Elia et al. 1987). Starvation produced a threefold increase in glycerol turnover and a sixfold increase in the calculated rate of esterification or recycling of energy into the triacylglycerol stores. The calculated energy cost of triacylglycerol-fatty acid cycle also increased sixfold. Factors that are responsible for the stimulation of re-esterification during starvation are not clear and may be dependent on neurohormonal factors or may possibly result from the elevated FFA levels. This may contribute in some small measure to the total energy expenditure during an energy-restricted state.
Protein catabolism and protein turnover Apart from FFA, tissue protein mobilization will liberate amino acids as an energy
source during energy restriction. The maintenance of substantial nitrogen excretion during the first week of a partial or complete starvation is well documented indicating the extent to which tissue protein provides the metabolic substrates for gluconeogenesis (Cahill, 1976). It has been estimated from the 24 h N excretion that in a normal man fasting for 3 4 d approximately 75 g amino acids are released from muscle (Cahill et al. 1966; Cahill, 1976). Cahill (1976) has proposed that the rate of protein catabolism in starvation is determined by the gluconeogenic demands and with prolonged starvation there is a decline in tissue protein catabolism due to a fall in the glucose needs of nervous tissue and increased dependence on ketones. Henry et al. (1988) have a different perspective. They argue that in normal adults the reduction in N excretion seen with fasting is part of an overall reduction in fuel use as a consequence of the reduced BMR and not due to any specific sparing of body protein. They argue that the relative importance of tissue protein as a fuel during fasting is dictated by the adiposity of the subject, the fall in N excretion and RMR occurring in parallel in the normal fasting adult, in contrast to the selective reduction in the use of protein as a fuel in the obese.
It is well recognized that protein synthesis makes a significant contribution to energy expenditure and whilst there is less certainty about the cost of protein breakdown it is generally believed that it will not represent a significant cost (Waterlow & Millward, 1989). Waterlow & Jackson (1981) have shown a constant relationship between whole-body protein turnover and the 0.75 power of body-weight, a relationship that holds for BMR over a wide range of species. They have also shown how these relationships hold good for an infant and an adult. Approximate estimates suggest that protein synthesis accounts for 10% of the BMR (Millward et al. 1976; Waterlow & Millward, 1989). Obese subjects receiving a low energy intake showed no effect on either their protein synthetic or break- down rate unless there was an additional deficiency of dietary protein intake (Garlick et al. 1980). On a protein-free diet, the alterations in protein turnover were mainly due to a reduction in protein breakdown rate. Whole-body protein synthesis and degradation changes rapidly during a fast. There is a 40% reduction in whole-body protein synthetic rate and a 50% reduction specifically in muscle protein synthesis (Waterlow, 1984). The decrease in T, levels that occur during energy restriction can help mediate by reducing protein degradation (Millward, 1985). Obese adults on a low-protein low-energy diet reduced N loss and achieved near balance during the first few weeks of energy restriction. This was reversed by the administration of T, and the N excretion doubled (Koppeschaar et al. 1983). It can, hence, be concluded that some amount of energy saving may occur as
https://www.cambridge.org/core/terms. https://doi.org/10.1079/NRR19900006Downloaded from https://www.cambridge.org/core, IP address: 65.21.229.84, on subject to the Cambridge Core terms of use, available at
64 P. S. SHETTY
a result of the T, fall although the processes of protein turnover may be only marginally affected during partial energy and protein restriction.
RESPONSES OF METABOLIC RATES TO ACUTE ENERGY RESTRICTION: TIME RELATIONS A N D
From the literature on the effects of a complete fast (Benedict, 1915; Takahira, 1925) or of semi-starvation in obese subjects (Bray, 1969a, b ; Shetty 1980) it is seen that the RMR responds slowly with the onset of energy deprivation. The time lag is usually of the order of 48 h ; by day 4 the RMR begins to fall and by day 6 or 7 there is a significant reduction as compared with prerestricted baselines. There may be several factors operating to maintain the RMR at basal levels during the first 2-4 d of restricted intake.
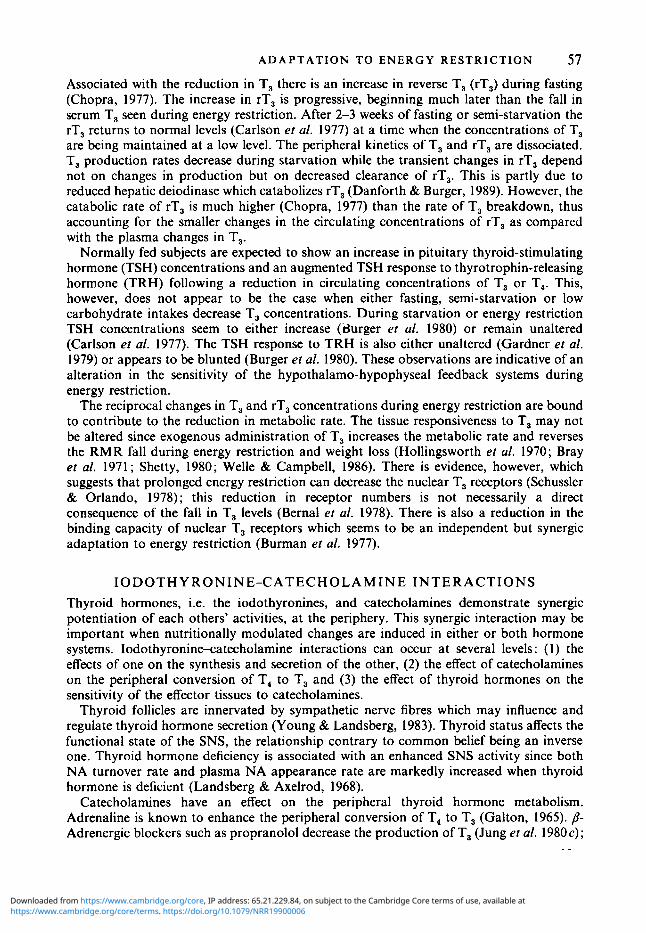
The time lag in the RMR response to partial or complete energy restriction may be attributed to the time for the transition from the fed to the fasted or restricted state. The hormonal signals would respond to these changes and a coordinated outcome would initiate a reduction in cellular metabolic rate (see Fig. 2). This reduction in the rate of metabolism of the active tissue mass would be affected by three major hormonal signals acting in a concerted manner. SNS activity would respond fairly rapidly to the reduced energy flux, while the sustained negative energy balance from energy restriction would signal the reduction in insulin secretion and induce more slowly the changes in peripheral thyroid metabolism. When the level and activity of all three key thermogenic hormones decreases, this would reduce cellular metabolism and cause a measurable decrease in the RMR. Recent studies in humans (Danforth & Burger, 1989) support our earlier surmise that the nutritionally induced changes in SNS activity appear to be critical to the adaptive decrease in RMR. The reduced peripheral T, production, which is also influenced by the changes in catecholamines, will in synergy with the rapid reduction in catecholamines contribute to this. Thyroid hormones, however, seem to play a slower, more prolonged and permissive role. Intermittent periods of refeeding carried out during the classical semi- starvation studies of this century also reveal how the RMR responses to refeeding are also not immediate. The refeeding studies confirm the contribution from reduced cellular metabolism to the decrease in RMR during dietary restriction. In Benedict’s (1919) study the metabolic rate measurements were made after 4 d of refeeding (during Thanksgiving, 1917) and after 18 d (during Christmas recess, 1917-18) and were found to return to near normal levels even without the restoration of body-weight to control levels. In the Minnesota studies of Keys et af. (1950), the earliest measurements of metabolic rate were made 10 d after rehabilitation and the increase in metabolic rate was related to the energy intake of the rehabilitation diet. Even during refeeding of semi-starved obese subjects (Jung et af. 19806) the changes in SNS activity (as measured by plasma levels of NA and 24 h urinary excretion of HMMA) show a dramatic rise within 1 d of the increased intake. The changes in peripheral thyroid metabolism take longer.
Metabolic changes initiated mainly by a reduction in insulin levels which is the key hormonal signal, aided by a rise in plasma glucagon, will help mobilize glucose from liver by glycogenolysis and subsequently increase gluconeogenesis and lipolysis. An increase in amino acid mobilization will take place when the active tissues begin to act as a source of substrate fuels. Euglycaemia will be maintained both by an increase in hepatic glucose production as well as reduced utilization of glucose both in muscle and adipose tissue. A shift in the substrate fuels used by the tissue occurs later with a preference for fatty acids and ketone bodies.
H 0 R M ON E-S U B S TR ATE INTER ACTIONS
https://www.cambridge.org/core/terms. https://doi.org/10.1079/NRR19900006Downloaded from https://www.cambridge.org/core, IP address: 65.21.229.84, on subject to the Cambridge Core terms of use, available at
A D A P T A T I O N TO E N E R G Y RESTRICTION 65
ENERGY RESTRICTION I
1 REDUCTION IN R M R
65 % (active)
Decrease in metabolic activity of FFM
Response to negative Response to reduced energy balance energy flux ,
I I I I 1 f FFA 1' TG-FFA CYCLING
1 INSULIN 1 T4 + T3 = 1 T3 (f rT3)
5 SNS ACTIVITY AND CATE C H 0 LAM IN E S
'? PROTEIN CATABOLISM '? GLUCAGON f GH
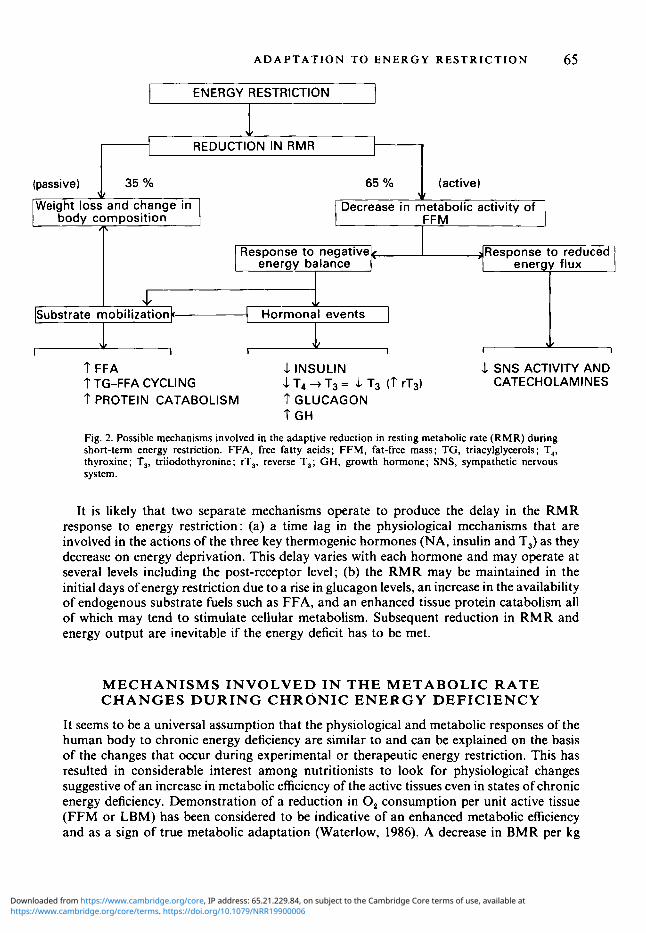
Fig. 2. Possible mechanisms involved in the adaptive reduction in resting metabolic rate (RMR) during short-term energy restriction. FFA, free fatty acids; FFM, fat-free mass; TG, triacylglycerols; T,, thyroxine; T,, triiodothyronine ; rT,, reverse T,; GH, growth hormone; SNS, sympathetic nervous system.
It is likely that two separate mechanisms operate to produce the delay in the RMR response to energy restriction: (a) a time lag in the physiological mechanisms that are involved in the actions of the three key thermogenic hormones (NA, insulin and T3) as they decrease on energy deprivation. This delay varies with each hormone and may operate at several levels including the post-receptor level; (b) the RMR may be maintained in the initial days ofenergy restriction due to a rise in glucagon levels, an increase in the availability of endogenous substrate fuels such as FFA, and an enhanced tissue protein catabolism all of which may tend to stimulate cellular metabolism. Subsequent reduction in RM R and energy output are inevitable if the energy deficit has to be met.
MECHANISMS INVOLVED I N THE METABOLIC RATE C H A N G E S D U R I N G CHRONIC E N E R G Y DEFICIENCY
It seems to be a universal assumption that the physiological and metabolic responses of the human body to chronic energy deficiency are similar to and can be explained on the basis of the changes that occur during experimental or therapeutic energy restriction. This has resulted in considerable interest among nutritionists to look for physiological changes suggestive of an increase in metabolic efficiency of the active tissues even in states of chronic energy deficiency. Demonstration of a reduction in 0, consumption per unit active tissue (FFM or LBM) has been considered to be indicative of an enhanced metabolic efficiency and as a sign of true metabolic adaptation (Waterlow, 1986). A decrease in BMR per kg
https://www.cambridge.org/core/terms. https://doi.org/10.1079/NRR19900006Downloaded from https://www.cambridge.org/core, IP address: 65.21.229.84, on subject to the Cambridge Core terms of use, available at
66 P. S. SHETTY
FFM (or LBM) in turn implies that the increase in metabolic efficiency is demonstrable in the other components of energy expenditure, particularly a decrease in the energy cost of physical activity of the individual (Ferro-Luzzi, 1985).
If, in fact, enhanced metabolic efficiency is an accompaniment of long-standing or chronic energy deficiency, one should be able to demonstrate changes in the key hormonal mechanisms that we believe play an important role in this response. The information on malnutrition in children and its relationship to catecholamines is confusing. In a small number of malnourished children the 24 h urinary excretion of metanephrines (expressed in pg/m* body surface area (BSA)) was significantly lower than in normal controls or in those children after recuperation (Bourgeois et al. 1973). Hoeldtke & Wurtman (1973) observed a reduction in urinary excretion of vanilyl mandelic acid (VMA) and dopamine, an unaltered NA excretion and an elevated adrenaline excretion in acute kwashiorkor. Ramirez et al. (1978) reported a high output of HMMA in malnourished children; whether these children were infected or were already under dietary rehabilitation is not clear. Graham & Placko (1 975) found elevated catecholamine concentrations in infected malnourished children while uninfected marasmic infants showed a rise in catecholamine excretion during partial recovery. Similar increases during rehabilitation have been reported by others (Parra et al. 1973). Adults with protein-energy malnutrition have low levels of T, (Rastogi et al. 1974). Chopra & Smith (1975) have reported lower T, and free T, levels in adults with protein-energy malnutrition which responds to refeeding. Similar changes in thyroid status are seen, but are more marked in infants (Ingenbleek & Beckers, 1975) and children (Graham & Blizzard, 1973; Onuora et al. 1983) with malnutrition. Impaired glucose tolerance and a blunted insulin secretory response to glucose have been reported in protein-nergy malnutrition (James & Coore, 1970; Rao & Raghuramulu, 1972; Milner, 1972). Nutritional rehabilitation results in partial recovery (within weeks) of the glucose tolerance and insulin secretion. Whether the impairment persists in later life is not resolved although recent animal models of protein-energy malnutrition in early life show a persistence of the impairment of insulin secretion (Swenne et al. 1987).
A critical analysis of the available information on catecholamines, insulin and thyroid status in chronic undernutrition or energy deficiency irrespective of whether they are in children or adults would confirm a reduction in all three hormones. Measurements made in a large group of healthy, active and non-anaemic but chronically energy-deficient individuals with short stature, low body-weights, low body mass indices on low energy intakes showed low basal levels of NA and low T, levels as compared with well-nourished controls; they, however, had comparable levels of T, and free T, (Shetty et al. 1988; Shetty, 1990). Their insulin levels varied. These energy-deficient subjects showed several functional characteristics indicative of changes in their SNS activity (Shetty & Kurpad, 1990) and lowered thermogenic responses to NA infusions (Kurpad et al. 1989b). These changes in their SNS activity and thyroid status, which are similar to that seen during experimental or therapeutic energy restriction, are on the face of it indications of the existence of a true metabolic adaptation since it has been argued in the present review that such alterations in these key thermogenic hormones have, possibly, an important role to play in the adaptive changes in BMR.
BMR expressed either in absolute terms (i.e. MJ/d) or expressed per unit BSA are always low in individuals who are chronically undernourished or energy-deficient. Undernourished German prisoners who had lost more than 25% of their body-weight had BMR per unit BSA 16% below normal values (Beattie & Herbert, 1947). Male adults who were malnourished and semi-starved showed a 20% reduction in their BMR per unit BSA (Venkatachalam et al. 1954). Victims of severe malnutrition in the Warsaw ghettos also had markedly lower BMR varying between - 10 % and -40 YO depending on the severity of the
https://www.cambridge.org/core/terms. https://doi.org/10.1079/NRR19900006Downloaded from https://www.cambridge.org/core, IP address: 65.21.229.84, on subject to the Cambridge Core terms of use, available at
A D A P T A T I O N TO ENERGY RESTRICTION 67 malnutrition (Fliederbaum et al. 1979). Similar findings were reported in other groups of chronically malnourished individuals during the Second World War. The picture, however, is confusing when attempts were made to express BMR per unit weight of the active tissue mass; some of the previously-described studies on malnourished subjects were in fact interpreted as failing to demonstrate any significant decrease in metabolic rate per unit active tissue mass, although the BMR per unit BSA were lower (Beattie & Herbert, 1947; Venkatachalam et al. 1954). Ashworth (1968) while reporting a 12% reduction in BMR in Jamaican subjects on low energy intakes also confirmed her inability to show clear-cut evidence of an adaptive response in the BMR.
In one study a conscious and deliberate attempt was made to demonstrate possible similarities in the metabolic response to prolonged experimental semi-starvation and chronic undernutrition. BMR measurements made in healthy, undernourished labourers in 1972-3 (Shetty, 1984) showed a reduction in the metabolic activity of the active tissue mass which perhaps could be interpreted as indicating an enhanced metabolic efficiency, although the major share of the fall in BMR was attributed to a decrease in the total mass of lean tissues. Recalculation of data from an earlier report by Ramanamurthy et al. (1962) also showed that the BMR expressed per unit active tissue was considerably lower in adult, undernourished males. However, a large number of measurements made over the last decade, in chronically energy-deficient subjects who had functional changes in their SNS activity and thyroid hormone status showed no reduction in BMR per unit FFM (Kurpad et al. 1989b). On the contrary, it now appears that BMR expressed per kg FFM is significantly higher in a large number of chronically energy-deficient subjects as compared to well-nourished controls (M. J. Soares & P. S. Shetty, unpublished results). A comparable and equally large series of BMR measurements reported by Srikantia (1985) also showed the same trend, BMR per unit body-weight increasing as the weight-for-height expressed as a percentage of standard diminished. BMR measurements made in a rural, south Indian village (McNeil et al. 1987) were also comparable to ones referred to earlier and provided no evidence of metabolic adaptation in individuals from poor socio-economic groups on lower levels of intake. The changes in BMR measurements made on chronically- undernourished individuals over the last two to three decades in India seem to show a trend over a period of time when food intake surveys have also indicated a remarkable increase in the mean energy intake of individuals and households (Rao et al. 1985).
The evidence that mechanisms of improved efficiency of energy utilization are operative in free-living populations on low energy intakes with very similar but compromised anthropometry appears therefore to be tenuous and contradictory. If enhanced metabolic efficiency is indeed present during chronic undernutrition, then a reduction in BMR per kg FFM may not necessarily reflect this phenomenon. If individuals who have anthropometric or functional characteristics suggestive of long-term energy inadequacy manifest a reduction in BMR per kg FFM, either BMR per kg active tissue is not an index of metabolic efficiency as is universally believed (Waterlow, 1986) or metabolic efficiency is not a characteristic and constant feature of chronic energy deficiency. Changes in BMR per unit of active tissue mass are perhaps not a sine qua non for metabolic efficiency.
Recent studies examining changes in body composition of adults with naturally occurring chronic undernutrition reveal a gradation of changes related to the severity of the deficiency (Barac-Nieto et al. 1978). Body cell mass was reduced even with moderate deficiency and the muscle mass was more affected than other cells. Muscle cell mass seemed to decrease linearly with increasing severity of undernutrition, while the visceral cell mass showed little change. Other recent estimations also indicate a greater reduction in muscle mass with visceral mass apparently being spared (M. J. Soares & P. S. Shetty, unpublished results). Protein turnover using 15N-labelled glycine in those chronically undernourished
https://www.cambridge.org/core/terms. https://doi.org/10.1079/NRR19900006Downloaded from https://www.cambridge.org/core, IP address: 65.21.229.84, on subject to the Cambridge Core terms of use, available at
68 P. S. SHETTY
with elevated BMR per kg FFM also revealed the existence of a greater visceral pool and a reduced muscle mass (P. S. Shetty, M. J. Soares, L. S. Piers, S. Robinson, A. A. Jackson & J. C. Waterlow, unpublished results). These findings may help explain the increase in BMR per unit active tissue since the FFM or LBM appears to have a higher proportion of the metabolically active visceral mass as opposed to a relatively less active muscle mass.
Passmore & Draper (1964) attempted to partition the resting 0, utilization among the principal organs of a healthy man. According to them skeletal muscles, which comprise nearly 50% of body-weight, contribute about 18 ?LO of resting metabolism, while visceral organs such as the liver, heart and kidney use up nearly 45 O/O of the total 0, consumption at rest. A more recent analysis by Keys et al. (1973) shows that in normal adults the combined weights of the brain and liver constitute only 3 - 5 % of total body-weight but require about 40% of RMR while skeletal muscle which constitutes between 25 and 50% of body-weight accounts for only 15-25% of RMR. An elegant series of experiments by Koong & Ferrell (1990) has demonstrated how animal models of similar body-weight, produced by different nutritional regimens, show a change in BMR corrected for metabolic body size when the visceral mass: body-weight ratio changes. These experiments prove that metabolically active tissues account for a significant proporation of basal metabolic activity which is far in excess of the proportional weights of these tissues. RMR, thus, seems to be dictated by the heterogeneity of active protoplasmic tissues in the body, and these various aerobic tissues are vastly different per unit mass in different individuals and nutritional states. These disproportionate rates of requirement of 0, at rest per unit mass of the tissue explains why a variety of body compositional variables do not always predict RMR as well as we should expect them to.
Along with these changes in body composition seen during long-term energy inadequacy, there is also a change in the extra-cellular fluid compartment which will also contribute to influence the BMR expressed per unit active tissue (Barac-Nieto et al. 1978; Widdowson, 1985). Chronically undernourished subjects who have to do hard physical labour may be expected to have relatively more dense bones which may also influence this variable and thereby contribute further to demonstrate an apparent increase in metabolic efficiency (Sims, 1986). If the range of body composition changes seen during chronic energy deficiency influence the BMR per unit active tissue, undoubtedly BMR per unit FFM or LBM cannot reflect a true change in the matabolic efficiency of the active tissue mass of the body. Partitioning of the body into FFM or LBM and fat mass is inadequate; simple techniques need to be evolved to further partition FFM or LBM into muscle and visceral masses. Investment in clinical evaluation of body composition is clearly an emerging area demanding further research inputs.
S U M M A R Y
Energy restriction in humans results in a reduction in the BMR. Over a short period, the decrease in metabolic activity of the tissues contributes most to this reduction: in the long run the loss of body tissue contributes more to the lowered BMR. Several physiological mechanisms, chiefly hormonal, operate to decrease the metabolic activity of the tissue mass to enhance its metabolic efficiency. SNS activity is toned down, signalled by the decrease in energy flux, while the negative energy deficit initiates changes in peripheral thyroid metabolism and lowers insulin secretion. The reduction in the activities of these three key thermogenic hormones possibly acts in a concerted manner to lower cellular metabolic rate. Changes in other hormones such as glucagon, growth hormone and glucocorticoids will influence these changes and at the same time in association with the insulin deficiency will
https://www.cambridge.org/core/terms. https://doi.org/10.1079/NRR19900006Downloaded from https://www.cambridge.org/core, IP address: 65.21.229.84, on subject to the Cambridge Core terms of use, available at
A D A P T A T I O N T O E N E R G Y R E S T R I C T I O N 69
promote endogenous substrate mobilization which will lead to an increase in circulating FFA and ketone bodies. The elevated FFA levels, alterations in substrate recycling and protein catabolism will also influence the resting energy expenditure. What contribution reductions in Na+-K' pumping across the cell membrane and futile substrate cycling (now considered possible sensitive metabolic regulators) make to the reduced energy output is not known. These hormonal and metabolic changes that accompany energy restriction aid the survival of the organism and can, nence, be considered as adaptive in nature.
Whether similar adaptive changes occur in individuals who have been chronically energy deficient for long periods is very doubtful. Chronically undernourished subjects may show similar alterations in some of the hormones as well as functional changes in their responses. However, the changes in metabolic rate which have been considered as indicative of an enhanced matabolic efficiency of the tissues may well be attributed to incorrect estimates of FFM and to the body compositional changes that accompany chronic undernutrition. It is, hence, unlikely that the reduction in metabolic rate per unit active tissues, when seen in the undernourished, reflects a true increase in metabolic efficiency which can be considered as a beneficial, adaptive response.
The suggestions and comments of several of my colleagues, and in particular Drs A. V. Kurpad and M. J. Soares, are gratefully acknowledged.
REFERENCES Acheson, K. J., Ravussin, E., Wahren, J. & Jequier, E. (1984). Thermic effect of glucose in man. Obligatory and
Apfelbaum, M. (1978). Adaptation to changes in caloric intake. Progress in Food & Nutrition Science 2, 543-559. Ashworth. A. (1968). An investigation of very low calorie intakes reported in Jamaica. British Journal of Nutrition
Barac-Nieto, M., Spurr, G. B., Lotero, H. & Maksud, M. G. (1978). Body composition in chronic undernutrition.
Barton, M. & Wiesner, 8 . P. (1945). Thermogenic effect of progesterone. Lancet ii, 671 672. Beattie, J. & Herbert, P. H. (1947). The estimation of the metabolic rate in the starvation state. British Journal of
Nutrition 1, 1985 1991. Benedict, F. G . (1915). A Study of Prolonged Fasting. Carnegie Institute of Washington Publication no. 203.
Washington, DC : Carnegie Institute of Washington. Benedict, F. G., Miles, W. R., Roth, P. & Smith, H. M. (1919). Human Vitality and Eficiency Under Prolonged
Restricted Diet. Carnegie lnstiture of Wmhington Publication no. 280. Washington, DC: Carnegie Institute of Washington.
Bessard, T., Schutz, Y. & Jequier, E. (1983). Energy expenditure and postprandial thermogenesis in obese women before and after weight loss. American Journal of Clinical Nutrition 38, 680-693.
Bilezikian, J. P. & Loeb, J. N. (1983). The influence of hyperthyroidism and hypothyroidism on alpha and beta adrenergic receptor systems and adrenergic responsiveness. Endocrine Reviews 4, 378 -388.
Bisdee, J. T., James, W. P. T. & Shaw, M. A. (1989). Changes in energy expenditure during the menstrual cycle. British Journal of Nutrition 61, 187-199.
Bourgeois, B., Schmidt, B. J. & Bourgeois, R. (1973). Some aspects of catecholamines in undernutrition. In Endocrine Aspects of Malnutrition. Proceedings of Symposium. Kroc Foundation, Cali/ornia, pp. 163-1 79 [L. I. Gardner and P. Amacher, editors].
Bray, G. A. (1969~). Calorigenic effect of human growth hormone in obesity. Journal of Clinical Endocrinology and Metabolism 29, I19 126.
Bray, G. A. (19696). Effect of caloric restriction on energy expenditure in obese patients. Lancet ii, 397-398. Bray, G. A. (1976). The Obese Patient, Major Problems in Internal Medicine, pp. 1450. Philadelphia, PA: W. B.
Saunders. Bray, G. A., Melvin, K. E. W. & Choprd, I. J. (1973). Effect of triiodothyronine on some metabolic responses of
obese patients. American Journal of Clinical Nutrition 26, 715 721. Bray, G. A., Raben, M. S., Londono, J. & Gallagher, T. F. (1971). Effects of triicdothyronine, growth hormone
and anabolic steroids on nitrogen excretion and oxygen consumption of obese patients. Journal of Clinical Endocrinology and Metabolism 33, 293-300.
Brozek, J. (1955). Nutrition and behavior: psychologic changes in acute starvation with hard physical work. Journal of the American Dietetic Association 31, 703-707.
facultative thennogenesis. Journal of Clinical Investigation 74, 1572-1580.
22, 341 -355.
American Journal of Clinical Nutrition 31, 2340.
https://www.cambridge.org/core/terms. https://doi.org/10.1079/NRR19900006Downloaded from https://www.cambridge.org/core, IP address: 65.21.229.84, on subject to the Cambridge Core terms of use, available at
70 P. S. S H E T T Y
Burger, A. G., Weissel, M. & Burger, M. (1980). Starvation induces a partial failure of triiodothyronine to inhibit the thyrotropin response to thyrotropin releasing hormone. Journal of Clinical Endocrinology and Metabolism 51, 1064-1067.
Cahill, G. F. (1976). Starvation in man. Clinics in Endocrinology and Metabolism 5 , 397415. Cahill, G. F., Herrera, M. G., Morgan, A. P., Soeldner, J. S., Steinke, J., Levy, P. L., Reichard, G. A. & Kipnis,
D. M. (1966). Hormone-fuel interrelationships during fasting. Journal of Clinical Investigation 45, 1751-1769. Carlson, H. E., Drenick, E. J., Chopra, 1. J. & Hershman, J. M. (1977). Alterations in basal and TRH-stimulated
serum levels of thyrotropin, prolactin, and thyroid hormones in starved obese men. Journal of Clinical Endocrinology and Metabolism 45, 707 7 13.
Chopra, 1. J. (1977). A study of extrathyroidal conversion of thyroxine (T,) to 3.3'5,-triiodothyronine (T3) in vitro. Endocrinology 101,453463.
Chopra, I. J. & Smith, S. R. (1975). Circulating thyroid hormones and thyrotropin in adult patients with protein- calorie malnutrition. Journal of Clinical Endocrinology and Metabolism 40, 221-227.
Christin, L., Nacht, C. A,, Verney, 0.. Ravussin, E., Jquier, E. & Acheson, K. J. (1986). Insulin - its role in the thermic effect of glucose. Journal of Clinical Investigation 77, 1747 1755.
Clausen, T. & Kohn, P. G. (1977). The effect of insulin on the transport of sodium and potassium in rat soleus muscle. Journal of Physiology 265, 1942.
Clemmons, D. R., Snyder, D. K., Williams, R. & Underwood, L. E. (1987). Growth hormone administration conserves lean body mass during dietary restriction in obese subjects. Journal of Clinical Endocrinology & Metabolism 64, 878-883.
Croxson, M. S., Hall, T. D., Kletzky, 0. A., Jaramillo, J. E. & NicoloIT, J. T. (1977). Decreased serum thyrotropin induced by fasting. Journal of Clinical Endocrinology and Metabolism 45, 560 -568.
Danforth, E. (1985). Hormonal adaptation to over- and underfeeding. In Substrate and Energy Metabolism in Man, Third Clinical Research Centre Symposium, 1984, pp. 155-168 [J. S. Garow and D. Halliday, editors]. London: John Libbey.
Danforth, E. (1986). Effect of fasting and altered nutrition on thyroid hormone metabolism in man. In Thyroid Hormone Metabolism, pp. 335-358 [G. Henneman, editor]. New York: Marcel Dekker.
Danforth, E. (1989). Hormonal adaptations to energy balance and imbalance and the regulation of energy expenditure. In Hormones, Thermogenesis and Obesity, pp. 19- 32 (H. Lardy and F. Stratham, editors]. Amsterdam: Elsevier Science Publishing Co.
Danforth, E. & Burger, A. G. (1989). The impact of nutrition on thyroid hormone physiology and action. Annual Review of Nutrition 9, 201-227.
Danforth, E. & Landsberg, L. (1983). Energy expenditure and its regulation. In Contemporary Issues in Clinical Nutrition, vol. 4 [M. R. C. Greenwood, editor]. New York: Churchill Livingstone.
Davidson, L., Rouse, 1. L., Vandongen, R. & Beilin, L. J. (1985). Plasma noradrenaline and its relationship to plasma oestradiol in normal women during the menstrual cycle. Clinical and Experimental Pharmacology and Physiology 12, 48949 I .
DeHaven. J.. Sherwin, R., Hendler, R. & Felig, P. (1980). Nitrogen and sodium balance and sympathetic nervous system activity in obese subjects treated with low calorie protein or mixed diet. New England JournalofMedicine 302, 477482.
De Nayer, Ph., Dozin, B., Vandeput, Y., Bottazzo, F. C. & Crabbe, J . (1987). Altered interactions between triiodothyronine and its nuclear receptors in absence of cortisol: a proposed mechanism for increased thyrotropin secretion in corticosteroid deficiency states. European Journal of Clinical Investigation 17, I ( M 1 10.
Elia, M., Zed, C., Neale, G. & Livesey, G. (1987). The energy cost of triglyceride-fatty acid cycling in non-obese subjects after an overnight fast and four days of starvation. Metabolism 36, 251-255.
Ferro-Luzzi, A. (1985). Range of variation in energy expenditure and scope of regulation. In Proceedings XIII International Congress of Nutrition, pp. 393 399 [T. G. Taylor and N. K. Jenkins, editors]. London: John Libbey.
Fliederbaum, J., Heller, A., Zweibaum, K., Szejnfinkel, S.. Elbinger, R. & Ferszt, F. (1979). Hunger Disease, pp. 79-172 [M. Winick, editor]. New York: Wiley Interscience.
Fylling, P. (1971). Propranolol blockade of vasopressin induced increase in plasma progesterone in early human pregnancy. Acta Endocrinologica 66, 283-288.
Galster, A. D., Clutter, W. E. & Cryer, P. E. (1981). Epinephrine plasma thresholds for lipolytic effects in man. Journal of Clinical Endocrinology and Metabolism 53, 1207-1 2 12.
Galton, V. A. (1965). Thyroid hormone-catecholamine interrelationships. Endocrinology 77, 278- 284. Galvao-Teles, A,, Graves, L., Burke, C. W., Fotherby, K. & Frazer, R. (1976). Free cortisol in obesity: effect of
Gardner, D. F., Kaplan, M. M., Stanky, C. A. & Utiger, R. D. (1979). Effect of triiodothyronine replacement on
Garlick, P. J., Clugston, G. A. & Waterlow, J. C. (1980). Influence of low energy diets on whole body protein
Goodman, H. M. & Knobil, E. (1959). Effect of adrenergic blocking agents on fatty acid mobilization during
fasting. Acta Endocrinologica 81, 321-329.
the metabolic and pituitary responses to starvation. New England Journal of Medicine 300, 579-584.
turnover in obese subjects. American Journal of Physiology 238, E235-244.
fasting. Proceedings of the Society for Experimental Biology and Medicine 102, 493495.
https://www.cambridge.org/core/terms. https://doi.org/10.1079/NRR19900006Downloaded from https://www.cambridge.org/core, IP address: 65.21.229.84, on subject to the Cambridge Core terms of use, available at

A D A P T A T I O N T O E N E R G Y R E S T R I C T I O N 71
Graham, G. G. & Blizzard, R. M. (1973). Thyroid hormone studies in severely malnourished Peruvian infants and small children. In Endocrine Aspects of Malnutrition. Proceedings of Symposium, Kroc Foundation, California, pp. 205219 [L. I. Gardner and P. Amacher, editors].
Graham, G. G. & Placko, R. P. (1975). Free catecholamine excretion in the urine in normal infants and those with marasmus or kwashiorkor. Journal of Pediafrics 86, 965969.
Grande, F. (1 964). Man under caloric deficiency. Handbook of Physiology, Adaptation to the Environment, pp. 91 1-937. Washington, DC: American Physiological Society.
Grande, F., Anderson, J. T. & Keys, A. (1958). Changes of basal metabolic rate in man in semistarvation and refeeding. Journal of Applied Physiology 12, 230 238.
Guernsey & Edelman, I. S. (1983). Regulation of thyroid thermogenesis by thyroid hormones. In Molecular Basis of Thyroid Hormone Action, pp. 293-301 [J. H. Oppenheimer and H. H. Samuels, editors]. New York: Academic Press.
Henneman, P. H., Forbes, A. P., Moldawern, M., Dempsey, E. F. & Caroll, E. F. (1960). Effects of human growth hormone in man. Journal of Clinical Investigation 39, 1223-1226.
Henry, C. J. K., Rivers, J. P. W. & Payne, P. R. (1988). Protein and energy metabolism in starvation reconsidered. European Journal of Clinical Nutrifion 42, 543-549.
Himms-Hagen, J. (1976). Cellular thermogenesis. Annual Review of Physiology 38, 3 15-351. Himms-Hagen, J. (1983). Thyroid hormones and thermogenesis. In Mammalian Thermogenesis, pp. 141-1 77
Hoeldtke, R. D. & Wurtman, R. J. (1973). Excretion of catecholamines and catecholamine metabolites in
Hollingsworth, D. R., Amaturda, T. T. & Scheig, R. (1970). Quantitative and qualitative effects of L-
Ingenbleek, Y. & Beckers, C. (1975). Triiodothyronine and thyroid stimulating hormone in protein calorie
Isaksson, 0. G. P., Eden, S. & Jansson, J. 0. (1985). Mode of action of pituitary growth hormone on target cells.
Issekutz, B., Paul, P., Miller, H. I. & Bortz, W. M. (1968). Oxidation of plasma FFA in lean and obese humans.
James, W. P. T. & Coore, H. G. (1970). Persistent impairment of insulin secretion and glucose tolerance after
James, W. P. T. & Shetty, P. S. (1982). Metabolic adaptation and energy requirements in developing countries.
Jordan, A. W., Caffrey, J. L. & Niswender, G. D. (1978). Catecholamine induced stimulation of progesterone and
Jung, R. T., Liddell, F., Shetty, P. S. & James, W. P. T. (1981). The effect of L-Dopa with carbidopa (Sinemet)
Jung, R. T., Shetty, P. S., Barrand, M., Callingham, B. A. & James, W. P. T. (19790). Role of catecholamines in
Jung, R. T., Shetty, P. S. & James, W. P. T. (1979h). Reduced thermogenesis in obesity. Nature 279, 322-323. Jung, R. T., Shetty, P. S. & James, W. P. T. (1980a). Nutritional effects on thyroid and catecholamine
metabolism. Clinical Science 58, 183-191. Jung, R. T., Shetty, P. S. &James, W. P. T. (1980b). The effect of refeeding after semistarvation on catecholamine
and thyroid metabolism. International Journal of Obesity 4, 95 -100. Jung, R. T., Shetty, P. S. &James, W. P. T. (1980~) . The effect of beta-adrenergic blockade on resting metabolic
rate and peripheral thyroid metabolism in obesity. European Journal of Clinical Investigation 10, 179-182. Kaciuba-Uscilko, H. (1973). The effect of previous thyroxine administration on the metabolic response to
adrenaline in new-born pigs. Biology of the Neonate 19, 22Ck226. Kappas, A. & Palmer, R. H. (1965). Thermogenic properties of steroids. In Methoh in Hormone Research, vol.
4, pp. I19 129 [R. I. Dorfman, editor]. New York: Academic Press. Katzeff, H., LaGrange, B., Horton, E. & Danforth, E. (1986). Substrate and hormone response to graded
infusions of norepinephrine during over and undernutrition in lean and obese man. Metabolism 35, 166-175. Keys, A,, Brozek, J., Henschel, A,, Mickelson, 0. & Taylor, H. L. (1950). The Biology of Human Starvation.
Minneapolis, MN : University of Minnesota Press. Keys, A,, Taylor, H. L. & Grande, F. (1973). Basal metabolism and age of adult man. Metabolism 22, 579-587. Kolanowski, J., Jeanjean, M. & Lambert, A. E. (1975). Hormonal adaptation to short term total fast in the obese.
Koong, L. J. & Ferrell, C. L. (1990). Effects of short term nutritional manipulation on organ size and fasting heat
Koppeschaar, H. P. F., Melnders, A. E. & Schwartz, F. (1983). Metabolic responses in grossly obese subjects
Krebs, H. A. (1972). Some aspects of the regulation of fuel supply in omnivorous animals. In Advances in Enzyme
[L. Giardier and M. J. Stock, editors]. London: Chapman and Hall.
kwashiorkor. American Journal of Clinical Nutrition 26, 205-210.
triiodothyronine in massive obesity. Metabolism 12, 934-945.
malnutrition in infants. Lancet ii, 845-846.
Annual Review of Physiology 47, 483 499.
Metabolism 24, 62-73.
malnutrition. American Journal of Clinical Nutrition 23, 386389.
Human Nutrition: Clinical Nutrition 36, 331 336.
adenosine 3’5’ monophosphate production by dispersed ovine luteal cells. Endocrinology 103, 385392.
on the metabolic response to semistarvation. International Journal of Obesity 4, 221-226.
the hypotensive response to dieting. British Medical Journal i, 12 -13.
In Regulation of Energy Balance in Men, [E, Jtquier, editor]. Geneva: Editions Medicine et Hygiene.
production. European Journal of Clinical Nutrition 44, Suppl. 1, 73-78.
treated with low calorie diet with and without T, treatment. International Journal of Obesity 7 , 133-141.
Regulation, vol. 10, pp. 397414 [G. Weber, editor]. Oxford: Pergamon Press.
https://www.cambridge.org/core/terms. https://doi.org/10.1079/NRR19900006Downloaded from https://www.cambridge.org/core, IP address: 65.21.229.84, on subject to the Cambridge Core terms of use, available at
72 P. S. S H E T T Y
Kurpad, A. V., Kulkarni, R. N., Sheela, M. L. & Shetty, P. S . (1989~). Thermogenic responses to graded doses of noradrenaline in undernourished Indian male subjects. British Journal of Nutrition 61, 201-208.
Kurpad, A. V., Kulkarni, R. N. & Shetty, P. S. (1989b). Reduced thermoregulatory thermogenesis in undernutrition. European Journal of Clinical Nutrition 43, 27-33.
Landsberg, L. & Axelrod, J. (1968). Influence of pituitary, thyroid, and adrenal hormones on norepinephrine turnover and metabolism in the rat heart. Circulation Research 22, 559-571.
Landsberg, L. & Bruno, S. J. (1973). 3.4-Dihydroxyphenylalanine (dopa), dopamine and norepinephrine storage in the rat heart after L-dopa : further evidence for norepinephrine release. Biochemical Pharmacology 22, 41 7425.
Landsberg, L. & Young, J. B. (1978). Fasting, feeding and regulation of the sympathetic nervous system. New England Journal of Medicine 298, 1295-1 301.
Landsberg, L. & Young, J. B. (1983~). The role of the sympathetic nervous system and catecholamines in the regulation of energy metabolism. American Journal of Clinical Nutrition 38, 1018 - 1024.
Landsberg, L. & Young, J. B. (1983 b). Autonomic regulation of thermogenesis. In Mammalian Thermogenesis, pp. 99-140 [L. Girardier and M. J. Stock, editors]. London: Chapman and Hall.
Landsberg, L. & Young, J. B. (1984). The role of the sympathoadrenal system in modulating energy expenditure. Clinics in Endocrinology and Metabolism 13, 475499.
Landsberg, L. & Young, J. B. (1985). Insulin-mediated glucose metabolism in the relationship between dietary intake and sympathetic nervous system activity. International Journal of Obesity 9, Suppl., 63--68.
Lee, J. B., Vance, V. K. & Cahill, G. F. (1962). Metabolism of C" labelled substrates by rabbit kidney cortex and medulla. American Journal of Physiology 203, 27-30.
Lefkowitz, R. J., Caron, H. G. & Stiles, G. L. (1984). Mechanism of membrane receptor regulation: biochemical, physiological and clinical insights derived from studies of adrenergic receptors. New England Journal of Medicine 310, 157C1579.
Levy, A. C. & Ramey, E. R. (1958). Effect of autonomic blocking agents on depot fat mobilization in normal and adrenalectomized animals. Proceedings of the Society for Experimental Biology and Medicine 99, 637-639.
Lumholtz, 1. B., Siersbeaek-Nielsen, K. & Faber, J. (1978). Effect of propranolol on extra thyroidal metabolism of thyroxine and triiodothyronine evaluated by non-compartmental kinetics. Journal of Clinical Endocrinology and Metabolism 47, 587-589.
Mansell, P. I. & Macdonald, I. A. (1989). Underfeeding and physiological responses to infused epinephrine in lean women. American Journal of Physiology 256, R583-589.
McNeill, G., Rivers, J. P. W., Payne, P. R., deBritto, J. J. & Abel, R. (1987). Basal metabolic rate of Indian men: no evidence of metabolic adaptation to a low plane of nutrition. Human Nutrition: Clinical Nutrition 41C, 473484.
Millward, D. J. (1985). Hormonal responses to low intakes in relation to adaptation. In Proceedings of XIII International Congress of Nutrition, pp. 419423 [T. G. Taylor and N. K. Jenkins, editors]. London: John Libbey.
Millward, D. J., Garlick, P. J. & Reeds, P. J. (1976). The energy cost of growth. Proceedings of the Nutrition Society 35, 339- 349.
Milner, R. D. G. (1972). Insulin secretion in human protein-calorie malnutrition. Proceedings of the Nutrition Society 31, 219-223.
Minderop, R. H., Hoeppner, W. & Seitz, H. J. (1987). Regulation of hepatic glucokinase gene expression. Role of carbohydrates and glucocorticoids and thyroid hormones. European Journal of Biochemnistry 164, 18 I --187.
Mitchell, H. H. (1944). Adaptation to undernutrition. Journal of the American Dietetic Association 20, 51 1-515. Moore, R. D. (1981). Stimulation of Na: H exchange by insulin. Biophysical Journal 33, 203-210. Motulsky, H. J. & Insel, P. A. (1982). Adrenergic receptors in man. Direct identification, physiological regulation
and clinical alterations. New England Journal of Medicine 307, 18-29. Nair, K. S . (1987). Hyperglucagonemia increases resting metabolic rate in man during insulin deficiency. Journal
of Clinical Endocrinology and Metabolirm 64. 896901. Newsholme, E. A. (1980). A possible metabolic basis for the control of body weight. New England Journal of
Medicine 302, 400-405. OBrian, J. T., Bybee, D. E., Burman, K. D., Osburne, R. C., Ksiazek, M. R., Wartofsky, L. & Georges, L. P.
(1980). Thyroid hormone homeostasis in states of relative caloric deprivation. Metabolism 29, 717-721. ODea, K., Esler, M., Leonard, P., Stockigt, J. R. & Nestel, P. (1.982). Noradrenaline turnover during under and
over eating in normal weight subjects. Metabolism 31, 896899. Onuora, C., Ajit Singh, G . M. & Etta, K. M. (1983). Thyroid status in various degrees of protein-energy
malnutrition in children. Clinical Endocrinology 19, 87-93. Oppenheimer, J. H., Schwartz, H. L., Mariash, C. N., Kinlaw, W. B., Wong, N. C. W. & Freake, H. C. (1987).
Advances in our understanding of thyroid hormone action at the cellular level. Endocrine Reviews 8, 288 -308. Parra, A., Serrano, P., Chavez, B., Garcia, G., Argote, R., Klish, W., Cuellar, A. & Nichols, B. L. (1973). Studies
of daily catecholamine excretion in kwashiorkor as observed in Mexico. In Endocrine Aspects of Malnutrition. Proceedings of Symposium of Kroc Foundation, California, pp. 172-181 [L. Gardner and P. Amacher, editors].
https://www.cambridge.org/core/terms. https://doi.org/10.1079/NRR19900006Downloaded from https://www.cambridge.org/core, IP address: 65.21.229.84, on subject to the Cambridge Core terms of use, available at
A D A P T A T I O N T O E N E R G Y R E S T R I C T I O N 73 Passmore, R. & Draper, M. H. (1965). Energy metabolism. In Newer Methods of Nutritional Biochemistry,
Phinney, S . D., LaGrange, B. M., OConnell, M. & Danforth, E. (1988). Effects of aerobic exercise on energy
Ramanamurthy, P. S. V., Srikantia, S. G. & Gopalan, C. (1962). Energy metabolism in undernourished subjects
Ramirez, A,, Fletes, L., Mizrahi, L. & Parra, A. (1978). Daily urinary catecholamine profile in marasmus and
Rao, K. S. J. & Raghuramulu, N. (1972). Insulin secretion in kwashiorkor. Journal of Clinical Endocrinology and
Rao, N. P., Sastry, J. G. & Rao, B. S. N. (1986). National Nutrition Monitoring Bureau: Achievements and
Rastogi, G. K., Sawhney, R. C., Panda, N. C. & Tripathy, B. B. (1974). Thyroid hormone levels in adult protein
Rothwell, N. J., Saville, M. E. &Stock, M. J. (1982). Sympathetic and thyroid influences on metabolic rate in fed,
Rowe, J. W., Young, J. B., Minaker, K. L., Stevens, A. L., Pallotta, J. & Landsberg, L. (1981). Effect of insulin
Sabeh, G., Alley, R. A., Robbins, T. J., Narduzzi, J. V., Kenny, F. M. & Danowski, T. S. (1969). Adrenocortical
Schachner, S. H., Wieland, R. G., Maynard, D. E., Kruger, F. A. & Hamwi, G. J. (1965). Alterations in adrenal
Schussler, G. C. &Orlando, J. (1978). Fasting decreases triiodothyronine receptor capacity. Science 199,686688. Schultz, A. L., Kerlow, A. & Ulstrom, R. A. (1964). Effect of starvation on adrenal cortical function in obese
subjects. Journal of Clinical Endocrinology and Metabolism 24, 1253-1 257. Sherwin, R. & Felig, P. (1987). Starvation in normal humans. In Endocrinology and Merabolism, pp. 1182--1183
[P. Felig, J. D. Baxter, A. E. Broadus and L. A. Frohman, editors]. New York: McGraw-Hill. Shetty, P. S. (1980). Studies on protein and energy restriction and dietary thermogenesis in obesity and chronic
undernutrition. PhD Thesis, University of Cambridge. Shetty, P. S. (1984). Adaptive changes in basal metabolic rate and lean body mass in chronic undernutrition.
Human Nutrition : Clinical Nutrition 38C, 443-452. Shetty, P. S . (1990). Energy metabolism in chronic energy deficiency. Proceedings ofNutrition Sociely of India. (In
the Press.) Shetty, P. S., Jung, R. T. & James, W. P. T. (1979). Effect of catecholamine replacement with levodopa on the
metabolic response to semistarvation. Lancet i, 77-79. Shetty, P. S. & Kurpad, A. V. (1990). Role of the sympathetic nervous system in adaptation to seasonal deficiency.
European Journal of Clinical Nutrition 44, Suppl. I , 47-54. Shetty, P. S . , Kurpad, A. V., Kulkarni, R. N. & Vaz, M. (1988). Thermogenic Responses to Norepinephrine in
Chronic Energy Deficiency. Bask : Nestle Foundation. Shulman, G. I., Ladenson, P. W., Wolfe, M. H., Ridgeway, E. C. & Wolfe, R. R. (1985). Substrate cycling
between gluconeogenesis and glycolysis in euthyroid, hypothyroid and hyperthyroid man. Journal of Clinical Investigation 16, 757-764.
[A. A. Albanese, editor]. New York: Academic Press.
expenditure and nitrogen balance during very low caloric dieting. Metabolism 37, 758-765.
before and after rehabilitation. Indian Journal of Medical Research 50, 108-1 12.
kwashiorkor. American Journal of Clinical Nutrition 31, 4 1 4 5 .
Metabolism 35, 6 3 4 6 .
Constraints. New Delhi: Indian Council of Medical Research.
calorie malnutrition. Hormone and Metabolic Research 6 , 528-529.
fasted and refed rats. American Journal of Physiology 234, R339-346.
and glucose infusions on sympathetic nervous system activity in normal man. Diaberes 30, 219-225.
indices during fasting in obesity. Endocrinology 29, 373-376.
cortical function in fasting obese subjects. Metabolism 14, 1051-1058.
Sims, E. A. H. (1986). Energy balance in human beings. Vitamins & Hormones 43, 1-101. Sjostrom, L. (1985). Catecholamine sensitivity with respect to metabolic rate in man. International Journal of
Obesity 9 , Suppl. 2, 123 129. Sjostrom, L., Schutz, Y., Gudinchet, F., Hegnell, L., Pittet, P. G. & Jequier, E. (1983). Epinephrine sensitivity with
respect to metabolic rate and other variables in women. American Journal of Physiology 245, E 4 3 1 4 2 . Snyder, D. K., Clemmons, D. R. & Underwood, L. E. (1989). Dietary carbohydrate content determines
responsiveness to growth hormone in energy restricted humans. Journal of Clinical Endocrinology & Metabolism 69, 745- 752.
Spencer, C. A., Lum, S . M. C., Wilbur, J. F., Kaptein, E. M. & Icoloff, J. T. (1983). Dynamics of serum thyrotropin and thyroid hormone changes in fasting. Journal of Clinical Endocrinology and Metabolism 56, X83-888.
Srikantia, S. G. (1985). Nutritional adaptation in man. Proceedings of Nutrition Society of India 31, 1-16. Steinberg, D., Nestel, P. J.. Buskirk, E. R. & Thompson, R. H. (1964). Calorigenic effect of norepinephrine
correlated with free fatty acid turnover and oxidation. Journal of Clinical Investigation 43, 167 176. Sterling, K. (1979). Thyroid hormone action at the cell level. New England Journal of Medicine 300, 117- 122. Swann, A. C. (1984). Na'-K' ATPase regulation by the sympathetic nervous system: effects of noradrenaline
Swenne, I . , Crace, C. J. & Milner, D. G. (1987). Persistent impairment of insulin secretory response to glucose in
Takahira, H. (1925). Metabolism during fasting and subsequent refeeding. Report of the Metabolic Lab of the
stimulation. Journal of Pharmacology and Experimental Therapeutics 228, 304-3 1 I .
adult rats after limited period of protein-calorie malnutrition in early life. Diabetes 36, 454458.
Imperial Governmen1 Institute for Nutriiion, Tokyo 1, 63-82.
https://www.cambridge.org/core/terms. https://doi.org/10.1079/NRR19900006Downloaded from https://www.cambridge.org/core, IP address: 65.21.229.84, on subject to the Cambridge Core terms of use, available at
74 P. S. S H E T T Y
Taylor, H. L. & Keys, A. (1950). Adaptation to caloric restriction. Science 112, 215-218. Trisotto, A,, Busnardo, B., Frezatto, S., Girelli, M. L. & Federspil, G. (1970). Effect of glucagon on 0,
Venkatachalam, P. S., Srikantia, S. G. & Gopalan, C. (1954). Basal metabolism in nutritional edema. Metabolism
Waterlow, J. C. (1984). Protein turnover with special references to man. Quarterly Journal of Experimental
Waterlow, J. C. (1986). Metabolic adaptation to low intakes of energy and protein. Annual Review of Nutrition
Waterlow, J. C. & Jackson, A. A. (1981). Nutrition and protein turnover in man. British MedicalBulletin 37,5-I0. Waterlow, J. C. & Millward, D. J. (1989). Energy cost of turnover of protein and other cellular constituents. In
Energy Transformations in Cells and Organisms, pp. 277-282 [w. Weisser and E. Graiger, editors]. Stuttgart : Thieme Verlag.
Webb, P. & Abrams, T. (1983). Loss of fat stores and reduction in sedentary energy expenditure from undereating. Human Nutrition : Clinical Nutrition 37, 27 1-282.
Weisswange, A. F., Cuendet, G. S. & Marliss, E. B. (1975). Hormonal and metabolic response to a hypocaloric protein diet in normal working subjects. In Regulation of Energy Balance in Man, pp. 117-121 [E. Jequier, editor]. Geneva : Editions Medicine et Hygitne.
Welle, S. L., Amatruda, J. M., Forbes, G. B. & Lockwood, D. H. (1984). Resting metabolic rates of obese women after rapid weight loss. Journal of Clinical Endocrinology and Metabolism 59, 41-44.
Welle, S. L. & Campbell, R. G. (1986). Decrease in resting metabolic rate during rapid weight loss is reversed by low dose thyroid hormone treatment. Metabolism 35, 289-291.
Welle, S. L., Nair, K. S. &Campbell, R. G. (1989). Failure of chronic /I-adrenergic blockade to inhibit overfeeding induced thermogenesis in humans. American Journal of Physiology 256, R653-658.
Widdowson, E. M. (1985). Responses to deficits of dietary energy. In Nutritional Adaptation in Mun, pp. 97-104 [K. L. Blaxter and J. C. Waterlow, editors]. London: John Libbey.
Woo, R., OConnell, M., Horton, E. S. & Danforth, E. (1985). Changes in resting metabolism with increased intake and exercise. Clinical Research 33, 712 Abstr.
Young, J. B. & Landsberg, L. (1977~). Catecholamines and intermediary metabolism. Clinics in Endocrinology and Metabolism 6, 599-63 1.
Young, J. B. & Landsberg, L. (1977b). Suppression of sympathetic nervous system during fasting. Science 1%. 1473-1 475.
Young, J. B. & Landsberg, L. (1979). Effect of diet and cold exposure on norepinephrine turnover in pancreas and liver. American Journal of Physiology 236, E524-533.
Young, J. B. & Landsberg, L. (1983). Adrenergic influence on peripheral hormone secretion. In Adrenoceptors and Catecholamine Action, part B, pp. 157--217 [G. Kunos, editor]. New York: John Wiley & Sons.
Young, 1. B., Rosa, R. M. & Landsberg, L. (1984). Dissociation of sympathetic nervous system and adrenal medullary responses. American Journal of Physiology 240. E3 14-319.
consumption in man. Acta fsofopica (Padova) 10, 349-358.
2, 138-141.
Physiology 69, 405- 438.
6, 495-526.
Printed in Great Britain
https://www.cambridge.org/core/terms. https://doi.org/10.1079/NRR19900006Downloaded from https://www.cambridge.org/core, IP address: 65.21.229.84, on subject to the Cambridge Core terms of use, available at


