Embed Size (px)
Citation preview
ORI GIN AL PA PER
Activity Fields and the Dynamics of Crime
Advancing Knowledge About the Role of the Environment in CrimeCausation
Per-Olof H. Wikstrom • Vania Ceccato • Beth Hardie •
Kyle Treiber
Published online: 31 December 2009� Springer Science+Business Media, LLC 2009
Abstract Our current understanding of the role of the social environment in crime
causation is at best rudimentary. Guided by the theoretical framework of Situational
Action Theory, and using data from the ESRC financed Peterborough Adolescent and
Young Adult Development Study (PADS?), this paper aims to propose how we can
better theorise and study the role of the social environment, particularly the person and
place interaction, in crime causation. We will introduce, and illustrate the usefulness of,
a space–time budget methodology as a means of capturing people’s exposure to settings
and describing their activity fields. We will suggest and demonstrate that, combined with
a small area community survey and psychometric measures of individual characteristics,
a space–time budget is a powerful tool for advancing our knowledge about the role of
the social environment, and its interaction with people’s crime propensity, in crime
causation. Our unique data allows us to study the convergence in time and space of
crime propensity, criminogenic exposure and crime events. As far as we are aware, such
an analysis has never before been carried out. The findings show that there are (a) clear
associations between young people’s activity fields and their exposure to criminogenic
settings, (b) clear associations between their exposure to criminogenic settings and their
crime involvement, and, crucially, (c) that the influence of criminogenic exposure
depends on a person’s crime propensity. Having a crime-averse morality and strong
ability to exercise self-control appears to make young people practically situationally
immune to the influences of criminogenic settings, while having a crime-prone morality
The Peterborough Adolescent and Young Adult Development Study (PADS?) is funded by a large grantfrom the UK Economic and Social Research Council (ESRC). For further information about PADS? and itsresearch see www.pads.ac.uk.
P.-O. H. Wikstrom (&) � B. Hardie � K. TreiberInstitute of Criminology, University of Cambridge, Cambridge, UKe-mail: [email protected]
V. CeccatoRoyal Institute of Technology, Stockholm, Sweden
123
J Quant Criminol (2010) 26:55–87DOI 10.1007/s10940-009-9083-9
and poor ability to exercise self-control appears to make young people situationally
vulnerable to the influences of criminogenic settings.
Keywords Situational action theory � Peterborough adolescent and young
Adult Development Study (PADS?) � Space–time budgets � Crime causation �People and place interactions
Our current understanding of the role of the social environment in crime causation is at best
rudimentary (e.g., Elliott et al. 1996, pp. 389–390; Farrington 1993, pp. 30; Sampson et al.
1997, pp. 32; Sampson and Wikstrom 2008). This is partly a consequence of the lack of
well-developed theoretical models for how social environments influence people’s
engagement in acts of crime. In addition, criminological research has generally lacked
adequate methodologies to study and measure people’s exposure to social environments
and how it interacts with people’s crime propensity. In this study we aim to contribute to
the advancement of theory regarding the role of the social environment in crime causation
and, on that basis, to the development of new methodologies that can better capture the role
of the social environment, and its interaction with people’s crime propensity, in the
exploration of the causes of acts of crime.
Theoretically, we propose that Situational Action Theory (SAT) can help further the
analysis of the role of the social environment in crime causation. We will compare and
contrast SAT’s explanation with that of Social Disorganisation and Routine Activity
Theory. SAT is one of very few theories in criminology that take the person-environment
interaction seriously, making specific predictions for how the interaction between a per-
son’s propensity and environmental exposure causes acts of crime and suggesting the
causal process through which this happens.
Methodologically, we suggest and aim to demonstrate that, combined with ecometric
measures drawn from a small area community survey and psychometric measures of
personal characteristics, a space–time budget is a powerful tool for advancing our
knowledge about the role of the social environment, and its interaction with people’s crime
propensity, in crime causation.
Empirically, we will first present findings that show the importance of exploring peo-
ple’s exposure to different environmental settings, as their activity fields reach far beyond
their neighborhood environments (the traditional unit of analysis in studies of environ-
mental influences on crime). In this context, we will also show data that shines some light
on what shapes young people’s activity fields (i.e., why young people move around in
space and time in particular configurations). We will then move on to investigate the
relationship between some causally relevant aspects of young people’s activity fields (their
exposure to criminogenic settings) and their level of crime involvement, and the depen-
dency of this relationship on their crime propensity. Finally, we will explore the conver-gence in time and space of a person’s (a) crime propensity, (b) exposure to a setting
conducive to crime, and (c) commission of an act of crime. As far as we know, this
convergence in time and space has never before been empirically studied.
The data for the empirical analyses of this study is taken from the PeterboroughAdolescent and Young Adult Development Study (PADS?), a longitudinal study financed
by the UK Economic and Social Research Council (ESRC). This paper will present
findings for the composite early to mid adolescent period (ages 13–17). Other publications
from PADS? deal with age-specific patterns and change (e.g., Wikstrom 2009).
56 J Quant Criminol (2010) 26:55–87
123
Main Approaches to the Study of Environmental Effects in Criminology
There are two major traditions in criminology when it comes to exploring the role and
influence of the social environment on crime, Social Disorganisation/Collective Efficacy
Theory and Routine Activity Theory.1 We will briefly discuss the major strands of these
two traditions and highlight some of their shortcomings when it comes to analysing the
person-environment interaction in crime causation. We will, particularly, compare and
contrast Routine Activity Theory with the recently developed Situational Action Theory, as
these two criminological theories most explicitly address, and provide a situational model
for, the person-environment interaction in crime causation. We will suggest how Situa-
tional Action Theory may better deal with and in some cases overcome some of the
problems which are undeveloped or unaddressed in the situational model of Routine
Activity Theory.
Social Disorganisation/Collective Efficacy Theory
Social Disorganisation Theory (SD) is one of the most significant theoretical approaches
within criminology. It emerged as part of the classic Chicago School and its study of crime
and other social problems (e.g., Shaw and McKay 1969) and has evolved over many years
into its present form (e.g., Kornhauser 1978; Bursik 1988; Sampson 2006a). An important
aim of the SD tradition has been to analyse and understand the causes of residential
segregation and its social and behavioural consequences (such as crime and related social
problems).
A core idea in SD is that neighborhoods (communities), as a result of the social process
of residential segregation, vary in their population composition and their related social
organisation, that this affects the efficacy of processes of socialisation and social control
amongst its residents (and social control of its visitors), and that this, in turn, influences the
rate of crime and offenders in the neighborhood. The modern social disorganisation per-
spective has been further developed by Sampson and colleagues (e.g., Sampson 2006b)
through their focus on advancing our understanding of neighborhood social processes, and
in this context they have introduced the important concept of collective efficacy (Sampson
et al. 1997).
Although the Social Disorganisation tradition has contributed substantially to our
understanding of the role of the social environment and, particularly, drawn attention to
aspects of the social environment which may be causally relevant in crime causation, it has
some general shortcomings when it comes to explaining why acts of crime occur.
Neighborhood structural characteristics and social processes are mainly analysed at the
area level and therefore do not tell us that much about how (through what processes)
environmental characteristics are linked to individual action. Wikstrom and Sampson
(2003, pp. 127, our emphasis) suggest ‘‘what has been missing is a concept that directly
links the community context to individual development and actions… behavior-setting is a
concept that may provide such a linkage’’. Moreover, SD does not provide any situationalmodel that helps explain how the interaction between people and environments causes
people to engage in acts of crime. The theory largely ignores the importance of individualdifferences in crime propensities and, particularly, how such propensities interact with
environmental conditions in crime causation. We propose that Situational Action Theory
1 Although Routine Activity Theory has become the established label, it should be noted that one of theoriginators of RAT (Marcus Felson) prefers to call it an approach rather than a theory (Felson 2006).
J Quant Criminol (2010) 26:55–87 57
123
can help overcome these theoretical shortcomings in Social Disorganisation Theory when
it comes to explaining the person-environment interaction in crime causation.
Research in the SD tradition has focused on residential environments (neighborhoods)
and their effects on crime, particularly the relationship between neighborhood population
characteristics (SES, population heterogeneity and instability and, more recently, level of
family disruption) and residents’ involvement in crime (and related social problems). Most
early research was based on official aggregate statistics for rather large administrative areas
and studied variation in neighborhood offender rates (particularly young offender rates)
rather than crime rates. Only recently has it become possible (as a consequence of the
introduction of large scale community surveys) to empirically study some key hypothe-
sized mediating social processes such as neighborhood social cohesion and informal social
control (see, for example, Sampson and Groves 1989; Sampson et al. 1997; Wikstrom and
Dolmen 2001; Sampson and Wikstrom 2008).
A particular problem with a lot of the research in the SD tradition is the crude and
undeveloped measures of the environment employed. Raudenbush and Sampson (1999, pp.
3) have rightly argued that ‘‘without comparable standards to evaluate ecological assess-
ments, the search for individual and ecological effects may overemphasize the individual
component simply because well-studied psychometric properties are likely to be superior
to the unstudied ecometric ones’’. Their seminal development of ecometrics (the quanti-
tative assessment of ecological settings such as neighbourhoods and schools) is a great step
forward in the study of the role of environments in crime causation (Raudenbush and
Sampson 1999). However, this approach does not solve the fundamental problem of
measuring the dynamics of the person-environment interaction. To fully understand the
role of the social environment in crime causation we also need to better capture this
dynamic by developing and using methodologies that can tap into it.
It can be argued that people’s actions are only influenced by the part of the environment
(settings) they experience with their senses (Wikstrom 2006). The units of analysis com-
monly used in SD research are generally too large to approximate settings2 and often tooheterogeneous to warrant the assumption that the neighborhood environment is homoge-
neous in causally relevant features (see further, Oberwittler and Wikstrom 2009). More-
over, and crucially, people move about in space and hence are exposed to and interact with
a wide variety of different environments beyond their neighborhoods. Restricting the
measurement of environmental influences to relevant features of a person’s neighborhood
is therefore problematic.
A particular problem that has haunted research in the SD tradition is whether one can
adequately draw conclusions about individual-level relationships from associations at the
aggregate level. As a rule, relationships at the aggregate-level are stronger than the cor-
responding relationship at the individual-level, and sometimes the direction of the rela-
tionships may even be different (e.g., Robinson 1950; Hammond 1973). There is an
emerging body of research that investigates neighborhood effects at the individual-level
and can therefore help overcome the potential problem of ecological fallacy (e.g., Reiss
and Rhodes 1961; Braithwaite 1979, pp. 126–157; Simcha-Fagan and Schwartz 1986;
Gottfredson et al. 1991; Jarjoura and Triplett 1997; Lynham et al. 2000; Wikstrom and
Loeber 2000). However, with a few exceptions (Wikstrom 2009), this research does not go
beyond the subjects’ neighborhoods when exploring environmental influences on their
crime involvement.
2 It is not uncommon for studies to use areas encompassing 5,000–10,000 inhabitants as units of analysis.
58 J Quant Criminol (2010) 26:55–87
123
To advance our understanding of the person-environment interaction in crime causation,
we need to study this relationship at the individual-level, measuring environments by
ecometric methods applied to small area units of analysis that approximate settings (the
part of the environment a person can access with his or her senses), and utilising meth-
odologies that allow us to take into consideration people’s activity fields (the configuration
of the different settings to which they are exposed during a given time period).
Routine Activity Theory
Routine Activity Theory (RAT) emerged as a key theoretical approach in criminology in
the late 1970s (Cohen and Felson 1979). Routine activities refer to generalised patterns of
social activities in a society (i.e., spatial and temporal patterns in family, work and leisure
activities). Two key ideas of RAT are (a) that the structure of routine activities in a society
influences what kinds of situations emerge and (b) that people commit acts of crime in
response to situational conditions (opportunities). The situational model of RAT defines
what constitutes an opportunity, that is, the convergence of a motivated offender and a
suitable target in the absence of guardianship (supervision, control) (Cohen and Felson
1979; Felson and Cohen 1980). It is an interactional model that by its logic requires allthree elements to be present simultaneously for a crime to occur. Felson tellingly talks
about the chemistry of crime (Felson 2002). However, this dynamic aspect of the theory
has never really been properly empirically tested (Bursik and Grasmick 1993). Moreover,
and crucially, the theory does not specify why (through what causal process) this con-
vergence brings about an act of crime. If this question is touched upon at all, proponents of
Routine Activity Theory generally seem to allude to some version of Rational Choice
Theory to explain why the convergence makes a person engage in an act of crime (Felson
and Cohen 1980). However, this argument is not well developed and RAT and Rational
Choice Theory have never been properly integrated (Clarke and Felson 1993, pp. 1–14).
The role of individual differences in crime propensity is particularly poorly treated in
RAT, something that is perhaps understandable against the background of the following
claim by Clarke and Felson (1993, pp. 2): ‘‘the routine activity approach offered a thought
experiment: to see how far one could go in explaining crime trends without ever discussing
any of the various theories about criminal motivation’’. However, the concept of motivated
offenders seems to acknowledge that people differ in their propensity to engage in acts of
crime (see Felson 2002), although some scholars who work in this tradition seem to take
the rather extreme position that all people are motivated offenders, that is, that acts of
crime are solely a function of momentary influences on action by environmental conditions
with no input of (differential) individual propensity (Wilcox et al. 2003).
On the surface, Routine Activity Theory (RAT) and Situational Action Theory (SAT)
have some basic similarities. Both focus on the explanation of crime events. Both rec-
ognise that some environmental conditions are more criminogenic than others. Both
recognise that people vary in their propensity to engage in acts of crime (with the above-
mentioned exception of some more extreme applications of RAT). Both provide situational
models that stress that acts of crime are an outcome of the convergence between people
and settings. However, the two theories differ in what factors they assume are important in
the person-environment interaction. Moreover, while SAT provides an action theory that
aims to explain how the convergence of people and settings may bring about acts of crime,
RAT does not. SAT focuses on how the intersection of people and settings (propensity and
exposure) produces a causal process (a perception-choice process) that brings about acts of
crime. RAT focuses on specifying the necessary conditions for a crime to occur (offender,
J Quant Criminol (2010) 26:55–87 59
123
suitable target, lack of control) without really explaining how (by which process) this
convergence causes a person to engage in an act of crime.
The two theories differ in clarity regarding what they aim to explain. While SAT clearly
defines what is to be explained by the theory (i.e., breaches of moral rules), RAT is more
ambiguous.3 Although some advances have recently been made regarding the role of
individual factors in RAT (e.g., Felson 2002), the theory is still somewhat unclear about
which (and particularly how) individual characteristics and experiences are relevant to
crime causation. SAT, on the other hand, clearly states that a person’s morality and ability
to exercise self-control are the causally relevant personal characteristics in the explanation
of acts of crime, and also specifies how these characteristics interact with setting features in
crime causation. In contrast to RAT, SAT provides an explanation of the role played by the
social environment in the development of people’s differential crime propensities (see
Wikstrom 2005; Wikstrom and Treiber 2009a, b), an aspect we will not, however, deal
with further in this paper, which focuses on the explanation and study of crime events.
In its empirical applications, RAT has generally been studied at the aggregate level
using crude indicators of routine activities (such as demographic characteristics). A meta-
analysis by Pratt and Cullen (2005) reports that the empirical support for Routine Activity
Theory is only moderate. However, Eck (1995) has argued that RAT really should be
tested at the situational level (i.e., the convergence of the situational elements), something
which has never been adequately done. In this study we will provide data on the con-
vergence in time and space of a person’s propensity, environmental exposure and acts of
crime.
Situational Action Theory
Social (or human) ecology may be broadly defined as the analysis and study of the social
and behavioural consequences of the interaction between human beings and their envi-
ronments. Situational Action Theory (SAT) aims to provide a truly ecological perspective
in the analysis and study of moral action and crime. It is a general theory that seeks to
integrate personal and environmental explanatory perspectives within the framework of a
situational action theory. The theory is specifically designed to address the role of the
interaction between people and their social environments in crime causation (see Wikstrom
2004, 2005, 2006, 2007a, b, 2010; Wikstrom and Treiber 2007, 2009a, b).
According to SAT, crimes are moral actions and therefore should be analysed and
explained as such. Acts of crime are breaches of moral rules of conduct (defined in law).
Moral rules are rules that stipulate what it is right or wrong to do in a particular cir-
cumstance. What a theory of crime causation ultimately should explain is thus why people
follow and breach moral rules. SAT argues that there is, in principle, no difference between
explaining acts of crime and moral rule-breaking more generally because the situational
process that determines any moral action is the same.
In brief, Situational Action Theory proposes that the convergence (in time and space)
between a person’s propensity (P) and exposure (E) initiates a perception-choice process
3 For example, in a recent work Felson (2006) defines crime as ‘‘any identifiable behavior that an appre-ciable number of governments has specifically prohibited and formally punished’’ (pp. 35); he goes on to saythat ‘‘crime’s comprehensive definition includes past and present crimes and leaves room for future crimes’’(pp. 36). In our view this definition does not contribute much towards specifying what it is RAT aims toexplain.
60 J Quant Criminol (2010) 26:55–87
123
(?) whose outcome is an action (or inaction), for example, an act of crime (C). The
situational model’s explanation of acts of crime can be summarised as
P� E! C
Situational Action Theory does not propose a simple additive model of propensity and
exposure but that propensity and exposure interact to determine a person’s crime
involvement. Specific combinations of propensity and exposure are likely to produce
specific outcomes in terms of a person’s engagement in acts of crime.
SAT suggests that the causally relevant personal characteristics that determine people’s
crime propensity are their morality (personal moral rules and related emotions such as
shame and guilt) and ability to exercise self-control, while the causally relevant environ-
mental features that determine criminogenic exposure are the moral rules of the settings in
which a person takes part and their enforcement (through the process of deterrence). The
relevant perception-choice process is one of moral perception and moral choice (see fur-
ther, Wikstrom 2006). Actions (like acts of crime) are an outcome of how people perceivetheir action alternatives and (on that basis) make choices when confronted with the par-
ticularities of a setting. This process can be either predominantly habitual (automated) or
deliberate (reasoned) depending on the person’s familiarity with the setting and its cir-
cumstances. The more familiar the setting and the circumstances, the more likely it is the
process will be predominantly habitual in nature.
The likelihood an act of crime will be committed by a particular person in a particular
setting depends upon the extent to which that person’s moral rules and the moral rules of
that setting are consistent with the rules of conduct defined by law. If the person’s moral
rules and the moral rules of the setting encourage him or her to act in opposition to the
rules of conduct defined by law, an act of crime is likely. If the person’s moral rules and the
moral rules of the setting encourage him or her to act in accordance with the rules of
conduct defined by law, an act of crime is unlikely. This is referred to as the principle ofmoral correspondence.
When there is a discrepancy between a person’s moral rules and the moral rules of the
setting, the outcome will be determined by the efficacy of controls. SAT distinguishes
between two main kinds of controls: a person’s ability to exercise self-control,4 which
comes into play when a person’s moral rules discourage but the moral rules of the setting
encourage an act of crime; and deterrence, which comes into play when a person’s moral
rules encourage but the moral rules of the setting discourage an act of crime. This is
referred to as the principle of the conditional relevance of controls (see further Wikstrom
and Treiber 2009a, b; Wikstrom 2010).
The role of the social environment is crucial within the explanatory framework of SAT.
Two key concepts are setting,5 defined as the part of the environment which an individual
can, at a particular moment in time, access with his or her senses, including any media
present, and activity field, defined as the configuration of settings a person takes part in
during a specific time period. SAT suggests that people’s actions (and their development)
are only influenced by the causally relevant environmental conditions of the settings in
4 Please note that we use the concept of self-control somewhat differently than Gottfredson and Hirschi(1990), as a situational concept rather than a personal trait (see Wikstrom and Treiber 2007).5 The concept of behavior-setting was originally proposed by Barker (1968). The concept of setting asemployed in SAT is inspired by but not identical to the concept of behavior-setting used by Barker. Taylor(1997) makes a strong theoretical argument for the use of behavior-settings as a unit of analysis whenassessing environmental influences on crime and related outcomes.
J Quant Criminol (2010) 26:55–87 61
123
which they take part, and that how people respond when exposed to a setting (its action
relevant moral rules and controls) depends on their propensity (their action relevant moral
rules and controls). For example, those who have strong moral rules consistent with the
rules of conduct defined by law and a strong ability to exercise self-control (causing a weak
crime propensity) are unlikely to engage in acts of crime regardless of the criminogenic
features of the settings in which they take part.
In this study we will focus on the role of exposure in crime causation. We will use
measures of particular settings thought to be criminogenic and study how exposure to such
settings is linked to young people’s crime involvement in early to mid adolescence. We
will specifically test the hypothesis that only those with a higher crime propensity will be
influenced by exposure to criminogenic settings, while those with a low crime propensity
will be largely immune to criminogenic exposure.6
The Peterborough Adolescent and Young Adult Development Study (PADS1)
The data for this study is taken from the Peterborough Adolescent and Young Adult
Development Study (PADS?), an ongoing ESRC financed longitudinal study of a ran-
domly selected sample of young people who were 11 years old and living in the UK city of
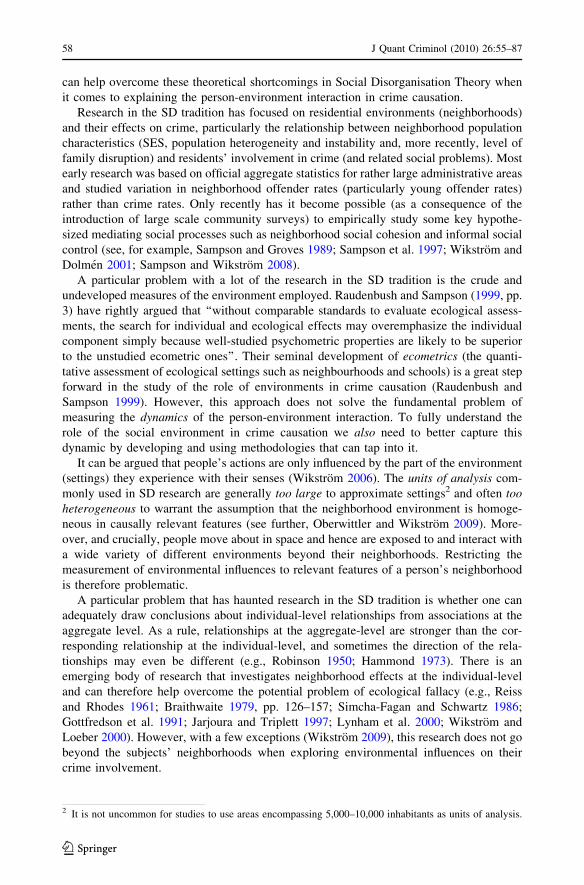
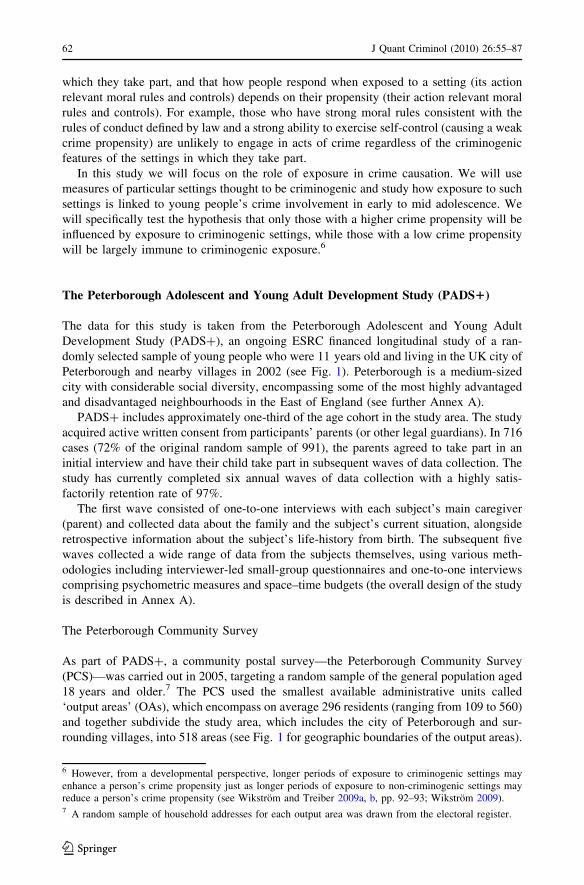
Peterborough and nearby villages in 2002 (see Fig. 1). Peterborough is a medium-sized
city with considerable social diversity, encompassing some of the most highly advantaged
and disadvantaged neighbourhoods in the East of England (see further Annex A).
PADS? includes approximately one-third of the age cohort in the study area. The study
acquired active written consent from participants’ parents (or other legal guardians). In 716
cases (72% of the original random sample of 991), the parents agreed to take part in an
initial interview and have their child take part in subsequent waves of data collection. The
study has currently completed six annual waves of data collection with a highly satis-
factorily retention rate of 97%.
The first wave consisted of one-to-one interviews with each subject’s main caregiver
(parent) and collected data about the family and the subject’s current situation, alongside
retrospective information about the subject’s life-history from birth. The subsequent five
waves collected a wide range of data from the subjects themselves, using various meth-
odologies including interviewer-led small-group questionnaires and one-to-one interviews
comprising psychometric measures and space–time budgets (the overall design of the study
is described in Annex A).
The Peterborough Community Survey
As part of PADS?, a community postal survey—the Peterborough Community Survey
(PCS)—was carried out in 2005, targeting a random sample of the general population aged
18 years and older.7 The PCS used the smallest available administrative units called
‘output areas’ (OAs), which encompass on average 296 residents (ranging from 109 to 560)
and together subdivide the study area, which includes the city of Peterborough and sur-
rounding villages, into 518 areas (see Fig. 1 for geographic boundaries of the output areas).
6 However, from a developmental perspective, longer periods of exposure to criminogenic settings mayenhance a person’s crime propensity just as longer periods of exposure to non-criminogenic settings mayreduce a person’s crime propensity (see Wikstrom and Treiber 2009a, b, pp. 92–93; Wikstrom 2009).7 A random sample of household addresses for each output area was drawn from the electoral register.
62 J Quant Criminol (2010) 26:55–87
123
The PCS included an average of 13 respondents per unit for a total sample of 6,615
respondents (for details see Oberwittler and Wikstrom 2009). To ensure that we measured
small areas (approximating settings) as much as possible, and that the information provided
was highly accurate,8 the survey asked respondents to report on
‘the area within a short walking distance (say a couple of minutes) from your home.That is the street you live in and the streets, houses, shops, parks and other areasclose to your home’’
Questions such as ‘Is there a fire station within a short walking distance?’ were used to
test that respondents referred only to the area immediately surrounding their home; a
comparison of respondents’ reports of the presence of particular services (e.g., fire and
police stations) close to their home with the actual locations of such services supports the
survey method’s efficacy (see further Oberwittler and Wikstrom 2009). The random
Fig. 1 The study area, output areas and location of city and local centres. Disadvantaged output areasshaded in grey (top 25th percentile)
8 It is likely that residents have accurate knowledge about the social conditions of the area immediatelysurrounding their residence. The extent to which they have such knowledge about the typically much largergeographic areas commonly used in ‘‘neighborhood research’’ is more questionable. Moreover, the largerthe area the more likely it is to be heterogeneous in relevant social conditions and therefore that residents’reports on these conditions will be less uniform (reflecting residents’ differential exposure to parts of thearea depending on the location of their residence within the area).
J Quant Criminol (2010) 26:55–87 63
123
geographic spread of responses within each output area9 ensured that each output area was
effectively covered by overlapping observations. Social environment variables were then
created by amalgamating responses for each output area. Tests run to ensure inter-rater
reliability amongst respondents in each output area demonstrated good convergence on the
social environmental variables social cohesion and informal social control used in sub-
sequent analyses (for details see Oberwittler and Wikstrom 2009).
The main purpose of the PCS was to use residents as social observers to collect data
about social settings (e.g., small area levels of social cohesion and informal social control)
which could then be linked to space–time budget data in order to measure PADS? sub-
jects’ exposure to different social environments (their activity fields). The linkage between
the small area community survey and the space–time budget data was made possible
because both studies included the same geographic locator (i.e., output areas) by which the
data could be geographically matched.
In addition to the PCS data, data from the Census and Generalised Land Use Database(ODPM 2001) (and some other official data sources) were collected for output areas which
made it possible to also match these data (e.g., data on disadvantage, land use and public
entertainment activities) with data from the space–time budget and the PCS.
The Space–Time Budget
Space–time budgets were initially developed to assist research on travel, tourism and urban
planning (see, for example, Anderson 1971; Tomlinson et al. 1973; Forer and Kivell 1981;
Janelle et al. 1988; Fenell 1996; Mey and Heide 1997). Space–time budget methodology
built upon earlier time budgets (or time diaries), which are useful for analysing the timing,
sequence and frequency of events (see Pentland et al. 1999) but fail to address the spatial
dimensions of activity patterns (Hanson and Hanson 1980). Space–time budget method-
ology is relatively new even in fields like tourism research (e.g., Dietvorst 1994; Fenell
1996; Thornton et al. 1997) and urban ecology (e.g., Janelle et al. 1988). Despite its
obvious potential for studying, and comparing, the activity patterns of different groups of
individuals, we only know of one previous instance in which it has been used in crimi-
nological research, the Peterborough Youth Study (PYS). The PYS was a cross-sectional
fore-runner of PADS? conducted in 2000, in which, among other things, the space–time
budget methodology was piloted (see Wikstrom and Butterworth 2006). We used expe-
riences from the PYS to refine the space–time budget methodology used in PADS?. For
example, while a 7 day recall period was used in the PYS, we opted for a 4 day recall
period in PADS?, as we found that 4 days would provide sufficiently representative data
to capture main differences in subjects’ activity patterns while arguably providing more
accurate data due to a more focused recall period.
PADS? space–time budget data comprises detailed hourly information covering a four-day period (each year), including the subject’s geographic location (output area), the place(e.g., home, school, street), who the subject was with (e.g., peers only, family), and his or
her main activity (e.g., socializing, playing tennis). To minimize the possible influence of
seasonal variation this data was collected during the first 4 months of each year. The
coding is very detailed and includes hundreds of categories. Additional information was
also collected regarding the time and location of any acts of crimes (and other events such
as victimisation and alcohol and drug use) which took place during the 4 day period.
9 The fact that we have the exact geographic location of respondents’ addresses makes it possible to maptheir location within output areas and hence confirm that they were generally well spread.
64 J Quant Criminol (2010) 26:55–87
123
Space–time budget data thus makes it possible to describe and classify settings based on
subjects’ involvement with particular places, people and activities and, in combination
with PCS and official data (census and land use data), describe the characteristics of the
environments in which those events take place (e.g., in an area with poor collective
efficacy or high pub and nightclub density).
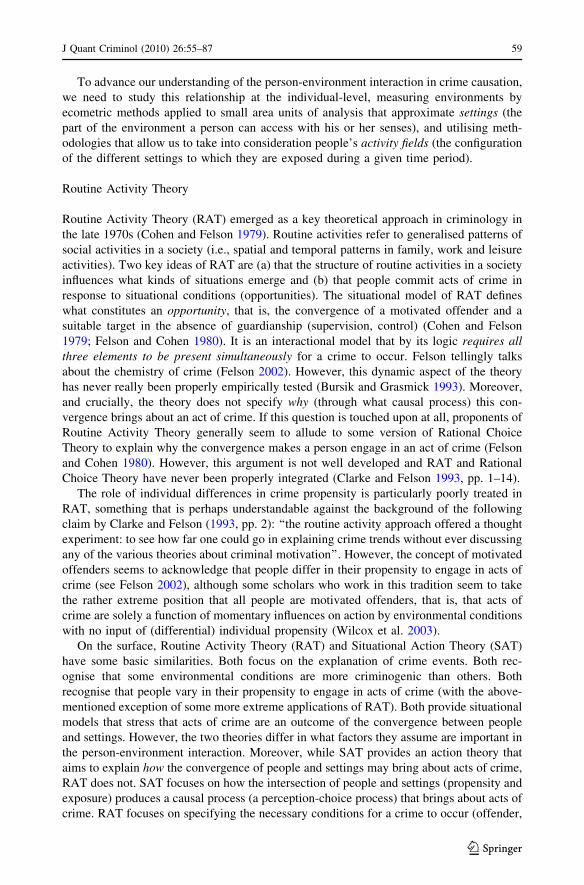
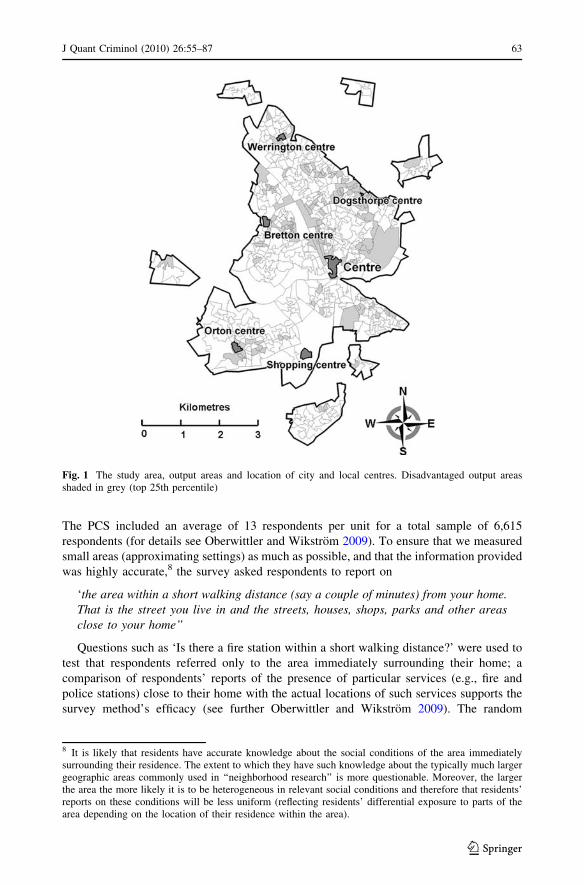
An activity field represents a person’s exposure to different settings during a specific
time period as illustrated for one person for one day in Fig. 2. Settings are marked by black
squares while the arrows represent the subject’s movements between settings. Summing
the hours a person has spent in a particular kind of setting (e.g., unsupervised with peers in
an area with poor collective efficacy) during a specific time period provides a measure of
his or her exposure to that particular setting during that particular time period.
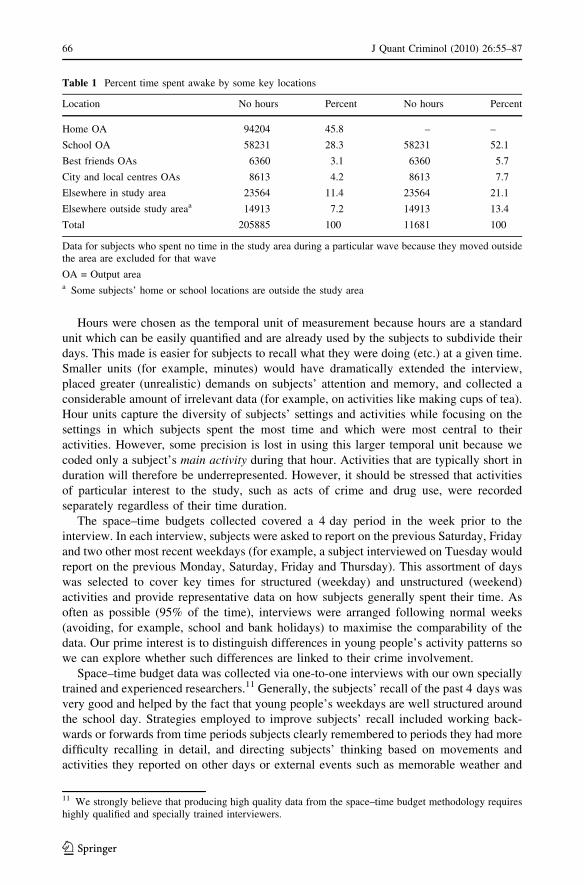
Of particular importance is the fact that altogether the subjects (who lived in the study
area10) spent 93% of their time awake in locations within the study area (as defined in
Fig. 1) which means that PCS measures (e.g., output area collective efficacy) characterise
all but 7% of the time which eligible subjects spent awake (see Table 1). However, setting
characteristics based only on space–time budget data (e.g., being in a setting unsupervised
with peers) do not have the same restrictions as they are not limited to time spent in the
study area (as PCS data are).
Fig. 2 Illustration of one person’s activity field for one day (time awake only)
10 Space–time budget data has been excluded for subjects who spent no time in the study area because theymoved permanently, or temporarily, out of the area during the study period (N = 35). For some analyses,those who did not take part in all five waves (N = 23) are also excluded.
J Quant Criminol (2010) 26:55–87 65
123
Hours were chosen as the temporal unit of measurement because hours are a standard
unit which can be easily quantified and are already used by the subjects to subdivide their
days. This made is easier for subjects to recall what they were doing (etc.) at a given time.
Smaller units (for example, minutes) would have dramatically extended the interview,
placed greater (unrealistic) demands on subjects’ attention and memory, and collected a
considerable amount of irrelevant data (for example, on activities like making cups of tea).
Hour units capture the diversity of subjects’ settings and activities while focusing on the
settings in which subjects spent the most time and which were most central to their
activities. However, some precision is lost in using this larger temporal unit because we
coded only a subject’s main activity during that hour. Activities that are typically short in
duration will therefore be underrepresented. However, it should be stressed that activities
of particular interest to the study, such as acts of crime and drug use, were recorded
separately regardless of their time duration.
The space–time budgets collected covered a 4 day period in the week prior to the
interview. In each interview, subjects were asked to report on the previous Saturday, Friday
and two other most recent weekdays (for example, a subject interviewed on Tuesday would
report on the previous Monday, Saturday, Friday and Thursday). This assortment of days
was selected to cover key times for structured (weekday) and unstructured (weekend)
activities and provide representative data on how subjects generally spent their time. As
often as possible (95% of the time), interviews were arranged following normal weeks
(avoiding, for example, school and bank holidays) to maximise the comparability of the
data. Our prime interest is to distinguish differences in young people’s activity patterns so
we can explore whether such differences are linked to their crime involvement.
Space–time budget data was collected via one-to-one interviews with our own specially
trained and experienced researchers.11 Generally, the subjects’ recall of the past 4 days was
very good and helped by the fact that young people’s weekdays are well structured around
the school day. Strategies employed to improve subjects’ recall included working back-
wards or forwards from time periods subjects clearly remembered to periods they had more
difficulty recalling in detail, and directing subjects’ thinking based on movements and
activities they reported on other days or external events such as memorable weather and
Table 1 Percent time spent awake by some key locations
Location No hours Percent No hours Percent
Home OA 94204 45.8 – –
School OA 58231 28.3 58231 52.1
Best friends OAs 6360 3.1 6360 5.7
City and local centres OAs 8613 4.2 8613 7.7
Elsewhere in study area 23564 11.4 23564 21.1
Elsewhere outside study areaa 14913 7.2 14913 13.4
Total 205885 100 11681 100
Data for subjects who spent no time in the study area during a particular wave because they moved outsidethe area are excluded for that wave
OA = Output areaa Some subjects’ home or school locations are outside the study area
11 We strongly believe that producing high quality data from the space–time budget methodology requireshighly qualified and specially trained interviewers.
66 J Quant Criminol (2010) 26:55–87
123
popular television programs. Researchers were equipped with a number of tools to help
them identify geographical locations. For example, if a subject did not know the address of
a friend’s house he or she visited, researchers could use landmarks like local shops and
parks to find it. Extensive lists of local shops, restaurants, leisure venues, schools, etc. and
their geographic locations were developed to make space–time budget interviews more
efficient and accurate. Subjects’ own knowledge was critical in solving such problems and
helped engage them in the process. Researchers generally found subjects willing to discuss
their movements and activities, and often interested in the space–time budget method as a
way of telling us about and portraying their social lives.
Data collected on incidents of substance use, offending, victimisation, risk experiences
(for example, being in or witnessing an argument) and weapon possession were the most
sensitive covered by the interview and researchers worked with subjects on an individual
basis to ensure they were comfortable reporting these activities accurately. Methods for
ensuring confidentiality were clearly disclosed; researchers ensured interviews were
always conducted out of the hearing of others and subjects were allowed to point to their
answers if they did not want to answer out loud. The one-to-one nature of the interview
also allowed researchers to elicit additional information to ensure incidents were accurately
coded. Researchers again found that subjects were generally willing to disclose their
activities.
Four day interviews provide 96 h of data per subject per year. This amounted to a total
of 335,13612 hours over the five sweeps. For the analyses presented in this paper, we are
concerned only with the hours which subjects spent awake, which amounted to 209016 h.
For this study, we will use the total hours a subject spent awake in a setting over the five
waves (in total 20 days) as a measure of his or her exposure to that particular setting in
early to mid adolescence (ages 13–17). Other studies will explore age-specific patterns and
changes in exposure and links to their crime involvement (e.g., Wikstrom 2009).
Based on Situational Action Theory, three key analytical concepts will be used in this
study to explore the person-environment interaction in crime causation during early to mid
adolescence: propensity, exposure and acts of crime. In the following sections we describe
the data used to create measures of these concepts and how they have been operationalized.
Propensity
The concept of propensity refers to the likelihood someone will act in a specific way when
exposed to particular environmental conditions. People vary in propensity, meaning that
different people react differently to the same setting (environmental conditions). According
to Situational Action Theory, the general propensity to breach moral rules defined by law
(commit acts of crime) depends on a person’s morality (relevant moral rules) and ability to
exercise self-control, because these are the key personal factors influencing the perception
and choice of crime as an action alternative. To assess crime propensity in this study we
have therefore used a composite measure based on a morality scale and a scale measuring
the generalised ability to exercise self-control. The rationale for combining morality and
12 A small number of participants were unable to complete the spatial dimension of the space–time budgetbecause they have moved outside the study area. For analyses which involve a spatial element (e.g.,collective efficacy, entertainment settings) these subjects’ hours are excluded, leaving a total of 329,952 h,and 205,885 h awake.
J Quant Criminol (2010) 26:55–87 67
123
self-control is that when people act, they draw upon these personal factors in a holisticmanner, rather than discretely.13
Data on morality and the ability to exercise self-control were collected through a
questionnaire which, to enhance data quality, was administered in small groups of no more
than four subjects. To make sure subjects understood the questions as intended (as much as
possible), the questionnaire was divided into blocks of questions by topic (e.g., neigh-
borhood, family bonds, moral values or self-control) and each block was introduced by a
project researcher who explained definitions and invited subjects to raise any queries
before writing their responses. At the end of each block, the researcher asked subjects to
check they had answered all the questions in that block before moving on to the next one,
keeping internal non-responses to a minimum.
The questions on moral values14 ask the subjects how wrong they think it is for someone
their age to do 16 specific acts, ranging in seriousness from ‘‘Ride a bike through a red
light’’ to ‘‘Use a weapon or force to get money or things from another young person’’ (see
Annex B for the full list). The instruction given to subjects before they completed the scale
read as follows:
Now I would like you to answer some questions about what things you think arewrong for a person your age to do. I would like you to tick ‘very wrong’ if it issomething someone your age should never ever do, ‘wrong’ if it is somethingsomeone your age normally should not do, ‘a little wrong’ if it is something that is alittle bad but not too bad to do, and ‘not wrong at all’ if it is something not bad at allthat someone your age can always do. If you have problems understanding any of thequestions please raise your hand and I will come over and help you.
The questions about the ability to exercise self-control form a modified scale based on
Grasmick et al.’s (1993) self-control scale. The modified scale includes eight questions.
Questions from the original Grasmick et al. scale have been excluded because they do not
refer to self-control as defined by SAT; some, for example, are arguably more relevant to
morality than self-control. Examples of questions that are included are ‘‘I often act on the
spur of the moment without stopping to think’’ and ‘‘I lose my temper pretty easily’’ (see
Annex B for the full list). This scale is best viewed as a scale of the generalized ability to
exercise self-control since subjects report on their general tendency to be able to control
themselves in unspecified circumstances.
The questions about self-control were introduced in the following manner:
Now I would like you to answer some questions about how you are as a person, forexample, if you easily get upset, easily get angry, if you care about what others thinkof you, and if you think a lot about what is going to happen to you in the future. Foreach question I would like you to tick the box that best fits how you are as a person. Ifthe statement is true about you, tick strongly agree, if it is mostly true about you tickmostly agree, if it is only a little bit true about you tick mostly disagree and if it is notat all true about you tick strongly disagree. If you have problems understanding anyof the questions please raise your hand and I will come over and help you.
13 However, specific analysis of the relationship between propensity and crime shows there is an interactioneffect in that self-control only becomes relevant when a person’s (crime-relevant) morality is weak(Wikstrom and Svensson 2009).14 PADS? includes several morality scales. This particular scale is inspired by a scale used by Rolf Loeberin the Pittsburgh Youth Study.
68 J Quant Criminol (2010) 26:55–87
123
We created a composite crime propensity score for each subject for the study period
(ages 13–17) which was standardized for all subjects’ scores on both subscales (morality
and self-control) across all waves.15 The crime propensity score is approximately normally
distributed (skewness = 0.39, S.E. of skewness = 0.041, Mean = 0.00, STD = 1.73). For
most analyses in this paper, we divide the scale into three groups: low, medium and high
propensity, where low propensity is defined as one standard deviation or more below the
mean and high propensity as one standard deviation or more above the mean.
Exposure
People not only vary in their crime propensity but also in their exposure to different kinds
of settings, some of which are more criminogenic than others.16 People act in response to
settings (environmental conditions they can experience through their senses); therefore
their exposure to settings which encourage acts of crime is important for understanding
their crime involvement. According to SAT, whether a setting is criminogenic depends on
the moral context (relevant moral rules and their enforcement) in which a person
encounters opportunities and frictions to which one possible response is an act of crime
(see further Wikstrom 2006).
To measure criminogenic exposure we need to measure (a) criminogenic features of
settings and (b) people’s contact with such settings. Exposure is measured as the numberof hours a person has spent awake in settings with a specific characteristic, or combinationof characteristics, during the 20 days covered by the space–time budget over the five
waves. For this study we have selected three kinds of settings believed to have crimino-
genic features: settings in which one is unsupervised with peers, settings with poor col-
lective efficacy and settings characterised by public entertainment (pubs and nightclubs).
We believe that these are kinds of settings in which young people with a higher crime
propensity are more likely to see crime as an action alternative and choose to commit it.
However, these aspects are by no means exhaustive and there are arguably many other
kinds of settings that have criminogenic qualities. This paper introduces the methodology
to study exposure and provides an initial analysis of the role of criminogenic exposure and
its interaction with crime propensity. Subsequent studies will expand and refine the
measure of exposure based on space–time budget, small area community survey (PCS) and
official output area data (i.e., census and land use data).
Unsupervised with Peers
The first criminogenic aspect selected is whether or not the young person is in a setting
where he or she is unsupervised with peers. A number of previous studies show there is an
association between frequent informal socialising with peers outside the home and crime
involvement (e.g., Mahoney and Stattin 2000; Osgood et al. 1996; Riley 1987; Sampson
and Groves 1989; West and Farrington 1977; Wikstrom and Butterworth 2006). It is a well
established fact that most young people commit crime with their peers (e.g., Reiss 1986;
Sarnecki 1986; Warr 2002; Wikstrom and Butterworth 2006). Spending time unsupervised
with peers does not in itself cause young people to commit crime. However, it does mean
15 See Wikstrom (2009) for details on how this measure was created.16 The reason why people are differentially exposed to settings is due to processes of self and socialselection, an aspect we will not deal with specifically in this paper but return to exploring in subsequentpublications.
J Quant Criminol (2010) 26:55–87 69
123
they are in a setting free from potential adult supervision.17 Such settings, if they also
provide opportunities or frictions, may be particularly criminogenic for young people with
higher levels of crime propensity.
Spending time in a setting unsupervised with peers is measured using space–time
budget data on subject’s activities (doing anything other than sleeping) and their com-
panions (being with peers and no adult guardian). Peers were defined as companions who
were not the subjects’ family members and took part in activities not in a supervisory role.
An adult guardian was defined as anyone over the age of 18 who took part in activities in a
supervisory role. The measure of exposure to being unsupervised with peers is defined as
the number of hours in the study period spent awake in a setting (output area) unsupervised
with peers.
Poor Collective Efficacy
The second criminogenic aspect we have selected is spending time in settings with poorcollective efficacy. Such settings have criminogenic potential because collective efficacy
represents a lack of willingness by those living in the area to intervene when acts of crime
and moral rule-breaking occur (Sampson et al. 1997). We believe that the level of col-
lective efficacy in a setting can serve as a measure of a key aspect of the moral context (the
level of enforcement of relevant moral rules). A number of studies have demonstrated that
there is an association between an area’s level of poor collective efficacy and its level of
crime (e.g., Sampson and Wikstrom 2008). Being in a setting with poor collective efficacy
does not in itself cause a person to engage in acts of crime. However, it is reasonable to
hypothesise that a setting with poor collective efficacy in which young people spend time
unsupervised with peers has criminogenic qualities, particularly for those with a higher
crime propensity.
Poor collective efficacy was measured using data from the PCS and combines infor-
mation from two scales measuring small area informal social control and social cohesion
(see Annex B). The scale of poor collective efficacy is an empirical Bayes estimate
adjusted for individual-level socio-demographic composition18 as recommended by
Sampson et al. (1997). The measure of exposure to poor collective efficacy is defined as the
number of hours during the study period spent awake in settings (output areas) that fall into
the top 25th percentile of the poor collective efficacy estimate.19 Of the output areas, 125
(24%) meet this criteria.
Public Entertainment Settings
A particularly interesting kind of urban setting is entertainment settings where pubs and
nightclubs are concentrated. The social life in such settings (particularly at later hours on
the weekends) is likely to include criminogenic influences due to the general informal and
unstructured orientation of activities and the fact that many people are under the influence
of alcohol and recreational drugs. This kind of setting tends to create high levels of friction
17 Generally, adults are assumed to uphold moral rules defined by law, but this is not always the case. Thereare even some (albeit rare) instances in which, for example, parents offend alongside their offspring.18 For details see Oberwittler and Wikstrom (2009).19 It should be noted that cut-off points are important, as a more liberal operationalization would lead tomore acts of crime being defined as having taken place in settings with poor collective efficacy. The cut-offpoint chosen for this dichotomization is somewhat arbitrary.
70 J Quant Criminol (2010) 26:55–87
123
between people. It is also not unreasonable to hypothesize that the level of adherence to
conventional moral rules and sensitivity to deterrence is generally lower in these contexts.
It is well known from research into violence and vandalism that areas of public enter-
tainment tend to encompass spatial and temporal concentrations for these kinds of crime
(e.g., Wikstrom 1991). Entertainment settings are likely to be particularly criminogenic for
young people who spend time in such settings unsupervised with their peers, particularly if
they also have a higher level of crime propensity.20
Public entertainment settings were identified using pub and nightclub density, a measure
derived from data on the number of valid license applications (acquired from the Peter-
borough City Council’s licensing team) per output area, taking into account the balance of
residential and non-residential land use via data acquired from the Generalised Land Use
Database (ODPM 2001). The measure of exposure to public entertainment settings is
defined as the number of hours during the study period spent awake in a setting (output
area) with a pub and nightclub density in the upper half of the density range. Of the output
areas, 38 (7%) met this criteria.
Acts of Crime
In this study we use two measures of subjects’ crime involvement in early to mid
adolescence: (a) their annual self-reported crime frequency (during the previous year),
collected via questionnaire; and (b) the crimes they reported having committed during the
4 days collected annually in the space–time budget. These data will be presented for the
five waves combined.
Self-Reported Crime (Questionnaire)
Questions in the study about self-reported criminality refer to ten different types of crime:
shoplifting, theft from a person, residential burglary, non-residential burglary, theft from a
car, theft of a car, vandalism, arson, assault and robbery from a person. Subjects were
asked whether they had committed the crime in question during the last year and, if so, how
many times they had done so. Although these questions cover most of the kinds of crime
young people tend to engage in, it should be noted that fraudulent or sexual crimes were
not included (nor were traffic crimes).
The questions about self-reported criminality were introduced by the project staff
member supervising the questionnaire using the following instructions (the text is from the
2005 questionnaire):
Now I would like you to answer some questions about things you may or may nothave done. The questions will ask about things that happened in 2005, that is, in thesecond and third term of year 9, the summer break and the first term of year 10.When you answer these questions do not include anything that happened after NewYears Eve. [Here the supervisor stopped and asked the subjects if this was all clear
20 It should be noted that our subjects are in the age range of 13–17 so they are not legally allowed to visitpubs and nightclubs (which may not, however, prevent the oldest from being able to frequent such estab-lishments). However, the criminogenic features of settings characterized by public entertainment are notrestricted to pub and nightclub venues but may also characterize the surrounding environment, in whichyoung people may take part.
J Quant Criminol (2010) 26:55–87 71
123
and if they had any questions. When he or she was convinced that they all understood
the time frame he or she would continue the introduction.] The questions follow thesame format. First they ask you to answer yes or no whether you have done some-thing. If you answer yes, you need to say how many times you did it in 2005. If youanswer no, you need to go onto the next question. Please remember that nobody, notyour family, not your teachers, not the police nor anybody else will be told what youhave told us. You can be sure that what you tell us will remain secret.
The crime data is, as expected, highly skewed (skewness = 7.42, S.E. of skewness
= 0.093, Mean = 23.0, STD = 67.7).
Self-Reported Crime (Space–Time Budget)
For each of the 4 days covered in the space–time budget each year, subjects were asked if
they had been involved in any act/s of crime.21 If so, they were asked to indicate the time,
location and the circumstances. Over all five waves (covering 13,964 days), 74 subjects
reported 141 acts of crime. These crimes are dominated by acts of violence (51%) and
vandalism (31%), although subjects also reported acts of theft (14%) and some driving
offences (4%). Most thefts involved shoplifting but some involved theft from another
person and even burglary. Most violence occurred between people who were acquainted or
knew each other by appearance; in less than one-fifth of the cases (17%), subjects reported
that the victim was a total stranger. Here it is important to bear in mind that we are dealing
with violence by offenders aged 13–17 in a medium sized city; we would expect that such
violence would often occur between young people who know each other at least by
appearance. Most cases of vandalism included (in rank order) damaging vehicles, buildings
and street-lights and spraying graffiti.
The fact that subjects had to discuss the circumstances of their crimes (including time
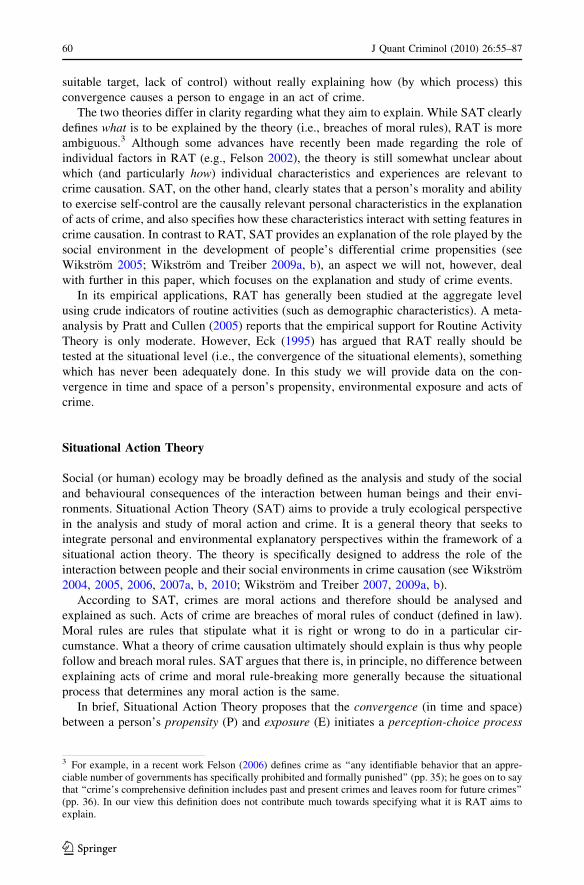
and location) makes it unlikely they would be able to fabricate incidents. This assumption
is corroborated by the fact that when we compared the locations by output area of police
recorded crimes by the same age groups (n = 3,649) with those reported by our subjects in
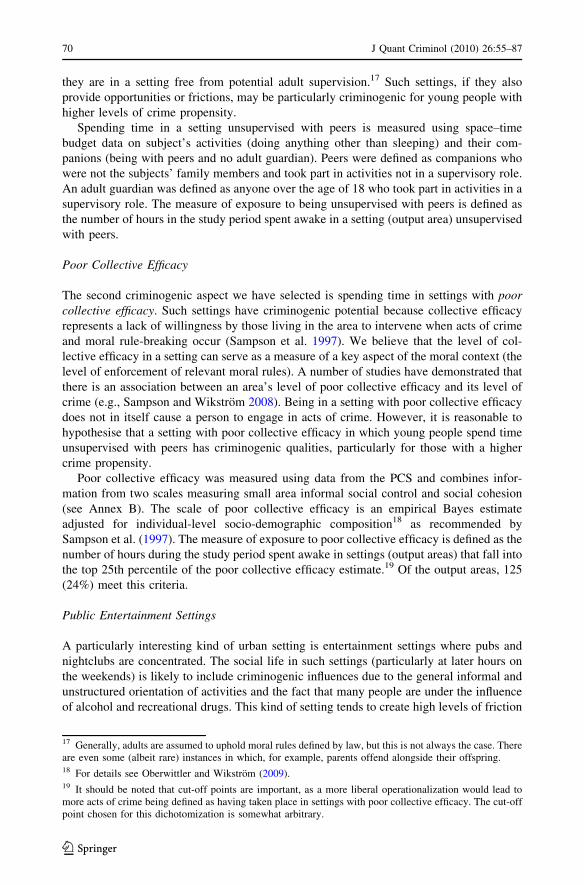
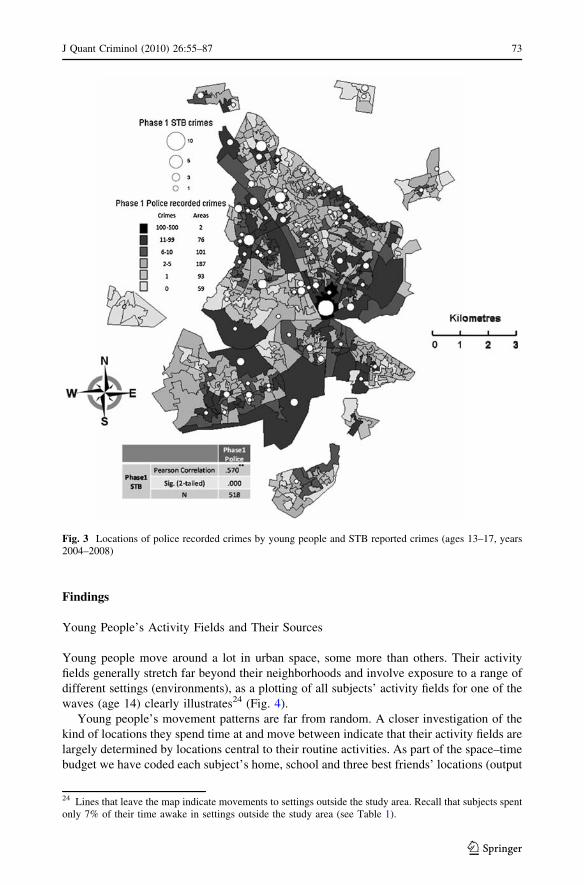
space–time budgets (n = 132),22 we found, as shown in Fig. 3, that the locations of the
subjects’ reported crimes to a large extent coincided with concentrations of police recorded
crimes by young people of the same ages (r = 0.57, p = 0.000, n = 518).
Moreover, there is a significant individual-level correlation between the subjects’ total
number of police recorded crimes (as recorded in the police national computer) and the
total number of self-reported crimes in their space–time budget (r = 0.23, p = 0.000,
n = 657) for the studied age period (early to mid adolescence).23 All this gives us con-
fidence that the crimes reported in the space–time budget are accurate representations of
young people’s crime and their settings.
21 There were less restrictions as to specific types of crime than in the questionnaire. However, all reportedcrimes, apart from six driving offences, fit into crime categories covered by those included in thequestionnaire.22 Please note that nine crimes reported were committed outside the study area and hence are not includedhere.23 Please note that these are totally independent sources of data on the young people’s crime involvementand further that the space–time budget only covers a short period each year, which makes it even moreremarkable that these data correlate significantly with police recorded crimes.
72 J Quant Criminol (2010) 26:55–87
123
Findings
Young People’s Activity Fields and Their Sources
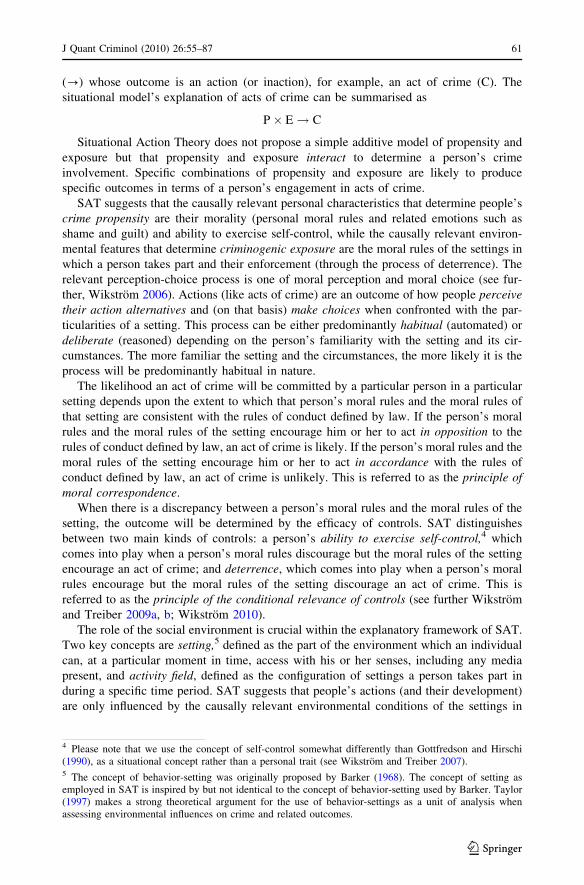
Young people move around a lot in urban space, some more than others. Their activity
fields generally stretch far beyond their neighborhoods and involve exposure to a range of
different settings (environments), as a plotting of all subjects’ activity fields for one of the
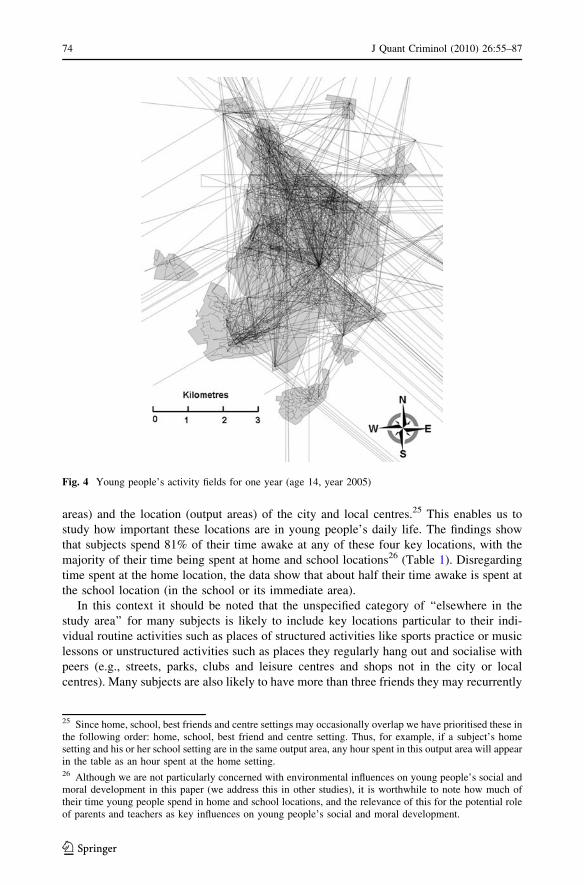
waves (age 14) clearly illustrates24 (Fig. 4).
Young people’s movement patterns are far from random. A closer investigation of the
kind of locations they spend time at and move between indicate that their activity fields are
largely determined by locations central to their routine activities. As part of the space–time
budget we have coded each subject’s home, school and three best friends’ locations (output
Fig. 3 Locations of police recorded crimes by young people and STB reported crimes (ages 13–17, years2004–2008)
24 Lines that leave the map indicate movements to settings outside the study area. Recall that subjects spentonly 7% of their time awake in settings outside the study area (see Table 1).
J Quant Criminol (2010) 26:55–87 73
123
areas) and the location (output areas) of the city and local centres.25 This enables us to
study how important these locations are in young people’s daily life. The findings show
that subjects spend 81% of their time awake at any of these four key locations, with the
majority of their time being spent at home and school locations26 (Table 1). Disregarding
time spent at the home location, the data show that about half their time awake is spent at
the school location (in the school or its immediate area).
In this context it should be noted that the unspecified category of ‘‘elsewhere in the
study area’’ for many subjects is likely to include key locations particular to their indi-
vidual routine activities such as places of structured activities like sports practice or music
lessons or unstructured activities such as places they regularly hang out and socialise with
peers (e.g., streets, parks, clubs and leisure centres and shops not in the city or local
centres). Many subjects are also likely to have more than three friends they may recurrently
Fig. 4 Young people’s activity fields for one year (age 14, year 2005)
25 Since home, school, best friends and centre settings may occasionally overlap we have prioritised these inthe following order: home, school, best friend and centre setting. Thus, for example, if a subject’s homesetting and his or her school setting are in the same output area, any hour spent in this output area will appearin the table as an hour spent at the home setting.26 Although we are not particularly concerned with environmental influences on young people’s social andmoral development in this paper (we address this in other studies), it is worthwhile to note how much oftheir time young people spend in home and school locations, and the relevance of this for the potential roleof parents and teachers as key influences on young people’s social and moral development.
74 J Quant Criminol (2010) 26:55–87
123
visit (see Annex C for more details regarding what is included in the category ‘‘elsewhere
in the study area’’).
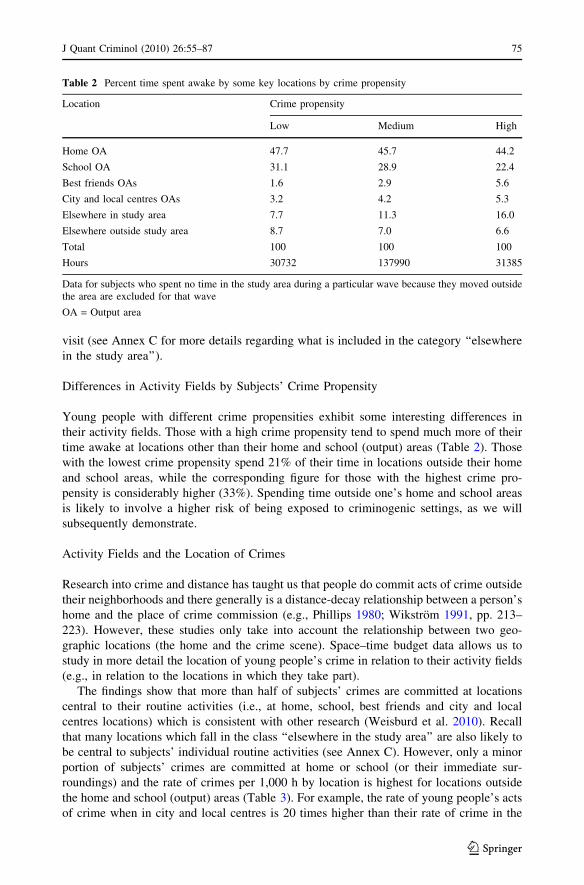
Differences in Activity Fields by Subjects’ Crime Propensity
Young people with different crime propensities exhibit some interesting differences in
their activity fields. Those with a high crime propensity tend to spend much more of their
time awake at locations other than their home and school (output) areas (Table 2). Those
with the lowest crime propensity spend 21% of their time in locations outside their home
and school areas, while the corresponding figure for those with the highest crime pro-
pensity is considerably higher (33%). Spending time outside one’s home and school areas
is likely to involve a higher risk of being exposed to criminogenic settings, as we will
subsequently demonstrate.
Activity Fields and the Location of Crimes
Research into crime and distance has taught us that people do commit acts of crime outside
their neighborhoods and there generally is a distance-decay relationship between a person’s
home and the place of crime commission (e.g., Phillips 1980; Wikstrom 1991, pp. 213–
223). However, these studies only take into account the relationship between two geo-
graphic locations (the home and the crime scene). Space–time budget data allows us to
study in more detail the location of young people’s crime in relation to their activity fields
(e.g., in relation to the locations in which they take part).
The findings show that more than half of subjects’ crimes are committed at locations
central to their routine activities (i.e., at home, school, best friends and city and local
centres locations) which is consistent with other research (Weisburd et al. 2010). Recall
that many locations which fall in the class ‘‘elsewhere in the study area’’ are also likely to
be central to subjects’ individual routine activities (see Annex C). However, only a minor
portion of subjects’ crimes are committed at home or school (or their immediate sur-
roundings) and the rate of crimes per 1,000 h by location is highest for locations outside
the home and school (output) areas (Table 3). For example, the rate of young people’s acts
of crime when in city and local centres is 20 times higher than their rate of crime in the
Table 2 Percent time spent awake by some key locations by crime propensity
Location Crime propensity
Low Medium High
Home OA 47.7 45.7 44.2
School OA 31.1 28.9 22.4
Best friends OAs 1.6 2.9 5.6
City and local centres OAs 3.2 4.2 5.3
Elsewhere in study area 7.7 11.3 16.0
Elsewhere outside study area 8.7 7.0 6.6
Total 100 100 100
Hours 30732 137990 31385
Data for subjects who spent no time in the study area during a particular wave because they moved outsidethe area are excluded for that wave
OA = Output area
J Quant Criminol (2010) 26:55–87 75
123
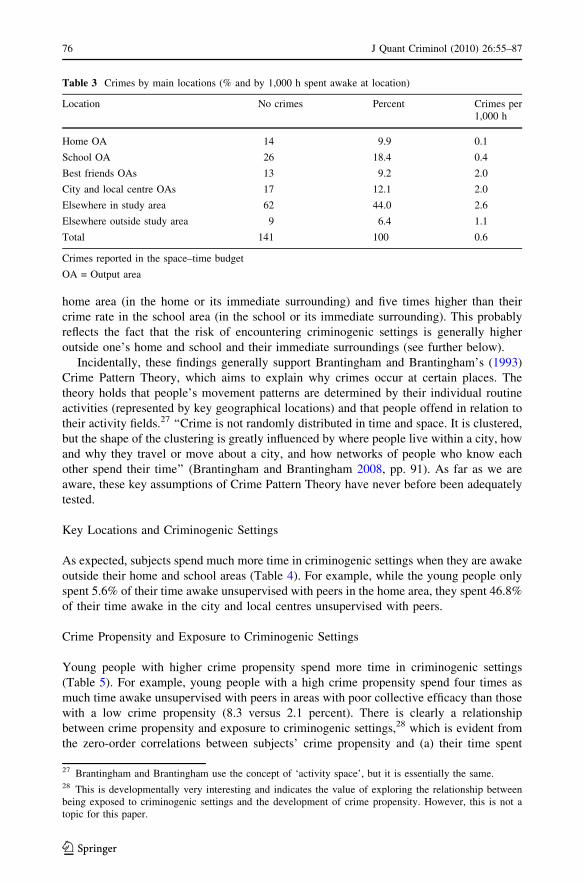
home area (in the home or its immediate surrounding) and five times higher than their
crime rate in the school area (in the school or its immediate surrounding). This probably
reflects the fact that the risk of encountering criminogenic settings is generally higher
outside one’s home and school and their immediate surroundings (see further below).
Incidentally, these findings generally support Brantingham and Brantingham’s (1993)
Crime Pattern Theory, which aims to explain why crimes occur at certain places. The
theory holds that people’s movement patterns are determined by their individual routine
activities (represented by key geographical locations) and that people offend in relation to
their activity fields.27 ‘‘Crime is not randomly distributed in time and space. It is clustered,
but the shape of the clustering is greatly influenced by where people live within a city, how
and why they travel or move about a city, and how networks of people who know each
other spend their time’’ (Brantingham and Brantingham 2008, pp. 91). As far as we are
aware, these key assumptions of Crime Pattern Theory have never before been adequately
tested.
Key Locations and Criminogenic Settings
As expected, subjects spend much more time in criminogenic settings when they are awake
outside their home and school areas (Table 4). For example, while the young people only
spent 5.6% of their time awake unsupervised with peers in the home area, they spent 46.8%
of their time awake in the city and local centres unsupervised with peers.
Crime Propensity and Exposure to Criminogenic Settings
Young people with higher crime propensity spend more time in criminogenic settings
(Table 5). For example, young people with a high crime propensity spend four times as
much time awake unsupervised with peers in areas with poor collective efficacy than those
with a low crime propensity (8.3 versus 2.1 percent). There is clearly a relationship
between crime propensity and exposure to criminogenic settings,28 which is evident from
the zero-order correlations between subjects’ crime propensity and (a) their time spent
Table 3 Crimes by main locations (% and by 1,000 h spent awake at location)
Location No crimes Percent Crimes per1,000 h
Home OA 14 9.9 0.1
School OA 26 18.4 0.4
Best friends OAs 13 9.2 2.0
City and local centre OAs 17 12.1 2.0
Elsewhere in study area 62 44.0 2.6
Elsewhere outside study area 9 6.4 1.1
Total 141 100 0.6
Crimes reported in the space–time budget
OA = Output area
27 Brantingham and Brantingham use the concept of ‘activity space’, but it is essentially the same.28 This is developmentally very interesting and indicates the value of exploring the relationship betweenbeing exposed to criminogenic settings and the development of crime propensity. However, this is not atopic for this paper.
76 J Quant Criminol (2010) 26:55–87
123
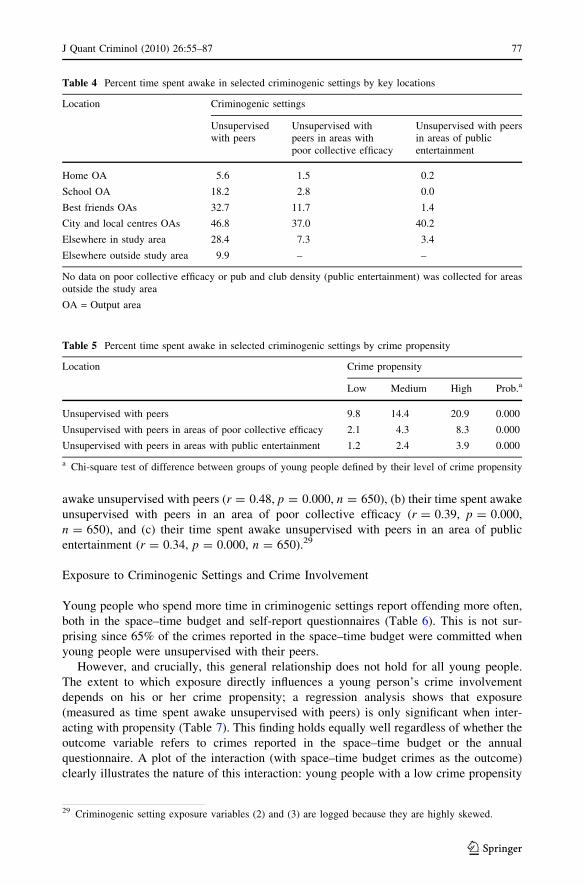
awake unsupervised with peers (r = 0.48, p = 0.000, n = 650), (b) their time spent awake
unsupervised with peers in an area of poor collective efficacy (r = 0.39, p = 0.000,
n = 650), and (c) their time spent awake unsupervised with peers in an area of public
entertainment (r = 0.34, p = 0.000, n = 650).29
Exposure to Criminogenic Settings and Crime Involvement
Young people who spend more time in criminogenic settings report offending more often,
both in the space–time budget and self-report questionnaires (Table 6). This is not sur-
prising since 65% of the crimes reported in the space–time budget were committed when
young people were unsupervised with their peers.
However, and crucially, this general relationship does not hold for all young people.
The extent to which exposure directly influences a young person’s crime involvement
depends on his or her crime propensity; a regression analysis shows that exposure
(measured as time spent awake unsupervised with peers) is only significant when inter-
acting with propensity (Table 7). This finding holds equally well regardless of whether the
outcome variable refers to crimes reported in the space–time budget or the annual
questionnaire. A plot of the interaction (with space–time budget crimes as the outcome)
clearly illustrates the nature of this interaction: young people with a low crime propensity
Table 5 Percent time spent awake in selected criminogenic settings by crime propensity
Location Crime propensity
Low Medium High Prob.a
Unsupervised with peers 9.8 14.4 20.9 0.000
Unsupervised with peers in areas of poor collective efficacy 2.1 4.3 8.3 0.000
Unsupervised with peers in areas with public entertainment 1.2 2.4 3.9 0.000
a Chi-square test of difference between groups of young people defined by their level of crime propensity
Table 4 Percent time spent awake in selected criminogenic settings by key locations
Location Criminogenic settings
Unsupervisedwith peers
Unsupervised withpeers in areas withpoor collective efficacy
Unsupervised with peersin areas of publicentertainment
Home OA 5.6 1.5 0.2
School OA 18.2 2.8 0.0
Best friends OAs 32.7 11.7 1.4
City and local centres OAs 46.8 37.0 40.2
Elsewhere in study area 28.4 7.3 3.4
Elsewhere outside study area 9.9 – –
No data on poor collective efficacy or pub and club density (public entertainment) was collected for areasoutside the study area
OA = Output area
29 Criminogenic setting exposure variables (2) and (3) are logged because they are highly skewed.
J Quant Criminol (2010) 26:55–87 77
123
commit virtually no acts of crime regardless of their exposure, while the crime involve-
ment of those with a high crime propensity is clearly affected by their exposure (Fig. 5).
The Convergence of Propensity, Exposure and Acts of Crime
We have demonstrated that young people who have a higher crime propensity and who
spend more time in criminogenic settings tend to commit more crime. This supports the
basic proposition of Situational Action Theory that acts of crime are an outcome of the
interaction between crime propensity and exposure to criminogenic settings. However,
such analysis does not establish that those who have a higher crime propensity actually
tend to commit their crimes when exposed to criminogenic settings. This is an assumption
one has to make in these kinds of analyses (an assumption which is rarely highlighted or
discussed). PADS? data (which includes data from space–time budgets, a small area
community survey, and psychometric measures) makes it uniquely possible to take this
analysis a step forward and begin to explore to what extent people who have a higher crime
propensity tend to commit acts of crime when exposed to criminogenic settings.
To further test the situational model of SAT (the propensity-exposure interaction), we
have calculated the rate of crime per 1,000 h spent awake in criminogenic and other
Table 6 Zero-order correlations (Pearson and Spearman). Exposure to criminogenic settings and crimeinvolvement. Crimes reported in the space–time budget and crimes reported in the annual questionnaire.Ages 13–17, years 2004–2008
Exposure (No hours awake) STB crimes Self-reported crimes (annual quest.)
r. Rank r. r. (log crime) Rank
1. Unsupervised with peers 0.19 0.23 0.24 0.43 0.41
2. Unsupervised with peers in areasof poor collective efficacy
0.16 0.17 0.18 0.30 0.31
3. Unsupervised with peers in areaswith public entertainment
0.12 0.14 0.14 0.25 0.26
Criminogenic setting exposure variables 2 and 3 are logged because they are highly skewed. All coefficientsare significant at the 0.01 level or better
Table 7 Multiple regression. Propensity, exposure and their interaction predicting crime involvement.Crimes reported in the space–time budget and crimes reported in the annual questionnaire. Ages 13–17,years 2004–2008
Exposure STB crimes Self-reported crimes(annual quest.)
Beta Prob. Beta Prob.
Crime propensity (morality and self-control) 0.32 0.000 0.43 0.000
Criminogenic exposure(unsupervised with peers)
-0.01 n.s. -0.02 n.s.
Interaction term(Exposure 9 Propensity)
0.11 0.008 0.14 0.000
Multiple R2 9 100 12.5 21.8
Model does not include any logged variables. Variables centred and multiplied when calculating theinteraction term
78 J Quant Criminol (2010) 26:55–87
123
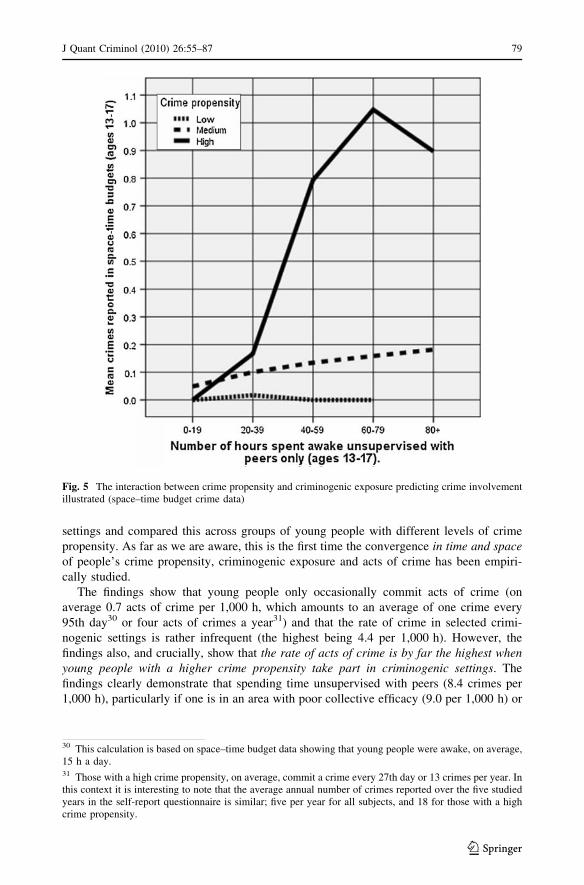
settings and compared this across groups of young people with different levels of crime
propensity. As far as we are aware, this is the first time the convergence in time and spaceof people’s crime propensity, criminogenic exposure and acts of crime has been empiri-
cally studied.
The findings show that young people only occasionally commit acts of crime (on
average 0.7 acts of crime per 1,000 h, which amounts to an average of one crime every
95th day30 or four acts of crimes a year31) and that the rate of crime in selected crimi-
nogenic settings is rather infrequent (the highest being 4.4 per 1,000 h). However, the
findings also, and crucially, show that the rate of acts of crime is by far the highest whenyoung people with a higher crime propensity take part in criminogenic settings. The
findings clearly demonstrate that spending time unsupervised with peers (8.4 crimes per
1,000 h), particularly if one is in an area with poor collective efficacy (9.0 per 1,000 h) or
Fig. 5 The interaction between crime propensity and criminogenic exposure predicting crime involvementillustrated (space–time budget crime data)
30 This calculation is based on space–time budget data showing that young people were awake, on average,15 h a day.31 Those with a high crime propensity, on average, commit a crime every 27th day or 13 crimes per year. Inthis context it is interesting to note that the average annual number of crimes reported over the five studiedyears in the self-report questionnaire is similar; five per year for all subjects, and 18 for those with a highcrime propensity.
J Quant Criminol (2010) 26:55–87 79
123
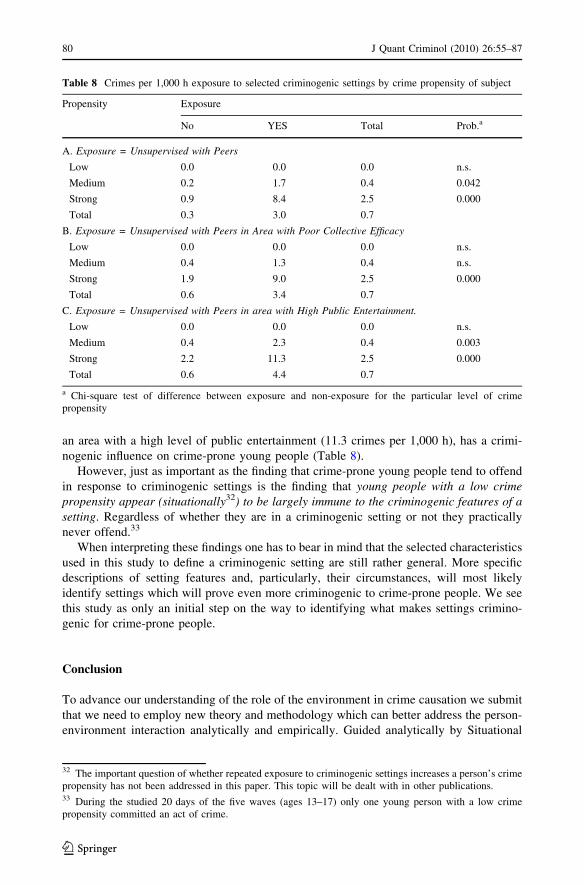
an area with a high level of public entertainment (11.3 crimes per 1,000 h), has a crimi-
nogenic influence on crime-prone young people (Table 8).
However, just as important as the finding that crime-prone young people tend to offend
in response to criminogenic settings is the finding that young people with a low crimepropensity appear (situationally32) to be largely immune to the criminogenic features of asetting. Regardless of whether they are in a criminogenic setting or not they practically
never offend.33
When interpreting these findings one has to bear in mind that the selected characteristics
used in this study to define a criminogenic setting are still rather general. More specific
descriptions of setting features and, particularly, their circumstances, will most likely
identify settings which will prove even more criminogenic to crime-prone people. We see
this study as only an initial step on the way to identifying what makes settings crimino-
genic for crime-prone people.
Conclusion
To advance our understanding of the role of the environment in crime causation we submit
that we need to employ new theory and methodology which can better address the person-
environment interaction analytically and empirically. Guided analytically by Situational
Table 8 Crimes per 1,000 h exposure to selected criminogenic settings by crime propensity of subject
Propensity Exposure
No YES Total Prob.a
A. Exposure = Unsupervised with Peers
Low 0.0 0.0 0.0 n.s.
Medium 0.2 1.7 0.4 0.042
Strong 0.9 8.4 2.5 0.000
Total 0.3 3.0 0.7
B. Exposure = Unsupervised with Peers in Area with Poor Collective Efficacy
Low 0.0 0.0 0.0 n.s.
Medium 0.4 1.3 0.4 n.s.
Strong 1.9 9.0 2.5 0.000
Total 0.6 3.4 0.7
C. Exposure = Unsupervised with Peers in area with High Public Entertainment.
Low 0.0 0.0 0.0 n.s.
Medium 0.4 2.3 0.4 0.003
Strong 2.2 11.3 2.5 0.000
Total 0.6 4.4 0.7
a Chi-square test of difference between exposure and non-exposure for the particular level of crimepropensity
32 The important question of whether repeated exposure to criminogenic settings increases a person’s crimepropensity has not been addressed in this paper. This topic will be dealt with in other publications.33 During the studied 20 days of the five waves (ages 13–17) only one young person with a low crimepropensity committed an act of crime.
80 J Quant Criminol (2010) 26:55–87
123
Action Theory, we have empirically explored the interaction between young people’s
crime propensity and their exposure to (selected) criminogenic settings, utilising a new
innovative methodology which combines space–time budgets with a small area community
survey and individual measures of young people’s crime propensity collected through an
interviewer-led questionnaire.
Our analyses show that young people move around extensively in urban space and
that their activity fields normally stretch far beyond their neighborhood environments and
expose them to a range of different settings (environments). Their activity fields are
largely determined by movements between locations central to their routine activities
(such as the home, school, friends’ homes and city and local centres). Young people with
higher crime propensity (based on a crime-prone morality and ability to exercise self-
control) spend more of their time awake outside their home and school locations and
therefore are more frequently exposed to criminogenic settings (which are encountered
more often by young people when spending time in settings outside the home and school
areas). Those who spend more time in criminogenic settings (e.g., being unsupervised
with peers in areas with a poor collective efficacy) tend to be more frequently involved
in acts of crime. However, and importantly, this relationship depends on the young
person’s crime propensity. Having a crime-averse morality and strong ability to exercise
self-control appears to make young people practically situationally immune to influences
from criminogenic settings, while having a crime-prone morality and poor ability to
exercise self-control appears to make young people situationally vulnerable to influences
from criminogenic settings.
Annex A: Study Design
The City
Peterborough is a medium sized UK city, with a population of approximately 160,000. It
has been a centre of commerce and industry since medieval times, although most of the
city’s present-day character has been established since World War II, when it joined the
‘New Towns’ movement, a programme of urban renewal aimed at providing planned,
practical townships which would ‘break down the barriers’ between rich and poor.
Peterborough’s population is roughly representative of that of the UK, with a slight
overrepresentation of minority ethnic groups, particularly Asian, African Caribbean and
Chinese.
Geographically, the Peterborough district covers approximately 350 square kilometres,
encompassing a thriving city centre, a number of townships, and several outlying villages.
Areas in the district differ widely in relevant social characteristics, with some ranking
amongst the most and least deprived in England (Indices of Deprivation 200434).
The Sample
The sampling base comprised the cohort of 2349 young people living in Peterborough
(postcodes PE1 to PE7) poised to start year 7 in school in 2002. This cohort was identified
by combining data from the Local Education Authority, independent schools and
34 Based on income, employment, health, education, skills and training, living environment and healthdeprivation, disability, barriers to housing and services, and crime.
J Quant Criminol (2010) 26:55–87 81
123
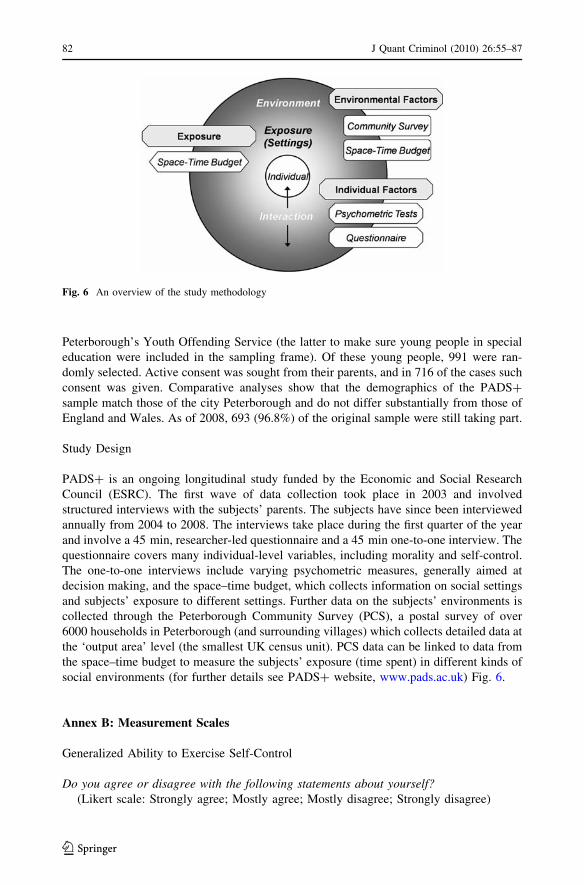
Peterborough’s Youth Offending Service (the latter to make sure young people in special
education were included in the sampling frame). Of these young people, 991 were ran-
domly selected. Active consent was sought from their parents, and in 716 of the cases such
consent was given. Comparative analyses show that the demographics of the PADS?
sample match those of the city Peterborough and do not differ substantially from those of
England and Wales. As of 2008, 693 (96.8%) of the original sample were still taking part.
Study Design
PADS? is an ongoing longitudinal study funded by the Economic and Social Research
Council (ESRC). The first wave of data collection took place in 2003 and involved
structured interviews with the subjects’ parents. The subjects have since been interviewed
annually from 2004 to 2008. The interviews take place during the first quarter of the year
and involve a 45 min, researcher-led questionnaire and a 45 min one-to-one interview. The
questionnaire covers many individual-level variables, including morality and self-control.
The one-to-one interviews include varying psychometric measures, generally aimed at
decision making, and the space–time budget, which collects information on social settings
and subjects’ exposure to different settings. Further data on the subjects’ environments is
collected through the Peterborough Community Survey (PCS), a postal survey of over
6000 households in Peterborough (and surrounding villages) which collects detailed data at
the ‘output area’ level (the smallest UK census unit). PCS data can be linked to data from
the space–time budget to measure the subjects’ exposure (time spent) in different kinds of
social environments (for further details see PADS? website, www.pads.ac.uk) Fig. 6.
Annex B: Measurement Scales
Generalized Ability to Exercise Self-Control
Do you agree or disagree with the following statements about yourself?(Likert scale: Strongly agree; Mostly agree; Mostly disagree; Strongly disagree)
Fig. 6 An overview of the study methodology
82 J Quant Criminol (2010) 26:55–87
123

• When I am really angry, other people better stay away from me
• I often act on the spur of the moment without stopping to think
• I sometimes find it exciting to do things that may be dangerous
• I don’t devote much thought and effort preparing for the future
• Sometimes I will take a risk just for the fun of it
• I often try to avoid things that I know will be difficult
• I never think about what will happen to me in the future
• I lose my temper pretty easily
Moral Rules
We would now like to ask you about a number of things that a young person your age mightget up to. I would like you to tell me how serious you think it is for someone of your age todo the following:
Do you think it is very wrong, wrong, a little wrong or not wrong at all to….
• Ride a bike through a red light
• Skip doing homework for school
• Skip school or work without an excuse
• Lie, disobey or talk back to teachers
• Go skateboarding in a place where skateboarding is not allowed
• Tease a classmate because of the way he or she dresses
• Smoke cigarettes
• Get drunk with friends on a Friday evening
• Hit another young person who makes a rude comment
• Steal a pencil from a classmate
• Paint graffiti on a house wall
• Smash a street light for fun
• Smoke cannabis
• Steal a CD from a shop
• Break into or try to break into a building to steal something
• Use a weapon or force to get money or things from another young person
Collective Efficacy
Informal Social Control
For each of the following, please state if it is very likely, likely, unlikely, or very unlikelythat people in your neighbourhood would act in the following manner.
• If a group of neighbourhood children were skipping school and hanging out on a street
corner, how likely is it that your neighbours would do something about it?
• If some children were spray-painting graffiti on a local building, how likely is it that
you or your neighbours would do something about it?
• If there was a fight in front of your house and someone was being beaten or threatened,
how likely is it that your neighbours would break it up?
• If a child was showing disrespect to an adult, how likely is it that people in your
neighbourhood would tell off or scold that child?
J Quant Criminol (2010) 26:55–87 83
123
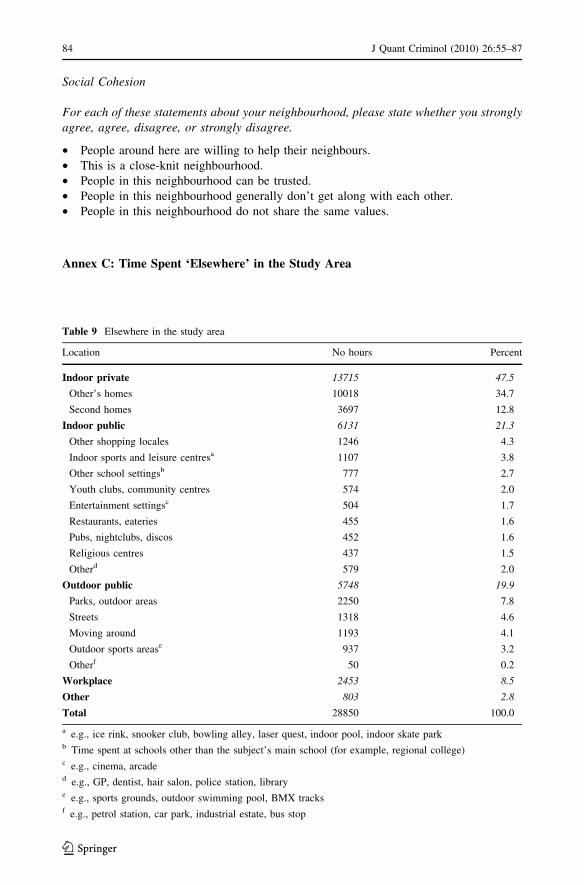
Social Cohesion
For each of these statements about your neighbourhood, please state whether you stronglyagree, agree, disagree, or strongly disagree.
• People around here are willing to help their neighbours.
• This is a close-knit neighbourhood.
• People in this neighbourhood can be trusted.
• People in this neighbourhood generally don’t get along with each other.
• People in this neighbourhood do not share the same values.
Annex C: Time Spent ‘Elsewhere’ in the Study Area
Table 9 Elsewhere in the study area
Location No hours Percent
Indoor private 13715 47.5
Other’s homes 10018 34.7
Second homes 3697 12.8
Indoor public 6131 21.3
Other shopping locales 1246 4.3
Indoor sports and leisure centresa 1107 3.8
Other school settingsb 777 2.7
Youth clubs, community centres 574 2.0
Entertainment settingsc 504 1.7
Restaurants, eateries 455 1.6
Pubs, nightclubs, discos 452 1.6
Religious centres 437 1.5
Otherd 579 2.0
Outdoor public 5748 19.9
Parks, outdoor areas 2250 7.8
Streets 1318 4.6
Moving around 1193 4.1
Outdoor sports arease 937 3.2
Otherf 50 0.2
Workplace 2453 8.5
Other 803 2.8
Total 28850 100.0
a e.g., ice rink, snooker club, bowling alley, laser quest, indoor pool, indoor skate parkb Time spent at schools other than the subject’s main school (for example, regional college)c e.g., cinema, arcaded e.g., GP, dentist, hair salon, police station, librarye e.g., sports grounds, outdoor swimming pool, BMX tracksf e.g., petrol station, car park, industrial estate, bus stop
84 J Quant Criminol (2010) 26:55–87
123
References
Anderson J (1971) Space-time budgets and activity studies in urban geography and planning. Environ PlanA 3:353–368
Barker RG (1968) Ecological psychology: concepts and methods for studying the environment of humanbehavior. Stanford University Press, Stanford
Braithwaite J (1979) Inequality, crime and public policy. Routledge, LondonBrantingham PL, Brantingham PJ (1993) Environment, routine, and situation: Toward a pattern theory of
crime. In: Clarke RV, Felson M (eds) Routine activity and rational choice, advances in criminologicaltheory, vol 5. Transaction Publishers, New Brunswick
Brantingham P, Brantingham P (2008) Crime pattern theory. In: Wortley R, Mazzerole L (eds) Environ-mental criminology and crime analysis. Willan Publishing, Cullompton
Bursik RJ Jr (1988) Social disorganization and theories of crime and delinquency: problems and prospects.Criminology 26:519–551
Bursik RJ, Grasmick HG (1993) Neighborhoods and crime: the dimensions of effective community control.Lexington Books, New York
Clarke RV, Felson M (1993) Introduction: criminology, routine activity, and rational choice. In: Clarke RV,Felson M (eds) Routine activity and rational choice, advances in criminological theory, vol 5.Transaction Publishers, New Brunswick
Cohen LE, Felson M (1979) Social change and crime rate trends: a routine activities approach. Am SociolRev 44:588–608
Dietvorst A (1994) Cultural tourism and time-space behaviour. In: Ashworth G, Larkham P (eds) Building anew heritage: tourism, culture and identity in the New Europe. Routledge, London, pp 69–89
Eck JE (1995) Examining routine activity theory: a review of two books. Justice Q 12:783–797Elliott DS, Wilson WJ, Huizinga D, Sampson RJ, Elliott A, Rankin B (1996) The effects of neighborhood
disadvantage on adolescent development. J Res Crime Delinq 33:389–426Farrington DP (1993) Have any individual, family or neighbourhood influences on offending been dem-
onstrated conclusively? In: Farrington DP, Sampson RJ, Wikstrom P-OH (eds) Integrating individualand ecological aspects of crime. National Council for Crime Prevention, Stockholm
Felson M (2002) Crime and everyday life, 3rd edn. SAGE publications, Thousand OaksFelson M (2006) Crime and nature. SAGE publications, Thousand OaksFelson M, Cohen LE (1980) Human ecology and crime: a routine activity approach. Hum Ecol 8:389–406Fenell DA (1996) A tourist space-time budget in the Shetland Islands. Ann Tourism Res 23:811–829Forer PC, Kivell H (1981) Space-time budgets, public transport, and spatial choice. Environ Plan A 13:
497–509Gottfredson M, Hirschi T (1990) A general theory of crime. Stanford University Press, StandfordGottfredson DC, McNeil RJ III, Gottfredson GD (1991) Social area influences on delinquency: a multi-level
analysis. J Res Crime Delinq 28:197–226Grasmick H, Tittle C, Bursik R Jr, Arneklev B (1993) Testing the core implications of Gottfredson and
Hirschi’s general theory of crime. J Res Crime Delinq 30:5–29Hammond JL (1973) Two sources of error in ecological correlation. Am Sociol Rev 38:764–777Hanson S, Hanson P (1980) Gender and urban activity patterns in Uppsala, Sweden. Geogr Rev 70:291–299Janelle DG, Goodchild MF, Klinkenberg B (1988) Space-time diaries and travel characteristics for different
levels of respondent aggregation. Environ Plan A 20:891–906Jarjoura GR, Triplett R (1997) The effects of social area characteristics on the relationship between social
class and delinquency. J Crim Justice 25:125–139Kornhauser RR (1978) The social sources of delinquency: an appraisal of analytic models. University of
Chicago Press, Chicago, ILLynham DR, Caspi A, Moffitt TE, Wikstrom P-OH, Loeber R, Novak SP (2000) The interaction between
impulsivity and neighborhood context on offending: The effects of impulsivity are stronger in poorneighborhoods. J Abnorm Psychol 109:563–574
Mahoney JL, Stattin H (2000) Leisure time activities and adolescent anti-social behavior: the role ofstructure and social context. J Adolesc 23:113–127
Mey MG, Heide H (1997) Towards spatiotemporal planning: practicable analysis of the day-to-day pathsthrough space and time. Environ Plan B: Plan Des 24:709–723
Oberwittler D, Wikstrom P-OH (2009) Why small is better. Advancing the study of the role of behavioralcontexts in crime causation. In: Weisburd D, Bernasco W, Bruinsma G (eds) Putting crime in its place:units of analysis in spatial crime research. Springer, New York
Osgood DW, Wilson JK, O’Malley PM, Bachman JG, Johnston LD (1996) Routine activities and individualdeviant behavior. Am Sociol Rev 61:635–655
J Quant Criminol (2010) 26:55–87 85
123
Pentland WE, Harvey AS, Lawton MP, McMoll MA (1999) Time use research in the social sciences.Kluwer Academic/Plenum, New York
Phillips PD (1980) Characteristics and typology of the journey of crime. In: Georges-Abeyie DE, HarriesKD (eds) Crime: a spatial perspective. Columbia University Press, New York
Pratt TC, Cullen FT (2005) Assessing macro-level predictors and theories of crime: a meta-analysis, crimeand justice, vol 32. University of Chicago Press, Chicago
Raudenbush SW, Sampson RJ (1999) Ecometrics: toward a science of assessing ecological settings, withapplication to the systematic social observation of neighborhoods. Sociol Methodol 29:1–41
Reiss AJ Jr (1986) Why are communities important in understanding crime? In: Reiss AJ Jr, Tonry M (eds)Communities and crime. University of Chicago Press, Chicago
Reiss AJ, Rhodes AL (1961) The distribution of juvenile delinquency in the social class structure. AmSociol Rev 26:720–732
Riley D (1987) Time and crime: the link between teenager lifestyle and delinquency. J Quant Criminol3:339–354
Robinson WS (1950) Ecological correlations and the behavior of individuals. Am Sociol Rev 15:351–357Sampson RJ (2006a) How does community context matter? Social mechanisms and the explanation of
crime. In: Wikstrom P-OH, Sampson RJ (eds) The explanation of crime: context, mechanisms, anddevelopment. Cambridge University Press, Cambridge, pp 31–60
Sampson RJ (2006b) Collective efficacy theory: Lessons learned and directions for future inquiry. In: CullenFT, Wright JP, Blevins K (eds) Taking stock: the status of criminological theory, advances in crim-inological theory, vol 15. Transaction, New Brunswick, pp 149–167
Sampson RJ, Groves WB (1989) Community structure and crime: testing social disorganization theory. AmJ Sociol 94:774–802
Sampson RJ, Wikstrom P-OH (2008) The social order of violence in Chicago and Stockholm neighbor-hoods: a comparative inquiry. In: Shapiro I, Kalyvas S, Masoud T (eds) Order, conflict, and violence.Cambridge University Press, Cambridge, pp 97–119
Sampson RJ, Raudenbush SW, Earls F (1997) Neighborhoods and violent crime: a multilevel study ofcollective efficacy. Science 277:918–924
Sarnecki J (1986) Delinquent networks. Report 1986, No 1, Stockholm, National Council for CrimePrevention
Shaw CR, McKay HD (1969[1942]) Juvenile delinquency and urban areas, University of Chicago Press,Chicago
Simcha-Fagan O, Schwartz JE (1986) Neighborhood and delinquency: an assessment of contextual effects.Criminology 24:667–703
Taylor RB (1997) Social order and disorder of street blocks and neighborhoods: ecology, microecology, andthe systemic model of social disorganization. J Res Crime Delinq 34:113–155
Thornton PR, Shaw G, Williams AM (1997) Tourist group holiday decision making and behaviour: theinfluence of children. Tourism Manage 18:287–297
Tomlinson J, Bullock N, Dickens P, Steadman P, Taylor E (1973) A model of student’s daily activitypatterns. Environ Plan 5:231–266
Warr M (2002) Companions in crime: the social aspects of criminal conduct. Cambridge University Press,Cambridge
Weisburd D, Morris N, Groff E (2010) Hot spots of juvenile crime: a longitudinal study of arrest incidents atstreet segments in Seattle, Washington. J Quant Criminol 26(1):443–467
West DJ, Farrington DP (1977) The delinquent way of life. Heinemann, LondonWikstrom P-OH (1991) Urban crime, criminals and victims. Springer, New YorkWikstrom P-OH (2004) Crime as alternative: towards a cross-level situational action theory of crime
causation. In: McCord J (ed) Beyond empiricism: institutions and intentions in the study of crime,advances in criminological theory. Transaction, New Brunswick
Wikstrom P-OH (2005) The social origins of pathways in crime: towards a developmental ecological actiontheory of crime involvement and its changes. In: Farrington DP (ed) Integrated developmental and life-course theories of offending, advances in criminological theory, vol 14. Transaction, New Brunswick
Wikstrom P-OH (2006) Individuals, settings and acts of crime: situational mechanisms and the explanationof crime. In: Wikstrom P-OH, Sampson RJ (eds) The explanation of crime: context, mechanisms anddevelopment. Cambridge University Press, Cambridge
Wikstrom P-OH (2007a) Deterrence and deterrence experiences: preventing crime through the threat ofpunishment. In: Shoham SG, Beck O, Kett M (eds) International handbook of penology and criminaljustice. CRC Press, London
Wikstrom P-OH (2007b) The social ecology of crime: the role of the environment in crime causation. In:Schneider HJ (ed) Internationales Handbuch der Kriminologie, vol 1. de Gruyter, Berlin, New York
86 J Quant Criminol (2010) 26:55–87
123
Wikstrom P-OH (2009) Crime propensity, criminogenic exposure and crime involvement in early to midadolescence. Monatschrift for Kriminalwissenschaft 92:253–266
Wikstrom P-OH (2010) Situational action theory. In: Cullen F, Wilcox P (eds) Encyclopaedia of crimi-nological theory. SAGE Publications, Beverly Hills
Wikstrom P-OH, Butterworth DA (2006) Adolescent crime: individual differences and lifestyles. WillanPublishing, Cullumpton
Wikstrom P-OH, Dolmen L (2001) Urbanisation, neighbourhood social integration, informal social control,minor social disorder, victimisation and fear of crime. Int Rev Victimology 8:163–182
Wikstrom P-OH, Loeber R (2000) Do disadvantaged neighborhoods cause well-adjusted children to becomeadolescent delinquents? Criminology 38:1109–1142
Wikstrom P-OH, Svensson R (2009) When does self-control matter? A study of the interaction betweenmorality and self-control in crime causation. (mimeo) (forthcoming)
Wikstrom P-OH, Sampson RJ (2003) Social mechanisms of community influences on crime and pathways incriminality. In: Lahey BB, Moffitt TE, Caspi A (eds) Causes of conduct disorder and juvenile delin-quency. Guilford Press, New York
Wikstrom P-OH, Treiber K (2007) The role of self-control in crime causation: beyond Gottfredson andHirschi’s general theory of crime. Eur J Criminol 4:237–264
Wikstrom P-OH, Treiber K (2009a) What drives persistent offending? The neglected and unexplored role ofthe social environment. In: Savage J (ed) The development of persistent offending. Oxford UniversityPress, Oxford, pp 389–420
Wikstrom P-OH, Treiber K (2009b) Violence as situational action. Int J Confl Violence 3:75–96Wilcox P, Land KC, Hunt SA (2003) Criminal circumstance: a dynamic multicontextual criminal oppor-
tunity theory. Aldine de Gruyter, New York
J Quant Criminol (2010) 26:55–87 87
123