Embed Size (px)
Citation preview

Chemical Physics 352 (2008) 35–47
Contents lists available at ScienceDirect
Chemical Physics
journal homepage: www.elsevier .com/locate /chemphys
Absorption and fluorescence spectroscopic characterisation of the circadianblue-light photoreceptor cryptochrome from Drosophila melanogaster (dCry)
J. Shirdel a, P. Zirak a, A. Penzkofer a,*, H. Breitkreuz b, E. Wolf b
a Institut II – Experimentelle und Angewandte Physik, Universität Regensburg, Universitätsstrasse 31, D-93053 Regensburg, Germanyb Max-Planck-Institute of Molecular Physiology, Department of Structural Biology, Otto-Hahn-Strasse 11, D-44227 Dortmund, Germany
a r t i c l e i n f o
Article history:Received 19 February 2008Accepted 12 June 2008Available online 18 June 2008
Keywords:Drosophila cryptochrome dCryFluorescence quantum yieldFluorescence lifetimePhoto-cycle dynamicsFlavin adenine dinucleotide (FAD)Oxidized FADAnionic FAD semiquinone5,10-Methenyltetrahydrofolate (MTHF)10-Formyldihydrofolate (10-FDHF)Electron transferPhoto-interconversion
0301-0104/$ - see front matter � 2008 Elsevier B.V. Adoi:10.1016/j.chemphys.2008.06.006
* Corresponding author. Tel.: +49 941 943 2107; faE-mail address: [email protected]
a b s t r a c t
The absorption and fluorescence behaviour of the circadian blue-light photoreceptor cryptochrome fromDrosophila melanogaster (dCry) in a pH 8 aqueous buffer solution is studied. The flavin adenine dinucle-otide (FAD) cofactor of dCry is identified to be present in its oxidized form (FADox), and the 5,10-methe-nyltetrahydrofolate (MTHF) cofactor is found to be hydrolyzed and oxidized to 10-formyldihydrofolate(10-FDHF). The absorption and the fluorescence behaviour of dCry is investigated in the dark-adapted(receptor) state, the light-adapted (signalling) state, and under long-time violet light exposure. Photo-excitation of FADox in dCry causes a reductive electron transfer to the formation of anionic FAD semiqui-none (FAD��), and photo-excitation of the generated FAD�� causes an oxidative electron transfer to theback formation of FADox. In light adapted dCry a photo-induced equilibrium between FADox and FAD��
exists. The photo-cycle dynamics of signalling state formation and recovery is discussed. Quantum yieldsof photo-induced signalling state formation of about 0.2 and of photo-induced back-conversion of about0.2 are determined. A recovery of FAD�� to FADox in the dark with a time constant of 1.6 min at room tem-perature is found.
� 2008 Elsevier B.V. All rights reserved.
1. Introduction
Cryptochromes are blue-light sensitive flavoproteins (for re-views see [1–14]) that are related to photolyases [1,12–15], butdo not have the DNA repair mechanism of photolyases. Crypto-chromes were found and investigated in the plant Arabidopsis tha-liana (cry1 [16–27], cry2 [24,25,28–30], cry3 also called cry-DASH[31–35]), in green algae [36,37], ferns [38], mosses [39], fruit flies(Drosophila melanogaster [40–48]), monarch butterflies (Danausplexippus [48–51]), mosquitos (Anopheles gambiae [48]), Chineseoak silk moths (Antherea pernyl [48]), birds (migrating garden war-bler [52]), mice [44,53], humans [54,55], and bacteria (Synechocys-tis sp. PCC 6803 cry-DASH [56,57], Vibrio cholerae cry-DASH[12,58], and others [12,59]). They regulate growth and develop-ment in plants, regulate circadian rhythms in plants and animals,act as chemical magneto receptors in migratory birds, and arefunctioning in bacteria and algae.
The animal cryptochromes divide into two broad groups: thetype 1 cryptochromes which are circadian photoreceptors, andthe type 2 cryptochromes which function as core clock proteins[48,60,61]. Drosophila cryptochrome (dCry), which is investigated
ll rights reserved.
x: +49 941 943 2754.sburg.de (A. Penzkofer).
herein, is a type 1 animal cryptochrome. It is involved in the syn-chronization of the Drosophila circadian clock with the environ-mental light-dark cycle [40–47].
In a recent paper successful expression of dCry from Sf21 insectcells was reported [46]. The purified photoreceptor was investi-gated in aqueous solution at pH 8. It was shown, that dCry containsflavin adenine dinucleotide (FAD) as a blue-light absorbing chro-mophore as well as 5,10-methenyltetrahydrofolate (MTHF). Thephotoreaction mechanism of dCry was studied in detail [46]. Thephoto-cyclic reduction of the oxidized cofactor FADox in the dCryreceptor state to the anionic semireduced form FAD�� in the puta-tive dCry signalling state was observed.
In this paper, absorption and emission spectroscopic studies ondCry in aqueous solution at pH 8 are continued. The redox statecomposition of FAD in dark-adapted dCry is determined showingthat FAD is practically exclusively present in its oxidized form(FADox). The folic acid derivative MTHF is found to have been con-verted to 10-formyldihydrofolate (10-FDHF). In absorption spec-troscopic studies photo-induced formation of FAD�� from FADox,and of FADox from FAD�� is found (photo-interconversion of FADox
and FAD��). The quantum efficiencies of anionic semiquinone for-mation (FAD��) from FADox and of FADox from FAD�� are calculatedfrom excitation intensity dependent absorption spectra changes.The recovery of FAD�� to FADox in the dark is monitored at three

36 J. Shirdel et al. / Chemical Physics 352 (2008) 35–47
temperatures. An Arrhenius-type recovery is observed and theactivation energy for back relaxation is determined. The fluores-cence behaviour of dCry is studied in the dark-adapted state, thelight-adapted state, and under long-time intense violet-light expo-sure. The fluorescence quantum yields of FAD and 10-FDHF indark-adapted dCry are determined. A rise in fluorescence efficiencywith exposure time is observed. The fluorescence lifetime behav-iour of FAD in dark-adapted dCry is investigated by femtosecondlaser fluorescence up-conversion and picosecond laser real-timefluorescence decay measurement.
The structural formulae of FAD in the oxidized (quinone) form(FADox), the fully reduced (hydroquinone) anionic form (FADredH�),fully reduced neutral form (FADredH2), semi-reduced (semiqui-none) neutral form (FADH�), semi-reduced anionic form (FAD��),
N
N
NH
N
O
HHH OHH OHH OHH H
O
OH3C
H3C
PO OHOPO OHO
HH
O
N
N
N
N
NH2
HO
HO
FADox
NH
N
NH
HNH3C
H3CO
OR
FADredH2
NH
NH3C
H3C
R
FADredH-
NH
NH3C
H3C
R
•FADH
−•FAD
N
NHN
OH3C
H3C
Lumichrome
N
N NR
OH3C
H3C
Fig. 1. Structural formulae of FAD in its oxidized form (FADox), fully reduced anionic form(FADH�), anionic (red) semiquinone form (FAD��), lumichrome, 5,10-methenyltetrahydr10-FDHF.
of lumichrome, and of MTHF-OH, 10-formyltetrahydrofolate (10-FTHF), as well as 10-formyldihydrofolate (10-FDHF) are shown inFig. 1.
2. Experimental
2.1. Sample preparation
The dCry protein fused to an N-terminal hexahistidine-tag (mo-lar mass: 64,155 g mol�1) was expressed in Sf21 insect cells andpurified as described in [46]. Its primary amino acid sequence is gi-ven in http://www.expasy.org/uniprot/Q9TYA0. It contains 16tryptophan and 18 tyrosine residues. The purified material wasconcentrated to 21 mg/ml (0.327 mM) according to Bradford anal-
NH
N-
O
O
NH
N
O
O
NH
O
HN
N NH
N
N+
NH
H
COOH
CH2
CH2
COOH
O
H2N
O OH-
56
78
9
10
12
34
11
MTHF
HN
N NH
HN
N
NH
H
COOH
CH2
CH2
COOH
O
H2N
O
HCO
10-FTHF
HN
N NH
N
N
NH
H
COOH
CH2
CH2
COOH
O
H2N
O
HCO
10-FDHF
NH
- O
(FADredH�), fully reduced neutral form (FADredH2), neutral (blue) semiquinone formofolate MTHF-OH, 10-formyltetrahydrofolate 10-FTHF, and 10-formyldihydrofolate

J. Shirdel et al. / Chemical Physics 352 (2008) 35–47 37
ysis [62] and stored at �80 �C in a buffer containing 25 mM Tris–HCl pH 8.0, 150 mM NaCl, 5 vol.-% glycerol, and 2 mM b-mercap-toethanol. After centrifugation of thawed samples (at 12,000 rpmfor 5 min) in order to remove aggregated material, the protein con-centration in the used supernatant was found to be 0.071 mM asdetermined by absorption analysis at 280 nm.
2.2. Spectroscopic techniques
The applied techniques of transmission measurement, fluores-cence spectra measurement, fluorescence lifetime measurement,and data analysis are described in the following.
2.2.1. Absorption studiesTransmission spectra measurements were carried out with a
commercial spectrophotometer (Cary 50 from Varian). The absorp-tion coefficient spectrum, a(k), has been determined from thetransmission spectrum by the relation, T(k) = exp[�a(k)‘], where‘ is the sample length. The absorption coefficient spectrum of theinvestigated dCry sample, a(k), is composed of the absorption coef-ficient spectra, ai(k), of its constituents with number densities, Ni,and absorption cross-sections, ri(k), according to
aðkÞ ¼X
i
aiðkÞ ¼X
i
NiriðkÞ
¼ N0rapðkÞ þ NFAD
Xj
xjrFAD;jðkÞ þ NMTHF;0
Xk
xkrFolate;kðkÞ: ð1Þ
N0 is the number density of the dCry protein molecules, and rap isthe absorption cross-section of the apo-protein. N0 was determinedby an absorption analysis at 280 nm (there the absorptioncross-sections are: ra(Tyr) � 4.63 � 10�18 cm2, ra(Trp) � 2.02 �10�17 cm2, ra(FADox) � 6.7 � 10�17 cm2, rap = 16ra(Trp) + 18ra
(Tyr) = 4.06 � 10�16 cm2, ra(10-FDHF) � 7.6 � 10�17 cm2). NFAD isthe number density of the FAD molecules, and NMTHF,0 is the num-ber density of the original MTHF molecules. The FAD molecules maybe present in different redox states and different ionization statesindicated by the index j with mole-fraction xj and absorptioncross-section rFAD,j (neutral oxidized form, anionic semiquinoneform, anionic hydroquinone form, etc.). The original MTHF mole-cules may be present as MTHF or as converted species like 10-for-myltetrahydrofolate (10-FTHF), 10-formyldihydrofolate (10-FDHF)indicated by the index k with mole-fraction xk and absorptioncross-section rFolate,k. Below, a de-convolution of a measureddark-adapted dCry absorption coefficient spectrum into its consti-tuents will be undertaken.
The dependence of the absorption spectra on short-wavelengthlight exposure was studied by exciting a small-volume sample(1.5 � 1.5 � 5 mm3) with a high-pressure mercury lamp throughan interference filter and probing the transmission with an atten-uated tungsten lamp using a spectrometer – diode-array detectionsystem. A detailed analysis of the spectra for determination of thequantum efficiencies of photo-induced receptor state FADox to sig-nalling state FAD�� formation and of signalling state FAD�� toreceptor state FADox back-transfer will be given in the discussionpart.
The thermal back recovery of the absorption from the lightadapted situation to the dark adapted situation was studied bylight switch-off and measuring probe light absorption spectra atcertain times after light switch-off. The absorption recovery ismeasured for three sample temperatures, 4 �C, 10 �C, and 21.3 �C.The observed decrease in recovery time with increasingtemperature will be interpreted in terms of Arrhenius-type barriercrossing.
Long time high-intensity sample excitation was carried out inorder to study the photo-stability of a light-adapted dCry sample
(excitation intensity Iexc = 0.14 W cm�2 in the wavelength range350–440 nm).
The photo-interconversion hinders a complete conversion ofFADox to FAD�� (complete conversion from receptor state to signal-ling state). Neglecting photo-induced back-transfer, the steady-state saturation intensity, Isat,ss,forward, for signalling state formationin an optically thin sample (excitation duration longer than recov-ery time, half of the dCry molecules are in the signalling state, opti-cally thin sample means high small-signal transmission) is [63]
Isat;ss;forward ¼hmexc
/sra;FADox;excsrec; ð2aÞ
where mexc is the excitation frequency, ra,FADox,exc is the absorptioncross-section of FADox at the excitation wavelength, srec is theabsorption recovery time (back recovery of signalling state to recep-tor state), and /s is the quantum efficiency of signalling-state for-mation. Using parameters for dCry at kexc = c0/mexc = 450 nm (c0 islight velocity in vacuum) where ra,FADox,exc � 4.4 � 10�17 cm2,srec � 1.6 min (at room temperature), and /s = 0.2 (see below) onefinds Isat,ss,forward � 5.23 � 10�4 W cm�2. Including photo-inducedback-conversion the steady-state saturation intensity becomes(see below)
Isat;ss ¼hmexc
ð/sra;FADox;exc � /bra;FAD�� ;excÞsrec; ð2bÞ
where /b is quantum efficiency of back transfer, and ra;FAD�� ;exc is theabsorption cross-section of FAD�� at kexc. Using /b = 0.2 andra;FAD�� ;exc � 2� 10�17 cm2, one finds Isat,ss � 9.58 � 10�4 W cm�2.
The transient forward saturation energy density, esat,tr,forward, forsignalling state formation in the case of excitation duration, texp,short compared to the recovery time, srec, is
esat;tr;forward ¼hmexc
/sra;FADox;exc: ð3aÞ
Inclusion of backward transfer gives
esat;tr ¼hmexc
/sra;FADox;exc � /bra;FAD�� ;exc: ð3bÞ
At kexc = 450 nm values of esat,tr,forward � 0.05 J cm�2 andesat,tr � 0.092 J cm�2 are found for dCry. The corresponding tran-sient excitation saturation intensities, Isat,tr,forward and Isat,tr, are
Isat;tr;forward ¼hmexc
/sra;FADox;exctexp; ð4aÞ
and
Isat;tr ¼hmexc
ð/sra;FADox;exc � /bra;FAD�� ;excÞtexp: ð4bÞ
The long-time excitation intensity has to be kept below Isat,ss, andthe short-time excitation intensity has to be kept below Isat,tr tohold the sample in the dark-adapted state.
2.2.2. Spectral fluorescence studiesFluorescence spectra were measured with a self-assembled
fluorimeter in 90� collection arrangement [64,65]. A mercury lamptogether with appropriate interference filters was used as excita-tion source. The samples were thermostated to 4 �C in a 4-windowoptical box with a thermoelectric Peltier cooler. The intrinsic fluo-rescence quantum distributions, EF(k), were measured under condi-tions of vertical polarized excitation and magic-angle fluorescencedetection (angle of 54.7� to vertical). A grating spectrometer withintensified silicon-diode array detector (OMA system from EG&GPrinceton Applied Research) was used for spectra recording. Theintrinsic fluorescence quantum yield, /F, is calculated by integra-tion over the fluorescence quantum distribution ½/F ¼
REFðkÞdk�.

38 J. Shirdel et al. / Chemical Physics 352 (2008) 35–47
The dye lumiflavin in aqueous solution at pH 8 was used as refer-ence (/F,R = 0.235 [66]). The same transmission at the excitationwavelength was used for dCry and reference dye.
The fluorescence behaviour of dCry in the dark-adapted state wasmeasured by low-intensity short-time exposure below the excita-tion intensity necessary for transforming the system into the signal-ling state (saturated light-adapted state), i.e. Iexctexp < esat,tr. Theexcitation wavelengths, kexc = 428 nm (excitation intensity Iexc =2.3 mW cm�2, duration texp = 3 s) and kexc = 365 nm (Iexc =5.0 mW cm�2, texp = 3 s) were selected. At kexc = 428 nm only theFAD cofactor is excited. At kexc = 365 nm the FAD cofactor (in its pos-sible redox states) and the MTHF cofactor (itself and in some possi-ble conversions), get excited. In the fluorescence spectra analysis thefluorescence contributions will be separated.
For the measurement of the fluorescence behaviour in the light-adapted state the sample was excited at kexc = 365 nm for aduration of texp = 3 min at an intensity of Iexc = 4.4 mW cm�2. Thefluorescence development in the signalling state was followed bylong-time exposure of the sample at Iexc = 0.108 W cm�2 in thewavelength range from 350 nm to 440 nm, well above the satura-tion intensity for steady-state keeping the protein in the signalling(saturated light-adapted) state.
The radiative lifetimes of emitting molecules are accessiblefrom their absorption cross-section spectra and their fluorescencespectra by application of the Strickler–Berg formula [67–69]
s�1rad ¼
8pc0 n3F
nA
Rem EFðkÞdkR
em EFðkÞk3dk
Zabs
raðkÞk
dk; ð5Þ
where c0 is the light velocity in vacuum, nA and nF are the averagerefractive indices in the absorption region (abs) and the emission re-gion (em) of the considered transition. A value of srad � 19 ns wasdetermined for FADox in [70,71]. For MTHF a value of srad � 7.6 nswas determined in [33]. For 10-FDHF an approximate value ofsrad(10-FDHF) � 32.5 ns is estimated by comparing the S0–S1
absorption band of 10-FDHF with the S0–S1 absorption band ofMTHF (see below).
Knowing the radiative lifetime, srad, and the fluorescence quan-tum yield, /F, of a molecule, its fluorescence lifetime (excited-statelifetime), sF, may be calculated by the relation
sF ¼ /Fsrad: ð6Þ
2.2.3. Temporal fluorescence studiesThe temporal fluorescence behaviour of dark–adapted samples
was studied by ultrashort pulse excitation at kL = 400 nm usingsecond harmonic pulses of a mode-locked titanium sapphire lasersystem (laser system Hurricane from Spectra-Physics). For theobservation of the fluorescence decay in the nanosecond time-range the sample was excited with pulses of 3 ps duration (energydensity 3 � 10�4 J cm�2) and the fluorescence signal in the wave-length range from 500 nm to 600 nm was monitored with a mi-cro-channel-plate photomultiplier (Hamamatsu type R1564-U01)and a fast digital oscilloscope (LeCroy type DSO 9362, 700 psFWHM of response function). For the observation of the fluores-cence decay in the sub-picosecond and picosecond time rangethe sample was excited at 400 nm with second harmonic Ti:sap-phire laser pulses of 150 fs duration. The fluorescence signal wassum-frequency mixed with time-delayed 800 nm fundamentalTi:sapphire laser pulses in a BBO crystal (fluorescence up-conver-sion) [72]. A fresh sample thawed from �80 �C to 4 �C in the darkand kept in the dark (concentration 7.1 � 10�5 mol dm�3) wasdiluted with pH 8 storage buffer to a concentration of2.2 � 10�6 mol dm�3 and measured in a cell of 1 cm length and4 mm width, where it was circulated with a magnetic stirrer (ap-plied volume 0.5 cm3). At each delay position the sample was ex-
posed with 20 shots at a repetition rate of 3 Hz. The single pulseexcitation energy density at the sample was 8 � 10�4 J cm�2.
3. Results
3.1. Absorption spectra and cofactor composition
The concentration of the dCry stock solution after centrifuga-tion was determined to be N0 = 4.25 � 1016 cm�3 (C0 = 7.1 �10�5 mol dm�3) by measuring its absorbance at 280 nm. Thepresence of FAD in its different redox states and of MTHF and itsconverted forms is de-convolved from the dCry absorption spec-trum in the wavelength range k > 320 nm. For this purpose theabsorption cross-section spectra of FAD in different redox statesare shown in Fig. 2a, and the absorption cross-section spectra ofMTHF, 10-FTHF, and 10-FDHF, are shown in Fig. 2b.
The measured absorption coefficient spectrum of the undiluteddark-adapted dCry solution is shown by the dashed curve in Fig. 3.The spectrum contains scattering contributions probably fromsome remaining aggregated unfolded apo-protein. The apparentabsorption coefficient spectrum in the transparent wavelength re-gion fits well to asca(k) = asca(k0) (k0/k)2 [73–75] as is shown by thedashed-triple-dotted curve in Fig. 3 which was fitted atk0 = 920 nm to the experimental spectrum. The exponent of 2 indi-cates the presence of large sized aggregates [73–75]. The solidcurve in Fig. 3 shows the true dCry absorption coefficient spectrumdeprived from the scattering contribution. In the wavelength re-gion > 400 nm the true dCry spectrum is reasonably well fittedby FADox absorption with a number density NFADox = 3.6 �1016 cm�3. The short-wavelength absorption in the rangefrom 320 nm to 400 nm can reasonably well be fitted by theadditional presence of 10-FDHF with a number density ofN10-FDHF = 2.8 � 1016 cm�3. The extracted 10-FDHF absorption con-tribution is shown by the triple-dotted curve in Fig. 3. The com-bined absorption spectrum of FADox and 10-FDHF is displayed bythe dotted curve in Fig. 3. The strong rise in absorption below320 nm is attributed to absorption of the protein (tryptophan, tyro-sine). The lower absorption of dCry around 400 nm compared toFADox in aqueous solution is attributed to the sharper vibronicstructure of FAD in the protein binding pocket compared to theaqueous solution (there stronger inhomogeneous broadening).The spectral decomposition of the absorption spectrum of dCryin Fig. 3 (solid curve) to its absorbing constituents with the aidof Fig. 2 clearly shows that FAD is only present in the oxidized form(FADox), and that MTHF is fully converted to 10-formyldihydrofo-late (10-FDHF). No FAD��, FADH, FADredH� or FadredH2, and nounmodified MTHF are found to be present in the investigateddark-adapted dCry sample.
The cofactor loading of dCry is obtained by the ratio of thecofactor number density to the protein number density. Values ofjFAD = NFADox/N0 � 0.85 and j10-FDHF = jMTHF,0 = N10-FDHF/N0 � 0.66are extracted (N10-FDHF/NFADox = 0.78).
3.2. Fluorescence spectra and fluorescence lifetimes
Fluorescence quantum distributions of FADox in neutral aque-ous solution (taken from [71]), of 4 � 10�5 M fresh preparedMTHF-Cl in pH 2.5 aqueous solution (pH adjusted with HCl), andof lumichrome in aqueous solution at pH 8 are displayed in Fig. 4for comparison with the fluorescence behaviour of dCry.
The fluorescence quantum distributions, EF(k), of dCry in thedark-adapted state (receptor state abbreviated by dCryr) in thecase of excitation at kexc = 428 nm (solid curve) and atkexc = 365 nm (dashed curve) are shown in Fig. 5. The correspond-ing fluorescence quantum yields are /F (428 nm) = 6.8 � 10�4 and

Fig. 2. (a) Absorption cross-section spectra of FADox in aqueous solution at pH 7 (from [70]), FADredH� (from [123]), FADH� (from [124]), FAD�� (this work), and lumichrome(from [66]). (b) Absorption cross-section spectra of MTHF (from [110]), 10-FTHF (from [111]), and 10-FDHF (from [109]).
Fig. 3. Absorption coefficient spectrum of dCry in aqueous solution at pH 8. Dashedcurve: measured dark-adapted spectrum of a freshly prepared sample. Dash-triple-dotted curve: expected scattering contribution determined byasca(k) = asca (k0)(k0/k)2
[73,74] with k0 = 920 nm and asca(k0) = 0.0691 cm�1. Solid curve: dCry absorptionspectrum without scattering contribution. Dash-dotted curve: expected absorptioncontribution from FADox (FADox cross-section spectrum from Fig. 2 with numberdensity NFADox = 3.6 � 1016 cm�3). Triple-dotted curve: extracted 10-FDHF withnumber density N10-FDHF � 2.8 � 1016 cm�3. Thick dotted curve: sum of the FADox
and 10-FDHF contribution. The dCry protein concentration is N0 = 4.25 � 1016 cm�3.Above 560 nm the wavelength scale is compressed.
Fig. 4. Fluorescence quantum distributions of aqueous solutions of FAD at pH 7(FADox, from [71]; solid curve, /F = 0.033), 4 � 10�5 M MTHF-Cl at pH 2.5 (dash-dotted curve, /F = 0.0013), and lumichrome at pH 8 (dashed curve, /F = 0.021).
J. Shirdel et al. / Chemical Physics 352 (2008) 35–47 39
/F (365 nm) = 9.4 � 10�4. The fluorescence spectrum due to428 nm excitation is attributed to FADox emission, i.e. EF(k,kexc =428 nm) = EF,dCry,r(k, FADox) and /F,dCry,r(FADox) � 6.8 � 10�4. Thefluorescence spectrum due to 365 nm excitation is composed oftwo contributions which are attributed to 10-FDHF emission andFADox emission, i.e. EF(k,kexc = 365 nm) = f10-FDHFEF(k, 10-FDHF) +fFADoxEF,dCry,r(k, FADox) where f10-FDHF = a10-FDHF(365 nm)/[a10-FDHF
(365 nm) + aFADox (365 nm)] and fFADox = 1 � f10-FDHF are the frac-
tions of light absorbed at 365 nm by either 10-FDHF or FADox.Using the de-convoluted absorption spectra of Fig. 3 we getf10-FDHF = 0.226 and we can separate out EF(k,10-FDHF in dCry)from EF(k,365 nm) and EF(k,428 nm) in Fig. 5. The resulting curveis shown by the dash-dotted curve in Fig. 5. The correspondingfluorescence quantum yield of 10-FDHF in dCry is /F � 1.8 � 10�3.The fluorescence quantum yield of 10-FDHF in aqueous solutionoutside dCry is expected to be higher because of Förster-typeenergy transfer [76] from 10-FDHF to FADox [33].
In Fig. 6a a fluorescence trace of dark-adapted dCry in aqueoussolution at pH 8 measured with a micro-channel-plate photomul-tiplier (response function FWHM �700 ps) is shown. The fluores-cence signal decay is well fitted with the sum of two exponential

Fig. 5. Fluorescence quantum distributions of dark-adapted dCry in aqueoussolution at pH 8. Solid curve starting at 480 nm was probed at 428 nm withexcitation intensity of Iexc,pr = 2.3 mW cm�2 and accumulation time of tacc = 3 s.Dashed curve starting at 395 nm was probed at 365 nm with excitation intensity ofIexc,pr = 5 mW cm�2 and accumulation time of tacc = 3 s. The dash-dotted curveshows the separated fluorescence quantum distribution of 10-FDHF in the dCrysample.
40 J. Shirdel et al. / Chemical Physics 352 (2008) 35–47
decays according to SF(t) = SF,0[j1exp(�t/sF,1) + j2exp (�t/sF,2)]with j1 = 0.57, sF,1 = 1.1 ns, j2 = 1 � j1 = 0.43, and sF,2 = 5.7 ns.The two fluorescence components are thought to be due to FADin two conformations not properly bound to the dCry activesite and FAD not in an U-shaped conformation [71,77]. Thefluorescence quantum yield of FADox in conformation 1 is/F,1(FADox) = sF,1/srad � 0.058, and the fluorescence quantum yield
Fig. 6. Temporal fluorescence behaviour of dark-adapted dCry in aqueous solution at pHchannel-plate photomultiplier. Fluorescence decay is fitted by a two-component exponj1 = 0.57, sF,1 = 1.1 ns, and sF,2 = 5.7 ns. Dotted curve shows system response function. (determined by fluorescence up-conversion. Dotted line-connected triangles show systeconversion data. The data points scatter because of the low photon detection mode of theline is a single-exponential regression fit, SF (t) = SF,0exp(�t/sF,0), to the fluorescence up-
of FADox in conformation 2 is /F,2(FADox) = sF,2/srad � 0.3 (srad �19 ns [71]).
In Fig. 6b a fluorescence trace of dark-adapted dCry in aqueoussolution at pH 8 measured by fluorescence up-conversion is shown(line-connected circles). The response function of the up-conver-sion system is included (dot-connected triangles). The time resolu-tion is determined by the steepness of the decaying slope of theresponse function (dt0.8�0.2 � 300 fs). The fluorescence signal decayis fitted with a single-exponential function according to SF(t)/SF,max = exp(�t/sF,0) with sF,0 = 1.4 ps. The corresponding fluores-cence quantum yield of FAD in the active receptor state (FADox)is /F,act(FADox) = sF,0/srad � 7.4 � 10�5. The fluorescence signal isattributed to the correctly bound active FAD whose emission isquenched by photo-induced reductive electron transfer [78]. Thedifference in fluorescence quantum yield, /F,dCry,r(FADox) �/F,act(FADox) = 6.06 � 10�4 is attributed to improperly boundFADox. The fraction of improperly bound FADox, xib, is given byxib = (/F,dCry,r(FADox)� /F,act(FADox))/(j1/F,1 + j2/F,2) � 0.0374 (molefraction of active receptor state FAD comes out to be xact = 96.26%).
3.3. Photocycle dynamics
3.3.1. Absorption spectroscopic investigationsThe changes of absorption due to short-wavelength light expo-
sure and due to recovery in the dark are studied in Fig. 7. A dCrysample in a small-volume cell (1.5 � 1.5 � 5 mm3) at 10 �C is ex-posed at 440 nm with an intensity of 1.27 mW cm�2 for a periodof 300 s and then the excitation light is switched off. The temporaldevelopment of the absorption coefficient spectra due to lightexposure is displayed in part (a). For comparison an absorptionspectrum of FADox in aqueous solution at pH 8 is included (dottedcurve, normalized to same absorption coefficient integral as unex-posed sample for k > 400 nm). The absorption around 450 nm islowered and the absorption around 360 nm is increased. A newabsorption peak at 402 nm builds up. There are two isobesticpoints at 495 nm and 412.5 nm. The spectral changes are causedby conversion of FADox to FAD�� [46]. Below in the data analysisthe absorption cross-section spectrum of FAD�� as well as the
8. Excitation wavelength is 400 nm. (a) Fluorescence signal measured with micro-ential function according to SF(t) = SF,0 [j1exp(�t/sF,1) + (1 � j1)exp (�t/sF,2)] with
b) Fluorescence signal behaviour of dark-adapted dCry in aqueous solution at pH 8m response function. Solid line-connected circles show measured fluorescence up-photomultiplier with averaging each data point only over 20 shots. The dash-dottedconversion data with sF,0 = 1.4 ps.

Fig. 8. Absorptive photo-cycle dynamics of dCry in aqueous solution at pH 8.Absorption coefficient a is shown versus time t. Excitation wavelength, kexc, is thesame as the probe wavelength, kpr. Sample length ‘ = 1.5 mm. Sample is exposed for5 min. Absorption decrease during exposure is fitted with equation system (7)–(11).Absorption recovery in the dark is fitted by a(t) = a(te) + (a(1) � a(te))[1 �exp(�(t � te)/srec)] where te is time position of light switch-off. (a) Sampletemperature # = 4 �C. kexc = kpr = 436 nm. Excitation intensity Iexc = 1.34 mW cm�2.Fit parameters are quantum efficiency of FADox to FAD�� conversion, /s = 0.2,quantum efficiency of FAD�� to FADox back conversion, /b = 0.2, ra;FAD�� ;exc ¼1:95� 10�17 cm2, and recovery time, srec = 298 s. (b) # = 10 �C. kexc = kpr = 440 nm.Iexc = 1.27 mW cm�2. /s = 0.2. /b = 0.2. ra;FAD�� ;exc ¼ 2� 10�17 cm2. srec = 173 s. (c)# = 21.3 �C. kexc = kpr = 440 nm. Iexc = 1.34 mW cm�2. /s = 0.2. ra;FAD�� ;exc ¼ 2�10�17 cm2. srec = 91.6 s. /b is varied: (1) /b = 0.25, (2) /b = 0.2, (3) /b = 0.15.
J. Shirdel et al. / Chemical Physics 352 (2008) 35–47 41
quantum yields of FAD�� formation and of FADox back formationare extracted from the displayed spectra.
The back recovery of the absorption spectra after light switch-off to the original dark-adapted FADox absorption spectrum isclearly seen in Fig. 7b. A complete recovery to the original receptorstate takes place in less than 10 min.
The temporal development of the absorption coefficient at thewavelength of excitation during exposure and after exposure isshown in Fig. 8. In part (a) the situation is shown for sample tem-perature of # = 4 �C, excitation wavelength kexc = 440 nm, and exci-tation intensity of Iexc = 1.34 mW cm�2. After light switch-off asingle-exponential absorption recovery is observed with a recoverytime of srec = 4.97 min. In part (b) the situation is shown for sampletemperature of # = 10 �C, excitation wavelength kexc = 440 nm, andexcitation intensity of Iexc = 1.27 mW cm�2. After light switch-off asingle-exponential absorption recovery is observed with a recoverytime of srec = 2.88 min. In part (c) the conditions are # = 21.3 �C,kexc = 440 nm, and Iexc = 1.34 mW cm�2. A recovery time ofsrec = 1.53 min is found.
The absorption behaviour in the case of intense long-time lightexposure is studied in Fig. 9. A dCry sample (in 1.5 � 1.5 � 5 mm3
cell) at 4 �C is exposed in the wavelength range from 350 to440 nm with an intensity of Iexc = 0.14 W cm�2 over a period of56 min. Within 2 min of exposure the steady-state light-saturatedconditions are obtained (no further spectral changes). After 56 minof exposure slight spectral changes are observed due to somephoto-degradation. During exposure some increase in Rayleighscattering took place as is shown by the dash-dotted curve inFig. 9. The dashed curve shows the absorption spectrum after scat-tering subtraction (exposure time 56 min).
From the change in absorption at kpr = 470 nm a quantum yieldof photo-degradation of /D � 2.2 � 10�6 is estimated (fraction ofdegraded molecules xd = Da/a � 0.069 corresponding to length-integrated number density of degraded molecules Nd‘ = Da‘/ra �3.1 � 1014 cm�2 of degraded molecules, number density of
a
b
Fig. 7. (a) Temporal development of absorption coefficient spectrum of dCry due tolight exposure at kexc = 440 nm with an intensity of Iexc = 1.27 mW cm�2 at 10 �C.For comparison an absorption spectrum of FAD in aqueous solution at pH 8 isincluded. (b) Recovery of absorption coefficient spectrum after light switch-off attexp = 5 min (situation of part a).
absorbed photons nph,abs = Iexctexp[1 � exp(�a‘)]/(hmexc) � 1.38 �1020 cm�2).
3.3.2. Fluorescence spectroscopic investigationsNormalized fluorescence spectra, S0FðkÞ=S0F;max;dark;428 nm for differ-
ent excitation conditions are displayed in Fig. 10a and b, whereS0FðkÞ ¼ SFðkÞ=½Iexc;prtacc� with SF(k) the fluorescence signal height atwavelength k, Iexc,pr the applied excitation intensity in fluorescencerecording, and tacc the corresponding fluorescence accumulationtime. S0F;max;dark;428 nm is the maximum S0FðkÞ value (occurring atk = 540 nm) of dark-adapted dCry in the case of fluorescence exci-tation at kexc,pr = 428 nm. The curves in Fig. 10a belong to fluores-cence probing wavelength kexc,pr = 365 nm, and the curves inFig. 10b belong to kexc,pr = 428 nm. The spectra are corrected forthe wavelength dependent sensitivity of the detection system.
The solid curves in Fig. 10 correspond to the dark-adapted situ-ation which was already studied in Fig. 5.
The dashed curves in Fig. 10 belong to the saturated light-adapted situation where the sample was excited for texp = 3 minwith Iexc = 4.4 mW cm�2 at kexc = 365 nm (exposed energy densityeexc = 0.79 J cm�2). The fluorescence spectra slightly increasedcompared to the dark-adapted situation. The rise in fluorescenceis attributed to some protein conformational changes which lowersthe fluorescence quenching by intra-FAD electron-transfer (be-tween isoalloxazine part and adenine part) or intra-cryptochromeelectron transfer (between FADox and an adjacent amino acid elec-tron donor).
The dotted curves in Fig. 10 belong to a prolonged lightexposure of texp = 25 min with Iexc = 0.108 W cm�2 at kexc =

Fig. 9. Development of the absorption coefficient spectrum of dCry due to intenselong-time light exposure. Excitation with high-pressure mercury lamp in thewavelength region from 350 to 440 nm with intensity Iexc = 0.14 W cm�2. Durationsof exposure are given in the figure. In dashed curve scattering contribution after56 min of exposure is subtracted.
Scheme 1.
a b
Fig. 10. Fluorescence spectra development due to short-wavelength light exposure.In part (a) the fluorescence probing excitation is at kexc,pr = 365 nm, while in part (b)it is at kexc,pr = 428 nm. The presented curves are normalized to the incidentexcitation energy density of fluorescence probing and to the maximum fluorescencespectral height of dark-adapted dCry in the case of 428 nm probing. The solid curvesbelong to dark-adapted dCry. The dashed curves belong to light-adapted dCry(excitation intensity Iexc = 4.4 mW cm�2 for a duration of texp = 3 min atkexc = 365 nm, accumulated excitation energy density eexc = 0.79 J cm�2). The dottedcurves belong to intense medium-time exposed dCry (Iexc = 0.108 W cm�2 fortexp = 25 min at kexc = 350–440 nm, eexc = 162 J cm�2). The dash-dotted curvesbelong to intense long-time exposed dCry (Iexc = 0.108 W cm�2 for texp = 3 h atkexc = 350–440 nm, eexc = 1167 J cm�2).
42 J. Shirdel et al. / Chemical Physics 352 (2008) 35–47
350–440 nm (sample in signalling state). The normalized fluores-cence signals increased both for fluorescence excitation at428 nm and at 365 nm. The fluorescence rise in the case ofkexc,pr = 428 nm probing is thought to be due to further FAD andprotein conformational changes. The fluorescence spectrumbelonging to 365 nm fluorescence probing shows two peaks at
510 nm and 460 nm and a shoulder at 410 nm. The broad bandwith maximum around 510 nm is thought to belong to FADox
and possibly FAD�� emission. The maximum around 460 nm isthought to belong to enlarged 10-FDHF contribution. If 10-FDHFis photo-released from the cryptochrome to the buffer solution arise in fluorescence is expected by reduced Förster-type energytransfer to FAD (distance increase).
In the dark (recovery to the receptor state) the fluorescence re-mained nearly unchanged in the case of fluorescence excitation at428 nm and increased slightly in the case of excitation at 365 nm.Some denaturation continued in the dark (observed by transmis-sion decrease due to scattering) which might be responsible forthis behaviour (10-FDHF release and FAD conformation change).
The dash-dotted curves in Fig. 10 show the fluorescence situa-tion after sample exposure for a duration of texp = 3 h atkexc = 350–440 nm with Iexc = 0.108 W cm�2. The fluorescencespectrum caused by excitation at kexc,pr = 428 nm is thought to becomposed of bound FADox, FAD��, and photoproduct emission[66]. The fluorescence spectrum caused by excitation atkexc,pr = 365 nm is thought to be dominated by 10-FDHF emissionwith bound FAD, and FAD-photoproduct (including lumichrome)contributions.
4. Discussion
4.1. Photo-excitation data analysis
The photo-induced forth and back reaction with thermal relax-ation is illustrated in Scheme 1.
The absorption dynamics is given by the following differentialequation system:
oN1
ot¼ Iexc
hmexcð�N1ra;1;exc/s þ N2ra;2;exc/bÞ þ
N2
srec; ð7Þ
oN2
ot¼ Iexc
hmexcðN1ra;1;exc/s � N2ra;2;exc/bÞ �
N2
srec; ð8Þ
oIexc
oz¼ �ðN1ra;1;exc þ N2ra;2;exc þ N3ra;3;excÞIexc: ð9Þ
With the initial conditions
N1ð0Þ ¼ jFADN0; N2ð0Þ ¼ 0; and N3 ¼ jMTHF;0N0: ð10Þ
N1 is the number density of FADox molecules, N2 is the number den-sity of FAD�� molecules, and N3 is the number density of 10-FDHFmolecules. ra,i,exc are the corresponding absorption cross-sectionsat the excitation wavelength kexc. mexc = c0/kexc is the excitation fre-quency (c0 is the velocity of light in vacuum). /s is the quantum effi-ciency of signalling state formation (FADox to FAD�� conversion),and /b is the quantum efficiency of back transfer (FAD�� to FADox
conversion). srec is the recovery time of FAD�� to FADox in the dark.t is the time coordinate, and z is the spatial coordinate along thepropagation direction.
The first term in Eq. (7) describes the photo-induced decrease ofFADox by FAD�� formation, the second term describes the photo-in-duced back transfer from FAD�� to FADox, and the last term givesthe thermal back transfer in the dark. The same terms with oppo-site sign appear in Eq. (8) for the description of the temporal FAD��
development. Eq. (9) describes the excitation light intensity reduc-tion by FADox, FAD��, and 10-FDHF absorption.

J. Shirdel et al. / Chemical Physics 352 (2008) 35–47 43
The length-averaged absorption coefficient of the sample at theexcitation wavelength, kexc, at time t is
aðkexc; tÞ ¼1‘
Z l
0ðN1ðt; zÞra;1;exc þ N2ðt; zÞra;2;exc
þ N3ðt; zÞra;3;excÞdz; ð11Þ
In a fit of the equation system (7)–(11) to the experimental depen-dencies in Fig. 8 the parameters /s, /b, and ra;2;exc ¼ ra;FAD�� ;exc aredetermined. With the fit parameters, the solution of the equationsystem also gives the temporal development of averaged numberdensities of FADox ðNFADoxðtÞ ¼
RN1ðt; zÞdz=‘Þ and of
FAD��ðNFAD�� ðtÞ ¼R ‘
0 N2ðt; zÞdz=‘Þ. The absorption cross-section spec-trum, ra;FAD�� ðkÞ, is determined from the absorption coefficient spec-trum, a(k,te), at the end of light exposure by rewriting Eq. (11) to
ra;FAD�� ðkÞ ¼ ra;2ðkÞ
¼ aðk; teÞ � NFADoxðteÞra;FADox � j10�FDHFN0ra;10�FDHFðkÞNFAD��
;
ð12Þ
The obtained spectrum is included in Fig. 2a. The absorption curvebelonging to te = texp = 300 s in Fig. 7a is used in the calculations.
The number densities, NFADox = N1 and NFAD�� ¼ N2, under stea-dy-state conditions (texp� srec) are obtained from Eq. (7) by set-ting oN1/ot = 0 and using N1 + N2 = jFADN0. The result is
NFADox ¼ jFADN0ra;FAD�� ðkexcÞ/b þ hmexc
Iexcsexc
ra;FADoxðkexcÞ/s þ ra;FAD�� ðkexcÞ/b þ hmexcIexcsexc
; ð13aÞ
NFAD�� ¼ jFADN0ra;FADoxðkexcÞ/s þ hmexc
Iexcsexc
ra;FADoxðkexcÞ/s þ ra;FAD�� ðkexcÞ/b þ hmexcIexcsexc
: ð13bÞ
The limiting population number densities for Iexc ?1 become
NFADox ¼ jFADN0ra;FAD�� ðkexcÞ/b
ra;FADoxðkexcÞ/s þ ra;FAD�� ðkexcÞ/b; ð14aÞ
NFAD�� ¼ jFADN0ra;FADoxðkexcÞ/s
ra;FADoxðkexcÞ/s þ ra;FAD�� ðkexcÞ/b: ð14bÞ
The steady-state saturation intensity, Isat,ss, where half of the FADmolecules are converted to the anionic semi-quinone form is ob-tained from Eq. (13a) by setting NFADox = jFADN0/2. The result is gi-ven in Eq. (2b) (no physical solution for Isat,ss in the case of/sra;FADox;exc < /bra;FAD�� ;exc, then less than 50% of the FAD moleculescan be photo-converted to FAD��).
4.2. Absorption recovery data analysis
The temperature dependence of the absorption recovery wasstudied in Fig. 8. The absorption recovered in a single-exponentialmanner completely back to the original strength after light switch-off. The absorption recovery time srec decreased with increasingtemperature # in an Arrhenius-type behaviour, which is given by[79,80]
srecð#Þ ¼ srec;0 expWb
kB#
� �; ð15Þ
where srec;0 ¼ k�1rec;0 is the inverse attempt frequency of barrier cross-
ing, kB is the Boltzmann constant, and Wb is the activation energy.This activation energy is obtained by applying Eq. (15) to two tem-peratures, #1 and #2, and solving for Wb which gives
Wb ¼kB#1#2 ln½srecð#2Þ=srecð#1Þ�
#1 � #2: ð16Þ
In the inset of Fig. 8c the experimental recovery times are fittedby application of Eq. (15) and (16) (solid curve). The obtained at-tempt frequency of barrier crossing is krec,0= (1.1 ± 0.1) � 108 s�1,
and the obtained activation energy is Wb = 7.68 � 10�20 Jð~mb ¼Wb=ðhc0Þ ¼ 3870 cm�1, h is Planck’s constant, and c0 is speedof light in vacuum).
4.3. Model of photo-cycle dynamics
The photoreaction mechanism for the circadian blue light pho-toreceptor Drosophila cryptochrome dCry is documented in [46]:The blue-light excitation of dCry in the receptor-state (dark-adapted state) causes an electron transfer from the surroundingprotein to the FAD cofactor in its oxidized redox state (FADox)thereby forming the anionic semiquinone form of FAD (FAD��).FAD�� is stabilized by the protein surroundings forming the signal-ling state (light adapted state). In the dark the signalling stateslowly recovers back to the receptor state.
The absorption spectroscopic studies of this paper revealed aphoto-induced forth and back reaction between FADox and FAD��
(photo-interconversion) with approximately equal quantum effi-ciency of FAD�� formation (/s � 0.2) and FADox back formation(/b � 0.2). A model of photo-induced forth and back electron trans-fer involving the adenine part of FAD is discussed in the following.In this model a photo-induced intra-molecular reductive electrontransfer in U-shaped FAD from the adenine part (A) to the isoallox-azine part (I) followed by extra-molecular reductive charge trans-fer from an adjacent tryptophan residue to the cationic adenine issupposed. The photo-excitation of the formed FAD��, absorbing inthe same wavelength region as FADox, causes oxidative electrontransfer from the excited isolloxazine part I�* to the adenine partand from there to the tryptophan cation giving the original FADox.In the dark an Arrhenius-type thermal activated charge recombina-tion from FAD�� to FADox occurs (recovery time srec � 1.6 min atroom temperature). The FAD�� Trp+ charge separation is stabilizedby (i) the neutral adenine (A) between Trp+ and the anionic isoal-lozazine moiety (I�), (ii) possibly further charge separation alongfurther tryptophans, and (iii) protein conformational changes to-wards environmental polarisation for charge shielding. Some irre-versible slight opening of the U-shaped isoalloxazine adeninearrangement is indicated by an irreversible rise in FAD fluores-cence efficiency. The rise in 10-FDHF fluorescence indicatessome photo-induced release of 10-FDHF out of the protein (leadingto reduced Förster-type excitation transfer).
For U-shaped FADox the occurrence of photo-induced reductiveelectron transfer [78,81] from the adenine moiety to the isoalloxa-zine moiety is well established [71,77,82–86]. Reductive electrontransfer requires that the ionization potential of the photo-excitedelectron acceptor is larger than the ionization potential of the elec-tron donor. The ionization potential of isoalloxazine has to be lar-ger than the ionization potential of adenine in order to enableelectron-transfer from adenine to isoalloxazine. For adenine thefirst ionization potential (in vacuum) is IP = 8.44 eV [87–89]. Thefirst ionization potential of Tyr is IP � 8.5 eV [90,91], and of Trpis IP � 7.9 eV [92–95]. Since Trp has a much lower ionization po-tential than adenine it is an ideal electron donor for adenine cat-ions with long-time stability.
The proposed photo-induced intra-molecular reductive chargetransfer (ICTr) from the adenine (A) part to the isoalloxazine part(I) of U-shaped FADox followed by extra-molecular reductivecharge transfer (ECTr) from an adjacent tryptophan (W) electrondonor to the adenine cation forming the anionic FAD semiquinoneFAD�� species and its photo-induced oxidative electron back-trans-fer together with the thermal recovery are shown in Scheme 2 andillustrated in Fig. 11.
The isoalloxazine part (I) of FADox is photo-excited from the S0
ground-state to the S1 excited-state (I*) designated as FAD�ox. In theexcited state reductive intra-molecular charge transfer (ICTr)[78,81] from the adenine (A) part to the isoalloxazine part (I)

. .
.
Fig. 11. Proposed photo-cycle scheme for FAD in dCry. I = isoalloxazine part.A = adenine part. W = tryptophan residue. ICT = intra-molecular charge transfer.ECT = external charge transfer. CR = charge recombination. REC = signalling state toreceptor state recovery. Stacking of isoalloxazine and adenine is indicated.
. .
Scheme 2.
44 J. Shirdel et al. / Chemical Physics 352 (2008) 35–47
occurs resulting in I�A+ designated as FAD+� [71,77]. This processquenches the FADox fluorescence to a lifetime of sF,0 = (1.4 ± 0.4)ps. It follows an extra-molecular reductive charge transfer (ECTr)from an adjacent tryptophan (W) electron donor at the adenine siteto the adenine cation forming the anionic FAD semiquinone FAD��
species (I�A). In the dark a slow recovery (REC) to FADox takesplace. Light exposure also photo-excites the formed FAD��. The ori-ginal HOMO (highest occupied molecular orbital) of isoalloxazinemay be excited and may contribute to the increased fluorescence,
Scheme
and the electron in the single occupied excited level may be furtherexcited. From the higher excited state of isoalloxazine oxidativeelectron transfer to the LUMO level of the adenine moiety and fur-ther to the LUMO level of Trp+ takes place, thereby bringing FAD toits original FADox ground-state and forming a neutral excited tryp-tophan molecule which relaxes on a sub-nanosecond to nanosec-ond time scale to the un-excited ground state.
Instead of the model discussed above, a direct extra-molecularcharge transfer model involving a tryptophan triad as shown inScheme 3 may explain the experimentally observed photo-cycledynamics.
In this model again the isoalloxazine part (I) of FADox is photo-excited from the S0 ground state to the S1 excited-state (I*). Thenthe 1-electron occupied HOMO level of I* is filled from an adjacenttryptophan residue. The generated hole in Trp may move alongadjacent tryptophan residues. The charge separation has to be sta-bilized by protein conformation and polarization (charge shielding)effects to hinder I� W+ charge recombination over a minutetimescale.
The photo-cycle process via a tryptophan triad is discussed in[48] for FAD�� formation from FADox in dCry thereby followingthe well established photo-reduction mechanism of FADH� toFADredH� for photolyases involving a tryptophan triad [1,96–98].The site directed mutation studies in [48] (substitution of Trp byphenalanine with decrease of FAD�� formation) favours theinvolvement of the tryptophan triad pathway if not protein distor-tions by the mutations affect the dynamics.
4.4. Comparison with FAD photo-dynamics in other cryptochromesand BLUF domains
Animal type 1 cryptochromes from butterfly (DpCry1) [51],mosquito (AgCry1), and silk moth (ApCry1) were studied in [48].Photo-excitation of FADox generated FAD��. The signalling state for-mation via a tryptophan triad is discussed there.
In the plant A. thaliana cryptochromes AtCry1, AtCry2, andAtCry3 [23,30,33] as well as in the green algae Chlamydomonasreinhardtii cryptochrome (CPH1) [37] no photo-induced FAD�� for-mation was observed. In AtCry1 [23], AtCry2 [30] and CPH1 [37]
. .
3.
J. Shirdel et al. / Chemical Physics 352 (2008) 35–47 45
FADox is converted to the neutral FADH� radical upon blue-lightexposure. In AtCry1 [23] and AtCry2 [30] FADH� excitation bygreen-light resulted in some deactivation of the photo-cycling pro-cess (explained by FADredH� formation with fast FADredH� re-oxi-dation to FADox [23]). In the photo-reduction of FADox to FADH�
of AtCry1 in A. thaliana, the involvement of photo-induced elec-tron-transfer along a tryptophan residue triad is discussed in[19,99]. In A. thaliana a magneto dependent enhanced hypocotylgrowth inhibition was found which is explained by radical pair for-mation (FADH� Trp�) [99,100].
In AtCry3 efficient protein conformation changes (showing upin enlarged MTHF fluorescence) and moderately efficient photo-reduction (FADox and FADH� reduction to FADredH�) occurs [33].FAD�� formation may be present but has not been resolved becauseof spectral overlap with FADox and MTHF and because of fast neu-tralisation to FADH� by proton take-up. Photo-induced reductiveelectron transfer from the adenine moiety to the isoalloxazine moi-ety of FAD is discussed in [33] as a reason of the observed FADox
fluorescence quenching. In the mutant AtCry3-E149A with re-moved MTHF blue-light photo-excitation causes FAD�� formation[101] (spectrally observable because no hiding MTHF absorptionis present).
Light dependent magnetic compass orientation of the night-migratory garden warbler bird by gwCry1a cryptochome is attrib-
HN
N NH
N
N+
H2N
O
HN
N NH
HN
H2N
O
H2C N
CHO
Scheme
HN
N NH
HN
H2N
O
H2C N
CHO
HN
N NH
N
H2N
O
H2C N
CHO
Scheme
uted to blue-light induced FADH� Trp� radical pair formation via aTrp-triad transfer chain [52].
In BLUF photoreceptors [63,102] (BLUF = sensors of blue lightusing FAD) the flavins FAD, FMN (flavin mononucleotide), and ribo-flavin act as cofactors in vitro [72,103,104]. FAD is non-covalentlybound to the apo-protein in un-stacked conformation (no photo-induced electron transfer possible between the adenine and isoal-loxazine moiety). Reductive electron transfer from a Tyr residue tophoto-excited FAD�ox forming FAD�� takes place on a picosecondtimescale causing hydrogen-bonding rearrangement between theprotein and the flavin cofactor [103,105–107]. The back chargerecombination occurs on a sub-nanosecond time scale[103,105,107] (no FAD�� state stabilisation by charge separationand polarization charge shielding). The hydrogen-bonding back-rearrangement in the dark is slow on a second to tens of minutetime scale [72,103,104,108].
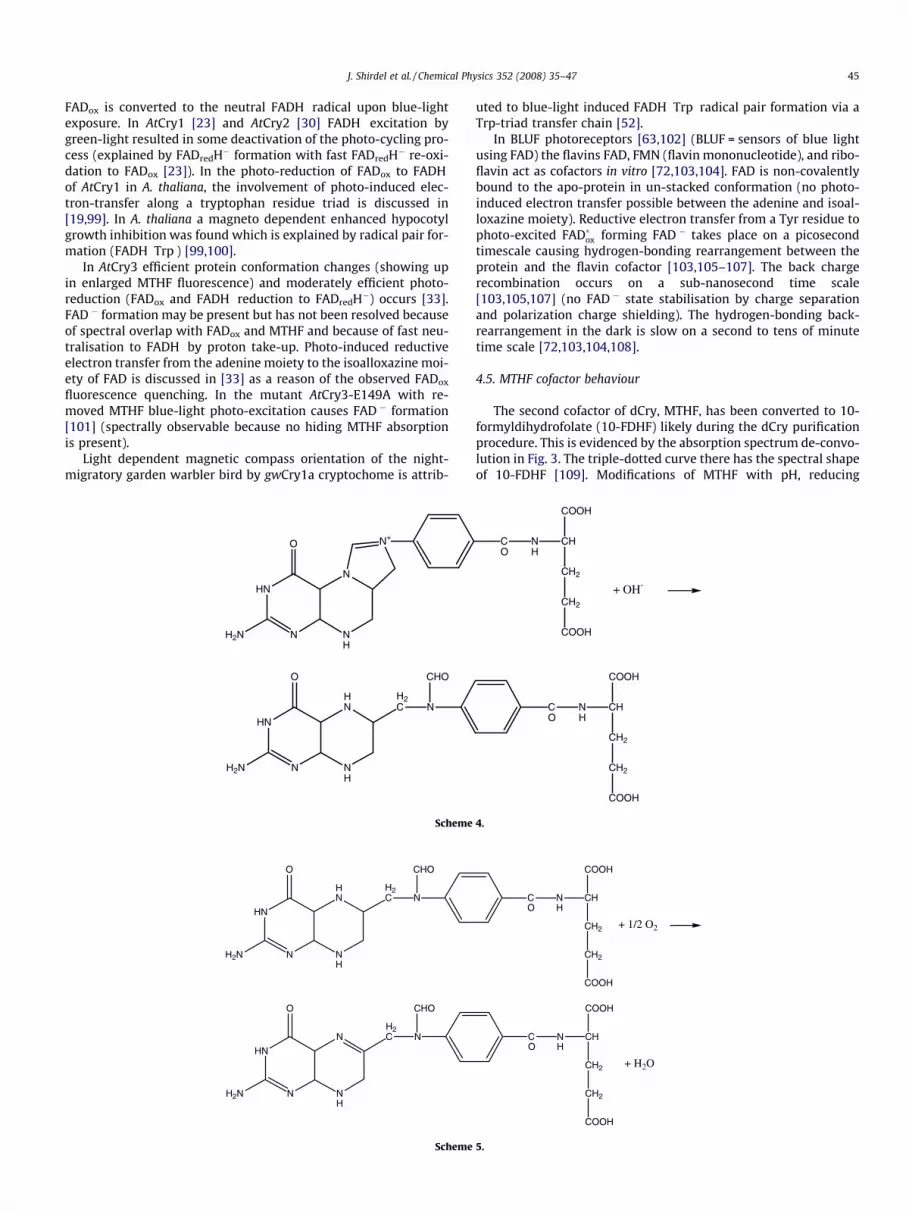
4.5. MTHF cofactor behaviour
The second cofactor of dCry, MTHF, has been converted to 10-formyldihydrofolate (10-FDHF) likely during the dCry purificationprocedure. This is evidenced by the absorption spectrum de-convo-lution in Fig. 3. The triple-dotted curve there has the spectral shapeof 10-FDHF [109]. Modifications of MTHF with pH, reducing
CO
NH
CH
CH2
+ OH-
COOH
CH2
COOH
CO
NH
CH
COOH
CH2
CH2
COOH
4.
+ 1/2 O2
CO
NH
CH
COOH
CH2
CH2
COOH
CO
NH
CH
COOH
CH2
CH2
COOH
+ H2O
5.

46 J. Shirdel et al. / Chemical Physics 352 (2008) 35–47
conditions, aerobic and anaerobic conditions, have been investi-gated in the literature [109–117]. 5,10-methenyltetrahydrofolatehydrolyses at pH 8 to 10-formyltetrahydrofolate (10-FTHF) accord-ing to Scheme 4. [109,111] and 10-FTHF oxidizes to 10-formyldihy-drofolate (10-FDHF) under aerobic conditions [109] according toScheme 5. 10-FDHF is thought to be bound to dCry, since otherwiseit should have been lost during the purification procedure. A partialloss may have occurred since the loading of 10-FDHF was found tobe only 66% (see above). Some release of 10-FDHF by short-wave-length exposure is thought to take place, since a rise in fluores-cence efficiency of 10-FDHF with light exposure was observed.
5. Conclusions
An absorption and emission spectroscopic study on D. melano-gaster cryptochrome (dCry) was carried out. A quantitative absorp-tion spectra analysis revealed a FAD loading of about 85% and a10-FDHF loading of approximately 66% of the cryptochrome. Theoriginal cofactor MTHF became hydrolysed to 10-FTHF andoxidized to 10-FDHF during the preparation procedure. An absorp-tion spectroscopic analysis of the photo-cycle dynamics revealedan FADox FAD�� photo-interconversion with quantum efficienciesof about 20% for FADox to FAD�� reduction and also of about 20%for FAD�� to FADox oxidation.
The fluorescence quantum efficiency of FAD in the active site(binding pocket) of dCry was found to be very low (/F �7.4 � 10�5) and the fluorescence lifetime very short (sF,0 � 1.4 ps).Photo-excitation led to a rise in fluorescence efficiency likely dueto some protein conformational changes and some 10-FDHFrelease.
A model of photo-interconversion has been developed: Photo-excitation of U-shaped FADox causes fast reductive intra-molecularelectron transfer from the adenine moiety to the isoalloxazine moi-ety, which is followed by external reductive electron transfer froman adjacent tryptophan residue to the positively charged adeninepart. The neutralized adenine part acts as charge separator be-tween the isoalloxazine anion and the tryptophan cation. Charge-separation, protein conformational changes, and charge shieldingby protein polarization stabilizes FAD�� to very slow re-oxidationto FADox in the minute time range. Photo-excitation of FAD��
causes oxidative electron transfer converting FAD�� back to FADox
and neutralizing Trp+ to Trp on a picosecond to nanosecondtimescale.
A photo-induced equilibration between signalling state andreceptor state has to be generally taken into account in photore-ceptors. In dCry photo-induced reductive electron transfer fromTrp to FADox and photo-induced oxidative electron transfer fromFAD�� to Trp+ are in action. In Atcry1 and Atcry2 a forth and backtransfer between FADox and FADH� (reported via reduction toFADH� and fast re-oxidation) is occurring [23,30]. In phototropinphoto-excitation of the generated FMN-C(4a)-cysteinyl adductstate causes some recovery back to the non-covalently bound con-formation [118,119]. For the red-light photoreceptor phytochromethere exists a photochemical interconversion between the redabsorbing (Pr) and far-red absorbing isomer states of tetrapyrrole[120] (central dogma of phytochrome action [121]). In sensory rho-dopsins, signalling state isomer photo-excitation leads to a recov-ery to the receptor state isomer [122].
Acknowledgements
The authors thank Anja Merkel for excellent technical assis-tance. They thank the Deutsche Forschungsgemeinschaft (DFG)for support in the Research Group, FOR 526, ‘‘Sensory Blue-lightReceptors”, which enabled this collaborative work.
References
[1] A. Sancar, Chem. Rev. 103 (2003) 2203.[2] A. Sancar, Annu. Rev. Biochem. 69 (2000) 31.[3] C. Lin, D. Shalitin, Annu. Rev. Plant Biol. 54 (2003) 469.[4] M. Ahmad, Cur. Opin. Plant Biol. 2 (1999) 230.[5] A.R. Cashmore, J.A. Jarillo, Y.-J. Wu, D. Liu, Science 284 (1999) 760.[6] J.M. Christie, W.R. Briggs, J. Biol. Chem. 276 (2001) 11457.[7] A.R. Cashmore, Cell 114 (2003) 537.[8] C.L. Partch, A. Sancar, Photochem. Photobiol. 81 (2005) 1291.[9] A. Batschauer (Ed.), Photoreceptors and Light Signalling, Comprehensive
Series in Photochemistry and Photobiology, vol. 3, The Royal Society ofChemistry, Cambridge, UK, 2003.
[10] W.R. Briggs, J.L. Spudich (Eds.), Handbook of Photosensory Receptors, Wiley-VCH, Weinheim, Germany, 2005.
[11] E. Schäfer, F. Nagy (Eds.), Photomorphogenesis in Plants and Bacteria, thirded., Springer, Dordrecht, The Netherlands, 2006.
[12] A. Losi, Photochem. Photobiol. 83 (2007) 1283.[13] J. Deisenhofer, Mutat. Res. 460 (2000) 143.[14] Q.-H. Li, H.-Q. Yang, Photochem. Photobiol. 83 (2007) 94.[15] A. Sancar, Biochemistry 33 (1994) 2.[16] M. Ahmad, A.R. Cashmore, Nature 366 (1993) 162.[17] C. Lin, D.E. Robertson, M. Ahmad, A.A. Raibekas, M.S. Jorns, P.L. Dutton, A.R.
Cashmore, Science 209 (1995) 968.[18] M. Ahmad, N. Grancher, M. Heil, R.C. Black, B. Giovani, P. Galland, D.
Lardemer, Plant Physiol. 129 (2002) 774.[19] B. Giovani, M. Byrdin, M. Ahmad, K. Brettel, Nat. Struct. Biol. 10 (2003) 489.[20] A. Zeugner, M. Byrdin, J.-P. Bouly, N. Bakrim, B. Giovani, K. Brettel, M. Ahmad,
J. Biol. Chem. 280 (2005) 19437.[21] T. Kottke, A. Batschauer, M. Ahmad, J. Heberle, Biochemistry 45 (2006)
2472.[22] Y. Sang, Q.-H. Li, V. Rubio, Y.-C. Zhang, J. Mao, X.-W. Deng, H.-Q. Yang, Plant
Cell 17 (2005) 1569.[23] J.-P. Bouly, E. Schleicher, M. Dionisio-Sese, F. Vandenbussche, D. Van Der
Straeten, N. Bakrim, S. Meier, A. Batschauer, P. Galland, R. Bittl, M. Ahmad, J.Biol. Chem. 282 (2007) 9383.
[24] R.C. Canamero, N. Bakrim, J.-P. Bouly, A. Garay, E.E. Dudkin, Y. Habricot, M.Ahmad, Planta 224 (2006) 995.
[25] M. Ahmad, J.A. Jarillo, A.R. Cashmore, Plant Cell 10 (1998) 197.[26] C.A. Brautigam, B.S. Smith, Z. Ma, M. Palnitkar, D.R. Tomchick, M. Machius, J.
Deisenhofer, PNAS 101 (2004) 12142.[27] H.-Q. Yang, Y.-J. Wu, R.-H. Tang, D. Liu, Y. Liu, A.R. Cashmore, Cell 103 (2000)
815.[28] O. Kleiner, S. Kircher, K. Harter, A. Batschauer, Plant J. 19 (1999) 289.[29] A.J. Millar, Nat. Genet. 29 (2001) 357.[30] R. Banerjee, E. Schleicher, S. Meier, R.M. Viana, R. Pokorny, M. Ahmad, R. Bittl,
A. Batschauer, J. Biol. Chem. 282 (2007) 14916.[31] T. Kleine, P. Lockhart, A. Batschauer, Plant J. 35 (2003) 93.[32] R. Pokorny, T. Klar, L.-O. Essen, A. Batschauer, Acta Crystallogr., F 61 (2005)
935.[33] S.-H. Song, B. Dick, A. Penzkofer, R. Pokorny, A. Batschauer, L.-O. Essen, J.
Photochem. Photobiol. B: Biol. 85 (2006) 1.[34] Y. Huang, R. Baxter, B.S. Smith, C.L. Partch, C.L. Colbert, J. Deisenhofer, PNAS
103 (2006) 17701.[35] T. Klar, R. Pokorny, J. Moldt, A. Batschauer, L.-O. Essen, J. Mol. Biol. 366 (2007)
954.[36] G.D. Small, B. Min, P.A. Lefebvre, Plant Mol. Biol. 28 (1995) 443.[37] D. Immeln, R. Schesinger, J. Heberle, T. Kottke, J. Biol. Chem. 282 (2007)
21720.[38] T. Kanegae, M. Wada, Mol. Gen. Genet. 259 (1998) 345.[39] T. Imaizumi, A. Kadota, M. Hasebe, M. Wada, Plant Cell 14 (2002) 373.[40] P. Emery, W.V. So, M. Kaneko, J.C. Hall, M. Rosbash, Cell 95 (1998) 669.[41] R. Stanevsky, M. Kaneko, P. Emery, B. Beretta, K. Wager-Smith, S.A. Kay, M.
Rosbash, J.C. Hall, Cell 95 (1998) 681.[42] C.P. Selby, A. Sancar, Photochem. Photobiol. 69 (1999) 105.[43] S. Okano, S.-I. Kanno, M. Takao, A.P.M. Eker, K. Isono, Y. Tukahara, A. Yasui,
Photochem. Photobiol. 69 (1999) 108.[44] O. Froy, D.C. Chang, S.M. Reppert, Curr. Biol. 12 (2002) 147.[45] A. Busza, M. Emery-Le, M. Rosbash, P. Emery, Science 304 (2004) 1503.[46] A. Berndt, T. Kottke, H. Breitkreuz, R. Dvorsky, S. Hennig, M. Alexander, E.
Wolf, J. Biol. Chem. 282 (2007) 13011.[47] S.J. Van Vickle-Chavez, R.N. Van Gelder, J. Biol. Chem. 282 (2007) 10561.[48] N. Öztürk, S.H. Song, C.P. Selby, A. Sancar, J. Biol. Chem. 283 (2008) 3256.[49] O. Froy, A.L. Gotter, A.L. Casselman, S.M. Reppert, Science 300 (2003) 1303.[50] H. Zhu, Q. Yuan, A.D. Briscoe, O. Froy, A. Casselman, S.M. Reppert, Curr. Biol.
16 (2006) 730.[51] S.-H. Song, N. Öztürk, T.R. Denaro, N.Ö. Arat, Y.-T. Kao, H. Zhu, D. Zhong, S.M.
Reppert, A. Sancar, J. Biol. Chem. 282 (2007) 17608.[52] M. Liedvogel, K. Maeda, K. Henbest, E. Schleicher, T. Simon, C.R. Timmel, P.J.
Hore, H. Mouritsen, PLoS ONE 2 (10) (2007) e1106.[53] S. Loop, M. Katzer, T. Pieler, EMBO Rep. 6 (2005) 341.[54] D.S. Hsu, X. Zhao, S. Zhao, A. Kazantsev, R.-P. Wang, T. Todo, Y.-F. Wei, A.
Sancar, Biochemistry 35 (1996) 13871.[55] T. Todo, H. Ryo, K. Yamamoto, H. Toh, T. Inui, H. Ayaki, T. Nomura, M. Ikenaga,
Science 272 (1996) 109.

J. Shirdel et al. / Chemical Physics 352 (2008) 35–47 47
[56] K. Hitomi, K. Okamoto, H. Daiyasu, H. Miyashita, S. Iwai, H. Toh, M. Ishiura, T.Todo, Nucleic Acids Res. 28 (2000) 2353.
[57] R. Brudler, K. Hitomi, H. Daiyasu, H. Toh, Ken-ichi Kucho, M. Ishiura, M.Kanehisa, V.A. Roberts, T. Todo, J.A. Tainer, E.D. Getzoff, Mol. Cell 11 (2003)59.
[58] E.N. Worthington, I.H. Kavakli, G. Berrocal-Tito, B.E. Bondo, A. Sancar, J. Biol.Chem. 278 (2003) 39143.
[59] H. Daiyasu, T. Ishikawa, K.-I. Kuma, S. Iwai, T. Todo, H. Toh, Genes Cell 9(2004) 479.
[60] H. Zhu, Q. Yuan, O. Froy, A. Casselman, S.M. Reppert, Curr. Biol. 15 (2005)R953.
[61] Q. Yuan, D. Metterville, A.D. Briscoe, S.M. Reppert, J. Am. Chem. Soc. Mol. Biol.Evol. 24 (2007) 948.
[62] M.M. Bradford, Anal. Biochem. 72 (1976) 248.[63] A. Penzkofer, Appl. Phys. B 46 (1988) 43.[64] A. Penzkofer, W. Leupacher, J. Lumin. 37 (1987) 61.[65] W. Holzer, M. Pichlmaier, A. Penzkofer, D.D.C. Bradley, W.J. Blau, Chem. Phys.
246 (1999) 445.[66] W. Holzer, J. Shirdel, P. Zirak, A. Penzkofer, P. Hegemann, R. Deutzmann, E.
Hochmuth, Chem. Phys. 308 (2005) 69.[67] S.J. Strickler, R.A. Berg, J. Chem. Phys. 37 (1962) 814.[68] J.B. Birks, D.J. Dyson, Proc. Roy. Soc. London, Ser. A 275 (1963) 135.[69] A.V. Deshpande, A. Beidoun, A. Penzkofer, G. Wagenblast, Chem. Phys. 142
(1990) 123.[70] P. Drössler, W. Holzer, A. Penzkofer, P. Hegemann, Chem. Phys. 282 (2002)
429.[71] S.D.M. Islam, T. Susdorf, A. Penzkofer, P. Hegemann, Chem. Phys. 295 (2003)
139.[72] P. Zirak, A. Penzkofer, T. Schiereis, P. Hegemann, A. Jung, I. Schlichting, Chem.
Phys. 315 (2005) 142.[73] J. Jagger, in: Introduction to Research in Ultraviolet Photobiology, Prentice
Hall, Englewood Cliffs, NJ, USA, 1967, p. 54.[74] G. Oster, Light scattering, in: G. Oster, A.W. Pollister (Eds.), Physical
Techniques in Biological Research, vol. 1, Academic Press, New York, 1955,p. 51.
[75] A. Penzkofer, J. Shirdel, P. Zirak, H. Breitkreuz, E. Wolf, Chem. Phys. 342 (2007)55.
[76] Th. Förster, Fluoreszenz organischer Verbindungen, Vandenhoeck undRuprecht, Göttingen, Germany, 1951.
[77] P.A.W. van den Berg, J. Widengren, M.A. Hink, R. Rigler, A.J.W.G. Visser,Spectrochim. Acta A 57 (2001) 2135.
[78] B. Valeur, Molecular Fluorescence, Principles and Applications, Wiley-VCH,Weinheim, 2002.
[79] G.R. Fleming, Applications of Ultrafast Spectroscopy, Oxford University Press,London, 1986.
[80] J. Schmidt, A. Penzkofer, J. Chem. Phys. 91 (1989) 1403.[81] J. Shirdel, A. Penzkofer, R. Procházka, Z. Shen, J. Daub, Chem. Phys. 336 (2007)
1.[82] J.R. Barrio, G.L. Tolman, N.J. Leonard, R.D. Spencer, G. Weber, PNAS 70 (1973)
941.[83] G. Weber, Biochem. J. 47 (1950) 114.[84] Ph. Wahl, J.C. Auchet, A.J.W.G. Visser, F. Müller, FEBS Lett. 44 (1974) 67.[85] A.J.W.G. Visser, Photochem. Photobiol. 40 (1984) 703.[86] P.A.W. van den Berg, K.A. Feenstra, A.E. Mark, H.J.C. Berendsen, A.J.W.G.
Visser, J. Phys. Chem. B 106 (2002) 8858.[87] N.S. Hush, A.S. Cheung, Chem. Phys. Lett. 34 (1975) 11.[88] S. Peng, A. Padva, P.R. LeBreton, PNAS 73 (1976) 2966.[89] J.S. Kwiatkowski, B. Pullman, Int. J. Quant. Chem. 15 (1979) 499.
[90] W. Wiczk, A. Rzeska, J. Lukomska, K. Stachowiak, J. Karolczak, J. Malicka, L.Lankiewicz, Chem. Phys. Lett. 341 (2001) 99.
[91] J. Tong, X.-Y. Li, Chem. Phys. 284 (2002) 543.[92] E. Amouyal, A. Bernas, G. Grand, Photochem. Photobiol. 29 (1979) 1071.[93] H.B. Steen, Radiat. Res. 41 (1970) 268.[94] G.J. Smith, J. Chem. Coc. Faraday Trans. II 74 (1978) 1350.[95] L. Hanley, P.D. Edirisinghe, W.F. Calaway, I.V. Veryovkin, M.J. Pellin, J.F. Moore,
Appl. Surf. Sci. 252 (2006) 6723.[96] L.-O. Essen, Cur. Opin. Struct. Biol. 16 (2006) 51.[97] C. Aubert, M.H. Vos, P. Mathis, A.P.M. Eker, K. Brettel, Nature 405 (2000) 586.[98] M. Byrin, V. Sator, A.P.M. Eker, M.H. Vos, C. Aubert, K. Brettel, P. Mathis,
Biochim. Biophys. Acta 1655 (2004) 64.[99] I.A. Solv’yov, D.E. Chandler, K. Schulten, Biophys. J. 92 (2007) 2711.
[100] M. Ahmad, P. Galland, T. Ritz, R. Wiltschko, W. Wiltschko, Planta 225 (2007)615.
[101] P. Zirak, A. Penzkofer, R. Pokorny, A. Batschauer, preliminary results.[102] M. Gomelsky, G. Klug, Trends Biochem. Sci. 27 (2002) 497.[103] P. Zirak, A. Penkofer, P. Hegemann, T. Mathes, Chem. Phys. 335 (2007) 15.[104] W. Laan, T. Bednarz, J. Heberle, K.J. Hellingwerf, Photochem. Photobiol. Sci. 3
(2004) 1011.[105] S. Masuda, K. Hasewaga, A. Ishii, T. Ono, Biochemistry 43 (2004) 5304.[106] M. Gauden, S. Yeremenko, W. Laan, I.H.M. van Stokkum, J.A. Ihalainen, R. van
Grondelle, K.J. Hellingwerf, J.T.M. Kennis, Biochemistry 44 (2005) 3653.[107] A. Tyagi, A. Penzkofer, J. Griese, I. Schlichting, N.V. Kirienko, M. Gomelsky,
Photodynamics of BlrP1 protein from Klebsiella pneumoniae and itsphotoreceptor BLUF domain, submitted for publication.
[108] P. Zirak, A. Penzkofer, C. Lehmpfuhl, T. Mathes, P. Hegemann, J. Photochem.Photobiol. B: Biol. 86 (2007) 22.
[109] J.E. Baggott, G.L. Johanning, K.E. Branham, C.W. Prince, S.L. Morgan, I. Eto,W.H. Vaughn, Biochem. J. 308 (1995) 1031.
[110] J.L. Johnson, S. Hamm-Alvarez, G. Payne, G.B. Sancar, K.V. Rajagopalan, A.Sancar, PNAS 85 (1988) 2046.
[111] B. Wang, M.S. Jorns, Biochemistry 28 (1989) 1148.[112] M. May, T.J. Bardos, F.L. Barger, M. Lansford, J.M. Ravel, G.L. Sutherland, W.
Shive, J. Am. Chem. Soc. 73 (1951) 3067.[113] K. Uyeda, J.C. Rabinowitz, Analyt. Biochem. 6 (1963) 100.[114] S.K. Foo, D.J. Cichowicz, B. Shane, Analyt. Biochem. 107 (1980) 109.[115] S.-T. Kim, P.F. Heelis, T. Okamura, Y. Hirata, N. Mataga, A. Sancar,
Biochemistry 30 (1991) 11262.[116] J.E. Baggott, Biochemistry 39 (2000) 144647.[117] A.A. Henry, R. Jimenez, D. Hanway, F.E. Romesberg, ChemBioChem. 5 (2004)
1088.[118] J.T.M. Kennis, I.H.M. Van Stokkum, S. Crosson, M. Gauden, K. Moffat, R. van
Grondelle, J. Am. Chem. Soc. 126 (2004) 4512.[119] A. Penzkofer, L. Endres, T. Schiereis, P. Hegemann, Chem. Phys. 316 (2005)
185.[120] S.-L. Tu, J.C. Lagarias, in: W.R. Briggs, J.L. Spudich (Eds.), Handbook of
Photosensory Receptors, Wiley-VCH, 2005, p. 121.[121] T. Shinomura, A. Nagatani, H. Hanzawa, M. Kubota, M. Watanabe, M. Furuya,
PNAS 93 (1996) 8133.[122] M. Engelhard, G. Schmies, A.A. Wegener, in: A. Batschauer (Ed.),
Photoreceptors and Light Signalling, Comprehensive Series inPhotochemistry and Photobiology, vol. 3, The Royal Society of Chemistry,Cambridge, UK, 2003, p. 1.
[123] F. Müller (Ed.), Chemistry and Biochemistry of Flavoenzymes, vol. 1, CRCPress, Boca Raton, Fl., USA, 1991.
[124] S.-H. Song, B. Dick, A. Penzkofer, P. Hegemann, J. Photochem. Photobiol. 87(2007) 37.


