Embed Size (px)
Citation preview
A Wall Street Methodology for Valuing Law Firms Using capital market techniques to ascertain the value of the Am Law 100
May 2019
2
Table of Contents About The Author _________________________________________________________________________ 3
Overview ________________________________________________________________________________ 4
Valuation – A Journey ____________________________________________________________________ 4
Valuation Model ________________________________________________________________________ 5
The Valuation Framework __________________________________________________________________ 7
Equity Partner Ownership ________________________________________________________________ 7
Pure Pre-tax Profit ______________________________________________________________________ 7
Net Income ___________________________________________________________________________ 11
Cash Flow ____________________________________________________________________________ 14
Future Cash Flows ______________________________________________________________________ 15
Cost of Capital _________________________________________________________________________ 15
Terminal Value ________________________________________________________________________ 17
Findings: Valuation of the Am Law 100 _______________________________________________________ 19
Valuation ______________________________________________________________________________ 19
Comparison to Publicly Traded Firms ______________________________________________________ 21
Summary _______________________________________________________________________________ 21

3
About The Author
Other research from this author
Identifying Your Firm’s Peers: A New Approach (Link)
Selecting appropriate peers is a critical exercise for any law firm. Peer sets are used for benchmarking exercises, for annual
rate-setting, and in understanding how wider trends in the industry are impacting the firm’s specific corner of the market.
There is clearly a need for an objective, data-driven method to identify law firm peers.
What Drives Your Profit Per Equity Partner? (Link)
A data driven analysis of the key drivers operating drivers of profit per equity and a method to translate compensation into
factors that a law firm can manage – and then seek to enhance.
Have You Changed Your Peer Set Recently? (Link)
Our experience has been that firms seldom modify peers over time, despite changes in the firm, peers or the industry. This
inertia is understandable, as it can be a difficult exercise to create new peer sets manually each year. By contrast, the data-
driven approach can readily identify peers which are more reflective of the firm’s performance in any given year.
A New Approach to Law Firm Rankings (Link)
The Am Law rankings reveal the largest firms. A new approach looks at a broader range of metrics to identify firm’s overall
financial performance.
Madhav Srinivasan, Chief Financial Officer at Hunton Andrews Kurth LLP
Phone: (804) 788-8200
Email: [email protected]
Madhav Srinivasan is the Chief Financial Officer at Hunton Andrews Kurth LLP,
and leads the global finance and pricing competencies. He has extensive
experience in legal finance and management, combined with a deep background
in corporate finance, financial consulting and capital markets. Madhav is an
adjunct faculty at Columbia Law School in New York and University of Texas at
Austin School of Law; and an ALM Intelligence Fellow. He has published articles in
leading journals and is a frequent speaker at major conferences.
4
Overview
US law firms are privately held limited liability partnerships with equity partners as sole owners. Law firms are not publicly
traded, and transfer of ownership occurs only when partners exit or enter the partnership. There is no public capital market
for the purchase and sale of law firms. The values of law firms are neither quoted on any stock exchange, nor is there any
specific interest from partners or regulators in ascertaining this figure. Thus, law firm valuation is not a required exercise. So
why should law firm leaders and owners be interested in assessing the value of the organizations?
The answer lies not only in the final result, the numerical value of the law firm, but also in the similarity between the intent of
shareholders of publicly traded companies and the equity owners of law firms. Shareholders of publicly traded firms pay
attention to value of the companies they own for two reasons. Firstly, they wish to monitor the value of their investments
over time. Equally important is their desire that companies identify and pursue strategies which ultimately enhance the value
of their ownership holdings. Establishing valuations is an important tenet for both these goals. Analyzing the valuation of
publicly traded companies enables shareholders to estimate how specific investments or business decisions impact the value
of a company. As owners of their law firms, the goals of equity partners matches that of shareholders. And as managers,
equity partners are focused on enhancing the value of their holdings and be informed by valuation techniques on
implementing accretive business decisions. A good understanding of the mechanics of valuation and the underlying factors
can be very helpful indeed to help create additional value.
In today’s competitive legal environment, law firms are focused on revenue growth and profit generation. They are raising
lawyer rates, increasing attorney headcount, controlling expenses, improving their internal processes, acquiring lateral
partners, offering alternative fee arrangements, merging with other law firms, increasing productivity, reducing office space
and taking other decisive managerial actions. All of these help drive short-term increases in revenue and net income. They
also enhance the prospects for long-term profitable growth. Law firms naturally engage in such efforts with a notional goal of
enhancing the strength of the partnership - and indirectly the value of the law firm as an enterprise.
How can the results of a law firm’s managerial actions be numerically evaluated? While current revenue and profits are
certainly indicators, the value of a law firm - which captures the law firm’s expected future results – can be the ultimate
scorecard of all such strategies and business decisions. If a firm has a high value, or if its value is increasing over time, it is
likely that firm strategies are working well. Conversely, if a firm has a low value or value is declining over time, leadership
actions are perhaps not that successful. The magnitude of value creation is the cumulative financial end-result of all the
underlying operational drivers. Further, analyzing findings from the valuation exercise; and contrasting value drivers with peer
firms can help select the best avenue to increase the enterprise value of the organization.
Valuation – A Journey Valuing law firms turns out to be a complex exercise - and a journey. This journey involves an analysis of partnership
compensation, the calculation of “pure profits”, determining net income to shareholders, assessment of risk and the
estimation of future cash flows generated by the law firm. The journey has no clear precedent. Unlike public companies, law
firms have not been the focus of any detailed valuation efforts. Very limited data on law firms is publicly available. Further,
the ownership structure of law firms presents unique challenges. Thus, it will become necessary to make numerous, and
largely conservative assumptions to find pragmatic solutions to difficult issues. Many simplifications will be required to
estimate parameters which are inputs into the valuation model. This report focuses solely on the description of the valuation
methodology and the final numerical valuation results. Clearly, there are insights which accrue from this analysis, and these
will be covered in forthcoming articles.
5
The first public evidence of law firm valuation is from a 2012 article in The American Lawyer1 which applied a valuation
multiple to a firm’s calculated compensation-adjusted pre-tax cash flow. The multiple was derived by reviewing a firm’s
revenue, annual percentage growth in revenue and net income; and its brand strength. The final results were illuminating,
showing that valuations were indeed feasible. The analysis laid out in the article suggested the combined value of the Am Law
Global 100 in 2012 was $97 billion, which was 6 times their compensation-adjusted pre-tax cash flows of $16 billion and 1.15
times their total revenues of $84 billion. Further, the article showed that the value to cash flow multiple varied across
individual firms, ranging from a low of 3.5 to a high of 8.5.
This report proposes to update and enhance the valuation methodology used by the American Lawyer in 2012. Rather than
use a multiple, this capital markets based methodology relies on a calculated after-tax cash flow for each law firm, and
determines the net present value of all its future cash flows. This bottoms-up approach, as opposed to the top-down approach
used in the 2012 article is a reliable well-used methodology in valuing large companies. It is frequently used by Wall Street
analysts to value publicly traded companies which have steady profit growth profiles similar to law firms.
Valuation Model The methodology used in this report is an adapted two-stage discounted cash flow approach, otherwise known as Two Stage
Dividend Discount model. The first stage of this model includes a set of future periods where the annual cash flows are
specifically articulated. The second stage calculates a “terminal value” at the end of the first stage, based on a long-term
estimate for sustainable growth in future cash flows. The cash flows in the first stage and the terminal value of the second
stage are then discounted to the present to arrive at the enterprise value.
The first stage is defined here as the next five years. The second stage “terminal value” represents the present value of after-
tax cash flows for the firm over the long run, for years beyond the next five. Once the value of these two separate periods are
identified, they are discounted to their present values and then added together. This valuation is based solely on projected
cash flows for a law firm and does not take into account specific circumstances or any considerations external to these cash
flows.
Mathematically, the value of a firm is the sum of all future cash flows from year one to year five plus the terminal value
discounted by the cost of capital in that particular year.
This two-stage approach is favored for a number of reasons. First, it is a well-known valuation technique. Second, it is well
suited for law firm valuation, as law firms are generally stable-growth enterprises. Third, nearly all of the necessary inputs for
this approach can be calculated. Future cash flows, for example, can be reasonably projected for most law firms. Fourth, this
1 “Taking Stock” by Chris Johnson, The American Lawyer, December 2012, pp 60-69
Explaining the Methodology: The Law Firm Valuation Model
𝑉𝑎𝑙𝑢𝑒 𝑜𝑓 𝑓𝑖𝑟𝑚 = ∑t = 1, 5 𝐶𝑎𝑠ℎ 𝐹𝑙𝑜𝑤𝑠 𝑖𝑛 𝑌𝑒𝑎𝑟 1 𝑡𝑜 𝑌𝑒𝑎𝑟 5
(1 + Cost of Capital) ^t+
𝑇𝑒𝑟𝑚𝑖𝑛𝑎𝑙 𝑉𝑎𝑙𝑢𝑒 𝑖𝑛 𝑦𝑒𝑎𝑟 5
(1 + 𝐶𝑜𝑠𝑡 𝑜𝑓 𝐶𝑎𝑝𝑖𝑡𝑎𝑙) ^5
6
methodology is more robust, owing to its bottoms-up approach. Fifth, this methodology avoids the use of multiples, which can
lead to potentially misleading outcomes.
It is important to note that there are numerous data and forecasting challenges inherent in this approach. The information in
the Am Law 100 dataset, which is the foundation of this methodology, is limited to self-reported firm data. Additionally, there
are no estimates available for future profit growth for law firms. Law firms provide no information on how profit is distributed
across firm partners or their levels of debt and working capital. Finally, the majority of law firms are not publicly held and thus
not valued by objective third parties. These issues have forced the valuation model used in this report to rely on creative
solutions and several simplifying assumptions.
Specifically, the methodology used in this report uses the following approach for each individual law firm:
1. Calculate profits paid to owners: derive the ownership portion of the total operating income available to equity
partners. This ownership portion is similar to the risky stream of profits accruing to shareholders of a publicly
traded company.
2. Calculate after-tax profits: develop an after-tax net income for the law firm by subtracting a notional amount of
federal plus state income taxes.
3. Convert accounting based net income into after-tax cash flow: the methodology assumes capital expenditure is
equal to annual depreciation expense. It also assumes some of the net income remains in the law firm as annual
increases in working capital, and will not be distributed to equity partners.
4. Project cash flows for the next five years: project cash flows five years into the future by using a firm-specific
annual growth rate.
5. Calculate terminal value: calculate a terminal value at the end of year five using a sustainable growth rate. A
higher growth rate is generally applied to high-growth firms and a lower growth rate to low-growth firms.
6. Calculate value of each firm: discount future cash flows from year one to year five; and the terminal value by the
cost of capital to arrive at value.
7
The Valuation Framework
Equity Partner Ownership The first challenge in the valuation journey is to derive net income for law firms, similar to the profit stream accruing to risk-
oriented shareholders of a public company. In a publicly traded company, “profits” includes all business expenses and reflect
the underlying equity risk of the entity. The Am Law 100 dataset only provides pre-tax operating income to equity partners.
This profit is reported on a pre-tax basis since income taxes are effectively paid by the individual partners. Some adjustments
will have to be made to these reported figures so that they can serve as inputs into the valuation model.
Equity partners play a dual role in law firms: they are both managers and owners. Thus, their total compensation, or operating
income, consists of two components: a salary portion - equivalent to compensation of a non-equity partner; and the balance,
an ownership portion - reflecting the shareholder-type risk of an equity partner as an owner of the law firm. Law firm
valuation is based solely on the second component - the ownership portion of operating income. Thus, the salary portion
needs to be isolated, and then subtracted as a compensation expense in the law firm income statement.
A creative way to separate these two components of operating income to equity partners is needed. To accomplish this, the
model first divides the equity partners of a law firm into 10 FTE-based deciles based on their decreasing annual compensation.
For example, a law firm with 250 equity partners FTE will have 10 deciles, each with 25 equity partners FTE. Next, the model
apportions the total operating income into each decile, guided by data from The American Lawyer. The most highly
compensated equity partners (in decile 1) in a law firm account for a disproportionately higher proportion of the profit pool as
compared to equity partners with lowest compensation levels (in decile 10). For example, the model allocates 15% of the total
operating income to decile 2, and 6% to decile 8 (See Figure 1).
Next in each decile, the model allocates the operating income into two components: salary and ownership. In decile 10, which
has equity partners with lowest compensation, the model allocates 80% to salary and 20% to ownership. In other words, a
majority of such partners’ compensation is comparable to a non-equity salaried partner. In decile 1, with equity partners with
the highest compensation, the model allocates 35% to salary and 65% to ownership. This recognizes that senior partners
spend more effort on business generation, and take on higher risk in line with the business. For deciles between 1 and 10, the
model graduates these percentages in 5% increments. There is no precedence for such a division, but the approach laid out
here assumes that less-experienced equity partners have less of their compensation in sync with firm performance; and more-
experienced partners have more of their compensation at risk with the firm’s profitability. This allocation methodology,
though not purely scientific, seems fair and reflective of the compensation within most Am Law firms.
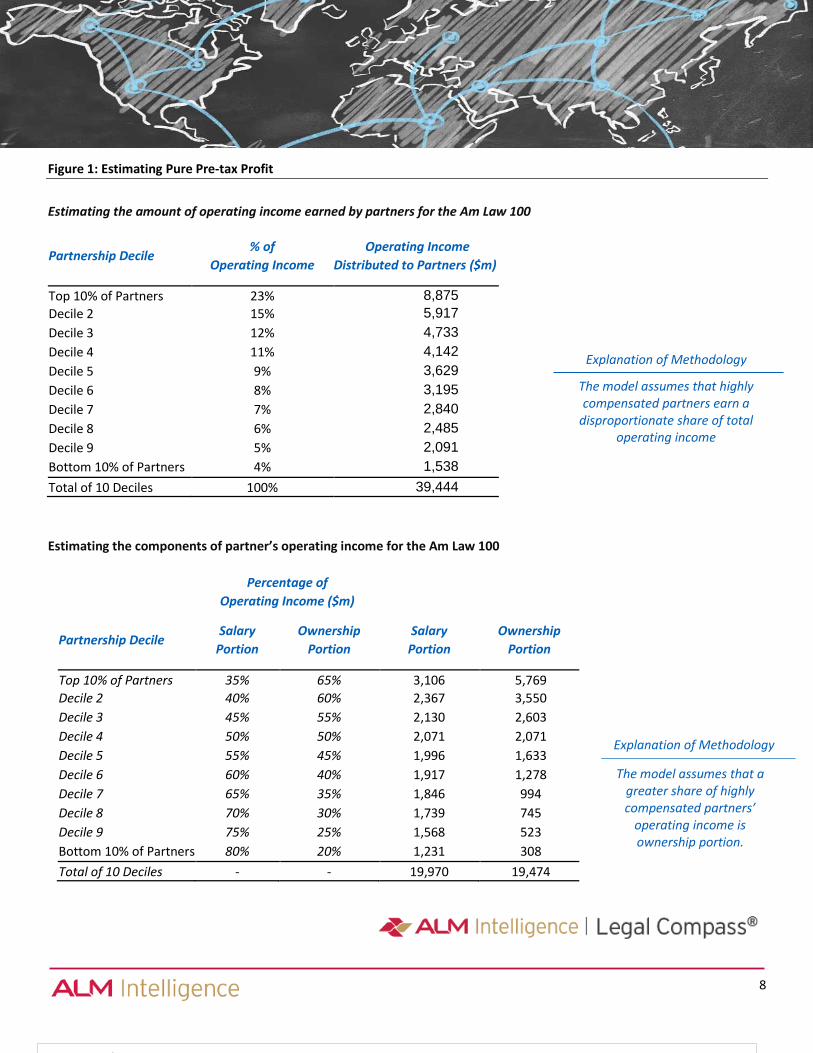
Pure Pre-tax Profit Applying this logic to each law firm, the model can calculate the salary portion and ownership portion of operating income to
equity partners. The salary portion can then be reclassified as a partners’ compensation expense on the firm’s income
statement and subtracted from operating income. The balance, which is the ownership portion, then becomes the profits
which are at risk. This at-risk profit, though still pre-tax, can be thought of as being similar to return to shareholder-owners of
a public company. For law firms, these shareholders are simply equity partners.
The American Lawyer denotes the total compensation to equity partners as operating income. This report coins a new term,
“pure pre-tax profit”, which is the at-risk ownership portion of operating income, recognizing this excludes the salary portion
of operating income. Figure 1 applies this calculation to the aggregate of Am Law 100 firms for calendar 2017.
8
Estimating the components of partner’s operating income for the Am Law 100
$91,443
Figure 1: Estimating Pure Pre-tax Profit
Partnership Decile % of
Operating Income
Operating Income
Distributed to Partners ($m)
Top 10% of Partners 23% 8,875
Decile 2 15% 5,917
Decile 3 12% 4,733
Decile 4 11% 4,142
Decile 5 9% 3,629
Decile 6 8% 3,195
Decile 7 7% 2,840
Decile 8 6% 2,485
Decile 9 5% 2,091
Bottom 10% of Partners 4% 1,538
Total of 10 Deciles 100% 39,444
Estimating the amount of operating income earned by partners for the Am Law 100
The model assumes that highly compensated partners earn a
disproportionate share of total operating income
Explanation of Methodology
The model assumes that a greater share of highly compensated partners’
operating income is ownership portion.
Explanation of Methodology
Percentage of
Operating Income ($m)
Partnership Decile Salary
Portion
Ownership
Portion
Salary
Portion
Ownership
Portion
Top 10% of Partners 35% 65% 3,106 5,769
Decile 2 40% 60% 2,367 3,550
Decile 3 45% 55% 2,130 2,603
Decile 4 50% 50% 2,071 2,071
Decile 5 55% 45% 1,996 1,633
Decile 6 60% 40% 1,917 1,278
Decile 7 65% 35% 1,846 994
Decile 8 70% 30% 1,739 745
Decile 9 75% 25% 1,568 523
Bottom 10% of Partners 80% 20% 1,231 308
Total of 10 Deciles - - 19,970 19,474
9
$19.5bn
Pure Pre-tax Profit (Operating income excluding partner salary portion)
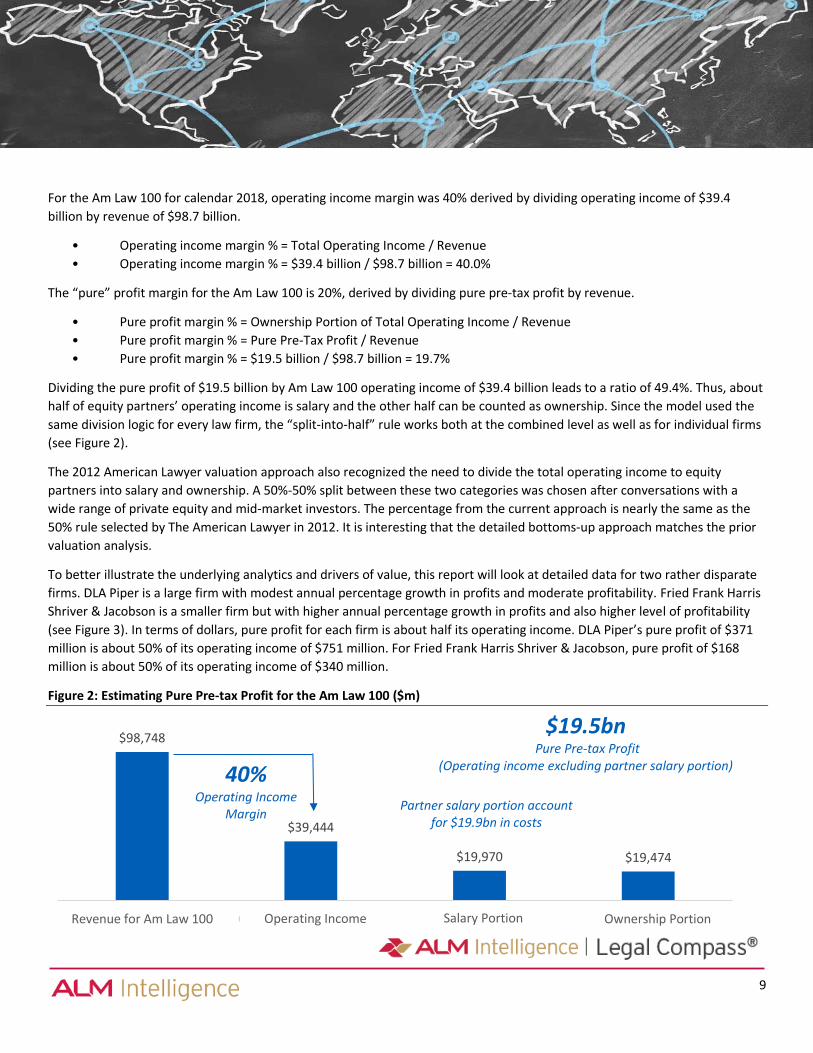
For the Am Law 100 for calendar 2018, operating income margin was 40% derived by dividing operating income of $39.4
billion by revenue of $98.7 billion.
• Operating income margin % = Total Operating Income / Revenue
• Operating income margin % = $39.4 billion / $98.7 billion = 40.0%
The “pure” profit margin for the Am Law 100 is 20%, derived by dividing pure pre-tax profit by revenue.
• Pure profit margin % = Ownership Portion of Total Operating Income / Revenue
• Pure profit margin % = Pure Pre-Tax Profit / Revenue
• Pure profit margin % = $19.5 billion / $98.7 billion = 19.7%
Dividing the pure profit of $19.5 billion by Am Law 100 operating income of $39.4 billion leads to a ratio of 49.4%. Thus, about
half of equity partners’ operating income is salary and the other half can be counted as ownership. Since the model used the
same division logic for every law firm, the “split-into-half” rule works both at the combined level as well as for individual firms
(see Figure 2).
The 2012 American Lawyer valuation approach also recognized the need to divide the total operating income to equity
partners into salary and ownership. A 50%-50% split between these two categories was chosen after conversations with a
wide range of private equity and mid-market investors. The percentage from the current approach is nearly the same as the
50% rule selected by The American Lawyer in 2012. It is interesting that the detailed bottoms-up approach matches the prior
valuation analysis.
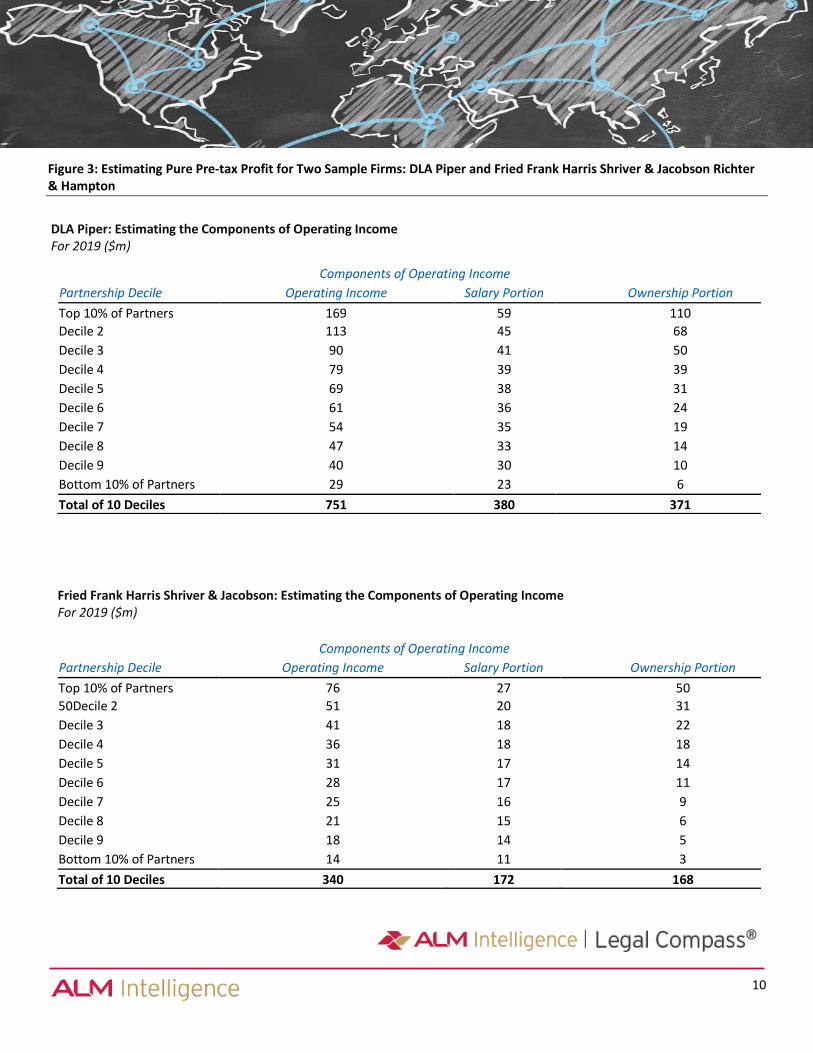
To better illustrate the underlying analytics and drivers of value, this report will look at detailed data for two rather disparate
firms. DLA Piper is a large firm with modest annual percentage growth in profits and moderate profitability. Fried Frank Harris
Shriver & Jacobson is a smaller firm but with higher annual percentage growth in profits and also higher level of profitability
(see Figure 3). In terms of dollars, pure profit for each firm is about half its operating income. DLA Piper’s pure profit of $371
million is about 50% of its operating income of $751 million. For Fried Frank Harris Shriver & Jacobson, pure profit of $168
million is about 50% of its operating income of $340 million.
Figure 2: Estimating Pure Pre-tax Profit for the Am Law 100 ($m)
$98,748
$39,444
$19,970 $19,474
Revenue for Am Law 100 Operating Income (Profit) Salary Income Ownership Income
Partner salary portion account for $19.9bn in costs
40% Operating Income
Margin
Operating Income Salary Portion Ownership Portion
10
DLA Piper: Estimating the Components of Operating Income For 2019 ($m)
Components of Operating Income
Partnership Decile Operating Income Salary Portion Ownership Portion
Top 10% of Partners 169 59 110
Decile 2 113 45 68
Decile 3 90 41 50
Decile 4 79 39 39
Decile 5 69 38 31
Decile 6 61 36 24
Decile 7 54 35 19
Decile 8 47 33 14
Decile 9 40 30 10
Bottom 10% of Partners 29 23 6
Total of 10 Deciles 751 380 371
Components of Operating Income
Partnership Decile Operating Income Salary Portion Ownership Portion
Top 10% of Partners 76 27 50
50Decile 2 51 20 31
Decile 3 41 18 22
Decile 4 36 18 18
Decile 5 31 17 14
Decile 6 28 17 11
Decile 7 25 16 9
Decile 8 21 15 6
Decile 9 18 14 5
Bottom 10% of Partners 14 11 3
Total of 10 Deciles 340 172 168
Figure 3: Estimating Pure Pre-tax Profit for Two Sample Firms: DLA Piper and Fried Frank Harris Shriver & Jacobson Richter & Hampton
Fried Frank Harris Shriver & Jacobson: Estimating the Components of Operating Income For 2019 ($m)
11
2,836
2,085
751 380
371 148 223
Revenue Costs OperatingIncome
Salary Portion ofOperating
Income
OwnershipPortion ofOperating
Income
Income Taxes Net Income
Costs subtracted from firm revenues to estimate operating income
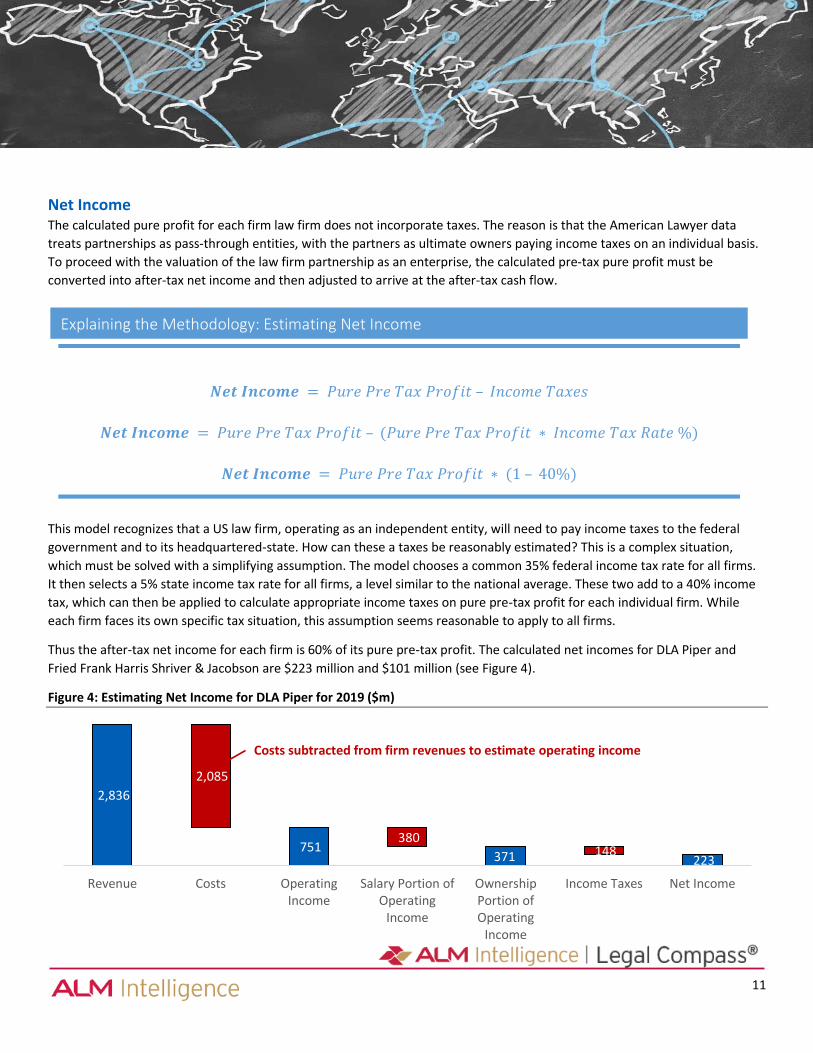
Net Income The calculated pure profit for each firm law firm does not incorporate taxes. The reason is that the American Lawyer data
treats partnerships as pass-through entities, with the partners as ultimate owners paying income taxes on an individual basis.
To proceed with the valuation of the law firm partnership as an enterprise, the calculated pre-tax pure profit must be
converted into after-tax net income and then adjusted to arrive at the after-tax cash flow.
This model recognizes that a US law firm, operating as an independent entity, will need to pay income taxes to the federal
government and to its headquartered-state. How can these a taxes be reasonably estimated? This is a complex situation,
which must be solved with a simplifying assumption. The model chooses a common 35% federal income tax rate for all firms.
It then selects a 5% state income tax rate for all firms, a level similar to the national average. These two add to a 40% income
tax, which can then be applied to calculate appropriate income taxes on pure pre-tax profit for each individual firm. While
each firm faces its own specific tax situation, this assumption seems reasonable to apply to all firms.
Thus the after-tax net income for each firm is 60% of its pure pre-tax profit. The calculated net incomes for DLA Piper and
Fried Frank Harris Shriver & Jacobson are $223 million and $101 million (see Figure 4).
Figure 4: Estimating Net Income for DLA Piper for 2019 ($m)
Explaining the Methodology: Estimating Net Income
𝑵𝒆𝒕 𝑰𝒏𝒄𝒐𝒎𝒆 = 𝑃𝑢𝑟𝑒 𝑃𝑟𝑒 𝑇𝑎𝑥 𝑃𝑟𝑜𝑓𝑖𝑡 – 𝐼𝑛𝑐𝑜𝑚𝑒 𝑇𝑎𝑥𝑒𝑠
𝑵𝒆𝒕 𝑰𝒏𝒄𝒐𝒎𝒆 = 𝑃𝑢𝑟𝑒 𝑃𝑟𝑒 𝑇𝑎𝑥 𝑃𝑟𝑜𝑓𝑖𝑡 – (𝑃𝑢𝑟𝑒 𝑃𝑟𝑒 𝑇𝑎𝑥 𝑃𝑟𝑜𝑓𝑖𝑡 ∗ 𝐼𝑛𝑐𝑜𝑚𝑒 𝑇𝑎𝑥 𝑅𝑎𝑡𝑒 %)
𝑵𝒆𝒕 𝑰𝒏𝒄𝒐𝒎𝒆 = 𝑃𝑢𝑟𝑒 𝑃𝑟𝑒 𝑇𝑎𝑥 𝑃𝑟𝑜𝑓𝑖𝑡 ∗ (1 – 40%)
12
For the Am Law 100, net income is pre-tax profit of $19.5 billion multiplied by 60% or $11.7 billion:
• Net Income = Pure Pretax Profit * (1 – Income Tax Rate %)
• = $19.5 Billion * 60%
• = $11.7 Billion
Net Income Margin is Net Income divided by Revenue, thus:
• Net Income Margin % = Net Income / Revenue
• = $11.7 Billion / $98.7 Billion
• = 11.8%
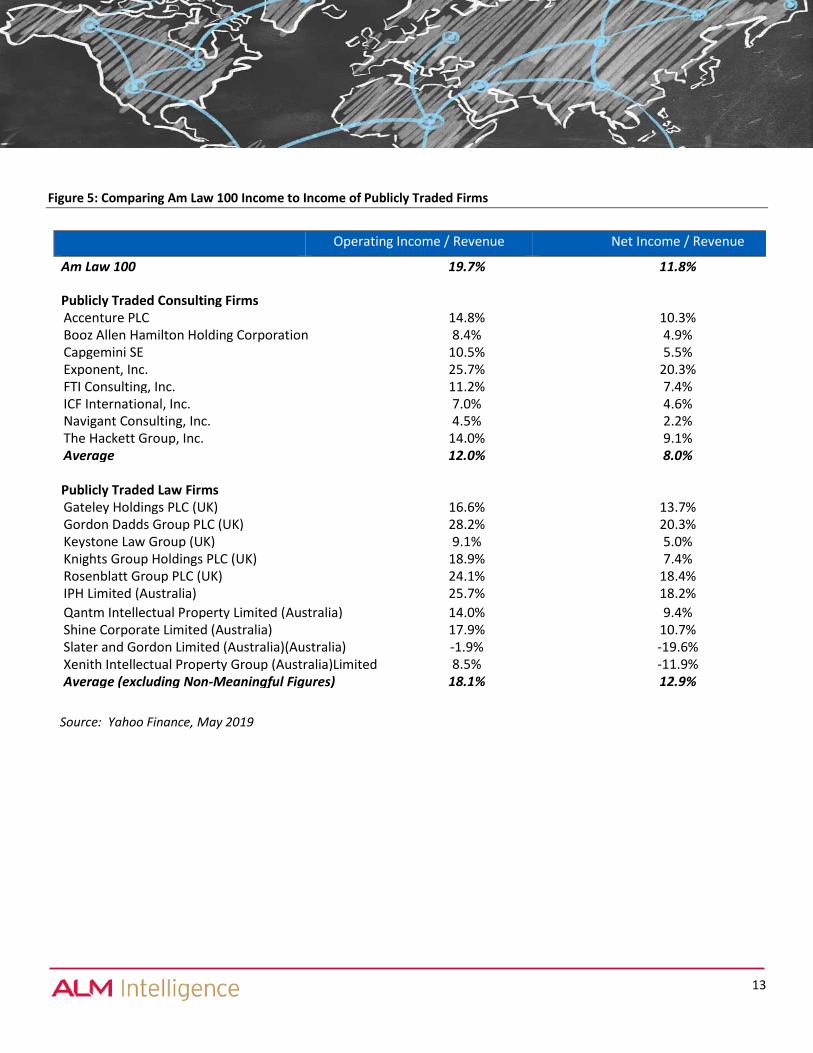
This Am Law 100 net income margin, after making these preceding adjustments, is equivalent to net income margin of publicly
traded companies. Figure 5 compares the Am Law 100 net margin to two closest peer sets whose valuation and parameters
are publicly available: publicly traded US consulting firms and publicly traded UK and Australian law firms. The Am Law 100
operating income and net income margins are both seen to be similar to the law firms’ average; and higher than
corresponding figures for US consulting firms. In particular, the Am Law 100’s net income margin is closest to Accenture, The
Hackett Group, Gateley Holdings (UK) and Shine Corporate (Australia). Our goal was to translate reported profit for Am Law
100 firms into net income which could be compared to publicly traded companies. On that basis, the eventual similarity is
reassuring, and validates our profit allocation methodology and tax assumptions.
13
Source: Yahoo Finance, May 2019
Figure 5: Comparing Am Law 100 Income to Income of Publicly Traded Firms
Operating Income / Revenue
(On Pre-Tax Basis)
Net Income / Revenue
(On After-Tax Basis) Am Law 100 19.7% 11.8%
Publicly Traded Consulting Firms
Accenture PLC 14.8% 10.3% Booz Allen Hamilton Holding Corporation 8.4% 4.9% Capgemini SE 10.5% 5.5% Exponent, Inc. 25.7% 20.3% FTI Consulting, Inc. 11.2% 7.4% ICF International, Inc. 7.0% 4.6% Navigant Consulting, Inc. 4.5% 2.2% The Hackett Group, Inc. 14.0% 9.1% Average 12.0% 8.0%
Publicly Traded Law Firms
Gateley Holdings PLC (UK) 16.6% 13.7% Gordon Dadds Group PLC (UK) 28.2% 20.3% Keystone Law Group (UK) 9.1% 5.0% Knights Group Holdings PLC (UK) 18.9% 7.4% Rosenblatt Group PLC (UK) 24.1% 18.4% IPH Limited (Australia) 25.7% 18.2%
Qantm Intellectual Property Limited (Australia)
(Australia)
14.0% 9.4% Shine Corporate Limited (Australia) 17.9% 10.7% Slater and Gordon Limited (Australia)(Australia) -1.9% -19.6% Xenith Intellectual Property Group (Australia)Limited
(Australia)
8.5% -11.9% Average (excluding Non-Meaningful Figures)
figures)dfigures)gures)
18.1% 12.9%
14
Cash Flow While the model has calculated after-tax net income, what is actually required for the valuation is after-tax cash flow. Why?
Net income is an accounting metric and cannot be subject to present value calculations. Cash flow is the available free cash
flow to firm equity partners, and can be present valued using the cost of capital.
How can accounting net income metric be translated into distributable cash flow? Two adjustments are needed. First, the
annual depreciation expense needs to be subtracted from net income and replaced by annual capital expenditures. Second,
annual increases in working capital must be subtracted from net income, as this is typically not distributable to equity
partners. Law firms are not asset intensive businesses, thus their annual capital expenditures are quite similar to their annual
depreciation expenses. Since these are roughly equal, such a substitution leads to a zero net mathematical effect.
Working capital for a typical law firm is cash plus unbilled time plus accounts receivables minus accounts payable. Since this
information is not available in the Am Law 100 dataset, the model will make a simplifying assumption for the level of working
capital. For valuation purposes, the working capital at the end of each financial year is assumed to be 20% of annual revenue.
We further assume that working capital will grow in the future at the same rate as the historical arithmetic average growth
rate of revenues from calendar 2014 to calendar 2018. This allows for a reasonable estimation for both the level of working
capital and the amount of its annual future accretion. Annual increases in working capital are effectively not distributable to
equity partners, thus is subtracted from net income to arrive at after-tax cash flow.
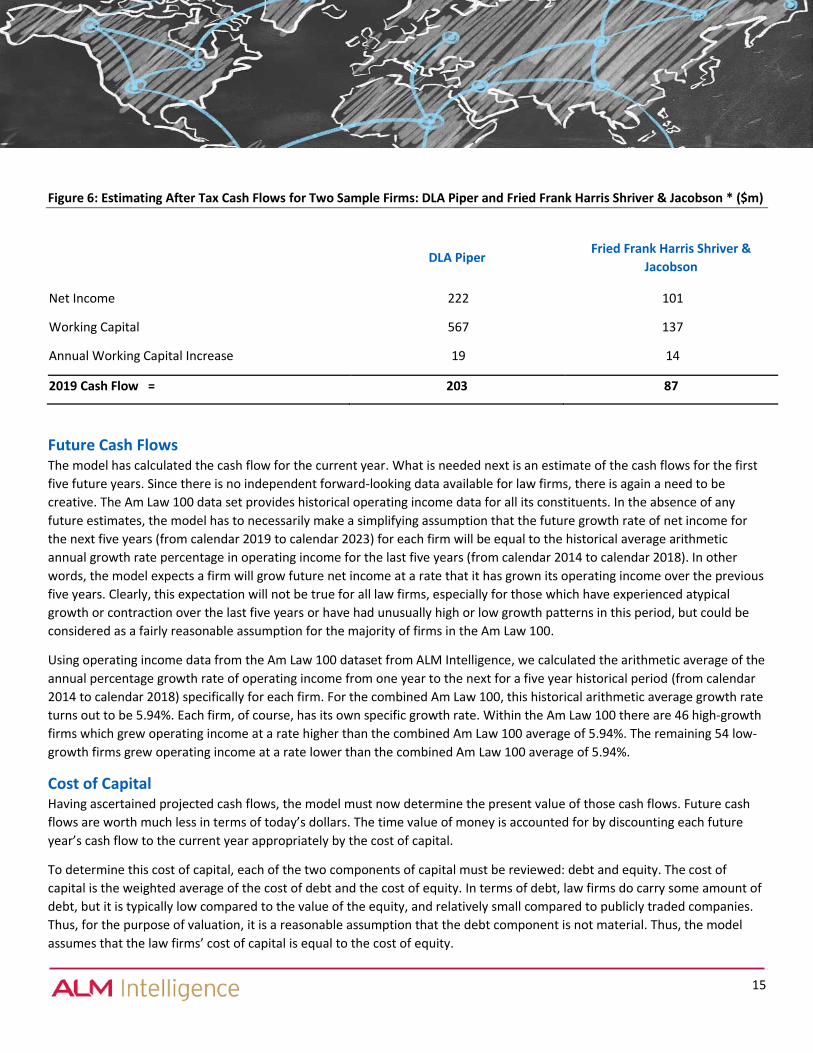
Using the methodology described above, after-tax cash flow for DLA Piper and Fried Frank Harris Shriver & Jacobson can be
calculated (see Figure 6). For DLA Piper, subtracting $19 million of working capital increases from $222 million of net income
leads to cash flow of $203 million. For Fried Frank Harris Shriver & Jacobson, net income is $101 million, and subtracting the
increase in working capital of $14 million leads to cash flow of $87 million. For a comparatively faster growing firm, the
increase in working capital turns out to be a higher proportion of its net income.
Explaining the Methodology: Estimating After Tax Cash Flows
𝑨𝒇𝒕𝒆𝒓 𝑻𝒂𝒙 𝑪𝒂𝒔𝒉 𝑭𝒍𝒐𝒘
= 𝐴𝑓𝑡𝑒𝑟 𝑇𝑎𝑥 𝑁𝑒𝑡 𝐼𝑛𝑐𝑜𝑚𝑒 + 𝐷𝑒𝑝𝑟𝑒𝑐𝑖𝑎𝑡𝑖𝑜𝑛 𝐸𝑥𝑝𝑒𝑛𝑠𝑒 − 𝐶𝑎𝑝𝑖𝑡𝑎𝑙 𝐸𝑥𝑝𝑒𝑛𝑑𝑖𝑡𝑢𝑟𝑒
− 𝑊𝑜𝑟𝑘𝑖𝑛𝑔 𝐶𝑎𝑝𝑖𝑡𝑎𝑙 𝐴𝑛𝑛𝑢𝑎𝑙 𝐼𝑛𝑐𝑟𝑒𝑎𝑠𝑒
𝑫𝒆𝒑𝒓𝒆𝒄𝒊𝒂𝒕𝒊𝒐𝒏 𝑬𝒙𝒑𝒆𝒏𝒔𝒆 = 𝐶𝑎𝑝𝑖𝑡𝑎𝑙 𝐸𝑥𝑝𝑒𝑛𝑑𝑖𝑡𝑢𝑟𝑒
𝑨𝒇𝒕𝒆𝒓 𝑻𝒂𝒙 𝑪𝒂𝒔𝒉 𝑭𝒍𝒐𝒘 = 𝑁𝑒𝑡 𝐼𝑛𝑐𝑜𝑚𝑒 − 𝑊𝑜𝑟𝑘𝑖𝑛𝑔 𝐶𝑎𝑝𝑖𝑡𝑎𝑙 𝐴𝑛𝑛𝑢𝑎𝑙 𝐼𝑛𝑐𝑟𝑒𝑎𝑠𝑒
15
Figure 6: Estimating After Tax Cash Flows for Two Sample Firms: DLA Piper and Fried Frank Harris Shriver & Jacobson * ($m)
DLA Piper Fried Frank Harris Shriver &
Jacobson
Net Income 222 101
Working Capital 567 137
Annual Working Capital Increase 19 14
2019 Cash Flow =
Net Income - Annual Working Capital Increase
203 87
Future Cash Flows The model has calculated the cash flow for the current year. What is needed next is an estimate of the cash flows for the first
five future years. Since there is no independent forward-looking data available for law firms, there is again a need to be
creative. The Am Law 100 data set provides historical operating income data for all its constituents. In the absence of any
future estimates, the model has to necessarily make a simplifying assumption that the future growth rate of net income for
the next five years (from calendar 2019 to calendar 2023) for each firm will be equal to the historical average arithmetic
annual growth rate percentage in operating income for the last five years (from calendar 2014 to calendar 2018). In other
words, the model expects a firm will grow future net income at a rate that it has grown its operating income over the previous
five years. Clearly, this expectation will not be true for all law firms, especially for those which have experienced atypical
growth or contraction over the last five years or have had unusually high or low growth patterns in this period, but could be
considered as a fairly reasonable assumption for the majority of firms in the Am Law 100.
Using operating income data from the Am Law 100 dataset from ALM Intelligence, we calculated the arithmetic average of the
annual percentage growth rate of operating income from one year to the next for a five year historical period (from calendar
2014 to calendar 2018) specifically for each firm. For the combined Am Law 100, this historical arithmetic average growth rate
turns out to be 5.94%. Each firm, of course, has its own specific growth rate. Within the Am Law 100 there are 46 high-growth
firms which grew operating income at a rate higher than the combined Am Law 100 average of 5.94%. The remaining 54 low-
growth firms grew operating income at a rate lower than the combined Am Law 100 average of 5.94%.
Cost of Capital Having ascertained projected cash flows, the model must now determine the present value of those cash flows. Future cash
flows are worth much less in terms of today’s dollars. The time value of money is accounted for by discounting each future
year’s cash flow to the current year appropriately by the cost of capital.
To determine this cost of capital, each of the two components of capital must be reviewed: debt and equity. The cost of
capital is the weighted average of the cost of debt and the cost of equity. In terms of debt, law firms do carry some amount of
debt, but it is typically low compared to the value of the equity, and relatively small compared to publicly traded companies.
Thus, for the purpose of valuation, it is a reasonable assumption that the debt component is not material. Thus, the model
assumes that the law firms’ cost of capital is equal to the cost of equity.
16
The cost of a firm’s equity can be calculated by using a framework which is commonly used in valuation exercises, specifically,
the Capital Asset Pricing Model (CAPM) framework. This CAPM framework recognizes equity investors need to be
compensated for holding risky assets. Thus the cost of equity exceeds the risk-free rate by the market risk premium multiplied
by the Beta factor. Beta is a measure of risk - higher the risk, higher the Beta and conversely lower the risk, lower the Beta.
Mathematically, CAPM says:
To calculate the cost of equity, each element on the right hand side must be estimated. The Risk Free Rate typically used for
valuation exercises is the prevailing 20-year US Treasury bond rate of 2.78%. The Equity Risk Premium, which is the premium
equity investors require to hold riskier stocks against no-risk debt, is estimated to be the prevailing figure of 5.50%.
Finally a Beta factor must be estimated using a comparable set of peers, including the publicly traded consulting firms in the
United States and publicly traded law firms in the UK and Australia. We considered publicly traded consulting and law firms
which had a meaningful level of the beta factor: Accenture, Booz Allen Hamilton, Capgemini, Navigant, The Hackett Group,
Gateley Holdings PLC and IPH Limited. The arithmetic average of the prevailing level of unlevered beta for these firms turned
out to be 1.05. The unlevered beta removes the impacts of different levels of debt to equity in these firms and makes them
comparable. Law firms have low amount of debt, thus there is no need to re-lever the beta to arrive at the appropriate
levered beta for calculating the cost of equity. In other words, the levered beta for law firms could be considered equal to
their unlevered beta. For simplicity, a levered Beta of 1.05 was selected for all the firms in the Am Law 100. This levered Beta
will be applied to all of the Am Law 100, regardless of any variations in their capital structures – a simplifying but solid
assumption.
Using this levered beta in the CAPM model, we can arrive at the cost of equity:
• Cost of Equity = 2.78% + 5.50% * 1.05
• Cost of Equity = 8.56%
And finally, since there we assume there is minimal debt in law firms, the cost of capital becomes equal to the cost of equity:
• Cost of Capital = Cost of Equity = 8.56%
Explaining the Methodology: Estimating The Cost of Equity
𝐶𝑜𝑠𝑡 𝑜𝑓 𝐸𝑞𝑢𝑖𝑡𝑦 = 𝑅𝑖𝑠𝑘 𝐹𝑟𝑒𝑒 𝑅𝑎𝑡𝑒 + 𝐸𝑞𝑢𝑖𝑡𝑦 𝑅𝑖𝑠𝑘 𝑃𝑟𝑒𝑚𝑖𝑢𝑚 ∗ 𝐵𝑒𝑡𝑎
17
Terminal Value Now, the final piece of the valuation puzzle must be determined. This is terminal value, which is the value of all future growth
at the end of the first 5-year stage growth period, that is, from year 5 to the year infinity. The terminal value features in the
stage two of the Two Stage Dividend Discount model. In stage one, the model used a specific annual growth rate for each firm.
However, for stage two, the model will use the same long-term growth rate% for all firms which fall in the same category.
There is no precedent in selecting such terminal growth rates for law firms. Thus the model considers two parameters: (1) the
5-year historical annual growth rate in profits; and (2) the 5-year historical annual growth rate in FTE headcount, presuming
that growth in FTE headcount could be a proxy for growth in demand. The model divides the Am Law 100 into four different
categories:
1. High growth in profits: 31 firms have 5-year annual historical growth rate in profits higher than 8%. For these
firms a 4.5% long-term growth rate is assumed. Such an assumption is reasonable compared to the actual growth
demonstrated by these firms.
2. High growth in demand: 30 firms have 5-year annual historical growth rate in FTE headcount higher than 2%. For
these firms a 3.0% long-term growth rate was assigned. This takes into account that such firms did increase their
headcount in response to market demand for their services.
3. Low growth in demand: 30 firms have 5-year annual historical growth rate in FTE headcount below 2%. For these
firms a 1.5% long-term growth rate was assigned. This provides for modest growth prospects for firms.
4. Low growth in profits: 9 firms have 5-year annual historical growth rate in profits lower than 0%. For these firms
a 0.0% long-term growth rate was assigned. This recognizes that these firms will likely internally restructure their
operations to achieve a flat level of profits over the long term.
Is such a categorization reasonable? For firms with high profit growth rates greater than 8% it is very likely they can achieve
long-term growth rates of 4.5%. Such a level appears achievable. It is equally reasonable to assume that firms with negative
profit growth will improve their operations to levels where profits will be flat over the long term.
But what about those firms which do not fall in either category? Demand growth is an important indicator to look at when
analyzing these firms. For firms which have experienced high growth in demand more than 2%, it is reasonable to anticipate
moderate growth rates but which is lower than for the high growth firms. Thus a 3.0% long term growth rate seems
reasonable. Finally, firms which have experienced a growth in demand below 2%. Such firms can be expected to grow, but
only at very modest long-term growth levels: a 1.5% long term growth rate seems quite achievable.
18
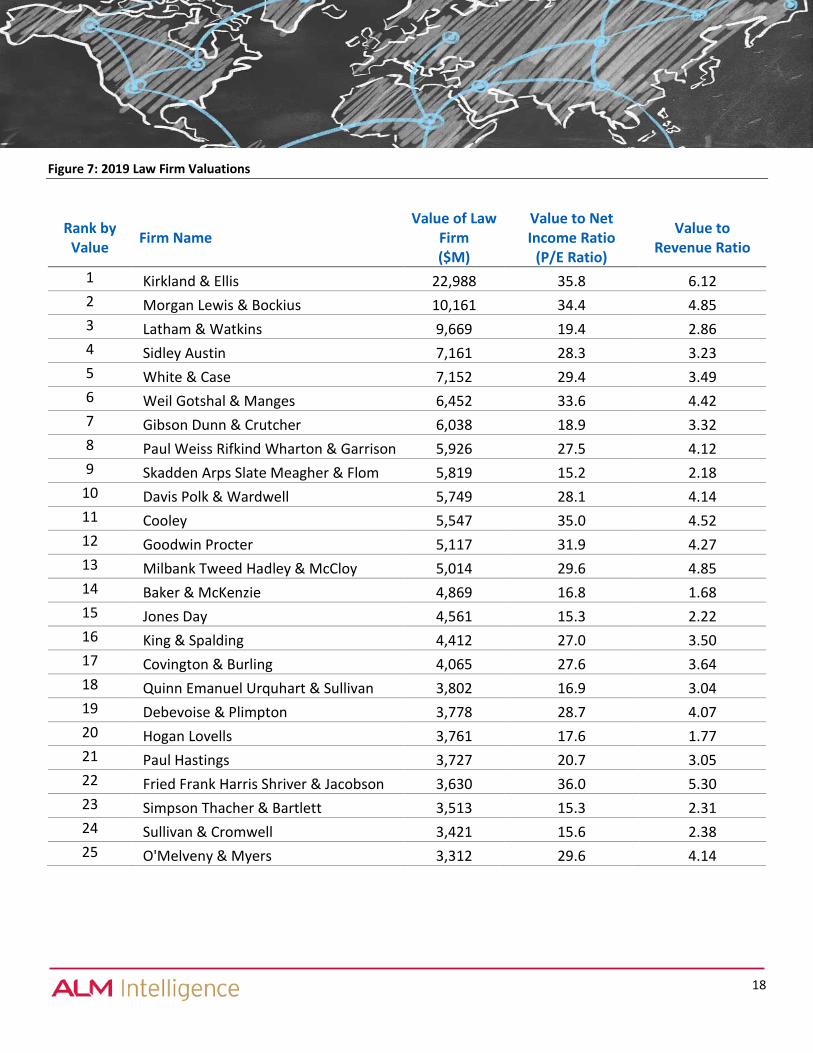
Figure 7: 2019 Law Firm Valuations
Rank by Value
Firm Name Value of Law
Firm ($M)
Value to Net Income Ratio
(P/E Ratio)
Value to Revenue Ratio
1 Kirkland & Ellis 22,988 35.8 6.12
2 Morgan Lewis & Bockius 10,161 34.4 4.85
3 Latham & Watkins 9,669 19.4 2.86
4 Sidley Austin 7,161 28.3 3.23
5 White & Case 7,152 29.4 3.49
6 Weil Gotshal & Manges 6,452 33.6 4.42
7 Gibson Dunn & Crutcher 6,038 18.9 3.32
8 Paul Weiss Rifkind Wharton & Garrison 5,926 27.5 4.12
9 Skadden Arps Slate Meagher & Flom 5,819 15.2 2.18
10 Davis Polk & Wardwell 5,749 28.1 4.14
11 Cooley 5,547 35.0 4.52
12 Goodwin Procter 5,117 31.9 4.27
13 Milbank Tweed Hadley & McCloy 5,014 29.6 4.85
14 Baker & McKenzie 4,869 16.8 1.68
15 Jones Day 4,561 15.3 2.22
16 King & Spalding 4,412 27.0 3.50
17 Covington & Burling 4,065 27.6 3.64
18 Quinn Emanuel Urquhart & Sullivan 3,802 16.9 3.04
19 Debevoise & Plimpton 3,778 28.7 4.07
20 Hogan Lovells 3,761 17.6 1.77
21 Paul Hastings 3,727 20.7 3.05
22 Fried Frank Harris Shriver & Jacobson 3,630 36.0 5.30
23 Simpson Thacher & Bartlett 3,513 15.3 2.31
24 Sullivan & Cromwell 3,421 15.6 2.38
25 O'Melveny & Myers 3,312 29.6 4.14
19
Findings: Valuation of the Am Law 100
Valuation Having calculated each input required for the valuation model, the 2019 value of each individual firm within the Am Law 100
can be estimated by discounting the five year cash flows and the terminal value. Figure 7 shows the values of the top 25 firms,
and the value as a multiple of net income and as a multiple of revenue. The top 5 firms by valuation are seen to be Kirkland &
Ellis (valuation of $23.0 billion), Morgan Lewis & Bockius ($10.2 billion), Latham & Watkins ($9.7 billion), Sidley Austin ($7.2
billion) and White & Case ($7.2 billion). The value to net income ratio ranges from a minimum of 7.9 to a maximum of 39.0;
the value to revenue ratio ranges from a minimum of 0.4 to a maximum of 6.1. Why such a wide variation in value and in the
multiples? This is due to the wide range in the level of profits, annual growth rates and profitability of all the hundred firms in
the Am Law 100.
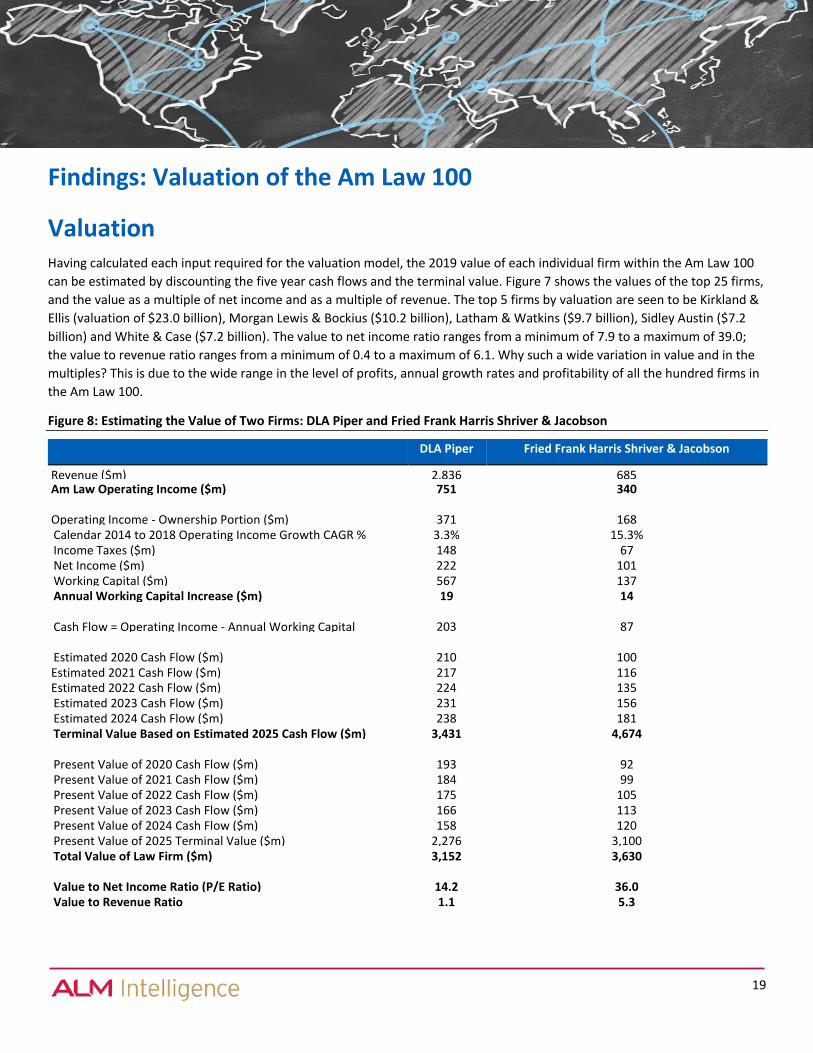
Figure 8: Estimating the Value of Two Firms: DLA Piper and Fried Frank Harris Shriver & Jacobson
DLA Piper Fried Frank Harris Shriver & Jacobson
Revenue ($m) 2,836 685 Am Law Operating Income ($m) 751 340 Operating Income - Ownership Portion ($m) 371 168 Calendar 2014 to 2018 Operating Income Growth CAGR % 3.3% 15.3% Income Taxes ($m) 148 67 Net Income ($m) 222 101 Working Capital ($m) 567 137 Annual Working Capital Increase ($m) 19 14 Cash Flow = Operating Income - Annual Working Capital
Increase ($m)
203 87 Estimated 2020 Cash Flow ($m) 210 100 Estimated 2021 Cash Flow ($m) 217 116 Estimated 2022 Cash Flow ($m) 224 135 Estimated 2023 Cash Flow ($m) 231 156 Estimated 2024 Cash Flow ($m) 238 181 Terminal Value Based on Estimated 2025 Cash Flow ($m) 3,431 4,674 Present Value of 2020 Cash Flow ($m) 193 92 Present Value of 2021 Cash Flow ($m) 184 99 Present Value of 2022 Cash Flow ($m) 175 105 Present Value of 2023 Cash Flow ($m) 166 113 Present Value of 2024 Cash Flow ($m) 158 120 Present Value of 2025 Terminal Value ($m) 2,276 3,100 Total Value of Law Firm ($m) 3,152 3,630 Value to Net Income Ratio (P/E Ratio) 14.2 36.0 Value to Revenue Ratio 1.1 5.3
20
Source: Yahoo Finance, May 2019
For the combined Am Law 100, the 2019 valuation is estimated at $247 billion, 23.4 times cash flow of $10.6 billion, 21.2
times net income of $11.7 billion, 12.7 times pure pre-tax profits of $19.5 billion, 6.27 times operating income of $39.4 billion
and 2.50 times revenue of $98.7 billion.
Turning to the two firms discussed earlier, DLA Piper’s value comes to $3.15 billion, 14.2 times its net income and 1.1 times its
revenue. DLA Piper’s ratios are below the combined Am Law 100 firms due to a lower annual growth rate in future cash flows.
Fried Frank Harris Shriver & Jacobson’s value is $3.633 billion, 36.0 times its net income and 5.3 times its revenue. Fried Frank
Harris Shriver & Jacobson’s ratios are above the combined Am Law 100 firms due to a higher annual growth rate in future cash
flows. Fried Frank Harris Shriver & Jacobson has higher profitability and a higher growth rate than DLA Piper. These two
factors contribute to its higher valuation ratios (see Figure 8).
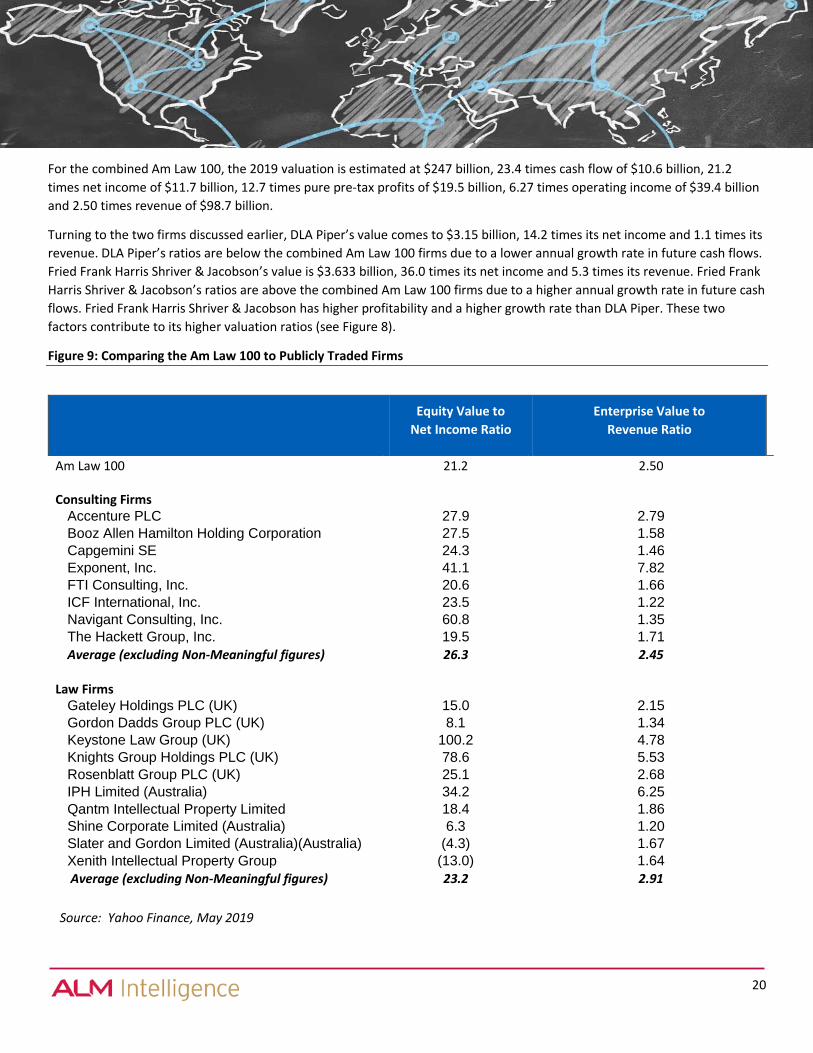
Figure 9: Comparing the Am Law 100 to Publicly Traded Firms
Equity Value to
Net Income Ratio
Enterprise Value to
Revenue Ratio
Am Law 100 21.2 2.50
Consulting Firms
Accenture PLC 27.9 2.79 Booz Allen Hamilton Holding Corporation 27.5 1.58 Capgemini SE 24.3 1.46 Exponent, Inc. 41.1 7.82 FTI Consulting, Inc. 20.6 1.66 ICF International, Inc. 23.5 1.22 Navigant Consulting, Inc. 60.8 1.35 The Hackett Group, Inc. 19.5 1.71
Average (excluding Non-Meaningful figures) 26.3 2.45
Law Firms
Gateley Holdings PLC (UK) 15.0 2.15 Gordon Dadds Group PLC (UK) 8.1 1.34 Keystone Law Group (UK) 100.2 4.78 Knights Group Holdings PLC (UK) 78.6 5.53 Rosenblatt Group PLC (UK) 25.1 2.68 IPH Limited (Australia) 34.2 6.25 Qantm Intellectual Property Limited
(Australia)((Australia) 18.4 1.86
Shine Corporate Limited (Australia) 6.3 1.20 Slater and Gordon Limited (Australia)(Australia) (4.3) 1.67 Xenith Intellectual Property Group
(Australia)Limited (Australia) (13.0) 1.64
Average (excluding Non-Meaningful figures) 23.2 2.91
21
Comparison to Publicly Traded Firms The calculated Am Law 100 overall valuation can be compared against external benchmarks. Figure 9 compares the Am Law
100 valuation ratios to two closest peer sets whose valuation parameters are publicly available: publicly traded US consulting
firms and publicly traded UK and Australian law firms. The equity value to net income (P/E) ratio of the Am Law 100 is seen to
be very close to publicly traded law firms and slightly lower than publicly traded consulting firms. On the other hand, the
enterprise value to revenue (P/S) ratio of the Am Law 100 is similar to publicly traded consulting firms but below that of
publicly traded law firms. Given that there are critical differences between the Am Law 100 and publicly traded consulting
firms and law firms in terms of limited data availability and absence of forward-looking estimates, such a close match is a solid
validation of the robustness of the methodology despite its numerous assumptions. The Am Law 100’s operational peers, the
UK and Australian law firms, have only recently become publicly traded and are relatively smaller enterprises. Publicly traded
consulting firms are larger in size and have a much longer history of operations and trading in capital markets. Am Law 100
firms are in the same business as publicly traded law firms but their size and operating history are more in line with consulting
firms. This closeness in valuation multiples suggest that the Am Law 100 contains characteristics of both groups and its
valuation appears to be a hybrid.
Summary This journey into law firm valuation has been quite demanding, but very insightful. It has required an analysis of partner
compensation structures, an evaluation of market risk for law firms, an estimate of net income, the construction of a cash
flow model and the development of potential future growth. The model built upon the very limited data available with
numerous simplifying and growth assumptions for calculating input parameters. Many of these approaches have been applied
for the first time in the legal industry. As a result, we have been able to derive new metrics, some which are very different
from commonly analyzed industry parameters. The final outcomes of this exercise turned out to be highly comparable to
publicly traded values observed in capital markets. This provides a good validation of the capital markets techniques and the
methodologies used here. There are many interesting insights accruing from this analysis which will be covered in
forthcoming articles.
The valuation varies markedly from the 2012 American Lawyer results. The previous approach derived a firm’s value by
multiplying its pre-tax cash flow by a multiple, which was based on quantitative measurement of size and growth and a
qualitative assessment of brand strength. While the approach did include key drivers of value, the calculation of the multiple
was broad and subjective; and did not account for firm-specific circumstances. In contrast, the methodology used in this
report is specific, bottoms-up, based on after-tax cash flow and standard valuation techniques.
This methodology vastly improves upon the prior approach for a more precise determination of value. That said, it must be
recognized that valuation is part science and part art. It is possible that more refined approaches may be applied in the future.
This report represents a step in numerically assessing the value of private law firm partnerships. The insights from a deep
analysis of partner compensation, valuation drivers, growth estimation and risk assessment have immediate applicability. And
while valuation is not a requirement today, it will become a necessity if and when law firms become publicly traded on capital
markets or when firm ownership is expanded beyond equity partners.