Embed Size (px)
Citation preview

REGULAR ARTICLE
A vector-dissimilarity-based approach for multi-criteriadecision making
Suprakash Gupta • Anjum Rahber •
Alireza Ahmadi • Uday Kumar
Received: 5 April 2013 / Revised: 16 July 2013 / Published online: 7 August 2013
� The Society for Reliability Engineering, Quality and Operations Management (SREQOM), India and The Division of Operation and
Maintenance, Lulea University of Technology, Sweden 2013
Abstract Decision making in complex environments is
influenced by a large number of conflicting and incom-
mensurable factors. It is multidimensional and the influ-
encing factors affect the decision process to varying
degrees. The performance measurement of decision alter-
natives in multi-criteria decision making (MCDM) may be
represented as a multidimensional vector in real space. The
technique for order preference by similarity to ideal solu-
tion (TOPSIS) is a popular MCDM tool. However, some-
times this technique shows its inability to differentiate
between decision alternatives. In this paper the limitations
of TOPSIS are examined and an improvement is suggested.
The proposed new method uses the vector dissimilarity
approach to remove the boundary restrictions and achieve
greater sovereignty. The improved method has been dem-
onstrated through a case study of maintenance design for
dump trucks deployed in a large surface mine.
Keywords Decision alternatives � Vectordissimilarity �Maintenance selection �MCDM �Mine
dump trucks
1 Introduction
In today’s highly competitive business environment,
managers have to make numerous decisions within a short
period. Often these decisions are made in complex envi-
ronments and are influenced by a large number of con-
flicting and incommensurable criteria. This compels
managers to take help from guiding tools that assist them in
choosing the right alternative at an acceptable risk. A
suitable multi-criteria decision making (MCDM) approach
helps managers by ranking the available alternatives
through evaluation with respect to multiple appraising
criteria. A decision process normally incorporates the fol-
lowing steps (Opricovic and Tzeng 2004):
(a) Establish the goal or decision objectives.
(b) Develop a list of feasible alternatives that can meet
the decision objectives.
(c) Establish an evaluation methodology, e.g. an MCDM
approach, for assessing the effectiveness of the
alternatives in meeting the objectives.
(d) Select a criteria set and assess the weight of the
criteria.
(e) Evaluate the performance of the alternatives in the
light of the criteria set.
(f) Rank the alternatives and choose the most apt option.
There is no direct and straightforward metric for mea-
suring/assessing the effectiveness of an alternative decision.
It is usually judged indirectly through a set of parameters
called decision making attributes/criteria. The efficacy of a
decision is evaluated through a set of n-attributes. Therefore,
the decision alternatives in a MCDM process may be
regarded as vectors in a real n-dimensional criteria space
where each alternative decision vector is characterised by its
S. Gupta (&) � A. RahberDepartment of Mining Engineering, Indian Institute
of Technology (BHU), Varanasi 221005, India
e-mail: [email protected]
A. Ahmadi � U. Kumar
Division of Operation, Maintenance and Acoustics,
Lulea University of Technology, 97187 Lulea, Sweden
123
Int J Syst Assur Eng Manag (July-Sept 2013) 4(3):249–261
DOI 10.1007/s13198-013-0187-0
Author's personal copy

direction and magnitude. The evaluation attributes may be
clustered into two groups based on their performance. Some
criteria may be of the benefit type, meaning that the larger
values are preferable to the lower values, while the lesser
values are more preferable than the higher for the cost type
criteria. The influences of these two groups are conflicting in
nature. Conflict management is the core of any MCDM
problem.
These two groups of criteria may be divided into sub-
groups, etc. This gives a list of criteria that influence the
decision to varying degrees. The importance of each cri-
terion may be assessed through a suitable technique like the
analytic hierarchy process (AHP). In MCDM, the alterna-
tives are assessed and compared with each other.
This paper proposes an adapted technique for order
preference by similarity to ideal solution (TOPSIS) meth-
odology which combines both the magnitude and the
direction of a decision vector in the assessment process.
The similarity and dissimilarity of the vector alternatives
are measured by agreement/disagreement in magnitude and
direction. A case study has been performed to illustrate the
use of the proposed methodology for the selection of an apt
maintenance strategy for dump truck components.
The rest of the article is organized as follows. Section 2
describes the AHP, which is used for assessing the relative
importance of different criteria. Section 3 introduces TOP-
SIS as a decision making methodology, while Sect. 4
examines its limitations. In Sect. 5 the proposed adapted
TOPSIS methodology is described. The proposed method-
ology is illustrated through a case study in Sect. 6, which
includes sub-sections on data collection and the development
of the maintenance selection criteria. Section 7 ends the
paper with a discussion and a presentation of conclusions.
2 The analytic hierarchy process (AHP) for assessing
the relative importance of different criteria
The AHP (Saaty 1980) helps the analyst to organize the
critical aspects of a problem into a hierarchical structure.
The method is very popular and interested readers may
refer (Saaty 1980;Gupta and Kumar 2012; Kumar et al.
2010) for details. The salient points of the AHP are as
follows:
The AHP employs pair-wise comparison in which
experts compare the importance of two factors on a rela-
tively subjective scale. These pair-wise comparisons are
carried out for all the attributes using a scale of absolute
judgments that represents ‘how much more’ one element
dominates another with respect to a given attribute. The
number of attributes is limited to seven on a level, fol-
lowing the concepts espoused by Miller (1956) for the
limits of human information processing capacity. The
judgment matrix A ¼ aij� �
of importance is built according
to the relative importance given by the experts. The
weighted mean value of aij for a group response is:
aij ¼Ynk¼1
wk � akij !1=wk
ð1Þ
where akij is the k-th expert’s paired comparison value, n is
the number of experts, and wk is the weight of the k-th
expert. In this study, it was assumed that all the experts had
equal expertise in their judgments and therefore wk ¼ 18k.Since human judgments are the basis of the AHP, some
degree of inconsistency may be introduced due to a lack of
adequate information, improper conceptualization, and
mental fatigue. Therefore, one needs to measure the con-
sistency of judgments, which is accomplished by calcu-
lating the consistency ratio (CR), i.e. by comparing the
consistency index (CI ¼ kmax�nn�1
, where kmax is the largest
Eigen value of the n 9 n pair-wise comparison matrix) in
relation to random index (RI). The judgments can be
considered acceptable if and only if the consistency ratio
(CR ¼ CIRI) is less than 0.1. If the CR is much in excess of
0.1, the judgments are untrustworthy, as they are too close
for comfort to randomness and the exercise is worthless or
must be repeated.
3 Decision making through TOPSIS
Multi-criteria decision making (MCDM) is used to select
an alternative from several alternatives according to vari-
ous criteria. The feasible set of alternatives may be regar-
ded as an array of n-dimensional vectors, when n is the
number of decision criteria. Each alternative is a point in n-
dimensional real space. Hwang and Yoon (1981) first
developed the TOPSIS to help the decision maker in
complex situations arising out of multiple criteria and
multiple perspectives. The TOPSIS approach is based on
the idea that the chosen alternative should have the shortest
distance from the positive ideal solution (PIS) and the
farthest from the negative ideal solution (NIS). The aim of
TOPSIS is to find the best values of the alternatives for the
PIS when the NIS is the minimal benefit solution and
incorporates all the worst values of the alternatives. Sub-
sequently the alternatives are ranked with respect to their
relative closeness to the ideal solutions. The calculation
procedure of TOPSIS is as follows.
3.1 Normalize the appraisal matrix
Experts assess different criteria in different units and use
different scales according to their individual perception and
250 Int J Syst Assur Eng Manag (July-Sept 2013) 4(3):249–261
123
Author's personal copy

subjective estimation. The basic prerequisite for compari-
son and aggregation or applying other mathematical oper-
ations on the collected appraisal data is the transformation
of different incommensurable criteria into common unit-
less functions. A normalization process transforms differ-
ent incommensurable criteria into n-dimensional criteria to
allow mathematical relations and operations. This sets their
values in the closed interval [0, 1]. Assume that xij is an
element of the appraisal matrix D ¼ xij� �
for the value of
the i-th appraisal criterion function of alternative Aj. xijindicates the rating of alternative Aj with respect to crite-
rion i. The element rij of the normalized appraisal matrix R
is usually calculated by the vector normalization method as
was originally proposed by Hwang and Yoon (1981) in
TOPSIS. Observing its unit dependence (Opricovic and
Tzeng 2004) and following Lai et al. (1994) and Ahmadi
et al. (2010), linear normalization has been vouched for
concerning sovereignty and the elimination of a scaling and
unit effect as given below:
rij ¼ xij � x�ixþi � x�i
for benifit criterion and
rij ¼ xþi � xij
xþi � x�ifor cost criterion
ð2Þ
where, i ¼ 1; 2; 3; . . .; n and j ¼ 1; 2; 3; . . .;m and xþiand x�i are the maximum and the minimum values of the i-
th criterion function for all the alternatives, respectively.
3.2 Construct the weighted normalized appraisal
matrix
All the appraisal criteria may not have an equal impor-
tance, because the different appraisal criteria have various
meanings and influence decisions to different degrees.
Various methods are used to determine importance/
weights, such as the Eigen vector method, weighted least
square method, entropy method, and AHP, as well as linear
programming techniques for multidimensional analysis of
preference (LINMAP). The AHP has been used here to
assess the corresponding weight of the criteria. The
weighted normalized appraisal matrix can be calculated by
multiplying the normalized appraisal matrix ½rij� by the
corresponding weight matrix W ¼ ½wi�. The weighted
normalized appraisal matrix V ¼ ½vij� or decision matrix is
formulated as follows:
vij ¼ rij � wi ð3Þ3.3 Determine the positive and negative ideal solutions
In TOPSIS, n-dimensional vector solution space is boun-
ded by two cardinal points, the PIS Aþð Þ and the NIS A�ð Þ.The PIS Aþð Þ is the most preferable alternative and has the
coordinates of all the best attainable values of the mono-
tonically increasing criterion function, while the NIS A� is
the least preferable alternative and is made up of all the
worst attainable values of the monotonically decreasing
criterion function. These two cardinal points form the basis
for calculating a separation measure. The expressions are
as follows: Aþ ¼ fðMaxjvijji 2 IÞ; ðMinjvijji 2 I0Þji ¼1; 2; 3; . . .; ng ¼ fv�1 ; vþ2 ; . . .v�i ; . . .v�n g—coordinates of the
positive ideal alternative solution in n-dimensional criteria
space. A� ¼ fðMinjvijji 2 IÞ; ðMaxjvijji 2 I0Þji ¼ 1; 2; 3;
. . .; ng ¼ fv�1 ; v�2 ; . . .v�i ; . . .v�n g—coordinates of the nega-
tive ideal alternative solution in n-dimensional criteria
space.
Here I is the set of benefit (max. type) criteria, I0 is theset of cost (min. type) criteria and vþi is the best feasible
value of the i-th criterion function, while v�i is the worst
attainable value of the i-th criterion function.
3.4 Calculate the separation measure
The separation distances of a feasible alternative solution,
Aj, from the PIS Aþð Þ and the NIS A�ð Þ are usually cal-
culated as Euclidean distances of n-criteria from cardinal
points as given below:
Sþj ¼ffiffiffiffiffiffiffiffiffiffiffiffiffiffiffiffiffiffiffiffiffiffiffiffiffiffiffiffiffiXni¼1
vij � vþi� �2s
; i ¼ 1; 2; 3; . . .N, ð4Þ
S�j ¼ffiffiffiffiffiffiffiffiffiffiffiffiffiffiffiffiffiffiffiffiffiffiffiffiffiffiffiffiffiXni¼1
vij � v�i� �2s
; i ¼ 1; 2; 3; . . .N: ð5Þ
3.5 Calculate the relative closeness to the ideal solution
The relative closeness of the j-th alternative with respect to
the ideal solution A? is defined as C�j , with the following
being valid: 1�C�j � 0. If alternative j is the PIS, then
C�j ¼ 1; however, if alternative j is the NIS, then C�
j ¼ 0.
In other words, if the value of C�j is closer to 1, the alter-
native j will be closer to the PIS.
C�j ¼ S�j = Sþj þ S�j
� �: ð6Þ
3.6 Rank the priority
A set of alternatives are then ranked according to the
descending order of C�j values.
4 Limitations of TOPSIS
The ranking of alternatives according to the descending
order of C�j values has some limitations, as pointed out by
Opricovic and Tzeng (2004). Referring to Fig. 1, Aþ and
Int J Syst Assur Eng Manag (July-Sept 2013) 4(3):249–261 251
123
Author's personal copy

A� are the two cardinal points in the feasible solution space
AþPA�Q. The Euclidean distances AþD1 and A�D1 used
as separation measures (Sþj and S�j ) consider only the
magnitude of the vectors. As a result, both the alternatives
Aj and Ak have equal C�j values and possess the same rank
in TOPSIS. The ranking of the alternatives using the rel-
ative closeness value C�j puts all the alternatives on the line
D1AcD2 on the same rank as all C�j ¼ 0:5. Any alternative
in the region E1AcE2D2AcD1E1 (the area hatched in blue)
has C�j [ 0:5 and therefore has a better rank than alterna-
tive Ac, although Ac is comparatively closer to Aþ. Simi-
larly, all the alternatives in the region F1AcF2D2AcD1F1
(the area hatched in red) have C�j \0:5 and therefore pos-
sess an inferior rank than alternative Ac, although they are
comparatively farther from A�.
5 Proposed adapted TOPSIS methodology
Having observed the limitations of the prevailing approach,
a modified approach is proposed here. The proposed
methodology represents all the alternative decisions as n-
dimensional vectors. The included angles between the
alternative decision vectors may be used as measures of
conflict. The closeness of an alternative decision vector to
the cardinal points is influenced by the direction and
magnitude of the separation vectors. Therefore, both of
these parameters will be included in the calculation. The
coordinates of the PIS and NIS are obtained following the
same procedure described in TOPSIS (step 1–3). Now the
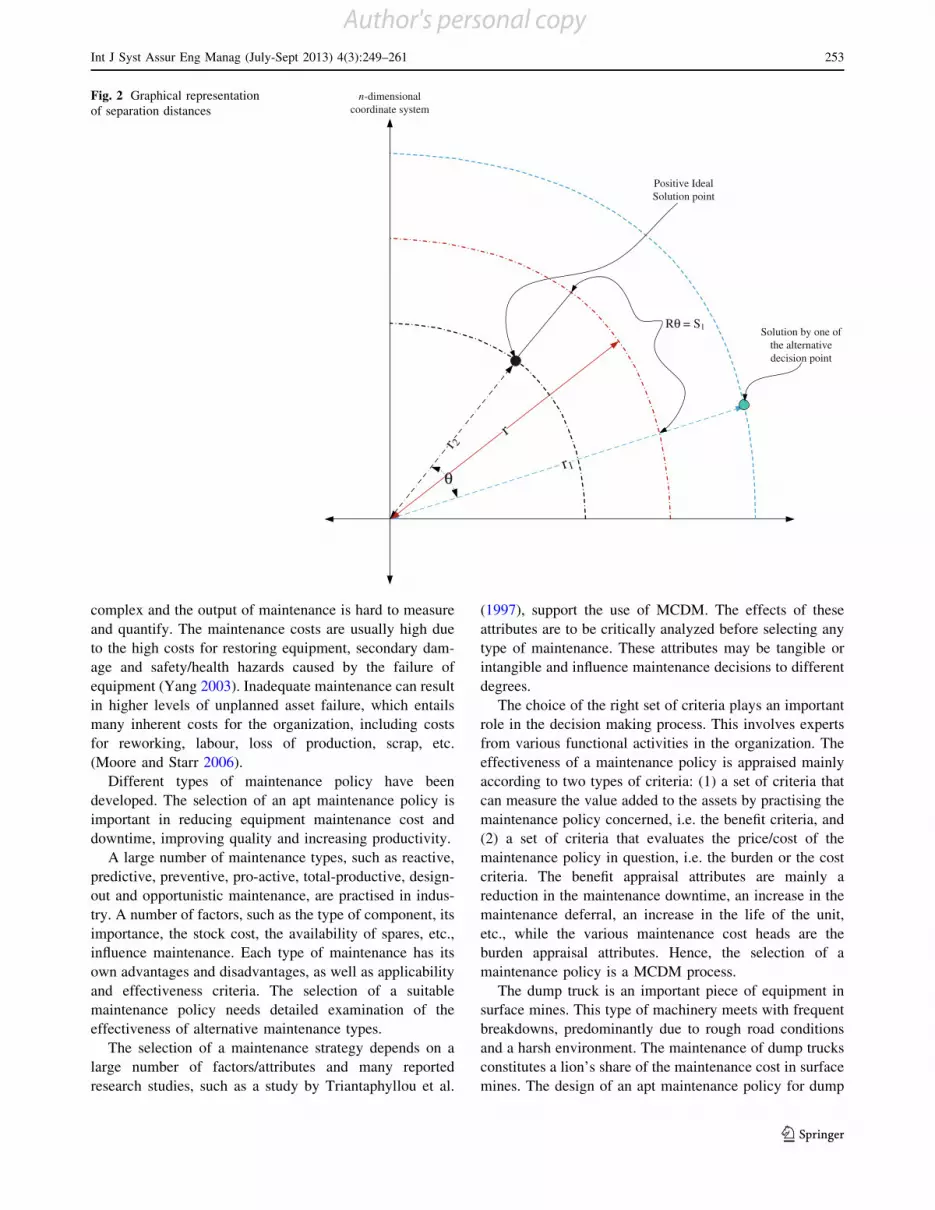
cardinal points (PIS and NIS) and all the alternative deci-
sion points are assumed to be on concentric circles with the
origin as the centre. Let the radii of the circles for the
alternative decision points and the PIS be represented as r1and r2, respectively (Fig. 2). The angle between the alter-
native decision vector and the PIS vector is represented by
hþ. The value of hþ is calculated from the co-ordinates of
the cardinal points and the alternative decision points using
the expression given below:
h ¼ cos�1 AþAj
Aþk k Aj
!
¼ cos�1
Pni¼1 v
þi � vijffiffiffiffiffiffiffiffiffiffiffiffiffiffiffiffiffiffiffiffiffiffiffiffiffiffiffiffiffiffiffiffiffiffiffiffiffiffiffiffiffiffiffiffiffiffiffiffiPn
i¼1ðvþi Þ2 �Pn
i¼1ðvijÞ2q
0B@
1CA: ð7Þ
The separation measure is estimated as the arc length
r � h, where r is the equivalent mean radius and is esti-
mated as r ¼ ffiffiffiffiffiffiffiffiffiffiffiffiffiffir1 � r2
p. The use of a geometric mean
normalizes the effect of the range domination of different
attributes and averaging data. This arc length is represented
by SMþðrþ � hþÞ. Similarly, the separation measure from
the NIS is calculated and represented by SM�ðr� � h�Þ.Now the preference index (PI) of the j-th alternative ðS�j Þ iscalculated as:
S�j ¼ SM�j =ðSMþ
j þ SM�j Þ ð8Þ
The values of S�j lie between 0 and 1. The closer the
value of S�j is to 1, the greater is its acceptability. S�j is
calculated as a ratio of separation arc lengths. Arc lengths
are influenced both by the vector magnitude and the
direction. Therefore, PI has a higher sensitivity.
6 Case study
Modern surface mining projects deploy gigantic machines
which involve huge capital investments. A steady pro-
duction assurance is a prerequisite for their economic
sustainability. The production rate is directly influenced by
the health and condition of the equipment, i.e. its func-
tionality and availability. Hence, maintenance plays an
important role for the healthy operation of an industrial
organization, and the maintenance cost represents 15–40 %
of the production cost (Al-Najjar and Alsyouf 2003). The
objective of maintenance is to maximize the utilization of a
component’s life by minimizing the number of failures and
replacements. Attaching insufficient importance to main-
tenance strategies has resulted in low maintenance effi-
ciency in the past (Wang et al. 2007). Moreover, one-third
of the maintenance cost may be saved by discarding
unjustifiable and unnecessary maintenance-related activi-
ties (Mobley 2002 cited by Wang et al. 2007).
Maintenance plays a key role in achieving organiza-
tional goals and objectives. Maintenance management is
E1 D1 F1
E2
AJ
AK
D2 F2
AC
C2
C1
Fig. 1 A two-dimensional representation of Euclidean distances from
PIS and NIS
252 Int J Syst Assur Eng Manag (July-Sept 2013) 4(3):249–261
123
Author's personal copy
complex and the output of maintenance is hard to measure
and quantify. The maintenance costs are usually high due
to the high costs for restoring equipment, secondary dam-
age and safety/health hazards caused by the failure of
equipment (Yang 2003). Inadequate maintenance can result
in higher levels of unplanned asset failure, which entails
many inherent costs for the organization, including costs
for reworking, labour, loss of production, scrap, etc.
(Moore and Starr 2006).
Different types of maintenance policy have been
developed. The selection of an apt maintenance policy is
important in reducing equipment maintenance cost and
downtime, improving quality and increasing productivity.
A large number of maintenance types, such as reactive,
predictive, preventive, pro-active, total-productive, design-
out and opportunistic maintenance, are practised in indus-
try. A number of factors, such as the type of component, its
importance, the stock cost, the availability of spares, etc.,
influence maintenance. Each type of maintenance has its
own advantages and disadvantages, as well as applicability
and effectiveness criteria. The selection of a suitable
maintenance policy needs detailed examination of the
effectiveness of alternative maintenance types.
The selection of a maintenance strategy depends on a
large number of factors/attributes and many reported
research studies, such as a study by Triantaphyllou et al.
(1997), support the use of MCDM. The effects of these
attributes are to be critically analyzed before selecting any
type of maintenance. These attributes may be tangible or
intangible and influence maintenance decisions to different
degrees.
The choice of the right set of criteria plays an important
role in the decision making process. This involves experts
from various functional activities in the organization. The
effectiveness of a maintenance policy is appraised mainly
according to two types of criteria: (1) a set of criteria that
can measure the value added to the assets by practising the
maintenance policy concerned, i.e. the benefit criteria, and
(2) a set of criteria that evaluates the price/cost of the
maintenance policy in question, i.e. the burden or the cost
criteria. The benefit appraisal attributes are mainly a
reduction in the maintenance downtime, an increase in the
maintenance deferral, an increase in the life of the unit,
etc., while the various maintenance cost heads are the
burden appraisal attributes. Hence, the selection of a
maintenance policy is a MCDM process.
The dump truck is an important piece of equipment in
surface mines. This type of machinery meets with frequent
breakdowns, predominantly due to rough road conditions
and a harsh environment. The maintenance of dump trucks
constitutes a lion’s share of the maintenance cost in surface
mines. The design of an apt maintenance policy for dump
r1
r 2
r
Positive Ideal Solution point
Solution by one of the alternative decision point
n-dimensional coordinate system
θ
Rθ = S1
Fig. 2 Graphical representation
of separation distances
Int J Syst Assur Eng Manag (July-Sept 2013) 4(3):249–261 253
123
Author's personal copy

trucks is very important. Maintenance policies differ from
component to component depending on their functionality,
cost, criticality, importance, working environment, etc.
This case study aims at the design of maintenance for the
three most critical components, i.e. the engine, tyre, and
transmission. The case study was conducted in a large
surface coal mine in India. This mine deployed a large fleet
of dump trucks of different capacities, varying from 85 to
120 t and manufactured by Terex, Caterpillar, Hulpack,
Komatsu and BEML.
The mine had three maintenance workshops, namely a
base workshop, a field workshop and a mine workshop.
The mine workshop dealt with small repair jobs near the
mine itself, while the field workshop took care of the more
critical problems and was involved only if it was not
possible to deal with the fault in the mine workshop. The
base workshop was mainly involved in supplying spares,
carrying out repairs and keeping stocks of equipment. A
survey was conducted and information was gathered
regarding the various types of maintenance techniques
applied in the main workshop. It was found that 4 main
types of maintenance strategies were implemented in the
main base workshop. These were as follows:-
(a) Corrective maintenance This can be defined as the
maintenance which is required when an item has
failed or is worn out, to bring it back to working
order. Corrective maintenance is the most commonly
used maintenance approach, but it has associated
demerits. Sudden equipment failures lead to excessive
downtime, affecting production and occasionally
damaging other parts. In most cases, this is expensive.
When a component needs replacement, the cost of the
replacement alone is substantial. Corrective mainte-
nance also leads to low availability figures and is
usually carried out on items for which the conse-
quences of failure or wearing out are not significant
(less important items).
(b) Periodic maintenance This is also known as sched-
uled maintenance. It has a fixed cost and is carried out
following the designer’s or manufacturer’s recom-
mendations. Here significant activities are carried out
regularly (following a certain predetermined sche-
dule) to maintain the condition or operational status
of a piece of equipment, machine, plant, or system.
(c) Preventive maintenance Preventive maintenance
actions are performed according to a clock-time-
based or machine-run-based schedule. They detect,
preclude, or mitigate the degradation of a component
or system with the aim of sustaining or extending its
useful life through controlling the degradation to an
acceptable level. While preventive maintenance is not
the optimum maintenance programme, it does have
several advantages over a purely reactive programme.
Practising preventive maintenance helps to extend the
life of the equipment and bring it closer to the
designed life. Preventive maintenance will generally
make the equipment run more efficiently. Although
catastrophic equipment failures cannot be averted, the
failure frequency may decrease through well-defined
preventive maintenance. Minimizing failures trans-
lates into maintenance and capital cost savings. The
major advantages of this type of maintenance strategy
are that it is cost-effective in many capital-intensive
processes, that its flexibility allows an adjustment of
the maintenance periodicity, and that it leads to an
increased component life cycle, energy savings and
reduced equipment or process failure. However, the
process suffers from a number of disadvantages:
catastrophic failures are still likely to occur; the
method is labour-intensive; occasionally it may
include over-maintenance; and there is a potential
risk of incidental damage to components in carrying
out the maintenance.
(d) Pro-active maintenance This is basically a type of
approach or attitude, rather than a technique. Pro-active
maintenance is the cheapest strategy of all and is based
on experience. With this strategy, if a particular type of
problem is encountered in a component/piece of
equipment, then as a preventive measure, all similar
components/equipment are upgraded.
6.1 Data collection
Failure and maintenance information on dump trucks was
collected from the field and classified as shown in Table 1.
Here one can observe that the engine, tyres and transmis-
sion are the most critical components of the dump trucks,
as they needed more maintenance hours and hence required
most attention. These three components have been con-
sidered for further study.
6.2 Development of the hierarchical structure
of the maintenance selection criteria
Structuring the problem into a hierarchy serves two pur-
poses. First it provides an overall view of the complex
relationship between the variables inherent in the problem,
and second, it helps the decision maker in making judg-
ments concerning the comparison of elements that are
homogenous and on the same level of the decision hier-
archy (Arunraj and Maiti 2010). The performance of a
maintenance strategy is reflected by various indicators
called decision attributes. The choice of these attributes
and sub-attributes affects the type of maintenance policy
254 Int J Syst Assur Eng Manag (July-Sept 2013) 4(3):249–261
123
Author's personal copy

adopted. The factors considered in this study were selected
in due consultation with the field experts of the case study
and are described below (Fig. 3).
6.2.1 Production
It is always desirable that the maintenance of any compo-
nent should have the least possible effect on the production
capacity. The target level of incessant production is man-
datory for the economic sustainability of any project. This
is mainly a reflection of the criticality of the component.
The failure of a critical component of any equipment may
lead to high downtime and must be avoided. Consequently,
the effect of failure of the component on production is of
the utmost importance for production equipment and
should be given due weightage when selecting a mainte-
nance policy. This issue takes into account continuous
output and high quality (the desired level of production in
conformance with the acceptable standards). Both factors
are important from the point of view of market demand and
the reputation of the firm, and hence should be focused
upon.
6.2.2 Feasibility
The feasibility or acceptability of a maintenance strategy is
one of the important criteria to be considered. This includes
the acceptability of a particular maintenance policy by
Table 1 Failure and maintenance information for various components of the dump trucks during the study period
Sl.
no.
Names of
system parts
Frequency of
maintenance
Total hours of
maintenance
Average
maintenance time
Minimum maintenance
time (h)
Maximum maintenance
time (h)
1 Tyre 218 3,965 18 2 160
2 Engine 20 3,090 154 16 1,106
3 Transmission 8 2,777 347 76 2,698
4 Hub seal 3 2,418 806 141 1,307
5 Hy-o-ring/tube/
valve
61 2,300 37 2 216
6 Suspension 41 1,950 47 7 191
7 Nose cone
bearing
1 1,848 1,848 Not available 1,848
8 NTL 255 1,749 7 2 Not available
9 Drive shaft/
spider
2 1,516 758 28 1,488
10 Linings 19 1,397 73 4 720
11 Coolant pump 9 1,035 115 30 104
12 Electrical circuit 32 957 29 10 159
13 Hyd-T/M hoses 14 628 45 Not available Not available
14 Battery 7 611 87 10 308
15 Hoist cylinder 3 527 175 130 249
16 Horn 79 504 6 2 Not available
17 Air ckt piping/
valves
59 504 8 2 216
18 Fan pulley/
bearing
4 313 78 14 205
19 Str/orbitrol
valve
2 222 111 28 194
20 Chassis 6 214 35 6 114
21 Coolant hoses 10 213 21 10 306
22 Air compressor 4 207 51 24 79
23 Tie rod/bushing 9 206 22 8 80
24 Tank mountings 7 195 27 5 71
25 Radiator 1 168 168 168 168
26 Steering hyd
pump
1 156 156 156 156
27 Dump body pin/
lock
7 152 21 4 46
Int J Syst Assur Eng Manag (July-Sept 2013) 4(3):249–261 255
123
Author's personal copy

work groups, especially the maintenance personnel. Any
maintenance policy can be implemented only if the per-
sonnel are interested in practising it. This can also be called
the ease with which the policy can be adopted and prac-
tised. It is a natural human tendency to continue practices
in which one is well-versed, and hence the more primitive
maintenance practices are much more preferred than the
newer ones.
6.2.3 Safety and reliability
Safety plays a vital role in choosing the type of mainte-
nance policy to be used. For any organization, the safety of
its personnel and its equipment and installations is of great
importance, and therefore the chosen maintenance strategy
should ensure a high level of safety to avoid any hazardous
incidents. If the failure of a particular component may
cause a severe accident and fatal injury, every attempt
should be made to avoid such a situation and that should be
reflected in the maintenance policy. The adopted mainte-
nance policy must be well tested and reliable enough.
6.2.4 Maintenance opportunity
Certain maintenance practices require special equipment
and facilities that should be ensured beforehand before
adopting these policies. Sometimes the maintenance work
load may justify the installation of costly facilities.
6.2.5 Time delay
It is desirable that all the equipment should have the
minimum downtime. Each maintenance type has a pattern
and some fixed steps to be followed. The time taken to
carry out any type of maintenance depends not only on
these steps, but also on the availability of maintenance
facilities, the designed maintainability of the equipment
concerned, the crew and materials, the total delay due to
Ease of implementation
Maintenance effectiveness
Direct-criteria (Benefit )
Inverse-criteria (Cost)
Maintenance characteristics
Cost of maintenance
Time delay
Production
Feasibility
Safety & reliability
Maintenance opportunity
Production regularity
Production quality
Acceptability of technique
Safety of facilities & personnel
Reliability of the procedure
Fleet of equipment
Facility available
Duration of maintenance
Logistic delay
Administrative delay
Delay in fault identification
Frequency of maintenance
Cost of manpower
Cost of mater ial
Corrective maintenance
Periodic maintenance
Preventive maintenance
Pro-active maintenance
Decision goal 1st
level criteria 2nd
level criteria 3rd
level criteriaMaintenance alternatives
Fig. 3 List of alternatives and hierarchy diagram of evaluating criteria
256 Int J Syst Assur Eng Manag (July-Sept 2013) 4(3):249–261
123
Author's personal copy

administrative reasons, logistic delays, and other reasons
connected with the procurement of the required spare parts.
It is always desirable to reduce these delays to a minimum
and the maintenance type that allows the minimum
downtime is the most favourable one and is to be preferred.
6.2.6 Maintenance characteristics
This attribute includes the maintenance and failure pattern
of a component. If a component bears a huge load or
rotates at a high speed, there is a risk of it being deterio-
rated by friction at a high rate. Such components are more
exposed to the risk of failure than others and should
therefore be more critically dealt with. These components
require frequent maintenance to be performed more than
other components. Similarly, the increased duration of the
maintenance has an adverse effect on the equipment
availability and the system production figures.
6.2.7 Cost of maintenance
The cost of each maintenance type includes the expenses
incurred in the basic setup required for the implementation
of any maintenance type, which include the cost of the
hardware, software, material and labour required for the
maintenance. If the maintenance of a particular component
is very costly, then it is always desirable to avoid its failure.
Hence it is desired that such components should be main-
tained before they undergo any failure. Preventive main-
tenance may help in saving time, money and production
losses in this case.
The first four criteria were grouped under the category
‘‘direct criteria’’ and the remaining three under ‘‘inverse
criteria’’. The relative importance of these criteria was
assessed, the one over the other, with the help of the AHP.
To estimate the relative importance of the various criteria
using the AHP, the problem was transformed into a deci-
sion hierarchical structure (Fig. 3) where the goal of the
decision was placed on the top of the tree, and then the
decision criteria were placed on successive levels, starting
from a broad perspective and continuing through the
intermediate levels (criteria on which subsequent sub-cri-
teria depend) to the lowest level (which is usually the set of
alternatives).
6.3 Collection of the judgments from experts
To construct the pair-wise comparison matrix, a question-
naire was prepared and distributed to three field experts of
the case study mine to collect their opinions and percep-
tions. These questionnaires concerned the pair-wise com-
parison of the attributes and the sub-attributes on each level
of hierarchy. The relative importance of all the attributes of
each level was calculated on the basis of the experts’
responses to the above questionnaire.
For pair-wise comparison between the two criteria on
the first level of the hierarchy diagram, i.e. benefit (direct
criteria) and total cost (inverse criteria), the following
question was asked:
6.3.1 Question A
‘‘To select the most effective maintenance policy for the
proposed unit, whose failure affects the normal operation
of the dump truck, we have identified two main criteria: (1)
the benefit that the selected maintenance policy creates and
(2) the total cost under the specific maintenance policy. In
your opinion, with respect to the overall goal, ‘selection of
the most effective maintenance policy’, which of these two
criteria is of greater importance (or priority) in the selec-
tion of a maintenance policy according to the following
scale of importance?’’
Likewise, a pair-wise comparison was made between the
criteria on the second and third levels of the evaluating
criteria. For example, for pair-wise comparison among the
four criteria of benefit on the second level, the following
question was asked:
6.3.2 Question B
‘‘The relevant factors defining the criteria of benefit are
identified as the contribution to production, feasibility,
safety and reliability and maintenance opportunity. In your
opinion, with respect to 1st level criterion 1, benefit, how
important is 2nd level criterion 1 (production) when com-
pared with 2nd level criterion 2 (feasibility)?’’ The ques-
tion was repeated, after adaptation, for the other attributes.
To assess the efficacy of each maintenance policy,
another set of questionnaires was prepared and distributed
to the field experts of the case study mine to collect their
opinions and perceptions concerning the extent to which
each maintenance policy, when implemented, would be
effective in achieving the target level of the decision
attributes.
The feedback and responses collected from the field
experts were analyzed to decide the importance of each
attribute for the decision. Table 2 gives the calculated
weight of the attributes of different levels obtained from
the responses of Expert 1, with the values of kmax, CI, RI
and CR. It shows that Expert 1 is quite consistent in his
judgment, as is evident from the CR values. The average
importance values for all the attributes, calculated from the
aggregated judgment matrix of all the experts, are pre-
sented in Table 3.
Int J Syst Assur Eng Manag (July-Sept 2013) 4(3):249–261 257
123
Author's personal copy

Table 2 AHP judgment matrix given by Expert 1 with calculated importance values and consistency measures
Production
regularity
Production
quality
Weight of criteria kmax CI RI CR
Total Net
Production
regularity
1 0.5 0.333333 0.115406 2 0 0 0
Production quality 2 1 0.666667 0.230812
Acceptability of technique Ease of implementation Weight of criteria kmax CI RI CR
Total Net
Acceptability of technique 1 3 0.75 0.091548 2 0 0 0
Ease of implementation 0.333333 1 0.25 0.030516
Safety of facilities and personnel Reliability of the procedure Weight of criteria kmax CI RI CR
Total Net
Safety of facilities and personnel 1 0.111111 0.1 0.034622 2 0 0 0
Reliability of the procedure 9 1 0.9 0.311596
Fleet of equipment Facility availability Weight of criteria kmax CI RI CR
Total Net
Fleet of equipment 1 0.5 0.333333 0.014214 2 0 0 0
Facility availability 2 1 0.666667 0.028429
Delay in fault identification Administrative
delay
Logistic
delay
Weight of criteria kmax CI RI CR
Total Net
Delay in fault identification 1 0.5 2 0.265152 0.026178 3.114286 0.057143 0.58 0.098522
Administrative delay 2 1 5 0.606061 0.059835
Logistic delay 0.5 0.2 1 0.128788 0.012715
Frequency of maintenance Duration of maintenance Weight of criteria kmax CI RI CR
Total Net
Frequency of maintenance 1 7 0.875 0.025524 2 0 0 0
Duration of maintenance 0.142857 1 0.125 0.003646
Cost of manpower Cost of material Weight of criteria kmax CI RI CR
Total Net
Cost of manpower 1 0.25 0.2 0.002992 2 0 0 0
Cost of material 4 1 0.8 0.011967
Production Feasibility Safety and reliability Maintenance
opportunity
Weight of criteria kmax CI RI CR
Total Net
Production 1 3 1 8 0.403921 0.346218 4.04304 0.014347 0.9 0.015941
Feasibility 0.333333 1 0.25 3 0.142408 0.122064
Safety and reliability 1 4 1 7 0.403921 0.346218
Maintenance opportunity 0.125 0.333333 0.142857 1 0.04975 0.042643
Time delay Maintenance
characteristics
Cost of
maintenance
Weight of criteria kmax CI RI CR
Total Net
Time delay 1 4 6 0.691099 0.098728 3.090909 0.045455 0.58 0.07837
Maintenance characteristics 0.25 1 2 0.204188 0.02917
Cost of maintenance 0.166667 0.5 1 0.104712 0.014959
258 Int J Syst Assur Eng Manag (July-Sept 2013) 4(3):249–261
123
Author's personal copy

The results show that procedural reliability has the
highest importance, followed by production regularity and
maintenance frequency. Therefore, the chosen maintenance
policy must be reliable enough and assure a continuous
production which reaches the target amount and quality
level with a smaller number of failures.
6.4 Ranking of the alternative maintenance strategies
In order to collect the data required to rank the alternatives,
a second set of questionnaires was developed. The purpose
was to collect engineering judgments regarding the capa-
bility of each maintenance alternative to realize the ideal
level of each evaluating criterion. For example, to identify
the ability of the maintenance alternatives to enhance the
‘‘production regularity’’, the following question was asked:
6.4.1 Question C
‘‘What score (0–100) do you assign to each maintenance
policy with respect to the criterion ‘production irregulari-
ties’?’’ The question inquires about the extent to which the
alternative is capable of enhancing the production irregu-
larity. If it is capable of eliminating production irregulari-
ties completely, a score of 100 will be assigned, and if it is
unable to contribute to any reduction, a score of ‘‘0’’ will
be assigned. If the expert is not sure about a specific score,
he can assign his judgments as a range, e.g. 65–80. The
results of various calculations in different steps of TOPSIS
and the proposed new method are shown in Table 4, along
with the judgments obtained from the experts.
The results of the MCDM for selection of the best
maintenance type for the engine, transmission and tyres of
a dump truck using TOPSIS and the modified TOPSIS are
presented in Table 5 below.
7 Discussion and conclusions
This type of study can help management to analyze dif-
ferent maintenance types for the optimization of trade-offs
between cost and benefit. In the case study mine, the
management presently implements preventive mainte-
nance for the engine (the most critical part), pro-active
maintenance for the transmission and corrective mainte-
nance for the tyres. An analysis of the collected decision
responses from the field experts using the TOPSIS
method suggests that the present maintenance practices
for the engine should be continued, whereas the proposed
new method suggests a change to periodic maintenance
for the engine. The proposed method suggests that one
should stick to the present pro-active maintenance for the
transmission and the present corrective maintenance for
the tyres. However, an analysis with the TOPSIS method
favours an alteration of the present maintenance practices
to preventive maintenance for the transmission and pro-
active maintenance for the tyres. This analysis provides
the management with scope for revising the present
maintenance practices.
Table 2 continued
Benefit Cost Weight of criteria kmax CI RI CR
Total Net
Benefit 1 6 0.857143 0.857143 2 0 0 0
Cost 0.166667 1 0.142857 0.142857
Table 3 Calculated aggregated weights of the attributes from the
opinions of three experts
Attributes Aggregated weight
Production regularity (PR) 0.081039
Production quality (PQ) 0.185533
Acceptability of technique (AT) 0.05027
Ease of implementation (EI) 0.015224
Safety of facilities and personnel (SFP) 0.021634
Reliability of the procedure (RP) 0.18721
Fleet of equipment (FE) 0.026803
Facility availability (FA) 0.077314
Delay in fault identification (DFI) 0.037972
Administrative delay (AD) 0.021945
Logistic delay (LD) 0.030638
Frequency of maintenance (FM) 0.123367
Duration of maintenance (DM) 0.064491
Cost of manpower (CMP) 0.029589
Cost of material (CM) 0.046969
Production (P) 0.266572
Feasibility (F) 0.065494
Safety and reliability (SR) 0.208844
Maintenance opportunity (MO) 0.104117
Time of delay (TD) 0.090556
Maintenance characteristics (MC) 0.187858
Cost of maintenance (C) 0.076558
Direct criteria (DC) 0.645028
Inverse criteria (IC) 0.354972
Int J Syst Assur Eng Manag (July-Sept 2013) 4(3):249–261 259
123
Author's personal copy

Table
4Combined
judgmentobtained
from
expertsfortheengineandthecalculationsforTOPSIS
andtheproposednew
method
Alternatives
Attribute
PR
PQ
AT
EI
SFP
RP
FE
FA
DFI
AD
LD
FM
DM
CMP
CM
x ijvalues
Corrective
70
80
85
80
80
85
90
90
75
85
80
70
85
90
75
Periodic
95
95
90
95
95
90
90
95
85
90
100
90
90
80
80
Preventive
100
100
100
100
90
95
80
100
100
100
90
95
95
95
90
Pro-active
80
100
70
95
85
80
95
85
90
75
90
80
80
70
85
r ijvalues
Corrective
0.401974
0.425045
0.488918
0.431018
0.456213
0.484726
0.506089
0.485601
0.426315
0.483157
0.443079
0.415191
0.484726
0.533817
0.453506
Periodic
0.545536
0.504741
0.517678
0.511834
0.541753
0.513239
0.506089
0.512578
0.483157
0.511578
0.553849
0.533817
0.513239
0.474504
0.483739
Preventive
0.574248
0.531306
0.575197
0.538772
0.513239
0.541753
0.449857
0.539556
0.56842
0.56842
0.498464
0.563473
0.541753
0.563473
0.544207
Pro-active
0.459399
0.531306
0.402638
0.511834
0.484726
0.456213
0.534205
0.458623
0.511578
0.426315
0.498464
0.474504
0.456213
0.415191
0.513973
v ijvalues
Corrective
0.020161
0.048771
0.014886
0.003978
0.006729
0.061735
0.009376
0.025925
0.011853
0.007728
0.005994
0.019844
0.012119
0.008782
0.011838
Periodic
0.027362
0.057915
0.015761
0.004724
0.00799
0.065367
0.009376
0.027365
0.013434
0.008183
0.007492
0.025514
0.012832
0.007806
0.012627
Preventive
0.028802
0.060964
0.017513
0.004973
0.00757
0.068998
0.008334
0.028805
0.015804
0.009092
0.006743
0.026931
0.013545
0.00927
0.014205
Pro-active
0.023042
0.060964
0.012259
0.004724
0.007149
0.058104
0.009897
0.024485
0.014224
0.006819
0.006743
0.022679
0.011406
0.00683
0.013416
Aþ
0.028802
0.060964
0.017513
0.004973
0.00799
0.068998
0.009897
0.028805
0.011853
0.006819
0.005994
0.019844
0.011406
0.00683
0.011838
A�
0.020161
0.048771
0.012259
0.003978
0.006729
0.058104
0.008334
0.024485
0.015804
0.009092
0.007492
0.026931
0.013545
0.00927
0.014205
Sþ j
S� j
C� i
coshþ
hþcosh�
h�rþ
r�SM
þSM
�S� i
Corrective
0.017299
0.010053
0.367543
0.995719
0.092566
0.994144
0.108272
0.099957
0.092897
0.009253
0.010058
0.520855
Periodic
0.008508
0.015021
0.6384
0.997229
0.07446
0.995135
0.098681
0.105924
0.098442
0.007887
0.009714
0.551905
Preventive
0.009503
0.019762
0.675269
0.996519
0.083461
0.995776
0.091948
0.108915
0.101222
0.00909
0.009307
0.505896
Pro-active
0.014684
0.014057
0.489085
0.993643
0.112821
0.990956
0.134594
0.102832
0.095569
0.011602
0.012863
0.525779
Bold
values
indicatethenearest
to1andthesuggestalternative
260 Int J Syst Assur Eng Manag (July-Sept 2013) 4(3):249–261
123
Author's personal copy

The proposed new approach adequately addresses the
concern about the ranking of alternatives solely on the
basis of Euclidean distances. The modification regarding
the separation measure will strengthen the comprehen-
siveness and reasonableness of the ranking order for
alternatives, and hence the decision making process will be
enhanced by implementing the proposed new method.
Maintenance practices of any mining equipment like
shovels, drills, draglines, dozers, etc. can be analysed
though the proposed model. The application domain of the
model can be extended through modification of the attri-
bute lists. This may prove to be an effective tool in conflict
management in MCDM.
References
Ahmadi A, Gupta S, Karim R, Kumar U (2010) Selection of
maintenance strategy for aircraft systems using multi-criteria
decision making methodologies. Int J Reliab Qual Saf Eng
17(3):223–243
Al-Najjar B, Alsyouf I (2003) Selecting the most efficient mainte-
nance approach using fuzzy multiple criteria decision making.
Int J Prod Econ 84:85–100
Arunraj NS, Maiti J (2010) Risk-based maintenance policy selection
using AHP and goal programming. Saf Sci 48:238–247
Gupta S, Kumar U (2012) An AHP guided decision model for
underground mining method selection. Int J Min Reclam
Environ 26(4):324–336
Hwang CL, Yoon K (1981) Multiple attribute decision making
methods and applications. Springer, New York
Kumar S, Gupta S, Ghodrarti B, Kumar U (2010) An approach for
risk assessment of rail defects. Int J Reliab Qual Saf Eng
17(4):291–311
Lai YJ, Liu TY, Hwang CL (1994) TOPSIS for MODM. Eur J Oper
Res 76:486–500
Miller GA (1956) The magic number seven plus or minus two: some
limits on our capacity for processing information. Psychol Rev
63:81–97
Mobley RK (2002) An introduction to predictive maintenance, 2nd
edn. Butterworth–Heinemann, New York
Moore WJ, Starr AG (2006) An intelligent maintenance system for
continuous cost-based prioritization of maintenance activities.
Comput Ind 57(6):595–606
Opricovic S, Tzeng G-H (2004) Compromise solution by MCDM
methods: a comparative analysis of VIKOR and TOPSIS. Eur J
Oper Res 156:445–455
Saaty TL (1980) The analytic hierarchy process. McGraw-Hill, New
York
Triantaphyllou E, Kovalerchuk B, Mann L, Knapp GM (1997)
Determining the most important criteria in maintenance decision
making. J Qual Maint Eng 3(1):16–24
Wang L, Chu J, Wu J (2007) Selection of optimum maintenance
strategies based on a fuzzy analytic hierarchy process. Int J Prod
Econ 107:151–163
Yang SK (2003) A condition-based failure-prediction and processing-
scheme for preventive maintenance. IEEE Trans Reliab
52(3):373–383
Table 5 Comparison of the decision results obtained using TOPSIS
and the proposed modified approach
Selection tool Component
Engine Transmission Tyres
TOPSIS Preventive Preventive Pro-active
Proposed method Periodic Pro-active Corrective
Present practice Preventive Pro-active Corrective
Int J Syst Assur Eng Manag (July-Sept 2013) 4(3):249–261 261
123
Author's personal copy


