Embed Size (px)
Citation preview
ARTICLE
A transcomplementing gene drive provides aflexible platform for laboratory investigation andpotential field deploymentVíctor López Del Amo 1, Alena L. Bishop 1, Héctor M. Sánchez C. 2, Jared B. Bennett3, Xuechun Feng 1,
John M. Marshall 2, Ethan Bier1,4 & Valentino M. Gantz 1*
CRISPR-based gene drives can spread through wild populations by biasing their own trans-
mission above the 50% value predicted by Mendelian inheritance. These technologies offer
population-engineering solutions for combating vector-borne diseases, managing crop pests,
and supporting ecosystem conservation efforts. Current technologies raise safety concerns
for unintended gene propagation. Herein, we address such concerns by splitting the drive
components, Cas9 and gRNAs, into separate alleles to form a trans-complementing
split–gene-drive (tGD) and demonstrate its ability to promote super-Mendelian inheritance
of the separate transgenes. This dual-component configuration allows for combinatorial
transgene optimization and increases safety by restricting escape concerns to experimentation
windows. We employ the tGD and a small–molecule-controlled version to investigate the
biology of component inheritance and resistant allele formation, and to study the effects of
maternal inheritance and impaired homology on efficiency. Lastly, mathematical modeling of
tGD spread within populations reveals potential advantages for improving current gene-drive
technologies for field population modification.
https://doi.org/10.1038/s41467-019-13977-7 OPEN
1 Section of Cell and Developmental Biology, University of California San Diego, La Jolla, CA 92093, USA. 2Division of Epidemiology and Biostatistics, Schoolof Public Health, University of California, Berkeley, CA 94720, USA. 3 Biophysics Graduate Group, University of California, Berkeley, CA 94720, USA. 4 TataInstitute for Genetics and Society, University of California, San Diego, 9500 Gilman Drive, La Jolla, CA 92093-0349, USA. *email: [email protected]
NATURE COMMUNICATIONS | (2020) 11:352 | https://doi.org/10.1038/s41467-019-13977-7 | www.nature.com/naturecommunications 1
1234
5678
90():,;
CRISPR gene-drive systems offer tremendous potential forengineering wild populations due to their ability to self-propagate, biasing inheritance from Mendelian (50%) to
super-Mendelian (>50%)1–7. This technology has importantapplications in fighting vector-borne diseases (e.g., malaria) bysuppressing3,7 or modifying4 mosquito populations to decreasetheir burden on public health, managing crop pests8,9, and sup-pressing invasive rodents to support island restoration efforts10,11.While the scientific community welcomes the enormous promiseof this technology for solving significant global issues, it alsoacknowledges that it is currently in its infancy and that severalgaps need to be filled before it can be safely deployed12–14. Inparticular, concerns have been raised about accidental releaseduring laboratory research or premature release of insects into thefield, highlighting a need for the development of strategies toincrease safety during optimization phases15.
Gene-drive systems use an allelic conversion process that occursin the germline, changing heterozygous to homozygous cellsthat can achieve the super-Mendelian inheritance necessary forpopulation engineering. Currently, two different approaches basedon the RNA-guided endonuclease Cas9 have been experimentallyevaluated: (1) a full gene drive (full GD) is the traditional format,consisting of a Cas9 and a guide RNA (gRNA) gene inserted atthe target location as a single unit. The two gene products combineto induce a double-strand break at the same position on thewild-type allele, which is then repaired via homology-directedrepair (HDR) using the intact chromosome carrying the gene-driveelement as a template2–4,7,16–18. (2) The gRNA-only gene drive(gRNA GD) is based on CopyCat gRNA elements19 that are cap-able of allelic conversion in the presence of a separate geneticsource of Cas9. Since only the gRNA element is propagated in thiscase, its spread is regulated by the presence of a separate, staticCas9 transgene10,19–21. The use of a full GD is causing concern tothe scientific community as an accidental release could spreadunchecked15. While a gRNA GD would address such concerns, itsapplication in the field for large-scale population engineering isunlikely to succeed since it would require that a large percentage ofthe population carried a Cas9 transgene22.
Here, we develop a CRISPR gene-drive method in Drosophilacalled trans-complementing gene drive (tGD), which combinesthe strengths of both approaches described above. This arrange-ment splits the Cas9 and gRNA into two different transgenic lines.When separated, neither component displays gene-drive activity,providing the same safety profile of a gRNA-only drive. Whencombined by genetic cross, however, the two complementarycomponents reconstitute the properties of a full GD, resulting inboth elements propagating together. Here, we demonstrate that atGD system can bias the inheritance of two interdependenttransgenes, and that such a split arrangement can be used todeconstruct specific drive parameters. We exploit the modularityof the tGD to dissect specific features influencing gene-driveefficiency: (1) the functionality of different Cas9 promoters andtheir maternal effect on the tGD that has been shown in othersystems to be a potential source of resistance2,4,16,17, (2) howgenomic context can affect gene-drive efficiency, and (3) the effectof impairing homology between the drive construct and the tar-geted allele. In addition, we apply a drug-regulation technology tothe tGD system such that super-Mendelian inheritance can becontrolled by the presence of a small molecule in the fly diet, anduse this tool to restrict Cas9 activation in the adult germline andstudy gene-drive function in this tissue. Last, we simulate thepropagation of tGD elements and uncover their potential tospread transgenes to a higher fraction of a population than acorresponding full-drive system, highlighting the tGD’s potentialfor future field applications.
ResultsThe tGD system displays super-Mendelian behavior. The tGDsystem was designed to split the two genetic elements, Cas9 and atwo-part gRNA gene construct (gRNA-A and gRNA-B), into twodistinct genomic locations, which when separated, behave asregular Mendelian transgenes (no gene-drive activity) (Fig. 1a).Once combined by genetic crossing, gRNA-A cleaves the genomeat the Cas9 integration site while gRNA-B cuts at the gRNA locus(Fig. 1a). Because the cleaved ends match with perfect homologyto the sequences flanking each of the transgenic elements, theHDR pathway inserts a copy of each transgene into the wild-typeallele (Fig. 1a).
As a first test of this system, we generated the tGD(y,e)targeting the coding sequences of the yellow (y) and ebony (e) loci.Loss-of-function mutations in either of these genes result inwhole-body pigmentation phenotypes, lighter and darker,respectively, and are therefore readily detectable23. To accomplishthis goal, we introduced a Streptococcus pyogenes SpCas9 (Cas9)source driven by the vasa promoter into the yellow gene(X chromosome) marked with a DsRed (Red) fluorescent reporterexpressed in the eye to generate the vasa-Cas9 line (Supplemen-tary Fig. 1). We placed the second transgene, carrying the gRNAtandem cassette (gRNA-y1 and gRNA-e1), on chromosome III(autosome), disrupting the ebony gene. This cassette was insteadmarked with EGFP (Green) to generate the e-[y1,e1] line(Supplementary Fig. 1).
We tested the tGD(y,e) arrangement by individually crossingvasa-Cas9 males to e-[y1,e1] virgin females (F0, Fig. 1b) andcollecting F1 transheterozygous virgin females carrying bothconstructs. These females were single-pair mated to wild-typeOregon-R (Or-R) males (F1, Fig. 1b). Phenotypic analysis ofthe fluorescent markers in the resulting F2 progeny allowedsimultaneous evaluation of the germline output inheritance ratesof both the Cas9 and gRNA transgenes of each single F1 female(F2, Fig. 1b). We scored the F2 progeny of 11 F1 females andobserved an inheritance of greater than 50% for both transgenes,with an average of 83% and 85% for Cas9-Red and gRNA-Green,respectively (Fig. 1c, Supplementary Data 1). In addition, we testedthe tGD(y,e) arrangement using a nanos-Cas9 construct insertedat the same yellow locus (Supplementary Fig. 1) and observedsimilar inheritance rates of the two elements (SupplementaryData 1). Since the gRNA-Green transgene is targeting the ebonygene, which is located on an autosome (Chromosome III), allelicconversion could occur both in females and males at this location.To test how the gRNA-Green transgene would perform in themale germline, we crossed F1 males (instead of F1 females)carrying both Cas9-Red and gRNA-Green transgenes to our wild-type strain females to score the inheritance rate in the F2 progeny.In this experiment, the gRNA-Green transgene displayed a 67%average inheritance. Interestingly, allelic conversion in F1 maleswas lower than that observed through the female germline (67%vs. 85%, respectively; see statistical analysis in SupplementaryData 1). Similar observations were made in a previous study usinga full gene drive targeting the cinnabar gene, also located on anautosome17. The Cas9-Red transgene carried on the X chromo-some of F1 males was, as expected, inherited in a Mendelianfashion (~50%). Males have only a single X chromosome;therefore, no gene conversion events are possible in this situationat the yellow locus. Indeed, the Cas9-Red construct was inheritedby all F2 daughters, while all males inheriting the Y chromosomewere DsRed negative (Supplementary Data 1).
The above results demonstrate that a CRISPR gene drive can besplit into two separate genetic elements located on differentchromosomes, which once combined, can be simultaneouslypropagated with super-Mendelian inheritance. This conditional
ARTICLE NATURE COMMUNICATIONS | https://doi.org/10.1038/s41467-019-13977-7
2 NATURE COMMUNICATIONS | (2020) 11:352 | https://doi.org/10.1038/s41467-019-13977-7 | www.nature.com/naturecommunications

property offers flexibility and increases safety while functioning asa full GD. Furthermore, these findings have implications for otherstrategies that similarly use multiple elements driving simulta-neously such as the proposed “daisy-chain drive”24 or integralgene drives25.
We next confirmed the tGD strategy in which the gRNAcomponent was inserted at different chromosomal sites, namelythe white (w) locus1,2,17. We tested the tGD(y,w) by constructingan EGFP-tagged tandem-gRNA element (w-[y1,w2]) targeting bothy and w (Supplementary Fig. 1). w-[y1,w2] virgin females (F0) werecrossed to y-inserted vasa-Cas9 males, and F1 virgin females werecollected and outcrossed to wild-type Or-R males (Fig. 2a). In the
F2 progeny, we observed 89 and 96% inheritance rates of theCas9-Red and gRNA-Green transgenes, respectively (Fig. 2e;Supplementary Data 2), which were both higher transmissionrates than when the gRNA construct was inserted into the ebonylocus. Interestingly, the same Cas9-Red transgene displayed asignificantly higher inheritance rate in the tGD(y,w) (89%) than inthe tGD(y,e) (83%) (statistical analysis in Supplementary Data 2).This difference might result from positional effects modulating they1-gRNA expression when inserted at a different genomic location(white or ebony, respectively), or perhaps reflects the distanceof the transgenes in the two systems: tGD(y,w) are close togetheron the same chromosome, while tGD(y,e) are on different
a
b c
Cas9
HDR HDR HDR HDR
gRNA-A gRNA-B
gRNA-A gRNA-B
Cas9
Marker scored
DsRed[Cas9]
100
50
0GFP
[gRNAs]
Sin
gle-
fem
ale
germ
line
inhe
ritan
ce (
%)
y-[Cas9, DsRed]
e-[gRNAs, EGFP]
Legend:
83% 85%
11 (613)
10% 6%
Average inheritance
Number of crosses [n] (flies scored)
St. Dev. inheritance
X
X
;;y+ e-[y1,e1]
y+ e-[y1,e1];;
y-[Cas9] e+
e+
;;y+ e+
e+;;
y-[Cas9] e+
y+ e-[y1,e1]
Score F2 progeny of each single-pair cross
for the DsRed and GFP markers
F0
F1
Male ( )
1st Chrom.
Y Chrom.
3rd Chrom. 1st Chrom. 3rd Chrom.
I allele
II allele
Female ( )
y+
e-[y1,e1]
y-[Cas9]
e+
Cas9 transgene marked with DsRed
Legend:
Yellow wild-type allele
Yellow alleles
Ebonyalleles
gRNAs transgene marked with GFP
Ebony wild-type allele
Potential conversion events
Allelic conversion at both loci
Fig. 1 The tGD system allows simultaneous super-Mendelian inheritance of two transgenes. a Schematic of the tGD genetic arrangement with twoelements that can be kept separated as different transgenic lines. The Cas9 transgene is inserted in the genomic location targeted by the gRNA-A, while aseparate cassette expressing a tandem-gRNA construct (gRNA-A, gRNA-B) is inserted at the location targeted by gRNA-B. Upon genetic cross, each of thegRNA-A and gRNA-B combines with Cas9 to generate a double-strand DNA break at each locus on the wild-type allele (dotted purple and brown arrows,respectively). Each break is then repaired by the homology-directed repair (HDR) pathway using the intact chromosome carrying the transgene as atemplate. b Outline of the genetic cross used to demonstrate tGD in fruit flies, indicating transgenes and wild-type allele location on differentchromosomes. Sex of the individuals is indicated with symbols “♂” for males and “♀” for females. F0 males carrying a DsRed-marked Cas9 transgeneinserted into the yellow locus were crossed to females carrying a GFP-marked cassette containing two gRNAs (y1–e1) inserted into the ebony codingsequence. Transheterozygous F1 females (carrying both Cas9 and gRNAs) were crossed to wild-type males to assess germline transmission rates of thefluorophores marking the transgenes in the F2 progeny. The conversion events are indicated by the red and green triangles in the F1 females. c Single F1female germline inheritance output is measured as GFP and DsRed marker presence in the F2 progeny. The black bar represents the inheritance average.The blue shading represents the deviation from the expected 50% “Mendelian” inheritance. Inheritance average, standard deviation, number of samples(n), and total number of flies scored in each experiment are represented over the graph in line with the respective data. Raw phenotypical scoring isprovided as “Supplementary Data 1”.
NATURE COMMUNICATIONS | https://doi.org/10.1038/s41467-019-13977-7 ARTICLE
NATURE COMMUNICATIONS | (2020) 11:352 | https://doi.org/10.1038/s41467-019-13977-7 | www.nature.com/naturecommunications 3
chromosomes. We further tested the impact of genomic locationon allelic conversion efficiency by swapping the locations of thetGD(y,w) transgenes, placing the Cas9 element in white and thegRNAs in yellow to generate tGD(w,y) (Supplementary Fig. 1). Thisswapped configuration displayed 95 and 98% conversion efficiencyfor the Cas9 and gRNA constructs, which are significantly higherrates than those observed for tGD(y,w) (89% at yellow and 96% atwhite; Supplementary Fig. 2, statistical analysis in SupplementaryData 2). The combined tGD(w,y) systems also copy with higherconversion rates than those observed in previous studies using fullGDs at the y and w loci2,17,21. These greater copying efficienciesmay reflect differing gRNA efficiencies26,27, or genetic backgroundeffects associated with our Or-R strains vs. the w[1118] andCanton-S strains used in previous studies2. Regardless, these results
suggest that conversion efficiencies are impacted by the genomiclocation of the transgene and that transgene size in the range tested(3–8.3 kbp) does not seem to negatively affect allelic conversion inour system.
X-chromosome tGD uncovers the maternal effect on inheri-tance. Previous studies reported that the inheritance of a genedrive from the female germline could lead to the generation ofearly embryogenesis mutations2,4,17, which occur when cleaved-allele repair results in small insertion/deletions (indels) at thecut site instead of allelic conversion, through alternative repairpathways such as nonhomologous end joining (NHEJ)28. Indelalleles therefore represent an obstacle for CRISPR gene-drivepropagation in subsequent generations; as such alleles would be
89% 96%
89(5047)
7% 5%
DsRed GFP
92% 97%
21(1622)
7% 4%
DsRed GFP
91% 95%
23(1109)
8% 5%
DsRed GFP
67% 53%
23(1183)
13% 11%
DsRed GFP
Sin
gle-
fem
ale
germ
line
inhe
ritan
ce (
%)
F0 F0 F0 F0(a) (b)
Average inheritance
Number of crosses [n] (flies scored)
St.Dev. inheritance
Marker scored
F0 parent with Cas9 (cross scheme panel)
Cas9 construct
y-[Cas9, DsRed]
w-[gRNAs, EGFP]
Legend:
vasa-Cas9
100
50
0
(c) (d)
X
X
y-[Cas9] w+
y-[Cas9] w+
y+ w+y-[Cas9] w+
y+ w-[y1,w2]
w-[y1,w2]y+F0
F1
X
X
y-[Cas9] w+
y+ w+y-[Cas9] w+
y+ w-[y1,w2]
w-[y1,w2]
w-[y1,w2]y+
y+F0
F1
Male ( )
1st Chrom. 1st Chrom.
Female ( )
F0
F1
X
X
y-[Cas9]
y+ w+y-[Cas9]
w+y+
w-[y1,w2]
w-[y1,w2] w+
w+y+
y+
Score F2 progeny Score F2 progeny
Score F2 progeny Score F2 progeny
F0
F1
X
Xy+ w+
y+ w+
y-[Cas9]
w+y+
w-[y1,w2]
y-[Cas9] w-[y1,w2]
y-[Cas9] w-[y1,w2]
e
ba
c d
Fig. 2 tGD targeting the yellow and white loci uncovers the maternal effect mechanism. a–d Genetic crosses performed using the tGD elements targetingyellow (DsRed-Cas9) and white (GFP-y1,w2-gRNAs) loci, both located on the first chromosome (X chromosome). Cross schemes used to test the F1 femalegermline by scoring the F2 progeny: a Cas9 from the F0 male and gRNAs from the F0 female, b Cas9 from the F0 female and gRNAs from the F0 male,c both Cas9 and gRNAs from the F0 male, and d both Cas9 and gRNAs from the F0 female. Allelic conversion events are indicated by the red and greentriangles in the F1 females of every cross scheme. e Analysis of the F2 inheritance rates of the fluorescent markers for all cross scheme combinations (a–d)using Cas9 constructs driven by the vasa promoter. Strong super-Mendelian inheritance is seen for all conditions except when both Cas9 and the gRNAsare inherited from the F0 female (d). Values for the inheritance average (black bar), standard deviation, number of samples (n), and total number of fliesscored in each experiment are represented over the graph in line with the respective data. Sex of the F0 parent carrying Cas9 is indicated with “♂” for malesand “♀” for females in panel (e). Raw phenotypic scoring is provided as “Supplementary Data 2”.
ARTICLE NATURE COMMUNICATIONS | https://doi.org/10.1038/s41467-019-13977-7
4 NATURE COMMUNICATIONS | (2020) 11:352 | https://doi.org/10.1038/s41467-019-13977-7 | www.nature.com/naturecommunications
resistant to the gene-drive action, preventing its spread2,4,16,17.These resistant alleles are generated at a high rate when a genedrive is inherited from a female parent, most likely due to Cas9deposition in the egg2–4,17. We therefore performed the reciprocalcross using our tGD(y,w) approach by collecting F0 vasa-Cas9females and gRNA-carrying males (Fig. 2b). In the F2 analysis, weobserved similar inheritance rates to the previous tGD analysis of92% (Cas9-Red) and 97% (gRNA-Green) (Fig. 2e, SupplementaryData 2), indicating no reduction in inheritance rates when Cas9but not the gRNA is received from the mother in the tGDarrangement, paralleling observations from a gRNA-only drivesystem21, and differing from what was reported in previous full-GD approaches2–4,17.
Since the two CRISPR components of our tGD are inheritedseparately, we used this system to test whether both componentshad to be simultaneously deposited in the egg to observe thematernal effect. We generated a homozygous line carrying bothelements on the same chromosome to analyze the allelicconversion efficiency for co-inheritance. As before, we analyzedthe F2 progeny of cross schemes in which the coupled Cas9/gRNA elements were inherited together from either the F0 male(Fig. 2c) or female (Fig. 2d) in a configuration mimicking a full-GD scenario. Here, the F2 progeny from F0 male inheritance hadinheritance rates of 91% (Cas9) and 95% (gRNA) (Fig. 2e). Incontrast, the inheritance rates from the F0 female were 67%(Cas9) and 53% (gRNAs) (Fig. 2e), suggesting that a strongmaternal effect on a gene drive is generated only when the twoelements are inherited together from a female germline,consistent with previous observations21. These results encouragenew gene-drive designs that delay Cas9 and/or gRNA functioningin the embryo to avoid the undesired generation of drive-resistantalleles.
We next tested how the tGD(y,w) would perform in terms ofinheritance rates and maternal effects when using a differentpromoter to drive expression of Cas9. We cloned the nanosgene regulatory region into our Cas9 construct and inserted itinto the same genomic location (yellow) to generate the nanos-Cas9 line (Supplementary Fig. 1). Performing the same crossschemes to combine the nanos-Cas9-Red with the y-[y1,w2] line(Fig. 2a–d), a similar pattern was seen for the vasa promoter, withcomparable inheritance rates for separated transgenes in the F0crosses and frequent formation of resistant alleles when thecombined Cas9/gRNA complex was inherited from F0 females(Supplementary Fig. 3, Supplementary Data 2). An additionalnoteworthy result from this experiment was that our tGD(y,w)driven by nanos did not display the inheritance differencesbetween the Cas9 and gRNAs as noted in our previous vasa-driven tGD(y,w) experiment in which both elements wereinherited separately (Fig. 2a, e; Supplementary Fig. 3; statisticalanalysis in Supplementary Data 2). These results reinforce thehypothesis that inheriting a preloaded Cas9–gRNA complexthrough the mother is an obstacle to the spread of gene drives,which did not occur when the elements were inherited separatelyin our system.
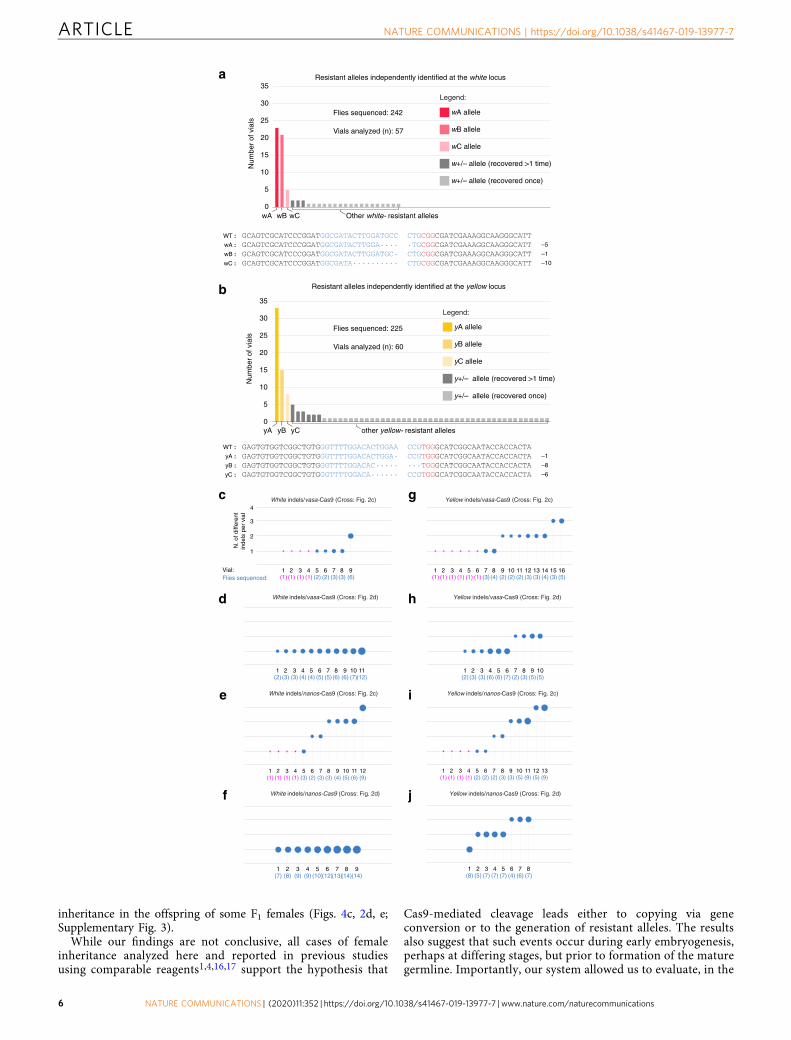
tGD generates predictable resistant alleles. To better understandthe maternal effect on gene-drive inheritance, we used malesrecovered from the F2 generation of the simultaneous-inheritancetGD(y,w) crosses that carried resistant alleles. Since males haveonly a single X chromosome, which is inherited from the F1female, they are suitable for phenotypic isolation and molecularcharacterization of non-conversion events (resistant alleles) thatoccurred in each single F1 female. We sequenced resistant allelesin F2 males from various experimental conditions selecting, from57 (white) and 60 (yellow) independent F1 female germlines, a
total of 242 and 225 flies per locus, respectively (Fig. 3a, b, Sup-plementary Fig. 4). Intriguingly, for both w and y, we recoveredthree resistant alleles that occurred repeatedly in the germline ofindependent F1 females and that covered the majority of allsequenced flies (named wA, wB, and wC and yA, yB, and yC;Fig. 3a, b, Supplementary Fig. 4). In addition, we observed fewerunique occurrences of other indels in white than in yellow, 18/242(7%) and 43/225 (19%), respectively (Fig. 3a, b, light gray). Thesefindings highlight the importance of characterizing the range ofpossible indels at genomic locations chosen for field gene-driveapplications. In addition, we analyzed the frequency of resistantmutations generated from conditions meant to resemble full-GDsituations, with both elements inherited simultaneously (Fig. 2c,d), and observed that the ratios and the type of recurrent allelesrecovered can vary drastically between different drive configura-tions (Supplementary Fig. 5).
Lastly, in an attempt to clarify at what time point duringdevelopment the allelic conversion process occurs, we alsotabulated the number of different resistant alleles recovered inthe F2 progeny of single F1 females. Under the analyzedconditions, we detected a range of 1–4 different resistant allelesper vial (Fig. 3c–j). When the Cas9 and gRNA constructs wereinherited from the F0 female (Fig. 2d), we recovered only oneresistant white allele per vial analyzed for both vasa and nanospromoters (Fig. 3d, f), in line with previous observations using afull gene drive driven by nanos17. Our results suggest that theseindels are generated as early as fertilization (or zygote),consistent with the average inheritance of ~50% observed (vasaFig. 2d, e and nanos Supplementary Fig. 3). This trend was notobserved for the yellow locus, in which up to three differentalleles were recovered under the same conditions, suggestingthat the promoter used to express the gRNAs or the gRNA itselfresults in lower efficiency of cutting at the yellow locus than forwhite (Fig. 3h, j). While previous work compiled multiple NHEJsequences by directly sequencing F1 females1,2, our resultsexpand on these observations by showing different resistantalleles are generated within the germline by tracking theindividual genotypes of multiple F2 progeny.
Regarding the male inheritance (Fig. 2c), we observe 1–4 indelsgenerated from each F1 female germline for either promoter andlocus analyzed (Fig. 3c, e, g, i). This fact, combined with the highinheritance rates observed in these experiments, suggests a modelin which resistant alleles are stochastically generated during lategermline development, following pole-cell formation (Fig. 4a).In addition, under these conditions, adult F1 females displayw-mosaic eyes due to leakiness of the vasa and nanos promotersin somatic tissues, suggesting that the somatic tissue was notpreviously edited during early embryogenesis (Fig. 4a). Theseobservations differ from previous work using nanos where nomosaicism was detected when the drive was inherited through themale17. These discrepancies could derive from the use ofdifferent codon usage for the Cas9 sequences.
Conversely, in female inheritance conditions, the indels seemto be generated in the syncytial blastoderm embryo beforecellularization of the ~3 primordial pole-cell precursors that havebeen estimated to be set aside for the germline at the 128-cellstage29. In fact, at the white locus, we observed only a single indelper female germline, which combined with the ~50% inheritancemeasured for the gRNA transgene and the fully w- F1 femalephenotype, suggests that Cas9 action occurs efficiently at thezygote stage (Fig. 4b). For yellow, we instead observed 1–3 indelsgenerated per F1 female, suggesting that Cas9 cutting happenslater or less efficiently prior to pole-cell formation. In the case ofyellow, our data are also consistent with a few nuclei escapingCas9 action in the blastoderm embryo and being converted laterduring germline development as we observe super-Mendelian
NATURE COMMUNICATIONS | https://doi.org/10.1038/s41467-019-13977-7 ARTICLE
NATURE COMMUNICATIONS | (2020) 11:352 | https://doi.org/10.1038/s41467-019-13977-7 | www.nature.com/naturecommunications 5
inheritance in the offspring of some F1 females (Figs. 4c, 2d, e;Supplementary Fig. 3).
While our findings are not conclusive, all cases of femaleinheritance analyzed here and reported in previous studiesusing comparable reagents1,4,16,17 support the hypothesis that
Cas9-mediated cleavage leads either to copying via geneconversion or to the generation of resistant alleles. The resultsalso suggest that such events occur during early embryogenesis,perhaps at differing stages, but prior to formation of the maturegermline. Importantly, our system allowed us to evaluate, in the
a
b
wA allele
wB allele
wC allele
w+/– allele (recovered >1 time)
w+/– allele (recovered once)
Legend:
yA allele
yB allele
yC allele
y+/– allele (recovered >1 time)
y+/– allele (recovered once)
Legend:
g Yellow indels/vasa-Cas9 (Cross: Fig. 2c)
N. o
f diff
eren
tin
dels
per
via
l
1
Vial:Flies sequenced:
2
3
4
h Yellow indels/vasa-Cas9 (Cross: Fig. 2d)
i
j
1(1)
2(1)
3(1)
4(1)
5(1)
6(1)
7(3)
8(4)
9(2)
10(2)
11(2)
12(3)
13(3)
14(4)
15(3)
16(5)
1(2)
2(3)
3(3)
4(6)
5(6)
6(7)
7(2)
8(3)
9(5)
10(5)
1(1)
2(1)
3(1)
4(1)
5(2)
6(2)
7(2)
8(3)
9(3)
10(5)
11(9)
12(5)
13(9)
1(8)
2(5)
3(7)
4(7)
5(7)
6(4)
7(6)
8(7)
c White indels/vasa-Cas9 (Cross: Fig. 2c)
1(1)
2(1)
3(1)
4(1)
5(2)
6(2)
7(3)
8(3)
9(6)
d White indels/vasa-Cas9 (Cross: Fig. 2d)
Yellow indels/nanos-Cas9 (Cross: Fig. 2c)
Yellow indels/nanos-Cas9 (Cross: Fig. 2d)
White indels/nanos-Cas9 (Cross: Fig. 2c)
White indels/nanos-Cas9 (Cross: Fig. 2d)
1(2)
2(3)
3(3)
4(4)
5(4)
6(5)
7(5)
8(6)
9(6)
10(7)
11(12)
e
1(1)
2(1)
3(1)
4(1)
5(3)
6(2)
7(3)
8(3)
9(4)
10(5)
11(6)
12(9)
f
1(7)
2(8)
3(9)
4(9)
5(10)
6(12)
7(13)
8(14)
9(14)
35
5
30
25
20
15
10
0
35
5
30
25
20
15
10
0yA yB yC other yellow- resistant alleles
wA wB wC Other white- resistant alleles
Resistant alleles independently identified at the white locus
Flies sequenced: 225
Vials analyzed (n): 60
Num
ber
of v
ials
Num
ber
of v
ials
Resistant alleles independently identified at the yellow locus
Flies sequenced: 242
Vials analyzed (n): 57
WT
wA
wB
wC
WT
yA
yB
yC
–5
–1
–10
–1
–8
–6
ARTICLE NATURE COMMUNICATIONS | https://doi.org/10.1038/s41467-019-13977-7
6 NATURE COMMUNICATIONS | (2020) 11:352 | https://doi.org/10.1038/s41467-019-13977-7 | www.nature.com/naturecommunications
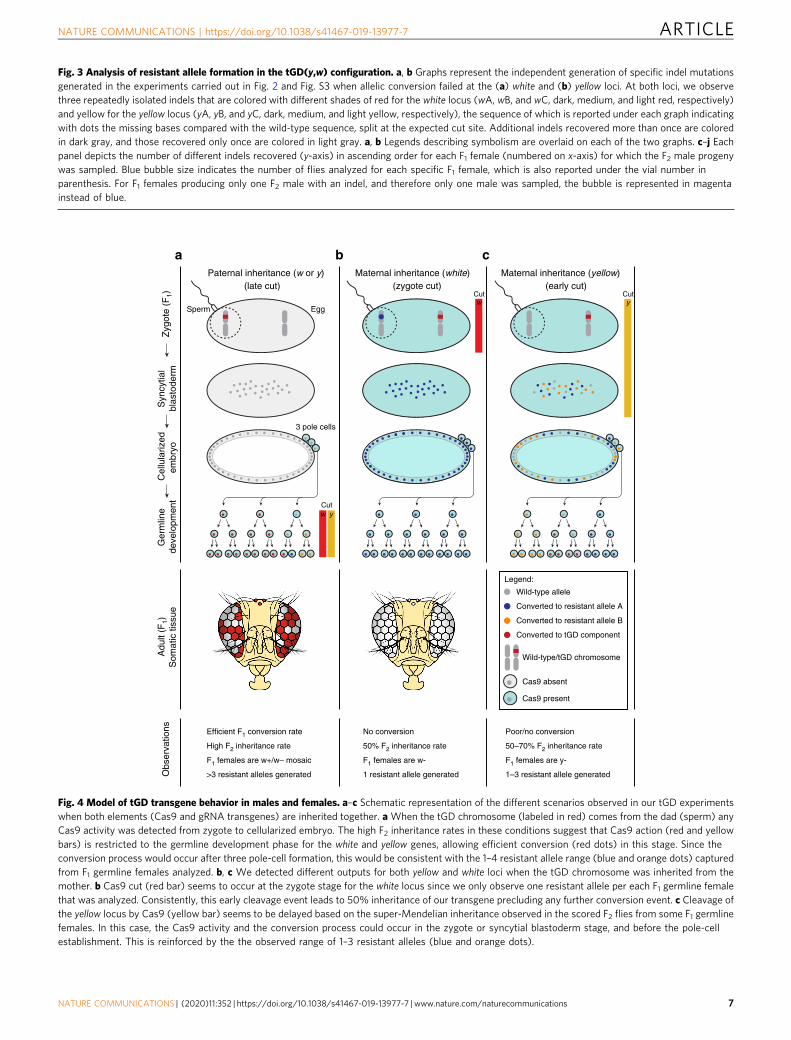
Fig. 3 Analysis of resistant allele formation in the tGD(y,w) configuration. a, b Graphs represent the independent generation of specific indel mutationsgenerated in the experiments carried out in Fig. 2 and Fig. S3 when allelic conversion failed at the (a) white and (b) yellow loci. At both loci, we observethree repeatedly isolated indels that are colored with different shades of red for the white locus (wA, wB, and wC, dark, medium, and light red, respectively)and yellow for the yellow locus (yA, yB, and yC, dark, medium, and light yellow, respectively), the sequence of which is reported under each graph indicatingwith dots the missing bases compared with the wild-type sequence, split at the expected cut site. Additional indels recovered more than once are coloredin dark gray, and those recovered only once are colored in light gray. a, b Legends describing symbolism are overlaid on each of the two graphs. c–j Eachpanel depicts the number of different indels recovered (y-axis) in ascending order for each F1 female (numbered on x-axis) for which the F2 male progenywas sampled. Blue bubble size indicates the number of flies analyzed for each specific F1 female, which is also reported under the vial number inparenthesis. For F1 females producing only one F2 male with an indel, and therefore only one male was sampled, the bubble is represented in magentainstead of blue.
Maternal inheritance (yellow)(early cut)
Maternal inheritance (white)(zygote cut)
Paternal inheritance (w or y) (late cut)
Sperm
Syn
cytia
l bl
asto
derm
Zyg
ote
(F1)
Cel
lula
rized
embr
yoG
erm
line
deve
lopm
ent
Adu
lt (F
1)
Som
atic
tiss
ueO
bser
vatio
ns
Egg
3 pole cells
Cut
CutCut
Efficient F1 conversion rate
High F2 inheritance rate
F1 females are w+/w– mosaic
>3 resistant alleles generated
No conversion
50% F2 inheritance rate
F1 females are w-
1 resistant allele generated
Poor/no conversion
50–70% F2 inheritance rate
F1 females are y-
1–3 resistant allele generated
Wild-type allele
Converted to resistant allele A
Converted to resistant allele B
Converted to tGD component
Legend:
Wild-type/tGD chromosome
Cas9 absent
Cas9 present
w
w
y
y
a b c
Fig. 4 Model of tGD transgene behavior in males and females. a–c Schematic representation of the different scenarios observed in our tGD experimentswhen both elements (Cas9 and gRNA transgenes) are inherited together. a When the tGD chromosome (labeled in red) comes from the dad (sperm) anyCas9 activity was detected from zygote to cellularized embryo. The high F2 inheritance rates in these conditions suggest that Cas9 action (red and yellowbars) is restricted to the germline development phase for the white and yellow genes, allowing efficient conversion (red dots) in this stage. Since theconversion process would occur after three pole-cell formation, this would be consistent with the 1–4 resistant allele range (blue and orange dots) capturedfrom F1 germline females analyzed. b, c We detected different outputs for both yellow and white loci when the tGD chromosome was inherited from themother. b Cas9 cut (red bar) seems to occur at the zygote stage for the white locus since we only observe one resistant allele per each F1 germline femalethat was analyzed. Consistently, this early cleavage event leads to 50% inheritance of our transgene precluding any further conversion event. c Cleavage ofthe yellow locus by Cas9 (yellow bar) seems to be delayed based on the super-Mendelian inheritance observed in the scored F2 flies from some F1 germlinefemales. In this case, the Cas9 activity and the conversion process could occur in the zygote or syncytial blastoderm stage, and before the pole-cellestablishment. This is reinforced by the the observed range of 1–3 resistant alleles (blue and orange dots).
NATURE COMMUNICATIONS | https://doi.org/10.1038/s41467-019-13977-7 ARTICLE
NATURE COMMUNICATIONS | (2020) 11:352 | https://doi.org/10.1038/s41467-019-13977-7 | www.nature.com/naturecommunications 7
same animal, the simultaneous action of two gRNAs andidentify how they differ in the maternal effect on super-Mendelian inheritance (Fig. 4).
Controlled tGD activation in the adult germline. Our above-presented studies on female germline resistance suggest that theCas9-induced cleavage events could happen as early as the zygotestage. As resistant alleles pose a potential problem to gene-driveapplications, we wondered how tGD would perform when Cas9activity was solely restricted to the adult germline. This is animportant question since, to our knowledge, no published gene-drive work has thus far been able to precisely establish the timingof drive conversion events.
We recently developed a small-molecule-controlled system foruse in active genetics approaches including CRISPR-based gene-drive systems30. Briefly, we fused Escherichia coli dihydrofolatereductase domains to SpCas9 to promote its rapid proteasomaldegradation in the absence of the stabilizing small moleculetrimethoprim (TMP)31,32. We showed that TMP addition to thefruit fly diet stabilized our modified SpCas9 (DD2-Cas9) andsustained super-Mendelian inheritance control of a CopyCatactive genetic element30.
Here, we first used a comparable DD2-Cas9 line and showedthat the mentioned drug-regulated system could be applied to thetGD(y,w) for controlling its super-Mendelian inheritance (Sup-plementary Fig. 6; Supplementary Data 3). Next, we used theTMP regulation in our tGD system and were able to activate Cas9only in the adult female germline, showing that super-Mendelianinheritance can be achieved when the gene-drive process isrestricted to this tissue (Supplementary Fig. 6; SupplementaryData 3), although resistant alleles were also detected (Supple-mentary Fig. 7).
This approach opens a new avenue for restricting Cas9activity to an optimal window when HDR is favored, perhapsrepresenting a way to bypass the maternal effect. In addition,future developments of this technology could bias inheritance,for example, in a spatially restricted fashion, such as by city,through the addition of the small molecule to urban waterreservoirs, therefore controlling the spread of a gene drive intoa circumscribed locale.
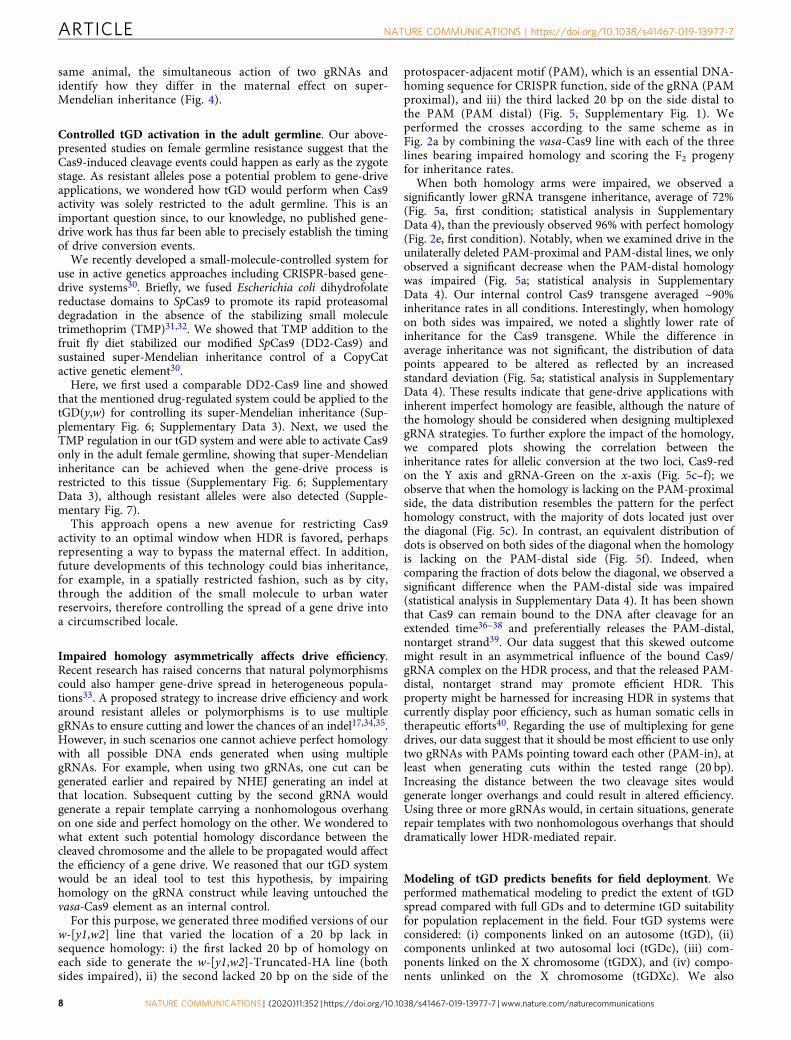
Impaired homology asymmetrically affects drive efficiency.Recent research has raised concerns that natural polymorphismscould also hamper gene-drive spread in heterogeneous popula-tions33. A proposed strategy to increase drive efficiency and workaround resistant alleles or polymorphisms is to use multiplegRNAs to ensure cutting and lower the chances of an indel17,34,35.However, in such scenarios one cannot achieve perfect homologywith all possible DNA ends generated when using multiplegRNAs. For example, when using two gRNAs, one cut can begenerated earlier and repaired by NHEJ generating an indel atthat location. Subsequent cutting by the second gRNA wouldgenerate a repair template carrying a nonhomologous overhangon one side and perfect homology on the other. We wondered towhat extent such potential homology discordance between thecleaved chromosome and the allele to be propagated would affectthe efficiency of a gene drive. We reasoned that our tGD systemwould be an ideal tool to test this hypothesis, by impairinghomology on the gRNA construct while leaving untouched thevasa-Cas9 element as an internal control.
For this purpose, we generated three modified versions of ourw-[y1,w2] line that varied the location of a 20 bp lack insequence homology: i) the first lacked 20 bp of homology oneach side to generate the w-[y1,w2]-Truncated-HA line (bothsides impaired), ii) the second lacked 20 bp on the side of the
protospacer-adjacent motif (PAM), which is an essential DNA-homing sequence for CRISPR function, side of the gRNA (PAMproximal), and iii) the third lacked 20 bp on the side distal tothe PAM (PAM distal) (Fig. 5, Supplementary Fig. 1). Weperformed the crosses according to the same scheme as inFig. 2a by combining the vasa-Cas9 line with each of the threelines bearing impaired homology and scoring the F2 progenyfor inheritance rates.
When both homology arms were impaired, we observed asignificantly lower gRNA transgene inheritance, average of 72%(Fig. 5a, first condition; statistical analysis in SupplementaryData 4), than the previously observed 96% with perfect homology(Fig. 2e, first condition). Notably, when we examined drive in theunilaterally deleted PAM-proximal and PAM-distal lines, we onlyobserved a significant decrease when the PAM-distal homologywas impaired (Fig. 5a; statistical analysis in SupplementaryData 4). Our internal control Cas9 transgene averaged ~90%inheritance rates in all conditions. Interestingly, when homologyon both sides was impaired, we noted a slightly lower rate ofinheritance for the Cas9 transgene. While the difference inaverage inheritance was not significant, the distribution of datapoints appeared to be altered as reflected by an increasedstandard deviation (Fig. 5a; statistical analysis in SupplementaryData 4). These results indicate that gene-drive applications withinherent imperfect homology are feasible, although the nature ofthe homology should be considered when designing multiplexedgRNA strategies. To further explore the impact of the homology,we compared plots showing the correlation between theinheritance rates for allelic conversion at the two loci, Cas9-redon the Y axis and gRNA-Green on the x-axis (Fig. 5c–f); weobserve that when the homology is lacking on the PAM-proximalside, the data distribution resembles the pattern for the perfecthomology construct, with the majority of dots located just overthe diagonal (Fig. 5c). In contrast, an equivalent distribution ofdots is observed on both sides of the diagonal when the homologyis lacking on the PAM-distal side (Fig. 5f). Indeed, whencomparing the fraction of dots below the diagonal, we observed asignificant difference when the PAM-distal side was impaired(statistical analysis in Supplementary Data 4). It has been shownthat Cas9 can remain bound to the DNA after cleavage for anextended time36–38 and preferentially releases the PAM-distal,nontarget strand39. Our data suggest that this skewed outcomemight result in an asymmetrical influence of the bound Cas9/gRNA complex on the HDR process, and that the released PAM-distal, nontarget strand may promote efficient HDR. Thisproperty might be harnessed for increasing HDR in systems thatcurrently display poor efficiency, such as human somatic cells intherapeutic efforts40. Regarding the use of multiplexing for genedrives, our data suggest that it should be most efficient to use onlytwo gRNAs with PAMs pointing toward each other (PAM-in), atleast when generating cuts within the tested range (20 bp).Increasing the distance between the two cleavage sites wouldgenerate longer overhangs and could result in altered efficiency.Using three or more gRNAs would, in certain situations, generaterepair templates with two nonhomologous overhangs that shoulddramatically lower HDR-mediated repair.
Modeling of tGD predicts benefits for field deployment. Weperformed mathematical modeling to predict the extent of tGDspread compared with full GDs and to determine tGD suitabilityfor population replacement in the field. Four tGD systems wereconsidered: (i) components linked on an autosome (tGD), (ii)components unlinked at two autosomal loci (tGDc), (iii) com-ponents linked on the X chromosome (tGDX), and (iv) compo-nents unlinked on the X chromosome (tGDXc). We also
ARTICLE NATURE COMMUNICATIONS | https://doi.org/10.1038/s41467-019-13977-7
8 NATURE COMMUNICATIONS | (2020) 11:352 | https://doi.org/10.1038/s41467-019-13977-7 | www.nature.com/naturecommunications
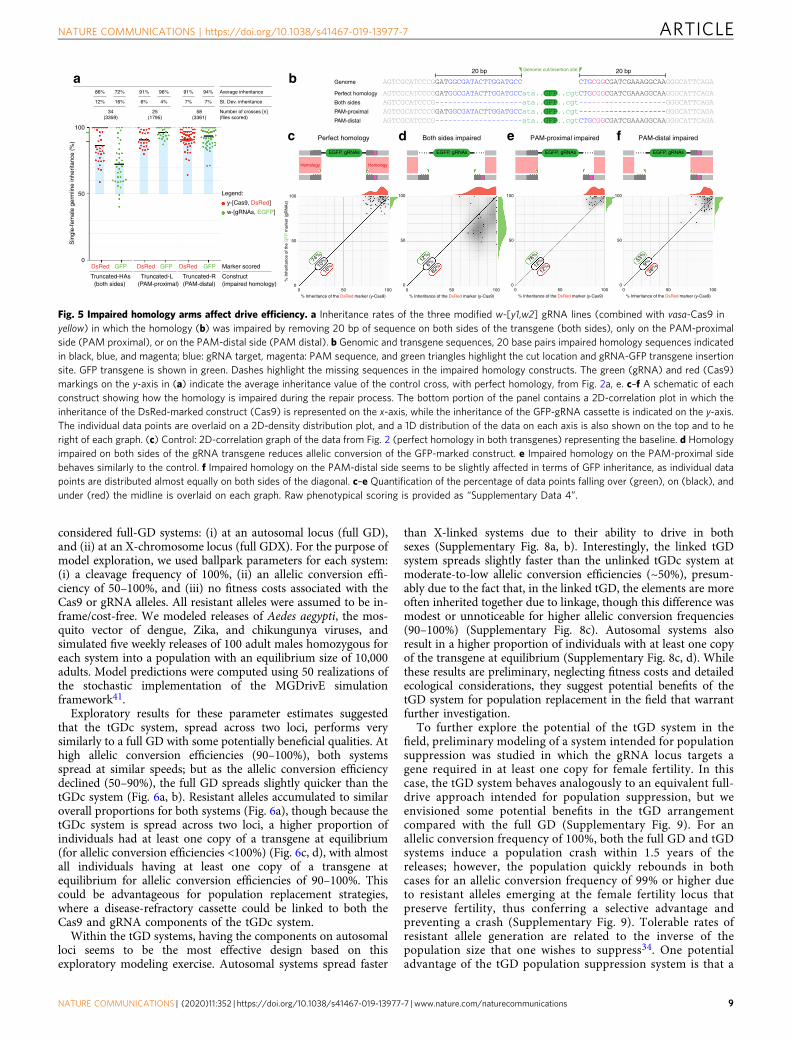
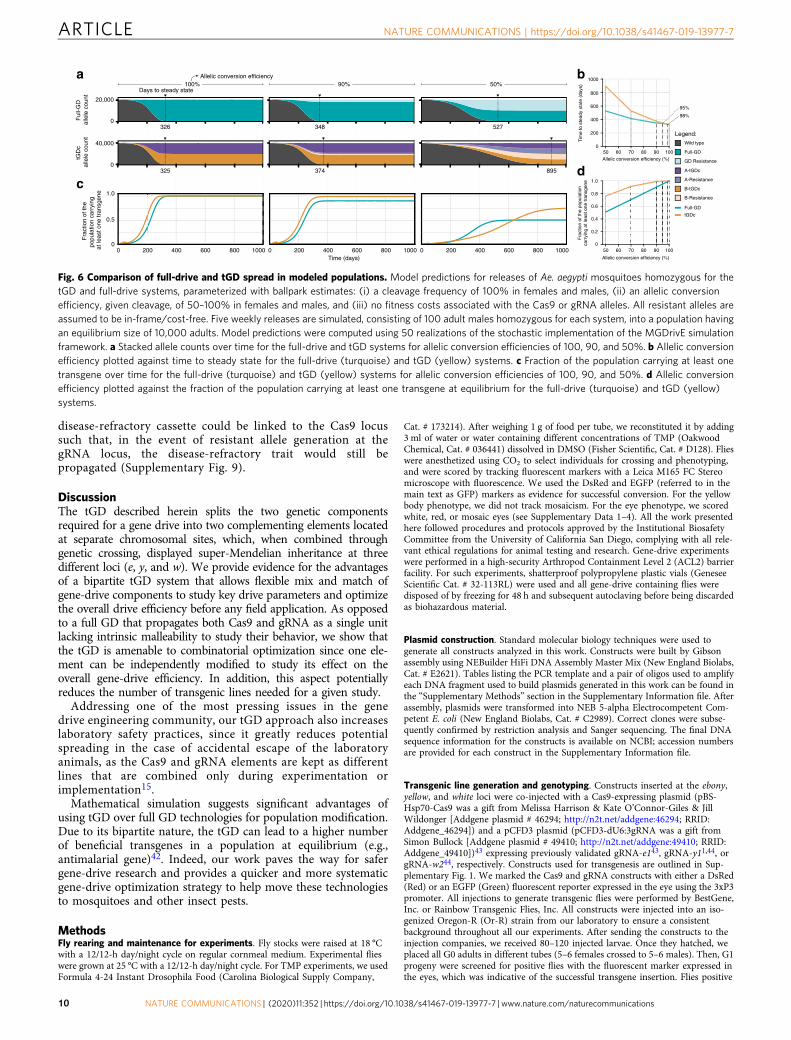
considered full-GD systems: (i) at an autosomal locus (full GD),and (ii) at an X-chromosome locus (full GDX). For the purpose ofmodel exploration, we used ballpark parameters for each system:(i) a cleavage frequency of 100%, (ii) an allelic conversion effi-ciency of 50–100%, and (iii) no fitness costs associated with theCas9 or gRNA alleles. All resistant alleles were assumed to be in-frame/cost-free. We modeled releases of Aedes aegypti, the mos-quito vector of dengue, Zika, and chikungunya viruses, andsimulated five weekly releases of 100 adult males homozygous foreach system into a population with an equilibrium size of 10,000adults. Model predictions were computed using 50 realizations ofthe stochastic implementation of the MGDrivE simulationframework41.
Exploratory results for these parameter estimates suggestedthat the tGDc system, spread across two loci, performs verysimilarly to a full GD with some potentially beneficial qualities. Athigh allelic conversion efficiencies (90–100%), both systemsspread at similar speeds; but as the allelic conversion efficiencydeclined (50–90%), the full GD spreads slightly quicker than thetGDc system (Fig. 6a, b). Resistant alleles accumulated to similaroverall proportions for both systems (Fig. 6a), though because thetGDc system is spread across two loci, a higher proportion ofindividuals had at least one copy of a transgene at equilibrium(for allelic conversion efficiencies <100%) (Fig. 6c, d), with almostall individuals having at least one copy of a transgene atequilibrium for allelic conversion efficiencies of 90–100%. Thiscould be advantageous for population replacement strategies,where a disease-refractory cassette could be linked to both theCas9 and gRNA components of the tGDc system.
Within the tGD systems, having the components on autosomalloci seems to be the most effective design based on thisexploratory modeling exercise. Autosomal systems spread faster
than X-linked systems due to their ability to drive in bothsexes (Supplementary Fig. 8a, b). Interestingly, the linked tGDsystem spreads slightly faster than the unlinked tGDc system atmoderate-to-low allelic conversion efficiencies (~50%), presum-ably due to the fact that, in the linked tGD, the elements are moreoften inherited together due to linkage, though this difference wasmodest or unnoticeable for higher allelic conversion frequencies(90–100%) (Supplementary Fig. 8c). Autosomal systems alsoresult in a higher proportion of individuals with at least one copyof the transgene at equilibrium (Supplementary Fig. 8c, d). Whilethese results are preliminary, neglecting fitness costs and detailedecological considerations, they suggest potential benefits of thetGD system for population replacement in the field that warrantfurther investigation.
To further explore the potential of the tGD system in thefield, preliminary modeling of a system intended for populationsuppression was studied in which the gRNA locus targets agene required in at least one copy for female fertility. In thiscase, the tGD system behaves analogously to an equivalent full-drive approach intended for population suppression, but weenvisioned some potential benefits in the tGD arrangementcompared with the full GD (Supplementary Fig. 9). For anallelic conversion frequency of 100%, both the full GD and tGDsystems induce a population crash within 1.5 years of thereleases; however, the population quickly rebounds in bothcases for an allelic conversion frequency of 99% or higher dueto resistant alleles emerging at the female fertility locus thatpreserve fertility, thus conferring a selective advantage andpreventing a crash (Supplementary Fig. 9). Tolerable rates ofresistant allele generation are related to the inverse of thepopulation size that one wishes to suppress34. One potentialadvantage of the tGD population suppression system is that a
Genome cut/insertion site
Average inheritance
Number of crosses [n] (flies scored)
86% 72%
34(3359)
12% 16% St. Dev. inheritance
Truncated-HAs(both sides)
100
50
0
91% 96%
25(1795)
6% 4%
Truncated-L (PAM-proximal)
91% 94%
58(3361)
7% 7%
Truncated-R(PAM-distal)
Marker scored
Construct(impaired homology)
DsRed GFP DsRed GFP DsRed GFP
a b
dc feEGFP, gRNAsEGFP, gRNAs EGFP, gRNAsEGFP, gRNAs
Homology Homology
Sin
gle-
fem
ale
germ
line
inhe
ritan
ce (
%)
y-[Cas9, DsRed]
w-[gRNAs, EGFP]
Legend:
20 bp 20 bp
0
50
100
0 50 1000
50
100
0 50 1000
50
100
0 50 1000
50
100
0 50 100
% Inheritance of the DsRed marker (y-Cas9)
Perfect homology Both sides impaired PAM-proximal impaired PAM-distal impaired
% Inheritance of the DsRed marker (y-Cas9) % Inheritance of the DsRed marker (y-Cas9) % Inheritance of the DsRed marker (y-Cas9)
% In
herit
ance
of t
he G
FP
mar
ker
(gR
NA
s)
74%
10%
16%
12%
6%
82%
76%
12%
12%
53%
9%
38%
Genome
Perfect homology
Both sides
PAM-proximal
PAM-distal
Fig. 5 Impaired homology arms affect drive efficiency. a Inheritance rates of the three modified w-[y1,w2] gRNA lines (combined with vasa-Cas9 inyellow) in which the homology (b) was impaired by removing 20 bp of sequence on both sides of the transgene (both sides), only on the PAM-proximalside (PAM proximal), or on the PAM-distal side (PAM distal). b Genomic and transgene sequences, 20 base pairs impaired homology sequences indicatedin black, blue, and magenta; blue: gRNA target, magenta: PAM sequence, and green triangles highlight the cut location and gRNA-GFP transgene insertionsite. GFP transgene is shown in green. Dashes highlight the missing sequences in the impaired homology constructs. The green (gRNA) and red (Cas9)markings on the y-axis in (a) indicate the average inheritance value of the control cross, with perfect homology, from Fig. 2a, e. c–f A schematic of eachconstruct showing how the homology is impaired during the repair process. The bottom portion of the panel contains a 2D-correlation plot in which theinheritance of the DsRed-marked construct (Cas9) is represented on the x-axis, while the inheritance of the GFP-gRNA cassette is indicated on the y-axis.The individual data points are overlaid on a 2D-density distribution plot, and a 1D distribution of the data on each axis is also shown on the top and to heright of each graph. (c) Control: 2D-correlation graph of the data from Fig. 2 (perfect homology in both transgenes) representing the baseline. d Homologyimpaired on both sides of the gRNA transgene reduces allelic conversion of the GFP-marked construct. e Impaired homology on the PAM-proximal sidebehaves similarly to the control. f Impaired homology on the PAM-distal side seems to be slightly affected in terms of GFP inheritance, as individual datapoints are distributed almost equally on both sides of the diagonal. c–e Quantification of the percentage of data points falling over (green), on (black), andunder (red) the midline is overlaid on each graph. Raw phenotypical scoring is provided as “Supplementary Data 4”.
NATURE COMMUNICATIONS | https://doi.org/10.1038/s41467-019-13977-7 ARTICLE
NATURE COMMUNICATIONS | (2020) 11:352 | https://doi.org/10.1038/s41467-019-13977-7 | www.nature.com/naturecommunications 9
disease-refractory cassette could be linked to the Cas9 locussuch that, in the event of resistant allele generation at thegRNA locus, the disease-refractory trait would still bepropagated (Supplementary Fig. 9).
DiscussionThe tGD described herein splits the two genetic componentsrequired for a gene drive into two complementing elements locatedat separate chromosomal sites, which, when combined throughgenetic crossing, displayed super-Mendelian inheritance at threedifferent loci (e, y, and w). We provide evidence for the advantagesof a bipartite tGD system that allows flexible mix and match ofgene-drive components to study key drive parameters and optimizethe overall drive efficiency before any field application. As opposedto a full GD that propagates both Cas9 and gRNA as a single unitlacking intrinsic malleability to study their behavior, we show thatthe tGD is amenable to combinatorial optimization since one ele-ment can be independently modified to study its effect on theoverall gene-drive efficiency. In addition, this aspect potentiallyreduces the number of transgenic lines needed for a given study.
Addressing one of the most pressing issues in the genedrive engineering community, our tGD approach also increaseslaboratory safety practices, since it greatly reduces potentialspreading in the case of accidental escape of the laboratoryanimals, as the Cas9 and gRNA elements are kept as differentlines that are combined only during experimentation orimplementation15.
Mathematical simulation suggests significant advantages ofusing tGD over full GD technologies for population modification.Due to its bipartite nature, the tGD can lead to a higher numberof beneficial transgenes in a population at equilibrium (e.g.,antimalarial gene)42. Indeed, our work paves the way for safergene-drive research and provides a quicker and more systematicgene-drive optimization strategy to help move these technologiesto mosquitoes and other insect pests.
MethodsFly rearing and maintenance for experiments. Fly stocks were raised at 18 °Cwith a 12/12-h day/night cycle on regular cornmeal medium. Experimental flieswere grown at 25 °C with a 12/12-h day/night cycle. For TMP experiments, we usedFormula 4-24 Instant Drosophila Food (Carolina Biological Supply Company,
Cat. # 173214). After weighing 1 g of food per tube, we reconstituted it by adding3 ml of water or water containing different concentrations of TMP (OakwoodChemical, Cat. # 036441) dissolved in DMSO (Fisher Scientific, Cat. # D128). Flieswere anesthetized using CO2 to select individuals for crossing and phenotyping,and were scored by tracking fluorescent markers with a Leica M165 FC Stereomicroscope with fluorescence. We used the DsRed and EGFP (referred to in themain text as GFP) markers as evidence for successful conversion. For the yellowbody phenotype, we did not track mosaicism. For the eye phenotype, we scoredwhite, red, or mosaic eyes (see Supplementary Data 1–4). All the work presentedhere followed procedures and protocols approved by the Institutional BiosafetyCommittee from the University of California San Diego, complying with all rele-vant ethical regulations for animal testing and research. Gene-drive experimentswere performed in a high-security Arthropod Containment Level 2 (ACL2) barrierfacility. For such experiments, shatterproof polypropylene plastic vials (GeneseeScientific Cat. # 32-113RL) were used and all gene-drive containing flies weredisposed of by freezing for 48 h and subsequent autoclaving before being discardedas biohazardous material.
Plasmid construction. Standard molecular biology techniques were used togenerate all constructs analyzed in this work. Constructs were built by Gibsonassembly using NEBuilder HiFi DNA Assembly Master Mix (New England Biolabs,Cat. # E2621). Tables listing the PCR template and a pair of oligos used to amplifyeach DNA fragment used to build plasmids generated in this work can be found inthe “Supplementary Methods” section in the Supplementary Information file. Afterassembly, plasmids were transformed into NEB 5-alpha Electrocompetent Com-petent E. coli (New England Biolabs, Cat. # C2989). Correct clones were subse-quently confirmed by restriction analysis and Sanger sequencing. The final DNAsequence information for the constructs is available on NCBI; accession numbersare provided for each construct in the Supplementary Information file.
Transgenic line generation and genotyping. Constructs inserted at the ebony,yellow, and white loci were co-injected with a Cas9-expressing plasmid (pBS-Hsp70-Cas9 was a gift from Melissa Harrison & Kate O’Connor-Giles & JillWildonger [Addgene plasmid # 46294; http://n2t.net/addgene:46294; RRID:Addgene_46294]) and a pCFD3 plasmid (pCFD3-dU6:3gRNA was a gift fromSimon Bullock [Addgene plasmid # 49410; http://n2t.net/addgene:49410; RRID:Addgene_49410])43 expressing previously validated gRNA-e143, gRNA-y11,44, orgRNA-w244, respectively. Constructs used for transgenesis are outlined in Sup-plementary Fig. 1. We marked the Cas9 and gRNA constructs with either a DsRed(Red) or an EGFP (Green) fluorescent reporter expressed in the eye using the 3xP3promoter. All injections to generate transgenic flies were performed by BestGene,Inc. or Rainbow Transgenic Flies, Inc. All constructs were injected into an iso-genized Oregon-R (Or-R) strain from our laboratory to ensure a consistentbackground throughout all our experiments. After sending the constructs to theinjection companies, we received 80–120 injected larvae. Once they hatched, weplaced all G0 adults in different tubes (5–6 females crossed to 5–6 males). Then, G1progeny were screened for positive flies with the fluorescent marker expressed inthe eyes, which was indicative of the successful transgene insertion. Flies positive
400200 600 800 100000
1.0
0.5
400200 600 800 10000 400200 600 800 10000
Ful
l-GD
alle
le c
ount
tGD
cal
lele
cou
ntF
ract
ion
of th
epo
pula
tion
carr
ying
at
leas
t one
tran
sgen
e
Time (days)
326 348 527
325 374 895
90%Allelic conversion efficiency
50%
050 60 70 80 90
95%
98%
100
200
400
600
1000
800
Tim
e to
ste
ady
stat
e (d
ays)
Wild type
Full-GD
GD Resistance
A-tGDc
A-Resistance
B-tGDc
B-Resistance
tGDc
Full-GD
100%a
c
b
d
Days to steady state
20,000
0
40,000
0
050
Allelic conversion efficiency (%)
Allelic conversion efficiency (%)
60 70 80 90 100
0.2
0.4
0.6
1.0
0.8
Fra
ctio
n of
the
popu
latio
nca
rryi
ng a
t lea
st o
ne tr
ansg
ene
Legend:
Fig. 6 Comparison of full-drive and tGD spread in modeled populations. Model predictions for releases of Ae. aegypti mosquitoes homozygous for thetGD and full-drive systems, parameterized with ballpark estimates: (i) a cleavage frequency of 100% in females and males, (ii) an allelic conversionefficiency, given cleavage, of 50–100% in females and males, and (iii) no fitness costs associated with the Cas9 or gRNA alleles. All resistant alleles areassumed to be in-frame/cost-free. Five weekly releases are simulated, consisting of 100 adult males homozygous for each system, into a population havingan equilibrium size of 10,000 adults. Model predictions were computed using 50 realizations of the stochastic implementation of the MGDrivE simulationframework. a Stacked allele counts over time for the full-drive and tGD systems for allelic conversion efficiencies of 100, 90, and 50%. b Allelic conversionefficiency plotted against time to steady state for the full-drive (turquoise) and tGD (yellow) systems. c Fraction of the population carrying at least onetransgene over time for the full-drive (turquoise) and tGD (yellow) systems for allelic conversion efficiencies of 100, 90, and 50%. d Allelic conversionefficiency plotted against the fraction of the population carrying at least one transgene at equilibrium for the full-drive (turquoise) and tGD (yellow)systems.
ARTICLE NATURE COMMUNICATIONS | https://doi.org/10.1038/s41467-019-13977-7
10 NATURE COMMUNICATIONS | (2020) 11:352 | https://doi.org/10.1038/s41467-019-13977-7 | www.nature.com/naturecommunications
for the marker were crossed individually to the same Or-R flies used for injection tomake a homozygous stock in subsequent generations by identifying the e, y, or wvisible marker. Last, we sequenced each stock to confirm correct transgeneintegration.
Molecular analysis of resistant alleles. For resistant allele sequence analysis, weperformed single-fly DNA extractions following the protocol described by GloorGB and colleagues45. We added 200 µL of water to dilute each sample to a finalvolume of 250 µL and used 1–5 µL of each DNA extraction as a template for a25-µL PCR reaction. We performed PCRs covering the gRNA cute site for eitherthe yellow or white locus in order to sequence the resistant allele present. The oligosused can be found in the Supplementary Information.
Graph generation and statistical analysis. We used GraphPad Prism 7 to gen-erate all our graphs. For statistical analysis, we used the Statkey analysis tool[http://www.lock5stat.com/StatKey/index.html]. We performed a RandomizationTest for a Difference in Means when comparing our experimental conditions(Supplementary Data 1, Supplementary Data 2 and Supplementary Data 4). InFig. 5 we also performed a Randomization Test for a Difference in Proportions(Supplementary Data 4) to evaluate differences in the distribution of the fraction ofdata points below the diagonal. In both cases we have performed 5000 randomi-zations of our data.
Mathematical modeling. To model the expected performance of the transcom-plementing gene-drive system in populations of Aedes aegypti, the mosquito vectorof dengue, chikungunya, and Zika viruses, we simulated release schemes for thetranscomplementing system with: (i) components linked on an autosome (tGD),(ii) components unlinked at two autosomal loci (tGDc), (iii) components linked onthe X chromosome (tGDX), and (iv) components unlinked at two loci on the Xchromosome (tGDXc). We also compared the system with standard full genedrives at an autosomal locus (Full-GD), and at an X-chromosome locus (Full-GDX). Releases were simulated consisting of 5 weekly releases of 100 adult maleshomozygous for each system using the MGDrivE simulation framework41 [https://marshalllab.github.io/MGDrivE/]. This framework models the egg, larval, pupal,and adult mosquito life stages (both female and male adults are modeled) imple-menting a daily time step, overlapping generations, and a mating structure inwhich adult males mate throughout their lifetime, while adult females mate onceupon emergence, retaining the genetic material of the adult male with whom theymate for the duration of their adult lifespan. Density-independent mortality ratesfor the juvenile life stages are assumed to be identical and are chosen for con-sistency with the population growth rate in the absence of density-dependentmortality. Additional density-dependent mortality occurs at the larval stage, theform of which is taken from previous studies46. The inheritance patterns for thetGD, tGDc, tGDX, tGDXc, Full-GD, and Full-GDX systems are modeled within theinheritance module of the MGDrivE framework41. We parameterized our trans-complementing and full gene-drive models using ballpark parameter estimates formodel exploration: (i) a cleavage frequency of 100% in females and males, (ii) afrequency of accurate homology-directed repair, given cleavage, of 50–100% infemales and males, (iii) no fitness costs associated with the Cas9 or gRNA alleles,and (iv) all resistant alleles being in-frame/cost-free. We implemented the sto-chastic version of the MGDrivE framework to capture the randomness associatedwith low genotype frequencies and rare events such as resistant allele generationunder some parameterizations. The code for running the simulation is freelyavailable from the MGDrivE GitHub repository [https://github.com/MarshallLab/MGDrivE], and the package can be installed on R through CRAN [https://cran.r-project.org/web/packages/MGDrivE/]. The inheritance cubes used in these simu-lations are the “cubeTGD” and “cubeTGDX” variants of the codebase. Parametervalues used in Aedes aegypti population model are reported here below:
β: Egg production per female (day−1)47—value: 20TE: Duration of egg stage (days)48—value: 5TL: Duration of larval stage (days)48—value: 6TP: Duration of pupal stage (days)48—value: 4r: Daily population growth rate (day−1)49—value: 1.175μM: Daily mortality rate of adult stage (day−1)50,51—value: 0.090N: Adult female population size52—value: 10,000
Reporting summary. Further information on research design is available inthe Nature Research Reporting Summary linked to this article.
Data availabilityThe sequence of all plasmid constructs generated in this paper has been deposited intothe GenBank database with accession codes:MN551085[https://www.ncbi.nlm.nih.gov/nuccore/MN551085],MN551086[https://www.ncbi.nlm.nih.gov/nuccore/MN551086], MN551087[https://
www.ncbi.nlm.nih.gov/nuccore/MN551087], MN551088[https://www.ncbi.nlm.nih.gov/nuccore/MN551088], MN551089[https://www.ncbi.nlm.nih.gov/nuccore/MN551089],MN551090[https://www.ncbi.nlm.nih.gov/nuccore/MN551090], MN551091[https://www.ncbi.nlm.nih.gov/nuccore/MN551091], MN551092[https://www.ncbi.nlm.nih.gov/
nuccore/MN551092], MN551093[https://www.ncbi.nlm.nih.gov/nuccore/MN551093],MN551094[https://www.ncbi.nlm.nih.gov/nuccore/MN551094].
In this study, we accessed the Addgene plasmid # 49411 [http://n2t.net/addgene:49411]; RRID:Addgene_49411. All raw phenotypical scoring data collected arereported in Supplementary Datas 1–4 files in Microsoft Excel format (.xlsx). All otherdata are available from the authors.
Code availabilityThe code for running the simulation of the mathematical modeling presented in thepaper is freely available from the MGDrivE GitHub repository [https://github.com/MarshallLab/MGDrivE], and the package can be installed on R through CRAN [https://cran.r-project.org/web/packages/MGDrivE/]. The inheritance cubes used in thesimulations are the “cubeTGD” and “cubeTGDX” variants of the codebase.
Received: 3 July 2019; Accepted: 11 December 2019;
References1. Gantz, V. M. & Bier, E. Genome editing. The mutagenic chain reaction: a
method for converting heterozygous to homozygous mutations. Science 348,442–444 (2015).
2. Champer, J. et al. Novel CRISPR/Cas9 gene drive constructs reveal insightsinto mechanisms of resistance allele formation and drive efficiency ingenetically diverse populations. PLoS Genet. 13, e1006796 (2017).
3. Hammond, A. et al. A CRISPR-Cas9 gene drive system targeting femalereproduction in the malaria mosquito vector Anopheles gambiae. Nat.Biotechnol. 34, 78–83 (2016).
4. Gantz, V. M. et al. Highly efficient Cas9-mediated gene drive for populationmodification of the malaria vector mosquito Anopheles stephensi. Proc. NatlAcad. Sci. USA 112, E6736–E6743 (2015).
5. Noble, C., Adlam, B., Church, G. M., Esvelt, K. M. & Nowak, M. A. CurrentCRISPR gene drive systems are likely to be highly invasive in wild populations.Elife 7, e33423 (2018).
6. Marshall, J. & Akbari, O. Can CRISPR-based gene drive be confined in thewild? A question for molecular and population biology. ACS Chem. Biol. 13,424–430 (2018).
7. Kyrou, K. et al. A CRISPR–Cas9 gene drive targeting doublesex causescomplete population suppression in caged Anopheles gambiae mosquitoes.Nat. Biotechnol. 36, 1062–1066 (2018).
8. Courtier‐Orgogozo, V., Morizot, B. & Boëte, C. Agricultural pest control withCRISPR‐based gene drive: time for public debate. EMBO Rep. 18, 878–880(2017).
9. McFarlane, G. R., Whitelaw, C. B. A. & Lillico, S. G. CRISPR-based gene drivesfor pest control. Trends Biotechnol. 36, 130–133 (2018).
10. Grunwald, H. A. et al. Super-Mendelian inheritance mediated byCRISPR–Cas9 in the female mouse germline. Nature 566, 105–109 (2019).
11. Esvelt, K. M., Smidler, A. L., Catteruccia, F. & Church, G. M. Emergingtechnology: concerning RNA-guided gene drives for the alteration of wildpopulations. Elife 3, e03401 (2014).
12. Adelman, Z. et al. Rules of the road for insect gene drive research and testing.Nat. Biotechnol. 35, 716–718 (2017).
13. James, A. A. Gene drive systems in mosquitoes: rules of the road. TrendsParasitol. 21, 64–67 (2005).
14. Committee on Gene Drive Research in Non-Human Organisms:Recommendations for Responsible Conduct, Board on Life Sciences, Divisionon Earth and Life Studies & National Academies of Sciences, Engineering, andMedicine. Gene Drives on the Horizon: Advancing Science, NavigatingUncertainty, and Aligning Research with Public Values. (National AcademiesPress, USA, 2016).
15. Akbari, O. S. et al. BIOSAFETY. Safeguarding gene drive experiments in thelaboratory. Science 349, 927–929 (2015).
16. Hammond, A. M. et al. The creation and selection of mutations resistant to agene drive over multiple generations in the malaria mosquito. PLoS Genet. 13,e1007039 (2017).
17. Champer, J. et al. Reducing resistance allele formation in CRISPR gene drive.Proc. Natl Acad. Sci. USA 115, 5522–5527 (2018).
18. DiCarlo, J. E., Chavez, A., Dietz, S. L., Esvelt, K. M. & Church, G. M.Safeguarding CRISPR-Cas9 gene drives in yeast. Nat. Biotechnol. 33,1250–1255 (2015).
19. Gantz, V. M. & Bier, E. The dawn of active genetics. Bioessays 38, 50–63(2016).
20. Xu, X.-R. S., Gantz, V. M., Siomava, N. & Bier, E. CRISPR/Cas9 and activegenetics-based trans-species replacement of the endogenous -L2 CRM revealsunexpected complexity. Elife 6, e30281 (2017).
NATURE COMMUNICATIONS | https://doi.org/10.1038/s41467-019-13977-7 ARTICLE
NATURE COMMUNICATIONS | (2020) 11:352 | https://doi.org/10.1038/s41467-019-13977-7 | www.nature.com/naturecommunications 11
21. Champer, J. et al. Molecular safeguarding of CRISPR gene drive experiments.Elife 8, e41439 (2019).
22. Li, M. et al. Development of a confinable gene-drive system in the humandisease vector, Aedes aegypti. Preprint at: https://www.biorxiv.org/content/10.1101/645440v1 (2019).
23. Wittkopp, P. J., True, J. R. & Carroll, S. B. Reciprocal functions of theDrosophila yellow and ebony proteins in the development and evolution ofpigment patterns. Development 129, 1849–1858 (2002).
24. Noble, C. et al. Daisy-chain gene drives for the alteration of local populations.Proc. Natl Acad. Sci. USA 116, 8275–8282 (2019).
25. Nash, A. et al. Integral gene drives for population replacement. Biol. Open8, bio037762 (2019).
26. Ren, X. et al. Enhanced specificity and efficiency of the CRISPR/Cas9 systemwith optimized sgRNA parameters in Drosophila. Cell Rep. 9, 1151–1162(2014).
27. Doench, J. G. et al. Rational design of highly active sgRNAs for CRISPR-Cas9-mediated gene inactivation. Nat. Biotechnol. 32, 1262–1267 (2014).
28. Chang, H. H. Y., Pannunzio, N. R., Adachi, N. & Lieber, M. R. Non-homologous DNA end joining and alternative pathways to double-strandbreak repair. Nat. Rev. Mol. Cell Biol. 18, 495–506 (2017).
29. Lindsley, D. L., Hardy, R. W., Ripoll, P. & Lindsley, D. Gonadal mosaicisminduced by chemical treatment of sperm in Drosophila melanogaster. Genetics202, 157–174 (2016).
30. Lopez Del Amo, V. et al. Small-molecule control of super-Mendelianinheritance in gene drives. Preprint at: https://www.biorxiv.org/content/10.1101/665620v1 (2019).
31. Maji, B. et al. Multidimensional chemical control of CRISPR–Cas9. Nat.Chem. Biol. 13, 9–11 (2016).
32. Iwamoto, M., Björklund, T., Lundberg, C., Kirik, D. & Wandless, T. J. Ageneral chemical method to regulate protein stability in the mammaliancentral nervous system. Chem. Biol. 17, 981–988 (2010).
33. Drury, D. W., Dapper, A. L., Siniard, D. J., Zentner, G. E. & Wade, M. J.CRISPR/Cas9 gene drives in genetically variable and nonrandomly matingwild populations. Sci. Adv. 3, e1601910 (2017).
34. Marshall, J. M., Buchman, A., Sánchez, C. H. M. & Akbari, O. S. Overcomingevolved resistance to population-suppressing homing-based gene drives. Sci.Rep. 7, 3776 (2017).
35. Champer, S. E. et al. Computational and experimental performance ofCRISPR homing gene drive strategies with multiplexed gRNAs. Preprint at:https://www.biorxiv.org/content/10.1101/679902v1 (2019).
36. Sternberg, S. H., Redding, S., Jinek, M., Greene, E. C. & Doudna, J. A. DNAinterrogation by the CRISPR RNA-guided endonuclease Cas9. Nature 507,62–67 (2014).
37. Shibata, M. et al. Real-space and real-time dynamics of CRISPR-Cas9 visualizedby high-speed atomic force microscopy. Nat. Commun. 8, 1430 (2017).
38. Yang, M. et al. The conformational dynamics of Cas9 governing DNAcleavage are revealed by single-molecule FRET. Cell Rep. 22, 372–382 (2018).
39. Richardson, C. D., Ray, G. J., DeWitt, M. A., Curie, G. L. & Corn, J. E.Enhancing homology-directed genome editing by catalytically active andinactive CRISPR-Cas9 using asymmetric donor DNA. Nat. Biotechnol. 34,339–344 (2016).
40. Orthwein, A. et al. A mechanism for the suppression of homologousrecombination in G1 cells. Nature 528, 422–426 (2015).
41. C., H. M. S. et al. MGDrivE: a modular simulation framework for the spreadof gene drives through spatially explicit mosquito populations. Methods Ecol.Evolution 00, 1–11 (2019).
42. Isaacs, A. T. et al. Transgenic Anopheles stephensi coexpressing single-chainantibodies resist Plasmodium falciparum development. Proc. Natl Acad. Sci.USA 109, E1922–E1930 (2012).
43. Port, F., Chen, H.-M., Lee, T. & Bullock, S. L. Optimized CRISPR/Cas tools forefficient germline and somatic genome engineering in Drosophila. Proc. NatlAcad. Sci. USA 111, E2967–E2976 (2014).
44. Bassett, A. R., Tibbit, C., Ponting, C. P. & Liu, J.-L. Highly efficient targetedmutagenesis of Drosophila with the CRISPR/Cas9 system. Cell Rep. 6,1178–1179 (2014).
45. Gloor, G. B. et al. Type I repressors of P element mobility. Genetics 135, 81–95(1993).
46. Deredec, A., Godfray, H. C. J. & Burt, A. Requirements for effective malariacontrol with homing endonuclease genes. Proc. Natl Acad. Sci. USA 108,E874–E880 (2011).
47. Otero, M., Solari, H. G. & Schweigmann, N. A stochastic population dynamicsmodel for Aedes aegypti: formulation and application to a city with temperateclimate. Bull. Math. Biol. 68, 1945–1974 (2006).
48. Christophers, S. R. Aëdes Aegypti (L.), the Yellow Fever Mosquito: Its LifeHistory, Bionomics, and Structure. (Cambridge University Press, 1960).
49. Simoy, M. I., Simoy, M. V. & Canziani, G. A. The effect of temperature on thepopulation dynamics of Aedes aegypti. Ecol. Model. 314, 100–110 (2015).
50. Focks, D. A., Haile, D. G., Daniels, E. & Mount, G. A. Dynamic life tablemodel for Aedes aegypti (Diptera: Culicidae): analysis of the literature andmodel development. J. Med. Entomol. 30, 1003–1017 (1993).
51. Horsfall, W. R. Mosquitoes: Their Bionomics and Relation to Disease. (1972).52. Carvalho, D. O. et al. Suppression of a field population of aedes aegypti in
brazil by sustained release of transgenic male mosquitoes. PLoS Negl. Trop.Dis. 9, e0003864 (2015).
AcknowledgementsWe thank Bill McGinnis, Steve Wasserman, Mike Perry, Kaycie Butler, and members ofthe Gantz laboratory for comments and edits on the paper. We thank Emily Bulger andShannon Xu for experimental contribution on generating reagents. Research reported inthis paper was supported by the University of California, San Diego, Department ofBiological Sciences, by the Office of the Director of the National Institutes of Healthunder award number DP5OD023098 and by a DARPA Safe Genes Program Grant (BrdiN66001-17-2-4055). A Paul G. Allen Frontiers Group Distinguished Investigators Awardsupported E.B., a gift from the Tata Trusts of India to TIGS-UCSD supported X.F., aDARPA Safe Genes Program Grant (HR0011-17-2-0047) supported J.B. and J.M.M., andfunds from the UC Irvine Malaria Initiative supported H.M.S.C. and J.M.M. The fruit flydrawing used in Fig. 4 was adapted from the original artwork by Madboy74 [CC BY-SA4.0] [https://creativecommons.org/licenses/by-sa/4.0].
Author contributionsE.B. and V.M.G. conceived the project. V.L.D.A. and V.M.G. contributed to the design ofthe experiments. V.L.D.A., V.M.G., A.L.B. and X.F. performed the experiments andcontributed to the collection and analysis of data. H.M.S.C., J.B. and J.M.M. designed andperformed the mathematical modeling experiments. V.L.D.A., J.M.M. and V.M.G. wrotethe paper. All authors edited the paper.
Competing interestsV.M.G. and E.B. have equity interests in Synbal, Inc. and Agragene, Inc., companies thatmay potentially benefit from the research results and also serve on the company’s Sci-entific Advisory Board and Board of Directors. The terms of this arrangement have beenreviewed and approved by the University of California, San Diego in accordance with itsconflict of interest policies. V.L.D.A., A.L.B., X.F., H.M.S.C., J.B. and J.M.M. declare nocompeting interests.
Additional informationSupplementary information is available for this paper at https://doi.org/10.1038/s41467-019-13977-7.
Correspondence and requests for materials should be addressed to V.M.G.
Peer review information Nature Communications thanks the anonymous reviewers fortheir contribution to the peer review of this work. Peer reviewer reports are available.
Reprints and permission information is available at http://www.nature.com/reprints
Publisher’s note Springer Nature remains neutral with regard to jurisdictional claims inpublished maps and institutional affiliations.
Open Access This article is licensed under a Creative CommonsAttribution 4.0 International License, which permits use, sharing,
adaptation, distribution and reproduction in any medium or format, as long as you giveappropriate credit to the original author(s) and the source, provide a link to the CreativeCommons license, and indicate if changes were made. The images or other third partymaterial in this article are included in the article’s Creative Commons license, unlessindicated otherwise in a credit line to the material. If material is not included in thearticle’s Creative Commons license and your intended use is not permitted by statutoryregulation or exceeds the permitted use, you will need to obtain permission directly fromthe copyright holder. To view a copy of this license, visit http://creativecommons.org/licenses/by/4.0/.
© The Author(s) 2020
ARTICLE NATURE COMMUNICATIONS | https://doi.org/10.1038/s41467-019-13977-7
12 NATURE COMMUNICATIONS | (2020) 11:352 | https://doi.org/10.1038/s41467-019-13977-7 | www.nature.com/naturecommunications


