Embed Size (px)
Citation preview
Volume 17 n Number 1 n Summer 2006 n 5
Anatolia: An International Journal of Tourism and Hospitality Research Volume 17, Number 1, pp. 5-24. 2006
Copyright © 2006 anatoliaPrinted in Turkey. All rights reserved
1303-2917/06 $20.00 + 0.00
A Tourism Carrying Capacity Indicator for Protected Areas
ABSTRACTThe aim of this article is to develop a tourism Carrying Capacity Indicator for protected areas that could assist regional planners and park managers to promote an equitable form of the spatial distribution of visitors’ environmental pressure. To measure the negative impact of visitors on an environmentally sensi-tive area, various indicators have been proposed, with regard to ecologically sustainable tourism. In this paper, we examine the unequal distribution of visitors to a protected area that causes significant additional environmental pressure on some sub-areas. This additional pressure, which may exceed the landscape’s carrying capacity, cannot be measured by the commonly used indices that represent an average for the whole area. Our objective is to depict the variability of pressure intensity within a protected area. For this purpose we introduce an indicator adjusted to the Gini co-efficient resulting from the Lorenz curve, used by economists to measure the unequal distribution of income. The proposed indicator is applied to the Mount Olympus National Park, Greece. Keywords: carrying capacity, indicators, sustainable tourism.
Stella Kostopoulou is Lecturer in the Department of Economics, Aristotle University of Thessaloniki, Greece. She obtained her degree in Economics from Aristotle University of Thessaloniki and her Maîtrise en Sciences Economiques from Université de Grenoble, France. She holds a Master’s degree in Economics and a Ph.D. in Regional Economics from Aristotle University of Thessaloniki. Her main research interests focus on regional plan-ning, tourism development and transport planning.Ioannis Kyritsis is Lecturer in the Department of Economics, Aristotle University of Thessaloniki, Greece. He obtained his degree in Mathematics from Aristotle University of Thessaloniki and in Economics from University of Macedonia, Greece. He holds a Master’s degree in Operational Research from University of Athens and a Ph.D. in Environmental Economics from Aristotle University of Thessaloniki. His main research interests focus on environ-mental planning, tourism development, operational research.
STELLA KOSTOPOULOUAristotle University of ThessalonikiDepartment of Economics Thessaloniki 541 24GreeceE-mail: [email protected]
IOANNIS KYRITSISAristotle University of Thessaloniki
Department of Economics Thessaloniki 541 24
Greece E-mail: [email protected]
AcknowledgementsThe authors would like to thank Professor Harry Coccossis, University of Thessaly, Greece and Professor Kostas Karantininis, The Royal Veterinary and Agricultural University, Denmark, for their valuable comments at the final stage of preparation of this paper. Note: An earlier version of this paper was presented at the International Conference on Sustainable Tourism Development and the Environment, University of the Aegean, Chios, October 2003.
6 n Anatolia: An International Journal of Tourism and Hospitality Research
A Tourism Carrying Capacity Indicator for Protected Areas
INTRODUCTIONTourism, one of the major interactions between humans and nature, has become a major sector of economic activity since the la� er part of the twentieth century. The world’s total annual expenditure on tourism has risen from $2 billion in 1950, to $444 billion in 1998 and international tourist arrivals from 25 million in 1950, to over 700 million in 2002 (WTO 2005). Tourism, the world’s largest industry today, is growing faster than any other economic sector, with enormous potential for expansion as global economies improve and leisure time increases in modern western societies. Along with this growth, a diversifi -cation of tourism products and destinations is taking place, with the demand for nature related tourism continuously increasing. Nature related tourism has risen from approximately 2% of all tourism in the late 1980s to about 20% of all leisure travel today (Weaver and Oppermann 2000).
Tourists are becoming increasingly sophisticated in their preferences, which now include aspects such as natural life, contact with local communities, learn-ing about special ecosystems and their conservation (Eagles et al. 2002). As a result, new forms of tourism have emerged like, ecotourism, green tourism, wilder-ness tourism, heritage tourism, and so on. This new demand manifests the eff ects of deep structural transformations and the changing social needs which have arisen from the life style and work conditions in urban society. The spatial distribu-tion of these tourism activities has been represented worldwide by a core-pe-riphery model in which tourist fl ow emerges from the metropolitan centres of industrialized nations towards destinations on the “pleasure periphery” (Hughes 2002). Many of these tourist destinations are located in natural pro-tected areas, ranging from strict nature reserves, managed by governments for the public, to protected landscapes occupied by humans (Hamilton 1996).
Protected areas, characterized by the Convention on Biological Diversity in 1992 as “geographically defi ned areas designated or regulated and managed to achieve specifi c conservation objectives”, make important contributions to human society by conserving the natural and cultural heritage and ensuring ecological balance. The International Union for the Conservation of Nature World Commission on Protected Areas (IUCN 1994) give a defi nition which is rather more precise with respect to what is protected: “areas especially dedi-cated to the protection and maintenance of biological diversity, and of natural and associated cultural resources, and managed through legal or other eff ec-tive means”.
In practice, protected areas, ranging from national parks to cultural land-scapes and natural monuments, are managed for a wide variety of purposes which may include (Green and Paine 1997): scientifi c research, wilderness pro-tection, preservation of species and ecosystems, maintenance of environmen-tal services, protection of specifi c natural and cultural features, tourism and recreation, education and sustainable use of resources from natural ecosys-tems. Tourism and recreation are set to play an increasing role in the future of protected areas, since these can absorb large numbers of visitors, bringing extra income to park authorities and local economies.income to park authorities and local economies.income to park authorities and local economies.
Volume 17 n Number 1 n Summer 2006 n 7
Stella Kostopoulou - Ioannis Kyritsis
However, the use of sensitive natural areas for tourism purposes, presents seri-ous environmental, social and economic problems since the recreational pres-sure on conservation reserves by private individuals and commercial tours, is continuously growing worldwide. Increasing numbers of visitors to national parks and other fragile environments, increase both actual and potential en-vironmental consequences, as well as the management eff ort and investment required to control impacts and maintain the primary conservation function of the areas concerned (Lindberg and McKercher 1997). In order to anticipate and prevent or mitigate negative eff ects of visitors, tourism impact monitor-ing is required, in which case determining the capacity of local systems to sus-tain tourism becomes an issue of major importance.
Scientifi c methods have been developed to eff ectively and effi ciently assess and evaluate the magnitude and trends of the impacts of tourism on recreation resources. The concept of carrying capacity has been introduced as a particularly useful approach for determining the intensity of tourism development that an area can support, considering its environmental, social and economic characteristics (Clivaz et al. 2004). Although the concept of carrying capacity for protected areas has been used for several decades, only a few a� empts have been actu-ally made to operationalise this concept and to transform it into a manage-ment tool by defi ning indicators to measure it (Manning 2002). In the relevant literature, among the most commonly used indices are the indicator of recrea-tional pressure, and the indicator of intensity of use, which measure the level of environmental pressure that visitors exert on the protected area as well as the potential level of overexploitation of natural resources during certain pe-riods (WTO 1997).
However, methods for quantifying and evaluating the spatial distribution of recreation resource impact, are relatively underdeveloped, since most in-dices of tourism pressure are used for rather large regions or whole countries (Lanquar et al. 1995 cited in Coccossis and Tsartas 2001, Leung 1998). Nev-ertheless, recreational use and associated impacts are unevenly distributed in visiting areas, such as national parks and other protected areas, primarily determined by the uneven distribution of recreation resources, facilities, and visitor distribution pa� erns. To ensure the sustainability of the ecosystem, park managers have traditionally used diff erent approaches to organize tour-ism and recreation. The most widely used regulatory technique is zoning, where diff erent areas are set aside for diff erent activities. Zoning and visitors’ preferences form overcrowding localities, leading to diff erent levels of envi-ronmental pressure within the protected area.
In this paper a measure of central tendency and spatial variability in the visi-tors’ pressure indicator is introduced, to evaluate the spatial pa� ern of recreation-al pressure on protected areas. The Lorenz curve, traditionally used in depicting wealth distribution, is here used as a statistical tool to estimate the spatial variability of visitors over the study area. In order to illustrate the proposed methodology, we have taken the National Park of Mount Olympus, Greece as a case study. The paper is presented in fi ve Sections: Following the introduc-tion in the fi rst Section, the research literature on tourism carrying capacity tion in the fi rst Section, the research literature on tourism carrying capacity tion in the fi rst Section, the research literature on tourism carrying capacity
8 n Anatolia: An International Journal of Tourism and Hospitality Research
A Tourism Carrying Capacity Indicator for Protected Areas
indicators is reviewed in Section two: we fi rst look at the root concepts of sus-tainability and carrying capacity and then present some relevant indicators. In Section three we introduce the indicator and the study area; some preliminary results of the application of the introduced indicator to data from the study area are presented in Section four; and fi nally, the results are summarized and some general conclusions are drawn in the last Section.
LITERATURE REVIEWThe basic concept of carrying capacity, the need for a limit or threshold in the tourist activity is present in one way or the other in the concerns and priori-ties of local policy makers for sustainable tourism development. To the extent that tourism related pressures on the natural environment create problems on the functioning of protected areas, visitor management agencies have to determine what the various thresholds are. The introduction of sustainability indicators to the analysis of tourist activity is therefore considered to be an es-sential fi rst step in the sustainable tourism development of fragile and sensi-tive destinations.
Sustainable tourism development in protected areasThe issue of tourism development in natural protected areas, is increasingly sought within a local strategy for sustainable development. The explicit idea of sustainability was fi rst highlighted by the International Union for the Con-servation of Nature and Natural Resources in 1980 in its World Conservation Strat-egy. Since then, sustainable development has become a buzzword in develop-ment studies in general and in tourism research in particular (Liu 2003:459). Although there is no universally accepted defi nition for sustainable develop-ment, the World Commission on Economic Development suggested, in the so-called Brundtland Report (WCED 1987), that it is the “development that meets the needs of the present without compromising the ability of future generations to meet their own needs”. Since the Rio Summit in 1992, there has been a shi� towards “the paradigm of sustainability”, which is nowadays ac-been a shi� towards “the paradigm of sustainability”, which is nowadays ac-knowledged as the main objective for integrated development policies on the economy and society worldwide (EEA 1999).
In the tourism research literature, the meaning of sustainable development has been broadened as a concept to entail the long-term viability of good quality been broadened as a concept to entail the long-term viability of good quality natural and human resources (Bramwell and Lane 1993). Others include in the concept of sustainability the quality of life for host communities, visitor satis-faction and conservative use of natural and social resources. The World Tour-ism Organisation (WTO 2001) defi nes sustainable tourism development as one that “meets the needs of present tourists and host regions while protect-ing and enhancing opportunities for the future. It is envisaged as leading to management of all resources in such a way that economic, social and aesthetic needs can be fulfi lled while maintaining cultural integrity, essential ecological progresses, biological diversity and life support systems”.
Tourism in protected areas is associated with appreciating and observing nature, scientifi c endeavour and education. Under the best of conditions, tour-nature, scientifi c endeavour and education. Under the best of conditions, tour-
Volume 17 n Number 1 n Summer 2006 n 9
Stella Kostopoulou - Ioannis Kyritsis
ism can serve as a self-fi nancing mechanism for the establishment and main-tenance of protected areas (Hamilton 1996). It can be a major tool for both the conser-vation of such areas and for raising the environmental awareness of residents and visitors alike. For these objectives to be achieved, tourism operations within protected areas need to be carefully planned, managed and moni-tored in order to ensure their long-term sustainability (Eagles et al. 2002). If unplanned or poorly managed and implemented, tourism development can have serious consequences on the natural and human environment aff ecting resources, social structures, cultural pa� erns, economic activities and land uses (Coccossis and Mexa 2004).
It is therefore becoming axiomatic that eff ective tourism management must also include the consideration of the natural and cultural environments. His-torically, diff erent approaches to managing tourism in protected areas have been emphasized at diff erent times, in diff erent conceptual frameworks. The fi rst methods that were developed to address the impact of tourism, emerged from the concept of carrying capacity, implying that sustainable tourism should be based on natural resource availability and ecosystem quality and thus, be in accordance with the capacity of the region for which it has been developed.
The concept of tourism carrying capacity
Several defi nitions of carrying capacity have been off ered, depending on how and where the concept is applied. The World Tourism Organisation defi nes carrying capacity as “the maximum number of people that may visit a tour-ist destination at the same time, without causing destruction of the physical, economic and socio-cultural environment and an unacceptable decrease in the quality of the visitors” (cited in Clivaz et al. 2004). The conventional defi -nition of carrying capacity as the point when more visitors would damage the environment or lower people’s enjoyment below an acceptable level (Doswell 1996), encouraged managers to try to solve visitor use problems only by set-ting limits to numbers based upon a pre-determined level, which was derived from ecological, social and other analyses. However, as Eagles et al. (2002:80) point out, this approach can be seen as working against protected area objectives de-signed to encourage appropriate visitor enjoyment and to make a valuation of the resource.
Newer defi nitions of carrying capacity for protected areas, focus on the ac-ceptability of natural resource and human impacts of visitation, and consider biophysical characteristics (soils, topography and vegetation), social factors (location and mode of travel, season of use, group size, and behavior of visi-tors), and management policies (visitor use restrictions) to be more important determinants of carrying capacity than the number of visitors (Prato 2001). Papageorgiou and Brotherton (1999) underline that central to all defi nitions of carrying capacity is the idea of the maintenance of the integrity of the re-source-base as well as the provision of a high-quality recreation experience to users.
10 n Anatolia: An International Journal of Tourism and Hospitality Research
A Tourism Carrying Capacity Indicator for Protected Areas
Although considered as a powerful concept for policy making, carrying capacity has met with considerable controversy due to the analytical diffi cul-ties in arriving at a “calculated” capacity (Coccossis and Mexa 2004). This dif-fi culty stems from the multiple dimensions of the concept, each one having diff erent thresholds and implications for tourism development (Liu 2003:469; Hunter 1995:67). Physical carrying capacity refers to the maximum number of tourists a site or destination can physically accommodate, beyond which environmental problems will arise. Ecological carrying capacity is related to the impacts of tourism on the natural environment and the long-term viabil-ity of the natural resources. Psychological carrying capacity is concerned with the perception and satisfaction of visitors, which varies across diff erent types of tourists, holidays and destinations. Social carrying capacity involves the social and cultural impacts of tourism that infl uence the a� itude of the local population towards tourism. Economic carrying capacity, which is strongly connected to the profi tability and opportunity costs of tourism development, refers to the ability to absorb tourism activities without displacing or disrupt-ing desirable local activities.
Since the 1970s, carrying capacity has been further advanced as a technique for managing tourism in sensitive environments. A variety of more sophisti-cated planning and management frameworks for protected areas have been developed, using qualitative methodologies. These frameworks set standards or ranges of acceptable change and describe a methodology for determining these standards, measuring impacts and identifying management strategies for controlling negative impacts. They include (Nilsen and Tayler 1998; Rome 1999; Eagles et al. 2002) Limits of Acceptable Change (LAC), Visitor Impact Management (VIM), Visitor Experience Resource Protection (VERP), Man-agement Process for Visitor Activities (VAMP), Recreation Opportunity Spec-trum (ROS), Tourism Optimisation Management Model (TOMM).
While each framework has a unique origin, they share common features (Nilsen and Tayler 1998) and could be considered as diff erent aspects of a single all-en-compassing monitoring and management strategy, since each one may have a place in diff erent potential applications under the appropriate circumstances (Buckley 1998). The key point of all these approaches is to make tourism sus-tainable in balance with other economic activities, without overusing natural resources and ecosystems when looking at it in long term. Thus, it is impor-tant for protected area planners to know whether the tourism development process is going towards or away from sustainability. To answer this ques-tion they need indicators that measure the three main areas of sustainability: the environmental, the social and the economic (Meaurio and Murray 2001). Extensive research has been undertaken on indicators of resource and social conditions, as infl uenced by visitors to natural areas, in order to help translate objectives into reality as well as to guide the choice of what to monitor and against what standards (Farrell and Marion 2002; Newsome et al. 2002) Tour-ism carrying capacity indicators have therefore become an integral part of the management frameworks of most protected areas. management frameworks of most protected areas. management frameworks of most protected areas.
Volume 17 n Number 1 n Summer 2006 n 11
Stella Kostopoulou - Ioannis Kyritsis
Tourism Carrying Capacity Indicators Tourism Carrying Capacity (TCC) issues concern the number of tourists, visi-tor fl ows and spatial pa� erns of concentration/dispersion vis-à-vis the protec-tion of nature and the functioning of ecosystems but also the quality of visitor experience (Coccossis and Mexa 2004). The implementation of TCC can be assisted, guided and monitored, with a coherent set of sustainable tourism indica-tors that aim at describing the pressures that are exerted, the state of the sys-tem and the impacts from tourism development. There are many ideas and defi nitions about what an indicator is or should be. Hart (1997) describes an indicator as “something that helps you to understand where you are, which way you are going and how far you are from where you want to be”. The Euro-pean Environmental Agency (EEA) (1999:10) characterizes indicators as “an approximation of the truth rather than a picture of reality”. According to EEA (1999) indicators present information that is derived from analyzing the raw data and other base information and therefore can be used to express the con-dition of complex systems, condensing the complex into a manageable and understandable message.
Sustainable tourism indicators are designed to provide reliable data and informa-tion on the environmental and socio-economic impacts of tourism develop-ment, thus facilitating responsible decision-making. Indicators of sustainable tourism, identifying specifi c cause/eff ect relationships between tourism and the environment, are increasingly of direct use to managers who are respon-sible for specifi c tourist destinations for instance, national park managers, re-sort owners or members of local communities concerned about the preserva-tion of the key a� ributes that a� ract tourists to their region. A set of indicators measuring carrying capacity at given destinations or regions of high ecologi-cal value, can help the planners and managers of tourism identify limits and opportunities and hence, anticipate and prevent, or modify, those tourism activities which may threaten key environmental a� ributes (WTO 1997). De-spite the growing concern for developing and utilising tools that could facili-tate planners and decision-makers in their eff orts to control tourism develop-ment, there is limited experience not only in implementing tourism carrying capacity but also in measuring it (Coccossis and Mexa 2004).
Tourism carrying capacity indicators measure the fragility of the site and identify changes in its robustness to support a variety of tourism activities. It will normally be a composite measurement of the quality, quantity and sensi-tivity of the site’s environmental assets (e.g., area of forest cover, quantity of natural areas etc.) and capacity of the built structures. The general objective of these indicators is to estimate the safe limits of tourist numbers doing the most common range of activities on the site.
On the basis of the scientifi c literature on the subject, tourism carrying ca-pacity considerations revolve around three basic components or dimensions: physical-ecological, socio-demographic and political-economic (Coccossis and Mexa 2004). These dimensions refl ect also the range of issues considered in practice, since the impacts of tourism in an area can be analysed in terms in practice, since the impacts of tourism in an area can be analysed in terms in practice, since the impacts of tourism in an area can be analysed in terms
12 n Anatolia: An International Journal of Tourism and Hospitality Research
A Tourism Carrying Capacity Indicator for Protected Areas
of three major axes: physical environment (natural and man-made including infrastructure), social (population and social structure and dynamics) and economic (including institutional and organizational). Following these axes Coccossis and Mexa (2004) suggest three types of indicators:
• Physical-ecological indicators (Natural Environment and Biodiversity, Air Quality, Noise Pollution, Energy, Water, Waste, Cultural Heritage, Tourist Infrastructure, Land, Landscape, Transport and Mobility)
• Socio-demographic indicators (Demography, Tourist Flow, Employment, So-cial Behaviour, Health and Safety, Psychological Issues)
• Political-economic indicators (Tourism Earnings and Investments, Employ-ment, Public Expenditure and Revenue, Policy for Tourism Development).
Physical-ecological indicators include tourism pressure or recreational pres-sure or site stress and use intensity indicators measuring the levels of stress on the site from tourists. Recreational pressure indicators refer to the stress of pressure which human activities place on the biodiversity, with specifi c refer-ence to the following types of risks associated with some tourism practices: stressing the capacity of the infrastructure by overcrowding; polluting air, water and soil; overuse of natural resources; creation of noise and nuisance; changing of the cultural character of host communities, such as use intensity, stress, waste management. They consist of the following factors: number of tourists, type of activity, frequency of activity, intensity/concentration of use. The indices created are measures of pressure on the system from a range of activities; if the number rises, it is assumed that the stress on the system has also risen, thereby potentially aff ecting the environment at the site and/or the tourism activities occurring on the site negatively.
Among these indices, the Recreational Use Intensity Indicator (WTO 1993, 1997) or the Ecosystems Overcrowding Indicator (Coccossis and Mexa 2004), that is the number of visitors per sq. km to natural protected areas, measures potential levels of the overuse of resources. It is considered to be a precau-tionary indicator (Popova 2003) that helps to identify and prevent problems, used to show compliance with the level of loading of recreation areas (the threat of exceeding the carrying capacity of the area). It shows how the tour-ists are spread over the territory on average, and it also gives a general indica-tion of pressures on land use due to tourism, with regard to a reference period (for example the year).
However, this indicator expresses an average value that cannot describe any deviations in visiting that may characterize sub-areas of the natural protected area. Park managers use zoning as a regulatory management tool for im-plementing Tourism Carrying Capacity in protected areas, since the special status of these areas allows the defi nition and delimitation of zones where protection, conservation and limitations in the various uses are imposed. A typical division in zones is the following (Coccossis and Mexa 2004): Zone A: Most valuable and vulnerable, where entry is permi� ed only to author-ised scientifi c teams; Zone B: Highly sensitive, where escorted visits in small ised scientifi c teams; Zone B: Highly sensitive, where escorted visits in small ised scientifi c teams; Zone B: Highly sensitive, where escorted visits in small
Volume 17 n Number 1 n Summer 2006 n 13
Stella Kostopoulou - Ioannis Kyritsis
groups are only permi� ed; Zone C: Considerable natural interest, where some traditional and tourist activities are allowed, and car access is limited; Zone D: Mild development and buff er, where tourism and visitor facilities are pro-vided, car access and parking and compatible activities are allowed.
Existing infrastructure combined with the visitors’ preferences to concen-trate on certain areas usually create an unequal spatial distribution of environ-mental impacts in protected areas. Therefore, Tourism Carrying Capacity could vary among the diff erent parts of an area (e.g. additional tourism pressure in vari-ous sub-areas within ecologically sensitive areas). Managers and policy mak-ers have to determine what the various thresholds in various sub-areas are for such aspects as: overcrowding (both quantitative and qualitative), noise, presence of human infrastructure and irreversible site damage. The addition-al pressure, which may exceed the carrying capacity of the sub-area, cannot be measured by the commonly used indices for tourism pressure, since these represent an average for the whole area (e.g. number of visitors per km²). As a result, the indices commonly used may not prove useful in depicting the car-rying capacity of an extremely sensitive sub-area of a national park.
In order to make an in-depth study on the diff erentiations of assorted sub-areas according to their “tourist” degree, requires that the scales of the indica-tor implementation be increased. With regards to the Recreational Pressure Indicator, which measures the intensity of use, we will have to determine the evolution of the spatial distribution of the visiting population.
METHODOLOGY In this paper, we introduce a measure of central tendency and spatial variabil-ity in the visitors’ pressure indicator, to evaluate the spatial pa� ern of recrea-tional pressure on protected areas. The proposed indicator depicts the spatial unequal distribution of visitors to a national park that causes signifi cant ad-ditional environmental pressure on some sub-areas and is therefore related to the ecological form of carrying capacity. The objective here is to further specify the recreational pressure indicator so as to describe the variability of pressure intensity within a protected area. For this purpose, we propose an indicator adjusted to the Gini co-effi cient resulting from the Lorenz curve, traditionally used by economists to measure the unequal distribution of income.
The Lorenz curve is derived by plo� ing the cumulative proportion of peo-ple (ranked from the poorest up) against the cumulative share of total income which they receive (Gillis et al. 1996; Todaro 1981). The shape of the curve indicates the degree of inequality in income distribution: if there were perfect equality, it would lie along the 45-degree line, whereas, for the case of absolute inequal-ity, the curve would trace the lower and right-hand borders of the diagram. Any actual income distribution falls between these two hypothetical extremes and is represented by a sagging line, where the greater the sag of the curve, the greater the inequality of the distribution. The degree of inequality, that is, the proportion of the triangular area which is between the curve and the diago-nal, is known as the Lorenz coeffi cient or the Gini index or Gini concentration nal, is known as the Lorenz coeffi cient or the Gini index or Gini concentration
14 n Anatolia: An International Journal of Tourism and Hospitality Research
A Tourism Carrying Capacity Indicator for Protected Areas
ratio. The larger the share of the area, the higher the value of the Gini concen-tration ratio and the higher the inequality of income distribution.
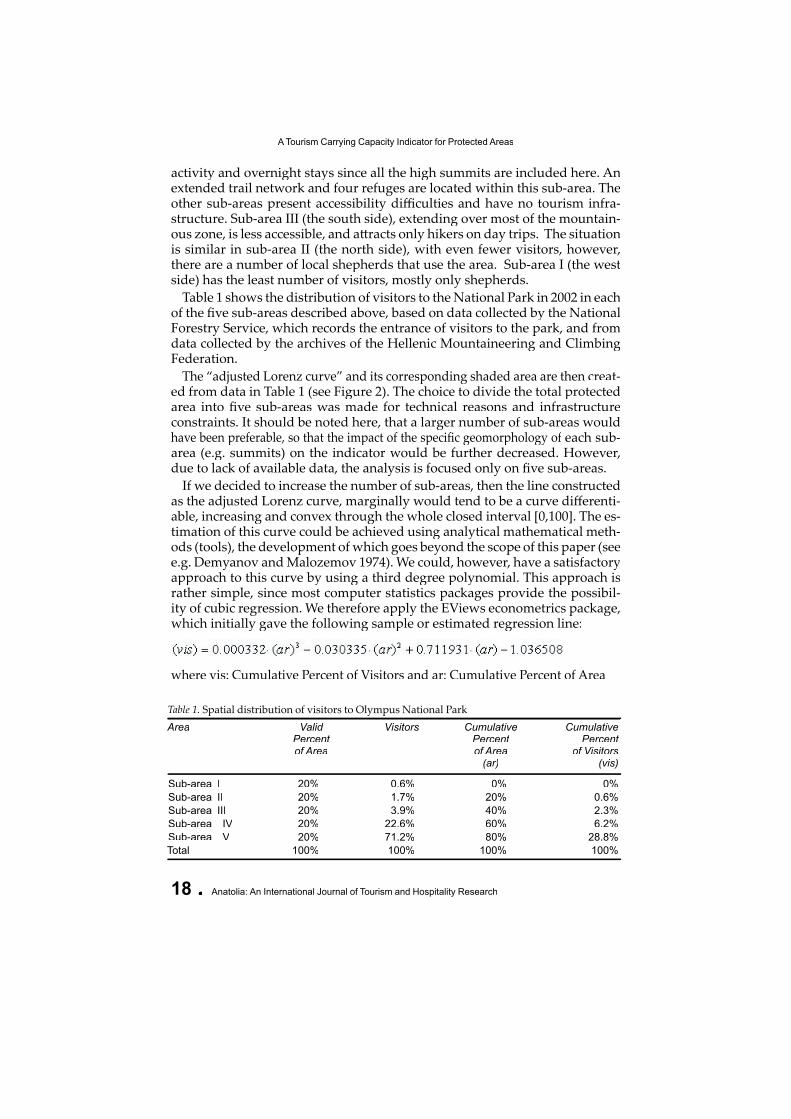
In this paper an “adjusted Lorenz curve” is introduced, which depicts the unequal distribution of visitors in a protected area as a spatial unit. The curve is created by dividing the study area into a number of smaller sub-areas or zones of equal size. Classifying these sub-areas from the least to the most visited, we then place them as cumulative percentages at the base of the hori-zontal axis. Similarly, the vertical axis depicts the percentages of visitors. The curve thus created shows the total percentage of visitors in relation to the cor-responding cumulative percentages of the surface area.
If the distribution of visitors to all sub-areas were equal, the curve would be identical to the diagonal bisecting the angle of the two axes. The more it curves away from the diagonal, the less equal the distribution. The area of the fi eld between the diagonal and the curve gives the measure of inequality. The ratio of this area to the total area beneath the diagonal gives the “adjusted Gini co-effi cient”, with values between 0 (perfect equality) and 1 (perfect inequality).
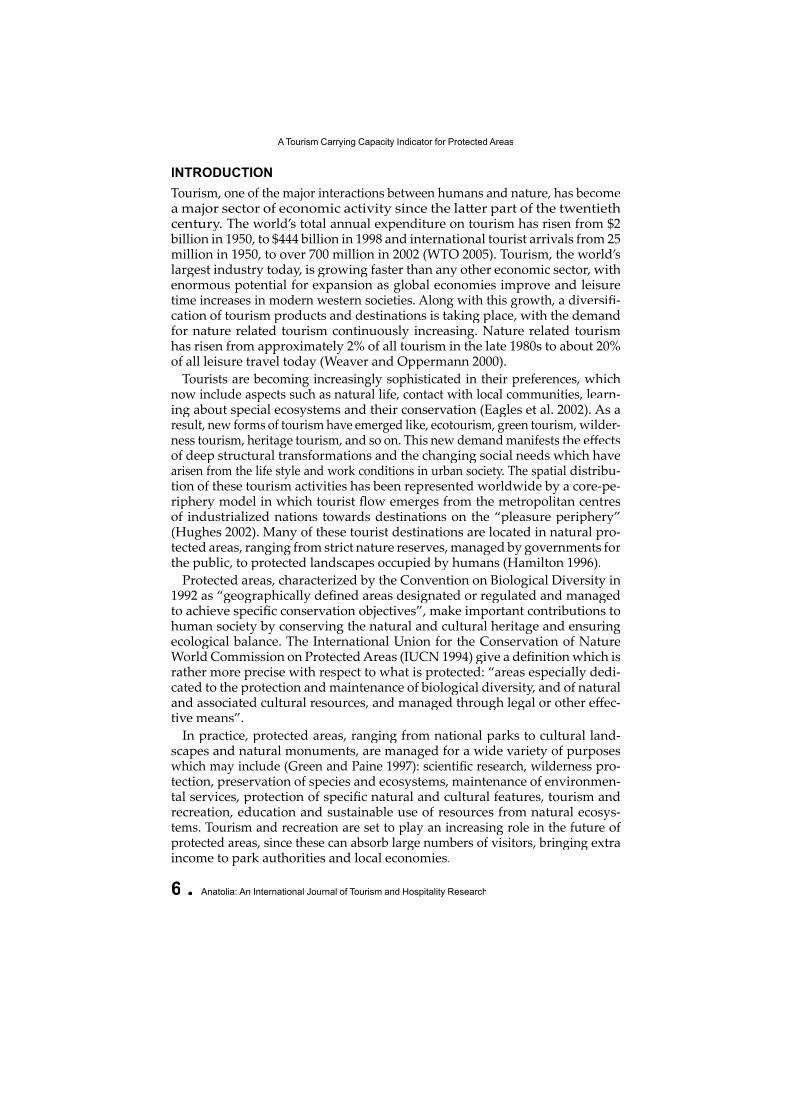
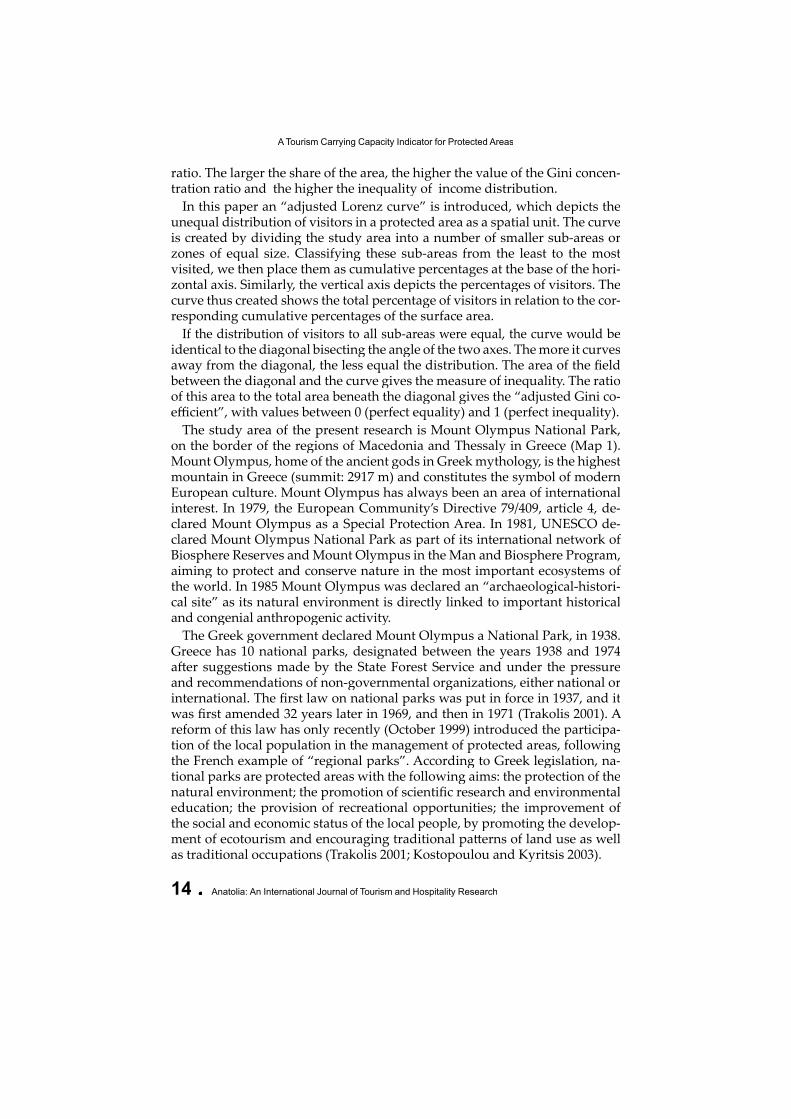
The study area of the present research is Mount Olympus National Park, on the border of the regions of Macedonia and Thessaly in Greece (Map 1). Mount Olympus, home of the ancient gods in Greek mythology, is the highest mountain in Greece (summit: 2917 m) and constitutes the symbol of modern European culture. Mount Olympus has always been an area of international interest. In 1979, the European Community’s Directive 79/409, article 4, de-clared Mount Olympus as a Special Protection Area. In 1981, UNESCO de-clared Mount Olympus National Park as part of its international network of Biosphere Reserves and Mount Olympus in the Man and Biosphere Program, aiming to protect and conserve nature in the most important ecosystems of the world. In 1985 Mount Olympus was declared an “archaeological-histori-cal site” as its natural environment is directly linked to important historical and congenial anthropogenic activity.
The Greek government declared Mount Olympus a National Park, in 1938. Greece has 10 national parks, designated between the years 1938 and 1974 a� er suggestions made by the State Forest Service and under the pressure and recommendations of non-governmental organizations, either national or international. The fi rst law on national parks was put in force in 1937, and it was fi rst amended 32 years later in 1969, and then in 1971 (Trakolis 2001). A reform of this law has only recently (October 1999) introduced the participa-tion of the local population in the management of protected areas, following the French example of “regional parks”. According to Greek legislation, na-tional parks are protected areas with the following aims: the protection of the natural environment; the promotion of scientifi c research and environmental education; the provision of recreational opportunities; the improvement of the social and economic status of the local people, by promoting the develop-ment of ecotourism and encouraging traditional pa� erns of land use as well as traditional occupations (Trakolis 2001; Kostopoulou and Kyritsis 2003).as traditional occupations (Trakolis 2001; Kostopoulou and Kyritsis 2003).
Volume 17 n Number 1 n Summer 2006 n 15
Stella Kostopoulou - Ioannis Kyritsis
Mount Olympus National Park, with a total area of 23,841 ha, is divided in two zones: a core area (7,150 ha) of strict conservation importance, and a pe-ripheral zone (16,691 ha). In the core areas of national parks the law demands expropriation of private property and allows only scientifi c research and en-vironmental education pursuits whereas, forestry activities, grazing, hunting and fi shing are prohibited. In the peripheral zone, there are no such restric-tions but the Forest Service can take any necessary measure for the realization of the aims of the park.
The Olympic range is a massive mountainous ridge containing several sum-mits over 2000m in altitude. In terms of fl ora, it is divided into three zones: the fi rst zone includes its lower piedmonts with olive groves and vineyards, many fruit trees and evergreens such as oaks, chestnuts and arbutus. The second zone, from 800m to 1800m is purely forestall, subdivided into birch, fi r and a mountain coniferous tree zone as well as a cold-living coniferous tree zone. The third zone is alpic over 1800m, and is characterized by scarce poan vegetation and zone is alpic over 1800m, and is characterized by scarce poan vegetation and zone is alpic over 1800m, and is characterized by scarce poan vegetation and
Map 1. Greece – Mount Olympus
16 n Anatolia: An International Journal of Tourism and Hospitality Research
A Tourism Carrying Capacity Indicator for Protected Areas
contains rare plant species of which 23 are found exclusively on Mount Olympus. All three zones contain important faunal habitats with rare wild-life species of reptiles birds and mammals. In terms of environmental protec-tion, there are fi ve zones: absolute protection, high protection, natural envi-ronment, religious-archaeological interest and controlled intervention.
Visiting Olympus from its eastern side, which is more interesting in terms of the view, as well as of its beauty and diversity, one starts at Litochoro, a small traditional town at an altitude of 400m, situated on the road and rail axis be-tween Athens-Thessaloniki. Litochoro is the base of the Hellenic Climbing Association which provides all information and assistance for climbing, such as fi nding a guide or load animals. From Litochoro, visitors can follow on foot the international track E4 which starts from the Pyrenees and, a� er travers-ing Europe’s most impressive mountain landscapes, reaches the Peloponesian Taygetos and the Cretan ridges.
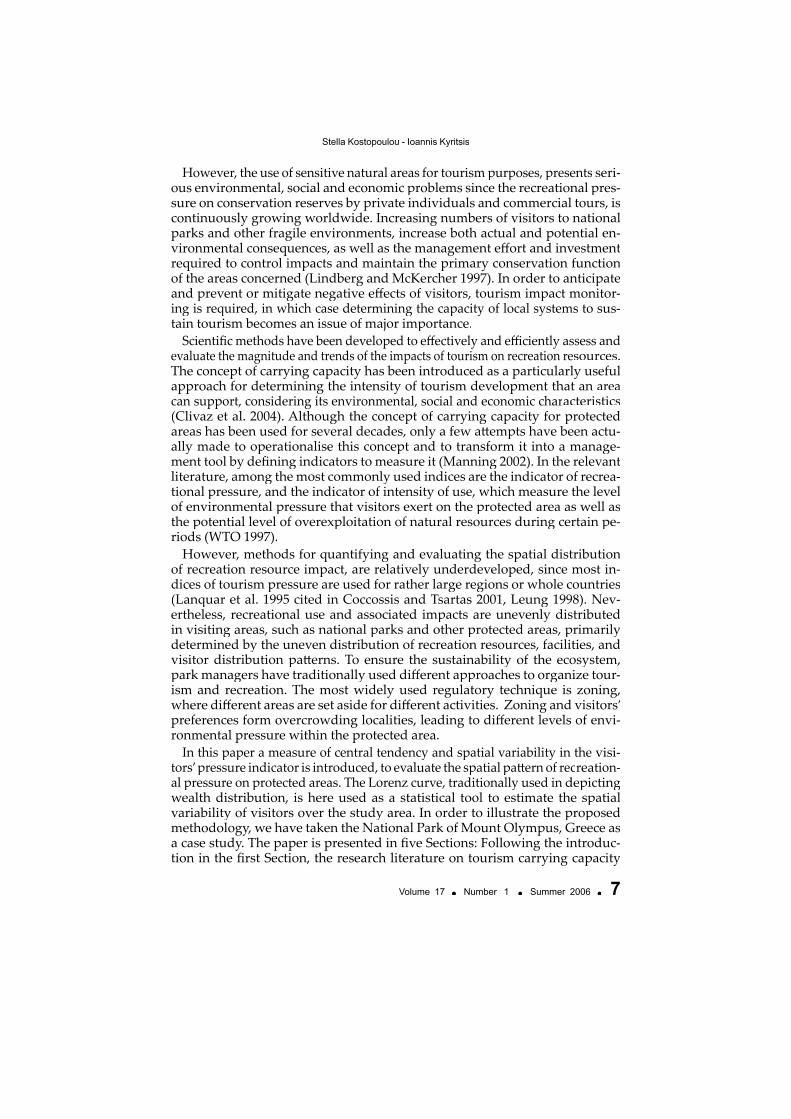
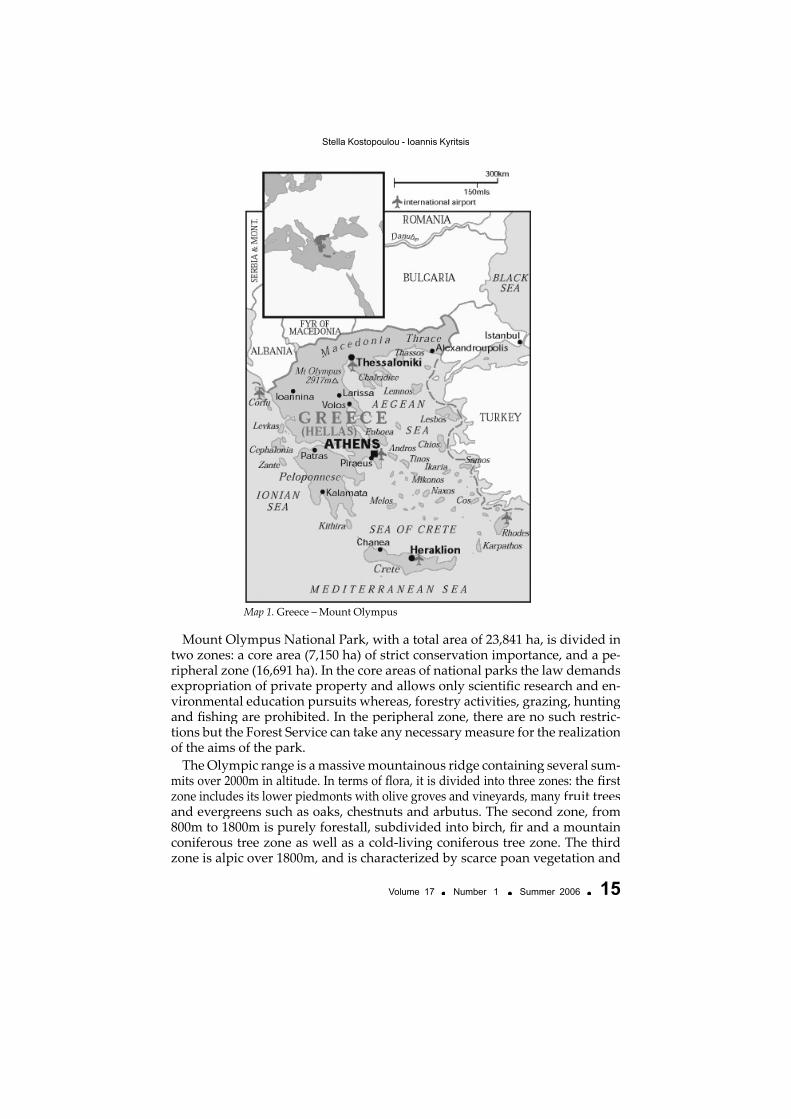
There are four refuges within the Mount Olympus National Park area. In spite of the fact that the fi rst refuge was built in 1930, climbing activities on the mountain did not begin until a� er World War II. Zacharopoulou and Kyritsis (1997), and Kyritsis and Tabakis (2002), using the Hellenic Mountaineering and Climbing Federation data on overnight stays at one of the park refuges during the last fi � y years, estimate a steadily growing number of visitors, which has tended to stabilise in the last few years (Figure 1). The rising trend of the number of visitors has created justifi able concern about the negative cumulative eff ects caused to the ecosystem by the pressure of tourism on the cumulative eff ects caused to the ecosystem by the pressure of tourism on the
Figure 1. Estimated number of visitors to Olympus National Park refuges
Volume 17 n Number 1 n Summer 2006 n 17
Stella Kostopoulou - Ioannis Kyritsis
natural environment. The study of visitor impact on the region is therefore urgently required.
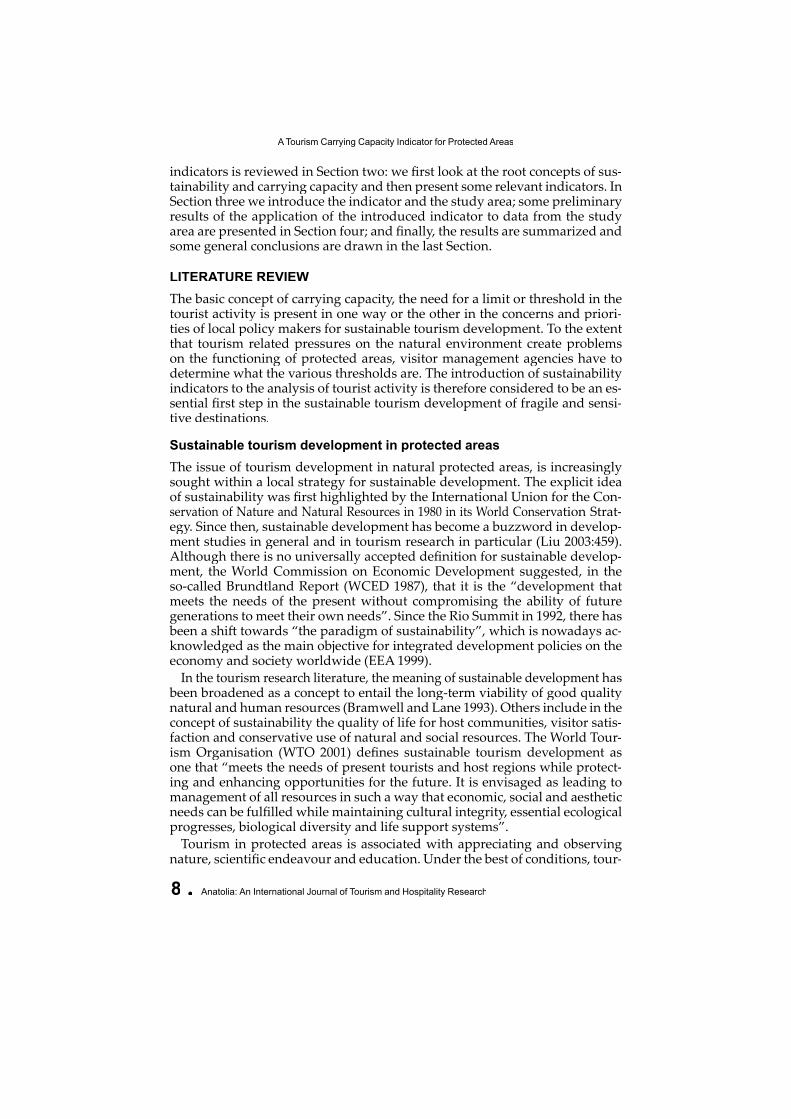
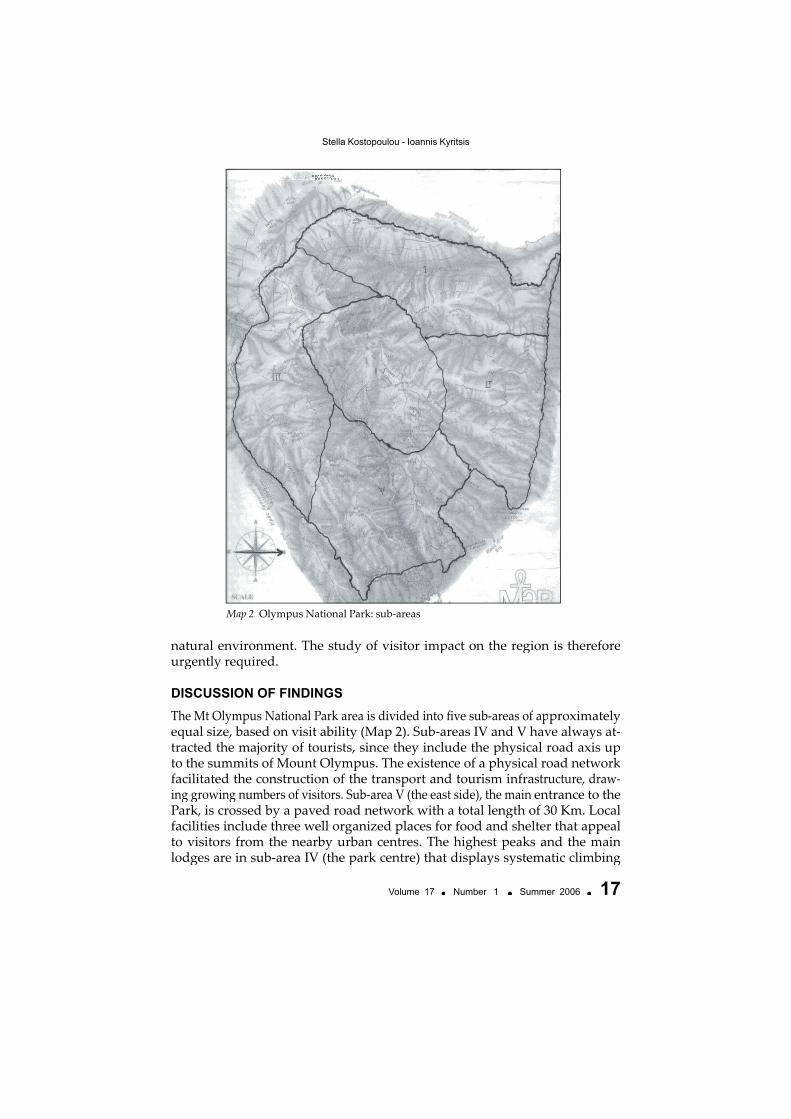
DISCUSSION OF FINDINGSThe Mt Olympus National Park area is divided into fi ve sub-areas of approximately equal size, based on visit ability (Map 2). Sub-areas IV and V have always at-tracted the majority of tourists, since they include the physical road axis up to the summits of Mount Olympus. The existence of a physical road network facilitated the construction of the transport and tourism infrastructure, draw-ing growing numbers of visitors. Sub-area V (the east side), the main entrance to the Park, is crossed by a paved road network with a total length of 30 Km. Local facilities include three well organized places for food and shelter that appeal to visitors from the nearby urban centres. The highest peaks and the main lodges are in sub-area IV (the park centre) that displays systematic climbing lodges are in sub-area IV (the park centre) that displays systematic climbing lodges are in sub-area IV (the park centre) that displays systematic climbing
Map 2. Olympus National Park: sub-areas
18 n Anatolia: An International Journal of Tourism and Hospitality Research
A Tourism Carrying Capacity Indicator for Protected Areas
activity and overnight stays since all the high summits are included here. An extended trail network and four refuges are located within this sub-area. The other sub-areas present accessibility diffi culties and have no tourism infra-structure. Sub-area III (the south side), extending over most of the mountain-ous zone, is less accessible, and a� racts only hikers on day trips. The situation is similar in sub-area II (the north side), with even fewer visitors, however, there are a number of local shepherds that use the area. Sub-area I (the west side) has the least number of visitors, mostly only shepherds.
Table 1 shows the distribution of visitors to the National Park in 2002 in each of the fi ve sub-areas described above, based on data collected by the National Forestry Service, which records the entrance of visitors to the park, and from data collected by the archives of the Hellenic Mountaineering and Climbing Federation.
The “adjusted Lorenz curve” and its corresponding shaded area are then creat-ed from data in Table 1 (see Figure 2). The choice to divide the total protected area into fi ve sub-areas was made for technical reasons and infrastructure constraints. It should be noted here, that a larger number of sub-areas would have been preferable, so that the impact of the specifi c geomorphology of each sub-area (e.g. summits) on the indicator would be further decreased. However, due to lack of available data, the analysis is focused only on fi ve sub-areas.
If we decided to increase the number of sub-areas, then the line constructed as the adjusted Lorenz curve, marginally would tend to be a curve diff erenti-able, increasing and convex through the whole closed interval [0,100]. The es-timation of this curve could be achieved using analytical mathematical meth-ods (tools), the development of which goes beyond the scope of this paper (see e.g. Demyanov and Malozemov 1974). We could, however, have a satisfactory approach to this curve by using a third degree polynomial. This approach is rather simple, since most computer statistics packages provide the possibil-ity of cubic regression. We therefore apply the EViews econometrics package, which initially gave the following sample or estimated regression line:
where vis: Cumulative Percent of Visitors and ar: Cumulative Percent of Area
AreaArea Valid Visitors Cumulative Cumulative Percent Percent Percent of Area of Area of Visitors (ar) (vis)
Sub-area I 20% 0.6% 0% 0%Sub-area II 20% 1.7% 20% 0.6%Sub-area III 20% 3.9% 40% 2.3%Sub-area IV 20% 22.6% 60% 6.2%Sub-area V 20% 71.2% 80% 28.8%Total Total 100% 100% 100% 100%
Table 1. Spatial distribution of visitors to Olympus National Park
Volume 17 n Number 1 n Summer 2006 n 19
Stella Kostopoulou - Ioannis Kyritsis
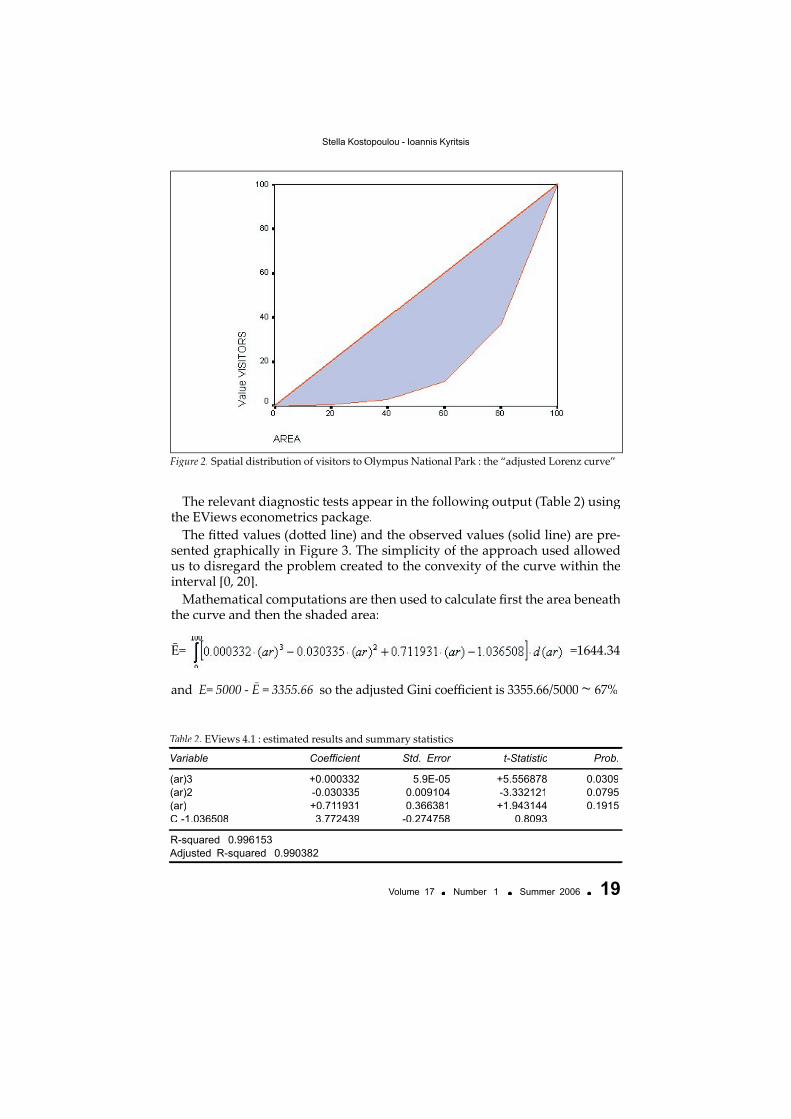
The relevant diagnostic tests appear in the following output (Table 2) using the EViews econometrics package.
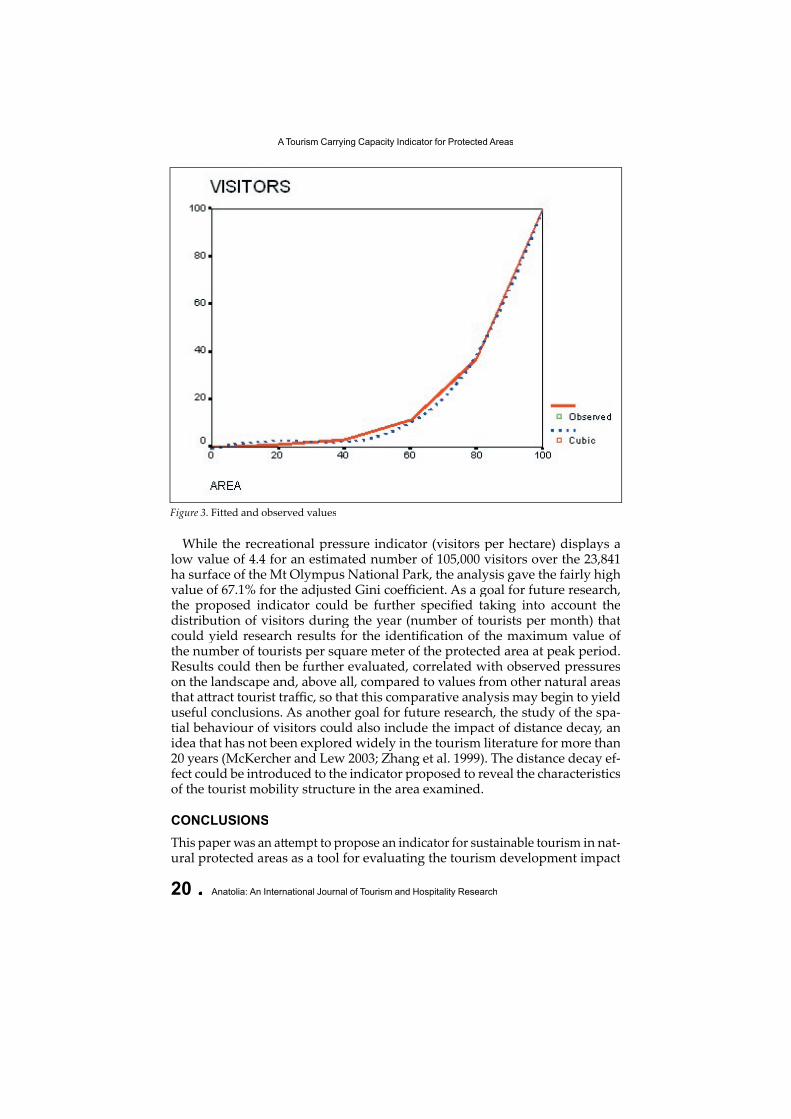
The fi � ed values (do� ed line) and the observed values (solid line) are pre-sented graphically in Figure 3. The simplicity of the approach used allowed us to disregard the problem created to the convexity of the curve within the interval [0, 20].
Mathematical computations are then used to calculate fi rst the area beneath the curve and then the shaded area:
Ē= =1644.34
and E= 5000 - Ē = 3355.66 so the adjusted Gini coeffi cient is 3355.66/5000 ~ 67%
Figure 2. Spatial distribution of visitors to Olympus National Park : the “adjusted Lorenz curve”
Variable Coefficient Std. Error t-Statistic Prob.
(ar)3 +0.000332 5.9E-05 +5.556878 0.0309(ar)2 -0.030335 0.009104 -3.332121 0.0795(ar) +0.711931 0.366381 +1.943144 0.1915C -1.036508 3.772439 -0.274758 0.8093
R-squared 0.996153Adjusted R-squared 0.990382
Table 2. EViews 4.1 : estimated results and summary statistics
20 n Anatolia: An International Journal of Tourism and Hospitality Research
A Tourism Carrying Capacity Indicator for Protected Areas
While the recreational pressure indicator (visitors per hectare) displays a low value of 4.4 for an estimated number of 105,000 visitors over the 23,841 ha surface of the Mt Olympus National Park, the analysis gave the fairly high value of 67.1% for the adjusted Gini coeffi cient. As a goal for future research, the proposed indicator could be further specifi ed taking into account the distribution of visitors during the year (number of tourists per month) that could yield research results for the identifi cation of the maximum value of the number of tourists per square meter of the protected area at peak period. Results could then be further evaluated, correlated with observed pressures on the landscape and, above all, compared to values from other natural areas that a� ract tourist traffi c, so that this comparative analysis may begin to yield useful conclusions. As another goal for future research, the study of the spa-tial behaviour of visitors could also include the impact of distance decay, an idea that has not been explored widely in the tourism literature for more than 20 years (McKercher and Lew 2003; Zhang et al. 1999). The distance decay ef-fect could be introduced to the indicator proposed to reveal the characteristics of the tourist mobility structure in the area examined.
CONCLUSIONSThis paper was an a� empt to propose an indicator for sustainable tourism in nat-ural protected areas as a tool for evaluating the tourism development impact ural protected areas as a tool for evaluating the tourism development impact ural protected areas as a tool for evaluating the tourism development impact
Figure 3. Fitted and observed values
Volume 17 n Number 1 n Summer 2006 n 21
Stella Kostopoulou - Ioannis Kyritsis
on an environmentally fragile area. The study of sustainability and tourism steadily gains momentum in environmental planning, as modern societies give increasing consideration to issues such as environmental conservation, quality of life and sustainable development. With large numbers of tourists visiting national parks and other natural protected areas, recreational pres-sure on conservation reserves and other fragile environments is continuing to grow around the world, implying the loss of a� ractiveness and the distur-bance of a natural habitat. Congestion and overuse caused by the tourism in-dustry has lead to the need for balancing the eff ect of tourism on the environ-ment, both physical and human, and limiting the number of tourists to match local carrying capacity (Murphy and Murphy 2000). Hence, there is a need for another form of monitoring and control, involving environmental assessment and carrying capacity management.
The establishment of monitoring programs, as well as the selection and appli-cation of management tools are choices made by park managers and regional planners. One of the major problems that protected area managers usually have to face is the strategic choice between concentrating or dispersing recre-ational use over the park area. Eagles et al. (2002:98) argue that, the dispersal strategy, o� en chosen to deal with negative impacts in a small area or several areas, will work eff ectively in biophysical se� ings that are relatively resilient to use. However, they point out that, such a strategy is less eff ective in more sensitive se� ings, where damaging impacts may just be spread more widely by this approach. They also assert that a concentration strategy, focusing rec-reational use on small areas with high levels of management, may eff ectively discourage visitors from gaining access to other parts of the protected areas. Coccossis and Mexa (2004) argue that from an environmental point of view, concentration is not always the best approach to manage tourist fl ow. Disper-sal is preferable, because externalities appear only when the system reaches certain threshold levels.
In all cases, measuring the spatial distribution of tourism carrying capacity by using appropriate indicators on the state of and impact on key assets of the areas concerned, is an essential fi rst step in the decision making process for the protection of fragile and sensitive destinations. Carrying capacity indica-tors on levels of stress upon diff erent sub-areas of the natural protected area or national park (e.g. tourist numbers, impacts on specifi c a� ributes) can act as an early warning system to alert authorities about specifi c areas of concern, so that prompt action to reduce or mitigate these stresses can be taken. For this reason, the approach introduced in this article could be easily adopted by management agencies in natural protected areas, as a useful tool for visi-tor management decision making. Widely used so� ware packages (e.g. SPSS) could be applied to make the necessary calculations.
Maintaining the quality of the destination in terms of natural and cultural diversity will ensure the sustainability of the tourism industry, as well as ensuring the long term survival of protected eco-systems. Given the diverse forces pressuring natural protected areas, a multi-disciplinary approach to sustainable tourism indicator development would appear to be indispensa-sustainable tourism indicator development would appear to be indispensa-sustainable tourism indicator development would appear to be indispensa-
22 n Anatolia: An International Journal of Tourism and Hospitality Research
A Tourism Carrying Capacity Indicator for Protected Areas
ble. Researchers from both the natural and social sciences are required, in order to provide suffi cient information on the planning of tourism develop-ment for such areas where the cultural and natural heritage defi nes the tourist product.
REFERENCESBramwell, B. and Lane, B. (1993). Interpretation and Sustainable Tourism: The Potentials and the
Pitfalls, Journal of Sustainable Tourism, 1(2): 71-80.
Buckley, R. (1998). Tools and Indicators for Managing Tourism in Parks, Annals of Tourism Re-search, 25(4): 208-211.
Clivaz, C., Hausser, Y. and Michalet, J. (2004). Tourism monitoring system based on the concept of carrying capacity- The case of the regional natural park Pfyn-Finges (Switzerland). Work-ing Papers of the Finnish Forest Research Institute2. Retrieved December 12, 2004 from the World Wide Web: h� p://www.metla.fi /julkaisut/ workingpapers/2004/mwp002.htm.
Coccossis, H. and Tsartas, P. (2001). Sustainable Tourism Development and Environment. Athens: Kritiki Publications (in Greek).
Coccossis, H. and Mexa, A. (Eds.) (2004). The Challenge of Tourism Carrying Capacity Assessment. Theory and Practice. Ashgate.
Demyanov, V. F. and Malozemov, V. N. (1974). Introduction to Minimax. NY: Dover Publications Inc.
Doswell, R. (1996). Tourism: How Eff ective Management Makes the Diff erence. Reed Educational & Professional Publishing Ltd.
Eagles, P. F .J., McCool, S.F. and Haynes, C.D. (2002). Sustainable Tourism in Protected Areas. Guide-lines for Planning and Management. World Commission on Protected Areas (WCPA), IUCN-The World Conservation Unit.
European Environmental Agency (1999). Current Indicator Work at the EU Level. Proceedings of the Workshop on Indicators as a Tool for Managing and Monitoring a Sustainable Lo-cal and Regional Planning Process, Brussels, 18th November 1999. Retrieved December 20, 2004 from the World Wide Web: h� p://www.europa.eu.int/comm/regional_policy/innovation/innovating/terra/pdf/indicators.pdf
Hamilton, L. (1996). The role of protected areas in sustainable mountain development. Parks, Special Mountain Issue, 6 (1). Retrieved December 15, 2004 from the World Wide Web: h� p://www.mtnforum.org/resources/library/cnppa96a.htm#LH
Hart, S. (1997). Strategies for a Sustainable World, Harvard Business Review, January-February, 67-76.
Hughes, G. (2002). Environmental Indicators, Annals of Tourism Research, 29(2): 457-477.Hunter, C. (1995). Key Concepts for Tourism and the Environment. In C. Hunter and H. Green (Eds.)
Tourism and the Environment. A Sustainable Relationship? London-NY: Routledge. Farrell, T. A. and Marion, J. L. (2002). The Protected Area Visitor Impact Management (PAVIM)
Framework: A Simplifi ed Process for Making Management Decisions, Journal of Sustainable Tourism, 10(1): 31-51.
Gillis, M., Perkins D. H., Roemer M. and Snodgrass D. R. (1996). Economics of Development. NY: W.W. Norton & Company.
Green, M. and Paine, J. (1997). State of the World’s Protected Areas at the End of the Twentieth Century. Paper presented at the IUCN World Commission on Protected Areas Symposium on “Protected Areas in the 21st Century: From Islands to Networks”, Albany, Australia, 24-29 November 1997.
Volume 17 n Number 1 n Summer 2006 n 23
Stella Kostopoulou - Ioannis Kyritsis
Kostopoulou, S. and Kyritsis, I. (2003). Local People’s Perceptions of Sustainable Tourism Devel-opment in Protected Mountain Areas: The Case of Mount Olympus, Greece. In E. Beriatos, C.A. Brebbia, H. Coccossis and A. Kungolos, (Eds.) Sustainable Planning and Development, First International Conference on Sustainable Planning and Development (pp. 47-58). South-ampton, UK: WIT Press.
Kyritsis, I. and Tabakis, N. (2002). An Application of the Birth and Death Mathematical Model in Visitor Management of Protected Areas. Proceedings of the 15th Hellenic Congress of Statis-tics. Hellenic Statistical Institute and University of Ioannina (pp.393-401).
IUCN (1994). Guidelines for Protected Area Management Categories. International Union for the Con-servation of Nature and Natural Resources, Gland, Switzerland and Cambridge.
Lanquar, R. et al. (1995). Tourisme et Environnement en Méditerranée. Les Fascicules du Plan Bleu, No 8, Paris: Economica.
Leung, Y. (1998). Assessing and Evaluating Recreation Resource Impacts: Spatial Analytical Approaches, Ph.D. Thesis, Virginia Polytechnic Institute and State University. Retrieved December 19, 2004 from the World Wide Web: h� p://www.scholar.lib.vt.edu/theses/available/etd-33098-132543/
Liu, Z. (2003). Sustainable Tourism Development: A Critique, Journal of Sustainable Tourism, 11(6): 459-475.
Lindberg, K. and McKercher, B. (1997). Ecotourism: A Critical Overview, Pacifi c Tourism Review, 1: 65-79.
Manning, R. E. (2002). How Much is Too Much? Carrying Capacity of National Parks and Pro-tected Areas. In A. Amberger, A. Branderburg and Muhar, A. (Eds.) Monitoring and Man-agement of Visitor Flows in Recreational and Protected Areas. Proceedings of the Conference held in Bodenkultur University Vienna, Austria, January 30 February 2002, Institute for Landscape Architecture and Landscape Management, Bodenkultur University Vienna (pp. 306-313).
McKercher, B. and Lew, A. (2003). Distance Decay and the Impact of Eff ective Tourism Exclusion Zones on International Travel Flows, Journal of Travel Research, 42: 159-165.
Meaurio, A. and Murray, I. (2001). Indicators of sustainable development in tourism: The case of the Balearic Islands. Paper presented at the Conference on Sustainable Development and Management of Ecotourism in Small Island Developing States (SIDS) and Other Small Islands, Preparatory Conference for the International Year of Ecotourism, 2002, Mahé, Seychelles, 8-10.12.2001. Retrieved December 4, 2004 from the World Wide Web: h� p://www.world-tourism.org/ sustainable/ IYE/Regional_Activities/Seychelles/Balears-Indicators.htm
Murphy, P. and Murphy, A. (2000). Regional tourism and its economic development links for small communities. Paper presented at the First National Conference on the Future of Australia’s Country Towns, La Trobe University, Australia. Retrieved November 11, 2004 from the World Wide Web: h� p://www.regional.org.au/au/countrytowns/global/ murphy.htm#TopOfPage
Newsome, D., Moore, S. and Dowling, R. (2002). Natural Area Tourism: Ecology, Impacts and Man-agement. Clevedon: Channel View
Nilsen, P. and Tayler, G. (1998). A Comparative Analysis of Protected Area Planning and Man-agement Frameworks,. In S. F. McCool and D. N. Cole D., (compilers) Limits of Acceptable Change and Related Planning Processes: Progress and Future Directions, Proceedings of Con-ference, 1997, May 20-22, Missoula, MN, Gen. Tech.Rep. INT-GTR-371. US Department of Agriculture, Forest Service, Rocky Mountains Research Station, Ogden, UT, USA.
Papageorgiou, K. and Brotherton, I. (1999). A Management Planning Framework Based on Eco-logical, Perceptual and Economic Carrying Capacity: The Case of Vicos-Aoos National Park, Greece, Journal of Environmental Management, 56(2): 71-284.
Popova, N. (2003). Eco-tourism Impact/Success Indicators Baseline Data 2002. Kalofer Oilot Re-gion of Central Balkan National Park. Bulgaria Biodiversity Conservation and Economic Growth Project (BCEG), Sofi a, Bulgaria. Retrieved October 04, 2004 from the World Wide Web: h� p://www.nric.net/tourism/AnnexA.1Bulgaria.pdf h� p://www.nric.net/tourism/AnnexA.1Bulgaria.pdf
24 n Anatolia: An International Journal of Tourism and Hospitality Research
A Tourism Carrying Capacity Indicator for Protected Areas
Prato,T. (2001). Modeling Carrying Capacity for National Parks, Ecological Economics, 39: 321-331.Rome, A. (1999). Ecotourism Impact Monitoring: A Review of Methodologies and Recommendations
for Developing Monitoring Programs in Latin America. Ecotourism Technical Report Series Number 1, The Nature Conservancy.
Todaro, M. (1981). Economic Development in the Third World. NY: Longman Inc.Trakolis, D. (2001). Local People’s Perceptions of Planning and Management Issues in Prespes
Lakes National Park, Greece, Journal of Environmental Management, 61: 227-241.World Commission on the Environment and Development (WCED) (1987). Our Common Future.
Oxford: Oxford University Press.Weaver, D. and Oppermann, M. (2000). Tourism Management. Brisbane, Queensland: John Wiley.World Tourism Organization (WTO) (1993). Indicators for the Sustainable Management of Tourism.
Report of the International Working Group. W.T.O., IISD and ISTC.World Tourism Organization (WTO) (1997). What Tourism Managers Need to Know. A Practical
Guide to the Development and Use of Indicators of Sustainable Tourism. Madrid: World Tourism Organization.
World Tourism Organization (WTO) (2001). Sustainable Development of Tourism: A Compilation of Sustainable Development of Tourism: A Compilation of Good Practices. Madrid: World Tourism Organization.
World Tourism Organization (WTO) (2005). Tourism Market Trends. Retrieved June 15, 2005 from the World Wide Web: h� p://www.world-tourism.org/facts/tmt/html
Zacharopoulou, C. and Kyritsis, I. (1997). Forecasting of the Number of Visitors to Mount Ol-ympus. Proceedings of the 9th Hellenic Congress of Statistics. Hellenic Statistical Institute and Polytechnic School, Democritius University of Thrace (pp.106-114).
Zhang, J., Du, J.-K., Zhou, Y.-K., Zhang, S.-Y., Pan, B. (1999). Spatial Structure of Tourist Source Areas for the Naturally Scenic Sightseeing Places: A Case Study of Jiuzhaigou, Acta Geo-graphica Sinica, 54(4): 357-364.
Submi� ed : 07 August 2005 Resubmi� ed : 28 October 2005Resubmi� ed : 01 November 2005
Accepted : 07 November 2005 Refereed anonymously


