Embed Size (px)
Citation preview
INDIANJOURNALOFPHYSICALEDUCATIONSPORTSMEDICINE&EXERCISESCIENCE
ISSN0976-1101Vol-18,SpecialIssue(2)
1
A STUDY ON TASK AND EGO ORIENTATION AND SELF-
ESTEEM AMONG COLLEGE ATHLETES
Dr. Yogamaya Panda
Lecturer in Psychology, Bhadrak Autonomous College, Odisha
ABSTRACT
The objective of the present investigation was to study the task and ego orientation and self-
esteem among college athletes. A total number of 80 college athletes (male = 35 and female =
45) of Odisha were included as subjects for the purpose of the study. All the subjects were tested
on the psychological variables, i.e., task and ego orientation and self-esteem. Task and ego
orientation of the subjects were measured by using Task and Ego Orientation in Sport
Questionnaire (TEOSQ) by Duda & Nicholls, (1992). To measure the self esteem level of the
athletes, Rosenberg’s (1965) Self-esteem scale was used. T-test was applied to find out the
significance difference between task oriented college athletes and ego oriented college athletes
on self-esteem. Result revealed that task oriented college athletes differed significantly from ego
oriented college athletes on self-esteem.A
KEY WORDS: Task orientation, Ego orientation, self-esteem
INTRODUCTION
Achievement goal orientation theory has been one of the key motivational theories that have
been successfully employed in both education and sport to explain behavior (Nicholls, 1984).
Achievement goal theory assumes that the individual is an intentional, goal directed organism
that strives to demonstrate ability or competence in an achievement setting (Kristiansen, Roberts
& Abrahamsen, 2007). There are two specific achievement goals identified by achievement goal
theorists such as (Nicholls, 1984), namely task and ego goal orientation. According to
(Pensgaard and Roberts, 2003), when an athlete is task-oriented or generally associated with
desirable or adaptive achievement behavior, his or her primary goal is to demonstrate mastery of
the task in hand. That individual’s perceptions of ability would be typically self-referenced; that
is there would be an interest in learning and self-development, and their focus would on
improving and working hard or putting forth maximum effort to the task with little or no concern
for the outcome. Previous studies within sport contexts have found that task orientation is a
positive predictor of pro-social behaviours (Kavussanu, 2006). For example, (Malete’s, 2006)
research found that task orientation and perceived sport ability were important predictors of
Botswana youth participation in sports, while Papaionnou, Bebetsos, Theodorakis,
Christodoulidis and Kouli (2006) identified that task orientation, intrinsic motivation and
perceived athletic competence predicted sport and exercise participation 7 to 14 months later.
According to Nicholls (1989), because the major concern of the task oriented individual is to
improve at the task , perceptions of competence and consequently high self-esteem may be more
easily maintained than they would for an ego oriented person. In contrast, in ego orientation,
perceived competence and accompanying feelings of self-esteem are dependent on how the
individual’s performance compares to that of others, which is not always one’s control. Because
the ego oriented individual’s self-esteem is contingent upon other- referenced accomplishment,
INDIANJOURNALOFPHYSICALEDUCATIONSPORTSMEDICINE&EXERCISESCIENCE
ISSN0976-1101Vol-18,SpecialIssue(2)
2
feelings of competence and self-esteem may be more difficult to be maintained under conditions
of high ego orientation (Kavussanu & Harnisch, 2000).
This study aims to study task and ego orientation and self-esteem among college athletes.
METHODOLOGY
This study was conducted on 80 college athletes from different colleges in Odisha . All the
athletes had participated in different National and State level competitions and have more than 3
to 4 years of experience in athletics. The age of the subject ranged between 17 to 20 years (mean
age = 18.5 years).
Task and ego goal orientations were measured using the Task and Ego orientation questionnaire
TEOSQ, (Duda, 1992). Duda has reported that (Cronbach, 1951) alpha coefficient have ranged
between .81 and .86 for the task orientated subscale and between .79 and .90 for the ego oriented
subscale. Test-retest reliability over a 3 week period has been reported at = .68 for the task
oriented subscale and at = .75 for the ego oriented subscale. Furthermore, these subscales have
been shown to be independent constructs based on their reported correlation (r = .03) (Duda,
1989). Factorial and Convergent validity have been shown for this measure as well.
The Rosenberg Self-Esteem Scale (RSES) is a 10-item questionnaire used to assess personal
self-esteem levels (Rosenberg, 1965). Participants read each item and then circle whether they
agree or disagree with the statement. This is measured on a 4-point Likert scale, ranging from
“strongly agree” to “strongly disagree”. Scores range from zero to 30, with higher scores
indicative of higher self-esteem. Specifically, scores of 0 to 14 indicate low self-esteem, scores
of 15 to 25 indicate normative self-esteem, and scores of 26 to 30 indicate high self-esteem. This
standardized measure has been proven to be valid and reliable in assessing self-esteem
(Heatherton & Wyland, 2003). This instrument is also a valid measure for assessing self-concept
(Wylie, 1989).
The instruments used in this present study were complied and printed out in English. The
respondents filled up the questionnaire individually in the presence of the researcher in their off
practice hours.
FINDINGS AND RESULTS:
To find out the significance of mean difference between task oriented college athletes and ego
oriented college athletes on self-esteem, t-test was applied. The results are presented in table - 1
below.
Table – 1:
Group Self- Esteem
Mean Std. Deviation N t- Value
Task Oriented 22.04 5.51 45 2.91
Ego Oriented 18.08 6.42 35
Note: N= 80, df = 78, p<.01**
Athletes were classified as task oriented and ego oriented based on their score on task and ego
oriented questionnaire. The t-test was found to be (2.91) with df = 78 which is significant at .01
INDIANJOURNALOFPHYSICALEDUCATIONSPORTSMEDICINE&EXERCISESCIENCE
ISSN0976-1101Vol-18,SpecialIssue(2)
3
level of significance. It means the self –esteem of task oriented college athletes are found to be
more compared to ego oriented college athletes.
From the result it is showed that there is a significant difference between task oriented and ego
oriented college athletes in self-esteem (P<.01). It means task oriented college athletes are found
to be having more self-esteem compared to the ego oriented college athletes. The reason could be
due to the fact that in case of task oriented athletes are found to be hard working, and their aim is
to improve their present performance compared to their previous performance.
On the other hand in this study athletes who are ego oriented found to having less self-esteem
compared to the task oriented oriented athletes. The reason could be sue to the fact that the ego
oriented athletes evaluate competence from a normatively referenced standpoint and derived
feeling of adequacy from the demonstration of superior ability over others. In a state of ego
involvement the focus while performing is on the adequacy and demonstration of one’s athletic
ability and people feel successful when they have outperformed others (especially with less
effort). Ego involved individuals focused on competition success, gaining recognition,
establishing superiority over others, and a belief in natural ability rather than hard work. Ego
involvement implies that superiority over others is the goal. When ego involved learning and
personal skill development are insufficient bases for the perception of high competence.
CONCLUSION
In summary there is a need to identify the goal orientation of each athletes accurately and
training should be planned accordingly. This is true for the task oriented athletes that they
achieve more success which results in having high self-esteem compared to the ego oriented
athletes. Therefore, in sport, identification of goal orientation of the athletes will be more helpful
for the trainers to train the athletes accordingly.
REFERENCES
Baumeister, R. F., Campbell , J. D., Krueger, J.I., & Vohs, K.D. (2003).Does high self-
esteem cause better performance, interpersonal success, or healthier lifestyles?
Psychological Science in the Public Interest, 4 (1). pp. 1-44.
Branden, (1990). Branden, N. (1990). What is self-esteem? Paper presented at the
International Conference on Self-esteem, Asker/Oslo, Norway, August 9th (Report No.
CG 022 939). (ERIC Document Reproduction Service No. ED 325783).
Cronbach, L.J. (1951). Coefficient alpha and the internal structure of tests.
Psychometrika,16, 297-334.
Duda, J.L. (1992). Motivation in sport setting. A goal perspective approach. In G.
Roberts (Ed), motivation in sport and exercise ( pp. 37-91).Champaign, 11: Human
Kinetics.
Duda, J.L., & Nicholls,J.G. (1992). Dimensions of achievement motivation in
schoolwork and sport. Journal of Educational psychology, 84 (3), 290-299.
Heatherton, T. F., & Wyland, C.L. (2003). Assessing self esteem. In Lopez, S.J. &
Snyder, C.R. (Eds.), Positive psychological assessment: A handbook of models and
measures (pp. 219-233). Washington, DC: American Psychological Association.
INDIANJOURNALOFPHYSICALEDUCATIONSPORTSMEDICINE&EXERCISESCIENCE
ISSN0976-1101Vol-18,SpecialIssue(2)
4
KINEMATIC DIFFERENCES AMONG THE
PLAYERS/REPETITIONS AND BETWEEN THE GENDER IN
REGARD TO LEFT LEG SPLIT SQUATS FOR LOWER
EXTREMITIES WITH 15 RM LOAD
Umesh Kr. Ahlawat, Dhananjoy Shaw
INTRODUCTION
Lower extremity acts as base of support in walking, running and jumping. Only concentrating on
upper extremity workout is a mistake. In human body the largest and longest muscles are located
in lower extremity namely largest muscle is Gluteus Maximus and longest muscle is Sartorius.
Largest and longest muscles are essential in movements performed in day to day activities and in
sports and games. Regular lower extremity exercise increase and develops strength in bones,
improves balance, stamina, economy in movement and also decreases the risk of injuries. A
strong lower extremity helps to slow the physical weakness that is the part of aging process and
maintain stamina, balance and confidence [1]
.
METHODOLOGY
Ten (10) healthy intervarsity sportsperson engaged in different sports were randomly selected as
sample or subject for this study. The inclusion criteria for this study was sample with age ranged
from 17 to 25 years and with at least intervarsity level sports participation as their achievement.
The sample consists of five male and five female. The weight of the subjects was 68.1±14.98
kilogram. The exclusion criterion for the subjects was those sportsperson who suffered a knee
injury in past or showed symptoms of discomfort in knee during performance of LLSS. Each
subject had performed LLSS with 15 RM load for 15 repetition and was recorded with a digital
video camera using two dimensional methods independently. Before participating in the study
each participant was explained about the proper technique of LLSS to be followed. 15 RM was
determined by using trial and error method for each subject independently. The video data was
analysed for selected variables using KINOVEA 0.8.21 software for 2D analysis. Ankle joint,
knee joint and hip join were marked for measuring angles of extension and flexion of knee joint.
Total time taken to perform each repetition was taken in seconds, time for each repetition were
recorded in different clocks. Angle of flexion and extension movement of knee joint of each
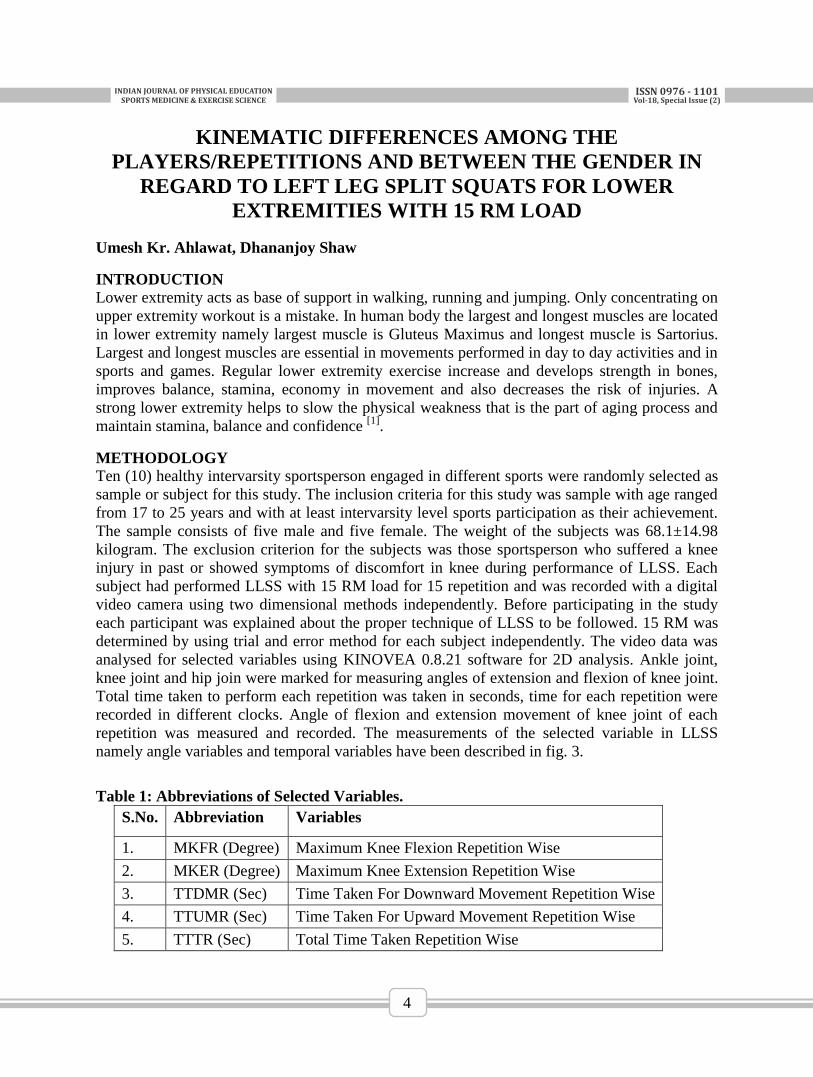
repetition was measured and recorded. The measurements of the selected variable in LLSS
namely angle variables and temporal variables have been described in fig. 3.
Table 1: Abbreviations of Selected Variables.
S.No. Abbreviation Variables
1. MKFR (Degree) Maximum Knee Flexion Repetition Wise
2. MKER (Degree) Maximum Knee Extension Repetition Wise
3. TTDMR (Sec) Time Taken For Downward Movement Repetition Wise
4. TTUMR (Sec) Time Taken For Upward Movement Repetition Wise
5. TTTR (Sec) Total Time Taken Repetition Wise
INDIANJOURNALOFPHYSICALEDUCATIONSPORTSMEDICINE&EXERCISESCIENCE
ISSN0976-1101Vol-18,SpecialIssue(2)
5
For statistical analysis mean, standard deviation, coefficient of variance (in the conducted study
the coefficient of variance (C.V.) equal to or more than ten percent considered as heterogeneous
otherwise homogeneous), ‘t’ test and ANOVA were computed, hypothesis was tested at 0.05
level of significance.
FINDINGS AND RESULTS
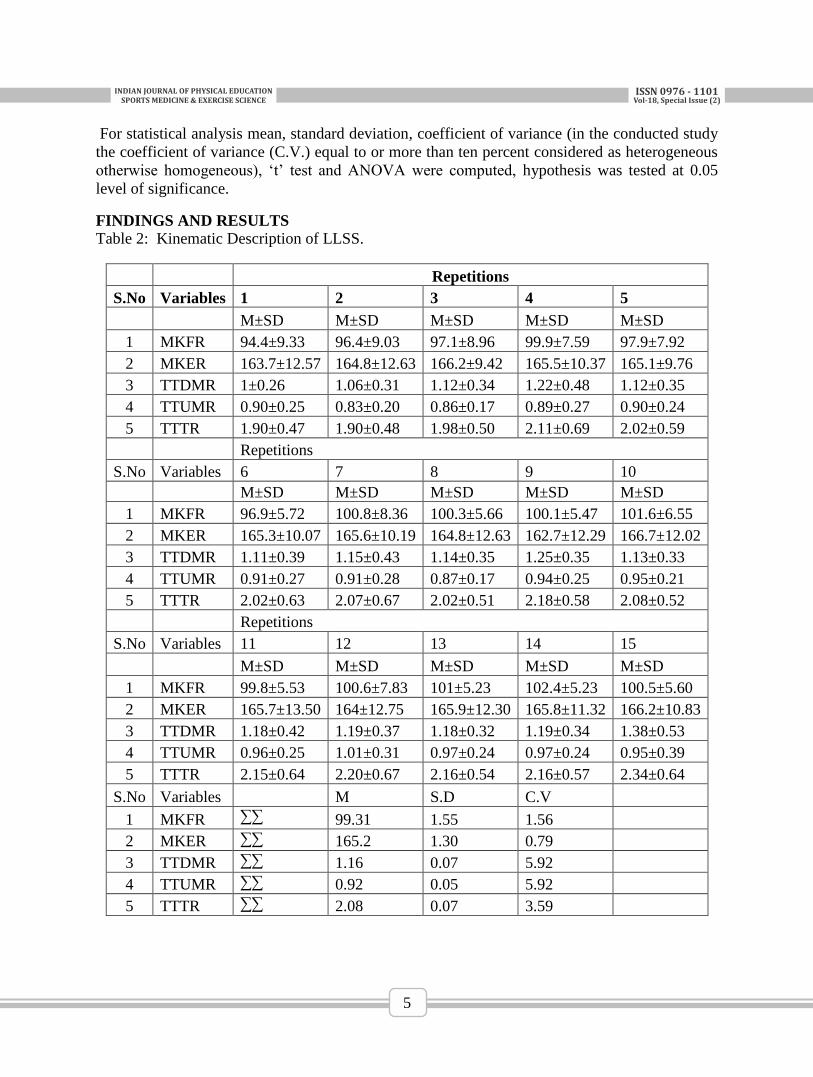
Table 2: Kinematic Description of LLSS.
Repetitions
S.No Variables 1 2 3 4 5
M±SD M±SD M±SD M±SD M±SD
1 MKFR 94.4±9.33 96.4±9.03 97.1±8.96 99.9±7.59 97.9±7.92
2 MKER 163.7±12.57 164.8±12.63 166.2±9.42 165.5±10.37 165.1±9.76
3 TTDMR 1±0.26 1.06±0.31 1.12±0.34 1.22±0.48 1.12±0.35
4 TTUMR 0.90±0.25 0.83±0.20 0.86±0.17 0.89±0.27 0.90±0.24
5 TTTR 1.90±0.47 1.90±0.48 1.98±0.50 2.11±0.69 2.02±0.59
Repetitions
S.No Variables 6 7 8 9 10
M±SD M±SD M±SD M±SD M±SD
1 MKFR 96.9±5.72 100.8±8.36 100.3±5.66 100.1±5.47 101.6±6.55
2 MKER 165.3±10.07 165.6±10.19 164.8±12.63 162.7±12.29 166.7±12.02
3 TTDMR 1.11±0.39 1.15±0.43 1.14±0.35 1.25±0.35 1.13±0.33
4 TTUMR 0.91±0.27 0.91±0.28 0.87±0.17 0.94±0.25 0.95±0.21
5 TTTR 2.02±0.63 2.07±0.67 2.02±0.51 2.18±0.58 2.08±0.52
Repetitions
S.No Variables 11 12 13 14 15
M±SD M±SD M±SD M±SD M±SD
1 MKFR 99.8±5.53 100.6±7.83 101±5.23 102.4±5.23 100.5±5.60
2 MKER 165.7±13.50 164±12.75 165.9±12.30 165.8±11.32 166.2±10.83
3 TTDMR 1.18±0.42 1.19±0.37 1.18±0.32 1.19±0.34 1.38±0.53
4 TTUMR 0.96±0.25 1.01±0.31 0.97±0.24 0.97±0.24 0.95±0.39
5 TTTR 2.15±0.64 2.20±0.67 2.16±0.54 2.16±0.57 2.34±0.64
S.No Variables M S.D C.V
1 MKFR ∑∑ 99.31 1.55 1.56
2 MKER ∑∑ 165.2 1.30 0.79
3 TTDMR ∑∑ 1.16 0.07 5.92
4 TTUMR ∑∑ 0.92 0.05 5.92
5 TTTR ∑∑ 2.08 0.07 3.59
INDIANJOURNALOFPHYSICALEDUCATIONSPORTSMEDICINE&EXERCISESCIENCE
ISSN0976-1101Vol-18,SpecialIssue(2)
6
Note: N = 10, MKFR and MKER measurements in degree, TTDMR, TTUMR and TTTR
measurements in seconds. MKFR = Maximum Knee Flexion Repetition Wise, MKER =
Maximum Knee Extension Repetition Wise, TTDMR = Time Taken For Downward Movement
Repetition Wise, TTUMR = Time Taken For Upward Movement Repetition Wise, TTTR = Total
Time Taken Repetition Wise S.D. = Standard Deviation, M = Mean, C.V. = Coefficient of
Variance and ∑∑ = Grand Mean, standard Deviation and Coefficient of Variance.
According to the findings of table 2, the kinematic description (variables) of LLSS namely
MKFR, MKER, TTDMR, TTUMR and TTTR demonstrated and irregular trends following the
repetitions. The grand mean and standard deviation of 15 repetitions of the variables namely
MKFR reported mean and standard deviation 99.31 ± 1.55 with C.V. 1.56, MKER reported mean
and standard deviation 165.2 ± 1.30 with C.V. 0.79, TTDMR reported mean and standard
deviation 1.16 ± 0.07 with C.V. 5.92, TTUMR reported mean and standard deviation 0.92 ± 0.05
with C.V. 5.92 and TTTR reported mean and standard deviation 2.08 ± 0.07 with C.V. 3.59
which suggest that repetitions are homogenous in regard to MKFR, MKER, TTDMR, TTUMR
and TTTR variables. It has been observed that the C.V. ranged from 0.79 to 5.92, further highest
was observed in the variable namely TTDMR and TTUMR followed by TTTR, MKFR, and the
least was MKER.
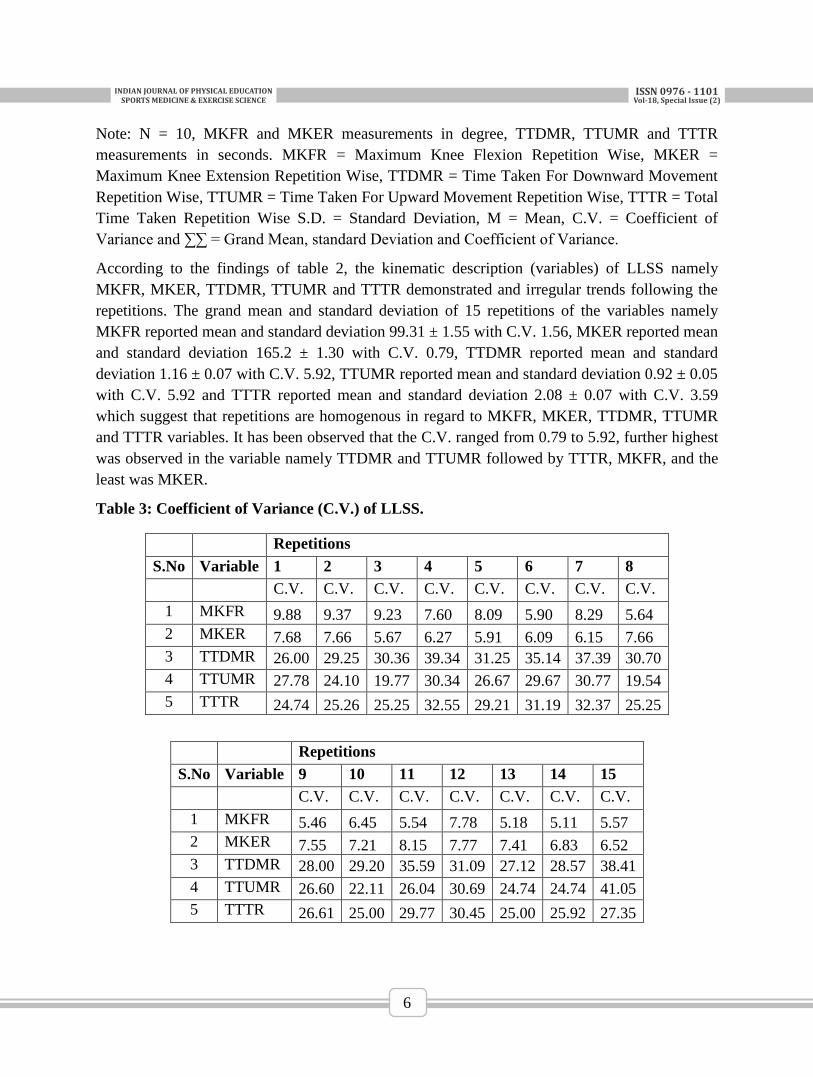
Table 3: Coefficient of Variance (C.V.) of LLSS.
Repetitions
S.No Variable 1 2 3 4 5 6 7 8
C.V. C.V. C.V. C.V. C.V. C.V. C.V. C.V.
1 MKFR 9.88 9.37 9.23 7.60 8.09 5.90 8.29 5.64
2 MKER 7.68 7.66 5.67 6.27 5.91 6.09 6.15 7.66
3 TTDMR 26.00 29.25 30.36 39.34 31.25 35.14 37.39 30.70
4 TTUMR 27.78 24.10 19.77 30.34 26.67 29.67 30.77 19.54
5 TTTR 24.74 25.26 25.25 32.55 29.21 31.19 32.37 25.25
Repetitions
S.No Variable 9 10 11 12 13 14 15
C.V. C.V. C.V. C.V. C.V. C.V. C.V.
1 MKFR 5.46 6.45 5.54 7.78 5.18 5.11 5.57
2 MKER 7.55 7.21 8.15 7.77 7.41 6.83 6.52
3 TTDMR 28.00 29.20 35.59 31.09 27.12 28.57 38.41
4 TTUMR 26.60 22.11 26.04 30.69 24.74 24.74 41.05
5 TTTR 26.61 25.00 29.77 30.45 25.00 25.92 27.35
INDIANJOURNALOFPHYSICALEDUCATIONSPORTSMEDICINE&EXERCISESCIENCE
ISSN0976-1101Vol-18,SpecialIssue(2)
7
Note: N = 10, MKFR, MKER, TTDMR, TTUMR and TTTR measurements in percentage.
MKFR = Maximum Knee Flexion Repetition Wise, MKER = Maximum Knee Extension
Repetition Wise, TTDMR = Time Taken For Downward Movement Repetition Wise, TTUMR =
Time Taken For Upward Movement Repetition Wise, TTTR = Total Time Taken Repetition
Wise, C.V. = Coefficient of Variance.
According to the finding of table 3, the Coefficient of Variance of LLSS selected angle and
temporal variables namely MKFR, MKER, TTDMR, TTUMR and TTTR demonstrated and
irregular trends following the repetitions. It has been observed that in the variable namely MKFR
the C.V. ranged from (5.11% to 9.88%), MKER the C.V. ranged from (5.67% to 8.15%),
TTDMR the C.V. ranged from (26.00% to 39.34%), TTUMR the C.V. ranged from (19.54% to
41.05%) and TTTR the C.V. ranged from (24.74% to 32.55%). It is concluded that the
comparison (C.V.) among the players demonstrated homogeneity in regard to angle variables
namely MKFR and MKER but heterogeneity for the remaining temporal variables namely
TTDMR, TTUMR, and TTTR..
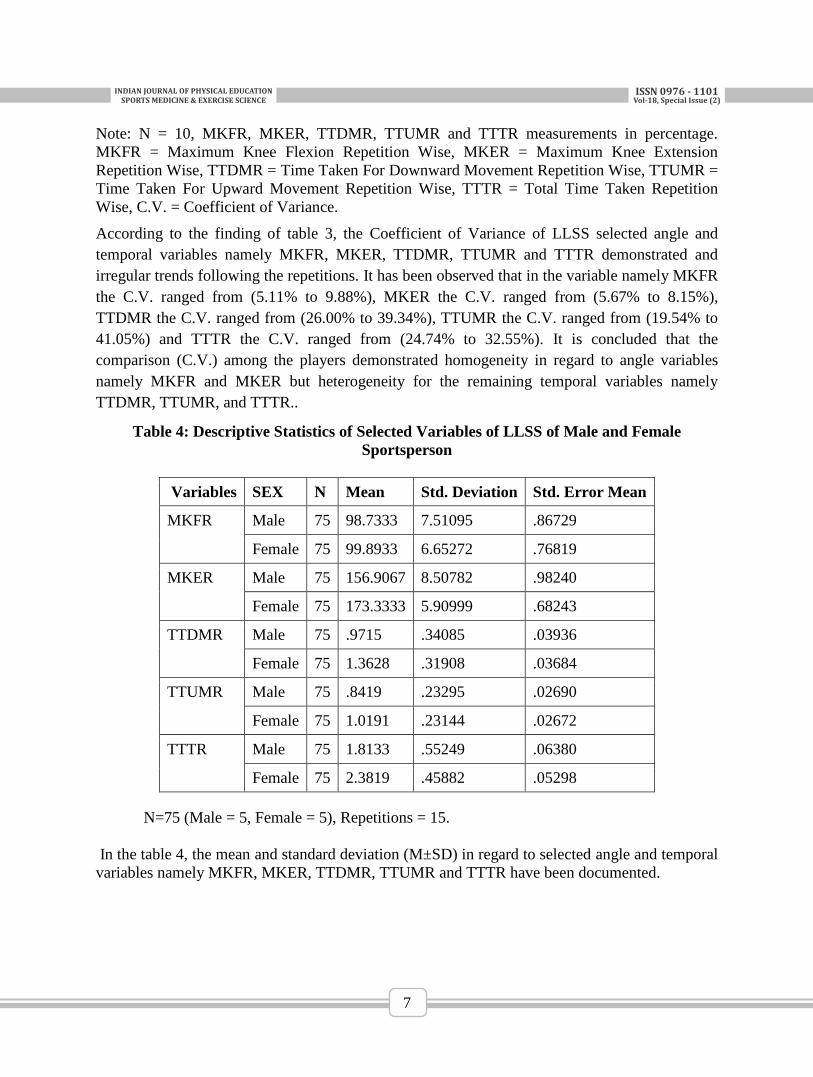
Table 4: Descriptive Statistics of Selected Variables of LLSS of Male and Female
Sportsperson
Variables SEX N Mean Std. Deviation Std. Error Mean
MKFR Male 75 98.7333 7.51095 .86729
Female 75 99.8933 6.65272 .76819
MKER Male 75 156.9067 8.50782 .98240
Female 75 173.3333 5.90999 .68243
TTDMR Male 75 .9715 .34085 .03936
Female 75 1.3628 .31908 .03684
TTUMR Male 75 .8419 .23295 .02690
Female 75 1.0191 .23144 .02672
TTTR Male 75 1.8133 .55249 .06380
Female 75 2.3819 .45882 .05298
N=75 (Male = 5, Female = 5), Repetitions = 15.
In the table 4, the mean and standard deviation (M±SD) in regard to selected angle and temporal
variables namely MKFR, MKER, TTDMR, TTUMR and TTTR have been documented.
INDIANJOURNALOFPHYSICALEDUCATIONSPORTSMEDICINE&EXERCISESCIENCE
ISSN0976-1101Vol-18,SpecialIssue(2)
8
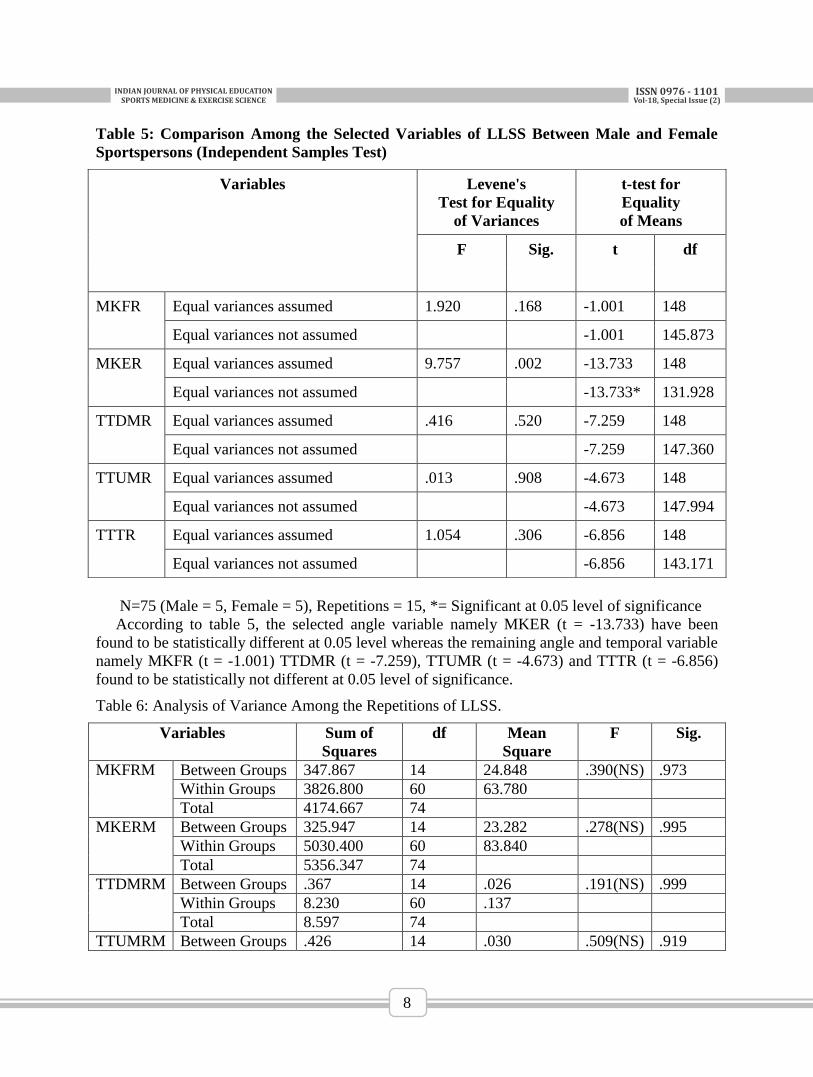
Table 5: Comparison Among the Selected Variables of LLSS Between Male and Female
Sportspersons (Independent Samples Test)
N=75 (Male = 5, Female = 5), Repetitions = 15, *= Significant at 0.05 level of significance
According to table 5, the selected angle variable namely MKER (t = -13.733) have been
found to be statistically different at 0.05 level whereas the remaining angle and temporal variable
namely MKFR (t = -1.001) TTDMR (t = -7.259), TTUMR (t = -4.673) and TTTR (t = -6.856)
found to be statistically not different at 0.05 level of significance.
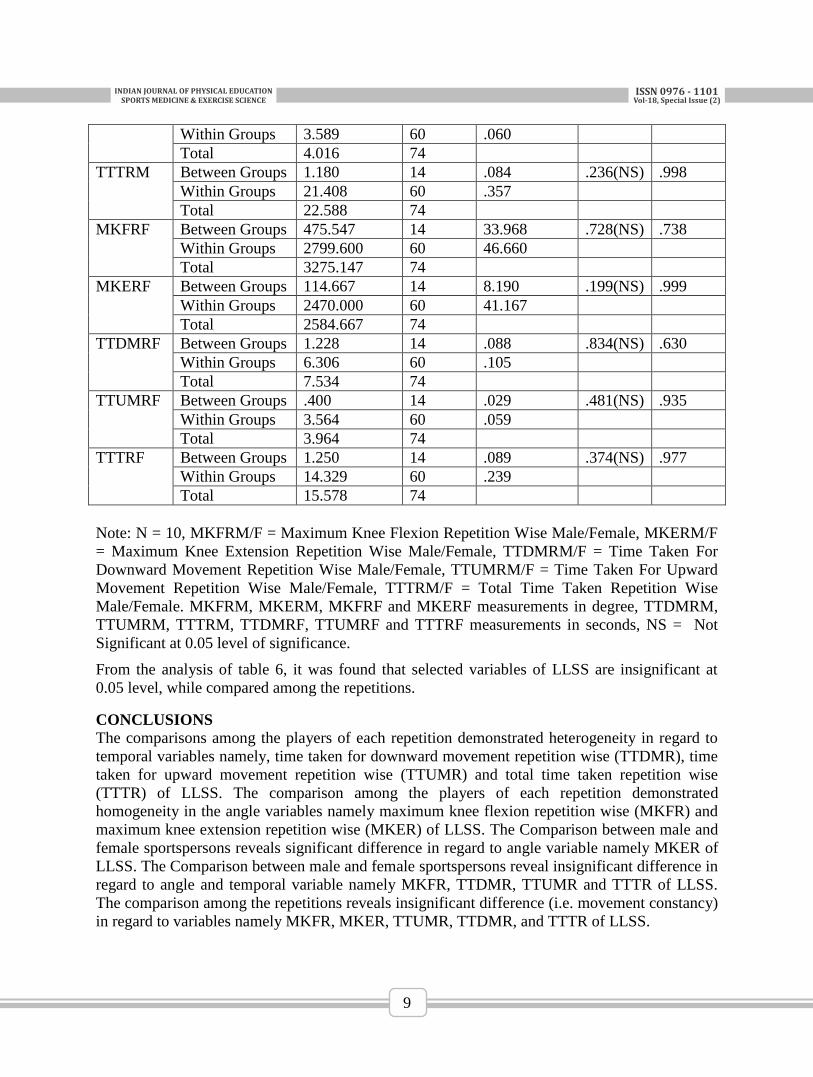
Table 6: Analysis of Variance Among the Repetitions of LLSS.
Variables Sum of
Squares
df Mean
Square
F Sig.
MKFRM Between Groups 347.867 14 24.848 .390(NS) .973
Within Groups 3826.800 60 63.780
Total 4174.667 74
MKERM Between Groups 325.947 14 23.282 .278(NS) .995
Within Groups 5030.400 60 83.840
Total 5356.347 74
TTDMRM Between Groups .367 14 .026 .191(NS) .999
Within Groups 8.230 60 .137
Total 8.597 74
TTUMRM Between Groups .426 14 .030 .509(NS) .919
Variables Levene's
Test for Equality
of Variances
t-test for
Equality
of Means
F Sig. t df
MKFR Equal variances assumed 1.920 .168 -1.001 148
Equal variances not assumed -1.001 145.873
MKER Equal variances assumed 9.757 .002 -13.733 148
Equal variances not assumed -13.733* 131.928
TTDMR Equal variances assumed .416 .520 -7.259 148
Equal variances not assumed -7.259 147.360
TTUMR Equal variances assumed .013 .908 -4.673 148
Equal variances not assumed -4.673 147.994
TTTR Equal variances assumed 1.054 .306 -6.856 148
Equal variances not assumed -6.856 143.171
INDIANJOURNALOFPHYSICALEDUCATIONSPORTSMEDICINE&EXERCISESCIENCE
ISSN0976-1101Vol-18,SpecialIssue(2)
9
Within Groups 3.589 60 .060
Total 4.016 74
TTTRM Between Groups 1.180 14 .084 .236(NS) .998
Within Groups 21.408 60 .357
Total 22.588 74
MKFRF Between Groups 475.547 14 33.968 .728(NS) .738
Within Groups 2799.600 60 46.660
Total 3275.147 74
MKERF Between Groups 114.667 14 8.190 .199(NS) .999
Within Groups 2470.000 60 41.167
Total 2584.667 74
TTDMRF Between Groups 1.228 14 .088 .834(NS) .630
Within Groups 6.306 60 .105
Total 7.534 74
TTUMRF Between Groups .400 14 .029 .481(NS) .935
Within Groups 3.564 60 .059
Total 3.964 74
TTTRF Between Groups 1.250 14 .089 .374(NS) .977
Within Groups 14.329 60 .239
Total 15.578 74
Note: N = 10, MKFRM/F = Maximum Knee Flexion Repetition Wise Male/Female, MKERM/F
= Maximum Knee Extension Repetition Wise Male/Female, TTDMRM/F = Time Taken For
Downward Movement Repetition Wise Male/Female, TTUMRM/F = Time Taken For Upward
Movement Repetition Wise Male/Female, TTTRM/F = Total Time Taken Repetition Wise
Male/Female. MKFRM, MKERM, MKFRF and MKERF measurements in degree, TTDMRM,
TTUMRM, TTTRM, TTDMRF, TTUMRF and TTTRF measurements in seconds, NS = Not
Significant at 0.05 level of significance.
From the analysis of table 6, it was found that selected variables of LLSS are insignificant at
0.05 level, while compared among the repetitions.
CONCLUSIONS
The comparisons among the players of each repetition demonstrated heterogeneity in regard to
temporal variables namely, time taken for downward movement repetition wise (TTDMR), time
taken for upward movement repetition wise (TTUMR) and total time taken repetition wise
(TTTR) of LLSS. The comparison among the players of each repetition demonstrated
homogeneity in the angle variables namely maximum knee flexion repetition wise (MKFR) and
maximum knee extension repetition wise (MKER) of LLSS. The Comparison between male and
female sportspersons reveals significant difference in regard to angle variable namely MKER of
LLSS. The Comparison between male and female sportspersons reveal insignificant difference in
regard to angle and temporal variable namely MKFR, TTDMR, TTUMR and TTTR of LLSS.
The comparison among the repetitions reveals insignificant difference (i.e. movement constancy)
in regard to variables namely MKFR, MKER, TTUMR, TTDMR, and TTTR of LLSS.
INDIANJOURNALOFPHYSICALEDUCATIONSPORTSMEDICINE&EXERCISESCIENCE
ISSN0976-1101Vol-18,SpecialIssue(2)
10
REFERENCES
Available at http://healthyliving.azcentral.com/importance-lowerbody-strength- 435.html;
retained on 20th Aug., 2017.
Pascal Schutz, R. L. (2014). Joint Angles of the Ankle, Knee, and Hip and Loading
Conditions During Split Squats. Human Kinetics Journals, 373-380.
Petr Stastny, M. L. (2015). Does the Dumbbell-Carrying Position Change the Muscle
Activity in Split Squats and Walking Lunges? Journal of Strength and Conditioning
Research, 3177–3187.
Robert G. Lockie et. al. (2017). Between-Leg Mechanical Differences as Measured by
the Bulgarian Split-Squat: Exploring Asymmetries and Relationships with Sprint
Acceleration. Multidisciplinary Digital Publishing Institute (MDPI), 65.
Chun-Hao Chang, C.-Y. C.-C.-S. (2016). Effect of different tibia angles to loading of
knee during split squat. 34 International Conference of Biomechanics in Sport (pp. 251-
254). Tsukuba: Conference Proceedings Archive.
Samantha K. Andrews et. al. (2016). The Interaction of Fatigue and Potentiation
Following an Acute Bout of Unilateral Squats. Journal of Sports Science and Medicine
(JSSM) , 625-632.
Codorean Horea, C. I. (2016). Functional rehabilitation of the knee joint after cruciate
ligament reconstruction in the football players - recovery in therapy room. Journal of the
Romanian Sports Medicine Society, 2792-2797.
Available at http://weighttraining.guide/exercises/barbell-bulgarian-split-squat/; viewed
on 21 Jan., 2018.
Available at http://www.sport-fitness-advisor.com/muscular-endurance.html; viewed on 7
Jan., 2017.
INDIANJOURNALOFPHYSICALEDUCATIONSPORTSMEDICINE&EXERCISESCIENCE
ISSN0976-1101Vol-18,SpecialIssue(2)
11
COMPARATIVE STUDY ON FOOT PRESSURE
DISTRIBUTION OF VRIKSHASANA BETWEEN VISUAL AND
NON-VISUAL YOGIC PRACTICE 1Kiran Kumari,
2Dr.Vinita Bajpai Mishra,
3Shivani Ojha
1&3M.P.Ed Students,LNIPE, Gwalior,
2Assistant Professor, LNIPE,Gwalior.
ABSTRACT
The present study was aimed at comparative analysis of Foot Pressure Distribution on single leg
balancing asana in eyes open and eyes closed. The study was conducted on 15 male students
from LNIPE Gwalior, age ranging from 18-25. Data were collected on BTS P- Walk
(Baropodometric Pressure Platform) on Vrikshasana in eyes open and eyes closed. All subjects
were asked to performed single-leg balancing asana in eyes open and eyes closed to measure the
C.O.P Distance and Average speed on pressure platform .Data was recorded for 10 seconds,
when subjects were on the pressure platform in both conditions i.e. eyes open and eyes closed. It
was hypothesized that there would be significant difference in eyes open and eyes closed. Paired
T- test was employed for the analysis of result at 5% level of significance. Finally, significant
differences were found in eyes open and eyes closed. In eyes closed selected variables were
found significantly higher than eyes open with mean and SD of visual (183.89±37.36) and non-
visual (567.03±263.78) of COP distance and average speed of visual (18.24±3.63) and non-
visual (64.52±29.69) on the vrikshasana with the static foot planter pressure distribution of the
subjects on the pressure platform. Thus it can be concluded that centre of pressure distance and
average speed were changed in eyes open and eyes closed.
Keywords : Standing one leg asana, BTS P-WALK., C.O.P Distance, Average speed, eyes open,
eyes closed.
INTRODUCTION
In biomechanics, balance is an ability to maintain the line of gravity vertical line from center of
mass of a body within the base of support with minimal postural sway. Sway is the horizontal
movement of the center of gravity even when a person is standing still.
Yoga is a group of physical, mental, and spiritual practices or disciplines which originated in
ancient India.
One-legged poses give us a chance to find our center of gravity and dance around its edges.
Create a sense of fluid stability. Concentrate on keeping your head, trunk, pelvis, and both of
your legs balance. while balancing on one leg like Vriksha sana (Tree Pose) and Ardha
Chandrasana (Half Moon Pose) demand our full, wakeful attention in a way that other standing
poses do not. Balance poses can required a deep sense of calm and alertness. When lifting one
leg while standing on the other leg, it can help to not only stabilize the pelvis, waist and ribcage,
but also to change their shape as required so that the muscles operating on the leg have room to
move (www.sensational-yoga-poses.com/stability-in-yoga-poses.html).
Pedobarography is the study of pressure fields acting between the plantar surface of the foot and
a supporting surface. Used most often for biomechanical analysis of gait and posture.
INDIANJOURNALOFPHYSICALEDUCATIONSPORTSMEDICINE&EXERCISESCIENCE
ISSN0976-1101Vol-18,SpecialIssue(2)
12
Pedobarography, also known as plantar dynamic pressure distribution measurement . If you work
on your single leg balance every day, you’ll find not only will you be able to stand with eyes
closed, but also be able to begin to rotate left and right with your eyes closed.
There is no research to show that your poor balance will result in injury, but there is research to
show that those with a number of lower extremity injuries do have poor balance.
This present study is to examine the comparison of foot pressure distribution during standing
postures between visual and non-visual yogic practices.
RESEARCH QUESTION
Whether all one-legged standing as anas in closed eyes have significance difference or not.
Methods and Materials
SELECTION OF SUBJECTS
For the purpose of the study 15 male subjects were selected from LNIPE, Gwalior aged ranges
from 18-25
DESIGN OF THE STUDY
On command subjects were mount on the pressure platform and take the final position for
Vrikshasna then data were recorded for 10 sec. in static position.
VARIABLES MEASURES
Stabiolometric evaluation:
A. C.O.P distance
B. Average speed, which analysed in eyes open and eyes closed with the help of BTS P- walk
(Baropodometric Pressure Plate)
RELIABILITY OF THE DATA
To acquire valid measurement , the tool which was used for the purpose of the present study is
Baropodometric pressure platform available at the research laboratory of Lakshmibai National
Institute of Physical Education, Gwalior, and the reliability was established by the
manufacturers. All measurements were taken by the research scholar under the supervision of
experts so, the data collection for the present study was considered reliable.
ADMINISTRATION OF THE TEST
For the collection of the data the 15 male subjects, age 18-25, were selected purposively from the
yoga practice group of Lakshmibai National Institute of Physical Education, Gwalior. Total
observation and collection of the data was done in a day. Each subjects were instructed to
performed Vrikshasana or single-leg balancing asana on the pressure platform with bare foot. All
15 subjects performed in two different condition, one time with the eyes open and other time
with eyes closed and focus on a point so that their body and mind more balance. The subjects
have to stand in static position on the platform upto ten seconds for getting the data of pressure
by the foot.
STATISTICAL ANALYSIS
Paired T test was applied for the analysis of results at 5% level of significance as the same
subject were tested repeatedly in eyes open and eyes closed.
INDIANJOURNALOFPHYSICALEDUCATIONSPORTSMEDICINE&EXERCISESCIENCE
ISSN0976-1101Vol-18,SpecialIssue(2)
13
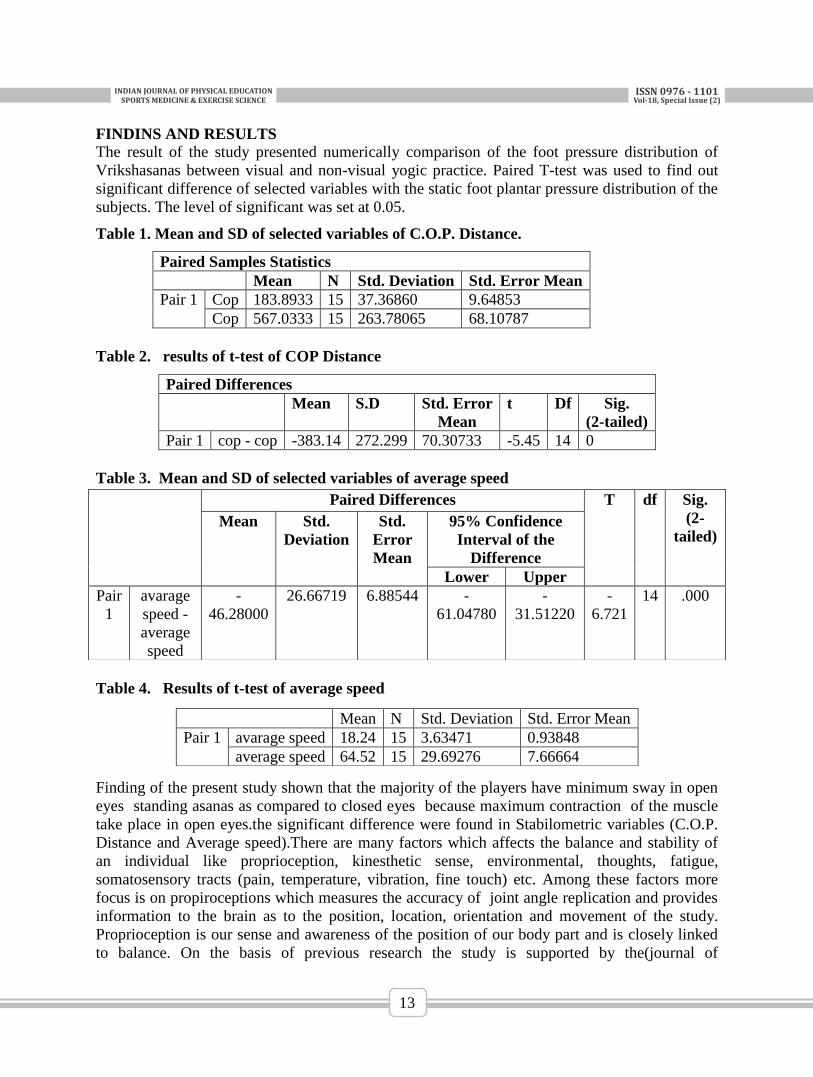
FINDINS AND RESULTS
The result of the study presented numerically comparison of the foot pressure distribution of
Vrikshasanas between visual and non-visual yogic practice. Paired T-test was used to find out
significant difference of selected variables with the static foot plantar pressure distribution of the
subjects. The level of significant was set at 0.05.
Table 1. Mean and SD of selected variables of C.O.P. Distance.
Paired Samples Statistics
Mean N Std. Deviation Std. Error Mean
Pair 1 Cop 183.8933 15 37.36860 9.64853
Cop 567.0333 15 263.78065 68.10787
Table 2. results of t-test of COP Distance
Paired Differences
Mean S.D Std. Error
Mean
t Df Sig.
(2-tailed)
Pair 1 cop - cop -383.14 272.299 70.30733 -5.45 14 0
Table 3. Mean and SD of selected variables of average speed
Table 4. Results of t-test of average speed
Finding of the present study shown that the majority of the players have minimum sway in open
eyes standing asanas as compared to closed eyes because maximum contraction of the muscle
take place in open eyes.the significant difference were found in Stabilometric variables (C.O.P.
Distance and Average speed).There are many factors which affects the balance and stability of
an individual like proprioception, kinesthetic sense, environmental, thoughts, fatigue,
somatosensory tracts (pain, temperature, vibration, fine touch) etc. Among these factors more
focus is on propiroceptions which measures the accuracy of joint angle replication and provides
information to the brain as to the position, location, orientation and movement of the study.
Proprioception is our sense and awareness of the position of our body part and is closely linked
to balance. On the basis of previous research the study is supported by the(journal of
Paired Differences T df Sig.
(2-
tailed) Mean Std.
Deviation
Std.
Error
Mean
95% Confidence
Interval of the
Difference
Lower Upper
Pair
1
avarage
speed -
average
speed
-
46.28000
26.66719 6.88544 -
61.04780
-
31.51220
-
6.721
14 .000
Mean N Std. Deviation Std. Error Mean
Pair 1 avarage speed 18.24 15 3.63471 0.93848
average speed 64.52 15 29.69276 7.66664
INDIANJOURNALOFPHYSICALEDUCATIONSPORTSMEDICINE&EXERCISESCIENCE
ISSN0976-1101Vol-18,SpecialIssue(2)
14
biomechanics, 2016). Proprioceptive training is realized throughout tasks that included the
establishing and maintenance of various positions on balance boards of different dimensions,
working surfaces and the size of the backbone(Adriana ljubojevic et al.,2012). This study in eyes
open in Vrikshasana balancing asana had less sway in central of pressure distance and average
speed due to more concentration on a point and maximum contraction of the muscle. When eyes
areclosed there is no way of proprioception because eyes worked as balance point for the
subjects. Similarly when eyes were closed then reference point goes away.
CONCLUSION
The present study shows that eyes closed have higher centre of pressure distance and average
speed then eyes open. So, it may be concluded that sway distance and average speed varies with
different situations on pressure platform due to proprioception, environmental conditions,
kinesthetic sense, thoughts, fatigue, somatosensory tracts and etc.
REFERENCE
Jerrold Petrofsky*, Iman Akef Khowailed, Brittney N Burtnett, Marina R Korkar and
Brittany M Kinn
D A Winter PhD, PEng Winter, David A., “Biomechanics and Motor Control of Human
Movement”, ThirdEdition John Wiley $ Sons, Inc.,(2005).
Department of Kinesiology, University of Waterloo, Waterloo, Ontario, Canada
www.sensational-yoga-poses.com/stability-in-yoga-poses.html
Toshiaki Tanaka, Hidekatsu Takeda , Takashi Izumi, Shuichi Ino & Tohru Ifukube Pages
997-1010 | Published Online: 10 Nov 2010.
http://www.engagingmuscles.com/2011/07/11/more-on-proprioception-biomechanics-
and-running-in-minimal-shoes-part-1.
INDIANJOURNALOFPHYSICALEDUCATIONSPORTSMEDICINE&EXERCISESCIENCE
ISSN0976-1101Vol-18,SpecialIssue(2)
15
THE INFLUENCE OF DIFFERENT BODY WEIGHT DOMINANCE
ON COORDINATION AMONG ADVANCE JUDOKA
*Vijendra Yadav & **Dr. Birendra Jhajhariya * PhD Scholar, LNIPE, Gwalior
** Assistant Professor, LNIPE, Gwalior
ABSTRACT:
The purpose of this study is to find the relationship between body weight dominance on
coordination among advance judo players. For this study 20 male judoka from LNIPE, Gwalior
age 19-24, weight 69.35±10.82, height 168±4cm were purposively selected for the study. It was
hypothesized that there is relationship between body weight and coordination among judo
players. Statistical analysis under taken with the help of SPSS 20 Pearson correlation was used to
check the relationship between body weight and coordination. The result was significant at 0.05
so it is concluded that there was significant relationship between different body weights with
coordination among advance judo players.
KEYWORDS: coordination, judoka, body weight
INTRODUCTION
Judo is generally considered as a sport which combines strength and endurance. In this sport,
with predominance of open movement habits, an important role is played by coordination
abilities. A judoka has to perfect complementary throws with a single grip in order to use attacks
in three to four directions and be effective during a bout (Calmet, Trezel, & Ahmaidi, 2006).
Judo is a sport characterized by numerous sport-specific techniques, i.e. by a large repertoire of
technical elements and a variety of exercises practiced in exceptionally changing conditions.
Furthermore, judoka’s movements must be quick and precise enough to ensure the effectiveness
of the fighting technique used. As a result, understood as a sport with the highest level of
coordination complexity (Hirtz & Starosta, 1991; Starosta, 2006).
METHODOLGY
Twenty male judoka, age 19 to 24 yrs, were purposively selected from Lakshmibai National
University of Physical Education, Gwalior,(M.P.),India. The subjects were approximately
undergone a similar kind of training regime and approximately having a similar kind of schedule
off the ground in terms of diet, life style, studies, daily activities like sleeping hours etc. Keeping
in mind the feasibility criteria and the specific purpose of this investigation, the researcher have
taken body weight as a independent variables and –front back and left-right coordination as a
dependant variable. Senso-balance machine was used for data collection which is totally
software based.
Data was collect in Exercise Physiology Laboratory of L.N.I.P.E. Gwalior. All the necessary
information pertaining to the requirement of the testing procedure was imparted to subjects. To
make the research finding more authentic, positive attitude towards investigation was
emphasized.
INDIANJOURNALOFPHYSICALEDUCATIONSPORTSMEDICINE&EXERCISESCIENCE
ISSN0976-1101Vol-18,SpecialIssue(2)
16
FINDINGS AND REULTS
The data analysis was done through IBM 20 SPSS statistics (20th
version).
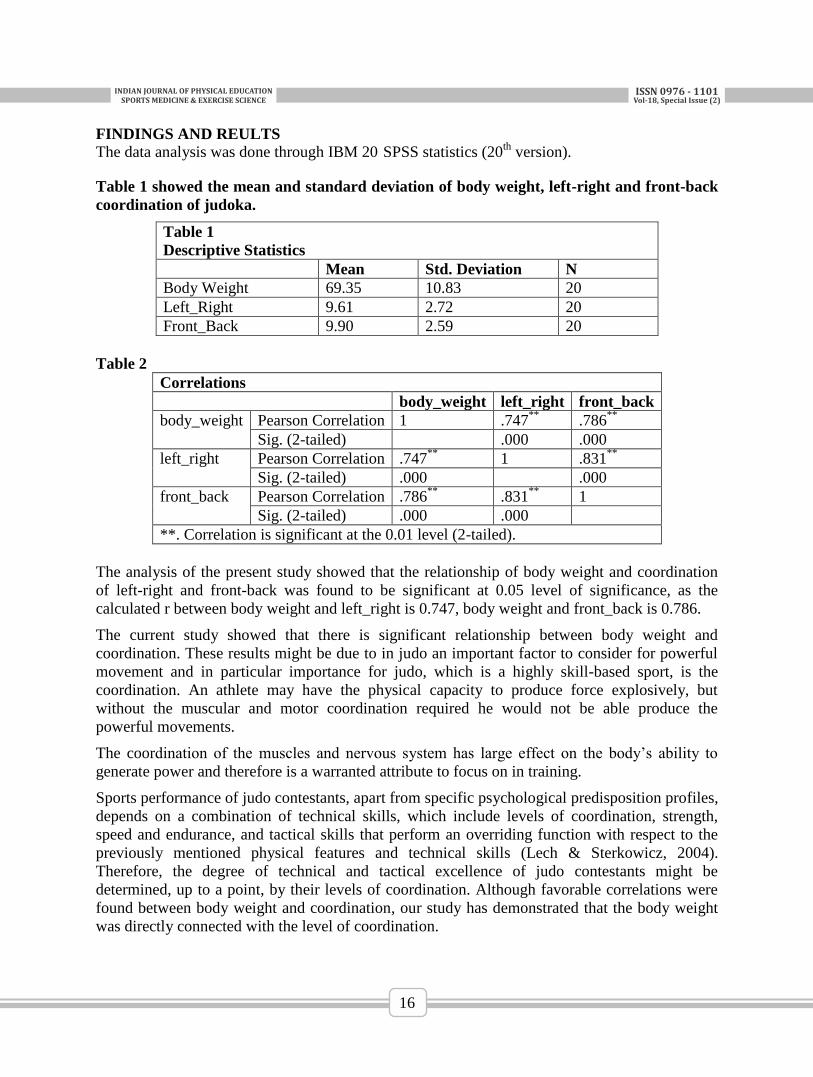
Table 1 showed the mean and standard deviation of body weight, left-right and front-back
coordination of judoka.
Table 1
Descriptive Statistics
Mean Std. Deviation N
Body Weight 69.35 10.83 20
Left_Right 9.61 2.72 20
Front_Back 9.90 2.59 20
Table 2
Correlations
body_weight left_right front_back
body_weight Pearson Correlation 1 .747**
.786**
Sig. (2-tailed) .000 .000
left_right Pearson Correlation .747**
1 .831**
Sig. (2-tailed) .000 .000
front_back Pearson Correlation .786**
.831**
1
Sig. (2-tailed) .000 .000
**. Correlation is significant at the 0.01 level (2-tailed).
The analysis of the present study showed that the relationship of body weight and coordination
of left-right and front-back was found to be significant at 0.05 level of significance, as the
calculated r between body weight and left_right is 0.747, body weight and front_back is 0.786.
The current study showed that there is significant relationship between body weight and
coordination. These results might be due to in judo an important factor to consider for powerful
movement and in particular importance for judo, which is a highly skill-based sport, is the
coordination. An athlete may have the physical capacity to produce force explosively, but
without the muscular and motor coordination required he would not be able produce the
powerful movements.
The coordination of the muscles and nervous system has large effect on the body’s ability to
generate power and therefore is a warranted attribute to focus on in training.
Sports performance of judo contestants, apart from specific psychological predisposition profiles,
depends on a combination of technical skills, which include levels of coordination, strength,
speed and endurance, and tactical skills that perform an overriding function with respect to the
previously mentioned physical features and technical skills (Lech & Sterkowicz, 2004).
Therefore, the degree of technical and tactical excellence of judo contestants might be
determined, up to a point, by their levels of coordination. Although favorable correlations were
found between body weight and coordination, our study has demonstrated that the body weight
was directly connected with the level of coordination.
INDIANJOURNALOFPHYSICALEDUCATIONSPORTSMEDICINE&EXERCISESCIENCE
ISSN0976-1101Vol-18,SpecialIssue(2)
17
The current findings and those obtained in the studies of adults (Lech, et al., 2007) demonstrated
that the ability to react fast as measured with time reaction tests was found to be of great
importance.
CONCLUSION:
The highest level of coordination was found between Body weight and left_right among Judokas.
The highest correlation factors were observed among body weight ad front_back among judokas.
REFERENCES
Calmet M, Miarka B, Franchini E. Modeling of grasps in judo contests. International
Journal of Performance Analysis in Sport 2010; 10 (3): 229-240.
Hrysomallis C. Balance ability and athletic performance. Sports Med 2011; 41(3): 221-
232.
Lech, G., Jaworski, J., Ljach W., & Krawczyk, R. (2011). Effect of the level of
coordinated motor abilities on performance in junior judokas. Journal of Human Kinetics,
30, 153-160.
Miarka, B., Panissa, V.L.G., Ferreira, U.J., Del Vecchio, F.B., Calmet, M., & Franchini,
E. (2012). A comparison of time-motion performance between age groups in judo
matches. Journal of Sports Sciences, 30(9), 899-905.
Starosta, W. (2003). Koordynacyjne zdolności motoryczne. [Coordinative motor abilities.
In Polish.] Warszawa: Instytut Sportu
INDIANJOURNALOFPHYSICALEDUCATIONSPORTSMEDICINE&EXERCISESCIENCE
ISSN0976-1101Vol-18,SpecialIssue(2)
18
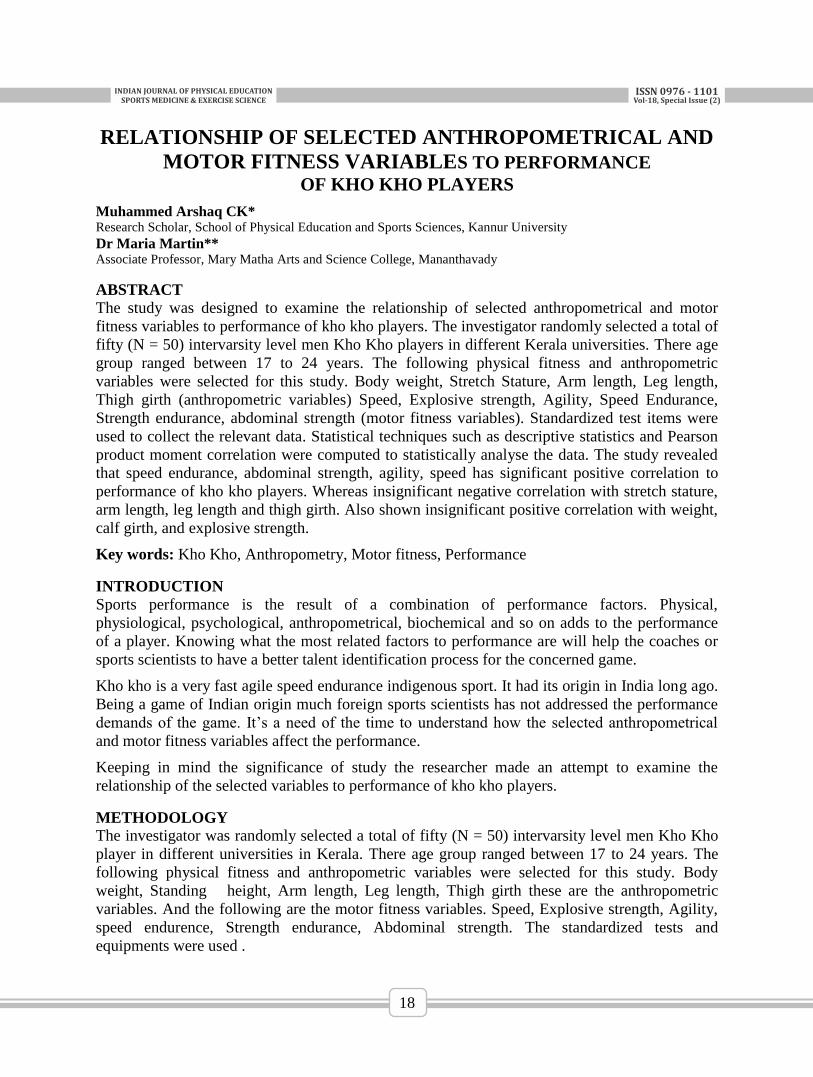
RELATIONSHIP OF SELECTED ANTHROPOMETRICAL AND
MOTOR FITNESS VARIABLES TO PERFORMANCE
OF KHO KHO PLAYERS
Muhammed Arshaq CK* Research Scholar, School of Physical Education and Sports Sciences, Kannur University
Dr Maria Martin** Associate Professor, Mary Matha Arts and Science College, Mananthavady
ABSTRACT
The study was designed to examine the relationship of selected anthropometrical and motor
fitness variables to performance of kho kho players. The investigator randomly selected a total of
fifty (N = 50) intervarsity level men Kho Kho players in different Kerala universities. There age
group ranged between 17 to 24 years. The following physical fitness and anthropometric
variables were selected for this study. Body weight, Stretch Stature, Arm length, Leg length,
Thigh girth (anthropometric variables) Speed, Explosive strength, Agility, Speed Endurance,
Strength endurance, abdominal strength (motor fitness variables). Standardized test items were
used to collect the relevant data. Statistical techniques such as descriptive statistics and Pearson
product moment correlation were computed to statistically analyse the data. The study revealed
that speed endurance, abdominal strength, agility, speed has significant positive correlation to
performance of kho kho players. Whereas insignificant negative correlation with stretch stature,
arm length, leg length and thigh girth. Also shown insignificant positive correlation with weight,
calf girth, and explosive strength.
Key words: Kho Kho, Anthropometry, Motor fitness, Performance
INTRODUCTION
Sports performance is the result of a combination of performance factors. Physical,
physiological, psychological, anthropometrical, biochemical and so on adds to the performance
of a player. Knowing what the most related factors to performance are will help the coaches or
sports scientists to have a better talent identification process for the concerned game.
Kho kho is a very fast agile speed endurance indigenous sport. It had its origin in India long ago.
Being a game of Indian origin much foreign sports scientists has not addressed the performance
demands of the game. It’s a need of the time to understand how the selected anthropometrical
and motor fitness variables affect the performance.
Keeping in mind the significance of study the researcher made an attempt to examine the
relationship of the selected variables to performance of kho kho players.
METHODOLOGY
The investigator was randomly selected a total of fifty (N = 50) intervarsity level men Kho Kho
player in different universities in Kerala. There age group ranged between 17 to 24 years. The
following physical fitness and anthropometric variables were selected for this study. Body
weight, Standing height, Arm length, Leg length, Thigh girth these are the anthropometric
variables. And the following are the motor fitness variables. Speed, Explosive strength, Agility,
speed endurence, Strength endurance, Abdominal strength. The standardized tests and
equipments were used .
INDIANJOURNALOFPHYSICALEDUCATIONSPORTSMEDICINE&EXERCISESCIENCE
ISSN0976-1101Vol-18,SpecialIssue(2)
19
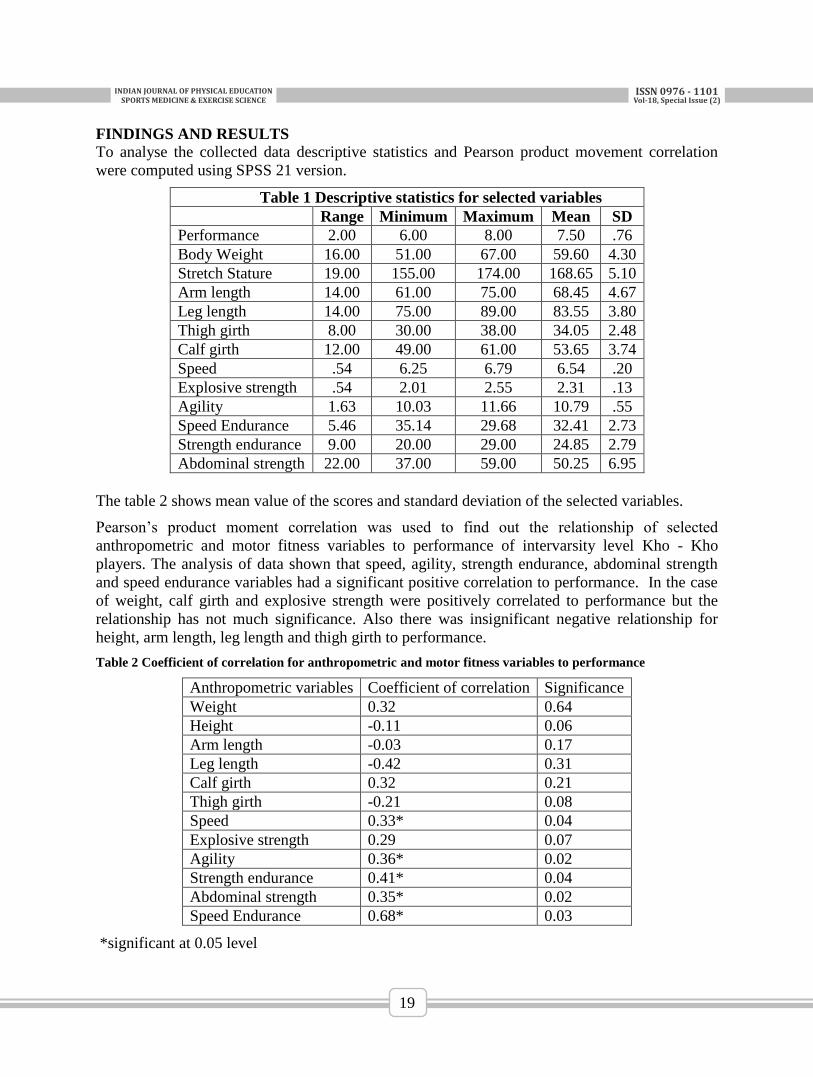
FINDINGS AND RESULTS
To analyse the collected data descriptive statistics and Pearson product movement correlation
were computed using SPSS 21 version.
Table 1 Descriptive statistics for selected variables
Range Minimum Maximum Mean SD
Performance 2.00 6.00 8.00 7.50 .76
Body Weight 16.00 51.00 67.00 59.60 4.30
Stretch Stature 19.00 155.00 174.00 168.65 5.10
Arm length 14.00 61.00 75.00 68.45 4.67
Leg length 14.00 75.00 89.00 83.55 3.80
Thigh girth 8.00 30.00 38.00 34.05 2.48
Calf girth 12.00 49.00 61.00 53.65 3.74
Speed .54 6.25 6.79 6.54 .20
Explosive strength .54 2.01 2.55 2.31 .13
Agility 1.63 10.03 11.66 10.79 .55
Speed Endurance 5.46 35.14 29.68 32.41 2.73
Strength endurance 9.00 20.00 29.00 24.85 2.79
Abdominal strength 22.00 37.00 59.00 50.25 6.95
The table 2 shows mean value of the scores and standard deviation of the selected variables.
Pearson’s product moment correlation was used to find out the relationship of selected
anthropometric and motor fitness variables to performance of intervarsity level Kho - Kho
players. The analysis of data shown that speed, agility, strength endurance, abdominal strength
and speed endurance variables had a significant positive correlation to performance. In the case
of weight, calf girth and explosive strength were positively correlated to performance but the
relationship has not much significance. Also there was insignificant negative relationship for
height, arm length, leg length and thigh girth to performance.
Table 2 Coefficient of correlation for anthropometric and motor fitness variables to performance
Anthropometric variables Coefficient of correlation Significance
Weight 0.32 0.64
Height -0.11 0.06
Arm length -0.03 0.17
Leg length -0.42 0.31
Calf girth 0.32 0.21
Thigh girth -0.21 0.08
Speed 0.33* 0.04
Explosive strength 0.29 0.07
Agility 0.36* 0.02
Strength endurance 0.41* 0.04
Abdominal strength 0.35* 0.02
Speed Endurance 0.68* 0.03
*significant at 0.05 level
INDIANJOURNALOFPHYSICALEDUCATIONSPORTSMEDICINE&EXERCISESCIENCE
ISSN0976-1101Vol-18,SpecialIssue(2)
20
Kho - Kho is a sport which demands rapid movement and fitness. The result of the study reveals
the relationship of selected motor fitness variables and the performance of Kho – Kho players.
Speed and agility shows a positive correlation to the performance. It may be because of the
nature of the game, the game demands quick reactions and speed movements for both running
and chasing. These characteristics of the game will influence the speed and agility of the players.
In the case of speed and strength endurance, the result shows a strong positive correlation. It may
be because of the game needs continuous quick movements in short period of time and there is
no time for taking long rest during the game. This will influence the players muscle groups and it
will turn to stronger. Abdominal strength of the players also shows a positive correlation it may
be due to the nature of the game needs continues sit, stand and quick running movements while
in the time of chasing. This will make a great effect on the abdominal muscles. Those
movements put pressure on the abdominal, hamstring and glut muscle. The result shows a
negative correlation of height, arm length, and thigh girth. Naturally Kho - Kho players are short
and lean body type. When the height increases the centre of gravity will be decreased. This will
affect the reaction ability of the players. The results of the study is in agreement with the results
of the study conducted by Jermy, Josh and Pivarnik (2004).
CONCLUSION
Kho - Kho is a sport which demands rapid movement and fitness. Over all the present study
shows speed, agility, strength endurance, abdominal strength and speed endurance variables had
a significant positive correlation to performance. In the case of weight, calf girth and explosive
strength were positively correlated to performance but the relationship has not much
significance. Also there was insignificant negative relationship for height, arm length, leg length
and thigh girth to performance.
REFERENCE
Knous Jermy, Ode Josh ,James M.Pivarnik, FACSM “Effect of a Collegiate Basketball
Season on Anthropometric Physiological Variabless”, Journals on Medicine and Science
in Sports and exercise ,volume 36(5) supplement May 2004,p S 207.
H.Harrison Clarke, “Relationship of Strength and Anthropometric Measures to Physical
Performance involving Trunk and Legs” Research Quarterly 28 (October 1957)
Jae Kenneth Ellenburg, “The Predictive Value of Selected Physical Variables in
determining Competitive Performance in High School Basketball”, Dissertation Abstracts
International 31 (April 1971), p 5174.
INDIANJOURNALOFPHYSICALEDUCATIONSPORTSMEDICINE&EXERCISESCIENCE
ISSN0976-1101Vol-18,SpecialIssue(2)
21
ASSESSMENT OF LEADERSHIP STYLES AMONG PHYSICAL
EDUCATION STUDENTS
Jesmy Jose* , Maria Martin Joseph
**
* PhD Scholar, Department of Physical Education, Kannur University, Kerala
**Associate Professor, Mary Matha Arts and Science College, Mananthavady, Kerala
ABSTRACT
Leadership is the process whereby an individual influences a group of individuals to achieve a
common goal. The study identifies the leadership styles which are dominating in the physical
education field. For this, total 122 students of physical education courses were selected from
various colleges in Kerala. Leadership style questionnaire constructed by Don Clark in 2004 was
used as the tool. The questionnaire contains 18 questions which measures 4 leadership styles;
detached leader, team leader, socially oriented leader and authoritarian leader. The statistical
technique used for the study was percentage analysis. The result of the study reveals that most of
the students have the characteristics of team leader. They are very good in making relationships
and also dedicated to achieve the team goal. Some of them shows socially oriented leaders and
very little number show detached and autocratic leadership. We can improve the leadership
qualities by giving them proper opportunities to act as a leader and also by motivating them to
take part in the leadership training courses.
KEYWORDS: Detached Leader, Authoritarian Leader, Socially Oriented Leader
INTRODUCTION
Teachers are great facilitators, motivators, leaders and companions. Persuading students to learn
is a Herculean task. And the success of an effective and efficient teacher lies in his skills to
persuade students to learn. In physical education, as any field of education, teacher needs to be
charismatic and at times are considered role model by students. The teacher should influence the
students to engage in physical education classes. The leader or the position of a leader is
determined by the authority. But the effectiveness of the leadership is determined by the
leadership skills or collectively called as leadership style.
Mainly three styles of leaderships are there. The styles are differentiated on the basis of nature of
the leader. The leader who is acting like Hitler will be known as autocratic leader. He will not
consider his teammates suggestions. Just opposite to the autocratic leadership known as laissez
faire. In this leader is in a dummy position. He will not do anything to achieve success.
Democratic leadership is the remaining style. As the name indicates this type is the most desired
and successful leadership style. In this study the researcher differentiates the leadership style in
four types; socially oriented leader, detached leader, authoritarian leader and team leader. These
classifications are made by evaluating the subject’s dedication for achieving the tasks and also
the ability to making and relationships and respecting others.
Teacher’s leadership style significantly affects the academic performance of the students
(Yildrim et al., 2008). In India since most of the times physical educators are the only promoters
of physical education, he should possess better leadership skills to serve his purpose. It is of great
importance to develop the best leadership styles among the physical education majors, so that he
would have a successful career. Training on leadership skills are one among the essential
component of physical education professional preparation curriculum. Keeping in mind the
INDIANJOURNALOFPHYSICALEDUCATIONSPORTSMEDICINE&EXERCISESCIENCE
ISSN0976-1101Vol-18,SpecialIssue(2)
22
importance of identifying the leadership style and nurturing it, the researcher examined the
leadership styles prevalent in physical education professional students of Kerala.
METHODOLOGY
Purposive sampling technique was used to select the samples. For the study 122 subjects were
selected from various physical education colleges in Kerala. Leadership style questionnaire
constructed by Don Clark in 2004 was used as the tool. The questionnaire contains 18 questions
which measures 4 leadership styles; detached leader, team leader, socially oriented leader and
authoritarian leader. In that questionnaire the appropriate style was identified by relating their
relationship aspects and also the efforts made by them to achieve their goals. Detached leader
means low in task and low in relationships on the other side team leader means high in
relationships and also high in task. Remaining authoritarian leader means low in relationship but
high in task. The socially oriented leader is just opposite to the authoritarian leader, having good
relationships but poor in achieving task. The statistical technique used in the study was
percentage analysis.
RESULTS AND DISCUSSION
The data on leadership style of physical education students were collected and calculated in
frequency and percentage distribution.
Table 1: frequency and distribution of leadership styles in total subjects
Leadership style Frequency and percentage
Team leader 105 (86.06%)
Socially oriented leader 8 (6.55%)
Authoritarian leader 5 (4.09 %)
Detached leader 4 (3.27%)
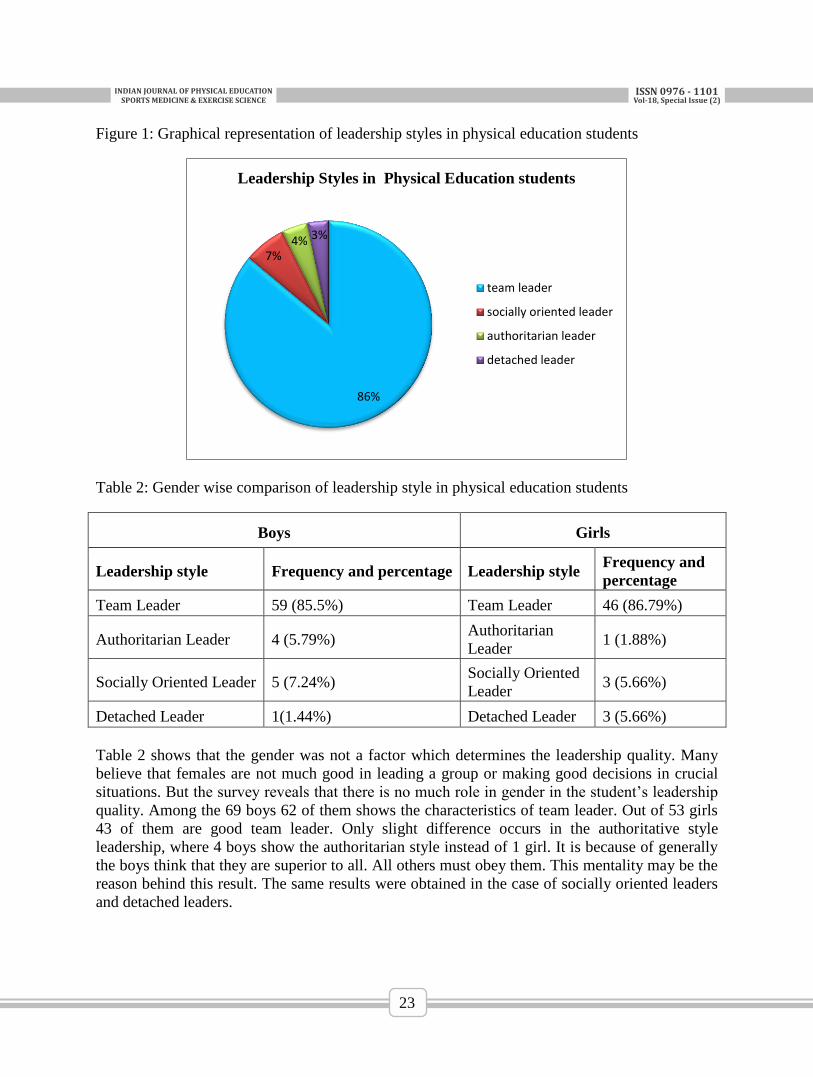
From table 1 it is evident that among the 122 physical education students, 86.06% students
possess team leader type leadership style. Only 6.55% of students have the characteristics of
socially oriented leadership. Very few of the students show the qualities of authoritarian and
detached leadership (5 and 4 respectively).
The student with the team leader characteristics are very good in making relationships and also
very dedicated to achieving the aims in all the situations. They can motivate their followers to
achieve the goals and they are always keeping their creative mind. If the teacher or coach is
lacking these qualities then he cannot perform his task well. So this nature will make the players
and other persons who are working in this field more creative and adjustable in every situation. It
is also an important quality of a democratic leader or team leader. According to behavioral
theory, people can become leaders through the process of teaching and observation. This may be
the reason behind most of the students shows the qualities of a team leader.
INDIANJOURNALOFPHYSICALEDUCATIONSPORTSMEDICINE&EXERCISESCIENCE
ISSN0976-1101Vol-18,SpecialIssue(2)
23
Figure 1: Graphical representation of leadership styles in physical education students
Table 2: Gender wise comparison of leadership style in physical education students
Boys Girls
Leadership style Frequency and percentage Leadership style Frequency and
percentage
Team Leader 59 (85.5%) Team Leader 46 (86.79%)
Authoritarian Leader 4 (5.79%) Authoritarian
Leader 1 (1.88%)
Socially Oriented Leader 5 (7.24%) Socially Oriented
Leader 3 (5.66%)
Detached Leader 1(1.44%) Detached Leader 3 (5.66%)
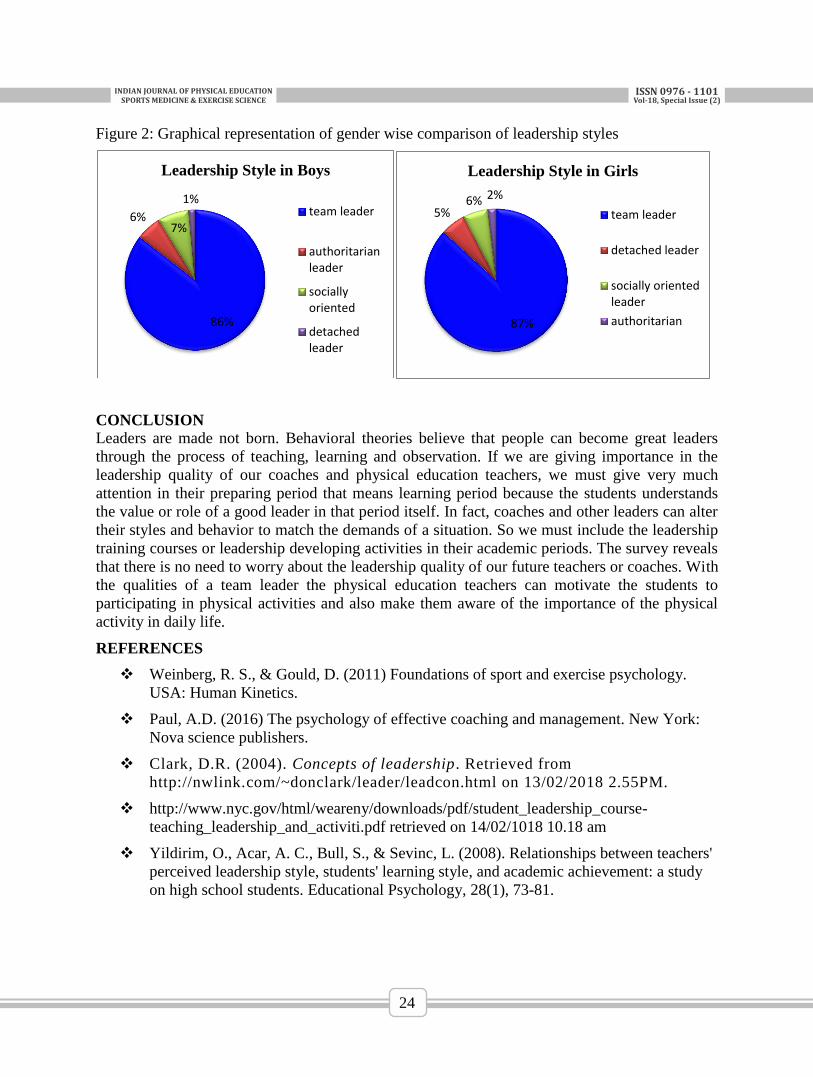
Table 2 shows that the gender was not a factor which determines the leadership quality. Many
believe that females are not much good in leading a group or making good decisions in crucial
situations. But the survey reveals that there is no much role in gender in the student’s leadership
quality. Among the 69 boys 62 of them shows the characteristics of team leader. Out of 53 girls
43 of them are good team leader. Only slight difference occurs in the authoritative style
leadership, where 4 boys show the authoritarian style instead of 1 girl. It is because of generally
the boys think that they are superior to all. All others must obey them. This mentality may be the
reason behind this result. The same results were obtained in the case of socially oriented leaders
and detached leaders.
86%
7% 4% 3%
Leadership Styles in Physical Education students
team leader
socially oriented leader
authoritarian leader
detached leader
INDIANJOURNALOFPHYSICALEDUCATIONSPORTSMEDICINE&EXERCISESCIENCE
ISSN0976-1101Vol-18,SpecialIssue(2)
24
Figure 2: Graphical representation of gender wise comparison of leadership styles
CONCLUSION
Leaders are made not born. Behavioral theories believe that people can become great leaders
through the process of teaching, learning and observation. If we are giving importance in the
leadership quality of our coaches and physical education teachers, we must give very much
attention in their preparing period that means learning period because the students understands
the value or role of a good leader in that period itself. In fact, coaches and other leaders can alter
their styles and behavior to match the demands of a situation. So we must include the leadership
training courses or leadership developing activities in their academic periods. The survey reveals
that there is no need to worry about the leadership quality of our future teachers or coaches. With
the qualities of a team leader the physical education teachers can motivate the students to
participating in physical activities and also make them aware of the importance of the physical
activity in daily life.
REFERENCES
Weinberg, R. S., & Gould, D. (2011) Foundations of sport and exercise psychology.
USA: Human Kinetics.
Paul, A.D. (2016) The psychology of effective coaching and management. New York:
Nova science publishers.
Clark, D.R. (2004). Concepts of leadership. Retrieved from
http://nwlink.com/~donclark/leader/leadcon.html on 13/02/2018 2.55PM.
http://www.nyc.gov/html/weareny/downloads/pdf/student_leadership_course-
teaching_leadership_and_activiti.pdf retrieved on 14/02/1018 10.18 am
Yildirim, O., Acar, A. C., Bull, S., & Sevinc, L. (2008). Relationships between teachers'
perceived leadership style, students' learning style, and academic achievement: a study
on high school students. Educational Psychology, 28(1), 73-81.
86%
6% 7%
1%
Leadership Style in Boys
team leader
authoritarianleader
sociallyoriented
detachedleader
87%
5% 6% 2%
Leadership Style in Girls
team leader
detached leader
socially orientedleader
authoritarian
INDIANJOURNALOFPHYSICALEDUCATIONSPORTSMEDICINE&EXERCISESCIENCE
ISSN0976-1101Vol-18,SpecialIssue(2)
25
EFFECT OF EIGHT WEEK YOGA PROGRAM ON SELECTED
PHYSIOLOGICAL VARIABLES OF RURAL SENIOR CITIZENS
Seemant Kumar Dubey1, Kalpana Sharma
2
1D.P.B.S. (PG) College, Anoopshahr, Bulandshahr (UP) INDIA
Email: [email protected]
2Amity School of Physical Education & Sports Sciences, Amity University, Noida, INDIA.
Email: [email protected]
ABSTRACT
Yoga is an oldest system or education based on higher philosophical knowledge and a spiritual
concept of man, for the harmonious development of the body and mind. It recognizes the
necessity of developing healthy, vital and well controlled body for the attainment of a high order
of mental life. This study was focused the effect of Yoga Practices through common yoga
protocol on senior citizen of rural area. This protocol started with Prayer and followed by
Sadilaja, Yogaasana, Kapaalabhaati, Pranayama, Dhyana and end with Sankalpa. Yoga practices
organized alternate day, total 45 minutes and up to eight weeks for 24 senior citizens. The results
of the study indicate that eight week yoga programme brought significant improvement in the
physiological variables of vital capacity, peak expiratory flow rate and resting heart rate, while
there was no any significant improvement shown in the physiological variables of basal
metabolic rate, systolic and diastolic blood pressure of rural senior citizen. Yogic disciplines
with its Asanas, Pranayama and meditation is a way to good health. This ancient therapy helps in
treating diseases, which eventually improves personal efficiency and assists in achieving mental
peace.
Key Words: Yoga, Senior Citizen, Basal metabolic rate
INTRODUCTION:
Medical research in last some years has uncovered so many physical and mental benefits through
Yoga practices. Anyone over 60 has grown used to living their life with different expectations to
the way they have to live their life right now. They have probably always been very busy and are
accustomed to the idea that one has to work, to do something useful and to keep busy. In today's
society they now have to find their way into the 'spare time' culture and to learn to enjoy 'doing
nothing'. They have to find other aims and a new purpose to life. Yoga can help them in this
transitional process of finding a place in today's society and a reason for living through body
awareness, breath awareness and relaxation, preventing stiffness in the joints, and mental
alertness and awareness. Yoga can help to slow down the process of ageing in the body, even to
reverse this process. Once one is aware of how to manage this process, and of the capabilities
one has, subtle qualities can appear such as wisdom, tranquility and maturity.
In 2700 BC, Yoga was considered as an "immortal cultural outcome" of the Indus Saraswati
Valley Civilization and has proven itself to cater to both physically and spiritual uplift of
humanity. The presence of Yoga is commonly available in folk culture and traditions. Though
Yoga was being practiced in the pre-Vedic period, Maharishi Patanjali systematized the existing
Yogic practices, its meaning and its related knowledge through Patanjali's Yoga Sutras. After
Maharishi Patanjali, many sages and Yoga masters preserved and developed well-documented
practices through various researches and various tactful literatures about Yoga. It has spread all
over the world by the teachings of eminent Yoga sages and Yoga masters from the ancient times.
INDIANJOURNALOFPHYSICALEDUCATIONSPORTSMEDICINE&EXERCISESCIENCE
ISSN0976-1101Vol-18,SpecialIssue(2)
26
METHODOLOGY: This study was focused the effect of Yoga Practices on senior citizen of rural area of Anoopshahr
Tehsil. The researchers administrated the common yoga protocol as a research tool for this study.
This protocol started with Prayer (2 Minutes) and followed by Sadilaja (6 Minutes),
Yogaasana (18 Minutes), Kapaalabhaati (3 Minutes), Pranayama (6 Minutes), Dhyana (8
Minutes) and end with Sankalpa (2 Minutes). Yoga practices organized alternate day, total 45
minutes and up to eight weeks for 24 senior citizens. The experimental group underwent to these
yoga practices for eight weeks from 5:30 am to 6:30 am. Based on the review of past studies and
in consultation with the experts in the field of study it was decided to explore the improvement in
selected physiological variables in rural senior citizen as subjects, by administering the yoga
practices with pre and post evaluation.
2.1. Selection of Variables
The researchers reviewed the available literatures pertaining to this study from internet, books,
journals, periodicals, magazines and research papers. The Study limited to the following
physiological variables:
2.2. Yoga Practices/Programme:
The Common Yoga Protocol given by Ministry of AYUSH, Government of India to awareness
of Yoga. In which, Yoga Practices describe in systematic and proper manner for all age groups.
The common yoga protocol was used in this study.
Table 2: Yoga Training Programmme and Timing
Sr.
No. Activity Components Duration
1 Prayer Meditative Posture with Namaskara Mudra and ending
with Yoga Mudrasana 2 minutes
2
Sadilaja /
Chaalan Kriyas/
Loosening
Practices
Neck, Shoulders,
Trunk& Knees movements 6 minutes
3 Yoga Asana
A. Standing Postures
(i) Taadaasan, (ii) Vrikshaasan,(iii) Pada-hastaasana /
Uttaanaasana,(iv) Ardha Chakraasana,(v) Trikonaasana
B. Sitting Postures
(vi) Bhadraasana/Baddha konaasan
(vii) Vajrasana/Veerasana
(viii) Ushtraasana ( Ardha for bigginners)
(ix) Shashankaasan , (x) Utthana Mandukasana
(xi) Marichyaasana/Vakraasana
C. Prone Lying Postures
(xii) Makaraasana,(xiii) Bhujangaasana
(xiv) Shalabhaasana
18
minutes
INDIANJOURNALOFPHYSICALEDUCATIONSPORTSMEDICINE&EXERCISESCIENCE
ISSN0976-1101Vol-18,SpecialIssue(2)
27
D. Supine Lying Postures
(xv) Setubandhasana, (xvi) Utthanapaadaasana
(xvii) Ardha Halasana,(xviii) Pavana Muktaasana
(xix) Shavaasana
4 Kapaalabhaati 3 cycles of 40 strokes each,
Each cycle will be followed deep breathing
3 minute
5 Pranayama
(i) Nadi Shodhana / AnulomaViloma Pranayama (5
rounds )
(ii) Sheetali Pranayama (5 rounds )
(iii) Bhraamari Pranayama (Bhramari Rechaka) (5
rounds)
6 minutes
6 Dhyana/
Meditation
Meditative Posture (eyes closed)
and hands in Jnana / Gyana Mudra 8 minutes
7 Sankalpa
I commit myself to always be in a balanced state of mind.
It is in this state that my highest self-development
reaches its greatest possibility. I commit to do my duty to
self, family, at work, to society, and to the world, for the
promotion of peace, health and harmony.
2 minutes
2.3. Statistical Techniques:
To find out the significance between the pre and post test means experimental groups the ‘t’ test
was applied for evaluation of the rural senior citizen of physical fitness variables.
FINDINGS AND RESULTS
Comparison of physiological variables in pre and post training periods and the effect of eight
week yoga practice of rural senior citizen are shown here. The Calculation of mean and ‘t’ value
of physiological variables between the pre and post periods of the experimental group were
furnished in table 3
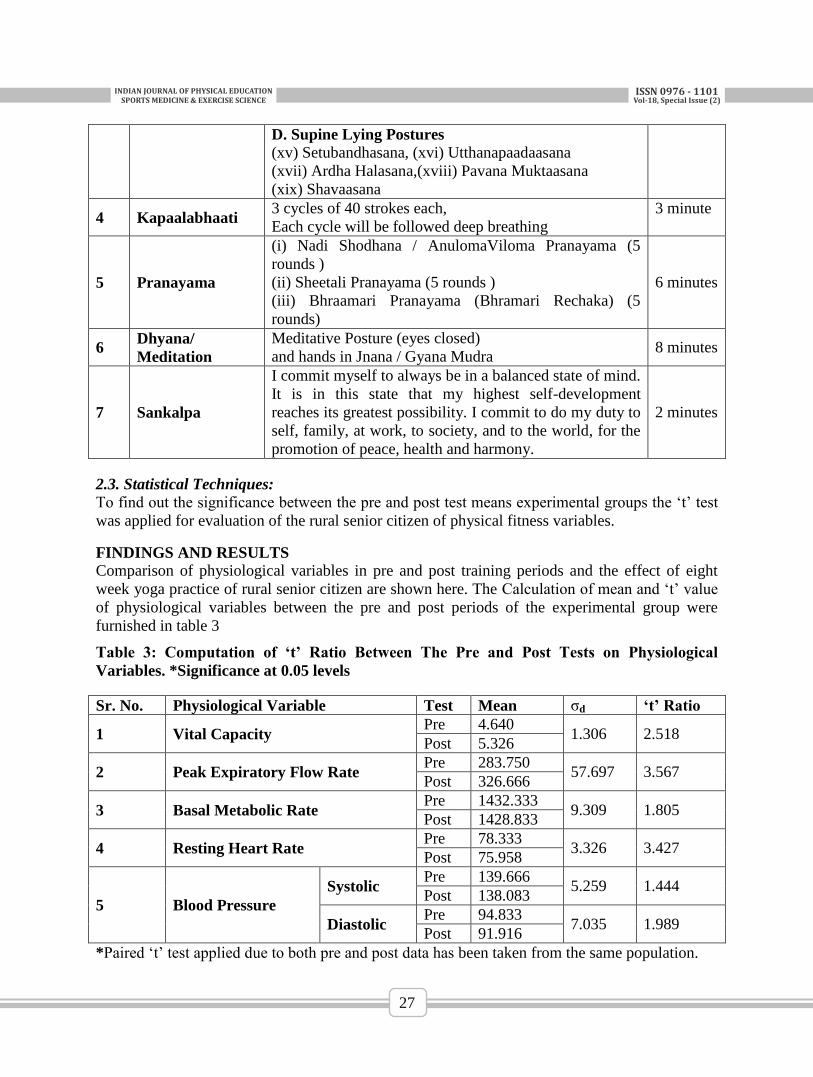
Table 3: Computation of ‘t’ Ratio Between The Pre and Post Tests on Physiological
Variables. *Significance at 0.05 levels
Sr. No. Physiological Variable Test Mean σd ‘t’ Ratio
1 Vital Capacity Pre 4.640
1.306 2.518 Post 5.326
2 Peak Expiratory Flow Rate Pre 283.750
57.697 3.567 Post 326.666
3 Basal Metabolic Rate Pre 1432.333
9.309 1.805 Post 1428.833
4 Resting Heart Rate Pre 78.333
3.326 3.427 Post 75.958
5 Blood Pressure
Systolic Pre 139.666
5.259 1.444 Post 138.083
Diastolic Pre 94.833
7.035 1.989 Post 91.916
*Paired ‘t’ test applied due to both pre and post data has been taken from the same population.
INDIANJOURNALOFPHYSICALEDUCATIONSPORTSMEDICINE&EXERCISESCIENCE
ISSN0976-1101Vol-18,SpecialIssue(2)
28
The table 3 show that the obtained mean value in physiological variables of vital capacity, peak
expiratory flow rate, basal metabolic rate, resting heart rate, systolic and diastolic blood
pressure of pre and post test scores of experimental group were 4.640 & 5.326, 283.750 &
326.666, 1432.333 & 1428.833, 78.333 & 75.958, 139.666 & 138.083, 94.833 & 91.916
respectively. The value of σd of these physiological variables respectively 1.306, 57.697, 9.309,
3.326, 5.259 and 7.035.
The obtained ‘t’ ratio is 2.518, 3.567, 1.805, 3.427, 1.444 and 1.989 respectively. The tabulated
value is 2.069 at 0.05 level of confidence for the degree of freedom 1 and 23. The obtained ‘t’
ratio of vital capacity, peak expiratory flow rate, resting heart rate was 2.518, 3.567 and 3.427
respectively, is greater than the tabulated value, while the obtained ‘t’ ratio of basal metabolic
rate, systolic and diastolic blood pressure was 1.805, 1.444 and 1.989 respectively, is lesser than
the tabulated value.
The results of the study indicate that eight week yoga programme brought significant
improvement in the physiological variables of vital capacity, peak expiratory flow rate and
resting heart rate, while there is no any significant improvement shown in the physiological
variables of basal metabolic rate, systolic and diastolic blood pressure of rural senior citizen. The
finding of vital capacity shows significant improvement similar to six week yoga programme
study done by Singh and Pandey (2017) and eight week yoga practices study done by Sekhon
and Shelvam in 2016. Findings of peak expiratory flow rate also similar with the study on six
week Kapalabhati programme done by Dinesh et al. (2013). The study of Rayat Sunil (2015) on
12 week yoga programme also show significant improvement in the physiological variables of
vital capacity, peak expiratory flow rate and resting heart rate of male students.
CONCLUSION:
There were rural senior citizen show significant improvement in physiological variable like vital
capacity, peak expiratory flow rate and as well as in resting heart rate, but basal metabolic rate,
systolic and diastolic blood pressure were not improved through eight week yoga programme.
EFERENCES:
Dinesh, T., Gaur, G.S., Sharma, V.K., Madanmohan, Harichandra, K.K.T., and
Grrishma, B. (2013). Effect of 6 Weeks of Kapalabhati Pranayama Training on Peak
Expiratory Flow Rate in Young, Healthy, Volunteers. Scholars Academic Journal of
Biosciences (SAJB) 1(4):111-114.
Rayat, S. (2015). Effect of Yoga on Selected Physical and Physiological Variables of
Physical Education Students. IOSR Journal of Sports and Physical Education (IOSR-
JSPE. 2(4):18-24.
Sekhon, B.S. and Shelvam, P.V. (2016). Effect of Selected Yogic Practices on Vital
Capacity among University Men Students. International Journal of Science and
Research (IJSR) 5(5):306-307.
Sathish, M. (2013). Effect of Yogasana Practice on Physical Fitness Variables of
College Obese Students. International Journal of Innovative Research & Development.
2(1):1-7.
Singh, K. and Pandey, S.K. (2017). Effect of Yoga on Vital Capacity of Female
Students. International Research Journal of Physical Education and Sports Sciences.
3(3):1-4.
INDIANJOURNALOFPHYSICALEDUCATIONSPORTSMEDICINE&EXERCISESCIENCE
ISSN0976-1101Vol-18,SpecialIssue(2)
29
EFFECT OF PLYOMETRIC TRAINING ON EXPLOSIVE
STRENGTH OF SWIMMERS
Amit Tomar, (Ph.D. Research scholar of University of Delhi)
Vaibhav Saxena, (Ph.D. Research scholar of University of Delhi)
Dr. Tarak Nath Pramanik, (Assistant Professor I.G.I.P.E.S.S Delhi)
ABSTRACT
The aim of the study was to investigate the Effects of Plyometric Training on Selected Physical
Fitness Variables in Swimmers. Total sample size is 60. The subjects were randomly assigned to
two equal groups of Thirty each and named as Group ‘A’ and Group ‘B’. Group ‘A’ underwent
plyometric training and Group ‘B’ underwent no training. The data was collected before and
after six weeks of training. The data was analysed by applying Dependent‘t’ test technique and
the level of significance was set at 0.05. The result revealed significant effect in increasing the
explosive strength among the training group swimmers whereas the group which hasn’t shown
any increase in their respective explosive strength.
Keywords: Plyometric Training, Swimmers, Physical Fitness and Explosive strength
INTRODUCTION
The swimming is one of the most popular Olympic sports, with several distant events in
butterfly, back, chest, freestyle and individual mix. In addition to these individual events, four
swimmers can participate in a free season or in the intermediate season. Swimming each stroke
requires special techniques, and in butterfly it requires bit high level skill.
The swimmers, who completed 20 to 25 minutes of plyometric exercises, centered twice a week
on the lower body, showed greater improvements in speed, acceleration and jumped than those
who had not done any plyometric exercises as part of their training. The National Federation of
State Secondary Schools states that research shows that plyometric exercises can improve group
performance by up to 15 percent because exercise increases maximum strength and allows
swimmers to push a greater distance from the block. The Explosive power built up by
Plyometrics allows the swimmers to run faster through the water when they come into the pool.
This means that swimmers performing plyometric exercises will make a faster transition from
the starting block to the pool.
The main goal of swimming is to get the swimmer out of the starting block as fast as possible
and with the greatest dynamics that can be developed. As a result of the start of the pool can be
considered as an Explosive event with a required movement pattern High power generation in a
short time. The grip start technique is carried out from the front lock in the fixed position with
the hands. Traditional Plyometric Training that use Depth acceleration and friction as as over
lighter during such dynamic activity Jumps and Limits. These activities extract that leg stage
with traditional weight Training activities or training methods.
The purpose of the study was to investigate the effect of plyometric training on Explosive
Strength of Swimmers
INDIANJOURNALOFPHYSICALEDUCATIONSPORTSMEDICINE&EXERCISESCIENCE
ISSN0976-1101Vol-18,SpecialIssue(2)
30
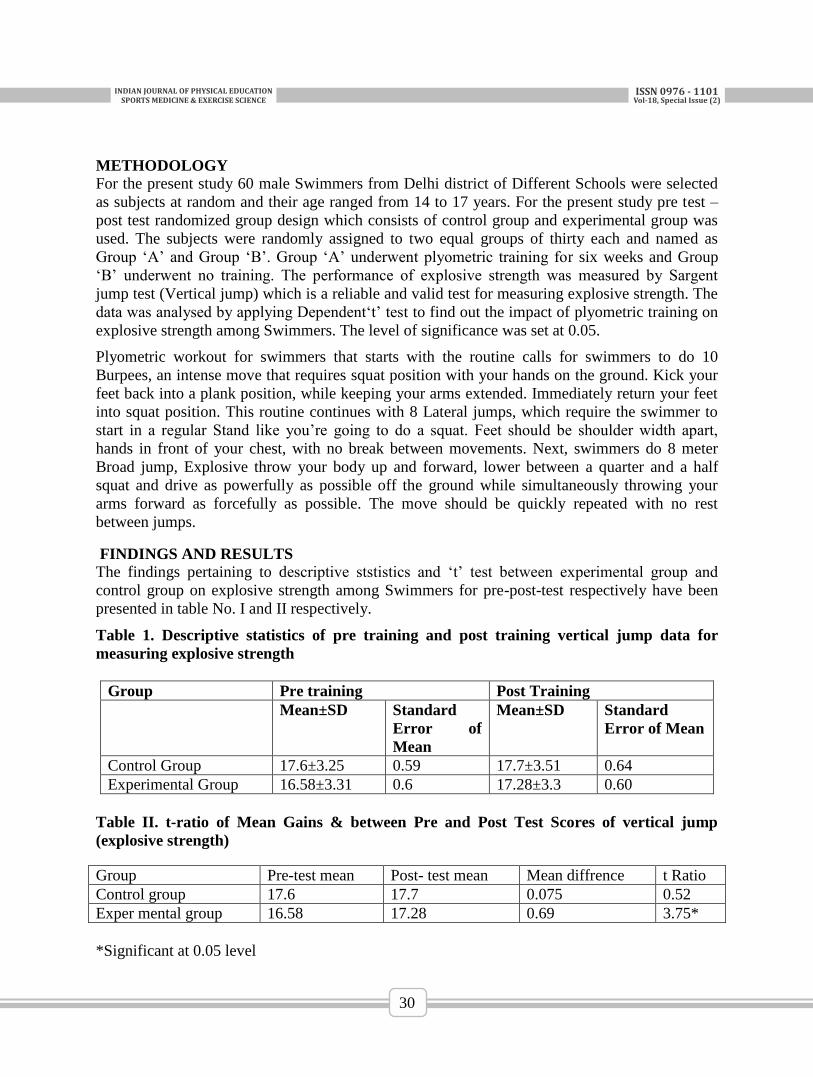
METHODOLOGY
For the present study 60 male Swimmers from Delhi district of Different Schools were selected
as subjects at random and their age ranged from 14 to 17 years. For the present study pre test –
post test randomized group design which consists of control group and experimental group was
used. The subjects were randomly assigned to two equal groups of thirty each and named as
Group ‘A’ and Group ‘B’. Group ‘A’ underwent plyometric training for six weeks and Group
‘B’ underwent no training. The performance of explosive strength was measured by Sargent
jump test (Vertical jump) which is a reliable and valid test for measuring explosive strength. The
data was analysed by applying Dependent‘t’ test to find out the impact of plyometric training on
explosive strength among Swimmers. The level of significance was set at 0.05.
Plyometric workout for swimmers that starts with the routine calls for swimmers to do 10
Burpees, an intense move that requires squat position with your hands on the ground. Kick your
feet back into a plank position, while keeping your arms extended. Immediately return your feet
into squat position. This routine continues with 8 Lateral jumps, which require the swimmer to
start in a regular Stand like you’re going to do a squat. Feet should be shoulder width apart,
hands in front of your chest, with no break between movements. Next, swimmers do 8 meter
Broad jump, Explosive throw your body up and forward, lower between a quarter and a half
squat and drive as powerfully as possible off the ground while simultaneously throwing your
arms forward as forcefully as possible. The move should be quickly repeated with no rest
between jumps.
FINDINGS AND RESULTS
The findings pertaining to descriptive ststistics and ‘t’ test between experimental group and
control group on explosive strength among Swimmers for pre-post-test respectively have been
presented in table No. I and II respectively.
Table 1. Descriptive statistics of pre training and post training vertical jump data for
measuring explosive strength
Group Pre training Post Training
Mean±SD Standard
Error of
Mean
Mean±SD Standard
Error of Mean
Control Group 17.6±3.25 0.59 17.7±3.51 0.64
Experimental Group 16.58±3.31 0.6 17.28±3.3 0.60
Table II. t-ratio of Mean Gains & between Pre and Post Test Scores of vertical jump
(explosive strength)
*Significant at 0.05 level
Group Pre-test mean Post- test mean Mean diffrence t Ratio
Control group 17.6 17.7 0.075 0.52
Exper mental group 16.58 17.28 0.69 3.75*
INDIANJOURNALOFPHYSICALEDUCATIONSPORTSMEDICINE&EXERCISESCIENCE
ISSN0976-1101Vol-18,SpecialIssue(2)
31
The results of table II indicates that the t ratio of control and experimental group are 0.52 and
3.75 respectively. The obtained t-ratio (3.75) is significant at 0.05 level of significance in
experimental group whereas t-ratio (0.52) of control group was insignificant. The results of this
study showed that the Plyometric training has a significant effect in increasing the explosive
strength among 14-17 age group swimmers.
The findings of our study reveal that the Plyometric Training is a significant way to increase the
explosive strength. The reasons of our findings lies in the core of Plyometric movement in which
the two types of contraction (concentric and eccentric) occurs simultaneously which is known as
stretch reflex movement. While doing the Plyometric movement the muscles undergo sudden
eccentric contraction before the concentric contraction, which in turn increases their total force
output as the stretch force of the muscles generated by eccentric contraction adds up to the
maximum force generating ability of that muscle while doing the concentric contraction.
CONCLUSIONS
It is concluded that Plyometric training has a significant effect in increasing the explosive
strength among the training group of swimmers whereas the group which hasn’t got the training
hasn’t shown any increase in their respective explosive strength.
REFERENCES
Barrow, M. H., McGhee, R. (1979). A practical approach to measurement in physical
education. Philadelphia:
Lea and Febiger, Edition-3rd
Chu, D. (1992). Jumping into Plyometrics. Champaign, IL: Human Kinetics.
Spurrs, R.W., Murphy, A.J., Watsford, M.L. The effect of plyometric training on distance
running performance. Eur J Appl Physiol. 2003;1–7.
Kubo, K., Morimoto, M., Komuro, T. et al, Effects of plyometric and weight training on
muscle-tendon complex and jump performance. Med Sci Sports Exerc. 2007; 1801–1810.
Behrens, M., Mau-Moeller, A., Bruhn, S. Effect of plyometric training on neural and
mechanical properties of the knee extensor muscles. Int J Sports Med. 2014; 101–109.
Malisoux, L., Francaux, M., Nielens, H. et al, Stretch-shortening cycle exercises: an
effective training paradigm to enhance power output of human single muscle fibers. J
Appl Physiol. 2006; 771–779.
INDIANJOURNALOFPHYSICALEDUCATIONSPORTSMEDICINE&EXERCISESCIENCE
ISSN0976-1101Vol-18,SpecialIssue(2)
32
MOMENTOUS STAMPING OF MARTIAL ARTS
TO PSYCHOLOGICAL WELL BEING
*Dr. Dominic Thomas, **Dr. K. Abdul Rahiman
*Principal, SES College, Sreekandapuram, Kannur University,
** Rahiman Associate Professor of Physical Education, Keyi Sahib Training College, Taliparamba,
Kannur University
ABSTRACT
The doctrines and ideology of psychological well being proposes a novel way to recognize and
appraise people's behaviors, manner of management styles, attitudes, interpersonal capacities and
skills and personal abilities and their innate potentials. Psychological well being is an important
consideration in human possessions, management, personal and inter-personal relations and other
services, and much more… It is one of the most prominent aims which individuals as well as
societies attempt for. It is the feeling of contentment, happiness, satisfaction work together with
the experiences acquires during one’s life situations.
This investigation examined the association of Kalarippayattu; the traditional form of Indian
martial art participation to psychological well being. The study was conducted at College level
students of north Kerala and compared the psychological attributes of well being of Traditional
martial arts participants with non-participants of boys and girls.
PWBS formulated by Dr. Devendra Singh Sisodia and Pooja Chaudhary was the tool used to
collect the data. The scale covers Satisfaction, Efficiency, Sociability, Menatal Health and Inter
Personal relations, finally summed up with over all performance. Two hundred students of
Martial arts participants and non participants from among colleges of north Kerala were analyzed
for the study during classroom situation. Data sheets were supplied and analyzed with the help of
scoring keys.
The results of the study were subjected to percentile analysis and finally compared the range of
psychological well being of martial art participants with non participants of boys and girls by
applying statistical treatment ‘t’ ratio. The conducted study establishes that the martial art
participation is the best activity to improve psychological well being at College level. Level of
significance chosen was 0.5.
Key words: Kalarippayattu; the traditional form of Indian martial art
INTRODUCTION
Psychological well being acts as a primitive force and condition for every human being for
guiding and acting and acting better. It is nothing but the means in which everyone evaluates
their lives. The identical portion of the same is an information based estimation of one’s life that
is when a person becomes conscientious and puts evaluative judgments about one’s satisfaction
with his behaviours and their lives with full drive. Psychological well-being leads to desirable
outcomes that happen impulsively. In most cases people who attain high score in psychological
well-being later perform better at work than people who score low in well-being. It is also found
to be related to physical health. In addition, it is frequently observed that what a society measures
INDIANJOURNALOFPHYSICALEDUCATIONSPORTSMEDICINE&EXERCISESCIENCE
ISSN0976-1101Vol-18,SpecialIssue(2)
33
will in turn influence the things that it seeks. If a society takes great effort to measure
productivity, people in the society are likely to focus more on it and sometimes even to the
detriment of other values(ebs.org.2015).
The route of mental growth is responsible for the development of an individual’s all round
capacities and mental or intellectual abilities like sensation, perception, imagination, memory,
reasoning, understanding, intelligence, generalization, interpretation, language ability,
conceptual ability, problem solving ability and decision making ability. The mind of a kid,
during his growing stage or school age, has a balanced understanding of problems. He has a
much better sense of analysis what a conceptual problem is. He can sensibly analyze a problem
and he is able to compact with the environment in a flexible, efficient and systematic manner.
The socializing influence of exer-dance cannot be denied although there must constantly be kept
in mind the fact that the kind of socialization which takes place depends upon the kind of
leadership that accompanies the social participation. It has been somewhat unfortunate; it is now
realized that man is to be taken as a whole and physical participation in exer-dance type activities
and martial arts is not merely concerned with his physical strength and capabilities. It develops
courage to stand against challenges and to face life evenly. It moulds man’s personal and group
relationship.
There is persuasive information that attests to the unique nature of children with respect to their
prosperity for physical activity. Rowland (1998) suggests a biological basis for the differences in
activity patterns between children and adults. It is further noted that children are inherently
active because it is physical movement that provide them with the necessary information
required by the central nervous system for stimulation. It is claimed, socially, that purposeful
engagement in any type of physical activity with coordinated module has the potential to
engender in young people positive social behaviour and to address as number of contemporary
social issues relating to problematic youth behaviour.
Many studies have been conducted so far to reveal the influence of martial arts participation and
exercise involved dances on emotional stability and mental steadiness. It is a proved that, there
is an association between emotional well being and martial arts participation. As a result of the
participation in martial arts, all muscular and nerve impulses will be more activated for better
sensation and consciousness. Purpose of the study was to assess how the martial arts
participation influences the youth in psychological well being . PWBS (Psychological Wellbeing
Scale developed by Dr. Devendra Singh Sisodia and Pooja Choudhary was used to collect the
data. The inventory covers five aspects of psychological well being, exclusively, Satisfaction,
Efficiency, Sociability, Mental Health and Inter personal relations. Two hundred students of
kalaripayattu participants and non participants from among colleges of north Kerala were
analyzed for the study during classroom situation. Data sheets were supplied and analyzed with
the help of scoring keys.
The collected data were tabulated and presented here to interpret the psychological well being
and thereby to compare these qualities among martial arts participants and non participants.
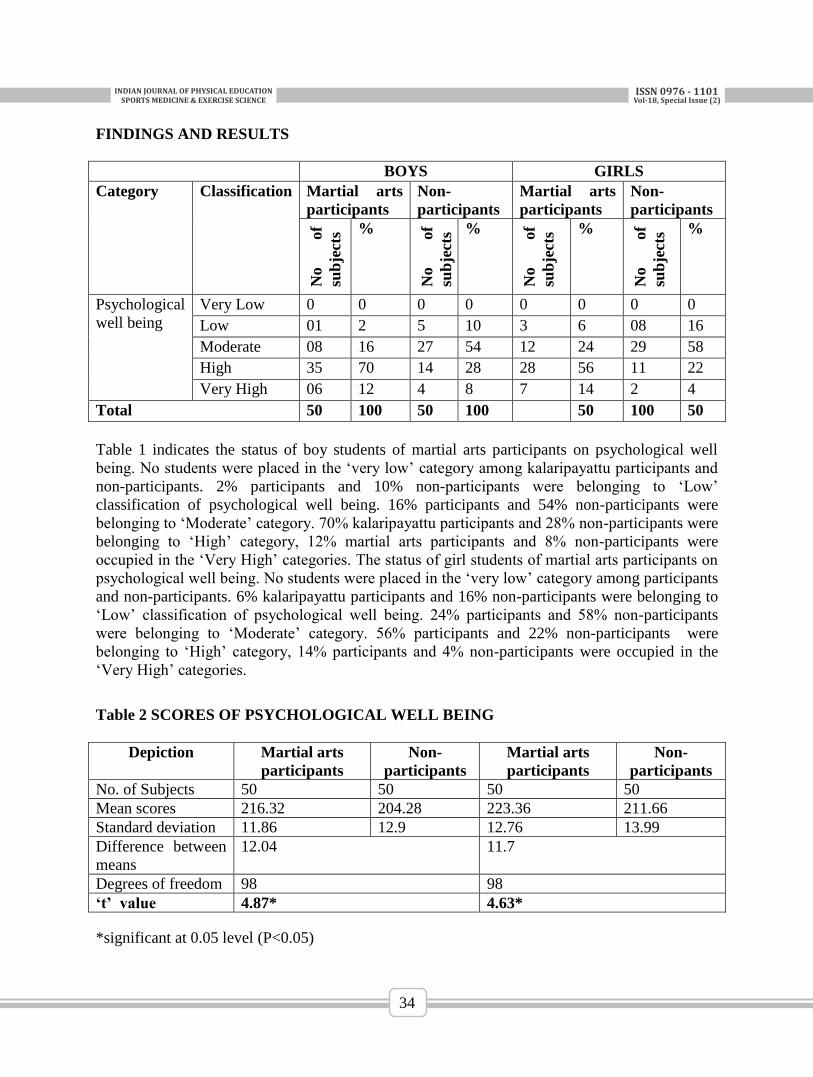
INDIANJOURNALOFPHYSICALEDUCATIONSPORTSMEDICINE&EXERCISESCIENCE
ISSN0976-1101Vol-18,SpecialIssue(2)
34
FINDINGS AND RESULTS
BOYS GIRLS
Category Classification Martial arts
participants
Non-
participants
Martial arts
participants
Non-
participants
No
of
sub
ject
s %
No
of
sub
ject
s %
No
of
sub
ject
s %
No
of
sub
ject
s %
Psychological
well being
Very Low 0 0 0 0 0 0 0 0
Low 01 2 5 10 3 6 08 16
Moderate 08 16 27 54 12 24 29 58
High 35 70 14 28 28 56 11 22
Very High 06 12 4 8 7 14 2 4
Total 50 100 50 100 50 100 50
Table 1 indicates the status of boy students of martial arts participants on psychological well
being. No students were placed in the ‘very low’ category among kalaripayattu participants and
non-participants. 2% participants and 10% non-participants were belonging to ‘Low’
classification of psychological well being. 16% participants and 54% non-participants were
belonging to ‘Moderate’ category. 70% kalaripayattu participants and 28% non-participants were
belonging to ‘High’ category, 12% martial arts participants and 8% non-participants were
occupied in the ‘Very High’ categories. The status of girl students of martial arts participants on
psychological well being. No students were placed in the ‘very low’ category among participants
and non-participants. 6% kalaripayattu participants and 16% non-participants were belonging to
‘Low’ classification of psychological well being. 24% participants and 58% non-participants
were belonging to ‘Moderate’ category. 56% participants and 22% non-participants were
belonging to ‘High’ category, 14% participants and 4% non-participants were occupied in the
‘Very High’ categories.
Table 2 SCORES OF PSYCHOLOGICAL WELL BEING
Depiction Martial arts
participants
Non-
participants
Martial arts
participants
Non-
participants
No. of Subjects 50 50 50 50
Mean scores 216.32 204.28 223.36 211.66
Standard deviation 11.86 12.9 12.76 13.99
Difference between
means
12.04 11.7
Degrees of freedom 98 98
‘t’ value 4.87* 4.63*
*significant at 0.05 level (P<0.05)
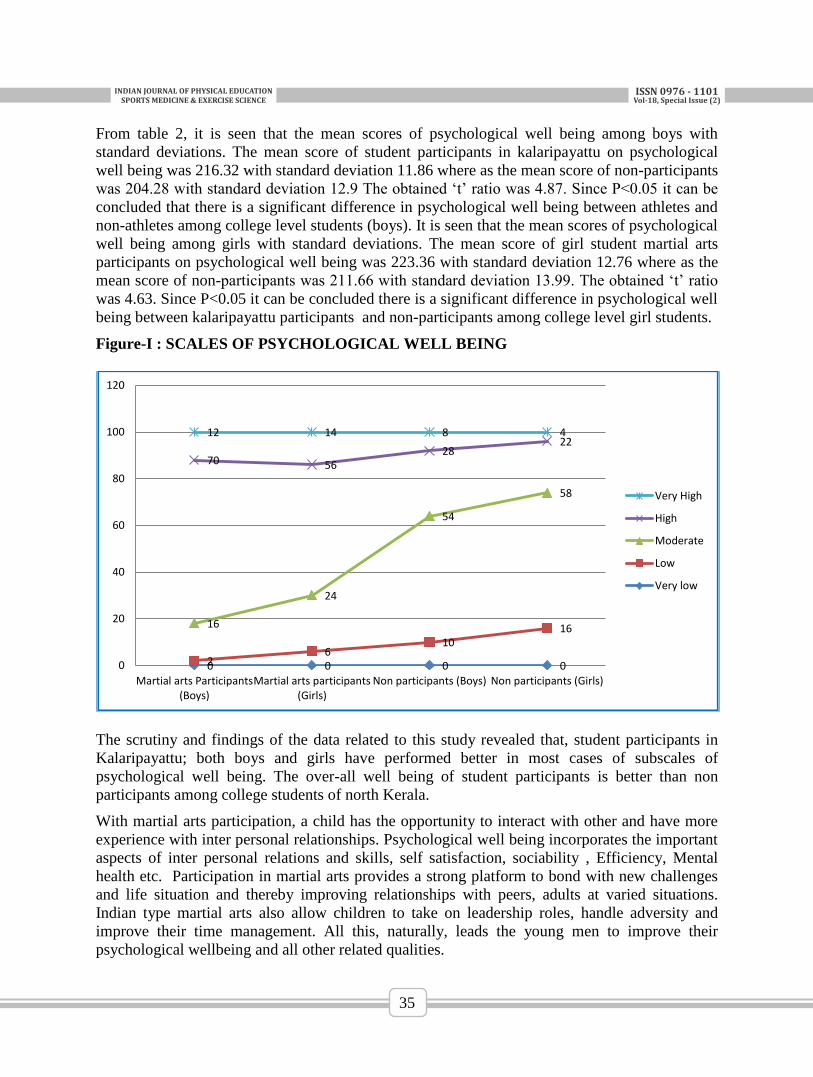
INDIANJOURNALOFPHYSICALEDUCATIONSPORTSMEDICINE&EXERCISESCIENCE
ISSN0976-1101Vol-18,SpecialIssue(2)
35
From table 2, it is seen that the mean scores of psychological well being among boys with
standard deviations. The mean score of student participants in kalaripayattu on psychological
well being was 216.32 with standard deviation 11.86 where as the mean score of non-participants
was 204.28 with standard deviation 12.9 The obtained ‘t’ ratio was 4.87. Since P<0.05 it can be
concluded that there is a significant difference in psychological well being between athletes and
non-athletes among college level students (boys). It is seen that the mean scores of psychological
well being among girls with standard deviations. The mean score of girl student martial arts
participants on psychological well being was 223.36 with standard deviation 12.76 where as the
mean score of non-participants was 211.66 with standard deviation 13.99. The obtained ‘t’ ratio
was 4.63. Since P<0.05 it can be concluded there is a significant difference in psychological well
being between kalaripayattu participants and non-participants among college level girl students.
Figure-I : SCALES OF PSYCHOLOGICAL WELL BEING
The scrutiny and findings of the data related to this study revealed that, student participants in
Kalaripayattu; both boys and girls have performed better in most cases of subscales of
psychological well being. The over-all well being of student participants is better than non
participants among college students of north Kerala.
With martial arts participation, a child has the opportunity to interact with other and have more
experience with inter personal relationships. Psychological well being incorporates the important
aspects of inter personal relations and skills, self satisfaction, sociability , Efficiency, Mental
health etc. Participation in martial arts provides a strong platform to bond with new challenges
and life situation and thereby improving relationships with peers, adults at varied situations.
Indian type martial arts also allow children to take on leadership roles, handle adversity and
improve their time management. All this, naturally, leads the young men to improve their
psychological wellbeing and all other related qualities.
0 0 0 0 2 6
10 16 16
24
54
58
70 56 28
22 12 14 8 4
0
20
40
60
80
100
120
Martial arts Participants(Boys)
Martial arts participants(Girls)
Non participants (Boys) Non participants (Girls)
Very High
High
Moderate
Low
Very low
INDIANJOURNALOFPHYSICALEDUCATIONSPORTSMEDICINE&EXERCISESCIENCE
ISSN0976-1101Vol-18,SpecialIssue(2)
36
CONCLUSION
Most of the studies on mental health strongly put forward the platform that the success in any
human Endeavour is dependant on one’s mental health, sociability and psychological well being
in addition to the other specific traits and skills. The ability for successful deal with daily
environmental demands ultimately influences ones over all psychological well being.
REFERENCES:
Chuan TA Chao, “Foreign language Anxiety and Emotional Intelligence: A study of EFL
Students in Taiwan”, 2003.
Dr. H.M Kasinath, Advanced Educational Psychology, VPG, Gadag, 2000.
J. C Aggarwal, Essentials of Educational Psychology, VPH ltd. New Delhi, 2001,p.115
www.2.bc.edu/-roya/htm. www.ebs.org 2015.
INDIANJOURNALOFPHYSICALEDUCATIONSPORTSMEDICINE&EXERCISESCIENCE
ISSN0976-1101Vol-18,SpecialIssue(2)
37
A COMPARATIVE STUDY ON KICKING LEG ANGULAR
KINEMATICS OF INSTEP KICK BETWEEN MALE AND
FEMALE SOCCER PLAYERS
Shaybal Chanda* Prof. Sumanta Kumar Mondal** *Research Scholar (ICCR), Department of Physical Education, Visva-Bharati, [email protected]
** Professor, Department of Physical Education, Visva-Bharati, W.B. , India. [email protected]
ABSTRACT
The most powerful kick in football is Instep Kick. Understanding the kinematic factors of
kicking leg in an instep soccer kick is important in particular since it plays a major determinant
role in execution of an accurate and powerful kick. Initially using random technique 10 boys and
10 girls soccer players and their age was between 16 years to 22 years old were selected, then the
best 5 performances from each group was finally selected for the study. All the players
represented Bangladesh national soccer team at least for once age groups to senior level. Video-
graphic technique was use for collecting kinematic data from Sagittal plane using Cannon
EOS7D camera placing by the same side of kicking leg perpendicularly 3.20 meter away from
the ball and at 1.13 meter of height. Girls’ hip joint angles of kicking leg were found slightly
higher than the boys in all three phases GC, BC & FT. Girls mean and SD of displacement of hip
joint angle was higher than the boys. Angular mean velocity of the kicking leg at ball contact
was found higher in the boys. Close similarity was observed in kicking leg knee joint angle at
GC and BC. Mean displacement of the knee angle was higher in boys. No statistically significant
difference was found among boys and girls in kicking leg ankle angle mean displacement ground
contact to ball contact. Boys mean angular velocity of kicking leg knee at ball contact was three
times higher than the girls. Kicking leg ankle angle of boys GC to BC reduced slightly where as
for girls it was increased. No statistical significant difference was found between the two groups
in kicking leg ankle mean displacement ground contact to ball. Velocity of kicking leg ankle
angle at ball contact was higher in girls but no significant difference was observed between the
groups. Though the boys mean ball velocity was little less than double in compared to girls ball
velocity but statistically no significant difference was found due to scattered data. There was
very little difference in total velocity of kicking leg i.e. hip joint angle, knee joint angle and ankle
joint between boys and girls.
Keywords: Kinematics, Angular Displacement, Angular Velocity, Ball Velocity.
INTRODUCTION
The most powerful kick in football is Instep Kick. It refers to the laces of the boots it keeps the
ball low, powerful and on target to makes easier to make a score. Ball is kicked comfortably and
almost vertically at the back of the ball with the instep of the foot. For a desired performance toe
of the foot must be down, knee should be placed over the ball, the body should be compact and
chest over the ball and follow-through also need to be in the straight line in the direction of the
kick and short. All these will depend on the placement of the non-kicking foot that is alongside
the ball.
Kinematics is a division of classical mechanics that explains the motion of points, bodies
(objects), and systems of bodies (groups of objects) without considering the mass of each or the
forces that created the motion. It is how forces act on masses falls within kinetics. Understanding
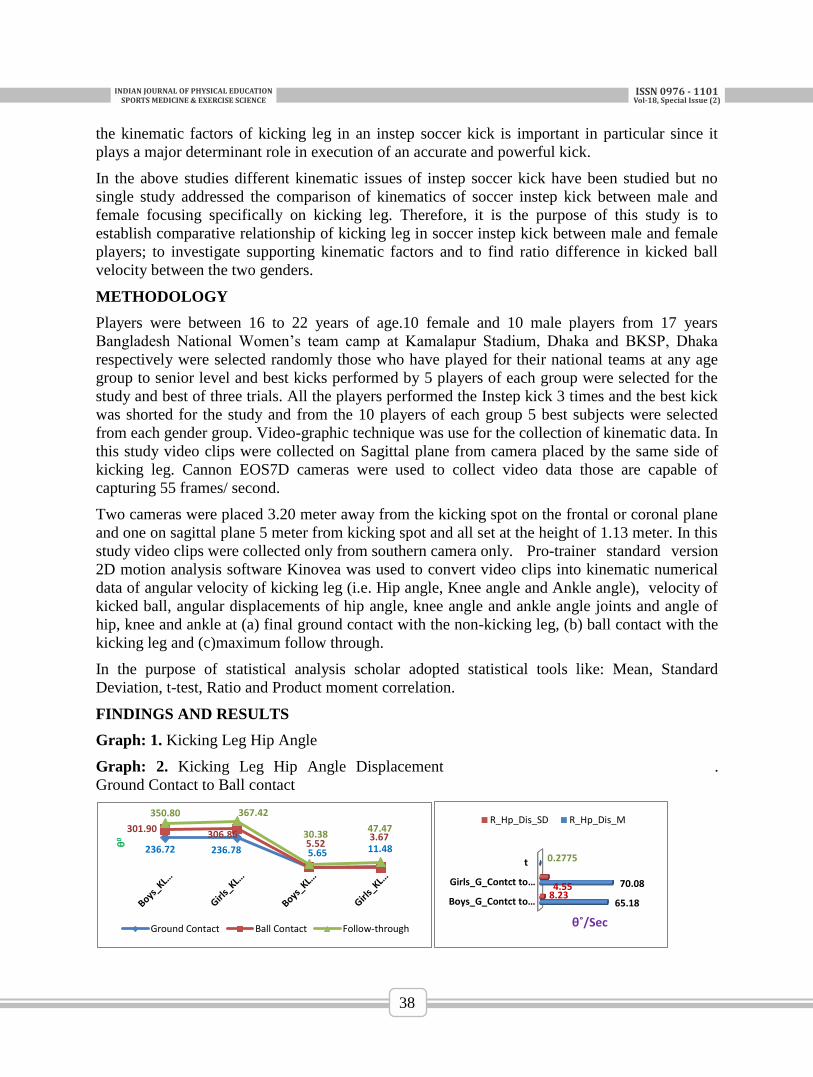
INDIANJOURNALOFPHYSICALEDUCATIONSPORTSMEDICINE&EXERCISESCIENCE
ISSN0976-1101Vol-18,SpecialIssue(2)
38
the kinematic factors of kicking leg in an instep soccer kick is important in particular since it
plays a major determinant role in execution of an accurate and powerful kick.
In the above studies different kinematic issues of instep soccer kick have been studied but no
single study addressed the comparison of kinematics of soccer instep kick between male and
female focusing specifically on kicking leg. Therefore, it is the purpose of this study is to
establish comparative relationship of kicking leg in soccer instep kick between male and female
players; to investigate supporting kinematic factors and to find ratio difference in kicked ball
velocity between the two genders.
METHODOLOGY
Players were between 16 to 22 years of age.10 female and 10 male players from 17 years
Bangladesh National Women’s team camp at Kamalapur Stadium, Dhaka and BKSP, Dhaka
respectively were selected randomly those who have played for their national teams at any age
group to senior level and best kicks performed by 5 players of each group were selected for the
study and best of three trials. All the players performed the Instep kick 3 times and the best kick
was shorted for the study and from the 10 players of each group 5 best subjects were selected
from each gender group. Video-graphic technique was use for the collection of kinematic data. In
this study video clips were collected on Sagittal plane from camera placed by the same side of
kicking leg. Cannon EOS7D cameras were used to collect video data those are capable of
capturing 55 frames/ second.
Two cameras were placed 3.20 meter away from the kicking spot on the frontal or coronal plane
and one on sagittal plane 5 meter from kicking spot and all set at the height of 1.13 meter. In this
study video clips were collected only from southern camera only. Pro-trainer standard version
2D motion analysis software Kinovea was used to convert video clips into kinematic numerical
data of angular velocity of kicking leg (i.e. Hip angle, Knee angle and Ankle angle), velocity of
kicked ball, angular displacements of hip angle, knee angle and ankle angle joints and angle of
hip, knee and ankle at (a) final ground contact with the non-kicking leg, (b) ball contact with the
kicking leg and (c)maximum follow through.
In the purpose of statistical analysis scholar adopted statistical tools like: Mean, Standard
Deviation, t-test, Ratio and Product moment correlation.
FINDINGS AND RESULTS
Graph: 1. Kicking Leg Hip Angle
Graph: 2. Kicking Leg Hip Angle Displacement .
Ground Contact to Ball contact
236.72 236.78 5.65 11.48
301.90 306.86
5.52 3.67
350.80 367.42
30.38 47.47
θ0
Ground Contact Ball Contact Follow-through
Boys_G_Contct to…
Girls_G_Contct to…
t
65.18
70.08
0.2775
4.55 8.23
θ˚/Sec
R_Hp_Dis_SD R_Hp_Dis_M
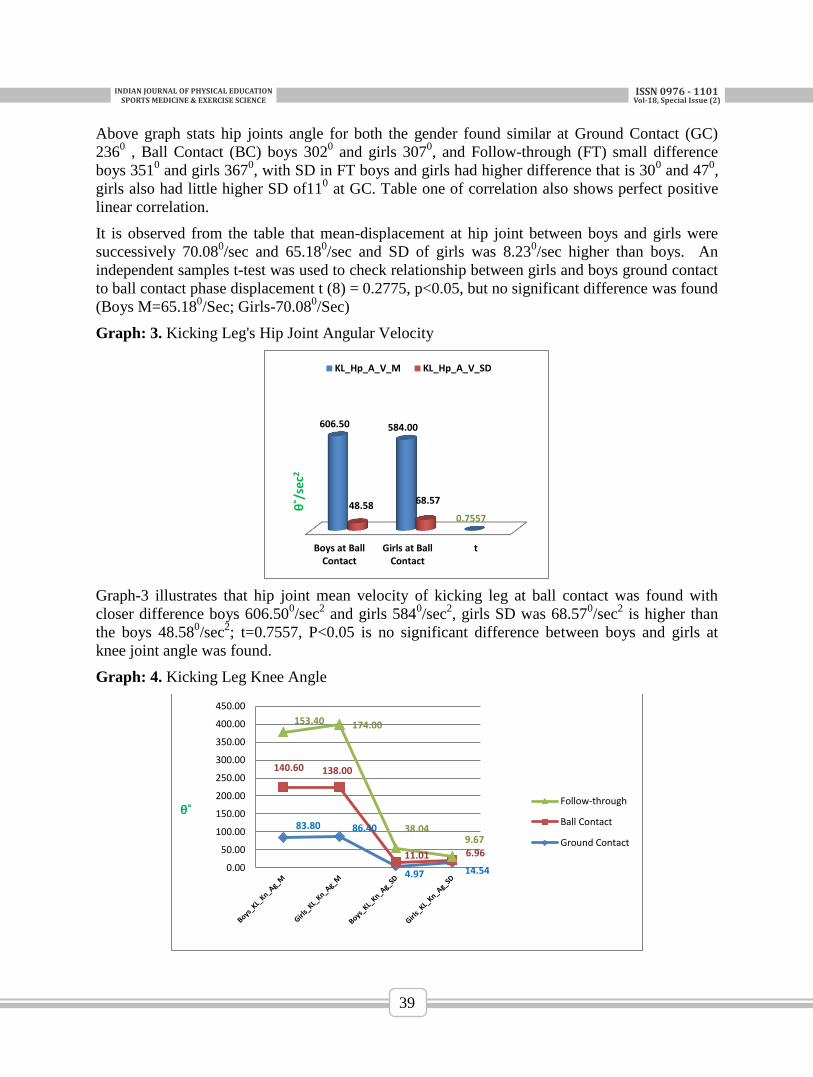
INDIANJOURNALOFPHYSICALEDUCATIONSPORTSMEDICINE&EXERCISESCIENCE
ISSN0976-1101Vol-18,SpecialIssue(2)
39
Above graph stats hip joints angle for both the gender found similar at Ground Contact (GC)
2360 , Ball Contact (BC) boys 302
0 and girls 307
0, and Follow-through (FT) small difference
boys 3510 and girls 367
0, with SD in FT boys and girls had higher difference that is 30
0 and 47
0,
girls also had little higher SD of110 at GC. Table one of correlation also shows perfect positive
linear correlation.
It is observed from the table that mean-displacement at hip joint between boys and girls were
successively 70.080/sec and 65.18
0/sec and SD of girls was 8.23
0/sec higher than boys. An
independent samples t-test was used to check relationship between girls and boys ground contact
to ball contact phase displacement t (8) = 0.2775, p<0.05, but no significant difference was found
(Boys M=65.180/Sec; Girls-70.08
0/Sec)
Graph: 3. Kicking Leg's Hip Joint Angular Velocity
Graph-3 illustrates that hip joint mean velocity of kicking leg at ball contact was found with
closer difference boys 606.500/sec
2 and girls 584
0/sec
2, girls SD was 68.57
0/sec
2 is higher than
the boys 48.580/sec
2; t=0.7557, P<0.05 is no significant difference between boys and girls at
knee joint angle was found.
Graph: 4. Kicking Leg Knee Angle
Boys at BallContact
Girls at BallContact
t
606.50 584.00
0.7557 48.58 68.57
θ˚/
sec2
KL_Hp_A_V_M KL_Hp_A_V_SD
83.80 86.40
4.97 14.54
140.60 138.00
11.01 6.96
153.40 174.00
38.04 9.67
0.00
50.00
100.00
150.00
200.00
250.00
300.00
350.00
400.00
450.00
θ˚ Follow-through
Ball Contact
Ground Contact
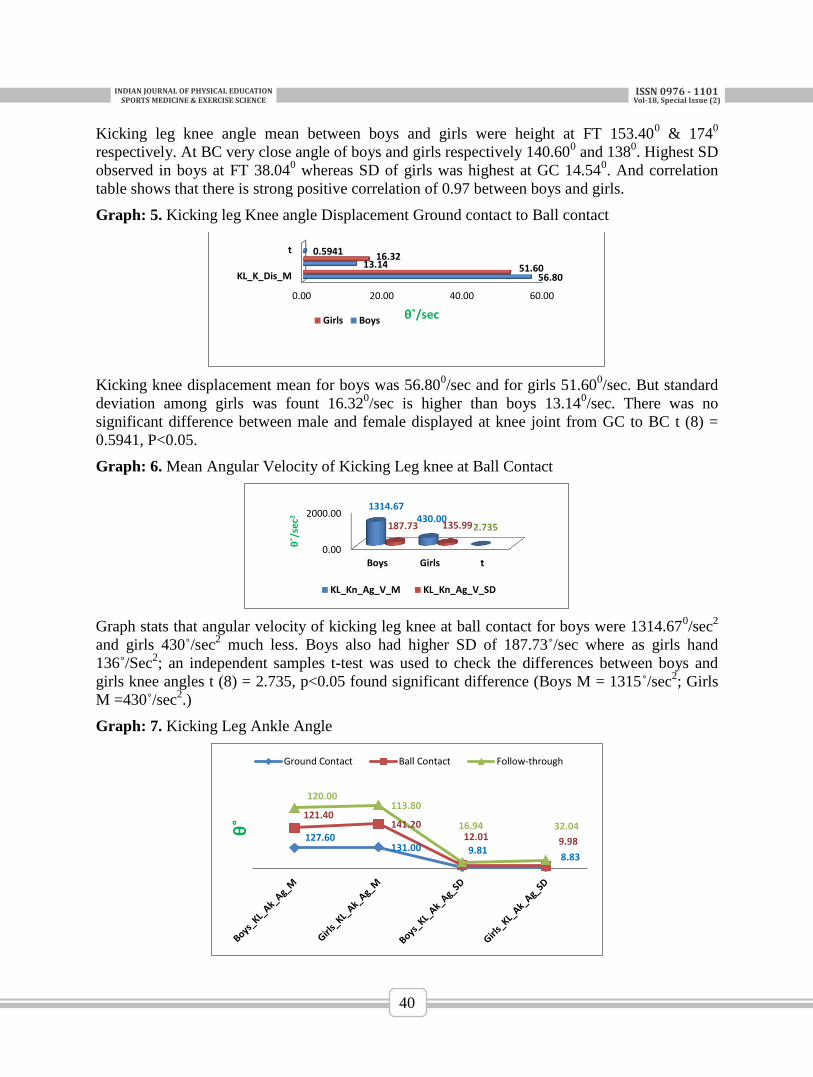
INDIANJOURNALOFPHYSICALEDUCATIONSPORTSMEDICINE&EXERCISESCIENCE
ISSN0976-1101Vol-18,SpecialIssue(2)
40
Kicking leg knee angle mean between boys and girls were height at FT 153.400 & 174
0
respectively. At BC very close angle of boys and girls respectively 140.600 and 138
0. Highest SD
observed in boys at FT 38.040 whereas SD of girls was highest at GC 14.54
0. And correlation
table shows that there is strong positive correlation of 0.97 between boys and girls.
Graph: 5. Kicking leg Knee angle Displacement Ground contact to Ball contact
Kicking knee displacement mean for boys was 56.800/sec and for girls 51.60
0/sec. But standard
deviation among girls was fount 16.320/sec is higher than boys 13.14
0/sec. There was no
significant difference between male and female displayed at knee joint from GC to BC t (8) =
0.5941, P<0.05.
Graph: 6. Mean Angular Velocity of Kicking Leg knee at Ball Contact
Graph stats that angular velocity of kicking leg knee at ball contact for boys were 1314.670/sec
2
and girls 430˚/sec2 much less. Boys also had higher SD of 187.73˚/sec where as girls hand
136˚/Sec2; an independent samples t-test was used to check the differences between boys and
girls knee angles t (8) = 2.735, p<0.05 found significant difference (Boys M = 1315˚/sec2; Girls
M =430˚/sec2.)
Graph: 7. Kicking Leg Ankle Angle
0.00 20.00 40.00 60.00
KL_K_Dis_M
t
56.80 13.14
0.5941
51.60 16.32
θ˚/sec Girls Boys
0.00
2000.00
Boys Girls t
1314.67 430.00
2.735 187.73 135.99
θ˚/
sec2
KL_Kn_Ag_V_M KL_Kn_Ag_V_SD
127.60 131.00 9.81
8.83
121.40 141.20
12.01 9.98
120.00 113.80
16.94 32.04 θ˚
Ground Contact Ball Contact Follow-through
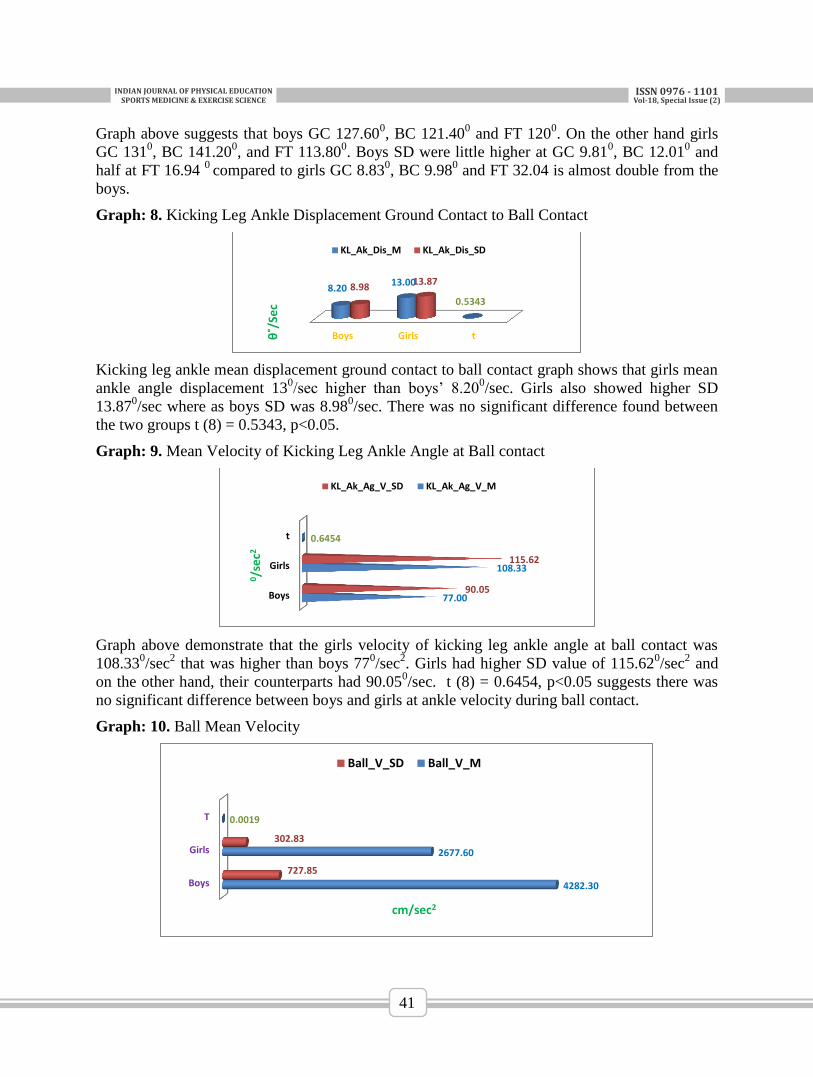
INDIANJOURNALOFPHYSICALEDUCATIONSPORTSMEDICINE&EXERCISESCIENCE
ISSN0976-1101Vol-18,SpecialIssue(2)
41
Graph above suggests that boys GC 127.600, BC 121.40
0 and FT 120
0. On the other hand girls
GC 1310, BC 141.20
0, and FT 113.80
0. Boys SD were little higher at GC 9.81
0, BC 12.01
0 and
half at FT 16.94 0
compared to girls GC 8.830, BC 9.98
0 and FT 32.04 is almost double from the
boys.
Graph: 8. Kicking Leg Ankle Displacement Ground Contact to Ball Contact
Kicking leg ankle mean displacement ground contact to ball contact graph shows that girls mean
ankle angle displacement 130/sec higher than boys’ 8.20
0/sec. Girls also showed higher SD
13.870/sec where as boys SD was 8.98
0/sec. There was no significant difference found between
the two groups t (8) = 0.5343, p<0.05.
Graph: 9. Mean Velocity of Kicking Leg Ankle Angle at Ball contact
Graph above demonstrate that the girls velocity of kicking leg ankle angle at ball contact was
108.330/sec
2 that was higher than boys 77
0/sec
2. Girls had higher SD value of 115.62
0/sec
2 and
on the other hand, their counterparts had 90.050/sec. t (8) = 0.6454, p<0.05 suggests there was
no significant difference between boys and girls at ankle velocity during ball contact.
Graph: 10. Ball Mean Velocity
Boys Girls t
8.20 13.00
0.5343
8.98 13.87
θ˚/
Sec
KL_Ak_Dis_M KL_Ak_Dis_SD
Boys
Girls
t
77.00
108.33
0.6454
90.05
115.62
0/s
ec2
KL_Ak_Ag_V_SD KL_Ak_Ag_V_M
Boys
Girls
T
4282.30
2677.60
0.0019
727.85
302.83
cm/sec2
Ball_V_SD Ball_V_M
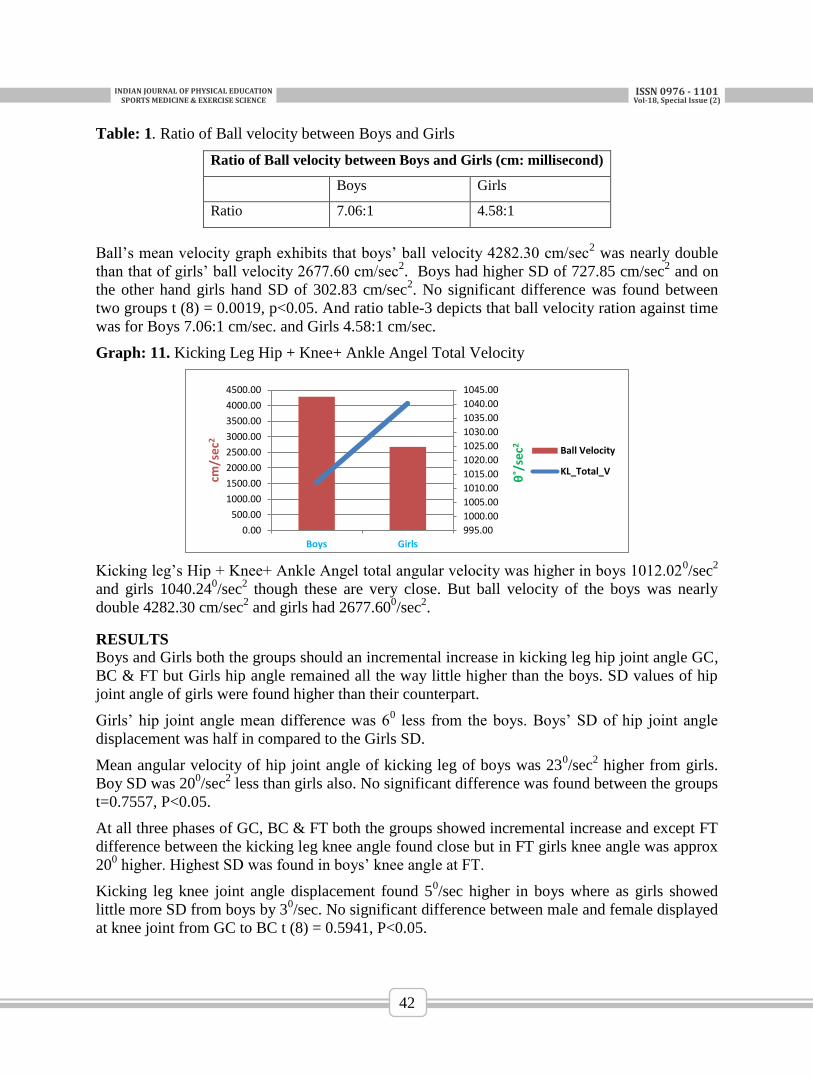
INDIANJOURNALOFPHYSICALEDUCATIONSPORTSMEDICINE&EXERCISESCIENCE
ISSN0976-1101Vol-18,SpecialIssue(2)
42
Table: 1. Ratio of Ball velocity between Boys and Girls
Ratio of Ball velocity between Boys and Girls (cm: millisecond)
Boys Girls
Ratio 7.06:1 4.58:1
Ball’s mean velocity graph exhibits that boys’ ball velocity 4282.30 cm/sec2 was nearly double
than that of girls’ ball velocity 2677.60 cm/sec2. Boys had higher SD of 727.85 cm/sec
2 and on
the other hand girls hand SD of 302.83 cm/sec2. No significant difference was found between
two groups t (8) = 0.0019, p<0.05. And ratio table-3 depicts that ball velocity ration against time
was for Boys 7.06:1 cm/sec. and Girls 4.58:1 cm/sec.
Graph: 11. Kicking Leg Hip + Knee+ Ankle Angel Total Velocity
Kicking leg’s Hip + Knee+ Ankle Angel total angular velocity was higher in boys 1012.020/sec
2
and girls 1040.240/sec
2 though these are very close. But ball velocity of the boys was nearly
double 4282.30 cm/sec2 and girls had 2677.60
0/sec
2.
RESULTS
Boys and Girls both the groups should an incremental increase in kicking leg hip joint angle GC,
BC & FT but Girls hip angle remained all the way little higher than the boys. SD values of hip
joint angle of girls were found higher than their counterpart.
Girls’ hip joint angle mean difference was 60 less from the boys. Boys’ SD of hip joint angle
displacement was half in compared to the Girls SD.
Mean angular velocity of hip joint angle of kicking leg of boys was 230/sec
2 higher from girls.
Boy SD was 200/sec
2 less than girls also. No significant difference was found between the groups
t=0.7557, P<0.05.
At all three phases of GC, BC & FT both the groups showed incremental increase and except FT
difference between the kicking leg knee angle found close but in FT girls knee angle was approx
200 higher. Highest SD was found in boys’ knee angle at FT.
Kicking leg knee joint angle displacement found 50/sec higher in boys where as girls showed
little more SD from boys by 30/sec. No significant difference between male and female displayed
at knee joint from GC to BC t (8) = 0.5941, P<0.05.
995.00
1000.00
1005.00
1010.00
1015.00
1020.00
1025.00
1030.00
1035.00
1040.00
1045.00
0.00
500.00
1000.00
1500.00
2000.00
2500.00
3000.00
3500.00
4000.00
4500.00
Boys Girls
θ˚/
sec2
cm/s
ec2
Ball Velocity
KL_Total_V
INDIANJOURNALOFPHYSICALEDUCATIONSPORTSMEDICINE&EXERCISESCIENCE
ISSN0976-1101Vol-18,SpecialIssue(2)
43
Mean angular velocity of kicking leg knee at ball contact was observed three time higher in boys
13150/sec from girls. Nearly 50
0/sec
2 of higher SD was found in the boys. An independent
samples t-test was used to check the difference between boys and girls knee angles t (8) = 2.735,
p<0.05 found significant difference (Boys M = 1315˚/sec2; Girls M =430˚/sec
2.
Boys and girls performed gradual decrease in angle mean of kicking leg angle except at BC girls
showed little irregularity with higher angle. Girls SD 320 at FT was found that is double than that
of girls.
Girls kicking leg ankle mean displacement ground contact to ball contact was found 50/sec
higher than the boys and almost the same happened with SD. No significant difference was
found between the two groups t (8) = 0.5343, p<0.05.
Velocity of Kicking Leg Ankle Angle at Ball contact was higher in girls by 210/sec
2 and SD also
by approx 150/sec
2.
Boys mean ball velocity 4282.30 cm/sec2 was little less than double in compared to girls ball
mean velocity 2677.60 cm/sec2. Boys had higher SD of 727.85 cm/sec
2 too and on the other hand
girls hand SD of 302.83 cm/sec2.
There was very little difference in total velocity of kicking leg i.e. hip joint angle, knee joint
angle and ankle joint angle together in boys 1012.020/sec
2 and girls 1040.24
0/sec
2 but ball
velocity of the boys was nearly double 4282.30 cm/sec2 from the girls had 2677.60
0/sec
2.
Girls hip joint angle of kicking leg were found slightly higher than the boys in all three phases
GC, BC & FT may be because of anatomical reason i.e. girls pelvic joint is wider than boys,
since all of the girls were well grown.
Probably due to anatomy of pelvic joint girls mean and SD of displacement of hip joint angle
were found higher than the boys.
Angular mean velocity of the kicking leg at ball contact was found higher in the boys may be
because of heavier and stronger hip joint muscles in compared to the girls.
Closer similarity was reviled in kicking leg knee joint angle at GC and BC but boys and girls
made FT with comparatively higher difference in angle as because girls Centre of Gravity (CG)
is lower than the boys thus need to come in ground contact early.
Since strength and size of leg muscles in boys is higher thus they produced little higher knee
angle mean displacement. There were no big difference in mean and SD value between boys and
girls at kicking leg Knee angle Displacement Ground contact to Ball contact thus no significant
difference was found.
Three times higher mean angular velocity of kicking leg knee at ball contact was observed
among the boys may be because of stronger quadriceps muscles of thigh in compared to the girls
that difference was statically significant.
Kicking leg ankle angle of boys GC to BC reduced slightly where as for girls it was increased.
Girls SD at FT ankle angle showed double from their counterpart.
Kicking leg ankle angle mean displacement ground contact to ball was scrutinized, no significant
difference was found between the two groups t (8) = 0.5343, p<0.05 may be because of highly
scattered data as witnessed by SD.
INDIANJOURNALOFPHYSICALEDUCATIONSPORTSMEDICINE&EXERCISESCIENCE
ISSN0976-1101Vol-18,SpecialIssue(2)
44
Velocity of kicking leg ankle angle at ball contact was higher in girls by 210/sec
2 may be because
of higher flexibility of joint. No significant difference was observed between the groups as
because data was highly scattered in both the groups as SD witness boys SD 900/sec
2 and girls
SD 1160/sec
2.
Boys mean ball velocity 4282.30 cm/sec2 was little less than double in compared to girls ball
velocity 2677.60 cm/sec2 but statistically no significant difference was found because of highly
scattered data as SD found for boys and girls 727.85 cm/sec2 and 302.83 cm/sec
2 respectively.
There was very little difference in total velocity of kicking leg i.e. hip joint angle, knee joint
angle and ankle joint angle together in boys 1012.020/sec
2 and girls 1040.24
0/sec
2 but ball
velocity of the boys was nearly double 4282.30 cm/sec2 from the girls had 2677.60
0/sec
2. This
might happened as because momentum is the product of Mass and Velocity and boys are higher
in body weight; on the other hand, Torque is the product of Force and Length of Moment Arm
and in this case kicking leg length of the boys is longer than girls.
CONCLUSIONS
Girls’ hip joint mean angles of kicking leg was found slightly higher than the boys in all three
phases GC, BC & FT. Girls mean and SD of displacement of hip joint angle was found higher
than the boys. Angular mean velocity of the kicking leg at ball contact was found higher in the
boys. Close similarity was reviled in kicking leg knee joint angle at GC and BC but boys and
girls made FT with comparatively higher difference in angle. Boys produced little higher knee
angle mean displacement than the girls. No statistically significant difference was found among
boys and girls in kicking leg ankle angle mean displacement ground contact to ball. Three times
higher than the girls mean angular velocity of kicking leg knee at ball contact was observed in
the boys. Kicking leg ankle angle of boys GC to BC reduced slightly where as for girls it was
increased. Though girls kicking leg ankle mean displacement ground contact to ball was slightly
higher but no statistical significant difference was found between the two groups. Velocity of
kicking leg ankle angle at ball contact was higher in girls but no significant difference was
observed between the groups. Though the boys mean ball velocity was little less than double in
compared to the girls ball velocity but statistically no significant difference was found due to
scattered data. There was very little difference in total velocity of kicking leg i.e. hip joint angle,
knee joint angle and ankle joint angle together between boys and girls, though girls were at upper
hand but ball velocity of the boys was nearly double from the girls.
INDIANJOURNALOFPHYSICALEDUCATIONSPORTSMEDICINE&EXERCISESCIENCE
ISSN0976-1101Vol-18,SpecialIssue(2)
45
REFERENCES
Ahsan, M. (2008). A study of linear and angular kinematic analysis of soccer instep and
inside instep foot kicks of different level players. University. Retrieved from
http://shodhganga.inflibnet.ac.in:8080/jspui/handle/10603/61886
Augustus, S., Mundy, P., & Smith, N. (2017). Support leg action can contribute to
maximal instep soccer kick performance: an intervention study. Journal of Sports
Sciences, 35(1), 89–98. https://doi.org/10.1080/02640414.2016.1156728
Clagg, S. E., Warnock, A., & Thomas, J. S. (2009). Kinetic analyses of maximal effort
soccer kicks in female collegiate athletes. Sports Biomechanics, 8(2), 141–153.
https://doi.org/10.1080/14763140902752106
Kapidžić, A., Huremović, T., & Biberovic, A. (2014). Kinematic Analysis of the Instep
Kick in Youth Soccer Players. Journal of Human Kinetics, 42, 81–90.
https://doi.org/10.2478/hukin-2014-0063
Katis, A., Kellis, E., & Lees, A. (2015). Age and gender differences in kinematics of
powerful instep kicks in soccer. Sports Biomechanics, 14(3), 287–299.
https://doi.org/10.1080/14763141.2015.1056221
INDIANJOURNALOFPHYSICALEDUCATIONSPORTSMEDICINE&EXERCISESCIENCE
ISSN0976-1101Vol-18,SpecialIssue(2)
46
CROSS SECTIONAL STUDY OF MINIMUM MUSCULAR
FITNESS OF SCHOOL GIRLS CHILDREN
Awadhesh Kumar Singh1, Dr. Barkha Bhardwaj
2 Dheerendra Singh3
1 Assistant Professor, DNPG College, Gualothi, Bulandshahr, UP.
2 Assistant Professor, Department of Physical Education, S.V.S. University, Meerut, U.P.
3PET, KVS, Manandragarh, Chhattisgarh.
ABSTRACT
The purpose of the study was found out minimum muscular fitness of school girls children. For
the purpose of the study, 60 female students, age 10-15 years, were selected randomly from
Simpkins School Agra U.P.. To find out the minimum muscular fitness Kraus -Weber test were
employed. The test contained six test item (Strength of the abdominal plus psoas muscles,
Strength of the abdominal minus psoas muscles, Strength of the psoas and lower abdominal
muscles, Strength of the upper back muscles, Length of back and hamstring muscles, Strength of
back and hamstring muscles). Percentile scale was applied to calculate the collected data. The
overall result of the present study on Kraus- Weber test indicate 69.35%of the school girls
children had passed in all the six test item and 30.65% could not pass in all the test item .When
the researcher consider each item of the test then the result show that in case of Strength of the
abdominal plus psoas muscles75.66% were passed and the 24.34% were failed in this test item,
in the same manner Strength of the abdominal minus psoas muscles 70.65% were pass and
29.35% , Strength of the psoas and lower abdominal muscles 64% and 36% , Strength of the
upper back muscles76.55 and 23.45%, Length of back and hamstring muscles95.66%and 4.34% ,
Strength of back and hamstring muscles35.66 %and 64.44% were failed.
KEYWORDS: kraus weber test, minimum muscular fitness, school girls
INTRODUCTION
Muscular fitness is one of the most important components of physical fitness. Many of the health
hazards and most of the disorders could be checked by maintaining a certain level of fitness. A
level of strength and flexibility measure of particular key muscular groups is necessary for the
function of the body below which the health of the individual seems to be in danger. A battery of
six muscular strength tests was prepared by Kraus and Hirchland after 18 years of clinical
experience and is a pass or fail test with one 'fail' on any of its six test items constituting a whole-
test failure. It was reported that those who failed in these tests appeared to be sick, emotionally
imbalanced and having constant strain in them.
A shift occurred in the 1900s when teachers became physical educators who emphasized sport
participation to promote the critical objectives of education, including physical fitness.
Unfortunately, physical fitness was secondary to sport and games. During the 1940s, 50s, and
60s public schools underwent intense scrutiny. The fitness status of World War II inductees was
so poor that the armed forces blamed the schools for emphasizing sports at the expenses of
physical fitness. About one- third, or 3 million, of the men examined for the Armed Services
failed their examinations because of physical and mental reasons. In 1943, the head of the
physical recreation program of the U.S. Army called for sport and play to be deemphasized and
replaced with an intense physical training program. A study of the fitness status of American
children as reported by Kraus and Hirschland, who based their results on a series of minimal
INDIANJOURNALOFPHYSICALEDUCATIONSPORTSMEDICINE&EXERCISESCIENCE
ISSN0976-1101Vol-18,SpecialIssue(2)
47
muscular fitness tests, found that 58 percent of American school children failed these tests,
whereas only 9 percent of European children failed the same tests. About the same time, the
release of scientific evidence that demonstrate a high degree of atherosclerosis found in autopsy
examinations of American soldiers during the Korean conflict sent shock waves through the
physical fitness and health professions.
It has been well documented that girls are less physically active than boys [3, 4, 6, 11]. For
example, one study analyzed cross-sectional PA data from the 2003–4 and 2005–6 National
Health and Nutrition Examination Survey with youth ages 6–19. The study found that females
spent significantly less time in daily moderateto-vigorous PA compared to males [27]. In another
study, 27.9% of adolescent girls were sedentary compared to 10.6% of adolescent boys.
Additionally, girls were more likely to play low-to-moderate intensity sports, while boys tended
to play high-intensity sports [28]. Given the reciprocal relationship between physical fitness and
PA, and given the gender disparity in PA, it is of great importance to investigate what physical
fitness components contribute most significantly to boys’ and girls’ PA levels in different PA
settings.
METHODOLOGY
For the purpose of the study, 60 female students, age10-15 years, were selected randomly from
Simpkins School Agra U.P.. To find out the minimum muscular fitness Kraus -Weber test were
employed. The test contained six test item (Strength of the abdominal plus psoas muscles,
Strength of the abdominal minus psoas muscles, Strength of the psoas and lower abdominal
muscles, Strength of the upper back muscles, Length of back and hamstring muscles, Strength of
back and hamstring muscles)The tests were administered in the form described by Clarke (1967).
Usually the scoring of each item is graded from pass/fail basis in addition to range of scoring
from zero to ten. Percentile scale was applied to calculate the collected data.
FINDINGS AND RESULTS:
Result on percentage wise data analysis on minimum muscular fitness variables
Table-1: Percentage wise result on Kraus Weber Minimum Muscular Fitness Test of school girls
Variables pass fail
Strength of the abdominal plus psoas muscles 75.66 24.34
Strength of the abdominal minus psoas muscles 70.65 29.35
Strength of the psoas and lower abdominal muscles 64 36
Strength of the upper back muscles 76.55 23.45
Length of back and hamstring muscles 95.66 4 .34
Strength of back and hamstring muscles 35.66 64.34
Table-2 Overall result on Kraus Weber Test of School Girls Children
Variable Pass Fail
Composite score of all the six items 69.35 30.65
From the above result the researcher can attribute that the school from where the subject were
consider was situated in rural area for that their life style not dependable on machine like the
urban student life style. As a result of physical exertion and life style of rural student ,minimum
INDIANJOURNALOFPHYSICALEDUCATIONSPORTSMEDICINE&EXERCISESCIENCE
ISSN0976-1101Vol-18,SpecialIssue(2)
48
muscular fitness was developed among themselves, then that of urban people and all the students
were belonging to the middle class family, and they were not only engaged in the school but also
they play different type of recreational games during the leisure time. The researcher found that
in school curricular each class has a period of physical education class which may develop their
minimum muscular fitness.
CONCLUSION
Selected minimum muscular fitness appears to be good among school children in Simpkins
School Agra. The school going girls children have been found to have the high percentage of
pass in Kraus Weber Tests.
REFERENCES
Kraus H, Hirschland R. Minimum muscular fitness of the school children. Research
Quarterly 1954; 25: 178-188.
Mathews DK. Measurements in physical education. Philadelphia: W. B. Saunders
Company.
Kraus H, Hirschland R. Muscular fitness tests and health. J Health Physical Education
and Recreation 1953; 24: 17.
For M, Janet A. Result of testing Iowa school children for health and fitness. J I!ealth
Physical Education and Recreation 1955; 26: 20
H. Kraus and R.P. Hirschland, “Minimal Muscular Fitness Test in School Children”,
Research Quarterly 25 (1954): 177-88.
INDIANJOURNALOFPHYSICALEDUCATIONSPORTSMEDICINE&EXERCISESCIENCE
ISSN0976-1101Vol-18,SpecialIssue(2)
49
CARDIOVASCULAR PROFILE AND ITS ASSOCIATION WITH
PHYSICAL ACTIVITY, BODY COMPOSITION, SLEEP
DURATION AMONG INDIAN ADOLESCENTS 1Tahir Ramzan Bhat, Ph.D. Scholar L.N.I.P.E. Gwalior, India
2Prof. S. Mukherjee, Professor L.N.I.P.E. Gwalior, India
ABSTRACT:
The purpose of the study was to assess the relationship of physical activity, sleep duration and
body composition with cardiovascular profile. A total of Two hundred forty (240) healthy male
students age ranging from 16-19 years were recruited for this study and basic information and
details about life style were taken via questionnaire and personal examination.The lifestyle of a
person includes meal frequency, sleep duration and physical activity. These factors were
analyzed along with body mass index, weight, waist circumference, Pulse rate, Systolic blood
pressure, Diastolic blood pressure and Pulse pressure. BMI was calculated as the weight (kg)
divided by the square of height in meters (M2). Waist circumference was measured at the
midpoint between the lower costal margin and the iliac crest to the nearest 0.5 cm at the end of
normal expiration. Cardiovascular was measured by using digital blood pressure monitor (Omron
Healthcare Inc., USA). Unpaired t-test was used to see the difference existed in BMI and
Cardiovascular profile between Meal frequency, ASDN and ISDN and One-way ANOVA was
used to study if any significant differences (P<0.05) existed in the BMI and cardiovascular
Profile between the high, moderate and low physical activity groups. Pearson’s correlation
coefficient was determined to assess the relationship of physical activity with the BMI and
cardiovascular profile.
Keywords: Meal frequency, Sleep Duration, Physical activity.
INTRODUCTION:
In recent years, there have been significant transitions in the lifestyle of people across continents
and especially in the developing countries like India due to accelerated industrialization and
globalization. However, an alarming consequence of these transitions is the rise in the prevalence
of cardiovascular risk factors like sedentary lifestyle and obesity amongst the children and
adolescents. Studies from various communities across India indicate increasing prevalence of
hypertension amongst the children and adolescents. An increase body weight and sedentary
lifestyle show strong associations with hypertension amongst the children and adolescents.
Health professionals across the globe have been involved in understanding the pathophysiology
of high blood pressure amongst children and adolescents with sedentary lifestyle and increase
body weight or adiposity. A number of pathophysiological changes like increase sympathetic
activity, decrease arterial elasticity and hyperinsulinemia associated with increase body mass and
unhealthy lifestyle have been implicated in the pathogenesis of hypertension. However, not much
is reported about the causal relationship of lifestyle and body composition with blood pressure in
the Indian children and adolescents. Studies also report that differences exist in the
aetiopathogenesis of disease across varied ethnic populations and age groups
Recent studies in various populations indicate that lifestyle is one of the potential risk factor
predisposing the youth to obesity and cardiovascular risk factors. Since there is a significant rise
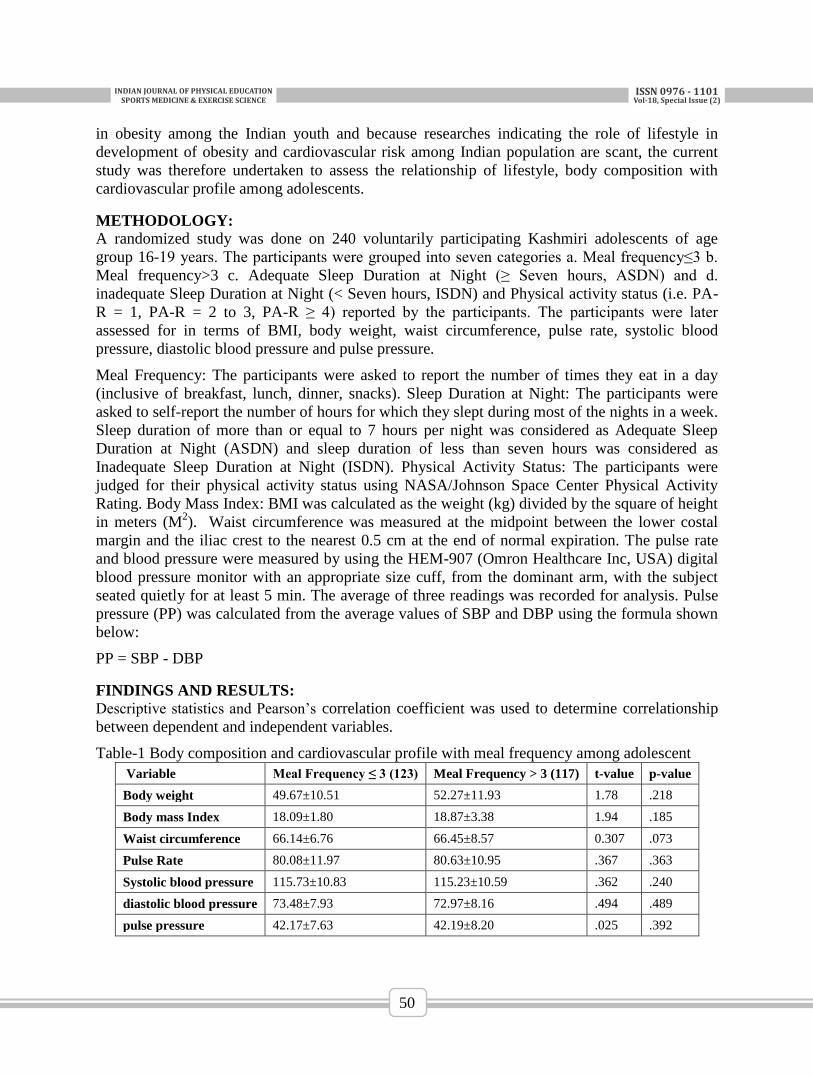
INDIANJOURNALOFPHYSICALEDUCATIONSPORTSMEDICINE&EXERCISESCIENCE
ISSN0976-1101Vol-18,SpecialIssue(2)
50
in obesity among the Indian youth and because researches indicating the role of lifestyle in
development of obesity and cardiovascular risk among Indian population are scant, the current
study was therefore undertaken to assess the relationship of lifestyle, body composition with
cardiovascular profile among adolescents.
METHODOLOGY:
A randomized study was done on 240 voluntarily participating Kashmiri adolescents of age
group 16-19 years. The participants were grouped into seven categories a. Meal frequency≤3 b.
Meal frequency>3 c. Adequate Sleep Duration at Night (≥ Seven hours, ASDN) and d.
inadequate Sleep Duration at Night (< Seven hours, ISDN) and Physical activity status (i.e. PA-
R = 1, PA-R = 2 to 3, PA-R ≥ 4) reported by the participants. The participants were later
assessed for in terms of BMI, body weight, waist circumference, pulse rate, systolic blood
pressure, diastolic blood pressure and pulse pressure.
Meal Frequency: The participants were asked to report the number of times they eat in a day
(inclusive of breakfast, lunch, dinner, snacks). Sleep Duration at Night: The participants were
asked to self-report the number of hours for which they slept during most of the nights in a week.
Sleep duration of more than or equal to 7 hours per night was considered as Adequate Sleep
Duration at Night (ASDN) and sleep duration of less than seven hours was considered as
Inadequate Sleep Duration at Night (ISDN). Physical Activity Status: The participants were
judged for their physical activity status using NASA/Johnson Space Center Physical Activity
Rating. Body Mass Index: BMI was calculated as the weight (kg) divided by the square of height
in meters (M2). Waist circumference was measured at the midpoint between the lower costal
margin and the iliac crest to the nearest 0.5 cm at the end of normal expiration. The pulse rate
and blood pressure were measured by using the HEM-907 (Omron Healthcare Inc, USA) digital
blood pressure monitor with an appropriate size cuff, from the dominant arm, with the subject
seated quietly for at least 5 min. The average of three readings was recorded for analysis. Pulse
pressure (PP) was calculated from the average values of SBP and DBP using the formula shown
below:
PP = SBP - DBP
FINDINGS AND RESULTS:
Descriptive statistics and Pearson’s correlation coefficient was used to determine correlationship
between dependent and independent variables.
Table-1 Body composition and cardiovascular profile with meal frequency among adolescent
Variable Meal Frequency ≤ 3 (123) Meal Frequency > 3 (117) t-value p-value
Body weight 49.67±10.51 52.27±11.93 1.78 .218
Body mass Index 18.09±1.80 18.87±3.38 1.94 .185
Waist circumference 66.14±6.76 66.45±8.57 0.307 .073
Pulse Rate 80.08±11.97 80.63±10.95 .367 .363
Systolic blood pressure 115.73±10.83 115.23±10.59 .362 .240
diastolic blood pressure 73.48±7.93 72.97±8.16 .494 .489
pulse pressure 42.17±7.63 42.19±8.20 .025 .392
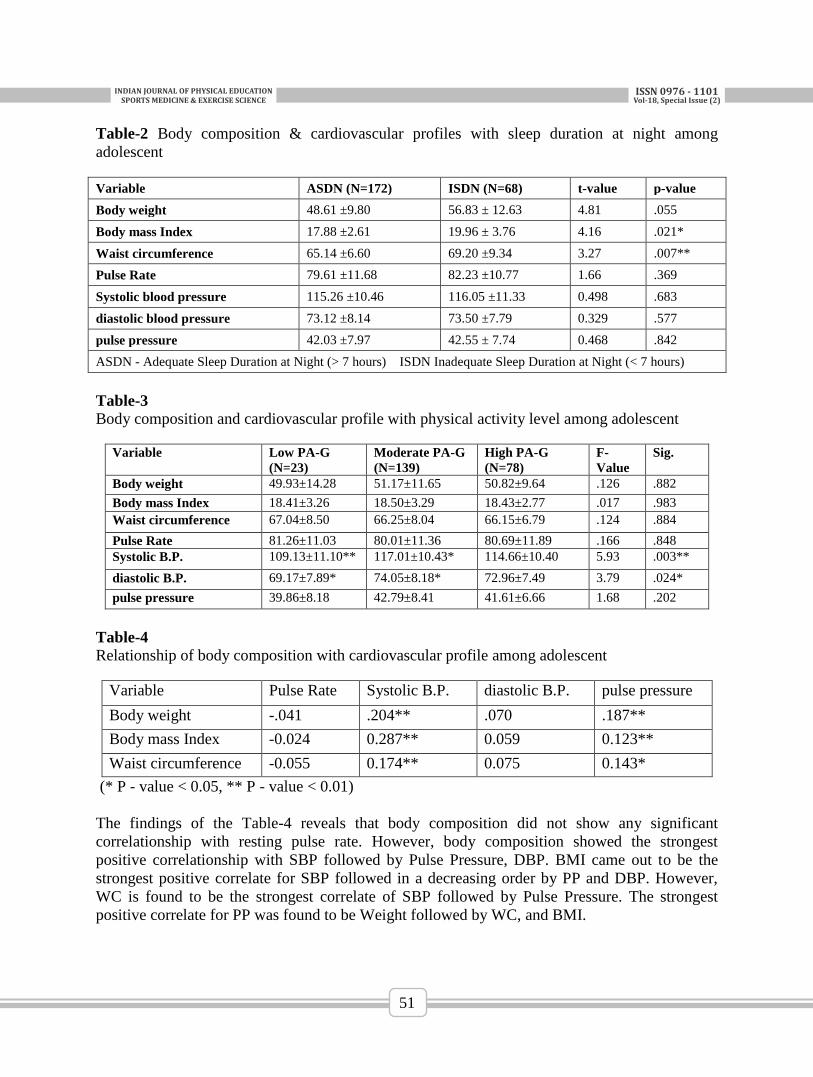
INDIANJOURNALOFPHYSICALEDUCATIONSPORTSMEDICINE&EXERCISESCIENCE
ISSN0976-1101Vol-18,SpecialIssue(2)
51
Table-2 Body composition & cardiovascular profiles with sleep duration at night among
adolescent
Variable ASDN (N=172) ISDN (N=68) t-value p-value
Body weight 48.61 ±9.80 56.83 ± 12.63 4.81 .055
Body mass Index 17.88 ±2.61 19.96 ± 3.76 4.16 .021*
Waist circumference 65.14 ±6.60 69.20 ±9.34 3.27 .007**
Pulse Rate 79.61 ±11.68 82.23 ±10.77 1.66 .369
Systolic blood pressure 115.26 ±10.46 116.05 ±11.33 0.498 .683
diastolic blood pressure 73.12 ±8.14 73.50 ±7.79 0.329 .577
pulse pressure 42.03 ±7.97 42.55 ± 7.74 0.468 .842
ASDN - Adequate Sleep Duration at Night (> 7 hours) ISDN Inadequate Sleep Duration at Night (< 7 hours)
Table-3
Body composition and cardiovascular profile with physical activity level among adolescent
Variable Low PA-G
(N=23)
Moderate PA-G
(N=139)
High PA-G
(N=78)
F-
Value
Sig.
Body weight 49.93±14.28 51.17±11.65 50.82±9.64 .126 .882
Body mass Index 18.41±3.26 18.50±3.29 18.43±2.77 .017 .983
Waist circumference 67.04±8.50 66.25±8.04 66.15±6.79 .124 .884
Pulse Rate 81.26±11.03 80.01±11.36 80.69±11.89 .166 .848
Systolic B.P. 109.13±11.10** 117.01±10.43* 114.66±10.40 5.93 .003**
diastolic B.P. 69.17±7.89* 74.05±8.18* 72.96±7.49 3.79 .024*
pulse pressure 39.86±8.18 42.79±8.41 41.61±6.66 1.68 .202
Table-4
Relationship of body composition with cardiovascular profile among adolescent
Variable Pulse Rate Systolic B.P. diastolic B.P. pulse pressure
Body weight -.041 .204** .070 .187**
Body mass Index -0.024 0.287** 0.059 0.123**
Waist circumference -0.055 0.174** 0.075 0.143*
(* P - value < 0.05, ** P - value < 0.01)
The findings of the Table-4 reveals that body composition did not show any significant
correlationship with resting pulse rate. However, body composition showed the strongest
positive correlationship with SBP followed by Pulse Pressure, DBP. BMI came out to be the
strongest positive correlate for SBP followed in a decreasing order by PP and DBP. However,
WC is found to be the strongest correlate of SBP followed by Pulse Pressure. The strongest
positive correlate for PP was found to be Weight followed by WC, and BMI.
INDIANJOURNALOFPHYSICALEDUCATIONSPORTSMEDICINE&EXERCISESCIENCE
ISSN0976-1101Vol-18,SpecialIssue(2)
52
Since meal frequency is not found to show any significant impact on the body composition in
this adolescent population, it probably therefore does not show any significant effect on
cardiovascular profile.
The current study shows that sleep duration does not affect the Body weight, PR, SBP, DBP and
PP in the adolescents. This is probably because of the finding that there is no significant effect of
sleep duration on the resting Sympathetic activity, which is considered to be one of the potential
mechanism through which sleep deprivation predisposes individuals to hypertension. These
results are contradictory to the findings in other studies conducted in adolescents as reported by
Sampei et al and Javaheri et al. A major reason for this discrepancy could probably be the fact
that the subjects in the current study have been grouped into ISDN and ASDN groups based on
the sleep duration reported by the subjects themselves and was not actually measured. Therefore
the amount of time reported for sleep may not be the actual time, as the subjects reported sleep
duration to be the duration from the time the subjects went to bed and woke up in the morning
which does not necessarily involve sleep.
The current study does not show any significant effect of Physical activity status on the Body
Composition and cardiovascular determinants of PR and PP. Similar findings have also been
reported earlier regarding the role of physical activity in lowering the blood pressure where no
relationship was found between physical activity and blood pressure (Brage et al, Rizzo et al,
Kvaavik et al and Soudarssanane et al). however, reports are also available that indicate a
marginal blood pressure lowering effect of physical activity in adolescents (Leary et al, Gidding
et and Fasting et al)
Enough evidence has been found from the current study which indicates a significant effect of
body composition on various cardiovascular determinants of blood pressure in the adolescent
population.
CONCLUSION:
Sleep duration and body composition start affecting the cardiovascular determinants of blood
pressure in the adolescents at an age as early as late adolescence.
Inadequate sleep duration does not influence the resting blood pressure of adolescents during the
late adolescence but it does predispose them to hypertension by causing a rise in adiposity, a rise
in vascular reactivity and a fall in vascular dispensability which are considered to be risk factors
for hypertension.
INDIANJOURNALOFPHYSICALEDUCATIONSPORTSMEDICINE&EXERCISESCIENCE
ISSN0976-1101Vol-18,SpecialIssue(2)
53
REFERENCES:
WHO. Diet, Nutrition and Prevention of Chronic Diseases. Report of a WHO
Consultation. WHO Technical Report Series 916. Geneva: World Health Organization,
2003.
Sampei M, Dakeishi M, Wood DC, Murata K. Impact of total sleep duration on blood
pressure in preschool children. Biomed Res. 2006 Jun; 27(3):111-5.
Javaheri S, Storfer-Isser A, Rosen CL, Redline S. Sleep quality and elevated blood
pressure in adolescents. Circulation. 2008 Sep 2; 118(10):1034-40.
Rizzo NS, Ruiz JR, Hurtig-Wennlof A, Ortega FB, Sjostrom M. Relationship of physical
activity, fitness, and fatness with clustered metabolic risk in children and 99 adolescents:
the European youth heart study. J Pediatr. 2007 Apr; 150(4):388- 94.
Kvaavik E, Klepp Kl, Tell GS, Meyer HE, Batty GD. Physical fitness and physical
activity at age 13 years as predictors of cardiovascular disease risk factors at ages 15, 25,
33, and 40 years: extended follow-up of the Oslo Youth Study. Pediatrics. 2009 Jan;
123(1):e80-6.
Gidding SS, Barton BA, Dorgan JA, Kimm SY, Kwiterovich PO, Lasser NL, Robson
AM, Stevens VJ, Van Horn L, Simons-Morton DG. Higher self-reported physical activity
is associated with lower systolic blood pressure: the Dietary Intervention Study in
Childhood (DISC)._Pediatrics. 2006 Dec; 118(6):2388-93. 100
INDIANJOURNALOFPHYSICALEDUCATIONSPORTSMEDICINE&EXERCISESCIENCE
ISSN0976-1101Vol-18,SpecialIssue(2)
54
COMPARATIVE STUDY OF SELECTED BREATHING
TECHNIQUES AND PRANAYAMA ON VITAL CAPACITY,
BREATH HOLD CAPACITY OF FEMALE ATHLETES
Nagle, Pooja, 1 , Gaurav, Lalitha
2
1BPEd, M.A(Yoga)., LNIPE
2 Asst. Professor, Department of Yogic Sciences, LNIPE
INTRODUCTION
The other form of breath regulatory practice is Pranayama. Pranayama means the systematic way
of exhalation, inhalation and retention. Pranayama is a Sanskrit word alternatively translated as
“extension of the prana (breath or life force)” or “breath control.” The word is composed from
two Sanskrit word: prana meaning life force (noted particularly as the breath), and either ayama
(to restrain or control the prana, implying a set of breathing techniques where the breath is
intentionally altered in order to produce specific result) or the negative form ayama, meaning to
extend or draw out (as in extension of the life force). Pranayama is the conscious awareness of
breath: the life force that both energizes and relaxes the body. It is a yogic discipline with origins
in ancient India.
The Indian tradition of Hatha yoga makes use of various pranayama techniques. The 15th
century Hatha Yoga Pradeepika is a key text of this tradition and includes various forms of
pranayama such as breath retention techniques termed kumbhaka and various body locks
(bandha). Other methods of pranayama include ujjayi breath (“victorious breath”), bhastrika
(“bellow breathing”) and nadishodhana (“balancing breath”), bhrahmari (“resonating breath”)
and so on. Pranayama consist of four discernible stages:
1. Puraka (inhalation)
2. Abhyantara kumbhaka (the mindful pause after inhalation or positive breath hold capacity).
3. Rechaka (exhalation).
4. Bahya Kumbhaka (the mindful pause after exhalation or negative breath hold capacity).
METHODOLOGY
The purpose of the study is to compare the effect of selected breathing techniques and selected
methods of Pranayama upon the vital capacity and breath hold capacity of collegiate female
athletes of L.N.I.P.E, Gwalior (M.P.0
The follow up period was limited to 8 weeks only.
The study was further restricted to measure of below mentioned pulmonary functions only
1.Vital capacity
2. Breath holding capacity
Inhale breath holding capacity (positive breath hold capacity)
Exhale breath holding capacity (negative breath hold capacity)
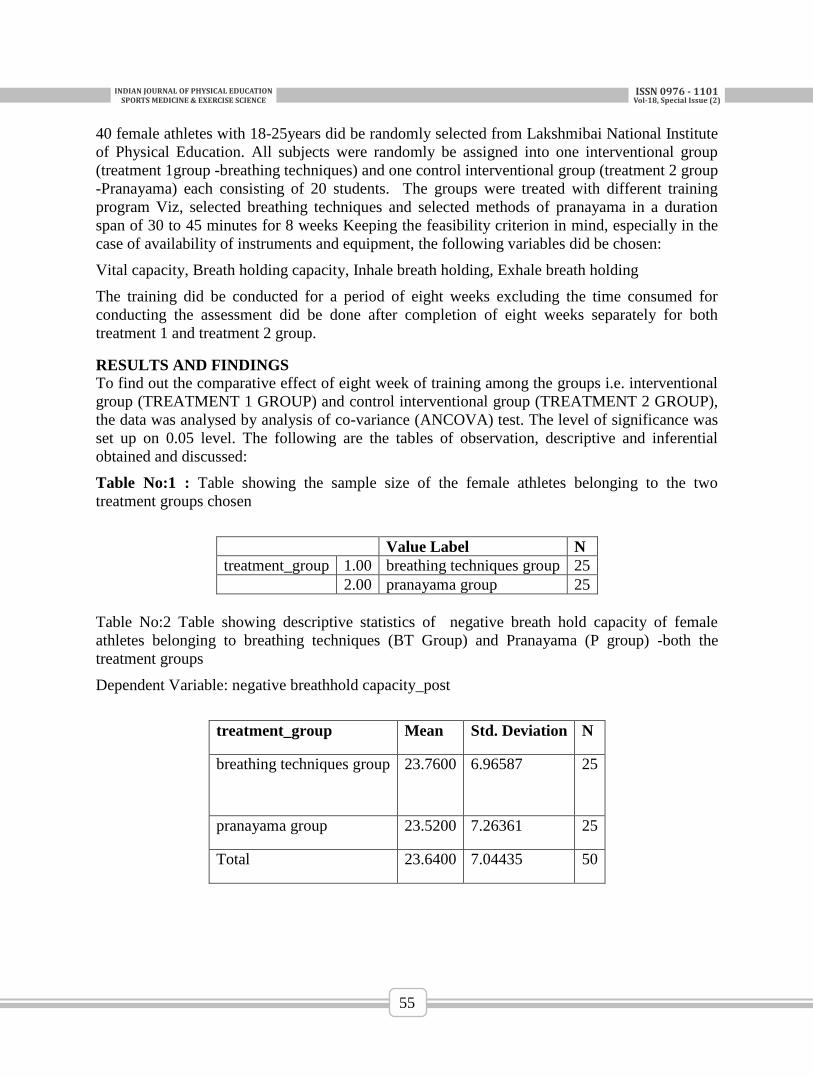
INDIANJOURNALOFPHYSICALEDUCATIONSPORTSMEDICINE&EXERCISESCIENCE
ISSN0976-1101Vol-18,SpecialIssue(2)
55
40 female athletes with 18-25years did be randomly selected from Lakshmibai National Institute
of Physical Education. All subjects were randomly be assigned into one interventional group
(treatment 1group -breathing techniques) and one control interventional group (treatment 2 group
-Pranayama) each consisting of 20 students. The groups were treated with different training
program Viz, selected breathing techniques and selected methods of pranayama in a duration
span of 30 to 45 minutes for 8 weeks Keeping the feasibility criterion in mind, especially in the
case of availability of instruments and equipment, the following variables did be chosen:
Vital capacity, Breath holding capacity, Inhale breath holding, Exhale breath holding
The training did be conducted for a period of eight weeks excluding the time consumed for
conducting the assessment did be done after completion of eight weeks separately for both
treatment 1 and treatment 2 group.
RESULTS AND FINDINGS
To find out the comparative effect of eight week of training among the groups i.e. interventional
group (TREATMENT 1 GROUP) and control interventional group (TREATMENT 2 GROUP),
the data was analysed by analysis of co-variance (ANCOVA) test. The level of significance was
set up on 0.05 level. The following are the tables of observation, descriptive and inferential
obtained and discussed:
Table No:1 : Table showing the sample size of the female athletes belonging to the two
treatment groups chosen
Value Label N
treatment_group 1.00 breathing techniques group 25
2.00 pranayama group 25
Table No:2 Table showing descriptive statistics of negative breath hold capacity of female
athletes belonging to breathing techniques (BT Group) and Pranayama (P group) -both the
treatment groups
Dependent Variable: negative breathhold capacity_post
treatment_group Mean Std. Deviation N
breathing techniques group 23.7600 6.96587 25
pranayama group 23.5200 7.26361 25
Total 23.6400 7.04435 50
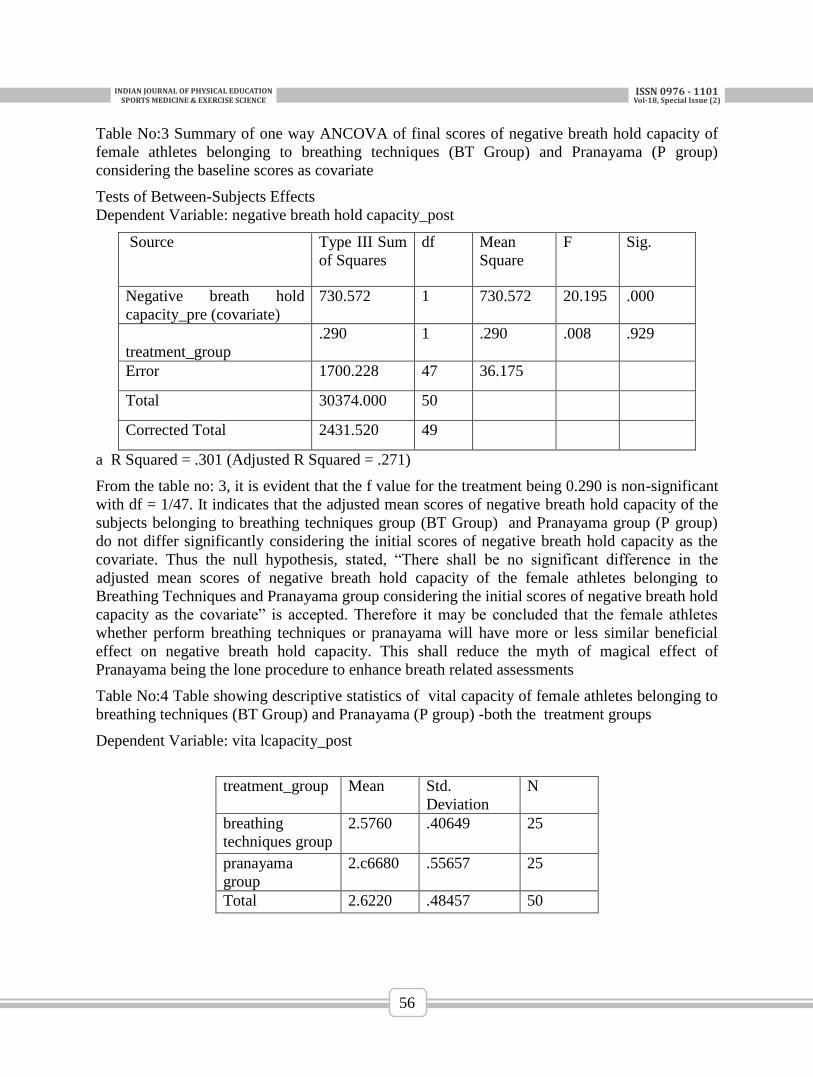
INDIANJOURNALOFPHYSICALEDUCATIONSPORTSMEDICINE&EXERCISESCIENCE
ISSN0976-1101Vol-18,SpecialIssue(2)
56
Table No:3 Summary of one way ANCOVA of final scores of negative breath hold capacity of
female athletes belonging to breathing techniques (BT Group) and Pranayama (P group)
considering the baseline scores as covariate
Tests of Between-Subjects Effects
Dependent Variable: negative breath hold capacity_post
Source Type III Sum
of Squares
df Mean
Square
F Sig.
Negative breath hold
capacity_pre (covariate)
730.572 1 730.572 20.195 .000
treatment_group
.290 1 .290 .008 .929
Error 1700.228 47 36.175
Total 30374.000 50
Corrected Total 2431.520 49
a R Squared = .301 (Adjusted R Squared = .271)
From the table no: 3, it is evident that the f value for the treatment being 0.290 is non-significant
with df = 1/47. It indicates that the adjusted mean scores of negative breath hold capacity of the
subjects belonging to breathing techniques group (BT Group) and Pranayama group (P group)
do not differ significantly considering the initial scores of negative breath hold capacity as the
covariate. Thus the null hypothesis, stated, “There shall be no significant difference in the
adjusted mean scores of negative breath hold capacity of the female athletes belonging to
Breathing Techniques and Pranayama group considering the initial scores of negative breath hold
capacity as the covariate” is accepted. Therefore it may be concluded that the female athletes
whether perform breathing techniques or pranayama will have more or less similar beneficial
effect on negative breath hold capacity. This shall reduce the myth of magical effect of
Pranayama being the lone procedure to enhance breath related assessments
Table No:4 Table showing descriptive statistics of vital capacity of female athletes belonging to
breathing techniques (BT Group) and Pranayama (P group) -both the treatment groups
Dependent Variable: vita lcapacity_post
treatment_group Mean Std.
Deviation
N
breathing
techniques group
2.5760 .40649 25
pranayama
group
2.c6680 .55657 25
Total 2.6220 .48457 50
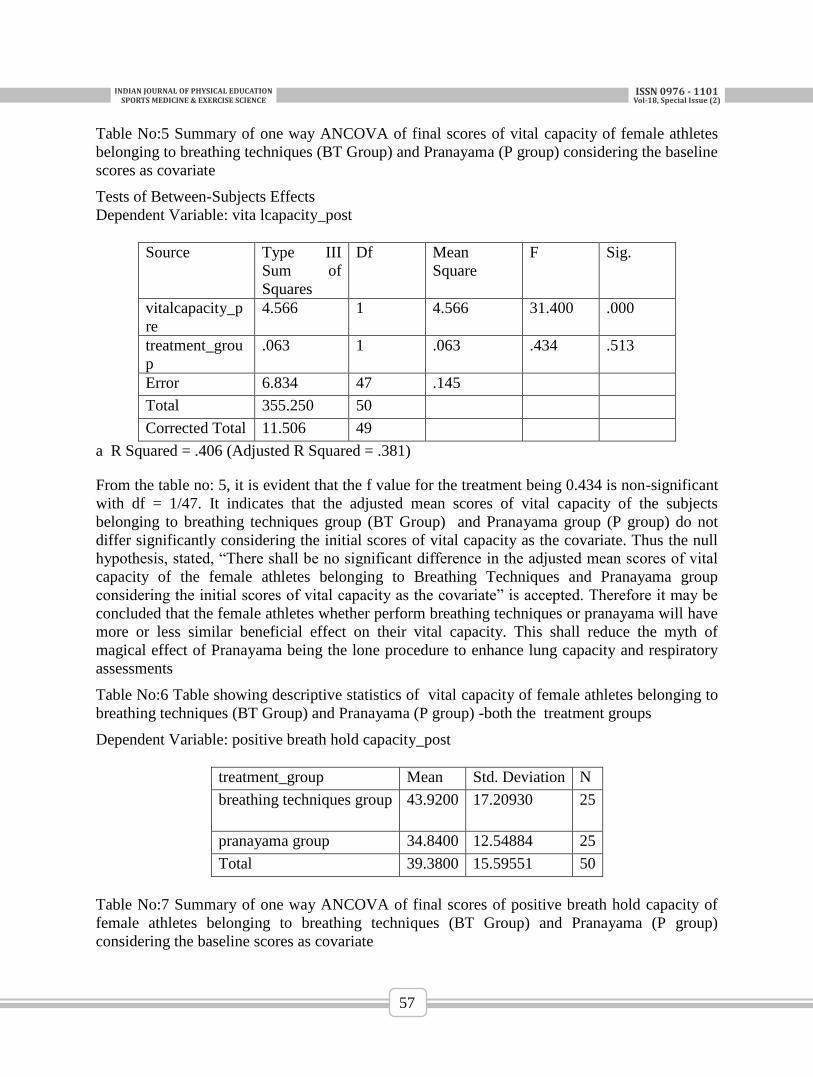
INDIANJOURNALOFPHYSICALEDUCATIONSPORTSMEDICINE&EXERCISESCIENCE
ISSN0976-1101Vol-18,SpecialIssue(2)
57
Table No:5 Summary of one way ANCOVA of final scores of vital capacity of female athletes
belonging to breathing techniques (BT Group) and Pranayama (P group) considering the baseline
scores as covariate
Tests of Between-Subjects Effects
Dependent Variable: vita lcapacity_post
Source Type III
Sum of
Squares
Df Mean
Square
F Sig.
vitalcapacity_p
re
4.566 1 4.566 31.400 .000
treatment_grou
p
.063 1 .063 .434 .513
Error 6.834 47 .145
Total 355.250 50
Corrected Total 11.506 49
a R Squared = .406 (Adjusted R Squared = .381)
From the table no: 5, it is evident that the f value for the treatment being 0.434 is non-significant
with df = 1/47. It indicates that the adjusted mean scores of vital capacity of the subjects
belonging to breathing techniques group (BT Group) and Pranayama group (P group) do not
differ significantly considering the initial scores of vital capacity as the covariate. Thus the null
hypothesis, stated, “There shall be no significant difference in the adjusted mean scores of vital
capacity of the female athletes belonging to Breathing Techniques and Pranayama group
considering the initial scores of vital capacity as the covariate” is accepted. Therefore it may be
concluded that the female athletes whether perform breathing techniques or pranayama will have
more or less similar beneficial effect on their vital capacity. This shall reduce the myth of
magical effect of Pranayama being the lone procedure to enhance lung capacity and respiratory
assessments
Table No:6 Table showing descriptive statistics of vital capacity of female athletes belonging to
breathing techniques (BT Group) and Pranayama (P group) -both the treatment groups
Dependent Variable: positive breath hold capacity_post
treatment_group Mean Std. Deviation N
breathing techniques group 43.9200 17.20930 25
pranayama group 34.8400 12.54884 25
Total 39.3800 15.59551 50
Table No:7 Summary of one way ANCOVA of final scores of positive breath hold capacity of
female athletes belonging to breathing techniques (BT Group) and Pranayama (P group)
considering the baseline scores as covariate
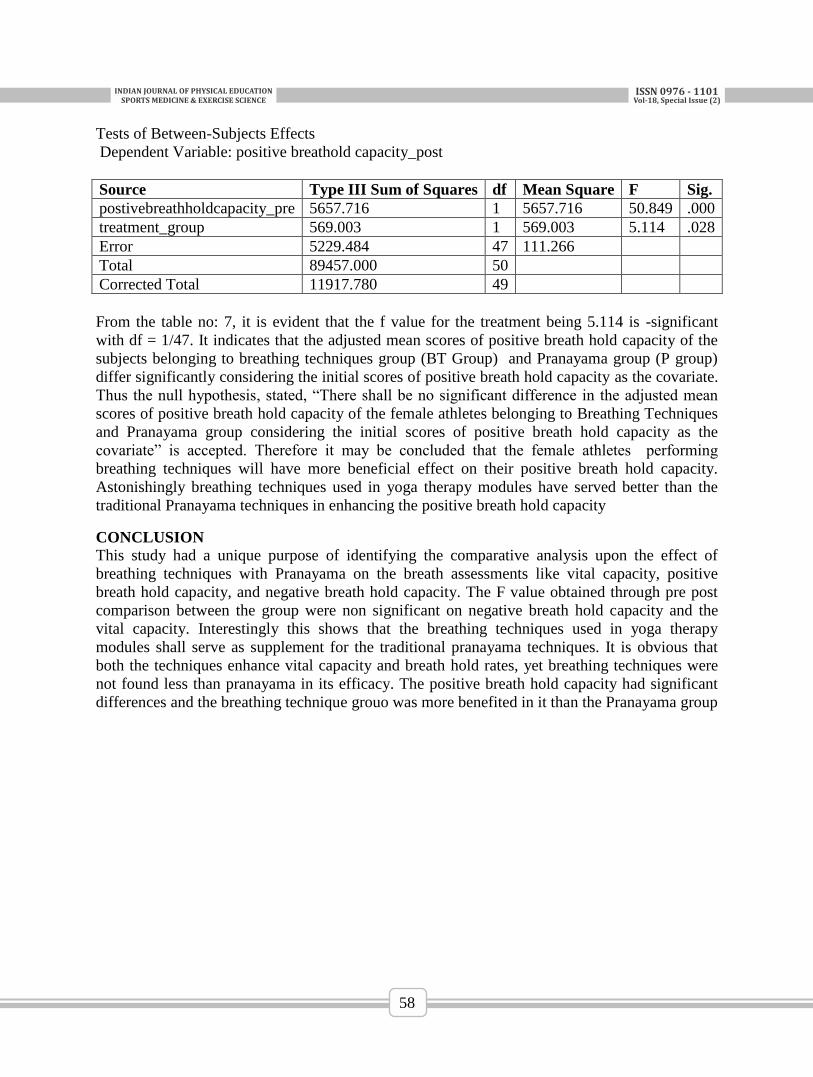
INDIANJOURNALOFPHYSICALEDUCATIONSPORTSMEDICINE&EXERCISESCIENCE
ISSN0976-1101Vol-18,SpecialIssue(2)
58
Tests of Between-Subjects Effects
Dependent Variable: positive breathold capacity_post
Source Type III Sum of Squares df Mean Square F Sig.
postivebreathholdcapacity_pre 5657.716 1 5657.716 50.849 .000
treatment_group 569.003 1 569.003 5.114 .028
Error 5229.484 47 111.266
Total 89457.000 50
Corrected Total 11917.780 49
From the table no: 7, it is evident that the f value for the treatment being 5.114 is -significant
with df = 1/47. It indicates that the adjusted mean scores of positive breath hold capacity of the
subjects belonging to breathing techniques group (BT Group) and Pranayama group (P group)
differ significantly considering the initial scores of positive breath hold capacity as the covariate.
Thus the null hypothesis, stated, “There shall be no significant difference in the adjusted mean
scores of positive breath hold capacity of the female athletes belonging to Breathing Techniques
and Pranayama group considering the initial scores of positive breath hold capacity as the
covariate” is accepted. Therefore it may be concluded that the female athletes performing
breathing techniques will have more beneficial effect on their positive breath hold capacity.
Astonishingly breathing techniques used in yoga therapy modules have served better than the
traditional Pranayama techniques in enhancing the positive breath hold capacity
CONCLUSION
This study had a unique purpose of identifying the comparative analysis upon the effect of
breathing techniques with Pranayama on the breath assessments like vital capacity, positive
breath hold capacity, and negative breath hold capacity. The F value obtained through pre post
comparison between the group were non significant on negative breath hold capacity and the
vital capacity. Interestingly this shows that the breathing techniques used in yoga therapy
modules shall serve as supplement for the traditional pranayama techniques. It is obvious that
both the techniques enhance vital capacity and breath hold rates, yet breathing techniques were
not found less than pranayama in its efficacy. The positive breath hold capacity had significant
differences and the breathing technique grouo was more benefited in it than the Pranayama group
INDIANJOURNALOFPHYSICALEDUCATIONSPORTSMEDICINE&EXERCISESCIENCE
ISSN0976-1101Vol-18,SpecialIssue(2)
59
REFERENCES
Manapure, S.P. (2011). Effect of selected breathing techniques on respiration rate and
breath holding time in healthy adults: International journal of applied and
paramacetical technology, 2(3)
Singh savita, (2012). Effect of yoga practices on pulmonary function test including
transfer factor of lung for carbon monoxide (TLCO) in asthma patients.” : Indian
journals of physiology and pharmacology.
Gupta s.s and sawane.m(2012), A comparative study of the effects of yoga and
swimming on pulmonary functions in sedentary subjects: International journal
yoga.2012 jul-dec
Manaspure shivraj p and fadia ameet (2011), The effect of selected breathing
techniques on respiratory rate and breath holding time in healthy adults: International
Journal of Applied Biology and Pharmaceutical Technology. 2(3): 225-229.
Sarkar d. (2008), Effect of alternate nostril breathing exercise on cardiorespiratory
functions. Nepal medical college journal.
INDIANJOURNALOFPHYSICALEDUCATIONSPORTSMEDICINE&EXERCISESCIENCE
ISSN0976-1101Vol-18,SpecialIssue(2)
60
PREDICTING THE OUTCOME OF ICC CRICKET WORLD
CUP MATCHES
Shiny Raizada1, Amritashish Bagchi
1, Harishankar Menon
2 and Nayana Nimkar
3
1Assistant Professor, Symbiosis School of Sports Sciences, Symbiosis International (Deemed University), Pune
2Student, Symbiosis School of Sports Sciences, Symbiosis International (Deemed University), Pune
3Professor, Symbiosis School of Sports Sciences, Symbiosis International (Deemed University), Pune
ABSTRACT
The purpose of the study was to develop a model to predict the outcome of ICC Cricket World
Cup ODI matches (Limited Overs) on the basis of first innings data. These probabilities can
assist a team captain or management in considering a certain aggressive or defensive batting or
bowling strategy for the next innings. The data was collected from last two world cup
tournaments i.e. 2011 and 2015. Data of 98 matches were recorded, out of which 8 matches were
not taken into consideration due to three reasons which were 1. Match Abandoned 2. Match Tied
3. Matches resolved by Duckworth Lewis Method. The dependent variable selected for this study
was Match Outcome (Win/Loss). Team score, Total Wickets Lost, Toss, Runs Scored in
Powerplay, Wickets lost in Powerplay, Team Run Rate and the Total number of Dot balls were
selected as the predictor variables. For the purpose of this study only the first innings data was
used and in statistical technique Binary Logistic regression was used to predict the outcome of a
match (Win/Loss). It was found that the developed Logistic regression Model was significant.
According to the statistical significance of the predictor variables, they were numerically
weighted and can be used to predict the match outcome. Out of seven predictor variables only
the variable Team score was included in the prediction model with coefficient of determination
(R2) of .272 (Cox & Snell) and .363 (Nagelkerke). 72.2 % of match results were correctly
classified by the model.
Keywords: Cricket, ICC Cricket World Cup, Prediction model, Win and Loss
INTRODUCTION
Cricket is one of the many sport that require a sphere ball and a bat to play, with a different set of
rules, which makes this game unique and different from others. It has evolved over the years
starting from a test match followed by one day matches and from past few years T20 cricket has
taken a lot of attention. But still the ICC Cricket World Cup is the most prestigious tournament
of the all, which is a form of limited overs match (50 overs).
Studies have been done in cricket in terms of physiological, psychological or physical demands
of batsmen, wicket keepers, spinners and pace-bowlers in different format of play (Noakes, and
Durandt, 2000; Christie and King, 2008; Thelwell, Weston and Greenlees, 2007; Jo-Anne, 2012;
Weissensteiner, Abernethy, Farrow, and Gross, 2012; Bagchi and Raizada, 2015). Recently few
of the studies have focused on the performance analysis of individual players or a whole team by
calculating the effect size (Peterson et al., 2008a; Najdan, Robins and Glazier, 2014). But to the
best of my knowledge none of the studies have focused to develop a prediction model to predict
the outcome of the match on the basis of first innings match data.
Developing prediction models in sports could be one of the solutions to predict the match
outcome. It will help the team captain, coaches and team managers to make different tactics
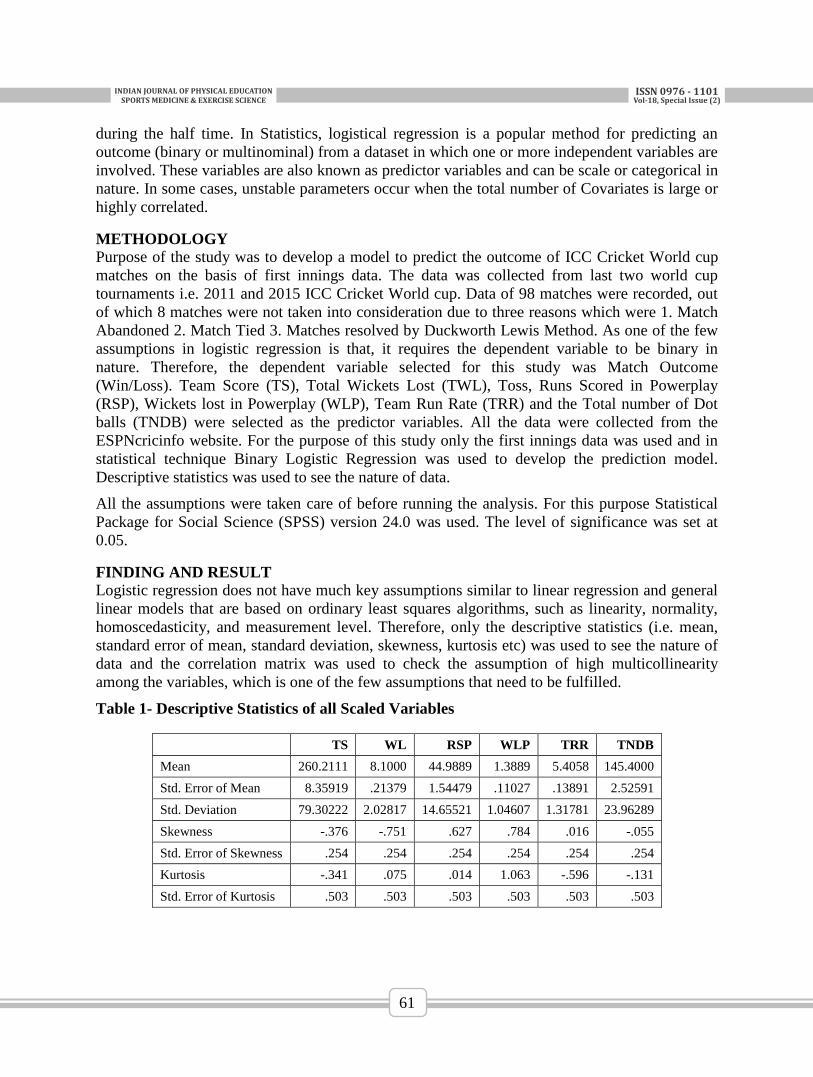
INDIANJOURNALOFPHYSICALEDUCATIONSPORTSMEDICINE&EXERCISESCIENCE
ISSN0976-1101Vol-18,SpecialIssue(2)
61
during the half time. In Statistics, logistical regression is a popular method for predicting an
outcome (binary or multinominal) from a dataset in which one or more independent variables are
involved. These variables are also known as predictor variables and can be scale or categorical in
nature. In some cases, unstable parameters occur when the total number of Covariates is large or
highly correlated.
METHODOLOGY
Purpose of the study was to develop a model to predict the outcome of ICC Cricket World cup
matches on the basis of first innings data. The data was collected from last two world cup
tournaments i.e. 2011 and 2015 ICC Cricket World cup. Data of 98 matches were recorded, out
of which 8 matches were not taken into consideration due to three reasons which were 1. Match
Abandoned 2. Match Tied 3. Matches resolved by Duckworth Lewis Method. As one of the few
assumptions in logistic regression is that, it requires the dependent variable to be binary in
nature. Therefore, the dependent variable selected for this study was Match Outcome
(Win/Loss). Team Score (TS), Total Wickets Lost (TWL), Toss, Runs Scored in Powerplay
(RSP), Wickets lost in Powerplay (WLP), Team Run Rate (TRR) and the Total number of Dot
balls (TNDB) were selected as the predictor variables. All the data were collected from the
ESPNcricinfo website. For the purpose of this study only the first innings data was used and in
statistical technique Binary Logistic Regression was used to develop the prediction model.
Descriptive statistics was used to see the nature of data.
All the assumptions were taken care of before running the analysis. For this purpose Statistical
Package for Social Science (SPSS) version 24.0 was used. The level of significance was set at
0.05.
FINDING AND RESULT
Logistic regression does not have much key assumptions similar to linear regression and general
linear models that are based on ordinary least squares algorithms, such as linearity, normality,
homoscedasticity, and measurement level. Therefore, only the descriptive statistics (i.e. mean,
standard error of mean, standard deviation, skewness, kurtosis etc) was used to see the nature of
data and the correlation matrix was used to check the assumption of high multicollinearity
among the variables, which is one of the few assumptions that need to be fulfilled.
Table 1- Descriptive Statistics of all Scaled Variables
TS WL RSP WLP TRR TNDB
Mean 260.2111 8.1000 44.9889 1.3889 5.4058 145.4000
Std. Error of Mean 8.35919 .21379 1.54479 .11027 .13891 2.52591
Std. Deviation 79.30222 2.02817 14.65521 1.04607 1.31781 23.96289
Skewness -.376 -.751 .627 .784 .016 -.055
Std. Error of Skewness .254 .254 .254 .254 .254 .254
Kurtosis -.341 .075 .014 1.063 -.596 -.131
Std. Error of Kurtosis .503 .503 .503 .503 .503 .503
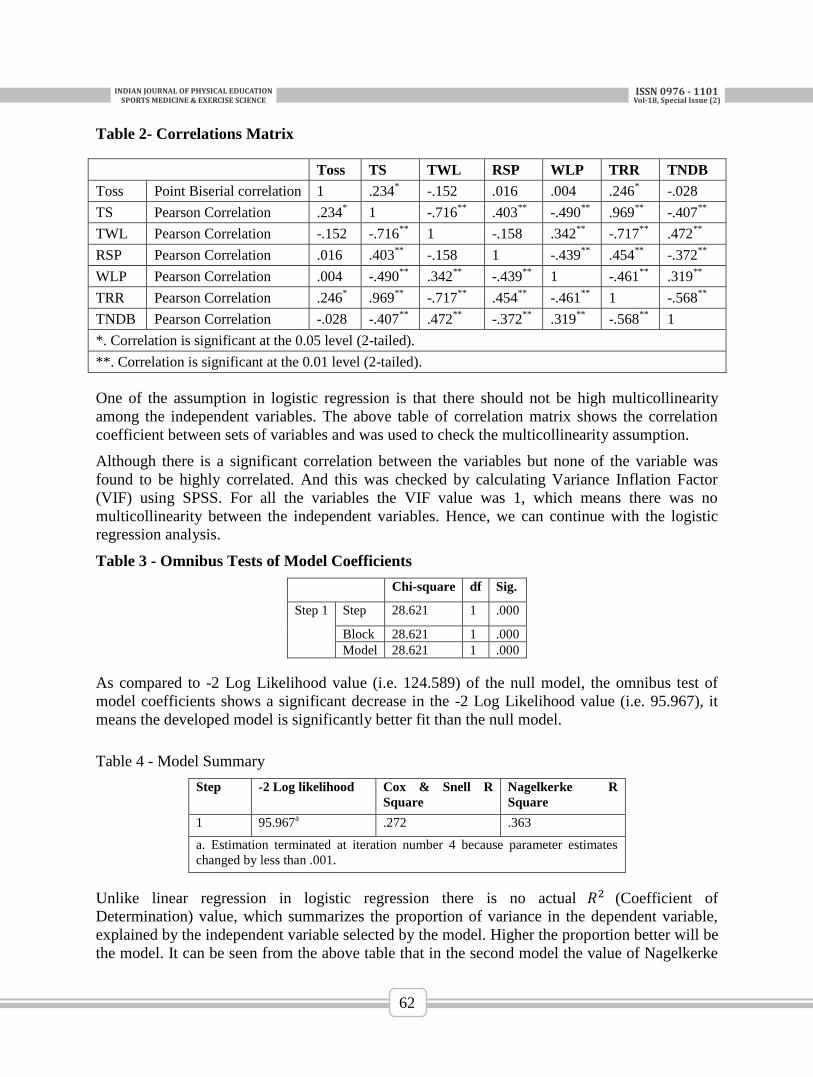
INDIANJOURNALOFPHYSICALEDUCATIONSPORTSMEDICINE&EXERCISESCIENCE
ISSN0976-1101Vol-18,SpecialIssue(2)
62
Table 2- Correlations Matrix
Toss TS TWL RSP WLP TRR TNDB
Toss Point Biserial correlation 1 .234* -.152 .016 .004 .246
* -.028
TS Pearson Correlation .234* 1 -.716
** .403
** -.490
** .969
** -.407
**
TWL Pearson Correlation -.152 -.716**
1 -.158 .342**
-.717**
.472**
RSP Pearson Correlation .016 .403**
-.158 1 -.439**
.454**
-.372**
WLP Pearson Correlation .004 -.490**
.342**
-.439**
1 -.461**
.319**
TRR Pearson Correlation .246* .969
** -.717
** .454
** -.461
** 1 -.568
**
TNDB Pearson Correlation -.028 -.407**
.472**
-.372**
.319**
-.568**
1
*. Correlation is significant at the 0.05 level (2-tailed).
**. Correlation is significant at the 0.01 level (2-tailed).
One of the assumption in logistic regression is that there should not be high multicollinearity
among the independent variables. The above table of correlation matrix shows the correlation
coefficient between sets of variables and was used to check the multicollinearity assumption.
Although there is a significant correlation between the variables but none of the variable was
found to be highly correlated. And this was checked by calculating Variance Inflation Factor
(VIF) using SPSS. For all the variables the VIF value was 1, which means there was no
multicollinearity between the independent variables. Hence, we can continue with the logistic
regression analysis.
Table 3 - Omnibus Tests of Model Coefficients
Chi-square df Sig.
Step 1 Step 28.621 1 .000
Block 28.621 1 .000
Model 28.621 1 .000
As compared to -2 Log Likelihood value (i.e. 124.589) of the null model, the omnibus test of
model coefficients shows a significant decrease in the -2 Log Likelihood value (i.e. 95.967), it
means the developed model is significantly better fit than the null model.
Table 4 - Model Summary
Step -2 Log likelihood Cox & Snell R
Square
Nagelkerke R
Square
1 95.967a
.272 .363
a. Estimation terminated at iteration number 4 because parameter estimates
changed by less than .001.
Unlike linear regression in logistic regression there is no actual 𝑅2 (Coefficient of
Determination) value, which summarizes the proportion of variance in the dependent variable,
explained by the independent variable selected by the model. Higher the proportion better will be
the model. It can be seen from the above table that in the second model the value of Nagelkerke
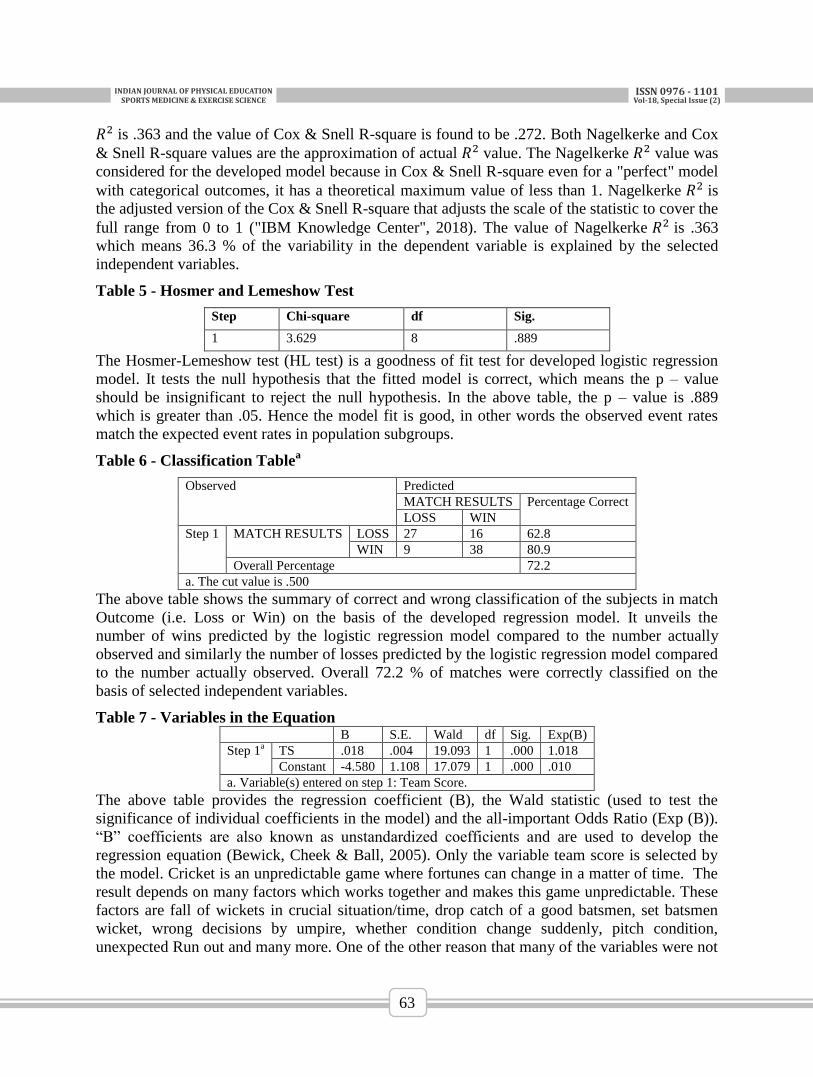
INDIANJOURNALOFPHYSICALEDUCATIONSPORTSMEDICINE&EXERCISESCIENCE
ISSN0976-1101Vol-18,SpecialIssue(2)
63
𝑅2 is .363 and the value of Cox & Snell R-square is found to be .272. Both Nagelkerke and Cox
& Snell R-square values are the approximation of actual 𝑅2 value. The Nagelkerke 𝑅2 value was
considered for the developed model because in Cox & Snell R-square even for a "perfect" model
with categorical outcomes, it has a theoretical maximum value of less than 1. Nagelkerke 𝑅2 is
the adjusted version of the Cox & Snell R-square that adjusts the scale of the statistic to cover the
full range from 0 to 1 ("IBM Knowledge Center", 2018). The value of Nagelkerke 𝑅2 is .363
which means 36.3 % of the variability in the dependent variable is explained by the selected
independent variables.
Table 5 - Hosmer and Lemeshow Test
Step Chi-square df Sig.
1 3.629 8 .889
The Hosmer-Lemeshow test (HL test) is a goodness of fit test for developed logistic regression
model. It tests the null hypothesis that the fitted model is correct, which means the p – value
should be insignificant to reject the null hypothesis. In the above table, the p – value is .889
which is greater than .05. Hence the model fit is good, in other words the observed event rates
match the expected event rates in population subgroups.
Table 6 - Classification Tablea
Observed Predicted
MATCH RESULTS Percentage Correct
LOSS WIN
Step 1 MATCH RESULTS LOSS 27 16 62.8
WIN 9 38 80.9
Overall Percentage 72.2
a. The cut value is .500
The above table shows the summary of correct and wrong classification of the subjects in match
Outcome (i.e. Loss or Win) on the basis of the developed regression model. It unveils the
number of wins predicted by the logistic regression model compared to the number actually
observed and similarly the number of losses predicted by the logistic regression model compared
to the number actually observed. Overall 72.2 % of matches were correctly classified on the
basis of selected independent variables.
Table 7 - Variables in the Equation B S.E. Wald df Sig. Exp(B)
Step 1a TS .018 .004 19.093 1 .000 1.018
Constant -4.580 1.108 17.079 1 .000 .010
a. Variable(s) entered on step 1: Team Score.
The above table provides the regression coefficient (B), the Wald statistic (used to test the
significance of individual coefficients in the model) and the all-important Odds Ratio (Exp (B)).
“B” coefficients are also known as unstandardized coefficients and are used to develop the
regression equation (Bewick, Cheek & Ball, 2005). Only the variable team score is selected by
the model. Cricket is an unpredictable game where fortunes can change in a matter of time. The
result depends on many factors which works together and makes this game unpredictable. These
factors are fall of wickets in crucial situation/time, drop catch of a good batsmen, set batsmen
wicket, wrong decisions by umpire, whether condition change suddenly, pitch condition,
unexpected Run out and many more. One of the other reason that many of the variables were not
INDIANJOURNALOFPHYSICALEDUCATIONSPORTSMEDICINE&EXERCISESCIENCE
ISSN0976-1101Vol-18,SpecialIssue(2)
64
selected by the model is - in ICC World Cup the level of teams are not same, for example if
Canada won the toss against Australia, no matter whatever is the decision the chances of winning
the match against Australia is too less.
The unpredictable nature of this game can be understood by the following two events of cricket
timeline -
1983 WORLD CUP
In 1983, India won the ODI world cup under Kapil Devs Captaincy. It wasn’t the best team in
the tournament. It simply played the best cricket that fortnight (Ghosh, 2017). West Indies was in
its best form; they won the toss and selected to bowl first. In that era, they were considered to be
a team with world's best bowling attack. They bowled well and India got all – out at 183 runs,
which was not a good target against West Indies. India bowled extremely well, Amarnath and
Madan Lal (3–31) each took three wickets, and one memorable moment was the sight of Kapil
Dev running a great distance (about 18–20 yards) to take a catch to dismiss Richards, the West
Indies top scorer and regarded as one of the greatest batsmen of all time ("1983 Cricket World
Cup Final", 2018). And at the end India won the cup.
2017 ICC CHAMPIONS TROPHY
At the time of ICC Champions Trophy, India was the world No 1 in all formats. And in the ICC
Champions Trophy opening match of Group B India vs. Pakistan, Pakistan lost the first match by
124 runs, outclassed by India in all departments. But the results reversed in the final match of the
tournament. Even though in ICC Champions Trophy finals India won the toss and opted to bowl
first, it was Pakistan who turned out to be victorious at the end to clinch the trophy as they
defeated India by a huge margin of 180 runs (Alter, 2018).
REGRESSION EQUATION
Using regression coefficients (B) of the model shown in the table 7, the regression equation was
developed which is as follows:
Logit = -4.580 + .018 (Team Score)
Odds = 𝑒𝑙𝑜𝑔𝑖𝑡 = 𝑒−4.580+ .018 (Team Score)
P(Y) = 𝑜𝑑𝑑𝑠
1+𝑜𝑑𝑑𝑠
The above regression equation can be used to predict the match outcome (i.e. Win/Loss) of the
future ICC World Cup Cricket Matches on the basis of one predictor/ independent variables (i.e.
Team Score) of the first innings data. It will only explain 36.3 % of variability in the dependent
variable, the remaining percentage of the variability (63.7 %) may explain by some other
variables.
CONCLUSION
The developed Logistic regression Model was found to be significant. According to the statistical
significance of the predictor variables, they were numerically weighted and were used to predict
the match outcome. Only one variable i.e. Team Score out of seven variables is selected by the
model with coefficient of determination (R2) of .272 (Cox & Snell) and .363 (Nagelkerke). 72.2
% of match results were correctly classified by the model.
INDIANJOURNALOFPHYSICALEDUCATIONSPORTSMEDICINE&EXERCISESCIENCE
ISSN0976-1101Vol-18,SpecialIssue(2)
65
REFERENCES
1983 Cricket World Cup Final. (2018). En.wikipedia.org. Retrieved 11 February 2018,
from https://en.wikipedia.org/wiki/1983_Cricket_World_Cup_Final
Alter, J. (2017). How Pakistan won the ICC Champions Trophy - Times of India. The
Times of India. Retrieved 11 February 2018, from
https://timesofindia.indiatimes.com/sports/cricket/champions-trophy-2017/top-
stories/how-pakistan-won-the-icc-champions-trophy/articleshow/59214643.cms
Bagchi, A., & Raizada, S. (2015).Anthropometric and Physical Variables as Predictors of
Off-Spin Performance in Cricket: A Multiple Regression Study. International Journal of
Sports Sciences & Fitness, 5 (2), 314 – 322.
Bewick V, Cheek L, & Ball J. (2005). Statistics review 14: logistic regression. Crit Care,
9 (1), 112–8
Christie, C. J. & King, G. A. (2008). Heart rate and perceived strain during batting in a
warm and cool environment. International Journal of Fitness, 4, 33- 38.
Cricket Records | Records | ICC Cricket World Cup, 2010/11 | | Match results |
ESPNcricinfo. (2018). Cricinfo. Retrieved 1 January 2018, from
http://stats.espncricinfo.com/icc_cricket_worldcup2011/engine/records/team/match_resul
ts.html?id=4857;type=tournament
INDIANJOURNALOFPHYSICALEDUCATIONSPORTSMEDICINE&EXERCISESCIENCE
ISSN0976-1101Vol-18,SpecialIssue(2)
66
COMPARISON OF LANDING IMPACT DURING COUNTER
MOVEMENT VERTICAL JUMP AMONG PLAYERS FROM
SELECTED SPORTS
Rahul Tiwari*, Dr. M D Ranga
**
* Research Fellow, Department of Biomechanics, SAI, NS NIS, Patiala
**Senior Scientific officer, Department of Biomechanics, SAI, NS NIS, Patiala
ABSTRACT
Counter movement jump (CMJ) on is a standard vertical jump test usually done on force
platform to measure ground reaction forces, which can be used to interpret number of important
parameters related to fitness, performance and injury prevention. Maximum landing force can be
normalized by body weight to obtain landing impact which is a direct indicator of fitness and to
find out injury probable. The purpose of this study was to compare the landing impact during
CMJ among players from Hockey, Fencing, Boxing and Wushu. The study was conducted on
231 players from all the mentioned disciplines. All the participants were part of Sports Training
Centre at Netaji Subhas National Institute of sports (NSNIS), Patiala. Each player performed
counter movement vertical jump (without arm swing) on force platform. Result of the study
indicate that hockey players recorded minimum ground reaction force while landing and Boxers
show the maximum. Landing impact basically shows the eccentric strength of the lower limb an
individual possesses, which is a trainable parameter.
KEYWORDS: Counter movement jump, vertical jump, landing impact, eccentric strength
INTRODUCTION
Jumping is a complex human movement that requires complex motor coordination between
upper and lower body segments. In particular, the propulsive action of the lower limbs during a
vertical jump has been considered particularly suited for evaluating explosive characteristics of
sedentary individuals and elite athletes (Markovic et. al., 2004). Also, since performance in most
individual and team sports depends on the athlete’s ability to produce force quickly (Newton and
Kraemer 1994), the use of reliable and valid testing procedures is beneficial for monitoring the
effects of training and for talent selection purposes.
Counter- movement jump (CMJ) (Markovic et al., 2004) measured by means of contact mats or
force plates are most reliable and widely accepted. The biomechanical characteristics of vertical
jumps allowed the possibility of studying contractile characteristics of individuals and the effect
of pre-stretch (Markovic et al., 2004). Force plates are commonly used in biomechanics
laboratories to measure ground forces involved in the motion of human or animal subjects (Cross
1999). A force plate is simply a metal plate with one or more sensors attached to give an
electrical output proportional to the force on the plate. The sensor can either be a strain gauge or
a piezoelectric element. The force plate is becoming a basic tool used in the study of jumping
activities, as it provides a direct measure of one of the principle components responsible for a
jump to occur – the force.
Standing vertical jump is becoming a popular test to perform on force platform to measure
ground reaction forces (Linthorne 2001). In a counter movement jump, the jumper starts from an
upright standing position, makes a preliminary downward movement by flexing at the knees and
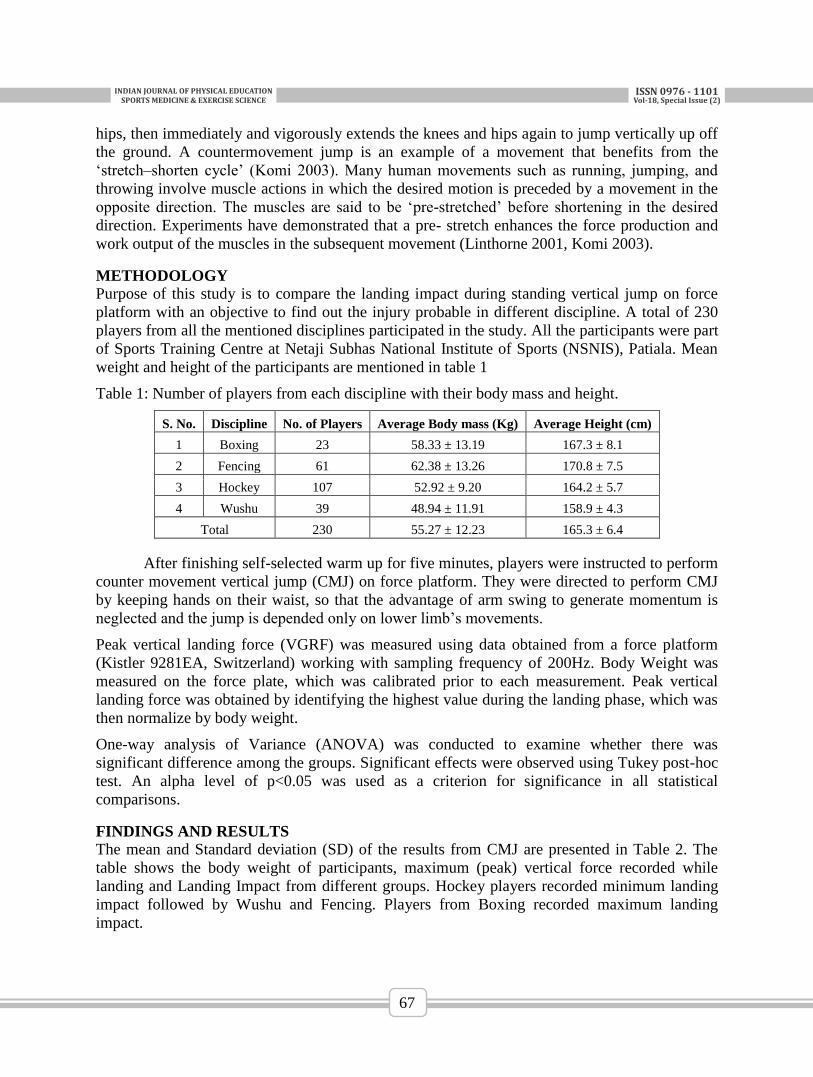
INDIANJOURNALOFPHYSICALEDUCATIONSPORTSMEDICINE&EXERCISESCIENCE
ISSN0976-1101Vol-18,SpecialIssue(2)
67
hips, then immediately and vigorously extends the knees and hips again to jump vertically up off
the ground. A countermovement jump is an example of a movement that benefits from the
‘stretch–shorten cycle’ (Komi 2003). Many human movements such as running, jumping, and
throwing involve muscle actions in which the desired motion is preceded by a movement in the
opposite direction. The muscles are said to be ‘pre-stretched’ before shortening in the desired
direction. Experiments have demonstrated that a pre- stretch enhances the force production and
work output of the muscles in the subsequent movement (Linthorne 2001, Komi 2003).
METHODOLOGY
Purpose of this study is to compare the landing impact during standing vertical jump on force
platform with an objective to find out the injury probable in different discipline. A total of 230
players from all the mentioned disciplines participated in the study. All the participants were part
of Sports Training Centre at Netaji Subhas National Institute of Sports (NSNIS), Patiala. Mean
weight and height of the participants are mentioned in table 1
Table 1: Number of players from each discipline with their body mass and height.
S. No. Discipline No. of Players Average Body mass (Kg) Average Height (cm)
1 Boxing 23 58.33 ± 13.19 167.3 ± 8.1
2 Fencing 61 62.38 ± 13.26 170.8 ± 7.5
3 Hockey 107 52.92 ± 9.20 164.2 ± 5.7
4 Wushu 39 48.94 ± 11.91 158.9 ± 4.3
Total 230 55.27 ± 12.23 165.3 ± 6.4
After finishing self-selected warm up for five minutes, players were instructed to perform
counter movement vertical jump (CMJ) on force platform. They were directed to perform CMJ
by keeping hands on their waist, so that the advantage of arm swing to generate momentum is
neglected and the jump is depended only on lower limb’s movements.
Peak vertical landing force (VGRF) was measured using data obtained from a force platform
(Kistler 9281EA, Switzerland) working with sampling frequency of 200Hz. Body Weight was
measured on the force plate, which was calibrated prior to each measurement. Peak vertical
landing force was obtained by identifying the highest value during the landing phase, which was
then normalize by body weight.
One-way analysis of Variance (ANOVA) was conducted to examine whether there was
significant difference among the groups. Significant effects were observed using Tukey post-hoc
test. An alpha level of p<0.05 was used as a criterion for significance in all statistical
comparisons.
FINDINGS AND RESULTS
The mean and Standard deviation (SD) of the results from CMJ are presented in Table 2. The
table shows the body weight of participants, maximum (peak) vertical force recorded while
landing and Landing Impact from different groups. Hockey players recorded minimum landing
impact followed by Wushu and Fencing. Players from Boxing recorded maximum landing
impact.
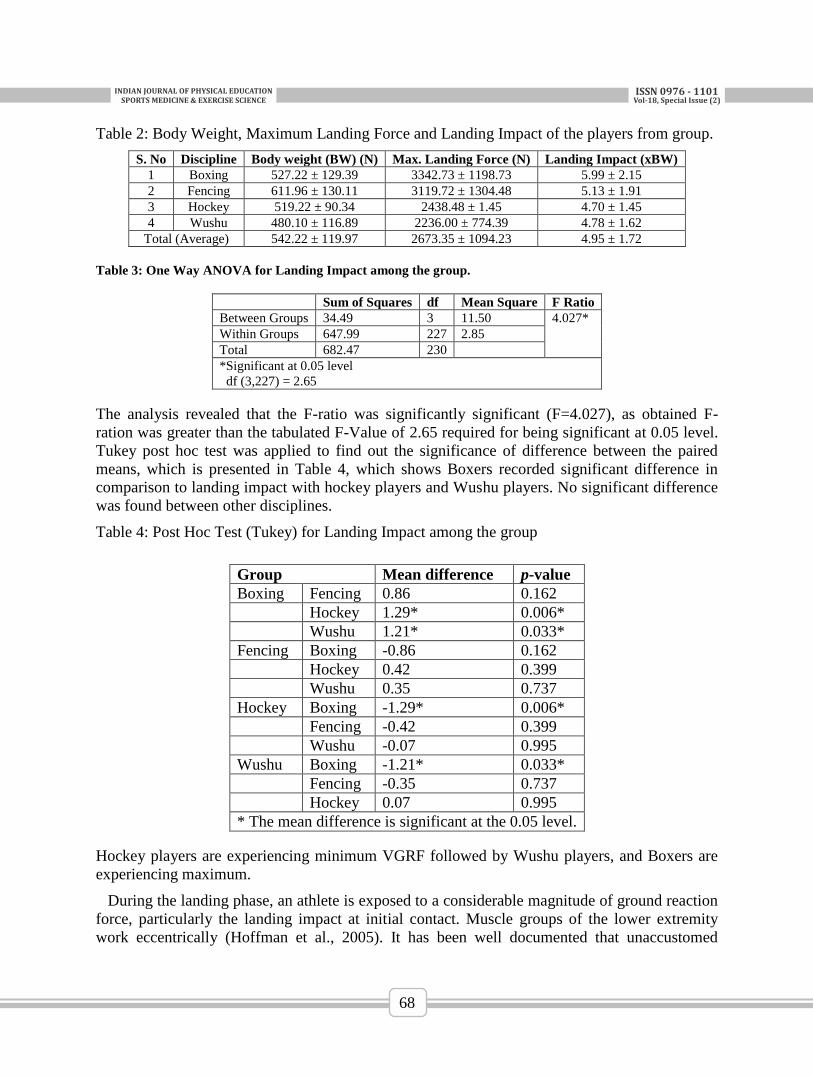
INDIANJOURNALOFPHYSICALEDUCATIONSPORTSMEDICINE&EXERCISESCIENCE
ISSN0976-1101Vol-18,SpecialIssue(2)
68
Table 2: Body Weight, Maximum Landing Force and Landing Impact of the players from group.
S. No Discipline Body weight (BW) (N) Max. Landing Force (N) Landing Impact (xBW)
1 Boxing 527.22 ± 129.39 3342.73 ± 1198.73 5.99 ± 2.15
2 Fencing 611.96 ± 130.11 3119.72 ± 1304.48 5.13 ± 1.91
3 Hockey 519.22 ± 90.34 2438.48 ± 1.45 4.70 ± 1.45
4 Wushu 480.10 ± 116.89 2236.00 ± 774.39 4.78 ± 1.62
Total (Average) 542.22 ± 119.97 2673.35 ± 1094.23 4.95 ± 1.72
Table 3: One Way ANOVA for Landing Impact among the group.
Sum of Squares df Mean Square F Ratio
Between Groups 34.49 3 11.50 4.027*
Within Groups 647.99 227 2.85
Total 682.47 230
*Significant at 0.05 level
df (3,227) = 2.65
The analysis revealed that the F-ratio was significantly significant (F=4.027), as obtained F-
ration was greater than the tabulated F-Value of 2.65 required for being significant at 0.05 level.
Tukey post hoc test was applied to find out the significance of difference between the paired
means, which is presented in Table 4, which shows Boxers recorded significant difference in
comparison to landing impact with hockey players and Wushu players. No significant difference
was found between other disciplines.
Table 4: Post Hoc Test (Tukey) for Landing Impact among the group
Group Mean difference p-value
Boxing Fencing 0.86 0.162
Hockey 1.29* 0.006*
Wushu 1.21* 0.033*
Fencing Boxing -0.86 0.162
Hockey 0.42 0.399
Wushu 0.35 0.737
Hockey Boxing -1.29* 0.006*
Fencing -0.42 0.399
Wushu -0.07 0.995
Wushu Boxing -1.21* 0.033*
Fencing -0.35 0.737
Hockey 0.07 0.995
* The mean difference is significant at the 0.05 level.
Hockey players are experiencing minimum VGRF followed by Wushu players, and Boxers are
experiencing maximum.
During the landing phase, an athlete is exposed to a considerable magnitude of ground reaction
force, particularly the landing impact at initial contact. Muscle groups of the lower extremity
work eccentrically (Hoffman et al., 2005). It has been well documented that unaccustomed
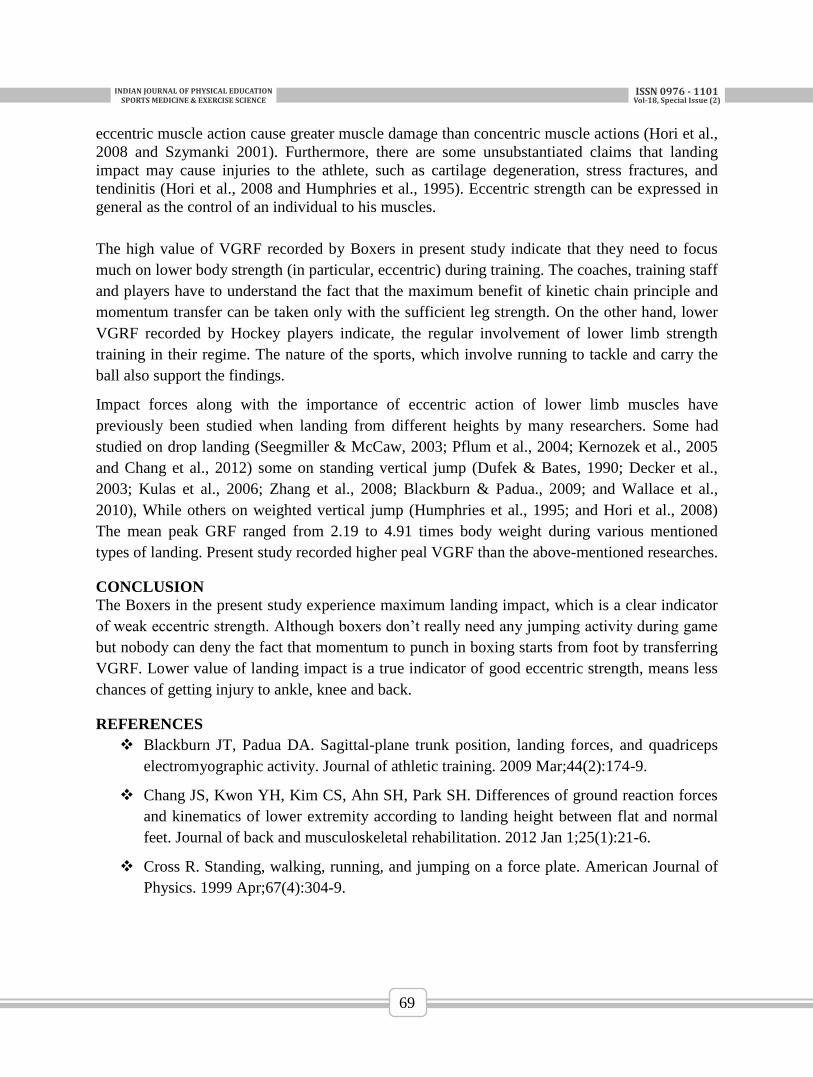
INDIANJOURNALOFPHYSICALEDUCATIONSPORTSMEDICINE&EXERCISESCIENCE
ISSN0976-1101Vol-18,SpecialIssue(2)
69
eccentric muscle action cause greater muscle damage than concentric muscle actions (Hori et al.,
2008 and Szymanki 2001). Furthermore, there are some unsubstantiated claims that landing
impact may cause injuries to the athlete, such as cartilage degeneration, stress fractures, and
tendinitis (Hori et al., 2008 and Humphries et al., 1995). Eccentric strength can be expressed in
general as the control of an individual to his muscles.
The high value of VGRF recorded by Boxers in present study indicate that they need to focus
much on lower body strength (in particular, eccentric) during training. The coaches, training staff
and players have to understand the fact that the maximum benefit of kinetic chain principle and
momentum transfer can be taken only with the sufficient leg strength. On the other hand, lower
VGRF recorded by Hockey players indicate, the regular involvement of lower limb strength
training in their regime. The nature of the sports, which involve running to tackle and carry the
ball also support the findings.
Impact forces along with the importance of eccentric action of lower limb muscles have
previously been studied when landing from different heights by many researchers. Some had
studied on drop landing (Seegmiller & McCaw, 2003; Pflum et al., 2004; Kernozek et al., 2005
and Chang et al., 2012) some on standing vertical jump (Dufek & Bates, 1990; Decker et al.,
2003; Kulas et al., 2006; Zhang et al., 2008; Blackburn & Padua., 2009; and Wallace et al.,
2010), While others on weighted vertical jump (Humphries et al., 1995; and Hori et al., 2008)
The mean peak GRF ranged from 2.19 to 4.91 times body weight during various mentioned
types of landing. Present study recorded higher peal VGRF than the above-mentioned researches.
CONCLUSION
The Boxers in the present study experience maximum landing impact, which is a clear indicator
of weak eccentric strength. Although boxers don’t really need any jumping activity during game
but nobody can deny the fact that momentum to punch in boxing starts from foot by transferring
VGRF. Lower value of landing impact is a true indicator of good eccentric strength, means less
chances of getting injury to ankle, knee and back.
REFERENCES
Blackburn JT, Padua DA. Sagittal-plane trunk position, landing forces, and quadriceps
electromyographic activity. Journal of athletic training. 2009 Mar;44(2):174-9.
Chang JS, Kwon YH, Kim CS, Ahn SH, Park SH. Differences of ground reaction forces
and kinematics of lower extremity according to landing height between flat and normal
feet. Journal of back and musculoskeletal rehabilitation. 2012 Jan 1;25(1):21-6.
Cross R. Standing, walking, running, and jumping on a force plate. American Journal of
Physics. 1999 Apr;67(4):304-9.
INDIANJOURNALOFPHYSICALEDUCATIONSPORTSMEDICINE&EXERCISESCIENCE
ISSN0976-1101Vol-18,SpecialIssue(2)
70
Decker MJ, Torry MR, Wyland DJ, Sterett WI, Steadman JR. Gender differences in
lower extremity kinematics, kinetics and energy absorption during landing. Clinical
biomechanics. 2003 Aug 1;18(7):662-9.
Dufek JS, Bates BT. The evaluation and prediction of impact forces during landings.
Medicine and Science in Sports and Exercise. 1990 Jun;22(3):370-7.
Hoffman JR, Ratamess NA, Cooper JJ, Kang JI. Comparison of loaded and unloaded
jump squat training on strength/power performance in college football players. Journal of
Strength and Conditioning Research. 2005 Nov 1;19(4):810.
INDIANJOURNALOFPHYSICALEDUCATIONSPORTSMEDICINE&EXERCISESCIENCE
ISSN0976-1101Vol-18,SpecialIssue(2)
71
COMPARATIVE STUDY ON SOCIAL SUPPORT
AMONG VARIOUS SPORTS OF MALE
AND FEMALE ATHLETES
Sushmita Choudhaury1, Rahul Sonava2, Shipra Srivastava3
1. Master degree (LNIPE, Gwalior), 2. Master degree (LNIPE, Gwalior), 3.PhD scholars (Lnipe Gwalior)
ABSTRACT:-
The purpose of the study is to measure the social support among the three format of sports and
also to see which factor is dominating in the support. In this study 60 male and female were
taken from various types of sports and their age group was 18-23 years. The statistical tool used
in the study was Two way ANNOVA and it is been found that there is no significant difference
among male and female social support but the significant difference is been found in the family
group support comparing to other and friend group and combative sports have significant
difference comparing to indigenous games. Similarly no significant difference found in
combative sports and water sports at 0.05 level.
INTRODUCTION:-
The laurence of any athletes not only depend on dedication, hard work and on the athlete own
self. The athlete is built by the social support aspect also in which his coaches, family, peer
group, other teachers and many more supports leads the athlete to the path of success. The social
support is one of the important phenomena which lead the athlete to build as a strong personality.
This social support enhances all the psychological strength which an athlete need during the
competition or in the bouts. The social support raise many psychological factors like confidence,
motivation level, need for achievement, focus and many more in an athlete. Social support is
highly required for achieving success as because success is highly dependent on social support.
METHOD:-
This study of social support was done on questionnaire called as Multidimensional Scale of
Perceived Social Support (MPSS) developed by Zimet, Dahlem, Zimet & Farley in 1988. The
questionnaire is having twelve questions and this questionnaire measures other support, family
support and friends support of an athlete. The study was conducted on 60 athletes , age group18-
23 years of LNIPE campus in which male and female athletes of combative sports, water sports
and indigenous games were taken. For the study statistical tool applied that is Two way
ANNOVA.
SCORING:-
The study is based on questionnaire called as Multidimensional Scale of Perceived Social
Support (MPSS) on 60 subjects.
To calculate mean scores:
Significant Other Subscale: Sum across items 1, 2, 5, & 10, then divide by 4.
Family Subscale: Sum across items 3, 4, 8, & 11, then divide by 4.
Friends Subscale: Sum across items 6, 7, 9, & 12, then divide by 4.
Total Scale: Sum across all
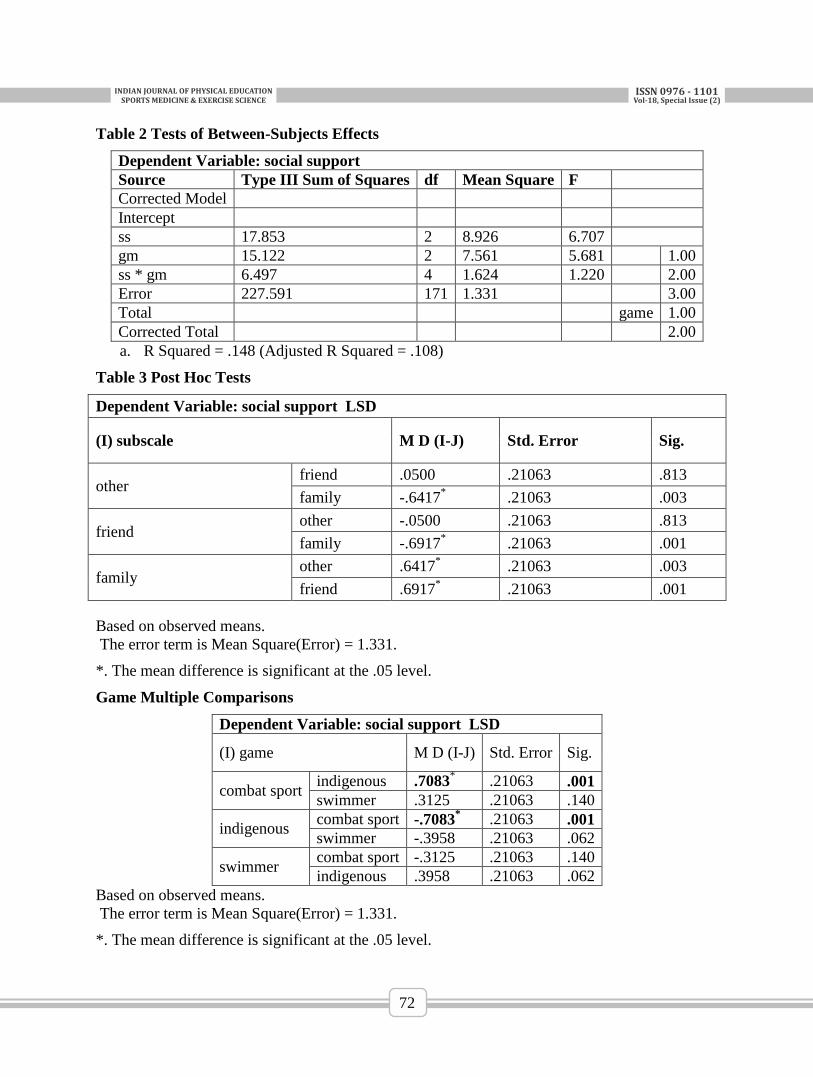
INDIANJOURNALOFPHYSICALEDUCATIONSPORTSMEDICINE&EXERCISESCIENCE
ISSN0976-1101Vol-18,SpecialIssue(2)
72
Table 2 Tests of Between-Subjects Effects
Dependent Variable: social support
Source Type III Sum of Squares df Mean Square F
Corrected Model
Intercept
ss 17.853 2 8.926 6.707
gm 15.122 2 7.561 5.681 1.00
ss * gm 6.497 4 1.624 1.220 2.00
Error 227.591 171 1.331
3.00
Total
game 1.00
Corrected Total
2.00
a. R Squared = .148 (Adjusted R Squared = .108)
Table 3 Post Hoc Tests
Dependent Variable: social support LSD
(I) subscale M D (I-J) Std. Error Sig.
other friend .0500 .21063 .813
family -.6417* .21063 .003
friend other -.0500 .21063 .813
family -.6917* .21063 .001
family other .6417
* .21063 .003
friend .6917* .21063 .001
Based on observed means.
The error term is Mean Square(Error) = 1.331.
*. The mean difference is significant at the .05 level.
Game Multiple Comparisons
Dependent Variable: social support LSD
(I) game M D (I-J) Std. Error Sig.
combat sport indigenous .7083
* .21063 .001
swimmer .3125 .21063 .140
indigenous combat sport -.7083
* .21063 .001
swimmer -.3958 .21063 .062
swimmer combat sport -.3125 .21063 .140
indigenous .3958 .21063 .062
Based on observed means.
The error term is Mean Square(Error) = 1.331.
*. The mean difference is significant at the .05 level.
INDIANJOURNALOFPHYSICALEDUCATIONSPORTSMEDICINE&EXERCISESCIENCE
ISSN0976-1101Vol-18,SpecialIssue(2)
73
DISCUSSION AND CONCLUSION:-
The study shows that the social support has significant difference in combative sports and
indigenous sports and significant difference is been seen in family support comparing to other
and friend group as because family plays vital role in any sportspersons life comparing to the
other factors and friend group. As it is been found that combative sports is having more
popularity in world level comparing to the indigenous games as indigenous games are not so
famous too. Similarly the interest towards the games also goes down as urbanization is reducing
the trends of indigenous games and increasing the trend of combative sports. The family support
is always high in comparison to friends and other factors. It is because a child is first closer to his
family than friends and others. And after being an athlete family is more supportive than friends
and other.
RECOMMENDATION:-
1. This study can be conducted on different format of sports like team games and individual
sports.
2. This study can be conducted on different age group athletes.
3. This study can be conducted on particular gender also.
4. This study can be done on elite level of athletes like international players or Olympians and
etc.
REFERENCE:-
Jarvie Grant (2012) Sport, Culture and Society: An Introduction, second edition
Routledge Taylor and Francis Group publication London and New York.
Prettyman Spickard Sandra, Lampman Brian (2011) Learning Culture through Sports:
Perspectives on Society and Organized Sports Rowman & Littlefield Publishers.
Houlihan Barrie, Malcolm Dominic Sport and Society: A Student Introduction
SAGE. Copyright.
INDIANJOURNALOFPHYSICALEDUCATIONSPORTSMEDICINE&EXERCISESCIENCE
ISSN0976-1101Vol-18,SpecialIssue(2)
74
KINEMATIC ANALYSIS OF BADMINTON CROSS COURT
DROP SHOT
Mottakin Ahmed1 and Pradeep Kumar
2
1. PhD Scholar L.N.I.P.E.Gwalior
2. T.G.T. Presidium Gurgaon
ABSTRACT
The motive of the study was to explore the difference of selected kinematic variables in cross
court drop shot of Badminton between Intermediate and advance players. Videography technique
was used in order to check the performance of the subjects in performing skill cross court Drop
Shot. The Nikon D- 3100 camera was used which has frequency is of 30 frames per second. The
videograph was taken in the horizontal (sagital) plan. Three trial were given out of three best
performance was selected the selected phases were taken out from the video by using Kinovea
8.23 software. Through the software, angle of knee joint, angle of ankle joint, is found out from
the photographic sequence. The best performance in cross court drop shot was used as the
criterion measure for the study. The data was analyzed by using independent t test (Verma, 2012,
p.311) is used to find out the difference of the selected kinematic variables with the performance
cross court drop shot in badminton. The biomechanical variables were consisting of selected
angular kinematic variables i.e. Angle of knee joint, angle of ankle joint during point of contact
of cross court drop shot in badminton. In result it was found that angle of ankle joint and knee
joint plays a significance role in cross court drop shot in Badminton
Key words: Cross court, Sagital Plan, Knee joint, Ankle joint, Kinovea
INTRODUCTION
The Science of Sports Biomechanics is the quantitative based scientific analyze of proficient
athletic sports. It is the study of scientific method and mechanic to study the effect of various
focuses on the sports performer. Research involves investigating and testing the things and
formulating new theories and principles at high level of sports performance researchers
associated with discipline of Biomechanics. In sports, people study the analysis and
interpretation of the performance of athletes. There emphasis is to know the reason of their high
performance. Since biomechanics is essentially the science of movement technique (Gerald,
1984, p.9). Badminton is a Racket game played with shuttlecock over a net. Badminton is a court
game may be played indoors or outdoors. Drop shot is the stroke which hit the shuttle ant it flies
over the net very smoothly and land in nearby net. It is one of the most useful overhead strokes
unlike the other two clear and smash, it is a airy stroke, relying on deception and touch, don’t
required more power, for its success.
METHODOLOGY
SELECTION OF SUBJECTS
Total ten no of male [N=10] badminton players out of which Five male [N=5] Right handed
Advance Badminton players (who represented intervarsity/state) and Five[N=5] male Right
handed intermediate badminton players who have been learning badminton since one year or
more(not played any tournament) of Lakshmibai National institute of Physical Education,
Gwalior from the Badminton match practice group were selected as the subject for the present
INDIANJOURNALOFPHYSICALEDUCATIONSPORTSMEDICINE&EXERCISESCIENCE
ISSN0976-1101Vol-18,SpecialIssue(2)
75
study and there range of mean age, mean height and mean weight were 19±.75 years,
169.9±4.55 cm and 63.4±6.55kg respectively.
EXPERIMENTAL FILMING PROTOCOL
Videography was used for the biomechanical kinematics analysis of Forehand cross court drop
shot. The camera that used for the study was a standard Nikon D3100 (with motor drive). The
video camera was organized on the tripod stand at the height of 1.05 mts. from the ground. The
video camera was placed perpendicularly at side line of badminton court the sagital plane at a
distance of 3.20 mts. The frequency of the camera was30 frames/second. The subjects performed
the skill three times and the best trail was used for the analysis.
FINDINGS
The results of the independent t test which were obtained in order to ascertain the difference of
selected angular kinematics variables i.e. Knee joint and Ankle joint are mentioned in table-1
Table-1: Descriptive statistic of selected angular kinematic variables of cross court drop shot
Variable
Std. Error
Group N Mean SD
Intermediate 5 165.20 10.23 4.57
KNEE JOINT
Advance
5 138.50 18.21 6.40
Intermediate 5 115.20 23.63 10.56
ANKLE JOINT
5 125.50 12.17 5.44
Advance 5
Table-1 reveals that mean and standard deviation of knee joint and ankle joint of Intermediate
Badminton players i.e., 165.20 ± 10.23, 115.20±23.63, and on the other hand mean and standard
deviation of Advance badminton players i.e., 138.50 ± 18.21, 125.80 ± 12.17, respectively. The
mean differences of both the group are also graphically represented in figure 1:
Table-2: comparative study of selected angular kinematic variables with cross court drop shot
Variables Levine’s Test for t-test for equality of Means
Equality of variance
F sig T df p-value
Knee joint 0.227 0.64 2.66 8 0.027*
Ankle joint 0.218 0.64 2.83 8 0.024*
The finding of table-3 showed the outcome of the Levine’s Test for Equality of Variances for the
homogeneity of the variance within group in which significance value in case of all angular
INDIANJOURNALOFPHYSICALEDUCATIONSPORTSMEDICINE&EXERCISESCIENCE
ISSN0976-1101Vol-18,SpecialIssue(2)
76
kinematic variable is greater than the level of significance [p>0.05] so in that case all selected
variables were not violated.
The outcome of the t test for equality of means in case all angular kinematics variable is less than
the level of significance [p<.05].researcher may conclude that null hypothesis is rejected at 5%
as t-value is significant. Hence researcher can reveal that angle of knee joint and angle ankle
joint plays significant role in to execute the cross court drop shot
DISCUSSIONS OF FINDINGS
The finding showed, the Angular kinematic variables showed significant difference in between
the angle at knee and ankle joint. It could be understood that to deliver cross court drop shot one
has to extend the knee joint and ankle joint which increases the lever of human body more the
height better the performance. Although, there is a significant difference between both (Knee
joint angle and Ankle joint) the variables but, it cannot be concluded that the angle at knee and
ankle joint is only the dominating factor to influence performance. So many other factors
mentioned above influence the technique of this particular skill directly or indirectly
REFFERENCES
Kurdson, D., “Fundamental of Biomechanics.” United Kingdom: Plenum Publisher.
(2003) pp.6-7.
Hochmuth, G., “Biomechanics of athletic Movement.” Sportsverloug; Berlin (1984) p.9.
Brahm, et al.,“Badminton hand book’’ Myer & Myer; UK (2010) pp.1-14.
Miller, D. et al.,“Biomechanics of Sports.” Henry Kempton; London (1973) pp. 119-120
James, G. H.,“The Biomechanics of Sports Techniques.” Englewood Cliffs N.J: Prentice
Hall Inc; UK (1993) p. 2.
Hussain, I., et al.”Video graphical analysis of short service in badminton.” Journal of
Education and Practice. 2(2), 2015: 104-111
Nagasa, et al.,”Smash motion analysis for Badminton from image” Processing of the
image electronic and visual computing workshop, kuching Malaysia (2012)
Huang, et al., “Analyze the performance of three different backhand overhead strokes.”
International journal of sports biomechanics. 2(3), 2006: 123-125
INDIANJOURNALOFPHYSICALEDUCATIONSPORTSMEDICINE&EXERCISESCIENCE
ISSN0976-1101Vol-18,SpecialIssue(2)
77
A COMPARATIVE STUDY OF GROUP COHESION BETWEEN
WINNERS OF WEST ZONE INTERVARSITY AND ALL INDIA
INTER ZONAL WOMENS FOOTBALL TEAMS
Ms Tenzing Norzom Bhutia, Ms Shweta Sen
ABSTRACT
The study was frame to compare the team cohesiveness between the women footballers, winners
of the West Zone Intervarsity and All India Inter Zonal (2017-18) teams. The subjects of the
study were the teams who procured the position of 1st,2
nd and 3
rd in the above tournament. The
study consisted of total 100 subjects (50 West Zone Intervarsity medalist and 50 All India Inter
Zonal medalist) with age ranges from 17-24 years (mean and standard deviation = 20.03 ±1.3).
Team cohesion was gauged by using the Group Environment Questionnaire (GEQ) by Lawrence
R. Brawley, Albert V. Carron and W. Neil Widmeyer (1987) . The descriptive statistic and
independent t-test was used as the statistical tool at 0.05 level of significance. The result of the
study showed that winners of the All India Inter Zonal team have higher team cohesion than the
winners of West Zone Intervarsity women footballers. Thus explaining that the team
performance does matter with the level of team cohesion and that it is one of the contributory
factors for achieving the victory.
INTRODUCTION
Teamwork is essential to life. It blends the talent and strength of individuals (Pat Riley,
Basketball Coach). Group cohesion is how much individuals need to add as an individual to the
gathering 's capacity to proceed as a work unit. Cohesiveness develops over time out of
interpersonal and group-level attraction, through collaboration, and as a result of a sense of
belonging. Where the word cohesion itself means sticking together. Festinger et al. (1950)
defined group cohesion as the sum of forces that influence members in whether to remain part of
a group. In sports it is a well established principle that a group with its individuals working
together is far more effective than the same individuals working independently of one another
(Cox 2000). A renounced Sport Psychologist defines group cohesion as “a dynamic process
which is reflected in the pursuit of goal” (Carron 1982). Within this, there are two further
dimensions of cohesion:
Task cohesion: the degree to which members of a team work together to achieve a specific and
identifiable goal.
Social cohesion: the degree to which members of a team like each other and enjoy
personal satisfaction from being members of the team.
While we talk of cohesion in team sport, football, the game played by eleven playing members
on each side usually is built with 20 plus members. In such sport with a team consisting many
individuals training together to achieve a common goal has to have positive attitude towards one
another and the goal to become successful. The well quoted line by Michael Jordan “talent wins
games, but teamwork and intelligence wins championships” amplifies the concept and necessity
of a good combination of task cohesion and social cohesion the dimensions stated above. Studies
so far has revealed the relationship of team cohesion and performance is positive but its
difference at certain level is rarely compared. Thus, the present study aim at comparing the team
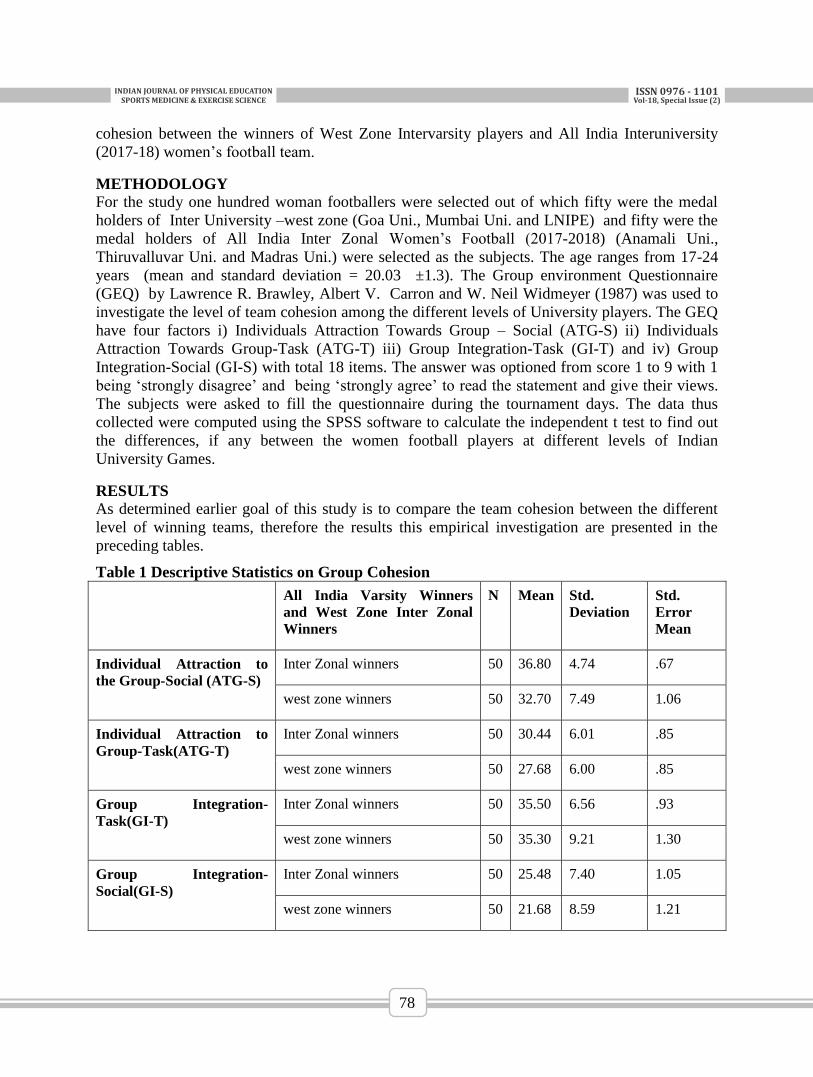
INDIANJOURNALOFPHYSICALEDUCATIONSPORTSMEDICINE&EXERCISESCIENCE
ISSN0976-1101Vol-18,SpecialIssue(2)
78
cohesion between the winners of West Zone Intervarsity players and All India Interuniversity
(2017-18) women’s football team.
METHODOLOGY
For the study one hundred woman footballers were selected out of which fifty were the medal
holders of Inter University –west zone (Goa Uni., Mumbai Uni. and LNIPE) and fifty were the
medal holders of All India Inter Zonal Women’s Football (2017-2018) (Anamali Uni.,
Thiruvalluvar Uni. and Madras Uni.) were selected as the subjects. The age ranges from 17-24
years (mean and standard deviation = 20.03 ±1.3). The Group environment Questionnaire
(GEQ) by Lawrence R. Brawley, Albert V. Carron and W. Neil Widmeyer (1987) was used to
investigate the level of team cohesion among the different levels of University players. The GEQ
have four factors i) Individuals Attraction Towards Group – Social (ATG-S) ii) Individuals
Attraction Towards Group-Task (ATG-T) iii) Group Integration-Task (GI-T) and iv) Group
Integration-Social (GI-S) with total 18 items. The answer was optioned from score 1 to 9 with 1
being ‘strongly disagree’ and being ‘strongly agree’ to read the statement and give their views.
The subjects were asked to fill the questionnaire during the tournament days. The data thus
collected were computed using the SPSS software to calculate the independent t test to find out
the differences, if any between the women football players at different levels of Indian
University Games.
RESULTS
As determined earlier goal of this study is to compare the team cohesion between the different
level of winning teams, therefore the results this empirical investigation are presented in the
preceding tables.
Table 1 Descriptive Statistics on Group Cohesion
All India Varsity Winners
and West Zone Inter Zonal
Winners
N Mean Std.
Deviation
Std.
Error
Mean
Individual Attraction to
the Group-Social (ATG-S)
Inter Zonal winners 50 36.80 4.74 .67
west zone winners 50 32.70 7.49 1.06
Individual Attraction to
Group-Task(ATG-T)
Inter Zonal winners 50 30.44 6.01 .85
west zone winners 50 27.68 6.00 .85
Group Integration-
Task(GI-T)
Inter Zonal winners 50 35.50 6.56 .93
west zone winners 50 35.30 9.21 1.30
Group Integration-
Social(GI-S)
Inter Zonal winners 50 25.48 7.40 1.05
west zone winners 50 21.68 8.59 1.21
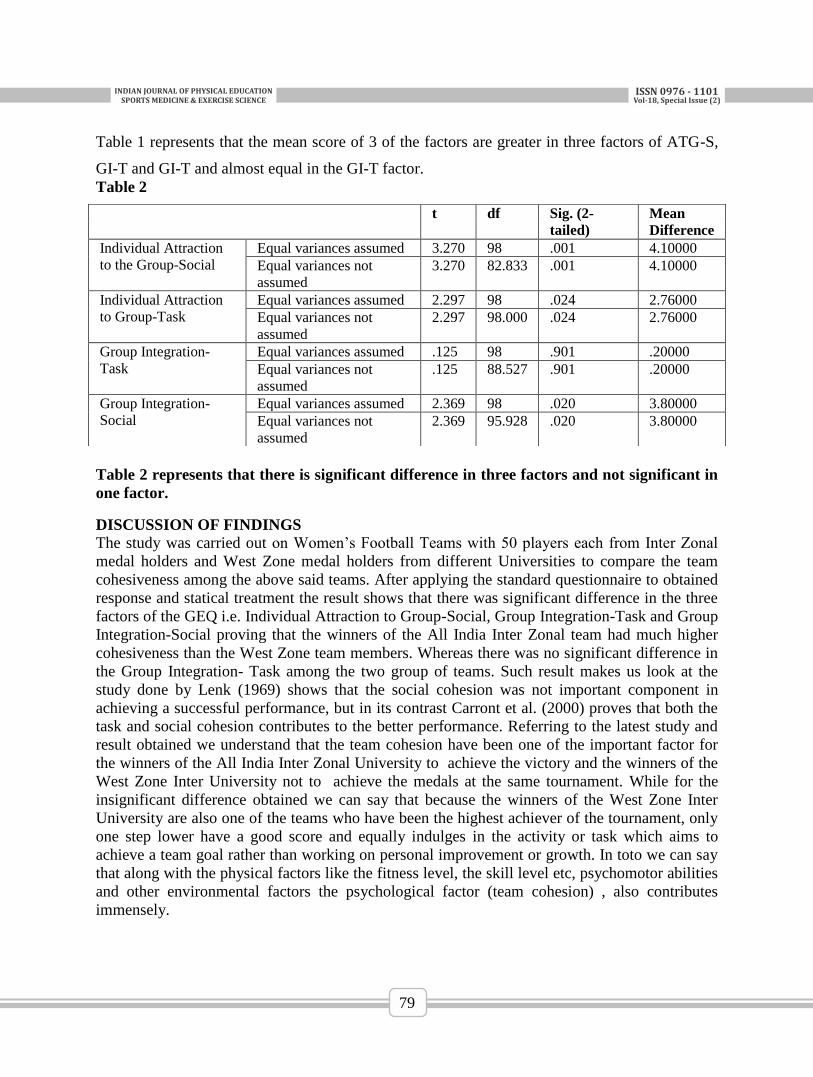
INDIANJOURNALOFPHYSICALEDUCATIONSPORTSMEDICINE&EXERCISESCIENCE
ISSN0976-1101Vol-18,SpecialIssue(2)
79
Table 1 represents that the mean score of 3 of the factors are greater in three factors of ATG-S,
GI-T and GI-T and almost equal in the GI-T factor.
Table 2
Table 2 represents that there is significant difference in three factors and not significant in
one factor.
DISCUSSION OF FINDINGS
The study was carried out on Women’s Football Teams with 50 players each from Inter Zonal
medal holders and West Zone medal holders from different Universities to compare the team
cohesiveness among the above said teams. After applying the standard questionnaire to obtained
response and statical treatment the result shows that there was significant difference in the three
factors of the GEQ i.e. Individual Attraction to Group-Social, Group Integration-Task and Group
Integration-Social proving that the winners of the All India Inter Zonal team had much higher
cohesiveness than the West Zone team members. Whereas there was no significant difference in
the Group Integration- Task among the two group of teams. Such result makes us look at the
study done by Lenk (1969) shows that the social cohesion was not important component in
achieving a successful performance, but in its contrast Carront et al. (2000) proves that both the
task and social cohesion contributes to the better performance. Referring to the latest study and
result obtained we understand that the team cohesion have been one of the important factor for
the winners of the All India Inter Zonal University to achieve the victory and the winners of the
West Zone Inter University not to achieve the medals at the same tournament. While for the
insignificant difference obtained we can say that because the winners of the West Zone Inter
University are also one of the teams who have been the highest achiever of the tournament, only
one step lower have a good score and equally indulges in the activity or task which aims to
achieve a team goal rather than working on personal improvement or growth. In toto we can say
that along with the physical factors like the fitness level, the skill level etc, psychomotor abilities
and other environmental factors the psychological factor (team cohesion) , also contributes
immensely.
t df Sig. (2-
tailed)
Mean
Difference
Individual Attraction
to the Group-Social
Equal variances assumed 3.270 98 .001 4.10000
Equal variances not
assumed
3.270 82.833 .001 4.10000
Individual Attraction
to Group-Task
Equal variances assumed 2.297 98 .024 2.76000
Equal variances not
assumed
2.297 98.000 .024 2.76000
Group Integration-
Task
Equal variances assumed .125 98 .901 .20000
Equal variances not
assumed
.125 88.527 .901 .20000
Group Integration-
Social
Equal variances assumed 2.369 98 .020 3.80000
Equal variances not
assumed
2.369 95.928 .020 3.80000
INDIANJOURNALOFPHYSICALEDUCATIONSPORTSMEDICINE&EXERCISESCIENCE
ISSN0976-1101Vol-18,SpecialIssue(2)
80
REFERENCES
Cox H. Richard (2000) ‘ Sport Psychology Concepts and Applications’, 5th
edition,
McGraw-Hill Humanities pp 329-335.
Onojaife Lauran, Kevin Pietersen: The Importance of team cohesion.
http://believeperform.com/coaching/teambuilding/kevin-pietersen-the-importance-of-
team-cohesion/
Brawley Lawrence R., Carron Albert and Widmeyer W. Neil (1987,9), Assessing the
Cohesion of Teams: Validity of the Group Environment Questionnaire.
https://pdfs.semanticscholar.org/2b09/36579dec31e77580ce61b4af53cf15d81073.pdf
Lumen, Boundless Management. Factors Influencing Team Performance.
https://courses.lumenlearning.com/boundless-management/chapter/factors-influencing-
team-performance/
Jarvis Matt (2004) ‘Sport Psychology’, Routledge Taylor and Francis Group London and
New York pp 89-94.
Weinberg Robert S., Gould Daniel (2015), ‘Foundations of Sport and Exercise
Psychology’, Human Kinetics pp 175-197.
Singh Agayajit (2013) ‘Sport Psychology for Coaches’, Khel Sahitya Kendra pp 277-280.
INDIANJOURNALOFPHYSICALEDUCATIONSPORTSMEDICINE&EXERCISESCIENCE
ISSN0976-1101Vol-18,SpecialIssue(2)
81
PHYSIOLOGICAL PROFILE OF YOUNG INDIAN JUDOKAS
Subrata Dey1, Anupal
1, Snehangshu Biswas
2, Neha
3, Tambi Medabala
4
1.Research Fellow, 2. Junior Scientific Assistant, 3. Scientific Assistant , 4. Junior Scientific Officer
ABSTRACT
This study was the level of aerobic fitness and anaerobic power of young well trained judo
players. Judo is a weight-classified, high-intensity combat sport where the athlete attempts to
throw the opponent onto his/her back or to control him/her during groundwork combat. Total
twenty (N=20), (male-10; height 173.19±6.73cm, weight 78.04±15.06kg) and (female=10;
height 159.69 ±5.43cm, weight 59.11±7.95kg) volunteers were taken from sports person
belonging to Centre of excellence (COE) inmates of Netaji Subhas National Institute of Sports,
Patiala. All the volunteers were in the age range of 18 to 28years.Aerobic fitness test by measure
20 m shuttle run test. Running based Anaerobic test (RAST) was used to measure the anaerobic
power of the players. Results indicated that the mean (SD) of relative maximum oxygen
consumption VO2 max (ml/kg/min) of judo male 55.22±4.8. But in the case of female combative
40.83 ±7.81. And the anaerobic power indexes (watts) like maximum power, minimum power
and average power was less as per international level. Fatigue index (FI) was also assessed.
Keywords: Combat sport, VO2 max, anaerobic power, fatigue index, training adaptation, judo
performance
INTRODUCTION
Competitive judo demands high-intensity intermittent actions, in which optimal physical
attributes are necessary in order to achieve technical-tactical development and success in combat
(Bohnnon, J. 2012 and Franchini et al., 2001). Actually, high training loads, which require
successful and coordinated actions, are applied to judokas in order to achieve high sport’s
performance. Since judo is a sport including weight categories (Artioli G et al., 2010) a major
training goal is the achievement of an optimal weight through the combination of restricted diet
and aerobic training, usually aiming to decrease fat mass rapidly (De Cree et al., 1993).
Competitive success in combat sports which originate from ancient skills such as judo, depends
on several factors among which we also find physiological characteristics.
The aerobic power (VO2 max) and capacity (indirectly evaluated by metabolic or ventilatory
thresholds) are considered relevant to the judo performance (Franchini et al., 2007; Muramatsu et
al.,1994), although conflicting evidence has been published concerning the influence of the
aerobic fitness variables on the judo-related performance (Borkowsky et al., 2001; Franchini et
al., 2005).
METHODOLOGY
SELECTION OF SUBJECTS
The study was conducted on total twenty (N=20), (male-10; height 173.19±6.73cm, weight
78.04±15.06kg) and (female=10; height 159.69 ±5.43cm, weight 59.11±7.95kg) judo players.
The volunteers were taken from sports person belonging to Centre of excellence (COE) inmates
of Netaji Subhas National Institute of Sports, Patiala. All the volunteers were in the age range of
18 to 28 years. The measurements of morphological variables were done by adopting the
standard procedure.
INDIANJOURNALOFPHYSICALEDUCATIONSPORTSMEDICINE&EXERCISESCIENCE
ISSN0976-1101Vol-18,SpecialIssue(2)
82
MEASUREMENT PHYSIOLOGICAL PARAMETERS:
The physiological parameters like maximum aerobic capacity (VO2 max, ml/kg/min), and the
Anaerobic power parameters (watts) that is maximum power (Pmax), average power (Pavg.),
minimum power (Pmin) and fatigue index (FI) were also assessed.
The participants were subjected to 20 m. shuttle run test for indirect evaluation of their VO2 max
(Leger & Lambert, 1982). Running based Anaerobic test (RAST) was conducted as per standard
protocol to measure the anaerobic power (Adamczyk, 2011) of the judo players. All the values of
physical, physiological were expressed as mean and standard deviation.
RESULTS AND DISCUSSION
Descriptive statistics of the anthropometric characteristics; age (year), height (cm) and weight
(kg) of young judokas are shown in Table 1. The mean Decimal age of male is 19.4±1.57 years
and for female is 21.8 ± 2.89 years. Which ranges from 18 to 28 years. The mean height of male
and female judokas are 173.19±6.73 cm 159.69±5.43 cm respectively. Whereas the weight of the
male and female judokas are 78.04±15.06 kg and 59.11±7.95 kg respectively.
Table 1: Mean and SD of physical parameters of male & female Judokas
AEROBIC CAPACITY
Maximal oxygen uptake (VO2 max) has been used as a measure of aerobic capacity in male and
female judokas.Results of the present study indicated that the mean (SD) of Relative maximum
oxygen consumption (VO2 max, ml/kg/min) of male judo players 55.22±4.8. But in the case of
female 40.83±7.81. The literature has reported VO2 max values between 43 and 65 ml/kg/min
(Aziz A et al., 2002). Male judokas had higher VO2,max values from 44–64 ml/kg/min than
females from 43–53 ml/kg/min) [De Cree et al., 1995; Degoutte F et al., 2004; Callister R et al.,
1991; Degoutte F et al., 2003 ]. This may be due to the nature of judo training, which is more
anaerobic rather than aerobic and does not consist to fan exercise stimulus for improvement of
the high level of VO2 max.
Table 2: Mean and SD of VO2 max (ml/kg/min) of male & female Judokas
Although the aerobic profile of judokas has been well documented by the aforementioned
studies, the chronic adaptations of aerobic capacity to judo training were less studied [De Cree et
al., 1995; Callister R et al., 1991 ]. There was a study supporting that judo training might induce
an increase of VO2max, where De Cree et al., reported a significant increase of VO2 max after
Subject Age (years) Height (cm) Weight (kg)
MALE (n=10) 19.4±1.57 173.19±6.73 78.04±15.06
FEMALE (n=10) 21.8±2.89 159.69±5.43 59.11±7.95
Subject VO2 Max ml/kg/min
MALE (n=10) 55.22±4.80
FEMALE (n=10) 40.83±7.81
INDIANJOURNALOFPHYSICALEDUCATIONSPORTSMEDICINE&EXERCISESCIENCE
ISSN0976-1101Vol-18,SpecialIssue(2)
83
six weeks of judo training in woman around 17–29 years. According to Tanaka 1993 there are
fewer reports in the literature of elite female cyclists, however VO2 max values have been
reported to be in the range of 3.05 L.min-1
to 3.52 L.min-1
.
Sbriccoli et al., (2007) studied on elite judo players. In their study the VO2 max of elite judo
competitor has been reported to be varying from 50 to 60 ml/kg/ min.
ANAEROBIC POWER
Combat category sports require fast and quick movements coupled with repeated fast punching
in boxing and explosive action in judo and therefore rely more on anaerobic power, followed by
intermittent sports (Football and Hockey), which require repeated short and long sprints and
explosive power.
Table 3 : Mean and SD anaerobic power parameters of male & female Judokas
Subject Anaerobic power parameters
Maximum power
(watts)
Minimum power
(watts)
Average power
(watts)
Fatigue
Index
MALE (n=10) 602.78±102.23 347.55±114.50 464.92±93.83 6.94±1.70
FEMALE
(n=10) 354.19±57.72 178.66±33.62 269.72±36.27 4.35±1.53
In the present study, the anaerobic power parameters (watts) for male judokas viz maximum
power, minimum power and average power were found 602.78±102.23, 347.55±114.50,
464.92±93.83 respectively. Whereas for the female judokas anaerobic power parameters (watts)
viz maximum power, minimum power, average power were found 354.19±57.72, 178.66±33.62,
and 269.72±36.27 respectively.
Anaerobic power reflects the ability of the adenosine triphosphate and phosphocreatine (ATP-
PCr) energy pathways to produce energy for muscle contraction. Studies by Sharp and
Koutedakis (1987) examined anaerobic power and capacity in elite gymnasts, rowers and judo
athletes. Several studies by Cipriano, (1993); Wolach, et al, (2000); Degoutte et al, (2003); have
looked at the physiological responses to a single judo contest but in reality, to become a
successful judo athlete, several judo contests must be fought in succession.
The fatigue index for both male and female judokas were found 6.94±1.70 and 4.35±1.53, which
is seems to be optimum. Fatigue index indicates the rate at which power declines for the athlete.
A low value (<10) indicates the ability for the athlete to maintain anaerobic performance. A high
fatigue index value (>10) indicates the athlete may need to focus on improving their lactate
tolerance.
CONCLUSION
The evaluation of physiological characteristics is an important part of the training process
because it gives information about the variables that need improvement and about the
effectiveness of a given training program. Physiological testing is commonly used to assess the
overall fitness level of the athletes and to set guidelines for individualized training. Athough
anaerobic power and aerobic capacity are considered relevant to judo performance, the available
INDIANJOURNALOFPHYSICALEDUCATIONSPORTSMEDICINE&EXERCISESCIENCE
ISSN0976-1101Vol-18,SpecialIssue(2)
84
data do not present differences among judo athletes from different competitive levels. So further
study is recommended with the large sample size so that physiological characteristics at
competitive levels can be compared. The values shown in this study are vital for training control.
It collaborates with the planning of training and maintaining the health of judokas. Coaches can
consider directions and guidelines; and can serve as support for their workouts. Physiological
parameters particularly anaerobic power and aerobic capacity interplay crucial role to find out
the relevant outcome of training and degree of adaptation in the Judokas.
REFERENCES:
Adamczyk, J. G (2011).The estimation of the RAST test usefulness in monitoring the
anaerobic capacity.The usefulness of the RAST test in athletics. Polish Journal of Sport
and Tourism, 18, 214-223.
Artioli, G.; Franchini, E.; Nicastro, H.; Sterkowicz, S.; Solis, M.Y.; Lancha, A.H. The
need of a weight management control program in judo: A proposal based on the
successful case of wrestling. J. Int. Soc. Sports Nutr. 2010, 7, 1–5. [CrossRef] [PubMed]
Aziz, A.; Tan, B.; Teh, K.C. Physiological responses during matches and profile of elite
pencak silat exponents. J. Sport Sci. Med. 2002, 1, 147–155.
Bohannon, J. The science of judo. Science 2012, 335, 1552.
Bonitch-Góngora, J.G.; Bonitch-Domínguez, J.G.; Padial, P.; Feriche, B. The effect of
lactate concentration on the handgrip strength during judo bouts. J. Strength Cond. Res.
2012, 26, 1863 1871. [CrossRef] [PubMed]
INDIANJOURNALOFPHYSICALEDUCATIONSPORTSMEDICINE&EXERCISESCIENCE
ISSN0976-1101Vol-18,SpecialIssue(2)
85
EFFECT OF PHYSICAL EXERCISE ON LIPIDS IN WOMEN
1Diksha Deshbhartar ,
2Aparna Rathi,
3Dr. Deepak Sharma
ABSTRACT
In this period of urbanisation it is well known fact that sedentary lifestyle leads to a poor
cardiovascular health .To investigate the effect of physical exercise on lipids, a moderate activity
program including walking, jogging, weight training and flexibility exercises was prepared for
women aging 30-39 years of age. Blood samples were collected from 10 women volunteers with
higher LDL before prescribing and starting the training schedule for six months and also after
completing the training schedule after six months. The investigation of lipids LDL, VLDL, TG,
TC and HDL was done from the blood samples. Descriptive statistics T-Test was used to
compare the mean .The level of significance was at p<0.05 and the calculations were done with
SPSS 17 software. The present study shows that regular physical exercises play a significant role
on controlling cholesterol level in women.
KEY WORDS –Lipids, Descriptive statistics, Cholesterol.
INRODUCTION
LIPIDS profile or lipid panel is a panel of blood tests that serves as an initial broad medical
screening tool for abnormalities in lipids, such as cholesterol and triglycerides. The lipid profile
typically included:
Low density lipoprotein (LDL)
High density lipoprotein (HDL)
Triglycerides
Total cholesterol
There are number of factors that influence the cholesterol and lipid profile of an individual such
as age, gender, genetic makeup, environment, diet, smoking, alcoholism, lifestyle and
menopausal status in women. Endurance trained athletes have much higher HDL-C values
compared to sedentary population (Haskell,1984). Cross sectional studies confirm that active
women have higher HDL-C levels than their sedentary counterparts. Apparently, the duration
and frequency of aerobic exercise may be more important in altering HDL-C than the intensity of
the exercise. However, because of exogenous hormone use, contraceptive use, alcohol
consumption, and age, the specific exercise recommendations for increasing HDL-C have yet to
be determined (Taylor and ward,1993).
METHODOLOGY
SUBJECTS-10 women volunteers for they were taken from Gwalior, M.P who had history of
higher LDL. Individuals with history of previous surgery hypertension, asthma, diabetes,
musculoskeletal disorders excluded. Fitness certificates from registered practitioners were
obtained from volunteers before starting up the exercise schedule.
ADMINISTRATION OF TEST-The blood samples from these volunteers were taken after
twelve hours of fasting initially as controlled and then after six months practicing the one hour
INDIANJOURNALOFPHYSICALEDUCATIONSPORTSMEDICINE&EXERCISESCIENCE
ISSN0976-1101Vol-18,SpecialIssue(2)
86
training program of moderate intensity or measuring lipid profile. Height, weight and blood
pressure were also being measured.
TRAINING PROTOCOL-The exercise program was designed to moderate intensity including
aerobic and resistance training activities. The heart rate of 50%-75%of heart rate of maximum
reserve for the duration of 40 min. ,5 days/week were maintained.
FINDINGS AND RESULTS:
Significant difference was found with mean and S.D before exercise and after exercise of LDL –
175.1_30.5 & 172.0 & 32.3 , HDL – 35.7_3.7 & 36.8_4.0 ,VLDL- 23_4.5 & 19.5_4.1, TC-
175.1_30.5 & 172.0_32.3,Triglycerides- 113.6_23.7 &103.9 & 24 respectively shown in table 1
Table 1.
*p-value-0.05[ level of significance]
The volunteers competed the exercise protocol for a period of 24 weeks/6 months to participate
in the study. The group was 30-39 years. Table shows the significant changes (p<0.05) in lipid
parameters before and after moderate intensity exercise . The heart rate maximum is also
responsible for the minimum duration it has to be maintained for the desired results and
metabolic activity for maximum oxygen consumption. Studies comparing aerobic and resistance
exercise have observed a significant changes in VLDL and HDL only with aerobic exercise
observed by Taylor , P.A & Ward, A (1993). Although standard management of abnormal blood
lipids id drug therapy and diet, seems prudent to incorporate aerobic exercise as an important
component of a healthy lifestyle. In certain individual, drug therapy may be decreased in dosage
or perhaps discontinued in the patient who is “exercise trained,” especially if there is associated
weight loss (Trejo -Gutierrez JF Fletcher G). However other studies also shows remarkable
change in lipid profile performing high intensity exercises.
CONCLUSION:
There was no significant difference was found between age groups but there was significant
change found between before and after moderate intensity exercise program was introduced for
six months 5 days/week. Moderate intensity exercise alone is sufficient in reducing the lipids and
blood pressure.
Variables Before exercise Value Mean_ SD After exercise
Values Mean _SD
TOTAL CHOLESTEROL 175.1_30.5 172.0±32.3
LDL CHOLESTEROL 123.2 ±28.3 114.7±27.0
HDL CHOLESTEROL 35.7±3.7 37.5±3.9
VLDL CHOLESTEROL 23±4.5 19.5±4.1
TRIGLYCERIDES
113.6±10.5 103.9±24
INDIANJOURNALOFPHYSICALEDUCATIONSPORTSMEDICINE&EXERCISESCIENCE
ISSN0976-1101Vol-18,SpecialIssue(2)
87
REFERENCES
Haskell, W. L.(1984).The influence of exercise on the concentration of Triglycerides and
cholesterol in human plasma. Exercise and sport sciences Reviews,12,205-244.
Taylor, P. A., & Ward, A. (1993).Women, high-density lipoprotein cholesterol, and
exercise. Archives of Internal Medicine,153,1173-1184.
Trejo-Gutierrez, JF & Fletcher, G Impact of exercise on blood lipids and lipoproteins. J
Clin Lipidol . 2007 Jul;1(3):175-81.doi;10.1016/j.jacl.2007.05.006. Epub 2007 jun.
Busby J, Notelovitz M, Putney K,Grow T. Exercise, high-density lipoprotein cholesterol,
and cardiorespiratory function in climacteric women. South Mes J. 1985;78:769.
Cauley JA, Kriska AM, LePorte RE, Sandler RB, Pambianco G. A two year randomised
exercise trial in older women: Effects on HDL cholesterol. Atherosclerosis.1987;66:247.
Davison RCR ,Grant S. The physiological effect of a 14 week walking programme on
sendentary middle-aged women. J Sports Sci. 1995;13:24.
Duncan JJ, Gordon NF, Scott CB. Women walking for health and fitness. JAMA.
1991;266:3295.
INDIANJOURNALOFPHYSICALEDUCATIONSPORTSMEDICINE&EXERCISESCIENCE
ISSN0976-1101Vol-18,SpecialIssue(2)
88
Elderly Nutrition, Life Style And Management
Nripendra Mani Sharma (Research Scholar , Dept. Of Health Education, Lnipe Gwalior)
Dr Brij Kishore Prasad (Asst. Professor , Dept. Of Health Education , Lnipe Gwalior)
ABSTRACT
Purpose of the article is to determine the specific nutrition needs for the older adults in the
society. These needs can be easily fulfilled with the help of a well organized and balanced
dietary pattern to be taken into consideration . While initial planning it must be observed that
these nutrients be proportioned in such a way that each micro and macro nutrients equally
balances with proper exercise. It further deals with the management of proper diet considerations
in such a way that it does not results in any harmful effects or complications. Therefore in
modern scenario there is a need of such enthusiastic and overwhelming programmes that in this
stage of life. It could help older people to stay healthy , maintain physical fitness and enjoy the
quality of life to its fullest possible without any infirmity and disease
Keywords : Nutrition , Older Adults , Exercise ,Management and Proper Diet .
INTRODUCTION :
Winston Churchil said “Healthy citizens are the greatest asset any country can have”
Old Age is probably the greatest challenge that an individual faces. The body ages as minutes
and heartbeats tick away butthe individual differences in the rate of aging are great. Many
factors determine the Health and Longevity of People. Individuals have little or no control over
their heredity.Growth and Atrophy are processes that are present in the human body at all times.
During youth , growing is decidedly in ascent, whereas Atrophy is most promiment in the aged.
However the rate of Atrophy varies with each individual , depending on his or her Nutrition,
Mental Health, Heredity or seriousness of any diseases & infections, Fatigue & General Health .
Specific Nutrients demand / caloric intake depends upon activity of individual. Nutrition is the
process of consuming , absorbing and using nutrients needed by the body for Growth ,
Development & Maintenance of Life . Nutrients are chemicals substances in foods that nourish
the body , they can be synthesized in the body. The Objective of proper diet is to achieve &
maintain a desirable Body Composition & large capacity for Physical and Mental work. The
Daily Requirements for Essential nutrients depend on a person’s Age , Sex, Metabolic and
Physical activity. Nutrition is the science that deals with food and its uses by the body.Nutrition
is the Science that interprets the interaction of nutrients and other substances in food in relation
to maintenance , growth , reproduction , health and disease of an organism. It includes food
intake ,absorption , assimilation , biosynthesis , catabolism and excretion.Proper Nutrition plays
a critical role in the prevention of many diseases and conditions associated with aging. Adequate
Nutrition and maintenance of a normal weight also help maintain optimal physical and mental
function as the person ages.A Life style Management Programme is referred to as a Health
Promotion Programme , Health Behaviour Change Programme , Life Style Improvement
Programme or Wellness Programme. A Life style Management Programme is closely linked to
the concept of Health Promotion which is the process of enabling People to increase control
over and to improve their health. A Life Style Management Programme is defined as a
structured , action oriented , Health Promotion Initiative Designed to help people to improve
INDIANJOURNALOFPHYSICALEDUCATIONSPORTSMEDICINE&EXERCISESCIENCE
ISSN0976-1101Vol-18,SpecialIssue(2)
89
their health and reduce health risks and promote healthy behaviour.Keywords :Nutrition , Older
Adults , Exercise ,Management and Proper Diet .
DIET CONSIDERATIONS FOR ELDERLY:
In nutrition, diet is the sum of food consumed by a person or other organism .The word diet often
implies the use of specific intake of nutrition for healthor weight-managementreasons . Although
humans are omnivores, each culture and each person holds some food preferences or some food
taboos. This may be due to personal tastes or ethical reasons. Individual dietary choices may be
more or less healthy.A nutritious daily diet is one factor that can assist people who are 55 and
older in maintaining optimal levels of health and preventing or delaying the onset of disease.
The Dietary Reference Intakes (DRI) are the quantities of nutrients that form the basis for
planning and assessing diets. The DRIs include the Recommended Dietary Allowances (RDA),
the nutrient levels that meet the requirement for nearly all (97–98%) healthy people. Two sets of
RDAs exist for elderly individuals, one for those 51 to 70 years of age, and one for those over 70
years of age.According to the RDAs, elderly people have the same nutrient requirements as their
younger counterparts, yet most need fewer calories. Vitamins D and B6, and calcium, are
exceptions and are needed in greater amounts for those 51 years old and older. Therefore, a
nutrient-dense diet, with fewer calorie-laden foods, becomes more crucial at older ages of the life
cycle. In general, women have nutrient requirements similar to men, though they require fewer
calories. Therefore, elderly women must be especially careful to select nutrient-dense foods.
Although age can diminish appetite and physical mobility, the body still requires as many
nutrients as a younger adult's ability to perform activities of daily living, including eating.
Protein : Many older adults need to consume relatively higher amounts of protein than they did
when they were younger . This is because of the stress on the body as you age and general loss of
protein from the muscles and internal organs. Protein deficiencies in older people can lead to
more infections, Fragile skin, Longer healing time and weakness. If one has stress or injuries you
need 50% more protein than usual. However if they have certain diseases such as kidney or liver
diseases then ones protein intake should be restricted. It is therefore recommended to take advice
from Health experts regarding daily protein intake. Carbohydrates : Much of our energy comes
from digesting carbohydrates. These are made up of various types of starch and sugar molecules.
About 50-60% of your daily intake comes from complex carbohydrates such as whole grains and
cereals, fruits and vegetables. Fats : Fats are nutrients that are necessary to the body . Fat
insulates and protects the body and serves as a source of energy and essential fatty acids. It also
carries the Fat soluble Vitamins (such as vitamin A, D, E, K) around the body. Fats can be
saturated or unsaturated. The Saturated Fats tend to be solid at room temperature and are
considered “bad” Fats for heart health. Unsaturated Fats are liquid at room temperature and are
considered as “good” Fats. Current dietary guidelines suggest that people of all age groups
should get no more than 10 % of their daily calories from saturated fats. Cholesterol has also
been linked the nutritional status .Vitamins & Minerals : Older adults have different vitamin
and mineral requirement than younger ones. A Nutritionist can advice on the levels one needs. It
is recommended to take in certain vitamins including Vitamin A and D. Fluids : As one age , the
body looses its ability to regulate body fluid levels which means that you might not feel thirsty
even if your body needs more fluids. This may cause risk of Dehydration which can lead to
reduced output of urine, constipation , low grade fever , dry gums and even confusion.
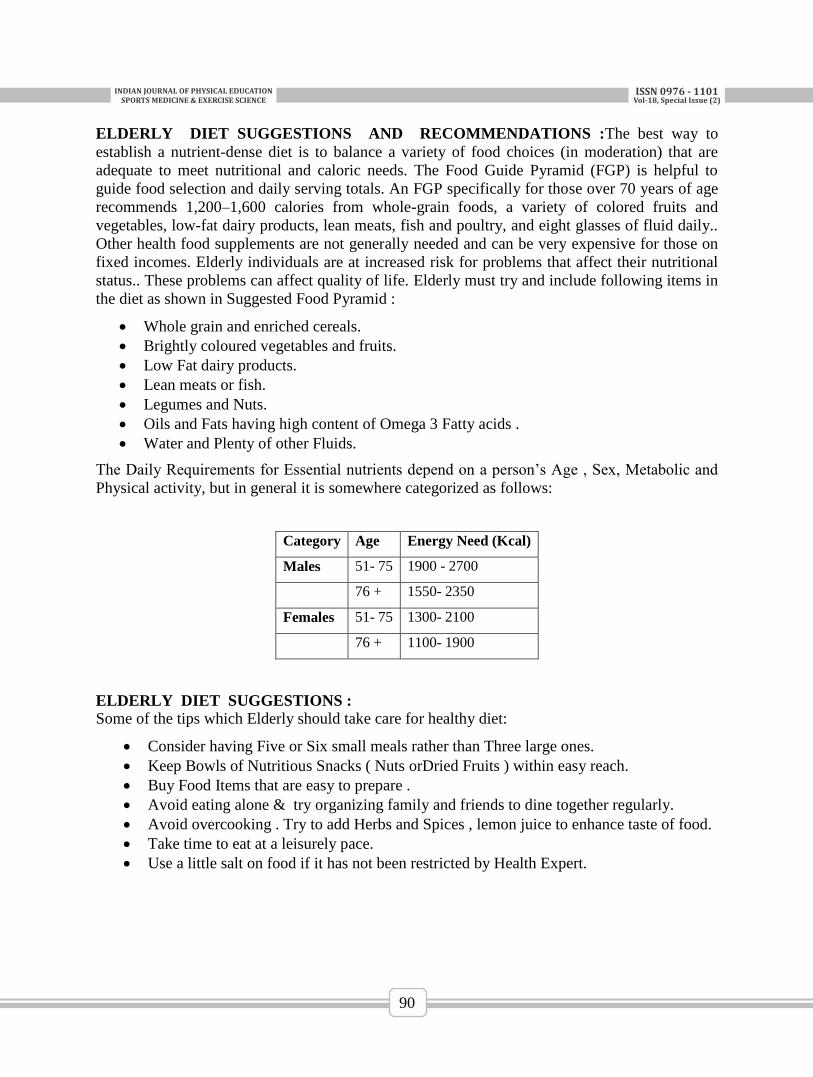
INDIANJOURNALOFPHYSICALEDUCATIONSPORTSMEDICINE&EXERCISESCIENCE
ISSN0976-1101Vol-18,SpecialIssue(2)
90
ELDERLY DIET SUGGESTIONS AND RECOMMENDATIONS :The best way to
establish a nutrient-dense diet is to balance a variety of food choices (in moderation) that are
adequate to meet nutritional and caloric needs. The Food Guide Pyramid (FGP) is helpful to
guide food selection and daily serving totals. An FGP specifically for those over 70 years of age
recommends 1,200–1,600 calories from whole-grain foods, a variety of colored fruits and
vegetables, low-fat dairy products, lean meats, fish and poultry, and eight glasses of fluid daily..
Other health food supplements are not generally needed and can be very expensive for those on
fixed incomes. Elderly individuals are at increased risk for problems that affect their nutritional
status.. These problems can affect quality of life. Elderly must try and include following items in
the diet as shown in Suggested Food Pyramid :
Whole grain and enriched cereals.
Brightly coloured vegetables and fruits.
Low Fat dairy products.
Lean meats or fish.
Legumes and Nuts.
Oils and Fats having high content of Omega 3 Fatty acids .
Water and Plenty of other Fluids.
The Daily Requirements for Essential nutrients depend on a person’s Age , Sex, Metabolic and
Physical activity, but in general it is somewhere categorized as follows:
Category Age Energy Need (Kcal)
Males 51- 75 1900 - 2700
76 + 1550- 2350
Females 51- 75 1300- 2100
76 + 1100- 1900
ELDERLY DIET SUGGESTIONS :
Some of the tips which Elderly should take care for healthy diet:
Consider having Five or Six small meals rather than Three large ones.
Keep Bowls of Nutritious Snacks ( Nuts orDried Fruits ) within easy reach.
Buy Food Items that are easy to prepare .
Avoid eating alone & try organizing family and friends to dine together regularly.
Avoid overcooking . Try to add Herbs and Spices , lemon juice to enhance taste of food.
Take time to eat at a leisurely pace.
Use a little salt on food if it has not been restricted by Health Expert.
INDIANJOURNALOFPHYSICALEDUCATIONSPORTSMEDICINE&EXERCISESCIENCE
ISSN0976-1101Vol-18,SpecialIssue(2)
91
IMPACT OF IMPROPER DIET :
If the information which has been suggested is not followed properly then it can lead towards
many complications as it is both harmful to gain and loose weight than normal weight for an
older individual . Some of the possible outcomes are as follows:
If Undernutrition is not tacked properly in older adults then it may lead to serious consequences
such as :
Weakness and Fatigue leading to less mobility , reduced ability to work and carry out
daily functions.
Depression which leads towards further reduced Appetite.
Weak Immune System which makes healing more time taking.
Anaemia which is low count of Red Blood Cells.
Reduced Muscle Mass which further increases weakness.
Worsening of Cognitive Ability.
Older adults with the problems of overnutrition can face complications like :
Problems with the Heart , Lungs , Kidneys and Digestive Systems.
Weak Skin and slow wound Healing.
Slower Recovery from surgery.
Longer Hospital Stays.
REFERENCES :
BOOKS
Fleck Henietta (1981) Introductionto Nutrition , Collier Macmillan Publishers , London
Pg 353.
Lakshmi Vijaya (2003) Sports Nutrition , KhelSahitya Kendra ,New Delhi Pg 1
INDIANJOURNALOFPHYSICALEDUCATIONSPORTSMEDICINE&EXERCISESCIENCE
ISSN0976-1101Vol-18,SpecialIssue(2)
92
SURVEY OF PHYSICAL EDUCATION PROGRAMMES IN
COLLEGES OF MADHYA PRADESH
Sonesh Poonia Ph.D Scholar, LNIPE, Gwalior
INTRODUCTION
Physical education and sport as an essential dimension of education and culture must develop the
ability, will-power and self discipline of every human being as a fully integrated member of
society. The continuity of physical activity and practice of sport must be ensured throughout life
by means of a global, lifelong and democratized education.
Physical education is an essential aspect of general education, in which physical activities help in
educating or modifying a person for better and fuller living. Thus, there is a close relationship
between physical education and general education. Physical education is an indispensable area of
any programme of good education. It is not a separate or partially related field. It is an
appropriate subsystem of our educational system and tries to identify the problems of students
and attempt to offer remedial suggestion and practical hints for wholesome development of
students. The function of education and physical education goes hand in hand. The classroom
teaching and practical instructions will make the people participate in greater number and grow
systematically. Physical education has marched from extracurricular to co-curricular and now as
curricular part of education. The new term physical education is must for every human being at
all age levels for leading a healthy life.
The profession of physical education is entering one of the most exciting eras in its history.
Physical education is not only concerned with the physical outcomes that accrue from
participation in activities but also in development of knowledge and attitudes conductive to
lifelong learning and participation. Programmes of physical education and sports in colleges not
only have to make the existence of this relatively new field justifiable, but also attempt to make
palpable contributions to the attainment of the objectives education.
Many researchers have been conducted in this area which supports the issue of compulsory
programme of physical education in colleges (Purandare, 1958 & Kothiwala, 1959).
Govindrajulu
(1959) stated that due to lack of academic value of Physical Education in Indian Universities,
people in charge of Physical Education are not in a position to organise and administer the
programme successfully. Muthuraj (1977) wrote on the “Problems of Physical education in
Colleges” and says that there is no use in spending millions of rupees on ‘Catch them Young’,
‘Talent Finding Scheme’, ‘Rural Sports’, and appointing ‘Problem Committees’ for our debates
in International tournaments etc, instead physical education must be made compulsory from
elementary school level and from higher secondary and collegiate level onwards, it must be
made a subject for the examination.
From the above reviews and by seeing the need and importance of physical education
programme at various levels of education system, the scholar attempts to make the survey of
Physical Education Programmes in colleges of Madhya Pradesh.
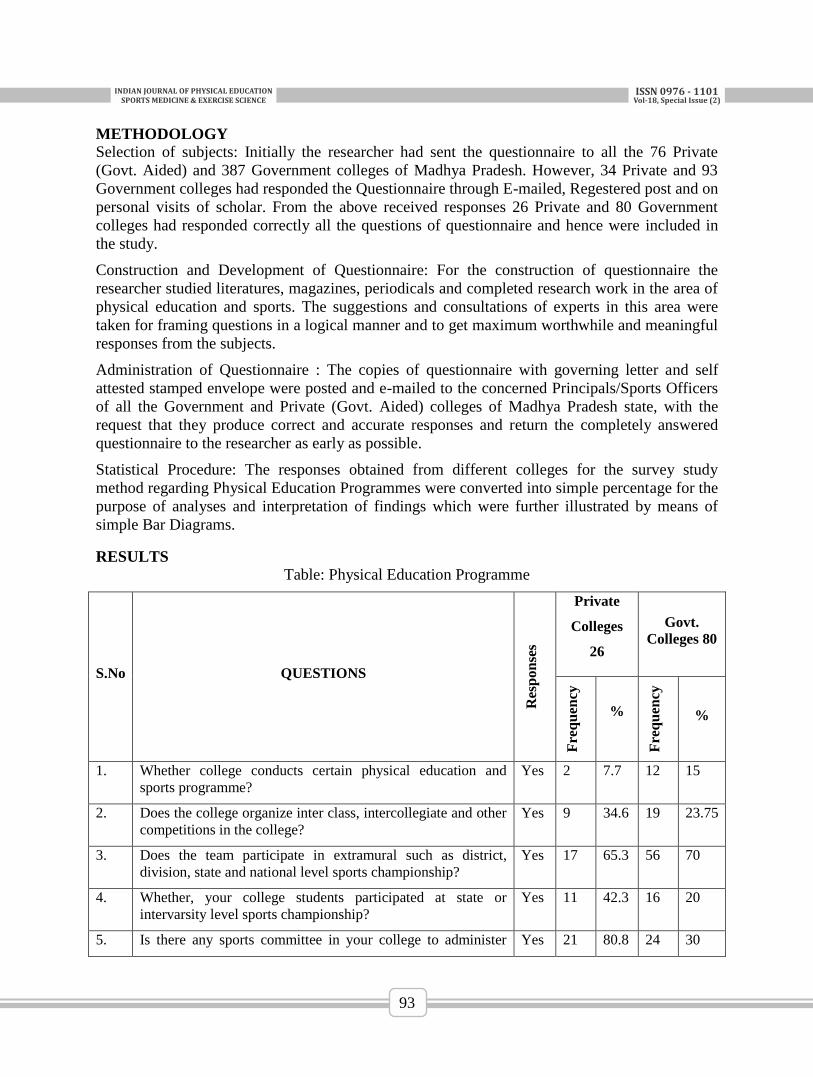
INDIANJOURNALOFPHYSICALEDUCATIONSPORTSMEDICINE&EXERCISESCIENCE
ISSN0976-1101Vol-18,SpecialIssue(2)
93
METHODOLOGY
Selection of subjects: Initially the researcher had sent the questionnaire to all the 76 Private
(Govt. Aided) and 387 Government colleges of Madhya Pradesh. However, 34 Private and 93
Government colleges had responded the Questionnaire through E-mailed, Regestered post and on
personal visits of scholar. From the above received responses 26 Private and 80 Government
colleges had responded correctly all the questions of questionnaire and hence were included in
the study.
Construction and Development of Questionnaire: For the construction of questionnaire the
researcher studied literatures, magazines, periodicals and completed research work in the area of
physical education and sports. The suggestions and consultations of experts in this area were
taken for framing questions in a logical manner and to get maximum worthwhile and meaningful
responses from the subjects.
Administration of Questionnaire : The copies of questionnaire with governing letter and self
attested stamped envelope were posted and e-mailed to the concerned Principals/Sports Officers
of all the Government and Private (Govt. Aided) colleges of Madhya Pradesh state, with the
request that they produce correct and accurate responses and return the completely answered
questionnaire to the researcher as early as possible.
Statistical Procedure: The responses obtained from different colleges for the survey study
method regarding Physical Education Programmes were converted into simple percentage for the
purpose of analyses and interpretation of findings which were further illustrated by means of
simple Bar Diagrams.
RESULTS
Table: Physical Education Programme
S.No QUESTIONS
Res
pon
ses
Private
Colleges
26
Govt.
Colleges 80
Fre
qu
ency
%
Fre
qu
ency
%
1. Whether college conducts certain physical education and
sports programme?
Yes 2 7.7 12 15
2. Does the college organize inter class, intercollegiate and other
competitions in the college?
Yes 9 34.6 19 23.75
3. Does the team participate in extramural such as district,
division, state and national level sports championship?
Yes 17 65.3 56 70
4. Whether, your college students participated at state or
intervarsity level sports championship?
Yes 11 42.3 16 20
5. Is there any sports committee in your college to administer Yes 21 80.8 24 30
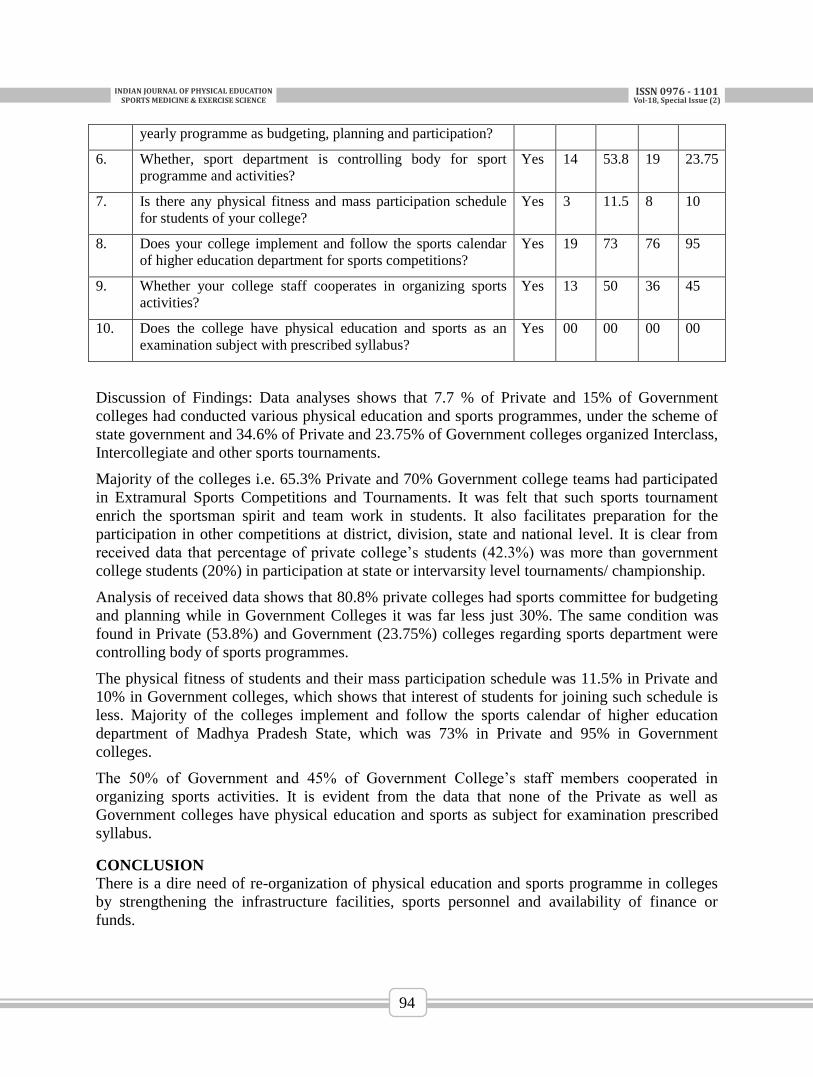
INDIANJOURNALOFPHYSICALEDUCATIONSPORTSMEDICINE&EXERCISESCIENCE
ISSN0976-1101Vol-18,SpecialIssue(2)
94
yearly programme as budgeting, planning and participation?
6. Whether, sport department is controlling body for sport
programme and activities?
Yes 14 53.8 19 23.75
7. Is there any physical fitness and mass participation schedule
for students of your college?
Yes 3 11.5 8 10
8. Does your college implement and follow the sports calendar
of higher education department for sports competitions?
Yes 19 73 76 95
9. Whether your college staff cooperates in organizing sports
activities?
Yes 13 50 36 45
10. Does the college have physical education and sports as an
examination subject with prescribed syllabus?
Yes 00 00 00 00
Discussion of Findings: Data analyses shows that 7.7 % of Private and 15% of Government
colleges had conducted various physical education and sports programmes, under the scheme of
state government and 34.6% of Private and 23.75% of Government colleges organized Interclass,
Intercollegiate and other sports tournaments.
Majority of the colleges i.e. 65.3% Private and 70% Government college teams had participated
in Extramural Sports Competitions and Tournaments. It was felt that such sports tournament
enrich the sportsman spirit and team work in students. It also facilitates preparation for the
participation in other competitions at district, division, state and national level. It is clear from
received data that percentage of private college’s students (42.3%) was more than government
college students (20%) in participation at state or intervarsity level tournaments/ championship.
Analysis of received data shows that 80.8% private colleges had sports committee for budgeting
and planning while in Government Colleges it was far less just 30%. The same condition was
found in Private (53.8%) and Government (23.75%) colleges regarding sports department were
controlling body of sports programmes.
The physical fitness of students and their mass participation schedule was 11.5% in Private and
10% in Government colleges, which shows that interest of students for joining such schedule is
less. Majority of the colleges implement and follow the sports calendar of higher education
department of Madhya Pradesh State, which was 73% in Private and 95% in Government
colleges.
The 50% of Government and 45% of Government College’s staff members cooperated in
organizing sports activities. It is evident from the data that none of the Private as well as
Government colleges have physical education and sports as subject for examination prescribed
syllabus.
CONCLUSION
There is a dire need of re-organization of physical education and sports programme in colleges
by strengthening the infrastructure facilities, sports personnel and availability of finance or
funds.
INDIANJOURNALOFPHYSICALEDUCATIONSPORTSMEDICINE&EXERCISESCIENCE
ISSN0976-1101Vol-18,SpecialIssue(2)
95
REFERENCES
Kothiwala, D.B. “A Plan for Making Physical Education Subject for Universities Degree
Examination” Journal of Physical Education and Recreation (8 October 1959): 29-32.
Purandare, G.N. “Compulsory Physical Education in Colleges” Journal of Physical
Education and Recreation (Jan, 1958).
Muthuraj, C. “Problems of Physical Education in College Report of the Second Seminar
of the Tamil Nadu State Collegiate Physical Education Association” Madurai University
Collegiate Physical Education Association, (March 1977).
Bucher Charles, A. “Administration of School Health and Physical Education
Programme” (2nd
Ed.) St. Louis: C.V. Mosby Company, 1958.
Gangopadhyay, S.R. Physical Education Today and Tomorrow, New Delhi: Friends
Publication, 1993.
Joseph, P.M. Organization of Physical Education. (2nd
Edition) Kandivli and Bombay;
Old Students Association, T.I.P.E.1956.
Kamlesh, M.L. Foundations of Physical Education (2nd
Review Ed) Metropolitan Book
Co. New Delhi 2002.
Sharma, S.R. and Gautam, G.P. Sports Policy of India, New Delhi Friends
Publications:2000.
INDIANJOURNALOFPHYSICALEDUCATIONSPORTSMEDICINE&EXERCISESCIENCE
ISSN0976-1101Vol-18,SpecialIssue(2)
96
ANALYZING THE EFFECT OF INTAKING ALKALINE
SOLUTION ON pH VALUE IN NATIONAL LEVEL SPRINT
DISTANCE TRIATHLON 1Rajarshi Gayen,
2Rekha Ningthoujam,
3 Prof. V.K. Srivastava
1&2 M.P.Ed. Student, LNIPE Gwalior
3 Professor LNIPE Gwalior
ABSTRACT:
Very often endurance athletes are focusing on controlling their acid-base regulation to optimize
their performance during competition. The current study aims to analyze the effect of intaking
NaHCO2 on controlling pH value in sub-maximal intensity sprint distance triathlon. For the
purpose of study five male (age ranged 18-23, height ranged 175 ± 5cm, 70 ± 3kg) National level
sprint distance triathlete were purposely selected from Gwalior. For the purpose of the study
Independent t-test was applied. The result showed statistically significant differences in the mean
value among pH level between placebo effect and experimental effect. Thus it can be concluded
that NaHCO2 has significant effect on body pH value alteration among triathlete.
KEY WORDS: Alkaline Solution, Triathlon, Body Ph Value, Sub-Maximal Intensity.
INTRODUCTION:
Athletes who are committed to legal, healthful ways of increasing performance, reducing fatigue,
and compressing recovery time need to understand pH balance and the negative impact of pH
imbalance. Endurance and elite sport athletes should be particularly concerned with maintaining
a healthy pH8balance, as they regularly place themselves under physical and
9 dietary stresses that
can lead to pH imbalances, most commonly lactic acid which indicates hydrogen ion build-up.
Whatever your level of athletic intensity, a healthy pH balance can mean the difference between
greater athletic achievement and being brought up short by muscle “burn.” Proper pH balance is
a key component of good health, and it is absolutely essential to athletic performance. pH is
measured on a 14-point scale, with 7 being neutral. The lower the pH value, the higher the
acidity; the higher the pH value, the more alkaline. pH values vary throughout systems in the
human body. So, as you might imagine, stomach acid has a very low pH value, ranging from 1.0
to 3.09. Pancreatic excretions are very high in pH value, ranging from 8.0 to 8.3. The pH value of
arterial blood in a healthy human is balanced around the middle of the 14-point scale at a narrow
range of 7.35 to 7.45, or just slightly alkaline. As the body metabolizes fuel (i.e., food), acid
wastes are created. To sustain a healthy blood pH balance, acid wastes must be removed from the
body or neutralized.
KEY WORDS: Alkaline Solution, Triathlon, Body Ph Value, Sub-Maximal Intensity.
METHODOLOGY:
For the purpose of the study five (5) national level sprint distance triathlete were selected from
Gwalior. The age of the subjects were ranging from 18 to 23 years. The test was administered on
male triathlete of Madhya Pradesh state triathlon team prior to the actual administration of the
testing program all the subjects were properly instructed regarding the procedure of the test.The
test were conducted in trial the triathlete are given to consume 500ml placebo solution before 2
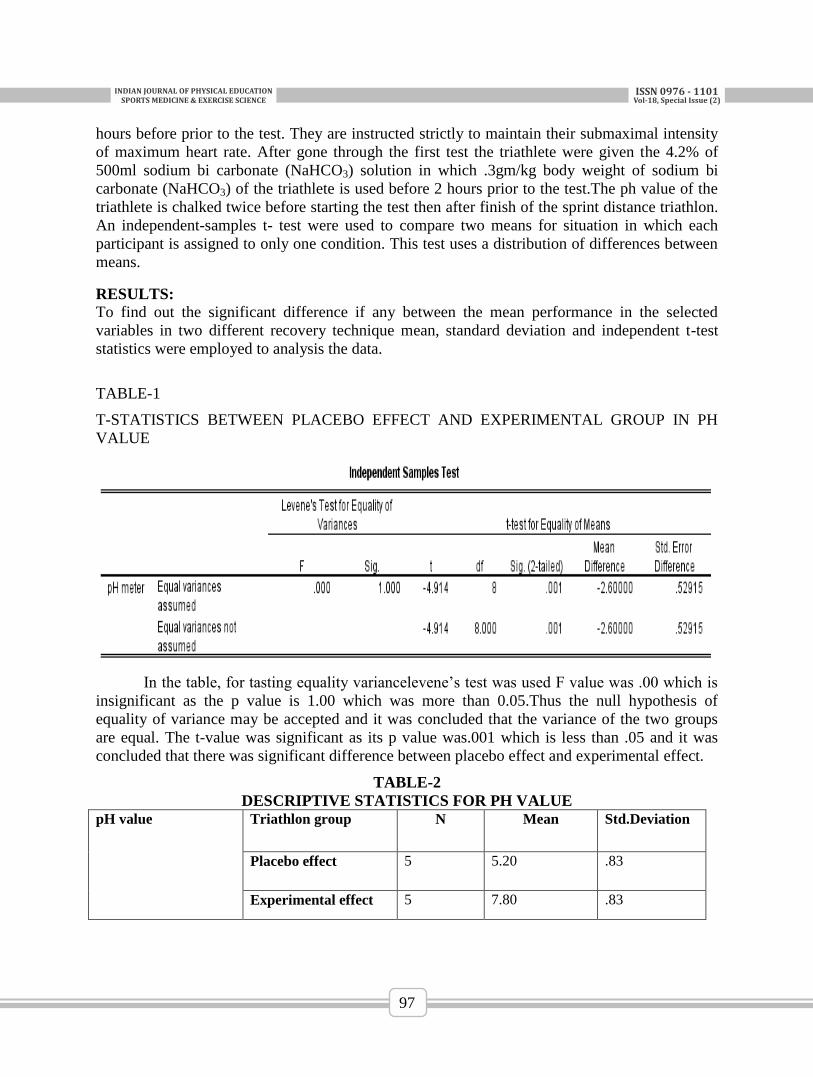
INDIANJOURNALOFPHYSICALEDUCATIONSPORTSMEDICINE&EXERCISESCIENCE
ISSN0976-1101Vol-18,SpecialIssue(2)
97
hours before prior to the test. They are instructed strictly to maintain their submaximal intensity
of maximum heart rate. After gone through the first test the triathlete were given the 4.2% of
500ml sodium bi carbonate (NaHCO3) solution in which .3gm/kg body weight of sodium bi
carbonate (NaHCO3) of the triathlete is used before 2 hours prior to the test.The ph value of the
triathlete is chalked twice before starting the test then after finish of the sprint distance triathlon.
An independent-samples t- test were used to compare two means for situation in which each
participant is assigned to only one condition. This test uses a distribution of differences between
means.
RESULTS:
To find out the significant difference if any between the mean performance in the selected
variables in two different recovery technique mean, standard deviation and independent t-test
statistics were employed to analysis the data.
TABLE-1
T-STATISTICS BETWEEN PLACEBO EFFECT AND EXPERIMENTAL GROUP IN PH
VALUE
In the table, for tasting equality variancelevene’s test was used F value was .00 which is
insignificant as the p value is 1.00 which was more than 0.05.Thus the null hypothesis of
equality of variance may be accepted and it was concluded that the variance of the two groups
are equal. The t-value was significant as its p value was.001 which is less than .05 and it was
concluded that there was significant difference between placebo effect and experimental effect.
TABLE-2
DESCRIPTIVE STATISTICS FOR PH VALUE
pH value Triathlon group N Mean Std.Deviation
Placebo effect 5 5.20 .83
Experimental effect 5 7.80 .83
INDIANJOURNALOFPHYSICALEDUCATIONSPORTSMEDICINE&EXERCISESCIENCE
ISSN0976-1101Vol-18,SpecialIssue(2)
98
Table 2 reveals that the mean and standard deviation for the placebo effect is 5.2±.83 and for
experimental effect is 7.80±.83 in relation to ph value.
DISCUSSION OF FINDINGS:
The purpose of the study was to analyze the effect of sodium bi carbonate on sprint distance
triathlon. Participants were supplemented with 0.3 g/kg body mass of either placebo or sodium
bicarbonate (SB)6. The Consumption of sodium bicarbonate (300 mg/kg 1-2 h before exercise)
can temporarily increase blood bicarbonate concentrations, enhancing extracellular buffering of
hydrogen10
ions which accumulate and efflux from the working muscle. Such 'bicarbonate
loading' provides an ergogenic strategy for sporting events involving high rates of anaerobic
glycolysis which are otherwise limited by the body's capacity to manage the progressive increase
in intracellular acidity.7 result showed statistically significant differences in the mean value
among pH level between placebo effect and experimental effect. It was hypothesized that there
will be a significant difference between placebo effect an experimental effect on body ph value
of national level male triathlete. Because Sodium bicarbonate (NaHCO3) is a buffering agent that
is suggested to improve performance by promoting the efflux of hydrogen ions from working
cells and tissues.. The popularity of buffering has generated a plethora of research dating back to
the 1930s, which continues to date. The "buffers." substances potentially provide the body with
added resistance against fatigue caused by deleterious changes in acid-base balance brought
about by a variety of exercise15
modes and durations5. NaHCO3 ingestion significantly improves
continuous constant load cycling stated by Matthew F. Higgins, Rob S. James & Mike J. Price.
CONCLUTION:
Thus it can be concluded that NaHCO3 has significant effect on body pH value alteration among
triathlete. The concentration of H+
accumulated in the body was eliminated by the NaHCO3
solution..NaHCO3 improved high-intensity-cycling capacity but individuals should determine
whether they respond well to SB supplementation before competition. It is further recommended
that there should be more study conducted in near future.14
INDIANJOURNALOFPHYSICALEDUCATIONSPORTSMEDICINE&EXERCISESCIENCE
ISSN0976-1101Vol-18,SpecialIssue(2)
99
REFERENCE:
Freis ,T., Hecksteden, A., Such,U., Meyer ,T.(2017).Effect of sodium bi carbonate on
prolonged running performance: A randomijrd, doublr-blind, crossover study. PLoS
One.12(8):e0182158. doi: 10.1371/journal.pone.0182158.
Lancha Junior AH, Painelli Vde S, Saunders B, Artioli GG.(2015).Nutritional Strategies
to Modulate Intracellular and Extracellular Buffering Capacity during High-Intensity
Exercise. Sports Med. 2015 Nov;45 Suppl 1:S71-81. doi: 10.1007/s40279-015-0397-5
McNaughton LR1, Gough L, Deb S, Bentley D, Sparks SA.(2016).Recent Developments
in the Use of Sodium Bicarbonate as an Ergogenic Aid.Curr Sports Med Rep.;15(4):233-
44. doi: 10.1249/JSR.0000000000000
INDIANJOURNALOFPHYSICALEDUCATIONSPORTSMEDICINE&EXERCISESCIENCE
ISSN0976-1101Vol-18,SpecialIssue(2)
100
AN INTROSPECTION TO HAPPINESS AMONG SCHOOL
GOING CHILDREN OF GREATER GWALIOR
TenzingChoying Bhutia, IndraRai
L.N.I.P.E(Dept. of Health Education)
Gwalior 474002, India
ABSTRACT:
Happiness is not something readymade, it comes from our action .happiness can be an indicator
for healthy life style, in our study we measured happiness profile which has been endorsement of
two different ways to be happy through participation in games and sports and others engaging in
other activities. Both of the orientations individually predicted life satisfaction people
simultaneously high on both the orientation with good level of happiness score. Among
teenagers involved in sports activity and teenager in activity other then sports. For the purpose of
study 200 school going children were randomly selected, (age ranged 13-18) from various
schools of Gwalior. Happiness was measured by using Oxford Happiness Questionnaire from
which comprises 29 questions with likert scale. The descriptive statistics and independent ‘t’ test
was used to analyse the data. To test the hypothesis, the level of significance was set at 0.05
Thus it can be concluded that uniform feeling of happiness can be achieved from various types of
activities.
Keywords : Happiness , teenagers, wellbeing, sport
INTRODUCTION
Happiness is not something readymade, it comes from our action and it is an indicator for
healthy life style. Happiness and satisfaction is something that everyone wants in all the aspects
of their life.In philosophy, happiness is translated from the Greek concept of eudemonia and
refers to the good life, or flourishing, as opposed to an emotion.In psychology, happiness is
a mental or emotional state of well-being which can be defined by, among others, positive
or pleasantmotions ranging from contentment to intense joy.Happy mental states may reflect
judgements by a person about their overall well-being.The reasoning of satisfaction is the
philosophical worry with the presence, nature, and achievement of bliss. Rationally, happiness
can be comprehended as the ethical objective of life or as a part of possibility; to be sure, in most
European dialects the term satisfaction is synonymous with good fortune. Along these lines,
thinkers ordinarily elucidate on happiness as either a perspective, or an existence that goes well
for the individual driving it.Talking about the teenagers every individual is different from one
another. Sports, dance, drama, singing and play is a part and parcel of their life. It has been
proven that physical activity produces estrogens hormones in the body which contributes in
happiness and for everyone specially teenagers when they are going through adolescence, facing
issues of confusion, health problems, mood swing, lack of confidence, self conscious,
psychological disorder as well as stress for studies and competition. It is very important to be
able to balance all and stay happy by doing one or the other actives that provides then
satisfaction and makes them happy. Keywords Happiness , teenagers, wellbeing, sport
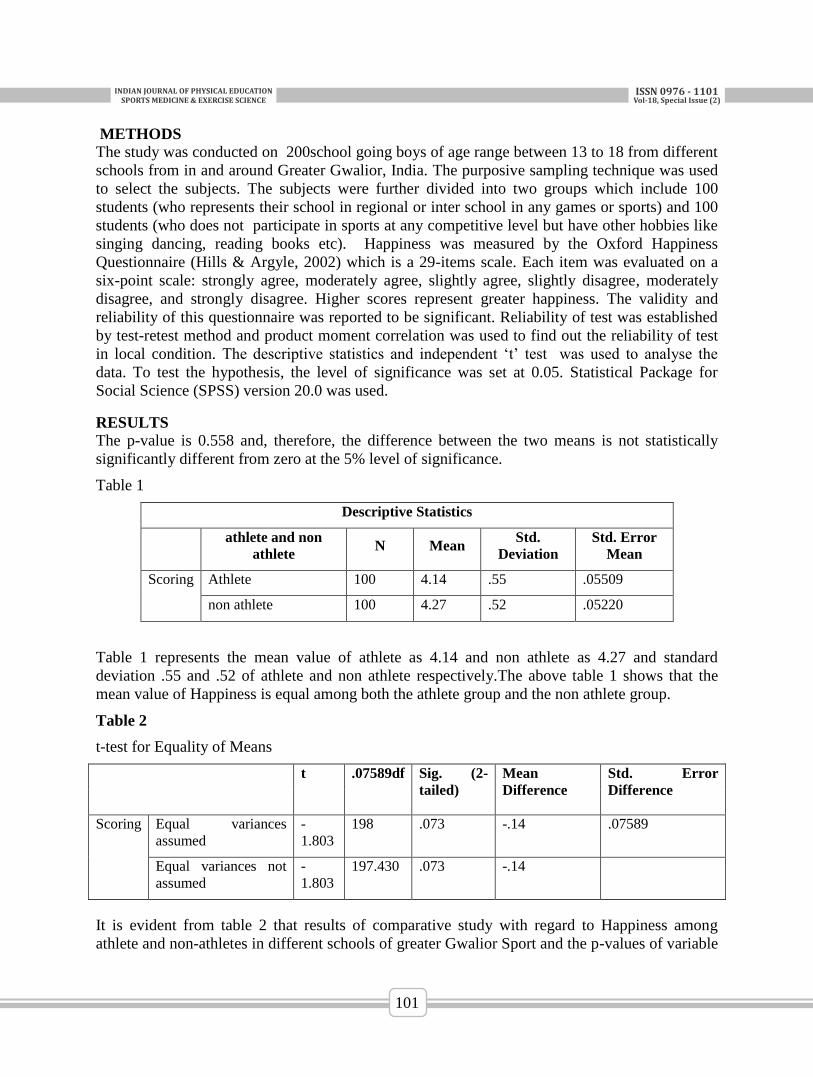
INDIANJOURNALOFPHYSICALEDUCATIONSPORTSMEDICINE&EXERCISESCIENCE
ISSN0976-1101Vol-18,SpecialIssue(2)
101
METHODS
The study was conducted on 200school going boys of age range between 13 to 18 from different
schools from in and around Greater Gwalior, India. The purposive sampling technique was used
to select the subjects. The subjects were further divided into two groups which include 100
students (who represents their school in regional or inter school in any games or sports) and 100
students (who does not participate in sports at any competitive level but have other hobbies like
singing dancing, reading books etc). Happiness was measured by the Oxford Happiness
Questionnaire (Hills & Argyle, 2002) which is a 29-items scale. Each item was evaluated on a
six-point scale: strongly agree, moderately agree, slightly agree, slightly disagree, moderately
disagree, and strongly disagree. Higher scores represent greater happiness. The validity and
reliability of this questionnaire was reported to be significant. Reliability of test was established
by test-retest method and product moment correlation was used to find out the reliability of test
in local condition. The descriptive statistics and independent ‘t’ test was used to analyse the
data. To test the hypothesis, the level of significance was set at 0.05. Statistical Package for
Social Science (SPSS) version 20.0 was used.
RESULTS
The p-value is 0.558 and, therefore, the difference between the two means is not statistically
significantly different from zero at the 5% level of significance.
Table 1
Descriptive Statistics
athlete and non
athlete N Mean
Std.
Deviation
Std. Error
Mean
Scoring Athlete 100 4.14 .55 .05509
non athlete 100 4.27 .52 .05220
Table 1 represents the mean value of athlete as 4.14 and non athlete as 4.27 and standard
deviation .55 and .52 of athlete and non athlete respectively.The above table 1 shows that the
mean value of Happiness is equal among both the athlete group and the non athlete group.
Table 2
t-test for Equality of Means
t .07589df Sig. (2-
tailed)
Mean
Difference
Std. Error
Difference
Scoring Equal variances
assumed
-
1.803
198 .073 -.14 .07589
Equal variances not
assumed
-
1.803
197.430 .073 -.14
It is evident from table 2 that results of comparative study with regard to Happiness among
athlete and non-athletes in different schools of greater Gwalior Sport and the p-values of variable
INDIANJOURNALOFPHYSICALEDUCATIONSPORTSMEDICINE&EXERCISESCIENCE
ISSN0976-1101Vol-18,SpecialIssue(2)
102
is found statistically insignificant as less than 0.05; the obtained F-ratios of the players is
0.345.On the basis of the results obtained above, it may be inferred that the happiness among
athletes in both the group of teenagers are same.
DISCUSSION AND CONCLUSION
This study tried to build up a positive gathering of the teenagers in various exercises on bliss
levels. The purpose behind the study was to look at a reflection of happiness among school going
kids. In light of the finding of this investigation, it was discovered that there were no significant
difference in joy of athlete and non athlete young people. The outcomes demonstrated that
satisfaction is equivalent among the both the gathering. Both the gathering are cheerful in light of
the fact that the competitors get the feeling of accomplishment while representing their schools at
various levels. As we probably are aware participating in a game can be a useful method for
lessening feelings of anxiety and expanding sentiments of physical and mental prosperity. We
may feel like we're essentially excessively occupied or excessively focused on, making it
impossible to join a sorted out action, however captivating in a lone game can likewise give
pressure soothing benefits. Whether you take part in a team activity like soccer or baseball or a
lone game, for example, swimming or running, physical movement of any kind empowers your
body's generation of neurotransmitters - or mind chemicals - known as endorphins. Endorphins
are the chemicals in charge of the inclination known as "sprinter's high”. Expanded levels of
endorphins cause a "vibe decent" reaction, diminish torment and help discharge side effects of
pressure and strain. Socialization: Participating in a gathering or group activity can give an
intense medium to securing the pressure mitigating advantages of social contact. By joining a
group activity, one may feel more roused to practice and also frequently get the opportunity to
visit better places. One additionally have the chance to make new companions and build up a
sentiment brotherhood by progressing in the direction of a common objective. Self-Esteem:
Engaging in a game can help expand sentiments of confidence and self-adequacy, which can
altogether diminish the general level of pressure. On the off chance that one at any point stayed
idle for a broadened timeframe, they are acquainted with that drowsy, passionless feeling that
can rapidly swing to sentiments of self-hatred or even sorrow, which can additionally fuel your
pressure levels. Due to every one of these reasons the youngsters even in their adolescence
accomplish a condition of prosperity and happiness. On the other hand the teenagers who do not
participate in any game or sports in professional level follow other hobbies they have. We could
see they were keen in dancing, singing, cooking, reading books, playing computer games,
gardening or playing any musical instruments. This group of people are happy because they have
no tension for competitions, stress regarding regular practice, tiredness in body or basically the
stress of losing. Every day they perform their hobbies they have a win-win situation. Since no
one forces them to train hard so they have the feeling of contentment in whatever standard they
are in, no sense of inferiority like there is chances in the sports and games. Along these lines
expanding positive feelings and higher life fulfilment in life taking an interest in games and
recreations isn't a definitive alternative. In the event that the young people need a burst of
satisfaction, they ought to get engaged with playing sports, dancing, singing or take after
whatever other side interest that influences them to feel like an achiever. Like how games and
diversions make the youths physiologically upbeat so does doing other movement gives mental
motivations to fulfil them moreover. It is therefore conceivable that taking an interest in any kind
of beneficial movement deliver enduring joy.
INDIANJOURNALOFPHYSICALEDUCATIONSPORTSMEDICINE&EXERCISESCIENCE
ISSN0976-1101Vol-18,SpecialIssue(2)
103
REFERENCE
Chen Lung Hung, Tsai Ying-Mei (September 2010), Psychometric Analysis of the
Orientations to Happiness Questionnaire in Taiwanese Undergraduate Students, , Volume
98, Issue 2, pp 239–249
Goswami, S., & Sarkar, L.N. (September, 2016). Impact of sport types on happiness of
university athletes. Journal of Physical Education Research, Volume 3, Issue III, 91-100.
Haifang H,1.Humphreys B.R. (August 2012). Sports participation and happiness:
Evidence from US microdata.Journal of Economic Psychology, Volume 33, Issue
4, Pages 776-793
Hills P, Argyle M,(September 1998)Personality and Individual Differences
Lyubomirsky, S., King, L., &Diener, E. (2005). The Benefits of Frequent Positive Affect:
Does Happiness Lead to Success? Psychological Bulletin, 131(6), 803-855.
Perneger Thomas V,Hudelson P.M, Bovier P K, ,( February 2004), Health and happiness
in young Swiss adults, Volume 13, Issue 1, pp 171–178
RasciuteSimona, Downward Paul (9 April 2010) Health or Happiness? What Is the
Impact of Physical Activity on the Individual? © 2010 Blackwell Publishing LtdVolume
25, Issue 3, Pages 523-535
INDIANJOURNALOFPHYSICALEDUCATIONSPORTSMEDICINE&EXERCISESCIENCE
ISSN0976-1101Vol-18,SpecialIssue(2)
104
PUBLIC RELATIONS IN SPORTS- AN EFFECIENCY FOR
SPORTS MANAGEMENT Caroline Satur
Govt. High School, Mahamand, Bilaspur
Dr. Sunil Gourah, Sports Officer
Govt. P.G. College, Ambikapur, Sarguja
Chattisgarh
INTRODUCTION
Public relations is a strategic communication process that builds mutually beneficial
relationships between organizations and their publics. Overall, public relations is a specialized
niche of the communications field that focuses on shaping an individual or organization in the
eyes of the public. Public relations’ specialists in sports, work hard to generate positive publicity
surrounding sporting events, athletes, and team news. Sports’ public relations experts coordinate
the flow of information from teams to the press and feed the public’s hunger for sports news
items, team data and player information. They also play an important "promotional" role in
generating public interest, increasing teams' visibility and filling stadiums with fans. The
explosion of media outlets bodes well for the future of public relations in sports. The efficiency
of a company's activity resides in designing and managing a long term relationship with the
athletes, spectators, sponsors and community. The relationship with any of these four
shareholders can be addressed through public relations, a marketing communication technique
that brings value both for the company sending the message, and for other categories interested
in its well-being. The purpose of our paper is to introduce readers to the relationships between
public relations and sports. It explores how sports’ public relations’ practitioners have developed
a range of successful strategies and tactics for influencing media coverage, and supporting the
sports’ domains. The authors find that the effective use of public relations in sport can generate
conversion, facilitate sport representatives positioning, and maintain continued sport sustenance.
This article explores links between public relations and sport. Considering that sport is both
international and a part of everyday life, it implies a role for public relations. International sports
PR focuses on mediarelations, media rights, promotional and publicity work, sponsorship, event
management and fan relationships. Major public relations consultancies have specialized in
sports sections, but there are also a number of dedicated agencies offering a range of PR,
marketing and sponsorship services. Sport, which in the modern age is both politics and
business, is an arena for debate and discourses about elites, resource allocation, privilege,
deprivation, exploitation, justice, nationalism, racism, gender, age, the body, ideologies, and
religion. Public relations work, whether or not it is formally acknowledged as such, facilitates the
international and national debates around such issues. Sports public relations goes way beyond
sport and is intrinsically political. In the sports circles, public relations has to do with the image
that is projected by those involved in sports to the rest of the people in the community; such an
image must aim at promoting good relations. The absence of good public relations among
personnel involved in the various aspects of sports is bound to lead to unnecessary friction,
frustration, disorder, division, unproductively and general lack of support or goodwill.
Development of sports at any levels of society is an endeavour that requires the corporate effort
of the sports managers, administrators and technical personnel on the one hand, and the rest of
INDIANJOURNALOFPHYSICALEDUCATIONSPORTSMEDICINE&EXERCISESCIENCE
ISSN0976-1101Vol-18,SpecialIssue(2)
105
the members of the community on the other. In the course of discharging their duties, sports
managers and administrators often become associated, either personally or professionally with
many individuals, organisations and groups of people. For Instance, they meet and interact with
many people who turn up to watch sports competitions, the organisers of such competitions,
athletes and so forth. In most cases, the sports administrators and managers find it necessary, and
are compelled to co-operate with or seek the assistance of the many individuals, organisations or
groups of people whom they encounter in the working environments. This means that sports
personnel cannot successfully fulfil their missions without the co-operation and/or assistance of
the other members of the community referred to as the public. This calls for the need for those in
the positions of leadership in sports to forge good relations with other persons and organisations
with vested interest in the sports programmes (Brovies & Hay, 1979; Dougherty & Bonan,
1979). Broyles and Hay (1979) emphasise that the main function of public relations in sports is
to provide a good image for the sports programmes and assist in promoting the programmes.
IMPORTANCE OF PUBLIC RELATIONS
Public Relation is all about building relationships to advance, promote, and benefit the reputation
of you yourself, your department and institution. It aids in marketing the department for
recruitment purposes and can lead to improved quality of student applicants.
It demonstrates to funding agencies that you are making a difference and actually have results. It
also improves the reputation of an individual department. The more PR you do, the greater
potential for even more media exposure. Examples includes Special Events, Special Promotions,
Public Affairs, Internal Relations, Community Relations, High Tech PR: blogging, social
networking etc.
The different areas involved in Sports Public Relations consist of these parts:
1- Player Relations
2- Community Relations
3- Media Relations
4- Investor Relations
Significance of Public Relations In Sports
Public Relations is a technique of communication through which the public learns about, and
appreciates the aims and accomplishments of an organisation (Fordham & Leaf, 1978).
Dougherty and Bonano (1979) view public relations as the image that a given organisation or
department projects to the community. Public relations involves good public impressions made
by people associated with an enterprise (Fordham & Leaf, 1978). In the course of discharging
their duties, sports leaders often become associated, either personally or professionally with
many individuals, groups of people, organisations, and the general public. Most often, the sports
leaders, including administrators and managers, find it necessary, and are compelled to co-
operate with and/or seek the support of the many people whom they encounter in their working
environments (Frost, Lockhart & Marchall, 1995). To be able to secure the necessary attitudinal
and material support of the various publics, administrators and managers must therefore forge
good relations with the related publics and project a good image of their departments and
programmes (Broyles & Hay, 1979; Bucher, 1979). Good public relations in sports helps in
increasing the public's faith in a given sports organisation and the sports programmes offered
INDIANJOURNALOFPHYSICALEDUCATIONSPORTSMEDICINE&EXERCISESCIENCE
ISSN0976-1101Vol-18,SpecialIssue(2)
106
(Broyles & Hay, 1979). Good public relations will also lead to the cultivation of cordial personal
and working relations between the sports personnel or organisation and the other individuals or
groups of people who have keen interest in sports, and thereby consolidate their efforts in
promoting their programmes. (Frost, Lockhart & Marchall, 1995)
THE GROWTH OF SPORTS PUBLIC RELATIONS IN INDIA
Sports is clearly growing in importance as a subject on India's agenda. Pointers include
emergence of multiple sports leagues, acceptance of sports (and not just cricket) as a career
option, rise in corporate sponsorships, and the highest number of participants in Rio Olympics
2016. The media is also mirroring these trends through increasing number of sports channels and
pages devoted to sports.
Through the last decade, We are the market leaders – having provided communications support
to virtually every significant sports league in the country – be it the Indian Premier League
(cricket), Indian Super League (football), Indian Open (golf), Indian Badminton League, Hockey
India League, Pro Kabaddi League, and now Premier Futsal. Besides the prominent leagues, we
have supported dozens of sports events organised by corporate sponsors. The sports industry in
India is deepening. According to the article by ‘Neilson Sports’, from 2013 as many as five
sports leagues have launched city based franchises including hockey, tennis, football and
kabaddi. For these to grow, develop their own fan base and heroes requires sustained public
relations, supported by corporate sponsors that have a long term vision for sports.
PUBLIC RELATIONS LITERATURE
While public relations literature has traditionally considered PR as a promotion and
communication tool, this article acknowledges that in the world of sport, public relations has a
much more sophisticated role to play. When conducting a literature review, we can identify
several public relations techniques that can be used in sports, the authors trying to classify them
based on the target audience or type of activity. Kotler and Keller (2008) are presenting a
classification in seven categories:
a) Publications – annual reports, articles, news-letters, magazines edited by the company;
b) Events - press conferences, seminars, trips, fairs, exhibitions, contests and competitions,
anniversaries;
c) Sponsorships;
d) News - constitutes one the main tasks of public relations professionals, they trying to
persuade the media to accept press releases and to attend press conferences;
e) Speeches - management representatives answer questions orgive speeches to enhance
company image;
f) Public service activities - monetary and time contribution to social causes;
g) Identity communication instruments - sending products with company logo to customers
and business partners.
Looking closely to the above mentioned classification, we can identify two particularities for
public relations in sports:
*first , sponsorship represents an independent technique, a main component of the
communicational mix; due to its importance in the marketing budget, as well as within
the sport-community-business environment relationship, sponsorship is treated
INDIANJOURNALOFPHYSICALEDUCATIONSPORTSMEDICINE&EXERCISESCIENCE
ISSN0976-1101Vol-18,SpecialIssue(2)
107
separately as a stand-alone communication technique, not a PR one; this doesn’t mean
that it’s totally separated from PR, considering that sponsorship efficiency is provided
by the integrated approach of the communicational process through all promotional
techniques, including public relations; a special role is allocated to news broadcasted
through mass media, where, whenever an information about a sport club is presented,
automatically also appears some identification elements of sponsors, media coverage
being their main objective.
*secondly, in sports we can identify a special technique – endorsement, where athletes are seen
as ambassadors of the brand, in order to build a better image for it; if normally, in
speeches, events and other occasions where the company appears before the public
company management representatives are used, in sports they are replaced very often
by famous athletes who are there to support the company and its products; such an
approach increases the attractiveness of the technique for both the public and the media;
additionally, using athletes to promote products and services in their field of activity
adds credibility to the message sent.
DISCUSSION
Public relations is a powerful promotional tool, capable of generating substantial publicity for the
sports organization. Although the practice of public relations is diverse within sports,
practitioners must possess certain basic skills. The two most prominent ways in which public
relations is practiced in sports are media relations and community relations. Media relations
programs focus on building relationships with members of the mass media to maximize positive
publicity and minimize the negative one. Community relations programs are structured to allow
members of the sport organizations to come in direct contact with their constituents.
CONCLUSION
Good and effective public relations is emphasised in sports and many other sectors of work in
society based on the fact that no person or group of persons can live in isolation. The element of
interdependence is inevitable. To achieve success in their work, sports administrators and
managers need the support of other people, most of whom they encounter in the course of
carrying out their duties. They are therefore compelled to establish good and meaningful
relations with people who have interest in sports, and whom they encounter in their fields of
work, and whose support is necessary in their endeavours of developing sports.
INDIANJOURNALOFPHYSICALEDUCATIONSPORTSMEDICINE&EXERCISESCIENCE
ISSN0976-1101Vol-18,SpecialIssue(2)
108
REFERENCES
Andrews, D. L., & Jackson, S. (Eds.) (2001), Sports Stars: The Cultural Politics of
Sporting Celebrity, London, Routledge.
Broyles, IF. and Hay, R.D. (1979). Administration of Sports Programmes: A Managerial
Approach. Englewood Cliffs, Prentice - Hall. Inc.
Bucher, C.A. (1979). Administration of Physical Education and Athletic Programs. Saint
Louis, The C.V. Mosby Company.
Dougherty, N.J. and Banana, D (1979). Contemporary Approaches to the Teaching of
Physical Education. Minneapolis , Minnesota, Burgess Publishing company.
Fordham, S.L. and Leaf, C.A. (1978). Physical Education and Sports: An Introduction to
Alternative Careers. New York, John Wiley and Sons, Inc.
INDIANJOURNALOFPHYSICALEDUCATIONSPORTSMEDICINE&EXERCISESCIENCE
ISSN0976-1101Vol-18,SpecialIssue(2)
109
COMPARISON OF AGGRESSION AND MENTAL TOUGHNESS
BETWEEN SUCCESSFUL AND UNSUCCESSFUL NETBALL
PLAYERS OF AMITY UNIVERSITY UTTAR PRADESH Dr. Poonam Singh Asst. Professor, ASPESS,
Amity University, Noida Campus, UP
Dr. Yatendra K Singh Assistant Professor, ASPESS,
Amity University, Noida Campus, UP
ABSTRACT
The purpose of the study was to compare the aggression and self-confidence between successful
and unsuccessful Netball players of Amity University Uttar Pradesh. For the purpose of the
study, female Netball players of eight teams of various institutions of Amity University, Uttar
Pradesh which participated in Inter College sports competition (SANGATHAN) held in Amity
University, Uttar Pradesh were selected as the subject for the study. Aggression was measured by
Sports Aggression Inventory of P.S Shukla and Mental toughness was measured by
Psychological Performance Inventory of James E.Loehr (1982). For the Comparison of
aggression and Mental Toughness between successful and unsuccessful Netball players of Amity
University Uttar Pradesh, the independent t test was applied. The level of significant was set at
0.05. The results showed that there was a significant difference between successful and
unsuccessful Netball players in Aggression and there was some changes in few sub-scales of
Mental Toughness and no significant difference in few subscales of Mental Toughness.
Keywords: Mental toughness, Aggression, successful and unsuccessful Netball players.
INTRODUCTION
Netball is a fast, skillful team game consisting of running, jumping, throwing and catching. It is
the most important team game for women in South Africa (SA) (Venter & Potgieter, 2003) and
has unrivalled international popularity among females, with more than seven million
participants from more than 70 countries (Netball SA, 2010). Optimal performance in this sport
is dependent on the interaction of a number of factors such as tactics (Beagles, 1992), nutrition
(Paish, 1992), physical conditioning, as well as technical and psychological skills (Venter et
al., 2005). “Sports is an activity that is governed by a set of rules or customs and often engaged
in competition. Used by itself, Sports Commonly refer to activities where the physical
capabilities of the Competitor are the sole or primary determinant of the outcome but the term is
also used to include activities such as mind sports and motor sports where mental acuity or
equipment quality are major factors. Sports are used as entertainment for the player and the
viewer. It has also proved by experiment that daily exercise would increase mental strength and
power to study more.
Methodology :Selection of Subjects: For the purpose of the study, female Netball players of
eight teams of various institutions of Amity University, Uttar Pradesh which participated in Inter
College sports competition (SANGATHAN) held in Amity University, Uttar Pradesh were
selected as the subject for the study Tools1. Mental toughness was measured by Psychological
Performance Inventory by James E.Loehr (1982).2. Aggression was measured by Sports
Aggression Inventory by P.S Shukla. Administration of the Test :Before administration of
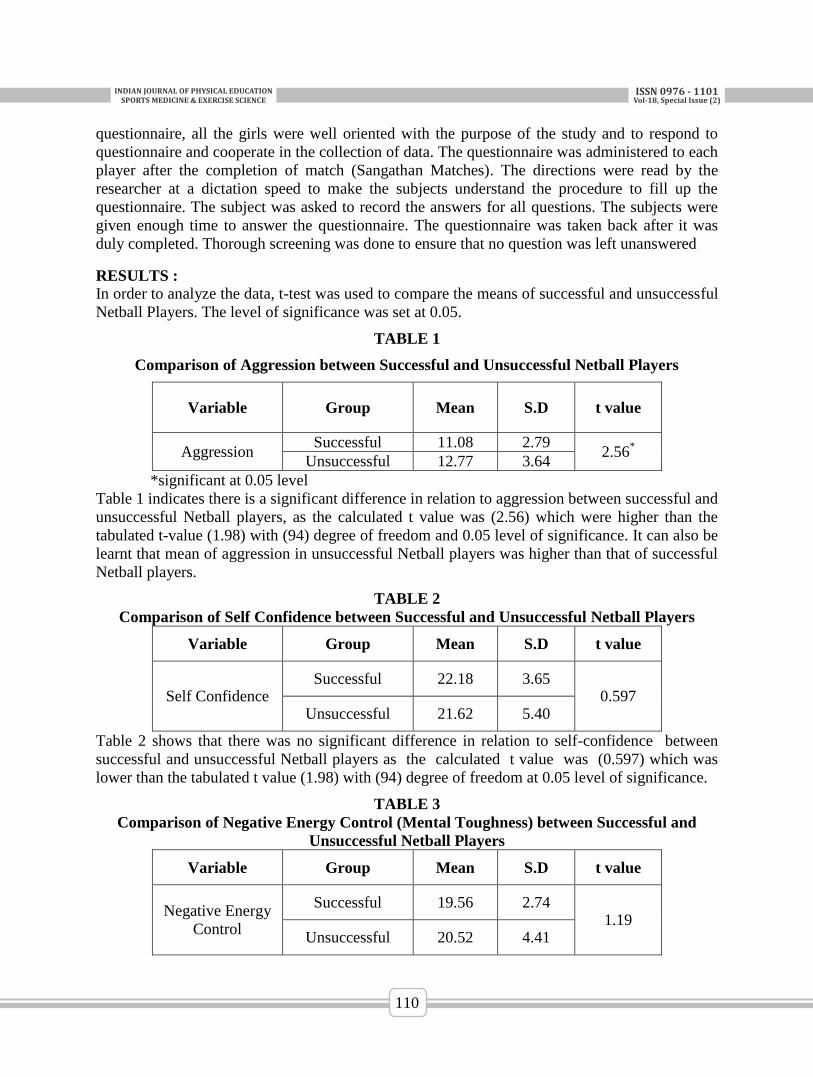
INDIANJOURNALOFPHYSICALEDUCATIONSPORTSMEDICINE&EXERCISESCIENCE
ISSN0976-1101Vol-18,SpecialIssue(2)
110
questionnaire, all the girls were well oriented with the purpose of the study and to respond to
questionnaire and cooperate in the collection of data. The questionnaire was administered to each
player after the completion of match (Sangathan Matches). The directions were read by the
researcher at a dictation speed to make the subjects understand the procedure to fill up the
questionnaire. The subject was asked to record the answers for all questions. The subjects were
given enough time to answer the questionnaire. The questionnaire was taken back after it was
duly completed. Thorough screening was done to ensure that no question was left unanswered
RESULTS :
In order to analyze the data, t-test was used to compare the means of successful and unsuccessful
Netball Players. The level of significance was set at 0.05.
TABLE 1
Comparison of Aggression between Successful and Unsuccessful Netball Players
Variable Group Mean S.D t value
Aggression Successful 11.08 2.79
2.56*
Unsuccessful 12.77 3.64 *significant at 0.05 level
Table 1 indicates there is a significant difference in relation to aggression between successful and
unsuccessful Netball players, as the calculated t value was (2.56) which were higher than the
tabulated t-value (1.98) with (94) degree of freedom and 0.05 level of significance. It can also be
learnt that mean of aggression in unsuccessful Netball players was higher than that of successful
Netball players.
TABLE 2
Comparison of Self Confidence between Successful and Unsuccessful Netball Players
Variable Group Mean S.D t value
Self Confidence Successful 22.18 3.65
0.597
Unsuccessful 21.62 5.40
Table 2 shows that there was no significant difference in relation to self-confidence between
successful and unsuccessful Netball players as the calculated t value was (0.597) which was
lower than the tabulated t value (1.98) with (94) degree of freedom at 0.05 level of significance.
TABLE 3
Comparison of Negative Energy Control (Mental Toughness) between Successful and
Unsuccessful Netball Players
Variable Group Mean S.D t value
Negative Energy
Control
Successful 19.56 2.74 1.19
Unsuccessful 20.52 4.41
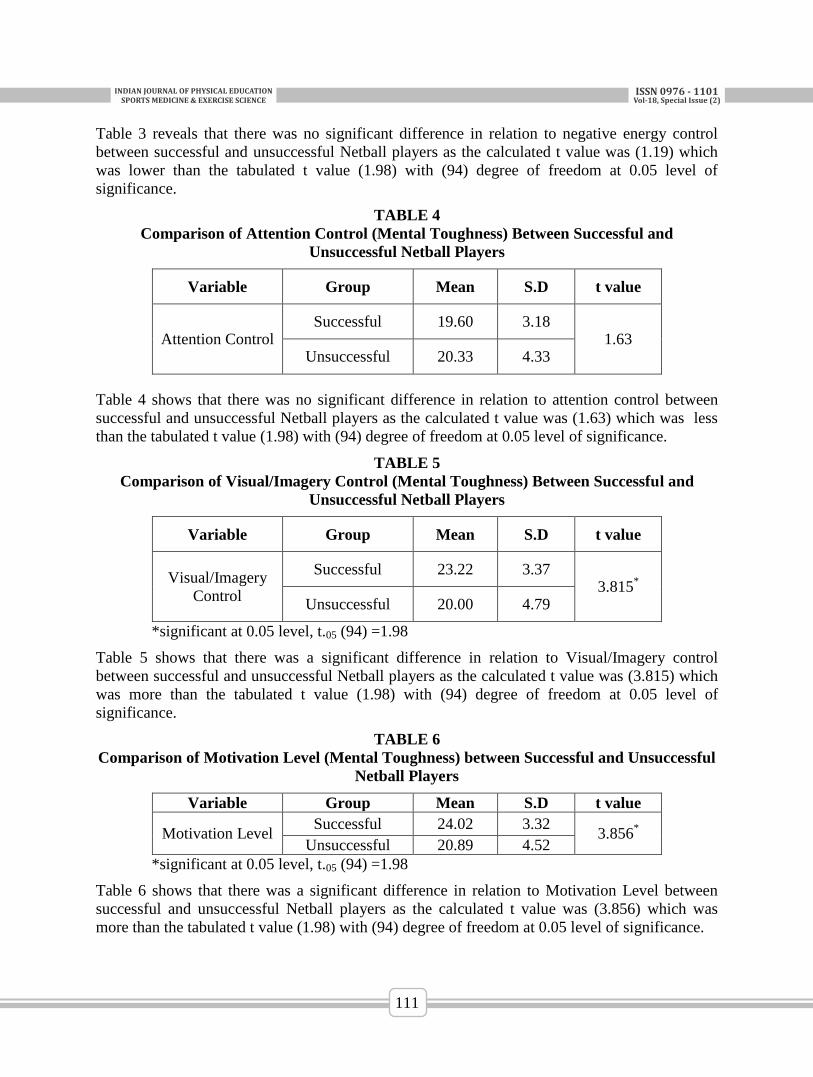
INDIANJOURNALOFPHYSICALEDUCATIONSPORTSMEDICINE&EXERCISESCIENCE
ISSN0976-1101Vol-18,SpecialIssue(2)
111
Table 3 reveals that there was no significant difference in relation to negative energy control
between successful and unsuccessful Netball players as the calculated t value was (1.19) which
was lower than the tabulated t value (1.98) with (94) degree of freedom at 0.05 level of
significance.
TABLE 4
Comparison of Attention Control (Mental Toughness) Between Successful and
Unsuccessful Netball Players
Variable Group Mean S.D t value
Attention Control Successful 19.60 3.18
1.63
Unsuccessful 20.33 4.33
Table 4 shows that there was no significant difference in relation to attention control between
successful and unsuccessful Netball players as the calculated t value was (1.63) which was less
than the tabulated t value (1.98) with (94) degree of freedom at 0.05 level of significance.
TABLE 5
Comparison of Visual/Imagery Control (Mental Toughness) Between Successful and
Unsuccessful Netball Players
Variable Group Mean S.D t value
Visual/Imagery
Control
Successful 23.22 3.37 3.815
*
Unsuccessful 20.00 4.79
*significant at 0.05 level, t.05 (94) =1.98
Table 5 shows that there was a significant difference in relation to Visual/Imagery control
between successful and unsuccessful Netball players as the calculated t value was (3.815) which
was more than the tabulated t value (1.98) with (94) degree of freedom at 0.05 level of
significance.
TABLE 6
Comparison of Motivation Level (Mental Toughness) between Successful and Unsuccessful
Netball Players
Variable Group Mean S.D t value
Motivation Level Successful 24.02 3.32
3.856*
Unsuccessful 20.89 4.52
*significant at 0.05 level, t.05 (94) =1.98
Table 6 shows that there was a significant difference in relation to Motivation Level between
successful and unsuccessful Netball players as the calculated t value was (3.856) which was
more than the tabulated t value (1.98) with (94) degree of freedom at 0.05 level of significance.
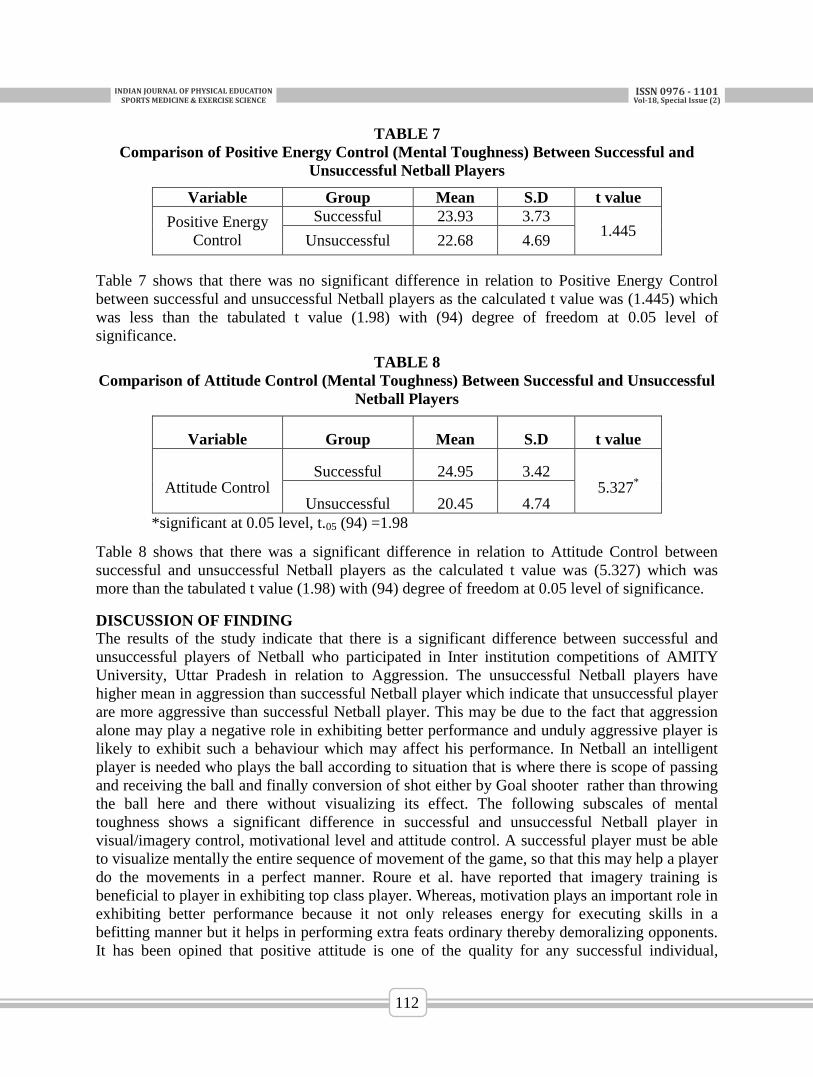
INDIANJOURNALOFPHYSICALEDUCATIONSPORTSMEDICINE&EXERCISESCIENCE
ISSN0976-1101Vol-18,SpecialIssue(2)
112
TABLE 7
Comparison of Positive Energy Control (Mental Toughness) Between Successful and
Unsuccessful Netball Players
Variable Group Mean S.D t value
Positive Energy
Control
Successful 23.93 3.73 1.445
Unsuccessful 22.68 4.69
Table 7 shows that there was no significant difference in relation to Positive Energy Control
between successful and unsuccessful Netball players as the calculated t value was (1.445) which
was less than the tabulated t value (1.98) with (94) degree of freedom at 0.05 level of
significance.
TABLE 8
Comparison of Attitude Control (Mental Toughness) Between Successful and Unsuccessful
Netball Players
Variable Group Mean S.D t value
Attitude Control Successful 24.95 3.42
5.327*
Unsuccessful 20.45 4.74
*significant at 0.05 level, t.05 (94) =1.98
Table 8 shows that there was a significant difference in relation to Attitude Control between
successful and unsuccessful Netball players as the calculated t value was (5.327) which was
more than the tabulated t value (1.98) with (94) degree of freedom at 0.05 level of significance.
DISCUSSION OF FINDING
The results of the study indicate that there is a significant difference between successful and
unsuccessful players of Netball who participated in Inter institution competitions of AMITY
University, Uttar Pradesh in relation to Aggression. The unsuccessful Netball players have
higher mean in aggression than successful Netball player which indicate that unsuccessful player
are more aggressive than successful Netball player. This may be due to the fact that aggression
alone may play a negative role in exhibiting better performance and unduly aggressive player is
likely to exhibit such a behaviour which may affect his performance. In Netball an intelligent
player is needed who plays the ball according to situation that is where there is scope of passing
and receiving the ball and finally conversion of shot either by Goal shooter rather than throwing
the ball here and there without visualizing its effect. The following subscales of mental
toughness shows a significant difference in successful and unsuccessful Netball player in
visual/imagery control, motivational level and attitude control. A successful player must be able
to visualize mentally the entire sequence of movement of the game, so that this may help a player
do the movements in a perfect manner. Roure et al. have reported that imagery training is
beneficial to player in exhibiting top class player. Whereas, motivation plays an important role in
exhibiting better performance because it not only releases energy for executing skills in a
befitting manner but it helps in performing extra feats ordinary thereby demoralizing opponents.
It has been opined that positive attitude is one of the quality for any successful individual,
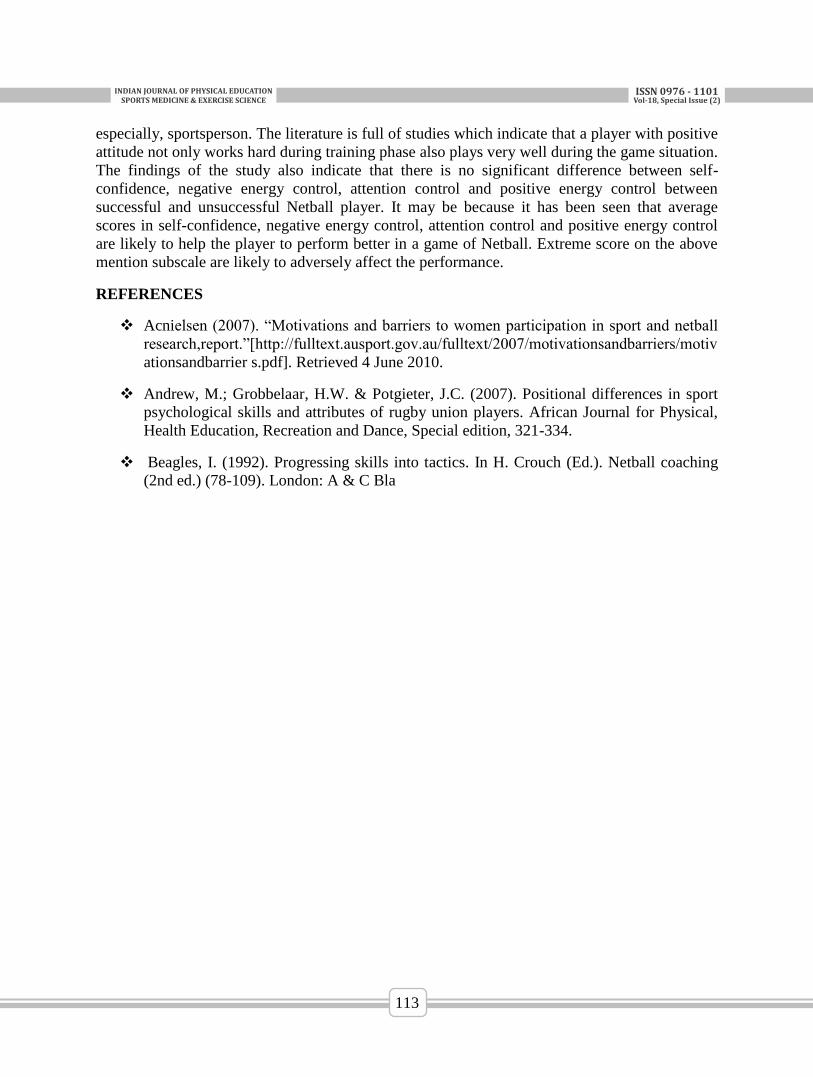
INDIANJOURNALOFPHYSICALEDUCATIONSPORTSMEDICINE&EXERCISESCIENCE
ISSN0976-1101Vol-18,SpecialIssue(2)
113
especially, sportsperson. The literature is full of studies which indicate that a player with positive
attitude not only works hard during training phase also plays very well during the game situation.
The findings of the study also indicate that there is no significant difference between self-
confidence, negative energy control, attention control and positive energy control between
successful and unsuccessful Netball player. It may be because it has been seen that average
scores in self-confidence, negative energy control, attention control and positive energy control
are likely to help the player to perform better in a game of Netball. Extreme score on the above
mention subscale are likely to adversely affect the performance.
REFERENCES
Acnielsen (2007). “Motivations and barriers to women participation in sport and netball
research,report.”[http://fulltext.ausport.gov.au/fulltext/2007/motivationsandbarriers/motiv
ationsandbarrier s.pdf]. Retrieved 4 June 2010.
Andrew, M.; Grobbelaar, H.W. & Potgieter, J.C. (2007). Positional differences in sport
psychological skills and attributes of rugby union players. African Journal for Physical,
Health Education, Recreation and Dance, Special edition, 321-334.
Beagles, I. (1992). Progressing skills into tactics. In H. Crouch (Ed.). Netball coaching
(2nd ed.) (78-109). London: A & C Bla
INDIANJOURNALOFPHYSICALEDUCATIONSPORTSMEDICINE&EXERCISESCIENCE
ISSN0976-1101Vol-18,SpecialIssue(2)
114
SURVEY OF FINANCIAL PROVISIONS IN COLLEGES OF
MADHYA PRADESH Gyanender Singh Poonia
1& Priti
2
1M.P.Ed Student, LNIPE, Guwahati (M.P)
2Research Assistant, LNIPE, Gwalior (M.P)
ABSTRACT
The ‘Finance’ is the primary need to make any programme successful. The achievement of any
programme depends upon the financial provision available. Finance should be made available
from Government, Association, Management, Students fee, Clubs, Institution, Private donation
and any other agencies. Therefore, the purpose of this study was to survey the financial
provisions in colleges of Madhya Pradesh state of India. The data was collected through a
carefully compiled Questionnaire, supplemented visits and interviews. The data was received
from 34 out of 76 Private (Govt. Aided) and 93 out of 387 Government Colleges, but 26 Private
and 80 Government colleges have replied correctly and these were considered as sample for the
present study. The responses obtained from them were converted into simple percentage (%) for
the purpose of analyses and interpretation of data. The results revealed that the availability of
finance for sports was collected from the students as sports fees and amalgamated fund at the
time of admission in college.
Key Words: financial provision, sports fees, fund.
INTRODUCTION
The ‘Finance’ is the primary need to make any programme successful. The achievement of any
programme depends upon the financial provision available. Finance should be made available
from Government, Association, Management, Students fee, Clubs, Institution, Private donation
and any other agencies. Finance means the management of public money, pertaining to coinage,
availability of funds for organization of any of the programme and competition in systematic and
well organized manner. Financial provisions include sports funds in terms of budget alloment,
expenses for constructions and maintenance of sports infrastructure and any other financial
assistance procured for sports programmes. Finance for any programme or competition in the
field of sports needs surveying the existing situation in the area under consideration. Finance
available for physical education and sports in the colleges of Madhya Pradesh state meet to be re-
designed for suitable modification and progress. Sauraz (1975) attempted to evaluate Physical
Education Programmes in selected secondary schools in Puerto Rico and concluded that most of
the school physical education programmes were very poorly financed. Thomas (1970) had given
some valuable recommendation for improving the physical education and sports programmes in
the country, which says that scholarship should be given to the outstanding sportsmen in each
district so that they could continue to improve their sports process along with their academic
careers. Keeping in mind the essentiality of funds and financial provisions, the present survey
was done to see the availability of financial provision in colleges of Madhya Pradesh.
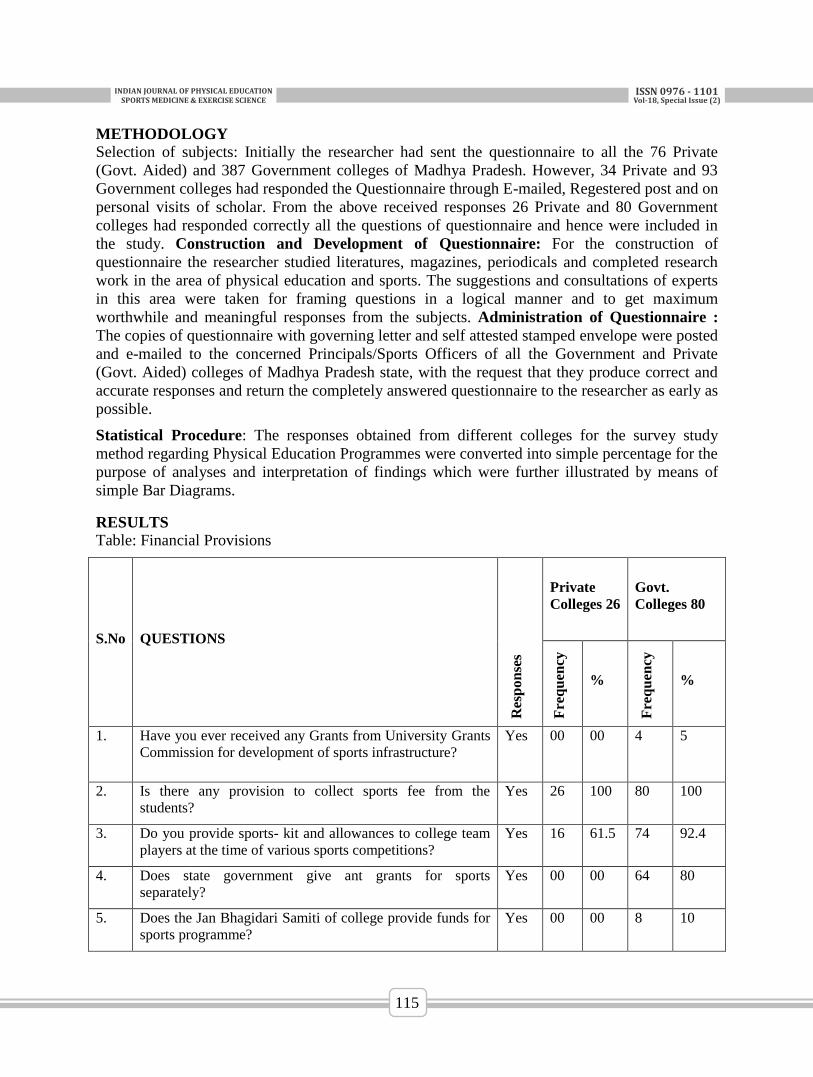
INDIANJOURNALOFPHYSICALEDUCATIONSPORTSMEDICINE&EXERCISESCIENCE
ISSN0976-1101Vol-18,SpecialIssue(2)
115
METHODOLOGY
Selection of subjects: Initially the researcher had sent the questionnaire to all the 76 Private
(Govt. Aided) and 387 Government colleges of Madhya Pradesh. However, 34 Private and 93
Government colleges had responded the Questionnaire through E-mailed, Regestered post and on
personal visits of scholar. From the above received responses 26 Private and 80 Government
colleges had responded correctly all the questions of questionnaire and hence were included in
the study. Construction and Development of Questionnaire: For the construction of
questionnaire the researcher studied literatures, magazines, periodicals and completed research
work in the area of physical education and sports. The suggestions and consultations of experts
in this area were taken for framing questions in a logical manner and to get maximum
worthwhile and meaningful responses from the subjects. Administration of Questionnaire :
The copies of questionnaire with governing letter and self attested stamped envelope were posted
and e-mailed to the concerned Principals/Sports Officers of all the Government and Private
(Govt. Aided) colleges of Madhya Pradesh state, with the request that they produce correct and
accurate responses and return the completely answered questionnaire to the researcher as early as
possible.
Statistical Procedure: The responses obtained from different colleges for the survey study
method regarding Physical Education Programmes were converted into simple percentage for the
purpose of analyses and interpretation of findings which were further illustrated by means of
simple Bar Diagrams.
RESULTS
Table: Financial Provisions
S.No QUESTIONS
Res
pon
ses
Private
Colleges 26
Govt.
Colleges 80
Fre
qu
ency
%
Fre
qu
ency
%
1. Have you ever received any Grants from University Grants
Commission for development of sports infrastructure?
Yes 00 00 4 5
2. Is there any provision to collect sports fee from the
students?
Yes 26 100 80 100
3. Do you provide sports- kit and allowances to college team
players at the time of various sports competitions?
Yes 16 61.5 74 92.4
4. Does state government give ant grants for sports
separately?
Yes 00 00 64 80
5. Does the Jan Bhagidari Samiti of college provide funds for
sports programme?
Yes 00 00 8 10
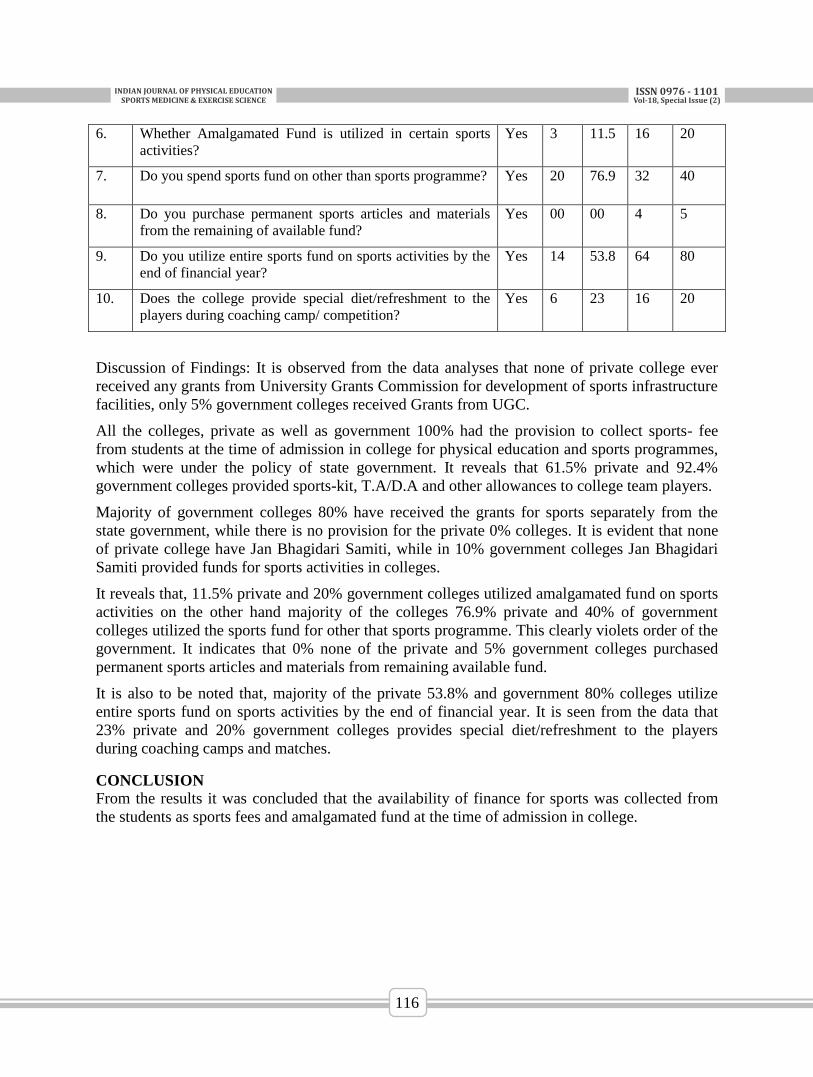
INDIANJOURNALOFPHYSICALEDUCATIONSPORTSMEDICINE&EXERCISESCIENCE
ISSN0976-1101Vol-18,SpecialIssue(2)
116
6. Whether Amalgamated Fund is utilized in certain sports
activities?
Yes 3 11.5 16 20
7. Do you spend sports fund on other than sports programme? Yes 20 76.9 32 40
8. Do you purchase permanent sports articles and materials
from the remaining of available fund?
Yes 00 00 4 5
9. Do you utilize entire sports fund on sports activities by the
end of financial year?
Yes 14 53.8 64 80
10. Does the college provide special diet/refreshment to the
players during coaching camp/ competition?
Yes 6 23 16 20
Discussion of Findings: It is observed from the data analyses that none of private college ever
received any grants from University Grants Commission for development of sports infrastructure
facilities, only 5% government colleges received Grants from UGC.
All the colleges, private as well as government 100% had the provision to collect sports- fee
from students at the time of admission in college for physical education and sports programmes,
which were under the policy of state government. It reveals that 61.5% private and 92.4%
government colleges provided sports-kit, T.A/D.A and other allowances to college team players.
Majority of government colleges 80% have received the grants for sports separately from the
state government, while there is no provision for the private 0% colleges. It is evident that none
of private college have Jan Bhagidari Samiti, while in 10% government colleges Jan Bhagidari
Samiti provided funds for sports activities in colleges.
It reveals that, 11.5% private and 20% government colleges utilized amalgamated fund on sports
activities on the other hand majority of the colleges 76.9% private and 40% of government
colleges utilized the sports fund for other that sports programme. This clearly violets order of the
government. It indicates that 0% none of the private and 5% government colleges purchased
permanent sports articles and materials from remaining available fund.
It is also to be noted that, majority of the private 53.8% and government 80% colleges utilize
entire sports fund on sports activities by the end of financial year. It is seen from the data that
23% private and 20% government colleges provides special diet/refreshment to the players
during coaching camps and matches.
CONCLUSION
From the results it was concluded that the availability of finance for sports was collected from
the students as sports fees and amalgamated fund at the time of admission in college.
INDIANJOURNALOFPHYSICALEDUCATIONSPORTSMEDICINE&EXERCISESCIENCE
ISSN0976-1101Vol-18,SpecialIssue(2)
117
REFERENCES
Thomas J.P. A look at our Physical Education and Sports Programmes, Vyayam, The
Alumni Association of YMCA Colleges of Physical Education Madras February 1970.
Saurez, Jose M. Dertila. To Asses the Physical Education Programme in Selected Higher
Secondary Schools in Puerto Rico. Dissertation Abstracts International 35 (March
1975):5908-5909-A.
Jack, Harold K. Analysis of the Physical Education Programme of the Minnesota
Secondary Schools. Research Quarterly 17(March 1946):24.
Feng X. And Humphreys, B.R. Assessing the Economic Impact of Sports Facilities on
Residential Property Values. A Spartial Hedonic Approach. North American Association
of Sports Economists Working Paper Series 08-12.
Sharma, S.R. and Gautam, G.P. Sports Policy of India, New Delhi Freinds Publications:
2000.
INDIANJOURNALOFPHYSICALEDUCATIONSPORTSMEDICINE&EXERCISESCIENCE
ISSN0976-1101Vol-18,SpecialIssue(2)
118
EMERGING TRENDS IN THE INDIAN FITNESS INDUSTRY Author: Co-Author:
Sujay John SK Chakravortty Assistant Professor Associate Professor
Department of Physical Education Department of Physical Education
St Stephen’s College St Stephen’s College
University of Delhi University of Delhi
ABSTRACT
India has scripted a new story from its days of from an impoverished post-colonial economy
creaking under many burdens to a liberalized democracy trying to face a brave new world of
opportunities. The changing landscape of modern India has witnessed a slow victory over
traditional health problems only to discover a new burden of diseases that inflict an invisible
crisis that have staggering ramifications on the growth and development of the country. Global
estimates place worldwide cost of five non-communicable diseases reaching over $47 trillion
over the next twenty years. Non-Communicable diseases like obesity, diabetes, cardiovascular
diseases and strokes are drastically spreading at epidemic proportions. Unfortunately, the
Government finds limited resources as far as allocating a sizable proportion towards National
Health Policy. This imbalance leaves a sizeable lacuna within the health market.
This imbalance is slowly shifting due to the sizeable youth population in the country - as India
having 356 million 10-24 year-olds, has is the world’s largest youth population. The Fitness
market in India is driven heavily by the urban youth who has a burning desire to look and feel
good. The Heath, Fitness and Wellness in India
Key Words: Fitness, Fitness Industry, Health, Wellness, Economy, Disposable Income,
India, Communicable diseases, Non-Communicable diseases, obesity, diabetes, cardiovascular
diseases, strokes, Fitness Market, Physical Inactivity, Population, Lifestyle, House Holds Out of
Pocket Expenditure
INTRODUCTION
India has scripted a new story from its days of from an impoverished post-colonial economy
creaking under many burdens to a liberalized democracy trying to face a brave new world of
opportunities. It is a fact that, with 356 million 10-24 year-olds, India has the world’s largest
youth population despite having a smaller population than China, as reported by the United
Nations Population Fund’s (UNFPA) State of the World’s Population report. [1] .A study
released by the World Economic Forum, the global cost of five non-communicable diseases will
reach over $47 trillion over the next twenty years - the diseases include CVD (cardiovascular
disease), diabetes, mental illness, chronic respiratory disease, and cancer. The authors of the
report wrote that 70% of lost output from non-communicable diseases are due to mental illness
and cardiovascular diseases. [2]Another report titled "The Global Economic Burden of Non-
Communicable Diseases" released by the World Economic Forum reveals Non-Communicable
Diseases or NCDs are caused "to a substantial degree" by: Tobacco usage, Alcohol abuse, Poor
eating habits and Physical inactivity [3]Key Words: Fitness, Fitness Industry, Health, Wellness,
Economy, Disposable Income, India, Communicable diseases, Non-Communicable diseases,
INDIANJOURNALOFPHYSICALEDUCATIONSPORTSMEDICINE&EXERCISESCIENCE
ISSN0976-1101Vol-18,SpecialIssue(2)
119
obesity, diabetes, cardiovascular diseases, strokes, Fitness Market, Physical Inactivity,
Population, Lifestyle, House Holds Out of Pocket Expenditure Indian Government Investment in
Health As a proportion of GDP, Indian government spent 1.15%, INR 1,57,743.36 Crore in
2015-16 and 1.28% 1,80,656.76 Crore in 2016-17 on health. The 2017 National Health Policy
set a goal of raising this figure to 2.5% of GDP by 2025 [4]. As a result, much of the onus for
health rests in the self-care of individuals. seem to be a useful approach to meet the challenges
raised by the threatening cost explosion in the care sector. Where Indian households spend on
health The National Health Accounts (NHA) published by the Union health ministry reveals that
medicines are the biggest financial burden on Indian households. Of more than three lakh crore
rupees that households spent on health in 2014-15, around 42% of the total out-of-pocket
spending (OOP) went in buying medicines. In private hospitals, households spent around 28% of
the OOP spending By including people – especially the older ones – to keep physically fit, the
demands for increased care costs and the shortcomings in the care personnel could be met.
[5].Changing Attitude Towards Fitness and Wellness This novel shift from former public care –
which traditionally was mostly limited to health insurances and medical personnel – to individual
care responsibility is an important step into a cognitive reframing of peoples mindset.
Understanding health issues and the importance of prevention in combination with a playful
approach increases the health motivation to promote bodily interaction to play. The
Overwhelming Indian Fitness and Wellness Market India’s population of 1.1 billion, second
highest in the world, is expected to reach 1.3 billion by 2015. India also has one of the youngest
populations in the world, with the proportion of under-29sprojected to reach 56% by 2015. This
group views shopping as a form of entertainment and is brand-conscious. With more than half of
the population young and single, the processed food, eating out, leisure, and health and fitness
sectors have experienced high consumer spending. bMiddle-aged adults (ages 45-55) currently
form the second largest proportion of the Indian population (21.2%), ashare expected to increase
to 23.4% by 2015.Rising on the Economic Wave India’s economic progress has given rise to a
stronger middle class, which is the main driver behind most consumer trends, however they are
spending on non-consumable products. The Indian middle class is expected to grow from 50
million in 2005 to 583 million in 2025. This increase could boost consumer spending to US $30
billion on high end goods by 2015. High-income families will account for 2% of the population,
but 20% of consumption by 2025.Increased Awareness about Fitness and Wellness The
increased emphasis on a healthy lifestyle is part of a trend to look fitter and well-groomed. The
rise in health-consciousness explains the huge increase of 203.5% on health goods and medical
services expenditures from 1995-2007. The growth is expected to continue at a rate of 63.3%
over 2007-2015. Indian consumers are joining weight loss clinics, a trend very popular with
northern Indians whose diets have a high intake of saturated foods. The market for products that
reduce stress, prevent aging, help the heart and fight diabetes are all on a growth curve. Industry
refers to the broad basket of health-oriented wellness products as the fast moving health goods
(FMHG) sector. [6]Fitness Club and Gym Culture:Fitness Clubs or Gyms are fitness facilities
which house exercise equipment, for the purpose of exercising More recently, it has been
witnessed a drastic transformation from the traditional open air wrestling akhadas and basement
run non-ventilated gyms, making way for organized retailing and Venture Capital trends
emerging in the fitness business. This developing trend will only accelerate in the coming times,
with the entry of global players, home grown startups as well as online marketplace The Drivers
for Growth in Fitness and Gym Culture: The following factors can be considered as
INDIANJOURNALOFPHYSICALEDUCATIONSPORTSMEDICINE&EXERCISESCIENCE
ISSN0976-1101Vol-18,SpecialIssue(2)
120
1. Rising lifestyle diseases, obesity, diabetes 2. A high population of youth which serves as the
target population 3. Growing disposable income and higher discretionary expenditure 4. Rising
awareness of healthy lifestyle among Indians 5. Industry least affected by slowdown in economy
6. Rapid urbanization and westernization Diverse Services of the Fitness Centre and Gym
Facility The growth in the awareness among the consumer has expanded the fitness facility or
clubs into different service oriented facilities like:1. Weight or Strength Training for Body
Building; 2.Endurance Training for Cardio Vascular Training;3. Beauty and rejuvenating spas;4.
Massage centers; 5. Yoga and its different forms like hatha yoga, ashtang yoga, power yoga , 6.
Diet and weight counselling services, 7. Specific Training Facilities like Pilates, Rowing,
Spinning, Functional fitness, Cross and High Intensity interval training, etc 8. Dance Training
like Aerobic Training, Zumba, Samba, Tango dance, 9. Merchandizing 10. Supplement and
Nutrition advise and sales, etc. [7]
Establishing the Fitness Brand in the Industry The Gym culture is a facet of the fitness
industry. In India the market for Gymnasium is still largely an unorganized and unstructured as
compared to the Americas, Australia and European countries. In urban India private enterprises
like. [8] Organized fitness market is concentrated in top eight cities of India - Delhi NCR,
Mumbai, Bengaluru, Chennai, Kolkata, Pune, Hyderabad and Ahmedabad with more than 60%
of top companies located in metropolitan cities. While the market will continue to grow in these
cities, high real estate costs will drive players to look at tier 2 and 3 cities for growth. Hence, a
higher growth in the premium and mid-end of the market is anticipated. However the trend to
expand into second tier cities are proving to be. [10] Dramatic Boost in Global Sports and
Fitness Media The young population is living life on the fast lane courtesy the boom in the IT
industry and BPO sectors. Since most of these industries work as per the western time zones,
their lifestyle keeps in them in the workplace almost round the clock. Further the globalization
and internet generation is exposed to the multimillion dollar Bollywood and Hollywood film
industry apart from the invasion of satellite television and DTH. This has brought the Gen Z a
feel of the International music and fashion diaspora along with an addiction to international
sports leagues such as the Premier League in England, the La Liga in Spain or the Seria A from
Italy. This media frenzy has induced an appetite for an fashion and the desire to look good. This
fast paced, hectic modern lifestyles which seldom allow a person to workout actively or follow a
well-crafted fitness regime Increased Spending and Personal Disposable Income People are
spending a sizeable earnings to look and feel good. The trend is encouraging people to take out
time from their busy schedules and visit the gym or follow a strict workout routine in the comfort
of their homes by taking personal training services. People are coming to terms with the fact that
those who exercise regularly are happier and healthier compared to those who don’t. Also,
regular workouts help in reducing stress, anxiety and depression and keep a host of diseases at
bay, including 13 types of Cancer. Strength, energy and stamina are the other immediate clear
cut benefits that come with working out regularly The Gym Demography Community centers
in residential societies and even apartment complexes nowadays, invariably hosts a gym. Not
just in metropolitan cities, the fitness boom is catching on in tier two and tier three citiesas they
are now home to a dozen of gyms and fitness centers. Multinational fitness chains and gyms are
taking the franchisee route to enter the Indian subcontinent. Rise in Personal Gyms and
Celebrity Trainers Small home gyms are also coming up in the houses of business tycoons,
industrialists, sport icons, celebrities, socialites and fitness freaks who can afford the price and
the space. Now, there are even personalized gyms to meet their specific whims and fancies. Case
INDIANJOURNALOFPHYSICALEDUCATIONSPORTSMEDICINE&EXERCISESCIENCE
ISSN0976-1101Vol-18,SpecialIssue(2)
121
Study – India’s Largest Gym Brand India’s largest listed gym operator is Talwalkars Better
Value Fitness. The $28 million (revenue) Mumbai company makes its debut on the Best Under A
Billion list this year. Revenues have more than tripled from 2008 and profits nearly
quadrupled.[13]
REFERENCES
UNFPA “State of world population 2014” [accessed Feb 13 2018]
https://www.unfpa.org/sites/default/files/pub-pdf/EN-SWOP14-Report_FINAL-
web.pdf.
“Five Non-communicable Diseases, $47 Trillion Global Burden Over Next Two
Decades” medicalnewstoday.com
“Spending on Health Sector” Min of Health and Family Welfare, Govt of India, Press
Information Bureau. April 11, 2017
“How-india-spends-on-health” Hindustantimes.com/india-news. Dec 11, 2017
https://www.hindustantimes.com/india-news/how-india-spends-on-health/story-
CPyiZZ4jcI4imSKJq03jBM.html
‘Exergames for elderly: Social exergames to persuade seniors to increase physical
activity” Brox et al. (2011)
INDIANJOURNALOFPHYSICALEDUCATIONSPORTSMEDICINE&EXERCISESCIENCE
ISSN0976-1101Vol-18,SpecialIssue(2)
122
COMPARATIVE STUDY OF THE SPORTS ACHIEVEMENT
MOTIVATION OF SOCCER PLAYERS IN ALL INDIA INTER-
UNIVERSITY LEVEL
Huirem Englancha Singh, P.G.D.S.C student
Khoirom Sanayaima Singh, M.P.Ed student
Lamabam Naocha Meitei, M.P.Ed student
Pukhrambam Osin Chanu, M.P.Ed student
L.N.I.P.E, Gwalior.
ABSTRACT
Several factors influence the selection of the specific sports participation of the current study.
First the researcher’s familiarity with football through participation experience, especially with
regard to motivation, initially spurred interest in the examination of motivational difference
among female soccer players .The psychologist status of female soccer players is different. Thus
the purpose of the present study was to compare the Sports Achievement Motivation between
finalist team participating in All India Inter University Women Football Tournament, 2017-2018
held in Lakshmibai National Institute of Physical Education, Gwalior. SAMT consist of 20
Multiple Choice Questions of 40 marks. Each Question carries two (2) marks for correct answer
and zero (0) mark for wrong answer. The question measured the extent to which student were
motivated towards sports achievement motivation. Considering the population of the study,
stratified random sampling technique has been employed and the sample size has been targeted
in this investigation only on finalist team of 20 female players in the tournament. Statistical tool
was used for accurate and systematic results. Independent t-test was use as Statistical Technique
for comparative analysis. And the level of significant was set at 0.05 levels. The result indicated
that there is no difference on achievement motivation between players competing in the final of
the tournament.
Keywords: Sport Achievement Motivation, college female Players, Independent t-test, stratified
random sampling.
INTRODUCTION
Where there are human beings, there is behaviour; and where there are behaviors -whether
individual or social-there is bound to be psychology, in one some form. The behavioral effects of
motivation are vital to all achievement-oriented tasks, whether the situation is the laboratory,
classroom, or playing field. How motivation functions in achievement setting is an important
question for parents, teachers, coaches, and scientists alike. It is not surprising, then, that a
common goal in social psychology and sports psychology is to develop knowledge to the extent
that motivation can be optimized for all individuals facing achievement tasks. If this goal is
achieved and equality of motivations and achievement striving is obtained, each individual will
have the opportunity of reaching his or her athletic potential. Although it could never be said
with certainly that an individual was fully developing this potential, those occasions when
development was definitely halted could be recognized. Within sports psychology, motivation is
of central importance as research attempt to understand and explain human behaviour within the
INDIANJOURNALOFPHYSICALEDUCATIONSPORTSMEDICINE&EXERCISESCIENCE
ISSN0976-1101Vol-18,SpecialIssue(2)
123
realm of physical activity via participation and discontinuation motives, intrinsic and extrinsic
orientation and achievement goals. Motivation sustains life; it acts as a catalyst for our growth
and development from a mere zygote state to adult stage. It inspires and empowers us to
accomplish and achieve incredible thins. It is a directing agent for our actions that aim at
something higher, better and greater. All life-activity can be explained on the basis of motivation
that we exhibit in greater or lesser degree in one situation or the other, and for one thing or the
other. No two individual are alike in everything that goes to construct personality. This research
present implication for practice and research, particularly in terms of situational factors (e.g.,
motivational climate) related to goal perspectives. The athletes in this study, particularly. The
female soccer players indicated the importance of social factors in achievement motivation. In
this study it was hypothesized that there would be significant difference in Sports achievement
motivation between team in final of All India Inter University Women Football Tournament.
METHODOLOGY
The data was collected on all the subjects by administering the M.L. Kamlesh Sports
Achievement Motivation Questionnaire (SAMT). SAMT consist of 20 Multiple Choice
Questions of 40 marks. Each Question carries two (2) marks for correct answer and zero (0)
mark for wrong answer. The question measured the extent to which student were motivated
towards sports achievement. The SAMT carrying a test retest reliability as 0.70, in a test of
twenty statements the response value of which range between 0 – 40. The validity SAMT with
the actual performance of the athletes had been worked out to be 0.55 which is marked.
Considering the study, sample size has been targeted in this investigation to 40 female Soccer
players in final of All India Inter University Women Football Tournament. Statistical tool was
used for accurate and systematic results. Independent t-test was use as Statistical Technique for
comparative analysis. And the level of significant was set at 0.05 levels.
FINDINGS AND RESULT
Researcher selected and identified appropriate raw data group wise. Mean score, Standard
Deviation of each group was calculated. After Calculating the Mean, Standard Deviation the
researcher applied Independent ‟t” test. The mean score of Annamalai University and
Thiruvallure University are 24.3 and 25.4 respectively. And Standard deviation for both team
are 5.4 and 1.5 respectively as shown in table no. 1. Figure bellow indicates the mean difference
scores of the teams.
Table no. 1
Mean and standard deviation of Annamalai University and Thiruvallure University
Groups Numbers of players Mean Std. Deviation T value
Male 20 24.3 5.4 -8.47
Female 20 25.4 1.5
*Significant at 0.05 level of Significance Tabulated‘t’ = 2.02
It may be observed from the given table (1) that there was an insignificant difference found
between Annamalia University and Thiruvallure University players on Sport Achievement
Motivation as the calculated ‟t” value (-8.47) is lower than tabulated ‟t” value (2.02) at 0.05 level
of confidence. From the results of the study it has been evident that no significant difference was
INDIANJOURNALOFPHYSICALEDUCATIONSPORTSMEDICINE&EXERCISESCIENCE
ISSN0976-1101Vol-18,SpecialIssue(2)
124
found between Annamalia University and Thiruvallure University players on Motivation. It
appears that when the players attain excellence and become mature, their level of motivation also
boost up at certain level. Whenever, such mature players perform, their motivation level usually
remains the same as appeared in cases of Inter-University.
CONCLUSIONS
On the basis of the results obtained from the present empirical investigation, it may be concluded
that the Finalist of All India Inter-University women tournament did not differ on their level of
motivation. Furthermore it may also be inferred that both finalist team’s player have a similar
level of motivation during the competition.
REFERENCE
M.L. Kamlesh, “Educational Sports Psychology”. ( New Delhi-Friends Publication,
2006).
Robert Glyn C. “Achievement Motivation in sports”. Department of Physical
Education.University of Iltinous.
M.L. Kamlesh, “Educational Sports Psychology”. ( New Delhi-Friends Publication,
2006).
C.P. Singh, M. Ahmed, and I. Hussain, “A Comparative Study of Sports Achievement
Motivation between Male and Female Badminton Players”Vyayam-Vidnyan, 43(3),
2010, pp.30-33.
K. Kaur, N.P. Sharma and D.K Dureha.“Relationship between Achievement Motivation
and Pre-Competition
Anxiety of Indian Inter University Hockey Players” Scientific Journal in Sports and
Exercise,3(2), 2007, pp.24-26.
B.S. Thakur, and L. Mohan “Personality Traits, Anxiety and Achievement Motivation
Level of Volleyball Players and NonSpotmen”, Journal of Sports and Sports Sciences,
31(4),2008, pp.23-29.
Tammy A. Schilling. “Achievement motivation: Conceptions of ability, subjective
experience, task choice, and performance”. Canadian journal of sports Psychology,91,
2001, pp.238-246.
INDIANJOURNALOFPHYSICALEDUCATIONSPORTSMEDICINE&EXERCISESCIENCE
ISSN0976-1101Vol-18,SpecialIssue(2)
125
PLANTAR & DORSI FLEXION OF ANKLE
AN INDICATOR OF AGEING
Rakesh Kumar1, Dr. Amar Kumar
2
1Research scholar, LNIPE, Gwalior, (M.P.)
2Assistant Professor, Dept. of Sports Biomechanics
Email- [email protected] LNIPE Gwalior, (M.P.) [email protected]
INTRODUCTION:
The ankle is a complex joint that connects the foot to the lower leg. A hinge joint formed by the
articulation of the tibia and the fibula with the talus below also called mortise joint. It bears up to
eight times the body weight when one runs. Normal ankle function is needed to walk with a
smooth and nearly effortless gait. The muscles, tendons, and ligaments that support the ankle
joint work together to propel the body (Chaurasia, 2012). Flexibility at the ankle joints provides
an important contribution to safe execution of many functional tasks (e.g. walking, negotiating
stairs, rising from a chair) and added efficiency in maintenance of postural stability (Nitz &
Nancy, 2004). Dorsi flexion where the toes are brought closer to the shin. This decreases the
angle between the dorsum of the foot and the leg (Kyung 2005). Plantar flexion is the movement
which decreases the angle between the sole of the foot and the back of the leg (Kendall 2005). Ankle joint flexibility and strengthening are necessary for functional tasks like walking quickly,
negotiating stairs, and rising from chair, balance and postural stability (Long L, Jackson K,
2013). Ageing is associated with several changes in joint physiology, including a reduction in the
water content of the cartilage, the synovial fluid volume and the proteoglycans. Several studies
have shown that ankle dorsiflexion-plantarflexion and subtalar joint inversion-eversion range of
motion are 12-30% lower in older people (James B, 1989; Nigg BM, 1992). Loss of ankle joint
range and strength of muscles around ankle are considered to be part of normal ageing process
(McAdam& Smith, 1988; Tinetti, 1986). Amongst the many factors described, the fact that the
aging process results in reduced joint flexibility and reduced afferent sensory information is well
established. All joints show a significant reduction in range of motion (ROM) with age. The aim
of this study is to investigate the effect of ageing process in the movement of planter &
dorsiflexion on ankle.
MATERIALS AND METHODS
Selection of subjects: The study was conducted 40 subjects were selected with the age ranging
from 20 to 60 years from LNIPE Gwalior (M.P.). Purposive sampling technique was used to
attain the objective of the study. Ten students are divided in four groups according to his age
category. Individuals who fulfilled the inclusion and exclusion criteria and gave written consent
for participation were selected. The purpose of this study was explained to the subjects. All the
subjects fulfilling the inclusion and exclusion criteria who volunteered to participate in the study
were described verbally about the procedure to be used in the study. Testing was performed only
after informed consent was taken from the subjects. Following procedures were performed –
Measurement of dorsi flexion and plantar flexion range- Subject was placed in high sitting
position on a plinth. A double arm digital goniometer was used to measure the range of motion.
Fulcrum was placed on the lateral malleoli, stable arm of goniometer along the tibia in such a
manner that an imaginary line joining the lateral malleoli and head of fibula. Foot was
maintained in 90 degree position to the tibia; movable arm of the goniometer was placed parallel
to V Metatarsal. Now subject was asked to move the ankle upward (dorsiflexion) maximally.
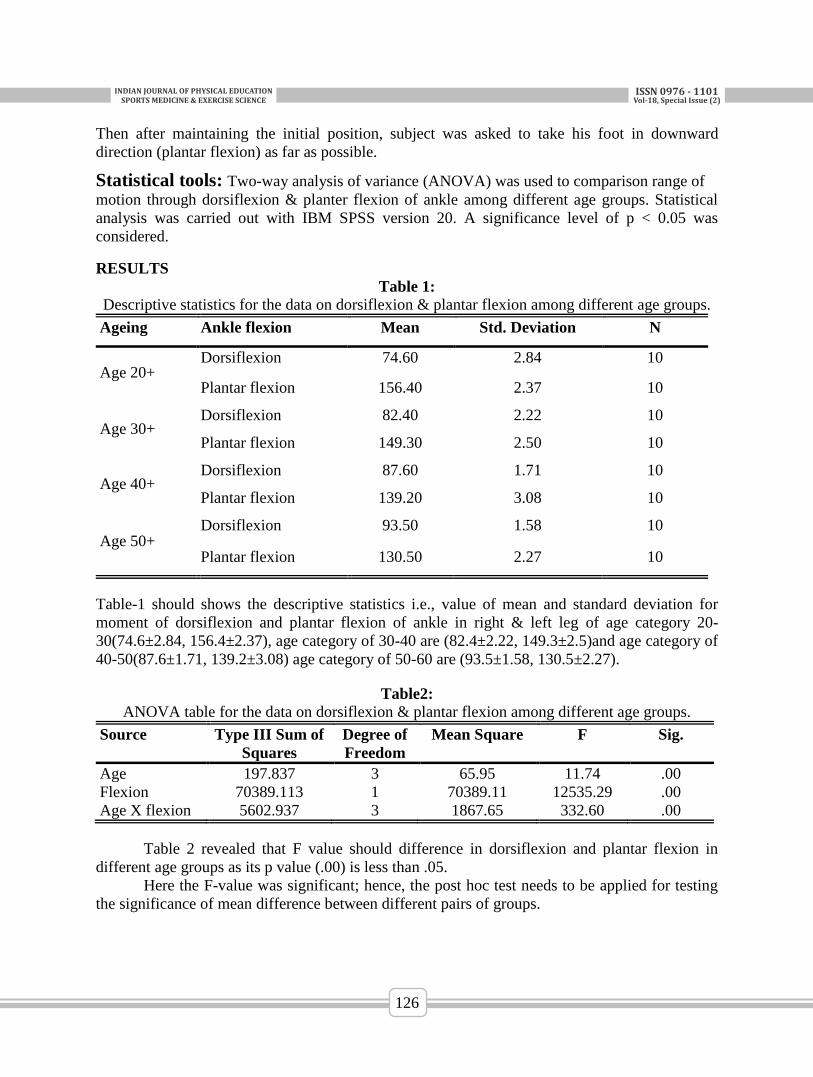
INDIANJOURNALOFPHYSICALEDUCATIONSPORTSMEDICINE&EXERCISESCIENCE
ISSN0976-1101Vol-18,SpecialIssue(2)
126
Then after maintaining the initial position, subject was asked to take his foot in downward
direction (plantar flexion) as far as possible.
Statistical tools: Two-way analysis of variance (ANOVA) was used to comparison range of
motion through dorsiflexion & planter flexion of ankle among different age groups. Statistical
analysis was carried out with IBM SPSS version 20. A significance level of p < 0.05 was
considered.
RESULTS
Table 1: Descriptive statistics for the data on dorsiflexion & plantar flexion among different age groups.
Ageing Ankle flexion Mean Std. Deviation N
Age 20+ Dorsiflexion 74.60 2.84 10
Plantar flexion 156.40 2.37 10
Age 30+ Dorsiflexion 82.40 2.22 10
Plantar flexion 149.30 2.50 10
Age 40+ Dorsiflexion 87.60 1.71 10
Plantar flexion 139.20 3.08 10
Age 50+ Dorsiflexion 93.50 1.58 10
Plantar flexion 130.50 2.27 10
Table-1 should shows the descriptive statistics i.e., value of mean and standard deviation for
moment of dorsiflexion and plantar flexion of ankle in right & left leg of age category 20-
30(74.6±2.84, 156.4±2.37), age category of 30-40 are (82.4±2.22, 149.3±2.5)and age category of
40-50(87.6±1.71, 139.2±3.08) age category of 50-60 are (93.5±1.58, 130.5±2.27).
Table2:
ANOVA table for the data on dorsiflexion & plantar flexion among different age groups.
Source Type III Sum of
Squares
Degree of
Freedom
Mean Square F Sig.
Age 197.837 3 65.95 11.74 .00
Flexion 70389.113 1 70389.11 12535.29 .00
Age X flexion 5602.937 3 1867.65 332.60 .00
Table 2 revealed that F value should difference in dorsiflexion and plantar flexion in
different age groups as its p value (.00) is less than .05.
Here the F-value was significant; hence, the post hoc test needs to be applied for testing
the significance of mean difference between different pairs of groups.
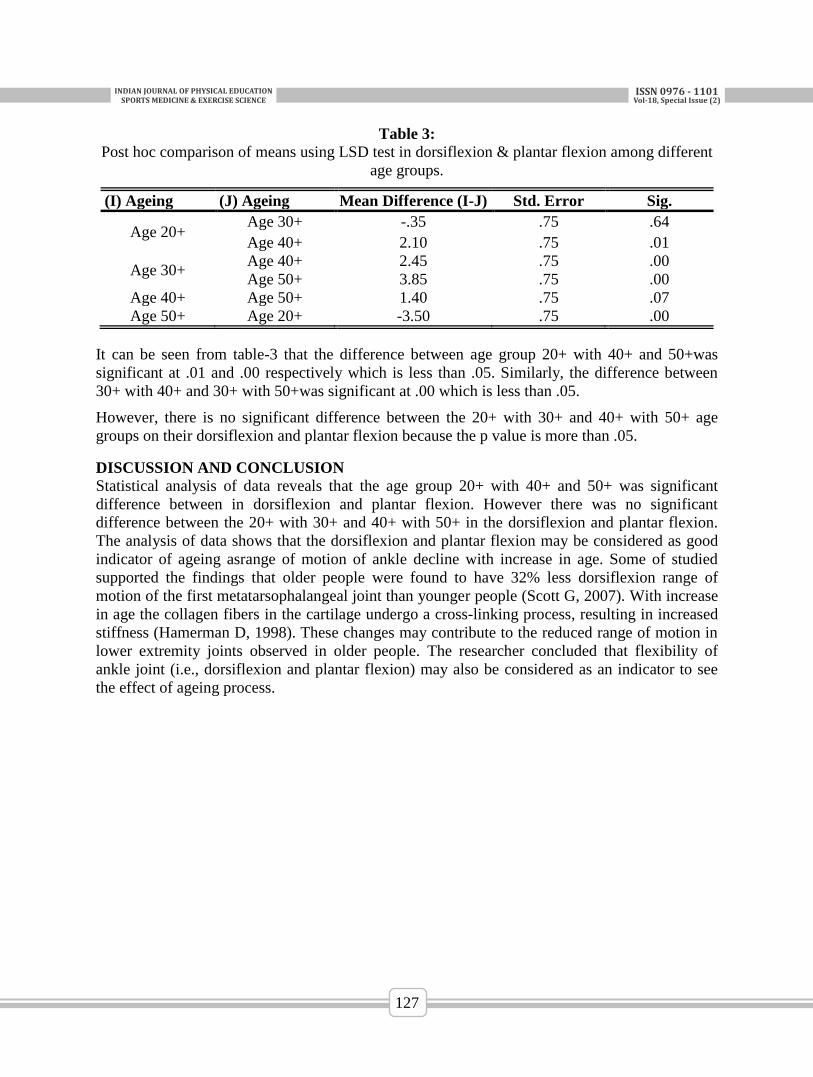
INDIANJOURNALOFPHYSICALEDUCATIONSPORTSMEDICINE&EXERCISESCIENCE
ISSN0976-1101Vol-18,SpecialIssue(2)
127
Table 3:
Post hoc comparison of means using LSD test in dorsiflexion & plantar flexion among different
age groups.
(I) Ageing (J) Ageing Mean Difference (I-J) Std. Error Sig.
Age 20+ Age 30+ -.35 .75 .64
Age 40+ 2.10 .75 .01
Age 30+ Age 40+ 2.45 .75 .00
Age 50+ 3.85 .75 .00
Age 40+ Age 50+ 1.40 .75 .07
Age 50+ Age 20+ -3.50 .75 .00
It can be seen from table-3 that the difference between age group 20+ with 40+ and 50+was
significant at .01 and .00 respectively which is less than .05. Similarly, the difference between
30+ with 40+ and 30+ with 50+was significant at .00 which is less than .05.
However, there is no significant difference between the 20+ with 30+ and 40+ with 50+ age
groups on their dorsiflexion and plantar flexion because the p value is more than .05.
DISCUSSION AND CONCLUSION
Statistical analysis of data reveals that the age group 20+ with 40+ and 50+ was significant
difference between in dorsiflexion and plantar flexion. However there was no significant
difference between the 20+ with 30+ and 40+ with 50+ in the dorsiflexion and plantar flexion.
The analysis of data shows that the dorsiflexion and plantar flexion may be considered as good
indicator of ageing asrange of motion of ankle decline with increase in age. Some of studied
supported the findings that older people were found to have 32% less dorsiflexion range of
motion of the first metatarsophalangeal joint than younger people (Scott G, 2007). With increase
in age the collagen fibers in the cartilage undergo a cross-linking process, resulting in increased
stiffness (Hamerman D, 1998). These changes may contribute to the reduced range of motion in
lower extremity joints observed in older people. The researcher concluded that flexibility of
ankle joint (i.e., dorsiflexion and plantar flexion) may also be considered as an indicator to see
the effect of ageing process.
INDIANJOURNALOFPHYSICALEDUCATIONSPORTSMEDICINE&EXERCISESCIENCE
ISSN0976-1101Vol-18,SpecialIssue(2)
128
REFERENCE
Long L, Jackson K, Laubach L. A home based exercises program for the foot and ankle
to improve balance, muscle performance and flexibility in community dwelling older
adults. Int J Phys Med Rehabil 2013;1(3)
Vandervoort AA, Chesworth BM, Cunningham DA, Paterson DH, Rechnitzer PA, Koval
JJ.Age and sex effects on mobility of the human ankle. J Gerontol. 1992;47:M17–M21
Chaurasia, B. D. 2012. Human Anatomy Lower Limb, regional and applied dissection
and clinical lower limb abdomen and pelvis (volume - 2) 5 edition (regional and applied
dissection and clinical lower limb abdomen and pelvis.Vol-2, Edition-6. CBS Publishers,
Daryaganj, Daryaganj, New Delhi, Delhi,
Nitz, Jennifer, C., & Choy, Nancy, Low. 2004. The relationship between ankle
dorsiflexion range, falls and activity level in women aged 40 to 80 years. New Zealand
Journal of Physiotherapy., 32(3): 121-125
INDIANJOURNALOFPHYSICALEDUCATIONSPORTSMEDICINE&EXERCISESCIENCE
ISSN0976-1101Vol-18,SpecialIssue(2)
129
PUBLIC RELATION FOR THE DEVELOPMENT OF PHYSICAL
EDUCATION
Waribam, J. Singh1 and L. Santosh Singh
2
Research Scholar, Dept. of Physical Edu. and Sports Science Manipur University, Imphal
Assistant Professor, Dept. of Physical Edu. and Sports Science Manipur University, Imphal
INTRODUCTION
Physical education as an instrument of health, fitness, performance and excellence is an integral
part of organized educational efforts. Its true image does not seem to have been well publicized.
Consequently people, in general, know little about its inherent philosophy, ideals, values and
objectives. The understanding and appreciation of profession-environment interactions and
evaluation of the experiences emanating there from will surely make physical education an
effective instrument of social change. This is possible through good public relations.
Public relations is a process by which an institution, organisation or profession projects its image
in the public through channels other than those constituting media, and receive feedback from
the external environment about the effectiveness of its policies and programmes obtained only
through the various publicity media.
For them, physical activity is a fad, a frill-a sheet waste of time. Parents are so seriously
concerned about the standing of their children in science, commerce or literature at school but
not in physical education. Lack of public relations i.e., free flow of information between the
institution and the public, is responsible for this state of affairs. Public relations include both
performance and communications used to form profitable relationships with the public.
PURPOSES
Davis and Walls (1961) precisely listed the following purposes of public relations in physical
education:
To help to understand the reasons for and values of physical education.
To create goodwill with all pertinent publics (students, parents, teachers, school personnel
and public in general).
To inform of present programmes and planned changes in programmes, policies etc.
To guide and promote public opinion in favour of worthy programmes of physical education.
To inform pertinent publics of services rendered by the department and its willingness of
serve.
Need of Public Relation in Physical Education:
To create and develop interest in physical education, it is essential that public should be well
informed about its different activities and programmes. It is impossible to make students,
teachers and outsiders interested in physical education without a good publicity programme. All
this information should be provided to them through effective and active public relation. The
following are some of the important items which should be essential publicised: -
INDIANJOURNALOFPHYSICALEDUCATIONSPORTSMEDICINE&EXERCISESCIENCE
ISSN0976-1101Vol-18,SpecialIssue(2)
130
a. Health and physical fitness of the students.
b. Achievements of students in physical education.
c. Importance of students’ achievement in practical life.
d. The physical activities available in the school.
e. Aims and objectives of physical education.
It requires, on the one side, necessary facilities and on the other side, discipline in the
participants and audience. These two essential requirements of ‘Sports Meet’ can’t be fulfil
without co-operation of the local public. Hence ‘Public Relation’ is a must in physical education.
Important Devices of Public Relations in Physical Education
For the development of physical education on healthy basis it is essential that the public should
be well informed about its utility and its various activities. The following are the important
devices to awaken public interest in physical education: -
Exhibitions: Through exhibitions certain items are displayed for public as well as students.
This is the medium through which knowledge regarding the achievements of the students
and availability of various physical activities in the school is imparted. Through the
exhibition of models, charts, pictures, graphs etc. skills of different games and physical
activities can be displayed for the benefit of public and students.
Play Day: Play Day is a powerful device of public relation. On that day the students are
left free to participate in any game they like. All participating children have fun and
recreation. Sport-skill is not given any importance on ‘Play Day’. But from the view of
entertainment and social contracts, it does have a great significance.
Demonstration: Demonstration is the most valuable form of publicizing the physical
activities of a school. It provides an opportunity through which the achievements of the
students and effectiveness of physical education is practically demonstrated to the public
and students.
Radio: Radio is a medium of wider publicity. Programmes of physical education can be
widely publicized through radio broadcasts. Running commentary on ‘Radio’ plays a
potential role in creating public interest. As a result, public interest in these two games is
developing greatly.
Television: Television has given a new direction to publicity. Radio can present only
running commentary, but T.V. has made it possible to see the actual match being played at
far off places and experience gained through eyes is more effective and solid.
Postures: To attract the public towards certain programmes of physical education, postures
can prove to be an effective medium. The posters should be printed in attractive colours
and eye-catching style.
Pamphlets: Pamphlets can also be used to attract the public to certain programmes of
physical education. A pamphlet depicts the summary of the programme to be presented by
an instruction or an organization which should be printed atrractively.

INDIANJOURNALOFPHYSICALEDUCATIONSPORTSMEDICINE&EXERCISESCIENCE
ISSN0976-1101Vol-18,SpecialIssue(2)
131
ROLE AND RESPONSIBILITY OF PHYSICAL EDUCATOR
Public relations in physical education and sport are the physical educator’s baby the nurture and
care of which is his responsibility. Other teachers, administrative and field staff act as a support
for it. Within the parameters of their defined roles and responsibilities, physical education
teachers must work out effective strategies of public relations in order to be successful at their
job, and in their mission.
With the help of administration and student-leaders, they must reach out to the targeted
section (s) of the society through verbal and non-verbal means giving information and
gathering feedback as well as seeking financial support for their programmes and activities.
They must, first of all, put their house in order and have transparency and credibility in their
working and dealings.
Participation in community programmes such as social work, calamity management outside
the precincts of the institution by the physical education teachers shall go a long way in
strengthening the public relation process.
Through a variety of demonstrative and competitive activity programmes, they should
constantly keep in touch with parents, general public and significant others allowing them to
receive right kind of information and impression.
Physical educators must remember that good human relations are at the heart of good public
relations. They should engage in commendable acts and actions and avoid indulging in
unbecoming behaviour.
In corporation with others, they should project a fair image of physical education profession
through example and not percent.
All out efforts must be made by physical educators to remove misgivings about physical
education and sports from the minds of the students. They must guard against false and
adverse propaganda, if any, and counter it with patience and diligence.
PUBLIC RELATION MEDIA
Public relation media refers to all the ways, means, techniques and strategies – both verbal and
non-verbal – which aim to develop pro-active relationship between the institution/organization
and the community ranging from students to the general public. A brief discussion on each of the
media or public relation may be useful to the reader.
Parent-teacher Meetings: Physical educators personally visit a few caring parents to apprise
them of the school activity programmes and seek their help in bringing about improvement in
their department. In fact, frequent meetings of parents and physical educators are the finest
means of public relation.
Public Speaking: Public speaking is an art but unfortunately few physical educators are
good at it. More often than not they feel shy of facing audience, they are not too articulate
resulting in not-so-good public relation.
INDIANJOURNALOFPHYSICALEDUCATIONSPORTSMEDICINE&EXERCISESCIENCE
ISSN0976-1101Vol-18,SpecialIssue(2)
132
Exhibition: In comparison to activity display, an exhibition is a passive and indirect public
relation strategy. Through a display of pictures, charts, graphs, drawings, diagrams, objects,
artifacts, models, sketches, paintings etc. various aspects of physical education could be
displayed.
Activity Competitions: Intramurals, extramurals in regular sports and games and inter-class,
inter-group competition in recreational activities are yet another effective and direct means of
public relation.
Play-days: As already pointed out elsewhere, play-days are highly important educational
experiences. Informal, rejuvenating and recreating as they are, they bring the school
authorities, teachers, parents and the public on one forum enabling them to interact with one
another more meaningfully.
Rallies: To project the programme of physical activity mass rallies are organized on large
scale at various levels – city, district, regional and national Rally should be planned carefully
and much in advance.
Conclaves: Conclave includes parent and public meetings, assemblies and core group
discussions at the institution with certain specified objectives.
Print Media: Bulletins, newsletters, newspapers, magazines, graphics, pictures, posters,
brochures, pamphlets etc. comprise print media that are used by the institution directly as an
instrument of publicity.
Electronic Media: Television, video, films and radio constitute electronic media. The
publicity dominated and information hungry world of today puts greater reliance on
electronic media than any other means of communication.
CONCLUSION
Public Relation is all the more essential for development of physical education. To create and
develop interest in physical education, it is essential that public should be well informed about its
different activities and programmes. ‘Public Relation’ is a powerful means to publicise and
spread the healthy concept of physical education. To reach out to people, physical education
must use public relations as a handy tool. It is deeply related with physical education and sports,
because it is the discipline which built, character, social, physical, mental, spiritual development
of a person. Moreover, it will also help to wash out the misconceptions of physical education
from them. In order to achieve the aim and objectives of physical education the role and
responsibility of physical educator is vital.
INDIANJOURNALOFPHYSICALEDUCATIONSPORTSMEDICINE&EXERCISESCIENCE
ISSN0976-1101Vol-18,SpecialIssue(2)
133
A COMPARATIVE STUDY OF FLEXIBILITY STATUS OF
SELECTED VARIABLES IN THE GAME OF FOOTBALL AND
BASKETBALL
Nabanita Sharma1, Chandan K Paswan
2
MPEd Student, LNIPE, Gwalior
PhD Scholar, LNIPE, Gwalior
ABSTRACT
In the field of games and sports flexibility plays a vital role in determining the performances of a
sports person. It can act like a determining factor by which one can evaluate the particular
sports performances. Keeping this factor in mind, the of comparative study of flexibility status on
selected variables in the game of football and basketball was taken to see the flexibility score of
the selected body parts. A total of 20 subjects were taken, 10 were from football match practice
group and the other 10 were from basketball match practice group. A total of five variables were
taken from the body site to compare the flexibility of the two team games that is football and
basketball. To compare the means of the two groups independent sample t-test was applied at
0.05 level of significance. The result showed there is no significance difference between the two
team games i.e. football and basketball.
Keywords: Flexibility
INTRODUCTION
In the field of physical education we rely on many factors that can determine the performance of
an athlete. The factors like strength, stamina, power, agility and speed play a vital role in the up-
liftment of an athlete. On the other hand, one of the main factors that we ignore in sports
performances is flexibility. Flexibility plays a vital role in enhancing sports performances and in
team games like football and basketball it has an upper hand to play. And to see the effect of
flexibility on selected body parts in the team game like football and basketball this particular
study was taken.
METHODOLOGY
A total of 20 players we randomly chosen for the purpose of the study. 10 were selected from
basket ball match practice and the rest 10 were from football. All the subjects were taken from
L.N.I.P.E, Gwalior and the study were delimited to the female footballers and basketballers of
the same institute. To compare the flexibility means of the both the games i.e. football and
basketball. Independent sample t-test was applied at 0.05 level of significance. Here are the
selected body movements that were taken to compare the flexibility of both the games:
Ankle dosri-flexion
Ankle planter-flexion
Knee flexion
Knee extension
Hip flexion
The following procedure was used to measure the flexibility of the players of both the games
which are as follows:
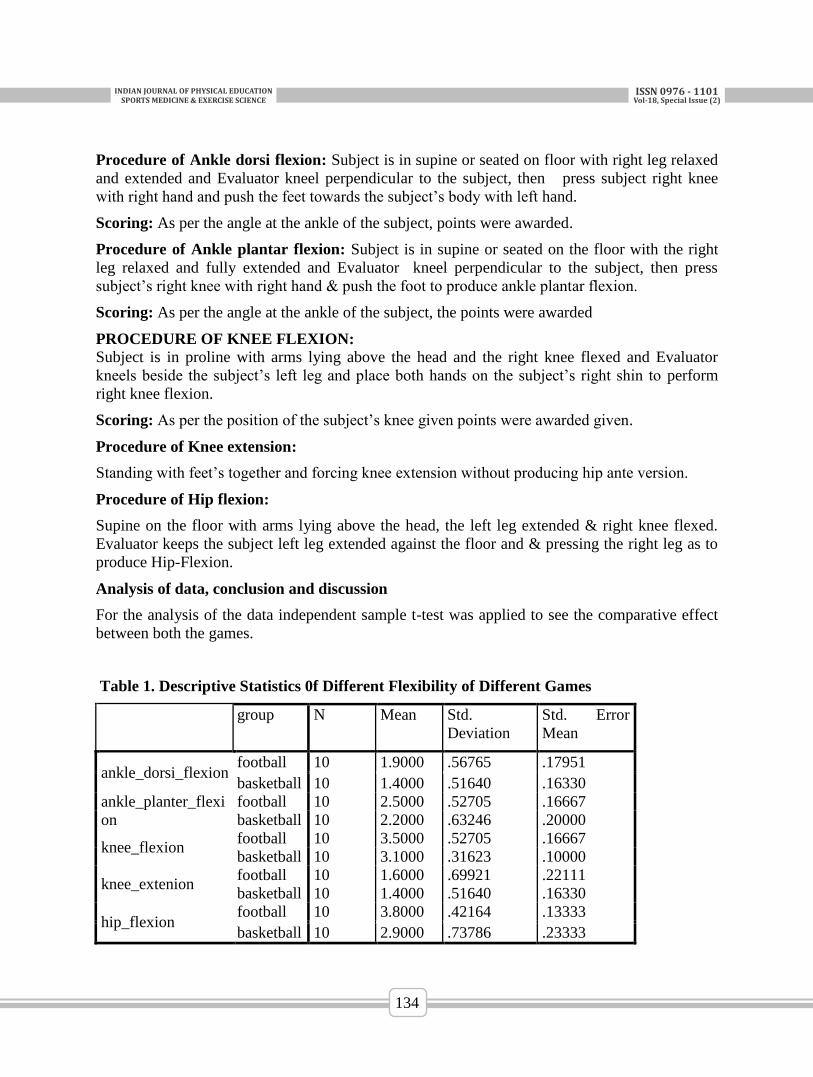
INDIANJOURNALOFPHYSICALEDUCATIONSPORTSMEDICINE&EXERCISESCIENCE
ISSN0976-1101Vol-18,SpecialIssue(2)
134
Procedure of Ankle dorsi flexion: Subject is in supine or seated on floor with right leg relaxed
and extended and Evaluator kneel perpendicular to the subject, then press subject right knee
with right hand and push the feet towards the subject’s body with left hand.
Scoring: As per the angle at the ankle of the subject, points were awarded.
Procedure of Ankle plantar flexion: Subject is in supine or seated on the floor with the right
leg relaxed and fully extended and Evaluator kneel perpendicular to the subject, then press
subject’s right knee with right hand & push the foot to produce ankle plantar flexion.
Scoring: As per the angle at the ankle of the subject, the points were awarded
PROCEDURE OF KNEE FLEXION:
Subject is in proline with arms lying above the head and the right knee flexed and Evaluator
kneels beside the subject’s left leg and place both hands on the subject’s right shin to perform
right knee flexion.
Scoring: As per the position of the subject’s knee given points were awarded given.
Procedure of Knee extension:
Standing with feet’s together and forcing knee extension without producing hip ante version.
Procedure of Hip flexion:
Supine on the floor with arms lying above the head, the left leg extended & right knee flexed.
Evaluator keeps the subject left leg extended against the floor and & pressing the right leg as to
produce Hip-Flexion.
Analysis of data, conclusion and discussion
For the analysis of the data independent sample t-test was applied to see the comparative effect
between both the games.
Table 1. Descriptive Statistics 0f Different Flexibility of Different Games
group N Mean Std.
Deviation
Std. Error
Mean
ankle_dorsi_flexion football 10 1.9000 .56765 .17951
basketball 10 1.4000 .51640 .16330
ankle_planter_flexi
on
football 10 2.5000 .52705 .16667
basketball 10 2.2000 .63246 .20000
knee_flexion football 10 3.5000 .52705 .16667
basketball 10 3.1000 .31623 .10000
knee_extenion football 10 1.6000 .69921 .22111
basketball 10 1.4000 .51640 .16330
hip_flexion football 10 3.8000 .42164 .13333
basketball 10 2.9000 .73786 .23333
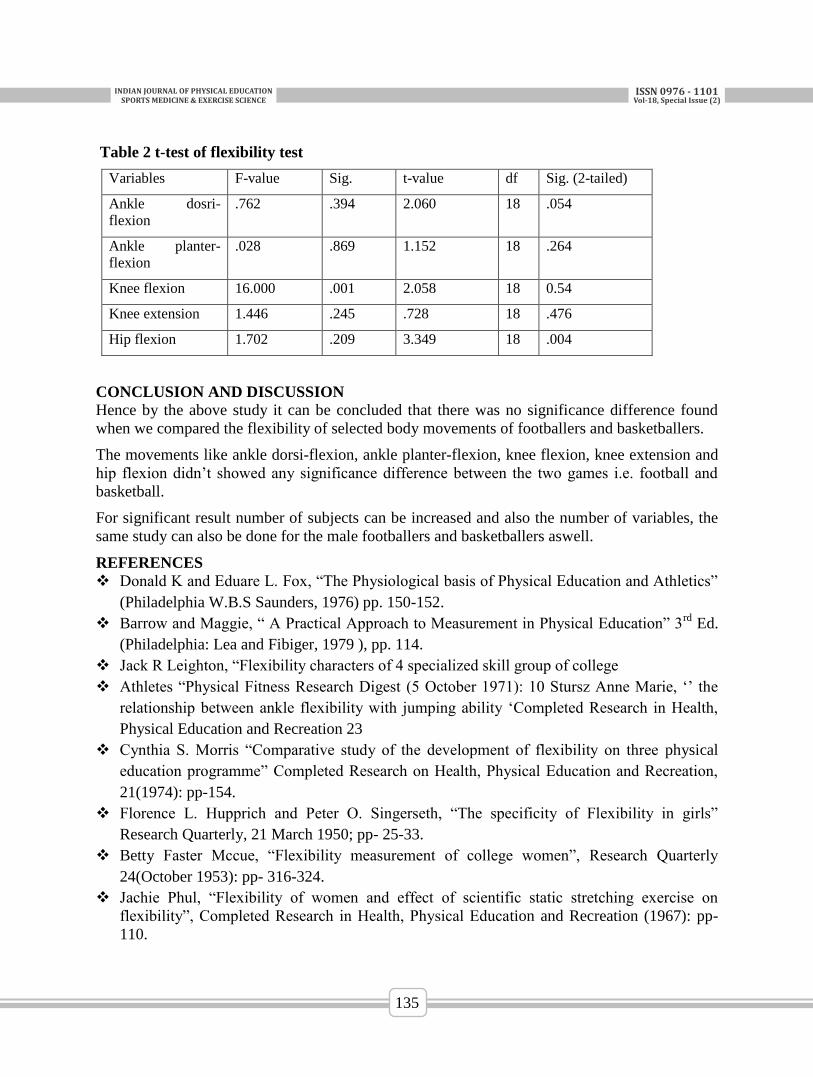
INDIANJOURNALOFPHYSICALEDUCATIONSPORTSMEDICINE&EXERCISESCIENCE
ISSN0976-1101Vol-18,SpecialIssue(2)
135
Table 2 t-test of flexibility test
Variables F-value Sig. t-value df Sig. (2-tailed)
Ankle dosri-
flexion
.762 .394 2.060 18 .054
Ankle planter-
flexion
.028 .869 1.152 18 .264
Knee flexion 16.000 .001 2.058 18 0.54
Knee extension 1.446 .245 .728 18 .476
Hip flexion 1.702 .209 3.349 18 .004
CONCLUSION AND DISCUSSION
Hence by the above study it can be concluded that there was no significance difference found
when we compared the flexibility of selected body movements of footballers and basketballers.
The movements like ankle dorsi-flexion, ankle planter-flexion, knee flexion, knee extension and
hip flexion didn’t showed any significance difference between the two games i.e. football and
basketball.
For significant result number of subjects can be increased and also the number of variables, the
same study can also be done for the male footballers and basketballers aswell.
REFERENCES
Donald K and Eduare L. Fox, “The Physiological basis of Physical Education and Athletics”
(Philadelphia W.B.S Saunders, 1976) pp. 150-152.
Barrow and Maggie, “ A Practical Approach to Measurement in Physical Education” 3rd
Ed.
(Philadelphia: Lea and Fibiger, 1979 ), pp. 114.
Jack R Leighton, “Flexibility characters of 4 specialized skill group of college
Athletes “Physical Fitness Research Digest (5 October 1971): 10 Stursz Anne Marie, ‘’ the
relationship between ankle flexibility with jumping ability ‘Completed Research in Health,
Physical Education and Recreation 23
Cynthia S. Morris “Comparative study of the development of flexibility on three physical
education programme” Completed Research on Health, Physical Education and Recreation,
21(1974): pp-154.
Florence L. Hupprich and Peter O. Singerseth, “The specificity of Flexibility in girls”
Research Quarterly, 21 March 1950; pp- 25-33.
Betty Faster Mccue, “Flexibility measurement of college women”, Research Quarterly
24(October 1953): pp- 316-324.
Jachie Phul, “Flexibility of women and effect of scientific static stretching exercise on
flexibility”, Completed Research in Health, Physical Education and Recreation (1967): pp-
110.
INDIANJOURNALOFPHYSICALEDUCATIONSPORTSMEDICINE&EXERCISESCIENCE
ISSN0976-1101Vol-18,SpecialIssue(2)
136
EFFECT OF STEP AEROBIC TRAINING FOR SIX WEEKS
WITH 6 INCHES STEP PLATFORM AT 118 AND 126 BEATS
PER MINUTE (BPM) ON KINEMATIC (PARTIAL
TEMPORAL) VARIABLES
Dr. Sonia Shalini*, Raghvendra Shukla**, Dr. Dhananjoy Shaw***
* Associate Professor, I.G.I.P.E.S.S, University of Delhi, New Delhi, India
** Research Scholar, D.P.E.S.S, University of Delhi, New Delhi, India
*** Officiating Principal, I.G.I.P.E.S.S, University of Delhi, New Delhi, India
A study conducted with the objective to test the effect of step aerobic training for six weeks with 6
inches step platform at 118 and 126 beats per minute (BPM) on selected kinematic (Partial
Temporal) variables. The study was delimited to female subjects only (N=30), age ranging from
18 to 22 years and the intensity of training set to 118 and 126 beats per minute as protocol 1 and
protocol 2 respectively. The Data Recording and quantification for pre test and post test were
administered by Video Analysis (analysis for partial temporal variables) post test was
conducted immediately after step aerobic training for 6 weeks with six inches step platform at
118 BMP as well as 126 BMP independently. Collected data was computed with mean, standard
deviation and t-test. The selected variables for the study were Leg Step Up Variable-Right (T1),
Leg Step Up Variable-Left (T2), Leg Step Down Variable-Right (T3), Leg Step Down Variable-
Left (T4), Upward Arm Swing Variable (T9), Downward Arm Swing Variable (T10), Ratio
Variables (T17-T32). Effect of step aerobic training for six weeks in different protocol were
found to be significant for biomechanical adaptation. All the selected kinematic (temporal)
variables supported each other as per the existing literature or research and were found suitable
for step aerobic training evaluation.
Keywords:- Step Aerobic Training, Kinematic, Temporal, BPM.
INTRODUCTION
Aerobic training leads to aerobic fitness, also called cardio respiratory fitness, which is the
ability of the heart and lungs to supply nutrients and oxygen to the muscles and other body
tissues. Frequency, duration, and intensity influence aerobic training Research studies
documented various factors that could affect the aerobic requirement (energy cost) of step
aerobics training. These included body weight, step platform height, stepping rate, stepping
pattern and use of hand-held weights.
The determination of biomechanical indicators during step aerobics training, was that the effect
of increases in step platform height studied by Santos-Rocha, et.al 2000 and increase in ground
reaction force, investigated by Farrington and Dyson, 1995; Bezner et al., documented that
increases in step platform height and music tempo appear to increase ground reaction force.
According to these studies the height of a step platform reduces the time interval between the
initial contact and the moment of achieving the maximum ground reaction force, which in turn
leads to increases in mechanical work load and can therefore influence the way in which the type
and technique of movement are adapted.
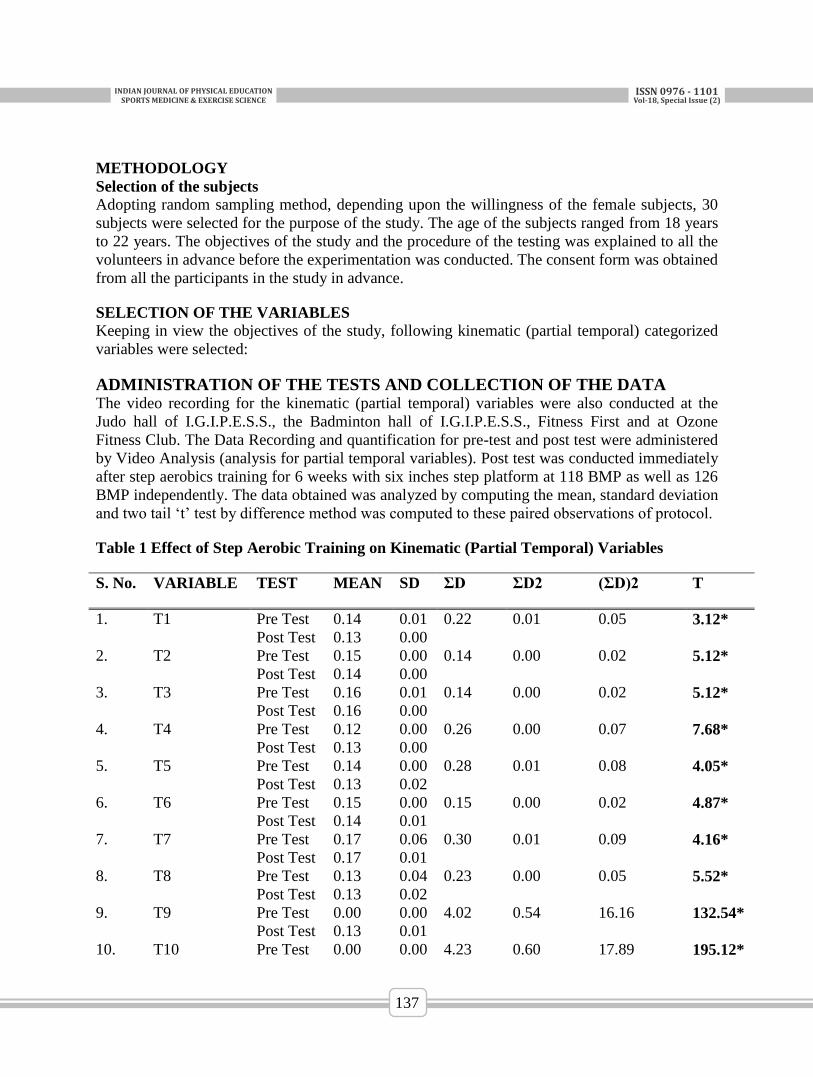
INDIANJOURNALOFPHYSICALEDUCATIONSPORTSMEDICINE&EXERCISESCIENCE
ISSN0976-1101Vol-18,SpecialIssue(2)
137
METHODOLOGY
Selection of the subjects
Adopting random sampling method, depending upon the willingness of the female subjects, 30
subjects were selected for the purpose of the study. The age of the subjects ranged from 18 years
to 22 years. The objectives of the study and the procedure of the testing was explained to all the
volunteers in advance before the experimentation was conducted. The consent form was obtained
from all the participants in the study in advance.
SELECTION OF THE VARIABLES
Keeping in view the objectives of the study, following kinematic (partial temporal) categorized
variables were selected:
ADMINISTRATION OF THE TESTS AND COLLECTION OF THE DATA The video recording for the kinematic (partial temporal) variables were also conducted at the
Judo hall of I.G.I.P.E.S.S., the Badminton hall of I.G.I.P.E.S.S., Fitness First and at Ozone
Fitness Club. The Data Recording and quantification for pre-test and post test were administered
by Video Analysis (analysis for partial temporal variables). Post test was conducted immediately
after step aerobics training for 6 weeks with six inches step platform at 118 BMP as well as 126
BMP independently. The data obtained was analyzed by computing the mean, standard deviation
and two tail ‘t’ test by difference method was computed to these paired observations of protocol.
Table 1 Effect of Step Aerobic Training on Kinematic (Partial Temporal) Variables
S. No. VARIABLE TEST MEAN SD ΣD ΣD2 (ΣD)2 T
1. T1 Pre Test 0.14 0.01 0.22 0.01 0.05 3.12*
Post Test 0.13 0.00
2. T2 Pre Test 0.15 0.00 0.14 0.00 0.02 5.12*
Post Test 0.14 0.00
3. T3 Pre Test 0.16 0.01 0.14 0.00 0.02 5.12*
Post Test 0.16 0.00
4. T4 Pre Test 0.12 0.00 0.26 0.00 0.07 7.68*
Post Test 0.13 0.00
5. T5 Pre Test 0.14 0.00 0.28 0.01 0.08 4.05*
Post Test 0.13 0.02
6. T6 Pre Test 0.15 0.00 0.15 0.00 0.02 4.87*
Post Test 0.14 0.01
7. T7 Pre Test 0.17 0.06 0.30 0.01 0.09 4.16*
Post Test 0.17 0.01
8. T8 Pre Test 0.13 0.04 0.23 0.00 0.05 5.52*
Post Test 0.13 0.02
9. T9 Pre Test 0.00 0.00 4.02 0.54 16.16 132.54*
Post Test 0.13 0.01
10. T10 Pre Test 0.00 0.00 4.23 0.60 17.89 195.12*
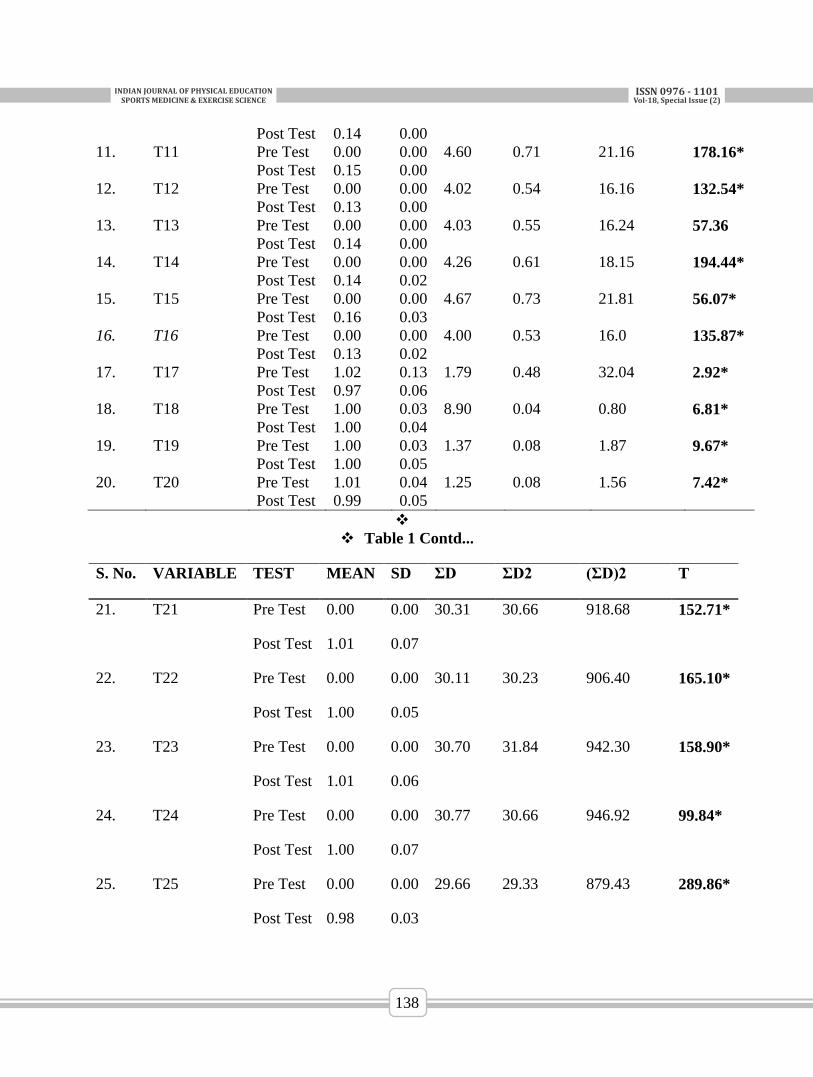
INDIANJOURNALOFPHYSICALEDUCATIONSPORTSMEDICINE&EXERCISESCIENCE
ISSN0976-1101Vol-18,SpecialIssue(2)
138
Post Test 0.14 0.00
11. T11 Pre Test 0.00 0.00 4.60 0.71 21.16 178.16*
Post Test 0.15 0.00
12. T12 Pre Test 0.00 0.00 4.02 0.54 16.16 132.54*
Post Test 0.13 0.00
13. T13 Pre Test 0.00 0.00 4.03 0.55 16.24 57.36
Post Test 0.14 0.00
14. T14 Pre Test 0.00 0.00 4.26 0.61 18.15 194.44*
Post Test 0.14 0.02
15. T15 Pre Test 0.00 0.00 4.67 0.73 21.81 56.07*
Post Test 0.16 0.03
16. T16 Pre Test 0.00 0.00 4.00 0.53 16.0 135.87*
Post Test 0.13 0.02
17. T17 Pre Test 1.02 0.13 1.79 0.48 32.04 2.92*
Post Test 0.97 0.06
18. T18 Pre Test 1.00 0.03 8.90 0.04 0.80 6.81*
Post Test 1.00 0.04
19. T19 Pre Test 1.00 0.03 1.37 0.08 1.87 9.67*
Post Test 1.00 0.05
20. T20 Pre Test 1.01 0.04 1.25 0.08 1.56 7.42*
Post Test 0.99 0.05
Table 1 Contd...
S. No. VARIABLE TEST MEAN SD ΣD ΣD2 (ΣD)2 T
21. T21 Pre Test 0.00 0.00 30.31 30.66 918.68 152.71*
Post Test 1.01 0.07
22. T22 Pre Test 0.00 0.00 30.11 30.23 906.40 165.10*
Post Test 1.00 0.05
23. T23 Pre Test 0.00 0.00 30.70 31.84 942.30 158.90*
Post Test 1.01 0.06
24. T24 Pre Test 0.00 0.00 30.77 30.66 946.92 99.84*
Post Test 1.00 0.07
25. T25 Pre Test 0.00 0.00 29.66 29.33 879.43 289.86*
Post Test 0.98 0.03
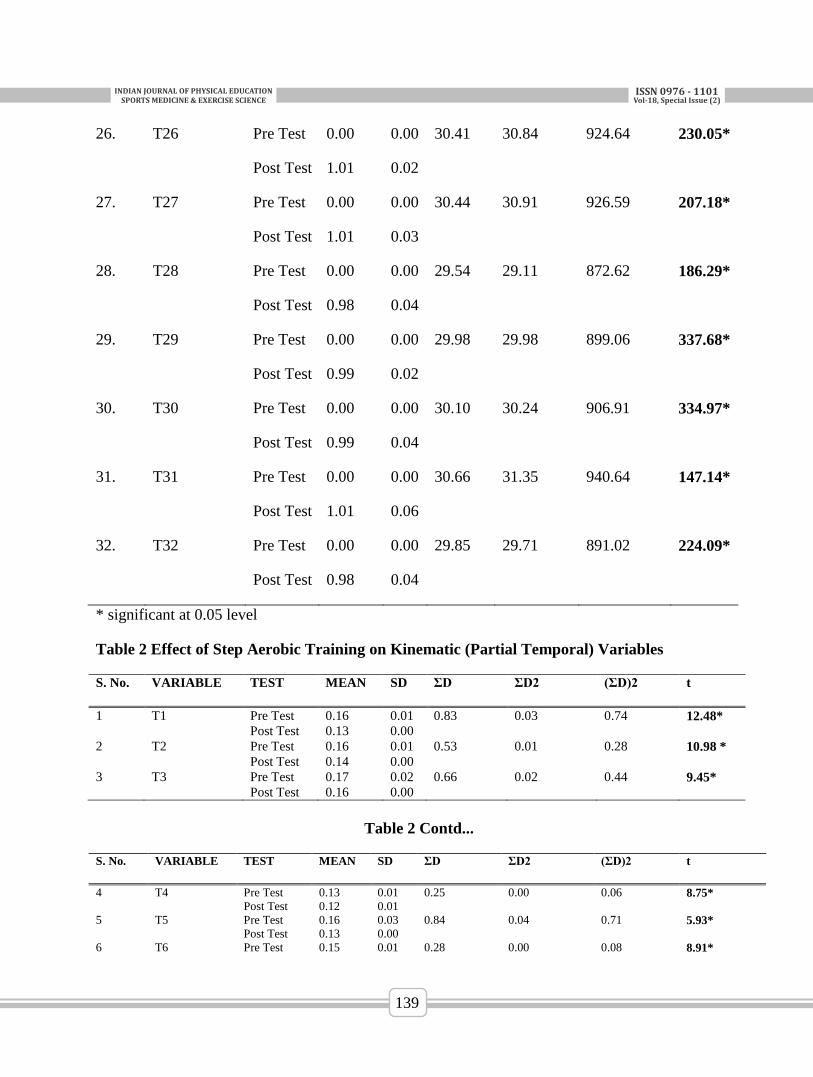
INDIANJOURNALOFPHYSICALEDUCATIONSPORTSMEDICINE&EXERCISESCIENCE
ISSN0976-1101Vol-18,SpecialIssue(2)
139
26. T26 Pre Test 0.00 0.00 30.41 30.84 924.64 230.05*
Post Test 1.01 0.02
27. T27 Pre Test 0.00 0.00 30.44 30.91 926.59 207.18*
Post Test 1.01 0.03
28. T28 Pre Test 0.00 0.00 29.54 29.11 872.62 186.29*
Post Test 0.98 0.04
29. T29 Pre Test 0.00 0.00 29.98 29.98 899.06 337.68*
Post Test 0.99 0.02
30. T30 Pre Test 0.00 0.00 30.10 30.24 906.91 334.97*
Post Test 0.99 0.04
31. T31 Pre Test 0.00 0.00 30.66 31.35 940.64 147.14*
Post Test 1.01 0.06
32. T32 Pre Test 0.00 0.00 29.85 29.71 891.02 224.09*
Post Test 0.98 0.04
* significant at 0.05 level
Table 2 Effect of Step Aerobic Training on Kinematic (Partial Temporal) Variables
S. No. VARIABLE TEST MEAN SD ΣD ΣD2 (ΣD)2 t
1 T1 Pre Test 0.16 0.01 0.83 0.03 0.74 12.48*
Post Test 0.13 0.00
2 T2 Pre Test 0.16 0.01 0.53 0.01 0.28 10.98 *
Post Test 0.14 0.00
3 T3 Pre Test 0.17 0.02 0.66 0.02 0.44 9.45*
Post Test 0.16 0.00
Table 2 Contd...
S. No. VARIABLE TEST MEAN SD ΣD ΣD2 (ΣD)2 t
4 T4 Pre Test 0.13 0.01 0.25 0.00 0.06 8.75*
Post Test 0.12 0.01
5 T5 Pre Test 0.16 0.03 0.84 0.04 0.71 5.93*
Post Test 0.13 0.00
6 T6 Pre Test 0.15 0.01 0.28 0.00 0.08 8.91*
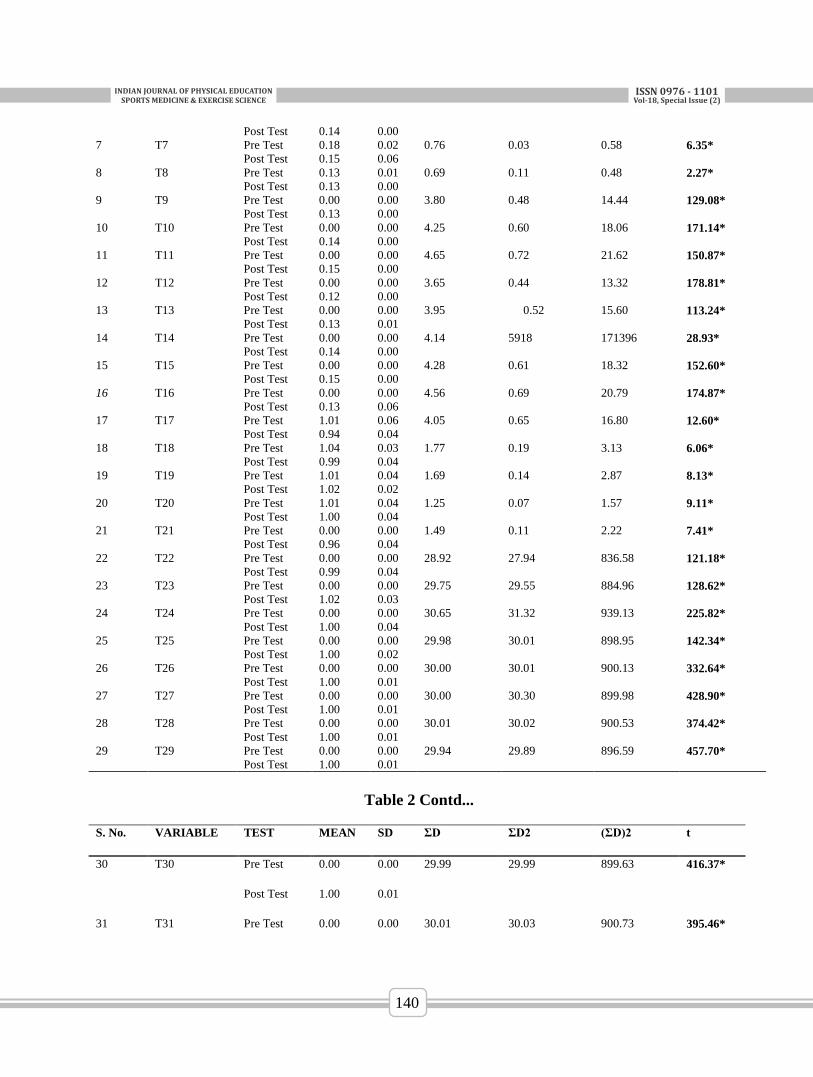
INDIANJOURNALOFPHYSICALEDUCATIONSPORTSMEDICINE&EXERCISESCIENCE
ISSN0976-1101Vol-18,SpecialIssue(2)
140
Post Test 0.14 0.00
7 T7 Pre Test 0.18 0.02 0.76 0.03 0.58 6.35*
Post Test 0.15 0.06
8 T8 Pre Test 0.13 0.01 0.69 0.11 0.48 2.27*
Post Test 0.13 0.00
9 T9 Pre Test 0.00 0.00 3.80 0.48 14.44 129.08*
Post Test 0.13 0.00
10 T10 Pre Test 0.00 0.00 4.25 0.60 18.06 171.14*
Post Test 0.14 0.00
11 T11 Pre Test 0.00 0.00 4.65 0.72 21.62 150.87*
Post Test 0.15 0.00
12 T12 Pre Test 0.00 0.00 3.65 0.44 13.32 178.81*
Post Test 0.12 0.00
13 T13 Pre Test 0.00 0.00 3.95 0.52 15.60 113.24*
Post Test 0.13 0.01
14 T14 Pre Test 0.00 0.00 4.14 5918 171396 28.93*
Post Test 0.14 0.00
15 T15 Pre Test 0.00 0.00 4.28 0.61 18.32 152.60*
Post Test 0.15 0.00
16 T16 Pre Test 0.00 0.00 4.56 0.69 20.79 174.87*
Post Test 0.13 0.06
17 T17 Pre Test 1.01 0.06 4.05 0.65 16.80 12.60*
Post Test 0.94 0.04
18 T18 Pre Test 1.04 0.03 1.77 0.19 3.13 6.06*
Post Test 0.99 0.04
19 T19 Pre Test 1.01 0.04 1.69 0.14 2.87 8.13*
Post Test 1.02 0.02
20 T20 Pre Test 1.01 0.04 1.25 0.07 1.57 9.11*
Post Test 1.00 0.04
21 T21 Pre Test 0.00 0.00 1.49 0.11 2.22 7.41*
Post Test 0.96 0.04
22 T22 Pre Test 0.00 0.00 28.92 27.94 836.58 121.18*
Post Test 0.99 0.04
23 T23 Pre Test 0.00 0.00 29.75 29.55 884.96 128.62*
Post Test 1.02 0.03
24 T24 Pre Test 0.00 0.00 30.65 31.32 939.13 225.82*
Post Test 1.00 0.04
25 T25 Pre Test 0.00 0.00 29.98 30.01 898.95 142.34*
Post Test 1.00 0.02
26 T26 Pre Test 0.00 0.00 30.00 30.01 900.13 332.64*
Post Test 1.00 0.01
27 T27 Pre Test 0.00 0.00 30.00 30.30 899.98 428.90*
Post Test 1.00 0.01
28 T28 Pre Test 0.00 0.00 30.01 30.02 900.53 374.42*
Post Test 1.00 0.01
29 T29 Pre Test 0.00 0.00 29.94 29.89 896.59 457.70*
Post Test 1.00 0.01
Table 2 Contd...
S. No. VARIABLE TEST MEAN SD ΣD ΣD2 (ΣD)2 t
30 T30 Pre Test 0.00 0.00 29.99 29.99 899.63 416.37*
Post Test 1.00 0.01
31 T31 Pre Test 0.00 0.00 30.01 30.03 900.73 395.46*
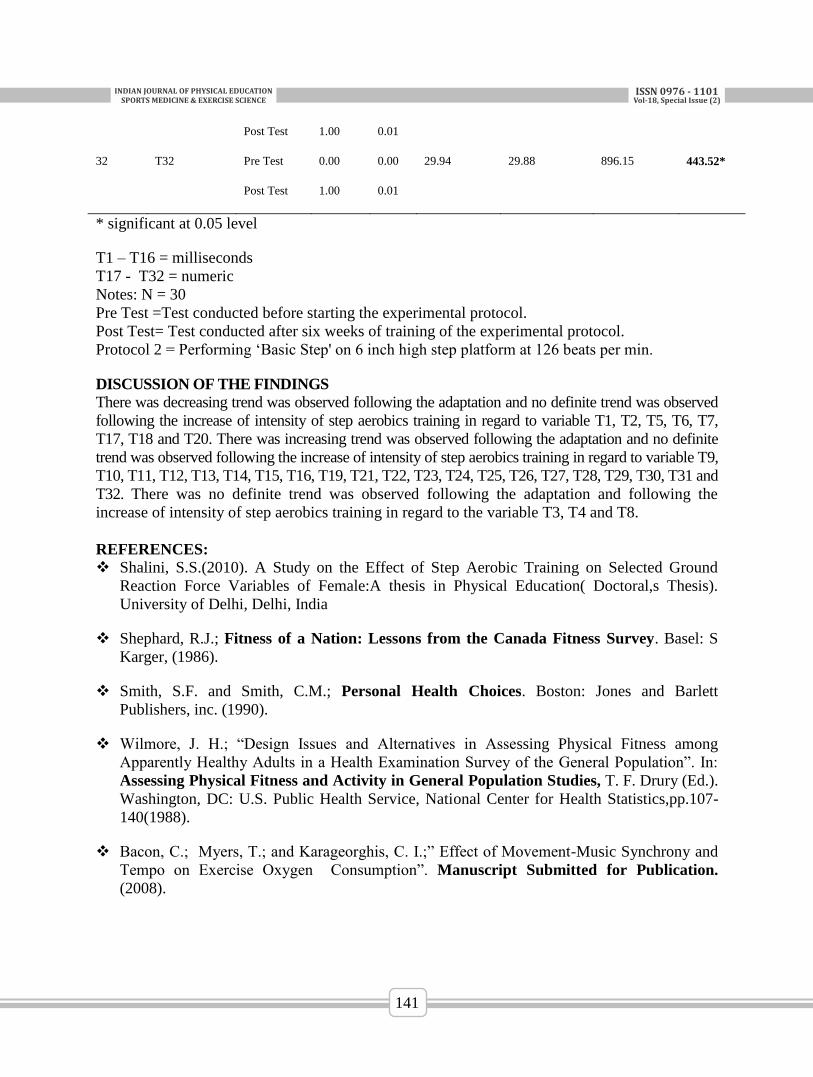
INDIANJOURNALOFPHYSICALEDUCATIONSPORTSMEDICINE&EXERCISESCIENCE
ISSN0976-1101Vol-18,SpecialIssue(2)
141
Post Test 1.00 0.01
32 T32 Pre Test 0.00 0.00 29.94 29.88 896.15 443.52*
Post Test 1.00 0.01
* significant at 0.05 level
T1 – T16 = milliseconds
T17 - T32 = numeric
Notes: N = 30
Pre Test =Test conducted before starting the experimental protocol.
Post Test= Test conducted after six weeks of training of the experimental protocol.
Protocol 2 = Performing ‘Basic Step' on 6 inch high step platform at 126 beats per min.
DISCUSSION OF THE FINDINGS
There was decreasing trend was observed following the adaptation and no definite trend was observed
following the increase of intensity of step aerobics training in regard to variable T1, T2, T5, T6, T7,
T17, T18 and T20. There was increasing trend was observed following the adaptation and no definite
trend was observed following the increase of intensity of step aerobics training in regard to variable T9,
T10, T11, T12, T13, T14, T15, T16, T19, T21, T22, T23, T24, T25, T26, T27, T28, T29, T30, T31 and
T32. There was no definite trend was observed following the adaptation and following the
increase of intensity of step aerobics training in regard to the variable T3, T4 and T8.
REFERENCES:
Shalini, S.S.(2010). A Study on the Effect of Step Aerobic Training on Selected Ground
Reaction Force Variables of Female:A thesis in Physical Education( Doctoral,s Thesis).
University of Delhi, Delhi, India
Shephard, R.J.; Fitness of a Nation: Lessons from the Canada Fitness Survey. Basel: S
Karger, (1986).
Smith, S.F. and Smith, C.M.; Personal Health Choices. Boston: Jones and Barlett
Publishers, inc. (1990).
Wilmore, J. H.; “Design Issues and Alternatives in Assessing Physical Fitness among
Apparently Healthy Adults in a Health Examination Survey of the General Population”. In:
Assessing Physical Fitness and Activity in General Population Studies, T. F. Drury (Ed.).
Washington, DC: U.S. Public Health Service, National Center for Health Statistics,pp.107-
140(1988).
Bacon, C.; Myers, T.; and Karageorghis, C. I.;” Effect of Movement-Music Synchrony and
Tempo on Exercise Oxygen Consumption”. Manuscript Submitted for Publication.
(2008).
INDIANJOURNALOFPHYSICALEDUCATIONSPORTSMEDICINE&EXERCISESCIENCE
ISSN0976-1101Vol-18,SpecialIssue(2)
142
POTENTIAL EFFECT OF AN INTEGRATED YOGA THERAPY
ON ALTERATION OF MYOELECTRIC SIGNAL ACQUISITION
OF VASTUS LATERALIS MUSCLE AMONG ATHLETES WITH
PATELLAR TENDINOSIS
Samanta, A. (Ph.D. Scholar) a; Prof. Mukherjee, S
b.
a LNIPE (Dept. Of Exercise. Physiology), Gwalior – 474002, India.
b LNIPE (Dean -Academics & Coordinator IQAC. H.O.D- Dept. of Sports Management and
Coaching), Gwalior-474002, India
The athletes who involved in sports requiring repetitive knee actions like jumping, running are at
greater risk due to overuse injury. 10 athletes with knee pain were purposively selected, Age 19
to 23 yrs., weight 64±15 kg. and height 169±10 cm. The EMG response and parameter– on VL
muscle, Root Mean Square values. Repeated mixed ANOVA was used with SPSS 20. Level of
significance -0.05. There was statistical significant result showed in EMG parameter. (p<0.05)
in the group received integrated yoga therapy. Statistical significant difference of EMG response
of VL muscle was happened may be due to the improved blood flow, ionic shift, and most
important is strength and flexibility development.
INTRODUCTION: In most cases knee pain develops gradually, without known trauma and without an acute
mechanism of injury. Blazina and colleagues in 1973 first described Jumper’s knee as a chronic
overuse injury of the patellar tendon resulting from excessive stress on the knee extensor
mechanism. Athletes who involved in sports requiring repetitive knee actions like jumping, (e.g.,
volleyball, basketball), running (track), are at greater risk due to overuse injury. Biomechanical
flaws, such as reduced muscle strength (Quadriceps weakness, improper firing pattern of VL
muscle) or flexibility imbalances and jumping mechanics are such very important factors for
developing Patellofemoral pain. An increased incidence of idiopathic Patellofemoral pain during
adolescence has been identified in patients with jumper’s knee most often in athletes. [1, 2, 3]
METHODOLOGY:
The purpose of the study was to find out the most effective approach between combinations of
integrated hatha yoga therapy and rehabilitation exercise for reducing pain, improvement in
strength and flexibility induced myoelectric signal specific differences in VL muscle among
persons with Patellar Tendinosis. We hypothesized that may be there was significant difference
between the two-exercise protocol to reduce VL EMG signal acquisition pattern.
SUBJECT SELECTION:
For the purpose of the study 12 male students of age group 19 to 23, weight 64±10 kg. and
height 169±10 cm. were purposively selected according to the availability of effected subjects.
The subjects were divided into two groups, first group were taking the combination of rehab and
yogic asanas and second group only rehab ex. All the persons were from LNIPE, Gwalior Only.
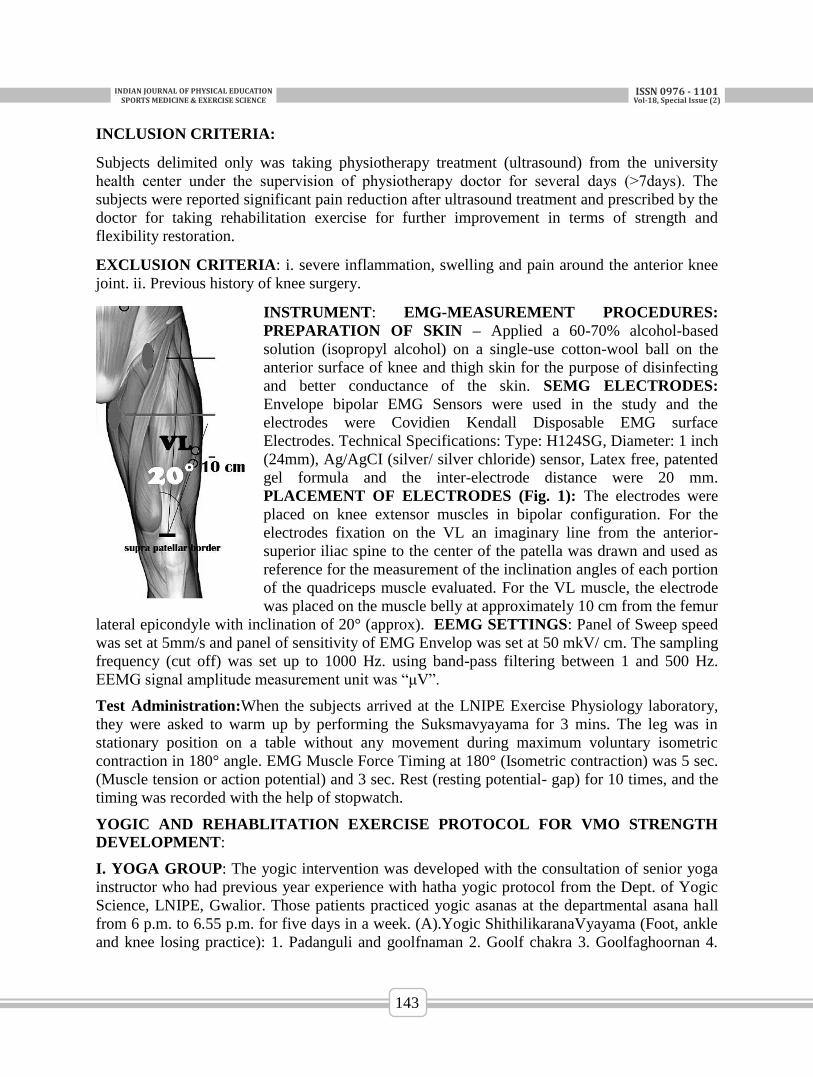
INDIANJOURNALOFPHYSICALEDUCATIONSPORTSMEDICINE&EXERCISESCIENCE
ISSN0976-1101Vol-18,SpecialIssue(2)
143
INCLUSION CRITERIA:
Subjects delimited only was taking physiotherapy treatment (ultrasound) from the university
health center under the supervision of physiotherapy doctor for several days (˃7days). The
subjects were reported significant pain reduction after ultrasound treatment and prescribed by the
doctor for taking rehabilitation exercise for further improvement in terms of strength and
flexibility restoration.
EXCLUSION CRITERIA: i. severe inflammation, swelling and pain around the anterior knee
joint. ii. Previous history of knee surgery.
INSTRUMENT: EMG-MEASUREMENT PROCEDURES:
PREPARATION OF SKIN – Applied a 60-70% alcohol-based
solution (isopropyl alcohol) on a single-use cotton-wool ball on the
anterior surface of knee and thigh skin for the purpose of disinfecting
and better conductance of the skin. SEMG ELECTRODES:
Envelope bipolar EMG Sensors were used in the study and the
electrodes were Covidien Kendall Disposable EMG surface
Electrodes. Technical Specifications: Type: H124SG, Diameter: 1 inch
(24mm), Ag/AgCI (silver/ silver chloride) sensor, Latex free, patented
gel formula and the inter-electrode distance were 20 mm.
PLACEMENT OF ELECTRODES (Fig. 1): The electrodes were
placed on knee extensor muscles in bipolar configuration. For the
electrodes fixation on the VL an imaginary line from the anterior-
superior iliac spine to the center of the patella was drawn and used as
reference for the measurement of the inclination angles of each portion
of the quadriceps muscle evaluated. For the VL muscle, the electrode
was placed on the muscle belly at approximately 10 cm from the femur
lateral epicondyle with inclination of 20° (approx). EEMG SETTINGS: Panel of Sweep speed
was set at 5mm/s and panel of sensitivity of EMG Envelop was set at 50 mkV/ cm. The sampling
frequency (cut off) was set up to 1000 Hz. using band-pass filtering between 1 and 500 Hz.
EEMG signal amplitude measurement unit was “μV”.
Test Administration:When the subjects arrived at the LNIPE Exercise Physiology laboratory,
they were asked to warm up by performing the Suksmavyayama for 3 mins. The leg was in
stationary position on a table without any movement during maximum voluntary isometric
contraction in 180° angle. EMG Muscle Force Timing at 180° (Isometric contraction) was 5 sec.
(Muscle tension or action potential) and 3 sec. Rest (resting potential- gap) for 10 times, and the
timing was recorded with the help of stopwatch.
YOGIC AND REHABLITATION EXERCISE PROTOCOL FOR VMO STRENGTH
DEVELOPMENT:
I. YOGA GROUP: The yogic intervention was developed with the consultation of senior yoga
instructor who had previous year experience with hatha yogic protocol from the Dept. of Yogic
Science, LNIPE, Gwalior. Those patients practiced yogic asanas at the departmental asana hall
from 6 p.m. to 6.55 p.m. for five days in a week. (A).Yogic ShithilikaranaVyayama (Foot, ankle
and knee losing practice): 1. Padanguli and goolfnaman 2. Goolf chakra 3. Goolfaghoornan 4.
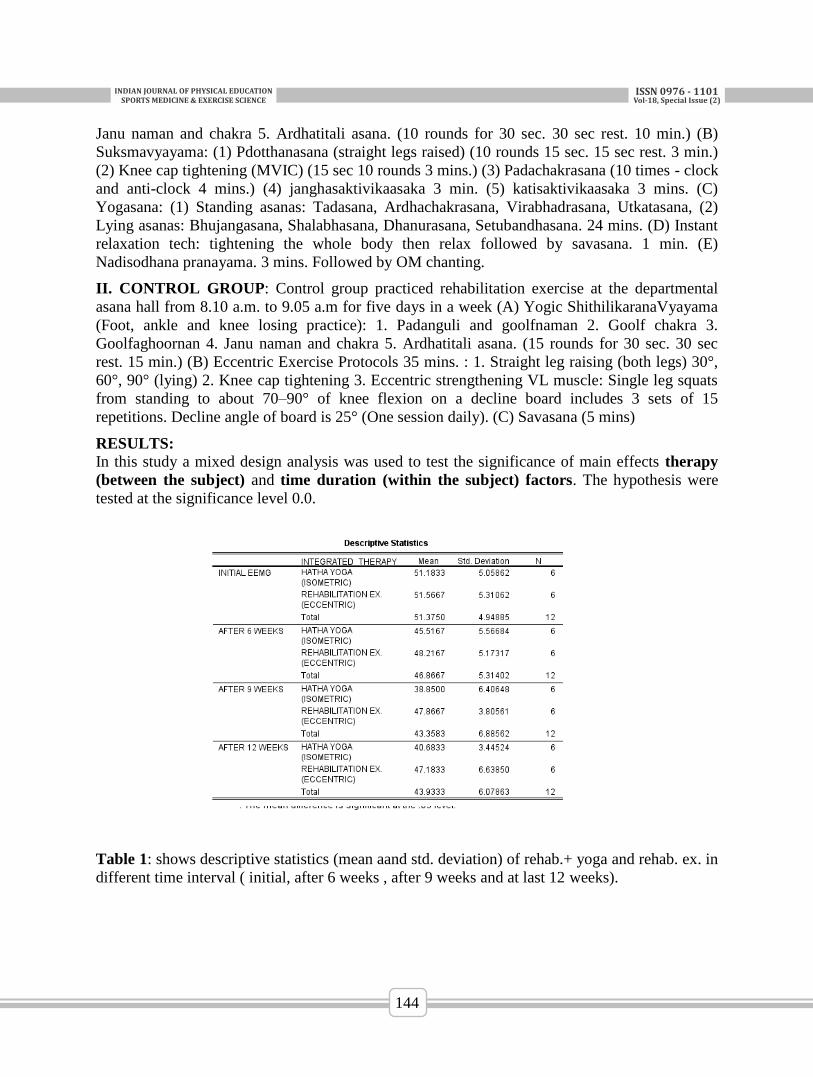
INDIANJOURNALOFPHYSICALEDUCATIONSPORTSMEDICINE&EXERCISESCIENCE
ISSN0976-1101Vol-18,SpecialIssue(2)
144
Janu naman and chakra 5. Ardhatitali asana. (10 rounds for 30 sec. 30 sec rest. 10 min.) (B)
Suksmavyayama: (1) Pdotthanasana (straight legs raised) (10 rounds 15 sec. 15 sec rest. 3 min.)
(2) Knee cap tightening (MVIC) (15 sec 10 rounds 3 mins.) (3) Padachakrasana (10 times - clock
and anti-clock 4 mins.) (4) janghasaktivikaasaka 3 min. (5) katisaktivikaasaka 3 mins. (C)
Yogasana: (1) Standing asanas: Tadasana, Ardhachakrasana, Virabhadrasana, Utkatasana, (2)
Lying asanas: Bhujangasana, Shalabhasana, Dhanurasana, Setubandhasana. 24 mins. (D) Instant
relaxation tech: tightening the whole body then relax followed by savasana. 1 min. (E)
Nadisodhana pranayama. 3 mins. Followed by OM chanting.
II. CONTROL GROUP: Control group practiced rehabilitation exercise at the departmental
asana hall from 8.10 a.m. to 9.05 a.m for five days in a week (A) Yogic ShithilikaranaVyayama
(Foot, ankle and knee losing practice): 1. Padanguli and goolfnaman 2. Goolf chakra 3.
Goolfaghoornan 4. Janu naman and chakra 5. Ardhatitali asana. (15 rounds for 30 sec. 30 sec
rest. 15 min.) (B) Eccentric Exercise Protocols 35 mins. : 1. Straight leg raising (both legs) 30°,
60°, 90° (lying) 2. Knee cap tightening 3. Eccentric strengthening VL muscle: Single leg squats
from standing to about 70–90° of knee flexion on a decline board includes 3 sets of 15
repetitions. Decline angle of board is 25° (One session daily). (C) Savasana (5 mins)
RESULTS:
In this study a mixed design analysis was used to test the significance of main effects therapy
(between the subject) and time duration (within the subject) factors. The hypothesis were
tested at the significance level 0.0.
Table 1: shows descriptive statistics (mean aand std. deviation) of rehab.+ yoga and rehab. ex. in
different time interval ( initial, after 6 weeks , after 9 weeks and at last 12 weeks).
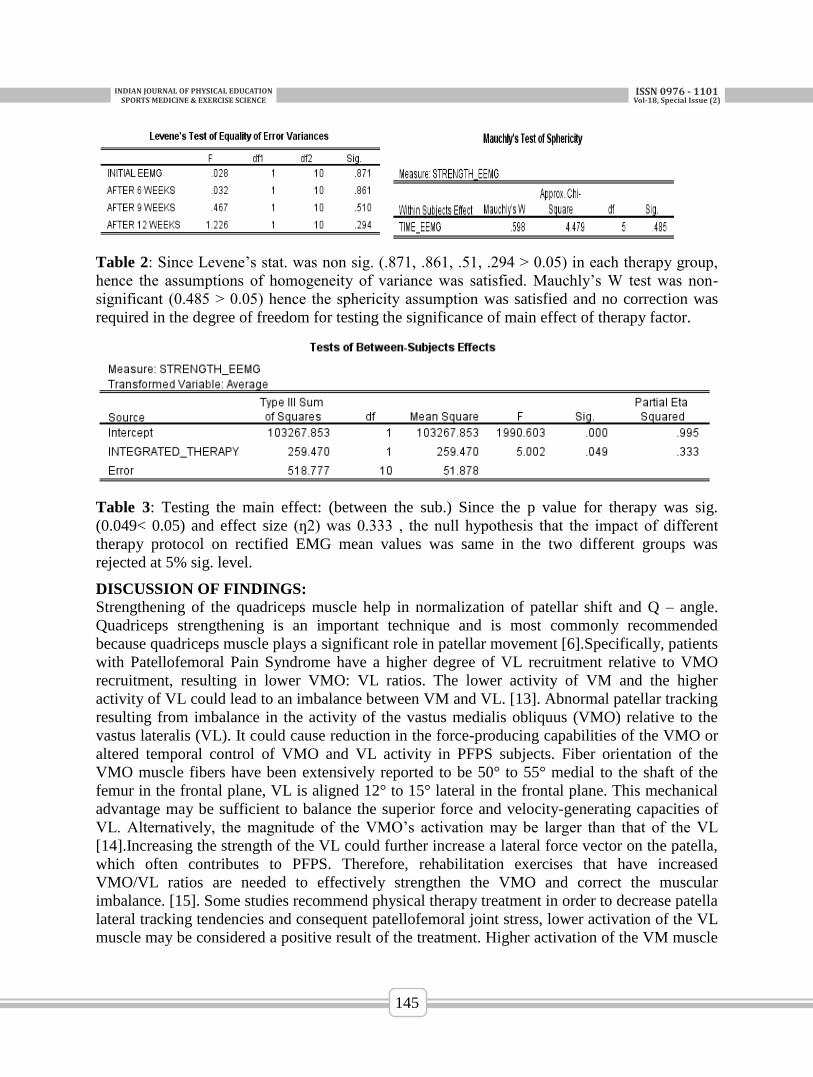
INDIANJOURNALOFPHYSICALEDUCATIONSPORTSMEDICINE&EXERCISESCIENCE
ISSN0976-1101Vol-18,SpecialIssue(2)
145
Table 2: Since Levene’s stat. was non sig. (.871, .861, .51, .294 ˃ 0.05) in each therapy group,
hence the assumptions of homogeneity of variance was satisfied. Mauchly’s W test was non-
significant (0.485 ˃ 0.05) hence the sphericity assumption was satisfied and no correction was
required in the degree of freedom for testing the significance of main effect of therapy factor.
Table 3: Testing the main effect: (between the sub.) Since the p value for therapy was sig.
(0.049< 0.05) and effect size (ƞ2) was 0.333 , the null hypothesis that the impact of different
therapy protocol on rectified EMG mean values was same in the two different groups was
rejected at 5% sig. level.
DISCUSSION OF FINDINGS:
Strengthening of the quadriceps muscle help in normalization of patellar shift and Q – angle.
Quadriceps strengthening is an important technique and is most commonly recommended
because quadriceps muscle plays a significant role in patellar movement [6].Specifically, patients
with Patellofemoral Pain Syndrome have a higher degree of VL recruitment relative to VMO
recruitment, resulting in lower VMO: VL ratios. The lower activity of VM and the higher
activity of VL could lead to an imbalance between VM and VL. [13]. Abnormal patellar tracking
resulting from imbalance in the activity of the vastus medialis obliquus (VMO) relative to the
vastus lateralis (VL). It could cause reduction in the force-producing capabilities of the VMO or
altered temporal control of VMO and VL activity in PFPS subjects. Fiber orientation of the
VMO muscle fibers have been extensively reported to be 50° to 55° medial to the shaft of the
femur in the frontal plane, VL is aligned 12° to 15° lateral in the frontal plane. This mechanical
advantage may be sufficient to balance the superior force and velocity-generating capacities of
VL. Alternatively, the magnitude of the VMO’s activation may be larger than that of the VL
[14].Increasing the strength of the VL could further increase a lateral force vector on the patella,
which often contributes to PFPS. Therefore, rehabilitation exercises that have increased
VMO/VL ratios are needed to effectively strengthen the VMO and correct the muscular
imbalance. [15]. Some studies recommend physical therapy treatment in order to decrease patella
lateral tracking tendencies and consequent patellofemoral joint stress, lower activation of the VL
muscle may be considered a positive result of the treatment. Higher activation of the VM muscle
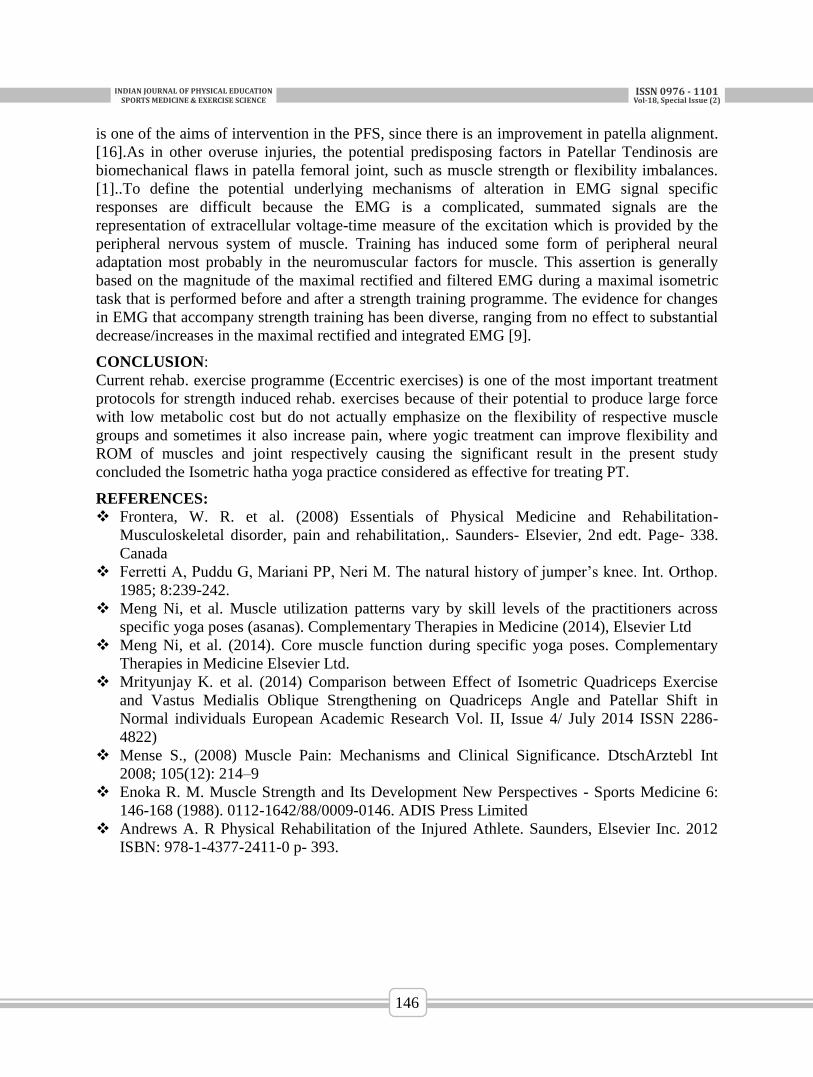
INDIANJOURNALOFPHYSICALEDUCATIONSPORTSMEDICINE&EXERCISESCIENCE
ISSN0976-1101Vol-18,SpecialIssue(2)
146
is one of the aims of intervention in the PFS, since there is an improvement in patella alignment.
[16].As in other overuse injuries, the potential predisposing factors in Patellar Tendinosis are
biomechanical flaws in patella femoral joint, such as muscle strength or flexibility imbalances.
[1]..To define the potential underlying mechanisms of alteration in EMG signal specific
responses are difficult because the EMG is a complicated, summated signals are the
representation of extracellular voltage-time measure of the excitation which is provided by the
peripheral nervous system of muscle. Training has induced some form of peripheral neural
adaptation most probably in the neuromuscular factors for muscle. This assertion is generally
based on the magnitude of the maximal rectified and filtered EMG during a maximal isometric
task that is performed before and after a strength training programme. The evidence for changes
in EMG that accompany strength training has been diverse, ranging from no effect to substantial
decrease/increases in the maximal rectified and integrated EMG [9].
CONCLUSION:
Current rehab. exercise programme (Eccentric exercises) is one of the most important treatment
protocols for strength induced rehab. exercises because of their potential to produce large force
with low metabolic cost but do not actually emphasize on the flexibility of respective muscle
groups and sometimes it also increase pain, where yogic treatment can improve flexibility and
ROM of muscles and joint respectively causing the significant result in the present study
concluded the Isometric hatha yoga practice considered as effective for treating PT.
REFERENCES:
Frontera, W. R. et al. (2008) Essentials of Physical Medicine and Rehabilitation-
Musculoskeletal disorder, pain and rehabilitation,. Saunders- Elsevier, 2nd edt. Page- 338.
Canada
Ferretti A, Puddu G, Mariani PP, Neri M. The natural history of jumper’s knee. Int. Orthop.
1985; 8:239-242.
Meng Ni, et al. Muscle utilization patterns vary by skill levels of the practitioners across
specific yoga poses (asanas). Complementary Therapies in Medicine (2014), Elsevier Ltd
Meng Ni, et al. (2014). Core muscle function during specific yoga poses. Complementary
Therapies in Medicine Elsevier Ltd.
Mrityunjay K. et al. (2014) Comparison between Effect of Isometric Quadriceps Exercise
and Vastus Medialis Oblique Strengthening on Quadriceps Angle and Patellar Shift in
Normal individuals European Academic Research Vol. II, Issue 4/ July 2014 ISSN 2286-
4822)
Mense S., (2008) Muscle Pain: Mechanisms and Clinical Significance. DtschArztebl Int
2008; 105(12): 214–9
Enoka R. M. Muscle Strength and Its Development New Perspectives - Sports Medicine 6:
146-168 (1988). 0112-1642/88/0009-0146. ADIS Press Limited
Andrews A. R Physical Rehabilitation of the Injured Athlete. Saunders, Elsevier Inc. 2012
ISBN: 978-1-4377-2411-0 p- 393.
INDIANJOURNALOFPHYSICALEDUCATIONSPORTSMEDICINE&EXERCISESCIENCE
ISSN0976-1101Vol-18,SpecialIssue(2)
147
STRUCTURAL VARIABLES & EXPLOSIVE STRENGTH OF
HOCKEY PLAYERS IN RELATION TO THEIR PLAYING AGE
* Kiran and **Dr. vivek pandey *PhD Scholar, Lakshmibai National Institute of Physical Education, Gwalior (M.P)
**Professor, Lakshmibai National Institute of Physical Education, Gwalior (M.P)
ABSTRACT Purpose of the study was to compare the structural variables & explosive strength of hockey
players in relation to their playing age. The study was conducted on 30 players; age ranging
from 14 to 21 years. Subjects were divided into three groups (each group consisted of ten
players) on the basis of their playing age after entering hockey academy (0-2, 2-4, 4-6).
Collected data was analyzed by using ANOVA at 0.05 level of significance and significant
difference was found between means of different playing age groups of hockey players.
Key words- structural variables, explosive strength, hockey players, playing age
INTRODUCTION Today the preparation of an athlete for top notch achievement is a completely dynamic state
characterized by a high level of physical and physiological efficiency and degree of perfection of
the necessary skills and knowledge, technique and tactical preparation. An athlete arrives at this
stage only as a result of appropriate training. Thus, athlete’s training today is a multisided
process of expedient use of aggregate factor so as to influence the development of an athlete and
ensure the necessary level of participation. Anthropometric measurements were central concerns
of the first phase of the scientific era of measurements, which have been began in three areas,
girth measures, body type and body composition. The assess must of such measures include
classification, prediction of growth patterns and prediction of success in motor activities as well
as assessment of ability.
METHODOLOGY: 30 Hockey Players, age ranging between 14 to 21 years from MP Women Hockey Academy,
Gwalior, were selected as subjects of this study. To compare the structural variables & explosive
strength of hockey players in relation to their playing age ANOVA Test were employed.
Structural variables were measured by flexible steel tape & explosive strength was measured by
administering the Standing broad jump test.
STATISTICAL METHODS:
ANOVA test was applied to compare the structural variables & explosive strength of hockey
players. The hypothesis was tested at 0.05 level of significance
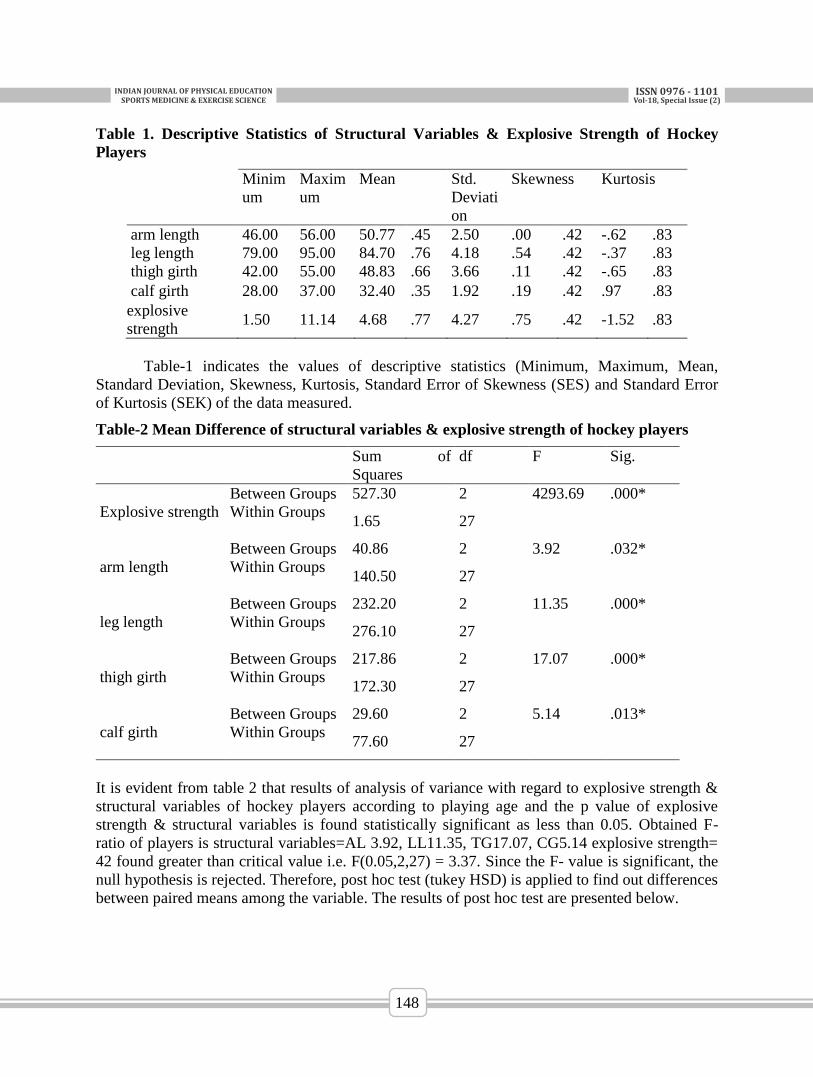
INDIANJOURNALOFPHYSICALEDUCATIONSPORTSMEDICINE&EXERCISESCIENCE
ISSN0976-1101Vol-18,SpecialIssue(2)
148
Table 1. Descriptive Statistics of Structural Variables & Explosive Strength of Hockey
Players
Minim
um
Maxim
um
Mean Std.
Deviati
on
Skewness Kurtosis
arm length 46.00 56.00 50.77 .45 2.50 .00 .42 -.62 .83
leg length 79.00 95.00 84.70 .76 4.18 .54 .42 -.37 .83
thigh girth 42.00 55.00 48.83 .66 3.66 .11 .42 -.65 .83
calf girth 28.00 37.00 32.40 .35 1.92 .19 .42 .97 .83
explosive
strength 1.50 11.14 4.68 .77 4.27 .75 .42 -1.52 .83
Table-1 indicates the values of descriptive statistics (Minimum, Maximum, Mean,
Standard Deviation, Skewness, Kurtosis, Standard Error of Skewness (SES) and Standard Error
of Kurtosis (SEK) of the data measured.
Table-2 Mean Difference of structural variables & explosive strength of hockey players
Sum of
Squares
df F Sig.
Explosive strength
Between Groups 527.30 2 4293.69 .000*
Within Groups
1.65 27
arm length
Between Groups 40.86 2 3.92 .032*
Within Groups
140.50 27
leg length
Between Groups 232.20 2 11.35 .000*
Within Groups
276.10 27
thigh girth
Between Groups 217.86 2 17.07 .000*
Within Groups
172.30 27
calf girth
Between Groups 29.60 2 5.14 .013*
Within Groups
77.60 27
It is evident from table 2 that results of analysis of variance with regard to explosive strength &
structural variables of hockey players according to playing age and the p value of explosive
strength & structural variables is found statistically significant as less than 0.05. Obtained F-
ratio of players is structural variables=AL 3.92, LL11.35, TG17.07, CG5.14 explosive strength=
42 found greater than critical value i.e. F(0.05,2,27) = 3.37. Since the F- value is significant, the
null hypothesis is rejected. Therefore, post hoc test (tukey HSD) is applied to find out differences
between paired means among the variable. The results of post hoc test are presented below.
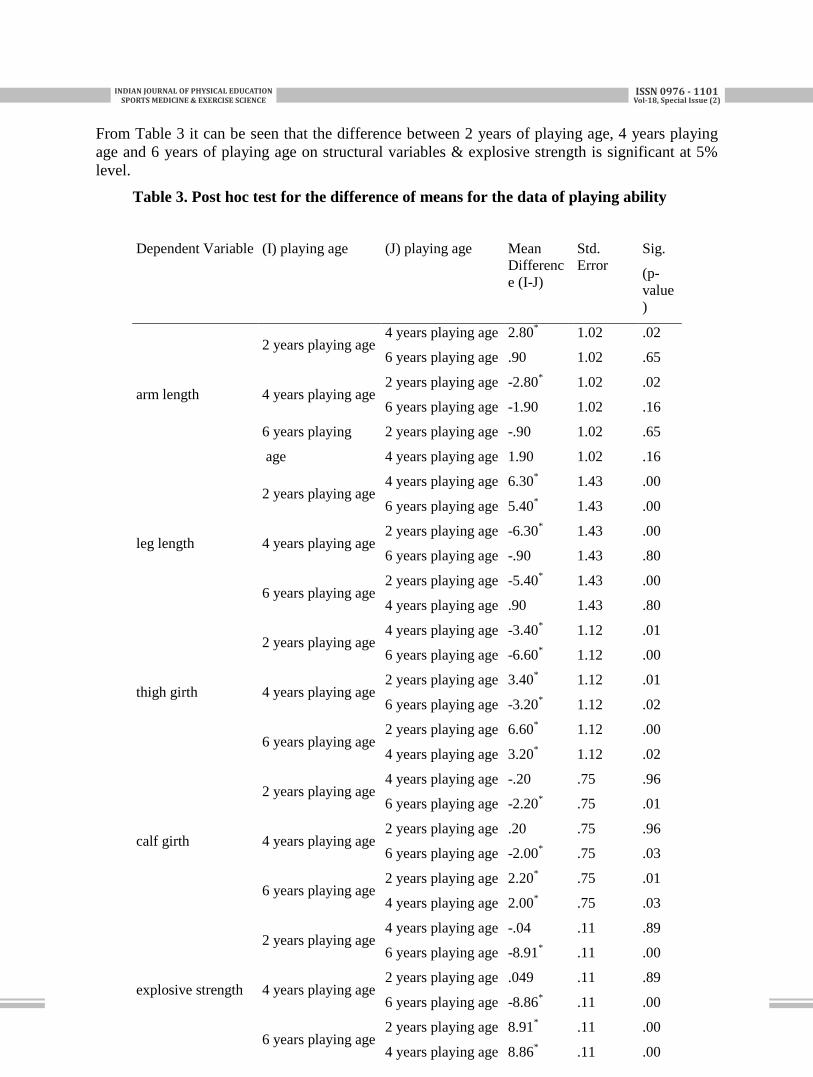
INDIANJOURNALOFPHYSICALEDUCATIONSPORTSMEDICINE&EXERCISESCIENCE
ISSN0976-1101Vol-18,SpecialIssue(2)
149
From Table 3 it can be seen that the difference between 2 years of playing age, 4 years playing
age and 6 years of playing age on structural variables & explosive strength is significant at 5%
level.
Table 3. Post hoc test for the difference of means for the data of playing ability
Dependent Variable (I) playing age (J) playing age Mean
Differenc
e (I-J)
Std.
Error Sig.
(p-
value
)
arm length
2 years playing age 4 years playing age 2.80
* 1.02 .02
6 years playing age .90 1.02 .65
4 years playing age 2 years playing age -2.80
* 1.02 .02
6 years playing age -1.90 1.02 .16
6 years playing
age
2 years playing age -.90 1.02 .65
4 years playing age 1.90 1.02 .16
leg length
2 years playing age 4 years playing age 6.30
* 1.43 .00
6 years playing age 5.40* 1.43 .00
4 years playing age 2 years playing age -6.30
* 1.43 .00
6 years playing age -.90 1.43 .80
6 years playing age 2 years playing age -5.40
* 1.43 .00
4 years playing age .90 1.43 .80
thigh girth
2 years playing age 4 years playing age -3.40
* 1.12 .01
6 years playing age -6.60* 1.12 .00
4 years playing age 2 years playing age 3.40
* 1.12 .01
6 years playing age -3.20* 1.12 .02
6 years playing age 2 years playing age 6.60
* 1.12 .00
4 years playing age 3.20* 1.12 .02
calf girth
2 years playing age 4 years playing age -.20 .75 .96
6 years playing age -2.20* .75 .01
4 years playing age 2 years playing age .20 .75 .96
6 years playing age -2.00* .75 .03
6 years playing age 2 years playing age 2.20
* .75 .01
4 years playing age 2.00* .75 .03
explosive strength
2 years playing age 4 years playing age -.04 .11 .89
6 years playing age -8.91* .11 .00
4 years playing age 2 years playing age .049 .11 .89
6 years playing age -8.86* .11 .00
6 years playing age 2 years playing age 8.91
* .11 .00
4 years playing age 8.86* .11 .00
INDIANJOURNALOFPHYSICALEDUCATIONSPORTSMEDICINE&EXERCISESCIENCE
ISSN0976-1101Vol-18,SpecialIssue(2)
150
DISCUSSION OF FINDINGS:
The analysis revealed that there was significant difference in arm length, leg length of 2years, 4
years and 6 years playing age of hockey players. Climatic factors continue to be significant
correlates of world-wide variation in human body size and morphology; differential changes in
nutrition among tropical, developing world populations have moderated their influence. Each
child’s path or pattern of growth and development is determined by genetic and environmental
factors. The genetic factors determine the potential and limitations of growth and development.
The environmental factors, such as adequate nutrition, facilitate the achievement of the genetic
potential of growth and development. Climate may shape morphology through its influence on
food availability and nutrition linear builds of tropical populations are the consequence of
nutritional rather than thermal stress. In the case of playing age group selected in this study lies
under the years of growth and Development, more or less total food intake, more or less of any
essential nutrient, more or less physical activity (and the type of activity) could influence body
shape. Hypertrophy, an increase in mass or girth, of a muscle can be induced by a number of
stimuli. The most familiar of these is exercise. The analysis indicated that thigh girth and calf
girth measurements were also significant for the hockey players of 2yeras, 4 years and 6 years
playing age. It may be due to the different type of isotonic exercises used in the training. When
different type of training programme is imparted to the hockey players the improvement will be
different and above reason may be the cause for significant difference. The analysis also revealed
that in case of explosive strength there were significant differences among the groups. Explosive
strength had direct correlation with thigh girth and calf girth. Thigh girth and calf girth was
significant in all three playing age groups as mentioned above. Therefore, this may be the
probable reason for significant difference in explosive strength.
CONCLUSION:
With the limitations of the study it may be concluded that, there was significant difference found
between the means of hockey players in relation to their playing age.
REFERENCES: Coswig, V. S., Dall’Agnol, C., & Del Vecchio, F. B. (2016). Anthropometric measurements usage to
control the exercise intensity during the performance of suspension rowing and back squats.
RevistaAndaluza de MedicinadelDeporte, 9(3), 119-123.
AninditaMondal, RumilaMajumdar and Suva Pal (2011).Anthropometry and Physiological Profile of
Indian Shooter.” International Journal of Applied Sports Sciences Vol.23 (2) 394-405.
Brogdon, GyleLynon (1973) A Comparison of Physical Fitness and Anthropometric Measurements of
Pre-Adolescent Mexican-American and Anglo-American Males,” Dissertation Abstracts
International, 33: 6157-A.
Chiara Milanese; Oscar Bortolami; MatteoBertucco; Giuseppe Verlato and Carlo
Zancanaro.(2010).Anthropometry and Motor Fitness in Children Aged 6-12 Years. Journal of Human
Sport & Exercise Vol.V(II) : 265-279.
Dr.K.M.Valsaraj(2013) Relationship Between Motor Fitness Components And Body Mass Index Of
Uttarakhand Boys. Global journal of biology, agriculture & health sciences.2 (4) 33-36.
Wassmer, D. J., &Mookerjee, S. (2002). A descriptive profile of elite US women's collegiate field
hockey players.Journal of sports medicine and physical fitness, 42(2), 165.
INDIANJOURNALOFPHYSICALEDUCATIONSPORTSMEDICINE&EXERCISESCIENCE
ISSN0976-1101Vol-18,SpecialIssue(2)
151
COMPARATIVE ANALYSIS OF ISOMETRIC MAXIMUM
VOLUNTARY CONTRACTION OF HIP FLEXORS AMONG
DIFFERENT ANGLES
Payel, Das1, Vivek, Pandey
2, Nibu R. Krishna
3
1Ph.D Scholar, LNIPE, Gwalior, India
2Professor (Exercise Physiology), Lnipe, Gwalior, India
3Asist. Prof. (Sports Psychology), Lnipe, Gwalior, India
ABSTRACT
The present study was aimed at comparative analysis of isometric contraction (concentric) of hip
flexors among different angle. The study was conducted on 15 male fitness students from LNIPE,
Gwalior age ranging from 23-28 with mean and SD of age 25±1.95 years, height 171.87±7.00
cm and body weight 69.73± 6.00 kg (as data were normally distributed). Data were collected on
isometric maximum voluntary contraction (MVC) of hip flexors in 30o, 60
o and 90
o angle with
the help of Humac Norm isokinetic dynamometer. All the subjects were tested repeatedly on
isometric contraction of hip first in 30o, 60
o and 90
o. The test was consisted of 5 seconds
maximum voluntary contraction for 5 reps in each angle. It was hypothesized that there would be
significant difference of among different angles on peak torque, average torque, peak torque
slope. One-way repeated measure ANOVA was employed for the analysis of result at 5% level of
significance. Finally, significant difference (p >0.05) was found in peak torque among different
angles. Peak torque was found significantly higher (p>0.05) in 30o
(103.80± 3.53) than 60o
(84.86±3.49) and 90
o. (71.00±3.11). Thus, it can be concluded that Maximum Voluntary
Contraction (MVC)or peak torque varies in different angle of hip flexion due to force- muscle
length (F-L) relationship and the muscle fibres involvement.
Key words: Isometric maximum voluntary contraction, peak torque, muscles movement arm.
INTRODUCTION
Strength has been expressed in a variety of ways, including maximum weight lifted angle-
specific maximum isometric torque (Hughes et al., 1996; Kotake et al., 1993;), angle-specific
maximum isokinetic torque (Pavol et al., 2002). Voluntary muscle strength is a fundamental
component of human physical capabilities which can be measured in the form of maximum
voluntary torque or peak torque where muscle action is strongest at a single joint angle and
angular velocity. The Maximum voluntary joint torque changes substantially with joint position
and velocity because of muscle force–length (F-L) relationship (Sale et al., 1982). The primary
hip flexor muscles are illiacus muscle, psoas major, tensor fasciae latae, rectus femoris, sartorius
causes hip flexion from 0-120o range of motion as well as knee extension. Most previous studies
examined the quadriceps and hamstring muscles strength during various angle of knee extension
and flexion (Trent J. Herda et. al., 2008; Behm D.J. et. al., 1998). The present study has
investigated the isometric maximum voluntary contraction of hip flexors muscles (illopsoas,
rectus femoris and sartorius) at different joint angles of hip flexion.
METHODOLOGY
For the purpose of the study 15 healthy active male students (fitness management) were selected
from LNIPE, Gwalior aged ranges from 23-28 with mean and SD of age, height and weight
INDIANJOURNALOFPHYSICALEDUCATIONSPORTSMEDICINE&EXERCISESCIENCE
ISSN0976-1101Vol-18,SpecialIssue(2)
152
respectively 25±1.95 years, 171.87±7.00 cm and 69.73± 6.00 kg. Recording were made on the
subjects repeatedly on isometric concentric maximum voluntary contraction (MVC) of hip
flexion first in 30o, 60
o and 90
0. Peak torque or maximum voluntary contraction (MVC), average
torque and peak torque slope (fatigue) were analysed in 30,60 and 90 of hip flexion with the help
of humac norms isokinetic dynamometer (hip flexion reliability, r=0.84-0.89, Nicola A. et al.,
2007). Isometric concentric maximum voluntary contraction (MVC) test was consisted of 5 sec
maximum voluntary contraction with 5 reps at each angle (30o, 60
o and 90
o) (Brown, Lee E,
2001).
ADMINISTRATION OF THE TEST
The subjects were asked to lie down on the back on the chair of Humac norms machine with A-Z
all manual setting of hip flexion and extension. Then the subjects were instructed to give
maximum effort and were verbally motivated throughout the protocol to contract their dominant
leg first at 30o
angle than 60o and 90
o of hip flexion. Straps were applied across the chest to
minimize extraneous body movements during thigh muscle contractions, pelvis and mid-thigh.
The alignment between the dynamometer rotational axis and the hip joint rotation axis was
checked at the beginning of each trial. Subjects are contracted maximally for 5 secs in each
repetition total 5 reps in each angle. 5 sec rest were given between each reps.
STATISTICAL ANALYSIS
One-way ANOVA with repeated measured designed was employed for the analysis of the results
at 5% level of significance as the same subjects were tested repeatedly.
RESULTS
One-way repeated measure ANOVA was employed at 0.05 level to compare the mean among
different angle (30o, 60
o and 90
0) of hip flexion. data of all the three groups were normally
distributed (p>0.05) tested in Mauchly test with SPSS 20. Significant differences (p<0.05) was
shown in peak torque with F-value 51.65 (Sphericity assumed) among different angle of hip
flexion. peak torque was found significantly higher (p<0.05) in 30o (103±3.53 N-m) than 60
o
(84.86±3.49 N-m) and 90o (70±3.11 N-m) shown in table no.1 and 2 (mean compared with
Bonferroni test).
Table no.1 descriptive statistics of peak torque
Angle of hip flexion Mean
Std.
Deviation N
Peak torque 30 103.8000 13.68628 15
Peak torque 60 84.8667 13.51648 15
Peak torque 90 71.0000 12.07713 15
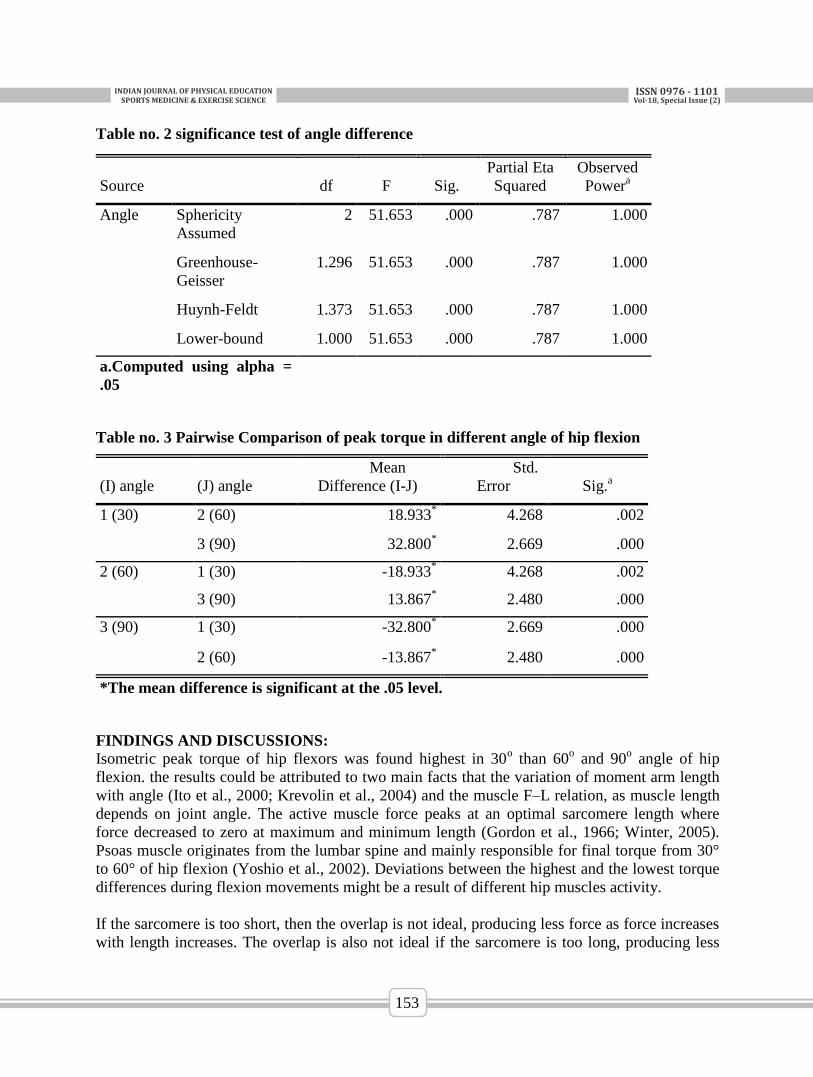
INDIANJOURNALOFPHYSICALEDUCATIONSPORTSMEDICINE&EXERCISESCIENCE
ISSN0976-1101Vol-18,SpecialIssue(2)
153
Table no. 2 significance test of angle difference
Table no. 3 Pairwise Comparison of peak torque in different angle of hip flexion
(I) angle (J) angle
Mean
Difference (I-J)
Std.
Error Sig.a
1 (30) 2 (60) 18.933* 4.268 .002
3 (90) 32.800* 2.669 .000
2 (60) 1 (30) -18.933* 4.268 .002
3 (90) 13.867* 2.480 .000
3 (90) 1 (30) -32.800* 2.669 .000
2 (60) -13.867* 2.480 .000
*The mean difference is significant at the .05 level.
FINDINGS AND DISCUSSIONS:
Isometric peak torque of hip flexors was found highest in 30o than 60
o and 90
o angle of hip
flexion. the results could be attributed to two main facts that the variation of moment arm length
with angle (Ito et al., 2000; Krevolin et al., 2004) and the muscle F–L relation, as muscle length
depends on joint angle. The active muscle force peaks at an optimal sarcomere length where
force decreased to zero at maximum and minimum length (Gordon et al., 1966; Winter, 2005).
Psoas muscle originates from the lumbar spine and mainly responsible for final torque from 30°
to 60° of hip flexion (Yoshio et al., 2002). Deviations between the highest and the lowest torque
differences during flexion movements might be a result of different hip muscles activity.
If the sarcomere is too short, then the overlap is not ideal, producing less force as force increases
with length increases. The overlap is also not ideal if the sarcomere is too long, producing less
Source df F Sig.
Partial Eta
Squared
Observed
Powera
Angle Sphericity
Assumed
2 51.653 .000 .787 1.000
Greenhouse-
Geisser
1.296 51.653 .000 .787 1.000
Huynh-Feldt 1.373 51.653 .000 .787 1.000
Lower-bound 1.000 51.653 .000 .787 1.000
a.Computed using alpha =
.05
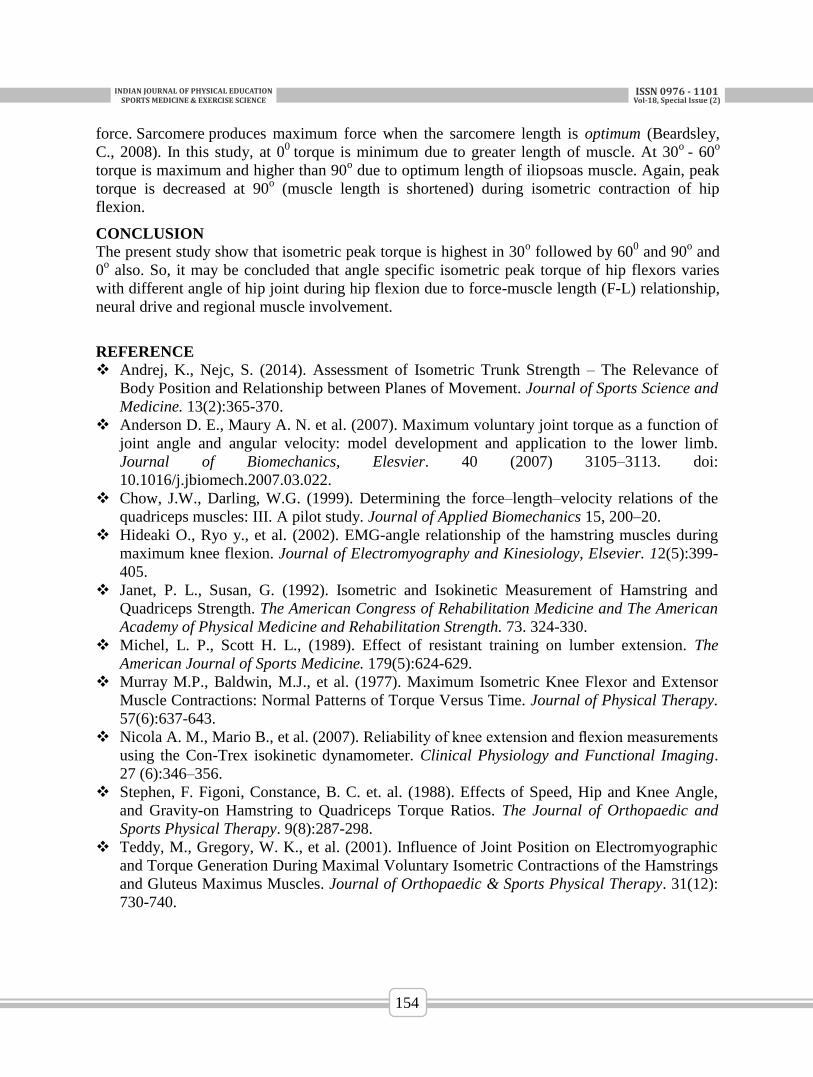
INDIANJOURNALOFPHYSICALEDUCATIONSPORTSMEDICINE&EXERCISESCIENCE
ISSN0976-1101Vol-18,SpecialIssue(2)
154
force. Sarcomere produces maximum force when the sarcomere length is optimum (Beardsley,
C., 2008). In this study, at 00
torque is minimum due to greater length of muscle. At 30o
- 60o
torque is maximum and higher than 90o due to optimum length of iliopsoas muscle. Again, peak
torque is decreased at 90o (muscle length is shortened) during isometric contraction of hip
flexion.
CONCLUSION
The present study show that isometric peak torque is highest in 30o followed by 60
0 and 90
o and
0o also. So, it may be concluded that angle specific isometric peak torque of hip flexors varies
with different angle of hip joint during hip flexion due to force-muscle length (F-L) relationship,
neural drive and regional muscle involvement.
REFERENCE
Andrej, K., Nejc, S. (2014). Assessment of Isometric Trunk Strength – The Relevance of
Body Position and Relationship between Planes of Movement. Journal of Sports Science and
Medicine. 13(2):365-370.
Anderson D. E., Maury A. N. et al. (2007). Maximum voluntary joint torque as a function of
joint angle and angular velocity: model development and application to the lower limb.
Journal of Biomechanics, Elesvier. 40 (2007) 3105–3113. doi:
10.1016/j.jbiomech.2007.03.022.
Chow, J.W., Darling, W.G. (1999). Determining the force–length–velocity relations of the
quadriceps muscles: III. A pilot study. Journal of Applied Biomechanics 15, 200–20.
Hideaki O., Ryo y., et al. (2002). EMG-angle relationship of the hamstring muscles during
maximum knee flexion. Journal of Electromyography and Kinesiology, Elsevier. 12(5):399-
405.
Janet, P. L., Susan, G. (1992). Isometric and Isokinetic Measurement of Hamstring and
Quadriceps Strength. The American Congress of Rehabilitation Medicine and The American
Academy of Physical Medicine and Rehabilitation Strength. 73. 324-330.
Michel, L. P., Scott H. L., (1989). Effect of resistant training on lumber extension. The
American Journal of Sports Medicine. 179(5):624-629.
Murray M.P., Baldwin, M.J., et al. (1977). Maximum Isometric Knee Flexor and Extensor
Muscle Contractions: Normal Patterns of Torque Versus Time. Journal of Physical Therapy.
57(6):637-643.
Nicola A. M., Mario B., et al. (2007). Reliability of knee extension and flexion measurements
using the Con-Trex isokinetic dynamometer. Clinical Physiology and Functional Imaging.
27 (6):346–356.
Stephen, F. Figoni, Constance, B. C. et. al. (1988). Effects of Speed, Hip and Knee Angle,
and Gravity-on Hamstring to Quadriceps Torque Ratios. The Journal of Orthopaedic and
Sports Physical Therapy. 9(8):287-298.
Teddy, M., Gregory, W. K., et al. (2001). Influence of Joint Position on Electromyographic
and Torque Generation During Maximal Voluntary Isometric Contractions of the Hamstrings
and Gluteus Maximus Muscles. Journal of Orthopaedic & Sports Physical Therapy. 31(12):
730-740.
INDIANJOURNALOFPHYSICALEDUCATIONSPORTSMEDICINE&EXERCISESCIENCE
ISSN0976-1101Vol-18,SpecialIssue(2)
155
RELATIONSHIP STUDY OF CARDIOMETABOLIC RISK
FACTORS WITH SELECTED PHYSICAL AND PHYSIOLOGICAL
VARIABLES AMONG SEDENTORY POSTMENOPAUSAL
WOMEN
Mukherjee A1., Prof. Mukherjee S.
2
1Dept. Of health education), LNIPE, Gwalior, India
2 H.O.D.-Dept. Of sports management and coaching, LNIPE, Gwalior, India
INTRODUCTION
Obesity defined as an excessive body fat saturation which increases the risk of several clinical
conditions. For clinical purposes, assessments that are usually used to define obesity include
body weight and body mass index (BMI). The BMI assessment represents the ratio between
weight and height, and is derived by calculating the weight (in kg) divided by the height (in
meters squared). The BMI classification is based on data that has been collected from large
epidemiological studies that evaluated body weight and mortality. This classification gives
clinicians with a mechanism for identifying patients at high risk associated with obesity. It has
been well established that those individuals considered obese, i.e. BMI ≥ 30, are at much higher
risk for cardiovascular mortality. According to the World Health Organization (WHO), it has
been estimated that over 1 billion adults worldwide are overweight and at least 300 million are
considered obese. Many factors contribute to this rise, but among the major factors are sedentary
lifestyles, consumption of high-fat caloric-dense diets, and increased urbanization among
sedentary women. Postmenopausal women or women undergone oophorectomy have a higher
risk of coronary artery disease and osteoporosis than premenopausal women. Among sedentary
people obesity is also inversely related to total bone density.
METHODOLOGY
the purpose of the study was to find out whether there is correlation among cardiometabolic risk
factors with total body calcium, and BMI among post-menopausal women. We hypothesized that
there may be correlation among cardiometabolic risk with TBCa and BMI.
All the sadentery women were taken from Gwalior, their age were 50 to 55 years, hight 150 to
165 cm and weight 65 to 90 kgs, were purposively selected for the of the study.
Bioscan-916 (Maltron Body Composition/Bioelectrical Impedance Analysers) was used for total
body calcium was measured from this equipment and Tanita BC-418 was used for measuring
BMI of the subjects. Omrom hem- 7120 Blood pressure of the women in Gwalior were measured
by this equipment. Data were analyzed using Pearson correlation with SPSS 20. The level of
significance was set at 0.05.
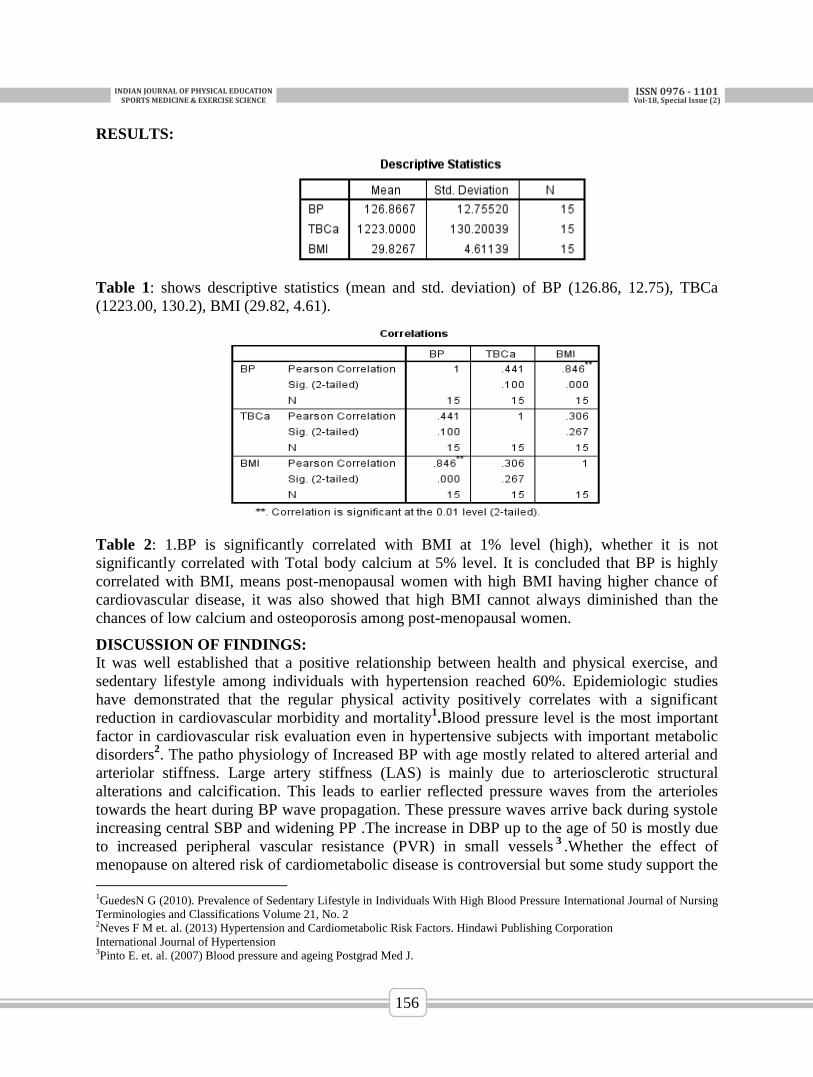
INDIANJOURNALOFPHYSICALEDUCATIONSPORTSMEDICINE&EXERCISESCIENCE
ISSN0976-1101Vol-18,SpecialIssue(2)
156
RESULTS:
Table 1: shows descriptive statistics (mean and std. deviation) of BP (126.86, 12.75), TBCa
(1223.00, 130.2), BMI (29.82, 4.61).
Table 2: 1.BP is significantly correlated with BMI at 1% level (high), whether it is not
significantly correlated with Total body calcium at 5% level. It is concluded that BP is highly
correlated with BMI, means post-menopausal women with high BMI having higher chance of
cardiovascular disease, it was also showed that high BMI cannot always diminished than the
chances of low calcium and osteoporosis among post-menopausal women.
DISCUSSION OF FINDINGS:
It was well established that a positive relationship between health and physical exercise, and
sedentary lifestyle among individuals with hypertension reached 60%. Epidemiologic studies
have demonstrated that the regular physical activity positively correlates with a significant
reduction in cardiovascular morbidity and mortality1.Blood pressure level is the most important
factor in cardiovascular risk evaluation even in hypertensive subjects with important metabolic
disorders2. The patho physiology of Increased BP with age mostly related to altered arterial and
arteriolar stiffness. Large artery stiffness (LAS) is mainly due to arteriosclerotic structural
alterations and calcification. This leads to earlier reflected pressure waves from the arterioles
towards the heart during BP wave propagation. These pressure waves arrive back during systole
increasing central SBP and widening PP .The increase in DBP up to the age of 50 is mostly due
to increased peripheral vascular resistance (PVR) in small vessels3.Whether the effect of
menopause on altered risk of cardiometabolic disease is controversial but some study support the
1GuedesN G (2010). Prevalence of Sedentary Lifestyle in Individuals With High Blood Pressure International Journal of Nursing
Terminologies and Classifications Volume 21, No. 2 2Neves F M et. al. (2013) Hypertension and Cardiometabolic Risk Factors. Hindawi Publishing Corporation
International Journal of Hypertension 3Pinto E. et. al. (2007) Blood pressure and ageing Postgrad Med J.
INDIANJOURNALOFPHYSICALEDUCATIONSPORTSMEDICINE&EXERCISESCIENCE
ISSN0976-1101Vol-18,SpecialIssue(2)
157
relation of cardiovascular disease with menopause among women4, but it was confirmed that
total cholesterol, LDL cholesterol and apolipo protein Bare the primary cardiac risk factors
affected by sedentary menopause5, although the measurement of these factors are beyond the
limitation of the present study. The relationship between BMI and osteoporosis is widely
debated, but some study showed that higher body weight imposes a greater mechanical load on
the bone, with an increase of bone mass in order to accommodate this load and body fat seems to
exert a protective factor for fractures. Furthermore, adipocytes are important estrogen production
sources, causing an increase in serum levels of this hormone and also of other hormones, such as
leptin, insulin, preptin, and amylin, and may act directly and/orindirectly on osteoblast and
osteoclast activity, resulting in the development of bone mass, but it is important to note that not
all types of fat are beneficial for bone mass. Subcutaneous and visceral fat has opposite effects
on the bone structure6.
CONCLUSION
In this present study it is concluded that there was a significant positive relation between high
blood pressure with high BMI in post-menopausal women but failed to find any relation with
total body calcium among post-menopausal women.
REFERENCES
Cefalu W T et al. atlas of Cardiometabolic risk, Informa healthcare
Matthews K, A. et al. (1989) Menopause and Risk Factors for Coronary Heart Disease. The
New England Journal of Medicine
Zhao LJ. et. al. (2007) relationship of obesity with osteoporosis. The journal of clinical
endocrinology and metabolism
Guedes N G (2010). Prevalence of Sedentary Lifestyle in Individuals With High Blood
Pressure International Journal of Nursing Terminologies and Classifications Volume 21, No.
2
Neves F M et. al. (2013) Hypertension and Cardiometabolic Risk Factors. Hindawi
Publishing Corporation
International Journal of Hypertension
Pinto E. et. al. (2007) Blood pressure and ageing Postgrad Med J.
Colditz G. A., et al. (1987) Menopause and the risk of coronary heart disease in women. The
New England journal of medicine. Massachusetts Medical Society.
Peters H. W. et. al. (1999) Menopausal status and risk factors for cardiovascular disease
Journal of Internal Medicine.
Mazocco L. et al. (2016) Association between body mass index and osteoporosis in women
from northwestern Rio Grande do Sul, RevistaBrasileira De Reumatologia.
4Colditz G. A., et al. (1987) Menopause and the risk of coronary heart disease in women. The New England journal of medicine.
Massachusetts Medical Society. 5 Peters H. W. et. al. (1999) Menopausal status and risk factors for cardiovascular disease Journal of Internal Medicine. 6Mazocco L. et al. (2016) Association between body mass index and osteoporosis in women from northwestern Rio Grande do
Sul, RevistaBrasileira DeReumatologia
INDIANJOURNALOFPHYSICALEDUCATIONSPORTSMEDICINE&EXERCISESCIENCE
ISSN0976-1101Vol-18,SpecialIssue(2)
158
EFFECT OF PROTEIN SUPPLEMENTS ON DIFFERENT TIME
DURATIONS ON CARDIOVASCULAR AND MUSCULAR
ENDURANCE OF WOMEN ATHLETES
*Sathi Pal **Prof. L.N. Sarkar
*Research Scholar, Lakshmibai National institute of Physical Education, Gwalior (M.P.) **HOD,Dept of Health Education, Lakshmibai National institute of Physical Education, Gwalior(M.P.)
ABSTRACT
The study was conducted to find out the effect of the protein supplement on different durations on
cardiovascular and muscular endurance of female athletes. Fifteen female athletes were
selected, whose ages were between 18 to 24 years. Subjects were given protein supplements four
days a week for eight weeks continuously. 12 Min Run and Walk Test to assess aerobic fitness
and Sit-Ups to assess the ability of muscle or group of muscles to exert force over an extended
period of time was conducted after a duration of four weeks, six weeks, and eight weeks. The
data was examined by applying statistical technique repeated measures within group design and
the level of significance was set at 0.05. The analysis of data revealed that there is a significant
difference in the cardiovascular endurance and muscular endurance due to the effect of different
time durations of protein supplements on the women athletes.
Keywords : Protein Supplement, Cardiovascular Endurance And Muscular Endurance
INTRODUCTION
Nutrition is increasingly recognized as the main component of optimal sporting performance,
with science and practice of sports nutrition developing rapidly. Recent studies have found that a
planned scientific nutritional strategy (consisting of fluid, carbohydrate, sodium, and caffeine)
compared with a self-chosen nutritional strategy helps non elite runners to complete a marathon
run faster and trained cyclists complete a time trial faster than before. Whereas training has the
greatest potential to increase performance, it has been estimated that consumption of
supplements or relatively low doses of caffeine may improve a 40 km cycling time trial per-
formance by 32–42 and 55–84 seconds, respectively.
Dietary strategies in enhancing the performance include optimizing intakes of macronutrients,
micronutrients, and fluids, including their composition and spacing throughout the day. Sport
and nutrition scientists have supplied a range of recommendations for protein intake over years.
Differentiations in recommendations exist between endurance and strength athletes due to the
metabolic demands of their sport and the adaptations desired from training. Less commonly,
researchers point out that these requirements increase while athletes consume energy restricted
diets.
METHODOLOGY
Fifteen students from Lakshmibai National Institute of Physical Education, Gwalior were
randomly selected as subjects for the study. To evaluate the cardiovascular and muscular
endurance offemale athletes, selected test for the selected variables of the components were
administered based on the validity and reliability of the tests developed by different tester.
Cardiovascular endurance- to assess aerobic fitness.
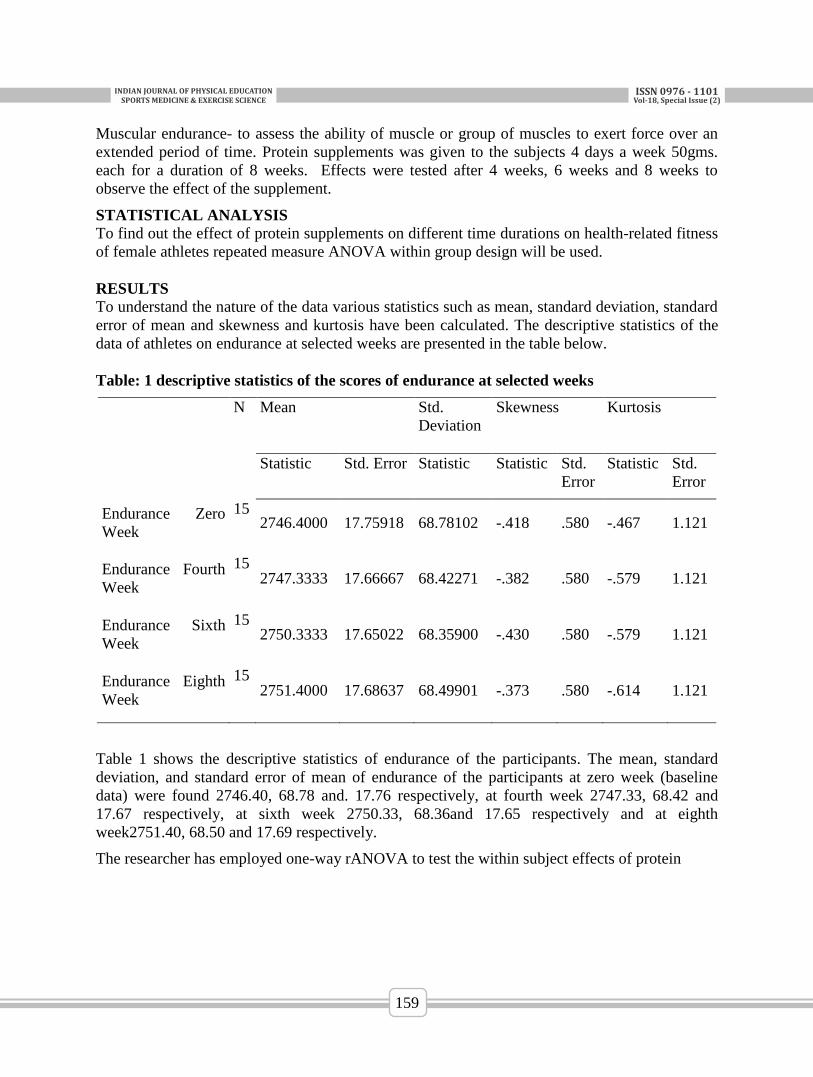
INDIANJOURNALOFPHYSICALEDUCATIONSPORTSMEDICINE&EXERCISESCIENCE
ISSN0976-1101Vol-18,SpecialIssue(2)
159
Muscular endurance- to assess the ability of muscle or group of muscles to exert force over an
extended period of time. Protein supplements was given to the subjects 4 days a week 50gms.
each for a duration of 8 weeks. Effects were tested after 4 weeks, 6 weeks and 8 weeks to
observe the effect of the supplement.
STATISTICAL ANALYSIS
To find out the effect of protein supplements on different time durations on health-related fitness
of female athletes repeated measure ANOVA within group design will be used.
RESULTS
To understand the nature of the data various statistics such as mean, standard deviation, standard
error of mean and skewness and kurtosis have been calculated. The descriptive statistics of the
data of athletes on endurance at selected weeks are presented in the table below.
Table: 1 descriptive statistics of the scores of endurance at selected weeks
N Mean Std.
Deviation
Skewness Kurtosis
Statistic Std. Error Statistic Statistic Std.
Error
Statistic Std.
Error
Endurance Zero
Week
15 2746.4000 17.75918 68.78102 -.418 .580 -.467 1.121
Endurance Fourth
Week
15 2747.3333 17.66667 68.42271 -.382 .580 -.579 1.121
Endurance Sixth
Week
15 2750.3333 17.65022 68.35900 -.430 .580 -.579 1.121
Endurance Eighth
Week
15 2751.4000 17.68637 68.49901 -.373 .580 -.614 1.121
Table 1 shows the descriptive statistics of endurance of the participants. The mean, standard
deviation, and standard error of mean of endurance of the participants at zero week (baseline
data) were found 2746.40, 68.78 and. 17.76 respectively, at fourth week 2747.33, 68.42 and
17.67 respectively, at sixth week 2750.33, 68.36and 17.65 respectively and at eighth
week2751.40, 68.50 and 17.69 respectively.
The researcher has employed one-way rANOVA to test the within subject effects of protein
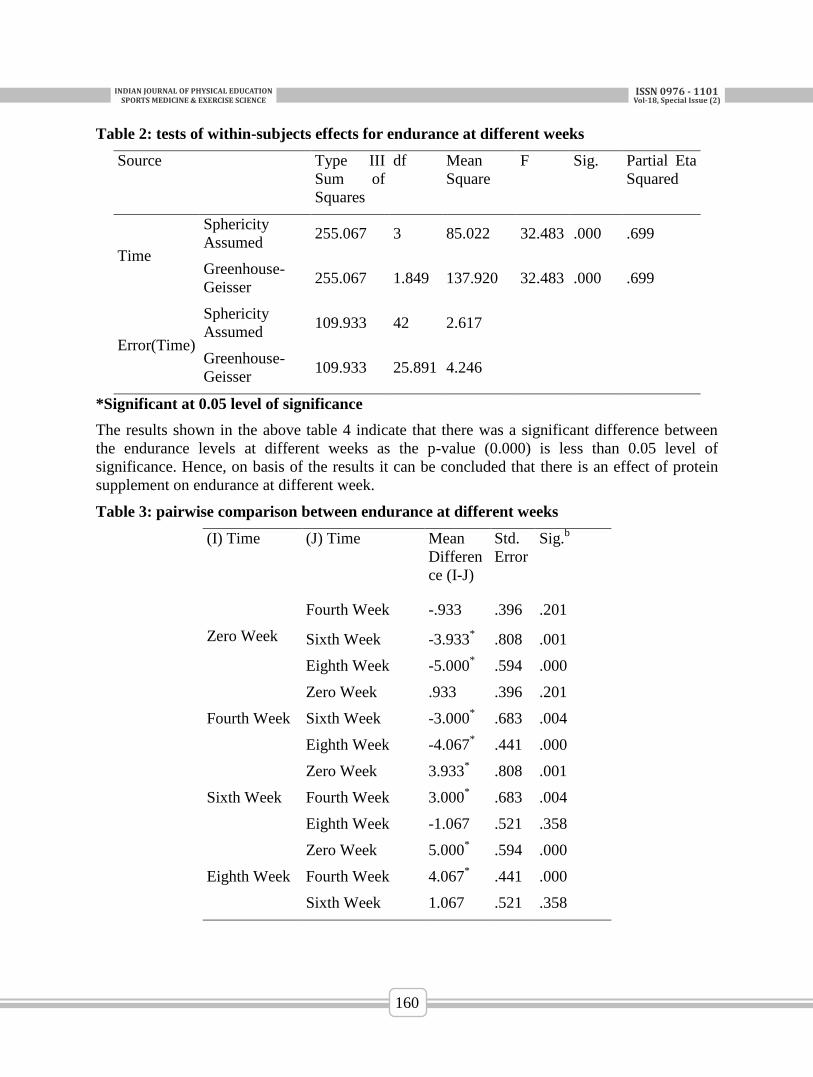
INDIANJOURNALOFPHYSICALEDUCATIONSPORTSMEDICINE&EXERCISESCIENCE
ISSN0976-1101Vol-18,SpecialIssue(2)
160
Table 2: tests of within-subjects effects for endurance at different weeks
Source Type III
Sum of
Squares
df Mean
Square
F Sig. Partial Eta
Squared
Time
Sphericity
Assumed 255.067 3 85.022 32.483 .000 .699
Greenhouse-
Geisser 255.067 1.849 137.920 32.483 .000 .699
Error(Time)
Sphericity
Assumed 109.933 42 2.617
Greenhouse-
Geisser 109.933 25.891 4.246
*Significant at 0.05 level of significance
The results shown in the above table 4 indicate that there was a significant difference between
the endurance levels at different weeks as the p-value (0.000) is less than 0.05 level of
significance. Hence, on basis of the results it can be concluded that there is an effect of protein
supplement on endurance at different week.
Table 3: pairwise comparison between endurance at different weeks
(I) Time (J) Time Mean
Differen
ce (I-J)
Std.
Error
Sig.b
Zero Week
Fourth Week -.933 .396 .201
Sixth Week -3.933* .808 .001
Eighth Week -5.000* .594 .000
Fourth Week
Zero Week .933 .396 .201
Sixth Week -3.000* .683 .004
Eighth Week -4.067* .441 .000
Sixth Week
Zero Week 3.933* .808 .001
Fourth Week 3.000* .683 .004
Eighth Week -1.067 .521 .358
Eighth Week
Zero Week 5.000* .594 .000
Fourth Week 4.067* .441 .000
Sixth Week 1.067 .521 .358
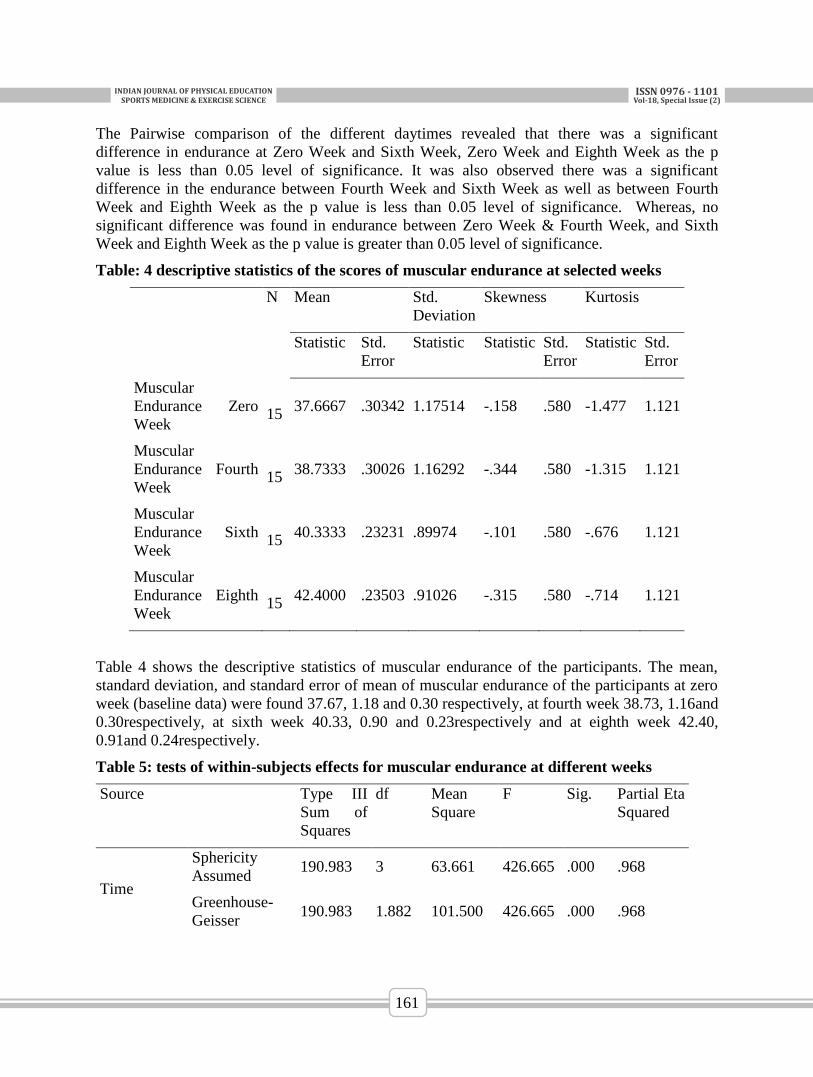
INDIANJOURNALOFPHYSICALEDUCATIONSPORTSMEDICINE&EXERCISESCIENCE
ISSN0976-1101Vol-18,SpecialIssue(2)
161
The Pairwise comparison of the different daytimes revealed that there was a significant
difference in endurance at Zero Week and Sixth Week, Zero Week and Eighth Week as the p
value is less than 0.05 level of significance. It was also observed there was a significant
difference in the endurance between Fourth Week and Sixth Week as well as between Fourth
Week and Eighth Week as the p value is less than 0.05 level of significance. Whereas, no
significant difference was found in endurance between Zero Week & Fourth Week, and Sixth
Week and Eighth Week as the p value is greater than 0.05 level of significance.
Table: 4 descriptive statistics of the scores of muscular endurance at selected weeks
N Mean Std.
Deviation
Skewness Kurtosis
Statistic Std.
Error
Statistic Statistic Std.
Error
Statistic Std.
Error
Muscular
Endurance Zero
Week
15 37.6667 .30342 1.17514 -.158 .580 -1.477 1.121
Muscular
Endurance Fourth
Week
15 38.7333 .30026 1.16292 -.344 .580 -1.315 1.121
Muscular
Endurance Sixth
Week
15 40.3333 .23231 .89974 -.101 .580 -.676 1.121
Muscular
Endurance Eighth
Week
15 42.4000 .23503 .91026 -.315 .580 -.714 1.121
Table 4 shows the descriptive statistics of muscular endurance of the participants. The mean,
standard deviation, and standard error of mean of muscular endurance of the participants at zero
week (baseline data) were found 37.67, 1.18 and 0.30 respectively, at fourth week 38.73, 1.16and
0.30respectively, at sixth week 40.33, 0.90 and 0.23respectively and at eighth week 42.40,
0.91and 0.24respectively.
Table 5: tests of within-subjects effects for muscular endurance at different weeks
Source Type III
Sum of
Squares
df Mean
Square
F Sig. Partial Eta
Squared
Time
Sphericity
Assumed 190.983 3 63.661 426.665 .000 .968
Greenhouse-
Geisser 190.983 1.882 101.500 426.665 .000 .968
INDIANJOURNALOFPHYSICALEDUCATIONSPORTSMEDICINE&EXERCISESCIENCE
ISSN0976-1101Vol-18,SpecialIssue(2)
162
Error(Time)
Sphericity
Assumed 6.267 42 .149
Greenhouse-
Geisser 6.267 26.342 .238
*Significant at 0.05 level of significance
The results shown in the above table 5 indicate that there was a significant difference between
the muscular endurance at different weeks as the p-value (0.000) is less than 0.05 level of
significance. As the tests of within-subjects effects for muscular endurance at different weeks
was found to be significant, Pairwise comparison has been done to see the differences among
selected time..
Table 6: pairwise comparison between muscular endurance at different weeks
Measure: Muscular Endurance
(I) Time (J) Time Mean
Difference (I-J)
Std.
Error
Sig.b 95% Confidence Interval for
Differenceb
Lower Bound Upper Bound
Zero Week
Fourth Week -1.067* .153 .000 -1.537 -.596
Sixth Week -2.667* .126 .000 -3.053 -2.280
Eighth Week -4.733* .118 .000 -5.096 -4.371
Fourth Week
Zero Week 1.067* .153 .000 .596 1.537
Sixth Week -1.600* .163 .000 -2.101 -1.099
Eighth Week -3.667* .187 .000 -4.240 -3.093
Sixth Week
Zero Week 2.667* .126 .000 2.280 3.053
Fourth Week 1.600* .163 .000 1.099 2.101
Eighth Week -2.067* .067 .000 -2.271 -1.862
Eighth Week
Zero Week 4.733* .118 .000 4.371 5.096
Fourth Week 3.667* .187 .000 3.093 4.240
Sixth Week 2.067* .067 .000 1.862 2.271
*. The mean difference is significant at the .05 level.
The results derived from Pairwise comparison revealed that there is a significant difference in
muscular endurance between the different weeks i.e. Zero Week & Fourth Week, Zero Week &
Sixth Week and Zero Week & Eighth Week as the p value was less than 0.05 level of
significance. A significant difference also lied in muscular endurance between Fourth Week and
INDIANJOURNALOFPHYSICALEDUCATIONSPORTSMEDICINE&EXERCISESCIENCE
ISSN0976-1101Vol-18,SpecialIssue(2)
163
Sixth Week as well as between Fourth Week and Eighth Week as the p value was less than 0.05
level of significance. Significant difference was also observed between Sixth Week and Eighth
Week as the p value was less than 0.05 level of significance.
DISCUSSION OF FINDINGS
The analysis of data revealed that there is a significant difference in the endurance and muscular
endurance due to the effect of different time durations of protein supplements on the female
athletes. In case of endurance and muscular endurance it can be seen that the significant
difference has occurred during the sixth week and the eighth week which can be attributed to the
fact that protein is essential for the repair, construction and maintenance of the muscle mass.
When we exercise for prolonged period of time, our body turns to protein as an additional source
of energy, making it even more important to consume adequate protein so that you do not
sacrifice the muscle tissue.
CONCLUSION
According to the findings of the study, it provided the sports professionals like the physical
education teachers, trainers, coaches that their athletes diet may be planned or designed with the
inclusion of required amounts of protein supplements, as it helps in improving the performance
of the athletes in this case significant changes occurred in endurance and muscular endurance
after eight weeks rather than after four weeks and six weeks.
REFERENCE
Burke LM, Meyer NL, Pearce J. National nutritional programs for the 2012 London Olympic
Games: A systematic approach by three different countries. In: van Loon LJC, Meeusen R,
editors. Limits of Human Endurance. Nestle Nutrition Institute Workshop Series, volume 76.
Vevey, Switzerland: Nestec Ltd; 2013:103–120.
Hansen EA, Emanuelsen A, Gertsen RM, Sørensen SSR. Improved marathon performance
by in-race nutritional strategy intervention. Int J Sport NutrExercMetab. 2014;24(6):645–
655.
Hottenrott K, Hass E, Kraus M, Neumann G, Steiner M, Knechtle B. A scientific nutrition
strategy improves time trial performance by ≈6% when compared with a self-chosen
nutrition strategy in trained cyclists: a randomized cross-over study. ApplPhysiolNutrMetab.
2012; 37(4):637–645.
Coggan AR, Habash DL, Mendenhall LA, Swanson SC, and Kien CL. Isotopic estimation of
CO2 production during exercise before and afterendurance training.J ApplPhysiol75: 70–75,
1993.
Ivy, J. L., Res, P. T., Sprague, R. C., &Widzer, M. O. (2003).Effect of a carbohydrate-protein
supplement on endurance performance during exercise of varying intensity. International
journal of sport nutrition and exercise metabolism, 13(3), 382-395.
Fryburg DA, Jahn LA, Hill SA, Oliveras DM, and Barrett EJ.Insulin and insulin-like growth
factor-I enhance human skeletal muscle protein anabolism during hyperaminoacidemia by
different mechanisms. J ClinInvest 96: 1722–1729, 1995
Koopman, R., Pannemans, D. L., Jeukendrup, A. E., Gijsen, A. P., Senden, J. M., Halliday,
D., ... &Wagenmakers, A. J. (2004). Combined ingestion of protein and carbohydrate
improves protein balance during ultra-endurance exercise. American Journal of Physiology-
Endocrinology and Metabolism,287(4), E712-E720
INDIANJOURNALOFPHYSICALEDUCATIONSPORTSMEDICINE&EXERCISESCIENCE
ISSN0976-1101Vol-18,SpecialIssue(2)
164
EFFECT OF YOGIC INTERVENTION ON SELECTED
PHYSIOLOGICAL VARIABLE AMONG COLLEGE WOMEN
*Gyanendu rai **Prof. L.N. Sarkar *Research scholar, Lakshmibai National Institute of Physical Education, Gwalior (M.P)
**HOD Dept. of Health Education, Lakshmibai National Institute of Physical Education, Gwalior
(M.P)
ABSTRACT
Yoga is the art and science of living and is concerned with the evolution of mind and body. Acc.
Shrimadbhagwat Gita, lord Krishna defined yoga as “yoga is the art of proper or right action. It
has been incorporated into modern medicine during the few decades because of increasing
incidence of diseases of modern civilization such as obesity, hypertension, coronary artery
diseases, and diabetes mellitus, which are rooted in faulty lifestyle and psychological stress. The
Purpose of the study was to find out the effect of yogic training on selected physiological
variables. For the present study 20 female students of lakshmibai national institute of physical
education Gwalior (M.P.) were selected randomly as the subjects for the study. The age of the
subjects were ranging from 17-24 years. The variables selected for the present study were yogic
training (independent variable), Breathing holding capacity, pulse rate, systolic pressure,
diastolic pressure (dependent variables). The data was collected through the pre and posttest.
For the study single group design was used in which the pretest was taken prior to the yogic
training and posttest was taken after six weeks of yogic training. For comparing pre and posttest
means of breathing holding capacity, pulse rate, systolic pressure, diastolic pressure, descriptive
analysis and paired t-test were applied at 0.05 level of significant. Significant difference was
found among pre-post systolic and diastolic; pre- post breathing holding capacity as the p value
(0.00; 0.000; 0.010) respectively which is less than .05. Thus, also found insignificant difference
in pre-post pulse rate as the p value (0.531) which is more than 0.05. On the basis of the findings
it was concluded that the yogic intervention may be responsible for the improvement of selected
physiological variables.
Keywords: Yogic intervention, breathing holding capacity, pulse rate, systolic pressure and
diastolic pressure.
INTRODUCTION Yoga is the art and science of living and is concerned with the evolution of mind and body.
Therefore, yoga incorporates a system of disciplines for furthering an integrated development of
all aspects of the individual. It has been incorporated into modern medicine during the few
decades because of increasing incidence of diseases of modern civilization such as obesity,
hypertension, coronary artery diseases, and diabetes mellitus, which are rooted in faulty lifestyle
and psychological stress. Yoga is the best lifestyle modification, which aims to attain the unity of
mind, body and spirit through asana (exercise), pranayama (breathing), and meditation.
Pranayama is the art of prolongation and control of breath helps in bringing conscious awareness
to breathing and the reshaping of breathing habits and patterns. Meditation is a yogic process of
providing deep rest to the system by allowing the mind to calm down to its basal states. It is
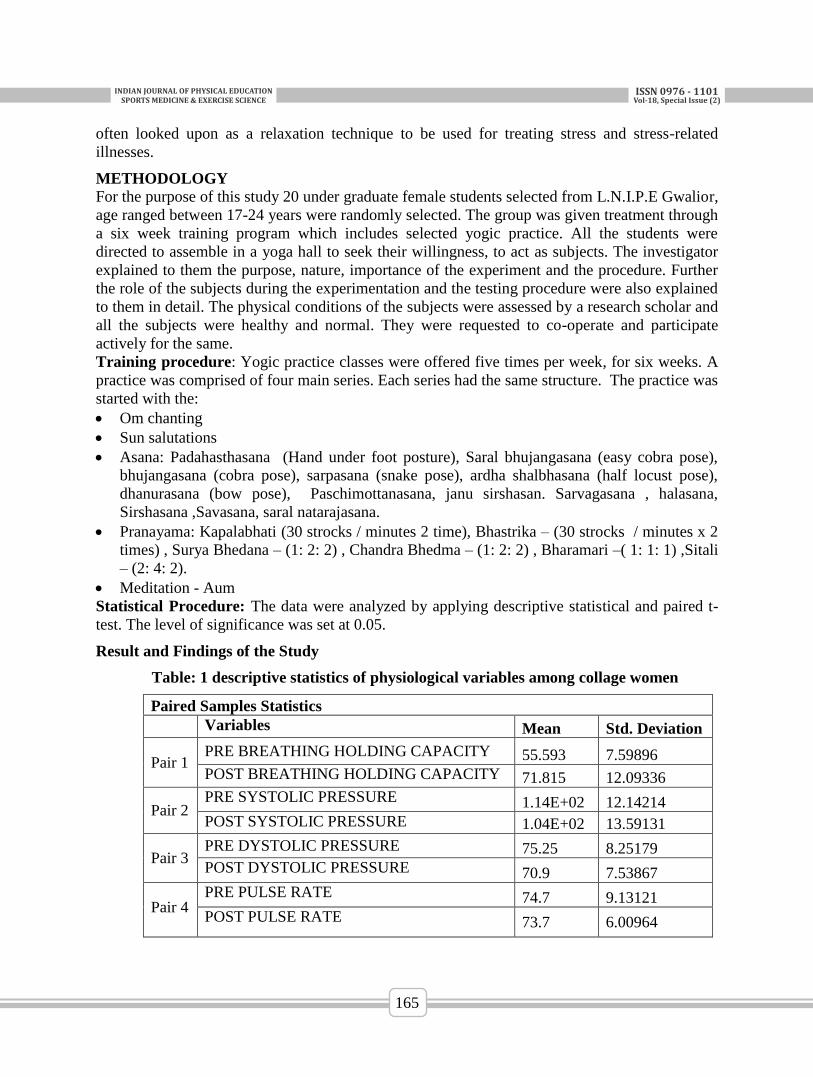
INDIANJOURNALOFPHYSICALEDUCATIONSPORTSMEDICINE&EXERCISESCIENCE
ISSN0976-1101Vol-18,SpecialIssue(2)
165
often looked upon as a relaxation technique to be used for treating stress and stress-related
illnesses.
METHODOLOGY
For the purpose of this study 20 under graduate female students selected from L.N.I.P.E Gwalior,
age ranged between 17-24 years were randomly selected. The group was given treatment through
a six week training program which includes selected yogic practice. All the students were
directed to assemble in a yoga hall to seek their willingness, to act as subjects. The investigator
explained to them the purpose, nature, importance of the experiment and the procedure. Further
the role of the subjects during the experimentation and the testing procedure were also explained
to them in detail. The physical conditions of the subjects were assessed by a research scholar and
all the subjects were healthy and normal. They were requested to co-operate and participate
actively for the same.
Training procedure: Yogic practice classes were offered five times per week, for six weeks. A
practice was comprised of four main series. Each series had the same structure. The practice was
started with the:
Om chanting
Sun salutations
Asana: Padahasthasana (Hand under foot posture), Saral bhujangasana (easy cobra pose),
bhujangasana (cobra pose), sarpasana (snake pose), ardha shalbhasana (half locust pose),
dhanurasana (bow pose), Paschimottanasana, janu sirshasan. Sarvagasana , halasana,
Sirshasana ,Savasana, saral natarajasana.
Pranayama: Kapalabhati (30 strocks / minutes 2 time), Bhastrika – (30 strocks / minutes x 2
times) , Surya Bhedana – (1: 2: 2) , Chandra Bhedma – (1: 2: 2) , Bharamari –( 1: 1: 1) ,Sitali
– (2: 4: 2).
Meditation - Aum
Statistical Procedure: The data were analyzed by applying descriptive statistical and paired t-
test. The level of significance was set at 0.05.
Result and Findings of the Study
Table: 1 descriptive statistics of physiological variables among collage women
Paired Samples Statistics
Variables Mean Std. Deviation
Pair 1 PRE BREATHING HOLDING CAPACITY 55.593 7.59896
POST BREATHING HOLDING CAPACITY 71.815 12.09336
Pair 2 PRE SYSTOLIC PRESSURE 1.14E+02 12.14214
POST SYSTOLIC PRESSURE 1.04E+02 13.59131
Pair 3 PRE DYSTOLIC PRESSURE 75.25 8.25179
POST DYSTOLIC PRESSURE 70.9 7.53867
Pair 4 PRE PULSE RATE 74.7 9.13121
POST PULSE RATE 73.7 6.00964
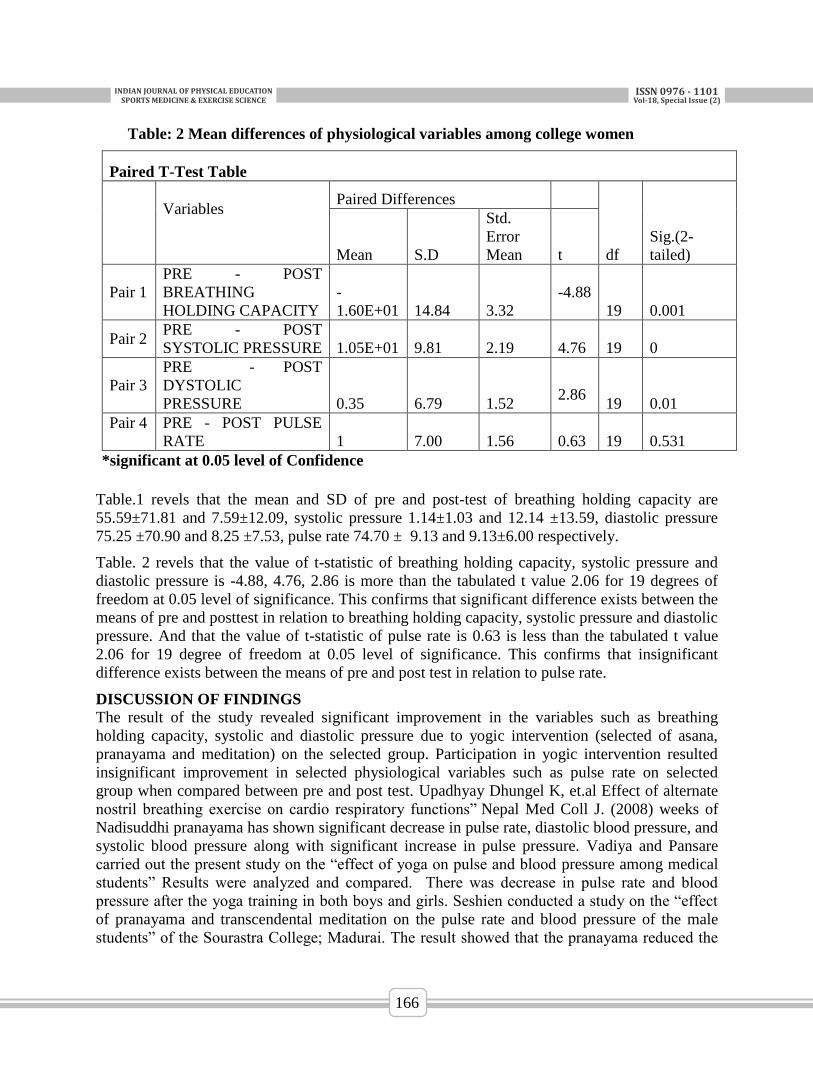
INDIANJOURNALOFPHYSICALEDUCATIONSPORTSMEDICINE&EXERCISESCIENCE
ISSN0976-1101Vol-18,SpecialIssue(2)
166
Table: 2 Mean differences of physiological variables among college women
*significant at 0.05 level of Confidence
Paired T-Test Table
Variables Paired Differences
df
Sig.(2-
tailed) Mean S.D
Std.
Error
Mean t
Pair 1
PRE - POST
BREATHING
HOLDING CAPACITY
-
1.60E+01 14.84 3.32
-4.88
19 0.001
Pair 2 PRE - POST
SYSTOLIC PRESSURE 1.05E+01 9.81 2.19
4.76 19 0
Pair 3
PRE - POST
DYSTOLIC
PRESSURE 0.35 6.79 1.52
2.86 19 0.01
Pair 4 PRE - POST PULSE
RATE 1 7.00 1.56
0.63 19 0.531
Table.1 revels that the mean and SD of pre and post-test of breathing holding capacity are
55.59±71.81 and 7.59±12.09, systolic pressure 1.14±1.03 and 12.14 ±13.59, diastolic pressure
75.25 ±70.90 and 8.25 ±7.53, pulse rate 74.70 ± 9.13 and 9.13±6.00 respectively.
Table. 2 revels that the value of t-statistic of breathing holding capacity, systolic pressure and
diastolic pressure is -4.88, 4.76, 2.86 is more than the tabulated t value 2.06 for 19 degrees of
freedom at 0.05 level of significance. This confirms that significant difference exists between the
means of pre and posttest in relation to breathing holding capacity, systolic pressure and diastolic
pressure. And that the value of t-statistic of pulse rate is 0.63 is less than the tabulated t value
2.06 for 19 degree of freedom at 0.05 level of significance. This confirms that insignificant
difference exists between the means of pre and post test in relation to pulse rate.
DISCUSSION OF FINDINGS
The result of the study revealed significant improvement in the variables such as breathing
holding capacity, systolic and diastolic pressure due to yogic intervention (selected of asana,
pranayama and meditation) on the selected group. Participation in yogic intervention resulted
insignificant improvement in selected physiological variables such as pulse rate on selected
group when compared between pre and post test. Upadhyay Dhungel K, et.al Effect of alternate
nostril breathing exercise on cardio respiratory functions” Nepal Med Coll J. (2008) weeks of
Nadisuddhi pranayama has shown significant decrease in pulse rate, diastolic blood pressure, and
systolic blood pressure along with significant increase in pulse pressure. Vadiya and Pansare
carried out the present study on the “effect of yoga on pulse and blood pressure among medical
students” Results were analyzed and compared. There was decrease in pulse rate and blood
pressure after the yoga training in both boys and girls. Seshien conducted a study on the “effect
of pranayama and transcendental meditation on the pulse rate and blood pressure of the male
students” of the Sourastra College; Madurai. The result showed that the pranayama reduced the
INDIANJOURNALOFPHYSICALEDUCATIONSPORTSMEDICINE&EXERCISESCIENCE
ISSN0976-1101Vol-18,SpecialIssue(2)
167
blood pressure. Transcendental meditation has a positive effect on systolic blood pressure only
combined pranayama and transcendental meditation showed very good effect on all the
physiological parameters
REFERENCE
Iyengar BKS. 7th ed. New Delhi: Harpercollins Publishers; 2002. Light on yoga.
Bjlani RL. 3rd ed. New Delhi: Jaypee Brothers; 2004. Understanding medical physiology;
pp. 871–910.
Nagarathna R, Nagendra HR. 4th ed. Bangalore: Swami Vivekananda Yoga Prakashana;
2006. Yoga for promotion of positive health.
Ankad RB, Herur A, Patil S, Shashikala GV, Chinagudi S. Effect of Short-Term Pranayama
and Meditation on Cardiovascular Functions in Healthy Individuals. Heart
Views. 2011;12:58–62.
Telles S, Nagarthna R, Nagendra HR. Autonomic changes during “OM” meditation. Indian J
Physiol Pharmacol. 1995;39:418–20
A.Chandrabose, “The Therapeutic effect of yoga practice on patients suffering from
bronchial asthma”, unpublished md project. Pondicherry University,1994
Gopal KS, Bhatnagar OP, Subramanian N, et al. Effect of yogasana and pranayamas on
blood pressure pulse rate and some respiratory functions. Indian J Physiol Pharmacol
1973;17(3):273-276.
Joseph S, Sridharan K, Patil SK, et al. Study of some physiological and biochemical
parameter in subjects undergoing yogic training. Indian J Med Res 1981;74:120-124.
M. Vaidya and M.S. Pansare, “Effect of Yoga on Pulse and Blood Pressure”, Indian Journal
of Physiological and Pharmacology, 30:5 (1986), p.8.
Seshien L.S., “Effect of pranayama and transcendental meditation on the pulse rate and blood
pressure of the male students of the sourastra college”, Madurai Unpublished M.phil thesis,
Alagappa University, (1988)
K.N. Udapa el al., “Physiological and Biochemical Studies on the Effect of Yogic and
Certain other Exercises’, Indian Journal of Medicines Research, (1975)
INDIANJOURNALOFPHYSICALEDUCATIONSPORTSMEDICINE&EXERCISESCIENCE
ISSN0976-1101Vol-18,SpecialIssue(2)
168
A COMPARATIVE STUDY OF ISOMETRIC LEG STRENGTH
BETWEEN WEIGHTLIFTERS AND POWERLIFTERS
Moirangthem Ebhion Singh
Ph.D scholar, Lakshmibai National Institute of Physical Education
ABSTRACT
The purpose of the study was to compare the selected isometric variables between weightlifters
and powerlifters. Twenty (N= 20) male lifters were selected. They were further divided into two
groups N1 = 10 weightlifters and N2 = 10 powerlifters. The purposive sampling technique was
used to attain the objective of the study. Independent‘t’ test was employed to compare the mean
differences of the variables. To test the hypothesis, the level of significance was set at 0.05. It is
concluded that significance difference was found between the weightlifters and powerlifters on
isometric knee flexion and knee extension.
Key words: isometric, knee flexion, knee extension, hip adduction, hip abduction
INTRODUCTION
We agree that understanding the features and mechanisms of the variables is important for
inferences. One can understand the importance of variable and finding the superior than other. In
fact, the comparison is meaningful only when the variables are similar or having common
features but the important is to find out the unique difference. Strength is one of the most
important variables in sports. One cannot survive without strength. Weightlifting and
powerlifting are the sport where strength is dominant. Isometric is the type of strength training in
which the joint angle and muscle length do not change during contraction. Isometric exercises
are thousands of years old with examples listed from the static holds in certain branches of yoga
or oriental martial arts. Isometric exercises are first brought to the modern public attention in the
early days of physical culture. Many of today training schedules incorporates isometric exercises
but still the awareness to the society need to be more.
METHODS AND PROCEDURE
Selection of subjects
For this purpose, twenty (N=20) male lifters of weightlifting and powerlifting were selected. The
purposive sampling technique was used to attain the objective of the study.
Selection of variables
The following isometric variables were chosen for the study:
Knee flexion
Knee extension
Hip abduction
Hip adduction
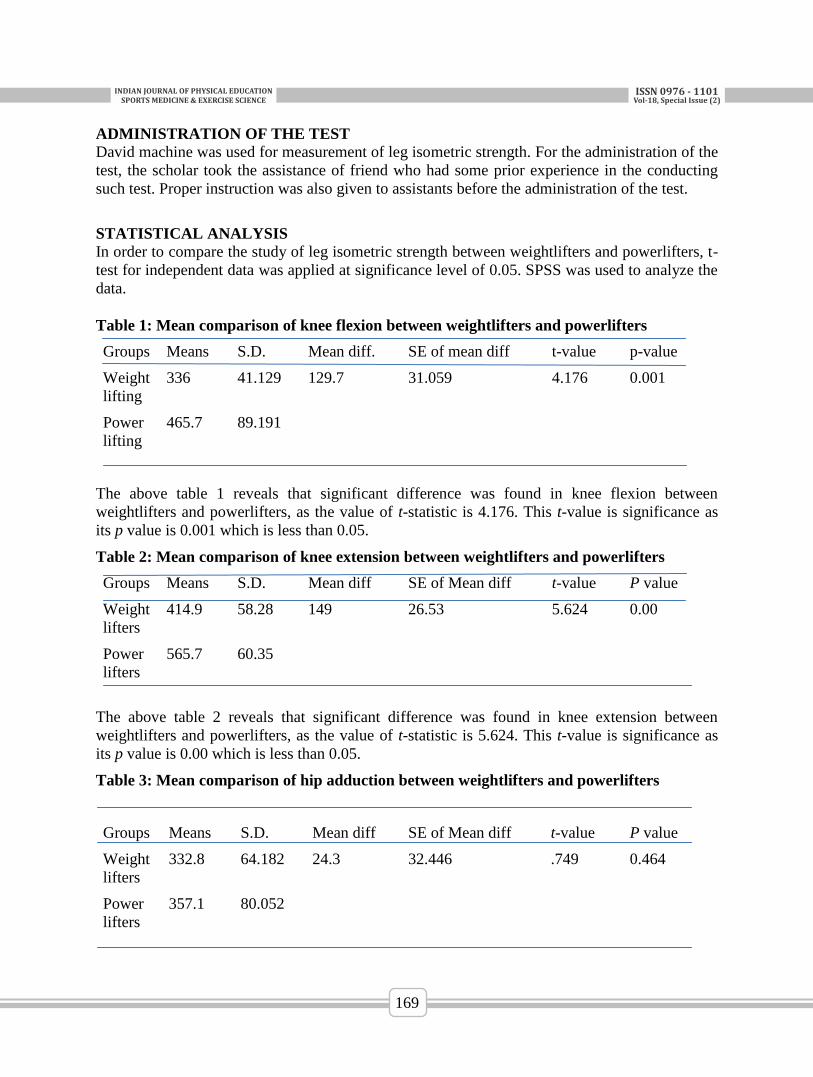
INDIANJOURNALOFPHYSICALEDUCATIONSPORTSMEDICINE&EXERCISESCIENCE
ISSN0976-1101Vol-18,SpecialIssue(2)
169
ADMINISTRATION OF THE TEST
David machine was used for measurement of leg isometric strength. For the administration of the
test, the scholar took the assistance of friend who had some prior experience in the conducting
such test. Proper instruction was also given to assistants before the administration of the test.
STATISTICAL ANALYSIS
In order to compare the study of leg isometric strength between weightlifters and powerlifters, t-
test for independent data was applied at significance level of 0.05. SPSS was used to analyze the
data.
Table 1: Mean comparison of knee flexion between weightlifters and powerlifters
Groups Means S.D. Mean diff. SE of mean diff t-value p-value
Weight
lifting
336 41.129 129.7 31.059 4.176 0.001
Power
lifting
465.7 89.191
The above table 1 reveals that significant difference was found in knee flexion between
weightlifters and powerlifters, as the value of t-statistic is 4.176. This t-value is significance as
its p value is 0.001 which is less than 0.05.
Table 2: Mean comparison of knee extension between weightlifters and powerlifters
Groups Means S.D. Mean diff SE of Mean diff t-value P value
Weight
lifters
414.9 58.28 149 26.53 5.624 0.00
Power
lifters
565.7 60.35
The above table 2 reveals that significant difference was found in knee extension between
weightlifters and powerlifters, as the value of t-statistic is 5.624. This t-value is significance as
its p value is 0.00 which is less than 0.05.
Table 3: Mean comparison of hip adduction between weightlifters and powerlifters
Groups Means S.D. Mean diff SE of Mean diff t-value P value
Weight
lifters
332.8 64.182 24.3 32.446 .749 0.464
Power
lifters
357.1 80.052
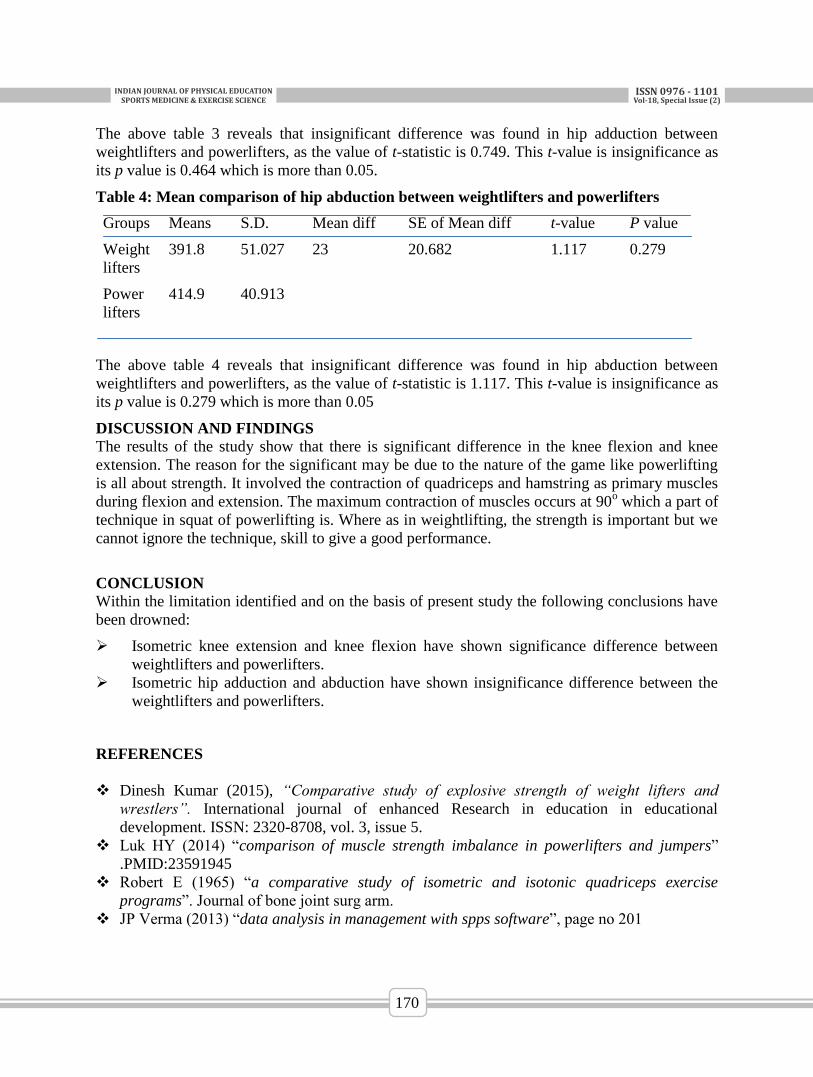
INDIANJOURNALOFPHYSICALEDUCATIONSPORTSMEDICINE&EXERCISESCIENCE
ISSN0976-1101Vol-18,SpecialIssue(2)
170
The above table 3 reveals that insignificant difference was found in hip adduction between
weightlifters and powerlifters, as the value of t-statistic is 0.749. This t-value is insignificance as
its p value is 0.464 which is more than 0.05.
Table 4: Mean comparison of hip abduction between weightlifters and powerlifters
Groups Means S.D. Mean diff SE of Mean diff t-value P value
Weight
lifters
391.8 51.027 23 20.682 1.117 0.279
Power
lifters
414.9 40.913
The above table 4 reveals that insignificant difference was found in hip abduction between
weightlifters and powerlifters, as the value of t-statistic is 1.117. This t-value is insignificance as
its p value is 0.279 which is more than 0.05
DISCUSSION AND FINDINGS
The results of the study show that there is significant difference in the knee flexion and knee
extension. The reason for the significant may be due to the nature of the game like powerlifting
is all about strength. It involved the contraction of quadriceps and hamstring as primary muscles
during flexion and extension. The maximum contraction of muscles occurs at 90o which a part of
technique in squat of powerlifting is. Where as in weightlifting, the strength is important but we
cannot ignore the technique, skill to give a good performance.
CONCLUSION
Within the limitation identified and on the basis of present study the following conclusions have
been drowned:
Isometric knee extension and knee flexion have shown significance difference between
weightlifters and powerlifters.
Isometric hip adduction and abduction have shown insignificance difference between the
weightlifters and powerlifters.
REFERENCES
Dinesh Kumar (2015), “Comparative study of explosive strength of weight lifters and
wrestlers”. International journal of enhanced Research in education in educational
development. ISSN: 2320-8708, vol. 3, issue 5.
Luk HY (2014) “comparison of muscle strength imbalance in powerlifters and jumpers”
.PMID:23591945
Robert E (1965) “a comparative study of isometric and isotonic quadriceps exercise
programs”. Journal of bone joint surg arm.
JP Verma (2013) “data analysis in management with spps software”, page no 201
INDIANJOURNALOFPHYSICALEDUCATIONSPORTSMEDICINE&EXERCISESCIENCE
ISSN0976-1101Vol-18,SpecialIssue(2)
171
EFFECT OF A PRESCRIBED EXERCISE PROGRAM ON
REGULAR MALE GYM GOERS’ ON COMMITMENT
Rakesh Katoch1
Ajay Kumar2
PGT, Laxman Public School, Hauz Khas Enclave, New Delhi, India,
Devi Ahiliya Vishwavidyalaya, Khandwa Road, M.P, India
ABSTRACT
The purpose of this study was to analysis the “Effect of a prescribed exercise program on
regular male gym goers on Commitment”. One hundred Male were selected as subjects for this
study. They divided into two equal groups 50 subjects in each group named Experimental and
Control Group respectively. The age of the subjects were ranged between 25 to 40 years. The
Experimental group was given the training for 12 weeks for five days per week with two days of
rest. Control group workout at their own at their respective centers. A self made exercise
programme and Commitment questionnaire was made with the help of experts of respective
fields. The data was analyzed by applying analysis of t- test to draw appropriate conclusions and
to find out the effect of 12 weeks of prescribed exercise training on subjects. The significance
level was set at 0.05. The result of study showed that there was a significant difference between
Experimental Male and Control Male group.
Key Words: Commitment, Reliability, Experimental Group, Control Group, Prescribed Exercise
programme
INTRODUCTION
Due to globalization, among others, competition is fiercer than ever. This increased pressure has
resulted in the commitment of employers towards employees becoming less of a given. The
concept of lifetime employment has also become outdated. Committed employees bring added
value to the organization, including through their determination, proactive support, and relatively
high productivity and an awareness of quality. Organizational commitment refers to the extent to
which an employee develops an attachment and feels a sense of allegiance to his or her employer
(The Pennsylvania State University, 2011). The concept of commitment has been applied to
various aspects of psychology, such as work ethic, level of involvement in the job commitment
to their career/profession, commitment to work or organization, Commitment to family and its
members and, finally to the society.
METHODOLOGY
For the present study the subjects were delimited to 100 in two groups named Experimental and
Control Group (50 Male subjects in each group) of 25-40 yrs of age for control lab study. The
Experimental group was exposed to 12 weeks (5 Days per week and two days of active rest) of
prescribed training programme where as Control group was not exposed to any treatment. The
questionnaire targeted the professional involving in variety of jobs that put constant demand of
competency, professional commitment, excellence, making healthy lifestyles adjustment, social
lifestyles, solving problems. The Commitment questionnaire (self made) was made with the help
of experts in the field of psychology. Reliability of the Commitment Questionnaire was tested by
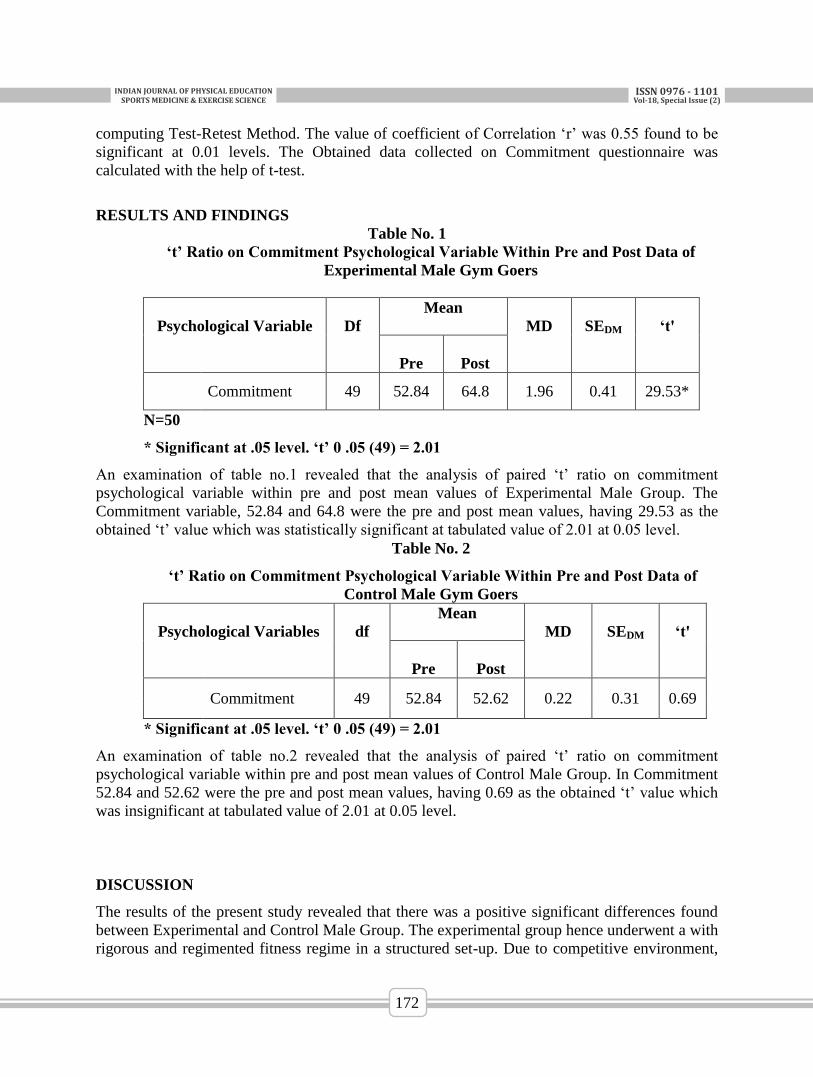
INDIANJOURNALOFPHYSICALEDUCATIONSPORTSMEDICINE&EXERCISESCIENCE
ISSN0976-1101Vol-18,SpecialIssue(2)
172
computing Test-Retest Method. The value of coefficient of Correlation ‘r’ was 0.55 found to be
significant at 0.01 levels. The Obtained data collected on Commitment questionnaire was
calculated with the help of t-test.
RESULTS AND FINDINGS
Table No. 1
‘t’ Ratio on Commitment Psychological Variable Within Pre and Post Data of
Experimental Male Gym Goers
Psychological Variable Df
Mean
MD SEDM ‘t'
Pre Post
Commitment 49 52.84 64.8 1.96 0.41 29.53*
N=50
* Significant at .05 level. ‘t’ 0 .05 (49) = 2.01
An examination of table no.1 revealed that the analysis of paired ‘t’ ratio on commitment
psychological variable within pre and post mean values of Experimental Male Group. The
Commitment variable, 52.84 and 64.8 were the pre and post mean values, having 29.53 as the
obtained ‘t’ value which was statistically significant at tabulated value of 2.01 at 0.05 level.
Table No. 2
‘t’ Ratio on Commitment Psychological Variable Within Pre and Post Data of
Control Male Gym Goers
Psychological Variables df
Mean
MD SEDM ‘t'
Pre Post
Commitment 49 52.84 52.62 0.22 0.31 0.69
* Significant at .05 level. ‘t’ 0 .05 (49) = 2.01
An examination of table no.2 revealed that the analysis of paired ‘t’ ratio on commitment
psychological variable within pre and post mean values of Control Male Group. In Commitment
52.84 and 52.62 were the pre and post mean values, having 0.69 as the obtained ‘t’ value which
was insignificant at tabulated value of 2.01 at 0.05 level.
DISCUSSION
The results of the present study revealed that there was a positive significant differences found
between Experimental and Control Male Group. The experimental group hence underwent a with
rigorous and regimented fitness regime in a structured set-up. Due to competitive environment,
INDIANJOURNALOFPHYSICALEDUCATIONSPORTSMEDICINE&EXERCISESCIENCE
ISSN0976-1101Vol-18,SpecialIssue(2)
173
they have to complete the work on time. So, as the programme progressed people become more
and more committed and enjoyed to the training programme. Due to more commitment in their
job, more appreciations and incentives form management side and well cooperation among
colleagues. The results of the present study were supported by the findings of Kent et.al.
investigated that involvement in fitness activities useful in commitment, self image and athletic
ability, and high level of motivation. According to Boni (2004), there was positive impact of
physical fitness and exercise on productivity, overall job performance, job satisfaction,
absenteeism and organizational commitment. Chang et.al(2010); Sibley et.al.(2010) assessed
that aerobic exercises have positive impact on the executive functioning of planning and problem
solving, promotes organizational commitment.
CONCLUSION
The results concluded that there is positive significant improvement exhibited by experimental
group in Commitment after exposed to 12 weeks of prescribed exercise programme in
comparison to control group subjects. Hence, it is concluded that this prescribed programme was
an effective training to improve the people’s commitment ability.
REFERENCE
Beyrouti, Nouri and Jaber, Wael. (2011). Physical exercise / fitness: job satisfaction and
work productivity. International Journal of Strategic Management, 11:1.Cited in
http://www.freepatentsonline.com/article/International-Journal-Strategic-manage
ment/272739813.html
Boni, Nadia. (2004). Exercise and Physical Fitness: The Impact on Work Outcomes,
Cognition, and Psychological Well-Being for Police. Australasian Centre for Policing
Research. Cited in https://www.ncjrs.gov/App/Publications/ abstract.aspx ?ID=208101.
Der-Karabetian, Aghop and Gebharbp, Norma. (1986). Effect of physical fitness program in
the workplace. Journal of Business and Psychology, 1:1: 51-58. Cited in
nk.springer.com/article/1.
Dugdill Lindsey (2008). Physical activity and the workplace. International Journal of
Workplace Health Management. 1:3. Cited in http://www.emeraldinsight.com/
journals.htm/journals.htm?article.
Chang, Yu-Kai; Tsai, Chia-Liang; Hung, Tsung-Min; Cheung So, Edmund; Chen, Feng-Tzu
and Etnier, L. Jennifer. (2010). Effects of Acute Exercise on Executive Function: A Study
with a Tower of London Task. JSEP, 33:6:847-865. Cited in
http://journals.humankinetics.com/jsep-current-issue.
Güleryüz G, Güney S, Aydin EM and Aşan O.(2008). The mediating effect of job
satisfaction between emotional intelligence and organisational commitment of nurses: a
questionnaire survey. International Journal of Nursing Studies, 45:11:1625-35.Cited
inhttp://www.ncbi.nlm.nih.gov/pubmed/18394625.
Jane, R. Williams (2004). Job Satisfaction and Organizational Commitment. Sloan Work
and Family Encyclopedia Entry. Cited in
http://www.bc.edu/bc_org/avp/wfnetwork/rft/wfpedia/index.html.
INDIANJOURNALOFPHYSICALEDUCATIONSPORTSMEDICINE&EXERCISESCIENCE
ISSN0976-1101Vol-18,SpecialIssue(2)
174
FORECASTING THE WINNER OF PRO KABADDI LEAGUE
MATCHES
Amritashish Bagchi1, Shiny Raizada
1and Aniket Mhatre
2
1Assistant Professor, Symbiosis International (Deemed University), Pune
2Student, Symbiosis International (Deemed University), Pune
ABSTRACT
The purpose of the study was to develop a predictionmodel to forecast the outcome of pro
kabaddi league matches. These probabilities can assist a coach, team captain or manager in
considering a certain tactics for the other half. The data was collected from 2017 season of Pro
Kabaddi League (PKL). A total data of272 matches were recorded, out of which 32 matches
were draw and therefore not included in the study. The dependent variable selected for this study
was Match Outcome (Win/Loss). Raid Points, Tackle points, All Out Points and Extra Points
were selected as the predictor variables. For the purpose of this study only the first half data was
used and in statistical technique Binary Logistic regression was used to predict the outcome of a
match (Win/Loss). The result indicates that the developed Logistic regression Model was
significant. All the predictor variables except Extra Points were included in the prediction model
with coefficient of determination ( 𝑅2 ) of .203 (Cox & Snell) and .271 (Nagelkerke). The
classification matrix shows that 68.8 % of match results were correctly classified by the model.
Keywords – Kabaddi, Pro Kabaddi League (PKL), prediction model, Win and Loss
INTRODUCTION
Kabaddi is one of the traditional sports of India, which requires a combination of Agility, Speed,
Power, Strength and Co-ordination. Kabaddi is a contact team sport, where 14 players (7 on each
side) take part at time and needs no equipmentwhich makes it a very popular sport in the
developing countries (Devarajuet. al. 2012).In today’s high-tech world, technology in sport plays
a vital role for not only recording data in many ways that the coaches could easily interpret and
make some conclusion for the individual or team performance.
Many researches were done to predict the future events on the basis of present or past data.
These researches had proved that the future performance of an individual or team could be
predicted through the analysis of certain variables, which are found to be the basis for total
performance. Researches in Kabaddi show the characterstics of Kabaddi players (Ali &
Adhikari, 2011; Palanisamy, et al. 2012; Nizama, 2012). But to the best of my knowledge none
of the studies in Kabaddi were focused in predicting the match winner on the basis of match
statistics.
Logistic regression is one of the statistical methods that can be one of the solutions of many
prediction models in sports. The main purpose of this statistical technique is to predict the
outcome (binary or multinominal) on the basis of predictor variables selected by the researcher
(Schoonjans, 2018). Many prediction models have been developed by researchers in predicting
the match outcome in several sports. The purpose of this study is to develop a prediction model
to predict the outcome of a Kabaddi match on the basis of match statistics of first half.
INDIANJOURNALOFPHYSICALEDUCATIONSPORTSMEDICINE&EXERCISESCIENCE
ISSN0976-1101Vol-18,SpecialIssue(2)
175
METHODOLOGY
A total data of 272 matches were recorded, out of which 32 matches were draw and therefore not
included in the study. All the data were collected from the website flashscore.com ("Pro Kabaddi
League 2017 Results - Kabaddi/India", 2018). The dependent variable selected for this study was
Match Outcome (Win/Loss). Raid Points, Tackle points, All Out Points and Extra Points were
selected as the predictor variables. The statistical technique Binary Logistic Regression was used
to develop the prediction model. For this purpose Statistical Package for Social Science (SPSS)
version 24.0 was used. The level of significance was set at 0.05.
RESULTS AND DISCUSSION
Unlike linear regression and general linear models, logistic regression does not make many of
the key assumptions that are based on ordinary least squares algorithms, such as linearity,
normality, homoscedasticity, and measurement level.
Table 1 – Descriptive statistics
Table 2 – Correlation Matrix
Raid points Tackle Points All Out Points Extra Points
Raid points Pearson
Correlation
1 .067 .570**
.007
Tackle Points Pearson
Correlation
.067 1 .471**
.012
All Out Points Pearson
Correlation
.570**
.471**
1 .212**
Extra Points Pearson
Correlation
.007 .012 .212**
1
**. Correlation is significant at the 0.01 level (2-tailed).
There is a significant correlation between variables but none of the variables were found to be
highly correlated and this was checked by calculating Variance Inflation Factor. It quantifies the
severity of multicollinearity. For all the variables the VIF value was near by 1, which means the
multicollinearity between the independent variables was low.
Table 3 – Omnibus Tests of Model Coefficients
Chi-square Df Sig.
Step 1 Step 54.462 3 .000
Block 54.462 3 .000
Raid points Tackle Points All Out Points Extra Points
Mean 8.9125 4.1667 1.0000 .9042
Std. Error of
Mean
.23147 .14253 .08516 .06091
Std. Deviation 3.58586 2.20814 1.31931 .94359
INDIANJOURNALOFPHYSICALEDUCATIONSPORTSMEDICINE&EXERCISESCIENCE
ISSN0976-1101Vol-18,SpecialIssue(2)
176
Model 54.462 3 .000
The omnibus test of model coefficients shows a significant decrease in the -2 Log Likelihood
value (i.e. 278.249), it means the developed model is significantly better fit than the null model.
Table 4 – Model Summary
Step -2 Log likelihood Cox & Snell R Square Nagelkerke R Square
1 278.249a
.203 .271
a. Estimation terminated at iteration number 5 because parameter estimates changed by
less than .001.
From the above table it can be seen that the value of Nagelkerke𝑅2 is .271 in the third model
developed in binary logistic regression, but the value of Cox & Snell R-square is found to be
.203.
Table 5 - Hosmer and Lemeshow Test
Step Chi-square df Sig.
1 8.011 8 .432
In the above table, the p – value of Hosmer and Lemeshow test is .432 which is insignificant.
Table 6 – Classification Table
Steps
Observed Predicted
Match Results Percentage Correct
LOSS WIN
Step 1 Match Results
LOSS 91 29 75.8
WIN 46 74 61.7
Overall Percentage 68.8
a. The cut value is .500
The above table shows the summary of correct and wrong classification of the subjects in match
Outcome (i.e. Loss or Win. Overall 68.8 % of matches were correctly classified on the basis of
selected independent variables.
Table 7 - Variables in the Equation
B S.E. Wald df Sig. Exp(B)
Step 1a
Raid Point .096 .055 3.086 1 .079 1.101
Tackle Point .236 .090 6.844 1 .009 1.267
All Out Point .522 .163 10.225 1 .001 1.685
Constant -2.270 .646 12.369 1 .000 .103
a. Variable(s) entered on step 1: raid point, tackle point, all out point.
INDIANJOURNALOFPHYSICALEDUCATIONSPORTSMEDICINE&EXERCISESCIENCE
ISSN0976-1101Vol-18,SpecialIssue(2)
177
All the independent variables in the model were found to be significantly contributing. All these
variables are important in predicting the match outcome of a Kabaddi match, the variables
included in the model is highly significant and it can classify upto 68.8 % of cases correctly, still
it only explain 27.1 % of thevariability in the dependent variable. It means 72.9 % of the
variability is explained by some other variables which were not included in the study.
CONCLUSION
The developed Logistic regression Model was found to be significant. According to the statistical
significance of the predictor variables, they were numerically weighted & were used to predict
the match outcome. Out of four predictor variables three were included in the prediction model
with coefficient of determination (R2) of .203 (Cox & Snell) & .271 (Nagelkerke). 68.8 % of
match results were correctly classified by the model.
REFERENCES
Ali, S., & Adhikari, D. (2011). Physical and Anthropometric Characteristics of Kabaddi
Players. Indian Journal of Applied Research, 4(1), 464-465.
Bewick V, Cheek L, & Ball J. (2005). Statistics review 14: logistic regression. Crit Care, 9
(1), 112–8
Devaraju, K., &Kalidasan, R. (2012). Prediction of Kabaddi Playing Ability from Selected
Anthropometrical and Physical Variables among College Level Players. Asian Journal of
Information Technology, 11(4), 131-134.
Klaassen, F. J., & Magnus, J. R. (2003). Forecasting the winner of a tennis match. European
Journal of Operational Research, 148(2), 257-267.
Patel, S., Pandey, U., & Saxena, S. (2011). Comparative Study of Mental Toughness among
Kabaddi Players of Different Level. Indian Journal of Applied Research, 1(3), 201-202.
Pro Kabaddi League 2017 Results - Kabaddi/India. (2018). Flashscore.com. Retrieved 12
February 2018, from https://www.flashscore.com/kabaddi/india/pro-kabaddi/results/
Schoonjans, F. (2018). Logistic regression. MedCalc. Retrieved 3 February 2018, from
https://www.medcalc.org/manual/logistic_regression.php
INDIANJOURNALOFPHYSICALEDUCATIONSPORTSMEDICINE&EXERCISESCIENCE
ISSN0976-1101Vol-18,SpecialIssue(2)
178
THE DETERMINATION OF AEROBIC CAPACITY AND BODY
COMPOSITION OF ALL INDIA INTER-UNIVERSITY FEMALE
SOCCER PLAYERS.
Chandan K Paswan* PhD Scholar, L.N.I.P.E Gwalior
Dr. Anindita Das** Assistant professor, L.N.I.P.E Gwalior
ABSTRACT
“The study was basically focused on to determine the aerobic capacity and body composition of
all India inter-university female soccer players of L.N.I.P.E Gwalior”.
There was also a secondary problem that was also taken in the study; the main aim was to find
out the relationship of aerobic capacity with the percent body fat, aerobic capacity with the lean
body weight and aerobic capacity with the body density.
For the purpose of the study a total of 15 female inter-university players were chosen from
L.N.I.P.E Gwalior, coopers 10 mins run/walk test was used to test the aerobic capacity of the
players.
The fat percentage was measured with the help of skin fold callipers from various sites of the
body; the lean body weight was calculated by subtracting weight of body fat from the total body
weight of the players.
The result of the study showed that the lean body mass was significantly related with the aerobic
capacity of the players.
The study also showed insignificant and showed negative relationship when fat percentage was
related to aerobic capacity.
And the body density of the players was found insignificant with the aerobic c capacity.
Keywords: aerobic capacity, lean body mass
INTRODUCTION
Soccer is a game which calls for strenuous and continuous thrilling action. The skills involved in
the game are simple, natural, highly stimulating and satisfying to anyone who participates in the
game, some of the well known skills are kicking, running, jumping, throwing, dodging and so
on.7
Modern soccer is a vigorous, fast game requiring accelerating sprint, rough tackling, and power
in kicking and endurance to sustain skilful play for 90 minutes.8
It has been claimed that a high level of general fitness with motor abilities like strength,
endurance, speed of movement, jumping ability, agility, flexibility, and cardio-vascular
endurance etc. Are the essential qualities required to be developed by the footballers to play this
international game?
7 J.p. Thomas, let us coach soccer(msdras:the Y.M.C.A college of physical education,1964),p.1
8 The amrit bazar patrika(Calcutta:march 8,1982), page 8, col, 2.
INDIANJOURNALOFPHYSICALEDUCATIONSPORTSMEDICINE&EXERCISESCIENCE
ISSN0976-1101Vol-18,SpecialIssue(2)
179
Usually there are two kind of endurance, muscular and cardio-respiratory. Cardio-respiratory
endurance is characterized by moderate contraction of large muscle groups for relatively long
periods of time during which maximal adjustment of the cardio-respiratory system are necessary
as in sustained, running, swimming, climbing, bicycling and the like 9
Cardio-vascular endurance is one of the major physical fitness components required for the game
of football.
Maximum aerobic power (VO2 max) is recognised as an index of cardio-vascular function and is
widely accepted as being important to the success in endurance sports/events.10
METHODOLOGY
A total of 15 female football players were taken from the purpose of the study who have
represented L.N.I.P.E Gwalior in inter-varsity games. The age group of the players were kept
between 18-25 years. The criterion measures chosen to test the aerobic capacity and the body
composition is coopers 10 mins run/walk test. The fat percentage was estimated by adding the
skin fold measurements in millimetres taken from the following sites:
1. Biceps
2. Triceps
3. Sub-scapular
4. Supra-iliac
Durin and rahaman method was used for to determine the body fat percentage. Lean body weight
was calculated by subtracting weight of the body fat (in kg) from the total body weight (in kg).
Body density was calculated using abdominal skin fold
(a) Chest skin fold), (b) arm skin fold, (c) by using formula:
Body density =1.1017-(0.000282) × (a)-(0.000737) × (b)-(0.00088) ×(c) 3
ANALYSIS OF DATA, CONCLUSION AND DISCUSSION
For the purpose of the study and to see the relationship between the aerobic capacity and each of
the body composition i.e. percentage of fat, lean body mass percentage and body density, product
moment method for computing correlation was employed. The mean and the standard deviation
of body composition variables are given in the table 1 and the correlation between aerobic
capacity and body composition is given in table 2.
Descriptives: table 1
S.no Variables Mean Standard Deviation
1. Body density 1.065402 .0012402
2. Percentage of body
fat
16.3265 2.13445
9 H.harrison Clarke, “physical fitness testing in schools,”physical fitness research digest(January 1975):7
10 Yutuka murase et.al.,” longitudinal study of aerobic power is superior Jr. Athletes,”medicine and science in sport
exercise 13(1981):180
INDIANJOURNALOFPHYSICALEDUCATIONSPORTSMEDICINE&EXERCISESCIENCE
ISSN0976-1101Vol-18,SpecialIssue(2)
180
3. Lean body mass (
percentage)
72.2563 2.13445
4. Aerobic Capacity 2152.36 189.3786
Correlation: table 2
S.no Variables Coefficient of correlation
1. Aerobic capacity and fat
percentage
-.346*
2. Aerobic capacity and lean
body mass
.346*
3. Aerobic capacity and body
density
.174
*significant at 0.05 level of confidence
CONCLUSION
1. Lean body mass (percentage) was found to be significantly related to the aerobic capacity.
2. There was negative significant relationship between the fat percentage and the aerobic
capacity.
3. Body density was also found to be insignificantly related to the aerobic capacity.
DISCUSSION AND FINDINGS
The reason for significant relationship between aerobic capacity and lean body mass may be
because lean body mass mainly comprises of muscles which help the individual to perform better
in distance running. As the individual has more of muscle and less of fat tissue the significant
relationship between aerobic capacity and lean body mass seems logical, lean body
mass(percentage) as a whole basically contribute to carry an aerobic functions thus helps in the
aerobic type of activity.
An insight negative relationship between aerobic capacity and fat percentage, may be due to the
fact that excess of fat act as a dead weight which an individual has to carry for executing various
movements ,this additional weight possess extra demands on the system of the body where by an
individual gets exhausted soon, the aerobic capacity due to the fact that fat does not provide
energy to the working muscle during activity, therefore there is negative correlation its fat
percentage and aerobic capacity.
The aerobic capacity is insignificantly related to the body density which may be because of
greater amount of fat in body which may place additional demands on human organism. It may
also be because of larger surface area which may put extra frictional process there by leading the
individual to undergo extra amount of work, which can be done more efficiently when this extra
amount of fat is absent.
INDIANJOURNALOFPHYSICALEDUCATIONSPORTSMEDICINE&EXERCISESCIENCE
ISSN0976-1101Vol-18,SpecialIssue(2)
181
REFERENCES
Gutin, B. (June 1992). Defining Health and Fitness: First Step toward establishing
children's fitness standards. Research Quarterly, 63(2): 128-132.
Helgerud, J., Høydal, K., Wang, E., Karlsen, T., Berg, P., et al. (2007). Aerobic
highintensity intervals improve VO2max more than moderate training. Medicine and
Science in Sports and Exercise, 39(4): 665-671.
Pathak,r(2011), effect of selected physiological variables on deaf and dumb children,lnipe
Gwalior,department of advance studies
Ted A. Baumgartner, T.A., Jackson, A.S. (1987). Measurement for Evaluation in Physical
Education and Exercise Science (3rd edition; Dubeque, Iowa: W.Mc. Brown Publishers), p.
11.
Wisløff, U., Ellingsen, Ø., and Kemi, O. J. (2009). High-intensity interval training to
maximize cardiac benefits of exercise training? Exercise Sport Science Review, 37(3): 139-
146.
INDIANJOURNALOFPHYSICALEDUCATIONSPORTSMEDICINE&EXERCISESCIENCE
ISSN0976-1101Vol-18,SpecialIssue(2)
182
A QUALITY APPROACH TO THE PHYSICAL EDUCATION
AND SPORTS PROGRAM
Dr. Monika Dewan
INTRODUCTION Physical Education has always been an integral part of the holistic education process. The
session will focus on the Quality of the Physical Education / Sports program running in the
schools. It is the responsibility of the Physical educators and Coaches as professionals to deliver
developmentally appropriate and meaningful teaching to realize the outcome of developing
physically, mentally, emotionally and socially fit global citizens. The presenter will share the
Doctoral research results submitted at the Jamia Millia Islamia University in 2012. There will be
reference to the Shape America guidelines, PE standards and recommendations. Physical
Education / Sports deserve respect just like any other subject area in the schools. The academic
achievements and results due to participation in Physical activities based upon research will be
highlighted too. PE classes should be taken seriously by the Indian education system and treated
as a learning experience. PE deserves its long due respect by our society.
SIGNIFICANCE OF THE STUDY
The result of the study will bring out the comparison of the variables of the study with
regards to the three types of schools and gather ideas from PE programs running in various
schools.
The study will contribute towards highlighting the best practices followed in our schools.
The study will be beneficial for the Heads of Institution and Physical Educators who are
engaged in framing and execution of various policies at different levels, to get rid of existing
lacunae in the program.
An outcome of the study will be to highlight effective and meaningful teaching and
assessment practices and curriculum, useful to physical educators in creating physically
educated students.
The study will help to obtain concrete information about present day PE scenario which
enlightens the children about their mental and physical development.
An importance of the study will be to come up with recommendations to help upgrade the
standards and status of PE in India and bridge the gap between high and low quality
programs.
The study will suggest alternate ways of organizing PE program when facilities are not
adequate.
The study will be of great help for the researcher to suggest amendments in the right
direction in context of the basic problems of Physical Education.
METHODOLOGY
sample, tools, methodology of the present study, steps involved in the development of the
questionnaire, and steps for the analysis of the data, including the statistical tools used, have been
detailed. The self developed questionnaire was administered after establishing its relevance with
regard to the objectives of the study and considering the variables of the study.

INDIANJOURNALOFPHYSICALEDUCATIONSPORTSMEDICINE&EXERCISESCIENCE
ISSN0976-1101Vol-18,SpecialIssue(2)
183
STATISTICAL PROCEDURES
The data collected through Questionnaire schedule was documented, analyzed both
quantitatively and qualitatively, using the appropriate statistical procedures, useful to convey the
results of the findings in the most effective and meaningful manner. The standard statistical tools
such as percentage, average, chi square test have been used as per the requirements for the
analysis needs of the questionnaire. The graphical presentation has been made to visually depict
the data as much as possible to enhance understanding of the results.
RECOMMENDATIONS
The following are a few recommendations that can help rectify the problems in this field.
Importance of PE as a subject for overall development of children should be emphasized
greater in all types of schools.
Requisite curriculum must be circulated by concerned authorities for grades KG. and above
just like secondary classes in all types of schools. The curriculum prescribed should be age
and developmentally appropriate, thoughtfully created. At the existing levels where the
curriculum is available, it needs to be revisited.
Both awareness creation about PE Program and maintenance of physical fitness should be
emphasized upon.
Effective remedial strategies must be followed with students who fail to achieve the grade
specific learning expectations set out in the curriculum of public, government and foreign
schools.
The respective administrators need to understand and encourage their styles of participation
with respect to genders, in their schools. Mixed gender approach may be used where it is
essential to inculcate gender sensitivity value towards the opposite gender.
Government and public schools must catch up on modern and interactive techniques of
assessment and use it in combination with traditional methods.
Administrators and supervisors ensure that an assessment system is in place and the teachers
follow the same while evaluating the students. All the teachers must decide the breakup of
weightage for various categories and grade them accordingly.
Government and public schools must have a moderate student teacher ratio just as foreign
schools for easier class management and lesser behavioral concerns. Class size must be
revisited at government and public schools and not overlook this aspect.
Besides fields and outdoor courts available in all types of schools, other infrastructure like
swimming pool, gymnasium and fitness centers would be desirable in government and
public schools.

INDIANJOURNALOFPHYSICALEDUCATIONSPORTSMEDICINE&EXERCISESCIENCE
ISSN0976-1101Vol-18,SpecialIssue(2)
184
A shared office for all the PE teachers will be a positive idea to be introduced in schools, to
boost the morale and confidence and raise the respect for the PE subject and department in
the school.
A regular refreshment system must be followed in all schools.
The initiative to improve the standard of Public Address system is very important for the
conduct of PE and Sports Programs very effectively and efficiently.
Regular Medical Health Checkup must be followed as a trend in schools especially public
and foreign schools.
The administration and management of all schools must be aware that the need of a dietician
and counselor are of extreme importance to cater to the needs of sports persons and guiding
them appropriately to improve on their diet, participation and behavior.
Foreign and government schools must maintain Intramural and Interschool sports profile of
sportspersons more effectively.
There should be clearly laid out guidelines and policies for activities meant for PE to avoid
discrepancies.
Participation levels in elementary and high school needs to improve in all types of schools.
The budget in the government schools is the lowest, hence, these schools may attempt to
look for sponsors to help raise funds for events/ infrastructural facilities. Sponsors can even
fund the awards for events like the Sports day.
Availability of PE as a subject at Government and Public schools, particularly at primary
level is a matter of concern.
Remedial strategies have been given due importance by all schools but their means and
methods of execution of strategies, vary according to the type of schools.
A major issue of concern is about the ratio of gender participating in PE program.
Government schools are found to have least activity where both genders may interact
together, where as foreign schools have the PE activities with maximum gender interaction
among them.
Effectiveness of PE program could be improved in Indian schools, particularly Government
schools through effective instruction strategies, ie: a scope of improvement have been found
for utilization of audio-video aids and partner work to make the PE program more effective.
Choices of indoor and outdoor activities are highly influenced by the facilities and
infrastructure in the schools.
Availability of locker rooms, change rooms and their conditions can be further improved in
all types of schools.
INDIANJOURNALOFPHYSICALEDUCATIONSPORTSMEDICINE&EXERCISESCIENCE
ISSN0976-1101Vol-18,SpecialIssue(2)
185
National organizations including the American Heart Association, the American Cancer
Society, the American Diabetes Association, NASPE, the Centers for Disease Control and
Prevention recommend 150 minutes of PE each week for children in elementary school and
225 minutes per week for middle school and high school.
The study has been an attempt to highlight the ongoing practices in various types of schools. The
administration and managements of various schools may opt to choose the best practices
prevalent in a PE Program, irrespective of the type of schools. A PE teacher must be a role model
and as professionals from this field, they must deliver their best. I assure you, when we as
Physical Educators will become disciplined role model for our students; our profession will get
the long deserved respect by the society.
INDIANJOURNALOFPHYSICALEDUCATIONSPORTSMEDICINE&EXERCISESCIENCE
ISSN0976-1101Vol-18,SpecialIssue(2)
186
SOCIO-ECONOMIC STATUS SURVEY OF UNIVERSITY
FEMALE ATHLETES OF BANGLADESH
Shaybal Chanda1& Nayana Chowdhury
2
1Assistant Professor, Department of Physical Education and Sports Science, Visva-Bharati,
2Deputy Director, Department of Physical Education, University of Dhaka, Bangladesh
ABSTRACTS
This study aimed to know the socio-economic status in the society of the university sportswomen
of Bangladesh. Data was collected by random selection of 95 female athletes from 09 different
public universities through questionnaire from the 5th
Bangladesh Universities Games, 2017
jointly organized by Dhaka University (DU) and Bangladesh University of Engineering and
Technology (BUET) between March-April, 2017. Data was analyzed by using mainly percentage
and mode. Self-motivation was found the main driving factor for sports. Majority of the female
players’ family income is low. Business was found as profession of a large proportion of the
father of female players and mothers are mostly homemaker. Some extent academic departments
of the university help for the sports participation. Most support comes to sportswomen from
family, self, father and friends for the sports. Yet there are various issues of sportswomen that
still need to be addressed properly with strong initiative taking help from this study findings for
the development of women sports in the university and ultimately in the national & international
arena of sports.
KEY WORDS: Socio-economic status, University Female Athletes.
INTRODUCTION
To stand high in the world sports arena Bangladesh also need to pay attention on equal
development of female athletes. University sports play an enormous role in grooming athletes for
the national and international sports. Female players are half of the total sports. Thus, it is
necessary to know about their socio-economic condition for preparing appropriate sports
developmental policy.
“Socioeconomic status is the social standing or class of an individual or group. It is often
measured as a combination of education, income and occupation”(APA’s Socioeconomic Status
Office publications, 2017). The Women of Bangladesh are rapidly coming in interaction of
social and economic factors. Movement of women is increasing in all aspects of national
development and sports are not an exception. Bangladesh Women’s national age group teams
like 14, 16 and 17 performance brought hope for the Bangladeshi football lovers and even girls
have subsided the men football team. Inter-University Sports Board (IUSB), Bangladesh
organized University Games / Sports giving equal importance to girls competitions. No research
conducted on socio-economic status of sports girls in Bangladesh in particular on University
women players. Thus, researcher has taken initiative to revel the socio-economic status of
University women players of Bangladesh by this study.
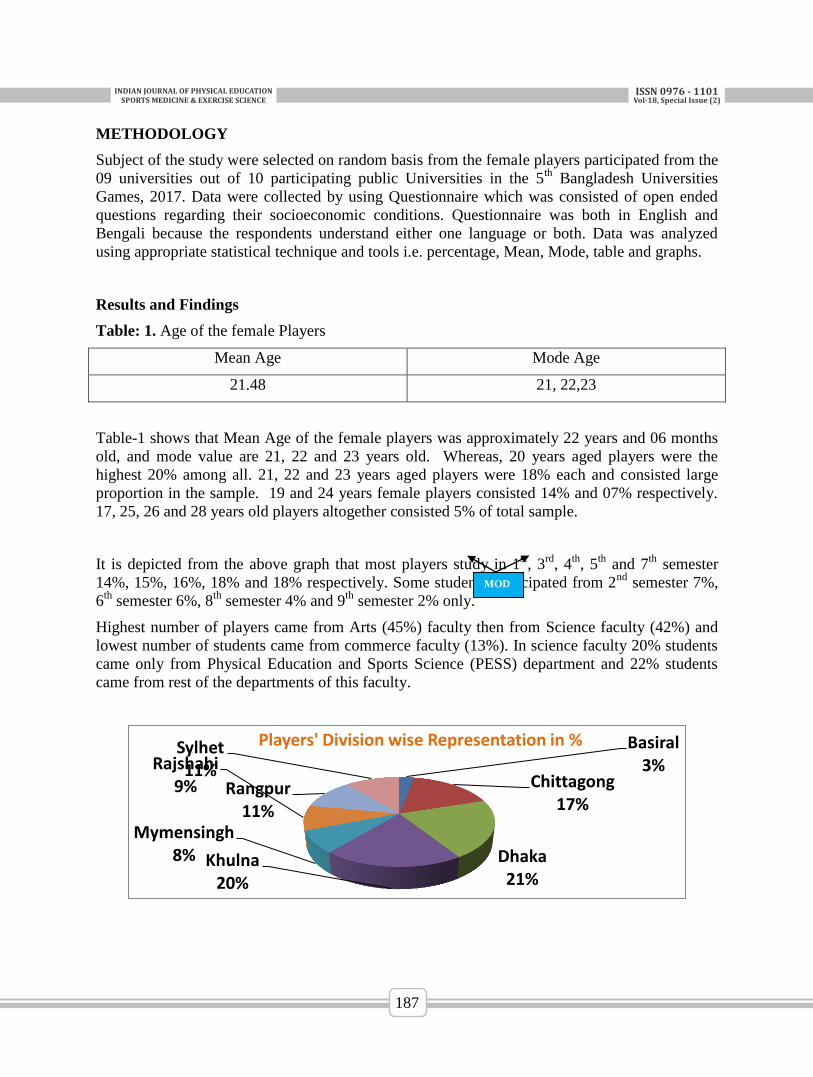
INDIANJOURNALOFPHYSICALEDUCATIONSPORTSMEDICINE&EXERCISESCIENCE
ISSN0976-1101Vol-18,SpecialIssue(2)
187
METHODOLOGY
Subject of the study were selected on random basis from the female players participated from the
09 universities out of 10 participating public Universities in the 5th
Bangladesh Universities
Games, 2017. Data were collected by using Questionnaire which was consisted of open ended
questions regarding their socioeconomic conditions. Questionnaire was both in English and
Bengali because the respondents understand either one language or both. Data was analyzed
using appropriate statistical technique and tools i.e. percentage, Mean, Mode, table and graphs.
Results and Findings
Table: 1. Age of the female Players
Mean Age Mode Age
21.48 21, 22,23
Table-1 shows that Mean Age of the female players was approximately 22 years and 06 months
old, and mode value are 21, 22 and 23 years old. Whereas, 20 years aged players were the
highest 20% among all. 21, 22 and 23 years aged players were 18% each and consisted large
proportion in the sample. 19 and 24 years female players consisted 14% and 07% respectively.
17, 25, 26 and 28 years old players altogether consisted 5% of total sample.
It is depicted from the above graph that most players study in 1st, 3
rd, 4
th, 5
th and 7
th semester
14%, 15%, 16%, 18% and 18% respectively. Some students participated from 2nd
semester 7%,
6th
semester 6%, 8th
semester 4% and 9th
semester 2% only.
Highest number of players came from Arts (45%) faculty then from Science faculty (42%) and
lowest number of students came from commerce faculty (13%). In science faculty 20% students
came only from Physical Education and Sports Science (PESS) department and 22% students
came from rest of the departments of this faculty.
Basiral 3%
Chittagong 17%
Dhaka 21%
Khulna 20%
Mymensingh 8%
Rajshahi 9% Rangpur
11%
Sylhet 11%
Players' Division wise Representation in %
MOD
E
INDIANJOURNALOFPHYSICALEDUCATIONSPORTSMEDICINE&EXERCISESCIENCE
ISSN0976-1101Vol-18,SpecialIssue(2)
188
DISCUSSION OF FINDINGS
Sportswomen were participated in the 5th
university games, Bangladesh in March-April 2017
with a Mean age of 22 and half years of age and most of them were between 21-23 years of age.
Mainly players were from 1st, 3
rd, 4th, 5
th, and 7
th semesters but no one have been found from the
master final semester (10th
Semester). Female players came to sports and games mainly being
self-motivated, a few came to keep uplift the family tradition and a very few players came to
sports being motivated by university sports quota for the admission, to make money and other
motivational factors.
Most of the female players do not face any obstacle form the family to take part in sports actively
but some of the players also face some shot of obstacles. 4/5th
of the female players believe that
there is an equal environment for the female players in the university sports arena but on the
other hand 1/5th
of the students seems that they are not enjoying equal opportunities as their
counterparts.
One third of the players’ father profession is Business, just little more than one fifth subjects’
father make their livelihood by government services, professions like Farmer, Teacher and
Private Employment all together consisted 1/3rd
of the total subjects’ father occupation. World
Bank (2016), half of the workforce of Bangladesh makes their living from Agriculture. But
unfortunately, in this study 11% farmers’ girls only could manage to come in university sports.
Female players of the Universities have given some suggestion to uplift the sports and games of
the Universities of Bangladesh are i. Long-term regular training, ii. Strong inspiration and
motivation is needed from the University, iii. University should increase and improve spots
facilities as well as to increase availability of equipment, iv. Equal opportunity for both the
genders, v. Teachers’ support for sports, vi. Financial incentive / support / scholarship from the
university, vii. Mentality of society should be widen and increased social values, viii.
Availability of competent Coach, ix. Strengthening social safety and security.
CONCLUSION
Mostly players’ age between 21-23 years old girls plays for the university and they are mainly
bachelor student. One player mostly plays only one game/sport for the university. Self
motivation was found prime driving factor for the girls to come in sports, and some girls also
come in sports and games to keep maintain family tradition. Except a few players most of the
sportswomen do not face any obstacle from their family.
REFERENCES:
CPD (2014) ‘Press Reports on How much Women Contribute to the Bangladesh Economy |
CPD’, Centre for Policy Dialogue (CPD), 26 October. Available at: http://cpd.org.bd/press-
reports-how-women-contribute-bangladesh-economy-centre-for-policy-dialogue-cpd/
(Accessed: 14 September 2017).
‘Female Secondary School Assistance Project: Bangladesh - 14828_Bangladesh-web.pdf’
(no date). Available at: http://siteresources.worldbank.org INTEMPOWERMENT/
Resources/14828_Bangladesh-web.pdf (Accessed: 14 September 2017).
INDIANJOURNALOFPHYSICALEDUCATIONSPORTSMEDICINE&EXERCISESCIENCE
ISSN0976-1101Vol-18,SpecialIssue(2)
189
Head, S. K. et al. (2015) ‘Customary and contemporary resources for women’s
empowerment in Bangladesh’, Development in Practice, 25(3), p. 360.
Hussain, Z. (2012) The Numbers Behind Bangladesh’s Goal of Middle Income Status by
2021, End Poverty in South Asia. Available at:
http://blogs.worldbank.org/endpovertyinsouthasia/numbers-behind-
bangladesh%E2%80%99s-goal-middle-income-status-2021 (Accessed: 9 October 2017).
Mondal (2017) ‘Study: 10% rise in women workforce to raise Bangladesh GDP by 1%’,
Dhaka Tribune, 8 March. Available at:
http://www.dhakatribune.com/business/2017/03/08/study-10-rise-women-workforce-raise-
bangladesh-gdp-1/ (Accessed: 14 September 2017).
Rahman, A. (2016) SA Games: Mahfuza wins 3rd gold for Bangladesh, The Daily Star.
Available at: http://www.thedailystar.net/sports/sa-games-mahfuza-wins-3rd-gold-
bangladesh-214381 (Accessed: 14 September 2017).
Roy, B. (2010) Golden girls shoot to glory, The Daily Star. Available at:
http://www.thedailystar.net/news-detail-124680 (Accessed: 14 September 2017).
Roy, I. (2016) ‘The Socio-Economic Contribution of Women Entrepreneurs in Bangladesh’,
Global Journal of Management And Business Research. Available at:
https://journalofbusiness.org/index.php/GJMBR/article/view/2018 (Accessed: 14 September
2017).
Schurmann, A. T. (2009) ‘Review of the Bangladesh Female Secondary School Stipend
Project Using a Social Exclusion Framework’, Journal of Health, Population, and Nutrition,
27(4), pp. 505–517.
World Bank (2016) Bangladesh: Growing the Economy through Advances in Agriculture,
World Bank. Available at: http://www.worldbank.org/en/results/2016/10/07/bangladesh-
growing-economy-through-advances-in-agriculture (Accessed: 9 October 2017).
INDIANJOURNALOFPHYSICALEDUCATIONSPORTSMEDICINE&EXERCISESCIENCE
ISSN0976-1101Vol-18,SpecialIssue(2)
190
BIOMECHANICAL COMPARISON OF OPEN AND CLOSED
STANCE BACKHAND STROKES AMONG UNIVERSITY
TENNIS PLAYERS
Amit Kumar*& Dr. Madan Singh Rathore**
*Ph.D. Scholar, LNIPE, Gwalior
** Asst. Prof. LNIPE, Gwalior
ABSTRACT
The purpose is to study Biomechanical comparison of open and closed stance backhand strokes
among university Tennis Players. Five male tennis players were selected from the players
studying in LNIPE Gwalior for the study. Their skills were captured using Nikon D- 3100, a
motor driven camera, with the frequency of 24 frames per second. 8 reflective markers attached
to anatomic landmarks for two-handed backhand drive data collection. The data was analyzed
by paired sample t- test ascertains the comparison of the selected kinematic variables at
moment of contact in open stance and closed stance backhand drive in Tennis. In case of
selected kinematic variables, the linear kinematic variables, right knee angle of closed and
open stance, left knee angle of closed and open stance has exhibited significant difference
between the open stance and closed stance backhand strokes.
Keywords: - Backhand drive, open stance, closed stance.
Introduction
Tennis is a sport that can be played individually against a single opponent (singles) or between
two teams of two players each (doubles). Each player uses a racquet that is strung with cord to
strike a hollow rubber ball covered with felt over or around a net and into the opponent's court.
For right-handed players, the backhand is a stroke that begins on the left side of their body,
continues across their body as contact is made with the ball, and ends on the right side of their
body. The double handed backhand can be one of the most complex tennis strokes. There are
many key phases in the stroke which make the stroke one of the hardest to master. The
game of tennis has evolved into a power game and less finesse as it was in the past. The Open
Stance is very popular among tennis right now. To perform this correctly, you must coil and turn
your upper body while keeping your lower body facing the net. This coil that you’ve just created,
between your upper and lower body, is creating torque that you’ll be using as an additional form
of energy. In the closed stance, your feet should be creating almost a 90 degree angle with the
baseline. If you are standing at the centre of the court, you will have to move your left foot
slightly forward to assist you in hitting the ball.
METHODOLOGY
Five male tennis players of LNIPE, Gwalior from the Tennis match practice group were
selected for the present study. Therefore it was considered that subjects posses reasonable
level of technique of backhand drive. Their age ranged between 20 to 24 years. For the
kinematic analysis of backhand drive following kinematic variables were selected:
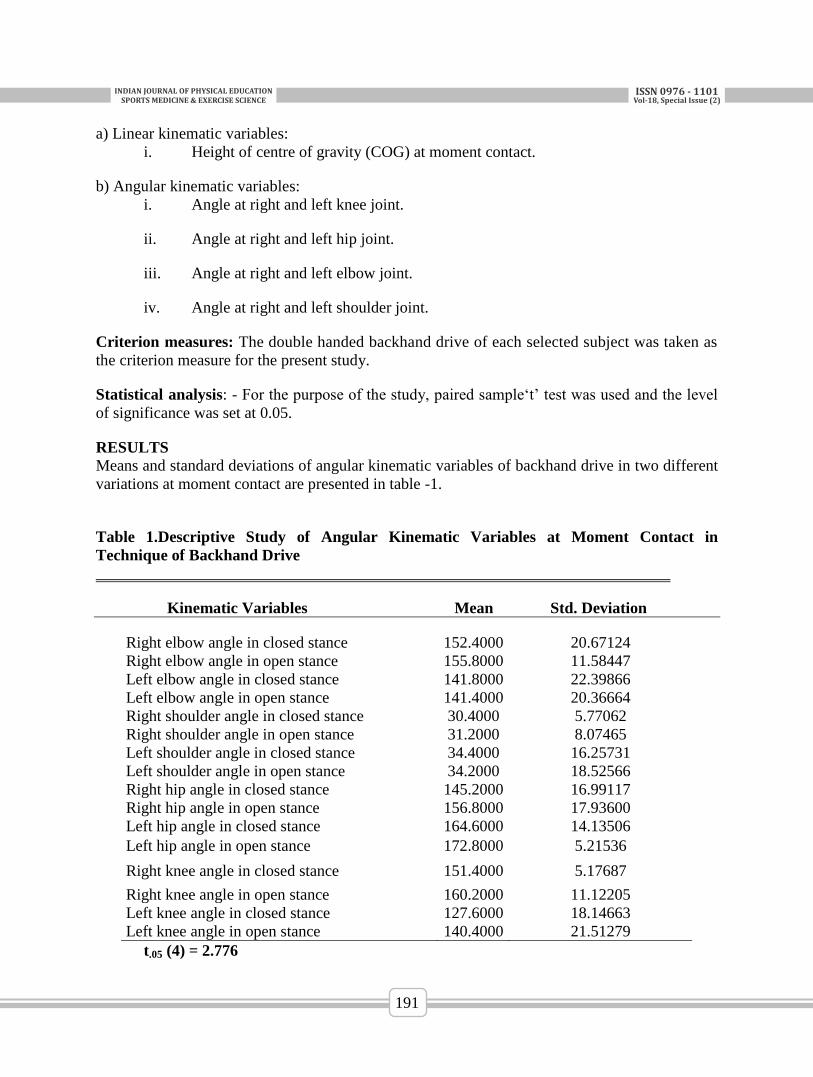
INDIANJOURNALOFPHYSICALEDUCATIONSPORTSMEDICINE&EXERCISESCIENCE
ISSN0976-1101Vol-18,SpecialIssue(2)
191
a) Linear kinematic variables:
i. Height of centre of gravity (COG) at moment contact.
b) Angular kinematic variables:
i. Angle at right and left knee joint.
ii. Angle at right and left hip joint.
iii. Angle at right and left elbow joint.
iv. Angle at right and left shoulder joint.
Criterion measures: The double handed backhand drive of each selected subject was taken as
the criterion measure for the present study.
Statistical analysis: - For the purpose of the study, paired sample‘t’ test was used and the level
of significance was set at 0.05.
RESULTS
Means and standard deviations of angular kinematic variables of backhand drive in two different
variations at moment contact are presented in table -1.
Table 1.Descriptive Study of Angular Kinematic Variables at Moment Contact in
Technique of Backhand Drive
Kinematic Variables Mean Std. Deviation
Right elbow angle in closed stance 152.4000 20.67124
Right elbow angle in open stance 155.8000 11.58447
Left elbow angle in closed stance 141.8000 22.39866
Left elbow angle in open stance 141.4000 20.36664
Right shoulder angle in closed stance 30.4000 5.77062
Right shoulder angle in open stance 31.2000 8.07465
Left shoulder angle in closed stance 34.4000 16.25731
Left shoulder angle in open stance 34.2000 18.52566
Right hip angle in closed stance 145.2000 16.99117
Right hip angle in open stance 156.8000 17.93600
Left hip angle in closed stance 164.6000 14.13506
Left hip angle in open stance 172.8000 5.21536
Right knee angle in closed stance 151.4000 5.17687
Right knee angle in open stance 160.2000 11.12205
Left knee angle in closed stance 127.6000 18.14663
Left knee angle in open stance 140.4000 21.51279
t.05 (4) = 2.776
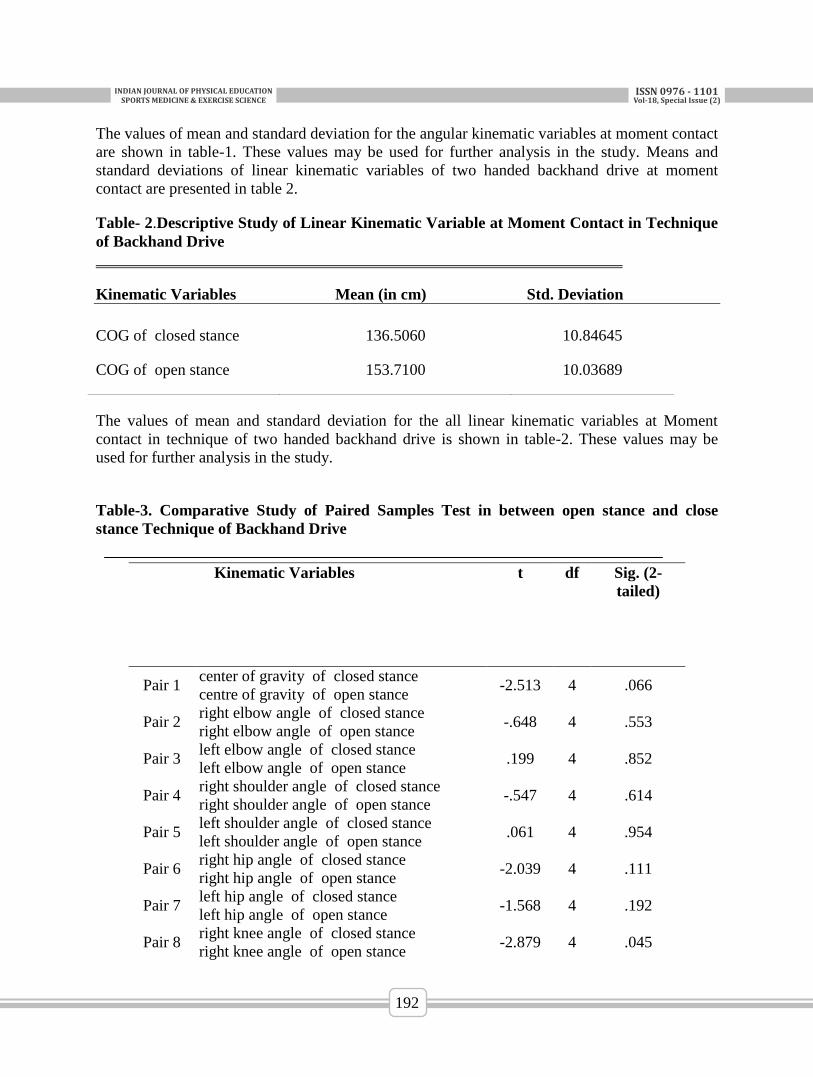
INDIANJOURNALOFPHYSICALEDUCATIONSPORTSMEDICINE&EXERCISESCIENCE
ISSN0976-1101Vol-18,SpecialIssue(2)
192
The values of mean and standard deviation for the angular kinematic variables at moment contact
are shown in table-1. These values may be used for further analysis in the study. Means and
standard deviations of linear kinematic variables of two handed backhand drive at moment
contact are presented in table 2.
Table- 2.Descriptive Study of Linear Kinematic Variable at Moment Contact in Technique
of Backhand Drive
Kinematic Variables Mean (in cm) Std. Deviation
The values of mean and standard deviation for the all linear kinematic variables at Moment
contact in technique of two handed backhand drive is shown in table-2. These values may be
used for further analysis in the study.
Table-3. Comparative Study of Paired Samples Test in between open stance and close
stance Technique of Backhand Drive
COG of closed stance 136.5060 10.84645
COG of open stance 153.7100 10.03689
Kinematic Variables t df Sig. (2-
tailed)
Pair 1 center of gravity of closed stance
centre of gravity of open stance -2.513 4 .066
Pair 2 right elbow angle of closed stance
right elbow angle of open stance -.648 4 .553
Pair 3 left elbow angle of closed stance
left elbow angle of open stance .199 4 .852
Pair 4 right shoulder angle of closed stance
right shoulder angle of open stance -.547 4 .614
Pair 5 left shoulder angle of closed stance
left shoulder angle of open stance .061 4 .954
Pair 6 right hip angle of closed stance
right hip angle of open stance -2.039 4 .111
Pair 7 left hip angle of closed stance
left hip angle of open stance -1.568 4 .192
Pair 8 right knee angle of closed stance
right knee angle of open stance -2.879 4 .045
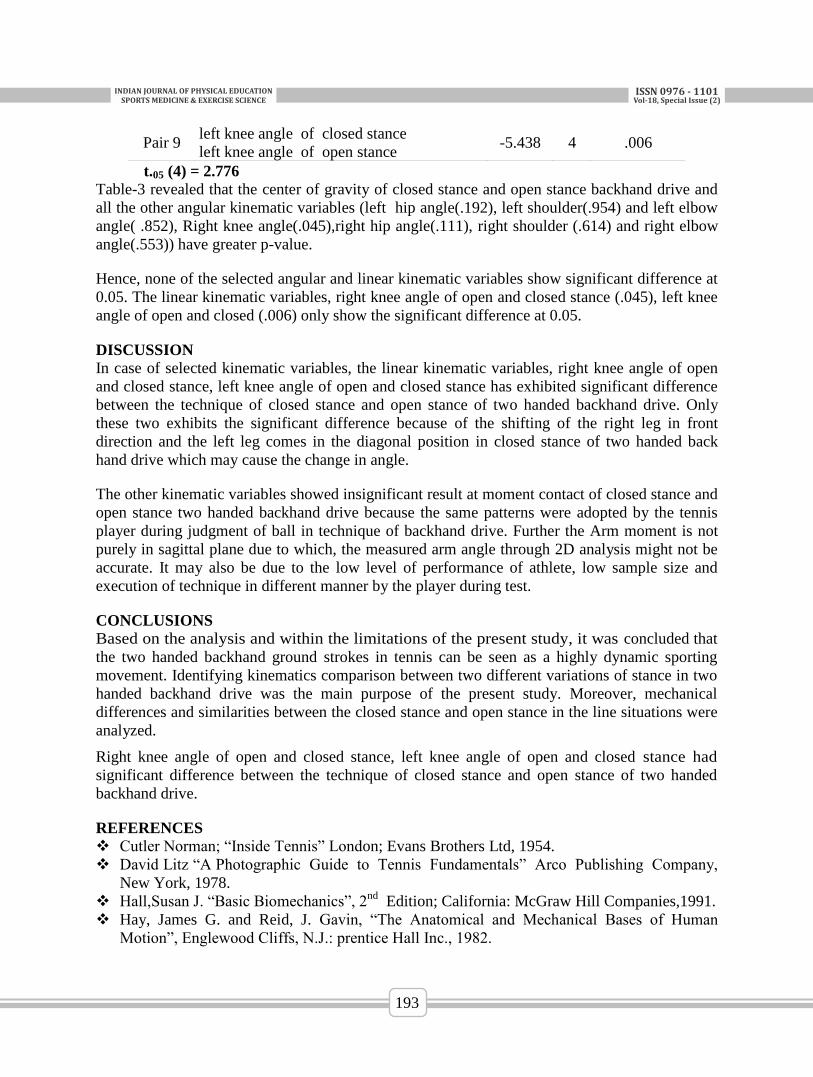
INDIANJOURNALOFPHYSICALEDUCATIONSPORTSMEDICINE&EXERCISESCIENCE
ISSN0976-1101Vol-18,SpecialIssue(2)
193
t.05 (4) = 2.776 Table-3 revealed that the center of gravity of closed stance and open stance backhand drive and
all the other angular kinematic variables (left hip angle(.192), left shoulder(.954) and left elbow
angle( .852), Right knee angle(.045),right hip angle(.111), right shoulder (.614) and right elbow
angle(.553)) have greater p-value.
Hence, none of the selected angular and linear kinematic variables show significant difference at
0.05. The linear kinematic variables, right knee angle of open and closed stance (.045), left knee
angle of open and closed (.006) only show the significant difference at 0.05.
DISCUSSION
In case of selected kinematic variables, the linear kinematic variables, right knee angle of open
and closed stance, left knee angle of open and closed stance has exhibited significant difference
between the technique of closed stance and open stance of two handed backhand drive. Only
these two exhibits the significant difference because of the shifting of the right leg in front
direction and the left leg comes in the diagonal position in closed stance of two handed back
hand drive which may cause the change in angle.
The other kinematic variables showed insignificant result at moment contact of closed stance and
open stance two handed backhand drive because the same patterns were adopted by the tennis
player during judgment of ball in technique of backhand drive. Further the Arm moment is not
purely in sagittal plane due to which, the measured arm angle through 2D analysis might not be
accurate. It may also be due to the low level of performance of athlete, low sample size and
execution of technique in different manner by the player during test.
CONCLUSIONS
Based on the analysis and within the limitations of the present study, it was concluded that
the two handed backhand ground strokes in tennis can be seen as a highly dynamic sporting
movement. Identifying kinematics comparison between two different variations of stance in two
handed backhand drive was the main purpose of the present study. Moreover, mechanical
differences and similarities between the closed stance and open stance in the line situations were
analyzed.
Right knee angle of open and closed stance, left knee angle of open and closed stance had
significant difference between the technique of closed stance and open stance of two handed
backhand drive.
REFERENCES
Cutler Norman; “Inside Tennis” London; Evans Brothers Ltd, 1954.
David Litz “A Photographic Guide to Tennis Fundamentals” Arco Publishing Company,
New York, 1978.
Hall,Susan J. “Basic Biomechanics”, 2nd
Edition; California: McGraw Hill Companies,1991.
Hay, James G. and Reid, J. Gavin, “The Anatomical and Mechanical Bases of Human
Motion”, Englewood Cliffs, N.J.: prentice Hall Inc., 1982.
Pair 9 left knee angle of closed stance
left knee angle of open stance -5.438 4 .006
INDIANJOURNALOFPHYSICALEDUCATIONSPORTSMEDICINE&EXERCISESCIENCE
ISSN0976-1101Vol-18,SpecialIssue(2)
194
PROTECTIVE SPORTS MOUTH GUARDS AND FEATURES OF
ORAL DENTAL PATHOLOGY IN SPORTS
1Ajay Kumar,
M.P.Ed Scholar, LNIPE, Gwalior (M.P.) 2Dr. Birendra Jhajharia,
Assistant Professor, LNIPE, Gwalior (M.P.)
ABSTRACT Blood supply to the head is abundant so that any injury to the face or mouth bleeds profusely. In
the case of dental/mouth injuries blood mixing with saliva increases the risk of blood-borne
infection. Dental trauma refers injury to the teeth and/or periodontium (gums, periodontal
ligament, alveolar bone), and nearby soft tissues such as the lips, tongue, etc. Athletes wear a
protective device (i.e. mouth guard) for the mouth that covers the teeth and gums to prevent and
reduce injury to the teeth, arches, lips and gums. It is most often used in contact sports like
Boxing, Wrestling, and Basketball etc. There are numerous types of mouth guards available in
market or sports store but in India use of mouth guard is little less in comparison to other
developed sports playing nation. We surveyed 100 athletes from different sports in Lakshmibai
National Institute of Physical Education, Gwalior concerning their opinions and use of mouth
guards. More than half of the athletes were aware of the existence of mouth guard mostly & they
are informed by the teammates & advertisement but they don’t use mouth guard in daily sports
practice because they find it of no use or missing regular adaptive use of mouth guard.
Key Words: Dental Trauma, Periodontium, Mouth guard.
INTRODUCTION
A mouth guard is a protective device for the mouth that covers the teeth and gums to prevent and
reduce injury to the teeth, arches, lips and gums. About 10% of sports accidents involve injuries
to the head, including oral injuries. In 25% of cases, tooth injury may progress to pulp necrosis
or severe pain3. A mouth guard is most often used to prevent injury in contact sports, as a
treatment for bruxism , or as part of certain dental procedures, such as tooth bleaching in many
sports including baseball, boxing, mixed martial arts, rugby, wrestling Australian
football, basketball, figure skating, ice hockey, field hockey, water polo, skiing,
and snowboarding. They prevent dental injuries, including dislocation, fracture, and tooth loss,
by reducing the impact force in the jaw. Because about 80% of dental injuries occur to the
central incisors of the upper jaw6-8
, authors have suggested the use of a maxillary mouthguard to
protect against orofacial trauma 10-12
. Moreover, even with regular use, effectiveness in
prevention on dental trauma is not complete, and injuries can still occur even when mouth guards
are used as users are not always aware of the best makes or size, which inevitably result in a poor
fit. In many cases, it is the result of advertising, which affects whether an athlete will purchase an
established protector.14
TYPES OF MOUTH GUARD
1. Stock or readymade: Manufactured in a pre-formed shape in various sizes but with nearly no
adjustment to fit the user's mouth
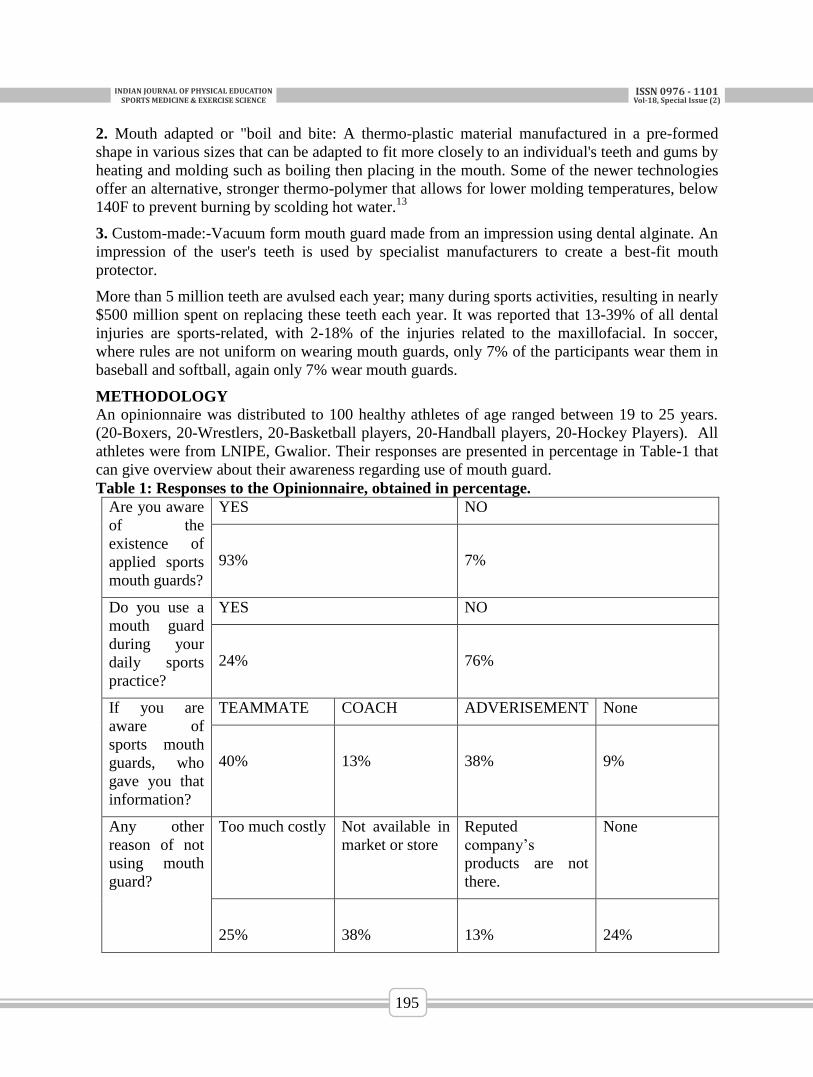
INDIANJOURNALOFPHYSICALEDUCATIONSPORTSMEDICINE&EXERCISESCIENCE
ISSN0976-1101Vol-18,SpecialIssue(2)
195
2. Mouth adapted or "boil and bite: A thermo-plastic material manufactured in a pre-formed
shape in various sizes that can be adapted to fit more closely to an individual's teeth and gums by
heating and molding such as boiling then placing in the mouth. Some of the newer technologies
offer an alternative, stronger thermo-polymer that allows for lower molding temperatures, below
140F to prevent burning by scolding hot water.13
3. Custom-made:-Vacuum form mouth guard made from an impression using dental alginate. An
impression of the user's teeth is used by specialist manufacturers to create a best-fit mouth
protector.
More than 5 million teeth are avulsed each year; many during sports activities, resulting in nearly
$500 million spent on replacing these teeth each year. It was reported that 13-39% of all dental
injuries are sports-related, with 2-18% of the injuries related to the maxillofacial. In soccer,
where rules are not uniform on wearing mouth guards, only 7% of the participants wear them in
baseball and softball, again only 7% wear mouth guards.
METHODOLOGY
An opinionnaire was distributed to 100 healthy athletes of age ranged between 19 to 25 years.
(20-Boxers, 20-Wrestlers, 20-Basketball players, 20-Handball players, 20-Hockey Players). All
athletes were from LNIPE, Gwalior. Their responses are presented in percentage in Table-1 that
can give overview about their awareness regarding use of mouth guard.
Table 1: Responses to the Opinionnaire, obtained in percentage.
Are you aware
of the
existence of
applied sports
mouth guards?
YES NO
93%
7%
Do you use a
mouth guard
during your
daily sports
practice?
YES NO
24%
76%
If you are
aware of
sports mouth
guards, who
gave you that
information?
TEAMMATE COACH ADVERISEMENT None
40%
13%
38%
9%
Any other
reason of not
using mouth
guard?
Too much costly Not available in
market or store
Reputed
company’s
products are not
there.
None
25%
38%
13%
24%
INDIANJOURNALOFPHYSICALEDUCATIONSPORTSMEDICINE&EXERCISESCIENCE
ISSN0976-1101Vol-18,SpecialIssue(2)
196
Results
On the basis of the evaluation of data following results have been made i.e. (93%) of the total
population was aware of the existence of applied sports mouth guards where (7%) were having
no information regarding mouth guard existence. Only (24%) of the population was using mouth
guard on regular basis during their sports practice where (76%) of population doesn’t use mouth
guard. Information regarding mouth guard was commonly obtained from teammates (40%) &
advertisement (38%). Information through coaches was (13%) & (9%) had information through
other sources. The frequent answer for not using mouth guard was lack of availability of mouth
guard in near sports store (38%) & (25%) said it was too costly for them to buy it. (13%) subjects
doesn’t find reputed company products in market & (24%) doesn’t have some specific reason.
DISCUSSION OF FINDINGS
The purposes of this study were to understand the knowledge held by athletes in Lakshmibai
National Institute of Physical Education, Gwalior about mouth guards, and the factors that
influence their choice and use of a mouth guard. We surveyed 100 athletes from different sports
In LNIPE, Gwalior concerning their opinions and use of mouth guards. More than half (93%) of
the samples were aware of the existence of mouth guard mostly they are informed by the
teammates (40%) & advertisement (38%) but they don’t use mouth guard in daily sports practice
because they find it of no use or missing regular adaptive use of mouth guard as many athletes
are comfortable with a mouthguard with regard to speech, phonetics, and retention, then the
athlete will not likely use the mouthguard. More marketing and reputed companies should come
forward with their products as many athletes don’t find mouthguard in near market.
CONCLUSIONS Athletes, teams, and health professionals should receive training and comprehensive educational
materials on oral protective devices, to improve the understanding and use of protective mouth
guards. Coaches & manager should emphasis on use of mouth guard for their players as any
injury would affect the performance during competition. Future studies should focus on
encouraging the use of fully customized mouth guards, to increase both protection and sports
performance.
REFERENCES
Connie M. Kracher , Knowlton Rick Sports-Related Dental Injuries and Sports Dentistry
Retrieved from:- (https://www.dentalcare.com/en-us/professional-education/ce-
courses/ce127/statistics)
Soporowski NJ, Tesini DA, Weiss AI (1994) Survey of orofacial sportsrelated injuries. J
Mass Dent Soc 43: 16-20.
Tulunoglu I, Özbek M (2006) Oral trauma, mouthguard awareness, and use in two contact
sports in Turkey. Dent Traumatol 22: 242-246.
Enrique A, Meléndez MR, Rodríguez E (1996) La salud oral en el deporte. Capitulo Noveno.
San Juan.
Takeda T, Ishigami K, Ogawa T, Nakajima K, Shibusawa M, et al. (2004) Are all
mouthguards the same and safe to use? The influence of occlusal supporting mouthguards in
decreasing bone distortion and fractures. Dent Traumatol 20: 305-306.
INDIANJOURNALOFPHYSICALEDUCATIONSPORTSMEDICINE&EXERCISESCIENCE
ISSN0976-1101Vol-18,SpecialIssue(2)
197
SURVEY OF SPORTS INFRASTRUCTURE IN COLLEGES OF
MADHYA PRADESH
Jyoti Gurjar
Sports Coach, K.V.No.3, Gwalior (M.P)
ABSTRACT
‘Infra-structure facilities’ are the basic need to make the programme successful. Facilities
include ground, equipment, gymnasium hall, swimming pool etc. The achievement of the
programme depends upon the facilities available. Types of facilities are bound to change from
place to place. Therefore, the purpose of this study was to survey the availability of sports
infrastructure in colleges of Madhya Pradesh state of India. The data was collected through a
carefully compiled Questionnaire, supplemented visits and interviews. The data was received
from 34 out of 76 Private (Govt.Aided) and 93 out of 387 Government Colleges, but 26 Private
and 80 Government colleges have replied correctly and these were considered as sample for the
present study. The responses obtained from them were converted into simple percentage (%) for
the purpose of analyses and interpretation of data. The major results revealed that most of the
colleges were not having adequate facilities and equipments for various games. The facilities for
gymnastics and swimming were not found in any of the colleges of Madhya Pradesh state.
Key Words: Infra-structure facilities, gymnasium hall, equipment.
INTRODUCTION
Infrastructure-facilities are the prime focus in physical education programmes, for the
reconstruction of the budding sportsman. Facilities like playgrounds, swimming pools,
gymnasium, play fields etc are essential. For classroom teaching programme separate classroom,
classroom furniture, libraries, laboratories and halls are needed. Facilities should be designed in
accordance with the need and strength of students. Adequate and sufficient facilities and
equipment must be provided and installed to meet the needs of intensive and safe participation in
both in college and out of college programmes concerning physical education and sports.
Hence keeping in mind the requirement of sports facilities, the present survey was done to find
out the availability of sports infrastructure in the colleges of Madhya Pradesh.
METHODOLOGY
Selection of subjects: Initially the researcher had sent the questionnaire to all the 76 Private
(Govt. Aided) and 387 Government colleges of Madhya Pradesh. However, 34 Private and 93
Government colleges had responded the Questionnaire through E-mailed, Regestered post and on
personal visits of scholar. From the above received responses 26 Private and 80 Government
colleges had responded correctly all the questions of questionnaire and hence were included in
the study.
Construction and Development of Questionnaire: For the construction of questionnaire the
researcher studied literatures, magazines, periodicals and completed research work in the area of
physical education and sports. The suggestions and consultations of experts in this area were
taken for framing questions in a logical manner and to get maximum worthwhile and meaningful
responses from the subjects.
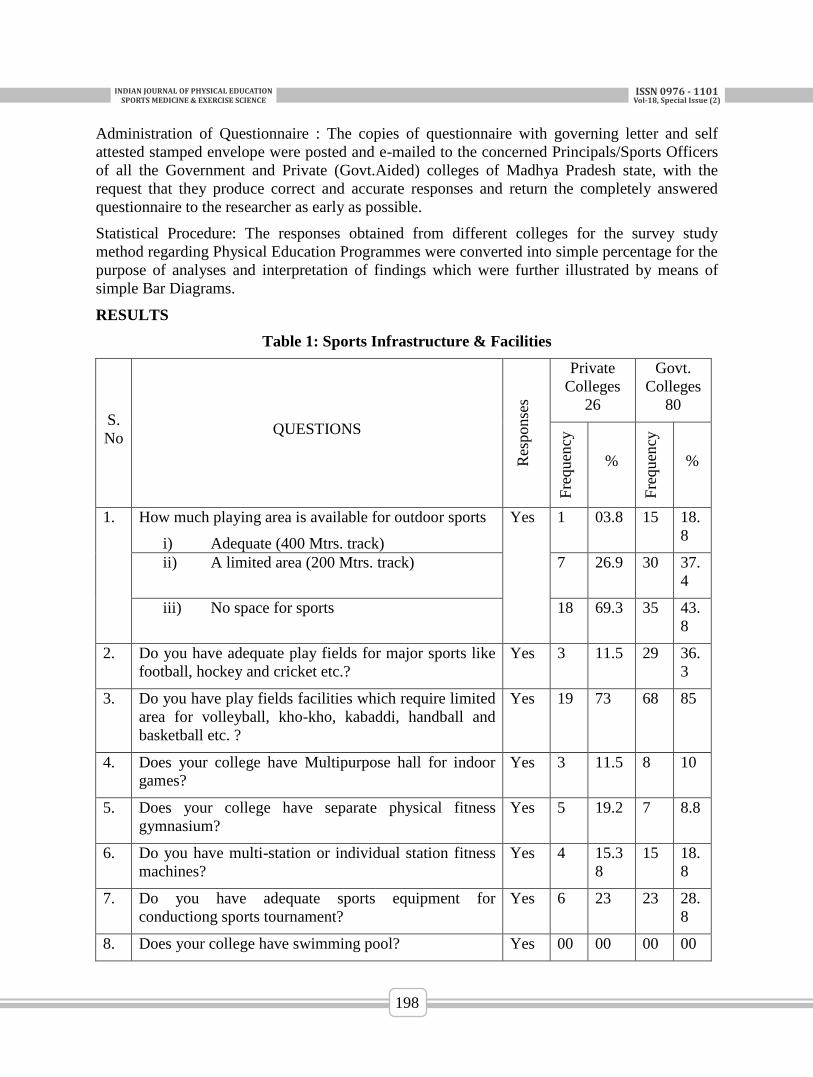
INDIANJOURNALOFPHYSICALEDUCATIONSPORTSMEDICINE&EXERCISESCIENCE
ISSN0976-1101Vol-18,SpecialIssue(2)
198
Administration of Questionnaire : The copies of questionnaire with governing letter and self
attested stamped envelope were posted and e-mailed to the concerned Principals/Sports Officers
of all the Government and Private (Govt.Aided) colleges of Madhya Pradesh state, with the
request that they produce correct and accurate responses and return the completely answered
questionnaire to the researcher as early as possible.
Statistical Procedure: The responses obtained from different colleges for the survey study
method regarding Physical Education Programmes were converted into simple percentage for the
purpose of analyses and interpretation of findings which were further illustrated by means of
simple Bar Diagrams.
RESULTS
Table 1: Sports Infrastructure & Facilities
S.
No QUESTIONS
Res
ponse
s
Private
Colleges
26
Govt.
Colleges
80
Fre
quen
cy
%
Fre
quen
cy
%
1. How much playing area is available for outdoor sports
i) Adequate (400 Mtrs. track)
Yes 1 03.8 15 18.
8
ii) A limited area (200 Mtrs. track) 7 26.9 30 37.
4
iii) No space for sports 18 69.3 35 43.
8
2. Do you have adequate play fields for major sports like
football, hockey and cricket etc.?
Yes 3 11.5 29 36.
3
3. Do you have play fields facilities which require limited
area for volleyball, kho-kho, kabaddi, handball and
basketball etc. ?
Yes 19 73 68 85
4. Does your college have Multipurpose hall for indoor
games?
Yes 3 11.5 8 10
5. Does your college have separate physical fitness
gymnasium?
Yes 5 19.2 7 8.8
6. Do you have multi-station or individual station fitness
machines?
Yes 4 15.3
8
15 18.
8
7. Do you have adequate sports equipment for
conductiong sports tournament?
Yes 6 23 23 28.
8
8. Does your college have swimming pool? Yes 00 00 00 00
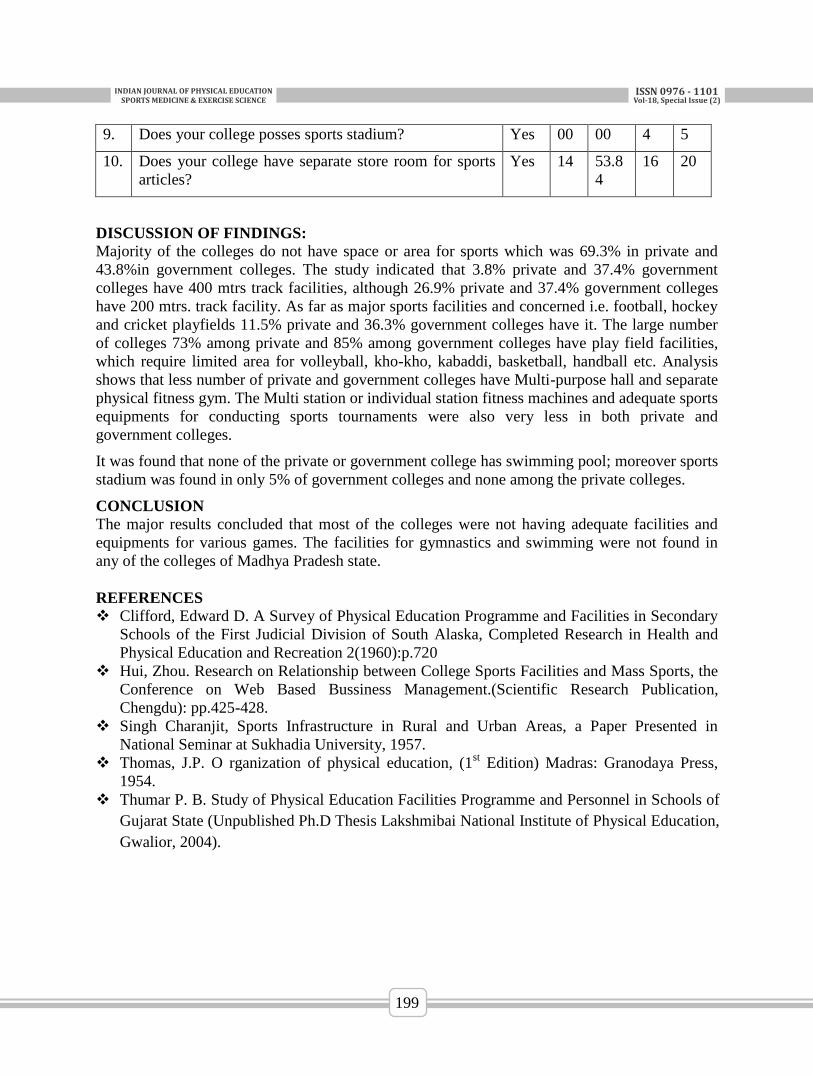
INDIANJOURNALOFPHYSICALEDUCATIONSPORTSMEDICINE&EXERCISESCIENCE
ISSN0976-1101Vol-18,SpecialIssue(2)
199
9. Does your college posses sports stadium? Yes 00 00 4 5
10. Does your college have separate store room for sports
articles?
Yes 14 53.8
4
16 20
DISCUSSION OF FINDINGS:
Majority of the colleges do not have space or area for sports which was 69.3% in private and
43.8%in government colleges. The study indicated that 3.8% private and 37.4% government
colleges have 400 mtrs track facilities, although 26.9% private and 37.4% government colleges
have 200 mtrs. track facility. As far as major sports facilities and concerned i.e. football, hockey
and cricket playfields 11.5% private and 36.3% government colleges have it. The large number
of colleges 73% among private and 85% among government colleges have play field facilities,
which require limited area for volleyball, kho-kho, kabaddi, basketball, handball etc. Analysis
shows that less number of private and government colleges have Multi-purpose hall and separate
physical fitness gym. The Multi station or individual station fitness machines and adequate sports
equipments for conducting sports tournaments were also very less in both private and
government colleges.
It was found that none of the private or government college has swimming pool; moreover sports
stadium was found in only 5% of government colleges and none among the private colleges.
CONCLUSION
The major results concluded that most of the colleges were not having adequate facilities and
equipments for various games. The facilities for gymnastics and swimming were not found in
any of the colleges of Madhya Pradesh state.
REFERENCES
Clifford, Edward D. A Survey of Physical Education Programme and Facilities in Secondary
Schools of the First Judicial Division of South Alaska, Completed Research in Health and
Physical Education and Recreation 2(1960):p.720
Hui, Zhou. Research on Relationship between College Sports Facilities and Mass Sports, the
Conference on Web Based Bussiness Management.(Scientific Research Publication,
Chengdu): pp.425-428.
Singh Charanjit, Sports Infrastructure in Rural and Urban Areas, a Paper Presented in
National Seminar at Sukhadia University, 1957.
Thomas, J.P. O rganization of physical education, (1st Edition) Madras: Granodaya Press,
1954.
Thumar P. B. Study of Physical Education Facilities Programme and Personnel in Schools of
Gujarat State (Unpublished Ph.D Thesis Lakshmibai National Institute of Physical Education,
Gwalior, 2004).
INDIANJOURNALOFPHYSICALEDUCATIONSPORTSMEDICINE&EXERCISESCIENCE
ISSN0976-1101Vol-18,SpecialIssue(2)
200
HUMAN RESOURCE PLANNING IN CHALLENGING SPORTS
COMPETITIONS
Dr. Jayarajan David. D Assistant Director, University of Kerala
ABSTRACT
The present study refers to the human resource assistance made available from parents, personal
coaches, friends, sports organization mechanisms, team mates and mission staff, etc., affecting
the confidence, long term motivational perspective and bottom line results of the athletes in the
most challenging sports competitions. The objective of the study is to profile and highlight the
need for behavioral interventions in personal and formal support infrastructure among Indian
sportspersons belonging to different sports disciplines. It would help in providing possible
suggestions for the refinement of support infrastructure educational systems across various
sports disciplines including the national sports organizations.
Background
The elite sport context is characterized by the changing roles of parents, coaches, and peers in
athlete’s lives (Bloom, 1985; Ericsson et.al., 1993). Research targeting the unique and
interrelated roles of the coaches, parents, and peers (including teammates) on enhancing the
youth elite sport experience is warranted. One approach to understanding how the multiple social
influences affect young athletes and their sport experience is to better understand the social
support context from the lived experiences of the athletes themselves.
Nicholson and Gallant (2011) reports the findings of an exploratory study in to the perceptions
of social support held by elite indigenous athletes playing in the Australian Football League.
Indigenous athletes within the AFL appear to require more culturally relevant and specialized
support structures than non-Indigenous athletes. The study highlighted that the family and
community connections held by Indigenous athletes form an essential network of social support
that provides the foundation for indigenous participation and individual success.
METHODS AND MATERIALS
216 national level sportspersons belonging to badminton, football, volleyball, basketball,
swimming and track and field were selected for this study which consists of 126 male
sportspersons and 90 female sportspersons. All the sportspersons had been playing at the national
level and few in the international level during the last three years. The age of the subjects ranged
from 15 to 29 years. Support Infrastructure of the was assessed using the Multidimensional Scale
of Perceived Social Support (MSPSS) by Zimet, G.D., Dahlem, N.W., Zimet, S.G. & Farley,
G.K. (1988).
The MSPSS was designed to assess the perceived adequacy of social support from family,
friends, and significant others (Zimet, Dahlem, Zimet, & Farley, 1988). The instrument taps the
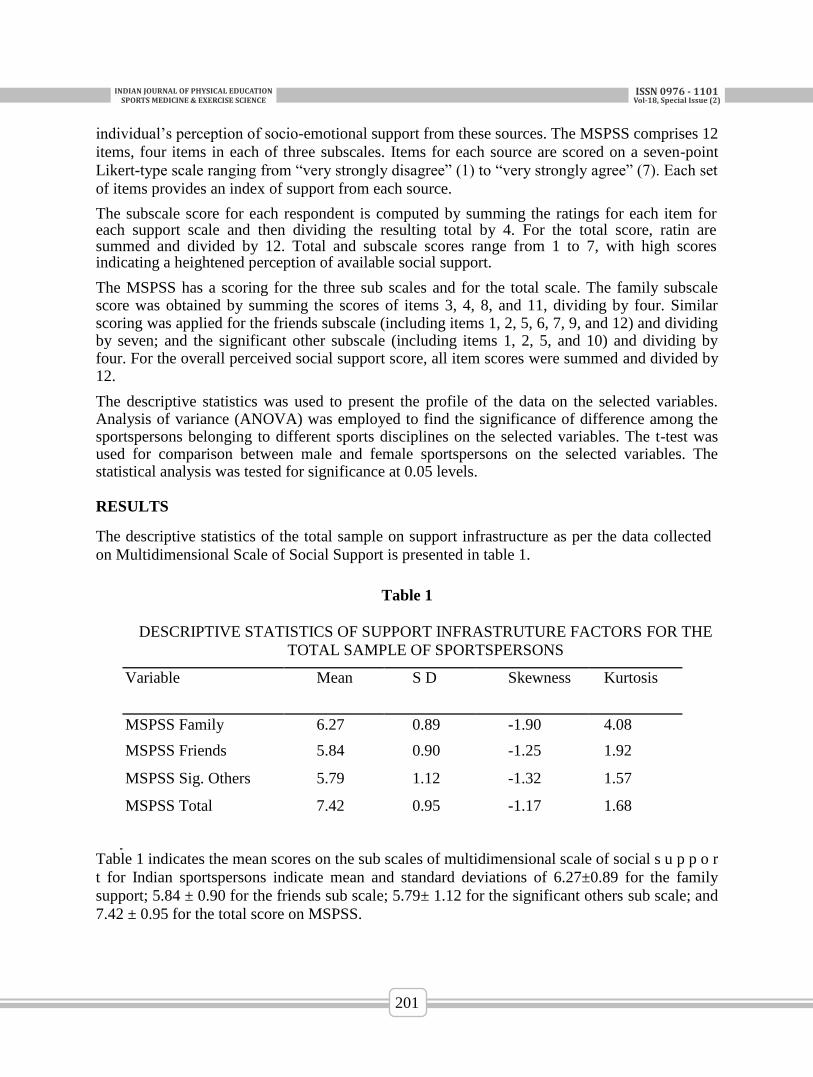
INDIANJOURNALOFPHYSICALEDUCATIONSPORTSMEDICINE&EXERCISESCIENCE
ISSN0976-1101Vol-18,SpecialIssue(2)
201
individual’s perception of socio-emotional support from these sources. The MSPSS comprises 12
items, four items in each of three subscales. Items for each source are scored on a seven-point
Likert-type scale ranging from “very strongly disagree” (1) to “very strongly agree” (7). Each set
of items provides an index of support from each source.
The subscale score for each respondent is computed by summing the ratings for each item for each support scale and then dividing the resulting total by 4. For the total score, ratin are summed and divided by 12. Total and subscale scores range from 1 to 7, with high scores indicating a heightened perception of available social support.
The MSPSS has a scoring for the three sub scales and for the total scale. The family subscale score was obtained by summing the scores of items 3, 4, 8, and 11, dividing by four. Similar scoring was applied for the friends subscale (including items 1, 2, 5, 6, 7, 9, and 12) and dividing by seven; and the significant other subscale (including items 1, 2, 5, and 10) and dividing by four. For the overall perceived social support score, all item scores were summed and divided by 12.
The descriptive statistics was used to present the profile of the data on the selected variables. Analysis of variance (ANOVA) was employed to find the significance of difference among the sportspersons belonging to different sports disciplines on the selected variables. The t-test was used for comparison between male and female sportspersons on the selected variables. The statistical analysis was tested for significance at 0.05 levels.
RESULTS
The descriptive statistics of the total sample on support infrastructure as per the data collected
on Multidimensional Scale of Social Support is presented in table 1.
Table 1
DESCRIPTIVE STATISTICS OF SUPPORT INFRASTRUTURE FACTORS FOR THE
TOTAL SAMPLE OF SPORTSPERSONS
Variable Mean S D Skewness Kurtosis
MSPSS Family 6.27 0.89 -1.90 4.08
MSPSS Friends 5.84 0.90 -1.25 1.92
MSPSS Sig. Others 5.79 1.12 -1.32 1.57
MSPSS Total 7.42 0.95 -1.17 1.68
Table 1 indicates the mean scores on the sub scales of multidimensional scale of social s u p p o r
t for Indian sportspersons indicate mean and standard deviations of 6.27±0.89 for the family
support; 5.84 ± 0.90 for the friends sub scale; 5.79± 1.12 for the significant others sub scale; and
7.42 ± 0.95 for the total score on MSPSS.
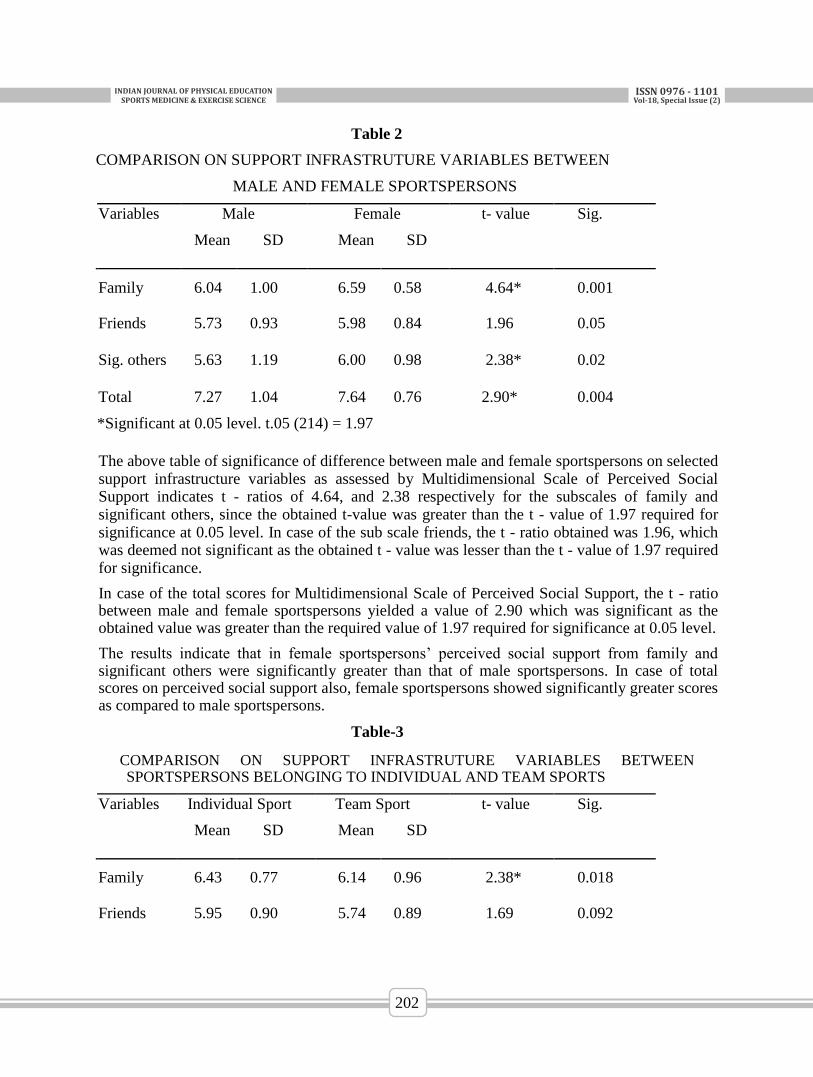
INDIANJOURNALOFPHYSICALEDUCATIONSPORTSMEDICINE&EXERCISESCIENCE
ISSN0976-1101Vol-18,SpecialIssue(2)
202
Table 2
COMPARISON ON SUPPORT INFRASTRUTURE VARIABLES BETWEEN
MALE AND FEMALE SPORTSPERSONS
Variables Male Female t- value Sig.
Mean SD Mean SD
Family 6.04 1.00 6.59 0.58 4.64* 0.001
Friends 5.73 0.93 5.98 0.84 1.96 0.05
Sig. others 5.63 1.19 6.00 0.98 2.38* 0.02
Total 7.27 1.04 7.64 0.76 2.90* 0.004
*Significant at 0.05 level. t.05 (214) = 1.97
The above table of significance of difference between male and female sportspersons on selected support infrastructure variables as assessed by Multidimensional Scale of Perceived Social Support indicates t - ratios of 4.64, and 2.38 respectively for the subscales of family and significant others, since the obtained t-value was greater than the t - value of 1.97 required for significance at 0.05 level. In case of the sub scale friends, the t - ratio obtained was 1.96, which was deemed not significant as the obtained t - value was lesser than the t - value of 1.97 required for significance.
In case of the total scores for Multidimensional Scale of Perceived Social Support, the t - ratio between male and female sportspersons yielded a value of 2.90 which was significant as the obtained value was greater than the required value of 1.97 required for significance at 0.05 level.
The results indicate that in female sportspersons’ perceived social support from family and significant others were significantly greater than that of male sportspersons. In case of total scores on perceived social support also, female sportspersons showed significantly greater scores as compared to male sportspersons.
Table-3
COMPARISON ON SUPPORT INFRASTRUTURE VARIABLES BETWEEN SPORTSPERSONS BELONGING TO INDIVIDUAL AND TEAM SPORTS
Variables Individual Sport Team Sport t- value Sig.
Mean SD Mean SD
Family 6.43 0.77 6.14 0.96 2.38* 0.018
Friends 5.95 0.90 5.74 0.89 1.69 0.092
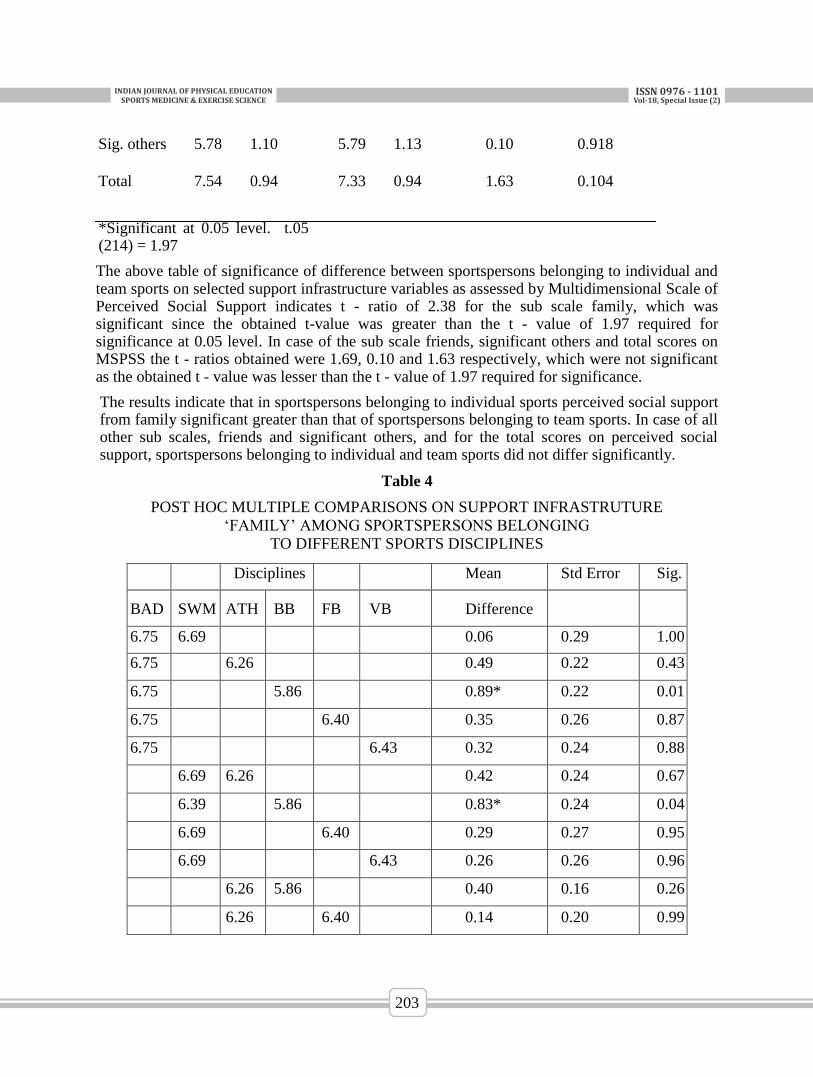
INDIANJOURNALOFPHYSICALEDUCATIONSPORTSMEDICINE&EXERCISESCIENCE
ISSN0976-1101Vol-18,SpecialIssue(2)
203
Sig. others 5.78 1.10 5.79 1.13 0.10 0.918
Total 7.54 0.94 7.33 0.94 1.63 0.104
*Significant at 0.05 level. t.05 (214) = 1.97
The above table of significance of difference between sportspersons belonging to individual and team sports on selected support infrastructure variables as assessed by Multidimensional Scale of Perceived Social Support indicates t - ratio of 2.38 for the sub scale family, which was significant since the obtained t-value was greater than the t - value of 1.97 required for significance at 0.05 level. In case of the sub scale friends, significant others and total scores on MSPSS the t - ratios obtained were 1.69, 0.10 and 1.63 respectively, which were not significant as the obtained t - value was lesser than the t - value of 1.97 required for significance.
The results indicate that in sportspersons belonging to individual sports perceived social support from family significant greater than that of sportspersons belonging to team sports. In case of all other sub scales, friends and significant others, and for the total scores on perceived social support, sportspersons belonging to individual and team sports did not differ significantly.
Table 4
POST HOC MULTIPLE COMPARISONS ON SUPPORT INFRASTRUTURE ‘FAMILY’ AMONG SPORTSPERSONS BELONGING
TO DIFFERENT SPORTS DISCIPLINES
Disciplines Mean Std Error Sig.
BAD SWM ATH BB FB VB Difference
6.75 6.69 0.06 0.29 1.00
6.75 6.26 0.49 0.22 0.43
6.75 5.86 0.89* 0.22 0.01
6.75 6.40 0.35 0.26 0.87
6.75 6.43 0.32 0.24 0.88
6.69 6.26 0.42 0.24 0.67
6.39 5.86 0.83* 0.24 0.04
6.69 6.40 0.29 0.27 0.95
6.69 6.43 0.26 0.26 0.96
6.26 5.86 0.40 0.16 0.26
6.26 6.40 0.14 0.20 0.99
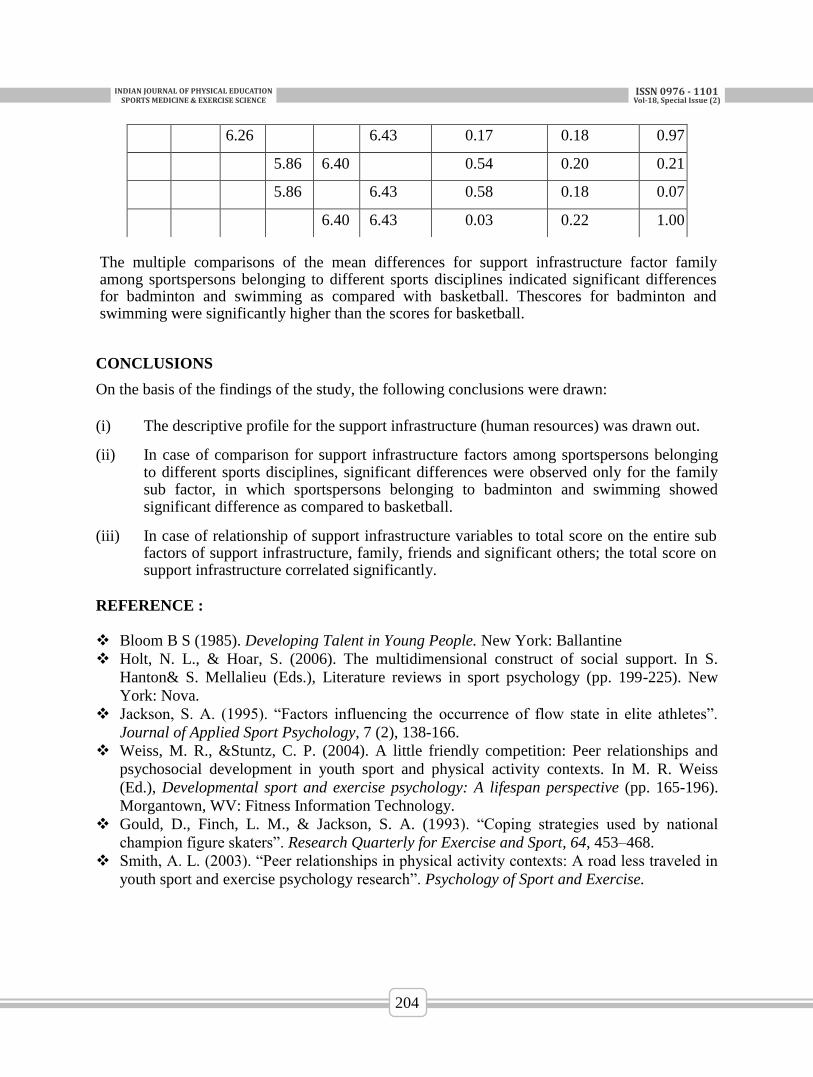
INDIANJOURNALOFPHYSICALEDUCATIONSPORTSMEDICINE&EXERCISESCIENCE
ISSN0976-1101Vol-18,SpecialIssue(2)
204
The multiple comparisons of the mean differences for support infrastructure factor family among sportspersons belonging to different sports disciplines indicated significant differences for badminton and swimming as compared with basketball. Thescores for badminton and swimming were significantly higher than the scores for basketball.
CONCLUSIONS
On the basis of the findings of the study, the following conclusions were drawn:
(i) The descriptive profile for the support infrastructure (human resources) was drawn out.
(ii) In case of comparison for support infrastructure factors among sportspersons belonging to different sports disciplines, significant differences were observed only for the family sub factor, in which sportspersons belonging to badminton and swimming showed significant difference as compared to basketball.
(iii) In case of relationship of support infrastructure variables to total score on the entire sub factors of support infrastructure, family, friends and significant others; the total score on support infrastructure correlated significantly.
REFERENCE :
Bloom B S (1985). Developing Talent in Young People. New York: Ballantine
Holt, N. L., & Hoar, S. (2006). The multidimensional construct of social support. In S.
Hanton& S. Mellalieu (Eds.), Literature reviews in sport psychology (pp. 199-225). New
York: Nova.
Jackson, S. A. (1995). “Factors influencing the occurrence of flow state in elite athletes”.
Journal of Applied Sport Psychology, 7 (2), 138-166.
Weiss, M. R., &Stuntz, C. P. (2004). A little friendly competition: Peer relationships and
psychosocial development in youth sport and physical activity contexts. In M. R. Weiss
(Ed.), Developmental sport and exercise psychology: A lifespan perspective (pp. 165-196).
Morgantown, WV: Fitness Information Technology.
Gould, D., Finch, L. M., & Jackson, S. A. (1993). “Coping strategies used by national
champion figure skaters”. Research Quarterly for Exercise and Sport, 64, 453–468.
Smith, A. L. (2003). “Peer relationships in physical activity contexts: A road less traveled in
youth sport and exercise psychology research”. Psychology of Sport and Exercise.
6.26 6.43 0.17 0.18 0.97
5.86 6.40 0.54 0.20 0.21
5.86 6.43 0.58 0.18 0.07
6.40 6.43 0.03 0.22 1.00